| UNITED STATES SECURITIES AND EXCHANGE COMMISSION |
| WASHINGTON, D.C. 20549 |
| | FORM N-CSR |
| | CERTIFIED SHAREHOLDER REPORT OF |
| REGISTERED MANAGEMENT INVESTMENT COMPANIES |
| |
| Investment Company Act file number: | | 811-21958
|
| Exact name of registrant as specified in charter: | | DGHM Investment Trust
|
| Address of principal executive offices: | | 8730 Stony Point Parkway, Suite 205 |
| | | Richmond, VA 23235 |
| Name and address of agent for service: | | The Corporation Trust Company |
| | | 1209 Orange Street |
| | | Wilmington, DE 19801 |
| | | with a copy to: |
| | | John H. Lively |
| | | The Law Offices of John H. Lively & Associates, Inc. |
| | | A member firm of The 1940 Act Law GroupTM |
| | | 11300 Tomahawk Creek Parkway, Ste. 310 |
| | | Leawood, KS 66211 |
| Registrant’s telephone number, including area code: | | 800-653-2839
|
| Date of fiscal year end: | | Last day of February |
| Date of reporting period: | | February 28, 2013 |
Item #1. Reports to Stockholders.

Dalton, Greiner, Hartman, Maher & Co., LLC
A Boston Private Wealth Management Company
DGHM INVESTMENT TRUST
Annual Report to Shareholders
DGHM ALL-CAP VALUE FUND
DGHM V2000 SMALLCAP VALUE FUND
For the year ended February 28, 2013
DGHM INVESTMENT TRUST TABLE OF CONTENTS
| | | PAGE |
| Shareholder Letter - | | |
DGHM All-Cap Value Fund | | 2 |
DGHM V2000 SmallCap Value Fund | | 4 |
| | | |
| Schedule of Investments - | | |
DGHM All-Cap Value Fund | | 12 |
DGHM V2000 SmallCap Value Fund | | 15 |
| | | |
| Statements of Assets and Liabilities | | 18 |
| | | |
| Statements of Operations | | 19 |
| | | |
| Statements of Changes in Net Assets | | 20 |
| | | |
| Financial Highlights - | | |
DGHM All-Cap Value Fund | | 21 |
DGHM V2000 SmallCap Value Fund | | 27 |
| | | |
| Notes to Financial Statements | | 31 |
| | | |
| Report of Independent Registered Public Accounting Firm | | 41 |
| | | |
| Supplemental Information | | 42 |
| | | |
| About Your Funds’ Expenses | | 51 |
| | | |
This report and the financial statements contained herein are submitted for the general information of the shareholders of the DGHM All-Cap Value Fund and the DGHM V2000 SmallCap Value Fund (the ”Funds”). This report is not authorized for distribution to prospective investors in the Funds unless preceded or accompanied by an effective prospectus. Mutual fund shares are not deposits or obligations of, or guaranteed by, any depository institution. Shares are not insured by the FDIC, Federal Reserve Board or any other agency, and are subject to investment risks, including possible loss of principal amount invested. Neither the Funds nor the Funds’ distributor is a bank.
Distributor: First Dominion Capital Corp., 8730 Stony Point Parkway, Suite 205, Richmond, VA 23235, Phone 1-800-653-2839.
Investments in the Funds are subject to investment risks, including the possible loss of some or the entire principal amount invested. There can be no assurance that the Funds will be successful in meeting their investment objectives. Investments in the Funds are subject to the following risks: market risk, small-cap, mid-cap and large-cap securities risk, management style risk, sector risk, issuer risk, ETF risks, and short-term investment risk. More information about these risks and other risks can be found in the Funds’ prospectus.
The performance information quoted in this Annual Report represents past performance, which is not a guarantee of future results. Investment return and principal value of an investment will fluctuate so that an investor’s shares, when redeemed, may be worth more of less than their original cost. Current performance may be lower or higher than the performance data quoted. To obtain actual performance data regarding the Funds, including performance data current to the Funds’ most recent month-end, please call 1-800-653-2839.
An investor should consider the investment objectives, risks, and charges and expense of the Funds carefully before investing. The prospectus contains this and other information about the Funds. Copies of the prospectus are available by calling Shareholder Services at 1/800-653-2839. The prospectus should be read carefully before investing.
Stated performance in the Funds was achieved at some or all points during the period by Dalton, Greiner, Hartman, Maher & Co., LLC, the investment advisor to the Funds. The advisor waived or reimbursed part of the DGHM V2000 SmallCap Value Fund’s total expenses. Had the investment advisor not waived or reimbursed expenses of this Fund, this Fund’s performance would have been worse.
This Annual Report was first distributed to shareholders on or about April 29, 2013.
For more information on your DGHM All-Cap Value Fund or your DGHM V2000 SmallCap Value Fund:
See our website at www.dghm.com or call our Shareholder Services Group toll-free at 1-800-653-2839.
Dear Shareholder of the DGHM All-Cap Value Fund:
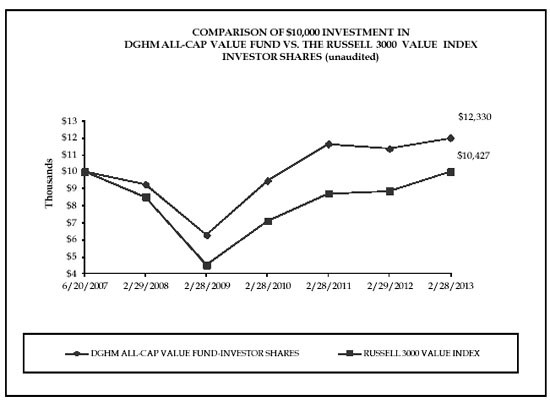
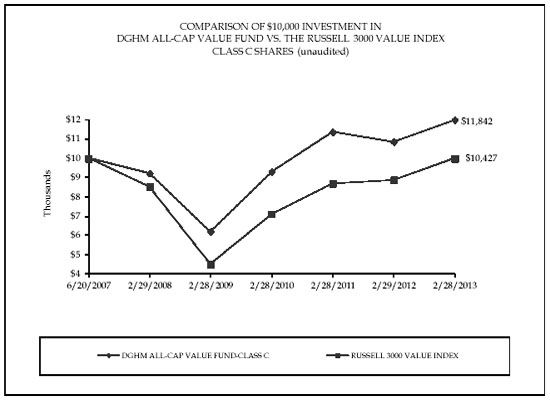
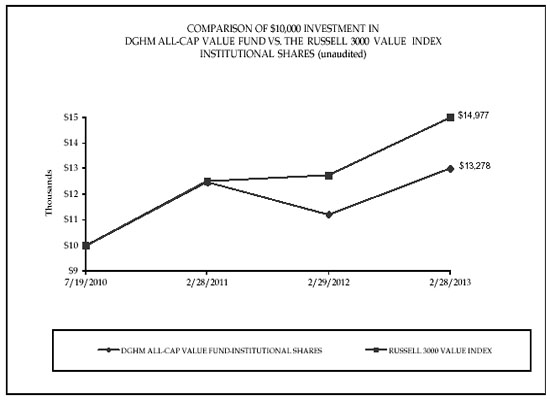
For the fiscal year ended February 28, 2013, the DGHM All-Cap Value Fund’s Investor Class shares returned 8.59%. The Fund’s Class C shares returned 7.88%. The Fund’s Institutional Class returned 9.03%. These returns are based on performance after fees and expenses. The Fund’s benchmark index (Russell 3000 Value) returned 17.57% during this time period.
Sectors that had a positive impact on performance were Technology, Insurance, and Business Services. Technology was led by Teradata (+9%), which is a database warehouse software company. Insurance was led by Aon (+22%) which is an insurance broker. Business Services was led by Manpower (+38%), which is temporary staffing company. As of the end of the period, we no longer hold Teredata and Aon, but continue to own Manpower.
Sectors that had a negative impact on performance were Retail, Consumer Services, and Energy. The Retail sector was negatively impacted by Best Buy (-54%), which is an electronics retailer. The consumer Services sector was negatively impacted by John Wiley (-18%), which is a publisher. The Energy sector was negatively impacted by Devon Corp (-25%), which is an Exploration & Production company with exposure to natural gas. All three of these positions have been sold from the portfolio. In fact, we have exited nine out of the ten worst performing positions over the past year.
While we are disappointed in our performance over the past year, the people and process that have produced strong positive results in the past are still in place. Every manager goes through periods of difficult performance and we are no exception. We have always performed strongly after periods of weakness in the past.
Given the events of the past several years in the economy and the stock market, I would like to remind all of our shareholders of the investment strategy that guides our stock picking:
| • | | We invest with a multi-year investment horizon rather than focusing on the month or quarter end. |
| | | |
| • | | We do not attempt to make macroeconomic calls. (i.e., predict economic growth, interest rates, currency levels, commodity prices etc.) |
| | | |
| • | | We do not predict the direction of the stock market. |
| | | |
| • | | We use a bottom-up selection process to attempt to identify companies that appear to be selling at a discount to our assessment of their potential value. |
| | | |
| • | | We focus on the cash flows, historical profitability, projected future earnings, and financial condition of individual companies in identifying which stocks we may purchase. |
| • | We also consider the following factors in deciding which companies may appear attractive: |
| | | • | Quality of the business franchise |
| | | • | Competitive advantage |
| | | • | Economic or market conditions |
| | | • | Deployment of capital |
| | | • | Reputation, experience, and competence of the company’s management |
| • | We believe that stocks purchased at prices below their potential value not only protect capital, but also offer significant price appreciation once the market recognizes a particular stock’s potential value. |
| | | | |
| • | Generally, stocks are sold when the characteristics and factors used to select the security change or the stock has appreciated to the point where it is no longer attractive versus other potential opportunities. |
We appreciate the opportunity to serve as your Fund’s Investment Advisor.
Yours truly,
Jeffrey C. Baker
Executive Vice President
Dalton, Greiner, Hartman, Maher & Co., LLC
Dear Shareholder of DGHM V2000 SmallCap Value Fund:
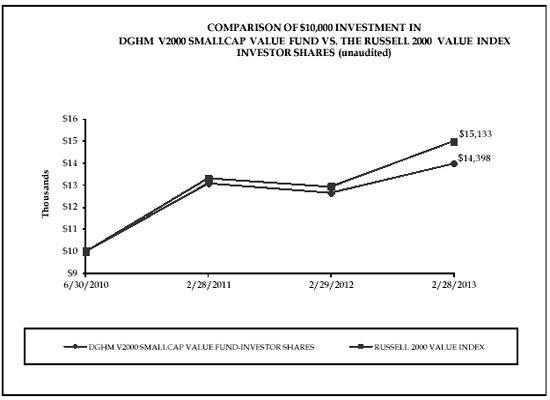
The DGHM V2000 Small Cap Fund Class I shares increased 14.1% and the Investor Class increased 13.8% for the fiscal year ending February 28, 2013. The Fund’s benchmark, the Russell 2000 Value, increased 16.9% during the same time period.
Gross of fees, the Fund outperformed the benchmark due to good stock selection in several sectors. The best performing sectors were capital goods, basic materials and health care partially offset by weakness in energy, technology and consumer services. The stocks driving the best performing sectors were Nacco Industries (+91%), Beacon Roofing (+56%), PolyOne Corp. (+72), PAREXEL International Corp. (+42%) and Icon PLC (+39%). Lower natural gas prices and poor execution caused declines in some of our energy stocks: Berry Petroleum(-42%) and Swift Energy (-38%). A delay in the Romley server product cycle drove the decline in technology holding Qlogic (-34%). Another technology holding, Lattice Semiconductor (-47%), reported poor results due to weakness in Europe and lower gross margins. Steiner Leisure (-6%), one of our consumer service stocks, declined due to softer revenue growth trends. Since we were able to find better risk-adjusted opportunities in other stocks we no long hold Berry Petroleum, Swift Energy, and Lattice Semiconductor.
At DGHM a key part of our strategy is conducting intensive fundamental research to build an attractive portfolio of high quality small cap stocks, one stock at a time. We strive to construct a portfolio with the ideal trade-off between low valuation, high profitability and financial strength. As the following table demonstrates, the collective effort of our ten sector specialists produced a portfolio with most characteristics superior to the benchmark.
| | | | | | | | | | | |
| | Portfolio Characteristics as of February 28, 2013 | |
| | | | | | | | | | | |
| | Valuation | | DGHM V2000 | | Russell 2000 Value | |
| | | | | | | | | | | |
| | EV/EBITDA(1) | | | 9.1x | | | | 9.5x | | |
| | Free Cash Flow Yield | | | 5.8% | | | | 5.4% | | |
| | Last 12 Months P/E | | | 18.7x | | | | 19.8x | | |
| | Dividend Yield | | | 2.0% | | | | 1.3% | | |
| | | | | | | | | | | |
| | Profitability | | | | | | | | | |
| | | | | | | | | | | |
| | EBITDA ROA (excludes cash) | | | 15.6% | | | | 11.7% | | |
| | 5YR Avg EBITDA ROA (excludes cash) | | | 16.1% | | | | 12.3% | | |
| | EBITDA Margins | | | 13.3% | | | | 12.3% | | |
| | Last 12 Months ROE | | | 10.0% | | | | 7.4% | | |
| | | | | | | | | | | |
| | Balance Sheet | | | | | | | | | |
| | | | | | | | | | | |
| | Net Debt / Total Capital | | | 35.6% | | | | 36.2% | | |
| | EBITDA / Interest Expense | | | 10.8x | | | | 8.0x | | |
| | (1) EV/EBITDA means Enterprise Value divided by Earnings Before Interest, Taxes, Depreciation and Amortization. Our definition of Enterprise Value is market capitalization plus debt plus other long-term liabilities minus cash. | |
| | | | | | | | | | | |
We appreciate the opportunity to serve as your Fund’s Investment Advisor.
Sincerely,
Peter Gulli, CFA
| | | Investor Shares | |
| | | | |
| | | | | | Average Annual Return | |
| | | | | | | |
| | | Total Return | | | | | | | |
| | | One Year Ended | | | Five years ended | | | Since Inception | |
| | | 2/28/2013 | | | 2/28/2013 | | | 06/20/07 to 02/28/13 | |
| | | | |
| | | | | | | | | | |
| DGHM All-Cap Value Fund: | | 8.59% | | | 5.89% | | | 3.74% | |
Russell 3000 Index: | | 17.57% | | | 4.11% | | | 0.74% | |
Returns do not reflect the deduction of taxes that a shareholder would pay on Fund distributions or redemption of shares. The total cumulative returns are historical in nature and measure net investment income and capital gain or loss from portfolio investments assuming reinvestments of dividends.
The Russell 3000 Value Index is generally considered to be representative of the performance of unmanaged common stocks that comprise the broad value segment of the U.S. securities markets. You cannot invest directly in this index. This index does not have an investment advisor and does not pay any commissions, expenses, or taxes. If this index did pay commissions, expenses, or taxes, its returns would be lower. The index is not adjusted to reflect expenses that the SEC requires to be reflected in the Fund’s performance.
The above returns for the Investor Shares of the Fund assumes an initial investment of $10,000 at June 20, 2007 (Commencement of Operations). All dividends and distributions are reinvested, if any. It is important to note that the Fund is a professionally managed mutual fund while the index is not available for investment and is unmanaged. The comparison is shown for illustrative purposes only. The Fund’s investment advisor has entered into a contractual arrangement with the Fund to waive its fees in an amount that limits Total Annual Fund Operating Expenses of the Fund to not more than 1.50%, excluding 12b-1 fees, for the period ending June 30, 2014. There can be no assurance that this arrangement will continue in the future. For more information, please see the Fund’s prospectus.
Performance quoted above represents past performance, which is no guarantee of future results. Investment return and principal value will fluctuate so that shares, when redeemed, may be worth more or less than their original cost. Current performance may be lower or higher than the performance data quoted.
| | | Class C Shares | |
| | | | |
| | | | | | Average Annual Return | |
| | | | | | | |
| | | Total Return | | | | | | | |
| | | One Year Ended | | | Five Years Ended | | | Since Inception | |
| | | 2/28/2013 | | | 2/28/2013 | | | 06/20/07 to 02/28/13 | |
| | | | |
| | | | | | | | | | |
| DGHM All-Cap Value Fund: | | 7.88% | | | 5.13% | | | 3.01% | |
Russell 3000 Index: | | 17.57% | | | 4.11% | | | 0.74% | |
Returns do not reflect the deduction of taxes that a shareholder would pay on Fund distributions or redemption of shares. The total cumulative returns are historical in nature and measure net investment income and capital gain or loss from portfolio investments assuming reinvestments of dividends.
The Russell 3000 Value Index is generally considered to be representative of the performance of unmanaged common stocks that comprise the broad value segment of the U.S. securities markets. You cannot invest directly in this index. This index does not have an investment advisor and does not pay any commissions, expenses, or taxes. If this index did pay commissions, expenses, or taxes, its returns would be lower. The index is not adjusted to reflect expenses that the SEC requires to be reflected in the Fund’s performance.
The above returns for the Class C Shares of the Fund assumes an initial investment of $10,000 at June 20, 2007 (Commencement of Operations). All dividends and distributions are reinvested, if any. It is important to note that the Fund is a professionally managed mutual fund while the index is not available for investment and is unmanaged. The comparison is shown for illustrative purposes only. The Fund’s investment advisor has entered into a contractual arrangement with the Fund to waive its fees in an amount that limits Total Annual Fund Operating Expenses of the Fund to not more than 1.50%, excluding 12b-1 fees, for the period ending June 30, 2014. There can be no assurance that this arrangement will continue in the future. For more information, please see the Fund’s prospectus.
Performance quoted above represents past performance, which is no guarantee of future results. Investment return and principal value will fluctuate so that shares, when redeemed, may be worth more or less than their original cost. Current performance may be lower or higher than the performance data quoted.
| | | Institutional Shares | |
| | | | |
| | | Total Return | | | | | | Return | |
| | | One Year Ended | | | | | | Since Inception | |
| | | 2/28/2013 | | | | | | 07/19/10 to 02/28/13 | |
| | | | |
| | | | | | | | | | |
| DGHM All-Cap Value Fund: | | 9.03% | | | | | | 11.45% | |
Russell 3000 Value Index: | | 17.57% | | | | | | 16.69% | |
Returns do not reflect the deduction of taxes that a shareholder would pay on Fund distributions or redemption of shares. The total cumulative returns are historical in nature and measure net investment income and capital gain or loss from portfolio investments assuming reinvestments of dividends.
The Russell 3000 Value Index is generally considered to be representative of the performance of unmanaged common stocks that comprise the broad value segment of the U.S. securities markets. You cannot invest directly in this index. This index does not have an investment advisor and does not pay any commissions, expenses, or taxes. If this index did pay commissions, expenses, or taxes, its returns would be lower. The index is not adjusted to reflect expenses that the SEC requires to be reflected in the Fund’s performance.
The above returns for the Institutional Shares of the Fund assumes an initial investment of $10,000 at July 19, 2010 (Commencement of Operations). All dividends and distributions are reinvested, if any. It is important to note that the Fund is a professionally managed mutual fund while the index is not available for investment and is unmanaged. The comparison is shown for illustrative purposes only. The Fund’s investment advisor has entered into a contractual arrangement with the Fund to waive its fees in an amount that limits Total Annual Fund Operating Expenses of the Fund to not more than 1.50%, excluding 12b-1 fees, for the period ending June 30, 2014. There can be no assurance that this arrangement will continue in the future. For more information, please see the Fund’s prospectus.
Performance quoted above represents past performance, which is no guarantee of future results. Investment return and principal value will fluctuate so that shares, when redeemed, may be worth more or less than their original cost. Current performance may be lower or higher than the performace data quoted.
| | | Investor Shares | |
| | | | |
| | | | | | | | | Average Annual | |
| | | Total Return | | | | | | Return | |
| | | One Year Ended | | | | | | Since Inception | |
| | | 2/28/2013 | | | | | | 06/30/10 to 02/28/13 | |
| | | | |
| | | | | | | | | | |
| DGHM V2000 SmallCap Value Fund: | | 13.77% | | | | | | 14.64% | |
Russell 2000 Value Index: | | 16.89% | | | | | | 16.80% | |
Returns do not reflect the deduction of taxes that a shareholder would pay on Fund distributions or redemption of shares. The total cumulative returns are historical in nature and measure net investment income and capital gain or loss from portfolio investments assuming reinvestments of dividends.
The Russell 2000 Value Index measures the performance of small-cap value segment of the U.S. equity universe. It includes those Russell 2000 companies with lower price-to-book ratios and lower forecasted growth values. The Russell 2000 Value Index is constructed to provide a comprehensive and unbiased barometer for the small-cap value segment. The Index is completely reconstituted annually to ensure larger stocks do not distort the performance and characteristics of the true small-cap opportunity set and that the represented companies continue to reflect value characteristics.
The above returns for the Investor Shares of the Fund assumes an initial investment of $10,000 at June 30, 2010 (Commencement of Operations). All dividends and distributions are reinvested, if any. It is important to note that the Fund is a professionally managed mutual fund while the index is not available for investment and is unmanaged. The comparison is shown for illustrative purposes only. The Fund’s investment advisor has entered into a contractual arrangement with the Fund to waive its fees in an amount that limits Total Annual Fund Operating Expenses of the Fund to not more than 1.65%, excluding 12b-1 fees, for the period ending June 30, 2014. There can be no assurance that this arrangement will continue in the future. For more information, please see the Fund’s prospectus.
Performance quoted above represents past performance, which is no guarantee of future results. Investment return and principal value will fluctuate so that shares, when redeemed, may be worth more or less than their original cost. Current performance may be lower or higher than the performance data quoted.

| | | Institutional Shares | |
| | | | |
| | | | | | | | | Average Annual | |
| | | Total Return | | | | | | Return | |
| | | One Year Ended | | | | | | Since Inception | |
| | | 2/28/2013 | | | | | | 06/30/10 to 02/28/13 | |
| | | | |
| | | | | | | | | | |
| DGHM V2000 SmallCap Value Fund: | | 14.08% | | | | | | 15.19% | |
Russell 2000 Value Index: | | 16.89% | | | | | | 16.80% | |
Returns do not reflect the deduction of taxes that a shareholder would pay on Fund distributions or redemption of shares. The total cumulative returns are historical in nature and measure net investment income and capital gain or loss from portfolio investments assuming reinvestments of dividends.
The Russell 2000 Value Index measures the performance of small-cap value segment of the U.S. equity universe. It includes those Russell 2000 companies with lower price-to-book ratios and lower forecasted growth values. The Russell 2000 Value Index is constructed to provide a comprehensive and unbiased barometer for the small-cap value segment. The Index is completely reconstituted annually to ensure larger stocks do not distort the performance and characteristics of the true small-cap opportunity set and that the represented companies continue to reflect value characteristics.
The above returns for the Institutional Shares of the Fund assumes an initial investment of $10,000 at June 30, 2010 (Commencement of Operations). All dividends and distributions are reinvested, if any. It is important to note that the Fund is a professionally managed mutual fund while the index is not available for investment and is unmanaged. The comparison is shown for illustrative purposes only. The Fund’s investment advisor has entered into a contractual arrangement with the Fund to waive its fees in an amount that limits Total Annual Fund Operating Expenses of the Fund to not more than 1.65%, excluding 12b-1 fees, for the period ending June 30, 2014. There can be no assurance that this arrangement will continue in the future. For more information, please see the Fund’s prospectus.
Performance quoted above represents past performance, which is no guarantee of future results. Investment return and principal value will fluctuate so that shares, when redeemed, may be worth more or less than their original cost. Current performance may be lower or higher than the performance data quoted.
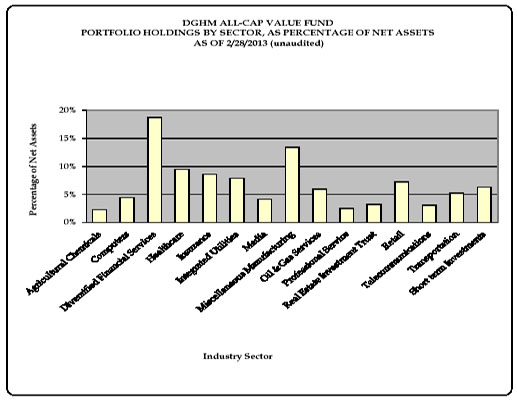
DGHM ALL-CAP VALUE FUND
SCHEDULE OF INVESTMENTS
February 28, 2013
| |
| Number of | | | | % of | | | | |
| Shares | | Security Description | | Net Assets | | Value |
| | | | | | | |
| | | COMMON STOCKS | | 96.17 | % | | | | |
| | | | | | | | | | |
| | | AGRICULTURAL CHEMICALS | | 2.31 | % | | | | |
| 13,811 | | Agrium Inc. | | | | | $ | 1,428,748 | |
| | | | | | | | |
| | | | | | | | | | |
| | | COMPUTERS | | 4.48 | % | | | | |
| 37,105 | | Akamai Technologies, Inc.* | | | | | | 1,371,401 | |
| 6,944 | | International Business Machines Corporation | | | | | | 1,394,564 | |
| | | | | | | | |
| | | | | | | | | 2,765,965 | |
| | | | | | | | |
| | | DIVERSIFIED FINANCIAL SERVICES | | 18.74 | % | | | | |
| 34,370 | | CIT Group Inc.* | | | | | | 1,438,728 | |
| 56,660 | | Invesco Limited | | | | | | 1,517,921 | |
| 49,244 | | JPMorgan Chase & Co. | | | | | | 2,409,016 | |
| 188,840 | | KeyCorp | | | | | | 1,773,208 | |
| 344,510 | | Regions Financial Corp. | | | | | | 2,635,502 | |
| 31,890 | | State Street Corp. | | | | | | 1,804,655 | |
| | | | | | | | |
| | | | | | | | | 11,579,030 | |
| | | | | | | | |
| | | HEALTHCARE | | 9.42 | % | | | | |
| 31,460 | | Baxter International Inc. | | | | | | 2,126,696 | |
| 24,770 | | Covance Inc.* | | | | | | 1,649,434 | |
| 31,975 | | Stryker Corp. | | | | | | 2,042,563 | |
| | | | | | | | |
| | | | | | | | | 5,818,693 | |
| | | | | | | | |
| | | INSURANCE | | 8.64 | % | | | | |
| 18,117 | | ACE Limited | | | | | | 1,547,011 | |
| 34,200 | | Allstate Corp. | | | | | | 1,573,884 | |
| 75,180 | | Lincoln National Corp. | | | | | | 2,220,817 | |
| | | | | | | | |
| | | | | | | | | 5,341,712 | |
| | | | | | | | |
| | | INTEGRATED UTILITIES | | 7.90 | % | | | | |
| 26,140 | | DTE Energy Co. | | | | | | 1,746,152 | |
| 43,550 | | Public Service Enterprise Group Inc. | | | | | | 1,419,295 | |
| 50,150 | | Southwestern Energy Co.* | | | | | | 1,718,641 | |
| | | | | | | | |
| | | | | | | | | 4,884,088 | |
| | | | | | | | |
| | | MEDIA | | 4.16 | % | | | | |
| 25,114 | | The DIRECTV Group, Inc. Class A* | | | | | | 1,209,741 | |
| 25,621 | | Time Warner Inc. | | | | | | 1,362,269 | |
| | | | | | | | |
| | | | | | | | | 2,572,010 | |
| | | | | | | | |
| | | MISCELLANEOUS MANUFACTURING | | 13.42 | % | | | | |
| 16,332 | | 3M Company | | | | | | 1,698,528 | |
| 38,365 | | Analog Devices, Inc. | | | | | | 1,734,865 | |
| 19,197 | | Becton, Dickinson and Co. | | | | | | 1,690,488 | |
| 22,630 | | Dover Corp. | | | | | | 1,659,911 | |
| 56,574 | | Kapstone Paper and Packing Corp. | | | | | | 1,507,131 | |
| | | | | | | | |
| | | | | | | | | 8,290,923 | |
| | | | | | | | |
| | | OIL & GAS SERVICES | | 5.90 | % | | | | |
| 14,200 | | Helmerich & Payne, Inc. | | | | | | 940,892 | |
| 26,370 | | Patterson-Uti Energy, Inc. | | | | | | 615,476 | |
| 16,627 | | Pioneer Natural Resources Co. | | | | | | 2,091,843 | |
| | | | | | | | |
| | | | | | | | | 3,648,211 | |
| | | | | | | | |
DGHM ALL-CAP VALUE FUND
SCHEDULE OF INVESTMENTS (continued)
February 28, 2013
| |
| Number of | | | | % of | | | | |
| Shares | | Security Description | | Net Assets | | Value |
| | | | | | | |
| | | PROFESSIONAL SERVICE | | 2.50 | % | | | | |
| 28,290 | | Manpower, Inc. | | | | | $ | 1,544,634 | |
| | | | | | | | |
| | | | | | | | | | |
| | | REAL ESTATE INVESTMENT TRUST | | 3.21 | % | | | | |
| 27,861 | | Alexandria Real Estate Equities, Inc. | | | | | | 1,982,031 | |
| | | | | | | | |
| | | | | | | | | | |
| | | RETAIL | | 7.21 | % | | | | |
| 87,095 | | Chico’s FAS, Inc. | | | | | | 1,478,873 | |
| 58,065 | | Iconix Brand Group, Inc.* | | | | | | 1,371,495 | |
| 54,860 | | The Kroger Co. | | | | | | 1,602,461 | |
| | | | | | | | |
| | | | | | | | | 4,452,829 | |
| | | | | | | | |
| | | | | | | | | | |
| | | TELECOMMUNICATIONS | | 3.04 | % | | | | |
| 52,290 | | AT&T Inc. | | | | | | 1,877,734 | |
| | | | | | | | |
| | | | | | | | | | |
| | | TRANSPORTATION | | 5.24 | % | | | | |
| 36,855 | | Thor Industries, Inc. | | | | | | 1,385,379 | |
| 39,092 | | Tidewater Inc. | | | | | | 1,850,224 | |
| | | | | | | | |
| | | | | | | | | 3,235,603 | |
| | | | | | | | |
| | | | | | | | | | |
| | | TOTAL COMMON STOCKS | | | | | | | |
| | | (Cost: $48,020,747) | | 96.17 | % | | | 59,422,211 | |
| | | | | | | | |
| | | | | | | | | | |
| | | SHORT TERM INVESTMENTS | | 6.30 | % | | | | |
| | | Well Fargo Advantage Treasury Plus | | | | | | | |
| | | Money Market Fund 0.1%** | | | | | | | |
| 3,893,794 | | (Cost: $3,893,794) | | | | | | 3,893,794 | |
| | | | | | | | |
| | | | | | | | | | |
| | | TOTAL INVESTMENTS: | | | | | | | |
| | | (Cost: $51,914,541) | | 102.47 | % | | | 63,316,005 | |
| | | Other liabilities, net of assets | | -2.47 | % | | | (1,529,829 | ) |
| | | | | | | |
| | | NET ASSETS | | 100.00 | % | | $ | 61,786,176 | |
| | | | | | | |
*Non-income producing (security is considered non-income producing if at least one dividend has not been paid during the the last year preceding the date of the Fund’s related balance sheet).
**Effective 7 day yield as of February 28, 2013
See Notes to Financial Statements
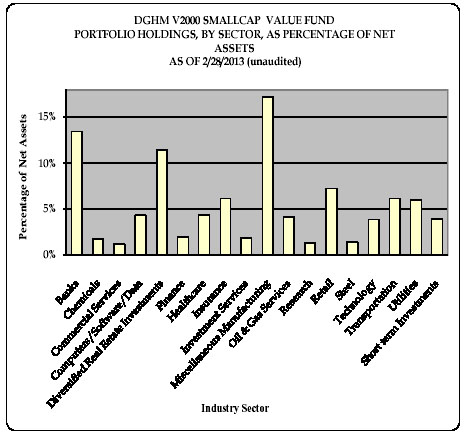
| DGHM V2000 SMALLCAP VALUE FUND |
| SCHEDULE OF INVESTMENTS |
| February 28, 2013 |
| |
| Number of | | | | % of | | | | |
| Shares | | Security Description | | Net Assets | | Value |
| | | | | | | |
| | | COMMON STOCKS | | 93.87 | % | | | | |
| | | | | | | | | | |
| | | BANKS | | 13.44 | % | | | | |
| 552 | | Associated Banc-Corp. | | | | | $ | 7,943 | |
| 365 | | Colony Financial Inc. | | | | | | 8,085 | |
| 87 | | Community Trust Bancorp, Inc. | | | | | | 2,969 | |
| 690 | | National Penn Bancshares, Inc. | | | | | | 6,762 | |
| 615 | | Old National Bancorp | | | | | | 8,303 | |
| 466 | | Provident Financial Services | | | | | | 6,985 | |
| 289 | | Sandy Spring Bancorp, Inc. | | | | | | 5,595 | |
| 235 | | Webster Financial Corp. | | | | | | 5,175 | |
| 249 | | WesBanco, Inc. | | | | | | 5,824 | |
| | | | | | | | |
| | | | | | | | | 57,641 | |
| | | | | | | | |
| | | | | | | | | | |
| | | CHEMICALS | | 1.71 | % | | | | |
| 321 | | PolyOne Corp. | | | | | | 7,316 | |
| | | | | | | | |
| | | | | | | | | | |
| | | COMMERCIAL SERVICES | | 1.21 | % | | | | |
| 110 | | Steiner Leisure Ltd.* | | | | | | 5,187 | |
| | | | | | | | |
| | | | | | | | | | |
| | | COMPUTERS/SOFTWARE/DATA | | 4.30 | % | | | | |
| 402 | | Acxiom Corp.* | | | | | | 7,320 | |
| 391 | | Qlogic Corp* | | | | | | 4,450 | |
| 449 | | Sykes Enterprise, Inc.* | | | | | | 6,672 | |
| | | | | | | | |
| | | | | | | | | 18,442 | |
| | | | | | | | |
| | | | | | | | | | |
| | | DIVERSIFIED REAL ESTATE INVESTMENTS | | 11.43 | % | | | | |
| 326 | | BioMed Realty Trust, Inc. | | | | | | 6,885 | |
| 313 | | Colonial Properties Trust | | | | | | 6,748 | |
| 799 | | Cousins Properties, Inc. | | | | | | 7,766 | |
| 535 | | Glimcher Realty Trust | | | | | | 6,024 | |
| 1,422 | | Hersha Hospitality Trust | | | | | | 7,978 | |
| 152 | | Koppers Holdings, Inc. | | | | | | 6,305 | |
| 157 | | Sun Communities, Inc. | | | | | | 7,305 | |
| | | | | | | | |
| | | | | | | | | 49,011 | |
| | | | | | | | |
| | | | | | | | | | |
| | | FINANCE | | 1.93 | % | | | | |
| 683 | | Global Cash Access Holdings, Inc.* | | | | | | 4,849 | |
| 89 | | Piper Jaffray Companies, Inc.* | | | | | | 3,433 | |
| | | | | | | | |
| | | | | | | | | 8,282 | |
| | | | | | | | |
| | | | | | | | | | |
| | | HEALTHCARE | | 4.32 | % | | | | |
| 209 | | Hanger, Inc.* | | | | | | 6,199 | |
| 255 | | ICON PLC ADR* | | | | | | 7,946 | |
| 77 | | ICU Medical, Inc.* | | | | | | 4,370 | |
| | | | | | | | |
| | | | | | | | | 18,515 | |
| | | | | | | | |
| DGHM V2000 SMALLCAP VALUE FUND |
| SCHEDULE OF INVESTMENTS (continued) |
| February 28, 2013 |
| |
| Number of | | | | % of | | | | |
| Shares | | Security Description | | Net Assets | | Value |
| | | | | | | |
| | | INSURANCE | | 6.16 | % | | | | |
| 269 | | Alterra Capital Holdings Ltd. | | | | | $ | 8,242 | |
| 168 | | First American Financial Corp. | | | | | | 4,081 | |
| 185 | | Hanover Insurance Group Inc. | | | | | | 7,896 | |
| 616 | | Maiden Holdings Ltd. | | | | | | 6,209 | |
| | | | | | | | |
| | | | | | | | | 26,428 | |
| | | | | | | | |
| | | | | | | | | | |
| | | INVESTMENT SERVICES | | 1.88 | % | | | | |
| 151 | | GAMCO Investors, Inc. Class A | | | | | | 8,079 | |
| | | | | | | | |
| | | | | | | | | | |
| | | MISCELLANEOUS MANUFACTURING | | 17.23 | % | | | | |
| 176 | | Beacon Roofing Supply, Inc.* | | | | | | 6,494 | |
| 155 | | Brady Corp. Class A | | | | | | 5,278 | |
| 84 | | Cytec Industries Inc. | | | | | | 6,081 | |
| 530 | | Electro Scientific Industries, Inc. | | | | | | 5,835 | |
| 238 | | EMCOR Group, Inc. | | | | | | 9,180 | |
| 70 | | L. B. Foster Co. Class A | | | | | | 3,091 | |
| 348 | | Herman Miller, Inc. | | | | | | 8,352 | |
| 82 | | Hyster-Yale Materials Handling, Inc. | | | | | | 4,201 | |
| 84 | | Kaiser Aluminum Corp. | | | | | | 5,144 | |
| 414 | | Kulicke & Soffa Industries, Inc.* | | | | | | 4,479 | |
| 118 | | Mueller Industries, Inc. | | | | | | 6,275 | |
| 41 | | NACCO Industries, Inc. Class A | | | | | | 2,382 | |
| 280 | | NetScout Systems, Inc. | | | | | | 7,121 | |
| | | | | | | | |
| | | | | | | | | 73,913 | |
| | | | | | | | |
| | | | | | | | | | |
| | | OIL & GAS SERVICES | | 4.18 | % | | | | |
| 348 | | Comstock Resources, Inc.* | | | | | | 4,914 | |
| 474 | | Rex Energy Corp.* | | | | | | 6,389 | |
| 201 | | Vectren Corp. | | | | | | 6,633 | |
| | | | | | | | |
| | | | | | | | | 17,936 | |
| | | | | | | | |
| | | | | | | | | | |
| | | RESEARCH | | 1.29 | % | | | | |
| 159 | | Parexel International Corp.* | | | | | | 5,516 | |
| | | | | | | | |
| | | | | | | | | | |
| | | RETAIL | | 7.25 | % | | | | |
| 200 | | The Cato Corp. Class A | | | | | | 5,132 | |
| 508 | | Chico’s FAS, Inc. | | | | | | 8,626 | |
| 95 | | Papa John’s International, Inc.* | | | | | | 4,941 | |
| 144 | | rue21, Inc.* | | | | | | 3,888 | |
| 210 | | Weis Markets, Inc. | | | | | | 8,496 | |
| | | | | | | | |
| | | | | | | | | 31,083 | |
| | | | | | | | |
| | | | | | | | | | |
| | | STEEL | | 1.43 | % | | | | |
| 92 | | Reliance Steel & Aluminum Co. | | | | | | 6,126 | |
| | | | | | | | |
| | | | | | | | | | |
| | | TECHNOLOGY | | 3.89 | % | | | | |
| 138 | | Anixter International Inc. | | | | | | 9,511 | |
| 183 | | Booz Allen Hamilton Holding Corp. | | | | | | 2,343 | |
| 369 | | Silicon Motiion Technology Corp. ADR | | | | | | 4,819 | |
| | | | | | | | |
| | | | | | | | | 16,673 | |
| | | | | | | | |
| DGHM V2000 SMALLCAP VALUE FUND |
| SCHEDULE OF INVESTMENTS (continued) |
| February 28, 2013 |
| |
| Number of | | | | % of | | | | |
| Shares | | Security Description | | Net Assets | | Value |
| | | | | | | |
| | | TRANSPORTATION | | 6.18 | % | | | | |
| 602 | | Heartland Express, Inc. | | | | | $ | 8,169 | |
| 180 | | Old Dominion Freight Line, Inc.* | | | | | | 6,471 | |
| 316 | | Thor Industries, Inc. | | | | | | 11,879 | |
| | | | | | | | |
| | | | | | | | | 26,519 | |
| | | | | | | | |
| | | | | | | | | | |
| | | UTILITIES | | 6.04 | % | | | | |
| 137 | | Cleco Corp. | | | | | | 6,069 | |
| 171 | | PDC Energy, Inc.* | | | | | | 7,975 | |
| 93 | | Pinnacle West Capital Corp. | | | | | | 5,202 | |
| 224 | | Portland General Electric Co. | | | | | | 6,651 | |
| | | | | | | | |
| | | | | | | | | 25,897 | |
| | | | | | | | |
| | | | | | | | | | |
| | | TOTAL COMMON STOCKS | | 93.87 | % | | | 402,564 | |
| | | | | | | | |
| | | (Cost: $346,557) | | | | | | | |
| | | | | | | | | | |
| | | | | | | | | | |
| | | SHORT TERM INVESTMENTS | | 3.97 | % | | | | |
| | | Wells Fargo Advantage Treasury Plus | | | | | | | |
| 17,056 | | Money Market Fund 0.1%** | | | | | | 17,056 | |
| | | | | | | | |
| | | (Cost: $17,056) | | | | | | | |
| | | | | | | | | | |
| | | TOTAL INVESTMENTS: | | | | | | | |
| | | (Cost: $363,613) | | 97.84 | % | | | 419,620 | |
| | | Other assets, net of liabilities | | 2.16 | % | | | 9,245 | |
| | | | | | | |
| | | NET ASSETS | | 100.00 | % | | $ | 428,865 | |
| | | | | | | |
*Non-income producing (security is considered non-income producing if at least one dividend has not been paid during the last year preceding the date of the Fund’s related balance sheet).
**Effective 7 day yield as of February 28, 2013
ADR - Security represented is held by the custodian bank in the form of American Depositary Receipts.
See Notes to Financial Statements
| DGHM INVESTMENT TRUST |
| STATEMENTS OF ASSETS AND LIABILITIES |
| February 28, 2013 |
| |
| | | | | | | DGHM V2000 |
| | | DGHM All-Cap | | SmallCap Value |
| | | Value Fund | | Fund |
| | | |
| ASSETS | | | | | | | | |
Investments at value (identified cost of $51,914,541 and $363,613, respectively) (Note 1) | | $ | 63,316,005 | | | $ | 419,620 | |
Receivable for investments sold | | | 13,063,827 | | | | 1,887 | |
Receivable for capital stock sold | | | 122,742 | | | | - | |
Dividends receivable | | | 76,100 | | | | 574 | |
Interest receivable | | | 31 | | | | - | |
Due from advisor | | | - | | | | 5,375 | |
Prepaid expenses | | | 23,406 | | | | 5,058 | |
| | | | | |
TOTAL ASSETS | | | 76,602,111 | | | | 432,514 | |
| | | | | |
| LIABILITIES | | | | | | | | |
Payable for securities purchased | | | 3,147,868 | | | | - | |
Payable for capital stock redeemed | | | 11,605,010 | | | | - | |
Accrued investment management fees | | | 37,065 | | | | - | |
Accrued 12b-1 fees | | | 2,783 | | | | 3 | |
Accrued administration, transfer agent and accounting fees | | | 6,340 | | | | 1,173 | |
Accrued custody fees | | | 1,371 | | | | 1,973 | |
Other accrued expenses | | | 15,498 | | | | 500 | |
| | | | | |
TOTAL LIABILITIES | | | 14,815,935 | | | | 3,649 | |
| | | | | |
| NET ASSETS | | $ | 61,786,176 | | | $ | 428,865 | |
| | | | | |
| Net Assets Consist of: | | | | | | | | |
Paid-in-capital applicable to 5,260,013 and 49,005 no par value shares of beneficial interest outstanding, respectively | | $ | 49,410,465 | | | $ | 374,302 | |
Accumulated net investment income (loss) | | | (61,729 | ) | | | 2,049 | |
Accumulated net realized gain (loss) on investments | | | 1,035,976 | | | | (3,493 | ) |
Net unrealized appreciation (depreciation) of investments | | | 11,401,464 | | | | 56,007 | |
| | | | | |
Net Assets | | $ | 61,786,176 | | | $ | 428,865 | |
| | | | | |
| NET ASSET VALUE, OFFERING AND REDEMPTION PRICE PER SHARE | | | | | | | | |
| Investor Class | | | | | | | | |
($30,165,360 / 2,557,761 shares outstanding and $238,041 / 27,507 shares outstanding, respectively) | | $ | 11.79 | | | $ | 8.65 | |
| | | | | |
| Class C (a) | | | | | | | | |
($5,111,472 / 445,716 shares outstanding) | | $ | 11.47 | | | | N/A | |
| | | | | |
| | | | | | | | | |
| Institutional Class | | | | | | | | |
($26,509,344 / 2,256,536 shares outstanding and $190,824 / 21,498 shares outstanding, respectively) | | $ | 11.75 | | | $ | 8.88 | |
| | | | | |
(a)May be subject to a contingent deferred sales charge if redeemed within one year of purchase (see Note 1)
See Notes to Financial Statements
| DGHM INVESTMENT TRUST |
| STATEMENTS OF OPERATIONS |
| For the year ended February 28, 2013 |
| |
| | | | | | | DGHM V2000 |
| | | DGHM All-Cap | | SmallCap Value |
| | | Value Fund | | Fund |
| | | | | |
| | | | | | | | | |
| INVESTMENT INCOME | | | | | | | | |
Dividends | | $ | 2,391,461 | | | $ | 11,506 | |
Interest | | | 239 | | | | 2 | |
| | | | | |
Total investment income | | | 2,391,700 | | | | 11,508 | |
| | | | | |
| | | | | | | | | |
| EXPENSES | | | | | | | | |
Investment advisory fees (Note 2) | | | 671,851 | | | | 2,745 | |
12b-1 fees (Note 2) | | | | | | | | |
Investor Class | | | 136,873 | | | | 346 | |
Class C | | | 46,921 | | | | - | |
Recordkeeping and administrative services (Note 2) | | | 94,588 | | | | 10,614 | |
Accounting fees (Note 2) | | | 51,681 | | | | 10,716 | |
Custodian fees | | | 36,271 | | | | 9,488 | |
Transfer agent fees (Note 2) | | | | | | | | |
Investor Class | | | 55,579 | | | | 4,453 | |
Class C | | | 5,400 | | | | - | |
Institutional Class | | | 16,988 | | | | 3,389 | |
Professional fees | | | 57,121 | | | | 11,983 | |
Filing and registration fees | | | 58,696 | | | | 6,000 | |
Trustee fees | | | 11,965 | | | | 2,035 | |
Compliance fees | | | 19,840 | | | | 6,543 | |
Shareholder servicing and reports | | | | | | | | |
Investor Class | | | 31,719 | | | | 254 | |
Class C | | | 1,963 | | | | - | |
Institutional Class | | | 17,662 | | | | 86 | |
Other | | | 72,542 | | | | 781 | |
| | | | | |
Total expenses | | | 1,387,660 | | | | 69,433 | |
Advisory fee waivers and reimbursed expenses (Note 2) | | | - | | | | (47,899 | ) |
Legal and Compliance fees waivers | | | - | | | | (15,526 | ) |
| | | | | |
Net Expenses | | | 1,387,660 | | | | 6,008 | |
| | | | | |
| | | | | | | | | |
Net investment income (loss) | | | 1,004,040 | | | | 5,500 | |
| | | | | |
| | | | | | | | | |
| REALIZED AND UNREALIZED GAIN (LOSS) ON INVESTMENTS | | | | | | | | |
Net realized gain (loss) on investments | | | 2,771,410 | | | | 5,232 | |
Net increase (decrease) in unrealized appreciation (depreciation) of investments | | | (241,010 | ) | | | 37,357 | |
| | | | | |
Net realized and unrealized gain (loss) on investments | | | 2,530,400 | | | | 42,589 | |
| | | | | |
| | | | | | | | | |
| | | | | | | | | |
| | | | | | | | | |
INCREASE (DECREASE) IN NET ASSETS FROM OPERATIONS | | $ | 3,534,440 | | | $ | 48,089 | |
| | | | | |
See Notes to Financial Statements
| DGHM INVESTMENT TRUST |
| STATEMENTS OF CHANGES IN NET ASSETS |
| |
| | | DGHM All-Cap Value Fund | | DGHM V2000 SmallCap Value Fund |
| | | | | |
| | | | | | | | | | | | | | | |
| | | For the | | For the | | For the | | For the |
| | | Year ended | | Year ended | | Year ended | | Year ended |
| | | February 28, 2013 | | | February 29, 2012 | | | February 28, 2013 | | February 29, 2012 |
| | | | | |
| Increase (decrease) in Net Assets | | | | | | | | | | | | | | | | |
| OPERATIONS | | | | | | | | | | | | | | | | |
Net investment income (loss) | | $ | 1,004,040 | | | $ | 988,777 | | | $ | 5,500 | | | $ | (1,085 | ) |
Net realized gain (loss) on investments | | | 2,771,410 | | | | 1,460,015 | | | | 5,232 | | | | 127,083 | |
Net increase (decrease) in unrealized appreciation (depreciation) of investments | | | (241,010 | ) | | | (3,681,521 | ) | | | 37,357 | | | | (139,941 | ) |
| | | | | | | | | |
Increase (decrease) in net assets from operations | | | 3,534,440 | | | | (1,232,729 | ) | | | 48,089 | | | | (13,943 | ) |
| | | | | | | | | |
| | | | | | | | | | | | | | | | | |
| DISTRIBUTIONS TO SHAREHOLDERS | | | | | | | | | | | | | | | | |
Net investment income | | | | | | | | | | | | | | | | |
Investor Class | | | (442,735 | ) | | | (420,103 | ) | | | (823 | ) | | | (2,858 | ) |
Class C | | | (55,742 | ) | | | - | | | | - | | | | - | |
Institutional Class | | | (790,843 | ) | | | (464,149 | ) | | | (2,628 | ) | | | (9,249 | ) |
Net realized gain | | | | | | | | | | | | | | | | |
Investor Class | | | (289,874 | ) | | | (676,148 | ) | | | (2,389 | ) | | | (23,167 | ) |
Class C | | | (46,769 | ) | | | (43,005 | ) | | | - | | | | - | |
Institutional Class | | | (346,596 | ) | | | (515,430 | ) | | | (2,454 | ) | | | (108,942 | ) |
| | | | | | | | | |
Decrease in net assets from distributions | | | (1,972,559 | ) | | | (2,118,835 | ) | | | (8,294 | ) | | | (144,216 | ) |
| | | | | | | | | |
| | | | | | | | | | | | | | | | | |
| CAPITAL STOCK TRANSACTIONS (Note 5) | | | | | | | | | | | | | | | | |
Shares sold | | | | | | | | | | | | | | | | |
Investor Class | | | 7,453,114 | | | | 29,935,397 | | | | 214,400 | | | | 28,553 | |
Class C | | | 568,788 | | | | 1,305,593 | | | | - | | | | - | |
Institutional Class | | | 9,834,182 | | | | 54,003,223 | | | | 24,029 | | | | 127,745 | |
Distributions reinvested | | | | | | | | | | | | | | | | |
Investor Class | | | 540,255 | | | | 929,237 | | | | 1,834 | | | | 26,024 | |
Class C | | | 94,640 | | | | 38,964 | | | | - | | | | - | |
Institutional Class | | | 916,989 | | | | 567,280 | | | | 5,034 | | | | 118,108 | |
Shares redeemed | | | | | | | | | | | | | | | | |
Investor Class | | | (54,276,992 | ) | | | (23,902,502 | ) | | | (73,555 | ) | | | (210,858 | ) |
Class C | | | (646,816 | ) | | | (1,012,844 | ) | | | - | | | | - | |
Institutional Class | | | (46,415,645 | ) | | | (9,679,422 | ) | | | (208,322 | ) | | | (764,301 | ) |
| | | | | | | | | |
Increase (decrease) in net assets from capital stock transactions | | | (81,931,485 | ) | | | 52,184,926 | | | | (36,580 | ) | | | (674,729 | ) |
| | | | | | | | | |
| | | | | | | | | | | | | | | | | |
| | | | | | | | | | | | | | | | | |
| NET ASSETS | | | | | | | | | | | | | | | | |
| | | | | | | | | | | | | | | | | |
Increase (decrease) during year | | | (80,369,604 | ) | | | 48,833,362 | | | | 3,215 | | | | (832,888 | ) |
Beginning of year | | | 142,155,780 | | | | 93,322,418 | | | | 425,650 | | | | 1,258,538 | |
| | | | | | | | | |
End of year (including accumulated net investment income (loss) of $(61,729), $104,525 and $2,049, $ -, respectively) | | $ | 61,786,176 | | | $ | 142,155,780 | | | $ | 428,865 | | | $ | 425,650 | |
| | | | | | | | | |
| | | | | | | | | | | | | | | | | |
See Notes to Financial Statements
| DGHM ALL-CAP VALUE FUND |
| FINANCIAL HIGHLIGHTS |
| SELECTED PER SHARE DATA FOR A SHARE OUTSTANDING THROUGHOUT EACH YEAR |
| |
| | | Investor Class Shares |
| | | |
| | | | | | | | | | | | | Year ended February 28, |
| | | | | | | | | | | | | |
| | | | | | | | | | | | | | | | | | | | | | | | | |
| | | Year ended | | | Year ended | | | | | | | | | | | | | | | |
| | | February 28, | | | February 29, | | | | | | | | | | | | | | | |
| | | 2013 | | | 2012 | | | 2011 | | | 2010 | | 2009 | |
| | | | | | | �� | | | | | | | | |
| Net asset value, beginning of year | | $ | 11.13 | | | | $ | 11.60 | | | | $ | 9.44 | | | | $ | 6.26 | | | $ | 9.26 | | |
| | | | | | | | | | | | | | | |
| Investment activities | | | | | | | | | | | | | | | | | | | | | | | | |
Net investment income (loss) | | | 0.09 | | (C) | | | 0.08 | | (C) | | | - | | (B)(C) | | | 0.01 | | | | 0.02 | | |
Net realized and unrealized gain | | | | | | | | | | | | | | | | | | | | | | | | |
(loss) on investments | | | 0.84 | | | | | (0.39 | ) | | | | 2.16 | | | | | 3.19 | | | | (3.01 | ) | |
| | | | | | | | | | | | | | | |
Total from investment activities | | | 0.93 | | | | | (0.31 | ) | | | | 2.16 | | | | | 3.20 | | | | (2.99 | ) | |
| | | | | | | | | | | | | | | |
| | | | | | | | | | | | | | | | | | | | | | | | | |
| Distributions | | | | | | | | | | | | | | | | | | | | | | | | |
Net investment income | | | (0.16 | ) | | | | (0.06 | ) | | | | - | | | | | - | | | | - | | |
Net realized gain | | | (0.11 | ) | | | | (0.10 | ) | | | | - | | (B) | | | (0.02 | ) | | | (0.01 | ) | |
| | | | | | | | | | | | | | | |
Total distributions | | | (0.27 | ) | | | | (0.16 | ) | | | | - | | | | | (0.02 | ) | | | (0.01 | ) | |
| | | | | | | | | | | | | | | |
| | | | | | | | | | | | | | | | | | | | | | | | | |
| | | | | | | | | | | | | | | | | | | | | | | | | |
| Net asset value, end of year | | $ | 11.79 | | | | $ | 11.13 | | | | $ | 11.60 | | | | $ | 9.44 | | | $ | 6.26 | | |
| | | | | | | | | | | | | | | |
| | | | | | | | | | | | | | | | | | | | | | | | | |
| | | | | | | | | | | | | | | | | | | | | | | | | |
| Total Return | | | 8.59% | | | | | (2.56% | ) | | | | 22.89% | | | | | 51.17% | | | | (32.26% | ) | |
| Ratios/Supplemental Data | | | | | | | | | | | | | | | | | | | | | | | | |
| Ratio to average net assets | | | | | | | | | | | | | | | | | | | | | | | | |
Expenses, net | | | 1.45% | | | | | 1.30% | | | | | 1.47% | | | | | 1.71% | | | | 1.75% | | (A) |
Net investment income (loss) | | | 0.86% | | | | | 0.74% | | | | | 0.04% | | | | | 0.19% | | | | 0.71% | | (A) |
| Portfolio turnover rate | | | 60.57% | | | | | 49.53% | | | | | 53.05% | | | | | 101.89% | | | | 90.97% | | |
| Net assets, end of year (000’s) | | $ | 30,165 | | | | $ | 75,004 | | | | $ | 71,124 | | | | $ | 43,669 | | | $ | 32,223 | | |
| (A) | Management fee waivers and reimbursement of expenses reduced the expense ratio and increased net investment income ratio by 0.72% for the year ended February 28, 2009. The ratios reflect the effect of the management fee waivers and reimbursement of expenses. |
| (B) | Less than $0.01 per share. |
| (C) | Per share amounts calculated using the average number of shares outstanding. |
See Notes to Financial Statements
DGHM ALL-CAP VALUE FUND
FINANCIAL HIGHLIGHTS
SELECTED PER SHARE DATA FOR A SHARE OUTSTANDING THROUGHOUT EACH YEAR
| | | Class C Shares |
| | | |
| | | | | | | | | | | | | | | | | | | | | |
| | | Year ended | | Year ended | | | | | | | | | | | | |
| | | February 28, | | February 29, | | Year ended February 28 |
| | | | | | | | | | | |
| | | 2013 | | 2012 | | 2011 | | 2010 | | 2009 |
| | | | | | | | | | | |
| Net asset value, beginning of year | | $ | 10.87 | | | $ | 11.36 | | | $ | 9.31 | | | $ | 6.20 | | | $ | 9.22 | |
| | | | | | | | | | | | | | | | |
| Investment activities | | | | | | | | | | | | | | | | | | | | |
Net investment income (loss) | | | 0.01 | (C) | | | - | (B)(C) | | | (0.07 | )(C) | | | (0.04 | ) | | | - | (B) |
Net realized and unrealized gain (loss) on investments | | | 0.83 | | | | (0.39 | ) | | | 2.12 | | | | 3.15 | | | | (3.02 | ) |
| | | | | | | | | | | | | | | | |
| Total from investment activities | | | 0.84 | | | | (0.39 | ) | | | 2.05 | | | | 3.11 | | | | (3.02 | ) |
| | | | | | | | | | | | | | | | |
| | | | | | | | | | | | | | | | | | | | | |
| Distributions | | | | | | | | | | | | | | | | | | | | |
Net investment income | | | (0.13 | ) | | | - | | | | - | | | | - | | | | - | |
Net realized gain | | | (0.11 | ) | | | (0.10 | ) | | | - | | | | - | | | | - | |
| | | | | | | | | | | | | | | | |
Total distributions | | | (0.24 | ) | | | (0.10 | ) | | | - | | | | - | | | | - | |
| | | | | | | | | | | | | | | | |
| Net asset value, end of year | | $ | 11.47 | | | $ | 10.87 | | | $ | 11.36 | | | $ | 9.31 | | | $ | 6.20 | |
| | | | | | | | | | | | | | | | |
| | | | | | | | | | | | | | | | | | | | | |
| Total Return | | | 7.88% | | | | (3.37% | ) | | | 22.02% | | | | 50.16% | | | | (32.75% | ) |
| | | | | | | | | | | | | | | | | | | | | |
| Ratios/Supplemental Data | | | | | | | | | | | | | | | | | | | | |
| Ratio to average net assets | | | | | | | | | | | | | | | | | | | | |
Expenses, net | | | 2.20% | | | | 2.08% | | | | 2.23% | | | | 2.46% | | | | 2.50% | (A) |
Net investment income (loss) | | | 0.12% | | | | (0.04% | ) | | | (0.69% | ) | | | (0.56% | ) | | | (0.04% | )(A) |
| Portfolio turnover rate | | | 60.57% | | | | 49.53% | | | | 53.05% | | | | 101.89% | | | | 90.97% | |
| Net assets, end of year (000’s) | | $ | 5,111 | | | $ | 4,832 | | | $ | 4,713 | | | $ | 2,304 | | | $ | 1,446 | |
| (A) Management fee waivers and reimbursement of expenses reduced the expense ratio and increased net investment income ratio by 0.72% for the year ended February 28, 2009. The ratios reflect the effect of the management fee waivers and reimbursement of expenses. |
| | (B) Less than $0.01 per share. |
| | (C) Per share amounts calculated using the average number of shares outstanding. |
| | | See Notes to Financial Statements |
DGHM ALL-CAP VALUE FUND
FINANCIAL HIGHLIGHTS
SELECTED PER SHARE DATA FOR A SHARE OUTSTANDING THROUGHOUT EACH PERIOD
| | | Institutional Class Shares |
| | | |
| | | | | | | | | | | | | |
| | | Year ended | | Year ended | | Period July 19, 2010* |
| | | February 28, 2013 | | February 29, 2012 | | to February 28, 2011 |
| | | | | | | |
| Net asset value, beginning of period | | $ | 11.13 | | | $ | 11.59 | | | $ | 9.33 | |
| | | | | | | | | | |
| Investment activities | | | | | | | | | | | | |
Net investment income (loss)(A) | | | 0.13 | | | | 0.11 | | | | 0.03 | |
Net realized and unrealized gain (loss) on investments | | | 0.85 | | | | (0.38 | ) | | | 2.26 | |
| | | | | | | | | | |
| Total from investment activities | | | 0.98 | | | | (0.27 | ) | | | 2.29 | |
| | | | | | | | | | |
| | | | | | | | | | | | | |
| Distributions | | | | | | | | | | | | |
Net investment income | | | (0.25 | ) | | | (0.09 | ) | | | - | |
Net realized gain | | | (0.11 | ) | | | (0.10 | ) | | | (0.03 | ) |
| | | | | | | | | | |
Total distributions | | | (0.36 | ) | | | (0.19 | ) | | | (0.03 | ) |
| | | | | | | | | | |
| | | | | | | | | | | | | |
| Net asset value, end of period | | $ | 11.75 | | | $ | 11.13 | | | $ | 11.59 | |
| | | | | | | | | | |
| | | | | | | | | | | | | |
| Total Return | | | 9.03% | | | | (2.21% | ) | | | 24.55% | *** |
| Ratios/Supplemental Data | | | | | | | | | | | | |
| Ratio to average net assets | | | | | | | | | | | | |
Expenses | | | 1.12% | | | | 1.01% | | | | 1.11% | ** |
Net investment income (loss) | | | 1.20% | | | | 1.03% | | | | 0.46% | ** |
| Portfolio turnover rate | | | 60.57% | | | | 49.53% | | | | 53.05% | *** |
| Net assets, end of period (000’s) | | $ | 26,509 | | | $ | 62,319 | | | $ | 17,486 | |
| * Commencement of operations |
| | ** Annualized |
| | *** Not annualized |
| | (A) Per share amounts calculated using the average number of shares outstanding. |
| | | See Notes to Financial Statements |
DGHM V2000 SMALLCAP VALUE FUND
FINANCIAL HIGHLIGHTS
SELECTED PER SHARE DATA FOR A SHARE OUTSTANDING THROUGHOUT EACH PERIOD
| | | Investor Class Shares |
| | | |
| | | | | | | | | | | | | |
| | | Year ended | | Period June 30, 2010* |
| | | | | | |
| | | February 28, 2013 | | February 29, 2012 | | to February 28, 2011 |
| | | | | | | |
| Net asset value, beginning of period | | $ | 7.75 | | | $ | 12.92 | | | $ | 10.00 | |
| | | | | | | | | | |
| Investment activities | | | | | | | | | | | | |
Net investment income (loss)(A) | | | 0.12 | | | | (0.05 | ) | | | - | (B) |
Net realized and unrealized gain (loss) on investments | | | 0.94 | | | | (0.74 | ) | | | 3.10 | |
| | | | | | | | | | |
Total from investment activities | | | 1.06 | | | | (0.79 | ) | | | 3.10 | |
| | | | | | | | | | |
| | | | | | | | | | | | | |
| Distributions | | | | | | | | | | | | |
Net investment income | | | (0.04 | ) | | | (0.48 | ) | | | - | |
Realized gains | | | (0.12 | ) | | | (3.90 | ) | | | (0.18 | ) |
| | | | | | | | | | |
Total distributions | | | (0.16 | ) | | | (4.38 | ) | | | (0.18 | ) |
| | | | | | | | | | |
| Net asset value, end of period | | $ | 8.65 | | | $ | 7.75 | | | $ | 12.92 | |
| | | | | | | | | | |
| | | | | | | | | | | | | |
| Total Return | | | 13.77 | % | | | (3.43 | %) | | | 31.05% | *** |
| | | | | | | | | | | | | |
| Ratios/Supplemental Data | | | | | | | | | | | | |
| Ratio to average net assets | | | | | | | | | | | | |
Expenses, gross | | | 21.40 | % | | | 29.98 | % | | | 15.71% | ** |
Expenses, net of legal and compliance fees waivers before management fee waivers | | | 16.87 | % | | | 29.98 | % | | | 15.71% | ** |
Expenses, net of all waivers | | | 1.90 | % | | | 1.90 | % | | | 1.90% | ** |
Net investment income (loss) | | | 1.45 | % | | | (0.40 | %) | | | 0.07% | ** |
| Portfolio turnover rate | | | 118.00 | % | | | 58.38 | % | | | 33.60% | *** |
| Net assets, end of period (000’s) | | $ | 238 | | | $ | 75 | | | $ | 260 | |
| * Commencement of operations |
| | ** Annualized |
| | *** Not annualized |
| | (A) Per share amounts calculated using the average number of shares outstanding. |
| | (B) Less than $0.01 per share. |
| | | See Notes to Financial Statements |
DGHM V2000 SMALLCAP VALUE FUND
FINANCIAL HIGHLIGHTS
SELECTED PER SHARE DATA FOR A SHARE OUTSTANDING THROUGHOUT EACH PERIOD
| | | Institutional Class Shares |
| | | |
| | | | | | | | | | | | | |
| | | Year ended | | Period June 30, 2010* |
| | | | | | |
| | | February 28, 2013 | | February 29, 2012 | | to February 28, 2011 |
| | | | | | | |
| | | | | | | | | | | | | |
| Net asset value, beginning of period | | $ | 8.01 | | | $ | 13.01 | | | $ | 10.00 | |
| | | | | | | | | | |
| Investment activities | | | | | | | | | | | | |
Net investment income (loss)(A) | | | 0.14 | | | | (0.02 | ) | | | 0.02 | |
Net realized and unrealized gain (loss) on investments | | | 0.98 | | | | (0.75 | ) | | | 3.20 | |
| | | | | | | | | | |
Total from investment activities | | | 1.12 | | | | (0.77 | ) | | | 3.22 | |
| | | | | | | | | | |
| Distributions | | | | | | | | | | | | |
Net investment income | | | (0.13 | ) | | | (0.33 | ) | | | (0.03 | ) |
Realized gains | | | (0.12 | ) | | | (3.90 | ) | | | (0.18 | ) |
| | | | | | | | | | |
Total distributions | | | (0.25 | ) | | | (4.23 | ) | | | (0.21 | ) |
| | | | | | | | | | |
| Net asset value, end of period | | $ | 8.88 | | | $ | 8.01 | | | $ | 13.01 | |
| | | | | | | | | | |
| | | | | | | | | | | | | |
| Total Return | | | 14.08% | | | | (3.34% | ) | | | 32.24% | *** |
| Ratios/Supplemental Data | | | | | | | | | | | | |
| Ratio to average net assets | | | | | | | | | | | | |
Expenses, gross | | | 19.45% | | | | 29.82% | | | | 15.46% | ** |
Expenses, net of legal and compliance fees waivers before | | | 14.92% | | | | 29.82% | | | | 15.46% | ** |
Expenses, net of all waivers | | | 1.65% | | | | 1.65% | | | | 1.65% | ** |
Net investment income (loss) | | | 1.70% | | | | (0.15% | ) | | | 0.32% | ** |
| Portfolio turnover rate | | | 118.00% | | | | 58.38% | | | | 33.60% | *** |
| Net assets, end of period (000’s) | | $ | 191 | | | $ | 351 | | | $ | 998 | |
| * Commencement of operations |
| | ** Annualized |
| | *** Not annualized |
| | (A) Per share amounts calculated using the average number of shares outstanding. |
| | | See Notes to Financial Statements |
DGHM INVESTMENT TRUST
NOTES TO FINANCIAL STATEMENTS
February 28, 2013
NOTE 1 – ORGANIZATION AND SIGNIFICANT ACCOUNTING POLICIES
The DGHM All-Cap Value Fund and the DGHM V2000 SmallCap Value Fund (the “Funds”) are series of the DGHM Investment Trust (the "Trust"). The Trust was organized as a Delaware statutory trust and is registered under the Investment Company Act of 1940, as amended (the “1940 Act”), as a diversified open-end management company. The DGHM All-Cap Value (“All-Cap Fund”) and DGHM V2000 SmallCap Value (“SmallCap Fund”) Funds commenced operations on June 20, 2007 and June 30, 2010, respectively.
The investment objectives of the Funds are to provide long-term capital appreciation through investments that Dalton, Greiner, Hartman, Maher & Co., LLC, the Funds’ investment advisor (“Advisor”), believes are undervalued.
The following is a summary of significant accounting policies consistently followed by the Funds. The policies are in conformity with accounting principles generally accepted in the United States of America (“GAAP”).
Security Valuation
The Funds’ securities are valued at current market prices. Investments traded on a principal exchange (U.S. or foreign) or included in the NASDAQ National Market System are valued at the last reported sales price on the exchange on which the securities are traded as of the close of business on the last day of the period or, lacking any sales, at the last available bid price. In cases where securities are traded on more than one exchange, the securities are valued on the exchange designated by or under the authority of the Funds’ Board of Trustees (the “Trustees”). Short-term debt securities (less than 60 days to maturity) are valued at their fair market value using amortized cost. Securities traded in the over-the-counter market are valued at the last available sale price in the over-the-counter market prior to time of valuation. Securities traded in the over-the-counter market and listed securities for which no sale was reported on that date are valued at the most recent bid price. Securities for which market quotations are not readily available are valued on a consistent basis at fair value as determined in good faith under procedures approved by the Funds’ Trustees. Fair value pricing may be used, for example, in situations where (i) a portfolio security is so thinly traded that there have been no transactions for that security over an extended period of time; (ii) the exchange on which the portfolio security is principally traded closes early; or (iii) trading of the portfolio security is halted during the day and does not resume prior to the Funds’ net asset value calculation. A portfolio security’s “fair value” price may differ from the price next available for that portfolio security using the Funds’ normal pricing procedures. Investment companies are valued at net asset value. If values of foreign securities have been materially affected by events occurring after the close of a foreign market, foreign securities may be
DGHM INVESTMENT TRUST
NOTES TO FINANCIAL STATEMENTS (continued)
February 28, 2013
valued by another method. Trading in corporate bonds, U.S. government securities and money market instruments is substantially completed each day at various times before the scheduled close of the New York Stock Exchange. The value of these securities used in computing the Funds’ net asset value is determined as of such times.
In accordance with GAAP, “fair value” is defined as the price that a fund would receive upon selling an investment in an orderly transaction to an independent buyer in the principal or most advantageous market for the investment. Various inputs are used in determining the value of a fund’s investments. GAAP establishes a three-tier hierarchy of inputs for classification of fair value measurements for disclosure purposes. Level 1 includes quoted prices in active markets for identical securities. Level 2 includes other significant observable market-based inputs (including quoted prices for similar securities, interest rates, prepayment speeds, credit risk, etc.). Level 3 includes significant unobservable inputs (including the Fund’s own assumptions in determining fair value of investments).
The inputs or methodology used for valuing securities are not necessarily an indication of the risk associated with investing in those securities.
The following is a summary of the inputs used to value the Funds’ investments as of February 28, 2013:
| | | | | | | Level 2 | | Level 3 | | | | |
| | | Level 1 | | Other Significant | | Significant | | | | |
| | | Quoted Prices | | Observable Inputs | | Unobservable Inputs | | | Total | |
| All-Cap Fund | | | | | | | | | | | | | | | | | | | |
| Common Stocks | | $ | 59,422,211 | | | | $ | - | | | | $ | - | | | | $ | 59,422,211 | |
| | | | | | | | | | | | | | | | | | | | |
| Short Term | | | | | | | | | | | | | | | | | | | |
Investments | | | 3,893,794 | | | | | - | | | | | - | | | | | 3,893,794 | |
| | | | | | | | | | | | | | | | |
| | | $ | 63,316,005 | | | | $ | - | | | | $ | - | | | | $ | 63,316,005 | |
| | | | | | | | | | | | | | | | |
| | | | | | | | | | | | | | | | | | | | |
| SmallCap Fund | | | | | | | | | | | | | | | | | | | |
| Common Stocks | | $ | 402,564 | | | | $ | - | | | | $ | - | | | | $ | 402,564 | |
| Short Term | | | | | | | | | | | | | | | | | | | |
Investments | | | 17,056 | | | | | - | | | | | - | | | | | 17,056 | |
| | | | | | | | | | | | | | | | |
| | | $ | 419,620 | | | | $ | - | | | | $ | - | | | | $ | 419,620 | |
| | | | | | | | | | | | | | | | |
DGHM INVESTMENT TRUST
NOTES TO FINANCIAL STATEMENTS (continued)
February 28, 2013
Refer to the Funds’ Schedules of Investments for a listing of securities by security type and industry. The Funds held no Level 3 securities at any time during the year. There were no transfers between levels during the year ended February 28, 2013. It is the Funds’ policy to recognize transfers between levels as of the end of the reporting period.
Security Transactions and Income
Security transactions are accounted for on the trade date. The cost of securities sold is determined generally on a specific identification basis. Dividends are recorded on the ex-dividend date. Interest income is recorded on an accrual basis and includes amortization of discounts and premiums.
Cash and Cash Equivalents
Cash and cash equivalents, if any, consist of overnight deposits with the custodian bank which earn interest at the current market rate.
Accounting Estimates
In preparing financial statements in conformity with GAAP, management makes estimates and assumptions that affect the reported amounts of assets and liabilities and disclosure of contingent assets and liabilities at the date of the financial statements, and the reported amounts of increases and decreases in the net assets during the reporting period. Actual results could differ from those estimates.
Federal Income Taxes
The Funds intend to comply with the requirements of the Internal Revenue Code applicable to regulated investment companies and to distribute all of their taxable income to their shareholders. The Funds also intend to distribute sufficient net investment income and net capital gains, if any, so that they will not be subject to excise tax on undistributed income and gains. Therefore, no federal income tax or excise tax provision is required.
The Funds recognize tax benefits on certain tax positions only where the position is “more likely than not” to be sustained assuming investigation from tax authorities. Management has reviewed the Funds’ tax positions and has concluded that no liability for unrecognized tax benefits should be recorded related to uncertain tax positions expected to be taken in the Funds’ 2013 tax returns. The Funds have no examinations in progress and management is not aware of any tax positions for which it is reasonably possible that the total amounts of unrecognized tax benefits will significantly change in the next twelve months. The All-Cap Fund’s Federal tax returns filed in the three-year period ended February 28, 2013
DGHM INVESTMENT TRUST
NOTES TO FINANCIAL STATEMENTS (continued)
February 28, 2013
and the SmallCap Fund’s Federal tax return for the period ended February 28, 2011 and filed in the two-year period ended February 28, 2013 remain subject to examination by the Internal Revenue Service. Interest and penalties, if any, associated with any federal or state income tax obligations, are recorded as income tax expense.
Reclassification of Capital Accounts
GAAP requires that certain components of net assets relating to permanent differences be reclassified between financial and tax reporting. These reclassifications have no effect on net assets or net asset value per share. As of February 28, 2013, such reclassifications reduced accumulated net realized gain on investments and accumulated net investment loss by $119,026 in the All-Cap Fund and there were no such reclassifications for the SmallCap Fund.
Class Net Asset Values and Expenses
Each Fund can offer three classes of shares: Investor Shares, Class C and Institutional Class shares. Each class of shares has equal rights as to assets of the Funds, and the classes are identical except for differences in their sales charge structures, ongoing distribution and service fees, shareholder servicing and reports fees and transfer agent fees. Income, expenses (other than distribution and service fees, shareholder servicing and reports fees and transfer agent fees), and realized and unrealized gains or losses on investments are allocated to each class of shares based upon its relative net assets. All classes have equal voting privileges, except where otherwise required by law or when the Board of Trustees determines that the matter to be voted on affects only the interests of the shareholders of a particular class. The Class C shares are subject to a 1% contingent deferred sales charge on proceeds that are redeemed within one year of the purchase date. The contingent deferred sales charge is payable to the Distributor of the Trust. Class C shares automatically convert into Investor Shares after seven years. As of February 28, 2013, there were no Class C shares of SmallCap Fund outstanding.
NOTE 2 – INVESTMENT ADVISORY AND DISTRIBUTION AGREEMENTS AND OTHER TRANSACTIONS WITH RELATED PARTIES
Pursuant to Investment Advisory Agreements, the Advisor provides investment advisory services for an annual fee of 0.65% on the average daily net assets of the All-Cap Fund and 0.80% on the average daily net assets of the SmallCap Fund. For the year ended February 28, 2013, the Advisor earned $671,851 in advisory fees from the All-Cap Fund. As of February 28, 2013, the Advisor was due $37,065 from the All-Cap Fund. For the year ended February 28, 2013, the Advisor earned and waived $2,745 in advisory fees from the SmallCap Fund.
DGHM INVESTMENT TRUST
NOTES TO FINANCIAL STATEMENTS (continued)
February 28, 2013
In the interest of limiting the operating expenses of the Funds, the Advisor has contractually agreed to waive or reduce its fees and to assume other expenses of the Funds through June 30, 2014, if necessary, in amounts that limit the Funds’ total operating expenses to 1.50% and 1.65% of average daily net assets of the All-Cap Fund and the SmallCap Fund, respectively. The limit does not apply to interest, taxes, brokerage commissions, other expenditures capitalized in accordance with GAAP, other extraordinary expenses not incurred in the ordinary course of the Fund’s business, dividend expense on short sales and amounts, if any, payable pursuant to a plan adopted in accordance with Rule 12b-1 of the 1940 Act. In determining each Fund’s total operating expenses, expenses that the Fund would have incurred but did not actually pay because of expense offset or brokerage/services arrangements shall be added to the aggregate expenses so as not to benefit the Advisor. Additionally, fees reimbursed to the Funds relating to brokerage/services arrangements shall not be taken into account in determining the Funds’ total operating expenses so as to benefit the Advisor. Finally, these expense limitation arrangements exclude any “acquired fund fees and expenses” as that term is described in the prospectus of the Funds. In addition, the Advisor may be entitled to reimbursement of fees waived or remitted by the Advisor to the Funds. The total amount of reimbursement shall be the sum of all fees previously waived or reduced by the Advisor and all other payments remitted by the Advisor to the Funds during any of the previous three fiscal years , less any reimbursement previously paid by the Funds to the Advisor with respect to such waivers, reductions and payments. Amounts reimbursed may not cause the Funds to exceed expense limits that were in place at the time such fees and expenses were waived and/or reimbursed. As of February 28, 2013, there were no fee waivers or reimbursements eligible for reimbursement to the Advisor pertaining to the All-Cap Fund. For the year ended February 28, 2013, the Advisor earned and waived $2,745 in advisory fees and reimbursed expenses of $45,154 for the SmallCap Fund. At February 28, 2013, the SmallCap Fund was due $5,375 from the Advisor. The total amount of recoverable reimbursements as of February 28, 2013 was $262,469 and expires as follows:
| | 2014 | $ | 75,763 |
| | 2015 | | 138,807 |
| | 2016 | | 47,899 |
| | | |
| | | $ | 262,469 |
| | | |
The Funds have adopted plans of distribution in accordance with Rule 12b-1 under the 1940 Act (each a “Plan” and collectively, the “Plans”). Pursuant to the Plans, the Funds compensate the Funds’ principal underwriter for services rendered and expenses borne in connection with activities primarily intended to result in the sale of the Funds’ shares. The Plans provide that the Funds will pay the annual rate of up to 0.25% of the average daily net assets of the Funds’ Investor Shares and up to 1.00% of the average daily net assets of the Funds’ Class C Shares
DGHM INVESTMENT TRUST
NOTES TO FINANCIAL STATEMENTS (continued)
February 28, 2013
for activities primarily intended to result in the sale of those shares. These activities include reimbursement to entities for providing distribution and shareholder servicing with respect to the Funds’ shares. The 0.25% fee for the Investor Shares is a service fee. The 1.00% fee for the Class C Shares is comprised shareholder servicing with respect to the Funds’ shares. The 0.25% fee for the Investor Shares is a service fee. The 1.00% fee for the Class C Shares is comprised of a 0.25% service fee and a 0.75% distribution fee. The All-Cap Fund incurred $136,873 and $46,921, in 12b-1 fees under the Plans with respect to Investor Shares and Class C Shares, respectively, for the year ended February 28, 2013. The SmallCap Fund incurred $346 in 12b-1 fees under the Plans with respect to Investor Shares for the year ended February 28, 2013.
First Dominion Capital Corporation (the “FDCC”) acts as the Funds’ principal underwriter and distributor. For the year ended February 28, 2013, FDCC received no commissions or underwriting fees from the sale of the Funds’ shares. In addition, FDCC receives a contingent deferred sales charge (“CDSC”) of 1% of Class C share redemptions occurring within one year of purchase. Shares redeemed subject to a CDSC will receive a lower redemption value per share. For the year ended February 28, 2013, FDCC received $537 in CDSC fees.
Commonwealth Shareholder Services, Inc. (“CSS”) provides shareholder, recordkeeping, administrative and blue-sky filing services as the administrative agent for the Funds. For such administrative services, CSS receives 0.10% per annum of average daily net assets of the Funds on the first $75 million and 0.07% per annum of the average daily net assets over $75 million subject to a $20,000 minimum per year for the All-Cap Fund and $10,950 minimum per annum for the SmallCap Fund. For the year ended February 28, 2013, CSS earned $94,588 for its services and at February 28, 2013, was due $2,007 from the All-Cap Fund. For the year ended February 28, 2013, CSS earned $10,614 for its services and at February 28, 2013, was due $430 from the SmallCap Fund.
Commonwealth Fund Services, Inc. (“CFSI”) is the Funds’ transfer and dividend disbursing agent. For such services, CFSI receives the greater of a basis point charge or a per-account charge, subject to a $15,000 minimum per year for the All Cap fund and a $8,100 minimum per annum for the SmallCap Fund. CFSI earned $77,967 for its services for the year ended February 28, 2013 and at Februray 28, 2013, was due $3,165 from the All-Cap Fund. CFSI earned $7,842 for its services for the year ended February 28, 2013 and at February 28, 2013, was due $316 from the SmallCap Fund.
Commonwealth Fund Accounting (“CFA”) is the Funds’ pricing agent. CFA earned $51,681 for its services for the year ended February 28, 2013 and at February 28, 2013, was due $1,168 from the All-Cap Fund. CFA earned $10,716 for its services for the year ended February 28, 2013 and at February 28, 2013, was due $427 from the SmallCap Fund.
DGHM INVESTMENT TRUST
NOTES TO FINANCIAL STATEMENTS (continued)
February 28, 2013
One Trustee and certain officers of the Trust are also officers of the Advisor. One officer of the Fund is also an officer and/or director of FDCC, CSS, CFA and CFSI.
NOTE 3 – INVESTMENTS
The cost of purchases and proceeds from the sales of securities other than short-term securities for the year ended February 28, 2013, were $61,039,584 and $139,932,214, respectively for the All-Cap Fund. The cost of purchases and proceeds from the sales of securities other than short-term notes for the year ended February 28, 2013, were $390,576 and $414,149, respectively for the SmallCap Fund.
NOTE 4 – DISTRIBUTIONS TO SHAREHOLDERS AND TAX COMPONENTS OF CAPITAL
Distributions from net investment income and realized gains, if any, are recorded on the ex-dividend date. Income distributions and capital gain distributions are determined in accordance with income tax regulations, which may differ from GAAP.
The tax character of distributions during the year ended February 28, 2013 and the year ended February 29, 2012 were as follows:
| | | All-Cap Fund | | | | SmallCap Fund | |
| | | | | | | | |
| | | Year ended | | | Year ended | | | Year ended | | | Year ended | |
| | | February 28, | | | February 29, | | | February 28, | | | February 29, | |
| | | 2013 | | | | 2012 | | | | 2013 | | | | 2012 | |
| | | | | | | | | | | | | |
| Distributions | | | | | | | | | | | | | | | | |
| paid from: | | | | | | | | | | | | | | | | |
| Ordinary income | | | $1,170,294 | | | | $ 884,252 | | | | $6,334 | | | | $142,707 | |
| Capital gains | | | 802,265 | | | | 1,234,583 | | | | 1,960 | | | | 1,509 | |
| | | | | | | | | | | | | | | | | |
| | | | $1,972,559 | | | | $2,118,835 | | | | $8,294 | | | | $144,216 | |
| | | | | | | | | | | | | | | | | |
As of February 28, 2013, the components of distributable earnings on a tax basis were as follows:
| | | | All-Cap Fund | | | SmallCap Fund |
| | | | | | | |
| Accumulated ordinary income | | | $ | - | | | | $ | 8,286 | |
| Accumulated net realized gain (loss) | | | | | | | | | | |
on investments | | | | 1,865,898 | | | | | 284 | |
| Unrealized appreciation | | | | | | | | | | |
(depreciation) | | | | 10,896,074 | | | | | 49,619 | |
| Other temporary differences | | | | (386,261 | ) | | | | (3,626 | ) |
| | | | | | | | | |
| | | | $ | 12,375,711 | | | | $ | 54,563 | |
| | | | | | | | | |
DGHM INVESTMENT TRUST
NOTES TO FINANCIAL STATEMENTS (continued)
February 28, 2013
The difference between components of distributable earnings on a book basis and tax basis is primarily related to wash sales losses, deferred post October losses and late year loss deferrals.
Cost of securities for Federal Income tax purpose is $52,419,931 for All-Cap Fund and $370,001 for SmallCap Fund and the related tax-based net unrealized appreciation (depreciation) consists of:
| | | | All-Cap Fund | | | SmallCap Fund |
| | | | | | | |
| Gross unrealized appreciation | | | $ | 11,535,596 | | | | $ | 61,750 | |
| Gross unrealized depreciation | | | | (639,522 | ) | | | | (12,131 | ) |
| | | | | | | | | |
| Net unrealized appreciation | | | | | | | | | | |
(depreciation) | | | $ | 10,896,074 | | | | $ | 49,619 | |
| | | | | | | | | |
NOTE 5 – TRANSACTIONS IN SHARES OF BENEFCIAL INTEREST
Shares of beneficial interest transactions for the Funds were:
| | | All-Cap Fund |
| | | |
| | | | | | | | | | | | | | | | | | | | | | | | | |
| | | Year ended February 28, 2013 |
| | | |
| | | Investor Class | | Class C | | Institutional Class |
| | | | | | | |
| | | Shares | | | Amount | | | Shares | | | Amount | | | Shares | | | Amount | |
| | | | | | | | | | | | | | | | | | | | | | | | | |
| Shares sold | | | 678,166 | | | $ | 7,453,114 | | | | 53,114 | | | $ | 568,788 | | | | 904,425 | | | $ | 9,834,182 | |
| Shares reinvested | | | 49,701 | | | | 540,255 | | | | 8,945 | | | | 94,640 | | | | 84,749 | | | | 916,989 | |
| Shares redeemed | | | (4,907,100 | ) | | | (54,276,992 | ) | | | (60,816 | ) | | | (646,816 | ) | | | (4,333,124 | ) | | | (46,415,645 | ) |
| | | | | | | | | | | | | | | | | | | | | | |
| Net increase (decrease) | | | (4,179,233 | ) | | $ | (46,283,623 | ) | | | 1,243 | | | $ | 16,612 | | | | (3,343,950 | ) | | $ | (35,664,474 | ) |
| | | | | | | | | | | | | | | | | | | | | | |
DGHM INVESTMENT TRUST
NOTES TO FINANCIAL STATEMENTS (continued)
February 28, 2013
| | | All-Cap Fund |
| | | |
| | | | | | | | | | | | | | | | | | | | | | | | | |
| | | Year ended February 29, 2012 |
| | | |
| | | Investor Class | | Class C | | Institutional Class |
| | | | | | | |
| | | Shares | | | Amount | | | Shares | | | Amount | | | Shares | | | Amount | |
| | | | | | | | | | | | | | | | | | | | | | | | | |
| Shares sold | | | 2,748,851 | | | $ | 29,935,397 | | | | 120,055 | | | $ | 1,305,593 | | | | 4,959,749 | | | $ | 54,003,223 | |
| Shares reinvested | | | 90,632 | | | | 929,237 | | | | 3,889 | | | | 38,964 | | | | 55,398 | | | | 567,280 | |
| Shares redeemed | | | (2,232,458 | ) | | | (23,902,502 | ) | | | (94,370 | ) | | | (1,012,844 | ) | | | (922,865 | ) | | | (9,679,422 | ) |
| | | | | | | | | | | | | | | | | | | | | | |
| Net increase (decrease) | | | 607,025 | | | $ | 6,962,132 | | | | 29,574 | | | $ | 331,713 | | | | 4,092,282 | | | $ | 44,891,081 | |
| | | | | | | | | | | | | | | | | | | | | | |
| | | SmallCap Fund |
| | | |
| | | Year ended February 28, 2013 |
| | | |
| | | Investor Class | | Institutional Class |
| | | | | |
| | | Shares | | Amount | | Shares | | Amount |
| | | | | | | | | | | | | | | | | |
| Shares sold | | | 26,394 | | | $ | 214,400 | | | | 2,887 | | | $ | 24,029 | |
| Shares reinvested | | | 224 | | | | 1,834 | | | | 601 | | | | 5,034 | |
| Shares redeemed | | | (8,777 | ) | | | (73,555 | ) | | | (25,795 | ) | | | (208,322 | ) |
| | | | | | | | | | | | | | | |
| Net increase (decrease) | | | 17,841 | | | $ | 142,679 | | | | (22,307 | ) | | $ | (179,259 | ) |
| | | | | | | | | | | | | | | |
| | | SmallCap Fund |
| | | |
| | | Year ended February 29, 2012 |
| | | |
| | | Investor Class | | Institutional Class |
| | | | | |
| | | Shares | | Amount | | Shares | | Amount |
| | | | | | | | | | | | | | | | | |
| Shares sold | | | 2,379 | | | $ | 28,553 | | | | 9,834 | | | $ | 127,745 | |
| Shares reinvested | | | 3,620 | | | | 26,024 | | | | 15,896 | | | | 118,108 | |
| Shares redeemed | | | (16,486 | ) | | | (210,858 | ) | | | (58,665 | ) | | | (764,301 | ) |
| | | | | | | | | | | | | | | |
| Net increase (decrease) | | | (10,487 | ) | | $ | (156,281 | ) | | | (32,935 | ) | | $ | (518,448 | ) |
| | | | | | | | | | | | | | | |
DGHM INVESTMENT TRUST
NOTES TO FINANCIAL STATEMENTS (continued)
February 28, 2013
NOTE 6 – COMMITMENTS AND CONTINGENCIES
Under the Trust’s organizational documents, its officers and Trustees are indemnified against certain liabilities arising out of the performance of their duties to the Funds. In addition, in the normal course of business, the Trust entered into contracts with its vendors, on behalf of the Funds, and others that provide for general indemnifications. The Funds’ maximum exposure under these DGHM arrangements is unknown, as this would involve future claims that may be made against the Funds. The Funds expect that risk of loss to be remote.
NOTE 7 – SUBSEQUENT EVENTS
Management has evaluated all transactions and events subsequent to the date of the statements of assets and liabilities through the date these financial statements were issued. Except as already included in the notes to these financial statements, no additional items require disclosure.

REPORT OF INDEPENDENT REGISTERED PUBLIC ACCOUNTING FIRM
To the Board of Trustees of DGHM Investment Trust
and the Shareholders of DGHM All-Cap Value Fund
and DGHM V2000 SmallCap Value Fund
We have audited the accompanying statements of assets and liabilities of DGHM All-Cap Value Fund and DGHM V2000 SmallCap Value Fund, each a series of shares of the DGHM Investment Trust, including the schedules of investments, as of February 28, 2013, and the related statements of operations for the year then ended, the statements of changes in net assets for each of the years in the two-year period then ended and the financial highlights for each of the years or periods presented in the five-year period then ended. These financial statements and financial highlights are the responsibility of the Funds’ management. Our responsibility is to express an opinion on these financial statements and financial highlights based on our audits.
We conducted our audits in accordance with the standards of the Public Company Accounting Oversight Board (United States). Those standards require that we plan and perform the audits to obtain reasonable assurance about whether the financial statements and financial highlights are free of material misstatement. An audit includes examining, on a test basis, evidence supporting the amounts and disclosures in the financial statements. Our procedures included confirmation of securities owned as of February 28, 2013 by correspondence with the custodian and brokers. An audit also includes assessing the accounting principles used and significant estimates made by management, as well as evaluating the overall financial statement presentation. We believe that our audits provide a reasonable basis for our opinion.
In our opinion, the financial statements and financial highlights referred to above present fairly, in all material respects, the financial position of DGHM All-Cap Value Fund and DGHM V2000 SmallCap Value Fund as of February 28, 2013, the results of their operations for the year then ended, the changes in their net assets for each of the years in the two-year period then ended and their financial highlights for each of the years or periods presented in the five-year period then ended, in conformity with accounting principles generally accepted in the United States of America.

BBD, LLP
Philadelphia, Pennsylvania
April 26, 2013
SUPPLEMENTAL INFORMATION (unaudited)
DGHM INVESTMENT TRUST (the “Trust”)
| Information pertaining to the Trustees and officers of the Trust is set forth below. The names, addresses and age of the Trustees and officers of the Trust, together with information as to their principal occupations during the past five years, are listed below. The Trustee who is considered an “interested person” as defined in Section 2(a)(19) of the 1940 Act, as well as those persons affiliated with the investment advisor and the principal underwriter, and officers of the Trust, are noted with an asterisk (*). The Statement of Additional Information (the “SAI”) includes additional information about the Trustees and the officer and is available without charge, upon request by calling, toll-free, (800) 773-3863. The address of each trustee and officer of the Trust, unless otherwise indicated, is 8730 Stony Point Parkway, Suite 205, Richmond, Virginia 23235. |
| | | | | |
| Name, Address and Age | Position(s) Held with Trust and Tenure | Number of Funds in Trust Overseen | Principal Occupation(s) During the Past Five (5) Years | Other Directorships by Trustees and Number of Funds in the Complex Overseen |
| Interested Trustees: |
| Jeffrey C. Baker* 565 Fifth Avenue Suite 2101 New York, NY 10017 47 | Trustee, President, and Principal Executive Officer since 04/07 | 2 | Executive Vice President, Dalton, Greiner, Hartman, Maher & Co., LLC (investment advisor to the Funds) since 2005; previously, Senior Vice President, Dalton, Greiner, Hartman, Maher & Co., LLC, 2002 to 2005; and Vice President, Dalton, Greiner, Hartman, Maher & Co., LLC, 2000 to 2002. | None |
SUPPLEMENTAL INFORMATION (unaudited)
DGHM INVESTMENT TRUST (the “Trust”)
| Independent Trustees: |
| Jack E. Brinson 81 | Trustee since 04/07 | 2 | Retired since January 2000; previously, President, Brinson Investment Co. (personal investments) and President, Brinson Chevrolet, Inc. (auto dealership). | Independent Trustee of Gardner Lewis Investment Trust for the two series of that trust; Brown Capital Management Mutual Funds for the three series of that trust; Hillman Capital Management Investment Trust for the one series of that trust; Tilson Investment Trust for the two series of that trust; and Starboard Investment Trust for the 24 series of that trust; (all registered investment companies). |
SUPPLEMENTAL INFORMATION (unaudited)
DGHM INVESTMENT TRUST (the “Trust”)
| Theo H. Pitt, Jr. 76 | Trustee and Chairman since 04/07 | 2 | Senior Partner, Community Financial Institutions Consulting (bank consulting) since 1997 and Account Administrator, Holden Wealth Management Group of Wachovia Securities (money management firm) from 2003 to 2008. | Independent Trustee of Gardner Lewis Investment Trust for the two series of that trust; and Starboard Investment Trust for the 24 series of that trust; (all registered investment companies). |
| Officers: |
| Thomas F. Gibson 565 Fifth Avenue Suite 2101 New York, NY 10017 48 | Treasurer and Principal Financial Officer since 04/07 | N/A | Vice President, Chief Financial Officer, and Chief Compliance Officer, Dalton, Greiner, Hartman, Maher & Co., LLC since 2005; previously, Chief Financial Officer and Chief Compliance Officer, Bingham Legg Advisers, LLC, 1999 to 2005. | N/A |
| Lauren Jones 30 | Assistant Secretary since 12/09 | N/A | Relationship Manager, Commonwealth Shareholder Services since 2006; previously, Account Manager, Insider NYC, an event planning firm, from 2004 to 2005 | N/A |
SUPPLEMENTAL INFORMATION (unaudited)
DGHM INVESTMENT TRUST (the “Trust”)
| Karen Shupe 48 | Secretary and Assistant Treasurer since 11/08 | N/A | Executive Vice President, Commonwealth Shareholder Services, Inc., since 2003; previously, Financial Reporting Manager, Commonwealth Shareholder Services, Inc., 2001 to 2003. | N/A |
| Julian Winters 44 | Chief Compliance Officer since 11/08 | N/A | Managing Member of Watermark Solutions (investment compliance and consulting) since March 2007; previously, Vice-President – Compliance Administration, the Nottingham Company (investment company administrator and fund accountant) 1998 to 2007 | N/A |
DGHM INVESTMENT TRUST (the “Trust”)
SUPPLEMENTAL INFORMATION (unaudited)
VOTING PROXIES ON FUND PORTFOLIO SECURITIES
A copy of the Trust’s Proxy Voting and Disclosure Policy and the Advisor’s Proxy Voting and Disclosure Policy are included as Appendix B to the Fund’s Statement of Additional Information and is available, without charge, (1) upon request, by calling 1-800-653-2839 and (2) on the SEC’s website at http://www.sec.gov. Information regarding how the Funds voted proxies relating to portfolio securities during the most recent 12-month period ended June 30 is available without charge, (1) upon request, by calling the Funds at the number above and (2) on the SEC’s website at http://www.sec.gov.
QUARTERLY PORTFOLIO HOLDINGS
The Funds file with the SEC a complete schedule of its portfolio holdings, as of the close of the first and third quarters of its fiscal year, on “Form N-Q”. These filings are available on the SEC’s website at www.sec.gov. The Funds’ Forms N-Q may be reviewed and copied at the SEC’s Public Reference Room in Washington, D.C. Information on the operation of the Public Reference Room may be obtained by calling 1-800-SEC-0330.
APPROVAL OF THE RENEWAL OF INVESTMENT ADVISORY AGREEMENTS
Dalton, Greiner, Hartman, Maher & Co., LLC (the “Advisor”) supervises the investments of the DGHM All-Cap Value Fund and DGHM V2000 SmallCap Value Fund (the “Funds”), each a series portfolio of the DGHM Investment Trust (the “Trust”), pursuant to an Investment Advisory Agreement (each an “Agreement”) between the Advisor and the Trust with respect to each of the Funds. At the quarterly meeting of the Board of Trustees of the Trust (the “Board” or “Trustees”) that was held on February 13, 2013 (the “Meeting”), the Trustees, including a majority of the Trustees who are not parties to the Agreement or “interested persons” of any such party as such term is defined under the Investment Company Act of 1940, as amended (the “Independent Trustees”), voting separately, unanimously approved the renewal of the Agreement for a one-year period from March 1, 2013 until February 28, 2014, under the terms and for the compensation described therein.
In considering whether to approve the Agreement, the Trustees reviewed and considered such information as they deemed reasonably necessary, including the following material factors: (i) the nature, extent, and quality of the services provided by the Advisor; (ii) the investment performance of the Funds; (iii) the costs of the services to be provided and profits to be realized by the Advisor from the relationship with the Funds; (iv) the extent to which economies of scale would be realized as the Funds grow and whether advisory fee levels reflect those economies of scale for the benefit of the Funds’ investors; and (v) the Advisor’s practices regarding possible conflicts of interest.
DGHM INVESTMENT TRUST (the “Trust”)
SUPPLEMENTAL INFORMATION (unaudited) (continued)
In assessing the factors described above and reaching its decision, the Board took into consideration information furnished for the Board’s review and consideration throughout the year at regular Board meetings, as well as information specifically prepared and/or presented in connection with the annual renewal process. At the Meeting, the Trustees reviewed various informational materials including, without limitation, copies of the Agreement and the Expense Limitation Agreements between the Advisor and the Trust with respect to the Funds (the “Expense Limitation Agreements”); materials provided by the Advisor to the Trustees containing information about the Advisor, its business, its finances, its personnel, its services to the Funds, and comparative performance and expense ratio information for other mutual funds with strategies similar to the Funds; and a memorandum from Fund Counsel that summarized the fiduciary duties and responsibilities of the Board in reviewing and approving the Agreement, including the types of information and factors that should be considered in order to make an informed decision.
Provided below is an overview of the factors the Board considered at its Meeting. The Board did not identify any particular information that was most relevant to its consideration to approve the Agreement and each Trustee may have afforded different weight to the various factors.
Nature, Extent and Quality of the Services Provided by the Advisor.
In considering the nature, extent, and quality of the services provided by the Advisor, the Trustees reviewed the responsibilities of the Advisor under the Agreement. The Trustees reviewed the services being provided by the Advisor to the Funds including, without limitation, the quality of its investment advisory services (including research and recommendations with respect to portfolio securities); the Advisor’s processes for formulating investment recommendations and assuring compliance with each Fund’s investment objectives and limitations, as well as for ensuring compliance with regulatory requirements; its coordination of services for the Funds among each Fund’s service providers and the Independent Trustees; and its efforts to promote the Funds, grow assets, and assist in the distribution of Fund shares. In particular, the Trustees recognized the extensive marketing efforts of the Advisor relating to the Funds. The Trustees considered the Advisor’s personnel, including the education and experience of the Advisor’s personnel. The Trustees noted that certain officers of the Trust, including the principal executive officer and principal financial officer for the Trust were employees of the Advisor, and they served the Trust without additional compensation. After reviewing the foregoing information and further information in the Advisor’s memorandum (e.g., descriptions of the Advisor’s business, the Advisor’s compliance programs, and the Advisor’s Form ADV), the Board
DGHM INVESTMENT TRUST (the “Trust”)
SUPPLEMENTAL INFORMATION (unaudited) (continued)
concluded that, in light of all the facts and circumstances, the quality, extent, and nature of the services to be provided by the Advisor were satisfactory and adequate for the Funds.
Investment Performance of the Fund and the Advisor.
In considering the investment performance of the Funds and the Advisor, the Trustees compared the performance of the Funds for various periods during each Fund’s existence with the performance of Funds’ respective benchmarks – the Russell 3000 Value Index for the All-Cap Value Fund and the Russell 2000 Value Index for the V2000 SmallCap Value Fund. The Trustees also considered the consistency of the Advisor’s management of the Funds with the Funds’ investment objectives and policies. The Trustees noted that the All-Cap Value Fund underperformed its benchmark index in the short term and outperformed its benchmark index for the five-year term. The Trustees noted that the V2000 SmallCap Value Fund slightly underperformed its benchmark index in the short term periods of its existence. The Trustees noted that that All-Cap Value Fund lagged its peers in the short-term and that the V2000 SmallCap Value Fund was comparable to its peer group averages. The Trustees also considered the Funds’ performance relative to other accounts managed by the Advisor which are managed in the same manner as the Funds. The Trustees noted that each Fund’s year-to-date performance was generally comparable to the performance of other accounts managed by the Advisor. After reviewing and discussing the performance of the Fund further, the Advisor’s experience managing the Fund, the Advisor’s historical investment performance, and other relevant factors, the Board concluded, in light of all the facts and circumstances, that the investment performance of the Fund and the Advisor was satisfactory.
Costs of the Services to be Provided and Profits to be Realized by the Advisor.
In considering the costs of the services to be provided and profits to be realized by the Advisor and its affiliates from the relationship with the Funds, the Trustees considered the Advisor’s staffing, personnel, and methods of operating; the financial condition of the Advisor and the level of commitment to the Funds by the Advisor and its principals; the asset levels of the Funds; and the overall expenses of the Funds, including the nature and frequency of advisory fee payments. The Trustees considered financial statements of the Advisor and discussed the financial stability and productivity of the firm. The Trustees noted that the Advisor was profitable in regard to the All-Cap Value Fund, but not in regard to the V2000 SmallCap Value Fund due to its asset levels. The Trustees also considered potential benefits for the Advisor in managing the Funds, including the potential for the Advisor to generate soft dollars from Fund trades that may benefit the Advisor’s other clients. The Trustees considered the fees and expenses of the Funds (including the management fee) relative to other funds comparable in terms of the
DGHM INVESTMENT TRUST (the “Trust”)
SUPPLEMENTAL INFORMATION (unaudited) (continued)
type of fund, the nature of its investment strategy, its style of investment management, and its size, among other factors. The Board determined that the Funds’ expenses, including the management fee, were higher than some of the comparable funds and lower than others, but recognized the Advisor’s commitment to working to reduce the expense ratio of the Funds (even though the All-Cap Value Fund was currently operating beneath its expense limitation). The Trustees also considered the Advisor’s efforts in continuing to secure fee concessions from certain of the service providers of the V2000 SmallCap Value Fund while the Advisor focuses on increasing asset levels of the Fund. Based on the foregoing, the Board concluded that the fees to be paid to the Advisor by the Funds, the costs of the services to be provided, and the profits that may be realized by the Advisor, in light of all the facts and circumstances, were fair and reasonable in relation to the nature and quality of the services provided by the Advisor and that they reflected charges within a range of what could have been negotiated at arm’s length.
Economies of Scale.
In considering the extent to which economies of scale would be realized as the Funds grow and whether advisory fee levels reflect those economies of scale for the benefit of the Funds’ investors, the Trustees considered the Funds’ fee arrangements with the Advisor. The Trustees determined that although the management fee would stay the same as asset levels increased, the shareholders of the Funds would benefit from the expense limitation arrangement if, among other reasons, assets were to decrease to a point where Fund expenses increased beyond the expense cap. The Trustees also noted that the Funds would benefit from economies of scale under its agreements with some of its service providers other than the Advisor. The Trustees also considered the Advisor’s fees for separate accounts that are managed in a manner similar to the Funds – the Trustees noted that the Advisor’s standard fees schedule provides breakpoints that are not provided in the advisory fees for the Funds. The Trustees noted that the Funds enjoyed lower fees at the lower asset levels than the Advisor’s separate account clients. The Trustees considered the Advisor’s rationale for the differences in fee rates between the Funds and the Advisor’s separate account clients and determined that rationale to be appropriate. Following further discussion of the Funds’ asset levels, expectations for growth, and levels of fees, the Board determined that the Funds’ fee arrangements, in light of all the facts and circumstances, were fair and reasonable and that the expense limitation arrangement provided potential savings or protection for the benefit of the Funds’ investors.
Advisor’s Practices Regarding Possible Conflicts of Interest.
In considering the Advisor’s practices regarding conflicts of interest, the Trustees evaluated the potential for conflicts of interest and considered such matters as the
DGHM INVESTMENT TRUST (the “Trust”)
SUPPLEMENTAL INFORMATION (unaudited) (continued)
experience and ability of the advisory and compliance personnel assigned to the Funds; the basis for soft dollar payments with broker-dealers; the basis of decisions to buy or sell securities for the Funds and/or the Advisor’s other accounts; and the substance and administration of the Advisor’s code of ethics. Based on the foregoing, the Board determined that the Advisor’s standards and practices relating to the identification and mitigation of possible conflicts of interest were satisfactory.
Based upon all of the foregoing considerations, the Board, including a majority of the Independent Trustees, voting separately, unanimously approved the renewal of the Agreement for a one-year period from March 1, 2013 until February 28, 2014, under the terms and for the compensation described therein.
DGHM INVESTMENT TRUST
FUND EXPENSES (unaudited)
Fund Expenses Example
As a shareholder of the Fund, you incur two types of costs: (1) transaction costs, including deferred sales charges on certain redemptions made within one year of purchase (Class C shares in DGHM All-Cap Value Fund) and (2) ongoing costs, including management fees, distribution (12b-1) fees and other Fund expenses. This example is intended to help you understand your ongoing costs (in dollars) of investing in the Fund and to compare these costs with the ongoing costs of investing in other mutual funds. The example is based on an investment of $1,000 invested at the beginning of the period, September 1, 2012, and held for the six months ended February 28, 2013.
Actual Expenses Example
The first line of the table below provides information about actual account values and actual expenses. You may use the information in this line, together with the amount you invested, to estimate the expenses that you paid over the period. Simply divide your account value by $1,000 (for example, an $8,600 account value divided by $1,000= 8.6), then multiply the result by the number in the first line under the heading entitled “Expenses Paid During Period” to estimate the expenses you paid on your account during this period.
Hypothetical Example for Comparison Purposes
The second line of the table below provides information about hypothetical account values and hypothetical expenses based on the Fund’s actual expense ratio and an assumed rate of return of 5% per year before expenses, which is not the Fund’s actual return. The hypothetical account values and expenses may not be used to estimate the actual ending account balance or expenses you paid for the period. You may use this information to compare the ongoing costs of investing in the Fund and other funds. To do so, compare this 5% hypothetical example with the 5% hypothetical examples that appear in the shareholder reports of the other funds.
Please note that the expenses shown in the table are meant to highlight your ongoing costs only and do not reflect any transactional costs, such as contingent deferred sales charges on certain redemptions. Therefore, the second line of the table is useful in comparing ongoing costs only, and will not help you determine the relative total costs of owning different funds. In addition, if these transactional costs were included, your costs would have been higher.
DGHM INVESTMENT TRUST
FUND EXPENSES (unaudited) (continued)
DGHM ALL-CAP VALUE FUND
| INVESTOR CLASS | Beginning
Account Value
September 1, 2012 | Ending
Account Value
February 28,
2013 | Expenses Paid
During Period*
September 1, 2012
through February 28,
2013 |
| Actual | $1,000.00 | $1,110.70 | $7.59 |
| Hypothetical (5% return before expenses) | $1,000.00 | $1,017.75 | $7.25 |
| CLASS C | Beginning
Account Value
September 1, 2012 | Ending
Account Value
February 28,
2013 | Expenses Paid
During Period*
September 1, 2012
through February 28,
2013 |
| Actual | $1,000.00 | $1,107.30 | $11.49 |
| Hypothetical (5% return before expenses) | $1,000.00 | $1,014.00 | $10.99 |
| INSTITUTIONAL CLASS | Beginning
Account Value
September 1, 2012 | Ending
Account Value
February 28,
2013 | Expenses Paid
During Period*
September 1, 2012
through February 28,
2013 |
| Actual | $1,000.00 | $1,112.30 | $5.87 |
| Hypothetical (5% return before expenses) | $1,000.00 | $1,019.40 | $5.61 |
* - Expenses are equal to the Fund’s annualized expense ratio of 1.45% for Investor Class, 2.20% for Class C and 1.12% for Institutional Class, multiplied by the average account value for the period, multiplied by 181 days in the most recent fiscal half year divided by 365 days in the current year.
DGHM INVESTMENT TRUST
FUND EXPENSES (unaudited) (continued)
DGHM V2000 SMALLCAP VALUE FUND
| INVESTOR CLASS | Beginning
Account Value
September 1, 2012 | Ending
Account Value
February 28,
2013 | Expenses Paid
During Period*
September 1, 2012
through February 28,
2013 |
| Actual | $1,000.00 | $1,111.90 | $9.95 |
| Hypothetical (5% return before expenses) | $1,000.00 | $1,016.00 | $9.00 |
| INSTITUTIONAL CLASS | Beginning
Account Value
September 1,
2012 | Ending
Account Value
February 28,
2013 | Expenses Paid
During Period*
September 1, 2012
through February 28,
2013 |
| Actual | $1,000.00 | $1,114.40 | $8.65 |
| Hypothetical (5% return before expenses) | $1,000.00 | $1,017.25 | $7.75 |
* - Expenses are equal to the Fund’s annualized expense ratio of 1.90% for Investor Class and 1.65% for Institutional Class, multiplied by the average account value for the period, multiplied by 181 days in the most recent fiscal half year divided by 365 days in the current year.
Investment Adviser:
Dalton, Greiner, Hartman, Maher & Co., LLC
565 Fifth Avenue, Suite 2101
New York, New York 10017-2413
Distributor:
First Dominion Capital Corp.
8730 Stony Point Parkway, Suite 205
Richmond, Virginia 23235
Independent Registered Public Accounting Firm:
BBD, LLP
1835 Market Street, 26th Floor
Philadelphia, Pennsylvania 19103
Legal Counsel:
The Law Offices of John H. Lively & Associates, Inc.
A member firm of The 1940 Act Law Group(TM)
11300 Tomahawk Creek Parkway, Suite 310
Leawood, Kansas 66211
Transfer Agent:
For account information, wire purchase or redemptions, call or write to DGHM
Investment Trust’s Transfer Agent:
Commonwealth Fund Services, Inc.
8730 Stony Point Parkway, Suite 205
Richmond, Virginia 23235
(800) 653-2839 (Toll Free)
| ITEM 2. CODE OF ETHICS. |
| | | | |
| | (a) | | The registrant, as of the end of the period covered by this report, has adopted a code of ethics that applies to the registrant’s principal executive officer, principal financial officer, principal accounting officer or controller, or persons performing similar functions, regardless of whether these individuals are employed by the registrant or a third party. |
| | | | |
| | (b) | | There have been no amendments, during the period covered by this report, to a provision of the code of ethics that applies to the registrant’s principal executive officer, principal financial officer, principal accounting officer or controller, or persons performing similar functions, regardless of whether these individuals are employed by the registrant or a third party, and that relates to any element of the code of ethics description. |
| | | | |
| | (c) | | The registrant has not granted any waivers, including an implicit waiver, from a provision of the code of ethics that applies to the registrant’s principal executive officer, principal financial officer, principal accounting officer or controller, or persons performing similar functions, regardless of whether these individuals are employed by the registrant or a third party, that relates to one or more of the items set forth in paragraph (b) of this item’s instructions. |
| | | | |
| ITEM 3. AUDIT COMMITTEE FINANCIAL EXPERT. |
| | | | |
| | (a)(1) | | The registrant does not have an audit committee financial expert serving on its audit committee. |
| | | | |
| | (a)(2) | | Not applicable. |
| | | | |
| | (a)(3) | | At this time, the registrant believes that the collective experience provided by the members of the audit committee together offer the registrant adequate oversight for the registrant’s level of financial complexity. |
| | | | |
| ITEM 4. PRINCIPAL ACCOUNTANT FEES AND SERVICES. |
| | | | |
| | (a) | | The aggregate fees billed for each of the last two fiscal years for professional services rendered by the principal accountant for the audit of the registrant’s annual financial statements or services that are normally provided by the accountant in connection with statutory and regulatory filings or engagements for those fiscal years are $26,000 for 2013 and $26,000 for 2012. |
| | | | |
| | (b) | | The aggregate fees billed in each of the last two fiscal years for assurance and related services by the principal accountant that are reasonably related to the performance of the audit of the registrant’s financial statements and are not reported under paragraph (a) of this Item are $0 for 2013 and $0 for 2012. |
| | | | |
| | (c) | | The aggregate fees billed in each of the last two fiscal years for professional services rendered by the principal accountant for tax compliance, tax advice, and tax planning are $4,000 for 2013 and $4,000 for 2012. |
| | | | |
| | (d) | | The aggregate fees billed in each of the last two fiscal years for products and services provided by the principal accountant, other than the services reported in paragraphs (a) through (c) of this Item are and $0 for 2013 and $0 for 2012. |
| | | | |
| | (e)(1) | | Disclose the audit committee’s pre-approval policies and procedures described in paragraph (c)(7) of Rule 2-01 of Regulation S-X. |
| Pursuant to its charter, the registrant’s Audit Committee must pre-approve all audit and non-audit services to be provided to the registrant. The Audit Committee also pre-approves any non-Audit services provided by the registrant’s principal accountant to the Fund. |
| | | | | |
| | | (e)(2) | | The percentage of services described in each of paragraphs (b) through (d) of this Item that were approved by the audit committee pursuant to paragraph (c)(7)(i)(C) of Rule 2-01 of Regulation S-X are as follows: |
| | | | | |
| (b) | | NA | | |
| | | | | |
| (c) | | 100% | | |
| | | | | |
| (d) | | NA | | |
| | | | | |
| | | (f) | | The percentage of hours expended on the principal accountant’s engagement to audit the registrant’s financial statements for the most recent fiscal year that were attributed to work performed by persons other than the principal accountant’s full-time, permanent employees was zero percent (0%). |
| | | | | |
| | | (g) | | The aggregate non-audit fees billed by the registrant’s accountant for services rendered to the registrant, and rendered to the registrant’s investment adviser (not including any sub-adviser whose role is primarily portfolio management and is subcontracted with or overseen by another investment adviser), and any entity controlling, controlled by, or under common control with the adviser that provides ongoing services to the registrant for each of the last two fiscal years of the registrant was $0 for 2013 and $0 for 2012. |
| | | | | |
| | | (h) | | Not applicable. The Audit Committee pre-approved all non-audit services rendered to the registrant’s investment adviser and any control affiliates that provide ongoing services to the registrant. |
| | | | | |
| ITEM 5. AUDIT COMMITTEE OF LISTED REGISTRANTS. |
| | | | | |
| Not applicable. |
| | | | | |
| ITEM 6. SCHEDULE OF INVESTMENTS. |
| | | | | |
| Schedule filed under Item 1 of the Form. |
| | | | | |
| ITEM 7. DISCLOSURE OF PROXY VOTING POLICIES AND PROCEDURES FOR CLOSED-END MANAGEMENT INVESTMENT COMPANIES. |
| | | | | |
| Not applicable. |
| | | | | |
| ITEM 8. PORTFOLIO MANAGERS OF CLOSED-END MANAGEMENT INVESTMENT COMPANIES. |
| | | | | |
| Not applicable. |
| | | | | |
| ITEM 9. PURCHASES OF EQUITY SECURITIES BY CLOSED-END MANAGEMENT INVESTMENT COMPANY AND AFFILIATED PURCHASERS. |
| | | | |
| Not applicable. |
| ITEM 10. SUBMISSION OF MATTERS TO A VOTE OF SECURITY HOLDERS. |
| | | | |
| Not applicable. |
| | | | |
| | | | |
| ITEM 11. CONTROLS AND PROCEDURES. |
| | | | |
| | (a) | | The registrant’s principal executive and principal financial officers, or persons performing similar functions, have concluded that the registrant’s disclosure controls and procedures (as defined in Rule 30a-3(c) under the Investment Company Act of 1940, as amended (the “1940 Act”) (17 CFR 270.30a-3(c))) are effective, as of a date within 90 days of the filing date of the report that includes the disclosure required by this paragraph, based on their evaluation of these controls and procedures required by Rule 30a-3(b) under the 1940 Act (17 CFR 270.30a-3(b)) and Rules 13a-15(b) or 15d-15(b) under the Securities Exchange Act of 1934, as amended (17 CFR 240.13a-15(b) or 240.15d-15(b)). |
| | | | |
| | (b) | | There were no changes in the registrant’s internal control over financial reporting (as defined in Rule 30a-3(d) under the 1940 Act (17 CFR 270.30a-3(d)) that occurred during the second fiscal quarter of the period covered by the report that has materially affected or is reasonably likely to materially affect, the registrant’s internal control over financial reporting. |
| | | | |
| | | | |
| ITEM 12. EXHIBITS. |
| | | | |
| | (a)(1) | | Code of ethics, or any amendment thereto, that is the subject of disclosure required by Item 2 is attached hereto. |
| | | | |
| | (a)(2) | | Certifications pursuant to Section 302 of the Sarbanes-Oxley Act of 2002 are attached hereto. |
| | | | |
| | (a)(3) | | Not applicable. There were no solicitations to purchase securities under Rule 23c-1 under the Act sent or given during the period covered by this report by or on behalf of the registrant. |
| | | | |
| | | | |
| | (b) | | Certifications pursuant to Section 906 of the Sarbanes-Oxley Act of 2002 are attached hereto. |
SIGNATURES
Pursuant to the requirements of the Securities Exchange Act of 1934 and the Investment Company Act of 1940, the registrant has duly caused this report to be signed on its behalf by the undersigned, thereunto duly authorized.
(Registrant): DGHM Investment Trust
By: /s/ Jeffrey C. Baker
Jeffrey C. Baker
President and Principal Executive Officer
Date: May 9, 2013
Pursuant to the requirements of the Securities Exchange Act of 1934 and the Investment Company Act of 1940, this report has been signed below by the following persons on behalf of the registrant and in the capacities and on the dates indicated.
By: /s/ Jeffrey C. Baker
Jeffrey C. Baker
President and Principal Executive Officer,
DGHM Investment Trust
Date: May 9, 2013
By: /s/ Thomas F. Gibson
Thomas F. Gibson
Principal Financial Officer,
DGHM Investment Trust
Date: May 9, 2013