UNITED STATES
SECURITIES AND EXCHANGE COMMISSION
Washington, D.C. 20549
FORM N-CSR
CERTIFIED SHAREHOLDER REPORT OF REGISTERED
MANAGEMENT INVESTMENT COMPANIES
Investment Company Act file number 811-21972
Name of Fund: BlackRock Credit Allocation Income Trust (BTZ)
Fund Address: 100 Bellevue Parkway, Wilmington, DE 19809
Name and address of agent for service: John M. Perlowski, Chief Executive Officer, BlackRock Credit Allocation Income Trust, 55 East 52nd Street, New York, NY 10055
Registrant’s telephone number, including area code: (800) 882-0052, Option 4
Date of fiscal year end: 10/31/2016
Date of reporting period: 04/30/2016
Item 1 – Report to Stockholders
APRIL 30, 2016
| | | | |
SEMI-ANNUAL REPORT (UNAUDITED) | | | |  |
BlackRock Credit Allocation Income Trust (BTZ)
BlackRock Floating Rate Income Trust (BGT)
BlackRock Multi-Sector Income Trust (BIT)
|
| Not FDIC Insured • May Lose Value • No Bank Guarantee |
| | | | | | |
| | | | | | | |
| 2 | | SEMI-ANNUAL REPORT | | APRIL 30, 2016 | | |
Dear Shareholder,
Diverging monetary policies and shifting economic outlooks across regions have been the overarching themes driving financial markets over the past couple of years. Investors spent most of 2015 anticipating the end of the Federal Reserve’s (the “Fed”) near-zero interest rate policy as U.S. growth outpaced other developed markets. The Fed ultimately hiked rates in December, whereas the European Central Bank and the Bank of Japan took additional steps to stimulate growth, even introducing negative interest rates. The U.S. dollar had strengthened considerably ahead of these developments, causing profit challenges for U.S. companies that generate revenues overseas, and pressuring emerging market currencies and commodities prices.
Global market volatility increased in the latter part of 2015 and spilled over into early 2016. Oil prices were a key factor behind the instability after collapsing in mid-2015 due to excess global supply. China, one of the world’s largest consumers of oil, was another notable source of stress for financial markets. Signs of slowing economic growth, a depreciating yuan and declining confidence in the country’s policymakers stoked investors’ worries about the potential impact of China’s weakness on the global economy. Risk assets (such as equities and high yield bonds) suffered in this environment.
After a painful start to the new year, fears of a global recession began to fade as the first quarter wore on, allowing markets to calm and risk assets to rebound. Central bank stimulus in Europe and Japan, combined with a more tempered outlook for rate hikes in the United States, helped bolster financial markets. A softening in U.S. dollar strength offered some relief to U.S. exporters and emerging market economies. Oil prices found firmer footing as global supply showed signs of leveling off.
The selloff in risk assets at the turn of the year brought valuations to more reasonable levels, creating some appealing entry points for investors in 2016. Nonetheless, slow but relatively stable growth in the United States is countered by a less optimistic global economic outlook and uncertainties around the efficacy of China’s policy response, the potential consequences of negative interest rates in Europe and Japan, and a host of geopolitical risks.
For the 12 months ended April 30, 2016, higher-quality assets such as municipal bonds, U.S. Treasuries and investment grade corporate bonds generated positive returns, while riskier assets such as non-U.S. and small cap equities broadly declined.
At BlackRock, we believe investors need to think globally, extend their scope across a broad array of asset classes and be prepared to adjust accordingly as market conditions change over time. We encourage you to talk with your financial advisor and visit blackrock.com for further insight about investing in today’s markets.
Sincerely,

Rob Kapito
President, BlackRock Advisors, LLC

Rob Kapito
President, BlackRock Advisors, LLC
| | | | | | | | |
| Total Returns as of April 30, 2016 | |
| | | 6-month | | | 12-month | |
U.S. large cap equities
(S&P 500® Index) | | | 0.43 | % | | | 1.21 | % |
U.S. small cap equities
(Russell 2000® Index) | | | (1.90 | ) | | | (5.94 | ) |
International equities
(MSCI Europe, Australasia,
Far East Index) | | | (3.07 | ) | | | (9.32 | ) |
Emerging market equities
(MSCI Emerging Markets Index) | | | (0.13 | ) | | | (17.87 | ) |
3-month Treasury bills
(BofA Merrill Lynch 3-Month
U.S. Treasury Bill Index) | | | 0.14 | | | | 0.15 | |
U.S. Treasury securities
(BofA Merrill Lynch
10-Year U.S. Treasury
Index) | | | 3.76 | | | | 3.74 | |
U.S. investment grade bonds
(Barclays U.S.
Aggregate Bond Index) | | | 2.82 | | | | 2.72 | |
Tax-exempt municipal
bonds (S&P Municipal
Bond Index) | | | 3.52 | | | | 5.16 | |
U.S. high yield bonds
(Barclays U.S. Corporate
High Yield 2% Issuer
Capped Index) | | | 2.38 | | | | (1.08 | ) |
| Past performance is no guarantee of future results. Index performance is shown for illustrative purposes only. You cannot invest directly in an index. | |
| | | | | | |
| | | | | | | |
| | THIS PAGE NOT PART OF YOUR FUND REPORT | | | | 3 |
| | | | |
| Trust Summary as of April 30, 2016 | | BlackRock Credit Allocation Income Trust |
BlackRock Credit Allocation Income Trust’s (BTZ) (the “Trust”) investment objective is to provide current income, current gains and capital appreciation. The Trust seeks to achieve its investment objective by investing, under normal market conditions, at least 80% of its assets in credit-related securities, including, but not limited to, investment grade corporate bonds, high yield bonds (commonly referred to as “junk” bonds), bank loans, preferred securities or convertible bonds or derivatives with economic characteristics similar to these credit-related securities. The Trust may invest directly in such securities or synthetically through the use of derivatives.
No assurance can be given that the Trust’s investment objective will be achieved.
| | |
| Trust Information | | |
Symbol on New York Stock Exchange (“NYSE”) | | BTZ |
Initial Offering Date | | December 27, 2006 |
Current Distribution Rate on Closing Market Price as of April 30, 2016 ($12.66)1 | | 7.20% |
Current Monthly Distribution per Common Share2 | | $0.076 |
Current Annualized Distribution per Common Share2 | | $0.912 |
Economic Leverage as of April 30, 20163 | | 28% |
| | 1 | | Current distribution rate on closing market price is calculated by dividing the current annualized distribution per share by the closing market price. The current distribution rate consists of income, net realized gains and/or a return of capital. Past performance does not guarantee future results. |
| | 2 | | The distribution rate is not constant and is subject to change. A portion of the distribution may be deemed a return of capital or net realized gain. |
| | 3 | | Represents reverse repurchase agreements as a percentage of total managed assets, which is the total assets of the Trust (including any assets attributable to any borrowings) minus the sum of liabilities (other than borrowings representing financial leverage). For a discussion of leveraging techniques utilized by the Trust, please see The Benefits and Risks of Leveraging on page 10. |
|
| Performance and Portfolio Management Commentary |
Returns for the six months ended April 30, 2016 were as follows:
| | | | | | | | |
| | | Returns Based On | |
| | | Market Price | | | NAV | |
BTZ1,2 | | | 4.97 | % | | | 2.88 | % |
Lipper Corporate BBB-Rated Debt Funds (Leveraged)3 | | | 5.60 | % | | | 2.74 | % |
| | 1 | | All returns reflect reinvestment of dividends and/or distributions. |
| | 2 | | The Trust’s discount to NAV, which narrowed during the period, accounts for the difference between performance based on price and performance based on NAV. |
The following discussion relates to the Trust’s absolute performance based on NAV:
What factors influenced performance?
| • | | The Trust’s allocations to the wireline, tobacco, pharmaceuticals, cable & satellite, and midstream energy industries made positive contributions to performance, as did its position in U.S. banks. The Trust’s weighting in high-yield bonds, which rallied strongly from mid-February onward, also contributed on an absolute basis. |
| • | | The largest detractors from performance included the Trust’s positions in the metals & mining, independent energy and refining industries, all of which weakened in conjunction with the volatility in commodity prices. An allocation to capital securities also hurt results, as the sector gave back some of its prior gains during the first quarter of 2016. (Capital securities are dividend-paying securities that combine some features of both corporate bonds and preferred stocks, while generally providing higher yields to compensate for being less senior in the issuer’s capital structure.) |
| • | | The Trust held derivatives in the form of futures, swaps, swaptions and options in order to manage duration and convexity risk. (Duration is a |
| | | measure of interest rate sensitivity; convexity measures how duration changes as interest rates change.) The positions negatively affected performance due to the continued selloff in swap spreads, which became increasingly negative throughout the period. Derivatives were also used to aid in implementing the Trust’s yield curve positioning. The Trust used credit default swaps, including those linked to broad indices or individual securities, to manage credit risk. In addition, the Trust used leverage to enhance yield. |
Describe recent portfolio activity.
| • | | The Trust lowered its weighting in industrials through reductions in the metals & mining, pharmaceuticals, and wireless subsectors. The Trust added to its weighting in the midstream energy and electric utilities industries. From a quality perspective, the Trust’s exposure increased in bonds rated A, CCC and BB, and its exposure decreased to securities rated B and BBB on a risk-adjusted basis. |
Describe portfolio positioning at period end.
| • | | In the industrials sector, the Trust held its largest weightings in the energy and communications industries. Within these groups, the investment advisor favored the midstream energy and wireline subsectors, respectively. The Trust also had significant allocations to the pharmaceuticals and mining industries, although it reduced its weighting in both groups during the period. |
| • | | Within financials, the Trust held the largest position in U.S. banks. This aspect of the Trust’s positioning reflected the investment advisor’s positive view on the sector following the weakness it experienced in the first quarter of 2016. From a ratings perspective, the Trust held its largest exposure in BBB-rated issues. |
The views expressed reflect the opinions of BlackRock as of the date of this report and are subject to change based on changes in market, economic or other conditions. These views are not intended to be a forecast of future events and are no guarantee of future results.
| | | | | | |
| | | | | | | |
| 4 | | SEMI-ANNUAL REPORT | | APRIL 30, 2016 | | |
| | |
| | | BlackRock Credit Allocation Income Trust |
| | |
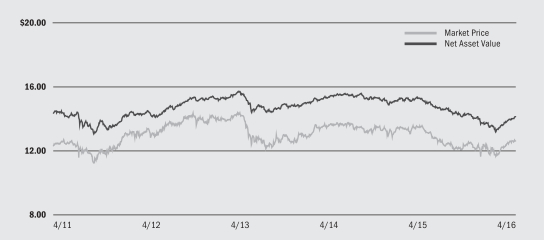
| Market Price and Net Asset Value Per Share Summary |
| | | | | | | | | | | | | | | | | | | | |
| | | 4/30/16 | | | 10/31/15 | | | Change | | | High | | | Low | |
Market Price | | $ | 12.66 | | | $ | 12.53 | | | | 1.04 | % | | $ | 12.74 | | | $ | 11.60 | |
Net Asset Value | | $ | 14.19 | | | $ | 14.33 | | | | (0.98 | )% | | $ | 14.33 | | | $ | 13.23 | |
| | |
| Market Price and Net Asset Value History For the Past Five Years |
| | |
| Overview of the Trust’s Total Investments |
| | | | | | | | |
| Portfolio Composition | | 4/30/16 | | | 10/31/15 | |
Corporate Bonds | | | 75 | % | | | 76 | % |
Preferred Securities | | | 16 | | | | 19 | |
Asset-Backed Securities | | | 4 | | | | 4 | |
U.S. Treasury Obligations | | | 3 | | | | — | |
Municipal Bonds | | | 1 | | | | 1 | |
Foreign Agency Obligations | | | 1 | | | | — | |
Other | | | — | 1 | | | — | 2 |
| | 1 | | Includes a less than 1% holding in each of the following investment types: Short-Term Securities, U.S. Government Sponsored Agency Securities, Options Purchased, Options Written and Common Stocks. |
| | 2 | | Includes a less than 1% holding in each of the following investment types: Foreign Agency Obligations, Options Purchased, Options Written, U.S. Government Sponsored Agency Securities and Short-Term Securities. |
| | | | | | | | |
| Credit Quality Allocation3,4 | | 4/30/16 | | | 10/31/15 | |
AAA/Aaa5 | | | 3 | % | | | 1 | % |
AA/Aa | | | 2 | | | | 2 | |
A | | | 18 | | | | 19 | |
BBB/Baa | | | 48 | | | | 48 | |
BB/Ba | | | 17 | | | | 18 | |
B | | | 8 | | | | 9 | |
CCC/Caa | | | 1 | | | | 1 | |
N/R | | | 3 | | | | 2 | |
| | 3 | | For financial reporting purposes, credit quality ratings shown above reflect the highest rating assigned by either Standard & Poor’s (“S&P”) or Moody’s Investors Service (“Moody’s”) if ratings differ. These rating agencies are independent, nationally recognized statistical rating organizations and are widely used. Investment grade ratings are credit ratings of BBB/Baa or higher. Below investment grade ratings are credit ratings of BB/Ba or lower. Investments designated N/R are not rated by either rating agency. Unrated investments do not necessarily indicate low credit quality. Credit quality ratings are subject to change. |
| | 4 | | Excludes Short-Term Securities, Options Purchased and Options Written. |
| | 5 | | The investment advisor evaluates the credit quality of not-rated investments based upon certain factors including, but not limited to, credit ratings for similar investments and financial analysis of sectors, individual investments and/or issuer. Using this approach, the investment advisor has deemed U.S. Government Sponsored Agency Securities and U.S. Treasury Obligations as AAA/Aaa. |
| | | | | | |
| | | | | | | |
| | SEMI-ANNUAL REPORT | | APRIL 30, 2016 | | 5 |
| | | | |
| Trust Summary as of April 30, 2016 | | BlackRock Floating Rate Income Trust |
BlackRock Floating Rate Income Trust’s (BGT) (the “Trust”) primary investment objective is to provide a high level of current income. The Trust’s secondary investment objective is to seek the preservation of capital. The Trust seeks to achieve its investment objectives by investing primarily, under normal conditions, at least 80% of its assets in floating and variable rate instruments of U.S. and non-U.S. issuers, including a substantial portion of its assets in global floating and variable rate securities including senior secured floating rate loans made to corporate and other business entities. Under normal market conditions, the Trust expects that the average effective duration of its portfolio will be no more than 1.5 years. The Trust may invest directly in such securities or synthetically through the use of derivatives.
No assurance can be given that the Trust’s investment objectives will be achieved.
| | |
Symbol on NYSE | | BGT |
Initial Offering Date | | August 30, 2004 |
Current Distribution Rate on Closing Market Price as of April 30, 2016 ($12.88)1 | | 5.43% |
Current Monthly Distribution per Common Share2 | | $0.0583 |
Current Annualized Distribution per Common Share2 | | $0.6996 |
Economic Leverage as of April 30, 20163 | | 27% |
| | 1 | | Current distribution rate on closing market price is calculated by dividing the current annualized distribution per share by the closing market price. The current distribution rate consists of income, net realized gains and/or a return of capital. Past performance does not guarantee future results. |
| | 2 | | The distribution rate is not constant and is subject to change. A portion of the distribution may be deemed a return of capital or net realized gain. |
| | 3 | | Represents bank borrowings outstanding as a percentage of total managed assets, which is the total assets of the Trust (including any assets attributable to any borrowings) minus the sum of liabilities (other than borrowings representing financial leverage). For a discussion of leveraging techniques utilized by the Trust, please see The Benefits and Risks of Leveraging on page 10. |
|
| Performance and Portfolio Management Commentary |
Returns for the six months ended April 30, 2016 were as follows:
| | | | | | | | |
| | | Returns Based On | |
| | | Market Price | | | NAV | |
BGT1,2 | | | 3.71 | % | | | 1.88 | % |
Lipper Loan Participation Funds3 | | | 3.95 | % | | | 0.97 | % |
| | 1 | | All returns reflect reinvestment of dividends and/or distributions. |
| | 2 | | The Trust’s discount to NAV, which narrowed during the period, accounts for the difference between performance based on price and performance based on NAV. |
The following discussion relates to the Trust’s absolute performance based on NAV:
What factors influenced performance?
| • | | For much of the six-month period, credit markets continued to be impacted by weakness in commodity-related sectors, with early 2016 being particularly challenging. Performance for floating rate loan interests (i.e. bank loans) and other credit assets began to improve around the middle of February as prices for oil and other commodities moved higher. Despite a recovery over the latter part of the period, the Trust’s exposure to energy-related sectors, specifically independent energy producers and midstream energy companies, detracted from performance for the six months. |
| • | | The broad floating rate bank loan market provided a positive return for the six-month period. The Trust’s exposure to loans in the consumer services, pharmaceuticals/health care and technology sectors contributed positively to performance. Performance for high yield bonds was positive and |
| | | ahead of that for loans during the period, and the Trust’s tactical allocation to this asset class contributed to results. |
Describe recent portfolio activity.
| • | | Throughout the six-month period, the Trust maintained its focus on the higher quality segments of the loan market in terms of loan structure, liquidity and overall credit quality. The Trust has concentrated its investments in strong companies with stable cash flows and high quality collateral, with the ability to meet interest obligations and ultimately return principal. From a sector perspective, the Trust added to names in the technology and health care sectors, while trimming exposure to pharmaceuticals and lodging. The Trust reduced its exposure to collateralized loan obligations (“CLOs”) and added slightly to its high yield bond position. |
Describe portfolio positioning at period end.
| • | | At period end, the Trust held 94% of its total portfolio in bank loans, with the remainder primarily in corporate bonds and CLOs. The Trust continued to favor loans rated B where the managers are comfortable with credit quality, in view of the incremental income they offered versus BB loans. Additionally, the Trust held a modest position in CCC-rated loans, with a focus on names that have shown consistent credit improvement. While it maintained exposure to energy and metals & mining, the Trust had a conservative posture overall with respect to commodities-oriented loans. Top issuer positions included Level 3 (Wirelines), Virgin Media (Cable & Satellite), and First Data (Technology). The strategy maintained a modest stake in more conservative high yield bonds. |
The views expressed reflect the opinions of BlackRock as of the date of this report and are subject to change based on changes in market, economic or other conditions. These views are not intended to be a forecast of future events and are no guarantee of future results.
| | | | | | |
| | | | | | | |
| 6 | | SEMI-ANNUAL REPORT | | APRIL 30, 2016 | | |
| | |
| | | BlackRock Floating Rate Income Trust |
| | | | | | | | | | |
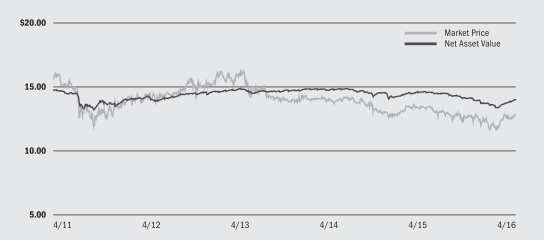
| Market Price and Net Asset Value Per Share Summary | | | | | | | | | | |
| | | | | | | | | | | | | | | | | | | | |
| | | 4/30/16 | | | 10/31/15 | | | Change | | | High | | | Low | |
Market Price | | $ | 12.88 | | | $ | 12.77 | | | | 0.86 | % | | $ | 12.99 | | | $ | 11.52 | |
Net Asset Value | | $ | 14.05 | | | $ | 14.18 | | | | (0.92 | )% | | $ | 14.19 | | | $ | 13.43 | |
| | |
| Market Price and Net Asset Value History For the Past Five Years |
| | |
| Overview of the Trust’s Total Investments |
| | | | | | | | |
| | |
| Portfolio Composition | | 4/30/16 | | | 10/31/15 | |
Floating Rate Loan Interests | | | 94 | % | | | 93 | % |
Corporate Bonds | | | 3 | | | | 3 | |
Asset-Backed Securities | | | 2 | | | | 4 | |
Short-Term Securities | | | 1 | | | | — | 1 |
Other2 | | | — | | | | — | |
| | 1 | | Includes a less than 1% holding in Short-Term Securities. |
| | 2 | | Includes a less than 1% holding in each of the following investment types: Non-Agency Mortgage — Backed Securities, Other Interests, Investment Companies, Warrants, Common Stocks and Options Purchased. |
| | | | | | | | |
| | |
| Credit Quality Allocation3,4 | | 4/30/16 | | | 10/31/15 | |
A | | | — | 5 | | | 1 | % |
BBB/Baa | | | 11 | % | | | 8 | |
BB/Ba | | | 46 | | | | 45 | |
B | | | 37 | | | | 39 | |
CCC/Caa | | | 3 | | | | 3 | |
N/R | | | 3 | | | | 4 | |
| | 3 | | For financial reporting purposes, credit quality ratings shown above reflect the highest rating assigned by either S&P’s or Moody’s if ratings differ. These rating agencies are independent, nationally recognized statistical rating organizations and are widely used. Investment grade ratings are credit ratings of BBB/Baa or higher. Below investment grade ratings are credit ratings of BB/Ba or lower. Investments designated N/R are not rated by either rating agency. Unrated investments do not necessarily indicate low credit quality. Credit quality ratings are subject to change. |
| | 4 | | Excludes Short-Term Securities and Options Purchased. |
| | 5 | | Represents less than 1% of total investments. |
| | | | | | |
| | | | | | | |
| | SEMI-ANNUAL REPORT | | APRIL 30, 2016 | | 7 |
| | | | |
| Trust Summary as of April 30, 2016 | | BlackRock Multi-Sector Income Trust |
BlackRock Multi-Sector Income Trust’s (BIT) (the “Trust”) primary investment objective is to seek high current income, with a secondary objective of capital appreciation. The Trust seeks to achieve its investment objectives by investing, under normal market conditions, at least 80% of its assets in loan and debt instruments and other investments with similar economic characteristics. The Trust may invest directly in such securities or synthetically through the use of derivatives.
No assurance can be given that the Trust’s investment objective will be achieved.
| | |
| Trust Information | | |
Symbol on NYSE | | BIT |
Initial Offering Date | | February 27, 2013 |
Current Distribution Rate on Closing Market Price as of April 30, 2016 ($16.15)1 | | 8.67% |
Current Monthly Distribution per Common Share2 | | $0.1167 |
Current Annualized Distribution per Common Share2 | | $1.4004 |
Economic Leverage as of April 30, 20163 | | 39% |
| | 1 | | Current distribution rate on closing market price is calculated by dividing the current annualized distribution per share by the closing market price. The current distribution rate consists of income, net realized gains and/or a return of capital. Past performance does not guarantee future results. |
| | 2 | | The distribution rate is not constant and is subject to change. A portion of the distribution may be deemed a return of capital or net realized gain. |
| | 3 | | Represents reverse repurchase agreements as a percentage of total managed assets, which is the total assets of the Trust (including any assets attributable to any borrowings) minus the sum of liabilities (other than borrowings representing financial leverage). For a discussion of leveraging techniques utilized by the Trust, please see The Benefits and Risks of Leveraging on page 10. |
|
| Performance and Portfolio Management Commentary |
Returns for the six months ended April 30, 2016 were as follows:
| | | | | | | | |
| | | Returns Based On | |
| | | Market Price | | | NAV | |
BIT1,2 | | | 4.07 | % | | | 1.64 | %4 |
Lipper General Bond Funds3 | | | 7.09 | % | | | 0.60 | % |
| | 1 | | All returns reflect reinvestment of dividends and/or distributions. |
| | 2 | | The Trust’s discount to NAV, which narrowed during the period, accounts for the difference between performance based on price and performance based on NAV. |
| | 4 | | Performance results do not reflect adjustments related to valuation and income recognition for financial reporting purposes in accordance with U.S. generally accepted accounting principles and therefore differ from the return reported in the Financial Highlights on page 75. |
The following discussion relates to the Trust’s absolute performance based on NAV:
What factors influenced performance?
| • | | The Trust’s positions in high yield corporate bonds, emerging market debt and senior loans were the most significant contributors to performance. Performance was also aided by the Trust’s positioning within investment grade corporate bonds. |
| • | | The Trust’s allocations in commercial mortgage-backed securities (“CMBS”) non-agency mortgage-backed securities (“MBS”) and asset-backed securities (“ABS”) were the largest detractors from performance. |
| • | | During the period the Trust used futures, forwards, options, and swaps as a substitute for cash bond exposure, and/or to manage duration, yield curve, convexity, spread risk and credit risk. The Trust also used forward contracts to manage foreign currency exposure and express active currency views. Collectively, these positions detracted from performance. |
Describe recent portfolio activity.
| • | | During the period, the Trust’s exposure to credit risk was reduced as the investment advisor adopted a more cautious stance toward the markets. Allocations to MBS, ABS and CMBS were trimmed, and the Trust’s high yield allocation was rotated toward more defensive issuers within the sector. In addition, the Trust’s exposure to capital securities was reduced, while its position in high quality investment grade industrials was increased. The Trust’s duration (and corresponding interest rate sensitivity) was increased in response to weaker U.S. economic data and dovish rhetoric from the Fed. Lastly, the Trust’s allocation to floating rate securities was reduced. |
Describe portfolio positioning at period end.
| • | | The Trust maintained a diversified exposure to non-government spread sectors, including non-agency MBS, high yield corporates, capital securities, ABS, collateralized loan obligations, CMBS and senior loans. The Trust also held marginal exposure to government-related sectors such as supranationals (multinational foreign government obligations) and foreign agencies. |
The views expressed reflect the opinions of BlackRock as of the date of this report and are subject to change based on changes in market, economic or other conditions. These views are not intended to be a forecast of future events and are no guarantee of future results.
| | | | | | |
| | | | | | | |
| 8 | | SEMI-ANNUAL REPORT | | APRIL 30, 2016 | | |
| | |
| | | BlackRock Multi-Sector Income Trust |
| | | | | | | | | | |
| Market Price and Net Asset Value Per Share Summary | | | | | | | | | | |
| | | | | | | | | | | | | | | | | | | | |
| | | 4/30/16 | | | 10/31/15 | | | Change | | | High | | | Low | |
Market Price | | $ | 16.15 | | | $ | 16.31 | | | | (0.98 | )% | | $ | 16.36 | | | $ | 14.70 | |
Net Asset Value | | $ | 18.23 | 1 | | $ | 18.91 | | | | (3.60 | )% | | $ | 18.96 | | | $ | 17.16 | |
| | 1 | | The net asset value does not reflect adjustments related to valuation and income recognition for financial reporting purposes in accordance with U.S. generally accepted accounting principles and therefore differs from the net asset value reported in the Statements of Assets and Liabilities and the Financial Highlights. |
| | |
| Market Price and Net Asset Value History Since Inception |
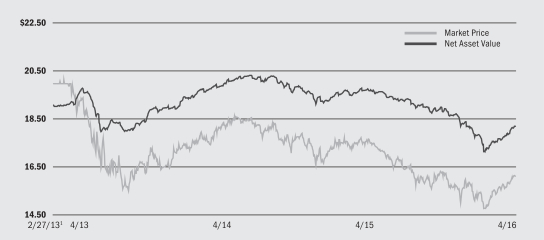
| | 1 | | Commencement of operations. |
| | |
| Overview of the Trust’s Total Investments |
| | | | | | | | |
| Portfolio Composition | | 4/30/16 | | | 10/31/15 | |
Corporate Bonds | | | 34 | % | | | 33 | % |
Non-Agency Mortgage-Backed Securities | | | 21 | | | | 25 | |
Asset-Backed Securities | | | 20 | | | | 21 | |
Preferred Securities | | | 11 | | | | 13 | |
Floating Rate Loan Interests | | | 5 | | | | 5 | |
U.S. Treasury Obligations | |
| 5
|
| | | — | |
Foreign Agency Obligations | | | 2 | | | | 2 | |
Short-Term Securities | | | 2 | | | | 1 | |
Other | | | — | 1 | | | — | 2 |
| | 1 | | Includes a less than 1% holding in each of the following investment types: Common Stocks, Options Purchased and Options Written. |
| | 2 | | Includes a less than 1% holding in each of the following investment types: Options Purchased and Options Written. |
| | | | | | | | |
| Credit Quality Allocation3,4 | | 4/30/16 | | | 10/31/15 | |
AAA/Aaa | | | 5 | % | | | — | |
A | | | 5 | | | | 3 | % |
BBB/Baa | | | 16 | | | | 17 | |
BB/Ba | | | 23 | | | | 28 | |
B | | | 13 | | | | 12 | |
CCC/Caa | | | 18 | | | | 19 | |
CC/Ca | | | 4 | | | | 5 | |
C | | | 1 | | | | — | |
N/R | | | 15 | | | | 16 | |
| | 3 | | For financial reporting purposes, credit quality ratings shown above reflect the highest rating assigned by either S&P’s or Moody’s if ratings differ. These rating agencies are independent, nationally recognized statistical rating organizations and are widely used. Investment grade ratings are credit ratings of BBB/Baa or higher. Below investment grade ratings are credit ratings of BB/Ba or lower. Investments designated N/R are not rated by either rating agency. Unrated investments do not necessarily indicate low credit quality. Credit quality ratings are subject to change. |
| | 4 | | Excludes Short-Term Securities, Options Purchased and Options Written. |
| | | | | | |
| | | | | | | |
| | SEMI-ANNUAL REPORT | | APRIL 30, 2016 | | 9 |
| | | | |
| The Benefits and Risks of Leveraging | | |
The Trusts may utilize leverage to seek to enhance the distribution rate on, and net asset value (“NAV”) of, their common shares (“Common Shares”). However, these objectives cannot be achieved in all interest rate environments.
In general, the concept of leveraging is based on the premise that the financing cost of leverage, which is based on short-term interest rates, is normally lower than the income earned by a Trust on its longer-term portfolio investments purchased with the proceeds from leverage. To the extent that the total assets of the Trusts (including the assets obtained from leverage) are invested in higher-yielding portfolio investments, the Trusts’ shareholders benefit from the incremental net income. The interest earned on securities purchased with the proceeds from leverage is paid to shareholders in the form of dividends, and the value of these portfolio holdings is reflected in the per share NAV.
To illustrate these concepts, assume a Trust’s capitalization is $100 million and it utilizes leverage for an additional $30 million, creating a total value of $130 million available for investment in longer-term income securities. If prevailing short-term interest rates are 3% and longer-term interest rates are 6%, the yield curve has a strongly positive slope. In this case, a Trust’s financing costs on the $30 million of proceeds obtained from leverage are based on the lower short-term interest rates. At the same time, the securities purchased by a Trust with the proceeds from leverage earn income based on longer-term interest rates. In this case, a Trust’s financing cost of leverage is significantly lower than the income earned on a Trust’s longer-term investments acquired from such leverage proceeds, and therefore the holders of Common Shares (“Common Shareholders”) are the beneficiaries of the incremental net income.
However, in order to benefit shareholders, the return on assets purchased with leverage proceeds must exceed the ongoing costs associated with the leverage. If interest and other costs of leverage exceed the Trusts’ return on assets purchased with leverage proceeds, income to shareholders is lower than if the Trusts had not used leverage. Furthermore, the value of the Trusts’ portfolio investments generally varies inversely with the direction of long-term interest rates, although other factors can influence the value of portfolio investments. In contrast, the value of the Trusts’ obligations under their respective leverage arrangements generally does not fluctuate in relation to interest rates. As a result, changes in interest
rates can influence the Trusts’ NAVs positively or negatively. Changes in the future direction of interest rates are very difficult to predict accurately, and there is no assurance that the Trusts’ intended leveraging strategy will be successful.
Leverage also generally causes greater changes in the Trusts’ NAVs, market prices and dividend rates than comparable portfolios without leverage. In a declining market, leverage is likely to cause a greater decline in the NAV and market price of the Trusts’ shares than if the Trusts were not leveraged. In addition, the Trusts may be required to sell portfolio securities at inopportune times or at distressed values in order to comply with regulatory requirements applicable to the use of leverage or as required by the terms of leverage instruments, which may cause the Trusts to incur losses. The use of leverage may limit the Trusts’ ability to invest in certain types of securities or use certain types of hedging strategies. The Trusts incur expenses in connection with the use of leverage, all of which are borne by shareholders and may reduce income to the shareholders. Moreover, to the extent the calculation of the Trusts’ investment advisory fees includes assets purchased with the proceeds of leverage, the investment advisory fees payable to the Trusts’ investment advisor will be higher than if the Trusts did not use leverage.
Each Trust may utilize leverage through a credit facility or reverse repurchase agreements as described in the Notes to Financial Statements.
Under the Investment Company Act of 1940, as amended (the “1940 Act”), the Trusts are permitted to issue debt up to 33 1/3% of their total managed assets. BIT is permitted to use economic leverage (which includes leverage attributable to reverse repurchase agreements) of up to 50% of its total managed assets. A Trust may voluntarily elect to limit its leverage to less than the maximum amount permitted under the 1940 Act. In addition, a Trust may also be subject to certain asset coverage, leverage or portfolio composition requirements imposed by its credit facility, which may be more stringent than those imposed by the 1940 Act.
If a Trust segregates or designates on its books and records cash or liquid assets having values not less than the value of a Trust’s obligations under the reverse repurchase agreement (including accrued interest), then such transaction is not considered a senior security and is not subject to the foregoing limitations and requirements under the 1940 Act.
| | |
| Derivative Financial Instruments | | |
The Trusts may invest in various derivative financial instruments. These instruments are used to obtain exposure to a security, commodity, index, market and/or other asset without owning or taking physical custody of securities, commodities and/or other referenced assets or to manage market, equity, credit, interest rate, foreign currency exchange rate, commodity and/or other risks. Derivative financial instruments may give rise to a form of economic leverage and involve risks, including the imperfect correlation between the value of a derivative financial instrument and the underlying asset, possible default of the counterparty to the
transaction or illiquidity of the instrument. The Trusts’ successful use of a derivative financial instrument depends on the investment advisor’s ability to predict pertinent market movements accurately, which cannot be assured. The use of these instruments may result in losses greater than if they had not been used, may limit the amount of appreciation a Trust can realize on an investment and/or may result in lower distributions paid to shareholders. The Trusts’ investments in these instruments, if any, are discussed in detail in the Notes to Financial Statements.
| | | | | | |
| | | | | | | |
| 10 | | SEMI-ANNUAL REPORT | | APRIL 30, 2016 | | |
| | |
Schedule of Investments April 30, 2016 (Unaudited) | | BlackRock Credit Allocation Income Trust (BTZ) (Percentages shown are based on Net Assets) |
| | | | | | | | | | | | |
| | | |
| Common Stocks — 0.0% | | | | | Shares | | | Value | |
Real Estate Investment Trusts (REITs) — 0.0% | | | | | |
Ovation Acquisition I LLC, (Acquired 12/28/15, cost $45,445) (a) | | | | | | | 2,951 | | | $ | 2,951 | |
| | | | | | | | | | | | |
| | | | | | | | | | | | | |
| | |
| Asset-Backed Securities (b) | | Par (000) | | | | |
Asset-Backed Securities — 6.2% | | | | | |
ACAS CLO Ltd., Series 2014-1A, Class C, 3.53%, 7/18/26 (c) | | | USD | | | | 750 | | | | 710,847 | |
ALM Loan Funding (c): | | | | | | | | | | | | |
Series 2012-5A, Class BR, 3.63%, 10/18/27 | | | | | | | 1,000 | | | | 970,600 | |
Series 2013-7R2A, Class B, 3.22%, 4/24/24 | | | | | | | 3,000 | | | | 2,892,982 | |
ALM XII Ltd., Series 2015-12A, Class B, 3.88%, 4/16/27 (c) | | | | | | | 1,000 | | | | 949,000 | |
ALM XIV Ltd., Series 2014-14A (c): | | | | | | | | | | | | |
Class B, 3.57%, 7/28/26 | | | | | | | 5,000 | | | | 4,876,050 | |
Class C, 4.07%, 7/28/26 | | | | | | | 4,500 | | | | 4,117,004 | |
ALM XVII Ltd., Series 2015-17A, Class B1, 4.00%, 1/15/28 (c) | | | | | | | 1,400 | | | | 1,389,360 | |
AMMC CLO Ltd., Series 2015-17A, Class C, 3.74%, 11/15/27 (c) | | | | | | | 1,000 | | | | 977,500 | |
Apidos CDO, Series 2012-9AR, Class CR, 3.53%, 7/15/23 (c) | | | | | | | 1,000 | | | | 982,893 | |
Apidos CLO XVIII, Series 2014-18A, Class C, 4.29%, 7/22/26 (c) | | | | | | | 1,300 | | | | 1,178,274 | |
Ares CLO Ltd., Series 2012-2A, Class CR, 3.33%, 10/12/23 (c) | | | | | | | 1,000 | | | | 975,800 | |
Atlas Senior Loan Fund V Ltd., Series 2014-1A (c): | | | | | | | | | | | | |
Class C, 3.63%, 7/16/26 | | | | | | | 2,000 | | | | 1,939,807 | |
Class D, 4.08%, 7/16/26 | | | | | | | 2,000 | | | | 1,765,583 | |
Atlas Senior Loan Fund VI Ltd., Series 2014-6A, Class D, 4.33%, 10/15/26 (c) | | | | | | | 3,000 | | | | 2,657,262 | |
Atrium CDO Corp., Series 5A, Class A4, 1.01%, 7/20/20 (c) | | | | | | | 9,000 | | | | 8,701,993 | |
Battalion CLO VII Ltd., Series 2014-7A, Class C, 4.52%, 10/17/26 (c) | | | | | | | 500 | | | | 409,961 | |
Benefit Street Partners CLO IV Ltd., Series 2014-IVA, Class B, 3.43%, 7/20/26 (c) | | | | | | | 1,250 | | | | 1,203,125 | |
Benefit Street Partners CLO VI Ltd., Series 2015-VIA, Class B, 3.68%, 4/18/27 (c) | | | | | | | 1,000 | | | | 970,000 | |
BlueMountain CLO Ltd., Series 2011-1A, Class D, 4.62%, 8/16/22 (c) | | | | | | | 2,000 | | | | 1,997,335 | |
Bowman Park CLO Ltd., Series 2014-1A, Class D2, 4.57%, 11/23/25 (c) | | | | | | | 1,000 | | | | 899,497 | |
| | | | | | | | | | | | |
| Asset-Backed Securities (b) | | Par (000) | | | Value | |
Asset-Backed Securities (continued) | | | | | |
Carlyle Global Market Strategies CLO Ltd. (c): | | | | | | | | | | | | |
Series 2012-2A, Class C1R, 3.52%, 7/20/23 | | | USD | | | | 1,000 | | | $ | 985,784 | |
Series 2014-5A, Class C, 4.77%, 10/16/25 | | | | | | | 1,000 | | | | 927,975 | |
Series 2015-1A, Class C, 3.78%, 4/20/27 | | | | | | | 500 | | | | 497,010 | |
Series 2016-1A, Class C, 5.53%, 4/20/27 | | | | | | | 1,000 | | | | 965,063 | |
CIFC Funding Ltd., Series 2014-3A (c): | | | | | | | | | | | | |
Class C1, 3.44%, 7/22/26 | | | | | | | 1,500 | | | | 1,438,306 | |
Class D, 4.04%, 7/22/26 | | | | | | | 1,071 | | | | 955,345 | |
Dryden 34 Senior Loan Fund, Series 2014-34A, Class C, 3.43%, 10/15/26 (c) | | | | | | | 250 | | | | 243,542 | |
GoldenTree Loan Opportunities IX Ltd., Series 2014-9A, Class D, 4.12%, 10/29/26 (c) | | | | | | | 1,000 | | | | 880,133 | |
Highbridge Loan Management Ltd. (c): | | | | | | | | | | | | |
Series 4A-2014, Class B, 3.62%, 7/28/25 | | | | | | | 750 | | | | 727,297 | |
Series 6A-2015, Class C, 3.69%, 5/05/27 | | | | | | | 1,500 | | | | 1,472,691 | |
Series 8A-2016, Class D, 5.33%, 4/20/27 | | | | | | | 500 | | | | 465,000 | |
ING IM CLO Ltd., Series 2012-4A, Class C, 5.13%, 10/15/23 (c) | | | | | | | 1,000 | | | | 972,726 | |
LCM XVIII LP, Series 18A, Class C1, 3.78%, 4/20/27 (c) | | | | | | | 1,000 | | | | 993,831 | |
Limerock CLO III LLC, Series 2014-3A, Class C, 4.23%, 10/20/26 (c) | | | | | | | 1,000 | | | | 880,571 | |
Madison Park Funding IX Ltd., Series 2012-9AR, Class C1R, 3.47%, 8/15/22 (c) | | | | | | | 2,000 | | | | 1,972,009 | |
Madison Park Funding Ltd. (c): | | | | | | | | | | | | |
Series 2012-10A, Class D, 4.88%, 1/20/25 | | | | | | | 3,000 | | | | 2,908,666 | |
Series 2012-8AR, Class CR, 3.10%, 4/22/22 | | | | | | | 1,350 | | | | 1,349,390 | |
Series 2012-8AR, Class DR, 4.15%, 4/22/22 | | | | | | | 1,500 | | | | 1,456,360 | |
Series 2014-14A,Class D, 4.23%, 7/20/26 | | | | | | | 2,000 | | | | 1,845,972 | |
Madison Park Funding XIII Ltd., Series 2014-13A, Class C, 3.38%, 1/19/25 (c) | | | | | | | 1,000 | | | | 973,661 | |
Madison Park Funding XV Ltd., Series 2014-15A, Class B1, 3.87%, 1/27/26 (c) | | | | | | | 2,400 | | | | 2,399,959 | |
Madison Park Funding XVI Ltd., Series 2015-16A, Class B, 3.63%, 4/20/26 (c) | | | | | | | 1,000 | | | | 993,600 | |
| | | | | | | | | | |
| ABS | | Asset-Backed Security | | EUR | | Euro | | NZD | | New Zealand Dollar |
| ARB | | Airport Revenue Bonds | | FKA | | Formerly Known As | | OTC | | Over-the-Counter |
| ARS | | Argentine Peso | | GBP | | British Pound | | PIK | | Payment-In-Kind |
| AUD | | Australian Dollar | | JPY | | Japanese Yen | | PLN | | Polish Zloty |
| BRL | | Brazilian Real | | KRW | | South Korean Won | | RB | | Revenue Bonds |
| BZOVER | | 1-Day Brazil Interbank Deposit | | KLIBOR | | Kuala Lumpur Interbank Offered Rate | | REMIC | | Real Estate Mortgage Investment Conduit |
| CAD | | Canadian Dollar | | KRWCD | | 3-Month Certificate of Deposit Rate | | RUB | | Russian Ruble |
| CLO | | Collateralized Loan Obligation | | LIBOR | | London Interbank Offered Rate | | USD | | U.S. Dollar |
| COP | | Colombian Peso | | MXIBTIIE | | Mexico Interbank TIIE 28 Day | | WIBOR | | Warsaw Interbank Offered Rate |
| CPOVER | | Colombia Overnight Interbank Reference Rate | | MXN | | Mexican Peso | | ZAR | | South African Rand |
| DIP | | Debtor-In-Possession | | NOK | | Norwegian Krone | | | | |
See Notes to Financial Statements.
| | | | | | |
| | | | | | | |
| | SEMI-ANNUAL REPORT | | APRIL 30, 2016 | | 11 |
| | |
Schedule of Investments (continued) | | BlackRock Credit Allocation Income Trust (BTZ) |
| | | | | | | | | | | | |
| Asset-Backed Securities (b) | | Par (000) | | | Value | |
Asset-Backed Securities (continued) | | | | | |
Oak Hill Credit Partners XII Ltd., Series 2015-12A, Class C2, 3.69%, 1/23/27 (c) | | | USD | | | | 1,600 | | | $ | 1,588,000 | |
Octagon Investment Partners 26 Ltd., Series 2016-1A, Class D, 5.57%, 4/15/27 (c) | | | | | | | 500 | | | | 474,749 | |
Octagon Investment Partners XX Ltd., Series 2014-1A, Class C, 3.42%, 8/12/26 (c) | | | | | | | 750 | | | | 718,835 | |
Octagon Loan Funding Ltd., Series 2014-1A, Class D, 4.27%, 11/18/26 (c) | | | | | | | 1,500 | | | | 1,321,808 | |
OZLM VI Ltd., Series 2014-6A, Class B, 3.53%, 4/17/26 (c) | | | | | | | 1,100 | | | | 1,060,901 | |
OZLM VII Ltd., Series 2014-7A, Class C, 4.23%, 7/17/26 (c) | | | | | | | 1,500 | | | | 1,346,017 | |
OZLM VIII Ltd., Series 2014-8A, Class B, 3.63%, 10/17/26 (c) | | | | | | | 900 | | | | 870,790 | |
OZLM XI Ltd., Series 2015-11A, Class B, 3.62%, 1/30/27 (c) | | | | | | | 2,750 | | | | 2,662,197 | |
Regatta IV Funding Ltd., Series 2014-1A (c): | | | | | | | | | | | | |
Class C, 3.57%, 7/25/26 | | | | | | | 1,500 | | | | 1,388,712 | |
Class D, 4.12%, 7/25/26 | | | | | | | 1,000 | | | | 850,843 | |
Regatta V Funding Ltd., Series 2014-1A (c): | | | | | | | | | | | | |
Class B, 3.62%, 10/25/26 | | | | | | | 1,000 | | | | 922,105 | |
Class C, 4.07%, 10/25/26 | | | | | | | 1,000 | | | | 871,417 | |
SLM Private Credit Student Loan Trust, Series 2004-B, Class A2, 0.83%, 6/15/21 | | | | | | | 1,138 | | | | 1,130,366 | |
Sound Point CLO Ltd., Series 2014-3A, Class D, 4.22%, 1/23/27 (c) | | | | | | | 1,000 | | | | 877,021 | |
Symphony CLO Ltd. (c): | | | | | | | | | | | | |
Series 2012-10AR, Class CR, 3.47%, 7/23/23 | | | | | | | 1,000 | | | | 987,555 | |
Series 2016-17A, Class D, 5.52%, 4/15/28 | | | | | | | 1,000 | | | | 955,263 | |
Symphony CLO XV Ltd., Series 2014-15A (c): | | | | | | | | | | | | |
Class C, 3.83%, 10/17/26 | | | | | | | 2,500 | | | | 2,471,934 | |
Class D, 4.38%, 10/17/26 | | | | | | | 1,000 | | | | 902,900 | |
Venture XIII CLO Ltd., Series 2013-13A, Class D, 4.19%, 6/10/25 (c) | | | | | | | 800 | | | | 711,429 | |
Voya CLO Ltd., Series 2014-4A, Class C, 4.63%, 10/14/26 (c) | | | | | | | 1,000 | | | | 903,543 | |
Webster Park CLO Ltd., Series 2015-1A, Class B1, 3.61%, 1/20/27 (c) | | | | | | | 4,000 | | | | 3,930,160 | |
WhiteHorse IX Ltd., Series 2014-9A, Class C, 3.33%, 7/17/26 (c) | | | | | | | 1,000 | | | | 870,236 | |
| Total Asset-Backed Securities — 6.2% | | | | | | | | | | | 94,686,545 | |
| | | | | | | | | | | | |
| | | | | | | | | | | | | |
|
| Corporate Bonds | |
Aerospace & Defense — 0.5% | |
Huntington Ingalls Industries, Inc., 5.00%, 12/15/21 (c) | | | | | | | 536 | | | | 561,798 | |
KLX, Inc., 5.88%, 12/01/22 (c) | | | | | | | 725 | | | | 729,531 | |
TransDigm, Inc.: | | | | | | | | | | | | |
6.00%, 7/15/22 | | | | | | | 4,360 | | | | 4,413,192 | |
6.50%, 7/15/24 | | | | | | | 1,845 | | | | 1,858,837 | |
| | | | | | | | | | | | |
| | | | | | | | | | | | 7,563,358 | |
Air Freight & Logistics — 0.2% | |
XPO Logistics, Inc. (c): | | | | | | | | | | | | |
7.88%, 9/01/19 | | | | | | | 1,548 | | | | 1,619,595 | |
6.50%, 6/15/22 | | | | | | | 1,576 | | | | 1,534,709 | |
| | | | | | | | | | | | |
| | | | | | | | | | | | 3,154,304 | |
| | | | | | | | | | | | |
| Corporate Bonds | | Par (000) | | | Value | |
Airlines — 1.0% | |
American Airlines Group, Inc., 4.63%, 3/01/20 (c) | | | USD | | | | 692 | | | $ | 679,890 | |
Continental Airlines Pass-Through Trust: | | | | | | | | | | | | |
Series 2009-2, Class B, 9.25%, 11/10/18 | | | | | | | 1,870 | | | | 1,968,646 | |
Series 2012-3, Class C, 6.13%, 4/29/18 | | | | | | | 2,040 | | | | 2,142,000 | |
Delta Air Lines Pass-Through Trust, Series 2002-1, Class G-1, 6.72%, 7/02/24 | | | | | | | 3,042 | | | | 3,453,138 | |
Turkish Airlines Pass Through Trust, 2015-1 Class A, 4.20%, 9/15/28 (c) | | | | | | | 2,919 | | | | 2,772,763 | |
United Airlines Pass-Through Trust, Series 2014-1, Class B, 4.75%, 10/11/23 | | | | | | | 3,807 | | | | 3,835,545 | |
Virgin Australia Trust, Series 2013-1, Class B, 6.00%, 4/23/22 (c) | | | | | | | 1,166 | | | | 1,183,647 | |
| | | | | | | | | | | | |
| | | | | | | | | | | | 16,035,629 | |
Auto Components — 1.1% | |
Goodyear Tire & Rubber Co., 6.50%, 3/01/21 | | | | | | | 1,600 | | | | 1,685,000 | |
Icahn Enterprises LP/Icahn Enterprises Finance Corp.: | | | | | | | | | | | | |
4.88%, 3/15/19 | | | | | | | 3,950 | | | | 3,920,375 | |
6.00%, 8/01/20 | | | | | | | 3,108 | | | | 3,100,541 | |
5.88%, 2/01/22 | | | | | | | 3,816 | | | | 3,639,510 | |
Schaeffler Finance BV, 4.75%, 5/15/21 (c) | | | | | | | 2,470 | | | | 2,537,925 | |
Schaeffler Holding Finance BV (c)(d): | | | | | | | | | | | | |
(6.25% Cash), 6.25%, 11/15/19 | | | | | | | 1,112 | | | | 1,159,260 | |
(6.75% Cash), 6.75%, 11/15/22 | | | | | | | 1,449 | | | | 1,576,739 | |
| | | | | | | | | | | | |
| | | | | | | | | | | | 17,619,350 | |
Automobiles — 0.5% | |
Ford Motor Co., 7.45%, 7/16/31 | | | | | | | 3,660 | | | | 4,857,263 | |
General Motors Co.: | | | | | | | | | | | | |
4.88%, 10/02/23 | | | | | | | 1,875 | | | | 2,007,206 | |
6.25%, 10/02/43 | | | | | | | 940 | | | | 1,059,349 | |
| | | | | | | | | | | | |
| | | | | | | | | | | | 7,923,818 | |
Banks — 4.5% | |
CIT Group, Inc.: | | | | | | | | | | | | |
4.25%, 8/15/17 | | | | | | | 4,600 | | | | 4,666,125 | |
5.25%, 3/15/18 | | | | | | | 4,030 | | | | 4,155,938 | |
6.63%, 4/01/18 (c) | | | | | | | 335 | | | | 353,006 | |
5.50%, 2/15/19 (c) | | | | | | | 5,147 | | | | 5,391,482 | |
5.00%, 8/01/23 | | | | | | | 660 | | | | 686,400 | |
City National Corp., 5.25%, 9/15/20 (e) | | | | | | | 2,900 | | | | 3,245,254 | |
Cooperatieve Rabobank UA, 3.95%, 11/09/22 (e) | | | | | | | 3,775 | | | | 3,884,275 | |
Credit Suisse Group AG, 6.50%, 8/08/23 (c) | | | | | | | 6,000 | | | | 6,378,084 | |
Discover Bank/Greenwood, 8.70%, 11/18/19 | | | | | | | 748 | | | | 870,327 | |
Fifth Third Bancorp, 5.10% (b)(f) | | | | | | | 5,000 | | | | 4,571,875 | |
HSBC Finance Corp., 6.68%, 1/15/21 (e) | | | | | | | 5,150 | | | | 5,916,881 | |
Intesa Sanpaolo SpA, 5.71%, 1/15/26 (c) | | | | | | | 3,840 | | | | 3,731,689 | |
Lloyds Banking Group PLC, 4.65%, 3/24/26 | | | | | | | 3,015 | | | | 3,062,037 | |
Royal Bank of Scotland Group PLC, 6.00%, 12/19/23 | | | | | | | 10,080 | | | | 10,310,026 | |
Wells Fargo & Co.: | | | | | | | | | | | | |
3.45%, 2/13/23 | | | | | | | 2,325 | | | | 2,381,574 | |
4.13%, 8/15/23 (e) | | | | | | | 4,000 | | | | 4,280,328 | |
5.61%, 1/15/44 (e) | | | | | | | 4,119 | | | | 4,825,124 | |
| | | | | | | | | | | | |
| | | | | | | | | | | | 68,710,425 | |
Beverages — 0.5% | |
Anheuser-Busch InBev Finance, Inc., 4.90%, 2/01/46 | | | | | | | 6,170 | | | | 6,997,138 | |
See Notes to Financial Statements.
| | | | | | |
| | | | | | | |
| 12 | | SEMI-ANNUAL REPORT | | APRIL 30, 2016 | | |
| | |
Schedule of Investments (continued) | | BlackRock Credit Allocation Income Trust (BTZ) |
| | | | | | | | | | | | |
| Corporate Bonds | | Par (000) | | | Value | |
Biotechnology — 0.5% | |
Amgen, Inc. (e): | | | | | | | | | | | | |
5.15%, 11/15/41 | | | USD | | | | 3,450 | | | $ | 3,928,491 | |
4.40%, 5/01/45 | | | | | | | 3,050 | | | | 3,168,261 | |
| | | | | | | | | | | | |
| | | | | | | | | | | | 7,096,752 | |
Building Products — 0.2% | |
American Builders & Contractors Supply Co., Inc., 5.75%, 12/15/23 (c) | | | | | | | 424 | | | | 444,140 | |
Building Materials Corp. of America, 6.00%, 10/15/25 (c) | | | | | | | 2,038 | | | | 2,195,945 | |
Masonite International Corp., 5.63%, 3/15/23 (c) | | | | | | | 610 | | | | 637,450 | |
Standard Industries, Inc., 5.13%, 2/15/21 (c) | | | | | | | 420 | | | | 436,800 | |
| | | | | | | | | | | | |
| | | | | | | | | | | | 3,714,335 | |
Capital Markets — 3.0% | |
E*Trade Financial Corp., 5.38%, 11/15/22 | | | | | | | 1,348 | | | | 1,430,915 | |
Goldman Sachs Group, Inc.: | | | | | | | | | | | | |
6.25%, 9/01/17 | | | | | | | 625 | | | | 663,285 | |
7.50%, 2/15/19 (e) | | | | | | | 5,165 | | | | 5,928,222 | |
5.25%, 7/27/21 | | | | | | | 1,175 | | | | 1,328,396 | |
5.75%, 1/24/22 (e) | | | | | | | 5,500 | | | | 6,329,890 | |
6.25%, 2/01/41 (e) | | | | | | | 15,000 | | | | 19,100,610 | |
Morgan Stanley (e): | | | | | | | | | | | | |
5.63%, 9/23/19 | | | | | | | 6,770 | | | | 7,535,213 | |
5.50%, 7/28/21 | | | | | | | 2,695 | | | | 3,061,620 | |
| | | | | | | | | | | | |
| | | | | | | | | | | | 45,378,151 | |
Casinos & Gambling — 0.0% | |
GLP Capital LP / GLP Financing II, Inc.: | | | | | | | | | | | | |
4.38%, 4/15/21 | | | | | | | 143 | | | | 146,218 | |
5.38%, 4/15/26 | | | | | | | 297 | | | | 309,622 | |
| | | | | | | | | | | | |
| | | | | | | | | | | | 455,840 | |
Chemicals — 1.6% | |
Ashland, Inc., 3.88%, 4/15/18 | | | | | | | 1,745 | | | | 1,792,987 | |
Axalta Coating Systems US Holdings, Inc./Axalta Coating Systems Dutch Holding BV, 7.38%, 5/01/21 (c) | | | | | | | 617 | | | | 652,478 | |
Basell Finance Co. BV, 8.10%, 3/15/27 (c)(e) | | | | | | | 6,000 | | | | 7,797,822 | |
CF Industries, Inc., 5.38%, 3/15/44 | | | | | | | 2,500 | | | | 2,461,822 | |
Chemours Co. (c): | | | | | | | | | | | | |
6.63%, 5/15/23 | | | | | | | 370 | | | | 323,750 | |
7.00%, 5/15/25 | | | | | | | 869 | | | | 753,857 | |
Huntsman International LLC: | | | | | | | | | | | | |
4.88%, 11/15/20 | | | | | | | 72 | | | | 72,540 | |
5.13%, 11/15/22 | | | | | | | 2,495 | | | | 2,507,475 | |
NOVA Chemicals Corp., 5.25%, 8/01/23 (c) | | | | | | | 2,277 | | | | 2,299,770 | |
Platform Specialty Products Corp. (c): | | | | | | | | | | | | |
10.38%, 5/01/21 | | | | | | | 165 | | | | 165,000 | |
6.50%, 2/01/22 | | | | | | | 1,372 | | | | 1,207,360 | |
PQ Corp., 6.75%, 11/15/22 (c)(g) | | | | | | | 935 | | | | 964,219 | |
Solvay Finance America LLC, 3.40%, 12/03/20 (c) | | | | | | | 3,180 | | | | 3,291,895 | |
| | | | | | | | | | | | |
| | | | | | | | | | | | 24,290,975 | |
Commercial Services & Supplies — 3.4% | | | | | | | | | | | | |
ADS Waste Holdings, Inc., 8.25%, 10/01/20 | | | | | | | 1,003 | | | | 1,044,374 | |
Aviation Capital Group Corp. (c): | | | | | | | | | | | | |
7.13%, 10/15/20 | | | | | | | 31,000 | | | | 35,030,000 | |
6.75%, 4/06/21 | | | | | | | 7,850 | | | | 8,899,937 | |
Mobile Mini, Inc., 7.88%, 12/01/20 | | | | | | | 2,480 | | | | 2,579,200 | |
United Rentals North America, Inc.: | | | | | | | | | | | | |
7.38%, 5/15/20 | | | | | | | 2,025 | | | | 2,106,000 | |
7.63%, 4/15/22 | | | | | | | 1,853 | | | | 1,978,078 | |
| | | | | | | | | | | | |
| | | | | | | | | | | | 51,637,589 | |
| | | | | | | | | | | | |
| Corporate Bonds | | Par (000) | | | Value | |
Communications Equipment — 0.5% | | | | | | | | | | | | |
CommScope Technologies Finance LLC, 6.00%, 6/15/25 (c) | | | USD | | | | 2,242 | | | $ | 2,298,050 | |
CommScope, Inc., 5.50%, 6/15/24 (c) | | | | | | | 254 | | | | 254,800 | |
Harris Corp., 5.05%, 4/27/45 | | | | | | | 1,790 | | | | 1,936,153 | |
Plantronics, Inc., 5.50%, 5/31/23 (c) | | | | | | | 423 | | | | 424,058 | |
Zayo Group LLC/Zayo Capital, Inc., 6.38%, 5/15/25 (c) | | | | | | | 2,126 | | | | 2,211,040 | |
| | | | | | | | | | | | |
| | | | | | | | | | | | 7,124,101 | |
Computer Technology — 0.1% | | | | | | | | | | | | |
Western Digital Corp., 7.38%, 4/01/23 (c) | | | | | | | 1,199 | | | | 1,210,241 | |
Construction & Engineering — 0.3% | | | | | | | | | | | | |
AECOM Co.: | | | | | | | | | | | | |
5.75%, 10/15/22 | | | | | | | 333 | | | | 347,153 | |
5.88%, 10/15/24 | | | | | | | 2,311 | | | | 2,426,550 | |
BlueLine Rental Finance Corp., 7.00%, 2/01/19 (c) | | | | | | | 413 | | | | 362,407 | |
Safway Group Holding LLC/Safway Finance Corp., 7.00%, 5/15/18 (c) | | | | | | | 568 | | | | 568,000 | |
Weekley Homes LLC/Weekley Finance Corp., 6.00%, 2/01/23 | | | | | | | 825 | | | | 767,250 | |
| | | | | | | | | | | | |
| | | | | | | | | | | | 4,471,360 | |
Construction Materials — 0.7% | | | | | | | | | | | | |
Allegion US Holding Co., Inc., 5.75%, 10/01/21 | | | | | | | 1,907 | | | | 1,992,815 | |
HD Supply, Inc.: | | | | | | | | | | | | |
7.50%, 7/15/20 | | | | | | | 2,620 | | | | 2,780,475 | |
5.25%, 12/15/21 (c) | | | | | | | 3,278 | | | | 3,441,900 | |
5.75%, 4/15/24 (c) | | | | | | | 1,701 | | | | 1,783,924 | |
PulteGroup, Inc., 5.50%, 3/01/26 | | | | | | | 926 | | | | 956,095 | |
| | | | | | | | | | | | |
| | | | | | | | | | | | 10,955,209 | |
Consumer Finance — 2.3% | | | | | | | | | | | | |
Ally Financial, Inc.: | | | | | | | | | | | | |
5.13%, 9/30/24 | | | | | | | 590 | | | | 618,025 | |
4.63%, 3/30/25 | | | | | | | 136 | | | | 137,360 | |
8.00%, 11/01/31 | | | | | | | 5,795 | | | | 6,939,513 | |
Capital One Bank USA NA, 3.38%, 2/15/23 (e) | | | | | | | 11,610 | | | | 11,682,992 | |
Countrywide Financial Corp., 6.25%, 5/15/16 (e) | | | | | | | 8,069 | | | | 8,082,112 | |
Discover Financial Services, 3.85%, 11/21/22 | | | | | | | 3,252 | | | | 3,293,079 | |
Experian Finance PLC, 2.38%, 6/15/17 (c)(e) | | | | | | | 2,550 | | | | 2,560,067 | |
Total System Services, Inc., 3.80%, 4/01/21 | | | | | | | 1,630 | | | | 1,692,030 | |
| | | | | | | | | | | | |
| | | | | | | | | | | | 35,005,178 | |
Containers & Packaging — 0.4% | | | | | | | | | | | | |
Ardagh Packaging Finance PLC/Ardagh MP Holdings USA, Inc., 4.63%, 5/15/23 (c)(g) | | | | | | | 1,192 | | | | 1,192,000 | |
Ball Corp., 4.38%, 12/15/20 | | | | | | | 681 | | | | 708,240 | |
Beverage Packaging Holdings Luxembourg II SA, 5.63%, 12/15/16 (c) | | | | | | | 904 | | | | 901,740 | |
Sealed Air Corp. (c): | | | | | | | | | | | | |
6.50%, 12/01/20 | | | | | | | 2,330 | | | | 2,641,638 | |
5.13%, 12/01/24 | | | | | | | 574 | | | | 601,265 | |
5.50%, 9/15/25 | | | | | | | 653 | | | | 692,996 | |
6.88%, 7/15/33 | | | | | | | 182 | | | | 192,465 | |
| | | | | | | | | | | | |
| | | | | | | | | | | | 6,930,344 | |
Diversified Consumer Services — 0.4% | |
Prime Security Services Borrower LLC/Prime Finance, Inc., 9.25%, 5/15/23 (c)(g) | | | | | | | 1,055 | | | | 1,094,562 | |
Service Corp. International, 4.50%, 11/15/20 | | | | | | | 4,382 | | | | 4,513,460 | |
| | | | | | | | | | | | |
| | | | | | | | | | | | 5,608,022 | |
See Notes to Financial Statements.
| | | | | | |
| | | | | | | |
| | SEMI-ANNUAL REPORT | | APRIL 30, 2016 | | 13 |
| | |
Schedule of Investments (continued) | | BlackRock Credit Allocation Income Trust (BTZ) |
| | | | | | | | | | | | |
| Corporate Bonds | | Par (000) | | | Value | |
Diversified Financial Services — 9.6% | |
AerCap Ireland Capital Ltd./AerCap Global Aviation Trust: | | | | | | | | | | | | |
4.63%, 10/30/20 | | | USD | | | | 1,619 | | | $ | 1,683,760 | |
4.63%, 7/01/22 | | | | | | | 518 | | | | 536,130 | |
Air Lease Corp., 3.75%, 2/01/22 | | | | | | | 5,000 | | | | 5,051,060 | |
Aircastle Ltd., 6.25%, 12/01/19 | | | | | | | 3,937 | | | | 4,320,857 | |
Bank of America Corp.: | | | | | | | | | | | | |
3.75%, 7/12/16 | | | | | | | 5,525 | | | | 5,555,128 | |
5.00%, 5/13/21 (e) | | | | | | | 17,100 | | | | 19,001,759 | |
5.70%, 1/24/22 | | | | | | | 2,590 | | | | 2,976,179 | |
4.45%, 3/03/26 | | | | | | | 1,765 | | | | 1,826,343 | |
Bank of America NA, 5.30%, 3/15/17 (e) | | | | | | | 13,440 | | | | 13,894,944 | |
Barclays PLC, 4.38%, 9/11/24 | | | | | | | 2,100 | | | | 2,037,452 | |
Citigroup, Inc. (e): | | | | | | | | | | | | |
4.45%, 1/10/17 | | | | | | | 4,800 | | | | 4,904,026 | |
6.68%, 9/13/43 | | | | | | | 4,125 | | | | 5,108,713 | |
Credit Suisse Group Funding Guernsey Ltd., 4.55%, 4/17/26 (c) | | | | | | | 5,000 | | | | 5,104,845 | |
Ford Motor Credit Co. LLC: | | | | | | | | | | | | |
8.00%, 12/15/16 | | | | | | | 4,000 | | | | 4,167,560 | |
5.88%, 8/02/21 | | | | | | | 9,420 | | | | 10,874,260 | |
General Motors Financial Co., Inc.: | | | | | | | | | | | | |
6.75%, 6/01/18 | | | | | | | 1,700 | | | | 1,856,558 | |
4.38%, 9/25/21 | | | | | | | 2,260 | | | | 2,389,767 | |
4.25%, 5/15/23 | | | | | | | 1,681 | | | | 1,730,497 | |
ING Bank NV, 5.00%, 6/09/21 (c)(e) | | | | | | | 8,000 | | | | 8,969,160 | |
Jefferies Finance LLC/JFIN Co-Issuer Corp., 7.38%, 4/01/20 (c) | | | | | | | 1,705 | | | | 1,572,863 | |
Leucadia National Corp., 5.50%, 10/18/23 | | | | | | | 4,000 | | | | 3,952,140 | |
Lloyds Banking Group PLC (c): | | | | | | | | | | | | |
4.58%, 12/10/25 | | | | | | | 1,985 | | | | 1,990,195 | |
5.30%, 12/01/45 | | | | | | | 1,120 | | | | 1,143,430 | |
Moody’s Corp., 6.06%, 9/07/17 | | | | | | | 20,000 | | | | 20,538,740 | |
MSCI, Inc., 5.75%, 8/15/25 (c) | | | | | | | 523 | | | | 556,341 | |
Resparcs Funding LP I, 8.00% (f)(h) | | | | | | | 4,000 | | | | 720,000 | |
Reynolds Group Issuer, Inc.: | | | | | | | | | | | | |
8.50%, 5/15/18 | | | | | | | 276 | | | | 276,331 | |
9.00%, 4/15/19 | | | | | | | 370 | | | | 375,550 | |
7.88%, 8/15/19 | | | | | | | 2,480 | | | | 2,566,800 | |
9.88%, 8/15/19 | | | | | | | 147 | | | | 151,961 | |
5.75%, 10/15/20 | | | | | | | 2,866 | | | | 2,973,475 | |
6.88%, 2/15/21 | | | | | | | 105 | | | | 109,069 | |
Royal Bank of Scotland Group PLC: | | | | | | | | | | | | |
6.10%, 6/10/23 | | | | | | | 2,500 | | | | 2,590,128 | |
5.13%, 5/28/24 | | | | | | | 5,250 | | | | 5,138,789 | |
| | | | | | | | | | | | |
| | | | | | | | | | | | 146,644,810 | |
Diversified Telecommunication Services — 6.1% | |
AT&T, Inc.: | | | | | | | | | | | | |
5.00%, 3/01/21 (e) | | | | | | | 8,575 | | | | 9,582,425 | |
6.30%, 1/15/38 (e) | | | | | | | 12,000 | | | | 14,313,312 | |
4.30%, 12/15/42 | | | | | | | 265 | | | | 251,369 | |
4.35%, 6/15/45 | | | | | | | 367 | | | | 343,999 | |
CenturyLink, Inc., 6.45%, 6/15/21 | | | | | | | 1,660 | | | | 1,693,200 | |
Frontier Communications Corp.: | | | | | | | | | | | | |
6.25%, 9/15/21 | | | | | | | 980 | | | | 911,400 | |
7.13%, 1/15/23 | | | | | | | 55 | | | | 48,675 | |
7.63%, 4/15/24 | | | | | | | 1,309 | | | | 1,161,999 | |
6.88%, 1/15/25 | | | | | | | 1,219 | | | | 1,014,818 | |
Level 3 Financing, Inc.: | | | | | | | | | | | | |
5.38%, 8/15/22 | | | | | | | 2,250 | | | | 2,300,625 | |
5.13%, 5/01/23 | | | | | | | 1,183 | | | | 1,203,703 | |
5.38%, 1/15/24 (c) | | | | | | | 754 | | | | 765,310 | |
5.38%, 5/01/25 | | | | | | | 2,003 | | | | 2,038,052 | |
5.25%, 3/15/26 (c) | | | | | | | 706 | | | | 716,590 | |
Telefonica Emisiones SAU, 3.19%, 4/27/18 | | | | | | | 6,550 | | | | 6,743,959 | |
| | | | | | | | | | | | |
| Corporate Bonds | | Par (000) | | | Value | |
Diversified Telecommunication Services (continued) | |
Verizon Communications, Inc.: | | | | | | | | | | | | |
5.15%, 9/15/23 (e) | | | USD | | | | 8,775 | | | $ | 10,092,066 | |
6.40%, 9/15/33 | | | | | | | 9,475 | | | | 11,885,383 | |
7.35%, 4/01/39 (e) | | | | | | | 7,825 | | | | 10,570,949 | |
6.55%, 9/15/43 (e) | | | | | | | 13,225 | | | | 17,444,264 | |
| | | | | | | | | | | | |
| | | | | | | | | | | | 93,082,098 | |
Electric Utilities — 3.9% | |
CMS Energy Corp., 5.05%, 3/15/22 | | | | | | | 9,900 | | | | 11,169,289 | |
Duke Energy Corp., 3.55%, 9/15/21 (e) | | | | | | | 3,650 | | | | 3,836,066 | |
Great Plains Energy, Inc., 5.29%, 6/15/22 (i) | | | | | | | 5,550 | | | | 6,203,429 | |
Midland Cogeneration Venture LP, 5.25%, 3/15/25 (c) | | | | | | | 4,383 | | | | 4,417,344 | |
NiSource Finance Corp., 6.80%, 1/15/19 (e) | | | | | | | 3,075 | | | | 3,467,441 | |
Oncor Electric Delivery Co. LLC (e): | | | | | | | | | | | | |
4.10%, 6/01/22 | | | | | | | 4,150 | | | | 4,529,679 | |
5.30%, 6/01/42 | | | | | | | 2,750 | | | | 3,242,470 | |
Progress Energy, Inc., 7.00%, 10/30/31 (e) | | | | | | | 12,000 | | | | 15,815,208 | |
Puget Energy, Inc.: | | | | | | | | | | | | |
6.00%, 9/01/21 | | | | | | | 275 | | | | 313,423 | |
5.63%, 7/15/22 | | | | | | | 5,550 | | | | 6,221,872 | |
Texas Competitive Electric Holdings Co. LLC/TCEH Finance Inc. (h)(j): | | | | | | | | | | | | |
10.50%, 11/01/16 | | | | | | | 91 | | | | 4,323 | |
Series A, 10.25%, 11/01/2015 | | | | | | | 137 | | | | 6,507 | |
| | | | | | | | | | | | |
| | | | | | | | | | | | 59,227,051 | |
Electronic Equipment, Instruments & Components — 0.6% | |
CDW LLC/CDW Finance Corp.: | | | | | | | | | | | | |
6.00%, 8/15/22 | | | | | | | 1,270 | | | | 1,359,700 | |
5.00%, 9/01/23 | | | | | | | 306 | | | | 313,381 | |
5.50%, 12/01/24 | | | | | | | 2,458 | | | | 2,587,045 | |
Jabil Circuit, Inc., 8.25%, 3/15/18 | | | | | | | 2,600 | | | | 2,827,500 | |
Sanmina Corp., 4.38%, 6/01/19 (c) | | | | | | | 1,415 | | | | 1,446,837 | |
| | | | | | | | | | | | |
| | | | | | | | | | | | 8,534,463 | |
Energy Equipment & Services — 0.6% | |
Genesis Energy LP/Genesis Energy Finance Corp.: | | | | | | | | | | | | |
5.75%, 2/15/21 | | | | | | | 473 | | | | 444,620 | |
6.75%, 8/01/22 | | | | | | | 1,175 | | | | 1,128,059 | |
GrafTech International Ltd., 6.38%, 11/15/20 | | | | | | | 890 | | | | 594,075 | |
Halliburton Co., 5.00%, 11/15/45 | | | | | | | 6,615 | | | | 6,776,538 | |
Noble Holding International Ltd.: | | | | | | | | | | | | |
4.63%, 3/01/21 | | | | | | | 110 | | | | 88,825 | |
6.95%, 4/01/25 | | | | | | | 285 | | | | 234,413 | |
Transocean, Inc., 6.00%, 3/15/18 (e) | | | | | | | 540 | | | | 513,000 | |
| | | | | | | | | | | | |
| | | | | | | | | | | | 9,779,530 | |
Food & Staples Retailing — 1.7% | |
CVS Health Corp.: | | | | | | | | | | | | |
4.75%, 12/01/22 (c) | | | | | | | 289 | | | | 324,998 | �� |
5.00%, 12/01/24 (c) | | | | | | | 183 | | | | 211,599 | |
5.13%, 7/20/45 (e) | | | | | | | 3,879 | | | | 4,533,186 | |
Dollar Tree, Inc. (c): | | | | | | | | | | | | |
5.25%, 3/01/20 | | | | | | | 205 | | | | 212,944 | |
5.75%, 3/01/23 | | | | | | | 4,623 | | | | 4,936,439 | |
H.J. Heinz Finance Co., 7.13%, 8/01/39 (c) | | | | | | | 4,415 | | | | 5,888,943 | |
Rite Aid Corp.: | | | | | | | | | | | | |
6.75%, 6/15/21 | | | | | | | 541 | | | | 570,755 | |
6.13%, 4/01/23 (c) | | | | | | | 2,974 | | | | 3,169,184 | |
Wal-Mart Stores, Inc., 5.25%, 9/01/35 (e) | | | | | | | 5,150 | | | | 6,433,421 | |
| | | | | | | | | | | | |
| | | | | | | | | | | | 26,281,469 | |
Food Products — 0.9% | |
Kraft Foods, Inc.: | | | | | | | | | | | | |
6.50%, 8/11/17 (e) | | | | | | | 4,450 | | | | 4,725,206 | |
6.13%, 8/23/18 | | | | | | | 4,840 | | | | 5,316,266 | |
See Notes to Financial Statements.
| | | | | | |
| | | | | | | |
| 14 | | SEMI-ANNUAL REPORT | | APRIL 30, 2016 | | |
| | |
Schedule of Investments (continued) | | BlackRock Credit Allocation Income Trust (BTZ) |
| | | | | | | | | | | | |
| Corporate Bonds | | Par (000) | | | Value | |
Food Products (continued) | |
Pinnacle Foods Finance Corp., 5.88%, 1/15/24 (c) | | | USD | | | | 191 | | | $ | 201,983 | |
Post Holdings, Inc. (c): | | | | | | | | | | | | |
7.75%, 3/15/24 | | | | | | | 1,502 | | | | 1,633,425 | |
8.00%, 7/15/25 | | | | | | | 743 | | | | 823,801 | |
Smithfield Foods, Inc., 5.88%, 8/01/21 (c) | | | | | | | 715 | | | | 745,387 | |
TreeHouse Foods, Inc., 6.00%, 2/15/24 (c) | | | | | | | 431 | | | | 458,476 | |
| | | | | | | | | | | | |
| | | | | | | | | | | | 13,904,544 | |
Health Care Equipment & Supplies — 0.7% | |
DJO Finance LLC/DJO Finance Corp., 8.13%, 6/15/21 (c) | | | | | | | 2,065 | | | | 1,806,875 | |
Kinetic Concepts, Inc./KCI USA, Inc., 7.88%, 2/15/21 (c) | | | | | | | 328 | | | | 354,650 | |
Mallinckrodt International Finance SA/Mallinckrodt CB LLC (c): | | | | | | | | | | | | |
4.88%, 4/15/20 | | | | | | | 517 | | | | 496,320 | |
5.75%, 8/01/22 | | | | | | | 1,370 | | | | 1,292,937 | |
5.63%, 10/15/23 | | | | | | | 1,099 | | | | 1,030,313 | |
Medtronic, Inc., 4.63%, 3/15/45 (e) | | | | | | | 4,565 | | | | 5,207,642 | |
| | | | | | | | | | | | |
| | | | | | | | | | | | 10,188,737 | |
Health Care Providers & Services — 3.9% | |
Acadia Healthcare Co., Inc., 5.13%, 7/01/22 | | | | | | | 191 | | | | 193,626 | |
Amsurg Corp., 5.63%, 7/15/22 | | | | | | | 1,466 | | | | 1,504,482 | |
Centene Escrow Corp. (c): | | | | | | | | | | | | |
5.63%, 2/15/21 | | | | | | | 875 | | | | 920,938 | |
6.13%, 2/15/24 | | | | | | | 645 | | | | 680,475 | |
CHS/Community Health Systems, Inc.: | | | | | | | | | | | | |
5.13%, 8/15/18 | | | | | | | 1,620 | | | | 1,640,250 | |
6.88%, 2/01/22 | | | | | | | 1,111 | | | | 1,005,455 | |
DaVita HealthCare Partners, Inc.: | | | | | | | | | | | | |
5.13%, 7/15/24 | | | | | | | 1,990 | | | | 2,025,263 | |
5.00%, 5/01/25 | | | | | | | 1,646 | | | | 1,646,000 | |
HCA, Inc.: | | | | | | | | | | | | |
3.75%, 3/15/19 | | | | | | | 4,364 | | | | 4,484,010 | |
6.50%, 2/15/20 | | | | | | | 10,421 | | | | 11,541,257 | |
7.50%, 2/15/22 | | | | | | | 2,214 | | | | 2,507,355 | |
5.88%, 3/15/22 | | | | | | | 340 | | | | 371,450 | |
4.75%, 5/01/23 | | | | | | | 676 | | | | 692,900 | |
5.88%, 2/15/26 | | | | | | | 1,297 | | | | 1,345,637 | |
HealthSouth Corp.: | | | | | | | | | | | | |
5.13%, 3/15/23 | | | | | | | 512 | | | | 513,280 | |
5.75%, 11/01/24 | | | | | | | 637 | | | | 657,703 | |
Hologic, Inc., 5.25%, 7/15/22 (c) | | | | | | | 805 | | | | 843,238 | |
MEDNAX, Inc., 5.25%, 12/01/23 (c) | | | | | | | 587 | | | | 607,545 | |
RegionalCare Hospital Partners Holdings, Inc., 8.25%, 5/01/23 (c) | | | | | | | 1,109 | | | | 1,153,360 | |
Tenet Healthcare Corp.: | | | | | | | | | | | | |
6.25%, 11/01/18 | | | | | | | 736 | | | | 787,520 | |
4.75%, 6/01/20 | | | | | | | 1,450 | | | | 1,493,500 | |
6.00%, 10/01/20 | | | | | | | 3,645 | | | | 3,863,700 | |
4.50%, 4/01/21 | | | | | | | 73 | | | | 73,913 | |
4.38%, 10/01/21 | | | | | | | 961 | | | | 963,403 | |
8.13%, 4/01/22 | | | | | | | 1,907 | | | | 1,978,512 | |
6.75%, 6/15/23 | | | | | | | 1,758 | | | | 1,736,025 | |
UnitedHealth Group, Inc., 6.88%, 2/15/38 (e) | | | | | | | 10,000 | | | | 14,183,910 | |
| | | | | | | | | | | | |
| | | | | | | | | | | | 59,414,707 | |
Hotels, Restaurants & Leisure — 0.7% | |
Boyd Gaming Corp., 6.38%, 4/01/26 (c) | | | | | | | 71 | | | | 72,598 | |
ESH Hospitality, Inc., 5.25%, 5/01/25 (c) | | | | | | | 1,970 | | | | 1,942,912 | |
MGM Resorts International: | | | | | | | | | | | | |
8.63%, 2/01/19 | | | | | | | 1,006 | | | | 1,144,325 | |
6.75%, 10/01/20 | | | | | | | 214 | | | | 228,445 | |
6.00%, 3/15/23 | | | | | | | 948 | | | | 984,735 | |
| | | | | | | | | | | | |
| Corporate Bonds | | Par (000) | | | Value | |
Hotels, Restaurants & Leisure (continued) | |
MGP Escrow Issuer LLC/MGP Escrow Co-Issuer, Inc., 5.63%, 5/01/24 (c) | | | USD | | | | 743 | | | $ | 774,577 | |
New Red Finance, Inc., 6.00%, 4/01/22 (c) | | | | | | | 2,215 | | | | 2,286,987 | |
Pinnacle Entertainment, Inc., 5.63%, 5/01/24 (c) | | | | | | | 205 | | | | 204,744 | |
RHP Hotel Properties LP/RHP Finance Corp., 5.00%, 4/15/23 | | | | | | | 407 | | | | 418,193 | |
Sabre GLBL, Inc. (c): | | | | | | | | | | | | |
5.38%, 4/15/23 | | | | | | | 594 | | | | 604,395 | |
5.25%, 11/15/23 | | | | | | | 294 | | | | 297,675 | |
Six Flags Entertainment Corp., 5.25%, 1/15/21 (c) | | | | | | | 1,718 | | | | 1,778,130 | |
| | | | | | | | | | | | |
| | | | | | | | | | | | 10,737,716 | |
Household Durables — 0.7% | |
Beazer Homes USA, Inc., 6.63%, 4/15/18 | | | | | | | 1,960 | | | | 1,999,200 | |
Brookfield Residential Properties, Inc./Brookfield Residential US Corp., 6.13%, 7/01/22 (c) | | | | | | | 1,647 | | | | 1,525,155 | |
Lennar Corp.: | | | | | | | | | | | | |
4.75%, 11/15/22 | | | | | | | 1,805 | | | | 1,832,075 | |
4.88%, 12/15/23 | | | | | | | 711 | | | | 721,665 | |
Standard Pacific Corp., 8.38%, 1/15/21 | | | | | | | 3,015 | | | | 3,550,162 | |
TRI Pointe Holdings, Inc.: | | | | | | | | | | | | |
4.38%, 6/15/19 | | | | | | | 920 | | | | 922,300 | |
5.88%, 6/15/24 | | | | | | | 625 | | | | 628,125 | |
| | | | | | | | | | | | |
| | | | | | | | | | | | 11,178,682 | |
Household Products — 0.4% | |
Newell Rubbermaid, Inc.: | | | | | | | | | | | | |
3.85%, 4/01/23 | | | | | | | 2,585 | | | | 2,702,920 | |
4.20%, 4/01/26 | | | | | | | 955 | | | | 1,008,949 | |
Spectrum Brands, Inc.: | | | | | | | | | | | | |
6.38%, 11/15/20 | | | | | | | 810 | | | | 854,769 | |
6.63%, 11/15/22 | | | | | | | 1,110 | | | | 1,198,800 | |
5.75%, 7/15/25 | | | | | | | 1,002 | | | | 1,062,771 | |
| | | | | | | | | | | | |
| | | | | | | | | | | | 6,828,209 | |
Independent Power and Renewable Electricity Producers — 0.8% | |
Calpine Corp.: | | | | | | | | | | | | |
6.00%, 1/15/22 (c) | | | | | | | 1,548 | | | | 1,635,075 | |
5.38%, 1/15/23 | | | | | | | 2,109 | | | | 2,127,454 | |
5.88%, 1/15/24 (c) | | | | | | | 823 | | | | 873,409 | |
5.50%, 2/01/24 | | | | | | | 1,481 | | | | 1,495,810 | |
5.75%, 1/15/25 | | | | | | | 1,064 | | | | 1,074,640 | |
Dynegy, Inc., 6.75%, 11/01/19 | | | | | | | 1,945 | | | | 1,961,532 | |
NRG Energy, Inc.: | | | | | | | | | | | | |
6.25%, 7/15/22 | | | | | | | 991 | | | | 971,497 | |
6.25%, 5/01/24 | | | | | | | 218 | | | | 212,550 | |
QEP Resources, Inc., 5.38%, 10/01/22 | | | | | | | 1,927 | | | | 1,825,833 | |
| | | | | | | | | | | | |
| | | | | | | | | | | | 12,177,800 | |
Insurance — 3.1% | |
American International Group, Inc., 6.40%, 12/15/20 (e) | | | | | | | 8,710 | | | | 10,128,232 | |
Aon Corp., 5.00%, 9/30/20 (e) | | | | | | | 7,700 | | | | 8,519,280 | |
Aon PLC, 4.25%, 12/12/42 (e) | | | | | | | 6,500 | | | | 6,024,616 | |
Forethought Financial Group, Inc., 8.63%, 4/15/21 (c) | | | | | | | 3,400 | | | | 3,691,176 | |
Northwestern Mutual Life Insurance Co., 6.06%, 3/30/40 (c)(e) | | | | | | | 12,000 | | | | 14,615,496 | |
Principal Financial Group, Inc., 8.88%, 5/15/19 | | | | | | | 2,825 | | | | 3,358,942 | |
Trader Corp., 9.88%, 8/15/18 (c) | | | | | | | 725 | | | | 752,187 | |
| | | | | | | | | | | | |
| | | | | | | | | | | | 47,089,929 | |
See Notes to Financial Statements.
| | | | | | |
| | | | | | | |
| | SEMI-ANNUAL REPORT | | APRIL 30, 2016 | | 15 |
| | |
Schedule of Investments (continued) | | BlackRock Credit Allocation Income Trust (BTZ) |
| | | | | | | | | | | | |
| Corporate Bonds | | Par (000) | | | Value | |
Internet Software & Services — 0.1% | |
Equinix, Inc., 5.88%, 1/15/26 | | | USD | | | | 1,061 | | | $ | 1,122,665 | |
Netflix, Inc., 5.50%, 2/15/22 | | | | | | | 563 | | | | 588,335 | |
| | | | | | | | | | | | |
| | | | | | | | | | | | 1,711,000 | |
IT Services — 1.1% | |
Ceridian HCM Holding, Inc., 11.00%, 3/15/21 (c) | | | | | | | 1,755 | | | | 1,755,000 | |
Fidelity National Information Services, Inc., 5.00%, 10/15/25 | | | | | | | 1,935 | | | | 2,136,437 | |
First Data Corp. (c): | | | | | | | | | | | | |
6.75%, 11/01/20 | | | | | | | 1,768 | | | | 1,856,400 | |
5.38%, 8/15/23 | | | | | | | 1,854 | | | | 1,916,573 | |
7.00%, 12/01/23 | | | | | | | 5,545 | | | | 5,697,487 | |
5.00%, 1/15/24 | | | | | | | 3,757 | | | | 3,794,570 | |
5.75%, 1/15/24 | | | | | | | 410 | | | | 416,150 | |
| | | | | | | | | | | | |
| | | | | | | | | | | | 17,572,617 | |
Life Sciences Tools & Services — 0.9% | |
Life Technologies Corp., 6.00%, 3/01/20 (e) | | | | | | | 12,000 | | | | 13,499,916 | |
Media — 7.3% | |
21st Century Fox America, Inc., 6.15%, 3/01/37 (e) | | | | | | | 9,575 | | | | 11,691,506 | |
A&E Television Networks LLC, 3.11%, 8/22/19 | | | | | | | 5,000 | | | | 5,112,500 | |
Altice Financing SA, 7.50%, 5/15/26 (c)(g) | | | | | | | 703 | | | | 703,879 | |
Altice SA (c): | | | | | | | | | | | | |
7.75%, 5/15/22 | | | | | | | 2,362 | | | | 2,356,095 | |
7.63%, 2/15/25 | | | | | | | 993 | | | | 959,486 | |
Altice US Finance I Corp. (c): | | | | | | | | | | | | |
5.38%, 7/15/23 | | | | | | | 2,919 | | | | 2,980,445 | |
5.50%, 5/15/26 | | | | | | | 1,211 | | | | 1,223,110 | |
AMC Networks, Inc.: | | | | | | | | | | | | |
7.75%, 7/15/21 | | | | | | | 1,330 | | | | 1,393,175 | |
4.75%, 12/15/22 | | | | | | | 685 | | | | 690,137 | |
5.00%, 4/01/24 | | | | | | | 432 | | | | 432,540 | |
CCO Holdings LLC/CCO Holdings Capital Corp. (c): | | | | | | | | | | | | |
5.88%, 4/01/24 | | | | | | | 1,759 | | | | 1,842,552 | |
5.50%, 5/01/26 | | | | | | | 1,219 | | | | 1,243,380 | |
CCO Safari II LLC (c): | | | | | | | | | | | | |
4.91%, 7/23/25 | | | | | | | 5,000 | | | | 5,390,235 | |
6.38%, 10/23/35 | | | | | | | 479 | | | | 552,908 | |
6.48%, 10/23/45 | | | | | | | 4,584 | | | | 5,415,409 | |
6.83%, 10/23/55 | | | | | | | 3,540 | | | | 4,068,692 | |
CCOH Safari LLC, 5.75%, 2/15/26 (c) | | | | | | | 499 | | | | 515,218 | |
Cinemark USA, Inc., 5.13%, 12/15/22 | | | | | | | 349 | | | | 361,215 | |
Clear Channel Worldwide Holdings, Inc., 6.50%, 11/15/22 | | | | | | | 10,205 | | | | 10,159,495 | |
Cox Communications, Inc.,
8.38%, 3/01/39 (c)(e) | | | | | | | 5,000 | | | | 5,807,340 | |
CSC Holdings LLC, 8.63%, 2/15/19 | | | | | | | 4,005 | | | | 4,445,550 | |
Gray Television, Inc., 7.50%, 10/01/20 | | | | | | | 543 | | | | 568,792 | |
Grupo Televisa SAB, 5.00%, 5/13/45 (e) | | | | | | | 3,345 | | | | 3,142,858 | |
Intelsat Jackson Holdings SA: | | | | | | | | | | | | |
7.25%, 10/15/20 | | | | | | | 1,107 | | | | 808,110 | |
6.63%, 12/15/22 | | | | | | | 545 | | | | 352,888 | |
5.50%, 8/01/23 (e) | | | | | | | 1,127 | | | | 712,123 | |
8.00%, 2/15/24 (c) | | | | | | | 875 | | | | 905,625 | |
Interpublic Group of Cos., Inc., 3.75%, 2/15/23 | | | | | | | 6,025 | | | | 6,129,178 | |
Lamar Media Corp., 5.75%, 2/01/26 (c) | | | | | | | 224 | | | | 236,880 | |
Live Nation Entertainment, Inc., 7.00%, 9/01/20 (c) | | | | | | | 463 | | | | 484,993 | |
MDC Partners, Inc., 6.50%, 5/01/24 (c) | | | | | | | 1,246 | | | | 1,290,358 | |
| | | | | | | | | | | | |
| Corporate Bonds | | Par (000) | | | Value | |
Media (continued) | |
NAI Entertainment Holdings/NAI Entertainment Holdings Finance Corp., 5.00%, 8/01/18 (c) | | | USD | | | | 1,471 | | | $ | 1,493,065 | |
Neptune Finco Corp., 6.63%, 10/15/25 (c) | | | | | | | 832 | | | | 894,400 | |
Nielsen Finance LLC/Nielsen Finance Co., 5.00%, 4/15/22 (c) | | | | | | | 475 | | | | 484,500 | |
Numericable Group SA, 6.00%, 5/15/22 (c) | | | | | | | 4,544 | | | | 4,549,907 | |
Numericable-SFR SA, 7.38%, 5/01/26 (c) | | | | | | | 5,843 | | | | 5,930,645 | |
Outfront Media Capital LLC/Outfront Media Capital Corp.: | | | | | | | | | | | | |
5.25%, 2/15/22 | | | | | | | 249 | | | | 257,093 | |
5.63%, 2/15/24 | | | | | | | 122 | | | | 126,880 | |
Sirius XM Radio, Inc., 4.25%, 5/15/20 (c) | | | | | | | 2,300 | | | | 2,343,125 | |
Time Warner Cable, Inc., 6.55%, 5/01/37 (e) | | | | | | | 3,519 | | | | 4,049,704 | |
Tribune Media Co., 5.88%, 7/15/22 (c) | | | | | | | 1,308 | | | | 1,301,460 | |
Unitymedia Hessen GmbH & Co. KG/Unitymedia NRW GmbH, 5.50%, 1/15/23 (c) | | | | | | | 1,000 | | | | 1,036,250 | |
Univision Communications, Inc. (c): | | | | | | | | | | | | |
5.13%, 5/15/23 | | | | | | | 5,293 | | | | 5,332,697 | |
5.13%, 2/15/25 | | | | | | | 999 | | | | 987,761 | |
Virgin Media Secured Finance PLC (c): | | | | | | | | | | | | |
5.38%, 4/15/21 | | | | | | | 1,255 | | | | 1,311,057 | |
5.50%, 8/15/26 | | | | | | | 487 | | | | 489,742 | |
| | | | | | | | | | | | |
| | | | | | | | | | | | 112,564,958 | |
Metals & Mining — 2.3% | |
Alcoa, Inc., 5.13%, 10/01/24 | | | | | | | 1,903 | | | | 1,853,046 | |
Anglo American Capital PLC, 4.45%, 9/27/20 (c) | | | | | | | 136 | | | | 128,520 | |
AngloGold Ashanti Holdings PLC, 5.13%, 8/01/22 | | | | | | | 5,000 | | | | 5,062,500 | |
ArcelorMittal: | | | | | | | | | | | | |
6.13%, 6/01/18 | | | | | | | 2,575 | | | | 2,669,966 | |
7.75%, 3/01/41 | | | | | | | 455 | | | | 420,875 | |
Commercial Metals Co., 4.88%, 5/15/23 | | | | | | | 2,194 | | | | 1,996,540 | |
Constellium NV: | | | | | | | | | | | | |
4.63%, 5/15/21 | | | EUR | | | | 490 | | | | 476,352 | |
5.75%, 5/15/24 (c) | | | USD | | | | 1,728 | | | | 1,308,960 | |
First Quantum Minerals Ltd. (c): | | | | | | | | | | | | |
7.00%, 2/15/21 | | | | | | | 303 | | | | 246,945 | |
7.25%, 5/15/22 | | | | | | | 912 | | | | 715,920 | |
FMG Resources August 2006 Property Ltd., 9.75%, 3/01/22 (c) | | | | | | | 826 | | | | 868,374 | |
Freeport-McMoRan, Inc.: | | | | | | | | | | | | |
2.38%, 3/15/18 | | | | | | | 3,817 | | | | 3,664,320 | |
4.00%, 11/14/21 | | | | | | | 370 | | | | 327,450 | |
3.55%, 3/01/22 | | | | | | | 665 | | | | 555,275 | |
3.88%, 3/15/23 | | | | | | | 2,319 | | | | 1,942,163 | |
5.40%, 11/14/34 | | | | | | | 737 | | | | 563,731 | |
5.45%, 3/15/43 | | | | | | | 32 | | | | 24,000 | |
Novelis, Inc., 8.75%, 12/15/20 | | | | | | | 2,983 | | | | 3,079,947 | |
Southern Copper Corp., 5.88%, 4/23/45 | | | | | | | 3,870 | | | | 3,547,807 | |
Steel Dynamics, Inc.: | | | | | | | | | | | | |
5.13%, 10/01/21 | | | | | | | 1,105 | | | | 1,129,863 | |
6.38%, 8/15/22 | | | | | | | 1,430 | | | | 1,505,075 | |
5.25%, 4/15/23 | | | | | | | 309 | | | | 313,635 | |
5.50%, 10/01/24 | | | | | | | 240 | | | | 243,900 | |
Teck Resources Ltd.: | | | | | | | | | | | | |
2.50%, 2/01/18 | | | | | | | 73 | | | | 69,350 | |
3.00%, 3/01/19 | | | | | | | 295 | | | | 269,188 | |
4.75%, 1/15/22 | | | | | | | 44 | | | | 36,520 | |
3.75%, 2/01/23 | | | | | | | 820 | | | | 631,400 | |
Wise Metals Group LLC/Wise Alloys Finance Corp., 8.75%, 12/15/18 (c) | | | | | | | 1,472 | | | | 1,361,600 | |
| | | | | | | | | | | | |
| | | | | | | | | | | | 35,013,222 | |
See Notes to Financial Statements.
| | | | | | |
| | | | | | | |
| 16 | | SEMI-ANNUAL REPORT | | APRIL 30, 2016 | | |
| | |
Schedule of Investments (continued) | | BlackRock Credit Allocation Income Trust (BTZ) |
| | | | | | | | | | | | |
| Corporate Bonds | | Par (000) | | | Value | |
Multi-Utilities — 1.3% | |
CenterPoint Energy, Inc. (e): | | | | | | | | | | | | |
5.95%, 2/01/17 | | | USD | | | | 9,000 | | | $ | 9,267,750 | |
6.50%, 5/01/18 | | | | | | | 9,675 | | | | 10,467,479 | |
| | | | | | | | | | | | |
| | | | | | | | | | | | 19,735,229 | |
Multiline Retail — 0.2% | |
Dufry Finance SCA, 5.50%, 10/15/20 (c) | | | | | | | 3,460 | | | | 3,598,400 | |
Offshore Drilling & Other Services — 0.0% | |
Sensata Technologies BV, 5.63%, 11/01/24 (c) | | | | | | | 695 | | | | 726,275 | |
Oil, Gas & Consumable Fuels — 12.7% | |
Access Midstream Partners LP/ACMP Finance Corp.: | | | | | | | | | | | | |
6.13%, 7/15/22 | | | | | | | 1,668 | | | | 1,659,175 | |
4.88%, 5/15/23 | | | | | | | 343 | | | | 314,806 | |
Anadarko Petroleum Corp., 6.38%, 9/15/17 | | | | | | | 75 | | | | 79,632 | |
California Resources Corp., 8.00%, 12/15/22 (c) | | | | | | | 2,642 | | | | 1,816,375 | |
CONSOL Energy, Inc., 5.88%, 4/15/22 | | | | | | | 4,724 | | | | 3,932,730 | |
Continental Resources, Inc.: | | | | | | | | | | | | |
5.00%, 9/15/22 | | | | | | | 7,519 | | | | 7,020,866 | |
4.50%, 4/15/23 | | | | | | | 469 | | | | 418,876 | |
Denbury Resources, Inc., 5.50%, 5/01/22 | | | | | | | 304 | | | | 195,320 | |
El Paso LLC: | | | | | | | | | | | | |
7.80%, 8/01/31 | | | | | | | 197 | | | | 213,439 | |
7.75%, 1/15/32 | | | | | | | 4,586 | | | | 4,940,333 | |
El Paso Natural Gas Co. LLC, 8.63%, 1/15/22 | | | | | | | 2,345 | | | | 2,714,903 | |
El Paso Pipeline Partners Operating Co. LLC, 6.50%, 4/01/20 | | | | | | | 5,075 | | | | 5,518,702 | |
Enbridge Energy Partners LP, 9.88%, 3/01/19 (e) | | | | | | | 6,000 | | | | 6,791,034 | |
Energy Transfer Equity LP: | | | | | | | | | | | | |
7.50%, 10/15/20 | | | | | | | 598 | | | | 602,485 | |
5.88%, 1/15/24 | | | | | | | 5,241 | | | | 4,900,335 | |
5.50%, 6/01/27 | | | | | | | 870 | | | | 746,695 | |
Energy Transfer Partners LP: | | | | | | | | | | | | |
5.20%, 2/01/22 | | | | | | | 10,200 | | | | 10,304,795 | |
6.13%, 12/15/45 | | | | | | | 3,579 | | | | 3,425,067 | |
Enterprise Products Operating LLC: | | | | | | | | | | | | |
4.90%, 5/15/46 | | | | | | | 5,375 | | | | 5,440,408 | |
Series N, 6.50%, 1/31/19 (e) | | | | | | | 12,000 | | | | 13,388,628 | |
Hilcorp Energy I LP/Hilcorp Finance Co., 5.00%, 12/01/24 (c) | | | | | | | 3,666 | | | | 3,409,380 | |
Kinder Morgan Energy Partners LP: | | | | | | | | | | | | |
6.85%, 2/15/20 (e) | | | | | | | 12,000 | | | | 13,241,268 | |
4.25%, 9/01/24 | | | | | | | 2,170 | | | | 2,100,460 | |
5.40%, 9/01/44 | | | | | | | 3,615 | | | | 3,250,377 | |
MEG Energy Corp. (c): | | | | | | | | | | | | |
6.50%, 3/15/21 | | | | | | | 3,839 | | | | 3,013,615 | |
7.00%, 3/31/24 | | | | | | | 3,100 | | | | 2,433,500 | |
Midcontinent Express Pipeline LLC, 6.70%, 9/15/19 (c) | | | | | | | 3,500 | | | | 3,255,000 | |
Nexen Energy ULC, 6.40%, 5/15/37 | | | | | | | 2,000 | | | | 2,301,982 | |
NGPL PipeCo LLC (c): | | | | | | | | | | | | |
7.12%, 12/15/17 | | | | | | | 2,859 | | | | 2,951,917 | |
9.63%, 6/01/19 | | | | | | | 902 | | | | 940,786 | |
Noble Energy, Inc.: | | | | | | | | | | | | |
5.63%, 5/01/21 | | | | | | | 1,784 | | | | 1,833,274 | |
5.05%, 11/15/44 | | | | | | | 3,500 | | | | 3,313,481 | |
ONEOK Partners LP, 8.63%, 3/01/19 (e) | | | | | | | 10,000 | | | | 11,147,300 | |
PDC Energy, Inc., 7.75%, 10/15/22 | | | | | | | 1,225 | | | | 1,267,875 | |
Petroleos Mexicanos (e): | | | | | | | | | | | | |
3.50%, 1/30/23 | | | | | | | 5,000 | | | | 4,643,750 | |
4.88%, 1/18/24 | | | | | | | 2,000 | | | | 1,992,500 | |
| | | | | | | | | | | | |
| Corporate Bonds | | Par (000) | | | Value | |
Oil, Gas & Consumable Fuels (continued) | |
Pioneer Natural Resources Co., 6.88%, 5/01/18 | | | USD | | | | 1,665 | | | $ | 1,797,977 | |
Plains All American Pipeline LP/PAA Finance Corp.: | | | | | | | | | | | | |
4.70%, 6/15/44 | | | | | | | 1,498 | | | | 1,206,813 | |
4.90%, 2/15/45 | | | | | | | 2,102 | | | | 1,722,902 | |
Range Resources Corp., 5.00%, 8/15/22 | | | | | | | 32 | | | | 29,880 | |
Rockies Express Pipeline LLC (c): | | | | | | | | | | | | |
5.63%, 4/15/20 | | | | | | | 295 | | | | 292,788 | |
6.88%, 4/15/40 | | | | | | | 580 | | | | 510,400 | |
RSP Permian, Inc., 6.63%, 10/01/22 | | | | | | | 789 | | | | 814,642 | |
Ruby Pipeline LLC, 6.00%, 4/01/22 (c) | | | | | | | 10,000 | | | | 9,590,700 | |
Sabine Pass Liquefaction LLC: | | | | | | | | | | | | |
5.63%, 4/15/23 | | | | | | | 10,510 | | | | 10,299,800 | |
5.75%, 5/15/24 | | | | | | | 2,575 | | | | 2,491,312 | |
Sabine Pass LNG LP, 7.50%, 11/30/16 | | | | | | | 4,471 | | | | 4,574,392 | |
Sanchez Energy Corp.: | | | | | | | | | | | | |
7.75%, 6/15/21 | | | | | | | 153 | | | | 125,843 | |
6.13%, 1/15/23 | | | | | | | 821 | | | | 613,697 | |
SM Energy Co.: | | | | | | | | | | | | |
6.50%, 1/01/23 | | | | | | | 177 | | | | 161,955 | |
5.00%, 1/15/24 | | | | | | | 181 | | | | 150,683 | |
Southwestern Energy Co.: | | | | | | | | | | | | |
3.30%, 1/23/18 | | | | | | | 799 | | | | 755,055 | |
7.50%, 2/01/18 | | | | | | | 314 | | | | 308,505 | |
Targa Resources Partners LP/Targa Resources Partners Finance Corp.: | | | | | | | | | | | | |
6.88%, 2/01/21 | | | | | | | 1,449 | | | | 1,481,602 | |
6.38%, 8/01/22 | | | | | | | 255 | | | | 257,550 | |
5.25%, 5/01/23 | | | | | | | 37 | | | | 35,520 | |
6.75%, 3/15/24 (c) | | | | | | | 184 | | | | 187,220 | |
Tesoro Logistics LP / Tesoro Logistics Finance Corp., 6.25%, 10/15/22 | | | | | | | 1,519 | | | | 1,556,975 | |
TransCanada PipeLines Ltd., 4.88%, 1/15/26 | | | | | | | 4,485 | | | | 4,932,298 | |
Weatherford International Ltd.: | | | | | | | | | | | | |
4.50%, 4/15/22 | | | | | | | 90 | | | | 79,119 | |
6.50%, 8/01/36 | | | | | | | 90 | | | | 69,525 | |
Western Gas Partners LP, 5.38%, 6/01/21 | | | | | | | 5,125 | | | | 5,206,170 | |
Whiting Petroleum Corp., 6.25%, 4/01/23 | | | | | | | 161 | | | | 134,033 | |
Williams Cos., Inc.: | | | | | | | | | | | | |
3.70%, 1/15/23 | | | | | | | 2,245 | | | | 1,885,329 | |
4.55%, 6/24/24 | | | | | | | 1,253 | | | | 1,079,923 | |
8.75%, 3/15/32 | | | | | | | 2,478 | | | | 2,502,780 | |
5.75%, 6/24/44 | | | | | | | 685 | | | | 534,300 | |
Williams Partners LP, 5.10%, 9/15/45 | | | | | | | 5,075 | | | | 4,140,758 | |
WPX Energy, Inc., 6.00%, 1/15/22 | | | | | | | 164 | | | | 147,600 | |
| | | | | | | | | | | | |
| | | | | | | | | | | | 195,199,115 | |
Paper & Forest Products — 2.1% | | | | | |
International Paper Co. (e): | | | | | | | | | | | | |
7.50%, 8/15/21 | | | | | | | 9,675 | | | | 11,826,372 | |
8.70%, 6/15/38 | | | | | | | 4,000 | | | | 5,621,804 | |
7.30%, 11/15/39 | | | | | | | 10,000 | | | | 13,067,130 | |
Louisiana-Pacific Corp., 7.50%, 6/01/20 | | | | | | | 2,130 | | | | 2,215,200 | |
| | | | | | | | | | | | |
| | | | | | | | | | | | 32,730,506 | |
Pharmaceuticals — 3.4% | | | | | |
AbbVie, Inc. (e): | | | | | | | | | | | | |
2.90%, 11/06/22 | | | | | | | 5,675 | | | | 5,798,011 | |
4.70%, 5/14/45 | | | | | | | 3,255 | | | | 3,457,048 | |
Actavis Funding SCS: | | | | | | | | | | | | |
3.45%, 3/15/22 | | | | | | | 7,335 | | | | 7,514,319 | |
3.85%, 6/15/24 | | | | | | | 6,000 | | | | 6,163,302 | |
4.75%, 3/15/45 | | | | | | | 1,450 | | | | 1,466,716 | |
Endo Finance LLC/Endo Finco, Inc. (c): | | | | | | | | | | | | |
7.50%, 1/15/22 | | | | | | | 499 | | | | 516,465 | |
See Notes to Financial Statements.
| | | | | | |
| | | | | | | |
| | SEMI-ANNUAL REPORT | | APRIL 30, 2016 | | 17 |
| | |
Schedule of Investments (continued) | | BlackRock Credit Allocation Income Trust (BTZ) |
| | | | | | | | | | | | |
| Corporate Bonds | | Par (000) | | | Value | |
Pharmaceuticals (continued) | | | | | |
Endo Finance LLC/Endo Finco, Inc. (c) (continued): | | | | | | | | | | | | |
6.00%, 7/15/23 | | | USD | | | | 1,514 | | | $ | 1,485,612 | |
6.00%, 2/01/25 | | | | | | | 1,401 | | | | 1,337,955 | |
Forest Laboratories, Inc. (c): | | | | | | | | | | | | |
4.38%, 2/01/19 | | | | | | | 2,924 | | | | 3,085,849 | |
5.00%, 12/15/21 | | | | | | | 1,631 | | | | 1,799,331 | |
Grifols Worldwide Operations Ltd., 5.25%, 4/01/22 | | | | | | | 1,613 | | | | 1,661,390 | |
Merck & Co., Inc., 6.50%, 12/01/33 (e) | | | | | | | 6,420 | | | | 8,682,434 | |
Valeant Pharmaceuticals International, Inc. (c): | | | | | | | | | | | | |
6.75%, 8/15/18 | | | | | | | 6,135 | | | | 5,920,275 | |
5.38%, 3/15/20 | | | | | | | 62 | | | | 54,909 | |
7.00%, 10/01/20 | | | | | | | 447 | | | | 411,240 | |
6.38%, 10/15/20 | | | | | | | 1,015 | | | | 919,844 | |
7.50%, 7/15/21 | | | | | | | 273 | | | | 249,795 | |
5.63%, 12/01/21 | | | | | | | 1,137 | | | | 963,607 | |
5.50%, 3/01/23 | | | | | | | 31 | | | | 26,350 | |
5.88%, 5/15/23 | | | | | | | 665 | | | | 556,937 | |
6.13%, 4/15/25 | | | | | | | 116 | | | | 96,904 | |
| | | | | | | | | | | | |
| | | | | | | | | | | | 52,168,293 | |
Professional Services — 0.4% | |
Dun & Bradstreet Corp., 3.25%, 12/01/17 | | | | | | | 5,750 | | | | 5,870,698 | |
Real Estate Investment Trusts (REITs) — 3.3% | |
American Tower Corp.: | | | | | | | | | | | | |
4.50%, 1/15/18 | | | | | | | 6,500 | | | | 6,794,703 | |
5.05%, 9/01/20 | | | | | | | 500 | | | | 547,240 | |
5.90%, 11/01/21 (e) | | | | | | | 3,770 | | | | 4,317,608 | |
AvalonBay Communities, Inc., 6.10%, 3/15/20 (e) | | | | | | | 10,000 | | | | 11,482,780 | |
DDR Corp.: | | | | | | | | | | | | |
4.75%, 4/15/18 | | | | | | | 2,140 | | | | 2,245,029 | |
7.88%, 9/01/20 | | | | | | | 2,650 | | | | 3,196,973 | |
ERP Operating LP, 5.75%, 6/15/17 (e) | | | | | | | 10,000 | | | | 10,501,410 | |
Felcor Lodging LP, 5.63%, 3/01/23 | | | | | | | 999 | | | | 1,026,472 | |
Host Hotels & Resorts LP, 3.75%, 10/15/23 (e) | | | | | | | 3,600 | | | | 3,563,233 | |
iStar Financial, Inc., 4.00%, 11/01/17 | | | | | | | 825 | | | | 812,625 | |
UDR, Inc., 4.25%, 6/01/18 (e) | | | | | | | 5,225 | | | | 5,476,673 | |
| | | | | | | | | | | | |
| | | | | | | | | | | | 49,964,746 | |
Real Estate Management & Development — 0.3% | |
Northwest Florida Timber Finance LLC, 4.75%, 3/04/29 (c)(e) | | | | | | | 4,485 | | | | 3,962,457 | |
Realogy Group LLC/Realogy Co-Issuer Corp. (c): | | | | | | | | | | | | |
4.50%, 4/15/19 | | | | | | | 803 | | | | 833,113 | |
5.25%, 12/01/21 (e) | | | | | | | 344 | | | | 359,480 | |
| | | | | | | | | | | | |
| | | | | | | | | | | | 5,155,050 | |
Road & Rail — 1.2% | |
Hertz Corp.: | | | | | | | | | | | | |
4.25%, 4/01/18 | | | | | | | 983 | | | | 992,830 | |
6.75%, 4/15/19 | | | | | | | 1,167 | | | | 1,187,691 | |
5.88%, 10/15/20 | | | | | | | 925 | | | | 939,347 | |
7.38%, 1/15/21 | | | | | | | 310 | | | | 319,688 | |
Norfolk Southern Corp., 6.00%, 3/15/05 | | | | | | | 12,700 | | | | 14,699,005 | |
| | | | | | | | | | | | |
| | | | | | | | | | | | 18,138,561 | |
Semiconductors & Semiconductor Equipment — 0.3% | |
NXP BV/NXP Funding LLC (c): | | | | | | | | | | | | |
4.13%, 6/15/20 | | | | | | | 1,154 | | | | 1,185,735 | |
5.75%, 2/15/21 | | | | | | | 1,655 | | | | 1,733,613 | |
4.63%, 6/15/22 | | | | | | | 490 | | | | 508,375 | |
| | | | | | | | | | | | |
| Corporate Bonds | | Par (000) | | | Value | |
Semiconductors & Semiconductor Equipment (continued) | |
Sensata Technologies BV, 5.00%, 10/01/25 (c) | | | USD | | | | 1,418 | | | $ | 1,425,090 | |
| | | | | | | | | | | | |
| | | | | | | | | | | | 4,852,813 | |
Software — 0.5% | |
Infor US, Inc., 6.50%, 5/15/22 | | | | | | | 2,425 | | | | 2,238,299 | |
Informatica LLC, 7.13%, 7/15/23 (c) | | | | | | | 477 | | | | 463,883 | |
Nuance Communications, Inc., 5.38%, 8/15/20 (c) | | | | | | | 4,435 | | | | 4,534,787 | |
| | | | | | | | | | | | |
| | | | | | | | | | | | 7,236,969 | |
Specialty Retail — 1.2% | |
AutoNation, Inc., 6.75%, 4/15/18 | | | | | | | 4,867 | | | | 5,226,662 | |
L Brands, Inc.: | | | | | | | | | | | | |
7.00%, 5/01/20 | | | | | | | 3,050 | | | | 3,522,750 | |
6.88%, 11/01/35 | | | | | | | 1,514 | | | | 1,665,400 | |
Penske Automotive Group, Inc., 5.38%, 12/01/24 | | | | | | | 1,951 | | | | 1,965,632 | |
VF Corp., 5.95%, 11/01/17 (e) | | | | | | | 5,000 | | | | 5,352,015 | |
| | | | | | | | | | | | |
| | | | | | | | | | | | 17,732,459 | |
Textiles, Apparel & Luxury Goods — 0.3% | |
Levi Strauss & Co., 5.00%, 5/01/25 | | | | | | | 699 | | | | 707,738 | |
Springs Industries, Inc., 6.25%, 6/01/21 | | | | | | | 1,674 | | | | 1,703,295 | |
William Carter Co., 5.25%, 8/15/21 | | | | | | | 1,406 | | | | 1,465,052 | |
| | | | | | | | | | | | |
| | | | | | | | | | | | 3,876,085 | |
Thrifts & Mortgage Finance — 0.1% | |
Radian Group, Inc., 5.25%, 6/15/20 | | | | | | | 1,475 | | | | 1,486,063 | |
Tobacco — 2.4% | |
Altria Group, Inc., 10.20%, 2/06/39 (e) | | | | | | | 13,392 | | | | 24,471,523 | |
Reynolds American, Inc.: | | | | | | | | | | | | |
3.50%, 8/04/16 | | | | | | | 8,375 | | | | 8,431,707 | |
4.85%, 9/15/23 | | | | | | | 1,120 | | | | 1,274,830 | |
5.85%, 8/15/45 | | | | | | | 2,335 | | | | 2,866,161 | |
| | | | | | | | | | | | |
| | | | | | | | | | | | 37,044,221 | |
Trading Companies & Distributors — 0.3% | |
Doric Nimrod Air Alpha Pass-Through Trust, Series 2013-1 (c): | | | | | | | | | | | | |
Class A, 5.25%, 5/30/25 | | | | | | | 2,467 | | | | 2,509,800 | |
Class B, 6.13%, 11/30/21 | | | | | | | 2,805 | | | | 2,840,416 | |
| | | | | | | | | | | | |
| | | | | | | | | | | | 5,350,216 | |
Transportation Infrastructure — 0.8% | |
CEVA Group PLC, 4.00%, 5/01/18 (c) | | | | | | | 1,800 | | | | 1,656,000 | |
Penske Truck Leasing Co. LP/PTL Finance Corp., 4.88%, 7/11/22 (c) | | | | | | | 10,500 | | | | 11,322,664 | |
| | | | | | | | | | | | |
| | | | | | | | | | | | 12,978,664 | |
Wireless Telecommunication Services — 4.0% | |
America Movil SAB de CV (e): | | | | | | | | | | | | |
2.38%, 9/08/16 | | | | | | | 12,495 | | | | 12,552,939 | |
3.13%, 7/16/22 | | | | | | | 1,275 | | | | 1,311,647 | |
American Tower Corp., 4.00%, 6/01/25 | | | | | | | 4,225 | | | | 4,421,158 | |
Crown Castle International Corp., 5.25%, 1/15/23 | | | | | | | 1,380 | | | | 1,531,800 | |
Crown Castle Towers LLC (c): | | | | | | | | | | | | |
5.50%, 1/15/37 | | | | | | | 4,000 | | | | 4,026,201 | |
4.17%, 8/15/37 | | | | | | | 3,000 | | | | 3,056,471 | |
6.11%, 1/15/40 | | | | | | | 4,555 | | | | 5,044,952 | |
Digicel Group Ltd., 7.13%, 4/01/22 (c) | | | | | | | 370 | | | | 301,088 | |
Digicel Ltd., 6.00%, 4/15/21 (c) | | | | | | | 1,285 | | | | 1,175,775 | |
SBA Tower Trust, 5.10%, 4/15/42 (c) | | | | | | | 13,975 | | | | 14,057,472 | |
Sprint Communications, Inc., 9.00%, 11/15/18 (c) | | | | | | | 5,290 | | | | 5,594,175 | |
Sprint Corp., 7.13%, 6/15/24 | | | | | | | 1,755 | | | | 1,316,250 | |
See Notes to Financial Statements.
| | | | | | |
| | | | | | | |
| 18 | | SEMI-ANNUAL REPORT | | APRIL 30, 2016 | | |
| | |
Schedule of Investments (continued) | | BlackRock Credit Allocation Income Trust (BTZ) |
| | | | | | | | | | | | |
| Corporate Bonds | | Par (000) | | | Value | |
Wireless Telecommunication Services (continued) | |
T-Mobile USA, Inc.: | | | | | | | | | | | | |
6.63%, 4/28/21 | | | USD | | | | 2,680 | | | $ | 2,824,050 | |
6.73%, 4/28/22 | | | | | | | 2,495 | | | | 2,625,988 | |
6.84%, 4/28/23 | | | | | | | 645 | | | | 687,731 | |
6.50%, 1/15/26 | | | | | | | 1,365 | | | | 1,446,900 | |
| | | | | | | | | | | | |
| | | | | | | | | | | | 61,974,597 | |
| Total Corporate Bonds — 101.9% | | | | | | | | | | | 1,563,132,537 | |
| | | | | | | | | | | | |
| | | | | | | | | | | | | |
| | | |
| Foreign Agency Obligations | | | | | | | | | |
Brazilian Government International Bond, 5.00%, 1/27/45 | | | | | | | 4,525 | | | | 3,653,938 | |
Indonesia Government International Bond, 5.88%, 1/15/24 (c) | | | | | | | 4,400 | | | | 5,007,046 | |
Mexico Government International Bond, 4.75%, 3/08/44 | | | | | | | 2,300 | | | | 2,323,000 | |
| Total Foreign Agency Obligations — 0.7% | | | | | | | | | | | 10,983,984 | |
| | | | | | | | | | | | |
| | | | | | | | | | | | | |
| | | |
| Municipal Bonds | | | | | | | | | |
City of Chicago Illinois, Refunding ARB, O’Hare International Airport, General 3rd Lien, Build America Bonds, Series B, 6.85%, 1/01/38 | | | | | | | 5,000 | | | | 5,661,650 | |
Metropolitan Transportation Authority, RB, Build America Bonds, Series B-1, 6.55%, 11/15/31 | | | | | | | 10,000 | | | | 13,279,600 | |
| Total Municipal Bonds — 1.2% | | | | | | | | | | | 18,941,250 | |
| | | | | | | | | | | | |
| | | | | | | | | | | | | |
| | | |
| Preferred Securities | | | | | | | | | |
| | | |
| Capital Trusts | | | | | | | | | |
Banks — 4.1% | | | | | | | | | | | | |
BNP Paribas SA (b)(c)(f): | | | | | | | | | | | | |
7.20% | | | | | | | 5,000 | | | | 5,437,500 | |
7.38% | | | | | | | 4,535 | | | | 4,478,312 | |
Capital One Financial Corp., Series E, 5.55% (b)(f) | | | | | | | 10,000 | | | | 9,980,000 | |
Citigroup, Inc. (b)(f): | | | | | | | | | | | | |
5.90% | | | | | | | 2,210 | | | | 2,204,475 | |
5.95% | | | | | | | 7,000 | | | | 6,780,200 | |
Credit Suisse Group AG, 7.50% (b)(c)(f) | | | | | | | 3,250 | | | | 3,228,043 | |
HSBC Capital Funding LP, 10.18% (b)(c)(f) | | | | | | | 11,835 | | | | 17,382,656 | |
JPMorgan Chase & Co., Series Q, 5.15% (b)(f) | | | | | | | 4,000 | | | | 3,890,000 | |
Nordea Bank AB, 6.13% (b)(c)(f) | | | | | | | 5,540 | | | | 5,344,992 | |
Wells Fargo & Co. (b)(f): | | | | | | | | | | | | |
Series K, 7.98% | | | | | | | 809 | | | | 841,360 | |
Series S, 5.90% | | | | | | | 281 | | | | 287,674 | |
Series U, 5.88% | | | | | | | 2,655 | | | | 2,835,872 | |
| | | | | | | | | | | | |
| | | | | | | | | | | | 62,691,084 | |
Capital Markets — 1.9% | |
Ameriprise Financial, Inc., 7.52%, 6/01/66 (b) | | | | | | | 3,000 | | | | 2,925,000 | |
Goldman Sachs Group, Inc., Series L, 5.70% (b)(f) | | | | | | | 2,950 | | | | 2,872,563 | |
Morgan Stanley, Series H, 5.45% (b)(f) | | | | | | | 8,675 | | | | 8,262,938 | |
State Street Capital Trust IV, 1.63%, 6/01/77 (b) | | | | | | | 17,845 | | | | 13,071,462 | |
State Street Corp., Series F, 5.25% (b)(f) | | | | | | | 1,855 | | | | 1,890,245 | |
| | | | | | | | | | | | |
| | | | | | | | | | | | 29,022,208 | |
| | | | | | | | | | | | |
| Capital Trusts | | Par (000) | | | Value | |
Consumer Finance — 0.3% | |
American Express Co., Series C, 4.90% (b)(f) | | | USD | | | | 4,510 | | | $ | 4,059,000 | |
Diversified Financial Services — 3.4% | | | | | | | | | | | | |
Bank of America Corp. (b)(f)(h): | | | | | | | | | | | | |
Series AA, 6.10% | | | | | | | 6,630 | | | | 6,634,144 | |
Series K, 8.00% | | | | | | | 2,420 | | | | 2,359,500 | |
Series U, 5.20% | | | | | | | 5,785 | | | | 5,380,050 | |
Barclays PLC, 6.63% (b)(f) | | | | | | | 4,885 | | | | 4,469,775 | |
Credit Agricole SA, 8.13% (b)(c)(f) | | | | | | | 5,000 | | | | 5,162,500 | |
JPMorgan Chase & Co., (b)(f)(h): | | | | | | | | | | | | |
6.75% | | | | | | | 7,775 | | | | 8,601,871 | |
Series 1, 7.90% | | | | | | | 3,650 | | | | 3,670,531 | |
Series R, 6.00% | | | | | | | 14,130 | | | | 14,449,338 | |
Royal Bank of Scotland Group PLC,
8.00% (b)(f) | | | | | | | 970 | | | | 929,684 | |
| | | | | | | | | | | | |
| | | | | | | | | | | | 51,657,393 | |
Electric Utilities — 0.4% | |
PPL Capital Funding, Inc., Series A, 6.70%, 3/30/67 (b) | | | | | | | 8,300 | | | | 6,422,125 | |
Industrial Conglomerates — 0.7% | |
General Electric Co., Series D, 5.00% (b)(f) | | | | | | | 10,777 | | | | 11,194,609 | |
Insurance — 4.9% | |
ACE Capital Trust II, 9.70%, 4/01/30 (e) | | | | | | | 7,000 | | | | 9,975,000 | |
Allstate Corp, 6.50%, 5/15/67 (b) | | | | | | | 10,400 | | | | 11,232,000 | |
American International Group, Inc., 8.18%, 5/15/68 (b) | | | | | | | 3,755 | | | | 4,721,912 | |
Bank One Capital III, 8.75%, 9/0130 (e) | | | | | | | 2,000 | | | | 2,933,620 | |
Chubb Corp., 6.38%, 3/29/67 (b)(e) | | | | | | | 7,400 | | | | 6,364,000 | |
Equitable of Iowa Cos. Capital Trust II, Series B, 8.42%, 4/01/27 | | | | | | | 5,000 | | | | 6,058,680 | |
Farmers Exchange Capital II, 6.15%, 11/01/53 (b)(c) | | | | | | | 4,890 | | | | 5,008,788 | |
Great-West Life & Annuity Insurance Capital LP II, 7.15%, 5/16/46 (b)(c) | | | | | | | 500 | | | | 443,750 | |
Hartford Financial Services Group, Inc., 8.13%, 6/15/68 (b) | | | | | | | 5,050 | | | | 5,454,000 | |
MetLife, Inc., 6.40%, 12/15/66 | | | | | | | 5,000 | | | | 5,328,000 | |
Principal Financial Group, Inc., 4.70%, 5/15/55 (b) | | | | | | | 5,000 | | | | 4,912,500 | |
Reinsurance Group of America, Inc., 3.30%, 12/15/65 (b) | | | | | | | 12,000 | | | | 7,920,000 | |
Swiss Re Capital I LP, 6.85% (b)(c)(f) | | | | | | | 4,450 | | | | 4,450,000 | |
| | | | | | | | | | | | |
| | | | | | | | | | | | 74,802,250 | |
Media — 0.4% | |
NBCUniversal Enterprise, Inc., 5.25% (c)(f) | | | | | | | 5,600 | | | | 5,796,000 | |
Multi-Utilities — 0.2% | |
Dominion Resources, Inc., 7.50%, 6/30/66 (b) | | | | | | | 4,400 | | | | 3,696,000 | |
Oil, Gas & Consumable Fuels — 1.2% | | | | | | | | | | | | |
Enterprise Products Operating LLC: | | | | | | | | | | | | |
7.00%, 6/01/67 (b) | | | | | | | 2,500 | | | | 1,889,000 | |
Series A, 8.38%, 8/01/66 (b) | | | | | | | 9,325 | | | | 7,766,419 | |
TransCanada PipeLines Ltd., 6.35%, 5/15/67 (b) | | | | | | | 9,400 | | | | 6,462,500 | |
TransCanada Trust, 5.63%, 5/20/75 (b) | | | | | | | 2,755 | | | | 2,472,613 | |
| | | | | | | | | | | | |
| | | | | | | | | | | | 18,590,532 | |
Real Estate Investment Trusts (REITs) — 0.6% | |
Sovereign Real Estate Investment Trust, 12.00% (c)(f) | | | | | | | 7,000 | | | | 8,540,000 | |
Road & Rail — 0.4% | |
BNSF Funding Trust I, 6.61%, 12/15/55 (b) | | | | | | | 6,125 | | | | 6,890,625 | |
| Total Capital Trusts — 18.5% | | | | | | | | | | | 283,361,826 | |
See Notes to Financial Statements.
| | | | | | |
| | | | | | | |
| | SEMI-ANNUAL REPORT | | APRIL 30, 2016 | | 19 |
| | |
Schedule of Investments (continued) | | BlackRock Credit Allocation Income Trust (BTZ) |
| | | | | | | | | | |
| | | |
| Preferred Stocks | | | | Shares | | | Value | |
Banks — 1.8% | |
Citigroup, Inc., Series K, 6.88% (b)(f) | | | | | 488,320 | | | $ | 13,472,749 | |
Wells Fargo & Co., 5.85% (b)(f) | | | | | 550,500 | | | | 14,494,665 | |
| | | | | | | | | | |
| | | | | | | | | | 27,967,414 | |
Capital Markets — 0.7% | |
Goldman Sachs Group, Inc., Series J, 5.50% (b)(f) | | | | | 162,450 | | | | 4,082,369 | |
SCE Trust III, 5.75% (b)(f) | | | | | 31,650 | | | | 860,880 | |
State Street Corp., Series D, 5.90% (b)(f) | | | | | 220,495 | | | | 5,990,849 | |
| | | | | | | | | | |
| | | | | | | | | | 10,934,098 | |
Consumer Finance — 0.0% | |
Ally Financial, Inc., Series A, 8.50% (b)(f) | | | | | 10,220 | | | | 255,295 | |
Electric Utilities — 0.2% | |
Entergy Louisiana LLC, 5.25% | | | | | 90,000 | | | | 2,275,200 | |
Machinery — 0.1% | |
Stanley Black & Decker, Inc., 6.25% (j) | | | | | 11,107 | | | | 1,306,850 | |
Real Estate Investment Trusts (REITs) — 0.2% | |
Ventas Realty LP/Ventas Capital Corp., 5.45% | | | | | 75,000 | | | | 1,926,000 | |
Vornado Realty Trust, Series K, 5.70% (f) | | | | | 50,000 | | | | 1,286,000 | |
| | | | | | | | | | |
| | | | | | | | | | 3,212,000 | |
Wireless Telecommunication Services — 1.2% | |
Centaur Funding Corp., 9.08% (c) | | | | | 15,143 | | | | 18,001,241 | |
| Total Preferred Stocks — 4.2% | | | | | | | | | 63,952,098 | |
|
| Trust Preferred — 0.5% | |
Diversified Financial Services — 0.5% | |
GMAC Capital Trust I, Series 2, 8.13%, 2/15/40 | | | | | 300,141 | | | | 7,394,135 | |
| Total Preferred Securities — 23.2% | | | | 354,708,059 | |
| | | | | | | | | | | | |
| U.S. Government Sponsored Agency Securities | | | Par (000) | | | Value | |
Agency Obligations — 0.2% | |
Fannie Mae, 0.00%, 10/09/19 (e)(k) | | | USD | | | | 3,945 | | | $ | 3,749,150 | |
| | | | | | | | | | | | |
| | | | | | | | | | | | | |
| | | |
| U.S. Treasury Obligations | | | | | | | | | |
U.S. Treasury Bonds, 2.88%, 8/15/45 | | | | | | | 400 | | | | 417,359 | |
U.S. Treasury Notes (e): | | | | | | | | | | | | |
1.75%, 12/31/20 | | | | | | | 11,600 | | | | 11,856,465 | |
1.13%, 2/28/21 | | | | | | | 3,200 | | | | 3,179,376 | |
1.63%, 2/15/26 | | | | | | | 47,325 | | | | 46,504,195 | |
| Total U.S. Treasury Obligations — 4.0% | | | | 61,957,395 | |
Total Long-Term Investments
(Cost — $2,028,648,483) — 137.4% | | | | 2,108,161,871 | |
| | | | | | | | | | | | |
| | | | | | | | | | | | | |
| | | |
| Short-Term Securities — 0.4% | | | | | Shares | | | | |
BlackRock Liquidity Funds, TempFund, Institutional Class, 0.40% (l)(m) | | | | | | | 5,871,985 | | | | 5,871,985 | |
Total Short-Term Securities
(Cost — $5,871,985) — 0.4% | | | | 5,871,985 | |
Options Purchased
(Cost — $2,445,129) — 0.1% | | | | 1,081,435 | |
Total Investments Before Options Written
(Cost — $2,036,965,597) — 137.9% | | | | 2,115,115,291 | |
Options Written
(Premiums Received — $3,622,663) — (0.2)% | | | | (3,092,332 | ) |
Total Investments, Net of Options Written
(Cost — $2,033,342,934) — 137.7% | | | | 2,112,022,959 | |
| Liabilities in Excess of Other Assets — (37.7)% | | | | (578,598,803 | ) |
| | | | | | | | | | | | |
Net Assets — 100.0% | | | | | | | | | | $ | 1,533,424,156 | |
| | | | | | | | | | | | |
| | | | | | |
| Notes to Schedule of Investments |
| (a) | | Restricted security as to resale, excluding 144A securities. As of period end, the Trust held restricted securities with a current value of $2,951 and an original cost of $45,446 which was less than 0.05% of its net assets. |
| (b) | | Variable rate security. Rate as of period end. |
| (c) | | Security exempt from registration pursuant to Rule 144A under the Securities Act of 1933, as amended. These securities may be resold in transactions exempt from registration to qualified institutional investors. |
| (d) | | Payment-in-kind security which may pay interest/dividends in additional par/shares and/or in cash. Rates shown are the current rate and possible payment rates. |
| (e) | | All or a portion of security has been pledged as collateral in connection with outstanding reverse repurchase agreements. |
| (f) | | Perpetual security with no stated maturity date. |
| (g) | | When-issued security. |
| (h) | | Issuer filed for bankruptcy and/or is in default of interest payments. |
| (i) | | Step-up bond that pays an initial coupon rate for the first period and then a higher coupon rate for the following periods. Rate as of period end. |
| (j) | | Convertible security. |
| (l) | | During the six months ended April 30, 2016, investments in issuers considered to be an affiliate of the Trust for purposes of Section 2(a)(3) of the Investment Company Act of 1940, as amended, were as follows: |
| | | | | | | | | | | | | | | | |
| Affiliate | | Shares Held
at October 31,
2015 | | | Net
Activity | | | Shares Held
at April 30,
2016 | | | Income | |
BlackRock Liquidity Funds, TempFund, Institutional Class | | | 610,104 | | | | 5,261,881 | | | | 5,871,985 | | | $ | 32,077 | |
| (m) | | Current yield as of period end. |
See Notes to Financial Statements.
| | | | | | |
| | | | | | | |
| 20 | | SEMI-ANNUAL REPORT | | APRIL 30, 2016 | | |
| | |
Schedule of Investments (continued) | | BlackRock Credit Allocation Income Trust (BTZ) |
| • | | For Trust compliance purposes, the Trust’s industry classifications refer to one or more of the industry sub-classifications used by one or more widely recognized market indexes or rating group indexes, and/or as defined by the investment advisor. These definitions may not apply for purposes of this report, which may combine such industry sub-classifications for reporting ease. |
Reverse Repurchase Agreements
| | | | | | | | | | | | | | | | | | | | | | | | |
| Counterparty | | Interest
Rate | | | Trade
Date | | | Maturity
Date1 | | | Face Value | | | Face Value
Including
Accrued
Interest | | | Type of
Underlying
Collateral | | Remaining
Contractual
Maturity of
the Agreements1 |
Deutsche Bank Securities, Inc. | | | 0.43 | % | | | 3/5/15 | | | | Open | | | $ | 3,570,225 | | | $ | 3,578,177 | | | U.S. Government Sponsored Agency Securities | | Open/Demand |
Barclays Capital, Inc. | | | 0.55 | % | | | 12/17/15 | | | | Open | | | | 6,863,500 | | | | 6,877,656 | | | Capital Trusts | | Open/Demand |
Barclays Capital, Inc. | | | 0.55 | % | | | 12/17/15 | | | | Open | | | | 10,770,000 | | | | 10,792,213 | | | Corporate Bonds | | Open/Demand |
Barclays Capital, Inc. | | | 0.55 | % | | | 12/17/15 | | | | Open | | | | 4,499,250 | | | | 4,508,530 | | | Corporate Bonds | | Open/Demand |
Barclays Capital, Inc. | | | 0.55 | % | | | 12/17/15 | | | | Open | | | | 710,625 | | | | 712,091 | | | Corporate Bonds | | Open/Demand |
Barclays Capital, Inc. | | | 0.55 | % | | | 12/17/15 | | | | Open | | | | 5,906,250 | | | | 5,918,432 | | | Corporate Bonds | | Open/Demand |
Barclays Capital, Inc. | | | 0.55 | % | | | 12/17/15 | | | | Open | | | | 1,184,375 | | | | 1,186,818 | | | Corporate Bonds | | Open/Demand |
Barclays Capital, Inc. | | | 0.55 | % | | | 12/17/15 | | | | Open | | | | 4,691,813 | | | | 4,701,489 | | | Corporate Bonds | | Open/Demand |
Barclays Capital, Inc. | | | 0.55 | % | | | 12/17/15 | | | | Open | | | | 2,514,500 | | | | 2,519,686 | | | Corporate Bonds | | Open/Demand |
Barclays Capital, Inc. | | | 0.55 | % | | | 12/17/15 | | | | Open | | | | 4,867,413 | | | | 4,877,452 | | | Corporate Bonds | | Open/Demand |
Barclays Capital, Inc. | | | 0.55 | % | | | 12/17/15 | | | | Open | | | | 2,768,500 | | | | 2,774,210 | | | Corporate Bonds | | Open/Demand |
Barclays Capital, Inc. | | | 0.55 | % | | | 12/17/15 | | | | Open | | | | 8,268,750 | | | | 8,285,804 | | | Corporate Bonds | | Open/Demand |
Barclays Capital, Inc. | | | 0.60 | % | | | 12/17/15 | | | | Open | | | | 9,843,750 | | | | 9,865,898 | | | Capital Trusts | | Open/Demand |
Barclays Capital, Inc. | | | 0.60 | % | | | 12/17/15 | | | | Open | | | | 11,820,000 | | | | 11,846,595 | | | Corporate Bonds | | Open/Demand |
Credit Suisse Securities (USA) LLC | | | 0.50 | % | | | 12/17/15 | | | | Open | | | | 2,720,000 | | | | 2,725,100 | | | Corporate Bonds | | Open/Demand |
Credit Suisse Securities (USA) LLC | | | 0.65 | % | | | 12/17/15 | | | | Open | | | | 3,238,688 | | | | 3,246,582 | | | Corporate Bonds | | Open/Demand |
Credit Suisse Securities (USA) LLC | | | 0.65 | % | | | 12/17/15 | | | | Open | | | | 2,199,375 | | | | 2,204,736 | | | Corporate Bonds | | Open/Demand |
Credit Suisse Securities (USA) LLC | | | 0.65 | % | | | 12/17/15 | | | | Open | | | | 2,664,063 | | | | 2,670,556 | | | Corporate Bonds | | Open/Demand |
Credit Suisse Securities (USA) LLC | | | 0.65 | % | | | 12/17/15 | | | | Open | | | | 522,500 | | | | 523,774 | | | Corporate Bonds | | Open/Demand |
Credit Suisse Securities (USA) LLC | | | 0.65 | % | | | 12/17/15 | | | | Open | | | | 4,800,000 | | | | 4,811,707 | | | Corporate Bonds | | Open/Demand |
Credit Suisse Securities (USA) LLC | | | 0.70 | % | | | 12/17/15 | | | | Open | | | | 5,113,969 | | | | 5,127,393 | | | Corporate Bonds | | Open/Demand |
Credit Suisse Securities (USA) LLC | | | 0.70 | % | | | 12/17/15 | | | | Open | | | | 6,318,969 | | | | 6,335,556 | | | Corporate Bonds | | Open/Demand |
Credit Suisse Securities (USA) LLC | | | 0.70 | % | | | 12/17/15 | | | | Open | | | | 4,978,969 | | | | 4,992,039 | | | Corporate Bonds | | Open/Demand |
Credit Suisse Securities (USA) LLC | | | 0.70 | % | | | 12/17/15 | | | | Open | | | | 2,641,781 | | | | 2,648,716 | | | Corporate Bonds | | Open/Demand |
Credit Suisse Securities (USA) LLC | | | 0.75 | % | | | 12/17/15 | | | | Open | | | | 1,204,875 | | | | 1,208,264 | | | Corporate Bonds | | Open/Demand |
RBC Capital Markets, LLC | | | 0.64 | % | | | 12/17/15 | | | | Open | | | | 3,202,500 | | | | 3,210,186 | | | Corporate Bonds | | Open/Demand |
RBC Capital Markets, LLC | | | 0.64 | % | | | 12/17/15 | | | | Open | | | | 3,202,500 | | | | 3,210,186 | | | Corporate Bonds | | Open/Demand |
RBC Capital Markets, LLC | | | 0.64 | % | | | 12/17/15 | | | | Open | | | | 21,125,880 | | | | 21,176,582 | | | Corporate Bonds | | Open/Demand |
RBC Capital Markets, LLC | | | 0.64 | % | | | 12/17/15 | | | | Open | | | | 3,319,388 | | | | 3,327,354 | | | Corporate Bonds | | Open/Demand |
RBC Capital Markets, LLC | | | 0.64 | % | | | 12/17/15 | | | | Open | | | | 17,613,000 | | | | 17,655,271 | | | Corporate Bonds | | Open/Demand |
RBC Capital Markets, LLC | | | 0.64 | % | | | 12/17/15 | | | | Open | | | | 6,405,000 | | | | 6,420,372 | | | Corporate Bonds | | Open/Demand |
RBC Capital Markets, LLC | | | 0.64 | % | | | 12/17/15 | | | | Open | | | | 6,675,000 | | | | 6,691,020 | | | Corporate Bonds | | Open/Demand |
RBC Capital Markets, LLC | | | 0.64 | % | | | 12/17/15 | | | | Open | | | | 4,056,625 | | | | 4,066,361 | | | Corporate Bonds | | Open/Demand |
RBC Capital Markets, LLC | | | 0.64 | % | | | 12/17/15 | | | | Open | | | | 10,826,325 | | | | 10,852,308 | | | Corporate Bonds | | Open/Demand |
RBC Capital Markets, LLC | | | 0.64 | % | | | 12/17/15 | | | | Open | | | | 3,336,375 | | | | 3,344,382 | | | Corporate Bonds | | Open/Demand |
RBC Capital Markets, LLC | | | 0.64 | % | | | 12/17/15 | | | | Open | | | | 17,212,500 | | | | 17,253,810 | | | Corporate Bonds | | Open/Demand |
RBC Capital Markets, LLC | | | 0.64 | % | | | 12/17/15 | | | | Open | | | | 2,699,250 | | | | 2,705,728 | | | Corporate Bonds | | Open/Demand |
RBC Capital Markets, LLC | | | 0.64 | % | | | 12/17/15 | | | | Open | | | | 3,595,688 | | | | 3,604,317 | | | Corporate Bonds | | Open/Demand |
RBC Capital Markets, LLC | | | 0.64 | % | | | 12/17/15 | | | | Open | | | | 3,940,000 | | | | 3,949,456 | | | Corporate Bonds | | Open/Demand |
RBC Capital Markets, LLC | | | 0.64 | % | | | 12/17/15 | | | | Open | | | | 3,801,038 | | | | 3,810,160 | | | Corporate Bonds | | Open/Demand |
RBC Capital Markets, LLC | | | 0.64 | % | | | 12/17/15 | | | | Open | | | | 12,630,000 | | | | 12,660,312 | | | Corporate Bonds | | Open/Demand |
RBC Capital Markets, LLC | | | 0.64 | % | | | 12/17/15 | | | | Open | | | | 7,395,000 | | | | 7,412,748 | | | Corporate Bonds | | Open/Demand |
RBC Capital Markets, LLC | | | 0.64 | % | | | 12/17/15 | | | | Open | | | | 10,175,000 | | | | 10,199,420 | | | Corporate Bonds | | Open/Demand |
RBC Capital Markets, LLC | | | 0.64 | % | | | 12/17/15 | | | | Open | | | | 8,008,000 | | | | 8,027,219 | | | Corporate Bonds | | Open/Demand |
RBC Capital Markets, LLC | | | 0.64 | % | | | 12/17/15 | | | | Open | | | | 4,507,938 | | | | 4,518,757 | | | Corporate Bonds | | Open/Demand |
RBC Capital Markets, LLC | | | 0.64 | % | | | 12/17/15 | | | | Open | | | | 9,989,438 | | | | 10,013,412 | | | Corporate Bonds | | Open/Demand |
RBC Capital Markets, LLC | | | 0.64 | % | | | 12/17/15 | | | | Open | | | | 13,740,000 | | | | 13,772,976 | | | Corporate Bonds | | Open/Demand |
RBC Capital Markets, LLC | | | 0.64 | % | | | 12/17/15 | | | | Open | | | | 5,460,000 | | | | 5,480,475 | | | Corporate Bonds | | Open/Demand |
RBC Capital Markets, LLC | | | 0.64 | % | | | 12/17/15 | | | | Open | | | | 4,594,625 | | | | 4,605,652 | | | Corporate Bonds | | Open/Demand |
RBC Capital Markets, LLC | | | 0.64 | % | | | 12/17/15 | | | | Open | | | | 4,930,000 | | | | 4,941,832 | | | Corporate Bonds | | Open/Demand |
RBC Capital Markets, LLC | | | 0.64 | % | | | 12/17/15 | | | | Open | | | | 6,413,813 | | | | 6,429,206 | | | Corporate Bonds | | Open/Demand |
RBC Capital Markets, LLC | | | 0.64 | % | | | 12/17/15 | | | | Open | | | | 3,285,000 | | | | 3,292,884 | | | Corporate Bonds | | Open/Demand |
RBC Capital Markets, LLC | | | 1.00 | % | | | 12/17/15 | | | | Open | | | | 339,700 | | | | 338,426 | | | Corporate Bonds | | Open/Demand |
HSBC Securities (USA), Inc. | | | 0.63 | % | | | 12/18/15 | | | | Open | | | | 7,873,000 | | | | 7,891,187 | | | Corporate Bonds | | Open/Demand |
HSBC Securities (USA), Inc. | | | 0.65 | % | | | 12/18/15 | | | | Open | | | | 11,575,000 | | | | 11,602,587 | | | Capital Trusts | | Open/Demand |
BNP Paribas Securities Corp. | | | 0.75 | % | | | 12/21/15 | | | | Open | | | | 14,418,000 | | | | 14,457,349 | | | Corporate Bonds | | Open/Demand |
BNP Paribas Securities Corp. | | | 0.75 | % | | | 12/21/15 | | | | Open | | | | 7,067,000 | | | | 7,086,287 | | | Corporate Bonds | | Open/Demand |
BNP Paribas Securities Corp. | | | 0.75 | % | | | 12/21/15 | | | | Open | | | | 9,142,000 | | | | 9,166,950 | | | Corporate Bonds | | Open/Demand |
BNP Paribas Securities Corp. | | | 0.75 | % | | | 12/21/15 | | | | Open | | | | 7,963,000 | | | | 7,984,732 | | | Corporate Bonds | | Open/Demand |
BNP Paribas Securities Corp. | | | 0.75 | % | | | 12/21/15 | | | | Open | | | | 10,451,000 | | | | 10,479,523 | | | Corporate Bonds | | Open/Demand |
BNP Paribas Securities Corp. | | | 0.75 | % | | | 12/21/15 | | | | Open | | | | 3,014,000 | | | | 3,022,226 | | | Corporate Bonds | | Open/Demand |
BNP Paribas Securities Corp. | | | 0.75 | % | | | 12/21/15 | | | | Open | | | | 5,197,000 | | | | 5,211,183 | | | Corporate Bonds | | Open/Demand |
BNP Paribas Securities Corp. | | | 0.75 | % | | | 12/21/15 | | | | Open | | | | 3,160,000 | | | | 3,168,624 | | | Corporate Bonds | | Open/Demand |
BNP Paribas Securities Corp. | | | 0.75 | % | | | 12/21/15 | | | | Open | | | | 4,754,000 | | | | 4,766,974 | | | Corporate Bonds | | Open/Demand |
See Notes to Financial Statements.
| | | | | | |
| | | | | | | |
| | SEMI-ANNUAL REPORT | | APRIL 30, 2016 | | 21 |
| | |
Schedule of Investments (continued) | | BlackRock Credit Allocation Income Trust (BTZ) |
Reverse Repurchase Agreements (concluded)
| | | | | | | | | | | | | | | | | | | | | | | | |
| Counterparty | | Interest
Rate | | | Trade
Date | | | Maturity
Date1 | | | Face Value | | | Face Value
Including
Accrued
Interest | | | Type of
Underlying
Collateral | | Remaining
Contractual
Maturity of
the Agreements1 |
BNP Paribas Securities Corp. | | | 0.75 | % | | | 12/21/15 | | | | Open | | | $ | 11,933,000 | | | $ | 11,965,567 | | | Corporate Bonds | | Open/Demand |
BNP Paribas Securities Corp. | | | 0.75 | % | | | 12/21/15 | | | | Open | | | | 2,841,000 | | | | 2,848,754 | | | Corporate Bonds | | Open/Demand |
BNP Paribas Securities Corp. | | | 0.75 | % | | | 12/21/15 | | | | Open | | | | 5,189,000 | | | | 5,203,162 | | | Corporate Bonds | | Open/Demand |
BNP Paribas Securities Corp. | | | 0.75 | % | | | 12/21/15 | | | | Open | | | | 3,319,000 | | | | 3,328,058 | | | Corporate Bonds | | Open/Demand |
BNP Paribas Securities Corp. | | | 0.75 | % | | | 12/21/15 | | | | Open | | | | 1,771,000 | | | | 1,775,833 | | | Corporate Bonds | | Open/Demand |
BNP Paribas Securities Corp. | | | 0.75 | % | | | 12/21/15 | | | | Open | | | | 4,125,000 | | | | 4,136,258 | | | Corporate Bonds | | Open/Demand |
BNP Paribas Securities Corp. | | | 0.75 | % | | | 12/21/15 | | | | Open | | | | 5,096,000 | | | | 5,109,908 | | | Corporate Bonds | | Open/Demand |
BNP Paribas Securities Corp. | | | 0.75 | % | | | 12/21/15 | | | | Open | | | | 5,574,000 | | | | 5,589,212 | | | Corporate Bonds | | Open/Demand |
BNP Paribas Securities Corp. | | | 0.75 | % | | | 12/21/15 | | | | Open | | | | 4,455,000 | | | | 4,467,158 | | | Corporate Bonds | | Open/Demand |
BNP Paribas Securities Corp. | | | 0.75 | % | | | 12/21/15 | | | | Open | | | | 9,258,000 | | | | 9,283,267 | | | Corporate Bonds | | Open/Demand |
BNP Paribas Securities Corp. | | | 0.75 | % | | | 12/21/15 | | | | Open | | | | 4,444,000 | | | | 4,456,128 | | | Corporate Bonds | | Open/Demand |
BNP Paribas Securities Corp. | | | 0.75 | % | | | 12/21/15 | | | | Open | | | | 2,712,000 | | | | 2,719,401 | | | Corporate Bonds | | Open/Demand |
RBC Capital Markets, LLC | | | 0.64 | % | | | 12/22/15 | | | | Open | | | | 9,022,500 | | | | 9,043,512 | | | Corporate Bonds | | Open/Demand |
RBC Capital Markets, LLC | | | 0.64 | % | | | 12/22/15 | | | | Open | | | | 3,995,370 | | | | 4,004,675 | | | Corporate Bonds | | Open/Demand |
UBS Securities LLC | | | 0.75 | % | | | 12/22/15 | | | | Open | | | | 10,925,000 | | | | 10,954,589 | | | Corporate Bonds | | Open/Demand |
UBS Securities LLC | | | 0.75 | % | | | 12/22/15 | | | | Open | | | | 10,736,813 | | | | 10,765,891 | | | Corporate Bonds | | Open/Demand |
UBS Securities LLC | | | 0.75 | % | | | 12/22/15 | | | | Open | | | | 8,400,000 | | | | 8,422,750 | | | Corporate Bonds | | Open/Demand |
UBS Securities LLC | | | 0.75 | % | | | 12/22/15 | | | | Open | | | | 3,227,188 | | | | 3,235,928 | | | Corporate Bonds | | Open/Demand |
UBS Securities LLC | | | 0.75 | % | | | 12/22/15 | | | | Open | | | | 6,050,000 | | | | 6,066,385 | | | Corporate Bonds | | Open/Demand |
UBS Securities LLC | | | 0.75 | % | | | 12/22/15 | | | | Open | | | | 5,784,800 | | | | 5,800,467 | | | Corporate Bonds | | Open/Demand |
Barclays Capital, Inc. | | | 1.50 | % | | | 1/14/16 | | | | Open | | | | 389,475 | | | | 387,160 | | | Corporate Bonds | | Open/Demand |
RBC Capital Markets, LLC | | | 0.64 | % | | | 3/22/16 | | | | Open | | | | 8,847,167 | | | | 8,853,458 | | | Corporate Bonds | | Open/Demand |
Deutsche Bank Securities, Inc. | | | 0.06 | % | | | 4/19/16 | | | | Open | | | | 46,792,594 | | | | 46,798,833 | | | U.S. Treasury Obligations | | Open/Demand |
Credit Agricole Corporate and Investment Bank | | | 0.40 | % | | | 4/28/16 | | | | Open | | | | 11,919,000 | | | | 11,919,265 | | | U.S. Treasury Obligations | | Open/Demand |
Credit Agricole Corporate and Investment Bank | | | 0.40 | % | | | 4/28/16 | | | | Open | | | | 3,184,000 | | | | 3,184,058 | | | U.S. Treasury Obligations | | Open/Demand |
RBC Capital Markets, LLC | | | 0.25 | % | | | 4/29/16 | | | | Open | | | | 649,135 | | | | 649,142 | | | Corporate Bonds | | Open/Demand |
|
Total | | | | | | | | | | | | | | $ | 592,415,765 | | | $ | 593,716,727 | | | | | |
| | | | | | | | | | | | | | | | | | | | |
1 Certain agreements have no stated maturity and can be terminated by either party at any time. | | |
|
| Derivative Financial Instruments Outstanding as of Period End |
Futures Contracts
| | | | | | | | | | | | | | | | | | |
Contracts
Long (Short) | | | Issue | | Expiration | | Notional Value | | | Unrealized
Appreciation
(Depreciation) | | | |
| | 78 | | | 2-Year U.S. Treasury Note | | June 2016 | | USD | | | 17,052,750 | | | $ | (19,247 | ) | | |
| | (519 | ) | | 5-Year U.S. Treasury Note | | June 2016 | | USD | | | 62,754,399 | | | | 114,430 | | | |
| | 1,591 | | | 10-Year U.S. Treasury Note | | June 2016 | | USD | | | 206,929,437 | | | | 1,742 | | | |
| | 145 | | | U.S. Treasury Long Bond | | June 2016 | | USD | | | 23,680,313 | | | | (273,344 | ) | | |
| | (176 | ) | | Ultra U.S. Treasury Bond | | June 2016 | | USD | | | 30,156,500 | | | | 275,277 | | | |
| | (900 | ) | | 90-Day Euro-Dollar Future | | March 2017 | | USD | | | 222,930,000 | | | | (720,000 | ) | | |
| | Total | | | | | | | | | | | | | $ | (621,142 | ) | | |
| | | | | | | | | | | | | | | |
OTC Credit Default Swaptions Purchased
| | | | | | | | | | | | | | | | | | | | | | | | | | | | | | | | |
| Description | | Counterparty | | Put/
Call | | | Strike
Price | | | Pay/
Receive
Floating Rate
Index | | Floating Rate Index | | | Expiration
Date | | | Notional
Amount
(000) | | | Value | |
Bought Protection on 5 Year Credit Default Swap | | CitiBank N.A. | | | Put | | | | USD 95.00 | | | Receive | |
| CDX North America, Investment
Grade, Series 26, Version 1 |
| | | 7/20/16 | | | | USD | | | | 552,000 | | | $ | 1,081,169 | |
OTC Credit Default Swaptions Written
| | | | | | | | | | | | | | | | | | | | | | | | | | | | | | |
| Description | | Counterparty | | Put/
Call | | Strike
Price | | Pay/
Receive
Floating Rate
Index | | Floating Rate Index | | Credit Rating2 | | | Expiration
Date | | | Notional
Amount
(000)1 | | | Value | |
Sold Protection on 5 Year Credit Default Swap | | CitiBank N.A. | | Put | | USD 115.00 | | Pay | | CDX North America, Investment
Grade, Series 26, Version 1 | | | A | | | | 7/20/16 | | | | USD | | | | 552,000 | | | $ | (478,176 | ) |
1 The maximum potential amount the Trust may pay should a negative credit event take place as defined under the terms of the agreement. | |
2 Using Standard & Poor’s (“S&P’s”) rating of the issuer or the underlying securities of the index, as applicable. | |
See Notes to Financial Statements.
| | | | | | |
| | | | | | | |
| 22 | | SEMI-ANNUAL REPORT | | APRIL 30, 2016 | | |
| | |
Schedule of Investments (continued) | | BlackRock Credit Allocation Income Trust (BTZ) |
OTC Interest Rate Swaptions Purchased
| | | | | | | | | | | | | | | | | | | | | | | | | | |
| Description | | Counterparty | | Put/
Call | | Exercise
Rate | | Pay/
Receive
Exercise Rate | | Floating Rate
Index | | Expiration
Date | | | Notional
Amount
(000) | | | Value | |
30-Year Interest Swap | | Deutsche Bank AG | | Put | | 3.05% | | Pay | | 3-month LIBOR | | | 6/09/16 | | | | USD | | | | 63,150 | | | $ | 266 | |
OTC Interest Rate Swaptions Written
| | | | | | | | | | | | | | | | | | | | | | | | | | |
| Description | | Counterparty | | Put/
Call | | Exercise
Rate | | Pay/
Receive
Exercise Rate | | Floating Rate
Index | | Expiration
Date | | | Notional
Amount
(000) | | | Value | |
2-Year Interest Rate Swap | | Bank of America N.A. | | Call | | 1.55% | | Pay | | 6-month LIBOR | | | 3/15/18 | | | | USD | | | | 77,900 | | | $ | (807,890 | ) |
2-Year Interest Rate Swap | | Bank of America N.A. | | Call | | 1.47% | | Pay | | 6-month LIBOR | | | 3/19/18 | | | | USD | | | | 77,900 | | | | (743,112 | ) |
2-Year Interest Rate Swap | | Bank of America N.A. | | Put | | 1.55% | | Receive | | 6-month LIBOR | | | 3/15/18 | | | | USD | | | | 77,900 | | | | (502,063 | ) |
2-Year Interest Rate Swap | | Bank of America N.A. | | Put | | 1.47% | | Receive | | 6-month LIBOR | | | 3/19/18 | | | | USD | | | | 77,900 | | | | (561,091 | ) |
Total | | | | | | | | | | | | | | | | | | | | | | | | $ | (2,614,156 | ) |
| | | | | | | | | | | | | | | | | | | | | | | | | | |
OTC Credit Default Swaps — Buy Protection
| | | | | | | | | | | | | | | | | | | | | | | | | | | | |
| Issuer/Index | | Pay
Fixed Rate | | Counterparty | | Expiration
Date | | | Notional
Amount
(000) | | | Value | | | Premiums
Paid
(Received) | | | Unrealized
Appreciation | |
Anadarko Petroleum Corp. | | 1.00% | | Morgan Stanley Capital Services LLC | | | 6/20/17 | | | | USD | | | | 10 | | | $ | 37 | | | $ | (142 | ) | | $ | 179 | |
Anadarko Petroleum Corp. | | 1.00% | | UBS AG | | | 6/20/17 | | | | USD | | | | 994 | | | | 3,701 | | | | (13,869 | ) | | | 17,570 | |
Anadarko Petroleum Corp. | | 1.00% | | Credit Suisse International | | | 6/20/17 | | | | USD | | | | 2,425 | | | | 9,030 | | | | (29,188 | ) | | | 38,218 | |
Athem, Inc. (FKA WellPoint, Inc.) | | 1.00% | | Goldman Sachs Bank USA | | | 9/20/17 | | | | USD | | | | 4,500 | | | | 57,278 | | | | (12,065 | ) | | | 69,343 | |
Athem, Inc. (FKA WellPoint, Inc.) | | 1.00% | | Goldman Sachs International | | | 9/20/17 | | | | USD | | | | 2,800 | | | | 35,639 | | | | (8,074 | ) | | | 43,713 | |
United Health Group, Inc. | | 1.00% | | Goldman Sachs Bank USA | | | 9/20/17 | | | | USD | | | | 4,500 | | | | 62,658 | | | | (3,035 | ) | | | 65,693 | |
United Health Group, Inc. | | 1.00% | | Goldman Sachs International | | | 9/20/17 | | | | USD | | | | 2,800 | | | | 38,987 | | | | (2,031 | ) | | | 41,018 | |
Comcast Corp. | | 1.00% | | Credit Suisse International | | | 9/20/17 | | | | USD | | | | 12,200 | | | | 165,460 | | | | 15,482 | | | | 149,978 | |
MetLife, Inc. | | 1.00% | | Deutsche Bank AG | | | 3/20/18 | | | | USD | | | | 3,025 | | | | 34,215 | | | | (49,259 | ) | | | 83,474 | |
Bank of America Corp. | | 1.00% | | Deutsche Bank AG | | | 3/20/19 | | | | USD | | | | 16,700 | | | | 212,668 | | | | 75,001 | | | | 137,667 | |
Total | | | | | | | | | | | | | | | | | | $ | 619,673 | | | $ | (27,180 | ) | | $ | 646,853 | |
| | | | | | | | | | | | | | | | | | | | | | | | | | | | |
OTC Credit Default Swaps — Sell Protection
| | | | | | | | | | | | | | | | | | | | | | | | | | | | | | | | |
| Issuer/Index | | Receive
Fixed Rate | | | Counterparty | | Expiration
Date | | | Credit
Rating1 | | Notional
Amount
(000)2 | | | Value | | | Premiums
Paid
(Received) | | | Unrealized
Depreciation | |
Southwest Airlines Co. | | | 1.00 | % | | Goldman Sachs Bank USA | | | 12/20/16 | | | BBB- | | | USD | | | | 2,535 | | | $ | (18,065 | ) | | $ | 17,045 | | | $ | (35,110 | ) |
Southwest Airlines Co. | | | 1.00 | % | | Goldman Sachs International | | | 12/20/16 | | | BBB- | | | USD | | | | 1,465 | | | | (10,440 | ) | | | 9,287 | | | | (19,727 | ) |
Southwest Airlines Co. | | | 1.00 | % | | Royal Bank of Scotland PLC | | | 12/20/16 | | | BBB- | | | USD | | | | 4,000 | | | | (28,600 | ) | | | 27,560 | | | | (56,160 | ) |
STMicro Electronics | | | 1.00 | % | | Barclays Bank PLC | | | 6/20/17 | | | BBB | | | EUR | | | | 1,500 | | | | (12,168 | ) | | | 16,775 | | | | (28,943 | ) |
Cigna Corp. | | | 1.00 | % | | Goldman Sachs Bank USA | | | 9/20/17 | | | A | | | USD | | | | 4,500 | | | | (64,793 | ) | | | (3,048 | ) | | | (61,745 | ) |
Cigna Corp. | | | 1.00 | % | | Goldman Sachs International | | | 9/20/17 | | | A | | | USD | | | | 2,800 | | | | (40,316 | ) | | | (2,040 | ) | | | (38,276 | ) |
General Dynamics Corp. | | | 1.00 | % | | Credit Suisse International | | | 9/20/17 | | | A+ | | | USD | | | | 5,585 | | | | (79,291 | ) | | | (40,941 | ) | | | (38,350 | ) |
Humana, Inc. | | | 1.00 | % | | Goldman Sachs Bank USA | | | 9/20/17 | | | BBB+ | | | USD | | | | 4,500 | | | | (62,251 | ) | | | 20,980 | | | | (83,231 | ) |
Humana, Inc. | | | 1.00 | % | | Goldman Sachs International | | | 9/20/17 | | | BBB+ | | | USD | | | | 2,800 | | | | (38,734 | ) | | | 14,038 | | | | (52,772 | ) |
Lockheed Martin Corp. | | | 1.00 | % | | Credit Suisse International | | | 9/20/17 | | | BBB+ | | | USD | | | | 5,585 | | | | (80,100 | ) | | | (14,082 | ) | | | (66,018 | ) |
Northrop Grumman Corp. | | | 1.00 | % | | Credit Suisse International | | | 9/20/17 | | | BBB+ | | | USD | | | | 4,715 | | | | (68,055 | ) | | | (31,813 | ) | | | (36,242 | ) |
Raytheon Co. | | | 1.00 | % | | Credit Suisse International | | | 9/20/17 | | | A | | | USD | | | | 4,715 | | | | (68,296 | ) | | | (32,669 | ) | | | (35,627 | ) |
Citigroup, Inc. | | | 1.00 | % | | Deutsche Bank AG | | | 3/20/19 | | | BBB+ | | | USD | | | | 16,700 | | | | (205,865 | ) | | | (42,120 | ) | | | (163,745 | ) |
MetLife, Inc. | | | 1.00 | % | | Citibank N.A. | | | 6/20/21 | | | A- | | | USD | | | | 1,375 | | | | 14,068 | | | | 22,304 | | | | (8,236 | ) |
Newmont Mining Corp. | | | 1.00 | % | | Barclays Capital Inc. | | | 6/20/21 | | | BBB | | | USD | | | | 2,000 | | | | 13,334 | | | | 24,050 | | | | (10,716 | ) |
Newmont Mining Corp. | | | 1.00 | % | | Goldman Sachs International | | | 6/20/21 | | | BBB | | | USD | | | | 8,000 | | | | 53,337 | | | | 126,465 | | | | (73,128 | ) |
Prudential Financial, Inc. | | | 1.00 | % | | Citibank N.A. | | | 6/20/21 | | | A | | | USD | | | | 1,920 | | | | 15,879 | | | | 28,449 | | | | (12,570 | ) |
Prudential Financial, Inc. | | | 1.00 | % | | Goldman Sachs International | | | 6/20/21 | | | A | | | USD | | | | 1,155 | | | | 9,552 | | | | 18,202 | | | | (8,650 | ) |
Prudential Financial, Inc. | | | 1.00 | % | | JPMorgan Chase Bank N.A. | | | 6/20/21 | | | A | | | USD | | | | 9,500 | | | | 78,565 | | | | 123,212 | | | | (44,647 | ) |
Total | | | | | | | | | | | | | | | | | | | | | | $ | (592,239 | ) | | $ | 281,654 | | | $ | (873,893 | ) |
| | | | | | | | | | | | | | | | | | | | | | | | | | | | | | | | |
1 Using S&P’s rating of the issuer or the underlying securities of the index, as applicable. | |
2 The maximum potential amount the Trust may pay should a negative credit event take place as defined under the terms of the agreement. | |
See Notes to Financial Statements.
| | | | | | |
| | | | | | | |
| | SEMI-ANNUAL REPORT | | APRIL 30, 2016 | | 23 |
| | |
Schedule of Investments (continued) | | BlackRock Credit Allocation Income Trust (BTZ) |
|
| Transactions in Options Written for the Six Months Ended April 30, 2016 |
| | | | | | | | | | | | | | |
| | | | | Calls | |
| | | | | | | | Notional (000) | | | | |
| | | | | Contracts | | | USD | | | Premiums
Received | |
Outstanding options, beginning of period | | | | | — | | | | — | | | | — | |
Options written | | | | | — | | | $ | 155,800 | | | $ | 1,397,331 | |
Options exercised | | | | | — | | | | — | | | | — | |
Options expired | | | | | — | | | | — | | | | — | |
Options closed | | | | | — | | | | — | | | | — | |
| | | | | | |
Outstanding options, end of period | | | | | — | | | $ | 155,800 | | | $ | 1,397,331 | |
| | | | | | |
| | | | | | | | | | | | | | |
| | | | | Puts | |
| | | | | | | | Notional (000) | | | | |
| | | | | Contracts | | | USD | | | Premiums
Received | |
Outstanding options, beginning of period | | | | | 3,396 | | | | — | | | $ | 1,061,185 | |
Options written | | | | | — | | | $ | 707,800 | | | | 2,225,332 | |
Options exercised | | | | | — | | | | — | | | | — | |
Options expired | | | | | (3,396 | ) | | | — | | | | (1,061,185 | ) |
Options closed | | | | | — | | | | — | | | | — | |
| | | | | | |
Outstanding options, end of period | | | | | — | | | $ | 707,800 | | | $ | 2,225,332 | |
| | | | | | |
| | |
| Derivative Financial Instruments Categorized by Risk Exposure | | |
As of period end, the fair values of derivative financial instruments located in the Statements of Assets and Liabilities were as follows:
| | | | | | | | | | | | | | | | | | | | | | | | | | | | | | |
| | | | | Commodity
Contracts | | | Credit
Contracts | | | Equity
Contracts | | | Foreign
Currency
Exchange
Contracts | | | Interest
Rate
Contracts | | | Other
Contracts | | | Total | |
| Assets — Derivative Financial Instruments | | | | | | | | | | | | | | | | | | | |
Futures contracts | | Net unrealized appreciation1 | | | — | | | | — | | | | — | | | | — | | | $ | 391,449 | | | | — | | | $ | 391,449 | |
Options purchased | | Investments at value —unaffiliated2 | | | — | | | $ | 1,081,169 | | | | — | | | | — | | | | 266 | | | �� | — | | | | 1,081,435 | |
Swaps — OTC | | Unrealized appreciation on OTC swaps; Swap premiums paid | | | — | | | | 1,185,703 | | | | — | | | | — | | | | — | | | | — | | | | 1,185,703 | |
| | | | | | |
Total | | | | | — | | | $ | 2,266,872 | | | | — | | | | — | | | $ | 391,715 | | | | — | | | $ | 2,658,587 | |
| | | | | | |
| | | | | | | | | | | | | | | | | | | | | | | | | | | | | | |
| Liabilities — Derivative Financial Instruments | | | | | | | | | | | | | | | | | | | |
Futures contracts | | Net unrealized depreciation1 | | | — | | | | — | | | | — | | | | — | | | $ | 1,012,591 | | | | — | | | $ | 1,012,591 | |
Options written | | Options written at value | | | — | | | $ | 478,176 | | | | — | | | | — | | | | 2,614,156 | | | | — | | | | 3,092,332 | |
Swaps — OTC | | Unrealized depreciation on OTC swaps; Swap premiums received | | | — | | | $ | 1,158,269 | | | | — | | | | — | | | | — | | | | — | | | | 1,158,269 | |
| | | | | | |
Total | | | | | — | | | $ | 1,636,445 | | | | — | | | | — | | | $ | 3,626,747 | | | | — | | | $ | 5,263,192 | |
| | | | | | |
1 Includes cumulative appreciation (depreciation) on futures contracts and centrally cleared swaps, if any, as reported in the Schedules of Investments. Only current day’s variation margin is reported within the Statements of Assets and Liabilities. | |
2 Includes options purchased at value as reported in the Schedule of Investments. | |
See Notes to Financial Statements.
| | | | | | |
| | | | | | | |
| 24 | | SEMI-ANNUAL REPORT | | APRIL 30, 2016 | | |
| | |
Schedule of Investments (continued) | | BlackRock Credit Allocation Income Trust (BTZ) |
For the six months ended April 30, 2016, the effect of derivative financial instruments in the Statements of Operation was as follows:
| | | | | | | | | | | | | | | | | | | | | | | | | | | | |
| Net Realized Gain (Loss) from: | | Commodity
Contracts | | | Credit
Contracts | | | Equity
Contracts | | | Foreign
Currency
Exchange
Contracts | | | Interest
Rate
Contracts | | | Other
Contracts | | | Total | |
Futures contracts | | | — | | | | — | | | | — | | | | — | | | $ | 156,886 | | | | — | | | $ | 156,886 | |
Options purchased1 | | | — | | | | — | | | $ | 868,677 | | | | — | | | | (3,960,358 | ) | | | — | | | | (3,091,681 | ) |
Options written | | | — | | | | — | | | | — | | | | — | | | | 1,061,185 | | | | — | | | | 1,061,185 | |
Swaps | | | — | | | $ | 538,196 | | | | — | | | | — | | | | (16,734,108 | ) | | | — | | | | (16,195,912 | ) |
| | | | |
Total | | | — | | | $ | 538,196 | | | $ | 868,677 | | | | — | | | $ | (19,476,395 | ) | | | — | | | $ | (18,069,522 | ) |
| | | | |
1 Options purchased are included in net realized gain (loss) from investments. | |
| Net Change in Unrealized Appreciation (Depreciation) on: | |
Futures contracts | | | — | | | | — | | | | — | | | | — | | | $ | 2,195,718 | | | | — | | | $ | 2,195,718 | |
Options purchased1 | | | — | | | $ | (547,231 | ) | | $ | 85,760 | | | | — | | | | 2,693,886 | | | | — | | | | 2,232,415 | |
Options written | | | — | | | | 349,825 | | | | — | | | | — | | | | (859,454 | ) | | | — | | | | (509,629 | ) |
Swaps | | | — | | | | (633,987 | ) | | | — | | | | — | | | | 12,111,749 | | | | — | | | | 11,477,762 | |
| | | | |
Total | | | — | | | $ | (831,393 | ) | | $ | 85,760 | | | | — | | | $ | 16,141,899 | | | | — | | | $ | 15,396,266 | |
| | | | |
1 Options purchased are included in net change in unrealized appreciation (depreciation) on investments. | |
|
| Average Quarterly Balances of Outstanding Derivative Financial Instruments |
| | | | |
Futures contracts: | | | | |
Average notional value of contracts — long | | $ | 277,938,656 | |
Average notional value of contracts — short | | $ | 392,358,118 | |
| Options: | | | | |
Average value of option contracts purchased | | $ | 319,125 | |
Average value of option contracts written | | $ | 1,037,850 | 1 |
Average notional value of swaption contracts purchased | | $ | 339,150,000 | |
Average notional value of swaption contracts written | | $ | 431,800,000 | |
| Credit default swaps: | | | | |
Average notional value — buy protection | | $ | 113,256,263 | |
Average notional value — sell protection | | $ | 49,954,000 | |
| Interest rate swaps: | | | | |
Average notional value — pays fixed rate | | $ | 119,150,000 | |
Average notional value — receives fixed rate | | $ | 10,900,000 | 1 |
1 Actual amounts for the period are shown due to limited outstanding derivative financial instruments as of each quarter end. | |
For more information about the Trust’s investment risks regarding derivative financial instruments, refer to the Notes to Financial Statements.
|
| Derivative Financial Instruments — Offsetting as of Period End |
The Trust’s derivative assets and liabilities (by type) were as follows:
| | | | | | | | |
| | | Assets | | | Liabilities | |
| Derivative Financial Instruments: | | | | | | | | |
Futures contracts | | $ | 260,453 | | | $ | 219,414 | |
Swaps — OTC1 | | | 1,185,703 | | | | 1,158,269 | |
Options | | | 1,081,435 | 2 | | | 3,092,332 | |
| | | | |
Total derivative assets and liabilities in the Statements of Assets and Liabilities | | | 2,527,591 | | | | 4,470,015 | |
Derivatives not subject to a Master Netting Agreement or similar agreement (“MNA”) | | | (260,453 | ) | | | (219,414 | ) |
| | | | |
Total derivative assets and liabilities subject to an MNA | | $ | 2,267,138 | | | $ | 4,250,601 | |
| | | | |
1 Includes unrealized appreciation (depreciation) on OTC swaps and swap premiums paid/received in the Statements of Assets and Liabilities. | |
2 Includes options purchased at value which is included in Investments at value-unaffiliated in the Statements of Assets and Liabilities and reported in the Schedule of Investments. | |
See Notes to Financial Statements.
| | | | | | |
| | | | | | | |
| | SEMI-ANNUAL REPORT | | APRIL 30, 2016 | | 25 |
| | |
Schedule of Investments (continued) | | BlackRock Credit Allocation Income Trust (BTZ) |
The following tables present the Trust’s derivative assets and liabilities by counterparty net of amounts available for offset under an MNA and net of the related collateral received and pledged by the Trust:
| | | | | | | | | | | | | | | | | | | | |
| Counterparty | | Derivative Assets
Subject to an MNA
by Counterparty | | | Derivatives
Available for
Offset1 | | | Non-cash Collateral
Received | | | Cash Collateral
Received2 | | | Net
Amount of
Derivative
Assets3 | |
Barclays Bank PLC | | $ | 40,825 | | | $ | (39,659 | ) | | | — | | | | — | | | $ | 1,166 | |
Citibank N.A. | | | 1,131,922 | | | | (498,982 | ) | | | — | | | $ | (632,940 | ) | | | — | |
Credit Suisse International | | | 203,678 | | | | (203,678 | ) | | | — | | | | — | | | | — | |
Deutsche Bank AG | | | 296,408 | | | | (255,124 | ) | | | — | | | | (41,284 | ) | | | — | |
Goldman Sachs Bank USA | | | 173,061 | | | | (173,061 | ) | | | — | | | | — | | | | — | |
Goldman Sachs International | | | 252,723 | | | | (204,698 | ) | | | — | | | | — | | | | 48,025 | |
JPMorgan Chase Bank N.A. | | | 123,212 | | | | (44,647 | ) | | | — | | | | — | | | | 78,565 | |
Morgan Stanley Capital Services LLC | | | 179 | | | | (142 | ) | | | — | | | | — | | | | 37 | |
Royal Bank of Scotland PLC | | | 27,560 | | | | (27,560 | ) | | | — | | | | — | | | | — | |
UBS AG | | | 17,570 | | | | (13,869 | ) | | | — | | | | — | | | | 3,701 | |
| | | | |
Total | | $ | 2,267,138 | | | $ | (1,461,420 | ) | | | — | | | $ | (674,224 | ) | | $ | 131,494 | |
| | | | |
| | | | | | | | | | | | | | | | | | | | |
| Counterparty | | Derivative Liabilities
Subject to an MNA
by Counterparty | | | Derivatives
Available for
Offset1 | | | Non-cash Collateral
Pledged | | | Cash Collateral Pledged2 | | | Net
Amount of
Derivative
Liabilities4 | |
Bank of America N.A. | | $ | 2,614,156 | | | | — | | | | — | | | $ | (2,614,156 | ) | | | — | |
Barclays Bank PLC | | | 39,659 | | | $ | (39,659 | ) | | | — | | | | — | | | | — | |
Citibank N.A. | | | 498,982 | | | | (498,982 | ) | | | — | | | | — | | | | — | |
Credit Suisse International | | | 324,930 | | | | (203,678 | ) | | | — | | | | — | | | $ | 121,252 | |
Deutsche Bank AG | | | 255,124 | | | | (255,124 | ) | | | — | | | | — | | | | — | |
Goldman Sachs Bank USA | | | 198,234 | | | | (173,061 | ) | | | — | | | | — | | | | 25,173 | |
Goldman Sachs International | | | 204,698 | | | | (204,698 | ) | | | — | | | | — | | | | — | |
JPMorgan Chase Bank N.A. | | | 44,647 | | | | (44,647 | ) | | | — | | | | — | | | | — | |
Morgan Stanley Capital Services LLC | | | 142 | | | | (142 | ) | | | — | | | | — | | | | — | |
Royal Bank of Scotland PLC | | | 56,160 | | | | (27,560 | ) | | | — | | | | — | | | | 28,600 | |
UBS AG | | | 13,869 | | | | (13,869 | ) | | | — | | | | — | | | | — | |
| | | | |
Total | | $ | 4,250,601 | | | $ | (1,461,420 | ) | | | — | | | $ | (2,614,156 | ) | | $ | 175,025 | |
| | | | |
1 The amount of derivatives available for offset is limited to the amount of derivative assets and/or liabilities that are subject to an MNA. | |
2 Excess of collateral received from the individual counterparty is not shown for financial reporting purposes. | |
3 Net amount represents the net amount receivable from the counterparty in the event of default. | |
4 Net amount represents the net amount payable due to the counterparty in the event of default. | |
See Notes to Financial Statements.
| | | | | | |
| | | | | | | |
| 26 | | SEMI-ANNUAL REPORT | | APRIL 30, 2016 | | |
| | |
Schedule of Investments (continued) | | BlackRock Credit Allocation Income Trust (BTZ) |
| | |
| Fair Value Hierarchy as of Period End | | |
Various inputs are used in determining the fair value of investments and derivative financial instruments. For information about the Trust’s policy regarding valuation of investments and derivative financial instruments, refer to the Notes to Financial Statements.
The following tables summarize the Trust’s investments and derivative financial instruments categorized in the disclosure hierarchy:
| | | | | | | | | | | | | | | | |
| | | Level 1 | | | Level 2 | | | Level 3 | | | Total | |
Assets: | | | | | | | | | | | | | | | | |
| Investments: | | | | | | | | | | | | | | | | |
| Long-Term Investments: | | | | | | | | | | | | | | | | |
Asset-Backed Securities | | | — | | | $ | 79,371,500 | | | $ | 15,315,045 | | | $ | 94,686,545 | |
Common Stocks | | | — | | | | — | | | | 2,951 | | | | 2,951 | |
Corporate Bonds | | | — | | | | 1,558,020,037 | | | | 5,112,500 | | | | 1,563,132,537 | |
Foreign Agency Obligations | | | — | | | | 10,983,984 | | | | — | | | | 10,983,984 | |
Municipal Bonds | | | — | | | | 18,941,250 | | | | — | | | | 18,941,250 | |
Preferred Securities | | $ | 53,344,992 | | | | 301,363,067 | | | | — | | | | 354,708,059 | |
U.S. Government Sponsored Agency Securities | | | — | | | | 3,749,150 | | | | — | | | | 3,749,150 | |
U.S. Treasury Obligations | | | — | | | | 61,957,395 | | | | — | | | | 61,957,395 | |
| Short-Term Securities: | | | | | | | | | | | | | | | | |
Money Market Funds | | | 5,871,985 | | | | — | | | | — | | | | 5,871,985 | |
| Options Purchased | | | | | | | | | | | | | | | | |
Credit Contracts | | | — | | | | 1,081,169 | | | | — | | | | 1,081,169 | |
Interest Rate Contracts | | | — | | | | 266 | | | | — | | | | 266 | |
| | | | |
Total | | $ | 59,216,977 | | | $ | 2,035,467,818 | | | $ | 20,430,496 | | | $ | 2,115,115,291 | |
| | | | |
| | | | |
| Derivative Financial Instruments1 | | | | | | | | | | | | | | | | |
Assets: | | | | | | | | | | | | | | | | |
Credit contracts | | | — | | | $ | 646,853 | | | | — | | | $ | 646,853 | |
Interest rate contracts | | $ | 391,449 | | | | — | | | | — | | | | 391,449 | |
Liabilities: | | | | | | | | | | | | | | | | |
Credit contracts | | | — | | | | (1,352,069 | ) | | | — | | | | (1,352,069 | ) |
Interest rate contracts | | | (1,012,591 | ) | | | (2,614,156 | ) | | | — | | | | (3,626,747 | ) |
| | | | |
Total | | $ | (621,142 | ) | | $ | (3,319,372 | ) | | | — | | �� | $ | (3,940,514 | ) |
| | | | |
1 Derivative financial instruments are swaps, futures contracts and options written. Swaps and futures contracts are valued at the unrealized appreciation (depreciation) on the instrument and options written are shown at value. | |
The Trust may hold assets and/or liabilities in which the fair value approximates the carrying amount, or face value, including accrued interest, for financial statement purposes. As of period end, such assets and/or liabilities are categorized within the disclosure hierarchy as follows:
| | | | | | | | | | | | | | | | |
| | | Level 1 | | | Level 2 | | | Level 3 | | | Total | |
Assets: | | | | | | | | | | | | | | | | |
Cash | | $ | 30,669 | | | | — | | | | — | | | $ | 30,669 | |
Cash pledged: | | | | | | | | | | | | | | | | |
Collateral — OTC swaps | | | 2,670,000 | | | | — | | | | — | | | | 2,670,000 | |
Futures contracts | | | 2,028,000 | | | | — | | | | — | | | | 2,028,000 | |
Foreign currency at value | | | 13,541 | | | | — | | | | — | | | | 13,541 | |
Liabilities: | | | | | | | | | | | | | | | | |
Cash received: | | | | | | | | | | | | | | | | |
Collateral — reverse repurchase agreements | | | — | | | $ | (10,408,000 | ) | | | — | | | | (10,408,000 | ) |
Collateral — OTC swaps | | | — | | | | (1,230,000 | ) | | | — | | | | (1,230,000 | ) |
Reverse repurchase agreements | | | — | | | | (593,716,727 | ) | | | — | | | | (593,716,727 | ) |
| | | | |
Total | | $ | 4,742,210 | | | $ | (605,354,727 | ) | | | — | | | $ | (600,612,517 | ) |
| | | | |
| | During | | the six months ended April 30, 2016, there were no transfers between Level 1 and Level 2. |
See Notes to Financial Statements.
| | | | | | |
| | | | | | | |
| | SEMI-ANNUAL REPORT | | APRIL 30, 2016 | | 27 |
| | |
Schedule of Investments (concluded) | | BlackRock Credit Allocation Income Trust (BTZ) |
A reconciliation of Level 3 investments is presented when the Trust had a significant amount of Level 3 investments at the beginning and/or end of the period in relation to net assets. The following table is a reconciliation of Level 3 investments for which significant unobservable inputs were used in determining fair value:
| | | | | | | | | | | | | | | | |
| | | Asset-Backed Securities | | | Corporate
Bonds | | | Common
Stocks | | | Total | |
| Assets: | | | | | | | | | | | | | | | | |
Opening Balance, as of October 31, 2015 | | $ | 11,525,615 | | | $ | 5,079,000 | | | | — | | | $ | 16,604,615 | |
Transfers into Level 3 | | | — | | | | — | | | | — | | | | — | |
Transfers out of Level 31 | | | (1,990,590 | ) | | | — | | | | — | | | | (1,990,590 | ) |
Accrued discounts/premiums | | | 6,720 | | | | — | | | | — | | | | 6,720 | |
Net realized gain (loss) | | | (154,322 | ) | | | — | | | | — | | | | (154,322 | ) |
Net change in unrealized appreciation (depreciation)2,3 | | | (201,378 | ) | | | 33,500 | | | $ | (42,494 | ) | | | (210,372 | ) |
Purchases | | | 9,379,500 | | | | — | | | | 45,445 | | | | 9,424,945 | |
Sales | | | (3,250,500 | ) | | | — | | | | — | | | | (3,250,500 | ) |
| | | | | | | | | | | | | | | | |
Closing Balance, as of April 30, 2016 | | $ | 15,315,045 | | | $ | 5,112,500 | | | $ | 2,951 | | | $ | 20,430,496 | |
| | | | | | | | | | | | | | | | |
Net change in unrealized appreciation (depreciation) on investments still held at April 30, 20162 | | $ | (190,160 | ) | | $ | 33,500 | | | $ | (42,494 | ) | | $ | 199,154 | |
| | | | | | | | | | | | | | | | |
1 As of October 31, 2015, the Trust used significant unobservable inputs in determining the value of certain investments. As of April 30, 2016, the Trust used observable inputs in determining the value of the same investments. As a result, investments at beginning of period value were transferred from Level 3 to Level 2 in the disclosure hierarchy. | |
2 Included in the related net change in unrealized appreciation (depreciation) in the Statements of Operations. | |
3 Any difference between net change in unrealized appreciation (depreciation) and net change in unrealized appreciation (depreciation) on derivative financial instruments still held at April 30, 2016 is generally due to derivative financial instruments s no longer held or categorized as Level 3 at period end. | |
The Trust’s investments that are categorized as Level 3 were valued utilizing third party pricing information without adjustment. Such valuations are based on unobservable inputs. A significant change in third party information could result in a significantly lower or higher value of such Level 3 investments.
See Notes to Financial Statements.
| | | | | | |
| | | | | | | |
| 28 | | SEMI-ANNUAL REPORT | | APRIL 30, 2016 | | |
| | |
Schedule of Investments April 30, 2016 (Unaudited) | | BlackRock Floating Rate Income Trust (BGT) (Percentages shown are based on Net Assets) |
| | | | | | | | | | | | |
| | |
| Common Stocks | | Shares | | | Value | |
Construction & Engineering — 0.1% | |
USI United Subcontractors | | | | | | | 8,067 | | | $ | 242,024 | |
Health Care Management Services — 0.0% | | | | | | | | | | | | |
New Millennium HoldCo, Inc. (a) | | | | | | | 9,191 | | | | 55,146 | |
Household Durables — 0.0% | | | | | | | | | | | | |
Berkline Benchcraft Equity LLC (a) | | | | | | | 6,155 | | | | — | |
Oil, Gas & Consumable Fuels — 0.0% | | | | | | | | | | | | |
Southcross Holdings LP | | | | | | | 63 | | | | 15,750 | |
| Total Common Stocks — 0.1% | | | | | | | | | | | 312,920 | |
| | | | | | | | | | | | |
| | | | | | | | | | | | | |
| | |
| Asset-Backed Securities (c) | | Par (000) | | | | |
ALM Loan Funding (a): | | | | | | | | | | | | |
Series 2012-5A, Class BR, 3.63%, 10/18/27 | | | USD | | | | 310 | | | | 300,886 | |
Series 2013-7RA, Class C, 4.09%, 4/24/24 | | | | | | | 630 | | | | 602,781 | |
Series 2013-7RA, Class D, 5.64%, 4/24/24 | | | | | | | 550 | | | | 516,133 | |
ALM XIV Ltd., Series 2014-14A, Class C, 4.08%, 7/28/26 (a) | | | | | | | 463 | | | | 423,137 | |
ALM XVI Ltd./ALM XVI LLC, Series 2015-16A, Class B, 3.53%, 7/15/27 (a) | | | | | | | 630 | | | | 615,951 | |
ALM XVII Ltd., Series 2015-17A, Class C1, 4.75%, 1/15/28 (a) | | | | | | | 250 | | | | 238,368 | |
AMMC CLO 15 Ltd., Series 2014-15A, Class D, 4.84%, 12/09/26 (a) | | | | | | | 250 | | | | 221,875 | |
Apidos CDO XI, Series 2012-11A, Class D, 4.88%, 1/17/23 (a) | | | | | | | 500 | | | | 466,934 | |
Atlas Senior Loan Fund VI Ltd., Series 2014-6A, Class D, 4.33%, 10/15/26 (a) | | | | | | | 525 | | | | 465,021 | |
Atrium CDO Corp., Series 9A, Class D, 4.14%, 2/28/24 (a) | | | | | | | 500 | | | | 465,318 | |
Carlyle Global Market Strategies CLO Ltd. (a): | | | | | | | | | | | | |
Series 2012-4A, Class D, 5.13%, 1/20/25 | | | | | | | 450 | | | | 440,521 | |
Series 2013-1A, Class C, 4.62%, 2/14/25 | | | | | | | 250 | | | | 238,886 | |
Series 2014-5A, Class C, 4.78%, 10/16/25 | | | | | | | 1,250 | | | | 1,159,968 | |
CIFC Funding Ltd., Series 2014-2A, Class A3L, 3.47%, 5/24/26 (a) | | | | | | | 275 | | | | 264,644 | |
Highbridge Loan Management Ltd.,
Series 2015-7A, Class C, 4.00%, 11/15/26 (a) | | | | | | | 250 | | | | 249,653 | |
LCM XVIII LP, Series 18A, Class INC, 3.45%, 4/20/27 | | | | | | | 750 | | | | 454,986 | |
Madison Park Funding XI Ltd., Series 2013-11A, Class D, 4.14%, 10/23/25 (a) | | | | | | | 250 | | | | 221,596 | |
OZLM Funding Ltd., Series 2012-2A, Class C, 4.99%, 10/30/23 (a) | | | | | | | 500 | | | | 482,702 | |
Symphony CLO Ltd., Class D (a): | | | | | | | | | | | | |
Series 2012-9A, 4.88%, 4/16/22 | | | | | | | 775 | | | | 756,228 | |
Series 2016-17A, 5.52%, 4/15/28 | | | | | | | 250 | | | | 238,816 | |
Treman Park CLO LLC, Series 2015-1A, Class D, 4.49%, 4/20/27 (a) | | | | | | | 700 | | | | 656,250 | |
Webster Park CLO Ltd., Series 2015-1A (a): | | | | | | | | | | | | |
Class B1, 3.61%, 1/20/27 | | | | | | | 250 | | | | 245,635 | |
Class C, 4.56%, 1/20/27 | | | | | | | 250 | | | | 235,210 | |
| | | | | | | | | | | | |
| | | | | | | | | | | | 9,961,499 | |
| Total Asset-Backed Securities — 3.0% | | | | | | | | | | | 9,961,499 | |
| | | | | |
| | | | | | |
| | | |
| Corporate Bonds | | | | | | | | | |
Airlines — 0.7% | | | | | | | | | | | | |
American Airlines Pass-Through Trust, Series 2013-2, Class C, 6.00%, 1/15/17 (a) | | | | | | | 592 | | | | 602,504 | |
| | | | | | | | | | | | |
| Corporate Bonds | | Par (000) | | | Value | |
Airlines — (continued) | | | | | | | | | | | | |
US Airways Pass-Through Trust, Series 2012-2, Class C, 5.45%, 6/03/18 | | | USD | | | | 1,585 | | | $ | 1,600,850 | |
| | | | | | | | | | | | |
| | | | | | | | | | | | 2,203,354 | |
Capital Markets — 0.2% | | | | | | | | | | | | |
Blackstone CQP Holdco LP, 9.30%, 3/19/19 (a) | | | | | | | 606 | | | | 607,442 | |
Commercial Services & Supplies — 0.3% | | | | | | | | | | | | |
ADT Corp., 4.13%, 6/15/23 | | | | | | | 923 | | | | 858,390 | |
Avis Budget Car Rental LLC/Avis Budget Finance, Inc., 3.39%, 12/01/17 (c) | | | | | | | 179 | | | | 179,000 | |
| | | | | | | | | | | | |
| | | | | | | | | | | | 1,037,390 | |
Communications Equipment — 0.1% | | | | | | | | | | | | |
Avaya, Inc., 7.00%, 4/01/19 (a) | | | | | | | 450 | | | | 286,875 | |
Containers & Packaging — 0.5% | | | | | | | | | | | | |
Ardagh Packaging Finance PLC/Ardagh Holdings USA, Inc., 3.63%, 12/15/19 (a)(c) | | | | | | | 920 | | | | 929,085 | |
Ardagh Packaging Finance PLC/Ardagh MP Holdings USA, Inc., 1.00%, 5/15/21 (a)(c)(e) | | | | | | | 680 | | | | 676,600 | |
| | | | | | | | | | | | |
| | | | | | | | | | | | 1,605,685 | |
Diversified Telecommunication Services — 0.3% | |
Level 3 Financing, Inc.: | | | | | | | | | | | | |
4.41%, 1/15/18 (c) | | | | | | | 607 | | | | 612,002 | |
6.13%, 1/15/21 | | | | | | | 337 | | | | 353,007 | |
| | | | | | | | | | | | |
| | | | | | | | | | | | 965,009 | |
Health Care Equipment & Supplies — 0.0% | |
DJO Finance LLC/DJO Finance Corp., 8.13%, 6/15/21 (a) | | | | | | | 190 | | | | 166,250 | |
Health Care Providers & Services — 0.4% | | | | | | | | | | | | |
Care UK Health & Social Care PLC, 5.59%, 7/15/19 (c) | | | GBP | | | | 327 | | | | 406,127 | |
RegionalCare Hospital Partners Holdings, Inc., 8.25%, 5/01/23 (a) | | | USD | | | | 240 | | | | 249,600 | |
Tenet Healthcare Corp., 4.13%, 6/15/20 (a)(c) | | | | | | | 840 | | | | 841,050 | |
| | | | | | | | | | | | |
| | | | | | | | | | | | 1,496,777 | |
Household Durables — 0.0% | |
Berkline/Benchcraft LLC, 4.50%, 6/01/17 (a)(d) | | | | | | | 400 | | | | — | |
Media — 1.3% | | | | | | | | | | | | |
Altice Financing SA (a): | | | | | | | | | | | | |
6.63%, 2/15/23 | | | | | | | 335 | | | | 331,248 | |
7.50%, 5/15/26 (e) | | | | | | | 515 | | | | 515,644 | |
Altice US Finance I Corp., 5.38%, 7/15/23 (a) | | | | | | | 745 | | | | 760,682 | |
Clear Channel Worldwide Holdings, Inc., 6.50%, 11/15/22 | | | | | | | 989 | | | | 993,945 | |
Numericable Group SA, 6.00%, 5/15/22 (a) | | | | | | | 512 | | | | 512,666 | |
Numericable-SFR SA, 7.38%, 5/01/26 (a) | | | | | | | 1,230 | | | | 1,248,450 | |
| | | | | | | | | | | | |
| | | | | | | | | | | | 4,362,635 | |
Oil, Gas & Consumable Fuels — 0.4% | |
Carrizo Oil & Gas, Inc., 7.50%, 9/15/20 | | | | | | | 50 | | | | 50,250 | |
Concho Resources, Inc., 5.50%, 4/01/23 | | | | | | | 50 | | | | 50,375 | |
CONSOL Energy, Inc., 5.88%, 4/15/22 | | | | | | | 280 | | | | 233,100 | |
Continental Resources, Inc., 3.80%, 6/01/24 | | | | | | | 55 | | | | 46,888 | |
CrownRock LP/CrownRock Finance, Inc., 7.13%, 4/15/21 (a) | | | | | | | 50 | | | | 50,500 | |
MEG Energy Corp., 7.00%, 3/31/24 (a) | | | | | | | 325 | | | | 255,125 | |
Newfield Exploration Co., 5.63%, 7/01/24 | | | | | | | 50 | | | | 50,875 | |
QEP Resources, Inc., 6.88%, 3/01/21 | | | | | | | 55 | | | | 54,450 | |
RSP Permian, Inc., 6.63%, 10/01/22 | | | | | | | 50 | | | | 51,625 | |
Whiting Petroleum Corp., 5.75%, 3/15/21 | | | | | | | 210 | | | | 174,825 | |
WPX Energy, Inc., 6.00%, 1/15/22 | | | | | | | 190 | | | | 171,000 | |
| | | | | | | | | | | | |
| | | | | 1,189,013 | |
| Total Corporate Bonds — 4.2% | | | | 13,920,430 | |
See Notes to Financial Statements.
| | | | | | |
| | | | | | | |
| | SEMI-ANNUAL REPORT | | APRIL 30, 2016 | | 29 |
| | |
Schedule of Investments (continued) | | BlackRock Floating Rate Income Trust (BGT) |
| | | | | | | | | | | | |
| Floating Rate Loan Interests (c) | | Par (000) | | | Value | |
Aerospace & Defense — 1.4% | | | | | | | | | | | | |
BE Aerospace, Inc., 2014 Term Loan B, 4.00%, 12/16/21 | | | USD | | | | 1,355 | | | $ | 1,361,786 | |
Engility Corp., 2nd Lien Term Loan, 12.00%, 5/30/21 | | | | | | | 366 | | | | 346,544 | |
Transdigm, Inc.: | | | | | | | | | | | | |
2015 Term Loan E, 3.50%, 5/14/22 | | | | | | | 503 | | | | 497,707 | |
Term Loan C, 3.75%, 2/28/20 | | | | | | | 1,847 | | | | 1,844,153 | |
Term Loan D, 3.75%, 6/04/21 | | | | | | | 704 | | | | 699,771 | |
| | | | | | | | | | | | |
| | | | | | | | | | | | 4,749,961 | |
Air Freight & Logistics — 0.6% | | | | | | | | | | | | |
CEVA Group PLC, Synthetic LC, 6.50%, 3/19/21 | | | | | | | 423 | | | | 368,768 | |
CEVA Intercompany BV, Dutch Term Loan, 6.50%, 3/19/21 | | | | | | | 437 | | | | 381,105 | |
CEVA Logistics Canada ULC, Canadian Term Loan, 6.50%, 3/19/21 | | | | | | | 68 | | | | 59,693 | |
CEVA Logistics US Holdings, Inc., Term Loan, 6.50%, 3/19/21 | | | | | | | 602 | | | | 525,662 | |
XPO Logistics, Inc., Term Loan, 5.50%, 11/01/21 | | | | | | | 818 | | | | 821,017 | |
| | | | | | | | | | | | |
| | | | | | | | | | | | 2,156,245 | |
Airlines — 0.4% | |
Northwest Airlines, Inc.: | | | | | | | | | | | | |
2.75%, 3/10/17 | | | | | | | 158 | | | | 156,420 | |
2.13%, 9/10/18 | | | | | | | 362 | | | | 351,221 | |
US Airways Group, Inc., Term Loan B1, 3.50%, 5/23/19 | | | | | | | 686 | | | | 685,787 | |
| | | | | | | | | | | | |
| | | | | 1,193,428 | |
Auto Components — 2.0% | |
Autoparts Holdings Ltd.: | | | | | | | | | | | | |
1st Lien Term Loan, 7.00%, 7/29/17 | | | | | | | 1,446 | | | | 1,282,414 | |
2nd Lien Term Loan, 11.00%, 1/29/18 | | | | | | | 546 | | | | 357,859 | |
Dayco Products LLC, Term Loan B, 5.25%, 12/12/19 | | | | | | | 539 | | | | 527,150 | |
FPC Holdings, Inc., 1st Lien Term Loan, 5.25%, 11/19/19 | | | | | | | 884 | | | | 759,134 | |
Gates Global, Inc., Term Loan B, 4.25%, 7/06/21 | | | | | | | 3,006 | | | | 2,873,879 | |
Goodyear Tire & Rubber Co., 2nd Lien Term Loan, 3.75%, 4/30/19 | | | | | | | 562 | | | | 561,264 | |
GPX International Tire Corp., Term Loan: (a)(d) | | | | | | | | | | | | |
12.25%, 3/31/2012 | | | | | | | 274 | | | | — | |
PIK, 13.00%, 3/30/2012 (f) | | | | | | | 4 | | | | — | |
INA Beteiligungsgesellschaft mbH, Term Loan B, 4.25%, 5/15/20 | | | | | | | 416 | | | | 419,085 | |
| | | | | | | | | | | | |
| | | | | 6,780,785 | |
Automobiles — 0.4% | |
FCA US LLC, Term Loan B: | | | | | | | | | | | | |
2018, 3.25%, 12/31/18 | | | | | | | 291 | | | | 290,336 | |
3.50%, 5/24/17 | | | | | | | 992 | | | | 992,314 | |
| | | | | | | | | | | | |
| | | | | 1,282,650 | |
Banks — 0.3% | |
Redtop Acquisitions Ltd.: | | | | | | | | | | | | |
1st Lien Term Loan, 4.50%, 12/03/20 | | | | | | | 860 | | | | 856,441 | |
2nd Lien Term Loan, 8.25%, 6/03/21 | | | | | | | 181 | | | | 168,179 | |
| | | | | | | | | | | | |
| | | | | 1,024,620 | |
Biotechnology — 0.2% | |
AMAG Pharmaceuticals, Inc., 2015 1st Lien Term Loan, 4.75%, 8/13/21 | | | | | | | 507 | | | | 503,197 | |
Building Materials — 0.5% | |
USAGM HoldCo LLC: | | | | | | | | | | | | |
2015 2nd Lien Term Loan, 9.50%, 7/28/23 | | | | | | | 395 | | | | 356,160 | |
2015 Term Loan, 4.75%, 7/28/22 | | | | | | | 1,498 | | | | 1,461,159 | |
| | | | | | | | | | | | |
| | | | | 1,817,319 | |
| | | | | | | | | | | | |
| Floating Rate Loan Interests (c) | | Par (000) | | | Value | |
Building Products — 2.8% | |
Continental Building Products LLC,
1st Lien Term Loan, 4.00%, 8/28/20 | | | USD | | | | 727 | | | $ | 711,355 | |
CPG International, Inc., Term Loan, 4.75%, 9/30/20 | | | | | | | 3,221 | | | | 3,200,852 | |
GYP Holdings III Corp., 1st Lien Term Loan, 4.75%, 4/01/21 | | | | | | | 742 | | | | 707,554 | |
Jeld-Wen, Inc., Term Loan B, 5.25%, 10/15/21 | | | | | | | 1,148 | | | | 1,152,649 | |
Ply Gem Industries, Inc., Term Loan, 4.00%, 2/01/21 | | | | | | | 564 | | | | 560,349 | |
Quikrete Holdings, Inc., 1st Lien Term Loan, 4.00%, 9/28/20 | | | | | | | 1,366 | | | | 1,364,067 | |
Wilsonart LLC: | | | | | | | | | | | | |
Incremental Term Loan B2, 4.00%, 10/31/19 | | | | | | | 503 | | | | 501,942 | |
Term Loan B, 4.00%, 10/31/19 | | | | | | | 1,145 | | | | 1,142,048 | |
| | | | | | | | | | | | |
| | | | | 9,340,816 | |
Capital Markets — 0.9% | |
Affinion Group, Inc., Term Loan B, 6.75%, 4/30/18 | | | | | | | 392 | | | | 345,065 | |
American Capital Holdings, Inc., 2017 Term Loan, 3.50%, 8/22/17 | | | | | | | 481 | | | | 479,234 | |
RPI Finance Trust, Term Loan B4, 3.50%, 11/09/20 | | | | | | | 2,017 | | | | 2,025,276 | |
| | | | | | | | | | | | |
| | | | | 2,849,575 | |
Chemicals — 4.0% | |
Allnex (Luxembourg) & Cy SCA, Term Loan B1, 4.50%, 10/03/19 | | | | | | | 582 | | | | 579,837 | |
Allnex USA, Inc., Term Loan B2, 4.50%, 10/03/19 | | | | | | | 302 | | | | 300,849 | |
Axalta Coating Systems US Holdings, Inc., Term Loan, 3.75%, 2/01/20 | | | | | | | 1,244 | | | | 1,242,520 | |
CeramTec Acquisition Corp., Term Loan B2, 4.25%, 8/30/20 | | | | | | | 70 | | | | 69,907 | |
Charter NEX US Holdings, Inc., Term Loan B, 5.25%, 2/07/22 | | | | | | | 688 | | | | 685,787 | |
Chemours Company, Term Loan B, 3.75%, 5/12/22 | | | | | | | 692 | | | | 672,707 | |
Chemtura Corp., Term Loan B, 3.50%, 8/27/16 | | | | | | | 69 | | | | 68,400 | |
Evergreen Acqco 1 LP, Term Loan, 5.00%, 7/09/19 | | | | | | | 183 | | | | 153,406 | |
Huntsman International LLC: | | | | | | | | | | | | |
2013 Incremental Term Loan, 3.75%, 10/01/21 | | | | | | | 861 | | | | 862,202 | |
2016 Term Loan B, 4.25%, 3/23/23 | | | | | | | 500 | | | | 502,815 | |
Klockner-Pentaplast of America, Inc., Term Loan, 5.00%, 4/28/20 | | | | | | | 442 | | | | 441,544 | |
MacDermid, Inc.: | | | | | | | | | | | | |
1st Lien Term Loan, 5.50%, 6/07/20 | | | | | | | 1,025 | | | | 1,003,812 | |
Term Loan B2, 5.50%, 6/07/20 | | | | | | | 88 | | | | 86,595 | |
Term Loan B3, 5.50%, 6/07/20 | | | | | | | 1,647 | | | | 1,616,763 | |
OXEA Finance LLC, Term Loan B2, 4.25%, 1/15/20 | | | | | | | 1,394 | | | | 1,380,307 | |
PQ Corp., Term Loan, 5.75%, 10/14/22 | | | | | | | 630 | | | | 633,037 | |
Royal Holdings, Inc.: | | | | | | | | | | | | |
2015 1st Lien Term Loan, 4.50%, 6/19/22 | | | | | | | 690 | | | | 683,103 | |
2015 2nd Lien Term Loan, 8.50%, 6/19/23 | | | | | | | 285 | | | | 269,088 | |
Solenis International LP: | | | | | | | | | | | | |
1st Lien Term Loan, 4.25%, 7/31/21 | | | | | | | 931 | | | | 919,655 | |
2nd Lien Term Loan, 7.75%, 7/31/22 | | | | | | | 1,055 | | | | 952,138 | |
Tata Chemicals North America, Inc., Term Loan B, 3.75%, 8/07/20 | | | | | | | 315 | | | | 311,712 | |
| | | | | | | | | | | | |
| | | | | 13,436,184 | |
Commercial Services & Supplies — 7.3% | |
ADMI Corp., 2015 Term Loan B, 5.50%, 4/30/22 | | | | | | | 724 | | | | 726,518 | |
ADS Waste Holdings, Inc., Term Loan B2, 3.75%, 10/09/19 | | | | | | | 1,791 | | | | 1,784,508 | |
ARAMARK Corp.: | | | | | | | | | | | | |
Term Loan E, 3.25%, 9/07/19 | | | | | | | 1,426 | | | | 1,427,591 | |
Term Loan F, 3.25%, 2/24/21 | | | | | | | 522 | | | | 522,010 | |
Brand Energy & Infrastructure Services, Inc., Term Loan B, 4.75%, 11/26/20 | | | | | | | 1,739 | | | | 1,718,285 | |
See Notes to Financial Statements.
| | | | | | |
| | | | | | | |
| 30 | | SEMI-ANNUAL REPORT | | APRIL 30, 2016 | | |
| | |
Schedule of Investments (continued) | | BlackRock Floating Rate Income Trust (BGT) |
| | | | | | | | | | | | |
| Floating Rate Loan Interests (c) | | Par (000) | | | Value | |
Commercial Services & Supplies (continued) | |
Catalent Pharma Solutions, Inc., Term Loan B, 4.25%, 5/20/21 | | | USD | | | | 2,614 | | | $ | 2,624,632 | |
Connolly Corp.: | | | | | | | | | | | | |
1st Lien Term Loan, 4.50%, 5/14/21 | | | | | | | 1,828 | | | | 1,822,188 | |
2nd Lien Term Loan, 8.00%, 5/14/22 | | | | | | | 900 | | | | 864,000 | |
Creative Artists Agency LLC, Term Loan B, 5.50%, 12/17/21 | | | | | | | 632 | | | | 630,945 | |
Dealer Tire LLC, Term Loan B, 5.50%, 12/22/21 | | | | | | | 642 | | | | 640,716 | |
GCA Services Group, Inc., 2016 Term Loan, 5.75%, 3/01/23 | | | | | | | 1,170 | | | | 1,177,312 | |
KAR Auction Services, Inc.: | | | | | | | | | | | | |
Term Loan B2, 3.94%, 3/11/21 | | | | | | | 813 | | | | 816,109 | |
Term Loan B3, 4.25%, 3/09/23 | | | | | | | 1,075 | | | | 1,079,031 | |
Koosharem LLC, Exit Term Loan, 7.50%, 5/16/20 | | | | | | | 877 | | | | 760,086 | |
Livingston International, Inc., 1st Lien Term Loan, 5.00%, 4/18/19 | | | | | | | 797 | | | | 749,603 | |
Prime Security Services Borrower LLC, Incremental 1st Lien Term Loan, hunts%, 4/07/22 | | | | | | | 275 | | | | 276,031 | |
PSSI Holdings LLC, Term Loan B, 5.00%, 12/02/21 | | | | | | | 992 | | | | 991,197 | |
Spin Holdco, Inc., Term Loan B, 4.25%, 11/14/19 | | | | | | | 2,684 | | | | 2,629,516 | |
US Ecology, Inc., Term Loan, 3.75%, 6/17/21 | | | | | | | 402 | | | | 401,623 | |
Waste Industries USA, Inc., Term Loan B, 4.25%, 2/27/20 | | | | | | | 1,254 | | | | 1,256,081 | |
West Corp., Term Loan B10, 3.25%, 6/30/18 | | | | | | | 1,385 | | | | 1,375,958 | |
| | | | | | | | | | | | |
| | | | | 24,273,940 | |
Communications Equipment — 1.8% | |
Applied Systems, Inc.: | | | | | | | | | | | | |
1st Lien Term Loan, 4.25%, 1/25/21 | | | | | | | 474 | | | | 472,252 | |
2nd Lien Term Loan, 7.50%, 1/24/22 | | | | | | | 227 | | | | 222,842 | |
CommScope, Inc., Term Loan B5, 3.83%, 12/29/22 | | | | | | | 557 | | | | 557,896 | |
Riverbed Technology, Inc., Term Loan B, 6.00%, 4/24/22 | | | | | | | 572 | | | | 574,830 | |
Telesat Canada, Term Loan A, 3.00%, 3/28/17 | | | CAD | | | | 2,088 | | | | 1,655,525 | |
Zayo Group LLC, Term Loan B, 3.75%, 5/06/21 | | | USD | | | | 2,435 | | | | 2,433,613 | |
| | | | | | | | | | | | |
| | | | | 5,916,958 | |
Construction & Engineering — 0.1% | |
AECOM Technology Corp., 2014 Term Loan B, 3.75%, 10/15/21 | | | | | | | 322 | | | | 323,474 | |
Construction Materials — 1.5% | |
Filtration Group Corp., 1st Lien Term Loan, 4.25%, 11/21/20 | | | | | | | 1,813 | | | | 1,805,660 | |
Headwaters, Inc., Term Loan B, 4.50%, 3/24/22 | | | | | | | 446 | | | | 448,516 | |
HD Supply, Inc., 2015 Term Loan B, 3.75%, 8/13/21 | | | | | | | 2,314 | | | | 2,314,702 | |
McJunkin Red Man Corp., Term Loan, 4.75%, 11/08/19 | | | | | | | 264 | | | | 255,838 | |
| | | | | | | | | | | | |
| | | | | 4,824,716 | |
Containers & Packaging — 1.9% | |
Ardagh Holdings USA, Inc., Incremental Term Loan, 4.00%, 12/17/19 | | | | | | | 1,107 | | | | 1,104,117 | |
Berry Plastics Holding Corp.: | | | | | | | | | | | | |
Term Loan E, 3.75%, 1/06/21 | | | | | | | 763 | | | | 762,787 | |
Term Loan F, 4.00%, 10/01/22 | | | | | | | 3,744 | | | | 3,749,641 | |
BWAY Holding Co., Inc., Term Loan B, 5.50%, 8/14/20 | | | | | | | 852 | | | | 848,344 | |
| | | | | | | | | | | | |
| | | | | 6,464,889 | |
Distributors — 0.6% | |
ABC Supply Co., Inc., Term Loan, 3.50%, 4/16/20 | | | | | | | 993 | | | | 994,544 | |
American Tire Distributors Holdings, Inc., 2015 Term Loan, 5.25%, 9/01/21 | | | | | | | 941 | | | | 914,636 | |
| | | | | | | | | | | | |
| | | | | 1,909,180 | |
| | | | | | | | | | | | |
| Floating Rate Loan Interests (c) | | Par (000) | | | Value | |
Diversified Consumer Services — 4.3% | |
Allied Security Holdings LLC: | | | | | | | | | | | | |
1st Lien Term Loan, 4.25%, 2/12/21 | | | USD | | | | 1,732 | | | $ | 1,715,863 | |
2nd Lien Term Loan, 8.00%, 8/13/21 | | | | | | | 864 | | | | 838,196 | |
AssuredPartners, Inc., 2015 1st Lien Term Loan, 5.75%, 10/21/22 | | | | | | | 1,932 | | | | 1,924,369 | |
Bright Horizons Family Solutions, Inc.: | | | | | | | | | | | | |
Incremental Term Loan B1, 4.25%, 1/30/20 | | | | | | | 316 | | | | 316,594 | |
Term Loan B, 3.75%, 1/30/20 | | | | | | | 1,704 | | | | 1,704,880 | |
CT Technologies Intermediate Holdings, Inc.,
1st Lien Term Loan, 5.25%, 12/01/21 | | | | | | | 733 | | | | 726,886 | |
Nomad Foods Europe Midco Ltd., Term Loan C1, 3.50%, 6/30/20 | | | EUR | | | | 606 | | | | 682,858 | |
ROC Finance LLC, Term Loan, 5.00%, 6/20/19 | | | USD | | | | 1,044 | | | | 989,582 | |
ServiceMaster Co., 2014 Term Loan B, 4.25%, 7/01/21 | | | | | | | 4,622 | | | | 4,636,575 | |
Wand Intermediate I LP, 1st Lien Term Loan, 4.75%, 9/17/21 | | | | | | | 798 | | | | 795,318 | |
| | | | | | | | | | | | |
| | | | | 14,331,121 | |
Diversified Financial Services — 3.2% | |
AlixPartners LLP, 2015 Term Loan B, 4.50%, 7/28/22 | | | | | | | 1,174 | | | | 1,178,503 | |
Diamond US Holding LLC, Term Loan B, 4.75%, 12/17/21 | | | | | | | 593 | | | | 582,872 | |
Jefferies Finance LLC, Term Loan, 4.50%, 5/14/20 | | | | | | | 1,687 | | | | 1,661,941 | |
Onex Wizard US Acquisition, Inc., Term Loan, 4.25%, 3/13/22 | | | | | | | 1,257 | | | | 1,253,931 | |
Reynolds Group Holdings, Inc., Dollar Term Loan, 4.50%, 12/01/18 | | | | | | | 3,899 | | | | 3,906,015 | |
SAM Finance Luxembourg Sarl, Term Loan, 4.25%, 12/17/20 | | | | | | | 1,070 | | | | 1,074,896 | |
SIG Euro Holdings AG & Co. KG, 2013 Term Loan, 4.50%, 12/02/18 | | | EUR | | | | 878 | | | | 1,006,971 | |
| | | | | | | | | | | | |
| | | | | 10,665,129 | |
Diversified Telecommunication Services — 3.9% | |
Altice Financing SA, Term Loan: | | | | | | | | | | | | |
Delayed Draw, 5.50%, 7/02/19 | | | USD | | | | 1,844 | | | | 1,858,259 | |
5.25%, 2/04/22 | | | | | | | 14 | | | | 13,875 | |
Hawaiian Telcom Communications, Inc., Term Loan B, 5.00%, 6/06/19 | | | | | | | 1,419 | | | | 1,414,184 | |
Integra Telecom, Inc.: | | | | | | | | | | | | |
2015 1st Lien Term Loan, 5.25%, 8/14/20 | | | | | | | 1,381 | | | | 1,319,186 | |
2nd Lien Term Loan, 9.75%, 2/12/21 | | | | | | | 459 | | | | 432,651 | |
Level 3 Financing, Inc.: | | | | | | | | | | | | |
2013 Term Loan B, 4.00%, 1/15/20 | | | | | | | 4,685 | | | | 4,697,884 | |
2019 Term Loan, 4.00%, 8/01/19 | | | | | | | 2,452 | | | | 2,458,229 | |
Zayo Group LLC, Term Loan B2, 4.50%, 5/06/21 | | | | | | | 622 | | | | 625,353 | |
| | | | | | | | | | | | |
| | | | | 12,819,621 | |
Electrical Equipment — 0.9% | |
Texas Competitive Electric Holdings Co. LLC: | | | | | | | | | | | | |
DIP Term Loan, 3.75%, 11/07/16 | | | | | | | 2,753 | | | | 2,749,653 | |
Extended Term Loan, 4.91%, 10/10/17 | | | | | | | 1,050 | | | | 355,037 | |
| | | | | | | | | | | | |
| | | | | 3,104,690 | |
Electronic Equipment, Instruments & Components — 0.4% | |
CDW LLC, Term Loan, 3.25%, 4/29/20 | | | | | | | 990 | | | | 988,675 | |
CPI Acquisition, Inc., Term Loan B, 5.50%, 8/17/22 | | | | | | | 481 | | | | 481,322 | |
| | | | | | | | | | | | |
| | | | | 1,469,997 | |
Energy Equipment & Services — 0.3% | |
Dynegy Holdings, Inc., Term Loan B2, 4.00%, 4/23/20 | | | | | | | 491 | | | | 488,986 | |
Exgen Texas Power LLC, Term Loan B, 5.75%, 9/16/21 | | | | | | | 802 | | | | 569,682 | |
| | | | | | | | | | | | |
| | | | | 1,058,668 | |
See Notes to Financial Statements.
| | | | | | |
| | | | | | | |
| | SEMI-ANNUAL REPORT | | APRIL 30, 2016 | | 31 |
| | |
Schedule of Investments (continued) | | BlackRock Floating Rate Income Trust (BGT) |
| | | | | | | | | | | | |
| Floating Rate Loan Interests (c) | | Par (000) | | | Value | |
Food & Staples Retailing — 2.9% | |
Albertsons LLC, Term Loan B4, 5.50%, 8/25/21 | | | USD | | | | 2,492 | | | $ | 2,499,520 | |
Hostess Brands LLC: | | | | | | | | | | | | |
1st Lien Term Loan, 4.50%, 8/03/22 | | | | | | | 1,333 | | | | 1,337,193 | |
2nd Lien Term Loan, 8.50%, 8/03/23 | | | | | | | 316 | | | | 309,697 | |
Rite Aid Corp.: | | | | | | | | | | | | |
5.75%, 8/21/20 | | | | | | | 540 | | | | 541,123 | |
4.88%, 6/21/21 | | | | | | | 1,120 | | | | 1,120,706 | |
Supervalu, Inc., Refinancing Term Loan B, 4.50%, 3/21/19 | | | | | | | 1,066 | | | | 1,053,870 | |
US Foods, Inc., Refinancing Term Loan, 4.50%, 3/31/19 | | | | | | | 2,745 | | | | 2,741,549 | |
| | | | | | | | | | | | |
| | | | | 9,603,658 | |
Food Products — 2.0% | |
Blue Ribbon LLC, Term Loan, 5.50%, 11/13/21 | | | | | | | 1,082 | | | | 1,076,289 | |
CTI Foods Holding Co. LLC, 1st Lien Term Loan, 4.50%, 6/29/20 | | | | | | | 486 | | | | 471,690 | |
Dole Food Co., Inc., Term Loan B, 4.50%, 11/01/18 | | | | | | | 1,518 | | | | 1,515,790 | |
Performance Food Group Co., 2nd Lien Term Loan, 6.00%, 11/14/19 | | | | | | | 921 | | | | 923,474 | |
Pinnacle Foods Finance LLC: | | | | | | | | | | | | |
Incremental Term Loan I, 3.75%, 1/13/23 | | | | | | | 484 | | | | 485,878 | |
Term Loan G, 3.00%, 4/29/20 | | | | | | | 995 | | | | 993,138 | |
Post Holdings Inc., Series A Incremental Term Loan, 3.75%, 6/02/21 | | | | | | | — | (g) | | | 374 | |
Reddy Ice Corp.: | | | | | | | | | | | | |
1st Lien Term Loan, 6.75%, 5/01/19 | | | | | | | 975 | | | | 841,532 | |
2nd Lien Term Loan, 10.75%, 11/01/19 | | | | | | | 725 | | | | 507,500 | |
| | | | | | | | | | | | |
| | | | | 6,815,665 | |
Health Care Equipment & Supplies — 4.3% | |
Alere, Inc.: | | | | | | | | | | | | |
2015 Term Loan A, 3.44%, 6/18/20 | | | | | | | 292 | | | | 288,535 | |
2015 Term Loan B, 4.25%, 6/18/22 | | | | | | | 1,859 | | | | 1,840,471 | |
Auris Luxembourg III Sarl, Term Loan B4, 4.25%, 1/15/22 | | | | | | | 1,138 | | | | 1,137,347 | |
Capsugel Holdings US, Inc., Term Loan B, 4.00%, 7/31/21 | | | | | | | 2,372 | | | | 2,373,104 | |
DJO Finance LLC, 2015 Term Loan, 4.25%, 6/08/20 | | | | | | | 2,020 | | | | 1,961,948 | |
Iasis Healthcare LLC, Term Loan B2, 4.50%, 5/03/18 | | | | | | | 1,869 | | | | 1,864,618 | |
Immucor, Inc., Refinancing Term Loan B2, 5.00%, 8/17/18 | | | | | | | 1,402 | | | | 1,332,185 | |
National Vision, Inc., 1st Lien Term Loan, 4.00%, 3/12/21 | | | | | | | 1,916 | | | | 1,872,618 | |
Ortho-Clinical Diagnostics, Inc., Term Loan B, 4.75%, 6/30/21 | | | | | | | 1,671 | | | | 1,580,168 | |
| | | | | | | | | | | | |
| | | | | 14,250,994 | |
Health Care Management Services — 0.1% | |
New Millennium HoldCo, Inc., Exit Term Loan, 7.50%, 12/21/20 (d) | | | | | | | 314 | | | | 233,814 | |
Health Care Providers & Services — 9.9% | | | | | | | | | | | | |
Acadia Healthcare Co., Inc., Term Loan B, 4.25%, 2/11/22 | | | | | | | 290 | | | | 292,261 | |
Acadia Healthcare Company, Inc., Term Loan B2, 4.50%, 2/16/23 | | | | | | | 1,322 | | | | 1,330,358 | |
Air Medical Group Holdings, Inc., Term Loan B, 4.25%, 4/28/22 | | | | | | | 282 | | | | 277,488 | |
Amsurg Corp., 1st Lien Term Loan B, 3.50%, 7/16/21 | | | | | | | 1,771 | | | | 1,775,071 | |
CHG Healthcare Services Inc., Term Loan, 4.25%, 11/19/19 | | | | | | | 1,523 | | | | 1,522,709 | |
Community Health Systems, Inc.: | | | | | | | | | | | | |
Term Loan F, 3.69%, 12/31/18 | | | | | | | 866 | | | | 861,455 | |
Term Loan G, 3.75%, 12/31/19 | | | | | | | 1,943 | | | | 1,912,862 | |
| | | | | | | | | | | | |
| Floating Rate Loan Interests (c) | | Par (000) | | | Value | |
Health Care Providers & Services (continued) | |
Community Health Systems, Inc. (continued) | | | | | | | | | | | | |
Curo Health Services LLC, 2015 1st Lien Term Loan, 6.50%, 2/07/22 | | | USD | | | | 941 | | | $ | 935,017 | |
DaVita HealthCare Partners, Inc., Term Loan B, 3.50%, 6/24/21 | | | | | | | 5,831 | | | | 5,854,462 | |
Envision Healthcare Corp., Term Loan: | | | | | | | | | | | | |
4.25%, 5/25/18 | | | | | | | 897 | | | | 897,217 | |
B2, 4.50%, 10/28/22 | | | | | | | 594 | | | | 594,676 | |
HC Group Holdings III, Inc., Term Loan B, 6.00%, 4/07/22 | | | | | | | 891 | | | | 894,290 | |
HCA, Inc., Term Loan B6, 3.69%, 3/17/23 | | | | | | | 3,207 | | | | 3,227,079 | |
MPH Acquisition Holdings LLC, Term Loan, 3.75%, 3/31/21 | | | | | | | 1,928 | | | | 1,917,599 | |
National Mentor Holdings, Inc., Term Loan B, 4.25%, 1/31/21 | | | | | | | 298 | | | | 296,786 | |
NVA Holdings, Inc.: | | | | | | | | | | | | |
1st Lien Term Loan, 4.75%, 8/14/21 | | | | | | | 10 | | | | 10,079 | |
2016 Term Loan, 5.50%, 8/14/21 | | | | | | | 838 | | | | 837,792 | |
Precyse Acquisition Corp., 2016 1st Lien Term Loan, 6.50%, 9/30/22 | | | | | | | 1,009 | | | | 1,004,480 | |
Sterigenics-Nordion Holdings LLC, 2015 Term Loan B, 4.25%, 5/15/22 | | | | | | | 1,876 | | | | 1,870,886 | |
Surgery Center Holdings, Inc., 1st Lien Term Loan, 5.25%, 11/03/20 | | | | | | | 1,189 | | | | 1,190,912 | |
Surgical Care Affiliates, Inc., Term Loan B, 4.25%, 3/17/22 | | | | | | | 1,409 | | | | 1,404,780 | |
Team Health, Inc., 2015 Term Loan B, 4.50%, 11/23/22 | | | | | | | 1,340 | | | | 1,348,379 | |
U.S. Renal Care, Inc., 2015 Term Loan B, 5.25%, 12/31/22 | | | | | | | 1,436 | | | | 1,437,305 | |
Vizient, Inc., 1st Lien Term Loan, 6.25%, 2/13/23 | | | | | | | 1,270 | | | | 1,281,113 | |
| | | | | | | | | | | | |
| | | | | 32,975,056 | |
Health Care Technology — 0.6% | |
Emdeon Business Services LLC, Term Loan B3, 3.75%, 11/02/18 | | | | | | | 197 | | | | 196,631 | |
IMS Health, Inc., Term Loan, 3.50%, 3/17/21 | | | | | | | 1,970 | | | | 1,969,091 | |
| | | | | | | | | | | | |
| | | | | 2,165,722 | |
Hotels, Restaurants & Leisure — 7.8% | |
Amaya Holdings BV: | | | | | | | | | | | | |
1st Lien Term Loan, 5.00%, 8/01/21 | | | | | | | 1,646 | | | | 1,572,678 | |
2nd Lien Term Loan, 8.00%, 8/01/22 | | | | | | | 602 | | | | 594,784 | |
Boyd Gaming Corp., Term Loan B, 4.00%, 8/14/20 | | | | | | | 1,280 | | | | 1,282,180 | |
Bronco Midstream Funding LLC, Term Loan B, 5.00%, 8/15/20 | | | | | | | 1,536 | | | | 1,075,128 | |
Burger King Newco Unlimited Liability Co., Term Loan B2, 3.75%, 12/10/21 | | | | | | | 2,882 | | | | 2,887,220 | |
Caesars Entertainment Resort Properties LLC, Term Loan B, 7.00%, 10/11/20 | | | | | | | 4,623 | | | | 4,354,080 | |
CCM Merger, Inc., Term Loan B, 4.50%, 8/08/21 | | | | | | | 893 | | | | 894,484 | |
Diamond Resorts Corp., Term Loan, 5.50%, 5/09/21 | | | | | | | 668 | | | | 649,655 | |
Eldorado Resorts LLC, Term Loan B, 4.25%, 7/23/22 | | | | | | | 1,481 | | | | 1,476,833 | |
Hilton Worldwide Finance LLC, Term Loan B2, 3.50%, 10/26/20 | | | | | | | 1,579 | | | | 1,584,539 | |
La Quinta Intermediate Holdings LLC, Term Loan B, 3.75%, 4/14/21 | | | | | | | 920 | | | | 906,578 | |
Las Vegas Sands LLC, Term Loan B, 3.25%, 12/19/20 | | | | | | | 1,708 | | | | 1,708,426 | |
Pinnacle Entertainment, Inc., Term Loan B, 1.00%, 4/28/23 | | | | | | | 292 | | | | 300,564 | |
RHP Hotel Properties LP, Term Loan B, 3.50%, 1/15/21 | | | | | | | 776 | | | | 777,533 | |
Sabre, Inc.: | | | | | | | | | | | | |
Incremental Term Loan, 4.00%, 2/19/19 | | | | | | | 302 | | | | 302,250 | |
Term Loan B, 4.00%, 2/19/19 | | | | | | | 1,610 | | | | 1,612,239 | |
See Notes to Financial Statements.
| | | | | | |
| | | | | | | |
| 32 | | SEMI-ANNUAL REPORT | | APRIL 30, 2016 | | |
| | |
Schedule of Investments (continued) | | BlackRock Floating Rate Income Trust (BGT) |
| | | | | | | | | | | | |
| Floating Rate Loan Interests (c) | | Par (000) | | | Value | |
Hotels, Restaurants & Leisure (continued) | |
Scientific Games International, Inc., 2014 Term Loan B1, 6.00%, 10/18/20 | | | USD | | | | 717 | | | $ | 705,301 | |
Station Casinos LLC, Term Loan B, 4.25%, 3/02/20 | | | | | | | 3,094 | | | | 3,097,513 | |
| | | | | | | | | | | | |
| | | | | 25,781,985 | |
Household Products — 1.1% | |
Bass Pro Group LLC, 2015 Term Loan, 4.00%, 6/05/20 | | | | | | | 491 | | | | 482,588 | |
Spectrum Brands, Inc., Term Loan, 3.50%, 6/23/22 | | | | | | | 2,445 | | | | 2,451,906 | |
TruGreen Limited Partnership, 1st Lien Term Loan B, 6.50%, 4/13/23 | | | | | | | 630 | | | | 632,362 | |
| | | | | | | | | | | | |
| | | | | 3,566,856 | |
Independent Power and Renewable Electricity Producers — 3.5% | |
Aria Energy Operating LLC, Term Loan, 5.00%, 5/27/22 | | | | | | | 888 | | | | 710,630 | |
Calpine Construction Finance Co., LP, Term Loan B1, 3.00%, 5/03/20 | | | | | | | 985 | | | | 970,162 | |
Calpine Corp.: | | | | | | | | | | | | |
Term Loan B3, 4.00%, 10/09/19 | | | | | | | 547 | | | | 626,673 | |
Term Loan B5, 3.50%, 5/27/22 | | | | | | | 731 | | | | 726,481 | |
Term Loan B6, 4.00%, 1/15/23 | | | | | | | 1,317 | | | | 1,315,884 | |
Energy Future Intermediate Holding Co. LLC, DIP Term Loan, 4.25%, 12/19/16 | | | | | | | 3,571 | | | | 3,566,887 | |
Granite Acquisition, Inc.: | | | | | | | | | | | | |
Term Loan B, 5.00%, 12/19/21 | | | | | | | 1,878 | | | | 1,810,312 | |
Term Loan C, 5.00%, 12/19/21 | | | | | | | 84 | | | | 80,662 | |
NRG Energy, Inc., Refinancing Term Loan B, 2.75%, 7/02/18 | | | | | | | 1,219 | | | | 1,215,452 | |
Terra-Gen Finance Co. LLC, Term Loan B, 5.25%, 12/09/21 | | | | | | | 930 | | | | 762,283 | |
| | | | | | | | | | | | |
| | | | | 11,785,426 | |
Industrial Conglomerates — 0.1% | |
Sequa Corp., Term Loan B, 5.25%, 6/19/17 | | | | | | | 437 | | | | 333,136 | |
Insurance — 1.3% | |
AmWINS Group LLC, 2014 2nd Lien Term Loan, 9.50%, 9/04/20 | | | | | | | 349 | | | | 348,759 | |
Asurion LLC: | | | | | | | | | | | | |
Term Loan B1, 5.00%, 5/24/19 | | | | | | | 226 | | | | 224,842 | |
Term Loan B4, 5.00%, 8/04/22 | | | | | | | 928 | | | | 921,162 | |
Sedgwick Claims Management Services, Inc.: | | | | | | | | | | | | |
1st Lien Term Loan, 3.75%, 3/01/21 | | | | | | | 1,152 | | | | 1,128,470 | |
2016 1st Lien Term Loan, 1.00%, 2/28/21 | | | | | | | 530 | | | | 531,325 | |
2nd Lien Term Loan, 6.75%, 2/28/22 | | | | | | | 1,230 | | | | 1,168,500 | |
| | | | | | | | | | | | |
| | | | | 4,323,058 | |
Internet Software & Services — 0.7% | |
Go Daddy Operating Co. LLC, Term Loan B, 4.25%, 5/13/21 | | | | | | | 1,547 | | | | 1,549,650 | |
W3 Co., 2nd Lien Term Loan, 9.25%, 9/11/20 | | | | | | | 419 | | | | 175,959 | |
WaveDivision Holdings LLC, Term Loan B, 4.00%, 10/15/19 | | | | | | | 500 | | | | 498,540 | |
| | | | | | | | | | | | |
| | | | | 2,224,149 | |
IT Services — 4.2% | |
Blue Coat Holdings, Inc., 2015 Term Loan, 4.50%, 5/20/22 | | | | | | | 2,239 | | | | 2,224,758 | |
Epicor Software Corp., 1st Lien Term Loan, 4.75%, 6/01/22 | | | | | | | 518 | | | | 496,932 | |
First Data Corp.: | | | | | | | | | | | | |
2018 Term Loan, 3.94%, 9/24/18 | | | | | | | 730 | | | | 730,460 | |
2021 Extended Term Loan, 4.44%, 3/24/21 | | | | | | | 7,641 | | | | 7,657,173 | |
Global Payments, Inc., Term Loan B, 3.94%, 4/22/23 | | | | | | | 1,795 | | | | 1,809,049 | |
| | | | | | | | | | | | |
| Floating Rate Loan Interests (c) | | Par (000) | | | Value | |
IT Services — (continued) | |
Vantiv LLC, 2014 Term Loan B, 3.75%, 6/13/21 | | | USD | | | | 1,028 | | | $ | 1,031,550 | |
| | | | | | | | | | | | |
| | | | | 13,949,922 | |
Leisure Products — 0.2% | |
Bauer Performance Sports Ltd., Term Loan B, 4.50%, 4/15/21 | | | | | | | 883 | | | | 687,870 | |
Life Sciences Tools & Services — 0.1% | |
Pharmaceutical Product Development LLC, 1st Lien Term Loan, 1.00%, 8/18/22 | | | | | | | 255 | | | | 254,416 | |
Machinery — 2.1% | | | | | | | | | | | | |
Allison Transmission, Inc., Term Loan B3, 3.50%, 8/23/19 | | | | | | | 728 | | | | 728,015 | |
Faenza Acquisition GmbH: | | | | | | | | | | | | |
Term Loan B1, 4.25%, 8/30/20 | | | | | | | 658 | | | | 657,643 | |
Term Loan B3, 4.25%, 8/30/20 | | | | | | | 201 | | | | 200,405 | |
Infiltrator Systems, Inc., 2015 Term Loan, 5.25%, 5/27/22 | | | | | | | 922 | | | | 921,365 | |
Mueller Water Products, Inc., Term Loan B, 4.00%, 11/25/21 | | | | | | | 494 | | | | 495,602 | |
Rexnord LLC, 1st Lien Term Loan B, 4.00%, 8/21/20 | | | | | | | 1,581 | | | | 1,569,336 | |
Silver II US Holdings LLC, Term Loan, 4.00%, 12/13/19 | | | | | | | 2,169 | | | | 1,948,383 | |
Wabash National Corp., 2015 Term Loan B, 4.25%, 3/16/22 | | | | | | | 571 | | | | 569,650 | |
| | | | | | | | | | | | |
| | | | | 7,090,399 | |
Manufactured Goods — 0.1% | |
KP Germany Erste GmbH, 1st Lien Term Loan, 5.00%, 4/28/20 | | | | | | | 189 | | | | 188,694 | |
Media — 13.5% | |
Altice U.S. Finance I Corp., Extended Term Loan, 4.25%, 12/14/22 | | | | | | | 2,946 | | | | 2,941,555 | |
Cengage Learning Acquisitions, Inc., Term Loan: | | | | | | | | | | | | |
1st Lien, 7.00%, 3/31/20 | | | | | | | 2,572 | | | | 2,556,786 | |
0.00%, 7/03/16 (a)(d) | | | | | | | 1,296 | | | | — | |
Charter Communications Operating LLC: | | | | | | | | | | | | |
Term Loan H, 3.25%, 8/24/21 | | | | | | | 650 | | | | 650,305 | |
Term Loan I, 3.50%, 1/24/23 | | | | | | | 3,970 | | | | 3,985,602 | |
Clear Channel Communications, Inc., Term Loan D, 7.19%, 1/30/19 | | | | | | | 3,282 | | | | 2,446,843 | |
Gray Television, Inc., Term Loan C, 4.25%, 6/13/21 | | | | | | | 1,337 | | | | 1,340,994 | |
Hemisphere Media Holdings LLC, Term Loan B, 5.00%, 7/30/20 | | | | | | | 978 | | | | 965,913 | |
Houghton Mifflin Harcourt Publishing Co., 2015 Term Loan B, 4.00%, 5/31/21 | | | | | | | 1,687 | | | | 1,644,656 | |
iHeartCommunications, Inc., Extended Term Loan E, 7.94%, 7/30/19 | | | | | | | 315 | | | | 234,149 | |
Intelsat Jackson Holdings SA, Term Loan B2, 3.75%, 6/30/19 | | | | | | | 2,007 | | | | 1,879,996 | |
Liberty Cablevision of Puerto Rico LLC, 1st Lien Term Loan, 4.50%, 1/07/22 | | | | | | | 735 | | | | 701,315 | |
Live Nation Entertainment, Inc., 2020 Term Loan B1, 3.50%, 8/16/20 | | | | | | | 297 | | | | 298,365 | |
MCC Iowa LLC: | | | | | | | | | | | | |
Term Loan I, 2.91%, 6/30/17 | | | | | | | 658 | | | | 655,530 | |
Term Loan J, 3.75%, 6/30/21 | | | | | | | 319 | | | | 318,380 | |
Media General, Inc., Term Loan B, 4.00%, 7/31/20 | | | | | | | 1,333 | | | | 1,332,094 | |
Mediacom Communications Corp., Term Loan F, 2.91%, 3/31/18 | | | | | | | 500 | | | | 494,022 | |
Neptune Finco Corp., 2015 Term Loan B, 5.00%, 10/09/22 | | | | | | | 2,975 | | | | 2,984,312 | |
Numericable U.S. LLC: | | | | | | | | | | | | |
Term Loan B6, 4.75%, 2/10/23 | | | | | | | 2,329 | | | | 2,330,001 | |
Term Loan B7, 5.00%, 1/15/24 | | | | | | | 1,380 | | | | 1,384,885 | |
See Notes to Financial Statements.
| | | | | | |
| | | | | | | |
| | SEMI-ANNUAL REPORT | | APRIL 30, 2016 | | 33 |
| | |
Schedule of Investments (continued) | | BlackRock Floating Rate Income Trust (BGT) |
| | | | | | | | | | | | |
| Floating Rate Loan Interests (c) | | Par (000) | | | Value | |
Media (continued) | |
SBA Senior Finance II LLC, Term Loan B1, 3.25%, 3/24/21 | | | USD | | | | 2,696 | | | $ | 2,691,338 | |
Sinclair Television Group, Inc., Term Loan B, 3.00%, 4/09/20 | | | | | | | 121 | | | | 120,272 | |
Tribune Media Co., Term Loan, 3.75%, 12/27/20 | | | | | | | 2,228 | | | | 2,224,968 | |
Univision Communications, Inc., Term Loan C4, 4.00%, 3/01/20 | | | | | | | 3,621 | | | | 3,615,505 | |
Virgin Media Investment Holdings Ltd.: | | | | | | | | | | | | |
Term Loan E, 4.25%, 6/30/23 | | | GBP | | | | 1,105 | | | | 1,595,730 | |
Term Loan F, 3.65%, 6/30/23 | | | USD | | | | 2,405 | | | | 2,399,433 | |
WideOpenWest Finance LLC, Term Loan B1, 3.75%, 7/17/17 | | | | | | | 284 | | | | 282,483 | |
Ziggo Financing Partnership: | | | | | | | | | | | | |
Term Loan B1, 3.65%, 1/15/22 | | | | | | | 1,108 | | | | 1,103,530 | |
Term Loan B2A, 3.60%, 1/15/22 | | | | | | | 719 | | | | 715,887 | |
Term Loan B3, 3.60%, 1/15/22 | | | | | | | 1,182 | | | | 1,177,378 | |
| | | | | | | | | | | | |
| | | | | 45,072,227 | |
Metals & Mining — 0.7% | |
Ameriforge Group, Inc., 2nd Lien Term Loan, 8.75%, 12/19/20 | | | | | | | 265 | | | | 41,075 | |
FMG Resources August 2006 Property Ltd., Term Loan B, 4.25%, 6/30/19 | | | | | | | 532 | | | | 519,434 | |
Novelis, Inc., 2015 Term Loan B, 4.00%, 6/02/22 | | | | | | | 1,618 | | | | 1,607,539 | |
| | | | | | | | | | | | |
| | | | | 2,168,048 | |
Multiline Retail — 2.0% | |
BJ’s Wholesale Club, Inc.: | | | | | | | | | | | | |
1st Lien Term Loan, 4.50%, 9/26/19 | | | | | | | 2,173 | | | | 2,148,114 | |
2nd Lien Term Loan, 8.50%, 3/26/20 | | | | | | | 387 | | | | 374,519 | |
Dollar Tree, Inc., Term Loan B1, 3.50%, 7/06/22 | | | | | | | 2,257 | | | | 2,265,719 | |
Hudson’s Bay Co., 2015 Term Loan B, 4.75%, 9/30/22 | | | | | | | 832 | | | | 835,237 | |
Neiman Marcus Group, Inc., 2020 Term Loan, 4.25%, 10/25/20 | | | | | | | 1,115 | | | | 1,061,001 | |
| | | | | | | | | | | | |
| | | | | 6,684,590 | |
Oil, Gas & Consumable Fuels — 3.1% | |
CITGO Holding, Inc., 2015 Term Loan B, 9.50%, 5/12/18 | | | | | | | 823 | | | | 822,957 | |
Drillships Financing Holding, Inc., Term Loan B1, 6.00%, 3/31/21 | | | | | | | 749 | | | | 356,496 | |
Energy Transfer Equity LP, Term Loan, 3.25%, 12/02/19 | | | | | | | 120 | | | | 112,483 | |
Green Energy Partners/Stonewall LLC,
Term Loan B1, 6.50%, 11/13/21 | | | | | | | 545 | | | | 520,475 | |
MEG Energy Corp., Refinancing Term Loan, 3.75%, 3/31/20 | | | | | | | 1,895 | | | | 1,692,886 | |
Panda Patriot LLC, Term Loan B1, 6.75%, 12/19/20 | | | | | | | 865 | | | | 817,425 | |
Power Buyer LLC: | | | | | | | | | | | | |
1st Lien Term Loan, 4.25%, 5/06/20 | | | | | | | 308 | | | | 306,210 | |
2nd Lien Term Loan, 8.25%, 11/06/20 | | | | | | | 285 | | | | 273,600 | |
Samchully Midstream 3 LLC, Term Loan B, 5.75%, 10/20/21 | | | | | | | 890 | | | | 676,053 | |
Seventy Seven Operating LLC, Term Loan B, 3.75%, 6/25/21 (b)(d) | | | | | | | 160 | | | | 125,787 | |
Southcross Energy Partners LP, 1st Lien Term Loan, 5.25%, 8/04/21 | | | | | | | 614 | | | | 500,290 | |
Southcross Holdings Borrower LP, Exit Term Loan B, 3.50%, 4/13/23 | | | | | | | 56 | | | | 54,856 | |
Stonewall Gas Gathering LLC, Term Loan B, 8.75%, 1/28/22 | | | | | | | 732 | | | | 729,939 | |
TPF II Power LLC, Term Loan B, 5.50%, 10/02/21 | | | | | | | 1,290 | | | | 1,284,975 | |
Veresen Midstream Limited Partnership,
Term Loan B1, 5.25%, 3/31/22 | | | | | | | 1,015 | | | | 947,097 | |
| | | | | | | | | | | | |
| Floating Rate Loan Interests (c) | | Par (000) | | | Value | |
Oil, Gas & Consumable Fuels (continued) | |
WTG Holdings III Corp., 1st Lien Term Loan, 4.75%, 1/15/21 | | | USD | | | | 1,026 | | | $ | 1,005,848 | |
| | | | | | | | | | | | |
| | | | | 10,227,377 | |
Personal Products — 0.5% | |
Prestige Brands, Inc., Term Loan B3, 3.50%, 9/03/21 | | | | | | | 1,562 | | | | 1,564,719 | |
Pharmaceuticals — 6.0% | |
Akorn, Inc., Term Loan B, 6.00%, 4/16/21 | | | | | | | 905 | | | | 906,432 | |
Amneal Pharmaceuticals LLC, Term Loan, 4.50%, 11/01/19 | | | | | | | 1,104 | | | | 1,101,161 | |
CCC Information Services, Inc., Term Loan, 4.00%, 12/20/19 | | | | | | | 503 | | | | 499,327 | |
DPx Holdings BV, 2014 Incremental Term Loan, 4.25%, 3/11/21 | | | | | | | 2,970 | | | | 2,936,627 | |
Endo Luxembourg Finance Co. I Sarl, 2015
Term Loan B, 3.75%, 9/26/22 | | | | | | | 2,105 | | | | 2,096,832 | |
Grifols Worldwide Operations USA, Inc.,
Term Loan B, 3.44%, 2/27/21 | | | | | | | 2,579 | | | | 2,581,172 | |
Jaguar Holding Co. II, 2015 Term Loan B, 4.25%, 8/18/22 | | | | | | | 3,344 | | | | 3,336,020 | |
NBTY, Inc., Term Loan B, 1.00%, 4/26/23 | | | | | | | 1,082 | | | | 1,084,450 | |
Valeant Pharmaceuticals International, Inc.: | | | | | | | | | | | | |
Series A3 Tranche A, 3.89%, 10/20/18 | | | | | | | 432 | | | | 418,721 | |
Series A4 Tranche A, 5.75%, 4/01/20 | | | | | | | 396 | | | | 379,286 | |
Series C2 Term Loan B, 4.75%, 12/11/19 | | | | | | | 2,982 | | | | 2,902,405 | |
Series D2 Term Loan B, 4.50%, 2/13/19 | | | | | | | 933 | | | | 904,780 | |
Series E Term Loan B, 4.75%, 8/05/20 | | | | | | | 683 | | | | 662,880 | |
| | | | | | | | | | | | |
| | | | | 19,810,093 | |
Professional Services — 3.7% | |
Acosta Holdco, Inc., 2015 Term Loan, 4.25%, 9/26/21 | | | | | | | 718 | | | | 709,450 | |
Advantage Sales & Marketing, Inc.: | | | | | | | | | | | | |
2014 1st Lien Term Loan, 4.25%, 7/23/21 | | | | | | | 1,646 | | | | 1,630,153 | |
2014 2nd Lien Term Loan, 7.50%, 7/25/22 | | | | | | | 465 | | | | 437,100 | |
Emdeon Business Services LLC, Term Loan B2, 3.75%, 11/02/18 | | | | | | | 1,744 | | | | 1,743,176 | |
ON Assignment, Inc., 2015 Term Loan, 3.75%, 6/03/22 | | | | | | | 1,467 | | | | 1,469,564 | |
SIRVA Worldwide, Inc., Term Loan, 7.50%, 3/27/19 | | | | | | | 1,073 | | | | 1,013,525 | |
Sterling Infosystems, Inc., 1st Lien Term Loan B, 5.75%, 6/20/22 | | | | | | | 1,355 | | | | 1,344,529 | |
TransUnion LLC, Term Loan B2, 3.50%, 4/09/21 | | | | | | | 3,857 | | | | 3,838,783 | |
| | | | | | | | | | | | |
| | | | | 12,186,280 | |
Real Estate Investment Trusts (REITs) — 0.8% | |
Communications Sales & Leasing, Inc.,
Term Loan B, 5.00%, 10/24/22 | | | | | | | 1,020 | | | | 999,827 | |
MGM Growth Properties LLC, 2016 Term Loan B, 4.00%, 4/25/23 | | | | | | | 1,810 | | | | 1,819,430 | |
| | | | | | | | | | | | |
| | | | | 2,819,257 | |
Real Estate Management & Development — 2.0% | |
CityCenter Holdings LLC, Term Loan B, 4.25%, 10/16/20 | | | | | | | 1,319 | | | | 1,321,195 | |
DTZ U.S. Borrower LLC, 2015 1st Lien Term Loan, 4.25%, 11/04/21 | | | | | | | 1,496 | | | | 1,491,779 | |
Realogy Corp.: | | | | | | | | | | | | |
Extended Letter of Credit, 4.40%, 10/10/16 | | | | | | | 108 | | | | 106,961 | |
Term Loan A, 2.68%, 10/23/20 | | | | | | | 690 | | | | 672,750 | |
Term Loan B, 3.75%, 3/05/20 | | | | | | | 3,140 | | | | 3,136,947 | |
| | | | | | | | | | | | |
| | | | | | | | | | | | 6,729,632 | |
See Notes to Financial Statements.
| | | | | | |
| | | | | | | |
| 34 | | SEMI-ANNUAL REPORT | | APRIL 30, 2016 | | |
| | |
Schedule of Investments (continued) | | BlackRock Floating Rate Income Trust (BGT) |
| | | | | | | | | | | | |
| Floating Rate Loan Interests (c) | | Par (000) | | | Value | |
Road & Rail — 1.3% | | | | | | | | | | | | |
Hertz Corp., Term Loan B2, 3.00%, 3/11/18 | | | USD | | | | 2,618 | | | $ | 2,607,523 | |
Road Infrastructure Investment LLC: | | | | | | | | | | | | |
1st Lien Term Loan, 4.25%, 3/31/21 | | | | | | | 1,210 | | | | 1,178,876 | |
2nd Lien Term Loan, 7.75%, 9/30/21 | | | | | | | 600 | | | | 564,000 | |
| | | | | | | | | | | | |
| | | | | | | | | | | | 4,350,399 | |
Semiconductors & Semiconductor Equipment — 3.8% | |
Avago Technologies Cayman Ltd., 2016 Term Loan B1, 4.25%, 2/01/23 | | | | | | | 7,265 | | | | 7,266,308 | |
Microsemi Corp., 2015 Term Loan B, 5.25%, 1/15/23 | | | | | | | 567 | | | | 570,481 | |
NXP BV: | | | | | | | | | | | | |
2015 Term Loan B, 3.75%, 12/07/20 | | | | | | | 3,492 | | | | 3,500,619 | |
Term Loan D, 3.25%, 1/11/20 | | | | | | | 848 | | | | 844,314 | |
ON Semiconductor Corp., Term Loan B, 5.25%, 3/31/23 | | | | | | | 430 | | | | 431,703 | |
| | | | | | | | | | | | |
| | | | | | | | | | | | 12,613,425 | |
Software — 4.8% | | | | | | | | | | | | |
Infor US, Inc., Term Loan B5, 3.75%, 6/03/20 | | | | | | | 1,916 | | | | 1,869,355 | |
Informatica Corp., Term Loan, 4.25%, 8/05/22 | | | | | | | 2,124 | | | | 2,086,963 | |
IQOR US, Inc., Term Loan B, 6.00%, 4/01/21 | | | | | | | 302 | | | | 246,502 | |
Kronos, Inc.: | | | | | | | | | | | | |
2nd Lien Term Loan, 9.75%, 4/30/20 | | | | | | | 1,088 | | | | 1,100,330 | |
Initial Incremental Term Loan, 4.50%, 10/30/19 | | | | | | | 1,275 | | | | 1,271,350 | |
Mitchell International, Inc.: | | | | | | | | | | | | |
1st Lien Term Loan, 4.50%, 10/13/20 | | | | | | | 1,317 | | | | 1,307,890 | |
2nd Lien Term Loan, 8.50%, 10/11/21 | | | | | | | 1,000 | | | | 926,670 | |
SolarWinds, Inc., Term Loan, 6.50%, 2/03/23 | | | | | | | 1,785 | | | | 1,783,661 | |
Solera Holdings, Inc., Term Loan B, 5.75%, 3/03/23 | | | | | | | 600 | | | | 602,250 | |
Sophia LP, 2015 Term Loan B, 4.75%, 9/30/22 | | | | | | | 827 | | | | 824,932 | |
SS&C Technologies, Inc.: | | | | | | | | | | | | |
2015 Term Loan B1, 4.00%, 7/08/22 | | | | | | | 3,319 | | | | 3,326,956 | |
2015 Term Loan B2, 4.08%, 7/08/22 | | | | | | | 473 | | | | 473,684 | |
| | | | | | | | | | | | |
| | | | | | | | | | | | 15,820,543 | |
Specialty Retail — 2.9% | | | | | | | | | | | | |
CNT Holdings III Corp., Term Loan B, 5.25%, 1/22/23 | | | | | | | 830 | | | | 831,037 | |
Equinox Holdings, Inc., Repriced Term Loan B, 5.00%, 1/31/20 | | | | | | | 792 | | | | 790,931 | |
Leslie’s Poolmart, Inc., Term Loan, 4.25%, 10/16/19 | | | | | | | 673 | | | | 671,172 | |
Michaels Stores, Inc.: | | | | | | | | | | | | |
Incremental 2014 Term Loan B2, 4.00%, 1/28/20 | | | | | | | 1,768 | | | | 1,773,929 | |
Term Loan B, 3.75%, 1/28/20 | | | | | | | 967 | | | | 967,259 | |
Party City Holdings, Inc., 2015 Term Loan B, 4.25%, 8/19/22 | | | | | | | 1,905 | | | | 1,896,592 | |
Petco Animal Supplies, Inc.: | | | | | | | | | | | | |
2016 Term Loan B1, 5.75%, 1/26/23 | | | | | | | 509 | | | | 511,553 | |
2016 Term Loan B2, 5.64%, 1/26/23 | | | | | | | 998 | | | | 1,001,929 | |
PetSmart, Inc., Term Loan B, 4.25%, 3/11/22 | | | | | | | 818 | | | | 815,674 | |
Things Remembered, Inc., Term Loan B, 8.25%, 5/24/18 (a)(d) | | | | | | | 880 | | | | 242,114 | |
| | | | | | | | | | | | |
| | | | | | | | | | | | 9,502,190 | |
Technology Hardware, Storage & Peripherals — 0.8% | |
Dell International LLC, Term Loan B2, 4.00%, 4/29/20 | | | | | | | 861 | | | | 861,020 | |
Dell, Inc., Term Loan C, 3.75%, 10/29/18 | | | | | | | 1,480 | | | | 1,479,433 | |
Linxens France SA, Term Loan, 5.00%, 10/14/22 | | | | | | | 479 | | | | 477,603 | |
| | | | | | | | | | | | |
| | | | | | | | | | | | 2,818,056 | |
| | | | | | | | | | | | |
| Floating Rate Loan Interests (c) | | Par (000) | | | Value | |
Textiles, Apparel & Luxury Goods — 0.4% | | | | | | | | | | | | |
Ascend Performance Materials LLC, Term Loan B, 6.75%, 4/10/18 | | | USD | | | | 1,229 | | | $ | 1,170,187 | |
Samsonite International SA, Term Loan B, 4.00%, 4/13/23 | | | | | | | 305 | | | | 307,211 | |
| | | | | | | | | | | | |
| | | | | 1,477,398 | |
Thrifts & Mortgage Finance — 0.4% | |
IG Investment Holdings LLC, Term Loan B, 6.00%, 10/29/21 | | | | | | | 1,346 | | | | 1,334,627 | |
Trading Companies & Distributors — 0.2% | |
Beacon Roofing Supply, Inc., Term Loan B, 4.00%, 10/01/22 | | | | | | | 681 | | | | 681,700 | |
Transportation — 0.2% | |
Gruden Acquisition, Inc., 1st Lien Term Loan, 5.75%, 8/18/22 | | | | | | | 778 | | | | 684,684 | |
Transportation Infrastructure — 0.2% | |
Penn Products Terminals LLC, Term Loan B, 4.75%, 4/13/22 | | | | | | | 630 | | | | 611,015 | |
Wireless Telecommunication Services — 2.8% | |
LTS Buyer LLC: | | | | | | | | | | | | |
1st Lien Term Loan, 4.00%, 4/13/20 | | | | | | | 3,017 | | | | 3,006,141 | |
2nd Lien Term Loan, 8.00%, 4/12/21 | | | | | | | 150 | | | | 148,500 | |
New Lightsquared LLC, Exit Term Loan, 9.75% (9.75% PIK), 6/15/20 (f) | | | | | | | 4,448 | | | | 4,091,750 | |
T-Mobile USA, Inc., Term Loan B, 3.50%, 11/09/22 | | | | | | | 2,249 | | | | 2,262,024 | |
| | | | | | | | | | | | |
| | | | | | | | | | | | 9,508,415 | |
Total Floating Rate Loan Interests — 130.8% | | | | | | | | 435,192,658 | |
| | | | | | | | | | | | |
| | | | | | | | | | | | | |
| |
| Non-Agency Mortgage-Backed Securities — 0.2% | | | | |
Collateralized Mortgage Obligations — 0.2% | | | | | |
Hilton USA Trust, Series 2013-HLT, Class EFX, 4.45%, 11/05/30 (a)(c) | | | | | | | 598 | | | | 600,215 | |
| | | | | | | | | | | | |
| | | | | | | | | | | | | |
| | | |
| Investment Companies | | | | | Shares | | | | |
Capital Markets — 0.0% | |
Eaton Vance Floating-Rate Income Trust | | | | | | | 34 | | | | 448 | |
Eaton Vance Senior Income Trust | | | | | | | 8,925 | | | | 52,479 | |
| Total Investment Companies — 0.0% | | | | | | | | 52,927 | |
| | | | | | | | | | | | |
| | | | | | | | | | | | | |
| | | |
| Other Interests (h) | | | | | Beneficial
Interest
(000) | | | | |
Auto Components — 0.0% | | | | | | | | | | | | |
Lear Corp. Escrow | | | | | | | 500 | | | | 5 | |
Construction Materials — 0.1% | | | | | | | | | | | | |
USI Senior Holdings | | | | | | | 8 | | | | 169,417 | |
| Total Other Interests — 0.1% | | | | | | | | 169,422 | |
| | | | | | | | | | | | |
| | | | | | | | | | | | | |
| | | |
| Warrants | | | | | Shares | | | | |
Chemicals — 0.0% | |
British Vita Holdings Co. (Non-Expiring) | | | | | | �� | 166 | | | | — | |
Software — 0.0% | |
Bankruptcy Management Solutions, Inc., (Expires 07/01/18) | | | | 181 | | | | — | |
See Notes to Financial Statements.
| | | | | | |
| | | | | | | |
| | SEMI-ANNUAL REPORT | | APRIL 30, 2016 | | 35 |
| | |
Schedule of Investments (continued) | | BlackRock Floating Rate Income Trust (BGT) |
| | | | | | | | | | |
| | |
| Warrants | | Shares | | | Value | |
Software (continued) | |
Bankruptcy Management Solutions, Inc., (Expires 07/01/19) | | | | | 195 | | | $ | — | |
Bankruptcy Management Solutions, Inc., (Expires 07/01/20) | | | | | 292 | | | | — | |
HMH Holdings/EduMedia (Issued/exercisable 3/09/10, 19 Shares for 1 Warrant, Expires 6/22/19, Strike Price $42.27) | | | | | 1,501 | | | | 8,438 | |
| Total Warrants — 0.0% | | | | 8,438 | |
Total Long-Term Investments
(Cost — $468,252,885) — 138.4% | | | | 460,218,509 | |
| | | | | | | | | | |
| | |
| Short-Term Securities | | Shares | | | Value | |
BlackRock Liquidity Funds, TempFund, Institutional Class, 0.40% (i)(j) | | | | | 2,974,761 | | | $ | 2,974,761 | |
Total Short-Term Securities
(Cost — $2,974,761) — 0.9% | | | | 2,974,761 | |
Options Purchased
(Cost — $25,422) — 0.0% | | | | | | | — | |
Total Investments (Cost — $471,253,068) — 139.3% | | | | | | | 463,193,270 | |
Liabilities in Excess of Other Assets — (39.3)% | | | | | | | (130,680,811 | ) |
| | | | | | | | | | |
| Net Assets — 100.0% | | | | | | | | $ | 332,512,459 | |
| | | | | | | | | | |
|
| Notes to Schedule of Investments |
| (a) | | Security exempt from registration pursuant to Rule 144A under the Securities Act of 1933, as amended. These securities may be resold in transactions exempt from registration to qualified institutional investors. |
| (b) | | Non-income producing security. |
| (c) | | Variable rate security. Rate as of period end. |
| (d) | | Issuer filed for bankruptcy and/or is in default of interest payments. |
| (e) | | When-issued security. |
| (f) | | Payment-in-kind security which may pay interest/dividends in additional par/shares and/or in cash. Rates shown are the current rate and possible payment rates. |
| (g) | | Amount is less than $500. |
| (h) | | Other interests represent beneficial interests in liquidation trusts and other reorganization or private entities. |
| (i) | | During the six months ended April 30, 2016, investments in issuers considered to be an affiliate of the Trust for purposes of Section 2(a)(3) of the Investment Company Act of 1940, as amended, were as follows: |
| | | | | | | | | | | | | | | | |
| Affiliate | | Shares Held
at October 31,
2015 | | | Net
Activity | | | Shares Held
at April 30,
2016 | | | Income | |
BlackRock Liquidity Funds, TempFund, Institutional Class | | | 1,094,113 | | | | 1,880,648 | | | | 2,974,761 | | | $ | 500 | |
| (j) | | Current yield as of period end. |
| • | | For Trust compliance purposes, the Trust’s industry classifications refer to any one or more of the industry sub-classifications used by one or more widely recognized market indexes or rating group indexes, and/or defined by the investment advisor. These definitions may not apply for purposes of this report, which may combine such industry sub-classifications for reporting ease. |
|
| Derivative Financial Instruments Outstanding as of Period End |
Forward Foreign Currency Exchange Contracts
| | | | | | | | | | | | | | | | | | | | | | |
Currency Purchased | | | Currency
Sold | | | Counterparty | | Settlement
Date | | | Unrealized
Appreciation
(Depreciation) | | | |
| CAD | | | 110,000 | | | USD | | | 85,907 | | | Morgan Stanley & Co. International PLC | | | 5/04/16 | | | $ | 1,763 | | | |
| USD | | | 1,333,685 | | | CAD | | | 1,725,000 | | | Westpac Banking Corp. | | | 5/04/16 | | | | (41,142 | ) | | |
| USD | | | 1,095,713 | | | EUR | | | 961,000 | | | Morgan Stanley & Co. International PLC | | | 5/04/16 | | | | (4,712 | ) | | |
| USD | | | 1,611,892 | | | GBP | | | 1,121,000 | | | Royal Bank of Scotland PLC | | | 5/04/16 | | | | (26,059 | ) | | |
| USD | | | 1,289,303 | | | CAD | | | 1,615,000 | | | Westpac Banking Corp. | | | 6/06/16 | | | | 2,132 | | | |
| USD | | | 1,092,780 | | | EUR | | | 956,000 | | | Morgan Stanley & Co. International PLC | | | 6/06/16 | | | | (2,972 | ) | | |
| USD | | | 1,597,758 | | | GBP | | | 1,093,000 | | | State Street Bank and Trust Company | | | 6/06/16 | | | | 600 | | | |
| Total | | | | | | | | | | | | | | | | | | $ | (70,390 | ) | | |
| | | | | | | | | | | | | | | | | | | |
OTC Options Purchased
| | | | | | | | | | | | | | | | | | | | | | | | | | | | |
| Description | | Put/
Call | | | Counterparty | | | Expiration
Date | | | Strike
Price | | | Contracts | | | Value | |
Marsico Parent Superholdco LLC | | | Call | | | | Goldman Sachs & Co. | | | | 12/14/2019 | | | | USD | | | | 942.86 | | | | 26 | | | | — | |
OTC Total Return Swaps
| | | | | | | | | | | | | | | | | | | | | | | | | | | | | | | | |
| Reference Entity | | Fixed Rate
Floating Rate | | | Counterparty | | | Expiration
Date | | | Notional
Amount
(000) | | | Value | | | Premiums
Paid
(Received) | | | Unrealized
Depreciation | |
IBoxx USD Liquid High Yield Index | | | 3-month LIBOR | | | | JPMorgan Chase Bank N.A. | | | | 12/20/16 | | | | USD | | | | 345 | | | $ | (1,665 | ) | | $ | (233 | ) | | $ | (1,432 | ) |
See Notes to Financial Statements.
| | | | | | |
| | | | | | | |
| 36 | | SEMI-ANNUAL REPORT | | APRIL 30, 2016 | | |
| | |
Schedule of Investments (continued) | | BlackRock Floating Rate Income Trust (BGT) |
| | |
| Derivative Financial Instruments Categorized by Risk Exposure | | |
As of period end, the fair values of derivative financial instruments located in the Statements of Assets and Liabilities were as follows:
| | | | | | | | | | | | | | | | | | | | | | | | | | | | | | |
| | | | | Commodity
Contracts | | | Credit
Contracts | | | Equity
Contracts | | | Foreign
Currency
Exchange
Contracts | | | Interest
Rate
Contracts | | | Other
Contracts | | | Total | |
| Assets — Derivative Financial Instruments | | | | | | | | | | | | | | | | | | | | | |
Forward foreign currency exchange contracts | | Unrealized appreciation on forward foreign currency exchange contracts | | | — | | | | — | | | | — | | | $ | 4,495 | | | | — | | | | — | | | $ | 4,495 | |
Options purchased | | Investments at value — unaffiliated1 | | | — | | | | — | | | | — | | | | — | | | | — | | | | — | | | | — | |
| | | | | | | | | | | | | | | | | | | | | | | | | | | | | | |
Total | | | | | — | | | | — | | | | — | | | $ | 4,495 | | | | — | | | | — | | | $ | 4,495 | |
| | | | | | | | | | | | | | | | | | | | | | | | | | | | | | |
| | | | | | | | | | | | | | | | | | | | | | | | | | | | | | |
| Liabilities — Derivative Financial Instruments | | | | | | | | | | | | | | | | | | | | | |
Forward foreign currency exchange contracts | | Unrealized depreciation on forward foreign currency exchange contracts | | | — | | | | — | | | | — | | | $ | 74,885 | | | | — | | | | — | | | $ | 74,885 | |
Swaps — OTC | | Unrealized depreciation on OTC swaps; swap premiums received | | | — | | | | — | | | | — | | | | — | | | $ | 1,665 | | | | — | | | | 1,665 | |
| | | | | | | | | | | | | | | | | | | | | | | | | | | | | | |
Total | | | | | — | | | | — | | | | — | | | $ | 74,885 | | | $ | 1,665 | | | | — | | | $ | 76,550 | |
| | | | | | | | | | | | | | | | | | | | | | | | | | | | | | |
1 Includes options purchased at value as reported in the Schedule of Investments. | |
For the six months ended April 30, 2016, the effect of derivative financial instruments in the Statements of Operations was as follows:
| | | | | | | | | | | | | | | | | | | | | | | | | | | | |
| Net Realized Gain (Loss) from: | | Commodity
Contracts | | | Credit
Contracts | | | Equity
Contracts | | | Foreign
Currency
Exchange
Contracts | | | Interest
Rate
Contracts | | | Other
Contracts | | | Total | |
Forward foreign currency exchange contracts | | | — | | | | — | | | | — | | | $ | 38,625 | | | | — | | | | — | | | $ | 38,625 | |
Swaps | | | — | | | | — | | | | — | | | | — | | | $ | (68 | ) | | | — | | | | (68 | ) |
| | | | |
Total | | | — | | | | — | | | | — | | | $ | 38,625 | | | $ | (68 | ) | | | — | | | $ | 38,557 | |
| | | | |
| | | | | | | | | | | | | | | | | | | | | | | | | | | | |
| Net Change in Unrealized Appreciation (Depreciation) on: | | | | | | | | | | |
Forward foreign currency exchange contracts | | | — | | | | — | | | | — | | | $ | (81,446 | ) | | | — | | | | — | | | $ | (81,446 | ) |
Swaps | | | — | | | | — | | | | — | | | | — | | | $ | (1,432 | ) | | | — | | | | (1,432 | ) |
| | | | |
Total | | | — | | | | — | | | | — | | | $ | (81,446 | ) | | $ | (1,432 | ) | | | — | | | $ | (82,878 | ) |
| | | | |
|
| Average Quarterly Balances of Outstanding Derivative Financial Instruments |
| | | | |
Forward foreign currency exchange contracts: | | | | |
Average amounts purchased — in USD | | $ | 7,943,966 | |
Average amounts sold — in USD | | $ | 42,953 | |
| Total return swaps: | | | | |
Average notional value | | $ | 172,500 | |
For more information about the Trust’s investment risks regarding derivative financial instruments, refer to the Notes to Financial Statements.
|
| Derivative Financial Instruments — Offsetting as of Period End |
The Trust’s derivative assets and liabilities (by type) were as follows:
| | | | | | | | |
| | | Assets | | | Liabilities | |
Forward foreign currency exchange contracts | | $ | 4,495 | | | $ | 74,885 | |
Swaps — OTC1 | | | — | | | | 1,665 | |
| | | | |
Total derivative assets and liabilities in the Statements of Assets and Liabilities | | $ | 4,495 | | | $ | 76,550 | |
| | | | |
Total derivative assets and liabilities subject to a Master Netting Agreement or similar agreement (“MNA”) | | $ | 4,495 | | | $ | 76,550 | |
| | | | |
1 Includes unrealized appreciation (depreciation) on OTC swaps and swap premiums paid/received in the Statements of Assets and Liabilities. | |
See Notes to Financial Statements.
| | | | | | |
| | | | | | | |
| | SEMI-ANNUAL REPORT | | APRIL 30, 2016 | | 37 |
| | |
Schedule of Investments (continued) | | BlackRock Floating Rate Income Trust (BGT) |
The following table presents the Trust’s derivative assets and liabilities by counterparty net of amounts available for offset under an MNA and net of the related collateral received and pledged by the Trust:
| | | | | | | | | | | | | | | | | | | | |
| Counterparty | | Derivative Assets
Subject to an MNA
by Counterparty | | | Derivatives
Available for
Offset1 | | | Non-cash Collateral
Received | | | Cash Collateral
Received | | | Net
Amount of
Derivative
Assets2 | |
Morgan Stanley & Co. International PLC | | $ | 1,763 | | | $ | (1,763 | ) | | | — | | | | — | | | | — | |
State Street Bank and Trust Company | | | 600 | | | | — | | | | — | | | | — | | | $ | 600 | |
Westpac Banking Corp. | | | 2,132 | | | | (2,132 | ) | | | — | | | | — | | | | — | |
| | | | |
Total | | $ | 4,495 | | | $ | (3,895 | ) | | | — | | | | — | | | $ | 600 | |
| | | | |
| | | | | | | | | | | | | | | | | | | | |
| Counterparty | | Derivative Liabilities
Subject to an MNA
by Counterparty | | | Derivatives
Available for
Offset | | | Non-cash Collateral
Pledged | | | Cash Collateral
Pledged | | | Net
Amount of
Derivative
Liabilities3 | |
JPMorgan Chase Bank N.A. | | $ | 1,665 | | | | — | | | | — | | | | — | | | $ | 1,665 | |
Morgan Stanley & Co. International PLC | | | 7,684 | | | $ | (1,763 | ) | | | — | | | | — | | | | 5,921 | |
Royal Bank of Scotland PLC | | | 26,059 | | | | — | | | | — | | | | — | | | | 26,059 | |
Westpac Banking Corp. | | | 41,142 | | | | (2,132 | ) | | | — | | | | — | | | | 39,010 | |
| | | | |
Total | | $ | 76,550 | | | $ | (3,895 | ) | | | — | | | | — | | | $ | 72,655 | |
| | | | |
1 The amount of derivatives available for offset is limited to the amount of derivative assets and/or liabilities that are subject to an MNA. | |
2 Net amount represents the net amount receivable from the counterparty in the event of default. | |
3 Net amount represents the net amount payable due to the counterparty in the event of default. | |
| | |
| Fair Value Hierarchy as of Period End | | |
Various inputs are used in determining the fair value of investments and derivative financial instruments. For information about the Trust’s policy regarding valuation of investments and derivative financial instruments, refer to the Notes to Financial Statements.
The following tables summarize the Trust’s investments and derivative financial instruments categorized in the disclosure hierarchy:
| | | | | | | | | | | | | | | | |
| | | Level 1 | | | Level 2 | | | Level 3 | | | Total | |
Assets: | | | | | | | | | | | | | | | | |
| Investments: | | | | | | | | | | | | | | | | |
| Long-Term Investments: | | | | | | | | | | | | | | | | |
Asset-Backed Securities | | | — | | | $ | 7,197,671 | | | $ | 2,763,828 | | | $ | 9,961,499 | |
Common Stocks | | | — | | | | 55,146 | | | | 257,774 | | | | 312,920 | |
Corporate Bonds | | | — | | | | 13,312,988 | | | | 607,442 | | | | 13,920,430 | |
Floating Rate Loan Interests | | | — | | | | 405,509,954 | | | | 29,682,704 | | | | 435,192,658 | |
Investment Companies | | $ | 52,927 | | | | — | | | | — | | | | 52,927 | |
Non-Agency Mortgage-Backed Securities | | | — | | | | 600,215 | | | | — | | | | 600,215 | |
Other Interests | | | — | | | | — | | | | 169,422 | | | | 169,422 | |
Warrants | | | — | | | | — | | | | 8,438 | | | | 8,438 | |
Options Purchased | | | — | | | | — | | | | — | | | | — | |
Short-Term Securities | | | 2,974,761 | | | | — | | | | — | | | | 2,974,761 | |
| | | | |
Total | | $ | 3,027,688 | | | $ | 426,675,974 | | | $ | 33,489,608 | | | $ | 463,193,270 | |
| | | | |
| | | | |
| Derivative Financial Instruments1 | | | | | | | | | | | | | | | | |
Assets: | | | | | | | | | | | | | | | | |
Forward foreign currency contracts | | | — | | | $ | 4,495 | | | | — | | | $ | 4,495 | |
Liabilities: | | | | | | | | | | | | | | | | |
Forward foreign currency contracts | | | — | | | | (74,885 | ) | | | — | | | | (74,885 | ) |
Interest rate contracts | | | — | | | | (1,432 | ) | | | — | | | | (1,432 | ) |
| | | | |
Total | | | — | | | $ | (71,822 | ) | | | — | | | $ | (71,822 | ) |
| | | | |
1 Derivative financial instruments are swaps and forward foreign currency contracts, which are valued at the unrealized appreciation (depreciation) on the instrument. | |
See Notes to Financial Statements.
| | | | | | |
| | | | | | | |
| 38 | | SEMI-ANNUAL REPORT | | APRIL 30, 2016 | | |
| | |
Schedule of Investments (concluded) | | BlackRock Floating Rate Income Trust (BGT) |
The Trust may hold assets and/or liabilities in which the fair value approximates the carrying amount for financial statement purposes. As of period end, such assets and/or liabilities are categorized within the disclosure hierarchy as follows:
| | | | | | | | | | | | | | | | |
| | | Level 1 | | | Level 2 | | | Level 3 | | | Total | |
Assets: | | | | | | | | | | | | | | | | |
Cash | | $ | 594,473 | | | | — | | | | — | | | $ | 594,473 | |
Foreign currency at value | | | 33,948 | | | | — | | | | — | | | | 33,948 | |
Liabilities: | | | | | | | | | | | | | | | | |
Bank borrowings payable | | | — | | | $ | (121,000,000 | ) | | | — | | | | (121,000,000 | ) |
| | | | |
Total | | $ | 628,421 | | | $ | (121,000,000 | ) | | | — | | | $ | (120,371,579 | ) |
| | | | |
During the six months ended April 30, 2016, there were no transfers between Level 1 and Level 2.
A reconciliation of Level 3 investments is presented when the Trust had a significant amount of Level 3 investments at the beginning and/or end of the period in relation to net assets. The following table is a reconciliation of Level 3 investments for which significant unobservable inputs were used in determining fair value:
| | | | | | | | | | | | | | | | | | | | | | | | | | | | |
| | | Common
Stocks | | | Asset-Backed
Securities | | | Corporate
Bonds | | | Floating
Rate Loan Interests | | | Other
Interests | | | Warrants | | | Total | |
| Assets: | | | | | | | | | | | | | | | | | | | | | | | | | | | | |
Opening Balance, as of October 31, 2015 | | $ | 242,024 | | | $ | 4,308,660 | | | $ | 584,504 | | | $ | 20,360,572 | | | $ | 173,792 | | | $ | 8,643 | | | $ | 25,678,195 | |
Transfers into Level 31 | | | — | | | | 248,783 | | | | — | | | | 15,261,909 | | | | — | | | | — | | | | 15,510,692 | |
Transfers out of Level 32 | | | — | | | | — | | | | — | | | | (5,778,449 | ) | | | — | | | | — | | | | (5,778,449 | ) |
Accrued discounts/premiums | | | — | | | | 895 | | | | (308 | ) | | | 20,276 | | | | — | | | | — | | | | 20,863 | |
Net realized gain (loss) | | | — | | | | (209,837 | ) | | | — | | | | (189,006 | ) | | | — | | | | — | | | | (398,843 | ) |
Net change in unrealized appreciation (depreciation)3,4 | | | 9,486 | | | | (28,167 | ) | | | (3,964 | ) | | | (1,033,867 | ) | | | (4,370 | ) | | | (205 | ) | | | (1,061,087 | ) |
Purchases | | | 6,264 | | | | 726,947 | | | | 27,210 | | | | 4,450,546 | | | | — | | | | — | | | | 5,210,967 | |
Sales | | | — | | | | (2,283,453 | ) | | | — | | | | (3,409,277 | ) | | | — | | | | — | | | | (5,692,730 | ) |
| | | | |
Closing Balance, as of April 30, 2016 | | $ | 257,774 | | | $ | 2,763,828 | | | $ | 607,442 | | | $ | 29,682,704 | | | $ | 169,422 | | | $ | 8,438 | | | $ | 33,489,608 | |
| | | | |
Net change in unrealized appreciation (depreciation) on investments still held at April 30, 20164 | | $ | 9,486 | | | $ | (40,773 | ) | | $ | (3,964 | ) | | $ | (1,107,691 | ) | | $ | (4,370 | ) | | $ | (205 | ) | | $ | (1,147,517 | ) |
| | | | |
1 As of October 31, 2015, the Trust used observable inputs in determining the value of certain investments. As of April 30, 2016, the Trust used significant unobservable inputs in determining the value of the same investments. As a result, investments at beginning of period value were transferred from Level 2 to Level 3 in the disclosure hierarchy. | |
2 As of October 31, 2015, the Trust used significant unobservable inputs in determining the value of certain investments. As of April 30, 2016, the Trust used observable inputs in determining the value of the same investments. As a result, investments at beginning of period value were transferred from Level 3 to Level 2 in the disclosure hierarchy. | |
3 Included in the related net change in unrealized appreciation (depreciation) in the Statements of Operations. | |
4 Any difference between net change in unrealized appreciation (depreciation) on investments still held at April 30, 2016 is generally due to investments no longer held or categorized as Level 3 at period end. | |
See Notes to Financial Statements.
| | | | | | |
| | | | | | | |
| | SEMI-ANNUAL REPORT | | APRIL 30, 2016 | | 39 |
| | |
Consolidated Schedule of Investments April 30, 2016 (Unaudited) | | BlackRock Multi-Sector Income Trust (BIT) (Percentages shown are based on Net Assets) |
| | | | | | | | | | | | |
| | |
| Common Stocks | | Shares | | | Value | |
Aerospace & Defense — 0.4% | |
United Technologies Corp. | | | | | | | 25,650 | | | $ | 2,677,090 | |
Oil, Gas & Consumable Fuels — 0.0% | |
Vantage Drilling International (a) | | | | | | | 2,018 | | | | — | |
Real Estate Investment Trusts (REITs) — 0.0% | |
Ovation Acquisition I LLC, (Acquired 12/28/15, cost $8,635) (b) | | | | | | | 561 | | | | 561 | |
| Total Common Stocks — 0.4% | | | | | | | | | | | 2,677,651 | |
| | | | | | | | | | | | |
| | | | | | | | | | | | | |
| | |
| Asset-Backed Securities | | Par (000) | | | | |
Asset-Backed Securities — 33.1% | |
ACE Securities Corp. Home Equity Loan Trust, Series 2006-HE1, Class A2D,
0.73%, 2/25/36 (c) | | | USD | | | | 6,775 | | | | 6,059,045 | |
Adirondack Park CLO Ltd., Series 2013-1A,
Class E, 5.28%, 4/15/24 (c)(d) | | | | | | | 2,000 | | | | 1,643,491 | |
ALM Loan Funding, Series 2013-7RA, Class D, 5.62%, 4/24/24 (c)(d) | | | | | | | 1,000 | | | | 938,424 | |
ALM VI Ltd., Series 2012-6A (c)(d)(e): | | | | | | | | | | | | |
Class B2R, 3.42%, 7/15/26 | | | | | | | 1,300 | | | | 1,243,190 | |
Class CR, 4.37%, 7/15/26 | | | | | | | 1,000 | | | | 877,100 | |
ALM XIV Ltd., Series 2014-14A, Class C, 4.07%, 7/28/26 (c)(d)(e) | | | | | | | 3,610 | | | | 3,302,753 | |
American Homes 4 Rent, Series 2014-SFR2, Class E, 6.23%, 10/17/36 (d) | | | | | | | 2,000 | | | | 1,977,495 | |
AMMC CDO, Series 2015-16A, Class C, 3.73%, 4/14/27 (c)(d) | | | | | | | 1,250 | | | | 1,205,987 | |
AMMC CLO IX Ltd., Series 2011-9A, Class ER, 8.28%, 1/15/22 (c)(d) | | | | | | | 1,000 | | | | 934,700 | |
AMMC CLO XII Ltd., Series 2013-12A, Class D1, 4.37%, 5/10/25 (c)(d)(e) | | | | | | | 1,000 | | | | 881,881 | |
Anchorage Capital CLO 3 Ltd., Series 2014-3A, Class B, 3.62%, 4/28/26 (c)(d) | | | | | | | 1,000 | | | | 927,105 | |
Anchorage Capital CLO 6 Ltd.,
Series 2015-6A (c)(d): | | | | | | | | | | | | |
Class C, 3.48%, 4/15/27 | | | | | | | 700 | | | | 671,230 | |
Class D, 4.03%, 4/15/27 | | | | | | | 1,000 | | | | 864,800 | |
Apidos CDO, Series 2012-9AR, Class CR, 3.53%, 7/15/23 (c)(d)(e) | | | | | | | 1,250 | | | | 1,228,617 | |
Apidos CLO XII, Series 2013-12A, Class D, 3.68%, 4/15/25 (c)(d)(e) | | | | | | | 1,000 | | | | 902,904 | |
Atrium X, Series 10A (c)(d): | | | | | | | | | | | | |
Class D, 4.13%, 7/16/25 (e) | | | | | | | 1,000 | | | | 920,874 | |
Class E, 5.13%, 7/16/25 | | | | | | | 2,000 | | | | 1,669,960 | |
Bear Stearns Asset-Backed Securities I Trust, Series 2006-HE9, Class 2A,
0.58%, 11/25/36 (c) | | | | | | | 5,480 | | | | 4,623,278 | |
Benefit Street Partners CLO II Ltd.,
Series 2013-IIA, Class C, 4.13%, 7/15/24 (c)(d)(e) | | | | | | | 1,750 | | | | 1,594,250 | |
Benefit Street Partners CLO VI Ltd.,
Series 2015-VIA (c)(d)(e): | | | | | | | | | | | | |
Class B, 3.68%, 4/18/27 | | | | | | | 1,000 | | | | 970,000 | |
Class C, 4.33%, 4/18/27 | | | | | | | 1,000 | | | | 876,888 | |
Betony CLO Ltd., Series 2015-1A, Class D, 4.23%, 4/15/27 (c)(d) | | | | | | | 1,000 | | | | 873,122 | |
C-BASS Trust, Series 2006-CB7, Class A4, 0.60%, 10/25/36 (c) | | | | | | | 8,896 | | | | 6,325,327 | |
| | | | | | | | | | | | |
| Asset-Backed Securities | | Par (000) | | | Value | |
Asset-Backed Securities (continued) | |
Carlyle Global Market Strategies
CLO Ltd. (c)(d)(e): | | | | | | | | | | | | |
Series 2012-1AR, Class DR, 4.38%, 4/20/22 | | | USD | | | | 1,000 | | | $ | 960,100 | |
Series 2012-4A, Class D, 5.13%, 1/20/25 | | | | | | | 2,350 | | | | 2,300,499 | |
Series 2013-2A, Class D, 4.38%, 4/18/25 | | | | | | | 1,250 | | | | 1,171,656 | |
Carrington Mortgage Loan Trust,
Series 2006-FRE2 (c): | | | | | | | | | | | | |
Class A2, 0.55%, 10/25/36 | | | | | | | 6,333 | | | | 3,623,502 | |
Class A5, 0.51%, 10/25/36 | | | | | | | 13,047 | | | | 7,425,177 | |
CIFC Funding Ltd. (c)(d): | | | | | | | | | | | | |
Series 2012-1AR, Class B1R, 4.77%, 8/14/24 (e) | | | | | | | 2,000 | | | | 1,929,845 | |
Series 2014-3A, Class D, 4.04%, 7/22/26 | | | | | | | 480 | | | | 428,166 | |
DCP Rights LLC, Series 2014-1A, Class A, 5.46%, 10/25/44 (d) | | | | | | | 3,671 | | | | 3,616,889 | |
Flatiron CLO Ltd., Series 2012-1A, Class C, 5.12%, 10/25/24 (c)(d)(e) | | | | | | | 1,375 | | | | 1,343,745 | |
Fremont Home Loan Trust, Class 2A3 (c): | | | | | | | | | | | | |
Series 2006-A, 0.59%, 5/25/36 | | | | | | | 26,309 | | | | 13,870,024 | |
Series 2006-D, 0.58%, 11/25/36 | | | | | | | 24,099 | | | | 10,366,100 | |
GoldenTree Loan Opportunities VII Ltd.,
Series 2013-7A, Class D,
3.92%, 4/25/25 (c)(d) | | | | | | | 1,250 | | | | 1,167,061 | |
GSAMP Trust (c): | | | | | | | | | | | | |
Series 2006-FM2, Class A2C, 0.58%, 9/25/36 | | | | | | | 12,033 | | | | 5,510,072 | |
Series 2007-FM2, Class A2B, 0.52%, 1/25/37 | | | | | | | 8,635 | | | | 5,105,120 | |
Highbridge Loan Management Ltd.,
Series 4A-2014, Class B,
3.62%, 7/28/25 (c)(d)(e) | | | | | | | 2,000 | | | | 1,939,460 | |
Home Equity Mortgage Loan Asset-Backed Trust, Series 2006-E, Class 2A3,
0.61%, 4/25/37 (c) | | | | | | | 14,322 | | | | 8,734,597 | |
Lehman ABS Manufactured Housing Contract Trust, Series 2001-B, Class M2, 7.17%, 4/15/40 (c) | | | | | | | 6,207 | | | | 4,227,281 | |
Long Beach Mortgage Loan Trust,
Series 2006-1, Class 1A,
0.66%, 2/25/36 (c) | | | | | | | 6,472 | | | | 5,138,502 | |
Madison Park Funding IX Ltd., Series 2012-9AR, Class C1R, 3.47%, 8/15/22 (c)(d)(e) | | | | | | | 1,000 | | | | 986,005 | |
Madison Park Funding Ltd. (c): | | | | | | | | | | | | |
Series 2012-10A, Class D, 4.88%, 1/20/25 (d)(e) | | | | | | | 1,000 | | | | 969,555 | |
Series 2012-8X, Class E, 5.99%, 4/22/22 | | | | | | | 3,000 | | | | 2,720,938 | |
Madison Park Funding XV Ltd., Series 2014-15A, Class B1,
3.87%, 1/27/26 (c)(d)(e) | | | | | | | 1,600 | | | | 1,599,972 | |
Madison Park Funding XVI Ltd., Series 2015-16A (c)(d)(e): | | | | | | | | | | | | |
Class B, 3.63%, 4/20/26 | | | | | | | 1,000 | | | | 993,600 | |
Class C, 4.33%, 4/20/26 | | | | | | | 1,000 | | | | 910,800 | |
Mastr Asset-Backed Securities Trust (c): | | | | | | | | | | | | |
Series 2006-HE2, Class A3, 0.58%, 6/25/36 | | | | | | | 11,867 | | | | 6,204,345 | |
Series 2006-WMC2, Class A5, 0.68%, 4/25/36 | | | | | | | 9,069 | | | | 3,761,118 | |
See Notes to Financial Statements.
| | | | | | |
| | | | | | | |
| 40 | | SEMI-ANNUAL REPORT | | APRIL 30, 2016 | | |
| | |
Consolidated Schedule of Investments (continued) | | BlackRock Multi-Sector Income Trust (BIT) |
| | | | | | | | | | | | |
| Asset-Backed Securities | | Par (000) | | | Value | |
Asset-Backed Securities (continued) | |
Morgan Stanley IXIS Real Estate Capital Trust, Series 2006-2, Class A3,
0.58%, 11/25/36 (c) | | | USD | | | | 15,127 | | | $ | 6,635,446 | |
Octagon Investment Partners XIV Ltd., Series 2012-1A, Class C, 4.63%, 1/15/24 (c)(d)(e) | | | | | | | 1,000 | | | | 921,484 | |
Octagon Investment Partners XXI Ltd., Series 2014-1A, Class C,
4.27%, 11/14/26 (c)(d) | | | | | | | 1,000 | | | | 891,135 | |
OHA Credit Partners VII Ltd., Series 2012-7A, Class D, 4.62%, 11/20/23 (c)(d)(e) | | | | | | | 3,000 | | | | 2,859,984 | |
OneMain Financial Issuance Trust (d): | | | | | | | | | | | | |
Series 2015-1A, Class D, 6.63%, 3/18/26 | | | | | | | 575 | | | | 568,405 | |
Series 2015-2A, Class C, 4.32%, 7/18/25 (e) | | | | | | | 5,000 | | | | 4,736,128 | |
Series 2015-2A, Class D, 5.64%, 7/18/25 | | | | | | | 2,500 | | | | 2,393,329 | |
OZLM Funding IV Ltd., Series 2013-4A, Class C, 3.84%, 7/22/25 (c)(d)(e) | | | | | | | 1,250 | | | | 1,107,114 | |
OZLM Funding Ltd., Series 2012-2A, Class C, 4.97%, 10/30/23 (c)(d)(e) | | | | | | | 2,000 | | | | 1,930,807 | |
Pretium Mortgage Credit Partners LLC, Series 2016-NPL3, Class A1, 4.38%, 5/25/31 (d)(f) | | | | | | | 7,000 | | | | 7,000,000 | |
Race Point CLO Ltd., Series 2011-5AR, Class ER, 6.34%, 12/15/22 (c)(d) | | | | | | | 1,500 | | | | 1,417,236 | |
Renaissance Home Equity Loan Trust, Series 2007-3, Class AF2,
7.00%, 9/25/37 (f) | | | | | | | 4,651 | | | | 2,714,508 | |
Santander Drive Auto Receivables Trust (g): | | | | | | | | | | | | |
Series 2014-S2, 0.00%, 11/16/18 | | | | | | | 3 | | | | 6,296,400 | |
Series 2014-S3, 0.00%, 2/19/19 | | | | | | | 3 | | | | 9,031,200 | |
Series 2014-S4, 0.00%, 4/16/19 | | | | | | | 3 | | | | 11,829,600 | |
Saxon Asset Securities Trust, Series 2007-3, Class 2A3, 0.84%, 9/25/47 (c) | | | | | | | 5,000 | | | | 3,638,838 | |
Scholar Funding Trust, Series 2013-A,
Class R, 0.00% (d) | | | | | | | — | (h) | | | 3,023,604 | |
SMB Private Education Loan Trust, Series 2015-C, Class C, 4.50%, 9/17/46 (d) | | | | | | | 4,100 | | | | 3,951,365 | |
Symphony CLO Ltd., Series 2012-10AR, Class CR, 3.47%, 7/23/23 (c)(d)(e) | | | | | | | 1,500 | | | | 1,481,333 | |
Symphony CLO XV Ltd., Series 2014-15A, Class D, 4.38%, 10/17/26 (c)(d) | | | | | | | 3,500 | | | | 3,160,150 | |
TICP CLO I Ltd., Series 2015-1A, Class C, 3.63%, 7/20/27 (c)(d) | | | | | | | 1,000 | | | | 966,580 | |
Treman Park CLO LLC, Series 2015-1A, Class D, 4.49%, 4/20/27 (c)(d) | | | | | | | 1,500 | | | | 1,406,250 | |
Tyron Park CLO Ltd., Series 2013-1A (c)(d): | | | | | | | | | | | | |
Class C, 4.13%, 7/15/25 (e) | | | | | | | 1,250 | | | | 1,144,125 | |
Class D, 5.03%, 7/15/25 | | | | | | | 1,000 | | | | 813,910 | |
Venture XX CLO Ltd., Series 2015-20A (c)(d): | | | | | | | | | | | | |
Class C, 3.78%, 4/15/27 (e) | | | | | | | 1,000 | | | | 934,000 | |
Class D, 4.48%, 4/15/27 | | | | | | | 520 | | | | 436,852 | |
Venture XXI CLO Ltd., Series 2015-21A, Class D, 4.23%, 7/15/27 (c)(d) | | | | | | | 480 | | | | 433,810 | |
Voya CLO Ltd., Series 2012-2AR, Class CR, 3.58%, 10/15/22 (c)(d)(e) | | | | | | | 1,350 | | | | 1,309,837 | |
WaMu Asset-Backed Certificates Trust, Series 2007-HE3, Class 2A3, 0.67%, 5/25/47 (c) | | | | | | | 11,382 | | | | 7,351,908 | |
Westvue Mortgage Loan Trust, Series 2015-1A, Class A, 4.50%, 9/25/20 (d) | | | | | | | 3,021 | | | | 2,990,234 | |
| Total Asset-Backed Securities — 33.1% | | | | | | | | 231,892,122 | |
| | | | | | | | | | | | |
| Corporate Bonds | | Par (000) | | | Value | |
Aerospace & Defense — 0.7% | |
Accudyne Industries Borrower/Accudyne Industries LLC, 7.75%, 12/15/20 (d)(e) | | | USD | | | | 690 | | | $ | 567,525 | |
Bombardier, Inc. (d): | | | | | | | | | | | | |
7.50%, 3/15/18 | | | | | | | 71 | | | | 72,331 | |
5.50%, 9/15/18 | | | | | | | 186 | | | | 183,210 | |
6.00%, 10/15/22 | | | | | | | 158 | | | | 134,379 | |
7.50%, 3/15/25 | | | | | | | 142 | | | | 127,090 | |
KLX, Inc., 5.88%, 12/01/22 (d) | | | | | | | 275 | | | | 276,719 | |
TransDigm, Inc.: | | | | | | | | | | | | |
5.50%, 10/15/20 | | | | | | | 372 | | | | 377,580 | |
7.50%, 7/15/21 (e) | | | | | | | 312 | | | | 326,196 | |
6.00%, 7/15/22 (e) | | | | | | | 1,971 | | | | 1,995,046 | |
6.50%, 7/15/24 (e) | | | | | | | 626 | | | | 630,695 | |
| | | | | | | | | | | | |
| | | | | | | | | | | | 4,690,771 | |
Air Freight & Logistics — 0.1% | |
XPO Logistics, Inc., 6.50%, 6/15/22 (d)(e) | | | | | | | 760 | | | | 740,088 | |
Airlines — 4.7% | |
Air Canada Pass-Through Trust, Series 2013-1 (d)(e): | | | | | | | | | | | | |
Class B, 5.38%, 11/15/22 | | | | | | | 2,878 | | | | 2,871,257 | |
Class C, 6.63%, 5/15/18 | | | | | | | 761 | | | | 768,610 | |
American Airlines Pass-Through Trust (e): | | | | | | | | | | | | |
Series 2013-1, Class C,
6.13%, 7/15/18 (d) | | | | | | | 1,500 | | | | 1,567,500 | |
Series 2013-2, Class A,
4.95%, 7/15/24 | | | | | | | 2,100 | | | | 2,255,296 | |
Series 2013-2, Class C,
6.00%, 1/15/17 (d) | | | | | | | 2,763 | | | | 2,811,688 | |
Continental Airlines Pass-Through Trust (e): | | | | | | | | | | | | |
Series 2003-ERJ1, 7.88%, 1/02/20 | | | | | | | 4,192 | | | | 4,359,810 | |
Series 2007-1, Class B, 6.90%, 10/19/23 | | | | | | | 1,084 | | | | 1,124,171 | |
Series 2012-1, Class B, 6.25%, 10/11/21 | | | | | | | 400 | | | | 418,424 | |
Series 2012-3, Class C, 6.13%, 4/29/18 | | | | | | | 408 | | | | 428,400 | |
Delta Air Lines Pass-Through Trust,
Class B (e): | | | | | | | | | | | | |
Series 2007-1, 8.02%, 2/10/24 | | | | | | | 1,981 | | | | 2,233,575 | |
Series 2012-1, 6.88%, 5/07/19 (d) | | | | | | | 3,505 | | | | 3,798,306 | |
United Airlines Pass-Through Trust (e): | | | | | | | | | | | | |
Series 2014-2, Class B, 4.63%, 3/03/24 | | | | | | | 2,615 | | | | 2,595,490 | |
Series 2015-1, Class A, 3.70%, 6/01/24 | | | | | | | 3,570 | | | | 3,623,550 | |
US Airways Pass-Through Trust, Class B (e): | | | | | | | | | | | | |
Series 2011-1, 9.75%, 4/22/20 | | | | | | | 2,109 | | | | 2,362,517 | |
Series 2013-1, 5.38%, 5/15/23 | | | | | | | 1,516 | | | | 1,569,926 | |
| | | | | | | | | | | | |
| | | | | | | | | | | | 32,788,520 | |
Auto Components — 0.5% | |
Icahn Enterprises LP/Icahn Enterprises
Finance Corp. (e): | | | | | | | | | | | | |
4.88%, 3/15/19 | | | | | | | 931 | | | | 924,017 | |
5.88%, 2/01/22 | | | | | | | 625 | | | | 596,094 | |
Schaeffler Finance BV, 4.75%, 5/15/21 (d)(e) | | | | | | | 1,045 | | | | 1,073,737 | |
Schaeffler Holding Finance BV, (6.75% Cash), 6.75%, 11/15/22 (d)(e)(i) | | | | | | | 1,110 | | | | 1,207,819 | |
| | | | | | | | | | | | |
| | | | | | | | | | | | 3,801,667 | |
Automobiles — 0.4% | |
General Motors Co., 6.25%, 10/02/43 (e) | | | | | | | 2,194 | | | | 2,472,566 | |
See Notes to Financial Statements.
| | | | | | |
| | | | | | | |
| | SEMI-ANNUAL REPORT | | APRIL 30, 2016 | | 41 |
| | |
Consolidated Schedule of Investments (continued) | | BlackRock Multi-Sector Income Trust (BIT) |
| | | | | | | | | | | | |
| Corporate Bonds | | Par (000) | | | Value | |
Banks — 1.0% | | | | | | | | | | | | |
CIT Group, Inc.: | | | | | | | | | | | | |
5.25%, 3/15/18 (e) | | | USD | | | | 588 | | | $ | 606,375 | |
5.50%, 2/15/19 (d) | | | | | | | 280 | | | | 293,300 | |
5.00%, 8/01/23 (e) | | | | | | | 880 | | | | 915,200 | |
Rizal Commercial Banking Corp., 4.25%, 1/22/20 | | | | | | | 100 | | | | 104,618 | |
Sberbank of Russia Via SB Capital SA, 5.25%, 5/23/23 (d) | | | | | | | 5,000 | | | | 4,843,750 | |
| | | | | | | | | | | | |
| | | | | | | | | | | | 6,763,243 | |
Beverages — 0.3% | |
Anheuser-Busch InBev Finance, Inc., 4.90%, 2/01/46 (e) | | | | | | | 2,160 | | | | 2,449,565 | |
Building Products — 0.6% | | | | | | | | | | | | |
American Builders & Contractors
Supply Co., Inc. (d)(e): | | | | | | | | | | | | |
5.63%, 4/15/21 | | | | | | | 375 | | | | 388,125 | |
5.75%, 12/15/23 | | | | | | | 173 | | | | 181,218 | |
Building Materials Corp. of America, 6.00%, 10/15/25 (d)(e) | | | | | | | 667 | | | | 718,693 | |
Cemex SAB de CV, 5.88%, 3/25/19 (d)(e) | | | | | | | 200 | | | | 204,480 | |
Masonite International Corp.,
5.63%, 3/15/23 (d)(e) | | | | | | | 360 | | | | 376,200 | |
Ply Gem Industries, Inc., 6.50%, 2/01/22 (e) | | | | | | | 919 | | | | 912,107 | |
Standard Industries, Inc. (d)(e): | | | | | | | | | | | | |
5.13%, 2/15/21 | | | | | | | 157 | | | | 163,280 | |
5.50%, 2/15/23 | | | | | | | 257 | | | | 268,886 | |
USG Corp. (e): | | | | | | | | | | | | |
9.75%, 1/15/18 | | | | | | | 572 | | | | 642,070 | |
5.50%, 3/01/25 (d) | | | | | | | 420 | | | | 444,675 | |
| | | | | | | | | | | | |
| | | | | | | | | | | | 4,299,734 | |
Capital Markets — 0.3% | |
AE-Rotor Holding BV, 4.97%, 3/28/18 (e) | | | | | | | 140 | | | | 140,113 | |
American Capital Ltd., 6.50%, 9/15/18 (d)(e) | | | | | | | 700 | | | | 711,375 | |
E*Trade Financial Corp. (e): | | | | | | | | | | | | |
5.38%, 11/15/22 | | | | | | | 430 | | | | 456,449 | |
4.63%, 9/15/23 | | | | | | | 490 | | | | 495,978 | |
| | | | | | | | | | | | |
| | | | | | | | | | | | 1,803,915 | |
Casinos & Gambling — 0.0% | |
GLP Capital LP / GLP Financing II, Inc.: | | | | | | | | | | | | |
4.38%, 4/15/21 | | | | | | | 194 | | | | 198,365 | |
5.38%, 4/15/26 | | | | | | | 110 | | | | 114,675 | |
| | | | | | | | | | | | |
| | | | | 313,040 | |
Chemicals — 0.6% | | | | | | | | | | | | |
Axalta Coating Systems US Holdings, Inc./Axalta Coating Systems Dutch Holding BV, 7.38%, 5/01/21 (d)(e) | | | | | | | 570 | | | | 602,775 | |
Chemours Co. (d): | | | | | | | | | | | | |
6.63%, 5/15/23 | | | | | | | 140 | | | | 122,500 | |
7.00%, 5/15/25 | | | | | | | 165 | | | | 143,137 | |
Huntsman International LLC, 4.88%, 11/15/20 | | | | | | | 180 | | | | 181,350 | |
Momentive Performance Materials, Inc., 3.88%, 10/24/21 (e) | | | | | | | 499 | | | | 381,735 | |
NOVA Chemicals Corp., 5.25%, 8/01/23 (d) | | | | | | | 510 | | | | 515,100 | |
Platform Specialty Products Corp. (d)(e): | | | | | | | | | | | | |
10.38%, 5/01/21 | | | | | | | 65 | | | | 65,000 | |
6.50%, 2/01/22 | | | | | | | 1,349 | | | | 1,187,120 | |
PQ Corp., 6.75%, 11/15/22 (d)(j) | | | | | | | 355 | | | | 366,094 | |
WR Grace & Co-Conn (d): | | | | | | | | | | | | |
5.13%, 10/01/21 | | | | | | | 49 | | | | 51,303 | |
| | | | | | | | | | | | |
| Corporate Bonds | | Par (000) | | | Value | |
Chemicals (continued) | | | | | | | | | | | | |
WR Grace & Co-Conn (d) (continued): | | | | | | | | | | | | |
5.63%, 10/01/24 (e) | | | USD | | | | 300 | | | $ | 317,250 | |
| | | | | | | | | | | | |
| | | | | | | | | | | | 3,933,364 | |
Commercial Services & Supplies — 1.2% | |
ADT Corp.: | | | | | | | | | | | | |
3.50%, 7/15/22 | | | | | | | 412 | | | | 378,010 | |
4.13%, 6/15/23 | | | | | | | 170 | | | | 158,100 | |
4.88%, 7/15/42 | | | | | | | 40 | | | | 29,900 | |
Aviation Capital Group Corp.,
6.75%, 4/06/21 (d)(e) | | | | | | | 5,000 | | | | 5,668,750 | |
Brand Energy & Infrastructure Services, Inc., 8.50%, 12/01/21 (d) | | | | | | | 322 | | | | 304,290 | |
Iron Mountain, Inc., 6.00%, 10/01/20 (d)(e) | | | | | | | 555 | | | | 586,912 | |
United Rentals North America, Inc.: | | | | | | | | | | | | |
8.25%, 2/01/21 | | | | | | | 140 | | | | 145,950 | |
7.63%, 4/15/22 | | | | | | | 144 | | | | 153,720 | |
5.75%, 11/15/24 (e) | | | | | | | 800 | | | | 811,000 | |
| | | | | | | | | | | | |
| | | | | | | | | | | | 8,236,632 | |
Communications Equipment — 1.3% | |
Alcatel-Lucent USA, Inc., 6.45%, 3/15/29 (e) | | | | | | | 2,560 | | | | 2,739,200 | |
CommScope Technologies Finance LLC, 6.00%, 6/15/25 (d)(e) | | | | | | | 610 | | | | 625,250 | |
CommScope, Inc., 4.38%, 6/15/20 (d)(e) | | | | | | | 450 | | | | 464,625 | |
Nokia OYJ, 6.63%, 5/15/39 (e) | | | | | | | 245 | | | | 263,375 | |
Zayo Group LLC/Zayo Capital, Inc. (e): | | | | | | | | | | | | |
10.13%, 7/01/20 | | | | | | | 3,257 | | | | 3,472,776 | |
6.38%, 5/15/25 (d) | | | | | | | 1,383 | | | | 1,438,320 | |
| | | | | | | | | | | | |
| | | | | | | | | | | | 9,003,546 | |
Computer Services Software & Systems — 0.0% | |
Infinity Acquisition LLC/Infinity Acquisition Finance Corp., 7.25%, 8/01/22 (d) | | | | | | | 21 | | | | 18,375 | |
Computer Technology — 0.0% | | | | | | | | | | | | |
Western Digital Corp., 7.38%, 4/01/23 (d) | | | | | | | 215 | | | | 217,016 | |
Construction & Engineering — 0.2% | | | | | | | | | | | | |
BlueLine Rental Finance Corp., 7.00%, 2/01/19 (d)(e) | | | | | | | 643 | | | | 564,233 | |
Safway Group Holding LLC/Safway Finance Corp., 7.00%, 5/15/18 (d)(e) | | | | | | | 900 | | | | 900,000 | |
| | | | | | | | | | | | |
| | | | | | | | | | | | 1,464,233 | |
Construction Materials — 0.8% | |
American Tire Distributors, Inc.,
10.25%, 3/01/22 (d)(e) | | | | | | | 295 | | | | 264,763 | |
Beacon Roofing Supply, Inc.,
6.38%, 10/01/23 (e) | | | | | | | 353 | | | | 375,062 | |
HD Supply, Inc. (e): | | | | | | | | | | | | |
7.50%, 7/15/20 | | | | | | | 1,946 | | | | 2,065,192 | |
5.25%, 12/15/21 (d) | | | | | | | 1,265 | | | | 1,328,250 | |
5.75%, 4/15/24 (d) | | | | | | | 1,157 | | | | 1,213,404 | |
PulteGroup, Inc., 5.50%, 3/01/26 | | | | | | | 347 | | | | 358,278 | |
| | | | | | | | | | | | |
| | | | | | | | | | | | 5,604,949 | |
Consumer Finance — 1.0% | |
Ally Financial, Inc., 8.00%, 11/01/31 (e) | | | | | | | 5,360 | | | | 6,418,600 | |
Navient Corp.: | | | | | | | | | | | | |
5.00%, 10/26/20 (e) | | | | | | | 370 | | | | 353,350 | |
5.50%, 1/25/23 | | | | | | | 30 | | | | 26,962 | |
6.13%, 3/25/24 | | | | | | | 132 | | | | 118,206 | |
5.88%, 10/25/24 | | | | | | | 138 | | | | 121,095 | |
OneMain Financial Holdings LLC (d): | | | | | | | | | | | | |
6.75%, 12/15/19 | | | | | | | 112 | | | | 114,520 | |
7.25%, 12/15/21 | | | | | | | 38 | | | | 39,520 | |
| | | | | | | | | | | | |
| | | | | | | | | | | | 7,192,253 | |
See Notes to Financial Statements.
| | | | | | |
| | | | | | | |
| 42 | | SEMI-ANNUAL REPORT | | APRIL 30, 2016 | | |
| | |
Consolidated Schedule of Investments (continued) | | BlackRock Multi-Sector Income Trust (BIT) |
| | | | | | | | | | | | |
| Corporate Bonds | | Par (000) | | | Value | |
Containers & Packaging — 0.8% | |
Ardagh Packaging Finance PLC, 9.13%, 10/15/20 (d)(e) | | | USD | | | | 1,285 | | | $ | 1,352,462 | |
Ardagh Packaging Finance PLC/Ardagh MP Holdings USA, Inc. (d): | | | | | | | | | | | | |
6.25%, 1/31/19 | | | | | | | 403 | | | | 412,068 | |
3.88%, 5/15/21 (c)(j) | | | | | | | 322 | | | | 320,390 | |
4.63%, 5/15/23 (j) | | | | | | | 452 | | | | 452,000 | |
7.25%, 5/15/24 (j) | | | | | | | 726 | | | | 726,000 | |
Ball Corp.: | | | | | | | | | | | | |
4.38%, 12/15/20 (e) | | | | | | | 273 | | | | 283,920 | |
5.00%, 3/15/22 | | | | | | | 440 | | | | 460,944 | |
Crown Americas LLC/Crown Americas Capital Corp. IV, 4.50%, 1/15/23 | | | | | | | 287 | | | | 292,740 | |
Sealed Air Corp. (d): | | | | | | | | | | | | |
4.88%, 12/01/22 (e) | | | | | | | 100 | | | | 104,125 | |
5.13%, 12/01/24 (e) | | | | | | | 592 | | | | 620,120 | |
5.50%, 9/15/25 (e) | | | | | | | 410 | | | | 435,112 | |
6.88%, 7/15/33 | | | | | | | 115 | | | | 121,613 | |
| | | | | | | | | | | | |
| | | | | | | | | | | | 5,581,494 | |
Diversified Consumer Services — 0.2% | |
APX Group, Inc.: | | | | | | | | | | | | |
6.38%, 12/01/19 (e) | | | | | | | 289 | | | | 289,000 | |
8.75%, 12/01/20 | | | | | | | 125 | | | | 117,188 | |
Prime Security Services Borrower LLC/Prime Finance, Inc., 9.25%, 5/15/23 (d)(j) | | | | | | | 373 | | | | 386,987 | |
Service Corp. International, 5.38%, 5/15/24 (e) | | | | | | | 860 | | | | 915,900 | |
| | | | | | | | | | | | |
| | | | | | | | | | | | 1,709,075 | |
Diversified Financial Services — 1.5% | |
AerCap Ireland Capital Ltd./AerCap Global Aviation Trust (e): | | | | | | | | | | | | |
4.63%, 10/30/20 | | | | | | | 1,227 | | | | 1,276,080 | |
5.00%, 10/01/21 | | | | | | | 780 | | | | 822,900 | |
4.63%, 7/01/22 | | | | | | | 410 | | | | 424,350 | |
Aircastle Ltd.: | | | | | | | | | | | | |
6.25%, 12/01/19 (e) | | | | | | | 784 | | | | 860,440 | |
5.00%, 4/01/23 | | | | | | | 80 | | | | 81,453 | |
DPL, Inc., 6.50%, 10/15/16 | | | | | | | 50 | | | | 51,000 | |
General Motors Financial Co., Inc., 4.25%, 5/15/23 (e) | | | | | | | 326 | | | | 335,599 | |
International Lease Finance Corp., 5.88%, 8/15/22 (e) | | | | | | | 530 | | | | 580,350 | |
Intesa Sanpaolo SpA, 5.02%, 6/26/24 (d)(e) | | | | | | | 2,290 | | | | 2,155,233 | |
Jefferies Finance LLC/JFIN Co-Issuer Corp., 7.38%, 4/01/20 (d)(e) | | | | | | | 845 | | | | 779,513 | |
Mercury Bondco PLC, (8.25% Cash, 9.00% PIK), 8.25%, 5/30/21 (i) | | | EUR | | | | 250 | | | | 284,831 | |
Reynolds Group Issuer, Inc.: | | | | | | | | | | | | |
8.50%, 5/15/18 | | | USD | | | | 300 | | | | 300,360 | |
9.00%, 4/15/19 (e) | | | | | | | 300 | | | | 304,500 | |
9.88%, 8/15/19 (e) | | | | | | | 1,244 | | | | 1,285,985 | |
5.75%, 10/15/20 | | | | | | | 590 | | | | 612,125 | |
8.25%, 2/15/21 | | | | | | | 430 | | | | 445,050 | |
| | | | | | | | | | | | |
| | | | | | | | | | | | 10,599,769 | |
Diversified Telecommunication Services — 2.7% | |
AT&T, Inc., 4.75%, 5/15/46 (e) | | | | | | | 2,545 | | | | 2,564,398 | |
CenturyLink, Inc., 6.45%, 6/15/21 (e) | | | | | | | 834 | | | | 850,680 | |
Frontier Communications Corp.: | | | | | | | | | | | | |
7.13%, 3/15/19 | | | | | | | 195 | | | | 205,725 | |
7.13%, 1/15/23 (e) | | | | | | | 65 | | | | 57,525 | |
7.63%, 4/15/24 (e) | | | | | | | 285 | | | | 252,995 | |
6.88%, 1/15/25 (e) | | | | | | | 1,074 | | | | 894,105 | |
| | | | | | | | | | | | |
| Corporate Bonds | | Par (000) | | | Value | |
Diversified Telecommunication Services (continued) | |
Level 3 Financing, Inc.: | | | | | | | | | | | | |
5.38%, 8/15/22 | | | USD | | | | 180 | | | $ | 184,050 | |
5.63%, 2/01/23 (e) | | | | | | | 609 | | | | 625,748 | |
5.13%, 5/01/23 (e) | | | | | | | 1,110 | | | | 1,129,425 | |
5.38%, 1/15/24 (d)(e) | | | | | | | 294 | | | | 298,410 | |
5.38%, 5/01/25 (e) | | | | | | | 1,980 | | | | 2,014,650 | |
5.25%, 3/15/26 (d) | | | | | | | 186 | | | | 188,790 | |
Telecom Italia Capital SA, 6.00%, 9/30/34 (e) | | | | | | | 1,005 | | | | 992,437 | |
Verizon Communications, Inc., 6.55%, 9/15/43 (e) | | | | | | | 6,500 | | | | 8,573,740 | |
| | | | | | | | | | | | |
| | | | | | | | | | | | 18,832,678 | |
Electric Utilities — 0.3% | |
AES Corp.: | | | | | | | | | | | | |
8.00%, 6/01/20 (e) | | | | | | | 280 | | | | 323,400 | |
4.88%, 5/15/23 | | | | | | | 350 | | | | 344,750 | |
Star Energy Geothermal Wayang Windu Ltd., 6.13%, 3/27/20 (e) | | | | | | | 1,700 | | | | 1,717,000 | |
| | | | | | | | | | | | |
| | | | | | | | | | | | 2,385,150 | |
Electronic Equipment, Instruments & Components — 0.3% | |
CDW LLC/CDW Finance Corp.: | | | | | | | | | | | | |
6.00%, 8/15/22 (e) | | | | | | | 930 | | | | 995,686 | |
5.00%, 9/01/23 (e) | | | | | | | 920 | | | | 942,190 | |
5.50%, 12/01/24 | | | | | | | 270 | | | | 284,175 | |
| | | | | | | | | | | | |
| | | | | | | | | | | | 2,222,051 | |
Energy Equipment & Services — 0.2% | | | | | | | | | | | | |
Ensco PLC: | | | | | | | | | | | | |
4.70%, 3/15/21 | | | | | | | 85 | | | | 71,188 | |
4.50%, 10/01/24 | | | | | | | 317 | | | | 227,447 | |
5.20%, 3/15/25 (e) | | | | | | | 324 | | | | 236,115 | |
Noble Holding International Ltd.: | | | | | | | | | | | | |
4.63%, 3/01/21 | | | | | | | 40 | | | | 32,300 | |
6.95%, 4/01/25 | | | | | | | 105 | | | | 86,363 | |
Transocean, Inc.: | | | | | | | | | | | | |
7.13%, 12/15/21 | | | | | | | 475 | | | | 387,125 | |
5.05%, 10/15/22 | | | | | | | 330 | | | | 227,700 | |
| | | | | | | | | | | | |
| | | | | | | | | | | | 1,268,238 | |
Food & Staples Retailing — 0.7% | |
Dollar Tree, Inc., 5.75%, 3/01/23 (d)(e) | | | | | | | 2,510 | | | | 2,680,178 | |
Rite Aid Corp.: | | | | | | | | | | | | |
6.75%, 6/15/21 (e) | | | | | | | 329 | | | | 347,095 | |
6.13%, 4/01/23 (d)(e) | | | | | | | 1,727 | | | | 1,840,343 | |
7.70%, 2/15/27 | | | | | | | 222 | | | | 269,730 | |
| | | | | | | | | | | | |
| | | | | | | | | | | | 5,137,346 | |
Food Products — 0.6% | |
Acosta, Inc., 7.75%, 10/01/22 (d)(e) | | | | | | | 694 | | | | 645,420 | |
Aramark Services, Inc., 5.13%, 1/15/24 | | | | | | | 483 | | | | 510,772 | |
Pinnacle Foods Finance Corp.,
5.88%, 1/15/24 (d) | | | | | | | 75 | | | | 79,313 | |
Post Holdings, Inc.: | | | | | | | | | | | | |
6.75%, 12/01/21 (d) | | | | | | | 120 | | | | 125,776 | |
7.38%, 2/15/22 (e) | | | | | | | 484 | | | | 510,015 | |
7.75%, 3/15/24 (d)(e) | | | | | | | 570 | | | | 619,875 | |
8.00%, 7/15/25 (d) | | | | | | | 395 | | | | 437,956 | |
Smithfield Foods, Inc., 5.88%, 8/01/21 (d)(e) | | | | | | | 307 | | | | 320,047 | |
TreeHouse Foods, Inc., 6.00%, 2/15/24 (d)(e) | | | | | | | 439 | | | | 466,986 | |
WhiteWave Foods Co.,
5.38%, 10/01/22 (e) | | | | | | | 211 | | | | 225,648 | |
| | | | | | | | | | | | |
| | | | | | | | | | | | 3,941,808 | |
See Notes to Financial Statements.
| | | | | | |
| | | | | | | |
| | SEMI-ANNUAL REPORT | | APRIL 30, 2016 | | 43 |
| | |
Consolidated Schedule of Investments (continued) | | BlackRock Multi-Sector Income Trust (BIT) |
| | | | | | | | | | | | |
| Corporate Bonds | | Par (000) | | | Value | |
Forest Products — 0.0% | |
JBS USA LLC/JBS USA Finance, Inc., 5.75%, 6/15/25 (d) | | | USD | | | | 298 | | | $ | 274,160 | |
Gas Utilities — 0.0% | | | | | | | | | | | | |
ONEOK, Inc.: | | | | | | | | | | | | |
4.25%, 2/01/22 | | | | | | | 80 | | | | 70,400 | |
7.50%, 9/01/23 (e) | | | | | | | 150 | | | | 151,875 | |
| | | | | | | | | | | | |
| | | | | | | | | | | | 222,275 | |
Health Care Equipment & Supplies — 0.3% | |
DJO Finance LLC/DJO Finance Corp., 8.13%, 6/15/21 (d)(e) | | | | | | | 1,235 | | | | 1,080,625 | |
Fresenius US Finance II, Inc.,
4.50%, 1/15/23 (d) | | | | | | | 280 | | | | 287,000 | |
Kinetic Concepts, Inc./KCI USA, Inc., 7.88%, 2/15/21 (d) | | | | | | | 122 | | | | 131,913 | |
Mallinckrodt International Finance SA/Mallinckrodt CB LLC, 5.63%, 10/15/23 (d)(e) | | | | | | | 351 | | | | 329,062 | |
| | | | | | | | | | | | |
| | | | | | | | | | | | 1,828,600 | |
Health Care Providers & Services — 2.1% | |
Acadia Healthcare Co., Inc.: | | | | | | | | | | | | |
5.63%, 2/15/23 (e) | | | | | | | 575 | | | | 587,937 | |
6.50%, 3/01/24 (d) | | | | | | | 69 | | | | 72,795 | |
Amsurg Corp., 5.63%, 7/15/22 (e) | | | | | | | 1,066 | | | | 1,093,982 | |
Centene Corp., 4.75%, 5/15/22 (e) | | | | | | | 470 | | | | 481,163 | |
Centene Escrow Corp. (d): | | | | | | | | | | | | |
5.63%, 2/15/21 (e) | | | | | | | 403 | | | | 424,158 | |
6.13%, 2/15/24 | | | | | | | 238 | | | | 251,090 | |
CHS/Community Health Systems, Inc., 6.88%, 2/01/22 (e) | | | | | | | 1,018 | | | | 921,290 | |
DaVita HealthCare Partners, Inc., 5.13%, 7/15/24 (e) | | | | | | | 1,027 | | | | 1,045,198 | |
ExamWorks Group, Inc., 5.63%, 4/15/23 (e) | | | | | | | 190 | | | | 203,775 | |
HCA, Inc.: | | | | | | | | | | | | |
6.50%, 2/15/20 (e) | | | | | | | 1,103 | | | | 1,221,572 | |
7.50%, 2/15/22 (e) | | | | | | | 800 | | | | 906,000 | |
5.88%, 3/15/22 (e) | | | | | | | 124 | | | | 135,470 | |
4.75%, 5/01/23 (e) | | | | | | | 161 | | | | 165,025 | |
5.88%, 5/01/23 | | | | | | | 90 | | | | 94,669 | |
5.38%, 2/01/25 | | | | | | | 255 | | | | 260,738 | |
5.25%, 4/15/25 (e) | | | | | | | 1,500 | | | | 1,552,500 | |
5.88%, 2/15/26 (e) | | | | | | | 508 | | | | 527,050 | |
5.25%, 6/15/26 (e) | | | | | | | 520 | | | | 540,150 | |
HealthSouth Corp. (e): | | | | | | | | | | | | |
5.75%, 11/01/24 | | | | | | | 836 | | | | 863,170 | |
5.75%, 9/15/25 | | | | | | | 316 | | | | 326,902 | |
Hologic, Inc., 5.25%, 7/15/22 (d)(e) | | | | | | | 680 | | | | 712,300 | |
MEDNAX, Inc., 5.25%, 12/01/23 (d)(e) | | | | | | | 239 | | | | 247,365 | |
RegionalCare Hospital Partners Holdings, Inc., 8.25%, 5/01/23 (d) | | | | | | | 420 | | | | 436,800 | |
Surgery Center Holdings, Inc.,
8.88%, 4/15/21 (d) | | | | | | | 82 | | | | 82,000 | |
Tenet Healthcare Corp. (e): | | | | | | | | | | | | |
6.00%, 10/01/20 | | | | | | | 1,150 | | | | 1,219,000 | |
8.13%, 4/01/22 | | | | | | | 447 | | | | 463,763 | |
| | | | | | | | | | | | |
| | | | | 14,835,862 | |
Hotels, Restaurants & Leisure — 4.1% | |
Boyd Gaming Corp.: | | | | | | | | | | | | |
6.88%, 5/15/23 | | | | | | | 370 | | | | 383,875 | |
6.38%, 4/01/26 (d) | | | | | | | 76 | | | | 77,710 | |
Caesars Entertainment Resort Properties LLC/Caesars Entertainment Resort Property, 8.00%, 10/01/20 (e) | | | | | | | 2,379 | | | | 2,337,368 | |
Enterprise Inns PLC, 6.00%, 10/06/23 | | | GBP | | | | 3,320 | | | | 4,690,447 | |
| | | | | | | | | | | | |
| Corporate Bonds | | Par (000) | | | Value | |
Hotels, Restaurants & Leisure (continued) | |
ESH Hospitality, Inc., 5.25%, 5/01/25 (d)(e) | | | USD | | | | 1,009 | | | $ | 995,126 | |
MGM Resorts International: | | | | | | | | | | | | |
8.63%, 2/01/19 | | | | | | | 170 | | | | 193,375 | |
6.75%, 10/01/20 | | | | | | | 60 | | | | 64,050 | |
6.63%, 12/15/21 (e) | | | | | | | 1,550 | | | | 1,650,750 | |
6.00%, 3/15/23 (e) | | | | | | | 240 | | | | 249,300 | |
MGP Escrow Issuer LLC/MGP Escrow Co-Issuer, Inc., 5.63%, 5/01/24 (d)(e) | | | | | | | 1,098 | | | | 1,144,665 | |
New Red Finance, Inc., 6.00%, 4/01/22 (d)(e) | | | | | | | 1,130 | | | | 1,166,725 | |
Pinnacle Entertainment, Inc., 5.63%, 5/01/24 (d) | | | | | | | 77 | | | | 76,904 | |
RHP Hotel Properties LP/RHP Finance Corp., 5.00%, 4/15/21 (e) | | | | | | | 750 | | | | 774,375 | |
Sabre GLBL, Inc. (d): | | | | | | | | | | | | |
5.38%, 4/15/23 | | | | | | | 156 | | | | 158,730 | |
5.25%, 11/15/23 (e) | | | | | | | 152 | | | | 153,900 | |
Scientific Games International, Inc.: | | | | | | | | | | | | |
7.00%, 1/01/22 (d)(e) | | | | | | | 445 | | | | 453,622 | |
10.00%, 12/01/22 | | | | | | | 106 | | | | 87,609 | |
Six Flags Entertainment Corp.,
5.25%, 1/15/21 (d)(e) | | | | | | | 590 | | | | 610,650 | |
Station Casinos LLC, 7.50%, 3/01/21 (e) | | | | | | | 1,085 | | | | 1,149,696 | |
Unique Pub Finance Co. PLC: | | | | | | | | | | | | |
Series A3, 6.54%, 3/30/21 | | | GBP | | | | 2,155 | | | | 3,197,222 | |
Series M, 7.40%, 3/28/24 | | | | | | | 6,400 | | | | 9,097,598 | |
| | | | | | | | | | | | |
| | | | | | | | | | | | 28,713,697 | |
Household Durables — 0.8% | |
Brookfield Residential Properties, Inc./Brookfield Residential US Corp., 6.13%, 7/01/22 (d)(e) | | | USD | | | | 750 | | | | 694,515 | |
Century Communities, Inc., 6.88%, 5/15/22 (e) | | | | | | | 830 | | | | 807,175 | |
DR Horton, Inc., 4.00%, 2/15/20 (e) | | | | | | | 450 | | | | 466,875 | |
Lennar Corp.: | | | | | | | | | | | | |
4.50%, 11/15/19 (e) | | | | | | | 450 | | | | 467,156 | |
4.75%, 4/01/21 | | | | | | | 252 | | | | 262,458 | |
4.88%, 12/15/23 (e) | | | | | | | 231 | | | | 234,465 | |
4.75%, 5/30/25 (e) | | | | | | | 410 | | | | 411,025 | |
Meritage Homes Corp., 4.50%, 3/01/18 (e) | | | | | | | 600 | | | | 613,500 | |
PulteGroup, Inc., 6.38%, 5/15/33 (e) | | | | | | | 600 | | | | 609,000 | |
Standard Pacific Corp., 8.38%, 1/15/21 (e) | | | | | | | 480 | | | | 565,200 | |
TRI Pointe Holdings, Inc. (e): | | | | | | | | | | | | |
4.38%, 6/15/19 | | | | | | | 225 | | | | 225,563 | |
5.88%, 6/15/24 | | | | | | | 280 | | | | 281,400 | |
| | | | | | | | | | | | |
| | | | | 5,638,332 | |
Household Products — 0.2% | |
Prestige Brands, Inc., 6.38%, 3/01/24 (d) | | | | | | | 176 | | | | 184,800 | |
Spectrum Brands, Inc. (e): | | | | | | | | | | | | |
6.63%, 11/15/22 | | | | | | | 710 | | | | 766,800 | |
6.13%, 12/15/24 | | | | | | | 720 | | | | 769,500 | |
| | | | | | | | | | | | |
| | | | | 1,721,100 | |
Independent Power and Renewable Electricity Producers — 0.7% | |
Calpine Corp. (e): | | | | | | | | | | | | |
6.00%, 1/15/22 (d) | | | | | | | 254 | | | | 268,288 | |
5.38%, 1/15/23 | | | | | | | 895 | | | | 902,831 | |
5.88%, 1/15/24 (d) | | | | | | | 240 | | | | 254,700 | |
Dynegy, Inc., 6.75%, 11/01/19 (e) | | | | | | | 1,030 | | | | 1,038,755 | |
NRG Energy, Inc.: | | | | | | | | | | | | |
7.63%, 1/15/18 (e) | | | | | | | 455 | | | | 486,850 | |
7.88%, 5/15/21 | | | | | | | 355 | | | | 369,058 | |
6.25%, 7/15/22 | �� | | | | | | 176 | | | | 172,536 | |
6.25%, 5/01/24 | | | | | | | 50 | | | | 48,750 | |
See Notes to Financial Statements.
| | | | | | |
| | | | | | | |
| 44 | | SEMI-ANNUAL REPORT | | APRIL 30, 2016 | | |
| | |
Consolidated Schedule of Investments (continued) | | BlackRock Multi-Sector Income Trust (BIT) |
| | | | | | | | | | | | |
| Corporate Bonds | | Par (000) | | | Value | |
Independent Power and Renewable Electricity Producers (continued) | |
NRG Yield Operating LLC, 5.38%, 8/15/24 (e) | | | USD | | | | 130 | | | $ | 122,200 | |
QEP Resources, Inc., 5.38%, 10/01/22 (e) | | | | | | | 1,165 | | | | 1,103,838 | |
| | | | | | | | | | | | |
| | | | | 4,767,806 | |
Insurance — 0.4% | |
Aon PLC, 3.88%, 12/15/25 (e) | | | | | | | 1,280 | | | | 1,316,453 | |
HUB International Ltd. (d): | | | | | | | | | | | | |
9.25%, 2/15/21 | | | | | | | 195 | | | | 203,288 | |
7.88%, 10/01/21 (e) | | | | | | | 702 | | | | 687,960 | |
Trader Corp., 9.88%, 8/15/18 (d)(e) | | | | | | | 170 | | | | 176,375 | |
Wayne Merger Sub LLC, 8.25%, 8/01/23 (d) | | | | | | | 310 | | | | 308,450 | |
| | | | | | | | | | | | |
| | | | | 2,692,526 | |
Internet Software & Services — 0.4% | |
Blue Coat Holdings, Inc., 8.38%, 6/01/23 (d)(e) | | | | | | | 412 | | | | 433,630 | |
Equinix, Inc. (e): | | | | | | | | | | | | |
4.88%, 4/01/20 | | | | | | | 144 | | | | 149,904 | |
5.88%, 1/15/26 | | | | | | | 916 | | | | 969,238 | |
Netflix, Inc., 5.75%, 3/01/24 (e) | | | | | | | 860 | | | | 898,700 | |
| | | | | | | | | | | | |
| | | | | 2,451,472 | |
IT Services — 1.0% | |
Ceridian HCM Holding, Inc.,
11.00%, 3/15/21 (d)(e) | | | | | | | 287 | | | | 287,000 | |
First Data Corp. (d)(e): | | | | | | | | | | | | |
5.38%, 8/15/23 | | | | | | | 364 | | | | 376,285 | |
7.00%, 12/01/23 | | | | | | | 2,819 | | | | 2,896,522 | |
5.00%, 1/15/24 | | | | | | | 733 | | | | 740,330 | |
5.75%, 1/15/24 | | | | | | | 2,678 | | | | 2,718,170 | |
| | | | | | | | | | | | |
| | | | | 7,018,307 | |
Machinery — 0.0% | |
Gardner Denver, Inc., 6.88%, 8/15/21 (d) | | | | | | | 55 | | | | 47,025 | |
Media — 6.3% | |
Altice Financing SA, 7.50%, 5/15/26 (d)(j) | | | | | | | 264 | | | | 264,330 | |
Altice US Finance I Corp. (d): | | | | | | | | | | | | |
5.38%, 7/15/23 (e) | | | | | | | 1,380 | | | | 1,409,049 | |
5.50%, 5/15/26 | | | | | | | 488 | | | | 492,880 | |
Altice US Finance II Corp., 7.75%, 7/15/25 (d)(e) | | | | | | | 770 | | | | 781,550 | |
Altice US Finance SA, 7.75%, 7/15/25 (d) | | | | | | | 660 | | | | 660,000 | |
AMC Networks, Inc.: | | | | | | | | | | | | |
4.75%, 12/15/22 (e) | | | | | | | 344 | | | | 346,580 | |
5.00%, 4/01/24 | | | | | | | 161 | | | | 161,201 | |
Bharti Airtel International Netherlands BV, 5.13%, 3/11/23 (e) | | | | | | | 3,000 | | | | 3,229,272 | |
CCO Holdings LLC/CCO Holdings Capital Corp.: | | | | | | | | | | | | |
5.25%, 9/30/22 (e) | | | | | | | 560 | | | | 578,200 | |
5.13%, 2/15/23 (e) | | | | | | | 709 | | | | 726,725 | |
5.13%, 5/01/23 (d)(e) | | | | | | | 719 | | | | 733,380 | |
5.88%, 4/01/24 (d)(e) | | | | | | | 697 | | | | 730,107 | |
5.50%, 5/01/26 (d) | | | | | | | 470 | | | | 479,400 | |
5.88%, 5/01/27 (d)(e) | | | | | | | 1,010 | | | | 1,035,250 | |
CCO Safari II LLC, 6.48%, 10/23/45 (d)(e) | | | | | | | 3,000 | | | | 3,544,116 | |
CCOH Safari LLC, 5.75%, 2/15/26 (d)(e) | | | | | | | 196 | | | | 202,370 | |
Cequel Communications Holdings I LLC/Cequel Capital Corp., 5.13%, 12/15/21 (d) | | | | | | | 600 | | | | 565,500 | |
Clear Channel International BV, 8.75%, 12/15/20 (d)(e) | | | | | | | 508 | | | | 527,050 | |
Clear Channel Worldwide Holdings, Inc. (e): | | | | | | | | | | | | |
6.50%, 11/15/22 | | | | | | | 3,013 | | | | 3,028,065 | |
Series B, 7.63%, 3/15/20 | | | | | | | 574 | | | | 532,029 | |
| | | | | | | | | | | | |
| Corporate Bonds | | Par (000) | | | Value | |
Media (continued) | |
Columbus International, Inc.,
7.38%, 3/30/21 (d)(e) | | | USD | | | | 1,195 | | | $ | 1,269,329 | |
CSC Holdings LLC, 5.25%, 6/01/24 (e) | | | | | | | 1,205 | | | | 1,096,550 | |
DISH DBS Corp. (e): | | | | | | | | | | | | |
6.75%, 6/01/21 | | | | | | | 500 | | | | 515,105 | |
5.88%, 7/15/22 | | | | | | | 912 | | | | 886,920 | |
5.88%, 11/15/24 | | | | | | | 525 | | | | 492,713 | |
iHeartCommunications, Inc. (e): | | | | | | | | | | | | |
9.00%, 12/15/19 | | | | | | | 255 | | | | 197,625 | |
10.63%, 3/15/23 | | | | | | | 936 | | | | 664,560 | |
Intelsat Jackson Holdings SA: | | | | | | | | | | | | |
7.25%, 10/15/20 (e) | | | | | | | 475 | | | | 346,750 | |
6.63%, 12/15/22 | | | | | | | 419 | | | | 271,303 | |
5.50%, 8/01/23 (e) | | | | | | | 867 | | | | 547,836 | |
8.00%, 2/15/24 (d)(e) | | | | | | | 767 | | | | 793,845 | |
Lamar Media Corp., 5.75%, 2/01/26 (d) | | | | | | | 83 | | | | 87,773 | |
Live Nation Entertainment, Inc.,
7.00%, 9/01/20 (d)(e) | | | | | | | 199 | | | | 208,453 | |
McGraw-Hill Global Education Holdings LLC/McGraw-Hill Global Education Finance, 7.88%, 5/15/24 (d) | | | | | | | 101 | | | | 103,525 | |
MDC Partners, Inc., 6.50%, 5/01/24 (d) | | | | | | | 472 | | | | 488,803 | |
Midcontinent Communications & Midcontinent Finance Corp., 6.25%, 8/01/21 (d)(e) | | | | | | | 250 | | | | 258,125 | |
NAI Entertainment Holdings/NAI Entertainment Holdings Finance Corp.,
5.00%, 8/01/18 (d)(e) | | | | | | | 629 | | | | 638,435 | |
Neptune Finco Corp. (d)(e): | | | | | | | | | | | | |
10.13%, 1/15/23 | | | | | | | 988 | | | | 1,084,330 | |
6.63%, 10/15/25 | | | | | | | 350 | | | | 376,250 | |
Nielsen Finance LLC/Nielsen Finance Co., 5.00%, 4/15/22 (d)(e) | | | | | | | 1,040 | | | | 1,060,800 | |
Numericable Group SA, 6.00%, 5/15/22 (d)(e) | | | | | | | 1,492 | | | | 1,493,940 | �� |
Numericable-SFR SA, 7.38%, 5/01/26 (d) | | | | | | | 2,171 | | | | 2,203,565 | |
Outfront Media Capital LLC/Outfront Media Capital Corp. (e): | | | | | | | | | | | | |
5.25%, 2/15/22 | | | | | | | 502 | | | | 518,315 | |
5.63%, 2/15/24 | | | | | | | 364 | | | | 378,560 | |
RCN Telecom Services LLC/RCN Capital Corp., 8.50%, 8/15/20 (d)(e) | | | | | | | 350 | | | | 354,375 | |
Sirius XM Radio, Inc.,
4.25%, 5/15/20 (d)(e) | | | | | | | 994 | | | | 1,012,637 | |
Tribune Media Co., 5.88%, 7/15/22 (d)(e) | | | | | | | 776 | | | | 772,120 | |
Unitymedia Hessen GmbH & Co. KG/Unitymedia NRW GmbH, 5.50%, 1/15/23 (d)(e) | | | | | | | 762 | | | | 789,622 | |
Univision Communications, Inc. (d)(e): | | | | | | | | | | | | |
5.13%, 5/15/23 | | | | | | | 1,360 | | | | 1,370,200 | |
5.13%, 2/15/25 | | | | | | | 875 | | | | 865,156 | |
Virgin Media Finance PLC (d)(e): | | | | | | | | | | | | |
6.38%, 4/15/23 | | | | | | | 805 | | | | 829,150 | |
5.75%, 1/15/25 | | | | | | | 850 | | | | 856,375 | |
Virgin Media Secured Finance PLC, 5.50%, 8/15/26 (d) | | | | | | | 200 | | | | 201,126 | |
WaveDivision Escrow LLC/WaveDivision Escrow Corp., 8.13%, 9/01/20 (d)(e) | | | | | | | 980 | | | | 997,150 | |
| | | | | | | | | | | | |
| | | | | 44,058,375 | |
Metals & Mining — 1.8% | |
Alcoa, Inc. (e): | | | | | | | | | | | | |
5.87%, 2/23/22 | | | | | | | 900 | | | | 918,000 | |
5.13%, 10/01/24 | | | | | | | 450 | | | | 438,188 | |
Anglo American Capital PLC,
4.13%, 9/27/22 (d)(e) | | | | | | | 400 | | | | 362,000 | |
See Notes to Financial Statements.
| | | | | | |
| | | | | | | |
| | SEMI-ANNUAL REPORT | | APRIL 30, 2016 | | 45 |
| | |
Consolidated Schedule of Investments (continued) | | BlackRock Multi-Sector Income Trust (BIT) |
| | | | | | | | | | | | |
| Corporate Bonds | | Par (000) | | | Value | |
Metals & Mining (continued) | |
ArcelorMittal: | | | | | | | | | | | | |
6.13%, 6/01/18 (e) | | | USD | | | | 421 | | | $ | 436,526 | |
7.25%, 2/25/22 | | | | | | | 24 | | | | 25,245 | |
7.75%, 3/01/41 | | | | | | | 210 | | | | 194,250 | |
BlueScope Steel Finance Ltd./BlueScope Steel Finance Corp., 6.50%, 5/15/21 (d) | | | | | | | 144 | | | | 146,880 | |
Constellium NV (d)(e): | | | | | | | | | | | | |
8.00%, 1/15/23 | | | | | | | 1,500 | | | | 1,286,250 | |
5.75%, 5/15/24 | | | | | | | 500 | | | | 378,750 | |
Freeport-McMoRan, Inc.: | | | | | | | | | | | | |
2.30%, 11/14/17 | | | | | | | 322 | | | | 311,535 | |
2.38%, 3/15/18 (e) | | | | | | | 1,674 | | | | 1,607,040 | |
3.10%, 3/15/20 | | | | | | | 170 | | | | 153,000 | |
4.00%, 11/14/21 | | | | | | | 155 | | | | 137,175 | |
3.55%, 3/01/22 (e) | | | | | | | 726 | | | | 606,210 | |
3.88%, 3/15/23 | | | | | | | 599 | | | | 501,663 | |
5.40%, 11/14/34 (e) | | | | | | | 506 | | | | 387,039 | |
5.45%, 3/15/43 (e) | | | | | | | 254 | | | | 190,500 | |
Kaiser Aluminum Corp., 5.88%, 5/15/24 (d)(j) | | | | | | | 124 | | | | 126,945 | |
Novelis, Inc., 8.75%, 12/15/20 (e) | | | | | | | 1,517 | | | | 1,566,302 | |
Steel Dynamics, Inc.: | | | | | | | | | | | | |
5.13%, 10/01/21 (e) | | | | | | | 970 | | | | 991,825 | |
5.25%, 4/15/23 | | | | | | | 525 | | | | 532,875 | |
Teck Resources Ltd.: | | | | | | | | | | | | |
2.50%, 2/01/18 | | | | | | | 285 | | | | 270,750 | |
3.00%, 3/01/19 (e) | | | | | | | 343 | | | | 312,988 | |
4.50%, 1/15/21 | | | | | | | 126 | | | | 107,415 | |
4.75%, 1/15/22 | | | | | | | 21 | | | | 17,430 | |
3.75%, 2/01/23 | | | | | | | 183 | | | | 140,910 | |
5.40%, 2/01/43 | | | | | | | 97 | | | | 68,870 | |
Wise Metals Group LLC/Wise Alloys Finance Corp., 8.75%, 12/15/18 (d)(e) | | | | | | | 442 | | | | 408,850 | |
| | | | | | | | | | | | |
| | | | | 12,625,411 | |
Multiline Retail — 0.2% | |
Neiman Marcus Group Ltd. (d)(e): | | | | | | | | | | | | |
8.00%, 10/15/21 | | | | | | | 722 | | | | 628,140 | |
(8.75% Cash or 9.50% PIK), 8.75%, 10/15/21 (i) | | | | | | | 963 | | | | 799,290 | |
| | | | | | | | | | | | |
| | | | | 1,427,430 | |
Oil, Gas & Consumable Fuels — 5.2% | |
Alberta Energy Co. Ltd., 7.38%, 11/01/31 | | | | | | | 81 | | | | 76,833 | |
Anadarko Finance Co., Series B, 7.50%, 5/01/31 (e) | | | | | | | 98 | | | | 112,384 | |
Anadarko Petroleum Corp.: | | | | | | | | | | | | |
6.45%, 9/15/36 (e) | | | | | | | 135 | | | | 145,644 | |
6.20%, 3/15/40 | | | | | | | 89 | | | | 93,978 | |
Carrizo Oil & Gas, Inc., 6.25%, 4/15/23 (e) | | | | | | | 630 | | | | 604,800 | |
Cenovus Energy, Inc.: | | | | | | | | | | | | |
5.70%, 10/15/19 | | | | | | | 51 | | | | 52,881 | |
3.00%, 8/15/22 | | | | | | | 41 | | | | 36,778 | |
3.80%, 9/15/23 (e) | | | | | | | 110 | | | | 99,193 | |
6.75%, 11/15/39 (e) | | | | | | | 184 | | | | 178,683 | |
5.20%, 9/15/43 | | | | | | | 25 | | | | 20,719 | |
CONSOL Energy, Inc.: | | | | | | | | | | | | |
5.88%, 4/15/22 (e) | | | | | | | 1,339 | | | | 1,114,717 | |
8.00%, 4/01/23 | | | | | | | 221 | | | | 188,403 | |
Continental Resources, Inc.: | | | | | | | | | | | | |
5.00%, 9/15/22 | | | | | | | 359 | | | | 335,216 | |
4.50%, 4/15/23 | | | | | | | 223 | | | | 199,167 | |
3.80%, 6/01/24 (e) | | | | | | | 760 | | | | 647,900 | |
4.90%, 6/01/44 | | | | | | | 180 | | | | 144,900 | |
Crestwood Midstream Partners LP/Crestwood Midstream Finance Corp.,
6.25%, 4/01/23 (d) | | | | | | | 35 | | | | 31,938 | |
| | | | | | | | | | | | |
| Corporate Bonds | | Par (000) | | | Value | |
Oil, Gas & Consumable Fuels (continued) | |
CrownRock LP/CrownRock Finance, Inc., 7.13%, 4/15/21 (d)(e) | | | USD | | | | 1,121 | | | $ | 1,132,210 | |
Denbury Resources, Inc.: | | | | | | | | | | | | |
5.50%, 5/01/22 | | | | | | | 540 | | | | 346,950 | |
4.63%, 7/15/23 | | | | | | | 549 | | | | 322,537 | |
Diamondback Energy, Inc., 7.63%, 10/01/21 (e) | | | | | | | 572 | | | | 609,895 | |
Encana Corp. (e): | | | | | | | | | | | | |
3.90%, 11/15/21 | | | | | | | 164 | | | | 150,060 | |
6.50%, 8/15/34 | | | | | | | 286 | | | | 263,678 | |
6.63%, 8/15/37 | | | | | | | 180 | | | | 163,800 | |
6.50%, 2/01/38 | | | | | | | 526 | | | | 470,770 | |
5.15%, 11/15/41 | | | | | | | 216 | | | | 163,080 | |
Energy Transfer Equity LP: | | | | | | | | | | | | |
5.88%, 1/15/24 (e) | | | | | | | 770 | | | | 719,950 | |
5.50%, 6/01/27 | | | | | | | 319 | | | | 273,788 | |
Freeport-McMoRan Oil & Gas LLC/FCX Oil & Gas, Inc.: | | | | | | | | | | | | |
6.50%, 11/15/20 | | | | | | | 148 | | | | 139,860 | |
6.63%, 5/01/21 | | | | | | | 145 | | | | 136,844 | |
Genesis Energy LP / Genesis Energy Finance Corp., 5.63%, 6/15/24 | | | | | | | 449 | | | | 406,345 | |
Gulfport Energy Corp.: | | | | | | | | | | | | |
7.75%, 11/01/20 | | | | | | | 244 | | | | 246,440 | |
6.63%, 5/01/23 | | | | | | | 24 | | | | 23,280 | |
Hilcorp Energy I LP/Hilcorp Finance Co., 7.63%, 4/15/21 (d) | | | | | | | 50 | | | | 51,000 | |
Kerr-McGee Corp., 7.88%, 9/15/31 | | | | | | | 78 | | | | 88,980 | |
Marathon Oil Corp., 5.20%, 6/01/45 (e) | | | | | | | 325 | | | | 275,399 | |
MEG Energy Corp., 6.50%, 3/15/21 (d)(e) | | | | | | | 3,586 | | | | 2,815,010 | |
Memorial Resource Development Corp., 5.88%, 7/01/22 (e) | | | | | | | 928 | | | | 844,480 | |
MPLX LP, 4.88%, 6/01/25 (d)(e) | | | | | | | 790 | | | | 763,371 | |
NGPL PipeCo LLC (d): | | | | | | | | | | | | |
7.12%, 12/15/17 | | | | | | | 2,682 | | | | 2,769,165 | |
7.77%, 12/15/37 | | | | | | | 193 | | | | 177,560 | |
Noble Energy, Inc., 5.63%, 5/01/21 (e) | | | | | | | 1,700 | | | | 1,746,954 | |
Oasis Petroleum, Inc.: | | | | | | | | | | | | |
7.25%, 2/01/19 | | | | | | | 45 | | | | 42,750 | |
6.50%, 11/01/21 | | | | | | | 330 | | | | 301,950 | |
6.88%, 3/15/22 (e) | | | | | | | 594 | | | | 530,145 | |
6.88%, 1/15/23 | | | | | | | 195 | | | | 175,013 | |
Parsley Energy LLC/Parsley Finance Corp., 7.50%, 2/15/22 (d)(e) | | | | | | | 575 | | | | 608,062 | |
Pertamina Persero PT, 5.63%, 5/20/43 (d)(e) | | | | | | | 2,000 | | | | 1,845,812 | |
Pratama Agung Pte Ltd., 6.25%, 2/24/20 | | | | | | | 1,600 | | | | 1,618,608 | |
QEP Resources, Inc.: | | | | | | | | | | | | |
6.88%, 3/01/21 | | | | | | | 50 | | | | 49,500 | |
5.25%, 5/01/23 | | | | | | | 40 | | | | 37,600 | |
Range Resources Corp.: | | | | | | | | | | | | |
5.00%, 8/15/22 (e) | | | | | | | 91 | | | | 84,971 | |
5.00%, 3/15/23 | | | | | | | 310 | | | | 285,975 | |
4.88%, 5/15/25 | | | | | | | 45 | | | | 41,681 | |
Rockies Express Pipeline LLC,
5.63%, 4/15/20 (d)(e) | | | | | | | 685 | | | | 679,862 | |
RSP Permian, Inc., 6.63%, 10/01/22 | | | | | | | 290 | | | | 299,425 | |
Sabine Pass Liquefaction LLC: | | | | | | | | | | | | |
6.25%, 3/15/22 (e) | | | | | | | 752 | | | | 761,400 | |
5.63%, 4/15/23 (e) | | | | | | | 1,980 | | | | 1,940,400 | |
5.63%, 3/01/25 | | | | | | | 31 | | | | 30,225 | |
Sanchez Energy Corp.: | | | | | | | | | | | | |
7.75%, 6/15/21 | | | | | | | 536 | | | | 440,860 | |
6.13%, 1/15/23 (e) | | | | | | | 1,008 | | | | 753,480 | |
Seven Generations Energy Ltd., 8.25%, 5/15/20 (d)(e) | | | | | | | 1,550 | | | | 1,596,500 | |
See Notes to Financial Statements.
| | | | | | |
| | | | | | | |
| 46 | | SEMI-ANNUAL REPORT | | APRIL 30, 2016 | | |
| | |
Consolidated Schedule of Investments (continued) | | BlackRock Multi-Sector Income Trust (BIT) |
| | | | | | | | | | | | |
| Corporate Bonds | | Par (000) | | | Value | |
Oil, Gas & Consumable Fuels (continued) | |
SM Energy Co.: | | | | | | | | | | | | |
6.13%, 11/15/22 (e) | | | USD | | | | 847 | | | $ | 766,535 | |
5.00%, 1/15/24 | | | | | | | 15 | | | | 12,488 | |
Southwestern Energy Co.: | | | | | | | | | | | | |
3.30%, 1/23/18 | | | | | | | 335 | | | | 316,575 | |
7.50%, 2/01/18 | | | | | | | 120 | | | | 117,900 | |
Targa Resources Partners LP/Targa Resources Partners Finance Corp.: | | | | | | | | | | | | |
6.88%, 2/01/21 | | | | | | | 82 | | | | 83,845 | |
6.38%, 8/01/22 | | | | | | | 95 | | | | 95,950 | |
5.25%, 5/01/23 | | | | | | | 16 | | | | 15,360 | |
6.75%, 3/15/24 (d) | | | | | | | 82 | | | | 83,435 | |
Vantage Drilling International, 10.00%, 12/31/20 | | | | | | | 34 | | | | — | |
Weatherford International LLC: | | | | | | | | | | | | |
6.35%, 6/15/17 | | | | | | | 205 | | | | 208,075 | |
6.80%, 6/15/37 | | | | | | | 120 | | | | 94,200 | |
Weatherford International Ltd.: | | | | | | | | | | | | |
6.00%, 3/15/18 | | | | | | | 326 | | | | 326,000 | |
5.13%, 9/15/20 | | | | | | | 177 | | | | 162,287 | |
4.50%, 4/15/22 | | | | | | | 127 | | | | 111,646 | |
6.50%, 8/01/36 | | | | | | | 170 | | | | 131,325 | |
7.00%, 3/15/38 | | | | | | | 94 | | | | 73,790 | |
5.95%, 4/15/42 | | | | | | | 178 | | | | 131,720 | |
Whiting Petroleum Corp.: | | | | | | | | | | | | |
5.00%, 3/15/19 | | | | | | | 40 | | | | 35,400 | |
1.25%, 4/01/20 (d) | | | | | | | 1,582 | | | | 1,194,410 | |
5.75%, 3/15/21 (e) | | | | | | | 470 | | | | 391,275 | |
6.25%, 4/01/23 | | | | | | | 195 | | | | 162,338 | |
Williams Cos., Inc.: | | | | | | | | | | | | |
3.70%, 1/15/23 | | | | | | | 48 | | | | 40,310 | |
4.55%, 6/24/24 | | | | | | | 138 | | | | 118,938 | |
WPX Energy, Inc.: | | | | | | | | | | | | |
5.25%, 1/15/17 | | | | | | | 45 | | | | 45,619 | |
7.50%, 8/01/20 | | | | | | | 80 | | | | 76,200 | |
6.00%, 1/15/22 | | | | | | | 352 | | | | 316,800 | |
8.25%, 8/01/23 | | | | | | | 215 | | | | 202,100 | |
| | | | | | | | | | | | |
| | | | | 36,624,280 | |
Paper & Forest Products — 0.0% | |
Unifrax I LLC/Unifrax Holding Co., 7.50%, 2/15/19 (d)(e) | | | | | | | 390 | | | | 309,075 | |
Pharmaceuticals — 1.3% | | | | | | | | | | | | |
Alphabet Holding Co., Inc., 7.75%, 11/01/17 (i) | | | | | | | 218 | | | | 220,616 | |
DPx Holdings BV, 7.50%, 2/01/22 (d) | | | | | | | 135 | | | | 136,687 | |
Endo Finance LLC/Endo Finco, Inc. (d)(e): | | | | | | | | | | | | |
5.88%, 1/15/23 | | | | | | | 620 | | | | 593,650 | |
6.00%, 7/15/23 | | | | | | | 1,240 | | | | 1,216,750 | |
Forest Laboratories, Inc., 5.00%, 12/15/21 (d)(e) | | | | | | | 718 | | | | 792,103 | |
Grifols Worldwide Operations Ltd., 5.25%, 4/01/22 (e) | | | | | | | 544 | | | | 560,320 | |
Jaguar Holding Co. II/Pharmaceutical Product Development LLC, 6.38%, 8/01/23 (d)(e) | | | | | | | 1,166 | | | | 1,211,474 | |
NBTY, Inc., 7.63%, 5/15/21 (d)(j) | | | | | | | 662 | | | | 676,895 | |
Valeant Pharmaceuticals International, Inc. (d): | | | | | | | | | | | | |
6.75%, 8/15/18 | | | | | | | 1,517 | | | | 1,463,905 | |
5.38%, 3/15/20 | | | | | | | 161 | | | | 142,586 | |
6.75%, 8/15/21 | | | | | | | 1,276 | | | | 1,122,880 | |
5.63%, 12/01/21 | | | | | | | 932 | | | | 789,870 | |
5.88%, 5/15/23 | | | | | | | 97 | | | | 81,237 | |
| | | | | | | | | | | | |
| | | | | 9,008,973 | |
| | | | | | | | | | | | |
| Corporate Bonds | | Par (000) | | | Value | |
Real Estate Investment Trusts (REITs) — 0.6% | |
FelCor Lodging LP, 6.00%, 6/01/25 (e) | | | USD | | | | 265 | | | $ | 273,612 | |
Hilton Worldwide Finance LLC/Hilton Worldwide Finance Corp., 5.63%, 10/15/21 (e) | | | | | | | 545 | | | | 567,645 | |
Pakuwon Prima Pte Ltd., 7.13%, 7/02/19 | | | | | | | 3,350 | | | | 3,475,598 | |
| | | | | | | | | | | | |
| | | | | 4,316,855 | |
Real Estate Management & Development — 3.5% | |
Caifu Holdings Ltd., 8.75%, 1/24/20 | | | | | | | 3,000 | | | | 3,127,500 | |
Lai Sun International Finance 2012 Ltd., 5.70%, 1/18/18 | | | | | | | 2,000 | | | | 2,033,464 | |
Lodha Developers International Ltd., 12.00%, 3/13/20 | | | | | | | 350 | | | | 337,295 | |
Northwest Florida Timber Finance LLC, 4.75%, 3/04/29 (d)(e) | | | | | | | 4,360 | | | | 3,852,021 | |
Punch Taverns Finance B Ltd.: | | | | | | | | | | | | |
7.37%, 9/30/21 | | | GBP | | | | 2,565 | | | | 3,721,823 | |
Series A6, 5.94%, 9/30/22 | | | | | | | 6,346 | | | | 8,616,335 | |
Realogy Group LLC/Realogy Co-Issuer Corp. (d)(e): | | | | | | | | | | | | |
4.50%, 4/15/19 | | | USD | | | | 690 | | | | 715,875 | |
5.25%, 12/01/21 | | | | | | | 1,539 | | | | 1,608,255 | |
Vingroup JSC, 11.63%, 5/07/18 (e) | | | | | | | 250 | | | | 271,250 | |
| | | | | | | | | | | | |
| | | | | 24,283,818 | |
Restaurants — 0.0% | |
Yum! Brands, Inc.: | | | | | | | | | | | | |
3.75%, 11/01/21 | | | | | | | 80 | | | | 77,860 | |
3.88%, 11/01/23 | | | | | | | 30 | | | | 28,496 | |
| | | | | | | | | | | | |
| | | | | 106,356 | |
Road & Rail — 0.9% | |
Avis Budget Car Rental LLC/Avis Budget Finance, Inc. (d)(e): | | | | | | | | | | | | |
5.13%, 6/01/22 | | | | | | | 100 | | | | 94,938 | |
5.25%, 3/15/25 | | | | | | | 955 | | | | 876,212 | |
Hertz Corp. (e): | | | | | | | | | | | | |
4.25%, 4/01/18 | | | | | | | 400 | | | | 404,000 | |
7.38%, 1/15/21 | | | | | | | 825 | | | | 850,781 | |
Lima Metro Line 2 Finance Ltd.,
5.88%, 7/05/34 (d)(e) | | | | | | | 4,000 | | | | 4,104,000 | |
| | | | | | | | | | | | |
| | | | | 6,329,931 | |
Semiconductors & Semiconductor Equipment — 0.3% | |
NXP BV/NXP Funding LLC (d)(e): | | | | | | | | | | | | |
4.13%, 6/15/20 | | | | | | | 760 | | | | 780,900 | |
4.63%, 6/15/22 | | | | | | | 410 | | | | 425,375 | |
Sensata Technologies BV, 5.00%, 10/01/25 (d) | | | | | | | 15 | | | | 15,075 | |
Sensata Technologies UK Financing Co. PLC, 6.25%, 2/15/26 (d)(e) | | | | | | | 540 | | | | 576,450 | |
| | | | | | | | | | | | |
| | | | | 1,797,800 | |
Software — 0.6% | |
ACI Worldwide, Inc., 6.38%, 8/15/20 (d)(e) | | | | | | | 580 | | | | 598,850 | |
Infor US, Inc., 6.50%, 5/15/22 (e) | | | | | | | 955 | | | | 881,475 | |
Informatica LLC, 7.13%, 7/15/23 (d)(e) | | | | | | | 570 | | | | 554,325 | |
Nuance Communications, Inc.,
5.38%, 8/15/20 (d)(e) | | | | | | | 335 | | | | 342,538 | |
Rolta Americas LLC, 8.88%, 7/24/19 (e) | | | | | | | 200 | | | | 80,000 | |
Solera LLC/Solera Finance, Inc.,
10.50%, 3/01/24 (d)(e) | | | | | | | 997 | | | | 1,044,357 | |
SS&C Technologies Holdings, Inc., 5.88%, 7/15/23 (d)(e) | | | | | | | 410 | | | | 425,375 | |
| | | | | | | | | | | | |
| | | | | 3,926,920 | |
See Notes to Financial Statements.
| | | | | | |
| | | | | | | |
| | SEMI-ANNUAL REPORT | | APRIL 30, 2016 | | 47 |
| | |
Consolidated Schedule of Investments (continued) | | BlackRock Multi-Sector Income Trust (BIT) |
| | | | | | | | | | | | |
| Corporate Bonds | | Par (000) | | | Value | |
Specialty Retail — 0.5% | |
Asbury Automotive Group, Inc., 6.00%, 12/15/24 (e) | | | USD | | | | 860 | | | $ | 887,950 | |
L Brands, Inc., 6.88%, 11/01/35 (e) | | | | | | | 589 | | | | 647,900 | |
Michaels Stores, Inc., 5.88%, 12/15/20 (d)(e) | | | | | | | 440 | | | | 460,900 | |
Penske Automotive Group, Inc., 5.38%, 12/01/24 (e) | | | | | | | 743 | | | | 748,572 | |
Sally Holdings LLC/Sally Capital, Inc., 5.75%, 6/01/22 (e) | | | | | | | 647 | | | | 677,733 | |
| | | | | | | | | | | | |
| | | | | 3,423,055 | |
Technology Hardware, Storage & Peripherals — 0.1% | |
Pacific Emerald Property Ltd., 9.75%, 7/25/18 | | | | | | | 500 | | | | 506,250 | |
Textiles, Apparel & Luxury Goods — 0.1% | |
Levi Strauss & Co., 5.00%, 5/01/25 | | | | | | | 335 | | | | 339,187 | |
Springs Industries, Inc., 6.25%, 6/01/21 | | | | | | | 159 | | | | 161,783 | |
William Carter Co., 5.25%, 8/15/21 (e) | | | | | | | 134 | | | | 139,628 | |
| | | | | | | | | | | | |
| | | | | 640,598 | |
Thrifts & Mortgage Finance — 0.1% | |
Radian Group, Inc., 5.25%, 6/15/20 (e) | | | | | | | 550 | | | | 554,125 | |
Tobacco — 0.1% | |
Reynolds American, Inc., 5.85%, 8/15/45 (e) | | | | | | | 465 | | | | 570,777 | |
Trading Companies & Distributors — 0.4% | | | | | | | | | | | | |
Doric Nimrod Air Alpha Ltd. Pass-Through
Trust (d)(e): | | | | | | | | | | | | |
Series 2012-1, Class B, 6.50%, 5/30/21 | | | | | | | 618 | | | | 621,438 | |
Series 2013-1, Class A, 5.25%, 5/30/25 | | | | | | | 2,467 | | | | 2,509,800 | |
| | | | | | | | | | | | |
| | | | | 3,131,238 | |
Transportation Infrastructure — 0.1% | |
CEVA Group PLC, 7.00%, 3/01/21 (d) | | | | | | | 510 | | | | 466,650 | |
Transurban Finance Co., 4.13%, 2/02/26 (d)(e) | | | | | | | 520 | | | | 538,853 | |
| | | | | | | | | | | | |
| | | | | 1,005,503 | |
Wireless Telecommunication Services — 1.9% | |
Communications Sales & Leasing, Inc./CSL Capital LLC, 8.25%, 10/15/23 | | | | | | | 240 | | | | 227,400 | |
Digicel Ltd., 6.00%, 4/15/21 (d)(e) | | | | | | | 5,000 | | | | 4,575,000 | |
GEO Group, Inc.: | | | | | | | | | | | | |
5.13%, 4/01/23 (e) | | | | | | | 440 | | | | 432,300 | |
6.00%, 4/15/26 | | | | | | | 71 | | | | 72,740 | |
Softbank Corp., 4.50%, 4/15/20 (d)(e) | | | | | | | 1,500 | | | | 1,516,050 | |
Sprint Capital Corp.: | | | | | | | | | | | | |
6.90%, 5/01/19 | | | | | | | 155 | | | | 141,825 | |
6.88%, 11/15/28 (e) | | | | | | | 1,395 | | | | 1,035,787 | |
Sprint Communications, Inc.: | | | | | | | | | | | | |
9.00%, 11/15/18 (d)(e) | | | | | | | 2,191 | | | | 2,316,982 | |
7.00%, 8/15/20 | | | | | | | 305 | | | | 253,150 | |
Sprint Corp.: | | | | | | | | | | | | |
7.13%, 6/15/24 | | | | | | | 45 | | | | 33,750 | |
7.63%, 2/15/25 | | | | | | | 45 | | | | 33,919 | |
T-Mobile USA, Inc. (e): | | | | | | | | | | | | |
6.63%, 4/28/21 | | | | | | | 290 | | | | 305,588 | |
6.73%, 4/28/22 | | | | | | | 945 | | | | 994,612 | |
6.84%, 4/28/23 | | | | | | | 610 | | | | 650,413 | |
6.50%, 1/15/24 | | | | | | | 440 | | | | 468,600 | |
6.50%, 1/15/26 | | | | | | | 553 | | | | 586,180 | |
| | | | | | | | | | | | |
| | | | | 13,644,296 | |
| Total Corporate Bonds — 55.0% | | | | 385,973,314 | |
| | | | | | | | | | | | |
| Floating Rate Loan Interests (c) | | Par (000) | | | Value | |
Auto Components — 0.2% | |
Gates Global, Inc., Term Loan B, 4.25%, 7/06/21 | | | USD | | | | 1,318 | | | $ | 1,259,929 | |
Chemicals — 0.1% | | | | | | | | | | | | |
Allnex (Luxembourg) & Cy SCA, Term Loan B1, 4.50%, 10/03/19 | | | | | | | 86 | | | | 86,020 | |
Allnex USA, Inc., Term Loan B2, 4.50%, 10/03/19 | | | | | | | 45 | | | | 44,631 | |
MacDermid, Inc., Term Loan B3, 5.50%, 6/07/20 | | | | | | | 184 | | | | 180,723 | |
PQ Corp., Term Loan, 5.75%, 10/14/22 | | | | | | | 206 | | | | 206,993 | |
| | | | | | | | | | | | |
| | | | | 518,367 | |
Commercial Services & Supplies — 0.1% | |
ADS Waste Holdings, Inc., Term Loan B2, 3.75%, 10/09/19 | | | | | | | 359 | | | | 357,308 | |
Brand Energy & Infrastructure Services, Inc., Term Loan B, 4.75%, 11/26/20 | | | | | | | 209 | | | | 206,493 | |
| | | | | | | | | | | | |
| | | | | 563,801 | |
Diversified Consumer Services — 0.1% | |
AssuredPartners, Inc., 2015 1st Lien Term Loan, 5.75%, 10/21/22 | | | | | | | 195 | | | | 193,783 | |
Bright Horizons Family Solutions, Inc., Term Loan B, 3.75%, 1/30/20 | | | | | | | 484 | | | | 483,953 | |
Laureate Education, Inc., Term Loan B, 5.00%, 6/15/18 | | | | | | | 597 | | | | 552,772 | |
| | | | | | | | | | | | |
| | | | | 1,230,508 | |
Diversified Financial Services — 1.6% | |
Aviron Capital LLC, Term Loan, 15.00%, 10/20/16 | | | | | | | 11,204 | | | | 11,204,407 | |
Electronic Equipment, Instruments & Components — 0.0% | |
CDW LLC, Term Loan, 3.25%, 4/29/20 | | | | | | | 291 | | | | 290,749 | |
Energy Equipment & Services — 0.1% | |
Dynegy Holdings, Inc., Term Loan B2, 4.00%, 4/23/20 | | | | | | | 563 | | | | 560,309 | |
Food & Staples Retailing — 0.1% | | | | | | | | | | | | |
US Foods, Inc., Refinancing Term Loan, 4.50%, 3/31/19 | | | | | | | 495 | | | | 493,906 | |
Health Care Equipment & Supplies — 0.1% | |
Capsugel Holdings US, Inc., Term Loan B, 4.00%, 7/31/21 | | | | | | | 304 | | | | 304,503 | |
DJO Finance LLC, 2015 Term Loan, 4.25%, 6/08/20 | | | | | | | 280 | | | | 271,975 | |
Immucor, Inc., Refinancing Term Loan B2, 5.00%, 8/17/18 | | | | | | | 269 | | | | 255,839 | |
| | | | | | | | | | | | |
| | | | | 832,317 | |
Health Care Providers & Services — 0.1% | |
Envision Healthcare Corp., 5.13%, 7/01/22 (d) | | | | | | | 205 | | | | 208,587 | |
Vizient, Inc., 1st Lien Term Loan, 6.25%, 2/13/23 | | | | | | | 241 | | | | 243,109 | |
| | | | | | | | | | | | |
| | | | | 451,696 | |
Hotels, Restaurants & Leisure — 3.3% | |
Amaya Holdings BV, 1st Lien Term Loan, 5.00%, 8/01/21 | | | | | | | 315 | | | | 301,091 | |
Caesars Entertainment Resort Properties LLC, Term Loan B, 7.00%, 10/11/20 | | | | | | | 2,187 | | | | 2,059,616 | |
Hilton Ft. Lauderdale, Mezzanine Term Loan 5, 6.43%, 8/04/19 | | | | | | | 6,500 | | | | 6,467,500 | |
Hilton Los Cabos, B-Note, 8.43%, 9/18/18 | | | | | | | 5,375 | | | | 5,375,000 | |
Hilton Orlando, Mezzanine A3, 5.93%, 8/01/16 | | | | | | | 7,250 | | | | 7,250,000 | |
See Notes to Financial Statements.
| | | | | | |
| | | | | | | |
| 48 | | SEMI-ANNUAL REPORT | | APRIL 30, 2016 | | |
| | |
Consolidated Schedule of Investments (continued) | | BlackRock Multi-Sector Income Trust (BIT) |
| | | | | | | | | | | | |
| Floating Rate Loan Interests (c) | | Par (000) | | | Value | |
Hotels, Restaurants & Leisure (continued) | |
Starwood Schulte, Mezzanine Term Loan, 8.28%, 6/30/17 | | | USD | | | | 2,000 | | | $ | 1,973,000 | |
Station Casinos LLC, Term Loan B, 4.25%, 3/02/20 | | | | | | | 238 | | | | 237,829 | |
| | | | | | | | | | | | |
| | | | | 23,664,036 | |
Household Products — 0.0% | |
TruGreen Limited Partnership, 1st Lien Term Loan B, 6.50%, 4/13/23 | | | | | | | 124 | | | | 124,465 | |
Insurance — 0.6% | |
Dallas Design District, Mezzanine Term Loan, 7.33%, 11/09/16 | | | | | | | 4,000 | | | | 3,660,000 | |
Sedgwick Claims Management Services, Inc., 1st Lien Term Loan, 3.75%, 3/01/21 | | | | | | | 475 | | | | 465,051 | |
| | | | | | | | | | | | |
| | | | | 4,125,051 | |
IT Services — 0.1% | |
First Data Corp., 2021 Extended Term Loan, 4.44%, 3/24/21 | | | | | | | 840 | | | | 841,321 | |
Life Sciences Tools & Services — 0.0% | |
Pharmaceutical Product Development LLC, 1st Lien Term Loan, 4.25%, 8/18/22 | | | | | | | 101 | | | | 100,769 | |
Machinery — 0.1% | |
Silver II US Holdings LLC, Term Loan, 4.00%, 12/13/19 | | | | | | | 642 | | | | 577,020 | |
Media — 0.3% | |
Cengage Learning Acquisitions, Inc., 1st Lien Term Loan, 7.00%, 3/31/20 | | | | | | | 450 | | | | 447,002 | |
Clear Channel Communications, Inc., Term Loan D, 7.19%, 1/30/19 | | | | | | | 1,168 | | | | 870,995 | |
Intelsat Jackson Holdings SA, Term Loan B2, 3.75%, 6/30/19 | | | | | | | 199 | | | | 186,117 | |
Univision Communications, Inc., Term Loan C4, 4.00%, 3/01/20 | | | | | | | 485 | | | | 484,025 | |
| | | | | | | | | | | | |
| | | | | 1,988,139 | |
Metals & Mining — 0.1% | |
FMG Resources August 2006 Property Ltd., Term Loan B, 4.25%, 6/30/19 | | | | | | | 856 | | | | 811,724 | |
Oil, Gas & Consumable Fuels — 0.0% | |
MEG Energy Corp., Refinancing Term Loan, 3.75%, 3/31/20 | | | | | | | 97 | | | | 86,829 | |
Pharmaceuticals — 0.2% | | | | | | | | | | | | |
DPx Holdings BV, 2014 Incremental Term Loan, 4.25%, 3/11/21 | | | | | | | 320 | | | | 316,360 | |
Jaguar Holding Co. II, 2015 Term Loan B, 4.25%, 8/18/22 | | | | | | | 627 | | | | 625,731 | |
NBTY, Inc., Term Loan B, 5.00%, 4/26/23 | | | | | | | 177 | | | | 177,480 | |
Valeant Pharmaceuticals International, Inc.: | | | | | | | | | | | | |
Series A3 Tranche A, 3.89%, 10/20/18 | | | | | | | 130 | | | | 125,938 | |
Series C2 Term Loan B, 4.75%, 12/11/19 | | | | | | | 41 | | | | 39,969 | |
Series E Term Loan B, 4.75%, 8/05/20 | | | | | | | 308 | | | | 299,105 | |
Series F1 Term Loan B, 5.00%, 4/01/22 | | | | | | | 89 | | | | 86,304 | |
| | | | | | | | | | | | |
| | | | | 1,670,887 | |
Professional Services — 0.1% | |
Advantage Sales & Marketing, Inc.: | | | | | | | | | | | | |
2014 1st Lien Term Loan, 1.00%, 7/23/21 | | | | | | | 300 | | | | 297,189 | |
| | | | | | | | | | | | |
| Floating Rate Loan Interests (c) | | Par (000) | | | Value | |
Professional Services (continued) | |
Advantage Sales & Marketing, Inc. (continued): | | | | | | | | | | | | |
2014 2nd Lien Term Loan, 7.50%, 7/25/22 | | | USD | | | | 159 | | | $ | 149,474 | |
| | | | | | | | | | | | |
| | | | | 446,663 | |
Real Estate Investment Trusts (REITs) — 0.1% | |
MGM Growth Properties LLC, 2016 Term Loan B, 4.00%, 4/25/23 | | | | | | | 463 | | | | 465,412 | |
Real Estate Management & Development — 0.7% | |
680 Madison Avenue, Mezzanine Term Loan, 5.65%, 8/09/17 | | | | | | | 4,000 | | | | 3,980,000 | |
Realogy Corp., Term Loan B, 3.75%, 3/05/20 | | | | | | | 868 | | | | 867,580 | |
| | | | | | | | | | | | |
| | | | | 4,847,580 | |
Road & Rail — 0.1% | |
Hertz Corp., Term Loan B2, 3.00%, 3/11/18 | | | | | | | 497 | | | | 495,481 | |
Semiconductors & Semiconductor Equipment — 0.3% | |
Avago Technologies Cayman Ltd., 2016 Term Loan B1, 4.25%, 2/01/23 | | | | | | | 1,791 | | | | 1,791,322 | |
Microsemi Corp., 2015 Term Loan B, 5.25%, 1/15/23 | | | | | | | 98 | | | | 98,633 | |
NXP BV, 2015 Term Loan B, 3.75%, 12/07/20 | | | | | | | 231 | | | | 231,471 | |
ON Semiconductor Corp., Term Loan B, 5.25%, 3/31/23 | | | | | | | 283 | | | | 284,121 | |
| | | | | | | | | | | | |
| | | | | 2,405,547 | |
Software — 0.1% | |
Solera Holdings, Inc., Term Loan B, 5.75%, 3/03/23 | | | | | | | 444 | | | | 445,665 | |
Textiles, Apparel & Luxury Goods — 0.0% | |
J. Crew Group, Inc., Term Loan B, 4.00%, 3/05/21 | | | | | | | 135 | | | | 107,310 | |
| Total Floating Rate Loan Interests — 8.6% | | | | 60,609,888 | |
| | | | | | | | | | | | |
| | | | | | | | | | | | | |
| | |
| Foreign Agency Obligations | | | | | | | |
Argentina Bonar Bonds: | | | | | | | | | | | | |
32.62%, 3/28/17 (c) | | | ARS | | | | 631 | | | | 43,637 | |
33.84%, 10/09/17 (c) | | | | | | | 1,561 | | | | 108,896 | |
9.00%, 11/29/18 | | | USD | | | | 144 | | | | 154,706 | |
Argentine Republic Government International Bond: | | | | | | | | | | | | |
32.61%, 9/29/16 (c) | | | ARS | | | | 777 | | | | 53,907 | |
6.25%, 4/22/19 (d)(j) | | | USD | | | | 471 | | | | 488,427 | |
6.88%, 4/22/21 (d)(j) | | | | | | | 169 | | | | 174,070 | |
7.50%, 4/22/26 (d)(j) | | | | | | | 3,627 | | | | 3,681,405 | |
5.83%, 12/31/33 (c) | | | ARS | | | | 54 | | | | 19,324 | |
7.63%, 4/22/46 (d)(j) | | | USD | | | | 2,767 | | | | 2,721,345 | |
Brazil Republic Government International Bond: | | | | | | | | | | | | |
2.63%, 1/05/23 | | | | | | | 200 | | | | 173,500 | |
6.00%, 4/07/26 | | | | | | | 314 | | | | 323,891 | |
Cyprus Government International Bond, 4.63%, 2/03/20 (d) | | | EUR | | | | 2,950 | | | | 3,572,128 | |
Development Bank of Mongolia LLC, 5.75%, 3/21/17 | | | USD | | | | 1,000 | | | | 977,500 | |
Iceland Government International Bond, 5.88%, 5/11/22 (e) | | | | | | | 3,415 | | | | 3,892,403 | |
Indonesia Government International Bond, 4.75%, 1/08/26 (d) | | | | | | | 207 | | | | 219,968 | |
See Notes to Financial Statements.
| | | | | | |
| | | | | | | |
| | SEMI-ANNUAL REPORT | | APRIL 30, 2016 | | 49 |
| | |
Consolidated Schedule of Investments (continued) | | BlackRock Multi-Sector Income Trust (BIT) |
| | | | | | | | | | | | |
| Foreign Agency Obligations | | Par (000) | | | Value | |
Mexican Bonos: | | | | | | | | | | | | |
4.75%, 6/14/18 | | | MXN | | | | 1,115 | | | $ | 65,242 | |
10.00%, 12/05/24 | | | | | | | 6,400 | | | | 479,431 | |
Mexican Udibonos, Inflation Protected, 3.50%, 12/14/17 | | | | | | | 295 | | | | 96,405 | |
Poland Government Bond, 2.00%, 4/25/21 | | | PLN | | | | 1,280 | | | | 331,392 | |
Portugal Government International Bond, 5.13%, 10/15/24 (d)(e) | | | USD | | | | 5,430 | | | | 5,389,568 | |
Russian Federal Bond, 7.00%, 8/16/23 | | | RUB | | | | 1,640 | | | | 23,015 | |
Slovenia Government International Bond: | | | | | | | | | | | | |
2.25%, 3/25/22 | | | EUR | | | | 922 | | | | 1,154,520 | |
5.85%, 5/10/23 (d)(e) | | | USD | | | | 766 | | | | 884,347 | |
Sri Lanka Government International Bond, 5.88%, 7/25/22 (e) | | | | | | | 3,000 | | | | 2,897,196 | |
| Total Foreign Agency Obligations — 4.0% | | | | 27,926,223 | |
| | | | | | | | | | | | |
| | | | | | | | | | | | | |
|
| Non-Agency Mortgage-Backed Securities | |
Collateralized Mortgage Obligations — 23.5% | |
American Home Mortgage Assets Trust, Series 2006-5, Class A1, 1.27%, 11/25/46 (c) | | | | | | | 6,566 | | | | 3,111,253 | |
CHL Mortgage Pass-Through Trust: | | | | | | | | | | | | |
Series 2006-3, Class 1A1, 0.67%, 3/25/36 (c) | | | | | | | 13,530 | | | | 10,584,046 | |
Series 2007-J2, Class 2A1, 1.08%, 7/25/37 (c) | | | | | | | 5,638 | | | | 3,278,673 | |
Series 2007-J2, Class 2A8, 6.00%, 7/25/37 | | | | | | | 3,113 | | | | 2,518,671 | |
Citigroup Mortgage Loan Trust, Series 2006-AR7, Class 2A3A, 2.73%, 11/25/36 (c) | | | | | | | 8,300 | | | | 6,851,870 | |
Countrywide Alternative Loan Trust: | | | | | | | | | | | | |
Series 2005-61, Class 2A1, 0.71%, 12/25/35 (c)(e) | | | | | | | 4,110 | | | | 3,550,780 | |
Series 2005-9CB, Class 1A3, 0.88%, 5/25/35 (c)(e) | | | | | | | 5,123 | | | | 4,081,426 | |
Series 2006-40T1, Class 2A5, 0.83%, 12/25/36 (c) | | | | | | | 3,097 | | | | 1,196,040 | |
Series 2006-7CB, Class 2A1, 6.50%, 5/25/36 | | | | | | | 3,784 | | | | 2,745,565 | |
Series 2006-J7, Class 2A1, 2.16%, 11/20/36 (c) | | | | | | | 8,049 | | | | 6,031,204 | |
Series 2006-J8, Class A5, 6.00%, 2/25/37 | | | | | | | 2,476 | | | | 1,873,168 | |
Series 2006-OA14, Class 3A1, 1.23%, 11/25/46 (c) | | | | | | | 12,976 | | | | 10,425,720 | |
Series 2006-OA16, Class A2, 0.62%, 10/25/46 (c) | | | | | | | 10,061 | | | | 8,735,957 | |
Series 2006-OA18, Class A1, 0.55%, 12/25/46 (c) | | | | | | | 6,074 | | | | 5,213,852 | |
Series 2006-OA22, Class A1, 0.59%, 2/25/47 (c) | | | | | | | 5,320 | | | | 4,374,590 | |
Series 2006-OA6, Class 1A1A, 0.64%, 7/25/46 (c) | | | | | | | 10,223 | | | | 7,717,001 | |
Series 2006-OA8, Class 1A1, 0.63%, 7/25/46 (c) | | | | | | | 3,747 | | | | 3,038,648 | |
Series 2007-12T1, Class A22, 5.75%, 6/25/37 (e) | | | | | | | 6,817 | | | | 5,486,992 | |
Series 2007-12T1, Class A5, 6.00%, 6/25/37 | | | | | | | 3,308 | | | | 2,717,541 | |
Series 2007-22, Class 2A16, 6.50%, 9/25/37 | | | | | | | 11,634 | | | | 8,810,498 | |
Series 2007-23CB, Class A1, 6.00%, 9/25/37 | | | | | | | 9,752 | | | | 8,357,251 | |
Series 2007-4CB, Class 1A3, 0.78%, 4/25/37 (c) | | | | | | | 6,225 | | | | 4,514,448 | |
| | | | | | | | | | | | |
| Non-Agency Mortgage-Backed Securities | | Par (000) | | | Value | |
Collateralized Mortgage Obligations (continued) | |
Countrywide Alternative Loan Trust (continued): | | | | | | | | | | | | |
Series 2007-OA2, Class 1A1, 1.19%, 3/25/47 (c) | | | USD | | | | 6,401 | | | $ | 4,797,687 | |
Countrywide Home Loan Mortgage Pass-Through Trust, Series 2006-OA5, Class 3A1, 0.63%, 4/25/46 (c) | | | | | | | 10,839 | | | | 9,437,850 | |
Fannie Mae Connecticut Avenue Securities, Class 1M2 (c): | | | | | | | | | | | | |
Series 2014-C02, 3.03%, 5/25/24 | | | | | | | 7,927 | | | | 7,295,778 | |
Series 2014-C03, 3.43%, 7/25/24 | | | | | | | 6,000 | | | | 5,680,301 | |
Morgan Stanley Re-REMIC Trust, Series 2010-R5, Class 7B, 0.77%, 5/26/37 (c)(d) | | | | | | | 16,976 | | | | 10,864,366 | |
Nomura Asset Acceptance Corp. Alternative Loan Trust, Series 2006-AF1, Class 1A2, 6.16%, 5/25/36 (c) | | | | | | | 9,557 | | | | 4,198,850 | |
Residential Asset Securitization Trust, Series 2006-A8, Class 2A5, 1.04%, 8/25/36 (c) | | | | | | | 8,038 | | | | 2,197,060 | |
WaMu Mortgage Pass-Through Certificates, Series 2007-OA4, Class 1A, 1.15%, 5/25/47 (c) | | | | | | | 5,906 | | | | 4,880,456 | |
| | | | | | | | | | | | |
| | | | | 164,567,542 | |
Commercial Mortgage-Backed Securities — 10.2% | |
Bank of America Merrill Lynch Commercial Mortgage Securities Trust, Series 2013-DSMZ, Class M, 6.12%, 9/15/18 (c)(d) | | | | | | | 7,500 | | | | 6,900,000 | |
CD Commercial Mortgage Trust, Series 2007-CD5, Class C, 6.33%, 11/15/44 (c)(e) | | | | | | | 3,372 | | | | 3,434,668 | |
CDGJ Commercial Mortgage Trust, Series 2014-BXCH, Class EPA, 4.68%, 12/15/27 (c)(d) | | | | | | | 5,000 | | | | 4,972,444 | |
CG-CCRE Commercial Mortgage Trust, Series 2014-FL1 (c)(d): | | | | | | | | | | | | |
Class D, 3.18%, 6/15/31 (e) | | | | | | | 3,000 | | | | 2,962,514 | |
Class E, 5.08%, 6/15/31 | | | | | | | 1,931 | | | | 1,925,109 | |
Commercial Mortgage Pass-Through Certificates (c)(d): | | | | | | | | | | | | |
Series 2013-LC13, Class D, 5.21%, 8/10/46 (e) | | | | | | | 2,650 | | | | 2,455,660 | |
Series 2014-FL5, Class HFL1, 3.69%, 7/15/31 | | | | | | | 6,057 | | | | 5,611,536 | |
Series 2014-KYO, Class F, 3.94%, 6/11/27 (e) | | | | | | | 8,080 | | | | 8,000,672 | |
Series 2014-LC15, Class D, 5.11%, 4/10/47 (e) | | | | | | | 3,000 | | | | 2,393,571 | |
Series 2014-PAT, Class E, 3.59%, 8/13/27 | | | | | | | 1,000 | | | | 971,150 | |
Series 2014-PAT, Class F, 2.88%, 8/13/27 | | | | | | | 3,000 | | | | 2,850,430 | |
Series 2014-PAT, Class G, 2.03%, 8/13/27 | | | | | | | 2,000 | | | | 1,803,000 | |
Credit Suisse First Boston Mortgage Securities Corp., Series 2005-C3, Class B, 4.88%, 7/15/37 | | | | | | | 2,000 | | | | 1,998,082 | |
GAHR Commericial Mortgage Trust, Series 2015-NRF, Class GFX, 3.49%, 12/15/19 (c)(d) | | | | | | | 2,500 | | | | 2,292,114 | |
Goldman Sachs Mortgage Securities Trust, Series 2014-GSFL (c)(d): | | | | | | | | | | | | |
Class D, 4.33%, 7/15/31 (e) | | | | | | | 1,325 | | | | 1,273,900 | |
Class E, 6.38%, 7/15/31 | | | | | | | 1,000 | | | | 990,970 | |
See Notes to Financial Statements.
| | | | | | |
| | | | | | | |
| 50 | | SEMI-ANNUAL REPORT | | APRIL 30, 2016 | | |
| | |
Consolidated Schedule of Investments (continued) | | BlackRock Multi-Sector Income Trust (BIT) |
| | | | | | | | | | | | |
| Non-Agency Mortgage-Backed Securities | | Par (000) | | | Value | |
Commercial Mortgage-Backed Securities (continued) | |
Great Wolf Trust, Series 2015-WFMZ, Class M, 7.42%, 5/15/32 (c)(d) | | | USD | | | | 3,300 | | | $ | 3,086,028 | |
JPMorgan Chase Commercial Mortgage Securities Trust, Series 2014-DSTY, Class E, 3.93%, 6/10/27 (c)(d) | | | | | | | 5,000 | | | | 4,385,288 | |
London & Regional Debt Securitisation No. 2 PLC, Series 2, Class A, 3.59%, 10/15/18 (c) | | | GBP | | | | 1,402 | | | | 2,045,087 | |
Madison Avenue Trust, Series 2013-650M, Class E, 4.17%, 10/12/32 (c)(d) | | | USD | | | | 5,000 | | | | 4,972,270 | |
New York Mortgage Securitization Trust, Series 2013-1, Class A, 5.68%, 8/27/24 (c)(d) | | | | | | | 5,000 | | | | 5,031,250 | |
Wachovia Bank Commercial Mortgage Trust, Series 2007-C33, Class AJ, 6.15%, 2/15/51 (c) | | | | | | | 1,400 | | | | 1,382,040 | |
| | | | | | | | | | | | |
| | | | | 71,737,783 | |
| Total Non-Agency Mortgage-Backed Securities — 33.7% | | | | 236,305,325 | |
| | | | | | | | | | | | |
| | | | | | | | | | | | | |
| | |
| Preferred Securities | | | | | | | |
|
| Capital Trusts | |
Banks — 5.3% | |
BNP Paribas SA, 7.20% (c)(d)(e)(k) | | | | | | | 4,000 | | | | 4,350,000 | |
Capital One Financial Corp., Series E, 5.55% (c)(e)(k) | | | | | | | 3,500 | | | | 3,493,000 | |
Citigroup, Inc. (c)(k): | | | | | | | | | | | | |
5.90% (e) | | | | | | | 2,250 | | | | 2,244,375 | |
Series D, 5.95% (e) | | | | | | | 3,700 | | | | 3,583,820 | |
Series R, 6.13% (e) | | | | | | | 1,170 | | | | 1,189,012 | |
Series T, 6.25% | | | | | | | 320 | | | | 329,200 | |
Fifth Third Bancorp, Series J, 4.90% (c)(e)(k) | | | | | | | 3,000 | | | | 2,621,250 | |
JPMorgan Chase & Co. (c)(e)(k): | | | | | | | | | | | | |
Series Q, 5.15% | | | | | | | 5,500 | | | | 5,348,750 | |
Series V, 5.00% | | | | | | | 3,830 | | | | 3,686,758 | |
Wells Fargo & Co. (c)(e)(k): | | | | | | | | | | | | |
Series S, 5.90% | | | | | | | 8,800 | | | | 9,009,000 | |
Series U, 5.88% | | | | | | | 1,240 | | | | 1,324,475 | |
| | | | | | | | | | | | |
| | | | | 37,179,640 | |
Capital Markets — 1.1% | | | | | | | | | | | | |
Goldman Sachs Group, Inc., Series L, 5.70% (c)(e)(k) | | | | | | | 1,287 | | | | 1,253,216 | |
Morgan Stanley, Series H, 5.45% (c)(e)(k) | | | | | | | 5,007 | | | | 4,769,168 | |
State Street Corp., Series F, 5.25% (c)(e)(k) | | | | | | | 1,875 | | | | 1,910,625 | |
| | | | | | | | | | | | |
| | | | | 7,933,009 | |
Diversified Financial Services — 4.4% | | | | | | | | | | | | |
Bank of America Corp. (c)(k): | | | | | | | | | | | | |
Series AA, 6.10% (e) | | | | | | | 2,865 | | | | 2,866,791 | |
Series DD, 6.30% | | | | | | | 200 | | | | 209,500 | |
Series U, 5.20% (e) | | | | | | | 1,750 | | | | 1,627,500 | |
Series V, 5.13% (e) | | | | | | | 705 | | | | 660,056 | |
Series X, 6.25% (e) | | | | | | | 6,175 | | | | 6,198,156 | |
Bank of New York Mellon Corp., Series D, 4.50% (c)(e)(k) | | | | | | | 6,067 | | | | 5,715,114 | |
Macquarie Bank Ltd., 10.25%, 6/20/57 (c)(e) | | | | | | | 10,000 | | | | 10,615,610 | |
Societe Generale SA, 6.00% (c)(d)(e)(k) | | | | | | | 3,000 | | | | 2,677,500 | |
| | | | | | | | | | | | |
| | | | | 30,570,227 | |
Electric Utilities — 1.0% | |
Electricite de France SA, 5.25% (c)(d)(e)(k) | | | | | | | 7,500 | | | | 7,229,250 | |
| | | | | | | | | | | | |
| Capital Trusts | | Par (000) | | | Value | |
Industrial Conglomerates — 0.9% | |
General Electric Co., 5.00% (c)(e)(k) | | | USD | | | | 5,921 | | | $ | 6,150,439 | |
Insurance — 1.3% | |
Allstate Corp, 5.75%, 8/15/53 (c)(e) | | | | | | | 2,000 | | | | 2,057,500 | |
Prudential Financial, Inc., 5.63%, 6/15/43 (c)(e) | | | | | | | 6,000 | | | | 6,253,620 | |
Voya Financial, Inc., 5.65%, 5/15/53 (c)(e) | | | | | | | 1,090 | | | | 1,020,785 | |
| | | | | | | | | | | | |
| | | | | 9,331,905 | |
Oil, Gas & Consumable Fuels — 0.4% | |
Enterprise Products Operating LLC, Series A, 8.38%, 8/01/66 (c)(e) | | | | | | | 3,248 | | | | 2,705,129 | |
Real Estate Investment Trusts (REITs) — 1.8% | |
Firstar Realty LLC, 8.88% (d)(k) | | | | | | | 10 | | | | 12,409,375 | |
| Total Capital Trusts — 16.2% | | | | 113,508,974 | |
| | | | | | | | | | | | |
| | | | | | | | | | | | | |
| | |
| Preferred Stocks | | | Shares | | | | |
Banks — 0.3% | |
Citigroup, Inc., Series K, 6.88% (c)(k) | | | | | | | 75,000 | | | | 2,069,250 | |
Capital Markets — 1.9% | |
Goldman Sachs Group, Inc., Series J, 5.50% (c)(k) | | | | | | | 395,017 | | | | 9,926,777 | |
Morgan Stanley, 6.88% (c)(k) | | | | | | | 100,000 | | | | 2,744,000 | |
SCE Trust III, 5.75% (c)(k) | | | | | | | 23,730 | | | | 645,456 | |
| | | | | | | | | | | | |
| | | | | 13,316,233 | |
Real Estate Investment Trusts (REITs) — 0.2% | |
SunTrust Real Estate Investment Corp., 9.00% (d)(k) | | | | | | | 15 | | | | 1,531,716 | |
| Total Preferred Stocks — 2.4% | | | | 16,917,199 | |
| Total Preferred Securities — 18.6% | | | | 130,426,173 | |
| | | | | | | | | | | | |
| | | | | | | | | | | | | |
| | |
| U.S. Treasury Obligations | | Par (000) | | | | |
U.S. Treasury Notes: | | | | | | | | | | | | |
2.25%, 11/15/25 (e) | | | USD | | | | 34,500 | | | | 35,811,276 | |
1.63%, 2/15/26 | | | | | | | 15,500 | | | | 15,231,168 | |
| Total U.S. Treasury Obligations — 7.3% | | | | 51,042,444 | |
| | | | | | | | | | | | |
| | | | | | | | | | | | | |
| | |
| Warrants | | | Shares | | | | |
Diversified Financial Services — 0.0% | | | | | | | | | | | | |
Aviron Capital LLC (Expires 10/20/16) (l) | | | | | | | 10 | | | | — | |
Total Long-Term Investments
(Cost — $1,137,885,451) — 160.7% | | | | | | | | | | | 1,126,853,140 | |
See Notes to Financial Statements.
| | | | | | |
| | | | | | | |
| | SEMI-ANNUAL REPORT | | APRIL 30, 2016 | | 51 |
| | |
Consolidated Schedule of Investments (continued) | | BlackRock Multi-Sector Income Trust (BIT) |
| | | | | | | | | | |
| Short-Term Securities — 3.4% | | Shares | | | Value | |
BlackRock Liquidity Funds, TempFund, Institutional Class, 0.40% (m)(n) | | | | | 23,521,991 | | | $ | 23,521,991 | |
Total Short-Term Securities
(Cost — $23,521,991) — 3.4% | | | | 23,521,991 | |
Options Purchased
(Cost — $787,615) — 0.1% | | | | 772,727 | |
Total Investments Before Options Written
(Cost — $1,162,195,057) — 164.2% | | | | 1,151,147,858 | |
Options Written
(Premiums Received — $618,908) — (0.1)% | | | | (720,407 | ) |
Total Investments, Net of Options Written
(Cost — $1,161,576,149) — 164.1% | | | | 1,150,427,451 | |
| Liabilities in Excess of Other Assets — (64.1)% | | | | (449,364,920 | ) |
| | | | | | | | | | |
| Net Assets — 100.0% | | | $ | 701,062,531 | |
| | | | | | | | | | |
|
| Notes to Schedule of Investments |
| (a) | | Non-income producing security. |
| (b) | | Restricted security as to resale, excluding 144A securities. As of period end, the Trust held restricted securities with a current value of $561 and an original cost of $8,635 which was less than 0.01% of its net assets. |
| (c) | | Variable rate security. Rate as of period end. |
| (d) | | Security exempt from registration pursuant to Rule 144A under the Securities Act of 1933, as amended. These securities may be resold in transactions exempt from registration to qualified institutional investors. |
| (e) | | All or a portion of security has been pledged as collateral in connection with outstanding reverse repurchase agreements. |
| (f) | | Step-up bond that pays an initial coupon rate for the first period and then a higher coupon rate for the following periods. Rate as of period end. |
| (g) | | Security is eligible to receive residual cash flows. |
| (h) | | Amount is less than $500. |
| (i) | | Payment-in-kind security which may pay interest/dividends in additional par/shares and/or in cash. Rates shown are the current rate and possible payment rates. |
| (j) | | When-issued security. |
| (k) | | Perpetual security with no stated maturity date. |
| (l) | | All or a portion of security is held by a wholly owned subsidiary. |
| (m) | | During the six months ended April 30, 2016, investments in issuers considered to be an affiliate of the Trust for purposes of Section 2(a)(3) of the Investment Company Act of 1940, as amended, were as follows: |
| | | | | | | | | | | | | | | | |
| Affiliate | | Shares Held
at October 31,
2015 | | | Net
Activity | | | Shares Held
at April 30,
2016 | | | Income | |
BlackRock Liquidity Funds, TempFund, Institutional Class | | | 6,140,532 | | | | 17,381,459 | | | | 23,521,991 | | | $ | 38,533 | |
| (n) | | Current yield as of period end. |
| • | | For Trust compliance purposes, the Trust’s industry classifications refer to any one or more of the industry sub-classifications used by one or more widely recognized market indexes or rating group indexes, and/or as defined by the investment advisor. These definitions may not apply for purposes of this report, which may combine such industry subclassifications for reporting ease. |
Reverse Repurchase Agreements
| | | | | | | | | | | | | | | | | | | | | | | | |
| Counterparty | | Interest
Rate | | | Trade
Date | | | Maturity
Date1 | | | Face Value | | | Face Value
Including
Accrued
Interest | | | Type of Underlying Collateral | | Remaining
Contractual
Maturity of
the Agreements |
UBS Limited | | | 0.80 | % | | | 6/3/15 | | | | Open | | | $ | 158,000 | | | $ | 159,166 | | | Corporate Bonds | | Open/Demand1 |
UBS Limited | | | 0.85 | % | | | 6/3/15 | | | | Open | | | | 232,500 | | | | 234,323 | | | Corporate Bonds | | Open/Demand1 |
UBS Limited | | | 0.70 | % | | | 11/10/15 | | | | Open | | | | 5,117,775 | | | | 5,134,991 | | | Foreign Agency Obligations | | Open/Demand1 |
UBS Securities LLC | | | 0.80 | % | | | 12/9/15 | | | | Open | | | | 542,430 | | | | 544,142 | | | Corporate Bonds | | Open/Demand1 |
UBS Securities LLC | | | 0.80 | % | | | 12/9/15 | | | | Open | | | | 537,000 | | | | 538,695 | | | Corporate Bonds | | Open/Demand1 |
UBS Securities LLC | | | 0.80 | % | | | 12/9/15 | | | | Open | | | | 789,750 | | | | 792,242 | | | Corporate Bonds | | Open/Demand1 |
UBS Securities LLC | | | 0.80 | % | | | 12/9/15 | | | | Open | | | | 419,475 | | | | 420,799 | | | Corporate Bonds | | Open/Demand1 |
UBS Securities LLC | | | 0.80 | % | | | 12/9/15 | | | | Open | | | | 535,087 | | | | 536,776 | | | Corporate Bonds | | Open/Demand1 |
UBS Securities LLC | | | 0.80 | % | | | 12/9/15 | | | | Open | | | | 723,450 | | | | 725,733 | | | Corporate Bonds | | Open/Demand1 |
See Notes to Financial Statements.
| | | | | | |
| | | | | | | |
| 52 | | SEMI-ANNUAL REPORT | | APRIL 30, 2016 | | |
| | |
Consolidated Schedule of Investments (continued) | | BlackRock Multi-Sector Income Trust (BIT) |
Reverse Repurchase Agreements (continued)
| | | | | | | | | | | | | | | | | | | | | | | | |
| Counterparty | | Interest
Rate | | | Trade
Date | | | Maturity
Date1 | | | Face Value | | | Face Value
Including
Accrued
Interest | | | Type of Underlying Collateral | | Remaining
Contractual
Maturity of
the Agreements |
UBS Securities LLC | | | 0.80 | % | | | 12/9/15 | | | | Open | | | $ | 688,750 | | | $ | 690,923 | | | Corporate Bonds | | Open/Demand1 |
UBS Securities LLC | | | 0.80 | % | | | 12/9/15 | | | | Open | | | | 549,750 | | | | 551,485 | | | Corporate Bonds | | Open/Demand1 |
UBS Securities LLC | | | 0.80 | % | | | 12/9/15 | | | | Open | | | | 541,325 | | | | 543,033 | | | Corporate Bonds | | Open/Demand1 |
UBS Securities LLC | | | 0.80 | % | | | 12/9/15 | | | | Open | | | | 440,735 | | | | 442,126 | | | Corporate Bonds | | Open/Demand1 |
UBS Securities LLC | | | 0.80 | % | | | 12/9/15 | | | | Open | | | | 387,100 | | | | 388,322 | | | Corporate Bonds | | Open/Demand1 |
UBS Securities LLC | | | 0.80 | % | | | 12/9/15 | | | | Open | | | | 253,575 | | | | 254,375 | | | Corporate Bonds | | Open/Demand1 |
UBS Securities LLC | | | 0.80 | % | | | 12/9/15 | | | | Open | | | | 450,215 | | | | 451,636 | | | Corporate Bonds | | Open/Demand1 |
UBS Securities LLC | | | 0.80 | % | | | 12/9/15 | | | | Open | | | | 486,675 | | | | 488,211 | | | Corporate Bonds | | Open/Demand1 |
UBS Securities LLC | | | 0.80 | % | | | 12/9/15 | | | | Open | | | | 539,850 | | | | 541,554 | | | Corporate Bonds | | Open/Demand1 |
UBS Securities LLC | | | 0.80 | % | | | 12/9/15 | | | | Open | | | | 2,095,144 | | | | 2,101,755 | | | Corporate Bonds | | Open/Demand1 |
UBS Securities LLC | | | 0.80 | % | | | 12/9/15 | | | | Open | | | | 535,087 | | | | 536,776 | | | Corporate Bonds | | Open/Demand1 |
UBS Securities LLC | | | 0.80 | % | | | 12/9/15 | | | | Open | | | | 642,950 | | | | 644,979 | | | Corporate Bonds | | Open/Demand1 |
UBS Securities LLC | | | 0.80 | % | | | 12/9/15 | | | | Open | | | | 680,600 | | | | 682,748 | | | Corporate Bonds | | Open/Demand1 |
UBS Securities LLC | | | 0.80 | % | | | 12/9/15 | | | | Open | | | | 634,480 | | | | 636,482 | | | Corporate Bonds | | Open/Demand1 |
UBS Securities LLC | | | 0.80 | % | | | 12/9/15 | | | | Open | | | | 545,200 | | | | 546,920 | | | Corporate Bonds | | Open/Demand1 |
UBS Securities LLC | | | 0.80 | % | | | 12/9/15 | | | | Open | | | | 708,037 | | | | 710,272 | | | Corporate Bonds | | Open/Demand1 |
UBS Securities LLC | | | 0.80 | % | | | 12/9/15 | | | | Open | | | | 238,631 | | | | 239,384 | | | Corporate Bonds | | Open/Demand1 |
UBS Securities LLC | | | 0.80 | % | | | 12/10/15 | | | | Open | | | | 1,504,800 | | | | 1,509,415 | | | Corporate Bonds | | Open/Demand1 |
Barclays Capital, Inc. | | | 0.80 | % | | | 12/15/15 | | | | Open | | | | 230,312 | | | | 231,003 | | | Corporate Bonds | | Open/Demand1 |
Barclays Capital, Inc. | | | 0.80 | % | | | 12/17/15 | | | | Open | | | | 739,594 | | | | 741,814 | | | Corporate Bonds | | Open/Demand1 |
Barclays Capital, Inc. | | | 0.80 | % | | | 12/17/15 | | | | Open | | | | 702,406 | | | | 704,515 | | | Corporate Bonds | | Open/Demand1 |
Barclays Capital, Inc. | | | 0.95 | % | | | 12/17/15 | | | | Open | | | | 3,224,398 | | | | 3,235,885 | | | Corporate Bonds | | Open/Demand1 |
Barclays Bank PLC | | | 0.65 | % | | | 12/17/15 | | | | Open | | | | 2,677,500 | | | | 2,684,026 | | | Corporate Bonds | | Open/Demand1 |
Barclays Bank PLC | | | 0.75 | % | | | 12/17/15 | | | | Open | | | | 3,504,644 | | | | 3,514,501 | | | Foreign Agency Obligations | | Open/Demand1 |
Barclays Bank PLC | | | 0.80 | % | | | 12/17/15 | | | | Open | | | | 947,031 | | | | 949,872 | | | Corporate Bonds | | Open/Demand1 |
Barclays Bank PLC | | | 0.85 | % | | | 12/17/15 | | | | Open | | | | 1,387,625 | | | | 1,392,048 | | | Corporate Bonds | | Open/Demand1 |
Barclays Capital, Inc. | | | 0.60 | % | | | 12/17/15 | | | | Open | | | | 5,887,500 | | | | 5,900,747 | | | Capital Trusts | | Open/Demand1 |
Barclays Capital, Inc. | | | 0.80 | % | | | 12/17/15 | | | | Open | | | | 1,988,437 | | | | 1,994,403 | | | Capital Trusts | | Open/Demand1 |
Barclays Capital, Inc. | | | 0.80 | % | | | 12/17/15 | | | | Open | | | | 654,225 | | | | 656,188 | | | Capital Trusts | | Open/Demand1 |
Barclays Capital, Inc. | | | 0.80 | % | | | 12/17/15 | | | | Open | | | | 975,550 | | | | 978,477 | | | Capital Trusts | | Open/Demand1 |
Barclays Capital, Inc. | | | 0.80 | % | | | 12/17/15 | | | | Open | | | | 867,300 | | | | 869,902 | | | Corporate Bonds | | Open/Demand1 |
Barclays Capital, Inc. | | | 0.80 | % | | | 12/17/15 | | | | Open | | | | 459,635 | | | | 461,014 | | | Corporate Bonds | | Open/Demand1 |
Barclays Capital, Inc. | | | 0.80 | % | | | 12/17/15 | | | | Open | | | | 644,875 | | | | 646,811 | | | Corporate Bonds | | Open/Demand1 |
Credit Suisse Securities (USA) LLC | | | 1.15 | % | | | 12/17/15 | | | | Open | | | | 577,212 | | | | 579,702 | | | Corporate Bonds | | Open/Demand1 |
Credit Suisse Securities (USA) LLC | | | 0.70 | % | | | 12/17/15 | | | | Open | | | | 814,036 | | | | 816,173 | | | Corporate Bonds | | Open/Demand1 |
Credit Suisse Securities (USA) LLC | | | 1.10 | % | | | 12/17/15 | | | | Open | | | | 802,750 | | | | 806,061 | | | Corporate Bonds | | Open/Demand1 |
Deutsche Bank Securities, Inc. | | | 0.80 | % | | | 12/17/15 | | | | Open | | | | 789,000 | | | | 791,367 | | | Foreign Agency Obligations | | Open/Demand1 |
Deutsche Bank Securities, Inc. | | | 0.80 | % | | | 12/17/15 | | | | Open | | | | 2,427,000 | | | | 2,434,285 | | | Capital Trusts | | Open/Demand1 |
Deutsche Bank Securities, Inc. | | | 0.80 | % | | | 12/17/15 | | | | Open | | | | 2,450,000 | | | | 2,457,354 | | | Corporate Bonds | | Open/Demand1 |
Deutsche Bank Securities, Inc. | | | 0.80 | % | | | 12/17/15 | | | | Open | | | | 1,836,000 | | | | 1,841,511 | | | Capital Trusts | | Open/Demand1 |
Deutsche Bank Securities, Inc. | | | 0.80 | % | | | 12/17/15 | | | | Open | | | | 1,751,000 | | | | 1,756,256 | | | Capital Trusts | | Open/Demand1 |
Deutsche Bank Securities, Inc. | | | 0.80 | % | | | 12/17/15 | | | | Open | | | | 2,515,000 | | | | 2,522,545 | | | Corporate Bonds | | Open/Demand1 |
Deutsche Bank Securities, Inc. | | | 1.00 | % | | | 12/17/15 | | | | 1/15/17 | | | | 2,633,000 | | | | 2,642,879 | | | Corporate Bonds | | Greater Than 90 Days But Less Than One Year |
Deutsche Bank Securities, Inc. | | | 1.00 | % | | | 12/17/15 | | | | Open | | | | 345,000 | | | | 346,294 | | | Corporate Bonds | | Open/Demand |
Deutsche Bank Securities, Inc. | | | 1.00 | % | | | 12/17/15 | | | | Open | | | | 309,000 | | | | 310,159 | | | Corporate Bonds | | Open/Demand1 |
Deutsche Bank Securities, Inc. | | | 1.00 | % | | | 12/17/15 | | | | Open | | | | 870,000 | | | | 873,264 | | | Corporate Bonds | | Open/Demand1 |
Deutsche Bank Securities, Inc. | | | 1.00 | % | | | 12/17/15 | | | | Open | | | | 145,000 | | | | 145,544 | | | Corporate Bonds | | Open/Demand1 |
Deutsche Bank Securities, Inc. | | | 1.00 | % | | | 12/17/15 | | | | Open | | | | 598,000 | | | | 600,244 | | | Corporate Bonds | | Open/Demand1 |
Deutsche Bank Securities, Inc. | | | 1.00 | % | | | 12/17/15 | | | | Open | | | | 1,358,000 | | | | 1,363,095 | | | Corporate Bonds | | Open/Demand1 |
Deutsche Bank Securities, Inc. | | | 1.00 | % | | | 12/17/15 | | | | Open | | | | 1,092,000 | | | | 1,096,097 | | | Corporate Bonds | | Open/Demand1 |
Deutsche Bank Securities, Inc. | | | 1.00 | % | | | 12/17/15 | | | | Open | | | | 1,078,000 | | | | 1,082,043 | | | Corporate Bonds | | Open/Demand1 |
Deutsche Bank Securities, Inc. | | | 1.00 | % | | | 12/17/15 | | | | Open | | | | 1,520,000 | | | | 1,525,700 | | | Corporate Bonds | | Open/Demand1 |
Deutsche Bank Securities, Inc. | | | 1.00 | % | | | 12/17/15 | | | | Open | | | | 4,594,000 | | | | 4,611,159 | | | Corporate Bonds | | Open/Demand1 |
Deutsche Bank Securities, Inc. | | | 1.00 | % | | | 12/17/15 | | | | Open | | | | 2,521,000 | | | | 2,530,454 | | | Capital Trusts | | Open/Demand1 |
Deutsche Bank Securities, Inc. | | | 1.00 | % | | | 12/17/15 | | | | Open | | | | 1,480,000 | | | | 1,485,550 | | | Capital Trusts | | Open/Demand1 |
Deutsche Bank Securities, Inc. | | | 1.00 | % | | | 12/17/15 | | | | Open | | | | 2,842,000 | | | | 2,852,658 | | | Corporate Bonds | | Open/Demand1 |
Deutsche Bank Securities, Inc. | | | 1.00 | % | | | 12/17/15 | | | | Open | | | | 87,000 | | | | 87,326 | | | Corporate Bonds | | Open/Demand1 |
Deutsche Bank Securities, Inc. | | | 1.00 | % | | | 12/17/15 | | | | Open | | | | 792,000 | | | | 794,972 | | | Corporate Bonds | | Open/Demand1 |
Deutsche Bank Securities, Inc. | | | 1.00 | % | | | 12/17/15 | | | | Open | | | | 586,000 | | | | 588,199 | | | Corporate Bonds | | Open/Demand1 |
Deutsche Bank Securities, Inc. | | | 1.00 | % | | | 12/17/15 | | | | Open | | | | 2,074,000 | | | | 2,081,782 | | | Corporate Bonds | | Open/Demand1 |
Deutsche Bank Securities, Inc. | | | 1.00 | % | | | 12/17/15 | | | | Open | | | | 598,000 | | | | 600,244 | | | Corporate Bonds | | Open/Demand1 |
See Notes to Financial Statements.
| | | | | | |
| | | | | | | |
| | SEMI-ANNUAL REPORT | | APRIL 30, 2016 | | 53 |
| | |
Consolidated Schedule of Investments (continued) | | BlackRock Multi-Sector Income Trust (BIT) |
Reverse Repurchase Agreements (continued)
| | | | | | | | | | | | | | | | | | | | | | | | |
| Counterparty | | Interest
Rate | | | Trade
Date | | | Maturity
Date1 | | | Face Value | | | Face Value
Including
Accrued
Interest | | | Type of Underlying Collateral | | Remaining
Contractual
Maturity of
the Agreements |
Deutsche Bank Securities, Inc. | | | 1.00 | % | | | 12/17/15 | | | | Open | | | $ | 238,000 | | | $ | 238,893 | | | Corporate Bonds | | Open/Demand1 |
Deutsche Bank Securities, Inc. | | | 1.00 | % | | | 12/17/15 | | | | Open | | | | 250,000 | | | | 250,938 | | | Corporate Bonds | | Open/Demand1 |
Deutsche Bank Securities, Inc. | | | 1.00 | % | | | 12/17/15 | | | | Open | | | | 367,000 | | | | 368,377 | | | Corporate Bonds | | Open/Demand1 |
Deutsche Bank Securities, Inc. | | | 1.00 | % | | | 12/17/15 | | | | Open | | | | 189,000 | | | | 189,709 | | | Corporate Bonds | | Open/Demand1 |
Deutsche Bank Securities, Inc. | | | 1.00 | % | | | 12/17/15 | | | | Open | | | | 637,000 | | | | 639,390 | | | Corporate Bonds | | Open/Demand1 |
Deutsche Bank Securities, Inc. | | | 1.00 | % | | | 12/17/15 | | | | Open | | | | 95,000 | | | | 95,356 | | | Corporate Bonds | | Open/Demand1 |
Deutsche Bank Securities, Inc. | | | 1.00 | % | | | 12/17/15 | | | | Open | | | | 223,000 | | | | 223,837 | | | Corporate Bonds | | Open/Demand1 |
Deutsche Bank Securities, Inc. | | | 1.00 | % | | | 12/17/15 | | | | Open | | | | 1,428,000 | | | | 1,433,358 | | | Corporate Bonds | | Open/Demand1 |
Deutsche Bank Securities, Inc. | | | 1.00 | % | | | 12/17/15 | | | | Open | | | | 262,000 | | | | 262,983 | | | Corporate Bonds | | Open/Demand1 |
Deutsche Bank Securities, Inc. | | | 1.00 | % | | | 12/17/15 | | | | Open | | | | 5,150,000 | | | | 5,169,323 | | | Corporate Bonds | | Open/Demand1 |
Deutsche Bank Securities, Inc. | | | 1.00 | % | | | 12/17/15 | | | | Open | | | | 121,000 | | | | 121,454 | | | Corporate Bonds | | Open/Demand1 |
Deutsche Bank Securities, Inc. | | | 1.00 | % | | | 12/17/15 | | | | Open | | | | 312,000 | | | | 313,171 | | | Corporate Bonds | | Open/Demand1 |
Deutsche Bank Securities, Inc. | | | 1.00 | % | | | 12/17/15 | | | | Open | | | | 291,000 | | | | 292,092 | | | Corporate Bonds | | Open/Demand1 |
Deutsche Bank Securities, Inc. | | | 1.00 | % | | | 12/17/15 | | | | Open | | | | 697,000 | | | | 699,615 | | | Corporate Bonds | | Open/Demand1 |
Deutsche Bank Securities, Inc. | | | 1.00 | % | | | 12/17/15 | | | | Open | | | | 250,000 | | | | 250,938 | | | Corporate Bonds | | Open/Demand1 |
Deutsche Bank Securities, Inc. | | | 1.00 | % | | | 12/17/15 | | | | Open | | | | 287,000 | | | | 288,077 | | | Corporate Bonds | | Open/Demand1 |
Deutsche Bank Securities, Inc. | | | 1.00 | % | | | 12/17/15 | | | | Open | | | | 2,209,000 | | | | 2,217,288 | | | Corporate Bonds | | Open/Demand1 |
Deutsche Bank Securities, Inc. | | | 1.00 | % | | | 12/17/15 | | | | Open | | | | 3,320,000 | | | | 3,332,457 | | | Corporate Bonds | | Open/Demand1 |
Deutsche Bank Securities, Inc. | | | 1.00 | % | | | 12/17/15 | | | | Open | | | | 866,000 | | | | 869,249 | | | Corporate Bonds | | Open/Demand1 |
Deutsche Bank Securities, Inc. | | | 1.00 | % | | | 12/17/15 | | | | Open | | | | 135,000 | | | | 135,507 | | | Corporate Bonds | | Open/Demand1 |
Deutsche Bank Securities, Inc. | | | 1.00 | % | | | 12/17/15 | | | | Open | | | | 705,000 | | | | 707,645 | | | Corporate Bonds | | Open/Demand1 |
Deutsche Bank Securities, Inc. | | | 1.00 | % | | | 12/17/15 | | | | Open | | | | 553,000 | | | | 555,075 | | | Corporate Bonds | | Open/Demand1 |
Deutsche Bank Securities, Inc. | | | 1.00 | % | | | 12/17/15 | | | | Open | | | | 2,110,000 | | | | 2,117,917 | | | Corporate Bonds | | Open/Demand1 |
Deutsche Bank Securities, Inc. | | | 1.00 | % | | | 12/17/15 | | | | Open | | | | 3,102,000 | | | | 3,113,639 | | | Corporate Bonds | | Open/Demand1 |
Deutsche Bank Securities, Inc. | | | 1.00 | % | | | 12/17/15 | | | | Open | | | | 2,572,000 | | | | 2,581,650 | | | Capital Trusts | | Open/Demand1 |
Deutsche Bank Securities, Inc. | | | 1.00 | % | | | 12/17/15 | | | | Open | | | | 291,000 | | | | 292,091 | | | Corporate Bonds | | Open/Demand1 |
Deutsche Bank Securities, Inc. | | | 1.00 | % | | | 12/17/15 | | | | Open | | | | 181,000 | | | | 181,679 | | | Corporate Bonds | | Open/Demand1 |
Deutsche Bank Securities, Inc. | | | 1.00 | % | | | 12/17/15 | | | | Open | | | | 1,800,000 | | | | 1,806,754 | | | Capital Trusts | | Open/Demand1 |
Deutsche Bank Securities, Inc. | | | 1.00 | % | | | 12/17/15 | | | | Open | | | | 1,467,000 | | | | 1,472,504 | | | Capital Trusts | | Open/Demand1 |
Deutsche Bank Securities, Inc. | | | 1.00 | % | | | 12/17/15 | | | | Open | | | | 1,335,000 | | | | 1,340,009 | | | Corporate Bonds | | Open/Demand1 |
HSBC Securities (USA), Inc. | | | 0.65 | % | | | 12/17/15 | | | | Open | | | | 2,685,000 | | | | 2,691,545 | | | Capital Trusts | | Open/Demand1 |
HSBC Securities (USA), Inc. | | | 0.65 | % | | | 12/17/15 | | | | Open | | | | 3,456,000 | | | | 3,464,424 | | | Corporate Bonds | | Open/Demand1 |
RBC Capital Markets, LLC | | | 0.64 | % | | | 12/17/15 | | | | Open | | | | 484,900 | | | | 486,064 | | | Corporate Bonds | | Open/Demand1 |
RBC Capital Markets, LLC | | | 0.64 | % | | | 12/17/15 | | | | Open | | | | 424,625 | | | | 425,644 | | | Corporate Bonds | | Open/Demand1 |
RBC Capital Markets, LLC | | | 0.90 | % | | | 12/17/15 | | | | Open | | | | 388,220 | | | | 389,530 | | | Corporate Bonds | | Open/Demand1 |
RBC Capital Markets, LLC | | | 0.90 | % | | | 12/17/15 | | | | Open | | | | 202,125 | | | | 202,807 | | | Corporate Bonds | | Open/Demand1 |
RBC Capital Markets, LLC | | | 0.90 | % | | | 12/17/15 | | | | Open | | | | 123,487 | | | | 123,904 | | | Corporate Bonds | | Open/Demand1 |
RBC Capital Markets, LLC | | | 0.90 | % | | | 12/17/15 | | | | Open | | | | 97,947 | | | | 98,278 | | | Corporate Bonds | | Open/Demand1 |
RBC Capital Markets, LLC | | | 0.95 | % | | | 12/17/15 | | | | Open | | | | 188,125 | | | | 188,795 | | | Corporate Bonds | | Open/Demand1 |
RBC Capital Markets, LLC | | | 0.95 | % | | | 12/17/15 | | | | Open | | | | 462,075 | | | | 463,721 | | | Corporate Bonds | | Open/Demand1 |
RBC Capital Markets, LLC | | | 0.95 | % | | | 12/17/15 | | | | Open | | | | 310,780 | | | | 311,887 | | | Corporate Bonds | | Open/Demand1 |
RBC Capital Markets, LLC | | | 0.95 | % | | | 12/17/15 | | | | Open | | | | 275,200 | | | | 276,180 | | | Corporate Bonds | | Open/Demand1 |
RBC Capital Markets, LLC | | | 0.95 | % | | | 12/17/15 | | | | Open | | | | 167,860 | | | | 168,458 | | | Corporate Bonds | | Open/Demand1 |
RBC Capital Markets, LLC | | | 0.95 | % | | | 12/17/15 | | | | Open | | | | 369,000 | | | | 370,315 | | | Corporate Bonds | | Open/Demand1 |
RBC Capital Markets, LLC | | | 0.95 | % | | | 12/17/15 | | | | Open | | | | 737,200 | | | | 739,826 | | | Corporate Bonds | | Open/Demand1 |
RBC Capital Markets, LLC | | | 0.95 | % | | | 12/17/15 | | | | Open | | | | 715,950 | | | | 718,501 | | | Corporate Bonds | | Open/Demand1 |
RBC Capital Markets, LLC | | | 0.95 | % | | | 12/17/15 | | | | Open | | | | 235,935 | | | | 236,776 | | | Corporate Bonds | | Open/Demand1 |
RBC Capital Markets, LLC | | | 0.95 | % | | | 12/17/15 | | | | Open | | | | 448,800 | | | | 450,399 | | | Corporate Bonds | | Open/Demand1 |
RBC Capital Markets, LLC | | | 0.95 | % | | | 12/17/15 | | | | Open | | | | 467,775 | | | | 469,441 | | | Corporate Bonds | | Open/Demand1 |
RBC Capital Markets, LLC | | | 0.95 | % | | | 12/17/15 | | | | Open | | | | 376,875 | | | | 378,218 | | | Corporate Bonds | | Open/Demand1 |
RBC Capital Markets, LLC | | | 0.95 | % | | | 12/17/15 | | | | Open | | | | 1,973,420 | | | | 1,980,450 | | | Corporate Bonds | | Open/Demand1 |
RBC Capital Markets, LLC | | | 0.95 | % | | | 12/17/15 | | | | Open | | | | 315,900 | | | | 317,025 | | | Corporate Bonds | | Open/Demand1 |
RBC Capital Markets, LLC | | | 0.95 | % | | | 12/17/15 | | | | Open | | | | 233,250 | | | | 234,081 | | | Corporate Bonds | | Open/Demand1 |
RBC Capital Markets, LLC | | | 0.95 | % | | | 12/17/15 | | | | Open | | | | 179,877 | | | | 180,518 | | | Corporate Bonds | | Open/Demand1 |
RBC Capital Markets, LLC | | | 0.95 | % | | | 12/17/15 | | | | Open | | | | 267,637 | | | | 268,591 | | | Corporate Bonds | | Open/Demand1 |
RBC Capital Markets, LLC | | | 0.95 | % | | | 12/17/15 | | | | Open | | | | 1,121,250 | | | | 1,125,244 | | | Corporate Bonds | | Open/Demand1 |
RBC Capital Markets, LLC | | | 1.00 | % | | | 12/17/15 | | | | Open | | | | 120,080 | | | | 120,530 | | | Corporate Bonds | | Open/Demand1 |
RBC Capital Markets, LLC | | | 1.00 | % | | | 12/17/15 | | | | Open | | | | 181,640 | | | | 182,321 | | | Corporate Bonds | | Open/Demand1 |
RBC Capital Markets, LLC | | | 1.00 | % | | | 12/17/15 | | | | Open | | | | 358,875 | | | | 360,221 | | | Corporate Bonds | | Open/Demand1 |
RBC Capital Markets, LLC | | | 1.00 | % | | | 12/17/15 | | | | Open | | | | 245,700 | | | | 246,621 | | | Corporate Bonds | | Open/Demand1 |
RBC Capital Markets, LLC | | | 1.00 | % | | | 12/17/15 | | | | Open | | | | 80,250 | | | | 80,551 | | | Corporate Bonds | | Open/Demand1 |
RBC Capital Markets, LLC | | | 1.00 | % | | | 12/17/15 | | | | Open | | | | 270,100 | | | | 271,113 | | | Corporate Bonds | | Open/Demand1 |
RBC Capital Markets, LLC | | | 1.00 | % | | | 12/17/15 | | | | Open | | | | 364,100 | | | | 365,465 | | | Corporate Bonds | | Open/Demand1 |
See Notes to Financial Statements.
| | | | | | |
| | | | | | | |
| 54 | | SEMI-ANNUAL REPORT | | APRIL 30, 2016 | | |
| | |
Consolidated Schedule of Investments (continued) | | BlackRock Multi-Sector Income Trust (BIT) |
Reverse Repurchase Agreements (continued)
| | | | | | | | | | | | | | | | | | | | | | | | |
| Counterparty | | Interest
Rate | | | Trade
Date | | | Maturity
Date1 | | | Face Value | | | Face Value
Including
Accrued
Interest | | | Type of Underlying Collateral | | Remaining
Contractual
Maturity of
the Agreements |
RBC Capital Markets, LLC | | | 1.00 | % | | | 12/17/15 | | | | Open | | | $ | 373,500 | | | $ | 374,901 | | | Corporate Bonds | | Open/Demand1 |
RBC Capital Markets, LLC | | | 1.00 | % | | | 12/17/15 | | | | Open | | | | 243,000 | | | | 243,911 | | | Corporate Bonds | | Open/Demand1 |
RBC Capital Markets, LLC | | | 1.00 | % | | | 12/17/15 | | | | Open | | | | 88,400 | | | | 88,732 | | | Corporate Bonds | | Open/Demand1 |
RBC Capital Markets, LLC | | | 1.00 | % | | | 12/17/15 | | | | Open | | | | 214,130 | | | | 214,933 | | | Corporate Bonds | | Open/Demand1 |
RBC Capital Markets, LLC | | | 1.00 | % | | | 12/17/15 | | | | Open | | | | 194,375 | | | | 195,104 | | | Corporate Bonds | | Open/Demand1 |
RBC Capital Markets, LLC | | | 1.00 | % | | | 12/17/15 | | | | Open | | | | 78,500 | | | | 78,794 | | | Corporate Bonds | | Open/Demand1 |
RBC Capital Markets, LLC | | | 1.00 | % | | | 12/17/15 | | | | Open | | | | 323,900 | | | | 325,115 | | | Corporate Bonds | | Open/Demand1 |
RBC Capital Markets, LLC | | | 1.00 | % | | | 12/17/15 | | | | Open | | | | 54,925 | | | | 55,131 | | | Corporate Bonds | | Open/Demand1 |
RBC Capital Markets, LLC | | | 1.00 | % | | | 12/17/15 | | | | Open | | | | 492,900 | | | | 494,748 | | | Corporate Bonds | | Open/Demand1 |
RBC Capital Markets, LLC | | | 1.00 | % | | | 12/17/15 | | | | Open | | | | 398,475 | | | | 399,969 | | | Corporate Bonds | | Open/Demand1 |
RBC Capital Markets, LLC | | | 1.00 | % | | | 12/17/15 | | | | Open | | | | 443,620 | | | | 445,284 | | | Corporate Bonds | | Open/Demand1 |
RBC Capital Markets, LLC | | | 1.00 | % | | | 12/17/15 | | | | Open | | | | 414,050 | | | | 415,603 | | | Corporate Bonds | | Open/Demand1 |
RBC Capital Markets, LLC | | | 1.00 | % | | | 12/17/15 | | | | Open | | | | 267,137 | | | | 268,139 | | | Corporate Bonds | | Open/Demand1 |
RBC Capital Markets, LLC | | | 1.00 | % | | | 12/17/15 | | | | Open | | | | 835,275 | | | | 838,407 | | | Corporate Bonds | | Open/Demand1 |
RBC Capital Markets, LLC | | | 1.00 | % | | | 12/17/15 | | | | Open | | | | 378,200 | | | | 379,618 | | | Corporate Bonds | | Open/Demand1 |
RBC Capital Markets, LLC | | | 1.00 | % | | | 12/17/15 | | | | Open | | | | 492,800 | | | | 494,648 | | | Corporate Bonds | | Open/Demand1 |
RBC Capital Markets, LLC | | | 1.00 | % | | | 12/17/15 | | | | Open | | | | 241,425 | | | | 242,330 | | | Corporate Bonds | | Open/Demand1 |
RBC Capital Markets, LLC | | | 1.00 | % | | | 12/17/15 | | | | Open | | | | 622,500 | | | | 624,834 | | | Corporate Bonds | | Open/Demand1 |
RBC Capital Markets, LLC | | | 1.00 | % | | | 12/17/15 | | | | Open | | | | 495,600 | | | | 497,459 | | | Corporate Bonds | | Open/Demand1 |
RBC Capital Markets, LLC | | | 1.00 | % | | | 12/17/15 | | | | Open | | | | 152,220 | | | | 152,791 | | | Corporate Bonds | | Open/Demand1 |
RBC Capital Markets, LLC | | | 1.00 | % | | | 12/17/15 | | | | Open | | | | 767,350 | | | | 770,228 | | | Corporate Bonds | | Open/Demand1 |
RBC Capital Markets, LLC | | | 1.00 | % | | | 12/17/15 | | | | Open | | | | 192,625 | | | | 193,347 | | | Corporate Bonds | | Open/Demand1 |
RBC Capital Markets, LLC | | | 1.00 | % | | | 12/17/15 | | | | Open | | | | 45,390 | | | | 45,560 | | | Corporate Bonds | | Open/Demand1 |
RBC Capital Markets, LLC | | | 1.00 | % | | | 12/17/15 | | | | Open | | | | 78,680 | | | | 78,975 | | | Corporate Bonds | | Open/Demand1 |
RBC Capital Markets, LLC | | | 1.00 | % | | | 12/17/15 | | | | Open | | | | 45,338 | | | | 45,508 | | | Corporate Bonds | | Open/Demand1 |
RBC Capital Markets, LLC | | | 1.00 | % | | | 12/17/15 | | | | Open | | | | 193,590 | | | | 194,316 | | | Corporate Bonds | | Open/Demand1 |
RBC Capital Markets, LLC | | | 1.00 | % | | | 12/17/15 | | | | Open | | | | 103,500 | | | | 103,888 | | | Corporate Bonds | | Open/Demand1 |
RBC Capital Markets, LLC | | | 1.00 | % | | | 12/17/15 | | | | Open | | | | 138,400 | | | | 138,919 | | | Corporate Bonds | | Open/Demand1 |
RBC Capital Markets, LLC | | | 1.00 | % | | | 12/17/15 | | | | Open | | | | 367,875 | | | | 369,255 | | | Corporate Bonds | | Open/Demand1 |
RBC Capital Markets, LLC | | | 1.00 | % | | | 12/17/15 | | | | Open | | | | 1,178,000 | | | | 1,182,418 | | | Corporate Bonds | | Open/Demand1 |
RBC Capital Markets, LLC | | | 1.00 | % | | | 12/17/15 | | | | Open | | | | 2,054,280 | | | | 2,061,888 | | | Corporate Bonds | | Open/Demand1 |
RBC Capital Markets, LLC | | | 1.00 | % | | | 12/17/15 | | | | Open | | | | 323,900 | | | | 325,115 | | | Corporate Bonds | | Open/Demand1 |
RBC Capital Markets, LLC | | | 1.00 | % | | | 12/17/15 | | | | Open | | | | 124,000 | | | | 124,465 | | | Corporate Bonds | | Open/Demand1 |
RBC Capital Markets, LLC | | | 1.05 | % | | | 12/17/15 | | | | Open | | | | 133,200 | | | | 133,725 | | | Corporate Bonds | | Open/Demand1 |
RBC Capital Markets, LLC | | | 1.05 | % | | | 12/17/15 | | | | Open | | | | 245,700 | | | | 246,667 | | | Corporate Bonds | | Open/Demand1 |
RBC Capital Markets, LLC | | | 1.05 | % | | | 12/17/15 | | | | Open | | | | 227,250 | | | | 228,145 | | | Corporate Bonds | | Open/Demand1 |
RBC Capital Markets, LLC | | | 1.05 | % | | | 12/17/15 | | | | Open | | | | 64,080 | | | | 64,332 | | | Corporate Bonds | | Open/Demand1 |
RBC Capital Markets, LLC | | | 1.05 | % | | | 12/17/15 | | | | Open | | | | 1,247,750 | | | | 1,252,663 | | | Corporate Bonds | | Open/Demand1 |
Barclays Capital, Inc. | | | 0.80 | % | | | 12/18/15 | | | | Open | | | | 908,267 | | | | 910,992 | | | Corporate Bonds | | Open/Demand1 |
Deutsche Bank Securities, Inc. | | | 1.10 | % | | | 12/18/15 | | | | Open | | | | 2,036,000 | | | | 2,044,212 | | | Corporate Bonds | | Open/Demand1 |
RBC Capital Markets, LLC | | | 0.75 | % | | | 12/18/15 | | | | Open | | | | 1,680,725 | | | | 1,685,452 | | | Corporate Bonds | | Open/Demand1 |
RBC Capital Markets, LLC | | | 0.75 | % | | | 12/18/15 | | | | Open | | | | 1,073,572 | | | | 1,076,525 | | | Corporate Bonds | | Open/Demand1 |
RBC Capital Markets, LLC | | | 0.90 | % | | | 12/18/15 | | | | Open | | | | 222,495 | | | | 223,229 | | | Corporate Bonds | | Open/Demand1 |
RBC Capital Markets, LLC | | | 0.90 | % | | | 12/18/15 | | | | Open | | | | 482,850 | | | | 484,443 | | | Corporate Bonds | | Open/Demand1 |
RBC Capital Markets, LLC | | | 0.90 | % | | | 12/18/15 | | | | Open | | | | 245,050 | | | | 245,859 | | | Corporate Bonds | | Open/Demand1 |
RBC Capital Markets, LLC | | | 0.95 | % | | | 12/18/15 | | | | Open | | | | 406,400 | | | | 407,816 | | | Corporate Bonds | | Open/Demand1 |
RBC Capital Markets, LLC | | | 1.00 | % | | | 12/18/15 | | | | Open | | | | 1,050,000 | | | | 1,053,938 | | | Corporate Bonds | | Open/Demand1 |
BNP Paribas Securities Corp. | | | 0.75 | % | | | 12/21/15 | | | | Open | | | | 7,317,000 | | | | 7,336,969 | | | Corporate Bonds | | Open/Demand1 |
BNP Paribas Securities Corp. | | | 1.04 | % | | | 12/21/15 | | | | Open | | | | 619,000 | | | | 621,343 | | | Corporate Bonds | | Open/Demand1 |
BNP Paribas Securities Corp. | | | 1.04 | % | | | 12/21/15 | | | | Open | | | | 1,414,000 | | | | 1,419,351 | | | Corporate Bonds | | Open/Demand1 |
BNP Paribas Securities Corp. | | | 1.04 | % | | | 12/21/15 | | | | Open | | | | 1,350,000 | | | | 1,355,109 | | | Corporate Bonds | | Open/Demand1 |
BNP Paribas Securities Corp. | | | 1.04 | % | | | 12/21/15 | | | | Open | | | | 1,093,000 | | | | 1,097,136 | | | Corporate Bonds | | Open/Demand1 |
UBS Limited | | | 1.00 | % | | | 12/21/15 | | | | Open | | | | 1,464,000 | | | | 1,469,327 | | | Corporate Bonds | | Open/Demand1 |
UBS Limited | | | 1.00 | % | | | 12/21/15 | | | | Open | | | | 9,175,000 | | | | 9,208,387 | | | Capital Trusts | | Open/Demand1 |
UBS Securities LLC | | | 0.75 | % | | | 12/21/15 | | | | Open | | | | 4,963,750 | | | | 4,977,297 | | | Capital Trusts | | Open/Demand1 |
UBS Securities LLC | | | 0.75 | % | | | 12/21/15 | | | | Open | | | | 7,068,750 | | | | 7,088,042 | | | Capital Trusts | | Open/Demand1 |
UBS Securities LLC | | | 0.75 | % | | | 12/21/15 | | | | Open | | | | 3,540,000 | | | | 3,549,661 | | | Corporate Bonds | | Open/Demand1 |
UBS Securities LLC | | | 0.75 | % | | | 12/21/15 | | | | Open | | | | 5,125,000 | | | | 5,138,987 | | | Corporate Bonds | | Open/Demand1 |
UBS Securities LLC | | | 0.75 | % | | | 12/21/15 | | | | Open | | | | 8,206,000 | | | | 8,228,396 | | | Capital Trusts | | Open/Demand1 |
UBS Securities LLC | | | 1.00 | % | | | 12/21/15 | | | | Open | | | | 3,062,500 | | | | 3,073,644 | | | Capital Trusts | | Open/Demand1 |
UBS Securities LLC | | | 1.00 | % | | | 12/21/15 | | | | Open | | | | 3,135,750 | | | | 3,147,161 | | | Capital Trusts | | Open/Demand1 |
UBS Securities LLC | | | 1.00 | % | | | 12/21/15 | | | | Open | | | | 2,385,000 | | | | 2,393,679 | | | Foreign Agency Obligations | | Open/Demand1 |
UBS Securities LLC | | | 1.00 | % | | | 12/21/15 | | | | Open | | | | 4,071,000 | | | | 4,085,814 | | | Capital Trusts | | Open/Demand1 |
See Notes to Financial Statements.
| | | | | | |
| | | | | | | |
| | SEMI-ANNUAL REPORT | | APRIL 30, 2016 | | 55 |
| | |
Consolidated Schedule of Investments (continued) | | BlackRock Multi-Sector Income Trust (BIT) |
Reverse Repurchase Agreements (continued)
| | | | | | | | | | | | | | | | | | | | | | | | |
| Counterparty | | Interest
Rate | | | Trade
Date | | | Maturity
Date1 | | | Face Value | | | Face Value
Including
Accrued
Interest | | | Type of Underlying Collateral | | Remaining
Contractual
Maturity of
the Agreements |
UBS Securities LLC | | | 1.00 | % | | | 12/21/15 | | | | Open | | | $ | 3,812,500 | | | $ | 3,826,373 | | | Corporate Bonds | | Open/Demand1 |
RBC Capital Markets, LLC | | | 0.65 | % | | | 12/22/15 | | | | Open | | | | 52,981 | | | | 53,106 | | | Corporate Bonds | | Open/Demand1 |
RBC Capital Markets, LLC | | | 0.95 | % | | | 12/22/15 | | | | Open | | | | 616,875 | | | | 619,008 | | | Corporate Bonds | | Open/Demand1 |
RBC Capital Markets, LLC | | | 0.95 | % | | | 12/23/15 | | | | Open | | | | 507,642 | | | | 509,383 | | | Corporate Bonds | | Open/Demand1 |
UBS Securities LLC | | | 1.00 | % | | | 12/28/15 | | | | Open | | | | 1,042,335 | | | | 1,045,954 | | | Corporate Bonds | | Open/Demand1 |
RBC Capital Markets, LLC | | | 1.00 | % | | | 1/7/16 | | | | Open | | | | 469,040 | | | | 470,538 | | | Corporate Bonds | | Open/Demand1 |
RBC Capital Markets, LLC | | | 0.95 | % | | | 1/13/16 | | | | Open | | | | 1,595,051 | | | | 1,599,639 | | | Corporate Bonds | | Open/Demand1 |
UBS Securities LLC | | | 0.80 | % | | | 1/13/16 | | | | Open | | | | 971,856 | | | | 974,210 | | | Corporate Bonds | | Open/Demand1 |
Deutsche Bank Securities, Inc. | | | 1.00 | % | | | 1/14/16 | | | | Open | | | | 57,000 | | | | 57,169 | | | Corporate Bonds | | Open/Demand1 |
Deutsche Bank Securities, Inc. | | | 1.00 | % | | | 1/14/16 | | | | Open | | | | 125,000 | | | | 125,372 | | | Corporate Bonds | | Open/Demand1 |
Deutsche Bank Securities, Inc. | | | 0.40 | % | | | 1/15/16 | | | | Open | | | | 35,276,250 | | | | 35,318,190 | | | U.S. Treasury Obligations | | Open/Demand1 |
UBS Securities LLC | | | 0.60 | % | | | 1/21/16 | | | | Open | | | | 1,587,375 | | | | 1,590,047 | | | Corporate Bonds | | Open/Demand1 |
UBS Securities LLC | | | 1.00 | % | | | 1/22/16 | | | | Open | | | | 386,975 | | | | 388,018 | | | Corporate Bonds | | Open/Demand1 |
BNP Paribas Securities Corp. | | | 1.04 | % | | | 1/26/16 | | | | Open | | | | 1,248,000 | | | | 1,251,461 | | | Corporate Bonds | | Open/Demand1 |
RBC Capital Markets, LLC | | | 0.90 | % | | | 1/26/16 | | | | Open | | | | 88,075 | | | | 88,286 | | | Corporate Bonds | | Open/Demand1 |
RBC Capital Markets, LLC | | | 1.00 | % | | | 1/26/16 | | | | Open | | | | 845,975 | | | | 848,231 | | | Corporate Bonds | | Open/Demand1 |
Deutsche Bank Securities, Inc. | | | 1.00 | % | | | 1/27/16 | | | | Open | | | | 132,000 | | | | 132,348 | | | Corporate Bonds | | Open/Demand1 |
Deutsche Bank Securities, Inc. | | | 1.00 | % | | | 1/27/16 | | | | Open | | | | 504,000 | | | | 505,330 | | | Corporate Bonds | | Open/Demand1 |
Deutsche Bank Securities, Inc. | | | 1.00 | % | | | 1/28/16 | | | | Open | | | | 795,488 | | | | 797,565 | | | Corporate Bonds | | Open/Demand1 |
Deutsche Bank Securities, Inc. | | | 1.00 | % | | | 1/28/16 | | | | Open | | | | 1,249,962 | | | | 1,253,226 | | | Corporate Bonds | | Open/Demand1 |
UBS Securities LLC | | | 1.00 | % | | | 2/1/16 | | | | Open | | | | 434,625 | | | | 435,712 | | | Corporate Bonds | | Open/Demand1 |
UBS Securities LLC | | | 1.00 | % | | | 2/3/16 | | | | Open | | | | 663,000 | | | | 664,621 | | | Corporate Bonds | | Open/Demand1 |
RBC Capital Markets, LLC | | | 0.95 | % | | | 2/4/16 | | | | Open | | | | 271,440 | | | | 272,056 | | | Corporate Bonds | | Open/Demand1 |
RBC Capital Markets, LLC | | | 1.00 | % | | | 2/8/16 | | | | Open | | | | 560,512 | | | | 561,804 | | | Corporate Bonds | | Open/Demand1 |
UBS Securities LLC | | | 1.00 | % | | | 2/9/16 | | | | Open | | | | 978,412 | | | | 980,641 | | | Capital Trusts | | Open/Demand1 |
Deutsche Bank Securities, Inc. | | | 1.00 | % | | | 2/10/16 | | | | Open | | | | 291,000 | | | | 291,655 | | | Corporate Bonds | | Open/Demand1 |
Deutsche Bank Securities, Inc. | | | 1.00 | % | | | 2/10/16 | | | | Open | | | | 416,000 | | | | 416,936 | | | Corporate Bonds | | Open/Demand1 |
Deutsche Bank Securities, Inc. | | | 1.00 | % | | | 2/10/16 | | | | Open | | | | 446,000 | | | | 447,004 | | | Corporate Bonds | | Open/Demand1 |
Deutsche Bank Securities, Inc. | | | 1.00 | % | | | 2/10/16 | | | | Open | | | | 178,000 | | | | 178,401 | | | Corporate Bonds | | Open/Demand1 |
Deutsche Bank Securities, Inc. | | | 1.00 | % | | | 2/10/16 | | | | Open | | | | 640,000 | | | | 641,440 | | | Corporate Bonds | | Open/Demand1 |
Deutsche Bank Securities, Inc. | | | 1.00 | % | | | 2/10/16 | | | | Open | | | | 496,000 | | | | 497,116 | | | Corporate Bonds | | Open/Demand1 |
Deutsche Bank Securities, Inc. | | | 1.00 | % | | | 2/10/16 | | | | Open | | | | 563,000 | | | | 564,267 | | | Corporate Bonds | | Open/Demand1 |
UBS Securities LLC | | | 1.00 | % | | | 2/10/16 | | | | Open | | | | 1,034,426 | | | | 1,036,754 | | | Capital Trusts | | Open/Demand1 |
RBC Capital Markets, LLC | | | 1.00 | % | | | 2/11/16 | | | | Open | | | | 1,461,480 | | | | 1,464,687 | | | Corporate Bonds | | Open/Demand1 |
Deutsche Bank Securities, Inc. | | | 1.00 | % | | | 2/12/16 | | | | Open | | | | 773,000 | | | | 774,696 | | | Capital Trusts | | Open/Demand1 |
UBS Securities LLC | | | 1.00 | % | | | 2/16/16 | | | | Open | | | | 1,049,510 | | | | 1,051,667 | | | Capital Trusts | | Open/Demand1 |
Deutsche Bank Securities, Inc. | | | 1.00 | % | | | 2/17/16 | | | | Open | | | | 203,000 | | | | 203,417 | | | Corporate Bonds | | Open/Demand1 |
RBC Capital Markets, LLC | | | 0.95 | % | | | 2/18/16 | | | | Open | | | | 550,275 | | | | 551,321 | | | Corporate Bonds | | Open/Demand1 |
RBC Capital Markets, LLC | | | 1.00 | % | | | 2/23/16 | | | | Open | | | | 221,275 | | | | 221,687 | | | Corporate Bonds | | Open/Demand1 |
RBC Capital Markets, LLC | | | 1.00 | % | | | 2/23/16 | | | | Open | | | | 1,784,305 | | | | 1,787,626 | | | Corporate Bonds | | Open/Demand1 |
Deutsche Bank Securities, Inc. | | | 1.00 | % | | | 2/26/16 | | | | Open | | | | 404,000 | | | | 404,729 | | | Corporate Bonds | | Open/Demand1 |
UBS Securities LLC | | | 1.00 | % | | | 3/1/16 | | | | Open | | | | 3,795,000 | | | | 3,801,430 | | | Capital Trusts | | Open/Demand1 |
UBS Securities LLC | | | 1.00 | % | | | 3/1/16 | | | | Open | | | | 2,287,500 | | | | 2,291,376 | | | Capital Trusts | | Open/Demand1 |
RBC Capital Markets, LLC | | | 0.64 | % | | | 3/2/16 | | | | Open | | | | 2,187,000 | | | | 2,189,333 | | | Corporate Bonds | | Open/Demand1 |
RBC Capital Markets, LLC | | | 0.64 | % | | | 3/2/16 | | | | Open | | | | 1,389,760 | | | | 1,391,242 | | | Corporate Bonds | | Open/Demand1 |
RBC Capital Markets, LLC | | | 1.00 | % | | | 3/2/16 | | | | Open | | | | 717,200 | | | | 718,395 | | | Corporate Bonds | | Open/Demand1 |
RBC Capital Markets, LLC | | | 1.10 | % | | | 3/2/16 | | | | Open | | | | 602,062 | | | | 603,166 | | | Corporate Bonds | | Open/Demand1 |
UBS Securities LLC | | | 1.00 | % | | | 3/3/16 | | | | Open | | | | 689,670 | | | | 690,800 | | | Corporate Bonds | | Open/Demand1 |
Deutsche Bank Securities, Inc. | | | 1.00 | % | | | 3/7/16 | | | | Open | | | | 539,000 | | | | 539,809 | | | Corporate Bonds | | Open/Demand1 |
RBC Capital Markets, LLC | | | 1.00 | % | | | 3/10/16 | | | | Open | | | | 325,000 | | | | 325,460 | | | Corporate Bonds | | Open/Demand1 |
UBS Securities LLC | | | 1.00 | % | | | 3/10/16 | | | | Open | | | | 428,400 | | | | 429,007 | | | Corporate Bonds | | Open/Demand1 |
RBC Capital Markets, LLC | | | 0.95 | % | | | 3/14/16 | | | | Open | | | | 240,711 | | | | 241,016 | | | Corporate Bonds | | Open/Demand1 |
RBC Capital Markets, LLC | | | 0.95 | % | | | 3/15/16 | | | | Open | | | | 488,529 | | | | 489,135 | | | Corporate Bonds | | Open/Demand1 |
RBC Capital Markets, LLC | | | 0.95 | % | | | 3/16/16 | | | | Open | | | | 303,030 | | | | 303,390 | | | Corporate Bonds | | Open/Demand1 |
BNP Paribas Securities Corp. | | | 1.04 | % | | | 3/17/16 | | | | Open | | | | 808,000 | | | | 808,957 | | | Corporate Bonds | | Open/Demand1 |
Deutsche Bank Securities, Inc. | | | 1.00 | % | | | 3/17/16 | | | | Open | | | | 713,000 | | | | 713,812 | | | Corporate Bonds | | Open/Demand1 |
UBS Securities LLC | | | 1.00 | % | | | 3/17/16 | | | | Open | | | | 474,267 | | | | 474,808 | | | Corporate Bonds | | Open/Demand1 |
Deutsche Bank Securities, Inc. | | | 1.00 | % | | | 3/21/16 | | | | Open | | | | 340,000 | | | | 340,378 | | | Corporate Bonds | | Open/Demand1 |
RBC Capital Markets, LLC | | | 1.00 | % | | | 3/21/16 | | | | Open | | | | 463,250 | | | | 463,778 | | | Corporate Bonds | | Open/Demand1 |
Deutsche Bank Securities, Inc. | | | 0.80 | % | | | 3/22/16 | | | | Open | | | | 5,161,000 | | | | 5,165,588 | | | Capital Trusts | | Open/Demand1 |
HSBC Securities (USA), Inc. | | | 0.95 | % | | | 3/22/16 | | | | Open | | | | 908,000 | | | | 908,958 | | | Corporate Bonds | | Open/Demand1 |
HSBC Securities (USA), Inc. | | | 0.95 | % | | | 3/22/16 | | | | Open | | | | 1,178,000 | | | | 1,179,243 | | | Corporate Bonds | | Open/Demand1 |
RBC Capital Markets, LLC | | | 0.64 | % | | | 3/22/16 | | | | Open | | | | 1,219,200 | | | | 1,220,067 | | | Corporate Bonds | | Open/Demand1 |
See Notes to Financial Statements.
| | | | | | |
| | | | | | | |
| 56 | | SEMI-ANNUAL REPORT | | APRIL 30, 2016 | | |
| | |
Consolidated Schedule of Investments (continued) | | BlackRock Multi-Sector Income Trust (BIT) |
Reverse Repurchase Agreements (continued)
| | | | | | | | | | | | | | | | | | | | | | | | |
| Counterparty | | Interest
Rate | | | Trade
Date | | | Maturity
Date1 | | | Face Value | | | Face Value
Including
Accrued
Interest | | | Type of Underlying Collateral | | Remaining
Contractual
Maturity of
the Agreements |
RBC Capital Markets, LLC | | | 0.64 | % | | | 3/22/16 | | | | Open | | | $ | 534,750 | | | $ | 535,130 | | | Corporate Bonds | | Open/Demand1 |
RBC Capital Markets, LLC | | | 0.75 | % | | | 3/22/16 | | | | Open | | | | 278,225 | | | | 278,457 | | | Corporate Bonds | | Open/Demand1 |
RBC Capital Markets, LLC | | | 0.75 | % | | | 3/22/16 | | | | Open | | | | 405,000 | | | | 405,338 | | | Corporate Bonds | | Open/Demand1 |
RBC Capital Markets, LLC | | | 0.75 | % | | | 3/22/16 | | | | Open | | | | 670,770 | | | | 671,329 | | | Corporate Bonds | | Open/Demand1 |
RBC Capital Markets, LLC | | | 0.75 | % | | | 3/22/16 | | | | Open | | | | 242,222 | | | | 242,424 | | | Corporate Bonds | | Open/Demand1 |
RBC Capital Markets, LLC | | | 1.00 | % | | | 3/22/16 | | | | Open | | | | 695,625 | | | | 696,398 | | | Corporate Bonds | | Open/Demand1 |
RBC Capital Markets, LLC | | | 1.00 | % | | | 3/22/16 | | | | Open | | | | 701,250 | | | | 702,029 | | | Corporate Bonds | | Open/Demand1 |
RBC Capital Markets, LLC | | | 1.00 | % | | | 3/22/16 | | | | Open | | | | 982,350 | | | | 983,442 | | | Corporate Bonds | | Open/Demand1 |
RBC Capital Markets, LLC | | | 1.00 | % | | | 3/22/16 | | | | Open | | | | 732,000 | | | | 732,813 | | | Corporate Bonds | | Open/Demand1 |
RBC Capital Markets, LLC | | | 1.05 | % | | | 3/22/16 | | | | Open | | | | 778,325 | | | | 779,233 | | | Corporate Bonds | | Open/Demand1 |
RBC Capital Markets, LLC | | | 1.10 | % | | | 3/22/16 | | | | Open | | | | 692,000 | | | | 692,846 | | | Corporate Bonds | | Open/Demand1 |
Deutsche Bank Securities, Inc. | | | 1.00 | % | | | 3/23/16 | | | | Open | | | | 321,000 | | | | 321,348 | | | Corporate Bonds | | Open/Demand1 |
UBS Securities LLC | | | 1.00 | % | | | 3/28/16 | | | | Open | | | | 525,840 | | | | 526,322 | | | Corporate Bonds | | Open/Demand1 |
Deutsche Bank Securities, Inc. | | | 1.00 | % | | | 3/30/16 | | | | Open | | | | 395,000 | | | | 395,329 | | | Corporate Bonds | | Open/Demand1 |
RBC Capital Markets, LLC | | | 1.00 | % | | | 3/30/16 | | | | Open | | | | 1,054,100 | | | | 1,054,978 | | | Corporate Bonds | | Open/Demand1 |
RBC Capital Markets, LLC | | | 1.00 | % | | | 3/30/16 | | | | Open | | | | 463,137 | | | | 463,523 | | | Corporate Bonds | | Open/Demand1 |
RBC Capital Markets, LLC | | | 1.00 | % | | | 3/30/16 | | | | Open | | | | 919,537 | | | | 920,304 | | | Corporate Bonds | | Open/Demand1 |
RBC Capital Markets, LLC | | | 1.00 | % | | | 3/30/16 | | | | Open | | | | 2,133,500 | | | | 2,135,278 | | | Corporate Bonds | | Open/Demand1 |
JPMorgan Securities LLC | | | 1.79 | % | | | 3/31/16 | | | | 5/02/16 | | | | 5,582,000 | | | | 5,590,314 | | | Non-Agency Mortgage-Backed Securities | | Up to 30 Days |
UBS Securities LLC | | | 1.00 | % | | | 3/31/16 | | | | Open | | | | 431,681 | | | | 432,041 | | | Corporate Bonds | | Open/Demand1 |
Barclays Capital, Inc. | | | 1.94 | % | | | 4/1/16 | | | | 5/04/16 | | | | 10,478,413 | | | | 10,493,637 | | | Non-Agency Mortgage-Backed Securities | | Up to 30 Days |
BNP Paribas Securities Corp. | | | 1.44 | % | | | 4/1/16 | | | | 5/04/16 | | | | 5,380,000 | | | | 5,385,800 | | | Asset-Backed Securities | | Up to 30 Days |
BNP Paribas Securities Corp. | | | 1.59 | % | | | 4/1/16 | | | | 5/04/16 | | | | 17,702,000 | | | | 17,723,074 | | | Asset-Backed Securities | | Up to 30 Days |
RBC Capital Markets, LLC | | | 1.79 | % | | | 4/1/16 | | | | 5/04/16 | | | | 1,891,000 | | | | 1,893,539 | | | Non-Agency Mortgage-Backed Securities | | Up to 30 Days |
RBC Capital Markets, LLC | | | 1.00 | % | | | 4/5/16 | | | | Open | | | | 717,405 | | | | 717,883 | | | Corporate Bonds | | Open/Demand1 |
UBS Securities LLC | | | 1.00 | % | | | 4/5/16 | | | | Open | | | | 1,790,320 | | | | 1,791,613 | | | Corporate Bonds | | Open/Demand1 |
RBC Capital Markets, LLC | | | 0.64 | % | | | 4/6/16 | | | | Open | | | | 38,100 | | | | 38,116 | | | Corporate Bonds | | Open/Demand1 |
RBC Capital Markets, LLC | | | 0.75 | % | | | 4/6/16 | | | | Open | | | | 131,610 | | | | 131,676 | | | Corporate Bonds | | Open/Demand1 |
RBC Capital Markets, LLC | | | 0.75 | % | | | 4/6/16 | | | | Open | | | | 210,437 | | | | 210,543 | | | Corporate Bonds | | Open/Demand1 |
RBC Capital Markets, LLC | | | 0.75 | % | | | 4/6/16 | | | | Open | | | | 381,300 | | | | 381,491 | | | Corporate Bonds | | Open/Demand1 |
RBC Capital Markets, LLC | | | 0.75 | % | | | 4/6/16 | | | | Open | | | | 709,700 | | | | 710,055 | | | Corporate Bonds | | Open/Demand1 |
RBC Capital Markets, LLC | | | 0.75 | % | | | 4/6/16 | | | | Open | | | | 162,380 | | | | 162,461 | | | Corporate Bonds | | Open/Demand1 |
RBC Capital Markets, LLC | | | 0.75 | % | | | 4/6/16 | | | | Open | | | | 128,172 | | | | 128,237 | | | Corporate Bonds | | Open/Demand1 |
RBC Capital Markets, LLC | | | 0.75 | % | | | 4/6/16 | | | | Open | | | | 138,600 | | | | 138,669 | | | Corporate Bonds | | Open/Demand1 |
RBC Capital Markets, LLC | | | 0.75 | % | | | 4/6/16 | | | | Open | | | | 145,617 | | | | 145,690 | | | Corporate Bonds | | Open/Demand1 |
RBC Capital Markets, LLC | | | 0.75 | % | | | 4/6/16 | | | | Open | | | | 220,935 | | | | 221,045 | | | Corporate Bonds | | Open/Demand1 |
RBC Capital Markets, LLC | | | 0.95 | % | | | 4/6/16 | | | | Open | | | | 511,010 | | | | 511,334 | | | Corporate Bonds | | Open/Demand1 |
RBC Capital Markets, LLC | | | 1.10 | % | | | 4/6/16 | | | | Open | | | | 353,762 | | | | 354,022 | | | Corporate Bonds | | Open/Demand1 |
RBC Capital Markets, LLC | | | 1.10 | % | | | 4/6/16 | | | | Open | | | | 857,850 | | | | 858,479 | | | Corporate Bonds | | Open/Demand1 |
RBC Capital Markets, LLC | | | 1.10 | % | | | 4/6/16 | | | | Open | | | | 390,425 | | | | 390,711 | | | Corporate Bonds | | Open/Demand1 |
RBC Capital Markets, LLC | | | 1.10 | % | | | 4/6/16 | | | | Open | | | | 76,850 | | | | 76,906 | | | Corporate Bonds | | Open/Demand1 |
RBC Capital Markets, LLC | | | 1.10 | % | | | 4/6/16 | | | | Open | | | | 45,600 | | | | 45,633 | | | Corporate Bonds | | Open/Demand1 |
RBC Capital Markets, LLC | | | 1.10 | % | | | 4/6/16 | | | | Open | | | | 633,810 | | | | 634,275 | | | Corporate Bonds | | Open/Demand1 |
RBC Capital Markets, LLC | | | 0.75 | % | | | 4/7/16 | | | | Open | | | | 150,120 | | | | 150,183 | | | Corporate Bonds | | Open/Demand1 |
RBC Capital Markets, LLC | | | 1.00 | % | | | 4/7/16 | | | | Open | | | | 195,600 | | | | 195,725 | | | Corporate Bonds | | Open/Demand1 |
RBC Capital Markets, LLC | | | 1.00 | % | | | 4/7/16 | | | | Open | | | | 135,450 | | | | 135,537 | | | Corporate Bonds | | Open/Demand1 |
Morgan Stanley & Co. LLC | | | 1.50 | % | | | 4/8/16 | | | | 5/11/16 | | | | 3,941,400 | | | | 3,944,685 | | | Asset-Backed Securities | | Up to 30 Days |
Deutsche Bank Securities, Inc. | | | 1.00 | % | | | 4/8/16 | | | | Open | | | | 1,315,843 | | | | 1,316,537 | | | Corporate Bonds | | Open/Demand1 |
RBC Capital Markets, LLC | | | 0.75 | % | | | 4/13/16 | | | | Open | | | | 88,275 | | | | 88,306 | | | Corporate Bonds | | Open/Demand1 |
RBC Capital Markets, LLC | | | 0.75 | % | | | 4/13/16 | | | | Open | | | | 523,375 | | | | 523,560 | | | Corporate Bonds | | Open/Demand1 |
RBC Capital Markets, LLC | | | 0.75 | % | | | 4/13/16 | | | | Open | | | | 124,200 | | | | 124,244 | | | Corporate Bonds | | Open/Demand1 |
RBC Capital Markets, LLC | | | 0.95 | % | | | 4/13/16 | | | | Open | | | | 252,510 | | | | 252,623 | | | Corporate Bonds | | Open/Demand1 |
RBC Capital Markets, LLC | | | 0.95 | % | | | 4/13/16 | | | | Open | | | | 465,750 | | | | 465,959 | | | Corporate Bonds | | Open/Demand1 |
RBC Capital Markets, LLC | | | 0.95 | % | | | 4/13/16 | | | | Open | | | | 524,400 | | | | 524,635 | | | Corporate Bonds | | Open/Demand1 |
RBC Capital Markets, LLC | | | 0.95 | % | | | 4/13/16 | | | | Open | | | | 401,625 | | | | 401,805 | | | Corporate Bonds | | Open/Demand1 |
RBC Capital Markets, LLC | | | 0.95 | % | | | 4/13/16 | | | | Open | | | | 492,362 | | | | 492,583 | | | Corporate Bonds | | Open/Demand1 |
RBC Capital Markets, LLC | | | 0.95 | % | | | 4/13/16 | | | | Open | | | | 499,495 | | | | 499,719 | | | Corporate Bonds | | Open/Demand1 |
RBC Capital Markets, LLC | | | 0.95 | % | | | 4/13/16 | | | | Open | | | | 771,338 | | | | 771,684 | | | Corporate Bonds | | Open/Demand1 |
RBC Capital Markets, LLC | | | 0.95 | % | | | 4/13/16 | | | | Open | | | | 423,750 | | | | 423,940 | | | Corporate Bonds | | Open/Demand1 |
RBC Capital Markets, LLC | | | 1.00 | % | | | 4/13/16 | | | | Open | | | | 566,100 | | | | 566,367 | | | Corporate Bonds | | Open/Demand1 |
RBC Capital Markets, LLC | | | 1.00 | % | | | 4/13/16 | | | | Open | | | | 583,050 | | | | 583,325 | | | Corporate Bonds | | Open/Demand1 |
RBC Capital Markets, LLC | | | 1.00 | % | | | 4/13/16 | | | | Open | | | | 624,600 | | | | 624,895 | | | Corporate Bonds | | Open/Demand1 |
RBC Capital Markets, LLC | | | 1.00 | % | | | 4/13/16 | | | | Open | | | | 628,350 | | | | 628,647 | | | Corporate Bonds | | Open/Demand1 |
See Notes to Financial Statements.
| | | | | | |
| | | | | | | |
| | SEMI-ANNUAL REPORT | | APRIL 30, 2016 | | 57 |
| | |
Consolidated Schedule of Investments (continued) | | BlackRock Multi-Sector Income Trust (BIT) |
Reverse Repurchase Agreements (continued)
| | | | | | | | | | | | | | | | | | | | | | | | |
| Counterparty | | Interest
Rate | | | Trade
Date | | | Maturity
Date1 | | | Face Value | | | Face Value
Including
Accrued
Interest | | | Type of Underlying Collateral | | Remaining
Contractual
Maturity of
the Agreements |
RBC Capital Markets, LLC | | | 1.00 | % | | | 4/13/16 | | | | Open | | | $ | 350,212 | | | $ | 350,378 | | | Corporate Bonds | | Open/Demand1 |
RBC Capital Markets, LLC | | | 1.00 | % | | | 4/13/16 | | | | Open | | | | 510,038 | | | | 510,278 | | | Corporate Bonds | | Open/Demand1 |
RBC Capital Markets, LLC | | | 1.00 | % | | | 4/13/16 | | | | Open | | | | 483,000 | | | | 483,228 | | | Corporate Bonds | | Open/Demand1 |
RBC Capital Markets, LLC | | | 1.00 | % | | | 4/13/16 | | | | Open | | | | 608,000 | | | | 608,287 | | | Corporate Bonds | | Open/Demand1 |
RBC Capital Markets, LLC | | | 1.00 | % | | | 4/13/16 | | | | Open | | | | 909,150 | | | | 909,579 | | | Corporate Bonds | | Open/Demand1 |
RBC Capital Markets, LLC | | | 1.00 | % | | | 4/13/16 | | | | Open | | | | 412,610 | | | | 412,805 | | | Corporate Bonds | | Open/Demand1 |
RBC Capital Markets, LLC | | | 1.10 | % | | | 4/13/16 | | | | Open | | | | 402,675 | | | | 402,884 | | | Corporate Bonds | | Open/Demand1 |
RBC Capital Markets, LLC | | | 1.10 | % | | | 4/13/16 | | | | Open | | | | 251,450 | | | | 251,581 | | | Corporate Bonds | | Open/Demand1 |
RBC Capital Markets, LLC | | | 1.10 | % | | | 4/13/16 | | | | Open | | | | 483,840 | | | | 484,091 | | | Corporate Bonds | | Open/Demand1 |
RBC Capital Markets, LLC | | | 1.10 | % | | | 4/13/16 | | | | Open | | | | 696,142 | | | | 696,504 | | | Corporate Bonds | | Open/Demand1 |
RBC Capital Markets, LLC | | | 1.10 | % | | | 4/13/16 | | | | Open | | | | 490,245 | | | | 490,500 | | | Corporate Bonds | | Open/Demand1 |
Barclays Capital, Inc. | | | 1.93 | % | | | 4/14/16 | | | | 5/16/16 | | | | 3,227,515 | | | | 3,230,287 | | | Non-Agency Mortgage-Backed Securities | | Up to 30 Days |
Deutsche Bank Securities, Inc. | | | 1.00 | % | | | 4/15/16 | | | | Open | | | | 1,444,000 | | | | 1,444,481 | | | Corporate Bonds | | Open/Demand1 |
RBC Capital Markets, LLC | | | 0.95 | % | | | 4/15/16 | | | | Open | | | | 371,575 | | | | 371,693 | | | Corporate Bonds | | Open/Demand1 |
UBS Securities LLC | | | 1.00 | % | | | 4/15/16 | | | | Open | | | | 517,800 | | | | 517,973 | | | Corporate Bonds | | Open/Demand1 |
Citigroup Global Markets, Inc. | | | 2.09 | % | | | 4/20/16 | | | | 5/23/16 | | | | 3,323,250 | | | | 3,324,987 | | | Asset-Backed Securities | | Up to 30 Days |
Deutsche Bank Securities, Inc. | | | 1.00 | % | | | 4/20/16 | | | | Open | | | | 1,369,000 | | | | 1,369,380 | | | Capital Trusts | | Open/Demand1 |
RBC Capital Markets, LLC | | | 1.00 | % | | | 4/20/16 | | | | Open | | | | 217,120 | | | | 217,174 | | | Corporate Bonds | | Open/Demand1 |
RBC Capital Markets, LLC | | | 1.00 | % | | | 4/20/16 | | | | Open | | | | 156,940 | | | | 156,979 | | | Corporate Bonds | | Open/Demand1 |
RBC Capital Markets, LLC | | | 1.00 | % | | | 4/20/16 | | | | Open | | | | 593,844 | | | | 593,992 | | | Corporate Bonds | | Open/Demand1 |
UBS Securities LLC | | | 1.00 | % | | | 4/20/16 | | | | Open | | | | 180,565 | | | | 180,610 | | | Corporate Bonds | | Open/Demand1 |
RBC Capital Markets, LLC | | | 1.84 | % | | | 4/21/16 | | | | 5/25/16 | | | | 1,821,000 | | | | 1,821,558 | | | Non-Agency Mortgage-Backed Securities | | Up to 30 Days |
RBC Capital Markets, LLC | | | 1.89 | % | | | 4/21/16 | | | | 5/25/16 | | | | 2,504,000 | | | | 2,504,789 | | | Non-Agency Mortgage-Backed Securities | | Up to 30 Days |
BNP Paribas Securities Corp. | | | 1.54 | % | | | 4/21/16 | | | | 7/22/16 | | | | 1,252,000 | | | | 1,252,481 | | | Asset-Backed Securities | | 31 — 90 Days |
Deutsche Bank Securities, Inc. | | | 1.05 | % | | | 4/21/16 | | | | Open | | | | 544,000 | | | | 544,143 | | | Capital Trusts | | Open/Demand1 |
Deutsche Bank Securities, Inc. | | | 1.05 | % | | | 4/21/16 | | | | Open | | | | 1,409,000 | | | | 1,409,370 | | | Capital Trusts | | Open/Demand1 |
Deutsche Bank Securities, Inc. | | | 1.05 | % | | | 4/21/16 | | | | Open | | | | 1,953,000 | | | | 1,953,513 | | | Capital Trusts | | Open/Demand1 |
RBC Capital Markets, LLC | | | 0.75 | % | | | 4/21/16 | | | | Open | | | | 494,000 | | | | 494,093 | | | Corporate Bonds | | Open/Demand1 |
RBC Capital Markets, LLC | | | 0.75 | % | | | 4/21/16 | | | | Open | | | | 204,930 | | | | 204,968 | | | Corporate Bonds | | Open/Demand1 |
RBC Capital Markets, LLC | | | 0.75 | % | | | 4/21/16 | | | | Open | | | | 101,430 | | | | 101,449 | | | Corporate Bonds | | Open/Demand1 |
RBC Capital Markets, LLC | | | 0.75 | % | | | 4/21/16 | | | | Open | | | | 142,800 | | | | 142,827 | | | Corporate Bonds | | Open/Demand1 |
RBC Capital Markets, LLC | | | 0.95 | % | | | 4/21/16 | | | | Open | | | | 341,543 | | | | 341,624 | | | Corporate Bonds | | Open/Demand1 |
RBC Capital Markets, LLC | | | 0.95 | % | | | 4/21/16 | | | | Open | | | | 377,540 | | | | 377,630 | | | Corporate Bonds | | Open/Demand1 |
RBC Capital Markets, LLC | | | 0.95 | % | | | 4/21/16 | | | | Open | | | | 381,700 | | | | 381,791 | | | Corporate Bonds | | Open/Demand1 |
RBC Capital Markets, LLC | | | 0.95 | % | | | 4/21/16 | | | | Open | | | | 497,475 | | | | 497,593 | | | Corporate Bonds | | Open/Demand1 |
RBC Capital Markets, LLC | | | 0.95 | % | | | 4/21/16 | | | | Open | | | | 347,600 | | | | 347,683 | | | Corporate Bonds | | Open/Demand1 |
RBC Capital Markets, LLC | | | 0.95 | % | | | 4/21/16 | | | | Open | | | | 288,000 | | | | 288,068 | | | Corporate Bonds | | Open/Demand1 |
RBC Capital Markets, LLC | | | 0.95 | % | | | 4/21/16 | | | | Open | | | | 354,900 | | | | 354,984 | | | Corporate Bonds | | Open/Demand1 |
RBC Capital Markets, LLC | | | 0.95 | % | | | 4/21/16 | | | | Open | | | | 361,008 | | | | 361,093 | | | Corporate Bonds | | Open/Demand1 |
RBC Capital Markets, LLC | | | 0.95 | % | | | 4/21/16 | | | | Open | | | | 509,120 | | | | 509,241 | | | Corporate Bonds | | Open/Demand1 |
RBC Capital Markets, LLC | | | 0.95 | % | | | 4/21/16 | | | | Open | | | | 663,323 | | | | 663,480 | | | Corporate Bonds | | Open/Demand1 |
RBC Capital Markets, LLC | | | 1.00 | % | | | 4/21/16 | | | | Open | | | | 77,225 | | | | 77,246 | | | Corporate Bonds | | Open/Demand1 |
RBC Capital Markets, LLC | | | 1.00 | % | | | 4/21/16 | | | | Open | | | | 1,179,008 | | | | 1,179,302 | | | Corporate Bonds | | Open/Demand1 |
RBC Capital Markets, LLC | | | 1.00 | % | | | 4/21/16 | | | | Open | | | | 346,450 | | | | 346,537 | | | Corporate Bonds | | Open/Demand1 |
RBC Capital Markets, LLC | | | 1.00 | % | | | 4/21/16 | | | | Open | | | | 884,948 | | | | 885,169 | | | Corporate Bonds | | Open/Demand1 |
RBC Capital Markets, LLC | | | 1.00 | % | | | 4/21/16 | | | | Open | | | | 480,375 | | | | 480,495 | | | Corporate Bonds | | Open/Demand1 |
RBC Capital Markets, LLC | | | 1.00 | % | | | 4/21/16 | | | | Open | | | | 352,600 | | | | 352,659 | | | Corporate Bonds | | Open/Demand1 |
RBC Capital Markets, LLC | | | 1.10 | % | | | 4/21/16 | | | | Open | | | | 604,013 | | | | 604,179 | | | Corporate Bonds | | Open/Demand1 |
RBC Capital Markets, LLC | | | 1.10 | % | | | 4/21/16 | | | | Open | | | | 899,020 | | | | 899,267 | | | Corporate Bonds | | Open/Demand1 |
RBC Capital Markets, LLC | | | 1.10 | % | | | 4/21/16 | | | | Open | | | | 390,555 | | | | 390,662 | | | Corporate Bonds | | Open/Demand1 |
RBC Capital Markets, LLC | | | 1.10 | % | | | 4/21/16 | | | | Open | | | | 697,150 | | | | 697,342 | | | Corporate Bonds | | Open/Demand1 |
RBC Capital Markets, LLC | | | 1.10 | % | | | 4/21/16 | | | | Open | | | | 280,688 | | | | 280,765 | | | Corporate Bonds | | Open/Demand1 |
UBS Securities LLC | | | 1.00 | % | | | 4/21/16 | | | | Open | | | | 2,310,400 | | | | 2,310,978 | | | Corporate Bonds | | Open/Demand1 |
UBS Securities LLC | | | 1.00 | % | | | 4/21/16 | | | | Open | | | | 3,477,100 | | | | 3,477,969 | | | Corporate Bonds | | Open/Demand1 |
RBC Capital Markets, LLC | | | 0.95 | % | | | 4/22/16 | | | | Open | | | | 311,500 | | | | 311,541 | | | Corporate Bonds | | Open/Demand1 |
Barclays Capital, Inc. | | | 0.80 | % | | | 4/26/16 | | | | Open | | | | 310,531 | | | | 310,552 | | | Corporate Bonds | | Open/Demand1 |
RBC Capital Markets, LLC | | | 0.90 | % | | | 4/27/16 | | | | Open | | | | 858,572 | | | | 858,615 | | | Corporate Bonds | | Open/Demand1 |
RBC Capital Markets, LLC | | | 0.95 | % | | | 4/27/16 | | | | Open | | | | 251,273 | | | | 251,277 | | | Corporate Bonds | | Open/Demand1 |
UBS Securities LLC | | | 1.00 | % | | | 4/27/16 | | | | Open | | | | 5,976,400 | | | | 5,976,732 | | | Corporate Bonds | | Open/Demand1 |
RBC Capital Markets, LLC | | | 1.00 | % | | | 4/28/16 | | | | Open | | | | 197,104 | | | | 197,104 | | | Corporate Bonds | | Open/Demand1 |
RBC Capital Markets, LLC | | | 1.00 | % | | | 4/28/16 | | | | Open | | | | 586,704 | | | | 586,704 | | | Corporate Bonds | | Open/Demand1 |
JPMorgan Securities LLC | | | 1.79 | % | | | 4/29/16 | | | | 6/02/16 | | | | 5,717,000 | | | | 5,717,000 | | | Non-Agency Mortgage-Backed Securities | | 31 — 90 Days |
Deutsche Bank Securities, Inc. | | | 1.00 | % | | | 4/29/16 | | | | Open | | | | 157,007 | | | | 157,007 | | | Corporate Bonds | | Open/Demand1 |
See Notes to Financial Statements.
| | | | | | |
| | | | | | | |
| 58 | | SEMI-ANNUAL REPORT | | APRIL 30, 2016 | | |
| | |
Consolidated Schedule of Investments (continued) | | BlackRock Multi-Sector Income Trust (BIT) |
Reverse Repurchase Agreements (concluded)
| | | | | | | | | | | | | | | | | | | | | | | | |
| Counterparty | | Interest
Rate | | | Trade
Date | | | Maturity
Date1 | | | Face Value | | | Face Value
Including
Accrued
Interest | | | Type of Underlying Collateral | | Remaining
Contractual
Maturity of
the Agreements |
RBC Capital Markets, LLC | | | 0.25 | % | | | 4/29/16 | | | | Open | | | $ | 499,392 | | | $ | 499,392 | | | Corporate Bonds | | Open/Demand1 |
RBC Capital Markets, LLC | | | 1.00 | % | | | 4/29/16 | | | | Open | | | | 915,800 | | | | 915,800 | | | Corporate Bonds | | Open/Demand1 |
| | | |
Total | | | | | | | | | | | | | | $ | 445,247,883 | | | $ | 446,226,345 | | | | | |
| | | | | | | | | | | | | | | | | | | | |
1 Certain agreements have no stated maturity and can be terminated by either party at any time. |
| | | | | | | | | | |
| Derivative Financial Instruments Outstanding as of Period End | | | | | | | | | | |
Futures Contracts
| | | | | | | | | | | | | | |
Contracts
Short | | Issue | | | | Expiration | | Notional Value | | Unrealized
Appreciation | | | |
| (140) | | 2-Year U.S. Treasury Note | | | | June 2016 | | USD 30,607,500 | | $ | 20,874 | | | |
| (22) | | 10-Year U.S. Treasury Note | | | | June 2016 | | USD 2,861,375 | | | 9,543 | | | |
| (10) | | Euro BOBL Futures | | | | June 2016 | | EUR 1,498,298 | | | 7,433 | | | |
| Total | | | | | | | | | | $ | 37,850 | | | |
| | | | | | | | | | | |
Forward Foreign Currency Exchange Contracts
| | | | | | | | | | | | | | | | | | | | | | |
Currency Purchased | | | Currency Sold | | | Counterparty | | Settlement
Date | | | Unrealized
Appreciation
(Depreciation) | | | |
| BRL | | | 175,704 | | | USD | | | 48,000 | | | Deutsche Bank AG | | | 5/02/16 | | | $ | 3,088 | | | |
| BRL | | | 170,400 | | | USD | | | 48,697 | | | Royal Bank of Scotland PLC | | | 5/02/16 | | | | 849 | | | |
| COP | | | 275,639,000 | | | USD | | | 95,518 | | | Credit Suisse International | | | 5/02/16 | | | | 1,242 | | | |
| COP | | | 280,190,820 | | | USD | | | 91,000 | | | Credit Suisse International | | | 5/02/16 | | | | 7,358 | | | |
| JPY | | | 108,667,081 | | | USD | | | 985,000 | | | Morgan Stanley & Co. International PLC | | | 5/02/16 | | | | 36,307 | | | |
| JPY | | | 370,154,808 | | | USD | | | 3,420,000 | | | UBS AG | | | 5/02/16 | | | | 58,899 | | | |
| USD | | | 50,213 | | | BRL | | | 175,704 | | | Deutsche Bank AG | | | 5/02/16 | | | | (875 | ) | | |
| USD | | | 48,000 | | | BRL | | | 170,400 | | | Royal Bank of Scotland PLC | | | 5/02/16 | | | | (1,546 | ) | | |
| USD | | | 97,096 | | | COP | | | 280,190,820 | | | Credit Suisse International | | | 5/02/16 | | | | (1,262 | ) | | |
| USD | | | 91,000 | | | COP | �� | | 275,639,000 | | | Credit Suisse International | | | 5/02/16 | | | | (5,760 | ) | | |
| USD | | | 985,000 | | | JPY | | | 108,696,769 | | | Morgan Stanley & Co. International PLC | | | 5/02/16 | | | | (36,586 | ) | | |
| ARS | | | 170,004 | | | USD | | | 12,000 | | | BNP Paribas SA | | | 5/03/16 | | | | (121 | ) | | |
| ARS | | | 201,600 | | | USD | | | 14,135 | | | BNP Paribas SA | | | 5/03/16 | | | | (49 | ) | | |
| USD | | | 12,000 | | | ARS | | | 201,600 | | | BNP Paribas SA | | | 5/03/16 | | | | (2,087 | ) | | |
| USD | | | 11,920 | | | ARS | | | 170,004 | | | BNP Paribas SA | | | 5/03/16 | | | | 41 | | | |
| EUR | | | 93,420 | | | RUB | | | 7,120,566 | | | BNP Paribas SA | | | 5/04/16 | | | | (2,958 | ) | | |
| EUR | | | 66,374 | | | RUB | | | 4,871,160 | | | Deutsche Bank AG | | | 5/04/16 | | | | 800 | | | |
| EUR | | | 195,654 | | | RUB | | | 14,359,000 | | | Deutsche Bank AG | | | 5/04/16 | | | | 2,357 | | | |
| EUR | | | 63,000 | | | RUB | | | 4,929,120 | | | Deutsche Bank AG | | | 5/04/16 | | | | (3,959 | ) | | |
| MXN | | | 8,906,775 | | | USD | | | 508,059 | | | Citibank N.A. | | | 5/04/16 | | | | 9,588 | | | |
| RUB | | | 7,120,566 | | | EUR | | | 97,024 | | | BNP Paribas SA | | | 5/04/16 | | | | (1,169 | ) | | |
| RUB | | | 4,929,120 | | | EUR | | | 67,164 | | | Deutsche Bank AG | | | 5/04/16 | | | | (809 | ) | | |
| RUB | | | 14,359,000 | | | EUR | | | 173,000 | | | Deutsche Bank AG | | | 5/04/16 | | | | 23,584 | | | |
| RUB | | | 4,871,160 | | | EUR | | | 63,000 | | | Deutsche Bank AG | | | 5/04/16 | | | | 3,064 | | | |
| USD | | | 3,425,101 | | | EUR | | | 3,004,000 | | | Morgan Stanley & Co. International PLC | | | 5/04/16 | | | | (14,729 | ) | | |
| USD | | | 299,867 | | | EUR | | | 263,000 | | | Morgan Stanley & Co. International PLC | | | 5/04/16 | | | | (1,290 | ) | | |
| USD | | | 31,508,812 | | | GBP | | | 21,913,000 | | | Royal Bank of Scotland PLC | | | 5/04/16 | | | | (509,388 | ) | | |
| USD | | | 15,647 | | | MXN | | | 275,838 | | | HSBC Bank USA N.A. | | | 5/04/16 | | | | (384 | ) | | |
| USD | | | 185,989 | | | MXN | | | 3,417,195 | | | Morgan Stanley & Co. International PLC | | | 5/04/16 | | | | (12,613 | ) | | |
| MXN | | | 2,120,147 | | | USD | | | 122,000 | | | Deutsche Bank AG | | | 5/05/16 | | | | 1,208 | | | |
| USD | | | 122,000 | | | MXN | | | 2,124,240 | | | JPMorgan Chase Bank N.A. | | | 5/05/16 | | | | (1,446 | ) | | |
| CAD | | | 2,251,363 | | | GBP | | | 1,220,000 | | | Citibank N.A. | | | 5/06/16 | | | | 11,721 | | | |
| GBP | | | 1,220,000 | | | CAD | | | 2,222,662 | | | Citibank N.A. | | | 5/06/16 | | | | 11,153 | | | |
| CAD | | | 97,900 | | | USD | | | 76,500 | | | Bank of America N.A. | | | 5/09/16 | | | | 1,526 | | | |
| JPY | | | 10,156,800 | | | USD | | | 92,000 | | | Deutsche Bank AG | | | 5/09/16 | | | | 3,464 | | | |
| JPY | | | 48,791,065 | | | USD | | | 447,097 | | | Royal Bank of Scotland PLC | | | 5/09/16 | | | | 11,493 | | | |
| MXN | | | 2,189,344 | | | USD | | | 123,000 | | | Goldman Sachs International | | | 5/09/16 | | | | 4,181 | | | |
| USD | | | 8,383 | | | ARS | | | 131,521 | | | BNP Paribas SA | | | 5/09/16 | | | | (770 | ) | | |
See Notes to Financial Statements.
| | | | | | |
| | | | | | | |
| | SEMI-ANNUAL REPORT | | APRIL 30, 2016 | | 59 |
| | |
Consolidated Schedule of Investments (continued) | | BlackRock Multi-Sector Income Trust (BIT) |
Forward Foreign Currency Exchange Contracts (concluded)
| | | | | | | | | | | | | | | | | | | | | | |
Currency Purchased | | | Currency Sold | | | Counterparty | | Settlement
Date | | | Unrealized
Appreciation
(Depreciation) | | | |
| USD | | | 11,692 | | | ARS | | | 175,263 | | | BNP Paribas SA | | | 5/09/16 | | | $ | (505 | ) | | |
| USD | | | 153,000 | | | CAD | | | 201,488 | | | Goldman Sachs International | | | 5/09/16 | | | | (7,585 | ) | | |
| USD | | | 116,000 | | | JPY | | | 12,895,302 | | | Bank of America N.A. | | | 5/09/16 | | | | (5,204 | ) | | |
| USD | | | 192,326 | | | JPY | | | 21,623,500 | | | Barclays Bank PLC | | | 5/09/16 | | | | (10,914 | ) | | |
| USD | | | 192,813 | | | JPY | | | 21,623,500 | | | UBS AG | | | 5/09/16 | | | | (10,427 | ) | | |
| USD | | | 92,000 | | | KRW | | | 106,722,300 | | | Deutsche Bank AG | | | 5/09/16 | | | | (1,168 | ) | | |
| USD | | | 395,000 | | | KRW | | | 453,341,500 | | | JPMorgan Chase Bank N.A. | | | 5/09/16 | | | | (764 | ) | | |
| USD | | | 123,000 | | | MXN | | | 2,118,140 | | | Bank of America N.A. | | | 5/09/16 | | | | (44 | ) | | |
| USD | | | 93,000 | | | ZAR | | | 1,402,282 | | | BNP Paribas SA | | | 5/09/16 | | | | (5,410 | ) | | |
| MXN | | | 7,798,010 | | | USD | | | 442,172 | | | Bank of America N.A. | | | 5/11/16 | | | | 10,733 | | | |
| MXN | | | 1,097,071 | | | USD | | | 61,200 | | | Citibank N.A. | | | 5/11/16 | | | | 2,517 | | | |
| MXN | | | 816,813 | | | USD | | | 45,900 | | | Citibank N.A. | | | 5/11/16 | | | | 1,540 | | | |
| USD | | | 2,200 | | | ARS | | | 33,836 | | | BNP Paribas SA | | | 5/11/16 | | | | (152 | ) | | |
| USD | | | 123,000 | | | MXN | | | 2,115,539 | | | Deutsche Bank AG | | | 5/11/16 | | | | 131 | | | |
| USD | | | 50,000 | | | MXN | | | 870,700 | | | Goldman Sachs International | | | 5/11/16 | | | | (570 | ) | | |
| AUD | | | 2,294,218 | | | GBP | | | 1,195,000 | | | Citibank N.A. | | | 5/18/16 | | | | (2,807 | ) | | |
| EUR | | | 65,500 | | | PLN | | | 281,579 | | | State Street Bank and Trust Co. | | | 5/18/16 | | | | 1,286 | | | |
| GBP | | | 1,195,000 | | | AUD | | | 2,255,325 | | | Northern Trust Corp. | | | 5/18/16 | | | | 32,361 | | | |
| RUB | | | 6,331,520 | | | USD | | | 95,100 | | | JPMorgan Chase Bank N.A. | | | 5/18/16 | | | | 2,300 | | | |
| USD | | | 1,746,383 | | | EUR | | | 1,525,000 | | | Northern Trust Corp. | | | 5/18/16 | | | | (571 | ) | | |
| USD | | | 225,045 | | | MXN | | | 3,970,001 | | | State Street Bank and Trust Co. | | | 5/20/16 | | | | (5,323 | ) | | |
| USD | | | 21,590 | | | RUB | | | 1,764,324 | | | Morgan Stanley & Co. International PLC | | | 5/20/16 | | | | (5,537 | ) | | |
| USD | | | 93,000 | | | ZAR | | | 1,325,132 | | | Deutsche Bank AG | | | 5/20/16 | | | | 210 | | | |
| USD | | | 77,000 | | | ZAR | | | 1,107,013 | | | Morgan Stanley & Co. International PLC | | | 5/20/16 | | | | (516 | ) | | |
| USD | | | 166,938 | | | MXN | | | 2,914,192 | | | Citibank N.A. | | | 5/23/16 | | | | (2,114 | ) | | |
| USD | | | 11,604 | | | ARS | | | 188,329 | | | BNP Paribas SA | | | 5/26/16 | | | | (1,354 | ) | | |
| USD | | | 66,758 | | | MXN | | | 1,159,512 | | | Bank of America N.A. | | | 5/26/16 | | | | (485 | ) | | |
| CAD | | | 4,410,886 | | | USD | | | 3,495,000 | | | HSBC Bank USA N.A. | | | 5/27/16 | | | | 20,504 | | | |
| USD | | | 3,495,000 | | | CAD | | | 4,415,485 | | | HSBC Bank USA N.A. | | | 5/27/16 | | | | (24,170 | ) | | |
| BRL | | | 171,898 | | | USD | | | 48,000 | | | Royal Bank of Scotland PLC | | | 6/02/16 | | | | 1,491 | | | |
| MXN | | | 2,123,398 | | | USD | | | 123,000 | | | Bank of America N.A. | | | 6/02/16 | | | | 55 | | | |
| AUD | | | 9,280,000 | | | USD | | | 7,153,627 | | | Bank of America N.A. | | | 6/03/16 | | | | (106,582 | ) | | |
| AUD | | | 6,735,000 | | | USD | | | 5,045,140 | | | Goldman Sachs International | | | 6/03/16 | | | | 69,284 | | | |
| CAD | | | 2,195,000 | | | JPY | | | 189,445,906 | | | HSBC Bank USA N.A. | | | 6/03/16 | | | | (32,192 | ) | | |
| JPY | | | 195,130,868 | | | CAD | | | 2,215,000 | | | Northern Trust Corp. | | | 6/03/16 | | | | 69,715 | | | |
| USD | | | 5,045,411 | | | AUD | | | 6,790,000 | | | Northern Trust Corp. | | | 6/03/16 | | | | (110,778 | ) | | |
| USD | | | 131,000 | | | ZAR | | | 1,866,761 | | | Deutsche Bank AG | | | 6/03/16 | | | | 654 | | | |
| MXN | | | 5,213,743 | | | USD | | | 303,423 | | | Royal Bank of Scotland PLC | | | 6/06/16 | | | | (1,394 | ) | | |
| USD | | | 300,629 | | | EUR | | | 263,000 | | | Morgan Stanley & Co. International PLC | | | 6/06/16 | | | | (818 | ) | | |
| USD | | | 3,432,654 | | | EUR | | | 3,003,000 | | | Morgan Stanley & Co. International PLC | | | 6/06/16 | | | | (9,335 | ) | | |
| USD | | | 31,159,942 | | | GBP | | | 21,316,000 | | | State Street Bank and Trust Co. | | | 6/06/16 | | | | 11,704 | | | |
| USD | | | 242,503 | | | MXN | | | 4,209,458 | | | Citibank N.A. | | | 6/06/16 | | | | (1,349 | ) | | |
| USD | | | 199,501 | | | MXN | | | 3,476,681 | | | JPMorgan Chase Bank N.A. | | | 6/06/16 | | | | (1,901 | ) | | |
| USD | | | 19,300 | | | ARS | | | 301,080 | | | BNP Paribas SA | | | 6/15/16 | | | | (1,138 | ) | | |
| USD | | | 1,077,317 | | | EUR | | | 953,876 | | | Citibank N.A. | | | 6/15/16 | | | | (16,325 | ) | | |
| USD | | | 324,234 | | | PLN | | | 1,263,258 | | | JPMorgan Chase Bank N.A. | | | 6/29/16 | | | | (6,376 | ) | | |
| AUD | | | 2,300,000 | | | NOK | | | 14,227,027 | | | Citibank N.A. | | | 7/01/16 | | | | (21,869 | ) | | |
| MXN | | | 2,688,568 | | | USD | | | 155,000 | | | JPMorgan Chase Bank N.A. | | | 7/05/16 | | | | 317 | | | |
| USD | | | 12,000 | | | ARS | | | 178,164 | | | BNP Paribas SA | | | 7/05/16 | | | | 68 | | | |
| MXN | | | 1,787,168 | | | USD | | | 99,050 | | | HSBC Bank USA N.A. | | | 7/06/16 | | | | 4,184 | | | |
| USD | | | 96,588 | | | MXN | | | 1,731,917 | | | BNP Paribas SA | | | 7/06/16 | | | | (3,455 | ) | | |
| USD | | | 95,803 | | | MXN | | | 1,717,841 | | | BNP Paribas SA | | | 7/06/16 | | | | (3,426 | ) | | |
| USD | | | 90,752 | | | MXN | | | 1,646,422 | | | UBS AG | | | 7/06/16 | | | | (4,352 | ) | | |
| USD | | | 90,094 | | | MXN | | | 1,634,214 | | | State Street Bank and Trust Co. | | | 7/08/16 | | | | (4,287 | ) | | |
| MXN | | | 1,731,026 | | | USD | | | 95,835 | | | HSBC Bank USA N.A. | | | 7/20/16 | | | | 4,025 | | | |
| USD | | | 96,721 | | | MXN | | | 1,777,481 | | | State Street Bank and Trust Co. | | | 7/20/16 | | | | (5,818 | ) | | |
| USD | | | 89,690 | | | MXN | | | 1,665,488 | | | State Street Bank and Trust Co. | | | 7/20/16 | | | | (6,389 | ) | | |
| USD | | | 20,000 | | | ARS | | | 293,000 | | | BNP Paribas SA | | | 7/21/16 | | | | 585 | | | |
| USD | | | 5,000 | | | ARS | | | 73,400 | | | BNP Paribas SA | | | 7/21/16 | | | | 136 | | | |
| USD | | | 10,000 | | | ARS | | | 151,200 | | | Royal Bank of Scotland PLC | | | 7/22/16 | | | | (12 | ) | | |
| Total | | | | | | | | | | | | | | | | | | $ | (595,494 | ) | | |
| | | | | | | | | | | | | | | | | | | |
See Notes to Financial Statements.
| | | | | | |
| | | | | | | |
| 60 | | SEMI-ANNUAL REPORT | | APRIL 30, 2016 | | |
| | |
Consolidated Schedule of Investments (continued) | | BlackRock Multi-Sector Income Trust (BIT) |
OTC Options Purchased
| | | | | | | | | | | | | | | | | | | | | | | | | | | | |
| Description | | Put/
Call | | Counterparty | | Expiration
Date | | | Strike
Price | | | Notional
Amount
(000) | | | Contracts | | | Value | |
USD Currency | | Call | | HSBC Bank PLC | | | 05/06/2016 | | | | JPY | | | | 111.50 | | | | USD 160 | | | | — | | | $ | 13 | |
USD Currency | | Call | | Goldman Sachs International | | | 05/13/2016 | | | | BRL | | | | 3.85 | | | | USD 106 | | | | — | | | | 5 | |
USD Currency | | Call | | Deutsche Bank AG | | | 05/16/2016 | | | | CNH | | | | 6.62 | | | | USD 184 | | | | — | | | | 56 | |
USD Currency | | Call | | Deutsche Bank AG | | | 05/19/2016 | | | | KRW | | | | 1,165.00 | | | | USD 136 | | | | — | | | | 440 | |
CAD Currency | | Call | | Barclays Bank PLC | | | 06/01/2016 | | | | JPY | | | | 87.25 | | | | CAD 8,780 | | | | — | | | | 53,112 | |
GBP Currency | | Call | | BNP Paribas SA | | | 06/28/2016 | | | | AUD | | | | 1.93 | | | | GBP 4,855 | | | | — | | | | 148,496 | |
USD Currency | | Call | | Deutsche Bank AG | | | 12/15/2016 | | | | CNH | | | | 6.75 | | | | USD 240 | | | | — | | | | 3,377 | |
EUR Currency | | Put | | Deutsche Bank AG | | | 05/09/2016 | | | | JPY | | | | 116.00 | | | | EUR 6,025 | | | | — | | | | 711 | |
EUR Currency | | Put | | JPMorgan Chase Bank N.A. | | | 05/09/2016 | | | | JPY | | | | 120.00 | | | | EUR 6,025 | | | | — | | | | 11,804 | |
EUR Currency | | Put | | Deutsche Bank AG | | | 05/17/2016 | | | | RUB | | | | 82.00 | | | | EUR 154 | | | | — | | | | 18,093 | |
AUD Currency | | Put | | HSBC Bank PLC | | | 06/01/2016 | | | | USD | | | | 0.70 | | | | AUD 9,280 | | | | — | | | | 3,599 | |
USD Currency | | Put | | BNP Paribas SA | | | 06/01/2016 | | | | CAD | | | | 1.26 | | | | USD 6,855 | | | | — | | | | 87,956 | |
EUR Currency | | Put | | Deutsche Bank AG | | | 06/10/2016 | | | | RUB | | | | 76.00 | | | | EUR 68 | | | | — | | | | 2,757 | |
NZD Currency | | Put | | HSBC Bank PLC | | | 06/15/2016 | | | | USD | | | | 0.68 | | | | NZD 25,180 | | | | — | | | | 150,343 | |
AUD Currency | | Put | | UBS AG | | | 06/29/2016 | | | | NOK | | | | 6.24 | | | | AUD 13,215 | | | | — | | | | 291,965 | |
Total | | | | | | | | | | | | | | | | | | | | | | | | | | $ | 772,727 | |
| | | | | | | | | | | | | | | | | | | | | | | | | | | | |
OTC Options Written
| | | | | | | | | | | | | | | | | | | | | | | | |
| Description | | Put/
Call | | Counterparty | | Expiration
Date | | | Strike
Price | | | Notional
Amount
(000) | | | Contracts | | | Value | |
USD Currency | | Call | | HSBC Bank PLC | | | 05/06/2016 | | | JPY | 114.00 | | | USD | 160 | | | | — | | | | — | |
AUD Currency | | Call | | HSBC Bank PLC | | | 06/01/2016 | | | USD | 0.74 | | | AUD | 9,280 | | | | — | | | $ | (226,809 | ) |
AUD Currency | | Call | | UBS AG | | | 06/29/2016 | | | NOK | 6.60 | | | AUD | 13,215 | | | | — | | | | (18,760 | ) |
NZD Currency | | Call | | UBS AG | | | 07/22/2016 | | | NOK | 5.93 | | | NZD | 25,170 | | | | — | | | | (95,608 | ) |
USD Currency | | Call | | Deutsche Bank AG | | | 12/15/2016 | | | CNH | 7.10 | | | USD | 240 | | | | — | | | | (1,791 | ) |
EUR Currency | | Put | | JPMorgan Chase Bank N.A. | | | 05/09/2016 | | | JPY | 116.00 | | | EUR | 6,025 | | | | — | | | | (710 | ) |
EUR Currency | | Put | | Deutsche Bank AG | | | 05/17/2016 | | | RUB | 77.00 | | | EUR | 222 | | | | — | | | | (10,401 | ) |
EUR Currency | | Put | | Deutsche Bank AG | | | 06/10/2016 | | | RUB | 73.00 | | | EUR | 88 | | | | — | | | | (1,587 | ) |
NZD Currency | | Put | | HSBC Bank PLC | | | 06/15/2016 | | | USD | 0.65 | | | NZD | 50,360 | | | | — | | | | (99,092 | ) |
AUD Currency | | Put | | UBS AG | | | 06/29/2016 | | | NOK | 6.03 | | | AUD | 13,215 | | | | — | | | | (122,114 | ) |
NZD Currency | | Put | | UBS AG | | | 07/22/2016 | | | NOK | 5.36 | | | NZD | 25,170 | | | | — | | | | (143,535 | ) |
Total | | | | | | | | | | | | | | | | | | | | | | $ | (720,407 | ) |
| | | | | | | | | | | | | | | | | | | | | | | | |
OTC Credit Default Swaps — Buy Protection
| | | | | | | | | | | | | | | | | | | | | | | | | | | | |
| Issuer/Index | | Pay
Fixed Rate | | | Counterparty | | Expiration
Date | | Notional
Amount
(000) | | | Value | | | Premiums
Paid | | | Unrealized
Appreciation
(Depreciation) | |
United Mexican States | | | 1.00 | % | | Citibank N.A. | | 6/20/20 | | | USD | | | | 604 | | | $ | 6,081 | | | $ | 4,877 | | | $ | 1,204 | |
United Mexican States | | | 1.00 | % | | Bank of America N.A. | | 9/20/20 | | | USD | | | | 604 | | | | 8,535 | | | | 6,692 | | | | 1,843 | |
Federation of Malaysia | | | 1.00 | % | | Barclays Capital, Inc. | | 6/20/21 | | | USD | | | | 387 | | | | 11,487 | | | | 11,667 | | | | (180 | ) |
Republic of Philippines | | | 1.00 | % | | JPMorgan Chase Bank N.A. | | 6/20/21 | | | USD | | | | 344 | | | | 540 | | | | 2,721 | | | | (2,181 | ) |
Republic of South Africa | | | 1.00 | % | | Bank of America N.A. | | 6/20/21 | | | USD | | | | 135 | | | | 11,126 | | | | 14,783 | | | | (3,657 | ) |
Republic of South Africa | | | 1.00 | % | | Barclays Capital, Inc. | | 6/20/21 | | | USD | | | | 320 | | | | 26,374 | | | | 36,402 | | | | (10,028 | ) |
Republic of South Africa | | | 1.00 | % | | Barclays Capital, Inc. | | 6/20/21 | | | USD | | | | 150 | | | | 12,363 | | | | 15,553 | | | | (3,190 | ) |
Republic of South Africa | | | 1.00 | % | | BNP Paribas SA | | 6/20/21 | | | USD | | | | 75 | | | | 6,181 | | | | 8,465 | | | | (2,284 | ) |
Republic of South Africa | | | 1.00 | % | | BNP Paribas SA | | 6/20/21 | | | USD | | | | 80 | | | | 6,593 | | | | 8,752 | | | | (2,159 | ) |
Republic of South Africa | | | 1.00 | % | | Citibank N.A. | | 6/20/21 | | | USD | | | | 2 | | | | 165 | | | | 216 | | | | (51 | ) |
Republic of South Africa | | | 1.00 | % | | Citibank N.A. | | 6/20/21 | | | USD | | | | 79 | | | | 6,470 | | | | 8,237 | | | | (1,767 | ) |
Republic of South Africa | | | 1.00 | % | | Goldman Sachs International | | 6/20/21 | | | USD | | | | 75 | | | | 6,181 | | | | 8,467 | | | | (2,286 | ) |
Republic of South Africa | | | 1.00 | % | | HSBC Bank USA N.A. | | 6/20/21 | | | USD | | | | 90 | | | | 7,418 | | | | 10,119 | | | | (2,701 | ) |
Republic of South Africa | | | 1.00 | % | | HSBC Bank USA N.A. | | 6/20/21 | | | USD | | | | 85 | | | | 7,006 | | | | 9,656 | | | | (2,650 | ) |
Republic of South Africa | | | 1.00 | % | | JPMorgan Chase Bank N.A. | | 6/20/21 | | | USD | | | | 195 | | | | 16,072 | | | | 21,112 | | | | (5,040 | ) |
Total | | | $ | 132,592 | | | $ | 167,719 | | | $ | (35,127 | ) |
| | | | | | | | | | | | | | | | | | | | |
See Notes to Financial Statements.
| | | | | | |
| | | | | | | |
| | SEMI-ANNUAL REPORT | | APRIL 30, 2016 | | 61 |
| | |
Consolidated Schedule of Investments (continued) | | BlackRock Multi-Sector Income Trust (BIT) |
OTC Credit Default Swaps — Sell Protection
| | | | | | | | | | | | | | | | | | | | | | | | | | |
| Issuer/Index | | Receive
Fixed Rate | | | Counterparty | | Expiration
Date | | Credit
Rating1 | | Notional
Amount
(000)2 | | | Value | | | Premiums
Received | | | Unrealized
Appreciation
(Depreciation) | |
Dow Jones CDX North America Investment Grade, Series 9 | | | 5.00 | % | | Bank of America N.A. | | 12/20/17 | | BBB | | USD | 10,000 | | | $ | 590,552 | | | $ | (289,515 | ) | | $ | 880,067 | |
United Mexican States | | | 1.00 | % | | Bank of America N.A. | | 6/20/20 | | BBB+ | | USD | 604 | | | | (6,081 | ) | | | (5,112 | ) | | | (969 | ) |
United Mexican States | | | 1.00 | % | | Citibank N.A. | | 9/20/20 | | BBB+ | | USD | 604 | | | | (8,535 | ) | | | (6,346 | ) | | | (2,189 | ) |
Republic of Brazil | | | 1.00 | % | | Barclays Capital, Inc. | | 6/20/21 | | BB | | USD | 95 | | | | (10,075 | ) | | | (10,694 | ) | | | 619 | |
Republic of Indonesia | | | 1.00 | % | | Barclays Capital, Inc. | | 6/20/21 | | BB+ | | USD | 92 | | | | (3,785 | ) | | | (4,974 | ) | | | 1,189 | |
Markit CMBX North America, Series 7 | | | 3.00 | % | | Barclays Bank PLC | | 1/17/47 | | BBB- | | USD | 5,000 | | | | (409,609 | ) | | | (274,382 | ) | | | (135,227 | ) |
Markit CMBX North America, Series 7 | | | 3.00 | % | | Barclays Bank PLC | | 1/17/47 | | BBB- | | USD | 10,000 | | | | (819,217 | ) | | | (549,535 | ) | | | (269,682 | ) |
Markit CMBX North America, Series 7 | | | 3.00 | % | | Barclays Bank PLC | | 1/17/47 | | BBB- | | USD | 10,000 | | | | (819,217 | ) | | | (266,121 | ) | | | (553,096 | ) |
Markit CMBX North America, Series 8 | | | 3.00 | % | | Credit Suisse International | | 10/17/57 | | BBB- | | USD | 5,000 | | | | (771,773 | ) | | | (525,041 | ) | | | (246,732 | ) |
Markit CMBX North America, Series 8 | | | 3.00 | % | | Goldman Sachs & Co. | | 10/17/57 | | BBB- | | USD | 10,000 | | | | (1,543,546 | ) | | | (1,116,181 | ) | | | (427,365 | ) |
Total | | | | | | | | | | | | | | | | $ | (3,801,286 | ) | | $ | (3,047,901 | ) | | $ | (753,385 | ) |
| | | | | | | | | | | | | | | | | | | | | | | | | | |
1 Using Standard & Poor’s (“S&P’s”) rating of the issuer. | |
2 The maximum potential amount the Trust may pay should a negative credit event take place as defined under the terms of the agreement. | |
Centrally Cleared Interest Rate Swaps
| | | | | | | | | | | | | | | | | | |
| Fixed Rate | | Floating Rate | | Effective
Date | | Expiration
Date | | | Notional
Amount
(000) | | | Unrealized
Appreciation
(Depreciation) | |
2.13%1 | | 3-month LIBOR | | N/A | | | 8/25/25 | | | USD | | | 110 | | | $ | 4,655 | |
2.27%2 | | 3-month LIBOR | | N/A | | | 9/11/25 | | | USD | | | 68 | | | | (3,715 | ) |
Total | | | | | | | | | | | | | | | | $ | 940 | |
| | | | | | | | | | | | | | | | | | |
1 Trust pays the floating rate and receives the fixed rate. | |
2 Trust pays the fixed rate and receives the floating rate. | |
OTC Interest Rate Swaps
| | | | | | | | | | | | | | | | | | | | | | | | | | | | |
| Fixed Rate | | Floating
Rate | | Counterparty | | Effective
Date | | Expiration
Date | | Notional
Amount
(000) | | | Value | | | Premiums
Paid
(Received) | | | Unrealized
Appreciation
(Depreciation) | | | |
6.44%1 | | 1-Day CPOVER | | Credit Suisse International | | N/A | | 5/23/16 | | COP | | | 2,554,702 | | | $ | 503 | | | | — | | | $ | 503 | | | |
6.51%1 | | 1-Day CPOVER | | Credit Suisse International | | N/A | | 7/06/16 | | COP | | | 3,826,468 | | | | (203 | ) | | | — | | | | (203 | ) | | |
6.64%1 | | 1-Day CPOVER | | Credit Suisse International | | N/A | | 8/22/16 | | COP | | | 1,713,519 | | | | 434 | | | | — | | | | 434 | | | |
1.67%1 | | 3-Month KRWCD | | Bank of America N.A. | | N/A | | 6/08/17 | | KRW | | | 1,146,756 | | | | 2,401 | | | $ | 4 | | | | 2,397 | | | |
1.69%2 | | 3-Month KRWCD | | Deutsche Bank AG | | N/A | | 11/10/17 | | KRW | | | 911,735 | | | | (3,203 | ) | | | — | | | | (3,203 | ) | | |
1.92%1 | | 3-Month KRWCD | | Deutsche Bank AG | | N/A | | 11/10/17 | | KRW | | | 911,735 | | | | 6,388 | | | | 1,810 | | | | 4,578 | | | |
4.55%2 | | 3-Month KLIBOR | | Citibank N.A. | | N/A | | 9/11/20 | | MYR | | | 1,275 | | | | (11,684 | ) | | | — | | | | (11,684 | ) | | |
4.34%2 | | 3-Month KLIBOR | | Bank of America N.A. | | N/A | | 9/18/20 | | MYR | | | 1,277 | | | | (8,771 | ) | | | — | | | | (8,771 | ) | | |
12.61%1 | | 1-Day BZOVER | | Bank of America N.A. | | N/A | | 1/04/21 | | BRL | | | 216 | | | | 907 | | | | — | | | | 907 | | | |
12.74%1 | | 1-Day BZOVER | | JPMorgan Chase Bank N.A. | | N/A | | 1/04/21 | | BRL | | | 460 | | | | 2,673 | | | | — | | | | 2,673 | | | |
12.75%1 | | 1-Day BZOVER | | Citibank N.A. | | N/A | | 1/04/21 | | BRL | | | 672 | | | | 4,007 | | | | — | | | | 4,007 | | | |
1.92%1 | | 6-Month WIBOR | | Goldman Sachs International | | N/A | | 4/29/21 | | PLN | | | 1,325 | | | | (123 | ) | | | — | | | | (123 | ) | | |
12.62%1 | | 1-Day BZOVER | | Bank of America N.A. | | N/A | | 1/02/23 | | BRL | | | 166 | | | | 770 | | | | — | | | | 770 | | | |
12.73%1 | | 1-Day BZOVER | | Bank of America N.A. | | N/A | | 1/02/23 | | BRL | | | 143 | | | | 936 | | | | — | | | | 936 | | | |
12.75%1 | | 1-Day BZOVER | | Citibank N.A. | | N/A | | 1/02/23 | | BRL | | | 145 | | | | 1,004 | | | | — | | | | 1,004 | | | |
12.92%1 | | 1-Day BZOVER | | Bank of America N.A. | | N/A | | 1/02/23 | | BRL | | | 623 | | | | 6,124 | | | | — | | | | 6,124 | | | |
12.96%1 | | 1-Day BZOVER | | JPMorgan Chase Bank N.A. | | N/A | | 1/02/23 | | BRL | | | 284 | | | | 3,020 | | | | — | | | | 3,020 | | | |
6.32%1 | | 1-Month MXIBTIIE | | Morgan Stanley Capital Services LLC | | N/A | | 7/17/25 | | MXN | | | 5,813 | | | | 7,995 | | | | (25 | ) | | | 8,020 | | | |
6.33%1 | | 1-Month MXIBTIIE | | Citibank N.A. | | N/A | | 7/17/25 | | MXN | | | 2,897 | | | | 4,045 | | | | (15 | ) | | | 4,060 | | | |
6.32%1 | | 1-month MXIBTIIE | | Goldman Sachs International | | N/A | | 8/06/25 | | MXN | | | 8,688 | | | | 11,194 | | | | (42 | ) | | | 11,236 | | | |
6.31%2 | | 1-Month MXIBTIIE | | Deutsche Bank AG | | N/A | | 8/11/25 | | MXN | | | 6,393 | | | | (8,353 | ) | | | — | | | | (8,353 | ) | | |
6.31%2 | | 1-Month MXIBTIIE | | Bank of America N.A. | | N/A | | 8/11/25 | | MXN | | | 1,723 | | | | (2,271 | ) | | | — | | | | (2,271 | ) | | |
See Notes to Financial Statements.
| | | | | | |
| | | | | | | |
| 62 | | SEMI-ANNUAL REPORT | | APRIL 30, 2016 | | |
| | |
Consolidated Schedule of Investments (continued) | | BlackRock Multi-Sector Income Trust (BIT) |
OTC Interest Rate Swaps (concluded)
| | | | | | | | | | | | | | | | | | | | | | | | | | | | |
| Fixed Rate | | Floating
Rate | | Counterparty | | Effective
Date | | Expiration
Date | | Notional
Amount
(000) | | | Value | | | Premiums
Paid
(Received) | | | Unrealized
Appreciation
(Depreciation) | | | |
6.31%2 | | 1-Month MXIBTIIE | | Bank of America N.A. | | N/A | | 8/11/25 | | MXN | | | 1,723 | | | $ | (2,271 | ) | | | — | | | $ | (2,271 | ) | | |
5.96%1 | | 1-Month MXIBTIIE | | Citibank N.A. | | N/A | | 1/30/26 | | MXN | | | 4,811 | | | | (2,060 | ) | | | — | | | | (2,060 | ) | | |
6.23%1 | | 1-Month MXIBTIIE | | Citibank N.A. | | N/A | | 2/23/26 | | MXN | | | 3,356 | | | | 2,467 | | | | — | | | | 2,467 | | | |
6.24%1 | | 1-Month MXIBTIIE | | Goldman Sachs International | | N/A | | 2/23/26 | | MXN | | | 3,914 | | | | 3,140 | | | | — | | | | 3,140 | | | |
Total | | | | | | $ | 19,069 | | | $ | 1,732 | | | $ | 17,337 | | | |
| | | | | | | | | | | | | | | | | |
1 Trust pays the floating rate and receives the fixed rate. | | | | | | | | | | | | | | | | | | |
2 Trust pays the fixed rate and receives the floating rate. | | | | | | | | | | | | | | | | | | |
|
| Transactions in Options Written for the Six Months Ended April 30, 2016 |
| | | | | | | | | | | | | | | | | | | | | | | | | | | | | | |
| | | | | Calls | |
| | | | | | | | Notional (000) | | | | |
| | | | | Contracts | | | AUD | | | EUR | | | KRW | | | NZD | | | USD | | | Premiums
Received | |
Outstanding options, beginning of period | | | | | — | | | | — | | | | — | | | | 911,735 | | | | — | | | | 849 | | | $ | 10,853 | |
Options written | | | | | 69 | | | | 22,495 | | | | 3,790 | | | | — | | | | 25,170 | | | | 8,110 | | | | 476,698 | |
Options exercised | | | | | — | | | | — | | | | — | | | | — | | | | — | | | | (300 | ) | | | (2,659 | ) |
Options expired | | | | | — | | | | — | | | | (3,583 | ) | | | (911,735 | ) | | | — | | | | (7,967 | ) | | | (190,623 | ) |
Options closed | | | | | (69 | ) | | | — | | | | (207 | ) | | | — | | | | — | | | | (292 | ) | | | (19,387 | ) |
| | | | | | |
Outstanding options, end of period | | | | | — | | | | 22,495 | | | | — | | | | — | | | | 25,170 | | | | 400 | | | $ | 274,882 | |
| | | | | | |
| | |
| | | | | Puts | |
| | | | | | | | Notional (000) | | | | |
| | | | | Contracts | | | AUD | | | EUR | | | KRW | | | NZD | | | USD | | | Premiums
Received | |
Outstanding options, beginning of period | | | | | — | | | | — | | | | — | | | | — | | | | 22,340 | | | | 564 | | | $ | 101,656 | |
Options written | | | | | 35 | | | | 13,215 | | | | 26,216 | | | | — | | | | 95,470 | | | | 27,321 | | | | 714,824 | |
Options exercised | | | | | — | | | | — | | | | — | | | | — | | | | — | | | | — | | | | — | |
Options expired | | | | | — | | | | — | | | | (13,061 | ) | | | — | | | | (19,940 | ) | | | (7,136 | ) | | | (227,114 | ) |
Options closed | | | | | (35 | ) | | | — | | | | (6,820 | ) | | | — | | | | (22,340 | ) | | | (20,749 | ) | | | (245,340 | ) |
| | | | | | |
Outstanding options, end of period | | | | | — | | | | 13,215 | | | | 6,335 | | | | — | | | | 75,530 | | | | — | | | $ | 344,026 | |
| | | | | | |
| | |
| Derivative Financial Instruments Categorized by Risk Exposure | | |
As of period end, the fair values of derivative financial instruments located in the Statements of Assets and Liabilities were as follows:
| | | | | | | | | | | | | | | | | | | | | | | | | | | | | | |
| | | | | Commodity
Contracts | | | Credit
Contracts | | | Equity
Contracts | | | Foreign
Currency
Exchange
Contracts | | | Interest
Rate
Contracts | | | Other
Contracts | | | Total | |
| Assets — Derivative Financial Instruments | | | | | | | | | | | | | | | | | | | | | |
Futures contracts | | Net unrealized appreciation1 | | | — | | | | — | | | | — | | | | — | | | $ | 37,850 | | | | — | | | $ | 37,850 | |
Forward foreign currency exchange contracts | | Unrealized appreciation on forward foreign currency exchange contracts | | | — | | | | — | | | | — | | | $ | 425,723 | | | | — | | | | — | | | | 425,723 | |
Options purchased | | Investments at value — unaffiliated2 | | | — | | | | — | | | | — | | | | 772,727 | | | | — | | | | — | | | | 772,727 | |
Swaps — OTC | | Unrealized appreciation on OTC swaps; Swap premiums paid | | | — | | | $ | 1,052,641 | | | | — | | | | — | | | | 58,090 | | | | — | | | | 1,110,731 | |
Swaps — centrally cleared | | Net unrealized appreciation1 | | | — | | | | — | | | | — | | | | — | | | | 4,655 | | | | — | | | | 4,655 | |
| | | | | | | | | | | | | | | | | | | | | | | | | | | | | | |
Total | | | | | — | | | $ | 1,052,641 | | | | — | | | $ | 1,198,450 | | | $ | 100,595 | | | | — | | | $ | 2,351,686 | |
| | | | | | | | | | | | | | | | | | | | | | | | | | | | | | |
1 Includes cumulative appreciation (depreciation) on futures contracts and centrally cleared swaps, if any, as reported in the Schedule of Investments. Only current day’s variation margin is reported within the Statements of Assets and Liabilities. | |
2 Includes options purchased at value as reported in the Schedule of Investments. | |
See Notes to Financial Statements.
| | | | | | |
| | | | | | | |
| | SEMI-ANNUAL REPORT | | APRIL 30, 2016 | | 63 |
| | |
Consolidated Schedule of Investments (continued) | | BlackRock Multi-Sector Income Trust (BIT) |
As of period end, the fair values of derivative financial instruments located in the Statements of Assets and Liabilities were as follows (concluded):
| | | | | | | | | | | | | | | | | | | | | | | | | | | | | | |
| | | | | Commodity
Contracts | | | Credit
Contracts | | | Equity
Contracts | | | Foreign
Currency
Exchange
Contracts | | | Interest
Rate
Contracts | | | Other
Contracts | | | Total | |
| Liabilities — Derivative Financial Instruments | | | | | | | | | | | | | | | | | | | | | |
Forward foreign currency exchange contracts | | Unrealized depreciation on forward foreign currency exchange contracts | | | — | | | | — | | | | — | | | $ | 1,021,217 | | | | — | | | | — | | | $ | 1,021,217 | |
Options written | | Options written at value | | | — | | | | — | | | | — | | | | 720,407 | | | | — | | | | — | | | | 720,407 | |
Swaps — OTC | | Unrealized depreciation on OTC swaps; Swap premiums received | | | — | | | $ | 4,721,335 | | | | — | | | | — | | | $ | 39,021 | | | | — | | | | 4,760,356 | |
Swaps — centrally cleared | | Net unrealized depreciation1 | | | — | | | | — | | | | — | | | | — | | | | 3,715 | | | | — | | | | 3,715 | |
| | | | | | | | | | | | | | | | | | | | | | | | | | | | | | |
Total | | | | | — | | | $ | 4,721,335 | | | | — | | | $ | 1,741,624 | | | $ | 42,736 | | | | — | | | $ | 6,505,695 | |
| | | | | | | | | | | | | | | | | | | | | | | | | | | | | | |
1 Includes cumulative appreciation (depreciation) on futures contracts and centrally cleared swaps, if any, as reported in the Schedule of Investments. Only current day’s variation margin is reported within the Statements of Assets and Liabilities. | |
2 Includes options purchased at value as reported in the Schedule of Investments. | |
For the six months ended April 30, 2016, the effect of derivative financial instruments in the Statements of Operations was as follows:
| | | | | | | | | | | | | | | | | | | | | | | | | | | | |
| Net Realized Gain (Loss) from: | | Commodity
Contracts | | | Credit
Contracts | | | Equity
Contracts | | | Foreign
Currency
Exchange
Contracts | | | Interest
Rate
Contracts | | | Other
Contracts | | | Total | |
Futures contracts | | | — | | | | — | | | | — | | | | — | | | $ | (1,443,327 | ) | | | — | | | $ | (1,443,327 | ) |
Forward foreign currency exchange contracts | | | — | | | | — | | | | — | | | $ | 1,456,283 | | | | — | | | | — | | | | 1,456,283 | |
Options purchased1 | | | — | | | | — | | | | — | | | | (451,575 | ) | | | (11,348 | ) | | | — | | | | (462,923 | ) |
Options written | | | — | | | | — | | | | — | | | | 579,409 | | | | (8,658 | ) | | | — | | | | 570,751 | |
Swaps | | | — | | | $ | 846,728 | | | | — | | | | — | | | | (3,752 | ) | | | — | | | | 842,976 | |
| | | | |
Total | | | — | | | $ | 846,728 | | | | — | | | $ | 1,584,117 | | | $ | (1,467,085 | ) | | | — | | | $ | 963,760 | |
| | | | |
1 Options purchased are included in net realized gain (loss) from investments. | | | | | | | | | | | | | |
| Net Change in Unrealized Appreciation (Depreciation) on: | | | | | | | | | | |
Futures contracts | | | — | | | | — | | | | — | | | | — | | | $ | (37,163 | ) | | | — | | | $ | (37,163 | ) |
Forward foreign currency exchange contracts | | | — | | | | — | | | | — | | | $ | (296,834 | ) | | | — | | | | — | | | | (296,834 | ) |
Options purchased1 | | | — | | | | — | | | | — | | | | (6,177 | ) | | | (3,024 | ) | | | — | | | | (9,201 | ) |
Options written | | | — | | | | — | | | | — | | | | (108,841 | ) | | | 503 | | | | — | | | | (108,338 | ) |
Swaps | | | — | | | $ | (2,204,697 | ) | | | — | | | | — | | | | 8,655 | | | | — | | | | (2,196,042 | ) |
| | | | |
Total | | | — | | | $ | (2,204,697 | ) | | | — | | | $ | (411,852 | ) | | $ | (31,029 | ) | | | — | | | $ | (2,647,578 | ) |
| | | | |
1 Options purchased are included in net change in unrealized appreciation (depreciation) on investments. | | | | | | | | | | | | | |
|
| Average Quarterly Balances of Outstanding Derivative Financial Instruments |
| | | | |
Futures contracts: | | | | |
Average notional value of contracts — long | | $ | 3,470,800 | 1 |
Average notional value of contracts — short | | $ | 63,365,303 | |
| Forward foreign currency exchange contracts: | | | | |
Average amounts purchased — in USD | | $ | 94,331,634 | |
Average amounts sold — in USD | | $ | 25,544,333 | |
| Options: | | | | |
Average value of option contracts purchased | | $ | 524,044 | |
Average value of option contracts written | | $ | 422,000 | |
Average notional value of swaption contracts purchased | | $ | 799,732 | 1 |
Average notional value of swaption contracts written | | $ | 799,732 | 1 |
| Credit default swaps: | | | | |
Average notional value — buy protection | | $ | 22,779,544 | |
Average notional value — sell protection | | $ | 32,333,698 | |
| Interest rate swaps: | | | | |
Average notional value — pays fixed rate | | $ | 2,291,684 | |
Average notional value — receives fixed rate | | $ | 10,072,543 | |
1 Actual amounts for the period are shown due to limited outstanding derivative financial instruments as of each quarter end. | | | | |
See Notes to Financial Statements.
| | | | | | |
| | | | | | | |
| 64 | | SEMI-ANNUAL REPORT | | APRIL 30, 2016 | | |
| | |
Consolidated Schedule of Investments (continued) | | BlackRock Multi-Sector Income Trust (BIT) |
For more information about the Trust’s investment risks regarding derivative financial instruments, refer to the Notes to Financial Statements.
|
| Derivative Financial Instruments — Offsetting as of Period End |
The Trust’s derivative assets and liabilities (by type) were as follows:
| | | | | | | | |
| | | Assets | | | Liabilities | |
Futures contracts | | $ | 2,673 | | | $ | 5,011 | |
Forward foreign currency exchange contracts | | | 425,723 | | | | 1,021,217 | |
Options | | | 772,727 | 1 | | | 720,407 | |
Swaps — centrally cleared | | | — | | | | 33 | |
Swaps — OTC2 | | | 1,110,731 | | | | 4,760,356 | |
| | | | |
Total derivative assets and liabilities in the Statements of Assets and Liabilities | | $ | 2,311,854 | | | $ | 6,507,024 | |
Derivatives not subject to a Master Netting Agreement or similar agreement (“MNA”) | | | (2,673 | ) | | | (5,044 | ) |
| | | | |
Total derivative assets and liabilities subject to an MNA | | $ | 2,309,181 | | | $ | 6,501,980 | |
| | | | |
1 Includes options purchased at value which is included in Investments at value — unaffiliated in the Statements of Assets and Liabilities and reported in the Schedules of Investments. | |
2 Includes unrealized appreciation (depreciation) on OTC swaps and swap premiums paid/received in the Statements of Assets and Liabilities. | |
The following tables present the Trust’s derivative assets and liabilities by counterparty net of amounts available for offset under an MNA and net of the related collateral received and pledged by the Trust:
| | | | | | | | | | | | | | | | | | |
| Counterparty | | Derivative Assets
Subject to an MNA
by Counterparty | | | Derivatives
Available for
Offset1 | | | Non-cash Collateral
Received | | Cash Collateral
Received | | | Net
Amount of
Derivative
Assets2 | |
Bank of America N.A. | | $ | 926,837 | | | $ | (424,881 | ) | | — | | $ | (120,000 | ) | | $ | 381,956 | |
Barclays Bank PLC | | | 53,112 | | | | (53,112 | ) | | — | | | — | | | | — | |
Barclays Capital, Inc. | | | 65,430 | | | | (29,066 | ) | | — | | | — | | | | 36,364 | |
BNP Paribas SA | | | 254,499 | | | | (27,037 | ) | | — | | | — | | | | 227,462 | |
Citibank N.A. | | | 62,591 | | | | (62,591 | ) | | — | | | — | | | | — | |
Credit Suisse International | | | 9,537 | | | | (9,537 | ) | | — | | | — | | | | — | |
Deutsche Bank AG | | | 70,382 | | | | (32,146 | ) | | — | | | — | | | | 38,236 | |
Goldman Sachs International | | | 96,313 | | | | (10,606 | ) | | — | | | — | | | | 85,707 | |
HSBC Bank PLC | | | 153,955 | | | | (153,955 | ) | | — | | | — | | | | — | |
HSBC Bank USA N.A. | | | 48,488 | | | | (48,488 | ) | | — | | | — | | | | — | |
JPMorgan Chase Bank N.A. | | | 43,947 | | | | (18,418 | ) | | — | | | — | | | | 25,529 | |
Morgan Stanley & Co. International PLC | | | 36,307 | | | | (36,307 | ) | | — | | | — | | | | — | |
Morgan Stanley Capital Services LLC | | | 8,020 | | | | (25 | ) | | — | | | — | | | | 7,995 | |
Northern Trust Corp. | | | 102,076 | | | | (102,076 | ) | | — | | | — | | | | — | |
Royal Bank of Scotland PLC | | | 13,833 | | | | (13,833 | ) | | — | | | — | | | | — | |
State Street Bank and Trust Co. | | | 12,990 | | | | (12,990 | ) | | — | | | — | | | | — | |
UBS AG | | | 350,864 | | | | (350,864 | ) | | — | | | — | | | | — | |
| | | | |
Total | | $ | 2,309,181 | | | $ | (1,385,932 | ) | | — | | $ | (120,000 | ) | | $ | 803,249 | |
| | | | |
See Notes to Financial Statements.
| | | | | | |
| | | | | | | |
| | SEMI-ANNUAL REPORT | | APRIL 30, 2016 | | 65 |
| | |
Consolidated Schedule of Investments (continued) | | BlackRock Multi-Sector Income Trust (BIT) |
The following tables present the Trust’s derivative assets and liabilities by counterparty net of amounts available for offset under an MNA and net of the related collateral received and pledged by the Trust (concluded):
| | | | | | | | | | | | | | | | | | |
| Counterparty | | Derivative Liabilities
Subject to an MNA
by Counterparty | | | Derivatives
Available for
Offset | | | Non-cash Collateral
Pledged | | Cash Collateral
Pledged3 | | | Net
Amount of
Derivative
Liabilities4 | |
Bank of America N.A. | | $ | 424,881 | | | $ | (424,881 | ) | | — | | | — | | | | — | |
Barclays Bank PLC | | | 2,058,957 | | | | (53,112 | ) | | — | | $ | (1,850,000 | ) | | $ | 155,845 | |
Barclays Capital, Inc. | | | 29,066 | | | | (29,066 | ) | | — | | | — | | | | — | |
BNP Paribas SA | | | 27,037 | | | | (27,037 | ) | | — | | | — | | | | — | |
Citibank N.A. | | | 68,576 | | | | (62,591 | ) | | — | | | — | | | | 5,985 | |
Credit Suisse International | | | 778,998 | | | | (9,537 | ) | | — | | | (769,461 | ) | | | — | |
Deutsche Bank AG | | | 32,146 | | | | (32,146 | ) | | — | | | — | | | | — | |
Goldman Sachs & Co. | | | 1,543,546 | | | | — | | | — | | | (1,543,546 | ) | | | — | |
Goldman Sachs International | | | 10,606 | | | | (10,606 | ) | | — | | | — | | | | — | |
HSBC Bank PLC | | | 325,901 | | | | (153,955 | ) | | — | | | — | | | | 171,946 | |
HSBC Bank USA N.A. | | | 62,097 | | | | (48,488 | ) | | — | | | — | | | | 13,609 | |
JPMorgan Chase Bank N.A. | | | 18,418 | | | | (18,418 | ) | | — | | | — | | | | — | |
Morgan Stanley & Co. International PLC | | | 81,424 | | | | (36,307 | ) | | — | | | — | | | | 45,117 | |
Morgan Stanley Capital Services LLC | | | 25 | | | | (25 | ) | | — | | | — | | | | — | |
Northern Trust Corp. | | | 111,349 | | | | (102,076 | ) | | — | | | — | | | | 9,273 | |
Royal Bank of Scotland PLC | | | 512,340 | | | | (13,833 | ) | | — | | | — | | | | 498,507 | |
State Street Bank and Trust Co. | | | 21,817 | | | | (12,990 | ) | | — | | | — | | | | 8,827 | |
UBS AG | | | 394,796 | | | | (350,864 | ) | | — | | | — | | | | 43,932 | |
| | | | |
Total | | $ | 6,501,980 | | | $ | (1,385,932 | ) | | — | | $ | (4,163,007 | ) | | $ | 953,041 | |
| | | | |
1 The amount of derivatives available for offset is limited to the amount of derivative assets and/or liabilities that are subject to an MNA. | |
2 Net amount represents the net amount receivable from the counterparty in the event of default. | |
3 Excess of collateral pledged by the individual counterparty is not shown for financial reporting purposes. | |
4 Net amount represents the net amount payable due to the counterparty in the event of default. | |
| | |
| Fair Value Hierarchy as of Period End | | |
Various inputs are used in determining the fair value of investments and derivative financial instruments. For information about the Trust’s policy regarding valuation of investments and derivative financial instruments, refer to the Notes to Financial Statements.
The following tables summarize the Trust’s investments and derivative financial instruments categorized in the disclosure hierarchy:
| | | | | | | | | | | | | | | | |
| | | Level 1 | | | Level 2 | | | Level 3 | | | Total | |
Assets: | | | | | | | | | | | | | | | | |
| Investments: | | | | | | | | | | | | | | | | |
| Long-Term Investments: | | | | | | | | | | | | | | | | |
Asset-Backed Securities | | | — | | | $ | 179,431,586 | | | $ | 52,460,536 | | | $ | 231,892,122 | |
Common Stocks | | $ | 2,677,090 | | | | — | | | | 561 | | | | 2,677,651 | |
Corporate Bonds | | | — | | | | 385,973,314 | | | | — | | | | 385,973,314 | |
Floating Rate Loan Interests | | | — | | | | 20,699,981 | | | | 39,909,907 | | | | 60,609,888 | |
Foreign Agency Obligations | | | — | | | | 27,926,223 | | | | — | | | | 27,926,223 | |
Non-Agency Mortgage-Backed Securities | | | — | | | | 207,898,173 | | | | 28,407,152 | | | | 236,305,325 | |
Preferred Securities | | | 15,385,483 | | | | 113,508,974 | | | | 1,531,716 | | | | 130,426,173 | |
U.S. Treasury Obligations | | | — | | | | 51,042,444 | | | | — | | | | 51,042,444 | |
| Short-Term Securities: | | | | | | | | | | | | | | | | |
Money Market Funds | | | 23,521,991 | | | | — | | | | — | | | | 23,521,991 | |
| Options Purchased: | | | | | | | | | | | | | | | | |
Foreign currency exchange contracts | | | — | | | | 772,727 | | | | — | | | | 772,727 | |
| | | | | | | | | | | | | | | | |
Total | | $ | 41,584,564 | | | $ | 987,253,422 | | | $ | 122,309,872 | | | $ | 1,151,147,858 | |
| | | | | | | | | | | | | | | | |
| | | | |
| Derivative Financial Instruments1 | | | | | | | | | | | | | | | | |
Assets: | | | | | | | | | | | | | �� | | | |
Credit contracts | | | — | | | $ | 884,920 | | | | — | | | $ | 884,920 | |
Foreign currency exchange contracts | | | — | | | | 425,723 | | | | — | | | | 425,723 | |
Interest rate contracts | | $ | 37,850 | | | | 60,931 | | | | — | | | | 98,781 | |
Liabilities: | | | | | | | | | | | | | | | | |
Credit contracts | | | — | | | | (1,673,432 | ) | | | — | | | | (1,673,432 | ) |
Foreign currency exchange contracts | | | — | | | | (1,741,624 | ) | | | — | | | | (1,741,624 | ) |
Interest rate contracts | | | — | | | | (42,654 | ) | | | — | | | | (42,654 | ) |
| | | | | | | | | | | | | | | | |
Total | | $ | 37,850 | | | $ | (2,086,136 | ) | | | — | | | $ | (2,048,286 | ) |
| | | | | | | | | | | | | | | | |
1 Derivative financial instruments are swaps, futures contracts, forward foreign currency contracts and options written. Swaps, futures contracts and forward foreign currency exchange contracts are valued at the unrealized appreciation (depreciation) on the instrument and options written are shown at value. | |
See Notes to Financial Statements.
| | | | | | |
| | | | | | | |
| 66 | | SEMI-ANNUAL REPORT | | APRIL 30, 2016 | | |
| | |
Consolidated Schedule of Investments (concluded) | | BlackRock Multi-Sector Income Trust (BIT) |
The Trust may hold assets and/or liabilities in which the fair value approximates the carrying amount or face value, including accrued interest, for financial statement purposes. As of period end, such assets and/or liabilities are categorized within the disclosure hierarchy as follows:
| | | | | | | | | | | | | | |
| | | Level 1 | | | Level 2 | | | Level 3 | | Total | |
Assets: | | | | | | | | | | | | | | |
Cash | | $ | 1,649,795 | | | | — | | | — | | $ | 1,649,795 | |
Cash pledged: | | | | | | | | | | | | | | |
Collateral — OTC derivatives | | | 4,650,000 | | | | — | | | — | | | 4,650,000 | |
Centrally cleared swaps | | | 1,590 | | | | — | | | — | | | 1,590 | |
Futures contracts | | | 210,400 | | | | — | | | — | | | 210,400 | |
Foreign currency at value | | | 3,076,702 | | | | — | | | — | | | 3,076,702 | |
Liabilities: | | | | | | | | | | | | | | |
Cash received: | | | | | | | | | | | | | | |
Collateral — reverse repurchase agreements | | | — | | | $ | (3,253,000 | ) | | — | | | (3,253,000 | ) |
Collateral — OTC derivatives | | | — | | | | (120,000 | ) | | — | | | (120,000 | ) |
Reverse repurchase agreements | | | — | | | | (446,226,345 | ) | | — | | | (446,226,345 | ) |
| | | | | | | | | | | | | | |
Total | | $ | 9,588,487 | | | $ | (449,599,345 | ) | | — | | $ | (440,010,858 | ) |
| | | | | | | | | | | | | | |
During the six months ended April 30, 2016, there were no transfers between Level 1 and Level 2.
A reconciliation of Level 3 investments is presented when the Trust had a significant amount of Level 3 investments at the beginning and/or end of the period in relation to net assets. The following table is a reconciliation of Level 3 investments for which significant unobservable inputs were used in determining fair value:
| | | | | | | | | | | | | | | | | | | | | | | | | | | | |
| | | Asset-Backed
Securities | | | Corporate
Bonds | | | Floating
Rate Loan
Interests | | | Non-Agency
Mortgage-
Backed
Securities | | | Preferred
Securities | | | Common
Stocks | | | Total | |
| Assets: | | | | | | | | | | | | | | | | | | | | | | | | | | | | |
Opening balance, as of October 31, 2015 | | $ | 65,179,443 | | | $ | 515,294 | | | $ | 41,246,750 | | | $ | 26,217,945 | | | $ | 1,833,459 | | | | — | | | $ | 134,992,891 | |
Transfers into Level 31 | | | 3,957,160 | | | | — | | | | — | | | | 7,499,925 | | | | — | | | | — | | | | 11,457,085 | |
Transfers out of Level 32 | | | (7,268,850 | ) | | | (515,294 | ) | | | (131,751 | ) | | | — | | | | — | | | | — | | | | (7,915,895 | ) |
Accrued discounts/premiums | | | 12,987 | | | | — | | | | (108,053 | ) | | | 130,661 | | | | — | | | | — | | | | 35,595 | |
Net realized gain (loss) | | | 629,810 | | | | — | | | | (6,339 | ) | | | 116,918 | | | | — | | | | — | | | | 740,389 | |
Net change in unrealized appreciation (depreciation)3,4 | | | (1,131,923 | ) | | | — | | | | (490,192 | ) | | | (734,362 | ) | | | (301,743 | ) | | $ | (8,074 | ) | | | (2,666,294 | ) |
Purchases | | | 925,900 | | | | — | | | | 195,085 | | | | — | | | | — | | | | 8,635 | | | | 1,129,620 | |
Sales | | | (9,843,991 | ) | | | — | | | | (795,593 | ) | | | (4,823,935 | ) | | | — | | | | — | | | | (15,463,519 | ) |
Closing Balance, as of April 30, 2016 | | $ | 52,460,536 | | | | — | | | $ | 39,909,907 | | | $ | 28,407,152 | | | $ | 1,531,716 | | | $ | 561 | | | $ | 122,309,872 | |
| | | | | | | | |
Net change in unrealized appreciation (depreciation) on investments still held at April 30, 20164 | | $ | (1,208,241 | ) | | | — | | | $ | (490,192 | ) | | $ | (795,699 | ) | | $ | (301,743 | ) | | $ | (8,074 | ) | | $ | (2,803,949 | ) |
| | | | | | | | | | | | | | | | | | | | | | | | | | | | |
1 As of October 31, 2015, the Trust used observable inputs in determining the value of certain investments. As of April 30, 2016, the Trust used significant unobservable inputs in determining the value of the same investments. As a result, investments at beginning of period value were transferred from Level 2 to Level 3 in the disclosure hierarchy. | |
2 As of October 31, 2015, the Trust used significant unobservable inputs in determining the value of certain investments. As of April 30, 2016, the Trust used observable inputs in determining the value of the same investments. As a result, investments at beginning of period value were transferred from Level 3 to Level 2 in the disclosure hierarchy. | |
3 Included in the related net change in unrealized appreciation (depreciation) in the Statements of Operations. | |
4 Any difference between net change in unrealized appreciation (depreciation) and net change in unrealized appreciation (depreciation) on investments still held at April 30, 2016 is generally due to investments no longer held or categorized as Level 3 at period end. | |
The following table summarizes the valuation techniques used and unobservable inputs utilized by the BlackRock Global Valuation Methodologies Committee (the “Global Valuation Committee”) to determine the value of certain of the Trust’s Level 3 investments as of period end. The table does not include Level 3 investments with values based upon unadjusted third party pricing information in the amount of $109,573,749.
| | | | | | | | | | | | |
| | | Value | | | Valuation Techniques | | Unobservable Inputs | | Range of
Unobservable Inputs
Utilized | |
Assets: | |
Floating Rate Loan Interests | | $ | 11,204,407 | | | Cost1 | | N/A | | | — | |
Preferred Stocks | | | 1,531,716 | | | Market Comparables | | Illiquidity Discount2 | | | 200 bp | |
| | | | |
Total | | $ | 12,736,123 | | | | | | | | | |
| | | | | | | | | | | | |
1 The Trust fair values certain of its Level 3 investments using acquisition cost, although the transaction may not have occurred during the current reporting period. These investments are generally privately held investments. There may not be a secondary market, and/or there are a limited number of investors. The determination to fair value such investments at cost is based upon factors consistent with the principles of fair value measurement that are reasonably available to the Global Valuation Committee, or its delegate. Valuations are reviewed utilizing available market information to determine if the carrying value should be adjusted. Such market data may include, but is not limited to, observations of the trading multiples of public companies considered comparable to the private companies being valued, financial or operational information released by the company, and/or news or corporate events that affect the investment. Valuations may be adjusted to account for company-specific issues, the lack of liquidity inherent in a nonpublic investment and the fact that comparable public companies are not identical to the investments being fair valued by the Trust. | |
2 Increase in unobservable input may result in a significant decrease to value, while a decrease in the unobservable input may result in a significant increase to value. | |
See Notes to Financial Statements.
| | | | | | |
| | | | | | | |
| | SEMI-ANNUAL REPORT | | APRIL 30, 2016 | | 67 |
| | |
| Statements of Assets and Liabilities | | |
| | | | | | | | | | | | |
| April 30, 2016 (Unaudited) | | BlackRock
Credit Allocation
Income Trust
(BTZ) | | | BlackRock
Floating Rate
Income Trust
(BGT) | | | BlackRock
Multi-Sector
Income Trust
(BIT)1 | |
| | | | | | | | | | | | |
| Assets | | | | | | | | | | | | |
Investments at value — unaffiliated2 | | $ | 2,109,243,306 | | | $ | 460,218,509 | | | $ | 1,127,625,867 | |
Investments at value — affiliated3 | | | 5,871,985 | | | | 2,974,761 | | | | 23,521,991 | |
Cash | | | 30,669 | | | | 594,473 | | | | 1,649,795 | |
| Cash pledged: | | | | | | | | | | | | |
Collateral — OTC derivatives | | | 2,670,000 | | | | — | | | | 4,650,000 | |
Futures contracts | | | 2,028,000 | | | | — | | | | 210,400 | |
Centrally cleared swaps | | | — | | | | — | | | | 1,590 | |
Foreign currency at value4 | | | 13,541 | | | | 33,948 | | | | 3,076,702 | |
| Receivables: | | | | | | | | | | | | |
Interest — unaffiliated | | | 27,058,453 | | | | 1,735,215 | | | | 9,639,006 | |
Investments sold | | | 6,303,329 | | | | 3,960,796 | | | | 21,677,258 | |
Reverse repurchase agreements | | | 649,142 | | | | — | | | | 14,359,938 | |
Variation margin on futures contracts | | | 260,453 | | | | — | | | | 2,673 | |
Dividends — unaffiliated | | | 61,272 | | | | — | | | | 135,787 | |
Dividends — affiliated | | | 6,518 | | | | 170 | | | | 4,708 | |
Swaps | | | — | | | | 233 | | | | — | |
Swap premiums paid | | | 538,850 | | | | — | | | | 169,533 | |
Unrealized appreciation on: | | | | | | | | | | | | |
OTC derivatives | | | 646,853 | | | | — | | | | 941,198 | |
Forward foreign currency exchange contracts | | | — | | | | 4,495 | | | | 425,723 | |
Prepaid expenses | | | 61,298 | | | | 12,970 | | | | 27,344 | |
| | | | | | | | | | | | |
Total assets | | | 2,155,443,669 | | | | 469,535,570 | | | | 1,208,119,513 | |
| | | | | | | | | | | | |
| | | | | | | | | | | | |
| Liabilities | | | | | | | | | | | | |
Cash received: | | | | | | | | | | | | |
Collateral — reverse repurchase agreements | | | 10,408,000 | | | | — | | | | 3,253,000 | |
Collateral — OTC derivatives | | | 1,230,000 | | | | — | | | | 120,000 | |
Options written at value5 | | | 3,092,332 | | | | — | | | | 720,407 | |
Reverse repurchase agreements | | | 593,716,727 | | | | — | | | | 446,226,345 | |
Payables: | | | | | | | | | | | | |
Investments purchased | | | 8,777,900 | | | | 15,132,638 | | | | 37,153,660 | |
Investment advisory fees | | | 1,047,665 | | | | 271,260 | | | | 737,322 | |
Reverse repurchase agreements | | | 936,320 | | | | — | | | | 12,520,329 | |
Officer’s and Trustees’ fees | | | 649,719 | | | | 194,763 | | | | 58,630 | |
Income dividends | | | 325,345 | | | | 28,175 | | | | 178,548 | |
Variation margin on futures contracts | | | 219,414 | | | | — | | | | 5,011 | |
Bank borrowings | | | — | | | | 121,000,000 | | | | — | |
Interest expense | | | — | | | | 110,069 | | | | — | |
Variation margin on centrally cleared swaps | | | — | | | | — | | | | 33 | |
Other accrued expenses | | | 457,822 | | | | 209,656 | | | | 302,124 | |
Swap premiums received | | | 284,376 | | | | 233 | | | | 3,047,983 | |
| Unrealized depreciation on: | | | | | | | | | | | | |
OTC derivatives | | | 873,893 | | | | 1,432 | | | | 1,712,373 | |
Forward foreign currency exchange contracts | | | — | | | | 74,885 | | | | 1,021,217 | |
| | | | | | | | | | | | |
Total liabilities | | | 622,019,513 | | | | 137,023,111 | | | | 507,056,982 | |
| | | | | | | | | | | | |
Net Assets | | $ | 1,533,424,156 | | | $ | 332,512,459 | | | $ | 701,062,531 | |
| | | | |
| | | | | | | | | | | | |
| Net Assets Consist of | | | | | | | | | | | | |
Paid-in capital6,7,8 | | $ | 1,828,243,993 | | | $ | 427,370,162 | | | $ | 727,781,455 | |
Undistributed (distributions in excess of) net investment income | | | (1,582,230 | ) | | | 263,150 | | | | (3,477,724 | ) |
Accumulated net realized loss | | | (371,070,684 | ) | | | (86,989,552 | ) | | | (10,732,395 | ) |
Net unrealized appreciation (depreciation) | | | 77,833,077 | | | | (8,131,301 | ) | | | (12,508,805 | ) |
| | | | | | | | | | | | |
Net Assets | | $ | 1,533,424,156 | | | $ | 332,512,459 | | | $ | 701,062,531 | |
| | | | | | | | | | | | |
Net asset value | | $ | 14.19 | | | $ | 14.05 | | | $ | 18.25 | |
| | | | | | | | | | | | |
1 Consolidated Statement of Assets and Liabilities. | | | | | | | | | | | | |
2 Investments at cost — unaffiliated | | $ | 2,031,093,612 | | | $ | 468,278,307 | | | $ | 1,138,673,066 | |
3 Investments at cost — affiliated | | $ | 5,871,985 | | | $ | 2,974,761 | | | $ | 23,521,991 | |
4 Foreign currency at cost | | $ | 12,746 | | | $ | 33,819 | | | $ | 3,016,482 | |
5 Premiums received | | $ | 3,622,663 | | | | — | | | $ | 618,908 | |
6 Par value | | $ | 0.001 | | | $ | 0.001 | | | $ | 0.001 | |
7 Shares outstanding | | | 108,088,170 | | | | 23,663,232 | | | | 38,421,624 | |
8 Shares authorized | | | unlimited | | | | unlimited | | | | unlimited | |
| | | | | | |
| See Notes to Financial Statements. | | | | |
| | | | | | | |
| 68 | | SEMI-ANNUAL REPORT | | APRIL 30, 2016 | | |
| | | | | | | | | | | | |
| Six Months Ended April 30, 2016 (Unaudited) | | BlackRock
Credit Allocation
Income Trust
(BTZ) | | | BlackRock
Floating Rate
Income Trust
(BGT) | | | BlackRock
Multi-Sector
Income Trust
(BIT)1 | |
| | | | | | | | | | | | |
| Investment Income | | | | | | | | | | | | |
Interest | | $ | 54,743,443 | | | $ | 10,907,813 | | | $ | 32,423,678 | |
Other income — affiliated | | | — | | | | — | | | | 23,247 | |
Dividends — unaffiliated | | | 2,418,077 | | | | 1,863 | | | | 2,257,031 | |
Dividends — affiliated | | | 32,077 | | | | 500 | | | | 38,533 | |
| | | | |
Total income | | | 57,193,597 | | | | 10,910,176 | | | | 34,742,489 | |
| | | | |
| | | | | | | | | | | | |
| Expenses | | | | | | | | | | | | |
Investment advisory | | | 6,555,939 | | | | 1,606,360 | | | | 4,698,101 | |
Professional | | | 115,755 | | | | 75,037 | | | | 105,964 | |
Officer and Trustees | | | 111,108 | | | | 26,758 | | | | 41,422 | |
Accounting services | | | 84,122 | | | | 27,983 | | | | 49,833 | |
Transfer agent | | | 78,471 | | | | 19,096 | | | | 27,486 | |
Custodian | | | 62,553 | | | | 75,205 | | | | 74,314 | |
Printing | | | 18,604 | | | | 7,309 | | | | 11,424 | |
Registration | | | 14,555 | | | | 3,251 | | | | 5,173 | |
Miscellaneous | | | 68,658 | | | | 20,589 | | | | 48,373 | |
| | | | |
Total expenses excluding interest expense | | | 7,109,765 | | | | 1,861,588 | | | | 5,062,090 | |
Interest expense | | | 1,630,133 | | | | 591,029 | | | | 2,269,131 | |
| | | | |
Total expenses | | | 8,739,898 | | | | 2,452,617 | | | | 7,331,221 | |
Less fees waived by the Manager | | | (6,220 | ) | | | (131 | ) | | | (8,177 | ) |
Less fees paid indirectly | | | (1,236 | ) | | | — | | | | (763 | ) |
| | | | |
Total expenses after fees waived and paid indirectly | | | 8,732,442 | | | | 2,452,486 | | | | 7,322,281 | |
| | | | |
Net investment income | | | 48,461,155 | | | | 8,457,690 | | | | 27,420,208 | |
| | | | |
| | | | | | | | | | | | |
| Realized and Unrealized Gain (Loss) | | | | | | | | | | | | |
| Net realized gain (loss) from: | | | | | | | | | | | | |
Investments | | | (22,733,392 | ) | | | (4,775,814 | ) | | | (14,449,849 | ) |
Futures contracts | | | 156,886 | | | | — | | | | (1,443,327 | ) |
Foreign currency transactions | | | (582 | ) | | | 95,844 | | | | 2,334,336 | |
Options written | | | 1,061,185 | | | | — | | | | 570,751 | |
Swaps | | | (16,195,912 | ) | | | (68 | ) | | | 842,976 | |
| | | | |
| | | (37,711,815 | ) | | | (4,680,038 | ) | | | (12,145,113 | ) |
| | | | |
| Net change in unrealized appreciation (depreciation) on: | | | | | | | | | | | | |
Investments | | | 11,620,249 | | | | 1,663,745 | | | | (7,651,747 | ) |
Futures contracts | | | 2,195,718 | | | | — | | | | (37,163 | ) |
Foreign currency translations | | | 1,740 | | | | (93,881 | ) | | | (448,132 | ) |
Options written | | | (509,629 | ) | | | — | | | | (108,338 | ) |
Swaps | | | 11,477,762 | | | | (1,432 | ) | | | (2,196,042 | ) |
| | | | |
| | | 24,785,840 | | | | 1,568,432 | | | | (10,441,422 | ) |
| | | | |
Net realized and unrealized loss | | | (12,925,975 | ) | | | (3,111,606 | ) | | | (22,586,535 | ) |
| | | | |
Net Increase in Net Assets Resulting from Operations | | $ | 35,535,180 | | | $ | 5,346,084 | | | $ | 4,833,673 | |
| | | | |
1 Consolidated Statement of Operations. | |
| | | | | | |
| See Notes to Financial Statements. | | | | |
| | | | | | | |
| | SEMI-ANNUAL REPORT | | APRIL 30, 2016 | | 69 |
| | |
| Statements of Changes in Net Assets | | |
| | | | | | | | |
| | | BlackRock Credit Allocation
Income Trust (BTZ) | |
| Increase (Decrease) in Net Assets: | | Six Months Ended
April 30,
2016
(Unaudited) | | | Year Ended
October 31,
2015 | |
| | | | | | | | |
| Operations | | | | | | | | |
Net investment income | | $ | 48,461,155 | | | $ | 103,314,914 | |
Net realized loss | | | (37,711,815 | ) | | | (15,668,157 | ) |
Net change in unrealized appreciation (depreciation) | | | 24,785,840 | | | | (94,552,781 | ) |
| | | | |
Net increase (decrease) in net assets resulting from operations | | | 35,535,180 | | | | (6,906,024 | ) |
| | | | |
| | | | | | | | |
| Distributions to Shareholders1 | | | | | | | | |
From net investment income | | | (51,233,793 | ) | | | (97,419,415 | ) |
From return of capital | | | — | | | | (6,993,757 | ) |
| | | | |
Decrease in net assets resulting from distributions to shareholders | | | (51,233,793 | ) | | | (104,413,172 | ) |
| | | | |
| | | | | | | | |
| Net Assets | | | | | | | | |
Total decrease in net assets | | | (15,698,613 | ) | | | (111,319,196 | ) |
Beginning of period | | | 1,549,122,769 | | | | 1,660,441,965 | |
| | | | |
End of period | | $ | 1,533,424,156 | | | $ | 1,549,122,769 | |
| | | | |
Undistributed (distributions in excess of) net investment income, end of period | | $ | (1,582,230 | ) | | $ | 1,190,408 | |
| | | | |
| | | | | | | | |
| | | BlackRock Floating Rate
Income Trust (BGT) | |
| Increase (Decrease) in Net Assets: | | Six Months Ended
April 30,
2016
(Unaudited) | | | Year Ended
October 31,
20152 | |
| | | | | | | | |
| Operations | | | | | | | | |
Net investment income | | $ | 8,457,690 | | | $ | 18,385,851 | |
Net realized loss | | | (4,680,038 | ) | | | (6,311,073 | ) |
Net change in unrealized appreciation (depreciation) | | | 1,568,432 | | | | (2,117,191 | ) |
| | | | |
Net increase in net assets resulting from operations | | | 5,346,084 | | | | 9,957,587 | |
| | | | |
| | | | | | | | |
| Distributions to Shareholders1 | | | | | | | | |
From net investment income | | | (8,277,399 | ) | | | (19,181,416 | ) |
| | | | |
| | | | | | | | |
| Net Assets | | | | | | | | |
Total decrease in net assets | | | (2,931,315 | ) | | | (9,223,829 | ) |
Beginning of period | | | 335,443,774 | | | | 344,667,603 | |
| | | | |
End of period | | $ | 332,512,459 | | | $ | 335,443,774 | |
| | | | |
Undistributed net investment income, end of period | | $ | 263,150 | | | $ | 82,859 | |
| | | | |
| | 1 | | Distributions for annual periods determined in accordance with federal income tax regulations. |
| | 2 | | Consolidated Statement of Changes in Net Assets. |
| | | | | | |
| See Notes to Financial Statements. | | | | |
| | | | | | | |
| 70 | | SEMI-ANNUAL REPORT | | APRIL 30, 2016 | | |
| | |
| Statements of Changes in Net Assets | | |
| | | | | | | | |
| | | BlackRock Multi-Sector
Income Trust (BIT) | |
| Increase (Decrease) in Net Assets: | | Six Months Ended
April 30,
20161
(Unaudited) | | | Year Ended
October 31,
2015 | |
| | | | | | | | |
| Operations | | | | | | | | |
Net investment income | | $ | 27,420,208 | | | $ | 59,489,606 | |
Net realized loss | | | (12,145,113 | ) | | | (13,674,058 | ) |
Net change in unrealized appreciation (depreciation) | | | (10,441,422 | ) | | | (25,710,530 | ) |
| | | | |
Net increase in net assets resulting from operations | | | 4,833,673 | | | | 20,105,018 | |
| | | | |
| | | | | | | | |
| Distributions to Shareholders2 | | | | | | | | |
From net investment income | | | (30,202,816 | ) | | | (54,109,102 | ) |
From net realized gain | | | — | | | | (2,923,957 | ) |
| | | | |
Decrease in net assets resulting from distributions to shareholders | | | (30,202,816 | ) | | | (57,033,059 | ) |
| | | | |
| | | | | | | | |
| Net Assets | | | | | | | | |
Total decrease in net assets | | | (25,369,143 | ) | | | (36,928,041 | ) |
Beginning of period | | | 726,431,674 | | | | 763,359,715 | |
| | | | |
End of period | | $ | 701,062,531 | | | $ | 726,431,674 | |
| | | | |
Distributions in excess of net investment income, end of period | | $ | (3,477,724 | ) | | $ | (695,116 | ) |
| | | | |
| | 1 | | Consolidated Statement of Changes in Net Assets. |
| | 2 | | Distributions for annual periods determined in accordance with federal income tax regulations. |
| | | | | | |
| See Notes to Financial Statements. | | | | |
| | | | | | | |
| | SEMI-ANNUAL REPORT | | APRIL 30, 2016 | | 71 |
| | | | | | | | | | | | |
| Six Months Ended April 30, 2016 (Unaudited) | | BlackRock
Credit Allocation
Income Trust
(BTZ) | | | BlackRock
Floating Rate
Income Trust
(BGT) | | | BlackRock
Multi-Sector
Income Trust
(BIT)1 | |
| | | | | | | | | | | | |
| Cash Provided by (Used for) Operating Activities | | | | | | | | | | | | |
Net increase in net assets resulting from operations | | $ | 35,535,180 | | | $ | 5,346,084 | | | $ | 4,833,673 | |
Adjustments to reconcile net increase in net assets resulting from operations to net cash provided by (used for) operating activities: | | | | | | | | | | | | |
Proceeds from sales of long-term investments | | | 309,438,996 | | | | 97,680,060 | | | | 339,361,384 | |
Purchases of long-term investments | | | (240,287,451 | ) | | | (113,215,369 | ) | | | (271,197,374 | ) |
Net purchases of short-term securities | | | (5,261,881 | ) | | | (1,880,648 | ) | | | (17,381,459 | ) |
Amortization of premium and accretion of discount on investments | | | 2,290,635 | | | | (180,601 | ) | | | (5,746,263 | ) |
Premiums paid on closing options written | | | — | | | | — | | | | (128,174 | ) |
Premiums received from options written | | | 3,622,663 | | | | — | | | | 1,191,521 | |
Net realized loss on investments and options written | | | 22,825,375 | | | | 4,775,814 | | | | 16,923,584 | |
Net unrealized gain (loss) on investments, options written, swaps and foreign currency translations | | | (10,478,373 | ) | | | (1,568,432 | ) | | | 10,405,761 | |
(Increase) decrease in assets: | | | | | | | | | | | | |
Cash pledged: | | | | | | | | | | | | |
Collateral — reverse repurchase agreements | | | 2,704,000 | | | | — | | | | 1,881,755 | |
Collateral — OTC derivatives | | | (2,670,000 | ) | | | — | | | | (4,650,000 | ) |
Futures contracts | | | 2,274,780 | | | | — | | | | 571,000 | |
Centrally cleared swaps | | | 9,035,930 | | | | — | | | | 10 | |
Receivables: | | | | | | | | | | | | |
Dividends — affiliated | | | (6,518 | ) | | | (170 | ) | | | (4,708 | ) |
Interest | | | 2,281,296 | | | | (35,486 | ) | | | 1,071,291 | |
Swaps | | | 51,769 | | | | (233 | ) | | | 102,675 | |
Variation margin on futures contracts | | | 454,755 | | | | — | | | | 11,369 | |
Variation margin on centrally cleared swaps | | | — | | | | — | | | | 299 | |
Swap premiums paid | | | (275,244 | ) | | | — | | | | 107,689 | |
Prepaid expenses | | | (54,767 | ) | | | (11,528 | ) | | | (25,024 | ) |
Increase (decrease) in liabilities: | | | | | | | | | | | | |
Cash received: | | | | | | | | | | | | |
Collateral — reverse repurchase agreements | | | 10,408,000 | | | | — | | | | 3,253,000 | |
Collateral — OTC derivatives | | | 230,000 | | | | — | | | | (540,000 | ) |
Payables: | | | | | | | | | | | | |
Investment advisory fees | | | (124,981 | ) | | | (10,907 | ) | | | (101,187 | ) |
Interest expense and fees | | | (738,774 | ) | | | 23,783 | | | | (131,877 | ) |
Officer’s and Trustees’ fees | | | 39,972 | | | | 6,282 | | | | 20,660 | |
Other accrued expenses | | | 191,175 | | | | 22,690 | | | | 64,328 | |
Swaps | | | (126,776 | ) | | | — | | | | (68,413 | ) |
Variation margin on futures contracts | | | 59,097 | | | | — | | | | (21,609 | ) |
Variation margin on centrally cleared swaps | | | (498,178 | ) | | | — | | | | (154 | ) |
Swap premiums received | | | (342,934 | ) | | | 233 | | | | 623,449 | |
| | | | |
Net cash provided by (used for) operating activities | | | 140,577,746 | | | | (9,048,428 | ) | | | 80,427,206 | |
| | | | |
| | | | | | | | | | | | |
| Cash Provided by (Used for) Financing Activities | | | | | | | | | | | | |
Cash dividends paid to shareholders | | | (51,267,922 | ) | | | (8,277,303 | ) | | | (30,305,610 | ) |
Payments for bank borrowings | | | — | | | | (59,000,000 | ) | | | — | |
Proceeds from bank borrowings | | | — | | | | 76,000,000 | | | | — | |
Net borrowing of reverse repurchase agreements | | | (90,973,262 | ) | | | — | | | | (48,609,757 | ) |
| | | | |
Net cash provided by (used for) financing activities | | | (142,241,184 | ) | | | 8,722,697 | | | | (78,915,367 | ) |
| | | | |
| | | | | | | | | | | | |
| Cash Impact from Foreign Exchange Fluctuations | |
Cash impact from foreign exchange fluctuations | | $ | 1,128 | | | $ | 188 | | | $ | 64,984 | |
| | | | |
| | | | | | | | | | | | |
| Cash and Foreign Currency | | | | | | | | | | | | |
Net increase (decrease) in cash | | | (1,662,310 | ) | | | (325,543 | ) | | | 1,576,823 | |
Cash at beginning of period | | | 1,706,520 | | | | 953,964 | | | | 3,149,674 | |
| | | | |
Cash at end of period | | $ | 44,210 | | | $ | 628,421 | | | $ | 4,726,497 | |
| | | | |
| | | | | | | | | | | | |
| Supplemental Disclosure of Cash Flow Information | | | | | | | | | | | | |
Cash paid during the period for interest expense | | $ | 2,368,907 | | | $ | 567,246 | | | $ | 2,401,008 | |
| | | | |
| | 1 | | Consolidated Statement of Cash Flows. |
| | | | | | |
| See Notes to Financial Statements. | | | | |
| | | | | | | |
| 72 | | SEMI-ANNUAL REPORT | | APRIL 30, 2016 | | |
| | |
| Financial Highlights | | BlackRock Credit Allocation Income Trust (BTZ) |
| | | | | | | | | | | | | | | | | | | | | | | | |
| | | Six Months Ended
April 30,
2016
(Unaudited) | | | Year Ended October 31, | |
| | | | 2015 | | | 2014 | | | 2013 | | | 2012 | | | 2011 | |
| | | | | | | | | | | | | | | | | | | | | | | | |
| Per Share Operating Performance | | | | | | | | | | | | | | | | | | | | | | | | |
Net asset value, beginning of period | | $ | 14.33 | | | $ | 15.36 | | | $ | 14.99 | | | $ | 15.37 | | | $ | 13.94 | | | $ | 14.46 | |
| | | | |
Net investment income1 | | | 0.45 | | | | 0.96 | | | | 0.99 | | | | 0.97 | | | | 0.94 | | | | 0.88 | |
Net realized and unrealized gain (loss) | | | (0.12 | ) | | | (1.02 | ) | | | 0.35 | | | | (0.37 | ) | | | 1.43 | | | | (0.54 | ) |
Distributions to Preferred Shareholders from net investment income | | | — | | | | — | | | | — | | | | — | | | | — | | | | (0.01 | ) |
| | | | |
Net increase (decrease) from investment operations | | | 0.33 | | | | (0.06 | ) | | | 1.34 | | | | 0.60 | | | | 2.37 | | | | 0.33 | |
| | | | |
Distributions:2 | | | | | | | | | | | | | | | | | | | | | | | | |
From net investment income | | | (0.47 | ) | | | (0.91 | ) | | | (0.97 | ) | | | (0.98 | ) | | | (0.94 | ) | | | (0.85 | ) |
From return of capital | | | — | | | | (0.06 | ) | | | — | | | | — | | | | — | | | | — | |
| | | | |
Total distributions | | | (0.47 | ) | | | (0.97 | ) | | | (0.97 | ) | | | (0.98 | ) | | | (0.94 | ) | | | (0.85 | ) |
| | | | |
Net asset value, end of period | | $ | 14.19 | | | $ | 14.33 | | | $ | 15.36 | | | $ | 14.99 | | | $ | 15.37 | | | $ | 13.94 | |
| | | | |
Market price, end of period | | $ | 12.66 | | | $ | 12.53 | | | $ | 13.54 | | | $ | 12.97 | | | $ | 14.23 | | | $ | 12.08 | |
| | | | |
| | | | | | | | | | | | | | | | | | | | | | | | |
| Total Return Applicable to Common Shareholders3 | | | | | | | | | | | | | | | | | | | | | | | | |
Based on net asset value | | | 2.88% | 4 | | | 0.48% | | | | 10.11% | | | | 4.86% | | | | 18.35% | | | | 3.28% | |
| | | | |
Based on market price | | | 4.97% | 4 | | | (0.33)% | | | | 12.18% | | | | (2.01)% | | | | 26.44% | | | | (0.60)% | |
| | | | |
| | | | | | | | | | | | | | | | | | | | | | | | |
| Ratios to Average Net Assets Applicable to Common Shareholders | | | | | | | | | | | | | | | | | | | | | | | | |
Total expenses | | | 1.18% | 5 | | | 1.16% | | | | 1.11% | | | | 1.15% | 6 | | | 1.20% | 7 | | | 1.09% | 8 |
| | | | |
Total expenses after fees waived and paid indirectly | | | 1.18% | 5 | | | 1.15% | | | | 1.11% | | | | 1.15% | 6 | | | 1.20% | 7 | | | 1.09% | 8 |
| | | | |
Total expenses after fees waived and paid indirectly and excluding interest expense | | | 0.96% | 5 | | | 0.97% | | | | 0.96% | | | | 1.00% | 6 | | | 1.07% | 7 | | | 0.99% | 8 |
| | | | |
Net investment income | | | 6.52% | 5 | | | 6.40% | | | | 6.48% | | | | 6.43% | | | | 6.53% | | | | 6.25% | 8 |
| | | | |
Distributions to Preferred Shareholders | | | — | | | | — | | | | — | | | | — | | | | — | | | | 0.09% | |
| | | | |
Net investment income to Common Shareholders | | | 6.52% | 5 | | | 6.40% | | | | 6.48% | | | | 6.43% | | | | 6.53% | | | | 6.16% | |
| | | | |
| | | | | | | | | | | | | | | | | | | | | | | | |
| Supplemental Data | | | | | | | | | | | | | | | | | | | | | | | | |
Net assets, end of period (000) | | $ | 1,533,424 | | | $ | 1,549,123 | | | $ | 1,660,442 | | | $ | 1,619,703 | | | $ | 796,836 | | | $ | 722,337 | |
| | | | |
Borrowings outstanding, end of period (000) | | $ | 593,717 | | | $ | 685,716 | | | $ | 759,752 | | | $ | 812,028 | | | $ | 373,716 | | | $ | 339,303 | |
| | | | |
Portfolio turnover rate | | | 11% | | | | 19% | | | | 29% | | | | 43% | | | | 37% | | | | 54% | |
| | | | |
��
| | 1 | | Based on average shares outstanding. |
| | 2 | | Distributions for annual periods determined in accordance with federal income tax regulations. |
| | 3 | | Total returns based on market price, which can be significantly greater or less than the net asset value, may result in substantially different returns. Where applicable, excludes the effects of any sales charges and assumes the reinvestment of distributions. |
| | 4 | | Aggregate total return. |
| | 6 | | Includes reorganization costs associated with the Trust’s reorganization. Without these costs, total expenses, total expenses after fees waived, and total expenses after fees waived and excluding interest expense and income tax would have been 1.15%, 1.15% and 1.00%, respectively. |
| | 7 | | Includes reorganization costs associated with the Trust’s reorganization. Without these costs, total expenses, total expenses after fees waived and paid indirectly, and total expenses after fees waived and paid indirectly and excluding interest expense would have been 1.16%, 1.16% and 1.02%, respectively. |
| | 8 | | Does not reflect the effect of dividends to Preferred Shareholders. |
| | | | | | |
| See Notes to Financial Statements. | | | | |
| | | | | | | |
| | SEMI-ANNUAL REPORT | | APRIL 30, 2016 | | 73 |
| | |
| Financial Highlights | | BlackRock Floating Rate Income Trust (BGT) |
| | | | | | | | | | | | | | | | | | | | | | | | |
| | | Six Months Ended
April 30,
2016
(Unaudited) | | | Year Ended October 31, | |
| | | | 20151 | | | 20141 | | | 20131 | | | 20121 | | | 2011 | |
| | | | | | | | | | | | | | | | | | | | | | | | |
| Per Share Operating Performance | | | | | | | | | | | | | | | | | |
Net asset value, beginning of period | | $ | 14.18 | | | $ | 14.57 | | | $ | 14.79 | | | $ | 14.52 | | | $ | 13.97 | | | $ | 14.48 | |
| | | | |
Net investment income2 | | | 0.36 | | | | 0.78 | | | | 0.84 | | | | 0.94 | | | | 0.97 | | | | 1.00 | |
Net realized and unrealized gain (loss) | | | (0.14 | ) | | | (0.36 | ) | | | (0.22 | ) | | | 0.38 | | | | 0.68 | | | | (0.42 | ) |
| Distributions to Preferred Shareholders from net investment income | | | — | | | | — | | | | — | | | | — | | | | — | | | | (0.00 | )3 |
| | | | |
| Net increase from investment operations | | | 0.22 | | | | 0.42 | | | | 0.62 | | | | 1.32 | | | | 1.65 | | | | 0.58 | |
| | | | |
| Distributions to Common Shareholders from net investment income4 | | | (0.35 | ) | | | (0.81 | ) | | | (0.84 | ) | | | (1.05 | ) | | | (1.10 | ) | | | (1.09 | ) |
| | | | |
| Net asset value, end of period | | $ | 14.05 | | | $ | 14.18 | | | $ | 14.57 | | | $ | 14.79 | | | $ | 14.52 | | | $ | 13.97 | |
| | | | |
| Market price, end of period | | $ | 12.88 | | | $ | 12.77 | | | $ | 13.18 | | | $ | 14.12 | | | $ | 15.07 | | | $ | 13.00 | |
| | | | |
| | | | | | | | | | | | | | | | | | | | | | | | |
| Total Return Applicable to Common Shareholders5 | | | | | | | | | | | | | | | | | |
Based on net asset value | | | 1.88% | 6 | | | 3.54% | | | | 4.60% | | | | 9.37% | | | | 12.37% | | | | 4.03% | |
| | | | |
Based on market price | | | 3.71% | 6 | | | 3.08% | | | | (0.89)% | | | | 0.60% | | | | 25.33% | | | | (3.46)% | |
| | | | |
| | | | | | | | | | | | | | | | | | | | | | | | |
| Ratios to Average Net Assets Applicable to Common Shareholders | | | | | | | | | | | | | | | | | |
Total expenses | | | 1.51% | 7 | | | 1.55% | | | | 1.52% | | | | 1.57% | | | | 1.66% | | | | 1.73% | 8 |
| | | | |
Total expenses after fees waived | | | 1.51% | 7 | | | 1.54% | | | | 1.52% | | | | 1.57% | | | | 1.61% | | | | 1.60% | 8 |
| | | | |
Total expenses after fees waived and excluding interest expense | | | 1.15% | 7 | | | 1.19% | | | | 1.18% | | | | 1.19% | | | | 1.25% | 9 | | | 1.24% | 8 |
| | | | |
Net investment income | | | 5.21% | 7 | | | 5.37% | | | | 5.71% | | | | 6.39% | | | | 6.87% | | | | 6.95% | 8 |
| | | | |
Distributions to Preferred Shareholders | | | — | | | | — | | | | — | | | | — | | | | — | | | | 0.03% | |
| | | | |
Net investment income to Common Shareholders | | | 5.21 | 7 | | | 5.37% | | | | 5.71% | | | | 6.39% | | | | 6.87% | | | | 6.92% | |
| | | | |
| | | | | | | | | | | | | | | | | | | | | | | | |
| Supplemental Data | | | | | | | | | | | | | | | | | |
Net assets, end of period (000) | | $ | 332,512 | | | $ | 335,444 | | | $ | 344,668 | | | $ | 349,941 | | | $ | 343,282 | | | $ | 329,831 | |
| | | | |
Borrowings outstanding, end of period (000) | | $ | 121,000 | | | $ | 104,000 | | | $ | 145,000 | | | $ | 152,000 | | | $ | 145,000 | | | $ | 122,000 | |
| | | | |
Asset coverage, end of period per $1,000 of bank borrowings | | $ | 3,748 | | | $ | 4,225 | | | $ | 3,377 | | | $ | 3,302 | | | $ | 3,367 | | | $ | 3,704 | |
| | | | |
Portfolio turnover rate | | | 21% | | | | 42% | | | | 64% | | | | 72% | | | | 65% | | | | 89% | |
| | | | |
| | 1 | | Consolidated Financial Highlights. |
| | 2 | | Based on average shares outstanding. |
| | 3 | | Amount is greater than $(0.005) per share. |
| | 4 | | Distributions for annual periods determined in accordance with federal income tax regulations. |
| | 5 | | Total returns based on market price, which can be significantly greater or less than the net asset value, may result in substantially different returns. Where applicable, excludes the effects of any sales charges and assumes the reinvestment of distributions. |
| | 6 | | Aggregate total return. |
��
| | 8 | | Does not reflect the effect of dividends to Preferred Shareholders. |
| | 9 | | For the year ended October 31, 2012, the total expense ratio after fees waived and paid indirectly and excluding interest expense and borrowing costs was 1.14%. |
| | | | | | |
| See Notes to Financial Statements. | | | | |
| | | | | | | |
| 74 | | SEMI-ANNUAL REPORT | | APRIL 30, 2016 | | |
| | |
| Financial Highlights | | BlackRock Multi-Sector Income Trust (BIT) |
| | | | | | | | | | | | | | | | |
| | | Six Months Ended
April 30,
20161
(Unaudited) | | | Year Ended October 31, | | | Period
February 27, 20132
to October 31,
2013 | |
| | | | 2015 | | | 2014 | | |
| | | | | | | | | | | | | | | | |
| Per Share Operating Performance | | | | | | | | | | | | | | | | |
Net asset value, beginning of period | | $ | 18.91 | | | $ | 19.87 | | | $ | 18.95 | | | $ | 19.10 | 3 |
| | | | |
Net investment income4 | | | 0.71 | | | | 1.55 | | | | 1.62 | | | | 1.02 | |
Net realized and unrealized gain (loss) | | | (0.58 | ) | | | (1.03 | ) | | | 0.70 | | | | (0.35 | ) |
| | | | |
Net increase from investment operations | | | 0.13 | | | | 0.52 | | | | 2.32 | | | | 0.67 | |
| | | | |
Distributions5: | | | | | | | | | | | | | | | | |
From net investment income | | | (0.79 | ) | | | (1.40 | ) | | | (1.40 | ) | | | (0.70 | ) |
From net realized gain | | | — | | | | (0.08 | ) | | | — | | | | — | |
From return of capital | | | — | | | | — | | | | — | | | | (0.12 | ) |
| | | | |
Total distributions | | | (0.79 | ) | | | (1.48 | ) | | | (1.40 | ) | | | (0.82 | ) |
| | | | |
Net asset value, end of period | | $ | 18.25 | | | $ | 18.91 | 6 | | $ | 19.87 | | | $ | 18.95 | |
| | | | |
Market price, end of period | | $ | 16.15 | | | $ | 16.31 | | | $ | 17.79 | | | $ | 17.04 | |
| | | | |
| | | | | | | | | | | | | | | | |
| Total Return7 | | | | | | | | | | | | | | | | |
Based on net asset value | | | 1.43% | 8,9 | | | 3.87% | 6 | | | 13.40% | | | | 4.04% | 8 |
| | | | |
Based on market price | | | 4.07% | 8 | | | 0.06% | | | | 12.91% | | | | (10.66)% | 8 |
| | | | |
| | | | | | | | | | | | | | | | |
| Ratios to Average Net Assets | | | | | | | | | | | | | | | | |
Total expenses | | | 2.13% | 10 | | | 2.09% | 11 | | | 2.04% | | | | 1.67% | 10 |
| | | | |
Total expenses after fees waived and paid indirectly | | | 2.12% | 10 | | | 2.09% | 11 | | | 2.04% | | | | 1.67% | 10 |
| | | | |
Total expenses after fees waived and paid indirectly and excluding interest expense | | | 1.47% | 10 | | | 1.53% | 11 | | | 1.52% | | | | 1.33% | 10 |
| | | | |
Net investment income | | | 7.95% | 10 | | | 7.97% | 11 | | | 8.27% | | | | 8.05% | 10 |
| | | | |
| | | | | | | | | | | | | | | | |
| Supplemental Data | | | | | | | | | | | | | | | | |
Net assets, end of period (000) | | $ | 701,063 | | | $ | 726,432 | | | $ | 763,360 | | | $ | 727,908 | |
| | | | |
Borrowings outstanding, end of period (000) | | $ | 446,226 | | | $ | 510,352 | | | $ | 707,294 | | | $ | 552,040 | |
| | | | |
Portfolio turnover rate | | | 24% | | | | 21% | | | | 29% | | | | 77% | 12 |
| | | | |
| | 1 | | Consolidated Financial Highlights. |
| | 2 | | Commencement of operations. |
| | 3 | | Net asset value, beginning of period, reflects a deduction of $0.90 per share sales charge from the initial offering price of $20.00 per share. |
| | 4 | | Based on average shares outstanding. |
| | 5 | | Distributions for annual periods determined in accordance with federal income tax regulations. |
| | 6 | | For financial reporting purposes, the market value of certain investments were adjusted as of report date. Accordingly, the net asset value (“NAV”) per share and total return performance based on net asset value presented herein are different than the information previously published on October 31, 2015. |
| | 7 | | Total returns based on market price, which can be significantly greater or less than the net asset value, may result in substantially different returns. Where applicable, excludes the effects of any sales charges and assumes the reinvestment of distributions. |
| | 8 | | Aggregate total return. |
| | 9 | | Includes payment received from an affiliate, which had no impact on the Trust’s total return. |
| | 11 | | Ratios do not include expenses incurred indirectly as a result of investments in underlying funds of approximately 0.01% for the year ended October 31, 2015. |
| | 12 | | Includes mortgage dollar roll transactions. Excluding these transactions, the portfolio turnover would have been 54%. |
| | | | | | |
| See Notes to Financial Statements. | | | | |
| | | | | | | |
| | SEMI-ANNUAL REPORT | | APRIL 30, 2016 | | 75 |
| | |
| Notes to Financial Statements (Unaudited) | | |
1. Organization:
The following are registered under the Investment Company Act of 1940, as amended (the “1940 Act”), as closed-end management investment companies and are referred to herein collectively as the “Trusts”, or individually, a “Trust”:
| | | | | | | | | | | | |
| Trust Name | | Herein Referred To As | | | Organized | | | Diversification Classification | |
BlackRock Credit Allocation Income Trust | | | BTZ | | | | Delaware | | | | Non-diversified | |
BlackRock Floating Rate Income Trust | | | BGT | | | | Delaware | | | | Non-diversified | |
BlackRock Multi-Sector Income Trust | | | BIT | | | | Delaware | | | | Non-diversified | |
The Boards of Trustees of the Trusts are collectively referred to throughout this report as the “Board of Trustees” or the “Board,” and the trustees thereof are collectively referred to throughout this report as “Trustees.” The Trusts determine and make available for publication the net asset value (“NAV”) of their Common Shares on a daily basis.
The Trusts, together with certain other registered investment companies advised by BlackRock Advisors, LLC (the “Manager”) or its affiliates, are included in a complex of closed-end funds referred to as the Closed-End Complex.
Basis of Consolidation: The accompanying consolidated financial statements of BIT include the accounts of BIT Subsidiary, LLC (“BIT Subsidiary”). The BIT Subsidiary enables BIT to hold an investment in an operating company and satisfy Regulated Investment Company (“RIC”) tax requirements. Income earned and gains realized on the investment held by the BIT Subsidiary are taxable to the subsidiary. BIT may invest up to 25% of its total assets in the BIT Subsidiary. The BIT Subsidiary is subject to the same investment policies and restrictions that apply to BIT.
2. Significant Accounting Policies:
The financial statements are prepared in conformity with accounting principles generally accepted in the United States of America (“U.S. GAAP”), which may require management to make estimates and assumptions that affect the reported amounts of assets and liabilities in the financial statements, disclosure of contingent assets and liabilities at the date of the financial statements and the reported amounts of increases and decreases in net assets from operations during the reporting period. Actual results could differ from those estimates. Each Trust is considered an investment company under U.S. GAAP and follows the accounting and reporting guidance applicable to investment companies. Below is a summary of significant accounting policies:
Foreign Currency: Each Trust’s books and records are maintained in U.S. dollars. Purchases and sales of investments are recorded at the rates of exchange prevailing on the respective dates of such transactions. Generally, when the U.S. dollar rises in value against a foreign currency, the investments denominated in that currency will lose value; the opposite effect occurs if the U.S. dollar falls in relative value.
Each Trust does not isolate changes in the exchange rates from the changes in the market prices of investments held or sold for financial reporting purposes. Accordingly, the effects of changes in exchange rates on investments are not segregated in the Statements of Operations from the effects of changes in market prices of those investments, but are included as a component of net realized and unrealized gain (loss) from investments. Each Trust reports realized currency gains (losses) on foreign currency related transactions as components of net realized gain (loss) for financial reporting purposes, whereas such components are generally treated as ordinary income for federal income tax purposes.
Segregation and Collateralization: In cases where a Trust enters into certain investments (e.g., futures contracts, forward foreign currency exchange contracts, options written and swaps) or certain borrowings (e.g., reverse repurchase transactions) that would be treated as “senior securities” for 1940 Act purposes, a Trust may segregate or designate on its books and records cash or liquid assets having a market value at least equal to the amount of its future obligations under such investments or borrowings. Doing so allows the investment or borrowing to be excluded from treatment as a “senior security.” Furthermore, if required by an exchange or counterparty agreement, the Trusts may be required to deliver/deposit cash and/or securities to/with an exchange, or broker-dealer or custodian as collateral for certain investments or obligations.
Investment Transactions and Investment Income: For financial reporting purposes, investment transactions are recorded on the dates the transactions are entered into (the trade dates). Realized gains and losses on investment transactions are determined on the identified cost basis. Dividend income is recorded on the ex-dividend date. Dividends from foreign securities where the ex-dividend date may have passed are subsequently recorded when the Trusts are informed of the ex-dividend date. Under the applicable foreign tax laws, a withholding tax at various rates may be imposed on capital gains, dividends and interest. Upon notification from issuers, some of the dividend income received from a real estate investment trust may be redesignated as a reduction of cost of the related investment and/or realized gain. Interest income, including amortization and accretion of premiums and discounts on debt securities, is recognized on the accrual basis.
Distributions: Distributions from net investment income are declared and paid monthly. Distributions of capital gains are recorded on the ex-dividend date and made at least annually. Portions of return of capital distributions under U.S. GAAP may be taxed at ordinary income rates. The character of distributions is determined in accordance with federal income tax regulations, which may differ from U.S. GAAP. The portion of distributions that exceeds a Trust’s current and accumulated earnings and profits, as measured on a tax basis, constitute a non-taxable return of capital. Realized net capital gains can be offset by capital losses carried forward from prior years. However, certain Trusts have capital loss carryforwards from pre-2012 tax years that offset
| | | | | | |
| | | | | | | |
| 76 | | SEMI-ANNUAL REPORT | | APRIL 30, 2016 | | |
| | | | |
| Notes to Financial Statements (continued) | | |
realized net capital gains but do not offset current and accumulated earnings and profits. Consequently, if distributions in any tax year are less than the Trust’s current earnings and profits but greater than net investment income and net realized capital gains (taxable income), distributions in excess of taxable income are not treated as non-taxable return of capital, but rather may be taxable to shareholders at ordinary income rates. Under certain circumstances, taxable excess distributions could be significant.
Deferred Compensation Plan: Under the Deferred Compensation Plan (the “Plan”) approved by each Trust’s Board, the independent Trustees (“Independent Trustees”) may defer a portion of their annual complex-wide compensation. Deferred amounts earn an approximate return as though equivalent dollar amounts had been invested in common shares of certain other BlackRock Closed-End Funds selected by the Independent Trustees. This has the same economic effect for the Independent Trustees as if the Independent Trustees had invested the deferred amounts directly in certain other BlackRock Closed-End Funds.
The Plan is not funded and obligations thereunder represent general unsecured claims against the general assets of each Trust, if applicable. Deferred compensation liabilities are included in officer’s and trustees’ fees payable in the Statements of Assets and Liabilities and will remain as a liability of the Trusts until such amounts are distributed in accordance with the Plan.
Indemnifications: In the normal course of business, each Trust enters into contracts that contain a variety of representations that provide general indemnification. A Trust’s maximum exposure under these arrangements is unknown because it involves future potential claims against a Trust, which cannot be predicted with any certainty.
Other: Expenses directly related to a Trust are charged to that Trust. Other operating expenses shared by several funds, including other funds managed by the Manager, are prorated among those funds on the basis of relative net assets or other appropriate methods.
The Trusts have an arrangement with their custodian whereby fees may be reduced by credits earned on uninvested cash balances, which, if applicable, are shown as fees paid indirectly in the Statements of Operations. The custodian imposes fees on overdrawn cash balances, which can be offset by accumulated credits earned or may result in additional custody charges. Effective October 2015, the custodian is imposing fees on certain uninvested cash balances.
3. Investment Valuation and Fair Value Measurements:
Investment Valuation Policies: The Trusts’ investments are valued at fair value (also referred to as “market value” within the financial statements) as of the close of trading on the New York Stock Exchange (“NYSE”) (generally 4:00 p.m., Eastern time) (or if the reporting date falls on a day the NYSE is closed, investments are valued at fair value as of the report date). U.S. GAAP defines fair value as the price the Trusts would receive to sell an asset or pay to transfer a liability in an orderly transaction between market participants at the measurement date. The Trusts determine the fair values of their financial instruments using various independent dealers or pricing services under policies approved by the (the “Board”). The BlackRock Global Valuation Methodologies Committee (the “Global Valuation Committee”) is the committee formed by management to develop global pricing policies and procedures and to oversee the pricing function for all financial instruments.
Fair Value Inputs and Methodologies: The following methods (or “techniques”) and inputs are used to establish the fair value of each Trust’s assets and liabilities:
| • | | Equity investments traded on a recognized securities exchange are valued at the official closing price each day, if available. For equity investments traded on more than one exchange, the official close price on the exchange where the stock is primarily traded is used. Equity investments traded on a recognized exchange for which there were no sales on that day may be valued at the last available bid (long positions) or ask (short positions) price. |
| • | | Bond investments are valued on the basis of last available bid prices or current market quotations provided by dealers or pricing services. Floating rate loan interests are valued at the mean of the bid prices from one or more brokers or dealers as obtained from a pricing service. In determining the value of a particular investment, pricing services may use certain information with respect to transactions in such investments, quotations from dealers, pricing matrixes, market transactions in comparable investments, various relationships observed in the market between investments and calculated yield measures. Asset-backed and mortgage-backed securities are valued by independent pricing services using models that consider estimated cash flows of each tranche of the security, establish a benchmark yield and develop an estimated tranche-specific spread to the benchmark yield based on the unique attributes of the tranche. Generally, trading in foreign instruments is substantially completed each day at various times prior to the close of business on the NYSE. Occasionally, events affecting the values of such instruments may occur between the foreign market close and the close of business on the NYSE that may not be reflected in the computation of the Trusts’ net assets. |
| • | | Municipal investments (including commitments to purchase such investments on a “when-issued” basis) are valued on the basis of prices provided by dealers or pricing services. In determining the value of a particular investment, pricing services may use certain information with respect to transactions in such investments, quotations from dealers, pricing matrixes, market transactions in comparable investments and information with respect to various relationships between investments. |
| • | | Investments in open-end U.S. mutual funds are valued at NAV each business day. |
| | | | | | |
| | | | | | | |
| | SEMI-ANNUAL REPORT | | APRIL 30, 2016 | | 77 |
| | |
| Notes to Financial Statements (continued) | | |
| • | | Futures contracts traded on exchanges are valued at their last sale price. |
| • | | Securities and other assets and liabilities denominated in foreign currencies are translated into U.S. dollars using exchange rates determined as of the close of business on the NYSE. Forward foreign currency exchange contracts are valued at the mean between the bid and ask prices and are determined as of the close of business on the NYSE. Interpolated values are derived when the settlement date of the contract is an interim date for which quotations are not available. |
| • | | Exchange-traded options are valued at the mean between the last bid and ask prices at the close of the options market in which the options trade. An exchange-traded option for which there is no mean price is valued at the last bid (long positions) or ask (short positions) price. If no bid or ask price is available, the prior day’s price will be used, unless it is determined that the prior day’s price no longer reflects the fair value of the option. Over-the-Counter (“OTC”) options and options on swaps (“swaptions”) are valued by an independent pricing service using a mathematical model, which incorporates a number of market data factors, such as the trades and prices of the underlying instruments. |
| • | | Swap agreements are valued utilizing quotes received daily by the Trusts’ pricing service or through brokers, which are derived using daily swap curves and models that incorporate a number of market data factors, such as discounted cash flows, trades and values of the underlying reference instruments. |
If events (e.g., a company announcement, market volatility or a natural disaster) occur that are expected to materially affect the value of such instruments, or in the event that the application of these methods of valuation results in a price for an investment that is deemed not to be representative of the market value of such investment, or if a price is not available, the investment will be valued by the Global Valuation Committee, or its delegate, in accordance with a policy approved by the Board as reflecting fair value (“Fair Valued Investments”). When determining the price for Fair Valued Investments, the Global Valuation Committee, or its delegate, seeks to determine the price that each Trust might reasonably expect to receive or pay from the current sale or purchase of that asset or liability in an arm’s-length transaction. Fair value determinations shall be based upon all available factors that the Global Valuation Committee, or its delegate, deems relevant consistent with the principles of fair value measurement, which include the market approach, income approach and/or in the case of recent investments, the cost approach, as appropriate. The market approach generally consists of using comparable market transactions. The income approach generally is used to discount future cash flows to present value and is adjusted for liquidity as appropriate. These factors include but are not limited to: (i) attributes specific to the investment or asset; (ii) the principal market for the investment or asset; (iii) the customary participants in the principal market for the investment or asset; (iv) data assumptions by market participants for the investment or asset, if reasonably available; (v) quoted prices for similar investments or assets in active markets; and (vi) other factors, such as future cash flows, interest rates, yield curves, volatilities, prepayment speeds, loss severities, credit risks, recovery rates, liquidation amounts and/or default rates. Due to the inherent uncertainty of valuations of such investments, the fair values may differ from the values that would have been used had an active market existed. The Global Valuation Committee, or its delegate, employs various methods for calibrating valuation approaches for investments where an active market does not exist, including regular due diligence of each Trust’s pricing vendors, regular reviews of key inputs and assumptions, transactional back-testing or disposition analysis to compare unrealized gains and losses to realized gains and losses, reviews of missing or stale prices and large movements in market values and reviews of any market related activity. The pricing of all Fair Valued Investments is subsequently reported to the Board or a committee thereof on a quarterly basis.
Fair Value Hierarchy: Various inputs are used in determining the fair value of investments and derivative financial instruments. These inputs to valuation techniques are categorized into a fair value hierarchy consisting of three broad levels for financial statement purposes as follows:
| • | | Level 1 — unadjusted price quotations in active markets/exchanges for identical assets or liabilities that each Trust has the ability to access |
| • | | Level 2 — other observable inputs (including, but not limited to, quoted prices for similar assets or liabilities in markets that are active, quoted prices for identical or similar assets or liabilities in markets that are not active, inputs other than quoted prices that are observable for the assets or liabilities (such as interest rates, yield curves, volatilities, prepayment speeds, loss severities, credit risks and default rates) or other market–corroborated inputs) |
| • | | Level 3 — unobservable inputs based on the best information available in the circumstances, to the extent observable inputs are not available (including each Trust’s own assumptions used in determining the fair value of investments and derivative financial instruments) |
The hierarchy gives the highest priority to unadjusted quoted prices in active markets for identical assets or liabilities (Level 1 measurements) and the lowest priority to unobservable inputs (Level 3 measurements). Accordingly, the degree of judgment exercised in determining fair value is greatest for instruments categorized in Level 3. The inputs used to measure fair value may fall into different levels of the fair value hierarchy. In such cases, for disclosure purposes, the fair value hierarchy classification is determined based on the lowest level input that is significant to the fair value measurement in its entirety. The significant unobservable inputs used by the Global Valuation Committee in determining the price for Fair Valued Investments are typically categorized as Level 3. The fair value hierarchy for each Trust’s investments and derivative financial instruments has been included in the Schedules of Investments.
Changes in valuation techniques may result in transfers into or out of an assigned level within the hierarchy. In accordance with each Trust’s policy, transfers between different levels of the fair value hierarchy are deemed to have occurred as of the beginning of the reporting period. The categorization of a
| | | | | | |
| | | | | | | |
| 78 | | SEMI-ANNUAL REPORT | | APRIL 30, 2016 | | |
| | | | |
| Notes to Financial Statements (continued) | | |
value determined for investments and derivative financial instruments is based on the pricing transparency of the investments and derivative financial instruments and is not necessarily an indication of the risks associated with investing in those securities.
4. Securities and Other Investments:
Asset-Backed and Mortgage-Backed Securities: Asset-backed securities are generally issued as pass-through certificates or as debt instruments. Asset-backed securities issued as pass-through certificates represent undivided fractional ownership interests in an underlying pool of assets. Asset-backed securities issued as debt instruments, which are also known as collateralized obligations are typically issued as the debt of a special purpose entity organized solely for the purpose of owning such assets and issuing such debt. Asset-backed securities are often backed by a pool of assets representing the obligations of a number of different parties. The yield characteristics of certain asset-backed securities may differ from traditional debt securities. One such major difference is that all or a principal part of the obligations may be prepaid at any time because the underlying assets (i.e., loans) may be prepaid at any time. As a result, a decrease in interest rates in the market may result in increases in the level of prepayments as borrowers, particularly mortgagors, refinance and repay their loans. An increased prepayment rate with respect to an asset-backed security will have the effect of shortening the maturity of the security. In addition, a Trust may subsequently have to reinvest the proceeds at lower interest rates. If a Trust has purchased such an asset-backed security at a premium, a faster than anticipated prepayment rate could result in a loss of principal to the extent of the premium paid.
For mortgage pass-through securities (the “Mortgage Assets”), there are a number of important differences among the agencies and instrumentalities of the U.S. Government that issue mortgage-related securities and among the securities that they issue. For example, mortgage-related securities guaranteed by Ginnie Mae are guaranteed as to the timely payment of principal and interest by Ginnie Mae and such guarantee is backed by the full faith and credit of the United States. However, mortgage-related securities issued by Freddie Mac and Fannie Mae, including Freddie Mac and Fannie Mae guaranteed mortgage pass-through certificates, which are solely the obligations of Freddie Mac and Fannie Mae, are not backed by or entitled to the full faith and credit of the United States, but are supported by the right of the issuer to borrow from the U.S. Treasury.
Non-agency mortgage-backed securities are securities issued by non-governmental issuers and have no direct or indirect government guarantees of payment and are subject to various risks. Non-agency mortgage loans are obligations of the borrowers thereunder only and are not typically insured or guaranteed by any other person or entity. The ability of a borrower to repay a loan is dependent upon the income or assets of the borrower. A number of factors, including a general economic downturn, acts of God, terrorism, social unrest and civil disturbances, may impair a borrower’s ability to repay its loans.
Collateralized Debt Obligations: Collateralized debt obligations (“CDOs”) include collateralized bond obligations (“CBOs”) and collateralized loan obligations (“CLOs”), which are types of asset-backed securities. A CDO is an entity that is backed by a diversified pool of debt securities (CBOs) or syndicated bank loans (CLOs). The cash flows of the CDO can be split into multiple segments, called “tranches,” which will vary in risk profile and yield. The riskiest segment is the subordinated or “equity” tranche. This tranche bears the greatest risk of defaults from the underlying assets in the CDO and serves to protect the other, more senior, tranches from default in all but the most severe circumstances. Since it is shielded from defaults by the more junior tranches, a “senior” tranche will typically have higher credit ratings and lower yields than their underlying securities, and often receive investment grade ratings from one or more of the nationally recognized rating agencies. Despite the protection from the more junior tranches, senior tranches can experience substantial losses due to actual defaults, increased sensitivity to future defaults and the disappearance of one or more protecting tranches as a result of changes in the credit profile of the underlying pool of assets.
Multiple Class Pass-Through Securities: Multiple class pass-through securities, including collateralized mortgage obligations (“CMOs”) and commercial mortgage-backed securities, may be issued by Ginnie Mae, U.S. Government agencies or instrumentalities or by trusts formed by private originators of, or investors in, mortgage loans. In general, CMOs are debt obligations of a legal entity that are collateralized by a pool of residential or commercial mortgage loans or Mortgage Assets. The payments on these are used to make payments on the CMOs or multiple pass-through securities. Multiple class pass-through securities represent direct ownership interests in the Mortgage Assets. Classes of CMOs include interest only (“IOs”), principal only (“POs”), planned amortization classes and targeted amortization classes. IOs and POs are stripped mortgage-backed securities representing interests in a pool of mortgages, the cash flow from which has been separated into interest and principal components. IOs receive the interest portion of the cash flow while POs receive the principal portion. IOs and POs can be extremely volatile in response to changes in interest rates. As interest rates rise and fall, the value of IOs tends to move in the same direction as interest rates. POs perform best when prepayments on the underlying mortgages rise since this increases the rate at which the principal is returned and the yield to maturity on the PO. When payments on mortgages underlying a PO are slower than anticipated, the life of the PO is lengthened and the yield to maturity is reduced. If the underlying Mortgage Assets experience greater than anticipated prepayments of principal, the Trusts’initial investment in the IOs may not fully recoup.
Zero-Coupon Bonds: Zero-coupon bonds are normally issued at a significant discount from face value and do not provide for periodic interest payments. These bonds may experience greater volatility in market value than other debt obligations of similar maturity which provide for regular interest payments.
Capital Securities and Trust Preferred Securities: Capital securities, including trust preferred securities, are typically issued by corporations, generally in the form of interest-bearing notes with preferred securities characteristics. In the case of trust preferred securities, an affiliated business trust of a corporation
| | | | | | |
| | | | | | | |
| | SEMI-ANNUAL REPORT | | APRIL 30, 2016 | | 79 |
| | |
| Notes to Financial Statements (continued) | | |
issues these securities, generally in the form of beneficial interests in subordinated debentures or similarly structured securities. The securities can be structured with either a fixed or adjustable coupon that can have either a perpetual or stated maturity date. For trust preferred securities, the issuing bank or corporation pays interest to the trust, which is then distributed to holders of these securities as a dividend. Dividends can be deferred without creating an event of default or acceleration, although maturity cannot take place unless all cumulative payment obligations have been met. The deferral of payments does not affect the purchase or sale of these securities in the open market. Payments on these securities are treated as interest rather than dividends for federal income tax purposes. These securities generally are rated below that of the issuing company’s senior debt securities and are freely callable at the issuer’s option.
Preferred Stock: Preferred stock has a preference over common stock in liquidation (and generally in receiving dividends as well) but is subordinated to the liabilities of the issuer in all respects. As a general rule, the market value of preferred stock with a fixed dividend rate and no conversion element varies inversely with interest rates and perceived credit risk, while the market price of convertible preferred stock generally also reflects some element of conversion value. Because preferred stock is junior to debt securities and other obligations of the issuer, deterioration in the credit quality of the issuer will cause greater changes in the value of a preferred stock than in a more senior debt security with similar stated yield characteristics. Unlike interest payments on debt securities, preferred stock dividends are payable only if declared by the issuer’s board of directors. Preferred stock also may be subject to optional or mandatory redemption provisions.
Warrants: Warrants entitle a Trust to purchase a specified number of shares of common stock and are non-income producing. The purchase price and number of shares are subject to adjustment under certain conditions until the expiration date of the warrants, if any. If the price of the underlying stock does not rise above the strike price before the warrant expires, the warrant generally expires without any value and a Trust will lose any amount it paid for the warrant. Thus, investments in warrants may involve more risk than investments in common stock. Warrants may trade in the same markets as their underlying stock; however, the price of the warrant does not necessarily move with the price of the underlying stock.
Floating Rate Loan Interests: Floating rate loan interests are typically issued to companies (the “borrower”) by banks, other financial institutions, or privately and publicly offered corporations (the “lender”). Floating rate loan interests are generally non-investment grade, often involve borrowers whose financial condition is troubled or uncertain and companies that are highly leveraged. The Trusts may invest in obligations of borrowers who are in bankruptcy proceedings. In addition, transactions in floating rate loan interests may settle on a delayed basis, which may result to proceeds from the sale to not be readily available for the Trusts to make additional investments or meet its redemption obligations. Floating rate loan interests may include fully funded term loans or revolving lines of credit. Floating rate loan interests are typically senior in the corporate capital structure of the borrower. Floating rate loan interests generally pay interest at rates that are periodically determined by reference to a base lending rate plus a premium. The base lending rates are generally the lending rate offered by one or more European banks, such as the London Interbank Offered Rate (“LIBOR”), the prime rate offered by one or more U.S. banks or the certificate of deposit rate. Floating rate loan interests may involve foreign borrowers, and investments may be denominated in foreign currencies. These investments are treated as investments in debt securities for purposes of the Trusts’ investment policies.
When a Trust purchases a floating rate loan interest, it may receive a facility fee and when it sells a floating rate loan interest, it may pay a facility fee. On an ongoing basis, the Trusts may receive a commitment fee based on the undrawn portion of the underlying line of credit amount of a floating rate loan interest. Facility and commitment fees are typically amortized to income over the term of the loan or term of the commitment, respectively. Consent and amendment fees are recorded to income as earned. Prepayment penalty fees, which may be received by a Trust upon the prepayment of a floating rate loan interest by a borrower, are recorded as realized gains. A Trust may invest in multiple series or tranches of a loan. A different series or tranche may have varying terms and carry different associated risks.
Floating rate loan interests are usually freely callable at the borrower’s option. A Trust may invest in such loans in the form of participations in loans (“Participations”) or assignments (“Assignments”) of all or a portion of loans from third parties. Participations typically will result in the Trust having a contractual relationship only with the lender, not with the borrower. A Trust has the right to receive payments of principal, interest and any fees to which it is entitled only from the lender selling the Participation and only upon receipt by the lender of the payments from the borrower. In connection with purchasing Participations, the Trust generally will have no right to enforce compliance by the borrower with the terms of the loan agreement, nor any rights of offset against the borrower. A Trust may not benefit directly from any collateral supporting the loan in which it has purchased the Participation. As a result, a Trust assumes the credit risk of both the borrower and the lender that is selling the Participation. The Trust’s investment in loan participation interests involves the risk of insolvency of the financial intermediaries who are parties to the transactions. In the event of the insolvency of the lender selling the Participation, a Trust may be treated as a general creditor of the lender and may not benefit from any offset between the lender and the borrower. Assignments typically result in the Trust having a direct contractual relationship with the borrower, and the Trust may enforce compliance by the borrower with the terms of the loan agreement.
In connection with floating rate loan interests, the Trusts may also enter into unfunded floating rate loan interests (“commitments”). In connection with these commitments, a Trust earns a commitment fee, typically set as a percentage of the commitment amount. Such fee income, which is included in interest income in the Statements of Operations, is recognized ratably over the commitment period. Unfunded floating rate loan interests are marked-to-market daily, and any unrealized appreciation (depreciation) is included in the Statements of Assets and Liabilities and Statements of Operations. As of period end, the Trusts had no unfunded floating rate loan interests.
| | | | | | |
| | | | | | | |
| 80 | | SEMI-ANNUAL REPORT | | APRIL 30, 2016 | | |
| | | | |
| Notes to Financial Statements (continued) | | |
Forward Commitments and When-Issued Delayed Delivery Securities: Certain Trusts may purchase securities on a when-issued basis and may purchase or sell securities on a forward commitment basis. Settlement of such transactions normally occurs within a month or more after the purchase or sale commitment is made. A Trust may purchase securities under such conditions with the intention of actually acquiring them, but may enter into a separate agreement to sell the securities before the settlement date. Since the value of securities purchased may fluctuate prior to settlement, a Trust may be required to pay more at settlement than the security is worth. In addition, a Trust is not entitled to any of the interest earned prior to settlement. When purchasing a security on a delayed delivery basis, a Trust assumes the rights and risks of ownership of the security, including the risk of price and yield fluctuations. In the event of default by the counterparty, a Trust’s maximum amount of loss is the unrealized appreciation of unsettled when-issued transactions.
Reverse Repurchase Agreements: Reverse repurchase agreements are agreements with qualified third party broker-dealers in which a Trust sells securities to a bank or broker-dealer and agrees to repurchase the same securities at a mutually agreed upon date and price. A Trust receives cash from the sale to use for other investment purposes. During the term of the reverse repurchase agreement, a Trust continues to receive the principal and interest payments on the securities sold. Certain agreements have no stated maturity and can be terminated by either party at any time. Interest on the value of the reverse repurchase agreements issued and outstanding is based upon competitive market rates determined at the time of issuance. A Trust may utilize reverse repurchase agreements when it is anticipated that the interest income to be earned from the investment of the proceeds of the transaction is greater than the interest expense of the transaction. Reverse repurchase agreements involve leverage risk. If a Trust suffers a loss on its investment of the transaction proceeds from a reverse repurchase agreement, a Trust would still be required to pay the full repurchase price. Further, a Trust remains subject to the risk that the market value of the securities repurchased declines below the repurchase price. In such cases, a Trust would be required to return a portion of the cash received from the transaction or provide additional securities to the counterparty.
Cash received in exchange for securities delivered plus accrued interest due to the counterparty is recorded as a liability in the Statements of Assets and Liabilities at face value including accrued interest. Due to the short- term nature of the reverse repurchase agreements, face value approximates fair value. Interest payments made by a Trust to the counterparties are recorded as a component of interest expense in the Statements of Operations. In periods of increased demand for the security, a Trust may receive a fee for use of the security by the counterparty, which may result in interest income to a Trust.
For the six months ended April 30, 2016, the average amount of reverse repurchase agreements and the daily weighted average interest rate for the Trusts were as follows:
| | | | | | | | |
| | | Average
Amount
Outstanding | | | Daily
Weighted
Average
Interest Rate | |
BTZ | | $ | 633,750,170 | | | | 0.52% | |
BIT | | $ | 488,134,430 | | | | 0.94% | |
Reverse repurchase transactions are entered into by a Trust under Master Repurchase Agreements (each, an “MRA”), which permit a Trust, under certain circumstances, including an event of default (such as bankruptcy or insolvency), to offset payables and/or receivables under the MRA with collateral held and/or posted to the counterparty and create one single net payment due to or from a Trust. With reverse repurchase transactions, typically a Trust and the counterparty under an MRA are permitted to sell, re-pledge, or use the collateral associated with the transaction. Bankruptcy or insolvency laws of a particular jurisdiction may impose restrictions on or prohibitions against such a right of offset in the event of the MRA counterparty’s bankruptcy or insolvency. Pursuant to the terms of the MRA, a Trust receives or posts securities as collateral with a market value in excess of the repurchase price to be paid or received by a Trust upon the maturity of the transaction. Upon a bankruptcy or insolvency of the MRA counterparty, a Trust is considered an unsecured creditor with respect to excess collateral and, as such, the return of excess collateral may be delayed.
As of period end, the following table is a summary of the Trusts’ open reverse repurchase agreements by counterparty which are subject to offset under an MRA on a net basis:
| | | | | | | | | | | | | | | | |
| BTZ | | | | | | | | | | | | |
| Counterparty | | Reverse Repurchase
Agreements | | | Fair Value of Non-cash
Collateral Pledged
Including Accrued
Interest1 | | | Cash Collateral
Pledged | | | Net Amount | |
Barclays Capital, Inc. | | $ | 75,254,034 | | | $ | (75,254,034 | ) | | | — | | | | — | |
BNP Paribas Securities Corp. | | | 126,226,556 | | | | (126,226,556 | ) | | | — | | | | — | |
Credit Agricole Corporate and Investment Bank | | | 15,103,336 | | | | (15,103,336 | ) | | | — | | | | — | |
Credit Suisse Securities (USA) LLC | | | 36,494,421 | | | | (36,494,421 | ) | | | — | | | | — | |
Deutsche Bank Securities, Inc. | | | 50,377,009 | | | | (50,377,009 | ) | | | — | | | | — | |
HSBC Securities (USA) Inc. | | | 19,493,774 | | | | (19,493,774 | ) | | | — | | | | — | |
RBC Capital Markets, LLC | | | 225,521,587 | | | | (225,521,587 | ) | | | — | | | | — | |
UBS Securities LLC | | | 45,246,010 | | | | (45,246,010 | ) | | | — | | | | — | |
| | | | |
Total | | $ | 593,716,727 | | | $ | (593,716,727 | ) | | | — | | | | — | |
| | | | |
| | | | | | |
| | | | | | | |
| | SEMI-ANNUAL REPORT | | APRIL 30, 2016 | | 81 |
| | |
| Notes to Financial Statements (continued) | | |
| | | | | | | | | | | | | | | | |
| BIT | | | | | | | | | | | | |
| Counterparty | | Reverse Repurchase
Agreements | | | Fair Value of Non-cash
Collateral Pledged
Including Accrued
Interest1 | | | Cash Collateral
Pledged | | | Net Amount | |
Barclays Bank PLC | | $ | 8,540,447 | | | $ | (8,540,447 | ) | | | — | | | | — | |
Barclays Capital, Inc. | | | 31,366,227 | | | | (31,366,227 | ) | | | — | | | | — | |
BNP Paribas | | | 1,252,481 | | | | (1,252,481 | ) | | | — | | | | — | |
BNP Paribas Securities Corp. | | | 36,999,201 | | | | (36,999,201 | ) | | | — | | | | — | |
Citigroup Global Markets | | | 3,324,987 | | | | (3,324,987 | ) | | | — | | | | — | |
Credit Suisse Securities (USA) LLC | | | 2,201,936 | | | | (2,201,936 | ) | | | — | | | | — | |
Deutsche Bank Securities, Inc. | | | 129,305,724 | | | | (129,305,724 | ) | | | — | | | | — | |
HSBC Securities (USA), Inc. | | | 8,244,171 | | | | (8,244,171 | ) | | | — | | | | — | |
JPMorgan Securities LLC | | | 11,307,314 | | | | (11,307,314 | ) | | | — | | | | — | |
Morgan Stanley & Co. LLC | | | 3,944,685 | | | | (3,944,685 | ) | | | — | | | | — | |
RBC Capital Markets, LLC | | | 101,435,863 | | | | (101,435,863 | ) | | | — | | | | — | |
UBS Limited | | | 16,206,193 | | | | (16,206,193 | ) | | | — | | | | — | |
UBS Securities LLC | | | 92,097,116 | | | | (92,097,116 | ) | | | — | | | | — | |
| | | | |
Total | | $ | 446,226,345 | | | $ | (446,226,345 | ) | | | — | | | | — | |
| | | | |
| | 1 | | Net collateral with a value of $631,564,048 for BTZ and $516,745,382 for BIT has been pledged in connection with open reverse repurchase agreements. Excess of net collateral pledged to the individual counterparty is not shown for financial reporting purposes. |
In the event the counterparty of securities under an MRA files for bankruptcy or becomes insolvent, a Trust’s use of the proceeds from the agreement may be restricted while the counterparty, or its trustee or receiver, determines whether or not to enforce a Trust’s obligation to repurchase the securities.
5. Derivative Financial Instruments:
The Trusts engage in various portfolio investment strategies using derivative contracts both to increase the returns of the Trusts and/or to manage their exposure to certain risks such as credit risk, equity risk, interest rate risk, foreign currency exchange rate risk or other risk (e.g., inflation risk). Derivative financial instruments categorized by risk exposure are included in the Schedules of Investments. These contracts may be transacted on an exchange or OTC.
Futures Contracts: Certain Trusts invest in long and/or short positions in futures and options on futures to gain exposure to, or manage exposure to, changes in interest rates (interest rate risk).
Futures contracts are agreements between the Trusts and a counterparty to buy or sell a specific quantity of an underlying instrument at a specified price and on a specified date. Depending on the terms of a contract, it is settled either through physical delivery of the underlying instrument on the settlement date or by payment of a cash amount on the settlement date. Upon entering into a futures contract, the Trusts are required to deposit initial margin with the broker in the form of cash or securities in an amount that varies depending on a contract’s size and risk profile. The initial margin deposit must then be maintained at an established level over the life of the contract.
Securities deposited as initial margin are designated in the Schedules of Investments and cash deposited, if any, is shown as cash pledged for futures contracts in the Statements of Assets and Liabilities. Pursuant to the contract, the Trusts agree to receive from or pay to the broker an amount of cash equal to the daily fluctuation in market value of the contract (“variation margin”). Variation margin is recorded as unrealized appreciation (depreciation) and, if any, shown as variation margin receivable (or payable) on futures contracts in the Statements of Assets and Liabilities.
When the contract is closed, a realized gain or loss is recorded in the Statements of Operations equal to the difference between the value of the contract at the time it was opened and the value at the time it was closed. The use of futures contracts involves the risk of an imperfect correlation in the movements in the price of futures contracts and interest, foreign currency exchange rates or underlying assets.
Forward Foreign Currency Exchange Contracts: Certain Trusts enter into forward foreign currency exchange contracts to gain or reduce exposure to foreign currencies (foreign currency exchange rate risk). A forward foreign currency exchange contract is an agreement between two parties to buy and sell a currency at a set exchange rate on a specified date. These contracts help to manage the overall exposure to the currencies in which some of the investments held by the Trusts are denominated and in some cases, may be used to obtain exposure to a particular market. The daily change in market value is recorded as unrealized appreciation (depreciation) in the Statements of Assets and Liabilities. When a contract is closed, a realized gain or loss is recorded in the Statements of Operations equal to the difference between the value at the time it was opened and the value at the time it was closed. Non-deliverable forward foreign currency exchange contracts are settled with the counterparty in cash without delivery of foreign currency. The use of forward foreign currency exchange contracts involves the risk that the value of a forward foreign currency exchange contract changes unfavorably due to movements in the value of the referenced foreign currencies.
Options: Certain Trusts purchase and write call and put options to increase or decrease their exposure to the risks of underlying instruments, including equity risk and interest rate risk and/or, in the case of options written, to generate gains from options premiums. A call option gives the purchaser (holder)
| | | | | | |
| | | | | | | |
| 82 | | SEMI-ANNUAL REPORT | | APRIL 30, 2016 | | |
| | | | |
| Notes to Financial Statements (continued) | | |
of the option the right (but not the obligation) to buy, and obligates the seller (writer) to sell (when the option is exercised) the underlying instrument at the exercise or strike price at any time or at a specified time during the option period. A put option gives the holder the right to sell and obligates the writer to buy the underlying instrument at the exercise or strike price at any time or at a specified time during the option period.
Premiums paid on options purchased and premiums received on options written, as well as the daily fluctuations in market value, are include in investments at value — unaffiliated and options written at value, respectively, in the Statements of Assets and Liabilities. When an instrument is purchased or sold through the exercise of an option, the premium is offset against the cost or proceeds of the underlying instrument. When an option expires, a realized gain or loss is recorded in the Statements of Operations to the extent of the premiums received or paid. When an option is closed or sold, a gain or loss is recorded in the Statements of Operations to the extent the cost of the closing transaction exceeds the premiums received or paid. When the Trusts write a call option, such option is typically “covered,” meaning that the Trusts hold the underlying instrument subject to being called by the option counterparty. When the Trusts write a put option, such option is covered by cash in an amount sufficient to cover the obligation.
| • | | Swaptions — Certain Trusts purchase and write options on swaptions primarily to preserve a return or spread on a particular investment or portion of the Trusts’ holdings, as a duration management technique or to protect against an increase in the price of securities it anticipates purchasing at a later date. The purchaser and writer of a swaption is buying or granting the right to enter into a previously agreed upon interest rate or credit default swap agreement (interest rate risk and/or credit risk) at any time before the expiration of the option. |
| • | | Foreign Currency options — Certain Trusts purchase and write foreign currency options, foreign currency futures and options on foreign currency futures to gain or reduce exposure to foreign currencies (foreign currency exchange rate risk). Foreign currency options give the purchaser the right to buy from or sell to the writer a foreign currency at any time before the expiration of the option. |
In purchasing and writing options, the Trusts bear the risk of an unfavorable change in the value of the underlying instrument or the risk that the Trusts may not be able to enter into a closing transaction due to an illiquid market. Exercise of a written option could result in the Trusts purchasing or selling a security when it otherwise would not, or at a price different from the current market value.
Swaps: Certain Trusts enter into swap contracts to manage exposure to issuers, markets and securities. Such contracts are agreements between the Trusts and a counterparty to make periodic net payments on a specified notional amount or a net payment upon termination. Swap agreements are privately negotiated in the OTC market and may be entered into as a bilateral contract (“OTC swaps”) or centrally cleared (“centrally cleared swaps”).
For OTC swaps, any upfront premiums paid and any upfront fees received are shown as swap premiums paid and swap premiums received, respectively, in the Statements of Assets and Liabilities and amortized over the term of the contract. The daily fluctuation in market value is recorded as unrealized appreciation (depreciation) on OTC Swaps in the Statements of Assets and Liabilities. Payments received or paid are recorded in the Statements of Operations as realized gains or losses, respectively. When an OTC swap is terminated, a realized gain or loss is recorded in the Statements of Operations equal to the difference between the proceeds from (or cost of) the closing transaction and the Trusts’ basis in the contract, if any. Generally, the basis of the contract is the premium received or paid.
In a centrally cleared swap, immediately following execution of the swap contract, the swap contract is novated to a central counterparty (the “CCP”) and the Trusts’ counterparty on the swap agreement becomes the CCP. The Trusts are required to interface with the CCP through the broker. Upon entering into a centrally cleared swap, the Trusts are required to deposit initial margin with the broker in the form of cash or securities in an amount that varies depending on the size and risk profile of the particular swap. Securities deposited as initial margin are designated in the Schedules of Investments and cash deposited is shown as cash pledged for centrally cleared swaps in the Statements of Assets and Liabilities. Pursuant to the contract, the Trusts agree to receive from or pay to the broker an amount of cash equal to the daily fluctuation in market value of the contract (“variation margin”). Variation margin is recorded as unrealized appreciation (depreciation) and shown as variation margin receivable (or payable) on centrally cleared swaps in the Statements of Assets and Liabilities. Payments received from (paid to) the counterparty, including at termination, are recorded as realized gains (losses) in the Statements of Operations.
| • | | Credit default swaps — Certain Trusts enter into credit default swaps to manage their exposure to the market or certain sectors of the market, to reduce their risk exposure to defaults of corporate and/or sovereign issuers or to create exposure to corporate and/or sovereign issuers to which they are not otherwise exposed (credit risk). |
The Trusts may either buy or sell (write) credit default swaps on single-name issuers (corporate or sovereign), a combination or basket of single-name issuers or traded indexes. Credit default swaps are agreements in which the protection buyer pays fixed periodic payments to the seller in consideration for a promise from the protection seller to make a specific payment should a negative credit event take place with respect to the referenced entity (e.g., bankruptcy, failure to pay, obligation acceleration, repudiation, moratorium or restructuring). As a buyer, if an underlying credit event occurs, the Trusts will either (i) receive from the seller an amount equal to the notional amount of the swap and deliver the referenced security or underlying securities comprising the index, or (ii) receive a net settlement of cash equal to the notional amount of the swap less the recovery value of the security or underlying securities comprising the index. As a seller (writer), if an underlying credit event occurs, the Trusts will either pay the buyer an amount equal to the notional amount
| | | | | | |
| | | | | | | |
| | SEMI-ANNUAL REPORT | | APRIL 30, 2016 | | 83 |
| | |
| Notes to Financial Statements (continued) | | |
of the swap and take delivery of the referenced security or underlying securities comprising the index or pay a net settlement of cash equal to the notional amount of the swap less the recovery value of the security or underlying securities comprising the index.
| • | | Interest rate swaps — Certain Trusts enter into interest rate swaps to gain or reduce exposure to interest rates or to manage duration, the yield curve or interest rate risk (interest rate risk). |
Interest rate swaps are agreements in which one party pays a stream of interest payments, either fixed or floating, in exchange for another party’s stream of interest payments, either fixed or floating, on the same notional amount for a specified period of time. In more complex interest rate swaps, the notional principal amount may decline (or amortize) over time.
Swap transactions involve, to varying degrees, elements of interest rate, credit and market risk in excess of the amounts recognized in the Statements of Assets and Liabilities. Such risks involve the possibility that there will be no liquid market for these agreements, that the counterparty to the agreements may default on its obligation to perform or disagree as to the meaning of the contractual terms in the agreements, and that there may be unfavorable changes in interest rates and/or market values associated with these transactions.
Master Netting Arrangements: In order to define their contractual rights and to secure rights that will help them mitigate their counterparty risk, the Trusts may enter into an International Swaps and Derivatives Association, Inc. Master Agreement (“ISDA Master Agreement”) or similar agreement with their counterparties. An ISDA Master Agreement is a bilateral agreement between each Trust and a counterparty that governs certain OTC derivatives and typically contains, among other things, collateral posting terms and netting provisions in the event of a default and/or termination event. Under an ISDA Master Agreement, each Trust may, under certain circumstances, offset with the counterparty certain derivative financial instruments’ payables and/or receivables with collateral held and/or posted and create one single net payment. The provisions of the ISDA Master Agreement typically permit a single net payment in the event of default including the bankruptcy or insolvency of the counterparty. Bankruptcy or insolvency laws of a particular jurisdiction may restrict or prohibit the right of offset in bankruptcy, insolvency or other events. In addition, certain ISDA Master Agreements allow counterparties to terminate derivative contracts prior to maturity in the event the Trusts’ net assets decline by a stated percentage or the Trusts fail to meet the terms of their ISDA Master Agreements. The result would cause the Trusts to accelerate payment of any net liability owed to the counterparty.
Collateral Requirements: For derivatives traded under an ISDA Master Agreement, the collateral requirements are typically calculated by netting the mark-to-market amount for each transaction under such agreement and comparing that amount to the value of any collateral currently pledged by the Trust and the counterparty.
Cash collateral that has been pledged to cover obligations of the Trusts and cash collateral received from the counterparty, if any, is reported separately on the Statements of Assets and Liabilities as cash pledged as collateral and cash received as collateral, respectively. Non-cash collateral pledged by the Trusts, if any, is noted in the Schedules of Investments. Generally, the amount of collateral due from or to a counterparty is subject to a certain minimum transfer amount threshold before a transfer is required, which is determined at the close of business of the Trusts. Any additional required collateral is delivered to/pledged by the Trusts on the next business day. Typically, the counterparty is not permitted to sell, re-pledge or use cash and non-cash collateral it receives. A Trust generally agrees not to use non-cash collateral that it receives but may, absent default or certain other circumstances defined in the underlying ISDA Master Agreement, be permitted to use cash collateral received. In such cases, interest may be paid pursuant to the collateral arrangement with the counterparty. To the extent amounts due to the Trusts from their counterparties are not fully collateralized, they bear the risk of loss from counterparty non-performance. Likewise, to the extent the Trusts have delivered collateral to a counterparty and stand ready to perform under the terms of their agreement with such counterparty, they bear the risk of loss from a counterparty in the amount of the value of the collateral in the event the counterparty fails to return such collateral. Based on the terms of agreements, collateral may not be required for all derivative contracts.
For financial reporting purposes, the Trusts do not offset derivative assets and derivative liabilities that are subject to netting arrangements, if any, in the Statements of Assets and Liabilities.
6. Investment Advisory Agreement and Other Transactions with Affiliates:
The PNC Financial Services Group, Inc. is the largest stockholder and an affiliate of BlackRock, Inc. (“BlackRock”) for 1940 Act purposes.
Investment Advisory
Each Trust entered into an Investment Advisory Agreement with the Manager, the Trusts’ investment advisor, an indirect, wholly owned subsidiary of BlackRock, to provide investment advisory and administration services. The Manager is responsible for the management of each Trust’s portfolio and provides the personnel, facilities, equipment and certain other services necessary to the operations of each Trust. For such services, each Trust pays the Manager a monthly fee, which is determined by calculating a percentage of BTZ and BGT’s average weekly (average daily for BIT’s) Managed Assets at the following annual rates:
| | | | | | | | | | | | |
| | | BTZ | | | BGT | | | BIT | |
Investment advisory fees | | | 0.62% | | | | 0.75% | | | | 0.80% | |
| | | | | | |
| | | | | | | |
| 84 | | SEMI-ANNUAL REPORT | | APRIL 30, 2016 | | |
| | | | |
| Notes to Financial Statements (continued) | | |
“Managed Assets” means the total assets of the Trust (including any assets attributable to any borrowings) minus the sum of liabilities (other than borrowings representing financial leverage).
The Manager provides investment management and other services to the BIT Subsidiary. The Manager does not receive separate compensation from the BIT Subsidiary for providing investment management or administrative services. However, the Trust pays the Manager based on the Trust’s net assets, plus the proceeds of any debt securities or outstanding borrowings used for leverage, which includes the assets of the BIT Subsidiary.
The Manager, with respect to BIT, entered into a sub-advisory agreement with BlackRock (Singapore) Limited (“BRS”), an affiliate of the Manager. The Manager pays BRS, for services it provides, a monthly fee that is a percentage of the investment advisory fees paid by BIT to the Manager.
Waivers
The Manager voluntarily agreed to waive its investment advisory fees by the amount of investment advisory fees each Trust pays to the Manager indirectly through its investment in affiliated money market funds. These amounts are shown as fees waived by the Manager in the Statements of Operations. However, the Manager does not waive its investment advisory fees by the amount of investment advisory fees paid in connection with each Trust’s investments in other affiliated investment companies, if any. For the six months ended April 30, 2016, the amounts waived were as follows:
| | | | | | | | |
| BTZ | | BGT | | | BIT | |
| $6,220 | | $ | 131 | | | $ | 8,177 | |
Officers and Trustees
Certain officers and/or trustees of the Trusts are officers and/or directors of BlackRock or its affiliates. The Trusts reimburse the Manager for a portion of the compensation paid to the Trusts’ Chief Compliance Officer, which is included in Officer and Trustees in the Statements of Operations.
Other Transactions
During the six months ended April 30, 2016, BIT received reimbursements of $23,247 from an affiliate, which is shown as other income-affiliated in the Statements of Operations, relating to trade processing errors.
7. Purchases and Sales:
For the six months ended April 30, 2016, purchases and sales of investments including paydowns and excluding short-term securities, were as follows:
| | | | | | | | | | | | |
| Purchases | | BTZ | | | BGT | | | BIT | |
Non-U.S. Government Securities | | $ | 168,426,298 | | | $ | 115,593,204 | | | $ | 227,430,904 | |
U.S. Government Securities | | | 66,861,411 | | | | — | | | | 49,982,952 | |
| | | | |
Total Purchases | | $ | 235,287,709 | | | $ | 115,593,204 | | | $ | 277,413,856 | |
| | | | |
| | | | | | | | | | | | |
| Sales | | BTZ | | | BGT | | | BIT | |
Non-U.S. Government Securities | | $ | 305,533,869 | | | $ | 95,241,448 | | | $ | 340,629,418 | |
U.S. Government Securities | | | 4,880,713 | | | | — | | | | — | |
| | | | |
Total Sales | | $ | 310,414,582 | | | $ | 95,241,448 | | | $ | 340,629,418 | |
| | | | |
8. Income Tax Information:
It is the Trusts’ policy to comply with the requirements of the Internal Revenue Code of 1986, as amended, applicable to regulated investment companies, and to distribute substantially all of their taxable income to their shareholders. Therefore, no federal income tax provision is required, except with respect to any taxes related to the Taxable Subsidiaries.
Each Trust files U.S. federal and various state and local tax returns. No income tax returns are currently under examination. The statute of limitations on BTZ’s and BGT’s U.S. federal tax returns remains open for each of the four years ended October 31, 2015. The statute of limitations on BIT’s U.S. federal tax returns remains open for the period ended October 31, 2013 and the two years ended October 31, 2015. The statutes of limitations on the Trusts’ state and local tax returns may remain open for an additional year depending upon the jurisdiction.
Management has analyzed tax laws and regulations and their application to the Trusts as of April 30, 2016, inclusive of the open tax return years, and does not believe there are any uncertain tax positions that require recognition of a tax liability in the Trusts’ financial statements.
| | | | | | |
| | | | | | | |
| | SEMI-ANNUAL REPORT | | APRIL 30, 2016 | | 85 |
| | |
| Notes to Financial Statements (continued) | | |
As of October 31, 2015, the Trusts had capital loss carryforwards available to offset future realized capital gains through the indicated expiration dates as follows:
| | | | | | | | | | | | |
| Expires October 31, | | BTZ | | | BGT | | | BIT | |
No expiration date1 | | $ | 14,123,812 | | | $ | 5,826,539 | | | $ | 13,616,248 | |
2016 | | | 121,634,930 | | | | 14,130,109 | | | | — | |
2017 | | | 158,120,431 | | | | 45,385,443 | | | | — | |
2018 | | | 31,756,723 | | | | 16,526,601 | | | | — | |
2019 | | | 10,353,275 | | | | 409,424 | | | | — | |
| | | | |
Total | | $ | 335,989,171 | | | $ | 82,278,116 | | | $ | 13,616,248 | |
| | | | |
| | 1 | | Must be utilized prior to losses subject to expiration. |
As of April 30, 2016, gross unrealized appreciation and depreciation based on cost for federal income tax purposes were as follows:
| | | | | | | | | | | | |
| | | BTZ | | | BGT | | | BIT | |
Tax cost | | $ | 2,036,581,406 | | | $ | 472,668,824 | | | $ | 1,154,405,143 | |
| | | | |
Gross unrealized appreciation | | $ | 121,404,605 | | | $ | 2,700,585 | | | $ | 25,206,304 | |
Gross unrealized depreciation | | | (42,870,720 | ) | | | (12,176,139 | ) | | | (28,463,589 | ) |
| | | | |
Net unrealized appreciation (depreciation) | | $ | 78,533,885 | | | $ | (9,475,554 | ) | | $ | (3,257,285 | ) |
| | | | |
9. Bank Borrowings:
BGT is party to a senior committed secured, 360-day rolling line of credit facility and a separate security agreement (the “SSB Agreement”) with State Street Bank and Trust Company (“SSB”). SSB may elect to terminate its commitment upon 360-days written notice to the BGT. As of period end, BGT has not received any notice to terminate. BGT has granted a security interest in substantially all of its assets to SSB.
The SSB Agreement allows for a maximum commitment amount of $172,000,000.
Advances will be made by SSB to BGT, at BGT’s option of (a) the higher of (i) 0.80% above the Fed Funds rate and (ii) 0.80% above the Overnight LIBOR or (b) 0.80% above 7-day, 30-day, 60-day or 90-day LIBOR.
In addition, BGT paid a facility fee and may pay a commitment fee (based on the daily unused portion of the commitments). The commitment fees are waived if BGT meet certain conditions. The fees associated with each of the agreements are included in the Statements of Operations as borrowing costs, if any. Advances to BGT as of period end are shown in the Statements of Assets and Liabilities as bank borrowings payable. Based on the short-term nature of the borrowings under the line of credit and the variable interest rate, the carrying amount of the borrowings approximates fair value.
BGT may not declare dividends or make other distributions on shares or purchase any such shares if, at the time of the declaration, distribution or purchase, asset coverage with respect to the outstanding short-term borrowings is less than 300%.
For the six months ended April 30, 2016, the average amount of bank borrowings and the daily weighted average interest rates for BGT with loans under the revolving credit agreements were $104,324,176, and 1.14%, respectively.
10. Principal Risks:
In the normal course of business, certain Trusts invest in securities and enter into transactions where risks exist due to fluctuations in the market (market risk) or failure of the issuer to meet all its obligations, including the ability to pay principal and interest when due (issuer credit risk). The value of securities held by the Trusts may decline in response to certain events, including those directly involving the issuers of securities owned by the Trusts. Changes arising from the general economy, the overall market and local, regional or global political and/or social instability, as well as currency, interest rate and price fluctuations, may also affect the securities’ value.
Each Trust may be exposed to prepayment risk, which is the risk that borrowers may exercise their option to prepay principal earlier than scheduled during periods of declining interest rates, which would force each Trust to reinvest in lower yielding securities. Each Trust may also be exposed to reinvestment risk, which is the risk that income from each Trust’s portfolio will decline if each Trust invests the proceeds from matured, traded or called fixed income securities at market interest rates that are below each Trust’s portfolio’s current earnings rate.
Counterparty Credit Risk: Similar to issuer credit risk, the Trusts may be exposed to counterparty credit risk, or the risk that an entity may fail to or be unable to perform on its commitments related to unsettled or open transactions. The Trusts manage counterparty credit risk by entering into transactions only with counterparties that the Manager believes have the financial resources to honor their obligations and by monitoring the financial stability of those counterparties. Financial assets, which potentially expose the Trusts to market, issuer and counterparty credit risks, consist principally of financial instruments and receivables due from counterparties. The extent of the Trusts’ exposure to market, issuer and counterparty credit risks with respect to these financial assets is approximately their value recorded in the Statements of Assets and Liabilities, less any collateral held by the Trusts.
| | | | | | |
| | | | | | | |
| 86 | | SEMI-ANNUAL REPORT | | APRIL 30, 2016 | | |
| | | | |
| Notes to Financial Statements (concluded) | | |
A derivative contract may suffer a mark-to-market loss if the value of the contract decreases due to an unfavorable change in the market rates or values of the underlying instrument. Losses can also occur if the counterparty does not perform under the contract.
A Trust’s risk of loss from counterparty credit risk on OTC derivatives is generally limited to the aggregate unrealized gain less the value of any collateral held by the Trust.
For OTC options purchased, each Trust bears the risk of loss of the amount of the premiums paid plus the positive change in market values net of any collateral held by the Trust should the counterparty fail to perform under the contracts. Options written by the Trusts do not typically give rise to counterparty credit risk, as options written generally obligate the Trusts, and not the counterparty, to perform, though the Trusts may be exposed to counterparty credit risk with respect to options written to the extent the Trusts deposit collateral with its counterparty to a written option.
With exchange-traded options purchased and futures and centrally cleared swaps, there is less counterparty credit risk to the Trusts since the exchange or clearinghouse, as counterparty to such instruments, guarantees against a possible default. The clearinghouse stands between the buyer and the seller of the contract; therefore, credit risk is limited to failure of the clearinghouse. While offset rights may exist under applicable law, a Trust does not have a contractual right of offset against a clearing broker or clearinghouse in the event of a default (including the bankruptcy or insolvency). Additionally, credit risk exists in exchange-traded futures and centrally cleared swaps with respect to initial and variation margin that is held in a clearing broker’s customer accounts. While clearing brokers are required to segregate customer margin from their own assets, in the event that a clearing broker becomes insolvent or goes into bankruptcy and at that time there is a shortfall in the aggregate amount of margin held by the clearing broker for all its clients, typically the shortfall would be allocated on a pro rata basis across all the clearing broker’s customers, potentially resulting in losses to the Trusts.
Concentration Risk: As of period end, BIT invested a significant portion of its assets in securities in the financials sector. Changes in economic conditions affecting such sector would have a greater impact on the Trust and could affect the value, income and/or liquidity of positions in such securities.
Certain Trusts invest a significant portion of their assets in fixed-income securities and/or use derivatives tied to the fixed-income markets. Changes in market interest rates or economic conditions may affect the value and/or liquidity of such investments. Interest rate risk is the risk that prices of bonds and other fixed-income securities will increase as interest rates fall and decrease as interest rates rise. The Trusts may be subject to a greater risk of rising interest rates due to the current period of historically low rates.
Certain Trusts invest a significant portion of their assets in securities backed by commercial or residential mortgage loans or in issuers that hold mortgage and other asset-backed securities. Investment percentages in these securities are presented in the Schedules of Investments. Changes in economic conditions, including delinquencies and/or defaults on assets underlying these securities, can affect the value, income and/or liquidity of such positions.
11. Capital Share Transactions:
The Trusts are authorized to issue an unlimited number of $0.001 par value shares, which may be issued as either Common Shares or Preferred Shares.
Common Shares
For the six months ended April 30, 2016 and the year ended October 31, 2015, shares issued and outstanding remained constant for each Trust.
12. Subsequent Events:
Management’s evaluation of the impact of all subsequent events on the Trusts’ financial statements was completed through the date the financial statements were issued and the following items were noted:
The Trusts paid a net investment income dividend in the following amounts per share on May 31, 2016 to Common Shareholders of record on May 16, 2016:
| | | | |
| | | Common
Dividend
Per Share | |
BTZ | | $ | 0.0760 | |
BGT | | $ | 0.0583 | |
BIT | | $ | 0.1167 | |
Additionally, the Trusts declared a net investment income dividend on June 1, 2016 payable to Common Shareholders of record on June 15, 2016 for the same amounts noted above.
| | | | | | |
| | | | | | | |
| | SEMI-ANNUAL REPORT | | APRIL 30, 2016 | | 87 |
Richard E. Cavanagh, Chair of the Board and Trustee
Karen P. Robards, Vice Chair of the Board, Chair of the Audit Committee and Trustee
Michael J. Castellano, Trustee and Member of the Audit Committee
Cynthia L. Egan, Trustee
Frank J. Fabozzi, Trustee and Member of the Audit Committee
Jerrold B. Harris, Trustee
R. Glenn Hubbard, Trustee
Catherine A. Lynch, Trustee and Member of the Audit Committee
W. Carl Kester, Trustee and Member of the Audit Committee
Barbara G. Novick, Interested Trustee
John M. Perlowski, Interested Trustee, President and Chief Executive Officer
Jonathan Diorio, Vice President
Neal J. Andrews, Chief Financial Officer
Jay M. Fife, Treasurer
Charles Park, Chief Compliance Officer
Janey Ahn, Secretary
Effective December 31, 2015, Kathleen F. Feldstein and James T. Flynn retired as Trustees of the Trusts.
Effective March 1, 2016, Catherine A. Lynch was appointed to serve as a Trustee and a Member of the Audit Committee of the Trusts.
Effective April 1, 2016, Cynthia L. Egan was appointed to serve as a Trustee of the Trusts.
Effective April 27, 2016, Joshua Tarnow became a portfolio manager of BGT. The other portfolio managers are James Keenan and C. Adrian Marshall.
| | | | | | |
| | | | |
Investment Advisor BlackRock Advisors, LLC Wilmington, DE 19809 | | Accounting Agent and Custodian State Street Bank and
Trust Company
Boston, MA 02110 | | Independent Registered
Public Accounting Firm
Deloitte & Touche LLP
Boston, MA 02116 | | Address of the Trusts 100 Bellevue Parkway Wilmington, DE 19809 |
| | | |
Sub-Advisor
BlackRock (Singapore) Limited1
079912 Singapore | | Transfer Agent
Computershare Trust
Company, N.A.
Canton, MA 02021 | | Legal Counsel Skadden, Arps, Slate, Meagher & Flom LLP Boston, MA 02116 | | |
| | | | | | |
| | | | | | | |
| 88 | | SEMI-ANNUAL REPORT | | APRIL 30, 2016 | | |
Each Trust is listed for trading on the NYSE and have filed with the NYSE their annual chief executive officer certification regarding compliance with the NYSE’s listing standards. The Trusts filed with the SEC the certification of their chief executive officer and chief financial officer required by section 302 of the Sarbanes-Oxley Act.
Each Trust’s dividend policy is to distribute all or a portion of its net investment income to its shareholders on a monthly basis. In order to provide shareholders with a more stable level of dividend distributions, the distributions paid by the Trusts for any particular month may be more or less than the amount of net investment income earned by the Trusts during such month. The portion of distributions that exceeds a Trust’s current and accumulated earnings and profits, which are measured on a tax basis, will constitute a nontaxable return of capital. Distributions in excess of a Trust’s taxable income and net capital gains, but not in excess of a Trust’s earnings and profits, will be taxable to shareholders as ordinary income and will not constitute a nontaxable return of capital. The Trusts’ current accumulated but undistributed net investment income, if any, is disclosed in the Statements of Assets and Liabilities, which comprises part of the financial information included in this report.
The Trusts do not make available copies of their Statements of Additional Information because the Trusts’ shares are not continuously offered, which means that the Statement of Additional Information of each Trust has not been updated after completion of the respective Trust’s offerings and the information contained in each Trust’s Statement of Additional Information may have become outdated.
During the period there were no material changes in the Trusts’ investment objectives or policies or to the Trusts’ charters or by-laws that would delay or prevent a change of control of the Trusts that were not approved by the shareholders or in the principal risk factors associated with investment in the Trusts. There have been no changes in the persons who are primarily responsible for the day-to-day management of the Trusts’ portfolios.
Quarterly performance, semi-annual and annual reports, current net asset value and other information regarding the Trusts may be found on BlackRock’s website, which can be accessed at http://www.blackrock.com. This reference to BlackRock’s website is intended to allow investors public access to information regarding the Trusts and does not, and is not intended to, incorporate BlackRock’s website in this report.
Electronic Delivery
Shareholders can sign up for e-mail notifications of quarterly statements, annual and semi-annual shareholder reports by enrolling in the electronic delivery program. Electronic copies of shareholder reports are available on BlackRock’s website.
To enroll in electronic delivery:
Shareholders Who Hold Accounts with Investment Advisors, Banks or Brokerages:
Please contact your financial advisor. Please note that not all investment advisors, banks or brokerages may offer this service.
Householding
The Trusts will mail only one copy of shareholder documents, including annual and semi-annual reports and proxy statements, to shareholders with multiple accounts at the same address. This practice is commonly called “householding” and is intended to reduce expenses and eliminate duplicate mailings of shareholder documents. Mailings of your shareholder documents may be householded indefinitely unless you instruct us otherwise. If you do not want the mailing of these documents to be combined with those for other members of your household, please call the Trusts at (800) 882-0052.
| | | | | | |
| | | | | | | |
| | SEMI-ANNUAL REPORT | | APRIL 30, 2016 | | 89 |
| | |
| Additional Information (continued) | | |
|
| General Information (concluded) |
Availability of Quarterly Schedule of Investments
The Trusts file their complete schedule of portfolio holdings with the SEC for the first and third quarters of each fiscal year on Form N-Q. The Trusts’ Forms N-Q are available on the SEC’s website at http://www.sec.gov and may also be reviewed and copied at the SEC’s Public Reference Room in Washington, D.C. Information on how to access documents on the SEC’s website without charge may be obtained by calling (800) SEC-0330. The Trusts’ Forms N-Q may also be obtained upon request and without charge by calling (800) 882-0052.
Availability of Proxy Voting Policies and Procedures
A description of the policies and procedures that the Trusts use to determine how to vote proxies relating to portfolio securities is available upon request and without charge (1) by calling (800) 882-0052; (2) at http://www.blackrock.com; and (3) on the SEC’s website at http://www.sec.gov.
Availability of Proxy Voting Record
Information about how the Trusts voted proxies relating to securities held in the Trusts’ portfolios during the most recent 12-month period ended June 30 is available upon request and without charge (1) at http://www.blackrock.com; or by calling (800) 882-0052 and (2) on the SEC’s website at http://www.sec.gov.
Availability of Trust Updates
BlackRock will update performance and certain other data for the Trusts on a monthly basis on its website in the “Closed-end Funds” section of http://www.blackrock.com as well as certain other material information as necessary from time to time. Investors and others are advised to check the website for updated performance information and the release of other material information about the Trusts. This reference to BlackRock’s website is intended to allow investors public access to information regarding the Trusts and does not, and is not intended to, incorporate BlackRock’s website in this report.
These amounts and sources of distributions reported are estimates and are being provided to you pursuant to regulatory requirements and are not being provided for tax reporting purposes. The actual amounts and sources for tax reporting purposes will depend upon each Trust’s investment experience during the remainder of the fiscal year and may be subject to changes based on tax regulations. Each Trust will provide a Form 1099-DIV each calendar year that will tell you how to report these distributions for federal income tax purposes.
April 30, 2016
| | | | | | | | | | | | | | | | | | | | | | | | | | | | | | | | |
| | | Total Cumulative Distributions
for the Fiscal Year-to-Date | | | % Breakdown of the Total Cumulative
Distributions for the Fiscal Year-to-Date | |
| | | Net Investment
Income | | | Net Realized
Capital Gains | | | Return of
Capital | | | Total Per
Common Share | | | Net Investment
Income | | | Net Realized
Capital Gains | | | Return of
Capital | | | Total Per
Common Share | |
BTZ | | $ | 0.455916 | | | | — | | | $ | 0.018084 | | | $ | 0.474000 | | | | 96 | % | | | 0 | % | | | 4 | % | | | 100 | % |
The Trusts estimate that they have distributed more than the amount of earned income and net realized gains; therefore, a portion of the distribution may be a return of capital. A return of capital may occur, for example, when some or all of the shareholder’s investment in the Trusts are returned to the shareholder. A return of capital does not necessarily reflect the Trusts’ investment performance and should not be confused with ‘yield’ or ‘income.’ When distributions exceed total return performance, the difference will incrementally reduce the Trusts’ net asset value per share.
Section 19(a) notices for the Trusts, as applicable, are available on the BlackRock website at http://www.blackrock.com.
| | | | | | |
| | | | | | | |
| 90 | | SEMI-ANNUAL REPORT | | APRIL 30, 2016 | | |
| | |
| Additional Information (concluded) | | |
|
| BlackRock Privacy Principles |
BlackRock is committed to maintaining the privacy of its current and former fund investors and individual clients (collectively, “Clients”) and to safeguarding their non-public personal information. The following information is provided to help you understand what personal information BlackRock collects, how we protect that information and why in certain cases we share such information with select parties.
If you are located in a jurisdiction where specific laws, rules or regulations require BlackRock to provide you with additional or different privacy-related rights beyond what is set forth below, then BlackRock will comply with those specific laws, rules or regulations.
BlackRock obtains or verifies personal non-public information from and about you from different sources, including the following: (i) information we receive from you or, if applicable, your financial intermediary, on applications, forms or other documents; (ii) information about your transactions with us, our affiliates, or others; (iii) information we receive from a consumer reporting agency; and (iv) from visits to our websites.
BlackRock does not sell or disclose to non-affiliated third parties any non-public personal information about its Clients, except as permitted by law or as is necessary to respond to regulatory requests or to service Client accounts. These non-affiliated third parties are required to protect the confidentiality and security of this information and to use it only for its intended purpose.
We may share information with our affiliates to service your account or to provide you with information about other BlackRock products or services that may be of interest to you. In addition, BlackRock restricts access to non-public personal information about its Clients to those BlackRock employees with a legitimate business need for the information. BlackRock maintains physical, electronic and procedural safeguards that are designed to protect the non-public personal information of its Clients, including procedures relating to the proper storage and disposal of such information.
| | | | | | |
| | | | | | | |
| | SEMI-ANNUAL REPORT | | APRIL 30, 2016 | | 91 |
This report is intended for current holders. It is not a prospectus. Past performance results shown in this report should not be considered a representation of future performance. The Trusts have leveraged their Common Shares, which creates risks for Common Shareholders, including the likelihood of greater volatility of net asset value and market price of the Common Shares, and the risk that fluctuations in short-term interest rates may reduce the Common Shares’ yield. Statements and other information herein are as dated and are subject to change.

| | |
| CE-CAFRI-3-4/16-SAR | |  |
| Item 2 – | Code of Ethics – Not Applicable to this semi-annual report |
| Item 3 – | Audit Committee Financial Expert – Not Applicable to this semi-annual report |
| Item 4 – | Principal Accountant Fees and Services – Not Applicable to this semi-annual report |
| Item 5 – | Audit Committee of Listed Registrants – Not Applicable to this semi-annual report |
| | (a) | The registrant’s Schedule of Investments is included as part of the Report to Stockholders filed under Item 1 of this Form. |
| | (b) | Not Applicable due to no such divestments during the semi-annual period covered since the previous Form N-CSR filing. |
| Item 7 – | Disclosure of Proxy Voting Policies and Procedures for Closed-End Management Investment Companies – Not Applicable to this semi-annual report |
| Item 8 – | Portfolio Managers of Closed-End Management Investment Companies |
| | (a) | Not Applicable to this semi-annual report |
| | (b) | As of the date of this filing, there have been no changes in any of the portfolio managers identified in the most recent annual report on Form N-CSR. |
| Item 9 – | Purchases of Equity Securities by Closed-End Management Investment Company and Affiliated Purchasers – Not Applicable |
| Item 10 – | Submission of Matters to a Vote of Security Holders – There have been no material changes to these procedures. |
| Item 11 – | Controls and Procedures |
(a) – The registrant’s principal executive and principal financial officers, or persons performing similar functions, have concluded that the registrant’s disclosure controls and procedures (as defined in Rule 30a-3(c) under the Investment Company Act of 1940, as amended (the “1940 Act”)) are effective as of a date within 90 days of the filing of this report based on the evaluation of these controls and procedures required by Rule 30a-3(b) under the 1940 Act and Rule 13a-15(b) under the Securities Exchange Act of 1934, as amended.
(b) – There were no changes in the registrant’s internal control over financial reporting (as defined in Rule 30a-3(d) under the 1940 Act) that occurred during the second fiscal quarter of the period covered by this report that have materially affected, or are reasonably likely to materially affect, the registrant’s internal control over financial reporting.
| Item 12 – | Exhibits attached hereto |
(a)(1) – Code of Ethics – Not Applicable to this semi-annual report
(a)(2) – Certifications – Attached hereto
(a)(3) – Not Applicable
(b) – Certifications – Attached hereto
2
Pursuant to the requirements of the Securities Exchange Act of 1934 and the Investment Company Act of 1940, the registrant has duly caused this report to be signed on its behalf by the undersigned, thereunto duly authorized.
BlackRock Credit Allocation Income Trust
| | | | |
| By: | | /s/ John M. Perlowski | | |
| | John M. Perlowski | | |
| | Chief Executive Officer (principal executive officer) of | | |
| | BlackRock Credit Allocation Income Trust | | |
| |
| Date: July 1, 2016 | | |
|
| Pursuant to the requirements of the Securities Exchange Act of 1934 and the Investment Company Act of 1940, this report has been signed below by the following persons on behalf of the registrant and in the capacities and on the dates indicated. |
| | |
| By: | | /s/ John M. Perlowski | | |
| | John M. Perlowski | | |
| | Chief Executive Officer (principal executive officer) of | | |
| | BlackRock Credit Allocation Income Trust | | |
| |
| Date: July 1, 2016 | | |
| | |
| By: | | /s/ Neal J. Andrews | | |
| | Neal J. Andrews | | |
| | Chief Financial Officer (principal financial officer) of | | |
| | BlackRock Credit Allocation Income Trust | | |
| |
| Date: July 1, 2016 | | |
3