UNITED STATES
SECURITIES AND EXCHANGE COMMISSION
Washington, D.C. 20549
FORM N-CSR
CERTIFIED SHAREHOLDER REPORT OF REGISTERED MANAGEMENT INVESTMENT
COMPANIES
Investment Company Act file number 811-21972
Name of Fund: BlackRock Credit Allocation Income Trust (BTZ)
Fund Address: 100 Bellevue Parkway, Wilmington, DE 19809
Name and address of agent for service: John M. Perlowski, Chief Executive Officer, BlackRock Credit Allocation Income Trust, 55 East 52nd Street, New York, NY 10055
Registrant’s telephone number, including area code: (800) 882-0052, Option 4
Date of fiscal year end: 10/31/2017
Date of reporting period: 04/30/2017
Item 1 – Report to Stockholders
APRIL 30, 2017
| | | | |
SEMI-ANNUAL REPORT (UNAUDITED) | | | |  |
BlackRock Credit Allocation Income Trust (BTZ)
BlackRock Floating Rate Income Trust (BGT)
BlackRock Multi-Sector Income Trust (BIT)
|
| Not FDIC Insured • May Lose Value • No Bank Guarantee |
Dear Shareholder,
In the 12 months ended April 30, 2017, risk assets, such as stocks and high-yield bonds, delivered strong performance. These markets showed great resilience during a period with big surprises, including the United Kingdom’s vote to leave the European Union and the outcome of the U.S. presidential election, which brought only brief spikes in equity market volatility. However, high-quality assets with more interest rate sensitivity struggled. U.S. Treasuries posted negative returns as rising energy prices, modest wage increases and steady job growth led to expectations of higher inflation and anticipation of interest rate increases by the U.S. Federal Reserve (the “Fed”).
The global reflationary theme — rising nominal growth, wages and inflation — was the dominant driver of asset returns during the period, outweighing significant political upheavals and uncertainty. Reflationary expectations accelerated after the U.S. election and continued into the beginning of 2017, stoked by expectations that the new presidential administration’s policies would provide an extra boost to U.S. growth. More recently, however, growing skepticism about the likelihood of significant near-term U.S. tax reform and infrastructure spending has tempered enthusiasm around the reflation trade. Nonetheless, markets have remained generally positive thus far in 2017 and continue to exhibit low levels of volatility by historical standards. Although political uncertainty persisted, benign credit conditions and expectations for economic growth have kept markets fairly tranquil. The period ended with a global risk asset rally following centrist Emmanuel Macron’s win in the first round of the French presidential election and better-than-expected U.S. and European corporate earnings.
Although economic momentum is gaining traction, the capacity for rapid global growth is restrained by structural factors, including an aging population, low productivity growth and excess savings, as well as cyclical factors, like the Fed moving toward the normalization of monetary policy and the length of the current expansion. Tempered economic growth and high valuations across most assets have set the stage for muted returns going forward.
Equity markets still present opportunities, although the disparity between winners and losers is widening — a dynamic that increases both the risk and return potential of active investing. Fixed income investors are also facing challenges as many sectors are exhibiting higher valuations while rates remain at historically low levels.
In this environment, investors need to think globally, extend their scope across a broad array of asset classes, and be nimble as market conditions change. We encourage you to talk with your financial advisor and visit blackrock.com for further insight about investing in today’s markets.
Sincerely,

Rob Kapito
President, BlackRock Advisors, LLC

Rob Kapito
President, BlackRock Advisors, LLC
| | | | | | | | |
| Total Returns as of April 30, 2017 | |
| | | 6-month | | | 12-month | |
U.S. large cap equities
(S&P 500® Index) | | | 13.32 | % | | | 17.92 | % |
U.S. small cap equities
(Russell 2000® Index) | | | 18.37 | | | | 25.63 | |
International equities
(MSCI Europe, Australasia,
Far East Index) | | | 11.47 | | | | 11.29 | |
Emerging market equities
(MSCI Emerging Markets Index) | | | 8.88 | | | | 19.13 | |
3-month Treasury bills
(BofA Merrill Lynch 3-Month
U.S. Treasury Bill Index) | | | 0.23 | | | | 0.40 | |
U.S. Treasury securities
(BofA Merrill Lynch
10-Year U.S. Treasury
Index) | | | (3.13 | ) | | | (2.68 | ) |
U.S. investment grade bonds
(Bloomberg Barclays U.S.
Aggregate Bond Index) | | | (0.67 | ) | | | 0.83 | |
Tax-exempt municipal
bonds (S&P Municipal
Bond Index) | | | (0.41 | ) | | | 0.57 | |
U.S. high yield bonds
(Bloomberg Barclays U.S. Corporate High Yield 2% Issuer
Capped Index) | | | 5.30 | | | | 13.29 | |
| Past performance is no guarantee of future results. Index performance is shown for illustrative purposes only. You cannot invest directly in an index. | |
| | | | | | |
| | | | | | | |
| 2 | | THIS PAGE NOT PART OF YOUR FUND REPORT | | | | |
| | | | | | |
| | | | | | | |
| | SEMI-ANNUAL REPORT | | APRIL 30, 2017 | | 3 |
| | | | |
| Trust Summary as of April 30, 2017 | | BlackRock Credit Allocation Income Trust |
BlackRock Credit Allocation Income Trust’s (BTZ) (the “Trust”) investment objective is to provide current income, current gains and capital appreciation. The Trust seeks to achieve its investment objective by investing, under normal market conditions, at least 80% of its assets in credit-related securities, including, but not limited to, investment grade corporate bonds, high yield bonds (commonly referred to as “junk” bonds), bank loans, preferred securities or convertible bonds or derivatives with economic characteristics similar to these credit-related securities. The Trust may invest directly in such securities or synthetically through the use of derivatives.
No assurance can be given that the Trust’s investment objective will be achieved.
| | |
| Trust Information | | |
Symbol on New York Stock Exchange (“NYSE”) | | BTZ |
Initial Offering Date | | December 27, 2006 |
Current Distribution Rate on Closing Market Price as of April 30, 2017 ($13.41)1 | | 6.31% |
Current Monthly Distribution per Common Share2 | | $0.0705 |
Current Annualized Distribution per Common Share2 | | $0.8460 |
Economic Leverage as of April 30, 20173 | | 22% |
| | 1 | | Current distribution rate on closing market price is calculated by dividing the current annualized distribution per share by the closing market price. The current distribution rate consists of income, net realized gains and/or a return of capital. Past performance does not guarantee future results. |
| | 2 | | The distribution rate is not constant and is subject to change. A portion of the distribution may be deemed a return of capital or net realized gain. |
| | 3 | | Represents reverse repurchase agreements as a percentage of total managed assets, which is the total assets of the Trust (including any assets attributable to any borrowings) minus the sum of its liabilities (other than borrowings representing financial leverage). For a discussion of leveraging techniques utilized by the Trust, please see The Benefits and Risks of Leveraging on page 10. |
|
| Performance and Portfolio Management Commentary |
Returns for the six months ended April 30, 2017 were as follows:
| | | | | | | | |
| | | Returns Based On | |
| | | Market Price | | | NAV | |
BTZ1,2 | | | 7.64 | % | | | 3.59 | % |
Lipper Corporate BBB-Rated Debt Funds (Leveraged)3 | | | 2.84 | % | | | 1.90 | % |
| | 1 | | All returns reflect reinvestment of dividends and/or distributions at actual reinvestment prices. |
| | 2 | | The Trust’s discount to NAV narrowed during the period, which accounts for the difference between performance based on price and performance based on NAV. |
| | 3 | | Average return. Returns reflect reinvestment of dividends and/or distributions at NAV on the ex-dividend date as calculated by Lipper. |
| | | | Performance results may include adjustments made for financial reporting purposes in accordance with U.S. generally accepted accounting principles. |
The following discussion relates to the Trust’s absolute performance based on NAV:
What factors influenced performance?
| • | | The largest detractors from performance included the Trust’s positions in the tobacco, food & beverage, wireline and retail industries. |
| • | | Positive contributors to performance during the period included the Trust’s exposure to capital securities (dividend-paying securities that combine some features of both corporate bonds and preferred stocks, while generally providing higher yields to compensate for being less senior in the issuer’s capital structure). In terms of industries, holdings within midstream energy, utilities and U.S. banks added to performance. Exposure |
| | | to high yield bonds also contributed positively to performance on an absolute basis. Finally, positioning with respect to duration (and corresponding interest rate sensitivity) and yield curve positioning helped generate positive performance as well. |
Describe recent portfolio activity.
| • | | The Trust tactically shortened its duration in preparation for rates moving higher as a result of the reflationary environment and anticipated pro-growth policy initiatives. The Trust kept its preference for high quality assets given the lack of value in the overall market and somewhat elevated geopolitical risks, while tactically adding shorter-maturity high yield names. At the same time, the Trust was positioned to benefit from the extended credit cycle and investment grade corporate bonds as they continue to be supported by the reflation theme. |
Describe portfolio positioning at period end.
| • | | The Trust ended the period defensively positioned despite a constructive fundamental backdrop for credit, as the investment adviser views geopolitical risks as elevated and many of the supportive factors as already reflected in tightened spreads and active investor allocations to credit. The Trust continued its positive view on pipelines and cable/telecommunications, while maintaining a more defensive stance with respect to industrials. Within high quality industrials, the Trust favored short-maturity credits given the lack of value in the current market. With respect to financials, the Trust favored longer maturities within senior credits and short-end issues within subordinate issues. |
The views expressed reflect the opinions of BlackRock as of the date of this report and are subject to change based on changes in market, economic or other conditions. These views are not intended to be a forecast of future events and are no guarantee of future results.
| | | | | | |
| | | | | | | |
| 4 | | SEMI-ANNUAL REPORT | | APRIL 30, 2017 | | |
| | |
| | | BlackRock Credit Allocation Income Trust |
| | |
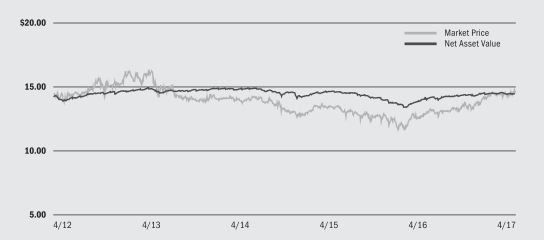
| Market Price and Net Asset Value Per Share Summary |
| | | | | | | | | | | | | | | | | | | | |
| | | 4/30/17 | | | 10/31/16 | | | Change | | | High | | | Low | |
Market Price | | $ | 13.41 | | | $ | 12.87 | | | | 4.20 | % | | $ | 13.41 | | | $ | 12.06 | |
Net Asset Value | | $ | 14.65 | | | $ | 14.61 | | | | 0.27 | % | | $ | 14.65 | | | $ | 14.14 | |
| | |
| Market Price and Net Asset Value History For the Past Five Years |

| | |
| Overview of the Trust’s Total Investments |
| | | | | | | | |
| Portfolio Composition | | 4/30/17 | | | 10/31/16 | |
Corporate Bonds | | | 72 | % | | | 71 | % |
Preferred Securities | | | 21 | | | | 17 | |
Asset-Backed Securities | | | 3 | | | | 4 | |
U.S. Treasury Obligations | | | 1 | | | | 6 | |
Municipal Bonds | | | 1 | | | | 1 | |
Foreign Agency Obligations | | | 2 | | | | 1 | |
Other1 | | | — | | | | — | |
| | 1 | | Includes a less than 1% holding in each of the following investment types: Short-Term Securities, U.S. Government Sponsored Agency Securities, Options Purchased, Options Written and Common Stocks. |
| | | | | | | | |
| Credit Quality Allocation2,3 | | 4/30/17 | | | 10/31/16 | |
AAA/Aaa4 | | | 2 | % | | | 7 | % |
AA/Aa | | | 2 | | | | 3 | |
A | | | 17 | | | | 17 | |
BBB/Baa | | | 49 | | | | 47 | |
BB/Ba | | | 18 | | | | 16 | |
B | | | 9 | | | | 8 | |
CCC/Caa | | | 1 | | | | 1 | |
N/R | | | 2 | | | | 1 | |
| | 2 | | For financial reporting purposes, credit quality ratings shown above reflect the highest rating assigned by either Standard & Poor’s (“S&P”) or Moody’s Investors Service (“Moody’s”) if ratings differ. These rating agencies are independent, nationally recognized statistical rating organizations and are widely used. Investment grade ratings are credit ratings of BBB/Baa or higher. Below investment grade ratings are credit ratings of BB/Ba or lower. Investments designated N/R are not rated by either rating agency. Unrated investments do not necessarily indicate low credit quality. Credit quality ratings are subject to change. |
| | 3 | | Excludes Short-Term Securities, Options Purchased and Options Written. |
| | 4 | | The investment adviser evaluates the credit quality of not-rated investments based upon certain factors including, but not limited to, credit ratings for similar investments and financial analysis of sectors, individual investments and/or issuer. Using this approach, the investment adviser has deemed U.S. Government Sponsored Agency Securities and U.S. Treasury Obligations as AAA/Aaa. |
| | | | | | |
| | | | | | | |
| | SEMI-ANNUAL REPORT | | APRIL 30, 2017 | | 5 |
| | | | |
| Trust Summary as of April 30, 2017 | | BlackRock Floating Rate Income Trust |
BlackRock Floating Rate Income Trust’s (BGT) (the “Trust”) primary investment objective is to provide a high level of current income. The Trust’s secondary investment objective is to seek the preservation of capital to the extent consistent with its primary objective of high current income. The Trust seeks to achieve its investment objectives by investing primarily, under normal conditions, at least 80% of its assets in floating and variable rate instruments of U.S. and non-U.S. issuers, including a substantial portion of its assets in global floating and variable rate securities including senior secured floating rate loans made to corporate and other business entities. Under normal market conditions, the Trust expects that the average effective duration of its portfolio will be no more than 1.5 years. The Trust may invest directly in such securities or synthetically through the use of derivatives.
No assurance can be given that the Trust’s investment objectives will be achieved.
| | |
Symbol on NYSE | | BGT |
Initial Offering Date | | August 30, 2004 |
Current Distribution Rate on Closing Market Price as of April 30, 2017 ($14.68)1 | | 4.77% |
Current Monthly Distribution per Common Share2 | | $0.0583 |
Current Annualized Distribution per Common Share2 | | $0.6996 |
Economic Leverage as of April 30, 20173 | | 29% |
| | 1 | | Current distribution rate on closing market price is calculated by dividing the current annualized distribution per share by the closing market price. The current distribution rate consists of income, net realized gains and/or a return of capital. Past performance does not guarantee future results. |
| | 2 | | The distribution rate is not constant and is subject to change. A portion of the distribution may be deemed a return of capital or net realized gain. |
| | 3 | | Represents bank borrowings outstanding as a percentage of total managed assets, which is the total assets of the Trust (including any assets attributable to any borrowings) minus the sum of its liabilities (other than borrowings representing financial leverage). For a discussion of leveraging techniques utilized by the Trust, please see The Benefits and Risks of Leveraging on page 10. |
|
| Performance and Portfolio Management Commentary |
Returns for the six months ended April 30, 2017 were as follows:
| | | | | | | | |
| | | Returns Based On | |
| | | Market Price | | | NAV | |
BGT1,2 | | | 11.29 | % | | | 3.59 | % |
Lipper Loan Participation Funds3 | | | 10.09 | % | | | 4.13 | % |
| | 1 | | All returns reflect reinvestment of dividends and/or distributions at actual reinvestment prices. |
| | 2 | | The Trust moved from a discount to NAV to a premium, which accounts for the difference between performance based on price and performance based on NAV. |
| | 3 | | Average return. Returns reflect reinvestment of dividends and/or distributions at NAV on the ex-dividend date as calculated by Lipper. |
| | | | Performance results may include adjustments made for financial reporting purposes in accordance with U.S. generally accepted accounting principles. |
The following discussion relates to the Trust’s absolute performance based on NAV:
What factors influence performance?
| • | | The Trust’s exposure to retailers was the principal detractor from performance, as secular changes in consumer spending behavior, shifting fashion trends, excess capacity, and potential fiscal reform all weighed on the segment. |
| • | | The broad floating rate loan interest (“bank loan”) market provided a positive return for the six-month period. Among the most notable drivers of positive returns in the Trust were allocations to the technology and health care sectors. The Trust’s tactical high yield bond allocation also benefited performance, as high yield bonds outperformed bank loans over the six-month period. |
Describe recent portfolio activity.
| • | | Throughout the six-month period, the Trust maintained its focus on the higher quality segments of the loan market in terms of loan structure, liquidity and overall credit quality. The Trust concentrated its investments in strong companies with stable cash flows and high quality collateral, with the ability to meet interest obligations and ultimately return principal. This high-quality bias constrained recent performance given the outperformance by the riskier areas of the market. To capture additional momentum and benefit from a more constructive narrative surrounding commodity-related assets, the Trust selectively added to its fixed-rate high yield bond allocation early in the period, which contributed to results given that market’s outperformance versus loans. This position was reduced as the period progressed amid tighter risk premiums in the high yield market and volatility in oil prices. From a sector standpoint, the Trust added to risk within the technology and health care sectors, while reducing exposure to names in the electric and transportation services sectors. |
Describe portfolio positioning at period end.
| • | | At period end, the Trust held 92% of its total portfolio in bank loans, with the remainder primarily in corporate bonds and collateralized loan obligations. Across the credit spectrum, the Trust held most of its assets in single B-rated credits, followed by BB-rated loan names. The Trust maintained minimal exposure to CCC and below rated loan credits, and avoided what it perceives to be the riskier segments of that universe (i.e. offshore drillers, retailers, and media). Top issuer positions included Level 3 (wirelines), Altice/Numericable (cable & satellite), and First Data (technology). The Trust continued its strategy to maintain a modest stake in more conservative high yield bonds. |
The views expressed reflect the opinions of BlackRock as of the date of this report and are subject to change based on changes in market, economic or other conditions. These views are not intended to be a forecast of future events and are no guarantee of future results.
| | | | | | |
| | | | | | | |
| 6 | | SEMI-ANNUAL REPORT | | APRIL 30, 2017 | | |
| | |
| | | BlackRock Floating Rate Income Trust |
| | | | | | | | | | |
| Market Price and Net Asset Value Per Share Summary | | | | | | | | | | |
| | | | | | | | | | | | | | | | | | | | |
| | | 4/30/17 | | | 10/31/16 | | | Change | | | High | | | Low | |
Market Price | | $ | 14.68 | | | $ | 13.58 | | | | 8.10 | % | | $ | 14.79 | | | $ | 13.23 | |
Net Asset Value | | $ | 14.50 | | | $ | 14.41 | | | | 0.62 | % | | $ | 14.59 | | | $ | 14.30 | |
| | |
| Market Price and Net Asset Value History For the Past Five Years |
| | |
| Overview of the Trust’s Total Investments |
| | | | | | | | |
| | |
| Portfolio Composition | | 4/30/17 | | | 10/31/16 | |
Floating Rate Loan Interests | | | 92 | % | | | 92 | % |
Corporate Bonds | | | 5 | | | | 4 | |
Asset-Backed Securities | | | 1 | | | | 2 | |
Short-Term Securities | | | 1 | | | | 2 | |
Other | | | 1 | 1 | | | — | 2 |
| | 1 | | Includes a less than 1% holding in each of the following investment types: Common Stocks, Other Interests, Rights, Warrants and Options Purchased. |
| | 2 | | Includes a less than 1% holding in each of the following investment types: Non-Agency Mortgage — Backed Securities, Other Interests, Investment Companies, Warrants, Common Stocks and Options Purchased. |
| | | | | | | | |
| | |
| Credit Quality Allocation3,4 | | 4/30/17 | | | 10/31/16 | |
A | | | — | | | | — | 5 |
BBB/Baa | | | 8 | % | | | 8 | % |
BB/Ba | | | 38 | | | | 43 | |
B | | | 43 | | | | 41 | |
CCC/Caa | | | 3 | | | | 3 | |
C | | | 1 | | | | — | |
N/R | | | 7 | | | | 5 | |
| | 3 | | For financial reporting purposes, credit quality ratings shown above reflect the highest rating assigned by either S&P’s or Moody’s if ratings differ. These rating agencies are independent, nationally recognized statistical rating organizations and are widely used. Investment grade ratings are credit ratings of BBB/Baa or higher. Below investment grade ratings are credit ratings of BB/Ba or lower. Investments designated N/R are not rated by either rating agency. Unrated investments do not necessarily indicate low credit quality. Credit quality ratings are subject to change. |
| | 4 | | Excludes Short-Term Securities and Options Purchased. |
| | 5 | | Represents less than 1% of total investments. |
| | | | | | |
| | | | | | | |
| | SEMI-ANNUAL REPORT | | APRIL 30, 2017 | | 7 |
| | | | |
| Trust Summary as of April 30, 2017 | | BlackRock Multi-Sector Income Trust |
BlackRock Multi-Sector Income Trust’s (BIT) (the “Trust”) primary investment objective is to seek high current income, with a secondary objective of capital appreciation. The Trust seeks to achieve its investment objectives by investing, under normal market conditions, at least 80% of its assets in loan and debt instruments and other investments with similar economic characteristics. The Trust may invest directly in such securities or synthetically through the use of derivatives.
No assurance can be given that the Trust’s investment objectives will be achieved.
| | |
| Trust Information | | |
Symbol on NYSE | | BIT |
Initial Offering Date | | February 27, 2013 |
Current Distribution Rate on Closing Market Price as of April 30, 2017 ($17.98)1 | | 7.79% |
Current Monthly Distribution per Common Share2 | | $0.1167 |
Current Annualized Distribution per Common Share2 | | $1.4004 |
Economic Leverage as of April 30, 20173 | | 39% |
| | 1 | | Current distribution rate on closing market price is calculated by dividing the current annualized distribution per share by the closing market price. The current distribution rate consists of income, net realized gains and/or a return of capital. Past performance does not guarantee future results. |
| | 2 | | The distribution rate is not constant and is subject to change. A portion of the distribution may be deemed a return of capital or net realized gain. |
| | 3 | | Represents reverse repurchase agreements as a percentage of total managed assets, which is the total assets of the Trust (including any assets attributable to any borrowings) minus the sum of its liabilities (other than borrowings representing financial leverage). For a discussion of leveraging techniques utilized by the Trust, please see The Benefits and Risks of Leveraging on page 10. |
|
| Performance and Portfolio Management Commentary |
Returns for the six months ended April 30, 2017 were as follows:
| | | | | | | | |
| | | Returns Based On | |
| | | Market Price | | | NAV | |
BIT1,2 | | | 14.18 | % | | | 7.96 | % |
Lipper General Bond Funds3 | | | 9.59 | % | | | 6.85 | % |
| | 1 | | All returns reflect reinvestment of dividends and/or distributions at actual reinvestment prices. |
| | 2 | | The Trust’s discount to NAV narrowed during the period, which accounts for the difference between performance based on price and performance based on NAV. |
| | 3 | | Average return. Returns reflect reinvestment of dividends and/or distributions at NAV on the ex-dividend date as calculated by Lipper. |
| | | | Performance results may include adjustments made for financial reporting purposes in accordance with U.S. generally accepted accounting principles. |
The following discussion relates to the Trust’s absolute performance based on NAV:
What factors influenced performance?
| • | | The Trust’s positions in high yield corporate bonds, residential mortgage-backed securities (“MBS”), commercial mortgage backed securities (“CMBS”), investment grade corporates and senior loans were the largest contributors to performance. The Trust’s allocations to asset-backed securities (“ABS”) as well as foreign government and agency obligations also supported absolute returns. |
| • | | The Trust’s duration (sensitivity to interest rate movements) and yield curve positioning detracted from performance during the period. |
Describe recent portfolio activity.
| • | | The investment adviser believes that the failure to pass health care reform has marginally dampened investors’ confidence in the ability of the Trump administration to move forward with its pro-growth agenda. Consequently, the Trust’s spread duration (sensitivity to credit spreads) was decreased as spread sector exposure was rotated out of corporate bonds and into sovereign plus and non-agency MBS. The Trust largely maintained its duration exposure over the period. From a sub-sector perspective, corporate spreads have been approaching their lowest levels of the cycle and appear to be overvalued relative to MBS. The Trust reduced its exposure to investment grade financials and rotated into non-agency collateralized mortgage obligations to take advantage of this imbalance. The investment adviser also believed that sovereign plus names appeared relatively attractive versus other fixed income spread sectors and increased the Trust’s exposure to lower quality sovereign issues. |
Describe portfolio positioning at period end.
| • | | At period end, the Trust maintained a diversified exposure to non-government spread sectors, including non-agency MBS, high yield corporates, capital securities, ABS, collateralized loan obligations, CMBS and senior loans. The Trust also held marginal exposure to foreign government and agency obligations. |
The views expressed reflect the opinions of BlackRock as of the date of this report and are subject to change based on changes in market, economic or other conditions. These views are not intended to be a forecast of future events and are no guarantee of future results.
| | | | | | |
| | | | | | | |
| 8 | | SEMI-ANNUAL REPORT | | APRIL 30, 2017 | | |
| | |
| | | BlackRock Multi-Sector Income Trust |
| | | | | | | | | | |
| Market Price and Net Asset Value Per Share Summary | | | | | | | | | | |
| | | | | | | | | | | | | | | | | | | | |
| | | 4/30/17 | | | 10/31/16 | | | Change | | | High | | | Low | |
Market Price | | $ | 17.98 | | | $ | 16.76 | | | | 7.28 | % | | $ | 17.98 | | | $ | 15.53 | |
Net Asset Value | | $ | 19.18 | | | $ | 18.91 | | | | 1.43 | % | | $ | 19.18 | | | $ | 18.28 | |
| | |
| Market Price and Net Asset Value History Since Inception |
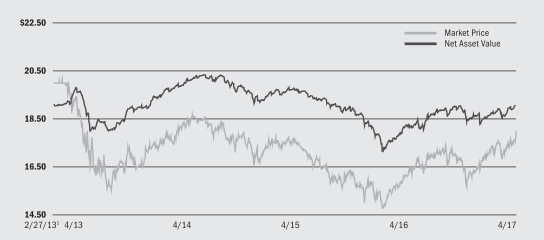
| | 1 | | Commencement of operations. |
| | |
| Overview of the Trust’s Total Investments |
| | | | | | | | |
| Portfolio Composition | | 4/30/17 | | | 10/31/16 | |
Corporate Bonds | | | 41 | % | | | 41 | % |
Asset-Backed Securities | | | 18 | | | | 19 | |
Non-Agency Mortgage-Backed Securities | | | 17 | | | | 18 | |
Preferred Securities | | | 12 | | | | 12 | |
Foreign Agency Obligations | | | 6 | | | | 4 | |
Floating Rate Loan Interests | | | 6 | | | | 5 | |
Short-Term Securities | | | — | 1 | | | 1 | |
Other | | | — | 2 | | | — | 3 |
| | 1 | | Represents less than 1% of total investments. |
| | 2 | | Includes a less than 1% holding in each of the following investment types: Common Stocks, Investment Companies, Options Purchased, Options Written, Short-Term Securities and Warrants. |
| | 3 | | Includes a less than 1% holding in each of the following investment types: Common Stocks, U.S. Treasury Obligations, Options Purchased and Options Written. |
| | | | | | | | |
| Credit Quality Allocation4,5 | | 4/30/17 | | | 10/31/16 | |
AAA/Aaa6 | | | — | 1 | | | — | 1 |
AA/Aa | | | 1 | % | | | 2 | % |
A | | | 5 | | | | 8 | |
BBB/Baa | | | 13 | | | | 18 | |
BB/Ba | | | 28 | | | | 22 | |
B | | | 23 | | | | 20 | |
CCC/Caa | | | 16 | | | | 16 | |
CC/Ca | | | 4 | | | | 5 | |
C | | | — | 1 | | | 1 | |
N/R | | | 10 | | | | 8 | |
| | 4 | | For financial reporting purposes, credit quality ratings shown above reflect the highest rating assigned by either S&P’s or Moody’s if ratings differ. These rating agencies are independent, nationally recognized statistical rating organizations and are widely used. Investment grade ratings are credit ratings of BBB/Baa or higher. Below investment grade ratings are credit ratings of BB/Ba or lower. Investments designated N/R are not rated by either rating agency. Unrated investments do not necessarily indicate low credit quality. Credit quality ratings are subject to change. |
| | 5 | | Excludes Short-Term Securities, Options Purchased and Options Written. |
| | 6 | | The investment adviser evaluates the credit quality of not-rated investments based upon certain factors including, but not limited to, credit ratings for similar investments and financial analysis of sectors, individual investments and/or issuer. Using this approach, the investment adviser has deemed U.S. Government Sponsored Agency Securities and U.S. Treasury Obligations as AAA/Aaa. |
| | | | | | |
| | | | | | | |
| | SEMI-ANNUAL REPORT | | APRIL 30, 2017 | | 9 |
| | | | |
| The Benefits and Risks of Leveraging | | |
The Trusts may utilize leverage to seek to enhance the distribution rate on, and net asset value (“NAV”) of, their common shares (“Common Shares”). However, these objectives cannot be achieved in all interest rate environments.
In general, the concept of leveraging is based on the premise that the financing cost of leverage, which is based on short-term interest rates, is normally lower than the income earned by a Trust on its longer-term portfolio investments purchased with the proceeds from leverage. To the extent that the total assets of the Trusts (including the assets obtained from leverage) are invested in higher-yielding portfolio investments, the Trusts’ shareholders benefit from the incremental net income. The interest earned on securities purchased with the proceeds from leverage is paid to shareholders in the form of dividends, and the value of these portfolio holdings is reflected in the per share NAV.
To illustrate these concepts, assume a Trust’s capitalization is $100 million and it utilizes leverage for an additional $30 million, creating a total value of $130 million available for investment in longer-term income securities. If prevailing short-term interest rates are 3% and longer-term interest rates are 6%, the yield curve has a strongly positive slope. In this case, a Trust’s financing costs on the $30 million of proceeds obtained from leverage are based on the lower short-term interest rates. At the same time, the securities purchased by a Trust with the proceeds from leverage earn income based on longer-term interest rates. In this case, a Trust’s financing cost of leverage is significantly lower than the income earned on a Trust’s longer-term investments acquired from such leverage proceeds, and therefore the holders of Common Shares (“Common Shareholders”) are the beneficiaries of the incremental net income.
However, in order to benefit shareholders, the return on assets purchased with leverage proceeds must exceed the ongoing costs associated with the leverage. If interest and other costs of leverage exceed the Trusts’ return on assets purchased with leverage proceeds, income to shareholders is lower than if the Trusts had not used leverage. Furthermore, the value of the Trusts’ portfolio investments generally varies inversely with the direction of long-term interest rates, although other factors can influence the value of portfolio investments. In contrast, the value of the Trusts’ obligations under their respective leverage arrangements generally does not fluctuate in relation to interest rates. As a result, changes in interest
rates can influence the Trusts’ NAVs positively or negatively. Changes in the future direction of interest rates are very difficult to predict accurately, and there is no assurance that the Trusts’ intended leveraging strategy will be successful.
The use of leverage also generally causes greater changes in each Trust’s NAV, market price and dividend rates than comparable portfolios without leverage. In a declining market, leverage is likely to cause a greater decline in the NAV and market price of a Trust’s shares than if the Trust were not leveraged. In addition, each Trust may be required to sell portfolio securities at inopportune times or at distressed values in order to comply with regulatory requirements applicable to the use of leverage or as required by the terms of leverage instruments, which may cause the Trusts to incur losses. The use of leverage may limit a Trust’s ability to invest in certain types of securities or use certain types of hedging strategies. Each Trust incurs expenses in connection with the use of leverage, all of which are borne by shareholders and may reduce income to the shareholders. Moreover, to the extent the calculation of the Trusts’ investment advisory fees includes assets purchased with the proceeds of leverage, the investment advisory fees payable to the Trusts’ investment adviser will be higher than if the Trusts did not use leverage.
Each Trust may utilize leverage through a credit facility or reverse repurchase agreements as described in the Notes to Financial Statements.
Under the Investment Company Act of 1940, as amended (the “1940 Act”), each Trust is permitted to issue debt up to 33 1/3% of its total managed assets. BIT is permitted to use economic leverage (which includes leverage attributable to reverse repurchase agreements) of up to 50% of its total managed assets. A Trust may voluntarily elect to limit its leverage to less than the maximum amount permitted under the 1940 Act. In addition, a Trust may also be subject to certain asset coverage, leverage or portfolio composition requirements imposed by its credit facility, which may be more stringent than those imposed by the 1940 Act.
If a Trust segregates or designates on its books and records cash or liquid assets having a value not less than the value of a Trust’s obligations under the reverse repurchase agreement (including accrued interest), then such transaction is not considered a senior security and is not subject to the foregoing limitations and requirements under the 1940 Act.
| | |
| Derivative Financial Instruments | | |
The Trusts may invest in various derivative financial instruments. These instruments are used to obtain exposure to a security, commodity, index, market and/or other asset without owning or taking physical custody of securities, commodities and/or other referenced assets or to manage market, equity, credit, interest rate, foreign currency exchange rate, commodity and/or other risks. Derivative financial instruments may give rise to a form of economic leverage and involve risks, including the imperfect correlation between the value of a derivative financial instrument and the underlying asset, possible default of the counterparty to the
transaction or illiquidity of the instrument. BIT may use economic leverage up to 100% of its net assets (50% of its total managed assets). The Trusts’ successful use of a derivative financial instrument depends on the investment adviser’s ability to predict pertinent market movements accurately, which cannot be assured. The use of these instruments may result in losses greater than if they had not been used, may limit the amount of appreciation a Trust can realize on an investment and/or may result in lower distributions paid to shareholders. The Trusts’ investments in these instruments, if any, are discussed in detail in the Notes to Financial Statements.
| | | | | | |
| | | | | | | |
| 10 | | SEMI-ANNUAL REPORT | | APRIL 30, 2017 | | |
| | |
Schedule of Investments April 30, 2017 (Unaudited) | | BlackRock Credit Allocation Income Trust (BTZ) (Percentages shown are based on Net Assets) |
| | | | | | | | | | | | |
| | | |
| Common Stocks — 0.0% | | | | | Shares | | | Value | |
| Real Estate Investment Trusts (REITs) — 0.0% | |
Ovation Acquisition I LLC, (Acquired 12/28/15, cost $45,445) (a) | | | | | | | 2,951 | | | | — | |
| | | | | | | | | | | | |
| | | | | | | | | | | | | |
| | | |
| Asset-Backed Securities (b) | | | | | Par (000) | | | | |
ALM Loan Funding, Series 2012-5A, Class BR, 4.16%, 10/18/27 (c) | | | USD | | | | 1,000 | | | $ | 1,003,336 | |
ALM XII Ltd., Series 2015-12A, Class B, 4.41%, 4/16/27 (c) | | | | | | | 1,000 | | | | 1,003,635 | |
ALM XIV Ltd., Series 2014-14A, Class C, 4.49%, 7/28/26 (c) | | | | | | | 4,500 | | | | 4,505,850 | |
ALM XVII Ltd., Series 2015-17A, Class B1, 4.56%, 1/15/28 (c) | | | | | | | 1,400 | | | | 1,408,717 | |
AMMC CLO Ltd., Series 2015-17A, Class C, 4.29%, 11/15/27 (c) | | | | | | | 1,000 | | | | 1,006,611 | |
Anchorage Capital CLO 3 Ltd., Series 2014-3A, Class C, 4.54%, 4/28/26 (c) | | | | | | | 1,000 | | | | 999,992 | |
Apidos CLO XVIII, Series 2014-18A, Class CR, 4.40%, 7/22/26 (b)(c) | | | | | | | 1,300 | | | | 1,300,000 | |
Atlas Senior Loan Fund II Ltd., Series 2012-2A, Class DR, 4.94%, 1/30/24 (c) | | | | | | | 750 | | | | 753,554 | |
Atlas Senior Loan Fund VI Ltd., Series 2014-6A, Class DR, 4.76%, 10/15/26 (c) | | | | | | | 2,500 | | | | 2,504,326 | |
Benefit Street Partners CLO VI Ltd., Series 2015-VIA, Class B, 4.21%, 4/18/27 (c) | | | | | | | 1,000 | | | | 1,005,664 | |
Bowman Park CLO Ltd., Series 2014-1A, Class D2R, 4.40%, 11/23/25 (c) | | | | | | | 1,000 | | | | 999,972 | |
Carlyle Global Market Strategies CLO Ltd., Class C (c): | | | | | | | | | | | | |
Series 2013-3A, 4.56%, 7/15/25 | | | | | | | 1,000 | | | | 1,002,838 | |
Series 2015-1A, 4.31%, 4/20/27 | | | | | | | 500 | | | | 501,928 | |
Series 2016-1A, 6.06%, 4/20/27 | | | | | | | 1,000 | | | | 1,014,774 | |
Series 2016-3A, 5.16%, 10/20/29 | | | | | | | 1,000 | | | | 1,010,654 | |
CIFC Funding Ltd., Series 2014-3A, Class C1, 3.95%, 7/22/26 (c) | | | | | | | 1,500 | | | | 1,500,834 | |
GoldenTree Loan Opportunities IX Ltd., Series 2014-9A, Class D, 4.54%, 10/29/26 (c) | | | | | | | 1,000 | | | | 1,001,654 | |
Highbridge Loan Management Ltd. (c): | | | | | | | | | | | | |
Series 4A-2014, Class B, 4.04%, 7/28/25 | | | | | | | 750 | | | | 750,846 | |
Series 6A-2015, Class C, 4.10%, 5/05/27 | | | | | | | 1,500 | | | | 1,508,178 | |
Series 8A-2016, Class D, 6.01%, 4/20/27 | | | | | | | 500 | | | | 509,158 | |
ING IM CLO Ltd., Series 2013-2A, Class C, 4.66%, 4/25/25 (c) | | | | | | | 1,000 | | | | 1,002,269 | |
LCM XVIII LP, Series 18A, Class C1, 4.31%, 4/20/27 (c) | | | | | | | 1,000 | | | | 1,004,164 | |
| | | | | | | | | | | | |
| Asset-Backed Securities (b) | | | | | Par (000) | | | Value | |
| Asset-Backed Securities (continued) | | | | |
Limerock CLO III LLC, Series 2014-3A, Class C, 4.76%, 10/20/26 (c) | | | USD | | | | 1,000 | | | $ | 999,975 | |
Madison Park Funding IX Ltd., Series 2012-9AR, Class C1R, 3.89%, 8/15/22 (c) | | | | | | | 2,000 | | | | 2,000,659 | |
Madison Park Funding XIII Ltd., Series 2014-13A, Class CR, 3.03%, 1/19/25 (c) | | | | | | | 1,000 | | | | 1,000,000 | |
Madison Park Funding XIV Ltd., Series 2014-14A, Class DR, 4.41%, 7/20/26 (c) | | | | | | | 2,000 | | | | 2,000,368 | |
Madison Park Funding XV Ltd., Series 2014-15A, Class B1R, 3.37%, 1/27/26 (c) | | | | | | | 2,000 | | | | 2,003,738 | |
Mill Creek II CLO Ltd., Series 2016-1A, Class D, 5.88%, 4/20/28 (c) | | | | | | | 1,000 | | | | 1,013,189 | |
Oak Hill Credit Partners XII Ltd., Series 2015-12A, Class C2, 4.40%, 1/23/27 (c) | | | | | | | 1,600 | | | | 1,606,400 | |
Octagon Investment Partners 26 Ltd., Series 2016-1A, Class D, 6.11%, 4/15/27 (c) | | | | | | | 500 | | | | 507,551 | |
Octagon Investment Partners XX Ltd., Series 2014-1A, Class C, 3.83%, 8/12/26 (c) | | | | | | | 750 | | | | 750,053 | |
OZLM XI Ltd., Series 2015-11A, Class B, 4.04%, 1/30/27 (c) | | | | | | | 2,750 | | | | 2,761,267 | |
Regatta IV Funding Ltd., Series 2014-1A, Class C, 4.11%, 7/25/26 (c) | | | | | | | 1,500 | | | | 1,501,767 | |
Regatta V Funding Ltd., Series 2014-1A (c): | | | | | | | | | | | | |
Class BR, 3.46%, 10/25/26 | | | | | | | 1,000 | | | | 1,000,000 | |
Class C, 4.61%, 10/25/26 | | | | | | | 1,000 | | | | 999,921 | |
Symphony CLO Ltd., Series 2016-17A, Class D, 5.96%, 4/15/28 (c) | | | | | | | 1,000 | | | | 1,016,076 | |
Symphony CLO XV Ltd., Series 2014-15A (c): | | | | | | | | | �� | | | |
Class CR, 3.22%, 10/17/26 | | | | | | | 2,500 | | | | 2,499,670 | |
Class DR, 4.37%, 10/17/26 | | | | | | | 1,000 | | | | 999,866 | |
Venture XIII CLO Ltd., Series 2013-13A, Class D, 4.66%, 6/10/25 (c) | | | | | | | 800 | | | | 802,733 | |
Vibrant CLO II Ltd., Series 2013-2A, Class C, 4.75%, 7/24/24 (c) | | | | | | | 1,000 | | | | 994,905 | |
Voya CLO Ltd., Series 2014-4A, Class C, 5.16%, 10/14/26 (c) | | | | | | | 1,000 | | | | 1,003,779 | |
Webster Park CLO Ltd., Series 2015-1A, Class B1, 4.26%, 1/20/27 (c) | | | | | | | 4,000 | | | | 4,027,106 | |
| Total Asset-Backed Securities — 3.6% | | | | | | | | | | | 56,787,977 | |
| | | | | | | | | | | | |
| | | | | | | | | | | | | |
|
| Corporate Bonds | |
| Aerospace & Defense — 0.6% | | | | | | | | | |
Huntington Ingalls Industries, Inc., 5.00%, 12/15/21 (c) | | | | | | | 536 | | | | 555,095 | |
KLX, Inc., 5.88%, 12/01/22 (c) | | | | | | | 725 | | | | 762,156 | |
| | | | | | | | | | |
| Portfolio Abbreviations | | | | | | | | |
| ABS | | Asset-Backed Security | | FKA | | Formerly Known As | | MYR | | Malaysian Ringgit |
| ARB | | Airport Revenue Bonds | | GBP | | British Pound | | OTC | | Over-the-Counter |
| ARS | | Argentine Peso | | JPY | | Japanese Yen | | PIK | | Payment-In-Kind |
| AUD | | Australian Dollar | | KRW | | South Korean Won | | RB | | Revenue Bonds |
| BRL | | Brazilian Real | | KRWCD | | 3-Month Certificate of Deposit Rate | | RUB | | Russian Ruble |
| BZDIOVER | | 1-Day Brazil Interbank Deposit | | LIBOR | | London Interbank Offered Rate | | TRY | | Turkish Lira |
| CLO | | Collateralized Loan Obligation | | LOC | | Letter of Credit | | TWD | | Taiwan Dollar |
| DIP | | Debtor-In-Possession | | MXIBTIIE | | Mexico Interbank TIIE 28 Day | | USD | | U.S. Dollar |
| EUR | | Euro | | MXN | | Mexican Peso | | ZAR | | South African Rand |
See Notes to Financial Statements.
| | | | | | |
| | | | | | | |
| | SEMI-ANNUAL REPORT | | APRIL 30, 2017 | | 11 |
| | |
Schedule of Investments (continued) | | BlackRock Credit Allocation Income Trust (BTZ) |
| | | | | | | | | | | | |
| Corporate Bonds | | Par (000) | | | Value | |
| Aerospace & Defense (continued) | | | | | | | | | |
Mexico City Airport Trust, 4.25%, 10/31/26 (c) | | | USD | | | | 1,350 | | | $ | 1,363,500 | |
TransDigm, Inc.: | | | | | | | | | | | | |
6.00%, 7/15/22 | | | | | | | 4,360 | | | | 4,490,800 | |
6.50%, 7/15/24 | | | | | | | 1,560 | | | | 1,602,900 | |
| | | | | | | | | | | | |
| | | | | | | | | | | | 8,774,451 | |
| Air Freight & Logistics — 0.1% | | | | | | | | | |
XPO Logistics, Inc. (c): | | | | | | | | | | | | |
6.50%, 6/15/22 | | | | | | | 1,421 | | | | 1,504,484 | |
6.13%, 9/01/23 | | | | | | | 496 | | | | 520,800 | |
| | | | | | | | | | | | |
| | | | | | | | | | | | 2,025,284 | |
| Airlines — 0.9% | | | | | | | | | |
American Airlines Group, Inc., 4.63%, 3/01/20 (c) | | | | | | | 692 | | | | 704,110 | |
Continental Airlines Pass-Through Trust: | | | | | | | | | | | | |
Series 2009-2, Class B, 9.25%, 11/10/18 | | | | | | | 1,278 | | | | 1,279,703 | |
Series 2012-3, Class C, 6.13%, 4/29/18 | | | | | | | 2,040 | | | | 2,113,950 | |
Delta Air Lines Pass-Through Trust, Series 2002-1, Class G-1, 6.72%, 7/02/24 | | | | | | | 2,885 | | | | 3,249,284 | |
Turkish Airlines Pass-Through Trust, Series 2015-1 Class A, 4.20%, 9/15/28 (c) | | | | | | | 2,700 | | | | 2,561,887 | |
United Airlines Pass-Through Trust, Series 2014-1, Class B, 4.75%, 10/11/23 | | | | | | | 3,425 | | | | 3,510,254 | |
Virgin Australia Trust, Series 2013-1, Class B, 6.00%, 4/23/22 (c) | | | | | | | 830 | | | | 846,716 | |
| | | | | | | | | | | | |
| | | | | | | | | | | | 14,265,904 | |
| Auto Components — 0.5% | | | | | | | | | |
Allison Transmission, Inc., 5.00%, 10/01/24 (c) | | | | | | | 68 | | | | 69,275 | |
Goodyear Tire & Rubber Co., 5.00%, 5/31/26 | | | | | | | 535 | | | | 549,044 | |
Icahn Enterprises LP/Icahn Enterprises Finance Corp.: | | | | | | | | | | | | |
4.88%, 3/15/19 | | | | | | | 3,950 | | | | 3,999,375 | |
6.00%, 8/01/20 | | | | | | | 3,108 | | | | 3,216,780 | |
| | | | | | | | | | | | |
| | | | | | | | | | | | 7,834,474 | |
| Automobiles — 0.5% | | | | | | | | | |
Ford Motor Co., 7.45%, 7/16/31 | | | | | | | 3,660 | | | | 4,616,746 | |
General Motors Co.: | | | | | | | | | | | | |
4.88%, 10/02/23 | | | | | | | 1,875 | | | | 1,999,031 | |
6.25%, 10/02/43 | | | | | | | 940 | | | | 1,026,930 | |
| | | | | | | | | | | | |
| | | | | | | | | | | | 7,642,707 | |
| Banks — 4.9% | | | | | | | | | |
CIT Group, Inc.: | | | | | | | | | | | | |
4.25%, 8/15/17 | | | | | | | 4,600 | | | | 4,631,050 | |
5.25%, 3/15/18 | | | | | | | 4,030 | | | | 4,158,154 | |
5.50%, 2/15/19 (c) | | | | | | | 3,967 | | | | 4,190,144 | |
5.00%, 8/01/23 | | | | | | | 660 | | | | 709,500 | |
City National Corp., 5.25%, 9/15/20 (d) | | | | | | | 2,900 | | | | 3,172,438 | |
Cooperatieve Rabobank UA, 3.95%, 11/09/22 (d) | | | | | | | 3,775 | | | | 3,917,616 | |
Credit Suisse Group AG, 6.50%, 8/08/23 (c) | | | | | | | 6,000 | | | | 6,681,228 | |
Credit Suisse Group Funding Guernsey Ltd., 4.55%, 4/17/26 (d) | | | | | | | 5,000 | | | | 5,247,150 | |
Discover Bank/Greenwood, 8.70%, 11/18/19 | | | | | | | 748 | | | | 847,401 | |
| | | | | | | | | | | | |
| Corporate Bonds | | Par (000) | | | Value | |
| Banks (continued) | | | | | | | | | |
Fifth Third Bancorp, 5.10% (b)(e) | | | USD | | | | 5,000 | | | $ | 4,975,000 | |
HSBC Finance Corp., 6.68%, 1/15/21 (d) | | | | | | | 5,150 | | | | 5,850,858 | |
Intesa Sanpaolo SpA, 5.71%, 1/15/26 (c) | | | | | | | 5,840 | | | | 5,751,752 | |
Royal Bank of Scotland Group PLC, 6.00%, 12/19/23 | | | | | | | 10,080 | | | | 10,871,401 | |
SunTrust Banks, Inc., 5.05% (b)(e) | | | | | | | 5,270 | | | | 5,270,000 | |
Wells Fargo & Co.: | | | | | | | | | | | | |
3.45%, 2/13/23 | | | | | | | 2,325 | | | | 2,366,973 | |
4.13%, 8/15/23 (d) | | | | | | | 4,000 | | | | 4,218,736 | |
5.61%, 1/15/44 (d) | | | | | | | 4,119 | | | | 4,721,189 | |
| | | | | | | | | | | | |
| | | | | | | | | | | | 77,580,590 | |
| Beverages — 0.5% | | | | | | | | | |
Anheuser-Busch InBev Finance, Inc., 4.90%, 2/01/46 (d) | | | | | | | 6,170 | | | | 6,740,435 | |
Molson Coors Brewing Co., 4.20%, 7/15/46 | | | | | | | 1,665 | | | | 1,574,809 | |
| | | | | | | | | | | | |
| | | | | | | | | | | | 8,315,244 | |
| Biotechnology — 0.4% | | | | | | | | | |
Amgen, Inc., 4.66%, 6/15/51 (d) | | | | | | | 6,709 | | | | 6,759,136 | |
| Building Products — 0.2% | | | | | | | | | |
American Builders & Contractors Supply Co., Inc., 5.75%, 12/15/23 (c) | | | | | | | 424 | | | | 451,560 | |
Building Materials Corp. of America, 6.00%, 10/15/25 (c) | | | | | | | 1,832 | | | | 1,955,660 | |
Masonite International Corp., 5.63%, 3/15/23 (c) | | | | | | | 610 | | | | 632,875 | |
Standard Industries, Inc., 5.13%, 2/15/21 (c) | | | | | | | 420 | | | | 439,425 | |
| | | | | | | | | | | | |
| | | | | | | | | | | | 3,479,520 | |
| Capital Markets — 2.8% | | | | | | | | | |
E*Trade Financial Corp., 5.38%, 11/15/22 | | | | | | | 1,348 | | | | 1,423,697 | |
Goldman Sachs Group, Inc.: | | | | | | | | | | | | |
6.25%, 9/01/17 | | | | | | | 625 | | | | 634,788 | |
7.50%, 2/15/19 (d) | | | | | | | 5,165 | | | | 5,654,936 | |
5.25%, 7/27/21 | | | | | | | 1,175 | | | | 1,292,538 | |
5.75%, 1/24/22 (d) | | | | | | | 5,500 | | | | 6,205,194 | |
6.25%, 2/01/41 (d) | | | | | | | 15,000 | | | | 18,926,505 | |
Morgan Stanley (d): | | | | | | | | | | | | |
5.63%, 9/23/19 | | | | | | | 6,770 | | | | 7,310,591 | |
5.50%, 7/28/21 | | | | | | | 2,695 | | | | 3,000,308 | |
| | | | | | | | | | | | |
| | | | | | | | | | | | 44,448,557 | |
| Chemicals — 1.0% | | | | | | | | | |
Axalta Coating Systems LLC, 4.88%, 8/15/24 (c) | | | | | | | 715 | | | | 740,468 | |
Basell Finance Co. BV, 8.10%, 3/15/27 (c)(d) | | | | | | | 6,000 | | | | 8,027,610 | |
Huntsman International LLC: | | | | | | | | | | | | |
4.88%, 11/15/20 | | | | | | | 72 | | | | 75,690 | |
5.13%, 11/15/22 | | | | | | | 2,495 | | | | 2,622,869 | |
NOVA Chemicals Corp., 5.25%, 8/01/23 (c) | | | | | | | 772 | | | | 793,230 | |
Platform Specialty Products Corp. (c): | | | | | | | | | | | | |
10.38%, 5/01/21 | | | | | | | 165 | | | | 183,769 | |
6.50%, 2/01/22 | | | | | | | 1,372 | | | | 1,406,300 | |
PQ Corp., 6.75%, 11/15/22 (c) | | | | | | | 935 | | | | 1,014,465 | |
| | | | | | | | | | | | |
| | | | | | | | | | | | 14,864,401 | |
| Commercial Services & Supplies — 2.9% | | | | | | | | | |
Aviation Capital Group Corp. (c): | | | | | | | | | | | | |
7.13%, 10/15/20 | | | | | | | 31,000 | | | | 35,452,344 | |
6.75%, 4/06/21 | | | | | | | 7,850 | | | | 8,969,905 | |
United Rentals North America, Inc., 7.63%, 4/15/22 | | | | | | | 664 | | | | 693,050 | |
| | | | | | | | | | | | |
| | | | | | | | | | | | 45,115,299 | |
See Notes to Financial Statements.
| | | | | | |
| | | | | | | |
| 12 | | SEMI-ANNUAL REPORT | | APRIL 30, 2017 | | |
| | |
Schedule of Investments (continued) | | BlackRock Credit Allocation Income Trust (BTZ) |
| | | | | | | | | | | | |
| Corporate Bonds | | Par (000) | | | Value | |
| Communications Equipment — 0.4% | | | | | | | | | |
CommScope Technologies Finance LLC, 6.00%, 6/15/25 (c) | | | USD | | | | 467 | | | $ | 497,939 | |
CommScope Technologies LLC, 5.00%, 3/15/27 (c) | | | | | | | 2,896 | | | | 2,921,340 | |
CommScope, Inc., 5.50%, 6/15/24 (c) | | | | | | | 254 | | | | 266,065 | |
Zayo Group LLC/Zayo Capital, Inc.: | | | | | | | | | | | | |
6.38%, 5/15/25 | | | | | | | 1,418 | | | | 1,533,213 | |
5.75%, 1/15/27 (c) | | | | | | | 593 | | | | 629,321 | |
| | | | | | | | | | | | |
| | | | | | | | | | | | 5,847,878 | |
| Construction & Engineering — 0.2% | | | | | | | | | |
BlueLine Rental Finance Corp., 9.25%, 3/15/24 (c) | | | | | | | 2,288 | | | | 2,390,960 | |
Weekley Homes LLC/Weekley Finance Corp., 6.00%, 2/01/23 | | | | | | | 825 | | | | 800,250 | |
| | | | | | | | | | | | |
| | | | | | | | | | | | 3,191,210 | |
| Construction Materials — 0.5% | | | | | | | | | |
Allegion US Holding Co., Inc., 5.75%, 10/01/21 | | | | | | | 1,907 | | | | 1,989,239 | |
HD Supply, Inc. (c): | | | | | | | | | | | | |
5.25%, 12/15/21 | | | | | | | 3,278 | | | | 3,470,582 | |
5.75%, 4/15/24 | | | | | | | 1,701 | | | | 1,807,313 | |
PulteGroup, Inc., 5.50%, 3/01/26 | | | | | | | 926 | | | | 976,930 | |
| | | | | | | | | | | | |
| | | | | | | | | | | | 8,244,064 | |
| Consumer Discretionary — 0.0% | | | | | | | | | |
Nielsen Co. Luxembourg SARL, 5.00%, 2/01/25 (c) | | | | | | | 475 | | | | 475,594 | |
| Consumer Finance — 1.2% | | | | | | | | | |
Ally Financial, Inc.: | | | | | | | | | | | | |
5.13%, 9/30/24 | | | | | | | 590 | | | | 602,538 | |
4.63%, 3/30/25 | | | | | | | 136 | | | | 134,215 | |
8.00%, 11/01/31 | | | | | | | 5,539 | | | | 6,591,410 | |
Capital One Bank USA NA, 3.38%, 2/15/23 (d) | | | | | | | 2,000 | | | | 2,013,726 | |
Discover Financial Services, 3.85%, 11/21/22 | | | | | | | 3,252 | | | | 3,333,576 | |
Experian Finance PLC, 2.38%, 6/15/17 (c)(d) | | | | | | | 2,550 | | | | 2,552,430 | |
Navient Corp.: | | | | | | | | | | | | |
6.63%, 7/26/21 | | | | | | | 461 | | | | 488,084 | |
7.25%, 9/25/23 | | | | | | | 996 | | | | 1,040,820 | |
Total System Services, Inc., 3.80%, 4/01/21 | | | | | | | 1,630 | | | | 1,697,291 | |
| | | | | | | | | | | | |
| | | | | | | | | | | | 18,454,090 | |
| Containers & Packaging — 0.4% | | | | | | | | | |
Ardagh Packaging Finance PLC/Ardagh Holdings USA, Inc., 6.00%, 2/15/25 (c) | | | | | | | 811 | | | | 838,371 | |
Ball Corp., 4.38%, 12/15/20 | | | | | | | 681 | | | | 716,752 | |
Reynolds Group Issuer, Inc./Reynolds Group Issuer LLC: | | | | | | | | | | | | |
5.75%, 10/15/20 | | | | | | | 2,866 | | | | 2,951,980 | |
6.88%, 2/15/21 | | | | | | | 68 | | | | 69,926 | |
7.00%, 7/15/24 (c) | | | | | | | 1,247 | | | | 1,342,084 | |
Sealed Air Corp., 6.88%, 7/15/33 (c) | | | | | | | 182 | | | | 197,925 | |
| | | | | | | | | | | | |
| | | | | | | | | | | | 6,117,038 | |
| Diversified Consumer Services — 0.4% | | | | | | | | | |
Prime Security Services Borrower LLC/Prime Finance, Inc., 9.25%, 5/15/23 (c) | | | | | | | 1,295 | | | | 1,414,787 | |
Service Corp. International, 4.50%, 11/15/20 | | | | | | | 4,382 | | | | 4,461,446 | |
| | | | | | | | | | | | |
| | | | | | | | | | | | 5,876,233 | |
| | | | | | | | | | | | |
| Corporate Bonds | | Par (000) | | | Value | |
| Diversified Financial Services — 4.9% | | | | | | | | | |
AerCap Ireland Capital Ltd./AerCap Global Aviation Trust: | | | | | | | | | | | | |
4.63%, 10/30/20 | | | USD | | | | 961 | | | $ | 1,020,268 | |
4.63%, 7/01/22 | | | | | | | 518 | | | | 551,387 | |
Air Lease Corp., 3.75%, 2/01/22 | | | | | | | 5,000 | | | | 5,176,450 | |
Aircastle Ltd., 6.25%, 12/01/19 | | | | | | | 3,937 | | | | 4,269,676 | |
Bank of America Corp.: | | | | | | | | | | | | |
5.00%, 5/13/21 (d) | | | | | | | 17,100 | | | | 18,611,845 | |
4.45%, 3/03/26 | | | | | | | 1,765 | | | | 1,825,921 | |
Citigroup, Inc., 6.68%, 9/13/43 (d) | | | | | | | 4,125 | | | | 5,270,871 | |
Ford Motor Credit Co. LLC, 5.88%, 8/02/21 | | | | | | | 9,420 | | | | 10,480,164 | |
General Motors Financial Co., Inc.: | | | | | | | | | | | | |
6.75%, 6/01/18 | | | | | | | 1,700 | | | | 1,786,328 | |
4.38%, 9/25/21 | | | | | | | 2,260 | | | | 2,380,268 | |
4.25%, 5/15/23 | | | | | | | 1,681 | | | | 1,731,018 | |
ING Bank NV, 5.00%, 6/09/21 (c)(d) | | | | | | | 8,000 | | | | 8,775,904 | |
Jefferies Finance LLC/JFIN Co-Issuer Corp., 7.38%, 4/01/20 (c) | | | | | | | 1,705 | | | | 1,743,363 | |
Leucadia National Corp., 5.50%, 10/18/23 | | | | | | | 4,000 | | | | 4,308,132 | |
Resparcs Funding LP I, 8.00% (e)(f) | | | | | | | 4,000 | | | | 900,000 | |
Royal Bank of Scotland Group PLC: | | | | | | | | | | | | |
6.10%, 6/10/23 | | | | | | | 2,500 | | | | 2,687,718 | |
5.13%, 5/28/24 | | | | | | | 5,250 | | | | 5,397,530 | |
| | | | | | | | | | | | |
| | | | | | | | | | | | 76,916,843 | |
| Diversified Telecommunication Services — 6.3% | |
AT&T, Inc.: | | | | | | | | | | | | |
5.00%, 3/01/21 (d) | | | | | | | 8,575 | | | | 9,309,483 | |
6.30%, 1/15/38 (d) | | | | | | | 12,000 | | | | 13,730,268 | |
4.30%, 12/15/42 | | | | | | | 265 | | | | 237,481 | |
4.35%, 6/15/45 | | | | | | | 367 | | | | 325,690 | |
CenturyLink, Inc.: | | | | | | | | | | | | |
6.45%, 6/15/21 | | | | | | | 1,660 | | | | 1,792,800 | |
Series Y, 7.50%, 4/01/24 | | | | | | | 1,181 | | | | 1,283,168 | |
Frontier Communications Corp.: | | | | | | | | | | | | |
6.25%, 9/15/21 | | | | | | | 980 | | | | 908,950 | |
7.13%, 1/15/23 | | | | | | | 55 | | | | 48,125 | |
7.63%, 4/15/24 | | | | | | | 1,309 | | | | 1,122,468 | |
6.88%, 1/15/25 | | | | | | | 3,964 | | | | 3,301,021 | |
Level 3 Financing, Inc.: | | | | | | | | | | | | |
5.38%, 8/15/22 | | | | | | | 2,095 | | | | 2,163,507 | |
5.13%, 5/01/23 | | | | | | | 1,183 | | | | 1,214,054 | |
5.38%, 1/15/24 | | | | | | | 754 | | | | 783,662 | |
5.38%, 5/01/25 | | | | | | | 2,003 | | | | 2,088,128 | |
SBA Communications Corp., 4.88%, 9/01/24 (c) | | | | | | | 1,658 | | | | 1,672,508 | |
Telefonica Emisiones SAU: | | | | | | | | | | | | |
3.19%, 4/27/18 | | | | | | | 6,550 | | | | 6,637,239 | |
5.21%, 3/08/47 | | | | | | | 5,000 | | | | 5,195,035 | |
Verizon Communications, Inc. (d): | | | | | | | | | | | | |
5.15%, 9/15/23 | | | | | | | 8,775 | | | | 9,711,222 | |
6.40%, 9/15/33 | | | | | | | 9,475 | | | | 11,321,535 | |
6.55%, 9/15/43 | | | | | | | 13,225 | | | | 16,230,183 | |
5.01%, 4/15/49 (c) | | | | | | | 10,578 | | | | 10,380,953 | |
| | | | | | | | | | | | |
| | | | | | | | | | | | 99,457,480 | |
| Electric Utilities — 4.7% | | | | | | | | | |
CMS Energy Corp., 5.05%, 3/15/22 | | | | | | | 9,900 | | | | 10,903,206 | |
Duke Energy Corp., 3.55%, 9/15/21 (d) | | | | | | | 3,650 | | | | 3,798,891 | |
Emera, Inc., Series 16-A, 6.75%, 6/15/76 (b) | | | | | | | 7,500 | | | | 8,259,375 | |
Great Plains Energy, Inc., 5.29%, 6/15/22 (g) | | | | | | | 5,550 | | | | 6,095,787 | |
Midland Cogeneration Venture LP, 5.25%, 3/15/25 (c) | | | | | | | 3,953 | | | | 4,091,500 | |
NiSource Finance Corp., 6.80%, 1/15/19 (d) | | | | | | | 3,075 | | | | 3,311,972 | |
See Notes to Financial Statements.
| | | | | | |
| | | | | | | |
| | SEMI-ANNUAL REPORT | | APRIL 30, 2017 | | 13 |
| | |
Schedule of Investments (continued) | | BlackRock Credit Allocation Income Trust (BTZ) |
| | | | | | | | | | | | |
| Corporate Bonds | | Par (000) | | | Value | |
| Electric Utilities (continued) | | | | | | | | | |
Oncor Electric Delivery Co. LLC (d): | | | | | | | | | | | | |
4.10%, 6/01/22 | | | USD | | | | 4,150 | | | $ | 4,423,751 | |
5.30%, 6/01/42 | | | | | | | 2,750 | | | | 3,252,972 | |
Progress Energy, Inc., 7.00%, 10/30/31 | | | | | | | 12,000 | | | | 15,965,592 | |
Puget Energy, Inc.: | | | | | | | | | | | | |
6.00%, 9/01/21 | | | | | | | 275 | | | | 307,272 | |
5.63%, 7/15/22 | | | | | | | 5,550 | | | | 6,169,663 | |
Southern Co., 4.40%, 7/01/46 | | | | | | | 7,500 | | | | 7,461,330 | |
| | | | | | | | | | | | |
| | | | | | | | | | | | 74,041,311 | |
| Electronic Equipment, Instruments & Components — 0.5% | |
CDW LLC/CDW Finance Corp.: | | | | | | | | | | | | |
5.00%, 9/01/23 | | | | | | | 306 | | | | 314,415 | |
5.50%, 12/01/24 | | | | | | | 2,458 | | | | 2,617,770 | |
Jabil Circuit, Inc., 8.25%, 3/15/18 | | | | | | | 2,600 | | | | 2,743,762 | |
Sanmina Corp., 4.38%, 6/01/19 (c) | | | | | | | 1,415 | | | | 1,450,375 | |
| | | | | | | | | | | | |
| | | | | | | | | | | | 7,126,322 | |
| Energy Equipment & Services — 0.7% | | | | | | | | | |
Genesis Energy LP/Genesis Energy Finance Corp.: | | | | | | | | | | | | |
5.75%, 2/15/21 | | | | | | | 473 | | | | 478,321 | |
6.75%, 8/01/22 | | | | | | | 1,175 | | | | 1,208,781 | |
GrafTech International Ltd., 6.38%, 11/15/20 | | | | | | | 890 | | | | 772,075 | |
Halliburton Co., 5.00%, 11/15/45 | | | | | | | 6,615 | | | | 7,061,764 | |
Noble Holding International Ltd., 4.63%, 3/01/21 | | | | | | | 34 | | | | 31,280 | |
Transocean, Inc., 6.00%, 3/15/18 | | | | | | | 880 | | | | 898,700 | |
| | | | | | | | | | | | |
| | | | | | | | | | | | 10,450,921 | |
| Food & Staples Retailing — 1.6% | | | | | | | | | |
Albertsons Cos. LLC/Safeway, Inc./New Albertson’s, Inc./Albertson’s LLC (c): | | | | | | | | | | | | |
6.63%, 6/15/24 | | | | | | | 775 | | | | 792,437 | |
5.75%, 3/15/25 | | | | | | | 1,120 | | | | 1,089,200 | |
CVS Health Corp.: | | | | | | | | | | | | |
4.75%, 12/01/22 | | | | | | | 289 | | | | 316,287 | |
5.00%, 12/01/24 | | | | | | | 183 | | | | 201,620 | |
5.13%, 7/20/45 (d) | | | | | | | 3,879 | | | | 4,335,031 | |
Dollar Tree, Inc.: | | | | | | | | | | | | |
5.25%, 3/01/20 | | | | | | | 105 | | | | 108,019 | |
5.75%, 3/01/23 | | | | | | | 3,938 | | | | 4,178,218 | |
H.J. Heinz Finance Co., 7.13%, 8/01/39 (c) | | | | | | | 4,415 | | | | 5,690,683 | |
Rite Aid Corp.: | | | | | | | | | | | | |
6.75%, 6/15/21 | | | | | | | 541 | | | | 545,058 | |
6.13%, 4/01/23 (c) | | | | | | | 2,194 | | | | 2,172,060 | |
Wal-Mart Stores, Inc., 5.25%, 9/01/35 (d) | | | | | | | 5,150 | | | | 6,180,051 | |
| | | | | | | | | | | | |
| | | | | | | | | | | | 25,608,664 | |
| Food Products — 1.1% | | | | | | | | | |
Aramark Services, Inc., 5.13%, 1/15/24 | | | | | | | 815 | | | | 859,825 | |
FAGE International SA/FAGE USA Dairy Industry, Inc., 5.63%, 8/15/26 (c) | | | | | | | 465 | | | | 473,138 | |
Kraft Foods, Inc.: | | | | | | | | | | | | |
6.50%, 8/11/17 (d) | | | | | | | 4,450 | | | | 4,507,841 | |
6.13%, 8/23/18 | | | | | | | 4,840 | | | | 5,109,191 | |
Kraft Heinz Foods Co., 4.38%, 6/01/46 | | | | | | | 2,475 | | | | 2,354,807 | |
Post Holdings, Inc. (c): | | | | | | | | | | | | |
7.75%, 3/15/24 | | | | | | | 1,502 | | | | 1,669,097 | |
8.00%, 7/15/25 | | | | | | | 743 | | | | 845,162 | |
5.00%, 8/15/26 | | | | | | | 1,349 | | | | 1,342,255 | |
TreeHouse Foods, Inc., 6.00%, 2/15/24 (c) | | | | | | | 431 | | | | 459,015 | |
| | | | | | | | | | | | |
| | | | | | | | | | | | 17,620,331 | |
| | | | | | | | | | | | |
| Corporate Bonds | | Par (000) | | | Value | |
| Health Care Equipment & Supplies — 0.6% | | | | | | | | | |
DJO Finco, Inc./DJO Finance LLC/DJO Finance Corp., 8.13%, 6/15/21 (c) | | | USD | | | | 2,065 | | | $ | 1,822,362 | |
Mallinckrodt International Finance SA/Mallinckrodt CB LLC (c): | | | | | | | | | | | | |
4.88%, 4/15/20 | | | | | | | 517 | | | | 515,708 | |
5.75%, 8/01/22 | | | | | | | 1,370 | | | | 1,346,025 | |
5.63%, 10/15/23 | | | | | | | 506 | | | | 483,230 | |
Medtronic, Inc., 4.63%, 3/15/45 (d) | | | | | | | 4,565 | | | | 4,965,793 | |
| | | | | | | | | | | | |
| | | | | | | | | | | | 9,133,118 | |
| Health Care Providers & Services — 3.6% | | | | | | | | | |
Acadia Healthcare Co., Inc., 5.13%, 7/01/22 | | | | | | | 191 | | | | 193,149 | |
Amsurg Corp., 5.63%, 7/15/22 | | | | | | | 1,466 | | | | 1,512,399 | |
Centene Corp.: | | | | | | | | | | | | |
5.63%, 2/15/21 | | | | | | | 875 | | | | 919,844 | |
6.13%, 2/15/24 | | | | | | | 645 | | | | 694,988 | |
CHS/Community Health Systems, Inc.: | | | | | | | | | | | | |
6.88%, 2/01/22 | | | | | | | 1,111 | | | | 919,352 | |
6.25%, 3/31/23 | | | | | | | 1,447 | | | | 1,472,322 | |
DaVita HealthCare Partners, Inc., 5.13%, 7/15/24 | | | | | | | 1,990 | | | | 2,045,979 | |
HCA, Inc.: | | | | | | | | | | | | |
3.75%, 3/15/19 | | | | | | | 4,364 | | | | 4,456,735 | |
6.50%, 2/15/20 | | | | | | | 10,421 | | | | 11,437,673 | |
7.50%, 2/15/22 | | | | | | | 2,214 | | | | 2,546,986 | |
5.88%, 3/15/22 | | | | | | | 340 | | | | 376,975 | |
4.75%, 5/01/23 | | | | | | | 236 | | | | 247,800 | |
5.38%, 2/01/25 | | | | | | | 440 | | | | 458,150 | |
5.88%, 2/15/26 | | | | | | | 1,297 | | | | 1,378,062 | |
HealthSouth Corp.: | | | | | | | | | | | | |
5.13%, 3/15/23 | | | | | | | 512 | | | | 513,920 | |
5.75%, 11/01/24 | | | | | | | 637 | | | | 648,944 | |
Hologic, Inc., 5.25%, 7/15/22 (c) | | | | | | | 742 | | | | 781,882 | |
MEDNAX, Inc., 5.25%, 12/01/23 (c) | | | | | | | 587 | | | | 600,208 | |
MPH Acquisition Holdings LLC, 7.13%, 6/01/24 (c) | | | | | | | 829 | | | | 891,175 | |
RegionalCare Hospital Partners Holdings, Inc., 8.25%, 5/01/23 (c) | | | | | | | 1,109 | | | | 1,179,837 | |
Tenet Healthcare Corp.: | | | | | | | | | | | | |
6.25%, 11/01/18 | | | | | | | 736 | | | | 771,431 | |
4.75%, 6/01/20 | | | | | | | 1,450 | | | | 1,471,750 | |
6.00%, 10/01/20 | | | | | | | 3,645 | | | | 3,836,362 | |
4.50%, 4/01/21 | | | | | | | 73 | | | | 72,909 | |
7.50%, 1/01/22 (c) | | | | | | | 394 | | | | 421,580 | |
8.13%, 4/01/22 | | | | | | | 1,907 | | | | 1,935,605 | |
6.75%, 6/15/23 | | | | | | | 1,758 | | | | 1,678,890 | |
UnitedHealth Group, Inc., 6.88%, 2/15/38 (d) | | | | | | | 10,000 | | | | 13,779,620 | |
| | | | | | | | | | | | |
| | | | | | | | | | | | 57,244,527 | |
| Hotels, Restaurants & Leisure — 0.4% | | | | | | | | | |
ESH Hospitality, Inc., 5.25%, 5/01/25 (c) | | | | | | | 910 | | | | 921,375 | |
KFC Holding Co/Pizza Hut Holdings LLC/Taco Bell of America LLC (c): | | | | | | | | | | | | |
5.00%, 6/01/24 | | | | | | | 600 | | | | 619,500 | |
5.25%, 6/01/26 | | | | | | | 650 | | | | 666,250 | |
MGM Resorts International, 6.75%, 10/01/20 | | | | | | | 214 | | | | 238,075 | |
New Red Finance, Inc., 6.00%, 4/01/22 (c) | | | | | | | 2,215 | | | | 2,309,138 | |
Sabre GLBL, Inc. (c): | | | | | | | | | | | | |
5.38%, 4/15/23 | | | | | | | 594 | | | | 617,760 | |
5.25%, 11/15/23 | | | | | | | 294 | | | | 304,290 | |
| | | | | | | | | | | | |
| | | | | | | | | | | | 5,676,388 | |
See Notes to Financial Statements.
| | | | | | |
| | | | | | | |
| 14 | | SEMI-ANNUAL REPORT | | APRIL 30, 2017 | | |
| | |
Schedule of Investments (continued) | | BlackRock Credit Allocation Income Trust (BTZ) |
| | | | | | | | | | | | |
| Corporate Bonds | | Par (000) | | | Value | |
| Household Durables — 0.8% | | | | | | | | | |
Brookfield Residential Properties, Inc./Brookfield Residential US Corp., 6.13%, 7/01/22 (c) | | | USD | | | | 1,647 | | | $ | 1,716,997 | |
CalAtlantic Group, Inc., 8.38%, 1/15/21 | | | | | | | 3,015 | | | | 3,542,625 | |
Lennar Corp.: | | | | | | | | | | | | |
4.75%, 11/15/22 | | | | | | | 1,805 | | | | 1,877,200 | |
4.88%, 12/15/23 | | | | | | | 466 | | | | 482,310 | |
Newell Brands, Inc.: | | | | | | | | | | | | |
3.85%, 4/01/23 | | | | | | | 2,585 | | | | 2,699,252 | |
4.20%, 4/01/26 | | | | | | | 955 | | | | 1,003,766 | |
TRI Pointe Group, Inc.: | | | | | | | | | | | | |
4.38%, 6/15/19 | | | | | | | 920 | | | | 947,600 | |
5.88%, 6/15/24 | | | | | | | 625 | | | | 657,813 | |
| | | | | | | | | | | | |
| | | | | | | | | | | | 12,927,563 | |
| Household Products — 0.2% | | | | | | | | | |
Spectrum Brands, Inc.: | | | | | | | | | | | | |
6.63%, 11/15/22 | | | | | | | 1,110 | | | | 1,168,275 | |
6.13%, 12/15/24 | | | | | | | 231 | | | | 246,172 | |
5.75%, 7/15/25 | | | | | | | 1,002 | | | | 1,074,054 | |
| | | | | | | | | | | | |
| | | | | | | | | | | | 2,488,501 | |
| Independent Power and Renewable Electricity Producers — 0.6% | |
Calpine Corp.: | | | | | | | | | | | | |
6.00%, 1/15/22 (c) | | | | | | | 1,548 | | | | 1,617,660 | |
5.88%, 1/15/24 (c) | | | | | | | 823 | | | | 864,150 | |
5.75%, 1/15/25 | | | | | | | 1,064 | | | | 1,029,420 | |
Dynegy, Inc., 6.75%, 11/01/19 | | | | | | | 1,945 | | | | 1,974,175 | |
NRG Energy, Inc., 6.63%, 1/15/27 | | | | | | | 2,746 | | | | 2,718,540 | |
QEP Resources, Inc., 5.38%, 10/01/22 | | | | | | | 1,927 | | | | 1,902,913 | |
| | | | | | | | | | | | |
| | | | | | | | | | | | 10,106,858 | |
| Industrial Conglomerates — 0.0% | | | | | | | | | |
Vertiv Group Corp, 9.25%, 10/15/24 (c) | | | | | | | 623 | | | | 668,946 | |
| Insurance — 2.8% | | | | | | | | | |
American International Group, Inc., 6.40%, 12/15/20 | | | | | | | 8,710 | | | | 9,863,500 | |
Aon Corp., 5.00%, 9/30/20 (d) | | | | | | | 7,700 | | | | 8,317,409 | |
Aon PLC, 4.25%, 12/12/42 (d) | | | | | | | 6,500 | | | | 6,046,937 | |
Forethought Financial Group, Inc., 8.63%, 4/15/21 (c) | | | | | | | 3,400 | | | | 3,804,478 | |
Northwestern Mutual Life Insurance Co., 6.06%, 3/30/40 (c)(d) | | | | | | | 12,000 | | | | 15,424,080 | |
Radian Group, Inc., 5.25%, 6/15/20 | | | | | | | 1,045 | | | | 1,092,025 | |
| | | | | | | | | | | | |
| | | | | | | | | | | | 44,548,429 | |
| Internet Software & Services — 0.1% | | | | | | | | | |
Equinix, Inc., 5.88%, 1/15/26 | | | | | | | 1,061 | | | | 1,143,228 | |
Netflix, Inc., 5.50%, 2/15/22 | | | | | | | 563 | | | | 602,410 | |
Symantec Corp., 5.00%, 4/15/25 (c) | | | | | | | 347 | | | | 358,711 | |
| | | | | | | | | | | | |
| | | | | | | | | | | | 2,104,349 | |
| IT Services — 0.7% | | | | | | | | | |
Ceridian HCM Holding, Inc., 11.00%, 3/15/21 (c) | | | | | | | 1,755 | | | | 1,851,525 | |
Fidelity National Information Services, Inc., 5.00%, 10/15/25 | | | | | | | 1,935 | | | | 2,134,796 | |
First Data Corp. (c): | | | | | | | | | | | | |
5.38%, 8/15/23 | | | | | | | 764 | | | | 794,560 | |
7.00%, 12/01/23 | | | | | | | 4,908 | | | | 5,262,358 | |
5.75%, 1/15/24 | | | | | | | 720 | | | | 747,000 | |
Gartner, Inc., 5.13%, 4/01/25 (c) | | | | | | | 483 | | | | 499,905 | |
| | | | | | | | | | | | |
| | | | | | | | | | | | 11,290,144 | |
| Life Sciences Tools & Services — 0.8% | | | | | | | | | |
Life Technologies Corp., 6.00%, 3/01/20 | | | | | | | 12,000 | | | | 13,151,616 | |
| | | | | | | | | | | | |
| Corporate Bonds | | Par (000) | | | Value | |
| Media — 7.4% | | | | | | | | | |
21st Century Fox America, Inc., 6.15%, 3/01/37 (d) | | | USD | | | | 9,575 | | | $ | 11,453,040 | |
A&E Television Networks LLC, 3.11%, 8/22/19 | | | | | | | 5,000 | | | | 5,033,000 | |
Altice Financing SA, 7.50%, 5/15/26 (c) | | | | | | | 2,172 | | | | 2,345,760 | |
Altice Luxembourg SA (c): | | | | | | | | | | | | |
7.75%, 5/15/22 | | | | | | | 2,362 | | | | 2,509,932 | |
7.63%, 2/15/25 | | | | | | | 1,752 | | | | 1,870,260 | |
Altice US Finance I Corp. (c): | | | | | | | | | | | | |
5.38%, 7/15/23 | | | | | | | 2,919 | | | | 3,046,706 | |
5.50%, 5/15/26 | | | | | | | 1,211 | | | | 1,251,871 | |
AMC Networks, Inc.: | | | | | | | | | | | | |
4.75%, 12/15/22 | | | | | | | 685 | | | | 698,700 | |
5.00%, 4/01/24 | | | | | | | 432 | | | | 437,681 | |
CCO Holdings LLC/CCO Holdings Capital Corp. (c): | | | | | | | | | | | | |
5.88%, 4/01/24 | | | | | | | 1,759 | | | | 1,884,329 | |
5.75%, 2/15/26 | | | | | | | 499 | | | | 530,028 | |
5.50%, 5/01/26 | | | | | | | 1,219 | | | | 1,279,194 | |
5.13%, 5/01/27 | | | | | | | 1,961 | | | | 2,000,220 | |
Charter Communications Operating LLC/Charter Communications Operating Capital: | | | | | | | | | | | | |
6.38%, 10/23/35 | | | | | | | 479 | | | | 548,968 | |
6.48%, 10/23/45 | | | | | | | 9,584 | | | | 11,255,191 | |
6.83%, 10/23/55 | | | | | | | 3,540 | | | | 4,153,323 | |
Cinemark USA, Inc., 5.13%, 12/15/22 | | | | | | | 349 | | | | 359,470 | |
Clear Channel Worldwide Holdings, Inc., 6.50%, 11/15/22 | | | | | | | 11,711 | | | | 12,090,706 | |
Cox Communications, Inc., 8.38%, 3/01/39 (c)(d) | | | | | | | 5,000 | | | | 6,211,295 | |
CSC Holdings LLC: | | | | | | | | | | | | |
8.63%, 2/15/19 | | | | | | | 4,005 | | | | 4,411,708 | |
6.63%, 10/15/25 (c) | | | | | | | 832 | | | | 910,000 | |
DISH DBS Corp., 7.75%, 7/01/26 | | | | | | | 1,901 | | | | 2,226,546 | |
Grupo Televisa SAB, 5.00%, 5/13/45 (d) | | | | | | | 3,345 | | | | 3,151,326 | |
Hughes Satellite Systems Corp. (c): | | | | | | | | | | | | |
5.25%, 8/01/26 | | | | | | | 1,017 | | | | 1,034,797 | |
6.63%, 8/01/26 | | | | | | | 685 | | | | 705,550 | |
Intelsat Jackson Holdings SA: | | | | | | | | | | | | |
7.25%, 4/01/19 | | | | | | | 1,107 | | | | 1,064,104 | |
5.50%, 8/01/23 | | | | | | | 1,127 | | | | 962,176 | |
Interpublic Group of Cos., Inc., 3.75%, 2/15/23 | | | | | | | 6,025 | | | | 6,214,884 | |
MDC Partners, Inc., 6.50%, 5/01/24 (c) | | | | | | | 1,036 | | | | 1,010,100 | |
NAI Entertainment Holdings/NAI Entertainment Holdings Finance Corp., 5.00%, 8/01/18 (c) | | | | | | | 1,471 | | | | 1,482,032 | |
Nexstar Broadcasting, Inc., 5.63%, 8/01/24 (c) | | | | | | | 495 | | | | 507,375 | |
Outfront Media Capital LLC/Outfront Media Capital Corp.: | | | | | | | | | | | | |
5.25%, 2/15/22 | | | | | | | 249 | | | | 258,649 | |
5.63%, 2/15/24 | | | | | | | 122 | | | | 128,100 | |
SFR Group SA (c): | | | | | | | | | | | | |
6.00%, 5/15/22 | | | | | | | 4,544 | | | | 4,737,120 | |
7.38%, 5/01/26 | | | | | | | 5,843 | | | | 6,142,454 | |
Time Warner Cable, Inc., 6.55%, 5/01/37 | | | | | | | 3,519 | | | | 4,090,081 | |
Time Warner, Inc.: | | | | | | | | | | | | |
4.65%, 6/01/44 | | | | | | | 28 | | | | 26,426 | |
4.85%, 7/15/45 | | | | | | | 97 | | | | 93,891 | |
Tribune Media Co., 5.88%, 7/15/22 | | | | | | | 1,308 | | | | 1,374,080 | |
Univision Communications, Inc. (c): | | | | | | | | | | | | |
5.13%, 5/15/23 | | | | | | | 5,293 | | | | 5,379,011 | |
5.13%, 2/15/25 | | | | | | | 999 | | | | 995,254 | |
See Notes to Financial Statements.
| | | | | | |
| | | | | | | |
| | SEMI-ANNUAL REPORT | | APRIL 30, 2017 | | 15 |
| | |
Schedule of Investments (continued) | | BlackRock Credit Allocation Income Trust (BTZ) |
| | | | | | | | | | | | |
| Corporate Bonds | | Par (000) | | | Value | |
| Media (continued) | | | | | | | | | |
Virgin Media Secured Finance PLC, 5.50%, 8/15/26 (c) | | | USD | | | | 487 | | | $ | 497,349 | |
| | | | | | | | | | | | |
| | | | | | | | | | | | 116,362,687 | |
| Metals & Mining — 3.5% | | | | | | | | | |
Alcoa Nederland Holding BV, 7.00%, 9/30/26 (c) | | | | | | | 291 | | | | 321,555 | |
Alcoa, Inc., 5.13%, 10/01/24 | | | | | | | 1,903 | | | | 1,993,392 | |
Anglo American Capital PLC, 4.45%, 9/27/20 (c) | | | | | | | 136 | | | | 141,440 | |
AngloGold Ashanti Holdings PLC, 5.13%, 8/01/22 | | | | | | | 5,000 | | | | 5,165,000 | |
ArcelorMittal: | | | | | | | | | | | | |
6.13%, 6/01/18 | | | | | | | 2,575 | | | | 2,683,897 | |
7.50%, 3/01/41 | | | | | | | 455 | | | | 511,875 | |
Commercial Metals Co., 4.88%, 5/15/23 | | | | | | | 2,194 | | | | 2,204,970 | |
Constellium NV: | | | | | | | | | | | | |
4.63%, 5/15/21 | | | EUR | | | | 490 | | | | 534,525 | |
5.75%, 5/15/24 (c) | | | USD | | | | 1,728 | | | | 1,620,000 | |
6.63%, 3/01/25 (c) | | | | | | | 1,353 | | | | 1,332,705 | |
First Quantum Minerals Ltd. (c): | | | | | | | | | | | | |
7.00%, 2/15/21 | | | | | | | 138 | | | | 142,830 | |
7.25%, 5/15/22 | | | | | | | 912 | | | | 939,360 | |
7.25%, 4/01/23 | | | | | | | 832 | | | | 847,080 | |
7.50%, 4/01/25 | | | | | | | 1,463 | | | | 1,492,260 | |
FMG Resources August 2006 Property Ltd., 9.75%, 3/01/22 (c) | | | | | | | 826 | | | | 950,416 | |
Freeport-McMoRan, Inc.: | | | | | | | | | | | | |
2.38%, 3/15/18 | | | | | | | 4,664 | | | | 4,640,680 | |
4.00%, 11/14/21 | | | | | | | 500 | | | | 490,625 | |
3.55%, 3/01/22 | | | | | | | 236 | | | | 221,840 | |
3.88%, 3/15/23 | | | | | | | 5,360 | | | | 4,971,400 | |
5.40%, 11/14/34 | | | | | | | 2,250 | | | | 1,996,875 | |
5.45%, 3/15/43 | | | | | | | 1,542 | | | | 1,314,555 | |
Novelis Corp. (c): | | | | | | | | | | | | |
6.25%, 8/15/24 | | | | | | | 2,862 | | | | 3,012,255 | |
5.88%, 9/30/26 | | | | | | | 2,060 | | | | 2,116,650 | |
Peabody Securities Finance Corp. (c): | | | | | | | | | | | | |
6.00%, 3/31/22 | | | | | | | 357 | | | | 364,140 | |
6.38%, 3/31/25 | | | | | | | 375 | | | | 380,625 | |
Southern Copper Corp., 5.88%, 4/23/45 | | | | | | | 3,870 | | | | 4,076,544 | |
Steel Dynamics, Inc.: | | | | | | | | | | | | |
5.13%, 10/01/21 | | | | | | | 1,105 | | | | 1,140,913 | |
6.38%, 8/15/22 | | | | | | | 1,430 | | | | 1,484,697 | |
5.25%, 4/15/23 | | | | | | | 309 | | | | 319,815 | |
5.50%, 10/01/24 | | | | | | | 240 | | | | 253,500 | |
5.00%, 12/15/26 (c) | | | | | | | 35 | | | | 35,788 | |
Teck Resources Ltd.: | | | | | | | | | | | | |
3.00%, 3/01/19 | | | | | | | 119 | | | | 120,488 | |
4.50%, 1/15/21 | | | | | | | 370 | | | | 382,110 | |
8.00%, 6/01/21 (c) | | | | | | | 1,202 | | | | 1,310,180 | |
8.50%, 6/01/24 (c) | | | | | | | 799 | | | | 925,841 | |
6.00%, 8/15/40 | | | | | | | 1,861 | | | | 1,914,504 | |
6.25%, 7/15/41 | | | | | | | 721 | | | | 764,260 | |
5.20%, 3/01/42 | | | | | | | 640 | | | | 611,200 | |
United States Steel Corp., 8.38%, 7/01/21 (c) | | | | | | | 944 | | | | 1,039,580 | |
| | | | | | | | | | | | |
| | | | | | | | | | | | 54,770,370 | |
| Offshore Drilling & Other Services — 0.1% | | | | | | | | | |
Sensata Technologies BV, 5.63%, 11/01/24 (c) | | | | | | | 695 | | | | 736,700 | |
| Oil, Gas & Consumable Fuels — 14.4% | | | | | | | | | |
Access Midstream Partners LP/ACMP Finance Corp., 4.88%, 5/15/23 | | | | | | | 343 | | | | 353,290 | |
| | | | | | | | | | | | |
| Corporate Bonds | | Par (000) | | | Value | |
| Oil, Gas & Consumable Fuels (continued) | | | | | | | | | |
California Resources Corp., 8.00%, 12/15/22 (c) | | | USD | | | | 1,492 | | | $ | 1,141,380 | |
Cheniere Corpus Christi Holdings LLC, 7.00%, 6/30/24 (c) | | | | | | | 1,231 | | | | 1,375,495 | |
CONSOL Energy, Inc., 5.88%, 4/15/22 | | | | | | | 7,210 | | | | 7,029,750 | |
Continental Resources, Inc.: | | | | | | | | | | | | |
5.00%, 9/15/22 | | | | | | | 7,519 | | | | 7,584,791 | |
4.50%, 4/15/23 | | | | | | | 469 | | | | 461,965 | |
DCP Midstream LLC, 6.75%, 9/15/37 (c) | | | | | | | 1,527 | | | | 1,673,058 | |
Denbury Resources, Inc., 9.00%, 5/15/21 (c) | | | | | | | 182 | | | | 192,010 | |
Devon Energy Corp., 5.85%, 12/15/25 | | | | | | | 4,000 | | | | 4,631,280 | |
El Paso LLC: | | | | | | | | | | | | |
7.80%, 8/01/31 | | | | | | | 197 | | | | 250,402 | |
7.75%, 1/15/32 | | | | | | | 4,586 | | | | 5,840,092 | |
El Paso Natural Gas Co. LLC, 8.63%, 1/15/22 | | | | | | | 2,345 | | | | 2,850,493 | |
El Paso Pipeline Partners Operating Co. LLC, 6.50%, 4/01/20 | | | | | | | 5,075 | | | | 5,622,709 | |
Enbridge Energy Partners LP, 9.88%, 3/01/19 (d) | | | | | | | 6,000 | | | | 6,795,546 | |
Energy Transfer Equity LP: | | | | | | | | | | | | |
7.50%, 10/15/20 | | | | | | | 598 | | | | 673,871 | |
5.88%, 1/15/24 | | | | | | | 5,241 | | | | 5,647,177 | |
5.50%, 6/01/27 | | | | | | | 870 | | | | 935,250 | |
Energy Transfer Partners LP: | | | | | | | | | | | | |
5.20%, 2/01/22 | | | | | | | 10,200 | | | | 11,040,959 | |
6.13%, 12/15/45 | | | | | | | 3,579 | | | | 3,888,573 | |
Enterprise Products Operating LLC: | | | | | | | | | | | | |
4.90%, 5/15/46 | | | | | | | 5,375 | | | | 5,621,643 | |
Series N, 6.50%, 1/31/19 (d) | | | | | | | 12,000 | | | | 12,916,680 | |
EP Energy LLC/Everest Acquisition Finance, Inc., 8.00%, 11/29/24 (c) | | | | | | | 415 | | | | 434,194 | |
Gulfport Energy Corp. (c): | | | | | | | | | | | | |
6.00%, 10/15/24 | | | | | | | 444 | | | | 437,340 | |
6.38%, 5/15/25 | | | | | | | 558 | | | | 555,908 | |
Hilcorp Energy I LP/Hilcorp Finance Co., 5.00%, 12/01/24 (c) | | | | | | | 3,666 | | | | 3,436,875 | |
Kinder Morgan Energy Partners LP: | | | | | | | | | | | | |
6.85%, 2/15/20 (d) | | | | | | | 12,000 | | | | 13,371,804 | |
4.25%, 9/01/24 | | | | | | | 2,170 | | | | 2,241,096 | |
5.40%, 9/01/44 | | | | | | | 3,615 | | | | 3,674,456 | |
MEG Energy Corp. (c): | | | | | | | | | | | | |
7.00%, 3/31/24 | | | | | | | 3,100 | | | | 2,766,750 | |
6.50%, 1/15/25 | | | | | | | 2,021 | | | | 1,995,737 | |
Midcontinent Express Pipeline LLC, 6.70%, 9/15/19 (c) | | | | | | | 3,500 | | | | 3,745,000 | |
MPLX LP: | | | | | | | | | | | | |
4.13%, 3/01/27 | | | | | | | 825 | | | | 835,661 | |
5.20%, 3/01/47 | | | | | | | 3,500 | | | | 3,583,716 | |
Murphy Oil Corp., 6.88%, 8/15/24 | | | | | | | 752 | | | | 800,880 | |
Nexen Energy ULC, 6.40%, 5/15/37 | | | | | | | 2,000 | | | | 2,497,852 | |
NGPL PipeCo LLC (c): | | | | | | | | | | | | |
7.12%, 12/15/17 | | | | | | | 2,859 | | | | 2,935,836 | |
7.77%, 12/15/37 | | | | | | | 690 | | | | 793,500 | |
Noble Energy, Inc.: | | | | | | | | | | | | |
5.63%, 5/01/21 | | | | | | | 1,784 | | | | 1,833,060 | |
5.05%, 11/15/44 | | | | | | | 3,500 | | | | 3,614,257 | |
Noble Holding International Ltd., 7.75%, 1/15/24 | | | | | | | 1,112 | | | | 1,014,700 | |
ONEOK Partners LP, 8.63%, 3/01/19 (d) | | | | | | | 10,000 | | | | 11,093,820 | |
PDC Energy, Inc., 7.75%, 10/15/22 | | | | | | | 1,225 | | | | 1,286,250 | |
Petroleos Mexicanos: | | | | | | | | | | | | |
3.50%, 1/30/23 (d) | | | | | | | 5,000 | | | | 4,773,000 | |
4.63%, 9/21/23 | | | | | | | 3,965 | | | | 3,987,997 | |
4.88%, 1/18/24 (d) | | | | | | | 2,000 | | | | 2,023,000 | |
See Notes to Financial Statements.
| | | | | | |
| | | | | | | |
| 16 | | SEMI-ANNUAL REPORT | | APRIL 30, 2017 | | |
| | |
Schedule of Investments (continued) | | BlackRock Credit Allocation Income Trust (BTZ) |
| | | | | | | | | | | | |
| Corporate Bonds | | Par (000) | | | Value | |
| Oil, Gas & Consumable Fuels (continued) | | | | | | | | | |
Pioneer Natural Resources Co., 6.88%, 5/01/18 | | | USD | | | | 1,665 | | | $ | 1,744,202 | |
Plains All American Pipeline LP/PAA Finance Corp.: | | | | | | | | | | | | |
4.70%, 6/15/44 | | | | | | | 1,498 | | | | 1,391,269 | |
4.90%, 2/15/45 | | | | | | | 2,102 | | | | 2,023,961 | |
Range Resources Corp., 5.00%, 8/15/22 (c) | | | | | | | 32 | | | | 31,640 | |
Rockies Express Pipeline LLC (c): | | | | | | | | | | | | |
5.63%, 4/15/20 | | | | | | | 295 | | | | 315,355 | |
6.88%, 4/15/40 | | | | | | | 580 | | | | 619,875 | |
RSP Permian, Inc., 6.63%, 10/01/22 | | | | | | | 789 | | | | 831,409 | |
Ruby Pipeline LLC, 6.00%, 4/01/22 (c) | | | | | | | 10,000 | | | | 10,623,000 | |
Sabine Pass Liquefaction LLC: | | | | | | | | | | | | |
5.63%, 2/01/21 | | | | | | | 405 | | | | 440,401 | |
5.63%, 4/15/23 | | | | | | | 10,510 | | | | 11,574,568 | |
5.75%, 5/15/24 | | | | | | | 2,575 | | | | 2,846,400 | |
5.88%, 6/30/26 (c) | | | | | | | 1,481 | | | | 1,651,491 | |
Sanchez Energy Corp.: | | | | | | | | | | | | |
7.75%, 6/15/21 | | | | | | | 153 | | | | 148,028 | |
6.13%, 1/15/23 | | | | | | | 2,119 | | | | 1,949,459 | |
SM Energy Co.: | | | | | | | | | | | | |
6.50%, 1/01/23 | | | | | | | 177 | | | | 179,655 | |
5.00%, 1/15/24 | | | | | | | 181 | | | | 170,593 | |
Southwestern Energy Co.: | | | | | | | | | | | | |
7.50%, 2/01/18 | | | | | | | 63 | | | | 65,678 | |
5.80%, 1/23/20 | | | | | | | 1,166 | | | | 1,177,660 | |
Targa Resources Partners LP/Targa Resources Partners Finance Corp.: | | | | | | | | | | | | |
6.38%, 8/01/22 | | | | | | | 255 | | | | 262,778 | |
5.25%, 5/01/23 | | | | | | | 37 | | | | 38,110 | |
6.75%, 3/15/24 | | | | | �� | | 184 | | | | 200,560 | |
Tesoro Corp. (c): | | | | | | | | | | | | |
4.75%, 12/15/23 | | | | | | | 1,230 | | | | 1,288,425 | |
5.13%, 12/15/26 | | | | | | | 937 | | | | 997,905 | |
Tesoro Logistics LP/Tesoro Logistics Finance Corp.: | | | | | | | | | | | | |
6.13%, 10/15/21 | | | | | | | 125 | | | | 130,469 | |
6.25%, 10/15/22 | | | | | | | 1,519 | | | | 1,629,128 | |
TransCanada PipeLines Ltd., 4.88%, 1/15/26 | | | | | | | 4,485 | | | | 5,022,038 | |
Weatherford International Ltd., 6.50%, 8/01/36 | | | | | | | 45 | | | | 42,525 | |
Western Gas Partners LP, 5.38%, 6/01/21 | | | | | | | 5,125 | | | | 5,558,180 | |
Whiting Petroleum Corp., 6.25%, 4/01/23 (d) | | | | | | | 1,697 | | | | 1,697,000 | |
Williams Cos., Inc.: | | | | | | | | | | | | |
3.70%, 1/15/23 | | | | | | | 2,245 | | | | 2,211,325 | |
4.55%, 6/24/24 | | | | | | | 527 | | | | 539,516 | |
8.75%, 3/15/32 | | | | | | | 2,478 | | | | 3,209,010 | |
5.75%, 6/24/44 | | | | | | | 685 | | | | 708,975 | |
Williams Partners LP, 5.10%, 9/15/45 | | | | | | | 5,075 | | | | 5,176,307 | |
WPX Energy, Inc., 6.00%, 1/15/22 | | | | | | | 164 | | | | 166,460 | |
| | | | | | | | | | | | |
| | | | | | | | | | | | 226,922,458 | |
| Paper & Forest Products — 1.9% | | | | | | | | | |
International Paper Co. (d): | | | | | | | | | | | | |
7.50%, 8/15/21 | | | | | | | 9,675 | | | | 11,581,459 | |
8.70%, 6/15/38 | | | | | | | 4,000 | | | | 5,771,200 | |
7.30%, 11/15/39 | | | | | | | 10,000 | | | | 13,169,940 | |
| | | | | | | | | | | | |
| | | | | | | | | | | | 30,522,599 | |
| Pharmaceuticals — 3.4% | | | | | | | | | |
AbbVie, Inc. (d): | | | | | | | | | | | | |
2.90%, 11/06/22 | | | | | | | 5,675 | | | | 5,699,017 | |
4.70%, 5/14/45 | | | | | | | 3,255 | | | | 3,277,267 | |
| | | | | | | | | | | | |
| Corporate Bonds | | Par (000) | | | Value | |
| Pharmaceuticals (continued) | | | | | | | | | |
Actavis Funding SCS: | | | | | | | | | | | | |
3.45%, 3/15/22 | | | USD | | | | 7,335 | | | $ | 7,540,299 | |
3.85%, 6/15/24 | | | | | | | 6,000 | | | | 6,163,872 | |
4.75%, 3/15/45 | | | | | | | 1,450 | | | | 1,476,812 | |
Endo Finance LLC/Endo Finco, Inc. (c): | | | | | | | | | | | | |
6.00%, 7/15/23 | | | | | | | 1,514 | | | | 1,326,642 | |
6.00%, 2/01/25 | | | | | | | 530 | | | | 447,585 | |
Forest Laboratories LLC (c): | | | | | | | | | | | | |
4.38%, 2/01/19 (c) | | | | | | | 2,924 | | | | 3,022,226 | |
5.00%, 12/15/21 (c) | | | | | | | 1,631 | | | | 1,779,644 | |
inVentiv Group Holdings, Inc./inVentiv Health, Inc./inVentiv Health Clinical, Inc., 7.50%, 10/01/24 (c) | | | | | | | 739 | | | | 763,017 | |
Merck & Co., Inc., 6.50%, 12/01/33 | | | | | | | 6,420 | | | | 8,384,135 | |
Mylan NV, 3.95%, 6/15/26 | | | | | | | 7,500 | | | | 7,418,280 | |
Valeant Pharmaceuticals International, Inc. (c): | | | | | | | | | | | | |
6.75%, 8/15/18 (d) | | | | | | | 1,786 | | | | 1,781,535 | |
7.00%, 10/01/20 | | | | | | | 447 | | | | 392,242 | |
7.50%, 7/15/21 | | | | | | | 148 | | | | 122,470 | |
6.75%, 8/15/21 | | | | | | | 91 | | | | 75,303 | |
5.63%, 12/01/21 | | | | | | | 1,164 | | | | 894,825 | |
6.50%, 3/15/22 | | | | | | | 829 | | | | 848,689 | |
5.50%, 3/01/23 | | | | | | | 31 | | | | 22,708 | |
5.88%, 5/15/23 | | | | | | | 665 | | | | 491,269 | |
7.00%, 3/15/24 | | | | | | | 1,303 | | | | 1,329,060 | |
6.13%, 4/15/25 | | | | | | | 243 | | | | 179,395 | |
| | | | | | | | | | | | |
| | | | | | | | | | | | 53,436,292 | |
| Professional Services — 0.4% | |
Dun & Bradstreet Corp., 3.50%, 12/01/17 | | | | | | | 5,750 | | | | 5,791,699 | |
| Real Estate Investment Trusts (REITs) — 3.2% | |
American Tower Corp.: | | | | | | | | | | | | |
4.50%, 1/15/18 | | | | | | | 6,500 | | | | 6,621,680 | |
5.05%, 9/01/20 | | | | | | | 500 | | | | 540,438 | |
5.90%, 11/01/21 (d) | | | | | | | 3,770 | | | | 4,240,326 | |
AvalonBay Communities, Inc., 6.10%, 3/15/20 | | | | | | | 10,000 | | | | 11,070,280 | |
DDR Corp.: | | | | | | | | | | | | |
4.75%, 4/15/18 | | | | | | | 2,140 | | | | 2,186,494 | |
7.88%, 9/01/20 | | | | | | | 2,650 | | | | 3,059,367 | |
ERP Operating LP, 5.75%, 6/15/17 (d) | | | | | | | 10,000 | | | | 10,048,490 | |
Hilton Domestic Operating Co., Inc., 4.25%, 9/01/24 (c) | | | | | | | 881 | | | | 887,607 | |
Host Hotels & Resorts LP, 3.75%, 10/15/23 (d) | | | | | | | 3,600 | | | | 3,655,267 | |
MGM Growth Properties Operating Partnership LP/MGP Finance Co-Issuer, Inc.: | | | | | | | | | | | | |
5.63%, 5/01/24 | | | | | | | 627 | | | | 676,376 | |
4.50%, 9/01/26 | | | | | | | 740 | | | | 737,225 | |
Starwood Property Trust, Inc., 5.00%, 12/15/21 (c) | | | | | | | 627 | | | | 653,648 | |
UDR, Inc., 4.25%, 6/01/18 (d) | | | | | | | 5,225 | | | | 5,354,120 | |
| | | | | | | | | | | | |
| | | | | | | | | | | | 49,731,318 | |
| Real Estate Management & Development — 0.4% | |
Northwest Florida Timber Finance LLC, 4.75%, 3/04/29 (c)(d) | | | | | | | 4,485 | | | | 4,260,750 | |
Realogy Group LLC/Realogy Co-Issuer Corp. (c): | | | | | | | | | | | | |
4.50%, 4/15/19 | | | | | | | 803 | | | | 835,120 | |
5.25%, 12/01/21 | | | | | | | 344 | | | | 362,060 | |
4.88%, 6/01/23 | | | | | | | 1,332 | | | | 1,345,320 | |
| | | | | | | | | | | | |
| | | | | | | | | | | | 6,803,250 | |
See Notes to Financial Statements.
| | | | | | |
| | | | | | | |
| | SEMI-ANNUAL REPORT | | APRIL 30, 2017 | | 17 |
| | |
Schedule of Investments (continued) | | BlackRock Credit Allocation Income Trust (BTZ) |
| | | | | | | | | | | | |
| Corporate Bonds | | Par (000) | | | Value | |
| Road & Rail — 1.1% | | | | | | | | | |
Hertz Corp.: | | | | | | | | | | | | |
6.75%, 4/15/19 | | | USD | | | | 420 | | | $ | 418,950 | |
5.88%, 10/15/20 | | | | | | | 647 | | | | 603,328 | |
7.38%, 1/15/21 | | | | | | | 310 | | | | 298,375 | |
5.50%, 10/15/24 (c)(d) | | | | | | | 764 | | | | 658,950 | |
Norfolk Southern Corp., 6.00%, 3/15/05 | | | | | | | 12,700 | | | | 14,708,276 | |
| | | | | | | | | | | | |
| | | | | | | | | | | | 16,687,879 | |
| Semiconductors & Semiconductor Equipment — 0.8% | |
Broadcom Corp./Broadcom Cayman Finance Ltd., 3.88%, 1/15/27 (c) | | | | | | | 7,500 | | | | 7,610,602 | |
Micron Technology, Inc., 5.50%, 2/01/25 | | | | | | | 40 | | | | 41,800 | |
NXP BV/NXP Funding LLC (c): | | | | | | | | | | | | |
4.13%, 6/15/20 | | | | | | | 951 | | | | 997,361 | |
4.13%, 6/01/21 | | | | | | | 1,461 | | | | 1,528,571 | |
4.63%, 6/15/22 | | | | | | | 490 | | | | 526,138 | |
4.63%, 6/01/23 | | | | | | | 204 | | | | 219,555 | |
Sensata Technologies BV, 5.00%, 10/01/25 (c) | | | | | | | 1,418 | | | | 1,448,133 | |
| | | | | | | | | | | | |
| | | | | | | | | | | | 12,372,160 | |
| Software — 0.8% | | | | | | | | | |
Inception Merger Sub, Inc./Rackspace Hosting, Inc., 8.63%, 11/15/24 (c) | | | | | | | 2,034 | | | | 2,153,497 | |
Infor US, Inc., 6.50%, 5/15/22 | | | | | | | 2,425 | | | | 2,522,000 | |
Informatica LLC, 7.13%, 7/15/23 (c) | | | | | | | 477 | | | | 469,249 | |
Nuance Communications, Inc., 5.38%, 8/15/20 (c) | | | | | | | 1,901 | | | | 1,941,396 | |
Oracle Corp., 2.65%, 7/15/26 (d) | | | | | | | 4,890 | | | | 4,720,239 | |
PTC, Inc., 6.00%, 5/15/24 | | | | | | | 313 | | | | 334,910 | |
| | | | | | | | | | | | |
| | | | | | | | | | | | 12,141,291 | |
| Specialty Retail — 0.7% | | | | | | | | | |
L Brands, Inc.: | | | | | | | | | | | | |
7.00%, 5/01/20 | | | | | | | 3,050 | | | | 3,377,875 | |
6.88%, 11/01/35 | | | | | | | 1,119 | | | | 1,103,334 | |
Penske Automotive Group, Inc., 5.38%, 12/01/24 | | | | | | | 1,951 | | | | 1,965,633 | |
VF Corp., 5.95%, 11/01/17 (d) | | | | | | | 5,000 | | | | 5,111,145 | |
| | | | | | | | | | | | |
| | | | | | | | | | | | 11,557,987 | |
| Technology Hardware, Storage & Peripherals — 0.4% | |
Diamond 1 Finance Corp./Diamond 2 Finance Corp. (c): | | | | | | | | | | | | |
5.88%, 6/15/21 | | | | | | | 615 | | | | 651,900 | |
7.13%, 6/15/24 | | | | | | | 747 | | | | 825,687 | |
8.35%, 7/15/46 | | | | | | | 2,355 | | | | 3,048,022 | |
Western Digital Corp.: | | | | | | | | | | | | |
7.38%, 4/01/23 (c) | | | | | | | 1,199 | | | | 1,312,905 | |
10.50%, 4/01/24 | | | | | | | 584 | | | | 687,660 | |
| | | | | | | | | | | | |
| | | | | | | | | | | | 6,526,174 | |
| Textiles, Apparel & Luxury Goods — 0.2% | | | | | | | | | |
Levi Strauss & Co., 5.00%, 5/01/25 | | | | | | | 699 | | | | 720,844 | |
Springs Industries, Inc., 6.25%, 6/01/21 | | | | | | | 304 | | | | 313,500 | |
William Carter Co., 5.25%, 8/15/21 | | | | | | | 1,406 | | | | 1,451,695 | |
| | | | | | | | | | | | |
| | | | | | | | | | | | 2,486,039 | |
| Thrifts & Mortgage Finance — 0.1% | | | | | | | | | |
Ladder Capital Finance Holdings LLLP/Ladder Capital Finance Corp., 5.25%, 3/15/22 (c) | | | | | | | 1,205 | | | | 1,236,631 | |
| Tobacco — 1.7% | | | | | | | | | |
Altria Group, Inc., 10.20%, 2/06/39 (d) | | | | | | | 13,392 | | | | 22,712,069 | |
Reynolds American, Inc.: | | | | | | | | | | | | |
4.85%, 9/15/23 | | | | | | | 1,120 | | | | 1,229,073 | |
5.85%, 8/15/45 | | | | | | | 2,335 | | | | 2,759,050 | |
| | | | | | | | | | | | |
| | | | | | | | | | | | 26,700,192 | |
| | | | | | | | | | | | |
| Corporate Bonds | | Par (000) | | | Value | |
| Trading Companies & Distributors — 0.3% | | | | | | | | | |
Doric Nimrod Air Alpha Ltd. Pass-Through Trust, Series 2013-1 (c): | | | | | | | | | | | | |
Class A, 5.25%, 5/30/25 | | | USD | | | | 2,182 | | | $ | 2,269,416 | |
Class B, 6.13%, 11/30/21 | | | | | | | 2,159 | | | | 2,218,153 | |
| | | | | | | | | | | | |
| | | | | | | | | | | | 4,487,569 | |
| Transportation Infrastructure — 0.8% | | | | | | | | | |
CEVA Group PLC, 9.00%, 9/01/20 (c)(h) | | | | | | | 1,845 | | | | 1,734,300 | |
Penske Truck Leasing Co. LP/PTL Finance Corp., 4.88%, 7/11/22 (c) | | | | | | | 10,500 | | | | 11,423,464 | |
| | | | | | | | | | | | |
| | | | | | | | | | | | 13,157,764 | |
| Wireless Telecommunication Services — 1.1% | |
America Movil SAB de CV, 3.13%, 7/16/22 | | | | | | | 1,275 | | | | 1,293,623 | |
Crown Castle International Corp., 5.25%, 1/15/23 | | | | | | | 1,380 | | | | 1,527,020 | |
Crown Castle Towers LLC, 6.11%, 1/15/40 (c) | | | | | | | 4,555 | | | | 4,934,288 | |
Digicel Group Ltd., 7.13%, 4/01/22 (c) | | | | | | | 370 | | | | 310,430 | |
Digicel Ltd., 6.00%, 4/15/21 (c) | | | | | | | 1,285 | | | | 1,220,750 | |
Sprint Communications, Inc., 9.00%, 11/15/18 (c) | | | | | | | 5,290 | | | | 5,785,937 | |
Sprint Corp., 7.13%, 6/15/24 | | | | | | | 1,755 | | | | 1,914,056 | |
T-Mobile USA, Inc., 6.84%, 4/28/23 | | | | | | | 645 | | | | 691,762 | |
| | | | | | | | | | | | |
| | | | | | | | | | | | 17,677,866 | |
| Total Corporate Bonds — 91.5% | | | | | | | | | | | 1,439,982,910 | |
| | | | | | | | | | | | |
| | | | | | | | | | | | | |
| | | |
| Foreign Agency Obligations | | | | | | | | | |
Brazilian Government International Bond, 5.00%, 1/27/45 | | | | | | | 6,525 | | | | 5,913,281 | |
Colombia Government International Bond, 5.63%, 2/26/44 | | | | | | | 4,000 | | | | 4,370,000 | |
Indonesia Government International Bond, 5.88%, 1/15/24 (c) | | | | | | | 4,400 | | | | 5,014,583 | |
Mexico Government International Bond, 4.75%, 3/08/44 | | | | | | | 5,800 | | | | 5,721,700 | |
Republic of Argentina, 5.63%, 1/26/22 | | | | | | | 6,485 | | | | 6,754,128 | |
Uruguay Government International Bond, 5.10%, 6/18/50 | | | | | | | 3,500 | | | | 3,482,500 | |
| Total Foreign Agency Obligations — 2.0% | | | | | | | | | | | 31,256,192 | |
| | | | | | | | | | | | |
| | | | | | | | | | | | | |
| | | |
| Municipal Bonds | | | | | | | | | |
City of Chicago Illinois, Refunding ARB, O’Hare International Airport, General 3rd Lien, Build America Bonds, Series B, 6.85%, 1/01/38 | | | | | | | 5,000 | | | | 5,532,500 | |
Metropolitan Transportation Authority, RB, Build America Bonds, Series B-1, 6.55%, 11/15/31 | | | | | | | 10,000 | | | | 12,910,200 | |
| Total Municipal Bonds — 1.2% | | | | | | | | | | | 18,442,700 | |
| | | | | | | | | | | | |
| | | | | | | | | | | | | |
| | | |
| Preferred Securities | | | | | | | | | |
| | | |
| Capital Trusts | | | | | | | | | |
| Banks — 4.8% | | | | | | | | | |
BNP Paribas SA (b)(c)(e): | | | | | | | | | | | | |
7.20% | | | | | | | 5,000 | | | | 5,562,500 | |
7.38% | | | | | | | 4,535 | | | | 4,824,106 | |
See Notes to Financial Statements.
| | | | | | |
| | | | | | | |
| 18 | | SEMI-ANNUAL REPORT | | APRIL 30, 2017 | | |
| | |
Schedule of Investments (continued) | | BlackRock Credit Allocation Income Trust (BTZ) |
| | | | | | | | | | | | |
| Capital Trusts | | Par (000) | | | Value | |
| Banks (continued) | | | | | | | | | |
Capital One Financial Corp., Series E, 5.55% (b)(e) | | | USD | | | | 5,000 | | | $ | 5,200,000 | |
Citigroup, Inc. (b)(e): | | | | | | | | | | | | |
5.90% | | | | | | | 2,210 | | | | 2,320,500 | |
5.95% | | | | | | | 7,000 | | | | 7,354,375 | |
Credit Suisse Group AG (b)(c)(e): | | | | | | | | | | | | |
6.25% | | | | | | | 5,000 | | | | 5,212,100 | |
7.50% | | | | | | | 3,250 | | | | 3,604,380 | |
HSBC Capital Funding LP, 10.18% (b)(c)(e) | | | | | | | 11,835 | | | | 18,166,725 | |
Macquarie Bank Ltd., 6.13% (b)(c)(e) | | | | | | | 1,885 | | | | 1,918,930 | |
Nordea Bank AB, 6.13% (b)(c)(e) | | | | | | | 5,540 | | | | 5,720,050 | |
U.S. Bancorp, Series J, 5.30% (b)(e) | | | | | | | 10,415 | | | | 10,766,506 | |
Wells Fargo & Co., (b)(e): | | | | | | | | | | | | |
Series K, 7.98% | | | | | | | 809 | | | | 846,416 | |
Series S, 5.90% | | | | | | | 281 | | | | 298,563 | |
Series U, 5.88% | | | | | | | 2,655 | | | | 2,880,675 | |
| | | | | | | | | | | | |
| | | | | | | | | | | | 74,675,826 | |
| Capital Markets — 2.3% | | | | | | | | | |
Charles Schwab Corp., Series E, 4.63% (b)(e) | | | | | | | 6,805 | | | | 6,873,050 | |
Goldman Sachs Group, Inc., Series L, 5.70% (b)(e) | | | | | | | 2,950 | | | | 3,045,875 | |
Morgan Stanley, Series H, 5.45% (b)(e) | | | | | | | 8,675 | | | | 8,881,031 | |
State Street Corp. (b): | | | | | | | | | | | | |
2.13%, 6/15/37 | | | | | | | 17,845 | | | | 15,681,294 | |
5.25%, 12/29/49 | | | | | | | 1,855 | | | | 1,947,750 | |
| | | | | | | | | | | | |
| | | | | | | | | | | | 36,429,000 | |
| Commercial Services & Supplies — 0.3% | | | | | | | | | |
AerCap Global Aviation Trust, 6.50%, 6/15/45 (b)(c) | | | | | | | 5,000 | | | | 5,250,000 | |
| Consumer Finance — 0.3% | | | | | | | | | |
American Express Co., Series C, 4.90% (b)(e) | | | | | | | 4,510 | | | | 4,583,288 | |
| Diversified Financial Services — 4.7% | | | | | | | | | |
Bank of America Corp. (b)(e): | | | | | | | | | | | | |
Series AA, 6.10% | | | | | | | 6,630 | | | | 7,102,387 | |
Series K, 8.00% | | | | | | | 2,420 | | | | 2,510,750 | |
Series U, 5.20% | | | | | | | 5,785 | | | | 5,806,983 | |
Barclays PLC, 6.63% (b)(e) | | | | | | | 7,385 | | | | 7,523,469 | |
BNP Paribas SA, 6.75% (b)(c)(e) | | | | | | | 5,000 | | | | 5,231,250 | |
Credit Agricole SA, 8.13% (b)(c)(e) | | | | | | | 5,000 | | | | 5,518,100 | |
JPMorgan Chase & Co. (b)(e): | | | | | | | 7,775 | | | | 8,770,200 | |
6.75% | | | | | | | | | | | | |
Series 1, 7.90% | | | | | | | 3,650 | | | | 3,814,250 | |
Series Q, 5.15% | | | | | | | 4,000 | | | | 4,040,000 | |
Series R, 6.00% | | | | | | | 14,130 | | | | 14,960,137 | |
Royal Bank of Scotland Group PLC (b)(e): | | | | | | | | | | | | |
8.00% | | | | | | | 970 | | | | 1,006,375 | |
8.63% | | | | | | | 5,135 | | | | 5,543,233 | |
Societe Generale SA, 7.38% (b)(c)(e) | | | | | | | 1,980 | | | | 2,093,850 | |
| | | | | | | | | | | | |
| | | | | | | | | | | | 73,920,984 | |
| Electric Utilities — 0.5% | | | | | | | | | |
PPL Capital Funding, Inc., Series A, 3.82%, 3/20/67 (b) | | | | | | | 8,300 | | | | 7,988,750 | |
| Industrial Conglomerates — 0.7% | | | | | | | | | |
General Electric Co., Series D, 5.00% (b)(e) | | | | | | | 10,777 | | | | 11,367,041 | |
| Insurance — 4.4% | | | | | | | | | |
ACE Capital Trust II, 9.70%, 4/1/30 | | | | | | | 7,000 | | | | 10,465,000 | |
Allstate Corp., 5.75%, 5/15/68 (b) | | | | | | | 5,000 | | | | 5,437,500 | |
American International Group, Inc., 8.18%, 5/15/68 (b) | | | | | | | 3,755 | | | | 4,843,950 | |
Bank One Capital III, 8.75%, 9/1/30 | | | | | | | 2,000 | | | | 2,920,000 | |
Chubb Corp., 3.41%, 3/29/67 (b)(d) | | | | | | | 7,400 | | | | 7,326,000 | |
| | | | | | | | | | | | |
| Capital Trusts | | Par (000) | | | Value | |
| Insurance (continued) | | | | | | | | | |
Equitable of Iowa Cos. Capital Trust II, Series B, 8.42%, 4/1/27 | | | USD | | | | 5,000 | | | $ | 5,725,130 | |
Farmers Exchange Capital II, 6.15%,
11/1/53 (b)(c) | | | | | | | 4,890 | | | | 5,440,321 | |
Great-West Life & Annuity Insurance Capital LP II, 3.58%, 5/16/46 (b)(c) | | | | | | | 500 | | | | 495,625 | |
Hartford Financial Services Group, Inc., 8.13%, 6/15/68 (b) | | | | | | | 5,050 | | | | 5,338,809 | |
MetLife, Inc., 6.40%, 12/15/66 | | | | | | | 5,000 | | | | 5,625,000 | |
Principal Financial Group, Inc., 4.70%, 5/15/55 (b) | | | | | | | 5,000 | | | | 5,112,500 | |
Reinsurance Group of America, Inc., 3.80%, 12/15/65 (b) | | | | | | | 12,000 | | | | 11,172,000 | |
| | | | | | | | | | | | |
| | | | | | | | | | | | 69,901,835 | |
| Media — 0.6% | | | | | | | | | |
NBCUniversal Enterprise, Inc., 5.25% (c)(e) | | | | | | | 5,600 | | | | 5,901,000 | |
Viacom, Inc. (b): | | | | | | | | | | | | |
5.88%, 2/28/57 | | | | | | | 2,170 | | | | 2,240,525 | |
6.25%, 2/28/57 | | | | | | | 590 | | | | 605,487 | |
| | | | | | | | | | | | |
| | | | | | | | | | | | 8,747,012 | |
| Oil, Gas & Consumable Fuels — 1.9% | | | | | | | | | |
Enbridge, Inc., Series 16-A, 6.00%, 1/15/77 (b) | | | | | | | 5,880 | | | | 5,997,600 | |
Enterprise Products Operating LLC (b): | | | | | | | | | | | | |
7.00%, 6/1/67 | | | | | | | 2,500 | | | | 2,368,750 | |
Series A, 4.88%, 8/1/66 | | | | | | | 9,325 | | | | 9,325,000 | |
TransCanada PipeLines Ltd., 6.35%, 5/15/67 (b) | | | | | | | 9,400 | | | | 8,671,500 | |
TransCanada Trust, 5.63%, 5/20/75 (b) | | | | | | | 2,755 | | | | 2,878,975 | |
| | | | | | | | | | | | |
| | | | | | | | | | | | 29,241,825 | |
| Real Estate Investment Trusts (REITs) — 0.6% | |
Sovereign Real Estate Investment Trust, 12.00% (c)(e) | | | | | | | 7,000 | | | | 8,706,250 | |
| Road & Rail — 0.4% | |
BNSF Funding Trust I, 6.61%, 12/15/55 (b) | | | | | | | 6,125 | | | | 6,982,500 | |
| Total Capital Trusts — 21.5% | | | | | | | | | | | 337,794,311 | |
| | | | | | | | | | | | |
| | | | | | | | | | | | | |
| | | |
| Preferred Stocks | | | | | Shares | | | | |
| Banks — 1.9% | |
Citigroup, Inc., Series K, 6.88% (b)(e) | | | | | | | 488,320 | | | | 14,381,024 | |
Wells Fargo & Co., 5.85% (b)(e) | | | | | | | 550,500 | | | | 14,918,550 | |
| | | | | | | | | | | | |
| | | | | | | | | | | | 29,299,574 | |
| Capital Markets — 0.7% | |
Goldman Sachs Group, Inc., Series J,
5.50% (b)(e) | | | | | | | 162,450 | | | | 4,379,652 | |
SCE Trust III, Series H, 5.75% (b)(e) | | | | | | | 31,650 | | | | 895,695 | |
State Street Corp., Series D, 5.90% (b)(e) | | | | | | | 220,495 | | | | 6,204,729 | |
| | | | | | | | | | | | |
| | | | | | | | | | | | 11,480,076 | |
| Electric Utilities — 0.1% | |
Entergy Louisiana LLC, 5.25% (e) | | | | | | | 90,000 | | | | 2,250,000 | |
| Real Estate Investment Trusts (REITs) — 0.2% | |
Ventas Realty LP/Ventas Capital Corp., 5.45% (e) | | | | | | | 75,000 | | | | 1,869,000 | |
Vornado Realty Trust, Series K, 5.70% (e) | | | | | | | 50,000 | | | | 1,273,500 | |
| | | | | | | | | | | | |
| | | | | | | | | | | | 3,142,500 | |
| Wireless Telecommunication Services — 1.1% | |
Centaur Funding Corp., 9.08% (c)(e) | | | | | | | 15,143 | | | | 17,580,077 | |
| Total Preferred Stocks — 4.0% | | | | | | | | | | | 63,752,227 | |
See Notes to Financial Statements.
| | | | | | |
| | | | | | | |
| | SEMI-ANNUAL REPORT | | APRIL 30, 2017 | | 19 |
| | |
Schedule of Investments (continued) | | BlackRock Credit Allocation Income Trust (BTZ) |
| | | | | | | | | | | | |
| Trust Preferred | | | | | Shares | | | Value | |
| Diversified Financial Services — 0.5% | |
GMAC Capital Trust I, Series 2, 6.82%, 2/15/40 (b) | | | | | | | 300,411 | | | $ | 7,533,492 | |
| Total Preferred Securities — 26.0% | | | | | | | | | | | 409,080,030 | |
| | | | | | | | | | | | |
| | | | | | | | | | | | | |
| | | |
U.S. Government Sponsored Agency
Securities — 0.2% | | | | | Par (000) | | | | |
| Agency Obligations — 0.2% | | | | | | | | | |
Fannie Mae, 0.00%, 10/09/19 (d)(i) | | | USD | | | | 3,945 | | | | 3,775,259 | |
| | | | | | | | | | | | |
| | | | | | | | | | | | | |
| | | |
| U.S. Treasury Obligations | | | | | | | | | |
U.S. Treasury Bonds: | | | | | | | | | | | | |
2.88%, 8/15/45 | | | | | | | 400 | | | | 393,219 | |
2.88%, 11/15/46 (d) | | | | | | | 27,625 | | | | 27,152,364 | |
| Total U.S. Treasury Obligations — 1.7% | | | | | | | | | | | 27,545,583 | |
Total Long-Term Investments
(Cost — $1,864,011,236) — 126.2% | | | | | | | | | | | 1,986,870,651 | |
| | | | | | | | | | | | |
| Short-Term Securities — 0.8% | | | | | Shares | | | Value | |
BlackRock Liquidity Funds, T-Fund, Institutional Class, 0.64% (j)(k) | | | | | | | 12,260,042 | | | $ | 12,260,042 | |
Total Short-Term Securities
(Cost — $12,260,042) — 0.8% | | | | 12,260,042 | |
Options Purchased
(Cost — $844,930) — 0.0% | | | | 484,375 | |
Total Investments Before Options Written
(Cost — $1,877,116,208) — 127.0% | | | | 1,999,615,068 | |
Options Written
(Premiums Received — $1,309,520) — (0.0)% | | | | (754,503 | ) |
Total Investments, Net of Options Written (Cost — $1,875,806,688) — 127.0% | | | | 1,998,860,565 | |
Liabilities in Excess of Other Assets — (27.0)% | | | | (425,032,534 | ) |
| | | | | | | | | | | | |
Net Assets — 100.0% | | | | | | | | | | $ | 1,573,828,031 | |
| | | | | | | | | | | | |
| | | | | | |
| Notes to Schedule of Investments |
| (a) | | Restricted security as to resale, excluding 144A securities. As of period end, the Trust held restricted securities with a current value of $0 and an original cost of $45,445, which was less than 0.05% of its net assets. |
| (b) | | Variable rate security. Rate as of period end. |
| (c) | | Security exempt from registration pursuant to Rule 144A under the Securities Act of 1933, as amended. These securities may be resold in transactions exempt from registration to qualified institutional investors. |
| (d) | | All or a portion of the security has been pledged as collateral in connection with outstanding reverse repurchase agreements. |
| (e) | | Perpetual security with no stated maturity date. |
| (f) | | Issuer filed for bankruptcy and/or is in default. |
| (g) | | Step-down bond that pays an initial coupon rate for the first period and then a lower coupon rate for the following periods. Rate as of period end. |
| (h) | | Payment-in-kind security which may pay interest/dividends in additional par/shares and/or in cash. Rates shown are the current rate and possible payment rates. |
| (j) | | During the period ended April 30, 2017, investments in issuers considered to be affiliate of the Trust for purposes of Section 2(a)(3) of the Investment Company Act of 1940, as amended, were as follows: |
| | | | | | | | | | | | | | | | | | | | | | | | | | |
| Affiliate | | Shares Held
at October 31,
2016 | | | Net
Activity | | | Shares Held
at April 30,
2017 | | | Value at
April 30,
2017 | | | Income | | | Net
Realized
Gain1 | | | Change in
Unrealized
Appreciation
(Depreciation) |
BlackRock Liquidity Funds, T-Fund, Institutional Class | | | 9,872,272 | | | | 2,387,770 | | | | 12,260,042 | | | $ | 12,260,042 | | | $ | 44,832 | | | $ | 132 | | | — |
1 Includes net capital gain distributions. |
| (k) | | Current yield as of period end. |
For Trust compliance purposes, the sector classifications refer to one or more of the sector sub-classifications used by one or more widely recognized market indexes or rating group indexes, and/or as defined by the investment adviser. These definitions may not apply for purposes of this report, which may combine such sector sub-classifications for reporting ease.
| | | | | | | | | | | | | | | | | | | | | | | | |
| Reverse Repurchase Agreements | | | | | | | | | | | |
| Counterparty | | Interest
Rate | | | Trade
Date | | | Maturity
Date1 | | | Face Value | | | Face Value
Including
Accrued
Interest | | | Type of Non-Cash Underlying Collateral | | Remaining
Contractual Maturity
of the Agreements1 |
Credit Suisse Securities (USA) LLC | | | 1.25 | % | | | 10/06/16 | | | | Open | | | $ | 4,645,500 | | | $ | 4,668,172 | | | Corporate Bonds | | Open/Demand |
RBC Capital Markets LLC | | | 1.34 | % | | | 11/10/16 | | | | Open | | | | 8,920,000 | | | | 8,958,425 | | | Corporate Bonds | | Open/Demand |
RBC Capital Markets LLC | | | 1.34 | % | | | 11/18/16 | | | | Open | | | | 5,005,778 | | | | 5,026,630 | | | Corporate Bonds | | Open/Demand |
Credit Suisse Securities (USA) LLC | | | 0.95 | % | | | 12/19/16 | | | | Open | | | | 2,935,625 | | | | 2,945,773 | | | Corporate Bonds | | Open/Demand |
Credit Suisse Securities (USA) LLC | | | 0.95 | % | | | 12/19/16 | | | | Open | | | | 2,229,562 | | | | 2,237,270 | | | Corporate Bonds | | Open/Demand |
See Notes to Financial Statements.
| | | | | | |
| | | | | | | |
| 20 | | SEMI-ANNUAL REPORT | | APRIL 30, 2017 | | |
| | |
Schedule of Investments (continued) | | BlackRock Credit Allocation Income Trust (BTZ) |
| | | | | | | | | | | | | | | | | | | | | | | | |
| Reverse Repurchase Agreements (continued) | | | | | | | | | | | |
| Counterparty | | Interest
Rate | | | Trade
Date | | | Maturity
Date1 | | | Face Value | | | Face Value
Including
Accrued
Interest | | | Type of Non-Cash Underlying Collateral | | Remaining
Contractual Maturity
of the Agreements1 |
Credit Suisse Securities (USA) LLC | | | 1.00 | % | | | 12/19/16 | | | | Open | | | $ | 525,938 | | | $ | 527,851 | | | Corporate Bonds | | Open/Demand |
Credit Suisse Securities (USA) LLC | | | 1.00 | % | | | 12/19/16 | | | | Open | | | | 6,304,656 | | | | 6,327,598 | | | Corporate Bonds | | Open/Demand |
Credit Suisse Securities (USA) LLC | | | 1.00 | % | | | 12/19/16 | | | | Open | | | | 5,055,188 | | | | 5,073,583 | | | Corporate Bonds | | Open/Demand |
Credit Suisse Securities (USA) LLC | | | 1.00 | % | | | 12/19/16 | | | | Open | | | | 4,973,062 | | | | 4,991,159 | | | Corporate Bonds | | Open/Demand |
Credit Suisse Securities (USA) LLC | | | 1.00 | % | | | 12/19/16 | | | | Open | | | | 2,919,531 | | | | 2,930,155 | | | Corporate Bonds | | Open/Demand |
RBC Capital Markets LLC | | | 1.04 | % | | | 12/19/16 | | | | Open | | | | 4,150,000 | | | | 4,165,825 | | | Corporate Bonds | | Open/Demand |
RBC Capital Markets LLC | | | 1.04 | % | | | 12/19/16 | | | | Open | | | | 5,606,250 | | | | 5,627,629 | | | Corporate Bonds | | Open/Demand |
RBC Capital Markets LLC | | | 1.04 | % | | | 12/19/16 | | | | Open | | | | 4,565,000 | | | | 4,582,408 | | | Corporate Bonds | | Open/Demand |
RBC Capital Markets LLC | | | 1.04 | % | | | 12/19/16 | | | | Open | | | | 3,244,125 | | | | 3,256,496 | | | Corporate Bonds | | Open/Demand |
RBC Capital Markets LLC | | | 1.04 | % | | | 12/19/16 | | | | Open | | | | 3,294,000 | | | | 3,306,561 | | | Corporate Bonds | | Open/Demand |
RBC Capital Markets LLC | | | 1.04 | % | | | 12/19/16 | | | | Open | | | | 7,834,750 | | | | 7,864,627 | | | Corporate Bonds | | Open/Demand |
RBC Capital Markets LLC | | | 1.04 | % | | | 12/19/16 | | | | Open | | | | 13,740,000 | | | | 13,792,395 | | | Corporate Bonds | | Open/Demand |
RBC Capital Markets LLC | | | 1.04 | % | | | 12/19/16 | | | | Open | | | | 6,630,000 | | | | 6,655,282 | | | Corporate Bonds | | Open/Demand |
RBC Capital Markets LLC | | | 1.04 | % | | | 12/19/16 | | | | Open | | | | 3,509,512 | | | | 3,522,895 | | | Corporate Bonds | | Open/Demand |
RBC Capital Markets LLC | | | 1.04 | % | | | 12/19/16 | | | | Open | | | | 7,425,000 | | | | 7,453,314 | | | Corporate Bonds | | Open/Demand |
RBC Capital Markets LLC | | | 1.04 | % | | | 12/19/16 | | | | Open | | | | 3,900,000 | | | | 3,914,872 | | | Corporate Bonds | | Open/Demand |
RBC Capital Markets LLC | | | 1.04 | % | | | 12/19/16 | | | | Open | | | | 9,825,000 | | | | 9,862,466 | | | Corporate Bonds | | Open/Demand |
RBC Capital Markets LLC | | | 1.04 | % | | | 12/19/16 | | | | Open | | | | 3,311,650 | | | | 3,324,278 | | | Corporate Bonds | | Open/Demand |
RBC Capital Markets LLC | | | 1.04 | % | | | 12/19/16 | | | | Open | | | | 4,405,500 | | | | 4,422,300 | | | Corporate Bonds | | Open/Demand |
RBC Capital Markets LLC | | | 1.04 | % | | | 12/19/16 | | | | Open | | | | 6,450,000 | | | | 6,474,596 | | | Corporate Bonds | | Open/Demand |
RBC Capital Markets LLC | | | 1.04 | % | | | 12/19/16 | | | | Open | | | | 12,570,000 | | | | 12,617,934 | | | Corporate Bonds | | Open/Demand |
RBC Capital Markets LLC | | | 1.04 | % | | | 12/19/16 | | | | Open | | | | 5,260,000 | | | | 5,280,058 | | | Corporate Bonds | | Open/Demand |
RBC Capital Markets LLC | | | 1.04 | % | | | 12/19/16 | | | | Open | | | | 3,225,000 | | | | 3,237,298 | | | Corporate Bonds | | Open/Demand |
RBC Capital Markets LLC | | | 1.04 | % | | | 12/19/16 | | | | Open | | | | 17,356,500 | | | | 17,422,686 | | | Corporate Bonds | | Open/Demand |
RBC Capital Markets LLC | | | 1.04 | % | | | 12/19/16 | | | | Open | | | | 3,633,437 | | | | 3,647,293 | | | Corporate Bonds | | Open/Demand |
RBC Capital Markets LLC | | | 1.04 | % | | | 12/19/16 | | | | Open | | | | 21,996,360 | | | | 22,080,239 | | | Corporate Bonds | | Open/Demand |
RBC Capital Markets LLC | | | 1.04 | % | | | 12/19/16 | | | | Open | | | | 4,034,160 | | | | 4,049,544 | | | Corporate Bonds | | Open/Demand |
RBC Capital Markets LLC | | | 1.04 | % | | | 12/19/16 | | | | Open | | | | 3,225,000 | | | | 3,237,298 | | | Corporate Bonds | | Open/Demand |
RBC Capital Markets LLC | | | 1.04 | % | | | 12/19/16 | | | | Open | | | | 17,512,500 | | | | 17,579,281 | | | Corporate Bonds | | Open/Demand |
RBC Capital Markets LLC | | | 1.04 | % | | | 12/19/16 | | | | Open | | | | 6,961,875 | | | | 6,988,423 | | | Corporate Bonds | | Open/Demand |
RBC Capital Markets LLC | | | 1.04 | % | | | 12/21/16 | | | | Open | | | | 8,789,375 | | | | 8,822,384 | | | Corporate Bonds | | Open/Demand |
Citigroup Global Markets, Inc. | | | (2.00 | )% | | | 1/04/17 | | | | Open | | | | 1,391,540 | | | | 1,382,572 | | | Corporate Bonds | | Open/Demand |
Credit Suisse Securities (USA) LLC | | | 1.30 | % | | | 1/11/17 | | | | Open | | | | 3,391,096 | | | | 3,402,306 | | | Corporate Bonds | | Open/Demand |
RBC Capital Markets LLC | | | 1.34 | % | | | 1/18/17 | | | | Open | | | | 1,898,800 | | | | 1,904,815 | | | Corporate Bonds | | Open/Demand |
Deutsche Bank Securities, Inc. | | | 0.88 | % | | | 2/07/17 | | | | Open | | | | 3,757,000 | | | | 3,763,051 | | | U.S. Government Sponsored Agency Securities | | Open/Demand |
RBC Capital Markets LLC | | | 1.34 | % | | | 2/13/17 | | | | Open | | | | 12,633,600 | | | | 12,664,861 | | | Corporate Bonds | | Open/Demand |
RBC Capital Markets LLC | | | 1.34 | % | | | 2/13/17 | | | | Open | | | | 5,842,100 | | | | 5,856,556 | | | Corporate Bonds | | Open/Demand |
Deutsche Bank Securities, Inc. | | | 0.63 | % | | | 2/17/17 | | | | Open | | | | 26,881,250 | | | | 26,898,573 | | | U.S. Treasury Obligations | | Open/Demand |
UBS Securities LLC | | | 1.25 | % | | | 3/16/17 | | | | Open | | | | 8,300,000 | | | | 8,312,969 | | | Corporate Bonds | | Open/Demand |
UBS Securities LLC | | | 1.25 | % | | | 3/16/17 | | | | Open | | | | 5,397,425 | | | | 5,405,858 | | | Corporate Bonds | | Open/Demand |
UBS Securities LLC | | | 1.25 | % | | | 3/16/17 | | | | Open | | | | 3,079,844 | | | | 3,084,656 | | | Corporate Bonds | | Open/Demand |
Barclays Capital, Inc. | | | 1.50 | % | | | 3/20/17 | | | | Open | | | | 2,768,500 | | | | 2,773,230 | | | Corporate Bonds | | Open/Demand |
Barclays Capital, Inc. | | | 1.50 | % | | | 3/20/17 | | | | Open | | | | 2,429,313 | | | | 2,433,463 | | | Corporate Bonds | | Open/Demand |
Barclays Capital, Inc. | | | 1.50 | % | | | 3/20/17 | | | | Open | | | | 6,956,000 | | | | 6,967,883 | | | Capital Trusts | | Open/Demand |
Barclays Capital, Inc. | | | 1.50 | % | | | 3/20/17 | | | | Open | | | | 1,198,438 | | | | 1,200,485 | | | Corporate Bonds | | Open/Demand |
Barclays Capital, Inc. | | | 1.50 | % | | | 3/20/17 | | | | Open | | | | 719,063 | | | | 720,291 | | | Corporate Bonds | | Open/Demand |
Citigroup Global Markets, Inc. | | | 0.00 | % | | | 3/21/17 | | | | Open | | | | 1,428,800 | | | | 1,428,800 | | | Corporate Bonds | | Open/Demand |
BNP Paribas S.A. | | | 1.36 | % | | | 3/22/17 | | | | Open | | | | 2,935,000 | | | | 2,939,324 | | | Corporate Bonds | | Open/Demand |
BNP Paribas S.A. | | | 1.36 | % | | | 3/22/17 | | | | Open | | | | 9,885,000 | | | | 9,899,564 | | | Corporate Bonds | | Open/Demand |
BNP Paribas S.A. | | | 1.36 | % | | | 3/22/17 | | | | Open | | | | 5,432,000 | | | | 5,440,003 | | | Corporate Bonds | | Open/Demand |
BNP Paribas S.A. | | | 1.36 | % | | | 3/22/17 | | | | Open | | | | 4,506,000 | | | | 4,512,639 | | | Corporate Bonds | | Open/Demand |
BNP Paribas S.A. | | | 1.36 | % | | | 3/22/17 | | | | Open | | | | 5,508,000 | | | | 5,516,115 | | | Corporate Bonds | | Open/Demand |
BNP Paribas S.A. | | | 1.36 | % | | | 3/22/17 | | | | Open | | | | 15,240,000 | | | | 15,262,454 | | | Corporate Bonds | | Open/Demand |
BNP Paribas S.A. | | | 1.36 | % | | | 3/22/17 | | | | Open | | | | 4,994,000 | | | | 5,001,358 | | | Corporate Bonds | | Open/Demand |
BNP Paribas S.A. | | | 1.36 | % | | | 3/22/17 | | | | Open | | | | 4,524,000 | | | | 4,530,665 | | | Corporate Bonds | | Open/Demand |
BNP Paribas S.A. | | | 1.36 | % | | | 3/22/17 | | | | Open | | | | 4,994,000 | | | | 5,001,358 | | | Corporate Bonds | | Open/Demand |
BNP Paribas S.A. | | | 1.36 | % | | | 3/22/17 | | | | Open | | | | 1,912,000 | | | | 1,914,817 | | | Corporate Bonds | | Open/Demand |
BNP Paribas S.A. | | | 1.36 | % | | | 3/22/17 | | | | Open | | | | 7,141,000 | | | | 7,151,521 | | | Corporate Bonds | | Open/Demand |
BNP Paribas S.A. | | | 1.36 | % | | | 3/22/17 | | | | Open | | | | 3,143,000 | | | | 3,147,631 | | | Corporate Bonds | | Open/Demand |
BNP Paribas S.A. | | | 1.36 | % | | | 3/22/17 | | | | Open | | | | 9,203,000 | | | | 9,216,559 | | | Corporate Bonds | | Open/Demand |
BNP Paribas S.A. | | | 1.36 | % | | | 3/22/17 | | | | Open | | | | 5,812,000 | | | | 5,820,563 | | | Corporate Bonds | | Open/Demand |
BNP Paribas S.A. | | | 1.36 | % | | | 3/22/17 | | | | Open | | | | 2,865,000 | | | | 2,869,221 | | | Corporate Bonds | | Open/Demand |
BNP Paribas S.A. | | | 1.36 | % | | | 3/22/17 | | | | Open | | | | 5,152,000 | | | | 5,159,591 | | | Corporate Bonds | | Open/Demand |
See Notes to Financial Statements.
| | | | | | |
| | | | | | | |
| | SEMI-ANNUAL REPORT | | APRIL 30, 2017 | | 21 |
| | |
Schedule of Investments (continued) | | BlackRock Credit Allocation Income Trust (BTZ) |
| | | | | | | | | | | | | | | | | | | | | | | | | | | | |
| Reverse Repurchase Agreements (continued) | | | | | | | | | | | | | |
| Counterparty | | Interest
Rate | | | Trade
Date | | | Maturity
Date1 | | | Face Value | | | Face Value
Including
Accrued
Interest | | | Type of Non-Cash Underlying Collateral | | | Remaining
Contractual Maturity
of the Agreements1 | |
BNP Paribas S.A. | | | 1.36 | % | | | 3/22/17 | | | | Open | | | $ | 3,257,000 | | | $ | 3,261,799 | | | | Corporate Bonds | | | | Open/Demand | |
BNP Paribas S.A. | | | 1.36 | % | | | 3/22/17 | | | | Open | | | | 10,655,000 | | | | 10,670,698 | | | | Corporate Bonds | | | | Open/Demand | |
RBC Capital Markets LLC | | | (4.00 | )% | | | 4/05/17 | | | | Open | | | | 611,200 | | | | 609,502 | | | | Corporate Bonds | | | | Open/Demand | |
RBC Capital Markets LLC | | | 1.34 | % | | | 4/06/17 | | | | Open | | | | 6,324,250 | | | | 6,329,900 | | | | Corporate Bonds | | | | Open/Demand | |
Total | | | $ | 438,136,053 | | | $ | 439,330,649 | | | | | | | | | |
| | | | | | | | | | | | | | | | | | | | | | | | |
1 Certain agreements have no stated maturity and can be terminated by either party at any time. | |
| | | | | | | | | | | | | | | | | | |
| Derivative Financial Instruments Outstanding as of Period End |
| | | | | | | | | | | | | | |
| Futures Contracts | |
Contracts
Long (Short) | | | Issue | | Expiration | | Notional
Value | | | Unrealized
Appreciation
(Depreciation) | |
| | (252 | ) | | 10-Year U.S. Treasury Note | | June 2017 | | $ | 31,681,125 | | | $ | (208,259 | ) |
| | 48 | | | 2-Year U.S. Treasury Note | | June 2017 | | $ | 10,397,250 | | | | 1,661 | |
| | 720 | | | 5-Year U.S. Treasury Note | | June 2017 | | $ | 85,252,500 | | | | 411,181 | |
| | (217 | ) | | Ultra U.S. Treasury Bond | | June 2017 | | $ | 35,357,437 | | | | (579,328 | ) |
| | Total | | | | | | | | | | | $ | (374,745 | ) |
| | | | | | | | | | | | | | |
| | | | | | | | | | | | | | | | | | | | | | |
| Exchange-Traded Options Purchased | |
| Description | | Put/
Call | | Expiration
Date | | | Strike
Price | | | Contracts | | | Value | |
10-Year U.S. Treasury Note Future | | Call | | | 5/26/17 | | | | USD | | | | 126.00 | | | | 1,000 | | | $ | 484,375 | |
| | | | | | | | | | | | | | | | | | | | | | |
| Exchange-Traded Options Written | |
| Description | | Put/
Call | | Expiration
Date | | | Strike
Price | | | Contracts | | | Value | |
10-Year U.S. Treasury Note Future | | Call | | | 5/26/17 | | | | USD | | | | 127.00 | | | | 1,000 | | | $ | (203,125 | ) |
| | | | | | | | | | | | | | | | | | | | | | | | | | | | | | |
| OTC Interest Rate Swaptions Written | |
| Description | | Counterparty | | Put/
Call | | Exercise
Rate | | | Pay/
Receive
Exercise Rate | | Floating Rate
Index | | | Expiration
Date | | | Notional
Amount
(000) | | | Value | |
2-Year Interest Rate Swap | | Bank of America N.A. | | Put | | | 2.30 | % | | Receive | | | 6-Month LIBOR | | | | 9/24/18 | | | | USD | | | | 155,800 | | | $ | (551,378 | ) |
| | | | | | | | | | | | | | | | | | | | | | | | | | | | |
| OTC Credit Default Swaps — Buy Protection | |
| Issuer/Index | | Pay
Fixed
Rate | | | Counterparty | | Expiration
Date | | | Notional
Amount
(000) | | | Value | | | Premiums
Paid
(Received) | | | Unrealized
Depreciation | |
STMicro Electronics | | | 1.00 | % | | Barclays Bank PLC | | | 6/20/17 | | | EUR | | | 1,500 | | | $ | (4,027 | ) | | $ | 5,711 | | | $ | (9,738 | ) |
Cigna Corp. | | | 1.00 | % | | Goldman Sachs Bank USA | | | 9/20/17 | | | USD | | | 4,500 | | | | (22,247 | ) | | | (850 | ) | | | (21,397 | ) |
Cigna Corp. | | | 1.00 | % | | Goldman Sachs International | | | 9/20/17 | | | USD | | | 2,800 | | | | (13,843 | ) | | | (569 | ) | | | (13,274 | ) |
General Dynamics Corp. | | | 1.00 | % | | Credit Suisse International | | | 9/20/17 | | | USD | | | 5,585 | | | | (27,909 | ) | | | (11,416 | ) | | | (16,493 | ) |
Humana, Inc. | | | 1.00 | % | | Goldman Sachs Bank USA | | | 9/20/17 | | | USD | | | 4,500 | | | | (22,128 | ) | | | 5,850 | | | | (27,978 | ) |
Humana, Inc. | | | 1.00 | % | | Goldman Sachs International | | | 9/20/17 | | | USD | | | 2,800 | | | | (13,769 | ) | | | 3,915 | | | | (17,684 | ) |
Lockheed Martin Corp. | | | 1.00 | % | | Credit Suisse International | | | 9/20/17 | | | USD | | | 5,585 | | | | (27,960 | ) | | | (3,927 | ) | | | (24,033 | ) |
Northrop Grumman Corp. | | | 1.00 | % | | Credit Suisse International | | | 9/20/17 | | | USD | | | 4,715 | | | | (23,697 | ) | | | (8,871 | ) | | | (14,826 | ) |
Raytheon Co. | | | 1.00 | % | | Credit Suisse International | | | 9/20/17 | | | USD | | | 4,715 | | | | (23,717 | ) | | | (9,109 | ) | | | (14,608 | ) |
Citigroup, Inc. | | | 1.00 | % | | Deutsche Bank AG | | | 3/20/19 | | | USD | | | 16,700 | | | | (246,844 | ) | | | (27,752 | ) | | | (219,092 | ) |
Prudential Financial, Inc. | | | 1.00 | % | | Citibank N.A. | | | 6/20/21 | | | USD | | | 1,920 | | | | (42,155 | ) | | | 23,064 | | | | (65,219 | ) |
Prudential Financial, Inc. | | | 1.00 | % | | Goldman Sachs International | | | 6/20/21 | | | USD | | | 1,155 | | | | (25,359 | ) | | | 14,757 | | | | (40,116 | ) |
Prudential Financial, Inc. | | | 1.00 | % | | JPMorgan Chase Bank N.A. | | | 6/20/21 | | | USD | | | 9,500 | | | | (208,580 | ) | | | 99,876 | | | | (308,456 | ) |
Total | | | | | | | | | | | | | | | | | | $ | (702,235 | ) | | $ | 90,679 | | | $ | (792,914 | ) |
| | | | | | | | | | | | | | | | | | | | |
See Notes to Financial Statements.
| | | | | | |
| | | | | | | |
| 22 | | SEMI-ANNUAL REPORT | | APRIL 30, 2017 | | |
| | |
Schedule of Investments (continued) | | BlackRock Credit Allocation Income Trust (BTZ) |
| | | | | | | | | | | | | | | | | | | | | | | | | | | | | | | | |
| OTC Credit Default Swaps — Sell Protection | |
| Issuer/Index | | Receive
Fixed
Rate | | | Counterparty | | Expiration
Date | | | Credit
Rating1 | | Notional
Amount
(000)2 | | | Value | | | Premiums
Paid
(Received) | | | Unrealized
Depreciation | |
Anadarko Petroleum Corp. | | | 1.00 | % | | Credit Suisse International | | | 6/20/17 | | | BBB | | | USD | | | | 2,425 | | | $ | 5,855 | | | $ | (3,526 | ) | | $ | 9,381 | |
Anadarko Petroleum Corp. | | | 1.00 | % | | Morgan Stanley & Co. International PLC | | | 6/20/17 | | | BBB | | | USD | | | | 10 | | | | 24 | | | | (17 | ) | | | 41 | |
Anadarko Petroleum Corp. | | | 1.00 | % | | UBS AG | | | 6/20/17 | | | BBB | | | USD | | | | 994 | | | | 2,400 | | | | (1,675 | ) | | | 4,075 | |
Athem, Inc. (FKA WellPoint, Inc.) | | | 1.00 | % | | Goldman Sachs Bank USA | | | 9/20/17 | | | A- | | | USD | | | | 4,500 | | | | 21,413 | | | | (3,364 | ) | | | 24,777 | |
Athem, Inc. (FKA WellPoint, Inc.) | | | 1.00 | % | | Goldman Sachs International | | | 9/20/17 | | | A- | | | USD | | | | 2,800 | | | | 13,323 | | | | (2,251 | ) | | | 15,574 | |
Comcast Corp. | | | 1.00 | % | | Credit Suisse International | | | 9/20/17 | | | A- | | | USD | | | | 12,200 | | | | 60,189 | | | | 4,317 | | | | 55,872 | |
United Health Group, Inc. | | | 1.00 | % | | Goldman Sachs Bank USA | | | 9/20/17 | | | A+ | | | USD | | | | 4,500 | | | | 22,336 | | | | (847 | ) | | | 23,183 | |
United Health Group, Inc. | | | 1.00 | % | | Goldman Sachs International | | | 9/20/17 | | | A+ | | | USD | | | | 2,800 | | | | 13,898 | | | | (567 | ) | | | 14,465 | |
MetLife, Inc. | | | 1.00 | % | | Deutsche Bank AG | | | 3/20/18 | | | A- | | | USD | | | | 3,025 | | | | 27,513 | | | | (23,364 | ) | | | 50,877 | |
Bank of America Corp. | | | 1.00 | % | | Deutsche Bank AG | | | 3/20/19 | | | BBB+ | | | USD | | | | 16,700 | | | | 247,478 | | | | 49,483 | | | | 197,995 | |
American Tower Corp. | | | 1.00 | % | | Morgan Stanley & Co. International PLC | | | 6/20/21 | | | BBB- | | | USD | | | | 10,000 | | | | (162,954 | ) | | | (340,328 | ) | | | 177,374 | |
Total | | | | | | | | | | | | | | | | $ | 251,475 | | | $ | (322,139 | ) | | $ | 573,614 | |
| | | | | | | | | | | | | | | | | | |
| | | | | | | | | | | | |
| Transactions in Options Written for the Six Months Ended April 30, 2017 |
| | | | | | | | | | | | | | | | | | | | | | | | |
| | | Calls | | | | | | Puts | |
| | | | | | Notional (000) | | | | | | Notional (000) | |
| | | Contracts | | | USD | | | Premiums
Received | | | | | | USD | | | Premiums
Received | |
Outstanding options, beginning of period | | | — | | | | 155,800 | | | $ | 513,805 | | | | | | | | 155,800 | | | $ | 437,313 | |
Options written | | | 1,000 | | | | — | | | | 498,820 | | | | | | | | 155,800 | | | | 810,700 | |
Options exercised | | | — | | | | — | | | | — | | | | | | | | — | | | | — | |
Options expired | | | — | | | | — | | | | — | | | | | | | | — | | | | — | |
Options closed | | | — | | | | (155,800 | ) | | | (513,805 | ) | | | | | | | (155,800 | ) | | | (437,313 | ) |
| | | | | | | | | | | | |
Outstanding options, end of period | | | 1,000 | | | | — | | | $ | 498,820 | | | | | | | | 155,800 | | | $ | 810,700 | |
| | | | | | | | | | | | |
| | | | | | | | | | | | |
| Derivative Financial Instruments Categorized by Risk Exposure |
As of period end, the fair values of derivative financial instruments located in the Statements of Assets and Liabilities were as follows:
| | | | | | | | | | | | | | | | | | | | | | | | | | |
| Assets — Derivative Financial Instruments | | Commodity
Contracts | | Credit
Contracts | | | Equity
Contracts | | Foreign
Currency
Exchange
Contracts | | Interest
Rate
Contracts | | | Other
Contracts | | Total | | | | |
Futures contracts | | Net unrealized appreciation1 | | — | | | — | | | — | | — | | $ | 412,842 | | | — | | $ | 412,842 | | | | | |
Options purchased | | Investments at value — unaffiliated2 | | — | | | — | | | — | | — | | | 484,375 | | | — | | | 484,375 | | | | | |
Swaps — OTC | | Unrealized appreciation on OTC swaps; Swap premiums paid | | — | | $ | 780,587 | | | — | | — | | | — | | | — | | | 780,587 | | | | | |
| | | | | |
Total | | | | — | | $ | 780,587 | | | — | | — | | $ | 897,217 | | | — | | $ | 1,677,804 | | | | | |
| | | | | |
| | | | | | | | | | | | | | | | | | | | | | | | | | |
| Liabilities — Derivative Financial Instruments | | | | | | | | | | | | | | | | | | | | |
Futures contracts | | Net unrealized depreciation | | — | | | — | | | — | | — | | $ | 787,587 | | | — | | $ | 787,587 | | | | | |
Options written | | Options written at value | | — | | | — | | | — | | — | | | 754,503 | | | — | | | 754,503 | | | | | |
Swaps — OTC | | Unrealized depreciation on OTC swaps; Swap premiums received | | — | | $ | 1,231,347 | | | — | | — | | | — | | | — | | | 1,231,347 | | | | | |
| | | | | |
Total | | | | — | | $ | 1,231,347 | | | — | | — | | $ | 1,542,090 | | | — | | $ | 2,773,437 | | | | | |
| | | | | |
1 Includes cumulative appreciation (depreciation) on futures contracts and centrally cleared swaps, if any, as reported in the Schedule of Investments. Only current day’s variation margin is reported within the Statements of Assets and Liabilities. | | | | | |
2 Includes options purchased at value as reported in the Schedule of Investments. | | | | | |
See Notes to Financial Statements.
| | | | | | |
| | | | | | | |
| | SEMI-ANNUAL REPORT | | APRIL 30, 2017 | | 23 |
| | |
Schedule of Investments (continued) | | BlackRock Credit Allocation Income Trust (BTZ) |
For the six months ended April 30, 2017, the effect of derivative financial instruments in the Statements of Operations was as follows:
| | | | | | | | | | | | | | | | | | | | | | | | | | | | | | | | |
| Net Realized Gain (Loss) from: | | Commodity
Contracts | | | Credit
Contracts | | | Equity
Contracts | | | Foreign
Currency
Exchange
Contracts | | | Interest
Rate
Contracts | | | Other
Contracts | | | Total | | | | |
Futures contracts | | | — | | | | — | | | | — | | | | — | | | $ | 6,100,706 | | | | — | | | $ | 6,100,706 | | | | | |
Options purchased1 | | | — | | | | — | | | | — | | | $ | (1,260,340 | ) | | | 8,400,274 | | | | — | | | | 7,139,934 | | | | | |
Options written | | | — | | | | — | | | | — | | | | — | | | | (328,569 | ) | | | — | | | | (328,569 | ) | | | | |
Swaps | | | — | | | $ | 805 | | | | — | | | | — | | | | 129,804 | | | | — | | | | 130,609 | | | | | |
| | | | |
Total | | | — | | | $ | 805 | | | | — | | | $ | (1,260,340 | ) | | $ | 14,302,215 | | | | — | | | $ | 13,042,680 | | | | | |
| | | | |
| | | | | | | | | | | | | | | | | | | | | | | | | | | | | | | | |
| Net Change in Unrealized Appreciation (Depreciation) on: | | | | | | | | | | | | | | | | | | | | | | | | |
Futures contracts | | | — | | | | — | | | | — | | | | — | | | $ | (4,389,517 | ) | | | — | | | $ | (4,389,517 | ) | | | | |
Options purchased1 | | | — | | | | — | | | | — | | | $ | 1,101,752 | | | | (464,852 | ) | | | — | | | | 636,900 | | | | | |
Options written | | | — | | | | — | | | | — | | | | — | | | | 282,764 | | | | — | | | | 282,764 | | | | | |
Swaps | | | — | | | $ | (164,287 | ) | | | — | | | | — | | | | — | | | | — | | | | (164,287 | ) | | | | |
| | | | |
Total | | | — | | | $ | (164,287 | ) | | | — | | | $ | 1,101,752 | | | $ | (4,571,605 | ) | | | — | | | $ | (3,634,140 | ) | | | | |
| | | | |
1 Options purchased are included in net realized gain (loss) from investments. | | | | | |
| | | | |
| Average Quarterly Balances of Outstanding Derivative Financial Instruments | |
| |
| Futures contracts: | |
Average notional value of contracts — long | | $ | 98,350,055 | |
Average notional value of contracts — short | | $ | 142,056,079 | |
| Options: | |
Average value of option contracts purchased | | $ | 242,188 | |
Average value of option contracts written | | $ | 101,563 | |
Average notional value of swaption contracts purchased | | $ | 382,000,000 | 1 |
Average notional value of swaption contracts written | | $ | 155,800,000 | |
| Credit default swaps: | |
Average notional value — buy protection | | $ | 66,101,600 | |
Average notional value — sell protection | | $ | 59,954,000 | |
| Interest rate swaps: | |
Average notional value — pays fixed rate | | $ | 23,125,000 | 1 |
1 Actual amounts for the period are shown due to limited outstanding derivative financial instruments as of each quarter end. | |
For more information about the Trust’s investment risks regarding derivative financial instruments, refer to the Notes to Financial Statements.
| | | | |
| Derivative Financial Instruments — Offsetting as of Period End | | | | |
The Trust’s derivative assets and liabilities (by type) were as follows:
| | | | | | | | |
| | | Assets | | | Liabilities | |
Derivative Financial Instruments: | | | | | | | | |
Futures contracts | | $ | 11,250 | | | $ | 110,096 | |
Options | | | 484,375 | 1 | | | 754,503 | |
Swaps — OTC2 | | | 780,587 | | | | 1,231,347 | |
| | | | |
Total derivative assets and liabilities in the Statements of Assets and Liabilities | | $ | 1,276,212 | | | $ | 2,095,946 | |
| | | | |
Derivatives not subject to a Master Netting Agreement or similar agreement (“MNA”) | | | (495,625 | ) | | | (313,221 | ) |
| | | | |
Total derivative assets and liabilities subject to an MNA | | $ | 780,587 | | | $ | 1,782,725 | |
| | | | |
1 Includes options purchased at value which is included in Investments at value — unaffiliated in the Statements of Assets and Liabilities and reported in the Schedule of Investments. | |
2 Includes unrealized appreciation (depreciation) on OTC swaps and swap premiums (paid/received) in the Statements of Assets and Liabilities. | |
See Notes to Financial Statements.
| | | | | | |
| | | | | | | |
| 24 | | SEMI-ANNUAL REPORT | | APRIL 30, 2017 | | |
| | |
Schedule of Investments (continued) | | BlackRock Credit Allocation Income Trust (BTZ) |
The following tables present the Trust’s derivative assets (and liabilities) by counterparty net of amounts available for offset under a Master Netting Agreement (“MNA”) and net of the related collateral received (and pledged) by the Trust:
| | | | | | | | | | | | | | | | | | | | | | |
| Counterparty | | Derivative Assets
Subject to an MNA
by Counterparty | | | Derivatives Available
for Offset1 | | | Non-cash
Collateral
Received | | Cash
Collateral
Received | | | Net Amount of
Derivative Assets2 | | | | |
Barclays Bank PLC | | $ | 5,711 | | | $ | (5,711 | ) | | — | | | — | | | | — | | | | | |
Citibank N.A. | | | 23,064 | | | | (23,064 | ) | | — | | | — | | | | — | | | | | |
Credit Suisse International | | | 69,570 | | | | (69,570 | ) | | — | | | — | | | | — | | | | | |
Deutsche Bank AG | | | 298,355 | | | | (270,208 | ) | | — | | $ | (28,147 | ) | | | — | | | | | |
Goldman Sachs Bank USA | | | 53,810 | | | | (53,810 | ) | | — | | | — | | | | — | | | | | |
Goldman Sachs International | | | 48,711 | | | | (48,711 | ) | | — | | | — | | | | — | | | | | |
JPMorgan Chase Bank N.A. | | | 99,876 | | | | (99,876 | ) | | — | | | — | | | | — | | | | | |
Morgan Stanley & Co. International PLC | | | 177,415 | | | | (177,415 | ) | | — | | | — | | | | — | | | | | |
UBS AG | | | 4,075 | | | | (1,675 | ) | | — | | | — | | | $ | 2,400 | | | | | |
| | | | |
Total | | $ | 780,587 | | | $ | (750,040 | ) | | — | | $ | (28,147 | ) | | $ | 2,400 | | | | | |
| | | | |
| | | | | | | | | | | | | | | | | | | | | | |
| Counterparty | | Derivative Liabilities
Subject to an MNA
by Counterparty | | | Derivatives Available
for Offset1 | | | Non-cash
Collateral
Pledged | | Cash
Collateral
Pledged | | | Net Amount of
Derivative Liabilities3 | | | | |
Bank of America N.A. | | $ | 551,378 | | | | — | | | — | | $ | (551,378 | ) | | | — | | | | | |
Barclays Bank PLC | | | 9,738 | | | $ | (5,711 | ) | | — | | | — | | | $ | 4,027 | | | | | |
Citibank N.A. | | | 65,219 | | | | (23,064 | ) | | — | | | — | | | | 42,155 | | | | | |
Credit Suisse International | | | 106,809 | | | | (69,570 | ) | | — | | | — | | | | 37,239 | | | | | |
Deutsche Bank AG | | | 270,208 | | | | (270,208 | ) | | — | | | — | | | | — | | | | | |
Goldman Sachs Bank USA | | | 54,436 | | | | (53,810 | ) | | — | | | — | | | | 626 | | | | | |
Goldman Sachs International | | | 74,461 | | | | (48,711 | ) | | — | | | — | | | | 25,750 | | | | | |
JPMorgan Chase Bank N.A. | | | 308,456 | | | | (99,876 | ) | | — | | | — | | | | 208,580 | | | | | |
Morgan Stanley & Co. International PLC | | | 340,345 | | | | (177,415 | ) | | — | | | — | | | | 162,930 | | | | | |
UBS AG | | | 1,675 | | | | (1,675 | ) | | — | | | — | | | | — | | | | | |
| | | | |
Total | | $ | 1,782,725 | | | $ | (750,040 | ) | | — | | $ | (551,378 | ) | | $ | 481,307 | | | | | |
| | | | |
1 The amount of derivatives available for offset is limited to the amount of derivative asset and/or liabilities that are subject to an MNA. | |
2 Net amount represents the net amount receivable from the counterparty in the event of default. | |
3 Net amount represents the net amount payable due to counterparty in the event of default. | |
|
| Fair Value Hierarchy as of Period End |
Various inputs are used in determining the fair value of investments and derivative financial instruments. For information about the Trust’s policy regarding valuation of investments and derivative financial instruments, refer to the Notes to Financial Statements.
The following tables summarize the Trust’s investments and derivative financial instruments categorized in the disclosure hierarchy:
| | | | | | | | | | | | | | | | |
| | | Level 1 | | | Level 2 | | | Level 3 | | | Total | |
Assets: | | | | | | | | | | | | | | | | |
| Investments: | | | | | | | | | | | | | | | | |
| Long-Term Investments: | | | | | | | | | | | | | | | | |
Asset-Backed Securities | | | — | | | $ | 47,382,069 | | | $ | 9,405,908 | | | $ | 56,787,977 | |
Corporate Bonds | | | — | | | | 1,434,949,910 | | | | 5,033,000 | | | | 1,439,982,910 | |
Foreign Agency Obligations | | | — | | | | 31,256,192 | | | | — | | | | 31,256,192 | |
Municipal Bonds | | | — | | | | 18,442,700 | | | | — | | | | 18,442,700 | |
Preferred Securities | | $ | 53,705,642 | | | | 355,374,388 | | | | — | | | | 409,080,030 | |
U.S. Government Sponsored Agency Securities | | | — | | | | 3,775,259 | | | | — | | | | 3,775,259 | |
U.S. Treasury Obligations | | | — | | | | 27,545,583 | | | | — | | | | 27,545,583 | |
Short-Term Securities | | | 12,260,042 | | | | — | | | | — | | | | 12,260,042 | |
| Options Purchased: | | | | | | | | | | | | | | | | |
Interest rate contracts | | | 484,375 | | | | — | | | | — | | | | 484,375 | |
| | | | |
Total | | $ | 66,450,059 | | | $ | 1,918,726,101 | | | $ | 14,438,908 | | | $ | 1,999,615,068 | |
| | | | |
See Notes to Financial Statements.
| | | | | | |
| | | | | | | |
| | SEMI-ANNUAL REPORT | | APRIL 30, 2017 | | 25 |
| | |
Schedule of Investments (concluded) | | BlackRock Credit Allocation Income Trust (BTZ) |
| | | | | | | | | | | | | | | | |
| | | Level 1 | | | Level 2 | | | Level 3 | | | Total | |
| Derivative Financial Instruments1 | | | | | | | | | | | | | | | | |
Assets: | | | | | | | | | | | | | | | | |
Credit contracts | | | — | | | $ | 573,614 | | | | — | | | $ | 573,614 | |
Interest rate contracts | | $ | 412,842 | | | | — | | | | — | | | | 412,842 | |
Liabilities: | | | | | | | | | | | | | | | | |
Credit contracts | | | — | | | | (792,914 | ) | | | — | | | | (792,914 | ) |
Interest rate contracts | | | (990,712 | ) | | | (551,378 | ) | | | — | | | | (1,542,090 | ) |
| | | | |
Total | | $ | (577,870 | ) | | $ | (770,678 | ) | | | — | | | $ | (1,348,548 | ) |
| | | | |
1 Derivative financial instruments are swaps, futures contracts, forward foreign currency exchange contracts and options written. Swaps, futures contracts and forward foreign currency exchange contracts are valued at the unrealized appreciation (depreciation) on the instrument and options written are shown at value. | |
The Trust may hold liabilities in which the fair value approximates the carrying amount or face value, including accrued interest, for financial statement purposes. As of period end, reverse repurchase agreements of $439,330,649 are categorized as Level 2 within the disclosure hierarchy.
During the six months ended April 30, 2017, there were no transfers between Level 1 and Level 2.
A reconciliation of Level 3 investments is presented when the Trust had a significant amount of Level 3 investments at the beginning and/or end of the period in relation to net assets. The following table is a reconciliation of Level 3 investments for which significant unobservable inputs were used in determining fair value:
| | | | | | | | | | | | | | | | |
| | | Asset-Backed Securities | | | Corporate Bonds | | | Common Stocks | | | Total | |
Assets: | | | | | | | | | | | | | | | | |
Opening Balance, as of October 31, 2016 | | $ | 15,186,952 | | | $ | 5,113,500 | | | $ | 2,951 | | | $ | 20,303,403 | |
Transfers into Level 3 | | | — | | | | — | | | | — | | | | — | |
Transfers out of Level 31 | | | (9,083,692 | ) | | | — | | | | — | | | | (9,083,692 | ) |
Accrued discounts/premiums | | | 1,732 | | | | — | | | | — | | | | 1,732 | |
Net realized gain (loss) | | | 76,713 | | | | — | | | | — | | | | 76,713 | |
Net change in unrealized appreciation (depreciation)2,3 | | | (75,797 | ) | | | (80,500 | ) | | | (2,951 | ) | | | (159,248 | ) |
Purchases | | | 7,800,000 | | | | — | | | | — | | | | 7,800,000 | |
Sales | | | (4,500,000 | ) | | | — | | | | — | | | | (4,500,000 | ) |
| | | | |
Closing Balance, as of April 30, 2017 | | $ | 9,405,908 | | | $ | 5,033,000 | | | | — | | | $ | 14,438,908 | |
| | | | |
Net change in unrealized appreciation (depreciation) on investments still held at April 30, 20172 | | $ | 3,508 | | | $ | (80,500 | ) | | $ | (2,951 | ) | | $ | (79,943 | ) |
| | | | |
1 As of October 31, 2016, the Trust used significant unobservable inputs in determining the value of certain investments. As of April 30, 2017, the Trust used observable inputs in determining the value of the same investments. As a result, investments at the beginning of period value were transferred from Level 3 to Level 2 in the disclosure hierarchy. | |
2 Included in the related net change in unrealized appreciation (depreciation) in the Statements of Operations. | |
3 Any difference between net change in unrealized appreciation (depreciation) and net change in unrealized appreciation (depreciation) on derivative financial instruments still held at April 30, 2017 is generally due to derivative financial instruments no longer held or categorized as Level 3 at period end. | |
The Trust’s investments that are categorized as Level 3 were valued utilizing third party pricing information without adjustment. Such valuations are based on unobservable inputs. A significant change in third party information could result in a significantly lower or higher value of such Level 3 investments.
See Notes to Financial Statements.
| | | | | | |
| | | | | | | |
| 26 | | SEMI-ANNUAL REPORT | | APRIL 30, 2017 | | |
| | |
Schedule of Investments April 30, 2017 (Unaudited) | | BlackRock Floating Rate Income Trust (BGT) (Percentages shown are based on Net Assets) |
| | | | | | | | | | | | |
| Common Stocks (a) | | | | | Shares | | | Value | |
| Health Care Management Services — 0.0% | | | | | | | | | |
New Millennium HoldCo, Inc. | | | | | | | 9,191 | | | $ | 10,570 | |
| Household Durables — 0.0% | | | | | | | | | |
Berkline Benchcraft Equity LLC | | | | | | | 6,155 | | | | — | |
| Internet Software & Services — 0.0% | | | | | | | | | |
New Holdings LLC | | | | | | | 365 | | | | 119,537 | |
| Specialty Retail — 0.0% | | | | | | | | | |
Things Remembered, Inc. | | | | | | | 551,052 | | | | 5 | |
| Total Common Stocks — 0.0% | | | | | | | | | | | 130,112 | |
| | | | | | | | | | | | |
| | | | | | | | | | | | | |
| Asset-Backed Securities (b)(c) | | | | | Par (000) | | | | |
ALM Loan Funding, Series 2012-5A, Class BR, 4.16%, 10/18/27 | | | USD | | | | 310 | | | | 311,034 | |
ALM VII R Ltd., Series 2013-7RA, Class BR, 3.86%, 10/15/28 | | | | | | | 250 | | | | 251,593 | |
ALM XIV Ltd., Series 2014-14A, Class C, 4.62%, 7/28/26 | | | | | | | 463 | | | | 463,101 | |
ALM XVII Ltd., Series 2015-17A, Class C1, 5.31%, 1/15/28 | | | | | | | 250 | | | | 252,637 | |
AMMC CLO Ltd., Series 2014-15A, Class D, 5.31%, 12/09/26 | | | | | | | 250 | | | | 251,671 | |
Ares XXXIII CLO Ltd., Series 2015-1A, Class A2R, 3.05%, 12/05/25 | | | | | | | 300 | | | | 302,558 | |
Atlas Senior Loan Fund VI Ltd., Series 2014-6A, Class DR, 4.76%, 10/15/26 | | | | | | | 500 | | | | 500,865 | |
Carlyle Global Market Strategies CLO Ltd., Series 2013-1A, Class C, 5.04%, 2/14/25 | | | | | | | 250 | | | | 251,204 | |
CIFC Funding Ltd.: | | | | | | | | | | | | |
Series 2013-1A, Class A2, 3.06%, 4/16/25 | | | | | | | 290 | | | | 290,345 | |
Series 2014-2A, Class A3LR, 3.28%, 5/24/26 | | | | | | | 275 | | | | 275,025 | |
GoldentTree Loan Management US CLO 1 Ltd., Series 2017-1A, Class C, 3.38%, 4/20/29 | | | | | | | 250 | | | | 250,000 | |
Grippen Park CLO Ltd., Series 2017-1A, Class C, 3.55%, 1/20/30 | | | | | | | 250 | | | | 250,221 | |
Highbridge Loan Management Ltd., Series 2015-7A, Class C, 4.42%, 11/15/26 | | | | | | | 250 | | | | 251,292 | |
LCM XVIII LP, Series 18A, Class INC, 0.00%, 4/20/27 | | | | | | | 750 | | | | 513,518 | |
Pinnacle Park CLO Ltd., Series 2014-1A, Class CR, 3.81%, 4/15/26 | | | | | | | 250 | | | | 250,175 | |
Symphony CLO Ltd., Series 2016-17A, Class D, 5.96%, 4/15/28 | | | | | | | 250 | | | | 254,019 | |
TCI-Cent CLO Ltd., Series 2016-1A, Class A2, 3.32%, 12/21/29 | | | | | | | 250 | | | | 251,852 | |
Treman Park CLO LLC, Series 2015-1A, Class D, 5.02%, 4/20/27 | | | | | | | 700 | | | | 701,416 | |
Voya CLO 2013-3 Ltd., Series 2013-3A, Class A2R, 2.66%, 1/18/26 | | | | | | | 250 | | | | 250,000 | |
Webster Park CLO Ltd., Series 2015-1A: | | | | | | | | | | | | |
Class B1, 4.26%, 1/20/27 | | | | | | | 250 | | | | 251,694 | |
Class C, 5.21%, 1/20/27 | | | | | | | 250 | | | | 252,593 | |
| | | | | | | | | | | | |
| | | | | | | | | | | | 6,626,813 | |
| Total Asset-Backed Securities — 1.9% | | | | | | | | | | | 6,626,813 | |
| | | | | | | | | | | | |
| | | | | | | | | | | | | |
| | | |
| Corporate Bonds | | | | | | | | | |
| Airlines — 0.4% | | | | | | | | | |
US Airways Pass-Through Trust, Series 2012-2, Class C, 5.45%, 6/03/18 | | | | | | | 1,585 | | | | 1,620,663 | |
| | | | | | | | | | | | |
| Corporate Bonds | | | | | Par (000) | | | Value | |
| Capital Markets — 0.3% | | | | | | | | | |
Blackstone CQP Holdco LP, 6.50%, 3/20/21 (c) | | | USD | | | | 941 | | | $ | 947,492 | |
| Chemicals — 0.2% | | | | | | | | | |
Momentive Performance Materials, Inc., 3.88%, 10/24/21 | | | | | | | 665 | | | | 660,844 | |
| Communications Equipment — 0.2% | | | | | | | | | |
Avaya, Inc., 7.00%, 4/01/19 (a)(c)(d) | | | | | | | 827 | | | | 694,680 | |
| Consumer Finance — 0.1% | | | | | | | | | |
Ally Financial, Inc., 8.00%, 11/01/31 | | | | | | | 150 | | | | 178,500 | |
| Containers & Packaging — 1.2% | | | | | | | | | |
Ardagh Packaging Finance PLC/Ardagh Holdings USA, Inc. (c): | | | | | | | | | | | | |
4.43%, 5/15/21 (b) | | | | | | | 280 | | | | 285,950 | |
4.25%, 9/15/22 | | | | | | | 480 | | | | 489,216 | |
7.25%, 5/15/24 | | | | | | | 200 | | | | 217,750 | |
Reynolds Group Issuer, Inc./Reynolds Group Issuer LLC, 4.66%, 7/15/21 (b)(c) | | | | | | | 3,125 | | | | 3,195,312 | |
| | | | | | | | | | | | |
| | | | | | | | | | | | 4,188,228 | |
| Diversified Consumer Services — 0.1% | | | | | | | | | |
Prime Security Services Borrower LLC/Prime Finance, Inc., 9.25%, 5/15/23 (c) | | | | | | | 175 | | | | 191,188 | |
| Diversified Telecommunication Services — 0.3% | | | | | | | | | |
Level 3 Financing, Inc.: | | | | | | | | | | | | |
4.94%, 1/15/18 (b) | | | | | | | 607 | | | | 608,517 | |
6.13%, 1/15/21 | | | | | | | 337 | | | | 348,374 | |
| | | | | | | | | | | | |
| | | | | | | | | | | | 956,891 | |
| Electric Utilities — 0.0% | | | | | | | | | |
Texas Competitive Electric Holdings Co. LLC/TCEH Finance, Inc., 11.50%, 10/01/20 (a)(c)(d) | | | | | | | 654 | | | | — | |
| Energy Equipment & Services — 0.3% | | | | | | | | | |
Transocean, Inc., 9.00%, 7/15/23 (c) | | | | | | | 976 | | | | 1,040,660 | |
Weatherford International Ltd.,
9.88%, 2/15/24 (c) | | | | | | | 200 | | | | 233,000 | |
| | | | | | | | | | | | |
| | | | | | | | | | | | 1,273,660 | |
| Environmental, Maintenance, & Security Service — 0.1% | | | | | | | |
Tervita Escrow Corp., 7.63%, 12/01/21 (c) | | | | | | | 330 | | | | 339,075 | |
| Health Care Providers & Services — 0.3% | | | | | | | | | |
CHS/Community Health Systems, Inc., 5.13%, 8/01/21 | | | | | | | 945 | | | | 936,731 | |
HCA, Inc., 5.25%, 6/15/26 | | | | | | | 200 | | | | 213,250 | |
RegionalCare Hospital Partners Holdings, Inc., 8.25%, 5/01/23 (c) | | | | | | | 45 | | | | 47,875 | |
| | | | | | | | | | | | |
| | | | | | | | | | | | 1,197,856 | |
| Household Durables — 0.0% | | | | | | | | | |
Berkline/Benchcraft LLC, 4.50%, 6/01/17 (a)(d) | | | | | | | 400 | | | | — | |
| Independent Power and Renewable Electricity Producers — 0.3% | |
NRG Energy, Inc., 6.25%, 7/15/22 | | | | | | | 925 | | | | 942,399 | |
| Internet Software & Services — 0.1% | | | | | | | | | |
Symantec Corp., 5.00%, 4/15/25 (c) | | | | | | | 175 | | | | 180,906 | |
| Media — 1.2% | | | | | | | | | |
Altice Financing SA (c): | | | | | | | | | | | | |
6.63%, 2/15/23 | | | | | | | 335 | | | | 354,681 | |
7.50%, 5/15/26 | | | | | | | 525 | | | | 567,000 | |
Altice US Finance I Corp., 5.50%, 5/15/26 (c) | | | | | | | 200 | | | | 206,750 | |
Clear Channel Worldwide Holdings, Inc., Series B, 7.63%, 3/15/20 | | | | | | | 175 | | | | 176,969 | |
CSC Holdings LLC, 10.88%, 10/15/25 (c) | | | | | | | 200 | | | | 240,250 | |
SFR Group SA (c): | | | | | | | | | | | | |
6.00%, 5/15/22 | | | | | | | 512 | | | | 533,760 | |
6.25%, 5/15/24 | | | | | | | 630 | | | | 652,050 | |
See Notes to Financial Statements.
| | | | | | |
| | | | | | | |
| | SEMI-ANNUAL REPORT | | APRIL 30, 2017 | | 27 |
| | |
Schedule of Investments (continued) | | BlackRock Floating Rate Income Trust (BGT) |
| | | | | | | | | | | | |
| Corporate Bonds | | | | | Par (000) | | | Value | |
SFR Group SA (c) (continued): | | | | | | | | | | | | |
7.38%, 5/01/26 | | | USD | | | | 1,130 | | | $ | 1,187,912 | |
Virgin Media Secured Finance PLC,
5.25%, 1/15/26 (c) | | | | | | | 200 | | | | 202,500 | |
| | | | | | | | | | | | |
| | | | | | | | | | | | 4,121,872 | |
| Metals & Mining — 1.2% | | | | | | | | | |
Constellium NV, 6.63%, 3/01/25 (c) | | | | | | | 250 | | | | 246,250 | |
Freeport-McMoRan, Inc.: | | | | | | | | | | | | |
2.38%, 3/15/18 | | | | | | | 1,238 | | | | 1,231,810 | |
3.10%, 3/15/20 | | | | | | | 725 | | | | 715,031 | |
3.88%, 3/15/23 | | | | | | | 375 | | | | 347,813 | |
Novelis Corp., 6.25%, 8/15/24 (c) | | | | | | | 375 | | | | 394,687 | |
Teck Resources Ltd.: | | | | | | | | | | | | |
4.50%, 1/15/21 | | | | | | | 514 | | | | 530,823 | |
3.75%, 2/01/23 | | | | | | | 783 | | | | 771,490 | |
| | | | | | | | | | | | |
| | | | | | | | | | | | 4,237,904 | |
| Oil, Gas & Consumable Fuels — 1.4% | | | | | | | | | |
Cheniere Corpus Christi Holdings LLC, 7.00%, 6/30/24 (c) | | | | | | | 415 | | | | 463,712 | |
CONSOL Energy, Inc., 5.88%, 4/15/22 | | | | | | | 1,385 | | | | 1,350,375 | |
Great Western Petroleum LLC/Great Western Finance, Inc., 9.00%, 9/30/21 (c) | | | | | | | 615 | | | | 636,525 | |
Halcon Resources Corp., 6.75%, 2/15/25 (c) | | | | | | | 865 | | | | 830,400 | |
MEG Energy Corp., 6.50%, 1/15/25 (c) | | | | | | | 624 | | | | 616,200 | |
NGPL PipeCo LLC, 7.12%, 12/15/17 (c) | | | | | | | 234 | | | | 240,289 | |
Noble Holding International Ltd., 7.75%, 1/15/24 | | | | | | | 170 | | | | 155,125 | |
Rowan Cos., Inc., 7.38%, 6/15/25 | | | | | | | 210 | | | | 207,375 | |
Sanchez Energy Corp., 6.13%, 1/15/23 | | | | | | | 328 | | | | 301,757 | |
| | | | | | | | | | | | |
| | | | | | | | | | | | 4,801,758 | |
| Real Estate Investment Trusts (REITs) — 0.1% | | | | | | | | | |
MGM Growth Properties Operating Partnership LP/MGP Finance Co-Issuer, Inc., 5.63%, 5/01/24 | | | | | | | 500 | | | | 539,375 | |
| Road & Rail — 0.1% | | | | | | | | | |
Avis Budget Car Rental LLC/Avis Budget Finance, Inc., 3.80%, 12/01/17 (b) | | | | | | | 179 | | | | 179,090 | |
| Software — 0.1% | | | | | | | | | |
Solera LLC/Solera Finance, Inc., 10.50%, 3/01/24 (c) | | | | | | | 175 | | | | 199,719 | |
| Wireless Telecommunication Services — 0.1% | | | | | | | | | |
Sprint Communications, Inc., 7.00%, 8/15/20 | | | | | | | 200 | | | | 216,500 | |
| Total Corporate Bonds — 8.1% | | | | | | | | | | | 27,668,600 | |
| | | | | | | | | | | | |
| | | | | | | | | | | | | |
| | | |
| Floating Rate Loan Interests (b) | | | | | | | | | |
| Aerospace & Defense — 1.7% | | | | | | | | | |
Engility Corp.: | | | | | | | | | | | | |
Term Loan B1, 4.24%, 8/12/20 | | | | | | | 209 | | | | 210,045 | |
Term Loan B2, 4.75%, 8/12/23 | | | | | | | 389 | | | | 391,313 | |
TransDigm, Inc.: | | | | | | | | | | | | |
2015 Term Loan E, 3.99%, 5/14/22 | | | | | | | 499 | | | | 497,940 | |
2016 Extended Term Loan F, 3.99%, 6/09/23 | | | | | | | 3,935 | | | | 3,929,303 | |
Term Loan D, 4.15%, 6/04/21 | | | | | | | 697 | | | | 698,071 | |
| | | | | | | | | | | | |
| | | | | | | | | | | | 5,726,672 | |
| Air Freight & Logistics — 1.5% | | | | | | | | | |
Avolon TLB Borrower 1 (Luxembourg) Sarl, Term Loan B2, 3.74%, 3/20/22 | | | | | | | 3,865 | | | | 3,921,423 | |
CEVA Group PLC, Synthetic LOC, 6.50%, 3/19/21 | | | | | | | 447 | | | | 377,590 | |
CEVA Intercompany BV, Dutch Term Loan, 6.67%, 3/19/21 | | | | | | | 457 | | | | 400,338 | |
| | | | | | | | | | | | |
| Floating Rate Loan Interests (b) | | | | | Par (000) | | | Value | |
| Air Freight & Logistics (continued) | | | | | | | | | |
CEVA Logistics Canada ULC, Canadian Term Loan, 6.67%, 3/19/21 | | | USD | | | | 81 | | | $ | 71,215 | |
CEVA Logistics US Holdings, Inc., Term Loan, 6.67%, 3/19/21 | | | | | | | 609 | | | | 533,183 | |
| | | | | | | | | | | | |
| | | | | | | | | | | | 5,303,749 | |
| Airlines — 0.1% | | | | | | | | | |
Northwest Airlines, Inc., Term Loan, 2.65%, 9/10/18 | | | | | | | 217 | | | | 213,328 | |
| Auto Components — 0.8% | | | | | | | | | |
Anchor Glass Container Corp.: | | | | | | | | | | | | |
2016 1st Lien Term Loan, 4.25%, 12/07/23 | | | | | | | 324 | | | | 326,376 | |
2016 2nd Lien Term Loan, 8.75%, 12/07/24 | | | | | | | 240 | | | | 244,200 | |
FPC Holdings, Inc., 1st Lien Term Loan, 5.25%, 11/19/19 | | | | | | | 588 | | | | 560,857 | |
Goodyear Tire & Rubber Co., 2nd Lien Term Loan, 2.99%, 4/30/19 | | | | | | | 374 | | | | 378,312 | |
GPX International Tire Corp., Term Loan (a)(d): | | | | | | | | | | | | |
12.25%, 3/30/2012 | | | | | | | 274 | | | | — | |
PIK, 13.00%, 3/30/2012 (e) | | | | | | | 4 | | | | — | |
TKC Holdings, Inc., 2017 2nd Lien Term Loan, 8.50%, 2/01/24 | | | | | | | 461 | | | | 464,458 | |
USI, Inc., 2017 Term Loan B, 3.25%, 3/30/24 | | | | | | | 635 | | | | 632,225 | |
| | | | | | | | | | | | |
| | | | | | | | | | | | 2,606,428 | |
| Automobiles — 0.3% | | | | | | | | | |
CH Hold Corp.: | | | | | | | | | | | | |
1st Lien Term Loan, 4.00%, 2/01/24 | | | | | | | 725 | | | | 729,444 | |
2nd Lien Term Loan, 8.25%, 2/01/25 | | | | | | | 150 | | | | 152,625 | |
| | | | | | | | | | | | |
| | | | | | | | | | | | 882,069 | |
| Biotechnology — 0.1% | | | | | | | | | |
AMAG Pharmaceuticals, Inc., 2015 1st Lien Term Loan, 4.78%, 8/13/21 | | | | | | | 477 | | | | 476,013 | |
| Building Materials — 1.0% | | | | | | | | | |
Allied Universal HoldCo LLC, 2015 Term Loan, 4.79%, 7/28/22 | | | | | | | 3,039 | | | | 3,048,608 | |
USAGM HoldCo LLC, 2015 2nd Lien Term Loan, 9.67%, 7/28/23 | | | | | | | 395 | | | | 398,622 | |
| | | | | | | | | | | | |
| | | | | | | | | | | | 3,447,230 | |
| Building Products — 2.6% | | | | | | | | | |
Continental Building Products LLC, 2017 Term Loan B, 3.65%, 8/18/23 | | | | | | | 684 | | | | 683,232 | |
CPG International, Inc., Term Loan, 4.90%, 9/30/20 | | | | | | | 3,196 | | | | 3,210,206 | |
GYP Holdings III Corp., 1st Lien Term Loan, 4.67%, 4/01/21 | | | | | | | 953 | | | | 956,120 | |
Jeld-Wen, Inc., 2017 Term Loan B, 4.15%, 7/01/22 | | | | | | | 1,093 | | | | 1,103,555 | |
Ply Gem Industries, Inc., Term Loan, 4.15%, 2/01/21 | | | | | | | 562 | | | | 564,253 | |
Quikrete Holdings, Inc., 2016 1st Lien Term Loan, 4.24%, 11/15/23 | | | | | | | 817 | | | | 817,825 | |
Wilsonart LLC, 2016 Term Loan, 4.65%, 12/19/23 | | | | | | | 1,636 | | | | 1,645,750 | |
| | | | | | | | | | | | |
| | | | | | | | | | | | 8,980,941 | |
| Capital Markets — 0.6% | | | | | | | | | |
Affinion Group, Inc., Term Loan B, 6.75%, 4/30/18 | | | | | | | 388 | | | | 387,002 | |
RPI Finance Trust, Term Loan B6, 3.15%, 3/27/23 | | | | | | | 1,675 | | | | 1,680,136 | |
| | | | | | | | | | | | |
| | | | | | | | | | | | 2,067,138 | |
See Notes to Financial Statements.
| | | | | | |
| | | | | | | |
| 28 | | SEMI-ANNUAL REPORT | | APRIL 30, 2017 | | |
| | |
Schedule of Investments (continued) | | BlackRock Floating Rate Income Trust (BGT) |
| | | | | | | | | | | | |
| Floating Rate Loan Interests (b) | | | | | Par (000) | | | Value | |
| Chemicals — 4.0% | | | | | | | | | |
Alpha 3 B.V., 2017 Term Loan B1, 4.15%, 1/31/24 | | | USD | | | | 630 | | | $ | 633,150 | |
Axalta Coating Systems US Holdings, Inc., Term Loan B1, 3.65%, 2/01/23 | | | | | | | 990 | | | | 998,759 | |
CeramTec Acquisition Corp., Term Loan B2, 3.80%, 8/30/20 | | | | | | | 69 | | | | 69,855 | |
Charter NEX US Holdings, Inc., Term Loan B, 5.40%, 2/07/22 | | | | | | | 663 | | | | 663,651 | |
Chemours Co., 2017 Term Loan B, 3.49%, 5/12/22 | | | | | | | 561 | | | | 564,519 | |
Evergreen Acqco 1 LP, Term Loan, 5.00%, 7/09/19 | | | | | | | 182 | | | | 164,902 | |
Huntsman International LLC, Term Loan B2, 3.99%, 4/01/23 | | | | | | | 1,347 | | | | 1,363,141 | |
Klockner-Pentaplast of America, Inc.: | | | | | | | | | | | | |
1st Lien Term Loan, 4.40%, 4/28/20 | | | | | | | 680 | | | | 684,976 | |
German Borrower, 4.40%, 4/28/20 | | | | | | | 291 | | | | 292,725 | |
MacDermid, Inc.: | | | | | | | | | | | | |
Term Loan B5, 4.50%, 6/07/20 | | | | | | | 1,177 | | | | 1,182,492 | |
Term Loan B6, 4.00%, 6/07/23 | | | | | | | 867 | | | | 870,520 | |
OXEA Finance LLC, Term Loan B2, 4.40%, 1/15/20 | | | | | | | 1,772 | | | | 1,719,025 | |
PQ Corp., 2016 Term Loan, 5.25%, 11/04/22 | | | | | | | 851 | | | | 860,458 | |
Royal Holdings, Inc.: | | | | | | | | | | | | |
2015 2nd Lien Term Loan, 8.65%, 6/19/23 | | | | | | | 157 | | | | 157,372 | |
2017 Term Loan B, 4.40%, 6/19/22 | | | | | | | 685 | | | | 689,921 | |
Solenis International LP: | | | | | | | | | | | | |
1st Lien Term Loan, 4.30%, 7/31/21 | | | | | | | 913 | | | | 915,119 | |
2nd Lien Term Loan, 7.80%, 7/31/22 | | | | | | | 1,055 | | | | 1,049,071 | |
Tata Chemicals North America, Inc., Term Loan B, 3.94%, 8/07/20 | | | | | | | 277 | | | | 276,977 | |
Versum Materials, Inc., Term Loan, 3.65%, 9/29/23 | | | | | | | 587 | | | | 593,167 | |
| | | | | | | | | | | | |
| | | | | | | | | | | | 13,749,800 | |
| Commercial Services & Supplies — 7.2% | | | | | | | | | |
Advanced Disposal Services, Inc., Term Loan B3, 3.70%, 11/10/23 | | | | | | | 2,025 | | | | 2,041,954 | |
Asurion LLC: | | | | | | | | | | | | |
2016 Term Loan B2, 4.24%, 7/08/20 | | | | | | | 344 | | | | 345,932 | |
Term Loan B4, 4.25%, 8/04/22 | | | | | | | 1,221 | | | | 1,228,313 | |
Term Loan B5, 4.75%, 11/03/23 | | | | | | | 1,470 | | | | 1,481,082 | |
Brand Energy & Infrastructure Services, Inc., Term Loan B, 4.93%, 11/26/20 | | | | | | | 1,721 | | | | 1,725,090 | |
Camelot UK HoldCo Ltd., 2017 Term Loan B, 4.50%, 10/03/23 | | | | | | | 1,313 | | | | 1,319,310 | |
Casella Waste Systems, Inc., 2017 Term Loan B, 3.75%, 10/17/23 | | | | | | | 579 | | | | 579,996 | |
Catalent Pharma Solutions, Inc., Term Loan B, 3.75%, 5/20/21 | | | | | | | 2,253 | | | | 2,276,944 | |
Creative Artists Agency LLC, 2017 1st Lien Term Loan B, 4.50%, 2/15/24 | | | | | | | 1,277 | | | | 1,291,700 | |
Dealer Tire LLC, 2016 Term Loan B, 4.94%, 12/22/21 | | | | | | | 636 | | | | 643,028 | |
Employbridge LLC, Exit Term Loan, 7.65%, 5/16/20 | | | | | | | 229 | | | | 212,394 | |
GCA Services Group, Inc., 2016 Term Loan, 5.77%, 3/01/23 | | | | | | | 1,149 | | | | 1,153,933 | |
Harland Clarke Holdings Corp., Term Loan B6, 6.65%, 2/09/22 | | | | | | | 655 | | | | 655,420 | |
Inmar Holdings, Inc., 2017 1st Lien Term Loan B, 4.75%, 4/21/24 | | | | | | | 650 | | | | 645,535 | |
KAR Auction Services, Inc.: | | | | | | | | | | | | |
Term Loan B2, 4.19%, 3/11/21 | | | | | | | 800 | | | | 806,571 | |
Term Loan B3, 4.50%, 3/09/23 | | | | | | | 1,064 | | | | 1,072,232 | |
| | | | | | | | | | | | |
| Floating Rate Loan Interests (b) | | | | | Par (000) | | | Value | |
| Commercial Services & Supplies (continued) | | | | | | | | | |
Livingston International, Inc., 1st Lien Term Loan, 5.50%, 4/18/19 | | | USD | | | | 789 | | | $ | 779,384 | |
PSSI Holdings LLC, Term Loan B, 4.80%, 12/02/21 | | | | | | | 982 | | | | 992,300 | |
Spin Holdco, Inc., Term Loan B, 4.28%, 11/14/19 | | | | | | | 2,209 | | | | 2,211,271 | |
TruGreen Limited Partnership, 1st Lien Term Loan B, 6.50%, 4/13/23 | | | | | | | 625 | | | | 629,183 | |
US Security Associates Holdings, Inc., 2016 Term Loan, 6.02%, 7/14/23 | | | | | | | 1,304 | | | | 1,315,380 | |
Waste Industries USA, Inc., 2016 Term Loan, 3.74%, 2/27/20 | | | | | | | 1,241 | | | | 1,250,631 | |
| | | | | | | | | | | | |
| | | | | | | | | | | | 24,657,583 | |
| Communications Equipment — 1.0% | | | | | | | | | |
Applied Systems, Inc.: | | | | | | | | | | | | |
1st Lien Term Loan, 4.40%, 1/25/21 | | | | | | | 559 | | | | 562,516 | |
2nd Lien Term Loan, 7.65%, 1/24/22 | | | | | | | 227 | | | | 229,005 | |
Avaya, Inc.: | | | | | | | | | | | | |
DIP Term Loan, 8.50%, 1/24/18 | | | | | | | 35 | | | | 35,903 | |
Term Loan B7, 6.28%, 5/29/20 (a)(d) | | | | | | | 153 | | | | 127,276 | |
Colorado Buyer, Inc, Term Loan B, 4.00%, 3/28/24 | | | | | | | 1,060 | | | | 1,065,565 | |
CommScope, Inc., Term Loan B5, 3.49%, 12/29/22 | | | | | | | 491 | | | | 494,499 | |
Riverbed Technology, Inc., 2016 Term Loan, 4.25%, 4/24/22 | | | | | | | 862 | | | | 859,927 | |
| | | | | | | | | | | | |
| | | | | | | | | | | | 3,374,691 | |
| Construction & Engineering — 1.1% | | | | | | | | | |
CNT Holdings III Corp., 2017 Term Loan, 4.28%, 1/22/23 | | | | | | | 822 | | | | 827,533 | |
Pike Corp., 2017 1st Lien Term Loan, 4.75%, 3/01/24 | | | | | | | 255 | | | | 257,550 | |
Safway Group Holding LLC, Term Loan B, 5.75%, 8/19/23 | | | | | | | 2,080 | | | | 2,097,746 | |
USIC Holdings, Inc., 2016 1st Lien Term Loan, 5.17%, 12/08/23 | | | | | | | 524 | | | | 526,961 | |
| | | | | | | | | | | | |
| | | | | | | | | | | | 3,709,790 | |
| Construction Materials — 0.8% | | | | | | | | | |
Filtration Group Corp., 1st Lien Term Loan, 4.30%, 11/21/20 | | | | | | | 2,146 | | | | 2,153,740 | |
Headwaters, Inc., 2016 Term Loan B, 4.00%, 3/24/22 | | | | | | | 435 | | | | 436,026 | |
McJunkin Red Man Corp., Term Loan, 5.00%, 11/08/19 | | | | | | | 210 | | | | 211,270 | |
| | | | | | | | | | | | |
| | | | | | | | | | | | 2,801,036 | |
| Containers & Packaging — 1.7% | | | | | | | | | |
Berlin Packaging LLC, 2014 1st Lien Term Loan, 4.50%, 10/01/21 | | | | | | | 361 | | | | 362,761 | |
Berry Plastics Group, Inc., Term Loan I, 3.49%, 10/01/22 | | | | | | | 3,385 | | | | 3,406,450 | |
BWAY Holding Co., 2017 Term Loan B, 4.40%, 4/03/24 | | | | | | | 1,103 | | | | 1,095,709 | |
Flex Acquisition Company, Inc., 1st Lien Term Loan, 4.40%, 12/29/23 | | | | | | | 730 | | | | 733,198 | |
Proampac PG Borrower LLC, 2016 1st Lien Term Loan, 5.06%, 11/18/23 | | | | | | | 304 | | | | 308,674 | |
| | | | | | | | | | | | |
| | | | | | | | | | | | 5,906,792 | |
| Distributors — 0.6% | | | | | | | | | |
American Builders & Contractors Supply Co., Inc., Term Loan B, 3.74%, 10/31/23 | | | | | | | 1,621 | | | | 1,630,182 | |
American Tire Distributors Holdings, Inc., 2015 Term Loan, 5.25%, 9/01/21 | | | | | | | 569 | | | | 569,385 | |
| | | | | | | | | | | | |
| | | | | | | | | | | | 2,199,567 | |
See Notes to Financial Statements.
| | | | | | |
| | | | | | | |
| | SEMI-ANNUAL REPORT | | APRIL 30, 2017 | | 29 |
| | |
Schedule of Investments (continued) | | BlackRock Floating Rate Income Trust (BGT) |
| | | | | | | | | | | | |
| Floating Rate Loan Interests (b) | | | | | Par (000) | | | Value | |
| Diversified Consumer Services — 4.2% | | | | | | | | | |
Bright Horizons Family Solutions, Inc., 2016 Term Loan B, 3.74%, 11/07/23 | | | USD | | | | 2,005 | | | $ | 2,019,768 | |
CT Technologies Intermediate Holdings, Inc., 1st Lien Term Loan, 5.25%, 12/01/21 | | | | | | | 725 | | | | 696,294 | |
J.D. Power and Associates, 1st Lien Term Loan, 5.25%, 9/07/23 | | | | | | | 776 | | | | 779,980 | |
Nomad Foods Europe Midco Ltd.: | | | | | | | | | | | | |
Term Loan B, 2.75%, 4/18/24 | | | | | | | 545 | | | | 546,815 | |
Term Loan C1, 3.50%, 6/30/20 | | | EUR | | | | 606 | | | | 663,706 | |
Prime Security Services Borrower LLC, 2016 1st Lien Term Loan, 4.25%, 5/02/22 | | | USD | | | | 1,429 | | | | 1,443,344 | |
Serta Simmons Bedding LLC: | | | | | | | | | | | | |
1st Lien Term Loan, 4.54%, 11/08/23 | | | | | | | 2,913 | | | | 2,920,448 | |
2nd Lien Term Loan, 9.04%, 11/08/24 | | | | | | | 655 | | | | 663,188 | |
ServiceMaster Co., 2016 Term Loan B, 3.48%, 11/08/23 | | | | | | | 2,569 | | | | 2,595,866 | |
Wand Intermediate I LP, 1st Lien Term Loan, 4.77%, 9/17/21 | | | | | | | 790 | | | | 796,785 | |
Weight Watchers International, Inc., Term Loan B2, 4.40%, 4/02/20 | | | | | | | 1,396 | | | | 1,324,176 | |
| | | | | | | | | | | | |
| | | | | | | | | | | | 14,450,370 | |
| Diversified Financial Services — 1.3% | | | | | | | | | |
AlixPartners LLP, 2017 Term Loan B, 4.15%, 4/04/24 | | | | | | | 1,635 | | | | 1,648,423 | |
Diamond US Holding LLC, 2017 Term Loan B, 4.29%, 3/29/24 | | | | | | | 587 | | | | 586,500 | |
Jefferies Finance LLC, Term Loan, 4.69%, 5/14/20 | | | | | | | 1,670 | | | | 1,666,074 | |
SAM Finance Luxembourg Sarl, Term Loan, 4.39%, 12/17/20 | | | | | | | 388 | | | | 391,102 | |
| | | | | | | | | | | | |
| | | | | | | | | | | | 4,292,099 | |
| Diversified Telecommunication Services — 6.3% | | | | | | | | | |
Consolidated Communications, Inc.: | | | | | | | | | | | | |
2016 Term Loan B, 4.00%, 10/04/23 | | | | | | | 413 | | | | 415,283 | |
Term Loan B2, 4.15%, 10/05/23 | | | | | | | 280 | | | | 281,400 | |
Hargray Communications Group, Inc., 2017 Term Loan B, 4.16%, 3/22/24 | | | | | | | 930 | | | | 931,162 | |
Hawaiian Telcom Communications, Inc., Term Loan B, 5.42%, 6/06/19 | | | | | | | 1,404 | | | | 1,403,915 | |
Level 3 Financing, Inc., 2017 Term Loan B, 3.24%, 2/22/24 | | | | | | | 7,110 | | | | 7,130,335 | |
Sprint Communications, Inc., 1st Lien Term Loan B, 3.50%, 2/02/24 | | | | | | | 1,785 | | | | 1,786,125 | |
Telenet International Finance Sarl: | | | | | | | | | | | | |
Term Loan AF, 3.97%, 1/31/25 | | | | | | | 2,475 | | | | 2,478,490 | |
Term Loan AI, 3.90%, 3/31/25 | | | | | | | 2,420 | | | | 2,426,050 | |
Telesat Canada, 2017 Term Loan B, 4.15%, 11/17/23 | | | | | | | 701 | | | | 706,056 | |
Virgin Media Investment Holdings Ltd., Term Loan J, 3.76%, 1/31/26 | | | GBP | | | | 1,101 | | | | 1,429,874 | |
WaveDivision Holdings LLC, Term Loan B, 3.93%, 10/15/19 | | | USD | | | | 892 | | | | 893,163 | |
Zayo Group LLC, 2017 Term Loan B2, 3.50%, 1/19/24 | | | | | | | 1,812 | | | | 1,823,866 | |
| | | | | | | | | | | | |
| | | | | | | | | | | | 21,705,719 | |
| Electric Utilities — 2.1% | | | | | | | | | |
Energy Future Intermediate Holding Co. LLC, 2016 DIP Term Loan, 4.30%, 6/30/17 | | | | | | | 3,761 | | | | 3,779,481 | |
PrimeLine Utility Services LLC, Term Loan, 6.52%, 11/12/22 | | | | | | | 845 | | | | 836,226 | |
TEX Operations Co. LLC: | | | | | | | | | | | | |
Exit Term Loan B, 3.79%, 8/04/23 | | | | | | | 1,674 | | | | 1,670,308 | |
Exit Term Loan C, 3.74%, 8/04/23 | | | | | | | 383 | | | | 382,144 | |
| | | | | | | | | | | | |
| Floating Rate Loan Interests (b) | | | | | Par (000) | | | Value | |
| Electric Utilities (continued) | | | | | | | | | |
Texas Competitive Electric Holdings Co. LLC/TCEH Finance, Inc., Escrow,
5.19%, 11/10/17 (a)(b)(d) | | | USD | | | | 1,050 | | | | — | |
Vistra Operations Co. LLC, 2016 Term Loan B2, 4.24%, 12/14/23 | | | | | | | 449 | | | $ | 450,280 | |
| | | | | | | | | | | | |
| | | | | | | | | | | | 7,118,439 | |
| Energy Equipment & Services — 0.8% | | | | | | | | | |
Exgen Texas Power LLC, Term Loan B, 5.90%, 9/16/21 | | | | | | | 527 | | | | 283,447 | |
Gavilan Resources LLC, 2nd Lien Term Loan, 7.00%, 3/01/24 | | | | | | | 1,225 | | | | 1,212,750 | |
Seadrill Partners Finco LLC, Term Loan B, 4.05%, 2/21/21 | | | | | | | 407 | | | | 273,371 | |
Weatherford International Ltd., Term Loan, 3.30%, 7/13/20 | | | | | | | 869 | | | | 851,261 | |
| | | | | | | | | | | | |
| | | | | | | | | | | | 2,620,829 | |
| Food & Staples Retailing — 4.1% | | | | | | | | | |
Albertsons LLC: | | | | | | | | | | | | |
2016 Term Loan B4, 3.99%, 8/22/21 | | | | | | | 2,767 | | | | 2,776,406 | |
2016 Term Loan B5, 4.40%, 12/22/22 | | | | | | | 217 | | | | 217,687 | |
BJ’s Wholesale Club, Inc.: | | | | | | | | | | | | |
2017 1st Lien Term Loan, 4.75%, 2/03/24 | | | | | | | 2,330 | | | | 2,319,329 | |
2017 2nd Lien Term Loan, 8.50%, 2/03/25 | | | | | | | 680 | | | | 680,993 | |
Hostess Brands LLC, 2016 1st Lien Term Loan, 4.00%, 8/03/22 | | | | | | | 1,692 | | | | 1,706,117 | |
Rite Aid Corp.: | | | | | | | | | | | | |
5.75%, 8/21/20 | | | | | | | 681 | | | | 682,367 | |
4.88%, 6/21/21 | | | | | | | 1,629 | | | | 1,630,227 | |
US Foods, Inc., 2016 Term Loan B, 3.74%, 6/27/23 | | | | | | | 4,020 | | | | 4,054,435 | |
| | | | | | | | | | | | |
| | | | | | | | | | | | 14,067,561 | |
| Food Products — 2.7% | | | | | | | | | |
Blue Ribbon LLC, Term Loan, 5.15%, 11/13/21 | | | | | | | 635 | | | | 588,538 | |
Chobani LLC, 1st Lien Term Loan, 5.25%, 10/07/23 | | | | | | | 1,273 | | | | 1,291,676 | |
Dole Food Company, Inc., 2017 Term Loan B, 4.03%, 4/06/24 | | | | | | | 650 | | | | 651,930 | |
JBS USA LLC, 2017 Term Loan B, 3.48%, 10/30/22 | | | | | | | 1,245 | | | | 1,250,117 | |
Pinnacle Foods Finance LLC, 2017 Term Loan B, 2.98%, 2/02/24 | | | | | | | 1,616 | | | | 1,625,032 | |
Reddy Ice Corp.: | | | | | | | | | | | | |
1st Lien Term Loan, 6.75%, 5/01/19 | | | | | | | 965 | | | | 950,232 | |
2nd Lien Term Loan, 10.75%, 11/01/19 | | | | | | | 328 | | | | 306,132 | |
Reynolds Group Holdings, Inc., 2017 Term Loan, 3.99%, 2/05/23 | | | | | | | 2,540 | | | | 2,552,592 | |
| | | | | | | | | | | | |
| | | | | | | | | | | | 9,216,249 | |
| Health Care Equipment & Supplies — 4.5% | | | | | | | | | |
Alere, Inc.: | | | | | | | | | | | | |
2015 Term Loan A, 3.99%, 6/18/20 | | | | | | | 277 | | | | 276,906 | |
2015 Term Loan B, 4.25%, 6/18/22 | | | | | | | 1,165 | | | | 1,169,953 | |
Auris Luxembourg III Sarl, 2017 Term Loan B7, 4.15%, 1/17/22 | | | | | | | 1,502 | | | | 1,513,269 | |
Capsugel Holdings US, Inc., Term Loan B, 4.00%, 7/31/21 | | | | | | | 2,320 | | | | 2,321,233 | |
Cotiviti Corp., Term Loan B, 3.90%, 9/28/23 | | | | | | | 1,595 | | | | 1,601,492 | |
DJO Finance LLC, 2015 Term Loan, 4.25%, 6/08/20 | | | | | | | 2,295 | | | | 2,239,535 | |
Immucor, Inc., Refinancing Term Loan B2, 5.00%, 8/17/18 | | | | | | | 1,388 | | | | 1,382,255 | |
Mallinckrodt International Finance SA, Term Loan B, 3.90%, 9/24/24 | | | | | | | 736 | | | | 735,814 | |
See Notes to Financial Statements.
| | | | | | |
| | | | | | | |
| 30 | | SEMI-ANNUAL REPORT | | APRIL 30, 2017 | | |
| | |
Schedule of Investments (continued) | | BlackRock Floating Rate Income Trust (BGT) |
| | | | | | | | | | | | |
| Floating Rate Loan Interests (b) | | | | | Par (000) | | | Value | |
| Health Care Equipment & Supplies (continued) | | | | | | | | | |
National Vision, Inc., 1st Lien Term Loan, 4.00%, 3/12/21 | | | USD | | | | 2,091 | | | $ | 2,090,672 | |
Ortho-Clinical Diagnostics, Inc., Term Loan B, 4.75%, 6/30/21 | | | | | | | 1,380 | | | | 1,372,500 | |
Tecomet, Inc., 2017 Term Loan B, 4.75%, 4/13/24 | | | | | | | 595 | | | | 597,975 | |
| | | | | | | | | | | | |
| | | | | | | | | | | | 15,301,604 | |
| Health Care Providers & Services — 8.2% | | | | | | | | | |
Acadia Healthcare Co., Inc.: | | | | | | | | | | | | |
Term Loan B, 3.98%, 2/11/22 | | | | | | | 287 | | | | 287,385 | |
Term Loan B2, 3.98%, 2/16/23 | | | | | | | 1,308 | | | | 1,308,437 | |
CHG Healthcare Services, Inc., 2016 Term Loan B, 4.92%, 6/07/23 | | | | | | | 2,089 | | | | 2,114,134 | |
Community Health Systems, Inc.: | | | | | | | | | | | | |
Term Loan G, 3.75%, 12/31/19 | | | | | | | 894 | | | | 890,298 | |
Term Loan H, 4.00%, 1/27/21 | | | | | | | 430 | | | | 427,487 | |
Curo Health Services Holdings, Inc., 2015 1st Lien Term Loan, 6.54%, 2/07/22 | | | | | | | 377 | | | | 379,773 | |
DaVita HealthCare Partners, Inc., Term Loan B, 3.74%, 6/24/21 | | | | | | | 3,409 | | | | 3,441,321 | |
Envision Healthcare Corp., 2016 Term Loan B, 4.15%, 12/01/23 | | | | | | | 4,663 | | | | 4,706,448 | |
HC Group Holdings III, Inc., Term Loan B, 6.00%, 4/07/22 | | | | | | | 882 | | | | 867,663 | |
HCA, Inc., Term Loan B9, 2.99%, 3/17/23 | | | | | | | 3,183 | | | | 3,192,883 | |
Iasis Healthcare LLC, Term Loan B3, 5.25%, 2/16/21 | | | | | | | 205 | | | | 205,000 | |
inVentiv Health, Inc., 2016 Term Loan B, 4.80%, 11/09/23 | | | | | | | 2,522 | | | | 2,534,508 | |
MPH Acquisition Holdings LLC, 2016 Term Loan B, 4.90%, 6/07/23 | | | | | | | 1,541 | | | | 1,561,001 | |
National Mentor Holdings, Inc., Term Loan B, 4.40%, 1/31/21 | | | | | | | 295 | | | | 297,191 | |
NVA Holdings, Inc., 1st Lien Term Loan B2, 4.65%, 8/14/21 | | | | | | | 916 | | | | 928,837 | |
Precyse Acquisition Corp., 2016 1st Lien Term Loan, 5.50%, 10/20/22 | | | | | | | 1,001 | | | | 1,011,336 | |
Surgery Center Holdings, Inc., 1st Lien Term Loan, 4.75%, 11/03/20 | | | | | | | 1,177 | | | | 1,182,533 | |
Team Health Holdings, Inc., 1st Lien Term Loan, 3.75%, 2/06/24 | | | | | | | 1,845 | | | | 1,827,712 | |
U.S. Renal Care, Inc., 2015 Term Loan B, 5.40%, 12/31/22 | | | | | | | 1 | | | | 514 | |
Vizient, Inc., 2016 Term Loan B, 5.00%, 2/13/23 | | | | | | | 1,117 | | | | 1,120,911 | |
| | | | | | | | | | | | |
| | | | | | | | | | | | 28,285,372 | |
| Health Care Technology — 2.1% | | | | | | | | | |
Change Healthcare Holdings, Inc., 2017 Term Loan B, 3.75%, 3/01/24 | | | | | | | 4,715 | | | | 4,727,401 | |
Press Ganey Holdings, Inc.: | | | | | | | | | | | | |
1st Lien Term Loan, 4.25%, 10/21/23 | | | | | | | 838 | | | | 837,900 | |
2nd Lien Term Loan, 8.25%, 10/21/24 | | | | | | | 310 | | | | 315,425 | |
Quintiles IMS, Inc., 2017 Term Loan B, 3.15%, 3/07/24 | | | | | | | 1,410 | | | | 1,422,846 | |
| | | | | | | | | | | | |
| | | | | | | | | | | | 7,303,572 | |
| Hotels, Restaurants & Leisure — 8.5% | | | | | | | | | |
Amaya Holdings BV: | | | | | | | | | | | | |
2nd Lien Term Loan, 8.15%, 8/01/22 | | | | | | | 602 | | | | 602,879 | |
Repriced Term Loan B, 4.65%, 8/01/21 | | | | | | | 1,629 | | | | 1,629,344 | |
AMF Bowling Centers, Inc., 2016 Term Loan, 6.00%, 8/17/23 | | | | | | | 714 | | | | 712,624 | |
Boyd Gaming Corp., 2017 Term Loan B2, 3.45%, 9/15/23 | | | | | | | 1,232 | | | | 1,236,668 | |
| | | | | | | | | | | | |
| Floating Rate Loan Interests (b) | | | | | Par (000) | | | Value | |
| Hotels, Restaurants & Leisure (continued) | | | | | | | | | |
Bronco Midstream Funding LLC, Term Loan B, 5.06%, 8/15/20 | | | USD | | | | 1,410 | | | $ | 1,420,771 | |
Burger King Newco Unlimited Liability Co., Term Loan B3, 3.40%, 2/16/24 | | | | | | | 2,854 | | | | 2,855,088 | |
Caesars Entertainment Operating Co., Term Loan B7, 6.13%, 3/01/22 (a) | | | | | | | 1,495 | | | | 1,832,616 | |
Caesars Entertainment Resort Properties LLC, Term Loan B, 7.00%, 10/11/20 | | | | | | | 4,575 | | | | 4,584,065 | |
Caesars Growth Properties Holdings LLC, Term Loan: | | | | | | | | | | | | |
2017, 4.00%, 5/08/21 | | | | | | | 320 | | | | 321,600 | |
6.25%, 5/08/21 | | | | | | | 800 | | | | 804,016 | |
CCM Merger, Inc., Term Loan B, 4.24%, 8/08/21 | | | | | | | 794 | | | | 797,532 | |
Eldorado Resorts LLC, Term Loan B: | | | | | | | | | | | | |
2017, 2.25%, 3/13/24 | | | | | | | 369 | | | | 368,077 | |
6.25%, 7/23/22 | | | | | | | 1,466 | | | | 1,459,212 | |
ESH Hospitality, Inc., 2017 Term Loan B, 3.49%, 8/30/23 | | | | | | | 1,990 | | | | 1,999,127 | |
Four Seasons Holdings, Inc., 1st Lien Term Loan, 4.15%, 11/30/23 | | | | | | | 140 | | | | 141,171 | |
Gateway Casinos & Entertainment Ltd., Term Loan B1, 4.80%, 2/22/23 | | | | | | | 185 | | | | 187,312 | |
Hilton Worldwide Finance LLC, Term Loan B2, 2.99%, 10/25/23 | | | | | | | 1,114 | | | | 1,123,271 | |
La Quinta Intermediate Holdings LLC, Term Loan B, 3.91%, 4/14/21 | | | | | | | 504 | | | | 508,124 | |
Playa Resorts Holding BV, 2017 Term Loan B, 4.25%, 4/05/24 | | | | | | | 875 | | | | 875,779 | |
RHP Hotel Properties LP, Term Loan B: | | | | | | | | | | | | |
2017, 3.41%, 4/19/24 | | | | | | | 840 | | | | 842,100 | |
3.75%, 1/15/21 | | | | | | | 751 | | | | 753,681 | |
Sabre GLBL, Inc., Term Loan B, 3.73%, 2/22/24 | | | | | | | 1,578 | | | | 1,592,981 | |
Scientific Games International, Inc., 2017 Term Loan B3, 4.99%, 10/01/21 | | | | | | | 1,177 | | | | 1,194,234 | |
Station Casinos LLC, 2016 Term Loan B, 3.50%, 6/08/23 | | | | | | | 522 | | | | 521,761 | |
Yum! Brands, Inc., 1st Lien Term Loan B, 2.99%, 6/16/23 | | | | | | | 896 | | | | 899,977 | |
| | | | | | | | | | | | |
| | | | | | | | | | | | 29,264,010 | |
| Household Products — 0.6% | | | | | | | | | |
Spectrum Brands, Inc., 2017 Term Loan B, 2.99%, 6/23/22 | | | | | | | 2,003 | | | | 2,014,610 | |
Independent Power and Renewable Electricity
Producers — 3.1% | | | | | | | | | |
Aria Energy Operating LLC, Term Loan, 5.55%, 5/27/22 | | | | | | | 734 | | | | 737,641 | |
Calpine Construction Finance Co., LP, Term Loan B1, 3.24%, 5/03/20 | | | | | | | 639 | | | | 639,630 | |
Calpine Corp.: | | | | | | | | | | | | |
Term Loan B5, 3.90%, 1/15/24 | | | | | | | 688 | | | | 689,661 | |
Term Loan B6, 3.90%, 1/15/23 | | | | | | | 1,304 | | | | 1,307,580 | |
Term Loan B7, 3.90%, 5/31/23 | | | | | | | 472 | | | | 473,429 | |
Dynegy, Inc., 2017 Term Loan C, 4.25%, 2/07/24 | | | | | | | 2,264 | | | | 2,262,412 | |
Granite Acquisition, Inc.: | | | | | | | | | | | | |
Term Loan B, 5.15%, 12/19/21 | | | | | | | 2,026 | | | | 2,043,560 | |
Term Loan C, 5.15%, 12/19/21 | | | | | | | 91 | | | | 91,986 | |
Nautilus Power LLC, Term Loan B, 5.50%, 4/26/24 | | | | | | | 1,610 | | | | 1,599,937 | |
Terra-Gen Finance Co. LLC, Term Loan B, 5.25%, 12/09/21 | | | | | | | 667 | | | | 627,298 | |
| | | | | | | | | | | | |
| | | | | | | | | | | | 10,473,134 | |
| Industrial Conglomerates — 0.9% | | | | | | | | | |
Cortes NP Acquisition Corp., 2017 Term Loan B, 5.00%, 11/30/23 | | | | | | | 1,805 | | | | 1,815,231 | |
See Notes to Financial Statements.
| | | | | | |
| | | | | | | |
| | SEMI-ANNUAL REPORT | | APRIL 30, 2017 | | 31 |
| | |
Schedule of Investments (continued) | | BlackRock Floating Rate Income Trust (BGT) |
| | | | | | | | | | | | |
| Floating Rate Loan Interests (b) | | | | | Par (000) | | | Value | |
| Industrial Conglomerates (continued) | | | | | | | | | |
Power Products LLC, Term Loan, 5.66%, 12/20/22 | | | USD | | | | 515 | | | $ | 517,899 | |
Sequa Corp., 1st Lien Term Loan, 6.67%, 11/26/21 | | | | | | | 760 | | | | 767,600 | |
| | | | | | | | | | | | |
| | | | | | | | | | | | 3,100,730 | |
| Insurance — 2.6% | | | | | | | | | |
Alliant Holdings I, Inc., 2015 Term Loan B, 4.39%, 8/12/22 | | | | | | | 1,032 | | | | 1,034,697 | |
AmWINS Group, Inc.: | | | | | | | | | | | | |
2017 2nd Lien Term Loan, 7.75%, 1/25/25 | | | | | | | 180 | | | | 183,150 | |
2017 Term Loan B, 3.75%, 1/25/24 | | | | | | | 1,152 | | | | 1,150,995 | |
AssuredPartners, Inc., 2016 Term Loan B, 5.25%, 10/21/22 | | | | | | | 1,660 | | | | 1,668,819 | |
Edgewood Partners Insurance Center, 2017 1st Lien Term Loan B, 6.00%, 3/16/23 | | | | | | | 530 | | | | 530,000 | |
Hub International Ltd., Term Loan B, 4.03%, 10/02/20 | | | | | | | 724 | | | | 726,949 | |
Lonestar Intermediate Super Holdings LLC, PIK Term Loan B, 10.00%, 8/31/21 (e) | | | | | | | 720 | | | | 747,900 | |
Sedgwick Claims Management Services, Inc.: | | | | | | | | | | | | |
1st Lien Term Loan, 3.75%, 3/01/21 | | | | | | | 1,140 | | | | 1,140,035 | |
2016 1st Lien Term Loan, 4.40%, 3/01/21 | | | | | | | 526 | | | | 526,025 | |
2nd Lien Term Loan, 6.75%, 2/28/22 | | | | | | | 1,230 | | | | 1,231,021 | |
| | | | | | | | | | | | |
| | | | | | | | | | | | 8,939,591 | |
| Internet & Direct Marketing Retail — 0.3% | | | | | | | | | |
Harbor Freight Tools USA, Inc., 2016 Term Loan B, 4.24%, 8/19/23 | | | | | | | 874 | | | | 870,956 | |
| Internet Software & Services — 1.6% | | | | | | | | | |
Go Daddy Operating Company LLC, 2017 Term Loan B, 3.49%, 2/15/24 | | | | | | | 2,319 | | | | 2,328,045 | |
GTT Communications, Inc., 2016 Term Loan B, 5.00%, 1/09/24 | | | | | | | 222 | | | | 224,529 | |
Rackspace Hosting, Inc., 1st Lien Term Loan, 4.53%, 11/03/23 | | | | | | | 2,045 | | | | 2,058,944 | |
TierPoint, LLC, 2017 1st Lien Term Loan, 4.75%, 5/18/24 | | | | | | | 920 | | | | 923,450 | |
| | | | | | | | | | | | |
| | | | | | | | | | | | 5,534,968 | |
| IT Services — 7.0% | | | | | | | | | |
Abacus Innovations Corp., Term Loan B, 3.25%, 8/16/23 | | | | | | | 2,504 | | | | 2,525,007 | |
Cision US, Inc., Term Loan B, 7.15%, 6/16/23 | | | | | | | 754 | | | | 758,698 | |
Cologix, Inc., 2017 1st Lien Term Loan, 4.15%, 3/20/24 | | | | | | | 1,085 | | | | 1,085,000 | |
First Data Corp.: | | | | | | | | | | | | |
2016 Repriced Term Loan, 3.99%, 7/10/22 | | | | | | | 522 | | | | 524,379 | |
2017 Term Loan, 3.99%, 3/24/21 | | | | | | | 7,487 | | | | 7,487,027 | |
Term Loan A, 2.99%, 6/02/20 | | | | | | | 393 | | | | 393,282 | |
Global Payments, Inc., Reprice Term Loan B, 3.49%, 4/22/23 | | | | | | | 1,008 | | | | 1,011,097 | |
NeuStar, Inc.: | | | | | | | | | | | | |
Term Loan B1, 3.25%, 8/28/19 | | | | | | | 174 | | | | 177,334 | |
Term Loan B2, 4.90%, 2/28/24 | | | | | | | 476 | | | | 481,755 | |
Optiv Security, Inc.: | | | | | | | | | | | | |
1st Lien Term Loan, 4.25%, 2/01/24 | | | | | | | 1,765 | | | | 1,762,052 | |
2nd Lien Term Loan, 8.25%, 2/01/25 | | | | | | | 465 | | | | 470,925 | |
TKC Holdings, Inc., 2017 Term Loan, 4.75%, 2/01/23 | | | | | | | 1,235 | | | | 1,247,350 | |
Vantiv LLC, 2014 Term Loan B, 3.49%, 10/14/23 | | | | | | | 673 | | | | 677,992 | |
VF Holding Corp., Reprice Term Loan, 4.25%, 6/30/23 | | | | | | | 2,950 | | | | 2,958,023 | |
WEX, Inc., Term Loan B, 4.49%, 7/01/23 | | | | | | | 2,313 | | | | 2,334,933 | |
| | | | | | | | | | | | |
| | | | | | | | | | | | 23,894,854 | |
| | | | | | | | | | | | |
| Floating Rate Loan Interests (b) | | | | | Par (000) | | | Value | |
| Life Sciences Tools & Services — 1.1% | | | | | | | | | |
DPx Holdings BV, 2017 Term Loan, 4.41%, 4/30/24 | | | USD | | | | 3,717 | | | $ | 3,723,418 | |
| Machinery — 3.4% | | | | | | | | | |
Columbus McKinnon Corp., Term Loan B, 4.15%, 1/31/24 | | | | | | | 138 | | | | 138,635 | |
Faenza Acquisition GmbH: | | | | | | | | | | | | |
Term Loan B1, 3.80%, 8/30/20 | | | | | | | 594 | | | | 598,650 | |
Term Loan B3, 3.80%, 8/30/20 | | | | | | | 181 | | | | 182,737 | |
Gardner Denver, Inc., Term Loan, 4.57%, 7/30/20 | | | | | | | 1,186 | | | | 1,185,245 | |
Gates Global LLC, 2017 Term Loan B, 4.41%, 4/01/24 | | | | | | | 2,021 | | | | 2,030,359 | |
Global Brass & Copper, Inc., 2016 Term Loan B, 5.25%, 7/18/23 | | | | | | | 697 | | | | 703,904 | |
Infiltrator Systems, Inc., 2016 Term Loan B, 4.65%, 5/27/22 | | | | | | | 1,208 | | | | 1,216,108 | |
Manitowoc Foodservice, Inc., 2016 Term Loan B, 4.00%, 3/03/23 | | | | | | | 70 | | | | 70,824 | |
Mueller Water Products, Inc., 2017 Term Loan B, 3.49%, 11/25/21 | | | | | | | 489 | | | | 493,868 | |
Navistar International Corp., 2017 Term Loan B, 5.00%, 8/07/20 | | | | | | | 585 | | | | 592,105 | |
Rexnord LLC, 2016 Term Loan B, 3.75%, 8/21/23 | | | | | | | 1,333 | | | | 1,336,670 | |
Signode Industrial Group US, Inc., Term Loan B, 3.75%, 5/01/21 | | | | | | | 562 | | | | 564,309 | |
Silver II US Holdings LLC, Term Loan, 4.15%, 12/13/19 | | | | | | | 1,669 | | | | 1,659,777 | |
Wabash National Corp., 2017 Term Loan B, 3.75%, 3/18/22 | | | | | | | 784 | | | | 788,236 | |
| | | | | | | | | | | | |
| | | | | | | | | | | | 11,561,427 | |
| Media — 12.8% | | | | | | | | | |
Altice US Finance I Corp., 2017 Term Loan: | | | | | | | | | | | | |
3.24%, 7/28/25 | | | | | | | 4,000 | | | | 3,995,680 | |
B, 2.75%, 6/21/25 | | | | | | | 625 | | | | 624,531 | |
CBS Radio, Inc., Term Loan B: | | | | | | | | | | | | |
2017, 2.75%, 3/02/24 | | | | | | | 295 | | | | 296,968 | |
4.50%, 10/17/23 | | | | | | | 610 | | | | 613,700 | |
Charter Communications Operating LLC, 2016 Term Loan I Add, 3.24%, 1/15/24 | | | | | | | 3,930 | | | | 3,948,969 | |
CSC Holdings LLC, 2017 1st Lien Term Loan, 3.24%, 7/15/25 | | | | | | | 2,624 | | | | 2,621,787 | |
Entercom Radio LLC, 2016 Term Loan, 4.55%, 11/01/23 | | | | | | | 324 | | | | 326,308 | |
Gray Television, Inc., 2017 Term Loan B, 3.48%, 2/07/24 | | | | | | | 399 | | | | 401,793 | |
Hemisphere Media Holdings LLC, 2017 Term Loan B, 4.49%, 2/08/24 | | | | | | | 976 | | | | 972,035 | |
Houghton Mifflin Harcourt Publishing Co., 2015 Term Loan B, 4.00%, 5/31/21 | | | | | | | 1,482 | | | | 1,364,425 | |
iHeartCommunications, Inc.: | | | | | | | | | | | | |
Extended Term Loan E, 8.49%, 7/30/19 | | | | | | | 315 | | | | 267,435 | |
Term Loan D, 7.74%, 1/30/19 | | | | | | | 3,806 | | | | 3,237,706 | |
Intelsat Jackson Holdings SA, Term Loan B2, 3.89%, 6/30/19 | | | | | | | 4,227 | | | | 4,167,758 | |
Learfield Communications, Inc., 2016 1st Lien Term Loan, 4.25%, 12/01/23 | | | | | | | 1,117 | | | | 1,125,072 | |
Liberty Cablevision of Puerto Rico LLC, 1st Lien Term Loan, 4.66%, 1/07/22 | | | | | | | 735 | | | | 733,390 | |
Live Nation Entertainment, Inc., Term Loan B2, 3.50%, 10/31/23 | | | | | | | 294 | | | | 296,670 | |
MCC Iowa LLC, Term Loan J, 3.70%, 6/30/21 | | | | | | | 316 | | | | 317,564 | |
Mediacom Illinois LLC, Term Loan K, 3.20%, 2/15/24 | | | | | | | 496 | | | | 498,043 | |
Mission Broadcasting, Inc., 2016 Term Loan B2, 3.99%, 1/17/24 | | | | | | | 255 | | | | 257,007 | |
See Notes to Financial Statements.
| | | | | | |
| | | | | | | |
| 32 | | SEMI-ANNUAL REPORT | | APRIL 30, 2017 | | |
| | |
Schedule of Investments (continued) | | BlackRock Floating Rate Income Trust (BGT) |
| | | | | | | | | | | | |
| Floating Rate Loan Interests (b) | | | | | Par (000) | | | Value | |
| Media (continued) | | | | | | | | | |
Nexstar Broadcasting, Inc., 2017 Term Loan B, 3.99%, 1/17/24 | | | USD | | | | 2,628 | | | $ | 2,650,944 | |
Numericable U.S. LLC, Term Loan B10, 4.42%, 1/14/25 | | | | | | | 518 | | | | 518,281 | |
PSAV Holdings LLC, Term Loan B, 4.75%, 4/21/24 | | | | | | | 1,135 | | | | 1,132,163 | |
SBA Senior Finance II LLC, Term Loan B1, 3.25%, 3/24/21 | | | | | | | 2,669 | | | | 2,684,148 | |
Sinclair Television Group, Inc., Term Loan B2, 3.25%, 1/03/24 | | | | | | | 632 | | | | 633,249 | |
Trader Corporation, 2017 Term Loan B, 4.29%, 9/28/23 | | | | | | | 965 | | | | 967,007 | |
Tribune Media Co., Term Loan C, 3.99%, 1/27/24 | | | | | | | 2,384 | | | | 2,397,627 | |
Univision Communications, Inc., Term Loan C5, 3.75%, 3/15/24 | | | | | | | 1,713 | | | | 1,701,282 | |
Virgin Media Bristol LLC, Term Loan I, 3.74%, 1/31/25 | | | | | | | 2,415 | | | | 2,423,501 | |
William Morris Endeavor Entertainment LLC, 1st Lien Term Loan, 4.40%, 5/06/21 | | | | | | | 150 | | | | 150,389 | |
Ziggo Secured Finance Partnership, Term Loan E, 3.49%, 4/15/25 | | | | | | | 2,585 | | | | 2,585,129 | |
| | | | | | | | | | | | |
| | | | | | | | | | | | 43,910,561 | |
| Metals & Mining — 0.1% | | | | | | | | | |
Ameriforge Group, Inc., 2nd Lien Term Loan, 8.75%, 12/19/20 | | | | | | | 265 | | | | 26,500 | |
WireCo WorldGroup, Inc., 2016 1st Lien Term Loan, 6.50%, 9/30/23 | | | | | | | 458 | | | | 461,513 | |
| | | | | | | | | | | | |
| | | | | | | | | | | | 488,013 | |
| Multiline Retail — 0.5% | | | | | | | | | |
Hudson’s Bay Co., 2015 Term Loan B, 4.25%, 9/30/22 | | | | | | | 1,360 | | | | 1,303,067 | |
Neiman Marcus Group, Inc., 2020 Term Loan, 4.25%, 10/25/20 | | | | | | | 432 | | | | 344,069 | |
| | | | | | | | | | | | |
| | | | | | | | | | | | 1,647,136 | |
| Oil, Gas & Consumable Fuels — 4.4% | | | | | | | | | |
California Resources Corp.: | | | | | | | | | | | | |
Second Out Term Loan, 11.38%, 12/31/21 | | | | | | | 2,075 | | | | 2,279,906 | |
Term Loan A, 3.99%, 10/01/19 | | | | | | | 1,499 | | | | 1,448,165 | |
Chesapeake Energy Corp., Term Loan, 8.55%, 8/23/21 | | | | | | | 2,125 | | | | 2,294,374 | |
CITGO Holding, Inc., 2015 Term Loan B, 9.65%, 5/12/18 | | | | | | | 649 | | | | 656,649 | |
Drillships Financing Holding, Inc., Term Loan B1, 8.00%, 3/31/21 | | | | | | | 627 | | | | 471,157 | |
Energy Transfer Equity LP, 2017 Term Loan B, 3.73%, 2/02/24 | | | | | | | 1,526 | | | | 1,529,350 | |
EWT Holdings III Corp., 1st Lien Term Loan, 4.90%, 1/15/21 | | | | | | | 1,016 | | | | 1,020,954 | |
Linn Energy LLC, Exit Term Loan, 8.49%, 2/27/21 | | | | | | | 144 | | | | 144,702 | |
MEG Energy Corp., 2017 Term Loan B, 4.67%, 12/31/23 | | | | | | | 1,041 | | | | 1,041,579 | |
Panda Patriot LLC, Term Loan B1, 6.90%, 12/19/20 | | | | | | | 211 | | | | 198,697 | |
Peabody Energy Corp., Exit Term Loan, 5.65%, 3/31/22 | | | | | | | 360 | | | | 360,900 | |
PowerTeam Services LLC: | | | | | | | | | | | | |
1st Lien Term Loan, 4.40%, 5/06/20 | | | | | | | 305 | | | | 302,461 | |
2nd Lien Term Loan, 8.40%, 11/06/20 | | | | | | | 285 | | | | 283,575 | |
Samchully Midstream 3 LLC, Term Loan B, 5.90%, 10/20/21 | | | | | | | 853 | | | | 826,958 | |
Ultra Resources, Inc., 1st Lien Term Loan, 4.00%, 3/23/24 | | | | | | | 457 | | | | 454,715 | |
| | | | | | | | | | | | |
| Floating Rate Loan Interests (b) | | | | | Par (000) | | | Value | |
| Oil, Gas & Consumable Fuels (continued) | | | | | | | | | |
Veresen Midstream LP, 2017 Term Loan B, 4.50%, 3/31/22 | | | USD | | | | 1,677 | | | $ | 1,687,335 | |
| | | | | | | | | | | | |
| | | | | | | | | | | | 15,001,477 | |
| Personal Products — 0.9% | | | | | | | | | |
Prestige Brands, Inc., Term Loan B4, 3.74%, 1/26/24 | | | | | | | 1,253 | | | | 1,264,060 | |
Revlon Consumer Products Corp., 2016 Term Loan B, 4.49%, 9/07/23 | | | | | | | 1,841 | | | | 1,842,609 | |
| | | | | | | | | | | | |
| | | | | | | | | | | | 3,106,669 | |
| Pharmaceuticals — 3.6% | | | | | | | | | |
Akorn, Inc., Term Loan B, 5.25%, 4/16/21 | | | | | | | 1,535 | | | | 1,549,702 | |
CPI Holdco LLC, 2017 1st Lien Term Loan, 5.15%, 3/21/24 | | | | | | | 261 | | | | 262,305 | |
Grifols Worldwide Operations USA, Inc., 2017 Acquisition Term Loan, 3.20%, 1/31/25 | | | | | | | 3,510 | | | | 3,517,441 | |
Jaguar Holding Co. II, 2015 Term Loan B, 4.25%, 8/18/22 | | | | | | | 3,906 | | | | 3,925,200 | |
Valeant Pharmaceuticals International, Inc., Series F1 Term Loan B, 5.74%, 4/01/22 | | | | | | | 3,208 | | | | 3,226,801 | |
| | | | | | | | | | | | |
| | | | | | | | | | | | 12,481,449 | |
| Professional Services — 2.2% | | | | | | | | | |
Acosta Holdco, Inc., 2015 Term Loan, 4.29%, 9/26/21 | | | | | | | 107 | | | | 99,651 | |
Advantage Sales & Marketing, Inc., 2014 1st Lien Term Loan, 4.25%, 7/23/21 | | | | | | | 865 | | | | 843,347 | |
Information Resources, Inc., 1st Lien Term Loan, 5.25%, 1/18/24 | | | | | | | 480 | | | | 484,651 | |
SIRVA Worldwide, Inc., 2016 Term Loan, 7.66%, 11/14/22 | | | | | | | 503 | | | | 500,226 | |
Sterling Infosystems, Inc., 1st Lien Term Loan B, 5.40%, 6/20/22 | | | | | | | 997 | | | | 1,001,492 | |
TransUnion LLC, Term Loan B2, 3.49%, 4/09/23 | | | | | | | 4,461 | | | | 4,496,871 | |
| | | | | | | | | | | | |
| | | | | | | | | | | | 7,426,238 | |
| Real Estate Investment Trusts (REITs) — 1.8% | | | | | | | | | |
Capital Automotive LP, 2017 1st Lien Term Loan, 4.00%, 3/24/24 | | | | | | | 475 | | | | 478,562 | |
Communications Sales & Leasing, Inc., 2017 Term Loan B, 4.00%, 10/24/22 | | | | | | | 1,456 | | | | 1,450,730 | |
Geo Group, Inc., 2017 Term Loan B, 3.25%, 3/17/24 | | | | | | | 1,501 | | | | 1,501,000 | |
MGM Growth Properties LLC, 2016 Term Loan B, 3.49%, 4/25/23 | | | | | | | 2,853 | | | | 2,858,052 | |
| | | | | | | | | | | | |
| | | | | | | | | | | | 6,288,344 | |
| Real Estate Management & Development — 1.5% | | | | | | | |
CityCenter Holdings LLC, 2017 Term Loan B, 3.75%, 4/18/24 | | | | | | | 1,481 | | | | 1,482,570 | |
DTZ U.S. Borrower LLC, 2015 1st Lien Term Loan, 4.42%, 11/04/21 | | | | | | | 1,146 | | | | 1,149,769 | |
Realogy Corp.: | | | | | | | | | | | | |
2017 Term Loan B, 3.24%, 7/20/22 | | | | | | | 1,910 | | | | 1,923,925 | |
Term Loan A, 2.99%, 10/23/20 | | | | | | | 655 | | | | 653,426 | |
| | | | | | | | | | | | |
| | | | | | | | | | | | 5,209,690 | |
| Road & Rail — 0.2% | | | | | | | | | |
Road Infrastructure Investment LLC, 2016 1st Lien Term Loan, 4.50%, 6/13/23 | | | | | | | 766 | | | | 770,747 | |
| Semiconductors & Semiconductor Equipment — 0.4% | | | | | | | |
Cavium, Inc., 2017 Term Loan B, 3.24%, 8/16/22 | | | | | | | 503 | | | | 503,548 | |
MaxLinear, Inc., Term Loan B, 3.75%, 4/05/24 | | | | | | | 265 | | | | 265,000 | |
Microsemi Corp., 2015 Term Loan B, 3.24%, 1/15/23 | | | | | | | 252 | | | | 253,421 | |
See Notes to Financial Statements.
| | | | | | |
| | | | | | | |
| | SEMI-ANNUAL REPORT | | APRIL 30, 2017 | | 33 |
| | |
Schedule of Investments (continued) | | BlackRock Floating Rate Income Trust (BGT) |
| | | | | | | | | | | | |
| Floating Rate Loan Interests (b) | | | | | Par (000) | | | Value | |
| Semiconductors & Semiconductor Equipment (continued) | | | | |
ON Semiconductor Corp., 2017 Term Loan B, 3.24%, 3/31/23 | | | USD | | | | 499 | | | $ | 501,372 | |
| | | | | | | | | | | | |
| | | | | | | | | | | | 1,523,341 | |
| Software — 10.7% | | | | | | | | | |
Aptean, Inc., 2016 1st Lien Term Loan, 6.04%, 12/20/22 | | | | | | | 355 | | | | 360,549 | |
BMC Software Finance, Inc., 2017 Term Loan, 5.00%, 9/13/22 | | | | | | | 1,643 | | | | 1,651,635 | |
CCC Information Services, Inc.: | | | | | | | | | | | | |
2017 1st Lien Term Loan, 4.25%, 3/29/24 | | | | | | | 566 | | | | 563,177 | |
2017 2nd Lien Term Loan, 8.00%, 3/29/25 | | | | | | | 320 | | | | 326,000 | |
Dell, Inc., 2017 Term Loan B, 3.50%, 9/07/23 | | | | | | | 1,587 | | | | 1,592,621 | |
DTI Holdco, Inc., 2016 Term Loan B, 6.42%, 9/30/23 | | | | | | | 896 | | | | 881,268 | |
Hyland Software, Inc., 2017 Term Loan, 4.24%, 7/01/22 | | | | | | | 242 | | | | 243,552 | |
Infor (US), Inc., Term Loan B6, 3.90%, 2/01/22 | | | | | | | 2,299 | | | | 2,293,203 | |
Informatica Corp., Term Loan, 4.65%, 8/05/22 | | | | | | | 2,489 | | | | 2,477,739 | |
IPS Corp., 2016 1st Lien Term Loan,
6.25%, 12/20/23 | | | | | | | 394 | | | | 395,983 | |
IQOR US, Inc., Term Loan B, 6.15%, 4/01/21 | | | | | | | 452 | | | | 443,646 | |
Kronos, Inc.: | | | | | | | | | | | | |
1st Lien Term Loan, 5.03%, 11/01/23 | | | | | | | 2,828 | | | | 2,836,396 | |
2nd Lien Term Loan, 9.28%, 11/01/24 | | | | | | | 1,045 | | | | 1,087,323 | |
LANDesk Group, Inc., 2017 Term Loan B, 5.25%, 1/20/24 | | | | | | | 245 | | | | 246,174 | |
MA FinanceCo., LLC, Term Loan B3, 3.00%, 4/18/24 | | | | | | | 160 | | | | 160,832 | |
Misys Europe SA: | | | | | | | | | | | | |
1st Lien Term Loan, 4.67%, 4/27/24 | | | | | | | 1,800 | | | | 1,812,384 | |
2nd Lien Term Loan, 8.25%, 4/27/25 | | | | | | | 200 | | | | 204,000 | |
Mitchell International, Inc.: | | | | | | | | | | | | |
1st Lien Term Loan, 4.54%, 10/13/20 | | | | | | | 1,303 | | | | 1,309,332 | |
2nd Lien Term Loan, 8.67%, 10/11/21 | | | | | | | 1,000 | | | | 1,007,500 | |
Project Alpha Intermediate Holding, Inc., 2017 Term Loan B, 4.50%, 4/18/24 | | | | | | | 950 | | | | 945,250 | |
RP Crown Parent LLC, 2016 Term Loan B, 4.50%, 10/12/23 | | | | | | | 1,362 | | | | 1,371,712 | |
Seattle Spinco, Inc., Term Loan B3, 2.75%, 4/30/24 | | | | | | | 1,083 | | | | 1,086,140 | |
SolarWinds Holdings, Inc., 2017 Term Loan, 4.50%, 2/05/23 | | | | | | | 1,985 | | | | 1,994,394 | |
Solera LLC, Term Loan B, 4.25%, 3/03/23 | | | | | | | 1,552 | | | | 1,562,117 | |
Sophia LP, 2017 Term Loan B, 4.40%, 9/30/22 | | | | | | | 1,523 | | | | 1,519,937 | |
SS&C Technologies, Inc.: | | | | | | | | | | | | |
2017 Term Loan B1, 3.24%, 7/08/22 | | | | | | | 2,921 | | | | 2,940,991 | |
2017 Term Loan B2, 3.24%, 7/08/22 | | | | | | | 242 | | | | 244,075 | |
Synchronoss Technologies, Inc., Term Loan, 4.08%, 1/19/24 | | | | | | | 609 | | | | 572,631 | |
Tempo Acquisition LLC, Term Loan, 3.00%, 3/15/24 | | | | | | | 1,670 | | | | 1,668,748 | |
Tibco Software, Inc., 2017 Term Loan B, 5.50%, 12/04/20 | | | | | | | 1,178 | | | | 1,188,297 | |
Veritas US, Inc., Term Loan B1, 6.77%, 1/27/23 | | | | | | | 1,873 | | | | 1,862,046 | |
| | | | | | | | | | | | |
| | | | | | | | | | | | 36,849,652 | |
| Specialty Retail — 2.1% | | | | | | | | | |
Academy Ltd., 2015 Term Loan B, 5.10%, 7/01/22 | | | | | | | 1,097 | | | | 754,403 | |
Bass Pro Group LLC, Asset Sale Term Loan, 5.90%, 6/09/18 | | | | | | | 410 | | | | 412,050 | |
Coinstar LLC, 1st Lien Term Loan, 5.25%, 9/27/23 | | | | | | | 498 | | | | 498,589 | |
Leslie’s Poolmart, Inc., 2016 Term Loan, 4.77%, 8/16/23 | | | | | | | 686 | | | | 689,557 | |
| | | | | | | | | | | | |
| Floating Rate Loan Interests (b) | | | | | Par (000) | | | Value | |
| Specialty Retail (continued) | | | | | | | | | |
Michaels Stores, Inc., 2016 Term Loan B1, 3.75%, 1/30/23 | | | USD | | | | 1,881 | | | $ | 1,877,064 | |
Party City Holdings, Inc., 2016 Term Loan, 4.03%, 8/19/22 | | | | | | | 1,383 | | | | 1,381,542 | |
Petco Animal Supplies, Inc., 2017 Term Loan B, 4.17%, 1/26/23 | | | | | | | 1,491 | | | | 1,347,142 | |
Things Remembered, Inc., 2016 Term Loan, 6.00%, 2/29/20 | | | | | | | 593 | | | | 148,241 | |
| | | | | | | | | | | | |
| | | | | | | | | | | | 7,108,588 | |
| Technology Hardware, Storage & Peripherals — 0.3% | | | | |
Oberthur Technologies SA, 2016 Term Loan B1, 4.90%, 1/10/24 | | | | | | | 143 | | | | 143,342 | |
Western Digital Corp., 2017 Term Loan B, 3.74%, 4/29/23 | | | | | | | 906 | | | | 913,414 | |
| | | | | | | | | | | | |
| | | | | | | | | | | | 1,056,756 | |
| Textiles, Apparel & Luxury Goods — 0.4% | | | | | | | | | |
Ascend Performance Materials Operations LLC, Term Loan B, 6.65%, 8/12/22 | | | | | | | 1,486 | | | | 1,493,027 | |
| Thrifts & Mortgage Finance — 0.5% | | | | | | | | | |
IG Investment Holdings LLC, Term Loan B, 6.15%, 10/29/21 | | | | | | | 1,689 | | | | 1,698,639 | |
| Trading Companies & Distributors — 0.9% | | | | | | | | | |
Beacon Roofing Supply, Inc., Term Loan B, 3.74%, 10/01/22 | | | | | | | 863 | | | | 867,661 | |
HD Supply, Inc.: | | | | | | | | | | | | |
Incremental Term Loan B1, 3.90%, 8/13/21 | | | | | | | 1,470 | | | | 1,479,772 | |
Incremental Term Loan B2, 3.90%, 10/17/23 | | | | | | | 622 | | | | 626,154 | |
Nexeo Solutions LLC, 2017 Term Loan B, 4.90%, 6/09/23 | | | | | | | 154 | | | | 155,378 | |
| | | | | | | | | | | | |
| | | | | | | | | | | | 3,128,965 | |
| Transportation — 0.2% | | | | | | | | | |
Gruden Acquisition, Inc., 1st Lien Term Loan, 5.90%, 8/18/22 | | | | | | | 770 | | | | 744,254 | |
| Wireless Telecommunication Services — 2.5% | |
Ligado Networks LLC, PIK Exit Term Loan (9.75% PIK), 9.75%, 12/07/20 (e) | | | | | | | 4,904 | | | | 4,712,534 | |
LTS Buyer LLC, 1st Lien Term Loan, 4.40%, 4/13/20 | | | | | | | 3,314 | | | | 3,322,855 | |
Radiate Holdco LLC, 1st Lien Term Loan, 3.99%, 2/01/24 | | | | | | | 635 | | | | 636,873 | |
| | | | | | | | | | | | |
| | | | | | | | | | | | 8,672,262 | |
| Total Floating Rate Loan Interests — 136.5% | | | | | | | | | | | 468,448,147 | |
| | | | | | | | | | | | |
| | | | | | | | | | | | | |
| | | |
| Other Interests (f) | | | | | Beneficial Interest
(000) | | | | |
| Auto Components — 0.0% | | | | | | | | | |
Lear Corp. Escrow | | | | | | | 500 | | | | 5 | |
| | | | | | | | | | | | |
| | | | | | | | | | | | | |
| | | |
| Rights | | | | | Shares | | | | |
| Electric Utilities — 0.0% | | | | | | | | | |
Tex Energy LLC | | | | | | | 28,707 | | | | 35,884 | |
See Notes to Financial Statements.
| | | | | | |
| | | | | | | |
| 34 | | SEMI-ANNUAL REPORT | | APRIL 30, 2017 | | |
| | |
Schedule of Investments (continued) | | BlackRock Floating Rate Income Trust (BGT) |
| | | | | | | | | | | | |
| Warrants | | | | | Shares | | | Value | |
| Chemicals — 0.0% | | | | | | | | | |
British Vita Holdings Co. (Non-Expiring) | | | | | | | 166 | | | | — | |
| Software — 0.0% | | | | | | | | | |
Bankruptcy Management Solutions, Inc | | | | | | | | | | | | |
(Expires 07/01/18) | | | | | | | 181 | | | | — | |
(Expires 07/01/19) | | | | | | | 195 | | | | — | |
(Expires 07/01/20) | | | | | | | 292 | | | | — | |
HMH Holdings/EduMedia (Issued/exercisable 3/09/10, 19 Shares for 1 Warrant, Expires 6/22/19, Strike Price $21.14) | | | | | | | 1,501 | | | $ | 420 | |
| Total Warrants — 0.0% | | | | | | | | | | | 420 | |
| Total Long-Term Investments (Cost — $501,819,658) — 146.5% | | | | | | | | | | | 502,909,981 | |
| | | | | | | | | | | | |
| Short-Term Securities | | | | | Shares | | | Value | |
BlackRock Liquidity Funds, T-Fund, Institutional Class, 0.64% (g)(h) | | | | | | | 3,852,270 | | | $ | 3,852,270 | |
Total Short-Term Securities
(Cost — $3,852,270) — 1.1% | | | | | | | | | | | 3,852,270 | |
| Options Purchased (Cost — $44,022) — 0.0% | | | | | | | | | | | 3,304 | |
Total Investments (Cost — $505,715,950) — 147.6% | | | | 506,765,555 | |
Liabilities in Excess of Other Assets — (47.6)% | | | | (163,539,310 | ) |
| | | | | | | | | | | | |
Net Assets — 100.0% | | | | | | | | | | $ | 343,226,245 | |
| | | | | | | | | | | | |
| | | | | | |
| Notes to Schedule of Investments |
| (a) | | Non-income producing security. |
| (b) | | Variable rate security. Rate as of period end. |
| (c) | | Security exempt from registration pursuant to Rule 144A under the Securities Act of 1933, as amended. These securities may be resold in transactions exempt from registration to qualified institutional investors. |
| (d) | | Issuer filed for bankruptcy and/or is in default. |
| (e) | | Payment-in-kind security which may pay interest/dividends in additional par/shares and/or in cash. Rates shown are the current rate and possible payment rates. |
| (f) | | Other interests represent beneficial interests in liquidation trusts and other reorganization or private entities. |
| (g) | | During the period ended April 30, 2017, investments in issuers considered to be affiliates of the Trust for purposes of Section 2(a)(3) of the Investment Company Act of 1940, as amended, were as follows: |
| | | | | | | | | | | | | | | | | | | | | | | | | | | | | | | | |
| Affiliate | | Shares Held
at October 31,
2016 | | | Shares Purchased | | | Shares
Sold | | | Shares Held
at April 30, 2017 | | | Value at
April 30,
2017 | | | Income | | | Net
Realized
Gain1 | | | Change in
Unrealized
Appreciation
(Depreciation) | |
BlackRock Liquidity Funds, T-Fund, Institutional Class | | | 7,275,589 | | | | — | | | | (3,423,319 | )2 | | | 3,852,270 | | | $ | 3,852,270 | | | $ | 3,310 | | | $ | 11 | | | | — | |
iShares iBoxx $ High Yield Corporate Bond ETF | | | 16,868 | | | | — | | | | (16,868 | ) | | | — | | | | — | | | | 6,508 | | | | 2,164 | | | $ | (4,939 | ) |
Total | | | | | | | $ | 3,852,270 | | | $ | 9,818 | | | $ | 2,175 | | | $ | (4,939 | ) |
| | | | | | | | | |
1 Includes net capital gain distributions. | |
2 Represents net shares sold. | |
| (h) | | Current yield as of period end. |
For Trust compliance purposes, the sector classifications refer to one or more of the sector sub-classifications used by one or more widely recognized market indexes or rating group indexes, and/or as defined by the investment adviser. These definitions may not apply for purposes of this report, which may combine such sector sub-classifications for reporting ease.
|
| Derivative Financial Instruments Outstanding as of Period End |
Forward Foreign Currency Exchange Contracts
| | | | | | | | | | | | | | | | | | | | | | | | |
Currency
Purchased | | | Currency
Sold | | | Counterparty | | Settlement
Date | | | Unrealized
Appreciation
(Depreciation) | | | | |
| USD | | | 650,155 | | | EUR | | | 595,000 | | | Deutsche Bank AG | | | 6/06/17 | | | $ | 962 | | | | | |
| | | | | | | | | | | | | | | | | | | | |
| USD | | | 639,017 | | | EUR | | | 597,000 | | | Morgan Stanley & Co. International PLC | | | 5/04/17 | | | | (11,327 | ) | | | | |
| USD | | | 1,327,712 | | | GBP | | | 1,064,000 | | | Morgan Stanley & Co. International PLC | | | 5/04/17 | | | | (50,419 | ) | | | | |
| USD | | | 1,371,572 | | | GBP | | | 1,059,000 | | | JPMorgan Chase Bank N.A. | | | 6/06/17 | | | | (1,305 | ) | | | | |
| | | | | | | | | | | | | | | | | | | | |
| | | | | | | | | | | | | | | | | | | | (63,051 | ) | | | | |
Net Unrealized Depreciation | | | $ | (62,089 | ) | | | | |
| | | | | | | | | | | | | | | | | |
See Notes to Financial Statements.
| | | | | | |
| | | | | | | |
| | SEMI-ANNUAL REPORT | | APRIL 30, 2017 | | 35 |
| | |
Schedule of Investments (continued) | | BlackRock Floating Rate Income Trust (BGT) |
| | | | | | | | | | | | | | | | | | | | | | | | | | | | | | | | | | | | |
| OTC Interest Rate Swaptions Purchased | |
| Description | | Counterparty | | | Put/
Call | | | Exercise
Rate | | | Pay/
Receive
Exercise Rate | | | Floating Rate
Index | | | Expiration
Date | | | Notional
Amount
(000) | | | Value | |
10-Year Interest Rate Swap | | | JPMorgan Chase Bank N.A. | | | | Put | | | | 2.75 | % | | | Pay | | | | 3-Month LIBOR | | | | 7/05/17 | | | | USD | | | | 4,000 | | | $ | 3,304 | |
| | | | | | | | | | | | | | | | | | | | | | | | |
| OTC Options Purchased | |
| Description | | Put/
Call | | Counterparty | | Expiration
Date | | | Strike
Price | | | Contracts | | | Value | |
Marsico Parent Superholdco LLC | | Call | | Goldman Sachs & Co. | | | 12/14/19 | | | USD | | | 942.86 | | | USD | | | 26 | | | | — | |
| | | | | | | | | | | | | | | | | | | | | | | | | | | | |
| Centrally Cleared Interest Rate Swaps | |
Fixed
Rate | | | Floating
Rate | | Effective
Date | | | Expiration
Date | | | Notional
Amount
(000) | | | Unrealized
Depreciation | | | | |
| | 1.92 | %1 | | 3-Month LIBOR | | | N/A | | | | 12/14/21 | | | | USD | | | | 1,305 | | | $ | (1,509 | ) | | | | |
| | 2.00 | %1 | | 3-Month LIBOR | | | N/A | | | | 2/21/22 | | | | USD | | | | 785 | | | | (3,135 | ) | | | | |
| | 2.14 | %1 | | 3-Month LIBOR | | | N/A | | | | 3/09/22 | | | | USD | | | | 750 | | | | (7,796 | ) | | | | |
| | 2.20 | %1 | | 3-Month LIBOR | | | N/A | | | | 3/13/22 | | | | USD | | | | 1,000 | | | | (13,310 | ) | | | | |
| | Total | | | | | | | | | | | | | | | | | | | | | $ | (25,750 | ) | | | | |
| | | | | | | | | | | | | | | | | | | | | | | | |
| | 1 The Trust pays a fixed rate and receives the floating rate. | | | | | |
|
| Derivative Financial Instruments Categorized by Risk Exposure |
As of period end, the fair values of derivative financial instruments located in the Statements of Assets and Liabilities were as follows:
| | | | | | | | | | | | | | | | | | | | | | | | | | | | | | | | | | |
| Assets — Derivative Financial Instruments | | Commodity
Contracts | | | Credit
Contracts | | | Equity
Contracts | | | Foreign
Currency
Exchange
Contracts | | | Interest
Rate
Contracts | | | Other
Contracts | | | Total | | | | |
Forward foreign currency exchange contracts | | Unrealized appreciation on forward foreign currency exchange contracts | | | — | | | | — | | | | — | | | $ | 962 | | | | — | | | | — | | | $ | 962 | | | | | |
Options purchased | | Investments at value — unaffiliated1 | | | — | | | | — | | | | — | | | | — | | | $ | 3,304 | | | | — | | | | 3,304 | | | | | |
| | | | | | |
Total | | | | | — | | | | — | | | | — | | | $ | 962 | | | $ | 3,304 | | | | — | | | $ | 4,266 | | | | | |
| | | | | | |
| | | | | | | | | | | | | | | | | | | | | | | | | | | | | | | | | | |
| Liabilities — Derivative Financial Instruments | | | | | | | | | | | | | | | | | | | | | | | | |
Forward foreign currency exchange contracts | | Unrealized depreciation on forward foreign currency exchange contracts | | | — | | | | — | | | | — | | | $ | 63,051 | | | | — | | | | — | | | $ | 63,051 | | | | | |
Swaps — centrally cleared | | Net unrealized depreciation | | | — | | | | — | | | | — | | | | — | | | $ | 25,750 | | | | — | | | | 25,750 | | | | | |
| | | | | | |
Total | | | | | — | | | | — | | | | — | | | $ | 63,051 | | | $ | 25,750 | | | | — | | | $ | 88,801 | | | | | |
| | | | | | |
1 Includes options purchased at value as reported in the Schedule of Investments. | | | | | | | | | | | | | | | | | | | | | |
For the six months ended April 30, 2017, the effect of derivative financial instruments in the Statements of Operations was as follows:
| | | | | | | | | | | | | | | | | | | | | | | | | | | | |
| Net Realized Gain (Loss) from: | | Commodity
Contracts | | | Credit
Contracts | | | Equity
Contracts | | | Foreign
Currency
Exchange
Contracts | | | Interest
Rate
Contracts | | | Other
Contracts | | | Total | |
Forward foreign currency exchange contracts | | | — | | | | — | | | | — | | | $ | (30,504 | ) | | | — | | | | — | | | $ | (30,504 | ) |
Swaps | | | | | | $ | 141,946 | | | | — | | | | — | | | $ | 20,889 | | | | — | | | | 162,835 | |
| | | | |
Total | | | — | | | $ | 141,946 | | | | — | | | $ | (30,504 | ) | | $ | 20,889 | | | | — | | | $ | 132,331 | |
| | | | |
| | | | | | | | | | | | | | | | | | | | | | | | | | | | |
| Net Change in Unrealized Appreciation (Depreciation) on: | | | | | | | | | | | | | |
Forward foreign currency exchange contracts | | | — | | | | — | | | | — | | | $ | (158,842 | ) | | | — | | | | — | | | $ | (158,842 | ) |
Options purchased1 | | | — | | | | — | | | | — | | | | — | | | $ | (15,296 | ) | | | — | | | | (15,296 | ) |
Swaps | | | — | | | | — | | | | — | | | | — | | | | (45,965 | ) | | | — | | | | (45,965 | ) |
| | | | |
Total | | | — | | | | — | | | | — | | | $ | (158,842 | ) | | $ | (61,261 | ) | | | — | | | $ | (220,103 | ) |
| | | | |
1 Options purchased are included in net change in unrealized appreciation (depreciation) on investments. | |
See Notes to Financial Statements.
| | | | | | |
| | | | | | | |
| 36 | | SEMI-ANNUAL REPORT | | APRIL 30, 2017 | | |
| | |
Schedule of Investments (continued) | | BlackRock Floating Rate Income Trust (BGT) |
| | | | |
| Average Quarterly Balances of Outstanding Derivative Financial Instruments |
| | | | |
| Forward foreign currency exchange contracts: | |
Average amounts bought — in USD | | $ | 3,968,332 | |
Average amounts sold — in USD | | $ | 3,150,290 | 1 |
| Options: | |
Average notional value of swaption contracts purchased | | $ | 2,000,000 | |
| Credit default swaps: | |
Average notional value — sell protection | | $ | 4,878,000 | 1 |
| Interest rate swaps: | |
Average notional amount — pays fixed rate | | $ | 3,757,500 | |
| Total return swaps: | |
Average notional amount | | $ | 345,000 | 1 |
1 Actual amounts for the period are shown due to limited outstanding derivative financial instruments as of each quarter end. | |
For more information about the Trust’s investment risks regarding derivative financial instruments, refer to the Notes to Financial Statements.
| | | | | | |
| Derivative Financial Instruments — Offsetting as of Period End |
The Trust’s derivative assets and liabilities (by type) were as follows:
| | | | | | | | |
| | | Assets | | | Liabilities | |
Derivative Financial Instruments: | | | | | | | | |
Forward foreign currency exchange contracts | | $ | 962 | | | $ | 63,051 | |
Options | | | 3,304 | 1 | | | — | |
Swaps — Centrally cleared | | | — | | | | 252 | |
| | | | | | | | |
Total derivative assets and liabilities in the Statements of Assets and Liabilities | | $ | 4,266 | | | $ | 63,303 | |
| | | | | | | | |
Derivatives not subject to a Master Netting Agreement or similar agreement (“MNA”) | | | — | | | | (252 | ) |
| | | | | | | | |
Total derivative assets and liabilities subject to an MNA | | $ | 4,266 | | | $ | 63,051 | |
| | | | | | | | |
1 Includes options purchased at value which is included in Investments at value — unaffiliated in the Statements of Assets and Liabilities and reported in the Schedule of Investments. | |
The following table presents the Trust’s derivative assets and liabilities by counterparty net of amounts available for offset under a Master Netting Agreement (“MNA”) and net of the related collateral received and pledged by the Trust:
| | | | | | | | | | | | | | | | | | | | | | | | |
| Counterparty | | Derivative Assets
Subject to an MNA
by Counterparty | | | Derivatives Available
for Offset1 | | | Non-cash
Collateral
Received | | | Cash
Collateral
Received | | | Net Amount of
Derivative Assets2 | | | | |
Deutsche Bank AG | | $ | 962 | | | | — | | | | — | | | | — | | | $ | 962 | | | | | |
JPMorgan Chase Bank N.A. | | | 3,304 | | | $ | (1,305 | ) | | | — | | | | — | | | | 1,999 | | | | | |
| | | | |
Total | | $ | 4,266 | | | $ | (1,305 | ) | | | — | | | | — | | | $ | 2,961 | | | | | |
| | | | |
| | | | | | | | | | | | | | | | | | | | | | | | |
| Counterparty | | Derivative Liabilities
Subject to an MNA
by Counterparty | | | Derivatives Available
for Offset1 | | | Non-cash
Collateral
Pledged | | | Cash
Collateral
Pledged | | | Net Amount of
Derivative Liabilities3 | | | | |
JPMorgan Chase Bank N.A. | | $ | 1,305 | | | $ | (1,305 | ) | | | — | | | | — | | | | — | | | | | |
Morgan Stanley & Co. International PLC | | | 61,746 | | | | — | | | | — | | | | — | | | $ | 61,746 | | | | | |
| | | | |
Total | | $ | 63,051 | | | $ | (1,305 | ) | | | — | | | | — | | | $ | 61,746 | | | | | |
| | | | |
1 The amount of derivatives available for offset is limited to the amount of derivative asset and/or liabilities that are subject to an MNA. | | | | | |
2 Net amount represents the net amount receivable from the counterparty in the event of default. | | | | | |
3 Net amount represents the net amount payable due to the counterparty in the event of default. | | | | | |
See Notes to Financial Statements.
| | | | | | |
| | | | | | | |
| | SEMI-ANNUAL REPORT | | APRIL 30, 2017 | | 37 |
| | |
Schedule of Investments (concluded) | | BlackRock Floating Rate Income Trust (BGT) |
|
| Fair Value Hierarchy as of Period End |
Various inputs are used in determining the fair value of investments. For information about the Trust’s policy regarding valuation of investments, refer to the Notes to Financial Statements.
The following tables summarize the Trust’s investments and derivative financial instruments categorized in the disclosure hierarchy:
| | | | | | | | | | | | | | | | |
| | | Level 1 | | | Level 2 | | | Level 3 | | | Total | |
Assets: | | | | | | | | | | | | | | | | |
| Investments: | | | | | | | | | | | | | | | | |
| Long-Term Investments: | | | | | | | | | | | | | | | | |
Asset-Backed Securities | | | — | | | $ | 5,851,788 | | | $ | 775,025 | | | $ | 6,626,813 | |
Common Stocks | | $ | 119,537 | | | | 10,570 | | | | 5 | | | | 130,112 | |
Corporate Bonds | | | — | | | | 27,668,600 | | | | — | | | | 27,668,600 | |
Floating Rate Loan Interests | | | — | | | | 446,181,968 | | | | 22,266,179 | | | | 468,448,147 | |
Other Interests | | | — | | | | — | | | | 5 | | | | 5 | |
Rights | | | — | | | | — | | | | 35,884 | | | | 35,884 | |
Warrants | | | — | | | | — | | | | 420 | | | | 420 | |
Short-Term Securities | | | 3,852,270 | | | | — | | | | — | | | | 3,852,270 | |
| Options Purchased: | | | | | | | | | | | | | | | | |
Interest rate contracts | | | — | | | | 3,304 | | | | — | | | | 3,304 | |
Unfunded Floating Rate Loan Interests1 | | | — | | | | 2,222 | | | | — | | | | 2,222 | |
| | | | |
Total | | $ | 3,971,807 | | | $ | 479,718,452 | | | $ | 23,077,518 | | | $ | 506,767,777 | |
| | | | |
| | | | | | | | | | | | | | | | | |
| Derivative Financial Instruments2 | | | | | | | | | | | | | | | | |
Assets: | | | | | | | | | | | | | | | | |
Foreign currency exchange contracts | | | — | | | $ | 962 | | | | — | | | $ | 962 | |
Liabilities: | | | | | | | | | | | | | | | | |
Foreign currency exchange contracts | | | — | | | | (63,051 | ) | | | — | | | | (63,051 | ) |
Interest rate contracts | | | — | | | | (25,750 | ) | | | — | | | | (25,750 | ) |
| | | | |
Total | | | — | | | $ | (87,839 | ) | | | — | | | $ | (87,839 | ) |
| | | | |
1 Unfunded floating rate loan interests are valued at the unrealized appreciation (depreciation) on the commitment. | |
2 Derivative financial instruments are swaps and forward foreign currency exchange contracts, which are valued at the unrealized appreciation (depreciation) on the instrument. | |
The Trust may hold assets and/or liabilities in which the fair value approximates the carrying amount for financial statement purposes. As of period end, bank borrowings payable of $139,000,000 are categorized as Level 2 within the disclosure hierarchy.
During the six months ended April 30, 2017, there were no transfers between Level 1 and Level 2.
A reconciliation of Level 3 investments is presented when the Trust had a significant amount of Level 3 investments at the beginning and/or end of the period in relation to net assets. The following table is a reconciliation of Level 3 investments for which significant unobservable inputs were used in determining fair value:
| | | | | | | | | | | | | | | | | | | | | | | | | | | | | | | | |
| | | Asset-Backed
Securities | | | Common Stocks | | | Corporate
Bonds | | | Floating
Rate Loan
Interests | | | Other
Interests | | | Rights | | | Warrants | | | Total | |
Assets: | | | | | | | | | | | | | | | | | | | | | | | | | | | | | | | | |
Opening Balance, as of October 31, 2016 | | $ | 1,497,774 | | | $ | 1,232,177 | | | $ | 13,080 | | | $ | 22,427,576 | | | $ | 5 | | | | — | | | $ | 4,350 | | | $ | 25,174,962 | |
Transfers into Level 31 | | | — | | | | — | | | | — | | | | 6,524,511 | | | | — | | | | — | | | | — | | | | 6,524,511 | |
Transfers out of Level 32 | | | (1,497,774 | ) | | | — | | | | — | | | | (10,680,119 | ) | | | — | | | | — | | | | — | | | | (12,177,893 | ) |
Other3 | | | — | | | | (22,050 | ) | | | — | | | | — | | | | — | | | $ | 22,050 | | | | — | | | | — | |
Accrued discounts (premiums) | | | — | | | | — | | | | — | | | | 42,947 | | | | — | | | | — | | | | — | | | | 42,947 | |
Net realized gain (loss) | | | — | | | | 859,717 | | | | — | | | | (401,773 | ) | | | — | | | | 15,786 | | | | — | | | | 473,730 | |
Net change in unrealized appreciation (depreciation)4,5 | | | 25 | | | | (462,799 | ) | | | (13,080 | ) | | | 450,872 | | | | — | | | | 20,098 | | | | (3,167 | ) | | | (8,051 | ) |
Purchases | | | 775,000 | | | | — | | | | — | | | | 11,858,431 | | | | — | | | | — | | | | — | | | | 12,633,431 | |
Sales | | | — | | | | (1,607,040 | ) | | | — | | | | (7,956,266 | ) | | | — | | | | (22,050 | ) | | | (763 | ) | | | (9,586,119 | ) |
| | | | | | | | | | | | | | | | | | | | | | | | | | | | | | | | |
Closing Balance, as of April 30, 2017 | | $ | 775,025 | | | $ | 5 | | | | — | | | $ | 22,266,179 | | | $ | 5 | | | $ | 35,884 | | | $ | 420 | | | | 23,077,518 | |
| | | | | | | | | | | | | | | | | | | | | | | | | | | | | | | | |
Net change in unrealized appreciation (depreciation) on investments still held at April 30, 20171 | | $ | 25 | | | | — | | | $ | (13,080 | ) | | $ | (15,591 | ) | | | — | | | $ | 20,098 | | | $ | (3,167 | ) | | $ | (11,715 | ) |
| | | | | | | | | | | | | | | | | | | | | | | | | | | | | | | | |
1 As of October 31, 2016, the Trust used observable inputs in determining the value of certain investments. As of April 30, 2017, the Trust used significant unobservable inputs in determining the value of the same investments. As a result, investments at the beginning of period value were transferred from Level 2 to Level 3 in the disclosure hierarchy. | |
2 As of October 31, 2016, the Trust used significant unobservable inputs in determining the value of certain investments. As of April 30, 2017, the Trust used observable inputs in determining the value of the same investments. As a result, investments at the beginning of period value were transferred from Level 3 to Level 2 in the disclosure hierarchy. | |
3 Certain Level 3 investments were re-classified between Common Stocks and Rights. | |
4 Included in the related net change in unrealized appreciation (depreciation) in the Statements of Operations. | |
5 Any difference between net change in unrealized appreciation (depreciation) on investments still held at April 30, 2017 is generally due to investments no longer held or categorized as Level 3 at period end. | |
The Trust’s investments that are categorized as Level 3 were valued utilizing third party pricing information without adjustment. Such valuations are based on unobservable inputs. A significant change in third party information could result in a significantly lower or higher value of such Level 3 investments.
See Notes to Financial Statements.
| | | | | | |
| | | | | | | |
| 38 | | SEMI-ANNUAL REPORT | | APRIL 30, 2017 | | |
| | |
Consolidated Schedule of Investments April 30, 2017 (Unaudited) | | BlackRock Multi-Sector Income Trust (BIT) (Percentages shown are based on Net Assets) |
| | | | | | | | | | | | |
| Common Stocks | | | | | Shares | | | Value | |
| Aerospace & Defense — 0.4% | | | | | | | | | |
United Technologies Corp. | | | | | | | 25,650 | | | $ | 3,052,094 | |
| Real Estate Investment Trusts (REITs) — 0.0% | |
Ovation Acquisition I LLC,
(Acquired 12/28/15, cost $8,635) (a) | | | | | | | 561 | | | | — | |
| Total Common Stocks — 0.4% | | | | | | | | | | | 3,052,094 | |
| | | | | | | | | | | | |
| | | | | | | | | | | | | |
| | | |
| Asset-Backed Securities | | | | | Par (000) | | | | |
ACE Securities Corp. Home Equity Loan Trust,
Series 2006-HE1, Class A2D, 1.29%, 2/25/36 (b) | | | USD | | | | 6,027 | | | | 5,668,557 | |
ALM VI Ltd., Series 2012-6A (b)(c)(d): | | | | | | | | | | | | |
Class B2R, 3.96%, 7/15/26 | | | | | | | 1,300 | | | | 1,301,157 | |
Class CR, 4.91%, 7/15/26 | | | | | | | 1,000 | | | | 1,005,740 | |
ALM XIV Ltd., Series 2014-14A, Class C, 4.49%, 7/28/26 (b)(c)(d) | | | | | | | 3,610 | | | | 3,614,693 | |
American Homes 4 Rent, Series 2014-SFR2, Class E, 6.23%, 10/17/36 (c) | | | | | | | 2,000 | | | | 2,203,748 | |
AMMC CDO, Series 2016-1A, Class E, 8.16%, 10/15/28 (b)(c) | | | | | | | 1,000 | | | | 1,009,100 | |
AMMC CLO 18 Ltd., Series 2016-18A,
Class E2, 8.30%, 5/26/28 (b)(c) | | | | | | | 1,000 | | | | 1,007,078 | |
AMMC CLO IX Ltd., Series 2011-9A, Class ER, 8.81%, 1/15/22 (b)(c) | | | | | | | 1,000 | | | | 1,002,228 | |
AMMC CLO XII Ltd., Series 2013-12A,
Class D1, 4.78%, 5/10/25 (b)(c)(d) | | | | | | | 1,000 | | | | 1,004,766 | |
Anchorage Capital CLO 3 Ltd., Series 2014-3A, Class BR,
3.69%, 4/28/26 (b)(c) | | | | | | | 1,000 | | | | 1,001,387 | |
Anchorage Capital CLO 6 Ltd., Series 2015-6A (b)(c): | | | | | | | | | | | | |
Class C, 4.01%, 4/15/27 | | | | | | | 700 | | | | 703,209 | |
Class D, 4.56%, 4/15/27 | | | | | | | 1,000 | | | | 991,869 | |
Anchorage Capital CLO Ltd., Series 2012-1A,
Class DR, 8.41%, 1/13/27 (b)(c) | | | | | | | 1,000 | | | | 1,009,341 | |
Apidos CLO XII, Series 2013-12A,
Class D, 4.21%, 4/15/25 (b)(c)(d) | | | | | | | 1,000 | | | | 997,045 | |
Ares CLO Ltd., Class D (b)(c): | | | | | | | | | | | | |
Series 2015-1A, 7.33%, 12/05/25 | | | | | | | 1,000 | | | | 1,005,814 | |
Series 2016-41A, 5.19%, 1/15/29 | | | | | | | 900 | | | | 912,778 | |
Arrowpoint CLO Ltd., Series 2013-1A,
Class CR, 5.72%, 11/15/28 (b)(c) | | | | | | | 800 | | | | 800,400 | |
Atrium X, Series 10A (b)(c): | | | | | | | | | | | | |
Class D, 4.66%, 7/16/25 (d) | | | | | | | 1,000 | | | | 1,002,322 | |
Class E, 5.66%, 7/16/25 | | | | | | | 2,000 | | | | 1,956,606 | |
Bear Stearns Asset-Backed Securities I Trust, Series 2006-HE9, Class 2A,
1.13%, 11/25/36 (b) | | | | | | | 4,774 | | | | 4,147,730 | |
Benefit Street Partners CLO II Ltd.,
Series 2013-IIA, Class C, 4.66%, 7/15/24 (b)(c)(d) | | | | | | | 1,750 | | | | 1,750,576 | |
Benefit Street Partners CLO VI Ltd.,
Series 2015-VIA (b)(c)(d): | | | | | | | | | | | | |
Class B, 4.21%, 4/18/27 | | | | | | | 1,000 | | | | 1,005,664 | |
Class C, 4.86%, 4/18/27 | | | | | | | 1,000 | | | | 999,274 | |
Betony CLO Ltd., Series 2015-1A,
Class D, 4.76%, 4/15/27 (b)(c) | | | | | | | 1,000 | | | | 997,716 | |
C-BASS Trust, Series 2006-CB7,
Class A4, 1.15%, 10/25/36 (b) | | | | | | | 8,169 | | | | 5,790,728 | |
| | | | | | | | | | | | |
| Asset-Backed Securities | | | | | Par (000) | | | Value | |
| Asset-Backed Securities (continued) | | | | | | | | | |
Carlyle Global Market Strategies CLO Ltd. (b)(c): | | | | | | | | | | | | |
Series 2013-2A, Class D, 4.91%, 4/18/25 (d) | | | USD | | | | 1,250 | | | $ | 1,252,500 | |
Series 2014-1A, Class CR, 3.91%, 4/17/25 | | | | | | | 1,500 | | | | 1,503,942 | |
Carrington Mortgage Loan Trust, Series 2006-FRE2 (b): | | | | | | | | | | | | |
Class A2, 1.11%, 10/25/36 | | | | | | | 5,685 | | | | 3,700,571 | |
Class A5, 1.07%, 10/25/36 | | | | | | | 11,712 | | | | 7,584,716 | |
CIFC Funding Ltd., Series 2014-3A, Class D, 4.55%, 7/22/26 (b)(c) | | | | | | | 480 | | | | 482,582 | |
DCP Rights LLC, Series 2014-1A, Class A, 5.46%, 10/25/44 (c) | | | | | | | 3,614 | | | | 3,618,854 | |
Fremont Home Loan Trust, Class 2A3 (b): | | | | | | | | | | | | |
Series 2006-A, 1.15%, 5/25/36 | | | | | | | 25,366 | | | | 15,101,618 | |
Series 2006-D, 1.14%, 11/25/36 | | | | | | | 22,765 | | | | 10,077,014 | |
GoldenTree Loan Opportunities VII Ltd.,
Series 2013-7A, Class D, 4.46%, 4/25/25 (b)(c) | | | | | | | 1,250 | | | | 1,251,061 | |
GSAMP Trust (b): | | | | | | | | | | | | |
Series 2006-FM2, Class A2C, 1.14%, 9/25/36 | | | | | | | 11,515 | | | | 5,317,056 | |
Series 2007-FM2, Class A2B, 1.08%, 1/25/37 | | | | | | | 7,872 | | | | 4,891,591 | |
Highbridge Loan Management Ltd. (b)(c): | | | | | | | | | | | | |
Series 3A-2014, Class D, 6.16%, 1/18/25 | | | | | | | 1,000 | | | | 984,532 | |
Series 4A-2014, Class B, 4.04%, 7/28/25 (d) | | | | | | | 2,000 | | | | 2,002,257 | |
Series 8A-2016, Class E, 9.06%, 4/20/27 | | | | | | | 1,000 | | | | 1,007,929 | |
Home Equity Mortgage Loan Asset-Backed Trust, Series 2006-E, Class 2A3, 1.16%, 4/25/37 (b) | | | | | | | 12,961 | | | | 9,226,258 | |
HPS Loan Management Ltd., Series 10A-16 (b)(c): | | | | | | | | | | | | |
Class C, 4.58%, 1/20/28 | | | | | | | 2,500 | | | | 2,486,043 | |
Class D, 7.43%, 1/20/28 | | | | | | | 1,000 | | | | 967,573 | |
LCM XVI LP, Series 16A, Class E,
5.76%, 7/15/26 (b)(c) | | | | | | | 1,000 | | | | 960,449 | |
Lehman ABS Manufactured Housing Contract Trust, Series 2001-B, Class M2, 7.17%, 4/15/40 (b) | | | | | | | 5,708 | | | | 3,933,002 | |
Long Beach Mortgage Loan Trust, Series 2006-1, Class 1A, 1.21%, 2/25/36 (b) | | | | | | | 5,800 | | | | 5,219,801 | |
Madison Park Funding IX Ltd., Series 2012-9AR, Class C1R,
3.89%, 8/15/22 (b)(c)(d) | | | | | | | 1,000 | | | | 1,000,329 | |
Madison Park Funding X Ltd., Series 2012-10A, Class ER, 8.78%, 1/20/29 (b)(c) | | | | | | | 1,000 | | | | 1,035,210 | |
Madison Park Funding XVI Ltd., Series 2015-16A, Class C, 4.73%, 4/20/26 (b)(c)(d) | | | | | | | 1,000 | | | | 1,002,147 | |
Mastr Asset-Backed Securities Trust (b): | | | | | | | | | | | | |
Series 2006-HE2, Class A3, 1.14%, 6/25/36 | | | | | | | 11,171 | | | | 6,215,417 | |
Series 2006-WMC2, Class A5, 1.24%, 4/25/36 | | | | | | | 8,336 | | | | 3,729,062 | |
Morgan Stanley IXIS Real Estate Capital Trust, Series 2006-2, Class A3, 1.14%, 11/25/36 (b) | | | | | | | 14,205 | | | | 6,841,229 | |
See Notes to Financial Statements.
| | | | | | |
| | | | | | | |
| | SEMI-ANNUAL REPORT | | APRIL 30, 2017 | | 39 |
| | |
Consolidated Schedule of Investments (continued) | | BlackRock Multi-Sector Income Trust (BIT) |
| | | | | | | | | | | | |
| Asset-Backed Securities | | | | | Par (000) | | | Value | |
| Asset-Backed Securities (continued) | | | | | | | | | |
Neuberger Berman CLO XVIII Ltd.,
Series 2014-18A, Class DR, 8.79%, 11/14/27 (b)(c) | | | USD | | | | 1,000 | | | $ | 1,004,492 | |
Octagon Investment Partners XIV Ltd.,
Series 2012-1A, Class C, 5.16%, 1/15/24 (b)(c)(d) | | | | | | | 1,000 | | | | 1,000,516 | |
Octagon Investment Partners XXI Ltd.,
Series 2014-1A, Class C, 4.69%, 11/14/26 (b)(c) | | | | | | | 1,000 | | | | 1,005,301 | |
OneMain Financial Issuance Trust,
Series 2015-2A, Class C, 4.32%, 7/18/25 (c) | | | | | | | 5,000 | | | | 4,999,251 | |
OZLM Funding II Ltd., Series 2012-2A (b)(c): | | | | | | | | | | | | |
Class CR, 4.89%, 10/30/27 | | | | | | | 1,250 | | | | 1,254,500 | |
Class DR, 8.19%, 10/30/27 | | | | | | | 1,250 | | | | 1,267,375 | |
OZLM Funding IV Ltd., Series 2013-4A, Class C, 4.35%, 7/22/25 (b)(c)(d) | | | | | | | 1,250 | | | | 1,249,212 | |
OZLM XV Ltd., Series 2016-15A, Class D, 8.07%, 1/20/29 (b)(c) | | | | | | | 1,000 | | | | 1,005,000 | |
Pretium Mortgage Credit Partners LLC,
Series 2016-NPL3, Class A1,
4.38%, 5/27/31 (c)(e) | | | | | | | 5,838 | | | | 5,840,393 | |
Renaissance Home Equity Loan Trust,
Series 2007-3, Class AF2, 7.00%, 9/25/37 (e) | | | | | | | 4,484 | | | | 2,638,020 | |
Saxon Asset Securities Trust,
Series 2007-3, Class 2A3, 1.39%, 9/25/47 (b) | | | | | | | 5,000 | | | | 3,967,663 | |
Scholar Funding Trust, Series 2013-A,
Class R, 0.00% | | | | | | | — | (f) | | | 2,292,830 | |
SMB Private Education Loan Trust,
Series 2015-C, Class C, 4.50%, 9/17/46 (c) | | | | | | | 4,100 | | | | 4,146,222 | |
Sound Point CLO X Ltd., Series 2015-3A,
Class E, 7.91%, 1/20/28 (b)(c) | | | | | | | 1,000 | | | | 1,005,327 | |
Sound Point CLO XIV Ltd, Series 2016-3A,
Class E, 7.80%, 1/23/29 (b)(c) | | | | | | | 1,000 | | | | 1,002,079 | |
Symphony CLO XV Ltd., Series 2014-15A,
Class DR, 4.37%, 10/17/26 (b)(c) | | | | | | | 3,500 | | | | 3,499,531 | |
TICP CLO I Ltd., Series 2015-1A, Class C, 4.16%, 7/20/27 (b)(c) | | | | | | | 1,000 | | | | 1,003,232 | |
Treman Park CLO LLC, Series 2015-1A, Class D, 5.02%, 4/20/27 (b)(c) | | | | | | | 1,500 | | | | 1,503,033 | |
Tyron Park CLO Ltd., Series 2013-1A (b)(c): | | | | | | | | | | | | |
Class C, 4.66%, 7/15/25 (d) | | | | | | | 1,250 | | | | 1,255,339 | |
Class D, 5.56%, 7/15/25 | | | | | | | 1,000 | | | | 963,176 | |
US Residential Opportunity Fund III Trust,
Series 2016-2III, Class A, 3.47%, 8/27/36 (c)(e) | | | | | | | 4,337 | | | | 4,312,774 | |
Venture XX CLO Ltd., Series 2015-20A (b)(c): | | | | | | | | | | | | |
Class C, 4.31%, 4/15/27 (d) | | | | | | | 1,000 | | | | 1,005,822 | |
Class D, 5.01%, 4/15/27 | | | | | | | 520 | | | | 520,236 | |
Venture XXI CLO Ltd., Series 2015-21A,
Class D, 4.76%, 7/15/27 (b)(c) | | | | | | | 480 | | | | 480,946 | |
Vibrant Clo III Ltd., Series 2015-3A (b)(c): | | | | | | | | | | | | |
Class A2R, 3.21%, 4/20/26 | | | | | | | 1,000 | | | | 999,650 | |
Class BR, 4.11%, 4/20/26 | | | | | | | 1,500 | | | | 1,501,120 | |
VOLT XLVI LLC, Series 2016-NPL6, Class A1, 3.84%, 6/25/46 (c)(e) | | | | | | | 3,820 | | | | 3,847,068 | |
Voya CLO Ltd. (b)(c): | | | | | | | | | | | | |
Series 2012-2AR, Class CR, 4.11%, 10/15/22 (d) | | | | | | | 1,350 | | | | 1,350,688 | |
Series 2016-3A, Class D, 8.01%, 10/18/27 | | | | | | | 385 | | | | 391,290 | |
WaMu Asset-Backed Certificates Trust, Series 2007-HE3, Class 2A3, 1.23%, 5/25/47 (b) | | | | | | | 10,534 | | | | 7,182,983 | |
| | | | | | | | | | | | |
| Asset-Backed Securities | | | | | Par (000) | | | Value | |
| Asset-Backed Securities (continued) | | | | | | | | | |
Westvue Mortgage Loan Trust, Series 2015-1A, Class A, 4.50%, 9/25/20 (c)(e) | | | USD | | | | 2,041 | | | $ | 2,076,036 | |
York CLO-3 Ltd., Series 2016-1A, Class E, 6.84%, 7/20/25 (b)(c) | | | | | | | 1,000 | | | | 980,261 | |
| Total Asset-Backed Securities — 28.8% | | | | | | | | | | | 210,833,635 | |
| | | | | | | | | | | | |
| | | | | | | | | | | | | |
|
| Corporate Bonds | |
| Aerospace & Defense — 1.2% | |
Accudyne Industries Borrower/Accudyne Industries LLC, 7.75%, 12/15/20 (c)(d) | | | | | | | 990 | | | | 992,475 | |
Bombardier, Inc. (c)(d): | | | | | | | | | | | | |
8.75%, 12/01/21 | | | | | | | 995 | | | | 1,106,937 | |
6.00%, 10/15/22 | | | | | | | 467 | | | | 465,832 | |
6.13%, 1/15/23 | | | | | | | 184 | | | | 183,540 | |
7.50%, 3/15/25 | | | | | | | 487 | | | | 506,480 | |
Colfax Corp., 3.25%, 5/15/25 | | | EUR | | | | 100 | | | | 110,183 | |
EnPro Industries, Inc., 5.88%, 9/15/22 (c) | | | USD | | | | 132 | | | | 138,600 | |
Harris Corp., 3.83%, 4/27/25 (d) | | | | | | | 750 | | | | 773,613 | |
KLX, Inc., 5.88%, 12/01/22 (c)(d) | | | | | | | 640 | | | | 672,800 | |
Koppers, Inc., 6.00%, 2/15/25 (c)(d) | | | | | | | 267 | | | | 279,682 | |
Kratos Defense & Security Solutions, Inc., 7.00%, 5/15/19 | | | | | | | 105 | | | | 105,263 | |
Lockheed Martin Corp., 4.70%, 5/15/46 (d) | | | | | | | 400 | | | | 439,533 | |
TransDigm, Inc.: | | | | | | | | | | | | |
5.50%, 10/15/20 | | | | | | | 262 | | | | 267,895 | |
6.00%, 7/15/22 (d) | | | | | | | 1,360 | | | | 1,400,800 | |
6.50%, 7/15/24 (d) | | | | | | | 388 | | | | 398,670 | |
6.50%, 5/15/25 (c) | | | | | | | 69 | | | | 70,553 | |
6.38%, 6/15/26 | | | | | | | 55 | | | | 55,413 | |
United Technologies Corp., 3.75%, 11/01/46 (d) | | | | | | | 700 | | | | 672,673 | |
| | | | | | | | | | | | |
| | | | | | | | | | | | 8,640,942 | |
| Air Freight & Logistics — 0.3% | |
FedEx Corp. (d): | | | | | | | | | | | | |
3.90%, 2/01/35 | | | | | | | 500 | | | | 485,850 | |
4.75%, 11/15/45 | | | | | | | 500 | | | | 520,258 | |
XPO Logistics, Inc.: | | | | | | | | | | | | |
5.75%, 6/15/21 | | | EUR | | | | 100 | | | | 114,592 | |
6.50%, 6/15/22 (c)(d) | | | USD | | | | 760 | | | | 804,650 | |
6.13%, 9/01/23 (c)(d) | | | | | | | 281 | | | | 295,050 | |
| | | | | | | | | | | | |
| | | | | | | | | | | | 2,220,400 | |
| Airlines — 3.1% | |
Air Canada Pass-Through Trust, Series 2013-1, Class B, 5.38%, 11/15/22 (c)(d) | | | | | | | 2,616 | | | | 2,714,495 | |
American Airlines Pass-Through Trust: | | | | | | | | | | | | |
Series 2013-1, Class C, 6.13%, 7/15/18 (c)(d) | | | | | | | 525 | | | | 544,031 | |
Series 2013-2, Class A, 4.95%, 7/15/24 (d) | | | | | | | 1,903 | | | | 2,030,795 | |
Series 2017-1, Class B, 4.95%, 8/15/26 | | | | | | | 1,735 | | | | 1,769,700 | |
Avianca Holdings SA/Avianca Leasing LLC/Grupo Taca Holdings Ltd., 8.38%, 5/10/20 | | | | | | | 426 | | | | 421,314 | |
Continental Airlines Pass-Through Trust (d): | | | | | | | | | | | | |
Series 2003-ERJ1, 7.88%, 1/02/20 | | | | | | | 274 | | | | 280,588 | |
Series 2007-1, Class B, 6.90%, 10/19/23 | | | | | | | 314 | | | | 326,671 | |
Series 2012-1, Class B, 6.25%, 10/11/21 | | | | | | | 342 | | | | 359,838 | |
See Notes to Financial Statements.
| | | | | | |
| | | | | | | |
| 40 | | SEMI-ANNUAL REPORT | | APRIL 30, 2017 | | |
| | |
Consolidated Schedule of Investments (continued) | | BlackRock Multi-Sector Income Trust (BIT) |
| | | | | | | | | | | | |
| Corporate Bonds | | | | | Par (000) | | | Value | |
| Airlines (continued) | |
Delta Air Lines Pass-Through Trust, Class B (d): | | | | | | | | | | | | |
Series 2007-1, 8.02%, 2/10/24 | | | USD | | | | 1,711 | | | $ | 1,945,803 | |
Series 2012-1, 6.88%, 5/07/19 (c) | | | | | | | 3,156 | | | | 3,344,911 | |
United Airlines Pass-Through Trust (d): | | | | | | | | | | | | |
Series 2014-2, Class B, 4.63%, 3/03/24 | | | | | | | 2,358 | | | | 2,417,435 | |
Series 2015-1, Class A, 3.70%, 6/01/24 | | | | | | | 3,570 | | | | 3,659,250 | |
US Airways Pass-Through Trust, Class B (d): | | | | | | | | | | | | |
Series 2011-1, 9.75%, 4/22/20 | | | | | | | 1,961 | | | | 2,166,521 | |
Series 2013-1, 5.38%, 5/15/23 | | | | | | | 787 | | | | 822,847 | |
| | | | | | | | | | | | |
| | | | | | | | | | | | 22,804,199 | |
| Auto Components — 0.4% | |
Allison Transmission, Inc., 5.00%, 10/01/24 (c) | | | | | | | 38 | | | | 38,713 | |
Delphi Automotive PLC (d): | | | | | | | | | | | | |
4.25%, 1/15/26 | | | | | | | 400 | | | | 422,687 | |
4.40%, 10/01/46 | | | | | | | 280 | | | | 266,578 | |
Faurecia, 3.63%, 6/15/23 | | | EUR | | | | 111 | | | | 127,200 | |
Federal-Mogul Holdings LLC, 4.55%, 4/15/24 (b) | | | | | | | 100 | | | | 108,521 | |
FTE Verwaltungs GmbH, 9.00%, 7/15/20 | | | | | | | 100 | | | | 113,668 | |
Goodyear Tire & Rubber Co., 5.00%, 5/31/26 | | | USD | | | | 77 | | | | 79,021 | |
Icahn Enterprises LP/Icahn Enterprises Finance Corp.: | | | | | | | | | | | | |
4.88%, 3/15/19 (d) | | | | | | | 481 | | | | 487,012 | |
6.25%, 2/01/22 (c) | | | | | | | 141 | | | | 146,640 | |
6.75%, 2/01/24 (c)(d) | | | | | | | 481 | | | | 502,044 | |
IHO Verwaltungs GmbH (g): | | | | | | | | | | | | |
(2.75% Cash or 3.50% PIK), 2.75%, 9/15/21 | | | EUR | | | | 100 | | | | 112,610 | |
(4.13% Cash or 4.88% PIK), 4.13%, 9/15/21 (c) | | | USD | | | | 214 | | | | 216,942 | |
(3.25% Cash or 4.00% PIK), 3.25%, 9/15/23 | | | | | | | 100 | | | | 113,309 | |
(3.75% Cash or 4.50% PIK), 3.75%, 9/15/26 | | | | | | | 100 | | | | 113,063 | |
(4.50% Cash or 5.25% PIK), 4.50%, 9/15/23 (c) | | | | | | | 229 | | | | 228,714 | |
ZF North America Capital, Inc., 4.75%, 4/29/25 (c) | | | | | | | 166 | | | | 172,652 | |
| | | | | | | | | | | | |
| | | | | | | | | | | | 3,249,374 | |
| Automobiles — 0.3% | |
Aston Martin Capital Holdings Ltd., 5.75%, 4/15/22 | | | GBP | | | | 100 | | | | 132,920 | |
General Motors Co., 6.25%, 10/02/43 (d) | | | USD | | | | 2,194 | | | | 2,396,897 | |
| | | | | | | | | | | | |
| | | | | | | | | | | | 2,529,817 | |
| Banks — 1.2% | |
Allied Irish Banks PLC, 4.13%, 11/26/25 (b) | | | EUR | | | | 100 | | | | 114,931 | |
Banco Inbursa SA Institucion de Banca Multiple, 4.38%, 4/11/27 (c) | | | USD | | | | 773 | | | | 757,540 | |
Banco Popolare, 2.75%, 7/27/20 | | | EUR | | | | 100 | | | | 111,488 | |
Bank of Ireland, 4.25%, 6/11/24 (b) | | | | | | | 100 | | | | 114,711 | |
Bankia SA (b): | | | | | | | | | | | | |
4.00%, 5/22/24 | | | | | | | 200 | | | | 226,705 | |
3.38%, 3/15/27 | | | | | | | 100 | | | | 111,145 | |
BPE Financiaciones SA, 2.00%, 2/03/20 | | | | | | | 100 | | | | 104,573 | |
CaixaBank SA, 3.50%, 2/15/27 (b) | | | | | | | 100 | | | | 112,986 | |
CIT Group, Inc.: | | | | | | | | | | | | |
5.25%, 3/15/18 (d) | | | USD | | | | 328 | | | | 338,430 | |
5.50%, 2/15/19 (c) | | | | | | | 94 | | | | 99,287 | |
5.00%, 8/01/23 (d) | | | | | | | 1,015 | | | | 1,091,125 | |
| | | | | | | | | | | | |
| Corporate Bonds | | | | | Par (000) | | | Value | |
| Banks (continued) | |
Erste Group Bank AG, 6.50% (b)(h) | | | EUR | | | | 200 | | | $ | 230,670 | |
HSBC Holdings PLC, 4.38%, 11/23/26 (d) | | | USD | | | | 370 | | | | 379,100 | |
Liberbank SA, 6.88%, 3/14/27 (b) | | | EUR | | | | 100 | | | | 112,892 | |
Rizal Commercial Banking Corp., 4.25%, 1/22/20 | | | USD | | | | 100 | | | | 103,543 | |
Sberbank of Russia Via SB Capital SA, 5.25%, 5/23/23 (c) | | | | | | | 5,000 | | | | 5,162,500 | |
| | | | | | | | | | | | |
| | | | | | | | | | | | 9,171,626 | |
| Beverages — 0.5% | | | | | | | | | |
Anheuser-Busch InBev Finance, Inc., 4.90%, 2/01/46 (d) | | | | | | | 2,160 | | | | 2,359,698 | |
BWAY Holding Co., 5.50%, 4/15/24 (c) | | | | | | | 198 | | | | 200,228 | |
Central American Bottling Corp., 5.75%, 1/31/27 (c) | | | | | | | 588 | | | | 623,339 | |
Horizon Holdings I SASU, 7.25%, 8/01/23 | | | EUR | | | | 100 | | | | 116,356 | |
Horizon Parent Holdings Sarl, (8.25% Cash), 8.25%, 2/15/22 (g) | | | | | | | 100 | | | | 114,600 | |
Silgan Holdings, Inc., 3.25%, 3/15/25 | | | | | | | 100 | | | | 110,019 | |
| | | | | | | | | | | | |
| | | | | | | | | | | | 3,524,240 | |
| Biotechnology — 0.3% | | | | | | | | | |
Amgen, Inc., 4.40%, 5/01/45 (d) | | | USD | | | | 1,100 | | | | 1,085,499 | |
Gilead Sciences, Inc., 4.75%, 3/01/46 (d) | | | | | | | 700 | | | | 721,883 | |
Senvion Holding GmbH: | | | | | | | | | | | | |
6.63%, 11/15/20 | | | EUR | | | | 145 | | | | 163,296 | |
3.88%, 10/25/22 (i) | | | | | | | 100 | | | | 109,293 | |
| | | | | | | | | | | | |
| | | | | | | | | | | | 2,079,971 | |
| Building Materials — 0.2% | | | | | | | | | |
Tecnoglass, Inc., 8.20%, 1/31/22 (c) | | | USD | | | | 1,134 | | | | 1,190,700 | |
Titan Global Finance PLC, 3.50%, 6/17/21 | | | EUR | | | | 100 | | | | 113,793 | |
| | | | | | | | | | | | |
| | | | | | | | | | | | 1,304,493 | |
| Building Products — 0.3% | | | | | | | | | |
American Builders & Contractors Supply Co., Inc. (c)(d): | | | | | | | | | | | | |
5.63%, 4/15/21 | | | USD | | | | 177 | | | | 181,646 | |
5.75%, 12/15/23 | | | | | | | 155 | | | | 165,075 | |
Building Materials Corp. of America (c): | | | | | | | | | | | | |
5.38%, 11/15/24 | | | | | | | 49 | | | | 51,083 | |
6.00%, 10/15/25 (d) | | | | | | | 247 | | | | 263,672 | |
Masonite International Corp.,
5.63%, 3/15/23 (c)(d) | | | | | | | 360 | | | | 373,500 | |
Ply Gem Industries, Inc., 6.50%, 2/01/22 (d) | | | | | | | 493 | | | | 515,185 | |
Standard Industries, Inc. (c)(d): | | | | | | | | | | | | |
5.13%, 2/15/21 | | | | | | | 47 | | | | 49,174 | |
5.50%, 2/15/23 | | | | | | | 159 | | | | 165,360 | |
USG Corp., 5.50%, 3/01/25 (c)(d) | | | | | | | 435 | | | | 456,750 | |
| | | | | | | | | | | | |
| | | | | | | | | | | | 2,221,445 | |
| Capital Markets — 0.4% | | | | | | | | | |
AE-Rotor Holding BV, 4.97%, 3/28/18 | | | | | | | 140 | | | | 140,015 | |
Blackstone CQP Holdco LP, 6.50%, 3/20/21 (c)(d) | | | | | | | 2,437 | | | | 2,453,813 | |
LPL Holdings, Inc., 5.75%, 9/15/25 (c) | | | | | | | 66 | | | | 66,990 | |
| | | | | | | | | | | | |
| | | | | | | | | | | | 2,660,818 | |
| Casinos & Gambling — 0.0% | | | | | | | | | |
GLP Capital LP/GLP Financing II, Inc., 5.38%, 4/15/26 | | | | | | | 112 | | | | 118,160 | |
| Chemicals — 1.1% | | | | | | | | | |
Alpha 3 BV/Alpha US Bidco, Inc., 6.25%, 2/01/25 (c)(d) | | | | | | | 900 | | | | 913,500 | |
Axalta Coating Systems Dutch Holding B BV, 3.75%, 1/15/25 | | | EUR | | | | 100 | | | | 114,986 | |
See Notes to Financial Statements.
| | | | | | |
| | | | | | | |
| | SEMI-ANNUAL REPORT | | APRIL 30, 2017 | | 41 |
| | |
Consolidated Schedule of Investments (continued) | | BlackRock Multi-Sector Income Trust (BIT) |
| | | | | | | | | | | | |
| Corporate Bonds | | | | | Par (000) | | | Value | |
| Chemicals (continued) | | | | | | | | | |
Axalta Coating Systems LLC, 4.88%, 8/15/24 (c)(d) | | | USD | | | | 265 | | | $ | 274,439 | |
Blue Cube Spinco, Inc.: | | | | | | | | | | | | |
9.75%, 10/15/23 | | | | | | | 95 | | | | 114,950 | |
10.00%, 10/15/25 | | | | | | | 45 | | | | 55,463 | |
CF Industries, Inc.: | | | | | | | | | | | | |
7.13%, 5/01/20 | | | | | | | 150 | | | | 163,500 | |
5.15%, 3/15/34 | | | | | | | 110 | | | | 99,550 | |
4.95%, 6/01/43 (d) | | | | | | | 164 | | | | 138,116 | |
Chemours Co.: | | | | | | | | | | | | |
6.63%, 5/15/23 (d) | | | | | | | 332 | | | | 355,240 | |
7.00%, 5/15/25 | | | | | | | 66 | | | | 72,518 | |
Hexion, Inc., 10.38%, 2/01/22 (c) | | | | | | | 240 | | | | 246,000 | |
Huntsman International LLC, 4.88%, 11/15/20 (d) | | | | | | | 440 | | | | 462,550 | |
Ineos Finance PLC, 4.00%, 5/01/23 | | | EUR | | | | 115 | | | | 130,099 | |
Inovyn Finance PLC, 6.25%, 5/15/21 | | | | | | | 100 | | | | 114,376 | |
Momentive Performance Materials, Inc., 3.88%, 10/24/21 (d) | | | USD | | | | 1,305 | | | | 1,296,844 | |
NOVA Chemicals Corp., 5.25%, 8/01/23 (c) | | | | | | | 145 | | | | 148,987 | |
Platform Specialty Products Corp. (c)(d): | | | | | | | | | | | | |
10.38%, 5/01/21 | | | | | | | 65 | | | | 72,394 | |
6.50%, 2/01/22 | | | | | | | 1,861 | | | | 1,907,525 | |
PQ Corp., 6.75%, 11/15/22 (c)(d) | | | | | | | 465 | | | | 504,520 | |
PSPC Escrow Corp., 6.00%, 2/01/23 | | | EUR | | | | 153 | | | | 175,069 | |
Tronox Finance LLC (d): | | | | | | | | | | | | |
6.38%, 8/15/20 | | | USD | | | | 248 | | | | 252,030 | |
7.50%, 3/15/22 (c) | | | | | | | 77 | | | | 80,465 | |
Versum Materials, Inc., 5.50%, 9/30/24 (c) | | | | | | | 140 | | | | 145,425 | |
WR Grace & Co-Conn (c): | | | | | | | | | | | | |
5.13%, 10/01/21 | | | | | | | 165 | | | | 177,169 | |
5.63%, 10/01/24 (d) | | | | | | | 300 | | | | 325,500 | |
| | | | | | | | | | | | |
| | | | | | | | | | | | 8,341,215 | |
| Commercial Services & Supplies — 1.5% | | | | | | | | | |
ADT Corp.: | | | | | | | | | | | | |
3.50%, 7/15/22 (d) | | | | | | | 339 | | | | 327,983 | |
4.13%, 6/15/23 | | | | | | | 288 | | | | 280,800 | |
4.88%, 7/15/32 (c)(d) | | | | | | | 463 | | | | 403,967 | |
Advanced Disposal Services, Inc., 5.63%, 11/15/24 (c) | | | | | | | 267 | | | | 274,676 | |
Aviation Capital Group Corp., 6.75%, 4/06/21 (c)(d) | | | | | | | 5,000 | | | | 5,713,315 | |
Bilbao Luxembourg SA, (10.50% Cash or 11.25% PIK), 10.50%, 12/01/18 (g) | | | EUR | | | | 100 | | | | 111,629 | |
Booz Allen Hamilton, Inc., 5.13%, 5/01/25 (c) | | | USD | | | | 500 | | | | 508,755 | |
Brand Energy & Infrastructure Services, Inc., 8.50%, 12/01/21 (c)(d) | | | | | | | 782 | | | | 830,875 | |
Covanta Holding Corp., 5.88%, 7/01/25 | | | | | | | 254 | | | | 254,000 | |
GW Honos Security Corp., 8.75%, 5/15/25 (c)(i) | | | | | | | 102 | | | | 104,040 | |
Harland Clarke Holdings Corp., 8.38%, 8/15/22 (c)(d) | | | | | | | 330 | | | | 339,900 | |
La Financiere Atalian SAS, 4.00%, 5/15/24 (i) | | | EUR | | | | 100 | | | | 110,662 | |
Mobile Mini, Inc., 5.88%, 7/01/24 (d) | | | USD | | | | 515 | | | | 533,540 | |
Park Aerospace Holdings Ltd., 5.25%, 8/15/22 (c) | | | | | | | 285 | | | | 301,031 | |
Ritchie Bros Auctioneers, Inc., 5.38%, 1/15/25 (c) | | | | | | | 221 | | | | 228,183 | |
United Rentals North America, Inc.: | | | | | | | | | | | | |
7.63%, 4/15/22 | | | | | | | 22 | | | | 22,963 | |
6.13%, 6/15/23 | | | | | | | 63 | | | | 65,835 | |
5.75%, 11/15/24 (d) | | | | | | | 450 | | | | 475,875 | |
5.88%, 9/15/26 | | | | | | | 90 | | | | 94,950 | |
| | | | | | | | | | | | |
| | | | | | | | | | | | 10,982,979 | |
| | | | | | | | | | | | |
| Corporate Bonds | | | | | Par (000) | | | Value | |
| Communications Equipment — 0.3% | | | | | | | | | |
CommScope Technologies Finance LLC, 6.00%, 6/15/25 (c) | | | USD | | | | 5 | | | $ | 5,331 | |
CommScope Technologies LLC, 5.00%, 3/15/27 (c)(d) | | | | | | | 280 | | | | 282,450 | |
CommScope, Inc., 5.00%, 6/15/21 (c)(d) | | | | | | | 170 | | | | 174,675 | |
Nokia OYJ, 6.63%, 5/15/39 (d) | | | | | | | 245 | | | | 267,859 | |
Zayo Group LLC/Zayo Capital, Inc. (d): | | | | | | | | | | | | |
6.38%, 5/15/25 | | | | | | | 1,037 | | | | 1,121,256 | |
5.75%, 1/15/27 (c) | | | | | | | 481 | | | | 510,461 | |
| | | | | | | | | | | | |
| | | | | | | | | | | | 2,362,032 | |
| Construction & Engineering — 0.5% | | | | | | | | | |
Aeropuerto Internacional de Tocumen SA, 5.63%, 5/18/36 (c) | | | | | | | 1,189 | | | | 1,239,532 | |
Aeropuertos Argentina 2000 SA, 6.88%, 2/01/27 (c) | | | | | | | 387 | | | | 408,478 | |
Aeropuertos Dominicanos Siglo XXI SA, 6.75%, 3/30/29 (c) | | | | | | | 387 | | | | 414,431 | |
BlueLine Rental Finance Corp., 9.25%, 3/15/24 (c)(d) | | | | | | | 1,238 | | | | 1,293,710 | |
Engility Corp., 8.88%, 9/01/24 (c)(d) | | | | | | | 298 | | | | 318,115 | |
SPIE SA, 3.13%, 3/22/24 | | | EUR | | | | 100 | | | | 111,807 | |
| | | | | | | | | | | | |
| | | | | | | | | | | | 3,786,073 | |
| Construction Materials — 0.5% | | | | | | | | | |
American Tire Distributors, Inc., 10.25%, 3/01/22 (c)(d) | | | USD | | | | 394 | | | | 404,342 | |
Beacon Roofing Supply, Inc., 6.38%, 10/01/23 (d) | | | | | | | 163 | | | | 175,633 | |
HD Supply, Inc. (c)(d): | | | | | | | | | | | | |
5.25%, 12/15/21 | | | | | | | 1,265 | | | | 1,339,319 | |
5.75%, 4/15/24 | | | | | | | 884 | | | | 939,250 | |
LKQ Italia Bondco SpA, 3.88%, 4/01/24 | | | EUR | | | | 202 | | | | 234,660 | |
PulteGroup, Inc.: | | | | | | | | | | | | |
5.50%, 3/01/26 | | | USD | | | | 213 | | | | 224,715 | |
6.00%, 2/15/35 | | | | | | | 48 | | | | 47,760 | |
Rexel SA, 3.50%, 6/15/23 | | | EUR | | | | 223 | | | | 253,723 | |
| | | | | | | | | | | | |
| | | | | | | | | | | | 3,619,402 | |
| Consumer Discretionary — 0.1% | | | | | | | | | |
Nielsen Co. Luxembourg SARL, 5.00%, 2/01/25 (c)(d) | | | USD | | | | 563 | | | | 563,704 | |
| Consumer Finance — 0.8% | | | | | | | | | |
Ally Financial, Inc., 8.00%, 11/01/31 (d) | | | | | | | 2,669 | | | | 3,176,110 | |
Cardtronics, Inc./Cardtronics USA, Inc., 5.50%, 5/01/25 (c) | | | | | | | 98 | | | | 100,083 | |
Navient Corp.: | | | | | | | | | | | | |
5.00%, 10/26/20 (d) | | | | | | | 370 | | | | 376,937 | |
6.63%, 7/26/21 | | | | | | | 236 | | | | 249,865 | |
6.50%, 6/15/22 | | | | | | | 36 | | | | 37,215 | |
5.50%, 1/25/23 (d) | | | | | | | 162 | | | | 160,275 | |
7.25%, 9/25/23 (d) | | | | | | | 306 | | | | 319,770 | |
6.13%, 3/25/24 (d) | | | | | | | 132 | | | | 130,680 | |
5.88%, 10/25/24 | | | | | | | 138 | | | | 134,205 | |
5.63%, 8/01/33 (d) | | | | | | | 105 | | | | 84,000 | |
OneMain Financial Holdings LLC (c): | | | | | | | | | | | | |
6.75%, 12/15/19 | | | | | | | 186 | | | | 195,532 | |
7.25%, 12/15/21 | | | | | | | 130 | | | | 135,214 | |
Tarjeta Naranja SA, 22.44%, 4/11/22 (b)(c) | | | | | | | 550 | | | | 563,750 | |
| | | | | | | | | | | | |
| | | | | | | | | | | | 5,663,636 | |
| Containers & Packaging — 1.3% | | | | | | | | | |
Ardagh Packaging Finance PLC/Ardagh Holdings USA, Inc.: | | | | | | | | | | | | |
4.25%, 1/15/22 | | | EUR | | | | 65 | | | | 72,386 | |
4.25%, 9/15/22 (c)(d) | | | USD | | | | 283 | | | | 288,434 | |
See Notes to Financial Statements.
| | | | | | |
| | | | | | | |
| 42 | | SEMI-ANNUAL REPORT | | APRIL 30, 2017 | | |
| | |
Consolidated Schedule of Investments (continued) | | BlackRock Multi-Sector Income Trust (BIT) |
| | | | | | | | | | | | |
| Corporate Bonds | | | | | Par (000) | | | Value | |
| Containers & Packaging (continued) | | | | | | | | | |
Ardagh Packaging Finance PLC/Ardagh Holdings USA, Inc. (continued): | | | | | | | | | | | | |
2.75%, 3/15/24 | | | EUR | | | | 125 | | | $ | 135,141 | |
6.75%, 5/15/24 | | | | | | | 156 | | | | 186,687 | |
7.25%, 5/15/24 (c)(d) | | | USD | | | | 1,809 | | | | 1,969,549 | |
6.00%, 2/15/25 (c)(d) | | | | | | | 1,251 | | | | 1,293,221 | |
Ardagh Packaging Finance PLC/Ardagh MP Holdings USA, Inc., 4.63%, 5/15/23 (c)(d) | | | | | | | 252 | | | | 257,355 | |
Bahia Sul Holdings GmbH, 5.75%, 7/14/26 (c) | | | | | | | 354 | | | | 363,558 | |
Ball Corp., 5.00%, 3/15/22 (d) | | | | | | | 440 | | | | 469,700 | |
Clearwater Paper Corp., 5.38%, 2/01/25 (c)(d) | | | | | | | 177 | | | | 174,345 | |
Crown European Holdings SA, 4.00%, 7/15/22 | | | EUR | | | | 103 | | | | 125,257 | |
Flex Acquisition Co., Inc., 6.88%, 1/15/25 (c) | | | USD | | | | 38 | | | | 39,140 | |
JH-Holding Finance SA, 8.25%, 12/01/22 (g) | | | EUR | | | | 102 | | | | 120,508 | |
Reynolds Group Issuer, Inc./Reynolds Group Issuer LLC: | | | | | | | | | | | | |
5.75%, 10/15/20 (d) | | | USD | | | | 590 | | | | 607,700 | |
4.66%, 7/15/21 (b)(c)(d) | | | | | | | 866 | | | | 885,485 | |
5.13%, 7/15/23 (c) | | | | | | | 194 | | | | 202,245 | |
7.00%, 7/15/24 (c)(d) | | | | | | | 655 | | | | 704,944 | |
Sappi Papier Holding GmbH, 4.00%, 4/01/23 | | | EUR | | | | 200 | | | | 228,730 | |
Sealed Air Corp.: | | | | | | | | | | | | |
4.88%, 12/01/22 (c)(d) | | | USD | | | | 100 | | | | 104,250 | |
4.50%, 9/15/23 | | | EUR | | | | 100 | | | | 121,555 | |
6.88%, 7/15/33 (c) | | | USD | | | | 44 | | | | 47,850 | |
Signode Industrial Group Lux SA/Signode Industrial Group US, Inc., 6.38%, 5/01/22 (c)(d) | | | | | | | 598 | | | | 616,006 | |
Suzano Trading Ltd., 5.88%, 1/23/21 (c) | | | | | | | 583 | | | | 621,769 | |
Verallia Packaging SASU, 5.13%, 8/01/22 | | | EUR | | | | 100 | | | | 115,965 | |
| | | | | | | | | | | | |
| | | | | | | | | | | | 9,751,780 | |
| Diversified Consumer Services — 0.5% | | | | | | | | | |
APX Group, Inc. (d): | | | | | | | | | | | | |
6.38%, 12/01/19 | | | USD | | | | 265 | | | | 274,275 | |
8.75%, 12/01/20 | | | | | | | 360 | | | | 373,050 | |
7.88%, 12/01/22 | | | | | | | 144 | | | | 156,960 | |
7.88%, 12/01/22 (c) | | | | | | | 230 | | | | 250,700 | |
Laureate Education, Inc., 8.25%, 5/01/25 (c) | | | | | | | 138 | | | | 141,795 | |
Prime Security Services Borrower LLC/Prime Finance, Inc., 9.25%, 5/15/23 (c)(d) | | | | | | | 2,068 | | | | 2,259,290 | |
Sotheby’s, 5.25%, 10/01/22 (c) | | | | | | | 71 | | | | 72,598 | |
Tereos Finance Groupe I SA, 4.13%, 6/16/23 | | | EUR | | | | 100 | | | | 109,066 | |
| | | | | | | | | | | | |
| | | | | | | | | | | | 3,637,734 | |
| Diversified Financial Services — 1.0% | | | | | | | | | |
AerCap Ireland Capital Ltd./AerCap Global Aviation Trust, 3.95%, 2/01/22 (d) | | | USD | | | | 1,750 | | | | 1,812,032 | |
Aircastle Ltd., 6.25%, 12/01/19 (d) | | | | | | | 784 | | | | 850,248 | |
ASP AMC Merger Sub, Inc., 8.00%, 5/15/25 (c) | | | | | | | 132 | | | | 131,010 | |
Banco Santander SA, 6.75% (b)(h) | | | EUR | | | | 200 | | | | 229,568 | |
FBM Finance, Inc., 8.25%, 8/15/21 (c) | | | USD | | | | 155 | | | | 167,400 | |
Ford Motor Credit Co. LLC, 4.39%, 1/08/26 (d) | | | | | | | 1,250 | | | | 1,287,635 | |
Garfunkelux Holdco 3 SA, 8.50%, 11/01/22 | | | GBP | | | | 100 | | | | 139,698 | |
General Motors Financial Co., Inc., 4.25%, 5/15/23 (d) | | | USD | | | | 326 | | | | 335,700 | |
Jefferies Finance LLC/JFIN Co-Issuer Corp., 7.38%, 4/01/20 (c)(d) | | | | | | | 845 | | | | 864,012 | |
Mercury Bondco PLC (g): | | | | | | | | | | | | |
(7.13% Cash), 7.13%, 5/30/21 | | | EUR | | | | 275 | | | | 307,632 | |
(8.25% Cash or 9.00% PIK), 8.25%, 5/30/21 | | | | | | | 358 | | | | 408,692 | |
| | | | | | | | | | | | |
| Corporate Bonds | | | | | Par (000) | | | Value | |
| Diversified Financial Services (continued) | | | | | | | | | |
Tempo Acquisition LLC/Tempo Acquisition Finance Corp., 6.75%, 6/01/25 (c)(i) | | | USD | | | | 227 | | | $ | 233,243 | |
UniCredit SpA: | | | | | | | | | | | | |
6.95%, 10/31/22 | | | EUR | | | | 270 | | | | 350,845 | |
5.75%, 10/28/25 (b) | | | | | | | 207 | | | | 245,486 | |
| | | | | | | | | | | | |
| | | | | | | | | | | | 7,363,201 | |
| Diversified Telecommunication Services — 2.7% | |
AT&T, Inc., 4.75%, 5/15/46 (d) | | | USD | | | | 2,545 | | | | 2,383,935 | |
CenturyLink, Inc.: | | | | | | | | | | | | |
6.45%, 6/15/21 (d) | | | | | | | 771 | | | | 832,680 | |
Series U, 7.65%, 3/15/42 | | | | | | | 174 | | | | 161,820 | |
Series W, 6.75%, 12/01/23 | | | | | | | 197 | | | | 211,036 | |
Series Y, 7.50%, 4/01/24 | | | | | | | 174 | | | | 189,053 | |
Cincinnati Bell, Inc., 7.00%, 7/15/24 (c)(d) | | | | | | | 928 | | | | 982,288 | |
Consolidated Communications, Inc., 6.50%, 10/01/22 | | | | | | | 113 | | | | 111,588 | |
Frontier Communications Corp.: | | | | | | | | | | | | |
8.13%, 10/01/18 | | | | | | | 125 | | | | 132,969 | |
7.13%, 3/15/19 (d) | | | | | | | 380 | | | | 399,950 | |
8.50%, 4/15/20 | | | | | | | 473 | | | | 503,154 | |
8.88%, 9/15/20 | | | | | | | 99 | | | | 104,506 | |
7.13%, 1/15/23 (d) | | | | | | | 65 | | | | 56,875 | |
7.63%, 4/15/24 (d) | | | | | | | 570 | | | | 488,775 | |
6.88%, 1/15/25 (d) | | | | | | | 1,205 | | | | 1,003,464 | |
Level 3 Financing, Inc.: | | | | | | | | | | | | |
5.38%, 8/15/22 | | | | | | | 140 | | | | 144,578 | |
5.63%, 2/01/23 (d) | | | | | | | 105 | | | | 108,938 | |
5.13%, 5/01/23 (d) | | | | | | | 360 | | | | 369,450 | |
5.38%, 1/15/24 (d) | | | | | | | 473 | | | | 491,608 | |
5.38%, 5/01/25 (d) | | | | | | | 535 | | | | 557,737 | |
5.25%, 3/15/26 | | | | | | | 311 | | | | 320,744 | |
OTE PLC, 3.50%, 7/09/20 | | | EUR | | | | 200 | | | | 222,413 | |
SBA Communications Corp., 4.88%, 9/01/24 (c)(d) | | | USD | | | | 309 | | | | 311,704 | |
SoftBank Group Corp., 4.75%, 7/30/25 | | | EUR | | | | 100 | | | | 122,568 | |
Telecom Italia Capital SA: | | | | | | | | | | | | |
6.38%, 11/15/33 | | | USD | | | | 91 | | | | 95,366 | |
6.00%, 9/30/34 (d) | | | | | | | 929 | | | | 949,902 | |
Telecom Italia Finance SA, 7.75%, 1/24/33 | | | EUR | | | | 81 | | | | 117,381 | |
Telecom Italia SpA: | | | | | | | | | | | | |
3.25%, 1/16/23 | | | | | | | 273 | | | | 321,879 | |
3.63%, 1/19/24 | | | | | | | 146 | | | | 171,443 | |
Verizon Communications, Inc., 6.55%, 9/15/43 (d) | | | USD | | | | 6,500 | | | | 7,977,027 | |
Windstream Corp., 7.75%, 10/01/21 | | | | | | | 31 | | | | 31,155 | |
| | | | | | | | | | | | |
| | | | | | | | | | | | 19,875,986 | |
| Electric Utilities — 0.9% | |
AES Corp., 4.88%, 5/15/23 (d) | | | | | | | 350 | | | | 353,500 | |
Baltimore Gas & Electric Co., 3.50%, 8/15/46 (d) | | | | | | | 500 | | | | 461,035 | |
Duke Energy Corp., 4.80%, 12/15/45 (d) | | | | | | | 1,500 | | | | 1,595,326 | |
Energuate Trust, 5.88%, 5/03/27 (c) | | | | | | | 522 | | | | 529,830 | |
Orazul Energy Egenor S en C por A, 5.63%, 4/28/27 (c) | | | | | | | 776 | | | | 775,263 | |
Pampa Energia SA, 7.50%, 1/24/27 (c) | | | | | | | 758 | | | | 807,270 | |
Southern Co., 4.40%, 7/01/46 (d) | | | | | | | 1,000 | | | | 994,844 | |
Talen Energy Supply LLC, 6.50%, 6/01/25 | | | | | | | 104 | | | | 82,680 | |
Virginia Electric & Power Co., Series A, 6.00%, 5/15/37 (d) | | | | | | | 750 | | | | 944,680 | |
| | | | | | | | | | | | |
| | | | | | | | | | | | 6,544,428 | |
| Electrical Equipment — 0.1% | |
Areva SA, 4.88%, 9/23/24 | | | EUR | | | | 100 | | | | 113,495 | |
Belden, Inc., 5.50%, 4/15/23 | | | | | | | 111 | | | | 127,392 | |
See Notes to Financial Statements.
| | | | | | |
| | | | | | | |
| | SEMI-ANNUAL REPORT | | APRIL 30, 2017 | | 43 |
| | |
Consolidated Schedule of Investments (continued) | | BlackRock Multi-Sector Income Trust (BIT) |
| | | | | | | | | | | | |
| Corporate Bonds | | | | | Par (000) | | | Value | |
| Electrical Equipment (continued) | |
Trionista TopCo GmbH, 6.88%, 4/30/21 | | | EUR | | | | 213 | | | $ | 241,722 | |
| | | | | | | | | | | | |
| | | | | | | | | | | | 482,609 | |
| Electronic Equipment, Instruments & Components — 0.1% | |
CDW LLC/CDW Finance Corp.: | | | | | | | | | | | | |
5.00%, 9/01/23 (d) | | | USD | | | | 325 | | | | 333,937 | |
5.50%, 12/01/24 | | | | | | | 118 | | | | 125,670 | |
5.00%, 9/01/25 | | | | | | | 127 | | | | 130,175 | |
SESI LLC, 7.13%, 12/15/21 | | | | | | | 100 | | | | 101,000 | |
| | | | | | | | | | | | |
| | | | | | | | | | | | 690,782 | |
| Energy Equipment & Services — 0.9% | |
Covey Park Energy LLC, 7.50%, 5/15/25 (c) | | | | | | | 250 | | | | 250,000 | |
Ensco PLC: | | | | | | | | | | | | |
4.50%, 10/01/24 (d) | | | | | | | 199 | | | | 164,175 | |
5.20%, 3/15/25 | | | | | | | 45 | | | | 38,138 | |
Gates Global LLC/Gates Global Co.: | | | | | | | | | | | | |
5.75%, 7/15/22 | | | EUR | | | | 100 | | | | 111,708 | |
6.00%, 7/15/22 (c)(d) | | | USD | | | | 916 | | | | 920,580 | |
Genesis Energy LP/Genesis Energy Finance Corp., 6.75%, 8/01/22 | | | | | | | 150 | | | | 154,313 | |
Halliburton Co., 3.80%, 11/15/25 (d) | | | | | | | 750 | | | | 771,362 | |
Noble Holding International Ltd., 4.63%, 3/01/21 | | | | | | | 12 | | | | 11,040 | |
Pattern Energy Group, Inc., 5.88%, 2/01/24 (c) | | | | | | | 163 | | | | 167,279 | |
Pioneer Energy Services Corp., 6.13%, 3/15/22 (d) | | | | | | | 325 | | | | 294,937 | |
Precision Drilling Corp.: | | | | | | | | | | | | |
6.50%, 12/15/21 | | | | | | | 120 | | | | 121,500 | |
5.25%, 11/15/24 | | | | | | | 193 | | | | 185,762 | |
Transocean, Inc.: | | | | | | | | | | | | |
6.00%, 3/15/18 (d) | | | | | | | 330 | | | | 337,012 | |
7.38%, 4/15/18 | | | | | | | 35 | | | | 35,875 | |
5.80%, 10/15/22 (d) | | | | | | | 538 | | | | 500,340 | |
9.00%, 7/15/23 (c)(d) | | | | | | | 1,321 | | | | 1,408,516 | |
6.80%, 3/15/38 | | | | | | | 42 | | | | 33,600 | |
Trinidad Drilling Ltd., 6.63%, 2/15/25 (c)(d) | | | | | | | 458 | | | | 461,435 | |
Weatherford International Ltd.: | | | | | | | | | | | | |
7.75%, 6/15/21 (d) | | | | | | | 307 | | | | 327,339 | |
8.25%, 6/15/23 | | | | | | | 145 | | | | 157,144 | |
9.88%, 2/15/24 (c) | | | | | | | 273 | | | | 318,045 | |
| | | | | | | | | | | | |
| | | | | | | | | | | | 6,770,100 | |
| Environmental, Maintenance, & Security Service — 0.1% | |
Befesa Zinc SAU Via Zinc Capital SA, 8.88%, 5/15/18 | | | EUR | | | | 100 | | | | 109,427 | |
Paprec Holding SA, 5.25%, 4/01/22 | | | | | | | 100 | | | | 114,574 | |
Tervita Escrow Corp., 7.63%, 12/01/21 (c)(d) | | | USD | | | | 477 | | | | 490,117 | |
| | | | | | | | | | | | |
| | | | | | | | | | | | 714,118 | |
| Food & Staples Retailing — 0.7% | |
Albertsons Cos. LLC/Safeway, Inc./New Albertson’s, Inc./Albertson’s LLC (c)(d): | | | | | | | | | | | | |
6.63%, 6/15/24 | | | | | | | 254 | | | | 259,715 | |
5.75%, 3/15/25 | | | | | | | 312 | | | | 303,420 | |
B&G Foods, Inc., 5.25%, 4/01/25 | | | | | | | 171 | | | | 175,066 | |
B&M European Value Retail SA, 4.13%, 2/01/22 | | | GBP | | | | 100 | | | | 134,970 | |
Casino Guichard Perrachon SA: | | | | | | | | | | | | |
5.98%, 5/26/21 | | | EUR | | | | 100 | | | | 128,178 | |
4.56%, 1/25/23 | | | | | | | 200 | | | | 244,554 | |
CVS Health Corp., 5.13%, 7/20/45 (d) | | | USD | | | | 750 | | | | 838,173 | |
Dollar Tree, Inc., 5.75%, 3/01/23 (d) | | | | | | | 1,616 | | | | 1,714,576 | |
Rite Aid Corp. (d): | | | | | | | | | | | | |
6.75%, 6/15/21 | | | | | | | 329 | | | | 331,468 | |
6.13%, 4/01/23 (c) | | | | | | | 111 | | | | 109,890 | |
7.70%, 2/15/27 | | | | | | | 359 | | | | 387,720 | |
| | | | | | | | | | | | |
| Corporate Bonds | | | | | Par (000) | | | Value | |
| Food & Staples Retailing (continued) | |
Walgreens Boots Alliance, Inc., 4.80%, 11/18/44 (d) | | | USD | | | | 750 | | | $ | 775,024 | |
| | | | | | | | | | | | |
| | | | | | | | | | | | 5,402,754 | |
| Food Products — 0.7% | |
Acosta, Inc., 7.75%, 10/01/22 (c)(d) | | | | | | | 424 | | | | 359,340 | |
Aramark Services, Inc. (d): | | | | | | | | | | | | |
5.13%, 1/15/24 | | | | | | | 144 | | | | 151,920 | |
4.75%, 6/01/26 | | | | | | | 252 | | | | 257,040 | |
Arcor SAIC, 6.00%, 7/06/23 (c) | | | | | | | 470 | | | | 503,722 | |
Chobani LLC/Chobani Finance Corp., Inc., 7.50%, 4/15/25 (c)(d) | | | | | | | 375 | | | | 386,719 | |
Clearwater Seafoods, Inc., 6.88%, 5/01/25 (c) | | | | | | | 90 | | | | 93,150 | |
FAGE International SA/FAGE USA Dairy Industry, Inc., 5.63%, 8/15/26 (c) | | | | | | | 200 | | | | 203,500 | |
JBS USA LLC/JBS USA Finance, Inc. (c): | | | | | | | | | | | | |
7.25%, 6/01/21 | | | | | | | 40 | | | | 41,100 | |
5.88%, 7/15/24 (c) | | | | | | | 169 | | | | 176,183 | |
5.75%, 6/15/25 | | | | | | | 558 | | | | 576,135 | |
Marfrig Holdings Europe BV, 8.00%, 6/08/23 (c)(d) | | | | | | | 243 | | | | 257,881 | |
Minerva Luxembourg SA, 6.50%, 9/20/26 (c) | | | | | | | 286 | | | | 283,852 | |
Post Holdings, Inc. (c)(d): | | | | | | | | | | | | |
7.75%, 3/15/24 | | | | | | | 721 | | | | 801,211 | |
8.00%, 7/15/25 | | | | | | | 234 | | | | 266,175 | |
5.00%, 8/15/26 | | | | | | | 227 | | | | 225,865 | |
TreeHouse Foods, Inc., 6.00%, 2/15/24 (c)(d) | | | | | | | 159 | | | | 169,335 | |
WhiteWave Foods Co., 5.38%, 10/01/22 (d) | | | | | | | 211 | | | | 235,793 | |
| | | | | | | | | | | | |
| | | | | | | | | | | | 4,988,921 | |
| Health Care Equipment & Supplies — 0.5% | |
Crimson Merger Sub, Inc., 6.63%, 5/15/22 (c)(d) | | | | | | | 1,043 | | | | 959,560 | |
DJO Finco, Inc./DJO Finance LLC/DJO Finance Corp., 8.13%, 6/15/21 (c)(d) | | | | | | | 893 | | | | 788,072 | |
IASIS Healthcare LLC/IASIS Capital Corp., 8.38%, 5/15/19 (d) | | | | | | | 290 | | | | 282,750 | |
Mallinckrodt International Finance SA/Mallinckrodt CB LLC (c)(d): | | | | | | | | | | | | |
5.63%, 10/15/23 | | | | | | | 342 | | | | 326,610 | |
5.50%, 4/15/25 | | | | | | | 302 | | | | 274,820 | |
Medtronic, Inc., 4.50%, 3/15/42 (d) | | | | | | | 1,000 | | | | 1,053,062 | |
Teleflex, Inc.: | | | | | | | | | | | | |
3.88%, 8/01/17 (j) | | | | | | | 90 | | | | 300,994 | |
4.88%, 6/01/26 | | | | | | | 63 | | | | 63,945 | |
| | | | | | | | | | | | |
| | | | | | | | | | | | 4,049,813 | |
| Health Care Providers & Services — 2.9% | |
Acadia Healthcare Co., Inc.: | | | | | | | | | | | | |
5.63%, 2/15/23 (d) | | | | | | | 432 | | | | 447,008 | |
6.50%, 3/01/24 | | | | | | | 69 | | | | 73,140 | |
Alere, Inc., 6.38%, 7/01/23 (c)(d) | | | | | | | 268 | | | | 291,785 | |
Amsurg Corp., 5.63%, 7/15/22 (d) | | | | | | | 810 | | | | 835,636 | |
Centene Corp.: | | | | | | | | | | | | |
5.63%, 2/15/21 (d) | | | | | | | 403 | | | | 423,654 | |
4.75%, 5/15/22 (d) | | | | | | | 402 | | | | 417,075 | |
6.13%, 2/15/24 | | | | | | | 40 | | | | 43,100 | |
4.75%, 1/15/25 (d) | | | | | | | 495 | | | | 503,044 | |
CHS/Community Health Systems, Inc.: | | | | | | | | | | | | |
8.00%, 11/15/19 | | | | | | | 176 | | | | 171,273 | |
5.13%, 8/01/21 (d) | | | | | | | 360 | | | | 356,850 | |
6.88%, 2/01/22 (d) | | | | | | | 461 | | | | 381,477 | |
6.25%, 3/31/23 | | | | | | | 455 | | | | 462,962 | |
DaVita HealthCare Partners, Inc., 5.13%, 7/15/24 (d) | | | | | | | 657 | | | | 675,481 | |
See Notes to Financial Statements.
| | | | | | |
| | | | | | | |
| 44 | | SEMI-ANNUAL REPORT | | APRIL 30, 2017 | | |
| | |
Consolidated Schedule of Investments (continued) | | BlackRock Multi-Sector Income Trust (BIT) |
| | | | | | | | | | | | |
| Corporate Bonds | | | | | Par (000) | | | Value | |
| Health Care Providers & Services (continued) | |
DaVita, Inc., 5.00%, 5/01/25 | | | USD | | | | 7 | | | $ | 7,053 | |
Envision Healthcare Corp., 5.13%, 7/01/22 (c)(d) | | | | | | | 205 | | | | 208,075 | |
HCA, Inc.: | | | | | | | | | | | | |
6.50%, 2/15/20 (d) | | | | | | | 1,103 | | | | 1,210,609 | |
7.50%, 2/15/22 (d) | | | | | | | 800 | | | | 920,320 | |
5.88%, 3/15/22 (d) | | | | | | | 84 | | | | 93,135 | |
4.75%, 5/01/23 | | | | | | | 56 | | | | 58,800 | |
5.88%, 5/01/23 | | | | | | | 90 | | | | 97,938 | |
5.00%, 3/15/24 (d) | | | | | | | 645 | | | | 684,506 | |
5.38%, 2/01/25 (d) | | | | | | | 862 | | | | 897,557 | |
5.25%, 4/15/25 (d) | | | | | | | 1,260 | | | | 1,354,109 | |
5.88%, 2/15/26 (d) | | | | | | | 508 | | | | 539,750 | |
5.25%, 6/15/26 (d) | | | | | | | 540 | | | | 575,775 | |
4.50%, 2/15/27 (d) | | | | | | | 511 | | | | 515,849 | |
HealthSouth Corp.: | | | | | | | | | | | | |
5.75%, 11/01/24 (d) | | | | | | | 76 | | | | 77,425 | |
5.75%, 9/15/25 (d) | | | | | | | 126 | | | | 127,418 | |
2.00%, 12/01/43 (j) | | | | | | | 214 | | | | 280,474 | |
Hologic, Inc.: | | | | | | | | | | | | |
5.25%, 7/15/22 (c)(d) | | | | | | | 417 | | | | 439,414 | |
Series 2012, 2.00%, 3/01/42 (e) | | | | | | | 323 | | | | 471,378 | |
MEDNAX, Inc., 5.25%, 12/01/23 (c)(d) | | | | | | | 239 | | | | 244,378 | |
MPH Acquisition Holdings LLC, 7.13%, 6/01/24 (c)(d) | | | | | | | 847 | | | | 910,525 | |
New Amethyst Corp., 6.25%, 12/01/24 (c) | | | | | | | 291 | | | | 306,278 | |
RegionalCare Hospital Partners Holdings, Inc., 8.25%, 5/01/23 (c)(d) | | | | | | | 350 | | | | 372,356 | |
Surgery Center Holdings, Inc., 8.88%, 4/15/21 (c) | | | | | | | 82 | | | | 87,125 | |
Tenet Healthcare Corp.: | | | | | | | | | | | | |
6.00%, 10/01/20 (d) | | | | | | | 1,150 | | | | 1,210,375 | |
4.50%, 4/01/21 | | | | | | | 130 | | | | 129,838 | |
8.13%, 4/01/22 (d) | | | | | | | 1,294 | | | | 1,313,410 | |
6.75%, 6/15/23 (d) | | | | | | | 974 | | | | 930,170 | |
Thermo Fisher Scientific, Inc., 2.95%, 9/19/26 (d) | | | | | | | 1,000 | | | | 959,165 | |
UnitedHealth Group, Inc., 4.38%, 3/15/42 (d) | | | | | | | 750 | | | | 783,698 | |
Vizient, Inc., 10.38%, 3/01/24 (c) | | | | | | | 90 | | | | 103,050 | |
WellCare Health Plans, Inc., 5.25%, 4/01/25 | | | | | | | 101 | | | | 105,040 | |
| | | | | | | | | | | | |
| | | | | | | | | | | | 21,097,478 | |
| Health Care Technology — 0.1% | | | | | | | | | |
Change Healthcare Holdings LLC/Change Healthcare Finance, Inc., 5.75%, 3/01/25 (c) | | | | | | | 282 | | | | 289,402 | |
Quintiles IMS, Inc., 3.25%, 3/15/25 (c) | | | EUR | | | | 100 | | | | 109,358 | |
| | | | | | | | | | | | |
| | | | | | | | | | | | 398,760 | |
| Hotels, Restaurants & Leisure — 4.0% | | | | | | | | | |
Burger King France SAS: | | | | | | | | | | | | |
4.93%, 5/01/23 (b) | | | | | | | 100 | | | | 111,109 | |
6.00%, 5/01/24 | | | | | | | 100 | | | | 113,015 | |
Caesars Entertainment Resort Properties LLC/Caesars Entertainment Resort Property, 8.00%, 10/01/20 | | | USD | | | | 1,840 | | | | 1,918,062 | |
Cemex Finance LLC, 9.38%, 10/12/22 (c) | | | | | | | 378 | | | | 406,822 | |
Codere Finance 2 Luxembourg SA, 6.75%, 11/01/21 | | | EUR | | | | 100 | | | | 110,564 | |
Eagle II Acquisition Co. LLC, 6.00%, 4/01/25 (c) | | | USD | | | | 102 | | | | 105,442 | |
Enterprise Inns PLC, 6.00%, 10/06/23 | | | GBP | | | | 3,320 | | | | 4,580,971 | |
ESH Hospitality, Inc., 5.25%, 5/01/25 (c)(d) | | | USD | | | | 154 | | | | 155,925 | |
International Game Technology PLC, 4.75%, 2/15/23 | | | EUR | | | | 107 | | | | 127,325 | |
| | | | | | | | | | | | |
| Corporate Bonds | | | | | Par (000) | | | Value | |
| Hotels, Restaurants & Leisure (continued) | | | | | | | | | |
Jacobs Entertainment, Inc., 7.88%, 2/01/24 (c) | | | USD | | | | 169 | | | $ | 176,605 | |
KFC Holding Co/Pizza Hut Holdings LLC/Taco Bell of America LLC (c): | | | | | | | | | | | | |
5.00%, 6/01/24 | | | | | | | 45 | | | | 46,463 | |
5.25%, 6/01/26 (d) | | | | | | | 159 | | | | 162,975 | |
McDonald’s Corp., 3.70%, 1/30/26 (d) | | | | | | | 750 | | | | 773,391 | |
MGM Resorts International: | | | | | | | | | | | | |
5.25%, 3/31/20 | | | | | | | 84 | | | | 88,830 | |
6.75%, 10/01/20 (d) | | | | | | | 180 | | | | 200,250 | |
6.63%, 12/15/21 (d) | | | | | | | 1,458 | | | | 1,636,605 | |
7.75%, 3/15/22 | | | | | | | 10 | | | | 11,650 | |
4.63%, 9/01/26 (d) | | | | | | | 146 | | | | 145,635 | |
New Red Finance, Inc., 6.00%, 4/01/22 (c)(d) | | | | | | | 1,130 | | | | 1,178,025 | |
PortAventura Entertainment Barcelona BV, 7.25%, 12/01/20 | | | EUR | | | | 208 | | | | 233,173 | |
RHP Hotel Properties LP/RHP Finance Corp., 5.00%, 4/15/21 (d) | | | USD | | | | 460 | | | | 468,625 | |
Sabre GLBL, Inc., 5.25%, 11/15/23 (c)(d) | | | | | | | 317 | | | | 328,095 | |
Scientific Games International, Inc. (d): | | | | | | | | | | | | |
7.00%, 1/01/22 (c) | | | | | | | 985 | | | | 1,054,561 | |
10.00%, 12/01/22 | | | | | | | 953 | | | | 1,034,005 | |
Six Flags Entertainment Corp. (c): | | | | | | | | | | | | |
4.88%, 7/31/24 (d) | | | | | | | 604 | | | | 609,285 | |
5.50%, 4/15/27 | | | | | | | 174 | | | | 177,371 | |
Station Casinos LLC, 7.50%, 3/01/21 (d) | | | | | | | 1,085 | | | | 1,129,756 | |
Stonegate Pub Co. Financing PLC, 4.88%, 3/15/22 | | | GBP | | | | 100 | | | | 130,083 | |
Thomas Cook Group PLC, 6.25%, 6/15/22 | | | EUR | | | | 100 | | | | 118,479 | |
Unique Pub Finance Co. PLC: | | | | | | | | | | | | |
Series A3, 6.54%, 3/30/21 | | | GBP | | | | 1,777 | | | | 2,500,669 | |
Series M, 7.40%, 3/28/24 | | | | | | | 6,400 | | | | 9,202,206 | |
Vue International Bidco PLC, 7.88%, 7/15/20 | | | | | | | 117 | | | | 156,567 | |
Yum! Brands, Inc., 3.88%, 11/01/23 | | | USD | | | | 110 | | | | 108,625 | |
| | | | | | | | | | | | |
| | | | | | | | | | | | 29,301,164 | |
| Household Durables — 0.8% | | | | | | | | | |
Brookfield Residential Properties, Inc./Brookfield Residential US Corp., 6.13%, 7/01/22 (c)(d) | | | | | | | 750 | | | | 781,875 | |
CalAtlantic Group, Inc.: | | | | | | | | | | | | |
8.38%, 1/15/21 | | | | | | | 144 | | | | 169,200 | |
5.38%, 10/01/22 | | | | | | | 6 | | | | 6,405 | |
5.25%, 6/01/26 | | | | | | | 47 | | | | 48,292 | |
Century Communities, Inc., 6.88%, 5/15/22 (d) | | | | | | | 830 | | | | 869,425 | |
Lennar Corp.: | | | | | | | | | | | | |
4.50%, 11/15/19 (d) | | | | | | | 320 | | | | 330,800 | |
4.75%, 4/01/21 | | | | | | | 42 | | | | 44,199 | |
4.13%, 1/15/22 | | | | | | | 139 | | | | 141,780 | |
4.75%, 11/15/22 | | | | | | | 53 | | | | 55,120 | |
4.88%, 12/15/23 (d) | | | | | | | 146 | | | | 151,110 | |
4.75%, 5/30/25 (d) | | | | | | | 410 | | | | 417,175 | |
Mattamy Group Corp., 6.88%, 12/15/23 (c) | | | | | | | 123 | | | | 127,612 | |
Newell Brands, Inc., 4.20%, 4/01/26 (d) | | | | | | | 1,000 | | | | 1,051,064 | |
PulteGroup, Inc., 6.38%, 5/15/33 (d) | | | | | | | 469 | | | | 492,886 | |
Riverbed Technology, Inc., 8.88%, 3/01/23 (c) | | | | | | | 180 | | | | 185,400 | |
Standard Pacific Corp., 5.88%, 11/15/24 | | | | | | | 38 | | | | 40,850 | |
Tempur Sealy International, Inc., 5.50%, 6/15/26 (d) | | | | | | | 483 | | | | 480,286 | |
TRI Pointe Group, Inc.: | | | | | | | | | | | | |
4.38%, 6/15/19 (d) | | | | | | | 225 | | | | 231,750 | |
4.88%, 7/01/21 | | | | | | | 210 | | | | 218,400 | |
5.88%, 6/15/24 (d) | | | | | | | 140 | | | | 147,350 | |
See Notes to Financial Statements.
| | | | | | |
| | | | | | | |
| | SEMI-ANNUAL REPORT | | APRIL 30, 2017 | | 45 |
| | |
Consolidated Schedule of Investments (continued) | | BlackRock Multi-Sector Income Trust (BIT) |
| | | | | | | | | | | | |
| Corporate Bonds | | | | | Par (000) | | | Value | |
| Household Durables (continued) | | | | | | | | | |
William Lyon Homes ,Inc., 5.88%, 1/31/25 (c) | | | USD | | | | 141 | | | $ | 144,525 | |
| | | | | | | | | | | | |
| | | | | | | | | | | | 6,135,504 | |
| Household Products — 0.1% | | | | | | | | | |
ACCO Brands Corp., 5.25%, 12/15/24 (c) | | | | | | | 102 | | | | 105,060 | |
Prestige Brands, Inc., 6.38%, 3/01/24 (c) | | | | | | | 176 | | | | 188,320 | |
Spectrum Brands, Inc., 6.63%, 11/15/22 (d) | | | | | | | 710 | | | | 747,275 | |
| | | | | | | | | | | | |
| | | | | | | | | | | | 1,040,655 | |
| Independent Power and Renewable Electricity Producers — 0.5% | |
Calpine Corp. (d): | | | | | | | | | | | | |
6.00%, 1/15/22 (c) | | | | | | | 64 | | | | 66,880 | |
5.38%, 1/15/23 | | | | | | | 190 | | | | 187,150 | |
5.88%, 1/15/24 (c) | | | | | | | 200 | | | | 210,000 | |
Dynegy, Inc.: | | | | | | | | | | | | |
6.75%, 11/01/19 (d) | | | | | | | 925 | | | | 938,875 | |
7.38%, 11/01/22 | | | | | | | 30 | | | | 28,725 | |
7.63%, 11/01/24 | | | | | | | 45 | | | | 41,175 | |
Genneia SA, 8.75%, 1/20/22 (c) | | | | | | | 491 | | | | 526,597 | |
NRG Energy, Inc.: | | | | | | | | | | | | |
7.88%, 5/15/21 | | | | | | | 82 | | | | 84,050 | |
6.63%, 3/15/23 | | | | | | | 45 | | | | 45,675 | |
6.63%, 1/15/27 (d) | | | | | | | 629 | | | | 622,710 | |
NRG Yield Operating LLC, 5.38%, 8/15/24 (d) | | | | | | | 130 | | | | 132,925 | |
QEP Resources, Inc., 5.38%, 10/01/22 (d) | | | | | | | 444 | | | | 438,450 | |
TerraForm Power Operating LLC, 6.38%, 2/01/23 (c)(e) | | | | | | | 258 | | | | 266,708 | |
| | | | | | | | | | | | |
| | | | | | | | | | | | 3,589,920 | |
| Industrial Conglomerates — 0.2% | | | | | | | | | |
General Electric Co., 4.13%, 10/09/42 (d) | | | | | | | 750 | | | | 774,505 | |
Vertiv Group Corp, 9.25%, 10/15/24 (c)(d) | | | | | | | 507 | | | | 544,391 | |
| | | | | | | | | | | | |
| | | | | | | | | | | | 1,318,896 | |
| Insurance — 0.7% | | | | | | | | | |
Achmea BV, 6.00%, 4/04/43 (b) | | | EUR | | | | 100 | | | | 121,380 | |
American International Group, Inc., 4.80%, 7/10/45 (d) | | | USD | | | | 500 | | | | 515,114 | |
Aon PLC, 3.88%, 12/15/25 (d) | | | | | | | 1,280 | | | | 1,315,552 | |
Assicurazioni Generali SpA (b): | | | | | | | | | | | | |
7.75%, 12/12/42 | | | EUR | | | | 100 | | | | 133,678 | |
5.50%, 10/27/47 | | | | | | | 100 | | | | 119,057 | |
Groupama SA, 6.00%, 1/23/27 | | | | | | | 100 | | | | 117,671 | |
HUB International Ltd., 7.88%, 10/01/21 (c)(d) | | | USD | | | | 1,058 | | | | 1,108,414 | |
Old Mutual PLC, 8.00%, 6/03/21 | | | GBP | | | | 100 | | | | 149,595 | |
Radian Group, Inc., 5.25%, 6/15/20 (d) | | | USD | | | | 390 | | | | 407,550 | |
USIS Merger Sub, Inc., 6.88%, 5/01/25 (c) | | | | | | | 140 | | | | 142,450 | |
Wayne Merger Sub LLC, 8.25%, 8/01/23 (c)(d) | | | | | | | 705 | | | | 752,676 | |
| | | | | | | | | | | | |
| | | | | | | | | | | | 4,883,137 | |
| Internet Software & Services — 0.2% | | | | | | | | | |
Equinix, Inc. (d): | | | | | | | | | | | | |
4.88%, 4/01/20 | | | | | | | 144 | | | | 147,600 | |
5.88%, 1/15/26 | | | | | | | 389 | | | | 419,148 | |
Netflix, Inc.: | | | | | | | | | | | | |
5.50%, 2/15/22 | | | | | | | 15 | | | | 16,050 | |
4.38%, 11/15/26 (c)(d) | | | | | | | 812 | | | | 799,820 | |
3.63%, 5/15/27 (i) | | | EUR | | | | 100 | | | | 110,139 | |
Symantec Corp., 5.00%, 4/15/25 (c) | | | USD | | | | 187 | | | | 193,311 | |
| | | | | | | | | | | | |
| | | | | | | | | | | | 1,686,068 | |
| IT Services — 0.9% | | | | | | | | | |
Ceridian HCM Holding, Inc., 11.00%, 3/15/21 (c)(d) | | | | | | | 482 | | | | 508,510 | |
| | | | | | | | | | | | |
| Corporate Bonds | | | | | Par (000) | | | Value | |
| IT Services (continued) | | | | | | | | | |
Fidelity National Information Services, Inc., 3.00%, 8/15/26 (d) | | | USD | | | | 1,000 | | | $ | 958,151 | |
First Data Corp. (c)(d): | | | | | | | | | | | | |
7.00%, 12/01/23 | | | | | | | 1,422 | | | | 1,524,668 | |
5.75%, 1/15/24 | | | | | | | 2,998 | | | | 3,110,425 | |
Gartner, Inc., 5.13%, 4/01/25 (c) | | | | | | | 207 | | | | 214,245 | |
| | | | | | | | | | | | |
| | | | | | | | | | | | 6,315,999 | |
| Machinery — 0.2% | | | | | | | | | |
Gardner Denver, Inc., 6.88%, 8/15/21 (c) | | | | | | | 155 | | | | 160,813 | |
Navistar International Corp., 8.25%, 11/01/21 | | | | | | | 55 | | | | 55,688 | |
SPX FLOW, Inc. (c): | | | | | | | | | | | | |
5.63%, 8/15/24 (d) | | | | | | | 330 | | | | 334,125 | |
5.88%, 8/15/26 | | | | | | | 175 | | | | 177,187 | |
Terex Corp., 5.63%, 2/01/25 (c)(d) | | | | | | | 474 | | | | 484,665 | |
Trinseo Materials Operating SCA/Trinseo Materials Finance, Inc., 6.38%, 5/01/22 | | | EUR | | | | 142 | | | | 165,477 | |
| | | | | | | | | | | | |
| | | | | | | | | | | | 1,377,955 | |
| Media — 7.1% | |
Adria Bidco BV, 7.88%, 11/15/20 | | | | | | | 100 | | | | 113,367 | |
Altice Financing SA, 7.50%, 5/15/26 (c)(d) | | | USD | | | | 1,291 | | | | 1,394,280 | |
Altice Luxembourg SA, 6.25%, 2/15/25 | | | EUR | | | | 100 | | | | 118,037 | |
Altice US Finance I Corp. (c): | | | | | | | | | | | | |
5.38%, 7/15/23 (d) | | | USD | | | | 780 | | | | 814,125 | |
5.50%, 5/15/26 | | | | | | | 288 | | | | 297,720 | |
AMC Entertainment Holdings, Inc., 6.38%, 11/15/24 | | | GBP | | | | 100 | | | | 137,900 | |
AMC Networks, Inc.: | | | | | | | | | | | | |
4.75%, 12/15/22 (d) | | | USD | | | | 344 | | | | 350,880 | |
5.00%, 4/01/24 | | | | | | | 161 | | | | 163,117 | |
Bharti Airtel International Netherlands BV, 5.13%, 3/11/23 | | | | | | | 1,500 | | | | 1,580,187 | |
Cablevision SA, 6.50%, 6/15/21 (c) | | | | | | | 389 | | | | 414,285 | |
Cablevision Systems Corp. (d): | | | | | | | | | | | | |
8.63%, 9/15/17 | | | | | | | 56 | | | | 57,540 | |
7.75%, 4/15/18 | | | | | | | 517 | | | | 540,911 | |
8.00%, 4/15/20 | | | | | | | 286 | | | | 319,428 | |
CBS Radio, Inc., 7.25%, 11/01/24 (c)(d) | | | | | | | 264 | | | | 287,100 | |
CCO Holdings LLC/CCO Holdings Capital Corp. (d): | | | | | | | | | | | | |
5.25%, 9/30/22 | | | | | | | 560 | | | | 581,000 | |
5.13%, 2/15/23 | | | | | | | 709 | | | | 737,360 | |
5.13%, 5/01/23 (c) | | | | | | | 719 | | | | 750,456 | |
5.75%, 2/15/26 (c) | | | | | | | 233 | | | | 247,488 | |
5.50%, 5/01/26 (c) | | | | | | | 470 | | | | 493,209 | |
5.13%, 5/01/27 (c) | | | | | | | 1,618 | | | | 1,650,360 | |
5.88%, 5/01/27 (c) | | | | | | | 663 | | | | 705,266 | |
Cequel Communications Holdings I LLC/Cequel Capital Corp. (c): | | | | | | | | | | | | |
6.38%, 9/15/20 | | | | | | | 101 | | | | 104,094 | |
5.13%, 12/15/21 (d) | | | | | | | 715 | | | | 731,087 | |
5.13%, 12/15/21 | | | | | | | 218 | | | | 222,905 | |
7.75%, 7/15/25 (d) | | | | | | | 1,630 | | | | 1,817,450 | |
Charter Communications Operating LLC/Charter Communications Operating Capital, 6.48%, 10/23/45 (d) | | | | | | | 3,000 | | | | 3,523,119 | |
Clear Channel International BV, 8.75%, 12/15/20 (c)(d) | | | | | | | 508 | | | | 543,560 | |
Clear Channel Worldwide Holdings, Inc.: | | | | | | | | | | | | |
6.50%, 11/15/22 | | | | | | | 261 | | | | 266,220 | |
6.50%, 11/15/22 (d) | | | | | | | 2,783 | | | | 2,883,884 | |
Series B, 7.63%, 3/15/20 (d) | | | | | | | 1,134 | | | | 1,146,757 | |
Columbus Cable Barbados Ltd., 7.38%, 3/30/21 (c)(d) | | | | | | | 1,195 | | | | 1,286,119 | |
See Notes to Financial Statements.
| | | | | | |
| | | | | | | |
| 46 | | SEMI-ANNUAL REPORT | | APRIL 30, 2017 | | |
| | |
Consolidated Schedule of Investments (continued) | | BlackRock Multi-Sector Income Trust (BIT) |
| | | | | | | | | | | | |
| Corporate Bonds | | | | | Par (000) | | | Value | |
| Media (continued) | |
Comcast Corp., 4.60%, 8/15/45 (d) | | | USD | | | | 1,750 | | | $ | 1,825,693 | |
CSC Holdings LLC (d): | | | | | | | | | | | | |
10.13%, 1/15/23 (c) | | | | | | | 1,388 | | | | 1,610,080 | |
5.25%, 6/01/24 | | | | | | | 921 | | | | 931,932 | |
6.63%, 10/15/25 (c) | | | | | | | 350 | | | | 382,812 | |
10.88%, 10/15/25 (c) | | | | | | | 933 | | | | 1,120,766 | |
Discovery Communications LLC, 4.95%, 5/15/42 (d) | | | | | | | 400 | | | | 370,610 | |
DISH DBS Corp.: | | | | | | | | | | | | |
6.75%, 6/01/21 (d) | | | | | | | 239 | | | | 259,912 | |
5.88%, 7/15/22 (d) | | | | | | | 241 | | | | 255,289 | |
5.00%, 3/15/23 | | | | | | | 105 | | | | 105,263 | |
5.88%, 11/15/24 (d) | | | | | | | 53 | | | | 55,650 | |
7.75%, 7/01/26 (d) | | | | | | | 1,355 | | | | 1,587,044 | |
DISH Network Corp., 3.38%, 8/15/26 (c)(j) | | | | | | | 293 | | | | 358,559 | |
eircom Finance DAC, 4.50%, 5/31/22 | | | EUR | | | | 100 | | | | 113,832 | |
EW Scripps Co., 5.13%, 5/15/25 (c) | | | USD | | | | 203 | | | | 208,329 | |
GTT Escrow Corp., 7.88%, 12/31/24 (c) | | | | | | | 87 | | | | 90,698 | |
Hughes Satellite Systems Corp.: | | | | | | | | | | | | |
7.63%, 6/15/21 | | | | | | | 113 | | | | 127,594 | |
5.25%, 8/01/26 (c)(d) | | | | | | | 564 | | | | 573,870 | |
6.63%, 8/01/26 (c)(d) | | | | | | | 121 | | | | 124,630 | |
iHeartCommunications, Inc.: | | | | | | | | | | | | |
9.00%, 12/15/19 | | | | | | | 474 | | | | 391,050 | |
10.63%, 3/15/23 | | | | | | | 1,256 | | | | 960,840 | |
Intelsat Jackson Holdings SA (d): | | | | | | | | | | | | |
7.25%, 4/01/19 | | | | | | | 500 | | | | 480,625 | |
7.25%, 10/15/20 | | | | | | | 405 | | | | 379,161 | |
5.50%, 8/01/23 | | | | | | | 1,149 | | | | 980,959 | |
Interpublic Group of Cos., Inc., 4.20%, 4/15/24 (d) | | | | | | | 1,000 | | | | 1,046,237 | |
LG Finance Co. Corp., 5.88%, 11/01/24 (c) | | | | | | | 101 | | | | 104,788 | |
LGE HoldCo VI BV, 7.13%, 5/15/24 | | | EUR | | | | 177 | | | | 218,603 | |
McGraw-Hill Global Education Holdings LLC/McGraw-Hill Global Education Finance, 7.88%, 5/15/24 (c) | | | USD | | | | 101 | | | | 98,349 | |
MDC Partners, Inc., 6.50%, 5/01/24 (c)(d) | | | | | | | 438 | | | | 427,050 | |
Midcontinent Communications/Midcontinent Finance Corp. (c): | | | | | | | | | | | | |
6.25%, 8/01/21 (d) | | | | | | | 250 | | | | 260,000 | |
6.88%, 8/15/23 | | | | | | | 138 | | | | 148,005 | |
National CineMedia LLC, 5.75%, 8/15/26 | | | | | | | 98 | | | | 99,960 | |
Nexstar Broadcasting, Inc., 5.63%, 8/01/24 (c)(d) | | | | | | | 267 | | | | 273,675 | |
Numericable Group SA, 5.38%, 5/15/22 | | | EUR | | | | 116 | | | | 131,571 | |
Outfront Media Capital LLC/Outfront Media Capital Corp. (d): | | | | | | | | | | | | |
5.25%, 2/15/22 | | | USD | | | | 102 | | | | 105,952 | |
5.63%, 2/15/24 | | | | | | | 202 | | | | 212,100 | |
Play Topco SA, 5.38%, 9/15/22 (g) | | | EUR | | | | 117 | | | | 131,130 | |
SFR Group SA (c)(d): | | | | | | | | | | | | |
6.00%, 5/15/22 | | | USD | | | | 1,492 | | | | 1,555,410 | |
7.38%, 5/01/26 | | | | | | | 1,721 | | | | 1,809,201 | |
Sirius XM Radio, Inc., 4.25%, 5/15/20 (c)(d) | | | | | | | 704 | | | | 711,040 | |
Telesat Canada/Telesat LLC, 8.88%, 11/15/24 (c) | | | | | | | 199 | | | | 218,900 | |
Time Warner, Inc.: | | | | | | | | | | | | |
4.65%, 6/01/44 | | | | | | | 111 | | | | 104,761 | |
4.85%, 7/15/45 (d) | | | | | | | 389 | | | | 376,532 | |
Tribune Media Co., 5.88%, 7/15/22 (d) | | | | | | | 540 | | | | 567,281 | |
Unitymedia Hessen GmbH & Co. KG/Unitymedia NRW GmbH: | | | | | | | | | | | | |
4.00%, 1/15/25 | | | EUR | | | | 117 | | | | 134,075 | |
5.00%, 1/15/25 (c) | | | USD | | | | 200 | | | | 207,628 | |
6.25%, 1/15/29 | | | EUR | | | | 100 | | | | 124,191 | |
| | | | | | | | | | | | |
| Corporate Bonds | | | | | Par (000) | | | Value | |
| Media (continued) | |
Univision Communications, Inc. (c)(d): | | | | | | | | | | | | |
5.13%, 5/15/23 | | | USD | | | | 624 | | | $ | 634,140 | |
5.13%, 2/15/25 | | | | | | | 193 | | | | 192,276 | |
UPCB Finance IV Ltd., 4.00%, 1/15/27 | | | EUR | | | | 114 | | | | 128,433 | |
Videotron, Ltd./Videotron Ltee, 5.13%, 4/15/27 (c) | | | USD | | | | 285 | | | | 290,614 | |
Virgin Media Finance PLC, 5.75%, 1/15/25 (c)(d) | | | | | | | 850 | | | | 867,000 | |
Virgin Media Receivables Financing Notes I DAC, 5.50%, 9/15/24 | | | GBP | | | | 100 | | | | 135,996 | |
Virgin Media Secured Finance PLC: | | | | | | | | | | | | |
5.50%, 8/15/26 (c) | | | USD | | | | 200 | | | | 204,250 | |
4.88%, 1/15/27 | | | GBP | | | | 130 | | | | 171,752 | |
6.25%, 3/28/29 | | | | | | | 175 | | | | 246,493 | |
WaveDivision Escrow LLC/WaveDivision Escrow Corp., 8.13%, 9/01/20 (c)(d) | | | USD | | | | 980 | | | | 1,009,400 | |
Wind Acquisition Finance SA: | | | | | | | | | | | | |
7.00%, 4/23/21 | | | EUR | | | | 122 | | | | 138,077 | |
7.38%, 4/23/21 (c)(d) | | | USD | | | | 1,130 | | | | 1,175,200 | |
| | | | | | | | | | | | |
| | | | | | | | | | | | 51,834,479 | |
| Metal Fabricating — 0.0% | |
Park-Ohio Industries, Inc., 6.63%, 4/15/27 (c) | | | | | | | 53 | | | | 54,325 | |
| Metals & Mining — 3.6% | |
Alcoa Nederland Holding BV, 7.00%, 9/30/26 (c) | | | | | | | 200 | | | | 221,000 | |
Alcoa, Inc.: | | | | | | | | | | | | |
5.87%, 2/23/22 (d) | | | | | | | 900 | | | | 970,650 | |
5.13%, 10/01/24 (d) | | | | | | | 405 | | | | 424,238 | |
5.90%, 2/01/27 | | | | | | | 120 | | | | 128,965 | |
5.95%, 2/01/37 | | | | | | | 105 | | | | 106,995 | |
Anglo American Capital PLC: | | | | | | | | | | | | |
4.45%, 9/27/20 (c) | | | | | | | 100 | | | | 104,000 | |
4.13%, 4/15/21 (c) | | | | | | | 200 | | | | 204,500 | |
3.50%, 3/28/22 | | | EUR | | | | 100 | | | | 119,232 | |
3.25%, 4/03/23 | | | | | | | 100 | | | | 118,244 | |
4.88%, 5/14/25 (c)(d) | | | USD | | | | 600 | | | | 625,500 | |
ArcelorMittal: | | | | | | | | | | | | |
7.75%, 10/15/39 | | | | | | | 108 | | | | 123,390 | |
7.50%, 3/01/41 (d) | | | | | | | 352 | | | | 396,000 | |
BHP Billiton Finance USA Ltd., 4.13%, 2/24/42 (d) | | | | | | | 250 | | | | 252,237 | |
Cliffs Natural Resources, Inc., 8.25%, 3/31/20 (c)(d) | | | | | | | 216 | | | | 234,630 | |
Constellium NV (c)(d): | | | | | | | | | | | | |
8.00%, 1/15/23 | | | | | | | 1,500 | | | | 1,550,250 | |
6.63%, 3/01/25 | | | | | | | 1,086 | | | | 1,069,710 | |
First Quantum Minerals Ltd. (c): | | | | | | | | | | | | |
7.00%, 2/15/21 (d) | | | | | | | 844 | | | | 873,540 | |
7.50%, 4/01/25 | | | | | | | 635 | | | | 647,700 | |
Freeport-McMoRan, Inc.: | | | | | | | | | | | | |
2.30%, 11/14/17 | | | | | | | 322 | | | | 322,000 | |
2.38%, 3/15/18 | | | | | | | 2,868 | | | | 2,853,660 | |
3.10%, 3/15/20 | | | | | | | 1,360 | | | | 1,341,300 | |
4.00%, 11/14/21 | | | | | | | 276 | | | | 270,825 | |
3.55%, 3/01/22 | | | | | | | 506 | | | | 475,640 | |
3.88%, 3/15/23 | | | | | | | 1,408 | | | | 1,305,920 | |
5.40%, 11/14/34 | | | | | | | 140 | | | | 124,250 | |
5.45%, 3/15/43 | | | | | | | 1,430 | | | | 1,219,075 | |
Grinding Media, Inc./MC Grinding Media Canada, Inc., 7.38%, 12/15/23 (c) | | | | | | | 215 | | | | 229,362 | |
Joseph T Ryerson & Son, Inc., 11.00%, 5/15/22 (c) | | | | | | | 192 | | | | 216,722 | |
Kaiser Aluminum Corp., 5.88%, 5/15/24 | | | | | | | 124 | | | | 130,820 | |
See Notes to Financial Statements.
| | | | | | |
| | | | | | | |
| | SEMI-ANNUAL REPORT | | APRIL 30, 2017 | | 47 |
| | |
Consolidated Schedule of Investments (continued) | | BlackRock Multi-Sector Income Trust (BIT) |
| | | | | | | | | | | | |
| Corporate Bonds | | | | | Par (000) | | | Value | |
| Metals & Mining (continued) | |
Kinross Gold Corp.: | | | | | | | | | | | | |
5.95%, 3/15/24 | | | USD | | | | 50 | | | $ | 53,610 | |
6.88%, 9/01/41 | | | | | | | 80 | | | | 83,300 | |
Novelis Corp. (c)(d): | | | | | | | | | | | | |
6.25%, 8/15/24 | | | | | | | 1,024 | | | | 1,077,760 | |
5.88%, 9/30/26 | | | | | | | 1,191 | | | | 1,223,752 | |
Nyrstar Netherlands Holdings BV, 6.88%, 3/15/24 | | | EUR | | | | 100 | | | | 109,420 | |
Peabody Securities Finance Corp. (c): | | | | | | | | | | | | |
6.00%, 3/31/22 | | | USD | | | | 145 | | | | 147,900 | |
6.38%, 3/31/25 | | | | | | | 152 | | | | 154,280 | |
Petra Diamonds US Treasury PLC, 7.25%, 5/01/22 (c) | | | | | | | 200 | | | | 209,000 | |
Rio Tinto Finance USA Ltd., 4.75%, 3/22/42 (d) | | | | | | | 400 | | | | 427,654 | |
Steel Dynamics, Inc.: | | | | | | | | | | | | |
5.13%, 10/01/21 (d) | | | | | | | 970 | | | | 1,001,525 | |
5.25%, 4/15/23 (d) | | | | | | | 525 | | | | 543,375 | |
5.00%, 12/15/26 (c) | | | | | | | 15 | | | | 15,338 | |
Teck Resources Ltd.: | | | | | | | | | | | | |
4.50%, 1/15/21 | | | | | | | 82 | | | | 84,684 | |
3.75%, 2/01/23 (d) | | | | | | | 648 | | | | 638,474 | |
8.50%, 6/01/24 (c)(d) | | | | | | | 418 | | | | 484,358 | |
6.13%, 10/01/35 | | | | | | | 102 | | | | 107,865 | |
6.00%, 8/15/40 (d) | | | | | | | 686 | | | | 705,722 | |
6.25%, 7/15/41 | | | | | | | 88 | | | | 93,280 | |
5.20%, 3/01/42 (d) | | | | | | | 673 | | | | 642,715 | |
5.40%, 2/01/43 (d) | | | | | | | 341 | | | | 331,623 | |
ThyssenKrupp AG, 1.38%, 3/03/22 | | | EUR | | | | 75 | | | | 80,293 | |
United States Steel Corp., 8.38%, 7/01/21 (c)(d) | | | USD | | | | 357 | | | | 393,146 | |
VM Holdings SA, 5.38%, 5/04/27 (c) | | | | | | | 777 | | | | 769,603 | |
| | | | | | | | | | | | |
| | | | | | | | | | | | 26,039,032 | |
| Multi-Utilities — 0.1% | |
NGL Energy Partners LP/NGL Energy Finance Corp. (d): | | | | | | | | | | | | |
5.13%, 7/15/19 | | | | | | | 150 | | | | 149,625 | |
6.88%, 10/15/21 | | | | | | | 240 | | | | 238,200 | |
7.50%, 11/01/23 (c) | | | | | | | 225 | | | | 225,000 | |
| | | | | | | | | | | | |
| | | | | | | | | | | | 612,825 | |
| Multiline Retail — 0.1% | |
Neiman Marcus Group Ltd., 8.00%, 10/15/21 (c)(d) | | | | | | | 257 | | | | 150,345 | |
Target Corp., 4.00%, 7/01/42 (d) | | | | | | | 300 | | | | 293,532 | |
| | | | | | | | | | | | |
| | | | | | | | | | | | 443,877 | |
| Oil, Gas & Consumable Fuels — 8.5% | | | | | | | | | |
Alta Mesa Holdings LP/Alta Mesa Finance Services Corp., 7.88%, 12/15/24 (c) | | | | | | | 139 | | | | 145,950 | |
Anadarko Petroleum Corp., 4.50%, 7/15/44 (d) | | | | | | | 500 | | | | 481,786 | |
Antero Midstream Partners LP/Antero Midstream Finance Corp., 5.38%, 9/15/24 (c) | | | | | | | 65 | | | | 66,463 | |
Antero Resources Corp.: | | | | | | | | | | | | |
5.13%, 12/01/22 | | | | | | | 92 | | | | 93,380 | |
5.63%, 6/01/23 | | | | | | | 88 | | | | 90,530 | |
Apache Corp., 4.75%, 4/15/43 (d) | | | | | | | 800 | | | | 814,479 | |
Ascent Resources Utica Holdings LLC/ARU Finance Corp., 10.00%, 4/01/22 (c)(d) | | | | | | | 344 | | | | 355,610 | |
California Resources Corp., 8.00%, 12/15/22 (c)(d) | | | | | | | 575 | | | | 439,875 | |
Callon Petroleum Co., 6.13%, 10/01/24 (c) | | | | | | | 248 | | | | 259,780 | |
Carrizo Oil & Gas, Inc., 6.25%, 4/15/23 (d) | | | | | | | 165 | | | | 166,238 | |
| | | | | | | | | | | | |
| Corporate Bonds | | | | | Par (000) | | | Value | |
| Oil, Gas & Consumable Fuels (continued) | | | | | | | | | |
Cheniere Corpus Christi Holdings LLC (c)(d): | | | | | | | | | | | | |
7.00%, 6/30/24 | | | USD | | | | 578 | | | $ | 645,846 | |
5.88%, 3/31/25 | | | | | | | 699 | | | | 744,435 | |
Chesapeake Energy Corp. (d): | | | | | | | | | | | | |
6.88%, 11/15/20 | | | | | | | 224 | | | | 225,120 | |
8.00%, 1/15/25 (c) | | | | | | | 341 | | | | 337,164 | |
Cia Latinoamericana de Infraestructura & Servicios SA, 9.50%, 7/20/23 (c) | | | | | | | 56 | | | | 58,730 | |
ConocoPhillips Co., 4.95%, 3/15/26 (d) | | | | | | | 700 | | | | 782,400 | |
CONSOL Energy, Inc.: | | | | | | | | | | | | |
5.88%, 4/15/22 (d) | | | | | | | 3,095 | | | | 3,017,625 | |
8.00%, 4/01/23 | | | | | | | 76 | | | | 79,183 | |
Continental Resources, Inc. (d): | | | | | | | | | | | | |
4.50%, 4/15/23 | | | | | | | 173 | | | | 170,405 | |
3.80%, 6/01/24 | | | | | | | 549 | | | | 516,060 | |
4.90%, 6/01/44 | | | | | | | 310 | | | | 268,925 | |
Crestwood Midstream Partners LP/Crestwood Midstream Finance Corp., 6.25%, 4/01/23 | | | | | | | 35 | | | | 36,531 | |
CrownRock LP/CrownRock Finance, Inc. (c): | | | | | | | | | | | | |
7.13%, 4/15/21 (d) | | | | | | | 961 | | | | 992,232 | |
7.75%, 2/15/23 | | | | | | | 160 | | | | 171,200 | |
DCP Midstream LLC (c): | | | | | | | | | | | | |
4.75%, 9/30/21 | | | | | | | 160 | | | | 163,600 | |
6.45%, 11/03/36 | | | | | | | 213 | | | | 228,442 | |
6.75%, 9/15/37 (d) | | | | | | | 278 | | | | 304,591 | |
Denbury Resources, Inc.: | | | | | | | | | | | | |
9.00%, 5/15/21 (c)(d) | | | | | | | 625 | | | | 659,375 | |
5.50%, 5/01/22 (d) | | | | | | | 508 | | | | 378,460 | |
4.63%, 7/15/23 | | | | | | | 48 | | | | 32,880 | |
Diamondback Energy, Inc., 5.38%, 5/31/25 (c) | | | | | | | 242 | | | | 250,470 | |
Eclipse Resources Corp., 8.88%, 7/15/23 | | | | | | | 80 | | | | 81,600 | |
Energy Transfer Equity LP (d): | | | | | | | | | | | | |
5.88%, 1/15/24 | | | | | | | 940 | | | | 1,012,850 | |
5.50%, 6/01/27 | | | | | | | 415 | | | | 446,125 | |
Energy Transfer Partners LP (d): | | | | | | | | | | | | |
6.13%, 12/15/45 | | | | | | | 500 | | | | 543,248 | |
5.30%, 4/15/47 | | | | | | | 350 | | | | 345,430 | |
Ensco Jersey Finance Ltd., 3.00%, 1/31/24 (c) | | | | | | | 291 | | | | 269,357 | |
Enterprise Products Operating LLC, 3.75%, 2/15/25 (d) | | | | | | | 1,250 | | | | 1,280,000 | |
EP Energy LLC/Everest Acquisition Finance, Inc. (d): | | | | | | | | | | | | |
9.38%, 5/01/20 | | | | | | | 392 | | | | 370,930 | |
8.00%, 11/29/24 (c) | | | | | | | 304 | | | | 318,060 | |
Extraction Oil & Gas Holdings LLC/Extraction Finance Corp., 7.88%, 7/15/21 (c)(d) | | | | | | | 360 | | | | 377,100 | |
GNL Quintero SA: | | | | | | | | | | | | |
4.63%, 7/31/29 (c)(d) | | | | | | | 286 | | | | 297,797 | |
4.63%, 7/31/29 | | | | | | | 279 | | | | 290,509 | |
Great Western Petroleum LLC/Great Western Finance, Inc., 9.00%, 9/30/21 (c)(d) | | | | | | | 381 | | | | 394,335 | |
Gulfport Energy Corp.: | | | | | | | | | | | | |
6.63%, 5/01/23 | | | | | | | 84 | | | | 85,050 | |
6.38%, 5/15/25 (c)(d) | | | | | | | 102 | | | | 101,618 | |
Halcon Resources Corp., 6.75%, 2/15/25 (c)(d) | | | | | | | 1,020 | | | | 979,200 | |
Hess Corp., 4.30%, 4/01/27 (d) | | | | | | | 750 | | | | 749,341 | |
Kinder Morgan Energy Partners LP, 4.25%, 9/01/24 (d) | | | | | | | 2,500 | | | | 2,581,907 | |
Matador Resources Co. (d): | | | | | | | | | | | | |
6.88%, 4/15/23 | | | | | | | 460 | | | | 485,300 | |
6.88%, 4/15/23 (c) | | | | | | | 531 | | | | 560,205 | |
MEG Energy Corp. (c): | | | | | | | | | | | | |
7.00%, 3/31/24 | | | | | | | 27 | | | | 24,098 | |
6.50%, 1/15/25 (d) | | | | | | | 933 | | | | 921,337 | |
See Notes to Financial Statements.
| | | | | | |
| | | | | | | |
| 48 | | SEMI-ANNUAL REPORT | | APRIL 30, 2017 | | |
| | |
Consolidated Schedule of Investments (continued) | | BlackRock Multi-Sector Income Trust (BIT) |
| | | | | | | | | | | | |
| Corporate Bonds | | | | | Par (000) | | | Value | |
| Oil, Gas & Consumable Fuels (continued) | | | | | | | | | |
Murphy Oil Corp.: | | | | | | | | | | | | |
6.88%, 8/15/24 (d) | | | USD | | | | 288 | | | $ | 306,720 | |
6.13%, 12/01/42 | | | | | | | 80 | | | | 75,600 | |
Nabors Industries, Inc., 0.75%, 1/15/24 (c)(j) | | | | | | | 472 | | | | 406,215 | |
New Enterprise Stone & Lime Co., Inc., 10.13%, 4/01/22 (c) | | | | | | | 190 | | | | 201,400 | |
Newfield Exploration Co., 5.63%, 7/01/24 | | | | | | | 132 | | | | 139,508 | |
NGPL PipeCo LLC (c)(d): | | | | | | | | | | | | |
7.12%, 12/15/17 | | | | | | | 1,002 | | | | 1,028,929 | |
7.77%, 12/15/37 | | | | | | | 614 | | | | 706,100 | |
Noble Holding International Ltd., 7.75%, 1/15/24 (d) | | | | | | | 437 | | | | 398,762 | |
Oasis Petroleum, Inc.: | | | | | | | | | | | | |
6.50%, 11/01/21 (d) | | | | | | | 450 | | | | 454,500 | |
2.63%, 9/15/23 (j) | | | | | | | 260 | | | | 315,575 | |
ONEOK, Inc.: | | | | | | | | | | | | |
7.50%, 9/01/23 (d) | | | | | | | 377 | | | | 445,960 | |
6.00%, 6/15/35 | | | | | | | 40 | | | | 42,100 | |
Paramount Resources Ltd., 6.88%, 6/30/23 (c)(d) | | | | | | | 1,235 | | | | 1,309,100 | |
Parker Drilling Co.: | | | | | | | | | | | | |
7.50%, 8/01/20 | | | | | | | 295 | | | | 274,350 | |
6.75%, 7/15/22 | | | | | | | 186 | | | | 164,145 | |
Parsley Energy LLC/Parsley Finance Corp. (c): | | | | | | | | | | | | |
6.25%, 6/01/24 | | | | | | | 79 | | | | 83,543 | |
5.38%, 1/15/25 | | | | | | | 361 | | | | 364,610 | |
5.25%, 8/15/25 | | | | | | | 91 | | | | 91,683 | |
Pertamina Persero PT, 5.63%, 5/20/43 (c)(d) | | | | | | | 2,000 | | | | 2,058,956 | |
Petrobras Argentina SA, 7.38%, 7/21/23 (c)(d) | | | | | | | 895 | | | | 956,943 | |
Petrobras Global Finance BV: | | | | | | | | | | | | |
4.88%, 3/17/20 | | | | | | | 382 | | | | 393,651 | |
8.38%, 5/23/21 (d) | | | | | | | 2,241 | | | | 2,537,932 | |
8.75%, 5/23/26 | | | | | | | 781 | | | | 910,646 | |
7.38%, 1/17/27 | | | | | | | 404 | | | | 434,421 | |
6.85%, 6/05/15 | | | | | | | 387 | | | | 344,623 | |
Petrobras International Finance Co.: | | | | | | | | | | | | |
5.75%, 1/20/20 | | | | | | | 382 | | | | 402,055 | |
5.38%, 1/27/21 (d) | | | | | | | 1,176 | | | | 1,208,164 | |
Petroleos Mexicanos: | | | | | | | | | | | | |
5.38%, 3/13/22 (c) | | | | | | | 47 | | | | 49,409 | |
4.63%, 9/21/23 | | | | | | | 309 | | | | 310,792 | |
Precision Drilling Corp., 7.75%, 12/15/23 (c) | | | | | | | 90 | | | | 95,400 | |
QEP Resources, Inc., 5.25%, 5/01/23 | | | | | | | 40 | | | | 39,100 | |
Raizen Fuels Finance SA, 5.30%, 1/20/27 (c) | | | | | | | 543 | | | | 561,467 | |
Range Resources Corp. (c): | | | | | | | | | | | | |
5.88%, 7/01/22 (d) | | | | | | | 579 | | | | 592,027 | |
5.00%, 8/15/22 (d) | | | | | | | 91 | | | | 89,976 | |
5.00%, 3/15/23 | | | | | | | 175 | | | | 173,250 | |
Resolute Energy Corp., 8.50%, 5/01/20 (d) | | | | | | | 282 | | | | 287,640 | |
Rockies Express Pipeline LLC (c)(d): | | | | | | | | | | | | |
5.63%, 4/15/20 | | | | | | | 875 | | | | 935,375 | |
6.88%, 4/15/40 | | | | | | | 521 | | | | 556,819 | |
Rowan Cos., Inc.: | | | | | | | | | | | | |
4.88%, 6/01/22 | | | | | | | 85 | | | | 79,900 | |
7.38%, 6/15/25 (d) | | | | | | | 722 | | | | 712,975 | |
RSP Permian, Inc.: | | | | | | | | | | | | |
6.63%, 10/01/22 | | | | | | | 290 | | | | 305,587 | |
5.25%, 1/15/25 (c) | | | | | | | 178 | | | | 180,670 | |
Sabine Pass Liquefaction LLC, 5.75%, 5/15/24 | | | | | | | 10 | | | | 11,054 | |
Sanchez Energy Corp. (d): | | | | | | | | | | | | |
7.75%, 6/15/21 | | | | | | | 536 | | | | 518,580 | |
6.13%, 1/15/23 | | | | | | | 943 | | | | 867,551 | |
SESI LLC, 6.38%, 5/01/19 | | | | | | | 110 | | | | 109,313 | |
| | | | | | | | | | | | |
| Corporate Bonds | | | | | Par (000) | | | Value | |
| Oil, Gas & Consumable Fuels (continued) | | | | | | | | | |
Seven Generations Energy Ltd., 8.25%, 5/15/20 (c)(d) | | | USD | | | | 196 | | | $ | 204,820 | |
Shell International Finance BV, 4.38%, 5/11/45 (d) | | | | | | | 450 | | | | 461,997 | |
SM Energy Co.: | | | | | | | | | | | | |
6.50%, 11/15/21 | | | | | | | 175 | | | | 178,938 | |
6.13%, 11/15/22 (d) | | | | | | | 27 | | | | 27,473 | |
5.00%, 1/15/24 | | | | | | | 5 | | | | 4,713 | |
5.63%, 6/01/25 (d) | | | | | | | 495 | | | | 472,725 | |
6.75%, 9/15/26 | | | | | | | 165 | | | | 166,238 | |
Southwestern Energy Co., 5.80%, 1/23/20 (d) | | | | | | | 1,316 | | | | 1,329,160 | |
Suncor Energy, Inc., 6.50%, 6/15/38 (d) | | | | | | | 800 | | | | 1,015,209 | |
Tallgrass Energy Partners LP/Tallgrass Energy Finance Corp. (c): | | | | | | | | | | | | |
5.50%, 9/15/24 (d) | | | | | | | 490 | | | | 492,450 | |
5.13%, 2/01/25 | | | | | | | 155 | | | | 160,038 | |
5.38%, 2/01/27 | | | | | | | 90 | | | | 94,050 | |
Targa Resources Partners LP/Targa Resources Partners Finance Corp.: | | | | | | | | | | | | |
6.38%, 8/01/22 | | | | | | | 95 | | | | 97,898 | |
5.25%, 5/01/23 | | | | | | | 16 | | | | 16,480 | |
Tesoro Corp. (c)(d): | | | | | | | | | | | | |
4.75%, 12/15/23 | | | | | | | 527 | | | | 552,032 | |
5.13%, 12/15/26 | | | | | | | 779 | | | | 829,635 | |
Tesoro Logistics LP/Tesoro Logistics Finance Corp.: | | | | | | | | | | | | |
6.13%, 10/15/21 | | | | | | | 44 | | | | 45,925 | |
6.25%, 10/15/22 | | | | | | | 80 | | | | 85,800 | |
Tullow Oil PLC, 6.25%, 4/15/22 (c) | | | | | | | 200 | | | | 191,236 | |
Tutor Perini Corp., 6.88%, 5/01/25 (c) | | | | | | | 165 | | | | 173,250 | |
Ultra Resources, Inc., 6.88%, 4/15/22 (c) | | | | | | | 70 | | | | 70,788 | |
Weatherford International LLC, 6.80%, 6/15/37 | | | | | | | 75 | | | | 70,875 | |
Weatherford International Ltd.: | | | | | | | | | | | | |
6.50%, 8/01/36 | | | | | | | 310 | | | | 292,950 | |
7.00%, 3/15/38 | | | | | | | 249 | | | | 238,417 | |
5.95%, 4/15/42 | | | | | | | 93 | | | | 81,375 | |
Whiting Petroleum Corp.: | | | | | | | | | | | | |
5.00%, 3/15/19 (d) | | | | | | | 851 | | | | 859,510 | |
5.75%, 3/15/21 | | | | | | | 85 | | | | 84,575 | |
WildHorse Resource Development Corp., 6.88%, 2/01/25 (c) | | | | | | | 281 | | | | 269,760 | |
Williams Cos., Inc., 5.75%, 6/24/44 (d) | | | | | | | 1,137 | | | | 1,176,795 | |
Williams Partners LP, 4.50%, 11/15/23 (d) | | | | | | | 1,750 | | | | 1,848,938 | |
WPX Energy, Inc.: | | | | | | | | | | | | |
7.50%, 8/01/20 | | | | | | | 80 | | | | 84,800 | |
6.00%, 1/15/22 | | | | | | | 20 | | | | 20,300 | |
8.25%, 8/01/23 | | | | | | | 215 | | | | 239,725 | |
5.25%, 9/15/24 (d) | | | | | | | 435 | | | | 424,125 | |
YPF SA: | | | | | | | | | | | | |
8.88%, 12/19/18 (c) | | | | | | | 1,495 | | | | 1,618,038 | |
8.50%, 3/23/21 (c) | | | | | | | 193 | | | | 218,331 | |
8.50%, 7/28/25 | | | | | | | 97 | | | | 109,731 | |
| | | | | | | | | | | | |
| | | | | | | | | | | | 62,335,338 | |
| Paper & Forest Products — 0.1% | |
Mercer International, Inc., 6.50%, 2/01/24 (c) | | | | | | | 134 | | | | 138,355 | |
Pfleiderer GmbH, 7.88%, 8/01/19 | | | EUR | | | | 168 | | | | 189,989 | |
Unifrax I LLC/Unifrax Holding Co., 7.50%, 2/15/19 (c)(d) | | | USD | | | | 390 | | | | 390,039 | |
| | | | | | | | | | | | |
| | | | | | | | | | | | 718,383 | |
See Notes to Financial Statements.
| | | | | | |
| | | | | | | |
| | SEMI-ANNUAL REPORT | | APRIL 30, 2017 | | 49 |
| | |
Consolidated Schedule of Investments (continued) | | BlackRock Multi-Sector Income Trust (BIT) |
| | | | | | | | | | | | |
| Corporate Bonds | | | | | Par (000) | | | Value | |
| Pharmaceuticals — 1.9% | |
AbbVie, Inc. (d): | | | | | | | | | | | | |
3.20%, 5/14/26 | | | USD | | | | 775 | | | $ | 755,271 | |
4.45%, 5/14/46 | | | | | | | 1,000 | | | | 974,749 | |
Actavis Funding SCS (d): | | | | | | | | | | | | |
3.80%, 3/15/25 | | | | | | | 1,000 | | | | 1,017,767 | |
4.75%, 3/15/45 | | | | | | | 500 | | | | 509,245 | |
Eagle Holding Co. II LLC, 7.63%, 5/15/22 (c)(g)(i) | | | | | | | 310 | | | | 315,813 | |
Endo Dac/Endo Finance LLC/Endo Finco, Inc., 5.88%, 10/15/24 (c) | | | | | | | 205 | | | | 208,844 | |
Endo Finance LLC/Endo Finco, Inc., 5.38%, 1/15/23 (c)(d) | | | | | | | 620 | | | | 531,650 | |
Forest Laboratories LLC, 5.00%, 12/15/21 (c)(d) | | | | | | | 718 | | | | 783,436 | |
Grifols SA, 3.20%, 5/01/25 | | | EUR | | | | 200 | | | | 216,457 | |
inVentiv Group Holdings, Inc./inVentiv Health, Inc./inVentiv Health Clinical, Inc., 7.50%, 10/01/24 (c)(d) | | | USD | | | | 474 | | | | 489,405 | |
Jaguar Holding Co. II/Pharmaceutical Product Development LLC, 6.38%, 8/01/23 (c)(d) | | | | | | | 1,166 | | | | 1,215,555 | |
Mylan NV, 3.95%, 6/15/26 (d) | | | | | | | 650 | | | | 642,918 | |
NBTY, Inc., 7.63%, 5/15/21 (c)(d) | | | | | | | 570 | | | | 605,625 | |
Shire Acquisitions Investments Ireland DAC, 3.20%, 9/23/26 (d) | | | | | | | 300 | | | | 290,462 | |
Synlab Bondco PLC, 6.25%, 7/01/22 | | | EUR | | | | 145 | | | | 171,003 | |
Synlab Unsecured Bondco PLC, 8.25%, 7/01/23 | | | | | | | 100 | | | | 121,441 | |
Tennessee Merger Sub, Inc., 6.38%, 2/01/25 (c)(d) | | | USD | | | | 864 | | | | 843,480 | |
Teva Pharmaceutical Finance Netherlands III BV, 3.15%, 10/01/26 (d) | | | | | | | 500 | | | | 465,549 | |
Unilabs Subholding AB, 5.75%, 5/15/25 (i) | | | EUR | | | | 100 | | | | 108,399 | |
Valeant Pharmaceuticals International, Inc. (c): | | | | | | | | | | | | |
6.75%, 8/15/18 (d) | | | USD | | | | 442 | | | | 440,895 | |
6.75%, 8/15/21 (d) | | | | | | | 1,276 | | | | 1,055,890 | |
5.63%, 12/01/21 (d) | | | | | | | 879 | | | | 675,731 | |
6.50%, 3/15/22 | | | | | | | 360 | | | | 368,550 | |
5.88%, 5/15/23 | | | | | | | 151 | | | | 111,551 | |
7.00%, 3/15/24 | | | | | | | 566 | | | | 577,320 | |
6.13%, 4/15/25 | | | | | | | 391 | | | | 288,656 | |
| | | | | | | | | | | | |
| | | | | | | | | | | | 13,785,662 | |
| Real Estate Investment Trusts (REITs) — 0.8% | |
American Tower Corp., 3.38%, 10/15/26 (d) | | | | | | | 250 | | | | 243,496 | |
Hilton Domestic Operating Co., Inc., 4.25%, 9/01/24 (c) | | | | | | | 204 | | | | 205,530 | |
iStar, Inc., 6.00%, 4/01/22 | | | | | | | 143 | | | | 146,575 | |
MGM Growth Properties Operating Partnership LP/MGP Finance Co-Issuer, Inc. (d): | | | | | | | | | | | | |
5.63%, 5/01/24 | | | | | | | 1,232 | | | | 1,329,020 | |
4.50%, 9/01/26 | | | | | | | 533 | | | | 531,001 | |
MPT Operating Partnership LP/MPT Finance Corp., 3.33%, 3/24/25 | | | EUR | | | | 100 | | | | 111,124 | |
NH Hotel Group SA, 3.75%, 10/01/23 | | | | | | | 129 | | | | 146,534 | |
Starwood Property Trust, Inc., 5.00%, 12/15/21 (c)(d) | | | USD | | | | 278 | | | | 289,815 | |
Trust F/1401, 6.95%, 1/30/44 | | | | | | | 376 | | | | 387,280 | |
TVL Finance PLC, 5.23%, 5/15/23 (b) | | | GBP | | | | 100 | | | | 129,766 | |
Wyndham Worldwide Corp., 4.15%, 4/01/24 (d) | | | USD | | | | 2,000 | | | | 2,039,618 | |
| | | | | | | | | | | | |
| | | | | | | | | | | | 5,559,759 | |
| Real Estate Management & Development — 1.1% | | | | |
Aroundtown Property Holdings PLC, 1.50%, 1/18/21 (j) | | | EUR | | | | 100 | | | | 120,782 | |
Howard Hughes Corp., 5.38%, 3/15/25 (c) | | | USD | | | | 177 | | | | 178,770 | |
| | | | | | | | | | | | |
| Corporate Bonds | | | | | Par (000) | | | Value | |
| Real Estate Management & Development (continued) | | | | |
Lai Sun International Finance 2012 Ltd., 5.70%, 1/18/18 | | | USD | | | | 2,000 | | | $ | 2,031,142 | |
Northwest Florida Timber Finance LLC, 4.75%, 3/04/29 (c)(d) | | | | | | | 4,360 | | | | 4,142,000 | |
Realogy Group LLC/Realogy Co-Issuer Corp. (c)(d): | | | | | | | | | | | | |
4.50%, 4/15/19 | | | | | | | 205 | | | | 213,200 | |
5.25%, 12/01/21 | | | | | | | 446 | | | | 469,415 | |
4.88%, 6/01/23 | | | | | | | 933 | | | | 942,330 | |
| | | | | | | | | | | | |
| | | | | | | | | | | | 8,097,639 | |
| Road & Rail — 1.1% | | | | | | | | | |
Avis Budget Car Rental LLC/Avis Budget Finance, Inc. (c)(d): | | | | | | | | | | | | |
5.13%, 6/01/22 | | | | | | | 745 | | | | 724,512 | |
5.25%, 3/15/25 | | | | | | | 655 | | | | 617,337 | |
Avis Budget Finance PLC: | | | | | | | | | | | | |
4.13%, 11/15/24 | | | EUR | | | | 100 | | | | 107,660 | |
4.50%, 5/15/25 | | | | | | | 100 | | | | 107,786 | |
Burlington Northern Santa Fe LLC, 4.38%, 9/01/42 (d) | | | USD | | | | 500 | | | | 526,732 | |
Herc Rentals, Inc. (c): | | | | | | | | | | | | |
7.50%, 6/01/22 | | | | | | | 95 | | | | 103,313 | |
7.75%, 6/01/24 | | | | | | | 255 | | | | 278,269 | |
Hertz Corp. (d): | | | | | | | | | | | | |
4.25%, 4/01/18 | | | | | | | 90 | | | | 91,125 | |
5.88%, 10/15/20 | | | | | | | 122 | | | | 113,765 | |
5.50%, 10/15/24 (c) | | | | | | | 305 | | | | 263,063 | |
Hertz Holdings Netherlands BV, 4.13%, 10/15/21 | | | EUR | | | | 100 | | | | 108,357 | |
Lima Metro Line 2 Finance Ltd., 5.88%, 7/05/34 (c)(d) | | | USD | | | | 4,000 | | | | 4,274,000 | |
Union Pacific Corp., 4.05%, 11/15/45 (d) | | | | | | | 500 | | | | 502,011 | |
| | | | | | | | | | | | |
| | | | | | | | | | | | 7,817,930 | |
| Semiconductors & Semiconductor Equipment — 1.1% | | | | |
Advanced Micro Devices, Inc., 7.50%, 8/15/22 | | | | | | | 89 | | | | 98,790 | |
Analog Devices, Inc., 3.50%, 12/05/26 (d) | | | | | | | 320 | | | | 320,763 | |
Broadcom Corp./Broadcom Cayman Finance Ltd., 3.88%, 1/15/27 (c)(d) | | | | | | | 2,600 | | | | 2,638,342 | |
Microchip Technology, Inc., 2.13%, 12/15/37 (j) | | | | | | | 75 | | | | 238,734 | |
Micron Technology, Inc.: | | | | | | | | | | | | |
5.25%, 8/01/23 (c)(d) | | | | | | | 343 | | | | 355,005 | |
5.50%, 2/01/25 | | | | | | | 11 | | | | 11,495 | |
Series G, 3.00%, 11/15/43 (j) | | | | | | | 860 | | | | 928,800 | |
Microsemi Corp., 9.13%, 4/15/23 (c) | | | | | | | 41 | | | | 47,150 | |
NXP BV/NXP Funding LLC (c)(d): | | | | | | | | | | | | |
4.13%, 6/15/20 | | | | | | | 760 | | | | 797,050 | |
4.13%, 6/01/21 | | | | | | | 203 | | | | 212,389 | |
4.63%, 6/15/22 | | | | | | | 410 | | | | 440,238 | |
3.88%, 9/01/22 | | | | | | | 200 | | | | 207,700 | |
4.63%, 6/01/23 | | | | | | | 224 | | | | 241,080 | |
QUALCOMM, Inc., 4.65%, 5/20/35 (d) | | | | | | | 400 | | | | 423,399 | |
Sensata Technologies BV, 5.00%, 10/01/25 (c) | | | | | | | 15 | | | | 15,319 | |
Sensata Technologies UK Financing Co. PLC, 6.25%, 2/15/26 (c)(d) | | | | | | | 540 | | | | 584,550 | |
Xilinx, Inc., 2.63%, 6/15/17 (j) | | | | | | | 175 | | | | 385,000 | |
| | | | | | | | | | | | |
| | | | | | | | | | | | 7,945,804 | |
| Software — 1.7% | | | | | | | | | |
ACI Worldwide, Inc., 6.38%, 8/15/20 (c)(d) | | | | | | | 580 | | | | 595,225 | |
BMC Software Finance, Inc., 8.13%, 7/15/21 (c)(d) | | | | | | | 1,469 | | | | 1,493,797 | |
See Notes to Financial Statements.
| | | | | | |
| | | | | | | |
| 50 | | SEMI-ANNUAL REPORT | | APRIL 30, 2017 | | |
| | |
Consolidated Schedule of Investments (continued) | | BlackRock Multi-Sector Income Trust (BIT) |
| | | | | | | | | | | | |
| Corporate Bonds | | | | | Par (000) | | | Value | |
| Software (continued) | | | | | | | | | |
Genesys Telecommunications Laboratories Inc/Greeneden Lux 3 Sarl/Greeneden US Ho, 10.00%, 11/30/24 (c) | | | USD | | | | 210 | | | $ | 232,601 | |
Inception Merger Sub, Inc./Rackspace Hosting, Inc., 8.63%, 11/15/24 (c)(d) | | | | | | | 609 | | | | 644,779 | |
Infinity Acquisition LLC/Infinity Acquisition Finance Corp., 7.25%, 8/01/22 (c) | | | | | | | 51 | | | | 47,940 | |
Infor US, Inc., 6.50%, 5/15/22 (d) | | | | | | | 1,857 | | | | 1,931,280 | |
Informatica LLC, 7.13%, 7/15/23 (c)(d) | | | | | | | 281 | | | | 276,434 | |
JDA Escrow LLC/JDA Bond Finance, Inc., 7.38%, 10/15/24 (c) | | | | | | | 209 | | | | 218,405 | |
Microsoft Corp., 3.70%, 8/08/46 (d) | | | | | | | 1,750 | | | | 1,668,653 | |
Nuance Communications, Inc. (c): | | | | | | | | | | | | |
5.38%, 8/15/20 (d) | | | | | | | 47 | | | | 47,999 | |
6.00%, 7/01/24 | | | | | | | 220 | | | | 232,100 | |
5.63%, 12/15/26 | | | | | | | 121 | | | | 125,084 | |
Oracle Corp., 4.00%, 7/15/46 (d) | | | | | | | 1,500 | | | | 1,465,893 | |
PTC, Inc., 6.00%, 5/15/24 | | | | | | | 119 | | | | 127,330 | |
Solera LLC/Solera Finance, Inc., 10.50%, 3/01/24 (c)(d) | | | | | | | 1,020 | | | | 1,164,075 | |
SS&C Technologies Holdings, Inc., 5.88%, 7/15/23 (d) | | | | | | | 584 | | | | 620,500 | |
TIBCO Software, Inc., 11.38%, 12/01/21 (c)(d) | | | | | | | 999 | | | | 1,106,392 | |
Veritas US, Inc./Veritas Bermuda Ltd.: | | | | | | | | | | | | |
7.50%, 2/01/23 | | | EUR | | | | 100 | | | | 115,193 | |
10.50%, 2/01/24 (c)(d) | | | USD | | | | 401 | | | | 427,065 | |
| | | | | | | | | | | | |
| | | | | | | | | | | | 12,540,745 | |
| Specialty Retail — 0.3% | | | | | | | | | |
Asbury Automotive Group, Inc., 6.00%, 12/15/24 (d) | | | | | | | 569 | | | | 587,492 | |
JC Penney Corp., Inc. (d): | | | | | | | | | | | | |
8.13%, 10/01/19 | | | | | | | 148 | | | | 161,320 | |
6.38%, 10/15/36 | | | | | | | 104 | | | | 79,560 | |
7.40%, 4/01/37 | | | | | | | 261 | | | | 213,368 | |
L Brands, Inc., 6.88%, 11/01/35 (d) | | | | | | | 424 | | | | 418,064 | |
Lowe’s Cos., Inc., 4.65%, 4/15/42 (d) | | | | | | | 400 | | | | 432,435 | |
Penske Automotive Group, Inc.: | | | | | | | | | | | | |
5.38%, 12/01/24 (d) | | | | | | | 540 | | | | 544,050 | |
5.50%, 5/15/26 | | | | | | | 83 | | | | 82,585 | |
| | | | | | | | | | | | |
| | | | | | | | | | | | 2,518,874 | |
| Technology Hardware, Storage & Peripherals — 0.6% | |
Apple, Inc., 4.65%, 2/23/46 (d) | | | | | | | 1,500 | | | | 1,634,413 | |
CA, Inc., 3.60%, 8/15/22 (d) | | | | | | | 660 | | | | 677,266 | |
Diamond 1 Finance Corp./Diamond 2 Finance Corp. (c): | | | | | | | | | | | | |
4.42%, 6/15/21 | | | | | | | 25 | | | | 26,245 | |
7.13%, 6/15/24 (d) | | | | | | | 774 | | | | 855,531 | |
6.02%, 6/15/26 | | | | | | | 170 | | | | 186,716 | |
8.35%, 7/15/46 | | | | | | | 100 | | | | 129,428 | |
Western Digital Corp.: | | | | | | | | | | | | |
7.38%, 4/01/23 (c)(d) | | | | | | | 515 | | | | 563,925 | |
10.50%, 4/01/24 | | | | | | | 287 | | | | 337,943 | |
| | | | | | | | | | | | |
| | | | | | | | | | | | 4,411,467 | |
| Textiles, Apparel & Luxury Goods — 0.0% | | | | | | | | | |
BiSoho SAS, 5.88%, 5/01/23 | | | EUR | | | | 90 | | | | 105,668 | |
Hanesbrands, Inc., 4.63%, 5/15/24 (c) | | | USD | | | | 59 | | | | 58,557 | |
Levi Strauss & Co., 3.38%, 3/15/27 | | | EUR | | | | 100 | | | | 109,747 | |
Springs Industries, Inc., 6.25%, 6/01/21 | | | USD | | | | 59 | | | | 60,844 | |
| | | | | | | | | | | | |
| | | | | | | | | | | | 334,816 | |
| Thrifts & Mortgage Finance — 0.1% | | | | | | | | | |
Jerrold Finco PLC, 6.25%, 9/15/21 | | | GBP | | | | 100 | | | | 134,675 | |
| | | | | | | | | | | | |
| Corporate Bonds | | | | | Par (000) | | | Value | |
| Thrifts & Mortgage Finance (continued) | | | | | | | | | |
Ladder Capital Finance Holdings LLLP/Ladder Capital Finance Corp., 5.25%, 3/15/22 (c)(d) | | | USD | | | | 422 | | | $ | 433,077 | |
MGIC Investment Corp., 5.75%, 8/15/23 | | | | | | | 101 | | | | 108,323 | |
| | | | | | | | | | | | |
| | | | | | | | | | | | 676,075 | |
| Tobacco — 0.3% | | | | | | | | | |
Altria Group, Inc., 4.50%, 5/02/43 (d) | | | | | | | 750 | | | | 775,652 | |
Philip Morris International, Inc., 4.38%, 11/15/41 (d) | | | | | | | 900 | | | | 915,464 | |
Reynolds American, Inc., 5.85%, 8/15/45 (d) | | | | | | | 715 | | | | 844,848 | |
| | | | | | | | | | | | |
| | | | | | | | | | | | 2,535,964 | |
| Trading Companies & Distributors — 0.4% | | | | | | | | | |
Doric Nimrod Air Alpha Ltd. Pass-Through Trust (c): | | | | | | | | | | | | |
Series 2012-1, Class B, 6.50%, 5/30/21 | | | | | | | 359 | | | | 371,707 | |
Series 2013-1, Class A, 5.25%, 5/30/25 (d) | | | | | | | 2,182 | | | | 2,269,416 | |
| | | | | | | | | | | | |
| | | | | | | | | | | | 2,641,123 | |
| Transportation Infrastructure — 0.4% | | | | | | | | | |
CEVA Group PLC, 7.00%, 3/01/21 (c)(d) | | | | | | | 510 | | | | 456,450 | |
CMA CGM SA, 7.75%, 1/15/21 | | | EUR | | | | 100 | | | | 112,806 | |
Empresa de Transporte de Pasajeros Metro SA, 5.00%, 1/25/47 (c) | | | USD | | | | 264 | | | | 281,849 | |
Penske Truck Leasing Co. LP/PTL Finance Corp., 3.40%, 11/15/26 (c)(d) | | | | | | | 390 | | | | 378,142 | |
Rumo Luxembourg Sarl, 7.38%, 2/09/24 (c) | | | | | | | 1,042 | | | | 1,085,764 | |
Transurban Finance Co. Property Ltd., 4.13%, 2/02/26 (c)(d) | | | | | | | 520 | | | | 539,751 | |
WFS Global Holding SAS, 9.50%, 7/15/22 | | | EUR | | | | 100 | | | | 117,734 | |
| | | | | | | | | | | | |
| | | | | | | | | | | | 2,972,496 | |
| Utilities — 0.5% | | | | | | | | | |
AES Panama SRL, 6.00%, 6/25/22 (c) | | | USD | | | | 291 | | | | 298,639 | |
ContourGlobal Power Holdings SA, 5.13%, 6/15/21 | | | EUR | | | | 100 | | | | 115,438 | |
Emera US Finance LP, 4.75%, 6/15/46 | | | USD | | | | 200 | | | | 202,832 | |
Generacion Mediterranea SA/Generacion Frias SA/Central Termica Roca SA, 9.63%, 7/27/23 (c) | | | | | | | 967 | | | | 1,033,771 | |
Inkia Energy Ltd., 8.38%, 4/04/21 (c) | | | | | | | 377 | | | | 389,064 | |
Stoneway Capital Corp., 10.00%, 3/01/27 (c) | | | | | | | 1,538 | | | | 1,614,900 | |
| | | | | | | | | | | | |
| | | | | | | | | | | | 3,654,644 | |
| Wireless Telecommunication Services — 2.9% | |
Communications Sales & Leasing, Inc./CSL Capital LLC: | | | | | | | | | | | | |
6.00%, 4/15/23 (c) | | | | | | | 177 | | | | 184,192 | |
8.25%, 10/15/23 (d) | | | | | | | 821 | | | | 876,163 | |
7.13%, 12/15/24 (c) | | | | | | | 84 | | | | 85,890 | |
CyrusOne LP/CyrusOne Finance Corp. (c): | | | | | | | | | | | | |
5.00%, 3/15/24 | | | | | | | 375 | | | | 385,312 | |
5.38%, 3/15/27 | | | | | | | 25 | | | | 25,750 | |
Digicel Group Ltd. (c): | | | | | | | | | | | | |
8.25%, 9/30/20 | | | | | | | 295 | | | | 269,925 | |
7.13%, 4/01/22 | | | | | | | 294 | | | | 246,666 | |
Digicel Ltd., 6.00%, 4/15/21 (c)(d) | | | | | | | 5,000 | | | | 4,750,000 | |
GEO Group, Inc.: | | | | | | | | | | | | |
5.13%, 4/01/23 (d) | | | | | | | 553 | | | | 555,765 | |
5.88%, 10/15/24 | | | | | | | 57 | | | | 58,283 | |
6.00%, 4/15/26 | | | | | | | 71 | | | | 72,953 | |
Matterhorn Telecom Holding SA, 4.88%, 5/01/23 | | | EUR | | | | 100 | | | | 109,525 | |
Matterhorn Telecom SA, 3.25%, 2/01/23 (b) | | | | | | | 100 | | | | 108,658 | |
See Notes to Financial Statements.
| | | | | | |
| | | | | | | |
| | SEMI-ANNUAL REPORT | | APRIL 30, 2017 | | 51 |
| | |
Consolidated Schedule of Investments (continued) | | BlackRock Multi-Sector Income Trust (BIT) |
| | | | | | | | | | | | |
| Corporate Bonds | | | | | Par (000) | | | Value | |
| Wireless Telecommunication Services (continued) | |
Radiate Holdco LLC/Radiate Finance, Inc., 6.63%, 2/15/25 (c)(d) | | | USD | | | | 319 | | | $ | 318,202 | |
Softbank Corp., 4.50%, 4/15/20 (c)(d) | | | | | | | 1,500 | | | | 1,559,100 | |
Sprint Capital Corp. (d): | | | | | | | | | | | | |
6.90%, 5/01/19 | | | | | | | 155 | | | | 165,656 | |
6.88%, 11/15/28 | | | | | | | 1,844 | | | | 1,996,130 | |
Sprint Communications, Inc. (d): | | | | | | | | | | | | |
9.00%, 11/15/18 (c) | | | | | | | 2,486 | | | | 2,719,062 | |
7.00%, 3/01/20 (c) | | | | | | | 441 | | | | 481,792 | |
7.00%, 8/15/20 | | | | | | | 69 | | | | 74,693 | |
Sprint Corp. (d): | | | | | | | | | | | | |
7.25%, 9/15/21 | | | | | | | 115 | | | | 125,781 | |
7.88%, 9/15/23 | | | | | | | 1,526 | | | | 1,712,935 | |
7.13%, 6/15/24 | | | | | | | 1,684 | | | | 1,836,621 | |
7.63%, 2/15/25 | | | | | | | 115 | | | | 128,369 | |
T-Mobile USA, Inc.: | | | | | | | | | | | | |
4.00%, 4/15/22 | | | | | | | 234 | | | | 239,850 | |
6.00%, 3/01/23 | | | | | | | 40 | | | | 42,750 | |
6.84%, 4/28/23 (d) | | | | | | | 610 | | | | 654,225 | |
6.50%, 1/15/24 (d) | | | | | | | 440 | | | | 476,850 | |
5.13%, 4/15/25 | | | | | | | 238 | | | | 250,792 | |
5.38%, 4/15/27 | | | | | | | 143 | | | | 153,010 | |
Trilogy International Partners LLC/Trilogy International Finance, Inc., 8.88%, 5/01/22 (c)(i) | | | | | | | 124 | | | | 128,340 | |
Uniti Group, Inc./Uniti Fiber Holdings, Inc./CSL Capital LLC, 7.13%, 12/15/24 (c)(i) | | | | | | | 179 | | | | 181,685 | |
Wind Acquisition Finance SA, 4.00%, 7/15/20 | | | EUR | | | | 100 | | | | 110,509 | |
| | | | | | | | | | | | |
| | | | | | | | | | | | 21,085,434 | |
| Total Corporate Bonds — 65.8% | | | | | | | | | | | 481,878,979 | |
| | | | | | | | | | | | |
| | | | | | | | | | | | | |
| | | |
| Floating Rate Loan Interests (b) | | | | | | | | | |
| Air Freight & Logistics — 0.0% | | | | | | | | | |
CEVA Group PLC, Synthetic LOC, 4.90%, 3/19/21 | | | USD | | | | 29 | | | | 24,637 | |
CEVA Intercompany BV, Dutch Term Loan, 7.00%, 3/19/21 | | | | | | | 30 | | | | 26,217 | |
CEVA Logistics Canada ULC, Canadian Term Loan, 6.50%, 3/19/21 | | | | | | | 5 | | | | 3,961 | |
CEVA Logistics US Holdings, Inc., Term Loan, 3.99%, 3/19/21 | | | | | | | 43 | | | | 37,337 | |
| | | | | | | | | | | | |
| | | | | | | | | | | | 92,152 | |
| Auto Components — 0.0% | | | | | | | | | |
USI, Inc., 2017 Term Loan B, 4.00%, 3/30/24 | | | | | | | 104 | | | | 103,545 | |
| Chemicals — 0.0% | | | | | | | | | |
Alpha 3 B.V., 2017 Term Loan B1, 4.25%, 1/31/24 | | | | | | | 142 | | | | 142,710 | |
MacDermid, Inc., Term Loan B5, 4.15%, 6/07/20 | | | | | | | 107 | | | | 107,930 | |
| | | | | | | | | | | | |
| | | | | | | | | | | | 250,640 | |
| Commercial Services & Supplies — 0.1% | | | | | | | | | |
Advanced Disposal Services, Inc., Term Loan B3, 3.70%, 11/10/23 | | | | | | | 285 | | | | 287,041 | |
Brand Energy & Infrastructure Services, Inc., Term Loan B, 3.74%, 11/26/20 | | | | | | | 207 | | | | 207,311 | |
| | | | | | | | | | | | |
| | | | | | | | | | | | 494,352 | |
| | | | | | | | | | | | |
| Floating Rate Loan Interests (b) | | | | | Par (000) | | | Value | |
| Diversified Consumer Services — 0.0% | | | | | | | | | |
Laureate Education, Inc., 2017 Term Loan B, 4.03%, 4/19/24 | | | USD | | | | 145 | | | $ | 144,698 | |
| Diversified Financial Services — 4.0% | | | | | | | | | |
Aviron Capital LLC, Term Loan, 4.65%, 10/31/17 | | | | | | | 32,551 | | | | 28,319,468 | |
Lone Star LSPT Future Funding, Mezzanine Term Loan, 4.15%, 9/09/20 | | | | | | | 1,176 | | | | 1,153,581 | |
| | | | | | | | | | | | |
| | | | | | | | | | | | 29,473,049 | |
| Energy Equipment & Services — 0.0% | | | | | | | | | |
Weatherford International Ltd., Term Loan, 4.74%, 7/13/20 | | | | | | | 290 | | | | 284,296 | |
| Food & Staples Retailing — 0.0% | | | | | | | | | |
BJ’s Wholesale Club, Inc., 2017 1st Lien Term Loan, 6.65%, 2/03/24 | | | | | | | 231 | | | | 229,942 | |
| Food Products — 0.0% | | | | | | | | | |
Chobani LLC, 1st Lien Term Loan, 6.67%, 10/07/23 | | | | | | | 71 | | | | 72,065 | |
| Health Care Equipment & Supplies — 0.1% | | | | | | | | | |
DJO Finance LLC, 2015 Term Loan, 3.49%, 6/08/20 | | | | | | | 412 | | | | 401,915 | |
Immucor, Inc., Refinancing Term Loan B2, 4.05%, 8/17/18 | | | | | | | 458 | | | | 456,087 | |
Ortho-Clinical Diagnostics, Inc., Term Loan B, 4.41%, 6/30/21 | | | | | | | 40 | | | | 39,682 | |
| | | | | | | | | | | | |
| | | | | | | | | | | | 897,684 | |
| Health Care Providers & Services — 0.1% | | | | | | | | | |
Iasis Healthcare LLC, Term Loan B3, 1.00%, 2/16/21 | | | | | | | 79 | | | | 79,000 | |
inVentiv Health, Inc., 2016 Term Loan B, 4.25%, 11/09/23 | | | | | | | 143 | | | | 143,576 | |
Team Health Holdings, Inc., 1st Lien Term Loan, 3.89%, 2/06/24 | | | | | | | 274 | | | | 271,433 | |
Vizient, Inc., 2016 Term Loan B, 4.77%, 2/13/23 | | | | | | | 113 | | | | 113,538 | |
| | | | | | | | | | | | |
| | | | | | | | | | | | 607,547 | |
| Hotels, Restaurants & Leisure — 3.1% | | | | | | | | | |
Amaya Holdings BV, Repriced Term Loan B, 4.39%, 8/01/21 | | | | | | | 131 | | | | 131,188 | |
Caesars Entertainment Resort Properties LLC, Term Loan B, 4.75%, 10/11/20 | | | | | | | 3,306 | | | | 3,312,049 | |
Hilton Ft. Lauderdale, Mezzanine Term Loan 5, 3.49%, 8/04/19 | | | | | | | 6,500 | | | | 6,305,000 | |
Hilton Los Cabos, B-Note, 3.75%, 9/18/18 | | | | | | | 5,375 | | | | 5,294,375 | |
Hilton Orlando, Mezzanine A3, 3.80%, 7/09/19 | | | | | | | 7,250 | | | | 7,250,000 | |
| | | | | | | | | | | | |
| | | | | | | | | | | | 22,292,612 | |
| Industrial Conglomerates — 0.1% | | | | | | | | | |
Cortes NP Acquisition Corp., 2017 Term Loan B, 3.75%, 11/30/23 | | | | | | | 672 | | | | 676,315 | |
Sequa Corp., 1st Lien Term Loan, 7.74%, 11/26/21 | | | | | | | 203 | | | | 205,030 | |
Sequa Corporation, 2nd Lien Term Loan, 5.00%, 4/13/22 | | | | | | | 73 | | | | 74,186 | |
| | | | | | | | | | | | |
| | | | | | | | | | | | 955,531 | |
| Insurance — 0.1% | | | | | | | | | |
Alliant Holdings I, Inc., 2015 Term Loan B, 4.25%, 8/12/22 | | | | | | | 136 | | | | 135,952 | |
Sedgwick Claims Management Services, Inc., 1st Lien Term Loan, 7.16%, 3/01/21 | | | | | | | 470 | | | | 469,817 | |
| | | | | | | | | | | | |
| | | | | | | | | | | | 605,769 | |
See Notes to Financial Statements.
| | | | | | |
| | | | | | | |
| 52 | | SEMI-ANNUAL REPORT | | APRIL 30, 2017 | | |
| | |
Consolidated Schedule of Investments (continued) | | BlackRock Multi-Sector Income Trust (BIT) |
| | | | | | | | | | | | |
| Floating Rate Loan Interests (b) | | | | | Par (000) | | | Value | |
| IT Services — 0.0% | | | | | | | | | |
NeuStar, Inc.: | | | | | | | | | | | | |
Term Loan B1, 4.03%, 8/28/19 | | | USD | | | | 55 | | | $ | 55,928 | |
Term Loan B2, 3.73%, 2/28/24 | | | | | | | 150 | | | | 151,938 | |
Optiv Security, Inc., 1st Lien Term Loan, 4.40%, 2/01/24 | | | | | | | 79 | | | | 79,040 | |
| | | | | | | | | | | | |
| | | | | | | | | | | | 286,906 | |
| Machinery — 0.2% | | | | | | | | | |
Gates Global LLC, 2017 Term Loan B, 5.25%, 4/01/24 | | | | | | | 331 | | | | 332,317 | |
Silver II US Holdings LLC, Term Loan, 5.25%, 12/13/19 | | | | | | | 982 | | | | 977,037 | |
| | | | | | | | | | | | |
| | | | | | | | | | | | 1,309,354 | |
| Media — 0.4% | | | | | | | | | |
CSC Holdings LLC, 2017 1st Lien Term Loan, 3.75%, 7/15/25 | | | | | | | 65 | | | | 65,118 | |
iHeartCommunications, Inc., Term Loan D, 3.75%, 1/30/19 | | | | | | | 1,169 | | | | 994,687 | |
Intelsat Jackson Holdings SA, Term Loan B2, 5.00%, 6/30/19 | | | | | | | 1,579 | | | | 1,557,008 | |
Ziggo Secured Finance Partnership, Term Loan E, 4.74%, 4/15/25 | | | | | | | 263 | | | | 263,013 | |
| | | | | | | | | | | | |
| | | | | | | | | | | | 2,879,826 | |
| Multiline Retail — 0.0% | | | | | | | | | |
Neiman Marcus Group, Inc., 2020 Term Loan, 4.00%, 10/25/20 | | | | | | | 329 | | | | 261,859 | |
| Oil, Gas & Consumable Fuels — 0.5% | | | | | | | | | |
California Resources Corp.: | | | | | | | | | | | | |
Second Out Term Loan, 8.50%, 12/31/21 | | | | | | | 734 | | | | 806,435 | |
Term Loan A, 5.00%, 10/01/19 | | | | | | | 535 | | | | 517,173 | |
Chesapeake Energy Corp., Term Loan, 6.67%, 8/23/21 | | | | | | | 2,076 | | | | 2,241,054 | |
| | | | | | | | | | | | |
| | | | | | | | | | | | 3,564,662 | |
| Professional Services — 0.1% | | | | | | | | | |
Advantage Sales & Marketing, Inc., 2014 1st Lien Term Loan, 4.25%, 7/23/21 | | | | | | | 297 | | | | 289,655 | |
Information Resources, Inc., 1st Lien Term Loan, 5.04%, 1/18/24 | | | | | | | 86 | | | | 86,833 | |
| | | | | | | | | | | | |
| | | | | | | | | | | | 376,488 | |
| Software — 0.6% | | | | | | | | | |
BMC Software Finance, Inc., 2017 Term Loan, 8.125%, 9/13/22 | | | | | | | 565 | | | | 567,774 | |
CCC Information Services, Inc.: | | | | | | | | | | | | |
2017 1st Lien Term Loan, 4.93%, 3/29/24 | | | | | | | 133 | | | | 132,705 | |
2017 2nd Lien Term Loan, 4.91%, 3/29/25 | | | | | | | 40 | | | | 40,750 | |
Kronos, Inc., 2nd Lien Term Loan, 4.15%, 11/01/24 | | | | | | | 624 | | | | 648,752 | |
MA FinanceCo., LLC, Term Loan B3, 4.15%, 4/18/24 | | | | | | | 22 | | | | 22,269 | |
Misys Europe SA: | | | | | | | | | | | | |
1st Lien Term Loan, 4.73%, 4/27/24 | | | | | | | 398 | | | | 400,738 | |
2nd Lien Term Loan, 8.25%, 4/27/25 | | | | | | | 88 | | | | 89,760 | |
Project Alpha Intermediate Holding, Inc., 2017 Term Loan B, 6.91%, 4/18/24 | | | | | | | 195 | | | | 194,025 | |
Seattle Spinco, Inc., Term Loan B3, 9.16%, 4/30/24 | | | | | | | 150 | | | | 150,389 | |
Tempo Acquisition LLC, Term Loan, 4.80%, 3/15/24 | | | | | | | 270 | | | | 269,798 | |
Tibco Software, Inc., 2017 Term Loan B, 4.00%, 12/04/20 | | | | | | | 71 | | | | 71,304 | |
| | | | | | | | | | | | |
| Floating Rate Loan Interests (b) | | | | | Par (000) | | | Value | |
| Software (continued) | | | | | | | | | |
Veritas US, Inc., Term Loan B1, 9.28%, 1/27/23 | | | USD | | | | 1,461 | | | $ | 1,452,264 | |
| | | | | | | | | | | | |
| | | | | | | | | | | | 4,040,528 | |
| Textiles, Apparel & Luxury Goods — 0.1% | | | | | | | | | |
Ascend Performance Materials Operations LLC, Term Loan B, 4.15%, 8/12/22 | | | | | | | 311 | | | | 312,583 | |
| Total Floating Rate Loan Interests — 9.5% | | | | | | | | | | | 69,536,088 | |
| | | | | | | | | | | | |
| | | | | | | | | | | | | |
|
| Foreign Agency Obligations | |
Argentina Bonar Bonds, 9.00%, 11/29/18 | | | | | | | 144 | | | | 158,207 | |
Argentine Bonos del Tesoro: | | | | | | | | | | | | |
22.75%, 3/05/18 | | | ARS | | | | 9,149 | | | | 605,996 | |
21.20%, 9/19/18 | | | | | | | 18,297 | | | | 1,219,745 | |
18.20%, 10/03/21 | | | | | | | 176 | | | | 12,413 | |
16.00%, 10/17/23 | | | | | | | 1,975 | | | | 142,226 | |
Argentine Republic Government International Bond: | | | | | | | | | | | | |
6.25%, 4/22/19 (d) | | | USD | | | | 6,334 | | | | 6,720,374 | |
5.83%, 12/31/33 (b) | | | ARS | | | | 54 | | | | 26,629 | |
7.82%, 12/31/33 | | | EUR | | | | 347 | | | | 404,263 | |
7.63%, 4/22/46 (d) | | | USD | | | | 2,767 | | | | 2,945,471 | |
Banque Centrale de Tunisie International Bond, 4.50%, 6/22/20 | | | EUR | | | | 644 | | | | 730,622 | |
Brazil Notas do Tesouro Nacional, Serie B, 6.00%, 5/15/21 | | | BRL | | | | 1,400 | | | | 1,378,930 | |
Colombia Government International Bond: | | | | | | | | | | | | |
11.75%, 2/25/20 | | | USD | | | | 43 | | | | 53,901 | |
4.38%, 7/12/21 (d) | | | | | | | 2,638 | | | | 2,801,556 | |
Cyprus Government International Bond, 4.63%, 2/03/20 (c) | | | EUR | | | | 2,950 | | | | 3,513,248 | |
Egypt Government International Bond: | | | | | | | | | | | | |
5.75%, 4/29/20 | | | USD | | | | 2,135 | | | | 2,219,546 | |
8.50%, 1/31/47 | | | | | | | 302 | | | | 328,652 | |
8.50%, 1/31/47 (c) | | | | | | | 426 | | | | 463,594 | |
Iceland Government International Bond, 5.88%, 5/11/22 | | | | | | | 3,415 | | | | 3,929,600 | |
Indonesia Government International Bond, 5.88%, 3/13/20 | | | | | | | 1,319 | | | | 1,439,913 | |
KSA Sukuk Ltd. (c): | | | | | | | | | | | | |
2.89%, 4/20/22 | | | | | | | 722 | | | | 721,975 | |
3.63%, 4/20/27 | | | | | | | 722 | | | | 725,278 | |
Kuwait International Government Bond, 2.75%, 3/20/22 (c) | | | | | | | 1,667 | | | | 1,682,003 | |
Lebanon Government International Bond, 6.85%, 3/23/27 | | | | | | | 720 | | | | 738,000 | |
Mexican Udibonos, 3.50%, 12/14/17 | | | MXN | | | | 1,694 | | | | 90,010 | |
Portugal Government International Bond, 5.13%, 10/15/24 (c) | | | USD | | | | 3,680 | | | | 3,592,232 | |
Republic of Argentina: | | | | | | | | | | | | |
6.88%, 4/22/21 | | | | | | | 150 | | | | 164,100 | |
3.88%, 1/15/22 | | | EUR | | | | 172 | | | | 188,051 | |
5.63%, 1/26/22 (d) | | | USD | | | | 5,314 | | | | 5,534,531 | |
7.50%, 4/22/26 (d) | | | | | | | 3,437 | | | | 3,765,233 | |
Russian Federal Bond — OFZ: | | | | | | | | | | | | |
7.50%, 8/18/21 | | | RUB | | | | 292,886 | | | | 5,119,063 | |
7.40%, 12/07/22 | | | | | | | 67,975 | | | | 1,180,753 | |
7.75%, 9/16/26 | | | | | | | 90,961 | | | | 1,614,583 | |
8.15%, 2/03/27 | | | | | | | 185,476 | | | | 3,411,035 | |
7.05%, 1/19/28 | | | | | | | 126,884 | | | | 2,144,391 | |
Slovenia Government International Bond, 5.85%, 5/10/23 (c) | | | USD | | | | 766 | | | | 889,779 | |
South Africa Government International Bond, 5.50%, 3/09/20 | | | | | | | 682 | | | | 723,880 | |
See Notes to Financial Statements.
| | | | | | |
| | | | | | | |
| | SEMI-ANNUAL REPORT | | APRIL 30, 2017 | | 53 |
| | |
Consolidated Schedule of Investments (continued) | | BlackRock Multi-Sector Income Trust (BIT) |
| | | | | | | | | | | | |
| Foreign Agency Obligations | | | | | Par (000) | | | Value | |
Sri Lanka Government International Bond, 5.88%, 7/25/22 | | | USD | | | | 3,000 | | | $ | 3,105,120 | |
Turkey Government Bond, 8.80%, 9/27/23 | | | TRY | | | | 2,830 | | | | 741,770 | |
Turkey Government International Bond: | | | | | | | | | | | | |
7.00%, 6/05/20 (d) | | | USD | | | | 3,661 | | | | 4,028,198 | |
7.38%, 2/05/25 | | | | | | | 427 | | | | 495,367 | |
6.00%, 3/25/27 | | | | | | | 374 | | | | 400,180 | |
| Total Foreign Agency Obligations — 9.6% | | | | | | | | | | | 70,150,418 | |
| | | | | | | | | | | | |
| | | | | | | | | | | | | |
| | | |
| Investment Companies — 0.1% | | | | | Shares | | | | |
| Real Estate Investment Trusts (REITs) — 0.1% | |
iShares MSCI Emerging Markets ETF (k) | | | | | | | 13,000 | | | | 520,780 | |
| | | | | | | | | | | | |
| | | | | | | | | | | | | |
| | | |
| Non-Agency Mortgage-Backed Securities | | | | | Par (000) | | | | |
| Collateralized Mortgage Obligations — 21.9% | |
American Home Mortgage Assets Trust, Series 2006-5, Class A1, 1.58%, 11/25/46 (b) | | | USD | | | | 6,102 | | | | 3,146,505 | |
CHL Mortgage Pass-Through Trust: | | | | | | | | | | | | |
Series 2006-3, Class 1A1, 1.23%, 3/25/36 (b) | | | | | | | 12,211 | | | | 9,826,022 | |
Series 2007-J2, Class 2A1, 1.64%, 7/25/37 (b) | | | | | | | 4,853 | | | | 2,522,226 | |
Series 2007-J2, Class 2A8, 6.00%, 7/25/37 | | | | | | | 2,680 | | | | 2,008,338 | |
Citigroup Mortgage Loan Trust, Series 2006-AR7, Class 2A3A, 3.20%, 11/25/36 (b) | | | | | | | 6,920 | | | | 6,255,851 | |
Countrywide Alternative Loan Trust: | | | | | | | | | | | | |
Series 2005-61, Class 2A1, 1.27%, 12/25/35 (b) | | | | | | | 3,551 | | | | 3,156,202 | |
Series 2005-9CB, Class 1A3, 1.44%, 5/25/35 (b) | | | | | | | 4,090 | | | | 3,311,507 | |
Series 2006-40T1, Class 2A5, 1.39%, 12/25/36 (b) | | | | | | | 2,810 | | | | 788,735 | |
Series 2006-7CB, Class 2A1, 6.50%, 5/25/36 (i) | | | | | | | 3,204 | | | | 2,196,854 | |
Series 2006-J7, Class 2A1, 2.09%, 11/20/46 (b) | | | | | | | 7,165 | | | | 4,308,207 | |
Series 2006-J8, Class A5, 6.00%, 2/25/37 | | | | | | | 2,136 | | | | 1,445,430 | |
Series 2006-OA14, Class 3A1, 1.51%, 11/25/46 (b) | | | | | | | 10,838 | | | | 9,182,096 | |
Series 2006-OA16, Class A2, 1.18%, 10/25/46 (b) | | | | | | | 7,256 | | | | 6,326,475 | |
Series 2006-OA18, Class A1, 1.11%, 12/25/46 (b) | | | | | | | 4,447 | | | | 3,948,655 | |
Series 2006-OA22, Class A1, 1.15%, 2/25/47 (b) | | | | | | | 4,069 | | | | 3,723,971 | |
Series 2006-OA6, Class 1A1A, 1.20%, 7/25/46 (b) | | | | | | | 8,028 | | | | 6,491,149 | |
Series 2006-OA8, Class 1A1, 1.18%, 7/25/46 (b) | | | | | | | 3,262 | | | | 2,825,752 | |
Series 2007-12T1, Class A22, 5.75%, 6/25/37 (d) | | | | | | | 5,892 | | | | 4,579,781 | |
Series 2007-12T1, Class A5, 6.00%, 6/25/37 | | | | | | | 2,859 | | | | 2,278,379 | |
Series 2007-22, Class 2A16, 6.50%, 9/25/37 | | | | | | | 10,427 | | | | 7,290,996 | |
Series 2007-23CB, Class A1, 6.00%, 9/25/37 | | | | | | | 8,329 | | | | 7,052,720 | |
| | | | | | | | | | | | |
| Non-Agency Mortgage-Backed Securities | | | | | Par (000) | | | Value | |
| Collateralized Mortgage Obligations (continued) | |
Countrywide Alternative Loan Trust (continued): | | | | | | | | | | | | |
Series 2007-4CB, Class 1A3, 1.34%, 4/25/37 (b) | | | USD | | | | 5,117 | | | $ | 3,873,192 | |
Series 2007-OA2, Class 1A1, 1.50%, 3/25/47 (b) | | | | | | | 5,344 | | | | 3,747,943 | |
Countrywide Home Loan Mortgage Pass-Through Trust, Series 2006-OA5, Class 3A1, 1.19%, 4/25/46 (b) | | | | | | | 9,792 | | | | 8,535,371 | |
Fannie Mae, Class 2M2 (b): | | | | | | | | | | | | |
Series 2016-C06, Class 1M2, 5.24%, 4/25/29 | | | | | | | 545 | | | | 592,741 | |
Series 2016-C07, 5.34%, 4/25/29 | | | | | | | 3,455 | | | | 3,712,771 | |
Fannie Mae Connecticut Avenue Securities (b): | | | | | | | | | | | | |
Series 2014-C02, Class 1M2, 3.59%, 5/25/24 | | | | | | | 7,872 | | | | 8,204,447 | |
Series 2014-C03, Class 1M2, 3.99%, 7/25/24 | | | | | | | 5,950 | | | | 6,258,347 | |
Series 2017-C02, 4.64%, 9/25/29 | | | | | | | 3,000 | | | | 3,103,327 | |
Freddie Mac, Series 2017-DNA2, Class M2, 4.44%, 10/25/29 (b) | | | | | | | 3,000 | | | | 3,074,179 | |
Freddie Mac Mortgage-Backed Securities, Series 4480, Class ZX, 4.00%, 11/15/44 (d) | | | | | | | 4,842 | | | | 5,091,264 | |
Morgan Stanley Re-REMIC Trust, Series 2010-R5, Class 7B, 1.44%, 5/26/37 (c)(e) | | | | | | | 14,760 | | | | 10,184,601 | |
Nomura Asset Acceptance Corp. Alternative Loan Trust, Series 2006-AF1, Class 1A2, 6.16%, 5/25/36 (b) | | | | | | | 8,806 | | | | 3,924,743 | |
Residential Asset Securitization Trust, Series 2006-A8, Class 2A5, 1.59%, 8/25/36 (b) | | | | | | | 7,452 | | | | 2,364,668 | |
WaMu Mortgage Pass-Through Certificates, Series 2007-OA4, Class 1A, 1.43%, 5/25/47 (b) | | | | | | | 5,262 | | | | 4,681,695 | |
| | | | | | | | | | | | |
| | | | | | | | | | | | 160,015,140 | |
| Commercial Mortgage-Backed Securities — 5.2% | |
Bank of America Merrill Lynch Commercial Mortgage Securities Trust, Series 2013-DSMZ, Class M, 6.60%, 9/15/18 (b)(c) | | | | | | | 7,500 | | | | 7,593,750 | |
CDGJ Commercial Mortgage Trust, Series 2014-BXCH, Class EPA, 5.24%, 12/15/27 (b)(c) | | | | | | | 4,446 | | | | 4,475,208 | |
CG-CCRE Commercial Mortgage Trust, Series 2014-FL1, Class E, 5.56%, 6/15/31 (b)(c) | | | | | | | 1,931 | | | | 1,928,357 | |
Commercial Mortgage Pass-Through Certificates (b)(c): | | | | | | | | | | | | |
Series 2014-FL5, Class HFL1, 4.24%, 7/15/31 | | | | | | | 6,057 | | | | 5,858,197 | |
Series 2014-PAT, Class E, 4.06%, 8/13/27 | | | | | | | 1,000 | | | | 1,004,386 | |
Series 2014-PAT, Class F, 3.35%, 8/13/27 | | | | | | | 3,000 | | | | 2,932,274 | |
Series 2014-PAT, Class G, 2.51%, 8/13/27 | | | | | | | 2,000 | | | | 1,871,800 | |
Credit Suisse First Boston Mortgage Securities Corp., Series 2005-C3, Class B, 4.88%, 7/15/37 | | | | | | | 792 | | | | 791,322 | |
GAHR Commercial Mortgage Trust, Series 2015-NRF, Class GFX, 3.49%, 12/15/34 (b)(c) | | | | | | | 2,500 | | | | 2,416,798 | |
See Notes to Financial Statements.
| | | | | | |
| | | | | | | |
| 54 | | SEMI-ANNUAL REPORT | | APRIL 30, 2017 | | |
| | |
Consolidated Schedule of Investments (continued) | | BlackRock Multi-Sector Income Trust (BIT) |
| | | | | | | | | | | | |
| Non-Agency Mortgage-Backed Securities | | | | | Par (000) | | | Value | |
| Commercial Mortgage-Backed Securities (continued) | |
Great Wolf Trust (b)(c): | | | | | | | | | | | | |
Series 2015-WFMZ, Class M, 7.98%, 5/15/32 | | | USD | | | | 3,300 | | | $ | 3,381,696 | |
Series 2015-WOLF, Class F, 5.99%, 5/15/34 | | | | | | | 1,080 | | | | 1,065,090 | |
Madison Avenue Trust, Series 2013-650M, Class E, 4.17%, 10/12/32 (b)(c) | | | | | | | 5,000 | | | | 4,961,076 | |
| | | | | | | | | | | | |
| | | | | | | | | | | | 38,279,954 | |
| Total Non-Agency Mortgage-Backed Securities — 27.1% | | | | 198,295,094 | |
| | | | | | | | | | | | |
| | | | | | | | | | | | | |
| | | |
| Preferred Securities | | | | | | | | | |
| | | |
| Capital Trusts | | | | | | | | | |
| Banks — 4.3% | |
Allied Irish Banks PLC, 7.38% (b)(h) | | | | | | | 200 | | | | 234,744 | |
Banco Bilbao Vizcaya Argentaria SA, 8.88% (b)(h) | | | | | | | 200 | | | | 247,492 | |
Banco Santander SA, 6.25%, 8/11/26 (b) | | | | | | | 200 | | | | 220,304 | |
Bank of Ireland, 7.38% (b)(h) | | | | | | | 200 | | | | 237,561 | |
BNP Paribas SA, 7.20% (b)(c)(d)(h) | | | | | | | 4,000 | | | | 4,450,000 | |
Capital One Financial Corp., Series E, 5.55% (b)(d)(h) | | | | | | | 3,500 | | | | 3,640,000 | |
Citigroup, Inc. (b)(d)(h): | | | | | | | | | | | | |
5.90% | | | | | | | 2,250 | | | | 2,362,500 | |
Series P, 5.95% | | | | | | | 3,700 | | | | 3,887,313 | |
Series R, 6.13% | | | | | | | 1,170 | | | | 1,246,694 | |
Cooperatieve Rabobank UA, 6.63% (b)(h) | | | | | | | 200 | | | | 241,297 | |
Fifth Third Bancorp, Series J, 4.90% (b)(d)(h) | | | | | | | 3,000 | | | | 3,000,000 | |
Intesa Sanpaolo SpA, 7.00% (b)(h) | | | | | | | 234 | | | | 262,862 | |
RZB Finance Jersey IV Ltd., 1.62% (b)(h) | | | | | | | 100 | | | | 104,028 | |
U.S. Bancorp, Series J, 5.30% (b)(d)(h) | | | | | | | 524 | | | | 541,685 | |
Wells Fargo & Co. (b)(d)(h): | | | | | | | | | | | | |
Series S, 5.90% | | | | | | | 9,010 | | | | 9,573,125 | |
Series U, 5.88% | | | | | | | 770 | | | | 835,450 | |
| | | | | | | | | | | | |
| | | | | | | | | | | | 31,085,055 | |
| Capital Markets — 1.1% | |
Goldman Sachs Group, Inc., Series L, 5.70% (b)(d)(h) | | | | | | | 967 | | | | 998,427 | |
Morgan Stanley, Series H, 5.45% (b)(d)(h) | | | | | | | 5,007 | | | | 5,125,916 | |
State Street Corp., Series F, 5.25% (b)(d)(h) | | | | | | | 1,875 | | | | 1,968,750 | |
UBS Group AG, 5.75% (b)(h) | | | | | | | 200 | | | | 237,995 | |
| | | | | | | | | | | | |
| | | | | | | | | | | | 8,331,088 | |
| Chemicals — 0.0% | |
Lanxess AG, 4.50%, 12/6/76 (b) | | | | | | | 50 | | | | 59,094 | |
Solvay Finance SA, 5.12% (b)(h) | | | | | | | 100 | | | | 120,269 | |
| | | | | | | | | | | | |
| | | | | | | | | | | | 179,363 | |
| Diversified Financial Services — 5.6% | |
Bank of America Corp. (b)(d)(h): | | | | | | | | | | | | |
Series AA, 6.10% | | | | | | | 2,865 | | | | 3,069,131 | |
Series U, 5.20% | | | | | | | 1,750 | | | | 1,756,650 | |
Series V, 5.13% | | | | | | | 705 | | | | 708,525 | |
Series X, 6.25% | | | | | | | 6,175 | | | | 6,623,367 | |
Bank of New York Mellon Corp., Series D, 4.50% (b)(d)(h) | | | | | | | 6,067 | | | | 5,875,889 | |
Barclays PLC, 7.25% (b)(h) | | | | | | | 200 | | | | 270,175 | |
HBOS Capital Funding LP, 6.85% (h) | | | | | | | 100 | | | | 101,606 | |
JPMorgan Chase & Co. (b)(d)(h): | | | | | | | | | | | | |
Series Q, 5.15% | | | | | | | 5,500 | | | | 5,555,000 | |
Series V, 5.00% | | | | | | | 3,830 | | | | 3,900,510 | |
Macquarie Bank Ltd., 10.25%, 6/20/57 (b) | | | | | | | 10,000 | | | | 10,093,280 | |
| | | | | | | | | | | | |
| Capital Trusts | | | | | Par (000) | | | Value | |
| Diversified Financial Services (continued) | |
Royal Bank of Scotland Group PLC, 8.63% (b)(h) | | | USD | | | | 200 | | | $ | 215,900 | |
Societe Generale SA, 6.00% (b)(c)(d)(h) | | | | | | | 3,000 | | | | 2,953,488 | |
| | | | | | | | | | | | |
| | | | | | | | | | | | 41,123,521 | |
| Diversified Telecommunication Services — 0.1% | |
Telefonica Europe BV (b)(h): | | | | | | | | | | | | |
3.75% | | | | | | | 100 | | | | 111,969 | |
4.20% | | | | | | | 300 | | | | 344,986 | |
| | | | | | | | | | | | |
| | | | | | | | | | | | 456,955 | |
| Electric Utilities — 1.1% | |
Electricite de France SA, 5.25% (b)(c)(d)(h) | | | | | | | 7,500 | | | | 7,500,000 | |
Enel SpA (b): | | | | | | | | | | | | |
6.50%, 1/10/74 | | | | | | | 102 | | | | 120,164 | |
7.75%, 9/10/75 | | | | | | | 100 | | | | 145,062 | |
Gas Natural Fenosa Finance BV, 4.13% (b)(h) | | | | | | | 100 | | | | 114,649 | |
| | | | | | | | | | | | |
| | | | | | | | | | | | 7,879,875 | |
| Industrial Conglomerates — 0.9% | |
General Electric Co., Series D, 5.00% (b)(d)(h) | | | | | | | 5,921 | | | | 6,245,175 | |
| Insurance — 1.3% | |
Allstate Corp., 5.75%, 8/15/53 (b)(d) | | | | | | | 2,000 | | | | 2,175,000 | |
Prudential Financial, Inc., 5.63%, 6/15/43 (b)(d) | | | | | | | 6,000 | | | | 6,547,500 | |
Voya Financial, Inc., 5.65%, 5/15/53 (b)(d) | | | | | | | 1,090 | | | | 1,125,425 | |
| | | | | | | | | | | | |
| | | | | | | | | | | | 9,847,925 | |
| Oil, Gas & Consumable Fuels — 0.0% | |
TOTAL SA, 3.88% (b)(h) | | | | | | | 100 | | | | 116,737 | |
| Total Capital Trusts — 14.4% | | | | | | | | | | | 105,265,694 | |
| | | | | | | | | | | | |
| Preferred Stocks | | | | | Shares | | | | |
| Banks — 0.3% | | | | | | | | | |
Citigroup, Inc., Series K, 6.88% (b)(h) | | | | | | | 75,000 | | | | 2,208,750 | |
| Capital Markets — 2.3% | | | | | | | | | |
Goldman Sachs Group, Inc., Series J, 5.50% (b)(h) | | | | | | | 395,017 | | | | 10,649,659 | |
Morgan Stanley (b)(h): | | | | | | | | | | | | |
Series F, 6.88% | | | | | | | 100,000 | | | | 2,900,000 | |
Series K, 5.85% | | | | | | | 89,329 | | | | 2,356,499 | |
SCE Trust III, 5.75% (b)(h) | | | | | | | 23,730 | | | | 671,559 | |
| | | | | | | | | | | | |
| | | | | | | | | | | | 16,577,717 | |
| Real Estate Investment Trusts (REITs) — 1.9% | |
Firstar Realty LLC, 8.88% (c)(h) | | | | | | | 10,000 | | | | 12,300,000 | |
SunTrust Real Estate Investment Corp., 9.00% (c)(h) | | | | | | | 15 | | | | 1,708,511 | |
| | | | | | | | | | | | |
| | | | | | | | | | | | 14,008,511 | |
| Total Preferred Stocks — 4.5% | | | | | | | | | | | 32,794,978 | |
| Total Preferred Securities — 18.9% | | | | | | | | | | | 138,060,672 | |
| | | | | | | | | | | | |
| | | | | | | | | | | | | |
| | | |
| Warrants — 0.0% | | | | | | | | | |
| Diversified Financial Services — 0.0% | | | | | | | | | |
Aviron Capital LLC (Expires 10/20/17) (K) | | | | | | | 38,421,624 | | | | — | |
Total Long-Term Investments
(Cost — $1,150,706,098) — 160.2% | | | | | | | | | | | 1,172,327,760 | |
See Notes to Financial Statements.
| | | | | | |
| | | | | | | |
| | SEMI-ANNUAL REPORT | | APRIL 30, 2017 | | 55 |
| | |
Consolidated Schedule of Investments (continued) | | BlackRock Multi-Sector Income Trust (BIT) |
| | | | | | | | | | | | |
| Short-Term Securities | | | | | Shares | | | Value | |
BlackRock Liquidity Funds, T-Fund, Institutional Class, 0.64% (l)(m) | | | | | | | 2,417,747 | | | $ | 2,417,747 | |
Total Short-Term Securities
(Cost — $2,417,747) — 0.3% | | | | 2,417,747 | |
Options Purchased
(Cost — $177,780) — 0.0% | | | | 188,630 | |
Total Investments Before Options Written
(Cost — $1,153,301,625) — 160.5% | | | | 1,174,934,137 | |
Options Written
(Premiums Received — $132,112) — (0.0)% | | | | (78,302 | ) |
Total Investments, Net of Options Written
(Cost — $1,153,169,513) — 160.5% | | | | 1,174,855,835 | |
Liabilities in Excess of Other Assets — (60.5)% | | | | (442,858,528 | ) |
| | | | | | | | | | | | |
Net Assets — 100.0% | | | | | | | | | | $ | 731,997,307 | |
| | | | | | | | | | | | |
|
| Notes to Schedule of Investments |
| (a) | | Restricted security as to resale, excluding 144A securities. As of period end, the Trust held restricted securities with a current value of $0 and an original cost of $8,635, which was less than 0.05% of its net assets. |
| (b) | | Variable rate security. Rate as of period end. |
| (c) | | Security exempt from registration pursuant to Rule 144A under the Securities Act of 1933, as amended. These securities may be resold in transactions exempt from registration to qualified institutional investors. |
| (d) | | All or a portion of the security has been pledged as collateral in connection with outstanding reverse repurchase agreements. |
| (e) | | Step-up bond that pays an initial coupon rate for the first period and then a higher coupon rate for the following periods. Rate as of period end. |
| (f) | | Amount is less than $500. |
| (g) | | Payment-in-kind security which may pay interest/dividends in additional par/shares and/or in cash. Rates shown are the current rate and possible payment rates. |
| (h) | | Perpetual security with no stated maturity date. |
| (i) | | When-issued security. |
| (j) | | Convertible security. |
| (k) | | All or a portion of the security is held by a wholly owned subsidiary. See Note 1 of the Notes to Financial Statements for details on the wholly owned subsidiary |
| (l) | | During the period ended April 30, 2017, investments in issuers considered to be affiliates of the Trust for purposes of Section 2(a)(3) of the Investment Company Act of 1940, as amended, were as follows: |
| | | | | | | | | | | | | | | | | | | | | | | | | | | | |
| Affiliate | | Shares
Held at
October 31,
2016 | | | Net
Activity | | | Shares
Held at
April 30,
2017 | | | Value at
April 30,
2017 | | | Income | | | Net
Realized
Gain1 | | | Change in
Unrealized
Appreciation
(Depreciation) | |
BlackRock Liquidity Funds, T-Fund, Institutional Class | | | 6,322,410 | | | | (3,904,663 | ) | | | 2,417,747 | | | $ | 2,417,747 | | | $ | 7,900 | | | $ | 35 | | | | — | |
iShares MSCI Emerging Markets ETF | | | — | | | | 13,000 | | | | 13,000 | | | | 520,780 | | | | — | | | | — | | | $ | 1,764 | |
Total | | | $ | 2,938,527 | | | $ | 7,900 | | | $ | 35 | | | $ | 1,764 | |
| | | | | | | | | | | | | | | | | |
1 Includes net capital gain distributions. | | | | | | | | | | | | | |
| (m) | | Current yield as of period end. |
For Trust compliance purposes, the sector classifications refer to one or more of the sector sub-classifications used by one or more widely recognized market indexes or rating group indexes, and/or as defined by the investment adviser. These definitions may not apply for purposes of this report, which may combine such sector sub-classifications for reporting ease.
| | | | | | | | | | | | | | | | | | | | | | | | |
| Reverse Repurchase Agreements | | | | | | | | | | | |
| Counterparty | | Interest
Rate | | | Trade
Date | | | Maturity
Date1 | | | Face Value | | | Face Value
Including
Accrued
Interest | | | Type of
Non-Cash
Underlying
Collateral | | Remaining
Contractual
Maturity of
the Agreements1 |
RBC Capital Markets, LLC | | | 1.70 | % | | | 10/04/16 | | | | Open | | | $ | 105,210 | | | $ | 105,932 | | | Corporate Bonds | | Open/Demand |
RBC Capital Markets, LLC | | | 1.70 | % | | | 10/11/16 | | | | Open | | | | 43,593 | | | | 43,838 | | | Corporate Bonds | | Open/Demand |
RBC Capital Markets, LLC | | | 1.70 | % | | | 10/13/16 | | | | Open | | | | 172,480 | | | | 173,635 | | | Corporate Bonds | | Open/Demand |
RBC Capital Markets, LLC | | | 0.64 | % | | | 10/19/16 | | | | Open | | | | 515,000 | | | | 516,776 | | | Corporate Bonds | | Open/Demand |
See Notes to Financial Statements.
| | | | | | |
| | | | | | | |
| 56 | | SEMI-ANNUAL REPORT | | APRIL 30, 2017 | | |
| | |
Consolidated Schedule of Investments (continued) | | BlackRock Multi-Sector Income Trust (BIT) |
| | | | | | | | | | | | | | | | | | | | | | | | |
| Reverse Repurchase Agreements (continued) | | | | | | | | | | | |
| Counterparty | | Interest
Rate | | | Trade
Date | | | Maturity
Date1 | | | Face Value | | | Face Value
Including
Accrued
Interest | | | Type of
Non-Cash
Underlying
Collateral | | Remaining
Contractual
Maturity of
the Agreements1 |
RBC Capital Markets, LLC | | | 0.64 | % | | | 10/19/16 | | | | Open | | | $ | 1,473,750 | | | $ | 1,478,833 | | | Corporate Bonds | | Open/Demand |
RBC Capital Markets, LLC | | | 0.64 | % | | | 10/19/16 | | | | Open | | | | 511,250 | | | | 513,013 | | | Corporate Bonds | | Open/Demand |
RBC Capital Markets, LLC | | | 0.64 | % | | | 10/19/16 | | | | Open | | | | 955,000 | | | | 958,294 | | | Corporate Bonds | | Open/Demand |
RBC Capital Markets, LLC | | | 0.64 | % | | | 10/19/16 | | | | Open | | | | 623,750 | | | | 625,901 | | | Corporate Bonds | | Open/Demand |
RBC Capital Markets, LLC | | | 0.64 | % | | | 10/19/16 | | | | Open | | | | 609,000 | | | | 611,100 | | | Corporate Bonds | | Open/Demand |
RBC Capital Markets, LLC | | | 0.64 | % | | | 10/19/16 | | | | Open | | | | 1,462,500 | | | | 1,467,544 | | | Corporate Bonds | | Open/Demand |
RBC Capital Markets, LLC | | | 0.64 | % | | | 10/19/16 | | | | Open | | | | 1,503,750 | | | | 1,508,936 | | | Corporate Bonds | | Open/Demand |
RBC Capital Markets, LLC | | | 0.64 | % | | | 10/19/16 | | | | Open | | | | 1,072,500 | | | | 1,076,199 | | | Corporate Bonds | | Open/Demand |
RBC Capital Markets, LLC | | | 0.64 | % | | | 10/19/16 | | | | Open | | | | 1,087,500 | | | | 1,091,251 | | | Corporate Bonds | | Open/Demand |
RBC Capital Markets, LLC | | | 0.64 | % | | | 10/19/16 | | | | Open | | | | 1,080,000 | | | | 1,083,725 | | | Corporate Bonds | | Open/Demand |
RBC Capital Markets, LLC | | | 0.64 | % | | | 10/19/16 | | | | Open | | | | 992,500 | | | | 995,923 | | | Corporate Bonds | | Open/Demand |
RBC Capital Markets, LLC | | | 0.64 | % | | | 10/19/16 | | | | Open | | | | 513,750 | | | | 515,522 | | | Corporate Bonds | | Open/Demand |
RBC Capital Markets, LLC | | | 1.05 | % | | | 10/19/16 | | | | Open | | | | 436,838 | | | | 439,309 | | | Corporate Bonds | | Open/Demand |
RBC Capital Markets, LLC | | | 1.05 | % | | | 10/19/16 | | | | Open | | | | 415,188 | | | | 417,537 | | | Corporate Bonds | | Open/Demand |
RBC Capital Markets, LLC | | | 1.05 | % | | | 10/19/16 | | | | Open | | | | 605,625 | | | | 609,052 | | | Corporate Bonds | | Open/Demand |
RBC Capital Markets, LLC | | | 1.05 | % | | | 10/19/16 | | | | Open | | | | 1,461,250 | | | | 1,469,518 | | | Corporate Bonds | | Open/Demand |
RBC Capital Markets, LLC | | | 1.05 | % | | | 10/19/16 | | | | Open | | | | 387,500 | | | | 389,693 | | | Corporate Bonds | | Open/Demand |
RBC Capital Markets, LLC | | | 0.64 | % | | | 10/20/16 | | | | Open | | | | 304,500 | | | | 305,539 | | | Corporate Bonds | | Open/Demand |
RBC Capital Markets, LLC | | | 0.64 | % | | | 10/20/16 | | | | Open | | | | 947,250 | | | | 950,483 | | | Corporate Bonds | | Open/Demand |
RBC Capital Markets, LLC | | | 0.64 | % | | | 10/20/16 | | | | Open | | | | 465,750 | | | | 467,340 | | | Corporate Bonds | | Open/Demand |
RBC Capital Markets, LLC | | | 0.64 | % | | | 10/20/16 | | | | Open | | | | 375,000 | | | | 376,280 | | | Corporate Bonds | | Open/Demand |
RBC Capital Markets, LLC | | | 0.64 | % | | | 10/20/16 | | | | Open | | | | 817,500 | | | | 820,290 | | | Corporate Bonds | | Open/Demand |
RBC Capital Markets, LLC | | | 0.64 | % | | | 10/20/16 | | | | Open | | | | 756,000 | | | | 758,580 | | | Corporate Bonds | | Open/Demand |
RBC Capital Markets, LLC | | | 0.64 | % | | | 10/20/16 | | | | Open | | | | 252,500 | | | | 253,362 | | | Corporate Bonds | | Open/Demand |
RBC Capital Markets, LLC | | | 0.64 | % | | | 10/20/16 | | | | Open | | | | 793,125 | | | | 795,832 | | | Corporate Bonds | | Open/Demand |
RBC Capital Markets, LLC | | | 0.64 | % | | | 10/20/16 | | | | Open | | | | 415,000 | | | | 416,417 | | | Corporate Bonds | | Open/Demand |
RBC Capital Markets, LLC | | | 0.64 | % | | | 10/20/16 | | | | Open | | | | 1,010,000 | | | | 1,013,447 | | | Corporate Bonds | | Open/Demand |
RBC Capital Markets, LLC | | | 0.64 | % | | | 10/20/16 | | | | Open | | | | 543,750 | | | | 545,606 | | | Corporate Bonds | | Open/Demand |
RBC Capital Markets, LLC | | | 0.64 | % | | | 10/20/16 | | | | Open | | | | 450,000 | | | | 451,536 | | | Corporate Bonds | | Open/Demand |
RBC Capital Markets, LLC | | | 0.64 | % | | | 10/20/16 | | | | Open | | | | 783,750 | | | | 786,425 | | | Corporate Bonds | | Open/Demand |
RBC Capital Markets, LLC | | | 0.64 | % | | | 10/20/16 | | | | Open | | | | 376,500 | | | | 377,785 | | | Corporate Bonds | | Open/Demand |
RBC Capital Markets, LLC | | | 0.64 | % | | | 10/20/16 | | | | Open | | | | 1,275,000 | | | | 1,279,352 | | | Corporate Bonds | | Open/Demand |
RBC Capital Markets, LLC | | | 0.64 | % | | | 10/20/16 | | | | Open | | | | 745,938 | | | | 748,484 | | | Corporate Bonds | | Open/Demand |
RBC Capital Markets, LLC | | | 0.64 | % | | | 10/20/16 | | | | Open | | | | 716,250 | | | | 718,695 | | | Corporate Bonds | | Open/Demand |
RBC Capital Markets, LLC | | | 0.64 | % | | | 10/20/16 | | | | Open | | | | 759,375 | | | | 761,967 | | | Corporate Bonds | | Open/Demand |
RBC Capital Markets, LLC | | | 0.64 | % | | | 10/20/16 | | | | Open | | | | 950,625 | | | | 953,870 | | | Corporate Bonds | | Open/Demand |
RBC Capital Markets, LLC | | | 0.64 | % | | | 10/20/16 | | | | Open | | | | 982,500 | | | | 985,854 | | | Corporate Bonds | | Open/Demand |
RBC Capital Markets, LLC | | | 0.64 | % | | | 10/20/16 | | | | Open | | | | 1,234,375 | | | | 1,238,588 | | | Corporate Bonds | | Open/Demand |
RBC Capital Markets, LLC | | | 0.64 | % | | | 10/20/16 | | | | Open | | | | 1,022,500 | | | | 1,025,990 | | | Corporate Bonds | | Open/Demand |
RBC Capital Markets, LLC | | | 0.64 | % | | | 10/20/16 | | | | Open | | | | 536,250 | | | | 538,080 | | | Corporate Bonds | | Open/Demand |
RBC Capital Markets, LLC | | | 0.64 | % | | | 10/20/16 | | | | Open | | | | 751,875 | | | | 754,441 | | | Corporate Bonds | | Open/Demand |
RBC Capital Markets, LLC | | | 0.64 | % | | | 10/20/16 | | | | Open | | | | 503,750 | | | | 505,469 | | | Corporate Bonds | | Open/Demand |
RBC Capital Markets, LLC | | | 0.64 | % | | | 10/20/16 | | | | Open | | | | 860,625 | | | | 863,563 | | | Corporate Bonds | | Open/Demand |
RBC Capital Markets, LLC | | | 0.64 | % | | | 10/20/16 | | | | Open | | | | 473,625 | | | | 475,242 | | | Corporate Bonds | | Open/Demand |
RBC Capital Markets, LLC | | | 0.64 | % | | | 10/20/16 | | | | Open | | | | 791,250 | | | | 793,951 | | | Corporate Bonds | | Open/Demand |
RBC Capital Markets, LLC | | | 0.64 | % | | | 10/20/16 | | | | Open | | | | 420,000 | | | | 421,434 | | | Corporate Bonds | | Open/Demand |
RBC Capital Markets, LLC | | | 0.64 | % | | | 10/20/16 | | | | Open | | | | 537,500 | | | | 539,335 | | | Corporate Bonds | | Open/Demand |
RBC Capital Markets, LLC | | | 0.64 | % | | | 10/20/16 | | | | Open | | | | 930,000 | | | | 933,174 | | | Corporate Bonds | | Open/Demand |
RBC Capital Markets, LLC | | | 0.64 | % | | | 10/20/16 | | | | Open | | | | 755,625 | | | | 758,204 | | | Corporate Bonds | | Open/Demand |
RBC Capital Markets, LLC | | | 0.64 | % | | | 10/20/16 | | | | Open | | | | 263,900 | | | | 264,801 | | | Corporate Bonds | | Open/Demand |
RBC Capital Markets, LLC | | | 0.64 | % | | | 10/20/16 | | | | Open | | | | 1,030,000 | | | | 1,033,516 | | | Corporate Bonds | | Open/Demand |
RBC Capital Markets, LLC | | | 1.34 | % | | | 10/20/16 | | | | Open | | | | 990,000 | | | | 994,617 | | | Corporate Bonds | | Open/Demand |
RBC Capital Markets, LLC | | | 1.70 | % | | | 10/20/16 | | | | Open | | | | 249,120 | | | | 250,795 | | | Corporate Bonds | | Open/Demand |
RBC Capital Markets, LLC | | | 0.64 | % | | | 10/25/16 | | | | Open | | | | 446,000 | | | | 447,475 | | | Corporate Bonds | | Open/Demand |
RBC Capital Markets, LLC | | | 0.95 | % | | | 10/25/16 | | | | Open | | | | 480,700 | | | | 483,059 | | | Corporate Bonds | | Open/Demand |
RBC Capital Markets, LLC | | | 0.95 | % | | | 10/25/16 | | | | Open | | | | 399,840 | | | | 401,803 | | | Corporate Bonds | | Open/Demand |
RBC Capital Markets, LLC | | | 0.95 | % | | | 10/25/16 | | | | Open | | | | 364,000 | | | | 365,787 | | | Corporate Bonds | | Open/Demand |
RBC Capital Markets, LLC | | | 0.95 | % | | | 10/25/16 | | | | Open | | | | 344,715 | | | | 346,407 | | | Corporate Bonds | | Open/Demand |
RBC Capital Markets, LLC | | | 0.95 | % | | | 10/25/16 | | | | Open | | | | 423,300 | | | | 425,378 | | | Corporate Bonds | | Open/Demand |
RBC Capital Markets, LLC | | | 1.00 | % | | | 10/25/16 | | | | Open | | | | 435,000 | | | | 437,248 | | | Corporate Bonds | | Open/Demand |
RBC Capital Markets, LLC | | | 1.00 | % | | | 10/25/16 | | | | Open | | | | 394,050 | | | | 396,086 | | | Corporate Bonds | | Open/Demand |
RBC Capital Markets, LLC | | | 1.00 | % | | | 10/28/16 | | | | Open | | | | 132,525 | | | | 133,191 | | | Corporate Bonds | | Open/Demand |
RBC Capital Markets, LLC | | | 1.70 | % | | | 11/04/16 | | | | Open | | | | 358,620 | | | | 360,760 | | | Corporate Bonds | | Open/Demand |
See Notes to Financial Statements.
| | | | | | |
| | | | | | | |
| | SEMI-ANNUAL REPORT | | APRIL 30, 2017 | | 57 |
| | |
Consolidated Schedule of Investments (continued) | | BlackRock Multi-Sector Income Trust (BIT) |
| | | | | | | | | | | | | | | | | | | | | | | | |
| Reverse Repurchase Agreements (continued) | | | | | | | | | | | |
| Counterparty | | Interest
Rate | | | Trade
Date | | | Maturity
Date1 | | | Face Value | | | Face Value
Including
Accrued
Interest | | | Type of
Non-Cash
Underlying
Collateral | | Remaining
Contractual
Maturity of
the Agreements1 |
RBC Capital Markets, LLC | | | 1.70 | % | | | 11/07/16 | | | | Open | | | $ | 770,800 | | | $ | 775,379 | | | Corporate Bonds | | Open/Demand |
RBC Capital Markets, LLC | | | 0.90 | % | | | 11/10/16 | | | | Open | | | | 528,885 | | | | 531,093 | | | Corporate Bonds | | Open/Demand |
RBC Capital Markets, LLC | | | 0.95 | % | | | 11/10/16 | | | | Open | | | | 411,750 | | | | 413,565 | | | Corporate Bonds | | Open/Demand |
RBC Capital Markets, LLC | | | 1.00 | % | | | 11/10/16 | | | | Open | | | | 871,080 | | | | 875,121 | | | Corporate Bonds | | Open/Demand |
RBC Capital Markets, LLC | | | 1.00 | % | | | 11/10/16 | | | | Open | | | | 86,625 | | | | 87,027 | | | Corporate Bonds | | Open/Demand |
RBC Capital Markets, LLC | | | 1.70 | % | | | 11/14/16 | | | | Open | | | | 336,000 | | | | 337,934 | | | Corporate Bonds | | Open/Demand |
RBC Capital Markets, LLC | | | 1.70 | % | | | 11/18/16 | | | | Open | | | | 183,888 | | | | 184,935 | | | Corporate Bonds | | Open/Demand |
RBC Capital Markets, LLC | | | 1.34 | % | | | 11/22/16 | | | | Open | | | | 271,700 | | | | 272,798 | | | Corporate Bonds | | Open/Demand |
RBC Capital Markets, LLC | | | 1.70 | % | | | 12/07/16 | | | | Open | | | | 2,774,638 | | | | 2,788,052 | | | Corporate Bonds | | Open/Demand |
RBC Capital Markets, LLC | | | 1.70 | % | | | 12/07/16 | | | | Open | | | | 744,625 | | | | 748,778 | | | Corporate Bonds | | Open/Demand |
RBC Capital Markets, LLC | | | 1.70 | % | | | 12/12/16 | | | | Open | | | | 312,960 | | | | 314,538 | | | Corporate Bonds | | Open/Demand |
HSBC Securities (USA), Inc. | | | 1.00 | % | | | 12/15/16 | | | | Open | | | | 2,753,000 | | | | 2,763,400 | | | Capital Trusts | | Open/Demand |
HSBC Securities (USA), Inc. | | | 1.00 | % | | | 12/15/16 | | | | Open | | | | 3,406,000 | | | | 3,418,867 | | | Corporate Bonds | | Open/Demand |
HSBC Securities (USA), Inc. | | | 1.30 | % | | | 12/15/16 | | | | Open | | | | 1,203,000 | | | | 1,208,908 | | | Corporate Bonds | | Open/Demand |
Credit Suisse Securities (USA) LLC | | | 1.00 | % | | | 12/19/16 | | | | Open | | | | 802,424 | | | | 805,344 | | | Corporate Bonds | | Open/Demand |
Credit Suisse Securities (USA) LLC | | | 1.55 | % | | | 12/19/16 | | | | Open | | | | 532,988 | | | | 535,994 | | | Corporate Bonds | | Open/Demand |
RBC Capital Markets, LLC | | | 1.04 | % | | | 12/19/16 | | | | Open | | | | 496,600 | | | | 498,494 | | | Corporate Bonds | | Open/Demand |
RBC Capital Markets, LLC | | | 1.40 | % | | | 12/19/16 | | | | Open | | | | 316,725 | | | | 318,351 | | | Corporate Bonds | | Open/Demand |
RBC Capital Markets, LLC | | | 1.40 | % | | | 12/19/16 | | | | Open | | | | 276,920 | | | | 278,342 | | | Corporate Bonds | | Open/Demand |
RBC Capital Markets, LLC | | | 1.40 | % | | | 12/19/16 | | | | Open | | | | 817,225 | | | | 821,420 | | | Corporate Bonds | | Open/Demand |
RBC Capital Markets, LLC | | | 1.40 | % | | | 12/19/16 | | | | Open | | | | 208,250 | | | | 209,319 | | | Corporate Bonds | | Open/Demand |
RBC Capital Markets, LLC | | | 1.40 | % | | | 12/19/16 | | | | Open | | | | 187,790 | | | | 188,754 | | | Corporate Bonds | | Open/Demand |
RBC Capital Markets, LLC | | | 1.40 | % | | | 12/19/16 | | | | Open | | | | 1,293,750 | | | | 1,300,391 | | | Corporate Bonds | | Open/Demand |
RBC Capital Markets, LLC | | | 1.40 | % | | | 12/19/16 | | | | Open | | | | 319,800 | | | | 321,442 | | | Corporate Bonds | | Open/Demand |
RBC Capital Markets, LLC | | | 1.40 | % | | | 12/19/16 | | | | Open | | | | 426,720 | | | | 428,911 | | | Corporate Bonds | | Open/Demand |
RBC Capital Markets, LLC | | | 1.40 | % | | | 12/19/16 | | | | Open | | | | 82,250 | | | | 82,672 | | | Corporate Bonds | | Open/Demand |
RBC Capital Markets, LLC | | | 1.40 | % | | | 12/19/16 | | | | Open | | | | 47,450 | | | | 47,694 | | | Corporate Bonds | | Open/Demand |
RBC Capital Markets, LLC | | | 1.40 | % | | | 12/19/16 | | | | Open | | | | 445,050 | | | | 447,335 | | | Corporate Bonds | | Open/Demand |
RBC Capital Markets, LLC | | | 1.40 | % | | | 12/19/16 | | | | Open | | | | 126,325 | | | | 126,973 | | | Corporate Bonds | | Open/Demand |
RBC Capital Markets, LLC | | | 1.40 | % | | | 12/19/16 | | | | Open | | | | 432,450 | | | | 434,670 | | | Corporate Bonds | | Open/Demand |
RBC Capital Markets, LLC | | | 1.40 | % | | | 12/19/16 | | | | Open | | | | 242,875 | | | | 244,122 | | | Corporate Bonds | | Open/Demand |
RBC Capital Markets, LLC | | | 1.40 | % | | | 12/19/16 | | | | Open | | | | 258,000 | | | | 259,324 | | | Corporate Bonds | | Open/Demand |
RBC Capital Markets, LLC | | | 1.40 | % | | | 12/19/16 | | | | Open | | | | 58,500 | | | | 58,800 | | | Corporate Bonds | | Open/Demand |
RBC Capital Markets, LLC | | | 1.40 | % | | | 12/19/16 | | | | Open | | | | 195,383 | | | | 196,385 | | | Corporate Bonds | | Open/Demand |
RBC Capital Markets, LLC | | | 1.40 | % | | | 12/19/16 | | | | Open | | | | 306,175 | | | | 307,747 | | | Corporate Bonds | | Open/Demand |
RBC Capital Markets, LLC | | | 1.40 | % | | | 12/19/16 | | | | Open | | | | 345,425 | | | | 347,198 | | | Corporate Bonds | | Open/Demand |
RBC Capital Markets, LLC | | | 1.40 | % | | | 12/20/16 | | | | Open | | | | 442,900 | | | | 445,156 | | | Corporate Bonds | | Open/Demand |
RBC Capital Markets, LLC | | | 1.40 | % | | | 12/20/16 | | | | Open | | | | 335,325 | | | | 337,033 | | | Corporate Bonds | | Open/Demand |
RBC Capital Markets, LLC | | | 1.40 | % | | | 12/20/16 | | | | Open | | | | 408,250 | | | | 410,330 | | | Corporate Bonds | | Open/Demand |
RBC Capital Markets, LLC | | | 1.40 | % | | | 12/20/16 | | | | Open | | | | 454,005 | | | | 456,318 | | | Corporate Bonds | | Open/Demand |
RBC Capital Markets, LLC | | | 1.40 | % | | | 12/20/16 | | | | Open | | | | 645,150 | | | | 648,437 | | | Corporate Bonds | | Open/Demand |
RBC Capital Markets, LLC | | | 1.40 | % | | | 12/20/16 | | | | Open | | | | 443,625 | | | | 445,885 | | | Corporate Bonds | | Open/Demand |
RBC Capital Markets, LLC | | | 1.40 | % | | | 12/20/16 | | | | Open | | | | 482,885 | | | | 485,345 | | | Corporate Bonds | | Open/Demand |
RBC Capital Markets, LLC | | | 1.40 | % | | | 12/20/16 | | | | Open | | | | 439,450 | | | | 441,689 | | | Corporate Bonds | | Open/Demand |
RBC Capital Markets, LLC | | | 1.40 | % | | | 12/20/16 | | | | Open | | | | 927,200 | | | | 931,924 | | | Corporate Bonds | | Open/Demand |
RBC Capital Markets, LLC | | | 1.40 | % | | | 12/20/16 | | | | Open | | | | 432,820 | | | | 435,025 | | | Corporate Bonds | | Open/Demand |
RBC Capital Markets, LLC | | | 1.40 | % | | | 12/20/16 | | | | Open | | | | 1,519,560 | | | | 1,527,301 | | | Corporate Bonds | | Open/Demand |
RBC Capital Markets, LLC | | | 1.04 | % | | | 12/21/16 | | | | Open | | | | 518,475 | | | | 520,422 | | | Corporate Bonds | | Open/Demand |
RBC Capital Markets, LLC | | | 1.04 | % | | | 12/21/16 | | | | Open | | | | 1,216,000 | | | | 1,220,567 | | | Corporate Bonds | | Open/Demand |
RBC Capital Markets, LLC | | | 1.04 | % | | | 12/21/16 | | | | Open | | | | 2,187,000 | | | | 2,195,213 | | | Corporate Bonds | | Open/Demand |
RBC Capital Markets, LLC | | | 1.04 | % | | | 12/21/16 | | | | Open | | | | 1,405,920 | | | | 1,411,200 | | | Corporate Bonds | | Open/Demand |
RBC Capital Markets, LLC | | | 1.15 | % | | | 12/21/16 | | | | Open | | | | 481,000 | | | | 482,997 | | | Corporate Bonds | | Open/Demand |
RBC Capital Markets, LLC | | | 1.40 | % | | | 12/21/16 | | | | Open | | | | 607,050 | | | | 610,119 | | | Corporate Bonds | | Open/Demand |
RBC Capital Markets, LLC | | | 1.40 | % | | | 12/21/16 | | | | Open | | | | 460,350 | | | | 462,677 | | | Corporate Bonds | | Open/Demand |
RBC Capital Markets, LLC | | | 1.40 | % | | | 12/21/16 | | | | Open | | | | 930,315 | | | | 935,018 | | | Corporate Bonds | | Open/Demand |
RBC Capital Markets, LLC | | | 1.40 | % | | | 12/21/16 | | | | Open | | | | 694,875 | | | | 698,388 | | | Corporate Bonds | | Open/Demand |
RBC Capital Markets, LLC | | | 1.40 | % | | | 12/21/16 | | | | Open | | | | 930,388 | | | | 935,091 | | | Corporate Bonds | | Open/Demand |
RBC Capital Markets, LLC | | | 1.40 | % | | | 12/21/16 | | | | Open | | | | 662,025 | | | | 665,372 | | | Corporate Bonds | | Open/Demand |
RBC Capital Markets, LLC | | | 1.40 | % | | | 12/21/16 | | | | Open | | | | 386,100 | | | | 388,052 | | | Corporate Bonds | | Open/Demand |
RBC Capital Markets, LLC | | | 1.40 | % | | | 12/21/16 | | | | Open | | | | 593,175 | | | | 596,174 | | | Corporate Bonds | | Open/Demand |
RBC Capital Markets, LLC | | | 1.40 | % | | | 12/21/16 | | | | Open | | | | 736,000 | | | | 739,721 | | | Corporate Bonds | | Open/Demand |
See Notes to Financial Statements.
| | | | | | |
| | | | | | | |
| 58 | | SEMI-ANNUAL REPORT | | APRIL 30, 2017 | | |
| | |
Consolidated Schedule of Investments (continued) | | BlackRock Multi-Sector Income Trust (BIT) |
| | | | | | | | | | | | | | | | | | | | | | | | |
| Reverse Repurchase Agreements (continued) | | | | | | | | | | | |
| Counterparty | | Interest
Rate | | | Trade
Date | | | Maturity
Date1 | | | Face Value | | | Face Value
Including
Accrued
Interest | | | Type of
Non-Cash
Underlying
Collateral | | Remaining
Contractual
Maturity of
the Agreements1 |
RBC Capital Markets, LLC | | | 1.40 | % | | | 12/21/16 | | | | Open | | | $ | 638,400 | | | $ | 641,627 | | | Corporate Bonds | | Open/Demand |
RBC Capital Markets, LLC | | | 1.40 | % | | | 12/21/16 | | | | Open | | | | 232,313 | | | | 233,487 | | | Corporate Bonds | | Open/Demand |
RBC Capital Markets, LLC | | | 1.40 | % | | | 12/21/16 | | | | Open | | | | 106,600 | | | | 107,139 | | | Corporate Bonds | | Open/Demand |
RBC Capital Markets, LLC | | | 1.40 | % | | | 12/21/16 | | | | Open | | | | 351,750 | | | | 353,528 | | | Corporate Bonds | | Open/Demand |
RBC Capital Markets, LLC | | | 1.40 | % | | | 12/21/16 | | | | Open | | | | 312,375 | | | | 313,954 | | | Corporate Bonds | | Open/Demand |
RBC Capital Markets, LLC | | | 1.04 | % | | | 1/06/17 | | | | Open | | | | 463,750 | | | | 465,250 | | | Corporate Bonds | | Open/Demand |
RBC Capital Markets, LLC | | | 1.04 | % | | | 1/06/17 | | | | Open | | | | 382,193 | | | | 383,429 | | | Corporate Bonds | | Open/Demand |
RBC Capital Markets, LLC | | | 1.04 | % | | | 1/06/17 | | | | Open | | | | 440,000 | | | | 441,424 | | | Corporate Bonds | | Open/Demand |
RBC Capital Markets, LLC | | | 1.04 | % | | | 1/06/17 | | | | Open | | | | 267,000 | | | | 267,864 | | | Corporate Bonds | | Open/Demand |
RBC Capital Markets, LLC | | | 1.04 | % | | | 1/06/17 | | | | Open | | | | 357,825 | | | | 358,983 | | | Corporate Bonds | | Open/Demand |
RBC Capital Markets, LLC | | | 1.04 | % | | | 1/06/17 | | | | Open | | | | 353,350 | | | | 354,493 | | | Corporate Bonds | | Open/Demand |
RBC Capital Markets, LLC | | | 1.04 | % | | | 1/06/17 | | | | Open | | | | 729,375 | | | | 731,735 | | | Corporate Bonds | | Open/Demand |
RBC Capital Markets, LLC | | | 1.04 | % | | | 1/06/17 | | | | Open | | | | 290,625 | | | | 291,565 | | | Corporate Bonds | | Open/Demand |
RBC Capital Markets, LLC | | | 1.04 | % | | | 1/06/17 | | | | Open | | | | 300,800 | | | | 301,773 | | | Corporate Bonds | | Open/Demand |
RBC Capital Markets, LLC | | | 1.04 | % | | | 1/06/17 | | | | Open | | | | 442,500 | | | | 443,932 | | | Corporate Bonds | | Open/Demand |
RBC Capital Markets, LLC | | | 1.04 | % | | | 1/06/17 | | | | Open | | | | 287,250 | | | | 288,179 | | | Corporate Bonds | | Open/Demand |
RBC Capital Markets, LLC | | | 1.04 | % | | | 1/06/17 | | | | Open | | | | 482,500 | | | | 484,061 | | | Corporate Bonds | | Open/Demand |
RBC Capital Markets, LLC | | | 1.04 | % | | | 1/06/17 | | | | Open | | | | 508,750 | | | | 510,396 | | | Corporate Bonds | | Open/Demand |
RBC Capital Markets, LLC | | | 1.04 | % | | | 1/06/17 | | | | Open | | | | 503,750 | | | | 505,380 | | | Corporate Bonds | | Open/Demand |
RBC Capital Markets, LLC | | | 1.04 | % | | | 1/06/17 | | | | Open | | | | 240,625 | | | | 241,404 | | | Corporate Bonds | | Open/Demand |
RBC Capital Markets, LLC | | | 1.04 | % | | | 1/06/17 | | | | Open | | | | 644,000 | | | | 646,084 | | | Corporate Bonds | | Open/Demand |
RBC Capital Markets, LLC | | | 1.04 | % | | | 1/06/17 | | | | Open | | | | 411,000 | | | | 412,330 | | | Corporate Bonds | | Open/Demand |
RBC Capital Markets, LLC | | | 1.04 | % | | | 1/06/17 | | | | Open | | | | 1,017,500 | | | | 1,020,792 | | | Corporate Bonds | | Open/Demand |
RBC Capital Markets, LLC | | | 1.04 | % | | | 1/06/17 | | | | Open | | | | 253,125 | | | | 253,944 | | | Corporate Bonds | | Open/Demand |
RBC Capital Markets, LLC | | | 1.70 | % | | | 1/09/17 | | | | Open | | | | 764,660 | | | | 768,122 | | | Corporate Bonds | | Open/Demand |
RBC Capital Markets, LLC | | | 1.70 | % | | | 1/17/17 | | | | Open | | | | 502,848 | | | | 505,007 | | | Corporate Bonds | | Open/Demand |
RBC Capital Markets, LLC | | | 1.40 | % | | | 1/18/17 | | | | Open | | | | 537,600 | | | | 539,753 | | | Corporate Bonds | | Open/Demand |
RBC Capital Markets, LLC | | | 1.40 | % | | | 1/18/17 | | | | Open | | | | 693,504 | | | | 696,282 | | | Corporate Bonds | | Open/Demand |
RBC Capital Markets, LLC | | | 1.40 | % | | | 1/18/17 | | | | Open | | | | 687,608 | | | | 690,362 | | | Corporate Bonds | | Open/Demand |
RBC Capital Markets, LLC | | | 1.40 | % | | | 1/18/17 | | | | Open | | | | 1,288,064 | | | | 1,293,223 | | | Corporate Bonds | | Open/Demand |
RBC Capital Markets, LLC | | | 1.40 | % | | | 1/18/17 | | | | Open | | | | 819,400 | | | | 822,682 | | | Corporate Bonds | | Open/Demand |
RBC Capital Markets, LLC | | | 1.40 | % | | | 1/18/17 | | | | Open | | | | 653,808 | | | | 656,427 | | | Corporate Bonds | | Open/Demand |
RBC Capital Markets, LLC | | | 1.40 | % | | | 1/18/17 | | | | Open | | | | 1,575,040 | | | | 1,581,349 | | | Corporate Bonds | | Open/Demand |
RBC Capital Markets, LLC | | | 1.70 | % | | | 1/18/17 | | | | Open | | | | 736,800 | | | | 739,878 | | | Corporate Bonds | | Open/Demand |
RBC Capital Markets, LLC | | | 1.40 | % | | | 1/20/17 | | | | Open | | | | 403,760 | | | | 405,346 | | | Corporate Bonds | | Open/Demand |
RBC Capital Markets, LLC | | | 1.40 | % | | | 1/20/17 | | | | Open | | | | 2,396,192 | | | | 2,405,604 | | | Corporate Bonds | | Open/Demand |
RBC Capital Markets, LLC | | | 1.40 | % | | | 1/20/17 | | | | Open | | | | 888,216 | | | | 891,705 | | | Corporate Bonds | | Open/Demand |
RBC Capital Markets, LLC | | | 1.40 | % | | | 1/20/17 | | | | Open | | | | 358,904 | | | | 360,314 | | | Corporate Bonds | | Open/Demand |
RBC Capital Markets, LLC | | | 1.40 | % | | | 1/20/17 | | | | Open | | | | 475,992 | | | | 477,862 | | | Corporate Bonds | | Open/Demand |
RBC Capital Markets, LLC | | | 1.40 | % | | | 1/20/17 | | | | Open | | | | 434,248 | | | | 435,954 | | | Corporate Bonds | | Open/Demand |
RBC Capital Markets, LLC | | | 1.70 | % | | | 1/23/17 | | | | Open | | | | 238,850 | | | | 239,811 | | | Corporate Bonds | | Open/Demand |
HSBC Securities (USA), Inc. | | | 1.25 | % | | | 1/26/17 | | | | Open | | | | 270,000 | | | | 270,853 | | | Corporate Bonds | | Open/Demand |
RBC Capital Markets, LLC | | | 1.40 | % | | | 1/30/17 | | | | Open | | | | 118,990 | | | | 119,411 | | | Corporate Bonds | | Open/Demand |
RBC Capital Markets, LLC | | | 1.40 | % | | | 1/30/17 | | | | Open | | | | 107,085 | | | | 107,464 | | | Corporate Bonds | | Open/Demand |
RBC Capital Markets, LLC | | | 1.40 | % | | | 1/30/17 | | | | Open | | | | 399,500 | | | | 400,914 | | | Corporate Bonds | | Open/Demand |
RBC Capital Markets, LLC | | | 1.40 | % | | | 1/30/17 | | | | Open | | | | 336,550 | | | | 337,741 | | | Corporate Bonds | | Open/Demand |
RBC Capital Markets, LLC | | | 1.40 | % | | | 1/30/17 | | | | Open | | | | 221,650 | | | | 222,434 | | | Corporate Bonds | | Open/Demand |
RBC Capital Markets, LLC | | | 1.40 | % | | | 2/03/17 | | | | Open | | | | 389,620 | | | | 390,938 | | | Corporate Bonds | | Open/Demand |
RBC Capital Markets, LLC | | | 1.40 | % | | | 2/03/17 | | | | Open | | | | 927,350 | | | | 930,488 | | | Corporate Bonds | | Open/Demand |
RBC Capital Markets, LLC | | | 1.40 | % | | | 2/03/17 | | | | Open | | | | 618,240 | | | | 620,332 | | | Corporate Bonds | | Open/Demand |
RBC Capital Markets, LLC | | | 1.40 | % | | | 2/03/17 | | | | Open | | | | 487,640 | | | | 489,290 | | | Corporate Bonds | | Open/Demand |
RBC Capital Markets, LLC | | | 1.40 | % | | | 2/03/17 | | | | Open | | | | 551,475 | | | | 553,341 | | | Corporate Bonds | | Open/Demand |
RBC Capital Markets, LLC | | | 1.40 | % | | | 2/03/17 | | | | Open | | | | 123,975 | | | | 124,375 | | | Corporate Bonds | | Open/Demand |
RBC Capital Markets, LLC | | | 1.70 | % | | | 2/06/17 | | | | Open | | | | 391,050 | | | | 392,425 | | | Corporate Bonds | | Open/Demand |
RBC Capital Markets, LLC | | | 1.70 | % | | | 2/06/17 | | | | Open | | | | 254,790 | | | | 255,686 | | | Corporate Bonds | | Open/Demand |
RBC Capital Markets, LLC | | | 1.70 | % | | | 2/06/17 | | | | Open | | | | 574,600 | | | | 576,621 | | | Corporate Bonds | | Open/Demand |
RBC Capital Markets, LLC | | | 1.70 | % | | | 2/06/17 | | | | Open | | | | 261,525 | | | | 262,445 | | | Corporate Bonds | | Open/Demand |
RBC Capital Markets, LLC | | | 1.70 | % | | | 2/06/17 | | | | Open | | | | 310,980 | | | | 312,074 | | | Corporate Bonds | | Open/Demand |
RBC Capital Markets, LLC | | | 1.70 | % | | | 2/06/17 | | | | Open | | | | 442,400 | | | | 443,956 | | | Corporate Bonds | | Open/Demand |
RBC Capital Markets, LLC | | | 1.70 | % | | | 2/06/17 | | | | Open | | | | 1,428,430 | | | | 1,433,342 | | | Corporate Bonds | | Open/Demand |
RBC Capital Markets, LLC | | | 1.70 | % | | | 2/07/17 | | | | Open | | | | 271,990 | | | | 272,915 | | | Corporate Bonds | | Open/Demand |
RBC Capital Markets, LLC | | | 1.70 | % | | | 2/08/17 | | | | Open | | | | 311,040 | | | | 312,085 | | | Corporate Bonds | | Open/Demand |
RBC Capital Markets, LLC | | | 1.70 | % | | | 2/09/17 | | | | Open | | | | 163,400 | | | | 163,956 | | | Corporate Bonds | | Open/Demand |
See Notes to Financial Statements.
| | | | | | |
| | | | | | | |
| | SEMI-ANNUAL REPORT | | APRIL 30, 2017 | | 59 |
| | |
Consolidated Schedule of Investments (continued) | | BlackRock Multi-Sector Income Trust (BIT) |
| | | | | | | | | | | | | | | | | | | | | | | | |
| Reverse Repurchase Agreements (continued) | | | | | | | | | | | |
| Counterparty | | Interest
Rate | | | Trade
Date | | | Maturity
Date1 | | | Face Value | | | Face Value
Including
Accrued
Interest | | | Type of
Non-Cash
Underlying
Collateral | | Remaining
Contractual
Maturity of
the Agreements1 |
RBC Capital Markets, LLC | | | 1.70 | % | | | 2/09/17 | | | | Open | | | $ | 262,550 | | | $ | 263,443 | | | Corporate Bonds | | Open/Demand |
RBC Capital Markets, LLC | | | 1.34 | % | | | 2/10/17 | | | | Open | | | | 585,000 | | | | 586,431 | | | Corporate Bonds | | Open/Demand |
RBC Capital Markets, LLC | | | 1.70 | % | | | 2/13/17 | | | | Open | | | | 99,704 | | | | 100,020 | | | Corporate Bonds | | Open/Demand |
RBC Capital Markets, LLC | | | 1.40 | % | | | 2/15/17 | | | | Open | | | | 405,450 | | | | 406,633 | | | Corporate Bonds | | Open/Demand |
RBC Capital Markets, LLC | | | 1.40 | % | | | 2/15/17 | | | | Open | | | | 1,578,450 | | | | 1,583,054 | | | Corporate Bonds | | Open/Demand |
RBC Capital Markets, LLC | | | 1.40 | % | | | 2/15/17 | | | | Open | | | | 258,570 | | | | 259,324 | | | Corporate Bonds | | Open/Demand |
RBC Capital Markets, LLC | | | 1.40 | % | | | 2/15/17 | | | | Open | | | | 397,100 | | | | 398,258 | | | Corporate Bonds | | Open/Demand |
RBC Capital Markets, LLC | | | 1.40 | % | | | 2/15/17 | | | | Open | | | | 266,710 | | | | 267,488 | | | Corporate Bonds | | Open/Demand |
RBC Capital Markets, LLC | | | 1.40 | % | | | 2/15/17 | | | | Open | | | | 852,600 | | | | 855,087 | | | Corporate Bonds | | Open/Demand |
RBC Capital Markets, LLC | | | 1.40 | % | | | 2/15/17 | | | | Open | | | | 212,940 | | | | 213,561 | | | Corporate Bonds | | Open/Demand |
RBC Capital Markets, LLC | | | 1.40 | % | | | 2/15/17 | | | | Open | | | | 569,600 | | | | 571,261 | | | Corporate Bonds | | Open/Demand |
RBC Capital Markets, LLC | | | 1.70 | % | | | 2/16/17 | | | | Open | | | | 202,364 | | | | 202,997 | | | Corporate Bonds | | Open/Demand |
RBC Capital Markets, LLC | | | 1.70 | % | | | 2/17/17 | | | | Open | | | | 137,535 | | | | 137,933 | | | Corporate Bonds | | Open/Demand |
RBC Capital Markets, LLC | | | 1.40 | % | | | 2/23/17 | | | | Open | | | | 1,422,080 | | | | 1,425,564 | | | Corporate Bonds | | Open/Demand |
RBC Capital Markets, LLC | | | 1.40 | % | | | 2/23/17 | | | | Open | | | | 444,150 | | | | 445,238 | | | Corporate Bonds | | Open/Demand |
RBC Capital Markets, LLC | | | 1.40 | % | | | 2/24/17 | | | | Open | | | | 504,000 | | | | 505,294 | | | Corporate Bonds | | Open/Demand |
RBC Capital Markets, LLC | | | 1.40 | % | | | 2/24/17 | | | | Open | | | | 925,100 | | | | 927,474 | | | Corporate Bonds | | Open/Demand |
RBC Capital Markets, LLC | | | 1.40 | % | | | 2/24/17 | | | | Open | | | | 466,200 | | | | 467,397 | | | Corporate Bonds | | Open/Demand |
RBC Capital Markets, LLC | | | 1.40 | % | | | 2/24/17 | | | | Open | | | | 251,875 | | | | 252,521 | | | Corporate Bonds | | Open/Demand |
RBC Capital Markets, LLC | | | 1.40 | % | | | 2/24/17 | | | | Open | | | | 860,655 | | | | 862,864 | | | Corporate Bonds | | Open/Demand |
RBC Capital Markets, LLC | | | 1.40 | % | | | 2/24/17 | | | | Open | | | | 262,960 | | | | 263,635 | | | Corporate Bonds | | Open/Demand |
RBC Capital Markets, LLC | | | 1.40 | % | | | 2/24/17 | | | | Open | | | | 267,090 | | | | 267,776 | | | Corporate Bonds | | Open/Demand |
RBC Capital Markets, LLC | | | 1.40 | % | | | 2/24/17 | | | | Open | | | | 273,075 | | | | 273,776 | | | Corporate Bonds | | Open/Demand |
RBC Capital Markets, LLC | | | 1.40 | % | | | 2/24/17 | | | | Open | | | | 255,200 | | | | 255,855 | | | Corporate Bonds | | Open/Demand |
RBC Capital Markets, LLC | | | 1.40 | % | | | 2/24/17 | | | | Open | | | | 340,200 | | | | 341,073 | | | Corporate Bonds | | Open/Demand |
RBC Capital Markets, LLC | | | 1.40 | % | | | 2/24/17 | | | | Open | | | | 331,470 | | | | 332,321 | | | Corporate Bonds | | Open/Demand |
RBC Capital Markets, LLC | | | 1.40 | % | | | 2/24/17 | | | | Open | | | | 256,000 | | | | 256,657 | | | Corporate Bonds | | Open/Demand |
RBC Capital Markets, LLC | | | 1.40 | % | | | 2/24/17 | | | | Open | | | | 308,000 | | | | 308,791 | | | Corporate Bonds | | Open/Demand |
RBC Capital Markets, LLC | | | 1.40 | % | | | 2/24/17 | | | | Open | | | | 741,125 | | | | 743,027 | | | Corporate Bonds | | Open/Demand |
RBC Capital Markets, LLC | | | 1.40 | % | | | 2/24/17 | | | | Open | | | | 287,550 | | | | 288,288 | | | Corporate Bonds | | Open/Demand |
RBC Capital Markets, LLC | | | 1.40 | % | | | 2/24/17 | | | | Open | | | | 275,550 | | | | 276,257 | | | Corporate Bonds | | Open/Demand |
RBC Capital Markets, LLC | | | 1.40 | % | | | 2/24/17 | | | | Open | | | | 264,275 | | | | 264,953 | | | Corporate Bonds | | Open/Demand |
RBC Capital Markets, LLC | | | 1.40 | % | | | 2/24/17 | | | | Open | | | | 797,400 | | | | 799,447 | | | Corporate Bonds | | Open/Demand |
RBC Capital Markets, LLC | | | 1.40 | % | | | 2/24/17 | | | | Open | | | | 381,840 | | | | 382,820 | | | Corporate Bonds | | Open/Demand |
RBC Capital Markets, LLC | | | 1.40 | % | | | 2/24/17 | | | | Open | | | | 334,400 | | | | 335,258 | | | Corporate Bonds | | Open/Demand |
RBC Capital Markets, LLC | | | 1.40 | % | | | 2/24/17 | | | | Open | | | | 320,460 | | | | 321,283 | | | Corporate Bonds | | Open/Demand |
RBC Capital Markets, LLC | | | 1.40 | % | | | 2/24/17 | | | | Open | | | | 305,100 | | | | 305,883 | | | Corporate Bonds | | Open/Demand |
RBC Capital Markets, LLC | | | 1.40 | % | | | 2/24/17 | | | | Open | | | | 269,775 | | | | 270,467 | | | Corporate Bonds | | Open/Demand |
RBC Capital Markets, LLC | | | 1.40 | % | | | 2/24/17 | | | | Open | | | | 400,200 | | | | 401,227 | | | Corporate Bonds | | Open/Demand |
RBC Capital Markets, LLC | | | 1.40 | % | | | 2/24/17 | | | | Open | | | | 373,500 | | | | 374,459 | | | Corporate Bonds | | Open/Demand |
RBC Capital Markets, LLC | | | 1.70 | % | | | 2/24/17 | | | | Open | | | | 136,950 | | | | 137,314 | | | Corporate Bonds | | Open/Demand |
RBC Capital Markets, LLC | | | 1.40 | % | | | 3/01/17 | | | | Open | | | | 214,650 | | | | 215,159 | | | Corporate Bonds | | Open/Demand |
RBC Capital Markets, LLC | | | 1.40 | % | | | 3/01/17 | | | | Open | | | | 260,260 | | | | 260,877 | | | Corporate Bonds | | Open/Demand |
RBC Capital Markets, LLC | | | 1.40 | % | | | 3/01/17 | | | | Open | | | | 127,440 | | | | 127,742 | | | Corporate Bonds | | Open/Demand |
RBC Capital Markets, LLC | | | 1.40 | % | | | 3/01/17 | | | | Open | | | | 222,600 | | | | 223,128 | | | Corporate Bonds | | Open/Demand |
RBC Capital Markets, LLC | | | 1.40 | % | | | 3/01/17 | | | | Open | | | | 241,165 | | | | 241,737 | | | Corporate Bonds | | Open/Demand |
RBC Capital Markets, LLC | | | 1.40 | % | | | 3/01/17 | | | | Open | | | | 149,040 | | | | 149,394 | | | Corporate Bonds | | Open/Demand |
RBC Capital Markets, LLC | | | 1.40 | % | | | 3/01/17 | | | | Open | | | | 203,550 | | | | 204,033 | | | Corporate Bonds | | Open/Demand |
RBC Capital Markets, LLC | | | 1.70 | % | | | 3/02/17 | | | | Open | | | | 400,000 | | | | 400,971 | | | Corporate Bonds | | Open/Demand |
Deutsche Bank Securities, Inc. | | | 1.45 | % | | | 3/06/17 | | | | Open | | | | 711,000 | | | | 712,546 | | | Corporate Bonds | | Open/Demand |
RBC Capital Markets, LLC | | | 1.40 | % | | | 3/06/17 | | | | Open | | | | 120,960 | | | | 121,214 | | | Corporate Bonds | | Open/Demand |
RBC Capital Markets, LLC | | | 1.40 | % | | | 3/06/17 | | | | Open | | | | 359,640 | | | | 360,395 | | | Corporate Bonds | | Open/Demand |
RBC Capital Markets, LLC | | | 1.40 | % | | | 3/06/17 | | | | Open | | | | 597,645 | | | | 598,900 | | | Corporate Bonds | | Open/Demand |
Deutsche Bank Securities, Inc. | | | 1.70 | % | | | 3/07/17 | | | | Open | | | | 521,000 | | | | 522,221 | | | Corporate Bonds | | Open/Demand |
RBC Capital Markets, LLC | | | 1.70 | % | | | 3/07/17 | | | | Open | | | | 655,200 | | | | 656,714 | | | Corporate Bonds | | Open/Demand |
RBC Capital Markets, LLC | | | 1.70 | % | | | 3/07/17 | | | | Open | | | | 423,916 | | | | 424,929 | | | Corporate Bonds | | Open/Demand |
RBC Capital Markets, LLC | | | 1.70 | % | | | 3/07/17 | | | | Open | | | | 1,048,381 | | | | 1,050,885 | | | Corporate Bonds | | Open/Demand |
RBC Capital Markets, LLC | | | 1.70 | % | | | 3/08/17 | | | | Open | | | | 258,375 | | | | 258,962 | | | Corporate Bonds | | Open/Demand |
RBC Capital Markets, LLC | | | 1.70 | % | | | 3/09/17 | | | | Open | | | | 558,740 | | | | 559,944 | | | Corporate Bonds | | Open/Demand |
RBC Capital Markets, LLC | | | 1.70 | % | | | 3/09/17 | | | | Open | | | | 209,125 | | | | 209,576 | | | Corporate Bonds | | Open/Demand |
RBC Capital Markets, LLC | | | 1.40 | % | | | 3/10/17 | | | | Open | | | | 96,990 | | | | 97,186 | | | Corporate Bonds | | Open/Demand |
See Notes to Financial Statements.
| | | | | | |
| | | | | | | |
| 60 | | SEMI-ANNUAL REPORT | | APRIL 30, 2017 | | |
| | |
Consolidated Schedule of Investments (continued) | | BlackRock Multi-Sector Income Trust (BIT) |
| | | | | | | | | | | | | | | | | | | | | | | | |
| Reverse Repurchase Agreements (continued) | | | | | | | | | | | |
| Counterparty | | Interest
Rate | | | Trade
Date | | | Maturity
Date1 | | | Face Value | | | Face Value
Including
Accrued
Interest | | | Type of
Non-Cash
Underlying
Collateral | | Remaining
Contractual
Maturity of
the Agreements1 |
RBC Capital Markets, LLC | | | 1.40 | % | | | 3/10/17 | | | | Open | | | $ | 172,260 | | | $ | 172,608 | | | Corporate Bonds | | Open/Demand |
RBC Capital Markets, LLC | | | 1.40 | % | | | 3/10/17 | | | | Open | | | | 102,300 | | | | 102,507 | | | Corporate Bonds | | Open/Demand |
RBC Capital Markets, LLC | | | 1.40 | % | | | 3/10/17 | | | | Open | | | | 130,380 | | | | 130,644 | | | Corporate Bonds | | Open/Demand |
RBC Capital Markets, LLC | | | 1.40 | % | | | 3/10/17 | | | | Open | | | | 301,785 | | | | 302,395 | | | Corporate Bonds | | Open/Demand |
RBC Capital Markets, LLC | | | 1.40 | % | | | 3/10/17 | | | | Open | | | | 293,460 | | | | 294,053 | | | Corporate Bonds | | Open/Demand |
RBC Capital Markets, LLC | | | 1.40 | % | | | 3/10/17 | | | | Open | | | | 221,610 | | | | 222,058 | | | Corporate Bonds | | Open/Demand |
RBC Capital Markets, LLC | | | 1.40 | % | | | 3/10/17 | | | | Open | | | | 131,720 | | | | 131,986 | | | Corporate Bonds | | Open/Demand |
RBC Capital Markets, LLC | | | 1.40 | % | | | 3/10/17 | | | | Open | | | | 122,310 | | | | 122,557 | | | Corporate Bonds | | Open/Demand |
RBC Capital Markets, LLC | | | 1.40 | % | | | 3/10/17 | | | | Open | | | | 66,040 | | | | 66,174 | | | Corporate Bonds | | Open/Demand |
RBC Capital Markets, LLC | | | 1.40 | % | | | 3/10/17 | | | | Open | | | | 66,675 | | | | 66,810 | | | Corporate Bonds | | Open/Demand |
BNP Paribas S.A. | | | 1.71 | % | | | 3/13/17 | | | | Open | | | | 1,315,000 | | | | 1,317,780 | | | Corporate Bonds | | Open/Demand |
Deutsche Bank Securities, Inc. | | | 1.45 | % | | | 3/13/17 | | | | Open | | | | 228,000 | | | | 228,450 | | | Corporate Bonds | | Open/Demand |
Deutsche Bank Securities, Inc. | | | 1.45 | % | | | 3/13/17 | | | | Open | | | | 206,000 | | | | 206,407 | | | Corporate Bonds | | Open/Demand |
Deutsche Bank Securities, Inc. | | | 1.45 | % | | | 3/13/17 | | | | Open | | | | 167,000 | | | | 167,330 | | | Corporate Bonds | | Open/Demand |
Deutsche Bank Securities, Inc. | | | 1.45 | % | | | 3/13/17 | | | | Open | | | | 193,000 | | | | 193,381 | | | Corporate Bonds | | Open/Demand |
Deutsche Bank Securities, Inc. | | | 1.45 | % | | | 3/13/17 | | | | Open | | | | 121,000 | | | | 121,239 | | | Corporate Bonds | | Open/Demand |
Deutsche Bank Securities, Inc. | | | 1.45 | % | | | 3/13/17 | | | | Open | | | | 202,000 | | | | 202,399 | | | Corporate Bonds | | Open/Demand |
Deutsche Bank Securities, Inc. | | | 1.45 | % | | | 3/13/17 | | | | Open | | | | 162,000 | | | | 162,320 | | | Corporate Bonds | | Open/Demand |
Deutsche Bank Securities, Inc. | | | 1.45 | % | | | 3/13/17 | | | | Open | | | | 179,000 | | | | 179,353 | | | Corporate Bonds | | Open/Demand |
Deutsche Bank Securities, Inc. | | | 1.45 | % | | | 3/13/17 | | | | Open | | | | 231,000 | | | | 231,456 | | | Corporate Bonds | | Open/Demand |
Deutsche Bank Securities, Inc. | | | 1.45 | % | | | 3/13/17 | | | | Open | | | | 299,000 | | | | 299,590 | | | Corporate Bonds | | Open/Demand |
Deutsche Bank Securities, Inc. | | | 1.45 | % | | | 3/13/17 | | | | Open | | | | 140,000 | | | | 140,276 | | | Corporate Bonds | | Open/Demand |
Deutsche Bank Securities, Inc. | | | 1.45 | % | | | 3/13/17 | | | | Open | | | | 189,000 | | | | 189,373 | | | Corporate Bonds | | Open/Demand |
Deutsche Bank Securities, Inc. | | | 1.45 | % | | | 3/13/17 | | | | Open | | | | 212,000 | | | | 212,418 | | | Corporate Bonds | | Open/Demand |
Deutsche Bank Securities, Inc. | | | 1.45 | % | | | 3/13/17 | | | | Open | | | | 272,000 | | | | 272,537 | | | Corporate Bonds | | Open/Demand |
Deutsche Bank Securities, Inc. | | | 1.45 | % | | | 3/13/17 | | | | Open | | | | 220,000 | | | | 220,434 | | | Corporate Bonds | | Open/Demand |
Deutsche Bank Securities, Inc. | | | 1.45 | % | | | 3/13/17 | | | | Open | | | | 237,000 | | | | 237,468 | | | Corporate Bonds | | Open/Demand |
Deutsche Bank Securities, Inc. | | | 1.70 | % | | | 3/13/17 | | | | Open | | | | 439,000 | | | | 439,923 | | | Corporate Bonds | | Open/Demand |
Deutsche Bank Securities, Inc. | | | 1.70 | % | | | 3/15/17 | | | | Open | | | | 125,000 | | | | 125,266 | | | Corporate Bonds | | Open/Demand |
Deutsche Bank Securities, Inc. | | | 1.30 | % | | | 3/16/17 | | | | Open | | | | 2,535,000 | | | | 2,539,119 | | | Capital Trusts | | Open/Demand |
Deutsche Bank Securities, Inc. | | | 1.30 | % | | | 3/16/17 | | | | Open | | | | 2,413,000 | | | | 2,416,921 | | | Corporate Bonds | | Open/Demand |
Deutsche Bank Securities, Inc. | | | 1.30 | % | | | 3/16/17 | | | | Open | | | | 1,924,000 | | | | 1,927,127 | | | Corporate Bonds | | Open/Demand |
Deutsche Bank Securities, Inc. | | | 1.30 | % | | | 3/16/17 | | | | Open | | | | 1,753,000 | | | | 1,755,849 | | | Capital Trusts | | Open/Demand |
Deutsche Bank Securities, Inc. | | | 1.70 | % | | | 3/16/17 | | | | Open | | | | 1,694,000 | | | | 1,697,600 | | | Corporate Bonds | | Open/Demand |
Deutsche Bank Securities, Inc. | | | 1.70 | % | | | 3/16/17 | | | | Open | | | | 741,000 | | | | 742,575 | | | Corporate Bonds | | Open/Demand |
Deutsche Bank Securities, Inc. | | | 1.70 | % | | | 3/16/17 | | | | Open | | | | 1,837,500 | | | | 1,841,405 | | | Corporate Bonds | | Open/Demand |
Deutsche Bank Securities, Inc. | | | 1.70 | % | | | 3/16/17 | | | | Open | | | | 2,525,000 | | | | 2,530,366 | | | Corporate Bonds | | Open/Demand |
Deutsche Bank Securities, Inc. | | | 1.70 | % | | | 3/16/17 | | | | Open | | | | 5,729,000 | | | | 5,741,174 | | | Capital Trusts | | Open/Demand |
Deutsche Bank Securities, Inc. | | | 1.70 | % | | | 3/16/17 | | | | Open | | | | 3,224,000 | | | | 3,230,851 | | | Corporate Bonds | | Open/Demand |
Deutsche Bank Securities, Inc. | | | 1.70 | % | | | 3/16/17 | | | | Open | | | | 706,000 | | | | 707,500 | | | Corporate Bonds | | Open/Demand |
Deutsche Bank Securities, Inc. | | | 1.70 | % | | | 3/16/17 | | | | Open | | | | 2,859,000 | | | | 2,865,075 | | | Corporate Bonds | | Open/Demand |
Deutsche Bank Securities, Inc. | | | 1.70 | % | | | 3/16/17 | | | | Open | | | | 2,700,000 | | | | 2,705,738 | | | Capital Trusts | | Open/Demand |
Deutsche Bank Securities, Inc. | | | 1.70 | % | | | 3/16/17 | | | | Open | | | | 307,000 | | | | 307,652 | | | Corporate Bonds | | Open/Demand |
Deutsche Bank Securities, Inc. | | | 1.70 | % | | | 3/16/17 | | | | Open | | | | 1,176,000 | | | | 1,178,499 | | | Corporate Bonds | | Open/Demand |
Deutsche Bank Securities, Inc. | | | 1.70 | % | | | 3/16/17 | | | | Open | | | | 314,094 | | | | 314,761 | | | Corporate Bonds | | Open/Demand |
Deutsche Bank Securities, Inc. | | | 1.70 | % | | | 3/16/17 | | | | Open | | | | 4,544,000 | | | | 4,553,656 | | | Corporate Bonds | | Open/Demand |
Deutsche Bank Securities, Inc. | | | 1.70 | % | | | 3/16/17 | | | | Open | | | | 2,619,000 | | | | 2,624,565 | | | Capital Trusts | | Open/Demand |
Deutsche Bank Securities, Inc. | | | 1.70 | % | | | 3/16/17 | | | | Open | | | | 2,231,000 | | | | 2,235,741 | | | Corporate Bonds | | Open/Demand |
Deutsche Bank Securities, Inc. | | | 1.70 | % | | | 3/16/17 | | | | Open | | | | 967,000 | | | | 969,055 | | | Corporate Bonds | | Open/Demand |
Deutsche Bank Securities, Inc. | | | 1.70 | % | | | 3/16/17 | | | | Open | | | | 130,000 | | | | 130,276 | | | Corporate Bonds | | Open/Demand |
Deutsche Bank Securities, Inc. | | | 1.70 | % | | | 3/16/17 | | | | Open | | | | 901,000 | | | | 902,915 | | | Corporate Bonds | | Open/Demand |
Deutsche Bank Securities, Inc. | | | 1.70 | % | | | 3/16/17 | | | | Open | | | | 207,000 | | | | 207,440 | | | Corporate Bonds | | Open/Demand |
Deutsche Bank Securities, Inc. | | | 1.70 | % | | | 3/16/17 | | | | Open | | | | 1,242,000 | | | | 1,244,639 | | | Corporate Bonds | | Open/Demand |
Deutsche Bank Securities, Inc. | | | 1.70 | % | | | 3/16/17 | | | | Open | | | | 152,000 | | | | 152,323 | | | Corporate Bonds | | Open/Demand |
Deutsche Bank Securities, Inc. | | | 1.70 | % | | | 3/16/17 | | | | Open | | | | 852,000 | | | | 853,811 | | | Corporate Bonds | | Open/Demand |
Deutsche Bank Securities, Inc. | | | 1.70 | % | | | 3/16/17 | | | | Open | | | | 555,000 | | | | 556,179 | | | Corporate Bonds | | Open/Demand |
Deutsche Bank Securities, Inc. | | | 1.70 | % | | | 3/16/17 | | | | Open | | | | 665,000 | | | | 666,413 | | | Capital Trusts | | Open/Demand |
Deutsche Bank Securities, Inc. | | | 1.70 | % | | | 3/16/17 | | | | Open | | | | 653,000 | | | | 654,388 | | | Corporate Bonds | | Open/Demand |
Deutsche Bank Securities, Inc. | | | 1.70 | % | | | 3/16/17 | | | | Open | | | | 843,000 | | | | 844,791 | | | Corporate Bonds | | Open/Demand |
Deutsche Bank Securities, Inc. | | | 1.70 | % | | | 3/16/17 | | | | Open | | | | 768,000 | | | | 769,632 | | | Corporate Bonds | | Open/Demand |
Deutsche Bank Securities, Inc. | | | 1.70 | % | | | 3/16/17 | | | | Open | | | | 460,000 | | | | 460,978 | | | Corporate Bonds | | Open/Demand |
Deutsche Bank Securities, Inc. | | | 1.70 | % | | | 3/16/17 | | | | Open | | | | 1,105,000 | | | | 1,107,348 | | | Corporate Bonds | | Open/Demand |
Deutsche Bank Securities, Inc. | | | 1.70 | % | | | 3/16/17 | | | | Open | | | | 922,000 | | | | 923,959 | | | Corporate Bonds | | Open/Demand |
See Notes to Financial Statements.
| | | | | | |
| | | | | | | |
| | SEMI-ANNUAL REPORT | | APRIL 30, 2017 | | 61 |
| | |
Consolidated Schedule of Investments (continued) | | BlackRock Multi-Sector Income Trust (BIT) |
| | | | | | | | | | | | | | | | | | | | | | | | |
| Reverse Repurchase Agreements (continued) | | | | | | | | | | | |
| Counterparty | | Interest
Rate | | | Trade
Date | | | Maturity
Date1 | | | Face Value | | | Face Value
Including
Accrued
Interest | | | Type of
Non-Cash
Underlying
Collateral | | Remaining
Contractual
Maturity of
the Agreements1 |
Deutsche Bank Securities, Inc. | | | 1.70 | % | | | 3/16/17 | | | | Open | | | $ | 124,000 | | | $ | 124,263 | | | Corporate Bonds | | Open/Demand |
Deutsche Bank Securities, Inc. | | | 1.70 | % | | | 3/16/17 | | | | Open | | | | 310,000 | | | | 310,659 | | | Corporate Bonds | | Open/Demand |
Deutsche Bank Securities, Inc. | | | 1.70 | % | | | 3/16/17 | | | | Open | | | | 1,254,000 | | | | 1,256,665 | | | Corporate Bonds | | Open/Demand |
Deutsche Bank Securities, Inc. | | | 1.70 | % | | | 3/16/17 | | | | Open | | | | 377,000 | | | | 377,801 | | | Corporate Bonds | | Open/Demand |
Deutsche Bank Securities, Inc. | | | 1.70 | % | | | 3/16/17 | | | | Open | | | | 71,000 | | | | 71,151 | | | Corporate Bonds | | Open/Demand |
Deutsche Bank Securities, Inc. | | | 1.70 | % | | | 3/16/17 | | | | Open | | | | 1,504,000 | | | | 1,507,196 | | | Corporate Bonds | | Open/Demand |
Deutsche Bank Securities, Inc. | | | 1.70 | % | | | 3/16/17 | | | | Open | | | | 1,050,000 | | | | 1,052,231 | | | Corporate Bonds | | Open/Demand |
Deutsche Bank Securities, Inc. | | | 1.70 | % | | | 3/16/17 | | | | Open | | | | 939,000 | | | | 940,995 | | | Corporate Bonds | | Open/Demand |
Deutsche Bank Securities, Inc. | | | 1.70 | % | | | 3/16/17 | | | | Open | | | | 1,393,000 | | | | 1,395,960 | | | Corporate Bonds | | Open/Demand |
Deutsche Bank Securities, Inc. | | | 1.70 | % | | | 3/16/17 | | | | Open | | | | 43,000 | | | | 43,091 | | | Corporate Bonds | | Open/Demand |
Deutsche Bank Securities, Inc. | | | 1.70 | % | | | 3/16/17 | | | | Open | | | | 823,000 | | | | 824,749 | | | Corporate Bonds | | Open/Demand |
Deutsche Bank Securities, Inc. | | | 1.70 | % | | | 3/16/17 | | | | Open | | | | 1,240,000 | | | | 1,242,635 | | | Corporate Bonds | | Open/Demand |
Deutsche Bank Securities, Inc. | | | 1.70 | % | | | 3/16/17 | | | | Open | | | | 1,072,000 | | | | 1,074,278 | | | Capital Trusts | | Open/Demand |
Deutsche Bank Securities, Inc. | | | 1.70 | % | | | 3/16/17 | | | | Open | | | | 423,000 | | | | 423,899 | | | Capital Trusts | | Open/Demand |
Deutsche Bank Securities, Inc. | | | 1.70 | % | | | 3/16/17 | | | | Open | | | | 838,000 | | | | 839,781 | | | Corporate Bonds | | Open/Demand |
Deutsche Bank Securities, Inc. | | | 1.70 | % | | | 3/16/17 | | | | Open | | | | 127,000 | | | | 127,270 | | | Corporate Bonds | | Open/Demand |
Deutsche Bank Securities, Inc. | | | 1.70 | % | | | 3/16/17 | | | | Open | | | | 343,000 | | | | 343,729 | | | Corporate Bonds | | Open/Demand |
Deutsche Bank Securities, Inc. | | | 1.70 | % | | | 3/16/17 | | | | Open | | | | 1,110,000 | | | | 1,112,359 | | | Corporate Bonds | | Open/Demand |
Deutsche Bank Securities, Inc. | | | 1.70 | % | | | 3/16/17 | | | | Open | | | | 523,000 | | | | 524,111 | | | Corporate Bonds | | Open/Demand |
Deutsche Bank Securities, Inc. | | | 1.70 | % | | | 3/16/17 | | | | Open | | | | 714,000 | | | | 715,517 | | | Corporate Bonds | | Open/Demand |
Deutsche Bank Securities, Inc. | | | 1.70 | % | | | 3/16/17 | | | | Open | | | | 164,000 | | | | 164,349 | | | Corporate Bonds | | Open/Demand |
Deutsche Bank Securities, Inc. | | | 1.70 | % | | | 3/16/17 | | | | Open | | | | 623,000 | | | | 624,324 | | | Corporate Bonds | | Open/Demand |
Deutsche Bank Securities, Inc. | | | 1.70 | % | | | 3/16/17 | | | | Open | | | | 540,000 | | | | 541,148 | | | Corporate Bonds | | Open/Demand |
Deutsche Bank Securities, Inc. | | | 1.70 | % | | | 3/16/17 | | | | Open | | | | 137,000 | | | | 137,291 | | | Corporate Bonds | | Open/Demand |
Deutsche Bank Securities, Inc. | | | 1.70 | % | | | 3/16/17 | | | | Open | | | | 122,000 | | | | 122,259 | | | Corporate Bonds | | Open/Demand |
Deutsche Bank Securities, Inc. | | | 1.70 | % | | | 3/16/17 | | | | Open | | | | 1,472,000 | | | | 1,475,128 | | | Capital Trusts | | Open/Demand |
Deutsche Bank Securities, Inc. | | | 1.70 | % | | | 3/16/17 | | | | Open | | | | 1,153,000 | | | | 1,155,450 | | | Corporate Bonds | | Open/Demand |
Deutsche Bank Securities, Inc. | | | 1.70 | % | | | 3/16/17 | | | | Open | | | | 533,781 | | | | 534,916 | | | Corporate Bonds | | Open/Demand |
Deutsche Bank Securities, Inc. | | | 1.70 | % | | | 3/16/17 | | | | Open | | | | 314,000 | | | | 314,667 | | | Corporate Bonds | | Open/Demand |
Deutsche Bank Securities, Inc. | | | 1.70 | % | | | 3/16/17 | | | | Open | | | | 582,000 | | | | 583,237 | | | Capital Trusts | | Open/Demand |
Deutsche Bank Securities, Inc. | | | 1.70 | % | | | 3/16/17 | | | | Open | | | | 170,000 | | | | 170,361 | | | Corporate Bonds | | Open/Demand |
Deutsche Bank Securities, Inc. | | | 1.70 | % | | | 3/16/17 | | | | Open | | | | 226,000 | | | | 226,480 | | | Corporate Bonds | | Open/Demand |
Deutsche Bank Securities, Inc. | | | 1.70 | % | | | 3/16/17 | | | | Open | | | | 61,000 | | | | 61,130 | | | Corporate Bonds | | Open/Demand |
Deutsche Bank Securities, Inc. | | | 1.70 | % | | | 3/16/17 | | | | Open | | | | 151,000 | | | | 151,321 | | | Corporate Bonds | | Open/Demand |
Deutsche Bank Securities, Inc. | | | 1.70 | % | | | 3/16/17 | | | | Open | | | | 776,000 | | | | 777,649 | | | Corporate Bonds | | Open/Demand |
Deutsche Bank Securities, Inc. | | | 1.70 | % | | | 3/16/17 | | | | Open | | | | 227,630 | | | | 228,114 | | | Corporate Bonds | | Open/Demand |
Deutsche Bank Securities, Inc. | | | 1.70 | % | | | 3/16/17 | | | | Open | | | | 727,000 | | | | 728,545 | | | Corporate Bonds | | Open/Demand |
Deutsche Bank Securities, Inc. | | | 1.70 | % | | | 3/16/17 | | | | Open | | | | 170,000 | | | | 170,361 | | | Corporate Bonds | | Open/Demand |
Deutsche Bank Securities, Inc. | | | 1.70 | % | | | 3/16/17 | | | | Open | | | | 469,000 | | | | 469,997 | | | Corporate Bonds | | Open/Demand |
Deutsche Bank Securities, Inc. | | | 1.70 | % | | | 3/16/17 | | | | Open | | | | 136,000 | | | | 136,289 | | | Corporate Bonds | | Open/Demand |
Deutsche Bank Securities, Inc. | | | 1.70 | % | | | 3/16/17 | | | | Open | | | | 1,522,000 | | | | 1,525,234 | | | Capital Trusts | | Open/Demand |
Deutsche Bank Securities, Inc. | | | 1.70 | % | | | 3/16/17 | | | | Open | | | | 2,015,000 | | | | 2,019,282 | | | Capital Trusts | | Open/Demand |
Deutsche Bank Securities, Inc. | | | 1.70 | % | | | 3/16/17 | | | | Open | | | | 755,000 | | | | 756,604 | | | Corporate Bonds | | Open/Demand |
Deutsche Bank Securities, Inc. | | | 1.70 | % | | | 3/16/17 | | | | Open | | | | 1,852,000 | | | | 1,855,936 | | | Capital Trusts | | Open/Demand |
UBS Ltd. | | | 1.50 | % | | | 3/16/17 | | | | Open | | | | 9,387,483 | | | | 9,405,089 | | | Corporate Bonds | | Open/Demand |
UBS Ltd. | | | 1.50 | % | | | 3/16/17 | | | | Open | | | | 124,000 | | | | 124,232 | | | Corporate Bonds | | Open/Demand |
UBS Ltd. | | | 1.50 | % | | | 3/16/17 | | | | Open | | | | 3,266,000 | | | | 3,272,124 | | | Corporate Bonds | | Open/Demand |
UBS Securities LLC | | | 1.25 | % | | | 3/16/17 | | | | Open | | | | 5,250,000 | | | | 5,258,203 | | | Corporate Bonds | | Open/Demand |
UBS Securities LLC | | | 1.25 | % | | | 3/16/17 | | | | Open | | | | 5,218,125 | | | | 5,226,278 | | | Capital Trusts | | Open/Demand |
UBS Securities LLC | | | 1.25 | % | | | 3/16/17 | | | | Open | | | | 6,984,375 | | | | 6,995,288 | | | Capital Trusts | | Open/Demand |
UBS Securities LLC | | | 1.25 | % | | | 3/16/17 | | | | Open | | | | 3,855,000 | | | | 3,861,023 | | | Corporate Bonds | | Open/Demand |
UBS Securities LLC | | | 1.25 | % | | | 3/16/17 | | | | Open | | | | 8,525,000 | | | | 8,538,320 | | | Capital Trusts | | Open/Demand |
UBS Securities LLC | | | 1.30 | % | | | 3/16/17 | | | | Open | | | | 326,700 | | | | 327,231 | | | Corporate Bonds | | Open/Demand |
UBS Securities LLC | | | 1.50 | % | | | 3/16/17 | | | | Open | | | | 2,553,750 | | | | 2,558,538 | | | Capital Trusts | | Open/Demand |
UBS Securities LLC | | | 1.50 | % | | | 3/16/17 | | | | Open | | | | 849,751 | | | | 851,345 | | | Capital Trusts | | Open/Demand |
UBS Securities LLC | | | 1.50 | % | | | 3/16/17 | | | | Open | | | | 1,180,699 | | | | 1,182,913 | | | Capital Trusts | | Open/Demand |
UBS Securities LLC | | | 1.50 | % | | | 3/16/17 | | | | Open | | | | 282,875 | | | | 283,405 | | | Capital Trusts | | Open/Demand |
UBS Securities LLC | | | 1.50 | % | | | 3/16/17 | | | | Open | | | | 775,013 | | | | 776,466 | | | Corporate Bonds | | Open/Demand |
UBS Securities LLC | | | 1.50 | % | | | 3/16/17 | | | | Open | | | | 641,331 | | | | 642,534 | | | Corporate Bonds | | Open/Demand |
UBS Securities LLC | | | 1.50 | % | | | 3/16/17 | | | | Open | | | | 1,548,500 | | | | 1,551,403 | | | Corporate Bonds | | Open/Demand |
UBS Securities LLC | | | 1.50 | % | | | 3/16/17 | | | | Open | | | | 89,378 | | | | 89,545 | | | Corporate Bonds | | Open/Demand |
UBS Securities LLC | | | 1.50 | % | | | 3/16/17 | | | | Open | | | | 795,600 | | | | 797,092 | | | Corporate Bonds | | Open/Demand |
UBS Securities LLC | | | 1.50 | % | | | 3/16/17 | | | | Open | | | | 214,360 | | | | 214,762 | | | Corporate Bonds | | Open/Demand |
See Notes to Financial Statements.
| | | | | | |
| | | | | | | |
| 62 | | SEMI-ANNUAL REPORT | | APRIL 30, 2017 | | |
| | |
Consolidated Schedule of Investments (continued) | | BlackRock Multi-Sector Income Trust (BIT) |
| | | | | | | | | | | | | | | | | | | | | | | | |
| Reverse Repurchase Agreements (continued) | | | | | | | | | | | |
| Counterparty | | Interest
Rate | | | Trade
Date | | | Maturity
Date1 | | | Face Value | | | Face Value
Including
Accrued
Interest | | | Type of
Non-Cash
Underlying
Collateral | | Remaining
Contractual
Maturity of
the Agreements1 |
UBS Securities LLC | | | 1.50 | % | | | 3/16/17 | | | | Open | | | $ | 2,160,874 | | | $ | 2,164,925 | | | Corporate Bonds | | Open/Demand |
UBS Securities LLC | | | 1.50 | % | | | 3/16/17 | | | | Open | | | | 419,063 | | | | 419,848 | | | Corporate Bonds | | Open/Demand |
UBS Securities LLC | | | 1.50 | % | | | 3/16/17 | | | | Open | | | | 4,148,438 | | | | 4,156,216 | | | Capital Trusts | | Open/Demand |
UBS Securities LLC | | | 1.50 | % | | | 3/16/17 | | | | Open | | | | 4,175,000 | | | | 4,182,828 | | | Corporate Bonds | | Open/Demand |
UBS Securities LLC | | | 1.50 | % | | | 3/16/17 | | | | Open | | | | 3,198,125 | | | | 3,204,121 | | | Capital Trusts | | Open/Demand |
UBS Securities LLC | | | 1.50 | % | | | 3/16/17 | | | | Open | | | | 3,700,550 | | | | 3,707,489 | | | Corporate Bonds | | Open/Demand |
UBS Securities LLC | | | 1.50 | % | | | 3/16/17 | | | | Open | | | | 3,840,000 | | | | 3,847,200 | | | Capital Trusts | | Open/Demand |
UBS Securities LLC | | | 1.50 | % | | | 3/16/17 | | | | Open | | | | 3,399,375 | | | | 3,405,749 | | | Capital Trusts | | Open/Demand |
UBS Securities LLC | | | 1.50 | % | | | 3/16/17 | | | | Open | | | | 19,415 | | | | 19,451 | | | Corporate Bonds | | Open/Demand |
UBS Securities LLC | | | 1.50 | % | | | 3/16/17 | | | | Open | | | | 287,820 | | | | 288,360 | | | Corporate Bonds | | Open/Demand |
UBS Securities LLC | | | 1.50 | % | | | 3/16/17 | | | | Open | | | | 662,419 | | | | 663,661 | | | Corporate Bonds | | Open/Demand |
UBS Securities LLC | | | 1.50 | % | | | 3/16/17 | | | | Open | | | | 429,721 | | | | 430,527 | | | Corporate Bonds | | Open/Demand |
UBS Securities LLC | | | 1.50 | % | | | 3/16/17 | | | | Open | | | | 363,308 | | | | 363,989 | | | Corporate Bonds | | Open/Demand |
UBS Securities LLC | | | 1.50 | % | | | 3/16/17 | | | | Open | | | | 137,638 | | | | 137,896 | | | Corporate Bonds | | Open/Demand |
UBS Securities LLC | | | 1.50 | % | | | 3/16/17 | | | | Open | | | | 251,213 | | | | 251,684 | | | Corporate Bonds | | Open/Demand |
UBS Securities LLC | | | 1.50 | % | | | 3/16/17 | | | | Open | | | | 525,625 | | | | 526,611 | | | Corporate Bonds | | Open/Demand |
UBS Securities LLC | | | 1.50 | % | | | 3/16/17 | | | | Open | | | | 1,020,275 | | | | 1,022,188 | | | Corporate Bonds | | Open/Demand |
UBS Securities LLC | | | 1.50 | % | | | 3/16/17 | | | | Open | | | | 738,650 | | | | 740,035 | | | Corporate Bonds | | Open/Demand |
UBS Securities LLC | | | 1.50 | % | | | 3/16/17 | | | | Open | | | | 1,061,775 | | | | 1,063,766 | | | Capital Trusts | | Open/Demand |
UBS Securities LLC | | | 1.50 | % | | | 3/16/17 | | | | Open | | | | 461,645 | | | | 462,511 | | | Corporate Bonds | | Open/Demand |
UBS Securities LLC | | | 1.50 | % | | | 3/16/17 | | | | Open | | | | 702,050 | | | | 703,366 | | | Corporate Bonds | | Open/Demand |
UBS Securities LLC | | | 1.50 | % | | | 3/16/17 | | | | Open | | | | 850,500 | | | | 852,095 | | | Corporate Bonds | | Open/Demand |
UBS Securities LLC | | | 1.50 | % | | | 3/16/17 | | | | Open | | | | 307,495 | | | | 308,072 | | | Corporate Bonds | | Open/Demand |
UBS Securities LLC | | | 1.50 | % | | | 3/16/17 | | | | Open | | | | 2,621,250 | | | | 2,626,165 | | | Corporate Bonds | | Open/Demand |
UBS Securities LLC | | | 1.50 | % | | | 3/16/17 | | | | Open | | | | 371,009 | | | | 371,704 | | | Corporate Bonds | | Open/Demand |
Deutsche Bank Securities, Inc. | | | 1.70 | % | | | 3/17/17 | | | | Open | | | | 218,000 | | | | 218,432 | | | Corporate Bonds | | Open/Demand |
Barclays Bank PLC | | | 1.15 | % | | | 3/20/17 | | | | Open | | | | 1,335,000 | | | | 1,336,748 | | | Non-Agency
Mortgage-Backed Securities | | Open/Demand |
Barclays Capital, Inc. | | | 1.45 | % | | | 3/20/17 | | | | Open | | | | 4,637,500 | | | | 4,645,158 | | | Corporate Bonds | | Open/Demand |
Barclays Capital, Inc. | | | 1.50 | % | | | 3/20/17 | | | | Open | | | | 6,142,500 | | | | 6,152,993 | | | Corporate Bonds | | Open/Demand |
Barclays Capital, Inc. | | | 1.75 | % | | | 3/20/17 | | | | Open | | | | 234,375 | | | | 234,842 | | | Corporate Bonds | | Open/Demand |
Barclays Capital, Inc. | | | 1.75 | % | | | 3/20/17 | | | | Open | | | | 916,300 | | | | 918,126 | | | Corporate Bonds | | Open/Demand |
Barclays Capital, Inc. | | | 1.75 | % | | | 3/20/17 | | | | Open | | | | 648,560 | | | | 649,853 | | | Corporate Bonds | | Open/Demand |
Barclays Capital, Inc. | | | 1.75 | % | | | 3/20/17 | | | | Open | | | | 792,188 | | | | 793,766 | | | Corporate Bonds | | Open/Demand |
Barclays Capital, Inc. | | | 1.75 | % | | | 3/20/17 | | | | Open | | | | 2,064,375 | | | | 2,068,489 | | | Capital Trusts | | Open/Demand |
Barclays Capital, Inc. | | | 1.75 | % | | | 3/20/17 | | | | Open | | | | 1,009,613 | | | | 1,011,625 | | | Capital Trusts | | Open/Demand |
Credit Suisse Securities (USA) LLC | | | 1.75 | % | | | 3/20/17 | | | | Open | | | | 205,639 | | | | 206,039 | | | Corporate Bonds | | Open/Demand |
BNP Paribas S.A. | | | 1.85 | % | | | 3/21/17 | | | | Open | | | | 1,056,000 | | | | 1,058,225 | | | Corporate Bonds | | Open/Demand |
Citigroup Global Markets | | | 0.00 | % | | | 3/21/17 | | | | Open | | | | 353,600 | | | | 353,600 | | | Corporate Bonds | | Open/Demand |
Deutsche Bank Securities, Inc. | | | 1.70 | % | | | 3/21/17 | | | | Open | | | | 403,500 | | | | 404,243 | | | Corporate Bonds | | Open/Demand |
Deutsche Bank Securities, Inc. | | | 1.70 | % | | | 3/21/17 | | | | Open | | | | 376,622 | | | | 377,316 | | | Corporate Bonds | | Open/Demand |
Deutsche Bank Securities, Inc. | | | 1.70 | % | | | 3/21/17 | | | | Open | | | | 3,262,000 | | | | 3,268,316 | | | Foreign Agency Obligations | | Open/Demand |
Deutsche Bank Securities, Inc. | | | 1.70 | % | | | 3/21/17 | | | | Open | | | | 2,253,000 | | | | 2,257,362 | | | Foreign Agency Obligations | | Open/Demand |
RBC Capital Markets, LLC | | | 1.34 | % | | | 3/21/17 | | | | Open | | | | 2,470,000 | | | | 2,473,769 | | | Corporate Bonds | | Open/Demand |
RBC Capital Markets, LLC | | | 1.34 | % | | | 3/21/17 | | | | Open | | | | 1,880,000 | | | | 1,882,869 | | | Corporate Bonds | | Open/Demand |
RBC Capital Markets, LLC | | | 1.70 | % | | | 3/21/17 | | | | Open | | | | 113,400 | | | | 113,609 | | | Corporate Bonds | | Open/Demand |
RBC Capital Markets, LLC | | | 1.70 | % | | | 3/21/17 | | | | Open | | | | 1,949,600 | | | | 1,953,375 | | | Corporate Bonds | | Open/Demand |
BNP Paribas S.A. | | | 1.36 | % | | | 3/22/17 | | | | Open | | | | 7,490,000 | | | | 7,501,035 | | | Corporate Bonds | | Open/Demand |
BNP Paribas S.A. | | | 1.71 | % | | | 3/22/17 | | | | Open | | | | 774,000 | | | | 775,434 | | | Corporate Bonds | | Open/Demand |
BNP Paribas S.A. | | | 1.71 | % | | | 3/22/17 | | | | Open | | | | 177,000 | | | | 177,328 | | | Corporate Bonds | | Open/Demand |
BNP Paribas S.A. | | | 1.71 | % | | | 3/22/17 | | | | Open | | | | 1,178,000 | | | | 1,180,182 | | | Corporate Bonds | | Open/Demand |
BNP Paribas S.A. | | | 1.71 | % | | | 3/22/17 | | | | Open | | | | 656,000 | | | | 657,215 | | | Corporate Bonds | | Open/Demand |
RBC Capital Markets, LLC | | | 1.70 | % | | | 3/22/17 | | | | Open | | | | 737,070 | | | | 738,393 | | | Corporate Bonds | | Open/Demand |
RBC Capital Markets, LLC | | | 1.70 | % | | | 3/23/17 | | | | Open | | | | 62,320 | | | | 62,423 | | | Corporate Bonds | | Open/Demand |
RBC Capital Markets, LLC | | | 1.70 | % | | | 3/27/17 | | | | Open | | | | 719,377 | | | | 720,566 | | | Corporate Bonds | | Open/Demand |
UBS Securities LLC | | | 1.50 | % | | | 3/27/17 | | | | Open | | | | 230,420 | | | | 230,737 | | | Corporate Bonds | | Open/Demand |
RBC Capital Markets, LLC | | | 1.70 | % | | | 3/28/17 | | | | Open | | | | 446,160 | | | | 446,834 | | | Corporate Bonds | | Open/Demand |
See Notes to Financial Statements.
| | | | | | |
| | | | | | | |
| | SEMI-ANNUAL REPORT | | APRIL 30, 2017 | | 63 |
| | |
Consolidated Schedule of Investments (continued) | | BlackRock Multi-Sector Income Trust (BIT) |
| | | | | | | | | | | | | | | | | | | | | | | | |
| Reverse Repurchase Agreements (continued) | | | | | | | | | | | |
| Counterparty | | Interest
Rate | | | Trade
Date | | | Maturity
Date1 | | | Face Value | | | Face Value
Including
Accrued
Interest | | | Type of
Non-Cash
Underlying
Collateral | | Remaining
Contractual
Maturity of
the Agreements1 |
RBC Capital Markets, LLC | | | 1.70 | % | | | 3/28/17 | | | | Open | | | $ | 80,580 | | | $ | 80,702 | | | Corporate Bonds | | Open/Demand |
Barclays Capital, Inc. | | | 2.00 | % | | | 3/29/17 | | | | Open | | | | 266,833 | | | | 266,373 | | | Corporate Bonds | | Open/Demand |
BNP Paribas S.A. | | | 1.98 | % | | | 3/30/17 | | | | 5/03/17 | | | | 1,073,000 | | | | 1,074,655 | | | Asset-Backed Securities | | Up to 30 Days |
BNP Paribas S.A. | | | 1.98 | % | | | 3/30/17 | | | | 5/03/17 | | | | 824,000 | | | | 825,271 | | | Asset-Backed Securities | | Up to 30 Days |
BNP Paribas S.A. | | | 1.98 | % | | | 3/30/17 | | | | 5/03/17 | | | | 826,000 | | | | 827,274 | | | Asset-Backed Securities | | Up to 30 Days |
BNP Paribas S.A. | | | 1.98 | % | | | 3/30/17 | | | | 5/03/17 | | | | 1,116,000 | | | | 1,117,721 | | | Asset-Backed Securities | | Up to 30 Days |
BNP Paribas S.A. | | | 1.98 | % | | | 3/30/17 | | | | 5/03/17 | | | | 827,000 | | | | 828,275 | | | Asset-Backed Securities | | Up to 30 Days |
BNP Paribas S.A. | | | 2.13 | % | | | 3/30/17 | | | | 5/03/17 | | | | 808,000 | | | | 809,340 | | | Asset-Backed Securities | | Up to 30 Days |
BNP Paribas S.A. | | | 2.13 | % | | | 3/30/17 | | | | 5/03/17 | | | | 805,000 | | | | 806,335 | | | Asset-Backed Securities | | Up to 30 Days |
BNP Paribas S.A. | | | 2.13 | % | | | 3/30/17 | | | | 5/03/17 | | | | 808,000 | | | | 809,340 | | | Asset-Backed Securities | | Up to 30 Days |
BNP Paribas S.A. | | | 2.13 | % | | | 3/30/17 | | | | 5/03/17 | | | | 807,000 | | | | 808,339 | | | Asset-Backed Securities | | Up to 30 Days |
BNP Paribas S.A. | | | 2.13 | % | | | 3/30/17 | | | | 5/03/17 | | | | 1,010,000 | | | | 1,011,675 | | | Asset-Backed Securities | | Up to 30 Days |
BNP Paribas S.A. | | | 2.13 | % | | | 3/30/17 | | | | 5/03/17 | | | | 794,000 | | | | 795,317 | | | Asset-Backed Securities | | Up to 30 Days |
BNP Paribas S.A. | | | 2.13 | % | | | 3/30/17 | | | | 5/03/17 | | | | 808,000 | | | | 809,340 | | | Asset-Backed Securities | | Up to 30 Days |
BNP Paribas S.A. | | | 2.13 | % | | | 3/30/17 | | | | 5/03/17 | | | | 1,413,000 | | | | 1,415,344 | | | Asset-Backed Securities | | Up to 30 Days |
BNP Paribas S.A. | | | 2.13 | % | | | 3/30/17 | | | | 5/03/17 | | | | 1,010,000 | | | | 1,011,675 | | | Asset-Backed Securities | | Up to 30 Days |
BNP Paribas S.A. | | | 2.13 | % | | | 3/30/17 | | | | 5/03/17 | | | | 999,000 | | | | 1,000,657 | | | Asset-Backed Securities | | Up to 30 Days |
RBC Capital Markets, LLC | | | 1.70 | % | | | 3/30/17 | | | | Open | | | | 1,585,840 | | | | 1,587,937 | | | Corporate Bonds | | Open/Demand |
Deutsche Bank Securities, Inc. | | | 1.70 | % | | | 3/31/17 | | | | Open | | | | 444,000 | | | | 444,566 | | | Corporate Bonds | | Open/Demand |
Deutsche Bank Securities, Inc. | | | 1.70 | % | | | 3/31/17 | | | | Open | | | | 718,000 | | | | 718,915 | | | Corporate Bonds | | Open/Demand |
RBC Capital Markets, LLC | | | 1.70 | % | | | 3/31/17 | | | | Open | | | | 131,175 | | | | 131,342 | | | Corporate Bonds | | Open/Demand |
RBC Capital Markets, LLC | | | 1.70 | % | | | 3/31/17 | | | | Open | | | | 350,760 | | | | 351,207 | | | Corporate Bonds | | Open/Demand |
UBS Securities LLC | | | 1.70 | % | | | 3/31/17 | | | | Open | | | | 368,550 | | | | 369,020 | | | Corporate Bonds | | Open/Demand |
Deutsche Bank Securities, Inc. | | | 1.70 | % | | | 4/03/17 | | | | Open | | | | 573,000 | | | | 573,704 | | | Corporate Bonds | | Open/Demand |
RBC Capital Markets, LLC | | | 1.70 | % | | | 4/03/17 | | | | Open | | | | 235,450 | | | | 235,761 | | | Corporate Bonds | | Open/Demand |
RBC Capital Markets, LLC | | | 1.70 | % | | | 4/03/17 | | | | Open | | | | 148,570 | | | | 148,766 | | | Corporate Bonds | | Open/Demand |
RBC Capital Markets, LLC | | | 1.70 | % | | | 4/03/17 | | | | Open | | | | 208,800 | | | | 209,076 | | | Corporate Bonds | | Open/Demand |
RBC Capital Markets, LLC | | | 1.70 | % | | | 4/03/17 | | | | Open | | | | 165,750 | | | | 165,969 | | | Corporate Bonds | | Open/Demand |
JPMorgan Securities LLC | | | 1.25 | % | | | 4/04/17 | | | | 5/05/17 | | | | 4,711,000 | | | | 4,715,253 | | | Non-Agency Mortgage-Backed
Securities | | Up to 30 Days |
JPMorgan Securities LLC | | | 2.14 | % | | | 4/04/17 | | | | 5/05/17 | | | | 1,702,000 | | | | 1,704,524 | | | Asset-Backed Securities | | Up to 30 Days |
JPMorgan Securities LLC | | | 2.29 | % | | | 4/04/17 | | | | 5/05/17 | | | | 750,000 | | | | 751,190 | | | Asset-Backed Securities | | Up to 30 Days |
Barclays Capital, Inc. | | | 2.49 | % | | | 4/05/17 | | | | 5/05/17 | | | | 5,201,231 | | | | 5,210,211 | | | Non-Agency Mortgage-Backed
Securities | | Up to 30 Days |
RBC Capital Markets, LLC | | | 1.70 | % | | | 4/05/17 | | | | Open | | | | 577,375 | | | | 578,029 | | | Corporate Bonds | | Open/Demand |
RBC Capital Markets, LLC | | | 1.70 | % | | | 4/05/17 | | | | Open | | | | 784,355 | | | | 785,244 | | | Corporate Bonds | | Open/Demand |
RBC Capital Markets, LLC | | | (4.00 | )% | | | 4/05/17 | | | | Open | | | | 244,000 | | | | 243,322 | | | Corporate Bonds | | Open/Demand |
JPMorgan Securities LLC | | | 2.29 | % | | | 4/06/17 | | | | 5/05/17 | | | | 2,707,000 | | | | 2,711,132 | | | Asset-Backed Securities | | Up to 30 Days |
Deutsche Bank Securities, Inc. | | | 1.70 | % | | | 4/06/17 | | | | Open | | | | 81,000 | | | | 81,080 | | | Corporate Bonds | | Open/Demand |
RBC Capital Markets, LLC | | | 1.70 | % | | | 4/06/17 | | | | Open | | | | 172,713 | | | | 172,908 | | | Corporate Bonds | | Open/Demand |
RBC Capital Markets, LLC | | | 1.70 | % | | | 4/06/17 | | | | Open | | | | 484,913 | | | | 485,462 | | | Corporate Bonds | | Open/Demand |
RBC Capital Markets, LLC | | | 1.70 | % | | | 4/06/17 | | | | Open | | | | 243,285 | | | | 243,561 | | | Corporate Bonds | | Open/Demand |
RBC Capital Markets, LLC | | | 1.70 | % | | | 4/06/17 | | | | Open | | | | 134,355 | | | | 134,507 | | | Corporate Bonds | | Open/Demand |
RBC Capital Markets, LLC | | | 1.70 | % | | | 4/06/17 | | | | Open | | | | 937,900 | | | | 938,963 | | | Corporate Bonds | | Open/Demand |
RBC Capital Markets, LLC | | | 1.70 | % | | | 4/06/17 | | | | Open | | | | 624,160 | | | | 624,867 | | | Corporate Bonds | | Open/Demand |
RBC Capital Markets, LLC | | | 1.70 | % | | | 4/06/17 | | | | Open | | | | 339,528 | | | | 339,912 | | | Corporate Bonds | | Open/Demand |
RBC Capital Markets, LLC | | | 1.70 | % | | | 4/06/17 | | | | Open | | | | 335,400 | | | | 335,780 | | | Corporate Bonds | | Open/Demand |
RBC Capital Markets, LLC | | | 1.70 | % | | | 4/06/17 | | | | Open | | | | 384,100 | | | | 384,535 | | | Corporate Bonds | | Open/Demand |
RBC Capital Markets, LLC | | | 1.70 | % | | | 4/06/17 | | | | Open | | | | 186,150 | | | | 186,361 | | | Corporate Bonds | | Open/Demand |
RBC Capital Markets, LLC | | | 1.70 | % | | | 4/06/17 | | | | Open | | | | 210,568 | | | | 210,806 | | | Corporate Bonds | | Open/Demand |
RBC Capital Markets, LLC | | | 1.70 | % | | | 4/06/17 | | | | Open | | | | 463,400 | | | | 463,925 | | | Corporate Bonds | | Open/Demand |
RBC Capital Markets, LLC | | | 1.70 | % | | | 4/06/17 | | | | Open | | | | 268,800 | | | | 269,105 | | | Corporate Bonds | | Open/Demand |
RBC Capital Markets, LLC | | | 1.70 | % | | | 4/06/17 | | | | Open | | | | 440,115 | | | | 440,614 | | | Corporate Bonds | | Open/Demand |
RBC Capital Markets, LLC | | | 1.70 | % | | | 4/06/17 | | | | Open | | | | 851,468 | | | | 852,433 | | | Corporate Bonds | | Open/Demand |
RBC Capital Markets, LLC | | | 1.70 | % | | | 4/06/17 | | | | Open | | | | 121,180 | | | | 121,317 | | | Corporate Bonds | | Open/Demand |
Credit Suisse Securities (USA) LLC | | | (1.00 | )% | | | 4/07/17 | | | | Open | | | | 730,500 | | | | 730,094 | | | Corporate Bonds | | Open/Demand |
RBC Capital Markets, LLC | | | 1.70 | % | | | 4/07/17 | | | | Open | | | | 267,800 | | | | 268,053 | | | Corporate Bonds | | Open/Demand |
RBC Capital Markets, LLC | | �� | 1.70 | % | | | 4/07/17 | | | | Open | | | | 90,576 | | | | 90,662 | | | Corporate Bonds | | Open/Demand |
See Notes to Financial Statements.
| | | | | | |
| | | | | | | |
| 64 | | SEMI-ANNUAL REPORT | | APRIL 30, 2017 | | |
| | |
Consolidated Schedule of Investments (continued) | | BlackRock Multi-Sector Income Trust (BIT) |
| | | | | | | | | | | | | | | | | | | | | | | | |
| Reverse Repurchase Agreements (continued) | | | | | | | | | | | |
| Counterparty | | Interest
Rate | | | Trade
Date | | | Maturity
Date1 | | | Face Value | | | Face Value
Including
Accrued
Interest | | | Type of
Non-Cash
Underlying
Collateral | | Remaining
Contractual
Maturity of
the Agreements1 |
RBC Capital Markets, LLC | | | 1.70 | % | | | 4/07/17 | | | | Open | | | $ | 152,856 | | | $ | 153,000 | | | Corporate Bonds | | Open/Demand |
RBC Capital Markets, LLC | | | 1.70 | % | | | 4/07/17 | | | | Open | | | | 416,064 | | | | 416,457 | | | Corporate Bonds | | Open/Demand |
RBC Capital Markets, LLC | | | 1.70 | % | | | 4/11/17 | | | | Open | | | | 234,215 | | | | 234,436 | | | Corporate Bonds | | Open/Demand |
RBC Capital Markets, LLC | | | 1.70 | % | | | 4/11/17 | | | | Open | | | | 886,075 | | | | 886,912 | | | Corporate Bonds | | Open/Demand |
RBC Capital Markets, LLC | | | 1.70 | % | | | 4/11/17 | | | | Open | | | | 751,120 | | | | 751,829 | | | Corporate Bonds | | Open/Demand |
RBC Capital Markets, LLC | | | 1.70 | % | | | 4/11/17 | | | | Open | | | | 251,250 | | | | 251,487 | | | Corporate Bonds | | Open/Demand |
RBC Capital Markets, LLC | | | 1.70 | % | | | 4/11/17 | | | | Open | | | | 406,445 | | | | 406,829 | | | Corporate Bonds | | Open/Demand |
RBC Capital Markets, LLC | | | 1.70 | % | | | 4/11/17 | | | | Open | | | | 287,240 | | | | 287,511 | | | Corporate Bonds | | Open/Demand |
RBC Capital Markets, LLC | | | 1.70 | % | | | 4/11/17 | | | | Open | | | | 1,558,588 | | | | 1,560,060 | | | Corporate Bonds | | Open/Demand |
RBC Capital Markets, LLC | | | 1.70 | % | | | 4/11/17 | | | | Open | | | | 201,500 | | | | 201,690 | | | Corporate Bonds | | Open/Demand |
RBC Capital Markets, LLC | | | 1.70 | % | | | 4/11/17 | | | | Open | | | | 349,872 | | | | 350,202 | | | Corporate Bonds | | Open/Demand |
RBC Capital Markets, LLC | | | 1.70 | % | | | 4/11/17 | | | | Open | | | | 333,498 | | | | 333,813 | | | Corporate Bonds | | Open/Demand |
Deutsche Bank Securities, Inc. | | | 1.70 | % | | | 4/12/17 | | | | Open | | | | 310,000 | | | | 310,264 | | | Corporate Bonds | | Open/Demand |
Deutsche Bank Securities, Inc. | | | 1.70 | % | | | 4/12/17 | | | | Open | | | | 375,000 | | | | 375,319 | | | Corporate Bonds | | Open/Demand |
Deutsche Bank Securities, Inc. | | | 1.70 | % | | | 4/12/17 | | | | Open | | | | 233,000 | | | | 233,198 | | | Corporate Bonds | | Open/Demand |
Deutsche Bank Securities, Inc. | | | 1.70 | % | | | 4/12/17 | | | | Open | | | | 565,000 | | | | 565,480 | | | Corporate Bonds | | Open/Demand |
Deutsche Bank Securities, Inc. | | | 1.70 | % | | | 4/12/17 | | | | Open | | | | 369,000 | | | | 369,314 | | | Corporate Bonds | | Open/Demand |
Deutsche Bank Securities, Inc. | | | 1.70 | % | | | 4/12/17 | | | | Open | | | | 980,000 | | | | 980,648 | | | Corporate Bonds | | Open/Demand |
Deutsche Bank Securities, Inc. | | | 1.70 | % | | | 4/12/17 | | | | Open | | | | 2,374,000 | | | | 2,375,569 | | | Corporate Bonds | | Open/Demand |
UBS Securities LLC | | | 1.50 | % | | | 4/12/17 | | | | Open | | | | 2,952,581 | | | | 2,954,304 | | | Corporate Bonds | | Open/Demand |
RBC Capital Markets, LLC | | | 1.70 | % | | | 4/13/17 | | | | Open | | | | 407,888 | | | | 408,138 | | | Corporate Bonds | | Open/Demand |
RBC Capital Markets, LLC | | | 1.70 | % | | | 4/17/17 | | | | Open | | | | 112,340 | | | | 112,404 | | | Corporate Bonds | | Open/Demand |
RBC Capital Markets, LLC | | | 1.70 | % | | | 4/17/17 | | | | Open | | | | 262,725 | | | | 262,874 | | | Corporate Bonds | | Open/Demand |
RBC Capital Markets, LLC | | | 1.70 | % | | | 4/17/17 | | | | Open | | | | 46,480 | | | | 46,511 | | | Corporate Bonds | | Open/Demand |
Credit Suisse Securities (USA) LLC | | | 1.75 | % | | | 4/18/17 | | | | Open | | | | 5,470,993 | | | | 5,474,450 | | | Foreign Agency Obligations | | Open/Demand |
Credit Suisse Securities (USA) LLC | | | 1.75 | % | | | 4/18/17 | | | | Open | | | | 2,788,266 | | | | 2,790,028 | | | Foreign Agency Obligations | | Open/Demand |
Credit Suisse Securities (USA) LLC | | | 1.75 | % | | | 4/18/17 | | | | Open | | | | 2,092,544 | | | | 2,093,866 | | | Foreign Agency Obligations | | Open/Demand |
Credit Suisse Securities (USA) LLC | | | (3.00 | )% | | | 4/18/17 | | | | Open | | | | 60,734 | | | | 60,673 | | | Corporate Bonds | | Open/Demand |
Deutsche Bank Securities, Inc. | | | 1.70 | % | | | 4/18/17 | | | | Open | | | | 4,450,475 | | | | 4,453,207 | | | Foreign Agency Obligations | | Open/Demand |
Deutsche Bank Securities, Inc. | | | 1.70 | % | | | 4/18/17 | | | | Open | | | | 145,000 | | | | 145,089 | | | Corporate Bonds | | Open/Demand |
RBC Capital Markets, LLC | | | (0.50 | )% | | | 4/18/17 | | | | Open | | | | 546,925 | | | | 546,834 | | | Corporate Bonds | | Open/Demand |
Deutsche Bank Securities, Inc. | | | 1.70 | % | | | 4/19/17 | | | | Open | | | | 75,000 | | | | 75,035 | | | Corporate Bonds | | Open/Demand |
RBC Capital Markets, LLC | | | 1.34 | % | | | 4/19/17 | | | | Open | | | | 638,550 | | | | 638,811 | | | Corporate Bonds | | Open/Demand |
RBC Capital Markets, LLC | | | 1.34 | % | | | 4/19/17 | | | | Open | | | | 329,875 | | | | 330,010 | | | Corporate Bonds | | Open/Demand |
RBC Capital Markets, LLC | | | 1.34 | % | | | 4/19/17 | | | | Open | | | | 229,375 | | | | 229,469 | | | Corporate Bonds | | Open/Demand |
RBC Capital Markets, LLC | | | 1.70 | % | | | 4/19/17 | | | | Open | | | | 135,625 | | | | 135,695 | | | Corporate Bonds | | Open/Demand |
RBC Capital Markets, LLC | | | 1.70 | % | | | 4/19/17 | | | | Open | | | | 220,275 | | | | 220,389 | | | Corporate Bonds | | Open/Demand |
RBC Capital Markets, LLC | | | 1.70 | % | | | 4/19/17 | | | | Open | | | | 1,211,925 | | | | 1,212,555 | | | Corporate Bonds | | Open/Demand |
RBC Capital Markets, LLC | | | 1.70 | % | | | 4/19/17 | | | | Open | | | | 911,588 | | | | 912,061 | | | Corporate Bonds | | Open/Demand |
RBC Capital Markets, LLC | | | 1.70 | % | | | 4/19/17 | | | | Open | | | | 235,575 | | | | 235,697 | | | Corporate Bonds | | Open/Demand |
RBC Capital Markets, LLC | | | 1.70 | % | | | 4/19/17 | | | | Open | | | | 754,813 | | | | 755,205 | | | Corporate Bonds | | Open/Demand |
RBC Capital Markets, LLC | | | 1.70 | % | | | 4/19/17 | | | | Open | | | | 100,625 | | | | 100,677 | | | Corporate Bonds | | Open/Demand |
RBC Capital Markets, LLC | | | 1.70 | % | | | 4/19/17 | | | | Open | | | | 120,908 | | | | 120,970 | | | Corporate Bonds | | Open/Demand |
RBC Capital Markets, LLC | | | 1.70 | % | | | 4/19/17 | | | | Open | | | | 370,098 | | | | 370,290 | | | Corporate Bonds | | Open/Demand |
RBC Capital Markets, LLC | | | 1.70 | % | | | 4/19/17 | | | | Open | | | | 139,888 | | | | 139,960 | | | Corporate Bonds | | Open/Demand |
RBC Capital Markets, LLC | | | 1.70 | % | | | 4/19/17 | | | | Open | | | | 1,009,260 | | | | 1,009,784 | | | Corporate Bonds | | Open/Demand |
RBC Capital Markets, LLC | | | 1.70 | % | | | 4/19/17 | | | | Open | | | | 244,140 | | | | 244,267 | | | Corporate Bonds | | Open/Demand |
RBC Capital Markets, LLC | | | 1.70 | % | | | 4/19/17 | | | | Open | | | | 407,138 | | | | 407,349 | | | Corporate Bonds | | Open/Demand |
RBC Capital Markets, LLC | | | 1.70 | % | | | 4/19/17 | | | | Open | | | | 389,865 | | | | 390,068 | | | Corporate Bonds | | Open/Demand |
RBC Capital Markets, LLC | | | 1.70 | % | | | 4/19/17 | | | | Open | | | | 167,960 | | | | 168,047 | | | Corporate Bonds | | Open/Demand |
RBC Capital Markets, LLC | | | 1.70 | % | | | 4/19/17 | | | | Open | | | | 101,775 | | | | 101,828 | | | Corporate Bonds | | Open/Demand |
RBC Capital Markets, LLC | | | 1.70 | % | | | 4/19/17 | | | | Open | | | | 95,450 | | | | 95,500 | | | Corporate Bonds | | Open/Demand |
RBC Capital Markets, LLC | | | 1.70 | % | | | 4/19/17 | | | | Open | | | | 177,060 | | | | 177,152 | | | Corporate Bonds | | Open/Demand |
Deutsche Bank Securities, Inc. | | | 1.70 | % | | | 4/20/17 | | | | Open | | | | 407,000 | | | | 407,135 | | | Corporate Bonds | | Open/Demand |
RBC Capital Markets, LLC | | | 1.70 | % | | | 4/20/17 | | | | Open | | | | 133,450 | | | | 133,494 | | | Corporate Bonds | | Open/Demand |
RBC Capital Markets, LLC | | | 1.70 | % | | | 4/20/17 | | | | Open | | | | 1,244,250 | | | | 1,244,661 | | | Corporate Bonds | | Open/Demand |
RBC Capital Markets, LLC | | | 1.70 | % | | | 4/20/17 | | | | Open | | | | 391,760 | | | | 391,890 | | | Corporate Bonds | | Open/Demand |
RBC Capital Markets, LLC | | | 1.70 | % | | | 4/20/17 | | | | Open | | | | 1,128,800 | | | | 1,129,173 | | | Corporate Bonds | | Open/Demand |
RBC Capital Markets, LLC | | | 1.70 | % | | | 4/21/17 | | | | Open | | | | 218,195 | | | | 218,257 | | | Corporate Bonds | | Open/Demand |
HSBC Securities (USA), Inc. | | | 1.50 | % | | | 4/24/17 | | | | Open | | | | 523,000 | | | | 523,153 | | | Corporate Bonds | | Open/Demand |
RBC Capital Markets, LLC | | | 1.70 | % | | | 4/24/17 | | | | Open | | | | 187,920 | | | | 187,964 | | | Corporate Bonds | | Open/Demand |
Deutsche Bank Securities, Inc. | | | 1.70 | % | | | 4/25/17 | | | | Open | | | | 501,000 | | | | 501,095 | | | Corporate Bonds | | Open/Demand |
RBC Capital Markets, LLC | | | 1.70 | % | | | 4/25/17 | | | | Open | | | | 131,340 | | | | 131,365 | | | Corporate Bonds | | Open/Demand |
See Notes to Financial Statements.
| | | | | | |
| | | | | | | |
| | SEMI-ANNUAL REPORT | | APRIL 30, 2017 | | 65 |
| | |
Consolidated Schedule of Investments (continued) | | BlackRock Multi-Sector Income Trust (BIT) |
| | | | | | | | | | | | | | | | | | | | | | | | |
| Reverse Repurchase Agreements (continued) | | | | | | | | | | | |
| Counterparty | | Interest
Rate | | | Trade
Date | | | Maturity
Date1 | | | Face Value | | | Face Value
Including
Accrued
Interest | | | Type of
Non-Cash
Underlying
Collateral | | Remaining
Contractual
Maturity of
the Agreements1 |
RBC Capital Markets, LLC | | | 1.70 | % | | | 4/25/17 | | | | Open | | | $ | 598,260 | | | $ | 598,373 | | | Corporate Bonds | | Open/Demand |
Deutsche Bank Securities, Inc. | | | 1.70 | % | | | 4/26/17 | | | | Open | | | | 208,000 | | | | 208,029 | | | Corporate Bonds | | Open/Demand |
Deutsche Bank Securities, Inc. | | | 1.70 | % | | | 4/26/17 | | | | Open | | | | 328,000 | | | | 328,046 | | | Corporate Bonds | | Open/Demand |
RBC Capital Markets, LLC | | | 1.70 | % | | | 4/26/17 | | | | Open | | | | 477,960 | | | | 478,028 | | | Corporate Bonds | | Open/Demand |
RBC Capital Markets, LLC | | | 1.70 | % | | | 4/26/17 | | | | Open | | | | 141,810 | | | | 141,830 | | | Corporate Bonds | | Open/Demand |
RBC Capital Markets, LLC | | | 1.70 | % | | | 4/27/17 | | | | Open | | | | 103,840 | | | | 103,840 | | | Corporate Bonds | | Open/Demand |
RBC Capital Markets, LLC | | | 1.70 | % | | | 4/27/17 | | | | Open | | | | 521,040 | | | | 521,040 | | | Corporate Bonds | | Open/Demand |
RBC Capital Markets, LLC | | | 1.70 | % | | | 4/28/17 | | | | Open | | | | 44,785 | | | | 44,785 | | | Corporate Bonds | | Open/Demand |
RBC Capital Markets, LLC | | | 1.70 | % | | | 4/28/17 | | | | Open | | | | 348,150 | | | | 348,150 | | | Corporate Bonds | | Open/Demand |
RBC Capital Markets, LLC | | | 1.70 | % | | | 4/28/17 | | | | Open | | | | 2,414,100 | | | | 2,414,100 | | | Corporate Bonds | | Open/Demand |
RBC Capital Markets, LLC | | | 1.70 | % | | | 4/28/17 | | | | Open | | | | 399,000 | | | | 399,000 | | | Corporate Bonds | | Open/Demand |
RBC Capital Markets, LLC | | | 1.70 | % | | | 4/28/17 | | | | Open | | | | 1,149,270 | | | | 1,149,270 | | | Corporate Bonds | | Open/Demand |
Total | | | $ | 457,769,210 | | | $ | 458,813,756 | | | | | |
| | | | | | | | | | | | | | | | | | | | |
1 Certain agreements have no stated maturity and can be terminated by either party at any time. |
| | | | | | | | | | |
| Derivative Financial Instruments Outstanding as of Period End |
| | | | | | | | | | | | | | | | | | | | |
| Futures Contracts | | | | | | | | | | | | | |
Contracts
Short | | | Issue | | Expiration | | Notional Value | | | Unrealized
Appreciation
(Depreciation) | | | | |
| | (32 | ) | | 5-Year U.S. Treasury Note | | June 2017 | | USD | | | 3,789,000 | | | $ | (13,724 | ) | | | | |
| | (44 | ) | | 10-Year U.S. Treasury Note | | June 2017 | | USD | | | 5,531,625 | | | | (31,541 | ) | | | | |
| | (3 | ) | | 10-Year U.S. Ultra Long Treasury Note | | June 2017 | | USD | | | 406,359 | | | | (12,613 | ) | | | | |
| | (5 | ) | | Euro BOBL | | June 2017 | | USD | | | 718,175 | | | | 2,218 | | | | | |
| | (6 | ) | | Euro Bund | | June 2017 | | USD | | | 1,057,361 | | | | 3,404 | | | | | |
| | (10 | ) | | Long U.S. Treasury Bond | | June 2017 | | USD | | | 1,529,688 | | | | (57,514 | ) | | | | |
| | (1 | ) | | UK Long Gilt Bond | | June 2017 | | USD | | | 166,135 | | | | (2,125 | ) | | | | |
| | (1 | ) | | Ultra U.S. Treasury Bond | | June 2017 | | USD | | | 162,938 | | | | (2,500 | ) | | | | |
| | (78 | ) | | 90 Day Euro Future | | December 2018 | | USD | | | 19,138,275 | | | | (36,181 | ) | | | | |
| | (213 | ) | | 90-Day Euro-Dollar | | March 2019 | | USD | | | 52,230,263 | | | | (202,640 | ) | | | | |
| | Total | | | $ | (353,216 | ) | | | | |
| | | | | | | | | | | | | | | | | | | | | | | | |
| Forward Foreign Currency Exchange Contracts | | | | |
Currency
Purchased | | | Currency
Sold | | | Counterparty | | Settlement
Date | | | Unrealized
Appreciation
(Depreciation) | | | | |
| BRL | | | 818,480 | | | USD | | | 255,903 | | | BNP Paribas S.A. | | | 5/03/17 | | | $ | 1,963 | | | | | |
| BRL | | | 4,418,526 | | | USD | | | 1,384,250 | | | Bank of America N.A. | | | 5/03/17 | | | | 7,828 | | | | | |
| BRL | | | 4,418,526 | | | USD | | | 1,381,480 | | | Barclays Bank PLC | | | 5/03/17 | | | | 10,598 | | | | | |
| BRL | | | 822,900 | | | USD | | | 257,285 | | | UBS AG | | | 5/03/17 | | | | 1,974 | | | | | |
| USD | | | 260,000 | | | BRL | | | 818,480 | | | BNP Paribas S.A. | | | 5/03/17 | | | | 2,134 | | | | | |
| USD | | | 260,000 | | | BRL | | | 822,900 | | | UBS AG | | | 5/03/17 | | | | 741 | | | | | |
| GBP | | | 176,000 | | | USD | | | 227,709 | | | BNP Paribas S.A. | | | 5/04/17 | | | | 253 | | | | | |
| GBP | | | 1,958,000 | | | USD | | | 2,533,339 | | | Citibank N.A. | | | 5/04/17 | | | | 2,734 | | | | | |
| GBP | | | 10,962,000 | | | USD | | | 14,183,074 | | | Citibank N.A. | | | 5/04/17 | | | | 15,307 | | | | | |
| GBP | | | 93,000 | | | USD | | | 120,346 | | | Deutsche Bank AG | | | 5/04/17 | | | | 111 | | | | | |
| USD | | | 506,240 | | | MXN | | | 9,525,462 | | | Goldman Sachs International | | | 5/05/17 | | | | 430 | | | | | |
| USD | | | 1,012,000 | | | MXN | | | 19,006,309 | | | HSBC Bank PLC | | | 5/05/17 | | | | 2,750 | | | | | |
| USD | | | 540,000 | | | KRW | | | 608,482,800 | | | JPMorgan Chase Bank N.A. | | | 5/11/17 | | | | 5,094 | | | | | |
| MXN | | | 2,858,356 | | | USD | | | 150,000 | | | BNP Paribas S.A. | | | 5/17/17 | | | | 1,468 | | | | | |
| MXN | | | 4,380,327 | | | USD | | | 230,000 | | | Barclays Bank PLC | | | 5/17/17 | | | | 2,119 | | | | | |
| MXN | | | 5,520,585 | | | USD | | | 290,000 | | | Goldman Sachs International | | | 5/17/17 | | | | 2,542 | | | | | |
| EUR | | | 597,000 | | | USD | | | 636,451 | | | HSBC Bank PLC | | | 5/18/17 | | | | 14,330 | | | | | |
| USD | | | 651,891 | | | EUR | | | 597,000 | | | BNP Paribas S.A. | | | 5/18/17 | | | | 1,110 | | | | | |
| EUR | | | 690,000 | | | JPY | | | 80,642,777 | | | Deutsche Bank AG | | | 5/22/17 | | | | 28,353 | | | | | |
| USD | | | 223,000 | | | ZAR | | | 2,905,425 | | | HSBC Bank PLC | | | 5/23/17 | | | | 6,340 | | | | | |
See Notes to Financial Statements.
| | | | | | |
| | | | | | | |
| 66 | | SEMI-ANNUAL REPORT | | APRIL 30, 2017 | | |
| | |
Consolidated Schedule of Investments (continued) | | BlackRock Multi-Sector Income Trust (BIT) |
| | | | | | | | | | | | | | | | | | | | | | | | |
| Forward Foreign Currency Exchange Contracts (continued) | | | | |
Currency
Purchased | | | Currency
Sold | | | Counterparty | | Settlement
Date | | | Unrealized
Appreciation
(Depreciation) | | | | |
| TRY | | | 3,742,109 | | | USD | | | 1,018,000 | | | Barclays Bank PLC | | | 5/25/17 | | | $ | 28,634 | | | | | |
| MXN | | | 12,929,581 | | | USD | | | 678,667 | | | Citibank N.A. | | | 5/30/17 | | | | 5,020 | | | | | |
| MXN | | | 6,465,881 | | | USD | | | 339,333 | | | Royal Bank of Scotland PLC | | | 5/30/17 | | | | 2,568 | | | | | |
| MYR | | | 1,202,942 | | | USD | | | 277,000 | | | Goldman Sachs International | | | 5/31/17 | | | | 434 | | | | | |
| USD | | | 1,337,815 | | | EUR | | | 1,222,000 | | | BNP Paribas S.A. | | | 6/06/17 | | | | 4,515 | | | | | |
| USD | | | 4,118,142 | | | EUR | | | 3,760,774 | | | Citibank N.A. | | | 6/06/17 | | | | 14,836 | | | | | |
| USD | | | 15,734,171 | | | EUR | | | 14,368,778 | | | Citibank N.A. | | | 6/06/17 | | | | 56,685 | | | | | |
| USD | | | 403,205 | | | EUR | | | 369,000 | | | Deutsche Bank AG | | | 6/06/17 | | | | 597 | | | | | |
| USD | | | 239,516 | | | RUB | | | 13,650,043 | | | Credit Suisse International | | | 6/16/17 | | | | 2,064 | | | | | |
| USD | | | 240,040 | | | RUB | | | 13,681,690 | | | Credit Suisse International | | | 6/16/17 | | | | 2,037 | | | | | |
| USD | | | 240,826 | | | RUB | | | 13,734,305 | | | Credit Suisse International | | | 6/16/17 | | | | 1,908 | | | | | |
| USD | | | 240,953 | | | RUB | | | 13,734,305 | | | Credit Suisse International | | | 6/16/17 | | | | 2,035 | | | | | |
| USD | | | 3,005,514 | | | RUB | | | 172,158,872 | | | Credit Suisse International | | | 6/16/17 | | | | 10,688 | | | | | |
| USD | | | 3,487,623 | | | RUB | | | 199,710,000 | | | Deutsche Bank AG | | | 6/16/17 | | | | 13,525 | | | | | |
| USD | | | 240,093 | | | RUB | | | 13,681,690 | | | Goldman Sachs International | | | 6/16/17 | | | | 2,090 | | | | | |
| USD | | | 240,135 | | | RUB | | | 13,681,690 | | | Goldman Sachs International | | | 6/16/17 | | | | 2,132 | | | | | |
| USD | | | 240,597 | | | RUB | | | 13,721,250 | | | Goldman Sachs International | | | 6/16/17 | | | | 1,906 | | | | | |
| USD | | | 238,651 | | | RUB | | | 13,598,360 | | | JPMorgan Chase Bank N.A. | | | 6/16/17 | | | | 2,098 | | | | | |
| USD | | | 241,175 | | | RUB | | | 13,734,305 | | | Morgan Stanley & Co. International PLC | | | 6/16/17 | | | | 2,257 | | | | | |
| EUR | | | 388,000 | | | USD | | | 414,919 | | | Goldman Sachs International | | | 6/19/17 | | | | 8,724 | | | | | |
| TRY | | | 15,102,000 | | | USD | | | 3,745,350 | | | Royal Bank of Scotland PLC | | | 6/19/17 | | | | 448,516 | | | | | |
| TRY | | | 15,102,000 | | | USD | | | 3,752,423 | | | Royal Bank of Scotland PLC | | | 6/19/17 | | | | 441,444 | | | | | |
| TRY | | | 3,113,116 | | | USD | | | 791,819 | | | Citibank N.A. | | | 6/28/17 | | | | 70,492 | | | | | |
| TRY | | | 9,948,002 | | | USD | | | 2,568,220 | | | HSBC Bank PLC | | | 6/28/17 | | | | 187,304 | | | | | |
| TRY | | | 2,140,001 | | | USD | | | 552,358 | | | Royal Bank of Scotland PLC | | | 6/28/17 | | | | 40,407 | | | | | |
| MYR | | | 608,160 | | | USD | | | 140,000 | | | JPMorgan Chase Bank N.A. | | | 7/17/17 | | | | 145 | | | | | |
| MYR | | | 1,212,200 | | | USD | | | 275,000 | | | JPMorgan Chase Bank N.A. | | | 7/17/17 | | | | 4,341 | | | | | |
| ARS | | | 2,375,825 | | | USD | | | 145,000 | | | BNP Paribas S.A. | | | 7/28/17 | | | | 3,040 | | | | | |
| ARS | | | 3,576,230 | | | USD | | | 217,400 | | | Citibank N.A. | | | 7/28/17 | | | | 5,438 | | | | | |
| | | | | | | | | | | | | | | | | | | | |
| | | | | | | | | | | | | | | | | | | 1,474,059 | | | | | |
| | | | | | | | | | | | | | | | | | | | |
| BRL | | | 1,641,900 | | | USD | | | 520,000 | | | Goldman Sachs International | | | 5/03/17 | | | | (2,711 | ) | | | | |
| USD | | | 1,381,480 | | | BRL | | | 4,418,526 | | | Bank of America N.A. | | | 5/03/17 | | | | (10,598 | ) | | | | |
| USD | | | 1,382,972 | | | BRL | | | 4,418,526 | | | Barclays Bank PLC | | | 5/03/17 | | | | (9,106 | ) | | | | |
| USD | | | 513,350 | | | BRL | | | 1,641,900 | | | Goldman Sachs International | | | 5/03/17 | | | | (3,938 | ) | | | | |
| USD | | | 726,115 | | | TRY | | | 2,668,737 | | | Deutsche Bank AG | | | 5/03/17 | | | | (25,015 | ) | | | | |
| EUR | | | 1,222,000 | | | USD | | | 1,335,768 | | | BNP Paribas S.A. | | | 5/04/17 | | | | (4,579 | ) | | | | |
| EUR | | | 3,760,774 | | | USD | | | 4,111,842 | | | Citibank N.A. | | | 5/04/17 | | | | (15,034 | ) | | | | |
| EUR | | | 14,368,778 | | | USD | | | 15,710,103 | | | Citibank N.A. | | | 5/04/17 | | | | (57,439 | ) | | | | |
| USD | | | 1,310,803 | | | EUR | | | 1,222,000 | | | BNP Paribas S.A. | | | 5/04/17 | | | | (20,386 | ) | | | | |
| USD | | | 159,038 | | | EUR | | | 150,000 | | | Bank of America N.A. | | | 5/04/17 | | | | (4,365 | ) | | | | |
| USD | | | 4,041,159 | | | EUR | | | 3,760,774 | | | Citibank N.A. | | | 5/04/17 | | | | (55,650 | ) | | | | |
| USD | | | 15,440,042 | | | EUR | | | 14,368,778 | | | Citibank N.A. | | | 5/04/17 | | | | (212,623 | ) | | | | |
| USD | | | 64,843 | | | EUR | | | 61,000 | | | Credit Suisse International | | | 5/04/17 | | | | (1,608 | ) | | | | |
| USD | | | 107,450 | | | EUR | | | 100,000 | | | Deutsche Bank AG | | | 5/04/17 | | | | (1,485 | ) | | | | |
| USD | | | 215,312 | | | EUR | | | 200,000 | | | Deutsche Bank AG | | | 5/04/17 | | | | (2,559 | ) | | | | |
| USD | | | 203,336 | | | EUR | | | 190,000 | | | Standard Chartered Bank | | | 5/04/17 | | | | (3,641 | ) | | | | |
| USD | | | 128,295 | | | GBP | | | 100,000 | | | BNP Paribas S.A. | | | 5/04/17 | | | | (1,229 | ) | | | | |
| USD | | | 219,996 | | | GBP | | | 176,000 | | | BNP Paribas S.A. | | | 5/04/17 | | | | (7,965 | ) | | | | |
| USD | | | 2,449,771 | | | GBP | | | 1,958,000 | | | Citibank N.A. | | | 5/04/17 | | | | (86,302 | ) | | | | |
| USD | | | 13,715,216 | | | GBP | | | 10,962,000 | | | Citibank N.A. | | | 5/04/17 | | | | (483,165 | ) | | | | |
| USD | | | 116,414 | | | GBP | | | 93,000 | | | Deutsche Bank AG | | | 5/04/17 | | | | (4,043 | ) | | | | |
| USD | | | 125,300 | | | GBP | | | 100,000 | | | Royal Bank of Scotland PLC | | | 5/04/17 | | | | (4,224 | ) | | | | |
| MXN | | | 28,294,419 | | | USD | | | 1,518,240 | | | HSBC Bank PLC | | | 5/05/17 | | | | (15,784 | ) | | | | |
| KRW | | | 612,198,000 | | | USD | | | 540,000 | | | JPMorgan Chase Bank N.A. | | | 5/11/17 | | | | (1,828 | ) | | | | |
| USD | | | 588,000 | | | TRY | | | 2,113,426 | | | Goldman Sachs International | | | 5/11/17 | | | | (5,479 | ) | | | | |
| JPY | | | 83,591,009 | | | EUR | | | 690,000 | | | BNP Paribas S.A. | | | 5/22/17 | | | | (1,886 | ) | | | | |
| USD | | | 244,266 | | | MXN | | | 5,063,997 | | | Royal Bank of Scotland PLC | | | 5/23/17 | | | | (23,816 | ) | | | | |
| ZAR | | | 2,670,161 | | | USD | | | 203,000 | | | JPMorgan Chase Bank N.A. | | | 5/23/17 | | | | (3,884 | ) | | | | |
| USD | | | 509,000 | | | TRY | | | 1,847,246 | | | BNP Paribas S.A. | | | 5/25/17 | | | | (7,658 | ) | | | | |
| USD | | | 339,333 | | | TRY | | | 1,228,479 | | | Citibank N.A. | | | 5/25/17 | | | | (4,261 | ) | | | | |
| USD | | | 169,667 | | | TRY | | | 614,371 | | | Goldman Sachs International | | | 5/25/17 | | | | (2,168 | ) | | | | |
| JPY | | | 41,384,419 | | | USD | | | 372,000 | | | Morgan Stanley & Co. International PLC | | | 5/26/17 | | | | (428 | ) | | | | |
| KRW | | | 534,390,000 | | | USD | | | 470,000 | | | JPMorgan Chase Bank N.A. | | | 5/26/17 | | | | (178 | ) | | | | |
See Notes to Financial Statements.
| | | | | | |
| | | | | | | |
| | SEMI-ANNUAL REPORT | | APRIL 30, 2017 | | 67 |
| | |
Consolidated Schedule of Investments (continued) | | BlackRock Multi-Sector Income Trust (BIT) |
| | | | | | | | | | | | | | | | | | | | | | | | | | |
| Forward Foreign Currency Exchange Contracts (continued) | | | | |
Currency
Purchased | | | Currency
Sold | | | Counterparty | | Settlement
Date | | | Unrealized
Appreciation
(Depreciation) | | | | |
| USD | | | 372,000 | | | | JPY | | | | 41,432,764 | | | HSBC Bank PLC | | | 5/26/17 | | | $ | (6 | ) | | | | |
| BRL | | | 1,688,713 | | | | USD | | | | 530,000 | | | Goldman Sachs International | | | 6/02/17 | | | | (1,938 | ) | | | | |
| BRL | | | 1,714,782 | | | | USD | | | | 538,182 | | | Goldman Sachs International | | | 6/02/17 | | | | (1,968 | ) | | | | |
| BRL | | | 3,004,400 | | | | USD | | | | 941,818 | | | JPMorgan Chase Bank N.A. | | | 6/02/17 | | | | (2,340 | ) | | | | |
| USD | | | 1,373,194 | | | | BRL | | | | 4,418,526 | | | Bank of America N.A. | | | 6/02/17 | | | | (8,482 | ) | | | | |
| USD | | | 227,909 | | | | GBP | | | | 176,000 | | | BNP Paribas S.A. | | | 6/06/17 | | | | (256 | ) | | | | |
| USD | | | 969,146 | | | | GBP | | | | 748,431 | | | Bank of America N.A. | | | 6/06/17 | | | | (1,112 | ) | | | | |
| USD | | | 2,535,579 | | | | GBP | | | | 1,958,000 | | | Citibank N.A. | | | 6/06/17 | | | | (2,753 | ) | | | | |
| USD | | | 14,195,615 | | | | GBP | | | | 10,962,000 | | | Citibank N.A. | | | 6/06/17 | | | | (15,415 | ) | | | | |
| USD | | | 120,452 | | | | GBP | | | | 93,000 | | | Deutsche Bank AG | | | 6/06/17 | | | | (112 | ) | | | | |
| USD | | | 259,032 | | | | GBP | | | | 200,000 | | | JPMorgan Chase Bank N.A. | | | 6/06/17 | | | | (246 | ) | | | | |
| USD | | | 1,040,326 | | | | GBP | | | | 803,403 | | | Royal Bank of Scotland PLC | | | 6/06/17 | | | | (1,198 | ) | | | | |
| USD | | | 114,072 | | | | RUB | | | | 6,716,807 | | | Credit Suisse International | | | 6/16/17 | | | | (2,771 | ) | | | | |
| USD | | | 252,221 | | | | RUB | | | | 14,869,157 | | | Credit Suisse International | | | 6/16/17 | | | | (6,439 | ) | | | | |
| USD | | | 483,437 | | | | RUB | | | | 28,569,680 | | | Credit Suisse International | | | 6/16/17 | | | | (13,553 | ) | | | | |
| USD | | | 484,006 | | | | RUB | | | | 28,569,680 | | | Credit Suisse International | | | 6/16/17 | | | | (12,984 | ) | | | | |
| USD | | | 967,654 | | | | RUB | | | | 57,350,424 | | | Credit Suisse International | | | 6/16/17 | | | | (29,998 | ) | | | | |
| USD | | | 978,295 | | | | RUB | | | | 57,687,635 | | | Credit Suisse International | | | 6/16/17 | | | | (25,222 | ) | | | | |
| USD | | | 12,928 | | | | RUB | | | | 763,276 | | | Goldman Sachs International | | | 6/16/17 | | | | (350 | ) | | | | |
| USD | | | 94,241 | | | | RUB | | | | 5,599,800 | | | Goldman Sachs International | | | 6/16/17 | | | | (3,172 | ) | | | | |
| USD | | | 243,320 | | | | RUB | | | | 14,365,618 | | | Goldman Sachs International | | | 6/16/17 | | | | (6,580 | ) | | | | |
| USD | | | 491,897 | | | | RUB | | | | 29,104,287 | | | Goldman Sachs International | | | 6/16/17 | | | | (14,393 | ) | | | | |
| USD | | | 522,031 | | | | RUB | | | | 30,737,172 | | | Goldman Sachs International | | | 6/16/17 | | | | (12,664 | ) | | | | |
| USD | | | 1,030,941 | | | | EUR | | | | 969,795 | | | Goldman Sachs International | | | 6/19/17 | | | | (27,943 | ) | | | | |
| USD | | | 3,834,649 | | | | TRY | | | | 15,102,000 | | | Citibank N.A. | | | 6/19/17 | | | | (359,217 | ) | | | | |
| USD | | | 3,828,913 | | | | TRY | | | | 15,102,000 | | | Royal Bank of Scotland PLC | | | 6/19/17 | | | | (364,953 | ) | | | | |
| USD | | | 220,686 | | | | ZAR | | | | 3,111,518 | | | Bank of America N.A. | | | 6/21/17 | | | | (10,202 | ) | | | | |
| USD | | | 165,840 | | | | ZAR | | | | 2,333,639 | | | Citibank N.A. | | | 6/21/17 | | | | (7,326 | ) | | | | |
| USD | | | 553,400 | | | | ZAR | | | | 7,792,866 | | | Deutsche Bank AG | | | 6/21/17 | | | | (24,864 | ) | | | | |
| USD | | | 277,192 | | | | ZAR | | | | 3,896,433 | | | Morgan Stanley & Co. International PLC | | | 6/21/17 | | | | (11,940 | ) | | | | |
| ZAR | | | 17,576,040 | | | | USD | | | | 1,323,976 | | | Deutsche Bank AG | | | 6/21/17 | | | | (19,758 | ) | | | | |
| USD | | | 3,852,944 | | | | TRY | | | | 15,102,000 | | | Citibank N.A. | | | 6/28/17 | | | | (330,201 | ) | | | | |
| USD | | | 25,847 | | | | TRY | | | | 99,118 | | | Goldman Sachs International | | | 6/28/17 | | | | (1,608 | ) | | | | |
| USD | | | 362,400 | | | | ARS | | | | 6,468,840 | | | BNP Paribas S.A. | | | 7/28/17 | | | | (40,679 | ) | | | | |
| USD | | | 171,598 | | | | EUR | | | | 159,068 | | | Citibank N.A. | | | 2/21/18 | | | | (4,497 | ) | | | | |
| USD | | | 281,504 | | | | EUR | | | | 261,840 | | | Deutsche Bank AG | | | 2/21/18 | | | | (8,364 | ) | | | | |
| USD | | | 280,894 | | | | EUR | | | | 261,284 | | | Morgan Stanley & Co. International PLC | | | 2/21/18 | | | | (8,358 | ) | | | | |
| | | | | | | | | | | | | | | | | | | | | | |
| | | | | | | | | | | | | | | | | | | | | | (2,468,897 | ) | | | | |
| Total | | | | | | | | | | | | | | | | | | | | $ | (994,838 | ) | | | | |
| | | | | | | | | | | | | | | | | | | | | | |
OTC Barrier Options Purchased
| | | | | | | | | | | | | | | | | | | | | | | | | | | | | | | | | | | | |
| Description | | Put/
Call | | | Type of
Option | | | Counterparty | | | Expiration
Date | | | Barrier
Price/Range | | | National | | | Value | |
USD Currency | | | Call | | | | Down-and-out | | | | Deutsche Bank AG | | | | 5/25/17 | | | | BRL | | | | 3.01 | | | | USD | | | | 800,000 | | | $ | 1,893 | |
USD Currency | | | Call | | | | Down-and-out | | | | Deutsche Bank AG | | | | 6/01/17 | | | | BRL | | | | 3.04 | | | | USD | | | | 800,000 | | | | 1,921 | |
Total | | | | | | | | | | | | | | | | | | | | | | | | | | | | | | | | | | $ | 3,814 | |
| | | | | | | | | | | | | | | | | | | | | | | | | | | | | | | | | | | | |
| | | | | | | | | | | | | | | | | | | | | | | | |
| OTC Options Purchased | |
| Description | | Put/
Call | | Counterparty | | Expiration
Date | | | Strike
Price | | | Notional
Amount
(000) | | | Value | |
USD Currency | | Call | | Citibank N.A. | | | 05/01/17 | | | JPY | | | 112.00 | | | USD | | | 720 | | | $ | 275 | |
USD Currency | | Call | | Goldman Sachs International | | | 05/05/17 | | | TRY | | | 3.80 | | | USD | | | 522 | | | | 2 | |
USD Currency | | Call | | Goldman Sachs International | | | 05/10/17 | | | TRY | | | 4.00 | | | USD | | | 368 | | | | — | |
USD Currency | | Call | | JPMorgan Chase Bank N.A. | | | 05/10/17 | | | TRY | | | 4.00 | | | USD | | | 735 | | | | — | |
USD Currency | | Call | | JPMorgan Chase Bank N.A. | | | 05/10/17 | | | TRY | | | 3.80 | | | USD | | | 882 | | | | 78 | |
USD Currency | | Call | | Deutsche Bank AG | | | 05/18/17 | | | RUB | | | 58.00 | | | USD | | | 730 | | | | 4,621 | |
USD Currency | | Call | | HSBC Bank PLC | | | 05/18/17 | | | BRL | | | 3.30 | | | USD | | | 520 | | | | 2,030 | |
USD Currency | | Call | | JPMorgan Chase Bank N.A. | | | 05/19/17 | | | ZAR | | | 12.80 | | | USD | | | 356 | | | | 17,586 | |
See Notes to Financial Statements.
| | | | | | |
| | | | | | | |
| 68 | | SEMI-ANNUAL REPORT | | APRIL 30, 2017 | | |
| | |
Consolidated Schedule of Investments (continued) | | BlackRock Multi-Sector Income Trust (BIT) |
| | | | | | | | | | | | | | | | | | | | | | | | | | | | | | |
| OTC Options Purchased (continued) | | | | |
| Description | | Put/
Call | | | Counterparty | | Expiration
Date | | | Strike
Price | | | Notional
Amount
(000) | | | Value | | | | |
USD Currency | | | Call | | | Morgan Stanley & Co. International PLC | | | 06/15/17 | | | TWD | | | 30.30 | | | USD | | | 1,500 | | | $ | 9,325 | | | | | |
MXN Currency | | | Call | | | Morgan Stanley & Co. International PLC | | | 06/19/17 | | | JPY | | | 5.82 | | | MXN | | | 19,510 | | | | 26,641 | | | | | |
USD Currency | | | Call | | | Morgan Stanley & Co. International PLC | | | 07/03/17 | | | MXN | | | 20.00 | | | USD | | | 1,103 | | | | 9,262 | | | | | |
USD Currency | | | Call | | | Morgan Stanley & Co. International PLC | | | 07/03/17 | | | MXN | | | 21.50 | | | USD | | | 370 | | | | 588 | | | | | |
USD Currency | | | Put | | | Goldman Sachs International | | | 05/10/17 | | | TRY | | | 3.66 | | | USD | | | 368 | | | | 10,195 | | | | | |
USD Currency | | | Put | | | JPMorgan Chase Bank N.A. | | | 05/10/17 | | | TRY | | | 3.69 | | | USD | | | 735 | | | | 26,219 | | | | | |
USD Currency | | | Put | | | Morgan Stanley & Co. International PLC | | | 05/10/17 | | | TRY | | | 3.69 | | | USD | | | 735 | | | | 26,015 | | | | | |
USD Currency | | | Put | | | Morgan Stanley & Co. International PLC | | | 05/18/17 | | | BRL | | | 3.15 | | | USD | | | 520 | | | | 3,266 | | | | | |
EUR Currency | | | Put | | | Goldman Sachs International | | | 05/22/17 | | | MXN | | | 20.60 | | | EUR | | | 596 | | | | 7,747 | | | | | |
AUD Currency | | | Put | | | Barclays Bank PLC | | | 06/02/17 | | | USD | | | 0.75 | | | AUD | | | 893 | | | | 7,129 | | | | | |
USD Currency | | | Put | | | Goldman Sachs International | | | 06/02/17 | | | BRL | | | 3.12 | | | USD | | | 520 | | | | 2,711 | | | | | |
USD Currency | | | Put | | | Deutsche Bank AG | | | 06/12/17 | | | TRY | | | 3.69 | | | USD | | | 735 | | | | 24,512 | | | | | |
USD Currency | | | Put | | | HSBC Bank PLC | | | 06/29/17 | | | TRY | | | 3.55 | | | USD | | | 580 | | | | 6,614 | | | | | |
Total | | | | | | $ | 184,816 | | | | | |
| | | | | | | | | | | | | | | | | | | | | | | | | | |
| | | | | | | | | | | | | | | | | | | | | | | | | | | | | | | | | | | | |
| OTC Options Written | | | | |
| Description | | Put/
Call | | | Counterparty | | | Expiration
Date | | | Strike
Price | | | Notional
Amount
(000) | | | Value | | | | |
USD Currency | | | Call | | | | JPMorgan Chase Bank N.A. | | | | 05/05/17 | | | | TRY | | | | 3.80 | | | | USD | | | | 522 | | | $ | (2 | ) | | | | |
USD Currency | | | Call | | | | Goldman Sachs International | | | | 05/10/17 | | | | ZAR | | | | 3.88 | | | | USD | | | | 368 | | | | (4 | ) | | | | |
USD Currency | | | Call | | | | JPMorgan Chase Bank N.A. | | | | 05/10/17 | | | | TRY | | | | 3.88 | | | | USD | | | | 735 | | | | (7 | ) | | | | |
USD Currency | | | Call | | | | Morgan Stanley & Co. International PLC | | | | 05/10/17 | | | | TRY | | | | 3.88 | | | | USD | | | | 368 | | | | (4 | ) | | | | |
USD Currency | | | Call | | | | Morgan Stanley & Co. International PLC | | | | 05/18/17 | | | | BRL | | | | 3.30 | | | | USD | | | | 520 | | | | (2,011 | ) | | | | |
USD Currency | | | Call | | | | UBS AG | | | | 05/19/17 | | | | ZAR | | | | 12.80 | | | | USD | | | | 356 | | | | (17,604 | ) | | | | |
AUD Currency | | | Call | | | | Barclays Bank PLC | | | | 06/02/17 | | | | USD | | | | 0.77 | | | | AUD | | | | 893 | | | | (800 | ) | | | | |
USD Currency | | | Call | | | | HSBC Bank PLC | | | | 06/05/17 | | | | ZAR | | | | 14.00 | | | | USD | | | | 367 | | | | (3,266 | ) | | | | |
USD Currency | | | Call | | | | Deutsche Bank AG | | | | 06/12/17 | | | | TRY | | | | 3.88 | | | | USD | | | | 367 | | | | (762 | ) | | | | |
MXN Currency | | | Call | | | | Morgan Stanley & Co. International PLC | | | | 06/19/17 | | | | JPY | | | | 6.04 | | | | MXN | | | | 25,510 | | | | (14,678 | ) | | | | |
USD Currency | | | Call | | | | HSBC Bank PLC | | | | 06/29/17 | | | | TRY | | | | 3.80 | | | | USD | | | | 580 | | | | (3,940 | ) | | | | |
USD Currency | | | Call | | | | Goldman Sachs International | | | | 07/03/17 | | | | MXN | | | | 22.60 | | | | USD | | | | 740 | | | | (277 | ) | | | | |
USD Currency | | | Call | | | | Morgan Stanley & Co. International PLC | | | | 07/03/17 | | | | MXN | | | | 19.00 | | | | USD | | | | 440 | | | | (10,587 | ) | | | | |
USD Currency | | | Call | | | | Deutsche Bank AG | | | | 07/17/17 | | | | ZAR | | | | 14.00 | | | | USD | | | | 367 | | | | (7,029 | ) | | | | |
USD Currency | | | Put | | | | HSBC Bank PLC | | | | 06/05/17 | | | | ZAR | | | | 13.20 | | | | USD | | | | 367 | | | | (4,353 | ) | | | | |
USD Currency | | | Put | | | | Morgan Stanley & Co. International PLC | | | | 06/15/17 | | | | TWD | | | | 29.70 | | | | USD | | | | 1,500 | | | | (4,512 | ) | | | | |
MXN Currency | | | Put | | | | Morgan Stanley & Co. International PLC | | | | 06/19/17 | | | | JPY | | | | 5.60 | | | | MXN | | | | 9,750 | | | | (3,860 | ) | | | | |
USD Currency | | | Put | | | | Deutsche Bank AG | | | | 07/17/17 | | | | ZAR | | | | 13.00 | | | | USD | | | | 367 | | | | (4,606 | ) | | | | |
Total | | | | | | | | | | | | | | | | | | | | | | | | | | | | | | $ | (78,302 | ) | | | | |
| | | | | | | | | | | | | | | | | | | | | | | | | | | | | | | | |
| | | | | | | | | | | | | | | | | | | | | | | | |
| Centrally Cleared Credit Default Swaps — Buy Protection | | | | | | | | | | | | | | | | | | |
| Issuer / Index | | Pay
Fixed Rate | | | Expiration
Date | | | Notional
Amount
(000) | | | Unrealized
Depreciation | | | | |
Markit CDX North America High Yield Index, Series 28, Version 1 | | | 1.00 | % | | | 6/20/22 | | | | USD | | | | 15,243 | | | $ | (26,512 | ) | | | | |
Markit iTraxx XO, Series 27, Version 1 | | | 5.00 | % | | | 6/20/22 | | | | EUR | | | | 150 | | | | (2,840 | ) | | | | |
Total | | | | | | | | | | | | | | | | | | $ | (29,352 | ) | | | | |
| | | | | | | | | | | | | | | | | | | | |
| | | | | | | | | | | | | | | | | | | | | | |
| Centrally Cleared Credit Default Swaps — Sell Protection | |
| Issuer / Index | | Receive
Fixed Rate | | | Expiration
Date | | | Credit
Rating1 | | Notional
Amount
(000)2 | | | Unrealized
Appreciation | |
Chesapeake Energy Corp. | | | 5.00 | % | | | 12/20/21 | | | CCC | | | USD | | | | 520 | | | $ | 4,982 | |
1 Using Standard & Poor’s (“S&P’s”) rating of the issuer or the underlying securities of the index, as applicable. | |
2 The maximum potential amount the Trust may pay should a negative credit event take place as defined under the terms of the agreement. | |
See Notes to Financial Statements.
| | | | | | |
| | | | | | | |
| | SEMI-ANNUAL REPORT | | APRIL 30, 2017 | | 69 |
| | |
Consolidated Schedule of Investments (continued) | | BlackRock Multi-Sector Income Trust (BIT) |
| | | | | | | | | | | | | | | | | | | | | | | | | | | | |
| Centrally Cleared Interest Rate Swaps | | | | |
Fixed
Rate | | | Floating
Rate | | Effective
Date | | | Expiration
Date | | | Notional
Amount
(000) | | | Unrealized
Appreciation
(Depreciation) | | | | |
| | 7.36 | %1 | | 1-Month MXIBTIIE | | | N/A | | | | 1/28/19 | | | | MXN | | | | 111,632 | | | $ | (13,711 | ) | | | | |
| | 1.50 | %1 | | 3-Month LIBOR | | | N/A | | | | 2/02/19 | | | | USD | | | | 8,000 | | | | 4,255 | | | | | |
| | 1.62 | %1 | | 3-Month LIBOR | | | N/A | | | | 4/04/19 | | | | USD | | | | 7,600 | | | | (8,582 | ) | | | | |
| | 7.32 | %2 | | 1-Month MXIBTIIE | | | N/A | | | | 2/20/20 | | | | MXN | | | | 100,257 | | | | 14,617 | | | | | |
| | 7.35 | %2 | | 1-Month MXIBTIIE | | | N/A | | | | 2/20/20 | | | | MXN | | | | 9,813 | | | | 1,766 | | | | | |
| | 7.16 | %2 | | 1-Month MXIBTIIE | | | N/A | | | | 3/20/20 | | | | MXN | | | | 67,200 | | | | 5,508 | | | | | |
| | 7.17 | %2 | | 1-Month MXIBTIIE | | | N/A | | | | 3/20/20 | | | | MXN | | | | 67,200 | | | | 4,565 | | | | | |
| | 2.01 | %1 | | 3-Month LIBOR | | | N/A | | | | 2/02/22 | | | | USD | | | | 15,000 | | | | (69,495 | ) | | | | |
| | 7.45 | %2 | | 1-Month MXIBTIIE | | | N/A | | | | 3/07/22 | | | | MXN | | | | 34,237 | | | | 14,787 | | | | | |
| | 7.47 | %2 | | 1-Month MXIBTIIE | | | N/A | | | | 3/07/22 | | | | MXN | | | | 17,117 | | | | 8,334 | | | | | |
| | 7.48 | %2 | | 1-Month MXIBTIIE | | | N/A | | | | 3/07/22 | | | | MXN | | | | 17,118 | | | | 8,710 | | | | | |
| | 6.32 | %2 | | 1-Month MXIBTIIE | | | N/A | | | | 7/17/25 | | | | MXN | | | | 5,813 | | | | 20,926 | | | | | |
| | 2.13 | %2 | | 3-Month LIBOR | | | N/A | | | | 8/25/25 | | | | USD | | | | 110 | | | | (312 | ) | | | | |
| | 2.27 | %1 | | 3-Month LIBOR | | | N/A | | | | 9/11/25 | | | | USD | | | | 68 | | | | (534 | ) | | | | |
| | 1.46 | %1 | | 3-Month LIBOR | | | N/A | | | | 6/28/26 | | | | USD | | | | 1,427 | | | | 90,322 | | | | | |
| | 1.46 | %1 | | 3-Month LIBOR | | | N/A | | | | 6/28/26 | | | | USD | | | | 357 | | | | 22,560 | | | | | |
| | 2.47 | %1 | | 3-Month LIBOR | | | N/A | | | | 12/29/26 | | | | USD | | | | 10,000 | | | | (209,452 | ) | | | | |
| | 2.25 | %1 | | 3-Month LIBOR | | | N/A | | | | 1/19/27 | | | | USD | | | | 3,400 | | | | (2,913 | ) | | | | |
| | 2.42 | %1 | | 3-Month LIBOR | | | N/A | | | | 4/04/27 | | | | USD | | | | 18,300 | | | | (286,102 | ) | | | | |
| | 2.30 | %1 | | 3-Month LIBOR | | | 4/27/17 | 3 | | | 5/02/27 | | | | USD | | | | 3,000 | | | | (12,506 | ) | | | | |
| | 7.85 | %2 | | 1-Month MXIBTIIE | | | N/A | | | | 3/02/37 | | | | MXN | | | | 13,446 | | | | 4,056 | | | | | |
| | 7.82 | %2 | | 1-Month MXIBTIIE | | | N/A | | | | 3/04/37 | | | | MXN | | | | 13,524 | | | | 1,484 | | | | | |
| | 2.70 | %1 | | 3-Month LIBOR | | | N/A | | | | 4/04/47 | | | | USD | | | | 13,200 | | | | (536,424 | ) | | | | |
| | Total | | | | | | | | | | | | | | | | | | | | | $ | (938,141 | ) | | | | |
| | | | | | | | | | | | | | | | | | | | | | | | |
| | 1 The Fund pays a fixed rate and receives the floating rate. | | | | | |
| | 2 The Fund pays a floating rate and receives the fixed rate. | | | | | |
| | 3 Forward swap. | | | | | |
| | | | | | | | | | | | | | | | | | | | | | | | | | | | | | | | | | |
| OTC Credit Default Swaps — Buy Protection | | | | |
| Issuer/Index | | Pay
Fixed
Rate | | | Counterparty | | Expiration
Date | | | Notional
Amount
(000) | | | Value | | | Premiums
Paid
(Received) | | | Unrealized
Depreciation | | | | |
United Mexican States | | | 1.00 | % | | Citibank N.A. | | | 6/20/20 | | | | USD | | | | 604 | | | $ | (7,019 | ) | | $ | 3,722 | | | $ | (10,741 | ) | | | | |
United Mexican States | | | 1.00 | % | | Bank of America N.A. | | | 9/20/20 | | | | USD | | | | 604 | | | | (5,971 | ) | | | 5,202 | | | | (11,173 | ) | | | | |
Federation of Russia | | | 1.00 | % | | Bank of America N.A. | | | 12/20/21 | | | | USD | | | | 245 | | | | 3,703 | | | | 13,454 | | | | (9,751 | ) | | | | |
Republic of Argentina | | | 5.00 | % | | Barclays Bank PLC | | | 6/20/22 | | | | USD | | | | 882 | | | | (74,588 | ) | | | (41,999 | ) | | | (32,589 | ) | | | | |
Republic of France | | | 0.25 | % | | Citibank N.A. | | | 6/20/22 | | | | USD | | | | 62 | | | | 215 | | | | 886 | | | | (671 | ) | | | | |
Republic of France | | | 0.25 | % | | Bank of America N.A. | | | 6/20/22 | | | | USD | | | | 46 | | | | 159 | | | | 801 | | | | (642 | ) | | | | |
Republic of Philippines | | | 1.00 | % | | JPMorgan Chase Bank N.A. | | | 6/20/22 | | | | USD | | | | 4,289 | | | | (46,622 | ) | | | (11,186 | ) | | | (35,436 | ) | | | | |
Republic of South Africa | | | 1.00 | % | | HSBC Bank PLC | | | 6/20/22 | | | | USD | | | | 175 | | | | 7,558 | | | | 8,654 | | | | (1,096 | ) | | | | |
Republic of South Africa | | | 1.00 | % | | Citibank N.A. | | | 6/20/22 | | | | USD | | | | 1,373 | | | | 59,297 | | | | 69,264 | | | | (9,967 | ) | | | | |
Republic of South Africa | | | 1.00 | % | | Bank of America N.A. | | | 6/20/22 | | | | USD | | | | 590 | | | | 25,481 | | | | 29,764 | | | | (4,283 | ) | | | | |
Republic of South Africa | | | 1.00 | % | | Goldman Sachs International | | | 6/20/22 | | | | USD | | | | 364 | | | | 15,699 | | | | 18,297 | | | | (2,598 | ) | | | | |
Total | | | $ | (22,088 | ) | | $ | 96,859 | | | $ | (118,947 | ) | | | | |
| | | | | | | | | | | | | | | | | | | | | | | | | | | | | | |
| | | | | | | | | | | | | | | | | | | | | | | | | | | | | | | | | | |
| OTC Credit Default Swaps — Sell Protection | | | | | | | | | | | | | | | | | | | | |
| Issuer/Index | | Receive
Fixed
Rate | | | Counterparty | | Expiration
Date | | | Credit
Rating1 | | Notional
Amount
(000)2 | | | Value | | | Premiums
Paid
(Received) | | | Unrealized
Appreciation
(Depreciation) | | | | |
Dow Jones CDX North America Investment Grade, Series 9 | | | 5.00 | % | | Bank of America N.A. | | | 12/20/17 | | | BBB+ | | USD | | | 10,000 | | | $ | 373,916 | | | $ | (112,850 | ) | | $ | 486,766 | | | | | |
United Mexican States | | | 1.00 | % | | Bank of America N.A. | | | 6/20/20 | | | BBB+ | | USD | | | 604 | | | | 7,020 | | | | (3,901 | ) | | | 10,921 | | | | | |
United Mexican States | | | 1.00 | % | | Citibank N.A. | | | 9/20/20 | | | BBB+ | | USD | | | 604 | | | | 5,971 | | | | (4,933 | ) | | | 10,904 | | | | | |
Hellenic Telecommunications Organization SA | | | 5.00 | % | | Barclays Bank PLC | | | 12/20/21 | | | B+ | | EUR | | | 30 | | | | 3,631 | | | | 1,878 | | | | 1,753 | | | | | |
GFKL Financial Services AG | | | 5.00 | % | | Credit Suisse International | | | 6/20/22 | | | NR | | EUR | | | 11 | | | | (772 | ) | | | (751 | ) | | | (21 | ) | | | | |
International Game Technology | | | 5.00 | % | | JPMorgan Chase Bank N.A. | | | 6/20/22 | | | BBB- | | EUR | | | 30 | | | | 4,277 | | | | 3,289 | | | | 988 | | | | | |
Markit CMBX North America, Series 7 | | | 3.00 | % | | Barclays Bank PLC | | | 1/17/47 | | | BBB- | | USD | | | 10,000 | | | | (804,785 | ) | | | (537,567 | ) | | | (267,218 | ) | | | | |
Markit CMBX North America, Series 7 | | | 3.00 | % | | Barclays Bank PLC | | | 1/17/47 | | | BBB- | | USD | | | 5,000 | | | | (402,392 | ) | | | (268,406 | ) | | | (133,986 | ) | | | | |
See Notes to Financial Statements.
| | | | | | |
| | | | | | | |
| 70 | | SEMI-ANNUAL REPORT | | APRIL 30, 2017 | | |
| | |
Consolidated Schedule of Investments (continued) | | BlackRock Multi-Sector Income Trust (BIT) |
| | | | | | | | | | | | | | | | | | | | | | | | | | | | | | | | | | |
| OTC Credit Default Swaps — Sell Protection (continued) | | | | | | | | | | | | | | | | | | | | |
| Issuer/Index | | Receive
Fixed
Rate | | | Counterparty | | Expiration
Date | | | Credit
Rating1 | | Notional
Amount
(000)2 | | | Value | | | Premiums
Paid
(Received) | | | Unrealized
Appreciation
(Depreciation) | | | | |
Markit CMBX North America, Series 7 | | | 3.00 | % | | Barclays Bank PLC | | | 1/17/47 | | | BBB- | | USD | | | 10,000 | | | $ | (804,784 | ) | | $ | (260,315 | ) | | $ | (544,469 | ) | | | | |
Markit CMBX North America, Series 8 | | | 2.00 | % | | Morgan Stanley & Co. International PLC | | | 10/17/57 | | | BBB- | | USD | | | 5,000 | | | | (267,130 | ) | | | (575,947 | ) | | | 308,817 | | | | | |
Markit CMBX North America, Series 8 | | | 3.00 | % | | Deutsche Bank AG | | | 10/17/57 | | | BBB- | | USD | | | 10,000 | | | | (1,540,469 | ) | | | (1,413,658 | ) | | | (126,811 | ) | | | | |
Markit CMBX North America, Series 8 | | | 3.00 | % | | Goldman Sachs International | | | 10/25/57 | | | BBB- | | USD | | | 10,000 | | | | (1,541,302 | ) | | | (1,100,796 | ) | | | (440,506 | ) | | | | |
Markit CMBX North America, Series 9 | | | 2.00 | % | | Credit Suisse International | | | 9/17/58 | | | A- | | USD | | | 2,500 | | | | (102,616 | ) | | | (355,682 | ) | | | 253,066 | | | | | |
Markit CMBX North America, Series 9 | | | 2.00 | % | | Morgan Stanley & Co. International PLC | | | 9/17/58 | | | A- | | USD | | | 2,500 | | | | (102,616 | ) | | | (352,247 | ) | | | 249,631 | | | | | |
Markit CMBX North America, Series 9 | | | 2.00 | % | | Morgan Stanley & Co. International PLC | | | 9/17/58 | | | A- | | USD | | | 5,000 | | | | (205,231 | ) | | | (697,934 | ) | | | 492,703 | | | | | |
Markit CMBX North America, Series 9 | | | 3.00 | % | | Morgan Stanley & Co. International PLC | | | 9/17/58 | | | BBB- | | USD | | | 2,500 | | | | (271,737 | ) | | | (569,296 | ) | | | 297,559 | | | | | |
Total | | | $ | (5,649,019 | ) | | $ | (6,249,116 | ) | | $ | 600,097 | | | | | |
| | | | | | | | | | | | | | | | | | | | | | | | | | | | | | |
1 Using S&P’s rating of the issuer or the underlying securities of the index, as applicable. | | | | | |
2 The maximum potential amount the Trust may pay should a negative credit event take place as defined under the terms of the agreement. | | | | | |
| | | | | | | | | | | | | | | | | | | | | | | | | | | | | | | | | | | | | | |
| OTC Interest Rate Swaps | | | | |
| Fixed Rate | | | Floating
Rate | | Counterparty | | Effective
Date | | | Expiration
Date | | | Notional
Amount
(000) | | | Value | | | Premiums
Paid
(Received) | | | Unrealized
Appreciation
(Depreciation) | | | | |
| | 12.85 | %1 | | 1-day BZDIOVER | | JPMorgan Chase Bank N.A. | | | N/A | | | | 7/03/17 | | | | BRL | | | | 582 | | | $ | (465 | ) | | | — | | | $ | (465 | ) | | | | |
| | 13.11 | %1 | | 1-day BZDIOVER | | Citibank N.A. | | | N/A | | | | 7/03/17 | | | | BRL | | | | 7,438 | | | | (8,996 | ) | | | — | | | | (8,996 | ) | | | | |
| | 13.13 | %1 | | 1-day BZDIOVER | | Bank of America N.A. | | | N/A | | | | 7/03/17 | | | | BRL | | | | 6,198 | | | | (7,797 | ) | | | — | | | | (7,797 | ) | | | | |
| | 1.69 | %2 | | 3-Month KRWCD | | Deutsche Bank AG | | | N/A | | | | 11/10/17 | | | | KRW | | | | 911,735 | | | | (1,467 | ) | | | — | | | | (1,467 | ) | | | | |
| | 1.92 | %2 | | 3-Month KRWCD | | Deutsche Bank AG | | | N/A | | | | 11/10/17 | | | | KRW | | | | 911,735 | | | | 2,840 | | | | — | | | | 2,840 | | | | | |
| | 9.98 | %1 | | 1-day BZDIOVER | | JPMorgan Chase Bank N.A. | | | N/A | | | | 1/02/18 | | | | BRL | | | | 13,433 | | | | (6,688 | ) | | | — | | | | (6,688 | ) | | | | |
| | 9.98 | %1 | | 1-day BZDIOVER | | JPMorgan Chase Bank N.A. | | | N/A | | | | 1/02/18 | | | | BRL | | | | 13,433 | | | | (6,688 | ) | | | — | | | | (6,688 | ) | | | | |
| | 9.99 | %1 | | 1-day BZDIOVER | | Citibank N.A. | | | N/A | | | | 1/02/18 | | | | BRL | | | | 13,432 | | | | (6,838 | ) | | | — | | | | (6,838 | ) | | | | |
| | 12.10 | %1 | | 1-day BZDIOVER | | Bank of America N.A. | | | N/A | | | | 1/02/18 | | | | BRL | | | | 7,064 | | | | (28,551 | ) | | | — | | | | (28,551 | ) | | | | |
| | 7.06 | %2 | | 28-day MXIBTIIE | | JPMorgan Chase Bank N.A. | | | N/A | | | | 11/21/18 | | | | MXN | | | | 42,610 | | | | (5,406 | ) | | | — | | | | (5,406 | ) | | | | |
| | 7.07 | %2 | | 28-day MXIBTIIE | | Citibank N.A. | | | N/A | | | | 11/21/18 | | | | MXN | | | | 35,508 | | | | (4,212 | ) | | | — | | | | (4,212 | ) | | | | |
| | 6.98 | %2 | | 28-day MXIBTIIE | | Citibank N.A. | | | N/A | | | | 11/28/18 | | | | MXN | | | | 60,600 | | | | (11,908 | ) | | | — | | | | (11,908 | ) | | | | |
| | 6.98 | %2 | | 28-day MXIBTIIE | | JPMorgan Chase Bank N.A. | | | N/A | | | | 11/28/18 | | | | MXN | | | | 34,377 | | | | (6,755 | ) | | | — | | | | (6,755 | ) | | | | |
| | 9.73 | %2 | | 1-day BZDIOVER | | Citibank N.A. | | | N/A | | | | 1/02/20 | | | | BRL | | | | 8,059 | | | | 2,085 | | | | — | | | | 2,085 | | | | | |
| | 9.73 | %2 | | 1-day BZDIOVER | | JPMorgan Chase Bank N.A. | | | N/A | | | | 1/02/20 | | | | BRL | | | | 8,059 | | | | 2,085 | | | | — | | | | 2,085 | | | | | |
| | 9.73 | %2 | | 1-day BZDIOVER | | JPMorgan Chase Bank N.A. | | | N/A | | | | 1/02/20 | | | | BRL | | | | 8,059 | | | | 2,085 | | | | — | | | | 2,085 | | | | | |
| | 10.98 | %2 | | 1-day BZDIOVER | | JPMorgan Chase Bank N.A. | | | N/A | | | | 1/02/20 | | | | BRL | | | | 1,483 | | | | 11,911 | | | | — | | | | 11,911 | | | | | |
| | 11.00 | %2 | | 1-day BZDIOVER | | Bank of America N.A. | | | N/A | | | | 1/02/20 | | | | BRL | | | | 2,965 | | | | 24,494 | | | | — | | | | 24,494 | | | | | |
| | 11.02 | %2 | | 1-day BZDIOVER | | Citibank N.A. | | | N/A | | | | 1/02/20 | | | | BRL | | | | 1,580 | | | | 13,313 | | | | — | | | | 13,313 | | | | | |
| | 11.10 | %2 | | 1-day BZDIOVER | | Goldman Sachs International | | | N/A | | | | 1/02/20 | | | | BRL | | | | 1,435 | | | | 12,820 | | | | — | | | | 12,820 | | | | | |
| | 11.38 | %2 | | 1-day BZDIOVER | | JPMorgan Chase Bank N.A. | | | N/A | | | | 1/02/20 | | | | BRL | | | | 335 | | | | 3,874 | | | | — | | | | 3,874 | | | | | |
| | 6.33 | %1 | | 1-Month MXIBTIIE | | Citibank N.A. | | | N/A | | | | 7/17/25 | | | | MXN | | | | 2,897 | | | | (10,417 | ) | | $ | (15 | ) | | | (10,402 | ) | | | | |
| | 6.32 | %2 | | 1-Month MXIBTIIE | | Goldman Sachs International | | | N/A | | | | 8/06/25 | | | | MXN | | | | 8,688 | | | | (31,478 | ) | | | (38 | ) | | | (31,440 | ) | | | | |
| | 6.31 | %1 | | 1-Month MXIBTIIE | | Bank of America N.A. | | | N/A | | | | 8/11/25 | | | | MXN | | | | 1,723 | | | | 6,343 | | | | — | | | | 6,343 | | | | | |
| | 6.31 | %1 | | 1-Month MXIBTIIE | | Bank of America N.A. | | | N/A | | | | 8/11/25 | | | | MXN | | | | 1,723 | | | | 6,343 | | | | — | | | | 6,343 | | | | | |
| | 6.31 | %1 | | 1-Month MXIBTIIE | | Deutsche Bank AG | | | N/A | | | | 8/11/25 | | | | MXN | | | | 6,393 | | | | 23,604 | | | | — | | | | 23,604 | | | | | |
| | 6.26 | %2 | | 1-Month MXIBTIIE | | Bank of America N.A. | | | N/A | | | | 6/15/26 | | | | MXN | | | | 38,640 | | | | (164,233 | ) | | | — | | | | (164,233 | ) | | | | |
| | Total | | | | | | | | | | | | | | | | | | | | | | | $ | (190,102 | ) | | $ | (53 | ) | | $ | (190,049 | ) | | | | |
| | | | | | | | | | | | | | | | | | | | | | | | | | |
| | 1 The Fund pays a fixed rate and receives the floating rate. | | | | | |
| | 2 The Fund pays a floating rate and receives the fixed rate. | | | | | |
| | | | | | | | | | | | | | | | |
| Transactions in Options Written for the Six Months Ended April 30, 2017 |
| | | | | | | | | | | | | | | | | | | | | | | | | | | | | | | | | | | | |
| | | Calls | |
| | | Notional (000) | |
| | | Contracts | | | AUD | | | EUR | | | GBP | | | MXN | | | NOK | | | USD | | | Premiums Received | | | | |
Outstanding options, beginning of period | | | — | | | | 43,230 | | | | 36,230 | | | | 11,205 | | | | — | | | | 89,855 | | | | 25,469 | | | $ | 1,011,560 | | | | | |
Options written | | | — | | | | 1,786 | | | | 24,561 | | | | — | | | | 52,522 | | | | — | | | | 40,087 | | | | 520,269 | | | | | |
Options exercised | | | — | | | | (14,465 | ) | | | (10,110 | ) | | | — | | | | (27,012 | ) | | | (89,855 | ) | | | (6,533 | ) | | | (347,086 | ) | | | | |
Options expired | | | — | | | | (29,658 | ) | | | (49,637 | ) | | | (5,585 | ) | | | — | | | | — | | | | (21,242 | ) | | | (685,800 | ) | | | | |
Options closed | | | — | | | | — | | | | (1,044 | ) | | | (5,620 | ) | | | — | | | | — | | | | (32,051 | ) | | | (388,632 | ) | | | | |
| | | | |
Outstanding options, end of period | | | — | | | | 893 | | | | — | | | | — | | | | 25,510 | | | | — | | | | 5,730 | | | $ | 110,311 | | | | | |
| | | | |
See Notes to Financial Statements.
| | | | | | |
| | | | | | | |
| | SEMI-ANNUAL REPORT | | APRIL 30, 2017 | | 71 |
| | |
Consolidated Schedule of Investments (continued) | | BlackRock Multi-Sector Income Trust (BIT) |
| | | | | | | | | | | | | | | | | | | | | | | | | | | | | | | | | | | | | | | | |
| | | Puts | |
| | | Notional (000) | |
| | | Contracts | | | AUD | | | CAD | | | EUR | | | GBP | | | MXN | | | NZD | | | USD | | | Premiums Received | | | | |
Outstanding options, beginning of period | | | — | | | | — | | | | 14,320 | | | | — | | | | 21,230 | | | | — | | | | — | | | | 2,740 | | | $ | 437,545 | | | | | |
Options written | | | — | | | | 9,410 | | | | — | | | | 27,950 | | | | — | | | | 18,754 | | | | 35,390 | | | | 10,620 | | | | 255,494 | | | | | |
Options exercised | | | — | | | | — | | | | — | | | | (12,990 | ) | | | (15,610 | ) | | | — | | | | — | | | | (3,991 | ) | | | (301,530 | ) | | | | |
Options expired | | | — | | | | — | | | | (14,320 | ) | | | (14,065 | ) | | | (5,620 | ) | | | — | | | | (35,390 | ) | | | (5,565 | ) | | | (329,877 | ) | | | | |
Options closed | | | — | | | | (9,410 | ) | | | — | | | | (895 | ) | | | — | | | | (9,004 | ) | | | — | | | | (1,570 | ) | | | (39,831 | ) | | | | |
| | | | |
Outstanding options, end of period | | | — | | | | — | | | | — | | | | — | | | | — | | | | 9,750 | | | | — | | | | 2,234 | | | $ | 21,801 | | | | | |
| | | | |
| | | | | | | | | | | | | | | | |
| Derivative Financial Instruments Categorized by Risk Exposure |
As of period end, the fair values of derivative financial instruments located in the Statements of Assets and Liabilities were as follows:
| | | | | | | | | | | | | | | | | | | | | | | | | | | | | | |
| Assets — Derivative Financial Instruments | | Commodity
Contracts | | | Credit
Contracts | | | Equity
Contracts | | Foreign
Currency
Exchange
Contracts | | | Interest
Rate
Contracts | | | Other
Contracts | | Total | | | | |
Futures contracts | | Net unrealized appreciation1 | | | — | | | | — | | | — | | | — | | | $ | 5,622 | | | — | | $ | 5,622 | | | | | |
Forward foreign currency exchange contracts | | Unrealized appreciation on forward foreign currency exchange contracts | | | — | | | | — | | | — | | $ | 1,474,059 | | | | — | | | — | | | 1,474,059 | | | | | |
Options purchased | | Investments at value — unaffiliated2; | | | — | | | | — | | | — | | | 188,630 | | | | — | | | — | | | 188,630 | | | | | |
Swaps — centrally cleared | | Net unrealized appreciation1 | | | — | | | $ | 4,982 | | | — | | | — | | | | 201,890 | | | — | | | 206,872 | | | | | |
Swaps — OTC | | Unrealized appreciation on OTC swaps; Swap premiums paid | | | — | | | | 2,268,319 | | | — | | | — | | | | 111,797 | | | — | | | 2,380,116 | | | | | |
| | | | | | |
Total | | | | | — | | | $ | 2,273,301 | | | — | | $ | 1,662,689 | | | $ | 319,309 | | | — | | $ | 4,255,299 | | | | | |
| | | | | | |
| | | | | | | | | | | | | | | | | | | | | | | | | | | | | | |
| Liabilities — Derivative Financial Instruments | | | | | | | | | | | | | | |
Futures contracts | | Net unrealized depreciation1 | | | — | | | | — | | | — | | | — | | | $ | 358,838 | | | — | | $ | 358,838 | | | | | |
Forward foreign currency exchange contracts | | Unrealized depreciation on forward foreign currency exchange contracts | | | — | | | | — | | | — | | $ | 2,468,897 | | | | — | | | — | | | 2,468,897 | | | | | |
Options written | | Options written at value; | | | — | | | | — | | | — | | | 78,302 | | | | — | | | — | | | 78,302 | | | | | |
Swaps — centrally cleared | | Net unrealized depreciation1 | | | — | | | $ | 29,352 | | | — | | | — | | | | 1,140,031 | | | — | | | 1,169,383 | | | | | |
Swaps — OTC | | Unrealized depreciation on OTC swaps; Swap premiums received | | | — | | | | 7,939,426 | | | — | | | — | | | | 301,899 | | | — | | | 8,241,325 | | | | | |
| | | | | | |
Total | | | | | — | | | $ | 7,968,778 | | | — | | $ | 2,547,199 | | | $ | 1800,768 | | | — | | $ | 12,316,745 | | | | | |
| | | | | | |
1 Includes cumulative appreciation (depreciation) on futures contracts and centrally cleared swaps, if any, as reported in the Schedule of Investments. Only current day’s variation margin is reported within the Statements of Assets and Liabilities. | |
2 Includes options purchased at value as reported in the Schedule of Investments. | |
For the six months ended April 30, 2017, the effect of derivative financial instruments in the Statements of Operations was as follows:
| | | | | | | | | | | | | | | | | | | | | | | | | | | | |
| Net Realized Gain (Loss) from: | | Commodity
Contracts | | | Credit
Contracts | | | Equity
Contracts | | | Foreign
Currency
Exchange
Contracts | | | Interest
Rate
Contracts | | | Other
Contracts | | | Total | |
Futures contracts | | | — | | | | — | | | | — | | | | — | | | $ | 1,547,112 | | | | — | | | $ | 1,547,112 | |
Forward foreign currency exchange contracts | | | — | | | | — | | | | — | | | $ | 4,354,069 | | | | — | | | | — | | | | 4,354,069 | |
Options purchased1 | | | — | | | | — | | | | — | | | | (1,413,223 | ) | | | — | | | | — | | | | (1,413,223 | ) |
Options written | | | — | | | | — | | | | — | | | | 1,007,302 | | | | — | | | | — | | | | 1,007,302 | |
Swaps | | | — | | | $ | 369,135 | | | | — | | | | — | | | | (59,176 | ) | | | — | | | | 309,959 | |
| | | | |
Total | | | — | | | $ | 369,135 | | | | — | | | $ | 3,948,148 | | | $ | 1,487,936 | | | | — | | | $ | 5,805,219 | |
| | | | |
1 Options purchased are included in net realized gain (loss) from investments. | |
See Notes to Financial Statements.
| | | | | | |
| | | | | | | |
| 72 | | SEMI-ANNUAL REPORT | | APRIL 30, 2017 | | |
| | |
Consolidated Schedule of Investments (continued) | | BlackRock Multi-Sector Income Trust (BIT) |
| | | | | | | | | | | | | | | | | | | | | | | | | | | | |
| Net Change in Unrealized Appreciation (Depreciation) on: | | Commodity
Contracts | | | Credit
Contracts | | | Equity
Contracts | | | Foreign
Currency
Exchange
Contracts | | | Interest
Rate
Contracts | | | Other
Contracts | | | Total | |
Futures contracts | | | — | | | | — | | | | — | | | | — | | | $ | (690,326 | ) | | | — | | | $ | (690,326 | ) |
Forward foreign currency exchange contracts | | | — | | | | — | | | | — | | | $ | (3,493,083 | ) | | | — | | | | — | | | | (3,493,083 | ) |
Options purchased1 | | | — | | | | — | | | | — | | | | (193,231 | ) | | | — | | | | — | | | | (193,231 | ) |
Options written | | | — | | | | — | | | | — | | | | 680,912 | | | | — | | | | — | | | | 680,912 | |
Swaps | | | — | | | $ | 381,149 | | | | — | | | | — | | | | (1,178,133 | ) | | | — | | | | (796,984 | ) |
| | | | |
Total | | | — | | | $ | 381,149 | | | | — | | | $ | (3,005,402 | ) | | $ | (1,868,459 | ) | | | — | | | $ | (4,492,712 | ) |
| | | | |
1 Options purchased are included in net change in unrealized appreciation (depreciation) on investments. | |
|
| Average Quarterly Balances of Outstanding Derivative Financial Instruments |
| | | | |
| Futures contracts: | |
Average notional value of contracts — long | | $ | 3,201,250 | |
Average notional value of contracts — short | | $ | 77,273,730 | |
| Forward foreign currency exchange contracts: | |
Average amounts purchased — in USD | | $ | 142,850,046 | |
Average amounts sold — in USD | | $ | 95,747,506 | |
| Options: | |
Average value of option contracts purchased | | $ | 245,939 | |
Average value of option contracts written | | $ | 84,676 | |
| Credit default swaps: | |
Average notional value — buy protection | | $ | 26,846,426 | |
Average notional value — sell protection | | $ | 73,763,088 | |
| Interest rate swaps: | |
Average notional value — pays fixed rate | | $ | 89,863,307 | |
Average notional value — receives fixed rate | | $ | 32,709,940 | |
For more information about the Fund’s investment risks regarding derivative financial instruments, refer to the Notes to Financial Statements.
|
| Derivative Financial Instruments — Offsetting as of Period End |
The Trust’s derivative assets and liabilities (by type) were as follows:
| | | | | | | | |
| | | Assets | | | Liabilities | |
Derivative Financial Instruments: | | | | | | | | |
Futures contracts | | $ | 9,349 | | | $ | 7,360 | |
Forward foreign currency exchange contracts | | | 1,474,059 | | | | 2,468,897 | |
Options | | | 188,630 | 1 | | | 78,302 | |
Swaps — Centrally cleared | | | — | | | | 97,457 | |
Swaps — OTC2 | | | 2,380,116 | | | | 8,241,325 | |
| | | | |
Total derivative assets and liabilities in the Statements of Assets and Liabilities | | $ | 4,052,154 | | | $ | 10,893,341 | |
| | | | |
Derivatives not subject to a Master Netting Agreement or similar agreement (“MNA”) | | | (9,349 | ) | | | (104,817 | ) |
| | | | |
Total derivative assets and liabilities subject to an MNA | | $ | 4,042,805 | | | $ | 10,788,524 | |
| | | | |
1 Includes options purchased at value which is included in Investments at value — unaffiliated in the Statements of Assets and Liabilities and reported in the Schedule of Investments. | |
2 Includes unrealized appreciation (depreciation) on OTC swaps and swap premiums paid/received in the Statements of Assets and Liabilities. | |
The following tables present the Trust’s derivative assets and liabilities by counterparty net of amounts available for offset under an MNA and net of the related collateral received and pledged by the Trust:
| | | | | | | | | | | | | | | | | | | | | | | | |
| Counterparty | | Derivative Assets
Subject to an MNA
by Counterparty | | | Derivatives Available
for Offset1 | | | Non-cash
Collateral
Received | | | Cash
Collateral
Received2 | | | Net Amount of
Derivative Assets3,4 | | | | |
Bank of America N.A. | | $ | 591,916 | | | $ | (377,940 | ) | | | — | | | $ | (213,976 | ) | | | — | | | | | |
Barclays Bank PLC | | | 52,111 | | | | (52,111 | ) | | | — | | | | — | | | | — | | | | | |
BNP Paribas S.A. | | | 14,483 | | | | (14,483 | ) | | | — | | | | — | | | | — | | | | | |
Citibank N.A. | | | 270,961 | | | | (270,961 | ) | | | — | | | | — | | | | — | | | | | |
Credit Suisse International | | | 271,798 | | | | (271,798 | ) | | | — | | | | — | | | | — | | | | | |
Deutsche Bank AG | | | 101,977 | | | | (101,977 | ) | | | — | | | | — | | | | — | | | | | |
Goldman Sachs International | | | 70,030 | | | | (70,030 | ) | | | — | | | | — | | | | — | | | | | |
HSBC Bank PLC | | | 228,022 | | | | (28,445 | ) | | | — | | | | — | | | $ | 199,577 | | | | | |
JPMorgan Chase Bank N.A. | | | 79,793 | | | | (79,793 | ) | | | — | | | | — | | | | — | | | | | |
Morgan Stanley & Co. International PLC | | | 1,426,064 | | | | (1,426,064 | ) | | | — | | | | — | | | | — | | | | | |
Royal Bank of Scotland PLC | | | 932,935 | | | | (394,191 | ) | | | — | | | | — | | | | 538,744 | | | | | |
UBS AG | | | 2,715 | | | | (2,715 | ) | | | — | | | | — | | | | — | | | | | |
| | | | |
Total | | $ | 4,042,805 | | | $ | (3,090,508 | ) | | | — | | | $ | (213,976 | ) | | $ | 738,321 | | | | | |
| | | | |
See Notes to Financial Statements.
| | | | | | |
| | | | | | | |
| | SEMI-ANNUAL REPORT | | APRIL 30, 2017 | | 73 |
| | |
Consolidated Schedule of Investments (continued) | | BlackRock Multi-Sector Income Trust (BIT) |
| | | | | | | | | | | | | | | | | | | | | | | | |
| Counterparty | | Derivative Liabilities
Subject to an MNA
by Counterparty | | | Derivatives Available
for Offset1 | | | Non-cash
Collateral
Pledged | | | Cash
Collateral
Pledged5 | | | Net Amount of
Derivative Liabilities4,6 | | | | |
Bank of America N.A. | | $ | 377,940 | | | $ | (377,940 | ) | | | — | | | | — | | | | — | | | | | |
Barclays Bank PLC | | | 2,096,455 | | | | (52,111 | ) | | | — | | | $ | (2,044,344 | ) | | | — | | | | | |
BNP Paribas S.A. | | | 84,638 | | | | (14,483 | ) | | | — | | | | — | | | $ | 70,155 | | | | | |
Citibank N.A. | | | 1,702,566 | | | | (270,961 | ) | | | — | | | | (720,000 | ) | | | 711,605 | | | | | |
Credit Suisse International | | | 449,029 | | | | (271,798 | ) | | | — | | | | (177,231 | ) | | | — | | | | | |
Deutsche Bank AG | | | 1,640,533 | | | | (101,977 | ) | | | — | | | | (1,538,556 | ) | | | — | | | | | |
Goldman Sachs International | | | 1,660,571 | | | | (70,030 | ) | | | — | | | | (1,590,541 | ) | | | — | | | | | |
HSBC Bank PLC | | | 28,445 | | | | (28,445 | ) | | | — | | | | — | | | | — | | | | | |
JPMorgan Chase Bank N.A. | | | 81,109 | | | | (79,793 | ) | | | — | | | | — | | | | 1,316 | | | | | |
Morgan Stanley & Co. International PLC | | | 2,251,802 | | | | (1,426,064 | ) | | | — | | | | (825,738 | ) | | | — | | | | | |
Royal Bank of Scotland PLC | | | 394,191 | | | | (394,191 | ) | | | — | | | | — | | | | — | | | | | |
Standard Chartered Bank | | | 3,641 | | | | — | | | | — | | | | — | | | | 3,641 | | | | | |
UBS AG | | | 17,604 | | | | (2,715 | ) | | | — | | | | — | | | | 14,889 | | | | | |
| | | | |
Total | | $ | 10,788,524 | | | $ | (3,090,508 | ) | | | — | | | $ | (6,896,410 | ) | | $ | 801,606 | | | | | |
| | | | |
1 The amount of derivatives available for offset is limited to the amount of derivative asset and/or liabilities that are subject to an MNA. | | | | | |
2 Excess of collateral received from the individual counterparty is not shown for financial reporting purposes. | | | | | |
3 Net amount represents the net amount receivable from the counterparty in the event of default. | | | | | |
4 Net amount may also include forward foreign currency exchange contracts that are not required to be collateralized. | | | | | |
5 Excess of collateral pledged to the individual counterparty is not shown for financial reporting purposes. | | | | | |
6 Net amount represents the net amount payable due to counterparty in the event of default. Net amount may be offset further by the options written receivable/payable on the Statements of Assets and Liabilities. | | | | | |
| | | | | | | | |
| Fair Value Hierarchy as of Period End |
Various inputs are used in determining the fair value of investments and derivative financial instruments. For information about the Trust’s policy regarding valuation of investments and derivative financial instruments, refer to the Notes to Financial Statements.
The following tables summarize the Trust’s investments and derivative financial instruments categorized in the disclosure hierarchy:
| | | | | | | | | | | | | | | | |
| | | Level 1 | | | Level 2 | | | Level 3 | | | Total | |
Assets: | |
| Investments: | |
| Long-Term Investments: | |
Asset-Backed Securities | | | — | | | $ | 195,092,533 | | | $ | 15,741,102 | | | $ | 210,833,635 | |
Common Stocks | | $ | 3,052,094 | | | | — | | | | — | | | | 3,052,094 | |
Corporate Bonds | | | 705,714 | | | | 481,173,265 | | | | — | | | | 481,878,979 | |
Floating Rate Loan Interests | | | — | | | | 20,377,127 | | | | 49,158,961 | | | | 69,536,088 | |
Foreign Agency Obligations | | | — | | | | 70,150,418 | | | | — | | | | 70,150,418 | |
Investment Companies | | | 520,780 | | | | — | | | | — | | | | 520,780 | |
Non-Agency Mortgage-Backed Securities | | | — | | | | 174,658,546 | | | | 23,636,548 | | | | 198,295,094 | |
Preferred Securities | | | 18,786,467 | | | | 117,565,694 | | | | 1,708,511 | | | | 138,060,672 | |
| Short-Term Securities: | |
Money Market Funds | | | 2,417,747 | | | | — | | | | — | | | | 2,417,747 | |
| Options Purchased: | |
Foreign currency exchange contracts | | | — | | | | 188,630 | | | | — | | | | 188,630 | |
Unfunded Floating Rate Loan Interest1 | | | — | | | | — | | | | 40,331 | | | | 40,331 | |
| | | | |
Total | | $ | 25,482,802 | | | $ | 1,059,206,213 | | | $ | 90,285,453 | | | $ | 1,174,974,468 | |
| | | | |
| | | | | | | | | | | | | | | | | |
| Derivative Financial Instruments2 | |
Assets: | |
Credit contracts | | | — | | | $ | 2,118,090 | | | | — | | | $ | 2,118,090 | |
Foreign currency exchange contracts | | | — | | | | 1,474,059 | | | | — | | | | 1,474,059 | |
Interest rate contracts | | $ | 5,622 | | | | 313,687 | | | | — | | | | 319,309 | |
Liabilities: | |
Credit contracts | | | — | | | | (1,661,310 | ) | | | — | | | | (1,661,310 | ) |
Foreign currency exchange contracts | | | — | | | | (2,547,199 | ) | | | — | | | | (2,547,199 | ) |
Interest rate contracts | | | (358,838 | ) | | | (1,441,877 | ) | | | — | | | | (1,800,715 | ) |
| | | | |
Total | | $ | (353,216 | ) | | $ | (1,744,550 | ) | | | — | | | $ | (2,097,766 | ) |
| | | | |
1 Unfunded floating rate loan interests are valued at the unrealized appreciation (depreciation) on the commitment. | |
2 Derivative financial instruments are swaps, futures contracts, forward foreign currency exchange contracts and options written. Swaps, futures contracts and forward foreign currency exchange contracts are valued at the unrealized appreciation (depreciation) on the instrument and options written are shown at value. | |
See Notes to Financial Statements.
| | | | | | |
| | | | | | | |
| 74 | | SEMI-ANNUAL REPORT | | APRIL 30, 2017 | | |
| | |
Consolidated Schedule of Investments (concluded) | | BlackRock Multi-Sector Income Trust (BIT) |
The Trust may hold assets and/or liabilities in which the fair value approximates the carrying amount or face value, including accrued interest, for financial statement purposes. As of period end, reverse repurchase agreements payable of $458,813,756 is categorized as Level 2 within the disclosure hierarchy.
During the six months ended April 30, 2017, there were no transfers between Level 1 and Level 2.
A reconciliation of Level 3 investments is presented when the Trust had a significant amount of Level 3 investments at the beginning and/or end of the period in relation to net assets. The following table is a reconciliation of Level 3 investments for which significant unobservable inputs were used in determining fair value:
| | | | | | | | | | | | | | | | | | | | | | | | | | | | |
| | | Asset-Backed
Securities | | | Common
Stocks | | | Floating
Rate Loan
Interests | | | Non-Agency Mortgage- Backed Securities | | | Preferred
Securities | | | Unfunded
Floating
Rate Loan
Interests | | | Total | |
| Assets: | | | | | | | | | | | | | | | | | | | | | | | | |
Opening balance, as of October 31, 2016 | | $ | 17,206,973 | | | $ | 561 | | | $ | 27,486,435 | | | $ | 24,015,690 | | | $ | 1,631,265 | | | | — | | | $ | 70,340,924 | |
Transfers into Level 31 | | | 2,442,500 | | | | — | | | | 202,000 | | | | — | | | | — | | | $ | 164,769 | | | | 2,809,269 | |
Transfers out of Level 32 | | | (7,297,861 | ) | | | — | | | | — | | | | — | | | | — | | | | — | | | | (7,297,861 | ) |
Accrued discounts/premiums | | | 5,994 | | | | — | | | | 27,083 | | | | 118,234 | | | | — | | | | — | | | | 151,311 | |
Net realized gain (loss) | | | 24,901 | | | | — | | | | 6,049 | | | | 426,797 | | | | — | | | | — | | | | 457,747 | |
Net change in unrealized appreciation (depreciation)3,4 | | | (294,793 | ) | | | (561 | ) | | | 2,592,597 | | | | 286,668 | | | | 77,246 | | | | (124,438 | ) | | | 2,536,719 | |
Purchases | | | 6,734,400 | | | | — | | | | 22,941,431 | | | | — | | | | — | | | | — | | | | 29,675,831 | |
Sales | | | (3,081,012 | ) | | | — | | | | (4,096,634 | ) | | | (1,210,841 | ) | | | — | | | | — | | | | (8,388,487 | ) |
| | | | |
| Closing Balance, as of April 30, 2017 | | $ | 15,741,102 | | | | — | | | $ | 49,158,961 | | | $ | 23,636,548 | | | $ | 1,708,511 | | | $ | 40,331 | | | $ | 90,285,453 | |
| | | | |
Net change in unrealized appreciation (depreciation) on investments still held at April 30, 20174 | | $ | (282,093 | ) | | $ | (561 | ) | | $ | 2,532,927 | | | $ | 286,668 | | | $ | 77,246 | | | $ | 40,331 | | | $ | 2,654,518 | |
| | | | |
1 As of October 31, 2016, the Trust used observable inputs in determining the value of certain investments. As of April 30, 2017, the Trust used significant unobservable inputs in determining the value of the same investments. As a result, investments at the beginning of period value were transferred from Level 2 to Level 3 in the disclosure hierarchy. | |
2 As of October 31, 2016, the Trust used significant unobservable inputs in determining the value of certain investments. As of April 30, 2017, the Trust used observable inputs in determining the value of the same investments. As a result, investments at the beginning of period value were transferred from Level 3 to Level 2 in the disclosure hierarchy. | |
3 Included in the related net change in unrealized appreciation (depreciation) in the Statements of Operations. | |
4 Any difference between net change in unrealized appreciation (depreciation) and net change in unrealized appreciation (depreciation) on investments still held at April 30, 2017 is generally due to investments no longer held or categorized as Level 3 at period end. | |
The following table summarizes the valuation approaches used and unobservable inputs utilized by the BlackRock Global Valuation Methodologies Committee (the “Global Valuation Committee”) to determine the value of certain of the Trust’s Level 3 investments as of period end. The table does not include Level 3 investments with values based upon unadjusted third party pricing information in the amount of $61,965,985. A significant change in such third party pricing information could result in a significantly lower or higher value of such Level 3 investments.
| | | | | | | | | | | | | | | | |
| | | Value | | | Valuation Approach | | | Unobservable Inputs | | | Range of
Unobservable
Inputs Utilized | |
Assets: | | | | | | | | | | | | | | | | |
Floating Rate Loan Interests | | $ | 28,319,468 | | | | Income | | | | Discount Rate1 | | | | 15.00 | % |
| | | | | | | | | | | | | | | | |
Total | | $ | 28,319,468 | | | | | | | | | | | | | |
| | | | | | | | | | | | | | | | |
1 Decrease in unobservable input may result in a significant increase to value, while an increase in the unobservable input may result in a significant decrease to value. | |
See Notes to Financial Statements.
| | | | | | |
| | | | | | | |
| | SEMI-ANNUAL REPORT | | APRIL 30, 2017 | | 75 |
| | |
| Statements of Assets and Liabilities | | |
| | | | | | | | | | | | |
| April 30, 2017 (Unaudited) | | BlackRock
Credit Allocation
Income Trust
(BTZ) | | | BlackRock
Floating Rate
Income Trust
(BGT) | | | BlackRock
Multi-Sector
Income Trust
(BIT)1 | |
| | | | | | | | | | | | |
| Assets | |
Investments at value — unaffiliated2 | | $ | 1,987,355,026 | | | $ | 502,913,285 | | | $ | 1,171,995,610 | |
Investments at value — affiliated3 | | | 12,260,042 | | | | 3,852,270 | | | | 2,938,527 | |
Cash | | | 29,475 | | | | 1,062,398 | | | | 400,912 | |
Cash pledged: | | | | | | | | | | | | |
Collateral — OTC derivatives | | | 920,000 | | | | — | | | | 7,940,000 | |
Centrally cleared swaps | | | — | | | | 56,000 | | | | 3,106,590 | |
Collateral — reverse repurchase agreements | | | — | | | | — | | | | 1,530,000 | |
Futures contracts | | | 491,000 | | | | — | | | | 295,740 | |
Foreign currency at value4 | | | 21,048 | | | | 9,026 | | | | 4,848,597 | |
Receivables: | | | | | | | | | | | | |
Interest — unaffiliated | | | 25,547,191 | | | | 1,493,031 | | | | 12,269,201 | |
Investments sold | | | 1,798,874 | | | | 12,593,776 | | | | 6,446,898 | |
Dividends — unaffiliated | | | 55,842 | | | | — | | | | 135,787 | |
Dividends — affiliated | | | 16,767 | | | | 792 | | | | 1,679 | |
Variation margin on futures contracts | | | 11,250 | | | | — | | | | 9,349 | |
Reverse repurchase agreements | | | — | | | | — | | | | 5,599,955 | |
Swap premiums paid | | | 206,973 | | | | — | | | | 155,211 | |
Unrealized appreciation on: | | | | | | | | | | | | |
Forward foreign currency exchange contracts | | | — | | | | 962 | | | | 1,474,059 | |
OTC derivatives | | | 573,614 | | | | — | | | | 2,224,905 | |
Unfunded floating rate loan interests | | | — | | | | 2,222 | | | | 40,331 | |
Prepaid expenses | | | 83,403 | | | | 13,619 | | | | 24,656 | |
| | | | |
Total assets | | | 2,029,370,505 | | | | 521,997,381 | | | | 1,221,438,007 | |
| | | | |
| | | | | | | | | | | | |
| Liabilities | |
| Cash received: | | | | | | | | | | | | |
Collateral — reverse repurchase agreements | | | 1,599,000 | | | | — | | | | 1,444,000 | |
Collateral — OTC derivatives | | | 40,000 | | | | — | | | | 230,000 | |
Options written at value5 | | | 754,503 | | | | — | | | | 78,302 | |
Reverse repurchase agreements | | | 439,330,649 | | | | — | | | | 458,813,756 | |
Payables: | | | | | | | | | | | | |
Investments purchased | | | 5,291,558 | | | | 38,775,417 | | | | 8,903,148 | |
Reverse repurchase agreements | | | 4,677,324 | | | | — | | | | 7,741,487 | |
Investment advisory fees | | | 1,036,964 | | | | 294,183 | | | | 777,730 | |
Officer’s and Trustees’ fees | | | 748,099 | | | | 220,112 | | | | 79,011 | |
Other accrued expenses | | | 443,628 | | | | 219,212 | | | | 383,321 | |
Income dividends | | | 279,306 | | | | — | | | | 171,913 | |
Variation margin on futures contracts | | | 110,096 | | | | — | | | | 7,360 | |
Bank borrowings | | | — | | | | 139,000,000 | | | | — | |
Options written | | | — | | | | — | | | | 2,993 | |
Interest expense | | | — | | | | 198,909 | | | | — | |
Variation margin on centrally cleared swaps | | | — | | | | 252 | | | | 97,457 | |
Swap premiums received | | | 438,433 | | | | — | | | | 6,307,521 | |
Unrealized depreciation on: | | | | | | | | | | | | |
Forward foreign currency exchange contracts | | | — | | | | 63,051 | | | | 2,468,897 | |
OTC derivatives | | | 792,914 | | | | — | | | | 1,933,804 | |
| | | | |
Total liabilities | | | 455,542,474 | | | | 178,771,136 | | | | 489,440,700 | |
| | | | |
Net Assets | | $ | 1,573,828,031 | | | $ | 343,226,245 | | | $ | 731,997,307 | |
| | | | |
| | | | | | | | | | | | |
| Net Assets Consist of | |
Paid-in capital6,7,8 | | $ | 1,691,482,486 | | | $ | 413,268,107 | | | $ | 723,427,409 | |
Undistributed (distributions in excess of) net investment income | | | 24,713 | | | | 1,324,300 | | | | (9,763,458 | ) |
Accumulated net realized loss | | | (240,139,111 | ) | | | (72,330,517 | ) | | | (1,386,712 | ) |
Net unrealized appreciation (depreciation) | | | 122,459,943 | | | | 964,355 | | | | 19,720,068 | |
| | | | |
Net Assets | | $ | 1,573,828,031 | | | $ | 343,226,245 | | | $ | 731,997,307 | |
| | | | |
Net asset value | | $ | 14.65 | | | $ | 14.50 | | | $ | 19.18 | |
| | | | |
1 Consolidated Statement of Assets and Liabilities | | | | | | | | | | | | |
2 Investments at cost — unaffiliated | | $ | 1,864,856,166 | | | $ | 501,863,680 | | | $ | 1,150,364,862 | |
3 Investments at cost — affiliated | | $ | 12,260,042 | | | $ | 3,852,270 | | | $ | 2,936,763 | |
4 Foreign currency at cost | | $ | 21,203 | | | $ | 8,917 | | | $ | 4,844,979 | |
5 Premiums received | | $ | 1,309,520 | | | | — | | | $ | 132,112 | |
6 Par value | | $ | 0.001 | | | $ | 0.001 | | | $ | 0.001 | |
7 Shares outstanding | | | 107,412,104 | | | | 23,665,166 | | | | 38,166,751 | |
8 Shares authorized | | | unlimited | | | | unlimited | | | | unlimited | |
| | | | | | |
| See Notes to Financial Statements. | | | | |
| | | | | | | |
| 76 | | SEMI-ANNUAL REPORT | | APRIL 30, 2017 | | |
| | | | | | | | | | | | |
| Six Months Ended April 30, 2017 (Unaudited) | | BlackRock
Credit Allocation
Income Trust
(BTZ) | | | BlackRock
Floating Rate
Income Trust
(BGT) | | | BlackRock
Multi-Sector
Income Trust
(BIT)1 | |
| | | | | | | | | | | | |
| Investment Income | |
Interest — unaffiliated | | $ | 51,692,492 | | | $ | 11,815,862 | | | $ | 35,244,091 | |
Dividends — unaffiliated | | | 1,969,899 | | | | 67,788 | | | | 1,454,980 | |
Dividends — affiliated | | | 44,832 | | | | 9,818 | | | | 7,900 | |
Foreign taxes withheld | | | — | | | | — | | | | (84 | ) |
| | | | |
Total investment income | | | 53,707,223 | | | | 11,893,468 | | | | 36,706,887 | |
| | | | |
| | | | | | | | | | | | |
| Expenses | |
Investment advisory | | | 6,421,870 | | | | 1,775,751 | | | | 4,583,313 | |
Officer and Trustees | | | 142,171 | | | | 34,961 | | | | 42,021 | |
Professional | | | 90,127 | | | | 75,296 | | | | 92,707 | |
Transfer agent | | | 76,211 | | | | 19,948 | | | | 27,671 | |
Custodian | | | 56,427 | | | | 69,543 | | | | 94,835 | |
Accounting services | | | 28,249 | | | | 32,014 | | | | 2,784 | |
Registration | | | 21,184 | | | | 4,781 | | | | 7,531 | |
Printing | | | 17,584 | | | | 9,214 | | | | 10,351 | |
Miscellaneous | | | 42,222 | | | | 18,088 | | | | 53,685 | |
| | | | |
Total expenses excluding interest expense | | | 6,896,045 | | | | 2,039,596 | | | | 4,914,898 | |
Interest expense | | | 2,310,714 | | | | 1,031,725 | | | | 2,781,104 | |
| | | | |
Total expenses | | | 9,206,759 | | | | 3,071,321 | | | | 7,696,002 | |
| Less: | | | | | | | | | | | | |
Fees waived by the Manager | | | (6,650 | ) | | | (722 | ) | | | (1,731 | ) |
Fees paid indirectly | | | (119 | ) | | | — | | | | — | |
| | | | |
Total expenses after fees waived and paid indirectly | | | 9,199,990 | | | | 3,070,599 | | | | 7,694,271 | |
| | | | |
Net investment income | | | 44,507,233 | | | | 8,822,869 | | | | 29,012,616 | |
| | | | |
| | | | | | | | | | | | |
| Realized and Unrealized Gain (Loss) | |
| Net realized gain (loss) from: | | | | | | | | | | | | |
Investments — unaffiliated | | | 1,371,751 | | | | 2,194,560 | | | | (1,711,776 | ) |
Investments — affiliated | | | — | | | | 2,164 | | | | — | |
Litigation proceeds | | | — | | | | — | | | | 1,203,995 | |
Futures contracts | | | 6,100,706 | | | | — | | | | 1,547,112 | |
Forward foreign currency exchange contracts | | | — | | | | (30,504 | ) | | | 4,354,069 | |
Foreign currency transactions | | | (1,035 | ) | | | 144,166 | | | | (562,750 | ) |
Capital gain distributions from investment companies — affiliated | | | 132 | | | | 11 | | | | 35 | |
Borrowed bonds | | | (413,483 | ) | | | — | | | | — | |
Options written | | | (328,569 | ) | | | — | | | | 1,007,302 | |
Swaps | | | 130,609 | | | | 162,835 | | | | 309,959 | |
| | | | |
| | | 6,860,111 | | | | 2,473,232 | | | | 6,147,946 | |
| | | | |
| Net change in unrealized appreciation (depreciation) on: | | | | | | | | | | | | |
Investments — unaffiliated | | | 2,016,724 | | | | 1,039,998 | | | | 20,293,780 | |
Investments — affiliated | | | — | | | | (4,939 | ) | | | 1,764 | |
Futures contracts | | | (4,389,517 | ) | | | — | | | | (690,326 | ) |
Forward foreign currency exchange contracts | | | — | | | | (158,842 | ) | | | (3,493,083 | ) |
Foreign currency translations | | | 587 | | | | (8,432 | ) | | | 2,103 | |
Options written | | | 282,764 | | | | — | | | | 680,912 | |
Swaps | | | (164,287 | ) | | | (45,965 | ) | | | (796,984 | ) |
Unfunded floating rate loan interests | | | — | | | | (989 | ) | | | (124,438 | ) |
| | | | |
| | | (2,253,729 | ) | | | 820,831 | | | | 15,873,728 | |
| | | | |
Net realized and unrealized gain | | | 4,606,382 | | | | 3,294,063 | | | | 22,021,674 | |
| | | | |
Net Increase in Net Assets Resulting from Operations | | $ | 49,113,615 | | | $ | 12,116,932 | | | $ | 51,034,290 | |
| | | | |
1 Consolidated Statement of Operations. | |
| | | | | | |
| See Notes to Financial Statements. | | | | |
| | | | | | | |
| | SEMI-ANNUAL REPORT | | APRIL 30, 2017 | | 77 |
| | |
| Statements of Changes in Net Assets | | |
| | | | | | | | |
| | | BlackRock Credit Allocation
Income Trust (BTZ) | |
| Increase (Decrease) in Net Assets: | | Six Months Ended
April 30,
2017
(Unaudited) | | | Year Ended
October 31,
2016 | |
| | | | | | | | |
| Operations | |
Net investment income | | $ | 44,507,233 | | | $ | 95,208,614 | |
Net realized gain (loss) | | | 6,860,111 | | | | (36,899,948 | ) |
Net change in unrealized appreciation (depreciation) | | | (2,253,729 | ) | | | 71,666,435 | |
| | | | |
Net increase in net assets resulting from operations | | | 49,113,615 | | | | 129,975,101 | |
| | | | |
| | | | | | | | |
| Distributions to Shareholders1 | |
From net investment income | | | (45,633,140 | ) | | | (93,623,404 | ) |
From return of capital | | | — | | | | (6,304,109 | ) |
| | | | |
Decrease in net assets resulting from distributions to shareholders | | | (45,633,140 | ) | | | (99,927,513 | ) |
| | | | |
| | | | | | | | |
| Capital Share Transactions | |
Redemption of shares resulting from share repurchase program (including transaction costs) | | | (8,822,801 | ) | | | — | |
| | | | |
| | | | | | | | |
| Net Assets | |
Total increase (decrease) in net assets | | | (5,342,326 | ) | | | 30,047,588 | |
Beginning of period | | | 1,579,170,357 | | | | 1,549,122,769 | |
| | | | |
End of period | | $ | 1,573,828,031 | | | $ | 1,579,170,357 | |
| | | | |
Undistributed net investment income, end of period | | $ | 24,713 | | | $ | 1,150,620 | |
| | | | |
| | | | | | | | |
| | | BlackRock Floating Rate
Income Trust (BGT) | |
| Increase (Decrease) in Net Assets: | | Six Months Ended
April 30,
2017
(Unaudited) | | | Year Ended
October 31,
2016 | |
| | | | | | | | |
| Operations | |
Net investment income | | $ | 8,822,869 | | | $ | 17,555,935 | |
Net realized gain (loss) | | | 2,473,232 | | | | (5,344,075 | ) |
Net change in unrealized appreciation (depreciation) | | | 820,831 | | | | 9,843,257 | |
| | | | |
Net increase in net assets resulting from operations | | | 12,116,932 | | | | 22,055,117 | |
| | | | |
| | | | | | | | |
| Distributions to Shareholders1 | |
From net investment income | | | (9,862,835 | ) | | | (16,554,797 | ) |
| | | | |
| | | | | | | | |
| Capital Share Transactions | |
Shares issued in reinvestment of distributions | | | 28,054 | | | | — | |
| | | | |
| | | | | | | | |
| Net Assets | |
Total increase in net assets | | | 2,282,151 | | | | 5,500,320 | |
Beginning of period | | | 340,944,094 | | | | 335,443,774 | |
| | | | |
End of period | | $ | 343,226,245 | | | $ | 340,944,094 | |
| | | | |
Undistributed net investment income, end of period | | $ | 1,324,300 | | | $ | 2,364,266 | |
| | | | |
| | 1 | | Distributions for annual periods determined in accordance with federal income tax regulations. |
| | | | | | |
| See Notes to Financial Statements. | | | | |
| | | | | | | |
| 78 | | SEMI-ANNUAL REPORT | | APRIL 30, 2017 | | |
| | |
| Consolidated Statements of Changes in Net Assets | | |
| | | | | | | | |
| | | BlackRock Multi-Sector
Income Trust (BIT) | |
| Increase (Decrease) in Net Assets: | | Six Months Ended
April 30,
2017
(Unaudited) | | | Year Ended
October 31,
2016 | |
| | | | | | | | |
| Operations | |
Net investment income | | $ | 29,012,616 | | | $ | 65,088,454 | |
Net realized gain (loss) | | | 6,147,946 | | | | (8,183,925 | ) |
Net change in unrealized appreciation (depreciation) | | | 15,873,728 | | | | 5,913,723 | |
| | | | |
Net increase in net assets resulting from operations | | | 51,034,290 | | | | 62,818,252 | |
| | | | |
| | | | | | | | |
| Distributions to Shareholders1 | |
From net investment income | | | (41,063,982 | ) | | | (62,868,881 | ) |
| | | | |
| | | | | | | | |
| Capital Share Transactions | |
Redemption of shares resulting from share repurchase program (including transaction costs) | | | (4,354,046 | ) | | | — | |
| | | | |
| | | | | | | | |
| Net Assets | |
Total increase (decrease) in net assets | | | 5,616,262 | | | | (50,629 | ) |
Beginning of period | | | 726,381,045 | | | | 726,431,674 | |
| | | | |
End of period | | $ | 731,997,307 | | | $ | 726,381,045 | |
| | | | |
Undistributed (distributions in excess of) net investment income, end of period | | $ | (9,763,458 | ) | | $ | 2,287,908 | |
| | | | |
| | 1 | | Distributions for annual periods determined in accordance with federal income tax regulations. |
| | | | | | |
| See Notes to Financial Statements. | | | | |
| | | | | | | |
| | SEMI-ANNUAL REPORT | | APRIL 30, 2017 | | 79 |
| | | | | | | | | | | | |
| Six Months Ended April 30, 2017 (Unaudited) | | BlackRock
Credit Allocation
Income Trust
(BTZ) | | | BlackRock
Floating Rate
Income Trust
(BGT) | | | BlackRock
Multi-Sector
Income Trust
(BIT)1 | |
| | | | | | | | | | | | |
| Cash Provided by Operating Activities | |
Net increase in net assets resulting from operations | | $ | 49,113,615 | | | $ | 12,116,932 | | | $ | 51,034,290 | |
Adjustments to reconcile net increase in net assets resulting from operations to net cash provided by operating activities: | | | | | | | | | | | | |
Proceeds from sales of long-term investments and principal paydowns | | | 497,951,652 | | | | 176,314,441 | | | | 276,486,287 | |
Purchases of long-term investments | | | (294,534,720 | ) | | | (169,406,282 | ) | | | (286,141,025 | ) |
Net purchases of short-term securities | | | (2,387,770 | ) | | | 3,423,319 | | | | 3,904,663 | |
Amortization of premium and accretion of discount on investments | | | 1,460,484 | | | | (535,012 | ) | | | (7,270,529 | ) |
Payments for borrowed bonds | | | (2,553,908 | ) | | | — | | | | — | |
Proceeds from borrowed bonds | | | 2,140,425 | | | | — | | | | — | |
Paid-in-kind income | | | — | | | | — | | | | 469,903 | |
Premiums received from options written | | | 1,309,520 | | | | — | | | | 135,012 | |
Premiums paid on closing options written | | | (1,279,686 | ) | | | — | | | | (437,689 | ) |
Net realized gain on investments | | | 316,051 | | | | (2,196,724 | ) | | | (722,450 | ) |
Net unrealized gain on investments | | | (2,135,201 | ) | | | (855,013 | ) | | | (17,559,061 | ) |
(Increase) Decrease in Assets: | | | | | | | | | | | | |
Cash Pledged: | | | | | | | | | | | | |
For futures contracts | | | 1,285,000 | | | | — | | | | 351,900 | |
Collateral — OTC derivatives | | | (840,000 | ) | | | — | | | | (2,660,000 | ) |
For centrally cleared swaps | | | — | | | | (56,000 | ) | | | (3,049,000 | ) |
Collateral — reverse repurchase agreements | | | 1,521,000 | | | | — | | | | (1,530,000 | ) |
Receivables: | | | | | | | | | | | | |
Interest — unaffiliated | | | 1,633,101 | | | | 5,868 | | | | (1,751,725 | ) |
Swaps | | | — | | | | — | | | | 12,941 | |
Dividends — affiliated | | | (13,410 | ) | | | (685 | ) | | | 1,187 | |
Variation margin on futures contracts | | | 41,563 | | | | — | | | | (2,849 | ) |
Due from broker — swap collateral | | | 520,000 | | | | — | | | | — | |
Other | | | 217,087 | | | | — | | | | — | |
Swap premiums paid | | | 63,824 | | | | — | | | | 777,112 | |
Prepaid expenses | | | (73,165 | ) | | | (11,325 | ) | | | (20,595 | ) |
Other assets | | | — | | | | 29,246 | | | | 48,877 | |
Increase (Decrease) in Liabilities: | | | | | | | | | | | | |
Cash Received: | | | | | | | | | | | | |
Collateral — OTC derivatives | | | (2,290,000 | ) | | | — | | | | (410,000 | ) |
Collateral — reverse repurchase agreements | | | (2,033,000 | ) | | | — | | | | (1,760,000 | ) |
Payables: | | | | | | | | | | | | |
Investment advisory fees | | | (168,751 | ) | | | (9,074 | ) | | | (4,901 | ) |
Interest expense and fees | | | (1,385,188 | ) | | | 52,118 | | | | (566,507 | ) |
Officer’s and Trustees’ fees | | | 56,738 | | | | 15,125 | | | | 12,601 | |
Variation margin on futures contracts | | | (191,169 | ) | | | — | | | | (74,432 | ) |
Variation margin on centrally cleared swaps | | | — | | | | 252 | | | | 95,426 | |
Swaps | | | — | | | | — | | | | (201 | ) |
Other accrued expenses | | | (41,043 | ) | | | (50,867 | ) | | | (56,714 | ) |
Swap premiums received | | | (132,493 | ) | | | — | | | | 1,271,657 | |
| | | | |
Net cash provided by operating activities | | | 247,570,556 | | | | 18,836,319 | | | | 10,584,178 | |
| | | | |
| | | | | | | | | | | | |
| Cash Used for Financing Activities | |
Proceeds from bank borrowings | | | — | | | | 120,000,000 | | | | — | |
Payments on bank borrowings | | | — | | | | (129,000,000 | ) | | | — | |
Net payments on redemption of Common Shares | | | (8,822,801 | ) | | | — | | | | (4,354,046 | ) |
Net borrowing of reverse repurchase agreements | | | (192,934,034 | ) | | | — | | | | 33,420,407 | |
Cash dividends paid to Common Shareholders | | | (45,648,033 | ) | | | (9,863,234 | ) | | | (41,070,070 | ) |
Decrease in bank overdraft | | | (132,344 | ) | | | — | | | | — | |
| | | | |
Net cash used for financing activities | | | (247,537,212 | ) | | | (18,863,234 | ) | | | (12,003,709 | ) |
| | | | |
| | | | | | | | | | | | |
| Cash Impact from Foreign Exchange Fluctuations | |
Cash impact from foreign exchange fluctuations | | $ | 128 | | | $ | (63 | ) | | $ | (14,456 | ) |
| | | | |
| | | | | | | | | | | | |
| Cash and Foreign Currency | |
Net increase (decrease) in cash and foreign currency | | | 33,472 | | | | (26,978 | ) | | | (1,433,987 | ) |
Cash and foreign currency at beginning of period | | | 17,051 | | | | 1,098,402 | | | | 6,683,496 | |
| | | | |
Cash and foreign currency at end of period | | $ | 50,523 | | | $ | 1,071,424 | | | $ | 5,249,509 | |
| | | | |
| | | | | | | | | | | | |
| Supplemental Disclosure of Cash Flow Information | |
Cash paid during the period for interest expense | | $ | 3,695,902 | | | $ | 979,607 | | | $ | 3,347,611 | |
| | | | |
| | | | | | | | | | | | |
| Non-Cash Financing Activities | |
Capital shares issued in reinvestment of distributions paid to Common Shareholders | | | — | | | | 28,054 | | | | — | |
| | | | |
| | 1 | | Consolidated Statement of Cash Flows. |
| | | | | | |
| See Notes to Financial Statements. | | | | |
| | | | | | | |
| 80 | | SEMI-ANNUAL REPORT | | APRIL 30, 2017 | | |
| | |
| Financial Highlights | | BlackRock Credit Allocation Income Trust (BTZ) |
| | | | | | | | | | | | | | | | | | | | | | | | |
| | | Six Months Ended
April 30,
2017
(Unaudited) | | | Year Ended October 31, | |
| | | | 2016 | | | 2015 | | | 2014 | | | 2013 | | | 2012 | |
| | | | | | | | | | | | | | | | | | | | | | | | |
| Per Share Operating Performance | |
Net asset value, beginning of period | | $ | 14.61 | | | $ | 14.33 | | | $ | 15.36 | | | $ | 14.99 | | | $ | 15.37 | | | $ | 13.94 | |
| | | | |
Net investment income1 | | | 0.41 | | | | 0.88 | | | | 0.96 | | | | 0.99 | | | | 0.97 | | | | 0.94 | |
Net realized and unrealized gain (loss) | | | 0.05 | | | | 0.32 | | | | (1.02 | ) | | | 0.35 | | | | (0.37 | ) | | | 1.43 | |
| | | | |
Net increase (decrease) from investment operations | | | 0.46 | | | | 1.20 | | | | (0.06 | ) | | | 1.34 | | | | 0.60 | | | | 2.37 | |
| | | | |
| Distributions:2 | | | | | | | | | | | | | | | | | | | | | | | | |
From net investment income | | | (0.42 | ) | | | (0.86 | ) | | | (0.91 | ) | | | (0.97 | ) | | | (0.98 | ) | | | (0.94 | ) |
From return of capital | | | — | | | | (0.06 | ) | | | (0.06 | ) | | | — | | | | — | | | | — | |
| | | | |
Total distributions | | | (0.42 | ) | | | (0.92 | ) | | | (0.97 | ) | | | (0.97 | ) | | | (0.98 | ) | | | (0.94 | ) |
| | | | |
Net asset value, end of period | | $ | 14.65 | | | $ | 14.61 | | | $ | 14.33 | | | $ | 15.36 | | | $ | 14.99 | | | $ | 15.37 | |
| | | | |
Market price, end of period | | $ | 13.41 | | | $ | 12.87 | | | $ | 12.53 | | | $ | 13.54 | | | $ | 12.97 | | | $ | 14.23 | |
| | | | |
| | | | | | | | | | | | | | | | | | | | | | | | |
| Total Return3 | |
Based on net asset value | | | 3.59% | 4 | | | 9.61% | | | | 0.48% | | | | 10.11% | | | | 4.86% | | | | 18.35% | |
| | | | |
Based on market price | | | 7.64% | 4 | | | 10.43% | | | | (0.33)% | | | | 12.18% | | | | (2.01)% | | | | 26.44% | |
| | | | |
| | | | | | | | | | | | | | | | | | | | | | | | |
| Ratios to Average Net Assets | |
Total expenses | | | 1.20% | 5 | | | 1.20% | | | | 1.16% | | | | 1.11% | | | | 1.15% | 6 | | | 1.20% | 7 |
| | | | |
Total expenses after fees waived and paid indirectly | | | 1.19% | 5 | | | 1.20% | | | | 1.15% | | | | 1.11% | | | | 1.15% | 6 | | | 1.20% | 7 |
| | | | |
Total expenses after fees waived and paid indirectly and excluding interest expense | | | 0.89% | 5 | | | 0.95% | | | | 0.97% | | | | 0.96% | | | | 1.00% | 6 | | | 1.07% | 7 |
| | | | |
Net investment income | | | 5.78% | 5 | | | 6.21% | | | | 6.40% | | | | 6.48% | | | | 6.43% | | | | 6.53% | |
| | | | |
| | | | | | | | | | | | | | | | | | | | | | | | |
| Supplemental Data | |
Net assets, end of period (000) | | $ | 1,573,828 | | | $ | 1,579,170 | | | $ | 1,549,123 | | | $ | 1,660,442 | | | $ | 1,619,703 | | | $ | 796,836 | |
| | | | |
Borrowings outstanding, end of period (000) | | $ | 439,331 | | | $ | 638,327 | | | $ | 685,716 | | | $ | 759,752 | | | $ | 812,028 | | | $ | 373,716 | |
| | | | |
Portfolio turnover rate | | | 13% | | | | 29% | | | | 19% | | | | 29% | | | | 43% | | | | 37% | |
| | | | |
| | 1 | | Based on average shares outstanding. |
| | 2 | | Distributions for annual periods determined in accordance with federal income tax regulations. |
| | 3 | | Total returns based on market price, which can be significantly greater or less than the net asset value, may result in substantially different returns. Where applicable, excludes the effects of any sales charges and assumes the reinvestment of distributions at actual reinvestment prices. |
| | 4 | | Aggregate total return. |
| | 6 | | Includes reorganization costs associated with the Trust’s reorganization. Without these costs, total expenses, total expenses after fees waived and paid indirectly, and total expenses after fees waived and paid indirectly and excluding interest expense would have been 1.15%, 1.15% and 1.00%, respectively. |
| | 7 | | Includes reorganization costs associated with the Trust’s reorganization. Without these costs, total expenses, total expenses after fees waived and paid indirectly, and total expenses after fees waived and paid indirectly and excluding interest expense would have been 1.16%, 1.16% and 1.02%, respectively. |
| | | | | | |
| See Notes to Financial Statements. | | | | |
| | | | | | | |
| | SEMI-ANNUAL REPORT | | APRIL 30, 2017 | | 81 |
| | |
| Financial Highlights | | BlackRock Floating Rate Income Trust (BGT) |
| | | | | | | | | | | | | | | | | | | | | | | | |
| | | Six Months Ended
April 30,
2017
(Unaudited) | | | Year Ended October 31, | |
| | | | 2016 | | | 20151 | | | 20141 | | | 20131 | | | 20121 | |
| | | | | | | | | | | | | | | | | | | | | | | | |
| Per Share Operating Performance | |
Net asset value, beginning of period | | $ | 14.41 | | | $ | 14.18 | | | $ | 14.57 | | | $ | 14.79 | | | $ | 14.52 | | | $ | 13.97 | |
| | | | |
Net investment income2 | | | 0.37 | | | | 0.74 | | | | 0.78 | | | | 0.84 | | | | 0.94 | | | | 0.97 | |
Net realized and unrealized gain (loss) | | | 0.14 | | | | 0.19 | | | | (0.36 | ) | | | (0.22 | ) | | | 0.38 | | | | 0.68 | |
| | | | |
Net increase from investment operations | | | 0.51 | | | | 0.93 | | | | 0.42 | | | | 0.62 | | | | 1.32 | | | | 1.65 | |
| | | | |
Distributions from net investment income3 | | | (0.42 | ) | | | (0.70 | ) | | | (0.81 | ) | | | (0.84 | ) | | | (1.05 | ) | | | (1.10 | ) |
| | | | |
Net asset value, end of period | | $ | 14.50 | | | $ | 14.41 | | | $ | 14.18 | | | $ | 14.57 | | | $ | 14.79 | | | $ | 14.52 | |
| | | | |
Market price, end of period | | $ | 14.68 | | | $ | 13.58 | | | $ | 12.77 | | | $ | 13.18 | | | $ | 14.12 | | | $ | 15.07 | |
| | | | |
| | | | | | | | | | | | | | | | | | | | | | | | |
| Total Return4 | |
Based on net asset value | | | 3.59% | 5 | | | 7.27% | | | | 3.54% | | | | 4.60% | | | | 9.37% | | | | 12.37% | |
| | | | |
Based on market price | | | 11.29% | 5 | | | 12.25% | | | | 3.08% | | | | (0.89)% | | | | 0.60% | | | | 25.33% | |
| | | | |
| | | | | | | | | | | | | | | | | | | | | | | | |
| Ratios to Average Net Assets | |
Total expenses | | | 1.81% | 6 | | | 1.58% | | | | 1.55% | | | | 1.52% | | | | 1.57% | | | | 1.66% | |
| | | | |
Total expenses after fees waived and paid indirectly | | | 1.81% | 6 | | | 1.58% | | | | 1.54% | | | | 1.52% | | | | 1.57% | | | | 1.61% | |
| | | | |
Total expenses after fees waived and paid indirectly and excluding interest expense | | | 1.20% | 6 | | | 1.16% | | | | 1.19% | | | | 1.18% | | | | 1.19% | | | | 1.25% | 7 |
| | | | |
Net investment income | | | 5.19% | 6 | | | 5.29% | | | | 5.37% | | | | 5.71% | | | | 6.39% | | | | 6.87% | |
| | | | |
| | | | | | | | | | | | | | | | | | | | | | | | |
| Supplemental Data | |
Net assets, end of period (000) | | $ | 343,226 | | | $ | 340,944 | | | $ | 335,444 | | | $ | 344,668 | | | $ | 349,941 | | | $ | 343,282 | |
| | | | |
Borrowings outstanding, end of period (000) | | $ | 139,000 | | | $ | 148,000 | | | $ | 104,000 | | | $ | 145,000 | | | $ | 152,000 | | | $ | 145,000 | |
| | | | |
Asset coverage, end of period per $1,000 of bank borrowings | | $ | 3,469 | | | $ | 3,304 | | | $ | 4,225 | | | $ | 3,377 | | | $ | 3,302 | | | $ | 3,367 | |
| | | | |
Portfolio turnover rate | | | 34% | | | | 47% | | | | 42% | | | | 64% | | | | 72% | | | | 65% | |
| | | | |
| | 1 | | Consolidated Financial Highlights. |
| | 2 | | Based on average shares outstanding. |
| | 3 | | Distributions for annual periods determined in accordance with federal income tax regulations. |
| | 4 | | Total returns based on market price, which can be significantly greater or less than the net asset value, may result in substantially different returns. Where applicable, excludes the effects of any sales charges and assumes the reinvestment of distributions at actual reinvestment prices. |
| | 5 | | Aggregate total return. |
| | 7 | | For the year ended October 31, 2012, the total expense ratio after fees waived and paid indirectly and excluding interest expense and borrowing costs was 1.14%. |
| | | | | | |
| See Notes to Financial Statements. | | | | |
| | | | | | | |
| 82 | | SEMI-ANNUAL REPORT | | APRIL 30, 2017 | | |
| | |
| Financial Highlights | | BlackRock Multi-Sector Income Trust (BIT) |
| | | | | | | | | | | | | | | | | | | | | | | | |
| | | Six Months Ended
April 30,
20171 (Unaudited) | | | Year Ended October 31, | | | Period
February 27, 20132
to October 31,
2013 | | | | |
| | | | 20161 | | | 2015 | | | 2014 | | | |
| | | | | | | | | | | | | | | | | | | | | | | | |
| Per Share Operating Performance | | | | | |
Net asset value, beginning of period | | $ | 18.91 | | | $ | 18.91 | | | $ | 19.87 | | | $ | 18.95 | | | $ | 19.10 | 3 | | | | |
| | | | |
Net investment income4 | | | 0.76 | | | | 1.69 | | | | 1.55 | | | | 1.62 | | | | 1.02 | | | | | |
Net realized and unrealized gain (loss) | | | 0.58 | | | | (0.05 | ) | | | (1.03 | ) | | | 0.70 | | | | (0.35 | ) | | | | |
| | | | |
Net increase from investment operations | | | 1.34 | | | | 1.64 | | | | 0.52 | | | | 2.32 | | | | 0.67 | | | | | |
| | | | |
| Distributions:5 | | | | | |
From net investment income | | | (1.07 | ) | | | (1.64 | ) | | | (1.40 | ) | | | (1.40 | ) | | | (0.70 | ) | | | | |
From net realized gain | | | — | | | | — | | | | (0.08 | ) | | | — | | | | — | | | | | |
From return of capital | | | — | | | | — | | | | — | | | | — | | | | (0.12 | ) | | | | |
| | | | |
Total distributions | | | (1.07 | ) | | | (1.64 | ) | | | (1.48 | ) | | | (1.40 | ) | | | (0.82 | ) | | | | |
| | | | |
Net asset value, end of period | | $ | 19.18 | | | $ | 18.91 | | | $ | 18.91 | 6 | | $ | 19.87 | | | $ | 18.95 | | | | | |
| | | | |
Market price, end of period | | $ | 17.98 | | | $ | 16.76 | | | $ | 16.31 | | | $ | 17.79 | | | $ | 17.04 | | | | | |
| | | | |
| | | | | | | | | | | | | | | | | | | | | | | | |
| Total Return7 | | | | | |
Based on net asset value | | | 7.96% | 8 | | | 10.51% | 9 | | | 3.87% | 6 | | | 13.40% | | | | 4.04% | 8 | | | | |
| | | | |
Based on market price | | | 14.18% | 8 | | | 13.56% | | | | 0.06% | | | | 12.91% | | | | (10.66)% | 8 | | | | |
| | | | |
| | | | | | | | | | | | | | | | | | | | | | | | |
| Ratios to Average Net Assets | | | | | |
Total expenses | | | 2.17% | 10 | | | 2.05% | 11 | | | 2.09% | 11 | | | 2.04% | | | | 1.67% | 10 | | | | |
| | | | |
Total expenses after fees waived and paid indirectly | | | 2.17% | 10 | | | 2.05% | 11 | | | 2.09% | 11 | | | 2.04% | | | | 1.67% | 10 | | | | |
| | | | |
Total expenses after fees waived and paid indirectly and excluding interest expense | | | 1.38% | 10 | | | 1.43% | 11 | | | 1.53% | 11 | | | 1.52% | | | | 1.33% | 10 | | | | |
| | | | |
Net investment income | | | 8.16% | 10 | | | 9.24% | 11 | | | 7.97% | 11 | | | 8.27% | | | | 8.05% | 10 | | | | |
| | | | |
| | | | | | | | | | | | | | | | | | | | | | | | |
| Supplemental Data | | | | | |
Net assets, end of period (000) | | $ | 731,997 | | | $ | 726,381 | | | $ | 726,432 | | | $ | 763,360 | | | $ | 727,908 | | | | | |
| | | | |
Borrowings outstanding, end of period (000) | | $ | 458,814 | | | $ | 427,329 | | | $ | 510,352 | | | $ | 707,294 | | | $ | 552,040 | | | | | |
| | | | |
Portfolio turnover rate | | | 24% | | | | 52% | | | | 21% | | | | 29% | | | | 77% | 12 | | | | |
| | | | |
| | 1 | | Consolidated Financial Highlights. |
| | 2 | | Commencement of operations. |
| | 3 | | Net asset value, beginning of period, reflects a deduction of $0.90 per share sales charge from the initial offering price of $20.00 per share. |
| | 4 | | Based on average shares outstanding. |
| | 5 | | Distributions for annual periods determined in accordance with federal income tax regulations. |
| | 6 | | For financial reporting purposes, the market value of certain investments were adjusted as of report date. Accordingly, the net asset value (“NAV”) per share and total return performance based on net asset value presented herein are different than the information previously published on October 31, 2015. |
| | 7 | | Total returns based on market price, which can be significantly greater or less than the net asset value, may result in substantially different returns. Where applicable, excludes the effects of any sales charges and assumes the reinvestment of distributions at actual reinvestment prices. |
| | 8 | | Aggregate total return. |
| | 9 | | Includes payment received from an affiliate, which had no impact on the Trust’s total return. |
| | 11 | | Ratios do not include expenses incurred indirectly as a result of investments in underlying funds of approximately 0.01% for the year ended October 31, 2016 and October 31, 2015. |
| | 12 | | Includes mortgage dollar roll transactions. Excluding these transactions, the portfolio turnover would have been 54%. |
| | | | | | |
| See Notes to Financial Statements. | | | | |
| | | | | | | |
| | SEMI-ANNUAL REPORT | | APRIL 30, 2017 | | 83 |
| | |
| Notes to Financial Statements (Unaudited) | | |
1. Organization:
The following are registered under the Investment Company Act of 1940, as amended (the “1940 Act”), as closed-end management investment companies and are referred to herein collectively as the “Trusts”, or individually, a “Trust”:
| | | | | | | | | | |
| Trust Name | | Herein Referred To As | | | Organized | | | Diversification Classification |
BlackRock Credit Allocation Income Trust | | | BTZ | | | | Delaware | | | Diversified |
BlackRock Floating Rate Income Trust | | | BGT | | | | Delaware | | | Diversified |
BlackRock Multi-Sector Income Trust | | | BIT | | | | Delaware | | | Non-diversified |
The Boards of Trustees of the Trusts are collectively referred to throughout this report as the “Board of Trustees” or the “Board,” and the trustees thereof are collectively referred to throughout this report as “Trustees.” The Trusts determine and make available for publication the net asset value (“NAV”) of their Common Shares on a daily basis.
The Trusts, together with certain other registered investment companies advised by BlackRock Advisors, LLC (the “Manager”) or its affiliates, are included in a complex of closed-end funds referred to as the Closed-End Complex.
Basis of Consolidation: The accompanying consolidated financial statements of BIT include the accounts of BIT Subsidiary, LLC (the “Taxable Subsidiary”), which is a wholly-owned taxable subsidiary of BIT. The Taxable Subsidiary enables BIT to hold an investment in an operating partnership and satisfy RIC tax requirements. Income earned and gains realized on the investment held by the Taxable Subsidiary are taxable to such subsidiary. A tax provision for income, if any, is shown as income tax in the Consolidated Statements of Operations for BIT. A tax provision for realized and unrealized gains, if any, is included as a reduction of realized and/or unrealized gain (loss) in the Consolidated Statement of Operations for BIT. BIT may invest up to 25% of its total assets in the Taxable Subsidiary. There were no assets in the Taxable Subsidiary as of period end. Intercompany accounts and transactions, if any, have been eliminated. The Taxable Subsidiary is subject to the same investment policies and restrictions that apply to BIT.
2. Significant Accounting Policies:
The financial statements are prepared in conformity with accounting principles generally accepted in the United States of America (“U.S. GAAP”), which may require management to make estimates and assumptions that affect the reported amounts of assets and liabilities in the financial statements, disclosure of contingent assets and liabilities at the date of the financial statements and the reported amounts of increases and decreases in net assets from operations during the reporting period. Actual results could differ from those estimates. Each Trust is considered an investment company under U.S. GAAP and follows the accounting and reporting guidance applicable to investment companies. Below is a summary of significant accounting policies:
Investment Transactions and Investment Income: For financial reporting purposes, investment transactions are recorded on the dates the transactions are entered into (the trade dates). Realized gains and losses on investment transactions are determined on the identified cost basis. Dividend income is recorded on the ex-dividend date. Dividends from foreign securities where the ex-dividend date may have passed are subsequently recorded when the Trusts are informed of the ex-dividend date. Under the applicable foreign tax laws, a withholding tax at various rates may be imposed on capital gains, dividends and interest. Upon notification from issuers, some of the dividend income received from a real estate investment trust may be redesignated as a reduction of cost of the related investment and/or realized gain. Interest income, including amortization and accretion of premiums and discounts on debt securities, is recognized on the accrual basis.
Foreign Currency: Each Trust’s books and records are maintained in U.S. dollars. Purchases and sales of investments are recorded at the rates of exchange prevailing on the respective dates of such transactions. Generally, when the U.S. dollar rises in value against a foreign currency, the investments denominated in that currency will lose value; the opposite effect occurs if the U.S. dollar falls in relative value.
Each Trust does not isolate the portion of the results of operations arising as a result of changes in the exchange rates from the changes in the market prices of investments held or sold for financial reporting purposes. Accordingly, the effects of changes in exchange rates on investments are not segregated in the Statements of Operations from the effects of changes in market prices of those investments, but are included as a component of net realized and unrealized gain (loss) from investments. Each Trust reports realized currency gains (losses) on foreign currency related transactions as components of net realized gain (loss) for financial reporting purposes, whereas such components are generally treated as ordinary income for federal income tax purposes.
Segregation and Collateralization: In cases where a Trust enters into certain investments (e.g., futures contracts, forward foreign currency exchange contracts, options written and swaps) or certain borrowings (e.g., reverse repurchase transactions) that would be treated as “senior securities” for 1940 Act purposes, a Trust may segregate or designate on its books and records cash or liquid assets having a market value at least equal to the amount of its future obligations under such investments or borrowings. Doing so allows the investment or borrowing to be excluded from treatment as a “senior security.” Furthermore, if required by an exchange or counterparty agreement, the Trusts may be required to deliver/deposit cash and/or securities to/with an exchange, or broker-dealer or custodian as collateral for certain investments or obligations.
Distributions: Distributions from net investment income are declared and paid monthly. Distributions of capital gains are recorded on the ex-dividend date and made at least annually. Portions of return of capital distributions under U.S. GAAP may be taxed at ordinary income rates. The character of
| | | | | | |
| | | | | | | |
| 84 | | SEMI-ANNUAL REPORT | | APRIL 30, 2017 | | |
| | | | |
| Notes to Financial Statements (continued) | | |
distributions is determined in accordance with U.S. federal income tax regulations, which may differ from U.S. GAAP. The portion of distributions that exceeds a Trust’s current and accumulated earnings and profits, as measured on a tax basis, constitute a non-taxable return of capital. Realized net capital gains can be offset by capital losses carried forward from prior years. However, certain Trusts have capital loss carryforwards from pre-2012 tax years that offset realized net capital gains but do not offset current earnings and profits. Consequently, if distributions in any tax year are less than the Trust’s current earnings and profits but greater than net investment income and net realized capital gains (taxable income), distributions in excess of taxable income are not treated as non-taxable return of capital, but rather may be taxable to shareholders at ordinary income rates. Under certain circumstances, taxable excess distributions could be significant.
Deferred Compensation Plan: Under the Deferred Compensation Plan (the “Plan”) approved by each Trust’s Board, the independent Trustees (“Independent Trustees”) may defer a portion of their annual complex-wide compensation. Deferred amounts earn an approximate return as though equivalent dollar amounts had been invested in common shares of certain other BlackRock Closed-End Funds selected by the Independent Trustees. This has the same economic effect for the Independent Trustees as if the Independent Trustees had invested the deferred amounts directly in certain other BlackRock Closed-End Funds.
The Plan is not funded and obligations thereunder represent general unsecured claims against the general assets of each Trust, if applicable. Deferred compensation liabilities are included in officer’s and trustees’ fees payable in the Statements of Assets and Liabilities and will remain as a liability of the Trusts until such amounts are distributed in accordance with the Plan.
Recent Accounting Standards: In November 2016, the Financial Accounting Standards Board issued Accounting Standards Update “Restricted Cash” which will require entities to include the total of cash, cash equivalents, restricted cash, and restricted cash equivalents in the beginning and ending cash balances in the Statements of Cash Flows. The guidance will be applied retrospectively and is effective for fiscal years beginning after December 15, 2017, and interim periods within those years. Management is evaluating the impact, if any, of this guidance on the Trusts’ presentation in the Statements of Cash Flows.
In March 2017, the Financial Accounting Standards Board issued Accounting Standards Update “Premium Amortization on Purchased Callable Debt Securities” which amends the amortization period for certain purchased callable debt securities. Under the new guidance, premium amortization of purchased callable debt securities that have explicit, non-contingent call features and are callable at fixed prices will be amortized to the earliest call date. The guidance will be applied on a modified retrospective basis and is effective for fiscal years, and their interim periods, beginning after December 15, 2018. Management is currently evaluating the impact of this guidance to the Trusts.
SEC Reporting Modernization: The Securities and Exchange Commission (“SEC”) adopted new rules and forms and amended other rules to enhance the reporting and disclosure of information by registered investment companies. As part of these changes, the SEC amended Regulation S-X to standardize and enhance disclosures in investment company financial statements. The compliance date for implementing the new or amended rules is August 1, 2017.
Indemnifications: In the normal course of business, a Trust enters into contracts that contain a variety of representations that provide general indemnification. A Trust’s maximum exposure under these arrangements is unknown because it involves future potential claims against a Trust, which cannot be predicted with any certainty.
Other: Expenses directly related to a Trust are charged to that Trust. Other operating expenses shared by several funds, including other funds managed by the Manager, are prorated among those funds on the basis of relative net assets or other appropriate methods.
Through May 31, 2016, the Trusts had an arrangement with their custodian whereby credits were earned on uninvested cash balances, which could be used to reduce custody fees and/or overdraft charges. Credits previously earned have been utilized until December 31, 2016. Under current arrangements effective June 1, 2016, the Trusts no longer earn credits on uninvested cash, and may incur charges on uninvested cash balances and overdrafts, subject to certain conditions.
3. Investment Valuation and Fair Value Measurements:
Investment Valuation Policies: The Trusts’ investments are valued at fair value (also referred to as “market value” within the financial statements) as of the close of trading on the New York Stock Exchange (“NYSE”) (generally 4:00 p.m., Eastern time) (or if the reporting date falls on a day the NYSE is closed, investments are valued at fair value as of the period end). U.S. GAAP defines fair value as the price the Trusts would receive to sell an asset or pay to transfer a liability in an orderly transaction between market participants at the measurement date. The Trusts determine the fair values of their financial instruments using various independent dealers or pricing services under policies approved by the Board of Trustees of each Trust (the “Board”). The BlackRock Global Valuation Methodologies Committee (the “Global Valuation Committee”) is the committee formed by management to develop global pricing policies and procedures and to oversee the pricing function for all financial instruments.
| | | | | | |
| | | | | | | |
| | SEMI-ANNUAL REPORT | | APRIL 30, 2017 | | 85 |
| | |
| Notes to Financial Statements (continued) | | |
Fair Value Inputs and Methodologies: The following methods and inputs are used to establish the fair value of each Trust’s assets and liabilities:
| • | | Equity investments traded on a recognized securities exchange are valued at the official closing price each day, if available. For equity investments traded on more than one exchange, the official closing price on the exchange where the stock is primarily traded is used. Equity investments traded on a recognized exchange for which there were no sales on that day may be valued at the last available bid (long positions) or ask (short positions) price. |
| • | | Fixed-income securities for which market quotations are readily available are generally valued using the last available bid prices or current market quotations provided by independent dealers or third party pricing services. Floating rate loan interests are valued at the mean of the bid prices from one or more independent brokers or dealers as obtained from a third party pricing service. Pricing services generally value fixed-income securities assuming orderly transactions of an institutional round lot size, but the Trust may hold or transact in such securities in smaller, odd lot sizes. Odd lots often trade at lower prices than institutional round lots. The pricing services may use matrix pricing or valuation models that utilize certain inputs and assumptions to derive values, including transaction data (e.g., recent representative bids and offers), credit quality information, perceived market movements, news, and other relevant information. Certain fixed-income securities, including asset-backed and mortgage related securities may be valued based on valuation models that consider the estimated cash flows of each tranche of the entity, establish a benchmark yield and develop an estimated tranche specific spread to the benchmark yield based on the unique attributes of the tranche. The amortized cost method of valuation may be used with respect to debt obligations with sixty days or less remaining to maturity unless the Manager determines such method does not represent fair value. |
Generally, trading in foreign instruments is substantially completed each day at various times prior to the close of trading on the NYSE. Occasionally, events affecting the values of such instruments may occur between the foreign market close and the close of trading on the NYSE that may not be reflected in the computation of the Trust’s net assets. Each business day, the Trusts use a pricing service to assist with the valuation of certain foreign exchange-traded equity securities and foreign exchange-traded over-the-counter (“OTC”) or if options (the “Systematic Fair Value Price”). Using current market factors, the Systematic Fair Value Price is designed to value such foreign securities and foreign options at fair value as of the close of trading on the NYSE, which follows the close of the local markets.
| • | | Municipal investments (including commitments to purchase such investments on a “when-issued” basis) are valued on the basis of prices provided by dealers or pricing services. In determining the value of a particular investment, pricing services may use certain information with respect to transactions in such investments, quotations from dealers, pricing matrixes, market transactions in comparable investments and information with respect to various relationships between investments. |
| • | | Investments in open-end U.S. mutual funds are valued at NAV each business day. |
| • | | Futures contracts traded on exchanges are valued at their last sale price. |
| • | | Securities and other assets and liabilities denominated in foreign currencies are translated into U.S. dollars using exchange rates determined as of the close of trading on the NYSE. Forward foreign currency exchange contracts are valued at the mean between the bid and ask prices and are determined as of the close of trading on the NYSE. Interpolated values are derived when the settlement date of the contract is an interim date for which quotations are not available. |
| • | | Exchange-traded options are valued at the mean between the last bid and ask prices at the close of the options market in which the options trade. An exchange-traded option for which there is no mean price is valued at the last bid (long positions) or ask (short positions) price. If no bid or ask price is available, the prior day’s price will be used, unless it is determined that the prior day’s price no longer reflects the fair value of the option. OTC options and options on swaps (“swaptions”) are valued by an independent pricing service using a mathematical model, which incorporates a number of market data factors, such as the trades and prices of the underlying instruments. |
| • | | Swap agreements are valued utilizing quotes received daily by the Trusts’ pricing service or through brokers, which are derived using daily swap curves and models that incorporate a number of market data factors, such as discounted cash flows, trades and values of the underlying reference instruments. |
If events (e.g., a company announcement, market volatility or a natural disaster) occur that are expected to materially affect the value of such investments, or in the event that the application of these methods of valuation results in a price for an investment that is deemed not to be representative of the market value of such investment, or if a price is not available, the investment will be valued by the Global Valuation Committee, or its delegate, in accordance with a policy approved by the Board as reflecting fair value (“Fair Valued Investments”). The fair valuation approaches that may be used by the Global Valuation Committee include Market approach, Income approach and Cost approach. Valuation techniques such as discounted cash flow, use of market comparables and matrix pricing are types of valuation approaches and typically used in determining fair value. When determining the price for Fair Valued Investments, the Global Valuation Committee, or its delegate, seeks to determine the price that each Trust might reasonably expect to receive or pay from the current sale or purchase of that asset or liability in an arm’s-length transaction. Fair value determinations shall be based upon all available factors that the Global Valuation Committee, or its delegate, deems relevant and consistent with the principles of fair value measurement.
| | | | | | |
| | | | | | | |
| 86 | | SEMI-ANNUAL REPORT | | APRIL 30, 2017 | | |
| | | | |
| Notes to Financial Statements (continued) | | |
The Global Valuation Committee, or its delegate, employs various methods for calibrating valuation approaches for investments where an active market does not exist, including regular due diligence of each Trust’s pricing vendors, regular reviews of key inputs and assumptions, transactional back-testing or disposition analysis to compare unrealized gains and losses to realized gains and losses, reviews of missing or stale prices and large movements in market values and reviews of any market related activity. The pricing of all Fair Valued Investments is subsequently reported to the Board or a committee thereof on a quarterly basis. As a result of the inherent uncertainty in valuation of these investments, the fair values may differ from the values that would have been used had an active market existed.
For investments in equity or debt issued by privately-held companies or funds (“Private Company” or collectively, the “Private Companies”) and other Fair Valued Investments, the fair valuation approaches that are used by third party pricing services utilize one or a combination of, but not limited to, the following inputs.
| | |
| Standard Inputs Generally Considered By Third Party Pricing Services |
Market approach | | (i) recent market transactions, including subsequent rounds of financing, in the underlying investment or comparable issuers; (ii) recapitalizations and other transactions across the capital structure; and (iii) market multiples of comparable issuers. |
Income approach | | (i) future cash flows discounted to present and adjusted as appropriate for liquidity, credit, and/or market risks; (ii) quoted prices for similar investments or assets in active markets; and (iii) other risk factors, such as interest rates, yield curves, volatilities, prepayment speeds, loss severities, credit risks, recovery rates, liquidation amounts and/or default rates. |
Cost approach | | (i) audited or unaudited financial statements, investor communications and financial or operational metrics issued by the Private Company; (ii) changes in the valuation of relevant indices or publicly traded companies comparable to the Private Company; (iii) relevant news and other public sources; and (iv) known secondary market transactions in the Private Company’s interests and merger or acquisition activity in companies comparable to the Private Company. |
Investments in series of preferred stock issued by Private Companies are typically valued utilizing the Market approach in determining the enterprise value of the company. Such investments often contain rights and preferences that differ from other series of preferred and common stock of the same issuer. Valuation techniques such as an option pricing model (“OPM”), a probability weighted expected return model (“PWERM”) or a hybrid of those techniques are used in allocating enterprise value of the company, as deemed appropriate under the circumstances. The use of OPM and PWERM techniques involve a determination of the exit scenarios of the investment in order to appropriately allocate the enterprise value of the company among the various parts of its capital structure.
The Private Companies are not subject to the public company disclosure, timing, and reporting standards as other investments held by a Trust. Typically, the most recently available information by a Private Company is as of a date that is earlier than the date a Trust is calculating its NAV. This factor may result in a difference between the value of the investment in series of preferred stock issues by Private Companies and the price a Trust could receive upon the sale of the investment.
Fair Value Hierarchy: Various inputs are used in determining the fair value of investments and derivative financial instruments. These inputs to valuation techniques are categorized into a fair value hierarchy consisting of three broad levels for financial statement purposes as follows:
| • | | Level 1 — unadjusted price quotations in active markets/exchanges for identical assets or liabilities that each Trust has the ability to access |
| • | | Level 2 — other observable inputs (including, but not limited to, quoted prices for similar assets or liabilities in markets that are active, quoted prices for identical or similar assets or liabilities in markets that are not active, inputs other than quoted prices that are observable for the assets or liabilities (such as interest rates, yield curves, volatilities, prepayment speeds, loss severities, credit risks and default rates) or other market–corroborated inputs) |
| • | | Level 3 — unobservable inputs based on the best information available in the circumstances, to the extent observable inputs are not available (including each Trust’s own assumptions used in determining the fair value of investments and derivative financial instruments) |
The hierarchy gives the highest priority to unadjusted quoted prices in active markets for identical assets or liabilities (Level 1 measurements) and the lowest priority to unobservable inputs (Level 3 measurements). Accordingly, the degree of judgment exercised in determining fair value is greatest for instruments categorized in Level 3. The inputs used to measure fair value may fall into different levels of the fair value hierarchy. In such cases, for disclosure purposes, the fair value hierarchy classification is determined based on the lowest level input that is significant to the fair value measurement in its entirety. Investments classified within Level 3 have significant unobservable inputs used by the Global Valuation Committee in determining the price for Fair Valued Investments. Level 3 investments include equity or debt issued by Private Companies. There may not be a secondary market, and/or there are a limited number of investors. Level 3 investments may also be adjusted to reflect illiquidity and/or non-transferability, with the amount of such discount estimated by the Global Valuation Committee in the absence of market information.
Changes in valuation techniques may result in transfers into or out of an assigned level within the hierarchy. In accordance with each Trust’s policy, transfers between different levels of the fair value hierarchy are deemed to have occurred as of the beginning of the reporting period. The categorization of a value determined for investments and derivative financial instruments is based on the pricing transparency of the investments and derivative financial instruments and is not necessarily an indication of the risks associated with investing in those securities.
| | | | | | |
| | | | | | | |
| | SEMI-ANNUAL REPORT | | APRIL 30, 2017 | | 87 |
| | |
| Notes to Financial Statements (continued) | | |
4. Securities and Other Investments:
Asset-Backed and Mortgage-Backed Securities: Asset-backed securities are generally issued as pass-through certificates or as debt instruments. Asset-backed securities issued as pass-through certificates represent undivided fractional ownership interests in an underlying pool of assets. Asset-backed securities issued as debt instruments, which are also known as collateralized obligations are typically issued as the debt of a special purpose entity organized solely for the purpose of owning such assets and issuing such debt. Asset-backed securities are often backed by a pool of assets representing the obligations of a number of different parties. The yield characteristics of certain asset-backed securities may differ from traditional debt securities. One such major difference is that all or a principal part of the obligations may be prepaid at any time because the underlying assets (i.e., loans) may be prepaid at any time. As a result, a decrease in interest rates in the market may result in increases in the level of prepayments as borrowers, particularly mortgagors, refinance and repay their loans. An increased prepayment rate with respect to an asset-backed security will have the effect of shortening the maturity of the security. In addition, a Trust may subsequently have to reinvest the proceeds at lower interest rates. If a Trust has purchased such an asset-backed security at a premium, a faster than anticipated prepayment rate could result in a loss of principal to the extent of the premium paid.
For mortgage pass-through securities (the “Mortgage Assets”), there are a number of important differences among the agencies and instrumentalities of the U.S. Government that issue mortgage-related securities and among the securities that they issue. For example, mortgage-related securities guaranteed by Ginnie Mae are guaranteed as to the timely payment of principal and interest by Ginnie Mae and such guarantee is backed by the full faith and credit of the United States. However, mortgage-related securities issued by Freddie Mac and Fannie Mae, including Freddie Mac and Fannie Mae guaranteed mortgage pass-through certificates, which are solely the obligations of Freddie Mac and Fannie Mae, are not backed by or entitled to the full faith and credit of the United States, but are supported by the right of the issuer to borrow from the U.S. Treasury.
Non-agency mortgage-backed securities are securities issued by non-governmental issuers and have no direct or indirect government guarantees of payment and are subject to various risks. Non-agency mortgage loans are obligations of the borrowers thereunder only and are not typically insured or guaranteed by any other person or entity. The ability of a borrower to repay a loan is dependent upon the income or assets of the borrower. A number of factors, including a general economic downturn, acts of God, terrorism, social unrest and civil disturbances, may impair a borrower’s ability to repay its loans.
Collateralized Debt Obligations: Collateralized debt obligations (“CDOs”), including collateralized bond obligations (“CBOs”) and collateralized loan obligations (“CLOs”), are types of asset-backed securities. A CDO is an entity that is backed by a diversified pool of debt securities (CBOs) or syndicated bank loans (CLOs). The cash flows of the CDO can be split into multiple segments, called “tranches,” which will vary in risk profile and yield. The riskiest segment is the subordinated or “equity” tranche. This tranche bears the greatest risk of defaults from the underlying assets in the CDO and serves to protect the other, more senior, tranches from default in all but the most severe circumstances. Since it is shielded from defaults by the more junior tranches, a “senior” tranche will typically have higher credit ratings and lower yields than their underlying securities, and often receive investment grade ratings from one or more of the nationally recognized rating agencies. Despite the protection from the more junior tranches, senior tranches can experience substantial losses due to actual defaults, increased sensitivity to future defaults and the disappearance of one or more protecting tranches as a result of changes in the credit profile of the underlying pool of assets.
Inflation-Indexed Bonds: Inflation-indexed bonds (other than municipal inflation-indexed and certain corporate inflation-indexed bonds) are fixed-income securities whose principal value is periodically adjusted according to the rate of inflation. If the index measuring inflation rises or falls, the principal value of inflation-indexed bonds (other than municipal inflation-indexed and certain corporate inflation-indexed bonds) will be adjusted upward or downward, and consequently the interest payable on these securities (calculated with respect to a larger or smaller principal amount) will be increased or reduced, respectively. Any upward or downward adjustment in the principal amount of an inflation-indexed bond will be included as interest income in the Statements of Operations, even though investors do not receive their principal until maturity. Repayment of the original bond principal upon maturity (as adjusted for inflation) is guaranteed in the case of U.S. Treasury inflation-indexed bonds. For bonds that do not provide a similar guarantee, the adjusted principal value of the bond repaid at maturity may be less than the original principal. With regard to municipal inflation-indexed bonds and certain corporate inflation-indexed bonds, the inflation adjustment is typically reflected in the semi-annual coupon payment. As a result, the principal value of municipal inflation-indexed bonds and such corporate inflation-indexed bonds does not adjust according to the rate of inflation.
Multiple Class Pass-Through Securities: Multiple class pass-through securities, including collateralized mortgage obligations (“CMOs”) and commercial mortgage-backed securities, may be issued by Ginnie Mae, U.S. Government agencies or instrumentalities or by trusts formed by private originators of, or investors in, mortgage loans. In general, CMOs are debt obligations of a legal entity that are collateralized by a pool of residential or commercial mortgage loans or Mortgage Assets. The payments on these are used to make payments on the CMOs or multiple pass-through securities. Multiple class pass-through securities represent direct ownership interests in the Mortgage Assets. Classes of CMOs include interest only (“IOs”), principal only (“POs”), planned amortization classes and targeted amortization classes. IOs and POs are stripped mortgage-backed securities representing interests in a pool of mortgages, the cash flow from which has been separated into interest and principal components. IOs receive the interest portion of the cash flow while POs receive the principal portion. IOs and POs can be extremely volatile in response to changes in interest rates. As interest rates rise and fall, the value of IOs tends to move in the same direction as interest rates. POs perform best when prepayments on the underlying mortgages rise since this increases the rate at which the principal is returned and the yield to maturity on the PO. When payments on mortgages underlying a PO are slower than anticipated, the life of
| | | | | | |
| | | | | | | |
| 88 | | SEMI-ANNUAL REPORT | | APRIL 30, 2017 | | |
| | | | |
| Notes to Financial Statements (continued) | | |
the PO is lengthened and the yield to maturity is reduced. If the underlying Mortgage Assets experience greater than anticipated prepayments of principal, a Trust’s initial investment in the IOs may not fully recoup.
Zero-Coupon Bonds: Zero-coupon bonds are normally issued at a significant discount from face value and do not provide for periodic interest payments. These bonds may experience greater volatility in market value than other debt obligations of similar maturity which provide for regular interest payments.
Capital Securities and Trust Preferred Securities: Capital securities, including trust preferred securities, are typically issued by corporations, generally in the form of interest-bearing notes with preferred securities characteristics. In the case of trust preferred securities, an affiliated business trust of a corporation issues these securities, generally in the form of beneficial interests in subordinated debentures or similarly structured securities. The securities can be structured with either a fixed or adjustable coupon that can have either a perpetual or stated maturity date. For trust preferred securities, the issuing bank or corporation pays interest to the trust, which is then distributed to holders of these securities as a dividend. Dividends can be deferred without creating an event of default or acceleration, although maturity cannot take place unless all cumulative payment obligations have been met. The deferral of payments does not affect the purchase or sale of these securities in the open market. These securities generally are rated below that of the issuing company’s senior debt securities and are freely callable at the issuer’s option.
Preferred Stocks: Preferred stock has a preference over common stock in liquidation (and generally in receiving dividends as well), but is subordinated to the liabilities of the issuer in all respects. As a general rule, the market value of preferred stock with a fixed dividend rate and no conversion element varies inversely with interest rates and perceived credit risk, while the market price of convertible preferred stock generally also reflects some element of conversion value. Because preferred stock is junior to debt securities and other obligations of the issuer, deterioration in the credit quality of the issuer will cause greater changes in the value of a preferred stock than in a more senior debt security with similar stated yield characteristics. Unlike interest payments on debt securities, preferred stock dividends are payable only if declared by the issuer’s board of directors. Preferred stock also may be subject to optional or mandatory redemption provisions.
Warrants: Warrants entitle a Trust to purchase a specified number of shares of common stock and are non-income producing. The purchase price and number of shares are subject to adjustment under certain conditions until the expiration date of the warrants, if any. If the price of the underlying stock does not rise above the strike price before the warrant expires, the warrant generally expires without any value and a Trust will lose any amount it paid for the warrant. Thus, investments in warrants may involve more risk than investments in common stock. Warrants may trade in the same markets as their underlying stock; however, the price of the warrant does not necessarily move with the price of the underlying stock.
Floating Rate Loan Interests: Floating rate loan interests are typically issued to companies (the “borrower”) by banks, other financial institutions, or privately and publicly offered corporations (the “lender”). Floating rate loan interests are generally non-investment grade, often involve borrowers whose financial condition is troubled or uncertain and companies that are highly leveraged or in bankruptcy proceedings. In addition, transactions in floating rate loan interests may settle on a delayed basis, which may result in proceeds from the sale to not be readily available for a Trust to make additional investments or meet its redemption obligations. Floating rate loan interests may include fully funded term loans or revolving lines of credit. Floating rate loan interests are typically senior in the corporate capital structure of the borrower. Floating rate loan interests generally pay interest at rates that are periodically determined by reference to a base lending rate plus a premium. Since the rates reset only periodically, changes in prevailing interest rates (and particularly sudden and significant changes) can be expected to cause some fluctuations in the NAV of a Trust to the extent that it invests in floating rate loan interests. The base lending rates are generally the lending rate offered by one or more European banks, such as the London Interbank Offered Rate (“LIBOR”), the prime rate offered by one or more U.S. banks or the certificate of deposit rate. Floating rate loan interests may involve foreign borrowers, and investments may be denominated in foreign currencies. These investments are treated as investments in debt securities for purposes of a Trust’s investment policies.
When a Trust purchases a floating rate loan interest, it may receive a facility fee and when it sells a floating rate loan interest, it may pay a facility fee. On an ongoing basis, a Trust may receive a commitment fee based on the undrawn portion of the underlying line of credit amount of a floating rate loan interest. Facility and commitment fees are typically amortized to income over the term of the loan or term of the commitment, respectively. Consent and amendment fees are recorded to income as earned. Prepayment penalty fees, which may be received by a Trust upon the prepayment of a floating rate loan interest by a borrower, are recorded as realized gains. A Trust may invest in multiple series or tranches of a loan. A different series or tranche may have varying terms and carry different associated risks.
Floating rate loan interests are usually freely callable at the borrower’s option. A Trust may invest in such loans in the form of participations in loans (“Participations”) or assignments (“Assignments”) of all or a portion of loans from third parties. Participations typically will result in a Trust having a contractual relationship only with the lender, not with the borrower. A Trust has the right to receive payments of principal, interest and any fees to which it is entitled only from the lender selling the Participation and only upon receipt by the lender of the payments from the borrower. In connection with purchasing Participations, a Trust generally will have no right to enforce compliance by the borrower with the terms of the loan agreement, nor any rights of offset against the borrower. A Trust may not benefit directly from any collateral supporting the loan in which it has purchased the Participation. As a result, a Trust assumes the credit risk of both the borrower and the lender that is selling the Participation. A Trust’s investment in loan participation interests involves the risk of insolvency of the financial intermediaries who are parties to the transactions. In the event of the insolvency of the lender selling the Participation, a Trust may be treated as a general creditor of the lender and may not benefit from any offset between the lender and the borrower. Assignments typically
| | | | | | |
| | | | | | | |
| | SEMI-ANNUAL REPORT | | APRIL 30, 2017 | | 89 |
| | |
| Notes to Financial Statements (continued) | | |
result in a Trust having a direct contractual relationship with the borrower, and a Trust may enforce compliance by the borrower with the terms of the loan agreement.
In connection with floating rate loan interests, certain Trusts may also enter into unfunded floating rate loan interests (“commitments”). In connection with these commitments, a Trust earns a commitment fee, typically set as a percentage of the commitment amount. Such fee income, which is included in interest income in the Statements of Operations, is recognized ratably over the commitment period. Unfunded floating rate loan interests are marked-to-market daily, and any unrealized appreciation (depreciation) is included in the Statements of Assets and Liabilities and Statements of Operations. As of period end, the Trusts had the following unfunded floating rate loan interests:
| | | | | | | | | | | | | | | | | | |
| | | Borrower | | Par | | | Commitment
Amount | | | Value | | | Unrealized
Appreciation
(Depreciation) | |
| BGT… | | CH Hold Corp., Delayed Draw Term Loan B | | $ | 75,090 | | | $ | 74,902 | | | $ | 75,559 | | | $ | 657 | |
| | | Oberthur Technologies SA, 2016 Term Loan B2 | | $ | 231,908 | | | $ | 230,748 | | | $ | 232,313 | | | $ | 1,565 | |
| BIT… | | Lone Star LSPT Future Funding, Mortgage Loan | | $ | 4,024,376 | | | $ | 3,908,588 | | | $ | 3,948,919 | | | $ | 40,331 | |
Forward Commitments and When-Issued Delayed Delivery Securities: Certain Trusts may purchase securities on a when-issued basis and may purchase or sell securities on a forward commitment basis. Settlement of such transactions normally occurs within a month or more after the purchase or sale commitment is made. A Trust may purchase securities under such conditions with the intention of actually acquiring them, but may enter into a separate agreement to sell the securities before the settlement date. Since the value of securities purchased may fluctuate prior to settlement, a Trust may be required to pay more at settlement than the security is worth. In addition, a Trust is not entitled to any of the interest earned prior to settlement. When purchasing a security on a delayed delivery basis, a Trust assumes the rights and risks of ownership of the security, including the risk of price and yield fluctuations. In the event of default by the counterparty, a Trust’s maximum amount of loss is the unrealized appreciation of unsettled when-issued transactions.
Borrowed Bond Agreements: Repurchase agreements may be referred to as borrowed bond agreements when entered into in connection with short sales of bonds. In a borrowed bond agreement, a Trust borrows a bond from counterparty in exchange for cash collateral. The agreement contains a commitment that the security and the cash will be returned to the counterparty and a Trust at a mutually agreed upon date. Certain agreements have no stated maturity and can be terminated by either party at any time. Earnings on cash collateral and compensation to the lender of the bond are based on agreed upon rates between a Trust and the counterparty. The value of the underlying cash collateral approximates the market value and accrued interest of the borrowed bond. To the extent that a borrowed bond transaction exceeds one business day, the value of the cash collateral in the possession of the counterparty is monitored on a daily basis to ensure the adequacy of the collateral. As the market value of the borrowed bond changes, the cash collateral is periodically increased or decreased with a frequency and in amounts prescribed in the borrowed bond agreement. A Trust may also experience delays in gaining access to the collateral.
Reverse Repurchase Agreements: Reverse repurchase agreements are agreements with qualified third party broker dealers in which a Trust sells securities to a bank or broker-dealer and agrees to repurchase the same securities at a mutually agreed upon date and price. A Trust receives cash from the sale to use for other investment purposes. During the term of the reverse repurchase agreement, a Trust continues to receive the principal and interest payments on the securities sold. Certain agreements have no stated maturity and can be terminated by either party at any time. Interest on the value of the reverse repurchase agreements issued and outstanding is based upon competitive market rates determined at the time of issuance. A Trust may utilize reverse repurchase agreements when it is anticipated that the interest income to be earned from the investment of the proceeds of the transaction is greater than the interest expense of the transaction. Reverse repurchase agreements involve leverage risk. If a Trust suffers a loss on its investment of the transaction proceeds from a reverse repurchase agreement, a Trust would still be required to pay the full repurchase price. Further, a Trust remains subject to the risk that the market value of the securities repurchased declines below the repurchase price. In such cases, a Trust would be required to return a portion of the cash received from the transaction or provide additional securities to the counterparty.
Cash received in exchange for securities delivered plus accrued interest due to the counterparty is recorded as a liability in the Statements of Assets and Liabilities at face value including accrued interest. Due to the short- term nature of the reverse repurchase agreements, face value approximates fair value. Interest payments made by a Trust to the counterparties are recorded as a component of interest expense in the Statements of Operations. In periods of increased demand for the security, a Trust may receive a fee for use of the security by the counterparty, which may result in interest income to a Trust.
For the six months ended April 30, 2017, the average amount of reverse repurchase agreements outstanding and the daily weighted average interest rate for the Trusts were as follows:
| | | | | | | | |
| | | Average
Amount
Outstanding | | | Daily
Weighted
Average
Interest Rate | |
BTZ | | $ | 533,400,139 | | | | 0.87% | |
BIT | | $ | 439,619,732 | | | | 1.28% | |
| | | | | | |
| | | | | | | |
| 90 | | SEMI-ANNUAL REPORT | | APRIL 30, 2017 | | |
| | | | |
| Notes to Financial Statements (continued) | | |
Borrowed bond agreements and reverse repurchase transactions are entered into by a Trust under Master Repurchase Agreements (each, an “MRA”), which permit a Trust, under certain circumstances, including an event of default (such as bankruptcy or insolvency), to offset payables and/or receivables under the MRA with collateral held and/or posted to the counterparty and create one single net payment due to or from a Trust. With borrowed bond agreements and reverse repurchase transactions, typically a Trust and counterparty under an MRA are permitted to sell, re-pledge, or use the collateral associated with the transaction. Bankruptcy or insolvency laws of a particular jurisdiction may impose restrictions on or prohibitions against such a right of offset in the event of the MRA counterparty’s bankruptcy or insolvency. Pursuant to the terms of the MRA, a Trust receives or posts securities as collateral with a market value in excess of the repurchase price to be paid or received by a Trust upon the maturity of the transaction. Upon a bankruptcy or insolvency of the MRA counterparty, a Trust is considered an unsecured creditor with respect to excess collateral and, as such, the return of excess collateral may be delayed.
As of period end, the following table is a summary of the Trusts’ open reverse repurchase agreements by counterparty which are subject to offset under an MRA on a net basis:
| | | | | | | | | | | | | | | | |
| BTZ | | | | | | | | | | | | |
| Counterparty | | Reverse
Repurchase
Agreements | | | Fair Value of Non-cash
Collateral Pledged
Including Accrued
Interest1 | | | Cash
Collateral
Pledged | | | Net Amount | |
Barclays Capital, Inc. | | $ | 14,095,352 | | | $ | (14,095,352 | ) | | | — | | | | — | |
BNP Paribas S.A. | | | 107,315,880 | | | | (107,315,880 | ) | | | — | | | | — | |
Citigroup Global Markets, Inc. | | | 2,811,372 | | | | (2,811,372 | ) | | | — | | | | — | |
Credit Suisse Securities (USA) LLC | | | 33,103,867 | | | | (33,103,867 | ) | | | — | | | | — | |
Deutsche Bank Securities, Inc. | | | 30,661,624 | | | | (30,661,624 | ) | | | — | | | | — | |
RBC Capital Markets LLC | | | 234,539,071 | | | | (234,539,071 | ) | | | — | | | | — | |
UBS Securities LLC | | | 16,803,483 | | | | (16,803,483 | ) | | | — | | | | — | |
| | | | |
Total | | $ | 439,330,649 | | | $ | (439,330,649 | ) | | | — | | | | — | |
| | | | |
| | 1 | | Net collateral with a value of $465,181,416 has been pledged in connection with open reverse repurchase agreements. Excess of net collateral pledged to the individual counterparty is not shown for financial reporting purposes. |
| | | | | | | | | | | | | | | | |
| BIT | | | | | | | | | | | | |
| Counterparty | | Reverse
Repurchase
Agreements | | | Fair Value of Non-cash
Collateral Pledged
Including Accrued
Interest1 | | | Cash
Collateral
Pledged | | | Net Amount | |
Barclays Bank PLC | | $ | 1,336,749 | | | $ | (1,336,749 | ) | | | — | | | | — | |
Barclays Capital, Inc. | | | 21,951,437 | | | | (21,951,437 | ) | | | — | | | | — | |
BNP Paribas S.A. | | | 26,617,759 | | | | (26,617,759 | ) | | | — | | | | — | |
Citigroup Global Markets, Inc. | | | 353,600 | | | | (353,600 | ) | | | — | | | | — | |
Credit Suisse Securities (USA) LLC | | | 12,696,487 | | | | (12,696,487 | ) | | | — | | | | — | |
Deutsche Bank Securities, Inc. | | | 106,335,336 | | | | (106,335,336 | ) | | | — | | | | — | |
HSBC Securities (USA), Inc. | | | 8,185,181 | | | | (8,185,181 | ) | | | — | | | | — | |
J.P. Morgan Securities LLC | | | 9,882,099 | | | | (9,882,099 | ) | | | — | | | | — | |
RBC Capital Markets LLC | | | 180,025,166 | | | | (180,025,166 | ) | | | — | | | | — | |
UBS Ltd. | | | 12,801,458 | | | | (12,801,458 | ) | | | — | | | | — | |
UBS Securities LLC | | | 78,628,484 | | | | (78,628,484 | ) | | | — | | | | — | |
| | | | |
Total | | $ | 458,813,756 | | | $ | (458,813,756 | ) | | | — | | | | — | |
| | | | |
| | 1 | | Net collateral with a value of $542,665,756 has been pledged in connection with open reverse repurchase agreements. Excess of net collateral pledged to the individual counterparty is not shown for financial reporting purposes. |
In the event the counterparty of securities under an MRA files for bankruptcy or becomes insolvent, a Trust’s use of the proceeds from the agreement may be restricted while the counterparty, or its trustee or receiver, determines whether or not to enforce a Trust’s obligation to repurchase the securities.
5. Derivative Financial Instruments:
The Trusts engage in various portfolio investment strategies using derivative contracts both to increase the returns of the Trusts and/or to manage their exposure to certain risks such as credit risk, equity risk, interest rate risk, foreign currency exchange rate risk, commodity price risk or other risks (e.g., inflation risk). Derivative financial instruments categorized by risk exposure are included in the Schedules of Investments. These contracts may be transacted on an exchange or OTC.
Futures Contracts: Certain Trusts invest in long and/or short positions in futures and options on futures contracts to gain exposure to, or manage exposure to changes in interest rates (interest rate risk), changes in the value of equity securities (equity risk) or foreign currencies (foreign currency exchange rate risk).
| | | | | | |
| | | | | | | |
| | SEMI-ANNUAL REPORT | | APRIL 30, 2017 | | 91 |
| | |
| Notes to Financial Statements (continued) | | |
Futures contracts are agreements between the Trusts and a counterparty to buy or sell a specific quantity of an underlying instrument at a specified price and on a specified date. Depending on the terms of a contract, it is settled either through physical delivery of the underlying instrument on the settlement date or by payment of a cash amount on the settlement date. Upon entering into a futures contract, the Trusts are required to deposit initial margin with the broker in the form of cash or securities in an amount that varies depending on a contract’s size and risk profile. The initial margin deposit must then be maintained at an established level over the life of the contract.
Securities deposited as initial margin are designated in the Schedules of Investments and cash deposited, if any, is shown as cash pledged for futures contracts in the Statements of Assets and Liabilities. Pursuant to the contract, the Trusts agree to receive from or pay to the broker an amount of cash equal to the daily fluctuation in market value of the contract (“variation margin”). Variation margin is recorded as unrealized appreciation (depreciation) and, if any, shown as variation margin receivable (or payable) on futures contracts in the Statements of Assets and Liabilities. When the contract is closed, a realized gain or loss is recorded in the Statements of Operations equal to the difference between the value of the contract at the time it was opened and the value at the time it was closed. The use of futures contracts involves the risk of an imperfect correlation in the movements in the price of futures contracts and interest, foreign currency exchange rates or underlying assets.
Forward Foreign Currency Exchange Contracts: Certain Trusts enter into forward foreign currency exchange contracts to gain or reduce exposure to foreign currencies (foreign currency exchange rate risk).
A forward foreign currency exchange contract is an agreement between two parties to buy and sell a currency at a set exchange rate on a specified date. These contracts help to manage the overall exposure to the currencies in which some of the investments held by the Trusts are denominated and in some cases, may be used to obtain exposure to a particular market.
The contract is marked to market daily and the change in market value is recorded as unrealized appreciation (depreciation) in the Statements of Assets and Liabilities. When a contract is closed, a realized gain or loss is recorded in the Statements of Operations equal to the difference between the value at the time it was opened and the value at the time it was closed. Non-deliverable forward foreign currency exchange contracts are settled with the counterparty in cash without the delivery of foreign currency. The use of forward foreign currency exchange contracts involves the risk that the value of a forward foreign currency exchange contract changes unfavorably due to movements in the value of the referenced foreign currencies.
Options: Certain Trusts purchase and write call and put options to increase or decrease their exposure to the risks of underlying instruments, including equity risk, interest rate risk and/or commodity price risk and/or, in the case of options written, to generate gains from options premiums.
A call option gives the purchaser (holder) of the option the right (but not the obligation) to buy, and obligates the seller (writer) to sell (when the option is exercised) the underlying instrument at the exercise or strike price at any time or at a specified time during the option period. A put option gives the holder the right to sell and obligates the writer to buy the underlying instrument at the exercise or strike price at any time or at a specified time during the option period.
Premiums paid on options purchased and premiums received on options written, as well as the daily fluctuation in market value, are included in investments at value — unaffiliated and options written at value, respectively, in the Statements of Assets and Liabilities. When an instrument is purchased or sold through the exercise of an option, the premium is offset against the cost or proceeds of the underlying instrument. When an option expires, a realized gain or loss is recorded in the Statements of Operations to the extent of the premiums received or paid. When an option is closed or sold, a gain or loss is recorded in the Statements of Operations to the extent the cost of the closing transaction exceeds the premiums received or paid. When the Trusts write a call option, such option is typically “covered,” meaning that they hold the underlying instrument subject to being called by the option counterparty. When the Trusts write a put option, such option is covered by cash in an amount sufficient to cover the obligation.
| • | | Swaptions — Certain Trusts purchase and write options on swaps (“swaptions”) primarily to preserve a return or spread on a particular investment or portion of the Trusts’ holdings, as a duration management technique or to protect against an increase in the price of securities it anticipates purchasing at a later date. The purchaser and writer of a swaption is buying or granting the right to enter into a previously agreed upon interest rate or credit default swap agreement (interest rate risk and/or credit risk) at any time before the expiration of the option. |
| • | | Foreign currency options — Certain Trusts purchase and write foreign currency options, foreign currency futures and options on foreign currency futures to gain or reduce exposure to foreign currencies (foreign currency exchange rate risk). Foreign currency options give the purchaser the right to buy from or sell to the writer a foreign currency at any time before the expiration of the option. |
| • | | Barrier options — Certain Trusts may purchase and write a variety of options with non-standard payout structures or other features (“barrier options”) that are generally traded OTC. |
The Trusts may invest in various types of barrier options, including down-and-out options, down-and-in options, double no-touch options, one-touch options, up-and-out options and up-and-in options. Down-and-out options expire worthless to the purchaser if the price of the underlying instrument falls below a specific barrier price level prior to the expiration date. Down-and-in options expire worthless to the purchaser unless the price of the underlying instrument falls below a specific barrier price level prior to the expiration date. Double no-touch options provide the purchaser an agreed-upon payout if
| | | | | | |
| | | | | | | |
| 92 | | SEMI-ANNUAL REPORT | | APRIL 30, 2017 | | |
| | | | |
| Notes to Financial Statements (continued) | | |
the price of the underlying instrument does not reach or surpass predetermined barrier price levels prior to the option’s expiration date. One-touch options provide the purchaser an agreed-upon payout if the price of the underlying instrument reaches or surpasses predetermined barrier price levels prior to the expiration date. Up-and-out options expire worthless if the price of the underlying instrument increases beyond a predetermined barrier price level prior to the expiration date. Up-and-in options can only be exercised when the price of the underlying instrument increases beyond a predetermined barrier price level.
In purchasing and writing options, the Trusts bear the risk of an unfavorable change in the value of the underlying instrument or the risk that they may not be able to enter into a closing transaction due to an illiquid market. Exercise of a written option could result in the Trusts purchasing or selling a security when it otherwise would not, or at a price different from the current market value.
Swaps: Certain Trusts enter into swap contracts to manage exposure to issuers, markets and securities. Such contracts are agreements between the Trusts and a counterparty to make periodic net payments on a specified notional amount or a net payment upon termination. Swap agreements are privately negotiated in the OTC market and may be entered into as a bilateral contract (“OTC swaps”) or centrally cleared (“centrally cleared swaps”).
For OTC swaps, any upfront premiums paid and any upfront fees received are shown as swap premiums paid and swap premiums received, respectively, in the Statements of Assets and Liabilities and amortized over the term of the contract. The daily fluctuation in market value is recorded as unrealized appreciation (depreciation) on OTC Swaps in the Statements of Assets and Liabilities. Payments received or paid are recorded in the Statements of Operations as realized gains or losses, respectively. When an OTC swap is terminated, a realized gain or loss is recorded in the Statements of Operations equal to the difference between the proceeds from (or cost of) the closing transaction and the Trusts’ basis in the contract, if any. Generally, the basis of the contract is the premium received or paid.
In a centrally cleared swap, immediately following execution of the swap contract, the swap contract is novated to a central counterparty (the “CCP”) and the Trusts’ counterparty on the swap agreement becomes the CCP. The Trusts are required to interface with the CCP through the broker. Upon entering into a centrally cleared swap, the Trusts are required to deposit initial margin with the broker in the form of cash or securities in an amount that varies depending on the size and risk profile of the particular swap. Securities deposited as initial margin are designated in the Schedules of Investments and cash deposited is shown as cash pledged for centrally cleared swaps in the Statements of Assets and Liabilities. Pursuant to the contract, the Trusts agree to receive from or pay to the broker an amount of cash equal to the daily fluctuation in market value of the contract (“variation margin”). Variation margin is recorded as unrealized appreciation (depreciation) and shown as variation margin receivable (or payable) on centrally cleared swaps in the Statements of Assets and Liabilities. Payments received from (paid to) the counterparty, including at termination, are recorded as realized gains (losses) in the Statements of Operations.
| • | | Credit default swaps — Certain Trusts enter into credit default swaps to manage their exposure to the market or certain sectors of the market, to reduce their risk exposure to defaults of corporate and/or sovereign issuers or to create exposure to corporate and/or sovereign issuers to which they are not otherwise exposed (credit risk). |
The Trusts may either buy or sell (write) credit default swaps on single-name issuers (corporate or sovereign), a combination or basket of single-name issuers or traded indexes. Credit default swaps are agreements in which the protection buyer pays fixed periodic payments to the seller in consideration for a promise from the protection seller to make a specific payment should a negative credit event take place with respect to the referenced entity (e.g., bankruptcy, failure to pay, obligation acceleration, repudiation, moratorium or restructuring). As a buyer, if an underlying credit event occurs, the Trusts will either (i) receive from the seller an amount equal to the notional amount of the swap and deliver the referenced security or underlying securities comprising the index, or (ii) receive a net settlement of cash equal to the notional amount of the swap less the recovery value of the security or underlying securities comprising the index. As a seller (writer), if an underlying credit event occurs, the Trusts will either pay the buyer an amount equal to the notional amount of the swap and take delivery of the referenced security or underlying securities comprising the index or pay a net settlement of cash equal to the notional amount of the swap less the recovery value of the security or underlying securities comprising the index.
| • | | Interest rate swaps — Certain Trusts enter into interest rate swaps to gain or reduce exposure to interest rates or to manage duration, the yield curve or interest rate (interest rate risk). |
Interest rate swaps are agreements in which one party pays a stream of interest payments, either fixed or floating, in exchange for another party’s stream of interest payments, either fixed or floating, on the same notional amount for a specified period of time. In more complex interest rate swaps, the notional principal amount may decline (or amortize) over time.
| • | | Forward swaps — Certain Trusts enter into forward interest rate swaps and forward total return swaps. In a forward swap, each Trust and the counterparty agree to make periodic net payments beginning on a specified date or a net payment at termination. |
| • | | Inflation swaps — Certain Trusts enter into inflation swaps to gain or reduce exposure to inflation (inflation risk). In an inflation swap, one party makes fixed interest payments on a notional principal amount in exchange for another party’s stream of variable payments based on an inflation index, such as the Consumer Price Index. |
| | | | | | |
| | | | | | | |
| | SEMI-ANNUAL REPORT | | APRIL 30, 2017 | | 93 |
| | |
| Notes to Financial Statements (continued) | | |
Swap transactions involve, to varying degrees, elements of interest rate, credit and market risk in excess of the amounts recognized in the Statements of Assets and Liabilities. Such risks involve the possibility that there will be no liquid market for these agreements, that the counterparty to the agreements may default on its obligation to perform or disagree as to the meaning of the contractual terms in the agreements, and that there may be unfavorable changes in interest rates and/or market values associated with these transactions.
Master Netting Arrangements: In order to define their contractual rights and to secure rights that will help them mitigate their counterparty risk, the Trusts may enter into an International Swaps and Derivatives Association, Inc. Master Agreement (“ISDA Master Agreement”) or similar agreement with their counterparties. An ISDA Master Agreement is a bilateral agreement between each Trust and a counterparty that governs certain OTC derivatives and typically contains, among other things, collateral posting terms and netting provisions in the event of a default and/or termination event. Under an ISDA Master Agreement, each Trust may, under certain circumstances, offset with the counterparty certain derivative financial instruments’ payables and/or receivables with collateral held and/or posted and create one single net payment. The provisions of the ISDA Master Agreement typically permit a single net payment in the event of default including the bankruptcy or insolvency of the counterparty. Bankruptcy or insolvency laws of a particular jurisdiction may restrict or prohibit the right of offset in bankruptcy, insolvency or other events. In addition, certain ISDA Master Agreements allow counterparties to terminate derivative contracts prior to maturity in the event the Trusts’ net assets decline by a stated percentage or the Trusts fail to meet the terms of their ISDA Master Agreements. The result would cause the Trusts to accelerate payment of any net liability owed to the counterparty.
Collateral Requirements: For derivatives traded under an ISDA Master Agreement, the collateral requirements are typically calculated by netting the mark-to-market amount for each transaction under such agreement and comparing that amount to the value of any collateral currently pledged by the Trust and the counterparty.
Cash collateral that has been pledged to cover obligations of the Trusts and cash collateral received from the counterparty, if any, is reported separately on the Statements of Assets and Liabilities as cash pledged as collateral and cash received as collateral, respectively. Non-cash collateral pledged by the Trusts, if any, is noted in the Schedules of Investments. Generally, the amount of collateral due from or to a counterparty is subject to a certain minimum transfer amount threshold before a transfer is required, which is determined at the close of business of the Trusts. Any additional required collateral is delivered to/pledged by the Trusts on the next business day. Typically, the counterparty is not permitted to sell, re-pledge or use cash and non-cash collateral it receives. A Trust generally agrees not to use non-cash collateral that it receives but may, absent default or certain other circumstances defined in the underlying ISDA Master Agreement, be permitted to use cash collateral received. In such cases, interest may be paid pursuant to the collateral arrangement with the counterparty. To the extent amounts due to the Trusts from their counterparties are not fully collateralized, they bear the risk of loss from counterparty non-performance. Likewise, to the extent the Trusts have delivered collateral to a counterparty and stand ready to perform under the terms of their agreement with such counterparty, they bear the risk of loss from a counterparty in the amount of the value of the collateral in the event the counterparty fails to return such collateral. Based on the terms of agreements, collateral may not be required for all derivative contracts.
For financial reporting purposes, the Trusts do not offset derivative assets and derivative liabilities that are subject to netting arrangements, if any, in the Statements of Assets and Liabilities.
6. Investment Advisory Agreement and Other Transactions with Affiliates:
The PNC Financial Services Group, Inc. is the largest stockholder and an affiliate of BlackRock, Inc. (“BlackRock”) for 1940 Act purposes.
Investment Advisory: Each Trust entered into an Investment Advisory Agreement with the Manager, the Trusts’ investment adviser, an indirect, wholly-owned subsidiary of BlackRock, to provide investment advisory and administration services. The Manager is responsible for the management of each Trust’s portfolio and provides the personnel, facilities, equipment and certain other services necessary to the operations of each Trust.
For such services, BTZ and BGT each pay the Manager a monthly fee at an annual rate equal to 0.62% and 0.75%, respectively, of the average weekly value of each Trust’s managed assets. For purposes of calculating these fees, “managed assets” mean the total assets of each Trust minus the sum of its accrued liabilities (other than the aggregate indebtedness constituting financial leverage).
For such services, BIT pays the Manager a monthly fee at an annual rate equal to 0.80% of the average daily value of the Trust’s managed assets. For purposes of calculating the investment advisory fees, “managed assets” means the total assets of the Trust (including any assets attributable to money borrowed for investment purposes) minus the sum of its accrued liabilities (other than money borrowed for investment purposes).
The Manager provides investment management and other services to the BIT Subsidiary. The Manager does not receive separate compensation from the Taxable Subsidiary for providing investment management or administrative services. However, the Trust pays the Manager based on the Trust’s net assets, plus the proceeds of any debt securities or outstanding borrowings used for leverage, which includes the assets of the Taxable Subsidiary.
With respect to BIT, the Manager entered into a sub-advisory agreement with BlackRock (Singapore) Limited (“BRS”), an affiliate of the Manager. The Manager pays BRS, for services it provides, a monthly fee that is a percentage of the investment advisory fees paid by BIT to the Manager.
| | | | | | |
| | | | | | | |
| 94 | | SEMI-ANNUAL REPORT | | APRIL 30, 2017 | | |
| | | | |
| Notes to Financial Statements (continued) | | |
Waivers: With respect to each Trust, the Manager voluntarily agreed to waive its investment advisory fees by the amount of investment advisory fees each Trust pays to the Manager indirectly through its investment in affiliated money market funds (the “affiliated money market fund waiver”). These amounts are included in fees waived by the Manager in the Statements of Operations. The amount of waivers and/or reimbursements of fees and expenses made pursuant to the expense limitation caps, as applicable, will be reduced by the amount of the affiliated money market fund waiver. For the six months ended April 30, 2017, the amounts waived were as follows:
| | | | |
| BTZ | | BGT | | BIT |
$6,650 | | $426 | | $1,280 |
The Manager voluntarily agreed to waive its investment advisory fee with respect to any portion of each Trust’s assets invested in affiliated equity and fixed-income mutual funds and affiliated exchange-traded funds that have a contractual management fee. Effective December 2, 2016, the waiver became contractual through June 30, 2018. The Agreement can be renewed for annual periods thereafter, and may be terminated on 90 days’ notice, each subject to approval by a majority of the Trusts’ Independent Trustees. For the six months ended April 30, 2017, the amounts waived in investment advisory fees pursuant to these arrangements were as follows:
Officers and Trustees: Certain officers and/or Trustees of the Trusts are officers and/or trustees of BlackRock or its affiliates. The Trusts reimburse the Manager for a portion of the compensation paid to the Trusts’ Chief Compliance Officer, which is included in Officer and Trustees in the Statements of Operations.
Other Transactions: The Trusts may purchase securities from, or sell securities to, an affiliated fund provided the affiliation is due solely to having a common investment adviser, common officers, or common trustees. For the six months ended April 30, 2017, the purchase and sale transactions and any net realized gains (losses) with an affiliated fund in compliance with Rule 17a-7 under the 1940 Act were as follows:
| | | | | | | | | | | | |
| | | Purchases | | | Sales | | | Net
Realized
Gain | |
BIT | | $ | 258,949 | | | $ | 574,141 | | | $ | 6,646 | |
7. Purchases and Sales:
For the six months ended April 30, 2017, purchases and sales of investments, including paydowns and excluding short-term securities, were as follows:
| | | | | | | | | | | | |
| Purchases | | BTZ | | | BGT | | | BIT | |
Non-U.S. Government Securities | | $ | 184,328,660 | | | $ | 174,017,555 | | | $ | 281,020,865 | |
U.S. Government Securities | | | 90,574,940 | | | | — | | | | — | |
| | | | |
Total Purchases | | $ | 274,903,600 | | | $ | 174,017,555 | | | $ | 281,020,865 | |
| | | | |
| | | | | | | | | | | | |
| Sales | | BTZ | | | BGT | | | BIT | |
Non-U.S. Government Securities | | $ | 275,004,848 | | | $ | 182,998,709 | | | $ | 270,619,371 | |
U.S. Government Securities | | | 192,571,140 | | | | — | | | | 3,628,739 | |
| | | | |
Total Sales | | $ | 467,575,988 | | | $ | 182,998,709 | | | $ | 274,248,110 | |
| | | | |
8. Income Tax Information:
It is the Trusts’ policy to comply with the requirements of the Internal Revenue Code of 1986, as amended, applicable to regulated investment companies, and to distribute substantially all of their taxable income to their shareholders. Therefore, no U.S. federal income tax provision is required, except with respect to any taxes related to the Taxable Subsidiaries.
Each Trust files U.S. federal and various state and local tax returns. No income tax returns are currently under examination. The statute of limitations on BTZ’s and BGT’s U.S. federal tax returns remains open for each of the four years ended October 31, 2016. The statute of limitations on BIT’s U.S. federal tax returns remains open for the period ended October 31, 2013 and the three years ended October 31, 2016. The statutes of limitations on the Trusts’ state and local tax returns may remain open for an additional year depending upon the jurisdiction.
Management has analyzed tax laws and regulations and their application to the Trusts as of April 30, 2017, inclusive of the open tax return years, and does not believe there are any uncertain tax positions that require recognition of a tax liability in the Trusts’ financial statements.
| | | | | | |
| | | | | | | |
| | SEMI-ANNUAL REPORT | | APRIL 30, 2017 | | 95 |
| | |
| Notes to Financial Statements (continued) | | |
As of October 31, 2016, the Trusts had capital loss carryforwards available to offset future realized capital gains through the indicated expiration dates as follows:
| | | | | | | | | | | | |
| Expires | | BTZ | | | BGT | | | BIT | |
No expiration date1 | | $ | 41,385,234 | | | $ | 12,406,397 | | | $ | 35,191,922 | |
2017 | | | 158,120,431 | | | | 45,385,443 | | | | — | |
2018 | | | 31,756,723 | | | | 16,526,601 | | | | — | |
2019 | | | 10,353,275 | | | | 409,424 | | | | — | |
| | | | | | | | | | | | |
Total | | $ | 241,615,663 | | | $ | 74,727,865 | | | $ | 35,191,922 | |
| | | | | | | | | | | | |
1 Must be utilized prior to losses subject to expiration. As of April 30, 2017, gross unrealized appreciation and depreciation based on cost for U.S. federal income tax purposes were as follows: | |
| | | BTZ | | | BGT | | | BIT | |
Tax cost | | $ | 1,877,334,934 | | | $ | 505,781,849 | | | $ | 1,138,627,265 | |
| | | | | | | | | | | | |
Gross unrealized appreciation | | | 136,036,970 | | | | 4,432,118 | | | | 45,671,284 | |
Gross unrealized depreciation | | | (13,756,836 | ) | | | (3,448,412 | ) | | | (9,364,412 | ) |
| | | | | | | | | | | | |
Net unrealized appreciation | | $ | 122,280,134 | | | $ | 983,706 | | | $ | 36,306,872 | |
| | | | | | | | | | | | |
9. Bank Borrowings:
BGT is party to a senior committed secured, 360-day rolling line of credit facility and a separate security agreement (the “SSB Agreement”) with State Street Bank and Trust Company (“SSB”). SSB may elect to terminate its commitment upon 360-days written notice to BGT. As of period end, BGT has not received any notice to terminate. BGT has granted a security interest in substantially all of its assets to SSB.
The SSB Agreement allows for the following maximum commitment amount of $168,000,000.
Advances will be made by SSB to BGT, at BGT’s option of (a) the higher of (i) 0.80% above the Fed Funds rate and (ii) 0.80% above Overnight LIBOR or (b) 0.80% above 7-day, 30-day, 60-day or 90-day LIBOR.
In addition, BGT paid a commitment fee (based on the daily unused portion of the commitments). The fees associated with each of the agreements are included in the Statements of Operations as borrowing costs, if any. Advances to BGT as of period end are shown in the Statements of Assets and Liabilities as bank borrowings payable. Based on the short-term nature of the borrowings under the line of credit and the variable interest rate, the carrying amount of the borrowings approximates fair value.
BGT may not declare dividends or make other distributions on shares or purchase any such shares if, at the time of the declaration, distribution or purchase, asset coverage with respect to the outstanding short-term borrowings is less than 300%.
For the six months ended April 30, 2017, the average amount of bank borrowings and the daily weighted average interest rates for BGT for loans under the revolving credit agreements were $135,066,298 and 1.54%, respectively.
10. Principal Risks:
In the normal course of business, the Trusts invest in securities and enter into transactions where risks exist due to fluctuations in the market (market risk) or failure of the issuer to meet all its obligations, including the ability to pay principal and interest when due (issuer credit risk). The value of securities held by the Trusts may decline in response to certain events, including those directly involving the issuers of securities owned by the Trusts. Changes arising from the general economy, the overall market and local, regional or global political and/or social instability, as well as currency, interest rate and price fluctuations, may also affect the securities’ value.
Each Trust may be exposed to prepayment risk, which is the risk that borrowers may exercise their option to prepay principal earlier than scheduled during periods of declining interest rates, which would force Each Trust to reinvest in lower yielding securities. Each Trust may also be exposed to reinvestment risk, which is the risk that income from Each Trust’s portfolio will decline if Each Trust invests the proceeds from matured, traded or called fixed-income securities at market interest rates that are below Each Trust portfolio’s current earnings rate.
Valuation Risk: The market values of equities, such as common stocks and preferred securities or equity related investments, such as futures and options, may decline due to general market conditions which are not specifically related to a particular company. They may also decline due to factors which affect a particular industry or industries. A Trust may invest in illiquid investments and may experience difficulty in selling those investments in a timely manner at the price that they believe the investments are worth. Prices may fluctuate widely over short or extended periods in response to company, market or economic news. Markets also tend to move in cycles, with periods of rising and falling prices. This volatility may cause each Trust’s NAV to experience significant increases or decreases over short periods of time. If there is a general decline in the securities and other markets, the NAV of a Trust may lose value, regardless of the individual results of the securities and other instruments in which a Trust invests.
| | | | | | |
| | | | | | | |
| 96 | | SEMI-ANNUAL REPORT | | APRIL 30, 2017 | | |
| | | | |
| Notes to Financial Statements (continued) | | |
The price a Trust could receive upon the sale of any particular portfolio investment may differ from a Trust’s valuation of the investment, particularly for securities that trade in thin or volatile markets or that are valued using a fair valuation technique or a price provided by an independent pricing service. Changes to significant unobservable inputs and assumptions (i.e., publicly traded company multiples, growth rate, time to exit) due to the lack of observable inputs may significantly impact the resulting fair value and therefore a Trust’s results of operations. As a result, the price received upon the sale of an investment may be less than the value ascribed by a Trust, and a Trust could realize a greater than expected loss or lesser than expected gain upon the sale of the investment. A Trust’s ability to value its investments may also be impacted by technological issues and/or errors by pricing services or other third party service providers.
Counterparty Credit Risk: Similar to issuer credit risk, the Trusts may be exposed to counterparty credit risk, or the risk that an entity may fail to or be unable to perform on its commitments related to unsettled or open transactions. The Trusts manage counterparty credit risk by entering into transactions only with counterparties that the Manager believes have the financial resources to honor their obligations and by monitoring the financial stability of those counterparties. Financial assets, which potentially expose the Trusts to market, issuer and counterparty credit risks, consist principally of financial instruments and receivables due from counterparties. The extent of the Trusts’ exposure to market, issuer and counterparty credit risks with respect to these financial assets is approximately their value recorded in the Statements of Assets and Liabilities, less any collateral held by the Trusts.
A derivative contract may suffer a mark-to-market loss if the value of the contract decreases due to an unfavorable change in the market rates or values of the underlying instrument. Losses can also occur if the counterparty does not perform under the contract.
A Trust’s risk of loss from counterparty credit risk on OTC derivatives is generally limited to the aggregate unrealized gain less the value of any collateral held by such Trust.
For OTC options purchased, each Trust bears the risk of loss in the amount of the premiums paid plus the positive change in market values net of any collateral held by such Trust should the counterparty fail to perform under the contracts. Options written by the Trusts do not typically give rise to counterparty credit risk, as options written generally obligate the Trusts, and not the counterparty, to perform. The Trusts may be exposed to counterparty credit risk with respect to options written to the extent the Trusts deposit collateral with its counterparty to a written option.
With exchange-traded options purchased and futures and centrally cleared swaps, there is less counterparty credit risk to the Trusts since the exchange or clearinghouse, as counterparty to such instruments, guarantees against a possible default. The clearinghouse stands between the buyer and the seller of the contract; therefore, credit risk is limited to failure of the clearinghouse. While offset rights may exist under applicable law, a Trust does not have a contractual right of offset against a clearing broker or clearinghouse in the event of a default (including the bankruptcy or insolvency). Additionally, credit risk exists in exchange-traded futures and centrally cleared swaps with respect to initial and variation margin that is held in a clearing broker’s customer accounts. While clearing brokers are required to segregate customer margin from their own assets, in the event that a clearing broker becomes insolvent or goes into bankruptcy and at that time there is a shortfall in the aggregate amount of margin held by the clearing broker for all its clients, typically the shortfall would be allocated on a pro rata basis across all the clearing broker’s customers, potentially resulting in losses to the Trusts.
Concentration Risk: Certain Trusts may invest in securities that are rated below investment grade quality (sometimes called “junk bonds”), which are predominantly speculative, have greater credit risk and generally are less liquid and have more volatile prices than higher quality securities.
Certain Trusts invest a significant portion of their assets in fixed-income securities and/or use derivatives tied to the fixed-income markets. Changes in market interest rates or economic conditions may affect the value and/or liquidity of such investments. Interest rate risk is the risk that prices of bonds and other fixed-income securities will increase as interest rates fall and decrease as interest rates rise. The Trusts may be subject to a greater risk of rising interest rates due to the current period of historically low rates.
Certain Trusts invest a significant portion of their assets in securities backed by commercial or residential mortgage loans or in issuers that hold mortgage and other asset-backed securities. Investment percentages in these securities are presented in the Schedules of Investments. Changes in economic conditions, including delinquencies and/or defaults on assets underlying these securities, can affect the value, income and/or liquidity of such positions.
11. Capital Share Transactions:
The Trusts are authorized to issue an unlimited number of shares, all of which were initially classified as Common Shares. The Board is authorized, however, to reclassify any unissued Common Shares to Preferred Shares without approval of Common Shareholders.
Common Shares
For the periods shown, shares issued and outstanding increased by the following amounts as a result of dividend reinvestment:
| | | | |
| | | BGT | |
Six months ended April 30, 2017 | | | 1,934 | |
Year ended October 31, 2016 | | | — | |
| | | | | | |
| | | | | | | |
| | SEMI-ANNUAL REPORT | | APRIL 30, 2017 | | 97 |
| | |
| Notes to Financial Statements (concluded) | | |
For the year ended October 31, 2016, shares issued and outstanding remained constant for each Trust.
On October 26, 2016, the Board approved the Trusts’ participation in an open market share repurchase program (the “Share Repurchase Program”). The Trusts are eligible to purchase, at prevailing market prices, up to 5% of their common shares outstanding as of the close of business on October 28, 2016, subject to certain conditions. Repurchases may be made through November 30, 2017. There is no assurance that a Trust will purchase shares in any particular amounts. For the six months ended April 30, 2017, BTZ and BIT repurchased 676,066 and 254,873 shares, respectively, at a cost of $8,822,801 and $4,354,046 including transaction costs, respectively. The total amount of such repurchases is reflected in the Statements of Changes in Net Assets.
12. Subsequent Events:
Management’s evaluation of the impact of all subsequent events on the Trusts’ financial statements was completed through the date the financial statements were issued and the following items were noted:
| | | | | | | | |
| | | Common Dividend Per Share | |
| | | Paid1 | | | Declared2 | |
BTZ | | $ | 0.0705 | | | $ | 0.0705 | |
BGT | | $ | 0.0583 | | | $ | 0.0583 | |
BIT | | $ | 0.1167 | | | $ | 0.1167 | |
| | 1 | | Net investment income dividend paid on May 31, 2017 to shareholders of record on May 15, 2017. |
| | 2 | | Net investment income dividend declared on June 1, 2017, payable to shareholders of record on June 15, 2017. |
| | | | | | |
| | | | | | | |
| 98 | | SEMI-ANNUAL REPORT | | APRIL 30, 2017 | | |
Richard E. Cavanagh, Chair of the Board and Trustee
Karen P. Robards, Vice Chair of the Board and Trustee
Michael J. Castellano, Trustee
Cynthia L. Egan, Trustee
Frank J. Fabozzi, Trustee
Jerrold B. Harris, Trustee
R. Glenn Hubbard, Trustee
W. Carl Kester, Trustee
Catherine A. Lynch, Trustee
Barbara G. Novick, Trustee
John M. Perlowski, Trustee, President and Chief Executive Officer
Jonathan Diorio, Vice President
Neal J. Andrews, Chief Financial Officer
Jay M. Fife, Treasurer
Charles Park, Chief Compliance Officer
Janey Ahn, Secretary
| | | | | | |
| | | | |
Investment Adviser BlackRock Advisors, LLC Wilmington, DE 19809 | | Accounting Agent and Custodian State Street Bank and
Trust Company
Boston, MA 02111 | | Independent Registered
Public Accounting Firm
Deloitte & Touche LLP
Boston, MA 02116 | | Address of the Trusts 100 Bellevue Parkway Wilmington, DE 19809 |
| | | |
Sub-Adviser
BlackRock (Singapore) Limited1
079912 Singapore | | Transfer Agent
Computershare Trust
Company, N.A.
Canton, MA 02021 | | Legal Counsel Skadden, Arps, Slate, Meagher & Flom LLP Boston, MA 02116 | | |
| | | | | | |
| | | | | | | |
| | SEMI-ANNUAL REPORT | | APRIL 30, 2017 | | 99 |
The Trusts are listed for trading on the NYSE and has filed with the NYSE its annual chief executive officer certification regarding compliance with the NYSE’s listing standards. The Trusts filed with the SEC the certification of their chief executive officer and chief financial officer required by section 302 of the Sarbanes-Oxley Act.
Each Trust’s dividend policy is to distribute all or a portion of its net investment income to its shareholders on a monthly basis. In order to provide shareholders with a more stable level of dividend distributions, the distributions paid by the Trusts for any particular month may be more or less than the amount of net investment income earned by the Trusts during such month. The portion of distributions that exceeds a Trust’s current and accumulated earnings and profits, which are measured on a tax basis, will constitute a nontaxable return of capital. Distributions in excess of a Trust’s taxable income and net capital gains, but not in excess of a Trust’s earnings and profits, will be taxable to shareholders as ordinary income and will not constitute a nontaxable return of capital. The Trusts’ current accumulated but undistributed net investment income, if any, is disclosed in the Statements of Assets and Liabilities, which comprises part of the financial information included in this report.
The Trusts do not make available copies of their Statements of Additional Information because the Trusts’ shares are not continuously offered, which means that the Statement of Additional Information of each Trust has not been updated after completion of the respective Trust’s offerings and the information contained in each Trust’s Statement of Additional Information may have become outdated.
In accordance with Section 23(c) of the Investment Company Act of 1940, as amended, the Trusts from time to time may purchase its common shares in the open market or in private transactions.
Except as described below, during the period there were no material changes in the Trusts’ investment objectives or policies or to the Trusts’ charter or by-laws that would delay or prevent a change of control of the Trusts that were not approved by shareholders or in the principal risk factors associated with investment in the Trusts. There have been no changes in the persons who are primarily responsible for the day-to-day management of the Trusts’ portfolio.
On October 28, 2016, BIT and BTZ announced that they had divided their Board of Trustees into three classes, with one class standing for election each year, and had adopted a voting standard of a majority of the outstanding shares for the election of trustees in a contested election.
Quarterly performance, semi-annual and annual reports, current net asset value and other information regarding the Trusts may be found on BlackRock’s website, which can be accessed at http://www.blackrock.com. Any reference to BlackRock’s website in this report is intended to allow investors public access to information regarding the Trusts and does not, and is not intended to, incorporate BlackRock’s website in this report.
Electronic Delivery
Shareholders can sign up for e-mail notifications of quarterly statements, annual and semi-annual shareholder reports by enrolling in the electronic delivery program. Electronic copies of shareholder reports are available on BlackRock’s website.
To enroll in electronic delivery:
Shareholders Who Hold Accounts with Investment Advisers, Banks or Brokerages:
Please contact your financial adviser. Please note that not all investment advisers, banks or brokerages may offer this service.
Householding
The Trusts will mail only one copy of shareholder documents, annual and semi-annual reports and proxy statements, to shareholders with multiple accounts at the same address. This practice is commonly called “householding” and is intended to reduce expenses and eliminate duplicate mailings of
| | | | | | |
| | | | | | | |
| 100 | | SEMI-ANNUAL REPORT | | APRIL 30, 2017 | | |
| | |
| Additional Information (continued) | | |
shareholder documents. Mailings of your shareholder documents may be householded indefinitely unless you instruct us otherwise. If you do not want the mailing of these documents to be combined with those for other members of your household, please call the Trusts at (800) 882-0052.
Availability of Quarterly Schedule of Investments
The Trusts file their complete schedule of portfolio holdings with the SEC for the first and third quarters of each fiscal year on Form N-Q. The Trusts’ Forms N-Q are available on the SEC’s website at http://www.sec.gov and may also be reviewed and copied at the SEC’s Public Reference Room in Washington, D.C. Information on the operation of the Public Reference Room or how to access documents on the SEC’s website without charge may be obtained by calling (800) SEC-0330. The Trusts’ Forms N-Q may also be obtained upon request and without charge by calling (800) 882-0052.
Availability of Proxy Voting Policies and Procedures
A description of the policies and procedures that the Trusts use to determine how to vote proxies relating to portfolio securities is available upon request and without charge (1) by calling (800) 882-0052; (2) at http://www.blackrock.com; and (3) on the SEC’s website at http://www.sec.gov.
Availability of Proxy Voting Record
Information about how the Trusts voted proxies relating to securities held in the Trusts’ portfolios during the most recent 12-month period ended June 30 is available upon request and without charge (1) at http://www.blackrock.com or by calling (800) 882-0052 and (2) on the SEC’s website at http://www.sec.gov.
Availability of Trust Updates
BlackRock will update performance and certain other data for the Trusts on a monthly basis on its website in the “Closed-end Funds” section of http://www.blackrock.com as well as certain other material information as necessary from time to time. Investors and others are advised to check the website for updated performance information and the release of other material information about the Trusts. This reference to BlackRock’s website is intended to allow investors public access to information regarding the Trusts and does not, and is not intended to, incorporate BlackRock’s website in this report.
These amounts and sources of distributions reported are estimates and are being provided to you pursuant to regulatory requirements and are not being provided for tax reporting purposes. The actual amounts and sources for tax reporting purposes will depend upon each Trust’s investment experience during the remainder of the fiscal year and may be subject to changes based on tax regulations. Each Trust will provide a Form 1099-DIV each calendar year that will tell you how to report these distributions for federal income tax purposes.
April 30, 2017
| | | | | | | | | | | | | | | | | | | | | | | | | | | | | | | | | | | | | | | | |
| | | Total Fiscal Year-to-Date
Cumulative Distributions by Character | | | Percentage of Fiscal Year-to-Date
Cumulative Distributions by Character | |
| | | Net Investment
Income | | | Net Realized
Capital Gains
Short Term
| | | Net Realized
Capital Gains
Long Term | | | Return of
Capital | | | Total Per
Common Share | | | Net Investment
Income | | | Net Realized
Capital Gains
Short Term | | | Net Realized
Capital Gains
Long Term | | | Return of
Capital | | | Total Per
Common Share | |
BTZ | | $ | 0.413418 | | | | — | | | | — | | | $ | 0.009582 | | | $ | 0.423000 | | | | 98 | % | | | — | | | | — | | | | 2 | % | | | 100 | % |
The Trusts estimate that they have distributed more than the amount of earned income and net realized gains; therefore, a portion of the distribution may be a return of capital. A return of capital may occur, for example, when some or all of the shareholder’s investment in the Trusts are returned to the shareholder. A return of capital does not necessarily reflect the Trusts’ investment performance and should not be confused with ‘yield’ or ‘income.’ When distributions exceed total return performance, the difference will incrementally reduce the Trusts’ net asset value per share.
Section 19(a) notices for the Trusts, as applicable, are available on the BlackRock website at http://www.blackrock.com.
| | | | | | |
| | | | | | | |
| | SEMI-ANNUAL REPORT | | APRIL 30, 2017 | | 101 |
| | | | |
| Additional Information (concluded) | | |
|
| BlackRock Privacy Principles |
BlackRock is committed to maintaining the privacy of its current and former fund investors and individual clients (collectively, “Clients”) and to safeguarding their non-public personal information. The following information is provided to help you understand what personal information BlackRock collects, how we protect that information and why in certain cases we share such information with select parties.
If you are located in a jurisdiction where specific laws, rules or regulations require BlackRock to provide you with additional or different privacy-related rights beyond what is set forth below, then BlackRock will comply with those specific laws, rules or regulations.
BlackRock obtains or verifies personal non-public information from and about you from different sources, including the following: (i) information we receive from you or, if applicable, your financial intermediary, on applications, forms or other documents; (ii) information about your transactions with us, our affiliates, or others; (iii) information we receive from a consumer reporting agency; and (iv) from visits to our websites.
BlackRock does not sell or disclose to non-affiliated third parties any non-public personal information about its Clients, except as permitted by law or as is necessary to respond to regulatory requests or to service Client accounts. These non-affiliated third parties are required to protect the confidentiality and security of this information and to use it only for its intended purpose.
We may share information with our affiliates to service your account or to provide you with information about other BlackRock products or services that may be of interest to you. In addition, BlackRock restricts access to non-public personal information about its Clients to those BlackRock employees with a legitimate business need for the information. BlackRock maintains physical, electronic and procedural safeguards that are designed to protect the non-public personal information of its Clients, including procedures relating to the proper storage and disposal of such information.
| | | | | | |
| | | | | | | |
| 102 | | SEMI-ANNUAL REPORT | | APRIL 30, 2017 | | |
This report is intended for current holders. It is not a prospectus. Past performance results shown in this report should not be considered a representation of future performance. The Trusts have leveraged their Common Shares, which creates risks for Common Shareholders, including the likelihood of greater volatility of net asset value and market price of the Common Shares, and the risk that fluctuations in short-term interest rates may reduce the Common Shares’ yield. Statements and other information herein are as dated and are subject to change.

| | |
| CE-CAFRI-3-4/17-SAR | |  |
| Item 2 – | Code of Ethics – Not Applicable to this semi-annual report |
| Item 3 – | Audit Committee Financial Expert – Not Applicable to this semi-annual report |
| Item 4 – | Principal Accountant Fees and Services – Not Applicable to this semi-annual report |
| Item 5 – | Audit Committee of Listed Registrants – Not Applicable to this semi-annual report |
(a) The registrant’s Schedule of Investments is included as part of the Report to Stockholders filed under Item 1 of this Form.
(b) Not Applicable due to no such divestments during the semi-annual period covered since the previous Form N-CSR filing.
| Item 7 – | Disclosure of Proxy Voting Policies and Procedures for Closed-End Management Investment Companies – Not Applicable to this semi-annual report |
| Item 8 – | Portfolio Managers of Closed-End Management Investment Companies |
(a) Not Applicable to this semi-annual report
| | (b) | As of the date of this filing, there have been no changes in any of the portfolio managers identified in the most recent annual report on Form N-CSR. |
| Item 9 – | Purchases of Equity Securities by Closed-End Management Investment Company and Affiliated Purchasers |
| | | | | | | | |
| Period | | (a) Total Number of Shares Purchased | | (b) Average Price Paid per Share | | (c) Total Number of Shares Purchased as Part of Publicly Announced Plans or Programs | | (d) Maximum Number of Shares that May Yet Be Purchased Under the Plans or Programs1 |
| November 1-30, 2016 | | N/A | | N/A | | N/A | | 5,404,408 |
| December 1-31, 2016 | | N/A | | N/A | | N/A | | 5,404,408 |
| January 1-31, 2017 | | 150,777 | | $13.0636 | | 150,777 | | 5,253,631 |
| February 1-28, 2017 | | 224,124 | | $13.1207 | | 224,124 | | 5,029,507 |
| March 1-31, 2017 | | 301,165 | | $12.9686 | | 301,165 | | 4,728,342 |
| April 1-30, 2017 | | N/A | | N/A | | N/A | | 4,728,342 |
| Total: | | 676,066 | | $13.0402 | | 676,066 | | 4,728,342 |
1The Fund announced an open market share repurchase program on October 28, 2016 pursuant to which the Fund may repurchase, through November 30, 2017, up to 5% of its outstanding common shares based on common shares outstanding on October 28, 2016 (5,404,408 common shares), in open market transactions, subject to certain conditions.
| Item 10 – | Submission of Matters to a Vote of Security Holders – There have been no material changes to these procedures. |
| Item 11 – | Controls and Procedures |
(a) – The registrant’s principal executive and principal financial officers, or persons performing similar functions, have concluded that the registrant’s disclosure controls and procedures (as defined in Rule 30a-3(c) under the Investment Company Act of 1940, as amended (the “1940 Act”)) are effective as of a date within 90 days of the filing of this report based on the evaluation of these controls and procedures required by Rule 30a-3(b) under the 1940 Act and Rule 13a-15(b) under the Securities Exchange Act of 1934, as amended.
2
(b) – There were no changes in the registrant’s internal control over financial reporting (as defined in Rule 30a-3(d) under the 1940 Act) that occurred during the second fiscal quarter of the period covered by this report that have materially affected, or are reasonably likely to materially affect, the registrant’s internal control over financial reporting.
| Item 12 – | Exhibits attached hereto |
(a)(1) – Code of Ethics – Not Applicable to this semi-annual report
(a)(2) – Certifications – Attached hereto
(a)(3) – Not Applicable
(b) – Certifications – Attached hereto
3
Pursuant to the requirements of the Securities Exchange Act of 1934 and the Investment Company Act of 1940, the registrant has duly caused this report to be signed on its behalf by the undersigned, thereunto duly authorized.
| | |
| BlackRock Credit Allocation Income Trust |
| |
| By: | | /s/ John M. Perlowski |
| | John M. Perlowski |
| | Chief Executive Officer (principal executive officer) of |
| | BlackRock Credit Allocation Income Trust |
|
| Date: July 5, 2017 |
Pursuant to the requirements of the Securities Exchange Act of 1934 and the Investment Company Act of 1940, this report has been signed below by the following persons on behalf of the registrant and in the capacities and on the dates indicated.
| | |
| By: | | /s/ John M. Perlowski |
| | John M. Perlowski |
| | Chief Executive Officer (principal executive officer) of |
| | BlackRock Credit Allocation Income Trust |
|
| Date: July 5, 2017 |
| |
| By: | | /s/ Neal J. Andrews |
| | Neal J. Andrews |
| | Chief Financial Officer (principal financial officer) of |
| | BlackRock Credit Allocation Income Trust |
|
| Date: July 5, 2017 |
4