UNITED STATES
SECURITIES AND EXCHANGE COMMISSION
Washington, D.C. 20549
SECURITIES AND EXCHANGE COMMISSION
Washington, D.C. 20549
FORM N-CSR
CERTIFIED SHAREHOLDER REPORT OF REGISTERED MANAGEMENT INVESTMENT COMPANIES
Investment Company Act file number811-21982
Guggenheim Strategic Opportunities Fund
(Exact name of registrant as specified in charter)
(Exact name of registrant as specified in charter)
227 West Monroe Street, Chicago, 60606
(Address of principal executive offices) (Zip code)
(Address of principal executive offices) (Zip code)
Amy J. Lee
227 West Monroe Street, Chicago, 60606
(Name and address of agent for service)
(Name and address of agent for service)
Registrant's telephone number, including area code: (312) 827-0100
Date of fiscal year end: May 31
Date of reporting period: June 1, 2016 - May 31, 2017
Item 1. Reports to Stockholders.
The registrant's annual report transmitted to shareholders pursuant to Rule 30e-1 under the Investment Company Act of 1940, as amended (the "Investment Company Act"), is as follows:
GUGGENHEIMINVESTMENTS.COM/GOF
... YOUR WINDOW TO THE LATEST, MOST UP-TO-DATE INFORMATION ABOUT GUGGENHEIM STRATEGIC OPPORTUNITIES FUND
The shareholder report you are reading right now is just the beginning of the story.
Online at guggenheiminvestments.com/gof, you will find:
| • | Daily, weekly and monthly data on share prices, net asset values, |
| distributions and more | |
| • | Portfolio overviews and performance analyses |
| • | Announcements, press releases and special notices |
| • | Fund and adviser contact information |
Guggenheim Partners Investment Management, LLC and Guggenheim Funds Investment Advisors, LLC are continually updating and expanding shareholder information services on the Fund’s website in an ongoing effort to provide you with the most current information about how your Fund’s assets are managed and the results of our efforts. It is just one more small way we are working to keep you better informed about your investment in the Fund.
| (Unaudited) | May 31, 2017 |
DEAR SHAREHOLDER
We thank you for your investment in the Guggenheim Strategic Opportunities Fund (the “Fund”). This report covers the Fund’s performance for the 12-month period ended May 31, 2017.
The Fund’s investment objective is to maximize total return through a combination of current income and capital appreciation. The Fund pursues a relative value-based investment philosophy. The Fund’s sub-adviser seeks to combine a credit-managed fixed-income portfolio with access to a diversified pool of alternative investments and equity strategies.
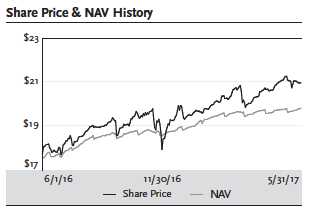
All Fund returns cited—whether based on net asset value (“NAV”) or market price—assume the reinvestment of all distributions. For the 12-month period ended May 31, 2017, the Fund provided a total return based on market price of 33.33% and a total return based on NAV of 26.76%. NAV return includes the deduction of management fees, operating expenses, and all other Fund expenses.
As of May 31, 2017, the Fund’s market price of $20.94 represented a premium of 5.86% to its NAV of $19.78. The market value of the Fund’s shares fluctuates from time to time and may be higher or lower than the Fund’s NAV. Past performance is not a guarantee of future results.
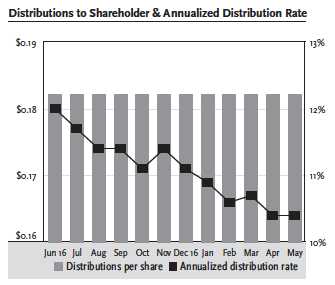
From June 2016 through May 2017, the Fund paid a monthly distribution of $0.1821. The latest distribution represents an annualized distribution rate of 10.44% based on the Fund’s closing market price of $20.94 on May 31, 2017. The Fund’s distribution rate is not constant and the amount of distributions, when declared by the Fund’s Board of Trustees, is subject to change based on the performance of the Fund. Please see Note 2(i) on page 50 for more information on distributions for the period.
Guggenheim Funds Investment Advisors, LLC (the “Adviser”) serves as the investment adviser to the Fund. Guggenheim Partners Investment Management, LLC (“GPIM” or the “Sub-Adviser”) serves as the Fund’s investment sub-adviser and is responsible for the management of the Fund’s portfolio of investments. Each of the Adviser and the Sub-Adviser is an affiliate of Guggenheim Partners, LLC (“Guggenheim”), a global diversified financial services firm.
We encourage shareholders to consider the opportunity to reinvest their distributions from the Fund through the Dividend Reinvestment Plan (“DRIP”), which is described in detail on page 82 of this report. When shares trade at a discount to NAV, the DRIP takes advantage of the discount by reinvesting the monthly dividend distribution in common shares of the Fund purchased in the market at a price less than NAV. Conversely, when the market price of the Fund’s common shares is at a premium above NAV, the DRIP reinvests participants’ dividends in newly-issued common shares at the greater of NAV per share or 95% of the market price per share. The DRIP provides a cost-effective means to accumulate additional shares and enjoy the benefits of compounding returns over time. Since the Fund endeavors to maintain a stable monthly distribution, the DRIP effectively provides an income averaging technique which causes shareholders to accumulate a larger number of Fund shares when the market price is depressed than when the price is higher.
GOF l GUGGENHEIM STRATEGIC OPPORTUNITIES FUND ANNUAL REPORT l 3
| DEAR SHAREHOLDER (Unaudited) continued | May 31, 2017 |
| To learn more about the Fund’s performance and investment strategy, we encourage you to read the | |
| Questions & Answers section of this report, which begins on page 5. You’ll find information on GPIM’s | |
| investment philosophy, views on the economy and market environment, and detailed information about | |
| the factors that impacted the Fund’s performance. | |
| We appreciate your investment and look forward to serving your investment needs in the future. For the | |
| most up-to-date information on your investment, please visit the Fund’s website at | |
| guggenheiminvestments.com/gof. | |
| Sincerely, | |

Donald C. Cacciapaglia
President and Chief Executive Officer
Guggenheim Strategic Opportunities Fund
June 30, 2017
4 l GOF l GUGGENHEIM STRATEGIC OPPORTUNITIES FUND ANNUAL REPORT
| QUESTIONS& ANSWERS (Unaudited) | May 31, 2017 |
Guggenheim Strategic Opportunities Fund (“Fund”) is managed by a team of seasoned professionals at Guggenheim Partners Investment Management, LLC (“GPIM”). This team includes B. Scott Minerd, Chairman of Guggenheim Investments and Global Chief Investment Officer; Anne B. Walsh, CFA, JD, Senior Managing Director and Assistant Chief Investment Officer; James W. Michal, Senior Managing Director and Portfolio Manager; and Steven H. Brown, CFA, Managing Director and Portfolio Manager. In the following interview, the investment team discusses the market environment and the Fund’s performance for the 12-month period ended May 31, 2017.
What is the Fund’s investment objective and how is it pursued?
The Fund seeks to maximize total return through a combination of current income and capital appreciation. The Fund pursues a relative value-based investment philosophy, which utilizes quantitative and qualitative analysis.
The Fund seeks to combine a credit-managed fixed-income portfolio with access to a diversified pool of alternative investments and equity strategies. The Fund seeks to achieve its investment objective by investing in a wide range of fixed-income and other debt and senior-equity securities (“Income Securities”) selected from a variety of credit qualities and sectors, including, but not limited to, corporate bonds, loans and loan participations, structured finance investments, U.S. government and agency securities, mezzanine and preferred securities and convertible securities, and in common stocks, limited liability company interests, trust certificates, and other equity investments (“Common Equity Securities,” exposure to which is obtained primarily by investing in exchange-traded funds, or ETFs) that GPIM believes offer attractive yield and/or capital appreciation potential, including employing a strategy of writing (selling) covered call and put options on such equities. GPIM believes the volatility of the Fund can be reduced by diversifying across a large number of sectors and securities, some of which historically have not been highly correlated to one another.
Under normal market conditions:
• The Fund may invest without limitation in fixed-income securities rated below investment grade (commonly referred to as “junk bonds”); the Fund may invest in below-investment grade income securities of any rating;
• The Fund may invest up to 20% of its total assets in non-U.S. dollar denominated fixed-income securities of corporate and governmental issuers located outside the U.S., including up to 10% of total assets in fixed-income securities of issuers located in emerging markets;
• The Fund may invest up to 50% of its total assets in common equity securities, and the Fund may invest in exchange-traded funds (“ETFs”) or other investment funds that track equity market indices and/or through derivative instruments that replicate the economic characteristics of exposure to Common Equity Securities; and
• The Fund may invest up to 30% of its total assets in investment funds that primarily hold (directly or indirectly) investments in which the Fund may invest directly, of which amount up to 30% of the Fund’s
GOF l GUGGENHEIM STRATEGIC OPPORTUNITIES FUND ANNUAL REPORT l 5
| QUESTIONS & ANSWERS (Unaudited) continued | May 31, 2017 |
| total assets may be invested in investment funds that are registered as investment companies under the Investment Company Act of 1940 (the “1940 Act”) to the extent permitted by applicable law and related interpretations of the staff of the U.S. Securities and Exchange Commission. |
GPIM’s process for determining whether to buy a security is a collaborative effort between various groups including: (i) economic research, which focus on key economic themes and trends, regional and country-specific analysis, and assessments of event-risk and policy impacts on asset prices, (ii) the Portfolio Construction Group, which utilize proprietary portfolio construction and risk modeling tools to determine allocation of assets among a variety of sectors, (iii) its Sector Specialists, who are responsible for identifying investment opportunities in particular securities within these sectors, including the structuring of certain securities directly with the issuers or with investment banks and dealers involved in the origination of such securities, and (iv) portfolio managers, who determine which securities best fit the Fund based on the Fund’s investment objective and top-down sector allocations. In managing the Fund, GPIM uses a process for selecting securities for purchase and sale that is based on intensive credit research and involves extensive due diligence on each issuer, region and sector. GPIM also considers macroeconomic outlook and geopolitical issues.
The Fund uses financial leverage (currently through borrowings and reverse repurchase agreements) to finance the purchase of additional securities. Although financial leverage may create an opportunity for increased return for shareholders, it also results in additional risks and can magnify the effect of any losses. There is no assurance that the strategy will be successful. If income and gains earned on securities purchased with the financial leverage proceeds are greater than the cost of the financial leverage, common shareholders’ return will be greater than if financial leverage had not been used. Conversely, if the income or gains from the securities purchased with the proceeds of financial leverage are less than the cost of the financial leverage, common shareholders’ return will be less than if financial leverage had not been used.
What were the significant events affecting the economy and market environment over the past 12 months?
The period was marked by significant events in the political sphere, both in the U.S. and globally. In June 2016, Britain’s vote to depart the European Union shocked world markets, distressing the many market participants who had positioned themselves for the opposite outcome. The result was a sharp but brief market sell off at the end of the second quarter of 2016.
With the election of Donald Trump, the market began anticipating that reduced regulation and fiscal stimulus would lead to stronger economic growth in the U.S. and globally. With the potential to finance some of this stimulus increased Treasury issuance, nominal interest rates climbed higher by the end of 2016.
By spring 2017, markets were reassessing their optimistic economic outlooks after not seeing much progress on the legislative front. This helped bond prices to stabilize and the yield curve to flatten. With the rate rise in June and the U.S. Federal Reserve’s (the “Fed”) announcement about reducing the size of its balance sheet, after the period end, investors may see increased Treasury market volatility through the rest of the year.
6 l GOF l GUGGENHEIM STRATEGIC OPPORTUNITIES FUND ANNUAL REPORT
| QUESTIONS & ANSWERS (Unaudited) continued | May 31, 2017 |
Still, GPIM believes the global macroeconomic environment remains positive. China has stabilized, Europe is recovering, corporate earnings in the United States are rising, confidence measures are strong, and a U.S. recession appears unlikely before 2019. However, tracking estimates for first-quarter real Gross Domestic Product (“GDP”) growth gradually fell throughout the quarter despite strong gains in consumer and business sentiment since the election. GDP increased at an annual rate of 1.4% in the first quarter of 2017. The prospects for quarterly U.S. GDP growth are better going forward, and GPIM expects a bounce back in the second quarter.
GPIM’s medium-term growth outlook has dimmed marginally as a result of the minimal progress seen to date on the Trump administration’s fiscal policy initiatives. The ongoing struggle to create a healthcare bill has sapped early legislative momentum, and tax reform shows that work still needs to be done to put the agenda into effect in a timely manner—meaning markets may come to realize that the Trump rally may be long on promise and short on delivery.
With the Fed set to continue to raise interest rates—possibly at a faster pace than the market is pricing in—the shape of the yield curve going forward will remain a major theme in many portfolios. In addition to another potential rate hike this year, the Fed may raise rates three to four more times in 2018. The Fed’s strategy to reduce its balance sheet could pressure yields higher in the short end and belly of the curve, which is where most of the new Treasury issuance is likely to come. At the long end, rates are likely to stay low for some time. Recall that the last time the 10-year Treasury note traded below 3%, it lasted nearly 22 years (June 1934 through March 1956.)
By many measures, the stock and bond markets have rarely been more expensive and more stable in the second quarter of 2017. High-yield bonds were trading near their narrowest-ever spreads relative to treasuries in May 2017. At the same time, U.S. stock market indexes are continuing to make new highs while the Chicago Board Options Exchange Volatility Index (VIX), which measures option-implied S&P 500 volatility, is near its lowest level since 1993. The amount of complacency built into the markets argues for caution.
How did the Fund perform for the 12 months ended May 31, 2017?
All Fund returns cited—whether based on net asset value (“NAV”) or market price—assume the reinvestment of all distributions. For the 12-month period ended May 31, 2017, the Fund provided a total return based on market price of 33.33% and a total return based on NAV of 26.76%. NAV return includes the deduction of management fees, operating expenses, and all other Fund expenses.
As of May 31, 2017, the Fund’s market price of $20.94 represented a premium of 5.86% to its NAV of $19.78. As of May 31, 2016, the Fund’s market price of $17.61 represented a premium of 0.63% to its NAV of $17.50. The market value of the Fund’s shares fluctuates from time to time and may be higher or lower than the Fund’s NAV. Past performance is not a guarantee of future results.
What were the Fund’s distributions?
From June 2016 through May 2017, the Fund paid a monthly distribution of $0.1821. The latest distribution represents an annualized distribution rate of 10.44% based on the Fund’s closing market price of $20.94 on May 31, 2017. The Fund’s distribution rate is not constant and the amount of
GOF l GUGGENHEIM STRATEGIC OPPORTUNITIES FUND ANNUAL REPORT l 7
| QUESTIONS & ANSWERS (Unaudited) continued | May 31, 2017 |
distributions, when declared by the Fund’s Board of Trustees, is subject to change based on the performance of the Fund. Please see Note 2(i) on page 50 for more information on distributions for the period.
Discuss performance over the period.
During the period, the Fund saw positive performance primarily attributable to the continued tightening of credit spreads across fixed income sectors, as well as the portfolio’s high carry. Carry refers to the income received net of borrowing costs from portfolio investments over a defined period. Returns from spread tightening during the period was chiefly driven by the portfolio’s investments in collateralized loan obligations (“CLO”), bank loans, and high yield corporate bonds.
During the risk-off atmosphere in the first quarter 2016, the Fund added to its credit exposure, including mezzanine CLOs, high yield corporate bonds and bank loans to help performance. The Fund has since reduced allocations as spreads have tightened over the period. This was not due to the default cycle, but rather continued relative overvaluation.
Spreads on bank loans and high-yield corporate bonds were driven to near-2014 lows by strong inflows from mutual funds and institutional investors. Tight spreads continue to reflect an optimistic outlook on corporate earnings and the promise of pro-growth fiscal policies. While earnings are improving as expected, fiscal policy uncertainty is rising, which may eventually be reflected in higher implied volatility. Implied volatility levels tend to be closely correlated with corporate bond spreads. If implied volatility rises this summer, GPIM expects to see some spread widening as well. This temporary spike in volatility should not be mistaken for fundamental deterioration in the leveraged credit space, however, as we continue to expect that defaults will decline through the end of the year.
In the CLO market, which has been dominated by refinancing and resets of 2014–2015 transactions, spreads have come in across all tranches to new three-year tights and approaching the post-crisis tights set in early 2013. Rising LIBOR rates also may make floating-rate assets more attractive than fixed rate, supporting further spread tightening.
The driving theme in the bank loan market continued to be the surge in refinancing activity, a trend GPIM expects will continue at least through the third quarter. Borrowers who completed a refinancing transaction in the first quarter reduced contractual spreads by almost 90 basis points. New issue volume has also been robust outside of refinancing activity, with institutional loan issuance totaling $96 billion in the first quarter of 2017, up from only $33 billion in the first quarter of 2016. This increase was accompanied by significant demand from CLOs and mutual funds.
Over half of the Fund’s portfolio is floating rate with limited interest rate duration risk, which should benefit given the anticipation of additional rate hikes in 2017 and 2018.
Discuss the Fund’s approach to duration.
Although the Fund has no set policy regarding portfolio duration or maturity, the Fund currently maintains a low-duration target, but adds opportunistically to attractive long duration assets when it can take advantage of short-term fluctuations in interest rates.
8 l GOF l GUGGENHEIM STRATEGIC OPPORTUNITIES FUND ANNUAL REPORT
| QUESTIONS & ANSWERS (Unaudited) continued | May 31, 2017 |
Discuss the Fund’s use of leverage
Since leverage adds to performance when the cost of leverage is less than the total return generated by investments, the use of leverage detracted from the Fund’s total return during this period. The purpose of leverage (borrowing and reverse repurchase agreements) is to fund the purchase of additional securities that provide increased income and potentially greater appreciation to common shareholders than could be achieved from an unlevered portfolio. Leverage results in greater NAV volatility and entails more downside risk than an unleveraged portfolio.
As of May 31, 2017, the amount of leverage was approximately 21% of managed assets (including the proceeds of leverage). GPIM employs leverage through two vehicles: reverse repurchase agreements, under which the Fund temporarily transfers possession of portfolio securities and receives cash which can be used for additional investments, and a committed financing facility through a leading financial institution. There is no guarantee that the Fund’s leverage strategy will be successful. The Fund’s use of leverage may cause the Fund’s NAV and market price of common shares to be more volatile and can magnify the effect of any losses.
Index Definitions
Indices are unmanaged and reflect no expenses. It is not possible to invest directly in an index.
The Standard & Poor’s 500 Index is a capitalization-weighted index of 500 stocks. The index is designed to measure the performance of the broad economy, representing all major industries and is considered a representative of U.S. stock market.
The Bloomberg Barclays U.S. Aggregate Bond Index is a broad-based flagship benchmark that measures the investment grade, U.S. dollar-denominated, fixed-rate taxable bond market, including U.S. Treasuries, government-related and corporate securities, mortgage-backed securities or “MBS” (agency fixed-rate and hybrid adjustable-rate mortgage, or “ARM”, pass-throughs), asset-backed securities (“ABS”), and commercial mortgage-backed securities (“CMBS”) (agency and non-agency).
The Bloomberg Barclays U.S. Corporate High Yield Index measures the U.S. dollar-denominated, high yield, fixed-rate corporate bond market. Securities are classified as high yield if the middle rating of Moody’s, Fitch, and S&P is Ba1/BB +/BB + or below.
The Bloomberg Barclays 1-3 Month U.S. Treasury Bill Index tracks the performance of U.S. Treasury Bills with a remaining maturity of one to three months. U.S. Treasury Bills, which are short-term loans to the U.S. government, are full-faith-and-credit obligations of the U.S. Treasury and are generally regarded as being free of any risk of default.
Risks and Other Considerations
Investing involves risk, including the possible loss of principal and fluctuation of value.
The views expressed in this report reflect those of the portfolio managers only through the report period as stated on the cover. These views are expressed for informational purposes only and are subject to change at any time, based on market and other conditions, and may not come to pass. These views may differ from views of other investment professionals at Guggenheim and should not be construed as
GOF l GUGGENHEIM STRATEGIC OPPORTUNITIES FUND ANNUAL REPORT l 9
| QUESTIONS & ANSWERS (Unaudited) continued | May 31, 2017 |
research, investment advice or a recommendation of any kind regarding the fund or any issuer or security, do not constitute a solicitation to buy or sell any security and should not be considered specific legal, investment or tax advice. The information provided does not take into account the specific objectives, financial situation or particular needs of any specific investor.
The views expressed in this report may also include forward looking statements that involve risk and uncertainty, and there is no guarantee that any predictions will come to pass. Actual results or events may differ materially from those projected, estimated, assumed or anticipated in any such forward-looking statements. Important factors that could result in such differences, in addition to the other factors noted with such forward-looking statements, include general economic conditions such as inflation, recession and interest rates.
There can be no assurance that the Fund will achieve its investment objectives or that any investment strategies or techniques discussed herein will be effective. The value of the Fund will fluctuate with the value of the underlying securities. Historically, closed-end funds often trade at a discount to their net asset value.
Performance data quoted represents past performance, which is no guarantee of future results and current performance may be lower or higher than the figures shown.
Please see guggenheiminvestments.com/gof for a detailed discussion of the Fund’s risks and considerations.
This material is not intended as a recommendation or as investment advice of any kind, including in connection with rollovers, transfers, and distributions. Such material is not provided in a fiduciary capacity, may not be relied upon for or in connection with the making of investment decisions, and does not constitute a solicitation of an offer to buy or sell securities. All content has been provided for informational or educational purposes only and is not intended to be and should not be construed as legal or tax advice and/or a legal opinion. Always consult a financial, tax and/or legal professional regarding your specific situation.
10 l GOF l GUGGENHEIM STRATEGIC OPPORTUNITIES FUND ANNUAL REPORT
| FUND SUMMARY (Unaudited) | May 31, 2017 |
| Fund Statistics | |
| Share Price | $20.94 |
| Net Asset Value | $19.78 |
| Premium to NAV | 5.86% |
| Net Assets ($000) | $410,465 |
| AVERAGE ANNUAL TOTAL RETURNS FOR THE | ||||
| PERIOD ENDED MAY 31, 2017 | ||||
| Since | ||||
| One | Three | Five | Inception | |
| Year | Year | Year | (07/26/07) | |
| Guggenheim Strategic Opportunities Fund | ||||
| NAV | 26.76% | 10.77% | 12.49% | 11.92% |
| Market | 33.33% | 10.62% | 11.32% | 12.19% |
Performance data quoted represents past performance, which is no guarantee of future results and current performance may be lower or higher than the figures shown. All NAV returns include the deduction of management fees, operating expenses and all other Fund expenses. The deduction of taxes that a shareholder would pay on Fund distributions or the sale of Fund shares is not reflected in the total returns. For the most recent month-end performance figures, please visit guggenheiminvestments.com/gof. The investment return and principal value of an investment will fluctuate with changes in market conditions and other factors so that an investor’s shares, when sold, may be worth more or less than their original cost.
| Ten Largest Holdings | |
| (% of Total Net Assets) | |
| GMAC Commercial Mortgage Asset Corp., 6.36% due 09/10/44 | 1.0% |
| Cosmopolitan Hotel Trust 2016, 5.64% due 11/15/33 | 0.9% |
| MP CLO V Ltd., 7.06% due 07/18/26 | 0.9% |
| QBE Insurance Group Ltd., 7.50% due 11/24/43 | 0.8% |
| Flatiron CLO Ltd., 4.76% due 01/17/26 | 0.8% |
| Citigroup, Inc., 5.95% | 0.8% |
| BBB Industries, LLC, 6.04% due 11/03/21 | 0.7% |
| Flagship CLO VIII Ltd., 6.36% due 01/16/26 | 0.7% |
| FDF II Ltd., 7.70% due 05/12/31 | 0.7% |
| Anchorage Credit Funding 1 Ltd., 6.30% due 07/28/30 | 0.7% |
| Top Ten Total | 8.0% |
| “Ten Largest Holdings” excludes any temporary cash or derivative investments. |
GOF l GUGGENHEIM STRATEGIC OPPORTUNITIES FUND ANNUAL REPORT l 11
FUND SUMMARY (Unaudited) continued May 31, 2017
12 l GOF l GUGGENHEIM STRATEGIC OPPORTUNITIES FUND ANNUAL REPORT
| FUND SUMMARY (Unaudited) continued | May 31, 2017 |
| Portfolio Breakdown | % of Net Assets |
| Investments: | |
| Senior Floating Rate Interests | 42.9% |
| Asset Backed Securities | 35.0% |
| Corporate Bonds | 30.6% |
| U.S. Government Securities | 7.6% |
| Collateralized Mortgage Obligations | 3.2% |
| Money Market Fund | 2.2% |
| Foreign Government Bonds | 1.5% |
| Preferred Stocks | 1.5% |
| Common Stocks | 0.5% |
| Municipal Bonds | 0.5% |
| Call Options Purchased | 0.2% |
| Put Options Purchased | 0.1% |
| Warrants | 0.0%* |
| Total Investments | 125.8% |
| Call Options Written | -0.3% |
| Other Assets & Liabilities, net | -25.5% |
| Net Assets | 100.0% |
| *Less than 0.1% | |
Holdings diversification and holdings are subject to change daily. For more information, please visit guggenheiminvestments.com/gof. The above summaries are provided for informational purposes only and should not be viewed as recommendations. Past performance does not guarantee future results.
GOF l GUGGENHEIM STRATEGIC OPPORTUNITIES FUND ANNUAL REPORT l 13
| FUND SUMMARY (Unaudited) continued | May 31, 2017 |
| Portfolio Composition by Quality Rating* | |
| % of Total | |
| Rating | Investments |
| Fixed Income Instruments | |
| AAA | 6.0% |
| AA | 0.5% |
| A | 4.5% |
| BBB | 14.5% |
| BB | 13.7% |
| B | 35.0% |
| CCC | 3.9% |
| CC | 0.6% |
| NR** | 13.0% |
| Other Instruments | |
| Other | 0.6% |
| Short Term Investments | 7.7% |
| Total Investments | 100.0% |
* Source: BlackRock Solutions. Credit quality ratings are measured on a scale that generally ranges from AAA (highest) to D (lowest). All securities except for “NR”, or not rated, have been rated by Moody’s, Standard & Poor’s (“S&P”), or Fitch, which are all a Nationally Recognized Statistical Rating Organization (“NRSRO”). For purposes of this presentation, when ratings are available from more than one agency, the highest rating is used. Guggenheim Investments has converted Moody’s and Fitch ratings to the equivalent S&P rating. Security ratings are determined at the time of purchase and may change thereafter.
** NR securities do not necessarily indicate low credit quality.
14 l GOF l GUGGENHEIM STRATEGIC OPPORTUNITIES FUND ANNUAL REPORT
| SCHEDULE OF INVESTMENTS | May 31, 2017 | |
| Shares | Value | |
COMMON STOCKS† – 0.5% | ||
| Energy – 0.3% | ||
SandRidge Energy, Inc.*,1 | 41,086 | $ 813,092 |
| Approach Resources, Inc.* | 112,884 | 286,725 |
Titan Energy LLC*,1 | 9,603 | 90,748 |
| Total Energy | 1,190,565 | |
| Technology – 0.2% | ||
Aspect Software Parent, Inc.*,†††,2,14 | 40,745 | 609,980 |
Aspect Software Parent, Inc.*,†††,2,14 | 15,032 | 225,037 |
Qlik Technologies, Inc. A*,†††,2 | 56 | 55,840 |
Qlik Technologies, Inc. B*,†††,2 | 13,812 | 564 |
Qlik Technologies, Inc.*,†† | 3,600 | – |
| Total Technology | 891,421 | |
| Communications – 0.0%** | ||
Cengage Learning Acquisitions, Inc.*,†† | 11,126 | 50,067 |
| Consumer, Non-cyclical – 0.0%** | ||
Targus Group International Equity, Inc.*,†††,2,14 | 13,409 | 20,113 |
| Basic Materials – 0.0%** | ||
Mirabela Nickel Ltd.*,†††,2 | 5,244,841 | 390 |
| Consumer, Cyclical – 0.0%** | ||
Deb Stores Holding LLC*,†††,2 | 9,389 | 1 |
| Industrial – 0.0%** | ||
Carey International, Inc.*,†††,2 | 5,666 | 1 |
| Total Common Stocks | ||
| (Cost $4,709,480) | 2,152,558 | |
PREFERRED STOCKS† – 1.5% | ||
| Financial – 1.2% | ||
| Morgan Stanley | ||
5.85%10 | 110,000 | 2,932,600 |
| Public Storage | ||
5.40%10 | 42,000 | 1,080,660 |
5.90%10 | 10,000 | 253,200 |
| AgriBank FCB | ||
6.88%1,10 | 4,000 | 435,500 |
| Total Financial | 4,701,960 | |
| Industrial – 0.3% | ||
| Seaspan Corp. | ||
6.38%1,10 | 54,825 | 1,376,108 |
| Total Preferred Stocks | ||
| (Cost $5,733,549) | 6,078,068 | |
See notes to financial statements.
GOF l GUGGENHEIM STRATEGIC OPPORTUNITIES FUND ANNUAL REPORT l 15
| SCHEDULE OF INVESTMENTS continued | May 31, 2017 | |
| Shares | Value | |
WARRANTS†† – 0.0%** | ||
| Comstock Resources, Inc. | ||
| expiring 09/06/18 | 3,575 | $ 23,416 |
| Total Warrants | ||
| (Cost $13,658) | 23,416 | |
| Face | ||
| Amount~ | Value | |
SHORT TERM INVESTMENTS†† – 9.8% | ||
U.S. GOVERNMENT SECURITIES†† – 7.6% | ||
| United States Treasury Bill | ||
0.75% due 06/22/171,3 | 5,900,000 | $ 5,897,510 |
0.88% due 08/10/171,3 | 5,550,000 | 5,540,143 |
0.86% due 08/03/171,3 | 5,500,000 | 5,491,261 |
0.83% due 07/27/171,3 | 5,000,000 | 4,993,215 |
0.73% due 06/15/171,3 | 3,000,000 | 2,999,142 |
0.76% due 07/06/171,3 | 2,800,000 | 2,797,973 |
0.83% due 07/20/173 | 2,300,000 | 2,297,293 |
0.76% due 07/13/171,3 | 1,400,000 | 1,398,649 |
| Total U.S. Government Securities | ||
| (Cost $31,416,894) | 31,415,186 | |
MONEY MARKET FUND† – 2.2% | ||
| Dreyfus Treasury Prime Cash Management Institutional Shares | ||
0.65%4 | ||
| (Cost $8,922,784) | 8,922,784 | 8,922,784 |
| Total Short Term Investments | ||
| (Cost $40,339,678) | 40,337,970 | |
SENIOR FLOATING RATE INTERESTS††,5 – 42.9% | ||
| Industrial – 9.1% | ||
| ILPEA Parent, Inc. | ||
| 6.55% due 03/02/23 | 2,700,000 | 2,699,999 |
| Advanced Integration Technology LP | ||
| 6.54% due 04/03/23 | 2,542,500 | 2,567,924 |
| Alion Science & Technology Corp. | ||
| 5.54% due 08/19/21 | 2,456,250 | 2,454,211 |
| Tronair Parent, Inc. | ||
| 5.86% due 09/08/23 | 2,386,992 | 2,363,122 |
| CareCore National LLC | ||
| 5.04% due 03/05/21 | 2,335,208 | 2,352,723 |
| American Bath Group LLC | ||
| 6.40% due 09/30/23 | 2,194,486 | 2,217,353 |
| SRS Distribution, Inc. | ||
| 9.75% due 02/24/23 | 2,030,000 | 2,085,825 |
| Transcendia Holdings, Inc. | ||
| 5.00% due 05/09/24 | 2,000,000 | 2,010,000 |
See notes to financial statements.
16 l GOF l GUGGENHEIM STRATEGIC OPPORTUNITIES FUND ANNUAL REPORT
| SCHEDULE OF INVESTMENTS continued | May 31, 2017 | |
| Face | ||
| Amount~ | Value | |
SENIOR FLOATING RATE INTERESTS††,5 – 42.9% (continued) | ||
| Industrial – 9.1% (continued) | ||
| Bioplan / Arcade | ||
| 5.79% due 09/23/21 | 1,959,837 | $ 1,923,913 |
| Zodiac Pool Solutions LLC | ||
| 5.65% due 12/20/23 | 1,546,125 | 1,553,856 |
| National Technical | ||
7.25% due 06/12/21†††,2 | 1,395,061 | 1,360,185 |
| Thor Bidco (Morrison Utility) | ||
| 5.33% due 09/20/23 | 1,000,000 GBP | 1,288,394 |
| HBC Hardware Holdings | ||
7.65% due 03/30/20††† | 1,293,750 | 1,267,875 |
| ProAmpac PG Borrower LLC | ||
| 9.67% due 11/18/24 | 1,000,000 | 1,015,000 |
| Diversitech Holdings, Inc. | ||
| 8.50% due 05/18/25 | 1,000,000 | 1,011,250 |
| Pregis Holding I Corp. | ||
| 4.65% due 05/20/21 | 1,000,000 | 1,003,130 |
| ACA Compliance Group Holdings | ||
| 5.75% due 02/01/21 | 1,000,000 | 1,002,500 |
| SiteOne Landscaping LLC | ||
| 4.53% due 04/29/22 | 990,025 | 996,213 |
| Resource Label Group LLC | ||
| 5.50% due 05/26/23 | 1,000,000 | 990,000 |
| Amspec Services, Inc. | ||
| 5.80% due 07/01/22 | 890,263 | 881,361 |
| 6.15% due 07/01/22 | 97,523 | 96,548 |
| ICSH Parent, Inc. | ||
| 5.18% due 04/29/24 | 847,059 | 844,941 |
| Kuehg Corp. – Kindercare | ||
| 4.92% due 08/12/22 | 744,269 | 747,990 |
| GYP Holdings III Corp. | ||
| 4.67% due 04/01/21 | 623,555 | 623,947 |
| Duran, Inc. | ||
| 4.75% due 03/21/24 | 550,000 | 548,625 |
| SI Organization | ||
| 5.90% due 11/22/19 | 494,146 | 497,442 |
| Ranpak | ||
| 8.25% due 10/03/22 | 435,556 | 433,378 |
| Hunter Defense Technologies | ||
| 7.16% due 08/05/19 | 365,333 | 335,650 |
| NaNa Development Corp. | ||
| 8.00% due 03/15/18 | 214,802 | 210,506 |
| Doncasters Group Ltd. | ||
| 9.50% due 10/09/20 | 101,379 | 97,493 |
See notes to financial statements.
GOF l GUGGENHEIM STRATEGIC OPPORTUNITIES FUND ANNUAL REPORT l 17
| SCHEDULE OF INVESTMENTS continued | May 31, 2017 | |
| Face | ||
| Amount~ | Value | |
SENIOR FLOATING RATE INTERESTS††,5 – 42.9% (continued) | ||
| Industrial – 9.1% (continued) | ||
| Carey International, Inc. | ||
9.00% due 05/23/20†††,2,13 | 47,834 | $ 6,792 |
| Total Industrial | 37,488,146 | |
| Consumer, Non-cyclical – 8.8% | ||
| Copernicus Group, Inc. | ||
| 6.15% due 08/15/22 | 2,983,377 | 2,983,377 |
| Reddy Ice Holdings, Inc. | ||
| 6.76% due 05/01/19 | 2,260,128 | 2,227,649 |
| American Seafoods Group LLC / American Seafoods Finance, Inc. | ||
| 6.07% due 08/19/21 | 2,026,255 | 2,030,470 |
0.88% due 08/19/21†††,2 | 25,000 | 22,381 |
| AT Home Holding III | ||
| 4.67% due 06/03/22 | 1,960,000 | 1,955,101 |
| Give and Go Prepared Foods Corp. | ||
| 6.65% due 07/29/23 | 1,841,249 | 1,859,661 |
| Pelican Products, Inc. | ||
| 5.40% due 04/10/20 | 1,779,646 | 1,777,422 |
| Equian LLC | ||
| 4.93% due 05/20/24 | 1,720,588 | 1,724,890 |
| Chef’s Warehouse Parent LLC | ||
| 6.79% due 06/22/22 | 1,624,273 | 1,644,576 |
| BCPE Eagle Buyer LLC | ||
| 5.34% due 03/18/24 | 1,200,000 | 1,197,000 |
| Authentic Brands | ||
| 5.15% due 05/27/21 | 1,175,692 | 1,181,570 |
| IHC Holding Corp. | ||
7.02% due 04/30/21†††,2 | 982,500 | 972,881 |
7.26% due 04/30/21†††,2 | 188,575 | 188,309 |
| Sho Holding I Corp. | ||
| 6.04% due 10/27/22 | 1,127,146 | 1,121,511 |
| Chobani LLC | ||
| 5.29% due 10/09/23 | 1,025,000 | 1,038,458 |
| Endo Luxembourg Finance Co. | ||
| 5.31% due 04/29/24 | 1,000,000 | 1,016,880 |
| Hanger, Inc. | ||
| 11.50% due 08/01/19 | 1,000,000 | 1,015,000 |
| Arctic Glacier Group Holdings, Inc. | ||
| 5.29% due 03/20/24 | 1,000,000 | 1,011,880 |
| CPI Holdco LLC | ||
| 5.15% due 03/21/24 | 1,000,000 | 1,005,000 |
| CPM Holdings | ||
| 5.29% due 04/11/22 | 984,868 | 995,130 |
| Springs Industries, Inc. | ||
7.50% due 06/01/21†††,2 | 992,500 | 992,500 |
See notes to financial statements.
18 l GOF l GUGGENHEIM STRATEGIC OPPORTUNITIES FUND ANNUAL REPORT
| SCHEDULE OF INVESTMENTS continued | May 31, 2017 | |
| Face | ||
| Amount~ | Value | |
SENIOR FLOATING RATE INTERESTS††,5 – 42.9% (continued) | ||
| Consumer, Non-cyclical – 8.8% (continued) | ||
| Alegeus Technologies LLC | ||
| 6.31% due 04/28/23 | 1,000,000 | $ 990,000 |
| Affordable Care Holding | ||
| 5.79% due 10/24/22 | 987,500 | 987,500 |
| American Tire Distributors, Inc. | ||
| 5.29% due 09/01/21 | 970,938 | 973,366 |
| ABB Concise Optical Group LLC | ||
| 6.13% due 06/15/23 | 965,150 | 972,997 |
| Lineage Logistics LLC | ||
| 4.54% due 04/07/21 | 937,914 | 939,086 |
| Amplify Snack Brands, Inc. | ||
| 6.50% due 09/02/23 | 940,000 | 933,730 |
| CTI Foods Holding Co. LLC | ||
| 8.40% due 06/28/21 | 1,105,000 | 928,200 |
| PT Intermediate Holdings III LLC | ||
7.54% due 06/23/22†††,2 | 786,750 | 786,750 |
| NES Global Talent | ||
| 6.67% due 10/03/19 | 313,987 | 282,588 |
| Packaging Coordinators Midco, Inc. | ||
1.11% due 07/01/21†††,2 | 115,385 | 103,600 |
| Rite Aid Corp. | ||
| 5.75% due 08/21/20 | 100,000 | 100,333 |
| Targus Group International, Inc. | ||
15.00% due 12/31/19†††,2,14 | 64,198 | 64,198 |
14.00% due 05/24/16†††,2,12,14 | 155,450 | – |
| Total Consumer, Non-cyclical | 36,023,994 | |
| Consumer, Cyclical – 7.8% | ||
| BBB Industries, LLC | ||
| 6.04% due 11/03/21 | 3,000,000 | 3,026,249 |
| Accuride Corp. | ||
| 8.15% due 11/17/23 | 2,615,000 | 2,634,612 |
| Navistar Inc. | ||
| 5.00% due 08/07/20 | 2,364,987 | 2,402,424 |
| BIG JACK Holdings | ||
| 5.25% due 04/05/24 | 2,375,000 | 2,389,843 |
| LSF9 Robin Investments Ltd. | ||
| 5.34% due 12/13/23 | 1,750,000 GBP | 2,283,820 |
| K & N Parent, Inc. | ||
| 5.79% due 10/20/23 | 1,995,000 | 1,999,988 |
| Blue Nile, Inc. | ||
| 7.66% due 02/17/23 | 2,000,000 | 1,980,000 |
| Mavis Tire | ||
6.29% due 11/02/20†††,2 | 1,965,000 | 1,946,091 |
See notes to financial statements.
GOF l GUGGENHEIM STRATEGIC OPPORTUNITIES FUND ANNUAL REPORT l 19
| SCHEDULE OF INVESTMENTS continued | May 31, 2017 | |
| Face | ||
| Amount~ | Value | |
SENIOR FLOATING RATE INTERESTS††,5 – 42.9% (continued) | ||
| Consumer, Cyclical – 7.8% (continued) | ||
| Boot Barn Holdings, Inc. | ||
5.65% due 06/29/21†††,2 | 1,965,000 | $ 1,882,666 |
| Sears Holdings Corp. | ||
| 5.54% due 06/30/18 | 1,916,128 | 1,878,765 |
| LA Fitness International LLC | ||
| 5.40% due 07/01/20 | 1,603,030 | 1,621,738 |
| National Vision, Inc. | ||
| 6.79% due 03/11/22 | 1,200,000 | 1,165,500 |
| Belk, Inc. | ||
| 5.91% due 12/12/22 | 1,324,584 | 1,135,421 |
| Truck Hero, Inc. | ||
| 5.16% due 05/16/24 | 1,000,000 | 993,440 |
| MyEyeDoctor | ||
7.40% due 08/16/21†††,2 | 985,399 | 978,491 |
| Checkers Drive-In Restaurants, Inc. | ||
| 5.41% due 04/25/24 | 900,000 | 894,943 |
| Sky Bet Cyan Blue HoldCo | ||
| 4.59% due 02/25/22 | 650,000 GBP | 846,300 |
| ABRA Auto Body | ||
| 8.33% due 09/19/22 | 500,000 | 500,000 |
| Amaya Holdings B.V. | ||
| 4.65% due 08/01/21 | 496,212 | 497,080 |
| Talbots, Inc. | ||
| 5.54% due 03/19/20 | 457,871 | 424,447 |
| Acosta, Inc. | ||
3.65% due 09/26/19†††,2 | 317,778 | 298,141 |
| CH Holding Corp. | ||
| 8.29% due 02/03/25 | 200,000 | 204,750 |
| Deb Stores Holding LLC | ||
1.50% due 10/11/16†††,2,13 | 769,055 | 1 |
| Total Consumer, Cyclical | 31,984,710 | |
| Technology – 7.0% | ||
| TIBCO Software, Inc. | ||
| 5.55% due 12/04/20 | 2,396,207 | 2,418,683 |
| LANDesk Group, Inc. | ||
| 5.30% due 01/20/24 | 2,270,000 | 2,272,837 |
| Epicor Software | ||
| 4.80% due 06/01/22 | 1,720,305 | 1,721,389 |
| 5.05% due 06/01/22 | 491,587 | 494,045 |
| Insight Venture | ||
7.25% due 07/15/21†††,2 | 1,650,000 GBP | 2,101,507 |
| Planview, Inc. (PHNTM Holdings, Inc.) | ||
6.29% due 01/27/23†††,2 | 1,000,000 | 985,907 |
10.79% due 07/27/23†††,2 | 900,000 | 887,254 |
See notes to financial statements.
20 l GOF l GUGGENHEIM STRATEGIC OPPORTUNITIES FUND ANNUAL REPORT
| SCHEDULE OF INVESTMENTS continued | May 31, 2017 | |
| Face | ||
| Amount~ | Value | |
SENIOR FLOATING RATE INTERESTS††,5 – 42.9% (continued) | ||
| Technology – 7.0% (continued) | ||
| EIG Investors Corp. | ||
| 6.18% due 02/09/23 | 1,863,799 | $ 1,867,303 |
| PowerSchool, Inc. | ||
6.03% due 07/30/21†††,2 | 985,000 | 985,000 |
6.15% due 07/30/21†††,2 | 580,650 | 580,650 |
6.53% due 07/30/21†††,2 | 248,750 | 248,750 |
| Aspect Software, Inc. | ||
11.02% due 05/25/2014 | 906,241 | 903,975 |
8.29% due 05/25/18†††,2,14 | 437,500 | 437,500 |
| Solera LLC | ||
3.38% due 03/03/21†††,2 | 1,456,983 | 1,303,000 |
| Ministry Brands LLC | ||
| 6.00% due 12/02/22 | 980,456 | 970,651 |
| 4.99% due 12/02/22 | 314,541 | 311,396 |
| Touchtunes Interactive Network | ||
| 5.90% due 05/28/21 | 884,250 | 886,461 |
| 5.75% due 05/28/21 | 360,000 | 360,900 |
| Advanced Computer Software | ||
| 10.67% due 01/31/23 | 1,250,000 | 1,140,625 |
| 6.67% due 03/18/22 | 99,745 | 97,002 |
| MRI Software LLC | ||
| 5.40% due 06/23/21 | 1,032,724 | 1,040,469 |
| Kronos, Inc. | ||
| 4.68% due 11/01/23 | 997,500 | 1,006,527 |
| Masergy Holdings, Inc. | ||
| 5.58% due 12/15/23 | 997,500 | 1,003,734 |
| Palermo Finance Corp. | ||
| 5.66% due 04/17/23 | 1,000,000 | 990,000 |
| CPI Acquisition, Inc. | ||
| 5.83% due 08/17/22 | 1,091,782 | 964,862 |
| Sparta Holding Corp. | ||
6.65% due 07/28/20†††,2 | 955,057 | 950,029 |
| Cologix Holdings, Inc. | ||
| 8.01% due 03/20/25 | 750,000 | 751,875 |
| GlobalLogic Holdings, Inc. | ||
| 5.65% due 06/20/22 | 491,189 | 494,259 |
| Active Network LLC | ||
| 6.00% due 11/13/20 | 442,612 | 445,931 |
| Ceridian Corp. | ||
| 4.54% due 09/15/20 | 250,697 | 250,071 |
| Total Technology | 28,872,592 | |
See notes to financial statements.
GOF l GUGGENHEIM STRATEGIC OPPORTUNITIES FUND ANNUAL REPORT l 21
| SCHEDULE OF INVESTMENTS continued | May 31, 2017 | |
| Face | ||
| Amount~ | Value | |
SENIOR FLOATING RATE INTERESTS††,5 – 42.9% (continued) | ||
| Basic Materials – 2.6% | ||
| Zep, Inc. | ||
| 5.04% due 06/27/22 | 1,965,000 | $ 1,969,914 |
| PetroChoice Holdings | ||
| 6.12% due 08/19/22 | 1,776,741 | 1,783,403 |
| Niacet Corp. | ||
| 5.65% due 02/01/24 | 1,700,000 | 1,691,500 |
| Arch Coal, Inc. | ||
| 5.04% due 03/07/24 | 1,600,000 | 1,601,200 |
| EP Minerals LLC | ||
| 5.50% due 08/20/20 | 1,550,000 | 1,550,000 |
| Niacet B.V. | ||
| 5.50% due 02/01/24 | 800,000 EUR | 894,181 |
| Hoffmaster Group, Inc. | ||
| 5.50% due 11/21/23 | 598,500 | 605,233 |
| PQ Corp. | ||
| 5.29% due 11/04/22 | 597,997 | 604,629 |
| Noranda Aluminum Acquisition Corp. | ||
7.50% due 02/28/1912 | 580,010 | 20,300 |
| Total Basic Materials | 10,720,360 | |
| Financial – 2.5% | ||
| Misys Ltd. | ||
| 4.50% due 04/26/24 | 2,000,000 | 2,003,839 |
| American Stock Transfer & Trust | ||
| 5.75% due 06/26/20 | 1,450,132 | 1,448,319 |
| Hyperion Insurance | ||
| 5.00% due 04/29/22 | 1,303,130 | 1,309,971 |
| Americold Realty Operating Partnership, LP | ||
| 4.79% due 12/01/22 | 1,147,538 | 1,159,736 |
| Acrisure LLC | ||
| 6.15% due 11/22/23 | 1,000,000 | 1,008,440 |
| Integro Parent, Inc. | ||
| 6.92% due 10/28/22 | 987,785 | 987,785 |
| Virtus Investment Partners, Inc. | ||
| 4.75% due 03/04/24 | 800,000 | 812,000 |
| Magic Newco, LLC | ||
| 12.00% due 06/12/19 | 750,000 | 771,098 |
| Assured Partners, Inc. | ||
| 3.50% due 10/21/22 | 390,000 | 390,164 |
| Ryan LLC | ||
| 6.79% due 08/07/20 | 312,910 | 310,955 |
| Total Financial | 10,202,307 | |
See notes to financial statements.
22 l GOF l GUGGENHEIM STRATEGIC OPPORTUNITIES FUND ANNUAL REPORT
| SCHEDULE OF INVESTMENTS continued | May 31, 2017 | |
| Face | ||
| Amount~ | Value | |
SENIOR FLOATING RATE INTERESTS††,5 – 42.9% (continued) | ||
| Communications – 1.7% | ||
| Anaren, Inc. | ||
| 9.40% due 08/18/21 | 1,000,000 | $ 985,000 |
| 5.65% due 02/18/21 | 931,056 | 931,056 |
| Houghton Mifflin Co. | ||
| 4.04% due 05/28/21 | 1,748,985 | 1,651,147 |
| Cengage Learning Acquisitions, Inc. | ||
| 5.25% due 06/07/23 | 1,714,007 | 1,613,103 |
| Proquest LLC | ||
| 10.01% due 12/15/22 | 772,000 | 747,875 |
| 5.29% due 10/24/21 | 396,932 | 401,727 |
| Mcgraw-Hill Global Education Holdings LLC | ||
| 5.04% due 05/04/22 | 500,000 | 494,145 |
| Total Communications | 6,824,053 | |
| Energy – 1.4% | ||
| Cactus Wellhead | ||
| 7.15% due 07/31/20 | 1,969,832 | 1,871,340 |
| Invenergy Thermal | ||
| 6.65% due 10/19/22 | 1,590,921 | 1,527,284 |
| PSS Companies | ||
| 5.65% due 01/28/20 | 1,848,106 | 1,506,206 |
| Exgen Texas Power LLC | ||
5.90% due 09/18/2113 | 1,126,302 | 639,176 |
| Associated Asphalt Partners LLC | ||
| 6.29% due 04/05/24 | 200,000 | 203,000 |
| Total Energy | 5,747,006 | |
| Transportation – 1.0% | ||
| Travelport Finance Luxembourg Sarl | ||
| 4.43% due 09/02/21 | 2,057,198 | 2,066,909 |
| Capstone Logistics | ||
| 5.50% due 10/07/21 | 1,084,176 | 1,076,045 |
| Arctic Long Carriers | ||
| 5.58% due 05/18/23 | 1,000,000 | 997,500 |
| Total Transportation | 4,140,454 | |
| Utilities – 1.0% | ||
| Panda Power | ||
| 7.65% due 08/21/20 | 1,239,741 | 1,126,615 |
| Lone Star Energy | ||
| 5.45% due 02/22/21 | 1,137,372 | 955,393 |
| Panda Moxie Patriot | ||
| 6.90% due 12/19/20 | 895,500 | 816,400 |
| Moss Creek Resources LLC | ||
9.50% due 04/07/22†††,2 | 777,778 | 760,278 |
See notes to financial statements.
GOF l GUGGENHEIM STRATEGIC OPPORTUNITIES FUND ANNUAL REPORT l 23
| SCHEDULE OF INVESTMENTS continued | May 31, 2017 | |
| Face | ||
| Amount~ | Value | |
SENIOR FLOATING RATE INTERESTS††,5 – 42.9% (continued) | ||
| Utilities – 1.0% (continued) | ||
| Panda Temple II Power | ||
| 7.25% due 04/03/19 | 495,236 | $ 433,332 |
| Total Utilities | 4,092,018 | |
| Total Senior Floating Rate Interests | ||
| (Cost $177,126,868) | 176,095,640 | |
ASSET BACKED SECURITIES†† – 35.0% | ||
| Collateralized Loan Obligations – 28.9% | ||
| FDF II Ltd. | ||
2016-2A, 7.70% due 05/12/311,6 | 3,000,000 | 3,010,132 |
| FDF I Ltd. | ||
2015-1A, 6.88% due 11/12/301,6 | 2,000,000 | 2,001,738 |
2015-1A, 7.50% due 11/12/306 | 1,000,000 | 1,001,919 |
| Voya CLO Ltd. | ||
2013-1A, 4.66% due 04/15/241,5,6 | 2,000,000 | 1,999,947 |
2014-4A, 7.16% due 10/14/265,6 | 1,950,000 | 1,810,251 |
2015-3A, 5.11% due 10/15/225,6 | 1,000,000 | 999,967 |
| Anchorage Credit Funding 1 Ltd. | ||
2015-1A, 6.30% due 07/28/306 | 3,000,000 | 3,003,068 |
| Anchorage Credit Funding 4 Ltd. | ||
2016-4A, 5.50% due 02/15/356 | 1,000,000 | 1,010,735 |
| MP CLO V Ltd. | ||
2014-1A, 7.06% due 07/18/265,6 | 3,750,000 | 3,493,955 |
| KVK CLO Ltd. | ||
2014-2A, 5.91% due 07/15/261,5,6 | 3,000,000 | 2,605,133 |
2013-1A, due 04/14/251,6,7 | 2,300,000 | 767,767 |
| Flatiron CLO Ltd. | ||
2013-1A, 4.76% due 01/17/261,5,6 | 3,300,000 | 3,299,716 |
| CIFC Funding Ltd. | ||
2014-5A, 7.71% due 01/17/275,6 | 2,000,000 | 1,875,201 |
2014-4A, 6.76% due 10/17/265,6 | 1,500,000 | 1,350,000 |
| Flagship CLO VIII Ltd. | ||
2014-8A, 6.36% due 01/16/261,5,6 | 3,250,000 | 3,014,139 |
| Venture XVI CLO Ltd. | ||
2014-16A, 4.61% due 04/15/261,5,6 | 3,000,000 | 2,971,169 |
| Great Lakes CLO Ltd. | ||
2015-1A, 4.91% due 07/15/265,6 | 1,500,000 | 1,459,679 |
2012-1A, due 01/15/231,7,8 | 2,500,000 | 1,001,679 |
2014-1A, 5.36% due 04/15/255,6 | 500,000 | 484,777 |
| OCP CLO Ltd. | ||
2015-9A, 7.56% due 07/15/275,6 | 2,250,000 | 2,015,353 |
2015-8A, 7.16% due 04/17/275,6 | 1,000,000 | 885,378 |
| Saranac CLO II Ltd. | ||
2014-2A, 6.32% due 02/20/251,5,6 | 3,000,000 | 2,814,497 |
See notes to financial statements.
24 l GOF l GUGGENHEIM STRATEGIC OPPORTUNITIES FUND ANNUAL REPORT
| SCHEDULE OF INVESTMENTS continued | May 31, 2017 | |
| Face | ||
| Amount~ | Value | |
ASSET BACKED SECURITIES†† – 35.0% (continued) | ||
| Collateralized Loan Obligations – 28.9% (continued) | ||
| AMMC CLO XII Ltd. | ||
2013-12A, 6.23% due 05/10/255,6 | 3,000,000 | $ 2,795,479 |
| Denali Capital CLO X Ltd. | ||
2013-1A, 6.92% due 04/28/255,6 | 3,000,000 | 2,794,619 |
| Newstar Trust | ||
2012-2I, 7.78% due 01/20/235 | 3,000,000 | 2,781,286 |
| Sound Point CLO III Ltd. | ||
2013-2A, 6.51% due 07/15/251,5,6 | 2,875,000 | 2,689,770 |
| Octagon Investment Partners XVI Ltd. | ||
2013-1A, 6.66% due 07/17/255,6 | 3,000,000 | 2,670,817 |
| Newstar Commercial Loan Funding LLC | ||
2017-1A, 6.14% due 03/20/275,6 | 2,000,000 | 1,984,662 |
2014-1A, 5.91% due 04/20/255,6 | 500,000 | 489,660 |
| Dryden 30 Senior Loan Fund | ||
2013-30A, 6.68% due 11/15/251,5,6 | 2,500,000 | 2,254,007 |
| Jamestown CLO III Ltd. | ||
2013-3A, 4.46% due 01/15/265,6 | 2,250,000 | 2,207,567 |
| Carlyle Global Market Strategies CLO Ltd. | ||
2012-3A, due 10/04/246,7 | 2,600,000 | 2,027,142 |
| Avery Point II CLO Ltd. | ||
2013-3X COM, due 01/18/257 | 2,399,940 | 2,017,398 |
| Fortress Credit Opportunities V CLO Ltd. | ||
2017-5A, 5.70% due 10/15/265,6 | 2,000,000 | 2,005,552 |
| Fortress Credit Opportunities VI CLO Ltd. | ||
2015-6A, 6.11% due 10/10/265,6 | 2,000,000 | 1,973,349 |
| Golub Capital Partners CLO 24M Ltd. | ||
2015-24A, 5.42% due 02/05/275,6 | 2,000,000 | 1,910,212 |
| Ares XXXIII CLO Ltd. | ||
2015-1A, 7.60% due 12/05/255,6 | 2,000,000 | 1,866,582 |
| WhiteHorse VI Ltd. | ||
2013-1A, 7.67% due 02/03/251,5,6 | 2,000,000 | 1,818,673 |
| OHA Credit Partners IX Ltd. | ||
2013-9A, due 10/20/256,7 | 2,000,000 | 1,801,006 |
| Treman Park CLO Ltd. | ||
2015-1A, due 04/20/276,7 | 2,000,000 | 1,761,732 |
| Cent CLO 19 Ltd. | ||
2013-19A, 4.47% due 10/29/251,5,6 | 1,750,000 | 1,736,931 |
| Monroe Capital CLO 2014-1 Ltd. | ||
2014-1A, 5.88% due 10/22/261,5,6 | 1,750,000 | 1,707,789 |
| THL Credit Wind River CLO Ltd. | ||
2015-2A, 8.96% due 10/15/275,6 | 1,725,000 | 1,700,134 |
| Mountain Hawk II CLO Ltd. | ||
2013-2A, 4.31% due 07/22/241,5,6 | 1,750,000 | 1,648,044 |
| Cent CLO 22 Ltd. | ||
2014-22A, 7.58% due 11/07/265,6 | 1,750,000 | 1,564,626 |
See notes to financial statements.
GOF l GUGGENHEIM STRATEGIC OPPORTUNITIES FUND ANNUAL REPORT l 25
| SCHEDULE OF INVESTMENTS continued | May 31, 2017 | |
| Face | ||
| Amount~ | Value | |
ASSET BACKED SECURITIES†† – 35.0% (continued) | ||
| Collateralized Loan Obligations – 28.9% (continued) | ||
| Ares XXVI CLO Ltd. | ||
2013-1A, due 04/15/256,7 | 3,700,000 | $ 1,541,306 |
| Race Point VII CLO Ltd. | ||
2012-7A, 5.43% due 11/08/241,5,6 | 1,500,000 | 1,499,907 |
| Atlas Senior Loan Fund II Ltd. | ||
2012-2A, due 01/30/241,6,7 | 2,600,000 | 1,494,581 |
| Catamaran CLO Ltd. | ||
2014-1A, 6.91% due 04/20/261,5,6 | 1,600,000 | 1,488,107 |
| Fortress Credit Opportunities | ||
2005-1A, 1.41% due 07/15/191,5,8 | 1,421,434 | 1,394,440 |
| Madison Park Funding XI Ltd. | ||
2013-11A, 6.30% due 10/23/255,6 | 1,500,000 | 1,391,439 |
| Avery Point IV CLO Ltd. | ||
2014-1A, 6.16% due 04/25/261,5,6 | 1,430,000 | 1,230,022 |
| NewStar Arlington Senior Loan Program LLC | ||
2014-1A, 5.41% due 07/25/251,5,6 | 750,000 | 718,670 |
2014-1A, 5.97% due 07/25/251,6 | 500,000 | 500,918 |
| Finn Square CLO Ltd. | ||
2012-1A, due 12/24/236,7 | 2,500,000 | 1,206,138 |
| Babson CLO Ltd. | ||
2012-2A, due 05/15/236,7 | 2,000,000 | 1,165,871 |
| Kingsland VI Ltd. | ||
2013-6A, 4.82% due 10/28/241,5,6 | 1,000,000 | 1,002,281 |
| Fortress Credit Opportunities III CLO, LP | ||
2017-3A, 4.25% due 04/28/265,6 | 1,000,000 | 1,000,487 |
| Sound Point CLO I Ltd. | ||
2012-1A, 5.74% due 10/20/231,5,6 | 1,000,000 | 1,000,366 |
| Cent CLO 16, LP | ||
2014-16A, 5.42% due 08/01/245,6 | 1,000,000 | 1,000,141 |
| Atlas Senior Loan Fund IV Ltd. | ||
2014-2A, 4.63% due 02/17/265,6 | 1,000,000 | 994,955 |
| Cerberus Onshore II CLO-2 LLC | ||
2014-1A, 5.17% due 10/15/235,6 | 1,000,000 | 991,817 |
| Garrison Funding Ltd. | ||
2016-2A, 5.17% due 09/29/275,6 | 1,000,000 | 982,954 |
| Golub Capital Partners CLO 25M Ltd. | ||
2015-25A, 4.82% due 08/05/275,6 | 1,000,000 | 975,044 |
| WhiteHorse VII Ltd. | ||
2013-1A, 5.99% due 11/24/255,6 | 1,000,000 | 929,175 |
| Ares XXV CLO Ltd. | ||
2012-25A, due 01/17/246,7 | 1,750,000 | 919,250 |
| Dryden 37 Senior Loan Fund | ||
2015-37A, due 04/15/276,7 | 1,050,000 | 844,134 |
| Venture XIII CLO Ltd. | ||
2013-13A, due 06/10/256,7 | 1,500,000 | 758,010 |
See notes to financial statements.
26 l GOF l GUGGENHEIM STRATEGIC OPPORTUNITIES FUND ANNUAL REPORT
| SCHEDULE OF INVESTMENTS continued | May 31, 2017 | |
| Face | ||
| Amount~ | Value | |
ASSET BACKED SECURITIES†† – 35.0% (continued) | ||
| Collateralized Loan Obligations – 28.9% (continued) | ||
| Resource Capital Corp. | ||
2014-CRE2, 3.50% due 04/15/321,5,6 | 729,000 | $ 728,694 |
| West CLO Ltd. | ||
2013-1A, due 11/07/256,7 | 1,350,000 | 716,497 |
| Octagon Loan Funding Ltd. | ||
2013-5X, 2014-1A, 6.38% due 11/18/261,5,6 | 700,000 | 678,915 |
| Marathon CLO Ltd. | ||
due 02/21/257 | 1,300,000 | 673,016 |
| COA Summit CLO Ltd. | ||
2014-1A, 5.01% due 04/20/231,5,6 | 500,000 | 498,358 |
| NXT Capital CLO 2013-1 LLC | ||
2013-1A, 5.31% due 04/25/241,5,6 | 500,000 | 496,512 |
| Keuka Park CLO Ltd. | ||
2013-1A, due 10/21/241,6,7 | 1,474,435 | 323,786 |
| Golub Capital Partners CLO Ltd. | ||
2014-18A, 5.16% due 04/25/265,6 | 300,000 | 294,305 |
| Marathon CLO II Ltd. | ||
2005-2A, due 12/20/19†††,2,6,7 | 3,000,000 | 3 |
| Total Collateralized Loan Obligation | 118,523,336 | |
| Transportation – 4.8% | ||
| Apollo Aviation Securitization Equity Trust | ||
2014-1, 7.38% due 12/15/295 | 2,890,721 | 2,890,721 |
2016-1A, 9.20% due 03/17/361,6,9 | 2,300,100 | 2,311,600 |
| 2016-2, 7.87% due 11/15/41 | 2,250,000 | 2,252,727 |
2014-1, 5.13% due 12/15/295 | 1,445,361 | 1,448,974 |
2017-1A, 5.93% due 05/16/426 | 1,000,000 | 1,002,137 |
| 2016-2, 5.93% due 11/15/41 | 954,500 | 957,148 |
| Falcon Aerospace Limited | ||
| 2017-1, 6.30% due 02/15/42 | 1,966,600 | 1,988,626 |
| ECAF I Ltd. | ||
2015-1A, 5.80% due 06/15/406 | 1,852,511 | 1,829,070 |
| Rise Ltd. | ||
6.50% due 02/12/39††† | 1,766,480 | 1,770,240 |
| Stripes 2103 Aircraft 1 Ltd. | ||
2013-1 A1, 4.51% due 03/20/23††† | 1,617,222 | 1,578,416 |
| Airplanes Pass Through Trust | ||
2001-1A, 1.54% due 03/15/195,8 | 8,270,600 | 951,119 |
| Turbine Engines Securitization Ltd. | ||
2013-1A, 6.38% due 12/13/488 | 645,245 | 600,078 |
| BBAM Acquisition Finance | ||
5.38% due 09/17/18††† | 196,561 | 195,578 |
| Total Transportation | 19,776,434 | |
See notes to financial statements.
GOF l GUGGENHEIM STRATEGIC OPPORTUNITIES FUND ANNUAL REPORT l 27
| SCHEDULE OF INVESTMENTS continued | May 31, 2017 | |
| Face | ||
| Amount~ | Value | |
ASSET BACKED SECURITIES†† – 35.0% (continued) | ||
| Collateralized Debt Obligations – 0.4% | ||
| SRERS Funding Ltd. | ||
2011-RS, 1.24% due 05/09/465,6 | 819,239 | $ 810,752 |
| Highland Park CDO I Ltd. | ||
2006-1A, 1.59% due 11/25/511,5,6 | 801,320 | 754,235 |
| Total Collateralized Debt Obligation | 1,564,987 | |
| Financial – 0.4% | ||
| NCBJ 2015-1 A | ||
5.88% due 07/08/22†††,2 | 1,500,000 | 1,502,894 |
| Transportation – 0.3% | ||
| Emerald Aviation Finance Ltd. | ||
2013-1, 6.35% due 10/15/386,9 | 1,237,281 | 1,274,070 |
| Oil & Gas – 0.2% | ||
| Glenn Pool Oil & Gas Trust | ||
6.00% due 08/02/21††† | 915,341 | 893,559 |
| Total Asset Backed Securities | ||
| (Cost $142,431,299) | 143,535,280 | |
CORPORATE BONDS†† – 30.6% | ||
| Financial – 14.2% | ||
| Bank of America Corp. | ||
6.50%1,10,11 | 2,000,000 | 2,212,499 |
6.10%1,10,11 | 1,750,000 | 1,879,063 |
6.30%1,10,11 | 1,000,000 | 1,103,125 |
| Citigroup, Inc. | ||
5.95%1,10,11 | 3,100,000 | 3,266,625 |
6.25%1,10,11 | 1,250,000 | 1,364,063 |
| Wells Fargo & Co. | ||
5.90%1,10,11 | 2,650,000 | 2,812,312 |
5.88%10,11 | 1,000,000 | 1,097,500 |
| QBE Insurance Group Ltd. | ||
7.50% due 11/24/435,6 | 3,000,000 | 3,450,000 |
| JPMorgan Chase & Co. | ||
6.10%10,11 | 1,750,000 | 1,883,437 |
6.00%1,10,11 | 1,400,000 | 1,488,382 |
| BBC Military Housing-Navy Northeast LLC | ||
6.30% due 10/15/49†††,1 | 2,900,000 | 2,837,446 |
| Citizens Financial Group, Inc. | ||
5.50%1,10,11 | 2,500,000 | 2,600,000 |
| Customers Bank | ||
6.13% due 06/26/295,8 | 2,500,000 | 2,553,125 |
| Fifth Third Bancorp | ||
4.90%10,11 | 1,500,000 | 1,492,500 |
5.10%10,11 | 815,000 | 816,019 |
See notes to financial statements.
28 l GOF l GUGGENHEIM STRATEGIC OPPORTUNITIES FUND ANNUAL REPORT
| SCHEDULE OF INVESTMENTS continued | May 31, 2017 | |
| Face | ||
| Amount~ | Value | |
CORPORATE BONDS†† – 30.6% (continued) | ||
| Financial – 14.2% (continued) | ||
| NewStar Financial, Inc. | ||
7.25% due 05/01/201 | 2,100,000 | $ 2,152,500 |
| KeyCorp | ||
5.00%1,10,11 | 2,100,000 | 2,110,500 |
| CNB Financial Corp. | ||
5.75% due 10/15/26†††,5,8 | 2,000,000 | 2,070,584 |
| NFP Corp. | ||
9.00% due 07/15/211,6 | 1,950,000 | 2,047,500 |
| Fort Knox Military Housing Privatization Project | ||
5.82% due 02/15/526 | 1,962,780 | 1,997,188 |
| Garfunkelux Holding Co. 3 S.A. | ||
| 8.50% due 11/01/22 | 1,400,000 GBP | 1,956,890 |
| FBM Finance, Inc. | ||
8.25% due 08/15/211,6 | 1,750,000 | 1,881,250 |
| Atlas Mara Ltd. | ||
| 8.00% due 12/31/20 | 2,200,000 | 1,819,400 |
| Greystar Real Estate Partners LLC | ||
8.25% due 12/01/221,6 | 1,550,000 | 1,670,125 |
| Cadence Bank North America | ||
6.25% due 06/28/291,5 | 1,600,000 | 1,600,000 |
| Jefferies Finance LLC / JFIN Company-Issuer Corp. | ||
7.38% due 04/01/201,6 | 1,075,000 | 1,111,281 |
6.88% due 04/15/226 | 200,000 | 201,000 |
| AmTrust Financial Services, Inc. | ||
6.13% due 08/15/231 | 1,261,000 | 1,232,076 |
| Fidelity & Guaranty Life Holdings, Inc. | ||
6.38% due 04/01/211,6 | 1,165,000 | 1,197,038 |
| Lincoln Finance Ltd. | ||
7.38% due 04/15/211,6 | 800,000 | 851,128 |
| Pacific Beacon LLC | ||
5.63% due 07/15/511,8 | 711,451 | 677,344 |
| GEO Group, Inc. | ||
5.88% due 10/15/241 | 600,000 | 618,000 |
| Atlantic Marine Corporations Communities LLC | ||
5.38% due 02/15/481 | 549,505 | 533,443 |
| Jefferies LoanCore LLC / JLC Finance Corp. | ||
6.88% due 06/01/201,6 | 500,000 | 507,500 |
| Bank of New York Mellon Corp. | ||
4.63%10,11 | 500,000 | 497,500 |
| Icahn Enterprises Limited Partnership / Icahn Enterprises Finance Corp. | ||
6.00% due 08/01/201 | 300,000 | 307,875 |
| Goldman Sachs Group, Inc. | ||
5.30%10,11 | 250,000 | 261,250 |
See notes to financial statements.
GOF l GUGGENHEIM STRATEGIC OPPORTUNITIES FUND ANNUAL REPORT l 29
| SCHEDULE OF INVESTMENTS continued | May 31, 2017 | |
| Face | ||
| Amount~ | Value | |
CORPORATE BONDS†† – 30.6% (continued) | ||
| Financial – 14.2% (continued) | ||
| Icahn Enterprises, LP / Icahn Enterprises Finance Corp. | ||
5.88% due 02/01/221 | 200,000 | $ 204,750 |
| Total Financial | 58,362,218 | |
| Industrial – 3.3% | ||
| Summit Materials LLC / Summit Materials Finance Corp. | ||
8.50% due 04/15/221 | 2,150,000 | 2,413,374 |
| Grinding Media Inc. / MC Grinding Media Canada Inc. | ||
7.38% due 12/15/231,6 | 2,050,000 | 2,211,438 |
| Exide Technologies | ||
11.00% due 04/30/221,13 | 2,255,576 | 1,790,927 |
| Dynagas LNG Partners Limited Partnership / Dynagas Finance, Inc. | ||
6.25% due 10/30/191 | 1,800,000 | 1,786,500 |
| Princess Juliana International Airport Operating Company N.V. | ||
5.50% due 12/20/27†††,1,2,6 | 1,786,703 | 1,767,148 |
| StandardAero Aviation Holdings, Inc. | ||
10.00% due 07/15/236 | 1,515,000 | 1,670,288 |
| LMI Aerospace, Inc. | ||
7.38% due 07/15/191 | 1,575,000 | 1,638,000 |
| Tutor Perini Corp. | ||
6.88% due 05/01/251,6 | 400,000 | 418,500 |
| Total Industrial | 13,696,175 | |
| Basic Materials – 2.6% | ||
| BHP Billiton Finance USA Ltd. | ||
6.75% due 10/19/751,5,6 | 2,000,000 | 2,267,340 |
| Yamana Gold, Inc. | ||
4.95% due 07/15/241 | 2,160,000 | 2,171,470 |
| Eldorado Gold Corp. | ||
6.13% due 12/15/201,6 | 1,950,000 | 1,998,750 |
| Constellium N.V. | ||
7.88% due 04/01/211,6 | 1,588,000 | 1,709,085 |
| GCP Applied Technologies, Inc. | ||
9.50% due 02/01/231,6 | 1,475,000 | 1,681,500 |
| New Day Aluminum | ||
10.00% due 10/28/20†††,2,13 | 928,981 | 855,592 |
| Mirabela Nickel Ltd. | ||
9.50% due 06/24/1912,13 | 1,388,176 | 97,172 |
1.00% due 09/10/44†††,2,12,13 | 27,743 | – |
| Total Basic Materials | 10,780,909 | |
| Consumer, Cyclical – 2.6% | ||
| Ferrellgas Limited Partnership / Ferrellgas Finance Corp. | ||
6.75% due 06/15/231 | 2,335,000 | 2,253,275 |
6.50% due 05/01/211 | 429,000 | 416,130 |
See notes to financial statements.
30 l GOF l GUGGENHEIM STRATEGIC OPPORTUNITIES FUND ANNUAL REPORT
| SCHEDULE OF INVESTMENTS continued | May 31, 2017 | |
| Face | ||
| Amount~ | Value | |
CORPORATE BONDS†† – 30.6% (continued) | ||
| Consumer, Cyclical – 2.6% (continued) | ||
| WMG Acquisition Corp. | ||
6.75% due 04/15/221,6 | 2,130,000 | $ 2,243,423 |
| HP Communities LLC | ||
6.82% due 09/15/531,8 | 974,638 | 1,072,228 |
6.16% due 09/15/53†††,1,8 | 1,000,000 | 1,021,365 |
| Nathan’s Famous, Inc. | ||
10.00% due 03/15/201,6 | 1,804,000 | 1,925,770 |
| TVL Finance PLC | ||
| 8.50% due 05/15/23 | 1,170,000 GBP | 1,664,072 |
| Total Consumer, Cyclical | 10,596,263 | |
| Energy – 2.3% | ||
| Husky Energy, Inc. | ||
4.00% due 04/15/241 | 900,000 | 922,569 |
3.95% due 04/15/221 | 600,000 | 630,182 |
| TerraForm Power Operating LLC | ||
6.37% due 02/01/231,6,9 | 1,096,000 | 1,134,360 |
| Hess Corp. | ||
8.13% due 02/15/191 | 950,000 | 1,036,790 |
| Sunoco Logistics Partners Operations, LP | ||
4.25% due 04/01/241 | 1,000,000 | 1,033,102 |
| American Midstream Partners Limited Partnership / American Midstream Finance Corp. | ||
8.50% due 12/15/211,6 | 1,000,000 | 1,020,000 |
| CONSOL Energy, Inc. | ||
8.00% due 04/01/231 | 850,000 | 895,688 |
| EQT Corp. | ||
8.13% due 06/01/191 | 800,000 | 888,810 |
| Buckeye Partners, LP | ||
4.35% due 10/15/241 | 750,000 | 783,194 |
| Crestwood Midstream Partners Limited Partnership / Crestwood Midstream Finance Corp. | ||
6.25% due 04/01/231 | 400,000 | 414,748 |
| QEP Resources, Inc. | ||
6.88% due 03/01/211 | 350,000 | 367,500 |
| Gibson Energy, Inc. | ||
6.75% due 07/15/211,6 | 182,000 | 188,825 |
| Schahin II Finance Co. SPV Ltd. | ||
5.88% due 09/25/228,12 | 1,216,133 | 158,097 |
| Total Energy | 9,473,865 | |
| Communications – 2.3% | ||
| MDC Partners, Inc. | ||
6.50% due 05/01/241,6 | 2,900,000 | 2,921,750 |
| SFR Group S.A. | ||
7.38% due 05/01/261,6 | 1,800,000 | 1,947,366 |
See notes to financial statements.
GOF l GUGGENHEIM STRATEGIC OPPORTUNITIES FUND ANNUAL REPORT l 31
| SCHEDULE OF INVESTMENTS continued | May 31, 2017 | |
| Face | ||
| Amount~ | Value | |
CORPORATE BONDS†† – 30.6% (continued) | ||
| Communications – 2.3% (continued) | ||
| Cengage Learning, Inc. | ||
9.50% due 06/15/241,6 | 1,900,000 | $ 1,643,500 |
| McGraw-Hill Global Education Holdings LLC / McGraw-Hill Global Education Finance | ||
7.88% due 05/15/241,6 | 1,275,000 | 1,243,125 |
| EIG Investors Corp. | ||
10.88% due 02/01/241 | 900,000 | 981,000 |
| CSC Holdings LLC | ||
6.75% due 11/15/211 | 500,000 | 553,125 |
| Total Communications | 9,289,866 | |
| Consumer, Non-cyclical – 1.9% | ||
| Bumble Bee Holdings, Inc. | ||
9.00% due 12/15/171,6 | 2,082,000 | 2,082,000 |
| Tenet Healthcare Corp. | ||
7.50% due 01/01/221,6 | 1,900,000 | 2,068,388 |
| Bumble Bee Holdco SCA | ||
9.63% due 03/15/181,6,13 | 1,400,000 | 1,372,000 |
| Valeant Pharmaceuticals International, Inc. | ||
7.00% due 03/15/241,6 | 1,000,000 | 1,057,510 |
| KeHE Distributors LLC / KeHE Finance Corp. | ||
7.63% due 08/15/216 | 550,000 | 552,750 |
| Great Lakes Dredge & Dock Corp. | ||
8.00% due 05/15/226 | 500,000 | 507,500 |
| Total Consumer, Non-cyclical | 7,640,148 | |
| Technology – 0.7% | ||
| Micron Technology, Inc. | ||
7.50% due 09/15/231 | 1,550,000 | 1,731,505 |
5.25% due 08/01/231,6 | 200,000 | 205,500 |
| First Data Corp. | ||
7.00% due 12/01/231,6 | 500,000 | 540,000 |
| Epicor Software | ||
9.40% due 06/21/23†††,2 | 500,000 | 488,500 |
| Total Technology | 2,965,505 | |
| Utilities – 0.7% | ||
| LBC Tank Terminals Holding Netherlands BV | ||
6.88% due 05/15/231,6 | 1,425,000 | 1,489,125 |
| Terraform Global Operating LLC | ||
9.75% due 08/15/221,6 | 1,150,000 | 1,282,250 |
| Total Utilities | 2,771,375 | |
| Total Corporate Bonds | ||
| (Cost $122,076,662) | 125,576,324 | |
See notes to financial statements.
32 l GOF l GUGGENHEIM STRATEGIC OPPORTUNITIES FUND ANNUAL REPORT
| SCHEDULE OF INVESTMENTS continued | May 31, 2017 | |
| Face | ||
| Amount~ | Value | |
COLLATERALIZED MORTGAGE OBLIGATIONS†† – 3.2% | ||
| Commercial Mortgage Backed Securities – 2.7% | ||
| GMAC Commercial Mortgage Asset Corp. | ||
2004-POKA, 6.36% due 09/10/446 | 3,500,000 | $ 3,962,607 |
| Cosmopolitan Hotel Trust | ||
2016-CSMO, 5.64% due 11/15/335,6 | 3,500,000 | 3,555,993 |
| Capmark Military Housing Trust | ||
2007-AETC, 5.75% due 02/10/521,8 | 1,912,676 | 1,906,957 |
2007-AET2, 6.06% due 10/10/521,8 | 485,082 | 513,537 |
| Motel 6 Trust | ||
2015-MTL6, 5.28% due 02/05/306 | 1,200,000 | 1,204,352 |
| Total Commercial Mortgage Backed Securities | 11,143,446 | |
| Residential Mortgage Backed Securities – 0.5% | ||
| TBW Mortgage Backed Pass-Through Certificates | ||
2006-6, 6.04% due 01/25/371,9 | 1,400,130 | 683,129 |
2006-6, 5.75% due 01/25/371,9 | 583,374 | 302,785 |
| Nomura Resecuritization Trust | ||
2012-1R, 1.48% due 08/27/471,5,6 | 915,171 | 910,587 |
| Total Residential Mortgage Backed Securities | 1,896,501 | |
| Total Collateralized Mortgage Obligations | ||
| (Cost $13,090,529) | 13,039,947 | |
FOREIGN GOVERNMENT BONDS†† – 1.5% | ||
| Senegal Government International Bond | ||
6.25% due 05/23/336 | 2,050,000 | 2,070,155 |
| Dominican Republic International Bond | ||
6.85% due 01/27/451,6 | 1,920,000 | 2,033,261 |
| Kenya Government International Bond | ||
6.88% due 06/24/246 | 1,965,000 | 2,021,887 |
| Total Foreign Government Bonds | ||
| (Cost $6,083,599) | 6,125,303 | |
MUNICIPAL BONDS†† – 0.5% | ||
| Illinois – 0.5% | ||
| City of Chicago Illinois General Obligation Unlimited | ||
| 6.26% due 01/01/40 | 2,350,000 | 2,081,677 |
| Total Municipal Bonds | ||
| (Cost $2,036,998) | 2,081,677 | |
| Contracts | Value | |
CALL OPTIONS PURCHASED†* – 0.2% | ||
| Call options on: | ||
| June 2017 iShares 20+ Year Treasury Bond ETF Expiring with strike price of $124.00 | 4,162 | $ 493,197 |
| June 2017 iShares 20+ Year Treasury Bond ETF Expiring with strike price of $125.00 | 6,019 | 445,406 |
| Total Call Options Purchased | ||
| (Cost $1,346,580) | 938,603 |
See notes to financial statements.
GOF l GUGGENHEIM STRATEGIC OPPORTUNITIES FUND ANNUAL REPORT l 33
SCHEDULE OF INVESTMENTS continued | May 31, 2017 | |
Contracts | Value | |
PUT OPTIONS PURCHASED†* – 0.1% | ||
| Put options on: | ||
| August 2017 United States Oil Fund LP Expiring with strike price of $8.50 | 27,824 | $ 347,800 |
Total Put Options Purchased | ||
| (Cost $427,000) | 347,800 | |
Total Investments – 125.8% | ||
| (Cost $515,415,900) | $ 516,332,586 | |
CALL OPTIONS WRITTEN†* – (0.3)% | ||
| Call options on: | ||
| iShares 20+ Year Treasury Bond ETF Expiring June 2017 with strike price of $128.00 | 10,181 | (157,806) |
| S&P 500 Index Expiring June 2017 with strike price of $2,390.00 | 281 | (916,060) |
Total Call Options Written | ||
| (Premiums received $1,117,114) | (1,073,866) | |
Other Assets & Liabilities, net – (25.5)% | (104,794,018) | |
Total Net Assets – 100.0% | $ 410,464,702 | |
Unrealized | ||
Contracts | Gain | |
EQUITY FUTURES CONTRACTS PURCHASED† | ||
| June 2017 S&P 500 Index E-Mini Futures Contracts | ||
| (Aggregate Value of Contracts $67,628,550) | 561 | $ 1,314,528 |
| ~ | The face amount is denominated in U.S. Dollars, unless otherwise indicated. |
| * | Non-income producing security. |
| ** | Less than 0.1% |
| † | Value determined based on Level 1 inputs, unless otherwise noted — See Note 4. |
| †† | Value determined based on Level 2 inputs, unless otherwise noted — See Note 4. |
| ††† | Value determined based on Level 3 inputs — See Note 4. |
| 1 | All or a portion of these securities have been physically segregated in connection with borrowings, reverse repurchase agreements and unfunded loan commitments. As of May 31, 2017, the total value of securities segregated was $182,276,187. |
| 2 | Security was fair valued by the Valuation Committee at May 31, 2017. The total market value of fair valued securities amounts to $24,368,924, (cost $28,035,865) or 5.9% of total net assets. |
| 3 | Zero coupon rate security. Rate indicated is the effective yield at the time of purchase. |
| 4 | Rate indicated is the 7-day yield as of May 31, 2017. |
| 5 | Variable rate security. Rate indicated is rate effective at May 31, 2017. |
See notes to financial statements.
34 l GOF l GUGGENHEIM STRATEGIC OPPORTUNITIES FUND ANNUAL REPORT
SCHEDULE OF INVESTMENTS continued May 31, 2017
| 6 | Security is a 144A or Section 4(a)(2) security. These securities have been determined to be liquid under guidelines established by the Board of Trustees. The total market value of 144A or Section 4(a)(2) liquid securities is $188,459,421 (cost $177,760,179), or 45.9% of total net assets. |
| 7 | Security has no stated coupon. However, it is expected to receive residual cash flow payments on defined deal dates. |
| 8 | Security is a 144A or Section 4(a)(2) security. These securities are considered illiquid and restricted under guidelines established by the Board of Trustees. The total market value of 144A or Section 4(a)(2) illiquid and restricted securities is $13,920,553 (cost $21,202,267), or 3.4% of total net assets — see Note 12. |
| 9 | Security is a step up/step down bond. The coupon increases or decreases at regular intervals until the bond reaches full maturity. Rate indicated is rate effective at May 31, 2017. |
| 10 | Perpetual maturity. |
| 11 | Security has a fixed rate coupon which will convert to a floating or variable rate coupon on a future date. |
| 12 | Security is in default. |
| 13 | Security is a pay-in-kind bond. |
| 14 | Investment in an affiliated issuer. See Note 13. |
| B.V. | Limited Liability Company |
| CDO | Collateralized Debt Obligation |
| CLO | Collateralized Loan Obligation |
| EUR | Euro |
| FCB | Farmers Credit Bureau |
| GBP | Great Britain Pound |
| LLC | Limited Liability Company |
| LP | Limited Partnership |
| N.V. | Publicly Traded Company |
| plc | Public Limited Company |
| S.A. | Corporation |
| SCA | Limited Partnership |
See Sector Classification in Supplemental Information section.
See notes to financial statements.
GOF l GUGGENHEIM STRATEGIC OPPORTUNITIES FUND ANNUAL REPORT l 35
| SCHEDULE OF INVESTMENTS continued | May 31, 2017 |
| Country Diversification | |
| % of Long-Term | |
| Country | Investments |
| United States | 91.0% |
| Canada | 1.9% |
| United Kingdom | 1.7% |
| Netherlands | 0.9% |
| Australia | 0.7% |
| Luxembourg | 0.7% |
| Marshall Islands | 0.7% |
| Senegal | 0.4% |
| Dominican Republic | 0.4% |
| Kenya | 0.4% |
| France | 0.4% |
| Saint Maarten | 0.4% |
| Niger | 0.2% |
| Jersey | 0.2% |
| Cayman Islands | 0.0%* |
| Total Long-Term Investments | 100.0% |
| *Less than 0.1%. | |
See notes to financial statements.
36 l GOF l GUGGENHEIM STRATEGIC OPPORTUNITIES FUND ANNUAL REPORT
| SCHEDULE OF INVESTMENTS continued | May 31, 2017 |
The following table represents the Fund’s investments carried on the Statement of Assets and Liabilities by caption and by level within the fair value hierarchy as of May 31, 2017 (see Note 4 in the Notes to Financial Statements):
| Level 2 | Level 3 | |||||||||||||||
| Level 1 | Significant | Significant | ||||||||||||||
| Quoted | Observable | Unobservable | ||||||||||||||
| Prices | Inputs | Inputs | Total | |||||||||||||
| Assets: | ||||||||||||||||
| Corporate Bonds | $ | – | $ | 116,535,689 | $ | 9,040,635 | $ | 125,576,324 | ||||||||
| Asset Backed Securities | – | 137,594,590 | 5,940,690 | 143,535,280 | ||||||||||||
| Collateralized Mortgage Obligations | – | 13,039,947 | – | 13,039,947 | ||||||||||||
| Senior Floating Rate Interests | – | 155,984,904 | 20,110,736 | 176,095,640 | ||||||||||||
| Municipal Bonds | – | 2,081,677 | – | 2,081,677 | ||||||||||||
| Foreign Government Bonds | – | 6,125,303 | – | 6,125,303 | ||||||||||||
| Common Stocks | 1,190,565 | 50,067 | 911,926 | 2,152,558 | ||||||||||||
| Preferred Stocks | 6,078,068 | – | – | 6,078,068 | ||||||||||||
| Warrants | – | 23,416 | – | 23,416 | ||||||||||||
| U.S. Government Securities | – | 31,415,186 | – | 31,415,186 | ||||||||||||
| Money Market Fund | 8,922,784 | – | – | 8,922,784 | ||||||||||||
| Forward Foreign Currency | ||||||||||||||||
| Exchange Contracts* | – | 43,452 | – | 43,452 | ||||||||||||
| Call Options Purchased | 938,603 | – | – | 938,603 | ||||||||||||
| Put Options Purchased | 347,800 | – | – | 347,800 | ||||||||||||
| Equity Futures Contracts* | 1,314,528 | – | – | 1,314,528 | ||||||||||||
| Total Assets | $ | 18,792,348 | $ | 462,894,231 | $ | 36,003,987 | $ | 517,690,566 | ||||||||
| Liabilities: | ||||||||||||||||
| Options Written | $ | 1,073,866 | $ | – | $ | – | $ | 1,073,866 | ||||||||
| Unfunded Commitments | – | – | 812,983 | 812,983 | ||||||||||||
| Forward Foreign Currency | ||||||||||||||||
| Exchange Contracts* | – | 23,950 | – | 23,950 | ||||||||||||
| Total Liabilities | $ | 1,073,866 | $ | 23,950 | $ | 812,983 | $ | 1,910,799 | ||||||||
*These amounts are reported as unrealized gain/(loss) as of May 31, 2017.
Please refer to the detailed Schedule of Investments for a breakdown of investment type by industry category.
See notes to financial statements.
GOF l GUGGENHEIM STRATEGIC OPPORTUNITIES FUND ANNUAL REPORT l 37
| SCHEDULE OF INVESTMENTS continued | May 31, 2017 |
| Ending Balance at | Input | |||
| Category | 5/31/2017 | Valuation Technique | Unobservable Inputs | Range |
| Assets: | ||||
| Corporate Bonds | $ 5,929,395 | Option adjusted spread off | Indicative Quote | – |
| the month end broker | ||||
| quote over the | ||||
| 3 month LIBOR | ||||
| Corporate Bonds | 3,111,240 | Model Price | Market Comparable Yields | 5.7% – 10.4% |
| Asset Backed | 4,437,793 | Option adjusted spread off | Indicative Quote | – |
| Securities | the month end broker | |||
| quote over the | ||||
| 3 month LIBOR | ||||
| Asset Backed | 1,502,897 | Option adjusted spread | Indicative Quote for | – |
| Securities | Comparable Security | |||
| Senior Floating | 1,267,875 | Option adjusted spread off | Indicative Quote | – |
| Rate Interests | the month end broker | |||
| quote over the | ||||
| 3 month LIBOR | ||||
| Senior Floating | 1,394,321 | Enterprise Value | Valuation Multiple | 6.7x – 13.0x |
| Rate Interests | ||||
| Senior Floating | 7,210,942 | Model Price | Market Comparable Yields | 4.6% – 6.4% |
| Rate Interests | ||||
| Senior Floating | 10,173,400 | Model Price | Purchase Price | – |
| Rate Interests | ||||
| Senior Floating | 64,198 | Model Price | Liquidation Value | – |
| Rate Interests | ||||
| Common Stocks | 390 | Model Price | Liquidation Value | – |
| Common Stocks | 911,536 | Enterprise Value | Valuation Multiple | 6.3x – 7.3x |
| Total assets | $ 36,003,987 | |||
| Liabilities: | ||||
| Unfunded Loan | ||||
| Commitments | $ 812,983 | Model Price | Purchase Price | – |
Significant changes in an indicative quote, liquidation value, market comparable yield or valuation multiple would generally result in significant changes in the fair value of the security.
Any remaining Level 3 securities held by the Fund and excluded from the tables above, were not considered material to the Fund.
Transfers between investment levels may occur as the markets fluctuate and/or the availability of data used in an investment’s valuation changes. Transfers between valuation levels, if any, are in comparison to the valuation levels at the end of the previous fiscal year, and are effective using the fair value as of the end of the current fiscal period.
See notes to financial statements.
38 l GOF l GUGGENHEIM STRATEGIC OPPORTUNITIES FUND ANNUAL REPORT
| SCHEDULE OF INVESTMENTS continued | May 31, 2017 |
| As of May 31, 2017, the Fund had securities with a total value of $5,014,261 transferred from Level 3 to Level 2 due to availability of market price information at year end. | |
| Summary of Fair Value Level 3 Activity | |
| Following is a reconciliation of Level 3 assets and liabilities for which significant unobservable inputs were used to determine fair value for the period ended May 31, 2017: | |
| Assets | Liabilities | |||||||||||||||||||||||||||
| Senior | ||||||||||||||||||||||||||||
| Asset | Floating | Collateralized | Unfunded | |||||||||||||||||||||||||
| Backed | Rate | Corporate | Mortgage | Common | Total | Loan | ||||||||||||||||||||||
| Securities | Interests | Bonds | Obligations | Stocks | Assets | Commitments | ||||||||||||||||||||||
| Beginning | ||||||||||||||||||||||||||||
| Balance | $ | 8,036,285 | $ | 19,029,841 | $ | 8,485,549 | $ | 3,380,625 | $ | 1,079,055 | $ | 40,011,355 | $ | (771,834 | ) | |||||||||||||
| Paydowns | ||||||||||||||||||||||||||||
| Received | (721,808 | ) | (4,381,458 | ) | (656,378 | ) | (26,932 | ) | – | (5,786,576 | ) | – | ||||||||||||||||
| Payment-in-kind | ||||||||||||||||||||||||||||
| Distributions | ||||||||||||||||||||||||||||
| Received | – | 35,525 | 28,783 | – | – | 64,308 | – | |||||||||||||||||||||
| Realized Gain/ | ||||||||||||||||||||||||||||
| (Loss) | – | (187,846 | ) | 10,027 | 338,151 | (13 | ) | 160,319 | 200,277 | |||||||||||||||||||
| Change in | ||||||||||||||||||||||||||||
| Unrealized | ||||||||||||||||||||||||||||
| Gain/(Loss) | 181,833 | (173,704 | ) | 264,391 | (106,070 | ) | (620,971 | ) | (454,521 | ) | 161,718 | |||||||||||||||||
| Accrued | ||||||||||||||||||||||||||||
| discounts/ | ||||||||||||||||||||||||||||
| (premiums) | 5,763 | 157,925 | 42,384 | 1,280 | – | 207,352 | – | |||||||||||||||||||||
| Purchases/ | ||||||||||||||||||||||||||||
| (Receipts) | 1,448,749 | 8,403,193 | 2,719,066 | – | 85,340 | 12,656,348 | (983,819 | ) | ||||||||||||||||||||
| (Sales)/Fundings | – | (2,772,740 | ) | (1,387,500 | ) | (1,680,097 | ) | – | (5,840,337 | ) | 580,675 | |||||||||||||||||
| Corporate | ||||||||||||||||||||||||||||
| actions | – | – | (368,515 | ) | – | 368,515 | – | – | ||||||||||||||||||||
| Transfers out | ||||||||||||||||||||||||||||
| of Level 3 | (3,010,132 | ) | – | (97,172 | ) | (1,906,957 | ) | – | (5,014,261 | ) | – | |||||||||||||||||
| Ending Balance | $ | 5,940,690 | $ | 20,110,736 | $ | 9,040,635 | $ | – | $ | 911,926 | $ | 36,003,987 | $ | (812,983 | ) | |||||||||||||
| Net change in | ||||||||||||||||||||||||||||
| unrealized | ||||||||||||||||||||||||||||
| appreciation | ||||||||||||||||||||||||||||
| (depreciation) | ||||||||||||||||||||||||||||
| for investments | ||||||||||||||||||||||||||||
| in securities | ||||||||||||||||||||||||||||
| still held at | ||||||||||||||||||||||||||||
| May 31, 2017 | $ | 134,985 | $ | (346,941 | ) | $ | 271,440 | $ | – | $ | (620,971 | ) | $ | (561,487 | ) | $ | (201,402 | ) | ||||||||||
See notes to financial statements.
GOF l GUGGENHEIM STRATEGIC OPPORTUNITIES FUND ANNUAL REPORT l 39
| STATEMENT OF ASSETS AND LIABILITIES | May 31, 2017 |
| ASSETS: | |
| Investments in unaffiliated issuers, at value (Cost $512,386,033) | $ 514,071,783 |
| Investments in affiliated issuers, at value (Cost $3,029,867) | 2,260,803 |
| Cash | 3,450,888 |
| Restricted cash | 1,513,469 |
| Unrealized appreciation on forward foreign currency exchange contracts | 43,452 |
| Foreign currency, at value (Cost $38,848) | 38,848 |
| Variation margin on futures | 8,415 |
| Receivables: | |
| Investments sold | 11,175,961 |
| Interest | 4,056,740 |
| Fund shares sold | 1,256,535 |
| Dividends | 72,095 |
| Tax reclaims | 3,925 |
| Other assets | 571 |
| Total assets | 537,953,485 |
| LIABILITIES: | |
| Reverse repurchase agreements | 91,424,819 |
| Borrowings | 16,704,955 |
| Due to broker | 1,288,000 |
| Written options, at value (proceeds $1,117,114) | 1,073,866 |
| Unfunded loan commitments, at value (Note 10) (Commitment fees received $1,101,906) | 812,983 |
| Interest payable on borrowings | 381,124 |
| Unrealized depreciation on forward foreign currency exchange contracts | 23,950 |
| Payable for: | |
| Investments purchased | 14,618,631 |
| Investment advisory fees | 462,936 |
| Offering costs | 450,824 |
| Professional fees | 113,664 |
| Trustees’ fees and expenses* | 22,839 |
| Accrued expenses and other liabilities | 110,192 |
| Total liabilities | 127,488,783 |
| NET ASSETS | $ 410,464,702 |
| NET ASSETS CONSIST OF: | |
| Common Stock, $0.01 par value per share; unlimited number of shares authorized, | |
| 20,751,418 shares issued and outstanding | $ 207,514 |
| Additional paid-in capital | 403,104,336 |
| Distributions in excess of net investment income | (10,407,369) |
| Accumulated net realized gain on investments | 15,024,247 |
| Net unrealized appreciation on investments | 2,535,974 |
| NET ASSETS | $ 410,464,702 |
| Net asset value | $ 19.78 |
* Relates to Trustees not deemed “interested persons” within the meaning of Section 2(a)(19) of the 1940 Act.
See notes to financial statements.
40 l GOF l GUGGENHEIM STRATEGIC OPPORTUNITIES FUND ANNUAL REPORT
| STATEMENT OF OPERATIONS | May 31, 2017 |
| For the Year Ended May 31, 2017 | |
| INVESTMENT INCOME: | |
| Interest from securities of unaffiliated issuers, net of foreign taxes withheld of $535 | $ 38,246,513 |
| Interest from securities of affiliated issuers | 184,917 |
| Dividends | 239,410 |
| Total investment income | 38,670,840 |
| EXPENSES: | |
| Investment advisory fees | 4,927,917 |
| Interest expense | 2,595,427 |
| Professional fees | 238,377 |
| Fund accounting fees | 123,943 |
| Trustees’ fees and expenses* | 115,709 |
| Administration fees | 113,055 |
| Printing fees | 84,953 |
| Custodian fees | 65,824 |
| Registration and filings | 27,740 |
| Transfer agent fees | 20,684 |
| Insurance | 12,811 |
| Miscellaneous | 2,582 |
| Total expenses | 8,329,022 |
| Net investment income | 30,341,818 |
| NET REALIZED AND UNREALIZED GAIN (LOSS): | |
| Net realized gain (loss) on: | |
| Investments in unaffiliated issuers | 13,944,734 |
| Foreign currency transactions | 652,530 |
| Options purchased | 1,375,050 |
| Written options | (1,648,793) |
| Futures contracts | 10,408,386 |
| Net realized gain | 24,731,907 |
| Net change in unrealized appreciation (depreciation) on: | |
| Investments in unaffiliated issuers | 28,581,553 |
| Investments in affiliated issuers | (624,615) |
| Foreign currency translations | (28,626) |
| Options purchased | (487,177) |
| Written options | 694,381 |
| Futures contracts | (970,108) |
| Net change in unrealized appreciation (depreciation) | 27,165,408 |
| Net realized and unrealized gain | 51,897,315 |
| Net increase in net assets resulting from operations | $ 82,239,133 |
* Relates to Trustees not deemed “interested persons” within the meaning of Section 2(a)(19) of the 1940 Act.
See notes to financial statements.
GOF l GUGGENHEIM STRATEGIC OPPORTUNITIES FUND ANNUAL REPORT l 41
| STATEMENTS OF CHANGES IN NET ASSETS | May 31, 2017 | |||||||
| Year Ended | Year Ended | |||||||
| May 31, 2017 | May 31, 2016 | |||||||
| INCREASE (DECREASE) IN NET ASSETS FROM OPERATIONS: | ||||||||
| Net investment income | $ | 30,341,818 | $ | 24,660,280 | ||||
| Net realized gain on investments | 24,731,907 | 6,158,770 | ||||||
| Net change in unrealized appreciation (depreciation) on investments | 27,165,408 | (29,493,024 | ) | |||||
| Net increase in net assets resulting from operations | 82,239,133 | 1,326,026 | ||||||
| DISTRIBUTIONS TO SHAREHOLDERS FROM: | ||||||||
| Net investment income | (40,937,408 | ) | (32,113,499 | ) | ||||
| Capital gains | (129,983 | ) | (6,431,359 | ) | ||||
| Total distributions to shareholders | (41,067,391 | ) | (38,544,858 | ) | ||||
| SHAREHOLDER TRANSACTIONS: | ||||||||
| Net proceeds from shares issued though at-the-market offering | 56,491,012 | 3,253,035 | ||||||
| Reinvestments | 2,898,572 | 1,244,253 | ||||||
| Common share offering costs charged to paid-in capital | (342,808 | ) | (19,815 | ) | ||||
| Net increase in net assets resulting from shareholder transactions | 59,046,776 | 4,477,473 | ||||||
| Net increase (decrease) in net assets | 100,218,518 | (32,741,359 | ) | |||||
| NET ASSETS: | ||||||||
| Beginning of period | 310,246,184 | 342,987,543 | ||||||
| End of period | $ | 410,464,702 | $ | 310,246,184 | ||||
| Distributions in excess of net investment income at end of period | $ | (10,407,369 | ) | $ | (7,884,106 | ) | ||
See notes to financial statements.
42 l GOF l GUGGENHEIM STRATEGIC OPPORTUNITIES FUND ANNUAL REPORT
| STATEMENT OF CASH FLOWS | May 31, 2017 |
| For the Year Ended May 31, 2017 | |
| Cash Flows from Operating Activities: | |
| Net Increase in net assets resulting from operations | $ 82,239,133 |
| Adjustments to Reconcile Net Increase in Net Assets Resulting from Operations to | |
| Net Cash Provided by Operating and Investing Activities: | |
| Net change in unrealized (appreciation) depreciation on investments | (27,469,761) |
| Net change in unrealized (appreciation) depreciation on written options | (694,381) |
| Net change in unrealized (appreciation) depreciation on foreign currency translations | 28,626 |
| Net realized gain on investments | (15,319,784) |
| Net realized loss on written options | 1,648,793 |
| Net accretion of discount and amortization of premium | (1,719,060) |
| Purchase of long-term investments | (281,651,627) |
| Paydowns received on mortgage and asset backed securities and bonds | 77,039,997 |
| Proceeds from written options | 9,371,412 |
| Cost of closing written options | (10,609,293) |
| Proceeds from sales of long-term investments | 188,092,812 |
| Other payments | 355,198 |
| Net purchases of short-term investments | (16,835,117) |
| Increase in dividends receivable | (65,220) |
| Decrease in interest receivable | 308,111 |
| Decrease in investments sold receivable | 1,426,259 |
| Decrease in tax reclaims receivable | 9,926 |
| Decrease in other assets | 269 |
| Increase in due to broker | 702,000 |
| Increase in investments purchased payable | 7,467,024 |
| Increase in interest payable on borrowings | 77,934 |
| Commitment fees received and repayments of unfunded commitments | 983,819 |
| Decrease in variation margin | (184,185) |
| Increase in investment advisory fees payable | 85,861 |
| Loan commitment fundings | (580,675) |
| Decrease in trustees’ fees and expenses* payable | (3,399) |
| Increase in accrued expenses and other liabilities | 39,331 |
| Net Cash Provided by Operating and Investing Activities | $ 14,744,003 |
| Cash Flows From Financing Activities: | |
| Net proceeds from the issuance of common shares | 55,234,477 |
| Distributions to common shareholders | (38,168,819) |
| Proceeds from reverse repurchase agreements | 1,009,242,453 |
| Payments made on reverse repurchase agreements | (1,048,387,680) |
| Proceeds from borrowings | 8,250,000 |
| Payments made on borrowings | (900,000) |
| Offering costs in connection with the issuance of common shares | (115,293) |
| Net Cash Used in Financing Activities | (14,844,862) |
| Net decrease in cash | (100,859) |
| Cash at Beginning of Period (including foreign currency and restricted cash) | 5,104,064 |
| Cash at End of Period (including foreign currency and restricted cash) | $ 5,003,205 |
| Supplemental Disclosure of Cash Flow Information: Cash paid during the period for interest | $ 2,517,493 |
| Supplemental Disclosure of Non Cash Financing Activity: Dividend reinvestment | $ 2,898,572 |
| Supplemental Disclosure of Non Cash Operating Activity: Additional principal received | |
| on payment-in-kind bonds | $ 222,913 |
* Relates to Trustees not deemed “interested persons” within the meaning of Section 2(a)(19) of the 1940 Act.
See notes to financial statements.
GOF l GUGGENHEIM STRATEGIC OPPORTUNITIES FUND ANNUAL REPORT l 43
| FINANCIAL HIGHLIGHTS | May 31, 2017 | |||||||||||||||||||
| Year Ended | Year Ended | Year Ended | Year Ended | Year Ended | ||||||||||||||||
| May 31, | May 31, | May 31, | May 31, | May 31, | ||||||||||||||||
| 2017 | 2016 | 2015 | 2014 | 2013 | ||||||||||||||||
| Per Share Data: | ||||||||||||||||||||
| Net asset value, beginning of period | $ | 17.50 | $ | 19.61 | $ | 20.56 | $ | 20.95 | $ | 19.00 | ||||||||||
| Income from investment operations: | ||||||||||||||||||||
Net investment income(a) | 1.61 | 1.40 | 1.28 | 1.44 | 1.68 | |||||||||||||||
| Net gain (loss) on investments (realized and unrealized) | 2.86 | (1.33 | ) | (0.05 | ) | 0.35 | 2.22 | |||||||||||||
| Total from investment operations | 4.47 | 0.07 | 1.23 | 1.79 | 3.90 | |||||||||||||||
| Less distributions: | ||||||||||||||||||||
| From and in excess of net investment income | (2.18 | ) | (1.82 | ) | (1.42 | ) | (1.82 | ) | (1.78 | ) | ||||||||||
| Capital gains | (0.01 | ) | (0.36 | ) | (0.76 | ) | (0.36 | ) | (0.17 | ) | ||||||||||
| Total distributions to shareholders | (2.19 | ) | (2.18 | ) | (2.18 | ) | (2.18 | ) | (1.95 | ) | ||||||||||
| Net asset value, end of period | $ | 19.78 | $ | 17.50 | $ | 19.61 | $ | 20.56 | $ | 20.95 | ||||||||||
| Market value, end of period | $ | 20.94 | $ | 17.61 | $ | 21.21 | $ | 21.83 | $ | 21.91 | ||||||||||
Total Return(b) | ||||||||||||||||||||
| Net asset value | 26.76 | % | 0.80 | % | 6.39 | % | 9.20 | % | 21.37 | % | ||||||||||
| Market value | 33.33 | % | -6.07 | % | 8.08 | % | 10.71 | % | 14.10 | % | ||||||||||
| Ratios/Supplemental Data: | ||||||||||||||||||||
| Net assets, end of period (in thousands) | $ | 410,465 | $ | 310,246 | $ | 342,988 | $ | 318,001 | $ | 286,471 | ||||||||||
| Ratio to average net assets applicable to Common Shares: | ||||||||||||||||||||
| Net investment income, including interest expense | 8.55 | % | 7.79 | % | 6.44 | % | 7.07 | % | 8.30 | % | ||||||||||
Total expenses, including interest expense(c)(d) | 2.35 | % | 2.38 | % | 2.16 | % | 2.28 | % | 2.47 | % | ||||||||||
| Portfolio turnover rate | 41 | % | 116 | % | 86 | % | 95 | % | 165 | % | ||||||||||
See notes to financial statements.
44 lGOF lGUGGENHEIM STRATEGIC OPPORTUNITIES FUND ANNUAL REPORT
| FINANCIAL HIGHLIGHTS continued | May 31, 2017 | ||||||||||||||||||
| Year Ended | Year Ended | Year Ended | Year Ended | Year Ended | |||||||||||||||
| May 31, | May 31, | May 31, | May 31, | May 31, | |||||||||||||||
| 2017 | 2016 | 2015 | 2014 | 2013 | |||||||||||||||
| Senior Indebtedness | |||||||||||||||||||
| Borrowings–committed facility agreement (in thousands) | $ | 16,705 | $ | 9,355 | $ | 45,489 | $ | 60,789 | $ | 56,099 | |||||||||
Asset coverage per $1,000 of borrowings(e) | $ | 31,044 | $ | 48,121 | $ | 11,063 | $ | 7,476 | $ | 7,167 | |||||||||
Reverse repurchase agreements (in thousands)(f) | $ | 91,425 | $ | 130,570 | $ | 114,758 | $ | 75,641 | $ | 59,474 | |||||||||
| Total borrowings and reverse repurchase agreements outstanding (in thousands) | $ | 108,130 | $ | 139,925 | $ | 160,247 | $ | 136,430 | $ | 115,573 | |||||||||
Asset coverage per $1,000 of total indebtedness(g) | $ | 4,796 | $ | 3,217 | $ | 3,140 | $ | 3,331 | $ | 3,479 | |||||||||
| (a) | Based on average shares outstanding. | |||||||||
| (b) | Total return is calculated assuming a purchase of a common share at the beginning of the period and a sale on the last day of the period reported either at net asset value | |||||||||
| (“NAV”) or market price per share. Dividends and distributions are assumed to be reinvested at NAV for NAV returns or the prices obtained under the Fund’s Dividend Reinvestment | ||||||||||
| Plan for market value returns. Total return does not reflect brokerage commissions. A return calculated for a period of less than one year is not annualized. | ||||||||||
| (c) | The ratios of total expenses to average net assets applicable to common shares do not reflect fees and expenses incurred indirectly by the Fund as a result of its investment in | |||||||||
| shares of other investment companies. If these fees were included in the expense ratios, the expense ratios would increase by 0.02%, 0.03%, 0.03% and 0.05% for the years | ||||||||||
| ended May 31, 2016, 2015, 2014 and 2013, respectively. | ||||||||||
| (d) | Excluding interest expense, the operating expense ratios for the years ended May 31 would be: | |||||||||
| 2017 | 2016 | 2015 | 2014 | 2013 |
| 1.62% | 1.74% | 1.72% | 1.78% | 1.81% |
| (e) | Calculated by subtracting the Fund’s total liabilities (not including the borrowings or reverse repurchase agreements) from the Fund’s total assets and dividing by the borrowings. | ||||||||
| (f) | As a result of the Fund having earmarked or segregated cash or liquid securities to collateralize the transactions or otherwise having covered the transactions, in accordance | ||||||||
| with releases and interpretive letters issued by the Securities and Exchange Commission (the “SEC”), the Fund does not treat its obligations under such transactions as senior | |||||||||
| securities representing indebtedness for purposes of the 1940 Act. | |||||||||
| (g) | Calculated by subtracting the Fund’s total liabilities (not including the borrowings or reverse repurchase agreements) from the Fund’s total assets and dividing by the total bor- | ||||||||
| rowings and reverse repurchase agreements. | |||||||||
GOF lGUGGENHEIM STRATEGIC OPPORTUNITIES FUND ANNUAL REPORT l45
| NOTES TO FINANCIAL STATEMENTS | May 31, 2017 | ||||||||||
Note 1 – Organization:
Guggenheim Strategic Opportunities Fund (the “Fund”) was organized as a Delaware statutory trust on November 13, 2006. The Fund is registered as a diversified, closed-end management investment company under the Investment Company Act of 1940, as amended (“1940 Act”).
The Fund’s investment objective is to maximize total return through a combination of current income and capital appreciation.
Note 2 – Accounting Policies:
The Fund operates as an investment company and accordingly follows the investment company accounting and reporting guidance of the Financial Accounting Standards Board (“FASB”) Accounting Standards Codification Topic 946 Financial Services – Investment Companies.
The following significant accounting policies are in conformity with U.S. generally accepted accounting principles (“GAAP”) and are consistently followed by the Fund. This requires management to make estimates and assumptions that affect the reported amount of assets and liabilities and disclosure of contingent assets and liabilities at the date of the financial statements and the reported amounts of revenues and expenses during the reporting period. Actual results could differ from these estimates. All time references are based on Eastern Time.
The following is a summary of significant accounting policies consistently followed by the Fund.
(a) Valuation of Investments
The Board of Trustees of the Fund (the “Board”) has adopted policies and procedures for the valuation of the Fund’s investments (the “Valuation Procedures”). Pursuant to the Valuation Procedures, the Board has delegated to a valuation committee, consisting of representatives from Guggenheim’s investment management, fund administration, legal and compliance departments (the “Valuation Committee”), the day-to-day responsibility for implementing the Valuation Procedures, including, under most circumstances, the responsibility for determining the fair value of the Fund’s securities or other assets.
Valuations of the Fund’s securities are supplied primarily by pricing services appointed pursuant to the processes set forth in the Valuation Procedures. The Valuation Committee convenes monthly, or more frequently as needed and will review the valuation of all assets which have been fair valued for reasonableness. The Fund’s officers, through the Valuation Committee and consistent with the monitoring and review responsibilities set forth in the Valuation Procedures, regularly review procedures used by, and valuations provided by, the pricing services.
If the pricing service cannot or does not provide a valuation for a particular investment or such valuation is deemed unreliable, such investment is fair valued by the Valuation Committee.
Equity securities listed on an exchange (New York Stock Exchange (“NYSE”) or American Stock Exchange) are valued at the last quoted sales price as of the close of business on the NYSE, usually 4:00 p.m. on the valuation date. Equity securities listed on the NASDAQ market system are valued at
46 l GOF l GUGGENHEIM STRATEGIC OPPORTUNITIES FUND ANNUAL REPORT
| NOTES TO FINANCIAL STATEMENTS continued | May 31, 2017 | ||||||||||
Open-end investment companies (“Mutual Funds”) are valued at their NAV as of the close of business on the valuation date. Exchange Traded Funds (“ETFs”) and closed-end investment companies are valued at the last quoted sale price.
Debt securities with a maturity of greater than 60 days at acquisition are valued at prices that reflect broker/dealer supplied valuations or are obtained from independent pricing services, which may consider the trade activity, treasury spreads, yields or price of bonds of comparable quality, coupon, maturity, and type, as well as prices quoted by dealers who make markets in such securities. Short-term debt securities with a maturity of 60 days or less at acquisition and repurchase agreements are valued at amortized cost, provided such amount approximates market value.
Typically loans are valued using information provided by an independent third party pricing service which uses broker quotes in a non-active market.
Listed options are valued at the Official Settlement Price listed in by the exchange, usually as of 4:00 p.m. Long options are valued using the bid price and short options are valued using the ask price. In the event that a settlement price is not available, fair valuation is enacted. Over-the-counter options are valued using the average bid price (for long options), or average ask price (for short options) obtained from one or more security dealers.
The value of futures contracts is accounted for using the unrealized gain or loss on the contracts that is determined by marking the contracts to their current settlement prices. Financial futures contracts are valued at 4:00 p.m. on the valuation date. In the event that the exchange for a specific futures contract closes earlier than 4:00 p.m., the futures contract is valued at the Official Settlement Price of the exchange. However, the underlying securities from which the futures contract value is derived are monitored until 4:00 p.m. to determine if fair valuation would provide a more accurate valuation.
Generally, trading in foreign securities markets is substantially completed each day at various times prior to the close of the NYSE. The values of foreign securities are determined as of the close of such foreign markets or the close of the NYSE, if earlier. All investments quoted in foreign currency are valued in U.S. dollars on the basis of the foreign currency exchange rates prevailing at the close of U.S. business at 4:00 p.m. Investments in foreign securities may involve risks not present in domestic investments. The Valuation Committee will determine the current value of such foreign securities by taking into consideration certain factors which may include those discussed above, as well as the following factors, among others: the value of the securities traded on other foreign markets, ADR trading, closed-end fund trading, foreign currency exchange activity, and the trading prices of financial products that are tied to foreign securities such as World Equity Benchmark Securities. In addition, under the Valuation Procedures, the Valuation Committee and Guggenheim Funds Investment Advisors, LLC (“GFIA” or the “Adviser”) are authorized to use prices and other information supplied by a third party pricing vendor in valuing foreign securities.
GOF l GUGGENHEIM STRATEGIC OPPORTUNITIES FUND ANNUAL REPORT l 47
| NOTES TO FINANCIAL STATEMENTS continued | May 31, 2017 | ||||||||||
Investments for which market quotations are not readily available are fair valued as determined in good faith by the Adviser, subject to review by the Valuation Committee, pursuant to methods established or ratified by the Board. Valuations in accordance with these methods are intended to reflect each security’s (or asset’s) “fair value.” Each such determination is based on a consideration of all relevant factors, which are likely to vary from one pricing context to another. Examples of such factors may include, but are not limited to: market prices; sale prices; broker quotes; and models which derive prices based on inputs such as prices of securities with comparable maturities and characteristics, or based on inputs such as anticipated cash flows or collateral, spread over Treasuries, and other information analysis.
(b) Investment Transactions and Investment Income
Investment transactions are accounted for on the trade date. Realized gains and losses on investments are determined on the identified cost basis. Paydown gains and losses on mortgage and asset-backed securities are treated as an adjustment to interest income. Dividend income is recorded net of applicable withholding taxes on the ex-dividend date and interest income is recorded on an accrual basis. Discounts or premiums on debt securities purchased are accreted or amortized to interest income over the lives of the respective securities using the effective interest method.
(c) Restricted Cash
A portion of cash on hand relates to collateral received by the Fund for repurchase agreements and futures contracts. This amount is presented on the Statement of Assets and Liabilities as Restricted Cash.
(d) Swaps
A swap is an agreement to exchange the return generated by one instrument for the return generated by another instrument. The Fund enters into swap agreements to manage its exposure to interest rates and/or credit risk or to generate income. Swaps are valued daily at current market value and any unrealized gain or loss is included in the Statement of Assets and Liabilities. Gain or loss is realized on the termination date of the swap and is equal to the difference between the Fund’s basis in the swap and the proceeds of the closing transaction, including any fees. Upon termination of a swap agreement, a payable to or receivable from swap counterparty is established on the Statement of Assets and Liabilities to reflect the net gain/loss, including interest income/expense, on terminated swap positions. The line item is removed upon settlement according to the terms of the swap agreement.
Realized gain (loss) upon termination of swap contracts is recorded on the Statement of Operations. Fluctuations in the value of swap contracts are recorded as a component of net change in unrealized appreciation (depreciation) of swap contracts. Net periodic payments received by the Fund are included as part of realized gain (loss) and, in the case of accruals for periodic payments, are included as part of unrealized appreciation (depreciation) on the Statement of Operations.
As of May 31, 2017, the Fund had no swap contracts outstanding.
48 l GOF l GUGGENHEIM STRATEGIC OPPORTUNITIES FUND ANNUAL REPORT
| NOTES TO FINANCIAL STATEMENTS continued | May 31, 2017 | ||||||||||
(e) Covered Call Options and Put Options
When an option is written, the premium received is recorded as an asset with an equal liability and is subsequently marked to market to reflect the current market value of the option written. These liabilities are reflected as written options on the Statement of Assets and Liabilities. Premiums received from writing options which expire unexercised are recorded on the expiration date as a realized gain. The difference between the premium received and the amount paid on effecting a closing purchase transaction, including brokerage commissions, is also treated as a realized gain, or if the premium is less than the amount paid for the closing purchase transactions, as a realized loss. If an option is exercised, the premium is added to the proceeds from the sale of the underlying security in determining whether there has been a realized gain or loss.
When a call option is purchased, the Fund obtains the right (but not the obligation) to buy the underlying instrument at the strike price at anytime during the option period. When a put option is purchased, the Fund obtains the right (but not the obligation) to sell the option’s underlying instrument at the strike price at anytime during the option period. When the Fund purchases an option, an amount equal to the premium paid by the Fund is reflected as an asset and subsequently marked-to-market to reflect the current market value of the option purchased. Purchased options are included with Investments on the Statement of Assets and Liabilities. Realized and unrealized gains and losses on purchased options are included with Investments on the Statement of Operations.
(f) Currency Translation
Assets and liabilities denominated in foreign currencies are translated into U.S. dollars at the mean of the bid and ask price of respective exchange rates on the last day of the period. Purchases and sales of investments denominated in foreign currencies are translated at the exchange rate on the bid and ask price of respective exchange rates on the date of the transaction.
The Fund does not isolate that portion of the results of operations resulting from changes in foreign exchange rates on investments from the fluctuations arising from changes in market prices of securities held. Such fluctuations are included with the net realized and unrealized gain or loss from investments.
Foreign exchange realized gain or loss resulting from holding of a foreign currency, expiration of a currency exchange contract, difference in exchange rates between the trade date and settlement date of an investment purchased or sold, and the difference between dividends or interest actually received compared to the amount shown in the Fund’s accounting records on the date of receipt is shown as net realized gains or losses on foreign currency transactions on the Fund’s Statement of Operations.
Foreign exchange unrealized gain or loss on assets and liabilities, other than investments, is shown as unrealized appreciation (depreciation) on foreign currency translation on the Fund’s Statement of Operations.
GOF l GUGGENHEIM STRATEGIC OPPORTUNITIES FUND ANNUAL REPORT l 49
| NOTES TO FINANCIAL STATEMENTS continued | May 31, 2017 | ||||||||||
(g) Forward Foreign Currency Exchange Contracts
Forward foreign currency exchange contracts are agreements between two parties to buy and sell currencies at a set price on a future date. Fluctuations in the value of open forward foreign currency exchange contracts are recorded for financial reporting purposes as unrealized appreciation and depreciation by the Fund until the contracts are closed. When the contracts are closed, realized gains and losses are recorded, and included on the Statement of Operations in foreign currency transactions.
(h) Futures Contracts
Upon entering into a futures contract, the Fund deposits and maintains as collateral such initial margin as required by the exchange on which the transaction is affected. Pursuant to the contract, the Fund agrees to receive from or pay to the broker an amount of cash equal to the daily fluctuation in value of the contract.
Such receipts or payments are known as variation margin and are recorded by the Fund as unrealized gains or losses. When the contract is closed, the Fund records a realized gain or loss equal to the difference between the value of the contract at the time it was opened and the value at the time it was closed.
(i) Distributions to Shareholders
The Fund declares and pays monthly distributions to common shareholders. These distributions consist of investment company taxable income, which generally includes qualified dividend income, ordinary income and short-term capital gains. Any net realized long-term capital gains are distributed annually to common shareholders. To the extent distributions exceed taxable income, the excess will be deemed a return of capital.
Distributions to shareholders are recorded on the ex-dividend date. The amount and timing of distributions are determined in accordance with federal income tax regulations, which may differ from GAAP.
(j) U.S. Government Agency Obligations
Certain U.S. Government and Agency Obligations are traded on a discount basis; the interest rates shown on the Schedules of Investments reflect the effective rates paid at the time of purchase by the Funds. Other securities bear interest at the rates shown, payable at fixed dates through maturity.
(k) Indemnifications
Under the Fund’s organizational documents, its Trustees and Officers are indemnified against certain liabilities arising out of the performance of their duties to the Fund. In addition, throughout the normal course of business, the Fund enters into contracts that contain a variety of representations and warranties which provide general indemnifications. The Fund’s maximum exposure under these arrangements is unknown, as this would involve future claims that may be made against the Fund and/or its affiliates that have not yet occurred. However, based on experience, the Fund expects the risk of loss to be remote.
50 l GOF l GUGGENHEIM STRATEGIC OPPORTUNITIES FUND ANNUAL REPORT
| NOTES TO FINANCIAL STATEMENTS continued | May 31, 2017 | ||||||||||
Note 3 – Investment Advisory Agreement, Sub-Advisory Agreement and Other Agreements:
Pursuant to an Investment Advisory Agreement between the Fund and the Adviser, the Adviser furnishes offices, necessary facilities and equipment, provides administrative services, oversees the activities of Guggenheim Partners Investment Management, LLC (“GPIM” or “Sub-Adviser”), provides personnel including certain officers required for the Fund’s administrative management and compensates the officers and trustees of the Fund who are affiliates of the Adviser. As compensation for these services, the Fund pays the Adviser a fee, payable monthly, in an amount equal to 1.00% of the Fund’s average daily managed assets (net assets applicable to common shareholders plus any assets attributable to financial leverage).
Pursuant to a Sub-Advisory Agreement among the Fund, the Adviser and GPIM, GPIM, under the supervision of the Fund’s Board of Trustees and the Adviser, provides a continuous investment program for the Fund’s portfolio; provides investment research; makes and executes recommendations for the purchase and sale of securities; and provides certain facilities and personnel, including certain officers required for its administrative management and pays the compensation of all officers and trustees of the Fund who are GPIM’s affiliates. As compensation for its services, the Adviser pays GPIM a fee, payable monthly, in an annual amount equal to 0.50% of the Fund’s average daily managed assets.
For purposes of calculating the fees payable under the foregoing agreements, average daily managed assets means the average daily value of the Fund’s total assets minus the sum of its accrued liabilities. Total assets means all of the Fund’s assets and is not limited to its investment securities. Accrued liabilities means all of the Fund’s liabilities other than borrowings for investment purposes.
Certain officers and trustees of the Fund may also be officers, directors and/or employees of the Adviser or GPIM. The Fund does not compensate its officers or trustees who are officers, directors and/or employees of the aforementioned firms.
On October 4, 2016, Rydex Fund Services (“RFS”) was purchased by MUFG Investor Services and as of that date RFS ceased to be an affiliate of the Investment Adviser. In connection with its acquisition, RFS changed its name to MUFG Investor Services (US), LLC (“MUIS”). This change has no impact on the financial statements of the Fund.
MUIS acts as the Fund’s administrator and accounting agent. As administrator and accounting agent, MUIS is responsible for maintaining the books and records of the Fund’s securities and cash. The Bank of New York (“BNY”) acts as the Fund’s custodian. As custodian, BNY is responsible for the custody of the Fund’s assets. For providing the aforementioned services, MUIS and BNY are entitled to receive a monthly fee equal to an annual percentage of the Fund’s average daily managed assets subject to certain minimum monthly fees and out of pocket expenses.
GOF l GUGGENHEIM STRATEGIC OPPORTUNITIES FUND ANNUAL REPORT l 51
| NOTES TO FINANCIAL STATEMENTS continued | May 31, 2017 | ||||||||||
Note 4 – Fair Value Measurement:
In accordance with GAAP, fair value is defined as the price that the Fund would receive to sell an investment or pay to transfer a liability in an orderly transaction with an independent buyer in the principal market, or in the absence of a principal market, the most advantageous market for the investment or liability. GAAP establishes a three-tier fair value hierarchy based on the types of inputs used to value assets and liabilities and requires corresponding disclosure. The hierarchy and the corresponding inputs are summarized below:
Level 1 — quoted prices in active markets for identical assets or liabilities.
Level 2 — significant other observable inputs (for example quoted prices for securities that are similar based on characteristics such as interest rates, prepayment speeds, credit risk, etc.).
Level 3 — significant unobservable inputs based on the best information available under the circumstances, to the extent observable inputs are not available, which may include assumptions.
The types of inputs available depend on a variety of factors, such as the type of security and the characteristics of the markets in which it trades, if any. Fair valuation determinations that rely on fewer or no observable inputs require greater judgment. Accordingly, fair value determinations for Level 3 securities require the greatest amount of judgment.
Independent pricing services are used to value a majority of the Fund’s investments. When values are not available from a pricing service, they will be determined under the valuation policies that have been reviewed and approved by the Board. In any event, values are determined using a variety of sources and techniques, including: market prices; broker quotes; and models which derive prices based on inputs such as prices of securities with comparable maturities and characteristics or based on inputs such as anticipated cash flows or collateral, spread over Treasuries, and other information and analysis. A significant portion of the Funds’ assets and liabilities are categorized as Level 2 or Level 3, as indicated in this report.
Indicative quotes from broker-dealers, adjusted for fluctuations in criteria such as credit spreads and interest rates, may be also used to value the Fund’s assets and liabilities, i.e. prices provided by a broker-dealer or other market participant who has not committed to trade at that price. Although indicative quotes are typically received from established market participants, the Fund may not have the transparency to view the underlying inputs which support the market quotations.
Certain fixed income securities are valued by obtaining a monthly indicative quote from a broker-dealer, adjusted for fluctuations in criteria such as credit spreads and interest rates. The Fund’s fair valuation guidelines categorize these securities as Level 3.
The inputs or methodologies used for valuing securities are not necessarily an indication of the risk associated with investing in those securities. The suitability of the techniques and sources employed to determine fair valuation are regularly monitored and subject to change.
52 l GOF l GUGGENHEIM STRATEGIC OPPORTUNITIES FUND ANNUAL REPORT
| NOTES TO FINANCIAL STATEMENTS continued | May 31, 2017 | ||||||||||
Note 5 – Federal Income Taxes:
The Fund intends to comply with the requirements of Subchapter M of the Internal Revenue Code of 1986, as amended, (the “Internal Revenue Code”), applicable to regulated investment companies.
The Fund may be subject to an excise tax of 4% of the amount by which 98% of the Fund’s annual taxable income and 98.2% of net realized gains exceed the distributions from such taxable income and realized gains for the calendar year.
For Federal income tax purposes, capital loss carryforwards represent realized losses of the Fund that may be carried forward and applied against future capital gains. Under the RIC Modernization Act of 2010, the Fund is permitted to carry forward capital losses incurred in taxable years beginning after December 22, 2010 for an unlimited period and such capital loss carryforwards will retain their character as either short-term or long-term capital losses. As of May 31, 2017, the Fund had no capital loss carryforwards.
Due to inherent differences in the recognition of income, expenses and realized gains/losses under GAAP and federal income tax purposes, permanent differences between book and tax basis reporting have been identified and appropriately reclassified on the Statement of Assets and Liabilities. As of May 31, 2017, the following reclassification were made to the capital accounts of the Fund to reflect permanent book and tax differences, primarily relating to foreign currency transactions, disposition of PFICs, paydown losses, equity to debt income accruals, dividend reclasses, collateralized loan obligations and the marking to market of forwards, futures and options contracts. Net investment income, net realized gains and net assets were not affected by the changes.
| Undistributed | Accumulated | |
| (distributions in excess of) | Net Realized | Additional |
| Net Investment Income | Gain/(Loss) | Paid in Capital |
| $8,072,327 | $(8,072,327) | $– |
As of May 31, 2017, the cost of investments and accumulated unrealized appreciation/ (depreciation) of investments for federal income tax purposes, were as follows:
| Net Tax | |||
| Gross Tax | Gross | Unrealized | |
| Cost of Investments | Unrealized | Tax Unrealized | Depreciation |
| for Tax Purposes | Appreciation | Depreciation | on Investments |
| $525,830,355 | $24,960,943 | $(34,458,712) | $(9,497,769) |
The differences between book basis and tax basis unrealized appreciation (depreciation) is primarily attributable to the tax deferral of losses on wash sales, equity to debt income accruals, adjustments for collateralized loan obligations, and the marking to market of forward foreign currency contracts, futures contracts and options contracts.
GOF l GUGGENHEIM STRATEGIC OPPORTUNITIES FUND ANNUAL REPORT l 53
| NOTES TO FINANCIAL STATEMENTS continued | May 31, 2017 | ||||||||||
As of May 31, 2017, the tax components of accumulated earnings/losses (excluding paid-in capital) on a tax basis were as follows:
| Undistributed | ||
| Long-Term Capital | ||
| Undistributed | Gains/(Accumulated | Net Unrealized |
| Ordinary Income | Capital and Other Losses) | Depreciation |
| $11,602,125 | $4,400,175 | $(8,849,448) |
For the years ended May 31, 2017 and 2016, the tax character of distributions paid to shareholders as reflected in the Statements of Changes in Net Assets was as follows:
| Distributions paid from | 2017 | 2016 |
| Ordinary income | $40,937,408 | $32,113,499 |
| Long –term capital gain | 129,983 | 6,431,359 |
| $41,067,391 | $38,544,858 |
Note: For federal income tax purposes, short-term capital gains are treated as ordinary income distributions.
For all open tax years and all major jurisdictions, management of the Fund has concluded that there are no significant uncertain tax positions that would require recognition in the financial statements. Uncertain tax positions are tax positions taken or expected to be taken in the course of preparing the Fund’s tax returns that would not meet a more-likely-than not threshold of being sustained by the applicable tax authority and would be recorded as a tax expense in the current year. Open tax years are those that are open for examination by taxing authorities (i.e. generally the last four tax year ends and the interim tax period since then).
Note 6 – Investments in Securities:
During the year ended May 31, 2017, the cost of purchases and proceeds from sales of investments, excluding written options, futures contracts and short-term investments, were $281,651,627 and $188,092,812, respectively.
The Fund is permitted to purchase or sell securities from or to certain affiliated funds under specified conditions outlined in procedures adopted by the Board. The procedures have been designed to ensure that any purchase or sale of securities by the Fund from or to another fund or portfolio that is or could be considered an affiliate by virtue of having a common investment adviser (or affiliated investment advisers), common trustees and/or common officers complies with Rule 17a-7 of the 1940 Act. Further, as defined under these procedures, each transaction is effected at the current market price to save costs, where permissible. For the year ended May 31, 2017, the Fund engaged in purchases and sales of securities, pursuant to Rule 17a-7 of the 1940 Act, as follows:
| Purchases | Sales | Realized Gain (Loss) |
| $2,056,813 | $19,309,424 | $939,169 |
54 l GOF l GUGGENHEIM STRATEGIC OPPORTUNITIES FUND ANNUAL REPORT
| NOTES TO FINANCIAL STATEMENTS continued | May 31, 2017 | ||||||||||
Note 7 – Derivatives:
Derivatives are instruments whose values depend on, or are derived from, in whole or in part, the value of one or more other assets, such as securities, currencies, commodities or indices. Derivative instruments may be used to increase investment flexibility (including to maintain cash reserves while maintaining exposure to certain other assets), for risk management (hedging) purposes, to facilitate trading, to reduce transaction costs and to pursue higher investment returns. Derivative instruments may also be used to mitigate certain investment risks, such as foreign currency exchange rate risk, interest rate risk and credit risk. GAAP requires disclosures to enable investors to better understand how and why a Fund uses derivative instruments, how these derivative instruments are accounted for and their effects on the Fund’s financial position and results of operations.
The Fund may utilize derivatives for the following purposes:
Hedge – an investment made in order to seek to reduce the risk of adverse price movements in a security, by taking an offsetting position to protect against broad market moves.
(a) Covered Call Options and Put Options
The Fund pursues its investment objective by employing an option strategy of writing (selling) covered call options and, from time to time, buys or sells put options on equity securities and indices. The Fund seeks to generate current gains from option premiums as a means to enhance distributions payable to the Fund’s common shareholders.
An option on a security is a contract that gives the holder of the option, in return for a premium, the right to buy from (in the case of a call) or sell to (in the case of a put) the writer of the option the security underlying the option at a specified exercise or “strike” price. The writer of an option on a security has the obligation upon exercise of the option to deliver the underlying security upon payment of the exercise price (in the case of a call) or to pay the exercise price upon delivery of the underlying security (in the case of a put).
There are several risks associated with transactions in options on securities. As the writer of a covered call option, the Fund forgoes, during the option’s life, the opportunity to profit from increases in the market value of the security covering the call option above the sum of the premium and the strike price of the call, but has retained the risk of loss should the price of the underlying security decline. A writer of a put option is exposed to the risk of loss if the fair value of the underlying security declines, but profits only to the extent of the premium received if the underlying security increases in value. The writer of an option has no control over the time when it may be required to fulfill its obligation as writer of the option. Once an option writer has received an exercise notice, it cannot effect a closing purchase transaction in order to terminate its obligation under the option and must deliver the underlying security at the exercise price.
GOF l GUGGENHEIM STRATEGIC OPPORTUNITIES FUND ANNUAL REPORT l 55
| NOTES TO FINANCIAL STATEMENTS continued | May 31, 2017 |
| To the extent that the Fund purchases options, the Fund will be subject to the following additional risks. If a put or call option purchased by the Fund is not sold when it has remaining value, and if the market price of the underlying security remains equal to or greater than the exercise price (in the case of a put), or remains less than or equal to the exercise price (in the case of a call), the Fund will lose its entire investment in the option. Also, where a put or call option on a particular security is purchased to hedge against price movements in a related security, the price of the put or call option may move more or less than the price of the related security. If restrictions on exercise were imposed, the Fund might be unable to exercise an option it had purchased. If the Fund were unable to close out an option that it had purchased on a security, it would have to exercise the option in order to realize any profit or the option may expire worthless. The maximum exposure the Fund has at risk when purchasing an option is the premium paid. |
| The Fund entered into written option contracts during the year ended May 31, 2017. | |
| Details of the transactions were as follows: | |
| Number of | Premiums | |
| Contracts | Received | |
| Options outstanding, beginning of the period | 279 | $ 706,202 |
| Options written during the period | 22,643 | 9,371,412 |
| Options closed during the period | (12,460) | (8,960,500) |
| Options outstanding, end of period | 10,462 | $ 1,117,114 |
(b) Swaps
Swap agreements are contracts between parties in which one party agrees to make periodic payments to the other party (the “Counterparty”) based on the change in market value or level of a specified rate, index or asset. In return, the Counterparty agrees to make periodic payments to the first party based on the return of a different specified rate, index or asset. Swap agreements will usually be done on a net basis, the Fund receiving or paying only the net amount of the two payments. The net amount of the excess, if any, of each Fund’s obligations over its entitlements with respect to each swap is accrued on a daily basis and an amount of cash or liquid securities having an aggregate value at least equal to the accrued excess is maintained in an account at the Fund’s custodian bank. During the period that the swap agreement is open, the Fund may be subject to risk from the potential inability of the counterparty to meet the terms of the agreement. The swaps involve elements of both market and credit risk in excess of the amounts reflected on the Statement of Assets and Liabilities.
Credit default swap transactions involve the Fund’s agreement to exchange the credit risk of an issuer. A buyer of a credit default swap is said to buy protection by paying periodic fees in return for a contingent payment from the seller if the issuer has a credit event such as bankruptcy, a failure to pay outstanding obligations or deteriorating credit while the swap is outstanding. A seller of a credit default swap is said to sell protection and thus collects the periodic fees and profits if the credit of the issuer remains stable or improves while the swap is outstanding but the seller in a credit default
56 l GOF l GUGGENHEIM STRATEGIC OPPORTUNITIES FUND ANNUAL REPORT
| NOTES TO FINANCIAL STATEMENTS continued | May 31, 2017 | ||||||||||
swap contract would be required to pay an agreed upon amount, which approximates the notional amount of the swap, to the buyer in the event of an adverse credit event of the issuer.
The Fund may utilize index swap transactions to manage its exposure to various securities markets, changes in interest rates, or currency values. Index swap transactions allow the Fund to receive the appreciation/depreciation of the specified index over a specified time period in exchange for an agreed upon fee paid to the counterparty.
The Fund did not have any swap agreements outstanding as of May 31, 2017.
(c) Forward Foreign Currency Exchange Contracts
The Fund enters into forward foreign currency exchange contracts in order to hedge its exposure to changes in foreign currency exchange rates on its foreign portfolio holdings, to hedge certain firm purchases and sales commitments denominated in foreign currencies and for investment purposes.
A forward foreign currency exchange contract is a commitment to purchase or sell a foreign currency on a future date at a negotiated forward rate. Forward foreign currency exchange contracts involve elements of both market and credit risk in excess of the amounts reflected on the Statement of Assets and Liabilities. Risk may arise from the potential inability of a counterparty to meet the terms of a contract and from unanticipated movements in the value of a foreign currency relative to the U.S. dollar. The face or contract amount, in U.S. dollars, reflects the total exposure the Fund has in that particular currency contract.
As of May 31, 2017, the following forward foreign currency exchange contracts were outstanding:
| Net Unrealized | ||||||
| Settlement | Settlement | Value as of | Appreciation | |||
| Contracts to Sell | Counterparty | Date | Value | 5/31/17 | (Depreciation) | |
| EUR | 801,000 | |||||
| for USD | 876,419 | Bank of America | 6/12/17 | $876,419 | $900,369 | $(23,950) |
| GBP | 6,952,000 | |||||
| for USD | 9,003,479 | JP Morgan | 6/12/17 | 9,003,479 | 8,960,027 | 43,452 |
| Net unrealized appreciation on forward foreign currency exchange contracts | $ 19,502 | |||||
(d) Futures Contracts
A futures contract is an agreement to purchase (long) or sell (short) an agreed amount of securities or other instruments at a set price for delivery at a future date. There are significant risks associated with a Fund’s use of futures contracts, including (i) there may be an imperfect or no correlation between the changes in market value of the underlying asset and the prices of futures contracts; (ii) there may not be a liquid secondary market for a futures contract; (iii) trading restrictions or limitations may be imposed by an exchange; and (iv) government regulations may restrict trading in futures contracts. When investing in futures, there is minimal counterparty credit risk to the Fund because futures are exchange-traded and the exchange’s clearinghouse, as counterparty to all exchange-traded futures, guarantees against default. Cash deposits are shown as segregated cash
GOF l GUGGENHEIM STRATEGIC OPPORTUNITIES FUND ANNUAL REPORT l 57
| NOTES TO FINANCIAL STATEMENTS continued | May 31, 2017 | ||||||||||
with broker on the Statement of Assets and Liabilities; securities held as collateral are noted on the Schedule of Investments.
(e) Summary of Derivatives Information
The Fund is required by GAAP to disclose: a) how and why a fund uses derivative instruments, b) how derivative instruments and related hedge fund items are accounted for, and c) how derivative instruments and related hedge items affect a fund’s financial position, results of operations and cash flows.
The following table presents the types of derivatives in the Fund by location as presented on the Statement of Assets and Liabilities as of May 31, 2017.
| Statement of Asset and Liabilities | |||||
| Presentation of Fair Values of Derivative Instruments (value in $000s): | |||||
| Asset Derivatives | Liability Derivatives | ||||
| Statement of Assets | Statement of Assets | ||||
| Primary Risk Exposure | and Liabilities Location | Fair Value | and Liabilities Location | Fair Value | |
| Equity risk | Options Purchased* | $1,286 | Options Written | $1,074 | |
| Equity risk | Unrealized appreciation on | 1,315 | Unrealized depreciation on | – | |
| futures contracts** | futures contracts* | ||||
| Foreign exchange risk | Unrealized appreciation on | Unrealized depreciation on | |||
| forward foreign currency | forward foreign currency | ||||
| exchange contracts | 43 | exchange contracts | 24 | ||
| Total | $2,644 | $1,098 | |||
* Included in investments in unaffiliated issuers.
** Includes cumulative appreciation (depreciation) of futures contracts as reported on the Schedule of Investments. Only current day’s variation margin is reported within the Statement of Assets and Liabilities.
58 l GOF l GUGGENHEIM STRATEGIC OPPORTUNITIES FUND ANNUAL REPORT
| NOTES TO FINANCIAL STATEMENTS continued | May 31, 2017 | ||||||||||
The following table presents the effect of derivative instruments on the Statement of Operations for the year ended May 31, 2017.
| Effect of Derivative Instruments on the Statement of Operations | |||||
| Amount of Realized Gain (Loss) on Derivatives (value in $000s): | |||||
| Primary | Purchased | Written | Foreign Currency | Futures | |
| Risk Exposure | Options | Options | Transactions | Contracts | Total |
| Equity risk | $1,375 | $(1,649) | $ – | $ 10,408 | $ 10,134 |
| Foreign exchange risk | – | – | 653 | – | 653 |
| Total | $1,375 | $(1,649) | $ 653 | $ 10,408 | $ 10,787 |
| Change in Unrealized Appreciation (Depreciation) on Derivatives (value in $000s): | |||||
| Primary Risk | Purchased | Written | Foreign Currency | Futures | |
| Exposure | Options | Options | Translations | Contracts | Total |
| Equity risk | $(487) | $694 | $ – | $ (970) | $ (763) |
| Foreign exchange risk | – | – | (3)* | – | (3) |
| Total | $(487) | $694 | $ (3) | $ (970) | $ (766) |
* The Statement of Operations includes change in unrealized appreciation (depreciation) on foreign currency and payables or receivables in foreign currency.
Derivative Volume
Forward Foreign Currency Exchange Contracts:
The Fund had the following activity in forward foreign currency exchange contracts during the year ended May 31, 2017:
| Quarterly Average Settlement Value Purchased | $ – |
| Quarterly Average Settlement Value Sold | 8,515,272 |
Futures Contracts:
The Fund had the following activity in futures contracts during the year ended May 31, 2017:
| Quarterly Average Notional Value | 64,141,081 |
Options Contracts:
The Fund had the following activity in option contracts during the year ended May 31, 2017:
| Quarterly Average Number of Outstanding Contracts Purchased | 9,501 |
Note 8 – Offsetting:
In the normal course of business, the Fund enters into transactions subject to enforceable master netting arrangements or other similar arrangements. Generally, the right to offset in those agreements allows the Fund to counteract the exposure to a specific counterparty with collateral received or delivered to that counterparty based on the terms of the arrangements. These arrangements provide for the right to liquidate upon the occurrence of an event of default, credit event upon merger or additional termination event.
GOF l GUGGENHEIM STRATEGIC OPPORTUNITIES FUND ANNUAL REPORT l 59
| NOTES TO FINANCIAL STATEMENTS continued | May 31, 2017 | ||||||||||
In order to better define their contractual rights and to secure rights that will help the Fund mitigate their counterparty risk, the Fund may enter into an International Swaps and Derivatives Association, Inc. Master Agreement (“ISDA Master Agreement”) or similar agreement with their derivative contract counterparties. An ISDA Master Agreement is a bilateral agreement between a Fund and a counterparty that governs OTC derivatives, including foreign exchange contracts, and typically contains, among other things, collateral posting terms and netting provisions in the event of a default and/or termination event. The provisions of the ISDA Master Agreement typically permit a single net payment in the event of a default (close-out netting) or similar event, including the bankruptcy or insolvency of the counterparty.
For derivatives traded under an ISDA Master Agreement, the collateral requirements are typically calculated by netting the mark to market amount for each transaction under such agreement and comparing that amount to the value of any collateral currently pledged by the Fund and the counterparty. For financial reporting purposes, cash collateral that has been pledged to cover obligations of the Fund and cash collateral received from the counterparty, if any, is reported separately on the Statement of Assets and Liabilities as segregated cash with broker/ receivable for variation margin, or payable for swap settlement/variation margin. Generally, the amount of collateral due from or to a counterparty must exceed a minimum transfer amount threshold (e.g., $300,000) before a transfer is required to be made. To the extent amounts due to the Fund from its counterparties are not fully collateralized, contractually or otherwise, the Fund bears the risk of loss from counterparty nonperformance. The Fund attempts to mitigate counterparty risk by only entering into agreements with counterparties that it believes to be of good standing and by monitoring the financial stability of those counterparties.
For financial reporting purposes, the Fund does not offset derivative assets and derivative liabilities that are subject to netting arrangements in the Statement of Assets and Liabilities.
The following tables present derivative financial instruments and secured financing transactions that are subject to enforceable netting arrangements and offset in the Statements of Assets and Liabilities in conformity with GAAP.
| Net Amounts | ||||||
| Gross Amounts | of Assets | Gross Amounts Not | ||||
| Gross | Offset in the | Presented in the | Offset in the Statement | |||
| Amounts of | Statement of | Statement of | of Assets and Liabilities | |||
| Recognized | Assets and | Assets and | Financial | Collateral | ||
| Description | Assets1 | Liabilities | Liabilities | Instruments | Received | Net Amount |
| Forward Foreign | ||||||
| Currency | ||||||
| Exchange | ||||||
| Contracts | $ 43,452 | $ – | $ 43,452 | $ – | $ – | $ 43,452 |
| Purchased | ||||||
| Options | ||||||
| Contracts | 1,286,403 | – | 1,286,403 | (181,756) | (580,000) | 524,647 |
60 l GOF l GUGGENHEIM STRATEGIC OPPORTUNITIES FUND ANNUAL REPORT
| NOTES TO FINANCIAL STATEMENTS continued | May 31, 2017 | ||||||||||
| Net Amounts | ||||||
| Gross Amounts | of Liabilities | Gross Amounts Not | ||||
| Gross | Offset in the | Presented in the | Offset in the Statement | |||
| Amounts of | Statement of | Statement of | of Assets and Liabilities | |||
| Recognized | Assets and | Assets and | Financial | Collateral | ||
| Description | Liabilities1 | Liabilities | Liabilities | Instruments | Pledged | Net Amount |
| Reverse | ||||||
| Repurchase | ||||||
| Agreements | $ 91,424,819 | $ – | $ 91,424,819 | $ (91,424,819) | $ – | $ – |
| Forward Foreign | ||||||
| Currency | ||||||
| Exchange | ||||||
| Contracts | 23,950 | – | 23,950 | (23,950) | – | – |
| Written | ||||||
| Options | ||||||
| Contracts | 157,806 | – | 157,806 | (157,806) | – | – |
1 Exchange-traded options and futures are excluded from these reported amounts.
Note 9 – Leverage:
Reverse Repurchase Agreements
The Fund may enter into reverse repurchase agreements as part of its financial leverage strategy. Under a reverse repurchase agreement, the Fund temporarily transfers possession of a portfolio instrument to another party, such as a bank or broker-dealer, in return for cash. At the same time, the Fund agrees to repurchase the instrument at an agreed upon time and price, which reflects an interest payment. Such agreements have the economic effect of borrowings. The Fund may enter into such agreements when it is able to invest the cash acquired at a rate higher than the cost of the agreement, which would increase earned income. When the Fund enters into a reverse repurchase agreement, any fluctuations in the market value of either the instruments transferred to another party or the instruments in which the proceeds may be invested would affect the market value of the Fund’s assets. As a result, such transactions may increase fluctuations in the market value of the Fund’s assets. For the year ended May 31, 2017, the average daily balance of reverse repurchase agreements outstanding amounted to $124,173,549. The weighted average interest rate was 1.89%. As of May 31, 2017, there was $91,424,819 in reverse repurchase agreements outstanding.
GOF l GUGGENHEIM STRATEGIC OPPORTUNITIES FUND ANNUAL REPORT l 61
| NOTES TO FINANCIAL STATEMENTS continued | May 31, 2017 | ||||||||||
As of May 31, 2017, the Fund had outstanding reverse repurchase agreements with various counterparties. Details of the reverse repurchase agreements by counterparty are as follows:
| Counterparty | Interest Rates | Maturity Dates | Face Value |
| Bank of America | 1.55% - 2.05% | 06/16/17 – 06/19/17 | $ 2,639,946 |
| Barclays Capital, Inc. | 2.10% | 06/16/17 | 4,383,625 |
| BNP Paribas | 1.58% - 2.24% | 06/01/17 – 06/26/17 | 19,016,175 |
| Citigroup Global Markets, Inc. | 0.75%* | Open maturity | 2,082,000 |
| Morgan Stanley, Inc. | 2.12% | 06/12/17 | 2,042,000 |
| Natixis Securities Americas LLC | 2.20% - 2.40% | 06/02/17 | 5,627,000 |
| Nomura | 2.18% - 3.52% | 06/05/17 – 03/02/18 | 20,019,916 |
| RBC Capital | 1.51% - 1.97% | 06/05/17 – 06/22/17 | 8,718,155 |
| Royal Bank of Canada | 2.25% | 06/05/17 | 2,824,000 |
| Societe Generale | 1.70% - 2.26% | 08/28/17 – 04/26/18 | 24,072,002 |
| $ 91,424,819 |
* Variable rate security. Rate indicated is rate effective as of May 31, 2017.
The following is a summary of the remaining contractual maturities of the reverse repurchase agreements outstanding as of May 31, 2017, aggregated by asset class of the related collateral pledged by the Fund:
| Overnight and | Up to | 31 – 90 | Greater than | ||
| Continuous | 30 days | days | 90 days | Total | |
| Asset Backed Securities | $ - | $13,266,800 | $ - | $ 9,967,625 | $23,234,425 |
| Corporate Bonds | 2,082,000 | 33,155,901 | 1,931,688 | 29,355,320 | 66,524,909 |
| Foreign Government Bonds | – | - | - | 1,665,485 | 1,665,485 |
| Total Borrowings | $2,082,000 | $46,422,701 | $1,931,688 | $40,988,430 | $91,424,819 |
| Gross amount of recognized | |||||
| liabilities for reverse | |||||
| repurchase agreements | $2,082,000 | $46,422,701 | $1,931,688 | $40,988,430 | $91,424,819 |
Borrowings
The Fund has entered into a $80,000,000 credit facility agreement with an approved lender whereby the lender has agreed to provide secured financing to the Fund and the Fund will provide pledged collateral to the lender. Interest on the amount borrowed is based on the 3-month LIBOR plus 0.85%. As of May 31, 2017, there was $16,704,955 outstanding in connection with the Fund’s credit facility. The average daily amount of borrowings on the credit facility during the year ended May 31, 2017, was $13,516,325 with a related average interest rate of 1.85%. The maximum amount outstanding during the year ended May 31, 2017 was $16,704,955. As of May 31, 2017, the total value of securities segregated and pledged as collateral in connection with borrowings was $20,541,810.
62 l GOF l GUGGENHEIM STRATEGIC OPPORTUNITIES FUND ANNUAL REPORT
| NOTES TO FINANCIAL STATEMENTS continued | May 31, 2017 | ||||||||||
There is no guarantee that the Fund’s leverage strategy will be successful. The Fund’s use of leverage may cause the Fund’s NAV and market price of common shares to be more volatile and can magnify the effect of any losses.
Note 10 – Loan Commitments
Pursuant to the terms of certain Term Loan agreements, the Fund held unfunded loan commitments as of May 31, 2017. The Fund is obligated to fund these loan commitments at the borrower’s discretion. The Fund reserves against such contingent obligations by designating cash, liquid securities, and liquid term loans as a reserve. As of May 31, 2017, the total amount segregated in connection with reverse repurchase agreements and unfunded commitments was $161,734,377.
GOF l GUGGENHEIM STRATEGIC OPPORTUNITIES FUND ANNUAL REPORT l 63
| NOTES TO FINANCIAL STATEMENTS continued | May 31, 2017 | ||||||||||
| Borrower | Maturity Date | Face Amount | Value |
| Acosta, Inc. | 09/26/2019 | $ 782,222 | $ 48,336 |
| American Seafoods Group LLC | 08/19/2021 | 475,000 | 49,602 |
| Amspec Services, Inc. | 07/01/2022 | 7,625 | 76 |
| Aspect Software, Inc. | 05/25/2018 | 187,500 | – |
| Cypress Int III | 04/27/2022 | 1,250,000 | 152,469 |
| Dominion Web Solutions | 08/08/2017 | 2,000,000 | – |
| Endries International, Inc. | 06/29/2017 | 2,000,000 | – |
| Equian LLC | 05/11/2024 | 529,412 | 2,630 |
| Eyemart Express | 12/18/2019 | 500,000 | 30,907 |
| Gold Merger, Co. | 07/27/2021 | 1,000,000 | 121,256 |
| Hostess Brands | 08/03/2020 | 500,000 | 44,919 |
| ICSH Parent, Inc. | 04/29/2024 | 152,942 | 755 |
| Insight Fourth Hospitality | 07/15/2020 | 500,000 | 50,273 |
| IntraWest Holdings | 12/10/2018 | 200,000 | 2,438 |
| Ministry Brands LLC | 12/2/2022 | 205,003 | 2,050 |
| National Technical | 06/12/2021 | 305,882 | 2,191 |
| Packaging Coordinators Midco, Inc. | 07/01/2021 | 1,384,615 | 141,384 |
| Pelican Products, Inc. | 04/11/2019 | 300,000 | 16,695 |
| PetSmart, Inc. - Argos Merger | 01/24/2018 | 1,000,000 | – |
| PowerSchool, Inc. | 07/29/2021 | 525,000 | 45,548 |
| PowerSchool, Inc. | 07/30/2021 | 350,003 | 40,577 |
| Solera LLC | 03/03/2021 | 576,017 | 60,877 |
| Surgery Center Holdings | 11/16/2017 | 2,000,000 | – |
| $16,731,221 | $ 812,983 |
Note 11 – Capital:
Common Shares
The Fund has an unlimited amount of common shares, $0.01 par value, authorized and 20,751,418 issued and outstanding.
Transactions in common shares were as follows:
| Year ended | Year ended | |
| May 31, 2017 | May 31, 2016 | |
| Beginning Shares | 17,729,262 | 17,493,253 |
| Common shares issued through at-the-market offering | 2,869,774 | 166,779 |
| Shares issued through dividend reinvestment | 152,382 | 69,230 |
| Ending Shares | 20,751,418 | 17,729,262 |
64 l GOF l GUGGENHEIM STRATEGIC OPPORTUNITIES FUND ANNUAL REPORT
| NOTES TO FINANCIAL STATEMENTS continued | May 31, 2017 | ||||||||||
On November 14, 2016, the Fund’s replacement shelf registration allowing for delayed or continuous offering of additional shares became effective. The shelf registration statement allows for the issuance of up to $125,000,000 of common shares. The Fund entered into an agreement with Cantor Fitzgerald & Co. for the sale of up to an additional 3,900,000 shares.
The Adviser has paid the costs associated with the at-the-market offering of shares and will be reimbursed by the Fund up to 0.60% of the offering price of common shares sold pursuant to the shelf registration statement, not to exceed the amount of actual offering costs incurred. For the year ended May 31, 2017, the Fund incurred $139,293 of expenses associated with the at-the market offerings.
Note 12 – Restricted Securities:
The securities below are considered illiquid and restricted under guidelines established by the Board:
| Restricted Securities | Acquisition Date | Cost | Value |
| Airplanes Pass Through Trust | |||
| 2001-1A, 1.54% due 03/15/2019 | 10/14/2009 | $ 6,669,521 | $ 951,119 |
| Capmark Military Housing Trust | |||
| 2007-AETC, 5.75% due 02/10/2052 | 09/18/2014 | 1,893,405 | 1,906,957 |
| Capmark Military Housing Trust | |||
| 2007-AET2, 6.06% due 10/10/2052 | 04/23/2015 | 485,940 | 513,537 |
| CNB Financial Corp. | |||
| 5.75% due 10/15/2026 | 09/14/2016 | 2,000,000 | 2,070,584 |
| Customers Bank | |||
| 6.13% due 06/26/2029 | 06/24/2014 | 2,500,000 | 2,553,125 |
| Fortress Credit Opportunities | |||
| 2005-1A, 1.41% due 07/15/2019 | 02/16/2012 | 1,366,065 | 1,394,440 |
| Great Lakes CLO Ltd. | |||
| 2012-1A, due 01/15/2023 | 12/06/2012 | 1,918,085 | 1,001,679 |
| HP Communities LLC | |||
| 6.82% due 09/15/2053 | 06/09/2014 | 971,160 | 1,072,228 |
| HP Communities LLC | |||
| 6.16% due 09/15/2053 | 07/21/2015 | 997,532 | 1,021,365 |
| Pacific Beacon LLC | |||
| 5.63% due 07/15/2051 | 01/15/2014 | 586,872 | 677,344 |
| Schahin II Finance Company SPV Ltd. | |||
| 5.88% due 09/25/2022 | 01/08/2014 | 1,178,715 | 158,097 |
| Turbine Engines Securitization Ltd. | |||
| 2013-1A, 6.38% due 12/13/2048 | 11/27/2013 | 634,972 | 600,078 |
| $ 21,202,267 | $ 13,920,553 |
GOF l GUGGENHEIM STRATEGIC OPPORTUNITIES FUND ANNUAL REPORT l 65
| NOTES TO FINANCIAL STATEMENTS continued | May 31, 2017 | ||||||||||
The Fund had the following transactions with affiliated securities during the year ended May 31, 2017.
| Share/Principal | |||||||
| Activity | |||||||
| Interest and | |||||||
| Amortization | |||||||
| Balance | Corporate | Balance | Included | ||||
| Security Name | 5/31/16 | Purchases | Sales | Actions | 5/31/17 | Value | in Income |
| Aspect Software Parent, Inc. | 37,128 | 3,617 | – | – | 40,745 | $ 609,980 | $ – |
| Aspect Software Parent, Inc. | – | – | – | 15,032 | 15,032 | 225,037 | – |
| Aspect Software, Inc., | |||||||
| 11.02% due 05/25/20 | 926,365 | – | 20,124 | – | 906,241 | 903,975 | 122,749 |
| Aspect Software, Inc., | |||||||
| 8.29% due 05/25/18 | – | 1,151,042 | 713,542 | – | 437,500 | 437,500 | 64,963 |
| Aspect Software, Inc., | |||||||
| 3.00% due 05/25/23 | 368,515 | – | – | (368,515) | – | – | – |
| Targus Group International | |||||||
| Equity, Inc. | 13,409 | – | – | – | 13,409 | 20,113 | – |
| Targus Group International, Inc., | |||||||
| 15.00% due 12/31/19 | 55,345 | 8,853 | – | – | 64,198 | 64,198 | 7,112 |
| Targus Group International, Inc., | |||||||
| 14.00% due 05/24/16 | 155,344 | 106 | – | – | 155,450 | – | (9,907) |
| 1,556,106 | 1,163,618 | 733,666 | (353,483) | 1,632,575 | $2,260,803 | $ 184,917 | |
Affiliated securities accounted for $(624,615) change in net unrealized appreciation/(depreciation) on investments during the year.
Note 14 – Subsequent Event:
The Fund evaluated subsequent events through the date the financial statements were available for issue and determined there were no additional material events that would require adjustment to or disclosure in the Fund’s financial statements.
66 l GOF l GUGGENHEIM STRATEGIC OPPORTUNITIES FUND ANNUAL REPORT
| REPORT OF INDEPENDENT REGISTERED PUBLIC ACCOUNTING FIRM | May 31, 2017 |
The Board of Trustees and Shareholders of Guggenheim Strategic Opportunities Fund We have audited the accompanying statement of assets and liabilities of the Guggenheim Strategic Opportunities Fund (the Fund), including the schedule of investments, as of May 31, 2017, and the related statements of operations and cash flows for the year then ended, the statements of changes in net assets for each of the two years in the period then ended, and the financial highlights for each of the five years in the period then ended. These financial statements and financial highlights are the responsibility of the Fund’s management. Our responsibility is to express an opinion on these financial statements and financial highlights based on our audits. We conducted our audits in accordance with the standards of the Public Company Accounting Oversight Board (United States). Those standards require that we plan and perform the audit to obtain reasonable assurance about whether the financial statements and financial highlights are free of material misstatement. We were not engaged to perform an audit of the Fund’s internal control over financial reporting. Our audits included consideration of internal control over financial reporting as a basis for designing audit procedures that are appropriate in the circumstances, but not for the purpose of expressing an opinion on the effectiveness of the Fund’s internal control over financial reporting. Accordingly, we express no such opinion. An audit also includes examining, on a test basis, evidence supporting the amounts and disclosures in the financial statements and financial highlights, assessing the accounting principles used and significant estimates made by management, and evaluating the overall financial statement presentation. Our procedures included confirmation of securities owned as of May 31, 2017, by correspondence with the custodian, brokers, and paying agents or by other appropriate auditing procedures where replies from brokers or paying agents were not received. We believe that our audits provide a reasonable basis for our opinion. In our opinion, the financial statements and financial highlights referred to above present fairly, in all material respects, the financial position of the Guggenheim Strategic Opportunities Fund at May 31, 2017, the results of its operations and its cash flows for the year then ended, the changes in its net assets for each of the two years in the period then ended, and its financial highlights for each of the five years in the period then ended, in conformity with U.S. generally accepted accounting principles. | |

Tysons, Virginia
July 31, 2017
July 31, 2017
GOF l GUGGENHEIM STRATEGIC OPPORTUNITIES FUND ANNUAL REPORT l 67
SUPPLEMENTAL INFORMATION (Unaudited) | May 31, 2017 |
Federal Income Tax Information
The Fund intends to designate the maximum amount of dividends that qualify for the reduced tax rate pursuant to the Jobs and Growth Relief Reconciliation Act of 2003. See qualified dividend income column in the table below.
In January 2018, you will be advised on IRS Form 1099 DIV or substitute 1099 DIV as to the federal tax status of the distributions received by you in the calendar year 2017. See dividend received deductions in the column below.
| Qualified Dividend | Dividend Received |
| Income | Deduction |
| 0.20% | 0.20% |
Additionally, of the taxable ordinary income distributions paid during the fiscal year ending May 31, 2017, the Fund had the corresponding percentages qualify as interest related dividends and qualified short-term capital gains as permitted by IRC Section 871(k)(1) and IRC Section 871(k)(2), respectively.
| % Qualifying | % Qualifying |
| Interest | Short-Term Capital Gain |
| 34.82% | 100% |
Results of Shareholders Votes
The Annual Meeting of Shareholders of the Fund was held on May 4, 2017. Common shareholders voted on the election of Trustees. With regards to the election of the following Trustees by common shareholders of the Fund:
| # of Shares in Favor | # of Shares Against | # of Shares Abstain | |
| Jerry B. Farley | 17,049,008 | 295,248 | 194,146 |
| Robert B. Karn III, | 17,026,596 | 309,385 | 202,421 |
| Ronald A. Nyberg | 17,087,032 | 207,804 | 243,566 |
| Maynard F. Oliverius | 17,059,797 | 269,064 | 209,541 |
| Ronald E. Toupin, Jr | 17,096,076 | 232,566 | 209,760 |
The other Trustees of the Fund not up for election in 2017 are Randall C. Barnes, Donald A. Chubb, Jr., Roman Friedrich III and Donald C. Cacciapaglia.
Sector Classification
Information in the “Schedule of Investments” is categorized by sectors using sector-level Classifications defined by the Bloomberg Industry Classification System, a widely recognized industry classification system provider. Each Fund’s registration statement has investment policies relating to concentration in specific sectors/industries. For purposes of these investment policies, the Funds usually classify sectors/industries based on industry-level Classifications used by widely recognized industry classification system providers such as Bloomberg Industry Classification System, Global Industry Classification Standards and Barclays Global Classification Scheme.
68 lGOF lGUGGENHEIM STRATEGIC OPPORTUNITIES FUND ANNUAL REPORT
SUPPLEMENTAL INFORMATION (Unaudited) continued | May 31, 2017 |
| Trustees | |||||
| The Trustees of the Guggenheim Strategic Opportunities Fund and their principal occupations during the past five years: | |||||
| Position(s) | Term of Office | Number of | |||
| Held | and Length | Portfolios in | |||
| Name, Address* | with | of Time | Principal Occupation(s) | Fund Complex | Other Directorships |
| and Year of Birth | Trust | Served** | During Past Five Years | Overseen | Held by Trustees |
| Independent Trustees | |||||
| Randall C. Barnes | Trustee | Since 2007 | Current: Private Investor (2001-present). | 98 | Current: Trustee, Purpose Investments |
| (1951) | Funds (2014-Present). | ||||
| Former: Senior Vice President and Treasurer, PepsiCo, Inc. (1993-1997); | |||||
| President, Pizza Hut International (1991-1993); Senior Vice President, | |||||
| Strategic Planning and New Business Development, PepsiCo, Inc. (1987-1990). | |||||
| Donald A. Chubb, Jr. | Trustee and | Since 2014 | Current: Business broker and manager of commercial real estate, Griffith & | 95 | Current: Midland Care, Inc. |
| (1946 ) | Chairman of | Blair, Inc. (1997-present). | (2011-present). | ||
| the Valuation | |||||
| Oversight | |||||
| Committee | |||||
| Jerry B. Farley | Trustee and | Since 2014 | Current: President, Washburn University (1997-present). | 95 | Current: Westar Energy, Inc. (2004- |
| (1946) | Chairman of | (2004-present); CoreFirst Bank & Trust (2000-present). | present), CoreFirst Bank & Trust | ||
| the Audit | |||||
| Committee | |||||
| Roman Friedrich III | Trustee and | Since 2010 | Current: Founder and Managing Partner, Roman Friedrich & Company (1998-present). | 95 | Current: Zincore Metals, Inc. |
| (1946) | Chairman of | (2009-present). | |||
| the Contracts | Former: Senior Managing Director, MLV & Co. LLC (2010-2011). | ||||
| Review | Former: Axiom Gold and Silver Corp. | ||||
| Committee | (2011-2012). | ||||
| Robert B. Karn III | Trustee | Since 2010 | Current: Consultant (1998-present). | 95 | Current: GP Natural Resource Partners, |
| (1942) | LLC (2002- present). | ||||
| Former: Arthur Andersen (1965-1997) and Managing Partner, Financial and Economic | |||||
| Consulting, St. Louis office (1987-1997). | Former: Peabody Energy Company | ||||
| (2003-April 2017). | |||||
GOF l GUGGENHEIM STRATEGIC OPPORTUNITIES FUND ANNUAL REPORT l 69
SUPPLEMENTAL INFORMATION (Unaudited) continued | May 31, 2017 |
| Position(s) | Term of Office | Number of | |||
| Held | and Length | Portfolios in | |||
| Name, Address* | with | of Time | Principal Occupation(s) | Fund Complex | Other Directorships |
| and Year of Birth | Trust | Served** | During Past Five Years | Overseen | Held by Trustees |
| Independent Trustees continued | |||||
| Ronald A. Nyberg | Trustee and | Since 2007 | Current: Partner, Momkus McCluskey Roberts, LLC (2016-present). | 100 | Current: Edward-Elmhurst Healthcare |
| (1953) | Chairman of | System (2012-present). | |||
| the Nominating | Former: Partner, Nyberg & Cassioppi, LLC (2000-2016); Executive Vice President, | ||||
| and Governance | General Counsel, and Corporate Secretary, Van Kampen Investments (1982-1999). | ||||
| Committee | |||||
| Maynard F. Oliverius | Trustee | Since 2014 | Current: Retired. | 95 | Current: Robert J. Dole Institute of |
| (1943) | Politics (2016-present); Stormont-Vail | ||||
| Former: President and CEO, Stormont-Vail HealthCare (1996-2012). | Foundation (2013-present); University of | ||||
| Minnesota MHA Alumni Philanthropy | |||||
| Committee (2009-present); Fort Hays | |||||
| State University Foundation (1999- | |||||
| present). | |||||
| Former: Topeka Community Foundation | |||||
| (2009-2014). | |||||
| Ronald E. Toupin, Jr. | Trustee and | Since 2007 | Current: Portfolio Consultant (2010-present). | 97 | Former: Bennett Group of Funds |
| (1958) | Chairman of | (2011-2013). | |||
| the Board | Former: Vice President, Manager and Portfolio Manager, Nuveen Asset | ||||
| Management (1998-1999); Vice President, Nuveen Investment Advisory Corp. | |||||
| (1992-1999); Vice President and Manager, Nuveen Unit Investment Trusts | |||||
| (1991-1999); and Assistant Vice President and Portfolio Manager, Nuveen Unit | |||||
| Investment Trusts (1988-1999), each of John Nuveen & Co., Inc. (1982-1999). | |||||
70 l GOF l GUGGENHEIM STRATEGIC OPPORTUNITIES FUND ANNUAL REPORT
SUPPLEMENTAL INFORMATION (Unaudited) continued | May 31, 2017 |
| Position(s) | Term of Office | Number of | ||||
| Held | and Length | Portfolios in | ||||
| Name, Address* | with | of Time | Principal Occupation(s) | Fund Complex | Other Directorships | |
| and Year of Birth | Trust | Served** | During Past Five Years | Overseen | Held by Trustees | |
| Interested Trustee | ||||||
| Donald C. | President, | Since 2012 | Current: President and CEO, certain other funds in the Fund Complex | 230 | Current: Clear Spring Life Insurance | |
| Cacciapaglia*** | Chief Executive | (2012-present); Vice Chairman, Guggenheim Investments (2010-present). | Company (2015-present); Guggenheim | |||
| (1951) | Officer and | Partners Japan, Ltd. (2014-present); | ||||
| Trustee | Former: Chairman and CEO, Channel Capital Group, Inc. (2002-2010). | Guggenheim Partners Investment | ||||
| Management Holdings, LLC (2014- | ||||||
| present); Delaware Life (2013-present); | ||||||
| Guggenheim Life and Annuity Company | ||||||
| (2011-present); Paragon Life Insurance | ||||||
| Company of Indiana (2011-present). | ||||||
| * | The business address of each Trustee is c/o Guggenheim Investments, 227 West Monroe, Chicago, IL 60606. | |||||
| ** | This is the period for which the Trustee began serving the Fund. After a Trustee’s initial term, each Trustee is expected to serve a two-year term concurrent | |||||
| with the class of Trustees for which he serves: | ||||||
| —Messrs. Barnes, Cacciapaglia, Chubb and Friedrich are Class I Trustees. Class I Trustees are expected to stand for re-election at the Fund’s annual meeting | ||||||
| of shareholders for the fiscal year ended May 31, 2018. | ||||||
| —Messrs. Farley, Karn, Nyberg, Oliverius and Toupin are Class II Trustees. Class II Trustees are expected to stand for re-election at the Fund’s annual meeting | ||||||
| of shareholders for the fiscal year ended May 31, 2019. | ||||||
| *** | This Trustee is deemed to be an “interested person” of the Funds under the 1940 Act by reason of his position with the Funds’ Investment Manager and/or | |||||
| the parent of the Investment Manager. | ||||||
GOF l GUGGENHEIM STRATEGIC OPPORTUNITIES FUND ANNUAL REPORT l 71
SUPPLEMENTAL INFORMATION (Unaudited) continued | May 31, 2017 |
| Officers | |||
| The Officers of the Guggenheim Strategic Opportunities Fund, who are not trustees, and their principal occupations during the past five years: | |||
| Position(s) | |||
| held | Term of Office | ||
| Name, Address* | with the | and Length of | |
| and Year of Birth | Trust | Time Served** | Principal Occupations During Past Five Years |
| Joanna M. | Chief | Since 2012 | Current: Chief Compliance Officer, certain funds in the Fund Complex (2012-present); Senior Managing Director, Guggenheim Investments |
| Catalucci | Compliance | (2012-present); AML Officer, certain funds in the Fund Complex (2016-present). | |
| (1966) | Officer | ||
| Former: Chief Compliance Officer and Secretary, certain other funds in the Fund Complex (2008-2012); Senior Vice President & Chief Compliance | |||
| Officer, Security Investors, LLC and certain affiliates (2010-2012); Chief Compliance Officer and Senior Vice President, Rydex Advisors, LLC and | |||
| certain affiliates (2010-2011). | |||
| James M. | Assistant | Since 2007 | Current: Managing Director, Guggenheim Investments (2004-present); Assistant Treasurer, certain other funds in the Fund Complex (2006-present). |
| Howley | Treasurer | ||
| (1972) | Former: Manager of Mutual Fund Administration, Van Kampen Investments, Inc. (1996-2004). | ||
| Keith Kemp | Assistant | Since 2016 | Current: Treasurer and Assistant Treasurer, certain other funds in the Fund Complex (2010-present); Managing Director of Guggenheim Partners |
| (1960) | Treasurer | Investment Management, LLC (2015-present); Chief Financial Officer, Guggenheim Specialized Products, LLC (2016-present). | |
| Former: Managing Director and Director, Transparent Value, LLC (2010-2016); Director, Guggenheim Partners Investment Management, LLC | |||
| (2010-2015); Chief Operating Officer, Macquarie Capital Investment Management (2007-2009). | |||
| Amy J. Lee | Chief Legal | Since 2013 | Current: Chief Legal Officer, certain other funds in the Fund Complex (2013-present); Senior Managing Director, Guggenheim Investments |
| (1961) | Officer | (2012-present). | |
| Former: Vice President, Associate General Counsel and Assistant Secretary, Security Benefit Life Insurance Company and Security Benefit | |||
| Corporation (2004-2012). | |||
| Mark E. Mathiasen | Secretary | Since 2008 | Current: Secretary, certain other funds in the Fund Complex (2007-present); Managing Director, Guggenheim Investments (2007-present). |
| (1978) | |||
72 l GOF l GUGGENHEIM STRATEGIC OPPORTUNITIES FUND ANNUAL REPORT
SUPPLEMENTAL INFORMATION (Unaudited) continued | May 31, 2017 |
| Position(s) | ||||
| held | Term of Office | |||
| Name, Address* | with the | and Length of | ||
| and Year of Birth | Trust | Time Served** | Principal Occupations During Past Five Years | |
| Officers continued: | ||||
| Glenn McWhinnie | Assistant | Since 2016 | Current: Vice President, Guggenheim Investments (2009-present). | |
| (1969) | Treasurer | |||
| Former: Tax Compliance Manager, Ernst & Young LLP (1996-2009). | ||||
| Michael P. Megaris | Assistant | Current: Assistant Secretary, certain other funds in the Fund Complex (2014-present); Vice President, Guggenheim Investments (2012-present). | ||
| (1984) | Secretary | Since 2014 | ||
| Former: J.D., University of Kansas School of Law (2009-2012). | ||||
| Adam J. Nelson | Assistant | Since 2015 | Current: Vice President, Guggenheim Investments (2015-present); Assistant Treasurer, certain other funds in the Fund Complex (2015-present). | |
| (1979) | Treasurer | |||
| Former: Assistant Vice President and Fund Administration Director, State Street Corporation (2013-2015); Fund Administration Assistant | ||||
| Director, State Street (2011-2013); Fund Administration Manager, State Street (2009-2011). | ||||
| Kimberly J. Scott | Assistant | Since 2012 | Current: Director, Guggenheim Investments (2012-present); Assistant Treasurer, certain other funds in the Fund Complex (2012-present). | |
| (1974) | Treasurer | |||
| Former: Financial Reporting Manager, Invesco, Ltd. (2010-2011); Vice President/Assistant Treasurer of Mutual Fund Administration, Van Kampen | ||||
| Investments, Inc./Morgan Stanley Investment Management (2009-2010); Manager of Mutual Fund Administration, Van Kampen Investments, | ||||
| Inc./Morgan Stanley Investment Management (2005-2009). | ||||
| Bryan Stone | Vice President | Since 2014 | Current: Vice President, certain other funds in the Fund Complex (2014-present); Director, Guggenheim Investments (2013-present). | |
| (1979) | ||||
| Former: Senior Vice President, Neuberger Berman Group LLC (2009-2013); Vice President, Morgan Stanley (2002-2009). | ||||
| John L. Sullivan | Chief | Since 2010 | Current: CFO, Chief Accounting Officer and Treasurer, certain other funds in the Fund Complex (2010-present); Senior Managing Director, | |
| (1955) | Financial | Guggenheim Investments (2010-present). | ||
| Chief Officer, | ||||
| Accounting | Former: Managing Director and CCO, each of the funds in the Van Kampen Investments fund complex (2004-2010); Managing Director and Head | |||
| Officer and | of Fund Accounting and Administration, Morgan Stanley Investment Management (2002-2004); CFO and Treasurer, Van Kampen Funds (1996-2004). | |||
| Treasurer | ||||
| * | The business address of each officer is c/o Guggenheim Investments, 227 West Monroe, Chicago, IL 60606. | |||
| ** | Each officer serves an indefinite term, until his or her successor is duly elected and qualified. | |||
GOF l GUGGENHEIM STRATEGIC OPPORTUNITIES FUND ANNUAL REPORT l 73
APPROVAL OF ADVISORY AGREEMENTS – GUGGENHEIM STRATEGIC OPPORTUNITIES FUND (GOF) | May 31, 2017 |
Guggenheim Strategic Opportunities Fund (the “Fund”) is a Delaware statutory trust that is registered as a diversified, closed-end management investment company under the Investment Company Act of 1940, as amended (the “1940 Act”). Guggenheim Funds Investment Advisors, LLC (“GFIA” or the “Adviser”), an indirect subsidiary of Guggenheim Partners, LLC, a global, diversified financial services firm (“Guggenheim Partners”), serves as the Fund’s investment adviser and provides certain administrative and other services pursuant to an investment advisory agreement between the Fund and GFIA (the “Investment Advisory Agreement”). (Guggenheim Partners, GFIA, Guggenheim Partners Investment Management, LLC (“GPIM” or the “Sub-Adviser”) and their affiliates may be referred to herein collectively as “Guggenheim.” “Guggenheim Investments” refers to the global asset management and investment advisory division of Guggenheim Partners and includes GFIA, GPIM, Security Investors, LLC and other affiliated investment management businesses of Guggenheim Partners.)
Under the terms of the Investment Advisory Agreement, GFIA is responsible for overseeing the activities of GPIM, which performs portfolio management and related services for the Fund pursuant to an investment sub-advisory agreement by and among the Fund, the Adviser and GPIM (the “Sub-Advisory Agreement” and together with the Investment Advisory Agreement, the “Advisory Agreements”). Under the supervision and oversight of GFIA and the Board of Trustees of the Fund (the “Board,” with the members of the Board referred to individually as the “Trustees”), GPIM provides a continuous investment program for the Fund’s portfolio, provides investment research, makes and executes recommendations for the purchase and sale of securities and provides certain facilities and personnel for the Fund.
Following an initial two-year term, each of the Advisory Agreements continues in effect from year to year provided that such continuance is specifically approved at least annually by (i) the Board or a majority of the outstanding voting securities (as defined in the 1940 Act) of the Fund, and, in either event, (ii) the vote of a majority of the Trustees who are not “interested person[s],” as defined by the 1940 Act, of the Fund (the “Independent Trustees”) casting votes in person at a meeting called for such purpose. At meetings held in person on April 25, 2017 (the “April Meeting”) and on May 23-24, 2017 (the “May Meeting”), the Contracts Review Committee of the Board (the “Committee”), consisting solely of the Independent Trustees, met separately from Guggenheim to consider the proposed renewal of the Advisory Agreements in connection with the Committee’s annual contract review schedule.
As part of its review process, the Committee was represented by independent legal counsel to the Independent Trustees (“Independent Legal Counsel”). Independent Legal Counsel reviewed and discussed with the Committee various key aspects of the Trustees’ legal responsibilities relating to the proposed renewal of the Advisory Agreements and other principal contracts. The Committee took into account various materials received from Guggenheim and Independent Legal Counsel. Recognizing that the evaluation process with respect to the services provided by each of GFIA and
74 l GOF l GUGGENHEIM STRATEGIC OPPORTUNITIES FUND ANNUAL REPORT
APPROVAL OF ADVISORY AGREEMENTS – GUGGENHEIM STRATEGIC OPPORTUNITIES FUND (GOF) continued | May 31, 2017 |
GPIM is an ongoing one, the Committee also considered the variety of written materials, reports and oral presentations the Board receives throughout the year regarding performance and operating results of the Fund.
In connection with the contract review process, FUSE Research Network LLC (“FUSE”), an independent, third-party research provider, was engaged to prepare advisory contract renewal reports designed specifically to help the Board fulfill its advisory contract renewal responsibilities. The objective of the reports is to present the subject funds’ relative position regarding fees, expenses and total return performance, with comparisons to a peer group of funds identified by Guggenheim, based on a methodology reviewed by the Board. In addition, Guggenheim provided materials and data in response to formal requests for information sent by Independent Legal Counsel on behalf of the Independent Trustees. Guggenheim also made a presentation at the April Meeting. Throughout the process, the Committee asked questions of management and requested certain additional information, which Guggenheim provided following the April Meeting (collectively with the foregoing reports and materials, the “Contract Review Materials”). The Committee considered the Contract Review Materials in the context of its accumulated experience in governing the Fund and weighed the factors and standards discussed with Independent Legal Counsel.
Following an analysis and discussion of the factors identified below and in the exercise of its business judgment, the Committee concluded that it was in the best interest of the Fund to recommend that the Board approve the renewal of each of the Advisory Agreements for an additional annual term.
Investment Advisory Agreement
Nature, Extent and Quality of Services Provided by the Adviser: With respect to the nature, extent and quality of services currently provided by the Adviser, the Committee noted that although the Adviser delegated responsibility for the investment and reinvestment of the Fund’s assets to the Sub-Adviser, as affiliated companies, both the Adviser and Sub-Adviser are part of the Guggenheim organization. Further, the Committee took into account that investment advisory-related services are provided by many Guggenheim employees under different related legal entities and thus, the services provided by the Adviser on the one hand and the Sub-Adviser on the other, as well as the risks assumed by each party, are not provided by distinct legal entities. The Committee considered the Adviser’s responsibility to oversee the Sub-Adviser and took into account information provided by Guggenheim describing the Adviser’s processes and activities for providing oversight of sub-advisers, including information regarding the Adviser’s Sub-Advisory Oversight Committee.
The Committee also considered the secondary market support services provided by Guggenheim to the Fund and, in this regard, noted the materials describing the activities of Guggenheim’s dedicated Closed-End Fund Team, including with respect to communication with financial advisors, data dissemination and relationship management. In addition, the Committee considered the
GOF l GUGGENHEIM STRATEGIC OPPORTUNITIES FUND ANNUAL REPORT l 75
APPROVAL OF ADVISORY AGREEMENTS – GUGGENHEIM STRATEGIC OPPORTUNITIES FUND (GOF) continued | May 31, 2017 |
qualifications, experience and skills of key personnel performing services for the Fund, including those personnel providing compliance oversight, as well as the supervisors and reporting lines for such personnel. In this connection, the Committee considered Guggenheim’s resources and related efforts to retain, attract and motivate capable personnel to serve the Fund and noted Guggenheim’s report on recent additions, departures and transitions in personnel who work on matters relating to the Fund or are significant to the operations of the Adviser.
The Committee also considered Guggenheim’s attention to relevant developments in the mutual fund industry, and issues germane to closed-end funds in particular, and its observance of compliance and regulatory requirements and noted that on a regular basis the Board receives and reviews information from the Fund’s Chief Compliance Officer regarding compliance policies and procedures established pursuant to Rule 38a-1 under the 1940 Act, as well as from Guggenheim’s Chief Risk Officer. In addition, the Committee noted Guggenheim’s implementation of additional controls and oversight processes relating to risk management, including the establishment of an Enterprise Risk Management Committee comprised of a multi-disciplinary team of senior personnel, as well as enhancements to the organization’s information security program.
In connection with the Committee’s evaluation of the overall package of services provided by the Adviser, the Committee considered Guggenheim’s role in monitoring and coordinating compliance responsibilities with the administrator, custodian and other service providers to the Fund. In this respect, the Committee took into account the initiatives undertaken by Guggenheim in connection with the outsourcing of its fund administration and fund accounting services business resulting from Guggenheim’s sale of Rydex Fund Services, LLC (“RFS”), formerly a Guggenheim affiliate and now known as MUFG Investor Services (US), LLC (“MUFG IS”), to Mitsubishi UFJ Trust and Banking Corporation, the trust banking arm of Mitsubishi UFJ Financial Group, a Japanese financial services organization (the “RFS Transaction”). In particular, the Committee considered Guggenheim’s establishment of the Office of Chief Financial Officer (“OCFO”), its structure and responsibilities, including its role in overseeing the services provided by MUFG IS. The Committee also considered the resources allocated by Guggenheim to support the OCFO and the detailed plans presented by management for functions for the OCFO both during and upon completion of the transition period with MUFG IS.
With respect to Guggenheim’s resources and the Adviser’s ability to carry out its responsibilities under the Investment Advisory Agreement, the Chief Financial Officer of Guggenheim Investments reviewed with the Committee certain unaudited financial information concerning the holding company for Guggenheim Investments, Guggenheim Partners Investment Management Holdings, LLC (“GPIMH”). The Committee received the audited consolidated financial statements of GPIMH as supplemental information. (Thereafter, the Committee received the audited consolidated financial statements of GPIM.)
76 l GOF l GUGGENHEIM STRATEGIC OPPORTUNITIES FUND ANNUAL REPORT
APPROVAL OF ADVISORY AGREEMENTS – GUGGENHEIM STRATEGIC OPPORTUNITIES FUND (GOF) continued | May 31, 2017 |
The Committee also considered the acceptability of the terms of the Investment Advisory Agreement, including the scope of services required to be performed by the Adviser.
Based on the foregoing, and based on other information received (both oral and written) at the April Meeting and the May Meeting, as well as other considerations, including the Committee’s knowledge of how the Adviser performs its duties obtained through Board meetings, discussions and reports during the year, the Committee concluded that the Adviser and its personnel were qualified to serve the Fund in such capacity and may reasonably be expected to continue to provide a high quality of services under the Investment Advisory Agreement with respect to the Fund.
Investment Performance: The Fund commenced investment operations on July 26, 2007. The Committee considered the Fund’s investment performance by reviewing the Fund’s total return on a net asset value (“NAV”) and market price basis for the five-year, three-year and one-year periods ended December 31, 2016. The Committee compared the Fund’s performance to a peer group of closed-end funds identified by Guggenheim (the “peer group of funds”) and the Fund’s benchmark for the same time periods. The peer group of funds includes other U.S.-listed taxable closed-end funds that generally invest greater than 10% in at least two of the following three investment categories: corporate bonds, asset-backed securities and bank loans, but excludes funds: (i) with generally less than 20% financial leverage; (ii) that generally invest at least 80% in one asset class, sector or country; (iii) that generally invest less than 50% in credit securities; (iv) that generally invest less than 80% in the U.S.; and (v) that generally invest less than 60% in below investment grade securities. In considering the Fund’s peer group, the Committee considered that the foregoing methodology reflected a refinement to the process implemented by the Adviser (and reviewed by the Board) in the fall of 2016, following a periodic review of the peer group constituents, resulting in a new peer group of nine other funds from multi-sector bond, bank loan and/or high yield bond categories (the “Peer Group”). The Committee noted that the refined peer group methodology implemented by the Adviser was intended to reflect the gradual evolution in the Fund’s investment strategies as well as the greater diversity of credit-oriented funds in the market, as compared to when the Fund launched. In this connection, the Committee noted that, at the request of the Independent Trustees, the Adviser provided comparative performance and fee data for both the Peer Group and the prior peer group of funds it replaced (the “Prior Peer Group”). In light of the foregoing, the Committee viewed the Peer Group as presenting a better fit of comparable funds than the Prior Peer Group and thus, determined to rely on the Peer Group data.
The Committee noted that the Fund’s investment results were consistent with its investment objective to maximize total return through a combination of current income and capital appreciation. The Committee also considered that the Adviser does not directly manage the investment portfolio but delegated such duties to the Sub-Adviser.
In addition, the Committee considered the Fund’s structure and form of leverage, and among other information related to leverage, the cost of the leverage and the aggregate leverage outstanding as of December 31, 2016, as well as net yield on leverage assets and net impact on common assets due
GOF l GUGGENHEIM STRATEGIC OPPORTUNITIES FUND ANNUAL REPORT l 77
APPROVAL OF ADVISORY AGREEMENTS – GUGGENHEIM STRATEGIC OPPORTUNITIES FUND (GOF) continued | May 31, 2017 |
to leverage for the one-year period ended December 31, 2016 and annualized for the three-year and since-inception periods ended December 31, 2016.
Based on the information provided, including with respect to the Adviser’s sub-advisory oversight processes, the Committee concluded that the Adviser had appropriately reviewed and monitored the Sub-Adviser’s investment performance.
Comparative Fees, Costs of Services Provided and the Profits Realized by the Adviser from its Relationship with the Fund: The Committee compared the Fund’s contractual advisory fee (which includes the sub-advisory fee paid to the Sub-Adviser) and total net expense ratio, in each case as a percentage of average net assets for the latest fiscal year, to the Peer Group and noted the Fund’s percentile rankings in this regard. The Committee also reviewed the average and median advisory fees and expense ratios, including expense ratio components (e.g., transfer agency fees, administration fees and other operating expenses) of the Peer Group.
The Committee observed that the Fund’s contractual advisory fee and total net expense ratio (excluding interest expense) were below the Peer Group median (ranking in the 44th percentile in each case). The Committee also took into account the Adviser’s statement that the Fund is unique relative to other closed-end funds as it incorporates a variety of fixed income, equity and alternative strategies and that, although the Adviser has presented a refined peer group methodology, no other closed-end funds employ the Fund’s unique approach to investing and diversity of asset classes.
As part of its evaluation of the Fund’s advisory fee, the Committee considered how such fee compared to the advisory fee charged by Guggenheim to one or more other clients that it manages pursuant to similar investment strategies, noting that, in certain instances, Guggenheim charges a lower advisory fee to such other clients. In this connection, the Committee considered, among other things, Guggenheim’s representations about the significant differences between managing registered funds as compared to other types of accounts. The Committee also considered Guggenheim’s explanation that lower fees are charged in certain instances due to various other factors, including the scope of contract, type of investors, differences in fee structure, applicable legal, governance and capital structures, tax status and historical pricing reasons. The Committee concluded that the information it received demonstrated that the aggregate services provided to the Fund were sufficiently different from those provided to other clients with similar investment strategies and/or the risks borne by Guggenheim were sufficiently greater than those associated with managing other clients with similar investment strategies to support the difference in fees.
With respect to the costs of services provided and profits realized by Guggenheim Investments from its relationship with the Fund, the Committee reviewed a profitability analysis and data from management setting forth the average assets under management for the twelve months ended December 31, 2016, ending assets under management as of December 31, 2016, gross revenues received by Guggenheim Investments, expenses allocated to the Fund, earnings and the operating margin/profitability rate, including variance information relative to the foregoing amounts as of
78 l GOF l GUGGENHEIM STRATEGIC OPPORTUNITIES FUND ANNUAL REPORT
APPROVAL OF ADVISORY AGREEMENTS – GUGGENHEIM STRATEGIC OPPORTUNITIES FUND (GOF) continued | May 31, 2017 |
December 31, 2015. In addition, the Chief Financial Officer of Guggenheim Investments reviewed with, and addressed questions from, the Committee concerning the expense allocation methodology employed in producing the profitability analysis.
In the course of its review of Guggenheim Investments’ profitability, the Committee took into account the methods used by Guggenheim Investments to determine expenses and profit. The Committee also noted steps taken by management to refine its methodology in preparation for contract review, including, among other things, revisions to the process for allocating expenses for shared service functions, as previously reported to and discussed with the Board. The Committee considered all of the foregoing in evaluating the costs of services provided, the profitability to Guggenheim Investments and the profitability rates presented, and concluded that the profits were not unreasonable.
The Committee considered other benefits available to the Adviser because of its relationship with the Fund and noted Guggenheim’s statement that until the completion of the RFS Transaction on October 4, 2016, the Adviser may have benefited from arrangements whereby an affiliate received fees from the Fund for providing certain administrative and fund accounting services. In addition, the Committee noted the Adviser’s statement that it may benefit from marketing synergies arising from offering a broad spectrum of products, including the Fund.
Economies of Scale: The Committee received and considered information regarding whether there have been economies of scale with respect to the management of the Fund as the Fund’s assets grow, whether the Fund has appropriately benefited from any economies of scale, and whether there is potential for realization of any further economies of scale. The Committee considered whether economies of scale in the provision of services to the Fund were being passed along to the shareholders. In this respect, the Committee considered that advisory fee breakpoints generally are not relevant given the structural nature of closed-end funds, which, though able to conduct additional share offerings periodically, do not continuously offer new shares and thus, do not experience daily inflows and outflows of capital. In addition, the Committee took into account that given the relative size of the Fund, Guggenheim does not believe breakpoints are appropriate at this time. The Committee also noted the additional shares offered by the Fund through secondary offerings in the past and considered that to the extent the Fund’s assets increase over time (whether through additional periodic offerings or internal growth from asset appreciation), the Fund and its shareholders should realize economies of scale as certain expenses, such as fixed fund fees, become a smaller percentage of overall assets.
The Committee determined that, taking into account all relevant factors, the Fund’s advisory fee was reasonable.
GOF l GUGGENHEIM STRATEGIC OPPORTUNITIES FUND ANNUAL REPORT l 79
APPROVAL OF ADVISORY AGREEMENTS – GUGGENHEIM STRATEGIC OPPORTUNITIES FUND (GOF) continued | May 31, 2017 |
Sub-Advisory Agreement
Nature, Extent and Quality of Services Provided by the Sub-Adviser: With respect to the nature, extent and quality of services provided by the Sub-Adviser, the Committee considered the qualifications, experience and skills of the Sub-Adviser’s portfolio management and other key personnel and information from the Sub-Adviser describing the scope of its services to the Fund. With respect to Guggenheim’s resources and the Sub-Adviser’s ability to carry out its responsibilities under the Sub-Advisory Agreement, as noted above, the Committee considered the financial condition of GPIMH. (Thereafter, the Committee received the audited consolidated financial statements of GPIM.)
The Committee also considered the acceptability of the terms of the Sub-Advisory Agreement, including the scope of services required to be performed by the Sub-Adviser. In addition, the Committee considered the Sub-Adviser’s efforts in pursuing the Fund’s investment objective of maximizing total return through a combination of current income and capital appreciation.
Based on the foregoing, and based on other information received (both oral and written) at the April Meeting and the May Meeting, as well as other considerations, including the Committee’s knowledge of how the Sub-Adviser performs its duties obtained through Board meetings, discussions and reports during the year, the Committee concluded that the Sub-Adviser and its personnel were qualified to serve the Fund in such capacity and may reasonably be expected to continue to provide a high quality of services under the Sub-Advisory Agreement.
Investment Performance: The Committee reviewed the performance of the Fund and the Peer Group over various periods of time. The Committee noted that the Fund had outperformed the median return of the Peer Group on an NAV basis for the five-year (1st percentile), three-year (1st percentile) and one-year (22nd percentile) periods ended December 31, 2016. The Committee also noted that the Fund’s performance on an NAV basis outperformed the Peer Group average and the return of the Fund’s benchmark, the Barclays U.S. Aggregate Bond Index, over each of the same periods.
In addition, the Committee noted Guggenheim’s belief that there is no single optimal performance metric, nor is there a single optimal time period over which to evaluate performance and that a thorough understanding of performance comes from analyzing measures of returns, risk and risk-adjusted returns, as well as evaluating strategies both relative to their market benchmarks and to peer groups of competing strategies. Thus, the Committee also reviewed and considered the additional performance and risk metrics provided by Guggenheim, including the Fund’s standard deviation, tracking error, beta, Sharpe ratio, information ratio and alpha compared to the benchmark, with the Fund’s risk metrics ranked against its peer group. In assessing the foregoing, the Committee considered Guggenheim’s statements that the Fund’s risk metrics have generally be in line with peers and risk adjusted returns have consistently exceeded those of peers across all relevant periods.
80 l GOF l GUGGENHEIM STRATEGIC OPPORTUNITIES FUND ANNUAL REPORT
APPROVAL OF ADVISORY AGREEMENTS – GUGGENHEIM STRATEGIC OPPORTUNITIES FUND (GOF) continued | May 31, 2017 |
After reviewing the foregoing and related factors, the Committee concluded that the Fund’s performance was acceptable.
Comparative Fees, Costs of Services Provided and the Profits Realized by the SubAdviser from its Relationship with the Fund: The Committee considered that the Sub-Advisory Agreement is with an affiliate of the Adviser, that the Adviser compensates the Sub-Adviser from its own fees so that the sub-advisory fee rate with respect to the Fund does not impact the fees paid by the Fund and that the Sub-Adviser’s revenues were included in the calculation of Guggenheim Investments’ profitability. Given its determination of the reasonableness of the advisory fee, the Committee concluded that the sub-advisory fee rate with respect to the Fund was reasonable.
Economies of Scale: The Committee recognized that, because the Sub-Adviser’s fees are paid by the Adviser and not the Fund, the analysis of economies of scale was more appropriate in the context of the Committee’s consideration of the Investment Advisory Agreement, which was separately considered. (See “Investment Advisory Agreement—Economies of Scale” above.)
Overall Conclusions
Based on the foregoing, the Committee determined that the investment advisory fees are fair and reasonable in light of the extent and quality of the services provided and other benefits received and that the continuation of each Advisory Agreement is in the best interest of the Fund. In reaching this conclusion, no single factor was determinative or conclusive and each Committee member, in the exercise of his business judgment, may attribute different weights to different factors. At the May Meeting, the Committee, constituting all of the Independent Trustees, recommended the renewal of each Advisory Agreement for an additional annual term.
Thereafter, on May 24, 2017, the Board, including all of the Independent Trustees, approved the renewal of each of the Advisory Agreements for an additional annual term.
GOF l GUGGENHEIM STRATEGIC OPPORTUNITIES FUND ANNUAL REPORT l 81
DIVIDEND REINVESTMENT PLAN (Unaudited) | May 31, 2017 |
Unless the registered owner of common shares elects to receive cash by contacting the Computershare Trust Company, N.A. (the “Plan Administrator”), all dividends declared on common shares of the Fund will be automatically reinvested by the Plan Administrator, Administrator for shareholders in the Fund’s Dividend Reinvestment Plan (the “Plan”), in additional common shares of the Fund. Participation in the Plan is completely voluntary and may be terminated or resumed at any time without penalty by notice if received and processed by the Plan Administrator prior to the dividend record date; otherwise such termination or resumption will be effective with respect to any subsequently declared dividend or other distribution. Some brokers may automatically elect to receive cash on your behalf and may re-invest that cash in additional common shares of the Fund for you. If you wish for all dividends declared on your common shares of the Fund to be automatically reinvested pursuant to the Plan, please contact your broker.
The Plan Administrator will open an account for each common shareholder under the Plan in the same name in which such common shareholder’s common shares are registered. Whenever the Fund declares a dividend or other distribution (together, a “Dividend”) payable in cash, non-participants in the Plan will receive cash and participants in the Plan will receive the equivalent in common shares. The common shares will be acquired by the Plan Administrator for the participants’ accounts, depending upon the circumstances described below, either (i) through receipt of additional unissued but authorized common shares from the Fund (“Newly Issued Common Shares”) or (ii) by purchase of outstanding common shares on the open market (“Open-Market Purchases”) on the New York Stock Exchange or elsewhere. If, on the payment date for any Dividend, the closing market price plus estimated brokerage commission per common share is equal to or greater than the net asset value per common share, the Plan Administrator will invest the Dividend amount in Newly Issued Common Shares on behalf of the participants. The number of Newly Issued Common Shares to be credited to each participant’s account will be determined by dividing the dollar amount of the Dividend by the net asset value per common share on the payment date; provided that, if the net asset value is less than or equal to 95% of the closing market value on the payment date, the dollar amount of the Dividend will be divided by 95% of the closing market price per common share on the payment date. If, on the payment date for any Dividend, the net asset value per common share is greater than the closing market value plus estimated brokerage commission, the Plan Administrator will invest the Dividend amount in common shares acquired on behalf of the participants in Open-Market Purchases.
If, before the Plan Administrator has completed its Open-Market Purchases, the market price per common share exceeds the net asset value per common share, the average per common share purchase price paid by the Plan Administrator may exceed the net asset value of the common shares, resulting in the acquisition of fewer common shares than if the Dividend had been paid in Newly Issued Common Shares on the Dividend payment date. Because of the foregoing difficulty with respect to Open-Market Purchases, the Plan provides that if the Plan Administrator is unable to invest the full Dividend amount in Open-Market Purchases during the purchase period or if the market discount shifts to a market premium during the purchase period, the Plan Administrator may cease making Open-Market Purchases and may invest the uninvested portion of the Dividend
82 l GOF l GUGGENHEIM STRATEGIC OPPORTUNITIES FUND ANNUAL REPORT
DIVIDEND REINVESTMENT PLAN (Unaudited) continued | May 31, 2017 |
amount in Newly Issued Common Shares at net asset value per common share at the close of business on the Last Purchase Date provided that, if the net asset value is less than or equal to 95% of the then current market price per common share; the dollar amount of the Dividend will be divided by 95% of the market price on the payment date.
The Plan Administrator maintains all shareholders’ accounts in the Plan and furnishes written confirmation of all transactions in the accounts, including information needed by shareholders for tax records. Common shares in the account of each Plan participant will be held by the Plan Administrator on behalf of the Plan participant, and each shareholder proxy will include those shares purchased or received pursuant to the Plan. The Plan Administrator will forward all proxy solicitation materials to participants and vote proxies for shares held under the Plan in accordance with the instruction of the participants.
There will be no brokerage charges with respect to common shares issued directly by the Fund. However, each participant will pay a pro rata share of brokerage commission incurred in connection with Open-Market Purchases. The automatic reinvestment of Dividends will not relieve participants of any Federal, state or local income tax that may be payable (or required to be withheld) on such Dividends.
The Fund reserves the right to amend or terminate the Plan. There is no direct service charge to participants with regard to purchases in the Plan; however, the Fund reserves the right to amend the Plan to include a service charge payable by the participants.
All correspondence or questions concerning the Plan should be directed to the Plan Administrator, Computershare Trust Company, N.A., P.O. Box 30170, College Station, TX 77842-3170; Attention: Shareholder Services Department, Phone Number: (866) 488-3559 or online at www.computershare.com/investor.
GOF l GUGGENHEIM STRATEGIC OPPORTUNITIES FUND ANNUAL REPORT l 83
FUND INFORMATION | May 31, 2017 |
| Board of Trustees | Investment Adviser |
| Randall C. Barnes | Guggenheim Funds Investment |
| Advisors, LLC | |
| Donald C. Cacciapaglia* | Chicago, IL |
| Donald A. Chubb Jr. | Investment Sub-Adviser |
| Guggenheim Partners Investment | |
| Jerry B. Farley | Management, LLC |
| Santa Monica, CA | |
| Roman Friedrich III | |
| Administrator & Accounting Agent | |
| Robert B. Karn III | MUFG Investor Services (US), LLC |
| Rockville, MD | |
| Ronald A. Nyberg | |
| Custodian | |
| Maynard F. Oliverius | The Bank of New York Mellon Corp |
| New York, NY | |
| Ronald E. Toupin, Jr., | |
| Chairperson | Legal Counsel |
| Skadden, Arps, Slate, | |
| * Trustee is an “interested person” (as defined | Meagher & Flom LLP |
| in section 2(a)(19) of the 1940 Act) | New York, NY |
| (“Interested Trustee”) of the Trust because of | |
| his position as the President and CEO of the | Independent Registered Public |
| Investment Adviser and Sub-Adviser. | Accounting Firm |
| Ernst & Young LLP | |
| Principal Executive Officers | Tysons, VA |
| Donald C. Cacciapaglia | |
| President and Chief Executive Officer | |
| Joanna M. Catalucci | |
| Chief Compliance Officer | |
| Amy J. Lee | |
| Chief Legal Officer | |
| Mark E. Mathiasen | |
| Secretary | |
| John L. Sullivan | |
| Chief Financial Officer, Chief Accounting | |
| Officer and Treasurer | |
84 l GOF l GUGGENHEIM STRATEGIC OPPORTUNITIES FUND ANNUAL REPORT
FUND INFORMATION continued | May 31, 2017 |
Privacy Principles of the Fund
The Fund is committed to maintaining the privacy of its shareholders and to safeguarding their non-public personal information. The following information is provided to help you understand what personal information the Fund collects, how the Fund protects that information and why, in certain cases, the Fund may share information with select other parties.
Generally, the Fund does not receive any non-public personal information relating to its shareholders, although certain non-public personal information of its shareholders may become available to the Fund. The Fund does not disclose any non-public personal information about its shareholders or former shareholders to anyone, except as permitted by law or as is necessary in order to service shareholder accounts (for example, to a transfer agent or third party administrator).
The Fund restricts access to non-public personal information about its shareholders to employees of the Fund’s investment advisor and its affiliates with a legitimate business need for the information. The Fund maintains physical, electronic and procedural safeguards designed to protect the non-public personal information of its shareholders.
Questions concerning your shares of Guggenheim Strategic Opportunities Fund?
• If your shares are held in a Brokerage Account, contact your Broker.
• If you have physical possession of your shares in certificate form, contact the Fund’s Transfer Agent:
Computershare Trust Company, N.A., P.O. Box 30170, College Station, TX 77842-3170; (866) 488-3559 or online at www.computershare.com/investor.
This report is sent to shareholders of Guggenheim Strategic Opportunities Fund for their information. It is not a Prospectus, circular or representation intended for use in the purchase or sale of shares of the Fund or of any securities mentioned in this report.
A description of the Fund’s proxy voting policies and procedures related to portfolio securities is available without charge, upon request, by calling the Fund at (800)345-7999.
Information regarding how the Fund voted proxies for portfolio securities, if applicable, during the most recent 12-month period ended June 30, is also available, without charge and upon request by calling (800)345-7999, by visiting the Fund’s website at guggenheiminvestments.com/gof or by accessing the Fund’s Form N-PX on the U.S. Securities and Exchange Commission’s (SEC) website at www.sec.gov.
The Fund files its complete schedule of portfolio holdings with the SEC for the first and third quarters of each fiscal year on Form N-Q. The Fund’s Form N-Q is available on the SEC website at www.sec.gov or by visiting the Fund’s website at guggenheiminvestments.com/gof. The Fund’s Form N-Q may also be viewed and copied at the SEC’s Public Reference Room in Washington, DC; information on the operation of the Public Reference Room may be obtained by calling (800) SEC-0330 or at www.sec.gov.
Notice to Shareholders
Notice is hereby given in accordance with Section 23(c) of the Investment Company Act of 1940, as amended, that the Fund from time to time may purchase shares of its common stock in the open market.
GOF l GUGGENHEIM STRATEGIC OPPORTUNITIES FUND ANNUAL REPORT l 85
This Page Intentionally Left Blank.
86 l GOF l GUGGENHEIM STRATEGIC OPPORTUNITIES FUND ANNUAL REPORT
This Page Intentionally Left Blank.
GOF l GUGGENHEIM STRATEGIC OPPORTUNITIES FUND ANNUAL REPORT l 87
ABOUT THE FUND MANAGERS
Guggenheim Partners Investment Management, LLC
Guggenheim Partners Investment Management, LLC (“GPIM”) is an indirect subsidiary of Guggenheim Partners, LLC, a diversified financial services firm. The firm provides capital markets services, portfolio and risk management expertise, wealth management, and investment advisory services. Clients of Guggenheim Partners, LLC subsidiaries are an elite mix of individuals, family offices, endowments, foundations, insurance companies and other institutions.
Investment Philosophy
GPIM’s investment philosophy is predicated upon the belief that thorough research and independent thought are rewarded with performance that has the potential to outperform benchmark indexes with both lower volatility and lower correlation of returns over time as compared to such benchmark indexes.
Investment Process
GPIM’s investment process is a collaborative effort between various groups including the Portfolio Construction Group, which utilize proprietary portfolio construction and risk modeling tools to determine allocation of assets among a variety of sectors, and its Sector Specialists, who are responsible for security selection within these sectors and for implementing securities transactions, including the structuring of certain securities directly with the issuers or with investment banks and dealers involved in the origination of such securities.
Guggenheim Funds Distributors, LLC
227 West Monroe Street
Chicago, IL 60606
Member FINRA/SIPC
(07/17)
227 West Monroe Street
Chicago, IL 60606
Member FINRA/SIPC
(07/17)
| NOT FDIC-INSURED l NOT BANK-GUARANTEED l MAY LOSE VALUE | CEF-GOF-AR-0517 |
Item 2. Code of Ethics.
(a) The registrant has adopted a code of ethics (the "Code of Ethics") that applies to its principal executive officer, principal financial officer, principal accounting officer or controller, or persons performing similar functions.
(b) No information need be disclosed pursuant to this paragraph.
(c) The registrant has not amended its Code of Ethics during the period covered by the report presented in Item 1 hereto.
(d) The registrant has not granted a waiver or an implicit waiver to its principal executive officer, principal financial officer, principal accounting officer or controller, or persons performing similar functions from a provision of its Code of Ethics during the period covered by this report.
(e) Not applicable.
(f) (1) The registrant's Code of Ethics is attached hereto as Exhibit (a)(1).
(2) Not applicable.
(3) Not applicable.
Item 3. Audit Committee Financial Expert.
The registrant's Board of Trustees has determined that it has at least one audit committee financial expert serving on its audit committee (the "Audit Committee"), Dr. Jerry B. Farley. Dr. Farley qualifies as an audit committee financial expert by virtue of his experience at educational institutions, where his business responsibilities have included all aspects of financial management and reporting.
(Under applicable securities laws, a person who is determined to be an audit committee financial expert will not be deemed an "expert" for any purpose, including without limitation for the purposes of Section 11 of the Securities Act of 1933, as amended, as a result of being designated or identified as an audit committee financial expert. The designation or identification of a person as an audit committee financial expert does not impose on such person any duties, obligations, or liabilities that are greater than the duties, obligations, and liabilities imposed on such person as a member of the Audit Committee and Board of Trustees in the absence of such designation or identification. The designation or identification of a person as an audit committee financial expert does
not affect the duties, obligations or liability of any other member of the Audit Committee or Board of Trustees.)
Item 4. Principal Accountant Fees and Services.
(a) Audit Fees: the aggregate fees billed for professional services rendered by the principal accountant for the audit of the registrant's annual financial statements or services that are normally provided by the accountant in connection with statutory and regulatory filings or engagements were $63,651 and $65,640 for the fiscal years ended May 31, 2017, and May 31, 2017, respectively.
(b) Audit-Related Fees: the aggregate fees billed for assurance and related services by the principal accountant that are reasonably related to the performance of the audit of the registrant's financial statements and are not reported under paragraph 4(a) of this Item, were $29,750 and $22,050 for the fiscal years ended May 31, 2017, and May 31, 2016, respectively.
The registrant's principal accountant did not bill fees for non-audit services that required approval by the Audit Committee pursuant to paragraph (c)(7)(ii) of Rule 2-01 of Regulation S-X during the registrant's last two fiscal years.
(c) Tax Fees: the aggregate fees billed for professional services rendered by the principal accountant for tax compliance, tax advice and tax planning, including federal, state and local income tax return preparation and related advice and determination of taxable income and miscellaneous tax advice were $13,639 and $12,988 for the fiscal years ended May 31, 2017, and May 31, 2016, respectively.
The registrant's principal accountant did not bill fees for tax services that required approval by the Audit Committee pursuant to paragraph (c)(7)(ii) of Rule 2-01 of Regulation S-X during the registrant's last two fiscal years.
(d) All Other Fees: the aggregate fees billed for products and services provided by the principal accountant, other than the services reported in paragraphs (a) through (c) of this Item 4 were $0 and $0 for the fiscal years ended May 31, 2017, and May 31, 2016, respectively.
The registrant's principal accountant did not bill for services not included in Items 4(a), (b) or (c) above that required approval by the Audit Committee pursuant to paragraph (c)(7)(ii) of Rule 2-01 of Regulation S-X during the registrant's last two fiscal years.
(e) Audit Committee Pre-Approval Policies and Procedures.
(1) The registrant's audit committee reviews, and in its sole discretion, pre-approves, pursuant to written pre-approval procedures (A) all engagements for audit and non-audit services to be provided by the principal accountant to the registrant and (B) all engagements for non-audit services to be provided by the principal accountant (1) to the registrant's investment adviser (not including a sub-adviser whose role is primarily
portfolio management and is sub-contracted or overseen by another investment adviser) and (2) to any entity controlling, controlled by or under common control with the registrant's investment adviser that provides ongoing services to the registrant; but in the case of the services described in subsection (B)(1) or (2), only if the engagement relates directly to the operations and financial reporting of the registrant; provided that such pre-approval need not be obtained in circumstances in which the pre-approval requirement is waived under rules promulgated by the Securities and Exchange Commission or New York Stock Exchange listing standards. Sections V.B.2 and V.B.3 of the registrant's audit committee's revised Audit Committee Charter contain the Audit Committee's Pre-Approval Policies and Procedures and such sections are included below.
V.B.2.Pre-approve any engagement of the independent auditors to provide any non-prohibited services, other than "prohibited non-audit services," to the Trust, including the fees and other compensation to be paid to the independent auditors (unless an exception is available under Rule 2-01 of Regulation S-X).
| (a) | The categories of services to be reviewed and considered for pre-approval include the following (collectively, "Identified Services"): |
Audit Services
| · | Annual financial statement audits |
| · | Seed audits (related to new product filings, as required) |
| · | SEC and regulatory filings and consents |
Audit-Related Services
| · | Accounting consultations |
| · | Fund merger/reorganization support services |
| · | Other accounting related matters |
| · | Agreed upon procedures reports |
| · | Attestation reports |
| · | Other internal control reports |
Tax Services
| · | Recurring tax services: |
| o | Preparation of Federal and state income tax returns, including extensions |
| o | Preparation of calculations of taxable income, including fiscal year tax designations |
| o | Preparation of annual Federal excise tax returns (if applicable) |
| o | Preparation of calendar year excise distribution calculations |
| o | Calculation of tax equalization on an as-needed basis |
| o | Preparation of the estimated excise distribution calculations on an as-needed basis |
| o | Preparation of quarterly Federal, state and local and franchise tax estimated tax payments on an as-needed basis |
| o | Preparation of state apportionment calculations to properly allocate Fund taxable income among the states for state tax filing purposes |
| o | Provision of tax compliance services in India for Funds with direct investments in India |
| o | Assistance with management's identification of passive foreign investment companies (PFICs) for tax purposes |
| · | Permissible non-recurring tax services upon request: |
| o | Assistance with determining ownership changes which impact a Fund's utilization of loss carryforwards |
| o | Assistance with calendar year shareholder reporting designations on Form 1099 |
| o | Assistance with corporate actions and tax treatment of complex securities and structured products |
| o | Assistance with IRS ruling requests and calculation of deficiency dividends |
| o | Conduct training sessions for the Adviser's internal tax resources |
| o | Assistance with Federal, state, local and international tax planning and advice regarding the tax consequences of proposed or actual transactions |
| o | Tax services related to amendments to Federal, state and local returns and sales and use tax compliance |
| o | RIC qualification reviews |
| o | Tax distribution analysis and planning |
| o | Tax authority examination services |
| o | Tax appeals support services |
| o | Tax accounting methods studies |
| o | Fund merger, reorganization and liquidation support services |
| o | Tax compliance, planning and advice services and related projects |
| (b) | The Committee has pre-approved Identified Services for which the estimated fees are less than $25,000. |
| (c) | For Identified Services with estimated fees of $25,000 or more, but less than $50,000, the Chair or any member of the Committee designated by the Chair is hereby authorized to pre-approve such services on behalf of the Committee. |
| (d) | For Identified Services with estimated fees of $50,000 or more, such services require pre-approval by the Committee. |
| (e) | All requests for Identified Services to be provided by the independent auditor that were pre-approved by the Committee shall be submitted to the Chief Accounting Officer ("CAO") of the Trust by the independent auditor using the pre-approval request form attached as Appendix C to the Audit Committee Charter. The Trust's CAO will determine whether such services are included within the list of services that have received the general pre-approval of the Committee. |
| (f) | The independent auditors or the CAO of the Trust (or an officer of the Trust who reports to the CAO) shall report to the Committee at each of its regular quarterly meetings all audit, audit-related and permissible non-audit services initiated since the last such report (unless the services were contained in the initial audit plan, as previously presented to, and approved by, the Committee). The report shall include a general description of the services and projected fees, and the means by which such services were approved by the Committee (including the particular category of Identified Services under which pre-approval was obtained). |
V.B.3. Pre-approve any engagement of the independent auditors, including the fees and other compensation to be paid to the independent auditors, to provide any non-audit services to the Adviser (or any "control affiliate" of the Adviser providing ongoing services to the Trust), if the engagement relates directly to the operations and financial reporting of the Trust (unless an exception is available under Rule 2-01 of Regulation S-X).
| (a) | The Chair or any member of the Committee designated by the Chair may grant the pre-approval for non-audit services to the Adviser (or any "control affiliate" of the Adviser providing ongoing services to the Trust) relating directly to the operations and financial reporting of the Trust for which the estimated fees are less than $25,000. All such delegated pre-approvals shall be presented to the Committee no later than the next Committee meeting. |
| (b) | For non-audit services to the Adviser (or any "control affiliate" of the Adviser providing ongoing services to the Trust) relating directly to the operations and financial reporting of the Trust for which the estimated fees are $25,000 or more, such services require pre-approval by the Committee. |
(2) None of the services described in each of Items 4(b) through (d) were approved by the Audit Committee pursuant to paragraph (c)(7)(i)(C) of Rule 2-01 of Regulation S-X.
(f) Not applicable.
(g) The aggregate non-audit fees billed by the registrant's accountant for services rendered to the registrant, the registrant's investment adviser (not including a sub-adviser whose role is primarily portfolio management and is sub-contracted with or overseen by
another investment adviser) and/or any entity controlling, controlled by, or under common control with the adviser that provides ongoing services to the registrant were $81,212 and $74,738 for the fiscal years ended May 31, 2017, and May 31, 2016, respectively.
(h) Not applicable.
Item 5. Audit Committee of Listed Registrants.
(a) The Audit Committee was established as a separately designated standing audit committee in accordance with Section 3(a)(58)(A) of the Securities Exchange Act of 1934, as amended. The Audit Committee of the registrant is composed of: Randall C. Barnes; Ronald A. Nyberg; Ronald E. Toupin, Jr; Robert B. Karn III; Donald A. Chubb; Jerry B. Farley; Maynard F. Oliverius; and Roman Friedrich III.
(b) Not applicable.
Item 6. Schedule of Investments.
The Schedule of Investments is included as part of Item 1.
Item 7. Disclosure of Proxy Voting Policies and Procedures for Closed-End Management Investment Companies.
The registrant has delegated the voting of proxies relating to its voting securities to the registrant's investment sub-adviser, Guggenheim Partners Investment Management, LLC ("GPIM"). Guggenheim's proxy voting policies and procedures are included as Exhibit (c) hereto.
Item 8. Portfolio Managers of Closed-End Management Investment Companies.
(a)(1) GPIM serves as sub-adviser for the registrant and is responsible for the day-to-day management of the registrant's portfolio. GPIM uses a team approach to manage client portfolios. Day to day management of a client portfolio is conducted under the auspices of GPIM's Portfolio Construction Group ("PCG"). PCG's members include the Chief Investment Officer ("CIO") and other key investment personnel. The PCG, in consultation with the CIO, provides direction for overall investment strategy. The PCG performs several duties as it relates to client portfolios including: determining both tactical and strategic asset allocations; monitoring portfolio adherence to asset allocation targets; providing sector specialists with direction for overall investment strategy, which may include portfolio design and the rebalancing of portfolios; performing risk management oversight; assisting sector managers and research staff in determining the relative valuation of market sectors; and providing a forum for the regular discussion of the economy and the financial markets to enhance the robustness of GPIM's strategic and tactical policy directives.
The following individuals at GPIM share primary responsibility for the management of the registrant's portfolio and is provided as of May 31, 2017:
| Name | Since | Professional Experience During the Last Five Years | |
| Scott Minerd - CIO | 2013 | Guggenheim Partners Investment Management, LLC: CIO – 2005–Present; Guggenheim Partners, LLC: Managing Partner – Insurance Advisory – 1998–Present. | |
| Anne B. Walsh, CFA, FLMI – Senior Managing Director and Assistant CIO | 2013 | Guggenheim Partners Investment Management, LLC: Senior Managing Director and Assistant CIO – 2007–Present. | |
| James W. Michal – Senior Managing Director | 2013 | Guggenheim Partners Investment Management, LLC.: Senior Managing Director – 2008–Present. | |
| Steven Brown – Managing Director | 2012 | Guggenheim Partners Investment Management, LLC - Managing Director – 2016 to Present; Guggenheim Partners Investment Management, LLC – Director 2014 to 2016; Guggenheim Partners Investment Management, LLC – Vice President 2013 to 2014; Senior Associate 2012 to 2013. | |
(a)(2)(i-iii) Other Accounts Managed by the Portfolio Managers
The following tables summarize information regarding each of the other accounts managed by the Guggenheim portfolio managers as of May 31, 2017:
Scott Minerd:
| Type of Account | Number of Accounts | Total Assets in the Accounts | Number of Accounts In Which the Advisory Fee is Based on Performance | Total Assets in the Accounts In Which the Advisory Fee is Based on Performance |
| Registered investments companies | 20 | $19,402,552,506 | 0 | $0 |
| Other pooled investment vehicles | 85 | $23,404,676,885 | 38 | $11,450,374,226 |
| Other accounts | 134 | $125,798,138,834 | 7 | $1,427,054,059 |
Anne B. Walsh:
| Type of Account | Number of Accounts | Total Assets in the Accounts | Number of Accounts In Which the Advisory Fee is Based on Performance | Total Assets in the Accounts In Which the Advisory Fee is Based on Performance |
| Registered investments companies | 20 | $21,632,645,556 | 0 | $0 |
| Other pooled investment vehicles | 3 | $3,133,493,854 | 2 | $3,019,667,009 |
| Other accounts | 26 | $89,838,848,203 | 1 | $325,219,479 |
James W. Michal:
| Type of Account | Number of Accounts | Total Assets in the Accounts | Number of Accounts In Which the Advisory Fee is Based on Performance | Total Assets in the Accounts In Which the Advisory Fee is Based on Performance |
| Registered investments companies | 19 | $21,220,647,304 | 0 | $0 |
| Other pooled investment vehicles | 5 | $3,847,733,602 | 2 | $3,019,667,009 |
| Other accounts | 13 | $2,672,406,345 | 5 | $1,044,735,334 |
Steven Brown:
| Type of Account | Number of Accounts | Total Assets in the Accounts | Number of Accounts In Which the Advisory Fee is Based on Performance | Total Assets in the Accounts In Which the Advisory Fee is Based on Performance |
| Registered investments companies | 15 | $17,181,731,338 | 0 | $0 |
| Other pooled investment vehicles | 5 | $3,847,733,602 | 2 | $3,019,667,009 |
| Other accounts | 11 | $2,080,917,650 | 4 | $625,660,638 |
(a)(2)(iv) Potential Conflicts of Interest
Actual or apparent conflicts of interest may arise when a portfolio manager has day-to-day management responsibilities with respect to more than one fund or other account. More specifically, portfolio managers who manage multiple funds and/or other accounts may be presented with one or more of the following potential conflicts.
The management of multiple funds and/or other accounts may result in a portfolio manager devoting unequal time and attention to the management of each fund and/or other account. GPIM seeks to manage such competing interests for the time and attention of a portfolio manager by having the portfolio manager focus on a particular investment discipline. Specifically, the ultimate decision maker for security selection for each client portfolio is the Sector Specialist Portfolio Manager. They are responsible for analyzing and selecting specific securities that they believe best reflect the risk and return level as provided in each client's investment guidelines.
GPIM may have clients with similar investment strategies. As a result, if an investment opportunity would be appropriate for more than one client, GPIM may be required to choose among those clients in allocating such opportunity, or to allocate less of such opportunity to a client than it would ideally allocate if it did not have to allocate to
multiple clients. In addition, GPIM may determine that an investment opportunity is appropriate for a particular account, but not for another.
Allocation decisions are made in accordance with the investment objectives, guidelines, and restrictions governing the respective clients and in a manner that will not unfairly favor one client over another. GPIM's allocation policy provides that investment decisions must never be based upon account performance or fee structure. Accordingly, GPIM's allocation procedures are designed to ensure that investment opportunities are allocated equitably among different client accounts over time. The procedures also seek to ensure reasonable efficiency in client transactions and to provide portfolio managers with flexibility to use allocation methodologies appropriate to GPIM's investment disciplines and the specific goals and objectives of each client account.
In order to minimize execution costs and obtain best execution for clients, trades in the same security transacted on behalf of more than one client may be aggregated. In the event trades are aggregated, GPIM's policy and procedures provide as follows: (i) treat all participating client accounts fairly; (ii) continue to seek best execution; (iii) ensure that clients who participate in an aggregated order will participate at the average share price with all transaction costs shared on a pro-rata basis based on each client's participation in the transaction; (iv) disclose its aggregation policy to clients.
GPIM, as a fiduciary to its clients, considers numerous factors in arranging for the purchase and sale of clients' portfolio securities in order to achieve best execution for its clients. When selecting a broker, individuals making trades on behalf of GPIM clients consider the full range and quality of a broker's services, including execution capability, commission rate, price, financial stability and reliability. GPIM is not obliged to merely get the lowest price or commission but also must determine whether the transaction represents the best qualitative execution for the account.
In the event that multiple broker/dealers make a market in a particular security, GPIM's Portfolio Managers are responsible for selecting the broker-dealer to use with respect to executing the transaction. The broker-dealer will be selected on the basis of how the transaction can be executed to achieve the most favorable execution for the client under the circumstances. In many instances, there may only be one counter-party active in a particular security at a given time. In such situations the Employee executing the trade will use his/her best effort to obtain the best execution from the counter-party.
GPIM and the registrant have adopted certain compliance procedures which are designed to address these types of conflicts. However, there is no guarantee that such procedures will detect each and every situation in which a conflict arises.
(a)(3) Portfolio Manager Compensation
GPIM compensates Mr. Minerd, Ms. Walsh and Mr. Michal for their management of the registrant's portfolio. Compensation is evaluated based on their contribution to investment performance relative to pertinent benchmarks and qualitatively based on
factors such as teamwork and client service efforts. GPIM's staff incentives may include: a competitive base salary, bonus determined by individual and firm wide performance, equity participation, and participation opportunities in various GPIM investments. All GPIM employees are also eligible to participate in a 401(k) plan to which GPIM may make a discretionary match after the completion of each plan year.
(a)(4) Portfolio Manager Securities Ownership
The following table discloses the dollar range of equity securities of the registrant beneficially owned by each GPIM portfolio manager as of May 31, 2017:
| Name of Portfolio Manager | Dollar Amount of Equity Securities in Fund |
| Scott Minerd | $500,000 - $1,000,000 |
| Anne B. Walsh | $100,001-$500,000 |
| James W. Michal | $10,000 - $50,000 |
| Steven Brown | None |
Item 9. Purchases of Equity Securities by Closed-End Management Investment Company and Affiliated Purchasers.
None.
Item 10. Submission of Matters to a Vote of Security Holders.
The registrant has not made any material changes to the procedures by which shareholders may recommend nominees to the registrant's Board of Trustees.
Item 11. Controls and Procedures.
(a) The registrant's principal executive officer and principal financial officer have evaluated the registrant's disclosure controls and procedures (as defined in Rule 30a-3(c) under the Investment Company Act) as of a date within 90 days of this filing and have concluded based on such evaluation, as required by Rule 30a-3(b) under the Investment Company Act, that the registrant's disclosure controls and procedures were effective, as of that date, in ensuring that information required to be disclosed by the registrant in this Form N-CSR was recorded, processed, summarized, and reported within the time periods specified in the Securities and Exchange Commission's rules and forms.
(b) There were no changes in the registrant's internal control over financial reporting (as defined in Rule 30a-3(d) under the Investment Company Act) that occurred during the registrant's second fiscal quarter of the period covered by this report that have materially affected, or are reasonably likely to materially affect, the registrant's internal control over financial reporting.
Item 12. Exhibits.
(a)(1) Code of Ethics for Chief Executive and Senior Financial Officers.
(a)(2) Certifications of principal executive officer and principal financial officer pursuant to Rule 30a-2(a) under the Investment Company Act.
(a)(3) Not applicable.
(b) Certification of principal executive officer and principal financial officer pursuant to Rule 30a-2(b) under the Investment Company Act and Section 906 of the Sarbanes-Oxley Act of 2002.
(c) Guggenheim Partners Investment Management, LLC Proxy Voting Policies and Procedures.
SIGNATURES
Pursuant to the requirements of the Securities Exchange Act of 1934 and the Investment Company Act of 1940, the registrant has duly caused this report to be signed on its behalf by the undersigned, thereunto duly authorized.
(Registrant) Guggenheim Strategic Opportunities Fund
By: /s/ Donald C. Cacciapaglia
Name: Donald C. Cacciapaglia
Title: President and Chief Executive Officer
Date: August 9, 2017
Pursuant to the requirements of the Securities Exchange Act of 1934 and the Investment Company Act of 1940, this report has been signed by the following persons on behalf of the registrant and in the capacities and on the dates indicated.
By: /s/ Donald C. Cacciapaglia
Name: Donald C. CacciapagliaTitle: President and Chief Executive Officer
Date: August 9, 2017
By: /s/ John L. Sullivan Name: John L. Sullivan
Title: Chief Financial Officer, Chief Accounting Officer and Treasurer
Date: August 9, 2017