UNITED STATES
SECURITIES AND EXCHANGE COMMISSION
WASHINGTON, D.C. 20549
FORM N-CSR
CERTIFIED SHAREHOLDER REPORT OF REGISTERED
MANAGEMENT INVESTMENT COMPANIES
Investment Company Act file number 811-22001
db-X Exchange-Traded Funds Inc.
(Exact name of Registrant as specified in charter)
60 Wall Street
New York, New York 10005
(Address of principal executive offices) (Zip code)
Alex Depetris
db-X Exchange-Traded Funds Inc.
60 Wall Street
New York, New York 10005
(Name and address of agent for service)
Registrant’s telephone number, including area code: (212) 250-4352
Date of fiscal year end: May 31, 2011
Date of reporting period: May 31, 2011
| Item 1. | Report to Stockholders. |
The Registrant’s annual report transmitted to shareholders pursuant to Rule 30e-1 under the Investment Company Act of 1940 is as follows:
ANNUAL REPORT
May 31, 2011
db-X Exchange-Traded Funds Inc.
db-X 2010 Target Date Fund
(formerly, TDX Independence 2010 Exchange-Traded Fund)
db-X 2020 Target Date Fund
(formerly, TDX Independence 2020 Exchange-Traded Fund)
db-X 2030 Target Date Fund
(formerly, TDX Independence 2030 Exchange-Traded Fund)
db-X 2040 Target Date Fund
(formerly, TDX Independence 2040 Exchange-Traded Fund)
db-X In-Target Date Fund
(formerly, TDX Independence In-Target Exchange-Traded Fund)
db-X Exchange-Traded Funds Inc.
TABLE OF CONTENTS
This Page is Intentionally Left Blank
TO OUR SHAREHOLDERS:
Dear Shareholder,
We are pleased to present this Annual Report for db-X Exchange-Traded Funds Inc. (formerly TDX Independence Funds, Inc.), which covers the year ending May 31, 2011.
Effective June 17, 2011, the names of the funds were changed to the “db-X” brand, to make it easier for investors to identify our funds. Although the names of the funds have changed, their ticker symbols and investment strategies remain the same. This change reflects our commitment to providing outstanding products and support in order to help you reach you investment goals.
Over the past year, the funds have continued to highlight the benefits of target-date investing. During the twelve months covered by this report, the db-X 2040 Target Date Fund (formerly TDX Independence 2040 Exchange-Traded Fund) and the db-X 2030 Target Date Fund (formerly TDX Independence 2030 Exchange-Traded Fund), which have the greatest percentage allocations to equities, benefitted from strong performance in domestic and international equity markets and experienced net asset value (NAV) returns of 26.32% and 23.74%, respectively.* The db-X 2020 Target Date Fund (formerly TDX Independence 2020 Exchange-Traded Fund), with a more balanced allocation between equity and fixed income securities, experienced a NAV return of 18.71%.* For investors with a shorter investment horizon, the db-X 2010 Target Date Fund (formerly TDX Independence 2010 Exchange-Traded Fund) and the db-X In-Target Date Fund (formerly TDX Independence In-Target Exchange-Traded Fund), which allocate a large percentage of assets to less volatile fixed-income securities, experienced NAV returns of 6.09% and 7.44%, respectively.*
Deutsche Bank, a leading global banking institution, has managed and operated a successful and growing platform of exchange-traded products since 2006. Our team at Deutsche Bank values the trust that you have placed in us and we look forward to meeting your investment needs by continuing to offer innovative index-driven strategies.
Very truly yours,
|

|
Alex N. Depetris Chairman, President and Chief Executive Officer July 25, 2011 |
* Performance quoted represents past performance, assumes reinvestment of all dividends and capital gains distributions at NAV, and does not guarantee future results. The NAV return is based on the changes in a Fund’s per share NAV for the period(s) indicated. The Fund’s NAV per share is calculated by dividing the value of the Fund’s total assets less total liabilities by the number of shares outstanding. Current performance may be higher or lower than the performance quoted. See pages 3-12 of this report for additional performance information, including performance data based on market value. Performance data for the most recent month end may be obtained by visiting www.dbxstrategicadvisors.db.com. Investment in the Funds poses investment risk including the possible loss of principal. The investment return and principal value of an investment will fluctuate, so that shares, when sold or redeemed, may be worth more or less than their original cost.
1
This Page is Intentionally Left Blank
db-X Exchange-Traded Funds Inc.
MANAGEMENT’S DISCUSSION OF FUND PERFORMANCE
After being range-bound for much of the summer in 2010, a six month rally spurred by the Federal Reserve’s second round of quantitative easing and improving economic conditions helped lead equity markets to strong gains for the year ended May 31, 2011 with the S&P 500 Index increasing 25.95%, the Russell 3000 Index increasing 27.04% and the NASDAQ Composite Index increasing 26.92%. International equity markets also exhibited strength, with the MSCI EAFE Index (measuring equities in Europe, Australasia and the Far East) gaining 30.41%. U.S. fixed income securities continued to be a haven for risk-averse investors, with the Barclays Capital U.S. Aggregate Bond Index increasing 5.84% during the same period.
db-X Exchange-Traded Funds Inc. (the “Funds”) had a wide range of returns during the year. (For specific performance results, please refer to the Fund Performance Section on the following pages of this report.) The wide range in the performance of the five Funds was due to the varying allocations in the funds to domestic equities, international equities and fixed income securities. The 2040 Fund, which is allocated heavily towards U.S. equities, experienced a strong gain of 26.32% during the one year period ending May 31, 2011. The 2010 Fund, which has a heavy exposure to short-term U.S. Treasury securities, returned a more modest 6.09% during the same period.
The Standard & Poor’s (“S&P”) 500 Index is a broad-based index designed to measure the performance of the domestic stock market as represented by 500 large capitalization stocks.
The Russell 3000 Index is a broad-based index representing approximately 98% of the investable U.S. equity market.
The NASDAQ Composite Index is a broad-based index of NASDAQ-listed securities commonly used as a barometer of technology stock performance.
The Morgan Stanley Capital International (“MSCI”) EAFE Index is a broad-based index representing the largest stocks by market capitalization in 21 developed countries in Europe, Australasia and the Far East.
The Barclays Capital U.S. Aggregate Bond Index is a broad-based index designed to represent the U.S. investment-grade bond universe.
One cannot invest directly in an index. Performance quoted represents past performance and does not guarantee future results.
2
db-X Exchange-Traded Funds Inc.
PERFORMANCE SUMMARY
db-X 2010 Target Date Fund (TDD)
The db-X 2010 Target Date Fund (the “Fund”) commenced investment operations and its shares began trading on the NYSE Arca, Inc. (“NYSE Arca”) on October 1, 2007. The Fund seeks to track the performance, before fees and expenses, of the Zacks 2010 Lifecycle Index. Both the Fund’s equity and bond portfolios held fewer securities than the Zacks 2010 Lifecycle Index, a constraint imposed by the relatively small size of the Fund.
For the fiscal year ended May 31, 2011, the Fund’s net asset value increased 6.09%, compared to an increase of 6.56% for the Zacks 2010 Lifecycle Index and 13.01% for the Dow Jones Target 2010 Index. The fund’s performance benefited from favorable results in several equity sectors, in particular Energy, Information Technology and Industrials, partially offset by the Fund’s heavier weighting to fixed income securities, in particular short-term U.S. Treasury securities.
Performance as of 5/31/11
| | | | | | | | |
| Average Annual Total Return |
| | | Net Asset Value | | Market Price | | Zacks 2010 Lifecycle
Index | | Dow Jones Target 2010
Index |
One Year | | 6.09% | | 3.53% | | 6.56% | | 13.01% |
Since Inception1 | | 1.09% | | 0.35% | | 1.25% | | 4.54% |
|
| Cumulative Total Return |
| | | Net Asset Value | | Market Price | | Zacks 2010 Lifecycle
Index | | Dow Jones Target 2010
Index |
One Year | | 6.09% | | 3.53% | | 6.56% | | 13.01% |
Since Inception1 | | 4.04% | | 1.31% | | 4.64% | | 17.67% |
1 Total returns are calculated based on the commencement of trading, 10/1/07 (“Inception”).
Performance quoted represents past performance, assumes reinvestment of all dividends and capital gain distributions, and does not guarantee future results. Current performance may be higher or lower than the performance quoted. Performance data current to the most recent month end may be obtained by visiting www.dbxstrategicadvisors.db.com. Investment in the fund poses investment risk including possible loss of principal. The investment return and principal value of an investment will fluctuate, so that shares, when sold or redeemed, may be worth more or less than their original cost. The gross expense ratio for the fiscal year ended May 31, 2010, as disclosed in the most recent prospectus dated September 28, 2010, was 2.10%. DBX Strategic Advisors LLC, the advisor to the Fund, has agreed to cap its fees and/or pay certain Fund operating expenses in order to limit Fund net annual operating expenses for shares of the Fund to 0.65% of the Fund’s average net assets until 9/30/11.
The preceding performance chart is provided for comparative purposes and represents the period(s) noted. The net asset value return is based on the changes in the Fund’s net asset value per share (“NAV”). The Fund’s NAV is calculated by dividing the value of the Fund’s total assets less total liabilities by the number of shares outstanding. The market price return is based on the change in the market price on the NYSE Arca of a share of the Fund for the period(s) indicated. The price used to calculate market price returns is the midpoint of the bid/ask spread for Fund shares at 4 p.m. Eastern Time on the NYSE Arca. NAV and market returns assume that dividends and capital gain distributions have been reinvested in the Fund at NAV and market price, respectively. The Dow Jones Target Date Indexes are indexes whose allocations are automatically adjusted to reduce potential risk over time. The Dow Jones Target Date Indexes are designed to measure the performance of multi-asset class portfolios that allocate among U.S. and global stock, bond and cash subindexes on a monthly basis. The indexes automatically adjust their asset allocation over time to reflect reductions in potential risk as the investor’s target date approaches.
An index is a statistical measure of a specified financial market or sector. An index does not actually hold a portfolio of securities, incur expenses or pay any transaction costs. Therefore index returns do not reflect deductions for fees or expenses and are not available for direct investment. In comparison, the Fund’s performance is negatively impacted by these deductions. Fund returns do not reflect brokerage commissions or taxes that a shareholder would pay on Fund distributions or on transactions in Fund shares.
“Target Date” refers to a time in the future, generally a specified year, in which the investor expects to retire or otherwise require the use of the invested funds. Target date funds are generally more aggressive the further the target date is from the present, with an objective of capital appreciation. As the target date approaches, the fund’s objective will generally become more conservative, aiming to achieve a higher level of capital preservation. Upon reaching the target date, the Underlying Index will have approximately a 10% allocation to equity securities. Over the next five years, allocations shift from conservative to more moderately-conservative allocations, allowing for a larger exposure to equities than at the target date (“Moderately-Conservative Allocation”).
Investors should note that although target date funds aim to preserve capital as the target date approaches, there is no guarantee that the Fund will achieve this objective.
3
db-X Exchange-Traded Funds Inc.
PERFORMANCE SUMMARY
db-X 2010 Target Date Fund (TDD) (Continued)
Growth of a $10,000 Investment in TDD2 as of 5/31/11
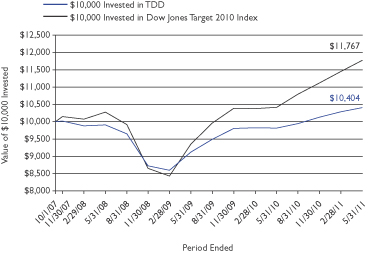
2 Based on Net Asset Value from commencement of trading 10/1/07.
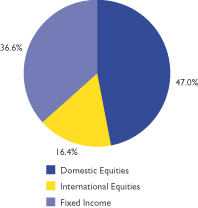
Asset Class Breakdown* as of 5/31/11
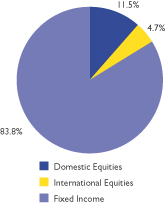
* Weightings are expressed as a percentage of total investments and may change over time.
Top Ten Holdings3 as of 5/31/11
| | | | | | | | | | | | |
| |
| Top Ten Equity Holdings | |
| | | |
| Description | | Shares | | | Value | | | % of Net Assets | |
Exxon Mobil Corp. | | | 794 | | | | $66,275 | | | | 0.5% | |
Apple, Inc. | | | 150 | | | | 52,174 | | | | 0.4% | |
Chevron Corp. | | | 325 | | | | 34,096 | | | | 0.2% | |
International Business Machines Corp. | | | 199 | | | | 33,617 | | | | 0.2% | |
General Electric Co. | | | 1,662 | | | | 32,641 | | | | 0.2% | |
Berkshire Hathaway, Inc., Class B | | | 409 | | | | 32,340 | | | | 0.2% | |
Microsoft Corp. | | | 1,217 | | | | 30,437 | | | | 0.2% | |
Wal-Mart Stores, Inc. | | | 551 | | | | 30,427 | | | | 0.2% | |
Procter & Gamble (The) Co. | | | 442 | | | | 29,614 | | | | 0.2% | |
Johnson & Johnson | | | 436 | | | | 29,337 | | | | 0.2% | |
| | | | | | | | | | | | |
| |
| Top Ten Fixed Income Holdings | |
| | | |
| Description | | Principal Amount | | | Value | | | % of Net Assets | |
U.S. Treasury Bond/Note, 4.75%, 5/15/14 | | | $955,200 | | | | $1,066,690 | | | | 7.4% | |
U.S. Treasury Bond/Note, 1.38%, 4/15/12 | | | 992,900 | | | | 1,003,217 | | | | 7.0% | |
U.S. Treasury Bond/Note, 1.38%, 2/15/13 | | | 901,200 | | | | 916,620 | | | | 6.4% | |
U.S. Treasury Bond/Note, 1.38%, 5/15/12 | | | 840,000 | | | | 849,384 | | | | 5.9% | |
U.S. Treasury Bond/Note, 1.38%, 3/15/13 | | | 830,000 | | | | 844,464 | | | | 5.9% | |
U.S. Treasury Bond/Note, 1.75%, 11/15/11 | | | 768,800 | | | | 774,596 | | | | 5.4% | |
U.S. Treasury Bond/Note, 2.38%, 2/28/15 | | | 689,700 | | | | 721,706 | | | | 5.0% | |
U.S. Treasury Bond/Note, 3.38%, 7/31/13 | | | 614,900 | | | | 653,283 | | | | 4.5% | |
U.S. Treasury Bond/Note, 1.38%, 2/15/12 | | | 420,000 | | | | 423,659 | | | | 2.9% | |
Fed. Home Loan Mort. Corp., 4.50%, 1/15/13 | | | 373,000 | | | | 397,821 | | | | 2.8% | |
3 Holdings are subject to change without notice and there is no guarantee that the Fund will remain invested in any particular security. For a complete list of holdings go to www.dbxstrategicadvisors.db.com.
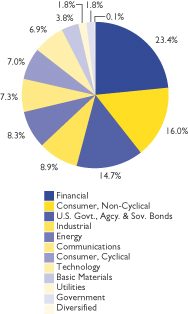
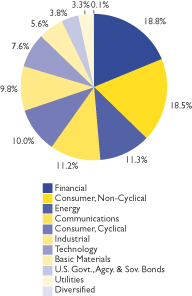
Sector Breakdown* as of 5/31/11
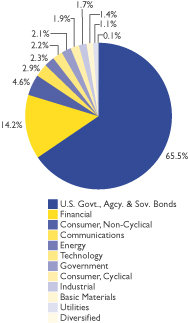
* Weightings are expressed as a percentage of total investments and may change over time. The sector classifications used above are based on company classifications under Bloomberg industry name.
4
db-X Exchange-Traded Funds Inc.
PERFORMANCE SUMMARY
db-X 2020 Target Date Fund (TDH)
The db-X 2020 Target Date Fund (the “Fund”) commenced investment operations and its shares began trading on the NYSE Arca, Inc. (“NYSE Arca”) on October 1, 2007. The Fund seeks to track the performance, before fees and expenses, of the Zacks 2020 Lifecycle Index. Both the Fund’s equity and bond portfolios held fewer securities than the Zacks 2020 Lifecycle Index, a constraint imposed by the relatively small size of the Fund.
For the fiscal year ended May 31, 2011, the Fund’s net asset value increased 18.71%, compared to an increase of 19.38% for the Zacks 2020 Lifecycle Index and 17.29% for the Dow Jones Target 2020 Index. The fund’s performance benefitted from favorable results in several equity sectors, in particular Energy, Information Technology and Industrials as well as strong performance in intermediate-term U.S. Treasury securities.
Performance as of 5/31/11
| | | | | | | | |
| Average Annual Total Return |
| | | Net Asset Value | | Market Price | | Zacks 2020 Lifecycle
Index | | Dow Jones Target 2020
Index |
One Year | | 18.71% | | 17.65% | | 19.38% | | 17.29% |
Since Inception1 | | 0.56% | | -0.17% | | 0.74% | | 2.60% |
|
| Cumulative Total Return |
| | | Net Asset Value | | Market Price | | Zacks 2020 Lifecycle
Index | | Dow Jones Target 2020
Index |
One Year | | 18.71% | | 17.65% | | 19.38% | | 17.29% |
Since Inception1 | | 2.07% | | -0.64% | | 2.72% | | 9.85% |
1 Total returns are calculated based on the commencement of trading, 10/1/07 (“Inception”).
Performance quoted represents past performance, assumes reinvestment of all dividends and capital gain distributions, and does not guarantee future results. Current performance may be higher or lower than the performance quoted. Performance data current to the most recent month end may be obtained by visiting www.dbxstrategicadvisors.db.com. Investment in the fund poses investment risk including possible loss of principal. The investment return and principal value of an investment will fluctuate, so that shares, when sold or redeemed, may be worth more or less than their original cost. The gross expense ratio for the fiscal year ended May 31, 2010, as disclosed in the most recent prospectus dated September 28, 2010, was 1.90%. DBX Strategic Advisors LLC, the advisor to the Fund, has agreed to cap its fees and/or pay certain Fund operating expenses in order to limit Fund net annual operating expenses for shares of the Fund to 0.65% of the Fund’s average net assets until 9/30/11.
The preceding performance chart is provided for comparative purposes and represents the period(s) noted. The net asset value return is based on the changes in the Fund’s net asset value per share (“NAV”). The Fund’s NAV is calculated by dividing the value of the Fund’s total assets less total liabilities by the number of shares outstanding. The market price return is based on the change in the market price on the NYSE Arca of a share of the Fund for the period(s) indicated. The price used to calculate market price returns is the midpoint of the bid/ask spread for Fund shares at 4 p.m. Eastern Time on the NYSE Arca. NAV and market returns assume that dividends and capital gain distributions have been reinvested in the Fund at NAV and market price, respectively. The Dow Jones Target Date Indexes are indexes whose allocations are automatically adjusted to reduce potential risk over time. The Dow Jones Target Date Indexes are designed to measure the performance of multi-asset class portfolios that allocate among U.S. and global stock, bond and cash subindexes on a monthly basis. The indexes automatically adjust their asset allocation over time to reflect reductions in potential risk as the investor’s target date approaches.
An index is a statistical measure of a specified financial market or sector. An index does not actually hold a portfolio of securities, incur expenses or pay any transaction costs. Therefore index returns do not reflect deductions for fees or expenses and are not available for direct investment. In comparison, the Fund’s performance is negatively impacted by these deductions. Fund returns do not reflect brokerage commissions or taxes that a shareholder would pay on Fund distributions or on transactions in Fund shares.
“Target Date” refers to a time in the future, generally a specified year, in which the investor expects to retire or otherwise require the use of the invested funds. Target date funds are generally more aggressive the further the target date is from the present, with an objective of capital appreciation. As the target date approaches, the fund’s objective will generally become more conservative, aiming to achieve a higher level of capital preservation. Upon reaching the target date, the Underlying Index will have approximately a 10% allocation to equity securities. Over the next five years, allocations shift from conservative to more moderately-conservative allocations, allowing for a larger exposure to equities than at the target date (“Moderately-Conservative Allocation”).
Investors should note that although target date funds aim to preserve capital as the target date approaches, there is no guarantee that the Fund will achieve this objective.
5
db-X Exchange-Traded Funds Inc.
PERFORMANCE SUMMARY
db-X 2020 Target Date Fund (TDH) (Continued)
Growth of a $10,000 Investment in TDH2 as of 5/31/11
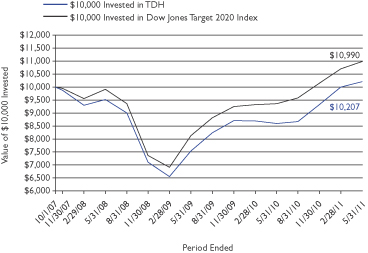
2 Based on Net Asset Value from commencement of trading 10/1/07.
Asset Class Breakdown* as of 5/31/11
* Weightings are expressed as a percentage of total investments and may change over time.
Top Ten Holdings3 as of 5/31/11
| | | | | | | | | | | | |
| |
| Top Ten Equity Holdings | |
| | | |
| Description | | Shares | | | Value | | | % of Net Assets | |
Exxon Mobil Corp. | | | 8,219 | | | | $686,039 | | | | 1.8% | |
Apple, Inc. | | | 1,488 | | | | 517,570 | | | | 1.3% | |
International Business Machines Corp. | | | 2,060 | | | | 347,997 | | | | 0.9% | |
Berkshire Hathaway, Inc., Class B | | | 4,171 | | | | 329,800 | | | | 0.9% | |
General Electric Co. | | | 16,693 | | | | 327,850 | | | | 0.9% | |
Chevron Corp. | | | 3,099 | | | | 325,116 | | | | 0.8% | |
Wal-Mart Stores, Inc. | | | 5,874 | | | | 324,362 | | | | 0.8% | |
Johnson & Johnson | | | 4,788 | | | | 322,184 | | | | 0.8% | |
Procter & Gamble (The) Co. | | | 4,797 | | | | 321,399 | | | | 0.8% | |
Microsoft Corp. | | | 12,843 | | | | 321,203 | | | | 0.8% | |
| | | | | | | | | | | | |
| |
| Top Ten Fixed Income Holdings | |
| | | |
| Description | | Principal Amount | | | Value | | | % of Net Assets | |
U.S. Treasury Bond/Note, 4.75%, 5/15/14 | | | $1,026,300 | | | | $1,146,089 | | | | 3.0% | |
U.S. Treasury Bond/Note, 8.13%, 8/15/19 | | | 527,900 | | | | 744,916 | | | | 1.9% | |
U.S. Treasury Bond/Note, 3.13%, 1/31/17 | | | 686,700 | | | | 731,175 | | | | 1.9% | |
European Investment Bank, MTN, 4.63%, 5/15/14 | | | 625,000 | | | | 689,733 | | | | 1.8% | |
General Electric Co., 5.25%, 12/06/17 | | | 543,000 | | | | 611,242 | | | | 1.6% | |
Fed. Natl. Mort. Assoc., 5.00%, 5/11/17 | | | 485,000 | | | | 559,033 | | | | 1.5% | |
U.S. Treasury Bond/Note, 2.50%, 3/31/15 | | | 510,600 | | | | 536,649 | | | | 1.4% | |
U.S. Treasury Bond/Note, 6.25%, 5/15/30 | | | 399,200 | | | | 526,570 | | | | 1.4% | |
Goldman Sachs Group (The), Inc., 5.00%, 10/01/14 | | | 459,000 | | | | 495,442 | | | | 1.3% | |
U.S. Treasury Bond/Note, 3.63%, 2/15/20 | | | 424,700 | | | | 452,372 | | | | 1.2% | |
3 Holdings are subject to change without notice and there is no guarantee that the Fund will remain invested in any particular security. For a complete list of holdings go to www.dbxstrategicadvisors.db.com.
Sector Breakdown* as of 5/31/11
* Weightings are expressed as a percentage of total investments and may change over time. The sector classifications used above are based on company classifications under Bloomberg industry name.
6
db-X Exchange-Traded Funds Inc.
PERFORMANCE SUMMARY
db-X 2030 Target Date Fund (TDN)
The db-X 2030 Target Date Fund (the “Fund”) commenced investment operations and its shares began trading on the NYSE Arca, Inc. (“NYSE Arca”) on October 1, 2007. The Fund seeks to track the performance, before fees and expenses, of the Zacks 2030 Lifecycle Index. Both the Fund’s equity and bond portfolios held fewer securities than the Zacks 2030 Lifecycle Index, a constraint imposed by the relatively small size of the Fund.
For the fiscal year ended May 31, 2011, the Fund’s net asset value increased 23.74%, compared to an increase of 24.63% for the Zacks 2030 Lifecycle Index and 22.79% for the Dow Jones Target 2030 Index. The fund’s performance benefitted from its heavy weighting to equities with favorable results in several sectors, in particular Energy, Information Technology and Industrials.
Performance as of 5/31/11
| | | | | | | | |
| Average Annual Total Return |
| | | Net Asset Value | | Market Price | | Zacks 2030 Lifecycle
Index | | Dow Jones Target 2030
Index |
One Year | | 23.74% | | 27.37% | | 24.63% | | 22.79% |
Since Inception1 | | -2.23% | | -2.26% | | -2.03% | | 1.40% |
|
| Cumulative Total Return |
| | | Net Asset Value | | Market Price | | Zacks 2030 Lifecycle
Index | | Dow Jones Target 2030
Index |
One Year | | 23.74% | | 27.37% | | 24.63% | | 22.79% |
Since Inception1 | | -7.95% | | -8.05% | | -7.23% | | 5.21% |
1 Total returns are calculated based on the commencement of trading, 10/1/07 (“Inception”).
Performance quoted represents past performance, assumes reinvestment of all dividends and capital gain distributions, and does not guarantee future results. Current performance may be higher or lower than the performance quoted. Performance data current to the most recent month end may be obtained by visiting www.dbxstrategicadvisors.db.com. Investment in the fund poses investment risk including possible loss of principal. The investment return and principal value of an investment will fluctuate, so that shares, when sold or redeemed, may be worth more or less than their original cost. The gross expense ratio for the fiscal year ended May 31, 2010, as disclosed in the most recent prospectus dated September 28, 2010, was 1.95%. DBX Strategic Advisors LLC, the advisor to the Fund, has agreed to cap its fees and/or pay certain Fund operating expenses in order to limit Fund net annual operating expenses for shares of the Fund to 0.65% of the Fund’s average net assets until 9/30/11.
The preceding performance chart is provided for comparative purposes and represents the period(s) noted. The net asset value return is based on the changes in the Fund’s net asset value per share (“NAV”). The Fund’s NAV is calculated by dividing the value of the Fund’s total assets less total liabilities by the number of shares outstanding. The market price return is based on the change in the market price on the NYSE Arca of a share of the Fund for the period(s) indicated. The price used to calculate market price returns is the midpoint of the bid/ask spread for Fund shares at 4 p.m. Eastern Time on the NYSE Arca. NAV and market returns assume that dividends and capital gain distributions have been reinvested in the Fund at NAV and market price, respectively. The Dow Jones Target Date Indexes are indexes whose allocations are automatically adjusted to reduce potential risk over time. The Dow Jones Target Date Indexes are designed to measure the performance of multi-asset class portfolios that allocate among U.S. and global stock, bond and cash subindexes on a monthly basis. The indexes automatically adjust their asset allocation over time to reflect reductions in potential risk as the investor’s target date approaches.
An index is a statistical measure of a specified financial market or sector. An index does not actually hold a portfolio of securities, incur expenses or pay any transaction costs. Therefore index returns do not reflect deductions for fees or expenses and are not available for direct investment. In comparison, the Fund’s performance is negatively impacted by these deductions. Fund returns do not reflect brokerage commissions or taxes that a shareholder would pay on Fund distributions or on transactions in Fund shares.
“Target Date” refers to a time in the future, generally a specified year, in which the investor expects to retire or otherwise require the use of the invested funds. Target date funds are generally more aggressive the further the target date is from the present, with an objective of capital appreciation. As the target date approaches, the fund’s objective will generally become more conservative, aiming to achieve a higher level of capital preservation. Upon reaching the target date, the Underlying Index will have approximately a 10% allocation to equity securities. Over the next five years, allocations shift from conservative to more moderately-conservative allocations, allowing for a larger exposure to equities than at the target date (“Moderately-Conservative Allocation”).
Investors should note that although target date funds aim to preserve capital as the target date approaches, there is no guarantee that the Fund will achieve this objective.
7
db-X Exchange-Traded Funds Inc.
PERFORMANCE SUMMARY
db-X 2030 Target Date Fund (TDN) (Continued)
Growth of a $10,000 Investment in TDN2 as of 5/31/11
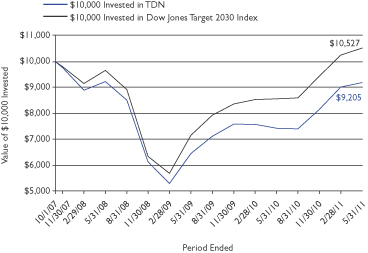
2 Based on Net Asset Value from commencement of trading 10/1/07.
Asset Class Breakdown* as of 5/31/11
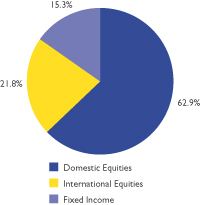
* Weightings are expressed as a percentage of total investments and may change over time.
Top Ten Holdings3 as of 5/31/11
| | | | | | | | | | | | |
| |
| Top Ten Equity Holdings | |
| | | |
| Description | | Shares | | | Value | | | % of Net Assets | |
Exxon Mobil Corp. | | | 10,062 | | | | $839,875 | | | | 2.4% | |
Apple, Inc. | | | 1,804 | | | | 627,485 | | | | 1.8% | |
International Business Machines Corp. | | | 2,560 | | | | 432,461 | | | | 1.2% | |
Wal-Mart Stores, Inc. | | | 7,325 | | | | 404,486 | | | | 1.1% | |
General Electric Co. | | | 20,565 | | | | 403,897 | | | | 1.1% | |
Berkshire Hathaway, Inc., Class B | | | 5,102 | | | | 403,415 | | | | 1.1% | |
Microsoft Corp. | | | 15,818 | | | | 395,607 | | | | 1.1% | |
Johnson & Johnson | | | 5,869 | | | | 394,925 | | | | 1.1% | |
Chevron Corp. | | | 3,758 | | | | 394,252 | | | | 1.1% | |
Procter & Gamble (The) Co. | | | 5,841 | | | | 391,347 | | | | 1.1% | |
| | | | | | | | | | | | |
| |
| Top Ten Fixed Income Holdings | |
| | | |
| Description | | Principal Amount | | | Value | | | % of Net Assets | |
U.S. Treasury Bond/Note, 4.38%, 2/15/38 | | | $304,200 | | | | $314,467 | | | | 0.9% | |
U.S. Treasury Bond/Note, 8.13%, 8/15/19 | | | 113,900 | | | | 160,724 | | | | 0.5% | |
Verizon Global Funding Corp., 7.75%, 12/01/30 | | | 124,000 | | | | 157,618 | | | | 0.4% | |
General Electric Capital Corp., Series A, MTN, 6.75%, 3/15/32 | | | 136,000 | | | | 155,873 | | | | 0.4% | |
MidAmerican Energy Holdings Co., 6.13%, 4/01/36 | | | 133,000 | | | | 147,432 | | | | 0.4% | |
Citigroup, Inc., 8.13%, 7/15/39 | | | 108,000 | | | | 141,230 | | | | 0.4% | |
U.S. Treasury Bond/Note, 1.75%, 11/15/11 | | | 139,600 | | | | 140,652 | | | | 0.4% | |
Target Corp., 7.00%, 1/15/38 | | | 110,000 | | | | 135,936 | | | | 0.4% | |
ConocoPhillips, 5.90%, 10/15/32 | | | 117,000 | | | | 130,145 | | | | 0.4% | |
Bank of New York Mellon (The) Corp., Series G, MTN, 4.60%, 1/15/20 | | | 117,000 | | | | 124,737 | | | | 0.4% | |
3 Holdings are subject to change without notice and there is no guarantee that the Fund will remain invested in any particular security. For a complete list of holdings go to www.dbxstrategicadvisors.db.com.
Sector Breakdown* as of 5/31/11
* Weightings are expressed as a percentage of total investments and may change over time. The sector classifications used above are based on company classifications under Bloomberg industry name.
8
db-X Exchange-Traded Funds Inc.
PERFORMANCE SUMMARY
db-X 2040 Target Date Fund (TDV)
The db-X 2040 Target Date Fund (the “Fund”) commenced investment operations and its shares began trading on the NYSE Arca, Inc. (“NYSE Arca”) on October 1, 2007. The Fund seeks to track the performance, before fees and expenses, of the Zacks 2040 Lifecycle Index. Both the Fund’s equity and bond portfolios held fewer securities than the Zacks 2040 Lifecycle Index, a constraint imposed by the relatively small size of the Fund.
For the fiscal year ended May 31, 2011, the Fund’s net asset value increased 26.32%, compared to an increase of 27.00% for the Zacks 2040 Lifecycle Index and 26.33% for the Dow Jones Target 2040 Index. The fund’s performance benefitted from its heavy weighting to equities with favorable results in several sectors, in particular Energy, Information Technology and Industrials.
Performance as of 5/31/11
| | | | | | | | |
| Average Annual Total Return |
| | | Net Asset Value | | Market Price | | Zacks 2040 Lifecycle
Index | | Dow Jones Target 2040
Index |
One Year | | 26.32% | | 30.20% | | 27.00% | | 26.33% |
Since Inception1 | | -2.88% | | -2.84% | | -2.73% | | 0.88% |
|
| Cumulative Total Return |
| | | Net Asset Value | | Market Price | | Zacks 2040 Lifecycle
Index | | Dow Jones Target 2040
Index |
One Year | | 26.32% | | 30.20% | | 27.00% | | 26.33% |
Since Inception1 | | -10.18% | | -10.03% | | -9.64% | | 3.26% |
1 Total returns are calculated based on the commencement of trading, 10/1/07 (“Inception”).
Performance quoted represents past performance, assumes reinvestment of all dividends and capital gain distributions, and does not guarantee future results. Current performance may be higher or lower than the performance quoted. Performance data current to the most recent month end may be obtained by visiting www.dbxstrategicadvisors.db.com. Investment in the fund poses investment risk including possible loss of principal. The investment return and principal value of an investment will fluctuate, so that shares, when sold or redeemed, may be worth more or less than their original cost. The gross expense ratio for the fiscal year ended May 31, 2010, as disclosed in the most recent prospectus dated September 28, 2010, was 1.97%. DBX Strategic Advisors LLC, the advisor to the Fund, has agreed to cap its fees and/or pay certain Fund operating expenses in order to limit Fund net annual operating expenses for shares of the Fund to 0.65% of the Fund’s average net assets until 9/30/11.
The preceding performance chart is provided for comparative purposes and represents the period(s) noted. The net asset value return is based on the changes in the Fund’s net asset value per share (“NAV”). The Fund’s NAV is calculated by dividing the value of the Fund’s total assets less total liabilities by the number of shares outstanding. The market price return is based on the change in the market price on the NYSE Arca of a share of the Fund for the period(s) indicated. The price used to calculate market price returns is the midpoint of the bid/ask spread for Fund shares at 4 p.m. Eastern Time on the NYSE Arca. NAV and market returns assume that dividends and capital gain distributions have been reinvested in the Fund at NAV and market price, respectively. The Dow Jones Target Date Indexes are indexes whose allocations are automatically adjusted to reduce potential risk over time. The Dow Jones Target Date Indexes are designed to measure the performance of multi-asset class portfolios that allocate among U.S. and global stock, bond and cash subindexes on a monthly basis. The indexes automatically adjust their asset allocation over time to reflect reductions in potential risk as the investor’s target date approaches.
An index is a statistical measure of a specified financial market or sector. An index does not actually hold a portfolio of securities, incur expenses or pay any transaction costs. Therefore index returns do not reflect deductions for fees or expenses and are not available for direct investment. In comparison, the Fund’s performance is negatively impacted by these deductions. Fund returns do not reflect brokerage commissions or taxes that a shareholder would pay on Fund distributions or on transactions in Fund shares.
“Target Date” refers to a time in the future, generally a specified year, in which the investor expects to retire or otherwise require the use of the invested funds. Target date funds are generally more aggressive the further the target date is from the present, with an objective of capital appreciation. As the target date approaches, the fund’s objective will generally become more conservative, aiming to achieve a higher level of capital preservation. Upon reaching the target date, the Underlying Index will have approximately a 10% allocation to equity securities. Over the next five years, allocations shift from conservative to more moderately-conservative allocations, allowing for a larger exposure to equities than at the target date (“Moderately-Conservative Allocation”).
Investors should note that although target date funds aim to preserve capital as the target date approaches, there is no guarantee that the Fund will achieve this objective.
9
db-X Exchange-Traded Funds Inc.
PERFORMANCE SUMMARY
db-X 2040 Target Date Fund (TDV) (Continued)
Growth of a $10,000 Investment in TDV2 as of 5/31/11
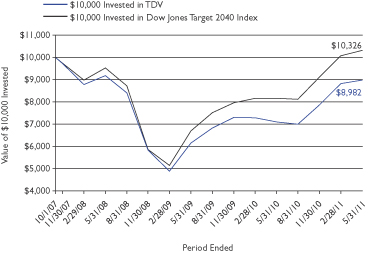
2 Based on Net Asset Value from commencement of trading 10/1/07.
Asset Class Breakdown* as of 5/31/11
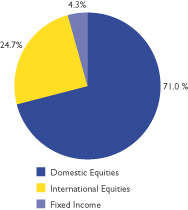
* Weightings are expressed as a percentage of total investments and may change over time.
Top Ten Holdings3 as of 5/31/11
| | | | | | | | | | | | |
| |
| Top Ten Equity Holdings | |
| | | |
| Description | | Shares | | | Value | | | % of Net Assets | |
Exxon Mobil Corp. | | | 11,239 | | | | $938,120 | | | | 2.7% | |
Apple, Inc. | | | 2,016 | | | | 701,225 | | | | 2.0% | |
International Business Machines Corp. | | | 2,872 | | | | 485,166 | | | | 1.4% | |
General Electric Co. | | | 23,220 | | | | 456,041 | | | | 1.3% | |
Berkshire Hathaway, Inc., Class B | | | 5,765 | | | | 455,839 | | | | 1.3% | |
Microsoft Corp. | | | 17,728 | | | | 443,376 | | | | 1.3% | |
Wal-Mart Stores, Inc. | | | 8,025 | | | | 443,142 | | | | 1.3% | |
Chevron Corp. | | | 4,208 | | | | 441,461 | | | | 1.3% | |
Johnson & Johnson | | | 6,484 | | | | 436,308 | | | | 1.3% | |
Procter & Gamble (The) Co. | | | 6,428 | | | | 430,676 | | | | 1.2% | |
| | | | | | | | | | | | |
| |
| Top Ten Fixed Income Holdings | |
| | | |
| Description | | Principal Amount | | | Value | | | % of Net Assets | |
U.S. Treasury Bond/Note, 4.38%, 5/15/40 | | | $115,500 | | | | $118,604 | | | | 0.3% | |
U.S. Treasury Bond/Note, 8.13%, 8/15/19 | | | 75,200 | | | | 106,114 | | | | 0.3% | |
U.S. Treasury Bond/Note, 7.63%, 2/15/25 | | | 62,700 | | | | 90,768 | | | | 0.3% | |
U.S. Treasury Bond/Note, 6.25%, 5/15/30 | | | 40,400 | | | | 53,290 | | | | 0.2% | |
Fed. Home Loan Mort. Corp., 6.25%, 7/15/32 | | | 42,000 | | | | 52,908 | | | | 0.2% | |
U.S. Treasury Bond/Note, 3.63%, 2/15/20 | | | 39,900 | | | | 42,500 | | | | 0.1% | |
U.S. Treasury Bond/Note, 4.38%, 2/15/38 | | | 40,800 | | | | 42,177 | | | | 0.1% | |
MidAmerican Energy Holdings Co., 6.13%, 4/01/36 | | | 31,000 | | | | 34,364 | | | | 0.1% | |
BellSouth Corp., 6.00%, 11/15/34 | | | 33,000 | | | | 34,353 | | | | 0.1% | |
ConocoPhillips, 5.90% 10/15/32 | | | 30,000 | | | | 33,371 | | | | 0.1% | |
3 Holdings are subject to change without notice and there is no guarantee that the Fund will remain invested in any particular security. For a complete list of holdings go to www.dbxstrategicadvisors.db.com.
Sector Breakdown* as of 5/31/11
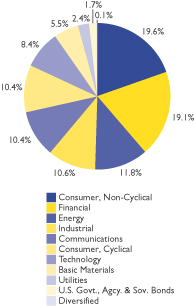
* Weightings are expressed as a percentage of total investments and may change over time. The sector classifications used above are based on company classifications under Bloomberg industry name.
10
db-X Exchange-Traded Funds Inc.
PERFORMANCE SUMMARY
db-X In-Target Date Fund (TDX)
The db-X In-Target Date Fund (the “Fund”) commenced investment operations and its shares began trading on the NYSE Arca, Inc. (“NYSE Arca”) on October 1, 2007. The Fund seeks to track the performance, before fees and expenses, of the Zacks In-Target Lifecycle Index. Both the Fund’s equity and bond portfolios held fewer securities than the Zacks In-Target Lifecycle Index, a constraint imposed by the relatively small size of the Fund.
For the fiscal year ended May 31, 2011, the Fund’s net asset value increased 7.44%, compared to an increase of 7.64% for the Zacks In-Target Lifecycle Index and 11.24% for the Dow Jones Target Today Index. The fund’s performance benefited from favorable results in several equity sectors, in particular Energy, Information Technology and Industrials, partially offset by the Fund’s heavier weighting to fixed income securities, in particular short-term U.S. Treasury securities.
Performance as of 5/31/11
| | | | | | | | |
| Average Annual Total Return |
| | | Net Asset Value | | Market Price | | Zacks In-Target Lifecycle
Index | | Dow Jones Target Today
Index |
One Year | | 7.44% | | 6.88% | | 7.64% | | 11.24% |
Since Inception1 | | 3.19% | | 2.51% | | 3.24% | | 5.70% |
|
| Cumulative Total Return |
| | | Net Asset Value | | Market Price | | Zacks In-Target Lifecycle
Index | | Dow Jones Target Today
Index |
One Year | | 7.44% | | 6.88% | | 7.64% | | 11.24% |
Since Inception1 | | 12.20% | | 9.52% | | 12.41% | | 22.52% |
1 Total returns are calculated based on the commencement of trading, 10/1/07 (“Inception”).
Performance quoted represents past performance, assumes reinvestment of all dividends and capital gain distributions, and does not guarantee future results. Current performance may be higher or lower than the performance quoted. Performance data current to the most recent month end may be obtained by visiting www.dbxstrategicadvisors.db.com. Investment in the fund poses investment risk including possible loss of principal. The investment return and principal value of an investment will fluctuate, so that shares, when sold or redeemed, may be worth more or less than their original cost. The gross expense ratio for the fiscal year ended May 31, 2010, as disclosed in the most recent prospectus dated September 28, 2010, was 2.06%. DBX Strategic Advisors LLC, the advisor to the Fund, has agreed to cap its fees and/or pay certain Fund operating expenses in order to limit Fund net annual operating expenses for shares of the Fund to 0.65% of the Fund’s average net assets until 9/30/11.
The preceding performance chart is provided for comparative purposes and represents the period(s) noted. The net asset value return is based on the changes in the Fund’s net asset value per share (“NAV”). The Fund’s NAV is calculated by dividing the value of the Fund’s total assets less total liabilities by the number of shares outstanding. The market price return is based on the change in the market price on the NYSE Arca of a share of the Fund for the period(s) indicated. The price used to calculate market price returns is the midpoint of the bid/ask spread for Fund shares at 4 p.m. Eastern Time on the NYSE Arca. NAV and market returns assume that dividends and capital gain distributions have been reinvested in the Fund at NAV and market price, respectively. The Dow Jones Target Date Indexes are indexes whose allocations are automatically adjusted to reduce potential risk over time. The Dow Jones Target Date Indexes are designed to measure the performance of multi-asset class portfolios that allocate among U.S. and global stock, bond and cash subindexes on a monthly basis. The indexes automatically adjust their asset allocation over time to reflect reductions in potential risk as the investor’s target date approaches.
An index is a statistical measure of a specified financial market or sector. An index does not actually hold a portfolio of securities, incur expenses or pay any transaction costs. Therefore index returns do not reflect deductions for fees or expenses and are not available for direct investment. In comparison, the Fund’s performance is negatively impacted by these deductions. Fund returns do not reflect brokerage commissions or taxes that a shareholder would pay on Fund distributions or on transactions in Fund shares.
“Target Date” refers to a time in the future, generally a specified year, in which the investor expects to retire or otherwise require the use of the invested funds. Target date funds are generally more aggressive the further the target date is from the present, with an objective of capital appreciation. As the target date approaches, the fund’s objective will generally become more conservative, aiming to achieve a higher level of capital preservation. Upon reaching the target date, the Underlying Index will have approximately a 10% allocation to equity securities. Over the next five years, allocations shift from conservative to more moderately-conservative allocations, allowing for a larger exposure to equities than at the target date (“Moderately-Conservative Allocation”).
Investors should note that although target date funds aim to preserve capital as the target date approaches, there is no guarantee that the Fund will achieve this objective.
11
db-X Exchange-Traded Funds Inc.
PERFORMANCE SUMMARY
db-X In-Target Date Fund (TDX) (Continued)
Growth of a $10,000 Investment in TDX2 as of 5/31/11
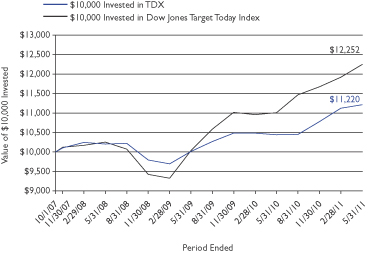
2 Based on Net Asset Value from commencement of trading 10/1/07.
Asset Class Breakdown* as of 5/31/11
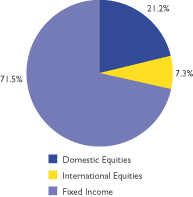
* Weightings are expressed as a percentage of total investments and may change over time.
Top Ten Holdings3 as of 5/31/11
| | | | | | | | | | | | |
| |
| Top Ten Equity Holdings | |
| | | |
| Description | | Shares | | | Value | | | % of Net Assets | |
Exxon Mobil Corp. | | | 1,531 | | | | $127,793 | | | | 0.8% | |
Apple, Inc. | | | 282 | | | | 98,088 | | | | 0.6% | |
International Business Machines Corp. | | | 375 | | | | 63,349 | | | | 0.4% | |
General Electric Co. | | | 3,193 | | | | 62,711 | | | | 0.4% | |
Microsoft Corp. | | | 2,502 | | | | 62,575 | | | | 0.4% | |
Chevron Corp. | | | 596 | | | | 62,526 | | | | 0.4% | |
Berkshire Hathaway, Inc., Class B | | | 778 | | | | 61,515 | | | | 0.4% | |
Wal-Mart Stores, Inc. | | | 1,075 | | | | 59,361 | | | | 0.4% | |
AT&T, Inc. | | | 1,796 | | | | 56,683 | | | | 0.4% | |
Procter & Gamble (The) Co. | | | 845 | | | | 56,615 | | | | 0.4% | |
| | | | | | | | | | | | |
| |
| Top Ten Fixed Income Holdings | |
| | | |
| Description | | Principal Amount | | | Value | | | % of Net Assets | |
U.S. Treasury Bond/Note, 4.25%, 9/30/12 | | | $786,900 | | | | $828,735 | | | | 5.2% | |
U.S. Treasury Bond/Note, 1.38%, 2/15/12 | | | 820,000 | | | | 827,144 | | | | 5.2% | |
U.S. Treasury Bond/Note, 4.75%, 5/15/14 | | | 727,500 | | | | 812,413 | | | | 5.1% | |
U.S. Treasury Bond/Note, 3.38%, 11/30/12 | | | 707,000 | | | | 739,561 | | | | 4.6% | |
U.S. Treasury Bond/Note, 2.88%, 1/31/13 | | | 635,500 | | | | 662,360 | | | | 4.2% | |
U.S. Treasury Bond/Note, 3.63%, 12/31/12 | | | 576,300 | | | | 606,398 | | | | 3.8% | |
U.S. Treasury Bond/Note, 4.63%, 2/29/12 | | | 553,300 | | | | 571,758 | | | | 3.6% | |
U.S. Treasury Bond/Note, 2.50%, 3/31/13 | | | 550,000 | | | | 571,313 | | | | 3.6% | |
U.S. Treasury Bond/Note, 4.50%, 11/30/11 | | | 550,800 | | | | 562,870 | | | | 3.5% | |
U.S. Treasury Bond/Note, 1.38%, 3/15/12 | | | 556,000 | | | | 561,321 | | | | 3.5% | |
3 Holdings are subject to change without notice and there is no guarantee that the Fund will remain invested in any particular security. For a complete list of holdings go to www.dbxstrategicadvisors.db.com.
Sector Breakdown* as of 5/31/11
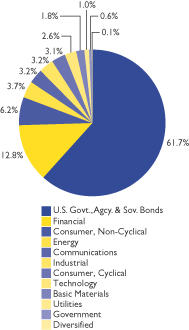
* Weightings are expressed as a percentage of total investments and may change over time. The sector classifications used above are based on company classifications under Bloomberg industry name.
12
db-X Exchange-Traded Funds Inc.
FEES AND EXPENSES
As a shareholder of one or more of the funds of db-X Exchange-Traded Funds Inc. (each, a “Fund” and collectively, the “Funds” or “db-X Target Date Funds”), you incur advisory fees and other Fund expenses. The expense examples below are intended to help you understand your ongoing costs (in dollars) of investing in the Funds and to compare these costs with the ongoing costs of investing in other funds.
The examples are based on an investment of $1,000 made at the beginning of the period and held through the six month period ended May 31, 2011.
ACTUAL EXPENSES
The first line in the following tables provides information about actual account values and actual expenses. You may use the information in this line, together with the amount you invested, to estimate the expenses that you paid over the period. Simply divide your account value by $1,000 (for example, an $8,600 account value divided by $1,000 = 8.6), then multiply the result by the number in the first line under the heading “Expenses Paid During the Period” to estimate the expenses you paid on your account during this period.
HYPOTHETICAL EXAMPLE FOR COMPARISON PURPOSES
The second line in the following tables provides information about hypothetical account values and hypothetical expenses based on the Funds’ actual expense ratios and an assumed rate of return of 5% per year before expenses (which is not the Funds’ actual return). The hypothetical account values and expenses may not be used to estimate the actual ending account balance or expenses you paid for the period. You may use this information to compare the ongoing costs of investing in the Fund and other funds. To do so, compare this 5% hypothetical example with the 5% hypothetical examples that appear in the shareholder reports of the other funds.
Please note that the expenses shown in the tables are meant to highlight your ongoing costs only, and do not reflect any transactional costs. Therefore the second line in the table is useful in comparing ongoing costs only, and will not help you determine the relative total costs of owning different funds. In addition, if these transactional costs were included, your costs would have been higher.
| | | | | | | | | | | | | | | | |
| | | Beginning
Account Value
December 1, 2010 | | | Ending
Account Value
May 31, 2011 | | | Annualized
Expense Ratio(1)
based on the number of
days in the period | | | Expenses Paid
During the Period(2)
December 1, 2010 to
May 31, 2011 | |
| db-X 2010 Target Date Fund | | | | | | | | | | | | | | | | |
Actual | | $ | 1,000.00 | | | $ | 1,027.28 | | | | 0.65 | % | | $ | 3.29 | |
Hypothetical (5% return before expenses) | | $ | 1,000.00 | | | $ | 1,021.69 | | | | 0.65 | % | | $ | 3.28 | |
| db-X 2020 Target Date Fund | | | | | | | | | | | | | | | | |
Actual | | $ | 1,000.00 | | | $ | 1,094.99 | | | | 0.65 | % | | $ | 3.40 | |
Hypothetical (5% return before expenses) | | $ | 1,000.00 | | | $ | 1,021.69 | | | | 0.65 | % | | $ | 3.28 | |
| db-X 2030 Target Date Fund | | | | | | | | | | | | | | | | |
Actual | | $ | 1,000.00 | | | $ | 1,127.08 | | | | 0.65 | % | | $ | 3.45 | |
Hypothetical (5% return before expenses) | | $ | 1,000.00 | | | $ | 1,021.69 | | | | 0.65 | % | | $ | 3.28 | |
| db-X 2040 Target Date Fund | | | | | | | | | | | | | | | | |
Actual | | $ | 1,000.00 | | | $ | 1,141.68 | | | | 0.65 | % | | $ | 3.47 | |
Hypothetical (5% return before expenses) | | $ | 1,000.00 | | | $ | 1,021.69 | | | | 0.65 | % | | $ | 3.28 | |
| db-X In-Target Date Fund | | | | | | | | | | | | | | | | |
Actual | | $ | 1,000.00 | | | $ | 1,040.79 | | | | 0.65 | % | | $ | 3.31 | |
Hypothetical (5% return before expenses) | | $ | 1,000.00 | | | $ | 1,021.69 | | | | 0.65 | % | | $ | 3.28 | |
(1) DBX Strategic Advisors LLC (the “Advisor”), has contractually agreed to reduce its fees and/or pay Fund operating expenses (excluding, among other things, acquired fund fees and expenses, interest, taxes and extraordinary expenses) in order to limit each Fund’s net annual operating expenses for shares of each Fund to 0.65% of the Fund’s average net assets (the “Expense Cap”). The Expense Cap will remain in effect until September 30, 2011. The Advisor is permitted to be reimbursed for fee reductions and/or expense payments made in the prior three fiscal years. This reimbursement may be paid to the Advisor if the aggregate amount actually paid by a Fund toward operating expenses for such fiscal year (taking into account the reimbursement) does not exceed the Expense Cap. Ratios would have been higher if fees were not reduced by the Advisor.
(2) Expenses are calculated using the annualized expense ratio, which represents the ongoing expenses as a percentage of net assets for the period December 1, 2010 to May 31, 2011. Expenses are calculated by multiplying the Fund’s annualized expense ratio by the average account value for the period; then multiplying the result by 182 days and then dividing the result by 365.
13
db-X Exchange-Traded Funds Inc.
SCHEDULE OF INVESTMENTS
db-X 2010 Target Date Fund
May 31, 2011
| | | | | | | | |
| | | Number
of Shares | | | Value | |
| | | | | | | | |
| COMMON STOCKS — 16.2% | | | | | | | | |
| Basic Materials — 1.0% | | | | | | | | |
Air Liquide S.A. (France) | | | 41 | | | $ | 5,690 | |
Allied Nevada Gold Corp.* | | | 150 | | | | 5,562 | |
Anglo American PLC (United Kingdom) | | | 208 | | | | 10,373 | |
ArcelorMittal (Luxembourg) | | | 132 | | | | 4,398 | |
BASF SE (Germany) | | | 136 | | | | 12,563 | |
Bayer AG (Germany) | | | 130 | | | | 10,643 | |
BHP Billiton Ltd. (Australia) | | | 289 | | | | 13,660 | |
BHP Billiton PLC (United Kingdom) | | | 337 | | | | 13,329 | |
Buckeye Technologies, Inc. | | | 150 | | | | 3,821 | |
Coeur d’Alene Mines Corp.* | | | 75 | | | | 2,068 | |
Dow Chemical (The) Co. | | | 74 | | | | 2,674 | |
E.I. du Pont de Nemours & Co. | | | 105 | | | | 5,597 | |
Freeport-McMoRan Copper & Gold, Inc. | | | 150 | | | | 7,746 | |
Metals USA Holdings Corp.* | | | 150 | | | | 2,358 | |
Newmont Mining Corp. | | | 70 | | | | 3,960 | |
Rio Tinto PLC (United Kingdom) | | | 199 | | | | 13,904 | |
Rockwood Holdings, Inc.* | | | 100 | | | | 5,259 | |
Sensient Technologies Corp. | | | 31 | | | | 1,180 | |
Sherwin-Williams (The) Co. | | | 75 | | | | 6,587 | |
Solutia, Inc.* | | | 50 | | | | 1,249 | |
Syngenta AG (Switzerland)* | | | 17 | | | | 5,871 | |
Vulcan Materials Co. | | | 150 | | | | 6,074 | |
| | | | | | | | |
| | | | | | | 144,566 | |
| | | | | | | | |
| Communications — 1.7% | | | | | | | | |
Acme Packet, Inc.* | | | 75 | | | | 5,677 | |
ADTRAN, Inc. | | | 75 | | | | 3,215 | |
Anixter International, Inc.* | | | 8 | | | | 542 | |
Arris Group, Inc.* | | | 119 | | | | 1,344 | |
AT&T, Inc. | | | 845 | | | | 26,668 | |
Calix, Inc.* | | | 150 | | | | 3,236 | |
Cisco Systems, Inc. | | | 748 | | | | 12,565 | |
Comcast Corp., Class A | | | 360 | | | | 9,086 | |
Corning, Inc. | | | 133 | | | | 2,679 | |
Deutsche Telekom AG (Germany) | | | 434 | | | | 6,445 | |
Digital River, Inc.* | | | 82 | | | | 2,669 | |
Discovery Communications, Inc., Class A* | | | 225 | | | | 9,801 | |
eResearch Technology, Inc.* | | | 193 | | | | 1,224 | |
France Telecom S.A. (France) | | | 295 | | | | 6,743 | |
Google, Inc., Class A* | | | 49 | | | | 25,921 | |
GSI Commerce, Inc.* | | | 75 | | | | 2,194 | |
Limelight Networks, Inc.* | | | 375 | | | | 2,149 | |
News Corp., Class A | | | 247 | | | | 4,530 | |
Nokia OYJ (Finland) | | | 549 | | | | 3,749 | |
NTT DoCoMo, Inc. (Japan) | | | 2 | | | | 3,737 | |
Orbitz Worldwide, Inc.* | | | 450 | | | | 1,035 | |
Rackspace Hosting, Inc.* | | | 124 | | | | 5,456 | |
Symantec Corp.* | | | 675 | | | | 13,196 | |
Telefonaktiebolaget LM Ericsson, Class B (Sweden) | | | 427 | | | | 6,305 | |
Telefonica S.A. (Spain) | | | 238 | | | | 5,774 | |
Thomson Reuters Corp. (Canada) | | | 150 | | | | 5,846 | |
TIBCO Software, Inc.* | | | 219 | | | | 6,152 | |
Time Warner, Inc. | | | 184 | | | | 6,703 | |
Verizon Communications, Inc. | | | 443 | | | | 16,360 | |
Vivendi (France) | | | 193 | | | | 5,381 | |
| | | | | | | | |
| | | Number
of Shares | | | Value | |
| | | | | | | | |
| Communications (Continued) | | | | | | | | |
Vodafone Group PLC (United Kingdom) | | | 4,388 | | | $ | 12,202 | |
Walt Disney (The) Co. | | | 277 | | | | 11,532 | |
Windstream Corp. | | | 375 | | | | 5,044 | |
Yahoo!, Inc.* | | | 207 | | | | 3,426 | |
| | | | | | | | |
| | | | | | | 238,586 | |
| | | | | | | | |
| Consumer, Cyclical — 1.7% | | | | | | | | |
Alaska Air Group, Inc.* | | | 75 | | | | 5,065 | |
Ascena Retail Group, Inc.* | | | 50 | | | | 1,673 | |
Buckle (The), Inc. | | | 32 | | | | 1,366 | |
Callaway Golf Co. | | | 300 | | | | 2,031 | |
Carter’s, Inc.* | | | 119 | | | | 3,772 | |
Casey’s General Stores, Inc. | | | 105 | | | | 4,352 | |
Cinemark Holdings, Inc. | | | 100 | | | | 2,175 | |
Coach, Inc. | | | 300 | | | | 19,097 | |
Columbia Sportswear Co. | | | 76 | | | | 4,986 | |
CVS Caremark Corp. | | | 190 | | | | 7,351 | |
Daimler AG (Germany) | | | 126 | | | | 8,895 | |
Dana Holding Corp.* | | | 150 | | | | 2,718 | |
Deckers Outdoor Corp.* | | | 75 | | | | 6,832 | |
Dillard’s, Inc., Class A | | | 75 | | | | 4,214 | |
Dollar General Corp.* | | | 300 | | | | 10,521 | |
DSW, Inc., Class A* | | | 97 | | | | 4,865 | |
Exide Technologies* | | | 300 | | | | 2,958 | |
Ford Motor Co.* | | | 447 | | | | 6,669 | |
G&K Services, Inc., Class A | | | 75 | | | | 2,372 | |
Hennes & Mauritz AB, Class B (Sweden) | | | 153 | | | | 5,674 | |
Honda Motor Co. Ltd. (Japan) | | | 46 | | | | 1,750 | |
JetBlue Airways Corp.* | | | 152 | | | | 923 | |
Johnson Controls, Inc. | | | 75 | | | | 2,970 | |
Jones Group (The), Inc. | | | 50 | | | | 615 | |
K-Swiss, Inc., Class A* | | | 150 | | | | 1,655 | |
La-Z-Boy, Inc.* | | | 225 | | | | 2,491 | |
Liz Claiborne, Inc.* | | | 350 | | | | 2,286 | |
Lowe’s Cos., Inc. | | | 225 | | | | 5,432 | |
McDonald’s Corp. | | | 165 | | | | 13,454 | |
Mitsubishi Corp. (Japan) | | | 241 | | | | 6,102 | |
Mitsui & Co. Ltd. (Japan) | | | 300 | | | | 5,111 | |
Nike, Inc., Class B | | | 75 | | | | 6,334 | |
Nintendo Co. Ltd. (Japan) | | | 15 | | | | 3,484 | |
Nissan Motor Co. Ltd. (Japan) | | | 386 | | | | 3,868 | |
Nu Skin Enterprises, Inc., Class A | | | 75 | | | | 2,932 | |
Owens & Minor, Inc. | | | 67 | | | | 2,318 | |
Panasonic Corp. (Japan) | | | 333 | | | | 3,910 | |
Sony Corp. (Japan) | | | 181 | | | | 4,819 | |
Toyota Motor Corp. (Japan) | | | 199 | | | | 8,328 | |
Under Armour, Inc., Class A* | | | 75 | | | | 4,889 | |
US Airways Group, Inc.* | | | 50 | | | | 455 | |
Vail Resorts, Inc.* | | | 82 | | | | 3,989 | |
Walgreen Co. | | | 150 | | | | 6,545 | |
Wal-Mart Stores, Inc. | | | 551 | | | | 30,427 | |
Warnaco Group (The), Inc.* | | | 26 | | | | 1,434 | |
Watsco, Inc. | | | 66 | | | | 4,418 | |
World Fuel Services Corp. | | | 64 | | | | 2,341 | |
| | | | | | | | |
| | | | | | | 240,866 | |
| | | | | | | | |
| | | | |
| See Notes to Financial Statements. | | 14 | | |
db-X Exchange-Traded Funds Inc.
SCHEDULE OF INVESTMENTS
db-X 2010 Target Date Fund (Continued)
May 31, 2011
| | | | | | | | |
| | | Number
of Shares | | | Value | |
| | | | | | | | |
| Consumer, Non-cyclical — 3.1% | | | | | | | | |
Abbott Laboratories | | | 224 | | | $ | 11,704 | |
Accuray, Inc.* | | | 300 | | | | 2,292 | |
Aetna, Inc. | | | 375 | | | | 16,380 | |
Amedisys, Inc.* | | | 75 | | | | 2,348 | |
American Medical Systems Holdings, Inc.* | | | 75 | | | | 2,246 | |
American Reprographics Co.* | | | 225 | | | | 2,111 | |
AMERIGROUP Corp.* | | | 42 | | | | 2,978 | |
Amgen, Inc.* | | | 150 | | | | 9,081 | |
Anheuser-Busch InBev NV (Belgium) | | | 100 | | | | 6,026 | |
AstraZeneca PLC (United Kingdom) | | | 202 | | | | 10,565 | |
British American Tobacco PLC (United Kingdom) | | | 268 | | | | 12,007 | |
Bruker Corp.* | | | 178 | | | | 3,510 | |
Catalyst Health Solutions, Inc.* | | | 32 | | | | 1,953 | |
CBIZ, Inc.* | | | 300 | | | | 2,295 | |
Coca-Cola (The) Co. | | | 371 | | | | 24,786 | |
Diageo PLC (United Kingdom) | | | 357 | | | | 7,604 | |
Ennis, Inc. | | | 75 | | | | 1,432 | |
GlaxoSmithKline PLC (United Kingdom) | | | 301 | | | | 6,540 | |
HEALTHSOUTH Corp.* | | | 150 | | | | 4,211 | |
Heidrick & Struggles International, Inc. | | | 166 | | | | 3,478 | |
Hospira, Inc.* | | | 150 | | | | 8,294 | |
Johnson & Johnson | | | 436 | | | | 29,337 | |
Kraft Foods, Inc., Class A | | | 128 | | | | 4,476 | |
Live Nation Entertainment, Inc.* | | | 225 | | | | 2,594 | |
Magellan Health Services, Inc.* | | | 11 | | | | 582 | |
Masimo Corp.* | | | 150 | | | | 4,608 | |
MasterCard, Inc., Class A | | | 30 | | | | 8,612 | |
Medifast, Inc.* | | | 75 | | | | 2,004 | |
Merck & Co., Inc. | | | 525 | | | | 19,294 | |
Molson Coors Brewing Co., Class B | | | 130 | | | | 6,065 | |
Nestle S.A. (Switzerland) | | | 325 | | | | 20,862 | |
Novartis AG (Switzerland) | | | 202 | | | | 13,026 | |
Novo Nordisk A/S, Class B (Denmark) | | | 67 | | | | 8,391 | |
Pfizer, Inc. | | | 1,283 | | | | 27,520 | |
Philip Morris International, Inc. | | | 236 | | | | 16,933 | |
Procter & Gamble (The) Co. | | | 442 | | | | 29,614 | |
Roche Holding AG (Switzerland) | | | 50 | | | | 8,794 | |
Rollins, Inc. | | | 81 | | | | 1,630 | |
Ruddick Corp. | | | 37 | | | | 1,626 | |
Safeway, Inc. | | | 362 | | | | 8,941 | |
Salix Pharmaceuticals Ltd.* | | | 75 | | | | 3,002 | |
Sanofi | | | 166 | | | | 13,130 | |
Sirona Dental Systems, Inc.* | | | 64 | | | | 3,460 | |
SonoSite, Inc.* | | | 75 | | | | 2,678 | |
Sotheby’s | | | 75 | | | | 3,192 | |
STERIS Corp. | | | 58 | | | | 2,093 | |
Takeda Pharmaceutical Co. Ltd. (Japan) | | | 136 | | | | 6,470 | |
Tesco PLC (United Kingdom) | | | 1,167 | | | | 8,049 | |
Teva Pharmaceutical Industries Ltd. (Israel) | | | 140 | | | | 7,176 | |
TreeHouse Foods, Inc.* | | | 75 | | | | 4,570 | |
Unilever NV (Netherlands) | | | 238 | | | | 7,760 | |
Unilever PLC (United Kingdom) | | | 187 | | | | 6,067 | |
UnitedHealth Group, Inc. | | | 171 | | | | 8,370 | |
Visa, Inc., Class A | | | 139 | | | | 11,267 | |
WellPoint, Inc. | | | 75 | | | | 5,863 | |
| | | | | | | | |
| | | | | | | 449,897 | |
| | | | | | | | |
| | | | | | | | |
| | | Number
of Shares | | | Value | |
| | | | | | | | |
| Diversified — 0.0% (a) | | | | | | | | |
LVMH Moet Hennessy Louis Vuitton S.A. (France) | | | 41 | | | $ | 7,125 | |
| | | | | | | | |
| Energy — 1.9% | | | | | | | | |
Berry Petroleum Co., Class A | | | 60 | | | | 3,145 | |
BG Group PLC (United Kingdom) | | | 548 | | | | 12,686 | |
Bill Barrett Corp.* | | | 33 | | | | 1,471 | |
BP PLC (United Kingdom) | | | 2,890 | | | | 22,278 | |
Brigham Exploration Co.* | | | 150 | | | | 4,671 | |
Chevron Corp. | | | 325 | | | | 34,096 | |
ConocoPhillips | | | 188 | | | | 13,765 | |
Delek US Holdings, Inc. | | | 225 | | | | 3,395 | |
Devon Energy Corp. | | | 75 | | | | 6,305 | |
Dril-Quip, Inc.* | | | 13 | | | | 964 | |
ENI S.p.A (Italy) | | | 412 | | | | 9,868 | |
Exxon Mobil Corp. | | | 794 | | | | 66,275 | |
Hornbeck Offshore Services, Inc.* | | | 75 | | | | 2,024 | |
Occidental Petroleum Corp. | | | 127 | | | | 13,697 | |
Peabody Energy Corp. | | | 211 | | | | 12,947 | |
Royal Dutch Shell PLC, Class A (United Kingdom) | | | 301 | | | | 10,860 | |
Royal Dutch Shell PLC, Class B (United Kingdom) | | | 157 | | | | 5,683 | |
RPC, Inc. | | | 112 | | | | 2,820 | |
Schlumberger Ltd. (Netherlands Antilles) | | | 157 | | | | 13,459 | |
Southwestern Energy Co.* | | | 43 | | | | 1,882 | |
Statoil ASA (Norway) | | | 202 | | | | 5,316 | |
Total S.A. (France) | | | 192 | | | | 11,049 | |
Williams (The) Cos., Inc. | | | 425 | | | | 13,341 | |
| | | | | | | | |
| | | | | | | 271,997 | |
| | | | | | | | |
| Financial — 3.3% | | | | | | | | |
Alexander’s, Inc. REIT | | | 11 | | | | 4,314 | |
Allianz SE (Germany) | | | 70 | | | | 9,679 | |
American Campus Communities, Inc. REIT | | | 111 | | | | 3,923 | |
American Capital Ltd.* | | | 375 | | | | 3,713 | |
American Express Co. | | | 150 | | | | 7,740 | |
Apollo Investment Corp. | | | 225 | | | | 2,567 | |
Ashford Hospitality Trust, Inc. REIT | | | 225 | | | | 3,211 | |
Associated Estates Realty Corp. REIT | | | 150 | | | | 2,529 | |
Australia & New Zealand Banking Group Ltd. (Australia) | | | 278 | | | | 6,555 | |
Banco Bilbao Vizcaya Argentaria S.A. (Spain) | | | 475 | | | | 5,541 | |
Banco Santander S.A. (Spain) | | | 428 | | | | 5,085 | |
Bank of America Corp. | | | 1,437 | | | | 16,885 | |
Barclays PLC (United Kingdom) | | | 1,133 | | | | 5,159 | |
Berkshire Hathaway, Inc., Class B* | | | 409 | | | | 32,340 | |
BioMed Realty Trust, Inc. REIT | | | 150 | | | | 3,074 | |
BNP Paribas (France) | | | 124 | | | | 9,665 | |
Boston Properties, Inc. REIT | | | 120 | | | | 13,002 | |
CBL & Associates Properties, Inc. REIT | | | 150 | | | | 2,886 | |
Charles Schwab (The) Corp. | | | 168 | | | | 3,026 | |
Citigroup, Inc. | | | 442 | | | | 18,188 | |
Commonwealth Bank of Australia (Australia) | | | 193 | | | | 10,410 | |
Community Trust Bancorp, Inc. | | | 75 | | | | 2,061 | |
Credit Suisse Group AG (Switzerland)* | | | 458 | | | | 19,664 | |
Entertainment Properties Trust REIT | | | 75 | | | | 3,644 | |
Equity One, Inc. REIT | | | 109 | | | | 2,137 | |
| | | | |
| See Notes to Financial Statements. | | 15 | | |
db-X Exchange-Traded Funds Inc.
SCHEDULE OF INVESTMENTS
db-X 2010 Target Date Fund (Continued)
May 31, 2011
| | | | | | | | |
| | | Number
of Shares | | | Value | |
| | | | | | | | |
| Financial (Continued) | | | | | | | | |
Equity Residential REIT | | | 75 | | | $ | 4,637 | |
Evercore Partners, Inc., Class A | | | 75 | | | | 2,776 | |
FirstMerit Corp. | | | 157 | | | | 2,558 | |
Franklin Resources, Inc. | | | 31 | | | | 4,017 | |
Goldman Sachs Group (The), Inc. | | | 58 | | | | 8,162 | |
Highwoods Properties, Inc. REIT | | | 81 | | | | 2,922 | |
Home Properties, Inc. REIT | | | 75 | | | | 4,643 | |
HSBC Holdings PLC (United Kingdom) | | | 1,538 | | | | 16,070 | |
Investors Bancorp, Inc.* | | | 150 | | | | 2,246 | |
JPMorgan Chase & Co. | | | 571 | | | | 24,690 | |
Kilroy Realty Corp. REIT | | | 75 | | | | 3,110 | |
LaSalle Hotel Properties REIT | | | 75 | | | | 2,099 | |
M&T Bank Corp. | | | 75 | | | | 6,623 | |
MFA Financial, Inc. REIT | | | 238 | | | | 1,961 | |
Mid-America Apartment Communities, Inc. REIT | | | 64 | | | | 4,387 | |
Mitsubishi UFJ Financial Group, Inc. (Japan) | | | 1,793 | | | | 8,276 | |
Mizuho Financial Group, Inc. (Japan) | | | 1,667 | | | | 2,626 | |
Muenchener Rueckversicherungs-Gesellschaft AG (Germany) | | | 32 | | | | 4,904 | |
National Australia Bank Ltd. (Australia) | | | 262 | | | | 7,393 | |
National Interstate Corp. | | | 75 | | | | 1,619 | |
National Retail Properties, Inc. REIT | | | 98 | | | | 2,526 | |
Nordea Bank AB (Sweden) | | | 450 | | | | 5,270 | |
Northern Trust Corp. | | | 211 | | | | 10,295 | |
OMEGA Healthcare Investors, Inc. REIT | | | 97 | | | | 2,065 | |
Pebblebrook Hotel Trust REIT | | | 75 | | | | 1,631 | |
Platinum Underwriters Holdings Ltd. (Bermuda) | | | 14 | | | | 478 | |
Potlatch Corp. REIT | | | 12 | | | | 432 | |
ProAssurance Corp.* | | | 65 | | | | 4,570 | |
Prosperity Bancshares, Inc. | | | 91 | | | | 3,981 | |
Signature Bank* | | | 75 | | | | 4,269 | |
Simon Property Group, Inc. REIT | | | 63 | | | | 7,438 | |
Societe Generale (France) | | | 71 | | | | 4,209 | |
Standard Chartered PLC (United Kingdom) | | | 288 | | | | 7,717 | |
Sumitomo Mitsui Financial Group, Inc. (Japan) | | | 121 | | | | 3,500 | |
SVB Financial Group* | | | 75 | | | | 4,454 | |
T. Rowe Price Group, Inc. | | | 225 | | | | 14,242 | |
Travelers (The) Cos., Inc. | | | 75 | | | | 4,656 | |
U.S. Bancorp | | | 300 | | | | 7,680 | |
UBS AG (Switzerland)* | | | 505 | | | | 9,675 | |
UMB Financial Corp. | | | 77 | | | | 3,284 | |
UniCredit S.p.A (Italy) | | | 2,261 | | | | 5,132 | |
Washington Real Estate Investment Trust REIT | | | 49 | | | | 1,692 | |
Webster Financial Corp. | | | 75 | | | | 1,565 | |
Wells Fargo & Co. | | | 807 | | | | 22,895 | |
Westpac Banking Corp. (Australia) | | | 391 | | | | 9,220 | |
Weyerhaeuser Co. REIT | | | 458 | | | | 9,865 | |
Zurich Financial Services AG (Switzerland)* | | | 23 | | | | 6,151 | |
| | | | | | | | |
| | | | | | | 471,609 | |
| | | | | | | | |
| Industrial — 1.7% | | | | | | | | |
AAON, Inc. | | | 75 | | | | 2,528 | |
ABB Ltd. (Switzerland)* | | | 328 | | | | 8,802 | |
Acuity Brands, Inc. | | | 75 | | | | 4,572 | |
Benchmark Electronics, Inc.* | | | 150 | | | | 2,592 | |
Boeing (The) Co. | | | 150 | | | | 11,705 | |
| | | | | | | | |
| | | Number
of Shares | | | Value | |
| | | | | | | | |
| Industrial (Continued) | | | | | | | | |
Cascade Corp. | | | 75 | | | $ | 3,047 | |
Caterpillar, Inc. | | | 99 | | | | 10,474 | |
CLARCOR, Inc. | | | 31 | | | | 1,321 | |
East Japan Railway Co. (Japan) | | | 33 | | | | 1,925 | |
Eaton Corp. | | | 254 | | | | 13,124 | |
EMCOR Group, Inc.* | | | 76 | | | | 2,308 | |
Emerson Electric Co. | | | 130 | | | | 7,091 | |
FedEx Corp. | | | 75 | | | | 7,023 | |
General Dynamics Corp. | | | 37 | | | | 2,746 | |
General Electric Co. | | | 1,662 | | | | 32,641 | |
GrafTech International Ltd.* | | | 114 | | | | 2,410 | |
Hexcel Corp.* | | | 75 | | | | 1,550 | |
Ingersoll-Rand PLC (Ireland) | | | 300 | | | | 14,971 | |
Knight Transportation, Inc. | | | 103 | | | | 1,761 | |
Koninklijke Philips Electronics NV (Netherlands) | | | 159 | | | | 4,406 | |
Lindsay Corp. | | | 75 | | | | 5,031 | |
Metabolix, Inc.* | | | 75 | | | | 663 | |
Moog, Inc., Class A* | | | 75 | | | | 3,079 | |
Nordson Corp. | | | 150 | | | | 7,803 | |
Parker Hannifin Corp. | | | 150 | | | | 13,328 | |
Republic Services, Inc. | | | 337 | | | | 10,621 | |
Rock-Tenn Co., Class A | | | 81 | | | | 6,224 | |
Schneider Electric S.A. (France) | | | 33 | | | | 5,437 | |
Siemens AG (Germany) | | | 54 | | | | 7,220 | |
Silgan Holdings, Inc. | | | 87 | | | | 3,905 | |
Sun Hydraulics Corp. | | | 75 | | | | 3,632 | |
Thermo Fisher Scientific, Inc.* | | | 75 | | | | 4,909 | |
TriMas Corp.* | | | 150 | | | | 3,060 | |
Union Pacific Corp. | | | 66 | | | | 6,929 | |
United Parcel Service, Inc., Class B | | | 116 | | | | 8,525 | |
United Technologies Corp. | | | 159 | | | | 13,955 | |
Vinci S.A. (France) | | | 62 | | | | 3,996 | |
Woodward, Inc. | | | 75 | | | | 2,642 | |
| | | | | | | | |
| | | | | | | 247,956 | |
| | | | | | | | |
| Technology — 1.4% | | | | | | | | |
Apple, Inc.* | | | 150 | | | | 52,174 | |
Applied Materials, Inc. | | | 225 | | | | 3,101 | |
CACI International, Inc., Class A* | | | 64 | | | | 4,085 | |
Concur Technologies, Inc.* | | | 32 | | | | 1,599 | |
EMC Corp.* | | | 268 | | | | 7,630 | |
Intel Corp. | | | 825 | | | | 18,570 | |
International Business Machines Corp. | | | 199 | | | | 33,617 | |
Jack Henry & Associates, Inc. | | | 103 | | | | 3,218 | |
Microsoft Corp. | | | 1,217 | | | | 30,437 | |
Netlogic Microsystems, Inc.* | | | 75 | | | | 2,874 | |
Parametric Technology Corp.* | | | 109 | | | | 2,539 | |
Quality Systems, Inc. | | | 66 | | | | 5,681 | |
Quest Software, Inc.* | | | 128 | | | | 2,905 | |
Riverbed Technology, Inc.* | | | 142 | | | | 5,385 | |
SAP AG (Germany) | | | 139 | | | | 8,627 | |
SRA International, Inc., Class A* | | | 121 | | | | 3,745 | |
Ultratech, Inc.* | | | 75 | | | | 2,383 | |
VeriFone Systems, Inc.* | | | 75 | | | | 3,610 | |
Xerox Corp. | | | 1,100 | | | | 11,231 | |
| | | | | | | | |
| | | | | | | 203,411 | |
| | | | | | | | |
| | | | |
| See Notes to Financial Statements. | | 16 | | |
db-X Exchange-Traded Funds Inc.
SCHEDULE OF INVESTMENTS
db-X 2010 Target Date Fund (Continued)
May 31, 2011
| | | | | | | | |
| | | Number
of Shares | | | Value | |
| | | | | | | | |
| Utilities — 0.4% | | | | | | | | |
Cleco Corp. | | | 75 | | | $ | 2,632 | |
E.ON AG (Germany) | | | 297 | | | | 8,426 | |
GDF Suez (France) | | | 181 | | | | 6,651 | |
National Fuel Gas Co. | | | 75 | | | | 5,403 | |
Nicor, Inc. | | | 24 | | | | 1,319 | |
Piedmont Natural Gas Co., Inc. | | | 85 | | | | 2,675 | |
RWE AG (Germany) | | | 71 | | | | 4,137 | |
Sempra Energy | | | 225 | | | | 12,413 | |
Southern Co. | | | 158 | | | | 6,333 | |
Tokyo Electric Power (The) Co., Inc. (Japan) | | | 180 | | | | 702 | |
WGL Holdings, Inc. | | | 33 | | | | 1,295 | |
| | | | | | | | |
| | | | | | | 51,986 | |
| | | | | | | | |
TOTAL COMMON STOCKS
(Cost $2,137,241) | | | | | | | 2,327,999 | |
| | | | | | | | |
| | |
| | | Principal
Amount | | | Value | |
| | | | | | | | |
| CORPORATE BONDS — 18.3% | | | | | | | | |
| Basic Materials — 0.4% | | | | | | | | |
BHP Billiton Finance USA Ltd. (Australia)
5.50%, 4/01/14 | | $ | 47,000 | | | | 52,518 | |
| | | | | | | | |
| Communications — 1.2% | | | | | | | | |
AT&T, Inc.
5.875%, 2/01/12 | | | 86,000 | | | | 89,030 | |
Cellco Partnership/Verizon Wireless Capital LLC
5.55%, 2/01/14 | | | 62,000 | | | | 68,525 | |
Telefonica Emisiones SAU (Spain)
4.949%, 1/15/15 | | | 22,000 | | | | 23,683 | |
| | | | | | | | |
| | | | | | | 181,238 | |
| | | | | | | | |
| Consumer, Cyclical — 0.3% | | | | | | | | |
Wal-Mart Stores, Inc.
4.55%, 5/01/13 | | | 35,000 | | | | 37,600 | |
| | | | | | | | |
| Consumer, Non-cyclical — 1.5% | | | | | | | | |
Diageo Finance BV (Netherlands)
5.30%, 10/28/15 | | | 30,000 | | | | 33,861 | |
UnitedHealth Group, Inc.
4.875%, 3/15/15 | | | 47,000 | | | | 51,662 | |
WellPoint, Inc.
5.25%, 1/15/16 | | | 56,000 | | | | 62,869 | |
Wyeth
5.50%, 2/01/14 | | | 56,000 | | | | 62,395 | |
| | | | | | | | |
| | | | | | | 210,787 | |
| | | | | | | | |
| Energy — 0.4% | | | | | | | | |
Apache Corp.
5.25%, 4/15/13 | | | 32,000 | | | | 34,631 | |
BP Capital Markets PLC (United Kingdom)
3.875%, 3/10/15 | | | 22,000 | | | | 23,261 | |
| | | | | | | | |
| | | | | | | 57,892 | |
| | | | | | | | |
| Financial — 10.9% | | | | | | | | |
Bank of America Corp.
4.875%, 1/15/13 | | | 110,000 | | | | 116,010 | |
| | | | | | | | |
| | | Principal
Amount | | | Value | |
| | | | | | | | |
| Financial (Continued) | | | | | | | | |
Bank of New York Mellon (The) Corp.
4.30%, 5/15/14 | | $ | 86,000 | | | $ | 93,385 | |
Berkshire Hathaway, Inc.
3.20%, 2/11/15 | | | 48,000 | | | | 50,441 | |
Boeing Capital Corp.
5.80%, 1/15/13 | | | 110,000 | | | | 118,958 | |
Boston Properties LP
6.25%, 1/15/13 | | | 2,000 | | | | 2,159 | |
Citigroup, Inc.
6.00%, 2/21/12 | | | 71,000 | | | | 73,707 | |
Goldman Sachs Group (The), Inc.
5.00%, 10/01/14 | | | 116,000 | | | | 125,209 | |
HSBC Finance Corp.
6.375%, 11/27/12 | | | 63,000 | | | | 67,861 | |
5.50%, 1/19/16 | | | 50,000 | | | | 55,814 | |
John Deere Capital Corp.
7.00%, 3/15/12 | | | 60,000 | | | | 63,121 | |
JPMorgan Chase & Co.
5.75%, 1/02/13 | | | 111,000 | | | | 118,715 | |
KFW (Germany)
3.25%, 10/14/11 | | | 52,000 | | | | 52,588 | |
Merrill Lynch & Co., Inc., Series C, MTN
5.00%, 1/15/15 | | | 78,000 | | | | 83,670 | |
MetLife, Inc.
5.00%, 6/15/15 | | | 75,000 | | | | 82,532 | |
Morgan Stanley
5.30%, 3/01/13 | | | 74,000 | | | | 78,901 | |
National Rural Utilities Cooperative Finance Corp., Series C, MTN
7.25%, 3/01/12 | | | 36,000 | | | | 37,805 | |
PNC Funding Corp.
5.25%, 11/15/15 | | | 41,000 | | | | 44,870 | |
Prudential Financial, Inc., Series B, MTN
5.10%, 9/20/14 | | | 18,000 | | | | 19,718 | |
Simon Property Group LP
5.10%, 6/15/15 | | | 33,000 | | | | 36,546 | |
Wachovia Corp.
5.25%, 8/01/14 | | | 94,000 | | | | 102,408 | |
Wells Fargo & Co.
5.00%, 11/15/14 | | | 138,000 | | | | 150,111 | |
| | | | | | | | |
| | | | | | | 1,574,529 | |
| | | | | | | | |
| Government — 2.1% | | | | | | | | |
European Investment Bank, MTN (Supranational)
4.625%, 5/15/14 | | | 192,000 | | | | 211,885 | |
Inter-American Development Bank (Supranational)
4.375%, 9/20/12 | | | 82,000 | | | | 86,223 | |
| | | | | | | | |
| | | | | | | 298,108 | |
| | | | | | | | |
| Technology — 0.8% | | | | | | | | |
Hewlett-Packard Co.
6.125%, 3/01/14 | | | 37,000 | | | | 41,652 | |
Oracle Corp.
5.25%, 1/15/16 | | | 66,000 | | | | 74,867 | |
| | | | | | | | |
| | | | | | | 116,519 | |
| | | | | | | | |
| | | | |
| See Notes to Financial Statements. | | 17 | | |
db-X Exchange-Traded Funds Inc.
SCHEDULE OF INVESTMENTS
db-X 2010 Target Date Fund (Continued)
May 31, 2011
| | | | | | | | |
| | | Principal
Amount | | | Value | |
| | | | | | | | |
| Utilities — 0.7% | | | | | | | | |
Dominion Resources, Inc., Series C
5.15%, 7/15/15 | | $ | 93,000 | | | $ | 103,496 | |
| | | | | | | | |
TOTAL CORPORATE BONDS
(Cost $2,493,016) | | | | | | | 2,632,687 | |
| | | | | | | | |
UNITED STATES GOVERNMENT &
AGENCIES OBLIGATIONS — 64.5% | | | | | | | | |
Federal Home Loan Mortgage
Corp. — 5.2% | | | | | | | | |
4.875%, 11/18/11 | | | 170,000 | | | | 173,733 | |
2.125%, 3/23/12 | | | 176,000 | | | | 178,683 | |
4.50%, 1/15/13 | | | 373,000 | | | | 397,821 | |
| | | | | | | | |
| | | | | | | 750,237 | |
| | | | | | | | |
Federal National Mortgage
Association — 4.9% | | | | | | | | |
2.625%, 11/20/14 | | | 230,000 | | | | 241,865 | |
5.00%, 4/15/15 | | | 208,000 | | | | 237,141 | |
5.00%, 5/11/17 | | | 195,000 | | | | 224,766 | |
| | | | | | | | |
| | | | | | | 703,772 | |
| | | | | | | | |
United States Treasury Bonds/
Notes — 54.4% | | | | | | | | |
1.75%, 11/15/11 | | | 768,800 | | | | 774,596 | |
1.375%, 2/15/12 | | | 420,000 | | | | 423,659 | |
1.375%, 4/15/12 | | | 992,900 | | | | 1,003,217 | |
1.375%, 5/15/12 | | | 840,000 | | | | 849,384 | |
1.75%, 8/15/12 | | | 217,400 | | | | 221,357 | |
4.00%, 11/15/12 | | | 104,900 | | | | 110,571 | |
1.375%, 2/15/13 | | | 901,200 | | | | 916,620 | |
1.375%, 3/15/13 | | | 830,000 | | | | 844,464 | |
3.375%, 7/31/13 | | | 614,900 | | | | 653,283 | |
4.75%, 5/15/14 | | | 955,200 | | | | 1,066,690 | |
2.625%, 12/31/14 | | | 246,100 | | | | 259,905 | |
2.375%, 2/28/15 | | | 689,700 | | | | 721,706 | |
| | | | | | | | |
| | | | | | | 7,845,452 | |
| | | | | | | | |
TOTAL UNITED STATES GOVERNMENT
& AGENCIES OBLIGATIONS
(Cost $9,095,623) | | | | | | | 9,299,461 | |
| | | | | | | | |
| SOVEREIGN BONDS — 0.7% | | | | | | | | |
Province of Ontario, Series G, MTN (Canada)
2.625%, 1/20/12 | | | 10,000 | | | | 10,148 | |
Province of Ontario (Canada)
2.95%, 2/05/15 | | | 26,000 | | | | 27,370 | |
United Mexican States, Series A, MTN (Mexico)
6.375%, 1/16/13 | | | 59,000 | | | | 64,074 | |
| | | | | | | | |
TOTAL SOVEREIGN BONDS
(Cost $97,906) | | | | | | | 101,592 | |
| | | | | | | | |
| | |
TOTAL INVESTMENTS — 99.7% (Cost $13,823,786) | | | | | | $ | 14,361,739 | |
Liabilities in excess of other assets — 0.3% | | | | | | | 46,201 | |
| | | | | | | | |
NET ASSETS — 100.0% | | | | | | $ | 14,407,940 | |
| | | | | | | | |
MTN – Medium Term Note.
REIT – Real Estate Investment Trust.
* Non-income producing security.
(a) Less than 0.1%.
COUNTRY BREAKDOWN AS OF MAY 31, 2011 (Unaudited)
| | | | | | | | |
| | | Value | | | % of
Net Assets | |
United States | | $ | 13,099,098 | | | | 90.9 | % |
Supranational | | | 298,109 | | | | 2.1 | |
United Kingdom | | | 204,355 | | | | 1.4 | |
Germany | | | 134,127 | | | | 0.9 | |
Australia | | | 99,756 | | | | 0.7 | |
Switzerland | | | 92,848 | | | | 0.7 | |
France | | | 79,076 | | | | 0.5 | |
Japan | | | 64,608 | | | | 0.5 | |
Mexico | | | 64,074 | | | | 0.5 | |
Netherlands | | | 46,028 | | | | 0.3 | |
Canada | | | 43,364 | | | | 0.3 | |
Spain | | | 40,083 | | | | 0.3 | |
Sweden | | | 17,250 | | | | 0.1 | |
Italy | | | 15,000 | | | | 0.1 | |
Ireland | | | 14,971 | | | | 0.1 | |
Netherlands Antilles | | | 13,458 | | | | 0.1 | |
Denmark | | | 8,391 | | | | 0.1 | |
Israel | | | 7,176 | | | | 0.1 | |
Belgium | | | 6,026 | | | | 0.0 | |
Norway | | | 5,316 | | | | 0.0 | |
Luxembourg | | | 4,398 | | | | 0.0 | |
Finland | | | 3,749 | | | | 0.0 | |
Bermuda | | | 478 | | | | 0.0 | |
| | | | | | | | |
TOTAL INVESTMENTS | | | 14,361,739 | | | | 99.7 | |
Other assets less liabilities | | | 46,201 | | | | 0.3 | |
| | | | | | | | |
NET ASSETS | | $ | 14,407,940 | | | | 100.0 | % |
| | | | | | | | |
| | | | |
| See Notes to Financial Statements. | | 18 | | |
db-X Exchange-Traded Funds Inc.
SCHEDULE OF INVESTMENTS
db-X 2020 Target Date Fund
May 31, 2011
| | | | | | | | |
| | | Number
of Shares | | | Value | |
| | | | | | | | |
| COMMON STOCKS — 63.0% | | | | | | | | |
| Basic Materials — 3.5% | | | | | | | | |
Air Liquide S.A. (France) | | | 252 | | | $ | 34,970 | |
Allied Nevada Gold Corp.* | | | 1,200 | | | | 44,496 | |
Anglo American PLC (United Kingdom) | | | 1,353 | | | | 67,477 | |
ArcelorMittal (Luxembourg) | | | 898 | | | | 29,918 | |
BASF SE (Germany) | | | 920 | | | | 84,990 | |
Bayer AG (Germany) | | | 770 | | | | 63,041 | |
BHP Billiton Ltd. (Australia) | | | 3,347 | | | | 158,206 | |
BHP Billiton PLC (United Kingdom) | | | 2,090 | | | | 82,664 | |
Buckeye Technologies, Inc. | | | 1,759 | | | | 44,802 | |
Coeur d’Alene Mines Corp.* | | | 1,120 | | | | 30,878 | |
Dow Chemical (The) Co. | | | 1,615 | | | | 58,350 | |
E.I. du Pont de Nemours & Co. | | | 1,337 | | | | 71,262 | |
Freeport-McMoRan Copper & Gold, Inc. | | | 1,280 | | | | 66,099 | |
Metals USA Holdings Corp.* | | | 1,440 | | | | 22,637 | |
Newmont Mining Corp. | | | 774 | | | | 43,785 | |
Rio Tinto Ltd. (Australia) | | | 459 | | | | 39,861 | |
Rio Tinto PLC (United Kingdom) | | | 1,363 | | | | 95,234 | |
Rockwood Holdings, Inc.* | | | 771 | | | | 40,547 | |
Sensient Technologies Corp. | | | 651 | | | | 24,771 | |
Sherwin-Williams (The) Co. | | | 1,022 | | | | 89,772 | |
Solutia, Inc.* | | | 1,440 | | | | 35,957 | |
Syngenta AG (Switzerland)* | | | 108 | | | | 37,304 | |
Vulcan Materials Co. | | | 1,121 | | | | 45,389 | |
Xstrata PLC (United Kingdom) | | | 2,073 | | | | 48,639 | |
| | | | | | | | |
| | | | | | | 1,361,049 | |
| | | | | | | | |
| Communications — 6.6% | | | | | | | | |
Acme Packet, Inc.* | | | 640 | | | | 48,442 | |
ADTRAN, Inc. | | | 640 | | | | 27,430 | |
Anixter International, Inc.* | | | 413 | | | | 27,956 | |
Arris Group, Inc.* | | | 1,735 | | | | 19,588 | |
AT&T, Inc. | | | 9,234 | | | | 291,424 | |
Calix, Inc.* | | | 1,679 | | | | 36,216 | |
Cisco Systems, Inc. | | | 8,473 | | | | 142,347 | |
Comcast Corp., Class A | | | 4,336 | | | | 109,441 | |
Corning, Inc. | | | 2,290 | | | | 46,143 | |
Deutsche Telekom AG (Germany) | | | 3,315 | | | | 49,229 | |
Digital River, Inc.* | | | 533 | | | | 17,349 | |
Discovery Communications, Inc., Class A* | | | 2,639 | | | | 114,955 | |
eResearch Technology, Inc.* | | | 3,050 | | | | 19,337 | |
France Telecom S.A. (France) | | | 2,063 | | | | 47,156 | |
Google, Inc., Class A* | | | 484 | | | | 256,046 | |
GSI Commerce, Inc.* | | | 800 | | | | 23,400 | |
Limelight Networks, Inc.* | | | 4,159 | | | | 23,831 | |
News Corp., Class A | | | 2,724 | | | | 49,958 | |
Nokia OYJ (Finland) | | | 4,591 | | | | 31,350 | |
NTT DoCoMo, Inc. (Japan) | | | 17 | | | | 31,765 | |
Orbitz Worldwide, Inc.* | | | 4,238 | | | | 9,747 | |
Rackspace Hosting, Inc.* | | | 1,711 | | | | 75,284 | |
Symantec Corp.* | | | 6,798 | | | | 132,901 | |
Tekelec* | | | 900 | | | | 8,190 | |
Telefonaktiebolaget LM Ericsson, Class B (Sweden) | | | 2,899 | | | | 42,811 | |
Telefonica S.A. (Spain) | | | 3,816 | | | | 92,574 | |
Thomson Reuters Corp. (Canada) | | | 1,360 | | | | 52,999 | |
TIBCO Software, Inc.* | | | 1,854 | | | | 52,079 | |
| | | | | | | | |
| | | Number
of Shares | | | Value | |
| | | | | | | | |
| Communications (Continued) | | | | | | | | |
Time Warner, Inc. | | | 1,783 | | | $ | 64,955 | |
Verizon Communications, Inc. | | | 4,873 | | | | 179,960 | |
Vivendi (France) | | | 1,001 | | | | 27,910 | |
Vodafone Group PLC (United Kingdom) | | | 51,118 | | | | 142,151 | |
Walt Disney (The) Co. | | | 3,074 | | | | 127,971 | |
Windstream Corp. | | | 3,919 | | | | 52,711 | |
Yahoo!, Inc.* | | | 2,686 | | | | 44,453 | |
| | | | | | | | |
| | | | | | | 2,520,059 | |
| | | | | | | | |
| Consumer, Cyclical — 6.8% | | | | | | | | |
Alaska Air Group, Inc.* | | | 400 | | | | 27,015 | |
Ascena Retail Group, Inc.* | | | 837 | | | | 28,006 | |
Buckle (The), Inc. | | | 649 | | | | 27,706 | |
Callaway Golf Co. | | | 2,959 | | | | 20,032 | |
Carter’s, Inc.* | | | 799 | | | | 25,328 | |
Casey’s General Stores, Inc. | | | 665 | | | | 27,564 | |
Cash America International, Inc. | | | 320 | | | | 16,659 | |
Cinemark Holdings, Inc. | | | 1,240 | | | | 26,970 | |
Coach, Inc. | | | 2,781 | | | | 177,037 | |
Collective Brands, Inc.* | | | 885 | | | | 13,806 | |
Columbia Sportswear Co. | | | 446 | | | | 29,258 | |
Compagnie Financiere Richemont S.A. (Switzerland) | | | 508 | | | | 33,116 | |
CVS Caremark Corp. | | | 2,182 | | | | 84,422 | |
Daimler AG (Germany) | | | 871 | | | | 61,487 | |
Dana Holding Corp.* | | | 1,599 | | | | 28,974 | |
Deckers Outdoor Corp.* | | | 480 | | | | 43,728 | |
Dillard’s, Inc., Class A | | | 880 | | | | 49,447 | |
Dollar General Corp.* | | | 3,199 | | | | 112,189 | |
DSW, Inc., Class A* | | | 904 | | | | 45,336 | |
Exide Technologies* | | | 3,199 | | | | 31,542 | |
Ford Motor Co.* | | | 4,607 | | | | 68,736 | |
G&K Services, Inc., Class A | | | 800 | | | | 25,304 | |
Gaylord Entertainment Co.* | | | 480 | | | | 15,480 | |
Hennes & Mauritz AB, Class B (Sweden) | | | 963 | | | | 35,716 | |
Honda Motor Co. Ltd. (Japan) | | | 1,898 | | | | 72,191 | |
JetBlue Airways Corp.* | | | 3,055 | | | | 18,544 | |
Johnson Controls, Inc. | | | 1,040 | | | | 41,184 | |
Jones Group (The), Inc. | | | 1,200 | | | | 14,748 | |
K-Swiss, Inc., Class A* | | | 1,759 | | | | 19,402 | |
La-Z-Boy, Inc.* | | | 2,239 | | | | 24,786 | |
Liz Claiborne, Inc.* | | | 4,239 | | | | 27,681 | |
Lowe’s Cos., Inc. | | | 2,399 | | | | 57,913 | |
McDonald’s Corp. | | | 1,583 | | | | 129,078 | |
Men’s Wearhouse (The), Inc. | | | 719 | | | | 24,755 | |
Mitsubishi Corp. (Japan) | | | 1,570 | | | | 39,753 | |
Mitsui & Co. Ltd. (Japan) | | | 2,099 | | | | 35,758 | |
Nike, Inc., Class B | | | 800 | | | | 67,560 | |
Nintendo Co. Ltd. (Japan) | | | 103 | | | | 23,924 | |
Nissan Motor Co. Ltd. (Japan) | | | 2,522 | | | | 25,270 | |
Nu Skin Enterprises, Inc., Class A | | | 640 | | | | 25,017 | |
Owens & Minor, Inc. | | | 881 | | | | 30,483 | |
Panasonic Corp. (Japan) | | | 2,075 | | | | 24,367 | |
Penske Automotive Group, Inc. | | | 1,040 | | | | 21,590 | |
Polaris Industries, Inc. | | | 400 | | | | 44,140 | |
Saks, Inc.* | | | 1,919 | | | | 21,704 | |
Skechers U.S.A., Inc., Class A* | | | 560 | | | | 9,789 | |
| | | | |
| See Notes to Financial Statements. | | 19 | | |
db-X Exchange-Traded Funds Inc.
SCHEDULE OF INVESTMENTS
db-X 2020 Target Date Fund (Continued)
May 31, 2011
| | | | | | | | |
| | | Number
of Shares | | | Value | |
| | | | | | | | |
| Consumer, Cyclical (Continued) | | | | | | | | |
Sony Corp. (Japan) | | | 1,208 | | | $ | 32,162 | |
Tenneco, Inc.* | | | 640 | | | | 26,720 | |
Toyota Motor Corp. (Japan) | | | 3,000 | | | | 125,554 | |
Under Armour, Inc., Class A* | | | 551 | | | | 35,914 | |
UniFirst Corp. | | | 267 | | | | 14,317 | |
US Airways Group, Inc.* | | | 1,475 | | | | 13,423 | |
Vail Resorts, Inc.* | | | 389 | | | | 18,925 | |
Walgreen Co. | | | 1,440 | | | | 62,827 | |
Wal-Mart Stores, Inc. | | | 5,874 | | | | 324,362 | |
Warnaco Group (The), Inc.* | | | 557 | | | | 30,719 | |
Watsco, Inc. | | | 483 | | | | 32,332 | |
World Fuel Services Corp. | | | 773 | | | | 28,276 | |
| | | | | | | | |
| | | | | | | 2,600,026 | |
| | | | | | | | |
| Consumer, Non-cyclical — 12.6% | | | | | | | | |
Abbott Laboratories | | | 2,459 | | | | 128,483 | |
ABM Industries, Inc. | | | 640 | | | | 14,579 | |
Accuray, Inc.* | | | 2,879 | | | | 21,996 | |
Aetna, Inc. | | | 3,759 | | | | 164,192 | |
Amedisys, Inc.* | | | 670 | | | | 20,971 | |
American Medical Systems Holdings, Inc.* | | | 880 | | | | 26,347 | |
American Reprographics Co.* | | | 2,239 | | | | 21,002 | |
AMERIGROUP Corp.* | | | 723 | | | | 51,268 | |
Amgen, Inc.* | | | 1,599 | | | | 96,803 | |
Anheuser-Busch InBev NV (Belgium) | | | 610 | | | | 36,761 | |
AstraZeneca PLC (United Kingdom) | | | 1,411 | | | | 73,795 | |
British American Tobacco PLC (United Kingdom) | | | 1,871 | | | | 83,826 | |
Bruker Corp.* | | | 2,533 | | | | 49,951 | |
Capella Education Co.* | | | 160 | | | | 7,734 | |
Catalyst Health Solutions, Inc.* | | | 619 | | | | 37,778 | |
CBIZ, Inc.* | | | 2,959 | | | | 22,636 | |
Centene Corp.* | | | 639 | | | | 22,237 | |
Coca-Cola (The) Co. | | | 3,477 | | | | 232,299 | |
DANONE S.A. (France) | | | 531 | | | | 38,893 | |
Diageo PLC (United Kingdom) | | | 2,446 | | | | 52,096 | |
Ennis, Inc. | | | 1,120 | | | | 21,381 | |
Fresh Del Monte Produce, Inc. (Cayman Islands) | | | 876 | | | | 24,081 | |
Gentiva Health Services, Inc.* | | | 622 | | | | 15,227 | |
GlaxoSmithKline PLC (United Kingdom) | | | 5,005 | | | | 108,741 | |
HEALTHSOUTH Corp.* | | | 1,200 | | | | 33,684 | |
Healthspring, Inc.* | | | 711 | | | | 31,177 | |
Heidrick & Struggles International, Inc. | | | 1,027 | | | | 21,516 | |
HMS Holdings Corp.* | | | 320 | | | | 24,979 | |
Hospira, Inc.* | | | 1,520 | | | | 84,041 | |
Invacare Corp. | | | 355 | | | | 11,921 | |
Johnson & Johnson | | | 4,788 | | | | 322,184 | |
Kraft Foods, Inc., Class A | | | 2,298 | | | | 80,361 | |
Lancaster Colony Corp. | | | 380 | | | | 23,043 | |
Live Nation Entertainment, Inc.* | | | 2,399 | | | | 27,660 | |
Magellan Health Services, Inc.* | | | 508 | | | | 26,894 | |
Masimo Corp.* | | | 1,360 | | | | 41,779 | |
MasterCard, Inc., Class A | | | 186 | | | | 53,391 | |
Medifast, Inc.* | | | 640 | | | | 17,101 | |
Merck & Co., Inc. | | | 5,038 | | | | 185,147 | |
Molina Healthcare, Inc.* | | | 532 | | | | 14,460 | |
| | | | | | | | |
| | | Number
of Shares | | | Value | |
| | | | | | | | |
| Consumer, Non-cyclical (Continued) | | | | | | | | |
Molson Coors Brewing Co., Class B | | | 1,373 | | | $ | 64,050 | |
Nestle S.A. (Switzerland) | | | 3,335 | | | | 214,083 | |
Novartis AG (Switzerland) | | | 2,064 | | | | 133,099 | |
Novo Nordisk A/S, Class B (Denmark) | | | 456 | | | | 57,111 | |
Pfizer, Inc. | | | 12,855 | | | | 275,740 | |
Philip Morris International, Inc. | | | 2,704 | | | | 194,012 | |
Procter & Gamble (The) Co. | | | 4,797 | | | | 321,399 | |
Reckitt Benckiser Group PLC (United Kingdom) | | | 591 | | | | 33,434 | |
Roche Holding AG (Switzerland) | | | 799 | | | | 140,521 | |
Rollins, Inc. | | | 1,759 | | | | 35,391 | |
Ruddick Corp. | | | 508 | | | | 22,327 | |
Safeway, Inc. | | | 3,475 | | | | 85,833 | |
Salix Pharmaceuticals Ltd.* | | | 640 | | | | 25,619 | |
Sanofi | | | 1,154 | | | | 91,278 | |
Seaboard Corp. | | | 14 | | | | 32,340 | |
Select Medical Holdings Corp.* | | | 2,159 | | | | 20,511 | |
Sirona Dental Systems, Inc.* | | | 729 | | | | 39,410 | |
SonoSite, Inc.* | | | 640 | | | | 22,854 | |
Sotheby’s | | | 720 | | | | 30,644 | |
STERIS Corp. | | | 812 | | | | 29,305 | |
Takeda Pharmaceutical Co. Ltd. (Japan) | | | 616 | | | | 29,306 | |
Tejon Ranch Co.* | | | 800 | | | | 29,480 | |
Tesco PLC (United Kingdom) | | | 7,993 | | | | 55,131 | |
Teva Pharmaceutical Industries Ltd. (Israel) | | | 997 | | | | 51,102 | |
TreeHouse Foods, Inc.* | | | 400 | | | | 24,372 | |
Unilever NV (Netherlands) | | | 1,648 | | | | 53,733 | |
Unilever PLC (United Kingdom) | | | 1,299 | | | | 42,142 | |
UnitedHealth Group, Inc. | | | 1,736 | | | | 84,977 | |
ViroPharma, Inc.* | | | 889 | | | | 17,202 | |
Visa, Inc., Class A | | | 1,320 | | | | 106,999 | |
WellCare Health Plans, Inc.* | | | 609 | | | | 29,993 | |
WellPoint, Inc. | | | 640 | | | | 50,029 | |
Woolworths Ltd. (Australia) | | | 1,240 | | | | 36,216 | |
| | | | | | | | |
| | | | | | | 4,852,058 | |
| | | | | | | | |
| Diversified — 0.1% | | | | | | | | |
LVMH Moet Hennessy Louis Vuitton S.A. (France) | | | 207 | | | | 35,978 | |
| | | | | | | | |
| Energy — 7.6% | | | | | | | | |
Berry Petroleum Co., Class A | | | 554 | | | | 29,035 | |
BG Group PLC (United Kingdom) | | | 3,312 | | | | 76,674 | |
Bill Barrett Corp.* | | | 554 | | | | 24,692 | |
BP PLC (United Kingdom) | | | 22,787 | | | | 175,661 | |
Brigham Exploration Co.* | | | 1,360 | | | | 42,350 | |
CARBO Ceramics, Inc. | | | 240 | | | | 36,065 | |
Chevron Corp. | | | 3,099 | | | | 325,116 | |
Complete Production Services, Inc.* | | | 800 | | | | 26,552 | |
ConocoPhillips. | | | 2,241 | | | | 164,086 | |
Delek US Holdings, Inc. | | | 2,639 | | | | 39,823 | |
Devon Energy Corp. | | | 720 | | | | 60,530 | |
Dril-Quip, Inc.* | | | 443 | | | | 32,862 | |
ENI S.p.A (Italy) | | | 2,408 | | | | 57,673 | |
Exxon Mobil Corp. | | | 8,219 | | | | 686,039 | |
Helix Energy Solutions Group, Inc.* | | | 1,439 | | | | 25,211 | |
Hornbeck Offshore Services, Inc.* | | | 1,120 | | | | 30,229 | |
Key Energy Services, Inc.* | | | 1,599 | | | | 28,270 | |
| | | | |
| See Notes to Financial Statements. | | 20 | | |
db-X Exchange-Traded Funds Inc.
SCHEDULE OF INVESTMENTS
db-X 2020 Target Date Fund (Continued)
May 31, 2011
| | | | | | | | |
| | | Number
of Shares | | | Value | |
| | | | | | | | |
| Energy (Continued) | | | | | | | | |
Occidental Petroleum Corp. | | | 1,264 | | | $ | 136,322 | |
Peabody Energy Corp. | | | 2,163 | | | | 132,722 | |
Royal Dutch Shell PLC, Class A (United Kingdom) | | | 3,537 | | | | 127,612 | |
Royal Dutch Shell PLC, Class B (United Kingdom) | | | 2,597 | | | | 93,997 | |
RPC, Inc. | | | 1,529 | | | | 38,500 | |
Schlumberger Ltd. (Netherlands Antilles) | | | 1,729 | | | | 148,210 | |
Southwestern Energy Co.* | | | 574 | | | | 25,124 | |
Statoil ASA (Norway) | | | 1,034 | | | | 27,214 | |
Total S.A. (France) | | | 2,155 | | | | 124,014 | |
Williams (The) Cos., Inc. | | | 5,118 | | | | 160,654 | |
Woodside Petroleum Ltd. (Australia) | | | 553 | | | | 27,477 | |
| | | | | | | | |
| | | | | | | 2,902,714 | |
| | | | | | | | |
| Financial — 12.1% | | | | | | | | |
Alexander’s, Inc. REIT | | | 72 | | | | 28,240 | |
Allianz SE (Germany) | | | 518 | | | | 71,623 | |
American Campus Communities, Inc. REIT | | | 694 | | | | 24,526 | |
American Capital Ltd.* | | | 3,919 | | | | 38,798 | |
American Express Co. | | | 1,839 | | | | 94,893 | |
Apollo Investment Corp. | | | 2,239 | | | | 25,547 | |
Ashford Hospitality Trust, Inc. REIT | | | 2,239 | | | | 31,951 | |
Associated Estates Realty Corp. REIT | | | 1,360 | | | | 22,930 | |
Australia & New Zealand Banking Group Ltd. (Australia) | | | 2,564 | | | | 60,461 | |
AXA S.A. (France) | | | 1,974 | | | | 42,113 | |
Banco Bilbao Vizcaya Argentaria S.A. (Spain) | | | 3,311 | | | | 38,627 | |
Banco Santander S.A. (Spain) | | | 7,135 | | | | 84,766 | |
Bank of America Corp. | | | 14,737 | | | | 173,160 | |
Barclays PLC (United Kingdom) | | | 12,280 | | | | 55,917 | |
Berkshire Hathaway, Inc., Class B* | | | 4,171 | | | | 329,800 | |
BioMed Realty Trust, Inc. REIT | | | 1,360 | | | | 27,866 | |
BNP Paribas (France) | | | 903 | | | | 70,386 | |
Boston Properties, Inc. REIT | | | 1,211 | | | | 131,211 | |
CBL & Associates Properties, Inc. REIT | | | 1,599 | | | | 30,765 | |
Charles Schwab (The) Corp. | | | 1,831 | | | | 32,976 | |
Citigroup, Inc. | | | 4,395 | | | | 180,854 | |
Commonwealth Bank of Australia (Australia) | | | 1,599 | | | | 86,246 | |
Community Trust Bancorp, Inc. | | | 720 | | | | 19,786 | |
Credit Acceptance Corp.* | | | 400 | | | | 32,000 | |
Credit Suisse Group AG (Switzerland)* | | | 1,107 | | | | 47,530 | |
Deutsche Bank AG (Germany) (a) | | | 897 | | | | 53,406 | |
Entertainment Properties Trust REIT | | | 560 | | | | 27,205 | |
Equity Lifestyle Properties, Inc. REIT | | | 346 | | | | 20,328 | |
Equity One, Inc. REIT | | | 1,149 | | | | 22,532 | |
Equity Residential REIT | | | 480 | | | | 29,678 | |
Evercore Partners, Inc., Class A | | | 800 | | | | 29,608 | |
FirstMerit Corp. | | | 1,098 | | | | 17,886 | |
Franklin Resources, Inc. | | | 349 | | | | 45,223 | |
Goldman Sachs Group (The), Inc. | | | 773 | | | | 108,784 | |
Highwoods Properties, Inc. REIT | | | 827 | | | | 29,838 | |
Home Properties, Inc. REIT | | | 400 | | | | 24,760 | |
HSBC Holdings PLC (United Kingdom) | | | 16,358 | | | | 170,915 | |
ING Groep NV (Netherlands)* | | | 3,721 | | | | 44,822 | |
Investors Bancorp, Inc.* | | | 1,440 | | | | 21,557 | |
JPMorgan Chase & Co. | | | 6,105 | | | | 263,980 | |
| | | | | | | | |
| | | Number
of Shares | | | Value | |
| | | | | | | | |
| Financial (Continued) | | | | | | | | |
Kilroy Realty Corp. REIT | | | 640 | | | $ | 26,541 | |
LaSalle Hotel Properties REIT | | | 800 | | | | 22,384 | |
Lloyds Banking Group PLC (United Kingdom)* | | | 37,182 | | | | 31,824 | |
M&T Bank Corp. | | | 1,120 | | | | 98,895 | |
MFA Financial, Inc. REIT | | | 3,140 | | | | 25,874 | |
Mid-America Apartment Communities, Inc. REIT | | | 393 | | | | 26,940 | |
Mitsubishi UFJ Financial Group, Inc. (Japan) | | | 14,570 | | | | 67,254 | |
Mizuho Financial Group, Inc. (Japan) | | | 17,029 | | | | 26,831 | |
Muenchener Rueckversicherungs-Gesellschaft AG (Germany) | | | 224 | | | | 34,328 | |
National Australia Bank Ltd. (Australia) | | | 2,209 | | | | 62,329 | |
National Interstate Corp. | | | 880 | | | | 18,999 | |
National Retail Properties, Inc. REIT | | | 941 | | | | 24,259 | |
Nomura Holdings, Inc. (Japan) | | | 4,399 | | | | 22,092 | |
Nordea Bank AB (Sweden) | | | 3,179 | | | | 37,228 | |
Northern Trust Corp. | | | 2,224 | | | | 108,509 | |
OMEGA Healthcare Investors, Inc. REIT | | | 1,133 | | | | 24,122 | |
Pebblebrook Hotel Trust REIT | | | 960 | | | | 20,870 | |
Platinum Underwriters Holdings Ltd. (Bermuda) | | | 336 | | | | 11,471 | |
Potlatch Corp. REIT | | | 533 | | | | 19,188 | |
ProAssurance Corp.* | | | 451 | | | | 31,710 | |
Prosperity Bancshares, Inc. | | | 635 | | | | 27,781 | |
Public Storage REIT | | | 240 | | | | 28,402 | |
Signature Bank* | | | 480 | | | | 27,322 | |
Simon Property Group, Inc. REIT | | | 436 | | | | 51,473 | |
Societe Generale (France) | | | 574 | | | | 34,031 | |
Standard Chartered PLC (United Kingdom) | | | 2,003 | | | | 53,673 | |
Sumitomo Mitsui Financial Group, Inc. (Japan) | | | 1,459 | | | | 42,204 | |
SVB Financial Group* | | | 560 | | | | 33,253 | |
T. Rowe Price Group, Inc. | | | 2,150 | | | | 136,096 | |
Tanger Factory Outlet Centers, Inc. REIT | | | 881 | | | | 24,192 | |
Tower Group, Inc. | | | 546 | | | | 13,268 | |
Travelers (The) Cos., Inc. | | | 800 | | | | 49,664 | |
U.S. Bancorp | | | 3,039 | | | | 77,798 | |
UBS AG (Switzerland)* | | | 3,494 | | | | 66,939 | |
UMB Financial Corp. | | | 518 | | | | 22,093 | |
UniCredit S.p.A (Italy) | | | 12,335 | | | | 28,000 | |
Universal Health Realty Income Trust REIT | | | 560 | | | | 24,254 | |
Washington Real Estate Investment Trust REIT | | | 781 | | | | 26,968 | |
Webster Financial Corp. | | | 960 | | | | 20,026 | |
Wells Fargo & Co. | | | 8,042 | | | | 228,151 | |
Westamerica Bancorporation | | | 336 | | | | 16,901 | |
Westpac Banking Corp. (Australia) | | | 3,171 | | | | 74,774 | |
Weyerhaeuser Co. REIT | | | 4,094 | | | | 88,184 | |
Zurich Financial Services AG (Switzerland)* | | | 124 | | | | 33,163 | |
| | | | | | | | |
| | | | | | | 4,663,752 | |
| | | | | | | | |
| Industrial — 6.8% | | | | | | | | |
AAON, Inc. | | | 800 | | | | 26,960 | |
ABB Ltd. (Switzerland)* | | | 1,936 | | | | 51,958 | |
Acuity Brands, Inc. | | | 480 | | | | 29,261 | |
BAE Systems PLC (United Kingdom) | | | 3,530 | | | | 19,185 | |
| | | | |
| See Notes to Financial Statements. | | 21 | | |
db-X Exchange-Traded Funds Inc.
SCHEDULE OF INVESTMENTS
db-X 2020 Target Date Fund (Continued)
May 31, 2011
| | | | | | | | |
| | | Number
of Shares | | | Value | |
| | | | | | | | |
| Industrial (Continued) | | | | | | | | |
Benchmark Electronics, Inc.* | | | 876 | | | $ | 15,137 | |
Boeing (The) Co. | | | 1,200 | | | | 93,636 | |
Brady Corp., Class A | | | 640 | | | | 22,061 | |
Cascade Corp. | | | 480 | | | | 19,502 | |
Caterpillar, Inc. | | | 885 | | | | 93,633 | |
CLARCOR, Inc. | | | 691 | | | | 29,444 | |
Clean Harbors, Inc.* | | | 320 | | | | 32,371 | |
East Japan Railway Co. (Japan) | | | 322 | | | | 18,787 | |
Eaton Corp. | | | 2,705 | | | | 139,766 | |
EMCOR Group, Inc.* | | | 766 | | | | 23,263 | |
Emerson Electric Co. | | | 1,176 | | | | 64,151 | |
EnerSys* | | | 560 | | | | 20,048 | |
Fanuc Corp. (Japan) | | | 233 | | | | 35,822 | |
FedEx Corp. | | | 480 | | | | 44,947 | |
General Dynamics Corp. | | | 600 | | | | 44,532 | |
General Electric Co. | | | 16,693 | | | | 327,850 | |
GrafTech International Ltd.* | | | 1,446 | | | | 30,568 | |
Graphic Packaging Holding Co.* | | | 3,759 | | | | 20,599 | |
Griffon Corp.* | | | 836 | | | | 8,853 | |
Hexcel Corp.* | | | 1,120 | | | | 23,150 | |
Ingersoll-Rand PLC (Ireland) | | | 2,790 | | | | 139,221 | |
Kaydon Corp. | | | 400 | | | | 14,548 | |
Knight Transportation, Inc. | | | 929 | | | | 15,886 | |
Komatsu Ltd. (Japan) | | | 960 | | | | 28,739 | |
Koninklijke Philips Electronics NV (Netherlands) | | | 1,042 | | | | 28,874 | |
L-1 Identity Solutions, Inc.* | | | 1,155 | | | | 12,844 | |
Lindsay Corp. | | | 560 | | | | 37,565 | |
Metabolix, Inc.* | | | 1,120 | | | | 9,901 | |
Mitsubishi Electric Corp. (Japan) | | | 2,399 | | | | 27,020 | |
Moog, Inc., Class A* | | | 560 | | | | 22,988 | |
Nordson Corp. | | | 800 | | | | 41,616 | |
Parker Hannifin Corp. | | | 1,351 | | | | 120,036 | |
Republic Services, Inc. | | | 3,414 | | | | 107,609 | |
Rock-Tenn Co., Class A | | | 433 | | | | 33,267 | |
Schneider Electric S.A. (France) | | | 231 | | | | 38,057 | |
Siemens AG (Germany) | | | 810 | | | | 108,294 | |
Silgan Holdings, Inc. | | | 876 | | | | 39,324 | |
Simpson Manufacturing Co., Inc. | | | 640 | | | | 17,933 | |
Sun Hydraulics Corp. | | | 800 | | | | 38,744 | |
Thermo Fisher Scientific, Inc.* | | | 640 | | | | 41,888 | |
Toshiba Corp. (Japan) | | | 3,999 | | | | 21,167 | |
TriMas Corp.* | | | 1,679 | | | | 34,252 | |
Union Pacific Corp. | | | 817 | | | | 85,761 | |
United Parcel Service, Inc., Class B | | | 1,498 | | | | 110,088 | |
United Technologies Corp. | | | 1,430 | | | | 125,512 | |
Vinci S.A. (France) | | | 454 | | | | 29,263 | |
Watts Water Technologies, Inc., Class A | | | 400 | | | | 13,996 | |
Woodward, Inc. | | | 800 | | | | 28,176 | |
Worthington Industries, Inc. | | | 880 | | | | 19,210 | |
| | | | | | | | |
| | | | | | | 2,627,263 | |
| | | | | | | | |
| Technology — 5.5% | | | | | | | | |
Apple, Inc.* | | | 1,488 | | | | 517,570 | |
Applied Materials, Inc. | | | 2,159 | | | | 29,751 | |
CACI International, Inc., Class A* | | | 410 | | | | 26,170 | |
Concur Technologies, Inc.* | | | 672 | | | | 33,580 | |
| | | | | | | | |
| | | Number
of Shares | | | Value | |
| | | | | | | | |
| Technology (Continued) | | | | | | | | |
EMC Corp.* | | | 3,091 | | | $ | 88,001 | |
Intel Corp. | | | 8,237 | | | | 185,415 | |
International Business Machines Corp. | | | 2,060 | | | | 347,997 | |
Jack Henry & Associates, Inc. | | | 1,164 | | | | 36,363 | |
JDA Software Group, Inc.* | | | 533 | | | | 17,605 | |
Mentor Graphics Corp.* | | | 1,244 | | | | 16,682 | |
Microsoft Corp. | | | 12,843 | | | | 321,203 | |
MKS Instruments, Inc. | | | 622 | | | | 16,359 | |
Netlogic Microsystems, Inc.* | | | 720 | | | | 27,590 | |
Parametric Technology Corp.* | | | 1,240 | | | | 28,880 | |
Quality Systems, Inc. | | | 427 | | | | 36,756 | |
Quest Software, Inc.* | | | 1,279 | | | | 29,027 | |
Riverbed Technology, Inc.* | | | 1,521 | | | | 57,676 | |
SAP AG (Germany) | | | 933 | | | | 57,903 | |
SRA International, Inc., Class A* | | | 739 | | | | 22,872 | |
SYNNEX Corp.* | | | 444 | | | | 14,537 | |
TriQuint Semiconductor, Inc.* | | | 1,688 | | | | 21,860 | |
Ultratech, Inc.* | | | 1,120 | | | | 35,582 | |
VeriFone Systems, Inc.* | | | 960 | | | | 46,205 | |
Xerox Corp. | | | 11,356 | | | | 115,945 | |
| | | | | | | | |
| | | | | | | 2,131,529 | |
| | | | | | | | |
| Utilities — 1.4% | | | | | | | | |
Cleco Corp. | | | 720 | | | | 25,265 | |
E.ON AG (Germany) | | | 2,092 | | | | 59,351 | |
ENEL S.p.A (Italy) | | | 7,248 | | | | 49,744 | |
GDF Suez (France) | | | 1,275 | | | | 46,850 | |
National Fuel Gas Co. | | | 720 | | | | 51,868 | |
Nicor, Inc. | | | 547 | | | | 30,063 | |
Piedmont Natural Gas Co., Inc. | | | 874 | | | | 27,505 | |
RWE AG (Germany) | | | 507 | | | | 29,541 | |
Sempra Energy | | | 2,159 | | | | 119,113 | |
Southern Co. | | | 1,288 | | | | 51,623 | |
Tokyo Electric Power (The) Co., Inc. (Japan) | | | 1,279 | | | | 4,991 | |
WGL Holdings, Inc. | | | 623 | | | | 24,453 | |
| | | | | | | | |
| | | | | | | 520,367 | |
| | | | | | | | |
TOTAL COMMON STOCKS
(Cost $21,327,487) | | | | | | | 24,214,795 | |
| | | | | | | | |
| | |
| | | Principal
Amount | | | Value | |
| CORPORATE BONDS — 21.8% | | | | | | | | |
| Basic Materials — 0.3% | | | | | | | | |
E.I. du Pont de Nemours & Co.
5.25%, 12/15/16 | | $ | 87,000 | | | | 99,199 | |
| | | | | | | | |
| Communications — 0.6% | | | | | | | | |
Cellco Partnership/Verizon Wireless Capital LLC
5.55%, 2/01/14 | | | 94,000 | | | | 103,893 | |
Cisco Systems, Inc.
4.45%, 1/15/20 | | | 104,000 | | | | 109,119 | |
France Telecom S.A. (France)
5.375%, 7/08/19 | | | 35,000 | | | | 39,552 | |
| | | | | | | | |
| | | | | | | 252,564 | |
| | | | | | | | |
| | | | |
| See Notes to Financial Statements. | | 22 | | |
db-X Exchange-Traded Funds Inc.
SCHEDULE OF INVESTMENTS
db-X 2020 Target Date Fund (Continued)
May 31, 2011
| | | | | | | | |
| | | Principal
Amount | | | Value | |
| | | | | | | | |
| Consumer, Cyclical — 0.2% | | | | | | | | |
McDonald’s Corp., MTN
5.35%, 3/01/18 | | $ | 56,000 | | | $ | 64,253 | |
| | | | | | | | |
| Consumer, Non-cyclical — 3.3% | | | | | | | | |
Abbott Laboratories
5.875%, 5/15/16 | | | 135,000 | | | | 157,835 | |
Amgen, Inc.
5.70%, 2/01/19 | | | 79,000 | | | | 90,684 | |
Coca-Cola Enterprises, Inc.
8.50%, 2/01/22 | | | 111,000 | | | | 152,771 | |
Diageo Finance BV (Netherlands)
5.30%, 10/28/15 | | | 174,000 | | | | 196,392 | |
GlaxoSmithKline Capital, Inc.
5.65%, 5/15/18 | | | 87,000 | | | | 99,899 | |
Merck & Co., Inc.
5.00%, 6/30/19 | | | 43,000 | | | | 47,953 | |
PepsiCo, Inc.
7.90%, 11/01/18 | | | 48,000 | | | | 62,428 | |
Philip Morris International, Inc.
5.65%, 5/16/18 | | | 27,000 | | | | 30,823 | |
Wyeth
5.50%, 2/01/14 | | | 375,000 | | | | 417,824 | |
| | | | | | | | |
| | | | | | | 1,256,609 | |
| | | | | | | | |
| Energy — 0.7% | | | | | | | | |
BP Capital Markets PLC (United Kingdom)
3.875%, 3/10/15 | | | 88,000 | | | | 93,046 | |
Chevron Corp.
3.95%, 3/03/14 | | | 87,000 | | | | 94,084 | |
TransCanada PipeLines Ltd. (Canada)
7.125%, 1/15/19 | | | 59,000 | | | | 73,479 | |
| | | | | | | | |
| | | | | | | 260,609 | |
| | | | | | | | |
| Financial — 11.1% | | | | | | | | |
Bank of New York Mellon (The) Corp.,
Series G, MTN
4.60%, 1/15/20 | | | 75,000 | | | | 79,960 | |
Bank of New York Mellon (The) Corp.
4.30%, 5/15/14 | | | 215,000 | | | | 233,463 | |
Barclays Bank PLC (United Kingdom)
5.20%, 7/10/14 | | | 160,000 | | | | 175,122 | |
5.125%, 1/08/20 | | | 150,000 | | | | 155,475 | |
Bear Stearns & Co., Inc.
7.25%, 2/01/18 | | | 22,000 | | | | 26,425 | |
Berkshire Hathaway, Inc.
3.20%, 2/11/15 | | | 19,000 | | | | 19,966 | |
Caterpillar Financial Services Corp., MTN
6.125%, 2/17/14 | | | 83,000 | | | | 94,051 | |
7.15%, 2/15/19 | | | 95,000 | | | | 118,877 | |
Deutsche Bank AG (Germany)
6.00%, 9/01/17 (a) | | | 133,000 | | | | 152,459 | |
Goldman Sachs Group (The), Inc.
5.00%, 10/01/14 | | | 459,000 | | | | 495,442 | |
HSBC Finance Corp.
5.50%, 1/19/16 | | | 150,000 | | | | 167,441 | |
JPMorgan Chase & Co.
6.30%, 4/23/19 | | | 91,000 | | | | 104,086 | |
JPMorgan Chase Bank NA
5.875%, 6/13/16 | | | 200,000 | | | | 224,703 | |
| | | | | | | | |
| | | Principal
Amount | | | Value | |
| | | | | | | | |
| Financial (Continued) | | | | | | | | |
KFW (Germany)
4.875%, 6/17/19 | | $ | 128,000 | | | $ | 146,979 | |
Landwirtschaftliche Rentenbank, Series G, MTN (Germany)
5.00%, 11/08/16 | | | 201,000 | | | | 229,845 | |
Merrill Lynch & Co., Inc., Series C, MTN
5.00%, 1/15/15 | | | 154,000 | | | | 165,194 | |
Merrill Lynch & Co., Inc., MTN
6.875%, 4/25/18 | | | 233,000 | | | | 265,888 | |
MetLife, Inc.
5.00%, 6/15/15 | | | 273,000 | | | | 300,416 | |
Morgan Stanley
5.30%, 3/01/13 | | | 149,000 | | | | 158,867 | |
PNC Funding Corp.
5.25%, 11/15/15 | | | 32,000 | | | | 35,020 | |
Simon Property Group LP
5.10%, 6/15/15 | | | 119,000 | | | | 131,788 | |
UBS AG, MTN (Switzerland)
5.875%, 12/20/17 | | | 175,000 | | | | 198,382 | |
Wachovia Corp.
5.25%, 8/01/14 | | | 297,000 | | | | 323,566 | |
Wells Fargo & Co.
5.00%, 11/15/14 | | | 255,000 | | | | 277,378 | |
| | | | | | | | |
| | | | | | | 4,280,793 | |
| | | | | | | | |
| Government — 1.8% | | | | | | | | |
European Investment Bank, MTN (Supranational)
4.625%, 5/15/14 | | | 625,000 | | | | 689,733 | |
| | | | | | | | |
| Industrial — 2.0% | | | | | | | | |
General Electric Co.
5.25%, 12/06/17 | | | 543,000 | | | | 611,242 | |
Honeywell International, Inc.
5.00%, 2/15/19 | | | 99,000 | | | | 110,380 | |
United Technologies Corp.
6.125%, 2/01/19 | | | 40,000 | | | | 47,442 | |
| | | | | | | | |
| | | | | | | 769,064 | |
| | | | | | | | |
| Technology — 1.3% | | | | | | | | |
Dell, Inc.
5.875%, 6/15/19 | | | 48,000 | | | | 54,254 | |
Hewlett-Packard Co.
6.125%, 3/01/14 | | | 95,000 | | | | 106,944 | |
International Business Machines Corp.
5.70%, 9/14/17 | | | 160,000 | | | | 187,119 | |
Microsoft Corp.
4.20%, 6/01/19 | | | 43,000 | | | | 45,715 | |
Oracle Corp.
5.25%, 1/15/16 | | | 111,000 | | | | 125,913 | |
| | | | | | | | |
| | | | | | | 519,945 | |
| | | | | | | | |
| Utilities — 0.5% | | | | | | | | |
Consolidated Edison Co. of New York, Inc.
7.125%, 12/01/18 | | | 48,000 | | | | 59,652 | |
Progress Energy Carolinas, Inc.
5.30%, 1/15/19 | | | 40,000 | | | | 45,075 | |
| | | | |
| See Notes to Financial Statements. | | 23 | | |
db-X Exchange-Traded Funds Inc.
SCHEDULE OF INVESTMENTS
db-X 2020 Target Date Fund (Continued)
May 31, 2011
| | | | | | | | |
| | | Principal
Amount | | | Value | |
| | | | | | | | |
| Utilities (Continued) | | | | | | | | |
Public Service Co. of Colorado
5.125%, 6/01/19 | | $ | 64,000 | | | $ | 71,458 | |
| | | | | | | | |
| | | | | | | 176,185 | |
| | | | | | | | |
TOTAL CORPORATE BONDS
(Cost $8,018,277) | | | | | | | 8,368,954 | |
| | | | | | | | |
| UNITED STATES GOVERNMENT & AGENCIES OBLIGATIONS — 14.0% | | | | | | | | |
| Federal National Mortgage Association —2.1% | | | | | | | | |
5.00%, 4/15/15 | | | 214,000 | | | | 243,981 | |
5.00%, 5/11/17 | | | 485,000 | | | | 559,033 | |
| | | | | | | | |
| | | | | | | 803,014 | |
| | | | | | | | |
United States Treasury Bonds/
Notes — 11.9% | | | | | | | | |
4.75%, 5/15/14 | | | 1,026,300 | | | | 1,146,089 | |
2.50%, 3/31/15 | | | 510,600 | | | | 536,649 | |
7.50%, 11/15/16 | | | 214,700 | | | | 278,338 | |
3.125%, 1/31/17 | | | 686,700 | | | | 731,175 | |
8.125%, 8/15/19 | | | 527,900 | | | | 744,916 | |
3.625%, 2/15/20 | | | 424,700 | | | | 452,372 | |
7.625%, 2/15/25 | | | 113,600 | | | | 164,454 | |
6.25%, 5/15/30 | | | 399,200 | | | | 526,570 | |
| | | | | | | | |
| | | | | | | 4,580,563 | |
| | | | | | | | |
TOTAL UNITED STATES GOVERNMENT & AGENCIES OBLIGATIONS
(Cost $5,143,903) | | | | | | | 5,383,577 | |
| | | | | | | | |
| SOVEREIGN BONDS — 0.7% | | | | | | | | |
Republic of Italy (Italy)
5.25%, 9/20/16 | | | 175,000 | | | | 191,960 | |
United Mexican States, Series A, MTN (Mexico)
6.375%, 1/16/13 | | | 53,000 | | | | 57,558 | |
| | | | | | | | |
TOTAL SOVEREIGN BONDS
(Cost $235,948) | | | | | | | 249,518 | |
| | | | | | | | |
| | |
TOTAL INVESTMENTS — 99.5% (Cost $34,725,615) | | | | | | $ | 38,216,844 | |
Other assets less liabilities — 0.5% | | | | | | | 195,231 | |
| | | | | | | | |
NET ASSETS — 100.0% | | | | | | $ | 38,412,075 | |
| | | | | | | | |
MTN – Medium Term Note.
REIT – Real Estate Investment Trust.
* Non-income producing security.
(a) Affiliated company. The Advisor is a subsidiary of Deutsche Bank AG. Therefore, Deutsche Bank AG is considered to be affiliated with the Fund.
COUNTRY BREAKDOWN AS OF MAY 31, 2011 (Unaudited)
| | | | | | | | |
| | | Value | | | % of
Net Assets | |
United States | | $ | 29,549,736 | | | | 76.9 | % |
United Kingdom | | | 2,114,431 | | | | 5.5 | |
Germany | | | 1,202,476 | | | | 3.1 | |
Switzerland | | | 956,095 | | | | 2.5 | |
Japan | | | 734,957 | | | | 1.9 | |
France | | | 700,451 | | | | 1.8 | |
Supranational | | | 689,733 | | | | 1.8 | |
Australia | | | 545,570 | | | | 1.4 | |
Italy | | | 327,377 | | | | 0.9 | |
Netherlands | | | 323,821 | | | | 0.9 | |
Spain | | | 215,967 | | | | 0.6 | |
Netherlands Antilles | | | 148,210 | | | | 0.4 | |
Ireland | | | 139,221 | | | | 0.4 | |
Canada | | | 126,478 | | | | 0.3 | |
Sweden | | | 115,755 | | | | 0.3 | |
Mexico | | | 57,558 | | | | 0.1 | |
Denmark | | | 57,111 | | | | 0.1 | |
Israel | | | 51,102 | | | | 0.1 | |
Belgium | | | 36,761 | | | | 0.1 | |
Finland | | | 31,350 | | | | 0.1 | |
Luxembourg | | | 29,918 | | | | 0.1 | |
Norway | | | 27,214 | | | | 0.1 | |
Cayman Islands | | | 24,081 | | | | 0.1 | |
Bermuda | | | 11,471 | | | | 0.0 | |
| | | | | | | | |
TOTAL INVESTMENTS | | | 38,216,844 | | | | 99.5 | |
Other assets less liabilities | | | 195,231 | | | | 0.5 | |
| | | | | | | | |
NET ASSETS | | $ | 38,412,075 | | | | 100.0 | % |
| | | | | | | | |
| | | | |
| See Notes to Financial Statements. | | 24 | | |
db-X Exchange-Traded Funds Inc.
SCHEDULE OF INVESTMENTS
db-X 2030 Target Date Fund
May 31, 2011
| | | | | | | | |
| | | Number
of Shares | | | Value | |
| | | | | | | | |
| COMMON STOCKS — 84.3% | | | | | | | | |
| Basic Materials — 4.7% | | | | | | | | |
Air Liquide S.A. (France) | | | 268 | | | $ | 37,191 | |
Allied Nevada Gold Corp.* | | | 1,512 | | | | 56,065 | |
Anglo American PLC (United Kingdom) | | | 1,682 | | | | 83,885 | |
ArcelorMittal (Luxembourg) | | | 1,059 | | | | 35,282 | |
BASF SE (Germany) | | | 1,099 | | | | 101,526 | |
Bayer AG (Germany) | | | 1,051 | | | | 86,047 | |
BHP Billiton Ltd. (Australia) | | | 4,040 | | | | 190,962 | |
BHP Billiton PLC (United Kingdom) | | | 2,571 | | | | 101,689 | |
Buckeye Technologies, Inc. | | | 2,134 | | | | 54,353 | |
Coeur d’Alene Mines Corp.* | | | 1,423 | | | | 39,232 | |
Dow Chemical (The) Co. | | | 2,021 | | | | 73,019 | |
E.I. du Pont de Nemours & Co. | | | 1,602 | | | | 85,387 | |
Freeport-McMoRan Copper & Gold, Inc. | | | 1,422 | | | | 73,432 | |
Metals USA Holdings Corp.* | | | 1,778 | | | | 27,950 | |
Newmont Mining Corp. | | | 926 | | | | 52,384 | |
Rio Tinto Ltd. (Australia) | | | 562 | | | | 48,805 | |
Rio Tinto PLC (United Kingdom) | | | 1,638 | | | | 114,448 | |
Rockwood Holdings, Inc.* | | | 943 | | | | 49,592 | |
Sensient Technologies Corp. | | | 769 | | | | 29,260 | |
Sherwin-Williams (The) Co. | | | 1,241 | | | | 109,009 | |
Solutia, Inc.* | | | 1,778 | | | | 44,397 | |
Syngenta AG (Switzerland)* | | | 130 | | | | 44,903 | |
Vulcan Materials Co. | | | 1,441 | | | | 58,346 | |
Xstrata PLC (United Kingdom) | | | 2,535 | | | | 59,479 | |
| | | | | | | | |
| | | | | | | 1,656,643 | |
| | | | | | | | |
| Communications — 8.7% | | | | | | | | |
Acme Packet, Inc.* | | | 800 | | | | 60,552 | |
ADTRAN, Inc. | | | 800 | | | | 34,288 | |
Anixter International, Inc.* | | | 593 | | | | 40,140 | |
Arris Group, Inc.* | | | 2,052 | | | | 23,167 | |
AT&T, Inc. | | | 11,368 | | | | 358,774 | |
Calix, Inc.* | | | 2,045 | | | | 44,111 | |
Cisco Systems, Inc. | | | 10,693 | | | | 179,642 | |
Comcast Corp., Class A | | | 5,309 | | | | 133,999 | |
Corning, Inc. | | | 2,843 | | | | 57,287 | |
Deutsche Telekom AG (Germany) | | | 2,804 | | | | 41,641 | |
Digital River, Inc.* | | | 605 | | | | 19,693 | |
Discovery Communications, Inc., Class A* | | | 3,201 | | | | 139,436 | |
eResearch Technology, Inc.* | | | 3,601 | | | | 22,830 | |
France Telecom S.A. (France) | | | 2,461 | | | | 56,253 | |
Google, Inc., Class A* | | | 595 | | | | 314,766 | |
GSI Commerce, Inc.* | | | 978 | | | | 28,607 | |
Limelight Networks, Inc.* | | | 5,068 | | | | 29,040 | |
News Corp., Class A | | | 3,192 | | | | 58,541 | |
Nokia OYJ (Finland) | | | 5,275 | | | | 36,021 | |
NTT DoCoMo, Inc. (Japan) | | | 20 | | | | 37,371 | |
Orbitz Worldwide, Inc.* | | | 5,157 | | | | 11,861 | |
Rackspace Hosting, Inc.* | | | 2,021 | | | | 88,923 | |
Symantec Corp.* | | | 8,358 | | | | 163,399 | |
Tekelec* | | | 1,100 | | | | 10,010 | |
Telefonaktiebolaget LM Ericsson, Class B (Sweden) | | | 3,495 | | | | 51,612 | |
Telefonica S.A. (Spain) | | | 4,752 | | | | 115,281 | |
Thomson Reuters Corp. (Canada) | | | 1,600 | | | | 62,352 | |
TIBCO Software, Inc.* | | | 2,717 | | | | 76,321 | |
| | | | | | | | |
| | | Number
of Shares | | | Value | |
| | | | | | | | |
| Communications (Continued) | | | | | | | | |
Time Warner, Inc. | | | 2,233 | | | $ | 81,348 | |
Verizon Communications, Inc. | | | 5,967 | | | | 220,361 | |
Vivendi (France) | | | 1,588 | | | | 44,277 | |
Vodafone Group PLC (United Kingdom) | | | 61,183 | | | | 170,139 | |
Walt Disney (The) Co. | | | 3,663 | | | | 152,490 | |
Windstream Corp. | | | 4,802 | | | | 64,587 | |
Yahoo!, Inc.* | | | 3,174 | | | | 52,530 | |
| | | | | | | | |
| | | | | | | 3,081,650 | |
| | | | | | | | |
| Consumer, Cyclical — 9.0% | | | | | | | | |
Alaska Air Group, Inc.* | | | 445 | | | | 30,056 | |
Ascena Retail Group, Inc.* | | | 989 | | | | 33,092 | |
Buckle (The), Inc. | | | 766 | | | | 32,701 | |
Callaway Golf Co. | | | 3,557 | | | | 24,081 | |
Carter’s, Inc.* | | | 947 | | | | 30,020 | |
Casey’s General Stores, Inc. | | | 788 | | | | 32,663 | |
Cash America International, Inc. | | | 445 | | | | 23,167 | |
Cinemark Holdings, Inc. | | | 1,535 | | | | 33,386 | |
Coach, Inc. | | | 3,468 | | | | 220,773 | |
Collective Brands, Inc.* | | | 1,125 | | | | 17,550 | |
Columbia Sportswear Co. | | | 528 | | | | 34,637 | |
Compagnie Financiere Richemont S.A. (Switzerland) | | | 589 | | | | 38,397 | |
CVS Caremark Corp. | | | 2,615 | | | | 101,174 | |
Daimler AG (Germany) | | | 1,029 | | | | 72,641 | |
Dana Holding Corp.* | | | 1,956 | | | | 35,443 | |
Deckers Outdoor Corp.* | | | 533 | | | | 48,556 | |
Dillard’s, Inc., Class A | | | 1,067 | | | | 59,955 | |
Dollar General Corp.* | | | 3,912 | | | | 137,194 | |
DSW, Inc., Class A* | | | 1,121 | | | | 56,218 | |
Exide Technologies* | | | 3,912 | | | | 38,572 | |
Ford Motor Co.* | | | 5,865 | | | | 87,506 | |
G&K Services, Inc., Class A | | | 978 | | | | 30,934 | |
Gaylord Entertainment Co.* | | | 533 | | | | 17,189 | |
Hennes & Mauritz AB, Class B (Sweden) | | | 1,197 | | | | 44,395 | |
Honda Motor Co. Ltd. (Japan) | | | 2,258 | | | | 85,884 | |
JetBlue Airways Corp.* | | | 3,789 | | | | 22,999 | |
Johnson Controls, Inc. | | | 1,245 | | | | 49,302 | |
Jones Group (The), Inc. | | | 1,423 | | | | 17,489 | |
K-Swiss, Inc., Class A* | | | 2,134 | | | | 23,538 | |
La-Z-Boy, Inc.* | | | 2,756 | | | | 30,509 | |
Liz Claiborne, Inc.* | | | 5,246 | | | | 34,256 | |
Lowe’s Cos., Inc. | | | 2,934 | | | | 70,827 | |
McDonald’s Corp. | | | 1,993 | | | | 162,510 | |
Men’s Wearhouse (The), Inc. | | | 847 | | | | 29,162 | |
Mitsubishi Corp. (Japan) | | | 1,797 | | | | 45,500 | |
Mitsui & Co. Ltd. (Japan) | | | 2,534 | | | | 43,169 | |
Nike, Inc., Class B | | | 889 | | | | 75,076 | |
Nintendo Co. Ltd. (Japan) | | | 123 | | | | 28,570 | |
Nissan Motor Co. Ltd. (Japan) | | | 2,974 | | | | 29,799 | |
Nu Skin Enterprises, Inc., Class A | | | 800 | | | | 31,272 | |
Owens & Minor, Inc. | | | 1,039 | | | | 35,949 | |
Panasonic Corp. (Japan) | | | 2,484 | | | | 29,170 | |
Penske Automotive Group, Inc. | | | 1,245 | | | | 25,846 | |
Polaris Industries, Inc. | | | 445 | | | | 49,106 | |
Saks, Inc.* | | | 2,401 | | | | 27,155 | |
Skechers U.S.A., Inc., Class A* | | | 711 | | | | 12,428 | |
| | | | |
| See Notes to Financial Statements. | | 25 | | |
db-X Exchange-Traded Funds Inc.
SCHEDULE OF INVESTMENTS
db-X 2030 Target Date Fund (Continued)
May 31, 2011
| | | | | | | | |
| | | Number
of Shares | | | Value | |
| | | | | | | | |
| Consumer, Cyclical (Continued) | | | | | | | | |
Sony Corp. (Japan) | | | 1,376 | | | $ | 36,635 | |
Tenneco, Inc.* | | | 800 | | | | 33,400 | |
Toyota Motor Corp. (Japan) | | | 3,822 | | | | 159,955 | |
Under Armour, Inc., Class A* | | | 711 | | | | 46,343 | |
UniFirst Corp. | | | 400 | | | | 21,448 | |
US Airways Group, Inc.* | | | 2,312 | | | | 21,039 | |
Vail Resorts, Inc.* | | | 476 | | | | 23,157 | |
Walgreen Co. | | | 1,778 | | | | 77,574 | |
Wal-Mart Stores, Inc. | | | 7,325 | | | | 404,486 | |
Warnaco Group (The), Inc.* | | | 543 | | | | 29,946 | |
Watsco, Inc. | | | 860 | | | | 57,569 | |
World Fuel Services Corp. | | | 1,019 | | | | 37,275 | |
| | | | | | | | |
| | | | | | | 3,188,643 | |
| | | | | | | | |
| Consumer, Non-cyclical — 17.0% | | | | | | | | |
Abbott Laboratories | | | 3,030 | | | | 158,318 | |
ABM Industries, Inc. | | | 800 | | | | 18,224 | |
Accuray, Inc.* | | | 3,557 | | | | 27,175 | |
Aetna, Inc. | | | 4,624 | | | | 201,976 | |
Amedisys, Inc.* | | | 703 | | | | 22,004 | |
American Medical Systems Holdings, Inc.* | | | 1,067 | | | | 31,946 | |
American Reprographics Co.* | | | 2,668 | | | | 25,026 | |
AMERIGROUP Corp.* | | | 854 | | | | 60,557 | |
Amgen, Inc.* | | | 1,956 | | | | 118,417 | |
Anheuser-Busch InBev NV (Belgium) | | | 791 | | | | 47,669 | |
AstraZeneca PLC (United Kingdom) | | | 1,684 | | | | 88,073 | |
British American Tobacco PLC (United Kingdom) | | | 2,230 | | | | 99,910 | |
Bruker Corp.* | | | 2,992 | | | | 59,003 | |
Capella Education Co.* | | | 267 | | | | 12,907 | |
Catalyst Health Solutions, Inc.* | | | 731 | | | | 44,613 | |
CBIZ, Inc.* | | | 3,557 | | | | 27,211 | |
Centene Corp.* | | | 754 | | | | 26,239 | |
Coca-Cola (The) Co. | | | 4,344 | | | | 290,223 | |
DANONE S.A. (France) | | | 651 | | | | 47,683 | |
Diageo PLC (United Kingdom) | | | 2,927 | | | | 62,341 | |
Ennis, Inc. | | | 1,334 | | | | 25,466 | |
Fresh Del Monte Produce, Inc.
(Cayman Islands) | | | 766 | | | | 21,057 | |
Gentiva Health Services, Inc.* | | | 400 | | | | 9,792 | |
GlaxoSmithKline PLC (United Kingdom) | | | 6,407 | | | | 139,202 | |
HEALTHSOUTH Corp.* | | | 1,423 | | | | 39,944 | |
Healthspring, Inc.* | | | 845 | | | | 37,053 | |
Heidrick & Struggles International, Inc. | | | 1,215 | | | | 25,454 | |
HMS Holdings Corp.* | | | 356 | | | | 27,789 | |
Hospira, Inc.* | | | 1,867 | | | | 103,226 | |
Invacare Corp. | | | 420 | | | | 14,104 | |
Johnson & Johnson | | | 5,869 | | | | 394,925 | |
Kraft Foods, Inc., Class A | | | 2,900 | | | | 101,413 | |
Lancaster Colony Corp. | | | 449 | | | | 27,227 | |
Live Nation Entertainment, Inc.* | | | 2,934 | | | | 33,829 | |
Magellan Health Services, Inc.* | | | 600 | | | | 31,764 | |
Masimo Corp.* | | | 1,689 | | | | 51,886 | |
MasterCard, Inc., Class A | | | 276 | | | | 79,226 | |
Medifast, Inc.* | | | 800 | | | | 21,376 | |
Merck & Co., Inc. | | | 6,435 | | | | 236,486 | |
Molina Healthcare, Inc.* | | | 1,500 | | | | 40,770 | |
| | | | | | | | |
| | | Number
of Shares | | | Value | |
| | | | | | | | |
| Consumer, Non-cyclical (Continued) | | | | | | | | |
Molson Coors Brewing Co., Class B | | | 1,737 | | | $ | 81,031 | |
Nestle S.A. (Switzerland) | | | 4,064 | | | | 260,880 | |
Novartis AG (Switzerland) | | | 2,524 | | | | 162,762 | |
Novo Nordisk A/S, Class B (Denmark) | | | 546 | | | | 68,383 | |
Pfizer, Inc. | | | 15,843 | | | | 339,832 | |
Philip Morris International, Inc. | | | 3,361 | | | | 241,152 | |
Procter & Gamble (The) Co. | | | 5,841 | | | | 391,347 | |
Reckitt Benckiser Group PLC
(United Kingdom) | | | 726 | | | | 41,071 | |
Roche Holding AG (Switzerland) | | | 925 | | | | 162,680 | |
Rollins, Inc. | | | 2,105 | | | | 42,353 | |
Ruddick Corp. | | | 813 | | | | 35,731 | |
Safeway, Inc. | | | 4,190 | | | | 103,493 | |
Salix Pharmaceuticals Ltd.* | | | 800 | | | | 32,024 | |
Sanofi | | | 1,385 | | | | 109,549 | |
Seaboard Corp. | | | 18 | | | | 41,580 | |
Select Medical Holdings Corp.* | | | 2,579 | | | | 24,501 | |
Sirona Dental Systems, Inc.* | | | 862 | | | | 46,600 | |
SonoSite, Inc.* | | | 800 | | | | 28,568 | |
Sotheby’s | | | 889 | | | | 37,836 | |
STERIS Corp. | | | 958 | | | | 34,574 | |
Takeda Pharmaceutical Co. Ltd. (Japan) | | | 963 | | | | 45,815 | |
Tejon Ranch Co.* | | | 978 | | | | 36,039 | |
Tesco PLC (United Kingdom) | | | 10,874 | | | | 75,002 | |
Teva Pharmaceutical Industries Ltd. (Israel) | | | 1,220 | | | | 62,532 | |
TreeHouse Foods, Inc.* | | | 533 | | | | 32,476 | |
Unilever NV (Netherlands) | | | 1,986 | | | | 64,753 | |
Unilever PLC (United Kingdom) | | | 1,552 | | | | 50,349 | |
UnitedHealth Group, Inc. | | | 2,098 | | | | 102,697 | |
ViroPharma, Inc.* | | | 1,233 | | | | 23,859 | |
Visa, Inc., Class A | | | 1,657 | | | | 134,316 | |
WellCare Health Plans, Inc.* | | | 718 | | | | 35,362 | |
WellPoint, Inc. | | | 800 | | | | 62,536 | |
Woolworths Ltd. (Australia) | | | 1,518 | | | | 44,336 | |
| | | | | | | | |
| | | | | | | 5,987,523 | |
| | | | | | | | |
| Diversified — 0.1% | | | | | | | | |
LVMH Moet Hennessy Louis Vuitton S.A. (France) | | | 270 | | | | 46,928 | |
| | | | | | | | |
| Energy — 10.2% | | | | | | | | |
Berry Petroleum Co., Class A | | | 758 | | | | 39,727 | |
BG Group PLC (United Kingdom) | | | 3,998 | | | | 92,555 | |
Bill Barrett Corp.* | | | 761 | | | | 33,918 | |
BP PLC (United Kingdom) | | | 28,143 | | | | 216,949 | |
Brigham Exploration Co.* | | | 1,689 | | | | 52,595 | |
CARBO Ceramics, Inc. | | | 267 | | | | 40,122 | |
Chevron Corp. | | | 3,758 | | | | 394,252 | |
Complete Production Services, Inc.* | | | 978 | | | | 32,460 | |
ConocoPhillips | | | 2,781 | | | | 203,625 | |
Delek US Holdings, Inc. | | | 3,201 | | | | 48,303 | |
Devon Energy Corp. | | | 889 | | | | 74,738 | |
Dril-Quip, Inc.* | | | 541 | | | | 40,131 | |
ENI S.p.A (Italy) | | | 3,345 | | | | 80,114 | |
Exxon Mobil Corp. | | | 10,062 | | | | 839,875 | |
Helix Energy Solutions Group, Inc.* | | | 1,689 | | | | 29,591 | |
Hornbeck Offshore Services, Inc.* | | | 1,334 | | | | 36,005 | |
Key Energy Services, Inc.* | | | 1,867 | | | | 33,009 | |
| | | | |
| See Notes to Financial Statements. | | 26 | | |
db-X Exchange-Traded Funds Inc.
SCHEDULE OF INVESTMENTS
db-X 2030 Target Date Fund (Continued)
May 31, 2011
| | | | | | | | |
| | | Number
of Shares | | | Value | |
| | | | | | | | |
| Energy (Continued) | | | | | | | | |
Occidental Petroleum Corp. | | | 1,548 | | | $ | 166,952 | |
Peabody Energy Corp. | | | 2,627 | | | | 161,193 | |
Royal Dutch Shell PLC, Class A (United Kingdom) | | | 4,417 | | | | 159,362 | |
Royal Dutch Shell PLC, Class B (United Kingdom) | | | 3,396 | | | | 122,916 | |
RPC, Inc. | | | 2,332 | | | | 58,720 | |
Schlumberger Ltd. (Netherlands Antilles) | | | 2,173 | | | | 186,269 | |
Southwestern Energy Co.* | | | 742 | | | | 32,477 | |
Statoil ASA (Norway) | | | 1,431 | | | | 37,662 | |
Total S.A. (France) | | | 2,635 | | | | 151,637 | |
Williams (The) Cos., Inc. | | | 6,313 | | | | 198,165 | |
Woodside Petroleum Ltd. (Australia) | | | 654 | | | | 32,495 | |
| | | | | | | | |
| | | | | | | 3,595,817 | |
| | | | | | | | |
| Financial — 16.2% | | | | | | | | |
Alexander’s, Inc. REIT | | | 84 | | | | 32,946 | |
Allianz SE (Germany) | | | 503 | | | | 69,549 | |
American Campus Communities, Inc. REIT | | | 822 | | | | 29,049 | |
American Capital Ltd.* | | | 4,802 | | | | 47,540 | |
American Express Co. | | | 2,312 | | | | 119,299 | |
Apollo Investment Corp. | | | 2,756 | | | | 31,446 | |
Ashford Hospitality Trust, Inc. REIT | | | 2,756 | | | | 39,328 | |
Associated Estates Realty Corp. REIT | | | 1,689 | | | | 28,477 | |
Australia & New Zealand Banking Group Ltd. (Australia) | | | 3,135 | | | | 73,925 | |
AXA S.A. (France) | | | 2,291 | | | | 48,876 | |
Banco Bilbao Vizcaya Argentaria S.A. (Spain) | | | 4,737 | | | | 55,262 | |
Banco Santander S.A. (Spain) | | | 8,413 | | | | 99,949 | |
Bank of America Corp. | | | 18,815 | | | | 221,076 | |
Barclays PLC (United Kingdom) | | | 15,018 | | | | 68,385 | |
Berkshire Hathaway, Inc., Class B* | | | 5,102 | | | | 403,415 | |
BioMed Realty Trust, Inc. REIT | | | 1,600 | | | | 32,784 | |
BNP Paribas (France) | | | 1,124 | | | | 87,612 | |
Boston Properties, Inc. REIT | | | 1,423 | | | | 154,183 | |
CBL & Associates Properties, Inc. REIT | | | 1,956 | | | | 37,633 | |
Charles Schwab (The) Corp. | | | 2,281 | | | | 41,081 | |
Citigroup, Inc.* | | | 5,513 | | | | 226,860 | |
Commonwealth Bank of Australia (Australia) | | | 1,956 | | | | 105,503 | |
Community Trust Bancorp, Inc. | | | 800 | | | | 21,984 | |
Credit Acceptance Corp.* | | | 445 | | | | 35,600 | |
Credit Suisse Group AG (Switzerland)* | | | 1,307 | | | | 56,117 | |
Deutsche Bank AG (Germany) (a) | | | 1,087 | | | | 64,718 | |
Entertainment Properties Trust REIT | | | 622 | | | | 30,217 | |
Equity Lifestyle Properties, Inc. REIT | | | 409 | | | | 24,029 | |
Equity One, Inc. REIT | | | 1,360 | | | | 26,670 | |
Equity Residential REIT | | | 533 | | | | 32,955 | |
Evercore Partners, Inc., Class A | | | 978 | | | | 36,196 | |
FirstMerit Corp. | | | 1,296 | | | | 21,112 | |
Franklin Resources, Inc. | | | 448 | | | | 58,052 | |
Goldman Sachs Group (The), Inc. | | | 913 | | | | 128,486 | |
Highwoods Properties, Inc. REIT | | | 1,015 | | | | 36,621 | |
Home Properties, Inc. REIT | | | 533 | | | | 32,993 | |
HSBC Holdings PLC (United Kingdom) | | | 20,507 | | | | 214,267 | |
ING Groep NV (Netherlands)* | | | 4,550 | | | | 54,808 | |
Investors Bancorp, Inc.* | | | 1,778 | | | | 26,617 | |
JPMorgan Chase & Co. | | | 7,430 | | | | 321,273 | |
| | | | | | | | |
| | | Number
of Shares | | | Value | |
| | | | | | | | |
| Financial (Continued) | | | | | | | | |
Kilroy Realty Corp. REIT | | | 800 | | | $ | 33,176 | |
LaSalle Hotel Properties REIT | | | 978 | | | | 27,364 | |
Lloyds Banking Group PLC (United Kingdom)* | | | 45,476 | | | | 38,923 | |
M&T Bank Corp. | | | 1,334 | | | | 117,792 | |
MFA Financial, Inc. REIT | | | 3,711 | | | | 30,579 | |
Mid-America Apartment Communities, Inc. REIT | | | 464 | | | | 31,807 | |
Mitsubishi UFJ Financial Group, Inc. (Japan) | | | 16,342 | | | | 75,434 | |
Mizuho Financial Group, Inc. (Japan) | | | 20,827 | | | | 32,815 | |
Muenchener Rueckversicherungs-Gesellschaft AG (Germany) | | | 268 | | | | 41,070 | |
National Australia Bank Ltd. (Australia) | | | 2,644 | | | | 74,603 | |
National Interstate Corp. | | | 1,067 | | | | 23,037 | |
National Retail Properties, Inc. REIT | | | 1,322 | | | | 34,081 | |
Nomura Holdings, Inc. (Japan) | | | 5,335 | | | | 26,793 | |
Nordea Bank AB (Sweden) | | | 3,775 | | | | 44,207 | |
Northern Trust Corp. | | | 2,604 | | | | 127,049 | |
OMEGA Healthcare Investors, Inc. REIT | | | 1,341 | | | | 28,550 | |
Pebblebrook Hotel Trust REIT | | | 1,245 | | | | 27,066 | |
Platinum Underwriters Holdings Ltd. (Bermuda) | | | 411 | | | | 14,032 | |
Potlatch Corp. REIT | | | 631 | | | | 22,716 | |
ProAssurance Corp.* | | | 534 | | | | 37,546 | |
Prosperity Bancshares, Inc. | | | 750 | | | | 32,813 | |
Public Storage REIT | | | 356 | | | | 42,129 | |
Signature Bank* | | | 622 | | | | 35,404 | |
Simon Property Group, Inc. REIT | | | 520 | | | | 61,391 | |
Societe Generale (France) | | | 704 | | | | 41,738 | |
Standard Chartered PLC (United Kingdom) | | | 2,592 | | | | 69,455 | |
Sumitomo Mitsui Financial Group, Inc. (Japan) | | | 1,759 | | | | 50,882 | |
SVB Financial Group* | | | 622 | | | | 36,934 | |
T. Rowe Price Group, Inc. | | | 2,668 | | | | 168,884 | |
Tanger Factory Outlet Centers, Inc. REIT | | | 1,046 | | | | 28,723 | |
Tower Group, Inc. | | | 646 | | | | 15,698 | |
Travelers (The) Cos., Inc. | | | 978 | | | | 60,714 | |
U.S. Bancorp | | | 3,735 | | | | 95,616 | |
UBS AG (Switzerland)* | | | 4,216 | | | | 80,771 | |
UMB Financial Corp. | | | 612 | | | | 26,102 | |
UniCredit S.p.A (Italy) | | | 20,155 | | | | 45,751 | |
Universal Health Realty Income Trust REIT | | | 711 | | | | 30,793 | |
Washington Real Estate Investment Trust REIT | | | 925 | | | | 31,940 | |
Webster Financial Corp. | | | 1,156 | | | | 24,114 | |
Wells Fargo & Co. | | | 10,283 | | | | 291,729 | |
Westamerica Bancorporation | | | 501 | | | | 25,200 | |
Westpac Banking Corp. (Australia) | | | 3,827 | | | | 90,243 | |
Weyerhaeuser Co. REIT | | | 5,268 | | | | 113,474 | |
Zurich Financial Services AG (Switzerland)* | | | 153 | | | | 40,918 | |
| | | | | | | | |
| | | | | | | 5,706,949 | |
| | | | | | | | |
| Industrial — 9.1% | | | | | | | | |
AAON, Inc. | | | 978 | | | | 32,959 | |
ABB Ltd. (Switzerland)* | | | 2,466 | | | | 66,183 | |
Acuity Brands, Inc. | | | 622 | | | | 37,917 | |
BAE Systems PLC (United Kingdom) | | | 4,475 | | | | 24,321 | |
Benchmark Electronics, Inc.* | | | 1,037 | | | | 17,919 | |
Boeing (The) Co. | | | 1,512 | | | | 117,981 | |
Brady Corp., Class A | | | 800 | | | | 27,576 | |
| | | | |
| See Notes to Financial Statements. | | 27 | | |
db-X Exchange-Traded Funds Inc.
SCHEDULE OF INVESTMENTS
db-X 2030 Target Date Fund (Continued)
May 31, 2011
| | | | | | | | |
| | | Number
of Shares | | | Value | |
| | | | | | | | |
| Industrial (Continued) | | | | | | | | |
Cascade Corp. | | | 622 | | | $ | 25,272 | |
Caterpillar, Inc. | | | 1,081 | | | | 114,370 | |
CLARCOR, Inc. | | | 823 | | | | 35,068 | |
Clean Harbors, Inc.* | | | 445 | | | | 45,016 | |
East Japan Railway Co. (Japan) | | | 432 | | | | 25,205 | |
Eaton Corp. | | | 3,258 | | | | 168,340 | |
EMCOR Group, Inc.* | | | 856 | | | | 25,997 | |
Emerson Electric Co. | | | 1,420 | | | | 77,462 | |
EnerSys* | | | 711 | | | | 25,454 | |
Fanuc Corp. (Japan) | | | 266 | | | | 40,895 | |
FedEx Corp. | | | 533 | | | | 49,910 | |
General Dynamics Corp. | | | 726 | | | | 53,884 | |
General Electric Co. | | | 20,565 | | | | 403,897 | |
GrafTech International Ltd.* | | | 1,667 | | | | 35,240 | |
Graphic Packaging Holding Co.* | | | 4,624 | | | | 25,340 | |
Griffon Corp.* | | | 555 | | | | 5,877 | |
Hexcel Corp.* | | | 1,334 | | | | 27,574 | |
Ingersoll-Rand PLC (Ireland) | | | 3,468 | | | | 173,052 | |
Kaydon Corp. | | | 445 | | | | 16,185 | |
Knight Transportation, Inc. | | | 1,407 | | | | 24,060 | |
Komatsu Ltd. (Japan) | | | 1,156 | | | | 34,606 | |
Koninklijke Philips Electronics NV (Netherlands) | | | 1,311 | | | | 36,327 | |
L-1 Identity Solutions, Inc.* | | | 1,400 | | | | 15,568 | |
Lindsay Corp. | | | 711 | | | | 47,694 | |
Metabolix, Inc.* | | | 1,423 | | | | 12,579 | |
Mitsubishi Electric Corp. (Japan) | | | 2,668 | | | | 30,049 | |
Moog, Inc., Class A* | | | 622 | | | | 25,533 | |
Nordson Corp. | | | 890 | | | | 46,298 | |
Parker Hannifin Corp. | | | 1,689 | | | | 150,068 | |
Republic Services, Inc. | | | 4,205 | | | | 132,541 | |
Rock-Tenn Co., Class A | | | 529 | | | | 40,643 | |
Schneider Electric S.A. (France) | | | 269 | | | | 44,317 | |
Siemens AG (Germany) | | | 980 | | | | 131,023 | |
Silgan Holdings, Inc. | | | 1,158 | | | | 51,982 | |
Simpson Manufacturing Co., Inc. | | | 800 | | | | 22,416 | |
Sun Hydraulics Corp. | | | 978 | | | | 47,365 | |
Thermo Fisher Scientific, Inc.* | | | 800 | | | | 52,360 | |
Toshiba Corp. (Japan) | | | 5,335 | | | | 28,238 | |
TriMas Corp.* | | | 2,045 | | | | 41,718 | |
Union Pacific Corp. | | | 1,038 | | | | 108,959 | |
United Parcel Service, Inc., Class B | | | 1,848 | | | | 135,810 | |
United Technologies Corp. | | | 1,739 | | | | 152,632 | |
Vinci S.A. (France) | | | 539 | | | | 34,741 | |
Watts Water Technologies, Inc., Class A | | | 533 | | | | 18,650 | |
Woodward, Inc. | | | 978 | | | | 34,445 | |
Worthington Industries, Inc. | | | 1,067 | | | | 23,293 | |
| | | | | | | | |
| | | | | | | 3,222,809 | |
| | | | | | | | |
| Technology — 7.5% | | | | | | | | |
Apple, Inc.* | | | 1,804 | | | | 627,485 | |
Applied Materials, Inc. | | | 2,668 | | | | 36,765 | |
CACI International, Inc., Class A* | | | 485 | | | | 30,958 | |
Concur Technologies, Inc.* | | | 796 | | | | 39,776 | |
EMC Corp.* | | | 3,793 | | | | 107,987 | |
Intel Corp. | | | 10,137 | | | | 228,184 | |
International Business Machines Corp. | | | 2,560 | | | | 432,461 | |
| | | | | | | | |
| | | Number
of Shares | | | Value | |
| | | | | | | | |
| Technology (Continued) | | | | | | | | |
Jack Henry & Associates, Inc. | | | 1,378 | | | $ | 43,049 | |
JDA Software Group, Inc.* | | | 1,200 | | | | 39,636 | |
Mentor Graphics Corp.* | | | 1,500 | | | | 20,115 | |
Microsoft Corp. | | | 15,818 | | | | 395,607 | |
MKS Instruments, Inc. | | | 700 | | | | 18,410 | |
Netlogic Microsystems, Inc.* | | | 889 | | | | 34,066 | |
Parametric Technology Corp.* | | | 1,888 | | | | 43,972 | |
Quality Systems, Inc. | | | 505 | | | | 43,470 | |
Quest Software, Inc.* | | | 1,512 | | | | 34,315 | |
Riverbed Technology, Inc.* | | | 1,864 | | | | 70,683 | |
SAP AG (Germany) | | | 1,116 | | | | 69,260 | |
SRA International, Inc., Class A* | | | 875 | | | | 27,081 | |
SYNNEX Corp.* | | | 600 | | | | 19,644 | |
TriQuint Semiconductor, Inc.* | | | 2,090 | | | | 27,066 | |
Ultratech, Inc.* | | | 1,334 | | | | 42,381 | |
VeriFone Systems, Inc.* | | | 1,156 | | | | 55,638 | |
Xerox Corp. | | | 13,960 | | | | 142,532 | |
| | | | | | | | |
| | | | | | | 2,630,541 | |
| | | | | | | | |
| Utilities — 1.8% | | | | | | | | |
Cleco Corp. | | | 800 | | | | 28,072 | |
E.ON AG (Germany) | | | 2,644 | | | | 75,013 | |
ENEL S.p.A (Italy) | | | 8,809 | | | | 60,457 | |
GDF Suez (France) | | | 1,514 | | | | 55,632 | |
National Fuel Gas Co. | | | 889 | | | | 64,043 | |
Nicor, Inc. | | | 663 | | | | 36,438 | |
Piedmont Natural Gas Co., Inc. | | | 1,053 | | | | 33,138 | |
RWE AG (Germany) | | | 605 | | | | 35,251 | |
Sempra Energy | | | 2,668 | | | | 147,194 | |
Southern Co. | | | 1,571 | | | | 62,966 | |
Tokyo Electric Power (The) Co., Inc. (Japan) | | | 1,510 | | | | 5,892 | |
WGL Holdings, Inc. | | | 842 | | | | 33,049 | |
| | | | | | | | |
| | | | | | | 637,145 | |
| | | | | | | | |
TOTAL COMMON STOCKS
(Cost $26,263,949) | | | | | | | 29,754,648 | |
| | | | | | | | |
| | |
| | | Principal
Amount | | | Value | |
| | | | | | | | |
| CORPORATE BONDS — 11.5% | | | | | | | | |
| Basic Materials — 0.8% | | | | | | | | |
ArcelorMittal (Luxembourg)
9.85%, 6/01/19 | | $ | 58,000 | | | | 74,819 | |
Dow Chemical (The) Co.
8.55%, 5/15/19 | | | 66,000 | | | | 86,077 | |
Rio Tinto Finance USA Ltd. (Australia)
9.00%, 5/01/19 | | | 66,000 | | | | 88,161 | |
Vale Overseas Ltd. (Cayman Islands)
6.875%, 11/21/36 | | | 46,000 | | | | 50,770 | |
| | | | | | | | |
| | | | | | | 299,827 | |
| | | | | | | | |
| Communications — 2.4% | | | | | | | | |
BellSouth Corp.
6.00%, 11/15/34 | | | 109,000 | | | | 113,471 | |
British Telecommunications PLC (United Kingdom)
9.875%, 12/15/30 (b) | | | 30,000 | | | | 42,907 | |
| | | | |
| See Notes to Financial Statements. | | 28 | | |
db-X Exchange-Traded Funds Inc.
SCHEDULE OF INVESTMENTS
db-X 2030 Target Date Fund (Continued)
May 31, 2011
| | | | | | | | |
| | | Principal
Amount | | | Value | |
| | | | | | | | |
| Communications (Continued) | | | | | | | | |
CBS Corp.
7.875%, 7/30/30 | | $ | 15,000 | | | $ | 18,224 | |
Cisco Systems, Inc.
4.45%, 1/15/20 | | | 60,000 | | | | 62,953 | |
5.90%, 2/15/39 | | | 46,000 | | | | 49,875 | |
Comcast Corp.
6.45%, 3/15/37 | | | 45,000 | | | | 49,068 | |
Deutsche Telekom International Finance BV (Netherlands)
8.75%, 6/15/30 (b) | | | 69,000 | | | | 94,636 | |
News America, Inc.
6.20%, 12/15/34 | | | 77,000 | | | | 80,222 | |
Telecom Italia Capital S.A. (Luxembourg)
7.721%, 6/04/38 | | | 43,000 | | | | 46,129 | |
Time Warner Cable, Inc.
6.55%, 5/01/37 | | | 18,000 | | | | 19,216 | |
Time Warner, Inc.
7.70%, 5/01/32 | | | 77,000 | | | | 94,148 | |
Verizon Global Funding Corp.
7.75%, 12/01/30 | | | 124,000 | | | | 157,618 | |
Viacom, Inc.
6.25%, 4/30/16 | | | 15,000 | | | | 17,370 | |
| | | | | | | | |
| | | | | | | 845,837 | |
| | | | | | | | |
| Consumer, Cyclical — 0.9% | | | | | | | | |
CVS Caremark Corp.
6.125%, 9/15/39 | | | 44,000 | | | | 46,066 | |
Target Corp.
7.00%, 1/15/38 | | | 110,000 | | | | 135,936 | |
Wal-Mart Stores, Inc.
4.55%, 5/01/13 | | | 5,000 | | | | 5,371 | |
6.50%, 8/15/37 | | | 106,000 | | | | 123,810 | |
| | | | | | | | |
| | | | | | | 311,183 | |
| | | | | | | | |
| Consumer, Non-cyclical — 1.5% | | | | | | | | |
Abbott Laboratories
5.875%, 5/15/16 | | | 14,000 | | | | 16,368 | |
Aetna, Inc.
6.625%, 6/15/36 | | | 18,000 | | | | 20,611 | |
Anheuser-Busch InBev Worldwide, Inc.
5.375%, 1/15/20 | | | 43,000 | | | | 47,752 | |
AstraZeneca PLC (United Kingdom)
6.45%, 9/15/37 | | | 45,000 | | | | 53,656 | |
Bristol-Myers Squibb Co.
5.875%, 11/15/36 | | | 52,000 | | | | 59,451 | |
Coca-Cola Enterprises, Inc.
8.50%, 2/01/22 | | | 88,000 | | | | 121,116 | |
Eli Lilly & Co.
5.55%, 3/15/37 | | | 30,000 | | | | 31,864 | |
Johnson & Johnson
5.95%, 8/15/37 | | | 33,000 | | | | 38,376 | |
Merck & Co., Inc.
5.00%, 6/30/19 | | | 21,000 | | | | 23,419 | |
Procter & Gamble (The) Co.
5.55%, 3/05/37 | | | 18,000 | | | | 19,826 | |
Unilever Capital Corp.
5.90%, 11/15/32 | | | 74,000 | | | | 85,031 | |
| | | | | | | | |
| | | | | | | 517,470 | |
| | | | | | | | |
| | | | | | | | |
| | | Principal
Amount | | | Value | |
| | | | | | | | |
| Energy — 1.1% | | | | | | | | |
ConocoPhillips
5.90%, 10/15/32 | | $ | 117,000 | | | $ | 130,145 | |
Kinder Morgan Energy Partners LP
5.80%, 3/15/35 | | | 87,000 | | | | 87,271 | |
Petrobras International Finance Co. (Cayman Islands)
5.75%, 1/20/20 | | | 48,000 | | | | 51,150 | |
Shell International Finance BV (Netherlands)
6.375%, 12/15/38 | | | 42,000 | | | | 50,362 | |
Suncor Energy, Inc. (Canada)
6.50%, 6/15/38 | | | 30,000 | | | | 34,145 | |
TransCanada PipeLines Ltd. (Canada)
7.625%, 1/15/39 | | | 17,000 | | | | 22,066 | |
| | | | | | | | |
| | | | | | | 375,139 | |
| | | | | | | | |
| Financial — 2.6% | | | | | | | | |
Allstate (The) Corp.
5.55%, 5/09/35 | | | 34,000 | | | | 34,254 | |
Bank of New York Mellon (The) Corp., Series G, MTN
4.60%, 1/15/20 | | | 117,000 | | | | 124,737 | |
Bear Stearns & Co., Inc.
7.25%, 2/01/18 | | | 30,000 | | | | 36,034 | |
Chubb Corp.
6.00%, 5/11/37 | | | 27,000 | | | | 29,465 | |
Citigroup, Inc.
8.125%, 7/15/39 | | | 108,000 | | | | 141,230 | |
Credit Suisse (USA), Inc.
7.125%, 7/15/32 | | | 56,000 | | | | 69,331 | |
General Electric Capital Corp., Series A, MTN
6.75%, 3/15/32 | | | 136,000 | | | | 155,873 | |
Goldman Sachs Group (The), Inc.
5.00%, 10/01/14 | | | 58,000 | | | | 62,605 | |
6.75%, 10/01/37 | | | 67,000 | | | | 67,528 | |
JPMorgan Chase Bank NA
5.875%, 6/13/16 | | | 50,000 | | | | 56,176 | |
Merrill Lynch & Co., Inc., Series C, MTN
5.00%, 1/15/15 | | | 64,000 | | | | 68,652 | |
PNC Funding Corp.
5.25%, 11/15/15 | | | 8,000 | | | | 8,755 | |
Principal Financial Group, Inc.
6.05%, 10/15/36 | | | 28,000 | | | | 29,991 | |
Travelers (The) Cos., Inc.
6.25%, 3/15/37 (b) | | | 27,000 | | | | 28,655 | |
| | | | | | | | |
| | | | | | | 913,286 | |
| | | | | | | | |
| Industrial — 0.6% | | | | | | | | |
Burlington Northern Santa Fe LLC
6.15%, 5/01/37 | | | 26,000 | | | | 28,799 | |
CSX Corp.
6.00%, 10/01/36 | | | 74,000 | | | | 79,815 | |
Lockheed Martin Corp., Series B
6.15%, 9/01/36 | | | 13,000 | | | | 14,615 | |
Norfolk Southern Corp.
7.90%, 5/15/97 | | | 32,000 | | | | 41,828 | |
United Parcel Service, Inc.
6.20%, 1/15/38 | | | 16,000 | | | | 18,821 | |
| | | | |
| See Notes to Financial Statements. | | 29 | | |
db-X Exchange-Traded Funds Inc.
SCHEDULE OF INVESTMENTS
db-X 2030 Target Date Fund (Continued)
May 31, 2011
| | | | | | | | |
| | | Principal
Amount | | | Value | |
| | | | | | | | |
| Industrial (Continued) | | | | | | | | |
United Technologies Corp.
6.125%, 7/15/38 | | $ | 32,000 | | | $ | 37,596 | |
| | | | | | | | |
| | | | | | | 221,474 | |
| | | | | | | | |
| Technology — 0.1% | | | | | | | | |
Dell, Inc.
5.875%, 6/15/19 | | | 23,000 | | | | 25,997 | |
Microsoft Corp.
4.20%, 6/01/19 | | | 28,000 | | | | 29,768 | |
| | | | | | | | |
| | | | | | | 55,765 | |
| | | | | | | | |
| Utilities — 1.5% | | | | | | | | |
Appalachian Power Co.
7.95%, 1/15/20 | | | 40,000 | | | | 51,165 | |
Florida Power & Light Co.
5.95%, 2/01/38 | | | 53,000 | | | | 60,358 | |
MidAmerican Energy Holdings Co.
6.125%, 4/01/36 | | | 133,000 | | | | 147,432 | |
Oncor Electric Delivery Co. LLC
7.00%, 9/01/22 | | | 71,000 | | | | 85,997 | |
Pacific Gas & Electric Co.
6.05%, 3/01/34 | | | 28,000 | | | | 30,632 | |
6.25%, 3/01/39 | | | 40,000 | | | | 44,664 | |
Public Service Co. of Colorado
5.125%, 6/01/19 | | | 44,000 | | | | 49,127 | |
Scana Corp., MTN
6.25%, 4/01/20 | | | 27,000 | | | | 30,357 | |
Southern California Edison Co.
6.05%, 3/15/39 | | | 21,000 | | | | 24,044 | |
| | | | | | | | |
| | | | | | | 523,776 | |
| | | | | | | | |
TOTAL CORPORATE BONDS
(Cost $3,912,689) | | | | | | | 4,063,757 | |
| | | | | | | | |
| UNITED STATES GOVERNMENT & AGENCIES OBLIGATIONS — 3.1% | | | | | | | | |
Federal Home Loan Mortgage
Corp. — 0.1% | | | | | | | | |
6.25%, 7/15/32 | | | 43,000 | | | | 54,168 | |
| | | | | | | | |
United States Treasury Bonds/
Notes — 3.0% | | | | | | | | |
1.75%, 11/15/11 | | | 139,600 | | | | 140,652 | |
7.50%, 11/15/16 | | | 93,300 | | | | 120,955 | |
8.125%, 8/15/19 | | | 113,900 | | | | 160,724 | |
3.625%, 2/15/20 | | | 74,100 | | | | 78,928 | |
6.25%, 5/15/30 | | | 17,700 | | | | 23,347 | |
4.375%, 2/15/38 | | | 304,200 | | | | 314,467 | |
4.625%, 2/15/40 | | | 96,000 | | | | 102,810 | |
4.375%, 5/15/40 | | | 100,400 | | | | 103,098 | |
| | | | | | | | |
| | | | | | | 1,044,981 | |
| | | | | | | | |
TOTAL UNITED STATES GOVERNMENT
& AGENCIES OBLIGATIONS
(Cost $1,076,196) | | | | | | | 1,099,149 | |
| | | | | | | | |
| SOVEREIGN BONDS — 0.6% | | | | | | | | |
Federative Republic of Brazil (Brazil)
7.125%, 1/20/37 | | | 53,000 | | | | 64,660 | |
| | | | | | | | |
| | | Principal
Amount | | | Value | |
| | | | | | | | |
| SOVEREIGN BONDS (Continued) | | | | | | | | |
Province of Quebec, Series PD (Canada)
7.50%, 9/15/29 | | $ | 64,000 | | | $ | 87,640 | |
Republic of Italy (Italy)
5.25%, 9/20/16 | | | 25,000 | | | | 27,423 | |
United Mexican States (Mexico)
5.625%, 1/15/17 | | | 44,000 | | | | 49,676 | |
| | | | | | | | |
TOTAL SOVEREIGN BONDS
(Cost $215,837) | | | | | | | 229,399 | |
| | | | | | | | |
| | |
TOTAL INVESTMENTS — 99.5%
(Cost $31,468,671) | | | | | | $ | 35,146,953 | |
Other assets less liabilities — 0.5% | | | | | | | 160,395 | |
| | | | | | | | |
NET ASSETS — 100.0% | | | | | | $ | 35,307,348 | |
| | | | | | | | |
MTN – Medium Term Note.
REIT – Real Estate Investment Trust.
* Non-income producing security.
(a) Affiliated company. The Advisor is a subsidiary of Deutsche Bank AG. Therefore, Deutsche Bank AG is considered to be affiliated with the Fund.
(b) Variable Rate Coupon. Stated interest rate was in effect at May 31, 2011.
COUNTRY BREAKDOWN AS OF MAY 31, 2011
(Unaudited)
| | | | | | | | |
| | | Value | | | % of
Net Assets | |
United States | | $ | 26,657,472 | | | | 75.5 | % |
United Kingdom | | | 2,189,284 | | | | 6.2 | |
Switzerland | | | 913,611 | | | | 2.6 | |
Japan | | | 892,677 | | | | 2.5 | |
France | | | 806,434 | | | | 2.3 | |
Germany | | | 787,739 | | | | 2.2 | |
Australia | | | 749,033 | | | | 2.1 | |
Netherlands | | | 300,886 | | | | 0.9 | |
Spain | | | 270,492 | | | | 0.8 | |
Italy | | | 213,745 | | | | 0.6 | |
Canada | | | 206,203 | | | | 0.6 | |
Netherlands Antilles | | | 186,269 | | | | 0.5 | |
Ireland | | | 173,052 | | | | 0.5 | |
Luxembourg | | | 156,230 | | | | 0.4 | |
Sweden | | | 140,214 | | | | 0.4 | |
Cayman Islands | | | 122,977 | | | | 0.4 | |
Denmark | | | 68,383 | | | | 0.2 | |
Brazil | | | 64,660 | | | | 0.2 | |
Israel | | | 62,532 | | | | 0.2 | |
Mexico | | | 49,676 | | | | 0.1 | |
Belgium | | | 47,669 | | | | 0.1 | |
Norway | | | 37,662 | | | | 0.1 | |
Finland | | | 36,021 | | | | 0.1 | |
Bermuda | | | 14,032 | | | | 0.0 | |
| | | | | | | | |
TOTAL INVESTMENTS | | | 35,146,953 | | | | 99.5 | |
Other assets less liabilities | | | 160,395 | | | | 0.5 | |
| | | | | | | | |
NET ASSETS | | $ | 35,307,348 | | | | 100.0 | % |
| | | | | | | | |
| | | | |
| See Notes to Financial Statements. | | 30 | | |
db-X Exchange-Traded Funds Inc.
SCHEDULE OF INVESTMENTS
db-X 2040 Target Date Fund
May 31, 2011
| | | | | | | | |
| | | Number
of Shares | | | Value | |
| | | | | | | | |
| | | | | | | | |
| COMMON STOCKS — 95.4% | | | | | | | | |
| Basic Materials — 5.4% | | | | | | | | |
Air Liquide S.A. (France) | | | 310 | | | $ | 43,019 | |
Allied Nevada Gold Corp.* | | | 1,689 | | | | 62,628 | |
Anglo American PLC (United Kingdom) | | | 1,968 | | | | 98,149 | |
ArcelorMittal (Luxembourg) | | | 1,147 | | | | 38,214 | |
BASF SE (Germany) | | | 1,200 | | | | 110,856 | |
Bayer AG (Germany) | | | 1,141 | | | | 93,415 | |
BHP Billiton Ltd. (Australia) | | | 4,740 | | | | 224,048 | |
BHP Billiton PLC (United Kingdom) | | | 2,942 | | | | 116,362 | |
Buckeye Technologies, Inc. | | | 2,400 | | | | 61,128 | |
Coeur d’Alene Mines Corp.* | | | 1,600 | | | | 44,112 | |
Dow Chemical (The) Co. | | | 2,347 | | | | 84,797 | |
E.I. du Pont de Nemours & Co. | | | 1,947 | | | | 103,775 | |
Freeport-McMoRan Copper & Gold, Inc. | | | 1,778 | | | | 91,816 | |
Metals USA Holdings Corp.* | | | 1,955 | | | | 30,733 | |
Newmont Mining Corp. | | | 1,188 | | | | 67,205 | |
Rio Tinto Ltd. (Australia) | | | 624 | | | | 54,190 | |
Rio Tinto PLC (United Kingdom) | | | 1,788 | | | | 124,929 | |
Rockwood Holdings, Inc.* | | | 1,013 | | | | 53,274 | |
Sensient Technologies Corp. | | | 835 | | | | 31,772 | |
Sherwin-Williams (The) Co. | | | 1,486 | | | | 130,530 | |
Solutia, Inc.* | | | 1,955 | | | | 48,816 | |
Syngenta AG (Switzerland)* | | | 141 | | | | 48,703 | |
Vulcan Materials Co. | | | 1,555 | | | | 62,962 | |
Xstrata PLC (United Kingdom) | | | 2,815 | | | | 66,048 | |
| | | | | | | | |
| | | | | | | 1,891,481 | |
| | | | | | | | |
| Communications — 9.8% | | | | | | | | |
Acme Packet, Inc.* | | | 889 | | | | 67,288 | |
ADTRAN, Inc. | | | 889 | | | | 38,103 | |
Anixter International, Inc.* | | | 640 | | | | 43,322 | |
Arris Group, Inc.* | | | 2,229 | | | | 25,165 | |
AT&T, Inc. | | | 12,690 | | | | 400,496 | |
Calix, Inc.* | | | 2,222 | | | | 47,929 | |
Cisco Systems, Inc. | | | 11,858 | | | | 199,214 | |
Comcast Corp., Class A | | | 5,861 | | | | 147,932 | |
Corning, Inc. | | | 3,146 | | | | 63,392 | |
Deutsche Telekom AG (Germany) | | | 3,808 | | | | 56,550 | |
Digital River, Inc.* | | | 656 | | | | 21,353 | |
Discovery Communications, Inc., Class A* | | | 3,555 | | | | 154,855 | |
eResearch Technology, Inc.* | | | 2,999 | | | | 19,014 | |
France Telecom S.A. (France) | | | 2,673 | | | | 61,099 | |
Google, Inc., Class A* | | | 675 | | | | 357,088 | |
GSI Commerce, Inc.* | | | 1,155 | | | | 33,784 | |
Limelight Networks, Inc.* | | | 5,688 | | | | 32,592 | |
News Corp., Class A | | | 3,805 | | | | 69,784 | |
Nokia OYJ (Finland) | | | 5,752 | | | | 39,278 | |
NTT DoCoMo, Inc. (Japan) | | | 22 | | | | 41,108 | |
Orbitz Worldwide, Inc.* | | | 5,777 | | | | 13,287 | |
Rackspace Hosting, Inc.* | | | 2,190 | | | | 96,360 | |
Symantec Corp.* | | | 9,243 | | | | 180,701 | |
Tekelec* | | | 1,200 | | | | 10,920 | |
Telefonaktiebolaget LM Ericsson, Class B (Sweden) | | | 3,850 | | | | 56,855 | |
Telefonica S.A. (Spain) | | | 5,384 | | | | 130,613 | |
Thomson Reuters Corp. (Canada) | | | 1,778 | | | | 69,289 | |
TIBCO Software, Inc.* | | | 2,442 | | | | 68,596 | |
| | | | | | | | |
| | | Number
of Shares | | | Value | |
| | | | | | | | |
| Communications (Continued) | | | | | | | | |
Time Warner, Inc. | | | 2,364 | | | $ | 86,121 | |
Verizon Communications, Inc. | | | 6,649 | | | | 245,548 | |
Vivendi (France) | | | 1,740 | | | | 48,515 | |
Vodafone Group PLC (United Kingdom) | | | 66,352 | | | | 184,514 | |
Walt Disney (The) Co. | | | 4,076 | | | | 169,683 | |
Windstream Corp. | | | 5,333 | | | | 71,729 | |
Yahoo!, Inc.* | | | 3,433 | | | | 56,816 | |
| | | | | | | | |
| | | | | | | 3,408,893 | |
| | | | | | | | |
| Consumer, Cyclical — 10.2% | | | | | | | | |
Alaska Air Group, Inc.* | | | 533 | | | | 35,998 | |
Ascena Retail Group, Inc.* | | | 1,400 | | | | 46,844 | |
Buckle (The), Inc. | | | 854 | | | | 36,457 | |
Callaway Golf Co. | | | 3,999 | | | | 27,073 | |
Carter’s, Inc.* | | | 1,060 | | | | 33,602 | |
Casey’s General Stores, Inc. | | | 861 | | | | 35,688 | |
Cash America International, Inc. | | | 444 | | | | 23,115 | |
Cinemark Holdings, Inc. | | | 1,750 | | | | 38,063 | |
Coach, Inc. | | | 3,899 | | | | 248,211 | |
Collective Brands, Inc.* | | | 1,244 | | | | 19,406 | |
Columbia Sportswear Co. | | | 580 | | | | 38,048 | |
Compagnie Financiere Richemont S.A. (Switzerland) | | | 691 | | | | 45,046 | |
CVS Caremark Corp. | | | 2,902 | | | | 112,278 | |
Daimler AG (Germany) | | | 1,226 | | | | 86,547 | |
Dana Holding Corp.* | | | 2,133 | | | | 38,650 | |
Deckers Outdoor Corp.* | | | 622 | | | | 56,664 | |
Dillard’s, Inc., Class A | | | 1,155 | | | | 64,899 | |
Dollar General Corp.* | | | 4,396 | | | | 154,168 | |
DSW, Inc., Class A* | | | 1,237 | | | | 62,036 | |
Exide Technologies* | | | 4,355 | | | | 42,940 | |
Ford Motor Co.* | | | 6,363 | | | | 94,936 | |
G&K Services, Inc., Class A | | | 1,155 | | | | 36,533 | |
Gaylord Entertainment Co.* | | | 622 | | | | 20,060 | |
Hennes & Mauritz AB, Class B (Sweden) | | | 1,326 | | | | 49,180 | |
Honda Motor Co. Ltd. (Japan) | | | 2,570 | | | | 97,751 | |
JetBlue Airways Corp.* | | | 4,153 | | | | 25,209 | |
Johnson Controls, Inc. | | | 1,422 | | | | 56,311 | |
Jones Group (The), Inc. | | | 1,600 | | | | 19,664 | |
K-Swiss, Inc., Class A* | | | 2,311 | | | | 25,490 | |
La-Z-Boy, Inc.* | | | 3,111 | | | | 34,439 | |
Liz Claiborne, Inc.* | | | 4,977 | | | | 32,500 | |
Lowe’s Cos., Inc. | | | 3,288 | | | | 79,373 | |
McDonald’s Corp. | | | 2,234 | | | | 182,160 | |
Men’s Wearhouse (The), Inc. | | | 936 | | | | 32,226 | |
Mitsubishi Corp. (Japan) | | | 1,992 | | | | 50,437 | |
Mitsui & Co. Ltd. (Japan) | | | 2,801 | | | | 47,718 | |
Nike, Inc., Class B | | | 1,067 | | | | 90,108 | |
Nintendo Co. Ltd. (Japan) | | | 137 | | | | 31,822 | |
Nissan Motor Co. Ltd. (Japan) | | | 3,204 | | | | 32,103 | |
Nu Skin Enterprises, Inc., Class A | | | 889 | | | | 34,751 | |
Owens & Minor, Inc. | | | 1,128 | | | | 39,029 | |
Panasonic Corp. (Japan) | | | 2,734 | | | | 32,105 | |
Penske Automotive Group, Inc. | | | 1,422 | | | | 29,521 | |
Polaris Industries, Inc. | | | 533 | | | | 58,817 | |
Saks, Inc.* | | | 2,666 | | | | 30,152 | |
Skechers U.S.A., Inc., Class A* | | | 800 | | | | 13,984 | |
| | | | |
| See Notes to Financial Statements. | | 31 | | |
db-X Exchange-Traded Funds Inc.
SCHEDULE OF INVESTMENTS
db-X 2040 Target Date Fund (Continued)
May 31, 2011
| | | | | | | | |
| | | Number
of Shares | | | Value | |
| | | | | | | | |
| Consumer, Cyclical (Continued) | | | | | | | | |
Sony Corp. (Japan) | | | 1,491 | | | $ | 39,698 | |
Tenneco, Inc.* | | | 889 | | | | 37,116 | |
Toyota Motor Corp. (Japan) | | | 4,328 | | | | 181,133 | |
Under Armour, Inc., Class A* | | | 700 | | | | 45,626 | |
UniFirst Corp. | | | 400 | | | | 21,448 | |
US Airways Group, Inc.* | | | 2,577 | | | | 23,451 | |
Vail Resorts, Inc.* | | | 516 | | | | 25,103 | |
Walgreen Co. | | | 1,955 | | | | 85,297 | |
Wal-Mart Stores, Inc. | | | 8,025 | | | | 443,142 | |
Warnaco Group (The), Inc.* | | | 688 | | | | 37,943 | |
Watsco, Inc. | | | 570 | | | | 38,156 | |
World Fuel Services Corp. | | | 1,113 | | | | 40,714 | |
| | | | | | | | |
| | | | | | | 3,540,939 | |
| | | | | | | | |
| Consumer, Non-cyclical — 19.2% | | | | | | | | |
Abbott Laboratories | | | 3,444 | | | | 179,949 | |
ABM Industries, Inc. | | | 889 | | | | 20,251 | |
Accuray, Inc.* | | | 3,910 | | | | 29,872 | |
Aetna, Inc. | | | 5,066 | | | | 221,282 | |
Amedisys, Inc.* | | | 827 | | | | 25,885 | |
American Medical Systems Holdings, Inc.* | | | 1,155 | | | | 34,581 | |
American Reprographics Co.* | | | 3,022 | | | | 28,346 | |
AMERIGROUP Corp.* | | | 926 | | | | 65,663 | |
Amgen, Inc.* | | | 2,133 | | | | 129,132 | |
Anheuser-Busch InBev NV (Belgium) | | | 859 | | | | 51,767 | |
AstraZeneca PLC (United Kingdom) | | | 1,825 | | | | 95,448 | |
British American Tobacco PLC
(United Kingdom) | | | 2,418 | | | | 108,333 | |
Bruker Corp.* | | | 3,243 | | | | 63,952 | |
Capella Education Co.* | | | 267 | | | | 12,907 | |
Catalyst Health Solutions, Inc.* | | | 835 | | | | 50,960 | |
CBIZ, Inc.* | | | 3,999 | | | | 30,593 | |
Centene Corp.* | | | 816 | | | | 28,397 | |
Coca-Cola (The) Co. | | | 4,833 | | | | 322,892 | |
DANONE S.A. (France) | | | 723 | | | | 52,957 | |
Diageo PLC (United Kingdom) | | | 3,168 | | | | 67,474 | |
Ennis, Inc. | | | 1,511 | | | | 28,845 | |
Fresh Del Monte Produce, Inc.
(Cayman Islands) | | | 1,116 | | | | 30,679 | |
Gentiva Health Services, Inc.* | | | 856 | | | | 20,955 | |
GlaxoSmithKline PLC (United Kingdom) | | | 6,908 | | | | 150,087 | |
HEALTHSOUTH Corp.* | | | 1,600 | | | | 44,912 | |
Healthspring, Inc.* | | | 978 | | | | 42,885 | |
Heidrick & Struggles International, Inc. | | | 1,315 | | | | 27,549 | |
HMS Holdings Corp.* | | | 444 | | | | 34,659 | |
Hospira, Inc.* | | | 2,044 | | | | 113,013 | |
Invacare Corp. | | | 500 | | | | 16,790 | |
Johnson & Johnson | | | 6,484 | | | | 436,308 | |
Kraft Foods, Inc., Class A | | | 3,240 | | | | 113,303 | |
Lancaster Colony Corp. | | | 493 | | | | 29,896 | |
Live Nation Entertainment, Inc.* | | | 3,288 | | | | 37,911 | |
Magellan Health Services, Inc.* | | | 648 | | | | 34,305 | |
Masimo Corp.* | | | 1,866 | | | | 57,324 | |
MasterCard, Inc., Class A | | | 342 | | | | 98,171 | |
Medifast, Inc.* | | | 889 | | | | 23,754 | |
Merck & Co., Inc. | | | 7,044 | | | | 258,867 | |
Molina Healthcare, Inc.* | | | 750 | | | | 20,385 | |
| | | | | | | | |
| | | Number
of Shares | | | Value | |
| | | | | | | | |
| Consumer, Non-cyclical (Continued) | | | | | | | | |
Molson Coors Brewing Co., Class B | | | 1,947 | | | $ | 90,828 | |
Nestle S.A. (Switzerland) | | | 4,675 | | | | 300,100 | |
Novartis AG (Switzerland) | | | 2,802 | | | | 180,689 | |
Novo Nordisk A/S, Class B (Denmark) | | | 593 | | | | 74,269 | |
Pfizer, Inc. | | | 17,686 | | | | 379,365 | |
Philip Morris International, Inc. | | | 3,835 | | | | 275,161 | |
Procter & Gamble (The) Co. | | | 6,428 | | | | 430,676 | |
Reckitt Benckiser Group PLC
(United Kingdom) | | | 783 | | | | 44,295 | |
Roche Holding AG (Switzerland) | | | 1,064 | | | | 187,126 | |
Rollins, Inc. | | | 2,403 | | | | 48,348 | |
Ruddick Corp. | | | 883 | | | | 38,808 | |
Safeway, Inc. | | | 5,019 | | | | 123,969 | |
Salix Pharmaceuticals Ltd.* | | | 889 | | | | 35,587 | |
Sanofi | | | 1,500 | | | | 118,645 | |
Seaboard Corp. | | | 23 | | | | 53,130 | |
Select Medical Holdings Corp.* | | | 2,933 | | | | 27,864 | |
Sirona Dental Systems, Inc.* | | | 931 | | | | 50,330 | |
SonoSite, Inc.* | | | 889 | | | | 31,746 | |
Sotheby’s | | | 978 | | | | 41,623 | |
STERIS Corp. | | | 1,038 | | | | 37,461 | |
Takeda Pharmaceutical Co. Ltd. (Japan) | | | 1,236 | | | | 58,803 | |
Tejon Ranch Co.* | | | 1,067 | | | | 39,319 | |
Tesco PLC (United Kingdom) | | | 11,750 | | | | 81,044 | |
Teva Pharmaceutical Industries Ltd. (Israel) | | | 1,354 | | | | 69,400 | |
TreeHouse Foods, Inc.* | | | 533 | | | | 32,476 | |
Unilever NV (Netherlands) | | | 2,155 | | | | 70,263 | |
Unilever PLC (United Kingdom) | | | 1,686 | | | | 54,697 | |
UnitedHealth Group, Inc. | | | 2,314 | | | | 113,270 | |
ViroPharma, Inc.* | | | 1,350 | | | | 26,123 | |
Visa, Inc., Class A | | | 1,848 | | | | 149,799 | |
WellCare Health Plans, Inc.* | | | 775 | | | | 38,169 | |
WellPoint, Inc. | | | 889 | | | | 69,493 | |
Woolworths Ltd. (Australia) | | | 1,685 | | | | 49,213 | |
| | | | | | | | |
| | | | | | | 6,663,328 | |
| | | | | | | | |
| Diversified — 0.2% | | | | | | | | |
LVMH Moet Hennessy Louis Vuitton S.A. (France) | | | 289 | | | | 50,230 | |
| | | | | | | | |
| Energy — 11.5% | | | | | | | | |
Berry Petroleum Co., Class A | | | 819 | | | | 42,924 | |
BG Group PLC (United Kingdom) | | | 4,721 | | | | 109,292 | |
Bill Barrett Corp.* | | | 823 | | | | 36,681 | |
BP PLC (United Kingdom) | | | 32,610 | | | | 251,384 | |
Brigham Exploration Co.* | | | 1,866 | | | | 58,107 | |
CARBO Ceramics, Inc. | | | 356 | | | | 53,496 | |
Chevron Corp. | | | 4,208 | | | | 441,461 | |
Complete Production Services, Inc.* | | | 1,155 | | | | 38,334 | |
ConocoPhillips | | | 3,141 | | | | 229,984 | |
Delek US Holdings, Inc. | | | 3,644 | | | | 54,988 | |
Devon Energy Corp. | | | 978 | | | | 82,220 | |
Dril-Quip, Inc.* | | | 581 | | | | 43,099 | |
ENI S.p.A (Italy) | | | 3,510 | | | | 84,066 | |
Exxon Mobil Corp. | | | 11,239 | | | | 938,120 | |
Helix Energy Solutions Group, Inc.* | | | 1,866 | | | | 32,692 | |
Hornbeck Offshore Services, Inc.* | | | 1,511 | | | | 40,782 | |
Key Energy Services, Inc.* | | | 2,133 | | | | 37,711 | |
| | | | |
| See Notes to Financial Statements. | | 32 | | |
db-X Exchange-Traded Funds Inc.
SCHEDULE OF INVESTMENTS
db-X 2040 Target Date Fund (Continued)
May 31, 2011
| | | | | | | | |
| | | Number
of Shares | | | Value | |
| | | | | | | | |
| Energy (Continued) | | | | | | | | |
Occidental Petroleum Corp. | | | 1,703 | | | $ | 183,669 | |
Peabody Energy Corp. | | | 2,916 | | | | 178,926 | |
Royal Dutch Shell PLC, Class A
(United Kingdom) | | | 4,815 | | | | 173,721 | |
Royal Dutch Shell PLC, Class B
(United Kingdom) | | | 3,604 | | | | 130,445 | |
RPC, Inc. | | | 2,023 | | | | 50,939 | |
Schlumberger Ltd. (Netherlands Antilles) | | | 2,401 | | | | 205,815 | |
Southwestern Energy Co.* | | | 804 | | | | 35,191 | |
Statoil ASA (Norway) | | | 1,371 | | | | 36,083 | |
Total S.A. (France) | | | 2,925 | | | | 168,325 | |
Williams (The) Cos., Inc. | | | 7,021 | | | | 220,389 | |
Woodside Petroleum Ltd. (Australia) | | | 707 | | | | 35,128 | |
| | | | | | | | |
| | | | | | | 3,993,972 | |
| | | | | | | | |
| Financial — 18.4% | | | | | | | | |
Alexander’s, Inc. REIT | | | 92 | | | | 36,084 | |
Allianz SE (Germany) | | | 569 | | | | 78,675 | |
American Campus Communities, Inc. REIT | | | 887 | | | | 31,347 | |
American Capital Ltd.* | | | 5,333 | | | | 52,797 | |
American Express Co. | | | 2,577 | | | | 132,973 | |
Apollo Investment Corp. | | | 3,022 | | | | 34,481 | |
Ashford Hospitality Trust, Inc. REIT | | | 3,111 | | | | 44,394 | |
Associated Estates Realty Corp. REIT | | | 1,866 | | | | 31,461 | |
Australia & New Zealand Banking Group Ltd. (Australia) | | | 3,481 | | | | 82,084 | |
AXA S.A. (France) | | | 2,401 | | | | 51,223 | |
Banco Bilbao Vizcaya Argentaria S.A. (Spain) | | | 5,237 | | | | 61,095 | |
Banco Santander S.A. (Spain) | | | 9,594 | | | | 113,980 | |
Bank of America Corp. | | | 20,586 | | | | 241,886 | |
Barclays PLC (United Kingdom) | | | 16,674 | | | | 75,925 | |
Berkshire Hathaway, Inc., Class B* | | | 5,765 | | | | 455,839 | |
BioMed Realty Trust, Inc. REIT | | | 1,778 | | | | 36,431 | |
BNP Paribas (France) | | | 1,216 | | | | 94,783 | |
Boston Properties, Inc. REIT | | | 1,600 | | | | 173,360 | |
CBL & Associates Properties, Inc. REIT | | | 2,222 | | | | 42,751 | |
Charles Schwab (The) Corp. | | | 2,489 | | | | 44,827 | |
Citigroup, Inc. | | | 6,123 | | | | 251,961 | |
Commonwealth Bank of Australia (Australia) | | | 2,171 | | | | 117,101 | |
Community Trust Bancorp, Inc. | | | 889 | | | | 24,430 | |
Credit Acceptance Corp.* | | | 533 | | | | 42,640 | |
Credit Suisse Group AG (Switzerland)* | | | 1,418 | | | | 60,883 | |
Deutsche Bank AG (Germany) (a) | | | 1,220 | | | | 72,637 | |
Entertainment Properties Trust REIT | | | 711 | | | | 34,540 | |
Equity Lifestyle Properties, Inc. REIT | | | 446 | | | | 26,203 | |
Equity One, Inc. REIT | | | 1,467 | | | | 28,768 | |
Equity Residential REIT | | | 622 | | | | 38,458 | |
Evercore Partners, Inc., Class A | | | 1,067 | | | | 39,490 | |
FirstMerit Corp. | | | 1,415 | | | | 23,050 | |
Franklin Resources, Inc. | | | 512 | | | | 66,345 | |
Goldman Sachs Group (The), Inc. | | | 1,044 | | | | 146,922 | |
Highwoods Properties, Inc. REIT | | | 1,275 | | | | 46,002 | |
Home Properties, Inc. REIT | | | 533 | | | | 32,993 | |
HSBC Holdings PLC (United Kingdom) | | | 22,855 | | | | 238,801 | |
ING Groep NV (Netherlands)* | | | 5,052 | | | | 60,855 | |
Investors Bancorp, Inc.* | | | 1,955 | | | | 29,266 | |
JPMorgan Chase & Co. | | | 8,466 | | | | 366,069 | |
| | | | | | | | |
| | | Number
of Shares | | | Value | |
| | | | | | | | |
| Financial (Continued) | | | | | | | | |
Kilroy Realty Corp. REIT | | | 800 | | | $ | 33,176 | |
LaSalle Hotel Properties REIT | | | 1,067 | | | | 29,855 | |
Lloyds Banking Group PLC (United Kingdom)* | | | 50,488 | | | | 43,212 | |
M&T Bank Corp. | | | 1,511 | | | | 133,422 | |
MFA Financial, Inc. REIT | | | 4,031 | | | | 33,215 | |
Mid-America Apartment Communities, Inc. REIT | | | 503 | | | | 34,481 | |
Mitsubishi UFJ Financial Group, Inc. (Japan) | | | 22,361 | | | | 103,217 | |
Mizuho Financial Group, Inc. (Japan) | | | 23,123 | | | | 36,432 | |
Muenchener Rueckversicherungs-Gesellschaft AG (Germany) | | | 291 | | | | 44,595 | |
National Australia Bank Ltd. (Australia) | | | 2,935 | | | | 82,813 | |
National Interstate Corp. | | | 1,155 | | | | 24,936 | |
National Retail Properties, Inc. REIT | | | 1,429 | | | | 36,840 | |
Nomura Holdings, Inc. (Japan) | | | 5,955 | | | | 29,907 | |
Nordea Bank AB (Sweden) | | | 4,150 | | | | 48,598 | |
Northern Trust Corp. | | | 3,073 | | | | 149,931 | |
OMEGA Healthcare Investors, Inc. REIT | | | 1,455 | | | | 30,977 | |
Pebblebrook Hotel Trust REIT | | | 1,333 | | | | 28,979 | |
Platinum Underwriters Holdings Ltd. (Bermuda) | | | 640 | | | | 21,850 | |
Potlatch Corp. REIT | | | 684 | | | | 24,624 | |
ProAssurance Corp.* | | | 581 | | | | 40,850 | |
Prosperity Bancshares, Inc. | | | 817 | | | | 35,744 | |
Public Storage REIT | | | 356 | | | | 42,129 | |
Signature Bank* | | | 711 | | | | 40,470 | |
Simon Property Group, Inc. REIT | | | 586 | | | | 69,183 | |
Societe Generale (France) | | | 764 | | | | 45,295 | |
Standard Chartered PLC (United Kingdom) | | | 2,921 | | | | 78,271 | |
Sumitomo Mitsui Financial Group, Inc. (Japan) | | | 2,002 | | | | 57,911 | |
SVB Financial Group* | | | 711 | | | | 42,219 | |
T. Rowe Price Group, Inc. | | | 3,022 | | | | 191,292 | |
Tanger Factory Outlet Centers, Inc. REIT | | | 1,138 | | | | 31,249 | |
Tower Group, Inc. | | | 707 | | | | 17,180 | |
Travelers (The) Cos., Inc. | | | 1,067 | | | | 66,239 | |
U.S. Bancorp | | | 4,177 | | | | 106,931 | |
UBS AG (Switzerland)* | | | 4,456 | | | | 85,369 | |
UMB Financial Corp. | | | 755 | | | | 32,201 | |
UniCredit S.p.A (Italy) | | | 15,830 | | | | 35,934 | |
Universal Health Realty Income Trust REIT | | | 711 | | | | 30,793 | |
Washington Real Estate Investment Trust REIT | | | 1,000 | | | | 34,530 | |
Webster Financial Corp. | | | 1,244 | | | | 25,950 | |
Wells Fargo & Co. | | | 10,997 | | | | 311,986 | |
Westamerica Bancorporation | | | 549 | | | | 27,615 | |
Westpac Banking Corp. (Australia) | | | 4,771 | | | | 112,503 | |
Weyerhaeuser Co. REIT | | | 5,807 | | | | 125,083 | |
Zurich Financial Services AG (Switzerland)* | | | 205 | | | | 54,825 | |
| | | | | | | | |
| | | | | | | 6,376,622 | |
| | | | | | | | |
| Industrial — 10.4% | | | | | | | | |
AAON, Inc. | | | 1,067 | | | | 35,957 | |
ABB Ltd. (Switzerland)* | | | 2,671 | | | | 71,684 | |
Acuity Brands, Inc. | | | 622 | | | | 37,917 | |
BAE Systems PLC (United Kingdom) | | | 4,850 | | | | 26,359 | |
Benchmark Electronics, Inc.* | | | 1,118 | | | | 19,319 | |
Boeing (The) Co. | | | 1,589 | | | | 123,990 | |
Brady Corp., Class A | | | 889 | | | | 30,644 | |
| | | | |
| See Notes to Financial Statements. | | 33 | | |
db-X Exchange-Traded Funds Inc.
SCHEDULE OF INVESTMENTS
db-X 2040 Target Date Fund (Continued)
May 31, 2011
| | | | | | | | |
| | | Number
of Shares | | | Value | |
| | | | | | | | |
| Industrial (Continued) | | | | | | | | |
Cascade Corp. | | | 711 | | | $ | 28,888 | |
Caterpillar, Inc. | | | 1,238 | | | | 130,980 | |
CLARCOR, Inc. | | | 897 | | | | 38,221 | |
Clean Harbors, Inc.* | | | 444 | | | | 44,915 | |
East Japan Railway Co. (Japan) | | | 551 | | | | 32,148 | |
Eaton Corp. | | | 3,770 | | | | 194,797 | |
EMCOR Group, Inc.* | | | 1,216 | | | | 36,930 | |
Emerson Electric Co. | | | 1,479 | | | | 80,679 | |
EnerSys* | | | 711 | | | | 25,454 | |
Fanuc Corp. (Japan) | | | 267 | | | | 41,049 | |
FedEx Corp. | | | 622 | | | | 58,244 | |
General Dynamics Corp. | | | 882 | | | | 65,462 | |
General Electric Co. | | | 23,220 | | | | 456,041 | |
GrafTech International Ltd.* | | | 1,795 | | | | 37,946 | |
Graphic Packaging Holding Co.* | | | 5,066 | | | | 27,762 | |
Griffon Corp.* | | | 1,086 | | | | 11,501 | |
Hexcel Corp.* | | | 1,511 | | | | 31,232 | |
Ingersoll-Rand PLC (Ireland) | | | 3,811 | | | | 190,169 | |
Kaydon Corp. | | | 533 | | | | 19,385 | |
Knight Transportation, Inc. | | | 1,534 | | | | 26,231 | |
Komatsu Ltd. (Japan) | | | 1,244 | | | | 37,240 | |
Koninklijke Philips Electronics NV (Netherlands) | | | 1,412 | | | | 39,126 | |
L-1 Identity Solutions, Inc.* | | | 1,600 | | | | 17,792 | |
Lindsay Corp. | | | 711 | | | | 47,694 | |
Metabolix, Inc.* | | | 1,511 | | | | 13,357 | |
Mitsubishi Electric Corp. (Japan) | | | 2,666 | | | | 30,027 | |
Moog, Inc., Class A* | | | 711 | | | | 29,187 | |
Nordson Corp. | | | 1,066 | | | | 55,453 | |
Parker Hannifin Corp. | | | 1,855 | | | | 164,817 | |
Republic Services, Inc. | | | 4,713 | | | | 148,555 | |
Rock-Tenn Co., Class A | | | 573 | | | | 44,024 | |
Schneider Electric S.A. (France) | | | 358 | | | | 58,980 | |
Siemens AG (Germany) | | | 1,200 | | | | 160,436 | |
Silgan Holdings, Inc. | | | 1,360 | | | | 61,050 | |
Simpson Manufacturing Co., Inc. | | | 889 | | | | 24,910 | |
Sun Hydraulics Corp. | | | 1,067 | | | | 51,675 | |
Thermo Fisher Scientific, Inc.* | | | 889 | | | | 58,185 | |
Toshiba Corp. (Japan) | | | 6,221 | | | | 32,928 | |
TriMas Corp.* | | | 2,222 | | | | 45,329 | |
Union Pacific Corp. | | | 1,142 | | | | 119,877 | |
United Parcel Service, Inc., Class B | | | 2,009 | | | | 147,641 | |
United Technologies Corp. | | | 1,930 | | | | 169,396 | |
Vinci S.A. (France) | | | 588 | | | | 37,899 | |
Watts Water Technologies, Inc., Class A | | | 622 | | | | 21,764 | |
Woodward, Inc. | | | 1,067 | | | | 37,580 | |
Worthington Industries, Inc. | | | 1,244 | | | | 27,157 | |
| | | | | | | | |
| | | | | | | 3,605,983 | |
| | | | | | | | |
| Technology — 8.3% | | | | | | | | |
Apple, Inc.* | | | 2,016 | | | | 701,225 | |
Applied Materials, Inc. | | | 2,933 | | | | 40,417 | |
CACI International, Inc., Class A* | | | 525 | | | | 33,511 | |
Concur Technologies, Inc.* | | | 763 | | | | 38,127 | |
EMC Corp.* | | | 4,385 | | | | 124,841 | |
Intel Corp. | | | 11,198 | | | | 252,067 | |
International Business Machines Corp. | | | 2,872 | | | | 485,166 | |
| | | | | | | | |
| | | Number
of Shares | | | Value | |
| | | | | | | | |
| Technology (Continued) | | | | | | | | |
Jack Henry & Associates, Inc. | | | 1,498 | | | $ | 46,798 | |
JDA Software Group, Inc.* | | | 700 | | | | 23,121 | |
Mentor Graphics Corp.* | | | 1,700 | | | | 22,797 | |
Microsoft Corp. | | | 17,728 | | | | 443,376 | |
MKS Instruments, Inc. | | | 800 | | | | 21,040 | |
Netlogic Microsystems, Inc.* | | | 978 | | | | 37,477 | |
Parametric Technology Corp.* | | | 1,741 | | | | 40,548 | |
Quality Systems, Inc. | | | 551 | | | | 47,430 | |
Quest Software, Inc.* | | | 1,438 | | | | 32,635 | |
Riverbed Technology, Inc.* | | | 2,114 | | | | 80,163 | |
SAP AG (Germany) | | | 1,212 | | | | 75,218 | |
SRA International, Inc., Class A* | | | 947 | | | | 29,310 | |
SYNNEX Corp.* | | | 500 | | | | 16,370 | |
TriQuint Semiconductor, Inc.* | | | 2,100 | | | | 27,195 | |
Ultratech, Inc.* | | | 1,511 | | | | 48,004 | |
VeriFone Systems, Inc.* | | | 1,244 | | | | 59,874 | |
Xerox Corp. | | | 15,542 | | | | 158,684 | |
| | | | | | | | |
| | | | | | | 2,885,394 | |
| | | | | | | | |
| Utilities — 2.0% | | | | | | | | |
Cleco Corp. | | | 889 | | | | 31,195 | |
E.ON AG (Germany) | | | 2,923 | | | | 82,929 | |
ENEL S.p.A (Italy) | | | 9,436 | | | | 64,760 | |
GDF Suez (France) | | | 1,639 | | | | 60,225 | |
National Fuel Gas Co. | | | 978 | | | | 70,455 | |
Nicor, Inc. | | | 716 | | | | 39,351 | |
Piedmont Natural Gas Co., Inc. | | | 1,157 | | | | 36,411 | |
RWE AG (Germany) | | | 655 | | | | 38,164 | |
Sempra Energy | | | 2,933 | | | | 161,814 | |
Southern Co. | | | 1,717 | | | | 68,817 | |
Tokyo Electric Power (The) Co., Inc. (Japan) | | | 1,689 | | | | 6,591 | |
WGL Holdings, Inc. | | | 915 | | | | 35,914 | |
| | | | | | | | |
| | | | | | | 696,626 | |
| | | | | | | | |
TOTAL COMMON STOCKS
(Cost $29,616,447) | | | | | | | 33,113,468 | |
| | | | | | | | |
| | |
| | | Principal
Amount | | | Value | |
| | | | | | | | |
| CORPORATE BONDS — 2.6% | | | | | | | | |
| Basic Materials — 0.0% (b) | | | | | | | | |
Vale Overseas Ltd. (Cayman Islands)
6.875%, 11/21/36 | | $ | 7,000 | | | | 7,726 | |
| | | | | | | | |
| Communications — 0.6% | | | | | | | | |
BellSouth Corp.
6.00%, 11/15/34 | | | 33,000 | | | | 34,353 | |
British Telecommunications PLC
(United Kingdom)
9.875%, 12/15/30 (d) | | | 10,000 | | | | 14,302 | |
CBS Corp.
7.875%, 7/30/30 | | | 4,000 | | | | 4,860 | |
Cisco Systems, Inc.
4.45%, 1/15/20 | | | 13,000 | | | | 13,640 | |
5.90%, 2/15/39 | | | 11,000 | | | | 11,927 | |
Comcast Corp.
6.45%, 3/15/37 | | | 14,000 | | | | 15,266 | |
| | | | |
| See Notes to Financial Statements. | | 34 | | |
db-X Exchange-Traded Funds Inc.
SCHEDULE OF INVESTMENTS
db-X 2040 Target Date Fund (Continued)
May 31, 2011
| | | | | | | | |
| | | Principal
Amount | | | Value | |
| | | | | | | | |
| Communications (Continued) | | | | | | | | |
Deutsche Telekom International Finance BV (Netherlands)
8.75%, 6/15/30 (d) | | $ | 15,000 | | | $ | 20,573 | |
News America, Inc.
6.20%, 12/15/34 | | | 11,000 | | | | 11,460 | |
Telecom Italia Capital S.A. (Luxembourg)
7.721%, 6/04/38 | | | 9,000 | | | | 9,655 | |
Time Warner Cable, Inc.
6.55%, 5/01/37 | | | 6,000 | | | | 6,405 | |
Time Warner, Inc.
7.70%, 5/01/32 | | | 18,000 | | | | 22,009 | |
Verizon Global Funding Corp.
7.75%, 12/01/30 | | | 24,000 | | | | 30,507 | |
Viacom, Inc.
6.25%, 4/30/16 | | | 6,000 | | | | 6,948 | |
| | | | | | | | |
| | | | | | | 201,905 | |
| | | | | | | | |
| Consumer, Cyclical — 0.2% | | | | | | | | |
CVS Caremark Corp.
6.302%, 6/01/37 (c) | | | 16,000 | | | | 15,844 | |
Target Corp.
7.00%, 1/15/38 | | | 16,000 | | | | 19,772 | |
Wal-Mart Stores, Inc.
6.50%, 8/15/37 | | | 25,000 | | | | 29,201 | |
| | | | | | | | |
| | | | | | | 64,817 | |
| | | | | | | | |
| Consumer, Non-cyclical — 0.4% | | | | | | | | |
Aetna, Inc.
6.625%, 6/15/36 | | | 5,000 | | | | 5,725 | |
Anheuser-Busch InBev Worldwide, Inc.
5.375%, 1/15/20 | | | 9,000 | | | | 9,994 | |
AstraZeneca PLC (United Kingdom)
6.45%, 9/15/37 | | | 14,000 | | | | 16,693 | |
Bristol-Myers Squibb Co.
5.875%, 11/15/36 | | | 19,000 | | | | 21,723 | |
Coca-Cola Enterprises, Inc.
8.50%, 2/01/22 | | | 16,000 | | | | 22,021 | |
Eli Lilly & Co.
5.55%, 3/15/37 | | | 6,000 | | | | 6,373 | |
Johnson & Johnson
5.95%, 8/15/37 | | | 8,000 | | | | 9,303 | |
Merck & Co., Inc.
5.00%, 6/30/19 | | | 6,000 | | | | 6,691 | |
Pepsi Bottling Group, Inc., Series B
7.00%, 3/01/29 | | | 4,000 | | | | 5,090 | |
Procter & Gamble (The) Co.
5.55%, 3/05/37 | | | 8,000 | | | | 8,812 | |
Unilever Capital Corp.
5.90%, 11/15/32 | | | 20,000 | | | | 22,981 | |
| | | | | | | | |
| | | | | | | 135,406 | |
| | | | | | | | |
| Energy — 0.2% | | | | | | | | |
ConocoPhillips
5.90%, 10/15/32 | | | 30,000 | | | | 33,371 | |
Kinder Morgan Energy Partners LP
5.80%, 3/15/35 | | | 11,000 | | | | 11,034 | |
Petrobras International Finance Co. (Cayman Islands)
5.75%, 1/20/20 | | | 11,000 | | | | 11,722 | |
| | | | | | | | |
| | | Principal
Amount | | | Value | |
| | | | | | | | |
| Energy (Continued) | | | | | | | | |
Shell International Finance BV (Netherlands)
6.375%, 12/15/38 | | $ | 11,000 | | | $ | 13,190 | |
Suncor Energy, Inc. (Canada)
6.50%, 6/15/38 | | | 9,000 | | | | 10,243 | |
TransCanada PipeLines Ltd. (Canada)
7.625%, 1/15/39 | | | 5,000 | | | | 6,490 | |
| | | | | | | | |
| | | | | | | 86,050 | |
| | | | | | | | |
| Financial — 0.6% | | | | | | | | |
Allstate (The) Corp.
5.55%, 5/09/35 | | | 5,000 | | | | 5,037 | |
Bank of New York Mellon (The) Corp., Series G, MTN
4.60%, 1/15/20 | | | 25,000 | | | | 26,653 | |
Chubb Corp.
6.00%, 5/11/37 | | | 8,000 | | | | 8,730 | |
Citigroup, Inc.
8.125%, 7/15/39 | | | 25,000 | | | | 32,693 | |
Credit Suisse (USA), Inc.
7.125%, 7/15/32 | | | 25,000 | | | | 30,951 | |
General Electric Capital Corp., Series A, MTN
6.75%, 3/15/32 | | | 6,000 | | | | 6,876 | |
Goldman Sachs Group (The), Inc.
6.75%, 10/01/37 | | | 21,000 | | | | 21,165 | |
JPMorgan Chase Bank NA
5.875%, 6/13/16 | | | 25,000 | | | | 28,088 | |
Landwirtschaftliche Rentenbank, Series G, MTN (Germany)
5.00%, 11/08/16 | | | 8,000 | | | | 9,148 | |
Merrill Lynch & Co., Inc., Series C, MTN
5.00%, 1/15/15 | | | 16,000 | | | | 17,163 | |
Merrill Lynch & Co., Inc., MTN
6.875%, 4/25/18 | | | 4,000 | | | | 4,565 | |
PNC Funding Corp.
5.25%, 11/15/15 | | | 4,000 | | | | 4,378 | |
Principal Financial Group, Inc.
6.05%, 10/15/36 | | | 8,000 | | | | 8,569 | |
Travelers (The) Cos., Inc.
6.25%, 3/15/37 (c) | | | 9,000 | | | | 9,552 | |
| | | | | | | | |
| | | | | | | 213,568 | |
| | | | | | | | |
| Industrial — 0.1% | | | | | | | | |
Burlington Northern Santa Fe LLC
6.15%, 5/01/37 | | | 7,000 | | | | 7,754 | |
CSX Corp.
6.00%, 10/01/36 | | | 8,000 | | | | 8,629 | |
Lockheed Martin Corp., Series B
6.15%, 9/01/36 | | | 5,000 | | | | 5,621 | |
Norfolk Southern Corp.
7.90%, 5/15/97 | | | 8,000 | | | | 10,457 | |
United Parcel Service, Inc.
6.20%, 1/15/38 | | | 7,000 | | | | 8,234 | |
United Technologies Corp.
6.125%, 7/15/38 | | | 7,000 | | | | 8,224 | |
| | | | | | | | |
| | | | | | | 48,919 | |
| | | | | | | | |
| Technology — 0.1% | | | | | | | | |
Dell, Inc.
5.875%, 6/15/19 | | | 8,000 | | | | 9,042 | |
| | | | |
| See Notes to Financial Statements. | | 35 | | |
db-X Exchange-Traded Funds Inc.
SCHEDULE OF INVESTMENTS
db-X 2040 Target Date Fund (Continued)
May 31, 2011
| | | | | | | | |
| | | Principal
Amount | | | Value | |
| | | | | | | | |
| Technology (Continued) | | | | | | | | |
Microsoft Corp.
4.20%, 6/01/19 | | $ | 8,000 | | | $ | 8,505 | |
| | | | | | | | |
| | | | | | | 17,547 | |
| | | | | | | | |
| Utilities — 0.4% | | | | | | | | |
Appalachian Power Co.
7.95%, 1/15/20 | | | 9,000 | | | | 11,512 | |
Florida Power & Light Co.
5.95%, 2/01/38 | | | 13,000 | | | | 14,805 | |
MidAmerican Energy Holdings Co.
6.125%, 4/01/36 | | | 31,000 | | | | 34,364 | |
Oncor Electric Delivery Co. LLC
7.00%, 9/01/22 | | | 18,000 | | | | 21,802 | |
Pacific Gas & Electric Co.
6.05%, 3/01/34 | | | 17,000 | | | | 18,598 | |
6.25%, 3/01/39 | | | 13,000 | | | | 14,516 | |
Scana Corp., MTN
6.25%, 4/01/20 | | | 8,000 | | | | 8,995 | |
Southern California Edison Co.
6.05%, 3/15/39 | | | 5,000 | | | | 5,725 | |
| | | | | | | | |
| | | | | | | 130,317 | |
| | | | | | | | |
TOTAL CORPORATE BONDS
(Cost $872,778) | | | | | | | 906,255 | |
| | | | | | | | |
| UNITED STATES GOVERNMENT & AGENCIES OBLIGATIONS — 1.5% | | | | | | | | |
Federal Home Loan Mortgage
Corp. — 0.1% | | | | | |
6.25%, 7/15/32 | | | 42,000 | | | | 52,908 | |
| | | | | | | | |
United States Treasury Bonds/
Notes — 1.4% | | | | | |
3.25%, 7/31/16 | | | 7,300 | | | | 7,851 | |
8.125%, 8/15/19 | | | 75,200 | | | | 106,114 | |
3.625%, 2/15/20 | | | 39,900 | | | | 42,500 | |
7.625%, 2/15/25 | | | 62,700 | | | | 90,768 | |
6.25%, 5/15/30 | | | 40,400 | | | | 53,290 | |
5.00%, 5/15/37 | | | 20,600 | | | | 23,468 | |
4.375%, 2/15/38 | | | 40,800 | | | | 42,177 | |
4.375%, 5/15/40 | | | 115,500 | | | | 118,604 | |
| | | | | | | | |
| | | | | | | 484,772 | |
| | | | | | | | |
TOTAL UNITED STATES GOVERNMENT
& AGENCIES OBLIGATIONS
(Cost $524,187) | | | | | | | 537,680 | |
| | | | | | | | |
| SOVEREIGN BONDS — 0.1% | | | | | | | | |
Federative Republic of Brazil (Brazil)
7.125%, 1/20/37 | | | 13,000 | | | | 15,860 | |
Province of Quebec, Series PD (Canada)
7.50%, 9/15/29 | | | 6,000 | | | | 8,216 | |
United Mexican States (Mexico)
5.625%, 1/15/17 | | | 8,000 | | | | 9,032 | |
| | | | | | | | |
TOTAL SOVEREIGN BONDS
(Cost $30,864) | | | | | | | 33,108 | |
| | | | | | | | |
| | |
TOTAL INVESTMENTS — 99.6% (Cost $31,044,276) | | | | | | $ | 34,590,511 | |
Other assets less liabilities — 0.4% | | | | | | | 132,110 | |
| | | | | | | | |
NET ASSETS — 100.0% | | | | | | $ | 34,722,621 | |
| | | | | | | | |
MTN – Medium Term Note.
REIT – Real Estate Investment Trust.
* Non-income producing security.
(a) Affiliated company. The Advisor is a subsidiary of Deutsche Bank AG. Therefore, Deutsche Bank AG is considered to be affiliated with the Fund.
(b) Less than 0.1%.
(c) Variable Rate Coupon. Stated interest rate was in effect at May 31, 2011.
(d) The rate shown reflects the coupon after the step date.
COUNTRY BREAKDOWN AS OF MAY 31, 2011 (Unaudited)
| | | | | | | | |
| | | Value | | | % of
Net Assets
| |
United States | | $ | 25,873,883 | | | | 74.5 | % |
United Kingdom | | | 2,349,785 | | | | 6.8 | |
Switzerland | | | 1,034,425 | | | | 3.0 | |
Japan | | | 1,020,128 | | | | 2.9 | |
Germany | | | 909,170 | | | | 2.6 | |
France | | | 891,195 | | | | 2.6 | |
Australia | | | 757,080 | | | | 2.2 | |
Spain | | | 305,688 | | | | 0.9 | |
Netherlands Antilles | | | 205,815 | | | | 0.6 | |
Netherlands | | | 204,007 | | | | 0.6 | |
Ireland | | | 190,169 | | | | 0.6 | |
Italy | | | 184,760 | | | | 0.5 | |
Sweden | | | 154,633 | | | | 0.5 | |
Canada | | | 94,238 | | | | 0.3 | |
Denmark | | | 74,269 | | | | 0.2 | |
Israel | | | 69,400 | | | | 0.2 | |
Belgium | | | 51,767 | | | | 0.1 | |
Cayman Islands | | | 50,127 | | | | 0.1 | |
Luxembourg | | | 47,869 | | | | 0.1 | |
Finland | | | 39,278 | | | | 0.1 | |
Norway | | | 36,083 | | | | 0.1 | |
Bermuda | | | 21,850 | | | | 0.1 | |
Brazil | | | 15,860 | | | | 0.0 | |
Mexico | | | 9,032 | | | | 0.0 | |
| | | | | | | | |
TOTAL INVESTMENTS | | | 34,590,511 | | | | 99.6 | |
Other assets less liabilities | | | 132,110 | | | | 0.4 | |
| | | | | | | | |
NET ASSETS | | $ | 34,722,621 | | | | 100.0 | % |
| | | | | | | | |
| | | | |
| See Notes to Financial Statements. | | 36 | | |
db-X Exchange-Traded Funds Inc.
SCHEDULE OF INVESTMENTS
db-X In-Target Date Fund
May 31, 2011
| | | | | | | | |
| | | Number
of Shares | | | Value | |
| | | | | | | | |
| COMMON STOCKS — 28.4% | | | | | | | | |
| Basic Materials — 1.6% | | | | | | | | |
Air Liquide S.A. (France) | | | 44 | | | $ | 6,106 | |
Allied Nevada Gold Corp.* | | | 225 | | | | 8,343 | |
Anglo American PLC (United Kingdom) | | | 207 | | | | 10,324 | |
ArcelorMittal (Luxembourg) | | | 139 | | | | 4,631 | |
BASF SE (Germany) | | | 142 | | | | 13,118 | |
Bayer AG (Germany) | | | 135 | | | | 11,053 | |
BHP Billiton Ltd. (Australia) | | | 633 | | | | 29,921 | |
BHP Billiton PLC (United Kingdom) | | | 353 | | | | 13,962 | |
Buckeye Technologies, Inc. | | | 300 | | | | 7,641 | |
Coeur d’Alene Mines Corp.* | | | 125 | | | | 3,446 | |
Dow Chemical (The) Co. | | | 351 | | | | 12,682 | |
E.I. du Pont de Nemours & Co. | | | 240 | | | | 12,792 | |
Freeport-McMoRan Copper & Gold, Inc. | | | 300 | | | | 15,492 | |
Metals USA Holdings Corp.* | | | 300 | | | | 4,716 | |
Newmont Mining Corp. | | | 162 | | | | 9,164 | |
Rio Tinto Ltd. (Australia) | | | 129 | | | | 11,203 | |
Rio Tinto PLC (United Kingdom) | | | 208 | | | | 14,533 | |
Rockwood Holdings, Inc.* | | | 180 | | | | 9,466 | |
Sensient Technologies Corp. | | | 127 | | | | 4,832 | |
Sherwin-Williams (The) Co. | | | 187 | | | | 16,426 | |
Solutia, Inc.* | | | 300 | | | | 7,491 | |
Syngenta AG (Switzerland)* | | | 17 | | | | 5,872 | |
Vulcan Materials Co. | | | 225 | | | | 9,110 | |
Xstrata PLC (United Kingdom) | | | 517 | | | | 12,130 | |
| | | | | | | | |
| | | | | | | 254,454 | |
| | | | | | | | |
| Communications — 2.9% | | | | | | | | |
Acme Packet, Inc.* | | | 150 | | | | 11,354 | |
ADTRAN, Inc. | | | 150 | | | | 6,429 | |
Anixter International, Inc.* | | | 92 | | | | 6,227 | |
Arris Group, Inc.* | | | 297 | | | | 3,353 | |
AT&T, Inc. | | | 1,796 | | | | 56,683 | |
Calix, Inc.* | | | 300 | | | | 6,471 | |
Cisco Systems, Inc. | | | 1,607 | | | | 26,997 | |
Comcast Corp., Class A | | | 871 | | | | 21,984 | |
Corning, Inc. | | | 485 | | | | 9,773 | |
Deutsche Telekom AG (Germany) | | | 450 | | | | 6,683 | |
Digital River, Inc.* | | | 91 | | | | 2,962 | |
Discovery Communications, Inc., Class A* | | | 525 | | | | 22,869 | |
eResearch Technology, Inc.* | | | 557 | | | | 3,531 | |
France Telecom S.A. (France) | | | 299 | | | | 6,834 | |
Google, Inc., Class A* | | | 88 | | | | 46,553 | |
GSI Commerce, Inc.* | | | 150 | | | | 4,388 | |
Limelight Networks, Inc.* | | | 749 | | | | 4,292 | |
News Corp., Class A | | | 587 | | | | 10,766 | |
Nokia OYJ (Finland) | | | 566 | | | | 3,865 | |
NTT DoCoMo, Inc. (Japan) | | | 8 | | | | 14,948 | |
Orbitz Worldwide, Inc.* | | | 824 | | | | 1,895 | |
Rackspace Hosting, Inc.* | | | 249 | | | | 10,956 | |
Symantec Corp.* | | | 1,274 | | | | 24,907 | |
Telefonaktiebolaget LM Ericsson, Class B (Sweden) | | | 212 | | | | 3,131 | |
Telefonica S.A. (Spain) | | | 599 | | | | 14,531 | |
Thomson Reuters Corp. (Canada) | | | 225 | | | | 8,768 | |
TIBCO Software, Inc.* | | | 422 | | | | 11,854 | |
Time Warner, Inc. | | | 351 | | | | 12,787 | |
| | | | | | | | |
| | | Number
of Shares | | | Value | |
| | | | | | | | |
| Communications (Continued) | | | | | | | | |
Verizon Communications, Inc. | | | 910 | | | $ | 33,606 | |
Vivendi (France) | | | 201 | | | | 5,604 | |
Vodafone Group PLC (United Kingdom) | | | 8,089 | | | | 22,494 | |
Walt Disney (The) Co. | | | 595 | | | | 24,769 | |
Windstream Corp. | | | 749 | | | | 10,074 | |
Yahoo!, Inc.* | | | 450 | | | | 7,448 | |
| | | | | | | | |
| | | | | | | 469,786 | |
| | | | | | | | |
| Consumer, Cyclical — 2.9% | | | | | | | | |
Alaska Air Group, Inc.* | | | 75 | | | | 5,066 | |
Ascena Retail Group, Inc.* | | | 180 | | | | 6,023 | |
Buckle (The), Inc. | | | 123 | | | | 5,251 | |
Callaway Golf Co. | | | 525 | | | | 3,554 | |
Carter’s, Inc.* | | | 152 | | | | 4,818 | |
Casey’s General Stores, Inc. | | | 118 | | | | 4,891 | |
Cinemark Holdings, Inc. | | | 281 | | | | 6,112 | |
Coach, Inc. | | | 525 | | | | 33,421 | |
Columbia Sportswear Co. | | | 35 | | | | 2,296 | |
Compagnie Financiere Richemont S.A. (Switzerland) | | | 100 | | | | 6,519 | |
CVS Caremark Corp. | | | 432 | | | | 16,714 | |
Daimler AG (Germany) | | | 130 | | | | 9,177 | |
Dana Holding Corp.* | | | 300 | | | | 5,436 | |
Deckers Outdoor Corp.* | | | 75 | | | | 6,833 | |
Dillard’s, Inc., Class A | | | 150 | | | | 8,429 | |
Dollar General Corp.* | | | 599 | | | | 21,007 | |
DSW, Inc., Class A* | | | 163 | | | | 8,174 | |
Exide Technologies* | | | 599 | | | | 5,906 | |
Ford Motor Co.* | | | 1,047 | | | | 15,621 | |
G&K Services, Inc., Class A | | | 150 | | | | 4,745 | |
Hennes & Mauritz AB, Class B (Sweden) | | | 154 | | | | 5,712 | |
Honda Motor Co. Ltd. (Japan) | | | 258 | | | | 9,813 | |
JetBlue Airways Corp.* | | | 635 | | | | 3,854 | |
Johnson Controls, Inc. | | | 125 | | | | 4,950 | |
Jones Group (The), Inc. | | | 225 | | | | 2,765 | |
K-Swiss, Inc., Class A* | | | 300 | | | | 3,309 | |
La-Z-Boy, Inc.* | | | 450 | | | | 4,982 | |
Liz Claiborne, Inc.* | | | 824 | | | | 5,381 | |
Lowe’s Cos., Inc. | | | 450 | | | | 10,862 | |
McDonald’s Corp. | | | 321 | | | | 26,174 | |
Men’s Wearhouse (The), Inc. | | | 112 | | | | 3,856 | |
Mitsubishi Corp. (Japan) | | | 249 | | | | 6,304 | |
Mitsui & Co. Ltd. (Japan) | | | 360 | | | | 6,133 | |
Nike, Inc., Class B | | | 150 | | | | 12,668 | |
Nintendo Co. Ltd. (Japan) | | | 16 | | | | 3,716 | |
Nissan Motor Co. Ltd. (Japan) | | | 599 | | | | 6,002 | |
Nu Skin Enterprises, Inc., Class A | | | 150 | | | | 5,864 | |
Owens & Minor, Inc. | | | 165 | | | | 5,709 | |
Panasonic Corp. (Japan) | | | 360 | | | | 4,227 | |
Polaris Industries, Inc. | | | 75 | | | | 8,277 | |
Saks, Inc.* | | | 375 | | | | 4,241 | |
Skechers U.S.A., Inc., Class A* | | | 75 | | | | 1,311 | |
Sony Corp. (Japan) | | | 169 | | | | 4,500 | |
Tenneco, Inc.* | | | 150 | | | | 6,263 | |
Toyota Motor Corp. (Japan) | | | 480 | | | | 20,089 | |
Under Armour, Inc., Class A* | | | 150 | | | | 9,777 | |
UniFirst Corp. | | | 75 | | | | 4,022 | |
| | | | |
| See Notes to Financial Statements. | | 37 | | |
db-X Exchange-Traded Funds Inc.
SCHEDULE OF INVESTMENTS
db-X In-Target Date Fund (Continued)
May 31, 2011
| | | | | | | | |
| | | Number
of Shares | | | Value | |
| | | | | | | | |
| Consumer, Cyclical (Continued) | | | | | | | | |
Vail Resorts, Inc.* | | | 135 | | | $ | 6,568 | |
Walgreen Co. | | | 300 | | | | 13,089 | |
Wal-Mart Stores, Inc. | | | 1,075 | | | | 59,361 | |
Warnaco Group (The), Inc.* | | | 83 | | | | 4,577 | |
Watsco, Inc. | | | 75 | | | | 5,021 | |
World Fuel Services Corp. | | | 158 | | | | 5,780 | |
| | | | | | | | |
| | | | | | | 465,150 | |
| | | | | | | | |
| Consumer, Non-cyclical — 5.6% | | | | | | | | |
Abbott Laboratories | | | 471 | | | | 24,610 | |
ABM Industries, Inc. | | | 150 | | | | 3,417 | |
Accuray, Inc.* | | | 525 | | | | 4,011 | |
Aetna, Inc. | | | 674 | | | | 29,439 | |
Amedisys, Inc.* | | | 135 | | | | 4,226 | |
American Medical Systems Holdings, Inc.* | | | 150 | | | | 4,491 | |
American Reprographics Co.* | | | 450 | | | | 4,221 | |
AMERIGROUP Corp.* | | | 136 | | | | 9,644 | |
Amgen, Inc.* | | | 300 | | | | 18,162 | |
Anheuser-Busch InBev NV (Belgium) | | | 112 | | | | 6,750 | |
AstraZeneca PLC (United Kingdom) | | | 207 | | | | 10,826 | |
British American Tobacco PLC
(United Kingdom) | | | 279 | | | | 12,500 | |
Bruker Corp.* | | | 444 | | | | 8,756 | |
Catalyst Health Solutions, Inc.* | | | 120 | | | | 7,324 | |
CBIZ, Inc.* | | | 524 | | | | 4,008 | |
Centene Corp.* | | | 150 | | | | 5,220 | |
Coca-Cola (The) Co. | | | 696 | | | | 46,499 | |
DANONE S.A. (France) | | | 130 | | | | 9,522 | |
Diageo PLC (United Kingdom) | | | 378 | | | | 8,051 | |
Ennis, Inc. | | | 225 | | | | 4,295 | |
Fresh Del Monte Produce, Inc.
(Cayman Islands) | | | 120 | | | | 3,299 | |
GlaxoSmithKline PLC (United Kingdom) | | | 1,161 | | | | 25,225 | |
HEALTHSOUTH Corp.* | | | 225 | | | | 6,316 | |
Healthspring, Inc.* | | | 100 | | | | 4,385 | |
Heidrick & Struggles International, Inc. | | | 187 | | | | 3,918 | |
HMS Holdings Corp.* | | | 75 | | | | 5,855 | |
Hospira, Inc.* | | | 300 | | | | 16,587 | |
Johnson & Johnson | | | 836 | | | | 56,253 | |
Kraft Foods, Inc., Class A | | | 406 | | | | 14,198 | |
Lancaster Colony Corp. | | | 64 | | | | 3,881 | |
Live Nation Entertainment, Inc.* | | | 450 | | | | 5,189 | |
Magellan Health Services, Inc.* | | | 103 | | | | 5,453 | |
Masimo Corp.* | | | 225 | | | | 6,912 | |
MasterCard, Inc., Class A | | | 35 | | | | 10,047 | |
Medifast, Inc.* | | | 150 | | | | 4,008 | |
Merck & Co., Inc. | | | 974 | | | | 35,795 | |
Molson Coors Brewing Co., Class B | | | 300 | | | | 13,995 | |
Nestle S.A. (Switzerland) | | | 679 | | | | 43,586 | |
Novartis AG (Switzerland) | | | 363 | | | | 23,408 | |
Novo Nordisk A/S, Class B (Denmark) | | | 79 | | | | 9,894 | |
Pfizer, Inc. | | | 2,410 | | | | 51,694 | |
Philip Morris International, Inc. | | | 563 | | | | 40,395 | |
Procter & Gamble (The) Co. | | | 845 | | | | 56,615 | |
Reckitt Benckiser Group PLC (United Kingdom) | | | 75 | | | | 4,243 | |
Roche Holding AG (Switzerland) | | | 164 | | | | 28,843 | |
| | | | | | | | |
| | | Number
of Shares | | | Value | |
| | | | | | | | |
| Consumer, Non-cyclical (Continued) | | | | | | | | |
Rollins, Inc. | | | 330 | | | $ | 6,640 | |
Ruddick Corp. | | | 128 | | | | 5,626 | |
Safeway, Inc. | | | 680 | | | | 16,796 | |
Salix Pharmaceuticals Ltd.* | | | 150 | | | | 6,005 | |
Sanofi | | | 168 | | | | 13,288 | |
Seaboard Corp. | | | 3 | | | | 6,930 | |
Sirona Dental Systems, Inc.* | | | 120 | | | | 6,487 | |
SonoSite, Inc.* | | | 150 | | | | 5,357 | |
Sotheby’s | | | 150 | | | | 6,384 | |
STERIS Corp. | | | 157 | | | | 5,666 | |
Takeda Pharmaceutical Co. Ltd. (Japan) | | | 160 | | | | 7,612 | |
Tejon Ranch Co.* | | | 150 | | | | 5,528 | |
Tesco PLC (United Kingdom) | | | 1,246 | | | | 8,594 | |
Teva Pharmaceutical Industries Ltd. (Israel) | | | 187 | | | | 9,585 | |
TreeHouse Foods, Inc.* | | | 75 | | | | 4,570 | |
Unilever NV (Netherlands) | | | 246 | | | | 8,021 | |
Unilever PLC (United Kingdom) | | | 197 | | | | 6,391 | |
UnitedHealth Group, Inc. | | | 339 | | | | 16,593 | |
Visa, Inc., Class A | | | 222 | | | | 17,995 | |
WellCare Health Plans, Inc.* | | | 120 | | | | 5,910 | |
WellPoint, Inc. | | | 150 | | | | 11,726 | |
Woolworths Ltd. (Australia) | | | 321 | | | | 9,375 | |
| | | | | | | | |
| | | | | | | 897,045 | |
| | | | | | | | |
| Diversified — 0.1% | | | | | | | | |
LVMH Moet Hennessy Louis Vuitton S.A. (France) | | | 46 | | | | 7,995 | |
| | | | | | | | |
| Energy — 3.5% | | | | | | | | |
Berry Petroleum Co., Class A | | | 75 | | | | 3,931 | |
BG Group PLC (United Kingdom) | | | 1,026 | | | | 23,752 | |
Bill Barrett Corp.* | | | 122 | | | | 5,438 | |
BP PLC (United Kingdom) | | | 4,485 | | | | 34,574 | |
Brigham Exploration Co.* | | | 225 | | | | 7,007 | |
CARBO Ceramics, Inc. | | | 75 | | | | 11,270 | |
Chevron Corp. | | | 596 | | | | 62,526 | |
Complete Production Services, Inc.* | | | 150 | | | | 4,979 | |
ConocoPhillips | | | 426 | | | | 31,192 | |
Delek US Holdings, Inc. | | | 525 | | | | 7,922 | |
Devon Energy Corp. | | | 150 | | | | 12,611 | |
Dril-Quip, Inc.* | | | 75 | | | | 5,564 | |
ENI S.p.A (Italy) | | | 414 | | | | 9,915 | |
Exxon Mobil Corp. | | | 1,531 | | | | 127,793 | |
Helix Energy Solutions Group, Inc.* | | | 300 | | | | 5,256 | |
Hornbeck Offshore Services, Inc.* | | | 225 | | | | 6,073 | |
Key Energy Services, Inc.* | | | 300 | | | | 5,304 | |
Occidental Petroleum Corp. | | | 243 | | | | 26,208 | |
Peabody Energy Corp. | | | 443 | | | | 27,182 | |
Royal Dutch Shell PLC, Class A
(United Kingdom) | | | 595 | | | | 21,467 | |
Royal Dutch Shell PLC, Class B
(United Kingdom) | | | 459 | | | | 16,613 | |
RPC, Inc. | | | 280 | | | | 7,050 | |
Schlumberger Ltd. (Netherlands Antilles) | | | 333 | | | | 28,544 | |
Southwestern Energy Co.* | | | 134 | | | | 5,865 | |
Statoil ASA (Norway) | | | 244 | | | | 6,422 | |
Total S.A. (France) | | | 350 | | | | 20,141 | |
Williams (The) Cos., Inc. | | | 974 | | | | 30,574 | |
| | | | |
| See Notes to Financial Statements. | | 38 | | |
db-X Exchange-Traded Funds Inc.
SCHEDULE OF INVESTMENTS
db-X In-Target Date Fund (Continued)
May 31, 2011
| | | | | | | | |
| | | Number
of Shares | | | Value | |
| | | | | | | | |
| Energy (Continued) | | | | | | | | |
Woodside Petroleum Ltd. (Australia) | | | 88 | | | $ | 4,372 | |
| | | | | | | | |
| | | | | | | 559,545 | |
| | | | | | | | |
| Financial — 5.6% | | | | | | | | |
Alexander’s, Inc. REIT | | | 13 | | | | 5,099 | |
Allianz SE (Germany) | | | 73 | | | | 10,094 | |
American Campus Communities, Inc. REIT | | | 64 | | | | 2,262 | |
American Capital Ltd.* | | | 749 | | | | 7,415 | |
American Express Co. | | | 375 | | | | 19,350 | |
Apollo Investment Corp. | | | 450 | | | | 5,135 | |
Ashford Hospitality Trust, Inc. REIT | | | 450 | | | | 6,422 | |
Associated Estates Realty Corp. REIT | | | 225 | | | | 3,794 | |
Australia & New Zealand Banking Group Ltd. (Australia) | | | 668 | | | | 15,752 | |
AXA S.A. (France) | | | 240 | | | | 5,120 | |
Banco Bilbao Vizcaya Argentaria S.A. (Spain) | | | 492 | | | | 5,740 | |
Banco Santander S.A. (Spain) | | | 1,056 | | | | 12,546 | |
Bank of America Corp. | | | 2,789 | | | | 32,771 | |
Barclays PLC (United Kingdom) | | | 2,950 | | | | 13,433 | |
Berkshire Hathaway, Inc., Class B* | | | 778 | | | | 61,515 | |
BioMed Realty Trust, Inc. REIT | | | 225 | | | | 4,610 | |
BNP Paribas (France) | | | 128 | | | | 9,977 | |
Boston Properties, Inc. REIT | | | 225 | | | | 24,378 | |
CBL & Associates Properties, Inc. REIT | | | 300 | | | | 5,772 | |
Charles Schwab (The) Corp. | | | 351 | | | | 6,322 | |
Citigroup, Inc. | | | 839 | | | | 34,525 | |
Commonwealth Bank of Australia (Australia) | | | 368 | | | | 19,849 | |
Community Trust Bancorp, Inc. | | | 150 | | | | 4,122 | |
Credit Acceptance Corp.* | | | 75 | | | | 6,000 | |
Credit Suisse Group AG (Switzerland)* | | | 139 | | | | 5,968 | |
Deutsche Bank AG (Germany) (a) | | | 85 | | | | 5,061 | |
Entertainment Properties Trust REIT | | | 75 | | | | 3,644 | |
Equity Lifestyle Properties, Inc. REIT | | | 75 | | | | 4,406 | |
Equity One, Inc. REIT | | | 230 | | | | 4,510 | |
Equity Residential REIT | | | 75 | | | | 4,637 | |
Evercore Partners, Inc., Class A | | | 150 | | | | 5,552 | |
FirstMerit Corp. | | | 325 | | | | 5,294 | |
Franklin Resources, Inc. | | | 76 | | | | 9,848 | |
Goldman Sachs Group (The), Inc. | | | 164 | | | | 23,079 | |
Highwoods Properties, Inc. REIT | | | 145 | | | | 5,232 | |
Home Properties, Inc. REIT | | | 75 | | | | 4,643 | |
HSBC Holdings PLC (United Kingdom) | | | 3,503 | | | | 36,600 | |
ING Groep NV (Netherlands)* | | | 901 | | | | 10,853 | |
Investors Bancorp, Inc.* | | | 300 | | | | 4,491 | |
JPMorgan Chase & Co. | | | 1,131 | | | | 48,904 | |
Kilroy Realty Corp. REIT | | | 150 | | | | 6,221 | |
LaSalle Hotel Properties REIT | | | 150 | | | | 4,197 | |
Lloyds Banking Group PLC (United Kingdom)* | | | 8,217 | | | | 7,033 | |
M&T Bank Corp. | | | 225 | | | | 19,868 | |
MFA Financial, Inc. REIT | | | 581 | | | | 4,787 | |
Mid-America Apartment Communities, Inc. REIT | | | 60 | | | | 4,113 | |
Mitsubishi UFJ Financial Group, Inc. (Japan) | | | 1,936 | | | | 8,936 | |
Mizuho Financial Group, Inc. (Japan) | | | 3,180 | | | | 5,010 | |
Muenchener Rueckversicherungs-Gesellschaft AG (Germany) | | | 33 | | | | 5,057 | |
National Australia Bank Ltd. (Australia) | | | 273 | | | | 7,703 | |
| | | | | | | | |
| | | Number
of Shares | | | Value | |
| | | | | | | | |
| Financial (Continued) | | | | | | | | |
National Interstate Corp. | | | 150 | | | $ | 3,239 | |
National Retail Properties, Inc. REIT | | | 210 | | | | 5,414 | |
Nomura Holdings, Inc. (Japan) | | | 1,424 | | | | 7,152 | |
Nordea Bank AB (Sweden) | | | 471 | | | | 5,516 | |
Northern Trust Corp. | | | 369 | | | | 18,003 | |
OMEGA Healthcare Investors, Inc. REIT | | | 219 | | | | 4,663 | |
Pebblebrook Hotel Trust REIT | | | 150 | | | | 3,261 | |
Platinum Underwriters Holdings Ltd. (Bermuda) | | | 112 | | | | 3,824 | |
ProAssurance Corp.* | | | 76 | | | | 5,344 | |
Prosperity Bancshares, Inc. | | | 101 | | | | 4,419 | |
Public Storage REIT | | | 75 | | | | 8,875 | |
Signature Bank* | | | 75 | | | | 4,269 | |
Simon Property Group, Inc. REIT | | | 82 | | | | 9,680 | |
Societe Generale (France) | | | 75 | | | | 4,447 | |
Standard Chartered PLC (United Kingdom) | | | 301 | | | | 8,066 | |
Sumitomo Mitsui Financial Group, Inc. (Japan) | | | 332 | | | | 9,604 | |
SVB Financial Group* | | | 75 | | | | 4,454 | |
T. Rowe Price Group, Inc. | | | 450 | | | | 28,484 | |
Tanger Factory Outlet Centers, Inc. REIT | | | 210 | | | | 5,767 | |
Tower Group, Inc. | | | 150 | | | | 3,645 | |
Travelers (The) Cos., Inc. | | | 150 | | | | 9,312 | |
U.S. Bancorp | | | 599 | | | | 15,334 | |
UBS AG (Switzerland)* | | | 522 | | | | 10,001 | |
UMB Financial Corp. | | | 85 | | | | 3,625 | |
UniCredit S.p.A (Italy) | | | 5,194 | | | | 11,790 | |
Universal Health Realty Income Trust REIT | | | 75 | | | | 3,248 | |
Washington Real Estate Investment Trust REIT | | | 154 | | | | 5,318 | |
Wells Fargo & Co. | | | 1,599 | | | | 45,363 | |
Westamerica Bancorporation | | | 65 | | | | 3,270 | |
Westpac Banking Corp. (Australia) | | | 1,169 | | | | 27,566 | |
Weyerhaeuser Co. REIT | | | 932 | | | | 20,074 | |
Zurich Financial Services AG (Switzerland)* | | | 23 | | | | 6,151 | |
| | | | | | | | |
| | | | | | | 886,828 | |
| | | | | | | | |
| Industrial — 3.2% | | | | | | | | |
AAON, Inc. | | | 150 | | | | 5,055 | |
ABB Ltd. (Switzerland)* | | | 360 | | | | 9,662 | |
Acuity Brands, Inc. | | | 75 | | | | 4,572 | |
BAE Systems PLC (United Kingdom) | | | 611 | | | | 3,321 | |
Benchmark Electronics, Inc.* | | | 225 | | | | 3,888 | |
Boeing (The) Co. | | | 225 | | | | 17,557 | |
Brady Corp., Class A | | | 150 | | | | 5,171 | |
Cascade Corp. | | | 75 | | | | 3,047 | |
Caterpillar, Inc. | | | 163 | | | | 17,245 | |
CLARCOR, Inc. | | | 124 | | | | 5,284 | |
Clean Harbors, Inc.* | | | 75 | | | | 7,586 | |
East Japan Railway Co. (Japan) | | | 120 | | | | 7,001 | |
Eaton Corp. | | | 570 | | | | 29,451 | |
EMCOR Group, Inc.* | | | 97 | | | | 2,946 | |
Emerson Electric Co. | | | 227 | | | | 12,382 | |
EnerSys* | | | 100 | | | | 3,580 | |
Fanuc Corp. (Japan) | | | 60 | | | | 9,225 | |
FedEx Corp. | | | 75 | | | | 7,023 | |
General Dynamics Corp. | | | 124 | | | | 9,203 | |
General Electric Co. | | | 3,193 | | | | 62,711 | |
GrafTech International Ltd.* | | | 300 | | | | 6,342 | |
| | | | |
| See Notes to Financial Statements. | | 39 | | |
db-X Exchange-Traded Funds Inc.
SCHEDULE OF INVESTMENTS
db-X In-Target Date Fund (Continued)
May 31, 2011
| | | | | | | | |
| | | Number
of Shares | | | Value | |
| | | | | | | | |
| Industrial (Continued) | | | | | | | | |
Hexcel Corp.* | | | 225 | | | $ | 4,651 | |
Ingersoll-Rand PLC (Ireland) | | | 525 | | | | 26,198 | |
Knight Transportation, Inc. | | | 346 | | | | 5,917 | |
Komatsu Ltd. (Japan) | | | 200 | | | | 5,987 | |
Koninklijke Philips Electronics NV (Netherlands) | | | 188 | | | | 5,209 | |
Lindsay Corp. | | | 75 | | | | 5,031 | |
Metabolix, Inc.* | | | 225 | | | | 1,989 | |
Mitsubishi Electric Corp. (Japan) | | | 1,000 | | | | 11,263 | |
Moog, Inc., Class A* | | | 75 | | | | 3,079 | |
Nordson Corp. | | | 150 | | | | 7,803 | |
Parker Hannifin Corp. | | | 300 | | | | 26,655 | |
Republic Services, Inc. | | | 653 | | | | 20,582 | |
Rock-Tenn Co., Class A | | | 94 | | | | 7,222 | |
Schneider Electric S.A. (France) | | | 37 | | | | 6,096 | |
Siemens AG (Germany) | | | 142 | | | | 18,985 | |
Silgan Holdings, Inc. | | | 189 | | | | 8,484 | |
Simpson Manufacturing Co., Inc. | | | 150 | | | | 4,203 | |
Sun Hydraulics Corp. | | | 150 | | | | 7,265 | |
Thermo Fisher Scientific, Inc.* | | | 150 | | | | 9,818 | |
Toshiba Corp. (Japan) | | | 1,499 | | | | 7,934 | |
TriMas Corp.* | | | 300 | | | | 6,120 | |
Union Pacific Corp. | | | 151 | | | | 15,851 | |
United Parcel Service, Inc., Class B | | | 308 | | | | 22,635 | |
United Technologies Corp. | | | 248 | | | | 21,766 | |
Vinci S.A. (France) | | | 71 | | | | 4,576 | |
Woodward, Inc. | | | 150 | | | | 5,283 | |
Worthington Industries, Inc. | | | 150 | | | | 3,275 | |
| | | | | | | | |
| | | | | | | 506,129 | |
| | | | | | | | |
| Technology — 2.4% | | | | | | | | |
Apple, Inc.* | | | 282 | | | | 98,088 | |
Applied Materials, Inc. | | | 375 | | | | 5,168 | |
CACI International, Inc., Class A* | | | 75 | | | | 4,787 | |
Concur Technologies, Inc.* | | | 120 | | | | 5,996 | |
EMC Corp.* | | | 597 | | | | 16,997 | |
Intel Corp. | | | 1,574 | | | | 35,431 | |
International Business Machines Corp. | | | 375 | | | | 63,349 | |
Jack Henry & Associates, Inc. | | | 202 | | | | 6,310 | |
Mentor Graphics Corp.* | | | 300 | | | | 4,023 | |
Microsoft Corp. | | | 2,502 | | | | 62,575 | |
Netlogic Microsystems, Inc.* | | | 150 | | | | 5,748 | |
Parametric Technology Corp.* | | | 294 | | | | 6,847 | |
Quality Systems, Inc. | | | 76 | | | | 6,542 | |
Quest Software, Inc.* | | | 231 | | | | 5,243 | |
Riverbed Technology, Inc.* | | | 322 | | | | 12,210 | |
SAP AG (Germany) | | | 151 | | | | 9,371 | |
TriQuint Semiconductor, Inc.* | | | 375 | | | | 4,856 | |
Ultratech, Inc.* | | | 225 | | | | 7,148 | |
VeriFone Systems, Inc.* | | | 150 | | | | 7,220 | |
Xerox Corp. | | | 2,248 | | | | 22,952 | |
| | | | | | | | |
| | | | | | | 390,861 | |
| | | | | | | | |
| Utilities — 0.6% | | | | | | | | |
Cleco Corp. | | | 150 | | | | 5,264 | |
E.ON AG (Germany) | | | 309 | | | | 8,767 | |
ENEL S.p.A (Italy) | | | 816 | | | | 5,600 | |
| | | | | | | | |
| | | Number
of Shares | | | Value | |
| | | | | | | | |
| Utilities (Continued) | | | | | | | | |
GDF Suez (France) | | | 185 | | | $ | 6,798 | |
National Fuel Gas Co. | | | 150 | | | | 10,806 | |
Nicor, Inc. | | | 111 | | | | 6,101 | |
Piedmont Natural Gas Co., Inc. | | | 177 | | | | 5,570 | |
RWE AG (Germany) | | | 186 | | | | 10,837 | |
Sempra Energy | | | 375 | | | | 20,689 | |
Southern Co. | | | 232 | | | | 9,298 | |
Tokyo Electric Power (The) Co., Inc. (Japan) | | | 180 | | | | 702 | |
WGL Holdings, Inc. | | | 121 | | | | 4,749 | |
| | | | | | | | |
| | | | | | | 95,181 | |
| | | | | | | | |
TOTAL COMMON STOCKS
(Cost $3,826,837) | | | | | | | 4,532,974 | |
| | | | | | | | |
| | |
| | | Principal
Amount | | | Value | |
| | | | | | | | |
| CORPORATE BONDS — 9.7% | | | | | | | | |
| Basic Materials — 0.1% | | | | | | | | |
BHP Billiton Finance USA Ltd. (Australia)
4.80%, 4/15/13 | | $ | 22,000 | | | | 23,591 | |
| | | | | | | | |
| Communications — 0.3% | | | | | | | | |
Cellco Partnership/Verizon Wireless Capital LLC
5.55%, 2/01/14 | | | 20,000 | | | | 22,105 | |
Telefonica Emisiones SAU (Spain)
4.949%, 1/15/15 | | | 18,000 | | | | 19,377 | |
| | | | | | | | |
| | | | | | | 41,482 | |
| | | | | | | | |
| Consumer, Cyclical — 0.2% | | | | | | | | |
Wal-Mart Stores, Inc.
4.55%, 5/01/13 | | | 29,000 | | | | 31,154 | |
| | | | | | | | |
| Consumer, Non-cyclical — 0.5% | | | | | | | | |
Diageo Finance BV (Netherlands)
5.30%, 10/28/15 | | | 17,000 | | | | 19,188 | |
UnitedHealth Group, Inc.
4.875%, 3/15/15 | | | 29,000 | | | | 31,876 | |
Wyeth
5.50%, 2/01/14 | | | 26,000 | | | | 28,969 | |
| | | | | | | | |
| | | | | | | 80,033 | |
| | | | | | | | |
| Energy — 0.2% | | | | | | | | |
Apache Corp.
5.25%, 4/15/13 | | | 20,000 | | | | 21,645 | |
BP Capital Markets PLC (United Kingdom)
3.875%, 3/10/15 | | | 13,000 | | | | 13,745 | |
| | | | | | | | |
| | | | | | | 35,390 | |
| | | | | | | | |
| Financial — 7.2% | | | | | | | | |
Bank of America Corp., MTN
3.125%, 6/15/12 | | | 108,000 | | | | 111,182 | |
Bank of America Corp.
4.875%, 1/15/13 | | | 112,000 | | | | 118,119 | |
Bank of New York Mellon (The) Corp.
4.30%, 5/15/14 | | | 52,000 | | | | 56,465 | |
Berkshire Hathaway, Inc.
3.20%, 2/11/15 | | | 37,000 | | | | 38,882 | |
Boeing Capital Corp.
5.80%, 1/15/13 | | | 54,000 | | | | 58,397 | |
| | | | |
| See Notes to Financial Statements. | | 40 | | |
db-X Exchange-Traded Funds Inc.
SCHEDULE OF INVESTMENTS
db-X In-Target Date Fund (Continued)
May 31, 2011
| | | | | | | | |
| | | Principal
Amount | | | Value | |
| | | | | | | | |
| Financial (Continued) | | | | | | | | |
Caterpillar Financial Services Corp., MTN
6.125%, 2/17/14 | | $ | 20,000 | | | $ | 22,663 | |
Citigroup, Inc.
6.00%, 2/21/12 | | | 59,000 | | | | 61,250 | |
General Electric Capital Corp., Series A, MTN
5.875%, 2/15/12 | | | 14,000 | | | | 14,536 | |
Goldman Sachs Group (The), Inc.
5.00%, 10/01/14 | | | 59,000 | | | | 63,684 | |
HSBC Finance Corp.
6.375%, 11/27/12 | | | 77,000 | | | | 82,941 | |
John Deere Capital Corp.
7.00%, 3/15/12 | | | 44,000 | | | | 46,288 | |
JPMorgan Chase & Co.
5.75%, 1/02/13 | | | 14,000 | | | | 14,973 | |
JPMorgan Chase Bank NA
5.875%, 6/13/16 | | | 70,000 | | | | 78,646 | |
KFW (Germany)
3.25%, 10/14/11 | | | 119,000 | | | | 120,348 | |
Merrill Lynch & Co., Inc., Series C, MTN
5.00%, 1/15/15 | | | 23,000 | | | | 24,672 | |
MetLife, Inc.
5.00%, 6/15/15 | | | 48,000 | | | | 52,820 | |
Morgan Stanley
5.30%, 3/01/13 | | | 64,000 | | | | 68,238 | |
National Rural Utilities Cooperative Finance Corp., Series C, MTN
7.25%, 3/01/12 | | | 17,000 | | | | 17,852 | |
PNC Funding Corp.
5.25%, 11/15/15 | | | 24,000 | | | | 26,265 | |
Prudential Financial, Inc., Series B, MTN
5.10%, 9/20/14 | | | 6,000 | | | | 6,573 | |
Simon Property Group LP
5.10%, 6/15/15 | | | 18,000 | | | | 19,934 | |
Wachovia Corp.
5.25%, 8/01/14 | | | 44,000 | | | | 47,936 | |
| | | | | | | | |
| | | | | | | 1,152,664 | |
| | | | | | | | |
| Government — 0.6% | | | | | | | | |
European Investment Bank, MTN (Supranational)
4.625%, 5/15/14 | | | 83,000 | | | | 91,597 | |
| | | | | | | | |
| Technology — 0.2% | | | | | | | | |
Hewlett-Packard Co.
6.125%, 3/01/14 | | | 26,000 | | | | 29,269 | |
| | | | | | | | |
| Utilities — 0.4% | | | | | | | | |
Dominion Resources, Inc., Series C
5.15%, 7/15/15 | | | 56,000 | | | | 62,319 | |
| | | | | | | | |
TOTAL CORPORATE BONDS
(Cost $1,482,239) | | | | | | | 1,547,499 | |
| | | | | | | | |
UNITED STATES GOVERNMENT &
AGENCIES OBLIGATIONS — 61.3% | | | | | | | | |
Federal Home Loan Mortgage
Corp. — 2.6% | | | | | | | | |
4.875%, 11/18/11 | | | 20,000 | | | | 20,439 | |
4.50%, 1/15/13 | | | 374,000 | | | | 398,888 | |
| | | | | | | | |
| | | | | | | 419,327 | |
| | | | | | | | |
| | | | | | | | |
| | | Principal
Amount | | | Value | |
| | | | | | | | |
Federal National Mortgage
Association — 2.5% | | | | | | | | |
2.625%, 11/20/14 | | $ | 306,000 | | | $ | 321,786 | |
5.00%, 4/15/15 | | | 70,000 | | | | 79,807 | |
| | | | | | | | |
| | | | | | | 401,593 | |
| | | | | | | | |
United States Treasury Bonds/
Notes — 56.2% | | | | | | | | |
5.125%, 6/30/11 | | | 215,400 | | | | 216,292 | |
4.875%, 7/31/11 | | | 506,700 | | | | 510,797 | |
4.625%, 8/31/11 | | | 74,800 | | | | 75,647 | |
4.50%, 11/30/11 | | | 550,800 | | | | 562,870 | |
1.375%, 2/15/12 | | | 820,000 | | | | 827,144 | |
4.625%, 2/29/12 | | | 553,300 | | | | 571,758 | |
1.375%, 3/15/12 | | | 556,000 | | | | 561,321 | |
1.375%, 5/15/12 | | | 158,700 | | | | 160,473 | |
4.75%, 5/31/12 | | | 355,800 | | | | 371,853 | |
4.25%, 9/30/12 | | | 786,900 | | | | 828,735 | |
3.375%, 11/30/12 | | | 707,000 | | | | 739,561 | |
3.625%, 12/31/12 | | | 576,300 | | | | 606,398 | |
2.875%, 1/31/13 | | | 635,500 | | | | 662,360 | |
2.50%, 3/31/13 | | | 550,000 | | | | 571,313 | |
3.375%, 7/31/13 | | | 484,000 | | | | 514,212 | |
4.75%, 5/15/14 | | | 727,500 | | | | 812,413 | |
2.50%, 3/31/15 | | | 343,000 | | | | 360,498 | |
| | | | | | | | |
| | | | | | | 8,953,645 | |
| | | | | | | | |
TOTAL UNITED STATES GOVERNMENT
& AGENCIES OBLIGATIONS
(Cost $9,698,088) | | | | | | | 9,774,565 | |
| | | | | | | | |
| SOVEREIGN BONDS — 0.3% | | | | | | | | |
Province of Ontario, Series G, MTN (Canada)
2.625%, 1/20/12 | | | 22,000 | | | | 22,326 | |
Province of Ontario (Canada)
2.95%, 2/05/15 | | | 15,000 | | | | 15,791 | |
| | | | | | | | |
TOTAL SOVEREIGN BONDS
(Cost $37,793) | | | | | | | 38,117 | |
| | | | | | | | |
| | |
TOTAL INVESTMENTS — 99.7% (Cost $15,044,957) | | | | | | $ | 15,893,155 | |
Other assets less liabilities — 0.3% | | | | | | | 54,891 | |
| | | | | | | | |
NET ASSETS — 100.0% | | | | | | $ | 15,948,046 | |
| | | | | | | | |
MTN – Medium Term Note.
REIT – Real Estate Investment Trust.
* Non-income producing security.
(a) Affiliated company. The Advisor is a subsidiary of Deutsche Bank AG. Therefore, Deutsche Bank AG is considered to be affiliated with the Fund.
(b) The rate shown reflects the coupon after the step date.
| | | | |
| See Notes to Financial Statements. | | 41 | | |
db-X Exchange-Traded Funds Inc.
SCHEDULE OF INVESTMENTS
db-X In-Target Date Fund (Continued)
May 31, 2011
COUNTRY BREAKDOWN AS OF MAY 31, 2011
(Unaudited)
| | | | | | | | |
| | | Value | | | % of
Net Assets | |
United States | | $ | 14,406,100 | | | | 90.3 | % |
United Kingdom | | | 327,877 | | | | 2.1 | |
Germany | | | 228,551 | | | | 1.4 | |
Japan | | | 156,158 | | | | 1.0 | |
Australia | | | 149,332 | | | | 0.9 | |
Switzerland | | | 140,010 | | | | 0.9 | |
France | | | 106,504 | | | | 0.7 | |
Supranational | | | 91,597 | | | | 0.6 | |
Spain | | | 52,194 | | | | 0.3 | |
Canada | | | 46,885 | | | | 0.3 | |
Netherlands | | | 43,271 | | | | 0.3 | |
Netherlands Antilles | | | 28,544 | | | | 0.2 | |
Italy | | | 27,305 | | | | 0.2 | |
Ireland | | | 26,198 | | | | 0.2 | |
Sweden | | | 14,359 | | | | 0.1 | |
Denmark | | | 9,894 | | | | 0.1 | |
Israel | | | 9,585 | | | | 0.1 | |
Belgium | | | 6,750 | | | | 0.0 | |
Norway | | | 6,422 | | | | 0.0 | |
Luxembourg | | | 4,631 | | | | 0.0 | |
Finland | | | 3,865 | | | | 0.0 | |
Bermuda | | | 3,824 | | | | 0.0 | |
Cayman Islands | | | 3,299 | | | | 0.0 | |
| | | | | | | | |
TOTAL INVESTMENTS | | | 15,893,155 | | | | 99.7 | |
Other assets less liabilities | | | 54,891 | | | | 0.3 | |
| | | | | | | | |
NET ASSETS | | $ | 15,948,046 | | | | 100.0 | % |
| | | | | | | | |
| | | | |
| See Notes to Financial Statements. | | 42 | | |
db-X Exchange-Traded Funds Inc.
STATEMENTS OF ASSETS AND LIABILITIES
May 31, 2011
| | | | | | | | | | | | |
| | | db-X 2010
Target Date
Fund | | | db-X 2020
Target Date
Fund | | | db-X 2030
Target Date
Fund | |
Assets: | | | | | | | | | | | | |
Investments at fair value | | $ | 14,361,739 | | | $ | 38,010,979 | | | $ | 35,082,235 | |
Investments in Affiliates at fair value (See Note 5) | | | — | | | | 205,865 | | | | 64,718 | |
Cash | | | 433,937 | | | | 12,741 | | | | 29,053 | |
Foreign currency at value | | | 8,374 | | | | 48,420 | | | | 40,307 | |
Receivables: | | | | | | | | | | | | |
Interest and dividends | | | 77,251 | | | | 212,619 | | | | 154,970 | |
From investment advisor | | | 5,976 | | | | — | | | | 2,922 | |
Foreign tax reclaim | | | 1,152 | | | | 18,202 | | | | 21,732 | |
Prepaid expense | | | 7,649 | | | | 7,649 | | | | 7,649 | |
| | | | | | | | | | | | |
Total Assets | | $ | 14,896,078 | | | $ | 38,516,475 | | | $ | 35,403,586 | |
| | | | | | | | | | | | |
| | | |
Liabilities: | | | | | | | | | | | | |
Payables: | | | | | | | | | | | | |
Investment securities purchased | | $ | 423,626 | | | $ | — | | | $ | — | |
Investment advisory fees | | | 15,561 | | | | 41,269 | | | | 37,949 | |
Accrued expenses and other liabilities | | | 48,951 | | | | 63,131 | | | | 58,289 | |
| | | | | | | | | | | | |
Total Liabilities | | | 488,138 | | | | 104,400 | | | | 96,238 | |
| | | | | | | | | | | | |
| | | |
Net Assets | | $ | 14,407,940 | | | $ | 38,412,075 | | | $ | 35,307,348 | |
| | | | | | | | | | | | |
| | | |
Net Assets Consist of: | | | | | | | | | | | | |
Paid-in capital | | $ | 15,824,773 | | | $ | 41,001,140 | | | $ | 39,276,279 | |
Undistributed net investment income | | | 49,122 | | | | 309,767 | | | | 280,210 | |
Accumulated net realized loss | | | (2,004,271 | ) | | | (6,392,933 | ) | | | (7,930,538 | ) |
Net unrealized appreciation | | | 538,316 | | | | 3,494,101 | | | | 3,681,397 | |
| | | | | | | | | | | | |
| | | |
Net Assets | | $ | 14,407,940 | | | $ | 38,412,075 | | | $ | 35,307,348 | |
| | | | | | | | | | | | |
| | | |
Number of Common Shares outstanding(1) | | | 600,800 | | | | 1,600,800 | | | | 1,600,800 | |
| | | | | | | | | | | | |
| | | |
Net Asset Value | | $ | 23.98 | | | $ | 24.00 | | | $ | 22.06 | |
| | | | | | | | | | | | |
| | | |
Investments at cost | | $ | 13,823,786 | | | $ | 34,725,615 | | | $ | 31,468,671 | |
| | | | | | | | | | | | |
Foreign currency at cost | | $ | 8,194 | | | $ | 47,630 | | | $ | 39,607 | |
| | | | | | | | | | | | |
| (1) | 12.5 billion Common Shares of par value $0.0001 have been authorized. |
| | | | |
| See Notes to Financial Statements. | | 43 | | |
db-X Exchange-Traded Funds Inc.
STATEMENTS OF ASSETS AND LIABILITIES (Continued)
May 31, 2011
| | | | | | | | |
| | | db-X 2040
Target Date
Fund | | | db-X
In-Target
Date Fund | |
Assets: | | | | | | | | |
Investments at fair value | | $ | 34,517,874 | | | $ | 15,888,094 | |
Investments in Affiliates at fair value (See Note 5) | | | 72,637 | | | | 5,061 | |
Cash | | | 33,506 | | | | 856,315 | |
Foreign currency at value | | | 53,644 | | | | 4,829 | |
Receivables: | | | | | | | | |
Interest and dividends | | | 107,095 | | | | 95,287 | |
From investment advisor | | | 1,408 | | | | 5,795 | |
Foreign tax reclaim | | | 23,449 | | | | 1,765 | |
Prepaid expense | | | 7,649 | | | | 7,649 | |
| | | | | | | | |
Total Assets | | $ | 34,817,262 | | | $ | 16,864,795 | |
| | | | | | | | |
| | |
Liabilities: | | | | | | | | |
Payables: | | | | | | | | |
Investment securities purchased | | $ | — | | | $ | 847,746 | |
Investment advisory fees | | | 37,374 | | | | 17,241 | |
Accrued expenses and other liabilities | | | 57,267 | | | | 51,762 | |
| | | | | | | | |
Total Liabilities | | | 94,641 | | | | 916,749 | |
| | | | | | | | |
| | |
Net Assets | | $ | 34,722,621 | | | $ | 15,948,046 | |
| | | | | | | | |
| | |
Net Assets Consist of: | | | | | | | | |
Paid-in capital | | $ | 39,794,904 | | | $ | 15,643,754 | |
Undistributed net investment income | | | 245,401 | | | | 44,596 | |
Accumulated net realized loss | | | (8,867,339 | ) | | | (588,944 | ) |
Net unrealized appreciation | | | 3,549,655 | | | | 848,640 | |
| | | | | | | | |
| | |
Net Assets | | $ | 34,722,621 | | | $ | 15,948,046 | |
| | | | | | | | |
| | |
Number of Common Shares outstanding(1) | | | 1,600,800 | | | | 600,800 | |
| | | | | | | | |
| | |
Net Asset Value | | $ | 21.69 | | | $ | 26.54 | |
| | | | | | | | |
| | |
Investments at cost | | $ | 31,044,276 | | | $ | 15,044,957 | |
| | | | | | | | |
Foreign currency at cost | | $ | 52,780 | | | $ | 4,643 | |
| | | | | | | | |
| (1) | 12.5 billion Common Shares of par value $0.0001 have been authorized. |
| | | | |
| See Notes to Financial Statements. | | 44 | | |
db-X Exchange-Traded Funds Inc.
STATEMENTS OF OPERATIONS
For the Year Ended May 31, 2011
| | | | | | | | | | | | |
| | | db-X 2010
Target Date
Fund | | | db-X 2020
Target Date
Fund | | | db-X 2030
Target Date
Fund | |
Investment Income: | | | | | | | | | | | | |
Unaffiliated interest income* | | $ | 309,154 | | | $ | 513,683 | | | $ | 267,429 | |
Affiliated interest income | | | — | | | | 9,062 | | | | 271 | |
Unaffiliated dividend income** | | | 58,217 | | | | 536,530 | | | | 623,059 | |
Affiliated dividend income | | | — | | | | 742 | | | | 910 | |
| | | | | | | | | | | | |
Total investment income | | | 367,371 | | | | 1,060,017 | | | | 891,669 | |
| | | | | | | | | | | | |
| | | |
Expenses: | | | | | | | | | | | | |
Professional fees | | | 75,652 | | | | 124,782 | | | | 102,527 | |
Sub-advisory fees | | | 40,620 | | | | 88,271 | | | | 72,356 | |
Advisory fees | | | 67,406 | | | | 174,663 | | | | 151,905 | |
Insurance | | | 26,408 | | | | 26,408 | | | | 26,408 | |
Directors | | | 21,193 | | | | 50,779 | | | | 43,176 | |
Printing | | | 25,522 | | | | 68,642 | | | | 57,182 | |
Listing fees | | | 17,974 | | | | 17,974 | | | | 17,974 | |
Compliance | | | 4,547 | | | | 18,133 | | | | 16,291 | |
Other expenses | | | 3,035 | | | | 5,978 | | | | 4,915 | |
| | | | | | | | | | | | |
Total Expenses | | | 282,357 | | | | 575,630 | | | | 492,734 | |
| | | | | | | | | | | | |
Less fees waived and expenses reimbursed (See Note 3) | | | (174,213 | ) | | | (312,578 | ) | | | (268,355 | ) |
| | | | | | | | | | | | |
Net Expenses | | | 108,144 | | | | 263,052 | | | | 224,379 | |
| | | | | | | | | | | | |
| | | |
Net Investment Income | | | 259,227 | | | | 796,965 | | | | 667,290 | |
| | | | | | | | | | | | |
| | | |
Net Realized and Unrealized Gain (Loss): | | | | | | | | | | | | |
Net realized gain (loss) from: | | | | | | | | | | | | |
Investments | | | 2,884 | | | | 255,144 | | | | (40,989 | ) |
Contributions from Advisor/Sub-Advisor (See Note 3) | | | 25,839 | | | | 10,751 | | | | 1,040 | |
In-kind redemptions | | | 216,817 | | | | 1,044,268 | | | | 757,123 | |
Foreign currency related transactions | | | 1,363 | | | | 5,054 | | | | 3,680 | |
| | | | | | | | | | | | |
Net realized gain (loss) | | | 246,903 | | | | 1,315,217 | | | | 720,854 | |
Net change in unrealized appreciation (depreciation) on: | | | | | | | | | | | | |
Investments | | | 488,027 | | | | 4,704,736 | | | | 6,031,102 | |
Foreign currency translations | | | 974 | | | | 4,849 | | | | 5,736 | |
| | | | | | | | | | | | |
Net change in unrealized appreciation (depreciation) | | | 489,001 | | | | 4,709,585 | | | | 6,036,838 | |
| | | | | | | | | | | | |
Net realized and unrealized gain | | | 735,904 | | | | 6,024,802 | | | | 6,757,692 | |
| | | | | | | | | | | | |
| | | |
Net Increase in Net Assets Resulting from Operations | | $ | 995,131 | | | $ | 6,821,767 | | | $ | 7,424,982 | |
| | | | | | | | | | | | |
* Foreign taxes withheld | | $ | 23 | | | $ | — | | | $ | — | |
** Foreign taxes withheld | | $ | 3,093 | | | $ | 20,689 | | | $ | 24,148 | |
| | | | |
| See Notes to Financial Statements. | | 45 | | |
db-X Exchange-Traded Funds Inc.
STATEMENTS OF OPERATIONS (Continued)
For the Year Ended May 31, 2011
| | | | | | | | |
| | | db-X 2040
Target Date
Fund | | | db-X
In-Target
Date Fund | |
Investment Income: | | | | | | | | |
Unaffiliated interest income* | | $ | 70,000 | | | $ | 190,408 | |
Affiliated interest income | | | — | | | | — | |
Unaffiliated dividend income** | | | 673,913 | | | | 100,547 | |
Affiliated dividend income | | | 1,025 | | | | 55 | |
| | | | | | | | |
Total investment income | | | 744,938 | | | | 291,010 | |
| | | | | | | | |
| | |
Expenses: | | | | | | | | |
Professional fees | | | 96,685 | | | | 77,223 | |
Sub-advisory fees | | | 67,816 | | | | 43,624 | |
Advisory fees | | | 143,438 | | | | 73,886 | |
Insurance | | | 26,408 | | | | 26,408 | |
Directors | | | 40,781 | | | | 23,071 | |
Printing | | | 53,971 | | | | 27,939 | |
Listing fees | | | 17,974 | | | | 17,974 | |
Compliance | | | 13,794 | | | | 5,566 | |
Other expenses | | | 4,981 | | | | 3,552 | |
| | | | | | | | |
Total Expenses | | | 465,848 | | | | 299,243 | |
| | | | | | | | |
Less fees waived and expenses reimbursed (See Note 3) | | | (254,476 | ) | | | (181,615 | ) |
| | | | | | | | |
Net Expenses | | | 211,372 | | | | 117,628 | |
| | | | | | | | |
| | |
Net Investment Income | | | 533,566 | | | | 173,382 | |
| | | | | | | | |
| | |
Net Realized and Unrealized Gain (Loss): | | | | | | | | |
Net realized gain (loss) from: | | | | | | | | |
Investments | | | (266,268 | ) | | | 160,264 | |
Contributions from Advisor/Sub-Advisor (See Note 3) | | | — | | | | 1,557 | |
In-kind redemptions | | | 423,726 | | | | 273,866 | |
Foreign currency related transactions | | | 4,152 | | | | 784 | |
| | | | | | | | |
Net realized gain (loss) | | | 161,610 | | | | 436,471 | |
Net change in unrealized appreciation (depreciation) on: | | | | | | | | |
Investments | | | 6,850,778 | | | | 675,539 | |
Foreign currency translations | | | 5,707 | | | | 949 | |
| | | | | | | | |
Net change in unrealized appreciation (depreciation) | | | 6,856,485 | | | | 676,488 | |
| | | | | | | | |
Net realized and unrealized gain | | | 7,018,095 | | | | 1,112,959 | |
| | | | | | | | |
| | |
Net Increase in Net Assets Resulting from Operations | | $ | 7,551,661 | | | $ | 1,286,341 | |
| | | | | | | | |
* Foreign taxes withheld | | $ | — | | | $ | — | |
** Foreign taxes withheld | | $ | 25,272 | | | $ | 4,068 | |
| | | | |
| See Notes to Financial Statements. | | 46 | | |
db-X Exchange-Traded Funds Inc.
STATEMENTS OF CHANGES IN NET ASSETS
| | | | | | | | | | | | | | | | |
| | | db-X 2010
Target Date
Fund | | | db-X 2020
Target Date
Fund | |
| | | Year Ended May 31, | | | Year Ended May 31, | |
| | | 2011 | | | 2010 | | | 2011 | | | 2010 | |
Increase (Decrease) in Net Assets from Operations: | | | | | | | | | | | | | | | | |
Net investment income | | $ | 259,227 | | | $ | 496,404 | | | $ | 796,965 | | | $ | 1,050,824 | |
Net realized gain (loss) | | | 246,903 | | | | (326,952 | ) | | | 1,315,217 | | | | (2,615,663 | ) |
Net change in unrealized appreciation (depreciation) | | | 489,001 | | | | 1,461,160 | | | | 4,709,585 | | | | 6,963,931 | |
| | | | | | | | | | | | | | | | |
Net increase resulting from operations | | | 995,131 | | | | 1,630,612 | | | | 6,821,767 | | | | 5,399,092 | |
| | | | | | | | | | | | | | | | |
| | | | |
Distributions to Shareholders from: | | | | | | | | | | | | | | | | |
Net investment income | | | (396,186 | ) | | | (508,513 | ) | | | (951,011 | ) | | | (1,045,885 | ) |
| | | | | | | | | | | | | | | | |
Total distributions | | | (396,186 | ) | | | (508,513 | ) | | | (951,011 | ) | | | (1,045,885 | ) |
| | | | | | | | | | | | | | | | |
| | | | |
Fund Share Transactions: | | | | | | | | | | | | | | | | |
Proceeds from shares sold | | | — | | | | 4,422,360 | | | | — | | | | 4,016,000 | |
Value of shares redeemed | | | (4,801,447 | ) | | | (4,626,618 | ) | | | (8,863,437 | ) | | | (4,106,764 | ) |
| | | | | | | | | | | | | | | | |
Net decrease resulting from fund share transactions | | | (4,801,447 | ) | | | (204,258 | ) | | | (8,863,437 | ) | | | (90,764 | ) |
| | | | | | | | | | | | | | | | |
Total increase (decrease) in Net Assets | | | (4,202,502 | ) | | | 917,841 | | | | (2,992,681 | ) | | | 4,262,443 | |
| | | | |
Net Assets: | | | | | | | | | | | | | | | | |
Beginning of year | | | 18,610,442 | | | | 17,692,601 | | | | 41,404,756 | | | | 37,142,313 | |
| | | | | | | | | | | | | | | | |
End of year | | $ | 14,407,940 | | | $ | 18,610,442 | | | $ | 38,412,075 | | | $ | 41,404,756 | |
| | | | | | | | | | | | | | | | |
Undistributed net investment income | | $ | 49,122 | | | $ | 184,718 | | | $ | 309,767 | | | $ | 458,759 | |
| | | | | | | | | | | | | | | | |
| | | | |
Changes in Shares Outstanding: | | | | | | | | | | | | | | | | |
Shares outstanding, beginning of year | | | 800,800 | | | | 800,800 | | | | 2,000,800 | | | | 2,000,800 | |
Shares sold | | | — | | | | 200,000 | | | | — | | | | 200,000 | |
Shares redeemed | | | (200,000 | ) | | | (200,000 | ) | | | (400,000 | ) | | | (200,000 | ) |
| | | | | | | | | | | | | | | | |
Shares outstanding, end of year | | | 600,800 | | | | 800,800 | | | | 1,600,800 | | | | 2,000,800 | |
| | | | | | | | | | | | | | | | |
| | | | |
| See Notes to Financial Statements. | | 47 | | |
db-X Exchange-Traded Funds Inc.
STATEMENTS OF CHANGES IN NET ASSETS (Continued)
| | | | | | | | | | | | | | | | |
| | | db-X 2030
Target Date
Fund | | | db-X 2040
Target Date
Fund | |
| | | Year Ended May 31, | | | Year Ended May 31, | |
| | | 2011 | | | 2010 | | | 2011 | | | 2010 | |
Increase (Decrease) in Net Assets from Operations: | | | | | | | | | | | | | | | | |
Net investment income | | $ | 667,290 | | | $ | 710,015 | | | $ | 533,566 | | | $ | 586,219 | |
Net realized gain (loss) | | | 720,854 | | | | (3,046,383 | ) | | | 161,610 | | | | (3,933,873 | ) |
Net change in unrealized appreciation (depreciation) | | | 6,036,838 | | | | 7,239,741 | | | | 6,856,485 | | | | 7,994,825 | |
| | | | | | | | | | | | | | | | |
Net increase resulting from operations | | | 7,424,982 | | | | 4,903,373 | | | | 7,551,661 | | | | 4,647,171 | |
| | | | | | | | | | | | | | | | |
| | | | |
Distributions to Shareholders from: | | | | | | | | | | | | | | | | |
Net investment income | | | (733,001 | ) | | | (663,238 | ) | | | (580,727 | ) | | | (547,621 | ) |
| | | | | | | | | | | | | | | | |
Total distributions | | | (733,001 | ) | | | (663,238 | ) | | | (580,727 | ) | | | (547,621 | ) |
| | | | | | | | | | | | | | | | |
| | | | |
Fund Share Transactions: | | | | | | | | | | | | | | | | |
Proceeds from shares sold | | | — | | | | 3,506,540 | | | | — | | | | 3,459,736 | |
Value of shares redeemed | | | (4,124,355 | ) | | | (3,944,243 | ) | | | (3,725,058 | ) | | | (3,733,659 | ) |
| | | | | | | | | | | | | | | | |
Net decrease resulting from fund share transactions | | | (4,124,355 | ) | | | (437,703 | ) | | | (3,725,058 | ) | | | (273,923 | ) |
| | | | | | | | | | | | | | | | |
Total increase (decrease) in Net Assets | | | 2,567,626 | | | | 3,802,432 | | | | 3,245,876 | | | | 3,825,627 | |
| | | | |
Net Assets: | | | | | | | | | | | | | | | | |
Beginning of year | | | 32,739,722 | | | | 28,937,290 | | | | 31,476,745 | | | | 27,651,118 | |
| | | | | | | | | | | | | | | | |
End of year | | $ | 35,307,348 | | | $ | 32,739,722 | | | $ | 34,722,621 | | | $ | 31,476,745 | |
| | | | | | | | | | | | | | | | |
Undistributed net investment income | | $ | 280,210 | | | $ | 342,241 | | | $ | 245,401 | | | $ | 288,410 | |
| | | | | | | | | | | | | | | | |
| | | | |
Changes in Shares Outstanding: | | | | | | | | | | | | | | | | |
Shares outstanding, beginning of year | | | 1,800,800 | | | | 1,800,800 | | | | 1,800,800 | | | | 1,800,800 | |
Shares sold | | | — | | | | 200,000 | | | | — | | | | 200,000 | |
Shares redeemed | | | (200,000 | ) | | | (200,000 | ) | | | (200,000 | ) | | | (200,000 | ) |
| | | | | | | | | | | | | | | | |
Shares outstanding, end of year | | | 1,600,800 | | | | 1,800,800 | | | | 1,600,800 | | | | 1,800,800 | |
| | | | | | | | | | | | | | | | |
| | | | |
| See Notes to Financial Statements. | | 48 | | |
db-X Exchange-Traded Funds Inc.
STATEMENTS OF CHANGES IN NET ASSETS (Continued)
| | | | | | | | |
| | | db-X
In-Target
Date Fund | |
| | | Year Ended May 31, | |
| | | 2011 | | | 2010 | |
Increase (Decrease) in Net Assets from Operations: | | | | | | | | |
Net investment income | | $ | 173,382 | | | $ | 314,849 | |
Net realized gain (loss) | | | 436,471 | | | | 89,867 | |
Net change in unrealized appreciation (depreciation) | | | 676,488 | | | | 696,320 | |
| | | | | | | | |
Net increase resulting from operations | | | 1,286,341 | | | | 1,101,036 | |
| | | | | | | | |
| | |
Distributions to Shareholders from: | | | | | | | | |
Net investment income | | | (231,750 | ) | | | (344,219 | ) |
| | | | | | | | |
Total distributions | | | (231,750 | ) | | | (344,219 | ) |
| | | | | | | | |
| | |
Fund Share Transactions: | | | | | | | | |
Proceeds from shares sold | | | — | | | | — | |
Value of shares redeemed | | | (5,180,562 | ) | | | (5,083,124 | ) |
| | | | | | | | |
Net decrease resulting from fund share transactions | | | (5,180,562 | ) | | | (5,083,124 | ) |
| | | | | | | | |
Total increase (decrease) in Net Assets | | | (4,125,971 | ) | | | (4,326,307 | ) |
| | |
Net Assets: | | | | | | | | |
Beginning of year | | | 20,074,017 | | | | 24,400,324 | |
| | | | | | | | |
End of year | | $ | 15,948,046 | | | $ | 20,074,017 | |
| | | | | | | | |
Undistributed net investment income | | $ | 44,596 | | | $ | 102,180 | |
| | | | | | | | |
| | |
Changes in Shares Outstanding: | | | | | | | | |
Shares outstanding, beginning of year | | | 800,800 | | | | 1,000,800 | |
Shares sold | | | — | | | | — | |
Shares redeemed | | | (200,000 | ) | | | (200,000 | ) |
| | | | | | | | |
Shares outstanding, end of year | | | 600,800 | | | | 800,800 | |
| | | | | | | | |
| | | | |
| See Notes to Financial Statements. | | 49 | | |
db-X Exchange-Traded Funds Inc.
FINANCIAL HIGHLIGHTS
For a Share outstanding throughout each period
| | | | | | | | | | | | | | | | |
| | | Year Ended May 31, | | | For the Period
October 1, 2007*
through
May 31, 2008 | |
db-X 2010 Target Date Fund | | | 2011 | | | | 2010 | | | | 2009 | | |
Net Asset Value, beginning of period | | $ | 23.24 | | | $ | 22.09 | | | $ | 24.93 | | | $ | 25.39 | |
| | | | | | | | | | | | | | | | |
Income from Investment Operations: | | | | | | | | | | | | | | | | |
Net investment income** | | | 0.37 | | | | 0.55 | | | | 0.69 | | | | 0.55 | |
Net realized and unrealized gain (loss)** | | | 0.99 | | | | 1.11 | | | | (2.67 | ) | | | (0.80 | ) |
Contributions from advisor | | | 0.04 | | | | — | | | | — | | | | — | |
| | | | | | | | | | | | | | | | |
Total from investment operations | | | 1.40 | | | | 1.66 | | | | (1.98 | ) | | | (0.25 | ) |
| | | | | | | | | | | | | | | | |
Distributions paid to shareholders from: | | | | | | | | | | | | | | | | |
Net investment income | | | (0.66 | ) | | | (0.51 | ) | | | (0.86 | ) | | | (0.18 | ) |
Net realized capital gains | | | — | | | | — | | | | — | | | | (0.03 | ) |
| | | | | | | | | | | | | | | | |
Total distributions | | | (0.66 | ) | | | (0.51 | ) | | | (0.86 | ) | | | (0.21 | ) |
| | | | | | | | | | | | | | | | |
Net Asset Value, end of period | | $ | 23.98 | | | $ | 23.24 | | | $ | 22.09 | | | $ | 24.93 | |
| | | | | | | | | | | | | | | | |
| | | | |
Total Return*** | | | 6.09 | % | | | 7.51 | % | | | (7.87 | )% | | | (0.99 | )% |
| | | | |
Ratios/Supplemental Data: | | | | | | | | | | | | | | | | |
Net Assets, end of period (000’s omitted) | | $ | 14,408 | | | $ | 18,610 | | | $ | 17,693 | | | $ | 24,953 | |
Ratios to average net assets: | | | | | | | | | | | | | | | | |
Expenses, net of expense reimbursements | | | 0.65 | % | | | 0.65 | % | | | 0.65 | % | | | 0.65 | %† |
Expenses, prior to fee waiver and expense reimbursements | | | 1.70 | % | | | 2.10 | % | | | 1.70 | % | | | 1.55 | %† |
Net investment income | | | 1.56 | % | | | 2.32 | % | | | 3.09 | % | | | 3.33 | %† |
Portfolio turnover rate†† | | | 58 | % | | | 51 | % | | | 54 | % | | | 22 | % |
| | |
| | | Year Ended May 31, | | | For the Period
October 1, 2007*
through
May 31, 2008 | |
db-X 2020 Target Date Fund | | | 2011 | | | | 2010 | | | | 2009 | | |
Net Asset Value, beginning of period | | $ | 20.69 | | | $ | 18.56 | | | $ | 24.18 | | | $ | 25.52 | |
| | | | | | | | | | | | | | | | |
Income from Investment Operations: | | | | | | | | | | | | | | | | |
Net investment income** | | | 0.44 | | | | 0.51 | | | | 0.61 | | | | 0.44 | |
Net realized and unrealized gain (loss)** | | | 3.39 | | | | 2.10 | | | | (5.64 | ) | | | (1.67 | ) |
Contributions from advisor | | | 0.01 | | | | — | | | | — | | | | — | |
| | | | | | | | | | | | | | | | |
Total from investment operations | | | 3.84 | | | | 2.61 | | | | (5.03 | ) | | | (1.23 | ) |
| | | | | | | | | | | | | | | | |
Distributions paid to shareholders from: | | | | | | | | | | | | | | | | |
Net investment income | | | (0.53 | ) | | | (0.48 | ) | | | (0.59 | ) | | | (0.10 | ) |
Net realized capital gains | | | — | | | | — | | | | (0.00 | )(a) | | | (0.01 | ) |
| | | | | | | | | | | | | | | | |
Total distributions | | | (0.53 | ) | | | (0.48 | ) | | | (0.59 | ) | | | (0.11 | ) |
| | | | | | | | | | | | | | | | |
Net Asset Value, end of period | | $ | 24.00 | | | $ | 20.69 | | | $ | 18.56 | | | $ | 24.18 | |
| | | | | | | | | | | | | | | | |
| | | | |
Total Return*** | | | 18.71 | % | | | 13.99 | % | | | (20.73 | )% | | | (4.82 | )% |
| | | | |
Ratios/Supplemental Data: | | | | | | | | | | | | | | | | |
Net Assets, end of period (000’s omitted) | | $ | 38,412 | | | $ | 41,405 | | | $ | 37,142 | | | $ | 43,539 | |
Ratios to average net assets: | | | | | | | | | | | | | | | | |
Expenses, net of expense reimbursements | | | 0.65 | % | | | 0.65 | % | | | 0.65 | % | | | 0.65 | %† |
Expenses, prior to fee waiver and expense reimbursements | | | 1.42 | % | | | 1.90 | % | | | 1.60 | % | | | 1.32 | %† |
Net investment income | | | 1.97 | % | | | 2.43 | % | | | 3.17 | % | | | 2.69 | %† |
Portfolio turnover rate†† | | | 49 | % | | | 37 | % | | | 64 | % | | | 20 | % |
| * | Commencement of Investment Operations. |
| ** | Based on average shares outstanding. |
| *** | Total Return is calculated assuming an initial investment made at the Net Asset Value at the beginning of the period, reinvestment of all dividends and capital gain distributions at Net Asset Value during the period, and redemption at Net Asset Value on the last day of the period. Total Return calculated for a period of less than one year is not annualized. The Total Return would have been lower if certain fees had not been reimbursed by the investment sub-advisor, Amerivest Investment Management LLC (from June 1, 2010 through October 20, 2010) and the Advisor, DBX Strategic Advisors LLC. |
| †† | Portfolio turnover rate is not annualized and does not include securities received or delivered from processing creations or redemptions. |
| (a) | Amount represents less than $0.01. |
| | | | |
| See Notes to Financial Statements. | | 50 | | |
db-X Exchange-Traded Funds Inc.
FINANCIAL HIGHLIGHTS (Continued)
For a Share outstanding throughout each period
| | | | | | | | | | | | | | | | |
| | | Year Ended May 31, | | | For the Period
October 1, 2007*
through
May 31, 2008 | |
db-X 2030 Target Date Fund | | | 2011 | | | | 2010 | | | | 2009 | | |
Net Asset Value, beginning of period | | $ | 18.18 | | | $ | 16.07 | | | $ | 23.57 | | | $ | 25.60 | |
| | | | | | | | | | | | | | | | |
Income from Investment Operations: | | | | | | | | | | | | | | | | |
Net investment income** | | | 0.39 | | | | 0.37 | | | | 0.44 | | | | 0.35 | |
Net realized and unrealized gain (loss) ** | | | 3.90 | | | | 2.07 | | | | (7.54 | ) | | | (2.29 | ) |
Contributions from advisor | | | 0.00 | (a) | | | — | | | | — | | | | — | |
| | | | | | | | | | | | | | | | |
Total from investment operations | | | 4.29 | | | | 2.44 | | | | (7.10 | ) | | | (1.94 | ) |
| | | | | | | | | | | | | | | | |
Distributions paid to shareholders from: | | | | | | | | | | | | | | | | |
Net investment income | | | (0.41 | ) | | | (0.33 | ) | | | (0.40 | ) | | | (0.08 | ) |
Net realized capital gains | | | — | | | | — | | | | — | | | | (0.01 | ) |
| | | | | | | | | | | | | | | | |
Total distributions | | | (0.41 | ) | | | (0.33 | ) | | | (0.40 | ) | | | (0.09 | ) |
| | | | | | | | | | | | | | | | |
Net Asset Value, end of period | | $ | 22.06 | | | $ | 18.18 | | | $ | 16.07 | | | $ | 23.57 | |
| | | | | | | | | | | | | | | | |
| | | | |
Total Return*** | | | 23.74 | % | | | 15.13 | % | | | (30.08 | )% | | | (7.59 | )% |
| | | | |
Ratios/Supplemental Data: | | | | | | | | | | | | | | | | |
Net Assets, end of period (000’s omitted) | | $ | 35,307 | | | $ | 32,740 | | | $ | 28,937 | | | $ | 33,021 | |
Ratios to average net assets: | | | | | | | | | | | | | | | | |
Expenses, net of expense reimbursements | | | 0.65 | % | | | 0.65 | % | | | 0.65 | % | | | 0.65 | %† |
Expenses, prior to fee waiver and expense reimbursements | | | 1.43 | % | | | 1.95 | % | | | 1.62 | % | | | 1.38 | %† |
Net investment income | | | 1.93 | % | | | 2.01 | % | | | 2.52 | % | | | 2.13 | %† |
Portfolio turnover rate†† | | | 39 | % | | | 42 | % | | | 64 | % | | | 13 | % |
| | |
| | | Year Ended May 31, | | | For the Period
October 1, 2007*
through
May 31, 2008 | |
db-X 2040 Target Date Fund | | | 2011 | | | | 2010 | | | | 2009 | | |
Net Asset Value, beginning of period | | $ | 17.48 | | | $ | 15.35 | | | $ | 23.49 | | | $ | 25.64 | |
| | | | | | | | | | | | | | | | |
Income from Investment Operations: | | | | | | | | | | | | | | | | |
Net investment income** | | | 0.32 | | | | 0.32 | | | | 0.37 | | | | 0.29 | |
Net realized and unrealized gain (loss)** | | | 4.25 | | | | 2.08 | | | | (8.15 | ) | | | (2.38 | ) |
| | | | | | | | | | | | | | | | |
Total from investment operations | | | 4.57 | | | | 2.40 | | | | (7.78 | ) | | | (2.09 | ) |
| | | | | | | | | | | | | | | | |
Distributions paid to shareholders from: | | | | | | | | | | | | | | | | |
Net investment income | | | (0.36 | ) | | | (0.27 | ) | | | (0.36 | ) | | | (0.06 | ) |
Net realized capital gains | | | — | | | | — | | | | — | | | | (0.00 | )(a) |
| | | | | | | | | | | | | | | | |
Total distributions | | | (0.36 | ) | | | (0.27 | ) | | | (0.36 | ) | | | (0.06 | ) |
| | | | | | | | | | | | | | | | |
Net Asset Value, end of period | | $ | 21.69 | | | $ | 17.48 | | | $ | 15.35 | | | $ | 23.49 | |
| | | | | | | | | | | | | | | | |
| | | | |
Total Return*** | | | 26.32 | % | | | 15.59 | % | | | (33.03 | )% | | | (8.14 | )% |
| | | | |
Ratios/Supplemental Data: | | | | | | | | | | | | | | | | |
Net Assets, end of period (000’s omitted) | | $ | 34,723 | | | $ | 31,477 | | | $ | 27,651 | | | $ | 37,605 | |
Ratios to average net assets: | | | | | | | | | | | | | | | | |
Expenses, net of expense reimbursements | | | 0.65 | % | | | 0.65 | % | | | 0.65 | % | | | 0.65 | %† |
Expenses, prior to fee waiver and expense reimbursements | | | 1.43 | % | | | 1.97 | % | | | 1.65 | % | | | 1.36 | %† |
Net investment income | | | 1.64 | % | | | 1.79 | % | | | 2.21 | % | | | 1.89 | %† |
Portfolio turnover rate†† | | | 35 | % | | | 38 | % | | | 56 | % | | | 10 | % |
| * | Commencement of Investment Operations. |
| ** | Based on average shares outstanding. |
| *** | Total Return is calculated assuming an initial investment made at the Net Asset Value at the beginning of the period, reinvestment of all dividends and capital gain distributions at Net Asset Value during the period, and redemption at Net Asset Value on the last day of the period. Total Return calculated for a period of less than one year is not annualized. The Total Return would have been lower if certain fees had not been reimbursed by the investment sub-advisor, Amerivest Investment Management LLC (from June 1, 2010 through October 20, 2010) and the Advisor, DBX Strategic Advisors LLC. |
| †† | Portfolio turnover rate is not annualized and does not include securities received or delivered from processing creations or redemptions. |
| (a) | Amount represents less than $0.01 or greater than $(0.01). |
| | | | |
| See Notes to Financial Statements. | | 51 | | |
db-X Exchange-Traded Funds Inc.
FINANCIAL HIGHLIGHTS (Continued)
For a Share outstanding throughout each period
| | | | | | | | | | | | | | | | |
| | | Year Ended May 31, | | | For the Period
October 1, 2007*
through
May 31, 2008 | |
db-X In-Target Date Fund | | | 2011 | | | | 2010 | | | | 2009 | | |
Net Asset Value, beginning of period | | $ | 25.07 | | | $ | 24.38 | | | $ | 25.46 | | | $ | 25.08 | |
| | | | | | | | | | | | | | | | |
Income from Investment Operations: | | | | | | | | | | | | | | | | |
Net investment income** | | | 0.25 | | | | 0.33 | | | | 0.47 | | | | 0.43 | |
Net realized and unrealized gain (loss)** | | | 1.61 | | | | 0.70 | | | | (0.96 | ) | | | 0.10 | |
Contributions from advisor | | | 0.00 | (a) | | | — | | | | — | | | | — | |
| | | | | | | | | | | | | | | | |
Total from investment operations | | | 1.86 | | | | 1.03 | | | | (0.49 | ) | | | 0.53 | |
| | | | | | | | | | | | | | | | |
Distributions paid to shareholders from: | | | | | | | | | | | | | | | | |
Net investment income | | | (0.39 | ) | | | (0.34 | ) | | | (0.59 | ) | | | (0.15 | ) |
Net realized capital gains | | | — | | | | — | | | | (0.00 | )(a) | | | (0.00 | )(a) |
| | | | | | | | | | | | | | | | |
Total distributions | | | (0.39 | ) | | | (0.34 | ) | | | (0.59 | ) | | | (0.15 | ) |
| | | | | | | | | | | | | | | | |
Net Asset Value, end of period | | $ | 26.54 | | | $ | 25.07 | | | $ | 24.38 | | | $ | 25.46 | |
| | | | | | | | | | | | | | | | |
| | | | |
Total Return*** | | | 7.44 | % | | | 4.23 | % | | | (1.87 | )% | | | 2.12 | % |
| | | | |
Ratios/Supplemental Data: | | | | | | | | | | | | | | | | |
Net Assets, end of period (000’s omitted) | | $ | 15,948 | | | $ | 20,074 | | | $ | 24,400 | | | $ | 30,576 | |
Ratios to average net assets: | | | | | | | | | | | | | | | | |
Expenses, net of expense reimbursements | | | 0.65 | % | | | 0.65 | % | | | 0.65 | % | | | 0.65 | %† |
Expenses, prior to fee waiver and expense reimbursements | | | 1.66 | % | | | 2.06 | % | | | 1.57 | % | | | 1.61 | %† |
Net investment income | | | 0.96 | % | | | 1.30 | % | | | 1.91 | % | | | 2.62 | %† |
Portfolio turnover rate†† | | | 60 | % | | | 42 | % | | | 75 | % | | | 21 | % |
| * | Commencement of Investment Operations. |
| ** | Based on average shares outstanding. |
| *** | Total Return is calculated assuming an initial investment made at the Net Asset Value at the beginning of the period, reinvestment of all dividends and capital gain distributions at Net Asset Value during the period, and redemption at Net Asset Value on the last day of the period. Total Return calculated for a period of less than one year is not annualized. The Total Return would have been lower if certain fees had not been reimbursed by the investment sub-advisor, Amerivest Investment Management LLC (from June 1, 2010 through October 20, 2010) and the Advisor, DBX Strategic Advisors LLC. |
| †† | Portfolio turnover rate is not annualized and does not include securities received or delivered from processing creations or redemptions. |
| (a) | Amount represents less than $0.01 or greater than $(0.01). |
| | | | |
| See Notes to Financial Statements. | | 52 | | |
db-X Exchange-Traded Funds Inc.
NOTES TO FINANCIAL STATEMENTS
1. ORGANIZATION
db-X Exchange-Traded Funds Inc. (formerly TDX Independence Funds, Inc.) (the “Company”) was organized as a Maryland corporation on December 22, 2006 and is registered under the Investment Company Act of 1940, as amended (the “Act”).
Effective June 17, 2011, the Board of Directors of TDX Independence Funds, Inc. agreed to change the name of the Company from TDX Independence Funds, Inc. to db-X Exchange-Traded Funds Inc. As of May 31, 2011, there were five (5) series of exchange-traded funds (“ETF”) (each, a “Fund,” and collectively, the “Funds,” or “db-X Exchange-Traded Funds”) in operation and trading, each of which were rebranded under the DBX Strategic Advisors LLC (“DBX” or the “Advisor”) name, as follows:
| | |
db-X 2010 Target Date Fund
(formerly TDX Independence 2010 Exchange-Traded Fund) | | “db-X 2010 Fund” |
| |
db-X 2020 Target Date Fund
(formerly TDX Independence 2020 Exchange-Traded Fund) | | “db-X 2020 Fund” |
| |
db-X 2030 Target Date Fund
(formerly TDX Independence 2030 Exchange-Traded Fund) | | “db-X 2030 Fund” |
| |
db-X 2040 Target Date Fund
(formerly TDX Independence 2040 Exchange-Traded Fund) | | “db-X 2040 Fund” |
| |
db-X In-Target Date Fund
(formerly TDX Independence In-Target Exchange-Traded Fund) | | “db-X In-Target Fund” |
DBX serves as investment advisor to the Funds and has overall responsibility for the general management and administration of the Funds, subject to the supervision of the Funds’ Board of Directors.
Each Fund offers shares, known as db-X Target Date Shares, that are listed and traded on the NYSE Arca, Inc. (“NYSE Arca”). Unlike conventional mutual funds, each Fund issues and redeems shares on a continuous basis, at net asset value, only in large specified lots consisting of 200,000 shares, each called a “Creation Unit.” Except when aggregated in Creation Units, shares are not individually redeemable securities of the Funds.
The investment objective of each Fund is to track the performance, before fees and expenses, of a particular index (the “Underlying Index”). Zacks Investment Research (“Zacks”) is the creator of each Underlying Index. Each Underlying Index is comprised of a mix of securities from three broad asset classes: international equities, domestic equities, and fixed income, which includes cash, cash equivalents or short-term money market instruments. Short-term instruments include obligations of the U.S. government and its agencies or instrumentalities; commercial paper, variable amount master demand notes and other debt securities, including high quality U.S. dollar-denominated short-term bonds and notes issued by domestic and foreign corporations; variable and floating rate securities; bank obligations; repurchase agreements collateralized by these securities; and shares of other investment companies that primarily invest in any of the above-referenced securities. These Underlying Indexes are designed to reflect a portfolio of investments that can be used for lifecycle investing. Lifecycle investing is an investment technique that starts by targeting a particular investment horizon. That investment horizon corresponds to the date the investor expects to need his or her invested assets.
The underlying indexes for the db-X Exchange-Traded Funds are:
| | |
Fund | | Underlying Index |
| db-X 2010 Fund | | Zacks 2010 Lifecycle Index |
| db-X 2020 Fund | | Zacks 2020 Lifecycle Index |
| db-X 2030 Fund | | Zacks 2030 Lifecycle Index |
| db-X 2040 Fund | | Zacks 2040 Lifecycle Index |
| db-X In-Target Fund | | Zacks In-Target Lifecycle Index |
Each Fund is entitled to use its respective Underlying Index pursuant to a licensing agreement between Zacks and DBX. There is no charge to the Funds in connection with these licensing agreements.
2. SIGNIFICANT ACCOUNTING POLICIES
The financial statements have been prepared in conformity with U.S. generally accepted accounting principles (“U.S. GAAP”), which require management to make certain estimates and assumptions that affect the reported amounts and disclosures in the financial statements. Actual results could differ from those estimates. The following is a summary of significant accounting policies followed by the Funds.
53
db-X Exchange-Traded Funds Inc.
NOTES TO FINANCIAL STATEMENTS (Continued)
Investment Valuation The Net Asset Value (“NAV”), of each Fund’s shares is calculated each business day as of the close of regular trading on the New York Stock Exchange, generally 4:00 p.m. Eastern Time. NAV per share is calculated by dividing a Fund’s net assets by the number of Fund shares outstanding. Investments are valued at fair value. Any assets or securities for which market quotations are not readily available are valued at fair-value in accordance with procedures adopted by the Board of Directors. The Board of Directors has delegated to the Advisor the responsibility to exercise oversight in the administration of these procedures.
The Funds are subject to fair value accounting standards that define fair value, establish the framework for measuring fair value and provide a three-tier hierarchy to maximize the use of observable market data and minimize the use of unobservable inputs. Inputs refer broadly to the assumptions that market participants would use in pricing the asset or liability, including assumptions about risk, for example, the risk inherent in a particular valuation technique used to measure fair value. Inputs may be based on independent market data (“observable inputs”) or they may be internally developed (“unobservable inputs”). The hierarchy gives the highest priority to unadjusted quoted prices in active markets for identical assets or liabilities (level 1 measurement) and the lowest priority to unobservable inputs (level 3 measurements). The three levels of the fair value hierarchy are as follows:
| | • | | Level 1 — quoted prices in active markets for identical securities |
| | • | | Level 2 — Inputs other than quoted prices included within Level 1 that are observable for the asset or liability either directly or indirectly, including quoted prices for similar assets or liabilities in active markets, quoted prices for identical or similar assets or liabilities in markets that are not considered to be active, inputs other than quoted prices that are observable for the asset or liability, and inputs that are derived principally from or corroborated by observable market data by correlation or other means |
| | • | | Level 3 — significant unobservable inputs (including a Fund’s own assumption in determining the fair value of investments |
The level of a value determined for a financial instrument within the fair value hierarchy is based on the lowest level of any input that is significant to the fair value measurement in its entirety. However, the determination of what constitutes an “observable” input may require significant judgment by the Funds. The Funds consider observable inputs to be market data that is readily available, regularly distributed or updated, reliable and verifiable, and provided by independent sources that are actively involved in the relevant market. The categorization of a value determined for a financial instrument within the hierarchy is based upon the pricing transparency of the instrument and does not necessarily correspond to the Funds’ perceived risk of that instrument.
Level 1 investments consist of active listed equities.
Level 2 investments generally include certain U.S. government and sovereign obligations, most government agency securities and investment-grade corporate bonds.
Level 3 investments may include unlisted securities related to corporate actions, securities whose trading have been suspended or which have been de-listed from their primary trading exchange and less liquid corporate debt securities. When observable prices are not available for these securities, the Funds use one or more valuation techniques (e.g., the market approach or the income approach) for which sufficient and reliable data is available. Within Level 3 of the fair value hierarchy, the use of the market approach generally consists of using comparable market transactions, while the use of the income approach generally consists of the net present value of estimated future cash flows, adjusted as appropriate for liquidity, credit, market and/or other risk factors.
The inputs used by the Funds in estimating the value of investments classified as Level 3 may include the original transaction price, quoted prices for similar securities or assets in active markets, completed or pending third-party transactions in the underlying investment or comparable issuers, and changes in financial ratios or cash flows. Level 3 securities may also be adjusted to reflect illiquidity and/or non-transferability, with the amount of such discount estimated by the Funds in the absence of market information. The fair value measurement of Level 3 securities does not include transaction costs that may have been capitalized as part of the security’s cost basis. Assumptions used by the Funds due to the lack of observable inputs may significantly impact the resulting fair value and therefore the Funds’ results of operations. There were no securities classified as Level 3 at May 31, 2011.
54
db-X Exchange-Traded Funds Inc.
NOTES TO FINANCIAL STATEMENTS (Continued)
Fair value pricing could result in a difference between the prices used to calculate a Fund’s net asset value and the prices used by the Fund’s underlying index, which in turn could result in a difference between the Fund’s performance and the performance of the Fund’s underlying index.
The following is a summary of the inputs used as of May 31, 2011 in valuing each Fund’s investments at fair value:
| | | | | | | | | | | | | | | | |
| | | Level 1 | | | Level 2 | | | Level 3 | | | Fair Value at
5/31/2011 | |
| db-X 2010 Fund | | | | | | | | | | | | | | | | |
Investments in Securities | | | | | | | | | | | | | | | | |
Common Stocks | | $ | 2,327,999 | | | $ | — | | | $ | — | | | $ | 2,327,999 | |
Corporate Bonds | | | — | | | | 2,632,687 | | | | — | | | | 2,632,687 | |
United States Government & Agencies Obligations | | | — | | | | 9,299,461 | | | | — | | | | 9,299,461 | |
Sovereign Bonds | | | — | | | | 101,592 | | | | — | | | | 101,592 | |
| | | | | | | | | | | | | | | | |
Total Investments | | $ | 2,327,999 | | | $ | 12,033,740 | | | $ | — | | | $ | 14,361,739 | |
| | | | | | | | | | | | | | | | |
| db-X 2020 Fund | | | | | | | | | | | | | | | | |
Investments in Securities | | | | | | | | | | | | | | | | |
Common Stocks | | $ | 24,214,795 | | | $ | — | | | $ | — | | | $ | 24,214,795 | |
Corporate Bonds | | | — | | | | 8,368,954 | | | | — | | | | 8,368,954 | |
United States Government & Agencies Obligations | | | — | | | | 5,383,577 | | | | — | | | | 5,383,577 | |
Sovereign Bonds | | | — | | | | 249,518 | | | | — | | | | 249,518 | |
| | | | | | | | | | | | | | | | |
Total Investments | | $ | 24,214,795 | | | $ | 14,002,049 | | | $ | — | | | $ | 38,216,844 | |
| | | | | | | | | | | | | | | | |
| db-X 2030 Fund | | | | | | | | | | | | | | | | |
Investments in Securities | | | | | | | | | | | | | | | | |
Common Stocks | | $ | 29,754,648 | | | $ | — | | | $ | — | | | $ | 29,754,648 | |
Corporate Bonds | | | — | | | | 4,063,757 | | | | — | | | | 4,063,757 | |
United States Government & Agencies Obligations | | | — | | | | 1,099,149 | | | | — | | | | 1,099,149 | |
Sovereign Bonds | | | — | | | | 229,399 | | | | — | | | | 229,399 | |
| | | | | | | | | | | | | | | | |
Total Investments | | $ | 29,754,648 | | | $ | 5,392,305 | | | $ | — | | | $ | 35,146,953 | |
| | | | | | | | | | | | | | | | |
| db-X 2040 Fund | | | | | | | | | | | | | | | | |
Investments in Securities | | | | | | | | | | | | | | | | |
Common Stocks | | $ | 33,113,468 | | | $ | — | | | $ | — | | | $ | 33,113,468 | |
Corporate Bonds | | | — | | | | 906,255 | | | | — | | | | 906,255 | |
United States Government & Agencies Obligations | | | — | | | | 537,680 | | | | — | | | | 537,680 | |
Sovereign Bonds | | | — | | | | 33,108 | | | | — | | | | 33,108 | |
| | | | | | | | | | | | | | | | |
Total Investments | | $ | 33,113,468 | | | $ | 1,477,043 | | | $ | — | | | $ | 34,590,511 | |
| | | | | | | | | | | | | | | | |
| db-X In-Target Fund | | | | | | | | | | | | | | | | |
Investments in Securities | | | | | | | | | | | | | | | | |
Common Stocks | | $ | 4,532,974 | | | $ | — | | | $ | — | | | $ | 4,532,974 | |
Corporate Bonds | | | — | | | | 1,547,499 | | | | — | | | | 1,547,499 | |
United States Government & Agencies Obligations | | | — | | | | 9,774,565 | | | | — | | | | 9,774,565 | |
Sovereign Bonds | | | — | | | | 38,117 | | | | — | | | | 38,117 | |
| | | | | | | | | | | | | | | | |
Total Investments. | | $ | 4,532,974 | | | $ | 11,360,181 | | | $ | — | | | $ | 15,893,155 | |
| | | | | | | | | | | | | | | | |
55
db-X Exchange-Traded Funds Inc.
NOTES TO FINANCIAL STATEMENTS (Continued)
In January 2010, the Financial Accounting Standards Board (“FASB”) issued Accounting Standards Update (“ASU”)
No. 2010-06 Improving Disclosures about Fair Value Measurements. ASU 2010-06 which, among other disclosure items requires the Funds to include disclosures on purchases, sales, issuances and settlements in the reconciliation of activity in Level 3 fair value measurements. This is effective for interim and annual reporting periods beginning after December 15, 2010. The Advisor has evaluated the implications of ASU No. 2010-06 and does not anticipate a material impact on the financial statements.
In May 2011, the FASB issued ASU No. 2011-04 Amendments to Achieve Common Fair Value Measurement and Disclosure Requirements in U.S. GAAP and IFRSs. ASU 2011-04 includes common requirements for measurement of and disclosure about fair value between U.S. GAAP and IFRS. ASU 2011-04 will require reporting entities to disclose the following information for fair value measurements categorized within Level 3 of the fair value hierarchy: quantitative information about the unobservable inputs used in the fair value measurement, the valuation processes used by the reporting entity and a narrative description of the sensitivity of the fair value measurement to changes in unobservable inputs and the interrelationships between those unobservable inputs. In addition, ASU 2011-04 will require reporting entities to make disclosures about amounts and reasons for transfers in and out of Level 1 and Level 2 fair value measurements. The new and revised disclosures are effective for interim and annual reporting periods beginning after December 15, 2011. The Advisor is currently evaluating the implications of ASU No. 2011-04 and its impact on the financial statements.
Investment Transactions and Investment Income Investment transactions are recorded as of the date that the
securities are purchased or sold (trade date). Realized gains and losses from the sale or disposition of securities are calculated on the identified cost-method. Dividend income is net of any foreign taxes withheld at source. Interest income is recorded on the accrual basis. Discounts and premiums on securities purchased are accreted/amortized over the lives of the respective securities.
Tax Information and Dividends and Distributions to Shareholders It is each Fund’s policy to comply with all requirements of the Internal Revenue Code of 1986, as amended (“the Code”). Each fund intends to qualify for and to elect treatment as a separate Regulated Investment Company (“RIC”) under Subchapter M of the Code. It is the policy of each Fund to pay out dividends, if any, to investors at least annually sufficient to relieve it from all, or substantially all, Federal income and excise taxes. Taxable net realized gains from investment transactions, reduced by capital loss carryforwards, if any, are declared and distributed to shareholders at least annually. The capital loss carryforward amount, if any, is available to offset future net capital gains. The Funds may occasionally be required to make supplemental distributions at some other time during the year. The Funds reserve the right to declare special distributions if, in their reasonable discretion, such action is necessary or advisable to preserve the status of each Fund as a RIC or to avoid imposition of income or excise taxes on undistributed income. Dividends and distributions to shareholders, if any, are recorded on the ex-dividend date. The amount of dividends and distributions from net investment income and net realized capital gains are determined in accordance with Federal income tax regulations which may differ from U.S. GAAP. These “book/tax” differences are either considered temporary or permanent in nature. To the extent these differences are permanent in nature, such amounts are reclassified at the end of the year within the components of net assets based on their federal tax treatment; temporary differences do not require reclassification. Dividends and distributions, which exceed earnings and profits for the full year for tax purposes, are reported as a tax return of capital. Each Fund pays out dividends from its net investment income to investors annually. Each Fund distributes any net capital gains annually.
Expenses Expenses that are directly related to a specific Fund are charged to that respective Fund. Expenses which are not readily identifiable to a specific Fund are allocated in such a manner as deemed equitable, taking into consideration the nature and type of expense and the relative net assets of each Fund.
Foreign Currency Translation The accounting records of the Funds are maintained in U.S. dollars. Foreign currencies, as well as investment securities and other assets and liabilities denominated in currencies other than the U.S. dollar are translated into U.S. dollars using an exchange rate deemed appropriate by the investment advisor. The effects of changes in foreign currency exchange rates on investments in securities are not segregated in the Statements of Operations from the effects of changes in market prices of those securities, but are included with the net realized and unrealized gain or loss on investments in securities. Unrealized gains and losses on assets and liabilities, other than investments in securities, which result from changes in foreign currency exchange rates have been included in “Net change in unrealized appreciation (depreciation) on foreign currency translations” on the Statements of Operations. The portion of foreign currency gains and losses related to fluctuations in exchange rates between the initial purchase trade date and subsequent sale trade date is included in “Net realized gain (loss) from foreign currency related transactions” on the Statements of Operations. Certain
56
db-X Exchange-Traded Funds Inc.
NOTES TO FINANCIAL STATEMENTS (Continued)
foreign exchange gains and losses included in realized and unrealized gains or losses are included in or are a reduction of ordinary income in accordance with U.S. Federal income tax regulations.
Taxes The Funds are subject to accounting standards that establish a minimum threshold for recognizing, and a system for measuring, the benefits of a tax position taken or expected to be taken in a tax return. Taxable years ended 2007, 2008, 2009, 2010 and 2011 remain open to federal and state audit.
Cash Equivalents The Company considers all highly liquid debt instruments purchased with a maturity of three months or less to be cash equivalents. As of May 31, 2011, there were no cash equivalents.
3. INVESTMENT ADVISORY AND OTHER AGREEMENTS
The Advisor has overall responsibility for the general management and administration of the Funds, subject to the supervision of the Fund’s Board of Directors. Under an investment advisory agreement between the Company, on behalf of the Funds, and the Advisor (the “Investment Advisory Agreement”), the Advisor is responsible for arranging sub-advisory, transfer agency, custody, fund administration, and all other non-distribution related services for the Funds to operate. The Advisor is also responsible for employing any sampling strategy for the Funds.
For the services it provides to the Funds, the Advisor receives a unified advisory fee computed daily and payable monthly in an amount equal to 0.65% on an annualized basis of each Fund’s average daily net assets. Out of the advisory fee, the Advisor pays, or arranges for the payment of, all fees and expenses of the Sub-Advisor, Transfer Agent, the Administrator and Accounting Agent and the Custodian. Each Fund is responsible for the payment of all other expenses associated with its operations, including but not limited to, brokerage expenses, taxes, interest, fees and expenses of counsel to the Funds, fees and expenses of the Disinterested Directors (including legal counsel fees), certain out-of-pocket expenses of the Advisor or Sub-Advisor, including, but not limited to, cost of obtaining prices for security valuations (including manual broker quotes), Federal Reserve charges related to securities transactions, postage and insurance on physical transfer items, telecommunication charges, and proxy voting execution, advice and reporting etc., fees and expenses of the Chief Compliance Officer and expenses associated with the Funds’ compliance program, litigation expenses, fees and expenses of the Funds’ independent auditors, registration fees, expenses associated with compliance by the Funds with regulatory requirements, including those relating to the development and distribution of its prospectus and shareholder reports, and extraordinary expenses. Pursuant to the Investment Advisory Agreement, the Advisor is authorized to engage one or more sub-advisors to perform any of the services contemplated to be performed by the Advisor under the Investment Advisory Agreement.
For the year ended May 31, 2011, the Advisor and Sub-Advisor reimbursed the Funds $1,532 and $37,655, respectively, in connection with the reversal of certain trades effected with an affiliated broker-dealer.
TDAM USA Inc. (“TDAM”) acts as investment sub-advisor to the Funds (“Sub-Advisor”). TDAM is a direct, wholly-owned subsidiary of The Toronto-Dominion Bank. The Sub-Advisor is responsible for the day-to-day management of the Funds, subject to the supervision of the Advisor and the Funds’ Board of Directors. In this regard, the Sub-Advisor is responsible for implementing the replication strategy for each Fund with regard to its underlying index and for general administration, compliance and management services as may be agreed between the Advisor and Sub Advisor from time to time. During the period June 1, 2010 to October 20, 2010, Amerivest Investment Management, LLC (“Amerivest”) was also a Sub-advisor. Amerivest is a wholly-owned subsidiary of TD AMERITRADE Holding Corporation.
The Advisor pays TDAM, out of its own resources, a fee based on a percentage of the average daily net assets of each Fund as set forth below:
| | • | | 10 basis points (0.10%) of the first $100 million in combined daily net assets of all Funds; and |
| | • | | 5 basis points (0.05%) of the combined daily net assets of all Funds in excess of $100 million. |
The Advisor pays TDAM a minimum annual fee of $35,000 per Fund.
The Advisor has contractually agreed to reduce its fees and/or pay Fund operating expenses (excluding, among other things, acquired fund fees and expenses, interest, taxes and extraordinary expenses) in order to limit each Fund’s net annual operating expenses to 0.65% of the Fund’s average daily net assets (the “Expense Cap”). The Expense Cap will remain in effect until September 30, 2011. The Advisor is permitted to be reimbursed for fee reductions and/or expense payments made in the prior three fiscal years. This reimbursement may be paid to the Advisor if the aggregate amount actually paid by a Fund toward operating expenses for such fiscal year (taking into account the reimbursement) does not exceed the Expense Cap. No amounts were reimbursed under this contractual arrangement during the fiscal year ended May 31, 2011.
57
db-X Exchange-Traded Funds Inc.
NOTES TO FINANCIAL STATEMENTS (Continued)
The amounts subject to potential reimbursement to the Advisor as of May 31, 2011 were as follows:
| | | | | | | | | | | | |
| | | Reimbursements available through: | |
| | | 5/31/2011 | | | 5/31/2012 | | | 5/31/2013 | |
db-X 2010 Fund | | $ | 690,777 | | | $ | 485,309 | | | $ | 174,213 | |
db-X 2020 Fund | | | 1,188,794 | | | | 854,315 | | | | 312,578 | |
db-X 2030 Fund | | | 998,623 | | | | 726,554 | | | | 268,355 | |
db-X 2040 Fund | | | 963,325 | | | | 687,803 | | | | 254,476 | |
db-X In-Target Fund | | | 761,474 | | | | 522,615 | | | | 181,615 | |
For the fiscal year ended May 31, 2011, the advisory fee waivers and expenses assumed by the Advisor were as follows:
| | | | | | | | | | | | | | | | |
| | | Sub-Advisory Fees
Waived by
Amerivest | | | Fees & Expenses
Assumed by
Amerivest | | | Advisory Fees
Waived by
DBX | | | Fees & Expenses
Assumed by
DBX | |
db-X 2010 Fund | | $ | 40,620 | | | $ | 36,579 | | | $ | 67,406 | | | $ | 29,608 | |
db-X 2020 Fund | | | 88,271 | | | | 54,464 | | | | 169,843 | | | | — | |
db-X 2030 Fund | | | 72,356 | | | | 46,915 | | | | 149,084 | | | | — | |
db-X 2040 Fund | | | 67,816 | | | | 48,530 | | | | 138,130 | | | | — | |
db-X In-Target Fund | | | 43,624 | | | | 37,663 | | | | 73,886 | | | | 26,442 | |
The Bank of New York Mellon, a wholly-owned subsidiary of The Bank of New York Mellon Corporation, serves as Administrator, Custodian, Accounting Agent and Transfer Agent for each Fund.
ALPS Distributors, Inc. serves as the distributor of Creation Units for each Fund on an agency basis. The Distributor does not maintain a secondary market in shares of the Funds.
The Board of Directors is currently comprised of four Directors, of whom three are Independent Directors. The Company pays each Independent Director an annual fee of $30,000, plus a fee of $4,000 per meeting attended in-person or $1,000 per meeting attended conducted telephonically. Each Independent Director also receives $2,000 per Audit Committee meeting attended in-person or $1,000 per meeting attended conducted telephonically, although the Audit Committee Chairman receives $3,000 per Audit Committee meeting attended in-person. The Company reimburses each Director for their costs and expenses associated with the performance of their duties hereunder, including the cost and expenses associated with attendance at meetings of the Board. Directors’ fees and expenses are allocated among the Funds based on each Fund’s relative average daily net assets.
4. FEDERAL INCOME TAXES
As of May 31, 2011 the components of accumulated earnings (losses) were as follows:
| | | | | | | | | | | | | | | | |
| | | Accumulated
Earnings | | | Net
Accumulated
Capital and
Other Gains
(Losses) | | | Unrealized
Appreciation
(Depreciation) | | | Total
Accumulated
Earnings (Losses) | |
db-X 2010 Fund | | $ | 49,122 | | | $ | (1,993,181 | ) | | $ | 527,226 | | | $ | (1,416,833 | ) |
db-X 2020 Fund | | | 309,767 | | | | (6,356,241 | ) | | | 3,457,409 | | | | (2,589,065 | ) |
db-X 2030 Fund | | | 280,210 | | | | (7,889,655 | ) | | | 3,640,514 | | | | (3,968,931 | ) |
db-X 2040 Fund | | | 245,401 | | | | (8,827,882 | ) | | | 3,510,198 | | | | (5,072,283 | ) |
db-X In-Target Fund | | | 44,596 | | | | (583,299 | ) | | | 842,995 | | | | 304,292 | |
For the years ended May 31, 2011 and May 31, 2010, the tax characterization of distributions paid for each Fund was equal to the book characterization of distributions paid. The total distributions and distributions per share are disclosed in the accompanying Statements of Changes in Net Assets and the Financial Highlights for all Funds.
58
db-X Exchange-Traded Funds Inc.
NOTES TO FINANCIAL STATEMENTS (Continued)
At May 31, 2011, for Federal income tax purposes, the Funds have capital loss carryforwards available as shown in the table below, to the extent provided by regulations, to offset future capital gains through the years indicated. To the extent that these loss carryforwards are used to offset future capital gains, it is probable that the capital gains so offset will not be distributed to shareholders. The use of some portion of the capital carryforwards by any one Fund may be limited by Federal tax rules. These rules limit the use of the carryforwards when there has been a greater than fifty percent change in ownership of a Fund.
| | | | | | | | | | | | | | | | |
| | | Year of Expiration | | | Total
Amount | |
| | | 2017 | | | 2018 | | | 2019 | | |
db-X 2010 Fund | | $ | 972,554 | | | $ | 1,020,627 | | | $ | — | | | $ | 1,993,181 | |
db-X 2020 Fund | | | 2,642,505 | | | | 3,713,736 | | | | — | | | | 6,356,241 | |
db-X 2030 Fund | | | 3,249,773 | | | | 4,568,179 | | | | 71,703 | | | | 7,889,655 | |
db-X 2040 Fund | | | 3,538,689 | | | | 4,936,668 | | | | 352,525 | | | | 8,827,882 | |
db-X In-Target Fund | | | 22,211 | | | | 561,088 | | | | — | | | | 583,299 | |
db-X 2010 Fund, db-X 2020 Fund and db-X In-Target Fund utilized $31,512, $241,594 and $154,425 respectively, of capital loss carryforwards during the fiscal year ended May 31, 2011.
Under the recently enacted Regulated Investment Company Modernization Act of 2010 (the “Act”), the Funds will be permitted to carry forward capital losses incurred in taxable years beginning after December 22, 2010 for an unlimited period. However, any losses incurred during those future taxable years (beginning on June 1, 2011) will be required to be utilized prior to the losses incurred in pre-enactment taxable years. As a result of this ordering rule, pre-enactment capital loss carryforwards presented in the table above may be more likely to expire unused. Additionally, post-enactment capital losses that are carried forward will retain their character as either short-term or long-term capital losses rather than being considered all short-term as under previous law.
Capital losses incurred after October 31 (“post-October losses”) within the taxable year are deemed to arise on the first business day of each Fund’s next taxable year. Capital losses can be carried forward for a period of eight years.
During the fiscal year ended May 31, 2011, the Funds incurred and elected to defer net capital losses as follows:
| | | | | | | | |
| | | Post-October
Losses on
Capital | | | Post-October
Losses on
Currency | |
db-X 2010 Fund | | $ | — | | | $ | 684 | |
db-X 2020 Fund | | | — | | | | — | |
db-X 2030 Fund | | | — | | | | — | |
db-X 2040 Fund | | | — | | | | — | |
db-X In-Target Fund | | | — | | | | 80 | |
In order to present paid-in capital and accumulated net realized gains or losses on the Statements of Assets and Liabilities that more closesly represent their tax character, certain adjustments have been made to additional paid-in capital, undistributed net investment income or loss and accumulated net realized gains or losses on investments. These differences are primarily due to currency gain/(loss) and redemptions-in-kind. For the fiscal year ended May 31, 2011, the adjustments were as follows:
| | | | | | | | | | | | |
| | | Undistributed
Net Investment
Income (Loss) | | | Undistributed
Capital Gains
(Accumulated Losses) | | | Paid-in
Capital | |
db-X 2010 Fund | | $ | 1,363 | | | $ | (217,510 | ) | | $ | 216,147 | |
db-X 2020 Fund | | | 5,054 | | | | (1,033,557 | ) | | | 1,028,503 | |
db-X 2030 Fund | | | 3,680 | | | | (744,603 | ) | | | 740,923 | |
db-X 2040 Fund | | | 4,152 | | | | (407,322 | ) | | | 403,170 | |
db-X In-Target Fund | | | 784 | | | | (274,639 | ) | | | 273,855 | |
59
db-X Exchange-Traded Funds Inc.
NOTES TO FINANCIAL STATEMENTS (Continued)
As of May 31, 2011, the cost of investments for Federal income tax purposes and the aggregated gross unrealized appreciation/depreciation on investments was as follows:
| | | | | | | | | | | | | | | | |
| | | Cost | | | Gross
Unrealized
Appreciation | | | Gross
Unrealized
(Depreciation) | | | Net
Unrealized
Appreciation
(Depreciation) | |
db-X 2010 Fund | | $ | 13,834,876 | | | $ | 739,755 | | | $ | (212,892 | ) | | $ | 526,863 | |
db-X 2020 Fund | | | 34,762,307 | | | | 4,933,534 | | | | (1,478,997 | ) | | | 3,454,537 | |
db-X 2030 Fund | | | 31,509,554 | | | | 5,555,210 | | | | (1,917,811 | ) | | | 3,637,399 | |
db-X 2040 Fund | | | 31,083,733 | | | | 5,805,159 | | | | (2,298,381 | ) | | | 3,506,778 | |
db-X In-Target Fund | | | 15,050,602 | | | | 1,003,862 | | | | (161,309 | ) | | | 842,553 | |
5. INVESTMENTS IN AFFILIATES
The Advisor is a wholly-owned subsidiary of Deutsche Bank AG. Therefore, Deutsche Bank AG is considered to be affiliated with the Fund. The table below shows the transactions in and earnings from investments in Deutsche Bank AG Securities for the fiscal year ended May 31, 2011.
| | | | | | | | | | | | | | | | | | | | | | | | | | | | |
| | | Fair Value
5/31/2010 | | | Purchases
at Cost | | | Proceeds
from Sales | | | Change in
Unrealized
Appreciation/
(Depreciation) | | | Realized
Gain | | | Fair Value
5/31/2011 | | | Interest
Income | |
db-X 2010 Fund | | | | | | | | | | | | | | | | | | | | | | | | | | | | |
Deutsche Bank AG (Common Stock) | | $ | 6,456 | | | $ | — | | | $ | (6,920 | ) | | $ | 3,132 | | | $ | (2,668 | ) | | $ | — | | | $ | — | |
db-X 2020 Fund | | | | | | | | | | | | | | | | | | | | | | | | | | | | |
Deutsche Bank AG, 6.00%, 9/01/17 | | $ | 179,528 | | | $ | — | | | $ | (38,839 | ) | | $ | 7,243 | | | $ | 4,527 | | | $ | 152,459 | | | $ | 9,062 | |
Deutsche Bank AG (Common Stock) | | | 41,485 | | | | 20,972 | | | | (11,241 | ) | | | 1,718 | | | | 472 | | | | 53,406 | | | | 742 | |
| | | | | | | | | | | | | | | | | | | | | | | | | | | | |
Total Investments in Affiliates | | $ | 221,013 | | | $ | 20,972 | | | $ | (50,080 | ) | | $ | 8,961 | | | $ | 4,999 | | | $ | 205,865 | | | $ | 9,804 | |
| | | | | | | | | | | | | | | | | | | | | | | | | | | | |
db-X 2030 Fund | | | | | | | | | | | | | | | | | | | | | | | | | | | | |
Deutsche Bank AG, 6.00%, 9/01/17 | | $ | 31,175 | | | $ | — | | | $ | (32,131 | ) | | $ | (1,691 | ) | | $ | 2,647 | | | $ | — | | | $ | 271 | |
Deutsche Bank AG (Common Stock) | | $ | 44,235 | | | $ | 26,901 | | | $ | (5,284 | ) | | $ | (861 | ) | | $ | (273 | ) | | $ | 64,718 | | | $ | 910 | |
| | | | | | | | | | | | | | | | | | | | | | | | | | | | |
Total Investments in Affiliates | | $ | 75,410 | | | $ | 26,901 | | | $ | 37,415 | | | $ | 2,552 | | | $ | 2,374 | | | $ | 64,718 | | | $ | 1,181 | |
| | | | | | | | | | | | | | | | | | | | | | | | | | | | |
db-X 2040 Fund | | | | | | | | | | | | | | | | | | | | | | | | | | | | |
Deutsche Bank AG (Common Stock) | | $ | 47,881 | | | $ | 27,881 | | | $ | (5,231 | ) | | $ | 3,165 | | | $ | (1,059 | ) | | $ | 72,637 | | | $ | 1,025 | |
db-X In-Target Fund | | | | | | | | | | | | | | | | | | | | | | | | | | | | |
Deutsche Bank AG (Common Stock) | | $ | 6,815 | | | $ | — | | | $ | (1,409 | ) | | $ | 216 | | | $ | (561 | ) | | $ | 5,061 | | | $ | 55 | |
On June 30, 2010, XShares Group, Inc. and Deutsche Bank AG consummated an agreement pursuant to which Deutsche Bank AG acquired all of the issued and outstanding membership interests in the investment advisor to the Company and rebranded the investment advisor from XShares Advisors, LLC, to DBX Strategic Advisors LLC.
6. INVESTMENT PORTFOLIO TRANSACTIONS
For the fiscal year ended May 31, 2011, the cost of investments purchased and proceeds from sale of investments (excluding in-kind transactions and short-term investments) were as follows:
| | | | | | | | | | | | | | | | |
| | | Purchases | | | Sales | |
| | | Other | | | U.S. Government | | | Other | | | U.S. Government | |
db-X 2010 Fund | | $ | 1,794,027 | | | $ | 6,787,531 | | | $ | 5,740,420 | | | $ | 3,867,207 | |
db-X 2020 Fund | | | 15,093,896 | | | | 4,697,035 | | | | 14,562,169 | | | | 4,962,407 | |
db-X 2030 Fund | | | 12,654,740 | | | | 775,301 | | | | 12,025,131 | | | | 1,290,238 | |
db-X 2040 Fund | | | 11,132,563 | | | | 304,770 | | | | 11,166,631 | | | | 209,592 | |
db-X In-Target Fund | | | 3,008,986 | | | | 7,545,363 | | | | 1,547,252 | | | | 8,818,442 | |
60
db-X Exchange-Traded Funds Inc.
NOTES TO FINANCIAL STATEMENTS (Continued)
For the fiscal year ended May 31, 2011 the cost of in-kind purchases and the proceeds from in-kind sales were as follows:
| | | | | | | | |
| | | Purchases | | | Sales | |
db-X 2010 Fund | | $ | — | | | $ | 4,060,921 | |
db-X 2020 Fund | | | — | | | | 8,817,781 | |
db-X 2030 Fund | | | — | | | | 4,109,584 | |
db-X 2040 Fund | | | — | | | | 3,722,705 | |
db-X In-Target Fund | | | — | | | | 4,955,264 | |
7. FUND SHARE TRANSACTIONS
As of May 31, 2011, there were 12.5 billion shares of $0.0001 par value Fund shares authorized by the Company. Fund shares are issued and redeemed by each Fund only in Creation Units or multiples thereof. Except when aggregated in Creation Units, shares of each Fund are not redeemable. Transactions in capital shares for each Fund are disclosed in detail in the Statements of Changes in Net Assets. The consideration for the purchase of Creation Units of a Fund generally consists of the in-kind contribution of a designated portfolio of securities constituting a portfolio sampling representation of the securities included in the relevant Fund’s underlying index and an amount of cash. Investors purchasing and redeeming Creation Units pay a purchase transaction fee and a redemption transaction fee to offset transfer and other transaction costs associated with the issuance and redemption of Creation Units.
8. INDEMNIFICATIONS
In the normal course of business the Company enters into contracts that contain a variety of representations that provide indemnification for certain liabilities. The Company’s maximum exposure under these arrangements is unknown, as this would involve future claims that may be made against the Funds that have not yet occurred. However, the Company expects the risk of loss to be remote.
9. SUBSEQUENT EVENTS
The Company evaluated the need for disclosure and/or adjustment resulting from subsequent events through the date the financial statements were available to be issued. This evaluation did not result in any subsequent events that necessitated disclosure and/or adjustment.
61
db-X Exchange-Traded Funds Inc.
REPORT OF INDEPENDENT REGISTERED PUBLIC ACCOUNTING FIRM
To the Shareholders and Board of Directors of
db-X Exchange-Traded Funds Inc.
We have audited the accompanying statements of assets and liabilities, including the schedules of investments, of db-X Exchange-Traded Funds Inc., formerly TDX Independence Funds, Inc. (the “Company”), consisting of: db-X 2010 Target Date Fund, db-X 2020 Target Date Fund, db-X 2030 Target Date Fund, db-X 2040 Target Date Fund, and db-X In-Target Date Fund (formerly, TDX Independence 2010 Exchange-Traded Fund, TDX Independence 2020 Exchange-Traded Fund, TDX Independence 2030 Exchange-Traded Fund, TDX Independence 2040 Exchange-Traded Fund, and TDX Independence In-Target Exchange-Traded Fund, respectively), as of May 31, 2011, and the related statements of operations for the year then ended, the statements of changes in net assets and the financial highlights for each of the two years in the period then ended. These financial statements and financial highlights are the responsibility of the Company’s management. Our responsibility is to express an opinion on these financial statements and financial highlights based on our audits. The financial highlights for the indicated periods through May 31, 2009, were audited by other auditors whose report, dated July 28, 2009, expressed an unqualified opinion on such financial statements and financial highlights.
We conducted our audits in accordance with the standards of the Public Company Accounting Oversight Board (United States). Those standards require that we plan and perform the audit to obtain reasonable assurance about whether the financial statements and financial highlights are free of material misstatement. We were not engaged to perform an audit of the Company’s internal control over financial reporting. Our audits included consideration of internal control over financial reporting as a basis for designing audit procedures that are appropriate in the circumstances, but not for the purpose of expressing an opinion on the effectiveness of the Company’s internal control over financial reporting. Accordingly, we express no such opinion. An audit also includes examining, on a test basis, evidence supporting the amounts and disclosures in the financial statements, assessing the accounting principles used and significant estimates made by management, and evaluating the overall financial statement presentation. Our procedures included confirmation of securities owned as of May 31, 2011, by correspondence with the custodian and brokers or by other appropriate auditing procedures where replies from brokers were not received. We believe that our audits provide a reasonable basis for our opinion.
In our opinion, the financial statements and financial highlights referred to above present fairly, in all material respects, the financial position of db-X 2010 Target Date Fund, db-X 2020 Target Date Fund, db-X 2030 Target Date Fund, db-X 2040 Target Date Fund, db-X In-Target Date Fund of db-X Exchange-Traded Funds Inc. at May 31, 2011, the results of their operations, the changes in their net assets and the financial highlights for each of the two years in the period then ended, in conformity with U.S. generally accepted accounting principles.

New York, New York
July 26, 2011
62
db-X Exchange-Traded Funds Inc.
FREQUENCY DISTRIBUTION OF DISCOUNTS & PREMIUMS
The tables that follow present information about the differences between the daily market price on secondary markets for shares of a Fund and that Fund’s net asset value (“NAV”). NAV is the price per share at which each Fund issues and redeems shares. It is calculated in accordance with the standard formula for valuing mutual fund shares. The price used to calculate market returns (“Market Price”) of each Fund generally is determined using the midpoint between the highest bid and the lower offer on the national securities exchange on which the shares of such Fund are listed for trading, as of the time that the Fund’s NAV is calculated. Each Fund’s Market Price may be at, above or below its NAV. The NAV of each Fund will fluctuate with changes in the market value of its portfolio holdings. The Market Price of each Fund will fluctuate in accordance with changes in its NAV, as well as market supply and demand. Shareholders may pay more than NAV when they buy Fund shares and receive less than NAV when they sell those shares, because shares are bought and sold at current market prices.
Premiums or discounts are the differences (expressed as a percentage) between the NAV and Market Price of a Fund on a given day, generally at the time NAV is calculated. A premium is the amount that a Fund is trading above the reported NAV, expressed as a percentage of the NAV. A discount is the amount that a Fund is trading below the reported NAV, expressed as a percentage of the NAV.
The following information shows the frequency distributions of premiums and discounts for each Fund included in this report. The information shown for each Fund is for each full calendar quarter completed after the inception date of such Fund, October 1, 2007, through the fiscal year ended May 31, 2011.
Each line in the table shows the number of trading days in which a Fund trades within the premium/discount range indicated. The number of trading days in each premium/discount range is also shown as a percentage of the total number of trading days in the period covered by each table. All data presented here represents past performance, which cannot be used to predict future results.
| | | | | | | | | | | | |
| | | MARKET PRICE
ABOVE OR EQUAL TO NAV | | MARKET PRICE
BELOW NAV |
| | | Basis point
Differential* | | | Number of
Days | | Percentage of
Total Days | | Number of
Days | | Percentage of
Total Days |
db-X 2010 Target Date Fund October 1, 2007 – May 31, 2011 | | | 0 - <.25% | | | 62 | | 6.71% | | 53 | | 5.73% |
| | | .25% - <.50% | | | 69 | | 7.47% | | 56 | | 6.06% |
| | | .50% - <.75% | | | 112 | | 12.12% | | 58 | | 6.28% |
| | | .75% - <1.00% | | | 73 | | 7.90% | | 47 | | 5.09% |
| | | >= 1.00% | | | 160 | | 17.32% | | 234 | | 25.32% |
| | | Total: | | | 476 | | 51.52% | | 448 | | 48.48% |
db-X 2020 Target Date Fund October 1, 2007 – May 31, 2011 | | | 0 - <.25% | | | 60 | | 6.49% | | 65 | | 7.03% |
| | | .25% - <.50% | | | 64 | | 6.92% | | 53 | | 5.74% |
| | | .50% - <.75% | | | 121 | | 13.10% | | 52 | | 5.63% |
| | | .75% - <1.00% | | | 90 | | 9.74% | | 58 | | 6.28% |
| | | >= 1.00% | | | 130 | | 14.07% | | 231 | | 25.00% |
| | | Total: | | | 465 | | 50.32% | | 459 | | 49.68% |
db-X 2030 Target Date Fund October 1, 2007 – May 31, 2011 | | | 0 - <.25% | | | 62 | | 6.71% | | 51 | | 5.52% |
| | | .25% - <.50% | | | 84 | | 9.09% | | 48 | | 5.19% |
| | | .50% - <.75% | | | 126 | | 13.64% | | 40 | | 4.33% |
| | | .75% - <1.00% | | | 58 | | 6.28% | | 49 | | 5.30% |
| | | >= 1.00% | | | 168 | | 18.18% | | 238 | | 25.76% |
| | | Total: | | | 498 | | 53.90% | | 426 | | 46.10% |
63
db-X Exchange-Traded Funds Inc.
FREQUENCY DISTRIBUTION OF DISCOUNTS & PREMIUMS (Continued)
| | | | | | | | | | | | |
| | | MARKET PRICE
ABOVE OR EQUAL TO NAV | | MARKET PRICE
BELOW NAV |
| | | Basis point
Differential* | | | Number of
Days | | Percentage of
Total Days | | Number of
Days | | Percentage of
Total Days |
db-X 2040 Target Date Fund October 1, 2007 – May 31, 2011 | | | 0 - <.25% | | | 98 | | 10.61% | | 70 | | 7.57% |
| | | .25% - <.50% | | | 93 | | 10.06% | | 62 | | 6.71% |
| | | .50% - <.75% | | | 129 | | 13.96% | | 53 | | 5.74% |
| | | .75% - <1.00% | | | 53 | | 5.74% | | 39 | | 4.22% |
| | | > = 1.00% | | | 161 | | 17.42% | | 166 | | 17.97% |
| | | Total: | | | 534 | | 57.79% | | 390 | | 42.21% |
db-X In-Target Date Fund October 1, 2007 – May 31, 2011 | | | 0 - <.25% | | | 69 | | 7.47% | | 70 | | 7.58% |
| | | .25% - <.50% | | | 66 | | 7.14% | | 86 | | 9.31% |
| | | .50% - <.75% | | | 147 | | 15.91% | | 83 | | 8.98% |
| | | .75% - <1.00% | | | 28 | | 3.03% | | 70 | | 7.57% |
| | | > = 1.00% | | | 73 | | 7.90% | | 232 | | 25.11% |
| | | Total: | | | 383 | | 41.45% | | 541 | | 58.55% |
* A basis point equals one-hundredth of one percent (0.01%).
64
db-X Exchange-Traded Funds Inc.
OFFICERS AND DIRECTORS
| | | | | | | | | | |
Name, Address,
and Age | | Position(s) Held
with Fund | | Term of Office
and Length of
Time Served | | Principal Occupation(s)
During Past 5 Years | | Number of
Portfolios in
Fund Complex
Overseen by
Director | | Other Directorships
held by Director |
Disinterested Directors: | | | | | | | | |
R. Charles Tschampion Age 65, 25 Great Oak Drive Short Hills, NJ 07078 | | Director, Chairman of the Audit Committee and Member of the Nominating Committee | | Since
2007 | | Director, Special Projects, CFA Institute (2005 to present); Trustee of Lehigh University (October 1998 to June 2010) and Chair of the Investment Sub-Committee for the Lehigh University Endowment Fund (October 1998 to December 2008). | | 5 | | Trustee and Member of the Audit Committee, SPDR Select Sector Trust; Director, Real Estate Information Standards Board. |
Ernest J. Scalberg Age 66, 176 Mal Paso Road Carmel, CA 93923 | | Director, Member of the Audit and Nominating Committees | | Since
2007 | | Research Professor and Director of the GLOBE Center, Monterey Institute of International Studies (2009 to present); Associate Vice President for External Programs and Dean of Fisher Graduate School of International Business (2001 to 2009); Director, Adviser or Trustee to numerous non-profit organizations (1974 to present). | | 5 | | Trustee and Member of the Audit Committee, SPDR Select Sector Trust; Chairman of the Board of the Foundation, International University in Geneva (IUG), Switzerland. |
Michael G. Smith Age 67, 614 Lenox Glen Ellyn, IL 60137 | | Director, Member of the Audit and Nominating Committees | | Since
2007 | | Retired since 1999. Formerly, Managing Director, Corporate and Institutional Client Group, Central Region, Merrill Lynch & Co., Inc. | | 5 | | Director, Ivy Funds, Inc; Director, Northwestern Mutual Series Fund, Inc; Executive Board Director, Cox Business School, Southern Methodist University. |
65
db-X Exchange-Traded Funds Inc.
OFFICERS AND DIRECTORS (Continued)
| | | | | | | | | | |
Name, Address,
and Age | | Position(s) Held
with Fund | | Term of Office
and Length of
Time Served | | Principal Occupation(s)
During Past 5 Years | | Number of
Portfolios in
Fund Complex
Overseen by
Director | | Other Directorships
held by Director |
Interested Director/Officers:* | | | | | | | | |
Alex Depetris** Age 31 60 Wall Street New York, New York 10005 | | Director, Chairman of the Board, President, Chief Executive Officer and Secretary | | Since
2010 | | Vice President in the DBX Group at Deutsche Bank AG 2008; Associate, Arnold & Porter 2006 until 2008; Associate, Sullivan & Worcester 2005 until 2006. | | 10 | | N/A |
Martin Kremenstein Age 34 60 Wall Street New York, New York 10005 | | Chief Operating Officer | | Since
2010 | | Director in the DBX Group at Deutsche Bank AG with responsibility for providing investor solutions to the DB sales force in North America since 2006; Vice President, Market Risk Management JP Morgan Chase until 2006. | | N/A | | N/A |
Michael Gilligan Age 44 60 Wall Street New York, New York 10005 | | Treasurer, Chief Financial Officer and Controller | | Since
2010 | | Director in the Finance Group at Deutsche Bank AG with CFO responsibility for DBX Strategic Advisors LLC, DBX Advisors LLC and DB Commodity Services LLC since 2008; Chief Operating Officer, Americas Credit Trading, Credit Suisse 2007 to 2008; Director in the Finance Group, Credit Suisse 1998 to 2007. | | N/A | | N/A |
66
db-X Exchange-Traded Funds Inc.
OFFICERS AND DIRECTORS (Continued)
| | | | | | | | | | |
Name, Address,
and Age | | Position(s) Held
with Fund | | Term of Office
and Length of
Time Served | | Principal Occupation(s)
During Past 5 Years | | Number of
Portfolios in
Fund Complex
Overseen by
Director | | Other Directorships
held by Director |
Frank Gecsedi Age 43 60 Wall Street New York, New York 10005 | | Chief Compliance Officer | | Since
2010 | | Vice President in Deutsche Bank’s Global Markets Legal, Risk and Capital Division Since 2010; Vice President and Compliance Manager at Bank of America Merill Lynch (Formerly Merrill Lynch) (2000-2010) | | N/A | | N/A |
* Officers/Director of the Company are “interested persons” as defined in the 1940 Act.
** Effective February 22, 2011, Mr. Depetris was elected as a Director of the Company and appointed Chairman of the Board. On such date, Mr. Depetris was also elected President and Chief Executive Officer of the Company. Mr. Depetris has served as the Company’s Secretary since 2010.
The Fund’s SAI includes additional information about the Fund’s Directors and is available by calling 1-877-369-4617, or on the Company’s website at www.dbxstrategicadvisors.db.com.
67
db-X Exchange-Traded Funds Inc.
ADDITIONAL INFORMATION
PROXY VOTING POLICIES AND PROCEDURES
A description of the policies and procedures that the Company uses to determine how to vote proxies related to each Fund’s portfolio securities, (and information on how the Funds voted proxies during the period ended June 30, 2010 on Form N-PX) is available without charge, upon request, (i) by calling 877-369-4617; (ii) on the Company’s website at www.dbxstrategicadvisors.db.com; and (iii) on the Securities and Exchange Commission’s (“SEC”) website at www.sec.gov.
QUARTERLY PORTFOLIO DISCLOSURE
The Funds are required to file their complete schedule of portfolio holdings with the SEC for their first and third fiscal quarters on Form N-Q. Copies of the filings are available without charge, upon request on the SEC’s website at www.sec.gov and are available by calling the Company at 877-369-4617. You can also obtain copies of Form N-Q by (i) visiting the SEC’s Public Reference Room in Washington, DC (information on the operation of the Public Reference Room may be obtained by calling 800-SEC-0330); (ii) sending your request and a duplicating fee to the SEC’s Public Reference Room, Washington, DC 20549-0102; or (iii) sending your request electronically to publicinfo@sec.gov.
Information about each Fund’s portfolio holdings is available daily at www.dbxstrategicadvisors.db.com.
TAX INFORMATION
Form 1099-DIV, Form 1042-S and other year-end tax information provide shareholders with actual calendar year amounts that should be included in their tax returns. Shareholders should consult their tax advisors.
The following distribution information is being provided as required by the Internal Revenue Code.
Each Fund designates the following amounts or, if subsequently determined to be different, the maximum amount allowable for its fiscal year ended May 31, 2011.
FEDERAL AND STATE INCOME TAX
| | | | | | | | |
| | | Qualified Dividend
Income* | | | Corporate Dividend
Received Deduction* | |
db-X 2010 Fund | | | 22% | | | | 13% | |
db-X 2020 Fund | | | 63% | | | | 37% | |
db-X 2030 Fund | | | 100% | | | | 57% | |
db-X 2040 Fund | | | 100% | | | | 75% | |
db-X In-Target Fund | | | 47% | | | | 28% | |
* The above percentage is based on ordinary income dividends paid to shareholders during each Fund’s fiscal year.
68
db-X Exchange-Traded Funds Inc.
PRIVACY POLICY NOTICE
DBX Strategic Advisors, LLC (“Advisors”) collects non-public information about you from the following sources: (i) information received from you on applications or other forms; and (ii) information about your transactions with the Advisors, Advisors’ affiliates and third-party service providers and vendors. Advisors does not disclose any non-public personal information about you to anyone, other than as set forth below, as permitted by applicable law and regulation. Advisors may disclose non-public personal information about you to the funds in which you invest, to Advisors’ affiliates, and to non-affiliated companies that work with Advisors to service your account(s), or to provide services or process transactions that you have requested. Advisors may disclose non-public personal information in situations that may include, but are not limited to, in response to legal and/or regulatory inquiries and the proposed or actual sale, assignment merger or other transfer of all or a portion of Advisors’ business to another business entity. Advisors may also disclose non-public personal information about you to parties representing you, such as your investment representative, your accountant, your tax adviser, or to other third parties at your direction/consent. Advisors will not sell, rent, license or trade your personal and financial information to or with third parties for their own direct marketing use unless you give us general or specific consent to do so. If you decide to close your account(s) or become an inactive customer, Advisors will adhere to the privacy policies and practices as described in this notice. Advisors restricts access to your personal and account information to those employees who need to know that information to provide products and services to you. Advisors maintains reasonable and customary physical, electronic and procedural safeguards to guard your non-public personal information.
Advisors reserves the right, at their discretion, to change, modify, add, or remove portions of this Privacy Policy Notice, and any of the policies described herein, at any time. Advisors will indicate any such changes to the Privacy Policy Notice at the privacy link which can be found at www.dbxstrategicadvisors.db.com. At all times, you are bound by the then-current version of the Privacy Policy and all applicable laws. Advisors highly recommends that you review this Privacy Policy Notice from time to time to ensure that you are familiar with the most recent version. The examples contained in this Privacy Policy Notice are illustrations; they are not intended to be exclusive.
69
db-X Exchange-Traded Funds Inc.
This report is intended for the shareholders of the db-X Exchange-Traded Funds. It may not be distributed to prospective Investors unless it is preceded or accompanied by the current prospectus.
An Investor should consider the fund’s investment objective, risks, charges and expenses carefully before investing. For this and more complete information about the fund call 877-369-4617 or visit the website www.dbxstrategicadvisors.db.com. Please read the prospectus carefully before investing.
There are risks involved with investing in exchange-traded funds including possible loss of money. db-X Exchange-Traded Funds are not actively managed and are subject to risks similar to stocks, including those related to short selling and margin maintenance. Losses from short sales may be unlimited, and losses from purchases on margin may exceed original investment.
Investments in small and medium capitalization companies will be subject to higher volatility than larger, more established companies.
Investments in foreign securities will be subject to certain risks not associated with domestic securities, such as currency fluctuations, and changes in political and economic conditions.
Investments in fixed income securities will be subject to certain risks as well. The prices of fixed income securities respond to economic developments, particularly interest rate changes, as well as to perceptions about the credit risk of individual issuers. Generally, fixed income securities will decrease in value if interest rates rise, and the volatility of lower rated securities is even greater than that of higher rated securities.
There is no assurance that the investment process will consistently lead to successful investing. Diversification does not eliminate the risk of experiencing investment losses.
The prospectus is not an offer to buy or sell the portfolio shares, nor is the fund soliciting an offer to buy its shares in any jurisdiction where the offer or sale is not permitted.
db-X Exchange-Traded Funds are distributed by ALPS Distributors, Inc., member of FINRA, which is neither affiliated with db-X Exchange-Traded Funds Inc. or any other affiliate, nor is it affiliated with The Bank of New York Mellon, Amerivest Investment Management, LLC, or TDAM USA Inc.
“Target Date” refers to a time in the future, generally a specified year, in which the investor expects to retire or otherwise require the use of the invested funds. Target date funds are generally more aggressive the further the target date is from the present, with an objective of capital appreciation. As the target date approaches, the fund’s objective will generally become more conservative, aiming to achieve a higher level of capital preservation.
Investors should note that although target date funds aim to preserve capital as the target date approaches, there is no guarantee that the fund will achieve this objective.
db-X Exchange-Traded Funds Inc.
INVESTMENT ADVISOR
DBX Strategic Advisors LLC
60 Wall Street
New York, NY 10005
INVESTMENT SUB-ADVISOR
TDAM USA Inc.
161 Bay Street, 35th Floor
TD Canada Trust Tower
Toronto, Ontario Canada M5J 2T2
ADMINISTRATOR, CUSTODIAN, FUND ACCOUNTANT & TRANSFER AGENT
The Bank of New York Mellon
101 Barclay Street
New York, NY 10286
DISTRIBUTOR
ALPS Distributors, Inc.
1290 Broadway
Suite 1100
Denver, CO 80203
INDEPENDENT REGISTERED PUBLIC ACCOUNTING FIRM
Ernst & Young LLP
5 Times Square
New York, NY 10036
LEGAL COUNSEL
Dechert LLP
1095 Avenue of the Americas
New York, NY 10036
(a) The Fund has adopted a code of ethics (the “Code of Ethics”) that applies to its principal executive officer, principal financial officer, principal accounting officer or controller, or persons performing similar functions. This Code is filed as an exhibit to this report on Form N-CSR under item (a)(1).
| Item 3. | Audit Committee Financial Expert. |
R. Charles Tschampion is the designated financial expert on the Audit Committee of db-X Exchange-Traded Funds Inc. With respect to db-X Exchange-Traded Funds Inc., R. Charles Tschampion is not an “interested person” as such terms are defined by Section 2(a)(19) of the Act (15 U.S.C. 80a-2(a)(19).
| Item 4. | Principal Accountant Fees and Services. |
(a) Audit Fees. Fees for audit services for the Registrant’s fiscal year ended May 31, 2011 and 2010, for professional services rendered by Ernst & Young LLP (“principal accountant”) for the audit of the Registrant’s annual financial statements were $90,000 and $90,000, respectively. Fees for professional services rendered by Eisner LLP (“predecessor accountant”) for the reissuance of the Registrant’s annual financial statements opinion for the fiscal year ended May 31, 2009, including examinations of securities conducted under rule 17f-2 of the 1940 Act for the fiscal year ended May 31, 2010 was $16,023.
(b) Audit-Related Fees. The aggregate fees billed for the Registrant’s fiscal year ended May 31, 2011 and 2010, for professional services rendered by the principal accountant for assurance and related services by the principal accountant that are reasonably related to the performance of the audit of the Registrant’s financial statements and are not reported above in Item 4(a) were $0 and $0, respectively.
(c) Tax Fees. Fees for tax services billed to the Registrant during the fiscal year ended May 31, 2011 and 2010, for professional services rendered by the principal accountant for tax compliance, tax advice and tax planning were $15,000 and $15,000, respectively.
(d) All Other Fees. All other aggregate fees billed for the Registrant’s fiscal year ended May 31, 2011 and 2010 were $0 and $0, respectively.
(e) Audit Committee Pre-Approval Policies and Procedures. In accordance with Rule 2-01(c)(7)(A), the Audit Committee pre-approves all of the audit and permissible non-audit services of the Registrant. All of the services described in paragraphs (b) through (d) above were approved by the Audit Committee in accordance with paragraph (c) (7) (i) (c) of Rule 2-01 of Regulation S-X.
(f) Not applicable.
(g) Not applicable.
(h) The Registrant’s Audit Committee has considered whether the provision of non-audit services that were rendered to the Registrant’s investment adviser, and any entity controlling, controlled by, or under common control with the investment adviser that provides ongoing services to the Registrant which were not pre-approved (not requiring pre-approval) is compatible with maintaining the principal accountant’s independence.
| Items 5. | Audit Committee of Listed Registrants. |
The Registrant is a listed issuer as defined in Rule 10A-3 under the Exchange Act and has a separately-designated standing audit committee established in accordance with Section 3(a)(58)(A) of the Exchange Act. The Registrant’s audit committee members are Ernest J. Scalberg, Michael G. Smith and R. Charles Tschampion.
| Item 6. | Schedule of Investments. |
(a) The schedule is included as a part of the report to shareholders filed under Item 1 of this Form.
(b) Not Applicable.
| Item 7. | Disclosure of Proxy Voting Policies and Procedures for Closed-End Management Investment Companies. |
Not applicable.
| Item 8. | Portfolio Managers of Closed-End Management Investment Companies. |
Not applicable.
| Item 9. | Purchases of Equity Securities by Closed-End Management Investment Company and Affiliated Purchasers. |
Not applicable.
| Item 10. | Submission of Matters to a Vote of Security Holders. |
There have been no material changes to the procedures by which the shareholders may recommend nominees to the Registrant’s Board of Directors that would require disclosure herein.
| Item 11. | Controls and Procedures. |
| a) | Based on their evaluation of the Registrant’s disclosure controls and procedures (as defined in Rule 30a-3-(c) under the Investment Company Act of 1940) as of a date within 90 days of the filing date of this report, the Registrant’s Chief Executive Officer (principal executive officer) and Chief Financial Officer (principal financial officer) have concluded that such disclosure controls and procedures are reasonably designed and are operating effectively to ensure that material information relating to the Registrant, including its consolidated subsidiaries, is made known to them by others within those entities, particularly during the period in which this report is being prepared, and that the information required in filings on Form N-CSR is recorded, processed, summarized and reported on a timely basis. |
| b) | There were no significant changes in the Registrant’s internal controls over financial reporting (as defined in Rule 30a-3(d) under the Investment Company Act of 1940) that occurred during the Registrant’s last fiscal quarter that have materially affected, or are reasonably likely to materially affect, the Registrant’s internal control over financial reporting. |
(a)(1) Code of Ethics
(a)(2) Certifications of the Registrant’s Chief Executive Officer and Chief Financial Officer pursuant to Section 302 of the Sarbanes-Oxley Act of 2002 are attached as Exhibit 302CERT.
(b) Certifications of the Registrant’s Chief Executive Officer and Chief Financial Officer pursuant to Section 906 of the Sarbanes-Oxley Act of 2002 are attached as Exhibit 906CERT.
.
SIGNATURES
Pursuant to the requirements of the Securities Exchange Act of 1934 and the Investment Company Act of 1940, the Registrant has duly caused this report to be signed on its behalf by the undersigned, thereunto duly authorized.
(Registrant) db-X Exchange-Traded Funds Inc.
By: /s/ Alex Depetris
Name: Alex Depetris
Title: President and Chief Executive Officer
Date: August 3, 2011
Pursuant to the requirements of the Securities Exchange Act of 1934 and the Investment Company Act of 1940, this report has been signed by the following persons on behalf of the Registrant and in the capacities and on the dates indicated.
By: /s/ Alex Depetris
Name: Alex Depetris
Title: President and Chief Executive Officer
Date: August 3, 2011
By: /s/ Michael Gilligan
Name: Michael Gilligan
Title: Treasurer, Chief Financial Officer and Controller
Date: August 3, 2011