UNITED STATES
SECURITIES AND EXCHANGE COMMISSION
Washington, D.C. 20549
FORM N-CSR
CERTIFIED SHAREHOLDER REPORT OF REGISTERED
MANAGEMENT INVESTMENT COMPANIES
Investment Company Act file number 811-22001
db-X Exchange-Traded Funds Inc.
(Exact name of registrant as specified in charter)
60 Wall Street
New York, New York 10005
(Address of principal executive offices) (Zip code)
Alex Depetris
db-X Exchange-Traded Funds Inc.
60 Wall Street
New York, New York 10005
(Name and address of agent for service)
Registrant’s telephone number, including area code: (212) 250-4352
Date of fiscal year end: May 31
Date of reporting period: May 31, 2013
Form N-CSR is to be used by management investment companies to file reports with the Commission not later than 10 days after the transmission to stockholders of any report that is required to be transmitted to stockholders under Rule 30e-1 under the Investment Company Act of 1940 (17 CFR 270.30e-1). The Commission may use the information provided on Form N-CSR in its regulatory, disclosure review, inspection, and policymaking roles.
A registrant is required to disclose the information specified by Form N-CSR, and the Commission will make this information public. A registrant is not required to respond to the collection of information contained in Form N-CSR unless the Form displays a currently valid Office of Management and Budget (“OMB”) control number. Please direct comments concerning the accuracy of the information collection burden estimate and any suggestions for reducing the burden to Secretary, Securities and Exchange Commission, 100 F Street, NE, Washington, DC 20549. The OMB has reviewed this collection of information under the clearance requirements of 44 U.S.C. § 3507.
| Item 1. | | Reports to Stockholders. |
The Report to Shareholders is attached herewith.
ANNUAL REPORT
May 31, 2013
db-X Exchange-Traded Funds Inc.
db X-trackers 2010 Target Date Fund (TDD)
(formerly known as db-X 2010 Target Date Fund)
db X-trackers 2020 Target Date Fund (TDH)
(formerly known as db-X 2020 Target Date Fund)
db X-trackers 2030 Target Date Fund (TDN)
(formerly known as db-X 2030 Target Date Fund)
db X-trackers 2040 Target Date Fund (TDV)
(formerly known as db-X 2040 Target Date Fund)
db X-trackers In-Target Date Fund (TDX)
(formerly known as db-X In-Target Date Fund)
db-X Exchange-Traded Funds Inc.
TABLE OF CONTENTS
TO OUR SHAREHOLDERS: (Unaudited)
Dear Shareholder,
We are pleased to present this Annual Report for db-X Exchange-Traded Funds Inc., which covers the year ended May 31, 2013.
We believe that these funds provide convenience and clarity for investors seeking a sophisticated product in one single investment. Over the past year, the funds have continued to highlight the benefits of target-date investing. During the one year covered by this report, investors with a longer investment horizon benefitted from higher exposure to equities as the db X-trackers 2040 Target Date Fund and the db X-trackers 2030 Target Date Fund, which allocate a large percentage of assets to domestic and international equities, experienced NAV returns of 26.35% and 20.94%, respectively.* The db X-trackers 2020 Target Date Fund, with a more balanced allocation between equity and fixed income securities, experienced a NAV return of 15.04%.* The db X-trackers 2010 Target Date Fund and the X-trackers In-Target Date Fund, which have the greatest percentage allocations to less volatile fixed income securities experienced NAV returns of 4.41% and 8.37%, respectively.*
Deutsche Bank, a leading global banking institution, has managed and operated a successful and growing platform of exchange-traded products since 2006. Our team at Deutsche Bank values the trust that you have placed in us and we look forward to meeting your investment needs by continuing to offer innovative index-driven strategies.
Very truly yours,
|
Alex Depetris Chairman, President and Chief Executive Officer |
July 26, 2013 |
*************************
* Past performance is no guarantee of future results. Fund performance assumes reinvestment of dividends and capital gains distributions. A Fund’s net asset value (“NAV”) return is based on the changes in the Fund’s NAV per share for the period indicated. A Fund’s NAV per share is calculated by dividing the value of the Fund’s total assets less total liabilities by the number of shares outstanding. Current Fund performance may be higher or lower than the performance quoted. The most recent month end performance may be obtained by visiting www.dbxus.com.
An index is a statistical measure of a specified financial market or sector. An index is unmanaged and one cannot invest directly in an index. An index does not actually hold a portfolio of securities, incur expenses, or pay any transaction costs. Therefore, index returns do not reflect deductions for fees or expenses. In comparison, a Fund’s performance is negatively impacted by these deductions. Fund returns do not reflect brokerage commissions or taxes that a shareholder would pay on Fund distributions or on transactions in Fund shares.
The views expressed in this report reflect those of the portfolio management team only through the end of the period of the report as stated on the cover. The management team’s views are subject to change at any time based on market and other conditions and should not be construed as a recommendation. Current and future portfolio holdings are subject to risk. Investment in the Funds poses investment risk, including possible loss of principal. The investment return and principal value of an investment will fluctuate, so that shares, when sold or redeemed, may be worth more or less than their original cost.
1
This Page is Intentionally Left Blank
2
db-X Exchange-Traded Funds Inc.
MANAGEMENT’S DISCUSSION OF FUND PERFORMANCE (Unaudited)
For the year ended May 31, 2013 equity markets strengthened around the world as a combination of improving economic fundamentals, waning concern over Eurozone instability and U.S Federal Reserve stimulus measures pushed stocks higher, with the S&P 500 Index increasing 27.28%, the Russell 3000 Index increasing 27.88% and the NASDAQ Composite Index increasing 19.80%. International markets were even stronger, with the Morgan Stanley Capital International EAFE Index (measuring equities in Europe, Australasia and the Far East) gaining 31.62%. Equity strength pushed U.S. fixed income securities to the back burner as risk appetites increased, with the Barclays Capital U.S. Aggregate Bond Index increasing only 0.91% during the same period.
The db-X Exchange-Traded Funds had a wide range of returns during the year (For specific performance results, please refer to the Performance Summary on the following pages of this report). The wide range in the performance of the five db-X Exchange-Traded Funds was due to the varying allocations in the funds to domestic equities, international equities and fixed income securities. The db X-trackers 2040 Target Date Fund, which has the greatest exposure to domestic and international equities, experienced an increase in NAV of 26.35% during the year ended May 31, 2013. The db X-trackers 2010 Target Date Fund, which has a heavy exposure to short term U.S. Treasuries, experienced a more modest increase in NAV of 4.41% during the same period.
The Standard & Poor’s (“S&P”) 500 Index is a broad-based index designed to measure the performance of the domestic stock market as represented by 500 large capitalization stocks.
The Russell 3000 Index is a broad-based index representing approximately 98% of the investable U.S. equity market.
The NASDAQ Composite Index is a broad-based index of NASDAQ-listed securities commonly used as a barometer of technology stock performance.
The Morgan Stanley Capital International (“MSCI”) EAFE Index is a broad-based index representing the largest stocks by market capitalization in 21 developed countries in Europe, Australasia and the Far East.
The Barclays Capital U.S. Aggregate Bond Index is a broad-based index designed to represent the U.S. investment-grade bond universe.
*************************
Performance quoted above represents past performance, assumes reinvestment of all dividends and capital gains distributions at net asset value (“NAV”), and does not guarantee future results. A Fund’s NAV return is based on the changes in the Fund’s NAV per share for the period indicated. A Fund’s NAV per share is calculated by dividing the value of the Fund’s total assets less total liabilities by the number of shares outstanding. Current Fund performance may be higher or lower than the performance quoted. Fund performance data current to the most recent month end may be obtained by visiting www.dbxus.com. See pages 4-13 of this report for additional performance information, including performance data based on market value.
An index is a statistical measure of a specified financial market or sector. An index does not actually hold a portfolio of securities, incur expenses, or pay any transaction costs. Therefore, index returns do not reflect deductions for fees or expenses and are not available for direct investment. In comparison, a Fund’s performance is negatively impacted by these deductions. Fund returns do not reflect brokerage commissions or taxes that a shareholder would pay on Fund distributions or on transactions in Fund shares.
The views expressed in this report reflect those of the portfolio management team only through the end of the period of the report as stated on the cover. The management team’s views are subject to change at any time based on market and other conditions and should not be construed as a recommendation. Current and future portfolio holdings are subject to risk. Investment in the Funds poses investment risk, including possible loss of principal. The investment return and principal value of an investment will fluctuate, so that shares, when sold or redeemed, may be worth more or less than their original cost.
3
db-X Exchange-Traded Funds Inc.
PERFORMANCE SUMMARY
db X-trackers 2010 Target Date Fund (TDD) (Unaudited)
The db X-trackers 2010 Target Date Fund (the “Fund”) commenced investment operations and its shares began trading on NYSE Arca, Inc. (“NYSE Arca”) on October 1, 2007. The Fund seeks to track the performance, before fees and expenses, of the Zacks 2010 Lifecycle Index. Both the Fund’s equity and bond portfolios held fewer securities than the Zacks 2010 Lifecycle Index, a constraint imposed by the relatively small size of the Fund.
For the year ended May 31, 2013, the Fund’s net asset value increased 4.41%, compared to an increase of 4.80% for the Zacks 2010 Lifecycle Index and an increase of 4.81% for the Dow Jones Target 2010 Index. The fund’s performance benefited from favorable results in short-term fixed income securities, though the bulk of the returns were the result of the fund’s exposure to domestic and international equities.
Performance as of 5/31/13
| | | | | | | | |
| Average Annual Total Returns |
| | | Net Asset Value | | Market Price | | Zacks 2010 Lifecycle
Index | | Dow Jones Target 2010
Index |
One Year | | 4.41% | | 6.65% | | 4.80% | | 4.81% |
Five Year | | 1.71% | | 0.84% | | 2.02% | | 4.24% |
Since Inception1 | | 1.33% | | 0.57% | | 1.62% | | 4.22% |
|
| Cumulative Total Returns |
| | | Net Asset Value | | Market Price | | Zacks 2010 Lifecycle
Index | | Dow Jones Target 2010
Index |
One Year | | 4.41% | | 6.65% | | 4.80% | | 4.81% |
Five Year | | 8.85% | | 4.28% | | 10.51% | | 23.09% |
Since Inception1 | | 7.78% | | 3.28% | | 9.56% | | 26.37% |
1 Total returns are calculated based on the commencement of trading, 10/1/07 (“Inception”).
Performance quoted represents past performance, assumes reinvestment of all dividends and capital gain distributions, and does not guarantee future results. Current performance may be higher or lower than the performance quoted. Performance data current to the most recent month end may be obtained by visiting www.dbxus.com. Investment in the fund poses investment risk including possible loss of principal. The investment return and principal value of an investment will fluctuate, so that shares, when sold or redeemed, may be worth more or less than their original cost. The gross expense ratio for the fiscal year ended May 31, 2012, as disclosed in the most recent prospectus dated September 28, 2012, was 1.39%. DBX Strategic Advisors LLC, the advisor to the Fund, has agreed to cap its fees and/or pay certain Fund operating expenses in order to limit Fund net annual operating expenses for shares of the Fund to 0.65% of the Fund’s average net assets until 9/30/13.
The preceding performance chart is provided for comparative purposes and represents the period(s) noted. The net asset value return is based on the changes in the Fund’s net asset value per share (“NAV”). The Fund’s NAV is calculated by dividing the value of the Fund’s total assets less total liabilities by the number of shares outstanding. The market price return is based on the change in the market price on the NYSE Arca of a share of the Fund for the period(s) indicated. The price used to calculate market price returns is the midpoint of the bid/ask spread for Fund shares at 4 p.m. Eastern Time on the NYSE Arca. NAV and market returns assume that dividends and capital gain distributions have been reinvested in the Fund at NAV and market price, respectively. The Dow Jones Target Date Indexes are indexes whose allocations are automatically adjusted to reduce potential risk over time. The Dow Jones Target Date Indexes are designed to measure the performance of multi-asset class portfolios that allocate among U.S. and global stock, bond and cash sub indexes on a monthly basis. The indexes automatically adjust their asset allocation over time to reflect reductions in potential risk as the investor’s target date approaches.
An index is a statistical measure of a specified financial market or sector. An index does not actually hold a portfolio of securities, incur expenses or pay any transaction costs. Therefore index returns do not reflect deductions for fees or expenses and are not available for direct investment. In comparison, the Fund’s performance is negatively impacted by these deductions. Fund returns do not reflect brokerage commissions or taxes that a shareholder would pay on Fund distributions or on transactions in Fund shares.
“Target Date” refers to a time in the future, generally a specified year, in which the investor expects to retire or otherwise require the use of the invested funds. Target date funds are generally more aggressive the further the target date is from the present, with an objective of capital appreciation. As the target date approaches, the fund’s objective will generally become more conservative, aiming to achieve a higher level of capital preservation. Upon reaching the target date, the index whose performance the Fund seeks to track will have approximately a 10% allocation to equity securities. Over the next five years, allocations shift from conservative to more moderately-conservative allocations, allowing for a larger exposure to equities than at the target date (“Moderately-Conservative Allocation”).
Investors should note that although target date funds aim to preserve capital as the target date approaches, there is no guarantee that the Fund will achieve this objective.
4
db-X Exchange-Traded Funds Inc.
PERFORMANCE SUMMARY
db X-trackers 2010 Target Date Fund (TDD) (Unaudited) (Continued)
Growth of a $10,000 Investment in TDD2 as of 5/31/13
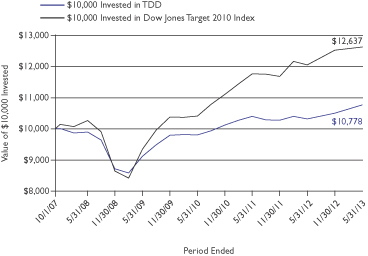
2 Based on Net Asset Value from commencement of trading 10/1/07.
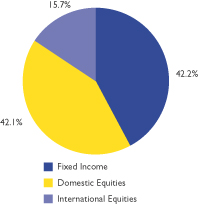
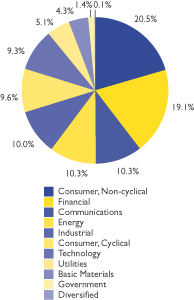
Asset Class Breakdown* as of 5/31/13
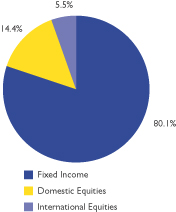
* Weightings are expressed as a percentage of total investments and may change over time.
Top Ten Holdings3 as of 5/31/13
| | | | | | | | | | | | |
| |
| Top Ten Equity Holdings | |
| | | |
| Description | | Shares | | | Value | | | % of Net Assets | |
Exxon Mobil Corp. | | | 497 | | | | $44,963 | | | | 0.5% | |
Apple, Inc. | | | 94 | | | | 42,270 | | | | 0.4% | |
Berkshire Hathaway, Inc., Class B | | | 312 | | | | 35,590 | | | | 0.4% | |
Google, Inc., Class A | | | 39 | | | | 33,946 | | | | 0.4% | |
Chevron Corp. | | | 250 | | | | 30,688 | | | | 0.3% | |
Microsoft Corp. | | | 879 | | | | 30,661 | | | | 0.3% | |
General Electric Co. | | | 1,210 | | | | 28,217 | | | | 0.3% | |
Johnson & Johnson | | | 324 | | | | 27,274 | | | | 0.3% | |
Procter & Gamble (The) Co. | | | 328 | | | | 25,177 | | | | 0.3% | |
Wells Fargo & Co. | | | 572 | | | | 23,195 | | | | 0.2% | |
| | | | | | | | | | | | |
| |
| Top Ten Fixed Income Holdings | |
| | | |
| Description | | Principal Amount | | | Value | | | % of Net Assets | |
US Treasury Bond/Note 1.75%, 3/31/14 | | | $500,000 | | | | $506,699 | | | | 5.2% | |
US Treasury Bond/Note 4.75%, 5/15/14 | | | 434,800 | | | | 453,771 | | | | 4.6% | |
US Treasury Bond/Note 2.375%, 9/30/14 | | | 435,000 | | | | 447,557 | | | | 4.6% | |
US Treasury Bond/Note 4.25%, 11/15/14 | | | 409,000 | | | | 432,756 | | | | 4.4% | |
US Treasury Bond/Note 0.50%, 10/15/13 | | | 426,000 | | | | 426,699 | | | | 4.3% | |
US Treasury Bond/Note 0.75%, 6/15/14 | | | 412,000 | | | | 414,527 | | | | 4.2% | |
US Treasury Bond/Note 0.25%, 12/15/14 | | | 405,000 | | | | 405,127 | | | | 4.1% | |
US Treasury Bond/Note 2.625%, 7/31/14 | | | 390,000 | | | | 401,091 | | | | 4.1% | |
US Treasury Bond/Note 0.50%, 10/15/14 | | | 395,000 | | | | 396,605 | | | | 4.0% | |
US Treasury Bond/Note 1.00%, 7/15/13 | | | 395,000 | | | | 395,494 | | | | 4.0% | |
3 Holdings are subject to change without notice and there is no guarantee that the Fund will remain invested in any particular security. For a complete list of holdings go to www.dbxus.com.
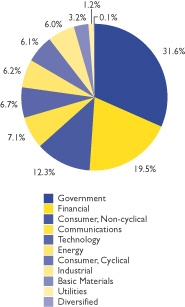
Sector Breakdown* as of 5/31/13
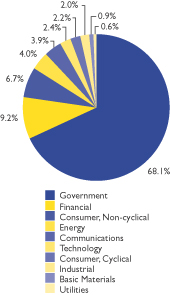
* Weightings are expressed as a percentage of total investments and may change over time. The sector classifications used above are based on company classifications under Bloomberg industry name.
5
db-X Exchange-Traded Funds Inc.
PERFORMANCE SUMMARY
db X-trackers 2020 Target Date Fund (TDH) (Unaudited)
The db X-trackers 2020 Target Date Fund (the “Fund”) commenced investment operations and its shares began trading on NYSE Arca, Inc. (“NYSE Arca”) on October 1, 2007. The Fund seeks to track the performance, before fees and expenses, of the Zacks 2020 Lifecycle Index. Both the Fund’s equity and bond portfolios held fewer securities than the Zacks 2020 Lifecycle Index, a constraint imposed by the relatively small size of the Fund.
For the year ended May 31, 2013, the Fund’s net asset value increased 15.04%, compared to an increase of 15.43% for the Zacks 2020 Lifecycle Index and 10.84% for the Dow Jones Target 2020 Index. The fund’s performance benefited from favorable results in domestic and international equities.
Performance as of 5/31/13
| | | | | | | | |
| Average Annual Total Returns |
| | | Net Asset Value | | Market Price | | Zacks 2020 Lifecycle
Index | | Dow Jones Target 2020
Index |
One Year | | 15.04% | | 20.50% | | 15.43% | | 10.84% |
Five Year | | 3.55% | | 2.98% | | 3.71% | | 4.03% |
Since Inception1 | | 2.24% | | 1.79% | | 2.38% | | 3.40% |
|
| Cumulative Total Returns |
| | | Net Asset Value | | Market Price | | Zacks 2020 Lifecycle
Index | | Dow Jones Target 2020
Index |
One Year | | 15.04% | | 20.50% | | 15.43% | | 10.84% |
Five Year | | 19.07% | | 15.79% | | 19.99% | | 21.84% |
Since Inception1 | | 13.35% | | 10.55% | | 14.29% | | 20.90% |
1 Total returns are calculated based on the commencement of trading, 10/1/07 (“Inception”).
Performance quoted represents past performance, assumes reinvestment of all dividends and capital gain distributions, and does not guarantee future results. Current performance may be higher or lower than the performance quoted. Performance data current to the most recent month end may be obtained by visiting www.dbxus.com. Investment in the fund poses investment risk including possible loss of principal. The investment return and principal value of an investment will fluctuate, so that shares, when sold or redeemed, may be worth more or less than their original cost. The gross expense ratio for the fiscal year ended May 31, 2012, as disclosed in the most recent prospectus dated September 28, 2012, was 1.16%. DBX Strategic Advisors LLC, the advisor to the Fund, has agreed to cap its fees and/or pay certain Fund operating expenses in order to limit Fund net annual operating expenses for shares of the Fund to 0.65% of the Fund’s average net assets until 9/30/13.
The preceding performance chart is provided for comparative purposes and represents the period(s) noted. The net asset value return is based on the changes in the Fund’s net asset value per share (“NAV”). The Fund’s NAV is calculated by dividing the value of the Fund’s total assets less total liabilities by the number of shares outstanding. The market price return is based on the change in the market price on the NYSE Arca of a share of the Fund for the period(s) indicated. The price used to calculate market price returns is the midpoint of the bid/ask spread for Fund shares at 4 p.m. Eastern Time on the NYSE Arca. NAV and market returns assume that dividends and capital gain distributions have been reinvested in the Fund at NAV and market price, respectively. The Dow Jones Target Date Indexes are indexes whose allocations are automatically adjusted to reduce potential risk over time. The Dow Jones Target Date Indexes are designed to measure the performance of multi-asset class portfolios that allocate among U.S. and global stock, bond and cash subindexes on a monthly basis. The indexes automatically adjust their asset allocation over time to reflect reductions in potential risk as the investor’s target date approaches.
An index is a statistical measure of a specified financial market or sector. An index does not actually hold a portfolio of securities, incur expenses or pay any transaction costs. Therefore index returns do not reflect deductions for fees or expenses and are not available for direct investment. In comparison, the Fund’s performance is negatively impacted by these deductions. Fund returns do not reflect brokerage commissions or taxes that a shareholder would pay on Fund distributions or on transactions in Fund shares.
“Target Date” refers to a time in the future, generally a specified year, in which the investor expects to retire or otherwise require the use of the invested funds. Target date funds are generally more aggressive the further the target date is from the present, with an objective of capital appreciation. As the target date approaches, the fund’s objective will generally become more conservative, aiming to achieve a higher level of capital preservation. Upon reaching the target date, the index whose performance the Fund seeks to track will have approximately a 10% allocation to equity securities. Over the next five years, allocations shift from conservative to more moderately-conservative allocations, allowing for a larger exposure to equities than at the target date (“Moderately-Conservative Allocation”).
Investors should note that although target date funds aim to preserve capital as the target date approaches, there is no guarantee that the Fund will achieve this objective.
6
db-X Exchange-Traded Funds Inc.
PERFORMANCE SUMMARY
db X-trackers 2020 Target Date Fund (TDH) (Unaudited) (Continued)
Growth of a $10,000 Investment in TDH2 as of 5/31/13
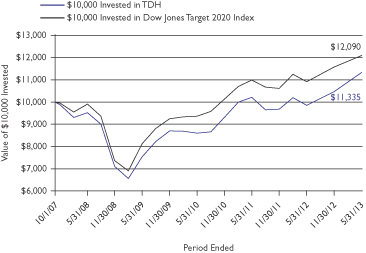
2 Based on Net Asset Value from commencement of trading 10/1/07.
Asset Class Breakdown* as of 5/31/13
* Weightings are expressed as a percentage of total investments and may change over time.
Top Ten Holdings3 as of 5/31/13
| | | | | | | | | | | | |
| |
| Top Ten Equity Holdings | |
| | | |
| Description | | Shares | | | Value | | | % of Net Assets | |
Exxon Mobil Corp. | | | 4,678 | | | | $423,219 | | | | 1.4% | |
Apple, Inc. | | | 919 | | | | 413,255 | | | | 1.3% | |
Microsoft Corp. | | | 8,581 | | | | 299,306 | | | | 1.0% | |
Google, Inc., Class A | | | 337 | | | | 293,327 | | | | 0.9% | |
Berkshire Hathaway, Inc., Class B | | | 2,520 | | | | 287,457 | | | | 0.9% | |
International Business Machines Corp. | | | 1,212 | | | | 252,120 | | | | 0.8% | |
General Electric Co. | | | 10,791 | | | | 251,646 | | | | 0.8% | |
Wal-Mart Stores, Inc. | | | 3,357 | | | | 251,238 | | | | 0.8% | |
Chevron Corp. | | | 1,927 | | | | 236,539 | | | | 0.8% | |
Johnson & Johnson | | | 2,737 | | | | 230,401 | | | | 0.7% | |
| | | | | | | | | | | | |
| |
| Top Ten Fixed Income Holdings | |
| | | |
| Description | | Principal Amount | | | Value | | | % of Net Assets | |
US Treasury Bond/Note 0.75%, 9/15/13 | | | $1,111,900 | | | | $1,114,202 | | | | 3.6% | |
National Rural Utilities Cooperative Finance Corp. 1.00%, 2/02/15 | | | 784,000 | | | | 790,141 | | | | 2.5% | |
US Treasury Bond/Note 0.25%, 12/15/14 | | | 719,800 | | | | 720,025 | | | | 2.3% | |
US Treasury Bond/Note 2.50%, 3/31/15 | | | 684,800 | | | | 712,380 | | | | 2.3% | |
US Treasury Bond/Note 4.25%, 8/15/15 | | | 642,700 | | | | 697,631 | | | | 2.2% | |
US Treasury Bond/Note 2.625%, 12/31/14 | | | 652,400 | | | | 676,941 | | | | 2.2% | |
US Treasury Bond/Note 2.375%, 9/30/14 | | | 652,400 | | | | 671,233 | | | | 2.2% | |
US Treasury Bond/Note 2.375%, 2/28/15 | | | 641,800 | | | | 665,191 | | | | 2.1% | |
US Treasury Bond/Note 2.125%, 5/31/15 | | | 641,800 | | | | 664,915 | | | | 2.1% | |
US Treasury Bond/Note 0.375%, 3/15/15 | | | 659,800 | | | | 660,909 | | | | 2.1% | |
| | | | | | | | | | | | | |
3 Holdings are subject to change without notice and there is no guarantee that the Fund will remain invested in any particular security. For a complete list of holdings go to www.dbxus.com.
Sector Breakdown* as of 5/31/13
* Weightings are expressed as a percentage of total investments and may change over time. The sector classifications used above are based on company classifications under Bloomberg industry name.
7
db-X Exchange-Traded Funds Inc.
PERFORMANCE SUMMARY
db X-trackers 2030 Target Date Fund (TDN) (Unaudited)
The db X-trackers 2030 Target Date Fund (the “Fund”) commenced investment operations and its shares began trading on NYSE Arca, Inc. (“NYSE Arca”) on October 1, 2007. The Fund seeks to track the performance, before fees and expenses, of the Zacks 2030 Lifecycle Index. Both the Fund’s equity and bond portfolios held fewer securities than the Zacks 2030 Lifecycle Index, a constraint imposed by the relatively small size of the Fund.
For the year ended May 31, 2013, the Fund’s net asset value increased 20.94%, compared to an increase of 21.88% for the Zacks 2030 Lifecycle Index and 17.75% for the Dow Jones Target 2030 Index. The fund’s performance benefitted from a large exposure to domestic and international equities.
Performance as of 5/31/13
| | | | | | | | |
| Average Annual Total Returns |
| | | Net Asset Value | | Market Price | | Zacks 2030 Lifecycle
Index | | Dow Jones Target 2030
Index |
One Year | | 20.94% | | 29.97% | | 21.88% | | 17.75% |
Five Year | | 3.55% | | 3.60% | | 4.04% | | 4.13% |
Since Inception1 | | 1.70% | | 1.78% | | 2.14% | | 3.01% |
|
| Cumulative Total Returns |
| | | Net Asset Value | | Market Price | | Zacks 2030 Lifecycle
Index | | Dow Jones Target 2030
Index |
One Year | | 20.94% | | 29.97% | | 21.88% | | 17.75% |
Five Year | | 19.06% | | 19.33% | | 21.93% | | 22.45% |
Since Inception1 | | 10.02% | | 10.49% | | 12.74% | | 18.32% |
1 Total returns are calculated based on the commencement of trading, 10/1/07 (“Inception”).
Performance quoted represents past performance, assumes reinvestment of all dividends and capital gain distributions, and does not guarantee future results. Current performance may be higher or lower than the performance quoted. Performance data current to the most recent month end may be obtained by visiting www.dbxus.com. Investment in the fund poses investment risk including possible loss of principal. The investment return and principal value of an investment will fluctuate, so that shares, when sold or redeemed, may be worth more or less than their original cost. The gross expense ratio for the fiscal year ended May 31, 2012, as disclosed in the most recent prospectus dated September 28, 2012, was 1.18%. DBX Strategic Advisors LLC, the advisor to the Fund, has agreed to cap its fees and/or pay certain Fund operating expenses in order to limit Fund net annual operating expenses for shares of the Fund to 0.65% of the Fund’s average net assets until 9/30/13.
The preceding performance chart is provided for comparative purposes and represents the period(s) noted. The net asset value return is based on the changes in the Fund’s net asset value per share (“NAV”). The Fund’s NAV is calculated by dividing the value of the Fund’s total assets less total liabilities by the number of shares outstanding. The market price return is based on the change in the market price on the NYSE Arca of a share of the Fund for the period(s) indicated. The price used to calculate market price returns is the midpoint of the bid/ask spread for Fund shares at 4 p.m. Eastern Time on the NYSE Arca. NAV and market returns assume that dividends and capital gain distributions have been reinvested in the Fund at NAV and market price, respectively. The Dow Jones Target Date Indexes are indexes whose allocations are automatically adjusted to reduce potential risk over time. The Dow Jones Target Date Indexes are designed to measure the performance of multi-asset class portfolios that allocate among U.S. and global stock, bond and cash subindexes on a monthly basis. The indexes automatically adjust their asset allocation over time to reflect reductions in potential risk as the investor’s target date approaches.
An index is a statistical measure of a specified financial market or sector. An index does not actually hold a portfolio of securities, incur expenses or pay any transaction costs. Therefore index returns do not reflect deductions for fees or expenses and are not available for direct investment. In comparison, the Fund’s performance is negatively impacted by these deductions. Fund returns do not reflect brokerage commissions or taxes that a shareholder would pay on Fund distributions or on transactions in Fund shares.
“Target Date” refers to a time in the future, generally a specified year, in which the investor expects to retire or otherwise require the use of the invested funds. Target date funds are generally more aggressive the further the target date is from the present, with an objective of capital appreciation. As the target date approaches, the fund’s objective will generally become more conservative, aiming to achieve a higher level of capital preservation. Upon reaching the target date, the index whose performance the Fund seeks to track will have approximately a 10% allocation to equity securities. Over the next five years, allocations shift from conservative to more moderately-conservative allocations, allowing for a larger exposure to equities than at the target date (“Moderately-Conservative Allocation”).
Investors should note that although target date funds aim to preserve capital as the target date approaches, there is no guarantee that the Fund will achieve this objective.
8
db-X Exchange-Traded Funds Inc.
PERFORMANCE SUMMARY
db X-trackers 2030 Target Date Fund (TDN) (Unaudited) (Continued)
Growth of a $10,000 Investment in TDN2 as of 5/31/13
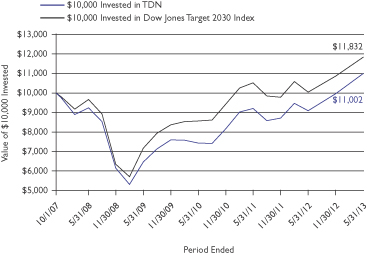
2 Based on Net Asset Value from commencement of trading 10/1/07.
Asset Class Breakdown* as of 5/31/13
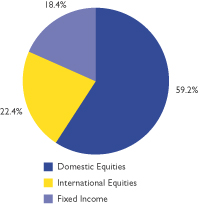
* Weightings are expressed as a percentage of total investments and may change over time.
Top Ten Holdings3 as of 5/31/13
| | | | | | | | | | | | |
| |
| Top Ten Equity Holdings | |
| | | |
| Description | | Shares | | | Value | | | % of Net Assets | |
Exxon Mobil Corp. | | | 6,426 | | | | $581,360 | | | | 1.9% | |
Apple, Inc. | | | 1,265 | | | | 568,845 | | | | 1.9% | |
Google, Inc., Class A | | | 464 | | | | 403,871 | | | | 1.3% | |
Microsoft Corp. | | | 11,539 | | | | 402,479 | | | | 1.3% | |
Berkshire Hathaway, Inc., Class B | | | 3,448 | | | | 393,314 | | | | 1.3% | |
International Business Machines Corp. | | | 1,748 | | | | 363,619 | | | | 1.2% | |
Wal-Mart Stores, Inc. | | | 4,710 | | | | 352,495 | | | | 1.2% | |
General Electric Co. | | | 14,969 | | | | 349,076 | | | | 1.2% | |
Chevron Corp. | | | 2,642 | | | | 324,306 | | | | 1.1% | |
Johnson & Johnson | | | 3,790 | | | | 319,042 | | | | 1.1% | |
| | | | | | | | | | | | |
| |
| Top Ten Fixed Income Holdings | |
| | | |
| Description | | Principal Amount | | | Value | | | % of Net Assets | |
Procter & Gamble (The) Co. 5.55%, 3/05/37 | | | $186,000 | | | | $229,631 | | | | 0.8% | |
General Electric Capital Corp. 2.10%, 1/07/14 | | | 222,000 | | | | 224,373 | | | | 0.7% | |
AT&T, Inc. 5.55%, 8/15/41 | | | 201,000 | | | | 222,847 | | | | 0.7% | |
Southern California Edison Co. 6.05%, 3/15/39 | | | 165,000 | | | | 210,958 | | | | 0.7% | |
Shell International Finance BV (Netherlands) 6.375%, 12/15/38 | | | 151,000 | | | | 202,160 | | | | 0.7% | |
Amgen, Inc. 5.65%, 6/15/42 | | | 158,000 | | | | 178,239 | | | | 0.6% | |
Cisco Systems, Inc. 5.90%, 2/15/39 | | | 137,000 | | | | 168,940 | | | | 0.6% | |
US Treasury Bond/Note 4.375%, 5/15/41 | | | 111,400 | | | | 135,265 | | | | 0.4% | |
Johnson & Johnson 5.95%, 8/15/37 | | | 101,000 | | | | 131,363 | | | | 0.4% | |
Florida Power & Light Co. 5.95%, 2/01/38 | | | 103,000 | | | | 130,527 | | | | 0.4% | |
3 Holdings are subject to change without notice and there is no guarantee that the Fund will remain invested in any particular security. For a complete list of holdings go to www.dbxus.com.
Sector Breakdown* as of 5/31/13
* Weightings are expressed as a percentage of total investments and may change over time. The sector classifications used above are based on company classifications under Bloomberg industry name.
9
db-X Exchange-Traded Funds Inc.
PERFORMANCE SUMMARY
db X-trackers 2040 Target Date Fund (TDV) (Unaudited)
The db X-trackers 2040 Target Date Fund (the “Fund”) commenced investment operations and its shares began trading on NYSE Arca, Inc. (“NYSE Arca”) on October 1, 2007. The Fund seeks to track the performance, before fees and expenses, of the Zacks 2040 Lifecycle Index. Both the Fund’s equity and bond portfolios held fewer securities than the Zacks 2040 Lifecycle Index, a constraint imposed by the relatively small size of the Fund.
For the year ended May 31, 2013, the Fund’s net asset value increased 26.35%, compared to an increase of 26.46% for the Zacks 2040 Lifecycle Index and 22.96% for the Dow Jones Target 2040 Index. The fund’s performance benefitted from a large exposure to domestic and international equities.
Performance as of 5/31/13
| | | | | | | | |
| Average Annual Total Returns |
| | | Net Asset Value | | Market Price | | Zacks 2040 Lifecycle
Index | | Dow Jones Target 2040
Index |
One Year | | 26.35% | | 20.50% | | 26.46% | | 22.96% |
Five Year | | 3.29% | | 2.52% | | 3.24% | | 4.31% |
Since Inception1 | | 1.36% | | 0.75% | | 1.33% | | 2.93% |
|
| Cumulative Total Returns |
| | | Net Asset Value | | Market Price | | Zacks 2040 Lifecycle
Index | | Dow Jones Target 2040
Index |
One Year | | 26.35% | | 20.50% | | 26.46% | | 22.96% |
Five Year | | 17.55% | | 13.23% | | 17.27% | | 23.47% |
Since Inception1 | | 7.98% | | 4.32% | | 7.78% | | 17.76% |
1 Total returns are calculated based on the commencement of trading, 10/1/07 (“Inception”).
Performance quoted represents past performance, assumes reinvestment of all dividends and capital gain distributions, and does not guarantee future results. Current performance may be higher or lower than the performance quoted. Performance data current to the most recent month end may be obtained by visiting www.dbxus.com. Investment in the fund poses investment risk including possible loss of principal. The investment return and principal value of an investment will fluctuate, so that shares, when sold or redeemed, may be worth more or less than their original cost. The gross expense ratio for the fiscal year ended May 31, 2012, as disclosed in the most recent prospectus dated September 28, 2012, was 1.20%. DBX Strategic Advisors LLC, the advisor to the Fund, has agreed to cap its fees and/or pay certain Fund operating expenses in order to limit Fund net annual operating expenses for shares of the Fund to 0.65% of the Fund’s average net assets until 9/30/13.
The preceding performance chart is provided for comparative purposes and represents the period(s) noted. The net asset value return is based on the changes in the Fund’s net asset value per share (“NAV”). The Fund’s NAV is calculated by dividing the value of the Fund’s total assets less total liabilities by the number of shares outstanding. The market price return is based on the change in the market price on the NYSE Arca of a share of the Fund for the period(s) indicated. The price used to calculate market price returns is the midpoint of the bid/ask spread for Fund shares at 4 p.m. Eastern Time on the NYSE Arca. NAV and market returns assume that dividends and capital gain distributions have been reinvested in the Fund at NAV and market price, respectively. The Dow Jones Target Date Indexes are indexes whose allocations are automatically adjusted to reduce potential risk over time. The Dow Jones Target Date Indexes are designed to measure the performance of multi-asset class portfolios that allocate among U.S. and global stock, bond and cash subindexes on a monthly basis. The indexes automatically adjust their asset allocation over time to reflect reductions in potential risk as the investor’s target date approaches.
An index is a statistical measure of a specified financial market or sector. An index does not actually hold a portfolio of securities, incur expenses or pay any transaction costs. Therefore index returns do not reflect deductions for fees or expenses and are not available for direct investment. In comparison, the Fund’s performance is negatively impacted by these deductions. Fund returns do not reflect brokerage commissions or taxes that a shareholder would pay on Fund distributions or on transactions in Fund shares.
“Target Date” refers to a time in the future, generally a specified year, in which the investor expects to retire or otherwise require the use of the invested funds. Target date funds are generally more aggressive the further the target date is from the present, with an objective of capital appreciation. As the target date approaches, the fund’s objective will generally become more conservative, aiming to achieve a higher level of capital preservation. Upon reaching the target date, the index whose performance the Fund seeks to track will have approximately a 10% allocation to equity securities. Over the next five years, allocations shift from conservative to more moderately-conservative allocations, allowing for a larger exposure to equities than at the target date (“Moderately-Conservative Allocation”).
Investors should note that although target date funds aim to preserve capital as the target date approaches, there is no guarantee that the Fund will achieve this objective.
10
db-X Exchange-Traded Funds Inc.
PERFORMANCE SUMMARY
db X-trackers 2040 Target Date Fund (TDV) (Unaudited) (Continued)
Growth of a $10,000 Investment in TDV2 as of 5/31/13
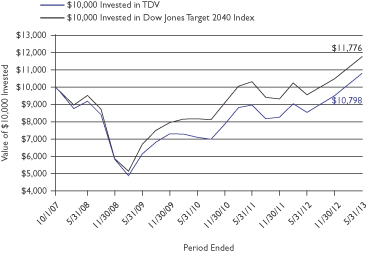
2 Based on Net Asset Value from commencement of trading 10/1/07.
Asset Class Breakdown* as of 5/31/13
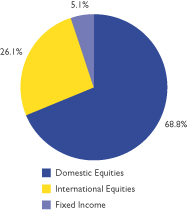
* Weightings are expressed as a percentage of total investments and may change over time.
Top Ten Holdings3 as of 5/31/13
| | | | | | | | | | | | |
| |
| Top Ten Equity Holdings | |
| | | |
| Description | | Shares | | | Value | | | % of Net Assets | |
Exxon Mobil Corp. | | | 7,397 | | | | $669,206 | | | | 2.2% | |
Apple, Inc. | | | 1,466 | | | | 659,230 | | | | 2.2% | |
Microsoft Corp. | | | 13,549 | | | | 472,590 | | | | 1.6% | |
Google, Inc., Class A | | | 529 | | | | 460,447 | | | | 1.5% | |
Berkshire Hathaway, Inc., Class B | | | 3,972 | | | | 453,086 | | | | 1.5% | |
International Business Machines Corp. | | | 1,982 | | | | 412,296 | | | | 1.4% | |
General Electric Co. | | | 17,320 | | | | 403,902 | | | | 1.3% | |
Wal-Mart Stores, Inc. | | | 5,378 | | | | 402,490 | | | | 1.3% | |
Chevron Corp. | | | 3,114 | | | | 382,244 | | | | 1.3% | |
Johnson & Johnson | | | 4,330 | | | | 364,499 | | | | 1.2% | |
| | | | | | | | | | | | |
| |
| Top Ten Fixed Income Holdings | |
| | | |
| Description | | Principal Amount | | | Value | | | % of Net Assets | |
US Treasury Bond/Note 4.375%, 11/15/39 | | | $112,200 | | | | $136,095 | | | | 0.5% | |
US Treasury Bond/Note 4.625%, 2/15/40 | | | 85,700 | | | | 108,049 | | | | 0.4% | |
US Treasury Bond/Note 4.375%, 5/15/41 | | | 81,400 | | | | 98,838 | | | | 0.3% | |
US Treasury Bond/Note 3.875%, 8/15/40 | | | 84,800 | | | | 94,910 | | | | 0.3% | |
US Treasury Bond/Note 4.375%, 5/15/40 | | | 75,800 | | | | 92,002 | | | | 0.3% | |
US Treasury Bond/Note 4.75%, 2/15/41 | | | 68,500 | | | | 88,076 | | | | 0.3% | |
US Treasury Bond/Note 4.50%, 2/15/36 | | | 66,200 | | | | 81,612 | | | | 0.3% | |
US Treasury Bond/Note 3.125%, 2/15/42 | | | 65,100 | | | | 63,249 | | | | 0.2% | |
General Electric Capital Corp. 2.10%, 1/07/14 | | | 34,000 | | | | 34,364 | | | | 0.1% | |
AT&T, Inc. 5.55%, 8/15/41 | | | 30,000 | | | | 33,261 | | | | 0.1% | |
| | | | | | | | | | | | | |
3 Holdings are subject to change without notice and there is no guarantee that the Fund will remain invested in any particular security. For a complete list of holdings go to www.dbxus.com.
Sector Breakdown* as of 5/31/13
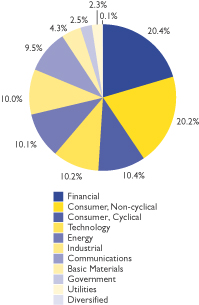
* Weightings are expressed as a percentage of total investments and may change over time. The sector classifications used above are based on company classifications under Bloomberg industry name.
11
db-X Exchange-Traded Funds Inc.
PERFORMANCE SUMMARY
db X-trackers In-Target Date Fund (TDX) (Unaudited)
The db X-trackers In-Target Date Fund (the “Fund”) commenced investment operations and its shares began trading on NYSE Arca, Inc. (“NYSE Arca”) on October 1, 2007. The Fund seeks to track the performance, before fees and expenses, of the Zacks In-Target Lifecycle Index. Both the Fund’s equity and bond portfolios held fewer securities than the Zacks In-Target Lifecycle Index, a constraint imposed by the relatively small size of the Fund.
For the year ended May 31, 2013, the Fund’s net asset value increased 8.37%, compared to an increase of 8.92% for the Zacks In-Target Lifecycle Index and an increase of 3.04% for the Dow Jones Target Today Index. The fund’s performance benefited from favorable results in domestic and international equities.
Performance as of 5/31/13
| | | | | | | | |
| Average Annual Total Returns |
| | | Net Asset Value | | Market Price | | Zacks In-Target Lifecycle
Index | | Dow Jones Target Today
Index |
One Year | | 8.37% | | 14.33% | | 8.92% | | 3.04% |
Five Year | | 3.18% | | 7.14% | | 3.44% | | 4.95% |
Since Inception1 | | 3.19% | | 2.67% | | 3.41% | | 4.81% |
|
| Cumulative Total Returns |
| | | Net Asset Value | | Market Price | | Zacks In-Target Lifecycle
Index | | Dow Jones Target Today
Index |
One Year | | 8.37% | | 14.33% | | 8.92% | | 3.04% |
Five Year | | 16.97% | | 41.17% | | 18.41% | | 27.32% |
Since Inception1 | | 19.47% | | 16.12% | | 20.92% | | 30.53% |
1 Total returns are calculated based on the commencement of trading, 10/1/07 (“Inception”).
Performance quoted represents past performance, assumes reinvestment of all dividends and capital gain distributions, and does not guarantee future results. Current performance may be higher or lower than the performance quoted. Performance data current to the most recent month end may be obtained by visiting www.dbxus.com. Investment in the fund poses investment risk including possible loss of principal. The investment return and principal value of an investment will fluctuate, so that shares, when sold or redeemed, may be worth more or less than their original cost. The gross expense ratio for the fiscal year ended May 31, 2012, as disclosed in the most recent prospectus dated September 28, 2012, was 1.36%. DBX Strategic Advisors LLC, the advisor to the Fund, has agreed to cap its fees and/or pay certain Fund operating expenses in order to limit Fund net annual operating expenses for shares of the Fund to 0.65% of the Fund’s average net assets until 9/30/13.
The preceding performance chart is provided for comparative purposes and represents the period(s) noted. The net asset value return is based on the changes in the Fund’s net asset value per share (“NAV”). The Fund’s NAV is calculated by dividing the value of the Fund’s total assets less total liabilities by the number of shares outstanding. The market price return is based on the change in the market price on the NYSE Arca of a share of the Fund for the period(s) indicated. The price used to calculate market price returns is the midpoint of the bid/ask spread for Fund shares at 4 p.m. Eastern Time on the NYSE Arca. NAV and market returns assume that dividends and capital gain distributions have been reinvested in the Fund at NAV and market price, respectively. The Dow Jones Target Date Indexes are indexes whose allocations are automatically adjusted to reduce potential risk over time. The Dow Jones Target Date Indexes are designed to measure the performance of multi-asset class portfolios that allocate among U.S. and global stock, bond and cash subindexes on a monthly basis. The indexes automatically adjust their asset allocation over time to reflect reductions in potential risk as the investor’s target date approaches.
An index is a statistical measure of a specified financial market or sector. An index does not actually hold a portfolio of securities, incur expenses or pay any transaction costs. Therefore index returns do not reflect deductions for fees or expenses and are not available for direct investment. In comparison, the Fund’s performance is negatively impacted by these deductions. Fund returns do not reflect brokerage commissions or taxes that a shareholder would pay on Fund distributions or on transactions in Fund shares.
“Target Date” refers to a time in the future, generally a specified year, in which the investor expects to retire or otherwise require the use of the invested funds. Target date funds are generally more aggressive the further the target date is from the present, with an objective of capital appreciation. As the target date approaches, the fund’s objective will generally become more conservative, aiming to achieve a higher level of capital preservation. Upon reaching the target date, the index whose performance the Fund seeks to track will have approximately a 10% allocation to equity securities. Over the next five years, allocations shift from conservative to more moderately-conservative allocations, allowing for a larger exposure to equities than at the target date (“Moderately-Conservative Allocation”).
Investors should note that although target date funds aim to preserve capital as the target date approaches, there is no guarantee that the Fund will achieve this objective.
12
db-X Exchange-Traded Funds Inc.
PERFORMANCE SUMMARY
db X-trackers In-Target Date Fund (TDX) (Unaudited) (Continued)
Growth of a $10,000 Investment in TDX2 as of 5/31/13
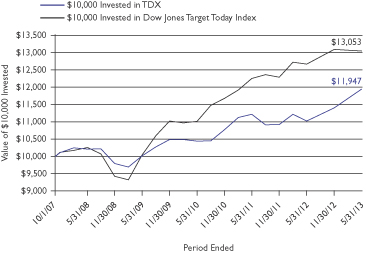
2 Based on Net Asset Value from commencement of trading 10/1/07.
Asset Class Breakdown* as of 5/31/13
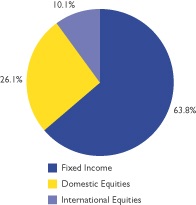
* Weightings are expressed as a percentage of total investments and may change over time.
Top Ten Holdings3 as of 5/31/13
| | | | | | | | | | | | |
| |
| Top Ten Equity Holdings | |
| | | |
| Description | | Shares | | | Value | | | % of Net Assets | |
Exxon Mobil Corp. | | | 1,055 | | | | $95,446 | | | | 0.9% | |
Apple, Inc. | | | 203 | | | | 91,285 | | | | 0.8% | |
Microsoft Corp. | | | 1,970 | | | | 68,715 | | | | 0.6% | |
Berkshire Hathaway, Inc., Class B | | | 539 | | | | 61,485 | | | | 0.5% | |
Google, Inc., Class A | | | 69 | | | | 60,058 | | | | 0.5% | |
General Electric Co. | | | 2,465 | | | | 57,484 | | | | 0.5% | |
Wal-Mart Stores, Inc. | | | 764 | | | | 57,177 | | | | 0.5% | |
International Business Machines Corp. | | | 270 | | | | 56,166 | | | | 0.5% | |
Chevron Corp. | | | 431 | | | | 52,905 | | | | 0.5% | |
Johnson & Johnson | | | 625 | | | | 52,612 | | | | 0.5% | |
| | | | | | | | | | | | |
| |
| Top Ten Fixed Income Holdings | |
| | | |
| Description | | Principal Amount | | | Value | | | % of Net Assets | |
US Treasury Bond/Note 4.75%, 5/15/14 | | | $582,900 | | | | $608,335 | | | | 5.4% | |
US Treasury Bond/Note 2.625%, 7/31/14 | | | 580,000 | | | | 596,494 | | | | 5.3% | |
US Treasury Bond/Note 1.25%, 3/15/14 | | | 500,000 | | | | 504,414 | | | | 4.5% | |
US Treasury Bond/Note 2.375%, 8/31/14 | | | 444,000 | | | | 456,089 | | | | 4.1% | |
US Treasury Bond/Note 0.25%, 12/15/14 | | | 375,000 | | | | 375,117 | | | | 3.4% | |
US Treasury Bond/Note 0.75%, 6/15/14 | | | 367,000 | | | | 369,251 | | | | 3.3% | |
US Treasury Bond/Note 1.25%, 2/15/14 | | | 363,700 | | | | 366,627 | | | | 3.3% | |
US Treasury Bond/Note 0.50%, 10/15/14 | | | 355,000 | | | | 356,442 | | | | 3.2% | |
US Treasury Bond/Note 2.125%, 11/30/14 | | | 345,000 | | | | 354,730 | | | | 3.2% | |
US Treasury Bond/Note 2.125%, 5/31/15 | | | 342,000 | | | | 354,317 | | | | 3.2% | |
3 Holdings are subject to change without notice and there is no guarantee that the Fund will remain invested in any particular security. For a complete list of holdings go to www.dbxus.com.
Sector Breakdown* as of 5/31/13
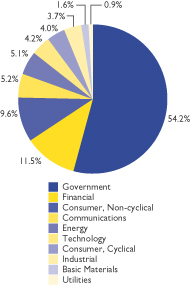
* Weightings are expressed as a percentage of total investments and may change over time. The sector classifications used above are based on company classifications under Bloomberg industry name.
13
db-X Exchange-Traded Funds Inc.
FEES AND EXPENSES (Unaudited)
As a shareholder of one or more of the funds of db-X Exchange-Traded Funds Inc. (each, a “Fund” and collectively, the “Funds” or “db-X Target Date Funds”), you incur advisory fees and other Fund expenses. The expense examples below are intended to help you understand your ongoing costs (in dollars) of investing in the Funds and to compare these costs with the ongoing costs of investing in other funds.
The examples are based on an investment of $1,000 made at the beginning of the period and held through the six month period ended May 31, 2013.
ACTUAL EXPENSES
The first line in the following tables provides information about actual account values and actual expenses. You may use the information in this line, together with the amount you invested, to estimate the expenses that you paid over the period. Simply divide your account value by $1,000 (for example, an $8,600 account value divided by $1,000 = 8.6), then multiply the result by the number in the first line under the heading “Expenses Paid During the Period” to estimate the expenses you paid on your account during this period.
HYPOTHETICAL EXAMPLE FOR COMPARISON PURPOSES
The second line in the following tables provides information about hypothetical account values and hypothetical expenses based on the Funds’ actual expense ratios and an assumed rate of return of 5% per year before expenses (which is not the Funds’ actual return). The hypothetical account values and expenses may not be used to estimate the actual ending account balance or expenses you paid for the period. You may use this information to compare the ongoing costs of investing in the Fund and other funds. To do so, compare this 5% hypothetical example with the 5% hypothetical examples that appear in the shareholder reports of the other funds.
Please note that the expenses shown in the tables are meant to highlight your ongoing costs only, and do not reflect any transactional costs. Therefore the second line in the table is useful in comparing ongoing costs only, and will not help you determine the relative total costs of owning different funds. In addition, if these transactional costs were included, your costs would have been higher.
| | | | | | | | | | | | | | | | |
| | | Beginning
Account Value
December 1, 2012 | | | Ending
Account Value
May 31, 2013 | | | Annualized
Expense Ratio(1)
based on the number of
days in the period | | | Expenses Paid
During the Period(2)
December 1, 2012 to
May 31, 2013 | |
| db X-trackers 2010 Target Date Fund | | | | | | | | | | | | | | | | |
Actual | | $ | 1,000.00 | | | $ | 1,026.25 | | | | 0.65 | % | | $ | 3.28 | |
Hypothetical (5% return before expenses) | | $ | 1,000.00 | | | $ | 1,021.69 | | | | 0.65 | % | | $ | 3.28 | |
| db X-trackers 2020 Target Date Fund | | | | | | | | | | | | | | | | |
Actual | | $ | 1,000.00 | | | $ | 1,081.58 | | | | 0.65 | % | | $ | 3.37 | |
Hypothetical (5% return before expenses) | | $ | 1,000.00 | | | $ | 1,021.69 | | | | 0.65 | % | | $ | 3.28 | |
| db X-trackers 2030 Target Date Fund | | | | | | | | | | | | | | | | |
Actual | | $ | 1,000.00 | | | $ | 1,103.71 | | | | 0.65 | % | | $ | 3.41 | |
Hypothetical (5% return before expenses) | | $ | 1,000.00 | | | $ | 1,021.69 | | | | 0.65 | % | | $ | 3.28 | |
| db X-trackers 2040 Target Date Fund | | | | | | | | | | | | | | | | |
Actual | | $ | 1,000.00 | | | $ | 1,135.12 | | | | 0.65 | % | | $ | 3.46 | |
Hypothetical (5% return before expenses) | | $ | 1,000.00 | | | $ | 1,021.69 | | | | 0.65 | % | | $ | 3.28 | |
| db X-trackers In-Target Date Fund | | | | | | | | | | | | | | | | |
Actual | | $ | 1,000.00 | | | $ | 1,047.71 | | | | 0.65 | % | | $ | 3.32 | |
Hypothetical (5% return before expenses) | | $ | 1,000.00 | | | $ | 1,021.69 | | | | 0.65 | % | | $ | 3.28 | |
(1) DBX Strategic Advisors LLC (the “Advisor”), has contractually agreed to reduce its fees and/or pay Fund operating expenses (excluding, among other things, acquired fund fees and expenses, interest, taxes and extraordinary expenses) in order to limit each Fund’s net annual operating expenses for shares of each Fund to 0.65% of the Fund’s average net assets (the “Expense Cap”). The Expense Cap will remain in effect until September 30, 2013. The Advisor is permitted to be reimbursed for fee reductions and/or expense payments made in the prior three fiscal years. This reimbursement may be paid to the Advisor if the aggregate amount actually paid by a Fund toward operating expenses for such fiscal year (taking into account the reimbursement) does not exceed the Expense Cap. Ratios would have been higher if fees were not reduced by the Advisor.
(2) Expenses are calculated using the annualized expense ratio, which represents the ongoing expenses as a percentage of net assets for the period December 1, 2012 to May 31, 2013. Expenses are calculated by multiplying the Fund’s annualized expense ratio by the average account value for the period; then multiplying the result by 182 days and then dividing the result by 365.
14
db-X Exchange-Traded Funds Inc.
SCHEDULE OF INVESTMENTS
db X-trackers 2010 Target Date Fund
May 31, 2013
| | | | | | | | |
| | | Number
of Shares | | | Value | |
| | | | | | | | |
| COMMON STOCKS — 19.8% | | | | | | | | |
| Basic Materials — 0.9% | | | | | | | | |
Air Liquide SA (France) | | | 29 | | | $ | 3,745 | |
Anglo American PLC (United Kingdom) | | | 139 | | | | 3,224 | |
BASF SE (Germany) | | | 80 | | | | 7,822 | |
BHP Billiton Ltd. (Australia) | | | 274 | | | | 9,147 | |
BHP Billiton PLC (United Kingdom) | | | 167 | | | | 4,860 | |
Coeur Mining Inc.* | | | 50 | | | | 710 | |
Dow Chemical (The) Co. | | | 116 | | | | 3,997 | |
E.I. du Pont de Nemours & Co. | | | 137 | | | | 7,643 | |
Freeport-McMoRan Copper & Gold, Inc. | | | 100 | | | | 3,105 | |
International Paper Co. | | | 200 | | | | 9,230 | |
Linde AG (Germany) | | | 17 | | | | 3,271 | |
Monsanto Co. | | | 100 | | | | 10,064 | |
Rio Tinto Ltd. (Australia) | | | 46 | | | | 2,429 | |
Rio Tinto PLC (United Kingdom) | | | 123 | | | | 5,339 | |
Sherwin-Williams (The) Co. | | | 50 | | | | 9,427 | |
Syngenta AG (Switzerland) | | | 8 | | | | 3,146 | |
| | | | | | | | |
| | | | | | | 87,159 | |
| | | | | | | | |
| Communications — 1.9% | | | | | | | | |
Amazon.com, Inc.* | | | 33 | | | | 8,878 | |
Anixter International, Inc.* | | | 105 | | | | 8,056 | |
AT&T, Inc. | | | 598 | | | | 20,924 | |
Bankrate, Inc.* | | | 100 | | | | 1,431 | |
Brightcove, Inc.* | | | 100 | | | | 748 | |
BT Group PLC, Class A (United Kingdom) | | | 709 | | | | 3,254 | |
CenturyLink, Inc. | | | 100 | | | | 3,415 | |
Cisco Systems, Inc. | | | 600 | | | | 14,448 | |
Comcast Corp., Class A | | | 240 | | | | 9,635 | |
Consolidated Communications Holdings, Inc. | | | 100 | | | | 1,702 | |
Corning, Inc. | | | 156 | | | | 2,398 | |
Deutsche Telekom AG (Germany) | | | 290 | | | | 3,331 | |
France Telecom SA (France) | | | 197 | | | | 2,008 | |
Google, Inc., Class A* | | | 39 | | | | 33,946 | |
Leap Wireless International, Inc.* | | | 300 | | | | 1,695 | |
News Corp., Class A | | | 165 | | | | 5,298 | |
SoftBank Corp. (Japan) | | | 100 | | | | 5,147 | |
Telefonaktiebolaget LM Ericsson, Class B (Sweden) | | | 574 | | | | 6,777 | |
Telefonica SA (Spain)* | | | 387 | | | | 5,332 | |
Thomson Reuters Corp. (Canada) | | | 100 | | | | 3,340 | |
Time Warner, Inc. | | | 123 | | | | 7,180 | |
Verizon Communications, Inc. | | | 329 | | | | 15,950 | |
Vodafone Group PLC (United Kingdom) | | | 3,915 | | | | 11,418 | |
Vonage Holdings Corp.* | | | 1,000 | | | | 2,740 | |
Walt Disney (The) Co. | | | 185 | | | | 11,669 | |
| | | | | | | | |
| | | | | | | 190,720 | |
| | | | | | | | |
| Consumer, Cyclical — 2.1% | | | | | | | | |
Arctic Cat, Inc. | | | 100 | | | | 4,689 | |
Ascena Retail Group, Inc.* | | | 67 | | | | 1,362 | |
Bayerische Motoren Werke AG (Germany) | | | 35 | | | | 3,352 | |
Cash America International, Inc. | | | 100 | | | | 4,771 | |
Cie Financiere Richemont SA (Switzerland) | | | 54 | | | | 4,848 | |
Cinemark Holdings, Inc. | | | 34 | | | | 998 | |
Compass Group PLC (United Kingdom) | | | 241 | | | | 3,173 | |
CVS Caremark Corp. | | | 127 | | | | 7,313 | |
| | | | | | | | |
| | | Number
of Shares | | | Value | |
| | | | | | | | |
| Consumer, Cyclical (Continued) | | | | | | | | |
Daimler AG (Germany) | | | 84 | | | $ | 5,395 | |
Dana Holding Corp. | | | 100 | | | | 1,892 | |
Dr Horton, Inc. | | | 100 | | | | 2,436 | |
DTS, Inc.* | | | 100 | | | | 1,976 | |
Ford Motor Co. | | | 499 | | | | 7,824 | |
GNC Holdings, Inc., Class A | | | 100 | | | | 4,503 | |
Hennes & Mauritz AB, Class B (Sweden) | | | 31 | | | | 1,067 | |
Honda Motor Co. Ltd. (Japan) | | | 131 | | | | 4,995 | |
Inditex SA (Spain) | | | 26 | | | | 3,238 | |
JetBlue Airways Corp.* | | | 200 | | | | 1,242 | |
Kohl’s Corp. | | | 134 | | | | 6,888 | |
Krispy Kreme Doughnuts, Inc.* | | | 300 | | | | 5,196 | |
Las Vegas Sands Corp. | | | 67 | | | | 3,879 | |
Lennar Corp., Class A | | | 100 | | | | 3,932 | |
Life Time Fitness, Inc.* | | | 100 | | | | 4,984 | |
Lions Gate Entertainment Corp. (Canada)* | | | 100 | | | | 2,880 | |
Lowe’s Cos., Inc. | | | 100 | | | | 4,211 | |
LVMH Moet Hennessy Louis Vuitton SA (France) | | | 19 | | | | 3,375 | |
Maidenform Brands, Inc.* | | | 100 | | | | 1,819 | |
MDC Holdings, Inc. | | | 100 | | | | 3,711 | |
Men’s Wearhouse, (The), Inc. | | | 100 | | | | 3,620 | |
Mitsui & Co. Ltd. (Japan) | | | 200 | | | | 2,570 | |
Nissan Motor Co. Ltd. (Japan) | | | 300 | | | | 3,330 | |
Penske Automotive Group, Inc. | | | 167 | | | | 5,362 | |
Red Robin Gourmet Burgers, Inc.* | | | 100 | | | | 5,252 | |
Ross Stores, Inc. | | | 100 | | | | 6,431 | |
Ruby Tuesday, Inc.* | | | 300 | | | | 2,775 | |
Saks, Inc.* | | | 167 | | | | 2,477 | |
Southwest Airlines Co. | | | 400 | | | | 5,668 | |
Systemax, Inc. | | | 100 | | | | 965 | |
Target Corp. | | | 67 | | | | 4,657 | |
Toyota Motor Corp. (Japan) | | | 233 | | | | 13,939 | |
VF Corp. | | | 100 | | | | 18,386 | |
Wabash National Corp.* | | | 300 | | | | 3,150 | |
Wal-Mart Stores, Inc. | | | 301 | | | | 22,526 | |
World Fuel Services Corp. | | | 10 | | | | 407 | |
| | | | | | | | |
| | | | | | | 207,464 | |
| | | | | | | | |
| Consumer, Non-cyclical — 4.1% | | | | | | | | |
Abbott Laboratories | | | 300 | | | | 11,001 | |
Acacia Research-Acacia Technologies | | | 100 | | | | 2,500 | |
Accuray, Inc.* | | | 300 | | | | 1,611 | |
Aetna, Inc. | | | 200 | | | | 12,075 | |
Align Technology, Inc.* | | | 100 | | | | 3,575 | |
Anheuser-Busch InBev NV (Belgium) | | | 67 | | | | 6,194 | |
Ariad Pharmaceuticals, Inc.* | | | 100 | | | | 1,834 | |
AstraZeneca PLC (United Kingdom) | | | 81 | | | | 4,170 | |
Avanir Pharmaceuticals, Inc., Class A* | | | 600 | | | | 1,992 | |
Bayer AG (Germany) | | | 65 | | | | 7,003 | |
Becton Dickinson and Co. | | | 100 | | | | 9,862 | |
BioScrip, Inc.* | | | 300 | | | | 4,194 | |
Bristol-Myers Squibb Co. | | | 134 | | | | 6,165 | |
British American Tobacco PLC (United Kingdom) | | | 179 | | | | 9,853 | |
Capella Education Co.* | | | 100 | | | | 4,356 | |
Centene Corp.* | | | 100 | | | | 4,950 | |
Chemocentryx, Inc.* | | | 100 | | | | 1,351 | |
Coca-Cola (The) Co. | | | 562 | | | | 22,475 | |
| | | | |
| See Notes to Financial Statements. | | 15 | | |
db-X Exchange-Traded Funds Inc.
SCHEDULE OF INVESTMENTS
db X-trackers 2010 Target Date Fund (Continued)
May 31, 2013
| | | | | | | | |
| | | Number
of Shares | | | Value | |
| | | | | | | | |
| Consumer, Non-cyclical (Continued) | | | | | | | | |
CONMED Corp. | | | 67 | | | $ | 2,206 | |
Convergys Corp. | | | 100 | | | | 1,817 | |
CSL Ltd. (Australia) | | | 61 | | | | 3,480 | |
DANONE SA (France) | | | 45 | | | | 3,319 | |
Diageo PLC (United Kingdom) | | | 238 | | | | 7,055 | |
Fresh Del Monte Produce, Inc. | | | 100 | | | | 2,677 | |
FTI Consulting, Inc.* | | | 100 | | | | 3,799 | |
GlaxoSmithKline PLC (United Kingdom) | | | 412 | | | | 10,726 | |
Hanger, Inc.* | | | 100 | | | | 3,191 | |
Harris Teeter Supermarkets, Inc. | | | 25 | | | | 1,175 | |
Imperial Tobacco Group PLC (United Kingdom) | | | 70 | | | | 2,522 | |
Incyte Corp. Ltd.* | | | 67 | | | | 1,485 | |
JM Smucker (The) Co. | | | 67 | | | | 6,764 | |
Johnson & Johnson | | | 324 | | | | 27,274 | |
Live Nation Entertainment, Inc.* | | | 83 | | | | 1,130 | |
Magellan Health Services, Inc.* | | | 7 | | | | 382 | |
Medtronic, Inc. | | | 100 | | | | 5,101 | |
Merck & Co., Inc. | | | 284 | | | | 13,263 | |
Molina Healthcare, Inc.* | | | 67 | | | | 2,533 | |
Mondelez International, Inc., Class A | | | 252 | | | | 7,424 | |
Nestle SA (Switzerland) | | | 264 | | | | 17,518 | |
Novartis AG (Switzerland) | | | 183 | | | | 13,205 | |
Novo Nordisk A/S, Class B (Denmark) | | | 32 | | | | 5,158 | |
Pfizer, Inc. | | | 823 | | | | 22,410 | |
Pilgrim’s Pride Corp.* | | | 400 | | | | 4,784 | |
Procter & Gamble (The) Co. | | | 328 | | | | 25,177 | |
Quad/Graphics, Inc. | | | 100 | | | | 2,330 | |
Reckitt Benckiser Group PLC (United Kingdom) | | | 51 | | | | 3,659 | |
Rent-A-Center, Inc. | | | 100 | | | | 3,658 | |
Roche Holding AG (Switzerland) | | | 59 | | | | 14,752 | |
Rollins, Inc. | | | 21 | | | | 530 | |
SABMiller PLC (United Kingdom) | | | 67 | | | | 3,390 | |
Salix Pharmaceuticals Ltd.* | | | 50 | | | | 3,034 | |
Sanofi (France) | | | 62 | | | | 6,649 | |
Santarus, Inc.* | | | 300 | | | | 6,681 | |
Seaboard Corp. | | | 1 | | | | 2,755 | |
Seattle Genetics, Inc.* | | | 67 | | | | 2,299 | |
Select Medical Holdings Corp. | | | 67 | | | | 529 | |
Sequenom, Inc.* | | | 500 | | | | 2,070 | |
Spectrum Brands Holdings, Inc. | | | 100 | | | | 6,029 | |
Takeda Pharmaceutical Co. Ltd. (Japan) | | | 100 | | | | 4,480 | |
Tesco PLC (United Kingdom) | | | 779 | | | | 4,326 | |
Teva Pharmaceutical Industries Ltd. (Israel) | | | 93 | | | | 3,571 | |
Unilever NV (Netherlands) | | | 159 | | | | 6,517 | |
Unilever PLC (United Kingdom) | | | 125 | | | | 5,270 | |
UnitedHealth Group, Inc. | | | 114 | | | | 7,140 | |
ViroPharma, Inc.* | | | 67 | | | | 1,843 | |
Woolworths Ltd. (Australia) | | | 100 | | | | 3,158 | |
| | | | | | | | |
| | | | | | | 405,406 | |
| | | | | | | | |
| Energy — 2.2% | | | | | | | | |
BG Group PLC (United Kingdom) | | | 277 | | | | 5,105 | |
BP PLC (United Kingdom) | | | 1,477 | | | | 10,625 | |
Cameron International Corp.* | | | 167 | | | | 10,165 | |
Cheniere Energy, Inc.* | | | 100 | | | | 2,935 | |
Chevron Corp. | | | 250 | | | | 30,688 | |
ConocoPhillips | | | 126 | | | | 7,729 | |
| | | | | | | | |
| | | Number
of Shares | | | Value | |
| | | | | | | | |
| Energy (Continued) | | | | | | | | |
Continental Resources, Inc.* | | | 100 | | | $ | 8,113 | |
CVR Energy, Inc. | | | 100 | | | | 6,281 | |
Dril-Quip, Inc.* | | | 9 | | | | 814 | |
Energy XXI Bermuda Ltd. (Bermuda) | | | 100 | | | | 2,553 | |
ENI S.p.A (Italy) | | | 153 | | | | 3,480 | |
Exxon Mobil Corp. | | | 497 | | | | 44,963 | |
Hess Corp. | | | 200 | | | | 13,482 | |
Kodiak Oil & Gas Corp.* | | | 200 | | | | 1,756 | |
McMoRan Exploration Co.* | | | 67 | | | | 1,114 | |
Oasis Petroleum, Inc.* | | | 100 | | | | 3,716 | |
Royal Dutch Shell PLC, Class A (United Kingdom) | | | 298 | | | | 9,975 | |
Royal Dutch Shell PLC, Class B (United Kingdom) | | | 208 | | | | 7,207 | |
Schlumberger Ltd. (Netherland Antilles) | | | 105 | | | | 7,668 | |
Southwestern Energy Co.* | | | 196 | | | | 7,387 | |
Statoil ASA (Norway) | | | 106 | | | | 2,415 | |
Targa Resources Corp. | | | 100 | | | | 6,442 | |
Tesco Corp.* | | | 200 | | | | 2,552 | |
Total SA (France) | | | 184 | | | | 9,228 | |
Vantage Drilling Co.* | | | 1,267 | | | | 2,433 | |
Williams (The) Cos., Inc. | | | 100 | | | | 3,518 | |
Woodside Petroleum Ltd. (Australia) | | | 80 | | | | 2,756 | |
| | | | | | | | |
| | | | | | | 215,100 | |
| | | | | | | | |
| Financial — 4.2% | | | | | | | | |
AIA Group Ltd. (Hong Kong) | | | 800 | | | | 3,561 | |
Allianz SE (Germany) | | | 21 | | | | 3,269 | |
American Campus Communities, Inc. REIT | | | 7 | | | | 286 | |
American Express Co. | | | 100 | | | | 7,571 | |
American International Group, Inc.* | | | 234 | | | | 10,404 | |
AON PLC (United Kingdom) | | | 200 | | | | 12,734 | |
Australia & New Zealand Banking Group Ltd. (Australia) | | | 186 | | | | 4,902 | |
Banco Bilbao Vizcaya Argentaria SA (Spain) | | | 321 | | | | 3,024 | |
Banco Santander SA (Spain) | | | 1,346 | | | | 9,692 | |
Bank of America Corp. | | | 1,160 | | | | 15,846 | |
Barclays PLC (United Kingdom) | | | 757 | | | | 3,686 | |
Berkshire Hathaway, Inc., Class B* | | | 312 | | | | 35,590 | |
BioMed Realty Trust, Inc. REIT | | | 133 | | | | 2,784 | |
BNP Paribas (France) | | | 152 | | | | 8,954 | |
Boston Properties, Inc. REIT | | | 80 | | | | 8,525 | |
CBL & Associates Properties, Inc. REIT | | | 100 | | | | 2,299 | |
Citigroup, Inc. | | | 328 | | | | 17,053 | |
Citizens, Inc.* | | | 200 | | | | 1,216 | |
Commonwealth Bank of Australia (Australia) | | | 129 | | | | 8,254 | |
Deutsche Bank AG (Germany) (a) | | | 56 | | | | 2,626 | |
Equity One, Inc. REIT | | | 73 | | | | 1,703 | |
Extra Space Storage, Inc. REIT | | | 100 | | | | 4,189 | |
Franklin Resources, Inc. | | | 21 | | | | 3,251 | |
Geo Group (The), Inc. REIT | | | 77 | | | | 2,681 | |
Goldman Sachs Group (The), Inc. | | | 39 | | | | 6,321 | |
Hancock Holding Co. | | | 100 | | | | 2,855 | |
Hatteras Financial Corp. REIT | | | 67 | | | | 1,730 | |
Highwoods Properties, Inc. REIT | | | 54 | | | | 1,967 | |
HSBC Holdings PLC (United Kingdom) | | | 1,524 | | | | 16,809 | |
ING Groep NV (Netherlands)* | | | 381 | | | | 3,581 | |
| | | | |
| See Notes to Financial Statements. | | 16 | | |
db-X Exchange-Traded Funds Inc.
SCHEDULE OF INVESTMENTS
db X-trackers 2010 Target Date Fund (Continued)
May 31, 2013
| | | | | | | | |
| | | Number
of Shares | | | Value | |
| | | | | | | | |
| Financial (Continued) | | | | | | | | |
Invesco Mortgage Capital, Inc. REIT | | | 67 | | | $ | 1,250 | |
JPMorgan Chase & Co. | | | 415 | | | | 22,654 | |
Kilroy Realty Corp. REIT | | | 50 | | | | 2,646 | |
LaSalle Hotel Properties REIT | | | 150 | | | | 3,960 | |
Marsh & McLennan Cos., Inc. | | | 100 | | | | 4,002 | |
Meadowbrook Insurance Group, Inc. | | | 234 | | | | 1,877 | |
MFA Financial, Inc. REIT | | | 226 | | | | 1,984 | |
Mitsubishi UFJ Financial Group, Inc. (Japan) | | | 1,000 | | | | 5,923 | |
Mizuho Financial Group, Inc. (Japan) | | | 1,113 | | | | 2,161 | |
Monmouth Real Estate Investment Corp., Class A REIT | | | 200 | | | | 2,052 | |
Muenchener Rueckversicherungs-Gesellschaft AG (Germany) | | | 18 | | | | 3,384 | |
National Australia Bank Ltd. (Australia) | | | 175 | | | | 4,857 | |
National Retail Properties, Inc. REIT | | | 65 | | | | 2,332 | |
Ocwen Financial Corp.* | | | 100 | | | | 4,278 | |
OMEGA Healthcare Investors, Inc. REIT | | | 65 | | | | 2,107 | |
Primerica, Inc. | | | 67 | | | | 2,360 | |
ProLogis, Inc. REIT | | | 200 | | | | 8,060 | |
Prudential PLC (United Kingdom) | | | 237 | | | | 4,022 | |
PS Business Parks, Inc. REIT | | | 100 | | | | 7,631 | |
Republic Bancorp, Inc., Class A | | | 100 | | | | 2,381 | |
Ryman Hospitality Properties REIT | | | 113 | | | | 4,323 | |
Simon Property Group, Inc. REIT | | | 42 | | | | 6,990 | |
Sovran Self Storage, Inc. REIT | | | 100 | | | | 6,487 | |
Standard Chartered PLC (United Kingdom) | | | 300 | | | | 7,006 | |
Starwood Property Trust, Inc. REIT | | | 100 | | | | 2,537 | |
Sumitomo Mitsui Financial Group, Inc. (Japan) | | | 81 | | | | 3,270 | |
T. Rowe Price Group, Inc. | | | 183 | | | | 13,882 | |
Tanger Factory Outlet Centers, Inc. REIT | | | 67 | | | | 2,310 | |
Taylor Capital Group, Inc.* | | | 100 | | | | 1,661 | |
Texas Capital Bancshares, Inc.* | | | 100 | | | | 4,416 | |
Two Harbors Investment Corp. REIT | | | 200 | | | | 2,206 | |
U.S. Bancorp | | | 200 | | | | 7,012 | |
UBS AG (Switzerland)* | | | 337 | | | | 5,995 | |
Visa, Inc., Class A | | | 93 | | | | 16,567 | |
Washington Real Estate Investment Trust REIT | | | 33 | | | | 918 | |
Wells Fargo & Co. | | | 572 | | | | 23,195 | |
Westpac Banking Corp. (Australia) | | | 261 | | | | 7,104 | |
Zurich Financial Services AG (Switzerland)* | | | 3 | | | | 797 | |
| | | | | | | | |
| | | | | | | 413,960 | |
| | | | | | | | |
| Industrial — 2.0% | | | | | | | | |
ABB Ltd. (Switzerland)* | | | 219 | | | | 4,848 | |
Altra Holdings, Inc. | | | 100 | | | | 2,881 | |
Apogee Enterprises, Inc. | | | 100 | | | | 2,668 | |
Boeing (The) Co. | | | 100 | | | | 9,902 | |
Builders FirstSource, Inc.* | | | 400 | | | | 2,696 | |
Caterpillar, Inc. | | | 66 | | | | 5,663 | |
Chart Industries, Inc.* | | | 100 | | | | 9,727 | |
Colfax Corp.* | | | 100 | | | | 4,990 | |
Darling International, Inc.* | | | 100 | | | | 1,961 | |
Eaton Corp. PLC (Ireland) | | | 136 | | | | 8,985 | |
EMCOR Group, Inc. | | | 100 | | | | 3,975 | |
Emerson Electric Co. | | | 87 | | | | 4,999 | |
Fabrinet (Cayman Islands)* | | | 200 | | | | 2,906 | |
FedEx Corp. | | | 50 | | | | 4,817 | |
| | | | | | | | |
| | | Number
of Shares | | | Value | |
| | | | | | | | |
| Industrial (Continued) | | | | | | | | |
FEI Co. | | | 100 | | | $ | 7,201 | |
General Dynamics Corp. | | | 25 | | | | 1,928 | |
General Electric Co. | | | 1,210 | | | | 28,217 | |
Graphic Packaging Holding Co.* | | | 300 | | | | 2,307 | |
Hexcel Corp.* | | | 100 | | | | 3,477 | |
Ingersoll-Rand PLC (Ireland) | | | 134 | | | | 7,709 | |
Koninklijke Philips Electronics NV (Netherlands) | | | 106 | | | | 3,017 | |
Mueller Industries, Inc. | | | 100 | | | | 5,445 | |
Rolls-Royce Holdings PLC (United Kingdom)* | | | 186 | | | | 3,405 | |
Schneider Electric SA (France) | | | 44 | | | | 3,508 | |
Siemens AG (Germany) | | | 67 | | | | 7,107 | |
Smith & Wesson Holding Corp.* | | | 200 | | | | 1,822 | |
Stanley Black & Decker, Inc. | | | 67 | | | | 5,308 | |
Tetra Tech, Inc.* | | | 100 | | | | 2,758 | |
Tredegar Corp. | | | 100 | | | | 2,496 | |
Union Pacific Corp. | | | 100 | | | | 15,462 | |
United Parcel Service, Inc., Class B | | | 77 | | | | 6,614 | |
United Technologies Corp. | | | 100 | | | | 9,490 | |
Vinci SA (France) | | | 41 | | | | 2,115 | |
Woodward, Inc. | | | 100 | | | | 3,915 | |
| | | | | | | | |
| | | | | | | 194,319 | |
| | | | | | | | |
| Technology — 2.1% | | | | | | | | |
Accelrys, Inc.* | | | 200 | | | | 1,668 | |
Activision Blizzard, Inc. | | | 501 | | | | 7,229 | |
Apple, Inc. | | | 94 | | | | 42,270 | |
Applied Materials, Inc. | | | 700 | | | | 10,640 | |
ASML Holding NV (Netherlands) | | | 36 | | | | 3,007 | |
Aspen Technology, Inc.* | | | 100 | | | | 3,062 | |
CACI International, Inc., Class A* | | | 100 | | | | 6,414 | |
Canon, Inc. (Japan) | | | 100 | | | | 3,514 | |
Citrix Systems, Inc.* | | | 100 | | | | 6,435 | |
Concur Technologies, Inc.* | | | 21 | | | | 1,695 | |
Cray, Inc.* | | | 200 | | | | 3,642 | |
Dell, Inc. | | | 200 | | | | 2,670 | |
EMC Corp.* | | | 200 | | | | 4,952 | |
EPIQ Systems, Inc. | | | 167 | | | | 2,026 | |
Fidelity National Information Services, Inc. | | | 100 | | | | 4,490 | |
Hewlett-Packard Co. | | | 200 | | | | 4,884 | |
International Business Machines Corp. | | | 100 | | | | 20,802 | |
Jack Henry & Associates, Inc. | | | 169 | | | | 7,931 | |
Mentor Graphics Corp. | | | 100 | | | | 1,899 | |
Microsemi Corp.* | | | 67 | | | | 1,469 | |
Microsoft Corp. | | | 879 | | | | 30,661 | |
Netsuite, Inc.* | | | 100 | | | | 8,760 | |
Progress Software Corp.* | | | 100 | | | | 2,351 | |
PTC, Inc.* | | | 73 | | | | 1,833 | |
QLIK Technologies, Inc.* | | | 167 | | | | 5,137 | |
SAP AG (Germany)* | | | 77 | | | | 5,808 | |
Solarwinds, Inc.* | | | 100 | | | | 4,215 | |
SYNNEX Corp.* | | | 100 | | | | 4,055 | |
| | | | | | | | |
| | | | | | | 203,519 | |
| | | | | | | | |
| Utilities — 0.3% | | | | | | | | |
Centrica PLC (United Kingdom) | | | 497 | | | | 2,870 | |
Dominion Resources, Inc. | | | 100 | | | | 5,655 | |
E.ON SE (Germany) | | | 84 | | | | 1,426 | |
| | | | |
| See Notes to Financial Statements. | | 17 | | |
db-X Exchange-Traded Funds Inc.
SCHEDULE OF INVESTMENTS
db X-trackers 2010 Target Date Fund (Continued)
May 31, 2013
| | | | | | | | |
| | | Number
of Shares | | | Value | |
| | | | | | | | |
| Utilities (Continued) | | | | | | | | |
Edison International | | | 200 | | | $ | 9,188 | |
GDF Suez (France) | | | 121 | | | | 2,477 | |
National Grid PLC (United Kingdom) | | | 270 | | | | 3,218 | |
Piedmont Natural Gas Co., Inc. | | | 24 | | | | 811 | |
SJW Corp. | | | 100 | | | | 2,705 | |
Wisconsin Energy Corp. | | | 100 | | | | 4,081 | |
| | | | | | | | |
| | | | | | | 32,431 | |
| | | | | | | | |
TOTAL COMMON STOCKS
(Cost $1,634,190) | | | | | | | 1,950,078 | |
| | | | | | | | |
| PREFERRED STOCKS — 0.0% (b) | | | | | | | | |
| Consumer, Cyclical — 0.0% (b) | | | | | | | | |
Volkswagen AG (Germany) | | | 15 | | | | 3,294 | |
| | | | | | | | |
| Industrial — 0.0% (b) | | | | | | | | |
Rolls-Royce Holdings PLC, Class C (United Kingdom)* | | | 22,134 | | | | 34 | |
| | | | | | | | |
TOTAL PREFERRED STOCKS
(Cost $2,548) | | | | | | | 3,328 | |
| | | | | | | | |
| | |
| | | Principal
Amount | | | Value | |
| | | | | | | | |
| CORPORATE BONDS — 11.9% | | | | | | | | |
| Communications — 2.0% | | | | | | | | |
Cellco Partnership/Verizon Wireless Capital LLC
5.55%, 2/01/14 | | $ | 170,000 | | | $ | 175,277 | |
Google, Inc.
1.25%, 5/19/14 | | | 7,000 | | | | 7,060 | |
Telefonica Emisiones S.A.U. (Spain)
4.949%, 1/15/15 | | | 10,000 | | | | 10,552 | |
| | | | | | | | |
| | | | | | | 192,889 | |
| | | | | | | | |
| Consumer, Non-cyclical — 2.6% | | | | | | | | |
Clorox (The) Co.
5.00%, 1/15/15 | | | 55,000 | | | | 58,466 | |
PepsiCo, Inc.
0.75%, 3/05/15 | | | 80,000 | | | | 80,313 | |
Wyeth
5.50%, 2/01/14 | | | 37,000 | | | | 38,223 | |
Yale University, MTN
2.90%, 10/15/14 | | | 75,000 | | | | 77,548 | |
| | | | | | | | |
| | | | | | | 254,550 | |
| | | | | | | | |
| Energy — 1.8% | | | | | | | | |
BP Capital Markets PLC (United Kingdom)
3.625%, 5/08/14 | | | 168,000 | | | | 172,929 | |
| | | | | | | | |
| Financial — 4.9% | | | | | | | | |
American Tower Corp.
4.625%, 4/01/15 | | | 50,000 | | | | 53,110 | |
Bank of New York Mellon (The) Corp., MTN
4.30%, 5/15/14 | | | 57,000 | | | | 59,125 | |
Caterpillar Financial Services Corp., MTN
6.125%, 2/17/14 | | | 13,000 | | | | 13,527 | |
Citigroup, Inc.
6.375%, 8/12/14 | | | 20,000 | | | | 21,268 | |
| | | | | | | | |
| | | Principal
Amount | | | Value | |
| | | | | | | | |
| Financial (Continued) | | | | | | | | |
National Rural Utilities Cooperative Finance Corp.
1.00%, 2/02/15 | | $ | 280,000 | | | $ | 282,192 | |
Prudential Financial, Inc., Series B, MTN
5.10%, 9/20/14 | | | 22,000 | | | | 23,220 | |
Wachovia Corp.
5.25%, 8/01/14 | | | 33,000 | | | | 34,707 | |
| | | | | | | | |
| | | | | | | 487,149 | |
| | | | | | | | |
| Technology — 0.3% | | | | | | | | |
Microsoft Corp.
0.875%, 9/27/13 | | | 30,000 | | | | 30,054 | |
| | | | | | | | |
| Utilities — 0.3% | | | | | | | | |
Exelon Generation Co. LLC
5.35%, 1/15/14 | | | 30,000 | | | | 30,856 | |
| | | | | | | | |
TOTAL CORPORATE BONDS
(Cost $1,161,856) | | | | | | | 1,168,427 | |
| | | | | | | | |
| UNITED STATES GOVERNMENT & AGENCIES OBLIGATIONS — 67.9% | | | | | | | | |
| United States Treasury Bonds/Notes — 67.9% | | | | | | | | |
1.00%, 7/15/13 | | | 395,000 | | | | 395,494 | |
0.50%, 10/15/13 | | | 426,000 | | | | 426,699 | |
1.25%, 3/15/14 | | | 390,000 | | | | 393,443 | |
0.25%, 3/31/14 | | | 198,000 | | | | 198,209 | |
1.75%, 3/31/14 | | | 500,000 | | | | 506,699 | |
4.75%, 5/15/14 | | | 434,800 | | | | 453,771 | |
0.75%, 6/15/14 | | | 412,000 | | | | 414,527 | |
2.625%, 7/31/14 | | | 390,000 | | | | 401,091 | |
2.375%, 8/31/14 | | | 378,000 | | | | 388,292 | |
2.375%, 9/30/14 | | | 435,000 | | | | 447,557 | |
0.50%, 10/15/14 | | | 395,000 | | | | 396,605 | |
0.375%, 11/15/14 | | | 162,000 | | | | 162,367 | |
4.25%, 11/15/14 | | | 409,000 | | | | 432,756 | |
2.125%, 11/30/14 | | | 378,000 | | | | 388,661 | |
0.25%, 12/15/14 | | | 405,000 | | | | 405,127 | |
4.00%, 2/15/15 | | | 365,000 | | | | 388,055 | |
2.50%, 3/31/15 | | | 83,000 | | | | 86,343 | |
2.125%, 5/31/15 | | | 376,000 | | | | 389,542 | |
| | | | | | | | |
| | | | | | | 6,675,238 | |
| | | | | | | | |
TOTAL UNITED STATES GOVERNMENT & AGENCIES OBLIGATIONS
(Cost $6,661,634) | | | | | | | 6,675,238 | |
| | | | | | | | |
| | |
TOTAL INVESTMENTS — 99.6% (Cost $9,460,228) | | | | | | $ | 9,797,071 | |
Other assets less liabilities — 0.4% | | | | | | | 35,000 | |
| | | | | | | | |
NET ASSETS — 100.0% | | | | | | $ | 9,832,071 | |
| | | | | | | | |
MTN – Medium Term Note.
REIT – Real Estate Investment Trust.
* Non-income producing security.
(a) Affiliated company. The Advisor is a subsidiary of Deutsche Bank AG. Therefore, Deutsche Bank AG is considered to be affiliated with the Fund.
(b) Less than 0.1%.
| | | | |
| See Notes to Financial Statements. | | 18 | | |
db-X Exchange-Traded Funds Inc.
SCHEDULE OF INVESTMENTS
db X-trackers 2020 Target Date Fund
May 31, 2013
| | | | | | | | |
| | | Number
of Shares | | | Value | |
| | | | | | | | |
| COMMON STOCKS — 57.5% | | | | | | | | |
| Basic Materials — 2.5% | | | | | | | | |
Air Liquide SA (France) | | | 207 | | | $ | 26,730 | |
Anglo American PLC (United Kingdom) | | | 1,078 | | | | 25,003 | |
BASF SE (Germany) | | | 684 | | | | 66,882 | |
BHP Billiton Ltd. (Australia) | | | 2,481 | | | | 82,820 | |
BHP Billiton PLC (United Kingdom) | | | 1,567 | | | | 45,606 | |
Coeur Mining Inc.* | | | 565 | | | | 8,017 | |
Dow Chemical (The) Co | | | 1,361 | | | | 46,900 | |
E.I. du Pont de Nemours & Co | | | 1,003 | | | | 55,957 | |
Freeport-McMoRan Copper & Gold, Inc | | | 960 | | | | 29,808 | |
HB Fuller Co | | | 300 | | | | 12,471 | |
International Paper Co | | | 1,971 | | | | 90,962 | |
Linde AG (Germany) | | | 111 | | | | 21,359 | |
Monsanto Co | | | 514 | | | | 51,729 | |
NewMarket Corp | | | 86 | | | | 23,585 | |
Rio Tinto Ltd. (Australia) | | | 269 | | | | 14,206 | |
Rio Tinto PLC (United Kingdom) | | | 1,022 | | | | 44,365 | |
Sensient Technologies Corp | | | 343 | | | | 14,156 | |
Sherwin-Williams (The) Co | | | 514 | | | | 96,904 | |
Syngenta AG (Switzerland) | | | 72 | | | | 28,311 | |
| | | | | | | | |
| | | | | | | 785,771 | |
| | | | | | | | |
| Communications — 5.5% | | | | | | | | |
Amazon.com, Inc.* | | | 450 | | | | 121,064 | |
Anixter International, Inc.* | | | 159 | | | | 12,200 | |
Arris Group, Inc.* | | | 771 | | | | 11,665 | |
AT&T, Inc | | | 6,167 | | | | 215,782 | |
Bankrate, Inc.* | | | 857 | | | | 12,264 | |
Brightcove, Inc.* | | | 943 | | | | 7,054 | |
BT Group PLC, Class A (United Kingdom) | | | 5,694 | | | | 26,136 | |
Centurylink, Inc | | | 600 | | | | 20,490 | |
Cisco Systems, Inc | | | 5,829 | | | | 140,362 | |
Comcast Corp., Class A | | | 2,694 | | | | 108,164 | |
Consolidated Communications Holdings, Inc | | | 857 | | | | 14,586 | |
Corning, Inc | | | 1,717 | | | | 26,391 | |
Deutsche Telekom AG (Germany) | | | 1,945 | | | | 22,343 | |
Finisar Corp.* | | | 700 | | | | 9,170 | |
France Telecom SA (France) | | | 1,547 | | | | 15,770 | |
Google, Inc., Class A* | | | 337 | | | | 293,327 | |
Leap Wireless International, Inc.* | | | 2,314 | | | | 13,074 | |
Meredith Corp | | | 300 | | | | 12,294 | |
Netgear, Inc.* | | | 257 | | | | 8,553 | |
News Corp., Class A | | | 1,529 | | | | 49,096 | |
Softbank Corp. (Japan) | | | 525 | | | | 27,020 | |
Telefonaktiebolaget LM Ericsson, Class B (Sweden) | | | 2,355 | | | | 27,805 | |
Telefonica SA (Spain)* | | | 3,262 | | | | 44,942 | |
Thomson Reuters Corp. (Canada) | | | 720 | | | | 24,048 | |
Time Warner, Inc | | | 912 | | | | 53,233 | |
Verizon Communications, Inc | | | 2,997 | | | | 145,295 | |
Viasat, Inc.* | | | 300 | | | | 21,018 | |
Vodafone Group PLC (United Kingdom) | | | 38,333 | | | | 111,798 | |
Vonage Holdings Corp.* | | | 7,713 | | | | 21,134 | |
Walt Disney (The) Co | | | 1,737 | | | | 109,569 | |
| | | | | | | | |
| | | | | | | 1,725,647 | |
| | | | | | | | |
| | | | | | | | |
| | | Number
of Shares | | | Value | |
| | | | | | | | |
| Consumer, Cyclical — 6.0% | | | | | | | | |
Arctic Cat, Inc | | | 343 | | | $ | 16,084 | |
Ascena Retail Group, Inc.* | | | 1,062 | | | | 21,590 | |
Bayerische Motoren Werke AG (Germany) | | | 278 | | | | 26,626 | |
Carter’s, Inc | | | 343 | | | | 24,720 | |
Cash America International, Inc | | | 240 | | | | 11,450 | |
Cie Financiere Richemont SA (Switzerland) | | | 381 | | | | 34,205 | |
Cinemark Holdings, Inc | | | 705 | | | | 20,685 | |
Columbia Sportswear Co | | | 244 | | | | 14,694 | |
Compass Group PLC (United Kingdom) | | | 1,374 | | | | 18,090 | |
CVS Caremark Corp | | | 1,329 | | | | 76,524 | |
Daimler AG (Germany) | | | 653 | | | | 41,936 | |
Dana Holding Corp | | | 835 | | | | 15,798 | |
Dr Horton, Inc | | | 1,371 | | | | 33,398 | |
DTS, Inc.* | | | 771 | | | | 15,235 | |
Ford Motor Co | | | 4,280 | | | | 67,110 | |
GNC Holdings, Inc., Class A | | | 600 | | | | 27,018 | |
Hennes & Mauritz AB, Class B (Sweden) | | | 722 | | | | 24,854 | |
Honda Motor Co. Ltd. (Japan) | | | 1,316 | | | | 50,175 | |
Inditex SA (Spain) | | | 170 | | | | 21,172 | |
JetBlue Airways Corp.* | | | 1,800 | | | �� | 11,178 | |
Kohl’s Corp | | | 1,007 | | | | 51,770 | |
Krispy Kreme Doughnuts, Inc.* | | | 2,057 | | | | 35,627 | |
Las Vegas Sands Corp | | | 1,018 | | | | 58,942 | |
Lennar Corp., Class A | | | 771 | | | | 30,316 | |
Life Time Fitness, Inc.* | | | 257 | | | | 12,809 | |
Lions Gate Entertainment Corp. (Canada)* | | | 943 | | | | 27,158 | |
Lowe’s Cos., Inc | | | 1,285 | | | | 54,112 | |
LVMH Moet Hennessy Louis Vuitton SA (France) | | | 194 | | | | 34,456 | |
Maidenform Brands, Inc.* | | | 685 | | | | 12,460 | |
MDC Holdings, Inc | | | 257 | | | | 9,537 | |
Men’s Wearhouse, (The), Inc | | | 314 | | | | 11,367 | |
Mitsubishi Corp. (Japan) | | | 877 | | | | 15,592 | |
Mitsui & Co. Ltd. (Japan) | | | 1,049 | | | | 13,481 | |
Nike, Inc., Class B | | | 1,070 | | | | 65,976 | |
Nissan Motor Co. Ltd. (Japan) | | | 1,885 | | | | 20,923 | |
Nu Skin Enterprises, Inc., Class A | | | 405 | | | | 23,814 | |
Penske Automotive Group, Inc | | | 577 | | | | 18,527 | |
Red Robin Gourmet Burgers, Inc.* | | | 375 | | | | 19,691 | |
Ross Stores, Inc | | | 1,114 | | | | 71,631 | |
Ruby Tuesday, Inc.* | | | 1,971 | | | | 18,232 | |
Saks, Inc.* | | | 1,117 | | | | 16,565 | |
SIX Flags Entertainment Corp | | | 343 | | | | 25,578 | |
Southwest Airlines Co. | | | 3,599 | | | | 50,998 | |
Systemax, Inc | | | 1,114 | | | | 10,750 | |
Target Corp | | | 650 | | | | 45,175 | |
Tenneco, Inc.* | | | 428 | | | | 18,986 | |
Toyota Motor Corp. (Japan) | | | 2,071 | | | | 123,902 | |
VF Corp | | | 514 | | | | 94,505 | |
Wabash National Corp.* | | | 2,228 | | | | 23,394 | |
Wal-Mart Stores, Inc | | | 3,357 | | | | 251,238 | |
Watsco, Inc. | | | 212 | | | | 18,498 | |
World Fuel Services Corp | | | 355 | | | | 14,459 | |
| | | | | | | | |
| | | | | | | 1,873,011 | |
| | | | | | | | |
| | | | |
| See Notes to Financial Statements. | | 19 | | |
db-X Exchange-Traded Funds Inc.
SCHEDULE OF INVESTMENTS
db X-trackers 2020 Target Date Fund (Continued)
May 31, 2013
| | | | | | | | |
| | | Number
of Shares | | | Value | |
| | | | | | | | |
| Consumer, Non-cyclical — 12.0% | | | | | | | | |
Abbott Laboratories | | | 3,223 | | | $ | 118,187 | |
Acacia Research-Acacia Technologies | | | 224 | | | | 5,600 | |
Accuray, Inc.* | | | 2,142 | | | | 11,503 | |
Aetna, Inc | | | 1,799 | | | | 108,624 | |
Align Technology, Inc.* | | | 514 | | | | 18,376 | |
Amsurg Corp.* | | | 224 | | | | 7,959 | |
Anheuser-Busch InBev NV (Belgium) | | | 518 | | | | 47,890 | |
Ariad Pharmaceuticals, Inc.* | | | 1,114 | | | | 20,431 | |
AstraZeneca PLC (United Kingdom) | | | 906 | | | | 46,639 | |
Avanir Pharmaceuticals, Inc., Class A* | | | 4,285 | | | | 14,226 | |
Bayer AG (Germany) | | | 637 | | | | 68,628 | |
Becton Dickinson and Co | | | 943 | | | | 92,998 | |
BioScrip, Inc.* | | | 1,885 | | | | 26,352 | |
Bristol-Myers Squibb Co | | | 1,799 | | | | 82,772 | |
British American Tobacco PLC (United Kingdom) | | | 1,403 | | | | 77,233 | |
Capella Education Co.* | | | 514 | | | | 22,390 | |
Centene Corp.* | | | 254 | | �� | | 12,573 | |
Cepheid, Inc.* | | | 428 | | | | 14,877 | |
Chemocentryx, Inc.* | | | 943 | | | | 12,740 | |
Coca-Cola (The) Co | | | 4,530 | | | | 181,154 | |
CONMED Corp | | | 224 | | | | 7,376 | |
Convergys Corp | | | 771 | | | | 14,009 | |
Costar Group, Inc.* | | | 171 | | | | 19,120 | |
CSL Ltd. (Australia) | | | 413 | | | | 23,558 | |
DANONE SA (France) | | | 398 | | | | 29,352 | |
Diageo PLC (United Kingdom) | | | 1,834 | | | | 54,366 | |
Fresh Del Monte Produce, Inc | | | 200 | | | | 5,354 | |
Fresh Market, (The), Inc.* | | | 343 | | | | 16,992 | |
FTI Consulting, Inc.* | | | 343 | | | | 13,031 | |
GlaxoSmithKline PLC (United Kingdom) | | | 3,968 | | | | 103,307 | |
Hain Celestial Group (The), Inc.* | | | 257 | | | | 17,121 | |
Hanger, Inc.* | | | 343 | | | | 10,945 | |
Harris Teeter Supermarkets, Inc | | | 381 | | | | 17,907 | |
Imperial Tobacco Group PLC (United Kingdom) | | | 710 | | | | 25,578 | |
Incyte Corp. Ltd.* | | | 750 | | | | 16,628 | |
Integra Lifesciences Holdings Corp.* | | | 200 | | | | 7,578 | |
JM Smucker (The) Co | | | 600 | | | | 60,576 | |
Johnson & Johnson | | | 2,737 | | | | 230,401 | |
Live Nation Entertainment, Inc.* | | | 1,124 | | | | 15,298 | |
Magellan Health Services, Inc.* | | | 230 | | | | 12,535 | |
MasterCard, Inc., Class A | | | 132 | | | | 75,273 | |
Medivation, Inc.* | | | 443 | | | | 21,512 | |
Medtronic, Inc | | | 1,028 | | | | 52,438 | |
Merck & Co., Inc | | | 2,702 | | | | 126,183 | |
Molina Healthcare, Inc.* | | | 300 | | | | 11,340 | |
Mondelez International, Inc., Class A | | | 2,687 | | | | 79,159 | |
Nestle SA (Switzerland) | | | 2,457 | | | | 163,030 | |
Novartis AG (Switzerland) | | | 1,757 | | | | 126,780 | |
Novo Nordisk A/S, Class B (Denmark) | | | 278 | | | | 44,808 | |
Onyx Pharmaceuticals, Inc.* | | | 278 | | | | 26,535 | |
Pfizer, Inc | | | 7,326 | | | | 199,487 | |
Pharmacyclics, Inc.* | | | 343 | | | | 31,432 | |
Pilgrim’s Pride Corp.* | | | 2,742 | | | | 32,794 | |
Procter & Gamble (The) Co. | | | 2,744 | | | | 210,630 | |
Quad/Graphics, Inc | | | 857 | | | | 19,968 | |
| | | | | | | | |
| | | Number
of Shares | | | Value | |
| | | | | | | | |
| Consumer, Non-cyclical (Continued) | | | | | | | | |
Questcor Pharmaceuticals, Inc | | | 428 | | | $ | 14,625 | |
Reckitt Benckiser Group PLC (United Kingdom) | | | 511 | | | | 36,662 | |
Rent-A-Center, Inc | | | 428 | | | | 15,656 | |
Roche Holding AG (Switzerland) | | | 536 | | | | 134,021 | |
Rollins, Inc | | | 944 | | | | 23,845 | |
SABMiller PLC (United Kingdom) | | | 675 | | | | 34,153 | |
Salix Pharmaceuticals Ltd.* | | | 330 | | | | 20,021 | |
Sanofi (France) | | | 601 | | | | 64,453 | |
Santarus, Inc.* | | | 1,971 | | | | 43,894 | |
Seaboard Corp | | | 8 | | | | 22,042 | |
Seattle Genetics, Inc.* | | | 825 | | | | 28,314 | |
Select Medical Holdings Corp | | | 1,019 | | | | 8,050 | |
Sequenom, Inc.* | | | 3,599 | | | | 14,900 | |
Spectrum Brands Holdings, Inc | | | 343 | | | | 20,679 | |
Takeda Pharmaceutical Co. Ltd. (Japan) | | | 462 | | | | 20,696 | |
Tesco PLC (United Kingdom) | | | 5,993 | | | | 33,277 | |
Teva Pharmaceutical Industries Ltd. (Israel) | | | 747 | | | | 28,684 | |
TreeHouse Foods, Inc.* | | | 300 | | | | 19,644 | |
Unilever NV (Netherlands) | | | 1,136 | | | | 46,562 | |
Unilever PLC (United Kingdom) | | | 974 | | | | 41,067 | |
United Natural Foods, Inc.* | | | 343 | | | | 18,152 | |
UnitedHealth Group, Inc | | | 1,237 | | | | 77,473 | |
ViroPharma, Inc.* | | | 441 | | | | 12,128 | |
Woolworths Ltd. (Australia) | | | 906 | | | | 28,614 | |
Wright Medical Group, Inc.* | | | 300 | | | | 7,509 | |
| | | | | | | | |
| | | | | | | 3,728,674 | |
| | | | | | | | |
| Diversified — 0.1% | | | | | | | | |
Hutchison Whampoa Ltd. (Hong Kong) | | | 1,500 | | | | 15,980 | |
| | | | | | | | |
| Energy — 5.9% | | | | | | | | |
BG Group PLC (United Kingdom) | | | 2,483 | | | | 45,763 | |
BP PLC (United Kingdom) | | | 13,220 | | | | 95,100 | |
Cameron International Corp.* | | | 1,200 | | | | 73,044 | |
Cheniere Energy, Inc.* | | | 1,200 | | | | 35,220 | |
Chevron Corp. | | | 1,927 | | | | 236,539 | |
ConocoPhillips | | | 1,273 | | | | 78,086 | |
Continental Resources, Inc.* | | | 857 | | | | 69,528 | |
CVR Energy, Inc | | | 514 | | | | 32,284 | |
Dril-Quip, Inc.* | | | 257 | | | | 23,246 | |
Energy XXI Bermuda Ltd. (Bermuda) | | | 428 | | | | 10,927 | |
ENI S.p.A (Italy) | | | 1,805 | | | | 41,056 | |
Exxon Mobil Corp | | | 4,678 | | | | 423,219 | |
Helix Energy Solutions Group, Inc.* | | | 685 | | | | 16,344 | |
Hess Corp | | | 1,628 | | | | 109,743 | |
Kodiak Oil & Gas Corp.* | | | 1,542 | | | | 13,539 | |
McMoRan Exploration Co.* | | | 900 | | | | 14,967 | |
Oasis Petroleum, Inc.* | | | 514 | | | | 19,100 | |
Royal Dutch Shell PLC, Class A (United Kingdom) | | | 2,689 | | | | 90,008 | |
Royal Dutch Shell PLC, Class B (United Kingdom) | | | 1,960 | | | | 67,914 | |
Schlumberger Ltd. (Netherland Antilles) | | | 1,361 | | | | 99,394 | |
Southwestern Energy Co.* | | | 1,555 | | | | 58,608 | |
Statoil ASA (Norway) | | | 775 | | | | 17,656 | |
Targa Resources Corp | | | 257 | | | | 16,556 | |
Tesco Corp.* | | | 1,200 | | | | 15,312 | |
| | | | |
| See Notes to Financial Statements. | | 20 | | |
db-X Exchange-Traded Funds Inc.
SCHEDULE OF INVESTMENTS
db X-trackers 2020 Target Date Fund (Continued)
May 31, 2013
| | | | | | | | |
| | | Number
of Shares | | | Value | |
| | | | | | | | |
| Energy (Continued) | | | | | | | | |
Total SA (France) | | | 1,596 | | | $ | 80,041 | |
Vantage Drilling Co.* | | | 8,548 | | | | 16,412 | |
Williams (The) Cos., Inc | | | 600 | | | | 21,108 | |
Woodside Petroleum Ltd. (Australia) | | | 595 | | | | 20,494 | |
| | | | | | | | |
| | | | | | | 1,841,208 | |
| | | | | | | | |
| Financial — 12.3% | | | | | | | | |
AIA Group Ltd. (Hong Kong) | | | 7,027 | | | | 31,276 | |
Alexander’s, Inc. REIT | | | 24 | | | | 7,305 | |
Allianz SE (Germany) | | | 326 | | | | 50,740 | |
American Campus Communities, Inc. REIT | | | 456 | | | | 18,618 | |
American Express Co | | | 1,157 | | | | 87,597 | |
American International Group, Inc.* | | | 1,832 | | | | 81,451 | |
American Tower Corp., Class A REIT | | | 343 | | | | 26,699 | |
AON PLC (United Kingdom) | | | 1,542 | | | | 98,179 | |
Australia & New Zealand Banking Group Ltd. (Australia) | | | 1,923 | | | | 50,685 | |
Banco Bilbao Vizcaya Argentaria SA (Spain) | | | 4,241 | | | | 39,947 | |
Banco Santander SA (Spain) | | | 12,170 | | | | 87,630 | |
Bank of America Corp | | | 11,901 | | | | 162,568 | |
Barclays PLC (United Kingdom) | | | 11,295 | | | | 54,995 | |
Berkshire Hathaway, Inc., Class B* | | | 2,520 | | | | 287,457 | |
BioMed Realty Trust, Inc. REIT | | | 817 | | | | 17,100 | |
BNP Paribas (France) | | | 809 | | | | 47,659 | |
Boston Properties, Inc. REIT | | | 713 | | | | 75,992 | |
CBL & Associates Properties, Inc. REIT | | | 920 | | | | 21,151 | |
Citigroup, Inc | | | 3,153 | | | | 163,924 | |
Citizens, Inc.* | | | 1,371 | | | | 8,336 | |
Coinstar, Inc.* | | | 257 | | | | 14,968 | |
Commonwealth Bank of Australia (Australia) | | | 1,143 | | | | 73,139 | |
Credit Acceptance Corp.* | | | 150 | | | | 17,079 | |
Deutsche Bank AG (Germany) (a) | | | 818 | | | | 38,355 | |
Equity Lifestyle Properties, Inc. REIT | | | 270 | | | | 20,836 | |
Equity One, Inc. REIT | | | 861 | | | | 20,087 | |
Equity Residential REIT | | | 360 | | | | 20,358 | |
Extra Space Storage, Inc. REIT | | | 600 | | | | 25,134 | |
Franklin Resources, Inc | | | 201 | | | | 31,117 | |
Geo Group (The), Inc. REIT | | | 518 | | | | 18,037 | |
Goldman Sachs Group (The), Inc | | | 493 | | | | 79,905 | |
Hancock Holding Co | | | 514 | | | | 14,675 | |
Hatteras Financial Corp. REIT | | | 707 | | | | 18,255 | |
Highwoods Properties, Inc. REIT | | | 481 | | | | 17,518 | |
Home Properties, Inc. REIT | | | 310 | | | | 18,839 | |
HSBC Holdings PLC (United Kingdom) | | | 14,106 | | | | 155,580 | |
ING Groep NV (Netherlands)* | | | 2,790 | | | | 26,225 | |
Invesco Mortgage Capital, Inc. REIT | | | 707 | | | | 13,186 | |
JPMorgan Chase & Co | | | 3,939 | | | | 215,031 | |
Kilroy Realty Corp. REIT | | | 426 | | | | 22,540 | |
LaSalle Hotel Properties REIT | | | 600 | | | | 15,840 | |
Marsh & McLennan Cos., Inc | | | 514 | | | | 20,570 | |
Meadowbrook Insurance Group, Inc | | | 1,500 | | | | 12,030 | |
MFA Financial, Inc. REIT | | | 2,355 | | | | 20,677 | |
Mid-America Apartment Communities, Inc. REIT | | | 219 | | | | 14,885 | |
Mitsubishi UFJ Financial Group, Inc. (Japan) | | | 8,826 | | | | 52,277 | |
Mizuho Financial Group, Inc. (Japan) | | | 17,226 | | | | 33,439 | |
| | | | | | | | |
| | | Number
of Shares | | | Value | |
| | | | | | | | |
| Financial (Continued) | | | | | | | | |
Monmouth Real Estate Investment Corp., Class A REIT | | | 1,200 | | | $ | 12,312 | |
Muenchener Rueckversicherungs-Gesellschaft AG (Germany) | | | 122 | | | | 22,937 | |
National Australia Bank Ltd. (Australia) | | | 1,656 | | | | 45,961 | |
National Retail Properties, Inc. REIT | | | 662 | | | | 23,746 | |
Ocwen Financial Corp.* | | | 857 | | | | 36,662 | |
OMEGA Healthcare Investors, Inc. REIT | | | 732 | | | | 23,724 | |
Post Properties, Inc. REIT | | | 300 | | | | 14,340 | |
Primerica, Inc | | | 450 | | | | 15,849 | |
ProAssurance Corp | | | 376 | | | | 18,875 | |
ProLogis, Inc. REIT | | | 2,142 | | | | 86,322 | |
Prudential PLC (United Kingdom) | | | 1,933 | | | | 32,807 | |
PS Business Parks, Inc. REIT | | | 171 | | | | 13,049 | |
Public Storage REIT | | | 180 | | | | 27,324 | |
Republic Bancorp, Inc., Class A | | | 600 | | | | 14,286 | |
Ryman Hospitality Properties REIT | | | 339 | | | | 12,970 | |
Signature Bank* | | | 310 | | | | 23,926 | |
Simon Property Group, Inc. REIT | | | 326 | | | | 54,259 | |
Sovran Self Storage, Inc. REIT | | | 200 | | | | 12,974 | |
Standard Chartered PLC (United Kingdom) | | | 1,734 | | | | 40,495 | |
Starwood Property Trust, Inc. REIT | | | 771 | | | | 19,560 | |
Sumitomo Mitsui Financial Group, Inc. (Japan) | | | 966 | | | | 38,994 | |
SVB Financial Group* | | | 270 | | | | 20,895 | |
T. Rowe Price Group, Inc | | | 1,312 | | | | 99,528 | |
Tanger Factory Outlet Centers, Inc. REIT | | | 532 | | | | 18,343 | |
Taylor Capital Group, Inc.* | | | 857 | | | | 14,235 | |
Texas Capital Bancshares, Inc.* | | | 257 | | | | 11,349 | |
Tompkins Financial Corp | | | 343 | | | | 14,248 | |
Two Harbors Investment Corp. REIT | | | 1,285 | | | | 14,174 | |
U.S. Bancorp | | | 1,885 | | | | 66,088 | |
UBS AG (Switzerland)* | | | 3,188 | | | | 56,709 | |
Visa, Inc., Class A | | | 851 | | | | 151,597 | |
Washington Real Estate Investment Trust REIT | | | 361 | | | | 10,043 | |
Wells Fargo & Co | | | 5,152 | | | | 208,913 | |
Westpac Banking Corp. (Australia) | | | 2,078 | | | | 56,560 | |
Zurich Financial Services AG (Switzerland)* | | | 109 | | | | 28,975 | |
| | | | | | | | |
| | | | | | | 3,812,920 | |
| | | | | | | | |
| Industrial — 6.0% | | | | | | | | |
ABB Ltd. (Switzerland)* | | | 1,606 | | | | 35,555 | |
Actuant Corp., Class A | | | 450 | | | | 15,300 | |
Acuity Brands, Inc | | | 260 | | | | 19,518 | |
Altra Holdings, Inc | | | 943 | | | | 27,168 | |
AO Smith Corp. | | | 600 | | | | 23,520 | |
Apogee Enterprises, Inc | | | 857 | | | | 22,865 | |
Boeing (The) Co | | | 771 | | | | 76,344 | |
Bristow Group, Inc | | | 300 | | | | 18,855 | |
Builders FirstSource, Inc.* | | | 2,914 | | | | 19,640 | |
Caterpillar, Inc | | | 663 | | | | 56,885 | |
Chart Industries, Inc.* | | | 257 | | | | 25,001 | |
Clean Harbors, Inc.* | | | 330 | | | | 18,876 | |
Colfax Corp.* | | | 685 | | | | 34,182 | |
Cummins, Inc | | | 257 | | | | 30,745 | |
Darling International, Inc.* | | | 685 | | | | 13,433 | |
East Japan Railway Co. (Japan) | | | 257 | | | | 19,392 | |
Eaton Corp. PLC (Ireland) | | | 1,664 | | | | 109,924 | |
| | | | |
| See Notes to Financial Statements. | | 21 | | |
db-X Exchange-Traded Funds Inc.
SCHEDULE OF INVESTMENTS
db X-trackers 2020 Target Date Fund (Continued)
May 31, 2013
| | | | | | | | |
| | | Number
of Shares | | | Value | |
| | | | | | | | |
| Industrial (Continued) | | | | | | | | |
EMCOR Group, Inc | | | 428 | | | $ | 17,013 | |
Emerson Electric Co | | | 682 | | | | 39,188 | |
EnerSys | | | 366 | | | | 18,238 | |
Fabrinet (Cayman Islands)* | | | 1,285 | | | | 18,671 | |
Fanuc Corp. (Japan) | | | 185 | | | | 28,066 | |
FedEx Corp | | | 360 | | | | 34,682 | |
FEI Co | | | 224 | | | | 16,130 | |
General Dynamics Corp | | | 350 | | | | 26,985 | |
General Electric Co | | | 10,791 | | | | 251,646 | |
Genesee & Wyoming, Inc., Class A* | | | 396 | | | | 35,264 | |
Golar LNG Ltd. (Bermuda) | | | 375 | | | | 12,750 | |
Graphic Packaging Holding Co.* | | | 2,485 | | | | 19,110 | |
Hexcel Corp.* | | | 685 | | | | 23,817 | |
Hitachi Ltd. (Japan) | | | 2,999 | | | | 20,898 | |
Ingersoll-Rand PLC (Ireland) | | | 1,439 | | | | 82,785 | |
Komatsu Ltd. (Japan) | | | 645 | | | | 16,765 | |
Koninklijke Philips Electronics NV (Netherlands) | | | 781 | | | | 22,226 | |
Middleby Corp.* | | | 86 | | | | 14,060 | |
Mitsubishi Electric Corp. (Japan) | | | 1,906 | | | | 18,537 | |
Mueller Industries, Inc | | | 257 | | | | 13,994 | |
Powell Industries, Inc.* | | | 343 | | | | 16,217 | |
Rolls-Royce Holdings PLC (United Kingdom)* | | | 1,474 | | | | 26,987 | |
Schneider Electric SA (France) | | | 346 | | | | 27,585 | |
Siemens AG (Germany) | | | 637 | | | | 67,568 | |
Smith & Wesson Holding Corp.* | | | 1,457 | | | | 13,273 | |
Stanley Black & Decker, Inc | | | 800 | | | | 63,375 | |
Tetra Tech, Inc.* | | | 428 | | | | 11,800 | |
Tredegar Corp | | | 943 | | | | 23,537 | |
Triumph Group, Inc | | | 300 | | | | 23,295 | |
Union Pacific Corp | | | 514 | | | | 79,475 | |
United Parcel Service, Inc., Class B | | | 948 | | | | 81,434 | |
United Technologies Corp | | | 943 | | | | 89,492 | |
Vinci SA (France) | | | 340 | | | | 17,542 | |
Woodward, Inc | | | 514 | | | | 20,123 | |
| | | | | | | | |
| | | | | | | 1,859,731 | |
| | | | | | | | |
| Technology — 6.2% | | | | | | | | |
Accelrys, Inc.* | | | 1,714 | | | | 14,295 | |
Activision Blizzard, Inc | | | 5,549 | | | | 80,072 | |
Apple, Inc | | | 919 | | | | 413,255 | |
Applied Materials, Inc | | | 6,770 | | | | 102,904 | |
ASML Holding NV (Netherlands) | | | 255 | | | | 21,298 | |
Aspen Technology, Inc.* | | | 600 | | | | 18,372 | |
Athenahealth, Inc.* | | | 257 | | | | 21,729 | |
CACI International, Inc., Class A* | | | 158 | | | | 10,134 | |
Canon, Inc. (Japan) | | | 921 | | | | 32,364 | |
Cirrus Logic, Inc.* | | | 514 | | | | 9,381 | |
Citrix Systems, Inc.* | | | 943 | | | | 60,682 | |
Commvault Systems, Inc.* | | | 343 | | | | 24,010 | |
Concur Technologies, Inc.* | | | 439 | | | | 35,440 | |
Cray, Inc.* | | | 1,114 | | | | 20,286 | |
Dell, Inc | | | 1,885 | | | | 25,165 | |
EMC Corp.* | | | 2,114 | | | | 52,343 | |
EPIQ Systems, Inc | | | 1,121 | | | | 13,598 | |
Fidelity National Information Services, Inc | | | 1,571 | | | | 70,538 | |
Hewlett-Packard Co | | | 2,399 | | | | 58,584 | |
| | | | | | | | |
| | | Number
of Shares | | | Value | |
| | | | | | | | |
| Technology (Continued) | | | | | | | | |
International Business Machines Corp | | | 1,212 | | | $ | 252,120 | |
Jack Henry & Associates, Inc | | | 573 | | | | 26,891 | |
Mentor Graphics Corp | | | 933 | | | | 17,718 | |
Microsemi Corp.* | | | 600 | | | | 13,158 | |
Microsoft Corp | | | 8,581 | | | | 299,306 | |
MKS Instruments, Inc | | | 343 | | | | 9,655 | |
Netsuite, Inc.* | | | 428 | | | | 37,493 | |
Progress Software Corp.* | | | 428 | | | | 10,062 | |
PTC, Inc.* | | | 855 | | | | 21,469 | |
QLIK Technologies, Inc.* | | | 782 | | | | 24,054 | |
SAP AG (Germany)* | | | 654 | | | | 49,328 | |
Solarwinds, Inc.* | | | 514 | | | | 21,665 | |
SYNNEX Corp.* | | | 257 | | | | 10,421 | |
Syntel, Inc | | | 257 | | | | 16,425 | |
Ultimate Software Group, Inc.* | | | 171 | | | | 19,032 | |
Veeco Instruments, Inc.* | | | 300 | | | | 12,717 | |
| | | | | | | | |
| | | | | | | 1,925,964 | |
| | | | | | | | |
| Utilities — 1.0% | | | | | | | | |
Centrica PLC (United Kingdom) | | | 3,914 | | | | 22,599 | |
Cleco Corp | | | 343 | | | | 15,610 | |
Dominion Resources, Inc | | | 600 | | | | 33,930 | |
E.ON SE (Germany) | | | 1,270 | | | | 21,558 | |
Edison International | | | 1,628 | | | | 74,790 | |
GDF Suez (France) | | | 956 | | | | 19,570 | |
National Grid PLC (United Kingdom) | | | 2,516 | | | | 29,990 | |
New Jersey Resources Corp | | | 257 | | | | 11,663 | |
Piedmont Natural Gas Co., Inc | | | 356 | | | | 12,029 | |
SJW Corp | | | 600 | | | | 16,230 | |
WGL Holdings, Inc | | | 343 | | | | 14,721 | |
Wisconsin Energy Corp | | | 1,114 | | | | 45,463 | |
| | | | | | | | |
| | | | | | | 318,153 | |
| | | | | | | | |
TOTAL COMMON STOCKS
(Cost $14,894,230) | | | | | | | 17,887,059 | |
| | | | | | | | |
| PREFERRED STOCKS — 0.1% | | | | | | | | |
| Consumer, Cyclical — 0.1% | | | | | | | | |
Volkswagen AG (Germany) | | | 98 | | | | 21,520 | |
| | | | | | | | |
| Industrial — 0.0% (b) | | | | | | | | |
Rolls-Royce Holdings PLC, Class C (United Kingdom)* | | | 175,406 | | | | 267 | |
| | | | | | | | |
TOTAL PREFERRED STOCKS
(Cost $21,233) | | | | | | | 21,787 | |
| | | | | | | | |
| | |
| | | Principal
Amount | | | Value | |
| | | | | | | | |
| CORPORATE BONDS — 10.5% | | | | | | | | |
| Basic Materials — 0.6% | | | | | | | | |
BHP Billiton Finance USA Ltd. (Australia) 1.00%, 2/24/15 | | $ | 197,000 | | | $ | 198,667 | |
| | | | | | | | |
| Communications — 1.5% | | | | | | | | |
Cellco Partnership/Verizon Wireless Capital LLC
5.55%, 2/01/14 | | | 70,000 | | | | 72,173 | |
Google, Inc.
1.25%, 5/19/14 | | | 14,000 | | | | 14,119 | |
| | | | |
| See Notes to Financial Statements. | | 22 | | |
db-X Exchange-Traded Funds Inc.
SCHEDULE OF INVESTMENTS
db X-trackers 2020 Target Date Fund (Continued)
May 31, 2013
| | | | | | | | |
| | | Principal
Amount | | | Value | |
| | | | | | | | |
| Communications (Continued) | | | | | | | | |
Telefonica Emisiones SAU. (Spain)
4.949%, 1/15/15 | | $ | 301,000 | | | $ | 317,619 | |
Verizon Communications, Inc.
1.25%, 11/03/14 | | | 50,000 | | | | 50,445 | |
Viacom, Inc.
1.25%, 2/27/15 | | | 25,000 | | | | 25,147 | |
| | | | | | | | |
| | | | | | | 479,503 | |
| | | | | | | | |
| Consumer, Non-cyclical — 0.3% | | | | | | | | |
Anheuser-Busch InBev Worldwide, Inc.
4.125%, 1/15/15 | | | 14,000 | | | | 14,768 | |
Clorox (The) Co.
5.00%, 1/15/15 | | | 59,000 | | | | 62,718 | |
Wyeth
5.50%, 2/01/14 | | | 14,000 | | | | 14,463 | |
| | | | | | | | |
| | | | | | | 91,949 | |
| | | | | | | | |
| Energy — 0.3% | | | | | | | | |
BP Capital Markets PLC (United Kingdom)
3.625%, 5/08/14 | | | 77,000 | | | | 79,259 | |
| | | | | | | | |
| Financial — 7.1% | | | | | | | | |
American Tower Corp.
4.625%, 4/01/15 | | | 100,000 | | | | 106,220 | |
Bank of New York Mellon (The) Corp., MTN
4.30%, 5/15/14 | | | 32,000 | | | | 33,193 | |
Bank of Nova Scotia (Canada)
3.40%, 1/22/15 | | | 25,000 | | | | 26,119 | |
Barclays PLC (United Kingdom)
5.20%, 7/10/14 | | | 55,000 | | | | 57,703 | |
Caterpillar Financial Services Corp., MTN
6.125%, 2/17/14 | | | 62,000 | | | | 64,512 | |
Citigroup, Inc.
6.375%, 8/12/14 | | | 372,000 | | | | 395,580 | |
Morgan Stanley, Series G, MTN
4.10%, 1/26/15 | | | 30,000 | | | | 31,372 | |
National Rural Utilities Cooperative Finance Corp.
1.00%, 2/02/15 | | | 784,000 | | | | 790,141 | |
Prudential Financial, Inc., Series B, MTN
5.10%, 9/20/14 | | | 63,000 | | | | 66,494 | |
Royal Bank of Canada, MTN (Canada)
1.15%, 3/13/15 | | | 85,000 | | | | 85,861 | |
Simon Property Group LP
5.10%, 6/15/15 | | | 98,000 | | | | 106,615 | |
Toyota Motor Credit Corp., Series G, MTN
1.25%, 11/17/14 | | | 445,000 | | | | 450,237 | |
| | | | | | | | |
| | | | | | | 2,214,047 | |
| | | | | | | | |
| Technology — 0.5% | | | | | | | | |
Hewlett-Packard Co.
6.125%, 3/01/14 | | | 106,000 | | | | 109,975 | |
Microsoft Corp.
0.875%, 9/27/13 | | | 34,000 | | | | 34,061 | |
| | | | | | | | |
| | | | | | | 144,036 | |
| | | | | | | | |
| | | | | | | | |
| | | Principal
Amount | | | Value | |
| | | | | | | | |
| Utilities — 0.2% | | | | | | | | |
Exelon Generation Co. LLC
5.35%, 1/15/14 | | $ | 63,000 | | | $ | 64,798 | |
| | | | | | | | |
TOTAL CORPORATE BONDS
(Cost $3,234,505) | | | | | | | 3,272,259 | |
| | | | | | | | |
| UNITED STATES GOVERNMENT & AGENCIES OBLIGATIONS — 31.5% | | | | | | | | |
United States Treasury Bonds/
Notes — 31.5% | | | | | | | | |
0.75%, 9/15/13 | | | 1,111,900 | | | | 1,114,202 | |
4.75%, 5/15/14 | | | 602,400 | | | | 628,685 | |
4.25%, 8/15/14 | | | 599,800 | | | | 629,134 | |
2.375%, 9/30/14 | | | 652,400 | | | | 671,233 | |
0.50%, 10/15/14 | | | 655,500 | | | | 658,163 | |
0.25%, 12/15/14 | | | 719,800 | | | | 720,025 | |
2.625%, 12/31/14 | | | 652,400 | | | | 676,941 | |
4.00%, 2/15/15 | | | 595,500 | | | | 633,114 | |
2.375%, 2/28/15 | | | 641,800 | | | | 665,191 | |
0.375%, 3/15/15 | | | 659,800 | | | | 660,909 | |
2.50%, 3/31/15 | | | 684,800 | | | | 712,380 | |
2.125%, 5/31/15 | | | 641,800 | | | | 664,915 | |
4.25%, 8/15/15 | | | 642,700 | | | | 697,631 | |
1.25%, 9/30/15 | | | 642,700 | | | | 655,855 | |
| | | | | | | | |
| | | | | | | 9,788,378 | |
| | | | | | | | |
TOTAL UNITED STATES GOVERNMENT & AGENCIES OBLIGATIONS
(Cost $9,759,352) | | | | | | | 9,788,378 | |
| | | | | | | | |
| | |
TOTAL INVESTMENTS — 99.6%
(Cost $27,909,320) | | | | | | $ | 30,969,483 | |
Other assets less liabilities — 0.4% | | | | | | | 127,676 | |
| | | | | | | | |
NET ASSETS — 100.0% | | | | | | $ | 31,097,159 | |
| | | | | | | | |
MTN – Medium Term Note.
REIT – Real Estate Investment Trust.
* Non-income producing security.
(a) Affiliated company. The Advisor is a subsidiary of Deutsche Bank AG.
Therefore, Deutsche Bank AG is considered to be affiliated with the Fund.
(b) Less than 0.1%.
| | | | |
| See Notes to Financial Statements. | | 23 | | |
db-X Exchange-Traded Funds Inc.
SCHEDULE OF INVESTMENTS
db X-trackers 2030 Target Date Fund
May 31, 2013
| | | | | | | | |
| | | Number
of Shares | | | Value | |
| | | | | | | | |
| COMMON STOCKS — 81.0% | | | | | | | | |
| Basic Materials — 3.7% | | | | | | | | |
Air Liquide SA (France) | | | 344 | | | $ | 44,421 | |
Anglo American PLC (United Kingdom) | | | 1,416 | | | | 32,842 | |
BASF SE (Germany) | | | 960 | | | | 93,868 | |
BHP Billiton Ltd. (Australia) | | | 3,466 | | | | 115,701 | |
BHP Billiton PLC (United Kingdom) | | | 2,211 | | | | 64,350 | |
Coeur Mining Inc* | | | 1,045 | | | | 14,829 | |
Dow Chemical (The) Co | | | 1,740 | | | | 59,960 | |
E.I. du Pont de Nemours & Co | | | 1,373 | | | | 76,599 | |
Freeport-McMoRan Copper & Gold, Inc | | | 1,216 | | | | 37,757 | |
Gold Resource Corp | | | 514 | | | | 4,934 | |
HB Fuller Co | | | 428 | | | | 17,792 | |
International Paper Co | | | 2,657 | | | | 122,621 | |
Linde AG (Germany) | | | 180 | | | | 34,637 | |
Monsanto Co | | | 686 | | | | 69,039 | |
NewMarket Corp | | | 186 | | | | 51,009 | |
Rio Tinto Ltd. (Australia) | | | 422 | | | | 22,286 | |
Rio Tinto PLC (United Kingdom) | | | 1,469 | | | | 63,769 | |
Sensient Technologies Corp | | | 428 | | | | 17,664 | |
Sherwin-Williams (The) Co | | | 686 | | | | 129,331 | |
Syngenta AG (Switzerland) | | | 98 | | | | 38,534 | |
| | | | | | | | |
| | | | | | | 1,111,943 | |
| | | | | | | | |
| Communications — 7.9% | | | | | | | | |
Amazon.com, Inc.* | | | 686 | | | | 184,555 | |
Anixter International, Inc.* | | | 359 | | | | 27,546 | |
Arris Group, Inc.* | | | 943 | | | | 14,268 | |
AT&T, Inc | | | 8,309 | | | | 290,732 | |
Bankrate, Inc.* | | | 1,114 | | | | 15,941 | |
Brightcove, Inc.* | | | 1,285 | | | | 9,612 | |
BT Group PLC, Class A (United Kingdom) | | | 7,762 | | | | 35,629 | |
CenturyLink, Inc | | | 857 | | | | 29,267 | |
Cisco Systems, Inc | | | 8,017 | | | | 193,049 | |
Comcast Corp., Class A | | | 3,638 | | | | 146,066 | |
Consolidated Communications Holdings, Inc | | | 1,200 | | | | 20,424 | |
Corning, Inc | | | 2,131 | | | | 32,754 | |
Deutsche Telekom AG (Germany) (a) | | | 2,614 | | | | 30,027 | |
Finisar Corp.* | | | 857 | | | | 11,227 | |
France Telecom SA (France) | | | 1,845 | | | | 18,808 | |
Google, Inc., Class A* | | | 464 | | | | 403,871 | |
Leap Wireless International, Inc.* | | | 3,085 | | | | 17,430 | |
Meredith Corp | | | 428 | | | | 17,539 | |
Netgear, Inc.* | | | 257 | | | | 8,553 | |
News Corp., Class A | | | 2,061 | | | | 66,179 | |
SoftBank Corp. (Japan) | | | 874 | | | | 44,981 | |
Telefonaktiebolaget LM Ericsson, Class B (Sweden) | | | 3,492 | | | | 41,229 | |
Telefonica SA (Spain)* | | | 4,670 | | | | 64,340 | |
Thomson Reuters Corp. (Canada) | | | 1,200 | | | | 40,080 | |
Time Warner, Inc | | | 1,332 | | | | 77,749 | |
Verizon Communications, Inc. | | | 4,063 | | | | 196,974 | |
ViaSat, Inc.* | | | 374 | | | | 26,202 | |
Vodafone Group PLC (United Kingdom) | | | 50,307 | | | | 146,721 | |
Vonage Holdings Corp.* | | | 10,284 | | | | 28,178 | |
Walt Disney (The) Co | | | 2,404 | | | | 151,643 | |
| | | | | | | | |
| | | | | | | 2,391,574 | |
| | | | | | | | |
| | | | | | | | |
| | | Number
of Shares | | | Value | |
| | | | | | | | |
| Consumer, Cyclical — 8.6% | | | | | | | | |
Arctic Cat, Inc | | | 514 | | | $ | 24,101 | |
Ascena Retail Group, Inc.* | | | 1,320 | | | | 26,836 | |
Bayerische Motoren Werke AG (Germany) | | | 379 | | | | 36,300 | |
Carter’s, Inc | | | 514 | | | | 37,044 | |
Cash America International, Inc | | | 162 | | | | 7,729 | |
Cie Financiere Richemont SA (Switzerland) | | | 569 | | | | 51,084 | |
Cinemark Holdings, Inc | | | 894 | | | | 26,230 | |
Columbia Sportswear Co | | | 342 | | | | 20,595 | |
Compass Group PLC (United Kingdom) | | | 2,098 | | | | 27,622 | |
CVS Caremark Corp | | | 1,875 | | | | 107,963 | |
Daimler AG (Germany) | | | 955 | | | | 61,331 | |
Dana Holding Corp | | | 1,466 | | | | 27,737 | |
Dr Horton, Inc | | | 1,885 | | | | 45,919 | |
DTS, Inc.* | | | 1,028 | | | | 20,313 | |
Ford Motor Co | | | 6,097 | | | | 95,601 | |
GNC Holdings, Inc., Class A | | | 857 | | | | 38,591 | |
Hennes & Mauritz AB, Class B (Sweden) | | | 897 | | | | 30,878 | |
Honda Motor Co. Ltd. (Japan) | | | 1,832 | | | | 69,848 | |
Inditex SA (Spain) | | | 216 | | | | 26,901 | |
JetBlue Airways Corp.* | | | 2,314 | | | | 14,370 | |
Kohl’s Corp | | | 1,457 | | | | 74,904 | |
Krispy Kreme Doughnuts, Inc.* | | | 2,742 | | | | 47,491 | |
Las Vegas Sands Corp | | | 1,328 | | | | 76,891 | |
Lennar Corp., Class A | | | 1,114 | | | | 43,802 | |
Life Time Fitness, Inc.* | | | 428 | | | | 21,332 | |
Lions Gate Entertainment Corp. (Canada)* | | | 1,285 | | | | 37,008 | |
Lowe’s Cos., Inc | | | 1,885 | | | | 79,377 | |
LVMH Moet Hennessy Louis Vuitton SA (France) | | | 278 | | | | 49,376 | |
Maidenform Brands, Inc.* | | | 857 | | | | 15,589 | |
MDC Holdings, Inc | | | 428 | | | | 15,883 | |
Men’s Wearhouse, (The), Inc | | | 432 | | | | 15,638 | |
Mitsubishi Corp. (Japan) | | | 1,347 | | | | 23,948 | |
Mitsui & Co. Ltd. (Japan) | | | 1,750 | | | | 22,490 | |
Nike, Inc., Class B | | | 1,333 | | | | 82,193 | |
Nissan Motor Co. Ltd. (Japan) | | | 2,742 | | | | 30,435 | |
Nu Skin Enterprises, Inc., Class A | | | 628 | | | | 36,926 | |
Penske Automotive Group, Inc | | | 933 | | | | 29,959 | |
Red Robin Gourmet Burgers, Inc.* | | | 524 | | | | 27,515 | |
Ross Stores, Inc | | | 1,543 | | | | 99,215 | |
Ruby Tuesday, Inc.* | | | 2,657 | | | | 24,577 | |
Saks, Inc.* | | | 1,800 | | | | 26,694 | |
SIX Flags Entertainment Corp | | | 428 | | | | 31,916 | |
Southwest Airlines Co | | | 5,142 | | | | 72,862 | |
Systemax, Inc | | | 1,457 | | | | 14,060 | |
Target Corp | | | 900 | | | | 62,550 | |
Tenneco, Inc.* | | | 514 | | | | 22,801 | |
Toyota Motor Corp. (Japan) | | | 2,930 | | | | 175,295 | |
VF Corp. | | | 686 | | | | 126,127 | |
Wabash National Corp.* | | | 2,999 | | | | 31,490 | |
Wal-Mart Stores, Inc | | | 4,710 | | | | 352,495 | |
Watsco, Inc | | | 270 | | | | 23,558 | |
World Fuel Services Corp | | | 506 | | | | 20,609 | |
| | | | | | | | |
| | | | | | | 2,611,999 | |
| | | | | | | | |
| | | | |
| See Notes to Financial Statements. | | 24 | | |
db-X Exchange-Traded Funds Inc.
SCHEDULE OF INVESTMENTS
db X-trackers 2030 Target Date Fund (Continued)
May 31, 2013
| | | | | | | | |
| | | Number
of Shares | | | Value | |
| | | | | | | | |
| Consumer, Non-cyclical — 16.9% | | | | | | | | |
Abbott Laboratories | | | 4,474 | | | $ | 164,062 | |
Acacia Research-Acacia Technologies | | | 343 | | | | 8,575 | |
Accuray, Inc.* | | | 2,914 | | | | 15,648 | |
Aetna, Inc | | | 2,485 | | | | 150,044 | |
Align Technology, Inc.* | | | 771 | | | | 27,563 | |
Amsurg Corp.* | | | 343 | | | | 12,187 | |
Anheuser-Busch InBev NV (Belgium) | | | 764 | | | | 70,633 | |
Ariad Pharmaceuticals, Inc.* | | | 1,457 | | | | 26,721 | |
AstraZeneca PLC (United Kingdom) | | | 1,262 | | | | 64,965 | |
Avanir Pharmaceuticals, Inc., Class A* | | | 5,742 | | | | 19,063 | |
Bayer AG (Germany) | | | 788 | | | | 84,896 | |
Becton Dickinson and Co | | | 1,371 | | | | 135,208 | |
BioScrip, Inc.* | | | 2,571 | | | | 35,943 | |
Bristol-Myers Squibb Co | | | 2,400 | | | | 110,424 | |
British American Tobacco PLC (United Kingdom) | | | 1,993 | | | | 109,712 | |
Capella Education Co.* | | | 686 | | | | 29,882 | |
Centene Corp.* | | | 394 | | | | 19,503 | |
Cepheid, Inc.* | | | 600 | | | | 20,856 | |
Chemocentryx, Inc.* | | | 1,457 | | | | 19,684 | |
Coca-Cola (The) Co | | | 6,370 | | | | 254,736 | |
CONMED Corp | | | 257 | | | | 8,463 | |
Convergys Corp | | | 1,114 | | | | 20,241 | |
Costar Group, Inc.* | | | 257 | | | | 28,735 | |
CSL Ltd. (Australia) | | | 525 | | | | 29,946 | |
DANONE S.A. (France) | | | 609 | | | | 44,912 | |
Diageo PLC (United Kingdom) | | | 2,376 | | | | 70,433 | |
Fresh Del Monte Produce, Inc | | | 514 | | | | 13,760 | |
Fresh Market, (The), Inc.* | | | 428 | | | | 21,203 | |
FTI Consulting, Inc.* | | | 428 | | | | 16,260 | |
GlaxoSmithKline PLC (United Kingdom) | | | 5,297 | | | | 137,908 | |
Hain Celestial Group (The), Inc.* | | | 343 | | | | 22,851 | |
Hanger, Inc.* | | | 257 | | | | 8,201 | |
Harris Teeter Supermarkets, Inc | | | 481 | | | | 22,607 | |
Imperial Tobacco Group PLC (United Kingdom) | | | 928 | | | | 33,431 | |
Incyte Corp. Ltd.* | | | 974 | | | | 21,594 | |
Integra Lifesciences Holdings Corp.* | | | 257 | | | | 9,738 | |
JM Smucker (The) Co | | | 739 | | | | 74,609 | |
Johnson & Johnson | | | 3,790 | | | | 319,042 | |
Live Nation Entertainment, Inc.* | | | 1,429 | | | | 19,449 | |
Magellan Health Services, Inc.* | | | 193 | | | | 10,519 | |
MasterCard, Inc., Class A | | | 172 | | | | 98,083 | |
Medivation, Inc.* | | | 514 | | | | 24,960 | |
Medtronic, Inc | | | 1,457 | | | | 74,322 | |
Merck & Co., Inc | | | 3,796 | | | | 177,273 | |
Molina Healthcare, Inc.* | | | 428 | | | | 16,178 | |
Mondelez International, Inc., Class A | | | 3,760 | | | | 110,770 | |
Nestle SA (Switzerland) | | | 3,388 | | | | 224,803 | |
Novartis AG (Switzerland) | | | 2,345 | | | | 169,208 | |
Novo Nordisk A/S, Class B (Denmark) | | | 410 | | | | 66,084 | |
Onyx Pharmaceuticals, Inc.* | | | 353 | | | | 33,694 | |
Pfizer, Inc | | | 10,165 | | | | 276,793 | |
Pharmacyclics, Inc.* | | | 514 | | | | 47,103 | |
Pilgrim’s Pride Corp.* | | | 3,685 | | | | 44,073 | |
Procter & Gamble (The) Co | | | 3,748 | | | | 287,697 | |
Quad/Graphics, Inc | | | 1,114 | | | | 25,956 | |
| | | | | | | | |
| | | Number
of Shares | | | Value | |
| | | | | | | | |
| Consumer, Non-cyclical (Continued) | | | | | | | | |
Questcor Pharmaceuticals, Inc | | | 600 | | | $ | 20,502 | |
Reckitt Benckiser Group PLC (United Kingdom) | | | 683 | | | | 49,003 | |
Rent-A-Center, Inc | | | 600 | | | | 21,948 | |
Roche Holding AG (Switzerland) | | | 720 | | | | 180,028 | |
Rollins, Inc | | | 1,246 | | | | 31,474 | |
SABMiller PLC (United Kingdom) | | | 966 | | | | 48,876 | |
Salix Pharmaceuticals Ltd.* | | | 514 | | | | 31,184 | |
Sanofi (France) | | | 807 | | | | 86,544 | |
Santarus, Inc.* | | | 2,571 | | | | 57,256 | |
Seaboard Corp | | | 14 | | | | 38,574 | |
Seattle Genetics, Inc.* | | | 1,050 | | | | 36,036 | |
Select Medical Holdings Corp | | | 1,457 | | | | 11,510 | |
Sequenom, Inc.* | | | 4,885 | | | | 20,224 | |
Spectrum Brands Holdings, Inc | | | 428 | | | | 25,804 | |
Takeda Pharmaceutical Co. Ltd. (Japan) | | | 722 | | | | 32,343 | |
Tesco PLC (United Kingdom) | | | 8,153 | | | | 45,271 | |
Teva Pharmaceutical Industries Ltd. (Israel) | | | 914 | | | | 35,097 | |
TreeHouse Foods, Inc.* | | | 399 | | | | 26,127 | |
Unilever NV (Netherlands) | | | 1,712 | | | | 70,171 | |
Unilever PLC (United Kingdom) | | | 1,354 | | | | 57,090 | |
United Natural Foods, Inc.* | | | 428 | | | | 22,650 | |
UnitedHealth Group, Inc | | | 1,573 | | | | 98,517 | |
ViroPharma, Inc.* | | | 686 | | | | 18,865 | |
Woolworths Ltd. (Australia) | | | 1,249 | | | | 39,447 | |
Wright Medical Group, Inc.* | | | 428 | | | | 10,713 | |
| | | | | | | | |
| | | | | | | 5,106,458 | |
| | | | | | | | |
| Diversified — 0.1% | | | | | | | | |
Hutchison Whampoa Ltd. (Hong Kong) | | | 2,250 | | | | 23,971 | |
| | | | | | | | |
| Energy — 8.3% | | | | | | | | |
BG Group PLC (United Kingdom) | | | 3,454 | | | | 63,659 | |
BP PLC (United Kingdom) | | | 18,527 | | | | 133,277 | |
Cameron International Corp.* | | | 1,574 | | | | 95,809 | |
Cheniere Energy, Inc.* | | | 1,714 | | | | 50,306 | |
Chevron Corp | | | 2,642 | | | | 324,306 | |
ConocoPhillips | | | 1,742 | | | | 106,854 | |
Continental Resources, Inc.* | | | 1,114 | | | | 90,379 | |
CVR Energy, Inc | | | 686 | | | | 43,088 | |
Dril-Quip, Inc.* | | | 320 | | | | 28,944 | |
Energy XXI Bermuda Ltd. (Bermuda) | | | 686 | | | | 17,514 | |
ENI S.p.A (Italy) | | | 2,507 | | | | 57,023 | |
Exxon Mobil Corp | | | 6,426 | | | | 581,360 | |
Helix Energy Solutions Group, Inc.* | | | 771 | | | | 18,396 | |
Hess Corp | | | 2,314 | | | | 155,987 | |
Kodiak Oil & Gas Corp.* | | | 2,057 | | | | 18,060 | |
McMoRan Exploration Co.* | | | 1,124 | | | | 18,692 | |
Oasis Petroleum, Inc.* | | | 771 | | | | 28,650 | |
Royal Dutch Shell PLC, Class A (United Kingdom) | | | 3,733 | | | | 124,953 | |
Royal Dutch Shell PLC, Class B (United Kingdom) | | | 2,693 | | | | 93,313 | |
Schlumberger Ltd. (Netherland Antilles) | | | 1,854 | | | | 135,398 | |
Southwestern Energy Co.* | | | 2,056 | | | | 77,491 | |
Statoil ASA (Norway) | | | 1,073 | | | | 24,445 | |
Targa Resources Corp | | | 343 | | | | 22,096 | |
Tesco Corp.* | | | 1,628 | | | | 20,773 | |
| | | | |
| See Notes to Financial Statements. | | 25 | | |
db-X Exchange-Traded Funds Inc.
SCHEDULE OF INVESTMENTS
db X-trackers 2030 Target Date Fund (Continued)
May 31, 2013
| | | | | | | | |
| | | Number
of Shares | | | Value | |
| | | | | | | | |
| Energy (Continued) | | | | | | | | |
Total SA (France) | | | 2,254 | | | $ | 113,040 | |
Vantage Drilling Co.* | | | 11,172 | | | | 21,450 | |
Williams (The) Cos., Inc | | | 857 | | | | 30,149 | |
Woodside Petroleum Ltd. (Australia) | | | 671 | | | | 23,112 | |
| | | | | | | | |
| | | | | | | 2,518,524 | |
| | | | | | | | |
| Financial — 17.2% | | | | | | | | |
AIA Group Ltd. (Hong Kong) | | | 9,769 | | | | 43,480 | |
Alexander’s, Inc. REIT | | | 86 | | | | 26,178 | |
Allianz SE (Germany) | | | 442 | | | | 68,795 | |
American Campus Communities, Inc. REIT | | | 616 | | | | 25,151 | |
American Express Co | | | 1,562 | | | | 118,259 | |
American International Group, Inc.* | | | 2,507 | | | | 111,461 | |
American Tower Corp., Class A REIT | | | 514 | | | | 40,010 | |
AON PLC (United Kingdom) | | | 2,142 | | | | 136,382 | |
Australia & New Zealand Banking Group Ltd. (Australia) | | | 2,618 | | | | 69,003 | |
Banco Bilbao Vizcaya Argentaria SA (Spain) | | | 5,831 | | | | 54,924 | |
Banco Santander SA (Spain) | | | 16,937 | | | | 121,956 | |
Bank of America Corp | | | 16,207 | | | | 221,388 | |
Barclays PLC (United Kingdom) | | | 16,568 | | | | 80,669 | |
Berkshire Hathaway, Inc., Class B* | | | 3,448 | | | | 393,314 | |
BioMed Realty Trust, Inc. REIT | | | 1,200 | | | | 25,116 | |
BNP Paribas (France) | | | 1,057 | | | | 62,269 | |
Boston Properties, Inc. REIT | | | 1,003 | | | | 106,900 | |
CBL & Associates Properties, Inc. REIT | | | 1,466 | | | | 33,703 | |
Citigroup, Inc | | | 4,359 | | | | 226,624 | |
Citizens, Inc., Class A* | | | 1,800 | | | | 10,944 | |
Coinstar, Inc.* | | | 257 | | | | 14,968 | |
Commonwealth Bank of Australia (Australia) | | | 1,466 | | | | 93,807 | |
Credit Acceptance Corp.* | | | 183 | | | | 20,836 | |
Deutsche Bank AG (Germany)(a) | | | 1,137 | | | | 53,312 | |
Equity Lifestyle Properties, Inc. REIT | | | 307 | | | | 23,691 | |
Equity One, Inc. REIT | | | 1,020 | | | | 23,797 | |
Equity Residential REIT | | | 399 | | | | 22,563 | |
Extra Space Storage, Inc. REIT | | | 857 | | | | 35,900 | |
Franklin Resources, Inc | | | 284 | | | | 43,966 | |
Geo Group (The), Inc. REIT | | | 691 | | | | 24,061 | |
Goldman Sachs Group (The), Inc | | | 674 | | | | 109,242 | |
Hancock Holding Co | | | 686 | | | | 19,585 | |
Hatteras Financial Corp. REIT | | | 943 | | | | 24,348 | |
Highwoods Properties, Inc. REIT | | | 644 | | | | 23,454 | |
Home Properties, Inc. REIT | | | 346 | | | | 21,026 | |
HSBC Holdings PLC (United Kingdom) | | | 19,724 | | | | 217,543 | |
ING Groep NV (Netherlands)* | | | 4,122 | | | | 38,746 | |
Invesco Mortgage Capital, Inc. REIT | | | 1,028 | | | | 19,172 | |
JPMorgan Chase & Co | | | 5,479 | | | | 299,099 | |
Kilroy Realty Corp. REIT | | | 600 | | | | 31,746 | |
LaSalle Hotel Properties REIT | | | 734 | | | | 19,378 | |
Marsh & McLennan Cos., Inc | | | 771 | | | | 30,855 | |
Meadowbrook Insurance Group, Inc | | | 2,024 | | | | 16,232 | |
MFA Financial, Inc. REIT | | | 2,783 | | | | 24,435 | |
Mid-America Apartment Communities, Inc. REIT | | | 348 | | | | 23,654 | |
Mitsubishi UFJ Financial Group, Inc. (Japan) | | | 12,318 | | | | 72,960 | |
Mizuho Financial Group, Inc. (Japan) | | | 23,071 | | | | 44,785 | |
Monmouth Real Estate Investment Corp., Class A REIT | | | 1,628 | | | | 16,703 | |
| | | | | | | | |
| | | Number
of Shares | | | Value | |
| | | | | | | | |
| Financial (Continued) | | | | | | | | |
Muenchener Rueckversicherungs-Gesellschaft AG (Germany) | | | 174 | | | $ | 32,713 | |
National Australia Bank Ltd. (Australia) | | | 2,307 | | | | 64,029 | |
National Retail Properties, Inc. REIT | | | 895 | | | | 32,104 | |
Ocwen Financial Corp.* | | | 1,114 | | | | 47,657 | |
OMEGA Healthcare Investors, Inc. REIT | | | 1,005 | | | | 32,572 | |
Post Properties, Inc. REIT | | | 374 | | | | 17,877 | |
Primerica, Inc | | | 428 | | | | 15,074 | |
ProAssurance Corp | | | 523 | | | | 26,255 | |
ProLogis, Inc. REIT | | | 2,999 | | | | 120,859 | |
Prudential PLC (United Kingdom) | | | 2,527 | | | | 42,888 | |
PS Business Parks, Inc. REIT | | | 257 | | | | 19,612 | |
Public Storage REIT | | | 215 | | | | 32,637 | |
Republic Bancorp, Inc., Class A | | | 857 | | | | 20,405 | |
Ryman Hospitality Properties REIT | | | 484 | | | | 18,518 | |
Signature Bank* | | | 380 | | | | 29,328 | |
Simon Property Group, Inc. REIT | | | 390 | | | | 64,912 | |
Sovran Self Storage, Inc. REIT | | | 257 | | | | 16,672 | |
Standard Chartered PLC (United Kingdom) | | | 2,481 | | | | 57,940 | |
Starwood Property Trust, Inc. REIT | | | 943 | | | | 23,924 | |
Sumitomo Mitsui Financial Group, Inc. (Japan) | | | 1,319 | | | | 53,243 | |
SVB Financial Group* | | | 380 | | | | 29,408 | |
T. Rowe Price Group, Inc | | | 1,700 | | | | 128,962 | |
Tanger Factory Outlet Centers, Inc. REIT | | | 784 | | | | 27,032 | |
Taylor Capital Group, Inc.* | | | 1,114 | | | | 18,504 | |
Texas Capital Bancshares, Inc.* | | | 343 | | | | 15,147 | |
Tompkins Financial Corp | | | 514 | | | | 21,352 | |
Two Harbors Investment Corp. REIT | | | 1,971 | | | | 21,740 | |
U.S. Bancorp | | | 2,571 | | | | 90,139 | |
UBS AG (Switzerland) | �� | | 4,326 | | | | 76,952 | |
Visa, Inc., Class A | | | 1,103 | | | | 196,488 | |
Washington Real Estate Investment Trust REIT | | | 693 | | | | 19,279 | |
Wells Fargo & Co | | | 7,110 | | | | 288,310 | |
Westpac Banking Corp. (Australia) | | | 2,869 | | | | 78,090 | |
Zurich Insurance Group AG (Switzerland) | | | 146 | | | | 38,811 | |
| | | | | | | | |
| | | | | | | 5,205,823 | |
| | | | | | | | |
| Industrial — 8.3% | | | | | | | | |
ABB Ltd. (Switzerland) | | | 2,140 | | | | 47,377 | |
Actuant Corp., Class A | | | 524 | | | | 17,816 | |
Acuity Brands, Inc | | | 295 | | | | 22,146 | |
Altra Holdings, Inc | | | 1,200 | | | | 34,572 | |
AO Smith Corp | | | 748 | | | | 29,322 | |
Apogee Enterprises, Inc | | | 1,114 | | | | 29,722 | |
Boeing (The) Co | | | 1,028 | | | | 101,793 | |
Bristow Group, Inc | | | 343 | | | | 21,558 | |
Builders FirstSource, Inc.* | | | 3,856 | | | | 25,989 | |
Caterpillar, Inc | | | 971 | | | | 83,312 | |
Chart Industries, Inc.* | | | 257 | | | | 25,001 | |
Clean Harbors, Inc.* | | | 568 | | | | 32,489 | |
Colfax Corp.* | | | 857 | | | | 42,764 | |
Cummins, Inc | | | 274 | | | | 32,779 | |
Darling International, Inc.* | | | 943 | | | | 18,492 | |
East Japan Railway Co. (Japan) | | | 343 | | | | 25,882 | |
Eaton Corp. PLC (Ireland) | | | 2,308 | | | | 152,465 | |
EMCOR Group, Inc | | | 600 | | | | 23,850 | |
Emerson Electric Co | | | 1,064 | | | | 61,137 | |
| | | | |
| See Notes to Financial Statements. | | 26 | | |
db-X Exchange-Traded Funds Inc.
SCHEDULE OF INVESTMENTS
db X-trackers 2030 Target Date Fund (Continued)
May 31, 2013
| | | | | | | | |
| | | Number
of Shares | | | Value | |
| | | | | | | | |
| Industrial (Continued) | | | | | | | | |
EnerSys* | | | 362 | | | $ | 18,038 | |
Fabrinet (Cayman Islands)* | | | 1,714 | | | | 24,904 | |
FANUC Corp. (Japan) | | | 210 | | | | 31,859 | |
FedEx Corp | | | 399 | | | | 38,440 | |
FEI Co | | | 343 | | | | 24,699 | |
General Dynamics Corp | | | 544 | | | | 41,942 | |
General Electric Co | | | 14,969 | | | | 349,076 | |
Genesee & Wyoming, Inc., Class A* | | | 460 | | | | 40,963 | |
Golar LNG Ltd. (Bermuda) | | | 524 | | | | 17,816 | |
Graphic Packaging Holding Co.* | | | 3,342 | | | | 25,700 | |
Hexcel Corp.* | | | 857 | | | | 29,798 | |
Hitachi Ltd. (Japan) | | | 4,648 | | | | 32,389 | |
Ingersoll-Rand PLC (Ireland) | | | 2,043 | | | | 117,533 | |
Komatsu Ltd. (Japan) | | | 866 | | | | 22,509 | |
Koninklijke Philips Electronics NV (Netherlands) | | | 983 | | | | 27,974 | |
Middleby Corp.* | | | 171 | | | | 27,957 | |
Mitsubishi Electric Corp. (Japan) | | | 2,000 | | | | 19,452 | |
Mueller Industries, Inc | | | 343 | | | | 18,676 | |
Powell Industries, Inc.* | | | 514 | | | | 24,302 | |
Rolls-Royce Holdings PLC (United Kingdom)* | | | 2,009 | | | | 36,783 | |
Schneider Electric SA (France) | | | 554 | | | | 44,169 | |
Siemens AG (Germany) | | | 864 | | | | 91,647 | |
Smith & Wesson Holding Corp.* | | | 1,971 | | | | 17,956 | |
Stanley Black & Decker, Inc | | | 1,139 | | | | 90,232 | |
Tetra Tech, Inc.* | | | 600 | | | | 16,542 | |
Tredegar Corp | | | 1,285 | | | | 32,074 | |
Triumph Group, Inc | | | 374 | | | | 29,041 | |
Union Pacific Corp | | | 686 | | | | 106,069 | |
United Parcel Service, Inc., Class B | | | 1,300 | | | | 111,670 | |
United Technologies Corp | | | 1,285 | | | | 121,946 | |
Vinci SA (France) | | | 404 | | | | 20,844 | |
Woodward, Inc | | | 686 | | | | 26,857 | |
| | | | | | | | |
| | | | | | | 2,508,323 | |
| | | | | | | | |
| Technology — 8.6% | | | | | | | | |
Accelrys, Inc.* | | | 2,228 | | | | 18,582 | |
Activision Blizzard, Inc | | | 7,272 | | | | 104,935 | |
Apple, Inc | | | 1,265 | | | | 568,845 | |
Applied Materials, Inc | | | 9,255 | | | | 140,675 | |
ASML Holding NV (Netherlands) | | | 324 | | | | 27,061 | |
Aspen Technology, Inc.* | | | 857 | | | | 26,241 | |
Athenahealth, Inc.* | | | 343 | | | | 29,001 | |
CACI International, Inc., Class A* | | | 192 | | | | 12,315 | |
Canon, Inc. (Japan) | | | 1,317 | | | | 46,280 | |
Cirrus Logic, Inc.* | | | 686 | | | | 12,520 | |
Citrix Systems, Inc.* | | | 1,285 | | | | 82,690 | |
CommVault Systems, Inc.* | | | 428 | | | | 29,960 | |
Concur Technologies, Inc.* | | | 511 | | | | 41,253 | |
Cray, Inc.* | | | 1,543 | | | | 28,098 | |
Dell, Inc | | | 2,657 | | | | 35,471 | |
EMC Corp.* | | | 2,828 | | | | 70,021 | |
EPIQ Systems, Inc | | | 1,350 | | | | 16,376 | |
Fidelity National Information Services, Inc | | | 1,971 | | | | 88,498 | |
Hewlett-Packard Co | | | 3,149 | | | | 76,899 | |
International Business Machines Corp | | | 1,748 | | | | 363,619 | |
Jack Henry & Associates, Inc | | | 691 | | | | 32,429 | |
| | | | | | | | |
| | | Number
of Shares | | | Value | |
| | | | | | | | |
| Technology (Continued) | | | | | | | | |
Mentor Graphics Corp | | | 1,114 | | | $ | 21,155 | |
Microsemi Corp.* | | | 750 | | | | 16,448 | |
Microsoft Corp | | | 11,539 | | | | 402,479 | |
MKS Instruments, Inc | | | 514 | | | | 14,469 | |
Netsuite, Inc.* | | | 614 | | | | 53,786 | |
Progress Software Corp.* | | | 600 | | | | 14,106 | |
PTC, Inc.* | | | 987 | | | | 24,784 | |
QLIK Technologies, Inc.* | | | 1,017 | | | | 31,283 | |
SAP AG (Germany)* | | | 936 | | | | 70,597 | |
Solarwinds, Inc.* | | | 771 | | | | 32,498 | |
SYNNEX Corp.* | | | 343 | | | | 13,909 | |
Syntel, Inc | | | 343 | | | | 21,921 | |
Ultimate Software Group, Inc.* | | | 257 | | | | 28,604 | |
Veeco Instruments, Inc.* | | | 343 | | | | 14,540 | |
| | | | | | | | |
| | | | | | | 2,612,348 | |
| | | | | | | | |
| Utilities — 1.4% | | | | | | | | |
Centrica PLC (United Kingdom) | | | 5,336 | | | | 30,809 | |
Cleco Corp | | | 514 | | | | 23,392 | |
Dominion Resources, Inc | | | 771 | | | | 43,600 | |
E.ON SE (Germany) | | | 1,554 | | | | 26,379 | |
Edison International | | | 2,228 | | | | 102,354 | |
GDF Suez (France) | | | 1,303 | | | | 26,674 | |
National Grid PLC (United Kingdom) | | | 3,703 | | | | 44,139 | |
New Jersey Resources Corp | | | 343 | | | | 15,565 | |
Piedmont Natural Gas Co., Inc | | | 532 | | | | 17,976 | |
SJW Corp | | | 771 | | | | 20,856 | |
WGL Holdings, Inc | | | 428 | | | | 18,370 | |
Wisconsin Energy Corp | | | 1,543 | | | | 62,969 | |
| | | | | | | | |
| | | | | | | 433,083 | |
| | | | | | | | |
TOTAL COMMON STOCKS (Cost $20,624,193) | | | | | | | 24,524,046 | |
| | | | | | | | |
| PREFERRED STOCKS — 0.1% | | | | | | | | |
| Consumer, Cyclical — 0.1% | | | | | | | | |
Volkswagen AG (Germany) | | | 129 | | | | 28,327 | |
| | | | | | | | |
| Industrial — 0.0% (b) | | | | | | | | |
Rolls-Royce Holdings PLC, Class C (United Kingdom)* | | | 237,071 | | | | 363 | |
| | | | | | | | |
TOTAL PREFERRED STOCKS
(Cost $27,963) | | | | | | | 28,690 | |
| | | | | | | | |
| | |
| | | Principal
Amount | | | Value | |
| | | | | | | | |
| CORPORATE BONDS — 16.9% | | | | | | | | |
| Basic Materials — 0.6% | | | | | | | | |
Barrick North America Finance LLC
5.70%, 5/30/41 | | $ | 64,000 | | | $ | 60,592 | |
BHP Billiton Finance USA Ltd. (Australia)
4.125%, 2/24/42 | | | 34,000 | | | | 33,581 | |
Ecolab, Inc.
5.50%, 12/08/41 | | | 30,000 | | | | 34,427 | |
International Paper Co.
6.00%, 11/15/41 | | | 30,000 | | | | 34,795 | |
| | | | |
| See Notes to Financial Statements. | | 27 | | |
db-X Exchange-Traded Funds Inc.
SCHEDULE OF INVESTMENTS
db X-trackers 2030 Target Date Fund (Continued)
May 31, 2013
| | | | | | | | |
| | | Principal
Amount | | | Value | |
| | | | | | | | |
| Basic Materials (Continued) | | | | | | | | |
Rio Tinto Finance USA Ltd. (Australia)
5.20%, 11/02/40 | | $ | 30,000 | | | $ | 32,448 | |
| | | | | | | | |
| | | | | | | 195,843 | |
| | | | | | | | |
| Communications — 2.4% | | | | | | | | |
America Movil S.A.B de CV (Mexico)
6.125%, 3/30/40 | | | 75,000 | | | | 85,788 | |
AT&T, Inc.
5.55%, 8/15/41 | | | 201,000 | | | | 222,847 | |
Cisco Systems, Inc.
5.90%, 2/15/39 | | | 137,000 | | | | 168,940 | |
Corning, Inc.
4.75%, 3/15/42 | | | 34,000 | | | | 35,033 | |
Discovery Communications LLC
4.95%, 5/15/42 | | | 68,000 | | | | 68,637 | |
Verizon Communications, Inc.
6.00%, 4/01/41 | | | 25,000 | | | | 29,155 | |
Viacom, Inc.
4.50%, 2/27/42 | | | 73,000 | | | | 67,682 | |
Walt Disney (The) Co., Series E
4.125%, 12/01/41 | | | 34,000 | | | | 33,864 | |
| | | | | | | | |
| | | | | | | 711,946 | |
| | | | | | | | |
| Consumer, Cyclical — 0.8% | | | | | | | | |
Home Depot, Inc.
5.95%, 4/01/41 | | | 25,000 | | | | 31,233 | |
Lowe’s Cos., Inc.
5.125%, 11/15/41 | | | 94,000 | | | | 102,870 | |
McDonald’s Corp., MTN
3.70%, 2/15/42 | | | 107,000 | | | | 98,980 | |
| | | | | | | | |
| | | | | | | 233,083 | |
| | | | | | | | |
| Consumer, Non-cyclical — 3.5% | | | | | | | | |
Amgen, Inc.
5.65%, 6/15/42 | | | 158,000 | | | | 178,239 | |
Archer-Daniels-Midland Co.
5.765%, 3/01/41 | | | 55,000 | | | | 65,967 | |
Diageo Investment Corp.
4.25%, 5/11/42 | | | 34,000 | | | | 33,614 | |
Express Scripts Holding Co.
6.125%, 11/15/41 | | | 30,000 | | | | 37,389 | |
General Mills, Inc.
5.40%, 6/15/40 | | | 30,000 | | | | 35,142 | |
Gilead Sciences, Inc.
5.65%, 12/01/41 | | | 60,000 | | | | 70,824 | |
Johnson & Johnson
5.95%, 8/15/37 | | | 101,000 | | | | 131,363 | |
Kimberly-Clark Corp.
5.30%, 3/01/41 | | | 30,000 | | | | 36,105 | |
Medtronic, Inc.
4.50%, 3/15/42 | | | 30,000 | | | | 31,030 | |
PepsiCo, Inc.
4.00%, 3/05/42 | | | 34,000 | | | | 32,438 | |
Philip Morris International, Inc.
4.50%, 3/20/42 | | | 68,000 | | | | 66,821 | |
Procter & Gamble (The) Co.
5.55%, 3/05/37 | | | 186,000 | | | | 229,631 | |
| | | | | | | | |
| | | Principal
Amount | | | Value | |
| | | | | | | | |
| Consumer, Non-cyclical (Continued) | | | | | | | | |
UnitedHealth Group, Inc.
4.625%, 11/15/41 | | $ | 47,000 | | | $ | 47,710 | |
WellPoint, Inc.
4.625%, 5/15/42 | | | 51,000 | | | | 50,805 | |
| | | | | | | | |
| | | | | | | 1,047,078 | |
| | | | | | | | |
| Energy — 1.9% | | | | | | | | |
Apache Corp.
4.75%, 4/15/43 | | | 30,000 | | | | 30,051 | |
Baker Hughes, Inc.
5.125%, 9/15/40 | | | 30,000 | | | | 34,060 | |
Devon Energy Corp.
4.75%, 5/15/42 | | | 68,000 | | | | 66,439 | |
Enterprise Products Operating LLC
4.85%, 8/15/42 | | | 103,000 | | | | 103,009 | |
Halliburton Co.
4.50%, 11/15/41 | | | 34,000 | | | | 36,080 | |
Plains All American Pipeline LP/PAA Finance Corp.
5.15%, 6/01/42 | | | 30,000 | | | | 31,771 | |
Shell International Finance BV (Netherlands)
6.375%, 12/15/38 | | | 151,000 | | | | 202,160 | |
Transcanada Pipelines Ltd. (Canada)
6.10%, 6/01/40 | | | 55,000 | | | | 68,481 | |
| | | | | | | | |
| | | | | | | 572,051 | |
| | | | | | | | |
| Financial — 1.8% | | | | | | | | |
Berkshire Hathaway Finance Corp.
4.40%, 5/15/42 | | | 34,000 | | | | 33,082 | |
Cooperatieve Centrale Raiffeisen-Boerenleenbank BA, MTN (Netherlands)
5.25%, 5/24/41 | | | 30,000 | | | | 33,411 | |
General Electric Capital Corp.
2.10%, 1/07/14 | | | 222,000 | | | | 224,373 | |
HSBC Holdings PLC (United Kingdom)
6.10%, 1/14/42 | | | 30,000 | | | | 37,346 | |
JPMorgan Chase & Co.
5.60%, 7/15/41 | | | 98,000 | | | | 113,554 | |
MetLife, Inc.
5.875%, 2/06/41 | | | 35,000 | | | | 42,136 | |
Simon Property Group LP
4.75%, 3/15/42 | | | 34,000 | | | | 35,523 | |
Travelers (The) Cos., Inc.
5.35%, 11/01/40 | | | 30,000 | | | | 35,316 | |
| | | | | | | | |
| | | | | | | 554,741 | |
| | | | | | | | |
| Industrial — 1.7% | | | | | | | | |
Caterpillar, Inc.
5.20%, 5/27/41 | | | 85,000 | | | | 96,487 | |
Deere & Co.
3.90%, 6/09/42 | | | 34,000 | | | | 32,304 | |
Dover Corp.
5.375%, 3/01/41 | | | 30,000 | | | | 35,636 | |
Illinois Tool Works, Inc.
4.875%, 9/15/41 | | | 30,000 | | | | 32,630 | |
Koninklijke Philips Electronics NV (Netherlands) 5.00%, 3/15/42 | | | 34,000 | | | | 36,331 | |
| | | | |
| See Notes to Financial Statements. | | 28 | | |
db-X Exchange-Traded Funds Inc.
SCHEDULE OF INVESTMENTS
db X-trackers 2030 Target Date Fund (Continued)
May 31, 2013
| | | | | | | | |
| | | Principal
Amount | | | Value | |
| | | | | | | | |
| Industrial (Continued) | | | | | | | | |
Norfolk Southern Corp.
4.837%, 10/01/41 | | $ | 98,000 | | | $ | 103,106 | |
7.90%, 5/15/97 | | | 23,000 | | | | 34,211 | |
Sonoco Products Co.
5.75%, 11/01/40 | | | 30,000 | | | | 33,485 | |
Stanley Black & Decker, Inc.
5.20%, 9/01/40 | | | 64,000 | | | | 69,935 | |
Union Pacific Corp.
4.75%, 9/15/41 | | | 30,000 | | | | 31,827 | |
| | | | | | | | |
| | | | | | | 505,952 | |
| | | | | | | | |
| Technology — 0.6% | | | | | | | | |
Applied Materials, Inc.
5.85%, 6/15/41 | | | 30,000 | | | | 34,223 | |
Intel Corp.
4.80%, 10/01/41 | | | 30,000 | | | | 30,948 | |
Microsoft Corp.
4.50%, 10/01/40 | | | 30,000 | | | | 31,710 | |
Oracle Corp.
5.375%, 7/15/40 | | | 84,000 | | | | 97,788 | |
| | | | | | | | |
| | | | | | | 194,669 | |
| | | | | | | | |
| Utilities — 3.6% | | | | | | | | |
AGL Capital Corp.
5.875%, 3/15/41 | | | 25,000 | | | | 29,928 | |
Alabama Power Co., Series 11-C
5.20%, 6/01/41 | | | 47,000 | | | | 53,771 | |
Arizona Public Service Co.
5.05%, 9/01/41 | | | 51,000 | | | | 56,867 | |
Duke Energy Indiana, Inc.
6.45%, 4/01/39 | | | 77,000 | | | | 100,224 | |
Florida Power & Light Co.
5.95%, 2/01/38 | | | 103,000 | | | | 130,527 | |
4.125%, 2/01/42 | | | 94,000 | | | | 94,090 | |
Georgia Power Co.
4.30%, 3/15/42 | | | 94,000 | | | | 92,635 | |
Nevada Power Co.
5.45%, 5/15/41 | | | 47,000 | | | | 55,577 | |
Puget Sound Energy, Inc.
4.434%, 11/15/41 | | | 81,000 | | | | 84,555 | |
Southern California Edison Co.
6.05%, 3/15/39 | | | 165,000 | | | | 210,958 | |
Southern California Gas Co.
5.125%, 11/15/40 | | | 78,000 | | | | 91,827 | |
Southern Power Co.
5.15%, 9/15/41 | | | 90,000 | | | | 97,795 | |
| | | | | | | | |
| | | | | | | 1,098,754 | |
| | | | | | | | |
TOTAL CORPORATE BONDS (Cost $5,647,832) | | | | | | | 5,114,117 | |
| | | | | | | | |
| | | | | | | | |
| | | Principal
Amount | | | Value | |
| | | | | | | | |
| UNITED STATES GOVERNMENT & AGENCIES OBLIGATIONS — 1.4% | | | | | | | | |
| United States Treasury Bonds/Notes — 1.4% | | | | | | | | |
4.50%, 2/15/36 | | $ | 85,100 | | | $ | 104,912 | |
4.50%, 8/15/39 | | | 53,400 | | | | 66,091 | |
4.375%, 11/15/39 | | | 27,700 | | | | 33,599 | |
4.625%, 2/15/40 | | | 71,900 | | | | 90,650 | |
4.375%, 5/15/41 | | | 111,400 | | | | 135,265 | |
| | | | | | | | |
| | | | | | | 430,517 | |
| | | | | | | | |
TOTAL UNITED STATES GOVERNMENT & AGENCIES OBLIGATIONS
(Cost $431,808) | | | | | | | 430,517 | |
| | | | | | | | |
| | |
TOTAL INVESTMENTS — 99.4% (Cost $26,731,796) | | | | | | $ | 30,097,370 | |
Other assets less liabilities — 0.6% | | | | | | | 166,740 | |
| | | | | | | | |
NET ASSETS — 100.0% | | | | | | $ | 30,264,110 | |
| | | | | | | | |
MTN – Medium Term Note.
REIT – Real Estate Investment Trust.
* Non-income producing security.
(a) Affiliated company. The Advisor is a subsidiary of Deutsche Bank AG. Therefore, Deutsche Bank AG is considered to be affiliated with the Fund.
(b) Less than 0.1%.
| | | | |
| See Notes to Financial Statements. | | 29 | | |
db-X Exchange-Traded Funds Inc.
SCHEDULE OF INVESTMENTS
db X-trackers 2040 Target Date Fund
May 31, 2013
| | | | | | | | |
| | | Number
of Shares | | | Value | |
| | | | | | | | |
| COMMON STOCKS — 94.4% | | | | | | | | |
| Basic Materials — 4.2% | | | | | | | | |
Air Liquide SA (France) | | | 398 | | | $ | 51,394 | |
Anglo American PLC (United Kingdom) | | | 1,716 | | | | 39,801 | |
BASF SE (Germany) | | | 1,098 | | | | 107,362 | |
BHP Billiton Ltd. (Australia) | | | 3,951 | | | | 131,891 | |
BHP Billiton PLC (United Kingdom) | | | 2,462 | | | | 71,655 | |
Coeur Mining, Inc.* | | | 1,271 | | | | 18,035 | |
Dow Chemical (The) Co | | | 2,102 | | | | 72,435 | |
E.I. du Pont de Nemours & Co | | | 1,516 | | | | 84,578 | |
Freeport-McMoRan Copper & Gold, Inc | | | 1,590 | | | | 49,370 | |
Gold Resource Corp | | | 600 | | | | 5,760 | |
HB Fuller Co | | | 514 | | | | 21,367 | |
International Paper Co | | | 3,084 | | | | 142,327 | |
Linde AG (Germany) | | | 211 | | | | 40,602 | |
Monsanto Co | | | 771 | | | | 77,593 | |
NewMarket Corp | | | 136 | | | | 37,297 | |
Rio Tinto Ltd. (Australia) | | | 468 | | | | 24,715 | |
Rio Tinto PLC (United Kingdom) | | | 1,681 | | | | 72,971 | |
Sensient Technologies Corp | | | 514 | | | | 21,213 | |
Sherwin-Williams (The) Co | | | 857 | | | | 161,570 | |
Syngenta AG (Switzerland) | | | 105 | | | | 41,286 | |
| | | | | | | | |
| | | | | | | 1,273,222 | |
| | | | | | | | |
| Communications — 9.1% | | | | | | | | |
Amazon.com, Inc.* | | | 741 | | | | 199,351 | |
Anixter International, Inc.* | | | 308 | | | | 23,633 | |
Arris Group, Inc.* | | | 1,114 | | | | 16,855 | |
AT&T, Inc | | | 9,706 | | | | 339,613 | |
Bankrate, Inc.* | | | 1,200 | | | | 17,172 | |
Brightcove, Inc.* | | | 1,542 | | | | 11,534 | |
BT Group PLC (United Kingdom) | | | 8,880 | | | | 40,760 | |
CenturyLink, Inc | | | 943 | | | | 32,203 | |
Cisco Systems, Inc | | | 9,232 | | | | 222,307 | |
Comcast Corp., Class A | | | 4,222 | | | | 169,513 | |
Consolidated Communications Holdings, Inc | | | 1,457 | | | | 24,798 | |
Corning, Inc | | | 2,786 | | | | 42,821 | |
Deutsche Telekom AG (Germany) | | | 2,855 | | | | 32,796 | |
Finisar Corp.* | | | 1,114 | | | | 14,593 | |
France Telecom SA (France) | | | 2,004 | | | | 20,429 | |
Google, Inc., Class A* | | | 529 | | | | 460,447 | |
Leap Wireless International, Inc.* | | | 3,770 | | | | 21,300 | |
Meredith Corp | | | 428 | | | | 17,539 | |
Netgear, Inc.* | | | 428 | | | | 14,244 | |
News Corp., Class A | | | 2,424 | | | | 77,835 | |
SoftBank Corp. (Japan) | | | 914 | | | | 47,040 | |
Telefonaktiebolaget LM Ericsson,
Class B (Sweden) | | | 3,737 | | | | 44,122 | |
Telefonica SA (Spain)* | | | 5,301 | | | | 73,034 | |
Thomson Reuters Corp. (Canada) | | | 1,333 | | | | 44,522 | |
Time Warner, Inc | | | 1,429 | | | | 83,411 | |
Verizon Communications, Inc | | | 4,670 | | | | 226,402 | |
ViaSat, Inc.* | | | 428 | | | | 29,986 | |
Vodafone Group PLC (United Kingdom) | | | 58,384 | | | | 170,277 | |
Vonage Holdings Corp.* | | | 12,594 | | | | 34,508 | |
Walt Disney (The) Co | | | 2,837 | | | | 178,957 | |
| | | | | | | | |
| | | | | | | 2,732,002 | |
| | | | | | | | |
| | | | | | | | |
| | | Number
of Shares | | | Value | |
| | | | | | | | |
| Consumer, Cyclical — 10.2% | | | | | | | | |
Arctic Cat, Inc | | | 600 | | | $ | 28,134 | |
Ascena Retail Group, Inc.* | | | 1,585 | | | | 32,223 | |
Bayerische Motoren Werke AG (Germany) | | | 434 | | | | 41,568 | |
Carter’s, Inc | | | 600 | | | | 43,242 | |
Cash America International, Inc | | | 333 | | | | 15,887 | |
Cie Financiere Richemont SA (Switzerland) | | | 691 | | | | 62,036 | |
Cinemark Holdings, Inc | | | 1,012 | | | | 29,692 | |
Columbia Sportswear Co | | | 334 | | | | 20,113 | |
Compass Group PLC (United Kingdom) | | | 2,250 | | | | 29,623 | |
CVS Caremark Corp | | | 2,167 | | | | 124,776 | |
Daimler AG (Germany) | | | 1,082 | | | | 69,487 | |
Dana Holding Corp | | | 1,599 | | | | 30,253 | |
DR Horton, Inc | | | 2,142 | | | | 52,179 | |
DTS, Inc.* | | | 1,285 | | | | 25,392 | |
Ford Motor Co | | | 6,969 | | | | 109,274 | |
GNC Holdings, Inc., Class A | | | 943 | | | | 42,463 | |
Hennes & Mauritz AB, Class B (Sweden) | | | 1,251 | | | | 43,064 | |
Honda Motor Co. Ltd. (Japan) | | | 2,098 | | | | 79,989 | |
Inditex SA (Spain) | | | 258 | | | | 32,132 | |
JetBlue Airways Corp.* | | | 2,656 | | | | 16,494 | |
Kohl’s Corp | | | 1,628 | | | | 83,695 | |
Krispy Kreme Doughnuts, Inc.* | | | 3,427 | | | | 59,356 | |
Las Vegas Sands Corp | | | 1,542 | | | | 89,282 | |
Lennar Corp., Class A | | | 1,285 | | | | 50,526 | |
Life Time Fitness, Inc.* | | | 428 | | | | 21,332 | |
Lions Gate Entertainment Corp. (Canada)* | | | 1,542 | | | | 44,410 | |
Lowe’s Cos., Inc | | | 2,228 | | | | 93,821 | |
LVMH Moet Hennessy Louis Vuitton SA (France) | | | 317 | | | | 56,303 | |
Maidenform Brands, Inc.* | | | 1,114 | | | | 20,264 | |
MDC Holdings, Inc | | | 514 | | | | 19,075 | |
Men’s Wearhouse (The), Inc | | | 445 | | | | 16,109 | |
Mitsubishi Corp. (Japan) | | | 1,493 | | | | 26,544 | |
Mitsui & Co. Ltd. (Japan) | | | 2,014 | | | | 25,883 | |
Nike, Inc., Class B | | | 1,600 | | | | 98,656 | |
Nissan Motor Co. Ltd. (Japan) | | | 3,170 | | | | 35,185 | |
Nu Skin Enterprises, Inc., Class A | | | 667 | | | | 39,220 | |
Penske Automotive Group, Inc | | | 1,066 | | | | 34,229 | |
Red Robin Gourmet Burgers, Inc.* | | | 720 | | | | 37,807 | |
Ross Stores, Inc | | | 1,714 | | | | 110,210 | |
Ruby Tuesday, Inc.* | | | 3,256 | | | | 30,118 | |
Saks, Inc.* | | | 1,999 | | | | 29,645 | |
SIX Flags Entertainment Corp | | | 514 | | | | 38,329 | |
Southwest Airlines Co | | | 5,655 | | | | 80,131 | |
Systemax, Inc | | | 1,799 | | | | 17,360 | |
Target Corp | | | 1,114 | | | | 77,423 | |
Tenneco, Inc.* | | | 685 | | | | 30,387 | |
Toyota Motor Corp. (Japan) | | | 3,330 | | | | 199,227 | |
VF Corp | | | 857 | | | | 157,568 | |
Wabash National Corp.* | | | 3,684 | | | | 38,682 | |
Wal-Mart Stores, Inc | | | 5,378 | | | | 402,490 | |
Watsco, Inc | | | 342 | | | | 29,839 | |
World Fuel Services Corp | | | 728 | | | | 29,651 | |
| | | | | | | | |
| | | | | | | 3,050,778 | |
| | | | | | | | |
| Consumer, Non-cyclical — 19.6% | | | | | | | | |
Abbott Laboratories | | | 5,180 | | | | 189,951 | |
Acacia Research - Acacia Technologies | | | 343 | | | | 8,575 | |
| | | | |
| See Notes to Financial Statements. | | 30 | | |
db-X Exchange-Traded Funds Inc.
SCHEDULE OF INVESTMENTS
db X-trackers 2040 Target Date Fund (Continued)
May 31, 2013
| | | | | | | | |
| | | Number
of Shares | | | Value | |
| | | | | | | | |
| Consumer, Non-cyclical (Continued) | | | | | | | | |
Accuray, Inc.* | | | 3,598 | | | $ | 19,321 | |
Aetna, Inc | | | 2,913 | | | | 175,887 | |
Align Technology, Inc.* | | | 943 | | | | 33,712 | |
Amsurg Corp.* | | | 343 | | | | 12,187 | |
Anheuser-Busch InBev NV (Belgium) | | | 894 | | | | 82,651 | |
Ariad Pharmaceuticals, Inc.* | | | 1,714 | | | | 31,435 | |
AstraZeneca PLC (United Kingdom) | | | 1,437 | | | | 73,973 | |
Avanir Pharmaceuticals, Inc., Class A* | | | 7,026 | | | | 23,326 | |
Bayer AG (Germany) | | | 918 | | | | 98,902 | |
Becton Dickinson and Co | | | 1,542 | | | | 152,072 | |
BioScrip, Inc.* | | | 3,170 | | | | 44,317 | |
Bristol-Myers Squibb Co | | | 2,742 | | | | 126,159 | |
British American Tobacco PLC (United Kingdom) | | | 2,291 | | | | 126,116 | |
Capella Education Co.* | | | 771 | | | | 33,585 | |
Centene Corp.* | | | 312 | | | | 15,444 | |
Cepheid, Inc.* | | | 685 | | | | 23,811 | |
Chemocentryx, Inc.* | | | 1,542 | | | | 20,832 | |
Coca-Cola (The) Co | | | 7,202 | | | | 288,008 | |
CONMED Corp | | | 343 | | | | 11,295 | |
Convergys Corp | | | 1,200 | | | | 21,804 | |
Costar Group, Inc.* | | | 257 | | | | 28,735 | |
CSL Ltd. (Australia) | | | 625 | | | | 35,650 | |
DANONE SA (France) | | | 706 | | | | 52,066 | |
Diageo PLC (United Kingdom) | | | 2,807 | | | | 83,210 | |
Fresh Del Monte Produce, Inc | | | 514 | | | | 13,760 | |
Fresh Market (The), Inc.* | | | 514 | | | | 25,464 | |
FTI Consulting, Inc.* | | | 514 | | | | 19,527 | |
GlaxoSmithKline PLC (United Kingdom) | | | 6,319 | | | | 164,516 | |
Hain Celestial Group (The), Inc.* | | | 428 | | | | 28,513 | |
Hanger, Inc.* | | | 428 | | | | 13,657 | |
Harris Teeter Supermarkets, Inc | | | 491 | | | | 23,077 | |
Imperial Tobacco Group PLC (United Kingdom) | | | 1,077 | | | | 38,799 | |
Incyte Corp. Ltd.* | | | 1,114 | | | | 24,697 | |
Integra Lifesciences Holdings Corp.* | | | 250 | | | | 9,472 | |
JM Smucker (The) Co | | | 843 | | | | 85,109 | |
Johnson & Johnson | | | 4,330 | | | | 364,499 | |
Live Nation Entertainment, Inc.* | | | 2,465 | | | | 33,549 | |
Magellan Health Services, Inc.* | | | 239 | | | | 13,026 | |
MasterCard, Inc., Class A | | | 216 | | | | 123,174 | |
Medivation, Inc.* | | | 685 | | | | 33,264 | |
Medtronic, Inc | | | 1,628 | | | | 83,044 | |
Merck & Co., Inc | | | 4,338 | | | | 202,585 | |
Molina Healthcare, Inc.* | | | 500 | | | | 18,900 | |
Mondelez International, Inc., Class A | | | 4,314 | | | | 127,090 | |
Nestle SA (Switzerland) | | | 3,859 | | | | 256,056 | |
Novartis AG (Switzerland) | | | 2,706 | | | | 195,256 | |
Novo Nordisk A/S, Class B (Denmark) | | | 445 | | | | 71,725 | |
Onyx Pharmaceuticals, Inc.* | | | 428 | | | | 40,853 | |
Pfizer, Inc | | | 11,630 | | | | 316,685 | |
Pharmacyclics, Inc.* | | | 600 | | | | 54,984 | |
Pilgrim’s Pride Corp.* | | | 4,455 | | | | 53,282 | |
Procter & Gamble (The) Co. | | | 4,319 | | | | 331,526 | |
Quad/Graphics, Inc | | | 1,371 | | | | 31,944 | |
Questcor Pharmaceuticals, Inc | | | 685 | | | | 23,406 | |
Reckitt Benckiser Group PLC (United Kingdom) | | | 791 | | | | 56,752 | |
Rent-A-Center, Inc | | | 685 | | | | 25,057 | |
| | | | | | | | |
| | | Number
of Shares | | | Value | |
| | | | | | | | |
| Consumer, Non-cyclical (Continued) | | | | | | | | |
Roche Holding AG (Switzerland) | | | 843 | | | $ | 210,783 | |
Rollins, Inc | | | 1,458 | | | | 36,829 | |
SABMiller PLC (United Kingdom) | | | 1,105 | | | | 55,909 | |
Salix Pharmaceuticals Ltd.* | | | 667 | | | | 40,467 | |
Sanofi (France) | | | 957 | | | | 102,631 | |
Santarus, Inc.* | | | 3,170 | | | | 70,596 | |
Seaboard Corp | | | 11 | | | | 30,308 | |
Seattle Genetics, Inc.* | | | 1,200 | | | | 41,184 | |
Select Medical Holdings Corp | | | 1,199 | | | | 9,472 | |
Sequenom, Inc.* | | | 5,997 | | | | 24,828 | |
Spectrum Brands Holdings, Inc | | | 514 | | | | 30,989 | |
Takeda Pharmaceutical Co. Ltd. (Japan) | | | 841 | | | | 37,674 | |
Tesco PLC (United Kingdom) | | | 9,327 | | | | 51,790 | |
Teva Pharmaceutical Industries Ltd. (Israel) | | | 1,015 | | | | 38,975 | |
TreeHouse Foods, Inc.* | | | 399 | | | | 26,127 | |
Unilever NV (Netherlands) | | | 1,943 | | | | 79,639 | |
Unilever PLC (United Kingdom) | | | 1,518 | | | | 64,004 | |
United Natural Foods, Inc.* | | | 514 | | | | 27,201 | |
UnitedHealth Group, Inc | | | 1,906 | | | | 119,373 | |
ViroPharma, Inc.* | | | 857 | | | | 23,568 | |
Woolworths Ltd. (Australia) | | | 1,465 | | | | 46,268 | |
Wright Medical Group, Inc.* | | | 500 | | | | 12,515 | |
| | | | | | | | |
| | | | | | | 5,897,402 | |
| | | | | | | | |
| Diversified — 0.1% | | | | | | | | |
Hutchison Whampoa Ltd. (Hong Kong) | | | 2,570 | | | | 27,380 | |
| | | | | | | | |
| Energy — 9.7% | | | | | | | | |
BG Group PLC (United Kingdom) | | | 3,927 | | | | 72,376 | |
BP PLC (United Kingdom) | | | 21,344 | | | | 153,541 | |
Cameron International Corp.* | | | 1,889 | | | | 114,983 | |
Cheniere Energy, Inc.* | | | 2,056 | | | | 60,344 | |
Chevron Corp | | | 3,114 | | | | 382,244 | |
ConocoPhillips | | | 2,012 | | | | 123,416 | |
Continental Resources, Inc.* | | | 1,271 | | | | 103,116 | |
CVR Energy, Inc | | | 771 | | | | 48,427 | |
Dril-Quip, Inc.* | | | 435 | | | | 39,346 | |
Energy XXI Bermuda Ltd. (Bermuda) | | | 771 | | | | 19,684 | |
ENI S.p.A (Italy) | | | 2,974 | | | | 67,645 | |
Exxon Mobil Corp | | | 7,397 | | | | 669,206 | |
Helix Energy Solutions Group, Inc.* | | | 1,028 | | | | 24,528 | |
Hess Corp | | | 2,656 | | | | 179,041 | |
Kodiak Oil & Gas Corp.* | | | 2,228 | | | | 19,562 | |
McMoRan Exploration Co.* | | | 1,285 | | | | 21,370 | |
Oasis Petroleum, Inc.* | | | 857 | | | | 31,846 | |
Royal Dutch Shell PLC, Class A (United Kingdom) | | | 4,301 | | | | 143,966 | |
Royal Dutch Shell PLC, Class B (United Kingdom) | | | 3,067 | | | | 106,272 | |
Schlumberger Ltd. (Netherland Antilles) | | | 2,103 | | | | 153,582 | |
Southwestern Energy Co.* | | | 2,402 | | | | 90,531 | |
Statoil ASA (Norway) | | | 1,208 | | | | 27,521 | |
Targa Resources Corp | | | 428 | | | | 27,572 | |
Tesco Corp.* | | | 1,971 | | | | 25,150 | |
Total SA (France) | | | 2,556 | | | | 128,185 | |
Vantage Drilling Co.* | | | 13,022 | | | | 25,002 | |
Williams (The) Cos., Inc | | | 1,028 | | | | 36,165 | |
Woodside Petroleum Ltd. (Australia) | | | 774 | | | | 26,660 | |
| | | | | | | | |
| | | | | | | 2,921,281 | |
| | | | | | | | |
| | | | |
| See Notes to Financial Statements. | | 31 | | |
db-X Exchange-Traded Funds Inc.
SCHEDULE OF INVESTMENTS
db X-trackers 2040 Target Date Fund (Continued)
May 31, 2013
| | | | | | | | |
| | | Number
of Shares | | | Value | |
| | | | | | | | |
| Financial—20.0% | | | | | | | | |
AIA Group Ltd. (Hong Kong) | | | 11,481 | | | $ | 51,100 | |
Alexander’s, Inc. REIT | | | 43 | | | | 13,089 | |
Allianz SE (Germany) | | | 513 | | | | 79,846 | |
American Campus Communities, Inc. REIT | | | 665 | | | | 27,152 | |
American Express Co | | | 1,932 | | | | 146,272 | |
American International Group, Inc.* | | | 2,947 | | | | 131,024 | |
American Tower Corp. REIT | | | 600 | | | | 46,704 | |
AON PLC (United Kingdom) | | | 2,485 | | | | 158,220 | |
Australia & New Zealand Banking Group Ltd. (Australia) | | | 3,039 | | | | 80,099 | |
Banco Bilbao Vizcaya Argentaria SA (Spain) | | | 6,431 | | | | 60,575 | |
Banco Santander SA (Spain) | | | 19,378 | | | | 139,533 | |
Bank of America Corp | | | 18,721 | | | | 255,729 | |
Barclays PLC (United Kingdom) | | | 17,288 | | | | 84,174 | |
Berkshire Hathaway, Inc., Class B* | | | 3,972 | | | | 453,086 | |
BioMed Realty Trust, Inc. REIT | | | 1,533 | | | | 32,086 | |
BNP Paribas SA (France) | | | 1,228 | | | | 72,343 | |
Boston Properties, Inc. REIT | | | 1,114 | | | | 118,730 | |
CBL & Associates Properties, Inc. REIT | | | 1,666 | | | | 38,301 | |
Citigroup, Inc | | | 5,018 | | | | 260,886 | |
Citizens, Inc.* | | | 2,228 | | | | 13,546 | |
Coinstar, Inc.* | | | 343 | | | | 19,976 | |
Commonwealth Bank of Australia (Australia) | | | 1,809 | | | | 115,755 | |
Credit Acceptance Corp.* | | | 228 | | | | 25,960 | |
Deutsche Bank AG (Germany) (a) | | | 1,324 | | | | 62,080 | |
Equity Lifestyle Properties, Inc. REIT | | | 420 | | | | 32,411 | |
Equity One, Inc. REIT | | | 1,100 | | | | 25,663 | |
Equity Residential REIT | | | 466 | | | | 26,352 | |
Extra Space Storage, Inc. REIT | | | 943 | | | | 39,502 | |
Franklin Resources, Inc | | | 324 | | | | 50,158 | |
Geo Group (The), Inc. REIT | | | 789 | | | | 27,473 | |
Goldman Sachs Group (The), Inc | | | 782 | | | | 126,746 | |
Hancock Holding Co. | | | 857 | | | | 24,467 | |
Hatteras Financial Corp. REIT | | | 1,028 | | | | 26,543 | |
Highwoods Properties, Inc. REIT | | | 699 | | | | 25,458 | |
Home Properties, Inc. REIT | | | 479 | | | | 29,109 | |
HSBC Holdings PLC (United Kingdom) | | | 22,685 | | | | 250,202 | |
ING Groep NV (Netherlands)* | | | 4,718 | | | | 44,348 | |
Invesco Mortgage Capital, Inc. REIT | | | 1,200 | | | | 22,380 | |
JPMorgan Chase & Co | | | 6,289 | | | | 343,316 | |
Kilroy Realty Corp. REIT | | | 700 | | | | 37,037 | |
LaSalle Hotel Properties REIT | | | 800 | | | | 21,120 | |
Marsh & McLennan Cos., Inc | | | 857 | | | | 34,297 | |
Meadowbrook Insurance Group, Inc | | | 2,313 | | | | 18,550 | |
MFA Financial, Inc. REIT | | | 3,532 | | | | 31,011 | |
Mid-America Apartment Communities, Inc. REIT | | | 377 | | | | 25,625 | |
Mitsubishi UFJ Financial Group, Inc. (Japan) | | | 14,363 | | | | 85,073 | |
Mizuho Financial Group, Inc. (Japan) | | | 26,671 | | | | 51,773 | |
Monmouth Real Estate Investment Corp., Class A REIT | | | 1,971 | | | | 20,223 | |
Muenchener Rueckversicherungs-Gesellschaft AG (Germany) | | | 202 | | | | 37,978 | |
National Australia Bank Ltd. (Australia) | | | 2,457 | | | | 68,192 | |
National Retail Properties, Inc. REIT | | | 985 | | | | 35,332 | |
Ocwen Financial Corp.* | | | 1,285 | | | | 54,972 | |
OMEGA Healthcare Investors, Inc. REIT | | | 1,091 | | | | 35,359 | |
| | | | | | | | |
| | | Number
of Shares | | | Value | |
| | | | | | | | |
| Financial (Continued) | | | | | | | | |
Post Properties, Inc. REIT | | | 485 | | | $ | 23,183 | |
Primerica, Inc | | | 685 | | | | 24,126 | |
ProAssurance Corp | | | 528 | | | | 26,506 | |
ProLogis, Inc. REIT | | | 3,427 | | | | 138,109 | |
Prudential PLC (United Kingdom) | | | 2,934 | | | | 49,795 | |
PS Business Parks, Inc. REIT | | | 257 | | | | 19,612 | |
Public Storage REIT | | | 267 | | | | 40,531 | |
Republic Bancorp, Inc., Class A | | | 1,028 | | | | 24,477 | |
Ryman Hospitality Properties REIT | | | 581 | | | | 22,229 | |
Signature Bank* | | | 533 | | | | 41,137 | |
Simon Property Group, Inc. REIT | | | 457 | | | | 76,063 | |
Sovran Self Storage, Inc. REIT | | | 257 | | | | 16,672 | |
Standard Chartered PLC (United Kingdom) | | | 2,816 | | | | 65,763 | |
Starwood Property Trust, Inc. REIT | | | 1,114 | | | | 28,262 | |
Sumitomo Mitsui Financial Group, Inc. (Japan) | | | 1,501 | | | | 60,590 | |
SVB Financial Group* | | | 462 | | | | 35,754 | |
T. Rowe Price Group, Inc | | | 1,923 | | | | 145,879 | |
Tanger Factory Outlet Centers, Inc. REIT | | | 853 | | | | 29,411 | |
Taylor Capital Group, Inc.* | | | 1,371 | | | | 22,772 | |
Texas Capital Bancshares, Inc.* | | | 343 | | | | 15,147 | |
Tompkins Financial Corp | | | 600 | | | | 24,924 | |
Two Harbors Investment Corp. REIT | | | 2,056 | | | | 22,678 | |
U.S. Bancorp | | | 2,913 | | | | 102,130 | |
UBS AG (Switzerland)* | | | 5,076 | | | | 90,293 | |
Visa, Inc., Class A | | | 1,264 | | | | 225,169 | |
Washington Real Estate Investment Trust REIT | | | 750 | | | | 20,865 | |
Wells Fargo & Co | | | 8,340 | | | | 338,188 | |
Westpac Banking Corp. (Australia) | | | 3,420 | | | | 93,087 | |
Zurich Insurance Group AG (Switzerland)* | | | 174 | | | | 46,254 | |
| | | | | | | | |
| | | | | | | 6,006,542 | |
| | | | | | | | |
| Industrial — 9.7% | | | | | | | | |
ABB Ltd. (Switzerland)* | | | 2,510 | | | | 55,568 | |
Actuant Corp., Class A | | | 685 | | | | 23,290 | |
Acuity Brands, Inc | | | 466 | | | | 34,983 | |
Altra Holdings, Inc | | | 1,542 | | | | 44,425 | |
AO Smith Corp | | | 856 | | | | 33,555 | |
Apogee Enterprises, Inc | | | 1,371 | | | | 36,578 | |
Boeing (The) Co | | | 1,200 | | | | 118,824 | |
Bristow Group, Inc | | | 343 | | | | 21,558 | |
Builders FirstSource, Inc.* | | | 4,712 | | | | 31,759 | |
Caterpillar, Inc | | | 1,099 | | | | 94,294 | |
Chart Industries, Inc.* | | | 343 | | | | 33,367 | |
Clean Harbors, Inc.* | | | 579 | | | | 33,119 | |
Colfax Corp.* | | | 1,028 | | | | 51,297 | |
Cummins, Inc | | | 343 | | | | 41,033 | |
Darling International, Inc.* | | | 1,114 | | | | 21,846 | |
East Japan Railway Co. (Japan) | | | 428 | | | | 32,295 | |
Eaton Corp. PLC (Ireland) | | | 2,740 | | | | 181,004 | |
EMCOR Group, Inc | | | 685 | | | | 27,229 | |
Emerson Electric Co | | | 1,180 | | | | 67,803 | |
EnerSys | | | 533 | | | | 26,559 | |
Fabrinet (Cayman Islands)* | | | 2,056 | | | | 29,874 | |
FANUC Corp. (Japan) | | | 241 | | | | 36,562 | |
FedEx Corp | | | 452 | | | | 43,546 | |
FEI Co | | | 428 | | | | 30,820 | |
General Dynamics Corp | | | 561 | | | | 43,253 | |
| | | | |
| See Notes to Financial Statements. | | 32 | | |
db-X Exchange-Traded Funds Inc.
SCHEDULE OF INVESTMENTS
db X-trackers 2040 Target Date Fund (Continued)
May 31, 2013
| | | | | | | | |
| | | Number
of Shares | | | Value | |
| | | | | | | | |
| Industrial (Continued) | | | | | | | | |
General Electric Co | | | 17,320 | | | $ | 403,902 | |
Genesee & Wyoming, Inc., Class A* | | | 514 | | | | 45,772 | |
Golar LNG Ltd. (Bermuda) | | | 600 | | | | 20,400 | |
Graphic Packaging Holding Co.* | | | 3,598 | | | | 27,669 | |
Hexcel Corp.* | | | 1,028 | | | | 35,744 | |
Hitachi Ltd. (Japan) | | | 5,997 | | | | 41,789 | |
Ingersoll-Rand PLC (Ireland) | | | 2,342 | | | | 134,735 | |
Komatsu Ltd. (Japan) | | | 1,232 | | | | 32,022 | |
Koninklijke Philips Electronics NV (Netherlands) | | | 1,058 | | | | 30,109 | |
Middleby Corp.* | | | 171 | | | | 27,957 | |
Mitsubishi Electric Corp. (Japan) | | | 2,559 | | | | 24,888 | |
Mueller Industries, Inc | | | 343 | | | | 18,676 | |
Powell Industries, Inc.* | | | 600 | | | | 28,368 | |
Rolls-Royce Holdings PLC (United Kingdom)* | | | 2,299 | | | | 42,092 | |
Schneider Electric SA (France) | | | 628 | | | | 50,068 | |
Siemens AG (Germany) | | | 1,007 | | | | 106,815 | |
Smith & Wesson Holding Corp.* | | | 2,399 | | | | 21,855 | |
Stanley Black & Decker, Inc | | | 1,257 | | | | 99,580 | |
Tetra Tech, Inc.* | | | 685 | | | | 18,885 | |
Tredegar Corp | | | 1,542 | | | | 38,488 | |
Triumph Group, Inc | | | 428 | | | | 33,234 | |
Union Pacific Corp | | | 771 | | | | 119,212 | |
United Parcel Service, Inc., Class B | | | 1,506 | | | | 129,365 | |
United Technologies Corp | | | 1,442 | | | | 136,846 | |
Vinci SA (France) | | | 596 | | | | 30,749 | |
Woodward, Inc | | | 857 | | | | 33,552 | |
| | | | | | | | |
| | | | | | | 2,927,213 | |
| | | | | | | | |
| Technology — 10.1% | | | | | | | | |
Accelrys, Inc.* | | | 2,742 | | | | 22,868 | |
Activision Blizzard, Inc | | | 8,482 | | | | 122,395 | |
Apple, Inc | | | 1,466 | | | | 659,230 | |
Applied Materials, Inc | | | 10,538 | | | | 160,177 | |
ASML Holding NV (Netherlands) | | | 387 | | | | 32,323 | |
Aspen Technology, Inc.* | | | 857 | | | | 26,241 | |
Athenahealth, Inc.* | | | 428 | | | | 36,187 | |
CACI International, Inc., Class A* | | | 222 | | | | 14,239 | |
Canon, Inc. (Japan) | | | 1,542 | | | | 54,186 | |
Cirrus Logic, Inc.* | | | 771 | | | | 14,071 | |
Citrix Systems, Inc.* | | | 1,432 | | | | 92,149 | |
Commvault Systems, Inc.* | | | 514 | | | | 35,980 | |
Concur Technologies, Inc.* | | | 572 | | | | 46,178 | |
Cray, Inc.* | | | 1,885 | | | | 34,326 | |
Dell, Inc | | | 2,913 | | | | 38,889 | |
EMC Corp.* | | | 3,284 | | | | 81,312 | |
EPIQ Systems, Inc | | | 1,542 | | | | 18,704 | |
Fidelity National Information Services, Inc | | | 2,378 | | | | 106,772 | |
Hewlett-Packard Co | | | 3,598 | | | | 87,863 | |
International Business Machines Corp | | | 1,982 | | | | 412,296 | |
Jack Henry & Associates, Inc | | | 901 | | | | 42,284 | |
Mentor Graphics Corp | | | 1,285 | | | | 24,402 | |
Microsemi Corp.* | | | 857 | | | | 18,794 | |
Microsoft Corp | | | 13,549 | | | | 472,590 | |
MKS Instruments, Inc | | | 600 | | | | 16,890 | |
Netsuite, Inc.* | | | 685 | | | | 60,006 | |
Progress Software Corp.* | | | 685 | | | | 16,104 | |
| | | | | | | | |
| | | Number
of Shares | | | Value | |
| | | | | | | | |
| Technology (Continued) | | | | | | | | |
PTC, Inc.* | | | 1,305 | | | $ | 32,769 | |
QLIK Technologies, Inc.* | | | 1,114 | | | | 34,267 | |
SAP AG (Germany)* | | | 1,062 | | | | 80,101 | |
Solarwinds, Inc.* | | | 857 | | | | 36,123 | |
SYNNEX Corp.* | | | 343 | | | | 13,909 | |
Syntel, Inc. | | | 428 | | | | 27,353 | |
Ultimate Software Group, Inc.* | | | 257 | | | | 28,604 | |
Veeco Instruments, Inc.* | | | 428 | | | | 18,143 | |
| | | | | | | | |
| | | | | | | 3,018,725 | |
| | | | | | | | |
| Utilities —1.7% | | | | | | | | |
Centrica PLC (United Kingdom) | | | 6,105 | | | | 35,249 | |
Cleco Corp | | | 600 | | | | 27,306 | |
Dominion Resources, Inc | | | 943 | | | | 53,327 | |
E.ON SE (Germany) | | | 1,848 | | | | 31,369 | |
Edison International | | | 2,570 | | | | 118,066 | |
GDF Suez (France) | | | 1,510 | | | | 30,911 | |
National Grid PLC (United Kingdom) | | | 4,442 | | | | 52,948 | |
New Jersey Resources Corp | | | 428 | | | | 19,423 | |
Piedmont Natural Gas Co., Inc | | | 867 | | | | 29,296 | |
SJW Corp | | | 943 | | | | 25,508 | |
WGL Holdings, Inc | | | 600 | | | | 25,752 | |
Wisconsin Energy Corp | | | 1,714 | | | | 69,948 | |
| | | | | | | | |
| | | | | | | 519,103 | |
| | | | | | | | |
TOTAL COMMON STOCKS
(Cost $23,908,809) | | | | | | | 28,373,648 | |
| | | | | | | | |
| PREFERRED STOCKS — 0.1% | | | | | | | | |
| Consumer, Cyclical — 0.1% | | | | | | | | |
Volkswagen AG (Germany) | | | 150 | | | | 32,939 | |
| | | | | | | | |
| Industrial — 0.0% (b) | | | | | | | | |
Rolls-Royce Holdings PLC, Class C (United Kingdom)* | | | 273,581 | | | | 415 | |
| | | | | | | | |
TOTAL PREFERRED STOCKS
(Cost $32,508) | | | | | | | 33,354 | |
| | | | | | | | |
| | |
| | | Principal
Amount | | | Value | |
| | | | | | | | |
| CORPORATE BONDS — 2.6% | | | | | | | | |
| Basic Materials — 0.1% | | | | | | | | |
Barrick North America Finance LLC
5.70%, 5/30/41 | | $ | 13,000 | | | $ | 12,308 | |
BHP Billiton Finance USA Ltd. (Australia)
4.125%, 2/24/42 | | | 5,000 | | | | 4,938 | |
International Paper Co.
6.00%, 11/15/41 | | | 5,000 | | | | 5,799 | |
Rio Tinto Finance USA Ltd. (Australia)
5.20%, 11/02/40 | | | 3,000 | | | | 3,245 | |
| | | | | | | | |
| | | | | | | 26,290 | |
| | | | | | | | |
| Communications — 0.4% | | | | | | | | |
America Movil S.A.B de CV (Mexico)
6.125%, 3/30/40 | | | 13,000 | | | | 14,870 | |
AT&T, Inc.
5.55%, 8/15/41 | | | 30,000 | | | | 33,261 | |
| | | | |
| See Notes to Financial Statements. | | 33 | | |
db-X Exchange-Traded Funds Inc.
SCHEDULE OF INVESTMENTS
db X-trackers 2040 Target Date Fund (Continued)
May 31, 2013
| | | | | | | | |
| | | Principal
Amount | | | Value | |
| | | | | | | | |
| Communications (Continued) | | | | | | | | |
Cisco Systems, Inc.
5.90%, 2/15/39 | | $ | 17,000 | | | $ | 20,963 | |
Corning, Inc.
4.75%, 3/15/42 | | | 5,000 | | | | 5,152 | |
Discovery Communications LLC
4.95%, 5/15/42 | | | 13,000 | | | | 13,122 | |
Verizon Communications, Inc.
6.00%, 4/01/41 | | | 6,000 | | | | 6,997 | |
Viacom, Inc.
4.50%, 2/27/42 | | | 13,000 | | | | 12,053 | |
Walt Disney (The) Co., Series E
4.125%, 12/01/41 | | | 5,000 | | | | 4,980 | |
| | | | | | | | |
| | | | | | | 111,398 | |
| | | | | | | | |
| Consumer, Cyclical — 0.1% | | | | | | | | |
Home Depot, Inc.
5.95%, 4/01/41 | | | 8,000 | | | | 9,994 | |
Lowe’s Cos., Inc.
5.125%, 11/15/41 | | | 13,000 | | | | 14,227 | |
McDonald’s Corp., MTN
3.70%, 2/15/42 | | | 17,000 | | | | 15,726 | |
| | | | | | | | |
| | | | | | | 39,947 | |
| | | | | | | | |
| Consumer, Non-cyclical — 0.5% | | | | | | | | |
Amgen, Inc.
5.65%, 6/15/42 | | | 25,000 | | | | 28,201 | |
Archer-Daniels-Midland Co.
5.765%, 3/01/41 | | | 8,000 | | | | 9,595 | |
Diageo Investment Corp.
4.25%, 5/11/42 | | | 4,000 | | | | 3,955 | |
General Mills, Inc.
5.40%, 6/15/40 | | | 5,000 | | | | 5,857 | |
Gilead Sciences, Inc.
5.65%, 12/01/41 | | | 8,000 | | | | 9,443 | |
Johnson & Johnson
5.95%, 8/15/37 | | | 13,000 | | | | 16,908 | |
Kimberly-Clark Corp.
5.30%, 3/01/41 | | | 5,000 | | | | 6,017 | |
Medtronic, Inc.
4.50%, 3/15/42 | | | 5,000 | | | | 5,172 | |
PepsiCo, Inc.
4.00%, 3/05/42 | | | 5,000 | | | | 4,770 | |
Philip Morris International, Inc.
4.50%, 3/20/42 | | | 13,000 | | | | 12,775 | |
Procter & Gamble (The) Co.
5.55%, 3/05/37 | | | 26,000 | | | | 32,100 | |
UnitedHealth Group, Inc.
4.625%, 11/15/41 | | | 8,000 | | | | 8,121 | |
WellPoint, Inc.
4.625%, 5/15/42 | | | 8,000 | | | | 7,969 | |
| | | | | | | | |
| | | | | | | 150,883 | |
| | | | | | | | |
| Energy — 0.3% | | | | | | | | |
Apache Corp.
4.75%, 4/15/43 | | | 5,000 | | | | 5,008 | |
Baker Hughes, Inc.
5.125%, 9/15/40 | | | 5,000 | | | | 5,677 | |
| | | | | | | | |
| | | Principal
Amount | | | Value | |
| | | | | | | | |
| Energy (Continued) | | | | | | | | |
Devon Energy Corp.
4.75%, 5/15/42 | | $ | 13,000 | | | $ | 12,702 | |
Enterprise Products Operating LLC
4.85%, 8/15/42 | | | 17,000 | | | | 17,001 | |
Halliburton Co.
4.50%, 11/15/41 | | | 5,000 | | | | 5,306 | |
Plains All American Pipeline LP / PAA Finance Corp.
5.15%, 6/01/42 | | | 5,000 | | | | 5,295 | |
Shell International Finance BV (Netherlands)
6.375%, 12/15/38 | | | 21,000 | | | | 28,115 | |
Transcanada Pipelines Ltd. (Canada)
6.10%, 6/01/40 | | | 8,000 | | | | 9,961 | |
| | | | | | | | |
| | | | | | | 89,065 | |
| | | | | | | | |
| Financial — 0.3% | | | | | | | | |
General Electric Capital Corp.
2.10%, 1/07/14 | | | 34,000 | | | | 34,364 | |
JPMorgan Chase & Co.
5.50%, 10/15/40 | | | 24,000 | | | | 27,386 | |
MetLife, Inc.
5.875%, 2/06/41 | | | 5,000 | | | | 6,019 | |
Simon Property Group LP
4.75%, 3/15/42 | | | 8,000 | | | | 8,358 | |
Travelers (The) Cos., Inc.
5.35%, 11/01/40 | | | 8,000 | | | | 9,418 | |
| | | | | | | | |
| | | | | | | 85,545 | |
| | | | | | | | |
| Industrial — 0.3% | | | | | | | | |
Caterpillar, Inc.
5.20%, 5/27/41 | | | 10,000 | | | | 11,352 | |
Deere & Co.
3.90%, 6/09/42 | | | 8,000 | | | | 7,601 | |
Dover Corp.
5.375%, 3/01/41 | | | 5,000 | | | | 5,939 | |
Illinois Tool Works, Inc.
4.875%, 9/15/41 | | | 5,000 | | | | 5,438 | |
Koninklijke Philips Electronics NV (Netherlands)
5.00%, 3/15/42 | | | 5,000 | | | | 5,343 | |
Norfolk Southern Corp.
4.837%, 10/01/41 7.90%, 5/15/97 | |
| 13,000
6,000 |
| |
| 13,677
8,925 |
|
Sonoco Products Co.
5.75%, 11/01/40 | | | 5,000 | | | | 5,581 | |
Stanley Black & Decker, Inc.
5.20%, 9/01/40 | | | 8,000 | | | | 8,742 | |
Union Pacific Corp.
4.75%, 9/15/41 | | | 6,000 | | | | 6,365 | |
| | | | | | | | |
| | | | | | | 78,963 | |
| | | | | | | | |
| Technology — 0.1% | | | | | | | | |
Applied Materials, Inc.
5.85%, 6/15/41 | | | 5,000 | | | | 5,704 | |
Intel Corp.
4.80%, 10/01/41 | | | 5,000 | | | | 5,158 | |
Oracle Corp.
5.375%, 7/15/40 | | | 19,000 | | | | 22,119 | |
| | | | | | | | |
| | | | | | | 32,981 | |
| | | | | | | | |
| | | | |
| See Notes to Financial Statements. | | 34 | | |
db-X Exchange-Traded Funds Inc.
SCHEDULE OF INVESTMENTS
db X-trackers 2040 Target Date Fund (Continued)
May 31, 2013
| | | | | | | | |
| | | Principal
Amount | | | Value | |
| | | | | | | | |
| Utilities — 0.5% | | | | | | | | |
Arizona Public Service Co.
5.05%, 9/01/41 | | $ | 13,000 | | | $ | 14,495 | |
Duke Energy Indiana, Inc.
6.45%, 4/01/39 | | | 17,000 | | | | 22,127 | |
Florida Power & Light Co.
5.95%, 2/01/38 5.25%, 2/01/41 | |
| 22,000
12,000 |
| |
| 27,880
14,117 |
|
Georgia Power Co.
5.40%, 6/01/40 | | | 13,000 | | | | 14,776 | |
Nevada Power Co.
5.45%, 5/15/41 | | | 13,000 | | | | 15,372 | |
Puget Sound Energy, Inc.
4.434%, 11/15/41 | | | 17,000 | | | | 17,746 | |
Southern California Edison Co.
6.05%, 3/15/39 | | | 3,000 | | | | 3,836 | |
Southern California Gas Co.
5.125%, 11/15/40 | | | 12,000 | | | | 14,127 | |
Southern Power Co.
5.15%, 9/15/41 | | | 13,000 | | | | 14,126 | |
| | | | | | | | |
| | | | | | | 158,602 | |
| | | | | | | | |
TOTAL CORPORATE BONDS
(Cost $804,674) | | | | | | | 773,674 | |
| | | | | | | | |
| UNITED STATES GOVERNMENT & AGENCIES OBLIGATIONS — 2.5% | | | | | | | | |
| United States Treasury Bonds/Notes — 2.5% | | | | | | | | |
4.50%, 2/15/36 | | | 66,200 | | | | 81,612 | |
4.375%, 11/15/39 | | | 112,200 | | | | 136,095 | |
4.625%, 2/15/40 | | | 85,700 | | | | 108,049 | |
4.375%, 5/15/40 | | | 75,800 | | | | 92,002 | |
3.875%, 8/15/40 | | | 84,800 | | | | 94,910 | |
4.75%, 2/15/41 | | | 68,500 | | | | 88,076 | |
4.375%, 5/15/41 | | | 81,400 | | | | 98,838 | |
3.125%, 2/15/42 | | | 65,100 | | | | 63,249 | |
| | | | | | | | |
| | | | | | | 762,831 | |
| | | | | | | | |
TOTAL UNITED STATES GOVERNMENT & AGENCIES OBLIGATIONS (Cost $725,761) | | | | | | | 762,831 | |
| | | | | | | | |
| | |
TOTAL INVESTMENTS — 99.6%
(Cost $25,471,752) | | | | | | $ | 29,943,507 | |
Other assets less liabilities — 0.4% | | | | | | | 118,228 | |
| | | | | | | | |
NET ASSETS — 100.0% | | | | | | $ | 30,061,735 | |
| | | | | | | | |
MTN – Medium Term Note.
REIT – Real Estate Investment Trust.
* Non-income producing securities.
(a) Affiliated company. The Advisor is a subsidiary of Deutsche Bank AG. Therefore, Deutsche Bank AG is considered to be affiliated with the fund.
(b) Less than 0.1%
| | | | |
| See Notes to Financial Statements. | | 35 | | |
db-X Exchange-Traded Funds Inc.
SCHEDULE OF INVESTMENTS
db X-trackers In-Target Date Fund
May 31, 2013
| | | | | | | | |
| | | Number
of Shares | | | Value | |
| | | | | | | | |
| COMMON STOCKS — 36.0% | | | | | | | | |
| Basic Materials — 1.6% | | | | | | | | |
Air Liquide SA (France) | | | 58 | | | $ | 7,490 | |
Anglo American PLC (United Kingdom) | | | 205 | | | | 4,755 | |
BASF SE (Germany) | | | 150 | | | | 14,667 | |
BHP Billiton Ltd. (Australia) | | | 561 | | | | 18,726 | |
BHP Billiton PLC (United Kingdom) | | | 390 | | | | 11,351 | |
Coeur Mining Inc.* | | | 184 | | | | 2,611 | |
Dow Chemical (The) Co | | | 334 | | | | 11,510 | |
E.I. du Pont de Nemours & Co | | | 260 | | | | 14,505 | |
Freeport-McMoRan Copper & Gold, Inc | | | 234 | | | | 7,266 | |
Gold Resource Corp | | | 100 | | | | 960 | |
HB Fuller Co | | | 100 | | | | 4,157 | |
International Paper Co | | | 400 | | | | 18,460 | |
Linde AG (Germany) | | | 39 | | | | 7,505 | |
Monsanto Co | | | 100 | | | | 10,064 | |
NewMarket Corp | | | 20 | | | | 5,485 | |
Rio Tinto Ltd. (Australia) | | | 86 | | | | 4,542 | |
Rio Tinto PLC (United Kingdom) | | | 234 | | | | 10,158 | |
Sensient Technologies Corp | | | 100 | | | | 4,127 | |
Sherwin-Williams (The) Co | | | 100 | | | | 18,852 | |
Syngenta AG (Switzerland) | | | 16 | | | | 6,291 | |
| | | | | | | | |
| | | | | | | 183,482 | |
| | | | | | | | |
| Communications — 3.4% | | | | | | | | |
Amazon.com, Inc.* | | | 104 | | | | 27,979 | |
Anixter International, Inc.* | | | 100 | | | | 7,673 | |
Arris Group, Inc.* | | | 200 | | | | 3,026 | |
AT&T, Inc | | | 1,365 | | | | 47,761 | |
Bankrate, Inc.* | | | 200 | | | | 2,862 | |
Brightcove, Inc.* | | | 200 | | | | 1,496 | |
BT Group PLC, Class A (United Kingdom) | | | 1,213 | | | | 5,568 | |
CenturyLink, Inc | | | 100 | | | | 3,415 | |
Cisco Systems, Inc | | | 1,239 | | | | 29,835 | |
Comcast Corp., Class A | | | 581 | | | | 23,327 | |
Consolidated Communications Holdings, Inc | | | 200 | | | | 3,404 | |
Corning, Inc | | | 391 | | | | 6,010 | |
Deutsche Telekom AG (Germany) | | | 518 | | | | 5,950 | |
Finisar Corp.* | | | 200 | | | | 2,620 | |
France Telecom SA (France) | | | 384 | | | | 3,914 | |
Google, Inc., Class A* | | | 69 | | | | 60,058 | |
Leap Wireless International, Inc.* | | | 500 | | | | 2,825 | |
Meredith Corp | | | 100 | | | | 4,098 | |
Netgear, Inc.* | | | 100 | | | | 3,328 | |
News Corp., Class A | | | 292 | | | | 9,376 | |
Softbank Corp. (Japan) | | | 100 | | | | 5,147 | |
Telefonaktiebolaget LM Ericsson, Class B (Sweden) | | | 904 | | | | 10,673 | |
Telefonica SA (Spain)* | | | 782 | | | | 10,774 | |
Thomson Reuters Corp. (Canada) | | | 150 | | | | 5,010 | |
Time Warner, Inc | | | 234 | | | | 13,659 | |
Verizon Communications, Inc | | | 641 | | | | 31,076 | |
Vodafone Group PLC (United Kingdom) | | | 8,001 | | | | 23,335 | |
Vonage Holdings Corp.* | | | 1,700 | | | | 4,658 | |
Walt Disney (The) Co | | | 397 | | | | 25,042 | |
| | | | | | | | |
| | | | | | | 383,899 | |
| | | | | | | | |
| | | | | | | | |
| | | Number
of Shares | | | Value | |
| | | | | | | | |
| Consumer, Cyclical — 4.0% | | | | | | | | |
Arctic Cat, Inc | | | 100 | | | $ | 4,689 | |
Ascena Retail Group, Inc.* | | | 340 | | | | 6,912 | |
Bayerische Motoren Werke AG (Germany) | | | 65 | | | | 6,226 | |
Carter’s, Inc | | | 100 | | | | 7,207 | |
Cash America International, Inc | | | 67 | | | | 3,197 | |
Cie Financiere Richemont SA (Switzerland) | | | 114 | | | | 10,235 | |
Cinemark Holdings, Inc | | | 188 | | | | 5,516 | |
Columbia Sportswear Co | | | 23 | | | | 1,385 | |
Compass Group PLC (United Kingdom) | | | 307 | | | | 4,042 | |
CVS Caremark Corp | | | 288 | | | | 16,583 | |
Daimler AG (Germany) | | | 163 | | | | 10,468 | |
Dana Holding Corp | | | 300 | | | | 5,676 | |
Dr Horton, Inc | | | 300 | | | | 7,308 | |
DTS, Inc.* | | | 200 | | | | 3,952 | |
Ford Motor Co | | | 1,032 | | | | 16,182 | |
GNC Holdings, Inc., Class A | | | 100 | | | | 4,503 | |
Hennes & Mauritz AB, Class B (Sweden) | | | 180 | | | | 6,196 | |
Honda Motor Co. Ltd. (Japan) | | | 272 | | | | 10,370 | |
Inditex SA (Spain) | | | 32 | | | | 3,985 | |
JetBlue Airways Corp.* | | | 400 | | | | 2,484 | |
Kohl’s Corp | | | 267 | | | | 13,726 | |
Krispy Kreme Doughnuts, Inc.* | | | 500 | | | | 8,660 | |
Las Vegas Sands Corp | | | 234 | | | | 13,549 | |
Lennar Corp., Class A | | | 200 | | | | 7,864 | |
Life Time Fitness, Inc.* | | | 100 | | | | 4,984 | |
Lions Gate Entertainment Corp. (Canada)* | | | 200 | | | | 5,760 | |
Lowe’s Cos., Inc | | | 300 | | | | 12,633 | |
LVMH Moet Hennessy Louis Vuitton SA (France) | | | 48 | | | | 8,525 | |
Maidenform Brands, Inc.* | | | 100 | | | | 1,819 | |
MDC Holdings, Inc | | | 100 | | | | 3,711 | |
Men’s Wearhouse (The), Inc | | | 175 | | | | 6,335 | |
Mitsubishi Corp. (Japan) | | | 366 | | | | 6,506 | |
Mitsui & Co. Ltd. (Japan) | | | 440 | | | | 5,655 | |
Nike, Inc., Class B | | | 200 | | | | 12,332 | |
Nissan Motor Co. Ltd. (Japan) | | | 500 | | | | 5,550 | |
Nu Skin Enterprises, Inc., Class A | | | 100 | | | | 5,880 | |
Penske Automotive Group, Inc | | | 234 | | | | 7,514 | |
Red Robin Gourmet Burgers, Inc.* | | | 67 | | | | 3,518 | |
Ross Stores, Inc | | | 200 | | | | 12,861 | |
Ruby Tuesday, Inc.* | | | 400 | | | | 3,700 | |
Saks, Inc.* | | | 250 | | | | 3,708 | |
SIX Flags Entertainment Corp | | | 100 | | | | 7,457 | |
Southwest Airlines Co | | | 800 | | | | 11,336 | |
Systemax, Inc | | | 300 | | | | 2,895 | |
Target Corp | | | 134 | | | | 9,313 | |
Tenneco, Inc.* | | | 100 | | | | 4,436 | |
Toyota Motor Corp. (Japan) | | | 420 | | | | 25,127 | |
VF Corp | | | 100 | | | | 18,386 | |
Wabash National Corp.* | | | 500 | | | | 5,250 | |
Wal-Mart Stores, Inc | | | 764 | | | | 57,177 | |
Watsco, Inc | | | 50 | | | | 4,363 | |
World Fuel Services Corp | | | 106 | | | | 4,317 | |
| | | | | | | | |
| | | | | | | 441,963 | |
| | | | | | | | |
| | | | |
| See Notes to Financial Statements. | | 36 | | |
db-X Exchange-Traded Funds Inc.
SCHEDULE OF INVESTMENTS
db X-trackers In-Target Date Fund (Continued)
May 31, 2013
| | | | | | | | |
| | | Number
of Shares | | | Value | |
| | | | | | | | |
| Consumer, Non-cyclical — 7.4% | | | | | | | | |
Abbott Laboratories | | | 744 | | | $ | 27,282 | |
Acacia Research-Acacia Technologies | | | 67 | | | | 1,675 | |
Accuray, Inc.* | | | 500 | | | | 2,685 | |
Aetna, Inc | | | 400 | | | | 24,152 | |
Align Technology, Inc.* | | | 100 | | | | 3,575 | |
Anheuser-Busch InBev NV (Belgium) | | | 122 | | | | 11,279 | |
Ariad Pharmaceuticals, Inc.* | | | 200 | | | | 3,668 | |
AstraZeneca PLC (United Kingdom) | | | 204 | | | | 10,501 | |
Avanir Pharmaceuticals, Inc., Class A* | | | 1,000 | | | | 3,320 | |
Bayer AG (Germany) | | | 132 | | | | 14,221 | |
Becton Dickinson and Co | | | 200 | | | | 19,724 | |
BioScrip, Inc.* | | | 400 | | | | 5,592 | |
Bristol-Myers Squibb Co | | | 334 | | | | 15,367 | |
British American Tobacco PLC (United Kingdom) | | | 319 | | | | 17,560 | |
Capella Education Co.* | | | 100 | | | | 4,356 | |
Centene Corp.* | | | 100 | | | | 4,950 | |
Cepheid, Inc.* | | | 100 | | | | 3,476 | |
Chemocentryx, Inc.* | | | 200 | | | | 2,702 | |
Coca-Cola (The) Co | | | 1,062 | | | | 42,469 | |
Convergys Corp | | | 100 | | | | 1,817 | |
CSL Ltd. (Australia) | | | 77 | | | | 4,392 | |
DANONE SA (France) | | | 87 | | | | 6,416 | |
Diageo PLC (United Kingdom) | | | 397 | | | | 11,769 | |
Fresh Del Monte Produce, Inc | | | 100 | | | | 2,677 | |
Fresh Market (The), Inc.* | | | 100 | | | | 4,954 | |
FTI Consulting, Inc.* | | | 100 | | | | 3,799 | |
GlaxoSmithKline PLC (United Kingdom) | | | 884 | | | | 23,015 | |
Hain Celestial Group (The), Inc.* | | | 100 | | | | 6,662 | |
Hanger, Inc.* | | | 100 | | | | 3,191 | |
Harris Teeter Supermarkets, Inc | | | 86 | | | | 4,042 | |
Imperial Tobacco Group PLC (United Kingdom) | | | 194 | | | | 6,989 | |
Incyte Corp. Ltd.* | | | 134 | | | | 2,971 | |
Integra Lifesciences Holdings Corp.* | | | 100 | | | | 3,789 | |
JM Smucker (The) Co | | | 134 | | | | 13,529 | |
Johnson & Johnson | | | 625 | | | | 52,612 | |
Live Nation Entertainment, Inc.* | | | 300 | | | | 4,083 | |
Magellan Health Services, Inc.* | | | 69 | | | | 3,761 | |
MasterCard, Inc., Class A | | | 23 | | | | 13,116 | |
Medivation, Inc.* | | | 100 | | | | 4,856 | |
Medtronic, Inc | | | 200 | | | | 10,202 | |
Merck & Co., Inc | | | 650 | | | | 30,355 | |
Molina Healthcare, Inc.* | | | 100 | | | | 3,780 | |
Mondelez International, Inc., Class A | | | 538 | | | | 15,849 | |
Nestle SA (Switzerland) | | | 557 | | | | 36,958 | |
Novartis AG (Switzerland) | | | 393 | | | | 28,358 | |
Novo Nordisk A/S, Class B (Denmark) | | | 70 | | | | 11,283 | |
Onyx Pharmaceuticals, Inc.* | | | 67 | | | | 6,395 | |
Pfizer, Inc | | | 1,642 | | | | 44,712 | |
Pharmacyclics, Inc.* | | | 100 | | | | 9,164 | |
Pilgrim’s Pride Corp.* | | | 600 | | | | 7,176 | |
Procter & Gamble (The) Co | | | 564 | | | | 43,293 | |
Quad/Graphics, Inc | | | 200 | | | | 4,660 | |
Questcor Pharmaceuticals, Inc | | | 100 | | | | 3,417 | |
Reckitt Benckiser Group PLC (United Kingdom) | | | 114 | | | | 8,179 | |
Rent-A-Center, Inc | | | 100 | | | | 3,658 | |
| | | | | | | | |
| | | Number
of Shares | | | Value | |
| | | | | | | | |
| Consumer, Non-cyclical (Continued) | | | | | | | | |
Roche Holding AG (Switzerland) | | | 125 | | | $ | 31,255 | |
Rollins, Inc | | | 320 | | | | 8,084 | |
SABMiller PLC (United Kingdom) | | | 151 | | | | 7,640 | |
Salix Pharmaceuticals Ltd.* | | | 100 | | | | 6,067 | |
Sanofi (France) | | | 145 | | | | 15,550 | |
Santarus, Inc.* | | | 400 | | | | 8,908 | |
Seaboard Corp | | | 1 | | | | 2,755 | |
Seattle Genetics, Inc.* | | | 134 | | | | 4,599 | |
Select Medical Holdings Corp | | | 200 | | | | 1,580 | |
Sequenom, Inc.* | | | 800 | | | | 3,312 | |
Spectrum Brands Holdings, Inc | | | 100 | | | | 6,029 | |
Takeda Pharmaceutical Co. Ltd. (Japan) | | | 107 | | | | 4,793 | |
Tesco PLC (United Kingdom) | | | 1,329 | | | | 7,380 | |
Teva Pharmaceutical Industries Ltd. (Israel) | | | 125 | | | | 4,800 | |
TreeHouse Foods, Inc.* | | | 50 | | | | 3,274 | |
Unilever NV (Netherlands) | | | 307 | | | | 12,583 | |
Unilever PLC (United Kingdom) | | | 218 | | | | 9,192 | |
United Natural Foods, Inc.* | | | 100 | | | | 5,292 | |
UnitedHealth Group, Inc | | | 226 | | | | 14,154 | |
ViroPharma, Inc.* | | | 67 | | | | 1,843 | |
Woolworths Ltd. (Australia) | | | 188 | | | | 5,938 | |
| | | | | | | | |
| | | | | | | 829,461 | |
| | | | | | | | |
| Energy — 3.7% | | | | | | | | |
BG Group PLC (United Kingdom) | | | 571 | | | | 10,524 | |
BP PLC (United Kingdom) | | | 3,015 | | | | 21,689 | |
Cameron International Corp.* | | | 300 | | | | 18,261 | |
Cheniere Energy, Inc.* | | | 300 | | | | 8,805 | |
Chevron Corp | | | 431 | | | | 52,905 | |
ConocoPhillips | | | 284 | | | | 17,421 | |
Continental Resources, Inc.* | | | 200 | | | | 16,226 | |
CVR Energy, Inc | | | 100 | | | | 6,281 | |
Dril-Quip, Inc.* | | | 50 | | | | 4,523 | |
Energy XXI Bermuda Ltd. (Bermuda) | | | 100 | | | | 2,553 | |
ENI S.p.A (Italy) | | | 414 | | | | 9,417 | |
Exxon Mobil Corp | | | 1,055 | | | | 95,446 | |
Helix Energy Solutions Group, Inc.* | | | 100 | | | | 2,386 | |
Hess Corp | | | 400 | | | | 26,964 | |
Kodiak Oil & Gas Corp.* | | | 300 | | | | 2,634 | |
McMoRan Exploration Co.* | | | 134 | | | | 2,228 | |
Oasis Petroleum, Inc.* | | | 100 | | | | 3,716 | |
Royal Dutch Shell PLC, Class A (United Kingdom) | | | 608 | | | | 20,351 | |
Royal Dutch Shell PLC, Class B (United Kingdom) | | | 438 | | | | 15,177 | |
Schlumberger Ltd. (Netherland Antilles) | | | 289 | | | | 21,105 | |
Southwestern Energy Co.* | | | 290 | | | | 10,930 | |
Statoil ASA (Norway) | | | 179 | | | | 4,078 | |
Targa Resources Corp | | | 100 | | | | 6,442 | |
Tesco Corp.* | | | 300 | | | | 3,828 | |
Total SA (France) | | | 357 | | | | 17,904 | |
Vantage Drilling Co.* | | | 2,702 | | | | 5,188 | |
Williams (The) Cos., Inc | | | 100 | | | | 3,518 | |
Woodside Petroleum Ltd. (Australia) | | | 139 | | | | 4,788 | |
| | | | | | | | |
| | | | | | | 415,288 | |
| | | | | | | | |
| Financial — 7.7% | | | | | | | | |
AIA Group Ltd. (Hong Kong) | | | 1,400 | | | | 6,231 | |
Alexander’s, Inc. REIT | | | 9 | | | | 2,740 | |
| | | | |
| See Notes to Financial Statements. | | 37 | | |
db-X Exchange-Traded Funds Inc.
SCHEDULE OF INVESTMENTS
db X-trackers In-Target Date Fund (Continued)
May 31, 2013
| | | | | | | | |
| | | Number
of Shares | | | Value | |
| | | | | | | | |
| Financial (Continued) | | | | | | | | |
Allianz SE (Germany) | | | 75 | | | $ | 11,673 | |
American Campus Communities, Inc. REIT | | | 210 | | | | 8,573 | |
American Express Co | | | 250 | | | | 18,927 | |
American International Group, Inc.* | | | 401 | | | | 17,828 | |
American Tower Corp., Class A REIT | | | 100 | | | | 7,784 | |
AON PLC (United Kingdom) | | | 300 | | | | 19,102 | |
Australia & New Zealand Banking Group Ltd. (Australia) | | | 446 | | | | 11,755 | |
Banco Bilbao Vizcaya Argentaria SA (Spain) | | | 875 | | | | 8,242 | |
Banco Santander SA (Spain) | | | 2,835 | | | | 20,414 | |
Bank of America Corp | | | 2,595 | | | | 35,448 | |
Barclays PLC (United Kingdom) | | | 2,969 | | | | 14,456 | |
Berkshire Hathaway, Inc., Class B* | | | 539 | | | | 61,485 | |
BioMed Realty Trust, Inc. REIT | | | 250 | | | | 5,233 | |
BNP Paribas (France) | | | 190 | | | | 11,193 | |
Boston Properties, Inc. REIT | | | 150 | | | | 15,986 | |
CBL & Associates Properties, Inc. REIT | | | 200 | | | | 4,598 | |
Citigroup, Inc | | | 727 | | | | 37,797 | |
Citizens, Inc.* | | | 300 | | | | 1,824 | |
Commonwealth Bank of Australia (Australia) | | | 290 | | | | 18,557 | |
Credit Acceptance Corp.* | | | 50 | | | | 5,693 | |
Deutsche Bank AG (Germany) (a) | | | 192 | | | | 9,003 | |
Equity Lifestyle Properties, Inc. REIT | | | 50 | | | | 3,859 | |
Equity One, Inc. REIT | | | 154 | | | | 3,593 | |
Equity Residential REIT | | | 50 | | | | 2,828 | |
Extra Space Storage, Inc. REIT | | | 100 | | | | 4,189 | |
Franklin Resources, Inc | | | 51 | | | | 7,895 | |
Geo Group (The), Inc. REIT | | | 192 | | | | 6,685 | |
Goldman Sachs Group (The), Inc | | | 110 | | | | 17,829 | |
Hancock Holding Co | | | 100 | | | | 2,855 | |
Hatteras Financial Corp. REIT | | | 167 | | | | 4,312 | |
Highwoods Properties, Inc. REIT | | | 97 | | | | 3,533 | |
Home Properties, Inc. REIT | | | 50 | | | | 3,039 | |
HSBC Holdings PLC (United Kingdom) | | | 3,179 | | | | 35,062 | |
ING Groep NV (Netherlands)* | | | 982 | | | | 9,231 | |
Invesco Mortgage Capital, Inc. REIT | | | 167 | | | | 3,115 | |
JPMorgan Chase & Co | | | 822 | | | | 44,872 | |
Kilroy Realty Corp. REIT | | | 133 | | | | 7,037 | |
LaSalle Hotel Properties REIT | | | 100 | | | | 2,640 | |
Marsh & McLennan Cos., Inc | | | 100 | | | | 4,002 | |
Meadowbrook Insurance Group, Inc | | | 467 | | | | 3,745 | |
MFA Financial, Inc. REIT | | | 488 | | | | 4,285 | |
Mid-America Apartment Communities, Inc. REIT | | | 40 | | | | 2,719 | |
Mitsubishi UFJ Financial Group, Inc. (Japan) | | | 1,992 | | | | 11,799 | |
Mizuho Financial Group, Inc. (Japan) | | | 3,827 | | | | 7,429 | |
Monmouth Real Estate Investment Corp., Class A REIT | | | 300 | | | | 3,078 | |
Muenchener Rueckversicherungs-Gesellschaft AG (Germany) | | | 30 | | | | 5,640 | |
National Australia Bank Ltd. (Australia) | | | 386 | | | | 10,713 | |
National Retail Properties, Inc. REIT | | | 140 | | | | 5,022 | |
Ocwen Financial Corp.* | | | 200 | | | | 8,556 | |
OMEGA Healthcare Investors, Inc. REIT | | | 146 | | | | 4,732 | |
Post Properties, Inc. REIT | | | 167 | | | | 7,983 | |
Primerica, Inc | | | 167 | | | | 5,882 | |
ProAssurance Corp | | | 102 | | | | 5,120 | |
| | | | | | | | |
| | | Number
of Shares | | | Value | |
| | | | | | | | |
| Financial (Continued) | | | | | | | | |
ProLogis, Inc. REIT | | | 500 | | | $ | 20,149 | |
Prudential PLC (United Kingdom) | | | 411 | | | | 6,975 | |
Public Storage REIT | | | 50 | | | | 7,590 | |
Republic Bancorp, Inc., Class A | | | 100 | | | | 2,381 | |
Ryman Hospitality Properties REIT | | | 113 | | | | 4,323 | |
Signature Bank* | | | 50 | | | | 3,859 | |
Simon Property Group, Inc. REIT | | | 55 | | | | 9,153 | |
Standard Chartered PLC (United Kingdom) | | | 415 | | | | 9,692 | |
Starwood Property Trust, Inc. REIT | | | 100 | | | | 2,537 | |
Sumitomo Mitsui Financial Group, Inc. (Japan) | | | 322 | | | | 12,998 | |
SVB Financial Group* | | | 50 | | | | 3,870 | |
T. Rowe Price Group, Inc | | | 234 | | | | 17,751 | |
Tanger Factory Outlet Centers, Inc. REIT | | | 174 | | | | 6,000 | |
Taylor Capital Group, Inc.* | | | 200 | | | | 3,322 | |
Tompkins Financial Corp | | | 100 | | | | 4,154 | |
Two Harbors Investment Corp. REIT | | | 300 | | | | 3,309 | |
U.S. Bancorp | | | 400 | | | | 14,024 | |
UBS AG (Switzerland)* | | | 693 | | | | 12,327 | |
Visa, Inc., Class A | | | 188 | | | | 33,490 | |
Washington Real Estate Investment Trust REIT | | | 103 | | | | 2,865 | |
Wells Fargo & Co | | | 1,134 | | | | 45,983 | |
Westpac Banking Corp. (Australia) | | | 516 | | | | 14,045 | |
Zurich Financial Services AG (Switzerland)* | | | 27 | | | | 7,177 | |
| | | | | | | | |
| | | | | | | 855,795 | |
| | | | | | | | |
| Industrial — 3.6% | | | | | | | | |
ABB Ltd. (Switzerland)* | | | 395 | | | | 8,745 | |
Actuant Corp., Class A | | | 167 | | | | 5,678 | |
Acuity Brands, Inc | | | 50 | | | | 3,754 | |
Altra Holdings, Inc | | | 200 | | | | 5,762 | |
AO Smith Corp | | | 134 | | | | 5,253 | |
Apogee Enterprises, Inc | | | 200 | | | | 5,336 | |
Boeing (The) Co | | | 200 | | | | 19,804 | |
Builders FirstSource, Inc.* | | | 600 | | | | 4,044 | |
Caterpillar, Inc | | | 169 | | | | 14,500 | |
Clean Harbors, Inc.* | | | 100 | | | | 5,720 | |
Colfax Corp.* | | | 200 | | | | 9,980 | |
Cummins, Inc | | | 40 | | | | 4,785 | |
Darling International, Inc.* | | | 100 | | | | 1,961 | |
East Japan Railway Co. (Japan) | | | 100 | | | | 7,546 | |
Eaton Corp. PLC (Ireland) | | | 347 | | | | 22,922 | |
EMCOR Group, Inc | | | 100 | | | | 3,975 | |
Emerson Electric Co | | | 252 | | | | 14,480 | |
EnerSys | | | 67 | | | | 3,339 | |
Fabrinet (Cayman Islands)* | | | 300 | | | | 4,359 | |
FANUC Corp. (Japan) | | | 40 | | | | 6,068 | |
FedEx Corp | | | 50 | | | | 4,817 | |
General Dynamics Corp | | | 83 | | | | 6,399 | |
General Electric Co | | | 2,465 | | | | 57,484 | |
Genesee & Wyoming, Inc., Class A* | | | 67 | | | | 5,966 | |
Golar LNG Ltd. (Bermuda) | | | 67 | | | | 2,278 | |
Graphic Packaging Holding Co.* | | | 600 | | | | 4,614 | |
Hexcel Corp.* | | | 100 | | | | 3,477 | |
Hitachi Ltd. (Japan) | | | 1,000 | | | | 6,968 | |
Ingersoll-Rand PLC (Ireland) | | | 350 | | | | 20,136 | |
Komatsu Ltd. (Japan) | | | 134 | | | | 3,483 | |
Koninklijke Philips Electronics NV (Netherlands) | | | 251 | | | | 7,143 | |
| | | | |
| See Notes to Financial Statements. | | 38 | | |
db-X Exchange-Traded Funds Inc.
SCHEDULE OF INVESTMENTS
db X-trackers In-Target Date Fund (Continued)
May 31, 2013
| | | | | | | | |
| | | Number
of Shares | | | Value | |
| | | | | | | | |
| Industrial (Continued) | | | | | | | | |
Powell Industries, Inc.* | | | 100 | | | $ | 4,728 | |
Rolls-Royce Holdings PLC (United Kingdom)* | | | 314 | | | | 5,749 | |
Schneider Electric SA (France) | | | 98 | | | | 7,813 | |
Siemens AG (Germany) | | | 138 | | | | 14,638 | |
Smith & Wesson Holding Corp.* | | | 300 | | | | 2,733 | |
Stanley Black & Decker, Inc | | | 234 | | | | 18,537 | |
Tetra Tech, Inc.* | | | 100 | | | | 2,757 | |
Tredegar Corp | | | 200 | | | | 4,992 | |
Triumph Group, Inc | | | 67 | | | | 5,203 | |
Union Pacific Corp | | | 100 | | | | 15,462 | |
United Parcel Service, Inc., Class B | | | 206 | | | | 17,695 | |
United Technologies Corp | | | 200 | | | | 18,980 | |
Vinci SA (France) | | | 47 | | | | 2,425 | |
Woodward, Inc | | | 100 | | | | 3,915 | |
| | | | | | | | |
| | | | | | | 406,403 | |
| | | | | | | | |
| Technology — 3.9% | | | | | | | | |
Accelrys, Inc.* | | | 400 | | | | 3,336 | |
Activision Blizzard, Inc | | | 1,168 | | | | 16,854 | |
Apple, Inc | | | 203 | | | | 91,285 | |
Applied Materials, Inc | | | 1,500 | | | | 22,799 | |
ASML Holding NV (Netherlands) | | | 47 | | | | 3,926 | |
Aspen Technology, Inc.* | | | 100 | | | | 3,062 | |
Athenahealth, Inc.* | | | 100 | | | | 8,455 | |
Canon, Inc. (Japan) | | | 200 | | | | 7,028 | |
Cirrus Logic, Inc.* | | | 100 | | | | 1,825 | |
Citrix Systems, Inc.* | | | 200 | | | | 12,870 | |
Commvault Systems, Inc.* | | | 100 | | | | 7,000 | |
Concur Technologies, Inc.* | | | 80 | | | | 6,458 | |
Cray, Inc.* | | | 300 | | | | 5,463 | |
Dell, Inc | | | 400 | | | | 5,340 | |
EMC Corp | | | 500 | | | | 12,380 | |
EPIQ Systems, Inc | | | 300 | | | | 3,639 | |
Fidelity National Information Services, Inc | | | 300 | | | | 13,470 | |
Hewlett-Packard Co | | | 567 | | | | 13,846 | |
International Business Machines Corp | | | 270 | | | | 56,166 | |
Jack Henry & Associates, Inc | | | 168 | | | | 7,884 | |
Mentor Graphics Corp | | | 200 | | | | 3,798 | |
Microsemi Corp.* | | | 34 | | | | 746 | |
Microsoft Corp | | | 1,970 | | | | 68,715 | |
MKS Instruments, Inc | | | 100 | | | | 2,815 | |
Netsuite, Inc.* | | | 100 | | | | 8,760 | |
Progress Software Corp.* | | | 100 | | | | 2,351 | |
PTC, Inc.* | | | 230 | | | | 5,775 | |
QLIK Technologies, Inc.* | | | 234 | | | | 7,198 | |
SAP AG (Germany)* | | | 157 | | | | 11,842 | |
Solarwinds, Inc.* | | | 100 | | | | 4,215 | |
SYNNEX Corp.* | | | 100 | | | | 4,055 | |
Syntel, Inc | | | 100 | | | | 6,391 | |
Ultimate Software Group, Inc.* | | | 29 | | | | 3,228 | |
Veeco Instruments, Inc.* | | | 100 | | | | 4,239 | |
| | | | | | | | |
| | | | | | | 437,214 | |
| | | | | | | | |
| Utilities — 0.7% | | | | | | | | |
Centrica PLC (United Kingdom) | | | 834 | | | | 4,815 | |
Cleco Corp | | | 100 | | | | 4,551 | |
Dominion Resources, Inc | | | 100 | | | | 5,655 | |
| | | | | | | | |
| | | Number
of Shares | | | Value | |
| | | | | | | | |
| Utilities (Continued) | | | | | | | | |
E.ON SE (Germany) | | | 320 | | | $ | 5,432 | |
Edison International | | | 400 | | | | 18,376 | |
GDF Suez (France) | | | 238 | | | | 4,872 | |
National Grid PLC (United Kingdom) | | | 456 | | | | 5,435 | |
New Jersey Resources Corp | | | 100 | | | | 4,538 | |
Piedmont Natural Gas Co., Inc | | | 118 | | | | 3,987 | |
SJW Corp | | | 100 | | | | 2,705 | |
WGL Holdings, Inc | | | 100 | | | | 4,292 | |
Wisconsin Energy Corp | | | 200 | | | | 8,163 | |
| | | | | | | | |
| | | | | | | 72,821 | |
| | | | | | | | |
TOTAL COMMON STOCKS
(Cost $3,282,403) | | | | | | | 4,026,326 | |
| | | | | | | | |
| PREFERRED STOCKS — 0.1% | | | | | | | | |
| Consumer, Cyclical — 0.1% | | | | | | | | |
Volkswagen AG (Germany) | | | 31 | | | | 6,807 | |
| | | | | | | | |
| Industrial — 0.0% (b) | | | | | | | | |
Rolls-Royce Holdings PLC, Class C (United Kingdom)* | | | 37,366 | | | | 57 | |
| | | | | | | | |
TOTAL PREFERRED STOCKS
(Cost $6,688) | | | | | | | 6,864 | |
| | | | | | | | |
| | |
| | | Principal
Amount | | | Value | |
| | | | | | | | |
| CORPORATE BONDS — 9.5% | | | | | | | | |
| Communications — 1.7% | | | | | | | | |
Cellco Partnership/Verizon Wireless Capital LLC
5.55%, 2/01/14 | | $ | 153,000 | | | $ | 157,749 | |
Google, Inc.
1.25%, 5/19/14 | | | 7,000 | | | | 7,060 | |
Telefonica Emisiones S.A.U. (Spain)
4.949%, 1/15/15 | | | 10,000 | | | | 10,552 | |
Time Warner Cable, Inc.
7.50%, 4/01/14 | | | 15,000 | | | | 15,842 | |
| | | | | | | | |
| | | | | | | 191,203 | |
| | | | | | | | |
| Consumer, Non-cyclical — 2.2% | | | | | | | | |
Clorox (The) Co.
5.00%, 1/15/15 | | | 50,000 | | | | 53,150 | |
PepsiCo, Inc.
0.75%, 3/05/15 | | | 70,000 | | | | 70,274 | |
Wyeth
5.50%, 2/01/14 | | | 37,000 | | | | 38,223 | |
Yale University, MTN
2.90%, 10/15/14 | | | 78,000 | | | | 80,649 | |
| | | | | | | | |
| | | | | | | 242,296 | |
| | | | | | | | |
| Energy — 1.3% | | | | | | | | |
BP Capital Markets PLC (United Kingdom)
3.625%, 5/08/14 | | | 145,000 | | | | 149,254 | |
| | | | | | | | |
| Financial — 3.8% | | | | | | | | |
American Tower Corp.
4.625%, 4/01/15 | | | 45,000 | | | | 47,799 | |
Bank of New York Mellon (The) Corp., MTN
4.30%, 5/15/14 | | | 35,000 | | | | 36,305 | |
| | | | |
| See Notes to Financial Statements. | | 39 | | |
db-X Exchange-Traded Funds Inc.
SCHEDULE OF INVESTMENTS
db X-trackers In-Target Date Fund (Continued)
May 31, 2013
| | | | | | | | |
| | | Principal
Amount | | | Value | |
| | | | | | | | |
| Financial (Continued) | | | | | | | | |
Caterpillar Financial Services Corp., MTN
6.125%, 2/17/14 | | $ | 13,000 | | | $ | 13,527 | |
Citigroup, Inc.
6.375%, 8/12/14 | | | 17,000 | | | | 18,078 | |
National Rural Utilities Cooperative Finance Corp.
1.00%, 2/02/15 | | | 255,000 | | | | 256,997 | |
Prudential Financial, Inc., Series B, MTN
5.10%, 9/20/14 | | | 24,000 | | | | 25,331 | |
Wachovia Corp.
5.25%, 8/01/14 | | | 29,000 | | | | 30,500 | |
| | | | | | | | |
| | | | | | | 428,537 | |
| | | | | | | | |
| Technology — 0.3% | | | | | | | | |
Microsoft Corp.
0.875%, 9/27/13 | | | 30,000 | | | | 30,054 | |
| | | | | | | | |
| Utilities — 0.2% | | | | | | | | |
Exelon Generation Co. LLC
5.35%, 1/15/14 | | | 27,000 | | | | 27,771 | |
| | | | | | | | |
TOTAL CORPORATE BONDS
(Cost $1,064,126) | | | | | | | 1,069,115 | |
| | | | | | | | |
| UNITED STATES GOVERNMENT & AGENCIES OBLIGATIONS — 54.0% | | | | | | | | |
| United States Treasury Bonds/Notes — 54.0% | | | | | | | | |
1.00%, 7/15/13 | | | 79,400 | | | | 79,499 | |
0.50%, 10/15/13 | | | 350,000 | | | | 350,574 | |
1.25%, 2/15/14 | | | 363,700 | | | | 366,627 | |
1.25%, 3/15/14 | | | 500,000 | | | | 504,414 | |
0.25%, 3/31/14 | | | 164,000 | | | | 164,173 | |
4.75%, 5/15/14 | | | 582,900 | | | | 608,335 | |
0.75%, 6/15/14 | | | 367,000 | | | | 369,251 | |
2.625%, 7/31/14 | | | 580,000 | | | | 596,494 | |
4.25%, 8/15/14 | | | 65,000 | | | | 68,179 | |
2.375%, 8/31/14 | | | 444,000 | | | | 456,089 | |
2.375%, 9/30/14 | | | 340,000 | | | | 349,815 | |
0.50%, 10/15/14 | | | 355,000 | | | | 356,442 | |
0.375%, 11/15/14 | | | 153,000 | | | | 153,347 | |
4.25%, 11/15/14 | | | 147,000 | | | | 155,539 | |
2.125%, 11/30/14 | | | 345,000 | | | | 354,730 | |
0.25%, 12/15/14 | | | 375,000 | | | | 375,117 | |
4.00%, 2/15/15 | | | 325,000 | | | | 345,528 | |
2.50%, 3/31/15 | | | 29,000 | | | | 30,168 | |
2.125%, 5/31/15 | | | 342,000 | | | | 354,317 | |
| | | | | | | | |
| | | | | | | 6,038,638 | |
| | | | | | | | |
TOTAL UNITED STATES GOVERNMENT & AGENCIES OBLIGATIONS
(Cost $6,029,731) | | | | | | | 6,038,638 | |
| | | | | | | | |
| | |
TOTAL INVESTMENTS — 99.6% (Cost $10,382,948) | | | | | | $ | 11,140,943 | |
Other assets less liabilities — 0.4% | | | | | | | 45,979 | |
| | | | | | | | |
NET ASSETS — 100.0% | | | | | | $ | 11,186,922 | |
| | | | | | | | |
MTN – Medium Term Note.
REIT – Real Estate Investment Trust.
* Non-income producing security.
(a) Affiliated company. The Advisor is a subsidiary of Deutsche Bank AG. Therefore, Deutsche Bank AG is considered to be affiliated with the Fund.
(b) Less than 0.1%.
| | | | |
| See Notes to Financial Statements. | | 40 | | |
This Page is Intentionally Left Blank
41
db-X Exchange-Traded Funds Inc.
STATEMENTS OF ASSETS AND LIABILITIES
May 31, 2013
| | | | | | | | | | | | |
| | | db X-trackers
2010 Target
Date Fund | | | db X-trackers
2020 Target
Date Fund | | | db X-trackers
2030 Target
Date Fund | |
Assets | | | | | | | | | | | | |
Investments at fair value | | $ | 9,794,445 | | | $ | 30,931,128 | | | $ | 30,044,058 | |
Investment in Affiliates at fair value (See Note 5) | | | 2,626 | | | | 38,355 | | | | 53,312 | |
Cash | | | 442,414 | | | | 28,063 | | | | 49,698 | |
Foreign currency at value | | | 7,479 | | | | 20,177 | | | | 19,733 | |
Receivables: | | | | | | | | | | | | |
Interest and dividends | | | 35,261 | | | | 121,777 | | | | 127,048 | |
Foreign tax reclaim | | | 1,070 | | | | 25,809 | | | | 33,378 | |
Prepaid expenses | | | 9,942 | | | | 10,673 | | | | 10,627 | |
| | | | | | | | | | | | |
Total Assets | | $ | 10,293,237 | | | $ | 31,175,982 | | | $ | 30,337,854 | |
| | | | | | | | | | | | |
| | | |
Liabilities | | | | | | | | | | | | |
Payables: | | | | | | | | | | | | |
Investment securities purchased | | $ | 426,666 | | | $ | — | | | $ | — | |
Investment advisory fees | | | 5,436 | | | | 17,230 | | | | 16,895 | |
Due to investment advisor | | | 2,031 | | | | 11,326 | | | | 5,180 | |
Accrued expenses and other liabilities | | | 27,033 | | | | 50,267 | | | | 51,669 | |
| | | | | | | | | | | | |
Total Liabilities | | | 461,166 | | | | 78,823 | | | | 73,744 | |
| | | | | | | | | | | | |
| | | |
Net Assets | | $ | 9,832,071 | | | $ | 31,097,159 | | | $ | 30,264,110 | |
| | | | | | | | | | | | |
| | | |
Net Assets Consist of | | | | | | | | | | | | |
Paid-in capital | | $ | 11,140,420 | | | $ | 32,183,472 | | | $ | 31,386,682 | |
Undistributed net investment income | | | 8,025 | | | | 122,922 | | | | 242,424 | |
Accumulated net realized gain (loss) | | | (1,653,149 | ) | | | (4,268,712 | ) | | | (4,729,747 | ) |
Net unrealized appreciation (depreciation) | | | 336,775 | | | | 3,059,477 | | | | 3,364,751 | |
| | | | | | | | | | | | |
| | | |
Net Assets | | $ | 9,832,071 | | | $ | 31,097,159 | | | $ | 30,264,110 | |
| | | | | | | | | | | | |
| | | |
Number of Common Shares outstanding | | | 400,800 | | | | 1,200,800 | | | | 1,200,800 | |
| | | | | | | | | | | | |
| | | |
Net Assets Value | | $ | 24.53 | | | $ | 25.90 | | | $ | 25.20 | |
| | | | | | | | | | | | |
| | | |
Investments at cost | | $ | 9,457,061 | | | $ | 27,843,646 | | | $ | 26,643,396 | |
| | | | | | | | | | | | |
| | | |
Investments in Affiliates at cost | | $ | 3,167 | | | $ | 65,674 | | | $ | 88,400 | |
| | | | | | | | | | | | |
Foreign currency at cost | | $ | 7,550 | | | $ | 20,236 | | | $ | 19,626 | |
| | | | | | | | | | | | |
| | | | |
| See Notes to Financial Statements. | | 42 | | |
db-X Exchange-Traded Funds Inc.
STATEMENTS OF ASSETS AND LIABILITIES (Continued)
May 31, 2013
| | | | | | | | |
| | | db X-trackers
2040 Target
Date Fund | | | db X-trackers
In-Target
Date Fund | |
Assets | | | | | | | | |
Investments at fair value | | $ | 29,881,427 | | | $ | 11,131,940 | |
Investment in Affiliates at fair value (See Note 5) | | | 62,080 | | | | 9,003 | |
Cash | | | 29,911 | | | | 372,598 | |
Foreign currency at value | | | 25,500 | | | | 7,792 | |
Receivables: | | | | | | | | |
Interest and dividends | | | 88,170 | | | | 40,314 | |
Foreign tax reclaim | | | 36,591 | | | | 2,814 | |
Prepaid expenses | | | 10,588 | | | | 9,975 | |
| | | | | | | | |
Total Assets | | $ | 30,134,267 | | | $ | 11,574,436 | |
| | | | | | | | |
| | |
Liabilities | | | | | | | | |
Payables: | | | | | | | | |
Investment securities purchased | | $ | — | | | $ | 350,547 | |
Investment advisory fees | | | 16,715 | | | | 6,191 | |
Due to investment advisor | | | 7,667 | | | | 2,783 | |
Accrued expenses and other liabilities | | | 48,150 | | | | 27,993 | |
| | | | | | | | |
Total Liabilities | | | 72,532 | | | | 387,514 | |
| | | | | | | | |
| | |
Net Assets | | $ | 30,061,735 | | | $ | 11,186,922 | |
| | | | | | | | |
| | |
Net Assets Consist of | | | | | | | | |
Paid-in capital | | $ | 32,518,756 | | | $ | 10,623,093 | |
Undistributed net investment income | | | 200,276 | | | | 21,890 | |
Accumulated net realized gain (loss) | | | (7,127,966 | ) | | | (215,788 | ) |
Net unrealized appreciation (depreciation) | | | 4,470,669 | | | | 757,727 | |
| | | | | | | | |
| | |
Net Assets | | $ | 30,061,735 | | | $ | 11,186,922 | |
| | | | | | | | |
| | |
Number of Common Shares outstanding | | | 1,200,800 | | | | 400,800 | |
| | | | | | | | |
| | |
Net Assets Value | | $ | 25.03 | | | $ | 27.91 | |
| | | | | | | | |
| | |
Investments at cost | | $ | 25,374,140 | | | $ | 10,371,969 | |
| | | | | | | | |
| | |
Investments in Affiliates at cost | | $ | 97,612 | | | $ | 10,979 | |
| | | | | | | | |
Foreign currency at cost | | $ | 25,460 | | | $ | 7,955 | |
| | | | | | | | |
| | | | |
| See Notes to Financial Statements. | | 43 | | |
db-X Exchange-Traded Funds Inc.
STATEMENTS OF OPERATIONS
For the Year Ended May 31, 2013
| | | | | | | | | | | | |
| | | db X-trackers
2010 Target
Date Fund | | | db X-trackers
2020 Target
Date Fund | | | db X-trackers
2030 Target
Date Fund | |
Investment Income | | | | | | | | | | | | |
Unaffiliated interest income | | $ | 46,483 | | | $ | 113,396 | | | $ | 260,896 | |
Affiliated dividend income | | | 84 | | | | 1,210 | | | | 1,821 | |
Unaffiliated dividend income* | | | 42,634 | | | | 420,630 | | | | 622,452 | |
| | | | | | | | | | | | |
Total Investment Income | | | 89,201 | | | | 535,236 | | | | 885,169 | |
| | | | | | | | | | | | |
| | | |
Expenses | | | | | | | | | | | | |
Advisory fees | | | 62,690 | | | | 201,090 | | | | 208,663 | |
Professional fees | | | 20,811 | | | | 22,572 | | | | 26,588 | |
Directors | | | 14,923 | | | | 45,935 | | | | 47,727 | |
Insurance | | | 17,810 | | | | 17,810 | | | | 17,810 | |
Listing fees | | | 18,044 | | | | 18,044 | | | | 18,044 | |
Printing | | | 13,194 | | | | 50,875 | | | | 51,681 | |
Other | | | 507 | | | | 526 | | | | 522 | |
| | | | | | | | | | | | |
Total Expenses | | | 147,979 | | | | 356,852 | | | | 371,035 | |
Less fees waived and expenses reimbursed: (See Note 3) | | | (84,788 | ) | | | (155,260 | ) | | | (161,871 | ) |
| | | | | | | | | | | | |
Net Expenses | | | 63,191 | | | | 201,592 | | | | 209,164 | |
| | | | | | | | | | | | |
| | | |
Net Investment Income | | | 26,010 | | | | 333,644 | | | | 676,005 | |
| | | | | | | | | | | | |
| | | |
Net Realized and Unrealized Gain (Loss) | | | | | | | | | | | | |
Net realized gain (loss) on: | | | | | | | | | | | | |
Investments | | | 25,494 | | | | (86,915 | ) | | | 1,125,942 | |
In-kind redemptions | | | — | | | | 434,484 | | | | 841,213 | |
Foreign currency related transactions | | | (273 | ) | | | (1,905 | ) | | | (1,790 | ) |
| | | | | | | | | | | | |
Net realized gain (loss) | | | 25,221 | | | | 345,664 | | | | 1,965,365 | |
Net change in unrealized appreciation (depreciation) on: | | | | | | | | | | | | |
Investments | | | 365,571 | | | | 3,725,189 | | | | 3,395,159 | |
Foreign currency translations | | | 271 | | | | 1,677 | | | | 1,321 | |
| | | | | | | | | | | | |
Net change in unrealized appreciation (depreciation) | | | 365,842 | | | | 3,726,866 | | | | 3,396,480 | |
| | | | | | | | | | | | |
Net realized and unrealized gain (loss) on investments and foreign currency transactions | | | 391,063 | | | | 4,072,530 | | | | 5,361,845 | |
| | | | | | | | | | | | |
| | | |
Net Increase (Decrease) in Net Assets from Operations | | $ | 417,073 | | | $ | 4,406,174 | | | $ | 6,037,850 | |
| | | | | | | | | | | | |
* Foreign taxes withheld | | $ | 1,847 | | | $ | 13,236 | | | $ | 18,112 | |
| | | | |
| See Notes to Financial Statements. | | 44 | | |
db-X Exchange-Traded Funds Inc.
STATEMENTS OF OPERATIONS (Continued)
For the Year Ended May 31, 2013
| | | | | | | | |
| | | db X-trackers
2040 Target
Date Fund | | | db X-trackers
In-Target
Date Fund | |
Investment Income | | | | | | | | |
Unaffiliated interest income | | $ | 65,507 | | | $ | 36,131 | |
Affiliated dividend income | | | 2,117 | | | | 235 | |
Unaffiliated dividend income* | | | 669,957 | | | | 89,132 | |
| | | | | | | | |
Total Investment Income | | | 737,581 | | | | 125,498 | |
| | | | | | | | |
| | |
Expenses | | | | | | | | |
Advisory fees | | | 189,623 | | | | 70,168 | |
Professional fees | | | 24,466 | | | | 20,810 | |
Directors | | | 43,572 | | | | 16,426 | |
Insurance | | | 17,810 | | | | 17,810 | |
Listing fees | | | 18,044 | | | | 18,044 | |
Printing | | | 46,413 | | | | 15,007 | |
Other | | | 523 | | | | 511 | |
| | | | | | | | |
Total Expenses | | | 340,451 | | | | 158,776 | |
Less fees waived and expenses reimbursed: (See Note 3) | | | (150,327 | ) | | | (88,106 | ) |
| | | | | | | | |
Net Expenses | | | 190,124 | | | | 70,670 | |
| | | | | | | | |
| | |
Net Investment Income | | | 547,457 | | | | 54,828 | |
| | | | | | | | |
| | |
Net Realized and Unrealized Gain (Loss) | | | | | | | | |
Net realized gain (loss) on: | | | | | | | | |
Investments | | | (15,465 | ) | | | 9,562 | |
In-kind redemptions | | | 649,462 | | | | — | |
Foreign currency related transactions | | | (1,071 | ) | | | (540 | ) |
| | | | | | | | |
Net realized gain (loss) | | | 632,926 | | | | 9,022 | |
Net change in unrealized appreciation (depreciation) on: | | | | | | | | |
Investments | | | 5,561,245 | | | | 803,293 | |
Foreign currency translations | | | 884 | | | | 358 | |
| | | | | | | | |
Net change in unrealized appreciation (depreciation) | | | 5,562,129 | | | | 803,651 | |
| | | | | | | | |
Net realized and unrealized gain (loss) on investments and foreign currency transactions | | | 6,195,055 | | | | 812,673 | |
| | | | | | | | |
| | |
Net Increase (Decrease) in Net Assets from Operations | | $ | 6,742,512 | | | $ | 867,501 | |
| | | | | | | | |
* Foreign taxes withheld | | $ | 19,895 | | | $ | 3,636 | |
| | | | |
| See Notes to Financial Statements. | | 45 | | |
db-X Exchange-Traded Funds Inc.
STATEMENTS OF CHANGES IN NET ASSETS
| | | | | | | | | | | | | | | | |
| | | db X-trackers
2010 Target
Date Fund | | | db X-trackers
2020 Target
Date Fund | |
| | | Year Ended May 31, | | | Year Ended May 31, | |
| | | 2013 | | | 2012 | | | 2013 | | | 2012 | |
Increase (Decrease) in Net Assets from Operations | | | | | | | | | | | | | | | | |
Net investment income | | $ | 26,010 | | | $ | 92,947 | | | $ | 333,644 | | | $ | 424,297 | |
Net realized gain (loss) | | | 25,221 | | | | 399,249 | | | | 345,664 | | | | 2,435,613 | |
Net change in unrealized appreciation (depreciation) | | | 365,842 | | | | (567,383 | ) | | | 3,726,866 | | | | (4,161,490 | ) |
| | | | | | | | | | | | | | | | |
Net increase (decrease) resulting from operations | | | 417,073 | | | | (75,187 | ) | | | 4,406,174 | | | | (1,301,580 | ) |
| | | | | | | | | | | | | | | | |
| | | |
Distributions to Shareholders from | | | | | | | | | | | | | |
Net investment income | | | (39,179 | ) | | | (120,259 | ) | | | (356,998 | ) | | | (585,276 | ) |
| | | | | | | | | | | | | | | | |
Total distributions | | | (39,179 | ) | | | (120,259 | ) | | | (356,998 | ) | | | (585,276 | ) |
| | | | | | | | | | | | | | | | |
| | | | |
Fund Shares Transactions | | | | | | | | | | | | | | | | |
Value of shares redeemed | | | — | | | | (4,758,317 | ) | | | (4,870,232 | ) | | | (4,607,004 | ) |
| | | | | | | | | | | | | | | | |
Net increase (decrease) in net assets resulting from fund share transactions | | | — | | | | (4,758,317 | ) | | | (4,870,232 | ) | | | (4,607,004 | ) |
| | | | | | | | | | | | | | | | |
Total increase (decrease) in Net Assets | | | 377,894 | | | | (4,953,763 | ) | | | (821,056 | ) | | | (6,493,860 | ) |
| | | | |
Net Assets | | | | | | | | | | | | | | | | |
Beginning of year | | | 9,454,177 | | | | 14,407,940 | | | | 31,918,215 | | | | 38,412,075 | |
| | | | | | | | | | | | | | | | |
End of year | | $ | 9,832,071 | | | $ | 9,454,177 | | | $ | 31,097,159 | | | $ | 31,918,215 | |
| | | | | | | | | | | | | | | | |
Undistributed net investment income | | $ | 8,025 | | | $ | 21,405 | | | $ | 122,922 | | | $ | 147,309 | |
| | | | | | | | | | | | | | | | |
| | | | |
Changes in Shares Outstanding | | | | | | | | | | | | | | | | |
Shares outstanding, beginning of year | | | 400,800 | | | | 600,800 | | | | 1,400,800 | | | | 1,600,800 | |
Shares redeemed | | | — | | | | (200,000 | ) | | | (200,000 | ) | | | (200,000 | ) |
| | | | | | | | | | | | | | | | |
Shares outstanding, end of year | | | 400,800 | | | | 400,800 | | | | 1,200,800 | | | | 1,400,800 | |
| | | | | | | | | | | | | | | | |
| | | | |
| See Notes to Financial Statements. | | 46 | | |
db-X Exchange-Traded Funds Inc.
STATEMENTS OF CHANGES IN NET ASSETS (Continued)
| | | | | | | | | | | | | | | | |
| | | db X-trackers
2030 Target
Date Fund | | | db X-trackers
2040 Target
Date Fund | |
| | | Year Ended May 31, | | | Year Ended May 31, | |
| | | 2013 | | | 2012 | | | 2013 | | | 2012 | |
Increase (Decrease) in Net Assets from Operations | | | | | | | | | | | | | | | | |
Net investment income | | $ | 676,005 | | | $ | 684,410 | | | $ | 547,457 | | | $ | 530,421 | |
Net realized gain (loss) | | | 1,965,365 | | | | 2,499,650 | | | | 632,926 | | | | 2,407,190 | |
Net change in unrealized appreciation (depreciation) | | | 3,396,480 | | | | (3,713,126 | ) | | | 5,562,129 | | | | (4,641,115 | ) |
| | | | | | | | | | | | | | | | |
Net increase (decrease) resulting from operations | | | 6,037,850 | | | | (529,066 | ) | | | 6,742,512 | | | | (1,703,504 | ) |
| | | | | | | | | | | | | | | | |
| | | |
Distributions to Shareholders from | | | | | | | | | | | | | |
Net investment income | | | (721,516 | ) | | | (672,939 | ) | | | (587,200 | ) | | | (533,276 | ) |
| | | | | | | | | | | | | | | | |
Total distributions | | | (721,516 | ) | | | (672,939 | ) | | | (587,200 | ) | | | (533,276 | ) |
| | | | | | | | | | | | | | | | |
| | | | |
Fund Shares Transactions | | | | | | | | | | | | | | | | |
Value of shares redeemed | | | (4,886,296 | ) | | | (4,271,271 | ) | | | (4,451,251 | ) | | | (4,128,167 | ) |
| | | | | | | | | | | | | | | | |
Net increase (decrease) in net assets resulting from fund share transactions | | | (4,886,296 | ) | | | (4,271,271 | ) | | | (4,451,251 | ) | | | (4,128,167 | ) |
| | | | | | | | | | | | | | | | |
Total increase (decrease) in Net Assets | | | 430,038 | | | | (5,473,276 | ) | | | 1,704,061 | | | | (6,364,947 | ) |
| | | | |
Net Assets | | | | | | | | | | | | | | | | |
Beginning of year | | | 29,834,072 | | | | 35,307,348 | | | | 28,357,674 | | | | 34,722,621 | |
| | | | | | | | | | | | | | | | |
End of year | | $ | 30,264,110 | | | $ | 29,834,072 | | | $ | 30,061,735 | | | $ | 28,357,674 | |
| | | | | | | | | | | | | | | | |
Undistributed net investment income | | $ | 242,424 | | | $ | 288,606 | | | $ | 200,276 | | | $ | 239,884 | |
| | | | | | | | | | | | | | | | |
| | | | |
Changes in Shares Outstanding | | | | | | | | | | | | | | | | |
Shares outstanding, beginning of year | | | 1,400,800 | | | | 1,600,800 | | | | 1,400,800 | | | | 1,600,800 | |
Shares redeemed | | | (200,000 | ) | | | (200,000 | ) | | | (200,000 | ) | | | (200,000 | ) |
| | | | | | | | | | | | | | | | |
Shares outstanding, end of year | | | 1,200,800 | | | | 1,400,800 | | | | 1,200,800 | | | | 1,400,800 | |
| | | | | | | | | | | | | | | | |
| | | | |
| See Notes to Financial Statements. | | 47 | | |
db-X Exchange-Traded Funds Inc.
STATEMENTS OF CHANGES IN NET ASSETS (Continued)
| | | | | | | | |
| | | db X-trackers
In-Target
Date Fund | |
| | | Year Ended May 31, | |
| | | 2013 | | | 2012 | |
Increase (Decrease) in Net Assets from Operations | | | | | | | | |
Net investment income | | $ | 54,828 | | | $ | 88,664 | |
Net realized gain (loss) | | | 9,022 | | | | 595,460 | |
Net change in unrealized appreciation (depreciation) | | | 803,651 | | | | (894,564 | ) |
| | | | | | | | |
Net increase (decrease) resulting from operations | | | 867,501 | | | | (210,440 | ) |
| | | | | | | | |
| |
Distributions to Shareholders from | | | | | |
Net investment income | | | (56,878 | ) | | | (107,883 | ) |
| | | | | | | | |
Total distributions | | | (56,878 | ) | | | (107,883 | ) |
| | | | | | | | |
| | |
Fund Shares Transactions | | | | | | | | |
Value of shares redeemed | | | — | | | | (5,253,424 | ) |
| | | | | | | | |
Net increase (decrease) in net assets resulting from fund share transactions | | | — | | | | (5,253,424 | ) |
| | | | | | | | |
Total increase (decrease) in Net Assets | | | 810,623 | | | | (5,571,747 | ) |
| | |
Net Assets | | | | | | | | |
Beginning of year | | | 10,376,299 | | | | 15,948,046 | |
| | | | | | | | |
End of year | | $ | 11,186,922 | | | $ | 10,376,299 | |
| | | | | | | | |
Undistributed net investment income | | $ | 21,890 | | | $ | 24,333 | |
| | | | | | | | |
| | |
Changes in Shares Outstanding | | | | | | | | |
Shares outstanding, beginning of year | | | 400,800 | | | | 600,800 | |
Shares redeemed | | | — | | | | (200,000 | ) |
| | | | | | | | |
Shares outstanding, end of year | | | 400,800 | | | | 400,800 | |
| | | | | | | | |
| | | | |
| See Notes to Financial Statements. | | 48 | | |
db-X Exchange-Traded Funds Inc.
FINANCIAL HIGHLIGHTS
For a Share outstanding throughout each period
| | | | | | | | | | | | | | | | | | | | |
| | | Year Ended May 31, | |
| db X-trackers 2010 Target Date Fund | | 2013 | | | 2012 | | | 2011 | | | 2010 | | | 2009 | |
Net Asset Value, beginning of year | | $ | 23.59 | | | $ | 23.98 | | | $ | 23.24 | | | $ | 22.09 | | | $ | 24.93 | |
| | | | | | | | | | | | | | | | | | | | |
Income from Investment Operations: | | | | | | | | | | | | | | | | | | | | |
Net investment income* | | | 0.06 | | | | 0.16 | | | | 0.37 | | | | 0.55 | | | | 0.69 | |
Net realized and unrealized gain (loss) | | | 0.98 | | | | (0.35 | ) | | | 0.99 | | | | 1.11 | | | | (2.67 | ) |
Contributions from advisor | | | — | | | | — | | | | 0.04 | | | | — | | | | — | |
| | | | | | | | | | | | | | | | | | | | |
Net increase (decrease) in net asset value from operations | | | 1.04 | | | | (0.19 | ) | | | 1.40 | | | | 1.66 | | | | (1.98 | ) |
| | | | | | | | | | | | | | | | | | | | |
Distributions paid to shareholders from: | | | | | | | | | | | | | | | | | | | | |
Net investment income | | | (0.10 | ) | | | (0.20 | ) | | | (0.66 | ) | | | (0.51 | ) | | | (0.86 | ) |
Net realized capital gains | | | — | | | | — | | | | — | | | | — | | | | — | |
| | | | | | | | | | | | | | | | | | | | |
Total distributions | | | (0.10 | ) | | | (0.20 | ) | | | (0.66 | ) | | | (0.51 | ) | | | (0.86 | ) |
| | | | | | | | | | | | | | | | | | | | |
Net Asset Value, end of year | | $ | 24.53 | | | $ | 23.59 | | | $ | 23.98 | | | $ | 23.24 | | | $ | 22.09 | |
| | | | | | | | | | | | | | | | | | | | |
| | | | | |
Total Return** | | | 4.41 | % | | | (0.79 | )% | | | 6.09 | % | | | 7.51 | % | | | (7.87 | )% |
| | | | | |
Ratios/Supplemental Data | | | | | | | | | | | | | | | | | | | | |
Net Assets, end of year (000’s omitted) | | $ | 9,832 | | | $ | 9,454 | | | $ | 14,408 | | | $ | 18,610 | | | $ | 17,693 | |
Ratios to average net assets: | | | | | | | | | | | | | | | | | | | | |
Expenses, net of fee waiver and expense reimbursements | | | 0.65 | % | | | 0.65 | % | | | 0.65 | % | | | 0.65 | % | | | 0.65 | % |
Expenses, prior to fee waiver and expense reimbursements | | | 1.53 | % | | | 1.39 | % | | | 1.70 | % | | | 2.10 | % | | | 1.70 | % |
Net investment income | | | 0.27 | % | | | 0.67 | % | | | 1.56 | % | | | 2.32 | % | | | 3.09 | % |
Portfolio turnover rate† | | | 86 | % | | | 65 | % | | | 58 | % | | | 51 | % | | | 54 | % |
| |
| | | Year Ended May 31, | |
| db X-trackers 2020 Target Date Fund | | 2013 | | | 2012 | | | 2011 | | | 2010 | | | 2009 | |
Net Asset Value, beginning of year | | $ | 22.79 | | | $ | 24.00 | | | $ | 20.69 | | | $ | 18.56 | | | $ | 24.18 | |
| | | | | | | | | | | | | | | | | | | | |
Income from Investment Operations: | | | | | | | | | | | | | | | | | | | | |
Net investment income* | | | 0.26 | | | | 0.28 | | | | 0.44 | | | | 0.51 | | | | 0.61 | |
Net realized and unrealized gain (loss) | | | 3.15 | | | | (1.12 | ) | | | 3.39 | | | | 2.10 | | | | (5.64 | ) |
Contributions from advisor | | | — | | | | — | | | | 0.01 | | | | — | | | | — | |
| | | | | | | | | | | | | | | | | | | | |
Net increase (decrease) in net asset value from operations | | | 3.41 | | | | (0.84 | ) | | | 3.84 | | | | 2.61 | | | | (5.03 | ) |
| | | | | | | | | | | | | | | | | | | | |
Distributions paid to shareholders from: | | | | | | | | | | | | | | | | | | | | |
Net investment income | | | (0.30 | ) | | | (0.37 | ) | | | (0.53 | ) | | | (0.48 | ) | | | (0.59 | ) |
Net realized capital gains | | | — | | | | — | | | | — | | | | — | | | | (0.00 | )(a) |
| | | | | | | | | | | | | | | | | | | | |
Total distributions | | | (0.30 | ) | | | (0.37 | ) | | | (0.53 | ) | | | (0.48 | ) | | | (0.59 | ) |
| | | | | | | | | | | | | | | | | | | | |
Net Asset Value, end of year | | $ | 25.90 | | | $ | 22.79 | | | $ | 24.00 | | | $ | 20.69 | | | $ | 18.56 | |
| | | | | | | | | | | | | | | | | | | | |
| | | | | |
Total Return** | | | 15.04 | % | | | (3.49 | )% | | | 18.71 | % | | | 13.99 | % | | | (20.73 | )% |
| | | | | |
Ratios/Supplemental Data | | | | | | | | | | | | | | | | | | | | |
Net Assets, end of year (000’s omitted) | | $ | 31,097 | | | $ | 31,918 | | | $ | 38,412 | | | $ | 41,405 | | | $ | 37,142 | |
Ratios to average net assets: | | | | | | | | | | | | | | | | | | | | |
Expenses, net of fee waiver and expense reimbursements | | | 0.65 | % | | | 0.65 | % | | | 0.65 | % | | | 0.65 | % | | | 0.65 | % |
Expenses, prior to fee waiver and expense reimbursements | | | 1.15 | % | | | 1.16 | % | | | 1.42 | % | | | 1.90 | % | | | 1.60 | % |
Net investment income | | | 1.08 | % | | | 1.20 | % | | | 1.97 | % | | | 2.43 | % | | | 3.17 | % |
Portfolio turnover rate† | | | 52 | % | | | 55 | % | | | 49 | % | | | 37 | % | | | 64 | % |
| * | Based on average shares outstanding. |
| ** | Total Return is calculated assuming an initial investment made at the Net Asset Value at the beginning of the period, reinvestment of all dividends and capital gain distributions at Net Asset Value during the period, and redemption at Net Asset Value on the last day of the period. Total Return calculated for a period of less than one year is not annualized. The Total Return would have been lower if certain fees had not been reimbursed by the investment sub-advisor, Amerivest Investment Management LLC (from October 1, 2007 through October 20, 2010) and the Advisor, DBX Strategic Advisors LLC. |
| † | Portfolio turnover rate is not annualized and does not include securities received or delivered from processing creations or redemptions. |
| (a) | Amount represents less than $0.01 or greater than $(0.01). |
| | | | |
| See Notes to Financial Statements. | | 49 | | |
db-X Exchange-Traded Funds Inc.
FINANCIAL HIGHLIGHTS (Continued)
For a Share outstanding throughout each period
| | | | | | | | | | | | | | | | | | | | |
| | | Year Ended May 31, | |
| db X-trackers 2030 Target Date Fund | | 2013 | | | 2012 | | | 2011 | | | 2010 | | | 2009 | |
Net Asset Value, beginning of year | | $ | 21.30 | | | $ | 22.06 | | | $ | 18.18 | | | $ | 16.07 | | | $ | 23.57 | |
| | | | | | | | | | | | | | | | | | | | |
Income from Investment Operations: | | | | | | | | | | | | | | | | | | | | |
Net investment income* | | | 0.49 | | | | 0.46 | | | | 0.39 | | | | 0.37 | | | | 0.44 | |
Net realized and unrealized gain (loss) | | | 3.93 | | | | (0.74 | ) | | | 3.90 | | | | 2.07 | | | | (7.54 | ) |
Contributions from advisor | | | — | | | | — | | | | 0.00 | (a) | | | — | | | | — | |
| | | | | | | | | | | | | | | | | | | | |
Net increase (decrease) in net asset value from operations | | | 4.42 | | | | (0.28 | ) | | | 4.29 | | | | 2.44 | | | | (7.10 | ) |
| | | | | | | | | | | | | | | | | | | | |
Distributions paid to shareholders from: | | | | | | | | | | | | | | | | | | | | |
Net investment income | | | (0.52 | ) | | | (0.48 | ) | | | (0.41 | ) | | | (0.33 | ) | | | (0.40 | ) |
Net realized capital gains | | | — | | | | — | | | | — | | | | — | | | | — | |
| | | | | | | | | | | | | | | | | | | | |
Total distributions | | | (0.52 | ) | | | (0.48 | ) | | | (0.41 | ) | | | (0.33 | ) | | | (0.40 | ) |
| | | | | | | | | | | | | | | | | | | | |
Net Asset Value, end of year | | $ | 25.20 | | | $ | 21.30 | | | $ | 22.06 | | | $ | 18.18 | | | $ | 16.07 | |
| | | | | | | | | | | | | | | | | | | | |
| | | | | |
Total Return** | | | 20.94 | % | | | (1.17 | )% | | | 23.74 | % | | | 15.13 | % | | | (30.08 | )% |
| | | | | |
Ratios/Supplemental Data | | | | | | | | | | | | | | | | | | | | |
Net Assets, end of year (000’s omitted) | | $ | 30,264 | | | $ | 29,834 | | | $ | 35,307 | | | $ | 32,740 | | | $ | 28,937 | |
Ratios to average net assets: | | | | | | | | | | | | | | | | | | | | |
Expenses, net of fee waiver and expense reimbursements | | | 0.65 | % | | | 0.65 | % | | | 0.65 | % | | | 0.65 | % | | | 0.65 | % |
Expenses, prior to fee waiver and expense reimbursements | | | 1.16 | % | | | 1.18 | % | | | 1.43 | % | | | 1.95 | % | | | 1.62 | % |
Net investment income | | | 2.11 | % | | | 2.17 | % | | | 1.93 | % | | | 2.01 | % | | | 2.52 | % |
Portfolio turnover rate† | | | 46 | % | | | 40 | % | | | 39 | % | | | 42 | % | | | 64 | % |
| |
| | | Year Ended May 31, | |
| db X-trackers 2040 Target Date Fund | | 2013 | | | 2012 | | | 2011 | | | 2010 | | | 2009 | |
Net Asset Value, beginning of year | | $ | 20.24 | | | $ | 21.69 | | | $ | 17.48 | | | $ | 15.35 | | | $ | 23.49 | |
| | | | | | | | | | | | | | | | | | | | |
Income from Investment Operations: | | | | | | | | | | | | | | | | | | | | |
Net investment income* | | | 0.43 | | | | 0.37 | | | | 0.32 | | | | 0.32 | | | | 0.37 | |
Net realized and unrealized gain (loss) | | | 4.85 | | | | (1.44 | ) | | | 4.25 | | | | 2.08 | | | | (8.15 | ) |
| | | | | | | | | | | | | | | | | | | | |
Net increase (decrease) in net asset value from operations | | | 5.28 | | | | (1.07 | ) | | | 4.57 | | | | 2.40 | | | | (7.78 | ) |
| | | | | | | | | | | | | | | | | | | | |
Distributions paid to shareholders from: | | | | | | | | | | | | | | | | | | | | |
Net investment income | | | (0.49 | ) | | | (0.38 | ) | | | (0.36 | ) | | | (0.27 | ) | | | (0.36 | ) |
Net realized capital gains | | | — | | | | — | | | | — | | | | — | | | | — | |
| | | | | | | | | | | | | | | | | | | | |
Total distributions | | | (0.49 | ) | | | (0.38 | ) | | | (0.36 | ) | | | (0.27 | ) | | | (0.36 | ) |
| | | | | | | | | | | | | | | | | | | | |
Net Asset Value, end of year | | $ | 25.03 | | | $ | 20.24 | | | $ | 21.69 | | | $ | 17.48 | | | $ | 15.35 | |
| | | | | | | | | | | | | | | | | | | | |
| | | | | |
Total Return** | | | 26.35 | % | | | (4.86 | )% | | | 26.32 | % | | | 15.59 | % | | | (33.03 | )% |
| | | | | |
Ratios/Supplemental Data | | | | | | | | | | | | | | | | | | | | |
Net Assets, end of year (000’s omitted) | | $ | 30,062 | | | $ | 28,358 | | | $ | 34,723 | | | $ | 31,477 | | | $ | 27,651 | |
Ratios to average net assets: | | | | | | | | | | | | | | | | | | | | |
Expenses, net of fee waiver and expense reimbursements | | | 0.65 | % | | | 0.65 | % | | | 0.65 | % | | | 0.65 | % | | | 0.65 | % |
Expenses, prior to fee waiver and expense reimbursements | | | 1.17 | % | | | 1.20 | % | | | 1.43 | % | | | 1.97 | % | | | 1.65 | % |
Net investment income | | | 1.88 | % | | | 1.84 | % | | | 1.64 | % | | | 1.79 | % | | | 2.21 | % |
Portfolio turnover rate† | | | 34 | % | | | 34 | % | | | 35 | % | | | 38 | % | | | 56 | % |
| * | Based on average shares outstanding. |
| ** | Total Return is calculated assuming an initial investment made at the Net Asset Value at the beginning of the period, reinvestment of all dividends and capital gain distributions at Net Asset Value during the period, and redemption at Net Asset Value on the last day of the period. Total Return calculated for a period of less than one year is not annualized. The Total Return would have been lower if certain fees had not been reimbursed by the investment sub-advisor, Amerivest Investment Management LLC (from October 1, 2007 through October 20, 2010) and the Advisor, DBX Strategic Advisors LLC. |
| † | Portfolio turnover rate is not annualized and does not include securities received or delivered from processing creations or redemptions. |
| (a) | Amount represents less than $0.01 or greater than $(0.01). |
| | | | |
| See Notes to Financial Statements. | | 50 | | |
db-X Exchange-Traded Funds Inc.
FINANCIAL HIGHLIGHTS (Continued)
For a Share outstanding throughout each period
| | | | | | | | | | | | | | | | | | | | |
| | | Year Ended May 31, | |
| db X-trackers In-Target Date Fund | | 2013 | | | 2012 | | | 2011 | | | 2010 | | | 2009 | |
Net Asset Value, beginning of year | | $ | 25.89 | | | $ | 26.54 | | | $ | 25.07 | | | $ | 24.38 | | | $ | 25.46 | |
| | | | | | | | | | | | | | | | | | | | |
Income from Investment Operations: | | | | | | | | | | | | | | | | | | | | |
Net investment income* | | | 0.14 | | | | 0.16 | | | | 0.25 | | | | 0.33 | | | | 0.47 | |
Net realized and unrealized gain (loss) | | | 2.02 | | | | (0.63 | ) | | | 1.61 | | | | 0.70 | | | | (0.96 | ) |
Contributions from advisor | | | — | | | | — | | | | 0.00 | (a) | | | — | | | | — | |
| | | | | | | | | | | | | | | | | | | | |
Net increase (decrease) in net asset value from operations | | | 2.16 | | | | (0.47 | ) | | | 1.86 | | | | 1.03 | | | | (0.49 | ) |
| | | | | | | | | | | | | | | | | | | | |
Distributions paid to shareholders from: | | | | | | | | | | | | | | | | | | | | |
Net investment income | | | (0.14 | ) | | | (0.18 | ) | | | (0.39 | ) | | | (0.34 | ) | | | (0.59 | ) |
Net realized capital gains | | | — | | | | — | | | | — | | | | — | | | | (0.00 | )(a) |
| | | | | | | | | | | | | | | | | | | | |
Total distributions | | | (0.14 | ) | | | (0.18 | ) | | | (0.39 | ) | | | (0.34 | ) | | | (0.59 | ) |
| | | | | | | | | | | | | | | | | | | | |
Net Asset Value, end of year | | $ | 27.91 | | | $ | 25.89 | | | $ | 26.54 | | | $ | 25.07 | | | $ | 24.38 | |
| | | | | | | | | | | | | | | | | | | | |
| | | | | |
Total Return** | | | 8.37 | % | | | (1.77 | )% | | | 7.44 | % | | | 4.23 | % | | | (1.87 | )% |
| | | | | |
Ratios/Supplemental Data | | | | | | | | | | | | | | | | | | | | |
Net Assets, end of year (000’s omitted) | | $ | 11,187 | | | $ | 10,376 | | | $ | 15,948 | | | $ | 20,074 | | | $ | 24,400 | |
Ratios to average net assets: | | | | | | | | | | | | | | | | | | | | |
Expenses, net of fee waiver and expense reimbursements | | | 0.65 | % | | | 0.65 | % | | | 0.65 | % | | | 0.65 | % | | | 0.65 | % |
Expenses, prior to fee waiver and expense reimbursements | | | 1.47 | % | | | 1.36 | % | | | 1.66 | % | | | 2.06 | % | | | 1.57 | % |
Net investment income | | | 0.51 | % | | | 0.59 | % | | | 0.96 | % | | | 1.30 | % | | | 1.91 | % |
Portfolio turnover rate† | | | 62 | % | | | 59 | % | | | 60 | % | | | 42 | % | | | 75 | % |
| * | Based on average shares outstanding. |
| ** | Total Return is calculated assuming an initial investment made at the Net Asset Value at the beginning of the period, reinvestment of all dividends and capital gain distributions at Net Asset Value during the period, and redemption at Net Asset Value on the last day of the period. Total Return calculated for a period of less than one year is not annualized. The Total Return would have been lower if certain fees had not been reimbursed by the investment sub-advisor, Amerivest Investment Management LLC (from October 1, 2007 through October 20, 2010) and the Advisor, DBX Strategic Advisors LLC. |
| † | Portfolio turnover rate is not annualized and does not include securities received or delivered from processing creations or redemptions. |
| (a) | Amount represents less than $0.01 or greater than $(0.01). |
| | | | |
| See Notes to Financial Statements. | | 51 | | |
db-X Exchange-Traded Funds Inc.
NOTES TO FINANCIAL STATEMENTS
1. Organization
db-X Exchange-Traded Funds Inc. (the “Company”) was organized as a Maryland corporation on December 22, 2006 and is registered under the Investment Company Act of 1940, as amended (the “Act”).
As of May 31, 2013, there were five (5) series of exchange-traded funds (“ETF”) (each, a “Fund,” and collectively, the “Funds”) in operation and trading:
| | |
db X-trackers 2010 Target Date Fund
(formerly known as db-X 2010 Target Date Fund) | | “db X-trackers 2010 Fund” |
db X-trackers 2020 Target Date Fund
(formerly known as db-X 2020 Target Date Fund) | | “db X-trackers 2020 Fund” |
db X-trackers 2030 Target Date Fund
(formerly known as db-X 2030 Target Date Fund) | | “db X-trackers 2030 Fund” |
db X-trackers 2040 Target Date Fund
(formerly known as db-X 2040 Target Date Fund) | | “db X-trackers 2040 Fund” |
db X-trackers In-Target Date Fund
(formerly known as db-X In-Target Date Fund) | | “db X-trackers In-Target Fund” |
DBX Strategic Advisors LLC (“DBX” or the “Advisor”) serves as investment advisor to the Funds and has overall responsibility for the general management and administration of the Funds, subject to the supervision of the Funds’ Board of Directors.
Each Fund offers shares, that are listed and traded on the NYSE Arca, Inc. (“NYSE Arca”). Unlike conventional mutual funds, each Fund issues and redeems shares on a continuous basis, at net asset value, only in large specified lots consisting of 200,000 shares, each called a “Creation Unit.” Except when aggregated in Creation Units, shares are not individually redeemable securities of the Funds.
The investment objective of each Fund is to track the performance, before fees and expenses, of a particular index (the “Underlying Index”). Zacks Investment Research (“Zacks”) is the creator of each Underlying Index. Each Underlying Index is comprised of a mix of securities from three broad asset classes: international equities, domestic equities, and fixed income, which includes cash, cash equivalents or short-term money market instruments. Short-term instruments include obligations of the U.S. government and its agencies or instrumentalities; commercial paper, variable amount master demand notes and other debt securities, including high quality U.S. dollar-denominated short-term bonds and notes issued by domestic and foreign corporations; variable and floating rate securities; bank obligations; repurchase agreements collateralized by these securities; and shares of other investment companies that primarily invest in any of the above-referenced securities. These Underlying Indexes are designed to reflect a portfolio of investments that can be used for lifecycle investing. Lifecycle investing is an investment technique that starts by targeting a particular investment horizon. That investment horizon corresponds to the date the investor expects to need his or her invested assets.
The underlying indexes for the Funds are:
| | |
Fund | | Underlying Index |
| db X-trackers 2010 Fund | | Zacks 2010 Lifecycle Index |
| db X-trackers 2020 Fund | | Zacks 2020 Lifecycle Index |
| db X-trackers 2030 Fund | | Zacks 2030 Lifecycle Index |
| db X-trackers 2040 Fund | | Zacks 2040 Lifecycle Index |
| db X-trackers In-Target Fund | | Zacks In-Target Lifecycle Index |
Each Fund is entitled to use its respective Underlying Index pursuant to a licensing agreement between Zacks and DBX. There is no charge to the Funds in connection with these licensing agreements.
Each Fund may invest in securities of non-U.S. issuers that may trade in non-U.S. Markets. This may involve certain considerations and risks not typically associated with securities of U.S. issuers. Such risks include, but are not limited to: generally less liquid and less efficient securities markets; generally greater price volatility; exchange rate fluctuations and exchange controls; imposition of restrictions on the expatriation of funds or other assets of the Fund; less publicly available information about issuers; the imposition of withholding or other taxes; higher transaction and custody costs; settlement delays and risk of loss attendant in settlement procedures; difficulties in enforcing contractual obligations; less regulation of securities markets; different accounting, disclosure and reporting requirements; more substantial governmental involvement in the economy; higher inflation rates; greater social, economic and political uncertainties; the risk of nationalization or expropriation of assets and the risk of war.
52
db-X Exchange-Traded Funds Inc.
NOTES TO FINANCIAL STATEMENTS (Continued)
Pursuant to the Company’s organizational documents, the Company’s officers and directors are indemnified against certain liabilities that may arise out of the performance of their duties to the Funds. Additionally, in the normal course of business the Company enters into contracts that contain a variety of representations that provide indemnification for certain liabilities. The director’s maximum exposure under these arrangements is unknown, as this would involve future claims that may be made against the Funds that have not yet occurred. However, the Company expects the risk of loss to be remote.
2. Significant Accounting Policies
The financial statements have been prepared in conformity with U.S. generally accepted accounting principles (“U.S. GAAP”), which require management to make certain estimates and assumptions that affect the reported amounts and disclosures in the financial statements. Actual results could differ from those estimates. The following is a summary of significant accounting policies followed by the Funds.
Investment Valuation The Net Asset Value (“NAV”), of each Fund’s shares is calculated each business day as of the close of regular trading on the New York Stock Exchange, generally 4:00 p.m. Eastern Time. NAV per share is calculated by dividing a Fund’s net assets by the number of Fund shares outstanding. Any assets or securities for which market quotations are not readily available are valued at fair-value in accordance with procedures adopted by the Board of Directors. The Board of Directors has delegated to the Advisor the responsibility to exercise oversight in the administration of these procedures.
Foreign securities (including foreign exchange contracts) are converted into U.S. dollar amounts using the applicable exchange rates as of the close of the New York Stock Exchange (“NYSE”). If market quotations are available and reliable for foreign exchange traded equity securities, the securities will be valued at the market quotations. Since trading hours for certain foreign securities end before the close of the NYSE, closing market quotations may become unreliable. If between the time trading ends on a particular security and the close of the customary trading session on the NYSE, events occur that are significant and make the closing price unreliable, the Funds may fair value the security. If the event is likely to have affected the closing price of the security, the security will be valued at fair value in good faith using procedures approved by the Board of Trustees. Adjustments to closing prices to reflect fair value may also be based on a screening process of an independent pricing service to indicate the degree of certainty, based on historical data, that the closing price in the principal market where a foreign security trades is not the current value as of the close of the NYSE. Foreign securities meeting the approved degree of certainty that the price is not reflective of current value will be priced at the indication of fair value from the independent pricing service. Multiple factors may be considered by the independent pricing service in determining adjustments to reflect fair value and may include information relating to sector indices, American Depositary Receipts and domestic and foreign index futures. Foreign securities may have additional risks including exchange rate changes, potential for sharply devalued currencies and high inflation, political and economical upheaval, the relative lack of issuer information, relatively low market liquidity and the potential lack of strict financial and accounting controls and standards.
In general, the market value of securities which are readily available and deemed reliable are determined as follows: securities listed on a national securities exchange (other than securities listed on the NASDAQ Stock Market, Inc. (“NASDAQ”)) or on a foreign securities exchange are valued at the last sale price at the close of the exchange or foreign securities exchange. If there has been no sale on such day, the securities are valued at the last traded price from the previous day. Securities listed on more than one exchange are valued by reference to the principal exchange on which the securities are traded; securities listed only on NASDAQ are valued in accordance with the NASDAQ Official Closing Price.
U.S. government securities and other debt instruments having 60 days or less remaining until maturity are valued at amortized cost if their original maturity was 60 days or less; or by amortizing their fair value as of the 61st day prior to maturity if their original term to maturity exceeded 60 days; fixed-income securities may be valued on the basis of prices provided by a pricing service or at a price obtained from one or more of the major broker/dealers. In cases where broker/dealer quotes are obtained, the Advisor may establish procedures whereby changes in market yields or spreads are used to adjust, on a daily basis, a recently obtained quoted price on a security.
Cash Cash consists of cash held at banks and are on deposit with major financial institutions.
Fair Value Measurement The Funds are subject to fair value accounting standards that define fair value, establish the framework for measuring fair value and provide a three-tier hierarchy to maximize the use of observable market data and minimize the use of unobservable inputs. Inputs refer broadly to the assumptions that market participants would use in pricing the asset or liability, including assumptions about risk, for example, the risk inherent in a particular valuation technique used to measure fair value. Inputs may be based on independent market data (“observable inputs”) or they may be internally developed (“unobservable inputs”). The hierarchy gives the highest priority to unadjusted quoted prices in active markets for identical assets
53
db-X Exchange-Traded Funds Inc.
NOTES TO FINANCIAL STATEMENTS (Continued)
or liabilities (level 1 measurement) and the lowest priority to unobservable inputs (level 3 measurements). The three levels of the fair value hierarchy are as follows:
| | • | | Level 1 — quoted prices in active markets for identical securities |
| | • | | Level 2 — Inputs other than quoted prices included within Level 1 that are observable for the asset or liability either directly or indirectly, including quoted prices for similar assets or liabilities in active markets, quoted prices for identical or similar assets or liabilities in markets that are not considered to be active, inputs other than quoted prices that are observable for the asset or liability, and inputs that are derived principally from or corroborated by observable market data by correlation or other means |
| | • | | Level 3 — significant unobservable inputs (including a Fund’s own assumption in determining the fair value of investments |
The level of a value determined for a financial instrument within the fair value hierarchy is based on the lowest level of any input that is significant to the fair value measurement in its entirety. However, the determination of what constitutes an “observable” input may require significant judgment by the Funds. The Funds consider observable inputs to be market data that is readily available, regularly distributed or updated, reliable and verifiable, and provided by independent sources that are actively involved in the relevant market. The categorization of a value determined for a financial instrument within the hierarchy is based upon the pricing transparency of the instrument and does not necessarily correspond to the Funds’ perceived risk of that instrument.
Level 1 investments consist of active listed equities.
Level 2 investments generally include certain U.S. government and sovereign obligations, most government agency securities, investment-grade corporate bonds and rights.
Level 3 investments may include unlisted securities related to corporate actions, securities whose trading have been suspended or which have been de-listed from their primary trading exchange and less liquid corporate debt securities. When observable prices are not available for these securities, the Funds use one or more valuation techniques (e.g., the market approach or the income approach) for which sufficient and reliable data is available. Within Level 3 of the fair value hierarchy, the use of the market approach generally consists of using comparable market transactions, while the use of the income approach generally consists of the net present value of estimated future cash flows, adjusted as appropriate for liquidity, credit, market and/or other risk factors.
The inputs used by the Funds in estimating the value of investments classified as Level 3 may include the original transaction price, quoted prices for similar securities or assets in active markets, completed or pending third-party transactions in the underlying investment or comparable issuers, and changes in financial ratios or cash flows. Level 3 securities may also be adjusted to reflect illiquidity and/or non-transferability, with the amount of such discount estimated by the Funds in the absence of market information. The fair value measurement of Level 3 securities does not include transaction costs that may have been capitalized as part of the security’s cost basis. Assumptions used by the Funds due to the lack of observable inputs may significantly impact the resulting fair value and therefore the Funds’ results of operations. There were no securities classified as Level 3 at May 31, 2013.
Fair value pricing could result in a difference between the prices used to calculate a Fund’s net asset value and the prices used by the Fund’s underlying index, which in turn could result in a difference between the Fund’s performance and the performance of the Fund’s underlying index.
The following table summarizes the valuation of each Fund’s investments by the above fair value hierarchy levels as of May 31, 2013 (see the Schedule of Investments for security categories). For the year ended May 31, 2013, there were no transfers between investment levels.
| | | | | | | | | | | | | | | | |
| | | Level 1 | | | Level 2 | | | Level 3 | | | Fair Value at
5/31/13 | |
| db X-trackers 2010 Fund | | | | | | | | | | | | | | | | |
Investments in Securities | | | | | | | | | | | | | | | | |
Common Stocks | | $ | 1,950,078 | | | $ | — | | | $ | — | | | $ | 1,950,078 | |
Preferred Stocks | | | 3,328 | | | | — | | | | — | | | | 3,328 | |
Corporate Bonds | | | — | | | | 1,168,427 | | | | — | | | | 1,168,427 | |
United States Government & Agencies Obligations | | | — | | | | 6,675,238 | | | | — | | | | 6,675,238 | |
| | | | | | | | | | | | | | | | |
Total Investments | | $ | 1,953,406 | | | $ | 7,843,665 | | | $ | — | | | $ | 9,797,071 | |
| | | | | | | | | | | | | | | | |
54
db-X Exchange-Traded Funds Inc.
NOTES TO FINANCIAL STATEMENTS (Continued)
| | | | | | | | | | | | | | | | |
| | | Level 1 | | | Level 2 | | | Level 3 | | | Fair Value at
5/31/13 | |
| db X-trackers 2020 Fund | | | | | | | | | | | | | | | | |
Investments in Securities | | | | | | | | | | | | | | | | |
Common Stocks | | $ | 17,887,059 | | | $ | — | | | $ | — | | | $ | 17,887,059 | |
Preferred Stocks | | | 21,787 | | | | — | | | | — | | | | 21,787 | |
Corporate Bonds | | | — | | | | 3,272,259 | | | | — | | | | 3,272,259 | |
United States Government & Agencies Obligations | | | — | | | | 9,788,378 | | | | — | | | | 9,788,378 | |
| | | | | | | | | | | | | | | | |
Total Investments | | $ | 17,908,846 | | | $ | 13,060,637 | | | $ | — | | | $ | 30,969,483 | |
| | | | | | | | | | | | | | | | |
| db X-trackers 2030 Fund | | | | | | | | | | | | | | | | |
Investments in Securities | | | | | | | | | | | | | | | | |
Common Stocks | | $ | 24,524,046 | | | $ | — | | | $ | — | | | $ | 24,524,046 | |
Preferred Stocks | | | 28,690 | | | | — | | | | — | | | | 28,690 | |
Corporate Bonds | | | — | | | | 5,114,117 | | | | — | | | | 5,114,117 | |
United States Government & Agencies Obligations | | | — | | | | 430,517 | | | | — | | | | 430,517 | |
| | | | | | | | | | | | | | | | |
Total Investments | | $ | 24,552,736 | | | $ | 5,544,634 | | | $ | — | | | $ | 30,097,370 | |
| | | | | | | | | | | | | | | | |
| db X-trackers 2040 Fund | | | | | | | | | | | | | | | | |
Investments in Securities | | | | | | | | | | | | | | | | |
Common Stocks | | $ | 28,373,648 | | | $ | — | | | $ | — | | | $ | 28,373,648 | |
Preferred Stocks | | | 33,354 | | | | — | | | | — | | | | 33,354 | |
Corporate Bonds | | | — | | | | 773,674 | | | | — | | | | 773,674 | |
United States Government & Agencies Obligations | | | — | | | | 762,831 | | | | — | | | | 762,831 | |
| | | | | | | | | | | | | | | | |
Total Investments | | $ | 28,407,002 | | | $ | 1,536,505 | | | $ | — | | | $ | 29,943,507 | |
| | | | | | | | | | | | | | | | |
| db X-trackers In-Target Fund | | | | | | | | | | | | | | | | |
Investments in Securities | | | | | | | | | | | | | | | | |
Common Stocks | | $ | 4,026,326 | | | $ | — | | | $ | — | | | $ | 4,026,326 | |
Preferred Stocks | | | 6,864 | | | | — | | | | — | | | | 6,864 | |
Corporate Bonds | | | — | | | | 1,069,115 | | | | — | | | | 1,069,115 | |
United States Government & Agencies Obligations | | | — | | | | 6,038,638 | | | | — | | | | 6,038,638 | |
| | | | | | | | | | | | | | | | |
Total Investments | | $ | 4,033,190 | | | $ | 7,107,753 | | | $ | — | | | $ | 11,140,943 | |
| | | | | | | | | | | | | | | | |
New Accounting Pronouncements In December 2011, the Financial Accounting Standards Board (the “FASB”) issued Accounting Standards Update (“ASU”) No. 2011-11 related to Disclosures about Offsetting Assets and Liabilities and in January 2013, issued ASU 2013-01, Clarifying the Scope of Disclosures about Offsetting Assets and Liabilities (collectively, the “Update”). The Update requires an entity to disclose information about offsetting and related arrangements to enable users of its financial statements to understand the effect of those arrangements on its financial position. The disclosure requirements are effective for annual reporting periods beginning on or after January 1, 2013, and interim periods within those annual periods. The guidance requires retrospective application for all comparative periods presented. The Advisor is currently evaluating the impact that the Update will have on the financial statement disclosures.
In June 2013, the FASB issued ASU No. 2013-08 which provides guidance that creates a two-tiered approach to assess whether an entity is an investment company. The guidance will also require an investment company to measure non-controlling ownership interests in other investment companies at fair value and will require additional disclosures relating to investment company status, any changes thereto and information about financial support provided or contractually required to be provided to any of the investment company’s investees. The guidance is effective for financial statements with fiscal years beginning on or after December 15, 2013 and interim periods within those fiscal years. Management is evaluating the impact of this guidance on the Funds’ financial statement disclosures.
55
db-X Exchange-Traded Funds Inc.
NOTES TO FINANCIAL STATEMENTS (Continued)
Investment Transactions and Investment Income Investment transactions are recorded as of the date that the
securities are purchased or sold (trade date). Realized gains and losses from the sale or disposition of securities are calculated on the identified cost-method. Dividend income is net of any foreign taxes withheld at source. Interest income is recorded on the accrual basis. Discounts and premiums on securities purchased are accreted/amortized over the lives of the respective securities.
Tax Information and Dividends and Distributions to Shareholders It is each Fund’s policy to comply with all requirements of the Internal Revenue Code of 1986, as amended (“the Code”). Each fund intends to qualify for and to elect treatment as a separate Regulated Investment Company (“RIC”) under Subchapter M of the Code. It is the policy of each Fund to pay out dividends, if any, to investors at least annually sufficient to relieve it from all, or substantially all, Federal income and excise taxes. Taxable net realized gains from investment transactions, reduced by capital loss carryforwards, if any, are declared and distributed to shareholders at least annually. The capital loss carryforward amount, if any, is available to offset future net capital gains. The Funds may occasionally be required to make supplemental distributions at some other time during the year. The Funds reserve the right to declare special distributions if, in their reasonable discretion, such action is necessary or advisable to preserve the status of each Fund as a RIC or to avoid imposition of income or excise taxes on undistributed income. Dividends and distributions to shareholders, if any, are recorded on the ex-dividend date. The amount of dividends and distributions from net investment income and net realized capital gains are determined in accordance with Federal income tax regulations which may differ from U.S. GAAP. These “book/tax” differences are either considered temporary or permanent in nature. To the extent these differences are permanent in nature, such amounts are reclassified at the end of the year within the components of net assets based on their federal tax treatment; temporary differences do not require reclassification. Dividends and distributions, which exceed earnings and profits for the full year for tax purposes, are reported as a tax return of capital. Each Fund pays out dividends from its net investment income to investors annually. Each Fund distributes any net capital gains annually.
The Funds are subject to accounting standards that establish a minimum threshold for recognizing, and a system for measuring, the benefits of a tax position taken or expected to be taken in a tax return. In accordance with U.S. GAAP requirements regarding accounting for uncertainties in income taxes, management has analyzed the Funds’ tax positions taken or expected to be taken on foreign, federal and state income tax returns for all open tax years and has concluded that no provision for income tax is required in the Funds’ financial statements. The Advisor does not believe that the unrecognized tax benefits will change significantly in the next 12 months.
The Funds’ recognize interest and penalties, if any, related to uncertain tax positions as income tax expense on the Statements of Operations. For the year ended May 31, 2013, the Funds did not incur any interest or penalties.
Foreign Taxes The Funds may be subject to foreign taxes (a portion of which may be reclaimable) on income, capital gains on investments, certain foreign currency transactions or other corporate events. All foreign taxes are recorded in accordance with the applicable foreign tax regulations and rates that exist in the foreign jurisdictions in which the Funds invest. These foreign taxes, if any, are paid by the Funds and are reflected in their Statements of Operations as follows: foreign taxes withheld at source are presented as a reduction of income, foreign taxes on capital gains from sales of investments and foreign currency transactions are included in their respective net realized gain (loss) categories, and foreign taxes on other corporate events are reflected in “Other foreign taxes.” Foreign taxes payable as of May 31, 2013, if any, are disclosed in the Funds’ Statements of Assets and Liabilities.
Expenses Expenses that are directly related to a specific Fund are charged to that respective Fund. Expenses which are not readily identifiable to a specific Fund are allocated in such a manner as deemed equitable, taking into consideration the nature and type of expense and the relative net assets of each Fund.
Foreign Currency Translation The accounting records of the Funds are maintained in U.S. dollars. Foreign currencies, as well as investment securities and other assets and liabilities denominated in currencies other than the U.S. dollar are translated into U.S. dollars using an exchange rate deemed appropriate by the investment advisor. The effects of changes in foreign currency exchange rates on investments in securities are not segregated in the Statements of Operations from the effects of changes in market prices of those securities, but are included with the net realized and unrealized gain or loss on investments in securities. Unrealized gains and losses on assets and liabilities, other than investments in securities, which result from changes in foreign currency exchange rates have been included in “Net change in unrealized appreciation (depreciation) on foreign currency translations” on the Statements of Operations. The portion of foreign currency gains and losses related to fluctuations in exchange rates between the initial purchase trade date and subsequent sale trade date is included in “Net realized gain (loss) from foreign currency related transactions” on the Statements of Operations. Certain
56
db-X Exchange-Traded Funds Inc.
NOTES TO FINANCIAL STATEMENTS (Continued)
foreign exchange gains and losses included in realized and unrealized gains or losses are included in or are a reduction of ordinary income in accordance with U.S. Federal income tax regulations.
3. Investment Advisory and Other Agreements
The Advisor has overall responsibility for the general management and administration of the Funds, subject to the supervision of the Funds’ Board of Directors. Under an investment advisory agreement between the Company, on behalf of the Funds, and the Advisor (the “Investment Advisory Agreement”), the Advisor is responsible for arranging sub-advisory, transfer agency, custody, fund administration, and all other non-distribution related services for the Funds to operate. The Advisor is also responsible for employing any sampling strategy for the Funds.
TDAM USA Inc. (“TDAM”) acts as investment sub-advisor to the Funds (“Sub-Advisor”). TDAM is a direct, wholly-owned subsidiary of The Toronto-Dominion Bank. The Sub-Advisor is responsible for the day-to-day management of the Funds, subject to the supervision of the Advisor and the Funds’ Board of Directors. In this regard, the Sub-Advisor is responsible for implementing the replication strategy for each Fund with regard to its underlying index and for general administration, compliance and management services as may be agreed between the Advisor and Sub Advisor from time to time.
For the services it provides to the Funds, the Advisor receives a unified advisory fee computed daily and payable monthly in an amount equal to 0.65% on an annualized basis of each Fund’s average daily net assets. Out of the advisory fee, the Advisor pays, or arranges for the payment of, all fees and expenses of the Transfer Agent, the Administrator and Accounting Agent and the Custodian. Each Fund is responsible for the payment of all other expenses associated with its operations, including but not limited to, brokerage expenses, taxes, interest, fees and expenses of counsel to the Funds, fees and expenses of the Disinterested Directors (including legal counsel fees), certain out-of-pocket expenses of the Advisor or Sub-Advisor, including, but not limited to, cost of obtaining prices for security valuations (including manual broker quotes), Federal Reserve charges related to securities transactions, postage and insurance on physical transfer items, telecommunication charges, and proxy voting execution, advice and reporting etc., fees and expenses of the Chief Compliance Officer and expenses associated with the Funds’ compliance program, litigation expenses, fees and expenses of the Funds’ independent auditors, registration fees, expenses associated with compliance by the Funds with regulatory requirements, including those relating to the development and distribution of its prospectus and shareholder reports, and extraordinary expenses. Pursuant to the Investment Advisory Agreement, the Advisor is authorized to engage one or more sub-advisors to perform any of the services contemplated to be performed by the Advisor under the Investment Advisory Agreement.
The Advisor pays TDAM, out of its own resources, a fee based on a percentage of the average daily net assets of each Fund as set forth below:
| | • | | 10 basis points (0.10%) of the first $100 million in combined daily net assets of all Funds; and |
| | • | | 5 basis points (0.05%) of the combined daily net assets of all Funds in excess of $100 million. |
The Advisor pays TDAM a minimum annual fee of $35,000 per Fund.
The Advisor has contractually agreed to reduce its fees and/or pay Fund operating expenses (excluding, among other things, acquired fund fees and expenses, interest, taxes and extraordinary expenses) in order to limit each Fund’s net annual operating expenses to 0.65% of the Fund’s average daily net assets (the “Expense Cap”). The Expense Cap will remain in effect until September 30, 2013. The Advisor is permitted to be reimbursed for fee reductions and/or expense payments made in the prior three fiscal years. This reimbursement may be paid to the Advisor if the aggregate amount actually paid by a Fund toward operating expenses for such fiscal year (taking into account the reimbursement) does not exceed the Expense Cap. No amounts were reimbursed under this contractual arrangement during the year ended May 31, 2013.
The amounts subject to potential reimbursement to the Advisor as of May 31, 2013 were as follows:
| | | | | | | | | | | | |
| | | Reimbursements available through: | |
| | | 5/31/2013 | | | 5/31/2014 | | | 5/31/2015 | |
db X-trackers 2010 Fund | | $ | 361,835 | | | $ | 187,622 | | | $ | 84,788 | |
db X-trackers 2020 Fund | | | 646,544 | | | | 333,966 | | | | 155,260 | |
db X-trackers 2030 Fund | | | 598,099 | | | | 329,744 | | | | 161,871 | |
db X-trackers 2040 Fund | | | 562,595 | | | | 308,119 | | | | 150,327 | |
db X-trackers In-Target Fund | | | 376,289 | | | | 194,674 | | | | 88,106 | |
57
db-X Exchange-Traded Funds Inc.
NOTES TO FINANCIAL STATEMENTS (Continued)
For the year ended May 31, 2013, the advisory fee waivers and expenses assumed by the Advisor were as follows:
| | | | | | | | |
| | | Advisory
Fees Waived
by DBX | | | Fees & Expenses
Assumed by
DBX | |
db X-trackers 2010 Fund | | $ | 62,690 | | | $ | 22,098 | |
db X-trackers 2020 Fund | | | 155,260 | | | | — | |
db X-trackers 2030 Fund | | | 161,871 | | | | — | |
db X-trackers 2040 Fund | | | 150,327 | | | | — | |
db X-trackers In-Target Fund | | | 70,168 | | | | 17,938 | |
The Bank of New York Mellon, a wholly-owned subsidiary of The Bank of New York Mellon Corporation, serves as Administrator, Custodian, Accounting Agent and Transfer Agent for each Fund.
ALPS Distributors, Inc. (the “Distributor”) serves as the distributor of Creation Units for each Fund on an agency basis. The Distributor does not maintain a secondary market in shares of the Funds.
The Board of Directors is currently comprised of four Directors, of whom three are Independent Directors. The Company pays each Independent Director an annual fee of $30,000, plus a fee of $4,000 per meeting attended in-person or $1,000 per meeting attended telephonically. Each Independent Director also receives $2,000 per Audit Committee meeting attended in-person or $1,000 per meeting attended telephonically, although the Audit Committee Chairman receives $3,000 per Audit Committee meeting attended in-person. The Company reimburses each Director for their costs and expenses associated with the performance of their duties hereunder, including the cost and expenses associated with attendance at meetings of the Board. Directors’ fees and expenses are allocated among the Funds based on each Fund’s relative average daily net assets.
4. Federal Income Taxes
As of May 31, 2013, the components of accumulated earnings (losses) were as follows:
| | | | | | | | | | | | | | | | |
| | | Undistributed
Net Investment
Income (Loss) | | �� | Net
Accumulated
Capital and
Other Gains
(Losses) | | | Unrealized
Appreciation
(Depreciation) | | | Total
Accumulated
Earnings
(Losses) | |
db X-trackers 2010 Fund | | $ | 8,443 | | | $ | (1,644,445 | ) | | $ | 327,653 | | | $ | (1,308,349 | ) |
db X-trackers 2020 Fund | | | 125,975 | | | | (4,242,950 | ) | | | 3,030,662 | | | | (1,086,313 | ) |
db X-trackers 2030 Fund | | | 246,310 | | | | (4,702,191 | ) | | | 3,333,309 | | | | (1,122,572 | ) |
db X-trackers 2040 Fund | | | 204,612 | | | | (7,117,996 | ) | | | 4,456,363 | | | | (2,457,021 | ) |
db X-trackers In-Target Fund | | | 22,670 | | | | (211,992 | ) | | | 753,151 | | | | 563,829 | |
For the years ended May 31, 2013 and May 31, 2012, the tax characterization of distributions paid for each Fund was equal to the book characterization of distributions paid. The total distributions and distributions per share are disclosed in the accompanying Statement of Changes in Net Assets and the Financial Highlights for all Funds.
At May 31, 2013, for Federal income tax purposes, the Funds have capital loss carryforwards available as shown in the table below, to the extent provided by regulations, to offset future capital gains through the years indicated. To the extent that these loss carryforwards are used to offset future capital gains, it is probable that the capital gains so offset will not be distributed to shareholders.
| | | | | | | | | | | | | | | | | | | | | | | | |
| | | Year of Expiration | | | Post-effective —
no expiration
short-term | | | Post-effective —
no expiration
long-term | | | Total
Amount | |
| | | 2017 | | | 2018 | | | 2019 | | | | |
db X-trackers 2010 Fund | | $ | 623,400 | | | $ | 1,020,627 | | | $ | — | | | $ | — | | | $ | — | | | $ | 1,644,027 | |
db X-trackers 2020 Fund | | | 418,939 | | | | 3,713,736 | | | | — | | | | 47,629 | | | | 59,593 | | | | 4,239,897 | |
db X-trackers 2030 Fund | | | 58,423 | | | | 4,568,179 | | | | 71,703 | | | | — | | | | — | | | | 4,698,305 | |
db X-trackers 2040 Fund | | | 1,809,203 | | | | 4,936,668 | | | | 352,525 | | | | — | | | | 15,264 | | | | 7,113,660 | |
db X-trackers In-Target Fund | | | — | | | | 211,212 | | | | — | | | | — | | | | — | | | | 211,212 | |
db X-trackers 2010 Fund, db X-trackers 2030 Fund and db X-trackers In-Target Fund utilized $25,185, $1,127,051 and $9,333 respectively, of capital loss carryforwards during the fiscal year ended May 31, 2013.
58
db-X Exchange-Traded Funds Inc.
NOTES TO FINANCIAL STATEMENTS (Continued)
Under the recently enacted Regulated Investment Company Modernization Act of 2010 (the “Act”), the Funds will be permitted to carry forward capital losses incurred in taxable years beginning after December 22, 2010 for an unlimited period. However, any losses incurred during those future taxable years (beginning on June 1, 2011) will be required to be utilized prior to the losses incurred in pre-enactment taxable years. As a result of this ordering rule, pre-enactment capital loss carryforwards presented in the table above may be more likely to expire unused. Additionally, post-enactment capital losses that are carried forward will retain their character as either short-term or long-term capital losses rather than being considered all short-term as under previous law.
Capital losses incurred after October 31 (“post-October losses”) within the taxable year are deemed to arise on the first business day of each Fund’s next taxable year.
In order to present paid-in capital and accumulated net realized gains or losses on the Statements of Assets and Liabilities that more closely represent their tax character, certain adjustments have been made to additional paid-in capital, undistributed net investment income or loss and accumulated net realized gains or losses on investments. These differences are primarily due to currency gain/(loss), return of capital adjustments and redemptions-in-kind. For the fiscal year ended May 31, 2013, the adjustments were as follows:
| | | | | | | | | | | | |
| | | Undistributed
Net Investment
Income (Loss) | | | Undistributed
Capital Gains
(Accumulated Losses) | | | Paid-in
Capital | |
db X-trackers 2010 Fund | | $ | (211 | ) | | $ | 211 | | | $ | — | |
db X-trackers 2020 Fund | | | (1,033 | ) | | | (432,988 | ) | | | 434,021 | |
db X-trackers 2030 Fund | | | (671 | ) | | | (836,585 | ) | | | 837,256 | |
db X-trackers 2040 Fund | | | 135 | | | | (625,963 | ) | | | 625,828 | |
db X-trackers In-Target Fund | | | (393 | ) | | | 393 | | | | — | |
As of May 31, 2013, the cost of investments for Federal income tax purposes and the aggregated gross unrealized appreciation/depreciation on investments were as follows:
| | | | | | | | | | | | | | | | |
| | | Cost | | | Net Unrealized
Appreciation
(Depreciation) | | | Gross
Unrealized
Appreciation | | | Gross
Unrealized
(Depreciation) | |
db X-trackers 2010 Fund | | $ | 9,469,350 | | | $ | 327,721 | | | $ | 426,946 | | | $ | (99,225 | ) |
db X-trackers 2020 Fund | | | 27,938,135 | | | | 3,031,348 | | | | 4,042,648 | | | | (1,011,300 | ) |
db X-trackers 2030 Fund | | | 26,763,238 | | | | 3,334,132 | | | | 5,391,030 | | | | (2,056,898 | ) |
db X-trackers 2040 Fund | | | 25,486,058 | | | | 4,457,449 | | | | 6,247,973 | | | | (1,790,524 | ) |
db X-trackers In-Target Fund | | | 10,387,524 | | | | 753,419 | | | | 896,983 | | | | (143,564 | ) |
5. Investments in Affiliates
The Advisor is a wholly-owned subsidiary of Deutsche Bank AG. Therefore, Deutsche Bank AG is considered to be affiliated with the Funds. The table below shows the transactions in and earnings from investments in Deutsche Bank AG Securities for the year ended May 31, 2013.
| | | | | | | | | | | | | | | | | | | | | | | | | | | | |
| | | Fair Value
5/31/12 | | | Purchases
at Cost | | | Proceeds
from Sales | | | Change in
Unrealized
Appreciation/
(Depreciation) | | | Realized
Gain (Loss) | | | Fair Value
5/31/13 | | | Dividend
Income | |
db X-trackers 2010 Fund | | | | | | | | | | | | | | | | | | | | | | | | | | | | |
Deutsche Bank AG (Common Stock) | | $ | 2,014 | | | $ | — | | | $ | — | | | $ | 612 | | | $ | — | | | $ | 2,626 | | | $ | 84 | |
db X-trackers 2020 Fund | | | | | | | | | | | | | | | | | | | | | | | | | | | | |
Deutsche Bank AG (Common Stock) | | | 28,230 | | | | 5,103 | | | | (5,583 | ) | | | 9,135 | | | | 1,470 | | | | 38,355 | | | | 1,210 | |
db X-trackers 2030 Fund | | | | | | | | | | | | | | | | | | | | | | | | | | | | |
Deutsche Bank AG (Common Stock) | | | 40,314 | | | | 8,887 | | | | (7,511 | ) | | | 12,308 | | | | (686 | ) | | | 53,312 | | | | 1,821 | |
db X-trackers 2040 Fund | | | | | | | | | | | | | | | | | | | | | | | | | | | | |
Deutsche Bank AG (Common Stock) | | | 46,787 | | | | 7,324 | | | | (9,565 | ) | | | 14,603 | | | | 2,931 | | | | 62,080 | | | | 2,117 | |
db X-trackers In-Target Fund | | | | | | | | | | | | | | | | | | | | | | | | | | | | |
Deutsche Bank AG (Common Stock) | | | 4,028 | | | | 2,401 | | | | — | | | | 2,574 | | | | — | | | | 9,003 | | | | 235 | |
59
db-X Exchange-Traded Funds Inc.
NOTES TO FINANCIAL STATEMENTS (Continued)
6. Investment Portfolio Transactions
For the year ended May 31, 2013, the cost of investments purchased and proceeds from sale of investments (excluding in-kind transactions and short-term investments) were as follows:
| | | | | | | | | | | | | | | | |
| | | Purchases | | | Sales | |
| | | Other | | | U.S. Government | | | Other | | | U.S. Government | |
db X-trackers 2010 Fund | | $ | 1,737,771 | | | $ | 4,992,708 | | | $ | 1,260,902 | | | $ | 6,012,102 | |
db X-trackers 2020 Fund | | | 8,298,541 | | | | 8,324,678 | | | | 8,121,105 | | | | 8,128,533 | |
db X-trackers 2030 Fund | | | 13,926,850 | | | | 633,266 | | | | 11,605,688 | | | | 2,939,938 | |
db X-trackers 2040 Fund | | | 9,448,765 | | | | 440,508 | | | | 9,816,457 | | | | 69,509 | |
db X-trackers In-Target Fund | | | 3,636,725 | | | | 2,168,070 | | | | 1,720,745 | | | | 4,102,672 | |
For the year ended May 31, 2013 the cost of in-kind purchases and the proceeds from in-kind sales were as follows:
| | | | | | | | |
| | | Purchases | | | Sales | |
db X-trackers 2020 Fund | | $ | — | | | $ | 4,858,033 | |
db X-trackers 2030 Fund | | | — | | | | 4,876,697 | |
db X-trackers 2040 Fund | | | — | | | | 4,448,289 | |
7. Fund Share Transactions
As of May 31, 2013, there were 12.5 billion Fund shares of $0.0001 par value authorized by the Company. Fund shares are issued and redeemed by each Fund only in Creation Units or multiples thereof. Except when aggregated in Creation Units, shares of each Fund are not redeemable. Transactions in capital shares for each Fund are disclosed in detail in the Statements of Changes in Net Assets. The consideration for the purchase of Creation Units of a Fund generally consists of the in-kind contribution of a designated portfolio of securities constituting a portfolio sampling representation of the securities included in the respective Fund’s underlying index and an amount of cash. Investors purchasing and redeeming Creation Units pay a purchase transaction fee and a redemption transaction fee to offset transfer and other transaction costs associated with the issuance and redemption of Creation Units.
8. Subsequent Events
The Company evaluated the need for disclosure and/or adjustment resulting from subsequent events through the date the financial statements were available to be issued. This evaluation did not result in any subsequent events that necessitated disclosure and/or adjustment.
60
db-X Exchange-Traded Funds Inc.
REPORT OF INDEPENDENT REGISTERED PUBLIC ACCOUNTING FIRM
To the Board of Directors and Shareholders of
db-X Exchange-Traded Funds Inc.:
We have audited the accompanying statements of assets and liabilities, including the schedules of investments, of db-X Exchange-Traded Funds Inc., formerly TDX Independence Funds, Inc. (the “Company”), consisting of: db X-trackers 2010 Target Date Fund, db X-trackers 2020 Target Date Fund, db X-trackers 2030 Target Date Fund, db X-trackers 2040 Target Date Fund, and db X-trackers In-Target Date Fund, as of May 31, 2013, and the related statements of operations for the year then ended, the statements of changes in net assets for each of the two years in the period then ended, and the financial highlights for each of the four years in the period then ended. These financial statements and financial highlights are the responsibility of the Company’s management. Our responsibility is to express an opinion on these financial statements and financial highlights based on our audits. The financial highlights for the indicated periods through May 31, 2009, were audited by other auditors whose report, dated July 28, 2009, expressed an unqualified opinion on such financial statements and financial highlights.
We conducted our audits in accordance with the standards of the Public Company Accounting Oversight Board (United States). Those standards require that we plan and perform the audit to obtain reasonable assurance about whether the financial statements and financial highlights are free of material misstatement. We were not engaged to perform an audit of the Company’s internal control over financial reporting. Our audits included consideration of internal control over financial reporting as a basis for designing audit procedures that are appropriate in the circumstances, but not for the purpose of expressing an opinion on the effectiveness of the Company’s internal control over financial reporting. Accordingly, we express no such opinion. An audit also includes examining, on a test basis, evidence supporting the amounts and disclosures in the financial statements and the financial highlights, assessing the accounting principles used and significant estimates made by management, and evaluating the overall financial statement presentation. Our procedures included confirmation of securities owned as of May 31, 2013, by correspondence with the custodian and brokers. We believe that our audits provide a reasonable basis for our opinion.
In our opinion, the financial statements and financial highlights referred to above present fairly, in all material respects, the financial position of db X-trackers 2010 Target Date Fund, db X-trackers 2020 Target Date Fund, db X-trackers 2030 Target Date Fund, db X-trackers 2040 Target Date Fund, and db X-trackers In-Target Date Fund of db-X Exchange-Traded Funds Inc. at May 31, 2013, the results of their operations for the year then ended, the changes in their net assets for each of the two years in the period then ended, and the financial highlights for each of the four years in the period then ended, in conformity with U.S. generally accepted accounting principles.

New York, New York
July 25, 2013
61
db-X Exchange-Traded Funds Inc.
FREQUENCY DISTRIBUTION OF DISCOUNTS & PREMIUMS (Unaudited)
| | | | | | | | | | | | |
| | | MARKET PRICE ABOVE OR EQUAL TO NAV | | MARKET PRICE BELOW NAV |
| | | Basis point
Differential* | | | Number of
Days | | Percentage of
Total Days | | Number of
Days | | Percentage of
Total Days |
db X-trackers 2010 Target Date Fund October 1, 2007 – May 31, 2013 | | | 0 - <.25% | | | 69 | | 4.83% | | 60 | | 4.20% |
| | | .25% - <.50% | | | 73 | | 5.12% | | 72 | | 5.04% |
| | | .50% - <.75% | | | 115 | | 8.06% | | 82 | | 5.75% |
| | | .75% - <1.00% | | | 73 | | 5.12% | | 74 | | 5.19% |
| | | >= 1.00% | | | 162 | | 11.35% | | 647 | | 45.34% |
| | | Total: | | | 492 | | 34.48% | | 935 | | 65.52% |
db X-trackers 2020 Target Date Fund October 1, 2007 – May 31, 2013 | | | 0 - <.25% | | | 70 | | 4.91% | | 71 | | 4.97% |
| | | .25% - <.50% | | | 69 | | 4.83% | | 66 | | 4.62% |
| | | .50% - <.75% | | | 121 | | 8.48% | | 68 | | 4.77% |
| | | .75% - <1.00% | | | 92 | | 6.45% | | 75 | | 5.26% |
| | | >= 1.00% | | | 132 | | 9.25% | | 663 | | 46.46% |
| | | Total: | | | 484 | | 33.92% | | 943 | | 66.08% |
db X-trackers 2030 Target Date Fund October 1, 2007 – May 31, 2013 | | | 0 - <.25% | | | 75 | | 5.26% | | 60 | | 4.20% |
| | | .25% - <.50% | | | 90 | | 6.31% | | 61 | | 4.27% |
| | | .50% - <.75% | | | 129 | | 9.04% | | 62 | | 4.35% |
| | | .75% - <1.00% | | | 61 | | 4.27% | | 65 | | 4.56% |
| | | >= 1.00% | | | 177 | | 12.40% | | 647 | | 45.34% |
| | | Total: | | | 532 | | 37.28% | | 895 | | 62.72% |
db X-trackers 2040 Target Date Fund October 1, 2007 – May 31, 2013 | | | 0 - <.25% | | | 121 | | 8.48% | | 86 | | 6.03% |
| | | .25% - <.50% | | | 118 | | 8.27% | | 84 | | 5.89% |
| | | .50% - <.75% | | | 147 | | 10.30% | | 83 | | 5.82% |
| | | .75% - <1.00% | | | 66 | | 4.63% | | 64 | | 4.48% |
| | | >= 1.00% | | | 191 | | 13.38% | | 467 | | 32.72% |
| | | Total: | | | 643 | | 45.06% | | 784 | | 54.94% |
db X-trackers In-Target Date Fund October 1, 2007 – May 31, 2013 | | | 0 - <.25% | | | 80 | | 5.61% | | 81 | | 5.67% |
| | | .25% - <.50% | | | 72 | | 5.05% | | 101 | | 7.08% |
| | | .50% - <.75% | | | 150 | | 10.51% | | 110 | | 7.71% |
| | | .75% - <1.00% | | | 29 | | 2.03% | | 96 | | 6.73% |
| | | >= 1.00% | | | 75 | | 5.25% | | 633 | | 44.36% |
| | | Total: | | | 406 | | 28.45% | | 1021 | | 71.55% |
62
db-X Exchange-Traded Funds Inc.
OFFICERS AND DIRECTORS (Unaudited)
| | | | | | | | | | |
Name, Address,
and Age | | Position(s) Held
with Fund | | Term of Office
and Length of
Time Served | | Principal Occupation(s)
During Past 5 Years | | Number of
Portfolios in
Fund Complex
Overseen by
Director | | Other Directorships
held by Director |
Disinterested Directors: | | | | | | | | |
R. Charles Tschampion
Age 67,
60 Wall Street
New York, New York
10005 | | Director, Chairman of the Audit Committee and Member of the Nominating Committee | | Since 2007 | | Director, Special Projects CFA Institute (2005 to present)); Trustee of Lehigh University (October 1998-June 2010) and Chair of the Investment Sub- Committee for the Lehigh University Endowment Fund (1998 to 2008). | | 5 | | Trustee and Member of the Audit Committee, SPDR Select Sector Trust; Director, Select High Yield Oversees Fund, LLC; Director, Real Estate Information Standards Board. |
Ernest J. Scalberg
Age 68,
60 Wall Street
New York, New York
10005 | | Director, Member of the Audit and Nominating Committees | | Since 2007 | | Research Professor, and Director of the GLOBE Center, Monterey Institute of International Studies (2009 to present); Associate Vice President for External Programs and Dean of the Fisher Graduate School of International Business (2001-2009); Director, Adviser or Trustee to numerous non-profit organizations (1974 to present). | | 5 | | Trustee and Chair of the Nominating and Governance Committee and Member of the Audit Committee, SPDR Select Sector Trust; Chairman of the Board of the Foundation, International University in Geneva (IUG), Switzerland. |
Michael G. Smith
Age 69,
60 Wall Street
New York, New York
10005 | | Director, Member of the Audit and Nominating Committees | | Since 2007 | | Retired; formerly with Merrill Lynch as Managing Director of Global Investor Client Strategy (1996 to 1998), Head of Regional U.S. Institutional Sales (1995 to 1996) and of U.S. Central Region (1986 to 1995). | | 5 | | Director, Ivy Funds, Inc.; Director, Northwestern Mutual Series Fund, Inc.; Director, Cox Business School, Southern Methodist University. |
63
db-X Exchange-Traded Funds Inc.
OFFICERS AND DIRECTORS (Unaudited) (Continued)
| | | | | | | | | | |
Name, Address,
and Age | | Position(s) Held
with Fund | | Term of Office
and Length of
Time Served | | Principal Occupation(s)
During Past 5 Years | | Number of
Portfolios in
Fund Complex
Overseen by
Director | | Other Directorships
held by Director |
Interested Director/Officers:* | | | | | | | | |
Alex Depetris
Age 33,
60 Wall Street
New York, New York
10005 | | Director, Chairman of the Board, President, Chief Executive Officer, and Secretary | | Since 2010 | | Director in the DBX Group at Deutsche Bank AG since 2008; Associate, with the law firm of Arnold & Porter, 2006 to 2008; Associate, with the law firm of Sullivan & Worcester, 2005 to 2006. | | 5 | | Trustee, Chairman of the Board, DBX ETF Trust. |
Martin Kremenstein
Age 36,
60 Wall Street
New York, New York
10005 | | Chief Operating Officer | | Since 2010 | | Director in the DBX Group at Deutsche Bank AG since 2006; Vice President, Market Risk Management JP Morgan Chase until 2006. | | N/A | | N/A |
Michael Gilligan
Age 46,
60 Wall Street
New York, New York
10005 | | Treasurer, Chief Financial Officer and Controller | | Since 2010 | | Director in the Finance Group at Deutsche Bank AG with CFO responsibility for DBX Strategic Advisors LLC, DBX Advisors LLC and DB Commodity Services LLC since 2008; Chief Operating Officer, Americas Credit Trading, Credit Suisse, 2007 to 2008; Director in the Finance Group, Credit Suisse, 1998 to 2007. | | N/A | | N/A |
64
db-X Exchange-Traded Funds Inc.
OFFICERS AND DIRECTORS (Unaudited) (Continued)
| | | | | | | | | | |
Name, Address,
and Age | | Position(s) Held
with Fund | | Term of Office
and Length of
Time Served | | Principal Occupation(s)
During Past 5 Years | | Number of
Portfolios in
Fund Complex
Overseen by
Director | | Other Directorships
held by Director |
Frank Gecsedi
Age 45,
60 Wall Street
New York, New York
10005 | | Chief Compliance Officer | | Since 2010 | | Vice President of Deutsche Bank’s Global Markets Legal, Risk and Capital Division since 2010; Vice President and Compliance Manager at Bank of America Merrill Lynch, 2000- 2010. | | N/A | | N/A |
* Officers/Director of the Company are “interested persons” as defined in the 1940 Act.
** Effective February 22, 2011, Mr. Depetris was elected as a Director of the Company and appointed Chairman of the Board. On such date, Mr. Depetris was also elected President and Chief Executive Officer of the Company. Mr. Depetris has served as the Company’s Secretary since 2010.
The Fund’s SAI includes additional information about the Fund’s Directors and is available by calling 1-877-369-4617, or on the Company’s website at www.dbxus.com.
65
db-X Exchange-Traded Funds Inc.
BOARD CONSIDERATIONS IN APPROVAL OF INVESTMENT ADVISORY AND SUB-ADVISORY CONTRACTS (Unaudited)
At its meeting on February 6, 2013, the Board of Directors, including the Independent Directors (those not affiliated with the Fund or its service providers), unanimously approved the continuance of the Investment Advisory Agreement and Sub-Advisory Agreement (together, the “Agreements”), on behalf of the Trust’s five (5) underlying portfolios (each, a “Fund”, and together, the “Funds”).
In reaching this decision with respect to the Investment Advisory Agreement (the “Advisory Agreement”), the Board considered all factors it believed relevant, including (1) the nature, extent and quality of the services to be provided to the Funds and their shareholders; (2) the Adviser’s financial resources and its resulting ability to perform its obligations under the Advisory Agreement; (3) the competitiveness of the advisory fee; (4) the total cost of the services to be provided by and the profits that could be realized by the Adviser from its relationship with the Funds; and (5) the extent to which economies of scale would be realized as the Funds grow, and if the fund shareholders would benefit from those economies.
In reaching this decision with respect to the Sub-Advisory Agreement, the Board considered all factors it believed relevant, including (1) the nature, extent and quality of the services to be provided to the Funds and their shareholders (including the investment performance of TDAM’s index fund clients); (2) the performance of TDAM with respect to its management of index funds generally, as well as TDAM’s financial resources and its resulting ability to perform its obligations under the Sub-Advisory Agreement; (3) the competitiveness of the sub-advisory fee; (4) the total cost of the services to be provided by and the profits that could be realized by TDAM from its relationship with the Funds; and (5) the extent to which economies of scale would be realized as the Funds grow, and if the fund shareholders would benefit from those economies.
The Board reached a determination, with the assistance of Fund counsel and through the exercise of its business judgment, that approval of the Agreements and the compensation to be received thereunder is consistent with the Board’s duties under state and federal law. The Board reached this conclusion based on multiple factors.
The Board considered the following in determining whether to approve the Advisory Agreement:
| | (i) | Nature, Extent and Quality of Services. |
In considering the nature, extent and quality of services that the Adviser proposes to provide to the Funds, the Board reviewed in detail the nature, extent and quality of services to be provided by the Adviser under the Advisory Agreement. The Board noted that these services include, among other things, furnishing a continuous investment program for the Funds, including arranging for, or implementing, the purchase and sale of portfolio securities, the provision of general corporate services such as portfolio management compliance services and the preparation and filing of certain reports on behalf of the Fund. The Board also considered, among other things, the professional experience and qualifications of the senior management and key professional personnel of the Adviser, including those individuals responsible for portfolio management. The Board considered that the Adviser provides, at its own expense, office facilities and equipment for use by the Funds and supervisory persons responsible for supervising and monitoring the Fund’s service providers. The Board also considered that the Adviser pays for the compensation of officers of the Fund who are also officers or employees of the Adviser, except as may otherwise be determined by the Board. The Board also considered that the Adviser arranges for the provision of transfer agency, custody, fund administration and accounting, and other non-distribution services necessary for the Funds’ operation.
The Board considered the performance of the Funds by discussing the Funds’ annualized index tracking error since the commencement of investment operations, which provides a comparison between the NAV of each Fund’s underlying index as compared to the NAV of each respective Fund. The Board determined that the Funds had tracked their respective indices within acceptable ranges since the Advisory Agreement was previously approved by the Board.
The Board evaluated these factors in consultation with Fund counsel. Based on its review, the Board concluded that the nature, extent, and quality of services to be provided by the Adviser under the Advisory Agreement were reasonable and appropriate in relation to the fees to be paid to the Adviser, taking special consideration of the fact that the Funds were subject to an expense waiver agreement which waived fees and/or reimbursed expenses after a specified point. The Board considered the staffing of the Adviser, including the training, qualifications and experience of investment personnel in managing index funds. The Board also considered the expertise of the Adviser in supervising third party service providers to the Fund, such as the administrator and custodian. The Board further considered the compliance program of the Adviser which supports the Fund’s compliance program.
66
db-X Exchange-Traded Funds Inc.
BOARD CONSIDERATIONS IN APPROVAL OF INVESTMENT ADVISORY AND SUB-ADVISORY CONTRACTS (Unaudited) (Continued)
| | (ii) | Adviser’s Financial Resources. |
In connection with the assessment of the ability of the Adviser to perform its duties under the Advisory Agreement, the Board considered the Adviser’s financial condition and whether it had the resources necessary to carry out its functions. The Board concluded that the Adviser had the financial resources necessary to perform its obligations under the Advisory Agreement.
| | (iii) | Competitiveness of Advisory Fee. |
The Board considered the level of the advisory fee for each Fund and discussed comparative advisory fees of other comparable exchange-traded funds. The Board considered that this type of information would be useful in assessing whether DBX would be providing services at a cost that was competitive with other exchange-traded funds. The Board concluded that the contract rate advisory fee and total fund expenses for each of the Funds were reasonable, but noted that the advisory fees charged by the Funds were higher than the advisory fees typically charged by the other exchange-traded funds. In concluding that the advisory fees and fund expenses were reasonable, the Board noted that each of the Fund’s peer ETFs were funds-of-funds and thus bore the expenses of the other ETFs in which they invested. The Board further noted that once those peer ETFs’ underlying expenses were properly accounted for, the Funds’ expenses were lower than those peer ETFs. In assessing this information, the Directors considered both the gross fees as well as the level of fees after waivers and/or reimbursements.
Based on its review, the Board concluded that the advisory fees were reasonable in light of the services provided.
The Board considered whether economies of scale would be realized by the Funds at higher asset levels. The Board also assessed whether certain costs would increase if asset levels rise. The Board concluded that under foreseeable conditions, they were unable to assess at this time whether economies of scale would be realized if the Funds were to experience significant growth. In the event there were to be significant asset growth in the Funds, the Board determined to reassess whether the advisory fees appropriately took into account any economies of scale that had been realized as a result of that growth.
Given all the information available to it and considering all material factors, the Board concluded that the Investment Advisory Agreement was fair and reasonable and it was unanimously approved.
The Board considered the following in determining whether to approve the Sub-Advisory Agreement:
| | (i) | Nature, Extent and Quality of Services. |
In considering the nature, extent and quality of services that TDAM provides to the Funds, the Board reviewed in detail the nature, extent and quality of services to be provided by TDAM under the Advisory Agreement. The Board noted that these services include, among other things, furnishing a continuous investment program for the Funds, including arranging for, or implementing, the purchase and sale of portfolio securities.
The Board also considered TDAM’s operational capabilities and resources, and its experience in serving as investment sub-adviser to the Funds and other funds (including certain other index-based ETFs advised by the Adviser). The Board considered the professional experience and qualifications of TDAM’s senior management and key professional personnel, as well as TDAM’s depth and breadth of experience in managing investment portfolios consisting of U.S. and non-U.S. equity securities. In addition, the Board considered TDAM’s operational capabilities and resources, and TDAM’s experience in managing index funds covering various asset classes. The Board noted that TDAM manages its index-based portfolios using both full replication and sampling techniques and maintains strict discipline in the implementation of its indexing strategies. To that end, the Board noted that when there are changes to a benchmark index, TDAM closely monitors any such changes to devise strategies to realign its portfolios at the lowest possible cost while tracking the respective benchmark index. The Board also noted TDAM’s processes to minimize the cost of trading.
The Board evaluated these factors in consultation with Fund counsel. Based on its review, the Board concluded that the nature, extent, and quality of services to be provided by TDAM under the Sub-Advisory Agreement were reasonable and appropriate in relation to the fees to be paid to TDAM, taking special consideration of the fact that the fees to be paid to TDAM were payable by the Adviser and not the Funds.
67
db-X Exchange-Traded Funds Inc.
BOARD CONSIDERATIONS IN APPROVAL OF INVESTMENT ADVISORY AND SUB-ADVISORY CONTRACTS (Unaudited) (Continued)
| | (ii) | Performance of TDAM; TDAM’s Financial Resources. |
The Board considered the performance of the Funds by discussing the Funds’ annualized index tracking error since the commencement of investment operations, which provides a comparison between the level of each Fund’s underlying index as compared to the NAV of each respective Fund. The Board determined that the Funds had tracked their respective indices within acceptable ranges since the Sub-Advisory Agreement was previously approved by the Board.
The Board also considered TDAM’s financial condition and whether it had the resources necessary to carry out its functions. The Board concluded that TDAM had the financial resources necessary to perform its obligations under the Sub-Advisory Agreement.
| | (iii) | Competitiveness of Sub-Advisory Fee. |
The Board noted that the fee to be paid to TDAM in respect of each Fund would be paid by the Adviser and not the Fund. Based on its review, the Board concluded that the sub-advisory fees were reasonable in light of the services provided.
| | (iv) | Costs of Services and Profitability. |
The Board considered the asset levels at which TDAM expected to “break-even” with respect to its operation of the Funds, and further noted that the fee paid by the Adviser to TDAM under the Sub-Advisory Agreement contained breakpoints.
The Board also considered whether TDAM would benefit in other ways from its relationship with the Funds. The Board discussed TDAM’s practices regarding the selection and compensation of brokers and dealers that execute portfolio transactions for the Funds and the brokers’ and dealers’ provision of brokerage services to TDAM. The Board discussed the potential benefits TDAM derives from the Funds’ soft dollar arrangements, whereby brokers provide brokerage services to the Funds or TDAM in return for allocating fund brokerage.
Given the costs of the services provided by and the profits that could be realized by TDAM in connection with the management of the Funds, the Board determined that the amount of potential profit was fair.
The Board considered whether economies of scale would be realized by the Funds at higher asset levels. The Board also assessed whether certain costs would increase if asset levels rise. The Board concluded that under foreseeable conditions, they were unable to assess at this time whether economies of scale would be realized if the Funds were to experience significant growth. In the event there were to be significant asset growth in the Funds, the Board determined to reassess whether the sub-advisory fees appropriately took into account any economies of scale that had been realized as a result of that growth. Given all the information available to it and considering all material factors, the Board concluded that the Sub-Advisory Agreement was fair and reasonable and it was unanimously approved.
68
db-X Exchange-Traded Funds Inc.
ADDITIONAL INFORMATION (Unaudited)
Proxy Voting Policies and Procedures
A description of the policies and procedures that the Company uses to determine how to vote proxies related to each Fund’s portfolio securities, (and information on how the Funds voted proxies during the period ended June 30, 2010 on Form N-PX) is available without charge, upon request, (i) by calling 877-369-4617; (ii) on the Company’s website at www.dbxus.com; and (iii) on the Securities and Exchange Commission’s (“SEC”) website at www.sec.gov.
Quarterly Portfolio Disclosure
The Funds are required to file their complete schedule of portfolio holdings with the SEC for their first and third fiscal quarters on Form N-Q. Copies of the filings are available without charge, upon request on the SEC’s website at www.sec.gov and are available by calling the Company at 877-369-4617. You can also obtain copies of Form N-Q by (i) visiting the SEC’s Public Reference Room in Washington, DC (information on the operation of the Public Reference Room may be obtained by calling 800-SEC-0330); (ii) sending your request and a duplicating fee to the SEC’s Public Reference Room, Washington, DC 20549-0102; or (iii) sending your request electronically to publicinfo@sec.gov.
Information about each Fund’s portfolio holdings is available daily at www.dbxus.com.
Tax Information
Form 1099-DIV, Form 1042-S and other year-end tax information provide shareholders with actual calendar year amounts that should be included in their tax returns. Shareholders should consult their tax advisors.
The following distribution information is being provided as required by the Internal Revenue Code.
Each Fund designates the following amounts or, if subsequently determined to be different, the maximum amount allowable for its fiscal year ended May 31, 2013.
Federal and State Income Tax
| | | | | | | | |
| | | Qualified Dividend
Income* | | | Dividends Received
Deduction* | |
db X-trackers 2010 Fund | | | 69 | % | | | 59 | % |
db X-trackers 2020 Fund | | | 100 | % | | | 69 | % |
db X-trackers 2030 Fund | | | 86 | % | | | 52 | % |
db X-trackers 2040 Fund | | | 100 | % | | | 70 | % |
db X-trackers In-Target Fund | | | 100 | % | | | 81 | % |
* The above percentage is based on ordinary income dividends paid to shareholders during each Fund’s fiscal year.
69
db-X Exchange-Traded Funds Inc.
PRIVACY POLICY NOTICE (Unaudited)
DBX Strategic Advisors, LLC (“Advisors”) collects non-public information about you from the following sources: (i) information received from you on applications or other forms; and (ii) information about your transactions with the Advisors, Advisors’ affiliates and third-party service providers and vendors. Advisors does not disclose any non-public personal information about you to anyone, other than as set forth below, as permitted by applicable law and regulation. Advisors may disclose non-public personal information about you to the funds in which you invest, to Advisors’ affiliates, and to non-affiliated companies that work with Advisors to service your account(s), or to provide services or process transactions that you have requested. Advisors may disclose non-public personal information in situations that may include, but are not limited to, in response to legal and/or regulatory inquiries and the proposed or actual sale, assignment merger or other transfer of all or a portion of Advisors’ business to another business entity. Advisors may also disclose non-public personal information about you to parties representing you, such as your investment representative, your accountant, your tax adviser, or to other third parties at your direction/consent. Advisors will not sell, rent, license or trade your personal and financial information to or with third parties for their own direct marketing use unless you give us general or specific consent to do so. If you decide to close your account(s) or become an inactive customer, Advisors will adhere to the privacy policies and practices as described in this notice. Advisors restricts access to your personal and account information to those employees who need to know that information to provide products and services to you. Advisors maintains reasonable and customary physical, electronic and procedural safeguards to guard your non-public personal information.
Advisors reserves the right, at their discretion, to change, modify, add, or remove portions of this Privacy Policy Notice, and any of the policies described herein, at any time. Advisors will indicate any such changes to the Privacy Policy Notice at the privacy link which can be found at www.dbxus.com. At all times, you are bound by the then-current version of the Privacy Policy and all applicable laws. Advisors highly recommends that you review this Privacy Policy Notice from time to time to ensure that you are familiar with the most recent version. The examples contained in this Privacy Policy Notice are illustrations; they are not intended to be exclusive.
70
db-X Exchange-Traded Funds Inc.
This report is intended for the shareholders of the db-X Exchange-Traded Funds. It may not be distributed to prospective Investors unless it is preceded or accompanied by the current prospectus.
An Investor should consider the fund’s investment objective, risks, charges and expenses carefully before investing. For this and more complete information about the fund call 877-369-4617 or visit the website www.dbxus.com. Please read the prospectus carefully before investing.
There are risks involved with investing in exchange-traded funds including possible loss of money. db-X Exchange-Traded Funds are not actively managed and are subject to risks similar to stocks, including those related to short selling and margin maintenance. Losses from short sales may be unlimited, and losses from purchases on margin may exceed original investment.
Investments in small and medium capitalization companies will be subject to higher volatility than larger, more established companies.
Investments in foreign securities will be subject to certain risks not associated with domestic securities, such as currency fluctuations, and changes in political and economic conditions.
Investments in fixed income securities will be subject to certain risks as well. The prices of fixed income securities respond to economic developments, particularly interest rate changes, as well as to perceptions about the credit risk of individual issuers. Generally, fixed income securities will decrease in value if interest rates rise, and the volatility of lower rated securities is even greater than that of higher rated securities.
There is no assurance that the investment process will consistently lead to successful investing. Diversification does not eliminate the risk of experiencing investment losses.
The prospectus is not an offer to buy or sell the portfolio shares, nor is the fund soliciting an offer to buy its shares in any jurisdiction where the offer or sale is not permitted.
db-X Exchange-Traded Funds are distributed by ALPS Distributors, Inc., member of FINRA, which is neither affiliated with db-X Exchange-Traded Funds Inc. or any other affiliate, nor is it affiliated with The Bank of New York Mellon, Amerivest Investment Management, LLC, or TDAM USA Inc.
“Target Date” refers to a time in the future, generally a specified year, in which the investor expects to retire or otherwise require the use of the invested funds. Target date funds are generally more aggressive the further the target date is from the present, with an objective of capital appreciation. As the target date approaches, the fund’s objective will generally become more conservative, aiming to achieve a higher level of capital preservation.
Zacks and Zacks Lifecycle index are servicemarks of Zacks Investment Research, Inc. (“Zacks”) and have been licensed for use by Deutsche Bank AG. The Fund is not sponsored, endorsed, issued, sold or promoted by Zacks. Zacks does not make any representation regarding the advisability of investing in the Funds.
Investors should note that although target date funds aim to preserve capital as the target date approaches, there is no guarantee that the fund will achieve this objective.
db-X Exchange-Traded Funds Inc.
INVESTMENT ADVISOR
DBX Strategic Advisors LLC
60 Wall Street
New York, NY 10005
INVESTMENT SUB-ADVISOR
TDAM USA Inc.
161 Bay Street, 35th Floor
TD Canada Trust Tower
Toronto, Ontario Canada M5J 2T2
ADMINISTRATOR, CUSTODIAN, FUND ACCOUNTANT & TRANSFER AGENT
The Bank of New York Mellon
101 Barclay Street
New York, NY 10286
DISTRIBUTOR
ALPS Distributors, Inc.
1290 Broadway
Suite 1100
Denver, CO 80203
INDEPENDENT REGISTERED PUBLIC ACCOUNTING FIRM
Ernst & Young LLP
5 Times Square
New York, NY 10036
LEGAL COUNSEL
Dechert LLP
1095 Avenue of the Americas
New York, NY 10036
| | (a) | The registrant, as of the end of the period covered by this report, has adopted a code of ethics that applies to the registrant’s principal executive officer, principal financial officer, principal accounting officer or controller, or persons performing similar functions, regardless of whether these individuals are employed by the registrant or a third party. |
| | (c) | There have been no amendments, during the period covered by this report, to a provision of the code of ethics that applies to the registrant’s principal executive officer, principal financial officer, principal accounting officer or controller, or persons performing similar functions, regardless of whether these individuals are employed by the registrant or a third party, and that relates to any element of the code of ethics description. |
| | (d) | The registrant has not granted any waivers, including an implicit waiver, from a provision of the code of ethics that applies to the registrant’s principal executive officer, principal financial officer, principal accounting officer or controller, or persons performing similar functions, regardless of whether these individuals are employed by the registrant or a third party, that relates to one or more of the items set forth in paragraph (b) of this item’s instructions. |
| Item 3. | | Audit Committee Financial Expert. |
R. Charles Tschampion is the designated financial expert on the Audit Committee of db-X Exchange-Traded Funds Inc. with respect to db-X Exchange-Traded Funds Inc., R. Charles Tschampion is not an “interested person” as such terms are defined by Section 2(a)(19) of the Act (15 U.S.C. 80a-2(a)(19).
| Item 4. | | Principal Accountant Fees and Services. |
Audit Fees
| | (a) | The aggregate fees billed for each of the last two fiscal years for professional services rendered by the principal accountant for the audit of the registrant’s annual financial statements or services that are normally provided by the accountant in connection with statutory and regulatory filings or engagements for those fiscal years are $98,000 for 2013 and $90,000 for 2012. |
Audit-Related Fees
| | (b) | The aggregate fees billed in each of the last two fiscal years for assurance and related services by the principal accountant that are reasonably related to the performance of the audit of the registrant’s financial statements and are not reported under paragraph (a) of this Item are $0 for 2013 and $0 for 2012. |
Tax Fees
| | (c) | The aggregate fees billed in each of the last two fiscal years for professional services rendered by the principal accountant for tax compliance, tax advice, and tax planning are $17,500 for 2013 and $15,000 for 2012. |
All Other Fees
| | (d) | The aggregate fees billed in each of the last two fiscal years for products and services provided by the principal accountant, other than the services reported in paragraphs (a) through (c) of this Item are $0 for 2013 and $0 for 2012. |
| | (e)(1) | In accordance with Rule 2-01(c)(7)(A), the Audit Committee pre-approves all of the audit and permissible non-audit services of the Registrant. |
| | (e)(2) | All of the services described in paragraphs (b) through (d) above were approved by the Audit Committee in accordance with paragraph (c) (7) (i) (c) of Rule 2-01 of Regulation S-X. |
| | (h) | The registrant’s audit committee of the board of directors has considered whether the provision of non-audit services that were rendered to the registrant’s investment adviser (not including any sub-adviser whose role is primarily portfolio management and is subcontracted with or overseen by another investment adviser), and any entity controlling, controlled by, or under common control with the investment adviser that provides ongoing services to the registrant that were not pre-approved pursuant to paragraph (c)(7)(ii) of Rule 2-01 of Regulation S-X is compatible with maintaining the principal accountant’s independence. |
| Item 5. | | Audit Committee of Listed registrants. |
The Registrant is a listed issuer as defined in Rule 10A-3 under the Exchange Act and has a separately-designated standing audit committee established in accordance with Section 3(a)(58)(A) of the Exchange Act. The Registrant’s audit committee members are Ernest J. Scalberg, Michael G. Smith and R. Charles Tschampion.
| | (a) | Schedule of Investments in securities of unaffiliated issuers as of the close of the reporting period is included as part of the report to shareholders filed under Item 1 of this form. |
| Item 7. | | Disclosure of Proxy Voting Policies and Procedures for Closed-End Management Investment Companies. |
Not applicable.
| Item 8. | | Portfolio Managers of Closed-End Management Investment Companies. |
Not applicable.
| Item 9. | | Purchases of Equity Securities by Closed-End Management Investment Company and Affiliated Purchasers. |
Not applicable.
| Item 10. | | Submission of Matters to a Vote of Security Holders. |
There have been no material changes to the procedures by which the shareholders may recommend nominees to the registrant’s board of directors, where those changes were implemented after the registrant last provided disclosure in response to the requirements of Item 407(c)(2)(iv) of Regulation S-K (17 CFR 229.407) (as required by Item 22(b)(15) of Schedule 14A (17 CFR 240.14a-101)), or this Item.
| Item 11. | | Controls and Procedures. |
| | (a) | The registrant’s principal executive and principal financial officers, or persons performing similar functions, have concluded that the registrant’s disclosure controls and procedures (as defined in Rule 30a-3(c) under the Investment Company Act of 1940, as amended (the “1940 Act”) (17 CFR 270.30a-3(c))) are effective, as of a date within 90 days of the filing date of the report that includes the disclosure required by this paragraph, based on their evaluation of these controls and procedures required by Rule 30a-3(b) under the 1940 Act (17 CFR 270.30a-3(b)) and Rules 13a-15(b) or 15d-15(b) under the Securities Exchange Act of 1934, as amended (17 CFR 240.13a-15(b) or 240.15d-15(b)). |
| | (b) | There were no changes in the registrant’s internal control over financial reporting (as defined in Rule 30a-3(d) under the 1940 Act (17 CFR 270.30a-3(d)) that occurred during the registrant’s second fiscal quarter of the period covered by this report that has materially affected, or is reasonably likely to materially affect, the registrant’s internal control over financial reporting. |
| | (a)(1) | Code of ethics, or any amendment thereto, that is the subject of disclosure required by Item 2 is attached hereto. |
| | (a)(2) | Certifications pursuant to Rule 30a-2(a) under the 1940 Act and Section 302 of the Sarbanes-Oxley Act of 2002 are attached hereto. |
| | (b) | Certifications pursuant to Rule 30a-2(b) under the 1940 Act and Section 906 of the Sarbanes- Oxley Act of 2002 are attached hereto. |
(12.other) Not applicable.
SIGNATURES
Pursuant to the requirements of the Securities Exchange Act of 1934 and the Investment Company Act of 1940, the registrant has duly caused this report to be signed on its behalf by the undersigned, thereunto duly authorized.
| | | | |
| (Registrant) | | db-X Exchange-Traded Funds Inc. | | |
| | | | |
| By (Signature and Title)* | | /s/ Alex Depetris | | |
| | Alex Depetris | | |
| | President and Chief Executive Officer | | |
Pursuant to the requirements of the Securities Exchange Act of 1934 and the Investment Company Act of 1940, this report has been signed below by the following persons on behalf of the registrant and in the capacities and on the dates indicated.
| | | | |
| By (Signature and Title)* | | /s/ Alex Depetris | | |
| | Alex Depetris | | |
| | President and Chief Executive Officer | | |
| | | | |
| By (Signature and Title)* | | /s/ Michael Gilligan | | |
| | Michael Gilligan | | |
| | Treasurer, Chief Financial Officer and Controller | | |
| * | Print the name and title of each signing officer under his or her signature. |