UNITED STATES
SECURITIES AND EXCHANGE COMMISSION
Washington, D.C. 20549
FORMN-CSR
CERTIFIED SHAREHOLDER REPORT OF REGISTERED MANAGEMENT
INVESTMENT COMPANIES
Investment Company Act file number811-22027
FundVantage Trust
(Exact name of registrant as specified in charter)
301 Bellevue Parkway
Wilmington, DE 19809
(Address of principal executive offices) (Zip code)
Joel L. Weiss
JW Fund Management LLC
100 Springdale Rd., SuiteA3-416
Cherry Hill, NJ 08003
(Name and address of agent for service)
Registrant’s telephone number, including area code:856-528-3500
Date of fiscal year end: April 30
Date of reporting period: April 30, 2019
FormN-CSR is to be used by management investment companies to file reports with the Commission not later than 10 days after the transmission to stockholders of any report that is required to be transmitted to stockholders under Rule30e-1 under the Investment Company Act of 1940 (17 CFR270.30e-1). The Commission may use the information provided on FormN-CSR in its regulatory, disclosure review, inspection, and policymaking roles.
A registrant is required to disclose the information specified by FormN-CSR, and the Commission will make this information public. A registrant is not required to respond to the collection of information contained in FormN-CSR unless the Form displays a currently valid Office of Management and Budget (“OMB”) control number. Please direct comments concerning the accuracy of the information collection burden estimate and any suggestions for reducing the burden to Secretary, Securities and Exchange Commission, 100 F Street, NE, Washington, DC 20549-0609. The OMB has reviewed this collection of information under the clearance requirements of 44 U.S.C. § 3507.
Item 1. Reports to Stockholders.
The Reports to Shareholders are attached herewith.
DUPONT CAPITAL EMERGING MARKETS FUND
Annual Investment Adviser’s Report
April 30, 2019
(Unaudited)
Dear Fund Shareholder,
The DuPont Capital Emerging Markets Fund returned-5.46%, net of fees, for the twelve-month period ending April 30, 2019. The MSCI Emerging Markets Net Dividend Index fell-5.04% over the trailing twelve-months ending April 30, 2019.
Emerging market equities were on a downward trend from April 2018 until the new calendar year. The decline was caused by an increasingly pessimistic outlook for global growth. This growth pessimism was triggered by tighter credit conditions in China and global trade tensions driven by aggressive U.S. trade policy. The new year brought optimism on both issues, boosting economic growth hopes. China eased credit conditions and a trade agreement between China and the U.S. appeared closer to resolution. Emerging market equities staged a rebound in January through April to finish down approximately-5% for the period.
Individual country returns were impacted by a mix of global macro-economic variables and domestic factors. The weakening growth outlook negatively impacted China and export-oriented countries such as South Korea, while a stronger U.S. Dollar put pressure on the financing costs for Argentina, Pakistan, and Turkey. As usual for emerging markets, politics played an important role in local equity market returns. Indonesia rose in anticipation of the reelection of its business-friendly prime minister, while Argentina continued to underperform due to the prospect of returning to the destructive economic policies of the prior president.
Economic sector returns lacked a consistent theme. The industrial and healthcare sectors were the worst performing, although for different reasons. The industrials sector was negatively impacted by the decline in the global growth outlook, while the health care sector struggled as investors questioned the validity of the sector’s high valuation multiples in the face of global resistance to higher pharmaceutical costs. On the positive side, the energy sector was the sole sector not to record a negative return despite wild swings in oil prices during the period.
The Fund’s performance relative to the benchmark was helped by stock selection in Taiwan, South Africa, and Russia. Positive relative performance in Taiwan was driven by a semiconductor company, which is benefiting from increasing demand from one of its new products. South African relative performance was enhanced by multiple positions. Among the more prominent positions was a mobile telecommunication provider, which is rapidly gaining market share due to its extensive and underutilized network. These positives were offset by unfavorable stock selection in Poland and Mexico and an over allocation to Argentina. Poland was negatively impacted by a position in a bank, which is struggling to grow profitability given very low interest rates in the country. A steel company in Mexico negatively impacted performance due to weakening global steel prices. Extremely high inflation and very weak economic growth in Argentina negatively impacted the outlook for the country.
DUPONT CAPITAL EMERGING MARKETS FUND
Annual Investment Adviser’s Report (Continued)
April 30, 2019
(Unaudited)
Relative performance from a sector perspective was positively impacted by favorable stock selection in technology and communications services and an under allocation to health care. The technology sector benefited from the previously mentioned semiconductor company in Taiwan, while the communications services sector benefited from the aforementioned mobile telecommunications provider in South Africa. These positive relative performance contributions were offset by unfavorable stock selection within financials and an over-allocation to industrials. The financial sector was negatively impacted by exposure to Korean and Polish financials, which are being negatively impacted by low interest rates in those countries. Having exposure to the Argentine banking sector and an Indian mortgage provider also negatively impacted relative returns, as both areas came under pressure with the rising U.S. Dollar.
Investment Environment and Outlook
Emerging market equity sits approximately where it was twelve months ago. Valuations still look attractive both relative to history and on an absolute basis. Sentiment still hangs on a combination of U.S. Federal Reserve policy rates, China growth expectations, and the hopeful conclusion of trade negotiations between the two largest economies in the world. Fortunately, we may see a positive break in sentiment over the next twelve months. The U.S. Federal Reserve appears to be finished with their interest rate increases. China’s growth expectations are starting to show improvement as credit conditions loosen and there are some signs a trade agreement might be tentatively agreed upon by year end. Given the current level of valuations, we believe a change in sentiment would be a positive catalyst for revaluation and outperformance for emerging market equities.
Effective June 1, 2019, Corteva Inc. succeeded E.I. du Pont de Nemours and Company as the sponsor of the DuPont Pension Plan. With this succession, DuPont Capital Management Corporation became a wholly-owned subsidiary of Corteva and continues to manage the legacy DuPont Pension Plan.
We appreciate your investment in the Fund and look forward to communicating with you in the future.
DuPont Capital Management Corporation
This letter is intended to assist shareholders in understanding how the Fund performed during the past twelve-months from April 30, 2018 through April 30, 2019 and reflects views of the investment adviser at the time of this writing. These views may change and do not guarantee future performance of the Fund or the markets.
Portfolio composition is subject to change. The current and future portfolio holdings of the Fund are subject to investment risks. The investment return and principal value of an investment in the Fund will fluctuate so that an investor’s shares, when redeemed, may be worth more or less than their original cost.
2
DUPONT CAPITAL EMERGING MARKETS FUND
Annual Investment Adviser’s Report (Concluded)
April 30, 2019
(Unaudited)
Mutual fund investing involves risks, including possible loss of principal. The Fund invests primarily in markets of emerging countries which are riskier than more developed markets and may be considered speculative. Emerging markets are riskier than more developed markets because they tend to develop unevenly or may never fully develop. Emerging markets are more likely to experience hyperinflation and currency valuations, which adversely affect returns to U.S. investors. In addition, many emerging markets have far lower trading volumes and less liquidity than developed markets.
Foreign securities are subject to political, social, and economic risks including instability in the country of the issuer of a security, variation in international trade patterns, the possibility of the imposition of exchange controls, expropriation, confiscatory taxation, limits on movement to currency or other assets and nationalization of assets.
3
DUPONT CAPITAL EMERGING MARKETS FUND
Annual Report
Performance Data
April 30, 2019
(Unaudited)
Comparison of Change in Value of $1,000,000 (investment minimum) Investment in the DuPont Capital Emerging
Markets Fund
Class I Shares vs MSCI Emerging Markets Net Dividend Index
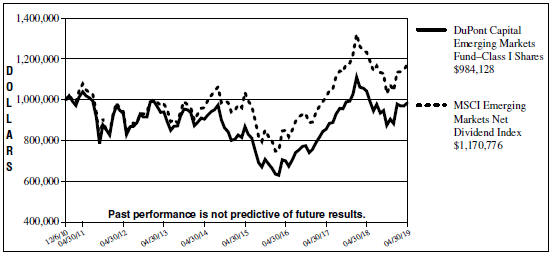
| Average Annual Total Returns for the Periods Ended April 30, 2019 | ||||||||
| 1 Year | 3 Year | 5 Year | Since Inception* | |||||
Class I Shares | -5.46% | 11.99% | 1.70% | -0.19% | ||||
MSCI Emerging | ||||||||
Markets Net Dividend | ||||||||
Index | -5.04% | 11.25% | 4.04% | 1.89%** | ||||
| * | The DuPont Capital Emerging Markets Fund (the “Fund”) commenced operations on December 6, 2010. |
| ** | Benchmark performance is from inception date of the Fund only and is not the inception date of the benchmark itself. |
The performance data quoted represents past performance and does not guarantee future results. The investment return and principal value of an investment in the Fund will fluctuate so that an investor’s shares, when redeemed, may be worth more or less than their original cost. The graph and table do not reflect the deduction of taxes that a shareholder would pay on Fund distributions or redemption of Fund shares. Current performance may be lower or higher. Performance data current to the most recentmonth-end may be obtained by calling (888)447-0014.
As stated in the current prospectus dated September 1, 2018, the Fund’s “Total Annual Fund Operating Expenses” and “Total Annual Fund Operating Expenses After Fee Waiver and/or Expense Reimbursement” are 2.18% and 1.28%, respectively of the Fund’s average daily net assets, which may differ from the actual expenses incurred by the Fund for the period covered by this report. DuPont Capital Management Corporation (the “Adviser”) has contractually agreed to reduce its investment advisory fee and/or reimburse certain expenses of the Fund to the extent necessary to ensure that the Fund’s total operating expenses, excluding taxes, fees and expenses attributable to a distribution
4
DUPONT CAPITAL EMERGING MARKETS FUND
Annual Report
Performance Data (Concluded)
April 30, 2019
(Unaudited)
or service plan adopted by FundVantage Trust (the “Trust”), “Acquired Fund Fees and Expenses,” interest, extraordinary items, and brokerage commissions do not exceed 1.27% (on an annual basis) of the Fund’s average daily net assets (the “Expense Limitation”). The Expense Limitation will remain in place until August 31, 2019, unless the Board of Trustees (“Board of Trustees”) of the Trust approves its earlier termination. The Adviser is entitled to recover, subject to approval by the Board of Trustees, such amounts reduced or reimbursed for a period of up to three (3) years from the date on which the Adviser reduced its compensation and/or assumed expenses for the Fund. The Adviser is permitted to seek reimbursement from the Fund, subject to certain limitations, for fees it waived and Fund expenses it paid to the extent the total annual fund operating expenses do not exceed the limits described above or any lesser limits in effect at the time of reimbursement. No recoupment will occur unless the Fund’s expenses are below the Expense Limitation amount. Total returns would be lower had such fees and expenses not been waived and/or reimbursed.
A 2.00% redemption fee applies to shares redeemed within 60 days of purchase. The redemption fee is not reflected in the returns shown above.
The Fund intends to evaluate performance as compared to that of the MSCI Emerging Markets Net Dividend Index. This index is a free float-adjusted market capitalization index and is designed to measure equity market performance of emerging markets. This index is net total return which reinvests dividends after the deduction of withholding taxes. The returns for this index do not include any transaction costs, management fees or other costs. It is impossible to invest directly in an index.
5
DUPONT CAPITAL EMERGING MARKETS DEBT FUND
Annual Investment Adviser’s Report
April 30, 2019
(Unaudited)
Dear Fund Shareholder,
The DuPont Capital Emerging Markets Debt Fund returned +1.16%, net of fees, for the twelve-month period ending April 30, 2019. The J.P. Morgan Emerging Markets Bond Index Global Diversified Index rose +6.01% over the trailing twelve-months ending April 30, 2019.
The U.S. economy showed very healthy growth over the past twelve months and this led to strong equity and credit markets. However, there was a significantsell-off at the end of 2018 as investors became concerned about slower growth in Europe and China and the “tough talk” from the Federal Reserve about future rate hikes. This decline reversed itself quickly in 2019 as the Fed changed its stance and announced that they were done raising rates for the near-term and the next change in rates will be dependent on future economic data. In total, the Fed raised the Funds Rate four times in 2018 to a range of 2.25% to 2.5%. Despite the increases, U.S. interest rates declined over the twelve-month reporting period. Thetwo-year Treasury declined by 22 basis points and closed at 2.27%. Theten-year treasury fell 44 basis bps to 2.51%.
Emerging markets debt performed well despite the volatile market and provided a return close to the coupon yield of 6% This return came despite the ongoing trade war with China, political uncertainties in many countries, problems in Argentina, Venezuela and Turkey and new administrations in Brazil and Mexico. Oil prices were very volatile with a peak of $76 a barrel in October and a low of $45 in December. Over the last twelve months, prices declined slightly and ended April at $63.9. Overall commodity prices were lower for the period. EMD was supported by lower interest rates and moderate global growth and inflation which more than offset the uncertainty caused by the trade war and problems in a few emerging countries. Local currency EMD lagged Hard currency EMD as the stronger economic growth in the U.S. pushed the dollar up against most currencies.
Within U.S. Dollar EMD, investment grade sovereigns outperformed lower quality sovereigns, partly due to the rise in Treasury prices. The best performing countries within US Dollar EMD included Ecuador, Pakistan, Peru and Uruguay with returns above +10%. Zambia, Argentina and Venezuela were the worst performing countries over the past twelve months. Asia was the strongest performing region. For all of EMD, spreads widened by 31 basis points during the last twelve months to +344 over Treasuries, while the yield of the index declined by 4 bps and closed at 6.01%. The wider spreads were offset by lower U.S. Treasury yields.
In regards to the performance of the Fund, the main negative drivers were overweights and positioning in Argentina, Venezuela and Turkey. In addition, our local currency positions mostly detracted from performance including Brazil and Poland. An overweight and positioning in Brazil and Mexico added to returns as did an underweight to Zambia.
6
DUPONT CAPITAL EMERGING MARKETS DEBT FUND
Annual Investment Adviser’s Report (Continued)
April 30, 2019
(Unaudited)
Heading into May, the primary overweight exposures in the Fund include Brazil, Ukraine, Egypt, Argentina and Israel. In local currency bonds, the main positions are in Mexico, Poland and Brazil. The Fund is underweight several higher quality countries that the investment team believes are overvalued including Peru and Philippines. Other underweights include Indonesia, Colombia and Panama. The Fund has a yield advantage when compared to the benchmark, mostly due to the overweights to Ukraine and Argentina and the local currency exposure to Brazil and Mexico.
Investment Environment and Outlook
After declining in 2018, EMD has performed well so far in 2019, with spreads tightening significantly. Over the last twelve months, spreads have widened by 31 basis points while yields are close to unchanged. Volatility has come down over the last month or two and spreads have stabilized. However, many headwinds remain including slower growth in China and Europe, the trade conflict with China, political instability in numerous countries, and the uncertainty of new administrations in Mexico and Brazil. Despite the headwinds, we believe the current valuations for EMD are modestly attractive for long-term investors. We will continue to gradually buy select credits and reduce cash as we find compelling opportunities. Our main hard currency overweights include Argentina, Ukraine, Mexico, Brazil and Egypt. Our local currency allocation did not change over the last few months and remains close to 12%. Our main positions in local currency are in Brazil, Poland, Russia and Mexico.
Effective June 1, 2019, Corteva Inc. succeeded E.I. du Pont de Nemours and Company as the sponsor of the DuPont Pension Plan. With this succession, DuPont Capital Management Corporation became a wholly-owned subsidiary of Corteva and continues to manage the legacy DuPont Pension Plan.
We appreciate your investment in the Fund and look forward to communicating with you in the future.
DuPont Capital Management Corporation
This letter is intended to assist shareholders in understanding how the Fund performed during the past twelve-months from April 30, 2018 through April 30, 2019 and reflects the views of the investment adviser at the time of this writing. These views may change and do not guarantee future performance of the Fund or the markets.
Portfolio composition is subject to change. The current and future portfolio holdings of the Fund are subject to investment risks. The investment return and principal value of an investment in the Fund will fluctuate so that an investor’s shares, when redeemed, may be worth more or less than their original cost.
7
DUPONT CAPITAL EMERGING MARKETS DEBT FUND
Annual Investment Adviser’s Report (Concluded)
April 30, 2019
(Unaudited)
Mutual fund investing involves risks, including possible loss of principal. The Fund invests primarily in markets of emerging countries which are riskier than more developed markets and may be considered speculative. Emerging markets are riskier than more developed markets because they tend to develop unevenly or may never fully develop. Emerging markets are more likely to experience hyperinflation and currency valuations, which adversely affect returns to U.S. investors. In addition, many emerging markets have far lower trading volumes and less liquidity than developed markets. The Fund isnon-diversified, which means that a large portion of the Fund’s assets may be invested in one or few companies or sectors. The Fund could fluctuate in value more than a diversified fund. Investing in foreign securities entails special risks, such as fluctuations in currency exchange rates and possible lax regulation of securities markets and accounting practices.
Foreign securities are subject to political, social, and economic risks including instability in the country of the issuer of a security, variation in international trade patterns, the possibility of the imposition of exchange controls, expropriation, confiscatory taxation, limits on movement to currency or other assets and nationalization of assets. The value of debt securities generally falls when interest rates rise. The Fund may invest without limit in below-investment grade debt securities commonly called “high yield” securities or “junk bonds.” Such securities may have greater default risk, less liquidity, and greater price volatility than investment-grade bonds.
8
DUPONT CAPITAL EMERGING MARKETS DEBT FUND
Annual Report
Performance Data
April 30, 2019
(Unaudited)
Comparison of Change in Value of $1,000,000 (investment minimum) Investment in the DuPont Capital Emerging
Markets Debt Fund
Class I Shares vs J.P. Morgan EMBI Global Diversified Index
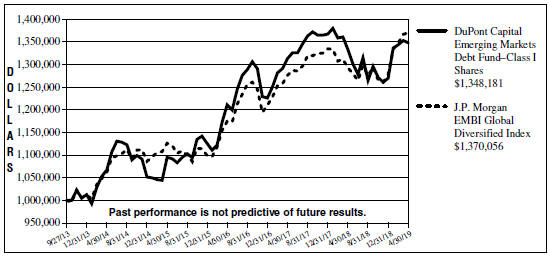
| Average Annual Total Returns for the Periods Ended April 30, 2019 | ||||||||
| 1 Year | 3 Year | 5 Year | Since Inception* | |||||
Class I Shares | 1.16% | 3.64% | 4.78% | 5.49% | ||||
J.P. Morgan EMBI | ||||||||
Global Diversified | ||||||||
Index | 6.01% | 5.26% | 5.23% | 5.81%** | ||||
| * | The DuPont Capital Emerging Markets Debt Fund (the “Fund”) commenced operations on September 27, 2013. |
| ** | Benchmark performance is from inception date of the Fund only and is not the inception date of the benchmark itself. |
The performance data quoted represents past performance and does not guarantee future results. The investment return and principal value of an investment in the Fund will fluctuate so that an investor’s shares, when redeemed, may be worth more or less than their original cost. The graph and table do not reflect the deduction of taxes that a shareholder would pay on Fund distributions or redemption of Fund shares. Current performance may be lower or higher. Performance data current to the most recentmonth-end may be obtained by calling (888)447-0014.
As stated in the current prospectus dated September 1, 2018, the Fund’s “Total Annual Fund Operating Expenses” and “Total Annual Fund Operating Expenses After Fee Waiver and/or Expense Reimbursement” are 3.46% and 0.89%, respectively, of the Fund’s average daily net assets, which may differ from the actual expenses incurred by the Fund for the period covered by this report. DuPont Capital Management Corporation (the “Adviser”) has contractually agreed to reduce its investment advisory fee and/or reimburse certain expenses of the Fund to the extent necessary to ensure that the Fund’s total operating expenses, excluding taxes, fees and expenses attributable to a distribution
9
DUPONT CAPITAL EMERGING MARKETS DEBT FUND
Annual Report
Performance Data (Concluded)
April 30, 2019
(Unaudited)
or service plan adopted by FundVantage Trust (the “Trust”), “Acquired Fund Fees and Expenses,” interest, extraordinary items, and brokerage commissions do not exceed 0.89% (on an annual basis) of the Fund’s average daily net assets (the “Expense Limitation”). The Expense Limitation will remain in place until August 31, 2019, unless the Board of Trustees (“Board of Trustees”) of the Trust approves its earlier termination. The Adviser is entitled to recover, subject to approval by the Board of Trustees, such amounts reduced or reimbursed for a period of up to three (3) years from the date on which the Adviser reduced its compensation and/or assumed expenses for the Fund. The Adviser is permitted to seek reimbursement from the Fund, subject to certain limitations, for fees it waived and Fund expenses it paid to the extent the total annual fund operating expenses do not exceed the limits described above or any lesser limits in effect at the time of reimbursement. No recoupment will occur unless the Fund’s expenses are below the Expense Limitation amount. Total returns would be lower had such fees and expenses not been waived and/or reimbursed.
A 2.00% redemption fee applies to shares redeemed within 60 days of purchase. The redemption fee is not reflected in the returns shown above.
The Fund intends to evaluate performance as compared to that of the J.P. Morgan Emerging Markets Bond Index Global Diversified (EMBI Global Diversified) Index. This index tracks the traded market for U.S.-dollar-denominated debt instruments issued by emerging market sovereign and quasi-sovereign entities and includes Brady bonds, loans, Eurobonds and external debt instruments. It limits the weights of those Index countries with larger debt stock by only including specified portions of these countries eligible current face amounts of debt outstanding. The returns for the index do not include any transaction costs, management fees or other costs. It is impossible to invest directly in an index.
10
DUPONT CAPITAL FUNDS
Fund Expense Disclosure
April 30, 2019
(Unaudited)
As a shareholder of the Fund(s), you incur two types of costs: (1) transaction costs, including redemption fees; and (2) ongoing costs, including management fees and other Fund expenses. These examples are intended to help you understand your ongoing costs (in dollars) of investing in the Fund and to compare these costs with the ongoing costs of investing in other mutual funds.
These examples are based on an investment of $1,000 invested at the beginning of the period from November 1, 2018 through April 30, 2019 and held for the entire period.
Actual Expenses
The first line for each Fund in the accompanying table provides information about actual account values and actual expenses. You may use the information in this line, together with the amount you invested, to estimate the expenses that you paid over the period. Simply divide your account value by $1,000 (for example, an $8,600 account value divided by $1,000 = 8.6), then multiply the result by the number in the first line under the heading entitled “Expenses Paid During Period” to estimate the expenses you paid on your account during this period.
Hypothetical Example for Comparison Purposes
The second line for each Fund in the accompanying table provides information about hypothetical account values and hypothetical expenses based on each Fund’s actual expense ratio and an assumed rate of return of 5% per year before expenses, which is not your Fund’s actual return. The hypothetical account values and expenses may not be used to estimate the actual ending account balance or expenses you paid for the period. You may use this information to compare the ongoing costs of investing in the Funds and other funds. To do so, compare this 5% hypothetical example with the 5% hypothetical examples that appear in the shareholder reports of other funds.
Please note that the expenses shown in the accompanying table are meant to highlight your ongoing costs only and do not reflect any transactional costs, such as redemption fees. Therefore, the second line of the accompanying table is useful in comparing ongoing costs only and will not help you determine the relative total costs of owning different funds. In addition, if these transactional costs were included, your costs would have been higher.
11
DUPONT CAPITAL FUNDS
Fund Expense Disclosure (Concluded)
April 30, 2019
(Unaudited)
| DuPont Capital Emerging Markets Fund | |||||||||||||||
| Beginning Account Value November 1, 2018 | Ending Account Value April 30, 2019 | Expenses Paid During Period* | |||||||||||||
Class I | |||||||||||||||
Actual | $ | 1,000.00 | $ | 1,125.80 | $ | 6.69 | |||||||||
Hypothetical (5% return before expenses) | 1,000.00 | 1,018.50 | 6.36 | ||||||||||||
| DuPont Capital Emerging Markets Debt Fund | |||||||||||||||
| Beginning Account Value November 1, 2018 | Ending Account Value April 30, 2019 | Expenses Paid During Period** | |||||||||||||
Class I | |||||||||||||||
Actual | $ | 1,000.00 | $ | 1,059.70 | $ | 4.55 | |||||||||
Hypothetical (5% return before expenses) | 1,000.00 | 1,020.38 | 4.46 | ||||||||||||
| * | Expenses are equal to an annualized expense ratio for thesix-month period ended April 30, 2019 of 1.27% for Class I Shares of the DuPont Capital Emerging Markets Fund, multiplied by the average account value over the period, multiplied by the number of days in the most recent period (181), then divided by 365 to reflect the period. The DuPont Capital Emerging Markets Fund’s ending account value on the first line in the table is based on the actual total return for thesix-month period ended April 30, 2019 for the Fund of 12.58%. |
| ** | Expenses are equal to an annualized expense ratio for thesix-month period ended April 30, 2019 of 0.89% for Class I Shares of the DuPont Capital Emerging Markets Debt Fund, multiplied by the average account value over the period, multiplied by the number of days in the most recent period (181), then divided by 365 to reflect the period. The DuPont Capital Emerging Markets Debt Fund’s ending account value on the first line in the table is based on the actual total return for thesix-month period ended April 30, 2019 for the Fund of 5.97%. |
12
DUPONT CAPITAL EMERGING MARKETS FUND
Portfolio Holdings Summary Table
April 30, 2019
(Unaudited)
The following table presents a summary by industry of the portfolio holdings of the Fund:
| % of Net Assets | Value | |||||||||
INDUSTRY CATEGORIES: | ||||||||||
Commercial Banks | 22.4 | % | $ | 5,707,575 | ||||||
Oil, Gas & Consumable Fuels | 7.9 | 2,017,111 | ||||||||
Internet & Catalog Retail | 7.5 | 1,916,464 | ||||||||
Semiconductors & Semiconductor Equipment | 6.4 | 1,624,913 | ||||||||
Interactive Media & Services | 5.9 | 1,493,060 | ||||||||
Technology Hardware, Storage & Peripherals | 5.4 | 1,365,880 | ||||||||
Exchange Traded Funds | 3.7 | 930,701 | ||||||||
Machinery | 3.0 | 769,434 | ||||||||
Insurance | 3.0 | 753,507 | ||||||||
Household Durables | 2.8 | 704,875 | ||||||||
Wireless Telecommunication Services | 2.6 | 672,621 | ||||||||
Food Products | 2.4 | 646,859 | ||||||||
Airlines | 2.2 | 561,233 | ||||||||
Chemicals | 2.1 | 529,188 | ||||||||
Diversified Telecommunication Services | 1.8 | 468,505 | ||||||||
IT Services | 1.7 | 442,340 | ||||||||
Real Estate Management & Development | 1.7 | 442,105 | ||||||||
Automobiles | 1.6 | 413,773 | ||||||||
Hotels, Restaurants & Leisure | 1.6 | 408,742 | ||||||||
Electronic Equipment, Instruments & Components | 1.5 | 377,716 | ||||||||
Specialty Retail | 1.4 | 348,050 | ||||||||
Media | 1.3 | 318,750 | ||||||||
Beverages | 1.2 | 316,284 | ||||||||
Industrial Conglomerates | 1.2 | 309,679 | ||||||||
Auto Components | 1.2 | 304,399 | ||||||||
Metals & Mining | 0.9 | 240,017 | ||||||||
Thrifts & Mortgage Finance | 0.8 | 209,267 | ||||||||
Air Freight & Logistics | 0.8 | 204,207 | ||||||||
Road & Rail | 0.8 | 193,942 | ||||||||
Building Products | 0.7 | 169,950 | ||||||||
Transportation Infrastructure | 0.5 | 121,065 | ||||||||
Personal Products | 0.5 | 119,435 | ||||||||
Independent Power And Renewable Electricity Producers | 0.4 | 96,071 | ||||||||
Diversified Consumer Services | 0.4 | 94,486 | ||||||||
Electric Utilities | 0.2 | 40,622 | ||||||||
Other Assets in Excess of Liabilities | 0.5 | 129,006 | ||||||||
|
|
|
| |||||||
NET ASSETS | 100.0 | % | $ | 25,461,832 | ||||||
|
|
|
| |||||||
Portfolio holdings are subject to change at any time.
The accompanying notes are an integral part of the financial statements.
13
DUPONT CAPITAL EMERGING MARKETS FUND
Portfolio of Investments
April 30, 2019
| Number of Shares | Value | |||||||
COMMON STOCKS — 92.3% |
| |||||||
Argentina — 1.2% | ||||||||
BBVA Banco Frances SA, ADR | 20,041 | $ | 160,729 | |||||
Central Puerto SA, SP ADR | 11,890 | 96,071 | ||||||
Pampa Energia SA, SP ADR* | 1,939 | 40,622 | ||||||
|
| |||||||
| 297,422 | ||||||||
|
| |||||||
Brazil — 3.7% | ||||||||
Banco Do Brasil SA* | 22,300 | 281,914 | ||||||
Even Construtora e Incorporadora SA* | 252,800 | 413,264 | ||||||
Iochpe Maxion SA* | 48,151 | 244,371 | ||||||
|
| |||||||
| 939,549 | ||||||||
|
| |||||||
China — 28.8% | ||||||||
Alibaba Group Holding, Ltd., SP ADR* | 4,677 | 867,911 | ||||||
Baidu, Inc., SP ADR* | 1,351 | 224,577 | ||||||
Beijing Capital International Airport Co., Ltd., Class H | 136,000 | 121,065 | ||||||
China Communications Services Corp., Ltd., Class H | 326,000 | 262,931 | ||||||
China Construction Bank Corp., Class H | 798,000 | 703,490 | ||||||
China Lesso Group Holdings, Ltd. | 240,000 | 169,950 | ||||||
China Maple Leaf Educational Systems, Ltd. | 202,000 | 94,486 | ||||||
China Mobile, Ltd. | 48,169 | 459,600 | ||||||
China Overseas Land & Investment, Ltd. | 118,000 | 442,105 | ||||||
CNOOC, Ltd. | 300,000 | 544,900 | ||||||
| Number of Shares | Value | |||||||
COMMON STOCKS — (Continued) |
| |||||||
China — (Continued) | ||||||||
Dali Foods Group Co., Ltd.(a) | 174,500 | $ | 123,932 | |||||
Dongfeng Motor Group Co., Ltd., Class H | 308,000 | 299,227 | ||||||
Haier Electronics Group Co., Ltd. | 102,000 | 291,611 | ||||||
Haitian International Holdings, Ltd. | 66,001 | 165,504 | ||||||
Industrial & Commercial Bank of China, Ltd., Class H | 425,000 | 319,668 | ||||||
Jiangsu Yanghe Brewery Joint-Stock Co., Ltd., Class A | 18,100 | 316,284 | ||||||
Lonking Holdings, Ltd. | 492,000 | 167,301 | ||||||
PICC Property & Casualty Co., Ltd., Class H | 255,000 | 286,500 | ||||||
Sinotrans, Ltd., Class H | 497,000 | 204,207 | ||||||
Tencent Holdings, Ltd. | 22,600 | 1,113,901 | ||||||
YY, Inc., ADR* | 1,827 | 154,582 | ||||||
|
| |||||||
| 7,333,732 | ||||||||
|
| |||||||
Czech Republic — 1.3% | ||||||||
Komercni Banka AS | 8,902 | 337,707 | ||||||
|
| |||||||
Greece — 0.9% | ||||||||
Jumbo SA | 11,907 | 217,316 | ||||||
|
| |||||||
India — 5.2% | ||||||||
HCL Technologies, Ltd. | 25,990 | 442,340 | ||||||
ICICI Bank, Ltd., SP ADR | 23,371 | 267,598 | ||||||
Indiabulls Housing Finance, Ltd. | 20,923 | 209,267 | ||||||
Reliance Industries, Ltd., SP | 9,872 | 397,534 | ||||||
|
| |||||||
| 1,316,739 | ||||||||
|
| |||||||
The accompanying notes are an integral part of the financial statements.
14
DUPONT CAPITAL EMERGING MARKETS FUND
Portfolio of Investments (Continued)
April 30, 2019
| Number of Shares | Value | |||||||
COMMON STOCKS — (Continued) |
| |||||||
Indonesia — 1.4% | ||||||||
Bank Rakyat Indonesia Persero Tbk PT | 1,132,184 | $ | 348,096 | |||||
|
| |||||||
Malaysia — 1.6% | ||||||||
Genting Bhd | 129,196 | 220,091 | ||||||
Malayan Banking Bhd | 82,605 | 184,837 | ||||||
|
| |||||||
| 404,928 | ||||||||
|
| |||||||
Mexico — 2.3% | ||||||||
Grupo Financiero Banorte SAB de CV, Class O | 56,400 | 357,361 | ||||||
Ternium SA, SP ADR | 9,737 | 240,017 | ||||||
|
| |||||||
| 597,378 | ||||||||
|
| |||||||
Poland — 0.4% | ||||||||
Bank Handlowy w Warszawie SA | 6,206 | 101,033 | ||||||
|
| |||||||
Russia — 5.1% | ||||||||
Globaltrans Investment PLC, SP GDR | 20,056 | 193,942 | ||||||
Ros Agro PLC, GDR | 22,187 | 254,263 | ||||||
Sberbank of Russia PJSC, SP ADR | 39,911 | 572,081 | ||||||
Tatneft PJSC, SP ADR | 3,986 | 280,684 | ||||||
|
| |||||||
| 1,300,970 | ||||||||
|
| |||||||
Saudi Arabia — 2.1% | ||||||||
Jarir Marketing Co. | 2,770 | 130,734 | ||||||
Saudi British Bank (The) | 12,580 | 137,195 | ||||||
Saudia Dairy & Foodstuff Co. | 8,622 | 268,664 | ||||||
|
| |||||||
| 536,593 | ||||||||
|
| |||||||
South Africa — 11.4% | ||||||||
Absa Group Ltd. | 24,242 | 279,260 | ||||||
MultiChoice Group, Ltd.* | 35,498 | 318,750 | ||||||
Naspers, Ltd., N Shares | 4,076 | 1,048,553 | ||||||
| Number of Shares | Value | |||||||
COMMON STOCKS — (Continued) |
| |||||||
South Africa — (Continued) | ||||||||
Nedbank Group, Ltd. | 13,516 | $ | 252,123 | |||||
Old Mutual, Ltd. | 158,698 | 255,265 | ||||||
Sasol, Ltd. | 10,911 | 361,988 | ||||||
Telkom SA SOC, Ltd. | 34,540 | 205,574 | ||||||
Tsogo Sun Holdings, Ltd. | 125,402 | 188,651 | ||||||
|
| |||||||
| 2,910,164 | ||||||||
|
| |||||||
South Korea — 14.0% | ||||||||
Hyundai Mipo Dockyard Co., Ltd. | 3,986 | 192,258 | ||||||
Hyundai Mobis Co., Ltd. | 1,526 | 304,399 | ||||||
Hyundai Motor Co. | 965 | 114,546 | ||||||
Jeju Air Co., Ltd. | 12,184 | 426,562 | ||||||
LG Chem, Ltd. | 539 | 167,200 | ||||||
Samsung Electronics Co., Ltd. | 34,740 | 1,365,880 | ||||||
Samsung Life Insurance Co., Ltd. | 2,911 | 211,742 | ||||||
Shinhan Financial Group Co., Ltd. | 12,147 | 459,095 | ||||||
SK Innovation Co., Ltd. | 2,017 | 315,376 | ||||||
|
| |||||||
| 3,557,058 | ||||||||
|
| |||||||
Taiwan — 9.8% | ||||||||
CTBC Financial Holding Co., Ltd. | 551,918 | 378,092 | ||||||
Hon Hai Precision Industry Co., Ltd. | 134,164 | 377,716 | ||||||
Novatek Microelectronics Corp. | 64,692 | 423,193 | ||||||
Taiwan Semiconductor Manufacturing Co., Ltd., SP ADR | 27,424 | 1,201,720 | ||||||
TCI Co., Ltd. | 8,000 | 119,435 | ||||||
|
| |||||||
| 2,500,156 | ||||||||
|
| |||||||
The accompanying notes are an integral part of the financial statements.
15
DUPONT CAPITAL EMERGING MARKETS FUND
Portfolio of Investments (Concluded)
April 30, 2019
| Number of Shares | Value | |||||||
COMMON STOCKS — (Continued) |
| |||||||
Thailand — 1.1% | ||||||||
Bangkok Bank PCL, NVDR | 11,901 | $ | 75,719 | |||||
Kasikornbank PCL, NVDR | 32,571 | 195,006 | ||||||
|
| |||||||
| 270,725 | ||||||||
|
| |||||||
Turkey — 2.0% | ||||||||
Enka Insaat Ve Sanayi AS | 152,530 | 137,348 | ||||||
KOC Holding AS | 63,474 | 172,331 | ||||||
Turkcell Iletisim Hizmetleri AS | 101,570 | 213,021 | ||||||
|
| |||||||
| 522,700 | ||||||||
|
| |||||||
TOTAL COMMON STOCKS (Cost $19,216,646) | 23,492,266 | |||||||
|
| |||||||
PREFERRED STOCKS — 3.6% |
| |||||||
Brazil — 3.6% | ||||||||
Azul SA* | 15,554 | 134,671 | ||||||
Itau Unibanco Holding SA | 34,263 | 296,571 | ||||||
Petroleo Brasileiro SA | 69,200 | 478,617 | ||||||
|
| |||||||
| 909,859 | ||||||||
|
| |||||||
TOTAL PREFERRED STOCKS (Cost $615,010) |
| 909,859 | ||||||
|
| |||||||
EXCHANGE TRADED FUND — 3.6% |
| |||||||
iShares MSCI Emerging Market Index Fund | 21,186 | 930,701 | ||||||
|
| |||||||
TOTAL EXCHANGE TRADED FUND (Cost $892,155) |
| 930,701 | ||||||
|
| |||||||
| Value | |||||||
TOTAL INVESTMENTS - 99.5% | $ | 25,332,826 | ||||||
OTHER ASSETS IN EXCESS OF LIABILITIES - 0.5% | 129,006 | |||||||
|
| |||||||
NET ASSETS - 100.0% | $ | 25,461,832 | ||||||
|
| |||||||
| * | Non-income producing. |
| (a) | Securities exempt from registration under Rule 144A of the Securities Act of 1933, as amended. These securities were purchased in accordance with the guidelines approved by the Fund’s Board of Trustees and may be resold, in transactions exempt from registration, to qualified institutional buyers. At April 30, 2019, these securities amounted to $521,466 or 2.05% of net assets. These securities have been determined by the Adviser to be liquid securities. |
ADR | American Depository Receipt | |
GDR | Global Depository Receipt | |
NVDR | Non-voting Depository Receipt | |
PCL | Public Company Limited | |
PJSC | Public Joint Stock Company | |
PLC | Public Limited Company | |
SP ADR | Sponsored American Depository Receipt | |
SP GDR | Sponsored Global Depository Receipt |
The accompanying notes are an integral part of the financial statements.
16
DUPONT CAPITAL EMERGING MARKETS DEBT FUND
Portfolio Holdings Summary Table
April 30, 2019
(Unaudited)
The following table presents a summary by security type of the portfolio holdings of the Fund:
| % of Net Assets | Value | |||||||||
SECURITY TYPE: | ||||||||||
Foreign Government Bonds and Notes | 71.8 | % | $ | 5,208,058 | ||||||
Corporate Bonds and Notes | 17.7 | 1,287,720 | ||||||||
U.S. Treasury Obligations | 5.4 | 393,398 | ||||||||
Common Stocks | 0.0 | 385 | ||||||||
Other Assets in Excess of Liabilities | 5.1 | 370,193 | ||||||||
|
|
|
| |||||||
NET ASSETS | 100.0 | % | $ | 7,259,754 | ||||||
|
|
|
| |||||||
Portfolio holdings are subject to change at any time.
The accompanying notes are an integral part of the financial statements.
17
DUPONT CAPITAL EMERGING MARKETS DEBT FUND
Portfolio of Investments
April 30, 2019
| Par* Value | Value | |||||||
CORPORATE BONDS AND NOTES — 17.7% |
| |||||||
Austria — 0.0% | ||||||||
OGX Austria GmbH | $ | 200,000 | $ | 2 | ||||
|
| |||||||
China — 4.5% | ||||||||
China Evergrande Group | 250,000 | 228,158 | ||||||
Sinochem Overseas Capital Co. Ltd. | 100,000 | 102,180 | ||||||
|
| |||||||
| 330,338 | ||||||||
|
| |||||||
Israel — 3.1% | ||||||||
Israel Electric Corp., Ltd. | 200,000 | 224,000 | ||||||
|
| |||||||
Netherlands — 3.1% | ||||||||
Petrobras Global Finance BV | 100,000 | 111,580 | ||||||
Petrobras Global Finance BV | 100,000 | 102,625 | ||||||
Petrobras Global Finance BV | 10,000 | 9,781 | ||||||
|
| |||||||
| 223,986 | ||||||||
|
| |||||||
Russia — 4.8% | ||||||||
Gazprom OAO Via Gaz Capital SA | 150,000 | 197,316 | ||||||
Russian Railways Via RZD Capital PLC | RUB | 10,000,000 | 151,710 | |||||
|
| |||||||
| 349,026 | ||||||||
|
| |||||||
| Par* Value | Value | |||||||||
CORPORATE BONDS AND NOTES — (Continued) |
| |||||||||
Venezuela — 2.2% | ||||||||||
Petroleos de Venezuela SA | $ | 300,000 | $ | 65,151 | ||||||
Petroleos de Venezuela SA | 100,000 | 21,717 | ||||||||
Petroleos de Venezuela SA | 350,000 | 73,500 | ||||||||
|
| |||||||||
| 160,368 | ||||||||||
|
| |||||||||
TOTAL CORPORATE BONDS AND NOTES | 1,287,720 | |||||||||
|
| |||||||||
FOREIGN GOVERNMENT BONDS AND NOTES — 71.8% |
| |||||||||
Argentina — 7.0% | ||||||||||
Argentine Republic Government International Bond | 460,000 | 329,820 | ||||||||
Argentine Republic Government International Bond | 70,000 | 48,405 | ||||||||
Argentine Republic Government International Bond | 190,000 | 132,050 | ||||||||
|
| |||||||||
| 510,275 | ||||||||||
|
| |||||||||
Brazil — 4.7% | ||||||||||
Brazil Notas Do Tesouro Nacional Serie F | BRL | 1,000,000 | 265,524 | |||||||
The accompanying notes are an integral part of the financial statements.
18
DUPONT CAPITAL EMERGING MARKETS DEBT FUND
Portfolio of Investments (Continued)
April 30, 2019
| Par* Value | Value | |||||||
FOREIGN GOVERNMENT BONDS AND NOTES — (Continued) |
| |||||||
Brazil — (Continued) | ||||||||
Brazil Notas Do Tesouro | ||||||||
Nacional Serie F | BRL | 290,000 | $ | 78,235 | ||||
|
| |||||||
| 343,759 | ||||||||
|
| |||||||
Costa Rica — 2.6% | ||||||||
Costa Rica Government International Bond | 200,000 | 191,250 | ||||||
|
| |||||||
Croatia — 3.1% | ||||||||
Croatia Government International Bond | 200,000 | 223,846 | ||||||
|
| |||||||
Dominican Republic — 3.1% | ||||||||
Dominican Republic International Bond | 200,000 | 226,250 | ||||||
|
| |||||||
Ecuador — 2.7% | ||||||||
Ecuador Government International Bond | 200,000 | 192,750 | ||||||
|
| |||||||
Egypt — 7.7% | ||||||||
Egypt Government International Bond | 100,000 | 92,193 | ||||||
Egypt Government International Bond | 250,000 | 257,594 | ||||||
Egypt Government International Bond | 200,000 | 206,075 | ||||||
|
| |||||||
| 555,862 | ||||||||
|
| |||||||
| Par* Value | Value | |||||||
FOREIGN GOVERNMENT BONDS AND NOTES — (Continued) |
| |||||||
Hungary — 1.0% | ||||||||
Hungary Government International Bond | $ | 50,000 | $ | 75,140 | ||||
|
| |||||||
Jordan — 2.7% | ||||||||
Jordan Government International Bond | 200,000 | 194,387 | ||||||
|
| |||||||
Lebanon — 3.5% | ||||||||
Lebanon Government International Bond | 50,000 | 48,904 | ||||||
Lebanon Government International Bond | 70,000 | 60,570 | ||||||
Lebanon Government International Bond | 175,000 | 145,478 | ||||||
|
| |||||||
| 254,952 | ||||||||
|
| |||||||
Malaysia — 0.5% | ||||||||
Malaysia Government Bond | MYR | 150,000 | 36,342 | |||||
|
| |||||||
Mexico — 6.5% | ||||||||
Mexican Bonos | MXN | 1,200,000 | 69,151 | |||||
Mexican Bonos | MXN | 1,000,000 | 60,415 | |||||
Petroleos Mexicanos | 125,000 | 115,189 | ||||||
Petroleos Mexicanos | 200,000 | 163,700 | ||||||
Petroleos Mexicanos | 50,000 | 41,700 | ||||||
The accompanying notes are an integral part of the financial statements.
19
DUPONT CAPITAL EMERGING MARKETS DEBT FUND
Portfolio of Investments (Continued)
April 30, 2019
| Par* Value | Value | |||||||
FOREIGN GOVERNMENT BONDS AND NOTES — (Continued) |
| |||||||
Mexico — (Continued) |
| |||||||
Petroleos Mexicanos | $ | 25,000 | $ | 23,050 | ||||
|
| |||||||
| 473,205 | ||||||||
|
| |||||||
Morocco — 2.8% | ||||||||
Morocco Government International Bond | 200,000 | 204,606 | ||||||
|
| |||||||
Nigeria — 2.7% | ||||||||
Nigeria Government International Bond | 200,000 | 196,652 | ||||||
|
| |||||||
Oman — 2.6% | ||||||||
Oman Government International Bond | 200,000 | 185,000 | ||||||
|
| |||||||
Pakistan — 1.4% | ||||||||
Pakistan Government International Bond | 100,000 | 97,692 | ||||||
|
| |||||||
Poland — 2.5% | ||||||||
Republic of Poland Government Bond | PLN | 700,000 | 183,045 | |||||
|
| |||||||
Romania — 0.8% | ||||||||
Romanian Government International Bond | 50,000 | 57,845 | ||||||
|
| |||||||
South Africa — 2.8% | ||||||||
Eskom Holdings SOC Ltd. | 200,000 | 200,460 | ||||||
|
| |||||||
| Par* Value | Value | |||||||
FOREIGN GOVERNMENT BONDS AND NOTES — (Continued) |
| |||||||
Turkey — 3.7% | ||||||||
Turkey Government International Bond | $ | 100,000 | $ | 98,950 | ||||
Turkey Government International Bond | 200,000 | 169,072 | ||||||
|
| |||||||
| 268,022 | ||||||||
|
| |||||||
Ukraine — 7.2% | ||||||||
Privatbank CJSC Via UK SPV Credit Finance PLC | 160,000 | 40,752 | ||||||
Ukraine Government International Bond | 50,000 | 31,867 | ||||||
Ukreximbank Via Biz Finance PLC,6-M LIBOR + 7.00%, | 210,000 | 199,542 | ||||||
Ukreximbank Via Biz Finance PLC | 250,000 | 251,057 | ||||||
|
| |||||||
| 523,218 | ||||||||
|
| |||||||
Venezuela — 0.2% | ||||||||
Venezuela Government International Bond | 50,000 | 13,500 | ||||||
|
| |||||||
TOTAL FOREIGN GOVERNMENT BONDS AND NOTES | 5,208,058 | |||||||
|
| |||||||
The accompanying notes are an integral part of the financial statements.
20
DUPONT CAPITAL EMERGING MARKETS DEBT FUND
Portfolio of Investments (Continued)
April 30, 2019
| Par* Value | Value | |||||||
U.S. TREASURY OBLIGATIONS — 5.4% |
| |||||||
United States Treasury Notes — 5.4% |
| |||||||
2.25%, 08/15/2027 | $ | 200,000 | $ | 196,820 | ||||
2.25%, 11/15/2027 | 200,000 | 196,578 | ||||||
TOTAL U.S. TREASURY OBLIGATIONS (Cost $395,917) | 393,398 | |||||||
|
| |||||||
| Number of Shares | ||||||||
COMMON STOCKS — 0.0% |
| |||||||
Brazil — 0.0% | ||||||||
Dommo Energia SA, SP ADR(a) | 31 | 385 | ||||||
|
| |||||||
TOTAL COMMON STOCKS (Cost $ — ) | 385 | |||||||
|
| |||||||
TOTAL INVESTMENTS - 94.9% (Cost $7,637,863) | 6,889,561 | |||||||
OTHER ASSETS IN EXCESS OF LIABILITIES - 5.1% | 370,193 | |||||||
|
| |||||||
NET ASSETS - 100.0% | $ | 7,259,754 | ||||||
|
| |||||||
| * | Par amount denominated in USD unless otherwise noted. |
| (a) | Security is deemed illiquid at April 30, 2019 (Unaudited). |
| (b) | Investments with a total aggregate value of $214,622 or 2.96% of net assets were in default as of April 30, 2019. |
| (c) | Securities exempt from registration under Rule 144A of the Securities Act of 1933, as amended. These securities were purchased in accordance with the guidelines approved by the Fund’s Board of Trustees and may be resold, in transactions exempt from registration, to qualified institutional buyers. At April 30, 2019 these securities amounted to $1,430,469 or 19.70% of net assets. These securities have been determined by the Adviser to be liquid securities. |
| (d) | Variable rate investments. The rate shown is based on the latest available information as of April 30, 2019. Certain variable rate securities are not based on a published reference rate and spread but are determined by the issuer or agent and are based on current market conditions. These securities do not indicate a reference rate or spread in their description. |
Forward foreign currency contracts outstanding as of April 30, 2019 were as follows:
Currency Purchased | Currency Sold | Expiration | Counterparty | Unrealized Appreciation | ||||
USD 71,154 | EUR 62,409 | 06/10/19 | CAS | $907 |
The accompanying notes are an integral part of the financial statements.
21
DUPONT CAPITAL EMERGING MARKETS DEBT FUND
Portfolio of Investments (Concluded)
April 30, 2019
BRL | Brazilian Real | |
CAS | Credit Agricole Securities Inc | |
CJSC | Closed Joint Stock Company | |
EUR | Euro | |
LIBOR | London Interbank Offered Rate | |
MXN | Mexican Peso | |
MYR | Malaysian Ringgit | |
PLC | Public Limited Company | |
PLN | Polish Zloty | |
RUB | Russian Ruble | |
SP ADR | Sponsored American Depository Receipt | |
USD | United States Dollar | |
6-M | Six Months |
The accompanying notes are an integral part of the financial statements.
22
DUPONT CAPITAL FUNDS
Statements of Assets and Liabilities
April 30, 2019
| DuPont Capital Emerging Markets Fund | DuPont Capital Emerging Markets Debt Fund | |||||||||
Assets | ||||||||||
Investments, at value (Cost $20,723,811 and $7,637,863, respectively) | $ 25,332,826 | $ 6,889,561 | ||||||||
Cash | 565,759 | 226,055 | ||||||||
Foreign Currency (Cost $ — and $63,199, respectively) | — | 62,770 | ||||||||
Unrealized appreciation on forward foreign currency contracts* | — | 907 | ||||||||
Receivable for investments sold | 20,870 | — | ||||||||
Dividends and interest receivable | 54,401 | 109,294 | ||||||||
Receivable from Investment Adviser | — | 22,710 | ||||||||
Prepaid expenses and other assets | 22,645 | 17,149 | ||||||||
|
|
|
| |||||||
Total assets | 25,996,501 | 7,328,446 | ||||||||
|
|
|
| |||||||
Liabilities | ||||||||||
Due to Custodian | 257,493 | — | ||||||||
Payable for investments purchased | 130,596 | — | ||||||||
Payable for administration and accounting fees | 41,903 | 26,416 | ||||||||
Payable for audit fees | 32,080 | 25,264 | ||||||||
Payable to Investment Adviser | 23,748 | — | ||||||||
Payable for printing fees | 20,681 | 5,168 | ||||||||
Payable for transfer agent fees | 14,193 | 6,106 | ||||||||
Payable for legal fees | 7,260 | 1,001 | ||||||||
Payable for custodian fees | 5,752 | 2,577 | ||||||||
Payable for foreign taxes | 430 | — | ||||||||
Accrued expenses | 533 | 2,160 | ||||||||
|
|
|
| |||||||
Total liabilities | 534,669 | 68,692 | ||||||||
|
|
|
| |||||||
Net Assets | $ 25,461,832 | $ 7,259,754 | ||||||||
|
|
|
| |||||||
Net Assets consisted of: | ||||||||||
Capital stock, $0.01 par value | $ 28,770 | $ 8,149 | ||||||||
Paid-in capital | 107,098,782 | 7,954,270 | ||||||||
Total distributable loss | (81,665,720 | ) | (702,665 | ) | ||||||
|
|
|
| |||||||
Net Assets | $ 25,461,832 | $ 7,259,754 | ||||||||
|
|
|
| |||||||
Class I: | ||||||||||
Net asset value, offering and redemption price per share ($25,461,832 / 2,877,037 shares) and ($7,259,754 / 814,939 shares), respectively | $8.85 | $8.91 | ||||||||
| * | Primary risk exposure is foreign currency contracts. |
The accompanying notes are an integral part of the financial statements.
23
DUPONT CAPITAL FUNDS
Statements of Operations
For the Year Ended April 30, 2019
| DuPont Capital Emerging Markets Fund | DuPont Capital Emerging Markets Debt Fund | |||||||||
Investment income | ||||||||||
Dividends | $ | 888,219 | $ | 2,752 | ||||||
Interest | — | 430,751 | ||||||||
Less: foreign taxes withheld | (95,442 | ) | — | |||||||
|
|
|
| |||||||
Total investment income | 792,777 | 433,503 | ||||||||
|
|
|
| |||||||
Expenses | ||||||||||
Advisory fees (Note 2) | 250,538 | 41,045 | ||||||||
Administration and accounting fees (Note 2) | 100,909 | 74,588 | ||||||||
Audit fees | 36,119 | 30,112 | ||||||||
Trustees’ and officers’ fees (Note 2) | 35,020 | 17,152 | ||||||||
Registration and filing fees | 33,632 | 31,328 | ||||||||
Legal fees | 33,470 | 9,890 | ||||||||
Custodian fees (Note 2) | 32,234 | 20,776 | ||||||||
Transfer agent fees (Note 2) | 29,867 | 32,352 | ||||||||
Printing and shareholder reporting fees | 2,443 | 7,151 | ||||||||
Other expenses | 10,209 | 4,066 | ||||||||
|
|
|
| |||||||
Total expenses before waivers and reimbursements | 564,441 | 268,460 | ||||||||
|
|
|
| |||||||
Less: waivers and reimbursements (Note 2) | (261,409 | ) | (207,576 | ) | ||||||
|
|
|
| |||||||
Net expenses after waivers and reimbursements | 303,032 | 60,884 | ||||||||
|
|
|
| |||||||
Net investment income | 489,745 | 372,619 | ||||||||
|
|
|
| |||||||
Net realized and unrealized gain/(loss) from investments | ||||||||||
Net realized gain from investments | 877,349 | 13,136 | ||||||||
Net realized loss from foreign currency transactions | (18,761 | ) | (4,465 | ) | ||||||
Net realized gain from forward foreign currency contracts* | — | 9,967 | ||||||||
Net change in unrealized appreciation/(depreciation) on investments(a) | (2,864,626 | ) | (289,759 | ) | ||||||
Net change in unrealized appreciation/(depreciation) on foreign currency translations | 946 | (154 | ) | |||||||
Net change in unrealized appreciation/(depreciation) on forward foreign currency contracts* | — | (1,393 | ) | |||||||
|
|
|
| |||||||
Net realized and unrealized loss on investments | (2,005,092 | ) | (272,668 | ) | ||||||
|
|
|
| |||||||
Net increase/(decrease) in net assets resulting from operations | $ | (1,515,347 | ) | $ | 99,951 | |||||
|
|
|
| |||||||
| * | Primary risk exposure is foreign currency contracts. |
| (a) | Change in net unrealized appreciation/(depreciation) on investments for the DuPont Capital Emerging Markets Fund was net of an increase in deferred foreign capital gains tax of $430. |
The accompanying notes are an integral part of the financial statements.
24
DUPONT CAPITAL EMERGING MARKETS FUND
Statements of Changes in Net Assets
| For the Year Ended April 30, 2019 | For the Year Ended April 30, 2018 | |||||||||
Increase/(decrease) in net assets from operations: | ||||||||||
Net investment income | $ | 489,745 | $ | 496,367 | ||||||
Net realized gain from investments and foreign currency transactions | 858,588 | 3,526,568 | ||||||||
Net change in unrealized appreciation/(depreciation) on investments, forward foreign currency contracts and foreign currency translations | (2,863,680 | ) | 2,520,039 | |||||||
|
|
|
| |||||||
Net increase/(decrease) in net assets resulting from operations | (1,515,347 | ) | 6,542,974 | |||||||
|
|
|
| |||||||
Less dividends and distributions to shareholders from: | ||||||||||
Total distributable earnings* | (436,646 | ) | (517,157 | ) | ||||||
|
|
|
| |||||||
Decrease in net assets from dividends and distributions to shareholders | (436,646 | ) | (517,157 | ) | ||||||
|
|
|
| |||||||
Decrease in net assets derived from capital share transactions (Note 4) | (1,590,174 | ) | (7,837,897 | ) | ||||||
|
|
|
| |||||||
Total decrease in net assets | (3,542,167 | ) | (1,812,080 | ) | ||||||
|
|
|
| |||||||
Net assets | ||||||||||
Beginning of year | 29,003,999 | 30,816,079 | ||||||||
|
|
|
| |||||||
End of year** | $ | 25,461,832 | $ | 29,003,999 | ||||||
|
|
|
| |||||||
| * | Distributions from net investment income and from realized capital gains are no longer required to be separately disclosed. See Note 1. For the year ended April 30, 2018, distributions from net investment income and net realized capital gains were $517,157 and $0, respectively. |
| ** | Parenthetical disclosure of accumulated net investment income/(loss) is no longer required. See Note 1. For the year ended April 30, 2018, end of year net assets included accumulated net investment income of $320. |
The accompanying notes are an integral part of the financial statements.
25
DUPONT CAPITAL EMERGING MARKETS DEBT FUND
Statements of Changes in Net Assets
| For the Year Ended April 30, 2019 | For the Year Ended April 30, 2018 | |||||||||
Increase/(decrease) in net assets from operations: | ||||||||||
Net investment income | $ | 372,619 | $ | 353,198 | ||||||
Net realized gain from investments, forward foreign currency contracts and foreign currency transactions | 18,638 | 29,685 | ||||||||
Net change in unrealized appreciation/(depreciation) on investments, forward foreign currency contracts and foreign currency translations | (291,306 | ) | (297,808 | ) | ||||||
|
|
|
| |||||||
Net increase in net assets resulting from operations | 99,951 | 85,075 | ||||||||
|
|
|
| |||||||
Less dividends and distributions to shareholders from: | ||||||||||
Total distributable earnings* | (388,320 | ) | (383,959 | ) | ||||||
|
|
|
| |||||||
Decrease in net assets from dividends and distributions to shareholders | (388,320 | ) | (383,959 | ) | ||||||
|
|
|
| |||||||
Increase in net assets derived from capital share transactions (Note 4) | 976,392 | 725,411 | ||||||||
|
|
|
| |||||||
Total increase in net assets | 688,023 | 426,527 | ||||||||
|
|
|
| |||||||
Net Assets | ||||||||||
Beginning of year | 6,571,731 | 6,145,204 | ||||||||
|
|
|
| |||||||
End of year** | $ | 7,259,754 | $ | 6,571,731 | ||||||
|
|
|
| |||||||
| * | Distributions from net investment income and from realized capital gains are no longer required to be separately disclosed. See Note 1. For the year ended April 30, 2018, distributions from net investment income and net realized capital gains were $383,959 and $0, respectively |
| ** | Parenthetical disclosure of accumulated net investment income/(loss) is no longer required. See Note 1. For the year ended April 30, 2018, end of year net assets included accumulated net investment income of $55,342. |
The accompanying notes are an integral part of the financial statements.
26
DUPONT CAPITAL EMERGING MARKETS FUND
Financial Highlights
Contained below is per share operating performance data for Class I shares outstanding, total investment return, ratios to average net assets and other supplemental data for the respective period. The total returns in the table represent the rate that an investor would have earned or lost on an investment in the Fund (assuming reinvestment of all dividends and distributions). This information has been derived from information provided in the financial statements and should be read in conjunction with the financial statements and the notes thereto.
| Class I | |||||||||||||||||||||||||
| For the Year Ended April 30, 2019 | For the Year Ended April 30, 2018 | For the Year Ended April 30, 2017 | For the Year Ended April 30, 2016 | For the Year Ended April 30, 2015 | |||||||||||||||||||||
Per Share Operating Performance | |||||||||||||||||||||||||
Net asset value, beginning of year | $ | 9.55 | $ | 7.97 | $ | 6.64 | $ | 8.28 | $ | 8.79 | |||||||||||||||
|
|
|
|
|
|
|
|
|
| ||||||||||||||||
Net investment income(1) | 0.18 | 0.14 | 0.11 | 0.13 | 0.17 | ||||||||||||||||||||
Net realized and unrealized gain/(loss) on investments | (0.72 | ) | 1.59 | 1.32 | (1.73 | ) | (0.53 | ) | |||||||||||||||||
|
|
|
|
|
|
|
|
|
| ||||||||||||||||
Net increase/(decrease) in net assets resulting from operations | (0.54 | ) | 1.73 | 1.43 | (1.60 | ) | (0.36 | ) | |||||||||||||||||
|
|
|
|
|
|
|
|
|
| ||||||||||||||||
Dividends and distributions to shareholders from: | |||||||||||||||||||||||||
Net investment income | (0.16 | ) | (0.15 | ) | (0.10 | ) | (0.04 | ) | (0.15 | ) | |||||||||||||||
|
|
|
|
|
|
|
|
|
| ||||||||||||||||
Net asset value, end of year | $ | 8.85 | $ | 9.55 | $ | 7.97 | $ | 6.64 | $ | 8.28 | |||||||||||||||
|
|
|
|
|
|
|
|
|
| ||||||||||||||||
Total investment return(2) | (5.46 | )% | 21.82 | % | 21.77 | % | (19.23 | )% | (3.97 | )% | |||||||||||||||
Ratios/Supplemental Data | |||||||||||||||||||||||||
Net assets, end of year (in thousands) | $ | 25,462 | $ | 29,004 | $ | 30,816 | $ | 54,137 | $ | 166,994 | |||||||||||||||
Ratio of expenses to average net assets | 1.27 | % | 1.27 | % | 1.39 | % | 1.60 | % | 1.35 | % | |||||||||||||||
Ratio of expenses to average net assets without waivers and expense reimbursements(3) | 2.37 | % | 2.17 | % | 2.06 | % | 1.63 | % | 1.35 | % | |||||||||||||||
Ratio of net investment income to average net assets | 2.05 | % | 1.52 | % | 1.51 | % | 1.81 | % | 1.95 | % | |||||||||||||||
Portfolio turnover rate | 34.7 | % | 64.9 | % | 28.3 | % | 53.3 | % | 86.4 | % | |||||||||||||||
| (1) | The selected per share data was calculated using the average shares outstanding method for the year. |
| (2) | Total investment return is calculated assuming a purchase of shares on the first day and a sale of shares on the last day of each period reported and includes reinvestment of dividends and distributions, if any. |
| (3) | During the period, certain fees were waived and/or reimbursed. If such fee waivers and/or reimbursements had not occurred, the ratios would have been as indicated (See Note 2). |
The accompanying notes are an integral part of the financial statements.
27
DUPONT CAPITAL EMERGING MARKETS DEBT FUND
Financial Highlights
Contained below is per share operating performance data for Class I shares outstanding, total investment return, ratios to average net assets and other supplemental data for the respective period. The total returns in the table represent the rate that an investor would have earned or lost on an investment in the Fund (assuming reinvestment of all dividends and distributions). This information has been derived from information provided in the financial statements and should be read in conjunction with the financial statements and the notes thereto.
| Class I | |||||||||||||||||||||||||
| For the Year Ended April 30, 2019 | For the Year Ended April 30, 2018 | For the Year Ended April 30, 2017 | For the Year Ended April 30, 2016 | For the Year Ended April 30, 2015 | |||||||||||||||||||||
Per Share Operating Performance | |||||||||||||||||||||||||
Net asset value, beginning of year | $ | 9.35 | $ | 9.79 | $ | 9.56 | $ | 9.77 | $ | 10.26 | |||||||||||||||
|
|
|
|
|
|
|
|
|
| ||||||||||||||||
Net investment income(1) | 0.48 | 0.53 | 0.66 | 0.74 | 0.67 | ||||||||||||||||||||
Net realized and unrealized gain/(loss) on investments | (0.40 | ) | (0.38 | ) | 0.11 | 0.21 | (0.43 | ) | |||||||||||||||||
|
|
|
|
|
|
|
|
|
| ||||||||||||||||
Net increase in net assets resulting from operations | 0.08 | 0.15 | 0.77 | 0.95 | 0.24 | ||||||||||||||||||||
|
|
|
|
|
|
|
|
|
| ||||||||||||||||
Dividends and distributions to shareholders from: | |||||||||||||||||||||||||
Net investment income | (0.52 | ) | (0.59 | ) | (0.52 | ) | (0.98 | ) | (0.44 | ) | |||||||||||||||
Net realized capital gains | — | — | (0.02 | ) | (0.18 | ) | (0.29 | ) | |||||||||||||||||
|
|
|
|
|
|
|
|
|
| ||||||||||||||||
Total dividends and distributions to shareholders | (0.52 | ) | (0.59 | ) | (0.54 | ) | (1.16 | ) | (0.73 | ) | |||||||||||||||
|
|
|
|
|
|
|
|
|
| ||||||||||||||||
Net asset value, end of year | $ | 8.91 | $ | 9.35 | $ | 9.79 | $ | 9.56 | $ | 9.77 | |||||||||||||||
|
|
|
|
|
|
|
|
|
| ||||||||||||||||
Total investment return(2) | 1.16 | % | 1.46 | % | 8.45 | % | 10.82 | % | 2.41 | % | |||||||||||||||
Ratios/Supplemental Data | |||||||||||||||||||||||||
Net assets, end of year (in thousands) | $ | 7,260 | $ | 6,572 | $ | 6,145 | $ | 5,810 | $ | 7,427 | |||||||||||||||
Ratio of expenses to average net assets | 0.89 | % | 0.89 | % | 0.89 | % | 0.89 | % | 0.89 | % | |||||||||||||||
Ratio of expenses to average net assets without waivers and expense reimbursements(3) | 3.92 | % | 3.46 | % | 3.70 | % | 3.34 | % | 2.25 | % | |||||||||||||||
Ratio of net investment income to average net assets | 5.45 | % | 5.45 | % | 6.84 | % | 7.93 | % | 6.70 | % | |||||||||||||||
Portfolio turnover rate | 10.4 | % | 16.9 | % | 17.9 | % | 24.6 | % | 23.7 | % | |||||||||||||||
| (1) | The selected per share data was calculated using the average shares outstanding method for the year. |
| (2) | Total investment return is calculated assuming a purchase of shares on the first day and a sale of shares on the last day of each period reported and includes reinvestment of dividends and distributions, if any. |
| (3) | During the period, certain fees were waived and/or reimbursed. If such fee waivers and/or reimbursements had not occurred, the ratios would have been as indicated (See Note 2). |
The accompanying notes are an integral part of the financial statements.
28
DUPONT CAPITAL FUNDS
Notes to Financial Statements
April 30, 2019
1. Organization and Significant Accounting Policies
The DuPont Capital Emerging Markets Fund is a diversified,open-end management investment company registered under the Investment Company Act of 1940, as amended (the “1940 Act”). The DuPont Capital Emerging Markets Debt Fund is anon-diversified,open-end management investment company registered under the 1940 Act (the DuPont Capital Emerging Markets Fund and the DuPont Capital Emerging Markets Debt Fund are each a “Fund”, and together, the “Funds”). The DuPont Capital Emerging Markets Fund commenced operations on December 6, 2010 and the DuPont Capital Emerging Markets Debt Fund commenced operations on September 27, 2013. The Funds are each a separate series of FundVantage Trust (the “Trust”) which was organized as a Delaware statutory trust on August 28, 2006. The Trust is a “series trust” authorized to issue an unlimited number of separate series or classes of shares of beneficial interest. Each series is treated as a separate entity for certain matters under the 1940 Act, and for other purposes, and a shareholder of one series is not deemed to be a shareholder of any other series. The Funds are each authorized to issue and offer Class I Shares.
The Funds are investment companies and follow accounting and reporting guidance in the Financial Accounting Standards Board Accounting Standards Codification Topic 946.
Portfolio Valuation— Each Fund’s net asset value (“NAV”) is calculated once daily at the closeof regular trading hours on the New York Stock Exchange (“NYSE”) (typically 4:00 p.m. Eastern time) on each day the NYSE is open. Securities held by each Fund are valued using the closing price or the last sale price on a national securities exchange or the National Association of Securities Dealers Automatic Quotation System (“NASDAQ”) market system where they are primarily traded. Equity securities listed on any national or foreign exchange market system will be valued at the last sale price. Equity securities traded in theover-the-counter market are valued at their closing price. If there were no transactions on that day, securities traded principally on an exchange will be valued at the mean of the last bid and ask prices prior to the market close. Prices for equity securities normally are supplied by an independent pricing service approved by the Trust’s Board of Trustees (“Board of Trustees”). Fixed income securities are valued based on market quotations, which are furnished by an independent pricing service approved by the FundVantage Board of Trustees. Fixed income securities having remaining maturities of 60 days or less are generally valued at amortized cost, provided such amounts approximates market value. Debt securities are valued on the basis of broker quotations or valuations provided by a pricing service, which utilizes information with respect to recent sales, market transactions in comparable securities, quotations from dealers, and various relationships between securities in determining value. Due to continued volatility in the current market, valuations developed through pricing techniques may materially vary from the actual amounts realized upon sale of the securities. Any assets held by the Funds that are denominated in foreign currencies are valued daily in U.S. dollars at the foreign currency exchange rates that are prevailing at the time that the Funds determine the daily NAV per share. Foreign securities may trade on weekends or other days when the Funds do not calculate NAV. As a result, the market value of these investments may change on days when you cannot buy or sell shares of the Funds. Foreign securities are valued
29
DUPONT CAPITAL FUNDS
Notes to Financial Statements (Continued)
April 30, 2019
based on prices from the primary market in which they are traded and are translated from the local currency into U.S. dollars using current exchange rates. Forward exchange contracts are valued at the forward rate. Investments in any mutual fund are valued at their respective NAVs as determined by those mutual funds each business day (which may use fair value pricing as disclosed in their prospectuses). If market quotations are unavailable or deemed unreliable, securities will be valued in accordance with procedures adopted by the Board of Trustees. Relying on prices supplied by pricing services or dealers or using fair valuation may result in values that are higher or lower than the values used by other investment companies and investors to price the same investments. In the event that market quotes are not readily available, and the security or asset cannot be valued pursuant to one of the valuation methods, the value of the security or asset will be determined in good faith by the Adviser. The Trust has established a Valuation Committee which performs certain functions including the oversight of the Adviser’s fair valuation determinations.
Fair Value Measurements— The inputs and valuation techniques used to measure fair valueof each Fund’s investments are summarized into three levels as described in the hierarchy below:
• Level 1 — | quoted prices in active markets for identical securities; | |
• Level 2 — | other significant observable inputs (including quoted prices for similar securities, interest rates, prepayment speeds, credit risk, etc.); and | |
• Level 3 — | significant unobservable inputs (including each Fund’s own assumptions in determining the fair value of investments). | |
The fair value of each Fund’s bonds is generally based on quotes received from brokers or independent pricing services. Bonds with quotes that are based on actual trades with a sufficient level of activity on or near the measurement date are classified as Level 2 assets.
The inputs or methodology used for valuing securities are not necessarily an indication of the risk associated with investing in those securities. Transfers in and out are recognized at the value at the end of the period.
Significant events (such as movement in the U.S. securities market, or other regional and local developments) may occur between the time that foreign markets close (where the security is principally traded) and the time that each Fund calculates its NAV (generally, the close of the NYSE) that may impact the value of securities traded in these foreign markets. As a result, each Fund fair values foreign securities using an independent pricing service which considers the correlation of the trading patterns of the foreign security to the intraday trading in the U.S. markets for investments such as American Depositary Receipts, financial futures, exchange traded funds and certain indexes as well as prices for similar securities. Such fair valuations are categorized as Level 2 in the hierarchy.
30
DUPONT CAPITAL FUNDS
Notes to Financial Statements (Continued)
April 30, 2019
Securities listed on anon-U.S. exchange are generally fair valued daily by an independent fair value pricing service approved by the Board of Trustees and categorized as Level 2 investments within the hierarchy. The fair valuations for these securities may not be the same as quoted or published prices of the securities on their primary markets. Securities for which daily fair value prices from the independent fair value pricing service are not available are generally valued at the last quoted sale price at the close of an exchange on which the security is traded and categorized as Level 1 investments within the hierarchy. Values of foreign securities, currencies, and other assets and liabilities denominated in foreign currencies are translated into U.S. dollars at the exchange rate of said currencies against the U.S. dollar, as of valuation time, as provided by an independent pricing service approved by the Board of Trustees.
The following is a summary of the inputs used, as of April 30, 2019, in valuing each Fund’s investments carried at fair value:
| DuPont Capital Emerging Markets Fund | ||||||||||||||||
Assets | Total Value at 04/30/19 | Level 1 Quoted Prices | Level 2 Other Significant Observable Inputs | Level 3 Significant Unobservable Inputs | ||||||||||||
Common Stocks | ||||||||||||||||
Argentina | $ | 297,422 | $ | 297,422 | $ | — | $ | — | ||||||||
Brazil | 939,549 | 939,549 | — | — | ||||||||||||
China | 7,333,732 | 1,247,070 | 6,086,662 | — | ||||||||||||
Czech Republic | 337,707 | — | 337,707 | — | ||||||||||||
Greece | 217,316 | — | 217,316 | — | ||||||||||||
India | 1,316,739 | 267,598 | 1,049,141 | — | ||||||||||||
Indonesia | 348,096 | — | 348,096 | — | ||||||||||||
Malaysia | 404,928 | — | 404,928 | — | ||||||||||||
Mexico | 597,378 | 597,378 | — | — | ||||||||||||
Poland | 101,033 | — | 101,033 | — | ||||||||||||
Russia | 1,300,970 | 448,205 | 852,765 | — | ||||||||||||
Saudi Arabia | 536,593 | 267,929 | 268,664 | — | ||||||||||||
South Africa | 2,910,164 | 507,401 | 2,402,763 | — | ||||||||||||
South Korea | 3,557,058 | — | 3,557,058 | — | ||||||||||||
Taiwan | 2,500,156 | 1,201,720 | 1,298,436 | — | ||||||||||||
Thailand | 270,725 | — | 270,725 | — | ||||||||||||
Turkey | 522,700 | 172,331 | 350,369 | — | ||||||||||||
Preferred Stocks | 909,859 | 909,859 | — | — | ||||||||||||
Exchange Traded Funds | 930,701 | 930,701 | — | — | ||||||||||||
|
|
|
|
|
|
|
| |||||||||
Total Investments | $ | 25,332,826 | $ | 7,787,163 | $ | 17,545,663 | $ | — | ||||||||
|
| �� |
|
|
|
|
|
| ||||||||
31
DUPONT CAPITAL FUNDS
Notes to Financial Statements (Continued)
April 30, 2019
| DuPont Capital Emerging Markets Debt Fund | ||||||||||||||||
Assets | Total Value at 04/30/19 | Level 1 Quoted Prices | Level 2 Other Significant Observable Inputs | Level 3 Significant Unobservable Inputs | ||||||||||||
Corporate Bonds and Notes | $ | 1,287,720 | $ | — | $ | 1,287,720 | $ | — | ||||||||
Foreign Government Bonds and Notes | 5,208,058 | — | 5,208,058 | — | ||||||||||||
U.S. Treasury Obligations | 393,398 | — | 393,398 | — | ||||||||||||
Common Stocks | 385 | — | 385 | — | ||||||||||||
Derivatives: | ||||||||||||||||
Foreign Currency Contracts | ||||||||||||||||
Forward Foreign Currency Contracts | 907 | — | 907 | — | ||||||||||||
|
|
|
|
|
|
|
| |||||||||
Total Assets | $ | 6,890,468 | $ | — | $ | 6,890,468 | $ | — | ||||||||
|
|
|
|
|
|
|
| |||||||||
At the end of each quarter, management evaluates the classification of Levels 1, 2 and 3 assets and liabilities. Various factors are considered, such as changes in liquidity from the prior reporting period; whether or not a broker is willing to execute at the quoted price; the depth and consistency of prices from third party pricing services; and the existence of contemporaneous, observable trades in the market. Additionally, management evaluates the classification of Level 1 and Level 2 assets and liabilities on a quarterly basis for changes in listings or delistings on national exchanges.
Due to the inherent uncertainty of determining the fair value of investments that do not have readily available market value, the fair value of each Fund’s investments may fluctuate from period to period. Additionally, the fair value of investments may differ significantly from the values that would have been used had a ready market existed for such investments and may differ materially from the values each Fund may ultimately realize. Further, such investments may be subject to legal and other restrictions on resale or otherwise less liquid than publicly traded securities.
For fair valuations using significant unobservable inputs, U.S. generally accepted accounting principles (“U.S. GAAP”) require each Fund to present a reconciliation of the beginning to ending balances for reported market values that present changes attributable to total realized and unrealized gains or losses, purchase and sales, and transfers in and out of Level 3 during the period. A reconciliation of Level 3 investments is presented only when each Fund had an amount of Level 3 investments at the end of the reporting period that was meaningful in relation to its net assets. The amounts and reasons for all transfers in and out of each Level within the three-tier hierarchy are disclosed when each Fund had an amount of total transfers during the reporting period that was meaningful in relation to its net assets as of the end of the reporting period.
For the year ended April 30, 2019, there were no transfers between Levels.
32
DUPONT CAPITAL FUNDS
Notes to Financial Statements (Continued)
April 30, 2019
Use of Estimates— The preparation of financial statements in conformity with U.S. GAAP requiresmanagement to make estimates and assumptions that affect the amounts reported in the financial statements and accompanying notes at the date of the financial statements and the reported amounts of revenues and expenses during the period. Actual results could differ from those estimates and those differences could be material.
Investment Transactions, Investment Income and Expenses— Investment transactions arerecorded on trade date for financial statement preparation purposes. Realized gains and losses on investments sold are recorded on the identified cost basis. Interest income is recorded on the accrual basis. Accretion of discounts and amortization of premiums are recorded on a daily basis using the effective yield method except for short term securities, which records discounts and premiums on a straight-line basis. Dividends are recorded on theex-dividend date. Estimated components of distributions received from real estate investment trusts may be considered income, return of capital distributions or capital gain distributions. Return of capital distributions are recorded as a reduction of cost of the related investments. General expenses of the Trust are generally allocated to each fund in proportion to its relative daily net assets. Expenses directly attributable to a particular fund in the Trust are charged directly to that fund.
Foreign Currency Translation— Assets and liabilities initially expressed innon-U.S. currenciesare translated into U.S. dollars based on the applicable exchange rates at the date of the last business day of the financial statement period. Purchases and sales of securities, interest income, dividends, variation margin received and expenses denominated in foreign currencies are translated into U.S. dollars at the exchange rates in effect on the transaction date.
Each Fund does not separately report the effect of changes in foreign exchange rates from changes in market prices of securities held. Such changes are included with the net realized gain or loss and change in unrealized appreciation or depreciation on investment securities in the Statement of Operations. Other foreign currency transactions resulting in realized and unrealized gain or loss are reported separately as net realized gain or loss and change in unrealized appreciation or depreciation on foreign currencies in the Statement of Operations.
Dividends and Distributions to Shareholders— Dividends from net investment income, if any,are declared and paid at least annually to shareholders of the DuPont Capital Emerging Markets Fund and dividends from net investment income are declared daily and paid monthly to shareholders of the DuPont Capital Emerging Markets Debt Fund. Distributions from net realized capital gains, if any, will be declared and paid at least annually to shareholders and recorded onex-date for both Funds. Income dividends and capital gain distributions are determined in accordance with U.S. federal income tax regulations, which may differ from U.S. GAAP.
33
DUPONT CAPITAL FUNDS
Notes to Financial Statements (Continued)
April 30, 2019
U.S. Tax Status— No provision is made for U.S. income taxes as it is each Fund’s intention tocontinue to qualify for and elect the tax treatment applicable to regulated investment companies under Subchapter M of the Internal Revenue Code of 1986, as amended (the “Internal Revenue Code”), and make the requisite distributions to its shareholders which will be sufficient to relieve it from U.S. income and excise taxes.
Other— In the normal course of business, each Fund may enter into contracts that provide generalindemnifications. Each Fund’s maximum exposure under these arrangements is dependent on claims that may be made against each Fund in the future, and, therefore, cannot be estimated; however, based on experience, the risk of material loss for such claims is considered remote.
Forward Foreign Currency Contracts— A forward foreign currency contract (“Forward Contract”)is a commitment to buy or sell a specific amount of a foreign currency at a negotiated price on a specified future date. Forward Contracts can help a fund manage the risk of changes in currency exchange rates. These contracts aremarked-to-market daily at the applicable forward currency translation rates. A fund records realized gains or losses at the time the Forward Contract is closed. A Forward Contract is extinguished through a closing transaction or upon delivery of the currency or entering an offsetting contract. The Fund’s maximum risk of loss from counterparty credit risk related to Forward Contracts is the fair value of the contract.
For the year ended April 30, 2019, the average monthly volume of forward foreign currency contracts of the DuPont Capital Emerging Markets Debt Fund was as follows:
| Forward Foreign Currency Contracts - Payable (Value At Trade Date) | Forward Foreign Currency Contracts - Receivable (Value At Trade Date) | |||
DuPont Capital Emerging Markets Debt Fund | $(24,168) | $24,168 |
Sovereign Debt Risk— The DuPont Capital Emerging Markets Debt Fund invests predominantlyin sovereign debt securities issued or guaranteed by governments of emerging market countries, their agencies or instrumentalities, or other government-related entities. Investments in sovereign debt are subject to risks including, but are not limited to, the risk that a governmental entity may delay or refuse, or otherwise be unable, to pay interest or repay the principal on its sovereign debt. There may also be no legal process for collecting sovereign debt that a government does not pay or bankruptcy proceedings through which all or part of such sovereign debt may be collected.
Currency Risk— Each Fund invests in securities of foreign issuers, including American DepositaryReceipts. These markets are subject to special risks associated with foreign investments not typically associated with investing in U.S. markets. Because the foreign securities in which each Fund may invest generally trade in currencies other than the U.S. dollar, changes in currency exchange rates will affect each
34
DUPONT CAPITAL FUNDS
Notes to Financial Statements (Continued)
April 30, 2019
Fund’s NAV, the value of dividends and interest earned and gains and losses realized on the sale of securities. Because the NAV for each Fund is determined on the basis of U.S. dollars, each Fund may lose money by investing in a foreign security if the local currency of a foreign market depreciates against the U.S. dollar, even if the local currency value of each Fund’s holdings goes up. Generally, a strong U.S. dollar relative to these other currencies will adversely affect the value of each Fund’s holdings in foreign securities.
Foreign Securities Market Risk— Securities of manynon-U.S. companies may be less liquidand their prices more volatile than securities of comparable U.S. companies. Securities of companies traded in many countries outside the U.S., particularly emerging markets countries, may be subject to further risks due to the inexperience of local investment professionals and financial institutions, the possibility of permanent or temporary termination of trading and greater spreads between bid and asked prices of securities. In addition,non-U.S. stock exchanges and investment professionals are subject to less governmental regulation, and commissions may be higher than in the United States. Also, there may be delays in the settlement ofnon-U.S. stock exchange transactions.
Emerging Markets Risk— Each Fund invests in emerging market instruments which are subjectto certain credit and market risks. The securities and currency markets of emerging market countries are generally smaller, less developed, less liquid and more volatile than the securities and currency markets of the United States and other developed markets. Disclosure and regulatory standards in many respects are less stringent than in other developed markets. There also may be a lower level of monitoring and regulation of securities markets in emerging market countries and the activities of investors in such markets and enforcement of existing regulations may be extremely limited. Political and economic structures in many of these countries may be in their infancy and developing rapidly, and such countries may lack the social, political and economic stability characteristics of more developed countries.
Debt Investment Risk— Debt investments are affected primarily by the financial condition of thecompanies or other entities that have issued them and by changes in interest rates. There is a risk that an issuer of a Fund’s debt investments may not be able to meet its financial obligations (e.g., may not be able to make principal and/or interest payments when they are due or otherwise default on other financial terms) and/or go bankrupt. Securities such as high-yield/high-risk bonds, e.g., bonds with low credit ratings by Moody’s (Ba or lower) or Standard & Poor’s (BB and lower) or if unrated are of comparable quality as determined by the manager, are especially subject to credit risk during periods of economic uncertainty or during economic downturns and are more likely to default on their interest and/or principal payments than higher rated securities. Debt investments may be affected by changes in interest rates. Debt investments with longer durations tend to be more sensitive to changes in interest rates, making them more volatile than debt investments with shorter durations or floating or adjustable interest rates. The value of debt investments may fall when interest rates rise.
35
DUPONT CAPITAL FUNDS
Notes to Financial Statements (Continued)
April 30, 2019
Recent Accounting Pronouncement— Effective November 5, 2018, the SEC amended existingrules intended to modernize reporting and disclosure of information. These amendments relate to RegulationS-X which sets forth the form and content of financial statements. The amendment requires collapsing the components of distributable earnings on the Statement of Assets and Liabilities and collapsing the distributions paid to shareholders on the Statements of Changes in Net Assets. Management has evaluated the implications of adopting these amendments and determined there is no significant impact on the financial statements and accompanying notes.
2. Transactions with Related Parties and Other Service Providers
DuPont Capital Management Corporation (“DuPont Capital” or the “Adviser”) serves as investment adviser to each Fund pursuant to an investment advisory agreement with the Trust. For its services, the Adviser is paid a monthly fee at the annual rate of 1.05% of the DuPont Capital Emerging Markets Fund’s average daily net assets; and 0.60% of the DuPont Capital Emerging Markets Debt Fund’s average daily net assets. The Adviser has contractually agreed to reduce its investment advisory fee and/or reimburse certain expenses of each Fund to the extent necessary to ensure that the Funds’ total operating expenses, excluding taxes, fees and expenses attributable to a distribution or service plan adopted by the Trust, “Acquired Fund Fees and Expenses,” interest, extraordinary items, and brokerage commissions, do not exceed 1.27% and 0.89%, respectively, (on an annual basis) of the DuPont Capital Emerging Markets Fund and the DuPont Capital Emerging Markets Debt Fund’s average daily net assets (the “Expense Limitation”), respectively. The Expense Limitations will each remain in place until August 31, 2019, unless the Board of Trustees approves their earlier termination. The Adviser is entitled to recover, subject to approval by the Board of Trustees, such amounts reduced or reimbursed for a period of up to three (3) years from the date on which the Adviser reduced its compensation and/or assumed expenses for each Fund. The Adviser is permitted to seek reimbursement from the Funds, subject to certain limitations, for fees it waived and Fund expenses it paid to the extent the total annual fund expenses do not exceed the limits described above or any lesser limits in effect at the time of reimbursement. No recoupment will occur unless each Fund’s expenses are below the respective Expense Limitation amounts.
For the year ended April 30, 2019, the Adviser earned advisory fees of $250,538 and $41,045 for the DuPont Capital Emerging Markets Fund and the DuPont Capital Emerging Markets Debt Fund, respectively. For the year ended April 30, 2019, the Adviser waived and reimbursed fees and expenses of $261,409 and $207,576 for the DuPont Capital Emerging Markets Fund and the DuPont Capital Emerging Markets Debt Fund, respectively.
36
DUPONT CAPITAL FUNDS
Notes to Financial Statements (Continued)
April 30, 2019
As of April 30, 2019, the amount of potential recoupment by the Adviser was as follows:
| Expiration 04/30/2020 | Expiration 04/30/2021 | Expiration 04/30/2022 | Total | |||||||||||||
DuPont Capital Emerging Markets Fund | $ | 263,954 | $ | 295,495 | $ | 261,409 | $ | 820,858 | ||||||||
DuPont Capital Emerging Markets Debt Fund | 167,169 | 166,742 | 207,576 | 541,487 | ||||||||||||
Other Service Providers
The Bank of New York Mellon (“BNY Mellon”) serves as administrator and custodian for the Funds. For providing administrative and accounting services, BNY Mellon is entitled to receive a monthly fee equal to an annual percentage rate of the Funds’ average daily net assets and is subject to certain minimum monthly fees. For providing certain custodial services, BNY Mellon is entitled to receive a monthly fee, subject to certain minimum, and out of pocket expenses.
BNY Mellon Investment Servicing (US) Inc. (the “Transfer Agent”) provides transfer agent services to the Funds. The Transfer Agent is entitled to receive a monthly fee, subject to certain minimum, and out of pocket expenses.
Foreside Funds Distributors LLC (the “Underwriter”) provides principal underwriting services to the Funds pursuant to an underwriting agreement between the Trust and the Underwriter.
Trustees and Officers
The Trust is governed by its Board of Trustees. The Trustees of the Trust receive compensation in the form of an annual retainer and per meeting fees for their services to the Trust. The remuneration paid to the Trustees by the Funds during the year ended April 30, 2019 was $8,894 for the DuPont Capital Emerging Markets Fund and $2,497 for the DuPont Capital Emerging Markets Debt Fund. An employee of BNY Mellon serves as the Secretary of the Trust and is not compensated by the Funds or the Trust.
JW Fund Management LLC (“JWFM”) provides a Principal Executive Officer and Principal Financial Officer, respectively, to the Trust. Duff & Phelps, LLC (“D&P”) provides the Trust with a Chief Compliance Officer and an Anti-Money Laundering Officer. JWFM and D&P are compensated for their services provided to the Trust.
37
DUPONT CAPITAL FUNDS
Notes to Financial Statements (Continued)
April 30, 2019
3. Investment in Securities
For the year ended April 30, 2019, aggregate purchases and sales of investment securities (excluding U.S. Government and agency short-term investments and other short-term investments) of the Funds were as follows:
| Purchases | Sales | |||||||
DuPont Capital Emerging Markets Fund Investment Securities | $ | 8,293,015 | $ | 9,721,161 | ||||
DuPont Capital Emerging Markets Debt Fund Investment Securities | $ | 1,886,594 | $ | 669,321 | ||||
4. Capital Share Transactions
For the years ended April 30, 2019 and 2018, transactions in capital shares (authorized shares unlimited) were as follows:
| DuPont Capital Emerging Markets Fund | ||||||||||||||||
| For the Year Ended April 30, 2019 | For the Year Ended April 30, 2018 | |||||||||||||||
| Shares | Amount | Shares | Amount | |||||||||||||
Class I | ||||||||||||||||
Sales | 108,199 | $ 942,412 | 147,489 | $ 1,403,791 | ||||||||||||
Reinvestments | 54,923 | 436,646 | 57,718 | 517,157 | ||||||||||||
Redemptions | (322,209 | ) | (2,969,232 | ) | (1,035,378 | ) | (9,758,845 | ) | ||||||||
Net decrease | (159,087 | ) | $(1,590,174 | ) | (830,171 | ) | $(7,837,897 | ) | ||||||||
| DuPont Capital Emerging Markets Debt Fund | ||||||||||||||||
| For the Year Ended April 30, 2019 | For the Year Ended April 30, 2018 | |||||||||||||||
| Shares | Amount | Shares | Amount | |||||||||||||
Class I | ||||||||||||||||
Sales | 66,855 | $588,072 | 34,630 | $341,452 | ||||||||||||
Reinvestments | 45,552 | 388,320 | 40,104 | 383,959 | ||||||||||||
Net increase | 112,407 | $976,392 | 74,734 | $725,411 | ||||||||||||
38
DUPONT CAPITAL FUNDS
Notes to Financial Statements (Continued)
April 30, 2019
5. Federal Tax Information
The Funds have followed the authoritative guidance on accounting for and disclosure of uncertainty in tax positions, which requires the Funds to determine whether a tax position is more likely than not to be sustained upon examination, including resolution of any related appeals or litigation processes, based on the technical merits of the position. Each Fund has determined that there was no effect on the financial statements from following this authoritative guidance. In the normal course of business, the Funds are subject to examination by federal, state and local jurisdictions, where applicable, for tax years for which applicable statutes of limitations have not expired.
Distributions are determined in accordance with federal income tax regulations, which may differ in amount or character from net investment income and realized gains for financial reporting purposes. Accordingly, the character of distributions and composition of net assets for tax purposes may differ from those reflected in the accompanying financial statements. To the extent these differences are permanent, such amounts are reclassified within the components of net assets based on the tax treatment; temporary differences do not require reclassifications. For the year ended April 30, 2019, there were no reclassifications.
For the year ended April 30, 2019, the tax character of distributions paid by the DuPont Capital Emerging Markets Fund and the DuPont Capital Emerging Markets Debt Fund were $436,646 and $388,320 of ordinary income dividends, respectively. For the year ended April 30, 2018, the tax character of distributions paid by the DuPont Capital Emerging Markets Fund and the DuPont Capital Emerging Markets Debt Fund were $517,157 and $383,959 of ordinary income dividends, respectively. Distributions from net investment income and short-term capital gains are treated as ordinary income for federal income tax purposes.
As of April 30, 2019, the components of distributable earnings on a tax basis were as follows:
| Capital Loss Carryforward | Undistributed Ordinary Income | Undistributed Long-Term Gain | Unrealized Appreciation/ (Depreciation) | Total Distributable Earnings | ||||||||||
DuPont Capital Emerging Markets Fund | $ | (85,073,823 | ) | $ 34,659 | $ — | $3,373,444 | $ | (81,665,720 | ) | |||||
DuPont Capital Emerging Markets Debt Fund | $ | — | $159,023 | $900 | $ (862,588) | $ | (702,665 | ) | ||||||
The differences between the book and tax basis components of distributable earnings relate primarily to the timing and recognition of income and gains for federal income tax purposes.
39
DUPONT CAPITAL FUNDS
Notes to Financial Statements (Concluded)
April 30, 2019
At April 30, 2019, the federal tax cost, aggregate gross unrealized appreciation and depreciation of securities held by the Funds were as follows:
| Federal Tax Cost | Unrealized Appreciation | Unrealized Depreciation | Net Unrealized Appreciation/ (Depreciation) | |||||||||||||
DuPont Capital Emerging Markets Fund | $ | 21,958,469 | $ | 6,243,472 | $ | (2,869,115 | ) | $3,374,357 | ||||||||
DuPont Capital Emerging Markets Debt Fund | 7,750,656 | 282,780 | (1,144,305 | ) | (861,525 | ) | ||||||||||
Pursuant to federal income tax rules applicable to regulated investment companies, the Funds may elect to treat certain net capital losses between November 1 and April 30 and late year ordinary losses ((i) ordinary losses between January 1 and April 30 and (ii) specified ordinary and currency losses between November 1 and April 30) as occurring on the first day of the following tax year. For the year ended April 30, 2019, any amount of losses elected within the tax return will not be recognized for federal income tax purposes until May 1, 2019. For the year ended April 30, 2019, the Funds had no capital loss or late year ordinary loss deferrals.
Accumulated capital losses represent net capital loss carryforwards as of April 30, 2019 that may be available to offset future realized capital gains and thereby reduce future capital gains distributions. As of April 30, 2019, the DuPont Capital Emerging Markets Fund had capital loss carryforwards of $85,073,823, of which $60,530,727 are long-term losses and $24,543,096 are short-term losses and have an unlimited period of capital loss carryforward. As of April 30, 2019, the DuPont Capital Emerging Markets Debt Fund had no capital loss carryforwards. On November 27, 2015, the DuPont Capital Emerging Markets Fund experienced a more than 50% change of ownership as defined by Internal Revenue Code Section 382(g) giving rise to an annual capital loss carryforward limitation on the use ofpre-ownership change capital losses. At the time of the change the DuPont Capital Emerging Markets Fund had $83,500,000 of capital loss carryforwards impacted by the ownership change and the use of those losses against capital gains will be limited to $1,618,329 per tax year. The permitted annual capital loss, if not applied to capital gains in the tax year, will accumulate and be available in the next year for use.
During the year ended April 30, 2019, the DuPont Capital Emerging Markets Fund and the DuPont Capital Emerging Markets Debt Fund utilized $477,639 and $12,056, respectively, of prior year capital loss carryforwards.
6. Subsequent Events
Management has evaluated the impact of all subsequent events on each Fund through the date the financial statements were issued and has determined that there are no material subsequent events requiring recognition or disclosure in the financial statements.
40
DUPONT CAPITAL FUNDS
Report of Independent Registered Public Accounting Firm
To the Board of Trustees of FundVantage Trust and Shareholders of DuPont Capital Emerging Markets Fund and DuPont Capital Emerging Markets Debt Fund
Opinions on the Financial Statements
We have audited the accompanying statements of assets and liabilities, including the portfolios of investments, of DuPont Capital Emerging Markets Fund and DuPont Capital Emerging Markets Debt Fund (two of the funds constituting FundVantage Trust, hereafter collectively referred to as the “Funds”) as of April 30, 2019, the related statements of operations for the year ended April 30, 2019, the statements of changes in net assets for each of the two years in the period ended April 30, 2019, including the related notes, and the financial highlights for each of the five years in the period ended April 30, 2019 (collectively referred to as the “financial statements”). In our opinion, the financial statements present fairly, in all material respects, the financial position of each of the Funds as of April 30, 2019, the results of each of their operations for the year then ended, the changes in each of their net assets for each of the two years in the period ended April 30, 2019 and each of the financial highlights for each of the five years in the period ended April 30, 2019 in conformity with accounting principles generally accepted in the United States of America.
Basis for Opinions
These financial statements are the responsibility of the Funds’ management. Our responsibility is to express an opinion on the Funds’ financial statements based on our audits. We are a public accounting firm registered with the Public Company Accounting Oversight Board (United States) (PCAOB) and are required to be independent with respect to the Funds in accordance with the U.S. federal securities laws and the applicable rules and regulations of the Securities and Exchange Commission and the PCAOB.
We conducted our audits of these financial statements in accordance with the standards of the PCAOB. Those standards require that we plan and perform the audit to obtain reasonable assurance about whether the financial statements are free of material misstatement, whether due to error or fraud.
Our audits included performing procedures to assess the risks of material misstatement of the financial statements, whether due to error or fraud, and performing procedures that respond to those risks. Such procedures included examining, on a test basis, evidence regarding the amounts and disclosures in the financial statements. Our audits also included evaluating the accounting principles used and significant estimates made by management, as well as evaluating the overall presentation of the financial statements. Our procedures included confirmation of securities owned as of April 30, 2019 by correspondence with the custodian and brokers; when replies were not received from brokers, we performed other auditing procedures. We believe that our audits provide a reasonable basis for our opinions.
/s/PricewaterhouseCoopers LLP
Philadelphia, Pennsylvania
June 24, 2019
We have served as the auditor of one or more DuPont Capital Management Corporation investment companies since 2011.
41
DUPONT CAPITAL FUNDS
Shareholder Tax Information
(Unaudited)
The DuPont Capital Emerging Markets Fund and the DuPont Capital Emerging Markets Debt Fund are required by Subchapter M of the Internal Revenue Code to advise its shareholders of the U.S. federal tax status of distributions received by the Funds’ shareholders in respect of such fiscal year. During the fiscal year ended April 30, 2019, the DuPont Capital Emerging Markets Fund and the DuPont Capital Emerging Markets Debt Fund paid $436,646 and $388,320 of ordinary income dividends, respectively, to their shareholders. The DuPont Capital Emerging Markets Fund and the DuPont Capital Emerging Markets Debt Fund did not pay long-term capital gains dividend, to their shareholders. Dividends from net investment income and short-term capital gains are treated as ordinary income dividends for federal income tax purposes.
The DuPont Capital Emerging Markets Fund and the DuPont Capital Emerging Markets Debt Fund designate 100.00% and 0.00%, respectively, of the ordinary income distribution as qualified dividend income pursuant to the Jobs and Growth Tax Relief Reconciliation Act of 2003.
The percentage of qualified interest income related dividends not subject to withholding tax fornon-resident aliens and foreign corporations for the DuPont Capital Emerging Markets Fund and the DuPont Capital Emerging Markets Debt Fund is 0.14% and 1.99%, respectively.
The percentage of ordinary income dividends qualifying for the corporate dividends received deduction for the DuPont Capital Emerging Markets Fund and the DuPont Capital Emerging Markets Debt Fund is 0.00% and 0.00%, respectively.
The DuPont Capital Emerging Markets Fund and the DuPont Capital Emerging Markets Debt Fund designate 100.00% of the ordinary income distributions as qualified short-term gain pursuant to the American Jobs Creation Act of 2004.
The percentage of the ordinary income distribution paid by the DuPont Capital Emerging Markets Debt Fund during 2019 which was derived from U.S. Treasury securities was 1.62%. Such income is exempt from state and local tax in all states. However, many states, including New York and California, allow a tax exemption for a portion of the income earned only if a mutual fund has invested at least 50% of its assets at the end of each quarter of the Fund’s fiscal year in U.S. Government securities. The Fund did not meet this strict requirement in 2019. Due to the diversity in state and local tax law, it is recommended that you consult your personal tax adviser as to the applicability of the information provided to your specific situation.
The DuPont Capital Emerging Markets Fund paid foreign taxes and recognized foreign source income as follows:
Foreign Taxes Paid | Foreign Source Income | |
| $61,243 | $886,380 |
42
DUPONT CAPITAL FUNDS
Shareholder Tax Information
(Unaudited)
All designations are based on financial information available as of the date of this annual report and, accordingly, are subject to change. For each item, it is the intention of the DuPont Capital Emerging Markets Fund and the DuPont Capital Emerging Markets Debt Fund to designate the maximum amount permitted under the Internal Revenue Code of 1986, as amended, and the regulations thereunder.
Because the Funds’ fiscal year is not the calendar year, another notification will be sent with respect to calendar year 2019. The second notification, which will reflect the amount, if any, to be used by calendar year taxpayers on their U.S. federal income tax returns, will be made in conjunction with Form1099-DIV and will be mailed in January 2020.
Foreign shareholders will generally be subject to U.S. withholding tax on the amount of their ordinary income dividends. They will generally not be entitled to a foreign tax credit or deduction for the withholding taxes paid by the Funds, if any.
In general, dividends received bytax-exempt recipients (e.g., IRAs and Keoghs) need not be reported as taxable income for U.S. federal income tax purposes. However, some retirement trusts (e.g., corporate, Keogh and 403(b)(7) plans) may need this information for their annual information reporting.
Shareholders are advised to consult their own tax advisers with respect to the tax consequences of their investment in the Funds.
43
DUPONT CAPITAL FUNDS
Other Information
(Unaudited)
Proxy Voting
Policies and procedures that the Funds use to determine how to vote proxies relating to portfolio securities as well as information regarding how the Funds voted proxies relating to portfolio securities for the most recent12-month period ended June 30 are available without charge, upon request, by calling (888)447-0014 and on the Securities and Exchange Commission’s (“SEC”) website athttp://www.sec.gov.
Quarterly Portfolio Schedules
The Trust files its complete schedule of portfolio holdings with the SEC for the first and third fiscal quarters of each fiscal year (quarters ended July 31 and January 31) on FormN-Q. The Trust’s FormsN-Q are available on the SEC’s website athttp://www.sec.gov. FormN-Q is being rescinded. Once FormN-Q is rescinded, disclosure of the Funds’ complete holdings will be required to be made monthly on FormN-PORT, with every third month made available to the public by the Commission upon filing.
44
DUPONT CAPITAL FUNDS
Privacy Notice
(Unaudited)
The privacy of your personal financial information is extremely important to us. When you open an account with us, we collect a significant amount of information from you in order to properly invest and administer your account. We take very seriously the obligation to keep that information private and confidential, and we want you to know how we protect that important information.
We collect nonpublic personal information about you from applications or other forms you complete and from your transactions with us or our affiliates. We do not disclose information about you, or our former clients, to our affiliates or to service providers or other third parties, except as permitted by law. We share only the information required to properly administer your accounts, which enables us to send transaction confirmations, monthly or quarterly statements, financials and tax forms. Even within FundVantage Trust and its affiliated entities, a limited number of people who actually service accounts will have access to your personal financial information. Further, we do not share information about our current or former clients with any outside marketing groups or sales entities.
To ensure the highest degree of security and confidentiality, FundVantage Trust and its affiliates maintain various physical, electronic and procedural safeguards to protect your personal information. We also apply special measures for authentication of information you request or submit to us on our web site.
If you have questions or comments about our privacy practices, please call us at (888)447-0014.
45
DUPONT CAPITAL FUNDS
Fund Management
(Unaudited)
FundVantage Trust (the “Trust”) is governed by a Board of Trustees (the “Trustees”). The primary responsibility of the Trustees is to represent the interest of the Trust’s shareholders and to provide oversight management of the Trust.
The following tables present certain information regarding the Trustees and officers of the Trust. None of the Trustees are an “interested person” of the Trust, the Adviser, another investment adviser of a series of the Trust, or Foreside Funds Distributors LLC, the principal underwriter of the Trust (“Underwriter”), within the meaning of the 1940 Act and each Trustee is referred to as an “Independent Trustee” and is listed under such heading below. Employees of certain service providers to the Trust serve as officers of the Trust; such persons are not compensated by the Funds. The address of each Trustee and Officer as it relates to the Trust’s business is 301 Bellevue Parkway, 2nd Floor, Wilmington, DE 19809.
The Statement of Additional Information for each Fund contains additional information about the Trustees and is available, without charge, upon request by calling (888)447-0014.
Name and Date of Birth | Position(s) Held with Trust | Term of Office and Length of Time Served | Principal Occupation(s) During Past Five Years | Number of Funds in Trust Complex Overseen by Trustee | Other Directorships Held by Trustee | |||||
| INDEPENDENT TRUSTEES | ||||||||||
ROBERT J. CHRISTIAN Date of Birth: 2/49 | Trustee and Chairman of the Board | Shall serve until death, resignation or removal. Trustee and Chairman since 2007. | Retired since February 2006; Executive Vice President of Wilmington Trust Company from February 1996 to February 2006; President of Rodney Square Management Corporation (“RSMC”) (investment advisory firm) from 1996 to 2005; Vice President of RSMC from 2005 to 2006.
| 44 | Optimum Fund Trust (registered investment company with 6 portfolios). | |||||
IQBAL MANSUR Date of Birth: 6/55 | Trustee | Shall serve until death, resignation or removal. Trustee since 2007.
| University Professor, Widener University. | 44 | None. | |||||
46
DUPONT CAPITAL FUNDS
Fund Management (Continued)
(Unaudited)
Name and Date of Birth | Position(s) Held with Trust | Term of Office and Length of Time Served | Principal Occupation(s) During Past Five Years | Number of Funds in Trust Complex Overseen by Trustee | Other Directorships Held by Trustee | |||||
NICHOLAS M. MARSINI, JR. Date of Birth: 8/55 | Trustee | Shall serve until death, resignation or removal. Trustee since 2016. | Retired since March 2016. President of PNC Bank Delaware from June 2011 to March 2016; Executive Vice President of Finance of BNY Mellon from July 2010 to January 2011; Executive Vice President and Chief Financial Officer of PNC Global Investment Servicing from September 1997 to July 2010.
| 44 | Brinker Capital Destinations Trust (registered investment company with 10 portfolios). | |||||
NANCY B. WOLCOTT Date of Birth: 11/54 | Trustee | Shall serve until death, resignation or removal. Trustee since 2011. | Retired since May 2014; EVP, Head of GFI Client Service Delivery, BNY Mellon from January 2012 to May 2014; EVP, Head of US Funds Services, BNY Mellon from July 2010 to January 2012; President of PNC Global Investment Servicing from 2008 to July 2010; Chief Operating Officer of PNC Global Investment Servicing from 2007 to 2008; Executive Vice President of PFPC Worldwide Inc. from 2006 to 2007.
| 44 | Lincoln Variable Insurance Products Trust (registered investment company with 92 portfolios). | |||||
STEPHEN M. WYNNE Date of Birth: 1/55 | Trustee | Shall serve until death, resignation or removal. Trustee since 2009. | Retired since December 2010; Chief Executive Officer of US Funds Services, BNY Mellon Asset Servicing from July 2010 to December 2010; Chief Executive Officer of PNC Global Investment Servicing from March 2008 to July 2010; President, PNC Global Investment Servicing from 2003 to 2008.
| 44 | Copeland Trust (registered investment company with 2 portfolios). | |||||
47
DUPONT CAPITAL FUNDS
Fund Management (Concluded)
(Unaudited)
Name and Date of Birth | Position(s) Held with Trust | Term of Office and Length of Time Served | Principal Occupation(s) During Past Five Years | |||
| EXECUTIVE OFFICERS | ||||||
JOEL L. WEISS Date of Birth: 1/63 | President and Chief Executive Officer | Shall serve until death, resignation or removal. Officer since 2007. | President of JW Fund Management LLC since June 2016; Vice President and Managing Director of BNY Mellon Investment Servicing (US) Inc. and predecessor firms from 1993 to June 2016.
| |||
T. RICHARD KEYES Date of Birth: 1/57 | Treasurer and Chief Financial Officer | Shall serve until death, resignation or removal. Officer since 2016. | President of TRK Fund Consulting LLC since July 2016; Head of Tax — U.S. Fund Services of BNY Mellon Investment Servicing (US) Inc. and predecessor firms from February 2006 to July 2016.
| |||
GABRIELLA MERCINCAVAGE Date of Birth: 6/68 | Assistant Treasurer | Shall serve until death, resignation or removal. Officer since 2019. | Fund Administration Consultant since January 2019; Fund Accounting and Tax Compliance Accountant to financial services companies from November 2003 to July 2018.
| |||
VINCENZO A. SCARDUZIO Date of Birth: 4/72 | Secretary | Shall serve until death, resignation or removal. Officer since 2012. | Director and Vice President Regulatory Administration of The Bank of New York Mellon and predecessor firms since 2001.
| |||
DAVID C. LEBISKY Date of Birth: 5/72 | Chief Compliance Officer and Anti-Money Laundering Officer | Shall serve until death, resignation or removal. Officer since 2015. | President of Lebisky Compliance Consulting LLC since October 2015; Consultant, Duff & Phelps, LLC since 2016; Senior Consultant, Freeh Group International Solutions, LLC (a global risk management firm) from 2015 to 2018; Scotia Institutional Investments US, LP, Director of Regulatory Administration from 2010 to 2014.
| |||
48
[THIS PAGE INTENTIONALLY LEFT BLANK.]
[THIS PAGE INTENTIONALLY LEFT BLANK.]
[THIS PAGE INTENTIONALLY LEFT BLANK.]
Investment Adviser
DuPont Capital Management Corporation
One Righter Parkway
Suite 3200
Wilmington, DE 19803
Administrator
The Bank of New York Mellon
301 Bellevue Parkway
Wilmington, DE 19809
Transfer Agent
BNY Mellon Investment Servicing (US) Inc.
4400 Computer Drive
Westborough, MA 01581
Principal Underwriter
Foreside Funds Distributors LLC
400 Berwyn Park
899 Cassatt Road
Berwyn, PA 19312
Custodian
The Bank of New York Mellon
240 Greenwich Street
New York, NY 10286
Independent Registered Public Accounting Firm
PricewaterhouseCoopers LLP
Two Commerce Square, Suite 1800
2001 Market Street
Philadelphia, PA 19103-7042
Legal Counsel
Pepper Hamilton LLP
3000 Two Logan Square
18th and Arch Streets
Philadelphia, PA 19103
DUP-0419
DUPONT CAPITAL
EMERGING MARKETS FUND
DUPONT CAPITAL
EMERGING MARKETS DEBT
FUND
of
FundVantage Trust
Class I
ANNUAL REPORT
April 30, 2019
IMPORTANT NOTE: Beginning on January 1, 2021, paper copies of the DuPont Funds’ annual and semi-annual shareholder reports will no longer be sent by mail, unless you specifically request paper copies of the shareholder reports from the DuPont Funds or from your financial intermediary. Instead, annual and semi-annual shareholder reports will be available on the DuPont Funds’ website (www.mutualfunds.dupontcapital.com), and you will be notified by mail each time a report is posted and provided with a website link to access the report.
You may elect to receive all future annual and semi-annual shareholder reports in paper, free of charge. To elect to receive paper copies of shareholder reports through the mail or otherwise change your delivery method, contact your financial intermediary or, if you hold your shares directly through the DuPont Funds, call the DuPont Funds toll-free at (888)447-0014 or write to the DuPont Funds at:
DuPont Funds
FundVantage Trust
c/o BNY Mellon Investment Servicing
P.O. Box 9829
Providence, RI 02940-8029
Your election to receive shareholder reports in paper will apply to all DuPont Funds that you hold through the financial intermediary, or directly with DuPont Funds.
This report is submitted for the general information of the shareholders of the DuPont Capital Emerging Markets Fund and the DuPont Capital Emerging Markets Debt Fund. It is not authorized for distribution unless preceded or accompanied by a current prospectus for the DuPont Capital Emerging Markets Fund and the DuPont Capital Emerging Markets Debt Fund.

EIC VALUE FUND
Annual Investment Adviser’s Report
April 30, 2019
(Unaudited)
Dear Fellow Shareholder,
Thank you for reviewing our annual report. In it, we discuss our perspective on the market, the EIC Value Fund’s (the “Fund”) performance, and some of the recent purchase and sale activity in the Fund. A listing of the Fund’s investments and other financial information follow our comments.
Perspective on the Market
Given the market’s sharp drop in the fourth quarter of 2018, perhaps the mirror-image rebound in the first four months of 2019 shouldn’t be a surprise. Economic uncertainty, which precipitated the 2018 decline, has not, however, abated. We continue to see slowing macro activity in China and Europe, and closer to home, corporate debt levels are elevated, the yield curve briefly inverted, and corporate earnings have been disappointing. There has also been notable fundamental weakness in bellwether cyclicals such as auto, housing, semiconductor, and transportation stocks.
Wall Street analysts now anticipate full-year 2019 earnings per share for S&P 500® companies should grow approximately 3%, and even that modest growth is heavily dependent on a strong fourth quarter.1 So, for now, the market seems to be looking past near-term softness and betting on a stronger future.
We view forecasts like this skeptically. The future is unpredictable. Thus, we don’t attempt to forecast macroeconomic factors like GDP, interest rates, inflation, employment levels, etc. We don’t believe predictions like these can be made with low enough error rates to justify basing investment decisions on them. Rather, we’rebottom-up investors, identifying investment opportunities and building portfolios on astock-by-stock basis.
Broadly speaking, we are seeing more attractive opportunities in economically sensitive stocks, while seeing increased risk in historically less economically sensitive ones. As shown in the following graph, valuations of less cyclical (“LC”) stocks, here represented by a simple average of the forward price/earnings (P/E) ratios of the consumer staples, utilities, and healthcare sectors, are trading at their highest levels relative to the Russell 3000® Index (R3000) since inception of the Fund in April of 2011 (red line, left scale). For comparison, as of March 31, 2019, the average forward P/E of this “LC” group is 23x vs. 17x for the R3000 overall, and for the value subset the average forward P/E of the “LC” group is 19x vs. 14x for the Russell 3000 Value Index.2
| 1 | Data Source: S&P Capital IQ. Year-over-year forecast of quarterly and calendar year 2019 earnings per share growth for S&P 500 based on consensus earnings estimates. Data as of April 11, 2019. |
| 2 | Data Source: Morningstar DirectSM. Russell 3000 Index Price/Projected Earnings and Russell 3000 Value Index Price/Projected Earnings. Forward P/E is Price/Projected Earnings calculated by Morningstar based on the asset-weighted average of each company’smonth-end share price to estimated consensus earnings per share for the company’s fiscal year. Sectors classified by Global Industry Classification Standard (GICS). Data as of March 31, 2019. |
1
EIC VALUE FUND
Annual Investment Adviser’s Report (Continued)
April 30, 2019
(Unaudited)
For further color, we show the percentage of Fund assets historically held in these “LC” sectors in the graph above (blue line, right scale). Generally, we tend to gravitate towards less cyclical stocks, particularly those in the consumer staples and healthcare sectors, for their positive financial characteristics, namely high and stable returns on equity, earnings and cash flows. Currently, however, many of those positive characteristics are under pressure as a result of competition, regulation, or increased leverage, while valuations for the group have risen. And though we maintain exposure to the group, we think many names in the less cyclical space, at today’s prices, are fully or over-valued, even when given the benefit of the doubt with respect to the headwinds they currently face.
How did we arrive here? We think the sharply increased valuation premium for the “LC” sectors beginning in 2018 likely resulted from a combination of the initially lower valuation of these sectors, a favorable interest rate environment – many less cyclical stocks pay higher dividends and therefore trade inversely with interest rates – and some increased appreciation by investors of the value of stable earnings. Moreover, we believeyear-end market volatility, especially in December, prompted a “flight to safety”, with strong investor interest and inflows into low volatility funds (especially
2
EIC VALUE FUND
Annual Investment Adviser’s Report (Continued)
April 30, 2019
(Unaudited)
with the growing popularity of passive factor funds andso-called “smart beta” funds). Whatever the cause, we think it’s likely that investors are buying today based on how the assets have historically performed without reflecting on the role low valuations played in generating the historical performance. We believe paying too high of a price for stability may negate its benefits.
As can be seen in the graph, the majority of Fund holdings since inception have been invested outside the “LC” sectors. Over its eight-year history, the Fund has typically outperformed the Russell 3000 Value Index in down markets, but given up ground relative to the index when it moves sharply upwards. These results were achieved not by attempting to minimize earnings volatility at any price but by building a diversified portfolio of well-capitalized, high quality companies trading at reasonable valuations. We think investors attempting to capture returns and reduce volatility based on the historical results of less cyclical stocks, as opposed to investing where value leads, will likely be disappointed.
Fund Performance
Here’s the performance for the Fund’s Institutional Class shares (net of expenses) over the twelve months ended April 30, 2019:
EIC Value Fund | Russell 3000 | S&P | |||||||||||||
| Month | (Institutional Class) | Value® Index | 500® Index | ||||||||||||
May | 0.35% | 0.99% | 2.41% | ||||||||||||
June | 0.97% | 0.28% | 0.62% | ||||||||||||
July | 2.88% | 3.79% | 3.72% | ||||||||||||
August | 2.07% | 1.55% | 3.26% | ||||||||||||
September | -0.92% | 0.00% | 0.57% | ||||||||||||
October | -4.16% | -5.46% | -6.84% | ||||||||||||
November | 1.86% | 2.89% | 2.04% | ||||||||||||
December | -8.70% | -9.78% | -9.03% | ||||||||||||
January | 7.35% | 8.00% | 8.01% | ||||||||||||
February | 3.12% | 3.24% | 3.21% | ||||||||||||
March | 0.15% | 0.39% | 1.94% | ||||||||||||
April | 2.87% | 3.56% | 4.05% | ||||||||||||
Twelve Months | 7.16% | 8.58% | 13.49% | ||||||||||||
Data Source: Morningstar DirectSM.
There can be no guarantee that any strategy will be successful. Diversification does not ensure a profit or guarantee against loss. All investing involves risk, including potential loss of principal.
The performance data quoted represents past performance and does not guarantee future results. The investment return and principal value of an investment in the Fund will fluctuate so that an investor’s shares, when redeemed, may be worth more or less than their original cost. Current performance may be lower or higher. Performance data current to the most recentmonth-end may be obtained by calling (855)430-6487.
3
EIC VALUE FUND
Annual Investment Adviser’s Report (Continued)
April 30, 2019
(Unaudited)
The results shown in the table are over a relatively short time period; thus, we caution against drawing sweeping conclusions. Nevertheless, the Fund’s return pattern was generally consistent with its history of declining less in down markets (e.g., October and December), while not keeping up with the indices during periods of strong upward movements (e.g., January). This combination led to overall performance that trailed that of the Russell 3000 Value Index over the full twelve-month period.
Performance attribution for the twelve-month period follows. Fund results are compared to the Russell 3000 Value Index.
The Fund’s shortfall relative to its benchmark was primarily attributable to its position in cash and short-term investments, as well as its sector weightings.
Given the market’s strong advance over the last twelve months, cash was obviously a drag on Fund performance. The Fund’s cash position (including short-term investments) continues to be relatively high, 11.7% at the end of April. Notably, we do not allocate to cash tactically; the Fund’s cash position is a residual of the stock-selection process and as such is primarily a function of the availability of undervalued stocks. We prefer to keep cash levels low, in the single digits if possible, but they can build up when attractive investment opportunities are scarce.
Similarly, we don’t target sector weightings, either in an absolute sense or relative to market indices; they too are principally a residual of stock selection. Nevertheless, it is at times instructive to see how sector allocations affected returns. On balance, they hurt Fund performance over the trailing twelve months.
Nine of the eleven sectors in the Russell 3000 Value Index posted positive returns for the twelve months ended April 30, 2019. Communication services and utilities were the top performing sectors, gaining 22.1% and 19.0%, respectively. Information technology was next in line, rising 18.1%. Relative to the index, the Fund was underweight in each of these sectors, which detracted from performance.
In contrast, energy and materials were the two worst performing sectors, declining 8.2% and 1.9%, respectively. Financials were also relatively weak, increasing just 2.9%. Fortunately, the Fund had less exposure to each of these sectors than the index did.
Our stock selection in the information technology sector contributed to Fund performance. The Fund’s holdings in this sector posted a collective return of 35.6%, while the index’s technology stocks rose 18.1%. Qualcomm, up 76.0%, and Cisco Systems, up 23.8%, were the Fund’s standout performers in this sector.
Our stock selection in the financial sector also helped Fund performance. The Fund’s holdings increased a combined 7.5%, versus a 2.9% gain for the index’s financial stocks. Strong showings by American Express, up 20.5%, and Travelers, up 11.9%, offset weak results from Wells Fargo, down 3.8%, and PNC Financial, down 3.2%.
Other notable Fund holdings included Procter & Gamble, up 47.6%, Lowe’s Companies, up 39.9%, Exelon Corp., up 32.5%, and PepsiCo, up 31.1%.
Securities in the Fund do not match those in the indices and performance of the Fund will differ. Indices are unmanaged, do not incur management fees, cost and expenses, and cannot be invested in directly.
4
EIC VALUE FUND
Annual Investment Adviser’s Report (Continued)
April 30, 2019
(Unaudited)
On the other hand, our security selection in the health care sector adversely affected Fund performance. Fund holdings advanced a combined 2.5%, trailing the index’s health care stocks, which rose 14.1%. In particular, McKesson fell 22.8%, and AmerisourceBergen dropped 18.2%.
The Fund’s worst performing holdings were in the energy sector, where Diamond Offshore Drilling tumbled 47.2% and Schlumberger sank 35.9%. Several other Fund holdings also detracted from performance, including Mohawk Industries, down 14.9%, Honda, down 13.5%, and Molson Coors, down 7.6%.
Portfolio Activity
The past year has seen an increase in stock-market volatility, a welcome change from 2017, which was one of the least volatile on record. Moreover, earnings growth has outpaced stock price gains, resulting in modestly improved valuations overall. Consequently, we now have more opportunities to consider versus the past several years, and portfolio turnover, particularly over the last few months, has increased. As a result of this activity, we worked down some of the Fund’s cash balance, though it’s still higher than we’d like.
Here’s a recap of some of the Fund’s recent purchase and sale activity.
In December, we purchased a new position in the Hartford Financial Services Group (HIG), a property and casualty insurance company focused primarily on commercial insurance. HIG also has an employee benefits business offering group life and group disability coverages, as well as a mutual fund business. In 2018, HIG sold the remainder of its individual life and variable annuity business, which has been a drag on company returns and a source of earnings volatility. The company’s remaining businesses are of good quality and the sale should allow the better underlying fundamentals of these to prevail. The company is well capitalized and conservatively invested, and we believe the price we paid for the stock represents an attractive entry point that offers upside potential.
Also during December, we sold the Fund’s position in Annaly Capital Management, while adding to positions in PNC Financial and SunTrust. While bank stocks declined reflecting, in part, increasing concerns about credit quality, Annaly’s stock remained stable despite the company having shifted its portfolio in recent years to take on more credit risk. Thus, the trades in Annaly and the banks took advantage of better relative value and, we believe, improved the Fund’s risk profile.
As the market fell in the fourth quarter, especially in December, we added to several Fund positions. In addition to the banks noted above, we added to McKesson, Johnson & Johnson, and UPS, lowering the Fund’s position in cash and short-term investments from 14.4% at the beginning of the quarter to 9.1% at December 31, consistent with our view that investment opportunities had improved.
During the first quarter of 2019, we purchased two new positions: Booking Holdings and Alliance Data Systems. We sold Fund positions in Cisco Systems and Procter & Gamble when they hit our target price, and sold Mack-Cali Realty based on fundamental deterioration. We also added to Kroger after it fell on earnings weakness, and trimmed American Express, Exelon, PNC and PepsiCo after strong recent price movements.
Booking Holdings (BKNG) is the world’s largest online travel agency (OTA), operating through its well-known brands including Booking.com, Priceline, Kayak, Agoda, and OpenTable. Its share price declined after weaker than expected 2019 guidance due to increasing advertising costs and slowing growth in its main European market. While growth
5
EIC VALUE FUND
Annual Investment Adviser’s Report (Continued)
April 30, 2019
(Unaudited)
has remained positive, it has decelerated over the past few years as other OTAs have gained a foothold, hotel companies have instituted loyalty programs, and AirBNB emerged as a competitor in alternative accommodations. To alleviate some of these pressures, BKNG is investing in its payments platform (to offer customers a more integrated experience) and brand awareness (to draw traffic directly to its sites rather than via costly search engines). We anticipate that BKNG will remain a leading OTA and were thus attracted to the quality characteristics it has shown – high returns on capital, continuing growth opportunities, a strong management team, and disciplined capital allocation – as well as its attractive valuation.
Alliance Data Systems (ADS) is a private label credit card lender with smaller businesses in loyalty-based digital marketing and a leading coalition loyalty program in Canada called Air Miles. The stock has underperformed recently on concerns about economic weakness and slowing growth in its credit card business. ADS has a history of effectively managing its portfolio through credit cycles, including during the financial crisis when its loans generally performed better than general purpose bank credit card portfolios. As its legacy mall-based apparel retailers have struggled, ADS has increasingly diversified its business toward higher-growth customers such as furniture retailers Wayfair and Ikea, and cosmetic retailer Ulta Beauty. A shifting retailer landscape has been a reality for ADS throughout its history. We think the low price we paid more than reflects the risks and offers the opportunity for attractive returns going forward.
As we approachmid-year 2019, we continue to be concerned about corporate leverage and the ability of companies to maintain historically high margins, given the expectations of slower growth ahead. Moreover, we think market volatility will likely persist this year, as investors digest the many forces impacting the economy, interest rates, and corporate profits. Nonetheless, our investment objective remains the same: constructing a portfolio of stocks that offers the Fund reasonable odds of investment success across a range of potential market outcomes.
This letter is intended to assist shareholders in understanding how the Fund performed during the fiscal year ended April 30, 2019 and reflects the views of the investment adviser at the time of this writing. Of course, these views may change and do not guarantee the future performance of the Fund or the markets.
The above commentary is for informational purposes only and does not represent an offer, recommendation or solicitation to buy, hold or sell any security. The specific securities identified and described do not represent all of the securities purchased or sold and you should not assume that investments in the securities identified and discussed will be profitable.
Portfolio composition is subject to change. The current and future portfolio holdings of the Fund are subject to investment risk.
6
EIC VALUE FUND
Annual Investment Adviser’s Report (Concluded)
April 30, 2019
(Unaudited)
London Stock Exchange Group PLC (“LSE Group”) is the source and owner of FTSE Russell index data. FTSE Russell is a trading name of certain of the LSE Group companies. “Russell®” is a trade mark of the relevant LSE Group companies and is used by any other LSE Group company under license. All rights in the FTSE Russell indexes or data vest in the relevant LSE Group company which owns the index or the data. Neither LSE Group nor its licensors accept any liability for any errors or omissions in the indexes or data and no party may rely on any indexes or data contained in this communication. No further distribution of data from the LSE Group is permitted without the relevant LSE Group company’s express written consent. The LSE Group does not promote, sponsor or endorse the content of this communication.
7
EIC VALUE FUND
Annual Report
Performance Data
April 30, 2019
(Unaudited)
Comparison of Change in Value of $10,000 Investment in EIC Value Fund’s Class A
vs. Russell 3000® Value Index and S&P 500® Index
Class A of an assumed $10,000 investment is adjusted for the maximum sales charge of 5.50%. This results in a net investment of $9,450. Performance of Class C will vary from Class A due to differences in class-specific fees.
| Average Annual Total Returns for the Periods Ended April 30, 2019 | ||||||||||||||||||
| 1 Year | 3 Years | 5 Years | Since Inception* |
| ||||||||||||||
Class A (with sales charge) | 1.01% | 7.09% | 5.12% | 7.58% | ||||||||||||||
Class A (without sales charge) | 6.86% | 9.13% | 6.32% | 8.34% | ||||||||||||||
Russell 3000® Value Index | 8.58% | 11.03% | 8.17% | 10.56% | ** | |||||||||||||
S&P 500® Index | 13.49% | 14.87% | 11.63% | 12.72% | ** | |||||||||||||
Class C (with CDSC charge) | 5.08% | 8.33% | 5.54% | 7.91% | ||||||||||||||
Class C (without CDSC charge) | 6.05% | 8.33% | 5.54% | 7.91% | ||||||||||||||
Russell 3000® Value Index | 8.58% | 11.03% | 8.17% | 11.38% | ** | |||||||||||||
S&P 500® Index | 13.49% | 14.87% | 11.63% | 13.38% | ** | |||||||||||||
| * | Class A and Class C of the EIC Value Fund (the “Fund”) commenced operations on May 19, 2011 and July 18, 2011, respectively. |
| ** | Benchmark performance is from commencement date of the Class only and is not the commencement date of the benchmark itself. |
The performance data quoted represents past performance and does not guarantee future results. The investment return and principal value of an investment in the Fund will fluctuate so that an investor’s shares, when redeemed, may be worth more or less than their original cost. The graph and table do not reflect the deduction of taxes that a shareholder would pay on Fund distributions or redemption of Fund shares. Current performance may be lower or higher. Performance data current to the most recentmonth-end may be obtained by calling (855)430-6487.
8
EIC VALUE FUND
Annual Report
Performance Data (Continued)
April 30, 2019
(Unaudited)
Comparison of Change in Value of $100,000 (investment minimum) Investment in
EIC Value Fund’s Institutional Class
vs. Russell 3000® Value Index and S&P 500® Index
| Average Annual Total Returns for the Periods Ended April 30, 2019 | ||||||||||||||||
| 1 Year | 3 Years | 5 Years | Since Inception* | |||||||||||||
Institutional Class | 7.16% | 9.41% | 6.60% | 8.56% | ||||||||||||
Russell 3000® Value Index | 8.58% | 11.03% | 8.17% | 10.29% | ** | |||||||||||
S&P 500® Index | 13.49% | 14.87% | 11.63% | 12.44% | ** | |||||||||||
| * | Institutional Class shares of the EIC Value Fund (the “Fund”) inception date was April 29, 2011. Operations commenced on May 1, 2011. |
| ** | Benchmark performance is from commencement date of the Class only and is not the commencement date of the benchmark itself. |
The performance data quoted represents past performance and does not guarantee future results. The investment return and principal value of an investment in the Fund will fluctuate so that an investor’s shares, when redeemed, may be worth more or less than their original cost. The graph and table do not reflect the deduction of taxes that a shareholder would pay on Fund distributions or redemption of Fund shares. Current performance may be lower or higher. Performance data current to the most recentmonth-end may be obtained by calling (855)430-6487.
9
EIC VALUE FUND
Annual Report
Performance Data (Concluded)
April 30, 2019
(Unaudited)
The returns shown for Class A shares reflect a deduction for the maximumfront-end sales charge of 5.50%. The returns shown for Class C shares reflect a maximum deferred sales charge of 1.00%. All of the Fund’s share classes apply a 2.00% fee to the value of shares redeemed within 30 days of purchase. This redemption fee is not reflected in the returns shown above. As stated in the current prospectus dated September 1, 2018, the Fund’s “Total Annual Fund Operating Expenses” are 1.30%, 2.05% and 1.05%, and the Fund’s “Total Annual Fund Operating Expenses After Fee Waiver and/or Expense Reimbursement” are 1.21%, 1.96% and 0.96% for Class A shares, Class C shares and Institutional Class Shares, respectively, of the Fund Class’ average daily net assets. The ratios may differ from the actual expenses incurred by the Fund for the period covered by this report. Equity Investment Corporation (the “Adviser”) has contractually agreed to waive or otherwise reduce its annual compensation received from the Fund to the extent necessary to ensure that the Fund’s “Total Annual Fund Operating Expenses,” excluding taxes, fees and expenses attributable to a distribution or service plan adopted by FundVantageTrust (the “Trust”), “Acquired Fund Fees and Expenses,” interest, extraordinary items and brokerage commissions, do not exceed 0.90% of average daily net assets of the Fund (the “Expense Limitation”). Prior to September 1, 2018, the Expense Limitation was 1.00%. The Expense Limitation will remain in place until August 31, 2019, unless the Board of Trustees of the Trust approves its earlier termination. Subject to approval by the Board of Trustees, the Adviser may recoup any expenses or fees it has reimbursed within a three-year period from the date on which the Adviser reduced its compensation and/or assumed expenses of the Fund. The Adviser is permitted to seek reimbursement from the Fund, subject to certain limitations, for fees it waived and Fund expenses it paid to the extent the total annual fund operating expenses do not exceed the limits described above or any lesser limits in effect at the time of reimbursement. No recoupment will occur unless the Fund’s expenses are below the Expense Limitation amount. Total returns would be lower had such fees and expenses not been waived and/or reimbursed.
Mutual fund investing involves risk, including possible loss of principal. Value investing involves the risk that the Fund’s investing in companies believed to be undervalued will not appreciate as anticipated. The Fund may invest in the stocks of smaller-andmedium-sized companies which may be more vulnerable to adverse business or economic events than larger, more established companies.
The Fund intends to evaluate performance as compared to that of the Standard & Poor’s 500 (“S&P 500®”) Index and the Russell 3000® Value Index. The S&P 500® is a widely recognized, unmanaged index of 500 common stocks which are generally representative of the U.S. stock market as a whole. The Russell 3000® Value Index is an unmanaged index that measures the performance of the broad value segment of the U.S. equity value universe. It includes those Russell 3000® Index companies with lowerprice-to-book ratios and lower forecasted growth rates.
10
EIC VALUE FUND
Fund Expense Disclosure
April 30, 2019
(Unaudited)
As a shareholder of the Fund, you incur two types of costs: (1) transaction costs including sales charges (loads) on purchase payments (if any) or redemption fees; and (2) ongoing costs, including management fees, distribution and/or service (Rule12b-1) fees (if any) and other Fund expenses. These examples are intended to help you understand your ongoing costs (in dollars) of investing in the Fund and to compare these costs with the ongoing costs of investing in other mutual funds.
These examples are based on an investment of $1,000 invested at the beginning of thesix-month period from November 1, 2018 through April 30, 2019 and held for the entire period.
Actual Expenses
The first line of each accompanying table provides information about actual account values and actual expenses. You may use the information in this line, together with the amount you invested, to estimate the expenses that you paid over the period. Simply divide your account value by $1,000 (for example, an $8,600 account value divided by $1,000 = 8.6), then multiply the result by the number in the first line under the heading entitled “Expenses Paid During Period” to estimate the expenses you paid on your account during this period.
Hypothetical Examples for Comparison Purposes
The second line of each accompanying table provides information about hypothetical account values and hypothetical expenses based on the Fund’s actual expense ratio and an assumed rate of return of 5% per year before expenses, which is not your Fund’s actual return. The hypothetical account values and expenses may not be used to estimate the actual ending account balance or expenses you paid for the period. You may use this information to compare the ongoing costs of investing in the Fund and other funds. To do so, compare these 5% hypothetical examples with the 5% hypothetical examples that appear in the shareholder reports of other funds.
Please note that the expenses shown in the accompanying tables are meant to highlight your ongoing costs only and do not reflect any transactional costs, such as sales charges (loads) on purchase payments (if any) or redemption fees. Therefore, the second line of each accompanying table is useful in comparing ongoing costs only, and will not help you determine the relative total costs of owning different funds. In addition, if these transactional costs were included, your costs would have been higher.
11
EIC VALUE FUND
Fund Expense Disclosure (Concluded)
April 30, 2019
(Unaudited)
| EIC Value Fund | |||||||||||||||
| Beginning Account Value November 1, 2018 | Ending Account Value April 30, 2019 | Expenses Paid During Period* | |||||||||||||
Class A | |||||||||||||||
Actual | $1,000.00 | $1,059.00 | $5.87 | ||||||||||||
Hypothetical (5% return before expenses) | 1,000.00 | 1,019.09 | 5.76 | ||||||||||||
Class C | |||||||||||||||
Actual | $1,000.00 | $1,055.30 | $9.68 | ||||||||||||
Hypothetical (5% return before expenses) | 1,000.00 | 1,015.37 | 9.49 | ||||||||||||
Institutional Class | |||||||||||||||
Actual | $1,000.00 | $1,060.60 | $4.60 | ||||||||||||
Hypothetical (5% return before expenses) | 1,000.00 | 1,020.33 | 4.51 | ||||||||||||
| * | Expenses are equal to the Fund’s annualized expense ratio for thesix-month period ended April 30, 2019 of 1.15%, 1.90%, and 0.90% for Class A, Class C, and Institutional Class shares, respectively, multiplied by the average account value over the period, multiplied by the number of days in the most recent period (181), then divided by 365 to reflect the period. The Fund’s ending account values on the first line in each table are based on the actualsix-month total returns for the Fund of 5.90%, 5.53%, and 6.06% for Class A, Class C, and Institutional Class shares, respectively. |
12
EIC VALUE FUND
Portfolio Holdings Summary Table
April 30, 2019
(Unaudited)
The following table presents a summary by sector of the portfolio holdings of the Fund:
| % of Net Assets | Value | |||||||||
COMMON STOCKS: | ||||||||||
Financial | 25.0 | % | $ | 54,009,014 | ||||||
Consumer,Non-cyclical | 21.9 | 47,322,075 | ||||||||
Communications | 11.6 | 25,139,353 | ||||||||
Energy | 8.5 | 18,258,205 | ||||||||
Consumer, Cyclical | 8.0 | 17,217,827 | ||||||||
Utilities | 4.4 | 9,503,130 | ||||||||
Industrial | 3.4 | 7,257,482 | ||||||||
Basic Materials | 2.6 | 5,584,188 | ||||||||
Technology | 2.1 | 4,551,970 | ||||||||
Short-Term Investments | 11.7 | 25,270,186 | ||||||||
Other Assets in Excess of Liabilities | 0.8 | 1,780,691 | ||||||||
|
|
|
| |||||||
NET ASSETS | 100.0 | % | $ | 215,894,121 | ||||||
|
|
|
| |||||||
Portfolio holdings are subject to change at any time.
The accompanying notes are an integral part of the financial statements.
13
EIC VALUE FUND
Portfolio of Investments
April 30, 2019
| Number of Shares | Value | |||||||
COMMON STOCKS — 87.5% |
| |||||||
Basic Materials — 2.6% | ||||||||
PPG Industries, Inc. | 47,525 | $ | 5,584,188 | |||||
|
| |||||||
Communications — 11.6% | ||||||||
Booking Holdings, Inc.* | 2,453 | 4,550,291 | ||||||
ebay, Inc. | 194,615 | 7,541,331 | ||||||
Facebook, Inc., Class A* | 33,392 | 6,458,013 | ||||||
Verizon Communications, Inc. | 115,225 | 6,589,718 | ||||||
|
| |||||||
| 25,139,353 | ||||||||
|
| |||||||
Consumer, Cyclical — 8.0% |
| |||||||
Honda Motor Co. Ltd., SP ADR | 70,000 | 1,952,300 | ||||||
Lowe’s Cos, Inc. | 38,350 | 4,338,919 | ||||||
Mohawk Industries, Inc.* | 32,175 | 4,383,844 | ||||||
Target Corp. | 84,510 | 6,542,764 | ||||||
|
| |||||||
| 17,217,827 | ||||||||
|
| |||||||
Consumer,Non-cyclical — 21.9% |
| |||||||
Amerisourcebergen Corp. | 58,050 | 4,339,818 | ||||||
GlaxoSmithKline PLC, SP ADR | 200,930 | 8,264,251 | ||||||
Johnson & Johnson | 44,065 | 6,221,978 | ||||||
Kroger Co. (The) | 216,125 | 5,571,702 | ||||||
McKesson Corp. | 36,835 | 4,392,574 | ||||||
Medtronic PLC | 69,060 | 6,133,219 | ||||||
Molson Coors Brewing Co.,Class-B | 107,265 | 6,885,340 | ||||||
Pepsico, Inc. | 43,055 | 5,513,193 | ||||||
|
| |||||||
| 47,322,075 | ||||||||
|
| |||||||
Energy — 8.5% | ||||||||
ConocoPhillips | 68,150 | 4,301,628 | ||||||
Diamond Offshore Drilling, Inc.* | 151,500 | 1,471,065 | ||||||
| Number of Shares | Value | |||||||
COMMON STOCKS — (Continued) |
| |||||||
Energy — (Continued) | ||||||||
Exxon Mobil Corp. | 92,100 | $ | 7,393,788 | |||||
Schlumberger Ltd. | 119,300 | 5,091,724 | ||||||
|
| |||||||
| 18,258,205 | ||||||||
|
| |||||||
Financial — 25.0% | ||||||||
Alliance Data Systems Corp. | 25,850 | 4,138,585 | ||||||
American Express Co. | 56,980 | 6,679,765 | ||||||
Franklin Resources, Inc. | 52,400 | 1,812,516 | ||||||
Hartford Financial Services Group, Inc. (The) | 90,775 | 4,748,440 | ||||||
PNC Financial Services Group, Inc. (The) | 38,670 | 5,295,083 | ||||||
SunTrust Banks, Inc. | 100,655 | 6,590,889 | ||||||
Torchmark Corp. | 44,052 | 3,861,598 | ||||||
Travelers Cos, Inc. (The) | 46,680 | 6,710,250 | ||||||
US Bancorp. | 147,765 | 7,878,830 | ||||||
Wells Fargo & Co. | 129,995 | 6,293,058 | ||||||
|
| |||||||
| 54,009,014 | ||||||||
|
| |||||||
Industrial — 3.4% | ||||||||
United Parcel Service, Inc.,Class-B | 68,325 | 7,257,482 | ||||||
|
| |||||||
Technology — 2.1% | ||||||||
QUALCOMM, Inc. | 52,850 | 4,551,970 | ||||||
|
| |||||||
Utilities — 4.4% | ||||||||
Exelon Corp. | 105,110 | 5,355,354 | ||||||
National Grid PLC, SP ADR | 75,800 | 4,147,776 | ||||||
|
| |||||||
| 9,503,130 | ||||||||
|
| |||||||
TOTAL COMMON STOCKS | 188,843,244 | |||||||
|
| |||||||
The accompanying notes are an integral part of the financial statements.
14
EIC VALUE FUND
Portfolio of Investments (Concluded)
April 30, 2019
| Number of Shares | Value | |||||||
SHORT-TERM INVESTMENTS — 11.7% |
| |||||||
Exchange Traded Fund — 6.0% |
| |||||||
iShares Short Treasury Bond ETF 2.34%(a) | 116,365 | $ | 12,865,314 | |||||
|
| |||||||
Money Market Fund — 5.7% |
| |||||||
Dreyfus Institutional Treasury Securities Cash Advantage Fund, Premier Shares 1.99% (b) | 12,404,872 | 12,404,872 | ||||||
|
| |||||||
TOTAL SHORT-TERM INVESTMENTS | 25,270,186 | |||||||
|
| |||||||
TOTAL INVESTMENTS - 99.2% |
| 214,113,430 | ||||||
OTHER ASSETS IN EXCESS OF LIABILITIES - 0.8% | 1,780,691 | |||||||
|
| |||||||
NET ASSETS - 100.0% | $ | 215,894,121 | ||||||
|
| |||||||
| * | Non-income producing. |
| (a) | Rate periodically changes. Rate disclosed is the30-day SEC yield at April 30, 2019. |
| (b) | Rate periodically changes. Rate disclosed is the7-day yield at April 30, 2019. |
PLC Public Limited Company
SP ADR Sponsored American Depository Receipt
The accompanying notes are an integral part of the financial statements.
15
EIC VALUE FUND
Statement of Assets and Liabilities
April 30, 2019
Assets | ||||
Investments, at value (Cost $169,005,432) | $ | 214,113,430 | ||
Receivable for investments sold | 1,416,294 | |||
Receivable for capital shares sold | 825,425 | |||
Dividends receivable | 156,099 | |||
Prepaid expenses and other assets | 37,674 | |||
|
| |||
Total assets | 216,548,922 | |||
|
| |||
Liabilities | ||||
Payable for capital shares redeemed | 370,449 | |||
Due to Custodian | 42 | |||
Payable to Adviser | 118,626 | |||
Payable for administration and accounting fees | 45,600 | |||
Payable for audit fees | 28,570 | |||
Payable for printing fees | 24,419 | |||
Payable for transfer agent fees | 22,853 | |||
Payable for distribution fees | 20,064 | |||
Payable for legal fees | 12,346 | |||
Payable for shareholder servicing fees | 5,665 | |||
Payable for custodian fees | 5,097 | |||
Accrued expenses | 1,070 | |||
|
| |||
Total liabilities | 654,801 | |||
|
| |||
Net Assets | $ | 215,894,121 | ||
|
| |||
Net Assets consisted of: | ||||
Capital stock, $0.01 par value | $ | 154,904 | ||
Paid-in capital | 164,034,601 | |||
Total distributable earnings | 51,704,616 | |||
|
| |||
Net Assets | $ | 215,894,121 | ||
|
| |||
Class A: | ||||
Net asset value, redemption price per share | $13.98 | |||
Maximum offering price per share (100/94.5 of $13.98) | $14.79 | |||
Class C: | ||||
Net asset value, offering and redemption price per share | $13.73 | |||
Institutional Class: | ||||
Net asset value, offering and redemption price per share | $13.97 | |||
The accompanying notes are an integral part of the financial statements.
16
EIC VALUE FUND
Statement of Operations
For the Year Ended April 30, 2019
Investment income | ||||
Dividends | $ | 6,097,544 | ||
Less: foreign taxes withheld | (33,594 | ) | ||
|
| |||
Total investment income | 6,063,950 | |||
|
| |||
Expenses | ||||
Advisory fees (Note 2) | 1,717,785 | |||
Distribution fees (Class C) (Note 2) | 233,904 | |||
Transfer agent fees (Note 2) | 150,209 | |||
Administration and accounting fees (Note 2) | 131,018 | |||
Shareholder servicing fees (Class C) (Note 2) | 77,968 | |||
Distribution fees (Class A) (Note 2) | 72,596 | |||
Trustees’ and officers’ fees (Note 2) | 58,262 | |||
Registration and filing fees | 51,220 | |||
Legal fees | 41,489 | |||
Printing and shareholder reporting fees | 33,697 | |||
Audit fees | 28,174 | |||
Custodian fees (Note 2) | 27,659 | |||
Other expenses | 14,513 | |||
|
| |||
Total expenses | 2,638,494 | |||
|
| |||
Less: waivers and reimbursements (Note 2) | (118,185 | ) | ||
|
| |||
Net expenses after waivers and reimbursements | 2,520,309 | |||
|
| |||
Net investment income | 3,543,641 | |||
|
| |||
Net realized and unrealized gain/(loss) from investments: | ||||
Net realized gain from investments | 15,100,484 | |||
Net change in unrealized appreciation/(depreciation) on investments | (5,445,416 | ) | ||
|
| |||
Net realized and unrealized gain on investments | 9,655,068 | |||
|
| |||
Net increase in net assets resulting from operations | $ | 13,198,709 | ||
|
|
The accompanying notes are an integral part of the financial statements.
17
EIC VALUE FUND
Statements of Changes in Net Assets
| For the Year Ended April 30, 2019 | For the Year Ended April 30, 2018 | |||||||
Increase/(decrease) in net assets from operations: | ||||||||
Net investment income | $ | 3,543,641 | $ | 3,066,415 | ||||
Net realized gain from investments | 15,100,484 | 22,167,785 | ||||||
Net change in unrealized appreciation/(depreciation) on investments | (5,445,416 | ) | (1,866,315 | ) | ||||
|
|
|
| |||||
Net increase in net assets resulting from operations | 13,198,709 | 23,367,885 | ||||||
|
|
|
| |||||
Less dividends and distributions to shareholders from: | ||||||||
Total distributable earnings* | ||||||||
Class A | (1,467,856 | ) | (4,316,204 | ) | ||||
Class C | (2,431,876 | ) | (3,163,855 | ) | ||||
Institutional Class | (16,589,140 | ) | (13,593,117 | ) | ||||
|
|
|
| |||||
Net decrease in net assets from dividends and distributions to shareholders | (20,488,872 | ) | (21,073,176 | ) | ||||
|
|
|
| |||||
Decrease in net assets derived from capital share transactions (Note 4) | (20,476,467 | ) | (27,654,951 | ) | ||||
|
|
|
| |||||
Total decrease in net assets | (27,766,630 | ) | (25,360,242 | ) | ||||
|
|
|
| |||||
Net assets | ||||||||
Beginning of year | 243,660,751 | 269,020,993 | ||||||
|
|
|
| |||||
End of year** | $ | 215,894,121 | $ | 243,660,751 | ||||
|
|
|
| |||||
| * | Distributions from net investment income and from realized gains are no longer required to be separately disclosed. See Note 1. For the year ended April 30, 2018, distributions from net investment income were $514,677, $188,526 and $1,960,906 for Class A, Class C and Institutional Class and net realized gains were $3,801,527, $2,975,329 and $11,632,211 for Class A, Class C and Institutional Class, respectively. |
| ** | Parenthetical disclosure of accumulated net investment income/(loss) is no longer required. See Note 1. For the year ended April 30, 2018, end of year net assets included accumulated net investment income of $955,149. |
The accompanying notes are an integral part of the financial statements.
18
EIC VALUE FUND
Financial Highlights
Contained below is per share operating performance data for Class A shares outstanding, total investment return, ratios to average net assets and other supplemental data for the respective period. The total returns in the table represent the rate that an investor would have earned or lost on an investment in the Fund (assuming reinvestment of all dividends and distributions). This information has been derived from information provided in the financial statements and should be read in conjunction with the financial statements and the notes thereto.
| Class A | ||||||||||||||||||||
| For the Year Ended April 30, 2019 | For the Year Ended April 30, 2018 | For the Year Ended April 30, 2017 | For the Year Ended April 30, 2016 | For the Year Ended April 30, 2015 | ||||||||||||||||
Per Share Operating Performance | ||||||||||||||||||||
Net asset value, beginning of year | $ | 14.33 | $ | 14.22 | $ | 13.02 | $ | 13.91 | $ | 13.37 | ||||||||||
|
|
|
|
|
|
|
|
|
| |||||||||||
Net investment income(1) | 0.21 | 0.17 | 0.13 | 0.11 | 0.12 | |||||||||||||||
Net realized and unrealized gain/(loss) on investments | 0.68 | 1.15 | 1.32 | (0.60 | ) | 0.98 | ||||||||||||||
|
|
|
|
|
|
|
|
|
| |||||||||||
Net increase/(decrease) in net assets resulting from operations | 0.89 | 1.32 | 1.45 | (0.49 | ) | 1.10 | ||||||||||||||
|
|
|
|
|
|
|
|
|
| |||||||||||
Dividends and distributions to shareholders from: | ||||||||||||||||||||
Net investment income | (0.16 | ) | (0.15 | ) | (0.11 | ) | (0.14 | ) | (0.10 | ) | ||||||||||
Net realized capital gains | (1.08 | ) | (1.06 | ) | (0.14 | ) | (0.26 | ) | (0.46 | ) | ||||||||||
|
|
|
|
|
|
|
|
|
| |||||||||||
Total dividends and distributions to shareholders | (1.24 | ) | (1.21 | ) | (0.25 | ) | (0.40 | ) | (0.56 | ) | ||||||||||
|
|
|
|
|
|
|
|
|
| |||||||||||
Redemption fees | — | (2) | — | (2) | — | — | (2) | — | (2) | |||||||||||
|
|
|
|
|
|
|
|
|
| |||||||||||
Net asset value, end of year | $ | 13.98 | $ | 14.33 | $ | 14.22 | $ | 13.02 | $ | 13.91 | ||||||||||
|
|
|
|
|
|
|
|
|
| |||||||||||
Total investment return(3) | 6.86 | % | 9.45 | % | 11.13 | % | (3.44 | )% | 8.22 | % | ||||||||||
Ratios/Supplemental Data | ||||||||||||||||||||
Net assets, end of year (in thousands) | $ | 15,019 | $ | 47,274 | $ | 52,845 | $ | 65,882 | $ | 85,653 | ||||||||||
Ratio of expenses to average net assets | 1.18 | % | 1.24 | % | 1.20 | % | 1.25 | % | 1.25 | % | ||||||||||
Ratio of expenses to average net assets without waivers, expense reimbursements, and/or recoupments, if any | 1.23 | %(4) | 1.24 | % | 1.20 | % | 1.21 | %(4) | 1.18 | %(4) | ||||||||||
Ratio of net investment income to average net assets | 1.47 | % | 1.16 | % | 0.98 | % | 0.85 | % | 0.90 | % | ||||||||||
Portfolio turnover rate | 42.04 | % | 33.11 | % | 28.92 | % | 34.03 | % | 26.89 | % | ||||||||||
| (1) | The selected per share data was calculated using the average shares outstanding method for the year. |
| (2) | Amount is less than $0.005 per share. |
| (3) | Total investment return is calculated assuming a purchase of shares on the first day and a sale of shares on the last day of each period reported and includes reinvestment of dividends and distributions, if any. Total investment return does not reflect the impact of the maximumfront-end sales load of 5.50%. If reflected, the return would be lower. |
| (4) | During the period, certain fees were waived, reimbursed, and/or recouped. If such fee waivers, reimbursements, and/or recoupments had not occurred, the ratios would have been as indicated (See Note 2). |
The accompanying notes are an integral part of the financial statements.
19
EIC VALUE FUND
Financial Highlights
Contained below is per share operating performance data for Class C shares outstanding, total investment return, ratios to average net assets and other supplemental data for the respective period. The total returns in the table represent the rate that an investor would have earned or lost on an investment in the Fund (assuming reinvestment of all dividends and distributions). This information has been derived from information provided in the financial statements and should be read in conjunction with the financial statements and the notes thereto.
| Class C | ||||||||||||||||||||
| For the Year Ended April 30, 2019 | For the Year Ended April 30, 2018 | For the Year Ended April 30, 2017 | For the Year Ended April 30, 2016 | For the Year Ended April 30, 2015 | ||||||||||||||||
Per Share Operating Performance | ||||||||||||||||||||
Net asset value, beginning of year | $ | 14.12 | $ | 14.06 | $ | 12.87 | $ | 13.75 | $ | 13.24 | ||||||||||
|
|
|
|
|
|
|
|
|
| |||||||||||
Net investment income(1) | 0.10 | 0.06 | 0.03 | 0.01 | 0.02 | |||||||||||||||
Net realized and unrealized gain/(loss) on investments | 0.67 | 1.13 | 1.30 | (0.60 | ) | 0.97 | ||||||||||||||
|
|
|
|
|
|
|
|
|
| |||||||||||
Net increase/(decrease) in net assets resulting from operations | 0.77 | 1.19 | 1.33 | (0.59 | ) | 0.99 | ||||||||||||||
|
|
|
|
|
|
|
|
|
| |||||||||||
Dividends and distributions to shareholders from: | ||||||||||||||||||||
Net investment income | (0.08 | ) | (0.07 | ) | — | (2) | (0.03 | ) | (0.02 | ) | ||||||||||
Net realized capital gains | (1.08 | ) | (1.06 | ) | (0.14 | ) | (0.26 | ) | (0.46 | ) | ||||||||||
|
|
|
|
|
|
|
|
|
| |||||||||||
Total dividends and distributions to shareholders | (1.16 | ) | (1.13 | ) | (0.14 | ) | (0.29 | ) | (0.48 | ) | ||||||||||
|
|
|
|
|
|
|
|
|
| |||||||||||
Redemption fees | — | (2) | — | (2) | — | — | (2) | — | (2) | |||||||||||
|
|
|
|
|
|
|
|
|
| |||||||||||
Net asset value, end of year | $ | 13.73 | $ | 14.12 | $ | 14.06 | $ | 12.87 | $ | 13.75 | ||||||||||
|
|
|
|
|
|
|
|
|
| |||||||||||
Total investment return(3) | 6.05 | % | 8.63 | % | 10.35 | % | (4.17 | )% | 7.49 | % | ||||||||||
Ratios/Supplemental Data | ||||||||||||||||||||
Net assets, end of year (in thousands) | $ | 27,407 | $ | 35,488 | $ | 45,071 | $ | 51,146 | $ | 62,378 | ||||||||||
Ratio of expenses to average net assets | 1.93 | % | 1.99 | % | 1.95 | % | 2.00 | % | 2.00 | % | ||||||||||
Ratio of expenses to average net assets without waivers, expense reimbursements, and/or recoupments, if any | 1.98 | %(4) | 1.99 | % | 1.95 | % | 1.96 | %(4) | 1.93 | %(4) | ||||||||||
Ratio of net investment income to average net assets | 0.71 | % | 0.41 | % | 0.23 | % | 0.10 | % | 0.15 | % | ||||||||||
Portfolio turnover rate | 42.04 | % | 33.11 | % | 28.92 | % | 34.03 | % | 26.89 | % | ||||||||||
| (1) | The selected per share data was calculated using the average shares outstanding method for the year. |
| (2) | Amount is less than $0.005 per share. |
| (3) | Total investment return is calculated assuming a purchase of shares on the first day and a sale of shares on the last day of each period reported and includes reinvestment of dividends and distributions, if any. Total investment return does not reflect any applicable sales charge. |
| (4) | During the period, certain fees were waived, reimbursed, and/or recouped. If such fee waivers, reimbursements, and/or recoupments had not occurred, the ratios would have been as indicated (See Note 2). |
The accompanying notes are an integral part of the financial statements.
20
EIC VALUE FUND
Financial Highlights
Contained below is per share operating performance data for Institutional Class shares outstanding, total investment return, ratios to average net assets and other supplemental data for the respective period. The total returns in the table represent the rate that an investor would have earned or lost on an investment in the Fund (assuming reinvestment of all dividends and distributions). This information has been derived from information provided in the financial statements and should be read in conjunction with the financial statements and the notes thereto.
| Institutional Class | ||||||||||||||||||||
| For the Year Ended April 30, 2019 | For the Year Ended April 30, 2018 | For the Year Ended April 30, 2017 | For the Year Ended April 30, 2016 | For the Year Ended April 30, 2015 | ||||||||||||||||
Per Share Operating Performance | ||||||||||||||||||||
Net asset value, beginning of year | $ | 14.37 | $ | 14.26 | $ | 13.06 | $ | 13.95 | $ | 13.41 | ||||||||||
|
|
|
|
|
|
|
|
|
| |||||||||||
Net investment income(1) | 0.24 | 0.21 | 0.17 | 0.14 | 0.16 | |||||||||||||||
Net realized and unrealized gain/(loss) on investments | 0.69 | 1.14 | 1.32 | (0.60 | ) | 0.98 | ||||||||||||||
|
|
|
|
|
|
|
|
|
| |||||||||||
Net increase/(decrease) in net assets resulting from operations | 0.93 | 1.35 | 1.49 | (0.46 | ) | 1.14 | ||||||||||||||
|
|
|
|
|
|
|
|
|
| |||||||||||
Dividends and distributions to shareholders from: | ||||||||||||||||||||
Net investment income | (0.25 | ) | (0.18 | ) | (0.15 | ) | (0.17 | ) | (0.14 | ) | ||||||||||
Net realized capital gains | (1.08 | ) | (1.06 | ) | (0.14 | ) | (0.26 | ) | (0.46 | ) | ||||||||||
|
|
|
|
|
|
|
|
|
| |||||||||||
Total dividends and distributions to shareholders | (1.33 | ) | (1.24 | ) | (0.29 | ) | (0.43 | ) | (0.60 | ) | ||||||||||
|
|
|
|
|
|
|
|
|
| |||||||||||
Redemption fees | — | (2) | — | (2) | — | — | (2) | — | (2) | |||||||||||
|
|
|
|
|
|
|
|
|
| |||||||||||
Net asset value, end of year | $ | 13.97 | $ | 14.37 | $ | 14.26 | $ | 13.06 | $ | 13.95 | ||||||||||
|
|
|
|
|
|
|
|
|
| |||||||||||
Total investment return(3) | 7.16 | % | 9.70 | % | 11.40 | % | (3.15 | )% | 8.54 | % | ||||||||||
Ratios/Supplemental Data | ||||||||||||||||||||
Net assets, end of year (in thousands) | $ | 173,468 | $ | 160,899 | $ | 171,105 | $ | 196,785 | $ | 189,860 | ||||||||||
Ratio of expenses to average net assets | 0.93 | % | 0.99 | % | 0.96 | % | 1.00 | % | 1.00 | % | ||||||||||
Ratio of expenses to average net assets without waivers, expense reimbursements, and/or recoupments, if any | 0.99 | %(4) | 0.99 | % | 0.96 | % | 0.96 | %(4) | 0.93 | %(4) | ||||||||||
Ratio of net investment income to average net assets | 1.72 | % | 1.41 | % | 1.23 | % | 1.10 | % | 1.14 | % | ||||||||||
Portfolio turnover rate | 42.04 | % | 33.11 | % | 28.92 | % | 34.03 | % | 26.89 | % | ||||||||||
| (1) | The selected per share data was calculated using the average shares outstanding method for the year. |
| (2) | Amount is less than $0.005 per share. |
| (3) | Total investment return is calculated assuming a purchase of shares on the first day and a sale of shares on the last day of each period reported and includes reinvestment of dividends and distributions, if any. |
| (4) | During the period, certain fees were waived, reimbursed, and/or recouped. If such fee waivers, reimbursements, and/or recoupments had not occurred, the ratios would have been as indicated (See Note 2). |
The accompanying notes are an integral part of the financial statements.
21
EIC VALUE FUND
Notes to Financial Statements
April 30, 2019
1. Organization and Significant Accounting Policies
The EIC Value Fund (the “Fund”) is a diversified,open-end management investment company registered under the Investment Company Act of 1940, as amended (the “1940 Act”), which commenced operations on May 1, 2011. The Fund is a separate series of FundVantage Trust (the “Trust”) which was organized as a Delaware statutory trust on August 28, 2006. The Trust is a “series trust” authorized to issue an unlimited number of separate series or classes of shares of beneficial interest. Each series is treated as a separate entity for certain matters under the 1940 Act, and for other purposes, and a shareholder of one series is not deemed to be a shareholder of any other series. The Fund offers separate classes of shares, Class A, Class C, Institutional Class and Retail Class shares. Class A shares are sold subject to afront-end sales charge.Front-end sales charges may be reduced or waived under certain circumstances. A contingent deferred sales charge (“CDSC”) may be applicable to the redemption of Class A shares. A CDSC, as a percentage of the lower of the original purchase price or net asset value at redemption, of up to 1.00% may be imposed on full or partial redemptions of Class A shares made within eighteen months of purchase where: (i) $1 million or more of Class A shares were purchased without an initial sales charge, and (ii) the Fund’s principal underwriter, Foreside Funds Distributors LLC (the “Underwriter”), paid a commission to the selling broker-dealer for such sale. A CDSC of up to 1.00% is assessed on redemptions of Class C Shares made within eighteen months after a purchase where the broker-dealer was paid a commission for such sale. As of April 30, 2019, the Retail Class Shares have not been issued.
The Fund is an investment company and follows accounting and reporting guidance in the Financial Accounting Standards Board Accounting Standards Codification Topic 946.
Portfolio Valuation— The Fund’s net asset value (“NAV”) is calculated once daily at the closeof regular trading hours on the New York Stock Exchange (“NYSE”) (typically 4:00 p.m. Eastern time) on each day the NYSE is open. Securities held by the Fund are valued using the closing price or the last sale price on a national securities exchange or the National Association of Securities Dealers Automatic Quotation System (“NASDAQ”) market system where they are primarily traded. Equity securities traded in theover-the-counter market are valued at their closing prices. If there were no transactions on that day, securities traded principally on an exchange or on NASDAQ will be valued at the mean of the last bid and ask prices prior to the market close. Investments in otheropen-end investment companies are valued based on the NAV of the investment companies (which may use fair value pricing as discussed in their prospectuses). If market quotations are unavailable or deemed unreliable, securities will be valued in accordance with procedures adopted by the Trust’s Board of Trustees (“Board of Trustees”). Relying on prices supplied by pricing services or dealers or using fair valuation may result in values that are higher or lower than the values used by other investment companies and investors to price the same investments. In the event that market quotes are not readily available, and the security or asset cannot be valued pursuant to one of the valuation methods, the value of the security or asset will be determined in good faith by the Adviser. The Trust has established a Valuation Committee which performs certain functions including the oversight of the Adviser’s fair valuation determinations.
22
EIC VALUE FUND
Notes to Financial Statements (Continued)
April 30, 2019
Fair Value Measurements— The inputs and valuation techniques used to measure fair value ofthe Fund’s investments are summarized into three levels as described in the hierarchy below:
● Level 1 — | quoted prices in active markets for identical securities; | |
● Level 2 — | other significant observable inputs (including quoted prices for similar securities, interest rates, prepayment speeds, credit risk, etc.); and | |
● Level 3 — | significant unobservable inputs (including the Fund’s own assumptions in determining the fair value of investments). | |
The inputs or methodology used for valuing securities are not necessarily an indication of the risk associated with investing in those securities.
The following is a summary of the inputs used, as of April 30, 2019, in valuing the Fund’s investments carried at fair value:
| Total Value at 04/30/19 | Level 1 Quoted Prices | Level 2 Other Significant Observable Inputs | Level 3 Significant Unobservable Inputs | |||||||||||||
Common Stocks* | $ | 188,843,244 | $ | 188,843,244 | $ | — | $ | — | ||||||||
Short-Term Investments* | 25,270,186 | 25,270,186 | — | — | ||||||||||||
|
|
|
|
|
|
|
| |||||||||
Total Investments | $ | 214,113,430 | $ | 214,113,430 | $ | — | $ | — | ||||||||
|
|
|
|
|
|
|
| |||||||||
| * | Please refer to Portfolio of Investments for further details on portfolio holdings. |
At the end of each quarter, management evaluates the classification of Levels 1, 2 and 3 assets and liabilities. Various factors are considered, such as changes in liquidity from the prior reporting period; whether or not a broker is willing to execute at the quoted price; the depth and consistency of prices from third party pricing services; and the existence of contemporaneous, observable trades in the market. Additionally, management evaluates the classification of Level 1 and Level 2 assets and liabilities on a quarterly basis for changes in listings or delistings on national exchanges.
Due to the inherent uncertainty of determining the fair value of investments that do not have a readily available market value, the fair value of the Fund’s investments may fluctuate from period to period. Additionally, the fair value of investments may differ significantly from the values that would have been used had a ready market existed for such investments and may differ materially from the values the Fund may ultimately realize. Further, such investments may be subject to legal and other restrictions on resale or are otherwise less liquid than publicly traded securities.
23
EIC VALUE FUND
Notes to Financial Statements (Continued)
April 30, 2019
For fair valuations using significant unobservable inputs, U.S. generally accepted accounting principles (“U.S. GAAP”) require the Fund to present a reconciliation of the beginning to ending balances for reported market values that present changes attributable to total realized and unrealized gains or losses, purchase and sales, and transfers in and out of Level 3 during the period. A reconciliation of Level 3 investments is presented only when the Fund had an amount of Level 3 investments at the end of the reporting period that was meaningful in relation to its net assets. The amounts and reasons for all transfers in and out of each Level within the three-tier hierarchy are disclosed when the Fund had an amount of total transfers during the reporting period that was meaningful in relation to its net assets as of the end of the reporting period.
For the year ended April 30, 2019, there were no transfers between Levels.
Use of Estimates— The preparation of financial statements in conformity with U.S. GAAP requiresmanagement to make estimates and assumptions that affect the amounts reported in the financial statements and accompanying notes at the date of the financial statements and the reported amounts of revenues and expenses during the period. Actual results could differ from those estimates and those differences could be material.
Investment Transactions, Investment Income and Expenses— Investment transactions arerecorded on trade date for financial statement preparation purposes. Realized gains and losses on investments sold are recorded on the identified cost basis. Interest income is recorded on the accrual basis. Dividends are recorded on theex-dividend date. Estimated components of distributions received from real estate investment trusts may be considered income, return of capital distributions or capital gain distributions. Return of capital distributions are recorded as a reduction of cost of the related investments. Distribution(12b-1) fees and shareholder services fees relating to a specific class are charged directly to that class. Fund level expenses common to all classes, investment income and realized and unrealized gains and losses on investments are allocated to each class based upon relative daily net assets of each class. General expenses of the Trust are generally allocated to each fund in proportion to its relative daily net assets. Expenses directly attributable to a particular fund in the Trust are charged directly to that fund.
Dividends and Distributions to Shareholders— Dividends from net investment income and distributionsfrom net realized capital gains, if any, are declared, recorded onex-date and paid at least annually to shareholders. Income dividends and capital gain distributions are determined in accordance with U.S. federal income tax regulations, which may differ from U.S. GAAP.
U.S. Tax Status— No provision is made for U.S. income taxes as it is the Fund’s intention to continueto qualify for and elect the tax treatment applicable to regulated investment companies under Subchapter M of the Internal Revenue Code of 1986, as amended (the “Internal Revenue Code”), and make the requisite distributions to its shareholders which will be sufficient to relieve it from U.S. income and excise taxes.
24
EIC VALUE FUND
Notes to Financial Statements (Continued)
April 30, 2019
Other— In the normal course of business, the Fund may enter into contracts that provide generalindemnifications. The Fund’s maximum exposure under these arrangements is dependent on claims that may be made against the Fund in the future, and therefore, cannot be estimated; however, based on experience, the risk of material loss for such claims is considered remote.
Recent Accounting Pronouncement— Effective November 5, 2018, the SEC amended existingrules intended to modernize reporting and disclosure of information. These amendments relate to RegulationS-X which sets forth the form and content of financial statements. The amendment requires collapsing the components of distributable earnings on the Statement of Assets and Liabilities and collapsing the distributions paid to shareholders on the Statements of Changes in Net Assets. Management has evaluated the implications of adopting these amendments and determined there is no significant impact on the financial statements and accompanying notes.
2. Transactions with Related Parties and Other Service Providers
Equity Investment Corporation (“EIC” or the “Adviser”) serves as investment adviser to the Fund pursuant to an investment advisory agreement with the Trust (the “Advisory Agreement”). For its services, the Adviser is paid a monthly fee at the annual rate of 0.75% of the Fund’s average daily net assets under $500 million; 0.65% of the Fund’s average daily net assets of $500 million or more but less than $1 billion; and 0.50% of the Fund’s average daily net assets of $1 billion and over. The Adviser has contractually agreed to waive or otherwise reduce its annual compensation received from the Fund to the extent necessary to ensure that the Fund’s total operating expenses, excluding taxes, fees and expenses attributable to a distribution or service plan adopted by the Trust, “Acquired Fund Fees and Expenses,” interest, extraordinary items and brokerage commissions, do not exceed 0.90% of average daily net assets of the Fund (the “Expense Limitation”). Prior to September 1, 2018, the Expense Limitation was 1.00%. The Expense Limitation will remain in place until August 31, 2019, unless the Board of Trustees approves its earlier termination. Subject to approval by the Board of Trustees, the Adviser may recoup any expenses or fees it has reimbursed within a three-year period from the date on which the Adviser reduced its compensation and/or assumed expenses of the Fund. The Adviser is permitted to seek reimbursement from the Fund, subject to certain limitations, for fees it waived and Fund expenses it paid to the extent the total annual fund operating expenses do not exceed the limits described above or any lesser limits in effect at the time of reimbursement. No recoupment will occur unless the Fund’s expenses are below the Expense Limitation amount.
25
EIC VALUE FUND
Notes to Financial Statements (Continued)
April 30, 2019
As of April 30, 2019, the amount of potential recovery was as follows:
Expiration 4/30/2022 |
$118,185 |
For the year ended April 30, 2019, the Adviser earned advisory fees of $1,717,785 and waived fees of $118,185.
Other Service Providers
The Bank of New York Mellon (“BNY Mellon”) serves as administrator and custodian for the Fund. For providing administrative and accounting services, BNY Mellon is entitled to receive a monthly fee equal to an annual percentage rate of the Fund’s average daily net assets and is subject to certain minimum monthly fees. For providing certain custodial services, BNY Mellon is entitled to receive a monthly fee, subject to certain minimum, and out of pocket expenses.
BNY Mellon Investment Servicing (US) Inc. (the “Transfer Agent”) provides transfer agent services to the Fund. The Transfer Agent is entitled to receive a monthly fee, subject to certain minimum, and out of pocket expenses.
Foreside Funds Distributors LLC (the “Underwriter”) provides principal underwriting services to the Fund pursuant to an underwriting agreement between the Trust and the Underwriter.
The Trust and the Underwriter are parties to an underwriting agreement. The Trust has adopted a distribution plan for Class A and Class C shares in accordance with Rule12b-1 under the 1940 Act. Pursuant to the Class A and Class C shares plan, the Fund compensates the Underwriter for direct and indirect costs and expenses incurred in connection with advertising, marketing and other distribution services in an amount not to exceed 0.25% and 1.00% (0.75% Rule12b-1 distribution fee and 0.25% shareholder service fee) on an annualized basis of the average daily net assets of the Fund’s Class A and Class C shares, respectively.
Trustees and Officers
The Trust is governed by its Board of Trustees. The Trustees receive compensation in the form of an annual retainer and per meeting fees for their services to the Trust. The remuneration paid to the Trustees by the Fund during the year ended April 30, 2019 was $15,188. An employee of BNY Mellon serves as the Secretary of the Trust and is not compensated by the Fund or the Trust.
26
EIC VALUE FUND
Notes to Financial Statements (Continued)
April 30, 2019
JW Fund Management LLC (“JWFM”) provides a Principal Executive Officer and Principal Financial Officer, respectively, to the Trust. Duff & Phelps, LLC (“D&P”) provides the Trust with a Chief Compliance Officer and an Anti-Money Laundering Officer. JWFM and D&P are compensated for their services provided to the Trust.
3. Investment in Securities
For the year ended April 30, 2019, aggregate purchases and sales of investment securities (excluding short-term investments) of the Fund were as follows:
| Purchases | Sales | |||||||
Investment Securities | $ | 88,488,235 | $ | 113,826,179 | ||||
4. Capital Share Transactions
For the years ended April 30, 2019 and 2018, transactions in capital shares (authorized shares unlimited) were as follows:
| For the Year Ended | For the Year Ended | |||||||||||||||
| April 30, 2019 | April 30, 2018 | |||||||||||||||
Shares | Amount | Shares | Amount | |||||||||||||
Class A | ||||||||||||||||
Sales | 107,434 | $ | 1,538,913 | 240,969 | $ | 3,462,175 | ||||||||||
Reinvestments | 89,030 | 1,155,614 | 263,275 | 3,758,046 | ||||||||||||
Redemption Fees* | — | 351 | — | 476 | ||||||||||||
Redemptions | (2,420,969 | ) | (35,638,291 | ) | (921,242 | ) | (13,339,578 | ) | ||||||||
|
|
|
|
|
|
|
| |||||||||
Net decrease | (2,224,505 | ) | $ | (32,943,413 | ) | (416,998 | ) | $ | (6,118,881 | ) | ||||||
|
|
|
|
|
|
|
| |||||||||
Class C | ||||||||||||||||
Sales | 69,363 | $ | 977,102 | 68,926 | $ | 978,967 | ||||||||||
Reinvestments | 180,955 | 2,312,609 | 206,666 | 2,913,843 | ||||||||||||
Redemption Fees* | — | 565 | — | 390 | ||||||||||||
Redemptions | (767,907 | ) | (10,657,230 | ) | (967,697 | ) | (13,744,098 | ) | ||||||||
|
|
|
|
|
|
|
| |||||||||
Net decrease | (517,589 | ) | $ | (7,366,954 | ) | (692,105 | ) | $ | (9,850,898 | ) | ||||||
|
|
|
|
|
|
|
| |||||||||
27
EIC VALUE FUND
Notes to Financial Statements (Continued)
April 30, 2019
| For the Year Ended | For the Year Ended | |||||||||||||||
| April 30, 2019 | April 30, 2018 | |||||||||||||||
Shares | Amount | Shares | Amount | |||||||||||||
Institutional Class | ||||||||||||||||
Sales | 4,091,856 | $ | 58,852,083 | 2,068,017 | $ | 29,963,800 | ||||||||||
Reinvestments | 1,258,074 | 16,292,060 | 908,748 | 12,993,852 | ||||||||||||
Redemption Fees* | — | 3,288 | — | 1,511 | ||||||||||||
Redemptions | (4,125,916 | ) | (55,313,531 | ) | (3,779,982 | ) | (54,644,335 | ) | ||||||||
|
|
|
|
|
|
|
| |||||||||
Net increase/(decrease) | 1,224,014 | $ | 19,833,900 | (803,217 | ) | $ | (11,685,172 | ) | ||||||||
|
|
|
|
|
|
|
| |||||||||
Total Net Decrease | (1,518,080 | ) | $ | (20,476,467 | ) | (1,912,320 | ) | $ | (27,654,951 | ) | ||||||
|
|
|
|
|
|
|
| |||||||||
| * | There is a 2.00% redemption fee that may be charged on shares redeemed which have been held for 30 days or less. The redemption fees are retained by the Fund for the benefit of the remaining shareholders and recorded aspaid-in-capital. |
5. Federal Tax Information
The Fund has followed the authoritative guidance on accounting for and disclosure of uncertainty in tax positions, which requires the Fund to determine whether a tax position is more likely than not to be sustained upon examination, including resolution of any related appeals or litigation processes, based on the technical merits of the position. The Fund has determined that there was no effect on the financial statements from following this authoritative guidance. In the normal course of business, the Fund is subject to examination by federal, state and local jurisdictions, where applicable, for tax years for which applicable statutes of limitations have not expired.
Distributions are determined in accordance with federal income tax regulations, which may differ in amount or character from net investment income and realized gains for financial reporting purposes. Accordingly, the character of distributions and composition of net assets for tax purposes may differ from those reflected in the accompanying financial statements. To the extent these differences are permanent, such amounts are reclassified within the components of net assets based on the tax treatment; temporary differences do not require reclassifications. For the year ended April 30, 2019, these adjustments were to increasepaid-in capital by $1,108,165 and decrease total distributable earnings by $1,108,165. These permanent differences were primarily attributable to the utilization of earnings and profits on shareholder redemptions (a tax accounting practice known as equalization). Net investment income, net realized losses and net assets were not affected by these adjustments.
For the year ended April 30, 2019, the tax character of distributions paid by the Fund was $3,467,250 of ordinary income dividends and $17,021,622 of long-term capital gains dividends. For the year ended April 30, 2018, the tax character of distributions paid by the fund was $2,664,109 of ordinary income dividends and $18,409,067 of long-term capital gains dividends. Distributions from net investment income and short-term gains are treated as ordinary income for federal income tax purposes.
28
EIC VALUE FUND
Notes to Financial Statements (Concluded)
April 30, 2019
As of April 30, 2019, the components of distributable earnings on a tax basis were as follows:
| Undistributed Ordinary Income | Undistributed Long-Term Gain | Net Unrealized Appreciation | Total Distributable Earnings | ||||
$820,915 | $5,775,703 | $45,107,998 | $51,704,616 |
The differences between the book and tax basis components of distributable earnings relate primarily to the timing and recognition of income and gains for federal income tax purposes.
As of April 30, 2019, the federal tax cost, aggregate gross unrealized appreciation and depreciation of securities held by the Fund were as follows:
Federal tax cost | $ | 169,005,432 | ||||
|
| |||||
Gross unrealized appreciation | $ | 47,303,764 | ||||
Gross unrealized depreciation | (2,195,766 | ) | ||||
|
| |||||
Net unrealized appreciation | $ | 45,107,998 | ||||
|
|
Pursuant to federal income tax rules applicable to regulated investment companies, the Fund may elect to treat certain capital losses between November 1 and April 30 and late year ordinary losses ((i) ordinary losses between January 1 and April 30, and (ii) specified ordinary and currency losses between November 1 and April 30) as occurring on the first day of the following tax year. For the year ended April 30, 2019, any amount of losses elected within the tax return will not be recognized for federal income tax purposes until May 1, 2019. For the year ended April 30, 2019, the Fund had no loss deferrals.
Accumulated capital losses represent net capital loss carry forwards as of April 30, 2019 that may be available to offset future realized capital gains and thereby reduce future capital gains distributions. As of April 30, 2019, the Fund did not have any capital loss carryforwards.
6. Subsequent Events
Management has evaluated the impact of all subsequent events on the Fund through the date the financial statements were issued, and has determined that there are no material subsequent events requiring recognition or disclosure in the financial statements.
29
EIC VALUE FUND
Report of Independent Registered Public Accounting Firm
To the Board of Trustees of FundVantage Trust and
Shareholders of EIC Value Fund:
Opinion on the Financial Statements
We have audited the accompanying statement of assets and liabilities of EIC Value Fund (the “Fund”) (one of the series constituting FundVantage Trust (the “Trust”)), including the portfolio of investments, as of April 30, 2019, and the related statement of operations for the year then ended, the statements of changes in net assets for each of the two years in the period then ended, the financial highlights for each of the five years in the period then ended and the related notes (collectively referred to as the “financial statements”). In our opinion, the financial statements present fairly, in all material respects, the financial position of the Fund (one of the series constituting FundVantage Trust) at April 30, 2019, the results of its operations for the year then ended, the changes in its net assets for each of the two years in the period then ended and its financial highlights for each of the five years in the period then ended, in conformity with U.S. generally accepted accounting principles.
Basis for Opinion
These financial statements are the responsibility of the Trust’s management. Our responsibility is to express an opinion on the Fund’s financial statements based on our audits. We are a public accounting firm registered with the Public Company Accounting Oversight Board (United States) (“PCAOB”) and are required to be independent with respect to the Trust in accordance with the U.S. federal securities laws and the applicable rules and regulations of the Securities and Exchange Commission and the PCAOB.
We conducted our audits in accordance with the standards of the PCAOB. Those standards require that we plan and perform the audit to obtain reasonable assurance about whether the financial statements are free of material misstatement, whether due to error or fraud. The Trust is not required to have, nor were we engaged to perform, an audit of the Trust’s internal control over financial reporting. As part of our audits, we are required to obtain an understanding of internal control over financial reporting, but not for the purpose of expressing an opinion on the effectiveness of the Trust’s internal control over financial reporting. Accordingly, we express no such opinion.
Our audits included performing procedures to assess the risks of material misstatement of the financial statements, whether due to error or fraud, and performing procedures that respond to those risks. Such procedures included examining, on a test basis, evidence regarding the amounts and disclosures in the financial statements. Our procedures included confirmation of securities owned as of April 30, 2019, by correspondence with the custodian. Our audits also included evaluating the accounting principles used and significant estimates made by management, as well as evaluating the overall presentation of the financial statements. We believe that our audits provide a reasonable basis for our opinion.

We have served as the auditor of one or more Equity Investment Corporation investment companies since 2012.
Philadelphia, Pennsylvania
June 24, 2019
30
EIC VALUE FUND
Shareholder Tax Information
(Unaudited)
The Fund is required by Subchapter M of the Internal Revenue Code to advise its shareholders of the U.S. federal tax status of distributions received by the Fund’s shareholders in respect of such fiscal year. During the fiscal year ended April 30, 2019, the Fund paid $3,467,250 of ordinary income dividends and $17,021,622 of long-term capital gain dividends to its shareholders. Dividends from net investment income and short-term capital gains are treated as ordinary income dividends for federal income tax purposes.
The Fund designates 100.00% of the ordinary income distribution as qualified dividend income pursuant to the Jobs and Growth Tax Relief Reconciliation Act of 2003.
The percentage of ordinary income dividends qualifying for the corporate dividends received deduction is 100.00%.
The percentage of qualified interest income related dividends not subject to withholding tax fornon-resident aliens and foreign corporations received is 5.85%.
All designations are based on financial information available as of the date of this annual report and, accordingly, are subject to change. For each item, it is the intention of the Fund to designate the maximum amount permitted under the Internal Revenue Code of 1986, as amended, and the regulations thereunder.
Because the Fund’s fiscal year is not the calendar year, another notification will be sent with respect to calendar year 2019. The second notification, which will reflect the amount, if any, to be used by calendar year taxpayers on their U.S. federal income tax returns, will be made in conjunction with Form1099-DIV and will be mailed in January 2020.
Foreign shareholders will generally be subject to U.S. withholding tax on the amount of their ordinary income dividends. They will generally not be entitled to a foreign tax credit or deduction for the withholding taxes paid by the Fund, if any.
In general, dividends received bytax-exempt recipients (e.g., IRAs and Keoghs) need not be reported as taxable income for U.S. federal income tax purposes. However, some retirement trusts (e.g., corporate, Keogh and 403(b)(7) plans) may need this information for their annual information reporting.
Shareholders are advised to consult their own tax advisers with respect to the tax consequences of their investment in the Fund.
31
EIC VALUE FUND
Other Information
(Unaudited)
Proxy Voting
Policies and procedures that the Fund uses to determine how to vote proxies relating to portfolio securities as well as information regarding how the Fund voted proxies relating to portfolio securities for the most recent12-month period ended June 30 are available without charge, upon request, by calling (855)430-6487 and on the Securities and Exchange Commission’s (“SEC”) website athttp://www.sec.gov.
Quarterly Portfolio Schedules
The Trust files its complete schedule of portfolio holdings with the SEC for the first and third fiscal quarters of each fiscal year (quarters ended July 31 and January 31) on FormN-Q. The Trust’s FormsN-Q are available on the SEC’s website athttp://www.sec.gov. FormN-Q is being rescinded. Once FormN-Q is rescinded, disclosure of the Fund’s complete holdings will be required to be made monthly on FormN-PORT, with every third month made available to the public by the Commission upon filing.
Board Consideration of Investment Advisory Agreement
At anin-person meeting held on December6-7, 2018 (the “Meeting”), the Board of Trustees (the “Board” or “Trustees”) of FundVantage Trust (“Trust”), including a majority of the Trustees who are not “interested persons” as defined in the Investment Company Act of 1940, as amended (“1940 Act”) (the “Independent Trustees”), unanimously approved the continuation of the advisory agreement (the “EIC Agreement”) between Equity Investment Corporation (“EIC” or the “Adviser”) and the Trust on behalf of the EIC Value Fund (the “Fund”).
In determining whether to approve the EIC Agreement, the Trustees considered information provided by the Adviser in accordance with Section 15(c) of the 1940 Act regarding: (i) services performed or to be performed for the Fund, (ii) the size and qualifications of the Adviser’s portfolio management staff, (iii) any potential or actual material conflicts of interest that may arise in connection with a portfolio manager’s management of the Fund, (iv) investment performance, (v) the capitalization and financial condition of the Adviser, (vi) brokerage selection procedures (including soft dollar arrangements, if any), (vii) the procedures for allocating investment opportunities between the Fund and other clients of the Adviser, (viii) results of any regulatory examination, including any recommendations or deficiencies noted, (ix) any litigation, investigation or administrative proceeding that may have a material impact on the Adviser’s ability to service the Fund, (x) compliance with the Fund’s investment objectives, policies and practices (including codes of ethics and proxy voting policies) and (xi) compliance with federal securities laws and other regulatory requirements. The Trustees noted the reports and discussions with portfolio managers as provided at the Board meetings throughout the year covering matters such as the relative performance of the Fund; compliance with the investment objectives, policies, strategies and limitations for the Fund;
32
EIC VALUE FUND
Other Information (Continued)
(Unaudited)
the compliance of management personnel with the code of ethics; and the adherence to the Trust’s pricing procedures as established by the Board.
Representatives from EIC attended the Meeting in person. The representatives discussed the firm’s history, performance and investment strategies in connection with the proposed approval of the EIC Agreement and answered questions from the Board.
The Board considered the overall investment performance of EIC and the Fund. Although the Trustees gave appropriate consideration to performance reports and discussions with portfolio managers at Board meetings throughout the year, the Trustees gave particular weight to their review of investment performance presented in connection with the approval of the EIC Agreement at the Meeting. The Trustees considered the investment performance for the Fund and EIC. The Trustees reviewed the historical performance of the Fund as compared to the LipperLarge-Cap Value Funds Index (the “Lipper Index”) , the Russell 3000 Value Total Return Index (the “Russell Index”), and the S&P 500 Daily Reinvested Index (the “S&P 500 Index”) for the one year calendaryear-to-date, one year, two year, three year, five year and since inception periods ended September 30, 2018.
The Trustees noted that the Fund’s Institutional Class shares underperformed the Lipper Index and the S&P 500 Index for theyear-to-date, one year, two year, three year, five year, and since inception periods ended September 30, 2018. The Trustees also noted that the Fund’s Institutional Class shares outperformed the Russell Index for the one year period ended September 30, 2018, and underperformed the Russell Index for theyear-to-date, two year, three year, five year and since inception periods ended September 30, 2018. The Trustees considered that, although the Fund underperformed certain benchmarks during certain periods, that the Fund performed in line with the Fund’s investment strategy given the macroeconomic environment and the parameters of the investment strategy.
The Board noted that EIC had provided information regarding its Advisory fees and an analysis of these fees in relation to the delivery of services to the Fund and any other ancillary benefit resulting from EIC’s relationship with the Fund. The Trustees considered the fees that EIC charges to the Fund as compared to the median fees charged to comparable funds with $500 million or less in assets (the “Lipper Peer Group”), and evaluated the explanations provided by EIC as to differences in fees charged to the Fund and the Lipper Peer Group.
The Trustees noted that the Net Total Expense Ratio, Contractual Advisory Fee, and Net Advisory Fee were each higher than the medians of the Net Total Expense Ratio, Contractual Advisory Fee and Net Advisory Fee charged to funds in the Fund’s Lipper Peer Group. The Trustees concluded that the Advisory Fee and services provided by EIC are sufficiently consistent with those of other advisers which manage mutual funds with investment objectives, strategies and policies similar to those of the Fund based on the information provided at the Meeting. The Trustees concluded that EIC’s contractual Advisory fee level was reasonable in relation to the nature and quality of the services provided, taking into account
33
EIC VALUE FUND
Other Information (Continued)
(Unaudited)
the fees charged by other advisers for managing comparable mutual funds with similar strategies. The Trustees also concluded that the overall expense ratio of the Fund was reasonable, taking into account the size of the Fund, the quality of services provided by EIC, the investment performance of the Fund and the expense limitations agreed to by EIC.
The Trustees considered the costs of the services provided by EIC, the compensation and benefits received by EIC in providing services to the Fund, as well as EIC’s profitability. The Trustees were provided with EIC’s most recent available financial information for EIC. The Trustees noted that EIC’s level of profitability is an appropriate factor to consider, and the Trustees should be satisfied that EIC’s profits are sufficient to continue as a healthy concern generally and as investment adviser of the Fund specifically.
The Trustees considered the services provided by EIC to the Fund and its shareholders. In reviewing the nature, extent, and quality of services, the Board considered the reports furnished to them during the year at regular Board meetings covering matters such as the relative performance of the Fund; compliance with the investment objectives, policies, strategies, and limitations for the Fund; the compliance of management personnel with the applicable code of ethics; and the adherence to fair value pricing procedures as established by the Board. The Trustees considered EIC’s personnel and the depth of EIC’s personnel who possess the experience to provide investment management services to the Fund. Based on the information provided by EIC, the Trustees concluded that (i) the nature, extent and quality of the services provided by EIC are appropriate and consistent with the terms of the EIC Agreement, (ii) that the quality of those services has been consistent with industry norms, (iii) the Fund is likely to benefit from the continued provision of those services, (iv) EIC has sufficient personnel, with the appropriate education and experience, to serve the Fund effectively and has demonstrated its continuing ability to attract and retain qualified personnel, and (v) the satisfactory nature, extent, and quality of services currently provided to the Fund and its shareholders is likely to continue under the EIC Agreement.
The Trustees considered the extent to which economies of scale would be realized relative to fee levels as the Fund grows, and whether the Advisory fee levels reflect these economies of scale for the benefit of shareholders. The Trustees considered and determined that economies of scale for the benefit of Fund shareholders should be achieved as assets of the Fund increase as a result of breakpoint reductions in the Advisory fee rate at specific asset levels which are reflected in the fee schedule of the EIC Agreement. In addition, the Trustees also considered the Adviser’s efforts to grow the Fund’s assets as economies of scale may be achieved due to the ability of the Fund to spread its fixed costs across a larger asset base.
In voting to approved the continuation of the EIC Agreement for an additionalone-year period, the Board did not identify any single factor as being of paramount importance and each member of the Board gave varying weights to each factor according to his or her own judgment. The Board determined that the approval of the EIC Agreement would be in the best interests of the Fund and its shareholders. As
34
EIC VALUE FUND
Other Information (Concluded)
(Unaudited)
a result, the Board, including a majority of the Independent Trustees, unanimously approved the EIC Agreement for an additional one year period.
35
EIC VALUE FUND
Privacy Notice
(Unaudited)
The privacy of your personal financial information is extremely important to us. When you open an account with us, we collect a significant amount of information from you in order to properly invest and administer your account. We take very seriously the obligation to keep that information private and confidential, and we want you to know how we protect that important information.
We collect nonpublic personal information about you from applications or other forms you complete and from your transactions with us or our affiliates. We do not disclose information about you, or our former clients, to our affiliates or to service providers or other third parties, except as permitted by law. We share only the information required to properly administer your accounts, which enables us to send transaction confirmations, monthly or quarterly statements, financials and tax forms. Even within FundVantage Trust and its affiliated entities, a limited number of people who actually service accounts will have access to your personal financial information. Further, we do not share information about our current or former clients with any outside marketing groups or sales entities.
To ensure the highest degree of security and confidentiality, FundVantage Trust and its affiliates maintain various physical, electronic and procedural safeguards to protect your personal information. We also apply special measures for authentication of information you request or submit to us on our web site.
If you have questions or comments about our privacy practices, please call us at (855)430-6487.
36
EIC VALUE FUND
Fund Management
(Unaudited)
FundVantage Trust (the “Trust”) is governed by a Board of Trustees (the “Trustees”). The primary responsibility of the Trustees is to represent the interest of the Trust’s shareholders and to provide oversight management of the Trust.
The following tables present certain information regarding the Trustees and officers of the Trust. None of the Trustees are an “interested person” of the Trust, the Adviser, another investment adviser of a series of the Trust, or Foreside Funds Distributors LLC, the principal underwriter of the Trust (“Underwriter”), within the meaning of the 1940 Act and each Trustee is referred to as an “Independent Trustee” and is listed under such heading below. Employees of certain service providers to the Trust serve as officers of the Trust; such persons are not compensated by the Fund. The address of each Trustee and officer as it relates to the Trust’s business is 301 Bellevue Parkway, 2nd Floor, Wilmington, DE 19809.
The Statement of Additional Information for the Fund contains additional information about the Trustees and is available, without charge, upon request, by calling (855)430-6487.
| Name and Date of Birth | Position(s) Held with Trust | Term of Office and Length of Time Served | Principal Occupation(s) During Past Five Years | Number of Funds in Trust Complex | Other Directorships Held by Trustee | |||||||
INDEPENDENT TRUSTEES
| ||||||||||||
ROBERT J. CHRISTIAN Date of Birth: 2/49 | Trustee and Chairman of the Board | Shall serve until death, resignation or removal. Trustee and Chairman since 2007. | Retired since February 2006; Executive Vice President of Wilmington Trust Company from February 1996 to February 2006; President of Rodney Square Management Corporation (“RSMC”) (investment advisory firm) from 1996 to 2005; Vice President of RSMC from 2005 to 2006.
| 44 | Optimum Fund Trust (registered investment company with 6 portfolios). | |||||||
IQBAL MANSUR Date of Birth: 6/55 | Trustee | Shall serve until death, resignation or removal. Trustee since 2007.
| University Professor, Widener University. | 44 | None. | |||||||
37
EIC VALUE FUND
Fund Management (Continued)
(Unaudited)
| Name and Date of Birth | Position(s) Held with Trust | Term of Office and Length of Time Served | Principal Occupation(s) During Past Five Years | Number of Funds in Trust Complex | Other Directorships Held by Trustee | |||||||
| NICHOLAS M. MARSINI, JR.Date of Birth: 8/55 | Trustee | Shall serve until death, resignation or removal. Trustee since 2016. | Retired since March 2016. President of PNC Bank Delaware from June 2011 to March 2016; Executive Vice President of Finance of BNY Mellon from July 2010 to January 2011; Executive Vice President and Chief Financial Officer of PNC Global Investment Servicing from September 1997 to July 2010.
| 44 | Brinker Capital Destinations Trust (registered investment company with 10 portfolios). | |||||||
NANCY B. WOLCOTT Date of Birth: 11/54 | Trustee | Shall serve until death, resignation or removal. Trustee since 2011. | Retired since May 2014; EVP, Head of GFI Client Service Delivery, BNY Mellon from January 2012 to May 2014; EVP, Head of US Funds Services, BNY Mellon from July 2010 to January 2012; President of PNC Global Investment Servicing from 2008 to July 2010; Chief Operating Officer of PNC Global Investment Servicing from 2007 to 2008; Executive Vice President of PFPC Worldwide Inc. from 2006 to 2007.
| 44 | Lincoln Variable Insurance Products Trust (registered investment company with 92 portfolios). | |||||||
STEPHEN M. WYNNE Date of Birth: 1/55 | Trustee | Shall serve until death, resignation or removal. Trustee since 2009. | Retired since December 2010; Chief Executive Officer of US Funds Services, BNY Mellon Asset Servicing from July 2010 to December 2010; Chief Executive Officer of PNC Global Investment Servicing from March 2008 to July 2010; President, PNC Global Investment Servicing from 2003 to 2008.
| 44 | Copeland Trust (registered investment company with 2 portfolios). | |||||||
38
EIC VALUE FUND
Fund Management (Concluded)
(Unaudited)
Name and Date of Birth | Position(s) Held with Trust | Term of Office and Length of Time Served | Principal Occupation(s) During Past Five Years | |||||
EXECUTIVE OFFICERS
| ||||||||
JOEL L. WEISS Date of Birth: 1/63 | President and Chief Executive Officer | Shall serve until death, resignation or removal. Officer since 2007. | President of JW Fund Management LLC since June 2016; Vice President and Managing Director of BNY Mellon Investment Servicing (US) Inc. and predecessor firms from 1993 to June 2016.
| |||||
T. RICHARD KEYES Date of Birth: 1/57 | Treasurer and Chief Financial Officer | Shall serve until death, resignation or removal. Officer since 2016. | President of TRK Fund Consulting LLC since July 2016; Head of Tax — U.S. Fund Services of BNY Mellon Investment Servicing (US) Inc. and predecessor firms from February 2006 to July 2016.
| |||||
GABRIELLA MERCINCAVAGE Date of Birth: 6/68 | Assistant Treasurer | Shall serve until death, resignation or removal. Officer since 2019. | Fund Administration Consultant since January 2019; Fund Accounting and Tax Compliance Accountant to financial services companies from November 2003 to July 2018.
| |||||
VINCENZO A. SCARDUZIO Date of Birth: 4/72 | Secretary | Shall serve until death, resignation or removal. Officer since 2012. | Director and Vice President Regulatory Administration of The Bank of New York Mellon and predecessor firms since 2001. | |||||
DAVID C. LEBISKY Date of Birth: 5/72 | Chief Compliance Officer and Anti-Money Laundering Officer | Shall serve until death, resignation or removal. Officer since 2015. | President of Lebisky Compliance Consulting LLC since October 2015; Consultant, Duff & Phelps, LLC since 2016; Senior Consultant, Freeh Group International Solutions, LLC (a global risk management firm) from 2015 to 2018; Scotia Institutional Investments US, LP, Director of Regulatory Administration from 2010 to 2014.
| |||||
39
Investment Adviser
Equity Investment Corporation
1776 Peachtree Street, NW
Suite 600S
Atlanta, GA 30309
Administrator
The Bank of New York Mellon
301 Bellevue Parkway
Wilmington, DE 19809
Transfer Agent
BNY Mellon Investment Servicing (US) Inc.
4400 Computer Drive
Westborough, MA 01581
Principal Underwriter
Foreside Funds Distributors LLC
400 Berwyn Park
899 Cassatt Road
Berwyn, PA 19312
Custodian
The Bank of New York Mellon
240 Greenwich Street
New York, NY 10286
Independent Registered Public Accounting Firm
Ernst & Young LLP
One Commerce Square
2005 Market Street, Suite 700
Philadelphia, PA 19103-7096
Legal Counsel
Pepper Hamilton LLP
3000 Two Logan Square
18th and Arch Streets
Philadelphia, PA 19103

of
FundVantage Trust
Class A
Class C
Institutional Class
ANNUAL REPORT
April 30, 2019
IMPORTANT NOTE: Beginning on January 1, 2021, paper copies of the EIC Value Fund’s annual and semi-annual shareholder reports will no longer be sent by mail, unless you specifically request paper copies of the shareholder reports from the EIC Value Fund or from your financial intermediary. Instead, annual and semi-annual shareholder reports will be available on the EIC Value Fund’s website (www.eicvalue.com), and you will be notified by mail each time a report is posted and provided with a website link to access the report.
You may elect to receive all future annual and semi-annual shareholder reports in paper, free of charge. To elect to receive paper copies of shareholder reports through the mail or otherwise change your delivery method, contact your financial intermediary or, if you hold your shares directly through the EIC Value Fund, call the EIC Value Fund toll-free at (855)430-6487 or write to the EIC Value Fund at:
EIC Value Fund
FundVantage Trust
c/o BNY Mellon Investment Servicing
P.O. Box 9829
Providence, RI 02940-8029
This report is submitted for the general information of the shareholders of the EIC Value Fund. It is not authorized for distribution unless preceded or accompanied by a current prospectus for the EIC Value Fund.
EIC-0419
LATEEF FOCUSED GROWTH FUND
Annual Investment Adviser’s Report
April 30, 2019
(Unaudited)
Dear Shareholders,
At Lateef Investment Management, we construct our portfolio based on four key tenants that we believe best positions us to outperform over the long term:
• Concentrated:We invest and allocate to ideas where we have the most conviction.
• Benchmark Agnostic:We invest with high active share and do not conform to benchmark weightings.
• Idiosyncratic:We strive to have idiosyncratic opportunities drive returns. We seek to own companieswith multiple ways to win independent of the broad market and macro-economic trends.
• Long-term:We invest as long-term shareholders.
By investing under this framework and filling our portfolio with high-quality structural compounders and opportunistic investments, we believe that we offer our shareholders a highly differentiated strategy to invest in U.S. equities. With ourall-cap strategy, we can select from a wider pool of opportunities, which further enhances our active share compared to capitalization-weighted benchmarks.
The significant stock market volatility over the past year has tested the mettle and process of long-term investors. We are pleased with how the Lateef Focus Growth Fund has performed over this period with the Fund off to its best start ever in 2019.
U.S. equities were strong through the third quarter of 2018 with the S&P 500 returning 10.56% and the Lateef Focused Growth Fund returning 13.81%(I-Shares). This performance was undone in the fourth quarter when fears of slowing global growth, mounting trade war rhetoric, and the pace of Fed rates hikes sparked severe market volatility and arisk-off drawdown. December was the culmination of these fears with the S&P 500 returning-9.03% for the month and-4.38% for the calendar year, which is the first negative full-year return since 2008. The Lateef Focused Growth Fund experienced this volatility as well, returning-11.53% in December and-9.60% for the calendar year(I-Shares).
Within our portfolio, our less expensive stocks performed worse than our more expensive stocks (by measure ofPrice-to-Earnings) while our smaller, more domestic-focused companies performed worse than our larger cap companies. This is the opposite of what we normally experience during periods of volatility.
The performance data quoted represents past performance and is not a guarantee of future results. Investment return and principal value of an investment will fluctuate so that an investor’s shares, when redeemed, may be worth more or less than their original cost. Current performance may be lower or higher than the performance information quoted. For the most recentmonth-end performance data, investors can call (866)499-2151.
1
LATEEF FOCUSED GROWTH FUND
Annual Investment Adviser’s Report (Continued)
April 30, 2019
(Unaudited)
We believe that how we react during periods of volatility and market uncertainty is critical to long-term outperformance. During the volatile 2018 fourth quarter, were-underwrote our investments, made a few adjustments, and went hunting for other high-quality companies.
We are pleased to report that during the first four months of 2019, Lateef Focused Growth Fund has experiencedone of our best periods of absolute and relative returns since inception, outperforming our benchmark by 10%. Through the first four months of this year, the Lateef Focused Growth Fund returned 28.28%(I-shares) compared to 18.25% for the S&P 500.
We believe this is a reflection of our years’ worth of research and consistent process as we saw several theses play out, multiple companies get acquired, and underappreciated stocks starting to get recognition. As long-term investors, we don’t put too much weight on short-term returns, but we are grateful that we’re off to a good start. We believe that there is a lot more to come in this portfolio. Thank you for your commitment and support.
Our Three-Step Process & Portfolio Positioning
When we experience stock prices fluctuating more based on fear than fundamentals, we employ a three-step process seeking to aide against permanent loss of capital and aiming to take advantage of the drawdown to find future compounders:
• First, were-underwrite our portfolio companies. We want to evaluate any concerns that could impair our investment thesis.
• Second, wemake adjustments. During these periods, we sometimes see management make decisions that are inconsistent with our thesis, which can lead us to sell our position.
• Third, we take a step back andhunt for opportunities to invest in high quality businesses where the stock price has also pulled back. We maintain a watch list of several dozen companies that we’d like to own at a target valuation. Often, these prices only become available during market corrections.
We would like to highlight a few examples of this three-step process in practice:
1)Re-underwrite
Visa Inc. (V) is a global processor of credit and debit payments. Approximately 50% of U.S. and 80%of global transactions are still in the form of cash and check. Every year, electronic payments take share from cash and check, and Visa benefits from this powerful secular growth trend. We have enjoyed double-digit compounding from Visa for many years.
2
LATEEF FOCUSED GROWTH FUND
Annual Investment Adviser’s Report (Continued)
April 30, 2019
(Unaudited)
Visa was a positive contributor to overall performance in 2018, however during the fourth quarter, Visa’s stock price dropped from nearly $151 to under $122, a 20% drawdown. While difficult to stomach, we found no change to the underlying core strength of Visa’s business. In fact, we believe that most of our portfolio companies’ stock price declines were inconsistent with the trajectory of their earnings. As such, we believe that this was a correction without a recession. At the end of April 2019 Visa was trading at $164 per share.
2) Make Portfolio Adjustments
We sold a couple of investments during the year. Specifically, we would like to highlight our decision to sellCommScope (COMM).
CommScopehas been a leading provider of telecom equipment to fixed and wireless networks. Weoriginally believed that CommScope would benefit from the coming investment cycle in 5G, or 5th generation, communications infrastructure. Earlier in the year, CommScope lowered full-year 2018 guidance because of input cost inflation and, more importantly, because the company accepted lower prices in exchange for increased orders from their two largest customers.
At the time, we confirmed that CommScope’s backlog grew significantly and decided to be patient with the company since 5G orders had started to benefit our other investment inKeysight (KEYS). Further, we believed that CommScope would be a later stage beneficiary in the 5G cycle.
During the fourth calendar quarter, CommScope again missed on earnings and announced plans to acquire ARRIS International (ARRS), a maker of video and broadband equipment. We disagree with CommScope’s decision to purchase ARRIS as we believe that acquiring a larger company (based on revenues) creates significant integration risk. Further ARRIS dilutes CommScope’s 5G portfolio and, along with it, the core of our original thesis. Finally, this deal adds significant debt to an already levered balance sheet. We estimate leverage will be over 6x earnings before interest, taxes, depreciation, and amortization (“EBITDA”) in 2019, a level that we are not comfortable with given the nature of CommScope’s business.
3) Go Hunting
As we looked across the stock market landscape, we saw several high-quality businesses trade down to what we believed were very attractive prices. Two companies that we viewed to be on sale that were added to our portfolio wereMartin Marietta Materials (MLM) and Hexcel Corporation (HXL). Both companies have been leaders in their industry, enjoy strong and growing demand for their products, and have generated attractive cash flow and return on invested capital.
3
LATEEF FOCUSED GROWTH FUND
Annual Investment Adviser’s Report (Continued)
April 30, 2019
(Unaudited)
Martin Mariettais a producer of aggregates (crushed rock) and downstream products. Aggregates area foundational material for the construction of highways, infrastructure, and buildings. We believe Martin Marietta will likely benefit from Federal, State, and Local infrastructure funding for many years to come.
Aggregate quarries are difficult to permit (noisy and dusty), are big (have decades of reserves), and products are heavy (which limits out of town competition). Once established, Martin Marietta’s quarries are 90% of the time the #1 or #2 provider in local markets, becoming the price setter with others following. We believe these characteristics create a high barrier to entry. Martin Marietta’s quarries also have led market share in the southwest and southeastern regions, which have growing populations, healthy state/local balance sheets, and aging roads and highways, paving way for increasing demand to upgrade their infrastructure.
We have long admired these business characteristics but so has the market. Martin Marietta’s10-year average price to earnings ratio (“P/E”) is 25x. Over the past two quarters, Martin Marietta’s stock price declined from approximately $230 per share to nearly $150 per share. We were able to start our position at $160 per share, or 16x 2019 estimated earnings. We believe the market pullback created a good entry point for a great business.
Hexcel Corporationis has been a leader in highly engineered composite materials. Their proprietarytechnology creates products like carbon fiber and honeycomb panels that are stronger and lighter than current materials on the market. After decades of engineering and refinement, we believe Hexcel is about to enjoy an inflection point in their sales and profitability.
Hexcel’s composites are designed into Boeing’s 787 fuselages, Airbus’s A350 planes, and GE’s LEAP engines. In fact, Hexcel enjoys a nine-year backlog with orders from Boeing and Airbus worth over $10 billion in revenues. There are other industrial markets for Hexcel’s products, including space & defense, wind energy, automotive, and marine. Our analysis concludes that Hexcel’s investment period has peaked and that, as it delivers on backlog, free cash flow and earnings should accelerate over the nextthree-to-five years.
Looking Ahead
As we look forward in 2019, key economic indicators like gross domestic product (“GDP”), inflation and interest rates all point to a growing U.S. economy. U.S. GDP growth is approximately 3% while inflation and interest rates are still modest. For instance,10-year U.S. Treasury bonds are yielding around 2.5% while equity valuations are also reasonable with the S&P 500 forward P/E at ~17x. We are not sensing investor euphoria, which is often a sign of a market top. Rather, the sentiment is quite somber, which often means that there are bargains to be had.
4
LATEEF FOCUSED GROWTH FUND
Annual Investment Adviser’s Report (Continued)
April 30, 2019
(Unaudited)
We continue to monitor for risks that can add volatility to markets. For instance, the U.S. trade war with China, geopolitical uncertainty and U.S. political drama can temporarily disrupt markets, as we have seen in the beginning of May. Despite these uncertainties, we believe that equities, as an asset class, are an essential tool to help clients with their investment goals. In seeking to generate returns that enable families and institutions to draw from and keep up with inflation, equities have historically been – and we believe will continue to be – an essential component of clients’ portfolios.
Over the long term, equities appreciate alongside the potential growth in earnings and cash flow. As such, companies that generate growth with low capital requirements are particularly attractive to us. We believe that our portfolio has many of these such businesses and that, over time, these businesses will likely continue to generate attractive returns.
As always, please don’t hesitate to call us at (415)461-3800.
Sincerely,
|
| | ||
Quoc K. Tran | Eric A. Winterhalter | |||
Chief Investment Officer | Chief Operating Officer |


~ Celebrating 40 Years of Exceptional Results in Investment Management ~
All opinions and data included in this commentary are as of April 30, 2019, unless otherwise noted, and are subject to change without notice. The opinions and views expressed herein are of Lateef Investment Management, L.P. (Lateef) and are not intended to be seen as fact, a forecast of future events, or a guarantee of future results. The information in this publication has been developed internally and/or obtained from sources believed to be reliable, but the accuracy or completeness of this information cannot be guaranteed. This publication is provided for informational purposes only and does not does constitute a solicitation, investment advice or recommendation for any particular investment product or strategy. Economic forecasts and estimated data reflect subjective judgments and assumptions and unexpected events may occur. Therefore, there can be no assurance that developments will transpire as may be forecasted in this publication. This information should not be used as the sole basis to make any investment decision. No investment strategy can assure a profit or protect against loss. Past performance is not a guarantee or indication of future performance. Current and future portfolio holdings are subject to change and risk.
5
LATEEF FOCUSED GROWTH FUND
Annual Investment Adviser’s Report (Continued)
April 30, 2019
(Unaudited)
Lateef Focused Growth Fund Leaders & Laggards from 5/1/2018 through 4/30/2019*
Our top contributors over the past year were Keysight Technologies, Starbucks, and IQVIA.
Keysight (KEYS)provides electronic measurement instruments and software solutions that allow telecomcarriers and equipment providers to test and properly calibrate communications and electronic systems. Since becoming an independent company, Keysight has increased investments in R&D, sharpened the company’s focus, and made several strategic acquisitions to broaden itsend-to-end solutions capabilities. We believed that these actions had positioned Keysight to potentially benefit from the upcoming deployment of 5G. With many years of attractive growth potential ahead, we were pleased to purchase shares at 14x our estimate of forward earnings.
Keysight was our top contributor this fiscal year, returning ~68% as the market started tocatch-up to our thesis on 5G. Keysight has been a primary beneficiary of 5G R&D spending as carriers and equipment manufacturers push towards the rollout of this new standard in the U.S. and abroad. The company’s early investments in 5G has led to share gains in 5G relative to 4G (where the company had underinvested as part of Agilent). Keysight has created anend-to-end portfolio of test & measurement solutions to serve 5G, including: early-stage development using the company’s design automation software, validation and verification of physical hardware during R&D, and protocol layer testing offered by Ixia. Outside of 5G, Keysight is also seeing strong demand from the end markets of next-generation data centers, automotive, and aerospace & defense.
Starbucks (SBUX)was a new purchase made in July and has returned ~53% since our initial purchase.We believed that Starbucks had the opportunity to generate consistent returns by revitalizing U.S. same-store sales trends, growing its store base in China and abroad, and leveraging its digital platform. More importantly, the company had streamlined its organization, added new management, and faced lower growth expectations. The company had the added benefit of capital returns, which management was proactively returning to shareholders.
This thesis continues to play out as the company’s efforts within the U.S. (footprint rationalization and store format changes, food & drink innovation, and digital customer engagement) has led to an reacceleration in volume and same-store sales trends. Meanwhile, Starbucks continues to expand in China, where new store additions are driving 80% of growth, and streamline the organization by entering into a Global Coffee Alliance with Nestlé. Through its licensing agreement with Nestlé for consumer products, Starbucks received over $7 billion upfront, which the company returned to shareholders via buybacks, and gained access to over 190 countries where Nestlé has presence. We anticipate Starbucks to return $25 billion to shareholders from fiscal 2018 to fiscal 2020.
IQVIA (IQV)was formed through the merger of IMS Health and Quintiles (we originally owned IMS).Through the combination of IMS’s industry-leading prescription data and Quintile’s leading clinical research
6
LATEEF FOCUSED GROWTH FUND
Annual Investment Adviser’s Report (Continued)
April 30, 2019
(Unaudited)
organization (CRO) business, IQVIA was attempting to disrupt the traditional clinical trial design and enrollment process by leveraging data to facilitate site selection and enrollment. With roughly 80% of clinical trials being delayed due to challenges in enrollment, we believed IQVIA’s next-generation CRO offering only grows in importance as drug being developed became more acute and targeted.
IQVIA returned~45% during the period as clinical trial bookings and revenues, partially driven by next-generation wins, exceeded expectations. Further, investments to develop a cloud-based customer engagement platform for pharmaceutical sales & marketing teams gained traction has led to an acceleration in overall organic growth to themid-to-high single digits. We believe IQVIA remains at the early innings of disrupting the clinical trial process as its first next-generation trials are set to complete enrollment over the next year.
Our bottom contributors over the past year were XPO Logistics, Flextronics, and CommScope.
XPO Logistics (XPO)has been a leading transportation services provider. We originally purchased XPOin the second quarter of 2017. Over the past few quarters, several developments challenged our thesis and we exited the position in the fourth quarter. Within a three month span, both the Chief Financial Officer and Chief Strategy Officer left for personal reasons. This was a cautionary sign. Then, after guiding to15-18% EBITDA growth in 2019 during the company’s earnings call in November, XPO revised down this guidance in December to12-15% growth due to a slowdown in global trade.
While this sounds reasonable, upon closer examination, we discovered that recent EBITDA growth was boosted by accounting choices such as including pension income, which was generally acceptable but aggressive from our standpoint. We viewed such income as alow-quality source of earnings because it was neither generated from normal operations nor recurring. We acknowledge that the stock traded higher after our sale and we could have tactically sold it better, but in our investment rubric, once we discover aggressive accounting, we step aside.
Flextronics (FLEX)provides design, engineering, manufacturing, and supply chain services to companiesoperating in a broad set of end markets. Over the past few years, Flex has shifted to provide more value-added services, such as concept design and prototype creation, in addition to its traditional service of contract manufacturing for electronics. We believed that as Flex expanded its addressable market into new verticals of industrial, healthcare, and automotive, its fundamentals would improve as these new verticals provided higher revenue visibility, margins, and growth rates.
In the fourth quarter of 2018, Nike and Flex announced that their joint project to automate the shoe manufacturing process would be canceled after years of updates and investment. The Nike contract was a highly visible representation of Flex’s ability to move away from consumer electronics and hardware and into new verticals, such as consumer products and devices. CEO Mike McNamara, who had been in the role since 2006, stepped down as a result with no clear replacement in sight. The quick and unexpected shift in
7
LATEEF FOCUSED GROWTH FUND
Annual Investment Adviser’s Report (Continued)
April 30, 2019
(Unaudited)
tone led us to lose confidence in management and we exited the position in order to reallocate to more attractive opportunities.
CommScope (COMM)was our final underperformer this year. CommScope is a leading provider of telecomequipment to fixed and wireless networks. We originally believed that CommScope would benefit from the coming investment cycle in 5G, or 5th generation, communications infrastructure. Earlier in the year, CommScope lowered full-year 2018 guidance because of input cost inflation and, more importantly, because the company accepted lower prices in exchange for increased orders from their two largest customers. At the time, we confirmed that CommScope’s backlog grew significantly and decided to be patient with the company since 5G orders had started to benefit our other investment in Keysight (KEYS). Further, we believed that CommScope would be a later stage beneficiary in the 5G cycle.
During the fourth calendar quarter, CommScope again missed on earnings and announced plans to acquire ARRIS International (ARRS), a maker of video and broadband equipment. We disagree with CommScope’s decision to purchase ARRIS as we believe that acquiring a larger company (based on revenues) creates significant integration risk. Further ARRIS dilutes CommScope’s 5G portfolio and, along with it, the core of our original thesis. Finally, this deal adds significant debt to an already levered balance sheet. We estimate leverage will be over 6x EBITDA in 2019, a level that we are not comfortable with given the nature of CommScope’s business. We sold CommScope in the fourth quarter and reallocated to more attractive opportunities given the wider market sell off.
*The list of top three and bottom three holdings should not be considered a recommendation to purchase or sell a particular security, represents only part of the Fund and the securities purchased for advisory clients, and may not remain in the Fund at the time you receive this letter. You should not assume that investments in the securities identified were, or will be, profitable or that decisions we make in the future will be profitable.
This letter is intended to assist shareholders in understanding how the Fund performed during the fiscal year ended April 30, 2019, and reflects the views of the investment adviser at the time of this writing. Of course, these views may change and do not guarantee the future performance of the Fund, its holdings or the markets. Discussion of particular Fund holdings is not intended as a recommendation to buy, hold or sell those securities. The Fund’s portfolio composition is subject to change. Current and future portfolio holdings are subject to investment risks. Since the Fund isnon-diversified and may invest a larger portion of its assets in the securities of a single issuer than a diversified fund, an investment in the Fund could fluctuate in value more than an investment in a diversified fund. Actual events may differ from the earnings projections and other forward looking statements presented herein. Visit www.lateef.com to see the Fund’s most recently published holdings list.
8
LATEEF FOCUSED GROWTH FUND
Annual Investment Adviser’s Report (Concluded)
April 30, 2019
(Unaudited)
All mutual fund investing involves risk, including possible loss of principal. The Fund isnon-diversified, which means that a portion of the Fund’s assets may be invested in one or few companies or sectors. The Fund could fluctuate in value more than a diversified fund.
Active Share is the percentage of Fund holdings that differ from the benchmark.
The Lateef Fund is distributed by Foreside Funds Distributors LLC
9
LATEEF FOCUSED GROWTH FUND
Annual Report
Performance Data
April 30, 2019
(Unaudited)
Comparison of Change in Value of $10,000 in Lateef Fund’s Class A and Class C Shares
vs. Russell 3000® Index and S&P 500® Index
Class A Shares growth of an assumed $10,000 investment is adjusted for the maximum sales charge of 5.00%. This results in a net initial investment of $9,500.
Comparison of Change in Value of $1,000,000 (Class I investment minimum) in Lateef Fund’s Class I Shares
vs. Russell 3000® Index and S&P 500® Index
10
LATEEF FOCUSED GROWTH FUND
Annual Report
Performance Data (Concluded)
April 30, 2019
(Unaudited)
| Average Annual Total Returns for the Periods Ended April 30, 2019 | ||||||||||
| 1 Year | 3 Years | 5 Years | 10 years | |||||||
Class A Shares (with sales charge) | 7.02% | 11.56% | 7.64% | 12.56% | ||||||
Class A Shares (without sales charge) | 12.62% | 13.50% | 8.76% | 13.14% | ||||||
Class C Shares | 11.91% | 12.65% | 7.94% | 12.30% | ||||||
Class I Shares | 12.85% | 13.76% | 9.02% | 13.42% | ||||||
Russell 3000® Index | 12.68% | 14.74% | 11.20% | 15.29% | ||||||
S&P 500® Index | 13.49% | 14.87% | 11.63% | 15.32% | ||||||
The performance data quoted represents past performance and does not guarantee future results. The investment return and principal value of an investment in the Fund will fluctuate so that an investor’s shares, when redeemed, may be worth more or less than their original cost. The graphs and table do not reflect the deduction of taxes that a shareholder would pay on Fund distributions or redemption of Fund shares. Current performance may be lower or higher. Performance data current to the most recentmonth-end may be obtained by calling (866)499-2151.
The returns shown for Class A Shares reflect a deduction for the maximumfront-end sales charge of 5.00%. All of the Fund’s share classes apply a 2.00% redemption fee to the value of shares redeemed within 30 days of purchase. This redemption fee is not reflected in the returns shown above. As stated in the current prospectus dated September 1, 2018, the Fund’s “Total Annual Fund Operating Expenses” are 1.57%, 2.32% and 1.32%, and the Fund’s “Total Annual Fund Operating Expenses After Fee Waiver and/or Expense Reimbursement” are 1.10%, 1.85% and 0.85% for Class A, Class C and Class I Shares, respectively, of the Fund’s average daily net assets. These rates may fluctuate and may differ from the actual expenses incurred by the Fund for the period covered by this report. Lateef Investment Management, L.P. (“the Adviser”) has contractually agreed to reduce its investment advisory fee and/or reimburse certain expenses of the Fund to the extent necessary to ensure that the Fund’s total operating expenses (excluding taxes, fees and expenses attributable to a distribution or service plan adopted by FundVantage Trust (the “Trust”), interest, extraordinary items, “Acquired Fund Fees and Expenses,“ and brokerage commissions) do not exceed 0.85% (on an annual basis) of the Fund’s average daily net assets (the “Expense Limitation”). The Expense Limitation shall remain in effect until August 31, 2019, unless the Board of Trustees of FundVantage Trust (”the Trust“) approves its earlier termination. Total returns would be lower had such fees and/or expenses not been waived and/or reimbursed.
All mutual fund investing involves risk, including possible loss of principal. The Fund isnon-diversified, which means that a portion of the Fund’s assets may be invested in one or few companies or sectors. The Fund could fluctuate in value more than a diversified fund.
The Fund intends to evaluate performance as compared to that of the Standard & Poor’s 500® Index (“S&P 500®”) and the Russell 3000® Index. The S&P 500® is a widely recognized, unmanaged index of 500 common stocks which are generally representative of the U.S. stock market as a whole. The Russell 3000® Index is an unmanaged index that measures the performance of the 3,000 largest U.S. stocks, representing about 98% of the total capitalization of the entire U.S. stock market. It is impossible to invest directly in an index.
11
LATEEF FOCUSED GROWTH FUND
Fund Expense Disclosure
April 30, 2019
(Unaudited)
As a shareholder of the Fund, you incur two types of costs: (1) transaction costs including sales charges (loads) on purchase payments (if any) or redemption fees; and (2) ongoing costs, including management fees, distribution and/or service (Rule12b-1) fees (if any) and other Fund expenses. These examples are intended to help you understand your ongoing costs (in dollars) of investing in the Fund and to compare these costs with the ongoing costs of investing in other mutual funds.
These examples are based on an investment of $1,000 invested at the beginning of thesix-month period from November 1, 2018 through April 30, 2019 and held for the entire period.
Actual Expenses
The first line of the accompanying table provides information about actual account values and actual expenses. You may use the information in this line, together with the amount you invested, to estimate the expenses that you paid over the period. Simply divide your account value by $1,000 (for example, an $8,600 account value divided by $1,000 = 8.6), then multiply the result by the number in the first line under the heading entitled “Expenses Paid During Period” to estimate the expenses you paid on your account during this period.
Hypothetical Examples for Comparison Purposes
The second line of the accompanying table provides information about hypothetical account values and hypothetical expenses based on the Fund’s actual expense ratio and an assumed rate of return of 5% per year before expenses, which is not your Fund’s actual return. The hypothetical account values and expenses may not be used to estimate the actual ending account balance or expenses you paid for the period. You may use this information to compare the ongoing costs of investing in the Fund and other funds. To do so, compare these 5% hypothetical examples with the 5% hypothetical examples that appear in the shareholder reports of other funds.
Please note that the expenses shown in the accompanying table are meant to highlight your ongoing costs only and do not reflect any transactional costs, such as sales charges (loads) on purchase payments (if any) or redemption fees. Therefore, each hypothetical line of the accompanying table is useful in comparing ongoing costs only and will not help you determine the relative total costs of owning different funds. In addition, if these transactional costs were included, your costs would have been higher.
12
LATEEF FOCUSED GROWTH FUND
Fund Expense Disclosure (Concluded)
April 30, 2019
(Unaudited)
| Lateef Fund | |||||||||||||||
| Beginning Account Value November 1, 2018 | Ending Account Value April 30, 2019 | Expenses Paid During Period* | |||||||||||||
Class A | |||||||||||||||
Actual | $1,000.00 | $1,149.00 | $5.86 | ||||||||||||
Hypothetical (5% return before expenses) | 1,000.00 | 1,019.34 | 5.51 | ||||||||||||
Class C | |||||||||||||||
Actual | $1,000.00 | $1,144.40 | $9.84 | ||||||||||||
Hypothetical (5% return before expenses) | 1,000.00 | 1,015.62 | 9.25 | ||||||||||||
Class I | |||||||||||||||
Actual | $1,000.00 | $1,149.10 | $4.53 | ||||||||||||
Hypothetical (5% return before expenses) | 1,000.00 | 1,020.58 | 4.26 | ||||||||||||
| * | Expenses are equal to an annualized expense ratio for thesix-month period ended April 30, 2019 of 1.10%, 1.85% and 0.85% for Class A, Class C and Class I shares, respectively, for the Fund, multiplied by the average account value over the period, multiplied by the number of days in the most recent period (181), then divided by 365 to reflect the period. The Fund’s ending account values on the first line in the table are based on the actualsix-month total returns for the Fund of 14.90%, 14.44% and 14.91% for Class A, Class C and Class I shares, respectively. |
13
LATEEF FOCUSED GROWTH FUND
Portfolio Holdings Summary Table
April 30, 2019
(Unaudited)
The following table presents a summary by sector of the portfolio holdings of the Fund:
| % of Net Assets | Value | |||||||
COMMON STOCKS: | ||||||||
Technology | 34.5 | % | $ | 17,991,312 | ||||
Industrial | 21.2 | 11,025,080 | ||||||
Consumer,Non-cyclical | 14.8 | 7,721,986 | ||||||
Financial | 11.5 | 5,997,596 | ||||||
Consumer, Cyclical | 10.5 | 5,437,164 | ||||||
Energy | 6.9 | 3,606,536 | ||||||
Other Assets in Excess of Liabilities | 0.6 | 325,470 | ||||||
|
|
|
| |||||
NET ASSETS | 100.0 | % | $ | 52,105,144 | ||||
|
|
|
| |||||
Portfolio holdings are subject to change at any time.
14
LATEEF FOCUSED GROWTH FUND
Portfolio of Investments
April 30, 2019
| Number | ||||||||
| of Shares | Value | |||||||
COMMON STOCKS — 99.4% |
| |||||||
Consumer, Cyclical — 10.5% |
| |||||||
Aptiv PLC | 24,654 | $ | 2,112,848 | |||||
Starbucks Corp. | 42,795 | 3,324,316 | ||||||
|
| |||||||
| 5,437,164 | ||||||||
|
| |||||||
Consumer,Non-cyclical — 14.8% |
| |||||||
Anthem, Inc. | 6,175 | 1,624,210 | ||||||
Danaher Corp. | 15,701 | 2,079,441 | ||||||
Elanco Animal Health, Inc.* | 31,540 | 993,510 | ||||||
IQVIA Holdings, Inc.* | 21,777 | 3,024,825 | ||||||
|
| |||||||
| 7,721,986 | ||||||||
|
| |||||||
Energy — 6.9% | ||||||||
Anadarko Petroleum Corp. | 35,721 | 2,602,275 | ||||||
Schlumberger Ltd. | 23,530 | 1,004,261 | ||||||
|
| |||||||
| 3,606,536 | ||||||||
|
| |||||||
Financial — 11.5% | ||||||||
Aon PLC | 5,951 | 1,072,013 | ||||||
Equinix, Inc. | 5,568 | 2,531,770 | ||||||
Progressive Corp. (The) | 30,631 | 2,393,813 | ||||||
|
| |||||||
| 5,997,596 | ||||||||
|
| |||||||
Industrial — 21.2% | ||||||||
Arconic, Inc. | 101,238 | 2,174,592 | ||||||
Hexcel Corp. | 40,632 | 2,873,089 | ||||||
Keysight Technologies, Inc.* | 28,583 | 2,487,578 | ||||||
Martin Marietta Materials, Inc. | 15,727 | 3,489,821 | ||||||
|
| |||||||
| 11,025,080 | ||||||||
|
| |||||||
| Number | ||||||||
| of Shares | Value | |||||||
COMMON STOCKS — (Continued) |
| |||||||
Technology — 34.5% | ||||||||
Alphabet, Inc., Class A* | 2,022 | $ | 2,424,297 | |||||
Autodesk, Inc.* | 11,201 | 1,996,130 | ||||||
CBS Corp. | 20,747 | 1,063,699 | ||||||
First Data Corp., Class A* | 90,417 | 2,338,184 | ||||||
Guidewire Software, Inc.* | 21,501 | 2,289,856 | ||||||
Instructure, Inc.* | 43,156 | 1,859,160 | ||||||
New York Times Co. (The), Class A | 82,990 | 2,751,118 | ||||||
Visa, Inc., Class A | 19,880 | 3,268,868 | ||||||
|
| |||||||
| 17,991,312 | ||||||||
|
| |||||||
TOTAL COMMON STOCKS |
| 51,779,674 | ||||||
|
| |||||||
TOTAL INVESTMENTS - 99.4% |
| 51,779,674 | ||||||
|
| |||||||
OTHER ASSETS IN | 325,470 | |||||||
|
| |||||||
NET ASSETS - 100.0% |
| $ | 52,105,144 | |||||
|
| |||||||
| * | Non-income producing. |
| PLC | Public Limited Company |
The accompanying notes are an integral part of the financial statements.
15
LATEEF FOCUSED GROWTH FUND
Statement of Assets and Liabilities
April 30, 2019
Assets | |||||
Investments, at value (Cost $36,548,280) | $ | 51,779,674 | |||
Cash | 468,840 | ||||
Receivable for capital shares sold | 124 | ||||
Dividends and interest receivable | 2,618 | ||||
Prepaid expenses and other assets | 29,452 | ||||
|
| ||||
Total assets | 52,280,708 | ||||
|
| ||||
Liabilities | |||||
Payable for capital shares redeemed | 48,606 | ||||
Payable for audit fees | 26,606 | ||||
Payable for administration and accounting fees | 23,768 | ||||
Payable to Investment Adviser | 19,932 | ||||
Payable for transfer agent fees | 19,177 | ||||
Payable for printing fees | 12,412 | ||||
Payable for distribution fees | 10,574 | ||||
Payable for custodian fees | 6,441 | ||||
Payable for shareholder service fees | 2,352 | ||||
Accrued expenses | 5,696 | ||||
|
| ||||
Total liabilities | 175,564 | ||||
|
| ||||
Net Assets | $ | 52,105,144 | |||
|
| ||||
Net Assets consisted of: | |||||
Capital stock, $0.01 par value | $ | 69,833 | |||
Paid-in capital | 29,875,712 | ||||
Total distributable earnings | 22,159,599 | ||||
|
| ||||
Net Assets | $ | 52,105,144 | |||
|
|
Class A Shares: | |||||
Net asset value and redemption price per share | $ | 7.73 | |||
|
| ||||
Maximum offering price per share (100/95 of $7.73) | $ | 8.14 | |||
|
| ||||
Class C Shares: | |||||
Net asset value, offering and redemption price per share | $ | 6.14 | |||
|
| ||||
Class I Shares: | |||||
Net asset value, offering and redemption price per share | $ | 8.12 | |||
|
| ||||
The accompanying notes are an integral part of the financial statements.
16
LATEEF FOCUSED GROWTH FUND
Statement of Operations
For the Year Ended April 30, 2019
Investment income | |||||
Dividends | $ | 570,441 | |||
Less: foreign taxes withheld | (9 | ) | |||
|
| ||||
Total investment income | 570,432 | ||||
|
| ||||
Expenses | |||||
Advisory fees (Note 2) | 556,132 | ||||
Transfer agent fees (Note 2) | 108,009 | ||||
Distribution fees (Class C) (Note 2) | 97,004 | ||||
Administration and accounting fees (Note 2) | 65,147 | ||||
Registration and filing fees | 64,410 | ||||
Distribution fees (Class A) (Note 2) | 46,121 | ||||
Trustees’ and officers’ fees (Note 2) | 34,741 | ||||
Legal fees | 34,455 | ||||
Shareholder services fees | 32,335 | ||||
Audit fees | 26,485 | ||||
Printing and shareholder reporting fees | 21,022 | ||||
Custodian fees (Note 2) | 20,165 | ||||
Other expenses | 11,907 | ||||
|
| ||||
Total expenses before waivers | 1,117,933 | ||||
|
| ||||
Less: waivers (Note 2) | (386,858 | ) | |||
|
| ||||
Net expenses after waivers | 731,075 | ||||
|
| ||||
Net investment loss | (160,643 | ) | |||
|
| ||||
Net realized and unrealized gain/(loss) from investments: | |||||
Net realized gain from investments | 9,527,447 | ||||
Net realized gain from written options* | 83,662 | ||||
Net change in unrealized appreciation/(depreciation) on investments | (3,876,905 | ) | |||
|
| ||||
Net realized and unrealized gain on investments | 5,734,204 | ||||
|
| ||||
Net increase in net assets resulting from operations | $ | 5,573,561 | |||
|
|
| * | Primary risk exposure is equity contracts. |
The accompanying notes are an integral part of the financial statements.
17
LATEEF FOCUSED GROWTH FUND
Statements of Changes in Net Assets
| For the | For the | |||||||
| Year Ended | Year Ended | |||||||
| April 30, 2019 | April 30, 2018 | |||||||
Increase/(decrease) in net assets from operations: | ||||||||
Net investment loss | $ | (160,643 | ) | $ | (363,287 | ) | ||
Net realized gain from investments and written options | 9,611,109 | 13,192,577 | ||||||
Net change in unrealized appreciation/(depreciation) on investments | (3,876,905 | ) | 1,618,578 | |||||
|
|
|
| |||||
Net increase in net assets resulting from operations: | 5,573,561 | 14,447,868 | ||||||
|
|
|
| |||||
Less dividends and distributions to shareholders from: | ||||||||
Total distributable earnings* | ||||||||
Class A | (3,422,289 | ) | (5,345,259 | ) | ||||
Class C | (2,775,002 | ) | (4,189,435 | ) | ||||
Class I | (5,884,973 | ) | (12,249,273 | ) | ||||
|
|
|
| |||||
Net decrease in net assets from dividends and distributions to shareholders | (12,082,264 | ) | (21,783,967 | ) | ||||
|
|
|
| |||||
Decrease in net assets derived from capital share transactions (Note 4) | (19,034,933 | ) | (26,165,632 | ) | ||||
|
|
|
| |||||
Total decrease in net assets | (25,543,636 | ) | (33,501,731 | ) | ||||
|
|
|
| |||||
Net assets | ||||||||
Beginning of year | 77,648,780 | 111,150,511 | ||||||
|
|
|
| |||||
End of year** | $ | 52,105,144 | $ | 77,648,780 | ||||
|
|
|
| |||||
| * | Distributions from net investment income and from realized gains are no longer required to be separately disclosed. See Note 1. For the year ended April 30, 2018, distributions from net investment income were $0, $0 and $0 for Class A, Class C and Class I and net realized gains were $5,345,259. $4,189,435 and $12,249,273 for Class A, Class C and Class I, respectively. |
| ** | Parenthetical disclosure of accumulated net investment income/(loss) is no longer required. See Note 1. For the year ended April 30, 2018, end of year net assets included accumulated net investment loss of ($95,917). |
The accompanying notes are an integral part of the financial statements.
18
LATEEF FOCUSED GROWTH FUND
Financial Highlights
Contained below is per share operating performance data for Class A shares outstanding, total investment return, ratios to average net assets and other supplemental data for the respective period. The total returns in the table represent the rate that an investor would have earned or lost on an investment in the Fund (assuming reinvestment of all dividends and distributions). This information has been derived from information provided in the financial statements and should be read in conjunction with the financial statements and the notes thereto.
| Class A Shares | |||||||||||||||||||||||||
| For the | For the | For the | For the | For the | |||||||||||||||||||||
| Year | Year | Year | Year | Year | |||||||||||||||||||||
| Ended | Ended | Ended | Ended | Ended | |||||||||||||||||||||
| April 30, | April 30, | April 30, | April 30, | April 30, | |||||||||||||||||||||
| 2019 | 2018 | 2017 | 2016 | 2015 | |||||||||||||||||||||
Per Share Operating Performance | |||||||||||||||||||||||||
Net asset value, beginning of year | $ | 8.60 | $ | 9.54 | $ | 10.77 | $ | 14.00 | $ | 14.20 | |||||||||||||||
|
|
|
|
|
|
|
|
|
| ||||||||||||||||
Net investment income/(loss)(1) | (0.02 | ) | (0.04 | ) | (0.04 | ) | (0.05 | ) | 0.01 | ||||||||||||||||
Net realized and unrealized gain/(loss) on investments | 0.79 | 1.40 | 1.25 | (0.19 | ) | 0.91 | |||||||||||||||||||
|
|
|
|
|
|
|
|
|
| ||||||||||||||||
Net increase/(decrease) in net assets resulting from operations | 0.77 | 1.36 | 1.21 | (0.24 | ) | 0.92 | |||||||||||||||||||
|
|
|
|
|
|
|
|
|
| ||||||||||||||||
Dividends and distributions to shareholders from: | |||||||||||||||||||||||||
Net investment income | — | — | — | (0.02 | ) | (0.01 | ) | ||||||||||||||||||
Net realized capital gains | (1.64 | ) | (2.30 | ) | (2.44 | ) | (2.97 | ) | (1.11 | ) | |||||||||||||||
|
|
|
|
|
|
|
|
|
| ||||||||||||||||
Total dividends and distributions to shareholders | (1.64 | ) | (2.30 | ) | (2.44 | ) | (2.99 | ) | (1.12 | ) | |||||||||||||||
|
|
|
|
|
|
|
|
|
| ||||||||||||||||
Redemption fees | — | (2) | — | (2) | — | — | (2) | — | (2) | ||||||||||||||||
|
|
|
|
|
|
|
|
|
| ||||||||||||||||
Net asset value, end of year | $ | 7.73 | $ | 8.60 | $ | 9.54 | $ | 10.77 | $ | 14.00 | |||||||||||||||
|
|
|
|
|
|
|
|
|
| ||||||||||||||||
Total investment return(3) | 12.62 | % | 15.26 | % | 12.64 | % | (2.31 | )% | 6.54 | % | |||||||||||||||
Ratios/Supplemental Data | |||||||||||||||||||||||||
Net assets, end of year (in thousands) | $ | 17,375 | $ | 20,580 | $ | 24,460 | $ | 56,657 | $ | 86,174 | |||||||||||||||
Ratio of expenses to average net assets | 1.10 | % | 1.14 | % | 1.24 | % | 1.24 | % | 1.24 | % | |||||||||||||||
Ratio of expenses to average net assets without waivers and expense reimbursements(4) | 1.69 | % | 1.65 | % | 1.57 | % | 1.42 | % | 1.38 | % | |||||||||||||||
Ratio of net investment income/(loss) to average net assets | (0.23 | )% | (0.38 | )% | (0.35 | )% | (0.37 | )% | 0.08 | % | |||||||||||||||
Portfolio turnover rate | 50.88 | % | 50.42 | % | 41.70 | % | 65.01 | % | 29.22 | % | |||||||||||||||
| (1) | The selected per share data was calculated using the average shares outstanding method for the year. |
| (2) | Amount is less than $0.005 per share. |
| (3) | Total investment return is calculated assuming a purchase of shares on the first day and a sale of shares on the last day of each period reported and includes reinvestment of dividends and distributions, if any. Total investment return does not reflect the impact of the maximumfront-end sales load of 5.00%. If reflected, the return would be lower. |
| (4) | During the period, certain fees were waived. If such fee waivers had not occurred, the ratios would have been as indicated (See Note 2). |
The accompanying notes are an integral part of the financial statements.
19
LATEEF FOCUSED GROWTH FUND
Financial Highlights
Contained below is per share operating performance data for Class C shares outstanding, total investment return, ratios to average net assets and other supplemental data for the respective period. The total returns in the table represent the rate that an investor would have earned or lost on an investment in the Fund (assuming reinvestment of all dividends and distributions). This information has been derived from information provided in the financial statements and should be read in conjunction with the financial statements and the notes thereto.
| Class C Shares | |||||||||||||||||||||||||
| For the | For the | For the | For the | For the | |||||||||||||||||||||
| Year | Year | Year | Year | Year | |||||||||||||||||||||
| Ended | Ended | Ended | Ended | Ended | |||||||||||||||||||||
| April 30, | April 30, | April 30, | April 30, | April 30, | |||||||||||||||||||||
| 2019 | 2018 | 2017 | 2016 | 2015 | |||||||||||||||||||||
Per Share Operating Performance | |||||||||||||||||||||||||
Net asset value, beginning of year | $ | 7.23 | $ | 8.41 | $ | 9.84 | $ | 13.11 | $ | 13.46 | |||||||||||||||
|
|
|
|
|
|
|
|
|
| ||||||||||||||||
Net investment loss(1) | (0.07 | ) | (0.09 | ) | (0.10 | ) | (0.13 | ) | (0.09 | ) | |||||||||||||||
Net realized and unrealized gain/(loss) on investments | 0.62 | 1.21 | 1.11 | (0.17 | ) | 0.85 | |||||||||||||||||||
|
|
|
|
|
|
|
|
|
| ||||||||||||||||
Net increase/(decrease) in net assets resulting from operations | 0.55 | 1.12 | 1.01 | (0.30 | ) | 0.76 | |||||||||||||||||||
|
|
|
|
|
|
|
|
|
| ||||||||||||||||
Dividends and distributions to shareholders from: | |||||||||||||||||||||||||
Net realized capital gains | (1.64 | ) | (2.30 | ) | (2.44 | ) | (2.97 | ) | (1.11 | ) | |||||||||||||||
Redemption fees | — | (2) | — | (2) | — | — | (2) | — | (2) | ||||||||||||||||
|
|
|
|
|
|
|
|
|
| ||||||||||||||||
Net asset value, end of year | $ | 6.14 | $ | 7.23 | $ | 8.41 | $ | 9.84 | $ | 13.11 | |||||||||||||||
|
|
|
|
|
|
|
|
|
| ||||||||||||||||
Total investment return(3) | 11.91 | % | 14.35 | % | 11.71 | % | (2.98 | )% | 5.65 | % | |||||||||||||||
Ratios/Supplemental Data | |||||||||||||||||||||||||
Net assets, end of year (in thousands) | $ | 11,563 | $ | 15,087 | $ | 19,721 | $ | 35,840 | $ | 46,879 | |||||||||||||||
Ratio of expenses to average net assets | 1.85 | % | 1.89 | % | 1.99 | % | 1.99 | % | 1.99 | % | |||||||||||||||
Ratio of expenses to average net assets without waivers and expense reimbursements(4) | 2.44 | % | 2.41 | % | 2.33 | % | 2.17 | % | 2.14 | % | |||||||||||||||
Ratio of net investment loss to average net assets | (0.98 | )% | (1.14 | )% | (1.10 | )% | (1.12 | )% | (0.67 | )% | |||||||||||||||
Portfolio turnover rate | 50.88 | % | 50.42 | % | 41.70 | % | 65.01 | % | 29.22 | % | |||||||||||||||
| (1) | The selected per share data was calculated using the average shares outstanding method for the year. |
| (2) | Amount is less than $0.005 per share. |
| (3) | Total investment return is calculated assuming a purchase of shares on the first day and a sale of shares on the last day of each period reported and includes reinvestment of dividends and distributions, if any. |
| (4) | During the period, certain fees were waived. If such fee waivers had not occurred, the ratios would have been as indicated (See Note 2). |
The accompanying notes are an integral part of the financial statements.
20
LATEEF FOCUSED GROWTH FUND
Financial Highlights
Contained below is per share operating performance data for Class I shares outstanding, total investment return, ratios to average net assets and other supplemental data for the respective period. The total returns in the table represent the rate that an investor would have earned or lost on an investment in the Fund (assuming reinvestment of all dividends and distributions). This information has been derived from information provided in the financial statements and should be read in conjunction with the financial statements and the notes thereto.
| Class I Shares | |||||||||||||||||||||||||
| For the | For the | For the | For the | For the | |||||||||||||||||||||
| Year | Year | Year | Year | Year | |||||||||||||||||||||
| Ended | Ended | Ended | Ended | Ended | |||||||||||||||||||||
| April 30, | April 30, | April 30, | April 30, | April 30, | |||||||||||||||||||||
| 2019 | 2018 | 2017 | 2016 | 2015 | |||||||||||||||||||||
Per Share Operating Performance | |||||||||||||||||||||||||
Net asset value, beginning of year | $ | 8.93 | $ | 9.80 | $ | 10.98 | $ | 14.22 | $ | 14.41 | |||||||||||||||
|
|
|
|
|
|
|
|
|
| ||||||||||||||||
Net investment income/(loss)(1) | 0.00 | (2) | (0.01 | ) | (0.01 | ) | (0.02 | ) | 0.05 | ||||||||||||||||
Net realized and unrealized gain/(loss) on investments | 0.83 | 1.44 | 1.27 | (0.19 | ) | 0.92 | |||||||||||||||||||
|
|
|
|
|
|
|
|
|
| ||||||||||||||||
Net increase/(decrease) in net assets resulting from operations | 0.83 | 1.43 | 1.26 | (0.21 | ) | 0.97 | |||||||||||||||||||
|
|
|
|
|
|
|
|
|
| ||||||||||||||||
Dividends and distributions to shareholders from: | |||||||||||||||||||||||||
Net investment income | — | — | — | (0.06 | ) | (0.05 | ) | ||||||||||||||||||
Net realized capital gains | (1.64 | ) | (2.30 | ) | (2.44 | ) | (2.97 | ) | (1.11 | ) | |||||||||||||||
|
|
|
|
|
|
|
|
|
| ||||||||||||||||
Total dividends and distributions to shareholders | (1.64 | ) | (2.30 | ) | (2.44 | ) | (3.03 | ) | (1.16 | ) | |||||||||||||||
|
|
|
|
|
|
|
|
|
| ||||||||||||||||
Redemption fees | — | (2) | — | (2) | — | — | (2) | — | (2) | ||||||||||||||||
|
|
|
|
|
|
|
|
|
| ||||||||||||||||
Net asset value, end of year | $ | 8.12 | $ | 8.93 | $ | 9.80 | $ | 10.98 | $ | 14.22 | |||||||||||||||
|
|
|
|
|
|
|
|
|
| ||||||||||||||||
Total investment return(3) | 12.85 | % | 15.59 | % | 12.86 | % | (2.04 | )% | 6.79 | % | |||||||||||||||
Ratios/Supplemental Data | |||||||||||||||||||||||||
Net assets, end of year (in thousands) | $ | 23,167 | $ | 41,982 | $ | 66,969 | $ | 358,492 | $ | 623,561 | |||||||||||||||
Ratio of expenses to average net assets | 0.85 | % | 0.89 | % | 0.99 | % | 0.99 | % | 0.99 | % | |||||||||||||||
Ratio of expenses to average net assets without waivers and expense reimbursements(4) | 1.44 | % | 1.41 | % | 1.28 | % | 1.16 | % | 1.14 | % | |||||||||||||||
Ratio of net investment income/(loss) to average net assets | 0.02 | % | (0.14 | )% | (0.09 | )% | (0.12 | )% | 0.33 | % | |||||||||||||||
Portfolio turnover rate | 50.88 | % | 50.42 | % | 41.70 | % | 65.01 | % | 29.22 | % | |||||||||||||||
| (1) | The selected per share data was calculated using the average shares outstanding method for the year. |
| (2) | Amount is less than $0.005 per share. |
| (3) | Total investment return is calculated assuming a purchase of shares on the first day and a sale of shares on the last day of each period reported and includes reinvestment of dividends and distributions, if any. |
| (4) | During the period, certain fees were waived. If such fee waivers had not occurred, the ratios would have been as indicated (See Note 2). |
The accompanying notes are an integral part of the financial statements.
21
LATEEF FOCUSED GROWTH FUND
Notes to Financial Statements
April 30, 2019
1. Organization and Significant Accounting Policies
The Lateef Focused Growth Fund (the “Fund”) is anon-diversified,open-end management investment company registered under the Investment Company Act of 1940, as amended (the “1940 Act”), which commenced investment operations on September 6, 2007. The Fund is a separate series of FundVantage Trust (the “Trust”) which was organized as a Delaware statutory trust on August 28, 2006. The Trust is a “series trust” authorized to issue an unlimited number of separate series or classes of shares of beneficial interest. Each series is treated as a separate entity for certain matters under the 1940 Act, and for other purposes, and a shareholder of one series is not deemed to be a shareholder of any other series. The Fund offers separate classes of shares, Class A, Class C and Class I shares. Class A shares are sold subject to afront-end sales charge.Front-end sales charges may be reduced or waived under certain circumstances. A contingent deferred sales charge (“CDSC”) may be applicable to the purchase of Class A shares. A CDSC, as a percentage of the lower of the original purchase price or net asset value at redemption, of up to 1.00% may be imposed on full or partial redemptions of Class A shares made within eighteen months of purchase where: (i) $1 million or more of Class A shares were purchased without an initial sales charge and (ii) the selling broker-dealer received a commission for such sale.
The Fund is an investment company and follows accounting and reporting guidance in the Financial Accounting Standards Board Accounting Standards Codification Topic 946.
Portfolio Valuation— The Fund’s net asset value (“NAV”) is calculated once daily at the closeof regular trading hours on the New York Stock Exchange (“NYSE”) (typically 4:00 p.m. Eastern time) on each day the NYSE is open. Securities held by the Fund are valued using the closing price or the last sale price on a national securities exchange or the National Association of Securities Dealers Automatic Quotation System (“NASDAQ”) market system where they are primarily traded. Equity securities traded in theover-the-counter market are valued at their closing prices. If there were no transactions on that day, securities traded principally on an exchange or on NASDAQ will be valued at the mean of the last bid and ask prices prior to the market close. Fixed income securities having a remaining maturity of greater than 60 days are valued using an independent pricing service. Fixed income securities having a remaining maturity of 60 days or less are generally valued at amortized cost, provided such amount approximates fair value. Foreign securities are valued based on prices from the primary market in which they are traded and are translated from the local currency into U.S. dollars using current exchange rates. Investments in otheropen-end investment companies are valued based on the NAV of the investment companies (which may use fair value pricing as discussed in their prospectuses). If market quotations are unavailable or deemed unreliable, securities will be valued in accordance with procedures adopted by the Trust’s Board of Trustees (“Board of Trustees”). Options are valued at last sale price. Relying on prices supplied by pricing services or dealers or using fair valuation may result in values that are higher or lower than the values used by other investment companies and investors to price the same investments. In the event that market quotes are not readily available, and the security or asset cannot be valued pursuant to one of the valuation methods, the value of the security or asset will be determined in good faith by the Adviser.
22
LATEEF FOCUSED GROWTH FUND
Notes to Financial Statements (Continued)
April 30, 2019
The Trust has established a Valuation Committee which performs certain functions including the oversight of the Adviser’s fair valuation determinations.
Fair Value Measurements— The inputs and valuation techniques used to measure fair value ofthe Fund’s investments are summarized into three levels as described in the hierarchy below:
• Level 1 | — | quoted prices in active markets for identical securities; | ||
• Level 2 | — | other significant observable inputs (including quoted prices for similar securities, interest rates, prepayment speeds, credit risk, etc.); and | ||
• Level 3 | — | significant unobservable inputs (including the Fund’s own assumptions in determining the fair value of investments). | ||
The inputs or methodology used for valuing securities are not necessarily an indication of the risk associated with investing in those securities.
The following is a summary of the inputs used, as of April 30, 2019, in valuing the Fund’s investments carried at fair value:
| Total Value at 04/30/19 | Level 1 Quoted Price | Level 2 Other Significant Observable Inputs | Level 3 Significant Unobservable Inputs | |||||||||||||
Investments in Securities* | $ | 51,779,674 | $ | 51,779,674 | $ | — | $ | — | ||||||||
|
|
|
|
|
|
|
| |||||||||
| * | Please refer to Portfolio of Investments for further details on portfolio holdings. |
At the end of each quarter, management evaluates the classification of Levels 1, 2 and 3 assets and liabilities. Various factors are considered, such as changes in liquidity from the prior reporting period; whether or not a broker is willing to execute at the quoted price; the depth and consistency of prices from third party pricing services; and the existence of contemporaneous, observable trades in the market. Additionally, management evaluates the classification of Level 1 and Level 2 assets and liabilities on a quarterly basis for changes in listings or delistings on national exchanges.
Due to the inherent uncertainty of determining the fair value of investments that do not have a readily available market value, the fair value of the Fund’s investments may fluctuate from period to period. Additionally, the fair value of investments may differ significantly from the values that would have been used had a ready market existed for such investments and may differ materially from the values the Fund may ultimately realize. Further, such investments may be subject to legal and other restrictions on resale or are otherwise less liquid than publicly traded securities.
23
LATEEF FOCUSED GROWTH FUND
Notes to Financial Statements (Continued)
April 30, 2019
For fair valuations using significant unobservable inputs, U.S. generally accepted accounting principles (“U.S. GAAP”) require the Fund to present a reconciliation of the beginning to ending balances for reported market values that present changes attributable to total realized and unrealized gains or losses, purchase and sales, and transfers in and out of Level 3 during the period. A reconciliation of Level 3 investments is presented only when the Fund had an amount of Level 3 investments at the end of the reporting period that was meaningful in relation to its net assets. The amounts and reasons for all transfers in and out of each Level within the three-tier hierarchy are disclosed when the Fund had an amount of total transfers during the reporting period that was meaningful in relation to its net assets as of the end of the reporting period.
For the year ended April 30, 2019, there were no transfers between Levels.
Use of Estimates— The preparation of financial statements in conformity with U.S. GAAP requiresmanagement to make estimates and assumptions that affect the amounts reported in the financial statements and accompanying notes at the date of the financial statements and the reported amounts of revenues and expenses during the period. Actual results could differ from those estimates and those differences could be material.
Investment Transactions, Investment Income and Expenses— Investment transactions arerecorded on trade date for financial statement preparation purposes. Realized gains and losses on investments sold are recorded on the identified cost basis. Interest income is recorded on the accrual basis. Dividends are recorded on theex-dividend date. Distribution(12b-1) fees and shareholder services fees relating to a specific class are charged directly to that class. Fund level expenses common to all classes, investment income and realized and unrealized gains and losses on investments are allocated to each class based upon the relative daily net assets of each class. General expenses of the Trust are generally allocated to each fund in proportion to its relative daily net assets. Expenses directly attributable to a particular fund in the Trust are charged directly to that fund.
Cash and Cash Equivalent— Cash and cash equivalents include cash and overnight investmentsin interest-bearing demand deposits with a financial institution with original maturities of three months or less. The Fund maintains deposits with a high quality financial institution in an amount that is in excess of federally insured limits.
Dividends and Distributions to Shareholders— Dividends from net investment income and distributionsfrom net realized capital gains, if any, are declared, recorded onex-date and paid at least annually to shareholders. Income dividends and capital gain distributions are determined in accordance with U.S. federal income tax regulations, which may differ from U.S. GAAP.
U.S. Tax Status— No provision is made for U.S. income taxes as it is the Fund’s intention to continueto qualify for and elect the tax treatment applicable to regulated investment companies under Subchapter
24
LATEEF FOCUSED GROWTH FUND
Notes to Financial Statements (Continued)
April 30, 2019
M of the Internal Revenue Code of 1986, as amended (the “Internal Revenue Code”), and make the requisite distributions to its shareholders which will be sufficient to relieve it from U.S. income and excise taxes.
Other— In the normal course of business, the Fund may enter into contracts that provide generalindemnifications. The Fund’s maximum exposure under these arrangements is dependent on claims that may be made against the Fund in the future, and therefore, cannot be estimated; however, based on experience, the risk of material loss for such claims is considered remote.
Currency Risk— The Fund invests in securities of foreign issuers, including American DepositaryReceipts. These markets are subject to special risks associated with foreign investments not typically associated with investing in U.S. markets. Because the foreign securities in which the Fund may invest generally trade in currencies other than the U.S. dollar, changes in currency exchange rates will affect the Fund’s NAV, the value of dividends and interest earned and gains and losses realized on the sale of securities. Because the NAV for the Fund is determined on the basis of U.S. dollars, the Fund may lose money by investing in a foreign security if the local currency of a foreign market depreciates against the U.S. dollar, even if the local currency value of the Fund’s holdings goes up. Generally, a strong U.S. dollar relative to these other currencies will adversely affect the value of the Fund’s holdings in foreign securities.
Written Options— The Fund is subject to equity and other risk exposure in the normal course ofpursuing its investment objectives and may enter into options written to hedge against changes in interest rates, foreign exchange rates and values of equities. Such options may relate to particular securities or domestic stock indices, and may or may not be listed on a domestic securities exchange or issued by the Options Clearing Corporation. An option contract is a commitment that gives the purchaser of the contract the right, but not the obligation, to buy or sell an underlying asset at a specific price on or before a specified future date. On the other hand, the writer of an option contract is obligated, upon the exercise of the option, to buy or sell an underlying asset at a specific price on or before a specified future date. The maximum risk of loss associated with writing put options is limited to the exercised fair value of the option contract. The maximum risk of loss associated with writing call options is potentially unlimited. The Fund also has the additional risk of being unable to enter into a closing transaction at an acceptable price if a liquid secondary market does not exist. The Fund also may writeover-the-counter options where completing the obligation depends upon the credit standing of the other party. Option contracts also involve the risk that they may result in loss due to unanticipated developments in market conditions or other causes. Written options are initially recorded as liabilities to the extent of premiums received and subsequently marked to market to reflect the current value of the option written. Gains or losses are realized when the option transaction expires or closes. When an option is exercised, the proceeds on sales for a written call option or the purchase cost for a written put option is adjusted by the amount of the premium received. Listed option contracts present minimal counterparty credit risk since they are exchange traded and the exchange’s clearinghouse, as counterparty to all exchange-traded options, guarantees the options against
25
LATEEF FOCUSED GROWTH FUND
Notes to Financial Statements (Continued)
April 30, 2019
default. The Fund’s maximum risk of loss from counterparty credit risk related to OTC option contracts is limited to the premium paid. As of April 30, 2019, the Fund had no written options.
For the year ended April 30, 2019, the Fund’s quarterly average volume of derivatives is as follows:
Written Options (Proceeds) |
$16,732 |
Recent Accounting Pronouncement— Effective November 5, 2018, the SEC amended existingrules intended to modernize reporting and disclosure of information. These amendments relate to RegulationS-X which sets forth the form and content of financial statements. The amendment requires collapsing the components of distributable earnings on the Statement of Assets and Liabilities and collapsing the distributions paid to shareholders on the Statements of Changes in Net Assets. Management has evaluated the implications of adopting these amendments and determined there is no significant impact on the financial statements and accompanying notes.
2. Transactions with Related Parties and Other Service Providers
Lateef Investment Management, L.P. (“Lateef” or the “Adviser”) serves as investment adviser to the Fund pursuant to an investment advisory agreement with the Trust. For its services, the Advisor is entitled to receive an annual investment advisory fee, paid monthly, comprising 0.85% of the average daily net assets of the Fund. The Adviser has contractually agreed to reduce its investment advisory fee and/or reimburse certain expenses of the Fund to the extent necessary to ensure that the Fund’s total operating expenses (excluding taxes, fees and expenses attributable to a distribution or service plan adopted by the Trust, interest, extraordinary items, “Acquired Fund Fees and Expenses ” and brokerage commissions) do not exceed 0.85% (on an annual basis) of the Fund’s average daily net assets (the “Expense Limitation”). The Expense Limitation shall remain in effect until August 31, 2019, unless the Board of Trustees of the Trust approves its earlier termination. Each class of shares of the Fund pays its respectivepro-rata portion of the advisory fee payable by the Fund.
For the year ended April 30, 2019, the Adviser earned advisory fees of $556,132 and waived fees of $386,858.
Other Service Providers
The Bank of New York Mellon (“BNY Mellon”) serves as administrator and custodian for the Fund. For providing administrative and accounting services, BNY Mellon is entitled to receive a monthly fee equal to an annual percentage rate of the Fund’s average daily net assets and is subject to certain minimum
26
LATEEF FOCUSED GROWTH FUND
Notes to Financial Statements (Continued)
April 30, 2019
monthly fees. For providing certain custodial services, BNY Mellon is entitled to receive a monthly fee, subject to certain minimum, and out of pocket expenses.
BNY Mellon Investment Servicing (US) Inc. (the “Transfer Agent”) provides transfer agent services to the Fund. The Transfer Agent is entitled to receive a monthly fee, subject to certain minimum, and out of pocket expenses.
Foreside Funds Distributors LLC (the “Underwriter”) provides principal underwriting services to the Fund pursuant to an underwriting agreement between the Trust and the Underwriter.
The Trust and the Underwriter are parties to an underwriting agreement. The Trust has adopted a distribution plan for Class A and Class C Shares in accordance with Rule12b-1 under the 1940 Act. Pursuant to the Class A and Class C Shares plan, the Fund compensates the Underwriter for direct and indirect costs and expenses incurred in connection with advertising, marketing and other distribution services in an amount not to exceed 0.25% and 1.00% (0.75% Rule12b-1 distribution fee and 0.25% shareholder service fee), respectively, on an annualized basis of the average daily net assets of the Fund’s Class A and Class C Shares.
Trustees and Officers
The Trust is governed by its Board of Trustees. The Trustees receive compensation in the form of an annual retainer and per meeting fees for their services to the Trust. The remuneration paid to the Trustees by the Fund during the year ended April 30, 2019 was $7,949. An employee of BNY Mellon serves as the Secretary of the Trust and is not compensated by the Fund or the Trust.
JW Fund Management LLC (“JWFM”) provides a Principal Executive Officer and Principal Financial Officer, respectively, to the Trust. Duff & Phelps, LLC (“D&P”) provides the Trust with a Chief Compliance Officer and an Anti-Money Laundering Officer. JWFM and D&P are compensated for their services provided to the Trust.
3. Investment in Securities
For the year ended April 30, 2019, aggregate purchases and sales of investment securities (excluding short-term investments) of the Fund were as follows:
| Purchases | Sales | |||||||
Investment Securities | $ | 32,452,786 | $ | 63,252,623 | ||||
4. Capital Share Transactions
For the years ended April 30, 2019 and 2018, transactions in capital shares (authorized shares unlimited) were as follows:
27
LATEEF FOCUSED GROWTH FUND
Notes to Financial Statements (Continued)
April 30, 2019
| For the Year Ended | For the Year Ended | |||||||||||||||
| April 30, 2019 | April 30, 2018 | |||||||||||||||
| Shares | Amount | Shares | Amount | |||||||||||||
Class A | ||||||||||||||||
Sales | 191,257 | $ | 1,383,540 | 334,054 | $ | 3,161,089 | ||||||||||
Reinvestments | 482,695 | 3,127,861 | 577,725 | 4,766,228 | ||||||||||||
Redemption Fees* | — | 7 | — | 87 | ||||||||||||
Redemptions | (820,032 | ) | (6,208,686 | ) | (1,082,224 | ) | (9,919,049 | ) | ||||||||
|
|
|
|
|
|
|
| |||||||||
Net decrease | (146,080 | ) | $ | (1,697,278 | ) | (170,445 | ) | $ | (1,991,645 | ) | ||||||
|
|
|
|
|
|
|
| |||||||||
Class C | ||||||||||||||||
Sales | 121,882 | $ | 636,092 | 126,930 | $ | 898,435 | ||||||||||
Reinvestments | 403,047 | 2,079,723 | 468,712 | 3,262,234 | ||||||||||||
Redemption Fees* | — | 5 | — | 64 | ||||||||||||
Redemptions | (727,258 | ) | (4,731,618 | ) | (853,927 | ) | (6,988,184 | ) | ||||||||
|
|
|
|
|
|
|
| |||||||||
Net decrease | (202,329 | ) | $ | (2,015,798 | ) | (258,285 | ) | $ | (2,827,451 | ) | ||||||
|
|
|
|
|
|
|
| |||||||||
Class I | ||||||||||||||||
Sales | 274,897 | $ | 2,164,802 | 695,095 | $ | 6,679,432 | ||||||||||
Reinvestments | 798,399 | 5,429,111 | 1,278,592 | 10,944,747 | ||||||||||||
Redemption Fees* | — | 11 | — | 181 | ||||||||||||
Redemptions | (2,924,137 | ) | (22,915,781 | ) | (4,102,398 | ) | (38,970,896 | ) | ||||||||
|
|
|
|
|
|
|
| |||||||||
Net decrease | (1,850,841 | ) | $ | (15,321,857 | ) | (2,128,711 | ) | $ | (21,346,536 | ) | ||||||
|
|
|
|
|
|
|
| |||||||||
Total Net decrease | (2,199,250 | ) | $ | (19,034,933 | ) | (2,557,441 | ) | $ | (26,165,632 | ) | ||||||
|
|
|
|
|
|
|
| |||||||||
| * | There is a 2.00% redemption fee that may be charged on shares redeemed which have been held 30 days or less. The redemption fees are retained by the Fund for the benefit of the remaining shareholders and recorded aspaid-in capital. |
5. Federal Tax Information
The Fund has followed the authoritative guidance on accounting for and disclosure of uncertainty in tax positions, which requires the Fund to determine whether a tax position is more likely than not to be sustained upon examination, including resolution of any related appeals or litigation processes, based on the technical merits of the position. The Fund has determined that there was no effect on the financial statements from following this authoritative guidance. In the normal course of business, the Fund is subject to examination by federal, state and local jurisdictions, where applicable, for tax years for which applicable statutes of limitations have not expired.
28
LATEEF FOCUSED GROWTH FUND
Notes to Financial Statements (Continued)
April 30, 2019
Distributions are determined in accordance with federal income tax regulations, which may differ in amount or character from net investment income and realized gains for financial reporting purposes. Accordingly, the character of distributions and composition of net assets for tax purposes may differ from those reflected in the accompanying financial statements. To the extent these differences are permanent, such amounts are reclassified within the components of net assets based on the tax treatment; temporary differences do not require reclassifications. For the year ended April 30, 2019, these adjustments were to decrease total distributable earnings by $1,552,572 and increasepaid-in capital by $1,552,572. These permanent differences were primarily attributable to net operating losswrite-off and the utilization of equalization debits. Net assets were not affected by these adjustments.
For the year ended April 30, 2019, the tax character of distributions paid by the Fund was $12,082,264 of long-term capital gains dividends. For the year ended April 30, 2018, the tax character of distributions paid by the Fund was $21,783,967 of long-term capital gains dividends.
As of April 30, 2019, the components of distributable earnings on a tax basis were as follows:
| Net | Total | |||
| Undistributed | Unrealized | Distributable | ||
Long-Term Gain | Appreciation | Earnings | ||
$6,928,205 | $15,231,394 | $22,159,599 |
The differences between the book and tax basis components of distributable earnings relate primarily to the timing and recognition of income and gains for federal income tax purposes. Short term capital gains are reported as ordinary income for federal income tax purposes.
As of April 30, 2019, the federal tax cost, aggregate gross unrealized appreciation and depreciation of securities held by the Fund were as follows:
| ||||||
Federal tax cost | $ | 36,548,280 | ||||
|
| |||||
Gross unrealized appreciation | $ | 15,559,537 | ||||
Gross unrealized depreciation | (328,143 | ) | ||||
|
| |||||
Net unrealized appreciation | $ | 15,231,394 | ||||
|
| |||||
Pursuant to federal income tax rules applicable to regulated investment companies, the Fund may elect to treat certain capital losses between November 1 and April 30 and late year ordinary losses ((i) ordinary losses between January 1 and April 30, and (ii) specified ordinary and currency losses between November 1 and April 30) as occurring on the first day of the following tax year. For the year ended April 30, 2019 any amount of losses elected within the tax return will not be recognized for federal income tax purposes until May 1, 2019. For the year ended April 30, 2019, the Fund had no short-term capital loss deferrals, long-term capital loss deferrals and ordinary late year loss deferrals.
Accumulated capital losses represent net capital loss carry forwards as of April 30, 2019 that may be available to offset future realized capital gains and thereby reduce future capital gains distributions. As of April 30, 2019, the Fund did not have any capital loss carry forwards.
29
LATEEF FOCUSED GROWTH FUND
Notes to Financial Statements (Concluded)
April 30, 2019
6. Subsequent Events
Management has evaluated the impact of all subsequent events on the Fund through the date the financial statements were issued, and has determined that there are no material subsequent events requiring recognition or disclosure in the financial statements.
30
LATEEF FOCUSED GROWTH FUND
Report of Independent Registered Public Accounting Firm
To the Board of Trustees of FundVantage Trust and Shareholders of Lateef Focused Growth Fund
Opinion on the Financial Statements
We have audited the accompanying statement of assets and liabilities, including the portfolio of investments, of Lateef Focused Growth Fund (one of the funds constituting FundVantage Trust, hereafter referred to as the “Fund”) as of April 30, 2019, the related statement of operations for the year ended April 30, 2019, the statements of changes in net assets for each of the two years in the period ended April 30, 2019, including the related notes, and the financial highlights for each of the five years in the period ended April 30, 2019 (collectively referred to as the “financial statements”). In our opinion, the financial statements present fairly, in all material respects, the financial position of the Fund as of April 30, 2019, the results of its operations for the year then ended, the changes in its net assets for each of the two years in the period ended April 30, 2019 and the financial highlights for each of the five years in the period ended April 30, 2019 in conformity with accounting principles generally accepted in the United States of America.
Basis for Opinion
These financial statements are the responsibility of the Fund’s management. Our responsibility is to express an opinion on the Fund’s financial statements based on our audits. We are a public accounting firm registered with the Public Company Accounting Oversight Board (United States) (PCAOB) and are required to be independent with respect to the Fund in accordance with the U.S. federal securities laws and the applicable rules and regulations of the Securities and Exchange Commission and the PCAOB.
We conducted our audits of these financial statements in accordance with the standards of the PCAOB. Those standards require that we plan and perform the audit to obtain reasonable assurance about whether the financial statements are free of material misstatement, whether due to error or fraud.
Our audits included performing procedures to assess the risks of material misstatement of the financial statements, whether due to error or fraud, and performing procedures that respond to those risks. Such procedures included examining, on a test basis, evidence regarding the amounts and disclosures in the financial statements. Our audits also included evaluating the accounting principles used and significant estimates made by management, as well as evaluating the overall presentation of the financial statements. Our procedures included confirmation of securities owned as of April 30, 2019 by correspondence with the custodian. We believe that our audits provide a reasonable basis for our opinion.
/s/ PricewaterhouseCoopers LLP
Philadelphia, Pennsylvania
June 24, 2019
We have served as the auditor of one or more Lateef Investment Management, L.P. investment companies since 2008.
31
LATEEF FOCUSED GROWTH FUND
Shareholder Tax Information
(Unaudited)
The Fund is required by Subchapter M of the Internal Revenue Code to advise its shareholders of the U.S. federal tax status of distributions received by the Fund’s shareholders in respect of such fiscal year. During the fiscal year ended April 30, 2019, the Fund paid $12,082,264 of long-term capital gain dividends to its shareholders of which $1,809,132 is from the utilization of equalization debits. Dividends from net investment income and short-term capital gains are treated as ordinary income dividends for federal income tax purposes.
All designations are based on financial information available as of the date of this annual report and, accordingly, are subject to change. For each item, it is the intention of the Fund to designate the maximum amount permitted under the Internal Revenue Code of 1986, as amended, and the regulations thereunder.
Because the Fund’s fiscal year is not the calendar year, another notification will be sent with respect to calendar year 2019. The second notification, which will reflect the amount, if any, to be used by calendar year taxpayers on their U.S. federal income tax returns, will be made in conjunction with Form1099-DIV and will be mailed in January 2020.
Foreign shareholders will generally be subject to U.S. withholding tax on the amount of their ordinary income dividends. They will generally not be entitled to a foreign tax credit or deduction for the withholding taxes paid by the Fund, if any.
In general, dividends received bytax-exempt recipients (e.g., IRAs and Keoghs) need not be reported as taxable income for U.S. federal income tax purposes. However, some retirement trusts (e.g., corporate, Keogh and 403(b)(7) plans) may need this information for their annual information reporting.
Shareholders are advised to consult their own tax advisers with respect to the tax consequences of their investment in the Fund.
32
LATEEF FOCUSED GROWTH FUND
Other Information
(Unaudited)
Proxy Voting
Policies and procedures that the Fund uses to determine how to vote proxies relating to portfolio securities as well as information regarding how the Fund voted proxies relating to portfolio securities for the most recent12-month period ended June 30 are available without charge, upon request, by calling (866)499-2151 and on the Securities and Exchange Commission’s (“SEC”) website athttp://www.sec.gov.
Quarterly Portfolio Schedules
The Trust files its complete schedule of portfolio holdings with the SEC for the first and third fiscal quarters of each fiscal year (quarters ended July 31 and January 31) on FormN-Q. The Trust’s FormsN-Q will be available on the SEC’s website athttp://www.sec.gov. FormN-Q is being rescinded. Once FormN-Q is rescinded, disclosure of the Fund’s complete holdings will be required to be made monthly on FormN-PORT, with every third month made available to the public by the Commission upon filing.
33
LATEEF FOCUSED GROWTH FUND
Privacy Notice
(Unaudited)
The privacy of your personal financial information is extremely important to us. When you open an account with us, we collect a significant amount of information from you in order to properly invest and administer your account. We take very seriously the obligation to keep that information private and confidential, and we want you to know how we protect that important information.
We collect nonpublic personal information about you from applications or other forms you complete and from your transactions with us or our affiliates. We do not disclose information about you, or our former clients, to our affiliates or to service providers or other third parties, except as permitted by law. We share only the information required to properly administer your accounts, which enables us to send transaction confirmations, monthly or quarterly statements, financials and tax forms. Even within FundVantage Trust and its affiliated entities, a limited number of people who actually service accounts will have access to your personal financial information. Further, we do not share information about our current or former clients with any outside marketing groups or sales entities.
To ensure the highest degree of security and confidentiality, FundVantage Trust and its affiliates maintain various physical, electronic and procedural safeguards to protect your personal information. We also apply special measures for authentication of information you request or submit to us on our web site.
If you have questions or comments about our privacy practices, please call us at (866)499-2151.
34
LATEEF FOCUSED GROWTH FUND
Fund Management
(Unaudited)
FundVantage Trust (the “Trust”) is governed by a Board of Trustees (the “Trustees”). The primary responsibility of the Trustees is to represent the interest of the Trust’s shareholders and to provide oversight management of the Trust.
The following tables present certain information regarding the Trustees and officers of the Trust. None of the Trustees are an “interested person” of the Trust, the Adviser, another investment adviser of a series of the Trust, or Foreside Funds Distributors LLC, the principal underwriter of the Trust (“Underwriter”), within the meaning of the 1940 Act and each Trustee is referred to as an “Independent Trustee” and is listed under such heading below. Employees of certain service providers to the Trust serve as officers of the Trust; such persons are not compensated by the Fund. The address of each Trustee and officer as it relates to the Trust’s business is 301 Bellevue Parkway, 2nd Floor, Wilmington, DE 19809.
The Statement of Additional Information for the Fund contains additional information about the Trustees and is available, without charge, upon request, by calling (866)499-2151.
| Name and Date of Birth | Position(s) Held with Trust | Term of Office and Length of Time Served | Principal Occupation(s) During Past Five Years |
Number of Funds in Trust Complex Overseen by Trustee
| Other Directorships Held by Trustee | |||||||
| INDEPENDENT TRUSTEES | ||||||||||||
ROBERT J. CHRISTIAN Date of Birth: 2/49 | Trustee and Chairman of the Board | Shall serve until death, resignation or removal. Trustee and Chairman since 2007. | Retired since February 2006; Executive Vice President of Wilmington Trust Company from February 1996 to February 2006; President of Rodney Square Management Corporation (“RSMC”) (investment advisory firm) from 1996 to 2005; Vice President of RSMC from 2005 to 2006. | 44 | Optimum Fund Trust (registered investment company with 6 portfolios). | |||||||
IQBAL MANSUR Date of Birth: 6/55 | Trustee | Shall serve until death, resignation or removal. Trustee since 2007. | University Professor, Widener University. | 44 | None. | |||||||
35
LATEEF FOCUSED GROWTH FUND
Fund Management (Continued)
(Unaudited)
| Name and Date of Birth | Position(s) Held with Trust | Term of Office and Length of Time Served | Principal Occupation(s) During Past Five Years |
Number of Funds in Trust Complex Overseen by Trustee
| Other Directorships Held by Trustee | |||||||
NICHOLAS M. MARSINI, JR. Date of Birth: 8/55 | Trustee | Shall serve until death, resignation or removal. Trustee since 2016. | Retired since March 2016. President of PNC Bank Delaware from June 2011 to March 2016; Executive Vice President of Finance of BNY Mellon from July 2010 to January 2011; Executive Vice President and Chief Financial Officer of PNC Global Investment Servicing from September 1997 to July 2010. | 44 | Brinker Capital Destinations Trust (registered investment company with 10 portfolios). | |||||||
NANCY B. WOLCOTT Date of Birth: 11/54 | Trustee | Shall serve until death, resignation or removal. Trustee since 2011. | Retired since May 2014; EVP, Head of GFI Client Service Delivery, BNY Mellon from January 2012 to May 2014; EVP, Head of US Funds Services, BNY Mellon from July 2010 to January 2012; President of PNC Global Investment Servicing from 2008 to July 2010; Chief Operating Officer of PNC Global Investment Servicing from 2007 to 2008; Executive Vice President of PFPC Worldwide Inc. from 2006 to 2007. | 44 | Lincoln Variable Insurance Products Trust (registered investment company with 92 portfolios). | |||||||
STEPHEN M. WYNNE Date of Birth: 1/55 | Trustee | Shall serve until death, resignation or removal. Trustee since 2009. | Retired since December 2010; Chief Executive Officer of US Funds Services, BNY Mellon Asset Servicing from July 2010 to December 2010; Chief Executive Officer of PNC Global Investment Servicing from March 2008 to July 2010; President, PNC Global Investment Servicing from 2003 to 2008. | 44 | Copeland Trust (registered investment company with 2 portfolios). | |||||||
36
LATEEF FOCUSED GROWTH FUND
Fund Management (Concluded)
(Unaudited)
Name and Date of Birth | Position(s) Held with Trust | Term of Office and Length of Time Served | Principal Occupation(s) During Past Five Years | |||
| EXECUTIVE OFFICERS | ||||||
JOEL L. WEISS Date of Birth: 1/63 | President and Chief Executive Officer | Shall serve until death, resignation or removal. Officer since 2007. | President of JW Fund Management LLC since June 2016; Vice President and Managing Director of BNY Mellon Investment Servicing (US) Inc. and predecessor firms from 1993 to June 2016. | |||
T. RICHARD KEYES Date of Birth: 1/57 | Treasurer and Chief Financial Officer | Shall serve until death, resignation or removal. Officer since 2016. | President of TRK Fund Consulting LLC since July 2016; Head of Tax — U.S. Fund Services of BNY Mellon Investment Servicing (US) Inc. and predecessor firms from February 2006 to July 2016. | |||
GABRIELLA MERCINCAVAGE Date of Birth: 6/68 | Assistant Treasurer | Shall serve until death, resignation or removal. Officer since 2019. | Fund Administration Consultant since January 2019; Fund Accounting and Tax Compliance Accountant to financial services companies from November 2003 to July 2018. | |||
VINCENZO A. SCARDUZIO Date of Birth: 4/72 | Secretary | Shall serve until death, resignation or removal. Officer since 2012. | Director and Vice President Regulatory Administration of The Bank of New York Mellon and predecessor firms since 2001. | |||
DAVID C. LEBISKY Date of Birth: 5/72 | Chief Compliance Officer and Anti-Money Laundering Officer | Shall serve until death, resignation or removal. Officer since 2015. | President of Lebisky Compliance Consulting LLC since October 2015; Consultant, Duff & Phelps, LLC since 2016; Senior Consultant, Freeh Group International Solutions, LLC (a global risk management firm) from 2015 to 2018; Scotia Institutional Investments US, LP, Director of Regulatory Administration from 2010 to 2014. | |||
37
[THIS PAGE INTENTIONALLY LEFT BLANK.]
[THIS PAGE INTENTIONALLY LEFT BLANK.]
Investment Adviser
Lateef Investment Management, L.P.
300 Drakes Landing Road
Suite 210
Greenbrae, CA 94904
Administrator
The Bank of New York Mellon
301 Bellevue Parkway
Wilmington, DE 19809
Transfer Agent
BNY Mellon Investment Servicing (US) Inc.
4400 Computer Drive
Westborough, MA 01581
Principal Underwriter
Foreside Funds Distributors LLC
400 Berwyn Park
899 Cassatt Road
Berwyn, PA 19312
Custodian
The Bank of New York Mellon
240 Greenwich Street
New York, NY 10286
Independent Registered Public Accounting Firm
PricewaterhouseCoopers LLP
Two Commerce Square, Suite 1800
2001 Market Street
Philadelphia, PA 19103-7042
Legal Counsel
Pepper Hamilton LLP
3000 Two Logan Square
18th and Arch Streets
Philadelphia, PA 19103
LAT-0419
LATEEF FOCUSED GROWTH FUND
of
FundVantage Trust
Class A Shares
Class C Shares
Class I Shares
ANNUAL REPORT
April 30, 2019
IMPORTANT NOTE: Beginning on January 1, 2021, paper copies of the Lateef Focused Growth Fund’s annual and semi-annual shareholder reports will no longer be sent by mail, unless you specifically request paper copies of the shareholder reports from the Lateef Focused Growth Fund or from your financial intermediary. Instead, annual and semi-annual shareholder reports will be available on the Lateef Focused Growth Fund’s website (www.lateef.com/lateef-focused-growth-fund), and you will be notified by mail each time a report is posted and provided with a website link to access the report.
You may elect to receive all future annual and semi-annual shareholder reports in paper, free of charge. To elect to receive paper copies of shareholder reports through the mail or otherwise change your delivery method, contact your financial intermediary or, if you hold your shares directly through the Lateef Focused Growth Fund, call the Lateef Focused Growth Fund toll-free at (866)499-2151 or write to the Lateef Focused Growth Fund at:
Lateef Focused Growth Fund
FundVantage Trust
c/o BNY Mellon Investment Servicing
P.O. Box 9829
Providence, RI 02940-8029
This report is submitted for the general information of the shareholders of the Lateef Fund. It is not authorized for distribution unless preceded or accompanied by a current prospectus for the Lateef Fund.

MOUNT LUCAS U.S. FOCUSED EQUITY FUND
of
FundVantage Trust
Class I
ANNUAL REPORT
April 30, 2019
IMPORTANT NOTE: Beginning on January 1, 2021, paper copies of the Mount Lucas U.S. Focused Equity Fund’s annual and semi-annual shareholder reports will no longer be sent by mail, unless you specifically request paper copies of the shareholder reports from the Mount Lucas U.S. Focused Equity Fund or from your financial intermediary. Instead, annual and semi-annual shareholder reports will be available on the Mount Lucas U.S. Focused Equity Fund’s website (www.mtlucas.com/BMLEX), and you will be notified by mail each time a report is posted and provided with a website link to access the report.
You may elect to receive all future annual and semi-annual shareholder reports in paper, free of charge. To elect to receive paper copies of shareholder reports through the mail or otherwise change your delivery method, contact your financial intermediary or, if you hold your shares directly through the Mount Lucas U.S. Focused Equity Fund, call the Mount Lucas U.S. Focused Equity Fund toll-free at (844)261-6483 or write to the Mount Lucas U.S. Focused Equity Fund at:
Mount Lucas U.S. Focused Equity Fund
FundVantage Trust
c/o BNY Mellon Investment Servicing
P.O. Box 9829
Providence, RI 02940-8029
This report is submitted for the general information of the shareholders of the Mount Lucas U.S. Focused Equity Fund. It is not authorized for distribution unless preceded or accompanied by a current prospectus for the Mount Lucas U.S. Focused Equity Fund.
MOUNT LUCAS U.S. FOCUSED EQUITY FUND
Annual Investment Adviser’s Report
April 30, 2019
(Unaudited)
Dear Shareholder,
I am pleased to provide you with this annual report for the Mount Lucas U.S. Focused Equity Fund (“Fund”). In this report, you will find important information about the Fund, as well as a discussion of investment performance for the12-month period ended April 30, 2019.
In the12-month period ended April 30, 2019, the Fund was down 8.9% compared to up 13.5% for the S&P 500® Index and up 9.0% for the Russell 1000® Value Index. By factor, our Momentum portfolio was up 18.0% during the period while our Value portfolio was down 14.9%. Afterout-performing the Russell 1000® Value Index by 17.4% in the prior12-month period ended April 30, 2018, the last12-months has been extremely difficult for our style of value investing.
For 19 years, we have consistently applied our value-oriented approach to earning the equity risk premium. A key tenet of our approach in earning alpha1 is the importance of investing in concentrated portfolios, offsetting the risk that over-diversification has in generating alpha. As such, we limit our portfolio to a maximum of 40 stocks, which helps drive our active share2 versus both the S&P 500 and the Russell 1000 Value Index consistently above 90%. Historically, this methodology has served our investors well as the profile of stocks we have selected has tended to be positively skewed, where both the number of stocks generating positive excess returns as well as the degree of outperformance of those stocks has more than compensated for any negative performing stocks. Over the last7-months, the period where the Fund’s underperformance relative to both the Russell 1000 Value Index and the S&P 500 took place, the opposite has occurred. The distribution of the returns of our holdings has been both negatively skewed and the underperformance of some of our stocks has been of a large enough magnitude to be a significant drag on the overall performance of the Fund.
The challenge of investing with an active manager is maintaining confidence in their investment process during periods of underperformance. Understanding that to outperform the benchmark, to be active, risks periods of tracking error below the benchmark. Our focus is, and always has been to create a repeatable process that shifts the probability of outcomes in our favor more often than not. While value investing has been particularly difficult during this bull market, we still believe that a value-oriented approach — buying good assets at cheap prices or buying decent assets at depressed prices — puts an investor in the best position to earn alpha over the long-term. However, this doesn’t mean we’re inflexible with our approach. Our current process involves combining several financial ratios and ranking our universe of stocks based on this blended methodology. We’ve looked at the efficacy of each financial ratio that we use in our model. We have also considered the possibility that structural changes in value investing, where the alpha from deep value investing has compressed and value investing may mean something different going forward.
Based on our analysis, we have yet to find any changes to our investment process that we believe are durable over investment cycles and not just a response to the most recent market environment. Nonetheless, we continue to research all the information available and test new theories in a never-ending quest to build the best strategy possible that earns the equity risk premium and produces alpha over the benchmark.
As of April 30, 2019, the strategy is invested in 40 equities for the first time ever. The strategy’s largest sector allocations are in the Information Technology sector (19.8% portfolio allocation), the Energy sector (18.4% portfolio allocation), and the Consumer Discretionary sector (17.7% portfolio allocation). Overall the strategy is invested in 10 of the 11 GICS sectors. The strategy’s largest industry allocations are in the Refining & Marketing industry (14.7% portfolio allocation), Computer Hardware & Storage industry (8.7% portfolio allocation), and the Department Stores industry (7.6% portfolio allocation). The five largest single stock positions in the strategy are Delta Air Lines, Inc. (DAL), AT&T Inc (T), Kohl’s Corp. (KSS), Citigroup Inc. (C), and Hewlett Packard Enterprise Co (HPE).
Thank you for your investment in the Fund. We value your ongoing confidence in us, and we look forward to serving your investment needs in the future.
Sincerely,
Timothy Rudderow
CEO and CIO
Mount Lucas Management LP
1
MOUNT LUCAS U.S. FOCUSED EQUITY FUND
Annual Investment Adviser’s Report (Concluded)
April 30, 2019
(Unaudited)
| 1 | Alpha is a measure of performance representing the excess return of an investment relative to the return of a benchmark. |
| 2 | Active Share Ratio is a measure of how closely a fund matches a benchmark index, where 0% means exactly like the index (no different) and 100% means completely different from the index. Research shows funds with higher Active Share are more likely to outperform the benchmark. |
There can be no guarantee that any strategy (risk management or otherwise) will be successful. All investing involves risk, including potential loss of principal.
This letter is intended to assist shareholders in understanding how the Fund performed during the year ended April 30, 2019 and reflects the views of the investment adviser at the time of this writing. Of course, these views may change and do not guarantee the future performance of the Fund or the markets.
The S&P 500® Index is a capitalization-weighted index designed to measure the performance of the broad U.S. economy through changes in the aggregate market value of 500 stocks representing all major industries. The index assumes the reinvestment of all dividends. Any Indexes mentioned are unmanaged statistical composites of stock market performance. Investing in an index is not possible.
The Russell 1000® Value Index measures the performance of thelarge-cap value segment of the U.S. equity universe. It includes those Russell 1000 companies with lowerprice-to-book ratios and lower expected growth values.
Portfolio composition is subject to change. The current and future portfolio holdings of the Fund are subject to investment risk.
2
MOUNT LUCAS U.S. FOCUSED EQUITY FUND
Annual Report
Performance Data
April 30, 2019
(Unaudited)
Comparison of Change in Account Value of $10,000 Investment in the Mount Lucas U.S. Focused Equity Fund
Class I vs. S&P 500® Index
| Average Annual Total Returns for the Periods Ended April 30, 2019 | ||||||||||||||||
| 1 Year | 3 Years | 5 Years | 10 years | |||||||||||||
Class I | -8.92% | 9.64% | 5.21% | 12.89% | ||||||||||||
S&P 500®Index | 13.49% | 14.87% | 11.63% | 15.32% | ||||||||||||
| † | Not annualized. |
The performance data quoted represents past performance and does not guarantee future results. The investment return and principal value of an investment in the Fund will fluctuate so that an investor’s shares, when redeemed, may be worth more or less than their original cost. The table does not reflect the deduction of taxes that a shareholder would pay on Fund distributions or redemption of Fund shares. Current performance may be lower or higher than the performance quoted. Performance data current to the most recentmonth-end may be obtained by calling (844)261-6483.
As stated in the current prospectus dated September 1, 2018, the Fund’s “Total Annual Fund Operating Expenses” and “Total Annual Fund Operating Expenses After Fee Waiver and/or Expense Reimbursement” are 3.12% and 0.95%, respectively, for Class I shares of the Fund’s average daily net assets. These rates may fluctuate and may differ from the actual expenses incurred by the Fund for the period covered by this report. Mount Lucas Management LP (the “Adviser”) has contractually agreed to waive fees and/or reimburse expenses in order to limit the Fund’s “Total Annual Fund Operating Expenses” (excluding taxes, fees and expenses attributable to a distribution or service plan adopted by FundVantage Trust (the “Trust”), “Acquired Fund Fees and Expenses,” dividend and interest expense on securities sold short, extraordinary items, brokerage commissions and interest) to, as a percentage of average daily net assets, 0.95% with respect to Class I shares (the “Expense Limitation”). The Expense Limitation will remain in place until August 31, 2019, unless the Board of Trustees (“Board of Trustees”) of the Trust approves its earlier termination. Subject to approval by the Board of Trustees, the Adviser may recoup any expenses or fees it has reimbursed within a three-year period from the date on which the Adviser reduced its compensation and/or assumed expenses of the Fund. The Adviser is permitted to seek reimbursement from the Fund, subject to certain limitations, for fees it waived and Fund expenses it paid to the extent the total annual fund operating expenses do not exceed the limits described above or any lesser limits in effect as the time of reimbursement. No recoupment will occur unless the Fund’s expenses are below the Expense Limitation amount. Total returns would be lower had such fees and/or expenses not been waived and/or reimbursed.
The Fund operated as a series of Scotia Institutional Funds prior to the opening of business on March 24, 2014 (the “Predecessor Fund”), at which time, the Predecessor Fund was reorganized into the Fund. Before the Fund commenced operations, all of the assets and liabilities of the Predecessor Fund were transferred to the Fund in a tax free reorganization (the “Reorganization”). The Reorganization occurred at the opening of business on March 24, 2014. As a result of the Reorganization, the Fund assumed the performance and accounting history of the Predecessor Fund prior to the date of the Reorganization. The Fund has the same investment objective
3
MOUNT LUCAS U.S. FOCUSED EQUITY FUND
Annual Report
Performance Data (Concluded)
April 30, 2019
(Unaudited)
and strategies as the Predecessor Fund. The Performance shown for periods prior to March 24, 2014 represents the performance for the Predecessor Fund.
Mutual fund investing involves risk. The value of the Fund’s investments in equity securities may fluctuate drastically fromday-to-day causing volatility and possible loss of principal. The Fund may invest in undervalued securities and is subject to the risk that the securities may not appreciate in value as anticipated.
The Fund isnon-diversified and invests in a limited number of securities. As a result, the Fund’s investment performance may be more volatile, as it may be more susceptible to risks associated with a single economic, political, or regulatory event than a fund that invests in a greater number of issuers.
The Fund intends to evaluate performance as compared to that of the Standard & Poor’s 500® Composite Price Index (“S&P 500®”). The S&P 500® is a widely recognized, unmanaged index of 500 common stocks which are generally representative of the U.S. stock market as a whole. It is impossible to invest directly in an index.
4
MOUNT LUCAS U.S. FOCUSED EQUITY FUND
Fund Expense Disclosure
April 30, 2019
(Unaudited)
As a shareholder of the Fund, you incur two types of costs: (1) transaction costs including sales charges (loads) on purchase payments, if any, or redemption fees; and (2) ongoing costs, including management fees, distribution and/or service (Rule12b-1) fees, if any, and other Fund expenses. These examples are intended to help you understand your ongoing costs (in dollars) of investing in the Fund and to compare these costs with the ongoing costs of investing in other mutual funds.
This example is based on an investment of $1,000 invested at the beginning of thesix-month period from November
1, 2018 through April 30, 2019 and held for the entire period.
Actual Expenses
The first line of the accompanying table provides information about actual account values and actual expenses. You may use the information in this line, together with the amount you invested, to estimate the expenses that you paid over the period. Simply divide your account value by $1,000 (for example, an $8,600 account value divided by $1,000 = 8.6), then multiply the result by the number in the first line under the heading entitled “Expenses Paid During Period” to estimate the expenses you paid on your account during this period.
Hypothetical Examples for Comparison Purposes
The second line of the accompanying table provides information about hypothetical account values and hypothetical expenses based on the Fund’s actual expense ratio and an assumed rate of return of 5% per year before expenses, which is not your Fund’s actual return. The hypothetical account values and expenses may not be used to estimate the actual ending account balance or expenses you paid for the period. You may use this information to compare the ongoing costs of investing in the Fund and other funds. To do so, compare these 5% hypothetical examples with the 5% hypothetical examples that appear in the shareholder reports of other funds.
Please note that the expenses shown in the accompanying table are meant to highlight your ongoing costs only and do not reflect any transactional costs, such as sales charges on purchase payments, if any, or redemption fees. Therefore, the second line of the accompanying table is useful in comparing ongoing costs only, and will not help you determine the relative total costs of owning different funds. In addition, if these transactional costs were included, your costs would have been higher.
| Mount Lucas U.S. Focused Equity Fund | |||||||||||||||
| Beginning Account Value November 1, 2018 | Ending Account Value April 30, 2019 | Expenses Paid During Period* | |||||||||||||
Class I | |||||||||||||||
Actual | $ | 1,000.00 | $ | 927.20 | $ | 4.54 | |||||||||
Hypothetical (5% return before expenses) | 1,000.00 | 1,020.08 | 4.76 | ||||||||||||
| * | Expenses are equal to the annualized expense ratio for thesix-month period ended April 30, 2019 of 0.95% for Class I shares, multiplied by the average account value over the period, multiplied by the number of days in the most recent period (181), then divided by 365 to reflect the period. The Fund’s ending account value on the first line in the table is based on the actualsix-month total return for the Fund of (7.28)% for Class I shares. |
5
MOUNT LUCAS U.S. FOCUSED EQUITY FUND
Portfolio Holdings Summary Table
April 30, 2019
(Unaudited)
The following table presents a summary by sector of the portfolio holdings of the Fund:
| % of Net Assets | Value | |||||||
COMMON STOCKS: | ||||||||
Information Technology | 19.8 | % | $ | 1,725,180 | ||||
Energy | 18.4 | 1,605,326 | ||||||
Consumer Discretionary | 17.7 | 1,536,483 | ||||||
Financials | 10.0 | 867,767 | ||||||
Consumer Staples | 9.6 | 835,023 | ||||||
Industrials | 7.1 | 615,052 | ||||||
Telecommunication Services | 6.9 | 602,236 | ||||||
Real Estate | 4.7 | 412,150 | ||||||
Materials | 3.8 | 333,631 | ||||||
Health Care | 1.8 | 156,632 | ||||||
Other Assets in Excess of Liabilities | 0.2 | 15,996 | ||||||
|
|
|
| |||||
NET ASSETS | 100.0 | % | $ | 8,705,476 | ||||
|
|
|
| |||||
Portfolio holdings are subject to change at any time.
The accompanying notes are an integral part of the financial statements.
6
MOUNT LUCAS U.S. FOCUSED EQUITY FUND
Portfolio of Investments
April 30, 2019
| Number of Shares | Value | |||||||
COMMON STOCKS — 99.8% |
| |||||||
Consumer Discretionary — 17.7% |
| |||||||
Gap, Inc. (The) | 13,020 | $ | 339,562 | |||||
General Motors Co. | 9,090 | 354,056 | ||||||
Genuine Parts Co. | 759 | 77,828 | ||||||
Kohl’s Corp. | 5,452 | 387,637 | ||||||
Macy’s, Inc. | 11,689 | 275,159 | ||||||
TJX Cos, Inc. (The) | 1,863 | 102,241 | ||||||
|
| |||||||
| 1,536,483 | ||||||||
|
| |||||||
Consumer Staples — 9.6% |
| |||||||
Costco Wholesale Corp. | 434 | 106,560 | ||||||
Procter & Gamble Co. (The) | 819 | 87,207 | ||||||
Walgreens Boots Alliance, Inc. | 5,389 | 288,689 | ||||||
Kroger Co. (The) | 13,676 | 352,567 | ||||||
|
| |||||||
| 835,023 | ||||||||
|
| |||||||
Energy — 18.4% |
| |||||||
Chevron Corp. | 2,738 | 328,724 | ||||||
HollyFrontier Corp. | 6,137 | 292,919 | ||||||
Marathon Petroleum Corp. | 4,942 | 300,820 | ||||||
Phillips 66 | 3,695 | 348,328 | ||||||
Valero Energy Corp. | 3,690 | 334,535 | ||||||
|
| |||||||
| 1,605,326 | ||||||||
|
| |||||||
Financials — 10.0% | ||||||||
Citigroup, Inc. | 5,435 | 384,254 | ||||||
Progressive Corp. (The) | 1,492 | 116,600 | ||||||
Synchrony Financial | 10,583 | 366,913 | ||||||
|
| |||||||
| 867,767 | ||||||||
|
| |||||||
Health Care — 1.8% | ||||||||
Eli Lilly & Co. | 653 | 76,427 | ||||||
Merck & Co., Inc. | 1,019 | 80,205 | ||||||
|
| |||||||
| 156,632 | ||||||||
|
| |||||||
Industrials — 7.1% | ||||||||
Cintas Corp. | 485 | 105,313 | ||||||
Delta Air Lines, Inc. | 6,694 | 390,193 | ||||||
Verisk Analytics, Inc. | 847 | 119,546 | �� | |||||
|
| |||||||
| 615,052 | ||||||||
|
| |||||||
| Number of Shares | Value | |||||||
COMMON STOCKS — (Continued) |
| |||||||
Information Technology — 19.8% | ||||||||
Broadridge Financial Solutions, Inc. | 773 | $ | 91,314 | |||||
Citrix Systems, Inc. | 925 | 93,388 | ||||||
Fiserv, Inc.* | 1,245 | 108,614 | ||||||
Hewlett Packard Enterprise Co. | 24,199 | 382,586 | ||||||
Mastercard, Inc., Class A | 459 | 116,696 | ||||||
Motorola Solutions, Inc. | 796 | 115,348 | ||||||
Paychex, Inc. | 1,065 | 89,790 | ||||||
Western Digital Corp. | 7,363 | 376,397 | ||||||
Xerox Corp. | 10,523 | 351,047 | ||||||
|
| |||||||
| 1,725,180 | ||||||||
|
| |||||||
Materials — 3.8% |
| |||||||
Nucor Corp. | 5,846 | 333,631 | ||||||
|
| |||||||
Real Estate — 4.7% | ||||||||
American Tower Corp. REIT | 434 | 84,760 | ||||||
AvalonBay Communities, Inc. REIT | 419 | 84,190 | ||||||
HCP, Inc. REIT | 2,655 | 79,066 | ||||||
Realty Income Corp. REIT | 1,147 | 80,302 | ||||||
UDR, Inc. REIT | 1,865 | 83,832 | ||||||
|
| |||||||
| 412,150 | ||||||||
|
| |||||||
Telecommunication Services — 6.9% |
| |||||||
AT&T, Inc. | 12,589 | 389,755 | ||||||
CenturyLink, Inc. | 18,606 | 212,481 | ||||||
|
| |||||||
| 602,236 | ||||||||
|
| |||||||
TOTAL COMMON STOCKS | 8,689,480 | |||||||
|
| |||||||
TOTAL INVESTMENTS - 99.8% | 8,689,480 | |||||||
|
| |||||||
OTHER ASSETS IN EXCESS OF LIABILITIES - 0.2% | 15,996 | |||||||
|
| |||||||
NET ASSETS - 100.0% | $ | 8,705,476 | ||||||
|
| |||||||
| * | Non-income producing. |
REIT Real Estate Investment Trust
The accompanying notes are an integral part of the financial statements.
7
MOUNT LUCAS U.S. FOCUSED EQUITY FUND
Statement of Assets and Liabilities
April 30, 2019
Assets | ||||
Investments, at value (Cost $9,309,069) | $ | 8,689,480 | ||
Receivable for investments sold | 121,689 | |||
Receivable for capital shares sold | 23,000 | |||
Dividends receivable | 10,846 | |||
Receivable from Investment Adviser | 17,034 | |||
Prepaid expenses and other assets | 10,995 | |||
|
| |||
Total assets | 8,873,044 | |||
|
| |||
Liabilities | ||||
Due to Custodian | 87,351 | |||
Payable for transfer agent fees | 4,600 | |||
Payable for audit fees | 28,489 | |||
Payable for administration and accounting fees | 23,051 | |||
Payable for legal fees | 10,236 | |||
Payable for printing fees | 8,459 | |||
Payable for custodian fees | 4,775 | |||
Payable for investments purchased | 208 | |||
Accrued expenses | 399 | |||
|
| |||
Total liabilities | 167,568 | |||
|
| |||
Net Assets | $ | 8,705,476 | ||
|
| |||
Net Assets consisted of: | ||||
Capital stock, $0.01 par value | $ | 8,610 | ||
Paid-in capital | 10,692,671 | |||
Total distributable earnings (loss) | (1,995,805 | ) | ||
|
| |||
Net Assets | $ | 8,705,476 | ||
|
| |||
Class I: | ||||
Net asset value, offering and redemption price per share | $10.11 | |||
The accompanying notes are an integral part of the financial statements.
8
MOUNT LUCAS U.S. FOCUSED EQUITY FUND
Statement of Operations
For the Year Ended April 30, 2019
Investment income | |||||
Dividends | $ | 382,342 | |||
|
| ||||
Total investment income | 382,342 | ||||
|
| ||||
Expenses | |||||
Advisory fees (Note 2) | 81,464 | ||||
Administration and accounting fees (Note 2) | 67,387 | ||||
Legal fees | 41,071 | ||||
Trustees’ and officers’ fees (Note 2) | 36,250 | ||||
Custodian fees (Note 2) | 35,165 | ||||
Transfer agent fees (Note 2) | 30,124 | ||||
Audit fees | 28,624 | ||||
Registration and filing fees | 27,760 | ||||
Printing and shareholder reporting fees | 14,180 | ||||
Other expenses | 7,606 | ||||
|
| ||||
Total expenses before waivers and reimbursements | 369,631 | ||||
|
| ||||
Less: waivers and reimbursements (Note 2) | (266,443 | ) | |||
|
| ||||
Net expenses after waivers and reimbursements | 103,188 | ||||
|
| ||||
Net investment income | 279,154 | ||||
|
| ||||
Net realized and unrealized gain/(loss) from investments: | |||||
Net realized gain from investments | 130,107 | ||||
Net change in unrealized appreciation/(depreciation) on investments | (1,814,392 | ) | |||
|
| ||||
Net realized and unrealized loss on investments | (1,684,285 | ) | |||
|
| ||||
Net decrease in net assets resulting from operations | $ | (1,405,131 | ) | ||
|
|
The accompanying notes are an integral part of the financial statements.
9
MOUNT LUCAS U.S. FOCUSED EQUITY FUND
Statements of Changes in Net Assets
| For the Year Ended April 30, 2019 | For the Year Ended April 30, 2018 | |||||||
Increase/(decrease) in net assets from operations: | ||||||||
Net investment income | $ | 279,154 | $ | 211,941 | ||||
Net realized gain from investments | 130,107 | 2,491,279 | ||||||
Net change in unrealized appreciation/(depreciation) on investments | (1,814,392 | ) | (73,709 | ) | ||||
|
|
|
| |||||
Net increase/(decrease) in net assets resulting from operations | (1,405,131 | ) | 2,629,511 | |||||
|
|
|
| |||||
Less dividends and distributions to shareholders from: | ||||||||
Total distributable earnings* | ||||||||
Class I | (211,407 | ) | (638,821 | ) | ||||
|
|
|
| |||||
Net decrease in net assets from dividends and distributions to shareholders | (211,407 | ) | (638,821 | ) | ||||
|
|
|
| |||||
Increase/(decrease) in net assets derived from capital share transactions (Note 4) | 1,358,949 | (8,918,514 | ) | |||||
|
|
|
| |||||
Total increase/(decrease) in net assets | (257,589 | ) | (6,927,824 | ) | ||||
|
|
|
| |||||
Net assets | ||||||||
Beginning of period | 8,963,065 | 15,890,889 | ||||||
|
|
|
| |||||
End of period** | $ | 8,705,476 | $ | 8,963,065 | ||||
|
|
|
| |||||
| * | Distributions from net investment income and from realized gains are no longer required to be separately disclosed. See Note 1. For the year ended April 30, 2018, distributions from net investment income and net realized gains were $638,821 and $0, respectively. |
| ** | Parenthetical disclosure of accumulated net investment income/(loss) is no longer required. See Note 1. For the year ended April 30, 2018, end of year net assets included accumulated net investment income of $209,067. |
The accompanying notes are an integral part of the financial statements.
10
MOUNT LUCAS U.S. FOCUSED EQUITY FUND
Financial Highlights
Contained below is per share operating performance data for Class I shares outstanding, total investment return, ratios to average net assets and other supplemental data for the respective period. The total returns in the table represent the rate that an investor would have earned or lost on an investment in the Fund (assuming reinvestment of all dividends and distributions). This information has been derived from information provided in the financial statements and should be read in conjunction with the financial statements and the notes thereto.
| For the Year Ended April 30, 2019 | For the Year Ended April 30, 2018 | For the Year Ended April 30, 2017 | For the Year Ended April 30, 2016 | For the Year Ended April 30, 2015 | |||||||||||||||||||||
Per Share Operating Performance | |||||||||||||||||||||||||
Net asset value, beginning of period | $ | 11.30 | $ | 9.61 | $ | 8.66 | $ | 10.01 | $ | 11.92 | |||||||||||||||
|
|
|
|
|
|
|
|
|
| ||||||||||||||||
Net investment income(1) | 0.28 | 0.19 | 0.19 | 0.14 | 0.15 | ||||||||||||||||||||
Net realized and unrealized gain/(loss) on investments | (1.29 | ) | 2.15 | 1.17 | (1.15 | ) | 0.79 | ||||||||||||||||||
|
|
|
|
|
|
|
|
|
| ||||||||||||||||
Net increase/(decrease) in net assets resulting from operations | (1.01 | ) | 2.34 | 1.36 | (1.01 | ) | 0.94 | ||||||||||||||||||
|
|
|
|
|
|
|
|
|
| ||||||||||||||||
Dividends and distributions to shareholders from: | |||||||||||||||||||||||||
Net investment income | (0.18 | ) | (0.65 | ) | (0.41 | ) | (0.04 | ) | (0.22 | ) | |||||||||||||||
Net realized capital gains | — | — | — | (0.30 | ) | (2.63 | ) | ||||||||||||||||||
|
|
|
|
|
|
|
|
|
| ||||||||||||||||
Total dividends and distributions to shareholders | (0.18 | ) | (0.65 | ) | (0.41 | ) | (0.34 | ) | (2.85 | ) | |||||||||||||||
|
|
|
|
|
|
|
|
|
| ||||||||||||||||
Net asset value, end of period | $ | 10.11 | $ | 11.30 | $ | 9.61 | $ | 8.66 | $ | 10.01 | |||||||||||||||
|
|
|
|
|
|
|
|
|
| ||||||||||||||||
Total investment return(2) | (8.92 | )% | 24.92 | % | 15.83 | % | (10.09 | )% | 8.81 | % | |||||||||||||||
Ratios/Supplemental Data | |||||||||||||||||||||||||
Net assets, end of period (in thousands) | $ | 8,706 | $ | 8,963 | $ | 15,891 | $ | 44,822 | $ | 58,645 | |||||||||||||||
Ratio of expenses to average net assets | 0.95 | % | 0.95 | % | 0.95 | % | 0.95 | % | 0.95 | % | |||||||||||||||
Ratio of expenses to average net assets without waivers and expense reimbursements(3) | 3.40 | % | 3.12 | % | 1.64 | % | 1.31 | % | 1.23 | % | |||||||||||||||
Ratio of net investment income to average net assets | 2.57 | % | 1.80 | % | 2.20 | % | 1.54 | % | 1.31 | % | |||||||||||||||
Portfolio turnover rate | 142.66 | % | 68.14 | % | 92.10 | % | 95.16 | % | 102.75 | % | |||||||||||||||
| (1) | Calculated based on the average number of shares outstanding during the period. |
| (2) | Total investment return is calculated assuming a purchase of shares on the first day and a sale of shares on the last day of each period reported and includes reinvestment of dividends and distributions, if any. |
| (3) | During the period, certain fees were waived and/or reimbursed. If such fee waivers and/or reimbursements had not occurred, the ratios would have been as indicated (See Note 2). |
The accompanying notes are an integral part of the financial statements.
11
MOUNT LUCAS U.S. FOCUSED EQUITY FUND
Notes to Financial Statements
April 30, 2019
1. Organization and Significant Accounting Policies
The Mount Lucas U.S. Focused Equity Fund (the “Fund”) is anon-diversified,open-end management investment company registered under the Investment Company Act of 1940, as amended (the “1940 Act”). The Fund is a separate series of FundVantage Trust (the “Trust”) which was organized as a Delaware statutory trust on August 28, 2006. The Trust is a “series trust” authorized to issue an unlimited number of separate series or classes of shares of beneficial interest. Each series is treated as a separate entity for certain matters under the 1940 Act, and for other purposes, and a shareholder of one series is not deemed to be a shareholder of any other series. The Fund offers separate classes of shares, Class I shares and Class II shares. As of April 30, 2019, Class II shares have not been issued.
The Fund is an investment company and follows accounting and reporting guidance in the Financial Accounting Standards Board Accounting Standards Codification Topic 946.
Portfolio Valuation— The Fund’s net asset value (“NAV”) is calculated once daily at the close of regular trading hours on the New York Stock Exchange (“NYSE”) (typically 4:00 p.m. Eastern time) on each day the NYSE is open. Securities held by the Fund are valued using the closing price or the last sale price on a national securities exchange or the National Association of Securities Dealers Automatic Quotation System (“NASDAQ”) market system where they are primarily traded. Equity securities traded in theover-the-counter (“OTC”) market are valued at their closing prices. If there were no transactions on that day, securities traded principally on an exchange or on NASDAQ will be valued at the mean of the last bid and ask prices prior to the market close. Investments in otheropen-end investment companies are valued based on the NAV of the investment companies (which may use fair value pricing as discussed in their prospectuses). If market quotations are unavailable or deemed unreliable, securities will be valued in accordance with procedures adopted by the Trust’s Board of Trustees (“Board of Trustees”). Relying on prices supplied by pricing services or dealers or using fair valuation may result in values that are higher or lower than the values used by other investment companies and investors to price the same investments. In the event that market quotes are not readily available, and the security or asset cannot be valued pursuant to one of the valuation methods, the value of the security or asset will be determined in good faith by the Adviser. The Trust has established a Valuation Committee which performs certain functions including the oversight of the Adviser’s fair valuation determinations.
Fair Value Measurements— The inputs and valuation techniques used to measure fair value of the Fund’s investments are summarized into three levels as described in the hierarchy below:
· Level 1 — | quoted prices in active markets for identical securities; | |
· Level 2 — | other significant observable inputs (including quoted prices for similar securities, interest rates, prepayment speeds, credit risk, etc.); and | |
· Level 3 — | significant unobservable inputs (including the Fund’s own assumptions in determining the fair value of investments). | |
The inputs or methodology used for valuing securities are not necessarily an indication of the risk associated with investing in those securities.
The following is a summary of the inputs used, as of April 30, 2019, in valuing the Fund’s investments carried at fair value:
| Total Value at 04/30/19 | Level 1 Quoted Price | Level 2 Other Significant Observable Inputs | Level 3 Significant Unobservable Inputs | |||||||||||||
Common Stocks* | $ | 8,689,480 | $ | 8,689,480 | $ | — | $ | — | ||||||||
|
|
|
|
|
|
|
| |||||||||
| * | Please refer to Portfolio of Investments for further details on portfolio holdings. |
12
MOUNT LUCAS U.S. FOCUSED EQUITY FUND
Notes to Financial Statements (Continued)
April 30, 2019
At the end of each quarter, management evaluates the classification of Levels 1, 2 and 3 assets and liabilities. Various factors are considered, such as changes in liquidity from the prior reporting period; whether or not a broker is willing to execute at the quoted price; the depth and consistency of prices from third party pricing services; and the existence of contemporaneous, observable trades in the market. Additionally, management evaluates the classification of Level 1 and Level 2 assets and liabilities on a quarterly basis for changes in listings or delistings on national exchanges.
Due to the inherent uncertainty of determining the fair value of investments that do not have a readily available market value, the fair value of the Fund’s investments may fluctuate from period to period. Additionally, the fair value of investments may differ significantly from the values that would have been used had a ready market existed for such investments and may differ materially from the values the Fund may ultimately realize. Further, such investments may be subject to legal and other restrictions on resale or otherwise less liquid than publicly traded securities.
For fair valuations using significant unobservable inputs, U.S. generally accepted accounting principles (“U.S. GAAP”) require the Fund to present a reconciliation of the beginning to ending balances for reported market values that present changes attributable to total realized and unrealized gains or losses, purchase and sales, and transfers in and out of Level 3 during the period. A reconciliation of Level 3 investments is presented only when the Fund had an amount of Level 3 investments at the end of the reporting period that was meaningful in relation to its net assets. The amounts and reasons for all transfers in and out of each Level within the three-tier hierarchy are disclosed when the Fund had an amount of total transfers during the reporting period that was meaningful in relation to its net assets as of the end of the reporting period.
For the year ended April 30, 2019, there were no transfers between Levels.
Use of Estimates— The preparation of financial statements in conformity with U.S. GAAP requires management to make estimates and assumptions that affect the amounts reported in the financial statements and accompanying notes at the date of the financial statements and the reported amounts of revenues and expenses during the period. Actual results could differ from those estimates and those differences could be material.
Investment Transactions, Investment Income and Expenses— Investment transactions are recorded on trade date for financial statement preparation purposes. Realized gains and losses on investments sold are recorded on the identified cost basis. Interest income is recorded on the accrual basis. Dividends are recorded on theex-dividend date. Estimated components of distributions received from real estate investment trusts may be considered income, return of capital distributions or capital gain distributions. Return of capital distributions are recorded as a reduction of cost of the related investment. General expenses of the Trust are generally allocated to each fund in proportion to its relative daily net assets. Expenses directly attributable to a particular fund in the Trust are charged directly to that fund.
Dividends and Distributions to Shareholders— Dividends from net investment income and distributions from net realized capital gains, if any, are declared, recorded onex-date and paid at least annually to shareholders. Income dividends and capital gain distributions are determined in accordance with U.S. federal income tax regulations, which may differ from U.S. GAAP.
U.S. Tax Status— No provision is made for U.S. income taxes as it is the Fund’s intention to continue to qualify for and elect the tax treatment applicable to regulated investment companies under Subchapter M of the Internal Revenue Code of 1986, as amended (the “Internal Revenue Code”), and make the requisite distributions to its shareholders which will be sufficient to relieve it from U.S. income and excise taxes.
Other— In the normal course of business, the Fund may enter into contracts that provide general indemnifications. The Fund’s maximum exposure under these arrangements is dependent on claims that may be made against the Fund in the future, and therefore, cannot be estimated; however, based on experience, the risk of material loss for such claims is considered remote.
13
MOUNT LUCAS U.S. FOCUSED EQUITY FUND
Notes to Financial Statements (Continued)
April 30, 2019
Recent Accounting Pronouncement— Effective November 5, 2018, the SEC amended existing rules intended to modernize reporting and disclosure of information. These amendments relate to Regulation S-X which sets forth the form and content of financial statements. The amendment requires collapsing the components of distributable earnings on the Statement of Assets and Liabilities and collapsing the distributions paid to shareholders on the Statements of Changes in Net Assets. Management has evaluated the implications of adopting these amendments and determined there is no significant impact on the financial statements and accompanying notes.
2. Transactions with Related Parties and Other Service Providers
Mount Lucas Management LP (“Mount Lucas” or the “Adviser”) serves as investment adviser to the Fund pursuant to an investment advisory agreement with the Trust. For its services, the Adviser is entitled to an investment advisory fee of 0.75% (on an annualized basis), which is calculated daily and paid monthly based on the average daily net assets of the Fund. The Adviser has contractually agreed to reduce its investment advisory fee and/or reimburse certain expenses of the Fund to the extent necessary to ensure that the Fund’s “total operating expenses” (excluding taxes, fees and expenses attributable to a distribution or service plan adopted by the Trust, “Acquired Fund Fees and Expenses,” dividend and interest expense on securities sold short, extraordinary items, brokerage commissions and interest) do not exceed 0.95% (on an annual basis) of the Fund’s average daily net assets of Class I shares (the “Expense Limitation”). The Expense Limitation shall remain in effect until August 31, 2019, unless the Board of Trustees approves its earlier termination. Subject to approval by the Board of Trustees, the Adviser may recoup any expenses or fees it has reimbursed within a three-year period from the date on which the Adviser reduced its compensation and/or assumed expenses of the Fund. The Adviser is permitted to seek reimbursement from the Fund, subject to certain limitations, for fees it waived and Fund expenses it paid to the extent the total annual fund operating expenses do not exceed the limits described above or any lesser limits in effect as the time of reimbursement. No recoupment will occur unless the Fund’s expenses are below the Expense Limitation amount. As of April 30, 2019, the amount of potential recovery was as follows:
| Expiration | ||||||
April 30, 2020 | April 30, 2021 | April 30, 2022 | Total | |||
| $200,931 | $255,858 | $266,443 | $723,232 | |||
For the year ended April 30, 2019, the Adviser earned advisory fees of $81,464 and waived and reimbursed fees and expenses of $266,443.
Other Service Providers
The Bank of New York Mellon (“BNY Mellon”) serves as administrator and custodian for the Fund. For providing administrative and accounting services, BNY Mellon is entitled to receive a monthly fee equal to an annual percentage rate of the Fund’s average daily net assets and is subject to certain minimum monthly fees. For providing certain custodial services, BNY Mellon is entitled to receive a monthly fee, subject to certain minimum, and out of pocket expenses.
BNY Mellon Investment Servicing (US) Inc. (the “Transfer Agent”) provides transfer agent services to the Fund. The Transfer Agent is entitled to receive a monthly fee, subject to certain minimum, and out of pocket expenses.
Foreside Funds Distributors LLC (the “Underwriter”) provides principal underwriting services to the Fund pursuant to an underwriting agreement between the Trust and the Underwriter.
14
MOUNT LUCAS U.S. FOCUSED EQUITY FUND
Notes to Financial Statements (Continued)
April 30, 2019
Trustees and Officers
The Trust is governed by its Board of Trustees. The Trustees receive compensation in the form of an annual retainer and per meeting fees for their services to the Trust. The remuneration paid to the Trustees by the Fund during the year ended April 30, 2019 was $5,486. An employee of BNY Mellon serves as the Secretary of the Trust and is not compensated by the Fund or the Trust.
JW Fund Management LLC (“JWFM”) provides a Principal Executive Officer and Principal Financial Officer, respectively, to the Trust. Duff & Phelps, LLC (“D&P”) provides the Trust with a Chief Compliance Officer and an Anti-Money Laundering Officer. JWFM and D&P are compensated for their services provided to the Trust.
3. Investment in Securities
For the year ended April 30, 2019, aggregate purchases and sales of investment securities (excluding short-term investments) of the Fund were as follows:
| Purchases | Sales | |||||||
Investment Securities | $ | 16,675,647 | $ | 15,162,593 | ||||
4. Capital Share Transactions
For the year ended April 30, 2019 and the year ended April 30, 2018, transactions in capital shares (authorized shares unlimited) were as follows:
| For the Year Ended April 30, 2019 | For the Year Ended April 30, 2018 | |||||||||||||||
| Shares | Value | Shares | Value | |||||||||||||
Class I | ||||||||||||||||
Sales | 564,314 | $ | 6,513,567 | 48,213 | $ | 513,325 | ||||||||||
Reinvestments | 19,190 | 191,900 | 56,774 | 594,992 | ||||||||||||
Redemptions | (515,922 | ) | (5,346,518 | ) | (965,984 | ) | (10,026,831 | ) | ||||||||
|
|
|
|
|
|
|
| |||||||||
Net Increase/(decrease) | 67,582 | $ | 1,358,949 | (860,997 | ) | $ | (8,918,514 | ) | ||||||||
|
|
|
|
|
|
|
| |||||||||
5. Federal Tax Information
The Fund has followed the authoritative guidance on accounting for and disclosure of uncertainty in tax positions, which requires the Fund to determine whether a tax position is more likely than not to be sustained upon examination, including resolution of any related appeals or litigation processes, based on the technical merits of the position. The Fund has determined that there was no effect on the financial statements from following this authoritative guidance. In the normal course of business, the Fund is subject to examination by federal, state and local jurisdictions, where applicable, for tax years for which applicable statutes of limitations have not expired.
Distributions are determined in accordance with federal income tax regulations, which may differ in amount or character from net investment income and realized gains for financial reporting purposes. Accordingly, the character of distributions and composition of net assets for tax purposes may differ from those reflected in the accompanying financial statements. To the extent these differences are permanent, such amounts are reclassified within the components of net assets based on the tax treatment; temporary differences do not require reclassifications. For the year ended April 30, 2019, there are no reclassifications.
15
MOUNT LUCAS U.S. FOCUSED EQUITY FUND
Notes to Financial Statements (Concluded)
April 30, 2019
For the year ended April 30, 2019, the tax character of distributions paid by the Fund was $211,407 of ordinary income dividends. For the year ended April 30, 2018, the tax character of distributions paid by the Fund was $638,821 of ordinary income dividends. Distributions from net investment income and short-term capital gains are treated as ordinary income for federal income tax purposes.
As of April 30, 2019, the components of distributable earnings on a tax basis were as follows:
Capital Loss | Undistributed Ordinary Income | Net Unrealized Depreciation | Other Book/Tax Differences | Total Distributable Earnings | ||||
| $(1,619,732) | $278,626 | $(652,889) | $(1,810) | $(1,995,805) |
The differences between the book and tax basis components of distributable earnings relate primarily to the timing and recognition of income and gains for federal income tax purposes.
As of April 30, 2019, the federal tax cost, aggregate gross unrealized appreciation and depreciation of securities held by the Fund were as follows:
Federal tax cost | $ | 9,342,369 | ||||
|
| |||||
Gross unrealized appreciation | $ | 285,465 | ||||
Gross unrealized depreciation | (938,354 | ) | ||||
|
| |||||
Net unrealized depreciation | $ | (652,889 | ) | |||
|
| |||||
Pursuant to federal income tax rules applicable to regulated investment companies, the Fund may elect to treat certain capital losses between November 1 and April 30 and late year ordinary losses ((i) ordinary losses between January 1 and April 30, and (ii) specified ordinary and currency losses between November 1 and April 30) as occurring on the first day of the following tax year. For the year ended April 30, 2019 the Fund had no short-term capital loss deferrals, no long-term capital loss deferrals or ordinary loss deferrals.
Accumulated capital losses represent net capital loss carryforwards as of April 30, 2019 that may be available to offset future realized capital gains and thereby reduce future capital gains distributions. As of April 30, 2019, the Fund had a capital loss carryforward of $1,619,732, of which $656,878 are short-term losses and $962,854 are long-term losses. All losses will be carried forward indefinitely and will retain their character as short-term and long-term capital losses.
During the year ended April 30, 2019, the Fund utilized $144,882 of prior year capital loss carryforwards.
6. Subsequent Events
Management has evaluated the impact of all subsequent events on the Fund through the date the financial statements were available to be issued, and has determined that there are no material subsequent events requiring recognition or disclosure in the financial statements.
16
MOUNT LUCAS U.S. FOCUSED EQUITY FUND
Report of Independent Registered Public Accounting Firm
To the Board of Trustees of FundVantage Trust and
Shareholders of the Mount Lucas U.S. Focused Equity Fund
Opinion on the Financial Statements
We have audited the accompanying statement of assets and liabilities of Mount Lucas U.S. Focused Equity Fund (the “Fund”) (one of the series constituting FundVantage Trust (the “Trust”)), including the portfolio of investments, as of April 30, 2019, and the related statement of operations for the year then ended, the statements of changes in net assets for each of the two years in the period then ended, the financial highlights for each of the five years in the period then ended and the related notes (collectively referred to as the “financial statements”). In our opinion, the financial statements present fairly, in all material respects, the financial position of the Fund (one of the series constituting FundVantage Trust) at April 30, 2019, the results of its operations for the year then ended, the changes in its net assets for each of the two years in the period then ended and its financial highlights for each of the five years in the period then ended, in conformity with U.S. generally accepted accounting principles.
Basis for Opinion
These financial statements are the responsibility of the Trust’s management. Our responsibility is to express an opinion on the Fund’s financial statements based on our audits. We are a public accounting firm registered with the Public Company Accounting Oversight Board (United States) (“PCAOB”) and are required to be independent with respect to the Trust in accordance with the U.S. federal securities laws and the applicable rules and regulations of the Securities and Exchange Commission and the PCAOB.
We conducted our audits in accordance with the standards of the PCAOB. Those standards require that we plan and perform the audit to obtain reasonable assurance about whether the financial statements are free of material misstatement, whether due to error or fraud. The Trust is not required to have, nor were we engaged to perform, an audit of the Trust’s internal control over financial reporting. As part of our audits, we are required to obtain an understanding of internal control over financial reporting, but not for the purpose of expressing an opinion on the effectiveness of the Trust’s internal control over financial reporting. Accordingly, we express no such opinion.
Our audits included performing procedures to assess the risks of material misstatement of the financial statements, whether due to error or fraud, and performing procedures that respond to those risks. Such procedures included examining, on a test basis, evidence regarding the amounts and disclosures in the financial statements. Our procedures included confirmation of securities owned as of April 30, 2019, by correspondence with the custodian and brokers or by other appropriate auditing procedures where replies from brokers were not received. Our audits also included evaluating the accounting principles used and significant estimates made by management, as well as evaluating the overall presentation of the financial statements. We believe that our audits provide a reasonable basis for our opinion.

We have served as the auditor of one or more Mount Lucas investment companies since 2014.
Philadelphia, Pennsylvania
June 24, 2019
17
MOUNT LUCAS U.S. FOCUSED EQUITY FUND
Shareholder Tax Information
(Unaudited)
The Fund is required by Subchapter M of the Internal Revenue Code to advise its shareholders of the U.S. federal tax status of distributions received by the Fund’s shareholders in respect of such fiscal year. During the fiscal year ended April 30, 2019, the Fund paid $211,407 of ordinary income dividends to its shareholders. Dividends from net investment income and short-term capital gains are treated as ordinary income dividends for federal income tax purposes.
The Fund designates 100.00% of the ordinary income distribution as qualified dividend income pursuant to the Jobs and Growth Tax Relief Reconciliation Act of 2003.
The percentage of ordinary income dividends qualifying for the corporate dividends received deduction is 100.00%.
All designations are based on financial information available as of the date of this annual report and, accordingly, are subject to change. For each item, it is the intention of the Fund to designate the maximum amount permitted under the Internal Revenue Code of 1986, as amended, and the regulations thereunder.
Because the Fund’s fiscal year is not the calendar year, another notification will be sent with respect to calendar year 2019. The second notification, which will reflect the amount, if any, to be used by calendar year taxpayers on their U.S. federal income tax returns, will be made in conjunction with Form1099-DIV and will be mailed in January 2020.
Foreign shareholders will generally be subject to U.S. withholding tax on the amount of their ordinary income dividends. They will generally not be entitled to a foreign tax credit or deduction for the withholding taxes paid by the Fund, if any.
In general, dividends received bytax-exempt recipients (e.g., IRAs and Keoghs) need not be reported as taxable income for U.S. federal income tax purposes. However, some retirement trusts (e.g., corporate, Keogh and 403(b)(7) plans) may need this information for their annual information reporting.
Shareholders are advised to consult their own tax advisers with respect to the tax consequences of their investment in the Fund.
18
MOUNT LUCAS U.S. FOCUSED EQUITY FUND
Other Information
(Unaudited)
Proxy Voting
Policies and procedures that the Fund uses to determine how to vote proxies relating to portfolio securities as well as information regarding how the Fund voted proxies relating to portfolio securities for the most recent12-month period ended June 30 are available without charge, upon request, by calling (844)261-6483 and on the Securities and Exchange Commission’s (“SEC”) website athttp://www.sec.gov.
Quarterly Portfolio Schedules
The Trust files its complete schedule of portfolio holdings with the SEC for the first and third fiscal quarters of each fiscal year (quarters ended July 31 and January 31) on FormN-Q. The Trust’s FormsN-Q are available on the SEC’s website athttp://www.sec.gov. FormN-Q is being rescinded. Once FormN-Q is rescinded, disclosure of the Fund’s complete holdings will be required to be made monthly on FormN-PORT, with every third month made available to the public by the Commission upon filing.
Board Consideration of Investment Advisory Agreement
At anin-person meeting held on December6-7, 2018 (the “Meeting”), the Board of Trustees (the “Board” or “Trustees”) of FundVantage Trust (“Trust”), including a majority of the Trustees who are not “interested persons” as defined in the Investment Company Act of 1940, as amended (“1940 Act”) (the “Independent Trustees”), unanimously approved the continuation of the advisory agreement (the “Agreement”) between Mount Lucas Management LP (“Mount Lucas” or the “Adviser”) and the Trust on behalf of the Mount Lucas U.S. Focused Equity Fund (the “Fund”).
In determining whether to continue the Mount Lucas Agreement, the Trustees considered information regarding (i) services performed for the Fund, (ii) the size and qualifications of the Adviser’s portfolio management staff, (iii) any potential or actual material conflicts of interest which may arise in connection with a portfolio manager’s management of the Fund, (iv) investment performance, (v) the capitalization and financial condition of Mount Lucas, (vi) brokerage selection procedures (including soft dollar arrangements, if any), (vii) the procedures for allocating investment opportunities between the Fund and other clients, (viii) results of any regulatory examination, including any recommendations or deficiencies noted, (ix) any litigation, investigation or administrative proceeding which may have a material impact on Mount Lucas’ ability to service the Fund, and (x) compliance with the Fund’s investment objectives, policies and practices (including codes of ethics and proxy voting policies), federal securities laws and other regulatory requirements. The Trustees noted the reports and discussions with portfolio managers as provided at the Board meetings throughout the year covering matters such as the relative performance of the Fund; compliance with the investment objectives, policies, strategies and limitations for the Fund; the compliance of management personnel with the applicable code of ethics; and the adherence to the Trust’s pricing procedures as established by the Board.
The Trustees considered the investment performance of the Fund and Mount Lucas. The Trustees reviewed the historical performance charts which showed the performance of the Fund as compared to the LipperMulti-Cap Value Funds Index and the S&P 500 Daily Reinvested Index, for the calendaryear-to-date, one year, two year, three year, five year, ten year and since inception periods ended September 30, 2018.
The Trustees noted that the Class I shares of the Fund outperformed the LipperMulti-Cap Value Funds Index for theyear-to-date, one year, two year, three year, five year, ten year and since inception periods ended September 30, 2018. The Trustees also noted that the Fund also outperformed the S&P 500 Daily Reinvested Index for the one year and two year periods ended September 30, 2018 and underperformed the S&P 500 Daily Reinvested Index for theyear-to-date, three year, five year, ten year and since inception periods ended September 30, 2018.
19
MOUNT LUCAS U.S. FOCUSED EQUITY FUND
Other Information (Continued)
(Unaudited)
The Trustees considered explanations provided by Mount Lucas regarding the various factors contributing to the relative underperformance of the Fund during certain periods, including, among other things, differences in the Fund’s investment strategy and portfolio construction in comparison to the S&P 500 Daily Reinvested Index. The Trustees considered other factors that supported the continuation of the Mount Lucas Agreement, including that Mount Lucas’ investment decisions, such as security selection and sector allocation, contributing to such underperformance were consistent with the Fund’s investment objective and policies. Taking note of Mount Lucas’ discussion of (i) the various factors contributing to the Fund’s performance and (ii) its continuing commitment to the Fund’s current investment strategy, the Trustees concluded that, although the Fund had underperformed the S&P 500 Daily Reinvested Index for certain periods, the performance of the Fund was within an acceptable range of performance relative to other mutual funds with similar investment objectives, strategies and policies based on the information provided at the Meeting.
The Trustees noted that the representatives of Mount Lucas had provided information regarding its advisory fees and an analysis of the fees in relation to services provided to the Fund and any other ancillary benefit resulting from Mount Lucas’ relationship with the Fund. The Trustees reviewed a peer comparison of advisory fees and total expenses for the Fund versus the universe of funds with similar share classes in the Lipper Multi Cap Value Funds Index category with $250 million or less in assets. The Trustees noted that the contractual advisory fee and net total expense ratio of the Fund’s Class I shares was higher than the medians of the contractual advisory fee and net total expense ratio of the universe of funds with a similar share class in the LipperMulti-Cap Value Funds Index category with $250 million or less in assets. The Trustees concluded that the advisory fees and services provided by Mount Lucas are consistent with those of other advisers which manage mutual funds with investment objectives, strategies and policies similar to those of the Fund based on the information provided at the Meeting.
The Trustees then reviewed materials regarding the costs of the services provided by Mount Lucas, the compensation and benefits received by Mount Lucas in providing services to the Fund, as well as Mount Lucas’ profitability. The Trustees were provided with Mount Lucas’ audited financial statements for the fiscal year ended December 31, 2017. The Trustees noted that Mount Lucas’ level of profitability is an appropriate factor to consider, and the Trustees should be satisfied that Mount Lucas’ profits are sufficient to continue as a healthy concern generally and as investment adviser of the Fund specifically.
The Board then considered the level and depth of knowledge of Mount Lucas, including the professional experience and qualifications of senior personnel. In evaluating the quality of services to be provided by Mount Lucas, the Board took into account its familiarity with Mount Lucas’ management through Board meetings, discussions and reports during the preceding year. The Board also took into account Mount Lucas’ compliance policies and procedures and reports regarding Mount Lucas’ compliance operations from the Trust’s Chief Compliance Officer. The Board also considered any potential conflicts of interest that may arise in a portfolio manager’s management of the Fund’s investments on the one hand, and the investments of other accounts, on the other.
The Trustees reviewed the services provided to the Fund by Mount Lucas and concluded that the nature, extent and quality of the services provided were appropriate and consistent with the terms of the Mount Lucas Agreement, that the quality of the services appeared to be consistent with industry norms and that the Fund is likely to benefit from the continued receipt of those services. They also concluded that Mount Lucas has sufficient personnel, with the appropriate education and experience, to serve the Fund effectively and that Mount Lucas had demonstrated their ability to attract and retain qualified personnel.
The Trustees considered the extent to which economies of scale would be realized relative to fee levels as the Fund grows, and whether the fee levels reflect these economies of scale for the benefit of shareholders. The Board determined that economies of scale may be achieved at higher asset levels for the Fund for the benefit of Fund shareholders, and that although the fee structure did not currently include breakpoint reductions as asset levels increased, that the Adviser was currently waiving or reimbursing a portion of its advisory fee.
20
MOUNT LUCAS U.S. FOCUSED EQUITY FUND
Other Information (Concluded)
(Unaudited)
In voting to approve the continuation of the Mount Lucas Agreement for an additionalone-year period, the Board considered all factors it deemed relevant and the information presented to the Board by Mount Lucas. In arriving at its decision, the Board did not identify any single factor as being of paramount importance and each member of the Board gave varying weights to each factor according to his or her own judgment. The Board determined that the continuation of the Mount Lucas Agreement would be in the best interests of the Fund and their shareholders. Accordingly, the Board, including the Independent Trustees, unanimously approved the continuation of the Mount Lucas Agreement for an additional one-year period.
21
MOUNT LUCAS U.S. FOCUSED EQUITY FUND
Privacy Notice
(Unaudited)
The privacy of your personal financial information is extremely important to us. When you open an account with us, we collect a significant amount of information from you in order to properly invest and administer your account. We take very seriously the obligation to keep that information private and confidential, and we want you to know how we protect that important information.
We collect nonpublic personal information about you from applications or other forms you complete and from your transactions with us or our affiliates. We do not disclose information about you, or our former clients, to our affiliates or to service providers or other third parties, except as permitted by law. We share only the information required to properly administer your accounts, which enables us to send transaction confirmations, monthly or quarterly statements, financials and tax forms. Even within FundVantage Trust and its affiliated entities, a limited number of people who actually service accounts will have access to your personal financial information. Further, we do not share information about our current or former clients with any outside marketing groups or sales entities.
To ensure the highest degree of security and confidentiality, FundVantage Trust and its affiliates maintain various physical, electronic and procedural safeguards to protect your personal information. We also apply special measures for authentication of information you request or submit to us on our web site.
If you have questions or comments about our privacy practices, please call us at (844)261-6483.
22
MOUNT LUCAS U.S. FOCUSED EQUITY FUND
Fund Management
(Unaudited)
FundVantage Trust (the “Trust”) is governed by a Board of Trustees (the “Trustees”). The primary responsibility of the Trustees is to represent the interest of the Trust’s shareholders and to provide oversight management of the Trust.
The following tables present certain information regarding the Trustees and officers of the Trust. None of the Trustees are an “interested person” of the Trust, the Adviser, another investment adviser of a series of the Trust, or Foreside Funds Distributors LLC, the principal underwriter of the Trust (“Underwriter”), within the meaning of the 1940 Act and each Trustee is referred to as an “Independent Trustee” and is listed under such heading below. Employees of certain service providers to the Trust serve as officers of the Trust; such persons are not compensated by the Fund. The address of each Trustee and officer as it relates to the Trust’s business is 301 Bellevue Parkway, 2nd Floor, Wilmington, DE 19809.
The Statement of Additional Information for the Fund contains additional information about the Trustees and is available, without charge, upon request by calling (844)261-6483.
Name and Date of Birth
| Position(s) Held
| Term of Office and Length of Time Served
| Principal Occupation(s) During Past Five Years
| Number of
| Other
| |||||
INDEPENDENT TRUSTEES | ||||||||||
ROBERT J. CHRISTIAN Date of Birth: 2/49 | Trustee and Chairman of the Board | Shall serve until death, resignation or removal. Trustee and Chairman since 2007. | Retired since February 2006; Executive Vice President of Wilmington Trust Company from February 1996 to February 2006; President of Rodney Square Management Corporation (“RSMC”) (investment advisory firm) from 1996 to 2005; Vice President of RSMC from 2005 to 2006.
| 44 | Optimum Fund Trust (registered investment company with 6 portfolios). | |||||
IQBAL MANSUR Date of Birth: 6/55 | Trustee | Shall serve until death, resignation or removal. Trustee since 2007.
| University Professor, Widener University. | 44 | None. | |||||
NICHOLAS M. MARSINI, JR. Date of Birth: 8/55 | Trustee | Shall serve until death, resignation or removal. Trustee since 2016. | Retired since March 2016. President of PNC Bank Delaware from June 2011 to March 2016; Executive Vice President of Finance of BNY Mellon from July 2010 to January 2011; Executive Vice President and Chief Financial Officer of PNC Global Investment Servicing from September 1997 to July 2010.
| 44 | Brinker Capital Destinations Trust (registered investment company with 10 portfolios). | |||||
NANCY B. WOLCOTT Date of Birth: 11/54 | Trustee | Shall serve until death, resignation or removal. Trustee since 2011. | Retired since May 2014; EVP, Head of GFI Client Service Delivery, BNY Mellon from January 2012 to May 2014; EVP, Head of US Funds Services, BNY Mellon from July 2010 to January 2012; President of PNC Global Investment Servicing from 2008 to July 2010; Chief Operating Officer of PNC Global Investment Servicing from 2007 to 2008; Executive Vice President of PFPC Worldwide Inc. from 2006 to 2007.
| 44 | Lincoln Variable Insurance Products Trust (registered investment company with 92 portfolios). | |||||
STEPHEN M. WYNNE Date of Birth: 1/55 | Trustee | Shall serve until death, resignation or removal. Trustee since 2009. | Retired since December 2010; Chief Executive Officer of US Funds Services, BNY Mellon Asset Servicing from July 2010 to December 2010; Chief Executive Officer of PNC Global Investment Servicing from March 2008 to July 2010; President, PNC Global Investment Servicing from 2003 to 2008.
| 44 | Copeland Trust (registered investment company with 2 portfolios). | |||||
23
MOUNT LUCAS U.S. FOCUSED EQUITY FUND
Fund Management (Concluded)
(Unaudited)
Name and Date of Birth | Position(s) Held
|
Term of Office and Length of | Principal Occupation(s) During Past Five Years | |||
EXECUTIVE OFFICERS | ||||||
JOEL L. WEISS Date of Birth: 1/63 | President and Chief Executive Officer | Shall serve until death, resignation or removal. Officer since 2007. | President of JW Fund Management LLC since June 2016; Vice President and Managing Director of BNY Mellon Investment Servicing (US) Inc. and predecessor firms from 1993 to June 2016. | |||
T. RICHARD KEYES Date of Birth: 1/57 | Treasurer and Chief Financial Officer | Shall serve until death, resignation or removal. Officer since 2016. | President of TRK Fund Consulting LLC since July 2016; Head of Tax — U.S. Fund Services of BNY Mellon Investment Servicing (US) Inc. and predecessor firms from February 2006 to July 2016. | |||
GABRIELLA MERCINCAVAGE Date of Birth: 6/68 | Assistant Treasurer | Shall serve until death, resignation or removal. Officer since 2019. | Fund Administration Consultant since January 2019; Fund Accounting and Tax Compliance Accountant to financial services companies from November 2003 to July 2018. | |||
VINCENZO A. SCARDUZIO Date of Birth: 4/72 | Secretary | Shall serve until death, resignation or removal. Officer since 2012. | Director and Vice President Regulatory Administration of The Bank of New York Mellon and predecessor firms since 2001. | |||
DAVID C. LEBISKY Date of Birth: 5/72 | Chief Compliance Officer and Anti-Money Laundering Officer | Shall serve until death, resignation or removal. Officer since 2015. | President of Lebisky Compliance Consulting LLC since October 2015; Consultant, Duff & Phelps, LLC since 2016; Senior Consultant, Freeh Group International Solutions, LLC (a global risk management firm) from 2015 to 2018; Scotia Institutional Investments US, LP, Director of Regulatory Administration from 2010 to 2014.
| |||
24
[THIS PAGE INTENTIONALLY LEFT BLANK.]
Investment Adviser
Mount Lucas Management LP
405 South State Street
Newtown, PA 18940
Administrator
The Bank of New York Mellon
301 Bellevue Parkway
Wilmington, DE 19809
Transfer Agent
BNY Mellon Investment Servicing (US) Inc.
4400 Computer Drive
Westborough, MA 01581
Principal Underwriter
Foreside Funds Distributors LLC
400 Berwyn Park
899 Cassatt Road
Berwyn, PA 19312
Custodian
The Bank of New York Mellon
240 Greenwich Street
New York, NY 10286
Independent Registered Public Accounting Firm
Ernst & Young LLP
One Commerce Square
2005 Market Street, Suite 700
Philadelphia, PA 19103-7096
Legal Counsel
Pepper Hamilton LLP
3000 Two Logan Square
18th and Arch Streets
Philadelphia, PA 19103
LUC-0419
PACIFIC CAPITAL FUNDS
Pacific CapitalTax-Free Securities Fund
Pacific CapitalTax-Free Short Intermediate Securities Fund
Annual Investment Adviser’s Report
April 30, 2019 (Unaudited)
Dear Shareholder:
U.S. Economy
The U.S. economy ended 2018 on a solid footing, expanding at an annual rate of 2.9%. Readings from recent forward-looking indicators (i.e. ISM Manufacturing andNon-Manufacturing Indices) suggest that economic growth for this year is expected to come in between 2.4% and 2.6%. Continued improvement in the labor market pushed the unemployment rate to 3.6% through the end of April, the lowest level in 50 years. After raising short-term rates 4 times during calendar year 2018, the Fed announced in March that it would hold off raising rates in 2019 with the possibility that this pause could be further extended, depending on U.S. economic growth and inflation prospects. We see a low probability of a recession this year, with the possibility of it creeping up towards next year. We expect U.S. economic growth to continue on a modest path and anticipate the Federal Reserve to be on hold for the rest of the year
Hawaii Economy
Although the Hawaii economy saw slower growth in 2018 compared with 2017, it was still positive and economic performance was solid. Visitor arrivals are expected to expand by1-2% for the next two years, with stable visitor spending. We are dependent on economic conditions on the U.S. Mainland and also Japan. Both geographic areas are expected to have positive growth but forecasts have recently been adjusted lower.
Labor market conditions in Hawaii remain healthy, but the unemployment rate is expected to creep up over the next couple of years, according to the First Quarter 2019 Report from the State of Hawaii Department of Business, Economic Development & Tourism. Looking forward, we will be watchful for any indications of weakness. We are mindful that the Hawaii economy has had record years of growth and that some slowing in the rate of expansion is likely. Our local government has been proactive in taking steps to mitigate economic volatility by increasing reserves
Municipal Market and Fund Performance
Strong demand and moderate supply propelled robust returns for municipal bonds for the 12 months ended April 30, 2019. The municipal market rally is attributed to several factors: (i) a decrease in the supply of new issue muni bonds coupled with a sharp increase in investor demand, (ii) weaker than expected global and U.S. economic data in the latter half of the period, (iii) the Federal Reserve’s surprise announcement in March to pause further interest rate hikes based on its analysis of economic growth and inflation, and (iv) a rise in recession fears stemming from the last two factors. Although the AAA muni yield curve flattened, unlike the Treasury curve, it did not invert. During the first quarter of 2019, rates on shorter-term (maturity out to 3 years) municipal bonds declined by25-35 basis points, while intermediate(7-10 year maturity) to longer term (maturity more than 10 years) declined 40 to 45 basis points. Investors, reassured by the Fed’s more dovish pronouncements, have extended out the yield curve to pick up more yield. Yield ratios for intermediate maturity muni bonds compared to Treasuries are near 80%. Investor demand remains strong for municipal bonds as they are still an attractive asset class relative to U.S. Treasury and Government Agency securities on a taxable equivalent basis with strong credit fundamentals in the short and long areas of the yield curve.
PACIFIC CAPITAL FUNDS
Pacific CapitalTax-Free Securities Fund
Pacific CapitalTax-Free Short Intermediate Securities Fund
Annual Investment Adviser’s Report (Concluded)
April 30, 2019 (Unaudited)
The Pacific CapitalTax-Free Securities Fund had a total return of 5.30% for the year ended April 30, 2019. The Pacific CapitalTax-Free Short Intermediate Securities had a total return of 3.01% from the same period. Total return reflects the market fluctuation of the share price as well as reinvested dividends. Gross of Fee returns were 5.46% for the Pacific CapitalTax-Free Securities Fund and 3.33% for the Pacific CapitalTax-Free Short Intermediate Fund.
Outlook and Strategy
Demand has remained strong for municipal bonds. With global growth slowing, the stock market having more volatility than most recent years, and the uncertainty of the implementation of Trump policies, investors have sought the stability of bond investments. We continue to focus on higher quality bonds and look for opportunities to achieve the funds’ objectives of high current income that is exempt from federal and Hawaii income tax.
These comments reflect the investment advisor’s views in general regarding the market and the economy and are compiled from Asset Management Group of Bank of Hawaii (“AMG”) research. These comments reflect opinions as of the date written and are subject to change.
This letter is intended to assist shareholders in understanding how the funds performed for the period ending April 30, 2019 and reflects the views of the investment advisor as of the date written. Of course, these views may change and do not guarantee the future performance of the funds or the markets.
Portfolio composition is subject to change. The current and future portfolio holdings of the funds are subject to investment risk.
All mutual fund investing involves risk, including possible loss of principal. The funds arenon-diversified, which means that a portion of the funds’ assets may be invested in one or fewer companies or sectors. The funds could fluctuate in value more than a diversified fund.
2
PACIFIC CAPITAL FUNDS
Pacific Capital U.S. Government Money Market Fund
Annual Investment Adviser’s Report
April 30, 2019 (Unaudited)
Dear Shareholder:
U.S. Economy
The U.S. economy ended 2018 on a solid footing, expanding at an annual rate of 2.9%. Readings from recent forward-looking indicators (i.e. ISM Manufacturing andNon-Manufacturing Indices) suggest that economic growth for this year is expected to come in between 2.4% and 2.6%. Continued improvement in the labor market pushed the unemployment rate to 3.6% through the end of April, the lowest level in 50 years. After raising short-term rates 4 times during calendar year 2018, the Fed announced in March that it would hold off raising rates in 2019 with the possibility that this pause could be further extended, depending on U.S. economic growth and inflation prospects. We see a low probability of a recession this year, with the possibility of it creeping up towards next year. We expect U.S. economic growth to continue on a modest path and anticipate the Federal Reserve to be on hold for the rest of the year.
Fund Performance
Since its commencement of operations on June 14, 2018, through April 30, 2019, the yield on the Pacific Capital U.S. Government Securities Cash Assets Trust rose from 1.29% to 2.07% through the period. The Pacific Capital U.S. Government Money Market Fund’s (PCUXX) yield reflects the Fed Funds target rate increase of 75 basis points implemented by the Federal Reserve’s FOMC over the 10 months since our fund launched.
Outlook and Strategy
The Pacific Capital U.S. Government Money Market Fund has a conservative portfolio construction. We believe the Fund is well laddered to provide for the money market fund safety and liquidity features that shareholders seek while also maintaining ample available dollars each day to take advantage of reinvestment opportunities throughout the Treasury bill and Agency discount note curves.
As investment advisors to the Pacific Capital U.S. Government Money Market Fund, we wish to highlight our efforts to remain focused on delivering shareholders competitive yields while maintaining top quality standards. The fund remains prudently invested in accordance with the SAI and prospectus.
These comments reflect the investment advisor’s views in general regarding the market and the economy and are compiled from Asset Management Group of Bank of Hawaii (“AMG”) research. These comments reflect opinions as of the date written and are subject to change.
This letter is intended to assist shareholders in understanding how the fund performed for the period ending April 30, 2019 and reflects the views of the investment advisor as of the date written. Of course, these views may change and do not guarantee the future performance of the fund or the markets.
Portfolio composition is subject to change. The current and future portfolio holdings of the fund are subject to investment risk.
3
PACIFIC CAPITAL FUNDS
Pacific Capital U.S. Government Money Market Fund
Annual Investment Adviser’s Report (Concluded)
April 30, 2019 (Unaudited)
All mutual fund investing involves risk, including possible loss of principal. An investment in the Fund is not insured or guaranteed by the Federal Deposit Insurance Corporation or any other government agency. Although the Fund seeks to preserve the value of your investment at $1.00 per share, it is possible to lose money by investing in the Fund.
4
PACIFIC CAPITAL FUNDS
Pacific Capital Tax-Free Securities Fund
Annual Report
Performance Data
April 30, 2019 (Unaudited)
Credit Quality as of April 30, 2019 (as a percentage of total investments)
Credit quality ratings are primarily sourced from Moody’s but in the event that Moody’s has not assigned a rating, the Fund will use S&P or Fitch. If these ratings are in conflict, S&P will be used before Fitch. If none of the major rating agencies have assigned a rating, the Fund will assign a rating of NR (non-rated security). The ratings represent their (Moody’s, S&P, and Fitch) opinions as to the quality of the underlying securities in the Fund, and not the Fund itself. The ratings range from AAA (extremely strong capacity to meet financial commitment) to D (in default). Ratings are relative and subjective and are not absolute standards of quality. A pre-refunded bond is secured by an escrow fund of U.S. government obligations (i.e. Treasury securities) and assumes the superior credit rating of the government obligation. The ratings do not predict performance and are subject to change. |
|
Investment Style
High-quality, intermediate-term, tax-exempt
Investment Objective
The Pacific Capital Tax-Free Securities Fund (the “Fund”) seeks high current income that is exempt from federal and Hawaii income tax by normally investing at least 80% of its net assets in investment grade municipal obligations. The Fund normally invests greater than 50% of its assets in Hawaii municipal obligations — debt securities issued by or on behalf of the State of Hawaii and its political subdivisions, agencies and instrumentalities that pay interest which is exempt from Hawaii income tax as well as federal income tax.
Investment Considerations
Income received from the Fund may be subject to certain state and local taxes and, depending on one’s tax status, to the federal alternative minimum tax. Bonds offer a relatively stable level of income, although bond prices will fluctuate, providing the potential for principal gain or loss. Generally, bond prices and values fall when interest rates rise, and vice versa. The longer the average maturity of the Fund’s portfolio, the greater the fluctuation in value. Since the Fund invests significantly in securities of issuers in Hawaii, it will also be affected by a variety of Hawaii’s economic and political factors. The values of any of the Fund’s investments may also decline in response to events affecting the issuer or its credit rating.
Investment Process | ||||||
● |
Top-down macroeconomic analysis of interest rate trends | |||||||
● |
Bottom-up credit research to identify high quality bonds | |||||||
Investment Management
Advised by Asset Management Group of Bank of Hawaii (“AMG”) | ||||||||
●
|
As of April 30, 2019, AMG manages $1.51 billion in mutual fund assets. In addition, AMG personnel also manage approximately $2.07 billion in assets on behalf of Bank of Hawaii clients.
| |||||||
5
PACIFIC CAPITAL FUNDS
Pacific Capital Tax-Free Securities Fund
Annual Report
Performance Data
April 30, 2019 (Unaudited)
Average Annual Total Returns for the Periods Ended April 30, 2019
|
| |||||||||||||||||||
| 1 Year | 3 Year | 5 Year | 10 Year | |||||||||||||||||
Class Y | 5.30% | 1.91% | 2.84% | 3.51% | ||||||||||||||||
Barclays Capital Hawaii | ||||||||||||||||||||
Municipal Bond Index | 5.71% | 2.20% | 3.24% | 4.04% | ||||||||||||||||
Past performance does not guarantee future results. The performance data quoted represents past performance and current returns may be lower or higher. The investment return and principal value will fluctuate so that an investor’s shares, when redeemed, may be worth more or less than the original cost. The table does not reflect the deduction of taxes that a shareholder would pay on Fund distributions or the redemption of Fund shares. To obtain performance information current to the most recent month end, please call (888) 678-6034.
As stated in the current prospectus dated May 1, 2019, the Fund’s “Total Annual Fund Operating Expenses” are 0.30%, and the Fund’s “Total Annual Fund Operating Expenses After Fee Waiver” are 0.10%, of the Fund’s average daily net assets. These rates may fluctuate and may differ from the actual expenses incurred by the Fund for the period covered in this report. The Adviser has contractually agreed to waive its advisory fee (the “Waiver”) until August 31, 2019. The Waiver may not be terminated at any time prior to that date without the consent of the Board of Trustees (“Board of Trustees”) of FundVantage Trust (the “Trust”).
Before the Fund commenced operations, all of the assets of the Tax-Free Securities Fund, a series of Pacific Capital Funds (the “Predecessor Fund”), were transferred to the Fund in a tax-free reorganization (the “Reorganization”). Performance presented prior to June 28, 2010 reflects the performance of the Predecessor Fund.
Total returns reflect the waiver of advisory fees. Had these waivers not been in effect, performance quoted would have been lower.
The performance of the Fund is measured against the Barclays Capital Hawaii Municipal Bond Index, a rules-based, market-value weighted index engineered for the long-term tax-exempt Hawaii bond market. The index has four main
6
PACIFIC CAPITAL FUNDS
Pacific Capital Tax-Free Securities Fund
Annual Report
Performance Data (Concluded)
April 30, 2019 (Unaudited)
sectors: general obligation bonds, revenue bonds, insured bonds and prerefunded bonds. The index is unmanaged and does not reflect the deduction of fees associated with a mutual fund, such as investment management and fund accounting fees. The Fund’s performance reflects the deduction of fees for these services. Investors cannot invest directly in an index.
The Fund is distributed by Foreside Funds Distributors LLC.
All mutual fund investing involves risk, including possible loss of principal. The Fund is non-diversified, which means that a portion of the Fund’s assets may be invested in one or few companies or sectors. The Fund could fluctuate in value more than a diversified fund.
7
PACIFIC CAPITAL FUNDS
Pacific Capital Tax-Free Short Intermediate Securities Fund
Annual Report
Performance Data
April 30, 2019 (Unaudited)
Credit Quality as of April 30, 2019 (as a percentage of total investments)
Credit quality ratings are primarily sourced from Moody’s but in the event that Moody’s has not assigned a rating, the Fund will use S&P or Fitch. If these ratings are in conflict, S&P will be used before Fitch. If none of the major rating agencies have assigned a rating, the Fund will assign a rating of NR (non-rated security). The ratings represent their (Moody’s, S&P, and Fitch) opinions as to the quality of the underlying securities in the Fund, and not the Fund itself. The ratings range from AAA (extremely strong capacity to meet financial commitment) to D (in default). Ratings are relative and subjective and are not absolute standards of quality. A pre-refunded bond is secured by an escrow fund of U.S. government obligations (i.e. Treasury securities) and assumes the superior credit rating of the government obligation. The ratings do not predict performance and are subject to change. |
| Investment Style
High-quality, short-intermediate term, tax-exempt
Investment Objective
The Pacific Capital Tax-Free Short Intermediate Securities Fund (the “Fund”) seeks high current income that is exempt from federal and Hawaii income tax by normally investing at least 80% of its net assets in investment grade municipal obligations. The Fund normally invests greater than 50% of its assets in Hawaii municipal obligations — debt securities issued by or on behalf of the State of Hawaii and its political subdivisions, agencies and instrumentalities that pay interest which is exempt from Hawaii income tax as well as federal income tax. The Fund seeks to provide greater price stability than a long-term bond fund.
Investment Considerations
Income received from the Fund may be subject to certain state and local taxes and, depending on one’s tax status, to the federal alternative minimum tax. Bonds offer a relatively stable level of income, although bond prices will fluctuate, providing the potential for principal gain or loss. Generally, bond prices and values fall when interest rates rise, and vice versa. Intermediate term, higher-quality bonds generally offer less risk than longer-term bonds and a lower rate of return. Since the Fund invests significantly in securities of issuers in Hawaii, it will also be affected by a variety of Hawaii’s economic and political factors. The values of any of the Fund’s investments may also decline in response to events affecting the issuer or its credit rating.
Investment Process
| ||||||
| ●
|
Top-down macroeconomic analysis of interest rate trends
| ||||||
●
|
Bottom-up credit research to identify high quality bonds | |||||||
Investment Management
Advised by Asset Management Group of Bank of Hawaii (“AMG”) | ||||||||
●
|
As of April 30, 2019, AMG manages $1.51 billion in mutual fund assets. In addition, AMG personnel also manage approximately $2.07 billion in assets on behalf of Bank of Hawaii clients.
| |||||||
8
PACIFIC CAPITAL FUNDS
Pacific Capital Tax-Free Short Intermediate Securities Fund
Annual Report
Performance Data (Continued)
April 30, 2019 (Unaudited)
| Average Annual Total Returns for the Periods Ended April 30, 2019 |
| |||||||||||||||||||
| 1 Year | 3 Year | 5 Year | 10 Year | |||||||||||||||||
Class Y | 3.01% | 0.91% | 1.18% | 1.28% | ||||||||||||||||
Barclays Capital Hawaii | ||||||||||||||||||||
3-Year Municipal Bond Index | 3.22% | 1.07% | 1.18% | 1.62% | ||||||||||||||||
Past performance does not guarantee future results. The performance data quoted represents past performance and current returns may be lower or higher. The investment return and principal value will fluctuate so that an investor’s shares, when redeemed, may be worth more or less than the original cost. The table does not reflect the deduction of taxes that a shareholder would pay on Fund distributions or the redemption of Fund shares. To obtain performance information current to the most recent month end, please call (888) 678-6034.
As stated in the current prospectus dated May 1, 2019, the Fund’s “Total Annual Fund Operating Expenses” are 0.45%, and the Fund’s “Total Annual Fund Operating Expense After Fee Waiver” are 0.25%, of the Fund’s average daily net assets. These rates may fluctuate and may differ from the actual expenses incurred by the Fund for the period covered in this report. The Adviser has contractually agreed to waive its advisory fee (the “Waiver”) until August 31, 2019. The Waiver may not be terminated at any time prior to that date without the consent of the Board of Trustees (“Board of Trustees”) of FundVantage Trust (the “Trust”).
Before the Fund commenced operations, all of the assets of the Tax-Free Short Intermediate Securities Fund, a series of Pacific Capital Funds (the “Predecessor Fund”), were transferred to the Fund in a tax-free reorganization (the “Reorganization”). Performance presented prior to June 28, 2010 reflects the performance of the Predecessor Fund.
Total returns reflect the waiver of advisory fees. Had these waivers not been in effect, performance quoted would have been lower.
9
PACIFIC CAPITAL FUNDS
Pacific Capital Tax-Free Short Intermediate Securities Fund
Annual Report
Performance Data (Concluded)
April 30, 2019 (Unaudited)
The performance of the Fund is measured against the Barclays Capital Hawaii 3-Year Municipal Bond Index, which is the 2-4 year component of the Barclays Capital Hawaii Municipal Bond Index and is a rules-based, market-value weighted index engineered for the Hawaii tax-exempt bond market. The index has four main sectors: general obligation bonds, revenue bonds, insured bonds, and prerefunded bonds. The index is unmanaged and does not reflect the deduction of fees associated with a mutual fund, such as investment management and fund accounting fees. The Fund’s performance reflects the deduction of fees for these services. Investors cannot invest directly in an index.
The Fund is distributed by Foreside Funds Distributors LLC.
All mutual fund investing involves risk, including possible loss of principal. The Fund is non-diversified, which means that a portion of the Fund’s assets may be invested in one or few companies or sectors. The Fund could fluctuate in value more than a diversified fund.
10
PACIFIC CAPITAL FUNDS
Fund Expense Disclosure
April 30, 2019
(Unaudited)
As a shareholder of the Fund(s), you incur two types of costs: (1) transaction costs, and (2) ongoing costs, including management fees, distribution and/or service (Rule 12b-1) fees (if any) and other Fund expenses. These examples are intended to help you understand your ongoing costs (in dollars) of investing in the Fund and to compare these costs with the ongoing costs of investing in other mutual funds.
These examples are based on an investment of $1,000 invested at the beginning of the six-month period from November 1, 2018 through April 30, 2019 and held for the entire period.
Actual Expenses
The first line for each Fund in the accompanying table provides information about actual account values and actual expenses. You may use the information in this line, together with the amount you invested, to estimate the expenses that you paid over the period. Simply divide your account value by $1,000 (for example, an $8,600 account value divided by $1,000 = 8.6), then multiply the result by the number in the first line of the table under the heading entitled “Expenses Paid During Period” to estimate the expenses you paid on your account during this period.
Hypothetical Examples for Comparison Purposes
The second line for each Fund in the accompanying table provides information about hypothetical account values and hypothetical expenses based on each Fund’s actual expense ratio and an assumed rate of return of 5% per year before expenses, which is not the Fund’s actual return. The hypothetical account values and expenses may not be used to estimate the actual ending account balance or expenses you paid for the period. You may use this information to compare the ongoing costs of investing in the Fund(s) and other funds. To do so, compare these 5% hypothetical examples with the 5% hypothetical examples that appear in the shareholder reports of other funds.
Please note that the expenses shown in the table are meant to highlight your ongoing costs only and do not reflect any transactional costs. Therefore, the second line of the accompanying table is useful in comparing ongoing costs only, and will not help you determine the relative total costs of owning different funds. In addition, if these transactional costs were included, your costs would have been higher.
11
PACIFIC CAPITAL FUNDS
Fund Expense Disclosure (Concluded)
April 30, 2019
(Unaudited)
| Beginning Account Value November 1, 2018 | Ending Account Value April 30, 2019 | Expenses Paid During Period* | Expense Ratio During Period** | ||||||||||||||||||||||
Pacific Capital Tax-Free | |||||||||||||||||||||||||
Actual Fund Return | Class Y | $1,000.00 | $1,050.50 | $0.56 | 0.11 | % | |||||||||||||||||||
Hypothetical Fund Return (5% return before expenses) | Class Y | 1,000.00 | 1,024.25 | 0.55 | 0.11 | % | |||||||||||||||||||
Pacific Capital Tax-Free Short Intermediate Securities Fund | |||||||||||||||||||||||||
Actual Fund Return | Class Y | $1,000.00 | $1,026.30 | $1.86 | 0.37 | % | |||||||||||||||||||
Hypothetical Fund Return (5% return before expenses) | Class Y | 1,000.00 | 1,022.96 | 1.86 | 0.37 | % | |||||||||||||||||||
Pacific Capital U.S. Government Money Market Fund | |||||||||||||||||||||||||
Actual Fund Return | Investor Class | $1,000.00 | $1,010.00 | $1.74 | 0.35 | % | |||||||||||||||||||
Hypothetical Fund Return (5% return before expenses) | Investor Class | 1,000.00 | 1,023.06 | 1.76 | 0.35 | % | |||||||||||||||||||
| * | Expense are equal to an annualized expense ratio for the six-month period ended April 30, 2019, multiplied by average account value over the period, multiplied by the number of days in the most recent period (181), then divided by 365 to reflect the period. The Funds’ ending account values on the first line in each table are based on the actual six-month total returns of 5.05% for the Pacific Capital Tax-Free Securities Fund, 2.63% for the Pacific Capital Tax-Free Short Intermediate Securities Fund and 1.00% for the Pacific Capital U.S. Government Money Market Fund. |
| ** | Annualized. |
12
PACIFIC CAPITAL FUNDS
Pacific Capital Tax-Free Securities Fund
Portfolio of Investments
April 30, 2019
| Principal Amount ($) | Value ($) | |||||||
MUNICIPAL BONDS — 98.2% |
| |||||||
Alaska — 0.1% | ||||||||
Matanuska-Susitna AK, | 380,000 | 385,529 | ||||||
Arizona — 2.3% | ||||||||
Phoenix Civic Improvement | 5,000,000 | 6,582,300 | ||||||
California — 1.5% | ||||||||
Norwalk-La Mirada Unified | 5,000,000 | 4,144,050 | ||||||
Hawaii — 91.9% | ||||||||
Hawaii County GO, Series A, | 170,000 | 173,420 | ||||||
Hawaii County GO, Series A, | 5,045,000 | 6,063,939 | ||||||
Hawaii County GO, Series A, | 4,775,000 | 5,688,362 | ||||||
Hawaii County GO, Series D, | 400,000 | 458,580 | ||||||
| Principal Amount ($) | Value ($) | |||||||
MUNICIPAL BONDS — (Continued) |
| |||||||
Hawaii — (Continued) | ||||||||
Hawaii Housing Finance & | 3,120,000 | 3,204,833 | ||||||
Hawaii Housing Finance & | 4,410,000 | 4,414,719 | ||||||
Hawaii Housing Finance & | 2,375,000 | 2,443,614 | ||||||
Hawaii State Airports | 400,000 | 440,056 | ||||||
Hawaii State Airports | 1,000,000 | 1,042,450 | ||||||
Hawaii State Airports | 1,010,000 | 1,049,168 | ||||||
The accompanying notes are an integral part of the financial statements.
13
PACIFIC CAPITAL FUNDS
Pacific Capital Tax-Free Securities Fund
Portfolio of Investments (Continued)
April 30, 2019
| Principal Amount ($) | Value ($) | |||||||
MUNICIPAL BONDS — (Continued) |
| |||||||
Hawaii — (Continued) | ||||||||
Hawaii State Airports | 2,000,000 | 2,138,500 | ||||||
Hawaii State Airports | 1,500,000 | 1,737,030 | ||||||
Hawaii State Airports | 1,000,000 | 1,044,110 | ||||||
Hawaii State Airports | 545,000 | 566,457 | ||||||
Hawaii State Airports | 4,040,000 | 4,194,288 | ||||||
Hawaii State Department of | 500,000 | 542,945 | ||||||
Hawaii State Department of | 1,330,000 | 1,489,361 | ||||||
| Principal Amount ($) | Value ($) | |||||||
MUNICIPAL BONDS — (Continued) |
| |||||||
Hawaii — (Continued) | ||||||||
Hawaii State Department of | 1,000,000 | 1,009,490 | ||||||
Hawaii State Department of | 3,500,000 | 3,556,875 | ||||||
Hawaii State Department of | 1,500,000 | 1,532,340 | ||||||
Hawaii State Department of | 1,790,000 | 1,991,536 | ||||||
Hawaii State Department of | 550,000 | 604,896 | ||||||
The accompanying notes are an integral part of the financial statements.
14
PACIFIC CAPITAL FUNDS
Pacific Capital Tax-Free Securities Fund
Portfolio of Investments (Continued)
April 30, 2019
| Principal Amount ($) | Value ($) | |||||||
MUNICIPAL BONDS — (Continued) |
| |||||||
Hawaii — (Continued) | ||||||||
Hawaii State Department of | 10,000,000 | 11,313,300 | ||||||
Hawaii State Department of | 1,370,000 | 1,456,625 | ||||||
Hawaii State Department of | 500,000 | 575,960 | ||||||
Hawaii State Department of | 945,000 | 1,140,360 | ||||||
Hawaii State Department of | 335,000 | 395,856 | ||||||
Hawaii State Department of | 1,170,000 | 1,431,589 | ||||||
Hawaii State Department of | 800,000 | 967,912 | ||||||
| Principal Amount ($) | Value ($) | |||||||
MUNICIPAL BONDS — (Continued) |
| |||||||
Hawaii — (Continued) | ||||||||
Hawaii State Department of | 815,000 | 977,120 | ||||||
Hawaii State GO, Series DQ, | 160,000 | 160,434 | ||||||
Hawaii State GO, Series DT, | 2,150,000 | 2,186,378 | ||||||
Hawaii State GO, Series DZ, | 155,000 | 167,694 | ||||||
Hawaii State GO, Series DZ, | 1,790,000 | 1,936,601 | ||||||
Hawaii State GO, Series DZ, | 885,000 | 958,650 | ||||||
Hawaii State GO, Series DZ, | 1,620,000 | 1,752,678 | ||||||
Hawaii State GO, Series DZ, | 1,155,000 | 1,251,119 | ||||||
The accompanying notes are an integral part of the financial statements.
15
PACIFIC CAPITAL FUNDS
Pacific Capital Tax-Free Securities Fund
Portfolio of Investments (Continued)
April 30, 2019
| Principal Amount ($) | Value ($) | |||||||
MUNICIPAL BONDS — (Continued) |
| |||||||
Hawaii — (Continued) | ||||||||
Hawaii State GO, Series DZ, | 1,805,000 | 1,955,212 | ||||||
Hawaii State GO, Series DZ, | 1,730,000 | 1,873,971 | ||||||
Hawaii State GO, Series DZ, | 300,000 | 325,761 | ||||||
Hawaii State GO, Series DZ, | 1,235,000 | 1,341,049 | ||||||
Hawaii State GO, Series DZ, | 1,095,000 | 1,189,028 | ||||||
Hawaii State GO, Series EA, | 265,000 | 270,228 | ||||||
Hawaii State GO, Series EA, | 2,000,000 | 2,171,300 | ||||||
Hawaii State GO, Series EE, | 55,000 | 61,335 | ||||||
Hawaii State GO, Series EE, | 1,450,000 | 1,617,026 | ||||||
| Principal Amount ($) | Value ($) | |||||||
MUNICIPAL BONDS — (Continued) |
| |||||||
Hawaii — (Continued) | ||||||||
Hawaii State GO, Series EE, | 90,000 | 100,367 | ||||||
Hawaii State GO, Series EE, | 1,000,000 | 1,115,190 | ||||||
Hawaii State GO, Series EE, | 90,000 | 100,367 | ||||||
Hawaii State GO, Series EE, | 740,000 | 825,241 | ||||||
Hawaii State GO, Series EE, | 20,000 | 22,304 | ||||||
Hawaii State GO, Series EE, | 100,000 | 111,519 | ||||||
Hawaii State GO, Series EE, | 1,365,000 | 1,522,234 | ||||||
Hawaii State GO, Series EE, | 345,000 | 384,741 | ||||||
The accompanying notes are an integral part of the financial statements.
16
PACIFIC CAPITAL FUNDS
Pacific Capital Tax-Free Securities Fund
Portfolio of Investments (Continued)
April 30, 2019
| Principal Amount ($) | Value ($) | |||||||
MUNICIPAL BONDS — (Continued) |
| |||||||
Hawaii — (Continued) | ||||||||
Hawaii State GO, Series EE, | 340,000 | 379,165 | ||||||
Hawaii State GO, Series EH, | 305,000 | 346,199 | ||||||
Hawaii State GO, Series EH, | 445,000 | 505,111 | ||||||
Hawaii State GO, Series EH, | 110,000 | 124,859 | ||||||
Hawaii State GO, Series EH, | 345,000 | 392,220 | ||||||
Hawaii State GO, Series EH, | 895,000 | 1,016,317 | ||||||
Hawaii State GO, Series EL, | 1,000,000 | 1,136,870 | ||||||
Hawaii State GO, Series EO, | 1,285,000 | 1,467,521 | ||||||
Hawaii State GO, Series EO, | 140,000 | 162,942 | ||||||
Hawaii State GO, Series EO, | 2,660,000 | 3,093,208 | ||||||
| Principal Amount ($) | Value ($) | |||||||
MUNICIPAL BONDS — (Continued) |
| |||||||
Hawaii — (Continued) | ||||||||
Hawaii State GO, Series EP, | 1,000,000 | 1,165,610 | ||||||
Hawaii State GO, Series ET, | 1,060,000 | 1,143,221 | ||||||
Hawaii State GO, Series EY, | 3,040,000 | 3,622,950 | ||||||
Hawaii State GO, Series EZ, | 4,000,000 | 4,321,000 | ||||||
Hawaii State GO, Series FB, | 5,000,000 | 5,922,600 | ||||||
Hawaii State GO, Series FB, | 2,000,000 | 2,246,520 | ||||||
Hawaii State GO, Series FG, | 10,000,000 | 11,994,200 | ||||||
Hawaii State GO, Series FG, | 1,000,000 | 1,093,210 | ||||||
Hawaii State GO, Series FK, | 1,000,000 | 1,069,300 | ||||||
Hawaii State GO, Series FK, | 2,500,000 | 2,993,225 | ||||||
Hawaii State GO, Series FK, | 2,000,000 | 2,173,260 | ||||||
Hawaii State GO, Series FN, | 2,500,000 | 3,056,925 | ||||||
Hawaii State GO, Series FT, | 1,950,000 | 2,326,136 | ||||||
Hawaii State GO, Series FT, | 4,000,000 | 4,802,200 | ||||||
The accompanying notes are an integral part of the financial statements.
17
PACIFIC CAPITAL FUNDS
Pacific Capital Tax-Free Securities Fund
Portfolio of Investments (Continued)
April 30, 2019
| Principal Amount ($) | Value ($) | |||||||
MUNICIPAL BONDS — (Continued) |
| |||||||
Hawaii — (Continued) | ||||||||
Hawaii State GO, Series FW, 4.00%, 01/01/34 | 2,000,000 | 2,231,220 | ||||||
Hawaii State Harbor System Revenue, Series A, Callable 07/01/20 at 100, | 220,000 | 227,478 | ||||||
Hawaii State Harbor System Revenue, Series A, Callable 07/01/20 at 100, | 4,125,000 | 4,303,654 | ||||||
Hawaii State Highway Fund Revenue, Series A, | 1,250,000 | 1,319,688 | ||||||
Hawaii State Highway Fund Revenue, Series A, Callable 07/01/24 at 100, | 1,085,000 | 1,241,945 | ||||||
Hawaii State Highway Fund Revenue, Series A, Prerefunded 01/01/22 at 100, 5.00%, 01/01/27 | 5,490,000 | 5,977,786 | ||||||
Hawaii State Highway Fund Revenue, Series A, Prerefunded 01/01/22 at 100, 5.00%, 01/01/28 | 1,120,000 | 1,219,512 | ||||||
Hawaii State Highway Fund Revenue, Series B, Callable 07/01/26 at 100, | 910,000 | 1,102,010 | ||||||
Hawaii State Highway Fund Revenue, Series B, Callable 07/01/26 at 100, | 5,000,000 | 6,031,300 | ||||||
| Principal Amount ($) | Value ($) | |||||||
MUNICIPAL BONDS — (Continued) |
| |||||||
Hawaii — (Continued) | ||||||||
Honolulu City & County Board of Water Supply System Revenue, Series A, Callable 07/01/24 at 100, | 1,500,000 | 1,739,325 | ||||||
Honolulu City & County Board of Water Supply System Revenue, Series A, Callable 07/01/22 at 100, | 3,125,000 | 3,434,812 | ||||||
Honolulu City & County Board of Water Supply System Revenue, Series A, Callable 07/01/24 at 100, | 850,000 | 981,928 | ||||||
Honolulu City & County Board of Water Supply System Revenue, Series A, | 1,235,000 | 1,451,150 | ||||||
Honolulu City & County GO, Series A, Callable 11/01/22 at 100, | 2,855,000 | 3,173,561 | ||||||
Honolulu City & County GO, | 2,000,000 | 2,223,160 | ||||||
Honolulu City & County GO, | 2,175,000 | 2,545,337 | ||||||
The accompanying notes are an integral part of the financial statements.
18
PACIFIC CAPITAL FUNDS
Pacific Capital Tax-Free Securities Fund
Portfolio of Investments (Continued)
April 30, 2019
| Principal Amount ($) | Value ($) | |||||||
MUNICIPAL BONDS — (Continued) |
| |||||||
Hawaii — (Continued) | ||||||||
Honolulu City & County GO, Series A, Callable 11/01/22 at 100, | 450,000 | 500,211 | ||||||
Honolulu City & County GO, Series A, Callable 11/01/22 at 100, | 1,970,000 | 2,189,813 | ||||||
Honolulu City & County GO, Series A, Callable 10/01/25 at 100, | 3,000,000 | 3,472,860 | ||||||
Honolulu City & County GO, Series A, Callable 10/01/25 at 100, | 1,000,000 | 1,151,160 | ||||||
Honolulu City & County GO, Series A, Callable 10/01/25 at 100, | 1,040,000 | 1,193,504 | ||||||
Honolulu City & County GO, Series A, Callable 10/01/25 at 100, | 1,000,000 | 1,144,190 | ||||||
Honolulu City & County GO, Series A, ETM, | 2,000,000 | 2,223,160 | ||||||
Honolulu City & County GO, Series A, Refunding, | 1,000,000 | 1,014,080 | ||||||
Honolulu City & County GO, Series A, Refunding, Callable 11/01/22 at 100, | 1,000,000 | 1,045,060 | ||||||
| Principal Amount ($) | Value ($) | |||||||
MUNICIPAL BONDS — (Continued) |
| |||||||
Hawaii — (Continued) | ||||||||
Honolulu City & County GO, | 2,050,000 | 2,281,937 | ||||||
Honolulu City & County GO, | 2,280,000 | 2,399,746 | ||||||
Honolulu City & County GO, | 1,220,000 | 1,230,248 | ||||||
Honolulu City & County GO, | 1,000,000 | 1,112,650 | ||||||
Honolulu City & County GO, | 2,300,000 | 2,755,837 | ||||||
Honolulu City & County GO, | 500,000 | 597,870 | ||||||
Honolulu City & County GO, | 1,215,000 | 1,395,622 | ||||||
Honolulu City & County GO, | 2,000,000 | 2,383,520 | ||||||
Honolulu City & County GO, | 4,115,000 | 4,862,037 | ||||||
The accompanying notes are an integral part of the financial statements.
19
PACIFIC CAPITAL FUNDS
Pacific Capital Tax-Free Securities Fund
Portfolio of Investments (Continued)
April 30, 2019
| Principal Amount ($) | Value ($) | |||||||
MUNICIPAL BONDS — (Continued) |
| |||||||
Hawaii — (Continued) | ||||||||
Honolulu City & County GO, Series E, Refunding, Callable 09/01/27 at 100, | 1,500,000 | 1,831,365 | ||||||
Honolulu City & County GO, Variable Honolulu Rail Transit Project, SIFMA + 0.30%, Callable 05/23/19 at 100, 2.60%, 09/01/22(a) | 1,500,000 | 1,499,745 | ||||||
Honolulu City & County Waste Water System Revenue, Refunding, Junior Series A, Callable 07/01/25 at 100, 5.00%, 07/01/30 | 4,000,000 | 4,671,960 | ||||||
Honolulu City & County Waste Water System Revenue, Senior 1st Bond Resolution, Refunding, | 250,000 | 259,845 | ||||||
Honolulu City & County Waste Water System Revenue, Senior 1st Bond Resolution, Refunding, Callable 07/01/25 at 100, | 3,000,000 | 3,572,460 | ||||||
Honolulu City & County Waste Water System Revenue, Senior 1st Bond Resolution, Refunding, Callable 07/01/25 at 100, | 1,325,000 | 1,568,296 | ||||||
| Principal Amount ($) | Value ($) | |||||||
MUNICIPAL BONDS — (Continued) |
| |||||||
Hawaii — (Continued) | ||||||||
Honolulu City & County Waste Water System Revenue, Senior 1st Bond Resolution, Series A, Callable 07/01/25 at 100, | 100,000 | 117,635 | ||||||
Honolulu City & County Waste Water System Revenue, Senior 1st Bond Resolution, Series A, Callable 01/01/28 at 100, | 2,000,000 | 2,388,520 | ||||||
Honolulu City & County Waste Water System Revenue, Senior Series B, Refunding, Callable 07/01/26 at 100, | 125,000 | 146,289 | ||||||
Kauai County GO, | 390,000 | 442,693 | ||||||
Kauai County GO, | 250,000 | 308,685 | ||||||
Kauai County GO, | 250,000 | 302,195 | ||||||
Kauai County GO, | 270,000 | 297,513 | ||||||
Kauai County GO, | 775,000 | 910,338 | ||||||
Kauai County GO, | 1,195,000 | 1,235,941 | ||||||
The accompanying notes are an integral part of the financial statements.
20
PACIFIC CAPITAL FUNDS
Pacific Capital Tax-Free Securities Fund
Portfolio of Investments (Continued)
April 30, 2019
| Principal Amount ($) | Value ($) | |||||||
MUNICIPAL BONDS — (Continued) |
| |||||||
Hawaii — (Continued) | ||||||||
Kauai County GO, Series A, Callable 08/01/22 at 100, 3.13%, 08/01/27 | 1,295,000 | 1,338,085 | ||||||
Kauai County GO, Series A, Refunding, | 260,000 | 262,184 | ||||||
Kauai County GO, Series A, Refunding, | 365,000 | 403,561 | ||||||
Maui County GO, Refunding, 5.00%, 06/01/19 | 525,000 | 526,433 | ||||||
Maui County GO, Refunding, 5.00%, 06/01/20 | 1,075,000 | 1,114,334 | ||||||
Maui County GO, Refunding, 5.00%, 06/01/23 | 300,000 | 339,951 | ||||||
Maui County GO, Refunding, 5.00%, 09/01/28 | 975,000 | 1,231,532 | ||||||
Maui County GO, Refunding, 4.00%, 09/01/31 | 5,305,000 | 6,048,761 | ||||||
University of Hawaii Revenue, Series A-2, | 170,000 | 171,695 | ||||||
University of Hawaii Revenue, Series B, Refunding, | 165,000 | 183,891 | ||||||
University of Hawaii Revenue, Series B, Refunding, Callable 10/01/25 at 100, | 1,000,000 | 1,159,310 | ||||||
| Principal Amount ($) | Value ($) | |||||||
MUNICIPAL BONDS — (Continued) |
| |||||||
Hawaii — (Continued) | ||||||||
University of Hawaii Revenue, Series E, Refunding, | 3,000,000 | 3,497,670 | ||||||
University of Hawaii Revenue, Series E, Refunding, Callable 10/01/26 at 100, | 1,000,000 | 1,184,990 | ||||||
University of Hawaii Revenue, Series F, Refunding, Callable 10/01/27 at 100, | 3,000,000 | 3,547,080 | ||||||
University of Hawaii Revenue, Series F, Refunding, Callable 10/01/27 at 100, | 2,000,000 | 2,357,380 | ||||||
| 258,678,595 | ||||||||
Illinois — 1.0% | ||||||||
Illinois Municipal Electric Agency Power Supply Revenue, | 2,665,000 | 2,816,211 | ||||||
Texas — 1.4% | ||||||||
Galveston County GO, CAB, OID, Series RD, | 2,630,000 | 2,399,218 | ||||||
The accompanying notes are an integral part of the financial statements.
21
PACIFIC CAPITAL FUNDS
Pacific Capital Tax-Free Securities Fund
Portfolio of Investments (Concluded)
April 30, 2019
| Principal Amount ($) | Value ($) | |||||||
MUNICIPAL BONDS — (Continued) |
| |||||||
Texas — (Continued) |
| |||||||
Houston Combined Utility System Revenue, Unrefunded Balance CAB, OID, Junior Series A, | 2,000,000 | 1,628,720 | ||||||
| 4,027,938 | ||||||||
TOTAL MUNICIPAL BONDS (Cost $268,081,684) | 276,634,623 | |||||||
| Shares | ||||||||
REGISTERED INVESTMENT COMPANY — 1.0% |
| |||||||
Dreyfus Government Cash Management Fund, Institutional Shares, | 2,656,692 | 2,656,692 | ||||||
TOTAL REGISTERED INVESTMENT COMPANY | 2,656,692 | |||||||
TOTAL INVESTMENTS - 99.2% | 279,291,315 | |||||||
OTHER ASSETS IN EXCESS OF LIABILITIES - 0.8% | 2,323,667 | |||||||
|
| |||||||
NET ASSETS - 100.0% | $ | 281,614,982 | ||||||
|
| |||||||
| (a) | Variable rate investments. The rate shown is based on the latest available information as of April 30, 2019. Certain variable rate securities are not based on a published reference rate and spread but are determined by the issuer or agent and are based on current market conditions. |
| (b) | Rate periodically changes. Rate disclosed is the 7-day yield at April 30, 2019. |
Portfolio holdings are subject to change at any time.
AGC | Assured Guaranty Corp. | |
AGM | Assured Guaranty Municipal Corp. | |
AGM-CR | Assured Guaranty Municipal Corp. Custodial Receipts | |
AMT | Subject to Alternative Minimum Tax | |
CAB | Capital Appreciation Bond | |
ETM | Escrowed to Maturity | |
FGIC | Financial Guaranty Insurance Co. | |
FHLMC | Federal Home Loan Mortgage Corp. | |
FNMA | Federal National Mortgage Association | |
GNMA | Government National Mortgage Association | |
GO | General Obligation | |
MWC | Make Whole Callable | |
NATL-RE | National Reinsurance Corp. | |
OID | Original Issue Discount | |
SIFMA | The Securities Industry and Financial | |
Markets Association Municipal Swap Index |
The accompanying notes are an integral part of the financial statements.
22
PACIFIC CAPITAL FUNDS
Pacific Capital Tax-Free Short Intermediate Securities Fund
Portfolio of Investments
April 30, 2019
| Principal Amount ($) | Value ($) | |||||||
MUNICIPAL BONDS — 96.8% |
| |||||||
Arizona — 1.8% | ||||||||
Tempe City Excise Tax Revenue, Series A, Callable 07/01/21 at 100, | 900,000 | 963,711 | ||||||
Hawaii — 94.1% | ||||||||
Hawaii County GO, Series A, | 1,000,000 | 1,044,830 | ||||||
Hawaii County GO, | 500,000 | 503,980 | ||||||
Hawaii County GO, | 500,000 | 573,225 | ||||||
Hawaii Housing Finance & Development Corp., Hale-Kewalo Apartments, | 2,150,000 | 2,152,300 | ||||||
Hawaii Housing Finance & Development Corp., Series B, | 25,000 | 25,032 | ||||||
Hawaii Housing Finance & Development Corp., | 100,000 | 100,471 | ||||||
| Principal Amount ($) | Value ($) | |||||||
MUNICIPAL BONDS — (Continued) |
| |||||||
Hawaii — (Continued) | ||||||||
Hawaii Pacific Health Revenue, Series A, OID, Prerefunded, Callable 07/01/20 at 100, | 635,000 | 662,902 | ||||||
Hawaii Pacific Health Revenue, Series B, ETM, | 175,000 | 181,685 | ||||||
Hawaii State Airports System Revenue, AMT, Callable 08/01/23 at 100, | 260,000 | 286,918 | ||||||
Hawaii State Airports System Revenue, Refunding, AMT, | 135,000 | 135,717 | ||||||
Hawaii State Airports System Revenue, Refunding, AMT, | 2,000,000 | 2,131,000 | ||||||
Hawaii State Airports System Revenue, Refunding, | 500,000 | 535,510 | ||||||
Hawaii State Airports System Revenue, Refunding, AMT, | 1,000,000 | 1,233,780 | ||||||
Hawaii State Airports System Revenue, Refunding, AMT, OID, Callable 07/01/21 at 100, | 500,000 | 520,275 | ||||||
The accompanying notes are an integral part of the financial statements.
23
PACIFIC CAPITAL FUNDS
Pacific Capital Tax-Free Short Intermediate Securities Fund
Portfolio of Investments (Continued)
April 30, 2019
| Principal Amount ($) | Value ($) | |||||||
MUNICIPAL BONDS — (Continued) |
| |||||||
Hawaii — (Continued) | ||||||||
Hawaii State Department of Budget & Finance Revenue, Hawaiian Electric Company Subsidiary, Callable 07/01/19 at 100, | 50,000 | 50,474 | ||||||
Hawaii State Department of Budget & Finance Revenue, Hawaiian Electric Company, AMT, MWC, | 1,520,000 | 1,544,700 | ||||||
Hawaii State Department of Budget & Finance, Pacific Health Obligation, | 220,000 | 242,169 | ||||||
Hawaii State Department of Budget & Finance, Series A, Queens Health System, | 400,000 | 401,496 | ||||||
Hawaii State Department of Budget & Finance, Series A, Queens Health System, | 115,000 | 126,215 | ||||||
Hawaii State Department of Budget & Finance, Series A, Queens Health System, | 495,000 | 569,705 | ||||||
| Principal Amount ($) | Value ($) | |||||||
MUNICIPAL BONDS — (Continued) |
| |||||||
Hawaii — (Continued) | ||||||||
Hawaii State Department of Budget & Finance, | 500,000 | 587,705 | ||||||
Hawaii State Department of | 300,000 | 350,535 | ||||||
Hawaii State Department of | 55,000 | 55,116 | ||||||
Hawaii State Department of Hawaiian Home Lands, Refunding, | 1,555,000 | 1,588,557 | ||||||
Hawaii State GO, Series DQ, Prerefunded, Callable 06/01/19 at 100, | 145,000 | 145,393 | ||||||
Hawaii State GO, Series DQ, Prerefunded, Callable 06/01/19 at 100, | 185,000 | 185,501 | ||||||
Hawaii State GO, Series DZ, Prerefunded, Callable 12/01/21 at 100, | 190,000 | 205,561 | ||||||
Hawaii State GO, Series DZ, Prerefunded, Callable 12/01/21 at 100, | 190,000 | 205,561 | ||||||
The accompanying notes are an integral part of the financial statements.
24
PACIFIC CAPITAL FUNDS
Pacific Capital Tax-Free Short Intermediate Securities Fund
Portfolio of Investments (Continued)
April 30, 2019
| Principal Amount ($) | Value ($) | |||||||
MUNICIPAL BONDS — (Continued) |
| |||||||
Hawaii — (Continued) | ||||||||
Hawaii State GO, Series DZ, Prerefunded, Callable 12/01/21 at 100, | 1,080,000 | 1,169,878 | ||||||
Hawaii State GO, Series DZ, Prerefunded, ETM, | 130,000 | 132,496 | ||||||
Hawaii State GO, Series DZ, Refunding, ETM, | 505,000 | 531,119 | ||||||
Hawaii State GO, Series DZ, | 360,000 | 390,913 | ||||||
Hawaii State GO, | 1,025,000 | 1,064,052 | ||||||
Hawaii State GO, Series EA, | 1,025,000 | 1,111,428 | ||||||
Hawaii State GO, | 1,305,000 | 1,411,110 | ||||||
Hawaii State GO, Series EE, Prerefunded, Callable 11/01/22 at 100, | 45,000 | 50,184 | ||||||
Hawaii State GO, Series EE, Prerefunded, Callable 11/01/22 at 100, | 25,000 | 27,880 | ||||||
| Principal Amount ($) | Value ($) | |||||||
MUNICIPAL BONDS — (Continued) |
| |||||||
Hawaii — (Continued) | ||||||||
Hawaii State GO, Series EE, Prerefunded, Callable 11/01/22 at 100, | 760,000 | 847,544 | ||||||
Hawaii State GO, Series | 980,000 | 1,090,172 | ||||||
Hawaii State GO, Series EH, Prerefunded, Callable 08/01/23 at 100, | 270,000 | 306,472 | ||||||
Hawaii State GO, Series EH, Unrefunded, Callable 08/01/23 at 100, | 830,000 | 942,506 | ||||||
Hawaii State GO, | 1,000,000 | 1,106,330 | ||||||
Hawaii State GO, Series FG, 5.00%, 10/01/22 | 410,000 | 455,752 | ||||||
Hawaii State GO, Series FT, 3.00%, 01/01/23 | 1,000,000 | 1,048,210 | ||||||
Hawaii State GO, Series FT, 4.00%, 01/01/24 | 1,000,000 | 1,104,040 | ||||||
Hawaii State GO, Series FW, 5.00%, 01/01/23 | 500,000 | 559,520 | ||||||
The accompanying notes are an integral part of the financial statements.
25
PACIFIC CAPITAL FUNDS
Pacific Capital Tax-Free Short Intermediate Securities Fund
Portfolio of Investments (Continued)
April 30, 2019
| Principal Amount ($) | Value ($) | |||||||
MUNICIPAL BONDS — (Continued) |
| |||||||
Hawaii — (Continued) | ||||||||
Hawaii State Harbor System Revenue, Refunding, | 500,000 | 520,765 | ||||||
Hawaii State Harbor System Revenue, Series A, | 585,000 | 606,563 | ||||||
Hawaii State Harbor System Revenue, Series A, OID, Callable 07/01/20 at 100, | 35,000 | 36,110 | ||||||
Hawaii State Highway Fund Revenue, Series A, | 1,000,000 | 1,055,750 | ||||||
Hawaii State Highway Fund | 1,000,000 | 1,039,400 | ||||||
Hawaii State Highway Fund Revenue, Series A, Callable 01/01/22 at 100, | 500,000 | 530,100 | ||||||
Honolulu City & County GO, Series A, Prerefunded, Callable 08/01/21 at 100, | 700,000 | 751,023 | ||||||
Honolulu City & County Board of Water Supply System Revenue, Refunding, | 320,000 | 332,602 | ||||||
| Principal Amount ($) | Value ($) | |||||||
MUNICIPAL BONDS — (Continued) |
| |||||||
Hawaii — (Continued) | ||||||||
Honolulu City & County Board of Water Supply System Revenue, Refunding, Series A, | 680,000 | 750,292 | ||||||
Honolulu City & County Board of Water Supply System Revenue, Refunding, Series A, | 515,000 | 583,098 | ||||||
Honolulu City & County Board of Water Supply System Revenue, Refunding, Series A, Callable 07/01/24 at 100, | 105,000 | 121,533 | ||||||
Honolulu City & County Board of Water Supply System Revenue, Refunding, Series A, Callable 07/01/24 at 100, | 210,000 | 242,594 | ||||||
Honolulu City & County GO, Honolulu Rail Transit Project, Series B, | 900,000 | 928,359 | ||||||
Honolulu City & County GO, Honolulu Rail Transit Project, Series B, | 500,000 | 554,480 | ||||||
Honolulu City & County GO, | 20,000 | 21,019 | ||||||
The accompanying notes are an integral part of the financial statements.
26
PACIFIC CAPITAL FUNDS
Pacific Capital Tax-Free Short Intermediate Securities Fund
Portfolio of Investments (Continued)
April 30, 2019
| Principal Amount ($) | Value ($) | |||||||
MUNICIPAL BONDS — (Continued) |
| |||||||
Hawaii — (Continued) | ||||||||
Honolulu City & County GO, Series B, | 500,000 | 504,985 | ||||||
Honolulu City & County GO, Series B, | 1,000,000 | 1,108,960 | ||||||
Honolulu City & County GO, Series D, ETM, | 115,000 | 116,316 | ||||||
Honolulu City & County GO, Variable Honolulu Rail Transit Project, SIFMA + 0.30%, Callable 05/23/19 at 100, | 500,000 | 499,915 | ||||||
Honolulu City & County Wastewater System Revenue, 1st Bond Resolution, Refunding, Senior Series A, | 1,000,000 | 1,039,380 | ||||||
Honolulu City & County Wastewater System Revenue, 1st Bond Resolution, Refunding, Senior Series A, | 1,015,000 | 1,087,532 | ||||||
Honolulu City & County Wastewater System Revenue, 1st Bond Resolution, Refunding, Senior Series B, | 545,000 | 572,403 | ||||||
| Principal Amount ($) | Value ($) | |||||||
MUNICIPAL BONDS — (Continued) |
| |||||||
Hawaii — (Continued) | ||||||||
Honolulu City & County Wastewater System Revenue, 1st Bond Resolution, Senior Series A, Prerefunded, Callable 07/01/22 at 100, | 500,000 | 552,235 | ||||||
Honolulu City & County Wastewater System Revenue, 1st Bond Resolution, Unrefunded, Callable 07/01/19 at 100, | 530,000 | 532,915 | ||||||
Honolulu City & County Wastewater System Revenue, Senior Series A, | 1,005,000 | 1,055,531 | ||||||
Honolulu City & County Wastewater System Revenue, Senior Series A, Prerefunded, Callable 07/01/21 at 100, | 35,000 | 37,721 | ||||||
Kauai Country GO, | 200,000 | 200,208 | ||||||
Kauai Country GO, | 305,000 | 310,322 | ||||||
Kauai County GO, | 35,000 | 35,294 | ||||||
Kauai County GO, | 150,000 | 150,892 | ||||||
The accompanying notes are an integral part of the financial statements.
27
PACIFIC CAPITAL FUNDS
Pacific Capital Tax-Free Short Intermediate Securities Fund
Portfolio of Investments (Continued)
April 30, 2019
| Principal Amount ($) | Value ($) | |||||||
MUNICIPAL BONDS — (Continued) |
| |||||||
Hawaii — (Continued) | ||||||||
Kauai County GO, Refunding, Series A, | 50,000 | 51,488 | ||||||
Kauai County GO, Refunding, Series A, | 345,000 | 351,020 | ||||||
Maui County GO, Refunding, | 185,000 | 185,505 | ||||||
Maui County GO, Refunding, | 1,225,000 | 1,310,811 | ||||||
Maui County GO, Refunding, | 20,000 | 21,565 | ||||||
Maui County GO, Refunding, | 1,000,000 | 1,140,710 | ||||||
University of Hawaii Revenue, Refunding, Series B, | 525,000 | 574,859 | ||||||
University of Hawaii Revenue, Refunding, Series B, | 500,000 | 557,245 | ||||||
University of Hawaii Revenue, Refunding, Series F, | 500,000 | 538,890 | ||||||
| 50,306,309 | ||||||||
| Principal Amount ($) | Value ($) | |||||||
MUNICIPAL BONDS — (Continued) |
| |||||||
New Mexico — 0.9% | ||||||||
Albuquerque Bernalillo County Water Utility Authority, Refunding, | 500,000 | 502,775 | ||||||
TOTAL MUNICIPAL BONDS | 51,772,795 | |||||||
REGISTERED INVESTMENT COMPANY — 2.1% |
| |||||||
Dreyfus Government Cash Management Fund, Institutional Shares, | 1,107,734 | 1,107,734 | ||||||
TOTAL REGISTERED INVESTMENT COMPANY | 1,107,734 | |||||||
TOTAL INVESTMENTS - 98.9% |
| 52,880,529 | ||||||
OTHER ASSETS IN EXCESS OF LIABILITIES - 1.1% | 598,944 | |||||||
|
| |||||||
NET ASSETS - 100.0% | $ 53,479,473 | |||||||
|
| |||||||
The accompanying notes are an integral part of the financial statements.
28
PACIFIC CAPITAL FUNDS
Pacific Capital Tax-Free Short Intermediate Securities Fund
Portfolio of Investments (Concluded)
April 30, 2019
| (a) | Variable rate investments. The rate shown is based on the latest available information as of April 30, 2019. Certain variable rate securities are not based on a published reference rate and spread but are determined by the issuer or agent and are based on current market conditions. |
| (b) | Rate periodically changes. Rate disclosed is the 7-day yield at April 30, 2019. |
Portfolio holdings are subject to change at any time.
AGM | Assured Guaranty Municipal Corp. | |
AMT | Alternative Minimum Tax | |
ETM | Escrowed To Maturity | |
FHLMC | Federal Home Loan Mortgage Corp. | |
FNMA | Federal National Mortgage Association | |
GNMA | Government National Mortgage Association | |
GO | General Obligation | |
MWC | Make Whole Callable | |
OID | Original Issue Discount | |
SIFMA | The Securities Industry and Financial Markets Association Municipal Swap Index |
The accompanying notes are an integral part of the financial statements.
29
PACIFIC CAPITAL FUNDS
Pacific Capital U.S. Government Money Market Fund
Portfolio Holdings Summary Table
April 30, 2019
(Unaudited)
The following table presents a summary by security type of the portfolio holdings of the Fund:
| % of Net Assets | Value | |||||||||
SECURITY TYPE: | ||||||||||
U.S. Government Agency Obligations | 52.8 | % | $ | 171,183,740 | ||||||
U.S. Treasury Obligations. | 52.4 | 169,754,740 | ||||||||
Registered Investment Company | 0.9 | 2,806,009 | ||||||||
Liabilities in Excess of Other Assets | (6.1 | ) | (19,852,017 | ) | ||||||
|
|
|
| |||||||
NET ASSETS | 100.0 | % | $ | 323,892,472 | ||||||
|
|
|
| |||||||
Portfolio holdings are subject to change at any time.
The accompanying notes are an integral part of the financial statements.
30
PACIFIC CAPITAL FUNDS
Pacific Capital U.S. Government Money Market Fund
Portfolio of Investments
April 30, 2019
| Principal Amount ($) | Value ($) | |||||||
U.S. GOVERNMENT AGENCY OBLIGATIONS — 52.8% |
| |||||||
Federal Farm Credit Banks — 1.8% |
| |||||||
2.37%(1-M LIBOR - 0.10%), 09/05/2019(a) | 6,000,000 | 5,999,979 | ||||||
|
| |||||||
Federal Home Loan Bank — 51.0% |
| |||||||
2.35%, 05/01/2019(b) | 59,398,000 | 59,398,000 | ||||||
2.38%, 05/03/2019(b) | 5,650,000 | 5,649,253 | ||||||
2.42%, 05/06/2019(b) | 10,000,000 | 9,996,660 | ||||||
2.41%, 05/09/2019(b) | 15,000,000 | 14,992,000 | ||||||
2.19%, 05/10/2019(c) | 20,000,000 | 19,987,975 | ||||||
2.42%, 05/13/2019(b) | 15,000,000 | 14,987,975 | ||||||
2.42%, 05/24/2019(b) | 30,000,000 | 29,953,808 | ||||||
2.38%, 05/29/2019(b) | 10,237,000 | 10,218,090 | ||||||
|
| |||||||
| 165,183,761 | ||||||||
|
| |||||||
TOTAL U.S. GOVERNMENT AGENCY OBLIGATIONS (Cost $171,183,740) | 171,183,740 | |||||||
|
| |||||||
U.S. TREASURY OBLIGATIONS — 52.4% |
| |||||||
U.S. Treasury Bills — 52.4% | ||||||||
1.20%, 05/02/2019(c) | 20,000,000 | 19,998,676 | ||||||
2.05%, 05/07/2019(c) | 20,000,000 | 19,992,108 | ||||||
2.11%, 05/09/2019(c) | 15,000,000 | 14,992,167 | ||||||
2.30%, 05/21/2019(c) | 30,000,000 | 29,960,167 | ||||||
2.33%, 05/23/2019(c) | 20,000,000 | 19,970,540 | ||||||
2.34%, 06/04/2019(c) | 30,000,000 | 29,932,652 | ||||||
2.34%, 06/06/2019(c) | 15,000,000 | 14,964,450 | ||||||
2.32%, 06/13/2019(c) | 20,000,000 | 19,943,980 | ||||||
|
| |||||||
| 169,754,740 | ||||||||
|
| |||||||
TOTAL U.S. TREASURY OBLIGATIONS | 169,754,740 | |||||||
|
| |||||||
| Shares | Value ($) | |||||||
REGISTERED INVESTMENT COMPANY — 0.9% |
| |||||||
Dreyfus Government Cash Management Fund, Institutional Shares, | 2,806,009 | 2,806,009 | ||||||
|
| |||||||
TOTAL REGISTERED INVESTMENT COMPANY (Cost $2,806,009) | 2,806,009 | |||||||
|
| |||||||
TOTAL INVESTMENTS - 106.1% |
| 343,744,489 | ||||||
LIABILITIES IN EXCESS OF OTHER ASSETS - (6.1)% | (19,852,017 | ) | ||||||
|
| |||||||
NET ASSETS - 100.0% |
$ |
323,892,472 |
| |||||
|
| |||||||
| (a) | Variable rate investments. The rate shown is based on the latest available information as of April 30, 2019. Certain variable rate securities are not based on a published reference rate and spread but are determined by the issuer or agent and are based on current market conditions. |
| (b) | Interest rate disclosed represents the discount rate at the time of purchase. |
| (c) | Rate disclosed represents the yield-to-maturity as of April 30, 2019. |
| (d) | Rate periodically changes. Rate disclosed is the 7-day yield at April 30, 2019. |
Portfolio holdings are subject to change at any time.
LIBOR | London Interbank Offered Rate | |
1-M | One Month |
The accompanying notes are an integral part of the financial statements.
31
PACIFIC CAPITAL FUNDS
Statements of Assets and Liabilities
April 30, 2019
| Pacific Capital Tax-Free Securities Fund | Pacific Capital Tax-Free Short Intermediate Securities Fund | Pacific Capital U.S. Government Money Market Fund | |||||||||||||
Assets | |||||||||||||||
Investments, at value* | $ | 279,291,315 | $ | 52,880,529 | $ | 343,744,489 | |||||||||
Cash | — | — | 149,406 | ||||||||||||
Receivable for capital shares sold | 69,376 | 18,289 | — | ||||||||||||
Receivable for investments sold | — | 586,287 | — | ||||||||||||
Interest receivable | 3,118,531 | 692,838 | 33,985 | ||||||||||||
Receivable from Investment Adviser | — | — | 9,462 | ||||||||||||
Deferred offering cost (Note 1) | — | — | 15,459 | ||||||||||||
Prepaid expenses and other assets | 17,195 | 59 | 7,358 | ||||||||||||
|
|
|
|
|
| ||||||||||
Total assets | 282,496,417 | 54,178,002 | 343,960,159 | ||||||||||||
|
|
|
|
|
| ||||||||||
Liabilities | |||||||||||||||
Payable for investments purchased | 115,013 | 536,782 | 19,987,975 | ||||||||||||
Payable for distributions to shareholders | 571,655 | 69,908 | — | ||||||||||||
Payable for capital shares redeemed | 82,500 | 13,958 | — | ||||||||||||
Payable for administration and accounting fees | 39,050 | 22,143 | 19,891 | ||||||||||||
Payable for audit fees | 28,395 | 28,395 | 18,500 | ||||||||||||
Payable for legal fees | 13,561 | 4,968 | 2,894 | ||||||||||||
Payable for custodian fees | 12,900 | 9,604 | 13,003 | ||||||||||||
Payable for printing fees | 12,213 | 6,192 | 6,800 | ||||||||||||
Payable for transfer agent fees | 5,876 | 5,783 | 5,251 | ||||||||||||
Accrued expenses | 272 | 796 | 13,373 | ||||||||||||
|
|
|
|
|
| ||||||||||
Total liabilities | 881,435 | 698,529 | 20,067,687 | ||||||||||||
|
|
|
|
|
| ||||||||||
Net Assets | $ | 281,614,982 | $ | 53,479,473 | $ | 323,892,472 | |||||||||
|
|
|
|
|
| ||||||||||
Net Assets consisted of: | |||||||||||||||
Capital stock, $0.01 par value | $ | 275,083 | $ | 53,002 | $ | 3,238,935 | |||||||||
Paid-in capital | 274,492,454 | 53,095,098 | 320,622,292 | ||||||||||||
Total distributable earnings | 6,847,445 | 331,373 | 31,245 | ||||||||||||
|
|
|
|
|
| ||||||||||
Net Assets | $ | 281,614,982 | $ | 53,479,473 | $ | 323,892,472 | |||||||||
|
|
|
|
|
| ||||||||||
Class Y: | |||||||||||||||
Net assets | $ | 281,614,982 | $ | 53,479,473 | $ | — | |||||||||
|
|
|
|
|
| ||||||||||
Shares outstanding | 27,508,316 | 5,300,234 | — | ||||||||||||
|
|
|
|
|
| ||||||||||
Net asset value, offering and redemption price per share | $ | 10.24 | $ | 10.09 | $ | — | |||||||||
|
|
|
|
|
| ||||||||||
Investor Class: | |||||||||||||||
Net assets | $ | — | $ | — | $ | 323,892,472 | |||||||||
|
|
|
|
|
| ||||||||||
Shares outstanding | — | — | 323,893,543 | ||||||||||||
|
|
|
|
|
| ||||||||||
Net asset value, offering and redemption price per share | $ | — | $ | — | $ | 1.00 | |||||||||
|
|
|
|
|
| ||||||||||
* Investments, at cost | $ | 270,738,376 | $ | 52,371,111 | $ | 343,744,489 | |||||||||
The accompanying notes are an integral part of the financial statements.
32
PACIFIC CAPITAL FUNDS
Statements of Operations
For the Year Ended April 30, 2019
| Pacific Capital Tax-Free Securities Fund | Pacific Capital Tax-Free Short Intermediate Securities Fund | Pacific Capital U.S. Government Money Market Fund* | |||||||||||||
Investment income | |||||||||||||||
Interest | $ | 7,351,751 | $ | 953,783 | $ | 6,359,767 | |||||||||
Dividends | 12,091 | 9,061 | 32,018 | ||||||||||||
|
|
|
|
|
| ||||||||||
Total investment income | 7,363,842 | 962,844 | 6,391,785 | ||||||||||||
|
|
|
|
|
| ||||||||||
Expenses | |||||||||||||||
Advisory fees (Note 2) | 564,374 | 100,710 | 1,160,354 | ||||||||||||
Administration and accounting fees | 85,356 | 58,491 | 70,656 | ||||||||||||
Trustees’ and officers’ fees (Note 2) | 65,708 | 21,043 | 52,485 | ||||||||||||
Legal fees | 46,784 | 7,695 | 31,729 | ||||||||||||
Custodian fees (Note 2) | 30,100 | 17,055 | 20,009 | ||||||||||||
Audit fees | 29,622 | 28,871 | 18,500 | ||||||||||||
Transfer agent fees (Note 2) | 25,970 | 23,351 | 21,760 | ||||||||||||
Printing and shareholder reporting fees | 12,174 | 8,743 | 15,966 | ||||||||||||
Registration and filing fees | 239 | 469 | 25,434 | ||||||||||||
Distribution fees (Investor Class) (Note 2) | — | — | 725,222 | ||||||||||||
Offering expenses | — | — | 32,322 | ||||||||||||
Other expenses | 16,042 | 7,086 | 58,955 | ||||||||||||
|
|
|
|
|
| ||||||||||
Total expenses before waivers and reimbursements | 876,369 | 273,514 | 2,233,392 | ||||||||||||
|
|
|
|
|
| ||||||||||
Less: waivers and reimbursements (Note 2) | (564,374 | ) | (100,710 | ) | (1,269,860 | ) | |||||||||
|
|
|
|
|
| ||||||||||
Net expenses after waivers and reimbursements | 311,995 | 172,804 | 963,532 | ||||||||||||
|
|
|
|
|
| ||||||||||
Net investment income | 7,051,847 | 790,040 | 5,428,253 | ||||||||||||
|
|
|
|
|
| ||||||||||
Net realized and unrealized gain/(loss) from investments | |||||||||||||||
Net realized gain/(loss) from investments | 20,043 | (106,437 | ) | (1,077 | ) | ||||||||||
Net change in unrealized appreciation/(depreciation) on investments | 7,540,470 | 849,209 | — | ||||||||||||
|
|
|
|
|
| ||||||||||
Net realized and unrealized gain/(loss) on investments | 7,560,513 | 742,772 | (1,077 | ) | |||||||||||
|
|
|
|
|
| ||||||||||
Net increase in net assets resulting from operations | $ | 14,612,360 | $ | 1,532,812 | $ | 5,427,176 | |||||||||
|
|
|
|
|
| ||||||||||
| * | The Pacific Capital U.S. Government Money Market Fund commenced operations on June 14, 2018. |
The accompanying notes are an integral part of the financial statements.
33
PACIFIC CAPITAL FUNDS
Pacific Capital Tax-Free Securities Fund
Statements of Changes in Net Assets
| Year Ended April 30, 2019 | Year Ended April 30, 2018 | |||||||||
Increase/(decrease) in net assets from operations: | ||||||||||
Net investment income | $ | 7,051,847 | $ | 7,434,038 | ||||||
Net realized gain from investments | 20,043 | 268,252 | ||||||||
Net change in unrealized appreciation/(depreciation) on investments | 7,540,470 | (5,575,319 | ) | |||||||
|
|
|
| |||||||
Net increase in net assets resulting from operations | 14,612,360 | 2,126,971 | ||||||||
|
|
|
| |||||||
Less dividends and distributions to shareholders from: | ||||||||||
Total distributable earnings* | (7,051,814 | ) | (7,434,041 | ) | ||||||
|
|
|
| |||||||
Decrease in net assets from dividends and distributions to shareholders | (7,051,814 | ) | (7,434,041 | ) | ||||||
|
|
|
| |||||||
Decrease in net assets derived from capital share transactions (Note 4) | (15,114,487 | ) | (20,256,905 | ) | ||||||
|
|
|
| |||||||
Total decrease in net assets | (7,553,941 | ) | (25,563,975 | ) | ||||||
|
|
|
| |||||||
Net assets | ||||||||||
Beginning of year | 289,168,923 | 314,732,898 | ||||||||
|
|
|
| |||||||
End of year** | $ | 281,614,982 | $ | 289,168,923 | ||||||
|
|
|
| |||||||
| * | Distributions from net investment income and from realized capital gains are no longer required to be separately disclosed. See Note 1. For the year ended April 30, 2018, distributions from net investment income and net realized capital gains were $7,434,041 and $0, respectively. |
| ** | Parenthetical disclosure of accumulated net investment income/(loss) is no longer required. See Note 1. For the year ended April 30, 2018, end of year net assets included accumulated net investment loss of $3. |
The accompanying notes are an integral part of the financial statements.
34
PACIFIC CAPITAL FUNDS
Pacific Capital Tax-Free Short Intermediate Securities Fund
Statements of Changes in Net Assets
| Year Ended April 30, 2019 | Year Ended April 30, 2018 | |||||||||
Increase/(decrease) in net assets from operations: | ||||||||||
Net investment income | $ | 790,040 | $ | 837,652 | ||||||
Net realized loss from investments | (106,437 | ) | (16,937 | ) | ||||||
Net change in unrealized appreciation/(depreciation) on investments | 849,209 | (1,040,931 | ) | |||||||
|
|
|
| |||||||
Net increase/(decrease) in net assets resulting from operations | 1,532,812 | (220,216 | ) | |||||||
|
|
|
| |||||||
Less dividends and distributions to shareholders from: | ||||||||||
Total distributable earnings* | (790,089 | ) | (857,428 | ) | ||||||
|
|
|
| |||||||
Decrease in net assets from dividends and distributions to shareholders | (790,089 | ) | (857,428 | ) | ||||||
|
|
|
| |||||||
Increase/(decrease) in net assets derived from capital share transactions (Note 4) | 374,072 | (14,634,599 | ) | |||||||
|
|
|
| |||||||
Total increase/(decrease) in net assets | 1,116,795 | (15,712,243 | ) | |||||||
|
|
|
| |||||||
Net assets | ||||||||||
Beginning of year | 52,362,678 | 68,074,921 | ||||||||
|
|
|
| |||||||
End of year** | $ | 53,479,473 | $ | 52,362,678 | ||||||
|
|
|
| |||||||
| * | Distributions from net investment income and from realized capital gains are no longer required to be separately disclosed. See Note 1. For the year ended April 30, 2018, distributions from net investment income and net realized capital gains were $837,602 and $19,826, respectively. |
| ** | Parenthetical disclosure of accumulated net investment income/(loss) is no longer required. See Note 1. For the year ended April 30, 2018, end of year net assets included accumulated net investment loss of $10,949. |
The accompanying notes are an integral part of the financial statements.
35
PACIFIC CAPITAL FUNDS
Pacific Capital U.S. Government Money Market Fund
Statement of Changes in Net Assets
| For the Period June 14, 2018* to April 30, 2019 | |||||
Increase in net assets from operations: | |||||
Net investment income | $ | 5,428,253 | |||
Net realized loss from investments | (1,077 | ) | |||
|
| ||||
Net increase in net assets resulting from operations | 5,427,176 | ||||
|
| ||||
Less dividends and distributions to shareholders from: | |||||
Total distributable earnings | (5,428,253 | ) | |||
|
| ||||
Decrease in net assets from dividends and distributions to shareholders | (5,428,253 | ) | |||
|
| ||||
Increase in net assets derived from capital share transactions (Note 4) | 323,893,549 | ||||
|
| ||||
Total increase in net assets | 323,892,472 | ||||
|
| ||||
Net assets | |||||
Beginning of period | — | ||||
|
| ||||
End of period | $ | 323,892,472 | |||
|
| ||||
| * | Commencement of operations. |
The accompanying notes are an integral part of the financial statements.
36
PACIFIC CAPITAL FUNDS
Pacific Capital Tax-Free Securities Fund
Financial Highlights
Contained below is per share operating performance data for Class Y shares outstanding, total investment return, ratios to average net assets and other supplemental data for the respective periods. The total returns in the table represent the rate that an investor would have earned or lost on an investment in the Fund (assuming reinvestment of all dividends and distributions). This information has been derived from information provided in the financial statements and should be read in conjunction with the financial statements and the notes thereto.
Class Y shares | For the Year Ended April 30, 2019 | For the Year Ended April 30, 2018 | For the Year Ended April 30, 2017 | For the Year Ended April 30, 2016 | For the Year Ended April 30, 2015 | |||||||||||||||
Per Share Operating Performance | ||||||||||||||||||||
Net asset value, beginning of year | $ | 9.97 | $ | 10.15 | $ | 10.41 | $ | 10.24 | $ | 10.18 | ||||||||||
|
|
|
|
|
|
|
|
|
| |||||||||||
Net investment income | 0.25 | 0.25 | 0.25 | 0.30 | 0.33 | |||||||||||||||
Net realized and unrealized gain/(loss) from investments | 0.27 | (0.18 | ) | (0.26 | ) | 0.17 | 0.06 | |||||||||||||
|
|
|
|
|
|
|
|
|
| |||||||||||
Net increase/(decrease) in net assets resulting from operations | 0.52 | 0.07 | (0.01 | ) | 0.47 | 0.39 | ||||||||||||||
|
|
|
|
|
|
|
|
|
| |||||||||||
Dividends and distributions to shareholders from: | ||||||||||||||||||||
Net investment income | (0.25 | ) | (0.25 | ) | (0.25 | ) | (0.30 | ) | (0.33 | ) | ||||||||||
|
|
|
|
|
|
|
|
|
| |||||||||||
Net asset value, end of year | $ | 10.24 | $ | 9.97 | $ | 10.15 | $ | 10.41 | $ | 10.24 | ||||||||||
|
|
|
|
|
|
|
|
|
| |||||||||||
Total investment return(1) | 5.30 | % | 0.63 | % | (0.10 | )% | 4.63 | % | 3.87 | % | ||||||||||
Ratios/Supplemental Data | ||||||||||||||||||||
Net assets, end of year (in thousands) | $281,615 | $289,169 | $314,733 | $300,517 | $211,289 | |||||||||||||||
Ratio of expenses to average net assets | 0.11 | % | 0.10 | % | 0.10 | % | 0.10 | % | 0.12 | % | ||||||||||
Ratio of expenses to average net assets without waivers(2) | 0.31 | % | 0.30 | % | 0.30 | % | 0.30 | % | 0.32 | % | ||||||||||
Ratio of net investment income to average net assets | 2.50 | % | 2.41 | % | 2.42 | % | 2.87 | % | 3.21 | % | ||||||||||
Portfolio turnover rate | 11.25 | % | 21.68 | % | 15.26 | % | 17.57 | % | 16.60 | % | ||||||||||
| (1) | Total investment return is calculated assuming a purchase of shares on the first day and a sale of shares on the last day of each period reported and includes reinvestment of dividends and distributions, if any. |
| (2) | During the period, certain fees were waived. If such fee waivers had not occurred, the ratios would have been as indicated (See Note 2). |
The accompanying notes are an integral part of the financial statements.
37
PACIFIC CAPITAL FUNDS
Pacific Capital Tax-Free Short Intermediate Securities Fund
Financial Highlights
Contained below is per share operating performance data for Class Y shares outstanding, total investment return, ratios to average net assets and other supplemental data for the respective periods. The total returns in the table represent the rate that an investor would have earned or lost on an investment in the Fund (assuming reinvestment of all dividends and distributions). This information has been derived from information provided in the financial statements and should be read in conjunction with the financial statements and the notes thereto.
Class Y shares | For the Year Ended April 30, 2019 | For the Year Ended April 30, 2018 | For the Year Ended April 30, 2017 | For the Year Ended April 30, 2016 | For the Year Ended April 30, 2015 | |||||||||||||||
Per Share Operating Performance | ||||||||||||||||||||
Net asset value, beginning of year | $ | 9.95 | $ | 10.14 | $ | 10.27 | $ | 10.19 | $ | 10.17 | ||||||||||
|
|
|
|
|
|
|
|
|
| |||||||||||
Net investment income | 0.16 | 0.14 | 0.13 | 0.12 | 0.10 | |||||||||||||||
Net realized and unrealized gain/(loss) from investments | 0.14 | (0.19 | ) | (0.10 | ) | 0.08 | 0.02 | |||||||||||||
|
|
|
|
|
|
|
|
|
| |||||||||||
Net increase/(decrease) in net assets resulting from operations | 0.30 | (0.05 | ) | 0.03 | 0.20 | 0.12 | ||||||||||||||
|
|
|
|
|
|
|
|
|
| |||||||||||
Dividends and distributions to shareholders from: | ||||||||||||||||||||
Net investment income | (0.16 | ) | (0.14 | ) | (0.13 | ) | (0.12 | ) | (0.10 | ) | ||||||||||
Net realized gains | — | (0.00 | )(1) | (0.03 | ) | — | — | |||||||||||||
|
|
|
|
|
|
|
|
|
| |||||||||||
Total dividends and distributions and shareholders | (0.16 | ) | (0.14 | ) | (0.16 | ) | (0.12 | ) | (0.10 | ) | ||||||||||
|
|
|
|
|
|
|
|
|
| |||||||||||
Net asset value, end of year | $ | 10.09 | $ | 9.95 | $ | 10.14 | $ | 10.27 | $ | 10.19 | ||||||||||
|
|
|
|
|
|
|
|
|
| |||||||||||
Total investment return(2) | 3.01 | % | (0.49 | )% | 0.24 | % | 1.93 | % | 1.23 | % | ||||||||||
Ratios/Supplemental Data | ||||||||||||||||||||
Net assets, end of year (in thousands) | $53,479 | $52,363 | $68,075 | $90,438 | $132,494 | |||||||||||||||
Ratio of expenses to average net assets | 0.34 | % | 0.25 | % | 0.25 | % | 0.15 | % | 0.13 | % | ||||||||||
Ratio of expenses to average net assets without waivers(3) | 0.54 | % | 0.45 | % | 0.45 | % | 0.35 | % | 0.33 | % | ||||||||||
Ratio of net investment income to average net assets | 1.57 | % | 1.36 | % | 1.24 | % | 1.12 | % | 1.02 | % | ||||||||||
Portfolio turnover rate | 33.73 | % | 27.24 | % | 18.90 | % | 18.87 | % | 24.07 | % | ||||||||||
| (1) | Amount is less than $0.005 per share. |
| (2) | Total investment return is calculated assuming a purchase of shares on the first day and a sale of shares on the last day of each period reported and includes reinvestment of dividends and distributions, if any. |
| (3) | During the period, certain fees were waived. If such fee waivers had not occurred, the ratios would have been as indicated (See Note 2). |
The accompanying notes are an integral part of the financial statements.
38
PACIFIC CAPITAL FUNDS
Pacific Capital U.S. Government Money Market Fund
Financial Highlights
Contained below is per share operating performance data for Investor Class shares outstanding, total investment return, ratios to average net assets and other supplemental data for the respective periods. The total returns in the table represent the rate that an investor would have earned or lost on an investment in the Fund (assuming reinvestment of all dividends and distributions). This information has been derived from information provided in the financial statements and should be read in conjunction with the financial statements and the notes thereto.
Investor Class shares |
For the Period June 14, 2018* | ||||
Per Share Operating Performance | |||||
Net asset value, beginning of period | $ | 1.00 | |||
|
| ||||
Net investment income | 0.0162 | ||||
Net realized loss from investments | (0.0000 | )(1) | |||
|
| ||||
Net increase in net assets resulting from operations | 0.0162 | ||||
|
| ||||
Dividends and distributions to shareholders from: | |||||
Net investment income | (0.0162 | ) | |||
|
| ||||
Net asset value, end of period | $ | 1.00 | |||
|
| ||||
Total investment return(2) | 1.64 | % | |||
Ratios/Supplemental Data | |||||
Net assets, end of period (in thousands) | $ | 323,892 | |||
Ratio of expenses to average net assets | 0.33 | %(3) | |||
Ratio of expenses to average net assets without waivers(4) | 0.77 | %(3) | |||
Ratio of net investment income to average net assets | 1.88 | %(3) | |||
| * | Commencement of operations. |
| (1) | Amount is less than $0.00005 per share. |
| (2) | Total investment return is calculated assuming a purchase of shares on the first day and a sale of shares on the last day of each period reported and includes reinvestment of dividends and distributions, if any. Total return for period less than one year is not annualized. |
| (3) | Annualized. |
| (4) | During the period, certain fees were waived and/or reimbursed. If such fee waivers and/or reimbursements had not occurred, the ratios would have been as indicated (See Note 2). |
The accompanying notes are an integral part of the financial statements.
39
PACIFIC CAPITAL FUNDS
Notes to Financial Statements
April 30, 2019
1. Organization and Significant Accounting Policies
The Pacific CapitalTax-Free Securities Fund, the Pacific CapitalTax-Free Short Intermediate Securities Fund and the Pacific Capital U.S. Government Money Market Fund (each a “Fund” and together the “Funds”) areopen-end management investment companies registered under the Investment Company Act of 1940, as amended (the “1940 Act”). The Pacific CapitalTax-Free Securities Fund and the Pacific CapitalTax-Free Short Intermediate Securities Fund arenon-diversified. The Pacific Capital U.S. Government Money Market Fund is diversified. The Funds are each a separate series of FundVantage Trust (the “Trust”) which was organized as a Delaware statutory trust on August 28, 2006. The Trust is a “series trust” authorized to issue an unlimited number of separate series or classes of shares of beneficial interest. Each series is treated as a separate entity for certain matters under the 1940 Act, and for other purposes, and a shareholder of one series is not deemed to be a shareholder of any other series. The Pacific CapitalTax-Free Securities Fund and the Pacific CapitalTax-Free Short Intermediate Securities Fund are each authorized to issue and offer Class Y shares. The Pacific Capital U.S. Government Money Market Fund commenced investment operations on June 14, 2018, and is authorized to issue and offer Investor Class shares.
The Funds are investment companies and follow accounting and reporting guidance in the Financial Accounting Standards BoardAccounting Standards CodificationTopic 946.
Portfolio Valuation— Each Fund’s net asset value (“NAV”) is calculated once daily at the close of regular trading hours on the New York Stock Exchange (“NYSE”) (typically 4:00 p.m. Eastern time) on each day the NYSE is open. Fixed income securities having a remaining maturity of greater than 60 days are valued using an independent pricing service. Fixed income securities having a remaining maturity of 60 days or less are generally valued at amortized cost, provided such amount approximates fair value. Debt securities are valued on the basis of broker quotations or valuations provided by a pricing service, which utilizes information with respect to recent sales, market transactions in comparable securities, quotations from dealers, and various relationships between securities in determining value. Valuations developed through pricing techniques may materially vary from the actual amounts realized upon sale of the securities. Investments in otheropen-end investment companies are valued based on the NAV of such investment companies (which may use fair value pricing as discussed in their prospectuses). If market quotations are unavailable or deemed unreliable, securities will be valued in accordance with procedures adopted by the Trust’s Board of Trustees (“Board of Trustees”). Relying on prices supplied by pricing services or dealers or using fair valuation may result in values that are higher or lower than the values used by other investment companies and investors to price the same investments. In the event that market quotes are not readily available, and the security or asset cannot be valued pursuant to one of the valuation methods, the value of the security or asset will be determined in good faith by the Adviser. The Trust has established a Valuation Committee which performs certain functions including the oversight of the Adviser’s fair valuation determinations.
40
PACIFIC CAPITAL FUNDS
Notes to Financial Statements (Continued)
April 30, 2019
The Pacific Capital U.S. Government Money Market Fund operates as a “government money market fund” and accordingly: (1) invests at least 99.5% of its total assets in: (i) cash; (ii) securities or instruments issued or guaranteed as to principal and interest by the United States or certain U.S. Government agencies or instrumentalities; and/or (iii) repurchase agreements that are collateralized fully by U.S. Government obligations or cash; (2) uses amortized cost, which approximates fair value, to value its portfolio securities and seeks to transact at a stable $1.00 NAV per Participation Certificate; and (3) has elected not to provide for the imposition of liquidity fees and redemption gates at this time as permitted under the amended rules.
Fair Value Measurements— The inputs and valuation techniques used to measure fair value of the Funds’ investments are summarized into three levels as described in the hierarchy below:
· Level 1 — | quoted prices in active markets for identical securities; | |
· Level 2 — | other significant observable inputs (including quoted prices for similar securities, interest rates, prepayment speeds, credit risk, etc.); and | |
· Level 3 — | significant unobservable inputs (including a Fund’s own assumptions in determining the fair value of investments). | |
The fair value of a Fund’s bonds are generally based on quotes received from brokers or independent pricing services. Bonds with quotes that are based on actual trades with a sufficient level of activity on or near the measurement date are classified as Level 2 assets.
Securities held within the Pacific Capital U.S. Government Money Market Fund are generally valued at amortized cost, which approximates fair value, in accordance with Rule2a-7 under the 1940 Act. Generally, amortized cost approximates the current fair value of a security, but since the value is not obtained from a quoted price in an active market, such securities are reflected as Level 2.
The inputs or methodology used for valuing securities are not necessarily an indication of the risk associated with investing in those securities.
41
PACIFIC CAPITAL FUNDS
Notes to Financial Statements (Continued)
April 30, 2019
The following is a summary of the inputs used, as of April 30, 2019, in valuing the Funds’ investments carried at fair value:
Funds | Total Value at 04/30/19 | Level 1 Quoted Price | Level 2 Other Significant Observable Inputs | Level 3 Significant Unobservable Inputs | ||||||||||||
Pacific CapitalTax-Free | ||||||||||||||||
Municipal Bonds | $ | 276,634,623 | $ | — | $ | 276,634,623 | $ | — | ||||||||
Registered Investment Company | 2,656,692 | 2,656,692 | — | — | ||||||||||||
|
|
|
|
|
|
|
| |||||||||
Total | $ | 279,291,315 | $ | 2,656,692 | $ | 276,634,623 | $ | — | ||||||||
|
|
|
|
|
|
|
| |||||||||
Pacific CapitalTax-Free Short | ||||||||||||||||
Municipal Bonds | $ | 51,772,795 | $ | — | $ | 51,772,795 | $ | — | ||||||||
Registered Investment Company | 1,107,734 | 1,107,734 | — | — | ||||||||||||
|
|
|
|
|
|
|
| |||||||||
Total | $ | 52,880,529 | $ | 1,107,734 | $ | 51,772,795 | $ | — | ||||||||
|
|
|
|
|
|
|
| |||||||||
Pacific Capital U.S. Government | ||||||||||||||||
U.S. Government Agency Obligations | $ | 171,183,740 | $ | — | $ | 171,183,740 | $ | — | ||||||||
U.S. Treasury Obligations | 169,754,740 | — | 169,754,740 | — | ||||||||||||
Registered Investment Company | 2,806,009 | 2,806,009 | — | — | ||||||||||||
|
|
|
|
|
|
|
| |||||||||
Total | $ | 343,744,489 | $ | 2,806,009 | $ | 340,938,480 | $ | — | ||||||||
|
|
|
|
|
|
|
| |||||||||
At the end of each quarter, management evaluates the classification of Levels 1, 2 and 3 assets and liabilities. Various factors are considered, such as changes in liquidity from the prior reporting period; whether or not a broker is willing to execute at the quoted price; the depth and consistency of prices from third party pricing services; and the existence of contemporaneous, observable trades in the market. Additionally, management evaluates the classification of Level 1 and Level 2 assets and liabilities on a quarterly basis for changes in listings or delistings on national exchanges.
Due to the inherent uncertainty of determining the fair value of investments that do not have a readily available market value, the fair value of a Fund’s investments may fluctuate from period to period. Additionally, the fair value of investments may differ significantly from the values that would have been used had a ready market existed for such investments and may differ materially from the values a Fund may ultimately
42
PACIFIC CAPITAL FUNDS
Notes to Financial Statements (Continued)
April 30, 2019
realize. Further, such investments may be subject to legal and other restrictions on resale or otherwise less liquid than publicly traded securities.
For fair valuations using significant unobservable inputs, U.S. generally accepted accounting principles (“U.S. GAAP”) require the Funds to present a reconciliation of the beginning to ending balances for reported market values that present changes attributable to total realized and unrealized gains or losses, purchase and sales, and transfers in and out of Level 3 during the period. A reconciliation of Level 3 investments is presented only when the Funds have an amount of Level 3 investments at the end of the reporting period that was meaningful in relation to its net assets. The amounts and reasons for all transfers in and out of each Level within the three-tier hierarchy are disclosed when the Funds have an amount of total transfers during the reporting period that was meaningful in relation to its net assets as of the end of the reporting period.
For the year ended April 30, 2019, there were no transfers between Levels.
Use of Estimates— The preparation of financial statements in conformity with U.S. GAAP requires management to make estimates and assumptions that affect the amounts reported in the financial statements and accompanying notes at the date of the financial statements and the reported amounts of revenues and expenses during the period. Actual results could differ from those estimates and those differences could be material.
Investment Transactions, Investment Income and Expenses— Investment transactions are recorded on trade date for financial statement preparation purposes. Realized gains and losses on investments sold are recorded on the identified cost basis. Interest income is recorded on the accrual basis. Accretion of discounts and amortization of premiums are recorded on a daily basis using the effective yield method except for short term securities, which records discounts and premiums on a straight-line basis. Dividends are recorded on theex-dividend date. Distribution(12b-1) fees and shareholder services fees relating to a specific class are charged directly to that class. General expenses of the Trust are generally allocated to each fund in proportion to its relative daily net assets. Expenses directly attributable to a particular fund in the Trust are charged directly to that fund.
Deferred Offering Costs —For the Pacific Capital U.S. Government Money Market Fund, offering costs, including costs of printing initial prospectus and legal fees, are amortized over twelve-months from inception of the Fund. As of April 30, 2019, the remaining amount still to be amortized for the Pacific Capital U.S. Government Money Market Fund was $15,459.
Dividends and Distributions to Shareholders— Dividends from net investment income for each Fund are declared daily and paid monthly to shareholders. Distributions, if any, of net short-term capital gain and net capital gain (the excess of net long-term capital gain over the short-term capital loss) realized by a Fund, after deducting any available capital loss carryovers are declared and paid to its shareholders
43
PACIFIC CAPITAL FUNDS
Notes to Financial Statements (Continued)
April 30, 2019
annually. Income dividends and capital gain distributions are determined in accordance with U.S. federal income tax regulations, which may differ from U.S. GAAP.
U.S. Tax Status— No provision is made for U.S. income taxes as it is each Fund’s intention to continue to qualify for and elect the tax treatment applicable to regulated investment companies under Subchapter M of the Internal Revenue Code of 1986, as amended (“Internal Revenue Code”), and make the requisite distributions to such Fund’s shareholders, which will be sufficient to relieve it from U.S. income and excise taxes.
Other— In the normal course of business, a Fund may enter into contracts that provide general indemnifications. A Fund’s maximum exposure under these arrangements is dependent on claims that may be made against it in the future, and, therefore, cannot be estimated; however, based on experience, the risk of material loss for such claims is considered remote.
Recent Accounting Pronouncements— On March 30, 2017, the FASB issued ASU2017-08, Premium Amortization on Purchased Callable Debt Securities, that will require the premium associated with the purchase of callable debt securities be amortized to the earliest call date and no longer amortized through the contractual life of the instrument. The changes are effective for fiscal years, and interim periods within those fiscal years, beginning after December 15, 2018. At this time, management is evaluating the implications of this ASU and its impact on the financial statements.
Effective November 5, 2018, the SEC amended existing rules intended to modernize reporting and disclosure of information. These amendments relate to Regulation S-X which sets forth the form and content of financial statements. The amendment requires collapsing the components of distributable earnings on the Statements of Assets and Liabilities and collapsing the distributions paid to shareholders on the Statements of Changes in Net Assets. Management has evaluated the implications of adopting these amendments and determined there is no significant impact on the financial statements and accompanying notes.
2. Transactions with Related Parties and Other Service Providers
Investment advisory services are provided to the Funds by the Asset Management Group of Bank of Hawaii (the “Adviser”). Under terms of an advisory agreement, the Pacific CapitalTax-Free Securities Fund and the Pacific CapitalTax-Free Short Intermediate Securities Fund are charged an annual fee of 0.20% which is computed daily and paid monthly based upon average daily net assets. The Adviser has contractually agreed to waive its advisory fee (the “Waiver”). The Waiver will remain in effect until August 31, 2019. The Waiver may not be terminated at any time prior to that date without the consent of the Board of Trustees of FundVantage Trust (the “Trust”). While the Adviser is currently waiving its entire investment advisory fee, investors who invest in a Fund through a bank trust account may be subject to
44
PACIFIC CAPITAL FUNDS
Notes to Financial Statements (Continued)
April 30, 2019
account level fees applicable to such amount charged by affiliates of the Adviser, including Bank of Hawaii’s Trust Services Group.
Fee rates for the year ended April 30, 2019, were as follows:
| Maximum Annual Advisory Fee | Net Annual Fees Paid After Contractual Waivers | |||
Pacific CapitalTax-Free Securities Fund | 0.20% | 0.00% | ||
Pacific CapitalTax-Free Short Intermediate Securities Fund | 0.20% | 0.00% |
For the Pacific Capital U.S. Government Money Market Fund, under terms of an advisory agreement, the Fund is charged an annual fee of 0.40% which is computed daily and paid monthly based upon average daily net assets. The Adviser has voluntarily agreed to reduce its advisory fee and/or reimburse certain expenses of the Fund (the “MMF Waiver”). The MMF Waiver may be discontinued at any time at the discretion of the Adviser. For the period June 14, 2018, commencement of operations, through April 30, 2019, the Adviser earned advisory fees of $1,160,354 and waived fees of $959,634 and reimbursed fees and expenses of $310,226.
Other Service Providers
The Bank of New York Mellon (“BNY Mellon”) serves as administrator and custodian for the Funds. For providing administrative and accounting services, BNY Mellon is entitled to receive a monthly fee equal to an annual percentage rate of the Funds’ average daily net assets and is subject to certain minimum monthly fees. For providing certain custodial services, BNY Mellon is entitled to receive a monthly fee, subject to certain minimum, and out of pocket expenses.
BNY Mellon Investment Servicing (US) Inc. (the “Transfer Agent”) provides transfer agent services to the Funds. The Transfer Agent is entitled to receive a monthly fee, subject to certain minimum, and out of pocket expenses.
Foreside Funds Distributors LLC (the “Underwriter”) provides principal underwriting services to the Funds pursuant to an underwriting agreement between the Trust and the Underwriter.
The Trust and the Underwriter are parties to an underwriting agreement. The Trust has adopted a distribution plan for Investor Class shares of the Pacific Capital U.S. Government Money Market Fund in accordance with Rule12b-1 under the 1940 Act. Pursuant to the distribution plan, the Fund compensates the Underwriter for direct and indirect costs and expenses incurred in connection with advertising, marketing and other distribution services in an amount not to exceed 0.25% on an annualized basis of the average daily net assets of the Fund’s Investor Class shares.
45
PACIFIC CAPITAL FUNDS
Notes to Financial Statements (Continued)
April 30, 2019
Trustees and Officers
The Trust is governed by its Board of Trustees. The Trustees receive compensation in the form of an annual retainer and per meeting fees for their services to the Trust. The remuneration paid to the Trustees by the Funds during the year ended April 30, 2019 was $19,197 for the Pacific CapitalTax-Free Securities Fund, $3,345 for the Pacific CapitalTax-Free Short Intermediate Securities Fund and $18,723 for the Pacific Capital U.S. Government Money Market Fund, respectively. An employee of BNY Mellon serves as the Secretary of the Trust and is not compensated by the Funds or the Trust.
JW Fund Management LLC (“JWFM”) provides a Principal Executive Officer and Principal Financial Officer, respectively, to the Trust. Duff & Phelps, LLC (“D&P”) provides the Trust with a Chief Compliance Officer and an Anti-Money Laundering Officer. JWFM and D&P are compensated for their services provided to the Trust.
3. Investment in Securities
For the year ended April 30, 2019, aggregate purchases and sales of investment securities (excluding short-term investments) of the Funds were as follows:
| Purchases | Sales | |||||||
Pacific CapitalTax-Free Securities Fund | $ | 31,340,287 | $ | 43,493,834 | ||||
Pacific CapitalTax-Free Short Intermediate Securities Fund | 18,024,783 | 16,335,256 | ||||||
The Funds are permitted to purchase or sell securities from or to certain other affiliated funds under specified conditions outlined in the procedures adopted by the Board of Trustees of the Funds. The procedures have been designed to provide assurances that any purchase or sale of securities by the Funds from or to another fund that is or could be considered an affiliate by virtue of having a common investment adviser (or affiliated investment adviser), common Trustees and/or common officers complies with Rule17a-7 under the 1940 act. Further, as defined under the procedures, each transaction is effective at the current market price.
For the year ended April 30, 2019, the Pacific CapitalTax-Free Securities Fund and the Pacific CapitalTax-Free Short Intermediate Securities Fund engaged in security transactions with affiliated funds under Rule17a-7. The Pacific CapitalTax-Free Securities Fund engaged in security sales with proceeds of $2,072,570 and net realized loss of $6,432. The Pacific CapitalTax-Free Securities Fund also engaged in security purchases of $617,045 under Rule17a-7. The Pacific CapitalTax-Free Short Intermediate Securities Fund engaged in security sales with proceeds of $617,045 and net realized loss of $10,948. The Pacific CapitalTax-Free Short Intermediate Securities Fund also engaged in security purchases of $2,608,630 under Rule17a-7.
46
PACIFIC CAPITAL FUNDS
Notes to Financial Statements (Continued)
April 30, 2019
4. Capital Share Transactions
For the year or period ended April 30, 2019 and for the year ended April 30, 2018, transactions in capital shares (authorized shares unlimited) were as follows:
| For the Year Ended April 30, 2019 | For the Year Ended April 30, 2018 | |||||||||||||||
| Shares | Amount | Shares | Amount | |||||||||||||
Pacific CapitalTax-Free | ||||||||||||||||
Class Y | ||||||||||||||||
Sales | 2,640,506 | $ | 26,536,650 | 3,227,335 | $ | 32,842,304 | ||||||||||
Reinvestments | 4,609 | 46,316 | 5,360 | 54,507 | ||||||||||||
Redemptions | (4,154,968 | ) | (41,697,453 | ) | (5,228,533 | ) | (53,153,716 | ) | ||||||||
|
|
|
|
|
|
|
| |||||||||
Net decrease | (1,509,853 | ) | $ | (15,114,487 | ) | (1,995,838 | ) | $ | (20,256,905 | ) | ||||||
|
|
|
|
|
|
|
| |||||||||
| For the Year Ended April 30, 2019 | For the Year Ended April 30, 2018 | |||||||||||||||
| Shares | Amount | Shares | Amount | |||||||||||||
Pacific CapitalTax-Free | ||||||||||||||||
Class Y | ||||||||||||||||
Sales | 1,102,203 | $ | 11,045,479 | 582,838 | $ | 5,893,782 | ||||||||||
Reinvestments | 478 | 4,783 | 503 | 5,074 | ||||||||||||
Redemptions | (1,067,544 | ) | (10,676,190 | ) | (2,034,837 | ) | (20,533,455 | ) | ||||||||
|
|
|
|
|
|
|
| |||||||||
Net increase/(decrease) | 35,137 | $ | 374,072 | (1,451,496 | ) | $ | (14,634,599 | ) | ||||||||
|
|
|
|
|
|
|
| |||||||||
| For the Period June 14, 2018* to April 30, 2019 | ||||||||
| Shares | Amount | |||||||
Pacific Capital U.S. Government | ||||||||
Investor Class | ||||||||
Sales | 2,343,451,670 | $ | 2,343,451,670 | |||||
Reinvestments | 5,426,754 | 5,426,760 | ||||||
Redemptions | (2,024,984,881 | ) | (2,024,984,881 | ) | ||||
|
|
|
| |||||
Net increase | 323,893,543 | $ | 323,893,549 | |||||
|
|
|
| |||||
| * | Commencement of operations. |
47
PACIFIC CAPITAL FUNDS
Notes to Financial Statements (Continued)
April 30, 2019
5. Federal Tax Information
The Funds have followed the authoritative guidance on accounting for and disclosure of uncertainty in tax positions, which requires the Funds to determine whether a tax position is more likely than not to be sustained upon examination, including resolution of any related appeals or litigation processes, based on the technical merits of the position. The Funds have determined that there was no effect on the financial statements from following this authoritative guidance. In the normal course of business, the Funds are subject to examination by federal, state, and local jurisdictions, where applicable, for tax years for which applicable statutes of limitations have not expired.
Distributions are determined in accordance with federal income tax regulations, which may differ in amount or character from net investment income and realized gains for financial reporting purposes. Accordingly, the character of distributions and composition of net assets for tax purposes may differ from those reflected in the accompanying financial statements. To the extent these differences are permanent, such amounts are reclassified within the components of net assets based on the tax treatment; temporary differences do not require reclassifications. Net assets were not affected by these adjustments. The following permanent difference as of April 30, 2019, primarily attributed to the disallowance of stock offering costs, was reclassified among the following accounts:
| Increase/(Decrease) Total Distributable Earnings | Increase/(Decrease) Additional Paid-In Capital | |||||||||
Pacific CapitalTax-Free Securities Fund | $ | — | $ | — | ||||||
Pacific CapitalTax-Free Short Intermediate Securities Fund | — | — | ||||||||
Pacific Capital U.S. Government Money Market Fund | 32,322 | (32,322) | ||||||||
The tax character of distributions paid during the year ended April 30, 2019, were as follows:
| Net Investment Income | Total Taxable Distributions | Tax Exempt Distributions | Total Distributions Paid* | |||||||||||||
Pacific CapitalTax-Free Securities Fund | $ | 53,432 | $ | 53,432 | $ | 6,525,946 | $ | 6,579,378 | ||||||||
Pacific CapitalTax-Free Short Intermediate Securities Fund | 34,167 | 34,167 | 696,962 | 731,129 | ||||||||||||
Pacific Capital U.S. Government Money Market Fund | 5,428,253 | 5,428,253 | — | 5,428,253 | ||||||||||||
| * | Distributions will not tie to Statement of Changes because distributions are recognized when actually paid for tax purposes. |
48
PACIFIC CAPITAL FUNDS
Notes to Financial Statements (Continued)
April 30, 2019
The tax character of distributions paid during the year ended April 30, 2018, were as follows:
| Net Investment Income | Net Long-Term Capital Gains | Total Taxable Distributions | Tax Exempt Distributions | Total Distributions Paid* | ||||||||||||||||
Pacific CapitalTax-Free Securities Fund | $ | 46,649 | $ | — | $ | 46,649 | $ | 7,389,604 | $ | 7,436,253 | ||||||||||
Pacific CapitalTax-Free Short Intermediate Securities Fund | 15,764 | 8,778 | 24,542 | 840,856 | 865,398 | |||||||||||||||
| * | Distributions will not tie to Statement of Changes because distributions are recognized when actually paid for tax purposes. |
Distributions from net investment income and short-term capital gains are treated as ordinary income for federal income tax purposes.
As of April 30, 2019, the components of accumulated earnings/(deficit) on a tax basis were as follows:
| Undistributed Tax-Exempt Income | Undistributed Ordinary Income | Qualified Late-Year Losses | Distributions Payable | Capital Loss Carryforwards | Unrealized Appreciation/ (Depreciation) | |||||||||||||||||||
Pacific CapitalTax-Free Securities Fund | $ | 571,685 | $ | — | $ | — | $ | (571,655 | ) | $ | (1,705,524 | ) | $ | 8,552,939 | ||||||||||
Pacific CapitalTax-Free Short Intermediate Securities Fund | 58,911 | — | — | (69,908 | ) | (167,048 | ) | 509,418 | ||||||||||||||||
Pacific Capital U.S. Government Money Market Fund | — | 32,322 | (1,077 | ) | — | — | — | |||||||||||||||||
The differences between the book and tax basis components of distributable earnings relate primarily to the timing and recognition of income and gains for federal income tax purposes. Short-term capital gain is reported as ordinary income for federal income tax purposes.
49
PACIFIC CAPITAL FUNDS
Notes to Financial Statements (Continued)
April 30, 2019
The cost for federal income tax purposes, gross unrealized appreciation, gross unrealized depreciation and net unrealized appreciation as of April 30, 2019 is as follows:
| Tax Cost of Securities | Unrealized Appreciation | Unrealized Depreciation | Net Unrealized Appreciation/ (Depreciation) | |||||||||||||
Pacific CapitalTax-Free Securities Fund | $ | 270,738,376 | $ | 8,869,106 | $ | (316,167 | ) | $8,552,939 | ||||||||
Pacific CapitalTax-Free Short Intermediate Securities Fund | 52,371,111 | 547,581 | (38,163 | ) | 509,418 | |||||||||||
Pacific Capital U.S. Government Money Market Fund | 343,744,489 | — | — | — | ||||||||||||
Pursuant to federal income tax rules applicable to regulated investment companies, the Funds may elect to treat certain capital losses between November 1 and April 30 and late year ordinary losses ((i) ordinary losses between January 1 and April 30, and (ii) specified ordinary and currency losses between November 1 and April 30) as occurring on the first day of the following tax year. For the year ended April 30, 2019, any amount of losses elected within the tax return will not be recognized for federal income tax purposes until May 1, 2019. For the year ended April 30, 2019, the Funds did not have late year ordinary loss deferrals and they deferred to May 1, 2019 the following losses:
| Short-Term Capital Loss Deferral | Long-Term Capital Loss Deferral | |||||
Pacific CapitalTax-Free Securities Fund | $ — | $— | ||||
Pacific CapitalTax-Free Short Intermediate Securities Fund | — | — | ||||
Pacific Capital U.S. Government Money Market Fund | 1,077 | — |
Accumulated capital losses represent net capital loss carryforwards as of April 30, 2019 that may be available to offset future realized capital gains and thereby reduce future capital gains distributions. As of April 30, 2019, the Funds’ capital loss carryforward, which were comprised of both short-term losses and long-term losses, and had an unlimited period of capital loss carryover were as follows:
| Capital Loss Carryforward | ||||||||
| Short-Term | Long-Term | |||||||
Pacific CapitalTax-Free Securities Fund | $ | 1,141,616 | $ | 563,908 | ||||
Pacific CapitalTax-Free Short Intermediate Securities Fund | 42,664 | 124,384 | ||||||
Pacific Capital U.S. Government Money Market Fund | — | — | ||||||
50
PACIFIC CAPITAL FUNDS
Notes to Financial Statements (Continued)
April 30, 2019
During the year ended April 30, 2019, the Pacific CapitalTax-Free Securities Fund utilized $20,043 of prior year capital loss carryforwards.
6. Concentration of Credit Risk
The Pacific CapitalTax-Free Securities Fund and the Pacific CapitalTax-Free Short Intermediate Securities Fund primarily invest in debt obligations issued by the state of Hawaii and its political subdivisions, agencies, and public authorities to obtain funds for various public purposes. The Funds are more susceptible to factors adversely affecting issues of Hawaii municipal securities than is a municipal bond fund that is not concentrated in these issuers to the same extent.
7. Debt Investment Risk
Debt investments are affected primarily by the financial condition of the companies or other entities that have issued them and by changes in interest rates. There is a risk that an issuer of a Fund’s debt investments may not be able to meet its financial obligations (e.g., may not be able to make principal and/or interest payments when they are due or otherwise default on other financial terms) and/or go bankrupt. Securities such as high-yield/high-risk bonds, e.g., bonds with low credit ratings by Moody’s (Ba or lower) or Standard & Poor’s (BB and lower) or if unrated are of comparable quality as determined by the manager, are especially subject to credit risk during periods of economic uncertainty or during economic downturns and are more likely to default on their interest and/or principal payments than higher rated securities. Debt investments may be affected by changes in interest rates. Debt investments with longer durations tend to be more sensitive to changes in interest rates, making them more volatile than debt investments with shorter durations or floating or adjustable interest rates. The value of debt investments may fall when interest rates rise.
8. U.S. Government Obligations Risk
Obligations of U.S. Government agencies, authorities, instrumentalities and sponsored enterprises have historically involved little risk of loss of principal if held to maturity. However, not all U.S. Government securities are backed by the full faith and credit of the United States. Obligations of certain agencies, authorities, instrumentalities and sponsored enterprises of the U.S. Government are backed by the full faith and credit of the United States (e.g., the Government National Mortgage Association); other obligations are backed by the right of the issuer to borrow from the U.S. Treasury (e.g., the Federal Home Loan Banks) and others are supported by the discretionary authority of the U.S. Government to purchase an agency’s obligations. Still others are backed only by the credit of the agency, authority, instrumentality or sponsored enterprise issuing the obligation. No assurance can be given that the U.S. Government would provide financial support to any of these entities if it is not obligated to do so by law.
51
PACIFIC CAPITAL FUNDS
Notes to Financial Statements (Continued)
April 30, 2019
9. Subsequent Events
Management has evaluated the impact of all subsequent events on the Funds through the date that the financial statements were issued, and has determined that there are no material subsequent events requiring recognition or disclosure in the financial statements.
52
PACIFIC CAPITAL FUNDS
Report of Independent Registered Public Accounting Firm
To the Board of Trustees of FundVantage Trust and Shareholders of each of the three funds listed in the table below
Opinions on the Financial Statements
We have audited the accompanying statements of assets and liabilities, including the portfolios of investments, of each of the funds listed in the table below (three of the funds constituting FundVantage Trust, hereafter collectively referred to as the “Funds”) as of April 30, 2019, the related statements of operations and the statements of changes in net assets for each of the periods indicated in the table below, including the related notes, and the financial highlights for each of the periods indicated therein (collectively referred to as the “financial statements”). In our opinion, the financial statements present fairly, in all material respects, the financial position of each of the Funds as of April 30, 2019, the results of each of their operations and the changes in each of their net assets for the periods indicated in the table below, and each of the financial highlights for each of the periods indicated therein, in conformity with accounting principles generally accepted in the United States of America.
| Pacific CapitalTax-Free Securities Fund and Pacific CapitalTax-Free Short Intermediate Securities Fund | Statement of operations for the year ended April 30, 2019 and the statements of changes in net assets for each of the two years in the period ended April 30, 2019
| |
Pacific Capital U.S. Government Money Market Fund | Statements of operations and changes in net assets for the period June 14, 2018 (commencement of operations) through April 30, 2019
| |
Basis for Opinions
These financial statements are the responsibility of the Funds’ management. Our responsibility is to express an opinion on the Funds’ financial statements based on our audits. We are a public accounting firm registered with the Public Company Accounting Oversight Board (United States) (PCAOB) and are required to be independent with respect to the Funds in accordance with the U.S. federal securities laws and the applicable rules and regulations of the Securities and Exchange Commission and the PCAOB.
We conducted our audits of these financial statements in accordance with the standards of the PCAOB. Those standards require that we plan and perform the audit to obtain reasonable assurance about whether the financial statements are free of material misstatement, whether due to error or fraud.
Our audits included performing procedures to assess the risks of material misstatement of the financial statements, whether due to error or fraud, and performing procedures that respond to those risks. Such procedures included examining, on a test basis, evidence regarding the amounts and disclosures in the financial statements. Our audits also included evaluating the accounting principles used and significant estimates made by management, as well as evaluating the overall presentation of the financial statements. Our procedures included confirmation of securities owned as of April 30, 2019 by correspondence with the custodian and brokers; when replies were not received from brokers, we performed other auditing procedures. We believe that our audits provide a reasonable basis for our opinions.
/s/ PricewaterhouseCoopers LLP
Philadelphia, Pennsylvania
June 24, 2019
We have served as the auditor of one or more Asset Management Group of the Bank of Hawaii investment companies since 2010.
53
PACIFIC CAPITAL FUNDS
Shareholder Tax Information
(Unaudited)
The Funds are required by Subchapter M of the Internal Revenue Code, to advise their shareholders of the U.S. federal tax status of distributions received by the Funds’ shareholders in respect of such fiscal year.
The tax character of distributions paid during the year ended April 30, 2019 were as follows:
| Net Investment Income | Total Taxable Distributions | Tax Exempt Distributions | Total Distributions Paid* | |||||||||||||
Pacific CapitalTax-Free Securities Fund | $ | 53,432 | $ | 53,432 | $ | 6,525,946 | $ | 6,579,378 | ||||||||
Pacific CapitalTax-Free Short Intermediate Securities Fund | 34,167 | 34,167 | 696,962 | 731,129 | ||||||||||||
Pacific Capital U.S. Government Money Market Fund | 5,428,253 | 5,428,253 | — | 5,428,253 | ||||||||||||
| * | Distributions will not tie to Statement of Changes because distributions are recognized when actually paid for tax purposes. |
Dividends from net investment income and short-term capital gains are treated as ordinary income dividends for federal income tax purposes.
The percentage of qualified interest income related dividends not subject to withholding tax fornon-resident aliens and foreign corporations for the Pacific CapitalTax-Free Securities Fund, the Pacific CapitalTax-Free Short Intermediate Securities Fund and the Pacific Capital U.S. Government Money Market Fund is 100%, 100% and 100%, respectively.
All designations are based on financial information available as of the date of this annual report and, accordingly, are subject to change. For each item, it is the intention of each Fund to designate the maximum amount permitted under the Internal Revenue Code of 1986, as amended, and the regulations thereunder.
The percentage of the ordinary income distribution paid by the Pacific Capital U.S. Government Money Market Fund during 2019 which was derived from direct obligations of the United States was 92.89%. Such income is exempt from state and local tax in all states. However, many states, including New York and California, allow a tax exemption for a portion of the income earned only if a mutual fund has invested at least 50% of its assets at the end of each quarter of the Fund’s fiscal year in U.S. Government securities. The Fund did not meet this strict requirement in 2019. Due to the diversity in state and local tax law, it is recommended that you consult your personal tax adviser as to the applicability of the information provided to your specific situation.
54
PACIFIC CAPITAL FUNDS
Shareholder Tax Information
(Unaudited)
Because the Funds’ fiscal year is not the calendar year, another notification will be sent with respect to calendar year 2019. The second notification, which will reflect the amount, if any, to be used by calendar year taxpayers on their U.S. federal income tax returns, will be made in conjunction with Form1099-DIV and will be mailed in January 2020.
Foreign shareholders will generally be subject to U.S. withholding tax on the amount of their ordinary income dividends. They will generally not be entitled to a foreign tax credit or deduction for the withholding taxes paid by the Funds, if any.
In general, dividends received bytax-exempt recipients (e.g., IRAs and Keoghs) need not be reported as taxable income for U.S. federal income tax purposes. However, some retirement trusts (e.g., corporate, Keogh and 403(b)(7) plans) may need this information for their annual information reporting.
Shareholders are advised to consult their own tax advisers with respect to the tax consequences of their investment in the Funds.
55
PACIFIC CAPITAL FUNDS
Other Information
(Unaudited)
Proxy Voting
Policies and procedures that the Funds use to determine how to vote proxies relating to portfolio securities as well as information regarding how the Funds voted proxies relating to portfolio securities for the most recent12-month period ended June 30 are available without charge, upon request, by calling (888)678-6034 and on the Securities and Exchange Commission’s (“SEC”) website athttp://www.sec.gov.
Quarterly Portfolio Schedules
The Trust files its complete schedule of portfolio holdings with the SEC for the first and third fiscal quarters of each fiscal year on FormN-Q. The Trust’s FormsN-Q are available on the SEC’s website athttp://www.sec.gov. FormN-Q is being rescinded. Once FormN-Q is rescinded, disclosure of the Funds’ complete holdings will be required to be made monthly on FormN-PORT, with every third month made available to the public by the Commission upon filing.
Board Consideration for Continuation of Investment Advisory Agreement
At anin-person meeting held on March12-13, 2019 (the “Meeting”), the Board of Trustees (the “Board” or “Trustees”) of FundVantage Trust (“Trust”), including a majority of the Trustees who are not “interested persons” as defined in the Investment Company Act of 1940, as amended (“1940 Act”) (the “Independent Trustees”), unanimously approved the continuation of the advisory agreement (the “AMG of BOH Agreement”) between Asset Management Group of Bank of Hawaii (“AMG of BOH” or the “Adviser”) and the Trust on behalf of the Pacific CapitalTax-Free Securities Fund (“Pacific Capital TF Fund”), Pacific CapitalTax-Free Short Intermediate Securities Fund (“Pacific Capital TFSI Fund”) and Pacific Capital U.S. Government Money Market Fund (“Pacific Capital MMF”) (together the “Pacific Capital Funds”).
In determining whether to approve the AMG of BOH Agreement, the Trustees considered information provided by the Adviser in accordance with Section 15(c) of the 1940 Act regarding: (i) services performed for the Pacific Capital Funds, (ii) the size and qualifications of their portfolio management staff, (iii) any potential or actual material conflicts of interest which may arise in connection with a portfolio manager’s management of the Fund, (iv) investment performance, (v) the capitalization and financial condition of AMG of BOH, (vi) brokerage selection procedures (including soft dollar arrangements, if any), (vii) the procedures for allocating investment opportunities between the Pacific Capital Funds and other clients, (viii) results of any regulatory examination, including any recommendations or deficiencies noted, (ix) any litigation, investigation or administrative proceeding which may have a material impact on AMG of BOH’s ability to service the Pacific Capital Funds, and (x) compliance with the Pacific Capital Funds’ investment objectives, policies and practices (including codes of ethics and proxy voting policies), federal securities laws and other regulatory requirements. The Trustees noted the reports provided at Board
56
PACIFIC CAPITAL FUNDS
Other Information
(Unaudited)
meetings throughout the year covering matters such as the relative performance of the Pacific Capital Funds; compliance with the investment objectives, policies, strategies and limitations for the Pacific Capital Funds; the compliance of management personnel with the applicable code of ethics; and the adherence to fair value pricing procedures as established by the Board.
The Trustees considered the investment performance for the Pacific Capital Funds and AMG of BOH. The Trustees reviewed the historical performance charts for the one year, two year, three year, five year and ten year periods ended December 31, 2018, for the Pacific Capital TF Fund and Pacific Capital TFSI Fund. The Trustees noted that the Pacific Capital TF Fund outperformed the Lipper Other States Intermediate Municipal Funds Index for the year to date, one year, three year, five year and ten year periods ended December 31, 2018. The Trustees also noted that the Pacific Capital TFSI Fund performed in line with the median of its Lipper peer group for the one year period ended December 31, 2018 and underperformed the median of its Lipper peer group for the two year, three year, five year and ten year periods ended December 31, 2018. The Trustees also reviewed the performance information for the Pacific Capital MMF, as provided by AMG of BOH for the period from inception through December 31, 2018. The Trustees noted that the Pacific Capital MMF was new, and therefore did not have sufficient historical performance by which to assess the Fund.
The Trustees noted that they also received information regarding AMG of BOH’s advisory fees and an analysis of these fees in relation to the delivery of services to the Pacific Capital Funds and any other ancillary benefit resulting from AMG of BOH’s relationship with the Pacific Capital Funds. The Trustees considered the fees that AMG of BOH charges to other clients, and evaluated the explanations provided by AMG of BOH as to differences in such fees. The Trustees also reviewed a peer comparison of advisory fees and total expenses for the Pacific Capital Funds versus other similarly managed funds. The Trustees concluded that the advisory fee and services provided by AMG of BOH are consistent with those of other advisers which manage mutual funds with investment objectives, strategies and policies similar to those of the Pacific Capital Funds based on the information provided at the Meeting.
The Board considered, among other data, the specific factors and related conclusions set forth below with respect to the Pacific Capital Funds:
Pacific CapitalTax-Free Securities Fund.With respect to advisory fees and expenses, the grossadvisory fee and net total expense ratio for the Fund were each lower than the median of the gross advisory fee and net total expense ratio of funds with a similar share class in the Lipper peer group with $500 million or less in assets. The Trustees also considered that the Adviser was currently voluntarily waiving its entire advisory fee with respect to the Fund.
Pacific CapitalTax-Free Short Intermediate Securities Fund.With respect to advisory fees and expenses,the gross advisory fee and net total expense ratio for the Fund were each lower than the median of the gross advisory fee and net total expense ratio of funds with a similar share class in the Lipper peer group
57
PACIFIC CAPITAL FUNDS
Other Information
(Unaudited)
With $250 million or less in assets. The Trustees also considered that the Adviser was currently voluntarily waiving its entire advisory fee with respect to the Fund.
Pacific Capital U.S. Government Money Market Fund.The Board then considered the level and depthof knowledge of AMG of BOH, including the professional experience and qualifications of senior personnel. With respect to advisory fees and expenses, the gross advisory fee and net total expense ratio for the Fund were each higher than the median of the gross advisory fee and net total expense ratio of funds with a similar share class in the Lipper peer group with $500 million or less in assets.
The Board then considered the level and depth of knowledge of AMG of BOH, including the professional experience and qualifications of senior personnel. In evaluating the quality of services to be provided by AMG of BOH, the Board took into account its familiarity with AMG of BOH’s senior management through Board meetings, discussions and reports during the preceding year. The Board also took into account AMG of BOH’s compliance policies and procedures and reports regarding AMG of BOH’s compliance operations from the Trust’s CCO. The Board also considered any potential conflicts of interest that may arise in a portfolio manager’s management of the Pacific Capital Funds’ investments on the one hand, and the investments of other accounts, on the other. The Trustees reviewed the services provided to the Pacific Capital Funds by AMG of BOH and concluded that the nature, extent and quality of the services were appropriate and consistent with the terms of the AMG of BOH Agreement, that the quality of the proposed services appeared to be consistent with industry norms and that the Pacific Capital Funds are likely to benefit from the continued provision of those services. They also concluded that AMG of BOH has sufficient personnel, with the appropriate education and experience, to serve the Pacific Capital Funds effectively and had demonstrated its ability to attract and retain qualified personnel.
The Trustees then considered the costs of the services provided by AMG of BOH, the compensation and benefits received by AMG of BOH in providing services to the Pacific Capital Funds, as well as AMG of BOH’s profitability. The Trustees were provided with a profitability analysis for the Pacific Capital Funds and the most recent financial statements for Bank of Hawaii Corporation, the parent company of AMG of BOH for the year ended December 31, 2018. The Trustees noted that AMG of BOH’s level of profitability is an important factor to consider, and the Trustees should be satisfied that AMG of BOH’s profits are sufficient to continue as a healthy concern generally and as investment adviser of the Pacific Capital Funds specifically. The Trustees concluded that AMG of BOH’s contractual advisory fee level was reasonable in relation to the nature and quality of the services provided, taking into account the fees charged by other advisers for managing comparable mutual funds with similar strategies. The Trustees also concluded that the overall expense ratio of the fund was reasonable, taking into account the quality of services provided by AMG of BOH and the current size and projected growth of the Funds during the renewal term.
The Trustees considered the extent to which economies of scale would be realized relative to fee levels as the Pacific Capital Funds grow, and whether the advisory fee levels reflect these economies
58
PACIFIC CAPITAL FUNDS
Other Information
(Unaudited)
of scale for the benefit of shareholders. The Board noted that economies of scale may be achieved at higher asset levels for each of the Pacific Capital Funds for the benefit of the Pacific Capital Funds’ shareholders, but that because such economies of scale did not yet exist and were not likely to exist in the near term, it was not appropriate to incorporate a mechanism for sharing the benefit of such economies with the Pacific Capital Funds’ shareholders in the advisory fee structure at this time. However, the Trustees noted that AMG of BOH was currently waiving its entire advisory fee with respect to the Pacific Capital TF Fund and Pacific Capital TFSI Fund.
In voting to approve the continuation of the AMG of BOH Agreement for an additionalone-year period, the Board considered all factors it deemed relevant and the information presented to the Board by AMG of BOH. In arriving at its decision, the Board did not identify any single factor as being of paramount importance and each member of the Board gave varying weights to each factor according to his or her own judgment. The Board determined that the continuation of the AMG of BOH Agreement would be in the best interests of each of the Pacific Capital Funds and their shareholders.
59
PACIFIC CAPITAL FUNDS
Privacy Notice
(Unaudited)
The privacy of your personal financial information is extremely important to us. When you open an account with us, we collect a significant amount of information from you in order to properly invest and administer your account. We take very seriously the obligation to keep that information private and confidential, and we want you to know how we protect that important information.
We collect nonpublic personal information about you from applications or other forms you complete and from your transactions with us or our affiliates. We do not disclose information about you, or our former clients, to our affiliates or to service providers or other third parties, except as permitted by law. We share only the information required to properly administer your accounts, which enables us to send transaction confirmations, monthly or quarterly statements, financials and tax forms. Even within FundVantage Trust and its affiliated entities, a limited number of people who actually service accounts will have access to your personal financial information. Further, we do not share information about our current or former clients with any outside marketing groups or sales entities.
To ensure the highest degree of security and confidentiality, FundVantage Trust and its affiliates maintain various physical, electronic and procedural safeguards to protect your personal information. We also apply special measures for authentication of information you request or submit to us on our web site.
If you have questions or comments about our privacy practices, please call us at (888)678-6034.
60
PACIFIC CAPITAL FUNDS
Fund Management
(Unaudited)
FundVantage Trust (the “Trust”) is governed by a Board of Trustees (the “Trustees”). The primary responsibility of the Trustees is to represent the interest of the Trust’s shareholders and to provide oversight management of the Trust.
The following tables present certain information regarding the Trustees and officers of the Trust. None of the Trustees are an “interested person” of the Trust, the Adviser, another investment adviser of a series of the Trust, or Foreside Funds Distributors LLC, the principal underwriter of the Trust (“Underwriter”), within the meaning of the 1940 Act and each Trustee is referred to as an “Independent Trustee” and is listed under such heading below. Employees of certain service providers to the Trust serve as officers of the Trust; such persons are not compensated by the Funds. The address of each Trustee and officer as it relates to the Trust’s business is 301 Bellevue Parkway, 2nd Floor, Wilmington, DE 19809.
The Statement of Additional Information for the Fund contains additional information about the Trustees and is available, without charge, upon request by calling (888)678-6034.
Name and Date of Birth
| Position(s) Held with Trust
| Term of Office and Length of Time Served
| Principal Occupation(s) During Past Five Years
| Number of Funds in Trust Complex Overseen by Trustee | Other Directorships Held by Trustee
| |||||
INDEPENDENT TRUSTEES | ||||||||||
ROBERT J. CHRISTIAN Date of Birth: 2/49 | Trustee and Chairman of the Board | Shall serve until death, resignation or removal. Trustee and Chairman since 2007. | Retired since February 2006; Executive Vice President of Wilmington Trust Company from February 1996 to February 2006; President of Rodney Square Management Corporation (“RSMC”) (investment advisory firm) from 1996 to 2005; Vice President of RSMC from 2005 to 2006. | 44 | Optimum Fund Trust (registered investment company with 6 portfolios). | |||||
IQBAL MANSUR Date of Birth: 6/55 | Trustee | Shall serve until death, resignation or removal. Trustee since 2007. | University Professor, Widener University. | 44 | None. | |||||
61
PACIFIC CAPITAL FUNDS
Fund Management (Continued)
(Unaudited)
Name and Date of Birth
| Position(s) Held with Trust
| Term of Office and Length of Time Served
| Principal Occupation(s) During Past Five Years
| Number of Funds in Trust Complex Overseen by Trustee | Other Directorships Held by Trustee
| |||||
NICHOLAS M. MARSINI, JR. Date of Birth: 8/55 | Trustee | Shall serve until death, resignation or removal. Trustee since 2016. | Retired since March 2016. President of PNC Bank Delaware from June 2011 to March 2016; Executive Vice President of Finance of BNY Mellon from July 2010 to January 2011; Executive Vice President and Chief Financial Officer of PNC Global Investment Servicing from September 1997 to July 2010. | 44 | Brinker Capital Destinations Trust (registered investment company with 10 portfolios). | |||||
NANCY B. WOLCOTT Date of Birth: 11/54 | Trustee | Shall serve until death, resignation or removal. Trustee since 2011. | Retired since May 2014; EVP, Head of GFI Client Service Delivery, BNY Mellon from January 2012 to May 2014; EVP, Head of US Funds Services, BNY Mellon from July 2010 to January 2012; President of PNC Global Investment Servicing from 2008 to July 2010; Chief Operating Officer of PNC Global Investment Servicing from 2007 to 2008; Executive Vice President of PFPC Worldwide Inc. from 2006 to 2007. | 44 | Lincoln Variable Insurance Products Trust (registered investment company with 92 portfolios). | |||||
STEPHEN M. WYNNE Date of Birth: 1/55 | Trustee | Shall serve until death, resignation or removal. Trustee since 2009. | Retired since December 2010; Chief Executive Officer of US Funds Services, BNY Mellon Asset Servicing from July 2010 to December 2010; Chief Executive Officer of PNC Global Investment Servicing from March 2008 to July 2010; President, PNC Global Investment Servicing from 2003 to 2008. | 44 | Copeland Trust (registered investment company with 2 portfolios). | |||||
62
PACIFIC CAPITAL FUNDS
Fund Management (Continued)
(Unaudited)
Name and Date of Birth
| Position(s) Held with Trust
| Term of Office and Length of Time Served | Principal Occupation(s) During Past Five Years
| |||
EXECUTIVE OFFICERS | ||||||
JOEL L. WEISS Date of Birth: 1/63 | President and Chief Executive Officer | Shall serve until death, resignation or removal. Officer since 2007. | President of JW Fund Management LLC since June 2016; Vice President and Managing Director of BNY Mellon Investment Servicing (US) Inc. and predecessor firms from 1993 to June 2016. | |||
T. RICHARD KEYES Date of Birth: 1/57 | Treasurer and Chief Financial Officer | Shall serve until death, resignation or removal. Officer since 2016. | President of TRK Fund Consulting LLC since July 2016; Head of Tax — U.S. Fund Services of BNY Mellon Investment Servicing (US) Inc. and predecessor firms from February 2006 to July 2016. | |||
GABRIELLA MERCINCAVAGE Date of Birth: 6/68 | Assistant Treasurer | Shall serve until death, resignation or removal. Officer since 2019. | Fund Administration Consultant since January 2019; Fund Accounting and Tax Compliance Accountant to financial services companies from November 2003 to July 2018. | |||
VINCENZO A. SCARDUZIO Date of Birth: 4/72 | Secretary | Shall serve until death, resignation or removal. Officer since 2012. | Director and Vice President Regulatory Administration of The Bank of New York Mellon and predecessor firms since 2001. | |||
DAVID C. LEBISKY Date of Birth: 5/72 | Chief Compliance Officer and Anti-Money Laundering Officer | Shall serve until death, resignation or removal. Officer since 2015. | President of Lebisky Compliance Consulting LLC since October 2015; Consultant, Duff & Phelps, LLC since 2016; Senior Consultant, Freeh Group International Solutions, LLC (a global risk management firm) from 2015 to 2018; Scotia Institutional Investments US, LP, Director of Regulatory Administration from 2010 to 2014. | |||
63
Investment Adviser
Asset Management Group of Bank of Hawaii
130 Merchant Street, Suite 370
Honolulu, HI 96813
Administrator
The Bank of New York Mellon
301 Bellevue Parkway
Wilmington, DE 19809
Transfer Agent
BNY Mellon Investment Servicing (US) Inc.
4400 Computer Drive
Westborough, MA 01581
Principal Underwriter
Foreside Funds Distributors LLC
400 Berwyn Park
899 Cassatt Road
Berwyn, PA 19312
Custodian
The Bank of New York Mellon
240 Greenwich Street
New York, NY 10286
Independent Registered Public Accounting Firm
PricewaterhouseCoopers LLP
Two Commerce Square, Suite 1800
2001 Market Street
Philadelphia, PA 19103-7042
Legal Counsel
Pepper Hamilton LLP
3000 Two Logan Square
18th and Arch Streets
Philadelphia, PA 19103
PAC-0419

of
FundVantage Trust
Pacific CapitalTax-Free
Securities Fund
Pacific CapitalTax-Free
Short Intermediate Securities Fund
Pacific Capital U.S. Government
Money Market Fund
ANNUAL REPORT
April 30, 2019
IMPORTANT NOTE: Beginning on January 1, 2021, paper copies of the Pacific Capital Fund’s annual and semi-annual shareholder reports will no longer be sent by mail, unless you specifically request paper copies of the shareholder reports from the Pacific Capital Funds or from your financial intermediary. Instead, annual and semi-annual shareholder reports will be available on the Pacific Capital Funds’ websites (www.boh.com/wealth-management/solutions/mutual-funds-investment-products.asp andwww.boh.com/personal/non-banking-products/mutual-funds-investment-products.asp), and you will be notified by mail each time a report is posted and provided with a website link to access the report.
You may elect to receive all future annual and semi-annual shareholder reports in paper, free of charge. To elect to receive paper copies of shareholder reports through the mail or otherwise change your delivery method, contact your financial intermediary or, if you hold your shares directly through the Pacific Capital Funds, call the Pacific Capital Funds toll-free at (888)678-6034 or write to the Pacific Capital Funds at:
Pacific Capital Funds
FundVantage Trust
c/o BNY Mellon Investment Servicing
P.O. Box 9829
Providence, RI 02940-8029
Your election to receive shareholder reports in paper will apply to all Pacific Capital Funds that you hold through the financial intermediary, or directly with the Pacific Capital Funds.
This report is submitted for the general information of the shareholders of the Pacific Capital Funds. It is not authorized for distribution unless preceded or accompanied by a current prospectus for the Pacific Capital Funds.
POLEN CAPITAL MANAGEMENT
Annual Investment Adviser’s Report
April 30, 2019
(Unaudited)
Dear Shareholders,
At Polen Capital, our “why” was shaped by our investing philosophy — find what we believe to be financially attractive, competitively advantaged companies that we can own for many years aiming to preserve and grow assets over time. We know that you have placed your financial security in our hands. We take this responsibility extremely seriously and it is the basis of our mission, our “why,” to strive for and deliver attractive results. We feel, very deeply, that fulfilling this responsibility requires an investment approach that emphasizes the preservation of capital first and the growth of that capital second. The conviction we have in our approach extends to the capabilities we’ve developed in small company investing and across U.S. and international geographies. We are proud to say that our entire strategy suite has added value for clients for the fiscal year period, and we look forward to serving your needs across the high-conviction growth equity investing landscape.
Looking Back
Volatility took the limelight in 2018. Sentiment ebbed and flowed between optimism and pessimism as investors digested better corporate earnings growth and benefits from the U.S. tax cuts, alongside concerns about trade wars and their impact on a slowing global economy as well as the potential for less accommodative monetary policy.
Geopolitical risk dominated headlines throughout the period, exacerbating concerns about slowing growth around the world. The Trump administration proposed and began to implement tariffs on goods entering the U.S., and other countries responded with retaliations or potential retaliations. China has experienced significant pressure from the increased political rhetoric and the tariffs placed on over $200 billion worth of goods. While we do not take a view on the merits of the policy actions behind the tariffs, we do recognize that this trade tension could last for some time.
U.S. markets diverged from the rest of the world by the third quarter 2018, ushering in the widest valuation gap between U.S. stocks and international stocks in several years. On top of trade sanctions, rising U.S. interest rates and a stronger U.S. dollar introduced challenges for emerging markets. Progress, or lack thereof, on Brexit talks between the EU and the UK and ongoing sovereign debt concerns further fueled investor uncertainty in international markets. Meanwhile, tightening monetary policy in the U.S. added to investor consternation throughout the year.
By the fourth quarter of 2018, every asset class, geography, and market cap landed in negative territory. But, by the first quarter 2019, investor sentiment and markets did an about-face. The concerns prevalent in the fourth quarter of 2018 around slowing growth in China, tepid to slowing growth in Europe, and the view that growth would decelerate in the U.S. seemed to give way to revived optimism spurred by a sudden shift in U.S. Federal Reserve policy direction that halted tightening and the expectation of a U.S.-China trade deal.
POLEN CAPITAL MANAGEMENT
Annual Investment Adviser’s Report
April 30, 2019
(Unaudited)
It is interesting how quickly perceptions change. The contrast between the fourth quarter 2018 and first quarter 2019 provides yet another example of why we focus on fundamentals and investing only in what we believe are the best businesses, rather than engaging in speculation or macroeconomic forecasting. Periods like these reinforce our conviction in our investment approach and also showcase the outperformance all our funds produced versus their counterpart indices for the fiscal-year and since-fund-inception periods.
Going Forward
Markets are off to a strong start in 2019, but we would not be surprised if volatility remains an undercurrent through 2019 as similar risks from 2018 still loom. Most importantly, we feel good about the strength of the businesses we own across all of our portfolios. We continue to believe that concentrating in only the highest quality growth companies will be an advantage for us and our clients long term. We feel it is virtually impossible to accurately predict geopolitical or macroeconomic outcomes. To that end, we remain focused on finding great companies that we believe can perform well regardless of those outcomes, and staying true to our long-term discipline and investment process rooted in rigorous research. Thank you for investing with Polen Capital Management and placing your trust in us.
Sincerely, | ||||||
| The Large Company Growth Team | The Small Company Growth Team | |||||
| Polen Growth Fund: | Polen U.S. Small Company Growth Fund: | |||||
|
|
|
| |||
Dan Davidowitz | Brandon Ladoff | Tucker Walsh | Rayna Lesser Hannaway | |||
| ||||||
Damon Ficklin | ||||||
| Polen Global Growth Fund: | Polen International Small Company Growth Fund: | |||||
|
|
| ||||
Damon Ficklin | Jeff Mueller | Rob Forker | ||||
| Polen International Growth Fund: | ||||||
|
| |||||
Todd Morris | Daniel Fields | |||||


2
POLEN GROWTH FUND
Annual Investment Adviser’s Report
April 30, 2019
(Unaudited)
Performance Summary:
| ● | U.S. markets reached new highs in 2018, erased the year’s market gains by the fourth quarter, and abruptly rebounded in the first quarter 2019. |
| ● | For the fiscal year ended April 30, 2019, the Polen Growth Fund’s (the “Fund”) institutional share class returned 26.44% net of fees versus the Russell 1000® Growth Index and S&P 500® Index which returned 17.43% and 13.49%, respectively. |
| ● | Since inception September 15, 2010 to April 30, 2019, the Fund’s institutional share class has had an average annual total return of 16.43% net of fees versus 16.11% and 14.20% for the Russell 1000® Growth Index and the S&P 500® Index respectively. |
The performance data quoted represents past performance and is not a guarantee of future results. Investment return and principal value of an investment will fluctuate so that an investor’s shares, when redeemed, may be worth more or less than their original cost. Current performance may be lower or higher than the performance information quoted. To obtain performance information current to the most recentmonth-end, please call1-888678-6024.
Performance Review:
For the fiscal year ended April 30, 2019, shares of the Fund’s institutional class returned 26.44% net of fees versus the Russell 1000® Growth Index and S&P 500® Index which returned 17.43% and 13.49% respectively. During the period, the top absolute contributors to the Fund’s performance wereMicrosoft, Adobe, andO’Reilly Automotive.
Microsoft has continued to execute very well with a focus on the long term. The company has benefited from a transition to the cloud in both its server businesses, i.e., Windows Server and Sequel Server, with Azure and with the shift of its Office franchise from a license-based to a subscription-based business. Both models have shown better economics, steadier and more recurring revenue streams and greater customer captivity. The Office franchise, the server businesses and the Windows operating system are all competitively advantaged in our view and, in aggregate, have delivered well above our long-term expectations ofmid-single-digit revenue growth andlow-double-digit earnings per share growth. Microsoft’s businesses and strategic shift have continued to propel its revenue growth, and we believe the runway ahead is long.
In the age of digital transformation, Adobe continues to strengthen its business and its value proposition as a mission-critical partner to governments and enterprises. Digital Media, overtwo-thirds of total revenue and its most profitable business, experienced 26% revenue growth during the 2018 calendar year as demand for digital content creation continued to increase. Digital Experience, roughly 30% of total revenue, grew revenues by 20% during 2018. Adobe also made two strategic acquisitions, Magento and Marketo, that combine with its existing solutions to create a full suite offering in digital experience management. Our long history of investing in software businesses tells us that the company offering a full suite solution
3
POLEN GROWTH FUND
Annual Investment Adviser’s Report
April 30, 2019
(Unaudited)
typically wins out over the companies offeringbest-of-breed point solutions. That said, Adobe’s point solutions within its full suite are typically best of breed, reinforcing the potency of its value proposition. We believe the world continues to move in Adobe’s direction and remain confident in the company’s ability to execute as a premier digital and creative software solutions provider.
O’Reilly Automotive’s business returned to strong revenue growth in 2018 after a slowdown in 2017. During the spring of 2017, the aftermarket auto parts industry was posting weaker comparable store sales. Many attributed the weakness to competition from Amazon, and, as a result, O’Reilly’s share price declined meaningfully. But our research dug deeper. Although Amazon is a formidable competitor in thedo-it-yourself (DIY) side of O’Reilly’s business, its presence in the industry is not new. Furthermore, our research highlighted that cars older than seven years, the sweet-spot age for repairs and O’Reilly’s most profitable cohort, were sold during the financial crisis and ensuing recession. This cohort had fallen by roughly 20% in 2017 relative to only two years before. We opportunistically added to our position in July 2017 because we felt confident that the slowdown was transitory, and that growth would accelerate quite quickly. Our diligence and patience were rewarded. Same-store-sales have reaccelerated in line with ourmid-single-digits expectations as the fleet of8-to-10-year-old cars has normalized. O’Reilly shares have nearly doubled since our addition, but we feel the valuation is still comfortable at just under 20x forward earnings estimates.
Conversely, onlyNVIDIA andBooking Holdings weighed on performance during the period with NVIDIA having the greatest impact on returns.
NVIDIA is the dominant supplier of graphics processing units (GPUs) for gaming and machine learning. GPUs are super-fast semiconductor chips that can process many calculations simultaneously, which makes them perfect for data-intense uses like video games and artificial intelligence (AI). Unfortunately, GPUs are also used for othernon-core activities like mining cryptocurrencies.
The timing of our NVIDIA purchase was unfortunate. We initiated a position in August 2018, just before the big market decline. Our original thesis was that the company’s gaming chip business, where it has 90% market share, would grow at a strong double-digit pace, but with the potential for some cyclicality. Furthermore, we believed the new, nascent opportunity in datacenter servers for AI could power exceptional incremental growth that would help to offset the cyclicality of NVIDIA’s gaming business. Within one quarter, the company’s results called into question the strength of our investment case. The company’s management was quick to blame excess channel inventory from the cryptocurrency boom/bust as NVIDIA chips were used for mining cryptocurrencies.
After further analysis, we felt the core gaming business had some real weakness outside the cryptocurrency-related inventory issues. Second, the datacenter business also slowed materially as large cloud customers like Amazon Web Services, Microsoft Azure and Google Cloud curtailed capex spending after a huge capacity building period. The combined impact has caused tremendous cyclicality in NVIDIA’s
4
POLEN GROWTH FUND
Annual Investment Adviser’s Report
April 30, 2019
(Unaudited)
results. In our minds, it called into question the magnitude of future revenue growth opportunities in both of NVIDIA’s end markets. Given ourre-evaluation of past growth drivers, we see NVIDIA’s future growth as less attractive and with higher potential cyclicality than we previously thought. We still believe the company’s competitive advantages are strongly intact and growth will likely be solid, but not enough for us to embrace the higher level of cyclicality we anticipate. We sold our position in favor of other opportunities.
Booking Holdings declined during the period. In the short term, Booking’s revenue growth is slowing but margins are expanding leading to substantial earnings per share growth. That said, we continue to evaluate the sustainability of the margin improvement and currently have a weighting that is smaller than average for us in this business.
Portfolio Activity:
During the period, we purchased shares of NVIDIA in August 2018 and exited our position after owning the stock for roughly six months. This short holding period is highly unusual for us given that our average holding period is approximately five years. One of the most important skills for a portfolio manager to hone is to know when an investment thesis is incorrect and to acknowledge a flawed investment case. It is easy to force dissenting evidence into an existing investment thesis or morph it into an entirely new investment case, especially on exceptional companies like NVIDIA. We believe we can generatemid-teens returns for our clients throughmid-teens earnings growth of our underlying portfolio companies, and we do not need overly difficult or complicated investment cases to seek that result. We reallocated the NVIDIA proceeds to initiate a position in digital payments processor PayPal Holdings, Inc.
PayPal provides quick, secure and frictionless payments to both consumers and merchants. The company has over $10 billion in net cash on the balance sheet, 20% free cash flow margins, a return on capital north of 20%, expanding profit margins and organic revenue growth in the high-teens percent range. Importantly, it benefits from multiple secular tailwinds including (1) the move from cash and check to digital forms of payment, (2) the growth ine-commerce, and (3) the continued globalization of commerce.
We were pleased with the strong revenue and earnings growth of the Fund’s holdings and remain optimistic about the future. The equity market may well continue to be volatile with slow economic and earnings growth and relatively high valuations, but we believe the future for our companies looks bright and will remain disciplined in our search for new additions.
Late last year, we announced that Brandon Ladoff had been promoted toco-portfolio manager of the Polen Growth Fund and that, after a transition period, Damon Ficklin, who also leads our Polen Global Growth Fund, would relinquish his Polen Growth Fund portfolio management role. This transition will occur on July 1, 2019, after which Dan Davidowitz and Brandon will remain the Polen Growth Fund portfolio
5
POLEN GROWTH FUND
Annual Investment Adviser’s Report
April 30, 2019
(Unaudited)
managers. Our entire team works very collaboratively, and Damon’s insights will not be lost, especially given the overlap in coverage universe and portfolio holdings between the Polen Growth Fund and the Polen Global Growth Fund. We thank Damon for his exceptional stewardship on Polen Growth Fund and look forward to continued success with Polen Global Growth Fund under his leadership.
This letter is intended to assist shareholders in understanding how the Fund performed during the fiscal year ended April 30, 2019 and reflects the views of the investment adviser at the time of this writing. Of course, these views may change and do not guarantee the future performance of the Fund or the markets.
Portfolio composition is subject to change. The current and future portfolio holdings of the Fund are subject to investment risk. The investment return and principal value of an investment in the Fund will fluctuate so that an investor’s shares, when redeemed, may be worth more or less than their original cost.
6
POLEN GROWTH FUND
Annual Report
Performance Data
April 30, 2019
(Unaudited)
Comparison of Change in Value of $100,000 (investment minimum) Investment in Polen Growth Fund
Institutional Class Shares
vs Russell 1000® Growth Index and S&P 500® Index
| Average Annual Total Returns for the Periods Ended April 30, 2019 |
| |||||||||||||||||||
| 1 Year | 3 Years | 5 Years | Since Inception* | |||||||||||||||||
Institutional Class | 26.44% | 19.86% | 17.22% | 16.43% | ||||||||||||||||
S&P 500® Index | 13.49% | 14.86% | 11.62% | 14.20%** | ||||||||||||||||
Russell 1000® Growth Index | 17.43% | 18.61% | 14.50% | 16.11%** | ||||||||||||||||
| * | The Polen Growth Fund (the “Fund”) Institutional Class Shares commenced operations on September 15, 2010. |
| ** | Benchmark performance is from the commencement date of the Fund Class only and is not the commencement date of the benchmark itself. |
The performance data quoted represents past performance and does not guarantee future results. Current performance may be lower or higher. Performance data current to the most recentmonth-end may be obtained by calling (888)678-6024. The investment return and principal value of an investment will fluctuate so that shares, when redeemed, may be worth more or less than their original cost. The graph and table do not reflect the deduction of taxes that a shareholder would pay on Fund distributions or the redemption of Fund shares.
7
POLEN GROWTH FUND
Annual Report
Performance Data
April 30, 2019
(Unaudited)
Comparison of Change in Value of $10,000 Investment in Polen Growth Fund Investor Class Shares
(formerly Retail Class) vs Russell 1000® Growth Index and S&P 500® Index
| Average Annual Total Returns for the Periods Ended April 30, 2019 |
| |||||||||||||||||||
| 1 Year | 3 Years | 5 Years | Since Inception* | |||||||||||||||||
Investor Class | 26.12% | 19.56% | 16.92% | 14.89% | ||||||||||||||||
S&P 500® Index | 13.49% | 14.86% | 11.62% | 13.06%** | ||||||||||||||||
Russell 1000® Growth Index | 17.43% | 18.61% | 14.50% | 14.68%** | ||||||||||||||||
| * | The Investor Class Shares commenced operations on December 30, 2010. |
| ** | Benchmark performance is from the commencement date of the Fund Class only and is not the commencement date of the benchmark itself. |
The performance data quoted represents past performance and does not guarantee future results. Current performance may be lower or higher. Performance data current to the most recentmonth-end may be obtained by calling (888)678-6024. The investment return and principal value of an investment will fluctuate so that shares, when redeemed, may be worth more or less than their original cost. The graph and table do not reflect the deduction of taxes that a shareholder would pay on Fund distributions or the redemption of Fund shares.
8
POLEN GROWTH FUND
Annual Report
Performance Data (Concluded)
April 30, 2019
(Unaudited)
The Fund’s “Total Annual Fund Operating Expenses” and “Total Annual Fund Operating Expenses After Fee Waiver and/or Expense Reimbursement,” as stated in the current prospectus dated September 1, 2018, are 0.98% and 1.00%, respectively, for the Institutional Class shares and 1.23% and 1.25%, respectively, for the Investor Class shares of the Fund’s average daily net assets, which may differ from the actual expenses incurred by the Fund for the period covered by this report. Polen Capital Management, LLC (“PCM” or the “Adviser”) has contractually agreed to reduce its investment advisory fee and/or reimburse certain expenses of the Fund to the extent necessary to ensure that the Fund’s total operating expenses (excluding taxes, fees and expenses attributable to a distribution or service plan adopted by the Trust, interest, extraordinary items, “Acquired Fund Fees and Expenses” and brokerage commissions) do not exceed 1.00% (on an annual basis) with respect to the Fund’s average daily net assets (the “Expense Limitation”). The Expense Limitation will remain in place until August 31, 2019 unless the Board of Trustees (“Board of Trustees”) of FundVantage Trust (the “Trust”) approves its earlier termination. The Adviser is entitled to recover, subject to approval by the Board of Trustees, any fees waived and/or expenses reimbursed by the Adviser on or after January 1, 2017 with respect to the Fund for a three (3) year period following the date of such fee waiver and/or expense reimbursement. The Adviser is permitted to seek reimbursement from the Fund, subject to certain limitations, for fees it waived and Fund expenses it paid to the extent the total annual fund operating expenses do not exceed the limits described above or any lesser limits in effect at the time of reimbursement. No recoupment will occur unless the Fund’s expenses are below the Expense Limitation amount. Total returns would be lower had such fees and expenses not been waived and/or reimbursed.
A 2.00% redemption fee applies to shares redeemed within 60 days of purchase. This redemption fee is not reflected in the returns shown above.
The Fund intends to evaluate performance as compared to that of the Standard & Poor’s 500 (“S&P 500®”) Index and the Russell 1000® Growth Index. The S&P 500® Index is a widely recognized, unmanaged index of 500 common stocks which are generally representative of the U.S. stock market as a whole. The Russell 1000® Growth Index is an unmanaged index that measures the performance of thelarge-cap growth segment of the U.S. equity universe. It includes those Russell 1000® Growth Index companies with higherprice-to-book ratios and higher forecasted growth values. It is impossible to invest directly in an index.
All mutual fund investing involves risk, including possible loss of principal. The Fund isnon-diversified, which means that a large portion of the Fund’s assets may be invested in one or few companies or sectors. The Fund could fluctuate in value more than a diversified fund.
9
POLEN GLOBAL GROWTH FUND
Annual Investment Adviser’s Report
April 30, 2019
(Unaudited)
Performance Summary:
| • | In 2018, global markets were down following a punishingsell-off in the fourth quarter but bounced back in the first quarter 2019. |
| • | For the fiscal year ended April 30, 2019, the Polen Global Growth Fund’s (the “Fund”) institutional share class returned 19.91% net of fees versus the MSCI All Country World®Index (“ACWI”) (Net Dividend) which returned 5.06%. |
| • | Since inception December 30, 2014 to April 30, 2019, the Fund’s institutional share class has had an average annual total return of 14.09% net of fees versus 7.27% for the MSCI ACWI (Net Dividend). |
The performance data quoted represents past performance and is not a guarantee of future results. Investment return and principal value of an investment will fluctuate so that an investor’s shares, when redeemed, may be worth more or less than their original cost. Current performance may be lower or higher than the performance information quoted. To obtain performance information current to the most recentmonth-end, please call1-888678-6024.
Performance Review:
The Polen Global Growth Fund (the “Fund”) delivered strong gains and outperformed the index by a wide margin for the fiscal year ended April 30, 2019. Top contributors to absolute performance wereAlign Technology,Adobe,Microsoft,Mastercard, andVisa.
Align Technology is disrupting the orthodontia market with Invisalign, its clear aligner alternative to metal braces. While shares were down for the calendar year 2018, the stock was the top contributor to performance for the Fund’s fiscal year due to our active management of the position. Earlier in the period, the stock had reached a valuation that we believed would make it more difficult to achieve a double-digit investment return. Our analysis led us to trim the position on two separate occasions. Shortly after our last trim, management reported disappointing quarterly results. A poorly executed promotional program created unexpected pressure on average sales prices. At the same time, competitors were entering the lowest end of the market. Given the high valuation and concerns about these developments, the stock fell by roughly 50%. After meeting with management and revisiting our investment case, we concluded that the business remains well positioned and that the valuation had returned to a reasonable level. We chose to opportunistically add back to our position at a better price. Align remains competitively advantaged in our estimation, dominates the market for clear aligners and still possesses only 10% of its addressable market. We believe Invisalign’s penetration will continue to increase globally and that clear aligners will eventually make braces obsolete over time.
In the age of digital transformation, Adobe continues to strengthen its business and its value proposition as a mission-critical partner to governments and enterprises. Digital Media, overtwo-thirds of total revenue and its most profitable business, experienced 26% revenue growth during the 2018 calendar year as
10
POLEN GLOBAL GROWTH FUND
Annual Investment Adviser’s Report
April 30, 2019
(Unaudited)
demand for digital content creation continued to increase. Digital Experience, roughly 30% of total revenue, grew revenues by 20% during 2018. Adobe also made two strategic acquisitions, Magento and Marketo, that combine with its existing solutions to create a full suite offering in digital experience management. Our long history of investing in software businesses tells us that the company with a full suite offering typically wins out over companies that sellbest-of-breed point solutions. That said, Adobe’s point solutions within its full suite are typically best of breed, reinforcing the potency of its value proposition.
We believe the world continues to move in Adobe’s direction and remain confident in the firm’s ability to execute as the premier digital and creative software solutions provider.
Microsoft has continued to execute very well with a focus on the long term. The company is benefiting from a transition to the cloud in both its server business with Azure, and with the shift of its Office franchise from a license-based to a subscription-based business. Both models have shown better economics, steadier and more recurring revenue streams and greater customer captivity. The Office franchise, the server business (Windows Server and Sequel Server) and the Windows operating system are all competitively advantaged in our view and, in aggregate, have delivered well above our long-term expectations ofmid-single digit revenue andlow-double digit earnings per share growth. These businesses and strategic shift have continued to propel Microsoft’s revenue growth, and we believe the runway ahead is long.
We view Visa and Mastercard as one position essentially. Both companies have benefited from their strong competitive advantages and a large addressable market driven by the global shift from cash and check to credit and electronic payments. Surprising to many, cash and check still represents over 80% of the world’s total transactions today. Mastercard and Visa benefited from the combination of personal consumption expenditure (PCE), which we anticipate will continue to grow4-5% per year for the next five plus years, deeper card penetration and ongoing share gains. Additionally, online transactions have twice the card usage as offline, ande-commerce, which represents less than 10% of global consumption, is growing3-4x the rate of total purchases. We believe both businesses will continue to enjoy strong sales and earnings growth, and we anticipate we will reap the benefits from the compounding of these businesses for many years to come.
On the other hand,Booking Holdings,EssilorLuxottica, andIndustria de Diseno Textil (“Inditex”)were a drag on returns during the period.
Booking Holdings declined during the period amid signs of slowing revenue and bookings growth. While the company continues to be the leading online travel platform, we think the market may be maturing as evidenced by signs of slowing room night growth. As the business continues to mature, we also believe it may become more economically sensitive. These factors combined with our decision to add to our positions in Adidas and Alibaba in the third quarter 2018 led us to eliminate Booking Holdings from the Fund’s portfolio.
EssilorLuxottica SA is the product of the recent merger between leadingeye-glass lens manufacturer Essilor, which we have owned for many years, and leading eyewear manufacturer and retailer Luxottica,
11
POLEN GLOBAL GROWTH FUND
Annual Investment Adviser’s Report
April 30, 2019
(Unaudited)
which we did not previously own. Together, the two are positioned to create a fully integrated business with€16bn in revenues and approximately~35-40% market share across the entire industry supply chain.
Shares declined during the period amid challenges and controversy surrounding the integration of the two companies. The founder and Chairman of Luxottica, Leonardo Del Vecchio, who is also the largest shareholder, filed a legal arbitration request alleging the group’s executive chairman violated their 2017 merger agreement. We think it is fair to say that the integration is not going smoothly. Despite this friction, we believe the combination has created one of the most competitively advantaged businesses available. Del Vecchio, 83 years old, is widely known to be an aggressive businessman – a risk that we acknowledged as merger talks developed years ago. Thispre-identified risk, which appears to be materializing, is part of the reason our position size in the combined entity is smaller than average. We will continue to monitor the situation closely.
The world’s largest fast fashion retailer Inditex is a vertically integrated company known for high-quality apparel. Shares declined during the period on slower-than-expected sales growth, particularly at its most well-known brand, Zara. Management attributed the slower growth to currency pressure, less promotional discounting, and a shift in its store optimization and online strategy.
We continue to believe the company has multiple competitive advantages and has incrementally improved its unique business model for decades. Inditex’s unique model allows it to produce quality goods faster than peers and to successfully enter new markets without large upfront investments. Itse-commerce business, which now accounts for about 10% of total revenue and is growing roughly 40% per year, only strengthens its ability to enter new markets and compete within existing markets more efficiently. The company’s centralized distribution and integrated information technology system creates a constant feedback loop of continual communication between what is being manufactured and what the customer is buying, eliminating most fashion risk from the company’s concepts. While each of the company’s advantages are strong in isolation, in our view, Inditex’s edge is its ability harmonize these advantages so well. We believe the company will continue to gain an increasing share of the highly-fragmented $1 trillion global retail market for many years to come.
Portfolio Activity:
During the period, we initiated positions inInditex,SAP SE, andSiemens Healthineers AG. We soldCheck Point SoftwareandBooking Holdings.
Inditex, which we discussed above, has multiple competitive advantages and has incrementally improved upon its unique business model for decades. We believe its investment intoe-commerce will further strengthen its leading position in the fast-fashion industry.
We have been studying Siemens Healthineers for some time and purchased it in November 2018. The company is a global leader in imaging and diagnostics medical equipment headquartered in Erlangen,
12
POLEN GLOBAL GROWTH FUND
Annual Investment Adviser’s Report
April 30, 2019
(Unaudited)
Germany. Siemens Healthineers operates three business segments: imaging equipment, diagnostics, and advanced therapies. We believe Siemens Healthineers is a stable, dominant business with a strong brand, and a number of areas of improvement that are well underway — the business is not very economically sensitive and serves as a ballast for the Fund’s portfolio.
SAP is one of the world’s leading enterprise software and software-related services providers. The company’s Enterprise Resource Planning (ERP) software and related Business Suite applications enable businesses with complex supply chains, operations, inventory and manufacturing needs to thrive in a world that is becoming more digital and more complex. SAP has continued to deliver solid sales growth as it transitions to the cloud and the company is finally starting to see margin benefits from the transition as well. We believe it is well positioned to drive double-digit earnings growth for the long term.
We sold Check Point Software Technologies Ltd. from the Fund’s portfolio during the period. While the company continues to be the leading provider of IT security software, offering products that are highly regarded on a consistent basis by third party organizations like Gartner, the sales force has had difficulties capitalizing on this reputation. Execution has been subpar for some time with the company losing share in the United States. We felt other investment opportunities were more compelling.
We sold Booking Holdings based on our analysis and the maturation of the business in favor of more compelling investment opportunities, as discussed above. By concentrating in only the highest-quality growth businesses, the Fund’s portfolio continued to deliver robust underlying earnings growth during the period, which helped us preserve capital once again in a very challenging market. We believe the merits of our investment discipline were apparent during such a volatile period, and we remain confident that strong underlying earnings growth will drive attractive investment returns over the long term.
This letter is intended to assist shareholders in understanding how the Fund performed during the fiscal year ended April 30, 2019 and reflects the views of the investment adviser at the time of this writing. Of course, these views may change and do not guarantee the future performance of the Fund or the markets.
Portfolio composition is subject to change. The current and future portfolio holdings of the Fund are subject to investment risk. The investment return and principal value of an investment in the Fund will fluctuate so that an investor’s shares, when redeemed, may be worth more or less than their original cost.
13
POLEN GLOBAL GROWTH FUND
Annual Report
Performance Data
April 30, 2019
(Unaudited)
Comparison of Change in Value of $100,000 (investment minimum) Investment in Polen Global Growth Fund
Institutional Class Shares
vs MSCI All Country World® Index
| Average Annual Total Returns for the Periods Ended April 30, 2019 | ||||||
| 1 Year | 3 Years | Since Inception* | ||||
Institutional Class | 19.91% | 18.34% | 14.09% | |||
MSCI All Country World®Index (“ACWI”)(Net Dividend) | 5.06% | 11.35% | 7.27%** | |||
| * | The Polen Global Growth Fund (the “Fund”) Institutional Class Shares commenced operations on December 30, 2014. |
| ** | Benchmark performance is from commencement date of the Fund Class (December 30, 2014) only and is not the commencement date of the benchmark itself. |
The performance data quoted represents past performance and does not guarantee future results. Current performance may be lower or higher. Performance data current to the most recentmonth-end may be obtained by calling (888)678-6024. The investment return and principal value of an investment will fluctuate so that shares, when redeemed, may be worth more or less than their original cost. The graph and table do not reflect the deduction of taxes that a shareholder would pay on Fund distributions or the redemption of Fund shares.
14
POLEN GLOBAL GROWTH FUND
Annual Report
Performance Data
April 30, 2019
(Unaudited)
Comparison of Change in Value of $10,000 Investment in Polen Global Growth Fund Investor Class Shares
(formerly Retail Class) vs MSCI All Country World® Index
| Average Annual Total Returns for the Periods Ended April 30, 2019 | ||||||
| 1 Year | 3 Years | Since Inception* | ||||
Investor Class | 19.66% | 18.05% | 14.84% | |||
MSCI All Country World®Index (“ACWI”)(Net Dividend) | 5.06% | 11.35% | 7.75%** | |||
| * | The Polen Global Growth Fund (the “Fund”) Investor Class Shares commenced operations on July 6, 2015. |
| ** | Benchmark performance is from commencement date of the Fund Class (July 6, 2015) only and is not the commencement date of the benchmark itself. |
The performance data quoted represents past performance and does not guarantee future results. Current performance may be lower or higher. Performance data current to the most recentmonth-end may be obtained by calling (888)678-6024. The investment return and principal value of an investment will fluctuate so that shares, when redeemed, may be worth more or less than their original cost. The graph and table do not reflect the deduction of taxes that a shareholder would pay on Fund distributions or the redemption of Fund shares.
The Fund’s “Total Annual Fund Operating Expenses” and “Total Annual Fund Operating Expenses After Fee Waiver and/or Expense Reimbursement,” as stated in the current prospectus dated September 1, 2018, are 1.50% and 1.10%, respectively, for the Institutional Class shares and 1.75% and 1.35%, respectively, for the Investor Class shares of the Fund’s average daily net assets, which may differ from the actual expenses incurred by the Fund for the period covered by this report. Polen Capital Management, LLC (“PCM” or the “Adviser”) has contractually agreed to reduce its investment advisory fee and/or reimburse certain expenses of the Fund to the extent necessary to ensure that the Fund’s total operating expenses (excluding taxes, fees and expenses attributable to a distribution or service plan adopted by the Trust, interest, extraordinary items, “Acquired Fund Fees and Expenses” and brokerage
15
POLEN GLOBAL GROWTH FUND
Annual Report
Performance Data
April 30, 2019
(Unaudited)
commissions) do not exceed 1.10% (on an annual basis) with respect to the Fund’s average daily net assets (the “Expense Limitation”). The Expense Limitation will remain in place until August 31, 2019 unless the Board of Trustees (“Board of Trustees”) of FundVantage Trust (the “Trust”) approves its earlier termination. The Adviser is entitled to recover, subject to approval by the Board of Trustees, such amounts reduced or reimbursed for a period of up to three (3) years from the date on which the Adviser reduced its compensation and/or assumed expenses for the Fund. The Adviser is permitted to seek reimbursement from the Fund, subject to certain limitations, for fees it waived and Fund expenses it paid to the extent the total annual fund operating expenses do not exceed the limits described above or any lesser limits in effect at the time of reimbursement. No recoupment will occur unless the Fund’s expenses are below the Expense Limitation amount. Total returns would be lower had such fees and expenses not been waived and/or reimbursed.
A 2.00% redemption fee applies to shares redeemed within 60 days of purchase. This redemption fee is not reflected in the returns shown above.
The Fund intends to evaluate performance as compared to that of the MSCI ACWI (Net Dividend), which captures large andmid-cap representation across 23 Developed Markets (DM) and 24 Emerging Markets (EM) countries. With 2,774 constituents, the index covers approximately 85% of the global investable equity opportunity set. Indexes are unmanaged and it is not possible to invest directly in an index.
All mutual fund investing involves risk, including possible loss of principal. The Fund isnon-diversified, which means that a large portion of the Fund’s assets may be invested in one or few companies or sectors. The Fund could fluctuate in value more than a diversified fund. Investing in foreign securities entails special risks, such as fluctuations in currency exchange rates and possible lax regulation of securities markets and accounting practices.
The Fund may invest a substantial amount of its assets in issuers located in a limited number of countries. If the Fund concentrates its investments in this manner, it assumes the risk that economic, political and social conditions in those countries will have a significant impact on its investment performance. The Fund’s investment performance may also be more volatile if it concentrates its investments in certain countries, especially emerging market countries.
16
POLEN INTERNATIONAL GROWTH FUND
Annual Investment Adviser’s Report
April 30, 2019
(Unaudited)
Performance Summary:
| • | International markets were not immune to the volatility for the period, landing in negative territory by the fourth quarter 2018 and then rebounding sharply in the first quarter 2019. |
| • | For the fiscal period ended April 30, 2019, the Polen International Growth Fund’s institutional share class (the “Fund”) returned 8.50% net of fees versus the MSCI All Country World®Index (“ACWI”)(ex-USA) which returned-3.23%. |
| • | Since inception December 30, 2016 to April 30, 2019, the Fund’s institutional share class has had an average annual total return of 17.13% net of fees versus 9.70% for the MSCI ACWI(ex-USA). |
The performance data quoted represents past performance and is not a guarantee of future results. Investment return and principal value of an investment will fluctuate so that an investor’s shares, when redeemed, may be worth more or less than their original cost. Current performance may be lower or higher than the performance information quoted. To obtain performance information current to the most recentmonth-end, please call1-888678-6024.
Performance Review:
The Polen International Growth Fund (the “Fund”) produced solid returns during the period and substantially outperformed the MSCI ACWIex-USA (the “Index”) for the fiscal year ended April 30, 2019. Leading contributors to performance wereExperian,Nestle, andAccenture.
Experian stock rose during the period on the back of strong organic growth as it reported solid performance across all its businesses. Results were particularly strong in the North American region where the company’s consumer services business has been revived thanks to a shift toward a “freemium plus” business model, which appears to have resonated well with its customers. As the largest credit reporting agency in the world, Experian has been able to leverage its scale to drive growth while also launching new revenue streams. Its breadth of business lines has helped it to maintain consistent growth throughout market cycles.
Accenture performed well throughout the period, surpassing profit and revenue expectations during the most recent quarter. Strong demand for the company’s services drove the fifth straight quarter of double-digit growth in consulting bookings. It also led the company to upgrade its guidance for the full year 2019 thanks to increased confidence in the growth outlook. As the largest IT consultant globally and with its reputation for helping a business transform itself through technology investments, Accenture has benefited from big trends in technology like cloud computing, artificial intelligence and data analytics. Thanks to strong growth over the past decade, corporate IT budgets have risen, and companies are investing heavily into these new technologies. This has helped to drive double digit earnings growth over the past several years for Accenture, which we believe will continue.
Nestle has done well, posting two quarters of improving organic growth and appreciation in both earnings and shares. Further, Nestle’sre-established ability to pass on rising prices is boosting organic
17
POLEN INTERNATIONAL GROWTH FUND
Annual Investment Adviser’s Report
April 30, 2019
(Unaudited)
growth. However, several long-term challenges could make this recent acceleration less sustainable, in our view. Those challenges include changing consumer tastes within the consumer-packaged goods industry and lower barriers to entry that enable new competition to come into the category. Given these headwinds and a full but fair valuation, we trimmed the position and deployed the capital into Siemens Healthineers and Medtronic. These two healthcare businesses possess defensive characteristics which should drive stable earnings growth in all environments and face fewer headwinds.
OnlyBaiduandEssilorLuxotticadetracted from absolute performance during the fiscal year.
Baidu is the leading internet search provider in China. Shares suffered along with other Chinese stocks during the period as economic data has exhibited signs of a slowing economy. Furthermore, tariffs and aggressive trade rhetoric from the Trump administration damaged investor sentiment. We feel that short-term volatility presents long-term investors with opportunity. Our five toten-year investment horizon lets us look past the current malaise. We added to our position in Baidu in the second half of 2018. The company continues to capture the attention of hundreds of millions of users daily and is making sizeable investments to expand its operations into exciting new areas of growth. We believe these investments offers the potential for continued strong earnings growth for years into the future.
French optical lens company Essilor recently completed a merger with Italian eyewear company Luxottica. While we had been positive on the merger, complications with the integration have increased the risks and decreased expected earnings growth for the newly combined company. Indeed, we believe the combined group will be a vertically integrated industry powerhouse with dominant market share across the eyewear value chain. However, integrating two very different cultures is proving to be difficult. More than two years have passed since the merger announcement, yet there is still no common strategy or even a finalized management team. This shows the depth of the problems. The most recent escalation, wherein Leonardo Del Vecchio, the former Chairman of Luxottica and largest shareholder of the newly combined group, is taking his Essilor counterparts to arbitration, suggests this could be adrawn-out battle. With such acrimony we cannot rule out the possibility that the two companies attempt to reverse the merger. We no longer believe that synergy benefits will accelerate earnings growth significantly in the next few years. Worse, this spat risks becoming a distraction which causes both companies to lose competitiveness. As such, we have sold EssilorLuxottica from the Fund’s portfolio.
Portfolio Activity:
During the fiscal period, no new positions were added to the Fund’s portfolio. Instead, we opportunistically added to positions on increased confidence in several of the businesses we currently own such asAlibaba.com,Siemens Healthineers, andSAP SE. We sold our positions inEssilorLuxottica,Christian Hansen Holding.
We added to Alibaba.com at an attractive price as Chinese stocks were punished on growth, tariff, and trade concerns. While high growth rates from less profitable business lines and high levels of investments
18
POLEN INTERNATIONAL GROWTH FUND
Annual Investment Adviser’s Report
April 30, 2019
(Unaudited)
are dampening current fiscal year earnings growth, the firm’s investments present even larger opportunities in the future. We believe Alibaba is capable of 25% earnings growth for the next three years.
Siemens Healthineers continues to perform very well, particularly on the back of its imaging business which continues to gain market share. The diagnostics side of the business is also doing well, though stronger than expected initial placements at large customers requiring complex installations recently depressed Margins and slowed revenue growth. The costs associated with these implementations are primarilyfront-end loaded while highly recurring revenue generation is delayed. We anticipate revenues and profit margins will accelerate in the coming quarters as these implementations finish and the associated recurring revenues begin to flow through. This is a nice problem to have as we believe these will eventually be very profitable customer relationships for Siemens Healthineers.
SAP has continued to deliver solid sales growth as it transitions to the cloud and the company is also starting to see margin benefits from the transition. We believe it is well positioned to drive double-digit earnings growth for the long term.
We sold EssilorLuxottica due our decreased confidence in the combined company’s ability to fully integrate the two businesses post-merger, as discussed in more detail above.
We exited our position on Danish bacteria and enzyme producer, Christian Hansen. Despite its steadylow-teens earnings growth potential, the stock’s valuation had become so full that we had to question our expected return potential. At the time of our sale, the stock’s forwardprice-to-earnings ratio (P/E) multiple had expanded from 30x to 45x in the 19 months we owned it. Getting a >10% annual return from Christian Hansen shares for the next five years would require the stock to remain at a >40x forward P/E multiple, and we have no way of knowing if the current valuation can persist. We believe Christian Hansen remains a great business, and we’ll continue to follow it.
Observing the volatility through the year serves as an important reminder of why our firm’s longstanding philosophy has often ignored short term market noise. We act like business owners, not stock market operators. We have an eye toward each company’s competitive advantages, corporate strategy and long-term earnings growth potential. These considerations force us to keep our heads down as markets gyrate. Our goal is to maintain a portfolio of high-quality companies which in aggregate can drive earnings growth – the long-term driver of share price movements – in excess of the Index.
This letter is intended to assist shareholders in understanding how the Fund performed during the fiscal year ended April 30, 2019 and reflects the views of the investment adviser at the time of this writing. Of course, these views may change and do not guarantee the future performance of the Fund or the markets.
Portfolio composition is subject to change. The current and future portfolio holdings of the Fund are subject to investment risk. The investment return and principal value of an investment in the Fund will fluctuate so that an investor’s shares, when redeemed, may be worth more or less than their original cost.
19
POLEN INTERNATIONAL GROWTH FUND
Annual Report
Performance Data
April 30, 2019
(Unaudited)
Comparison of Change in Value of $100,000 (investment minimum) Investment in Polen International Growth Fund
Institutional Class Shares
vs MSCI All Country World® Index (“ACWI”)(ex-USA)
| Average Annual Total Returns for the Periods Ended April 30, 2019 | ||||
| 1 Year | Since Inception* | |||
Institutional Class | 8.50% | 17.13% | ||
MSCI All Country World®Index (“ACWI”)(ex-USA) | -3.23% | 9.70%** | ||
| * | The Polen International Growth Fund (the “Fund”) Institutional Class Shares commenced operations on December 30, 2016. |
| ** | Benchmark performance is from commencement date of the Fund Class (December 30, 2016) only and is not the commencement date of the benchmark itself. |
The performance data quoted represents past performance and does not guarantee future results. Current performance may be lower or higher. Performance data current to the most recentmonth-end may be obtained by calling (888)678-6024. The investment return and principal value of an investment will fluctuate so that shares, when redeemed, may be worth more or less than their original cost. The graph and table do not reflect the deduction of taxes that a shareholder would pay on Fund distributions or the redemption of Fund shares.
20
POLEN INTERNATIONAL GROWTH FUND
Annual Report
Performance Data
April 30, 2019
(Unaudited)
Comparison of Change in Value of $10,000 Investment in Polen International Growth Fund Investor Class Shares
(formerly Retail Class) vs MSCI All Country World® Index (“ACWI”)(ex-USA)
| Average Annual Total Returns for the Periods Ended April 30, 2019 | ||||
| 1 Year | Since Inception* | |||
Investor Class | 8.25% | 13.87% | ||
MSCI All Country World®Index (“ACWI”)(ex-USA) | -3.23% | 7.58%** | ||
| * | The Polen International Growth Fund (the “Fund”) Investor Class Shares commenced operations on March 15, 2017. |
| ** | Benchmark performance is from commencement date of the Fund Class (March 15, 2017) only and is not the commencement date of the benchmark itself. |
The performance data quoted represents past performance and does not guarantee future results. Current performance may be lower or higher. Performance data current to the most recentmonth-end may be obtained by calling (888)678-6024. The investment return and principal value of an investment will fluctuate so that shares, when redeemed, may be worth more or less than their original cost. The graph and table do not reflect the deduction of taxes that a shareholder would pay on Fund distributions or the redemption of Fund shares.
The Fund’s “Total Annual Fund Operating Expenses” and “Total Annual Fund Operating Expenses After Fee Waiver and/or Expense Reimbursement,” as stated in the current prospectus dated September 1, 2018, are 3.45% and 1.10%, respectively, for the Institutional Class shares and 3.70% and 1.35%, respectively, for the Investor Class shares of the Fund’s average daily net assets, which may differ from the actual expenses incurred by the Fund for the period covered by this report. Polen Capital Management, LLC (“PCM” or the “Adviser”) has contractually agreed to reduce its investment advisory fee and/or reimburse certain expenses of the Fund to the extent necessary to ensure that the Fund’s total operating expenses (excluding taxes, fees and expenses attributable to a distribution or service plan adopted by the Trust, interest, extraordinary items, “Acquired Fund Fees and Expenses” and brokerage
21
POLEN INTERNATIONAL GROWTH FUND
Annual Report
Performance Data
April 30, 2019
(Unaudited)
commissions) do not exceed 1.10% (on an annual basis) with respect to the Fund’s average daily net assets (the “Expense Limitation”). The Expense Limitation will remain in place until August 31, 2019 unless the Board of Trustees (“Board of Trustees”) of FundVantage Trust (the “Trust”) approves its earlier termination. The Adviser is entitled to recover, subject to approval by the Board of Trustees, any fees waived and/or expenses reimbursed for a three (3) year period following the date of such fee waiver and/or expense reimbursement. The Adviser is permitted to seek reimbursement from the Fund, subject to certain limitations, for fees it waived and Fund expenses it paid to the extent the total annual fund operating expenses do not exceed the limits described above or any lesser limits in effect at the time of reimbursement. No recoupment will occur unless the Fund’s expenses are below the Expense Limitation amount. Total returns would be lower had such fees and expenses not been waived and/or reimbursed.
A 2.00% redemption fee applies to shares redeemed within 60 days of purchase. This redemption fee is not reflected in the returns shown above.
The Fund intends to evaluate performance as compared to that of the MSCI ACWI(ex-USA), which captures large andmid-cap representation across 22 of 23 Developed Markets (DM) countries (excluding the US) and 24 Emerging Markets (EM) countries. With 2,163 constituents, the index covers approximately 85% of the global equity opportunity set outside the US. Indexes are unmanaged and it is not possible to invest directly in an index.
All mutual fund investing involves risk, including possible loss of principal. The Fund isnon-diversified, which means that a large portion of the Fund’s assets may be invested in one or few companies or sectors. The Fund could fluctuate in value more than a diversified fund. Investing in foreign securities entails special risks, such as fluctuations in currency exchange rates and possible lax regulation of securities markets and accounting practices.
The Fund may invest a substantial amount of its assets in issuers located in a limited number of countries. If the Fund concentrates its investments in this manner, it assumes the risk that economic, political and social conditions in those countries will have a significant impact on its investment performance. The Fund’s investment performance may also be more volatile if it concentrates its investments in certain countries, especially emerging market countries.
22
POLEN U.S. SMALL COMPANY GROWTH FUND
Annual Investment Adviser’s Report
April 30, 2019
(Unaudited)
Performance Summary:
| • | After a strong start to 2018, U.S.small-cap stocks gave away their gains in the fourth quarter of 2018, along with the rest of world, and then came roaring back in the first quarter of 2019. |
| • | For the fiscal year ended April 30, 2019, the Fund’s institutional share class returned 21.94% net of fees versus the Russell 2000®Growth Index which returned 6.91%. |
| • | Since inception November 1, 2017 to April 30, 2019, the Fund’s institutional share class has had an average annual total return of 15.77% net of fees versus 8.35% for the Russell 2000®Growth Index. |
The performance data quoted represents past performance and is not a guarantee of future results. Investment return and principal value of an investment will fluctuate so that an investor’s shares, when redeemed, may be worth more or less than their original cost. Current performance may be lower or higher than the performance information quoted. To obtain performance information current to the most recentmonth-end, please call1-888678-6024.
Performance Review:
The Polen U.S. Small Company Growth Fund (the “Fund”) outperformed the Russell 2000® Growth Index (the “Index) for the fiscal year ended April 30, 2019.Fox Factory Holdingwas the top contributor to absolute returns, withPaycom SoftwareandGlobantalso adding value.
Fox Factory Holding was our strongest performer after reporting another year of solid growth. The company is a manufacturer of ride dynamics products that are used onhigh-end bicycles,side-by-side vehicles andon-road vehicles used foroff-road activities. Fox Factory has been growing revenue at a rate greater than 15% compounded over the last five years, and the management team has produced steady margin leverage, facilitating an increase to earning per share (EPS) at a 25% compounded growth rate. In addition, the company has solid returns on capital, with return on equity (ROE) consistently over 20%. In our view, management has done a good job of reinvesting back into the business by adding new products and investing in additional capex. These investments have presented complementary growth opportunities that expand the company’s total addressable market and accelerate its growth rate. We believe this dynamic will make Fox Factory a multi-year compounder.
Paycom operates in the Human Capital Management (HCM) software category, a fast-growing segment of thesoftware-as-a-solution (SaaS) industry. Paycom adds value for customers by delivering a SaaS that eases setup of manual processes and then sells additional modules as ongoing solutions. The recurring revenue nature of their business model is attractive, and we remain impressed by Paycom’s consistent sales execution at both existing and new offices. In a segment of the SaaS area that is gaining share fromnon-software based incumbent solutions, we believe the selling structure and repeatability of the model is a competitive advantage This selling structure has been executed with extremely high margin levels, allowing the company to compound value for shareholders. We believe this balanced approach
23
POLEN U.S. SMALL COMPANY GROWTH FUND
Annual Investment Adviser’s Report
April 30, 2019
(Unaudited)
of strong but repeatable growth through gradual geographic sales expansion, done profitably, should continue to position this company well going forward.
Globant was also a top contributor. The company has continued to report excellent results, exceeding management’s 20% revenue growth targets. The biggest drivers of its strengths are the strong global demand environment for digital transformation and its successful and deep penetration of its existing accounts through cross selling. We believe that Globant remains well positioned in the IT services marketplace, solving a critical need for clients trying to transform how they use technology internally and helping them drive a better customer experience. We believe Globant’s digital nativity, its access to talent in South America, and its long list of referenceable customers should position the company well for the future.
Stamps.com provides an Internet-based solution for mailing or shipping letters, packages, or parcels. Its solutions are designed to make shipping easier, more convenient, and more cost effective than other methods. The company has gradually transitioned from a company that sold postage on its website through a partnership with the US Postal Service (USPS) to a diversified service provider of shipping solutions. Recently, Stamps.com management announced that it would be ending its exclusive partnership with USPS to be in a better position to partner with other shipping companies that might offer more compelling shipping solutions, such as Amazon.com. This was a bold move that came as a surprise to investors, sending the stock tumbling. Two months following the initial announcement, management stated that USPS would renegotiate deals with many of Stamps.com’s affiliate partners, compounding the issue. After having more transparency around the numbers in the wake of these announcements, we are performing a deep reassessment of the business and evaluating whether the firm continues to meet our investment criteria.
Cantel Medical Corp. is a leader in delivering innovative infection prevention and control products and services for patients, caregivers and other healthcare providers in the medical and dental industries. Cantel’s products are intended to drive better outcomes, enhance safety and help save lives. The largest part of its business is the endoscopy segment, where results have been variable. We believe this variability may have caused the underperformance in the period. We believe that the company remains very well positioned in the infection prevention category, which is an area of increasing interest and concern for healthcare institutions. We believe the company’s products remain in high demand and that its sales process is repeatable. The business model remains attractive to us from both on a margins and returns on capital basis, and we feel management continues to do a good job of running the business and reinvesting well to fuel future growth.
Blackbaud is a leading cloud software company servingnon-profits and educational institutions. The company’s software portfolio is tailored to the unique needs of the vertical markets it serves, with targeted solutions for fundraising and CRM, marketing, advocacy,peer-to-peer fundraising, corporate social responsibility, school management, ticketing, grantmaking, financial management, payment processing, and analytics. Blackbaud has dealt with some recent challenges that have negatively impacted revenue growth and margins, but we continue to have confidence in the long-term earnings power of the business. The company recently reported encouraging results that reflect improvement in recurring revenue mix,
24
POLEN U.S. SMALL COMPANY GROWTH FUND
Annual Investment Adviser’s Report
April 30, 2019
(Unaudited)
significant growth in its salesforce, and gross margin improvement. We are especially excited about some of the changes management is driving that we believe will make BLKB’s sales more predictable and repeatable. We are also excited about the company’s entry into the church space, which significantly increases BLKB’s total available market (TAM). We believe that both business enhancements make the long-term investment case for Blackbaud stronger.
Portfolio Activity:
We initiated new positions in Globant,Floor & Décor,Ellie Mae, andAltair Engineeringduring the period. We eliminated our positions inWageWorks,Prestige Brands, andNutrisystem.
In our view, Globant is well-positioned in the fast-growing digital strategy consulting services industry, a market we expect will double over the next five years. We believe the firm should be able to exceed this strong industry growth by leveraging its brand, excellent customer relationships, deep digital expertise, and scale. Furthermore, we feel Globant’s access to talent in South America is an important advantage given the talent scarcity in the IT Services industry. It is important to be able to hire and retain people, manage utilization rates, and drive productivity levels in what is essentially a people business.
Floor & Decor is a specialty retailer that sells hard surface flooring. Hard surface flooring has benefitted from a15-year secular trend away from carpeting due to increased product innovation, better durability, easier maintenance, and concerns around hygiene with carpeting products. Floor & Decor has far outpaced industry growth levels due to its a differentiated business model. With the hard surface flooring market highly fragmented and largely led by competitively disadvantaged independent retailers, we believe Floor & Decor can continue to gain market share going forward.
Ellie Mae provides SaaS solutions to the mortgage origination industry. The company’s digital mortgage software handles most of the functions involved in running a mortgage origination business from end to end. The firm’s solutions help automate the origination process which drives down costs and the time to close loans while also addressing the statutory and regulatory changes that further complicate the mortgage origination process. We began building our position in Ellie Mae inmid-2018. In February 2019 the company agreed to be acquired by private equity firm Thoma Bravo for $99 per share in anall-cash transaction. This result was bittersweet for us, which is often the case when a company that we are excited about gets acquired. After the announcement, we decided to continue to hold the stock through the35-daygo-shop period where we believed there was potential for other financial bidders to emerge. The deal has since been completed so this is no longer a position in the Fund’s portfolio.
Altair Engineering is a leading provider of engineering software used across the entire product lifecycle from design toin-service operations. The company operates in attractive end markets (e.g. computer-aided engineering (CAE), high-performance computing, business analytics, and Internet of Things) that are experiencing increasing demand as products become more complex and design times have shortened. We believe the company can grow revenue12-13% annually over the next five years, led bymid-teens
25
POLEN U.S. SMALL COMPANY GROWTH FUND
Annual Investment Adviser’s Report
April 30, 2019
(Unaudited)
software sales and the company’s continuing efforts to invest in its global sales force. The company can double operating margins during this period through its ongoing positive mix shift and by leveraging operating expenses.
We sold out of our position in WageWorks during the period. We were originally attracted to WageWorks because of its footprint as the largest national administrator with a comprehensive portfolio of consumer-directed benefit plans. We believed that its scale and breadth would be more attractive to large corporations rolling out employee benefit programs nationally to help to offset their increasing share ofout-of-pocket healthcare costs. Last year, the company announced it would be conducting an internal investigation into its financial reporting and revenue recognition, alongside significant management changes. After some patience, we concluded that it was time to move on. We were uncomfortable with thenear-to-medium term uncertainty and opacity of the business’s performance. We determined that we had better opportunities in companies with similar return profiles and less risk.
We sold out of our position in Prestige Consumer Healthcare, the marketer and distributor of many well-knownover-the-counter healthcare brands including Monistat, Clear Eyes, Luden’s, DenTek and Debrox, among others. The firm has considerable exposure to the drug store and regional grocery channels, each of which are experiencing challenges that have led to inventory destocking that we believe could potentially be ongoing as these stores cede share toe-commerce and to the mass and dollar channels. While we feel Prestige is well-positioned in the dollar channels, its positioning online is not as established and the company’s success in this channel is harder for us to predict. We are concerned thate-commerce is threatening brand loyalty in the categories that Prestige serves. This drove us to sell out of our position.
We exited our position in Nutrisystem on the announcement that the company was being acquired by Tivity Health for a combination of cash and stock, which valued the company at roughly $47 per share. We believe Nutrisystem’s management could have created more value, continuing to build their business independently. After analyzing the dynamics of the deal, we decided it was best to sell the position right away and use the opportunistic market environment to redeploy the cash in companies that, in our view, had a better risk/reward profile and better expected returns.
The fundamental growth prospects for the companies in our portfolio continue to remain excellent, in our view. We do not know exactly how the macro economy will play out, but we believe the businesses we own are positioned to continue to do well in any scenario. We believe that owning a concentrated portfolio of the best businesses with potential to achieve our expected return targets gives us the best chance to compound long-term returns. We continue to focus on companies that are uniquely positioned, have a repeatable sales process, a robust earnings and cash flow model, and effective management teams who are making value-creating reinvestments – we feel these characteristics are what drive sustainable growth and persistently high returns on capital over the long term.
26
POLEN U.S. SMALL COMPANY GROWTH FUND
Annual Investment Adviser’s Report
April 30, 2019
(Unaudited)
This letter is intended to assist shareholders in understanding how the Fund performed during the fiscal period ended April 30, 2019 and reflects the views of the investment adviser at the time of this writing. Of course, these views may change and do not guarantee the future performance of the Fund or the markets.
Portfolio composition is subject to change. The current and future portfolio holdings of the Fund are subject to investment risk. The investment return and principal value of an investment in the Fund will fluctuate so that an investor’s shares, when redeemed, may be worth more or less than their original cost.
27
POLEN U.S. SMALL COMPANY GROWTH FUND
Annual Report
Performance Data
April 30, 2019
(Unaudited)
Comparison of Change in Value of $100,000 (investment minimum) Investment in
Polen U.S. Small Company Growth Fund Institutional Class Shares
vs Russell 2000® Growth Index
| Average Annual Total Returns for the Periods Ended April 30, 2019 | ||||
| 1 Year | Since Inception* | |||
Institutional Class | 21.94% | 15.77% | ||
Russell 2000®Growth Index | 6.91% | 8.35%** | ||
| * | The Polen U.S. Small Company Growth Fund (the “Fund”) Institutional Class Shares commenced operations on November 1, 2017. |
| ** | Benchmark performance is from commencement date of the Fund Class (November 1, 2017) only and is not the commencement date of the benchmark itself. |
The performance data quoted represents past performance and does not guarantee future results. Current performance may be lower or higher. Performance data current to the most recentmonth-end may be obtained by calling (888)678-6024. The investment return and principal value of an investment will fluctuate so that shares, when redeemed, may be worth more or less than their original cost. The graph and table do not reflect the deduction of taxes that a shareholder would pay on Fund distributions or the redemption of Fund shares.
28
POLEN U.S. SMALL COMPANY GROWTH FUND
Annual Report
Performance Data
April 30, 2019
(Unaudited)
Comparison of Change in Value of $100,000 (investment minimum) Investment in
Polen U.S. Small Company Growth Fund Investor Class Shares
vs Russell 2000® Growth Index
| Total Returns for the Period Ended April 30, 2019 | ||
| Since Inception*† | ||
Investor Class | 7.63% | |
Russell 2000®Growth Index | 6.62%** | |
| † | Not Annualized. |
| * | The Polen U.S. Small Company Growth Fund (the “Fund”) Investor Class Shares commenced operations on February 8, 2019. |
| ** | Benchmark performance is from commencement date of the Fund Class (February 8, 2019) only and is not the commencement date of the benchmark itself. |
The performance data quoted represents past performance and does not guarantee future results. Current performance may be lower or higher. Performance data current to the most recentmonth-end may be obtained by calling (888)678-6024. The investment return and principal value of an investment will fluctuate so that shares, when redeemed, may be worth more or less than their original cost. The graph and table do not reflect the deduction of taxes that a shareholder would pay on Fund distributions or the redemption of Fund shares.
The Fund’s “Total Annual Fund Operating Expenses” and “Total Annual Fund Operating Expenses After Fee Waiver and/or Expense Reimbursement,” as stated in the current prospectus dated September 1, 2018, are 7.51% and 1.25%, respectively, for the Institutional Class shares and 7.76% and 1.50%, respectively, for the Investor Class shares of the Fund’s average daily net assets, which may differ from the actual expenses incurred by the Fund for the period covered by this report. Polen Capital Management, LLC (“PCM” or the “Adviser”) has contractually agreed to reduce its investment advisory fee and/or reimburse certain expenses of the Fund to the extent necessary to
29
POLEN U.S. SMALL COMPANY GROWTH FUND
Annual Report
Performance Data
April 30, 2019
(Unaudited)
ensure that the Fund’s total operating expenses (excluding taxes, fees and expenses attributable to a distribution or service plan adopted by the Trust, interest, extraordinary items, “Acquired Fund Fees and Expenses” and brokerage commissions) do not exceed 1.25% (on an annual basis) with respect to the Fund’s average daily net assets (the “Expense Limitation”). The Expense Limitation will remain in place until August 31, 2019 unless the Board of Trustees (“Board of Trustees”) of FundVantage Trust (the “Trust”) approves its earlier termination. The Adviser is entitled to recover, subject to approval by the Board of Trustees, such amounts reduced or reimbursed for a period of up to three (3) years from the date on which the Adviser reduced its compensation and/or assumed expenses for the Fund. The Adviser is permitted to seek reimbursement from the Fund, for fees it waived and Fund expenses it paid to the extent the total annual fund expenses do not exceed the limits described above or any lesser limits in effect at the time of reimbursement. No reimbursement will occur unless the Fund’s expenses are below the Expense Limitation amount. Total returns would be lower had such fees and expenses not been waived and/or reimbursed.
A 2.00% redemption fee applies to shares redeemed within 60 days of purchase. This redemption fee is not reflected in the returns shown above.
The Fund intends to evaluate performance as compared to that of the Russell 2000® Growth Index, which is an unmanaged index measuring the performance of the 2,000 smallest companies in the Russell 3000® Index, which is made up of 3,000 of the biggest U.S. stocks. It is impossible to invest directly in an index.
All mutual fund investing involves risk, including possible loss of principal. The Fund isnon-diversified, which means that a large portion of the Fund’s assets may be invested in one or few companies or sectors. The Fund could fluctuate in value more than a diversified fund. The Fund invests in securities of small-capitalization companies, which may be subject to more abrupt or erratic market movements than securities of larger, more established companies. Small-capitalization companies may have limited product lines or financial resources, or may be dependent upon a small or inexperienced management group. Securities of small-capitalization companies may trade less frequently and in lower volumes than the securities of larger companies, which could lead to higher transaction costs. The Fund is a recently formed mutual fund and has a limited history of operations.
30
POLEN INTERNATIONAL SMALL COMPANY GROWTH FUND
Annual Investment Adviser’s Report
April 30, 2019
(Unaudited)
Performance Summary:
| • | The Polen International Small Company Growth Fund (the “Fund”) launched December 31, 2018 and the inaugural letter will review the period since inception to April 30, 2019. |
| • | For this approximately four-month period, the Fund’s institutional share class returned 19.30% net of fees versus the MSCI All Country World®Index (“ACWI”)(ex-USA Small Cap) which returned 12.70%. |
The performance data quoted represents past performance and is not a guarantee of future results. Investment return and principal value of an investment will fluctuate so that an investor’s shares, when redeemed, may be worth more or less than their original cost. Current performance may be lower or higher than the performance information quoted. To obtain performance information current to the most recentmonth-end, please call1-888678-6024.
Performance Review:
Compugroup Medical,Globant, andHalmawere the top contributors to absolute returns.
CompuGroup Medical develops software for doctors. The company has strong market share in Germany, France, Italy, Netherlands, and Spain. Retention rates are in the high 98 – 99% range depending on the product. This high visibility on cash flow allows Compugroup tore-invest in new geographies and to develop products in the future. Furthermore, its history of capital allocation over the last10-15 years is impressive with acquisitions that have strengthened the enterprise.
Halma has four distinct businesses. It makes products designed to protect people in various circumstances, such as devices for hazardous gas detection, corrosion monitoring, and infrastructure safety (including elevator safety and security solutions), as well as medical products that assist with eye surgery and sensor technologies, and sensors within environmental use cases. Within all these segments and products, Halma is the local leader and has strong market share in these niche areas. The high market share allows them to take healthy price increases. With these returns, Halma reinvests in R&D to make the enterprise stronger. Lastly, the firm has an exceptional track record in capital allocation with thoughtful M&A. Equally important, its culture is strong, which became clear during a visit to its headquarters in Amersham, UK last year. Halma has a decentralized approach which allows for nimble decision making, and its view on talent is forward-thinking.
Globant provides information technology services to companies undergoing a digital transformation. Globant is a pure play consulting firm in the digital arena that aids corporations as they adopt new technologies such as the cloud, artificial intelligence, and machine learnings. The company has a unique culture that allows them to be nimble and scale effectively. The total addressable market appears vast for its capabilities and we believe revenue growth of 20% or more is highly achievable. Increasingly, the company is successfully cross-selling capabilities to large existing clients. We believe this growth coupled with meaningful margin leverage could deliver compelling returns for the foreseeable future.
31
POLEN INTERNATIONAL SMALL COMPANY GROWTH FUND
Annual Investment Adviser’s Report
April 30, 2019
(Unaudited)
Conversely,LivanovaandM Dias Brancodetracted from performance during the period.
LivaNova is a medical device manufacturer focusing on the head and heart. The company has dominant share in niche markets and has a history of strong innovation. Recently, the company’s position within neuromodulation is in question from potential disruption via a new drug. LivaNova’s total addressable market in this key segment has been lessened. Understandably, the stock sold off materially as investors priced in this new and material risk.
M Dias Branco underperformed during the period. Drivers of the underperformance appear related to commodity inflation and its impact on gross margins. Wheat and other key inputs rise and fall, and history has shown that M Dias Branco has brands with robust distribution where they can recoup commodity inflation over time. Said differently, this appears to be largely a timing issue. Another reason for the stock’s underperformance may be related to tough macro conditions in Brazil. We feel that the company is taking the right steps to make the enterprise strong during this period, and have observed material gains in market share in key segments and thoughtful pricing strategies. Over the long-term, we feel the company has proven that they constantly innovate, thoughtfully enter adjacent categories, improve distribution of its products, invest in advertising to raise awareness of its brands, and seize opportunistically on acquisitions.
Portfolio Activity:
The investment philosophy of International Small Company Growth is consistent with all Polen Capital strategies. We look for high quality companies that have a clear competitive advantage and have the potential to compound their value at amid-teen level through an economic cycle for the foreseeable future. We believe the high-quality nature of these companies may have the ability to preserve capital in difficult market conditions given resilient business models and low leverage.
We made few changes to the Fund’s portfolio during the period, initiating a position inMorneau Shepelland sellingScout24.
Morneau Shepell is a Canadian-based human resource consulting and technology provider that is classified as an industrial. The company’s lines of business include Employee Support Solutions (~46% of sales), Administrative Solutions (~30%), Health & Benefit Consulting and Retirement Solutions (~15%), and Absence Management (~9%). Its services provide employees with supportive resources in personal contexts (such as child care, college counseling, major life events, trauma, gambling, and addiction) and with more technical resources for employers that Morneau Shepell can execute with expertise and at a lower cost (such as pension administration and related activities). On the employer side, its services aim to increase productivity, improve engagement, lower cost, and manage risk better. We believe that the company has a uniquely positioned product and service, repeatable sales process, robust earnings and cash flow, and strong management with a history of value creatingre-investment.
32
POLEN INTERNATIONAL SMALL COMPANY GROWTH FUND
Annual Investment Adviser’s Report
April 30, 2019
(Unaudited)
We soldScout24.The company received atake-out offer from a consortium of private equity and we elected to sell our equity ownership upon news of this offer.
The investment philosophy of the Fund is consistent with all Polen Capital strategies. We look for high quality companies that have a clear competitive advantage and have the potential to compound their value at amid-teens level though a cycle for the foreseeable future.
Like all Polen Capital strategies, the Fund is concentrated. While we are consistently analyzing new businesses, there simply are not an overabundance of companies that meet our high standards for ownership. We do not believe our shareholders would benefit if we lowered these standards and believe concentration with the goal of providing attractive returns and capital preservation can lead to better returns for our investors. Our 71st idea is never as good as the 5th.
We act and think like owners. Our buy and sell process reflects this way of thinking. And our turnover will be low.
This letter is intended to assist shareholders in understanding how the Fund performed during the period ended April 30, 2019 and reflects the views of the investment adviser at the time of this writing. Of course, these views may change and do not guarantee the future performance of the Fund or the markets.
Portfolio composition is subject to change. The current and future portfolio holdings of the Fund are subject to investment risk. The investment return and principal value of an investment in the Fund will fluctuate so that an investor’s shares, when redeemed, may be worth more or less than their original cost.
33
POLEN INTERNATIONAL SMALL COMPANY GROWTH FUND
Annual Report
Performance Data
April 30, 2019
(Unaudited)
Comparison of Change in Value of $100,000 (investment minimum) Investment in
Polen International Small Company Growth Fund Institutional Class Shares
vs MSCI All Country World® Index (“ACWI”)(ex-USA Small Cap)
| Total Returns for the Period Ended April 30, 2019 | ||
| Since Inception*† | ||
Institutional Class | 19.30% | |
MSCI All Country World®Index (“ACWI”) | ||
(ex-USA Small Cap) | 12.70%** | |
| † | Not Annualized. |
| * | The Polen International Small Company Growth Fund (the “Fund”) Institutional Class Shares commenced operations on December 31, 2018. |
| ** | Benchmark performance is from commencement date of the Fund Class (December 31, 2018) only and is not the commencement date of the benchmark itself. |
The performance data quoted represents past performance and does not guarantee future results. Current performance may be lower or higher. Performance data current to the most recentmonth-end may be obtained by calling (888)678-6024. The investment return and principal value of an investment will fluctuate so that shares, when redeemed, may be worth more or less than their original cost. The graph and table do not reflect the deduction of taxes that a shareholder would pay on Fund distributions or the redemption of Fund shares.
34
POLEN INTERNATIONAL SMALL COMPANY GROWTH FUND
Annual Report
Performance Data
April 30, 2019
(Unaudited)
Comparison of Change in Value of $10,000 Investment in
Polen International Small Company Growth Fund Investor Class Shares
vs MSCI All Country World® Index (“ACWI”)(ex-USA Small Cap)
| Total Returns for the Period Ended April 30, 2019 | ||
| Since Inception*† | ||
Investor Class | 10.27% | |
MSCI All Country World®Index (“ACWI”) | ||
(ex-USA Small Cap) | 4.14%** | |
| † | Not Annualized. |
| * | The Polen International Small Company Growth Fund (the “Fund”) Investor Class Shares commenced operations on February 8, 2019. |
| ** | Benchmark performance is from commencement date of the Fund Class (February 8, 2019) only and is not the commencement date of the benchmark itself. |
The performance data quoted represents past performance and does not guarantee future results. Current performance may be lower or higher. Performance data current to the most recentmonth-end may be obtained by calling (888)678-6024. The investment return and principal value of an investment will fluctuate so that shares, when redeemed, may be worth more or less than their original cost. The graph and table do not reflect the deduction of taxes that a shareholder would pay on Fund distributions or the redemption of Fund shares.
The Fund’s “Total Annual Fund Operating Expenses” and “Total Annual Fund Operating Expenses After Fee Waiver and/or Expense Reimbursement,” as stated in the current prospectus dated December 28, 2018, are 1.40% and 1.25%, respectively, for the Institutional Class shares and 1.65% and 1.50%, respectively, for the Investor Class shares of the Fund’s average daily net assets, which may differ from the actual expenses incurred by the Fund for the period covered by this report. Polen Capital Management, LLC (“PCM” or the “Adviser”) has contractually agreed to reduce its investment advisory fee and/or reimburse certain expenses of the Fund to the extent necessary to
35
POLEN INTERNATIONAL SMALL COMPANY GROWTH FUND
Annual Report
Performance Data
April 30, 2019
(Unaudited)
ensure that the Fund’s total operating expenses (excluding taxes, fees and expenses attributable to a distribution or service plan adopted by the Trust, interest, extraordinary items, “Acquired Fund Fees and Expenses” and brokerage commissions) do not exceed 1.25% (on an annual basis) with respect to the Fund’s average daily net assets (the “Expense Limitation”). The Expense Limitation will remain in place until August 31, 2020 unless the Board of Trustees (“Board of Trustees”) of FundVantage Trust (the “Trust”) approves its earlier termination. The Adviser is entitled to recover, subject to approval by the Board of Trustees, such amounts reduced or reimbursed for a period of up to three (3) years from the date on which the Adviser reduced its compensation and/or assumed expenses for the Fund. The Adviser is permitted to seek reimbursement from the Fund, for fees it waived and Fund expenses it paid to the extent the total annual fund expenses do not exceed the limits described above or any lesser limits in effect at the time of reimbursement. No recoupment will occur unless the Fund’s expenses are below the Expense Limitation amount. Total returns would be lower had such fees and expenses not been waived and/or reimbursed.
A 2.00% redemption fee applies to shares redeemed within 60 days of purchase. This redemption fee is not reflected in the returns shown above.
The Fund intends to evaluate performance as compared to that of the MSCI ACWI(ex-USA Small Cap), which captures small cap representation across 22 of 23 Developed Markets (DM) countries (excluding the US) and 24 Emerging Markets (EM) countries. With 4,108 constituents, the index covers approximately 14% of the global equity opportunity set outside the US. Indexes are unmanaged and it is not possible to invest directly in an index.
All mutual fund investing involves risk, including possible loss of principal. The Fund isnon-diversified, which means that a large portion of the Fund’s assets may be invested in one or few companies or sectors. The Fund could fluctuate in value more than a diversified fund. Investing in foreign securities entails special risks, such as fluctuations in currency exchange rates and possible lax regulation of securities markets and accounting practices.
The Fund may invest a substantial amount of its assets in issuers located in a limited number of countries. If the Fund concentrates its investments in this manner, it assumes the risk that economic, political and social conditions in those countries will have a significant impact on its investment performance. The Fund’s investment performance may also be more volatile if it concentrates its investments in certain countries, especially emerging market countries.
36
POLEN GROWTH FUNDS
Funds Expense Disclosure
April 30, 2019
(Unaudited)
As a shareholder of the Fund(s), you incur two types of costs: (1) transaction costs, including redemption fees; and (2) ongoing costs, including management fees, distribution and/or service (Rule12b-1) fees (if any) and other Fund expenses. These examples are intended to help you understand your ongoing costs (in dollars) of investing in the Fund(s) and to compare these costs with the ongoing costs of investing in other mutual funds.
These examples are based on an investment of $1,000 invested at the beginning of thesix-month period from November 1, 2018 through April 30, 2019 and held for the entire period.
Actual Expenses
The first line of each accompanying table provides information about actual account values and actual expenses. You may use the information in this line, together with the amount you invested, to estimate the expenses that you paid over the period. Simply divide your account value by $1,000 (for example, an $8,600 account value divided by $1,000 = 8.6), then multiply the result by the number in the first line under the heading entitled “Expenses Paid During Period” to estimate the expenses you paid on your account during this period.
Hypothetical Examples for Comparison Purposes
The second line of each accompanying table provides information about hypothetical account values and hypothetical expenses based on a Fund’s actual expense ratio and an assumed rate of return of 5% per year before expenses, which is not your Fund’s actual return. The hypothetical account values and expenses may not be used to estimate the actual ending account balance or expenses you paid for the period. You may use this information to compare the ongoing costs of investing in the Fund(s) and other funds. To do so, compare these 5% hypothetical examples with the 5% hypothetical examples that appear in the shareholder reports of other funds.
Please note that the expenses shown in the accompanying table are meant to highlight your ongoing costs only and do not reflect any transactional costs, such as redemption fees. Therefore, each hypothetical line of the accompanying table is useful in comparing ongoing costs only and will not help you determine the relative total costs of owning different funds. In addition, if these transactional costs were included, your costs would have been higher.
37
POLEN GROWTH FUNDS
Funds Expense Disclosure
April 30, 2019
(Unaudited)
| Polen Growth Fund | |||||||||||||||
| Beginning Account Value November 1, 2018 | Ending Account Value April 30, 2019 | Expenses Paid During Period | |||||||||||||
Institutional Class* | |||||||||||||||
Actual | $1,000.00 | $1,166.80 | $5.48 | ||||||||||||
Hypothetical (5% return before expenses) | 1,000.00 | 1,019.74 | 5.11 | ||||||||||||
Investor Class* | |||||||||||||||
Actual | $1,000.00 | $1,165.40 | $6.82 | ||||||||||||
Hypothetical (5% return before expenses) | 1,000.00 | 1,018.50 | 6.36 | ||||||||||||
| Polen Global Growth Fund | |||||||||||||||
| Beginning Account Value November 1, 2018 | Ending Account Value April 30, 2019 | Expenses Paid During Period | |||||||||||||
Institutional Class** | |||||||||||||||
Actual | $1,000.00 | $1,176.00 | $5.93 | ||||||||||||
Hypothetical (5% return before expenses) | 1,000.00 | 1,019.34 | 5.51 | ||||||||||||
Investor Class** | |||||||||||||||
Actual | $1,000.00 | $1,174.10 | $7.28 | ||||||||||||
Hypothetical (5% return before expenses) | 1,000.00 | 1,018.10 | 6.76 | ||||||||||||
| Polen International Growth Fund | |||||||||||||||
| Beginning Account Value November 1, 2018 | Ending Account Value April 30, 2019 | Expenses Paid During Period | |||||||||||||
Institutional Class*** | |||||||||||||||
Actual | $1,000.00 | $1,120.50 | $5.78 | ||||||||||||
Hypothetical (5% return before expenses) | 1,000.00 | 1,019.34 | 5.51 | ||||||||||||
Investor Class*** | |||||||||||||||
Actual | $1,000.00 | $1,118.90 | $7.09 | ||||||||||||
Hypothetical (5% return before expenses) | 1,000.00 | 1,018.10 | 6.76 | ||||||||||||
38
POLEN GROWTH FUNDS
Funds Expense Disclosure
April 30, 2019
(Unaudited)
| Polen U.S. Small Company Growth Fund | |||||||||||||||
| Beginning Account Value November 1, 2018 | Ending Account Value April 30, 2019 | Expenses Paid During Period | |||||||||||||
Institutional Class**** | |||||||||||||||
Actual | $ | 1,000.00 | $ | 1,171.20 | $ | 6.73 | |||||||||
Hypothetical (5% return before expenses) | 1,000.00 | 1,018.60 | 6.26 | ||||||||||||
Investor Class***** | |||||||||||||||
Actual | $ | 1,000.00 | $ | 1,076.30 | $ | 3.46 | |||||||||
Hypothetical (5% return before expenses) | 1,000.00 | 1,017.36 | 7.50 | ||||||||||||
| Polen International Small Company Growth Fund | |||||||||||||||
| Beginning Account Value November 1, 2018 | Ending Account Value April 30, 2019 | Expenses Paid During Period | |||||||||||||
Institutional Class****** | |||||||||||||||
Actual | $ | 1,000.00 | $ | 1,193.00 | $ | 4.51 | |||||||||
Hypothetical (5% return before expenses) | 1,000.00 | 1,018.60 | 6.26 | ||||||||||||
Investor Class******* | |||||||||||||||
Actual | $ | 1,000.00 | $ | 1,102.70 | $ | 3.50 | |||||||||
Hypothetical (5% return before expenses) | 1,000.00 | 1,017.36 | 7.50 | ||||||||||||
| * | Expenses are equal to an annualized expense ratio for thesix-month period ended April 30, 2019 of 1.02% for Institutional Class and 1.27% for Investor Class, multiplied by the average account value over the period, multiplied by the number of days in the most recent period (181), then divided by 365 to reflect the period. The Fund’s ending account values on the first line of each table are based on the actualsix-month total returns for the Fund of 16.68% and 16.54% for Institutional Class and Investor Class, respectively. |
| ** | Expenses are equal to an annualized expense ratio for thesix-month period ended April 30, 2019 of 1.10% for Institutional Class and 1.35% for Investor Class, multiplied by the average account value over the period, multiplied by the number of days in the most recent period (181), then divided by 365 to reflect the period. The Fund’s ending account values on the first line of each table are based on the actualsix-month total returns for the Fund of 17.60% and 17.41% for Institutional Class and Investor Class, respectively. |
| *** | Expenses are equal to an annualized expense ratio for thesix-month period ended April 30, 2019 of 1.10% for Institutional Class and 1.35% for Investor Class, multiplied by the average account value over the period, multiplied by the number of days in the most recent period (181), then divided by 365 to reflect the period. The Fund’s ending account values on the first line of each table are based on the actualsix-month total returns for the Fund of 12.05% and 11.89% for Institutional Class and Investor Class, respectively. |
| **** | Expenses are equal to an annualized expense ratio for thesix-month period ended April 30, 2019 of 1.25% for Institutional Class multiplied by the average account value over the period, multiplied by the number of days |
39
POLEN GROWTH FUNDS
Funds Expense Disclosure (Concluded)
April 30, 2019
(Unaudited)
in the most recent period (181), then divided by 365 to reflect the period. The Fund’s ending account values on the first line of each table are based on the actualsix-month total returns for the Fund of 17.12% Institutional Class.
| ***** | Expenses are equal to an annualized expense ratio for the period beginning February 8, 2019, commencement of operations, to April 30, 2019 of 1.50% for Investor Class, multiplied by the average account value over the period, multiplied by the number of days in the most recent period (81), then divided by 365 to reflect the period. The Fund’s ending account values on the first line of each table are based on the actualsix-month total returns for the Fund of 7.63% Investor Class. For comparative purposes, the Hypothetical expenses are as if the Investor Class had been in existence from November 1, 2018, and are equal to the Investor Class annualized expense ratio, multiplied by the average account value over the period, multiplied by the number of days in the most recentsix-month period (181), then divided by 365 to reflect the period. |
| ****** | Expenses are equal to an annualized expense ratio for the period beginning December 31, 2018, commencement of operations, to April 30, 2019 of 1.25% for Institutional Class multiplied by the average account value over the period, multiplied by the number of days in the most recent period (120), then divided by 365 to reflect the period. The Fund’s ending account values on the first line of each table are based on the actualsix-month total returns for the Fund of 19.30% Institutional Class. For comparative purposes, the Hypothetical expenses are as if the Institutional Class had been in existence from November 1, 2018, and are equal to the Institutional Class annualized expense ratio, multiplied by the average account value over the period, multiplied by the number of days in the most recentsix-month period (181), then divided by 365 to reflect the period. |
| ******* | Expenses are equal to an annualized expense ratio for the period beginning February 8, 2019, commencement of operations, to April 30, 2019 of 1.50% for Investor Class, multiplied by the average account value over the period, multiplied by the number of days in the most recent period (81), then divided by 365 to reflect the period. The Fund’s ending account values on the first line of each table are based on the actualsix-month total returns for the Fund of 10.27% Investor Class. For comparative purposes, the Hypothetical expenses are as if the Investor Class had been in existence from November 1, 2018, and are equal to the Institutional Class annualized expense ratio, multiplied by the average account value over the period, multiplied by the number of days in the most recentsix-month period (181), then divided by 365 to reflect the period. |
40
POLEN GROWTH FUND
Portfolio Holdings Summary Table
April 30, 2019
(Unaudited)
The following table presents a summary by industry of the portfolio holdings of the Fund:
| % of Net Assets | Value | |||||||
COMMON STOCKS: | ||||||||
Credit Services | 15.7 | % | $ | 577,467,029 | ||||
Internet Content & Information | 15.3 | 560,344,211 | ||||||
Software Infrastructure | 12.8 | 469,788,753 | ||||||
Information Technology Services | 8.3 | 302,773,070 | ||||||
Software Application | 6.0 | 218,926,383 | ||||||
Footwear & Accessories | 5.0 | 181,829,179 | ||||||
Drug Manufacturers - Specialty & Generic | 4.7 | 172,244,538 | ||||||
Business Services | 4.7 | 170,809,758 | ||||||
Discount Stores | 4.4 | 163,211,779 | ||||||
Restaurants | 3.9 | 144,549,430 | ||||||
Medical Devices | 3.7 | 136,315,599 | ||||||
Specialty Retail | 3.6 | 133,310,018 | ||||||
Packaged Foods | 3.2 | 118,015,937 | ||||||
Biotechnology | 2.5 | 91,038,130 | ||||||
Leisure | 1.9 | 70,298,556 | ||||||
Other Assets In Excess of Liabilities | 4.3 | 156,528,881 | ||||||
|
|
|
| |||||
NET ASSETS | 100.0 | % | $ | 3,667,451,251 | ||||
|
|
|
| |||||
Portfolio holdings are subject to change at any time.
The accompanying notes are an integral part of the financial statements.
41
POLEN GROWTH FUND
Portfolio of Investments
April 30, 2019
| Number of Shares | Value | |||||||
COMMON STOCKS — 95.7% |
| |||||||
Biotechnology — 2.5% |
| |||||||
Regeneron Pharmaceuticals, Inc.* | 265,309 | $ | 91,038,130 | |||||
|
| |||||||
Business Services — 4.7% |
| |||||||
Automatic Data Processing, Inc. | 1,039,052 | 170,809,758 | ||||||
|
| |||||||
Credit Services — 15.7% |
| |||||||
Mastercard, Inc., Class A | 729,929 | 185,577,149 | ||||||
PayPal Holdings, Inc.* | 1,196,623 | 134,943,176 | ||||||
Visa, Inc., Class A | 1,562,651 | 256,946,704 | ||||||
|
| |||||||
| 577,467,029 | ||||||||
|
| |||||||
Discount Stores — 4.4% |
| |||||||
Dollar General Corp. | 1,294,407 | 163,211,779 | ||||||
|
| |||||||
Drug Manufacturers - Specialty & Generic — 4.7% |
| |||||||
Zoetis, Inc. | 1,691,325 | 172,244,538 | ||||||
|
| |||||||
Footwear & Accessories — 5.0% |
| |||||||
NIKE, Inc., Class B | 2,070,240 | 181,829,179 | ||||||
|
| |||||||
Information Technology Services — 8.3% |
| |||||||
Accenture PLC, Class A | 942,407 | 172,149,487 | ||||||
Gartner, Inc.* | 821,687 | 130,623,583 | ||||||
|
| |||||||
| 302,773,070 | ||||||||
|
| |||||||
Internet Content & Information — 15.3% |
| |||||||
Alphabet, Inc., Class A* | 66,797 | 80,086,931 | ||||||
Alphabet, Inc., Class C* | 181,444 | 215,642,565 | ||||||
Facebook, Inc., Class A* | 1,368,225 | 264,614,715 | ||||||
|
| |||||||
| 560,344,211 | ||||||||
|
| |||||||
Leisure — 1.9% |
| |||||||
Booking Holdings, Inc.* | 37,897 | 70,298,556 | ||||||
|
| |||||||
| Number of Shares | Value | |||||||
COMMON STOCKS — (Continued) |
| |||||||
Medical Devices — 3.7% |
| |||||||
Align Technology, Inc.* | 419,846 | $ | 136,315,599 | |||||
|
| |||||||
Packaged Foods — 3.2% |
| |||||||
Nestle SA, SP ADR | 1,222,583 | 118,015,937 | ||||||
|
| |||||||
Restaurants — 3.9% |
| |||||||
Starbucks Corp. | 1,860,832 | 144,549,430 | ||||||
|
| |||||||
Software Application — 6.0% |
| |||||||
Adobe, Inc.* | 756,876 | 218,926,383 | ||||||
|
| |||||||
Software Infrastructure — 12.8% |
| |||||||
Microsoft Corp. | 2,579,820 | 336,924,492 | ||||||
Oracle Corp. | 2,401,306 | 132,864,261 | ||||||
|
| |||||||
| 469,788,753 | ||||||||
|
| |||||||
Specialty Retail — 3.6% | ||||||||
O’Reilly Automotive, Inc.* | 352,141 | 133,310,018 | ||||||
|
| |||||||
TOTAL COMMON STOCKS | 3,510,922,370 | |||||||
|
| |||||||
TOTAL INVESTMENTS - 95.7% | 3,510,922,370 | |||||||
OTHER ASSETS IN EXCESS OF LIABILITIES - 4.3% | 156,528,881 | |||||||
|
| |||||||
NET ASSETS - 100.0% | $ | 3,667,451,251 | ||||||
|
| |||||||
| * | Non-income producing. |
PLC | Public Limited Corporation | |
SP ADR | Sponsored American Depository Receipt |
The accompanying notes are an integral part of the financial statements.
42
POLEN GLOBAL GROWTH FUND
Portfolio Holdings Summary Table
April 30, 2019
(Unaudited)
The following table presents a summary by industry of the portfolio holdings of the Fund:
| % of Net Assets | Value | |||||||
COMMON STOCKS: | ||||||||
Software | 19.1 | % | $ | 15,254,973 | ||||
Information Technology Services | 17.6 | 14,006,162 | ||||||
Interactive Media & Services | 14.5 | 11,578,573 | ||||||
Textiles, Apparel & Luxury Goods | 9.1 | 7,223,653 | ||||||
Health Care Equipment & Supplies | 7.2 | 5,760,699 | ||||||
Biotechnology | 5.0 | 3,951,959 | ||||||
Specialty Retail | 4.4 | 3,517,457 | ||||||
Internet & Direct Marketing Retail | 4.3 | 3,396,859 | ||||||
Pharmaceuticals | 4.2 | 3,376,128 | ||||||
Hotels, Restaurants & Leisure | 3.5 | 2,800,209 | ||||||
Food Products | 2.6 | 2,100,875 | ||||||
Professional Services | 2.3 | 1,868,094 | ||||||
Household Products | 1.7 | 1,344,424 | ||||||
Other Assets In Excess of Liabilities | 4.5 | 3,565,479 | ||||||
|
|
|
| |||||
NET ASSETS | 100.0 | % | $ | 79,745,544 | ||||
|
|
|
| |||||
Portfolio holdings are subject to change at any time.
The accompanying notes are an integral part of the financial statements.
43
POLEN GLOBAL GROWTH FUND
Portfolio of Investments
April 30, 2019
| Number of Shares | Value | |||||||
COMMON STOCKS — 95.5% |
| |||||||
Australia — 3.1% | ||||||||
CSL, Ltd. | 17,837 | $ | 2,501,850 | |||||
|
| |||||||
China — 9.4% | ||||||||
Alibaba Group Holding, Ltd., SP ADR* | 18,305 | 3,396,859 | ||||||
Tencent Holdings, Ltd. | 83,020 | 4,091,862 | ||||||
|
| |||||||
| 7,488,721 | ||||||||
|
| |||||||
Denmark — 2.8% | ||||||||
Coloplast A/S, Class B | 13,545 | 1,463,151 | ||||||
Novo Nordisk A/S, SP ADR | 15,633 | 766,173 | ||||||
|
| |||||||
| 2,229,324 | ||||||||
|
| |||||||
France — 1.7% | ||||||||
EssilorLuxottica SA | 11,544 | 1,406,510 | ||||||
|
| |||||||
Germany — 10.1% | ||||||||
adidas AG | 11,686 | 3,010,184 | ||||||
SAP SE | 23,936 | 3,085,560 | ||||||
Siemens Healthineers AG | 45,900 | 1,964,722 | ||||||
|
| |||||||
| 8,060,466 | ||||||||
|
| |||||||
Ireland — 3.8% | ||||||||
Accenture PLC, Class A | 16,476 | 3,009,671 | ||||||
|
| |||||||
Spain — 1.6% | ||||||||
Industria De Diseno Textil SA | 42,240 | 1,278,973 | ||||||
|
| |||||||
Switzerland — 5.0% | ||||||||
Nestle SA, Registered Shares | 21,821 | 2,100,875 | ||||||
SGS SA, Registered Shares | 708 | 1,868,094 | ||||||
|
| |||||||
| 3,968,969 | ||||||||
|
| |||||||
United Kingdom — 1.7% | ||||||||
Reckitt Benckiser Group PLC | 16,617 | 1,344,424 | ||||||
|
| |||||||
| Number of Shares | Value | |||||||
COMMON STOCKS — (Continued) |
| |||||||
United States — 56.3% | ||||||||
Adobe, Inc.* | 18,865 | $ | 5,456,701 | |||||
Align Technology, Inc.* | 7,185 | 2,332,826 | ||||||
Alphabet, Inc., Class C* | 3,802 | 4,518,601 | ||||||
Automatic Data Processing, Inc. | 16,757 | 2,754,683 | ||||||
Facebook, Inc., Class A* | 15,347 | 2,968,110 | ||||||
Mastercard, Inc., Class A | 16,757 | 4,260,300 | ||||||
Microsoft Corp. | 40,125 | 5,240,325 | ||||||
NIKE, Inc., Class B | 31,959 | 2,806,959 | ||||||
Oracle Corp. | 26,611 | 1,472,387 | ||||||
O’Reilly Automotive, Inc.* | 5,913 | 2,238,484 | ||||||
Regeneron Pharmaceuticals, Inc.* | 4,226 | 1,450,109 | ||||||
Starbucks Corp. | 36,048 | 2,800,209 | ||||||
Visa, Inc., Class A | 24,214 | 3,981,508 | ||||||
Zoetis, Inc. | 25,628 | 2,609,955 | ||||||
|
| |||||||
| 44,891,157 | ||||||||
|
| |||||||
TOTAL COMMON STOCKS |
| 76,180,065 | ||||||
|
| |||||||
TOTAL INVESTMENTS - 95.5% | 76,180,065 | |||||||
OTHER ASSETS IN EXCESS OF LIABILITIES - 4.5% | 3,565,479 | |||||||
|
| |||||||
NET ASSETS - 100.0% | $ | 79,745,544 | ||||||
|
| |||||||
| * | Non-income producing. |
PLC | Public Limited Corporation | |
SP ADR | Sponsored American Depository Receipt |
The accompanying notes are an integral part of the financial statements.
44
POLEN INTERNATIONAL GROWTH FUND
Portfolio Holdings Summary Table
April 30, 2019
(Unaudited)
The following table presents a summary by industry of the portfolio holdings of the Fund:
| % of Net Assets | Value | |||||||
COMMON STOCKS: | ||||||||
Software | 16.2 | % | $ | 11,340,537 | ||||
Health Care Equipment & Supplies | 10.4 | 7,323,474 | ||||||
Interactive Media & Services | 9.8 | 6,877,310 | ||||||
Information Technology Services | 8.7 | 6,119,797 | ||||||
Professional Services | 7.6 | 5,362,215 | ||||||
Life Sciences Tools & Services | 5.9 | 4,165,963 | ||||||
Internet & Direct Marketing Retail | 5.9 | 4,133,015 | ||||||
Personal Products | 5.0 | 3,494,043 | ||||||
Textiles, Apparel & Luxury Goods | 4.0 | 2,795,870 | ||||||
Biotechnology | 3.9 | 2,729,775 | ||||||
Food Products | 3.4 | 2,413,970 | ||||||
Household Products | 3.2 | 2,225,901 | ||||||
Hotels, Restaurants & Leisure | 3.2 | 2,214,363 | ||||||
Specialty Retail | 2.7 | 1,864,260 | ||||||
Trading Companies & Distributors | 2.3 | 1,631,295 | ||||||
Food & Staples Retailing | 2.2 | 1,536,315 | ||||||
Other Assets In Excess of Liabilities | 5.6 | 3,949,844 | ||||||
|
|
|
| |||||
NET ASSETS | 100.0 | % | $ | 70,177,947 | ||||
|
|
|
| |||||
Portfolio holdings are subject to change at any time.
The accompanying notes are an integral part of the financial statements.
45
POLEN INTERNATIONAL GROWTH FUND
Portfolio of Investments
April 30, 2019
| Number of Shares | Value | |||||||
COMMON STOCKS — 94.4% |
| |||||||
Australia — 3.9% | ||||||||
CSL, Ltd. | 19,462 | $ | 2,729,775 | |||||
|
| |||||||
China — 15.7% | ||||||||
Alibaba Group Holding, Ltd., SP ADR* | 22,272 | 4,133,015 | ||||||
Baidu, Inc., SP ADR* | 11,974 | 1,990,438 | ||||||
Tencent Holdings, Ltd. | 99,150 | 4,886,872 | ||||||
|
| |||||||
| 11,010,325 | ||||||||
|
| |||||||
Denmark — 3.2% | ||||||||
Coloplast A/S, Class B | 20,775 | 2,244,146 | ||||||
|
| |||||||
France — 3.2% | ||||||||
Dassault Systemes SE | 14,223 | 2,252,404 | ||||||
|
| |||||||
Germany — 13.5% | ||||||||
adidas AG | 10,854 | 2,795,870 | ||||||
SAP SE | 33,317 | 4,294,853 | ||||||
Siemens Healthineers AG | 56,140 | 2,403,039 | ||||||
|
| |||||||
| 9,493,762 | ||||||||
|
| |||||||
Ireland — 19.0% | ||||||||
Accenture PLC, Class A | 20,028 | 3,658,515 | ||||||
Experian PLC | 96,566 | 2,810,936 | ||||||
ICON PLC* | 30,502 | 4,165,963 | ||||||
Medtronic PLC | 30,135 | 2,676,289 | ||||||
|
| |||||||
| 13,311,703 | ||||||||
|
| |||||||
Israel — 2.9% | ||||||||
Check Point Software Technologies, Ltd.* | 16,658 | 2,011,620 | ||||||
|
| |||||||
Mexico — 2.2% | ||||||||
Wal-Mart de Mexico SAB de CV | 522,892 | 1,536,315 | ||||||
|
| |||||||
Netherlands — 3.6% | ||||||||
RELX PLC | 111,348 | 2,551,279 | ||||||
|
| |||||||
| Number of Shares | Value | |||||||
COMMON STOCKS — (Continued) |
| |||||||
Spain — 6.2% | ||||||||
Amadeus IT Group SA | 30,883 | $ | 2,461,282 | |||||
Industria De Diseno Textil SA | 61,570 | 1,864,260 | ||||||
|
| |||||||
| 4,325,542 | ||||||||
|
| |||||||
Switzerland — 3.4% | ||||||||
Nestle SA, Registered Shares | 25,073 | 2,413,970 | ||||||
|
| |||||||
United Kingdom — 17.6% | ||||||||
Bunzl PLC | 54,086 | 1,631,295 | ||||||
Compass Group PLC | 97,318 | 2,214,363 | ||||||
Reckitt Benckiser Group PLC | 27,512 | 2,225,901 | ||||||
Sage Group PLC (The) | 293,450 | 2,781,660 | ||||||
Unilever PLC | 57,643 | 3,494,043 | ||||||
|
| |||||||
| 12,347,262 | ||||||||
|
| |||||||
TOTAL COMMON STOCKS | 66,228,103 | |||||||
|
| |||||||
TOTAL INVESTMENTS - 94.4% | 66,228,103 | |||||||
OTHER ASSETS IN EXCESS OF LIABILITIES - 5.6% | 3,949,844 | |||||||
|
| |||||||
NET ASSETS - 100.0% | $ | 70,177,947 | ||||||
|
| |||||||
| * | Non-income producing. |
PLC Public Limited Corporation
SP ADR Sponsored American Depository Receipt
The accompanying notes are an integral part of the financial statements.
46
POLEN U.S. SMALL COMPANY GROWTH FUND
Portfolio Holdings Summary Table
April 30, 2019
(Unaudited)
The following table presents a summary by industry of the portfolio holdings of the Fund:
| % of Net Assets | Value | |||||||||
COMMON STOCKS: | ||||||||||
Software Application | 21.4 | % | $ | 1,702,747 | ||||||
Medical Instruments & Supplies | 8.5 | 676,653 | ||||||||
Business Services | 7.7 | 610,129 | ||||||||
Recreational Vehicles | 7.2 | 569,196 | ||||||||
Leisure | 6.2 | 494,261 | ||||||||
Specialty Retail | 4.9 | 386,565 | ||||||||
Health Information Services | 4.2 | 332,722 | ||||||||
Building Materials | 3.8 | 300,285 | ||||||||
Discount Stores | 3.8 | 299,831 | ||||||||
Home Improvement Stores | 3.7 | 293,594 | ||||||||
Education & Training Services | 3.5 | 281,729 | ||||||||
Specialty Finance | 3.4 | 270,528 | ||||||||
Electronics Distribution | 3.1 | 249,503 | ||||||||
Information Technology Services | 2.8 | 220,792 | ||||||||
Diagnostics & Research | 2.4 | 194,537 | ||||||||
Medical Care | 2.4 | 187,416 | ||||||||
Restaurants | 2.2 | 177,693 | ||||||||
Software Infrastructure | 1.6 | 130,546 | ||||||||
Medical Devices | 1.5 | 119,252 | ||||||||
Other Assets In Excess of Liabilities | 5.7 | 455,698 | ||||||||
|
|
|
| |||||||
NET ASSETS | 100.0 | % | $ | 7,953,677 | ||||||
|
|
|
| |||||||
Portfolio holdings are subject to change at any time.
The accompanying notes are an integral part of the financial statements.
47
POLEN U.S. SMALL COMPANY GROWTH FUND
Portfolio of Investments
April 30, 2019
| Number of Shares | Value | |||||||
COMMON STOCKS — 94.3% |
| |||||||
Building Materials — 3.8% | ||||||||
Trex Co., Inc.* | 4,335 | $ | 300,285 | |||||
|
| |||||||
Business Services — 7.7% | ||||||||
Euronet Worldwide, Inc.* | 1,748 | 262,008 | ||||||
ExlService Holdings, Inc.* | 2,907 | 172,676 | ||||||
Healthcare Services Group, Inc. | 5,183 | 175,445 | ||||||
|
| |||||||
| 610,129 | ||||||||
|
| |||||||
Diagnostics & Research — 2.4% |
| |||||||
Neogen Corp.* | 3,207 | 194,537 | ||||||
|
| |||||||
Discount Stores — 3.8% | ||||||||
Ollie’s Bargain Outlet Holdings, Inc.* | 3,135 | 299,831 | ||||||
|
| |||||||
Education & Training Services — 3.5% |
| |||||||
Grand Canyon Education, Inc.* | 2,431 | 281,729 | ||||||
|
| |||||||
Electronics Distribution — 3.1% |
| |||||||
Littelfuse, Inc. | 1,241 | 249,503 | ||||||
|
| |||||||
Health Information Services — 4.2% |
| |||||||
Medidata Solutions, Inc.* | 3,683 | 332,722 | ||||||
|
| |||||||
Home Improvement Stores — 3.7% |
| |||||||
Floor & Decor Holdings, Inc., Class A* | 6,114 | 293,594 | ||||||
|
| |||||||
Information Technology Services — 2.8% |
| |||||||
EPAM Systems, Inc.* | 1,231 | 220,792 | ||||||
|
| |||||||
Leisure — 6.2% | ||||||||
Pool Corp. | 2,690 | 494,261 | ||||||
|
| |||||||
Medical Care — 2.4% | ||||||||
AMN Healthcare Services, Inc.* | 3,600 | 187,416 | ||||||
|
| |||||||
Medical Devices — 1.5% | ||||||||
Inogen, Inc.* | 1,366 | 119,252 | ||||||
|
| |||||||
| Number of Shares | Value | |||||||
COMMON STOCKS — (Continued) |
| |||||||
Medical Instruments & Supplies — 8.5% |
| |||||||
Cantel Medical Corp. | 3,218 | $ | 221,849 | |||||
LeMaitre Vascular, Inc. | 7,821 | 225,870 | ||||||
Masimo Corp.* | 1,759 | 228,934 | ||||||
|
| |||||||
| 676,653 | ||||||||
|
| |||||||
Recreational Vehicles — 7.2% |
| |||||||
Fox Factory Holding Corp.* | 7,335 | 569,196 | ||||||
|
| |||||||
Restaurants — 2.2% |
| |||||||
Texas Roadhouse, Inc. | 3,290 | 177,693 | ||||||
|
| |||||||
Software Application — 21.4% |
| |||||||
Alarm.com Holdings, Inc.* | 4,728 | 335,121 | ||||||
Blackbaud, Inc. | 4,345 | 344,515 | ||||||
Globant SA* | 5,017 | 421,378 | ||||||
Paycom Software, Inc.* | 1,665 | 337,212 | ||||||
Stamps.com, Inc.* | 3,083 | 264,521 | ||||||
|
| |||||||
| 1,702,747 | ||||||||
|
| |||||||
Software Infrastructure — 1.6% |
| |||||||
Altair Engineering, Inc., Class A* | 3,310 | 130,546 | ||||||
|
| |||||||
Specialty Finance — 3.4% | ||||||||
LendingTree, Inc.* | 703 | 270,528 | ||||||
|
| |||||||
Specialty Retail — 4.9% | ||||||||
Five Below, Inc.* | 1,345 | 196,895 | ||||||
Medifast, Inc. | 1,293 | 189,670 | ||||||
|
| |||||||
| 386,565 | ||||||||
|
| |||||||
TOTAL COMMON STOCKS |
| 7,497,979 | ||||||
|
| |||||||
The accompanying notes are an integral part of the financial statements.
48
POLEN U.S. SMALL COMPANY GROWTH FUND
Portfolio of Investments (Continued)
April 30, 2019
| Value | ||||
TOTAL INVESTMENTS - 94.3% | $ | 7,497,979 | ||
OTHER ASSETS IN | 455,698 | |||
|
| |||
NET ASSETS - 100.0% | $ | 7,953,677 | ||
|
| |||
| * | Non-income producing. |
The accompanying notes are an integral part of the financial statements.
49
POLEN INTERNATIONAL SMALL COMPANY GROWTH FUND
Portfolio Holdings Summary Table
April 30, 2019
(Unaudited)
The following table presents a summary by industry of the portfolio holdings of the Fund:
| % of Net Assets | Value | |||||||||
COMMON STOCKS: | ||||||||||
Software | 15.6 | % | $ | 529,141 | ||||||
Interactive Media & Services | 10.3 | 349,194 | ||||||||
Commercial Services & Supplies | 6.5 | 220,405 | ||||||||
Professional Services | 6.4 | 217,920 | ||||||||
Health Care Equipment & Supplies | 6.4 | 215,904 | ||||||||
Capital Markets | 6.0 | 202,549 | ||||||||
Health Care Technology | 5.9 | 200,737 | ||||||||
Entertainment | 5.6 | 191,571 | ||||||||
Aerospace & Defense | 5.2 | 175,652 | ||||||||
Information Technology Services | 4.3 | 145,554 | ||||||||
Leisure Products | 4.2 | 143,619 | ||||||||
Electronic Equipment, Instruments & Components | 4.0 | 136,237 | ||||||||
Health Care Providers & Services | 3.9 | 133,800 | ||||||||
Life Sciences Tools & Services | 3.4 | 114,456 | ||||||||
Semiconductors & Semiconductor Equipment | 2.6 | 87,752 | ||||||||
Household Products | 2.1 | 72,787 | ||||||||
Food Products | 2.1 | 71,287 | ||||||||
Internet & Direct Marketing Retail | 1.5 | 49,022 | ||||||||
Other Assets In Excess of Liabilities | 4.0 | 136,926 | ||||||||
|
|
|
| |||||||
NET ASSETS | 100.0 | % | $ | 3,394,513 | ||||||
|
|
|
| |||||||
Portfolio holdings are subject to change at any time.
The accompanying notes are an integral part of the financial statements.
50
POLEN INTERNATIONAL SMALL COMPANY GROWTH FUND
Portfolio of Investments
April 30, 2019
| Number of Shares | Value | |||||||
COMMON STOCKS — 96.0% |
| |||||||
Argentina — 1.5% | ||||||||
Despegar.com Corp.* | 3,360 | $ | 49,022 | |||||
|
| |||||||
Australia — 7.8% | ||||||||
Cochlear, Ltd. | 905 | 119,627 | ||||||
Computershare, Ltd. | 11,570 | 145,554 | ||||||
|
| |||||||
| 265,181 | ||||||||
|
| |||||||
Brazil — 2.1% | ||||||||
M. Dias Branco Sa | 6,700 | 71,287 | ||||||
|
| |||||||
Canada — 15.5% | ||||||||
CAE, Inc. | 7,552 | 175,652 | ||||||
Kinaxis, Inc.* | 2,070 | 113,118 | ||||||
Morneau Shepell, Inc. | 6,440 | 133,684 | ||||||
TMX Group, Ltd. | 1,639 | 104,552 | ||||||
|
| |||||||
| 527,006 | ||||||||
|
| |||||||
Denmark — 3.0% | ||||||||
SimCorp A/S | 1,025 | 100,624 | ||||||
|
| |||||||
Germany — 11.6% | ||||||||
CompuGroup Medical SE | 3,025 | 200,737 | ||||||
CTS Eventim AG & Co. KGaA | 3,730 | 191,571 | ||||||
|
| |||||||
| 392,308 | ||||||||
|
| |||||||
Israel — 3.7% | ||||||||
Nice Ltd., SP ADR* | 915 | 126,142 | ||||||
|
| |||||||
Italy — 3.9% | ||||||||
Amplifon SpA | 6,955 | 133,800 | ||||||
|
| |||||||
Japan — 12.3% | ||||||||
Kakaku.com, Inc. | 8,000 | 164,820 | ||||||
Nakanishi, Inc. | 5,000 | 96,277 | ||||||
Pigeon Corp. | 1,700 | 72,787 | ||||||
TechnoPro Holdings, Inc. | 1,400 | 84,236 | ||||||
|
| |||||||
| 418,120 | ||||||||
|
| |||||||
Luxembourg — 4.3% | ||||||||
Globant SA* | 1,740 | 146,143 | ||||||
|
| |||||||
| Number of Shares | Value | |||||||
COMMON STOCKS — (Continued) |
| |||||||
Norway — 2.2% | ||||||||
Tomra Systems ASA | 2,495 | $ | 75,271 | |||||
|
| |||||||
South Korea — 3.9% | ||||||||
Douzone Bizon Co. Ltd. | 880 | 43,114 | ||||||
Koh Young Technology, Inc. | 1,060 | 87,752 | ||||||
|
| |||||||
| 130,866 | ||||||||
|
| |||||||
Sweden — 4.2% | ||||||||
Thule Group AB (The) | 6,165 | 143,619 | ||||||
|
| |||||||
Switzerland — 3.4% | ||||||||
Tecan Group AG | 507 | 114,456 | ||||||
|
| |||||||
United Kingdom — 16.6% |
| |||||||
Auto Trader Group PLC | 15,060 | 111,329 | ||||||
Halma PLC | 5,790 | 136,237 | ||||||
HomeServe PLC | 10,240 | 145,134 | ||||||
Rightmove PLC | 10,330 | 73,045 | ||||||
Sanne Group PLC | 12,005 | 97,997 | ||||||
|
| |||||||
| 563,742 | ||||||||
|
| |||||||
TOTAL COMMON STOCKS |
| 3,257,587 | ||||||
|
| |||||||
TOTAL INVESTMENTS - 96.0% |
| 3,257,587 | ||||||
OTHER ASSETS IN | 136,926 | |||||||
|
| |||||||
NET ASSETS - 100.0% | $ | 3,394,513 | ||||||
|
| |||||||
| * | Non-income producing. |
PLC | Public Limited Corporation | |
SP ADR | Sponsored American Depository Receipt |
The accompanying notes are an integral part of the financial statements.
51
POLEN GROWTH FUNDS
Statements of Assets and Liabilities
April 30, 2019
| Polen Growth Fund | Polen Global Growth Fund | Polen International Growth Fund | ||||||||||
Assets | ||||||||||||
Investments, at value* | $ | 3,510,922,370 | $ | 76,180,065 | $ | 66,228,103 | ||||||
Cash | 136,852,848 | 3,397,790 | 4,800,557 | |||||||||
Foreign currency (Cost $0, $130 and $273, respectively) | — | 130 | 273 | |||||||||
Receivable for capital shares sold | 23,477,173 | 242,605 | 403,869 | |||||||||
Dividends and interest receivable | 5,276,820 | 133,589 | 113,741 | |||||||||
Prepaid expenses and other assets | 97,847 | 28,268 | 25,041 | |||||||||
|
|
|
|
|
| |||||||
Total assets | 3,676,627,058 | 79,982,447 | 71,571,584 | |||||||||
|
|
|
|
|
| |||||||
Liabilities | ||||||||||||
Payable for capital shares redeemed | 6,004,544 | 103,419 | 14,544 | |||||||||
Payable to Investment Adviser | 2,397,020 | 49,310 | 38,823 | |||||||||
Payable for transfer agent fees | 355,330 | 19,115 | 10,375 | |||||||||
Payable for administration and accounting fees | 202,532 | 15,505 | 13,376 | |||||||||
Payable for printing fees | 58,924 | 14,160 | 11,900 | |||||||||
Payable for distribution fees | 54,625 | 2,192 | 261 | |||||||||
Payable for custodian fees | 42,089 | 1,609 | 4,763 | |||||||||
Payable for legal fees | 32,808 | 1,589 | 299 | |||||||||
Payable for audit fees | 27,726 | 27,675 | 27,929 | |||||||||
Payable for investments purchased | — | — | 1,270,354 | |||||||||
Accrued expenses | 209 | 2,329 | 1,013 | |||||||||
|
|
|
|
|
| |||||||
Total liabilities | 9,175,807 | 236,903 | 1,393,637 | |||||||||
|
|
|
|
|
| |||||||
Net Assets | $ | 3,667,451,251 | $ | 79,745,544 | $ | 70,177,947 | ||||||
|
|
|
|
|
| |||||||
Net Assets consisted of: | ||||||||||||
Capital stock, $0.01 par value | $ | 1,177,394 | $ | 46,034 | $ | 48,895 | ||||||
Paid-in capital | 2,521,953,022 | 63,152,795 | 65,213,981 | |||||||||
Total distributable earnings | 1,144,320,835 | 16,546,715 | 4,915,071 | |||||||||
|
|
|
|
|
| |||||||
Net Assets | $ | 3,667,451,251 | $ | 79,745,544 | $ | 70,177,947 | ||||||
|
|
|
|
|
| |||||||
Institutional Class: | ||||||||||||
Net assets | $ | 3,381,068,118 | $ | 68,617,013 | $ | 68,857,425 | ||||||
|
|
|
|
|
| |||||||
Shares outstanding | 108,376,693 | 3,955,315 | 4,797,113 | |||||||||
|
|
|
|
|
| |||||||
Net asset value, offering and redemption price per share | $ | 31.20 | $ | 17.35 | $ | 14.35 | ||||||
|
|
|
|
|
| |||||||
Investor Class: | ||||||||||||
Net assets | $ | 286,383,133 | $ | 11,128,531 | $ | 1,320,522 | ||||||
|
|
|
|
|
| |||||||
Shares outstanding | 9,362,657 | 648,069 | 92,417 | |||||||||
|
|
|
|
|
| |||||||
Net asset value, offering and redemption price per share | $ | 30.59 | $ | 17.17 | $ | 14.29 | ||||||
|
|
|
|
|
| |||||||
* Investments, at cost | $ | 2,329,795,064 | $ | 59,174,591 | $ | 61,000,258 | ||||||
The accompanying notes are an integral part of the financial statements.
52
POLEN GROWTH FUNDS
Statements of Assets and Liabilities
April 30, 2019
| Polen U.S. Small Company Growth Fund | Polen International Small Company Growth Fund | |||||||||
Assets | ||||||||||
Investments, at value* | $ | 7,497,979 | $ | 3,257,587 | ||||||
Cash | 724,155 | 153,671 | ||||||||
Foreign currency (Cost $0 and $284, respectively) | — | 284 | ||||||||
Receivable for capital shares sold | 100,150 | — | ||||||||
Receivable from investment adviser | 11,120 | 12,025 | ||||||||
Dividends and interest receivable | 917 | 5,040 | ||||||||
Prepaid expenses and other assets | 27,322 | 33,055 | ||||||||
|
|
|
| |||||||
Total assets | 8,361,643 | 3,461,662 | ||||||||
|
|
|
| |||||||
Liabilities | ||||||||||
Payable for investments purchased | 354,327 | 34,100 | ||||||||
Payable for audit fees | 27,439 | 18,192 | ||||||||
Payable for transfer agent fees | 7,080 | 6,850 | ||||||||
Payable for printing fees | 7,052 | 3,824 | ||||||||
Payable for administration and accounting fees | 4,168 | 1,990 | ||||||||
Payable for custodian fees | 3,443 | 949 | ||||||||
Payable for capital shares redeemed | 2,971 | — | ||||||||
Payable for legal fees | 19 | 1,007 | ||||||||
Payable for distribution fees | 1 | 7 | ||||||||
Accrued expenses | 1,466 | 230 | ||||||||
|
|
|
| |||||||
Total liabilities | 407,966 | 67,149 | ||||||||
|
|
|
| |||||||
Net Assets | $ | 7,953,677 | $ | 3,394,513 | ||||||
|
|
|
| |||||||
Net Assets consisted of: | ||||||||||
Capital stock, $0.01 par value | $ | 6,401 | $ | 2,846 | ||||||
Paid-in capital | 6,935,139 | 2,993,580 | ||||||||
Total distributable earnings | 1,012,137 | 398,087 | ||||||||
|
|
|
| |||||||
Net Assets | $ | 7,953,677 | $ | 3,394,513 | ||||||
|
|
|
| |||||||
Institutional Class: | ||||||||||
Net assets | $ | 7,940,210 | $ | 3,357,057 | ||||||
|
|
|
| |||||||
Shares outstanding | 638,982 | 281,454 | ||||||||
|
|
|
| |||||||
Net asset value, offering and redemption price per share | $ | 12.43 | $ | 11.93 | ||||||
|
|
|
| |||||||
Investor Class: | ||||||||||
Net assets | $ | 13,467 | $ | 37,456 | ||||||
|
|
|
| |||||||
Shares outstanding | 1,084 | 3,142 | ||||||||
|
|
|
| |||||||
Net asset value, offering and redemption price per share | $ | 12.42 | $ | 11.92 | ||||||
|
|
|
| |||||||
* Investments, at cost | $ | 6,461,647 | $ | 2,842,324 | ||||||
The accompanying notes are an integral part of the financial statements.
53
POLEN GROWTH FUNDS
Statements of Operations
For the Year Ended April 30, 2019
| Polen Growth Fund | Polen Global Growth Fund | Polen International Growth Fund | |||||||||||||
Investment income | |||||||||||||||
Dividends | $ | 22,464,220 | $ | 552,341 | $ | 555,027 | |||||||||
Less: foreign taxes withheld | (1,170,192 | ) | (33,641 | ) | (34,034 | ) | |||||||||
|
|
|
|
|
| ||||||||||
Total investment income | 21,294,028 | 518,700 | 520,993 | ||||||||||||
|
|
|
|
|
| ||||||||||
Expenses | |||||||||||||||
Advisory fees (Note 2) | 22,088,322 | 453,367 | 334,684 | ||||||||||||
Transfer agent fees (Note 2) | 2,159,797 | 92,142 | 74,796 | ||||||||||||
Administration and accounting fees (Note 2) | 496,348 | 33,086 | 31,408 | ||||||||||||
Trustees’ and officers’ fees (Note 2) | 423,676 | 5,830 | 3,759 | ||||||||||||
Distribution fees (Investor Shares) (Note 2) | 387,253 | 19,524 | 2,212 | ||||||||||||
Printing and shareholder reporting fees | 236,311 | 20,734 | 17,728 | ||||||||||||
Custodian fees (Note 2) | 194,504 | 9,968 | 23,297 | ||||||||||||
Legal fees | 184,009 | 4,003 | 1,619 | ||||||||||||
Registration and filing fees | 129,428 | 48,187 | 22,127 | ||||||||||||
Audit fees | 30,648 | 28,440 | 35,384 | ||||||||||||
Other expenses | 95,627 | 5,214 | 4,881 | ||||||||||||
|
|
|
|
|
| ||||||||||
Total expenses before waivers and reimbursements | 26,425,923 | 720,495 | 551,895 | ||||||||||||
|
|
|
|
|
| ||||||||||
Less: waivers and reimbursements (Note 2) | (52,409 | ) | (114,262 | ) | (116,513 | ) | |||||||||
|
|
|
|
|
| ||||||||||
Net expenses after waivers and reimbursements | 26,373,514 | 606,233 | 435,382 | ||||||||||||
|
|
|
|
|
| ||||||||||
Net investment income/(loss) | (5,079,486 | ) | (87,533 | ) | 85,611 | ||||||||||
|
|
|
|
|
| ||||||||||
Net realized and unrealized gain/(loss) from investments | |||||||||||||||
Net realized gain/(loss) from investments | 20,384,872 | 182,980 | (312,862 | ) | |||||||||||
Net realized loss from foreign currency transactions | — | (27,917 | ) | (71,132 | ) | ||||||||||
Net change in unrealized appreciation/(depreciation) on investments | 623,497,248 | 10,788,173 | 4,582,562 | ||||||||||||
Net change in unrealized appreciation/(depreciation) on foreign currency translations | — | (1,148 | ) | (4,173 | ) | ||||||||||
|
|
|
|
|
| ||||||||||
Net realized and unrealized gain on investments | 643,882,120 | 10,942,088 | 4,194,395 | ||||||||||||
|
|
|
|
|
| ||||||||||
Net increase in net assets resulting from operations | $ | 638,802,634 | $ | 10,854,555 | $ | 4,280,006 | |||||||||
|
|
|
|
|
| ||||||||||
The accompanying notes are an integral part of the financial statements.
54
POLEN GROWTH FUNDS
Statements of Operations
For the Year Ended April 30, 2019
| Polen U.S. Small Company Growth Fund | Polen International Small Company Growth Fund* | |||||||||
Investment income | ||||||||||
Dividends | $ | 19,996 | $ | 11,721 | ||||||
Less: foreign taxes withheld | — | (1,206 | ) | |||||||
|
|
|
| |||||||
Total investment income | 19,996 | 10,515 | ||||||||
|
|
|
| |||||||
Expenses | ||||||||||
Advisory fees (Note 2) | 53,086 | 8,210 | ||||||||
Registration and filing fees | 33,060 | 10,345 | ||||||||
Audit fees | 27,043 | 18,192 | ||||||||
Transfer agent fees (Note 2) | 26,467 | 12,281 | ||||||||
Offering expenses | 12,433 | — | ||||||||
Printing and shareholder reporting fees | 10,104 | 3,232 | ||||||||
Administration and accounting fees (Note 2) | 7,726 | 1,990 | ||||||||
Custodian fees (Note 2) | 6,036 | 5,083 | ||||||||
Trustees’ and officers’ fees (Note 2) | 535 | 73 | ||||||||
Legal fees | 305 | 1,617 | ||||||||
Distribution fees (Investor Shares) (Note 2) | 4 | 11 | ||||||||
Other expenses | 2,492 | 1,633 | ||||||||
|
|
|
| |||||||
Total expenses before waivers and reimbursements | 179,291 | 62,667 | ||||||||
|
|
|
| |||||||
Less: waivers and reimbursements (Note 2) | (112,930 | ) | (52,240 | ) | ||||||
|
|
|
| |||||||
Net expenses after waivers and reimbursements | 66,361 | 10,427 | ||||||||
|
|
|
| |||||||
Net investment income/(loss) | (46,365 | ) | 88 | |||||||
|
|
|
| |||||||
Net realized and unrealized gain/(loss) from investments | ||||||||||
Net realized gain/(loss) from investments | 11,252 | (9,183 | ) | |||||||
Net realized loss from foreign currency transactions | — | (8,080 | ) | |||||||
Net change in unrealized appreciation/(depreciation) on investments | 1,010,346 | 415,263 | ||||||||
Net change in unrealized appreciation/(depreciation) on foreign currency translations | — | (1 | ) | |||||||
|
|
|
| |||||||
Net realized and unrealized gain on investments | 1,021,598 | 397,999 | ||||||||
|
|
|
| |||||||
Net increase in net assets resulting from operations | $ | 975,233 | $ | 398,087 | ||||||
|
|
|
| |||||||
| * | The Polen International Small Company Growth Fund commenced operations on December 31, 2018. |
The accompanying notes are an integral part of the financial statements.
55
POLEN GROWTH FUND
Statements of Changes in Net Assets
| For the Year Ended April 30, 2019 | For the Year Ended April 30, 2018 | |||||||
Increase/(decrease) in net assets from operations: | ||||||||
Net investment loss | $ | (5,079,486 | ) | $ | (4,322,327 | ) | ||
Net realized gain from investments | 20,384,872 | 40,759,840 | ||||||
Net change in unrealized appreciation/(depreciation) on investments | 623,497,248 | 237,987,039 | ||||||
|
|
|
| |||||
Net increase in net assets resulting from operations | 638,802,634 | 274,424,552 | ||||||
|
|
|
| |||||
Less dividends and distributions to shareholders from: | ||||||||
Total distributable earnings:* | ||||||||
Institutional Class | (61,771,852 | ) | (27,469,636 | ) | ||||
Investor Class | (4,657,005 | ) | (1,173,931 | ) | ||||
|
|
|
| |||||
Net decrease in net assets from dividends and distributions to shareholders | (66,428,857 | ) | (28,643,567 | ) | ||||
|
|
|
| |||||
Increase in net assets derived from capital share transactions (Note 4) | 1,188,667,121 | 189,539,954 | ||||||
|
|
|
| |||||
Total increase in net assets | 1,761,040,898 | 435,320,939 | ||||||
|
|
|
| |||||
Net assets | ||||||||
Beginning of year | 1,906,410,353 | 1,471,089,414 | ||||||
|
|
|
| |||||
End of year** | $ | 3,667,451,251 | $ | 1,906,410,353 | ||||
|
|
|
| |||||
| * | Distributions from net investment income and from realized gains are no longer required to be separately disclosed. See Note 1. For the year ended April 30, 2018, distributions from net realized gains were $27,469,636 and $1,173,931 for Institutional Class and Investor Class shares, respectively. |
| ** | Net assets - end of year includes accumulated net investment income of $0 for the year ended April 30, 2018. Effective November 5, 2018, the SEC has eliminated the requirements to disclose accumulated net investment income/(loss). |
The accompanying notes are an integral part of the financial statements.
56
POLEN GLOBAL GROWTH FUND
Statements of Changes in Net Assets
| For the Year Ended April 30, 2019 | For the Year Ended April 30, 2018 | |||||||||
Increase/(decrease) in net assets from operations: | ||||||||||
Net investment loss | $ | (87,533 | ) | $ | (49,472 | ) | ||||
Net realized gain from investments and foreign currency transactions | 155,063 | 560,417 | ||||||||
Net change in unrealized appreciation/(depreciation) on investments | 10,787,025 | 3,232,868 | ||||||||
|
|
|
| |||||||
Net increase in net assets resulting from operations | 10,854,555 | 3,743,813 | ||||||||
|
|
|
| |||||||
Less dividends and distributions to shareholders from: | ||||||||||
Total distributable earnings:* | ||||||||||
Institutional Class | (772,271 | ) | — | |||||||
Investor Class | (142,087 | ) | — | |||||||
|
|
|
| |||||||
Net decrease in net assets from dividends and distributions to shareholders | (914,358 | ) | — | |||||||
|
|
|
| |||||||
Increase in net assets derived from capital share transactions (Note 4) | 34,009,830 | 12,437,894 | ||||||||
|
|
|
| |||||||
Total increase in net assets | 43,950,027 | 16,181,707 | ||||||||
|
|
|
| |||||||
Net assets | ||||||||||
Beginning of year | 35,795,517 | 19,613,810 | ||||||||
|
|
|
| |||||||
End of year** | $ | 79,745,544 | $ | 35,795,517 | ||||||
|
|
|
| |||||||
| * | Distributions from net investment income and from realized gains are no longer required to be separately disclosed. See Note 1. For the period ended April 30, 2018, distributions from net investment income and net realized gains were $0 and $0, respectively. |
| ** | Net assets - end of year includes accumulated net investment income of $11 for the year ended April 30, 2018. Effective November 5, 2018, the SEC has eliminated the requirements to disclose accumulated net investment income/(loss). |
The accompanying notes are an integral part of the financial statements.
57
POLEN INTERNATIONAL GROWTH FUND
Statements of Changes in Net Assets
| For the Year Ended April 30, 2019 | For the Year Ended April 30, 2018 | |||||||||
Increase/(decrease) in net assets from operations: | ||||||||||
Net investment income | $ | 85,611 | $ | 26,389 | ||||||
Net realized gain/(loss) from investments and foreign currency transactions | (383,994 | ) | 17,824 | |||||||
Net change in unrealized appreciation/(depreciation) on investments | 4,578,389 | 379,860 | ||||||||
|
|
|
| |||||||
Net increase in net assets resulting from operations | 4,280,006 | 424,073 | ||||||||
|
|
|
| |||||||
Less dividends and distributions to shareholders from: | ||||||||||
Total distributable earnings:* | ||||||||||
Institutional Class | (42,741 | ) | (30,485 | ) | ||||||
Investor Class | (649 | ) | (980 | ) | ||||||
|
|
|
| |||||||
Net decrease in net assets from dividends and distributions to shareholders | (43,390 | ) | (31,465 | ) | ||||||
|
|
|
| |||||||
Increase in net assets derived from capital share transactions (Note 4) | 54,712,301 | 8,173,863 | ||||||||
|
|
|
| |||||||
Total increase in net assets | 58,948,917 | 8,566,471 | ||||||||
|
|
|
| |||||||
Net assets | ||||||||||
Beginning of year | 11,229,030 | 2,662,559 | ||||||||
|
|
|
| |||||||
End of year** | $ | 70,177,947 | $ | 11,229,030 | ||||||
|
|
|
| |||||||
| * | Distributions from net investment income and from realized gains are no longer required to be separately disclosed. See Note 1. For the year ended April 30, 2018, distributions from net investment income were $23,947 and $734, for Institutional Class and Investor Class, and net realized gains were $6,538 and $246 for Institutional Class and Investor Class, respectively. |
| ** | Net assets - end of year includes accumulated net investment income of $14,988 for the year ended April 30, 2018. Effective November 5, 2018, the SEC has eliminated the requirements to disclose accumulated net investment income. |
The accompanying notes are an integral part of the financial statements.
58
POLEN U.S. SMALL COMPANY GROWTH FUND
Statements of Changes in Net Assets
| For the Year Ended April 30, 2019 | For the Period Ended April 30, 2018* | |||||||||
Increase/(decrease) in net assets from operations: | ||||||||||
Net investment loss | $ | (46,365 | ) | $ | (9,980 | ) | ||||
Net realized gain from investments | 11,252 | 13,008 | ||||||||
Net change in unrealized appreciation/(depreciation) on investments | 1,010,346 | 25,986 | ||||||||
|
|
|
| |||||||
Net increase in net assets resulting from operations | 975,233 | 29,014 | ||||||||
|
|
|
| |||||||
Less dividends and distributions to shareholders from: | ||||||||||
Total distributable earnings:** | ||||||||||
Institutional Class | (9,611 | ) | — | |||||||
|
|
|
| |||||||
Net decrease in net assets from dividends and distributions to shareholders | (9,611 | ) | — | |||||||
|
|
|
| |||||||
Increase in net assets derived from capital share transactions (Note 4) | 3,654,361 | 3,304,680 | ||||||||
|
|
|
| |||||||
Total increase in net assets | 4,619,983 | 3,333,694 | ||||||||
|
|
|
| |||||||
Net assets | ||||||||||
Beginning of period | 3,333,694 | — | ||||||||
|
|
|
| |||||||
End of period*** | $ | 7,953,677 | $ | 3,333,694 | ||||||
|
|
|
| |||||||
| * | The Polen U.S. Small Company Growth Fund commenced operations on November 01, 2017. |
| ** | Distributions from net investment income and from realized gains are no longer required to be separately disclosed. See Note 1. For the year ended April 30, 2018, distributions from net investment income and net realized gains were $0 and $0, respectively. |
| *** | Net assets - end of period includes accumulated net investment income of $0 for the year ended April 30, 2018. Effective November 5, 2018, the SEC has eliminated the requirements to disclose accumulated net investment income/(loss). |
The accompanying notes are an integral part of the financial statements.
59
POLEN INTERNATIONAL SMALL COMPANY GROWTH FUND
Statements of Changes in Net Assets
| For the Period Ended April 30, 2019* | |||||
Increase/(decrease) in net assets from operations: | |||||
Net investment income | $ | 88 | |||
Net realized loss from investments and foreign currency transactions | (17,263 | ) | |||
Net change in unrealized appreciation/(depreciation) on investments | 415,262 | ||||
|
| ||||
Net increase/decrease in net assets resulting from operations | 398,087 | ||||
|
| ||||
Increase in net assets derived from capital share transactions (Note 4) | 2,996,426 | ||||
|
| ||||
Total increase in net assets | 3,394,513 | ||||
|
| ||||
Net assets | |||||
Beginning of period | — | ||||
|
| ||||
End of period | $ | 3,394,513 | |||
|
| ||||
| * | The Polen International Small Company Growth Fund commenced operations on December 31, 2018. |
The accompanying notes are an integral part of the financial statements.
60
POLEN GROWTH FUND
Financial Highlights
Contained below is per share operating performance data for Institutional Class shares outstanding, total investment return, ratios to average net assets and other supplemental data for the respective period. The total returns in the table represent the rate that an investor would have earned or lost on an investment in the Fund (assuming reinvestment of all dividends and distributions). This information has been derived from information provided in the financial statements and should be read in conjunction with the financial statements and the notes thereto.
| Institutional Class | |||||||||||||||||||||||||
| For the Year Ended April 30, 2019 | For the Year Ended April 30, 2018 | For the Year Ended April 30, 2017 | For the Year Ended April 30, 2016 | For the Year Ended April 30, 2015 | |||||||||||||||||||||
Per Share Operating Performance | |||||||||||||||||||||||||
Net asset value, beginning of period | $ | 25.34 | $ | 21.85 | $ | 18.92 | $ | 18.29 | $ | 16.45 | |||||||||||||||
|
|
|
|
|
|
|
|
|
| ||||||||||||||||
Net investment income/(loss)(1) | (0.05 | ) | (0.06 | ) | (0.04 | ) | 0.01 | 0.02 | |||||||||||||||||
Net realized and unrealized gain on investments | 6.62 | 3.95 | 2.97 | 1.45 | 3.09 | ||||||||||||||||||||
|
|
|
|
|
|
|
|
|
| ||||||||||||||||
Net increase in net assets resulting from operations | 6.57 | 3.89 | 2.93 | 1.46 | 3.11 | ||||||||||||||||||||
|
|
|
|
|
|
|
|
|
| ||||||||||||||||
Dividends and distributions to shareholders from: | |||||||||||||||||||||||||
Net investment income | — | — | — | (2) | — | (0.02 | ) | ||||||||||||||||||
Net realized capital gains | (0.71 | ) | (0.40 | ) | — | (0.83 | ) | (1.25 | ) | ||||||||||||||||
|
|
|
|
|
|
|
|
|
| ||||||||||||||||
Total dividends and distributions to shareholders | (0.71 | ) | (0.40 | ) | — | (0.83 | ) | (1.27 | ) | ||||||||||||||||
|
|
|
|
|
|
|
|
|
| ||||||||||||||||
Redemption fees | — | (2) | — | (2) | — | (2) | — | (2) | — | (2) | |||||||||||||||
|
|
|
|
|
|
|
|
|
| ||||||||||||||||
Net asset value, end of period | $ | 31.20 | $ | 25.34 | $ | 21.85 | $ | 18.92 | $ | 18.29 | |||||||||||||||
|
|
|
|
|
|
|
|
|
| ||||||||||||||||
Total investment return(3) | 26.44 | % | 17.90 | % | 15.50 | % | 7.86 | % | 19.17 | % | |||||||||||||||
Ratios/Supplemental Data | |||||||||||||||||||||||||
Net assets, end of period (in thousands) | $ | 3,381,068 | $ | 1,839,280 | $ | 1,363,731 | $ | 959,962 | $ | 376,718 | |||||||||||||||
Ratio of expenses to average net assets | 1.00 | % | 1.00 | % | 1.00 | % | 1.00 | % | 1.00 | % | |||||||||||||||
Ratio of expenses to average net assets without waivers, expense reimbursements and/or recoupment, if any(4) | 1.00 | % | 0.98 | % | 1.12 | % | 1.17 | % | 1.25 | % | |||||||||||||||
Ratio of net investment income/(loss) to average net assets | (0.18 | )% | (0.24 | )% | (0.18 | )% | 0.04 | % | 0.10 | % | |||||||||||||||
Portfolio turnover rate | 18.59 | % | 19.56 | % | 13.61 | % | 9.13 | % | 33.44 | % | |||||||||||||||
| (1) | The selected per share data was calculated using the average shares outstanding method for the year. |
| (2) | Amount is less than $0.005 per share. |
| (3) | Total investment return is calculated assuming a purchase of shares on the first day and a sale of shares on the last day of each period reported and includes reinvestment of dividends and distributions, if any. |
| (4) | During the period, certain fees were waived and/or reimbursed; or recouped, if any. If such fee waivers and/or reimbursements or recoupments had not occurred, the ratios would have been as indicated (See Note 2). |
The accompanying notes are an integral part of the financial statements.
61
POLEN GROWTH FUND
Financial Highlights
Contained below is per share operating performance data for Investor Class shares outstanding, total investment return, ratios to average net assets and other supplemental data for the respective period. The total returns in the table represent the rate that an investor would have earned or lost on an investment in the Fund (assuming reinvestment of all dividends and distributions). This information has been derived from information provided in the financial statements and should be read in conjunction with the financial statements and the notes thereto.
| Investor Class | |||||||||||||||||||||||||
| For the Year Ended April 30, 2019 | For the Year Ended April 30, 2018 | For the Year Ended April 30, 2017 | For the Year Ended April 30, 2016 | For the Year Ended April 30, 2015 | |||||||||||||||||||||
Per Share Operating Performance | |||||||||||||||||||||||||
Net asset value, beginning of period | $ | 24.92 | $ | 21.55 | $ | 18.70 | $ | 18.14 | $ | 16.35 | |||||||||||||||
|
|
|
|
|
|
|
|
|
| ||||||||||||||||
Net investment loss(1) | (0.12 | ) | (0.11 | ) | (0.08 | ) | (0.04 | ) | (0.02 | ) | |||||||||||||||
Net realized and unrealized gain on investments | 6.50 | 3.88 | 2.93 | 1.43 | 3.06 | ||||||||||||||||||||
|
|
|
|
|
|
|
|
|
| ||||||||||||||||
Net increase in net assets resulting from operations | 6.38 | 3.77 | 2.85 | 1.39 | 3.04 | ||||||||||||||||||||
|
|
|
|
|
|
|
|
|
| ||||||||||||||||
Dividends and distributions to shareholders from: | |||||||||||||||||||||||||
Net investment income | — | — | — | — | — | ||||||||||||||||||||
Net realized capital gains | (0.71 | ) | (0.40 | ) | — | (0.83 | ) | (1.25 | ) | ||||||||||||||||
|
|
|
|
|
|
|
|
|
| ||||||||||||||||
Total dividends and distributions to shareholders | (0.71 | ) | (0.40 | ) | — | (0.83 | ) | (1.25 | ) | ||||||||||||||||
|
|
|
|
|
|
|
|
|
| ||||||||||||||||
Redemption fees | — | (2) | — | (2) | — | (2) | — | (2) | — | (2) | |||||||||||||||
|
|
|
|
|
|
|
|
|
| ||||||||||||||||
Net asset value, end of period | $ | 30.59 | $ | 24.92 | $ | 21.55 | $ | 18.70 | $ | 18.14 | |||||||||||||||
|
|
|
|
|
|
|
|
|
| ||||||||||||||||
Total investment return(3) | 26.12 | % | 17.59 | % | 15.24 | % | 7.54 | % | 18.87 | % | |||||||||||||||
Ratios/Supplemental Data | |||||||||||||||||||||||||
Net assets, end of period (in thousands) | $ | 286,383 | $ | 67,130 | $ | 107,358 | $ | 150,617 | $ | 29,545 | |||||||||||||||
Ratio of expenses to average net assets | 1.25 | % | 1.25 | % | 1.25 | % | 1.25 | % | 1.25 | % | |||||||||||||||
Ratio of expenses to average net assets without waivers, expense reimbursements and/or recoupment, if any(4) | 1.26 | % | 1.23 | % | 1.38 | % | 1.42 | % | 1.50 | % | |||||||||||||||
Ratio of net investment loss to average net assets | (0.43 | )% | (0.49 | )% | (0.43 | )% | (0.21 | )% | (0.14 | )% | |||||||||||||||
Portfolio turnover rate | 18.59 | % | 19.56 | % | 13.61 | % | 9.13 | % | 33.44 | % | |||||||||||||||
| (1) | The selected per share data was calculated using the average shares outstanding method for the year. |
| (2) | Amount is less than $0.005 per share. |
| (3) | Total investment return is calculated assuming a purchase of shares on the first day and a sale of shares on the last day of each period reported and includes reinvestment of dividends and distributions, if any. |
| (4) | During the period, certain fees were waived and/or reimbursed; or recouped, if any. If such fee waivers and/or reimbursements or recoupments had not occurred, the ratios would have been as indicated (See Note 2). |
The accompanying notes are an integral part of the financial statements.
62
POLEN GLOBAL GROWTH FUND
Financial Highlights
Contained below is per share operating performance data for Institutional Class shares outstanding, total investment return, ratios to average net assets and other supplemental data for the respective period. The total returns in the table represent the rate that an investor would have earned or lost on an investment in the Fund (assuming reinvestment of all dividends and distributions). This information has been derived from information provided in the financial statements and should be read in conjunction with the financial statements and the notes thereto.
| Institutional Class | |||||||||||||||||||||||||
| For the Year Ended April 30, 2019 | For the Year Ended April 30, 2018 | For the Year Ended April 30, 2017 | For the Year Ended April 30, 2016 | For the Period December 30, 2014* to April 30, 2015 | |||||||||||||||||||||
Per Share Operating Performance | |||||||||||||||||||||||||
Net asset value, beginning of period | $ | 14.74 | $ | 12.29 | $ | 10.67 | $ | 10.29 | $ | 10.00 | |||||||||||||||
|
|
|
|
|
|
|
|
|
| ||||||||||||||||
Net investment income/(loss)(1) | (0.02 | ) | (0.03 | ) | (0.02 | ) | — | (2) | 0.02 | ||||||||||||||||
Net realized and unrealized gain on investments | 2.90 | 2.48 | 1.65 | 0.39 | 0.27 | ||||||||||||||||||||
|
|
|
|
|
|
|
|
|
| ||||||||||||||||
Net increase in net assets resulting from operations | 2.88 | 2.45 | 1.63 | 0.39 | 0.29 | ||||||||||||||||||||
|
|
|
|
|
|
|
|
|
| ||||||||||||||||
Dividends and distributions to shareholders from: | |||||||||||||||||||||||||
Net investment income | — | — | — | (0.01 | ) | — | |||||||||||||||||||
Net realized capital gains | (0.28 | ) | — | (0.01 | ) | — | — | ||||||||||||||||||
|
|
|
|
|
|
|
|
|
| ||||||||||||||||
Total dividends and distributions to shareholders | (0.28 | ) | — | (0.01 | ) | (0.01 | ) | — | |||||||||||||||||
|
|
|
|
|
|
|
|
|
| ||||||||||||||||
Redemption fees | 0.01 | — | (2) | — | (2) | — | (2) | — | |||||||||||||||||
|
|
|
|
|
|
|
|
|
| ||||||||||||||||
Net asset value, end of period | $ | 17.35 | $ | 14.74 | $ | 12.29 | $ | 10.67 | $ | 10.29 | |||||||||||||||
|
|
|
|
|
|
|
|
|
| ||||||||||||||||
Total investment return(3) | 19.91 | % | 19.94 | % | 15.24 | % | 3.78 | % | 2.90 | % | |||||||||||||||
Ratios/Supplemental Data | |||||||||||||||||||||||||
Net assets, end of period (in thousands) | $ | 68,617 | $ | 30,702 | $ | 18,618 | $ | 13,483 | $ | 3,076 | |||||||||||||||
Ratio of expenses to average net assets | 1.10 | % | 1.10 | % | 1.10 | % | 1.10 | % | | 1.10 | %(4) | ||||||||||||||
Ratio of expenses to average net assets without waivers and expense reimbursements(5) | 1.31 | % | 1.50 | % | 2.40 | % | 3.63 | % | | 9.78 | %(4) | ||||||||||||||
Ratio of net investment income/(loss) to average net assets | (0.13 | )% | (0.18 | )% | (0.18 | )% | (0.01 | )% | | 0.47 | %(4) | ||||||||||||||
Portfolio turnover rate | 19.86 | % | 14.39 | % | 12.13 | % | 6.99 | % | — | ||||||||||||||||
| * | Commencement of operations. |
| (1) | The selected per share data was calculated using the average shares outstanding method for the year. |
| (2) | Amount is less than $0.005 per share. |
| (3) | Total investment return is calculated assuming a purchase of shares on the first day and a sale of shares on the last day of each period reported and includes reinvestments of dividends and distributions, if any. Total returns for periods less than one year are not annualized. |
| (4) | Annualized. |
| (5) | During the period, certain fees were waived and/or reimbursed. If such fee waivers and/or reimbursements had not occurred, the ratios would have been as indicated (See Note 2). |
The accompanying notes are an integral part of the financial statements.
63
POLEN GLOBAL GROWTH FUND
Financial Highlights
Contained below is per share operating performance data for Investor Class shares outstanding, total investment return, ratios to average net assets and other supplemental data for the respective period. The total returns in the table represent the rate that an investor would have earned or lost on an investment in the Fund (assuming reinvestment of all dividends and distributions). This information has been derived from information provided in the financial statements and should be read in conjunction with the financial statements and the notes thereto.
| Investor Class | ||||||||||||||||||||
| For the Year Ended April 30, 2019 | For the Year Ended April 30, 2018 | For the Year Ended April 30, 2017 | For the Period July 6, 2015* to April 30, 2016 | |||||||||||||||||
Per Share Operating Performance | ||||||||||||||||||||
Net asset value, beginning of period | $ | 14.62 | $ | 12.23 | $ | 10.64 | $ | 10.32 | ||||||||||||
|
|
|
|
|
|
|
| |||||||||||||
Net investment loss(1) | (0.06 | ) | (0.06 | ) | (0.05 | ) | — | (2) | ||||||||||||
Net realized and unrealized gain on investments | 2.88 | 2.45 | 1.65 | 0.32 | ||||||||||||||||
|
|
|
|
|
|
|
| |||||||||||||
Net increase in net assets resulting from operations | 2.82 | 2.39 | 1.60 | 0.32 | ||||||||||||||||
|
|
|
|
|
|
|
| |||||||||||||
Dividends and distributions to shareholders from: | ||||||||||||||||||||
Net investment income | — | — | — | — | (2) | |||||||||||||||
Net realized capital gains | (0.28 | ) | — | (0.01 | ) | — | ||||||||||||||
|
|
|
|
|
|
|
| |||||||||||||
Total dividends and distributions to shareholders | (0.28 | ) | — | (0.01 | ) | — | ||||||||||||||
|
|
|
|
|
|
|
| |||||||||||||
Redemption fees | 0.01 | — | (2) | — | (2) | — | (2) | |||||||||||||
|
|
|
|
|
|
|
| |||||||||||||
Net asset value, end of period | $ | 17.17 | $ | 14.62 | $ | 12.23 | $ | 10.64 | ||||||||||||
|
|
|
|
|
|
|
| |||||||||||||
Total investment return(3) | 19.66 | % | 19.54 | % | 15.00 | % | 3.13 | % | ||||||||||||
Ratios/Supplemental Data | ||||||||||||||||||||
Net assets, end of period (in thousands) | $ | 11,129 | $ | 5,094 | $ | 996 | $ | 523 | ||||||||||||
Ratio of expenses to average net assets | 1.35 | % | 1.35 | % | 1.35 | % | | 1.35 | %(4) | |||||||||||
Ratio of expenses to average net assets without waivers and expense reimbursements(5) | 1.56 | % | 1.71 | % | 2.61 | % | | 3.51 | %(4) | |||||||||||
Ratio of net investment loss to average net assets | (0.38 | )% | (0.43 | )% | (0.43 | )% | | (0.06 | )%(4) | |||||||||||
Portfolio turnover rate | 19.86 | % | 14.39 | % | 12.13 | % | | 6.99 | %(6) | |||||||||||
| * | Commencement of operations. |
| (1) | The selected per share data was calculated using the average shares outstanding method for the year. |
| (2) | Amount is less than $0.005 per share. |
| (3) | Total investment return is calculated assuming a purchase of shares on the first day and a sale of shares on the last day of each period reported and includes reinvestments of dividends and distributions, if any. Total returns for periods less than one year are not annualized. |
| (4) | Annualized. |
| (5) | During the period, certain fees were waived and/or reimbursed. If such fee waivers and/or reimbursements had not occurred, the ratios would have been as indicated (See Note 2). |
| (6) | Reflects portfolio turnover of the Fund for the year ended April 30, 2016. |
The accompanying notes are an integral part of the financial statements.
64
POLEN INTERNATIONAL GROWTH FUND
Financial Highlights
Contained below is per share operating performance data for Institutional Class shares outstanding, total investment return, ratios to average net assets and other supplemental data for the respective period. The total returns in the table represent the rate that an investor would have earned or lost on an investment in the Fund (assuming reinvestment of all dividends and distributions). This information has been derived from information provided in the financial statements and should be read in conjunction with the financial statements and the notes thereto.
| Institutional Class | |||||||||||||||
| For the Year Ended April 30, 2019 | For the Year Ended April 30, 2018 | For the Period December 30, 2016* to April 30, 2017 | |||||||||||||
Per Share Operating Performance | |||||||||||||||
Net asset value, beginning of period | $ | 13.24 | $ | 11.57 | $ | 10.00 | |||||||||
|
|
|
|
|
| ||||||||||
Net investment income(1) | 0.03 | 0.06 | 0.05 | ||||||||||||
Net realized and unrealized gain on investments | 1.10 | 1.70 | 1.52 | ||||||||||||
|
|
|
|
|
| ||||||||||
Net increase in net assets resulting from operations | 1.13 | 1.76 | 1.57 | ||||||||||||
|
|
|
|
|
| ||||||||||
Dividends and distributions to shareholders from: | |||||||||||||||
Net investment income | (0.01 | ) | (0.07 | ) | — | ||||||||||
Net realized capital gains | (0.01 | ) | (0.02 | ) | — | ||||||||||
|
|
|
|
|
| ||||||||||
Total dividends and distributions to shareholders. | (0.02 | ) | (0.09 | ) | — | ||||||||||
|
|
|
|
|
| ||||||||||
Redemption fees | — | (2) | — | — | |||||||||||
|
|
|
|
|
| ||||||||||
Net asset value, end of period | $ | 14.35 | $ | 13.24 | $ | 11.57 | |||||||||
|
|
|
|
|
| ||||||||||
Total investment return(3) | 8.50 | % | 15.18 | % | 15.70 | % | |||||||||
Ratios/Supplemental Data | |||||||||||||||
Net assets, end of period (in thousands) | $ | 68,857 | $ | 10,982 | $ | 2,648 | |||||||||
Ratio of expenses to average net assets | 1.10 | % | 1.10 | % | 1.10 | %(4) | |||||||||
Ratio of expenses to average net assets without waivers and expense reimbursements(5) | 1.40 | % | 3.45 | % | 9.84 | %(4) | |||||||||
Ratio of net investment income to average net assets | 0.22 | % | 0.48 | % | 1.32 | %(4) | |||||||||
Portfolio turnover rate | 12.47 | % | 6.36 | % | — | ||||||||||
| * | Commencement of operations. |
| (1) | The selected per share data was calculated using the average shares outstanding method for the period. |
| (2) | Amount is less than $0.005 per share. |
| (3) | Total investment return is calculated assuming a purchase of shares on the first day and a sale of shares on the last day of each period reported and includes reinvestments of dividends and distributions, if any. Total returns for periods less than one year are not annualized. |
| (4) | Annualized. |
| (5) | During the period, certain fees were waived and/or reimbursed. If such fee waivers and/or reimbursements had not occurred, the ratios would have been as indicated (See Note 2). |
The accompanying notes are an integral part of the financial statements.
65
POLEN INTERNATIONAL GROWTH FUND
Financial Highlights
Contained below is per share operating performance data for Investor Class shares outstanding, total investment return, ratios to average net assets and other supplemental data for the respective period. The total returns in the table represent the rate that an investor would have earned or lost on an investment in the Fund (assuming reinvestment of all dividends and distributions). This information has been derived from information provided in the financial statements and should be read in conjunction with the financial statements and the notes thereto.
| Investor Class | |||||||||||||||
| For the Year Ended April 30, 2019 | For the Year Ended April 30, 2018 | For the Period March 15, 2017* to April 30, 2017 | |||||||||||||
Per Share Operating Performance | |||||||||||||||
Net asset value, beginning of period | $ | 13.21 | $ | 11.56 | $ | 10.91 | |||||||||
|
|
|
|
|
| ||||||||||
Net investment income/(loss)(1) | — | (2) | 0.03 | 0.04 | |||||||||||
Net realized and unrealized gain on investments | 1.09 | 1.69 | 0.61 | ||||||||||||
|
|
|
|
|
| ||||||||||
Net increase in net assets resulting from operations | 1.09 | 1.72 | 0.65 | ||||||||||||
|
|
|
|
|
| ||||||||||
Dividends and distributions to shareholders from: | |||||||||||||||
Net investment income | — | (0.05 | ) | — | |||||||||||
Net realized capital gains | (0.01 | ) | (0.02 | ) | — | ||||||||||
|
|
|
|
|
| ||||||||||
Total dividends and distributions to shareholders | (0.01 | ) | (0.07 | ) | — | ||||||||||
|
|
|
|
|
| ||||||||||
Redemption fees | — | (2) | — | — | |||||||||||
|
|
|
|
|
| ||||||||||
Net asset value, end of period | $ | 14.29 | $ | 13.21 | $ | 11.56 | |||||||||
|
|
|
|
|
| ||||||||||
Total investment return(3) | 8.25 | % | 14.91 | % | 5.96 | % | |||||||||
Ratios/Supplemental Data | |||||||||||||||
Net assets, end of period (in thousands) | $ | 1,321 | $ | 247 | $ | 14 | |||||||||
Ratio of expenses to average net assets | 1.35 | % | 1.35 | % | 1.35 | %(4) | |||||||||
Ratio of expenses to average net assets without waivers and expense reimbursements(5) | 1.64 | % | 3.50 | % | 9.47 | %(4) | |||||||||
Ratio of net investment income/(loss) to average net assets | (0.03 | )% | 0.23 | % | 2.63 | %(4) | |||||||||
Portfolio turnover rate | 12.47 | % | 6.36 | % | — | ||||||||||
| * | Commencement of operations. |
| (1) | The selected per share data was calculated using the average shares outstanding method for the period. |
| (2) | Amount is less than $0.005 per share. |
| (3) | Total investment return is calculated assuming a purchase of shares on the first day and a sale of shares on the last day of each period reported and includes reinvestments of dividends and distributions, if any. Total returns for periods less than one year are not annualized. |
| (4) | Annualized. |
| (5) | During the period, certain fees were waived and/or reimbursed. If such fee waivers and/or reimbursements had not occurred, the ratios would have been as indicated (See Note 2). |
The accompanying notes are an integral part of the financial statements.
66
POLEN U.S. SMALL COMPANY GROWTH FUND
Financial Highlights
Contained below is per share operating performance data for Institutional Class shares outstanding, total investment return, ratios to average net assets and other supplemental data for the respective period. The total returns in the table represent the rate that an investor would have earned or lost on an investment in the Fund (assuming reinvestment of all dividends and distributions). This information has been derived from information provided in the financial statements and should be read in conjunction with the financial statements and the notes thereto.
| Institutional Class | ||||||||||
| For the Year Ended April 30, 2019 | For the Period November 01, 2017* to April 30, 2018 | |||||||||
Per Share Operating Performance | ||||||||||
Net asset value, beginning of period | $ | 10.21 | $ | 10.00 | ||||||
|
|
|
| |||||||
Net investment loss(1) | (0.10 | ) | (0.05 | ) | ||||||
Net realized and unrealized gain on investments | 2.34 | 0.26 | ||||||||
|
|
|
| |||||||
Net increase in net assets resulting from operations | 2.24 | 0.21 | ||||||||
|
|
|
| |||||||
Dividends and distributions to shareholders from: | ||||||||||
Net realized capital gains | (0.02 | ) | — | |||||||
|
|
|
| |||||||
Redemption fees | — | (2) | — | |||||||
|
|
|
| |||||||
Net asset value, end of period | $ | 12.43 | $ | 10.21 | ||||||
|
|
|
| |||||||
Total investment return(3) | 21.94 | % | 2.10 | % | ||||||
Ratios/Supplemental Data | ||||||||||
Net assets, end of period (in thousands) | $ | 7,940 | $ | 3,334 | ||||||
Ratio of expenses to average net assets | 1.25 | % | 1.25 | %(4) | ||||||
Ratio of expenses to average net assets without waivers and expense reimbursements(5) | 3.38 | % | 7.51 | %(4) | ||||||
Ratio of net investment loss to average net assets | (0.87 | )% | (0.95 | )%(4) | ||||||
Portfolio turnover rate | 35.02 | % | 8.39 | %(6) | ||||||
| * | Commencement of operations. |
| (1) | The selected per share data was calculated using the average shares outstanding method for the period. |
| (2) | Amount is less than $0.005 per share. |
| (3) | Total investment return is calculated assuming a purchase of shares on the first day and a sale of shares on the last day of each period reported and includes reinvestments of dividends and distributions, if any. Total returns for periods less than one year are not annualized. |
| (4) | Annualized. |
| (5) | During the period, certain fees were waived and/or reimbursed. If such fee waivers and/or reimbursements had not occurred, the ratios would have been as indicated (See Note 2). |
| (6) | Not annualized. |
The accompanying notes are an integral part of the financial statements.
67
POLEN U.S. SMALL COMPANY GROWTH FUND
Financial Highlights
Contained below is per share operating performance data for Investor Class shares outstanding, total investment return, ratios to average net assets and other supplemental data for the respective period. The total returns in the table represent the rate that an investor would have earned or lost on an investment in the Fund (assuming reinvestment of all dividends and distributions). This information has been derived from information provided in the financial statements and should be read in conjunction with the financial statements and the notes thereto.
| Investor Class | |||||
| For the Period February 8, 2019* to April 30, 2019 | |||||
Per Share Operating Performance | |||||
Net asset value, beginning of period | $ | 11.54 | |||
|
| ||||
Net investment loss(1) | (0.03 | ) | |||
Net realized and unrealized gain on investments | 0.91 | ||||
|
| ||||
Net increase in net assets resulting from operations | 0.88 | ||||
|
| ||||
Net asset value, end of period | $ | 12.42 | |||
|
| ||||
Total investment return(2) | 7.63 | % | |||
Ratios/Supplemental Data | |||||
Net assets, end of period (in thousands) | $ | 13 | |||
Ratio of expenses to average net assets | 1.50 | %(3) | |||
Ratio of expenses to average net assets without waivers and expense reimbursements(4) | 2.98 | %(3) | |||
Ratio of net investment loss to average net assets | (1.12 | )%(3) | |||
Portfolio turnover rate | 35.02 | %(5) | |||
| * | Commencement of operations. |
| (1) | The selected per share data was calculated using the average shares outstanding method for the period. |
| (2) | Total investment return is calculated assuming a purchase of shares on the first day and a sale of shares on the last day of each period reported and includes reinvestments of dividends and distributions, if any. Total returns for periods less than one year are not annualized. |
| (3) | Annualized. |
| (4) | During the period, certain fees were waived and/or reimbursed. If such fee waivers and/or reimbursements had not occurred, the ratios would have been as indicated (See Note 2). |
| (5) | Reflects portfolio turnover of the Fund for the year ended April 30, 2019. |
The accompanying notes are an integral part of the financial statements.
68
POLEN INTERNATIONAL SMALL COMPANY GROWTH FUND
Financial Highlights
Contained below is per share operating performance data for Institutional Class shares outstanding, total investment return, ratios to average net assets and other supplemental data for the respective period. The total returns in the table represent the rate that an investor would have earned or lost on an investment in the Fund (assuming reinvestment of all dividends and distributions). This information has been derived from information provided in the financial statements and should be read in conjunction with the financial statements and the notes thereto.
| Institutional Class | |||||
| For the Period December 31, 2018 to April 30, 2019* | |||||
Per Share Operating Performance | |||||
Net asset value, beginning of period | $ | 10.00 | |||
|
| ||||
Net investment income/(loss)(1) | — | (2) | |||
Net realized and unrealized gain on investments | 1.93 | ||||
|
| ||||
Net increase in net assets resulting from operations | 1.93 | ||||
|
| ||||
Net asset value, end of period | $ | 11.93 | |||
|
| ||||
Total investment return(3) | 19.30 | % | |||
Ratios/Supplemental Data | |||||
Net assets, end of period (in thousands) | $ | 3,357 | |||
Ratio of expenses to average net assets | 1.25 | %(4) | |||
Ratio of expenses to average net assets without waivers and expense reimbursements(5) | 7.51 | %(4) | |||
Ratio of net investment income to average net assets | 0.01 | %(4) | |||
Portfolio turnover rate | 8.76 | %(6) | |||
| * | Commencement of operations. |
| (1) | The selected per share data was calculated using the average shares outstanding method for the period. |
| (2) | Amount is less than $0.005 per share. |
| (3) | Total investment return is calculated assuming a purchase of shares on the first day and a sale of shares on the last day of each period reported and includes reinvestments of dividends and distributions, if any. Total returns for periods less than one year are not annualized. |
| (4) | Annualized. |
| (5) | During the period, certain fees were waived and/or reimbursed. If such fee waivers and/or reimbursements had not occurred, the ratios would have been as indicated (See Note 2). |
| (6) | Not annualized. |
The accompanying notes are an integral part of the financial statements.
69
POLEN INTERNATIONAL SMALL COMPANY GROWTH FUND
Financial Highlights
Contained below is per share operating performance data for Investor Class shares outstanding, total investment return, ratios to average net assets and other supplemental data for the respective period. The total returns in the table represent the rate that an investor would have earned or lost on an investment in the Fund (assuming reinvestment of all dividends and distributions). This information has been derived from information provided in the financial statements and should be read in conjunction with the financial statements and the notes thereto.
| Investor Class | |||||
| For the Period February 8, 2019* to April 30, 2019 | |||||
Per Share Operating Performance | |||||
Net asset value, beginning of period | $ | 10.81 | |||
|
| ||||
Net investment income(1) | 0.01 | ||||
Net realized and unrealized gain on investments | 1.10 | ||||
|
| ||||
Net increase in net assets resulting from operations | 1.11 | ||||
|
| ||||
Net asset value, end of period | $ | 11.92 | |||
|
| ||||
Total investment return(2) | 10.27 | % | |||
Ratios/Supplemental Data | |||||
Net assets, end of period (in thousands) | $ | 37 | |||
Ratio of expenses to average net assets | 1.50 | %(3) | |||
Ratio of expenses to average net assets without waivers and expense reimbursements(4) | 7.17 | %(3) | |||
Ratio of net investment income to average net assets. | 0.36 | %(3) | |||
Portfolio turnover rate | 8.76 | %(5)(6) | |||
| * | Commencement of operations. |
| (1) | The selected per share data was calculated using the average shares outstanding method for the period. |
| (2) | Total investment return is calculated assuming a purchase of shares on the first day and a sale of shares on the last day of each period reported and includes reinvestments of dividends and distributions, if any. Total returns for periods less than one year are not annualized. |
| (3) | Annualized. |
| (4) | During the period, certain fees were waived and/or reimbursed. If such fee waivers and/or reimbursements had not occurred, the ratios would have been as indicated (See Note 2). |
| (5) | Not annualized. |
| (6) | Reflects portfolio turnover of the Fund for the period December 31, 2018 to April 30, 2019. |
The accompanying notes are an integral part of the financial statements.
70
POLEN GROWTH FUNDS
Notes to Financial Statements
April 30, 2019
1. Organization and Significant Accounting Policies
The Polen Growth Fund, Polen Global Growth Fund, Polen International Growth Fund, Polen U.S. Small Company Growth Fund and Polen International Small Company Growth Fund (each a “Fund” and together the “Funds”) arenon-diversified,open-end management investment companies registered under the Investment Company Act of 1940, as amended, (the “1940 Act”), which commenced investment operations on September 15, 2010, December 30, 2014, December 30, 2016, November 1, 2017 and December 31, 2018, respectively. The Funds are separate series of FundVantage Trust (the “Trust”) which was organized as a Delaware statutory trust on August 28, 2006. The Trust is a “series trust” authorized to issue an unlimited number of separate series or classes of shares of beneficial interest. Each series is treated as a separate entity for certain matters under the 1940 Act, and for other purposes, and a shareholder of one series is not deemed to be a shareholder of any other series. The Funds offer two separate classes of shares, Investor Class (formerly Retail Class) and Institutional Class.
The Funds are investment companies and follow accounting and reporting guidance in the Financial Accounting Standards Board Accounting Standards Codification Topic 946.
Portfolio Valuation— The Funds’ net asset value (“NAV”) is calculated once daily at the close of regular trading hours on the New York Stock Exchange (“NYSE”) (typically 4:00 p.m. Eastern time) on each day the NYSE is open. Securities held by the Funds are valued using the closing price or the last sale price on a national securities exchange or the National Association of Securities Dealers Automatic Quotation System (“NASDAQ”) market system where they are primarily traded. Equity securities traded in theover-the-counter market are valued at their closing prices. If there were no transactions on that day, securities traded principally on an exchange or on NASDAQ will be valued at the mean of the last bid and ask prices prior to the market close. Fixed income securities having a remaining maturity of greater than 60 days are valued using an independent pricing service. Fixed income securities having a remaining maturity of 60 days or less are generally valued at amortized cost, provided such amount approximates fair value. Investments in otheropen-end investment companies are valued based on the NAV of the investment companies (which may use fair value pricing as discussed in their prospectuses). If market quotations are unavailable or deemed unreliable, securities will be valued in accordance with procedures adopted by the Trust’s Board of Trustees (“Board of Trustees”). Relying on prices supplied by pricing services or dealers or using fair valuation may result in values that are higher or lower than the values used by other investment companies and investors to price the same investments. In the event that market quotes are not readily available, and the security or asset cannot be valued pursuant to one of the valuation methods, the value of the security or asset will be determined in good faith by the Adviser. The Trust has established a Valuation Committee which performs certain functions including the oversight of the Adviser’s fair valuation determinations.
71
POLEN GROWTH FUNDS
Notes to Financial Statements (Continued)
April 30, 2019
Fair Value Measurements —The inputs and valuation techniques used to measure fair value of the Funds’ investments are summarized into three levels as described in the hierarchy below:
| • | Level 1 — quoted prices in active markets for identical securities; |
| • | Level 2 — other significant observable inputs (including quoted prices for similar securities, interest rates, prepayment speeds, credit risk, etc.); and |
| • | Level 3 — significant unobservable inputs (including the Funds’ own assumptions in determining the fair value of investments). |
The inputs or methodology used for valuing securities are not necessarily an indication of the risk associated with investing in those securities.
Significant events (such as movement in the U.S. securities market, or other regional and local developments) may occur between the time that foreign markets close (where the security is principally traded) and the time that each Fund calculates its NAV (generally, the close of the NYSE) that may impact the value of securities traded in these foreign markets. As a result, each Fund fair values foreign securities using an independent pricing service which considers the correlation of the trading patterns of the foreign security to the intraday trading in the U.S. markets for investments such as American Depositary Receipts, financial futures, exchange traded funds and certain indexes as well as prices for similar securities. Such fair valuations are categorized as Level 2 in the hierarchy.
Securities listed on anon-U.S. exchange are generally fair valued daily by an independent fair value pricing service approved by the Board of Trustees and categorized as Level 2 investments within the hierarchy. The fair valuations for these securities may not be the same as quoted or published prices of the securities on their primary markets. Securities for which daily fair value prices from the independent fair value pricing service are not available are generally valued at the last quoted sale price at the close of an exchange on which the security is traded and categorized as Level 1 investments within the hierarchy. Values of foreign securities, currencies, and other assets and liabilities denominated in foreign currencies are translated into U.S. dollars at the exchange rate of said currencies against the U.S. dollar, as of valuation time, as provided by an independent pricing service approved by the Board of Trustees.
72
POLEN GROWTH FUNDS
Notes to Financial Statements (Continued)
April 30, 2019
The following is a summary of the inputs used, as of April 30, 2019, in valuing the Funds’ investments carried at fair value:
Funds | Total Value at 04/30/19 | Level 1 Quoted Price | Level 2 Other Significant Observable Inputs | Level 3 Significant Unobservable Inputs | ||||||||||||
Polen Growth Fund | ||||||||||||||||
Investments in Securities* | $ | 3,510,922,370 | $ | 3,510,922,370 | $ | — | $ | — | ||||||||
|
|
|
|
|
|
|
| |||||||||
Polen Global Growth Fund | ||||||||||||||||
Australia | $ | 2,501,850 | $ | — | $ | 2,501,850 | $ | — | ||||||||
China | 7,488,721 | 3,396,859 | 4,091,862 | — | ||||||||||||
Denmark | 2,229,324 | 766,173 | 1,463,151 | — | ||||||||||||
France | 1,406,510 | — | 1,406,510 | — | ||||||||||||
Germany | 8,060,466 | — | 8,060,466 | — | ||||||||||||
Ireland | 3,009,671 | 3,009,671 | — | — | ||||||||||||
Spain | 1,278,973 | — | 1,278,973 | — | ||||||||||||
Switzerland | 3,968,969 | — | 3,968,969 | — | ||||||||||||
United Kingdom | 1,344,424 | — | 1,344,424 | — | ||||||||||||
United States | 44,891,157 | 44,891,157 | — | — | ||||||||||||
|
|
|
|
|
|
|
| |||||||||
Total | $ | 76,180,065 | $ | 52,063,860 | $ | 24,116,205 | $ | — | ||||||||
|
|
|
|
|
|
|
| |||||||||
Polen International Growth Fund |
| |||||||||||||||
Australia | $ | 2,729,775 | $ | — | $ | 2,729,775 | $ | — | ||||||||
China | 11,010,325 | 6,123,453 | 4,886,872 | — | ||||||||||||
Denmark | 2,244,146 | — | 2,244,146 | — | ||||||||||||
France | 2,252,404 | — | 2,252,404 | — | ||||||||||||
Germany | 9,493,762 | — | 9,493,762 | — | ||||||||||||
Ireland | 13,311,703 | 10,500,767 | 2,810,936 | — | ||||||||||||
Israel | 2,011,620 | 2,011,620 | — | — | ||||||||||||
Mexico | 1,536,315 | 1,536,315 | — | — | ||||||||||||
Netherlands | 2,551,279 | — | 2,551,279 | — | ||||||||||||
Spain | 4,325,542 | — | 4,325,542 | — | ||||||||||||
Switzerland | 2,413,970 | — | 2,413,970 | — | ||||||||||||
United Kingdom | 12,347,262 | — | 12,347,262 | — | ||||||||||||
|
|
|
|
|
|
|
| |||||||||
Total | $ | 66,228,103 | $ | 20,172,155 | $ | 46,055,948 | $ | — | ||||||||
|
|
|
|
|
|
|
| |||||||||
73
POLEN GROWTH FUNDS
Notes to Financial Statements (Continued)
April 30, 2019
Funds | Total Value at 04/30/19 | Level 1 Quoted Price | Level 2 Other Significant Observable Inputs | Level 3 Significant Unobservable Inputs | ||||||||||||
Polen U.S. Small Company | ||||||||||||||||
Investments in Securities* | $ | 7,497,979 | $ | 7,497,979 | $ | — | $ | — | ||||||||
|
|
|
|
|
|
|
| |||||||||
Polen International Small | ||||||||||||||||
Argentina | $ | 49,022 | $ | 49,022 | $ | — | $ | — | ||||||||
Australia | 265,181 | — | 265,181 | — | ||||||||||||
Brazil | 71,287 | 71,287 | — | — | ||||||||||||
Canada | 527,006 | 527,006 | — | — | ||||||||||||
Denmark | 100,624 | — | 100,624 | — | ||||||||||||
Germany | 392,308 | — | 392,308 | — | ||||||||||||
Israel | 126,142 | 126,142 | — | — | ||||||||||||
Italy | 133,800 | — | 133,800 | — | ||||||||||||
Japan | 418,120 | — | 418,120 | — | ||||||||||||
Luxembourg | 146,143 | 146,143 | — | — | ||||||||||||
Norway | 75,271 | — | 75,271 | — | ||||||||||||
South Korea | 130,866 | — | 130,866 | — | ||||||||||||
Sweden | 143,619 | — | 143,619 | — | ||||||||||||
Switzerland | 114,456 | — | 114,456 | — | ||||||||||||
United Kingdom | 563,742 | 97,997 | 465,745 | — | ||||||||||||
|
|
|
|
|
|
|
| |||||||||
Total | $ | 3,257,587 | $ | 1,017,597 | $ | 2,239,990 | $ | — | ||||||||
|
|
|
|
|
|
|
| |||||||||
* Please refer to Portfolio of Investments for details on portfolio holdings.
At the end of each quarter, management evaluates the classification of Levels 1, 2 and 3 assets and liabilities. Various factors are considered, such as changes in liquidity from the prior reporting period; whether or not a broker is willing to execute at the quoted price; the depth and consistency of prices from third party pricing services; and the existence of contemporaneous, observable trades in the market. Additionally, management evaluates the classification of Level 1 and Level 2 assets and liabilities on a quarterly basis for changes in listings or delistings on national exchanges.
Due to the inherent uncertainty of determining the fair value of investments that do not have a readily available market value, the fair value of the Funds’ investments may fluctuate from period to period.
74
POLEN GROWTH FUNDS
Notes to Financial Statements (Continued)
April 30, 2019
Additionally, the fair value of investments may differ significantly from the values that would have been used had a ready market existed for such investments and may differ materially from the values the Funds may ultimately realize. Further, such investments may be subject to legal and other restrictions on resale or otherwise less liquid than publicly traded securities.
For fair valuations using significant unobservable inputs, U.S. generally accepted accounting principles (“U.S. GAAP”) require the Funds to present a reconciliation of the beginning to ending balances for reported market values that present changes attributable to total realized and unrealized gains or losses, purchase and sales, and transfers in and out of Level 3 during the period. A reconciliation of Level 3 investments is presented only when the Funds had an amount of Level 3 investments at the end of the reporting period that was meaningful in relation to their net assets. The amounts and reasons for all transfers in and out of Level 3 are disclosed when the Funds had an amount of transfers during the reporting period that was meaningful in relation to their net assets as of the end of the reporting period.
For the year ended April 30, 2019, there were no transfers between Levels.
Use of Estimates— The preparation of financial statements in conformity with U.S. GAAP requires management to make estimates and assumptions that affect the amounts reported in the financial statements and accompanying notes at the date of the financial statements and the reported amounts of revenues and expenses during the period. Actual results could differ from those estimates and those differences could be material.
Investment Transactions, Investment Income and Expenses— Investment transactions are recorded on trade date for financial statement preparation purposes. Realized gains and losses on investments sold are recorded on the identified cost basis. Interest income is recorded on the accrual basis. Dividends are recorded on theex-dividend date. Distribution(12b-1) fees relating to a specific class are charged directly to that class. Fund level expenses common to all classes, investment income and realized and unrealized gains and losses on investments are generally allocated to each class of each Fund based upon the relative daily net assets of each class of each Fund. General expenses of the Trust are generally allocated to each Fund in proportion to its relative daily net assets. Expenses directly attributable to a particular Fund in the Trust are charged directly to that Fund. The Funds’ investment income, expenses (other than class-specific expenses) and unrealized and realized gains and losses are allocated daily to each class of shares based upon the relative proportion of net assets of each class at the beginning of the day.
Deferred Offering Cost— Offering costs, including costs of printing initial prospectus and legal fees, are amortized over twelve-months from inception of the Fund. As of April 30, 2019, offering costs have been fully amortized by the Polen U.S. Small Company Growth Fund.
75
POLEN GROWTH FUNDS
Notes to Financial Statements (Continued)
April 30, 2019
Foreign Currency Translation— Assets and liabilities initially expressed innon-U.S. currencies are translated into U.S. dollars based on the applicable exchange rates at the date of the last business day of the financial statement period. Purchases and sales of securities, interest income, dividends, variation margin received and expenses denominated in foreign currencies are translated into U.S. dollars at the exchange rates in effect on the transaction date. The Funds do not separately report the effect of changes in foreign exchange rates from changes in market prices of securities held. Such changes are included with the net realized gain or loss and change in unrealized appreciation or depreciation on investment securities in the Statement of Operations. Other foreign currency transactions resulting in realized and unrealized gain or loss are reported separately as net realized gain or loss and change in unrealized appreciation or depreciation on foreign currencies in the Statement of Operations.
Dividends and Distributions to Shareholders— Dividends from net investment income and distributions from net realized capital gains, if any, are declared and paid at least annually to shareholders and are recorded onex-date. Income dividends and capital gain distributions are determined in accordance with U.S. federal income tax regulations, which may differ from U.S. GAAP.
U.S. Tax Status— No provision is made for U.S. income taxes as it is the Funds’ intention to continue to qualify for and elect the tax treatment applicable to regulated investment companies under Subchapter M of the Internal Revenue Code of 1986, as amended (“Internal Revenue Code”), and make the requisite distributions to its shareholders which will be sufficient to relieve it from U.S. income and excise taxes.
Other— In the normal course of business, the Funds may enter into contracts that provide general indemnifications. The Funds’ maximum exposure under these arrangements is dependent on claims that may be made against the Funds in the future, and therefore, cannot be estimated; however, based on experience, the risk of material loss for such claims is considered remote.
Currency Risk— The Funds invest in securities of foreign issuers, including American Depositary Receipts. These markets are subject to special risks associated with foreign investments not typically associated with investing in U.S. markets. Because the foreign securities in which the Funds may invest generally trade in currencies other than the U.S. dollar, changes in currency exchange rates will affect the Funds’ NAV, the value of dividends and interest earned and gains and losses realized on the sale of securities. Because the NAV for the Funds is determined on the basis of U.S. dollars, the Funds may lose money by investing in a foreign security if the local currency of a foreign market depreciates against the U.S. dollar, even if the local currency value of the Funds’ holdings goes up. Generally, a strong U.S. dollar relative to these other currencies will adversely affect the value of the Funds’ holdings in foreign securities.
Foreign Securities Market Risk— Securities of manynon-U.S. companies may be less liquid and their prices more volatile than securities of comparable U.S. companies. Securities of companies traded in many countries outside the U.S., particularly emerging markets countries, may be subject to
76
POLEN GROWTH FUNDS
Notes to Financial Statements (Continued)
April 30, 2019
further risks due to the inexperience of local investment professionals and financial institutions, the possibility of permanent or temporary termination of trading and greater spreads between bid and asked prices of securities. In addition,non-U.S. stock exchanges and investment professionals are subject to less governmental regulation, and commissions may be higher than in the United States. Also, there may be delays in the settlement ofnon-U.S. stock exchange transactions.
Recent Accounting Pronouncement— Effective November 5, 2018, the SEC amended existing rules intended to modernize reporting and disclosure of information. These amendments relate to RegulationS-X which sets forth the form and content of financial statements. The amendment requires collapsing the components of distributable earnings on the Statement of Assets and Liabilities and collapsing the distributions paid to shareholders on the Statements of Changes in Net Assets. Management has evaluated the implications of adopting these amendments and determined there is no significant impact on the financial statements and accompanying notes.
2. Transactions with Related Parties and Other Service Providers
Polen Capital Management, LLC (“PCM” or the “Adviser”) serves as investment adviser to the Funds pursuant to an investment advisory agreement with the Trust. For its services, the Adviser is paid a monthly fee at the annual rate of 0.85% of the average daily net assets of the Polen Growth Fund, Polen Global Growth Fund and Polen International Growth Fund, and 1.00% of average daily net assets of the Polen U.S. Small Company Growth Fund and Polen International Small Company Growth Fund. The Adviser has contractually agreed to reduce its investment advisory fee and/or reimburse certain expenses of the Funds to the extent necessary to ensure that the Funds’ total operating expenses (excluding taxes, fees and expenses attributable to a distribution or service plan adopted by the Trust, interest, extraordinary items, “Acquired Fund Fees and Expenses” and brokerage commissions) do not exceed (on an annual basis) 1.00% of the Polen Growth Fund’s, 1.10% of the Polen Global Growth Fund’s and Polen International Growth Fund’s and 1.25% of the Polen U.S. Small Company Growth Fund’s and Polen International Small Company Growth Fund’s, average daily net assets (the “Expense Limitations”). The Expense Limitations will remain in place until August 31, 2019 with respect to the Polen Growth Fund, Polen Global Growth Fund, Polen International Growth Fund and Polen U.S. Small Company Growth Fund and August 31, 2020 with respect to the Polen International Small Company Growth Fund, unless the Board of Trustees approves its earlier termination. The Adviser is entitled to recover, subject to approval by the Board of Trustees, such amounts reduced or reimbursed for a period of up to three (3) years from the date on which the Adviser reduced its compensation and/or assumed expenses for such Fund. The Adviser is permitted to seek reimbursement from a Fund, subject to certain limitations, for fees it waived and Fund expenses it paid to the extent the total annual fund expenses do not exceed the limits described above or any lesser limits in effect at the time of reimbursement. For the Polen Growth Fund, the Adviser is entitled to recoup only the advisory fees waived or expenses reimbursed on or after January 1, 2017. No recoupment will occur unless the Fund’s expenses are below the Expense Limitation amount.
77
POLEN GROWTH FUNDS
Notes to Financial Statements (Continued)
April 30, 2019
For the year ended April 30, 2019, the Adviser earned advisory fees of $22,088,322, $453,367, $334,684, $53,086 and $8,210 for the Polen Growth Fund, Polen Global Growth Fund, Polen International Growth Fund, Polen U.S. Small Company Growth Fund and Polen International Small Company Growth Fund, respectively. For the year ended April 30, 2019, the Adviser waived fees and reimbursed expenses of $52,409, $114,262, $116,513, $112,930 and $52,240 for the Polen Growth Fund, Polen Global Growth Fund, Polen International Growth Fund, Polen U.S. Small Company Growth Fund and Polen International Small Company Growth Fund, respectively.
As of April 30, 2019, the amount of potential recovery was as follows:
| Expiration | ||||||||||||||||
| 04/30/2020 | 04/30/2021 | 04/30/2022 | Total | |||||||||||||
Polen Growth Fund | $ | — | $ | — | $ | 52,409 | $ | 52,409 | ||||||||
Polen Global Growth Fund | $ | 207,831 | $ | 97,239 | $ | 114,262 | $ | 419,332 | ||||||||
Polen International Growth Fund | $ | 53,471 | $ | 130,305 | $ | 116,513 | $ | 300,289 | ||||||||
Polen U.S. Small Company Growth Fund | $ | — | $ | 65,823 | $ | 112,930 | $ | 178,753 | ||||||||
Polen International Small Company Growth Fund | $ | — | $ | — | $ | 52,240 | $ | 52,240 | ||||||||
Other Service Providers
The Bank of New York Mellon (“BNY Mellon”) serves as administrator and custodian for the Funds. For providing administrative and accounting services, BNY Mellon is entitled to receive a monthly fee equal to an annual percentage rate of the Funds’ average daily net assets and is subject to certain minimum monthly fees. For providing certain custodial services, BNY Mellon is entitled to receive a monthly fee, subject to certain minimum, and out of pocket expenses.
BNY Mellon Investment Servicing (US) Inc. (the “Transfer Agent”) provides transfer agent services to the Funds. The Transfer Agent is entitled to receive a monthly fee, subject to certain minimum, and out of pocket expenses.
Foreside Funds Distributors LLC (the “Underwriter”) provides principal underwriting services to the Funds.
The Trust and the Underwriter are parties to an underwriting agreement. The Trust has adopted a distribution plan for Investor Shares in accordance with Rule 12b-1 under the 1940 Act. Pursuant to the Investor Shares plan, the Funds compensate the Underwriter for direct and indirect costs and expenses incurred in connection with advertising, marketing and other distribution services in an amount not to exceed 0.25% on an annualized basis of the average daily net assets of the Funds’ Investor Shares.
78
POLEN GROWTH FUNDS
Notes to Financial Statements (Continued)
April 30, 2019
Trustees and Officers
The Trust is governed by its Board of Trustees. The Trustees receive compensation in the form of an annual retainer and per meeting fees for their services to the Trust. The remuneration paid to the Trustees by the Funds during the year or period ended April 30, 2019 was $125,261, $2,511, $1,684, $264 and $13 for the Polen Growth Fund, Polen Global Growth Fund, Polen International Growth Fund, Polen U.S. Small Company Growth Fund and Polen International Small Company Growth Fund, respectively. An employee of BNY Mellon serves as the Secretary of the Trust and is not compensated by the Funds or the Trust.
JW Fund Management LLC (“JWFM”) provides a Principal Executive Officer and Principal Financial Officer to the Trust. Duff & Phelps, LLC (“D&P”) provides the Trust with a Chief Compliance Officer and an Anti-Money Laundering Officer. JWFM and D&P are compensated for their services provided to the Trust.
3. Investment in Securities
For the year or period ended April 30, 2019, aggregate purchases and sales of investment securities (excluding short-term investments) of the Funds were as follows:
| Purchases | Sales | |||||||
Polen Growth Fund | $ | 1,505,949,409 | $ | 469,089,952 | ||||
Polen Global Growth Fund | $ | 42,535,748 | $ | 10,127,983 | ||||
Polen International Growth Fund | $ | 55,998,347 | $ | 4,730,063 | ||||
Polen U.S. Small Company Growth Fund | $ | 5,068,850 | $ | 1,792,579 | ||||
Polen International Small Company Growth Fund | $ | 3,086,189 | $ | 234,682 | ||||
79
POLEN GROWTH FUNDS
Notes to Financial Statements (Continued)
April 30, 2019
4. Capital Share Transactions
For the year or period ended April 30, 2019 and the year or period ended April 30, 2018, transactions in capital shares (authorized shares unlimited) were as follows:
| Polen Growth Fund | ||||||||||||||||
| For the Year Ended | For the Year Ended | |||||||||||||||
| April 30, 2019 | April 30, 2018 | |||||||||||||||
| Shares | Amount | Shares | Amount | |||||||||||||
Institutional Class | ||||||||||||||||
Sales | 51,581,595 | $ | 1,440,277,408 | 23,848,335 | $ | 574,279,460 | ||||||||||
Reinvestments | 2,018,326 | 52,859,833 | 978,852 | 23,678,426 | ||||||||||||
Redemption Fees* | — | 143,243 | — | 30,557 | ||||||||||||
Redemptions | (17,794,917 | ) | (492,616,940 | ) | (14,659,215 | ) | (355,086,882 | ) | ||||||||
|
|
|
|
|
|
|
| |||||||||
Net increase | 35,805,004 | $ | 1,000,663,544 | 10,167,972 | $ | 242,901,561 | ||||||||||
|
|
|
|
|
|
|
| |||||||||
Investor Class | ||||||||||||||||
Sales | 8,089,750 | $ | 226,705,821 | 926,360 | $ | 21,778,612 | ||||||||||
Reinvestments | 175,372 | 4,507,051 | 46,479 | 1,106,659 | ||||||||||||
Redemption Fees* | — | 10,082 | — | 1,534 | ||||||||||||
Redemptions | (1,596,154 | ) | (43,219,377 | ) | (3,261,202 | ) | (76,248,412 | ) | ||||||||
|
|
|
|
|
|
|
| |||||||||
Net increase/(decrease) | 6,668,968 | $ | 188,003,577 | (2,288,363 | ) | $ | (53,361,607 | ) | ||||||||
|
|
|
|
|
|
|
| |||||||||
Total net increase | 42,473,972 | $ | 1,188,667,121 | 7,879,609 | $ | 189,539,954 | ||||||||||
|
|
|
|
|
|
|
| |||||||||
| Polen Global Growth Fund | ||||||||||||||||
| For the Year Ended | For the Year Ended | |||||||||||||||
| April 30, 2019 | April 30, 2018 | |||||||||||||||
| Shares | Amount | Shares | Amount | |||||||||||||
Institutional Class | ||||||||||||||||
Sales | 2,544,773 | $ | 39,693,428 | 1,046,799 | $ | 15,438,256 | ||||||||||
Reinvestments | 50,021 | 738,309 | — | — | ||||||||||||
Redemption Fees* | — | 14,659 | — | 5 | ||||||||||||
Redemptions | (723,038 | ) | (11,082,475 | ) | (477,841 | ) | (6,885,282 | ) | ||||||||
|
|
|
|
|
|
|
| |||||||||
Net increase | 1,871,756 | $ | 29,363,921 | 568,958 | $ | 8,552,979 | ||||||||||
|
|
|
|
|
|
|
| |||||||||
Investor Class | ||||||||||||||||
Sales | 587,723 | $ | 9,053,374 | 285,605 | $ | 4,151,046 | ||||||||||
Reinvestments | 9,586 | 140,154 | — | — | ||||||||||||
Redemption Fees* | — | 2,520 | — | 1 | ||||||||||||
Redemptions | (297,551 | ) | (4,550,139 | ) | (18,725 | ) | (266,132 | ) | ||||||||
|
|
|
|
|
|
|
| |||||||||
80
POLEN GROWTH FUNDS
Notes to Financial Statements (Continued)
April 30, 2019
| Polen Global Growth Fund | ||||||||||||||||
| For the Year Ended | For the Year Ended | |||||||||||||||
| April 30, 2019 | April 30, 2018 | |||||||||||||||
| Shares | Amount | Shares | Amount | |||||||||||||
Net increase | 299,758 | $ | 4,645,909 | 266,880 | $ | 3,884,915 | ||||||||||
|
|
|
|
|
|
|
| |||||||||
Total net increase | 2,171,514 | $ | 34,009,830 | 835,838 | $ | 12,437,894 | ||||||||||
|
|
|
|
|
|
|
| |||||||||
| Polen International Growth Fund | ||||||||||||||||
| For the Year Ended | For the Year Ended | |||||||||||||||
| April 30, 2019 | April 30, 2018 | |||||||||||||||
| Shares | Amount | Shares | Amount | |||||||||||||
Institutional Class | ||||||||||||||||
Sales | 4,457,711 | $ | 60,314,850 | 687,459 | $ | 9,115,189 | ||||||||||
Reinvestments | 3,280 | 42,343 | 2,333 | 30,485 | ||||||||||||
Redemption Fees* | — | 6,973 | — | — | ||||||||||||
Redemptions | (493,161 | ) | (6,663,372 | ) | (89,315 | ) | (1,195,774 | ) | ||||||||
|
|
|
|
|
|
|
| |||||||||
Net increase | 3,967,830 | $ | 53,700,794 | 600,477 | $ | 7,949,900 | ||||||||||
|
|
|
|
|
|
|
| |||||||||
Investor Class | ||||||||||||||||
Sales | 103,864 | $ | 1,417,453 | 31,609 | $ | 413,041 | ||||||||||
Reinvestments | 50 | 649 | 75 | 980 | ||||||||||||
Redemption Fees* | — | 136 | — | — | ||||||||||||
Redemptions | (30,174 | ) | (406,731 | ) | (14,236 | ) | (190,058 | ) | ||||||||
|
|
|
|
|
|
|
| |||||||||
Net increase | 73,740 | $ | 1,011,507 | 17,448 | $ | 223,963 | ||||||||||
|
|
|
|
|
|
|
| |||||||||
Total net increase | 4,041,570 | $ | 54,712,301 | 617,925 | $ | 8,173,863 | ||||||||||
|
|
|
|
|
|
|
| |||||||||
| Polen U.S. Small Company Growth Fund** | ||||||||||||||||
| For the Year Ended | For the Period Ended | |||||||||||||||
| April 30, 2019 | April 30, 2018 | |||||||||||||||
| Shares | Amount | Shares | Amount | |||||||||||||
Institutional Class | ||||||||||||||||
Sales | 370,471 | $ | 4,242,234 | 326,612 | $ | 3,304,680 | ||||||||||
Reinvestments | 909 | 9,611 | — | — | ||||||||||||
Redemption Fees* | — | 431 | — | — | ||||||||||||
Redemptions | (59,010 | ) | (611,287 | ) | — | — | ||||||||||
|
|
|
|
|
|
|
| |||||||||
Net increase | 312,370 | $ | 3,640,989 | 326,612 | $ | 3,304,680 | ||||||||||
|
|
|
|
|
|
|
| |||||||||
81
POLEN GROWTH FUNDS
Notes to Financial Statements (Continued)
April 30, 2019
| Polen U.S. Small Company Growth Fund** | ||||||||||||||||
| For the Year Ended | For the Period Ended | |||||||||||||||
| April 30, 2019 | April 30, 2018 | |||||||||||||||
| Shares | Amount | Shares | Amount | |||||||||||||
Investor Class | ||||||||||||||||
Sales | 1,330 | $ | 16,165 | — | $ | — | ||||||||||
Reinvestments | — | — | — | — | ||||||||||||
Redemption Fees* | — | — | — | — | ||||||||||||
Redemptions | (246 | ) | (2,793 | ) | — | — | ||||||||||
|
|
|
|
|
|
|
| |||||||||
Net increase | 1,084 | $ | 13,372 | — | $ | — | ||||||||||
|
|
|
|
|
|
|
| |||||||||
Total net increase | 313,454 | $ | 3,654,361 | 326,612 | $ | 3,304,680 | ||||||||||
|
|
|
|
|
|
|
| |||||||||
| Polen International Small Company Growth Fund*** | ||||||||||
| For the Period Ended April 30, 2019 | ||||||||||
| Shares | Amount | |||||||||
Institutional Class | ||||||||||
Sales | 281,454 | $ | 2,960,716 | |||||||
Reinvestments | — | — | ||||||||
Redemption Fees* | — | — | ||||||||
Redemptions | — | — | ||||||||
|
|
|
| |||||||
Net increase | 281,454 | $ | 2,960,716 | |||||||
|
|
|
| |||||||
Investor Class | ||||||||||
Sales | 3,142 | $ | 35,710 | |||||||
Reinvestments | — | — | ||||||||
Redemption Fees* | — | — | ||||||||
Redemptions | — | — | ||||||||
|
|
|
| |||||||
Net increase | 3,142 | $ | 35,710 | |||||||
|
|
|
| |||||||
Total net increase | 284,596 | $ | 2,996,426 | |||||||
|
|
|
| |||||||
| * | There is a 2.00% redemption fee that may be charged on shares redeemed within the first 60 days of their acquisition. The redemption fees are retained by the Funds for the benefit of the remaining shareholders and recorded aspaid-in capital. |
| ** | The Polen U.S. Small Company Growth Fund’s Institutional Class and Investor Class commenced operations on November 1, 2017 and February 8, 2019, respectively. |
82
POLEN GROWTH FUNDS
Notes to Financial Statements (Continued)
April 30, 2019
| *** | The Polen International Small Company Growth Fund’s Institutional Class and Investor Class commenced operations on December 31, 2018 and February 8, 2019, respectively. |
5. Federal Tax Information
The Funds have followed the authoritative guidance on accounting for and disclosure of uncertainty in tax positions, which requires the Funds to determine whether a tax position is more likely than not to be sustained upon examination, including resolution of any related appeals or litigation processes, based on the technical merits of the position. The Funds have determined that there was no effect on the financial statements from following this authoritative guidance. In the normal course of business, the Funds are subject to examination by federal, state and local jurisdictions, where applicable, for tax years for which applicable statutes of limitations have not expired.
Distributions are determined in accordance with federal income tax regulations, which may differ in amount or character from net investment income and realized gains for financial reporting purposes. Accordingly, the character of distributions and composition of net assets for tax purposes may differ from those reflected in the accompanying financial statements. To the extent these differences are permanent, such amounts are reclassified within the components of net assets based on the tax treatment; temporary differences do not require reclassifications. Net assets were not affected by these adjustments.
The following permanent differences as of April 30, 2019, primarily attributed to short-term gains netted against net operating loss, reclasses from capital gain to ordinary income and disallowed expenses, were reclassified among the following accounts:
| Total Distributable Earnings | Paid-in-Capital | |||||||
Polen Growth Fund | $ — | $ — | ||||||
Polen Global Growth Fund | — | — | ||||||
Polen International Growth Fund | — | — | ||||||
Polen U.S. Small Company Growth Fund | 12,433 | (12,433 | ) | |||||
Polen International Small Company Growth Fund | — | — | ||||||
For the year ended April 30, 2019, the tax character of distributions paid by the Polen Growth Fund, Polen Global Growth Fund, Polen International Growth Fund and Polen U.S. Small Company Growth Fund were $6,667,348, $26,262, $18,339 and $9,611 of ordinary income dividends and $59,761,509, $888,096, $25,051 and $0 of long-term capital gains, respectively. There were no distributions for the Polen International Small Company Growth Fund. For the year ended April 30, 2018, the tax character of distributions paid by the Polen Growth Fund and Polen International Growth Fund were $6,446,679 and $31,465 of ordinary income dividends and $22,196,888 and $0 of long-term capital gains, respectively. There were no distributions for the Polen Global Growth Fund and Polen U.S. Small Company Growth Fund.
83
POLEN GROWTH FUNDS
Notes to Financial Statements (Continued)
April 30, 2019
Distributions from net investment income and short-term capital gains are treated as ordinary income for federal income tax purposes.
As of April 30, 2019 the components of distributable earnings on a tax basis were as follows:
| Undistributed Ordinary Income | Undistributed Long-Term Gain | Unrealized Appreciation | Qualified Late Year Loss Deferral | Total Distributable Earnings | |||||||||||||||||||||
Polen Growth Fund | $ | — | $ | — | $ | 1,175,348,879 | $ | (31,028,044) | $ | 1,144,320,835 | |||||||||||||||
Polen Global Growth Fund | $ | 21,679 | $ | 32,042 | $ | 16,492,994 | $ | — | $ | 16,546,715 | |||||||||||||||
Polen International Growth Fund | $ | 14,471 | $ | — | $ | 5,031,129 | $ | (130,529) | $ | 4,915,071 | |||||||||||||||
Polen U.S. Small Company Growth Fund | $ | 63,989 | $ | — | $ | 948,148 | $ | — | $ | 1,012,137 | |||||||||||||||
Polen International Small Company Growth Fund | $ | — | $ | — | $ | 415,271 | $ | (17,184) | $ | 398,087 | |||||||||||||||
The differences between the book and tax basis components of distributable earnings relate primarily to the timing and recognition of income and gains for federal income tax purposes. Foreign currency and short-term capital gains are reported as ordinary income for federal income tax purposes.
As of April 30, 2019, the federal tax cost, aggregate gross unrealized appreciation and depreciation of securities held by each Fund were as follows:
| Federal Tax Cost | Gross Unrealized Appreciation | Gross Unrealized Depreciation | Net Unrealized Appreciation | |||||||||||||
Polen Growth Fund | $ | 2,472,426,339 | $ | 1,188,512,004 | $ | (13,163,125 | ) | $ | 1,175,348,879 | |||||||
Polen Global Growth Fund | 59,685,112 | 17,887,463 | (1,392,510 | ) | 16,494,953 | |||||||||||
Polen International Growth Fund | 61,192,513 | 5,758,796 | (723,624 | ) | 5,035,172 | |||||||||||
Polen U.S. Small Company Growth Fund | 6,549,831 | 1,483,430 | (535,282 | ) | 948,148 | |||||||||||
Polen International Small Company Growth Fund | 2,842,324 | 451,729 | (36,458 | ) | 415,271 | |||||||||||
Pursuant to federal income tax rules applicable to regulated investment companies, the Funds may elect to treat certain capital losses between November 1 and April 30 and late year ordinary losses ((i) ordinary losses between January 1 and April 30, and (ii) specified ordinary and currency losses between November 1 and April 30) as occurring on the first day of the following tax year. For the year ended April
84
POLEN GROWTH FUNDS
Notes to Financial Statements (Concluded)
April 30, 2019
30, 2019, any amount of losses elected within the tax return will not be recognized for federal income tax purposes until May 1, 2019. For the year ended April 30, 2019, the Funds deferred to May 1, 2019 the following losses:
| Late-Year Ordinary Losses Deferral | Short-Term Capital Loss Deferral | Long-Term Capital Loss Deferral | |||||||||||||
Polen Growth Fund | $ | — | $ | 37,411,131 | $ | (6,383,087 | ) | ||||||||
Polen Global Growth Fund | — | — | — | ||||||||||||
Polen International Growth Fund | — | 112,883 | 17,646 | ||||||||||||
Polen U.S. Small Company Growth Fund | — | — | — | ||||||||||||
Polen International Small Company Growth Fund | 8,001 | 9,183 | — | ||||||||||||
Accumulated capital losses represent net capital loss carryforwards as of April 30, 2019 that may be available to offset future realized capital gains and thereby reduce future capital gains distributions. As of April 30, 2019, the Funds did not have any capital loss carryforwards.
6. Subsequent Events
Management has evaluated the impact of all subsequent events on the Funds through the date the financial statements were issued, and has determined that there are no material subsequent events requiring recognition or disclosure in the financial statements.
85
POLEN GROWTH FUNDS
Report of Independent Registered Public Accounting Firm
To the Board of Trustees of FundVantage Trust and Shareholders of each of the five funds listed in the table below
Opinions on the Financial Statements
We have audited the accompanying statements of assets and liabilities, including the portfolios of investments, of each of the funds listed in the table below (five of the funds constituting FundVantage Trust, hereafter collectively referred to as the “Funds”) as of April 30, 2019, the related statements of operations and the statements of changes in net assets for each of the periods indicated in the table below, including the related notes, and the financial highlights for each of the periods indicated therein (collectively referred to as the “financial statements”). In our opinion, the financial statements present fairly, in all material respects, the financial position of each of the Funds as of April 30, 2019, the results of each of their operations and the changes in each of their net assets for the periods indicated in the table below, and each of the financial highlights for each of the periods indicated therein, in conformity with accounting principles generally accepted in the United States of America.
| Polen Growth Fund, Polen Global Growth Fund, and Polen International Growth Fund | Statement of operations for the year ended April 30, 2019 and the statements of changes in net assets for each of the two years in the period ended April 30, 2019 | |
Polen U.S. Small Company Growth Fund | Statement of operations for the year ended April 30, 2019 and the statements of changes in net assets for the year ended April 30, 2019 and for the period November 1, 2017 (commencement of operations) through April 30, 2018 | |
Polen International Small Company Growth Fund | Statements of operations and changes in net assets for the period December 31, 2018 (commencement of operations) through April 30, 2019 |
Basis for Opinions
These financial statements are the responsibility of the Funds’ management. Our responsibility is to express an opinion on the Funds’ financial statements based on our audits. We are a public accounting firm registered with the Public Company Accounting Oversight Board (United States) (PCAOB) and are required to be independent with respect to the Funds in accordance with the U.S. federal securities laws and the applicable rules and regulations of the Securities and Exchange Commission and the PCAOB.
We conducted our audits of these financial statements in accordance with the standards of the PCAOB. Those standards require that we plan and perform the audit to obtain reasonable assurance about whether the financial statements are free of material misstatement, whether due to error or fraud.
Our audits included performing procedures to assess the risks of material misstatement of the financial statements, whether due to error or fraud, and performing procedures that respond to those risks. Such procedures included examining, on a test basis, evidence regarding the amounts and disclosures in the financial statements. Our audits also included evaluating the accounting principles used and significant estimates made by management, as well as evaluating the overall presentation of the financial statements. Our procedures included confirmation of securities owned as of April 30, 2019 by correspondence with the custodian and brokers; when replies were not received from brokers, we performed other auditing procedures. We believe that our audits provide a reasonable basis for our opinions.
/s/PricewaterhouseCoopers LLP
Philadelphia, Pennsylvania
June 24, 2019
We have served as the auditor of one or more Polen Capital Management, LLC investment companies since 2011.
86
POLEN GROWTH FUNDS
Shareholder Tax Information
(Unaudited)
The Funds are required by Subchapter M of the Internal Revenue Code of 1986, as amended, to advise their shareholders of the U.S. federal tax status of distributions received by the Funds’ shareholders in respect of such fiscal year. During the year ended April 30, 2019, the Polen Growth Fund, Polen Global Growth Fund, Polen International Growth Fund and Polen U.S. Small Company Growth Fund paid $6,667,348, $26,262, $18,339 and $9,611 of ordinary income dividends and $59,761,509, $888,096, $25,051 and $0 of long term capital gain dividends, respectively, to its shareholders. There were no distributions for the Polen International Small Company Growth Fund. Preceding information for the Polen Growth Fund, Polen Global Growth Fund, Polen International Growth Fund, Polen U.S. Small Company Growth Fund and Polen International Small Company Growth Fund dividends from net investment income andshort-term capital gains are treated as ordinary income dividends for federal income tax purposes.
The Polen Growth Fund, Polen Global Growth Fund, Polen International Growth Fund, Polen U.S. Small Company Growth Fund and Polen International Small Company Growth Fund, designates 100.00%, 100.00%, 100.00%, 1.68% and 100.00%, respectively, of ordinary income distributions as qualified dividend income pursuant to the Jobs and Growth Tax Relief Reconciliation Act of 2003.
The percentage of ordinary income dividends qualifying for corporate dividends received deduction for the Polen Growth Fund, Polen Global Growth Fund, Polen International Growth Fund and Polen U.S. Small Company Growth Fund, is 100.00%, 100.00%, 0.00%, 1.70% and 0.00%, respectively.
The paid foreign taxes and recognized foreign source income for the funds were as follows:
| Foreign Taxes Paid | Foreign Source Income | |||||||||||
Polen International Growth Fund | $ | 33,572 | $ | 484,036 | ||||||||
Polen International Small Company Growth Fund | $ | 1,206 | $ | 11,365 | ||||||||
All designations are based on financial information available as of the date of this annual report and, accordingly, are subject to change. For each item, it is the intention of the Funds to designate the maximum amount permitted under the Internal Revenue Code of 1986, as amended, and the regulations thereunder.
Because the Funds’ fiscal year is not the calendar year, another notification will be sent with respect to calendar year 2019. The second notification, which will reflect the amount, if any, to be used by calendar year taxpayers on their U.S. federal income tax returns, will be made in conjunction with Form1099-DIV and will be mailed in January 2020.
87
POLEN GROWTH FUNDS
Shareholder Tax Information (Concluded)
(Unaudited)
Foreign shareholders will generally be subject to U.S. withholding tax on the amount of their ordinary income dividends. They will generally not be entitled to a foreign tax credit or deduction for the withholding taxes paid by the Funds, if any.
In general, dividends received by tax-exempt recipients (e.g., IRAs and Keoghs) need not be reported as taxable income for U.S. federal income tax purposes. However, some retirement trusts (e.g., corporate, Keogh and 403(b)(7) plans) may need this information for their annual information reporting.
Shareholders are advised to consult their own tax advisers with respect to the tax consequences of their investment in the Funds.
88
POLEN GROWTH FUNDS
Other Information
(Unaudited)
Proxy Voting
Policies and procedures that the Funds use to determine how to vote proxies relating to portfolio securities as well as information regarding how the Funds voted proxies relating to portfolio securities for the most recent12-month period ended June 30 are available without charge, upon request, by calling (888)678-6024 and on the Securities and Exchange Commission’s (“SEC”) website athttp:// www.sec.gov.
Quarterly Portfolio Schedules
The Trust files its complete schedule of portfolio holdings with the SEC for the first and third fiscal quarters of each fiscal year (quarters ended July 31 and January 31) on Form N-Q. The Trust’s FormsN-Q are available on the SEC’s website at http://www.sec.gov. FormN-Q is being rescinded. Once FormN-Q is rescinded, disclosure of the Fund’s complete holdings will be required to be made monthly on FormN-PORT, with every third month made available to the public by the Commission upon filing.
Board Consideration of Investment Advisory Agreement
At anin-person meeting held on September26-27, 2018 (the “Meeting”), the Board of Trustees (the “Board” or the “Trustees”) of FundVantage Trust (the “Trust”), including a majority of the Trustees who are not “interested persons” within the meaning of Section 2(a)(19) of the Investment Company Act of 1940, as amended (the “1940 Act”) (the “Independent Trustees”), unanimously approved an investment advisory agreement between Polen Capital Management, LLC (“Polen” or the “Adviser”) and the Trust on behalf of the Polen International Small Company Growth Fund for an initial two year period (the “Agreement”).” In determining whether to approve the Agreement, the Trustees considered information provided by the Adviser in accordance with Section 15(c) of the 1940 Act regarding: (i) services to be performed for the Polen International Small Company Growth Fund, (ii) the size and qualifications of the Adviser’s portfolio management staff, (iii) any potential or actual material conflicts of interest that may arise in connection with a portfolio manager’s management of the Polen International Small Company Growth Fund, (iv) investment performance of similarly managed funds and accounts, (v) the capitalization and financial condition of Polen, (vi) brokerage selection procedures (including soft dollar arrangements, if any), (vii) the procedures for allocating investment opportunities between the Polen International Small Company Growth Fund and other clients, (viii) results of any regulatory examination, including any recommendations or deficiencies noted, (ix) any litigation, investigation or administrative proceeding that may have a material impact on Polen’s ability to service the Polen International Small Company Growth Fund, and (x) compliance with federal securities laws and other regulatory requirements.
89
POLEN GROWTH FUNDS
Other Information (Continued)
(Unaudited)
Investment Performance. With respect to the Polen International Small Company Growth Fund, the Trustees considered that the proposed strategy for the fund was new, and therefore did not have historical performance. The Trustees noted that they received performance information for the other series of the Trust advised by Polen, which were representative of the Adviser’s performance in implementing certain types of strategies to be employed for the Polen International Small Company Growth Fund. The Trustees concluded that the performance information relating to the comparable funds was acceptable for purposes of its consideration of the Agreement.
Fees. The Trustees also noted that Polen had provided information regarding its advisory fees and an analysis of these fees in relation to the delivery of services to the Polen International Small Company Growth Fund and any other ancillary benefit resulting from Polen’s relationship with the Fund. The Trustees considered the fees that Polen charges to the other series of the Trust advised by Polen, its similarly managed accounts, and evaluated the explanations provided by Polen as to differences in fees charged to the Polen International Small Company Growth Fund, other series of the Trust advised by Polen and similarly managed accounts. The Trustees also reviewed a peer comparison of advisory fees and total expenses for the Polen International Small Company Growth Fund versus other similarly managed funds.
The Trustees considered explanations provided by Polen as to differences in fees proposed to be charged to the Polen International Small Company Growth Fund and other similarly managed accounts or Polen Funds. The Trustees evaluated explanations provided by Polen regarding its belief that the proposed advisory fee for the Polen International Small Company Growth Fund is within the normal range of fees and expenses for funds of similar size, composition and type of investment product. The Trustees concluded that the advisory fee and services proposed to be provided by Polen are sufficiently consistent with those of other advisers which manage mutual funds with investment objectives, strategies and policies similar to those of the Polen International Small Company Growth Fund.
Knowledge, experience, and qualifications. The Board considered the level and depth of knowledge of Polen, including the professional experience and qualifications of senior personnel. In evaluating the quality of services to be provided by Polen, the Board took into account its familiarity with Polen’s senior management through Board meetings, discussions and reports during the preceding year. The Board also took into account Polen’s compliance policies and procedures and reports regarding Polen’s compliance operations from the Trust’s Chief Compliance Officer. The Board also considered any potential conflicts of interest that may arise in a portfolio manager’s management of the Polen International Small Company Growth Fund’s investments on the one hand, and the investments of other accounts, on the other. The Trustees reviewed the services to be provided to the Polen International Small Company Growth Fund by Polen and concluded that the nature, extent and quality of the services provided were appropriate and consistent with the terms of the Agreement, that the quality of the proposed services appeared to be consistent with industry norms and that the Polen International Small Company Growth Fund is likely to benefit from the continued provision of those services. They also concluded that Polen has sufficient
90
POLEN GROWTH FUNDS
Other Information (Concluded)
(Unaudited)
personnel, with the appropriate education and experience, to serve the Polen International Small Company Growth Fund effectively and had demonstrated their ability to attract and retain qualified personnel.
Cost of Services. The Trustees considered the costs of the services provided by Polen, the compensation and benefits to be received by, Polen in providing services to the Polen International Small Company Growth Fund, as well as Polen’s projected profitability in the first year of operation of the Polen International Small Company Growth Fund. The Trustees were provided with the audited financial statements of Polen for the years ended December 31, 2017 and December 31, 2016. The Trustees noted that Polen’s level of profitability is an appropriate factor to consider, and the Trustees should be satisfied that Polen’s profits are sufficient to continue as a healthy concern generally and as investment adviser of the Polen International Small Company Growth Fund specifically. The Trustees concluded that Polen’s fees derived from their relationship with the Polen International Small Company Growth Fund, in light of the Polen International Small Company Growth Fund expenses, were reasonable in relation to the nature and quality of the services provided, taking into account the fees charged by other advisers for managing comparable mutual funds with similar strategies.
Economies of Scale. The Trustees considered the extent to which economies of scale would be realized relative to fee levels as the Polen International Small Company Growth Fund is expected to grow, and whether the advisory fee levels reflect these economies of scale for the benefit of shareholders. The Board noted that economies of scale may be achieved at higher asset levels for the Polen International Small Company Growth Fund for the benefit of fund shareholders but that, the advisory fee did not currently include breakpoint reductions as asset levels increase.
At the Meeting, the Trustees unanimously approved the Agreement for an initial two year period. In voting to approve the New Agreement, the Board considered all factors it deemed relevant and the information presented to the Board by Polen. In arriving at its decision, the Board did not identify any single factor as being of paramount importance and each member of the Board gave varying weights to each factor according to his or her own judgment. The Board determined that the approval of the Agreement would be in the best interests of the Polen International Small Company Growth Fund and its shareholders. At this time, the Trustees determined to approve the Agreement for an initial two year period.
91
POLEN GROWTH FUNDS
Privacy Notice
(Unaudited)
The privacy of your personal financial information is extremely important to us. When you open an account with us, we collect a significant amount of information from you in order to properly invest and administer your account. We take very seriously the obligation to keep that information private and confidential, and we want you to know how we protect that important information.
We collect nonpublic personal information about you from applications or other forms you complete and from your transactions with us or our affiliates. We do not disclose information about you, or our former clients, to our affiliates or to service providers or other third parties, except as permitted by law. We share only the information required to properly administer your accounts, which enables us to send transaction confirmations, monthly or quarterly statements, financials and tax forms. Even within FundVantage Trust and its affiliated entities, a limited number of people who actually service accounts will have access to your personal financial information. Further, we do not share information about our current or former clients with any outside marketing groups or sales entities.
To ensure the highest degree of security and confidentiality, FundVantage Trust and its affiliates maintain various physical, electronic and procedural safeguards to protect your personal information. We also apply special measures for authentication of information you request or submit to us on our web site.
If you have questions or comments about our privacy practices, please call us at (888)678-6024.
92
POLEN GROWTH FUNDS
Fund Management
(Unaudited)
FundVantage Trust (the “Trust”) is governed by a Board of Trustees (the “Trustees”). The primary responsibility of the Trustees is to represent the interest of the Trust’s shareholders and to provide oversight management of the Trust.
The following tables present certain information regarding the Trustees and officers of the Trust. None of the Trustees are an “interested person” of the Trust, the Adviser, another investment adviser of a series of the Trust, or Foreside Funds Distributors LLC, the principal underwriter of the Trust (“Underwriter”), within the meaning of the 1940 Act and each Trustee is referred to as an “Independent Trustee” and is listed under such heading below. Employees of certain service providers to the Trust serve as officers of the Trust; such persons are not compensated by the Funds. The address of each Trustee and officer as it relates to the Trust’s business is 301 Bellevue Parkway, 2nd Floor, Wilmington, DE 19809.
The Statement of Additional Information for the Funds contains additional information about the Trustees and is available, without charge, upon request, by calling (888)678-6024.
Name and Date of Birth | Position(s) Held with Trust | Term of Office and Length of Time Served | Principal Occupation(s) During Past Five Years | Number of Funds in | Other Directorships Held by Trustee | |||||
| INDEPENDENT TRUSTEES | ||||||||||
ROBERT J. CHRISTIAN Date of Birth: 2/49 | Trustee and Chairman of the Board | Shall serve until death, resignation or removal. Trustee and Chairman since 2007. | Retired since February 2006; Executive Vice President of Wilmington Trust Company from February 1996 to February 2006; President of Rodney Square Management Corporation (“RSMC”) (investment advisory firm) from 1996 to 2005; Vice President of RSMC from 2005 to 2006. | 44 | Optimum Fund Trust (registered investment company with 6 portfolios). | |||||
IQBAL MANSUR Date of Birth: 6/55 | Trustee | Shall serve until death, resignation or removal. Trustee since 2007. | University Professor, Widener University. | 44 | None. | |||||
93
POLEN GROWTH FUNDS
Fund Management (Continued)
(Unaudited)
Name and Date of Birth | Position(s) Held with Trust | Term of Office and Length of Time Served | Principal Occupation(s) During Past Five Years | Number of Funds in | Other Directorships Held by Trustee | |||||
NICHOLAS M. MARSINI, JR. Date of Birth: 8/55 | Trustee | Shall serve until death, resignation or removal. Trustee since 2016. | Retired since March 2016. President of PNC Bank Delaware from June 2011 to March 2016; Executive Vice President of Finance of BNY Mellon from July 2010 to January 2011; Executive Vice President and Chief Financial Officer of PNC Global Investment Servicing from September 1997 to July 2010. | 44 | Brinker Capital Destinations Trust (registered investment company with 10 portfolios). | |||||
NANCY B. WOLCOTT Date of Birth: 11/54 | Trustee | Shall serve until death, resignation or removal. Trustee since 2011. | Retired since May 2014; EVP, Head of GFI Client Service Delivery, BNY Mellon from January 2012 to May 2014; EVP, Head of US Funds Services, BNY Mellon from July 2010 to January 2012; President of PNC Global Investment Servicing from 2008 to July 2010; Chief Operating Officer of PNC Global Investment Servicing from 2007 to 2008; Executive Vice President of PFPC Worldwide Inc. from 2006 to 2007. | 44 | Lincoln Variable Insurance Products Trust (registered investment company with 92 portfolios). | |||||
STEPHEN M. WYNNE Date of Birth: 1/55 | Trustee | Shall serve until death, resignation or removal. Trustee since 2009. | Retired since December 2010; Chief Executive Officer of US Funds Services, BNY Mellon Asset Servicing from July 2010 to December 2010; Chief Executive Officer of PNC Global Investment Servicing from March 2008 to July 2010; President, PNC Global Investment Servicing from 2003 to 2008. | 44 | Copeland Trust (registered investment company with 2 portfolios). |
94
POLEN GROWTH FUNDS
Fund Management (Concluded)
(Unaudited)
Name and Date of Birth | Position(s) Held with Trust | Term of Office and Length of Time Served | Principal Occupation(s) During Past Five Years | |||
| EXECUTIVE OFFICERS | ||||||
JOEL L. WEISS Date of Birth: 1/63 | President and Chief Executive Officer | Shall serve until death, resignation or removal. Officer since 2007. | President of JW Fund Management LLC since June 2016; Vice President and Managing Director of BNY Mellon Investment Servicing (US) Inc. and predecessor firms from 1993 to June 2016. | |||
T. RICHARD KEYES Date of Birth: 1/57 | Treasurer and Chief Financial Officer | Shall serve until death, resignation or removal. Officer since 2016. | President of TRK Fund Consulting LLC since July 2016; Head of Tax — U.S. Fund Services of BNY Mellon Investment Servicing (US) Inc. and predecessor firms from February 2006 to July 2016. | |||
| GABRIELLA MERCINCAVAGE Date of Birth: 6/68 | Assistant Treasurer | Shall serve until death, resignation or removal. Officer since 2019. | Fund Administration Consultant since January 2019; Fund Accounting and Tax Compliance Accountant to financial services companies from November 2003 to July 2018. | |||
VINCENZO A. SCARDUZIO Date of Birth: 4/72 | Secretary | Shall serve until death, resignation or removal. Officer since 2012. | Director and Vice President Regulatory Administration of The Bank of New York Mellon and predecessor firms since 2001. | |||
DAVID C. LEBISKY Date of Birth: 5/72 | Chief ComplianceOfficer and Anti-Money Laundering Officer | Shall serve until death, resignation or removal. Officer since 2015. | President of Lebisky Compliance Consulting LLC since October 2015; Consultant, Duff & Phelps, LLC since 2016; Senior Consultant, Freeh Group International Solutions, LLC (a global risk management firm) from 2015 to 2018; Scotia Institutional Investments US, LP, Director of Regulatory Administration from 2010 to 2014. | |||
95
Investment Adviser
Polen Capital Management, LLC
1825 NW Corporate Blvd.
Suite 300
Boca Raton, FL 33431
Administrator
The Bank of New York Mellon
301 Bellevue Parkway
Wilmington, DE 19809
Transfer Agent
BNY Mellon Investment Servicing (US) Inc.
4400 Computer Drive
Westborough, MA 01581
Principal Underwriter
Foreside Funds Distributors LLC
400 Berwyn Park
899 Cassatt Road
Berwyn, PA 19312
Custodian
The Bank of New York Mellon
240 Greenwich Street
New York, NY 10286
Independent Registered Public Accounting Firm
PricewaterhouseCoopers LLP
Two Commerce Square, Suite 1800
2001 Market Street
Philadelphia, PA 19103-7042
Legal Counsel
Pepper Hamilton LLP
3000 Two Logan Square
18th and Arch Streets
Philadelphia, PA 19103
POL-0419

Polen Growth Fund
Polen Global Growth Fund
Polen International Growth Fund
Polen U.S. Small Company Growth
Fund
Polen International Small Company
Growth Fund
of
FundVantage Trust
Institutional Class
Investor Class
ANNUAL REPORT
April 30, 2019
IMPORTANT NOTE: Beginning on January 1, 2021, paper copies of the Polen Funds’ annual and semi-annual shareholder reports will no longer be sent by mail, unless you specifically request paper copies of the shareholder reports from the Polen Funds or from your financial intermediary. Instead, annual and semi-annual shareholder reports will be available on the Polen Funds’ website (www.polencapital.com), and you will be notified by mail each time a report is posted and provided with a website link to access the report.
You may elect to receive all future annual and semi-annual shareholder reports in paper, free of charge. To elect to receive paper copies of shareholder reports through the mail or otherwise change your delivery method, contact your financial intermediary or, if you hold your shares directly through the Polen Funds, call the Polen Funds toll-free at (888)678-6024 or write to the Polen Funds at:
Polen Funds
FundVantage Trust
c/o BNY Mellon Investment Servicing
P.O. Box 9829
Providence, RI 02940-8029
Your election to receive shareholder reports in paper will apply to all Polen Funds that you hold through the financial intermediary, or directly with the Polen Funds.
This report is submitted for the general information of the shareholders of the Polen Growth Fund, the Polen Global Growth Fund, the Polen International Growth Fund, the Polen U.S. Small Company Growth Fund and the Polen International Small Company Growth Fund. It is not authorized for distribution unless preceded or accompanied by a current prospectus for the Polen Growth Fund, the Polen Global Growth Fund, the Polen International Growth Fund, the Polen U.S. Small Company Growth Fund and/or the Polen International Small Company Growth Fund.
PRIVATE CAPITAL MANAGEMENT VALUE FUND
Annual Investment Adviser’s Report
April 30, 2019
(Unaudited)
Dear Fellow Shareholder:
We are pleased to report that the Private Capital Management Value Fund performed well during the first quarter of 2019, recovering quickly from the unsettled market conditions that prevailed during the closing months of last year. Throughout the latter part of 2018 and into the first quarter of 2019, the Fund steadily deployed capital, while opportunistically trimming positions that approached our estimation of fair value. While we understand that market volatility can be unsettling to investors, we welcome the opportunities created during such periods as they afford us the ability to enhance the long-term return potential of the Fund.
We think it is important to put the market volatility during the fourth quarter of 2018 into context, since much of what occurred was, in our view, predictable cause and effect. As we have noted in the past, while the tax cuts promulgated by the Trump administration were a positive from the standpoint of U.S. competiveness, the resultant stimulus struck us as excessive and to a large degree unnecessary given where we were in the economic cycle. As a result, the Federal Reserve was left with the unenviable task of how to steadily and appropriately normalize monetary policy – certainly necessary as the economy approaches full employment – without unduly thwarting the benefits of the fiscal stimulus.
In this vein, Federal Reserve Chairman Jerome Powell likely erred, at least in tone, when he stated during a speech last October that interest rates were “a long way from neutral.” We suspect that at that juncture he was particularly focused on low unemployment and modest emerging indications of accelerating wage inflation and not on the perceptible softening in interest-sensitive pockets of the economy like housing and the growing general unease that was increasingly permeating our manufacturing economy due to the escalating trade fight with China.
Unfortunately, at least in our opinion, President Trump’s political inexperience compounded the problem when he began publicly attacking the Fed in general and Chairman Powell in particular. While one can appreciate the president’s intuition that the Fed’s expected rate action in December was potentially a step too far and likely counterproductive, his unwillingness to allow the FOMC (Federal Open Market Committee) to reach this conclusion independently presented the Fed with an impossible choice – either follow through on a broadly telegraphed but perhaps unnecessary rate increase or risk the Fed’s necessary independence by kowtowing to Trump’s jawboning. We feel strongly that it is abundantly obvious that the Fed chose to protect the sanctity of its independence, not just in that they followed through with the rate increase but also because an otherwise challenging decision was highlighted to have been approved unanimously by the FOMC. In effect, the Fed sent a message to the White House that it needed to back off.
The stock market’s reaction to thistit-for-tat was tantamount to a tantrum. Stocks plunged violently in ayear-endsell-off that was further exacerbated by tax motivated selling. To reiterate an important point, it was an excellent time to ignore the noise and deploy capital. Markets stabilized with the start of the
1
PRIVATE CAPITAL MANAGEMENT VALUE FUND
Annual Investment Adviser’s Report (Continued)
April 30, 2019
(Unaudited)
New Year as the Fed’s prior hawkish tone turned distinctly dovish. Further interest rate increases are now “temporarily” on hold and the Fed has pledged to be patient and data driven with regard to the timing of further increases. Translation, the Fed is not hell bent on fomenting a recession and is more than happy to be patient with monetary policy if the executive branch will allow it to do its job without undue interference.
With the specter of monetary policy Armageddon off the table, equities were able to recover. However, some real damage was done to market psychology as the consensus view now includes the modest possibility of a recession within the next eighteen months. To be clear, we think that the emergence of this view is a fantastic development for equities.
We are not whistling in a graveyard with our cheery take. The logic is straightforward. Prior to the fourth quarter imbroglio, the Fed’s recipe for 2019 was largely baked – a steady diet of interest rate increases that would have taken short-term rates above three percent before year end (all else being equal). Given the trade fight with China and the advanced stage of the economic recovery, there was a real chance of a Fed overshoot and the possibility of a more significant economic downturn in 2020. In contrast, the economic softness that resulted from the fourth quarter pullback was exactly the kind of pressure relief that can enable the U.S. economic expansion to continue, albeit at a more modest pace.
Although we are now ten years removed from the depths of the Great Recession, investors still seem to have an almost Pavlovian fear of an economic slowdown. A couple of quarters of modest or negative GDP growth need not portend the Four Horsemen of the Apocalypse. While there are some excesses in the economy, leveraged finance being one area currently receiving attention, we are worlds removed from the“sub-prime” crisis that afflicted a huge portion of the American population and infected bank balance sheets with toxic assets. Today’s banks are very well capitalized andnon-performing assets (i.e. bad loans) are at minimal levels. Although these statistics can be expected to deteriorate in a downturn, there is nothing to suggest anything beyond a plain vanilla business cycle correction – and it is not even clear that a downturn is probable.
Our view? With the 2020 presidential election on the not too distant horizon, there are strong incentives for the Trump administration to find a path forward with China that removes the trade dispute overhang that is currently clouding the world’s economic outlook. We do not, however, expect that this will necessarily be a smooth process. There comes a time when the price paid to implement a more equitable trade arrangement with a recalcitrant partner is more than justified, particularly if the goal is to protect the legitimate interests of American industry. While trade tariffs are an admittedly blunt instrument, when moral suasion has no effect something more effective than harsh language in required. More importantly, we are approaching an inflection point where the tariffs will actually start to hurt China more than they can hurt America.
2
PRIVATE CAPITAL MANAGEMENT VALUE FUND
Annual Investment Adviser’s Report (Concluded)
April 30, 2019
(Unaudited)
That said, we think that market volatility predicated upon trade concerns is likely to present more opportunity than long-term threat. The U.S. economy remains healthy and is enjoying a period of solid growth, low unemployment and negligible inflation. Federal Reserve policy, after a likely overstep with the last rate increase, remains on hold in the near term, with room for a rate reduction should growth slow meaningfully. An accommodative Fed strongly supports the notion that any meaningful economic slowdown is likely to be short and shallow. All in, this augurs well for equities in general and even better for stock pickers that are able to capitalize on values created during periods of short-term volatility.
We appreciate your continued support.
Private Capital Management
Mutual fund investing involves risk and it is possible to lose money by investing in a fund. The Fund is a diversified fund but nevertheless may invest a significant portion of its assets in the securities of one or more single issuers, which may cause the Fund’s value to fluctuate more widely than some other diversified funds. As a result of appreciation of certain Fund holdings, as of April 30, 2019 the Fund’s holdings profile reflected a portfolio concentration level normally associated with anon-diversified fund. The Fund may engage in strategies that are considered risky or invest in stocks of companies that are undervalued which may cause greater volatility and less liquidity.The above commentary is for informational purposes only and investors should consider the investment objectives, risks, charges, and expenses of the Fund carefully before investing. This report is not authorized for distribution unless preceded or accompanied by a current prospectus for the Private Capital Management Value Fund. The prospectus contains this and other important information about the Fund. Read it carefully before investing.
Shares of the Private Capital Management Value Fund are distributed by Foreside Funds Distributors LLC, not an adviser affiliate.
|
This letter is intended to assist shareholders in understanding how the Fund performed during the year ended April 30, 2019 and reflects the views of the investment adviser at the time of this writing. Of course, these views may change and do not guarantee the future performance of the Fund or the markets.
Portfolio composition is subject to change. The current and future portfolio holdings of the Fund are subject to investment risks.
3
PRIVATE CAPITAL MANAGEMENT VALUE FUND
Annual Report
Performance Data
April 30, 2019
(Unaudited)
Comparison of Change in Value of $10,000 Investment in Class A* of the Private Capital Management Value Fund vs. Russell
2000® and S&P 500® Indexes
The Fund’s growth of an assumed $10,000 investment is adjusted for the maximum sales charge of 5.00%. This results in a net initial investment of $9,500.
| Average Annual Total Returns for the Periods Ended April 30, 2019 |
| |||||||||||||||||||
| 1 Year | 3 Years | 5 Years | 10 Years | ||||||||||||||||
Class A (with sales charge)* | 2.63% | 9.50% | 6.10% | 11.49% | ||||||||||||||||
Class A (without sales charge)* | 8.02% | 11.38% | 7.20% | 12.07% | ||||||||||||||||
Russell 2000 Index | 4.61% | 13.60% | 8.63% | 14.10% | ||||||||||||||||
S&P 500 Index | 13.49% | 14.87% | 11.63% | 15.32% | ||||||||||||||||
The performance data quoted represents past performance and does not guarantee future results. Current performance may be lower or higher. Performance data current to the most recentmonth-end may be obtained by calling (888)568-1267. The investment return and principal value of an investment will fluctuate so that shares, when redeemed, may be worth more or less than their original cost. The graphs and tables do not reflect the deduction of taxes that a shareholder would pay on Fund distributions or the redemption of Fund shares.
*Performance shown for the period from May 1, 2009 to May 28, 2010 is the performance of a corporate defined contribution plan account (the “Predecessor Account”), which transferred its assets to the Fund in connection with the Fund’s commencement of operations on May 28, 2010 and does not reflect any taxes that you may pay as a result of any distributions or sale of shares of the Fund. Average annual total returns for Class A shares of the Fund reflect the imposition of the maximumfront-end sales charge of 5.00%. Performance shown for the periods prior to October 6, 2010, is the performance of the Class I shares, which includes the performance of the Predecessor Account for the period from May 1, 2009 to May 28, 2010, adjusted to reflect the monthly deduction of the Fund’s Total Annual Fund Operating Expenses After Fee Waiver and/or Expense Reimbursement applicable to Class A
4
PRIVATE CAPITAL MANAGEMENT VALUE FUND
Annual Report
Performance Data (Continued)
April 30, 2019
(Unaudited)
shares effective at the commencement of operations of Class A shares on October 6, 2010. The Predecessor Account was not registered as a mutual fund under the Investment Company Act of 1940, as amended (“1940 Act”), and therefore was not subject to certain investment restrictions, limitations and diversification requirements imposed by the 1940 Act and Internal Revenue Code. If the Predecessor Account had been registered under the 1940 Act its performance may have been different.
Class A shares have a 5.00% maximum sales charge.
5
PRIVATE CAPITAL MANAGEMENT VALUE FUND
Annual Report
Performance Data (Continued)
April 30, 2019
(Unaudited)
Comparison of Change in Value of $750,000 (investment minimum) Investment in Class I* of the Private Capital Management Value Fund vs. Russell 2000® and S&P 500®Indexes
| Average Annual Total Returns for the Periods Ended April 30, 2019 | ||||||||||||||||||
| 1 Year | 3 Years | 5 Years | 10 Years | |||||||||||||||
Class I * | 8.33% | 11.67% | 7.47% | 12.34% | ||||||||||||||
Russell 2000 Index | 4.61% | 13.60% | 8.63% | 14.10% | ||||||||||||||
S&P 500 Index | 13.49% | 14.87% | 11.63% | 15.32% | ||||||||||||||
The performance data quoted represents past performance and does not guarantee future results. Current performance may be lower or higher. Performance data current to the most recentmonth-end may be obtained by calling (888)568-1267. The investment return and principal value of an investment will fluctuate so that shares, when redeemed, may be worth more or less than their original cost. The graphs and tables do not reflect the deduction of taxes that a shareholder would pay on Fund distributions or the redemption of Fund shares.
| * | Performance shown for the period from May 1, 2009 to May 28, 2010 is the performance of a corporate defined contribution plan account (the “Predecessor Account”), which transferred its assets to the Fund in connection with the Fund’s commencement of operations on May 28, 2010 and does not reflect any taxes that you may pay as a result of any distributions or sale of shares of the Fund. The Predecessor Account’s performance has been adjusted to reflect the monthly deduction of the Fund’s Total Annual Fund Operating Expenses After Fee Waiver and/or Expense Reimbursement applicable to Class I shares of the Fund effective at the Fund’s commencement of operations on May 28, 2010. Performance from May 28, 2010 to April 30, 2019 is from the performance of the Class I Shares. The Predecessor Account was not registered as a mutual fund under the Investment Company Act of 1940, as amended (the “1940 Act”), and therefore was not subject to certain investment restrictions, limitations and diversification requirements imposed by the 1940 Act and the Internal Revenue Code of 1986, as amended. If the Predecessor Account had been registered under the 1940 Act, its performance may have been different. |
6
PRIVATE CAPITAL MANAGEMENT VALUE FUND
Annual Report
Performance Data (Concluded)
April 30, 2019
(Unaudited)
As stated in the current prospectus dated September 1, 2018, the Fund’s “Total Annual Fund Operating Expenses” are 1.63% and 1.38%, and the Fund’s “Total Annual Fund Operating Expenses After Fee Waiver and/or Expense Reimbursement” are 1.35% and 1.10% for Class A and Class I Shares, respectively, of the Fund’s average daily net assets. These ratios may differ from the actual expenses incurred by the Fund for the period covered by this report. Private Capital Management, LLC, (the “Adviser”) has contractually agreed to reduce its investment advisory fee and/or reimburse certain expenses of the Fund to the extent necessary to ensure that the Fund’s total operating expenses excluding taxes, fees and expenses attributable to a distribution or service plan adopted by the Trust, “Acquired Fund Fees and Expenses,” interest, extraordinary items and brokerage commissions do not exceed 1.10% (on an annual basis) of the Fund’s average daily net assets (the “Expense Limitation”). This agreement will terminate on August 31, 2019, unless the Board of Trustees of FundVantage Trust (the “Trust”) approves an earlier termination. The Adviser is entitled to recover, subject to approval by the Board of Trustees, such amounts reduced or reimbursed for a period of up to three (3) years from the date on which the Adviser reduced its compensation and/or assumed expenses for the Fund. The Adviser is permitted to seek reimbursement from the Fund, subject to certain limitations, for fees it waived and Fund expenses it paid to the extent the total annual fund expenses do not exceed the limits described above or any lesser limits in effect at the time of reimbursement. No recoupment will occur unless the Fund’s expenses are below the Expense Limitation amount. Total returns would be lower had such fees and/or expenses not been waived and/or reimbursed.
A 2.00% redemption fee applies to shares redeemed within 30 days of purchase. This redemption fee is not reflected in the returns shown above.
The Fund intends to evaluate performance as compared to that of the Russell 2000® Index which has been determined to be the appropriate comparison index for the Fund. The Russell 2000® Index is an unmanaged index measuring the performance of the 2,000 smallest companies in the Russell 3000® Index, which represents approximately 8% of the total market capitalization of the Russell 3000® Index. The Russell 3000® Index measures the performance of the 3,000 largest U.S. companies based on market capitalization, which represents approximately 98% of the investable U.S. equity market. In addition to its benchmark index, the performance of the Standard & Poor’s 500 Composite Stock Price Index (“S&P 500 Index”) is provided. The S&P 500® Index is a widely recognized, unmanaged index of 500 common stocks which are generally representative of the U.S. stock market as a whole.
Mutual fund investing involves risk, including possible loss of principal.
7
PRIVATE CAPITAL MANAGEMENT VALUE FUND
Fund Expense Disclosure
April 30, 2019
(Unaudited)
As a shareholder of the Fund you incur two types of costs: (1) transaction costs, including sales charges (loads) on purchase payments, if any, and redemption fees; and (2) ongoing costs, including management fees, distribution and/or service (Rule12b-1) fees, if any, and other Fund expenses. These examples are intended to help you understand your ongoing costs (in dollars) of investing in the Fund and to compare these costs with the ongoing costs of investing in other mutual funds.
These examples are based on an investment of $1,000 invested at the beginning of thesix-month period from November 1, 2018 through April 30, 2019 and held for the entire period.
Actual Expenses
The first line of the accompanying table provides information about actual account values and actual expenses. You may use the information in this line, together with the amount you invested, to estimate the expenses that you paid over the period. Simply divide your account value by $1,000 (for example, an $8,600 account value divided by $1,000 = 8.6), then multiply the result by the number in the first line under the heading entitled “Expenses Paid During Period” to estimate the expenses you paid on your account during this period.
Hypothetical Examples for Comparison Purposes
The second line of the accompanying table provides information about hypothetical account values and hypothetical expenses based on the Fund’s actual expense ratio and an assumed rate of return of 5% per year before expenses, which is not your Fund’s actual return. The hypothetical account values and expenses may not be used to estimate the actual ending account balance or expenses you paid for the period. You may use this information to compare the ongoing costs of investing in the Fund and other funds. To do so, compare these 5% hypothetical examples with the 5% hypothetical examples that appear in the shareholder reports of other funds.
Please note that the expenses shown in the accompanying table are meant to highlight your ongoing costs only and do not reflect any transactional costs, such as sales charges (loads), if any, and redemption fees. Therefore, each hypothetical line of the accompanying table is useful in comparing ongoing costs only and will not help you determine the relative total costs of owning different funds. In addition, if these transactional costs were included, your costs would have been higher.
8
PRIVATE CAPITAL MANAGEMENT VALUE FUND
Fund Expense Disclosure (Concluded)
April 30, 2019
(Unaudited)
| Private Capital Management Value Fund | |||||||||||||||
| Beginning Account Value November 1, 2018 | Ending Account Value April 30, 2019 | Expenses Paid During Period* | |||||||||||||
Class A | |||||||||||||||
Actual | $ | 1,000.00 | $ | 1,048.40 | $ | 6.86 | |||||||||
Hypothetical (5% return before expenses) | 1,000.00 | 1,018.10 | 6.76 | ||||||||||||
Class I | |||||||||||||||
Actual | $ | 1,000.00 | $ | 1,049.40 | $ | 5.59 | |||||||||
Hypothetical (5% return before expenses) | 1,000.00 | 1,019.34 | 5.51 | ||||||||||||
| * | Expenses are equal to an annualized expenses ratio for thesix-month period ended April 30, 2019 of 1.35% and 1.10% for Class A and Class I shares, respectively, for the Fund, multiplied by the average account value over the period, multiplied by the number of days in the most recent period (181), then divided by 365 to reflect the period. The Fund’s ending account values on the first line in each table are based on the actualsix-month total return for the Fund of 4.84% and 4.94% for Class A and Class I shares, respectively. |
9
PRIVATE CAPITAL MANAGEMENT VALUE FUND
Portfolio Holdings Summary Table
April 30, 2019
(Unaudited)
The following table presents a summary by sector of the portfolio holdings of the Fund:
| % of Net Assets | Value | |||||||
COMMON STOCKS: | ||||||||
Financials | 31.9 | % | $ | 15,208,368 | ||||
Consumer Discretionary | 23.9 | 11,383,924 | ||||||
Industrials | 11.4 | 5,427,769 | ||||||
Health Care | 8.1 | 3,846,444 | ||||||
Materials | 7.2 | 3,415,521 | ||||||
Information Technology | 6.7 | 3,165,165 | ||||||
Communication Services | 5.1 | 2,410,374 | ||||||
Utilities | 1.8 | 879,564 | ||||||
Consumer Staples | 1.2 | 580,616 | ||||||
Other Assets in Excess of Liabilities | 2.7 | 1,289,318 | ||||||
|
|
|
| |||||
NET ASSETS | 100.0 | % | $ | 47,607,063 | ||||
|
|
|
| |||||
Portfolio holdings are subject to change at any time.
The accompanying notes are an integral part of the financial statements.
10
PRIVATE CAPITAL MANAGEMENT VALUE FUND
Portfolio of Investments
April 30, 2019
| Number of Shares | Value | |||||||
COMMON STOCKS — 97.3% |
| |||||||
Communication Services — 5.1% |
| |||||||
QuinStreet, Inc.* | 168,912 | $ | 2,410,374 | |||||
|
| |||||||
Consumer Discretionary — 23.9% |
| |||||||
At Home Group, Inc.* | 53,680 | 1,260,943 | ||||||
Carrols Restaurant Group, Inc.* | 184,300 | 1,807,983 | ||||||
Fiesta Restaurant Group, Inc.* | 73,600 | 931,776 | ||||||
Gildan Activewear, Inc. (Canada) | 24,640 | 908,477 | ||||||
Motorcar Parts of America, Inc.* | 127,313 | 2,630,286 | ||||||
Stoneridge, Inc.* | 38,245 | 1,202,040 | ||||||
Target Hospitality Corp.* | 91,500 | 947,025 | ||||||
Visteon Corp.* | 25,680 | 1,695,394 | ||||||
|
| |||||||
| 11,383,924 | ||||||||
|
| |||||||
Consumer Staples — 1.2% | ||||||||
SpartanNash Co. | 35,907 | 580,616 | ||||||
|
| |||||||
Financials — 31.9% | ||||||||
Cadence BanCorp | 37,748 | 858,767 | ||||||
Community Financial Corp. (The) | 19,135 | 585,914 | ||||||
Ecn Capital Corp. (Canada) | 398,500 | 1,276,555 | ||||||
First Northwest Bancorp | 47,175 | 768,009 | ||||||
HomeTrust Bancshares, Inc. | 44,594 | 1,130,904 | ||||||
INTL. FCStone, Inc.* | 50,986 | 2,067,992 | ||||||
Jefferies Financial Group, Inc. | 73,905 | 1,520,226 | ||||||
KKR & Co., Inc., Class A | 109,420 | 2,675,319 | ||||||
Northrim BanCorp, Inc. | 13,200 | 468,468 | ||||||
OceanFirst Financial Corp. | 25,360 | 638,565 | ||||||
Old National Bancorp | 30,560 | 521,965 | ||||||
| Number of Shares | Value | |||||||
COMMON STOCKS — (Continued) |
| |||||||
Financials — (Continued) | ||||||||
Raymond James Financial, Inc. | 14,600 | $ | 1,336,922 | |||||
SmartFinancial, Inc.* | 29,500 | 613,305 | ||||||
Synovus Financial Corp. | 20,224 | 745,457 | ||||||
|
| |||||||
| 15,208,368 | ||||||||
|
| |||||||
Health Care — 8.1% | ||||||||
Allergan PLC (Ireland) | 14,627 | 2,150,169 | ||||||
Universal Health Services, Inc., Class B | 5,575 | 707,300 | ||||||
Zimmer Biomet Holdings, Inc. | 8,030 | 988,975 | ||||||
|
| |||||||
| 3,846,444 | ||||||||
|
| |||||||
Industrials — 11.4% | ||||||||
Air Transport Services Group, Inc.* | 91,800 | 2,160,054 | ||||||
DIRTT Environmental Solutions | 474,400 | 3,267,715 | ||||||
|
| |||||||
| 5,427,769 | ||||||||
|
| |||||||
Information Technology — 6.7% |
| |||||||
Everi Holdings, Inc.* | 240,271 | 2,472,389 | ||||||
Information Services Group, Inc.* | 194,600 | 692,776 | ||||||
|
| |||||||
| 3,165,165 | ||||||||
|
| |||||||
Materials — 7.2% | ||||||||
Celanese Corp. | 9,570 | 1,032,507 | ||||||
Tronox Holdings PLC (United Kingdom), Class A | 168,530 | 2,383,014 | ||||||
|
| |||||||
| 3,415,521 | ||||||||
|
| |||||||
The accompanying notes are an integral part of the financial statements.
11
PRIVATE CAPITAL MANAGEMENT VALUE FUND
Portfolio of Investments (Concluded)
April 30, 2019
| Value | ||||||||
COMMON STOCKS — (Continued) |
| |||||||
Utilities — 1.8% | ||||||||
National Fuel Gas Co. | 14,855 | $ | 879,564 | |||||
|
| |||||||
TOTAL COMMON STOCKS |
| 46,317,745 | ||||||
|
| |||||||
TOTAL INVESTMENTS - 97.3% |
| 46,317,745 | ||||||
OTHER ASSETS IN EXCESS OF LIABILITIES - 2.7% | 1,289,318 | |||||||
|
| |||||||
NET ASSETS - 100.0% | $ | 47,607,063 | ||||||
|
| |||||||
| * | Non-income producing. |
PLC Public Limited Company
The accompanying notes are an integral part of the financial statements.
12
PRIVATE CAPITAL MANAGEMENT VALUE FUND
Statement of Assets and Liabilities
April 30, 2019
Assets | ||||
Investments, at value (Cost $29,845,693) | $ | 46,317,745 | ||
Cash | 1,430,506 | |||
Foreign currency (Cost $1,894) | 1,903 | |||
Receivable for investments sold | 207,345 | |||
Receivable for capital shares sold | 11,864 | |||
Dividends and interest receivable | 8,252 | |||
Prepaid expenses and other assets | 49,465 | |||
|
| |||
Total assets | 48,027,080 | |||
|
| |||
Liabilities | ||||
Payable for investments purchased | 300,267 | |||
Payable for audit fees | 26,579 | |||
Payable for administration and accounting fees | 24,969 | |||
Payable for transfer agent fees | 20,041 | |||
Payable for printing fees | 13,330 | |||
Payable to Investment Adviser | 13,256 | |||
Payable for legal fees | 10,825 | |||
Payable for custodian fees | 4,210 | |||
Payable for capital shares redeemed | 3,000 | |||
Payable for distribution fees | 971 | |||
Accrued expenses | 2,569 | |||
|
| |||
Total liabilities | 420,017 | |||
|
| |||
Net Assets | $ | 47,607,063 | ||
|
| |||
Net Assets consisted of: | ||||
Capital Stock, $0.01 par value | $ | 30,284 | ||
Paid-in capital | 27,530,576 | |||
Total distributable earnings | 20,046,203 | |||
|
| |||
Net Assets | $ | 47,607,063 | ||
|
| |||
Class A: | ||||
Net asset value and redemption price per share ($4,624,602 / 299,427 shares) | $15.44 | |||
|
| |||
Maximum offering price per share (100/95 of $15.44) | $16.25 | |||
|
| |||
Class I: | ||||
Net asset value, offering and redemption price per share ($42,982,461 / 2,728,930 shares) | $15.75 | |||
|
| |||
The accompanying notes are an integral part of the financial statements.
13
PRIVATE CAPITAL MANAGEMENT VALUE FUND
Statement of Operations
For the Year Ended April 30, 2019
Investment income | ||||
Dividends | $ | 522,686 | ||
Less: foreign taxes withheld | (5,716 | ) | ||
Interest | 22,157 | |||
|
| |||
Total investment income | 539,127 | |||
|
| |||
Expenses | ||||
Advisory fees (Note 2) | 513,903 | |||
Transfer agent fees (Note 2) | 97,708 | |||
Administration and accounting fees (Note 2) | 67,190 | |||
Legal fees | 39,348 | |||
Trustees’ and officers’ fees (Note 2) | 38,495 | |||
Audit fees | 26,483 | |||
Registration and filing fees | 26,251 | |||
Distribution fees (Class A) (Note 2) | 14,350 | |||
Printing and shareholder reporting fees | 14,307 | |||
Custodian fees (Note 2) | 14,260 | |||
Other expenses | 9,661 | |||
|
| |||
Total expenses before waivers | 861,956 | |||
|
| |||
Less: waivers (Note 2) | (219,502 | ) | ||
|
| |||
Net expenses after waivers | 642,454 | |||
|
| |||
Net investment loss | (103,327 | ) | ||
|
| |||
Net realized and unrealized gain/(loss) from investments: | ||||
Net realized gain from investments | 9,715,427 | |||
Net change in unrealized appreciation/(depreciation) on investments | (6,592,137 | ) | ||
Net change in unrealized appreciation on foreign currency transactions | 8 | |||
|
| |||
Net realized and unrealized gain on investments | 3,123,298 | |||
|
| |||
Net increase in net assets resulting from operations | $ | 3,019,971 | ||
|
| |||
The accompanying notes are an integral part of the financial statements.
14
PRIVATE CAPITAL MANAGEMENT VALUE FUND
Statements of Changes in Net Assets
| For the Year Ended April 30, 2019 | For the Year Ended April 30, 2018 | |||||||
Increase/(decrease) in net assets from operations: | ||||||||
Net investment loss | $ | (103,327 | ) | $ | (175,334 | ) | ||
Net realized gain from investments | 9,715,427 | 4,243,386 | ||||||
Net change in unrealized appreciation/(depreciation) on investments | (6,592,129 | ) | 218,110 | |||||
|
|
|
| |||||
Net increase in net assets resulting from operations | 3,019,971 | 4,286,162 | ||||||
|
|
|
| |||||
Less dividends and distributions to shareholders from: | ||||||||
Total distributable earnings* | ||||||||
Class A | (857,373 | ) | (82,421 | ) | ||||
Class I | (7,873,214 | ) | (877,445 | ) | ||||
|
|
|
| |||||
Net decrease in net assets from dividends and distributions to shareholders | (8,730,587 | ) | (959,866 | ) | ||||
|
|
|
| |||||
Decrease in net assets derived from capital share transactions (Note 4) | (9,097,320 | ) | (18,147,363 | ) | ||||
|
|
|
| |||||
Total decrease in net assets | (14,807,936 | ) | (14,821,067 | ) | ||||
|
|
|
| |||||
Net assets | ||||||||
Beginning of year | 62,414,999 | 77,236,066 | ||||||
|
|
|
| |||||
End of year** | $ | 47,607,063 | $ | 62,414,999 | ||||
|
|
|
| |||||
| * | Distributions from net investment income and from realized gains are no longer required to be separately disclosed. See Note 1. For the year ended April 30, 2018, distributions from net investment income were $0 and $0, for Class A and Class I, and net realized gains were $82,421 and $877,445 for Class A and Class I, respectively. |
| ** | Parenthetical disclosure of accumulated net investment income/(loss) is no longer required. See Note 1. For the year ended April 30, 2018, end of year net assets included accumulated net investment loss of ($55,134). |
The accompanying notes are an integral part of the financial statements.
15
PRIVATE CAPITAL MANAGEMENT VALUE FUND
Financial Highlights
Contained below is per share operating performance data for Class A shares outstanding, total investment return, ratios to average net assets and other supplemental data for the respective period. The total returns in the table represent the rate that an investor would have earned or lost on an investment in the Fund (assuming reinvestment of all dividends and distributions). This information has been derived from information provided in the financial statements and should be read in conjunction with the financial statements and the notes thereto.
| Class A | ||||||||||||||||||||
For the |
For the |
For the |
For the |
For the | ||||||||||||||||
Per Share Operating Performance | ||||||||||||||||||||
Net asset value, beginning of year | $ | 17.13 | $ | 16.44 | $ | 13.72 | $ | 17.07 | $ | 15.16 | ||||||||||
|
|
|
|
|
|
|
|
|
| |||||||||||
Net investment income/(loss)(1) | (0.07 | ) | (0.08 | ) | (0.26 | ) | 0.16 | (0.03 | ) | |||||||||||
Net realized and unrealized gain/(loss) on investments | 1.07 | 1.00 | 3.15 | (2.55 | ) | 2.88 | ||||||||||||||
|
|
|
|
|
|
|
|
|
| |||||||||||
Net increase/(decrease) in net assets resulting from operations | 1.00 | 0.92 | 2.89 | (2.39 | ) | 2.85 | ||||||||||||||
|
|
|
|
|
|
|
|
|
| |||||||||||
Dividends and distributions to shareholders from: | ||||||||||||||||||||
Net investment income | — | — | (0.17 | ) | — | — | ||||||||||||||
Net realized capital gains | (2.69 | ) | (0.23 | ) | — | (0.96 | ) | (0.94 | ) | |||||||||||
|
|
|
|
|
|
|
|
|
| |||||||||||
Total dividends and distributions to shareholders | (2.69 | ) | (0.23 | ) | (0.17 | ) | (0.96 | ) | (0.94 | ) | ||||||||||
|
|
|
|
|
|
|
|
|
| |||||||||||
Redemption fees | — | (2) | — | — | (2) | — | (2) | — | ||||||||||||
|
|
|
|
|
|
|
|
|
| |||||||||||
Net asset value, end of year | $ | 15.44 | $ | 17.13 | $ | 16.44 | $ | 13.72 | $ | 17.07 | ||||||||||
|
|
|
|
|
|
|
|
|
| |||||||||||
Total investment return(3) | 8.02 | % | 5.56 | % | 21.18 | % | (14.00 | )% | 19.11 | % | ||||||||||
Ratios/Supplemental Data | ||||||||||||||||||||
Net assets, end of year (in thousands) | $ | 4,625 | $ | 5,965 | $ | 6,063 | $ | 7,408 | $ | 8,042 | ||||||||||
Ratio of expenses to average net assets | 1.35 | % | 1.32 | % | 1.25 | % | 1.25 | % | 1.25 | % | ||||||||||
Ratio of expenses to average net assets without waivers and expense reimbursements(4) | 1.74 | % | 1.63 | % | 1.59 | % | 1.54 | % | 1.69 | % | ||||||||||
Ratio of net investment income/(loss) to average net assets | (0.41 | )% | (0.47 | )% | (1.78 | )% | 1.06 | % | (0.20 | )% | ||||||||||
Portfolio turnover rate | 19.70 | % | 16.73 | % | 11.15 | % | 14.20 | % | 31.11 | % | ||||||||||
| (1) | The selected per share data was calculated using the average shares outstanding method for the year. |
| (2) | Amount is less than $0.005 per share. |
| (3) | Total investment return is calculated assuming a purchase of shares on the first day and a sale of shares on the last day of each period reported and includes reinvestments of dividends and distributions, if any. Total investment return does not reflect the impact of the maximumfront-end sales load of 5.00%. If reflected, the return would be lower. |
| (4) | During the period, certain fees were waived. If such fee waivers had not occurred, the ratios would have been as indicated (See Note 2). |
The accompanying notes are an integral part of the financial statements.
16
PRIVATE CAPITAL MANAGEMENT VALUE FUND
Financial Highlights
Contained below is per share operating performance data for Class I shares outstanding, total investment return, ratios to average net assets and other supplemental data for the respective period. The total returns in the table represent the rate that an investor would have earned or lost on an investment in the Fund (assuming reinvestment of all dividends and distributions). This information has been derived from information provided in the financial statements and should be read in conjunction with the financial statements and the notes thereto.
| Class I | ||||||||||||||||||||
For the |
For the Year |
For the Year |
For the Year |
For the | ||||||||||||||||
Per Share Operating Performance | ||||||||||||||||||||
Net asset value, beginning of year | $ | 17.37 | $ | 16.63 | $ | 13.88 | $ | 17.21 | $ | 15.24 | ||||||||||
|
|
|
|
|
|
|
|
|
| |||||||||||
Net investment income/(loss)(1) | (0.03 | ) | (0.04 | ) | (0.22 | ) | 0.20 | 0.01 | ||||||||||||
Net realized and unrealized gain/(loss) on investments | 1.10 | 1.01 | 3.19 | (2.57 | ) | 2.90 | ||||||||||||||
|
|
|
|
|
|
|
|
|
| |||||||||||
Net increase/(decrease) in net assets resulting from operations | 1.07 | 0.97 | 2.97 | (2.37 | ) | 2.91 | ||||||||||||||
|
|
|
|
|
|
|
|
|
| |||||||||||
Dividends and distributions to shareholders from: | ||||||||||||||||||||
Net investment income | — | — | (0.22 | ) | — | — | ||||||||||||||
Net realized capital gains | (2.69 | ) | (0.23 | ) | — | (0.96 | ) | (0.94 | ) | |||||||||||
|
|
|
|
|
|
|
|
|
| |||||||||||
Total dividends and distributions to shareholders | (2.69 | ) | (0.23 | ) | (0.22 | ) | (0.96 | ) | (0.94 | ) | ||||||||||
|
|
|
|
|
|
|
|
|
| |||||||||||
Redemption fees | — | (2) | — | — | (2) | — | (2) | — | ||||||||||||
|
|
|
|
|
|
|
|
|
| |||||||||||
Net asset value, end of year | $ | 15.75 | $ | 17.37 | $ | 16.63 | $ | 13.88 | $ | 17.21 | ||||||||||
|
|
|
|
|
|
|
|
|
| |||||||||||
Total investment return(3) | 8.33 | % | 5.80 | % | 21.50 | % | (13.76 | )% | 19.41 | % | ||||||||||
Ratios/Supplemental Data | ||||||||||||||||||||
Net assets, end of year (in thousands) | $ | 42,982 | $ | 56,450 | $ | 71,173 | $ | 79,078 | $ | 63,069 | ||||||||||
Ratio of expenses to average net assets | 1.10 | % | 1.07 | % | 1.00 | % | 1.00 | % | 1.00 | % | ||||||||||
Ratio of expenses to average net assets without waivers and expense reimbursements(4) | 1.48 | % | 1.38 | % | 1.34 | % | 1.29 | % | 1.45 | % | ||||||||||
Ratio of net investment income/(loss) to average net assets | (0.16 | )% | (0.22 | )% | (1.53 | )% | 1.30 | % | 0.05 | % | ||||||||||
Portfolio turnover rate | 19.70 | % | 16.73 | % | 11.15 | % | 14.20 | % | 31.11 | % | ||||||||||
| (1) | The selected per share data was calculated using the average shares outstanding method for the year. |
| (2) | Amount is less than $0.005 per share. |
| (3) | Total investment return is calculated assuming a purchase of shares on the first day and a sale of shares on the last day of each period reported and includes reinvestment of dividends and distributions, if any. |
| (4) | During the period, certain fees were waived. If such fee waivers had not occurred, the ratios would have been as indicated (See Note 2). |
The accompanying notes are an integral part of the financial statements.
17
PRIVATE CAPITAL MANAGEMENT VALUE FUND
Notes to Financial Statements
April 30, 2019
1. Organization and Significant Accounting Policies
The Private Capital Management Value Fund (the “Fund”) is operating as a diversified,open-end management investment company registered under the Investment Company Act of 1940, as amended, (the “1940 Act”), which commenced investment operations on May 28, 2010. The Fund is a separate series of FundVantage Trust (the “Trust”) which was organized as a Delaware statutory trust on August 28, 2006. The Trust is a “series trust” authorized to issue an unlimited number of separate series or classes of shares of beneficial interest. Each series is treated as a separate entity for certain matters under the 1940 Act, and for other purposes, and a shareholder of one series is not deemed to be a shareholder of any other series. The Fund offers separate classes of shares, Class A, Class C, Class I and Class R Shares. Class A Shares are sold subject to afront-end sales charge.Front-end sales charges may be reduced or waived under certain circumstances. A 1.00% contingent deferred sales charge (“CDSC”) will be assessed when Class C shares are redeemed within 12 months after initial purchase; however, the CDSC shall not apply to the purchases of Class C shares where the selling broker dealer was not paid a commission at the time of initial purchase. As of April 30, 2019, the Class C shares and the Class R shares have not yet commenced operations.
The Fund is an investment company and follows accounting and reporting guidance in the Financial Accounting Standards Board Accounting Standards Codification Topic 946.
Portfolio Valuation— The Fund’s net asset value (“NAV”) is calculated once daily as of the close of regular trading hours on the New York Stock Exchange (“NYSE”) (typically 4:00 p.m. Eastern time) on each day the NYSE is open. Securities held by the Fund are valued using the closing price or the last sale price on a national securities exchange or the National Association of Securities Dealers Automatic Quotation System (“NASDAQ”) market system where they are primarily traded. Equity securities traded in theover-the-counter market are valued at their closing prices. If there were no transactions on that day, securities traded principally on an exchange or on NASDAQ will be valued at the mean of the last bid and ask prices prior to the market close. Fixed income securities having a remaining maturity of greater than 60 days are valued using an independent pricing service. Fixed income securities having a remaining maturity of 60 days or less are generally valued at amortized cost, provided such amount approximates fair value. Foreign securities are valued based on prices from the primary market in which they are traded and are translated from the local currency into U.S. dollars using current exchange rates. Investments in otheropen-end investment companies are valued based on the NAV of the investment companies (which may use fair value pricing as discussed in their prospectuses). If market quotations are unavailable or deemed unreliable, securities will be valued in accordance with procedures adopted by the Trust’s Board of Trustees (“Board of Trustees”). Relying on prices supplied by pricing services or dealers or using fair valuation may result in values that are higher or lower than the values used by other investment companies and investors to price the same investments. In the event that market quotes are not readily available, and the security or asset cannot be valued pursuant to one of the valuation methods, the value
18
PRIVATE CAPITAL MANAGEMENT VALUE FUND
Notes to Financial Statements (Continued)
April 30, 2019
of the security or asset will be determined in good faith by the Adviser. The Trust has established a Valuation Committee which performs certain functions including the oversight of the Adviser’s fair valuation determinations.
Fair Value Measurements— The inputs and valuation techniques used to measure fair value of the Fund’s investments are summarized into three levels as described in the hierarchy below:
• Level 1 — | quoted prices in active markets for identical securities; | |
• Level 2 — | other significant observable inputs (including quoted prices for similar securities, interest rates, prepayment speeds, credit risk, etc.); and | |
• Level 3 — | significant unobservable inputs (including the Fund’s own assumptions in determining the fair value of investments). | |
The inputs or methodology used for valuing securities are not necessarily an indication of the risk associated with investing in those securities.
The following is a summary of the inputs used, as of April 30, 2019, in valuing the Fund’s investments carried at fair value:
| Total Value at 04/30/19 | Level 1 Quoted Price | Level 2 Other Significant Observable Inputs | Level 3 Significant Unobservable Inputs | |||||||||||||
Assets: | ||||||||||||||||
Investments in Securities* | $ | 46,317,745 | $ | 46,317,745 | $ | — | $ | — | ||||||||
|
|
|
|
|
|
|
| |||||||||
* Please refer to Portfolio of Investments for further details on portfolio holdings.
At the end of each quarter, management evaluates the classification of Levels 1, 2 and 3 assets and liabilities. Various factors are considered, such as changes in liquidity from the prior reporting period; whether or not a broker is willing to execute at the quoted price; the depth and consistency of prices from third party pricing services; and the existence of contemporaneous, observable trades in the market. Additionally, management evaluates the classification of Level 1 and Level 2 assets and liabilities on a quarterly basis for changes in listings or delistings on national exchanges.
Due to the inherent uncertainty of determining the fair value of investments that do not have a readily available market value, the fair value of the Fund’s investments may fluctuate from period to period. Additionally, the fair value of investments may differ significantly from the values that would have been used had a ready market existed for such investments and may differ materially from the values the Fund
19
PRIVATE CAPITAL MANAGEMENT VALUE FUND
Notes to Financial Statements (Continued)
April 30, 2019
may ultimately realize. Further, such investments may be subject to legal and other restrictions on resale or otherwise less liquid than publicly traded securities.
For fair valuations using significant unobservable inputs, U.S. generally accepted accounting principles (“U.S. GAAP”) require the Fund to present a reconciliation of the beginning to ending balances for reported market values that present changes attributable to total realized and unrealized gains or losses, purchase and sales, and transfers in and out of Level 3 during the period. A reconciliation of Level 3 investments is presented only when the Fund had an amount of Level 3 investments at the end of the reporting period that was meaningful in relation to its net assets. The amounts and reasons for all transfers in and out of each Level within the three-tier hierarchy are disclosed when the Fund had an amount of total transfers during the reporting period that was meaningful in relation to its net assets as of the end of the reporting period.
For the year ended April 30, 2019, there were no transfers between Levels.
Use of Estimates— The preparation of financial statements in conformity with U.S. GAAP requires management to make estimates and assumptions that affect the amounts reported in the financial statements and accompanying notes at the date of the financial statements and the reported amounts of revenues and expenses during the period. Actual results could differ from those estimates and those differences could be material.
Investment Transactions, Investment Income and Expenses— Investment transactions are recorded on trade date for financial statement preparation purposes. Realized gains and losses on investments sold are recorded on the identified cost basis. Interest income is recorded on the accrual basis. Dividends are recorded on theex-dividend date. Distribution(12b-1) fees relating to a specific class are charged directly to that class. Fund level expenses common to all classes, investment income and realized and unrealized gains and losses on investments are generally allocated to each class based upon the relative daily net assets of each class. General expenses of the Trust are generally allocated to each fund in proportion to its relative daily net assets. Expenses directly attributable to a particular fund in the Trust are charged directly to that fund.
Dividends and Distributions to Shareholders— Dividends from net investment income and distributions from net realized capital gains, if any, are declared, recorded onex-date and paid at least annually to shareholders. Income dividends and capital gain distributions are determined in accordance with U.S. federal income tax regulations, which may differ from U.S. GAAP.
U.S. Tax Status— No provision is made for U.S. income taxes as it is the Fund’s intention to continue to qualify for and elect the tax treatment applicable to regulated investment companies under Subchapter M of the Internal Revenue Code of 1986, as amended (“Internal Revenue Code”), and make the requisite distributions to its shareholders which will be sufficient to relieve it from U.S. income and excise taxes.
20
PRIVATE CAPITAL MANAGEMENT VALUE FUND
Notes to Financial Statements (Continued)
April 30, 2019
Other— In the normal course of business, the Fund may enter into contracts that provide general indemnifications. The Fund’s maximum exposure under these arrangements is dependent on claims that may be made against the Fund in the future, and therefore, cannot be estimated; however, based on experience, the risk of material loss for such claims is considered remote.
Currency Risk— The Fund invests in securities of foreign issuers, including American Depositary Receipts. These markets are subject to special risks associated with foreign investments not typically associated with investing in U.S. markets. Because the foreign securities in which the Fund may invest generally trade in currencies other than the U.S. dollar, changes in currency exchange rates will affect the Fund’s NAV, the value of dividends and interest earned and gains and losses realized on the sale of securities. Because the NAV for the Fund is determined on the basis of U.S. dollars, the Fund may lose money by investing in a foreign security if the local currency of a foreign market depreciates against the U.S. dollar, even if the local currency value of the Fund’s holdings goes up. Generally, a strong U.S. dollar relative to these other currencies will adversely affect the value of the Fund’s holdings in foreign securities.
Recent Accounting Pronouncement— Effective November 5, 2018, the SEC amended existing rules intended to modernize reporting and disclosure of information. These amendments relate to RegulationS-X which sets forth the form and content of financial statements. The amendment requires collapsing the components of distributable earnings on the Statement of Assets and Liabilities and collapsing the distributions paid to shareholders on the Statements of Changes in Net Assets. Management has evaluated the implications of adopting these amendments and determined there is no significant impact on the financial statements and accompanying notes.
2. Transactions with Related Parties and Other Service Providers
Private Capital Management, LLC (the “Adviser”) serves as the investment adviser to the Fund pursuant to an investment advisory agreement with the Trust (the “Advisory Agreement”). For its services, the Adviser is paid a monthly fee at the annual rate of 0.90% of the Fund’s average daily net assets. The Adviser has contractually agreed to reduce its investment advisory fee and/or reimburse certain expenses of the Fund to the extent necessary to ensure that the Fund’s total operating expenses, excluding taxes, fees and expenses attributable to a distribution or service plan adopted by the Trust, “Acquired Fund Fees and Expenses,” interest, extraordinary items and brokerage commissions do not exceed 1.10% (on an annual basis) of the Fund’s average daily net assets (the “Expense Limitation”). The Expense Limitation will remain in place until August 31, 2019, unless the Board of Trustees approves its earlier termination. The Adviser is entitled to recover, subject to approval by the Board of Trustees, such amounts reduced or reimbursed for a period of up to three (3) years from the date on which the Adviser reduced its compensation and/or assumed expenses for the Fund. The Adviser is permitted to seek reimbursement from the Fund, subject to certain limitations, for fees it waived and Fund expenses it paid to the extent
21
PRIVATE CAPITAL MANAGEMENT VALUE FUND
Notes to Financial Statements (Continued)
April 30, 2019
the total annual Fund expenses do not exceed the limits described above or any lesser limits in effect at the time of reimbursement. No recoupment will occur unless the Fund’s expenses are below the Expense Limitation amount.
As of April 30, 2019, the amount of potential recovery was as follows:
| Expiration | ||||||||||||
| 4/30/2020 | 4/30/2021 | 4/30/2022 | Total | |||||||||
| $265,948 | $ | 231,595 | $ | 219,502 | $ | 717,045 | ||||||
For the year ended April 30, 2019, the Adviser earned fees of $513,903 and waived fees of $219,502.
Other Service Providers
The Bank of New York Mellon (“BNY Mellon”) serves as administrator and custodian for the Fund. For providing administrative and accounting services, BNY Mellon is entitled to receive a monthly fee equal to an annual percentage rate of the Fund’s average daily net assets and is subject to certain minimum monthly fees. For providing certain custodial services, BNY Mellon is entitled to receive a monthly fee, subject to certain minimum, and out of pocket expenses.
BNY Mellon Investment Servicing (US) Inc. (the “Transfer Agent”) provides transfer agent services to the Fund. The Transfer Agent is entitled to receive a monthly fee, subject to certain minimum, and out of pocket expenses.
Foreside Funds Distributors LLC (the “Underwriter”) provides principal underwriting services to the Fund pursuant to an underwriting agreement between the Trust and the Underwriter.
The Trust and the Underwriter are parties to an underwriting agreement. The Trust has adopted a distribution plan for Class A Shares in accordance with Rule12b-1 under the 1940 Act. Pursuant to the Class A Shares plan, the Fund compensates the Underwriter for direct and indirect costs and expenses incurred in connection with advertising, marketing and other distribution services in an amount not to exceed 0.25% on an annualized basis of the average daily net assets of the Fund’s Class A Shares.
Trustees and Officers
The Trust is governed by its Board of Trustees. The Trustees receive compensation in the form of an annual retainer and per meeting fees for their services to the Trust. The remuneration paid to the Trustees by the Fund during the year ended April 30, 2019 was $7,587. An employee of BNY Mellon serves as the Secretary of the Trust and is not compensated by the Fund or the Trust.
22
PRIVATE CAPITAL MANAGEMENT VALUE FUND
Notes to Financial Statements (Continued)
April 30, 2019
JW Fund Management LLC (“JWFM”) provides a Principal Executive Officer and Principal Financial Officer, respectively, to the Trust. Duff & Phelps, LLC (“D&P”) provides the Trust with a Chief Compliance Officer and an Anti-Money Laundering Officer. JWFM and D&P are compensated for their services provided to the Trust.
3. Investment in Securities
For the year ended April 30, 2019, aggregate purchases and sales of investment securities (excluding short-term investments) of the Fund were as follows:
| Purchases | Sales | |||||||
Investment Securities | $ | 10,640,317 | $ | 28,849,252 | ||||
4. Capital Share Transactions
For the years ended April 30, 2019 and 2018, transactions in capital shares (authorized shares unlimited) were as follows:
| For the Year Ended April 30, 2019 | For the Year Ended April 30, 2018 | |||||||||||||||
| Shares | Amount | Shares | Amount | |||||||||||||
Class A | ||||||||||||||||
Sales | 34,520 | $ | 668,891 | 22,762 | $ | 376,550 | ||||||||||
Reinvestments | 61,649 | 836,578 | 4,612 | 79,464 | ||||||||||||
Redemption Fees* | — | 165 | — | — | ||||||||||||
Redemptions | (144,994 | ) | (2,310,788 | ) | (47,838 | ) | (812,888 | ) | ||||||||
|
|
|
|
|
|
|
| |||||||||
Net decrease | (48,825 | ) | $ | (805,154 | ) | (20,464 | ) | $ | (356,874 | ) | ||||||
|
|
|
|
|
|
|
| |||||||||
Class I | ||||||||||||||||
Sales | 282,371 | $ | 5,041,866 | 220,732 | $ | 3,760,556 | ||||||||||
Reinvestments | 453,396 | 6,270,466 | 34,963 | 610,103 | ||||||||||||
Redemption Fees* | — | 1,353 | — | — | ||||||||||||
Redemptions | (1,256,335 | ) | (19,605,851 | ) | (1,285,253 | ) | (22,161,148 | ) | ||||||||
|
|
|
|
|
|
|
| |||||||||
Net decrease | (520,568 | ) | $ | (8,292,166 | ) | (1,029,558 | ) | $ | (17,790,489 | ) | ||||||
|
|
|
|
|
|
|
| |||||||||
Total Net Decrease | (569,393 | ) | $ | (9,097,320 | ) | (1,050,022 | ) | $ | (18,147,363 | ) | ||||||
|
|
|
|
|
|
|
| |||||||||
| * | There is a 2.00% redemption fee that may be charged on shares redeemed within the first 30 days of their acquisition. The redemption fees are retained by the Fund for the benefit of the remaining shareholders and recorded aspaid-in capital. |
23
PRIVATE CAPITAL MANAGEMENT VALUE FUND
Notes to Financial Statements (Continued)
April 30, 2019
5. Federal Tax Information
The Fund has followed the authoritative guidance on accounting for and disclosure of uncertainty in tax positions, which requires the Fund to determine whether a tax position is more likely than not to be sustained upon examination, including resolution of any related appeals or litigation processes, based on the technical merits of the position. The Fund has determined that there was no effect on the financial statements from following this authoritative guidance. In the normal course of business, the Fund is subject to examination by federal, state and local jurisdictions, where applicable, for tax years for which applicable statutes of limitations have not expired.
Distributions are determined in accordance with federal income tax regulations, which may differ in amount or character from net investment income and realized gains for financial reporting purposes. Accordingly, the character of distributions and composition of net assets for tax purposes may differ from those reflected in the accompanying financial statements. To the extent these differences are permanent, such amounts are reclassified within the components of net assets based on the tax treatment; temporary differences do not require reclassifications. For the year ended April 30, 2019, these adjustments were to increase total distributable earnings by $4 and decreasepaid-in capital by $4. These permanent differences were primarily attributable to short-term gain netted against current year net operating loss,non-deductible expenses from partnerships, and tax exempt income from partnerships. Net investment income, net realized losses and net assets were not affected by these adjustments.
For the year ended April 30, 2019, the tax character of distributions paid by the Fund was $8,730,587 of long-term capital gains dividends. For the year ended April 30, 2018, the tax character of distributions paid by the Fund was $959,866 of long-term capital gains dividends. Distributions from net investment income and short-term capital gains are treated as ordinary income for federal income tax purposes.
As of April 30, 2019, the components of distributable earnings on a tax basis were as follows:
Undistributed Long-Term Gain | Net Unrealized Appreciation | QualifiedLate-Year Losses | Total Distributable Earnings | |||
| $4,076,667 | $16,213,657 | $(244,121) | $20,046,203 |
The differences between the book and tax basis components of distributable earnings relate primarily to the timing and recognition of income and gains for federal income tax purposes.
24
PRIVATE CAPITAL MANAGEMENT VALUE FUND
Notes to Financial Statements (Concluded)
April 30, 2019
At April 30, 2019, the federal tax cost, aggregate gross unrealized appreciation and depreciation of securities held by the Fund were as follows:
Federal tax cost | $ | 30,104,096 | ||||
|
| |||||
Gross unrealized appreciation | $ | 17,315,344 | ||||
Gross unrealized depreciation | (1,101,695 | ) | ||||
|
| |||||
Net unrealized appreciation | $ | 16,213,649 | ||||
|
|
Pursuant to federal income tax rules applicable to regulated investment companies, the Fund may elect to treat certain capital losses between November 1 and April 30 and late year ordinary losses ((i) ordinary losses between January 1 and April 30, and (ii) specified ordinary and currency losses between November 1 and April 30) as occurring on the first day of the following tax year. For the year ended April 30, 2019, any amount of losses elected within the tax return will not be recognized for federal income tax purposes until May 1, 2019. For the year ended April 30, 2019, the Fund had late-year ordinary loss deferrals of $244,121.
Accumulated capital losses represent net capital loss carry forwards as of April 30, 2019 that may be available to offset future realized capital gains and thereby reduce future capital gains distributions. As of April 30, 2019, the Fund had no capital losses.
6. Subsequent Events
At a meeting held on June 24, 2019, the Board of Trustees of FundVantage Trust unanimously approved Private Capital Management, LLC’s proposal to increase the Expense Limitation from 1.10% to 1.20% (on an annual basis) of the Fund’s average daily net assets, effective September 1, 2019.
25
PRIVATE CAPITAL MANAGEMENT VALUE FUND
Report of Independent Registered Public Accounting Firm
To the Board of Trustees of FundVantage Trust and Shareholders of Private Capital Management Value Fund
Opinion on the Financial Statements
We have audited the accompanying statement of assets and liabilities, including the portfolio of investments, of Private Capital Management Value Fund (one of the funds constituting FundVantage Trust, hereafter referred to as the “Fund”) as of April 30, 2019, the related statement of operations for the year ended April 30, 2019, the statements of changes in net assets for each of the two years in the period ended April 30, 2019, including the related notes, and the financial highlights for each of the five years in the period ended April 30, 2019 (collectively referred to as the “financial statements”). In our opinion, the financial statements present fairly, in all material respects, the financial position of the Fund as of April 30, 2019, the results of its operations for the year then ended, the changes in its net assets for each of the two years in the period ended April 30, 2019 and the financial highlights for each of the five years in the period ended April 30, 2019 in conformity with accounting principles generally accepted in the United States of America.
Basis for Opinion
These financial statements are the responsibility of the Fund’s management. Our responsibility is to express an opinion on the Fund’s financial statements based on our audits. We are a public accounting firm registered with the Public Company Accounting Oversight Board (United States) (PCAOB) and are required to be independent with respect to the Fund in accordance with the U.S. federal securities laws and the applicable rules and regulations of the Securities and Exchange Commission and the PCAOB.
We conducted our audits of these financial statements in accordance with the standards of the PCAOB. Those standards require that we plan and perform the audit to obtain reasonable assurance about whether the financial statements are free of material misstatement, whether due to error or fraud.
Our audits included performing procedures to assess the risks of material misstatement of the financial statements, whether due to error or fraud, and performing procedures that respond to those risks. Such procedures included examining, on a test basis, evidence regarding the amounts and disclosures in the financial statements. Our audits also included evaluating the accounting principles used and significant estimates made by management, as well as evaluating the overall presentation of the financial statements. Our procedures included confirmation of securities owned as of April 30, 2019 by correspondence with the custodian and brokers; when replies were not received from brokers, we performed other auditing procedures. We believe that our audits provide a reasonable basis for our opinion.
/s/PricewaterhouseCoopers LLP
Philadelphia, Pennsylvania
June 24, 2019
We have served as the auditor of one or more Private Capital Management, LLC investment companies since 2011.
26
PRIVATE CAPITAL MANAGEMENT VALUE FUND
Shareholder Tax Information
(Unaudited)
The Fund is required by Subchapter M of the Internal Revenue Code, to advise its shareholders of the U.S. federal tax status of distributions received by the Fund’s shareholders in respect of such fiscal year. During the year ended April 30, 2019, the Fund paid $8,730,587 of long-term capital gain dividends to its shareholders. Dividends from net investment income and short-term capital gains are treated as ordinary income dividends for federal income tax purposes.
All designations are based on financial information available as of the date of this annual report and, accordingly, are subject to change. For each item, it is the intention of the Fund to designate the maximum amount permitted under the Internal Revenue Code of 1986, as amended, and the regulations thereunder.
Because the Fund’s fiscal year is not the calendar year, another notification will be sent with respect to calendar year 2019. The second notification, which will reflect the amount, if any, to be used by calendar year taxpayers on their U.S. federal income tax returns, will be made in conjunction with Form1099-DIV and will be mailed in January 2020.
Foreign shareholders will generally be subject to U.S. withholding tax on the amount of their ordinary income dividends. They will generally not be entitled to a foreign tax credit or deduction for the withholding taxes paid by the Fund, if any.
In general, dividends received bytax-exempt recipients (e.g., IRAs and Keoghs) need not be reported as taxable income for U.S. federal income tax purposes. However, some retirement trusts (e.g., corporate, Keogh and 403(b)(7) plans) may need this information for their annual information reporting.
Shareholders are advised to consult their own tax advisers with respect to the tax consequences of their investment in the Fund.
27
PRIVATE CAPITAL MANAGEMENT VALUE FUND
Other Information
(Unaudited)
Proxy Voting
Policies and procedures that the Fund uses to determine how to vote proxies relating to portfolio securities as well as information regarding how the Fund voted proxies relating to portfolio securities for the most recent12-month period ended June 30 are available without charge, upon request, by calling (888)568-1267 and on the Securities and Exchange Commission’s (“SEC”) website athttp://www.sec.gov.
Quarterly Portfolio Schedules
The Trust files its complete schedule of portfolio holdings with the SEC for the first and third fiscal quarters of each fiscal year (quarters ended July 31 and January 31) on FormN-Q. The Trust’s FormsN-Q are available on the SEC’s website athttp://www.sec.gov. FormN-Q is being rescinded. Once FormN-Q is rescinded, disclosure of the Fund’s complete holdings will be required to be made monthly on FormN-PORT, with every third month made available to the public by the Commission upon filing.
28
PRIVATE CAPITAL MANAGEMENT VALUE FUND
Privacy Notice
(Unaudited)
The privacy of your personal financial information is extremely important to us. When you open an account with us, we collect a significant amount of information from you in order to properly invest and administer your account. We take very seriously the obligation to keep that information private and confidential, and we want you to know how we protect that important information.
We collect nonpublic personal information about you from applications or other forms you complete and from your transactions with us or our affiliates. We do not disclose information about you, or our former clients, to our affiliates or to service providers or other third parties, except as permitted by law. We share only the information required to properly administer your accounts, which enables us to send transaction confirmations, monthly or quarterly statements, financials and tax forms. Even within FundVantage Trust and its affiliated entities, a limited number of people who actually service accounts will have access to your personal financial information. Further, we do not share information about our current or former clients with any outside marketing groups or sales entities.
To ensure the highest degree of security and confidentiality, FundVantage Trust and its affiliates maintain various physical, electronic and procedural safeguards to protect your personal information. We also apply special measures for authentication of information you request or submit to us on our web site.
If you have questions or comments about our privacy practices, please call us at (888)568-1267.
29
PRIVATE CAPITAL MANAGEMENT VALUE FUND
Fund Management
(Unaudited)
FundVantage Trust (the “Trust”) is governed by a Board of Trustees (the “Trustees”). The primary responsibility of the Trustees is to represent the interest of the Trust’s shareholders and to provide oversight management of the Trust.
The following tables present certain information regarding the Trustees and officers of the Trust. None of the Trustees are an “interested person” of the Trust, the Adviser, another investment adviser of a series of the Trust, or Foreside Funds Distributors LLC, the principal underwriter of the Trust (“Underwriter”), within the meaning of the 1940 Act and each Trustee is referred to as an “Independent Trustee” and is listed under such heading below. Employees of certain service providers to the Trust serve as officers of the Trust; such persons are not compensated by the Fund. The address of each Trustee and officer as it relates to the Trust’s business is 301 Bellevue Parkway, 2nd Floor, Wilmington, DE 19809.
The Statement of Additional information for the Fund contains additional information about the Trustees and is available, without charge, upon request, by calling (888)568-1267.
Name and Date of Birth | Position(s) Held with Trust | Term of Office and Length of Time Served | Principal Occupation(s) During Past Five Years |
Number of
| Other Directorships Held by Trustee | |||||
INDEPENDENT TRUSTEES
| ||||||||||
| ROBERT J. CHRISTIAN Date of Birth: 2/49 | Trustee and Chairman of the Board | Shall serve until death, resignation or removal. Trustee and Chairman since 2007. | Retired since February 2006; Executive Vice President of Wilmington Trust Company from February 1996 to February 2006; President of Rodney Square Management Corporation (“RSMC”) (investment advisory firm) from 1996 to 2005; Vice President of RSMC from 2005 to 2006.
| 44 | Optimum Fund Trust (registered investment company with 6 portfolios). | |||||
| IQBAL MANSURDate of Birth: 6/55 | Trustee | Shall serve until death, resignation or removal. Trustee since 2007.
| University Professor, Widener University. | 44 | None. | |||||
30
PRIVATE CAPITAL MANAGEMENT VALUE FUND
Fund Management (Continued)
(Unaudited)
Name and Date of Birth | Position(s) Held with Trust | Term of Office and Length of Time Served | Principal Occupation(s) During Past Five Years |
Number of
| Other Directorships Held by Trustee | |||||
| NICHOLAS M. MARSINI, JR. Date of Birth: 8/55 | Trustee | Shall serve until death, resignation or removal. Trustee since 2016. | Retired since March 2016. President of PNC Bank Delaware from June 2011 to March 2016; Executive Vice President of Finance of BNY Mellon from July 2010 to January 2011; Executive Vice President and Chief Financial Officer of PNC Global Investment Servicing from September 1997 to July 2010.
| 44 | Brinker Capital Destinations Trust (registered investment company with 10 portfolios). | |||||
NANCY B. WOLCOTT Date of Birth: 11/54 | Trustee | Shall serve until death, resignation or removal. Trustee since 2011. | Retired since May 2014; EVP, Head of GFI Client Service Delivery, BNY Mellon from January 2012 to May 2014; EVP, Head of US Funds Services, BNY Mellon from July 2010 to January 2012; President of PNC Global Investment Servicing from 2008 to July 2010; Chief Operating Officer of PNC Global Investment Servicing from 2007 to 2008; Executive Vice President of PFPC Worldwide Inc. from 2006 to 2007.
| 44 | Lincoln Variable Insurance Products Trust (registered investment company with 92 portfolios). | |||||
STEPHEN M. WYNNE Date of Birth: 1/55 | Trustee | Shall serve until death, resignation or removal. Trustee since 2009. | Retired since December 2010; Chief Executive Officer of US Funds Services, BNY Mellon Asset Servicing from July 2010 to December 2010; Chief Executive Officer of PNC Global Investment Servicing from March 2008 to July 2010; President, PNC Global Investment Servicing from 2003 to 2008.
| 44 | Copeland Trust (registered investment company with 2 portfolios). | |||||
31
PRIVATE CAPITAL MANAGEMENT VALUE FUND
Fund Management (Concluded)
(Unaudited)
Name and Date of Birth | Position(s) Held with Trust |
Term of Office and Length of Time Served
| Principal Occupation(s) During Past Five Years | |||
EXECUTIVE OFFICERS
| ||||||
JOEL L. WEISS Date of Birth: 1/63 | President and Chief Executive Officer | Shall serve until death, resignation or removal. Officer since 2007. | President of JW Fund Management LLC since June 2016; Vice President and Managing Director of BNY Mellon Investment Servicing (US) Inc. and predecessor firms from 1993 to June 2016.
| |||
T. RICHARD KEYES Date of Birth: 1/57 | Treasurer and Chief Financial Officer | Shall serve until death, resignation or removal. Officer since 2016. | President of TRK Fund Consulting LLC since July 2016; Head of Tax — U.S. Fund Services of BNY Mellon Investment Servicing (US) Inc. and predecessor firms from February 2006 to July 2016.
| |||
GABRIELLA MERCINCAVAGE Date of Birth: 6/68 | Assistant Treasurer | Shall serve until death, resignation or removal. Officer since 2019. | Fund Administration Consultant since January 2019; Fund Accounting and Tax Compliance Accountant to financial services companies from November 2003 to July 2018.
| |||
VINCENZO A. SCARDUZIO Date of Birth: 4/72 | Secretary | Shall serve until death, resignation or removal. Officer since 2012. | Director and Vice President Regulatory Administration of The Bank of New York Mellon and predecessor firms since 2001.
| |||
DAVID C. LEBISKY Date of Birth: 5/72 | Chief Compliance Officer and Anti-Money Laundering Officer | Shall serve until death, resignation or removal. Officer since 2015. | President of Lebisky Compliance Consulting LLC since October 2015; Consultant, Duff & Phelps, LLC since 2016; Senior Consultant, Freeh Group International Solutions, LLC (a global risk management firm) from 2015 to 2018; Scotia Institutional Investments US, LP, Director of Regulatory Administration from 2010 to 2014.
| |||
32
[THIS PAGE INTENTIONALLY LEFT BLANK.]
[THIS PAGE INTENTIONALLY LEFT BLANK.]
[THIS PAGE INTENTIONALLY LEFT BLANK.]
Investment Adviser
Private Capital Management, LLC
8889 Pelican Bay Boulevard
Suite 500
Naples, FL 34108
Administrator
The Bank of New York Mellon
301 Bellevue Parkway
Wilmington, DE 19809
Transfer Agent
BNY Mellon Investment Servicing (US) Inc.
4400 Computer Drive
Westborough, MA 01581
Principal Underwriter
Foreside Funds Distributors LLC
400 Berwyn Park
899 Cassatt Road
Berwyn, PA 19312
Custodian
The Bank of New York Mellon
240 Greenwich Street
New York, NY 10286
Independent Registered Public Accounting Firm
PricewaterhouseCoopers LLP
Two Commerce Square, Suite 1800
2001 Market Street
Philadelphia, PA 19103-7042
Legal Counsel
Pepper Hamilton LLP
3000 Two Logan Square
18th and Arch Streets
Philadelphia, PA 19103
PRI-0419
PRIVATE CAPITAL
MANAGEMENT VALUE
FUND
of
FundVantage Trust
Class A
Class I
ANNUAL REPORT
April 30, 2019
IMPORTANT NOTE: Beginning on January 1, 2021, paper copies of the Private Capital Management Value Fund’s annual and semi-annual shareholder reports will no longer be sent by mail, unless you specifically request paper copies of the shareholder reports from the Private Capital Management Value Fund or from your financial intermediary. Instead, annual and semi-annual shareholder reports will be available on the Private Capital Management Value Fund’s website(www.private-cap.com), and you will be notified by mail each time a report is posted and provided with a website link to access the report.
You may elect to receive all future annual and semi-annual shareholder reports in paper, free of charge. To elect to receive paper copies of shareholder reports through the mail or otherwise change your delivery method, contact your financial intermediary or, if you hold your shares directly through the Private Capital Management Value Fund, call the Private Capital Management Value Fund toll-free at (888)568-1267 or write to the Private Capital Management Value Fund at:
Private Capital Management Value Fund
FundVantage Trust
c/o BNY Mellon Investment Servicing
P.O. Box 9829
Providence, RI 02940-8029
This report is submitted for the general information of the shareholders of the Private Capital Management Value Fund. It is not authorized for distribution unless preceded or accompanied by a current prospectus for the Private Capital Management Value Fund.
QUALITY DIVIDEND FUND
Annual Investment Adviser’s Report
April 30, 2019
(Unaudited)
Dear Shareholders,
During the fiscal year ended April 30, 2019, the Quality Dividend Fund (the “Fund”) Class A shares (without the sales charge) were up 14.66%, compared to 9.06% gain for the Russell 1000® Value Index (“Russell 1000”) and an increase of 13.49% for the Standard & Poor’s 500® Index (“S&P 500”). Since inception on September 30, 2013, the Fund’s Class A shares (without the sales charge) have risen at an annualized rate of 8.85% versus 9.99% for the Russell 1000 and 12.85% for the S&P 500. During the fiscal year, stocks enjoyed broad gains, with 10 of the 11 S&P 500 GICS economic sector indices finishing higher. Information Technology was the leading sector, gaining 22.2%, but strong returns were also posted by Real Estate (19.9%), Consumer Staples (17.3%), Utilities (16.7%) and Communication Services (15.04%). The Fund had a higher weighting than comparative stock indices to Real Estate, Utilities, and Consumer Staples, which was beneficial for returns. Relative performance of the Fund also benefited from stock market volatility and a downward movement in bond yields. A focus on traditionally defensive sectors was beneficial during the 4th quarter of 2019 when stocks suffered sharp declines. While rate concerns had pressured dividend paying stocks in early 2018, a decline in rates benefited returns in the latest fiscal year. Bond commentaries always contain the disclaimer “prices decline when rates rise” and the opposite holds true when rates decline. This relationship also applies to stocks with higher dividend yields, as a higher required yield in the market pressures price, and lower required yields provides a boost to prices. On April 30, 2019, the10-year treasury yield was 2.4%, well below the April 30, 2018 level of 2.9%. During this time, the average dividend yield of stocks in the Fund has been above the10-year treasury yield. As of April 30, 2019, the average yield of stocks in the Fund was 4.4%, the same as it was on April 30, 2018. The combination of favorable sector exposure, defensive positioning during heightened market volatility, and a declining yield environment were favorable for returns during the fiscal year.
The performance data quoted represents past performance and does not guarantee future results. The investment return and principal value of an investment in the Fund will fluctuate so that an investor’s shares, when redeemed, may be worth more or less than their original cost. Current performance may be lower or higher. Performance data current to the most recent month end may be obtained by calling (888)201-5799.
Changes
We removed 9 positions from the Fund and made 8 replacements over the last fiscal year. Stocks were removed for reasons including strong performance reducing current yield, concerns about the potential for future dividend reductions, and concerns regarding management commitment to future dividend growth. During the fiscal year purchases included BCE Inc. (BCE), Chevron Corp. (CVX), PacWest Bancorp (PACW), Huntington Bancshares Inc. (HBAN), SunTrust Banks, Inc. (STI), Ventas, Inc. (VTR), Iron Mountain Inc. (IRM), and Cardinal Health Inc. (CAH). Stocks that were removed during the fiscal year include General Mills Inc. (GIS), McDonald’s Corp. (MCD), Bank of Montreal (BMO), Toronto Dominion Bank (TD), PacWest Bancorp (PACW), Huntington Bancshares Inc. (HBAN), Omega Healthcare Investors Inc. (OHI), BCE Inc. (BCE), and Procter & Gamble Co. (PG).
QUALITY DIVIDEND FUND
Annual Investment Adviser’s Report (Continued)
April 30, 2019
(Unaudited)
Distributions
The Fund has had four income distributions and a capital gain distribution during the fiscal year. Class A shares distributed income of $0.082 per share on June 29, 2018, $0.101 per share on September 28, 2018, $0.102 per share on December 31, 2018 and $0.097 per share on March 29, 2019. Class C shares distributed income of $0.058 per share on June 29, 2018, $0.075 per share on September 28, 2018, $0.078 per share on December 31, 2018 and $0.075 per share on March 29, 2019. Class I shares distributed income of $0.090 per share on June 29, 2018, $0.109 per share on September 28, 2018, $0.110 per share on December 31, 2018 and $0.105 per share on March 29, 2019. All share classes distributed long-term capital gains of $0.581 per share on December 18, 2018.
Outlook
We continue to believe the Fund is well positioned to meet its objectives. The raw portfolio yield is currently 4.4% by our calculations. The earnings growth for the holdings is forecast at 6.4% over the next five years, and the average dividend growth forecast of 5.3%, which is not necessarily indicative of the overall performance of the Fund. Based on12-month forward estimates of EPS for common stocks and FFO for REITs, 67% of any earnings per share will be paid out to investors. With current projected earnings growth above estimated dividend growth, the payout ratio is unlikely to rise in the near term. To date, 16 of the 25 holdings in the Fund have raised dividends for calendar year 2019. We believe the remaining holdings will follow suit beforeyear-end. Additionally, the Price/Earnings ratio of the Fund is less than that of the S&P 500. In summary, we feel the relative valuation, manageable dividend level and forecast earnings growth position the Fund to meet its objectives of delivering current income and providing growth in income over time.
Past performances is no guarantee of future returns.
Sincerely,
Michael S. Scherer
Senior Portfolio Manager
Thomas P. Mulroy
Senior Portfolio Manager
Larry Baker, CFA
Senior Portfolio Adviser
Investments cannot be made directly in an Index. Unmanaged index returns assume reinvestment of any and all distributions and do not reflect fees, expenses, or sales charges.
This letter is intended to assist shareholders in understanding how the Fund performed during the fiscal year ended April 30, 2019 and reflects the views of the investment adviser at the time of this writing. Of course, these views may change and do not guarantee the future performance of the Fund or the markets.
2
QUALITY DIVIDEND FUND
Annual Investment Adviser’s Report (Concluded)
April 30, 2019
(Unaudited)
Mutual fund investing involves risk, including possible loss of principal. Although the Fund will invest primarily in income producing equities, the Fund cannot guarantee any particular level of distributions. Companies that have paid regular dividends to shareholders may decrease or eliminate dividend payments in the future. A fund pursuing a dividend oriented investment strategy may at times underperform other funds that invest more broadly or that have different investment styles.
The S&P 500 Index is an unmanaged index of equity prices and is representative of a broader market and range of securities than is found in the Fund’s portfolio. The Morningstar Large Value Category consists of Funds that invest primarily in big U.S. companies that are less expensive or growing more slowly than otherlarge-cap stocks. Stocks in the top 70% of the capitalization of the U.S. equity market are defined aslarge-cap. Value is defined based on low valuations (low price ratios and high dividend yields) and slow growth (low growth rates for earnings, sales, book value, and cash flow). The Russell 1000 Value Index consists of approximately 1,000 of the largest companies in the U.S. equity markets and measures how U.S. stocks in the equity value segment perform.
Foreign securities potentially entail special risks such as less liquid markets; political and economic instability; lax regulation; and adverse fluctuations in currency exchange rates.
Real estate investing is subject to special risks, including tenant default, declining occupancy rates, adverse changes in environmental and zoning regulations, and falling property values and rents due to deteriorating local or national economic conditions. REIT securities listed on a securities exchange may be subject to abrupt or erratic price movements because of interest rate changes and other factors.Non-listed REIT securities may lack sufficient liquidity to enable the Fund to sell them at an advantageous time or to minimize a loss.
Distributions from REITs may include a return of capital. A REIT that does not qualify as a REIT under the Internal Revenue Code (“IRC”) will pay taxes on its earnings, which will reduce the dividends paid by the REIT to the Fund Some REITs are highly leveraged, which may increase the risk of loss. MLPs are partnerships which are publicly traded and listed on a national securities exchange.
MLPs are interest rate sensitive investments that may trade in lower volumes and be subject to abrupt or erratic price movements and may involve less control by outside investors and potential conflicts of interest among an MLP and its general partner. The IRC treats distributions from an MLP asnon-taxable return of capital until the value of the distributions exceeds a partner’s basis in partnership interests, at which point the distributions are taxable. MLPs do not pay U.S. federal income tax at the partnership level, but an adverse change in tax laws could result in MLPs being treated as corporations for federal income tax purposes, which would reduce or eliminate an MLP’s tax deductions. MLPs primarily are engaged in energy and natural resource sectors, which makes them sensitive to negative developments in those sectors.
The above commentary is for informational purposes only and does not represent an offer, recommendation or solicitation to buy, hold or sell any security. The specific securities identified and described do not represent all of the securities purchased or sold and you should not assume that investments in the securities identified and discussed will be profitable.
Portfolio composition is subject to change. The current and future portfolio holdings of the Fund are subject to investment risk.
3
QUALITY DIVIDEND FUND
Annual Report
Performance Data
April 30, 2019
(Unaudited)
Comparison of Change in Value of $10,000 Investment in Quality Dividend Fund
Class A shares vs. Russell 1000® Value Index
Class A shares of an assumed $10,000 investment is adjusted for the maximum sales charge of 5.75%. This results in a net investment of $9,425. Performance of Class C shares will vary from Class A shares due to difference in class specific fees.
Comparison of Change in Value of $1,000,000 (investment minimum) Investment in Quality Dividend Fund
Institutional Class shares vs. Russell 1000® Value Index
4
QUALITY DIVIDEND FUND
Annual Report
Performance Data (Continued)
April 30, 2019
(Unaudited)
| Average Annual Total Returns for the Periods Ended April 30, 2019† | |||||||||||||||||||||||||
| 1 Year | 3 Years | 5 Years | Since Inception | ||||||||||||||||||||||
Class A (with sales charge) | 8.07% | 8.12% | 6.35% | 7.70% | |||||||||||||||||||||
Class A (without sales charge) | 14.66% | 10.26% | 7.61% | 8.85% | |||||||||||||||||||||
Russell 1000®Value Index | 9.06% | 10.96% | 8.33% | 9.99%* | |||||||||||||||||||||
Class C (with CDSC charge) | 12.73% | 9.44% | 6.80% | 8.05% | |||||||||||||||||||||
Class C (without CDSC charge) | 13.73% | 9.44% | 6.80% | 8.05% | |||||||||||||||||||||
Russell 1000®Value Index | 9.06% | 10.96% | 8.33% | 9.84%** | |||||||||||||||||||||
Institutional Class | 14.94% | N/A | N/A | 10.69% | |||||||||||||||||||||
Russell 1000®Value Index | 9.06% | N/A | N/A | 10.79%*** | |||||||||||||||||||||
| † | The Quality Dividend Fund (“the Fund”) Class A shares commenced operations on September 30, 2013; Class C shares commenced operations on October 1, 2013; Institutional Class shares commenced operations on October 4, 2016. |
| * | Benchmark performance is from the inception date of Class A shares of the Fund (September 30, 2013) only and is not the inception date of the benchmark itself. |
| ** | Benchmark performance is from the inception date of Class C shares of the Fund (October 1, 2013) only and is not the inception date of the benchmark itself. |
| *** | Benchmark performance is from the inception date of Institutional Class shares of the Fund (October 4, 2016) only and is not the inception date of the benchmark itself. |
The performance data quoted represents past performance and does not guarantee future results. The investment return and principal value of an investment in the Fund will fluctuate so that an investor’s shares, when redeemed, may be worth more or less than their original cost. The graphs and table do not reflect the deduction of taxes that a shareholder would pay on Fund distributions or redemption of Fund shares. Current performance may be lower or higher. Performance data current to the most recent month end may be obtained by calling (888)201-5799.
The returns of Class A shares reflect a deduction for the maximum front end sales charge of 5.75%. The returns shown for Class C shares reflect a maximum deferred sales charge of 1.00% that may apply to Class C shares when shares are redeemed within 12 months after initial purchase.
The Fund’s “Total Annual Fund Operating Expenses” and “Total Annual Fund Operating Expenses After Fee Waiver and/or Expense Reimbursement”, as stated in the current prospectus dated September 1, 2018, are 1.32% and 1.24%, respectively, for Class A shares, 2.07% and 1.99%, respectively, for Class C shares and 1.07% and 0.99%, for Institutional Class shares of the Fund’s average daily net assets. These rates may fluctuate and may differ from the actual expenses incurred by the Fund for the period covered by this report. Equity Compass Investment Management, LLC (“EquityCompass” or the “Adviser”) has contractually agreed to reduce its investment advisory fee and/or reimburse certain expenses of the Fund to the extent necessary to ensure that the Fund’s total operating expenses (excluding taxes, fees and expenses attributable to a distribution or service plan adopted by FundVantage Trust (the “Trust”), Acquired Fund Fees and Expenses,” dividend and interest expense on securities sold short, interest, extraordinary items and brokerage commissions) do not exceed 0.99% of average daily net assets of the Fund (the “Expense Limitation”). The Expense Limitation will remain in effect until August 31, 2019, unless the Board of Trustees (“Board of Trustees”) of the Trust approves its earlier termination. The Adviser is entitled to recover, subject to approval by the Board of Trustees, such amounts reduced or reimbursed for a period of up to three (3) years from the date on which the Adviser reduced its compensation and/or assumed expenses for the Fund. The Adviser is permitted to
5
QUALITY DIVIDEND FUND
Annual Report
Performance Data (Concluded)
April 30, 2019
(Unaudited)
seek reimbursement from the Fund, subject to certain limitations, for fees it waived and Fund expenses it paid to the extent the total annual fund operating expenses do not exceed the limits described above or any lesser limits in effect at the time of reimbursement. No recoupment will occur unless the Fund’s expenses are below the Expense Limitation amount. Total fees would be higher had such fees and expenses not been waived and/or reimbursed.
A 1.00% redemption fee applies to shares redeemed within 60 days of purchase. The redemption fee is not reflected in the returns shown above.
The Fund intends to evaluate performance as compared to those of the Russell 1000® Value Index. The Russell 1000® Value Index is an unmanaged index that measures the performance of the highest-ranking 1,000 stocks in the Russell 3000® Index, which represents about 90% of the total market capitalization of all listed U.S. stocks.
Mutual fund investing involves risk, including possible loss of principal. The Fund’s dividend income and distributions will fluctuate, and at times the Fund may underperform other funds that invest more broadly or that have different investment styles. Some of the assets in which the Fund may invest entail special risks. Foreign stocks may be affected by currency fluctuations, social and political instability, and lax regulatory and financial reporting standards. Master Limited Partnerships (“MLPs”) may fluctuate abruptly in value and be difficult to liquidate. Real Estate Investment Trusts (“REITs”) entail risks related to real estate, such as tenant defaults, declining occupancy rates, and falling property values due to deteriorating economic conditions. Listed REIT stocks may fluctuate erratically in market price whilenon-listed REITs may be illiquid.
6
QUALITY DIVIDEND FUND
Fund Expense Disclosure
April 30, 2019
(Unaudited)
As a shareholder of the Fund, you incur two types of costs: (1) transaction costs, including sales charges (loads) on purchase payments, if any, and redemption fees; and (2) ongoing costs, including management fees, distribution and/or service (Rule12b-1) fees, if any, and other Fund expenses. These examples are intended to help you understand your ongoing costs (in dollars) of investing in the Fund and to compare these costs with the ongoing costs of investing in other mutual funds.
These examples are based on an investment of $1,000 invested at the beginning of thesix-month period from November 1, 2018 through April 30, 2019 and held for the entire period.
Actual Expenses
The first line of each accompanying table provides information about actual account values and actual expenses. You may use the information in this line, together with the amount you invested, to estimate the expenses that you paid over the period. Simply divide your account value by $1,000 (for example, an $8,600 account value divided by $1,000 = 8.6), then multiply the result by the number in the first line under the heading entitled “Expenses Paid During Period” to estimate the expenses you paid on your account during this period.
Hypothetical Examples for Comparison Purposes
The second line of each accompanying table provides information about hypothetical account values and hypothetical expenses based on the Fund’s actual expense ratio and an assumed rate of return of 5% per year before expenses, which is not your Fund’s actual return. The hypothetical account values and expenses may not be used to estimate the actual ending account balance or expenses you paid for the period. You may use this information to compare the ongoing costs of investing in the Fund and other funds. To do so, compare these 5% hypothetical examples with the 5% hypothetical examples that appear in the shareholder reports of other funds.
Please note that the expenses shown in the accompanying table are meant to highlight your ongoing costs only and do not reflect any transactional costs, such as sales charges (loads), if any, or redemption fees. Therefore, the second line of the accompanying table is useful in comparing ongoing costs only, and will not help you determine the relative total costs of owning different funds. In addition, if these transactional costs were included, your costs would have been higher.
7
QUALITY DIVIDEND FUND
Fund Expense Disclosure (Concluded)
April 30, 2019
(Unaudited)
| Quality Dividend Fund | |||||||||||||||
| Beginning Account Value November 1, 2018 | Ending Account Value April 30, 2019 | Expenses Paid During Period* | |||||||||||||
Class A | |||||||||||||||
Actual | $ | 1,000.00 | $ | 1,109.80 | $ | 6.49 | |||||||||
Hypothetical (5% return before expenses) | 1,000.00 | 1,018.65 | 6.21 | ||||||||||||
Class C | |||||||||||||||
Actual | $ | 1,000.00 | $ | 1,106.10 | $ | 10.39 | |||||||||
Hypothetical (5% return before expenses) | 1,000.00 | 1,014.93 | 9.94 | ||||||||||||
Institutional Class | |||||||||||||||
Actual | $ | 1,000.00 | $ | 1,112.00 | $ | 5.18 | |||||||||
Hypothetical (5% return before expenses) | 1,000.00 | 1,019.89 | 4.96 | ||||||||||||
| * | Expenses are equal to an annualized expense ratio for thesix-month period ended April 30, 2019 of 1.24%, 1.99% and 0.99% for Class A, Class C and Institutional Class shares, respectively, for the Fund, multiplied by the average account value over the period, multiplied by the number of days in the most recent period (181), then divided by 365 to reflect the period. The Fund’s ending account values on the first line in the table are based on the actualsix-month total returns for the Fund of 10.98%, 10.61% and 11.20% for Class A, Class C and Institutional Class shares, respectively. |
8
QUALITY DIVIDEND FUND
Portfolio Holdings Summary Table
April 30, 2019
(Unaudited)
The following table presents a summary by sector of the portfolio holdings of the Fund:
| % of Net Assets | Value | |||||||
COMMON STOCKS: | ||||||||
Oil, Gas & Consumable Fuels | 19.3 | % | $ | 14,497,057 | ||||
REITs | 11.3 | 8,503,208 | ||||||
Electric Utilities | 8.3 | 6,269,739 | ||||||
Commercial Banks | 7.6 | 5,706,011 | ||||||
Pharmaceuticals | 7.5 | 5,628,322 | ||||||
Diversified Telecommunication Services | 7.3 | 5,475,040 | ||||||
Semiconductors & Semiconductor Equipment | 6.1 | 4,619,583 | ||||||
Communications Equipment | 4.2 | 3,143,159 | ||||||
IT Services | 4.2 | 3,141,627 | ||||||
Household Products | 4.1 | 3,117,965 | ||||||
Beverages | 4.0 | 2,977,991 | ||||||
Tobacco | 3.9 | 2,958,015 | ||||||
Health Care Providers & Services | 3.8 | 2,879,979 | ||||||
Biotechnology | 3.7 | 2,749,434 | ||||||
Containers & Packaging | 3.6 | 2,705,009 | ||||||
Exchange Traded Fund | 0.5 | 370,853 | ||||||
Other Assets in Excess of Liabilities | 0.6 | 428,007 | ||||||
|
|
|
| |||||
NET ASSETS | 100.0 | % | $ | 75,170,999 | ||||
|
|
|
| |||||
Portfolio holdings are subject to change at any time.
The accompanying notes are an integral part of the financial statements.
9
QUALITY DIVIDEND FUND
Portfolio of Investments
April 30, 2019
| Number of Shares | Value | |||||||
COMMON STOCKS — 98.9% |
| |||||||
Beverages — 4.0% | ||||||||
Coca-Cola Co. (The) | 60,701 | $ | 2,977,991 | |||||
|
| |||||||
Biotechnology — 3.7% |
| |||||||
AbbVie, Inc. | 34,632 | 2,749,434 | ||||||
|
| |||||||
Commercial Banks — 7.6% |
| |||||||
SunTrust Banks, Inc. | 46,358 | 3,035,522 | ||||||
Wells Fargo & Co. | 55,164 | 2,670,489 | ||||||
|
| |||||||
| 5,706,011 | ||||||||
|
| |||||||
Communications Equipment — 4.2% |
| |||||||
Cisco Systems, Inc. | 56,178 | 3,143,159 | ||||||
|
| |||||||
Containers & Packaging — 3.6% |
| |||||||
International Paper Co. | 57,787 | 2,705,009 | ||||||
|
| |||||||
Diversified Telecommunication Services — 7.3% |
| |||||||
AT&T, Inc. | 85,440 | 2,645,222 | ||||||
Verizon Communications, Inc. | 49,481 | 2,829,818 | ||||||
|
| |||||||
| 5,475,040 | ||||||||
|
| |||||||
Electric Utilities — 8.3% |
| |||||||
Duke Energy Corp. | 32,818 | 2,990,376 | ||||||
Southern Co. (The) | 61,619 | 3,279,363 | ||||||
|
| |||||||
| 6,269,739 | ||||||||
|
| |||||||
Health Care Providers & Services — 3.8% |
| |||||||
Cardinal Health, Inc. | 59,125 | 2,879,979 | ||||||
| �� |
|
| ||||||
Household Products — 4.1% |
| |||||||
Kimberly-Clark Corp. | 24,287 | 3,117,965 | ||||||
|
| |||||||
IT Services — 4.2% | ||||||||
International Business Machines Corp. | 22,397 | 3,141,627 | ||||||
|
| |||||||
Oil, Gas & Consumable Fuels — 19.3% |
| |||||||
Chevron Corp. | 22,564 | 2,709,034 | ||||||
Enbridge, Inc. (Canada) | 78,111 | 2,885,420 | ||||||
ONEOK, Inc. | 44,181 | 3,001,215 | ||||||
| Number of Shares | Value | |||||||
COMMON STOCKS — (Continued) |
| |||||||
Oil, Gas & Consumable Fuels — (Continued) |
| |||||||
Valero Energy Corp. | 32,006 | $ | 2,901,664 | |||||
Williams Cos, Inc. (The) | 105,885 | 2,999,724 | ||||||
|
| |||||||
| 14,497,057 | ||||||||
|
| |||||||
Pharmaceuticals — 7.5% |
| |||||||
Merck & Co., Inc. | 37,059 | 2,916,914 | ||||||
Pfizer, Inc. | 66,767 | 2,711,408 | ||||||
|
| |||||||
| 5,628,322 | ||||||||
|
| |||||||
REITs — 11.3% |
| |||||||
Digital Realty Trust, Inc. | 25,838 | 3,041,391 | ||||||
Iron Mountain, Inc. | 81,580 | 2,649,718 | ||||||
Ventas, Inc. | 46,017 | 2,812,099 | ||||||
|
| |||||||
| 8,503,208 | ||||||||
|
| |||||||
Semiconductors & Semiconductor Equipment — 6.1% |
| |||||||
QUALCOMM, Inc. | 53,635 | 4,619,583 | ||||||
|
| |||||||
Tobacco — 3.9% |
| |||||||
Philip Morris International, Inc. | 34,173 | 2,958,015 | ||||||
|
| |||||||
TOTAL COMMON STOCKS |
| 74,372,139 | ||||||
|
| |||||||
The accompanying notes are an integral part of the financial statements
10
QUALITY DIVIDEND FUND
Portfolio of Investments (Concluded)
April 30, 2019
Number | Value | |||||
EXCHANGE TRADED FUND — 0.5% | ||||||
SPDR S&P Dividend ETF | 3,653 | $ | 370,853 | |||
|
| |||||
TOTAL EXCHANGE TRADED FUND (Cost $314,697) | 370,853 | |||||
|
| |||||
TOTAL INVESTMENTS - 99.4% (Cost $63,685,644) | 74,742,992 | |||||
|
| |||||
OTHER ASSETS IN EXCESS OF LIABILITIES - 0.6% | 428,007 | |||||
|
| |||||
NET ASSETS - 100.0% | $ | 75,170,999 | ||||
|
| |||||
REIT | Real Estate Investment Trust | |
SPDR | Standard & Poor’s Depository Receipt |
The accompanying notes are an integral part of the financial statements
11
QUALITY DIVIDEND FUND
Statement of Assets and Liabilities
April 30, 2019
Assets | ||||
Investments, at value (Cost $63,685,644) | $ | 74,742,992 | ||
Cash | 268,480 | |||
Receivable for capital shares sold | 121,189 | |||
Dividends receivable | 148,660 | |||
Prepaid expenses and other assets | 21,761 | |||
|
| |||
Total assets | 75,303,082 | |||
|
| |||
Liabilities | ||||
Payable for audit fees | 28,462 | |||
Payable for distribution fees | 22,921 | |||
Payable for administration and accounting fees | 22,503 | |||
Payable for transfer agent fees | 14,755 | |||
Payable to Investment Adviser | 12,328 | |||
Payable for printing fees | 11,773 | |||
Payable for legal fees | 6,441 | |||
Payable for capital shares redeemed | 6,185 | |||
Payable for shareholder servicing fees | 4,927 | |||
Payable for custodian fees | 475 | |||
Accrued expenses | 1,313 | |||
|
| |||
Total liabilities | 132,083 | |||
|
| |||
Net Assets | $ | 75,170,999 | ||
|
| |||
Net Assets consisted of: | ||||
Capital stock, $0.01 par value | $ | 57,660 | ||
Paid-in capital | 62,992,484 | |||
Total distributable earnings | 12,120,855 | |||
|
| |||
Net Assets | $ | 75,170,999 | ||
|
| |||
Class A: | ||||
Net asset value and redemption price per share ($40,283,138 / 3,094,250 shares) | $13.02 | |||
Maximum offering price per share (100/94.25 of $13.02) | $13.81 | |||
Class C: | ||||
Net asset value, offering and redemption price per share ($24,325,657 / 1,860,863 shares) | $13.07 | |||
Institutional Class: | ||||
Net asset value, offering and redemption price per share ($10,562,204 / 810,903 shares) | $13.03 | |||
The accompanying notes are an integral part of the financial statements.
12
QUALITY DIVIDEND FUND
Statement of Operations
For the Year Ended April 30, 2019
Investment income | ||||
Dividends | $ | 2,818,616 | ||
Less: foreign taxes withheld | (38,179 | ) | ||
|
| |||
Total investment income | 2,780,437 | |||
|
| |||
Expenses | ||||
Advisory fees (Note 2) | 432,089 | |||
Distribution fees (Class C) (Note 2) | 178,718 | |||
Distribution fees (Class A) (Note 2) | 96,671 | |||
Transfer agent fees (Note 2) | 90,341 | |||
Registration and filing fees | 74,856 | |||
Administration and accounting fees (Note 2) | 65,360 | |||
Shareholder servicing fees (Class C) | 59,573 | |||
Legal fees | 40,392 | |||
Trustees’ and officers’ fees (Note 2) | 39,726 | |||
Printing and shareholder reporting fees | 31,521 | |||
Audit fees | 28,654 | |||
Custodian fees (Note 2) | 25,074 | |||
Other expenses | 10,747 | |||
|
| |||
Total expenses before waivers and reimbursements | 1,173,722 | |||
|
| |||
Less: waivers and reimbursements (Note 2) | (125,818 | ) | ||
|
| |||
Net expenses after waivers and reimbursements | 1,047,904 | |||
|
| |||
Net investment income | 1,732,533 | |||
|
| |||
Net realized and unrealized gain from investments: | ||||
Net realized gain from investments | 1,588,090 | |||
Net change in unrealized appreciation/(depreciation) on investments | 6,323,031 | |||
|
| |||
Net realized and unrealized gain on investments | 7,911,121 | |||
|
| |||
Net increase in net assets resulting from operations | $ | 9,643,654 | ||
|
| |||
The accompanying notes are an integral part of the financial statements.
13
QUALITY DIVIDEND FUND
Statements of Changes in Net Assets
| For the Year Ended April 30, 2019 | For the Year Ended April 30, 2018 | |||||||||
Increase/(decrease) in net assets from operations: | ||||||||||
Net investment income | $ | 1,732,533 | $ | 1,541,495 | ||||||
Net realized gain from investments | 1,588,090 | 6,512,251 | ||||||||
Net change in unrealized appreciation/(depreciation) on investments | 6,323,031 | (5,592,002 | ) | |||||||
|
|
|
| |||||||
Net increase in net assets resulting from operations | 9,643,654 | 2,461,744 | ||||||||
|
|
|
| |||||||
Less dividends and distributions to shareholders from: | ||||||||||
Total distributable earnings* | ||||||||||
Class A | (2,894,783 | ) | (1,072,698 | ) | ||||||
Class C | (1,585,083 | ) | (499,466 | ) | ||||||
Institutional Class | (734,246 | ) | (278,161 | ) | ||||||
|
|
|
| |||||||
Net decrease in net assets from dividends and distributions to shareholders | (5,214,112 | ) | (1,850,325 | ) | ||||||
|
|
|
| |||||||
Increase/(decrease) in net assets derived from capital share transactions (Note 4) | 206,093 | (1,785,789 | ) | |||||||
|
|
|
| |||||||
Total increase/(decrease) in net assets | 4,635,635 | (1,174,370 | ) | |||||||
|
|
|
| |||||||
Net assets | ||||||||||
Beginning of year | 70,535,364 | 71,709,734 | ||||||||
|
|
|
| |||||||
End of year** | $ | 75,170,999 | $ | 70,535,364 | ||||||
|
|
|
| |||||||
| * | Distributions from net investment income and from realized gains are no longer required to be separately disclosed. See Note 1. For the year ended April 30, 2018, distributions from net investment income were $1,072,698, $499,466 and $278,161 for Class A, Class C and Institutional Class shares, respectively. |
| ** | Parenthetical disclosure of accumulated net investment income/(loss) is no longer required. See Note 1. For the year ended April 30, 2018, end of year net assets included accumulated net investment income of $156,658. |
The accompanying notes are an integral part of the financial statements.
14
QUALITY DIVIDEND FUND
Financial Highlights
Contained below is per share operating performance data for each Class A share outstanding, total investment return, ratios to average net assets and other supplemental data for the respective period. The total returns in the table represent the rate that an investor would have earned or lost on an investment in the Fund (assuming reinvestment of all dividends and distributions). This information has been derived from information provided in the financial statements and should be read in conjunction with the financial statements and the notes thereto.
| Class A | |||||||||||||||||||||||||
| For the Year Ended April 30, 2019 | For the Year Ended April 30, 2018 | For the Year Ended April 30, 2017 | For the Year Ended April 30, 2016 | For the Year Ended April 30, 2015 | |||||||||||||||||||||
Per Share Operating Performance | |||||||||||||||||||||||||
Net asset value, beginning of period | $ | 12.29 | $ | 12.19 | $ | 11.03 | $ | 11.66 | $ | 11.02 | |||||||||||||||
|
|
|
|
|
|
|
|
|
| ||||||||||||||||
Net investment income(1) | 0.33 | 0.29 | 0.27 | 0.26 | 0.27 | ||||||||||||||||||||
Net realized and unrealized gain/(loss) on investments | 1.36 | 0.16 | 1.13 | (0.49 | ) | 0.79 | |||||||||||||||||||
|
|
|
|
|
|
|
|
|
| ||||||||||||||||
Net increase/(decrease) in net assets resulting from operations | 1.69 | 0.45 | 1.40 | (0.23 | ) | 1.06 | |||||||||||||||||||
|
|
|
|
|
|
|
|
|
| ||||||||||||||||
Dividends and distributions to shareholders from: | |||||||||||||||||||||||||
Net investment income | (0.38 | ) | (0.35 | ) | (0.24 | ) | (0.26 | ) | (0.28 | ) | |||||||||||||||
Net realized capital gains | (0.58 | ) | — | — | (0.14 | ) | (0.14 | ) | |||||||||||||||||
|
|
|
|
|
|
|
|
|
| ||||||||||||||||
Total dividends and distributions to shareholders | (0.96 | ) | (0.35 | ) | (0.24 | ) | (0.40 | ) | (0.42 | ) | |||||||||||||||
|
|
|
|
|
|
|
|
|
| ||||||||||||||||
Redemption fees | — | (2) | — | (2) | — | (2) | — | (2) | — | (2) | |||||||||||||||
|
|
|
|
|
|
|
|
|
| ||||||||||||||||
Net asset value, end of period | $ | 13.02 | $ | 12.29 | $ | 12.19 | $ | 11.03 | $ | 11.66 | |||||||||||||||
|
|
|
|
|
|
|
|
|
| ||||||||||||||||
Total investment return(3) | 14.66 | % | 3.64 | % | 12.82 | % | (1.84 | )% | 9.65 | % | |||||||||||||||
Ratios/Supplemental Data | |||||||||||||||||||||||||
Net assets, end of period (in thousands) | $ | 40,283 | $ | 37,800 | $ | 36,731 | $ | 35,607 | $ | 35,629 | |||||||||||||||
Ratio of expenses to average net assets | 1.24 | % | 1.24 | % | 1.24 | % | 1.24 | % | 1.24 | % | |||||||||||||||
Ratio of expenses to average net assets without waivers and expense reimbursements(4) | 1.41 | % | 1.32 | % | 1.35 | % | 1.37 | % | 1.62 | % | |||||||||||||||
Ratio of net investment income to average net assets | 2.62 | % | 2.32 | % | 2.35 | % | 2.40 | % | 2.33 | % | |||||||||||||||
Portfolio turnover rate | 37.23 | % | 51.32 | % | 43.59 | % | 62.74 | % | 67.56 | % | |||||||||||||||
| (1) | The selected per share data was calculated using the average shares outstanding method for the period. |
| (2) | Amount is less than $0.005 per share. |
| (3) | Total investment return is calculated assuming a purchase of shares on the first day and a sale of shares on the last day of each period reported and includes reinvestment of dividends and distributions, if any. Total investment return does not reflect the impact of the maximumfront-end sales load of 5.75%. If reflected, the return would be lower. |
| (4) | During the period, certain fees were waived and/or reimbursed. If such fee waivers and/or reimbursements had not occurred, the ratios would have been as indicated (See Note 2). |
The accompanying notes are an integral part of the financial statements.
15
QUALITY DIVIDEND FUND
Financial Highlights (Continued)
Contained below is per share operating performance data for each Class C share outstanding, total investment return, ratios to average net assets and other supplemental data for the respective period. The total returns in the table represent the rate that an investor would have earned or lost on an investment in the Fund (assuming reinvestment of all dividends and distributions). This information has been derived from information provided in the financial statements and should be read in conjunction with the financial statements and the notes thereto.
| Class C | |||||||||||||||||||||||||
| For the Year Ended April 30, 2019 | For the Year Ended April 30, 2018 | For the Year Ended April 30, 2017 | For the Year Ended April 30, 2016 | For the Year Ended April 30, 2015 | |||||||||||||||||||||
Per Share Operating Performance | |||||||||||||||||||||||||
Net asset value, beginning of period | $ | 12.34 | $ | 12.24 | $ | 11.06 | $ | 11.73 | $ | 11.02 | |||||||||||||||
|
|
|
|
|
|
|
|
|
| ||||||||||||||||
Net investment income(1) | 0.24 | 0.20 | 0.18 | 0.18 | 0.18 | ||||||||||||||||||||
Net realized and unrealized gain/(loss) on investments | 1.36 | 0.15 | 1.15 | (0.51 | ) | 0.80 | |||||||||||||||||||
|
|
|
|
|
|
|
|
|
| ||||||||||||||||
Net increase/(decrease) in net assets resulting from operations | 1.60 | 0.35 | 1.33 | (0.33 | ) | 0.98 | |||||||||||||||||||
|
|
|
|
|
|
|
|
|
| ||||||||||||||||
Dividends and distributions to shareholders from: | |||||||||||||||||||||||||
Net investment income | (0.29 | ) | (0.25 | ) | (0.15 | ) | (0.20 | ) | (0.13 | ) | |||||||||||||||
Net realized capital gains | (0.58 | ) | — | — | (0.14 | ) | (0.14 | ) | |||||||||||||||||
|
|
|
|
|
|
|
|
|
| ||||||||||||||||
Total dividends and distributions to shareholders | (0.87 | ) | (0.25 | ) | (0.15 | ) | (0.34 | ) | (0.27 | ) | |||||||||||||||
|
|
|
|
|
|
|
|
|
| ||||||||||||||||
Redemption fees | — | (2) | — | (2) | — | (2) | — | (2) | — | (2) | |||||||||||||||
|
|
|
|
|
|
|
|
|
| ||||||||||||||||
Net asset value, end of period | $ | 13.07 | $ | 12.34 | $ | 12.24 | $ | 11.06 | $ | 11.73 | |||||||||||||||
|
|
|
|
|
|
|
|
|
| ||||||||||||||||
Total investment return(3) | 13.73 | % | 2.84 | % | 12.07 | % | (2.65 | )% | 8.91 | % | |||||||||||||||
Ratios/Supplemental Data | |||||||||||||||||||||||||
Net assets, end of period (in thousands) | $24,326 | $23,728 | $26,247 | $23,217 | $20,820 | ||||||||||||||||||||
Ratio of expenses to average net assets | 1.99 | % | 1.99 | % | 1.99 | % | 1.99 | % | 1.99 | % | |||||||||||||||
Ratio of expenses to average net assets without waivers and expense reimbursements(4) | 2.16 | % | 2.06 | % | 2.10 | % | 2.12 | % | 2.35 | % | |||||||||||||||
Ratio of net investment income to average net assets | 1.87 | % | 1.57 | % | 1.58 | % | 1.65 | % | 1.58 | % | |||||||||||||||
Portfolio turnover rate | 37.23 | % | 51.32 | % | 43.59 | % | 62.74 | % | 67.56 | % | |||||||||||||||
| (1) | The selected per share data was calculated using the average shares outstanding method for the period. |
| (2) | Amount is less than $0.005 per share. |
| (3) | Total investment return is calculated assuming a purchase of shares on the first day and a sale of shares on the last day of each period reported and includes reinvestment of dividends and distributions, if any. Total investment return does not reflect any applicable sales charge. |
| (4) | During the period, certain fees were waived and/or reimbursed. If such fee waivers and/or reimbursements had not occurred, the ratios would have been as indicated (See Note 2). |
The accompanying notes are an integral part of the financial statements.
16
QUALITY DIVIDEND FUND
Financial Highlights (Concluded)
Contained below is per share operating performance data for each Institutional Class share outstanding, total investment return, ratios to average net assets and other supplemental data for the respective period. The total returns in the table represent the rate that an investor would have earned or lost on an investment in the Fund (assuming reinvestment of all dividends and distributions). This information has been derived from information provided in the financial statements and should be read in conjunction with the financial statements and the notes thereto.
| Institutional Class | |||||||||||||||
| For the Year Ended April 30, 2019 | For the Year Ended April 30, 2018 | For the Period October 4, 2016* to April 30, 2017 | |||||||||||||
Per Share Operating Performance | |||||||||||||||
Net asset value, beginning of period | $ | 12.30 | $ | 12.20 | $ | 11.33 | |||||||||
|
|
|
|
|
| ||||||||||
Net investment income(1) | 0.36 | 0.32 | 0.16 | ||||||||||||
Net realized and unrealized gain on investments | 1.36 | 0.16 | 0.83 | ||||||||||||
|
|
|
|
|
| ||||||||||
Net increase in net assets resulting from operations | 1.72 | 0.48 | 0.99 | ||||||||||||
|
|
|
|
|
| ||||||||||
Dividends and distributions to shareholders from: | |||||||||||||||
Net investment income | (0.41 | ) | (0.38 | ) | (0.12 | ) | |||||||||
Net realized capital gains | (0.58 | ) | — | — | |||||||||||
|
|
|
|
|
| ||||||||||
Total dividends and distributions to shareholders | (0.99 | ) | (0.38 | ) | (0.12 | ) | |||||||||
|
|
|
|
|
| ||||||||||
Redemption fees | — | (2) | — | (2) | — | (2) | |||||||||
|
|
|
|
|
| ||||||||||
Net asset value, end of period | $ | 13.03 | $ | 12.30 | $ | 12.20 | |||||||||
|
|
|
|
|
| ||||||||||
Total investment return(3) | 14.94 | % | 3.89 | % | 8.72 | % | |||||||||
Ratios/Supplemental Data | |||||||||||||||
Net assets, end of period (in thousands) | $ | 10,562 | $ | 9,007 | $ | 8,731 | |||||||||
Ratio of expenses to average net assets | 0.99 | % | 0.99 | % | 0.99 | %(4) | |||||||||
Ratio of expenses to average net assets without waivers and expense reimbursements(5) | 1.17 | % | 1.07 | % | 1.12 | %(4) | |||||||||
Ratio of net investment income to average net assets | 2.87 | % | 2.57 | % | 2.29 | %(4) | |||||||||
Portfolio turnover rate | 37.23 | % | 51.32 | % | 43.59 | %(6) | |||||||||
| * | Commencement of operations. |
| (1) | The selected per share data was calculated using the average shares outstanding method for the period. |
| (2) | Amount is less than $0.005 per share. |
| (3) | Total investment return is calculated assuming a purchase of shares on the first day and a sale of shares on the last day of each period reported and includes reinvestment of dividends and distributions, if any. Total returns for periods less than one year are not annualized. |
| (4) | Annualized. |
| (5) | During the period, certain fees were waived and/or reimbursed. If such fee waivers and/or reimbursements had not occurred, the ratios would have been as indicated (See Note 2). |
| (6) | Reflects portfolio turnover of the Fund for the year ended April 30, 2017. |
The accompanying notes are an integral part of the financial statements.
17
QUALITY DIVIDEND FUND
Notes to Financial Statements
April 30, 2019
1. Organization and Significant Accounting Policies
The Quality Dividend Fund (the “Fund”) is a diversified,open-end management investment company registered under the Investment Company Act of 1940, as amended, (the “1940 Act”), which commenced investment operations on September 30, 2013. The Fund is a separate series of FundVantage Trust (the “Trust”) which was organized as a Delaware statutory trust on August 28, 2006. The Trust is a “series trust” authorized to issue an unlimited number of separate series or classes of shares of beneficial interest. Each series is treated as a separate entity for certain matters under the 1940 Act, and for other purposes, and a shareholder of one series is not deemed to be a shareholder of any other series. The Fund offers separate classes of shares; Class A, Class C and Institutional Class shares. Class A shares are subject to a front end sales charge.Front-end sales charges may be reduced or waived under certain circumstances. A contingent deferred sales charge (“CDSC”), as a percentage of the lower of the original purchase price or net asset value at redemption, of 1.00% may be imposed on full or partial redemptions of Class A shares made within twelve months of purchase where: (i) $1 million or more of Class A shares was purchased without an initial sales charge, and (ii) the selling broker-dealer received a commission for such sale. A CDSC of 1% may apply to Class C shares when shares are redeemed within 12 months after initial purchase where the selling broker-dealer received a commission for such sale.
The Fund is an investment company and follows accounting and reporting guidance in the Financial Accounting Standards Board Accounting Standards Codification Topic 946.
Portfolio Valuation— The Fund’s net asset value (“NAV”) is calculated once daily at the close of regular trading hours on the New York Stock Exchange (“NYSE”) (typically 4:00 p.m. Eastern time) on each day the NYSE is open. Securities held by the Fund are valued using the closing price or the last sale price on a national securities exchange or the National Association of Securities Dealers Automatic Quotation System (“NASDAQ”) market system where they are primarily traded. Equity securities traded in theover-the-counter (“OTC”) market are valued at their closing prices. If there were no transactions on that day, securities traded principally on an exchange or on NASDAQ will be valued at the mean of the last bid and ask prices prior to the market close. Investments in otheropen-end investment companies are valued based on the NAV of the investment companies (which may use fair value pricing as discussed in their prospectuses). If market quotations are unavailable or deemed unreliable, securities will be valued in accordance with procedures adopted by the Trust’s Board of Trustees (“Board of Trustees”). Relying on prices supplied by pricing services or dealers or using fair valuation may result in values that are higher or lower than the values used by other investment companies and investors to price the same investments. In the event that market quotes are not readily available, and the security or asset cannot be valued pursuant to one of the valuation methods, the value of the security or asset will be determined in good faith by the Adviser. The Trust has established a Valuation Committee which performs certain functions including the oversight of the Adviser’s fair valuation determinations.
18
QUALITY DIVIDEND FUND
Notes to Financial Statements (Continued)
April 30, 2019
Fair Value Measurements— The inputs and valuation techniques used to measure fair value of the Fund’s investments are summarized into three levels as described in the hierarchy below:
• | Level 1 — | quoted prices in active markets for identical securities; | ||
• | Level 2 — | other significant observable inputs (including quoted prices for similar securities, interest rates, prepayment speeds, credit risk, etc.); and | ||
• | Level 3 — | significant unobservable inputs (including the Fund’s own assumptions in determining the fair value of investments). | ||
The inputs or methodology used for valuing securities are not necessarily an indication of the risk associated with investing in those securities.
The following is a summary of the inputs used, as of April 30, 2019, in valuing the Fund’s investments carried at fair value:
| Total Value at 04/30/19 | Level 1 Quoted Price | Level 2 Other Significant Observable Inputs | Level 3 Significant Unobservable Inputs | |||||||||||||
Common Stocks* | $ | 74,372,139 | $ | 74,372,139 | $ | — | $ | — | ||||||||
Exchange Traded Fund | 370,853 | 370,853 | — | — | ||||||||||||
|
|
|
|
|
|
|
| |||||||||
Total Investments | $ | 74,742,992 | $ | 74,742,992 | $ | — | $ | — | ||||||||
|
|
|
|
|
|
|
| |||||||||
| * | Please refer to Portfolio of Investments for further details on portfolio holdings. |
At the end of each quarter, management evaluates the classification of Levels 1, 2 and 3 assets and liabilities. Various factors are considered, such as changes in liquidity from the prior reporting period; whether or not a broker is willing to execute at the quoted price; the depth and consistency of prices from third party pricing services; and the existence of contemporaneous, observable trades in the market. Additionally, management evaluates the classification of Level 1 and Level 2 assets and liabilities on a quarterly basis for changes in listings or delistings on national exchanges.
Due to the inherent uncertainty of determining the fair value of investments that do not have a readily available market value, the fair value of the Fund’s investments may fluctuate from period to period. Additionally, the fair value of investments may differ significantly from the values that would have been used had a ready market existed for such investments and may differ materially from the values the Fund may ultimately realize. Further, such investments may be subject to legal and other restrictions on resale or otherwise less liquid than publicly traded securities.
19
QUALITY DIVIDEND FUND
Notes to Financial Statements (Continued)
April 30, 2019
For fair valuations using significant unobservable inputs, U.S. generally accepted accounting principles (“U.S. GAAP”) require the Fund to present a reconciliation of the beginning to ending balances for reported market values that present changes attributable to total realized and unrealized gains or losses, purchase and sales, and transfers in and out of Level 3 during the period. A reconciliation of Level 3 investments is presented only when the Fund had an amount of Level 3 investments at the end of the reporting period that was meaningful in relation to its net assets. The amounts and reasons for all transfers in and out of each Level within the three-tier hierarchy are disclosed when the Fund had an amount of total transfers during the reporting period that was meaningful in relation to its net assets as of the end of the reporting period.
For the year ended April 30, 2019, there were no transfers between Levels.
Use of Estimates— The preparation of financial statements in conformity with U.S. GAAP requires management to make estimates and assumptions that affect the amounts reported in the financial statements and accompanying notes at the date of the financial statements and the reported amounts of revenues and expenses during the period. Actual results could differ from those estimates and those differences could be material.
Investment Transactions, Investment Income and Expenses— Investment transactions are recorded on trade date for financial statement preparation purposes. Realized gains and losses on investments sold are recorded on the identified cost basis. Interest income is recorded on the accrual basis. Dividends are recorded on theex-dividend date. Estimated components of distributions received from real estate investment trusts may be considered income, return of capital distributions or capital gain distributions. Return of capital distributions are recorded as a reduction of cost of the related investments. Distribution(12b-1) fees and shareholder services fees relating to a specific class are charged directly to that class. Fund level expenses common to all classes, investment income and realized and unrealized gains and losses on investments are allocated to each class based upon relative daily net assets of each class. General expenses of the Trust are generally allocated to each fund in proportion to its relative daily net assets. Expenses directly attributable to a particular fund in the Trust are charged directly to that fund.
MLP Common Units— Master Limited Partnership (“MLP”) common units represent limited partnership interests in the MLP. Common units are generally listed and traded on the U.S. securities exchanges or OTC with their value fluctuating predominantly based on the success of the MLP. Unlike owners of common stock of a corporation, owners of MLP common units have limited voting rights and have no ability to annually elect directors. MLPs generally distribute all available cash flow (cash flow from operations less maintenance capital expenditures) in the form of quarterly distributions. Common unit holders have first priority to receive quarterly cash distributions up to the minimum quarterly distribution and have arrearage rights. In the event of liquidation, common unit holders have preference over subordinated units, but not debt holders or preferred unit holders, to remaining assets of the MLP.
20
QUALITY DIVIDEND FUND
Notes to Financial Statements (Continued)
April 30, 2019
Dividends and Distributions to Shareholders— Dividends from net investment income and distributions from net realized capital gains, if any, are declared, recorded onex-date and paid at least annually to shareholders. Income dividends and capital gain distributions are determined in accordance with U.S. federal income tax regulations, which may differ from U.S. GAAP.
U.S. Tax Status— No provision is made for U.S. income taxes as it is the Fund’s intention to continue to qualify for and elect the tax treatment applicable to regulated investment companies under Subchapter M of the Internal Revenue Code of 1986, as amended (the “Internal Revenue Code”), and make the requisite distributions to its shareholders which will be sufficient to relieve it from U.S. income and excise taxes.
Other— In the normal course of business, the Fund may enter into contracts that provide general indemnifications. The Fund’s maximum exposure under these arrangements is dependent on claims that may be made against the Fund in the future, and therefore, cannot be estimated; however, based on experience, the risk of material loss for such claims is considered remote.
Recent Accounting Pronouncement— Effective November 5, 2018, the SEC amended existing rules intended to modernize reporting and disclosure of information. These amendments relate to RegulationS-X which sets forth the form and content of financial statements. The amendment requires collapsing the components of distributable earnings on the Statement of Assets and Liabilities and collapsing the distributions paid to shareholders on the Statements of Changes in Net Assets. Management has evaluated the implications of adopting these amendments and determined there is no significant impact on the financial statements and accompanying notes.
2. Transactions with Related Parties and Other Service Providers
EquityCompass Investment Management, LLC (“EquityCompass” or the “Adviser”),serves as investment adviser to the Fund pursuant to an investment advisory agreement with the Trust. For its services, the Adviser is paid a monthly fee at the annual rate of 0.60% of the Fund’s average daily net assets. The Adviser has contractually agreed to reduce its investment advisory fee and/or reimburse certain expenses of the Fund to the extent necessary to ensure that the Fund’s total operating expenses (excluding taxes, fees and expenses attributable to a distribution or service plan adopted by the Trust, “Acquired Fund Fees and Expenses,” dividend and interest expense on securities sold short, interest, extraordinary items and brokerage commissions) do not exceed 0.99% of average daily net assets of the Fund (the “Expense Limitation”). The Expense Limitation will remain in effect until August 31, 2019 unless the Board of Trustees of the Trust approves its earlier termination. The Adviser is entitled to recover, subject to approval by the Board of Trustees, such amounts reduced or reimbursed for a period of up to three (3) years from the date on which the Adviser reduced its compensation and/or assumed expenses for the Fund. The Adviser is permitted to seek reimbursement from the Fund, subject to certain limitations, for fees it waived and Fund expenses it paid to the extent the total annual fund expenses do not exceed the limits described
21
QUALITY DIVIDEND FUND
Notes to Financial Statements (Continued)
April 30, 2019
above or any lesser limits in effect at the time of reimbursement. No recoupment will occur unless the Fund’s expenses are below the Expense Limitation amount. As of April 30, 2019, the amount of potential recovery was as follows:
| Expiration | ||||||
April 30, 2020 | April 30, 2021 | April 30, 2022 | Total | |||
$74,701 | $55,487 | $125,818 | $256,006 | |||
For the year ended April 30, 2019, the Adviser earned advisory fees of $432,089 and waived fees of $125,818.
Other Service Providers
The Bank of New York Mellon (“BNY Mellon”) serves as administrator and custodian for the Fund. For providing administrative and accounting services, BNY Mellon is entitled to receive a monthly fee equal to an annual percentage rate of the Fund’s average daily net assets and is subject to certain minimum monthly fees. For providing certain custodial services, BNY Mellon is entitled to receive a monthly fee, subject to certain minimum, and out of pocket expenses.
BNY Mellon Investment Servicing (US) Inc. (the “Transfer Agent”) provides transfer agent services to the Fund. The Transfer Agent is entitled to receive a monthly fee, subject to certain minimum, and out of pocket expenses.
Foreside Funds Distributors LLC (the “Underwriter”) provides principal underwriting services to the Fund pursuant to an underwriting agreement between the Trust and the Underwriter.
The Trust and the Underwriter are parties to an underwriting agreement. The Trust has adopted a distribution plan for Class A and Class C shares in accordance with Rule12b-1 under the 1940 Act. Pursuant to the Class A and Class C shares plan, the Fund compensates the Underwriter for direct and indirect costs and expenses incurred in connection with advertising, marketing and other distribution services in an amount not to exceed 0.25% and 1.00% (0.75% Rule12b-1 distribution fee and 0.25% shareholder service fee), respectively, on an annualized basis of the average daily net assets of the Fund’s Class A and Class C shares.
Trustees and Officers
The Trust is governed by its Board of Trustees. The Trustees receive compensation in the form of an annual retainer and per meeting fees for their services to the Trust. The remuneration paid to the
22
QUALITY DIVIDEND FUND
Notes to Financial Statements (Continued)
April 30, 2019
Trustees by the Fund during the year ended April 30, 2019 was $8,174. An employee of BNY Mellon serves as the Secretary of the Trust and is not compensated by the Fund or the Trust.
JW Fund Management LLC (“JWFM”) provides a Principal Executive Officer and Principal Financial Officer, respectively, to the Trust. Duff & Phelps, LLC (“D&P”) provides the Trust with a Chief Compliance Officer and an Anti-Money Laundering Officer. JWFM and D&P are compensated for their services provided to the Trust.
3. Investment in Securities
For the year ended April 30, 2019, aggregate purchases and sales of investment securities (excluding short-term investments) of the Fund were as follows:
| Purchases | Sales | |||||||
Investment Securities | $ | 26,666,521 | $ | 29,584,789 | ||||
4. Capital Share Transactions
For the year ended April 30, 2019 and the year ended April 30, 2018, transactions in capital shares (authorized shares unlimited) were as follows:
| For the Year Ended April 30, 2019 | For the Year Ended April 30, 2018 | |||||||||||||||
Shares | Amount | Shares | Amount | |||||||||||||
Class A | ||||||||||||||||
Sales | 317,608 | $ | 4,002,713 | 369,523 | $ | 4,646,590 | ||||||||||
Reinvestments | 182,887 | 2,186,047 | 61,288 | 768,765 | ||||||||||||
Redemption Fees* | — | 502 | — | 1,702 | ||||||||||||
Redemptions | (480,869 | ) | (6,041,107 | ) | (368,305 | ) | (4,639,106 | ) | ||||||||
|
|
|
|
|
|
|
| |||||||||
Net increase |
|
19,626 |
| $ | 148,155 | 62,506 | $ | 777,951 | ||||||||
|
|
|
|
|
|
|
| |||||||||
Class C | ||||||||||||||||
Sales | 153,614 | $ | 1,944,213 | 165,228 | $ | 2,118,604 | ||||||||||
Reinvestments | 113,038 | 1,350,775 | 32,390 | 407,367 | ||||||||||||
Redemption Fees* | — | 303 | — | 1,135 | ||||||||||||
Redemptions | (328,701 | ) | (4,185,180 | ) | (419,551 | ) | (5,278,202 | ) | ||||||||
|
|
|
|
|
|
|
| |||||||||
Net decrease |
|
(62,049 |
) | $ | (889,889 | ) | (221,933 | ) | $ | (2,751,096 | ) | |||||
|
|
|
|
|
|
|
| |||||||||
23
QUALITY DIVIDEND FUND
Notes to Financial Statements (Continued)
April 30, 2019
| For the Year Ended April 30, 2019 | For the Year Ended April 30, 2018 | |||||||||||||||
Shares | Amount | Shares | Amount | |||||||||||||
Institutional Class | ||||||||||||||||
Sales | 147,127 | $ | 1,845,337 | 189,459 | $ | 2,384,930 | ||||||||||
Reinvestments | 49,118 | 588,938 | 17,576 | 220,540 | ||||||||||||
Redemption Fees* | — | 123 | — | 405 | ||||||||||||
Redemptions | (117,623 | ) | (1,486,571 | ) | (190,430 | ) | (2,418,519 | ) | ||||||||
|
|
|
|
|
|
|
| |||||||||
Net increase | 78,622 | $ | 947,827 | 16,605 | $ | 187,356 | ||||||||||
|
|
|
|
|
|
|
| |||||||||
Total Net Increase/(Decrease) | 36,199 | $ | 206,093 | (142,822 | ) | $ | (1,785,789 | ) | ||||||||
|
|
|
|
|
|
|
| |||||||||
| * | There is a 1.00% redemption fee that may be charged on shares redeemed which have been held for 60 days or less. The redemption fees are retained by the Fund for the benefit of the remaining shareholders and recorded aspaid-in capital. |
5. Federal Tax Information
The Fund has followed the authoritative guidance on accounting for and disclosure of uncertainty in tax positions, which requires the Fund to determine whether a tax position is more likely than not to be sustained upon examination, including resolution of any related appeals or litigation processes, based on the technical merits of the position. Tax positions not deemed to meet themore-likely-than-not threshold would be recorded as tax benefit or expense in the current year. The Fund has determined that there was no effect on the financial statements from following this authoritative guidance. In the normal course of business, the Fund is subject to examination by federal, state and local jurisdictions, where applicable, for tax years for which applicable statutes of limitations have not expired.
Distributions are determined in accordance with federal income tax regulations, which may differ in amount or character from net investment income and realized gains for financial reporting purposes. Accordingly, the character of distributions and composition of net assets for tax purposes may differ from those reflected in the accompanying financial statements. To the extent these differences are permanent, such amounts are reclassified within the components of net assets based on the tax treatment; temporary differences do not require reclassifications. Net investment income, net realized gains and net assets are not affected by these adjustments. For the year ended April 30, 2019, there were no reclassifications.
For the year ended April 30, 2019, the tax character of distributions paid by the Fund was $1,895,819 of ordinary income dividends and $3,318,293 of long-term capital gains dividends. For the year ended April 30, 2018, the tax character of distributions paid by the Fund was $1,850,325 of ordinary income dividends. Short-term capital gains are reported as ordinary income for federal income tax purposes.
24
QUALITY DIVIDEND FUND
Notes to Financial Statements (Concluded)
April 30, 2019
As of April 30, 2019, the components of distributable earnings on a tax basis were as follows:
Undistributed Long-Term Gain | Net Unrealized Appreciation | Other Book/Tax Differences | Total Distributable Earnings | |||||
$1,132,832 | $10,994,649 | $(6,626) | $12,120,855 |
The differences between the book and tax basis components of distributable earnings relate primarily to the timing and recognition of income and gains for federal income tax purposes.
As of April 30, 2019, the federal tax cost, aggregate gross unrealized appreciation and depreciation of securities held by the Fund were as follows:
Federal tax cost | $ | 63,748,343 | ||
|
| |||
Gross unrealized appreciation | $ | 11,703,760 | ||
Gross unrealized depreciation | (709,111 | ) | ||
|
| |||
Net unrealized appreciation | $ | 10,994,649 | ||
|
|
Pursuant to federal income tax rules applicable to regulated investment companies, the Fund may elect to treat certain capital losses between November 1 and April 30 and late year ordinary losses ((i) ordinary losses between January 1 and April 30, and (ii) specified ordinary and currency losses between November 1 and April 30) as occurring on the first day of the following tax year. For the year ended April 30, 2019, the Fund had no short-term capital loss deferrals, no long-term capital loss deferrals or ordinary loss deferrals.
Accumulated capital losses represent net capital loss carryforwards as of April 30, 2019, that may be available to offset future realized capital gains and thereby reduce future capital gains distributions. As of April 30, 2019, the Fund did not have any capital loss carryforwards.
6. Subsequent Events
Management has evaluated the impact of all subsequent events on the Fund through the date the financial statements were available to be issued and has determined that there are no material subsequent events requiring recognition or disclosure in the financial statements.
25
QUALITY DIVIDEND FUND
Report of Independent Registered Public Accounting Firm
To the Board of Trustees of FundVantage Trust and
Shareholders of the Quality Dividend Fund
Opinion on the Financial Statements
We have audited the accompanying statement of assets and liabilities of Quality Dividend Fund (the “Fund”) (one of the series constituting FundVantage Trust (the “Trust”)), including the portfolio of investments, as of April 30, 2019, and the related statement of operations for the year then ended, the statements of changes in net assets for each of the two years in the period then ended, the financial highlights for each of the five years in the period then ended and the related notes (collectively referred to as the “financial statements”). In our opinion, the financial statements present fairly, in all material respects, the financial position of the Fund (one of the series constituting FundVantage Trust) at April 30, 2019, the results of its operations for the year then ended, the changes in its net assets for each of the two years in the period then ended and its financial highlights for each of the five years in the period then ended, in conformity with U.S. generally accepted accounting principles.
Basis for Opinion
These financial statements are the responsibility of the Trust’s management. Our responsibility is to express an opinion on the Fund’s financial statements based on our audits. We are a public accounting firm registered with the Public Company Accounting Oversight Board (United States) (“PCAOB”) and are required to be independent with respect to the Trust in accordance with the U.S. federal securities laws and the applicable rules and regulations of the Securities and Exchange Commission and the PCAOB.
We conducted our audits in accordance with the standards of the PCAOB. Those standards require that we plan and perform the audit to obtain reasonable assurance about whether the financial statements are free of material misstatement, whether due to error or fraud. The Trust is not required to have, nor were we engaged to perform, an audit of the Trust’s internal control over financial reporting. As part of our audits, we are required to obtain an understanding of internal control over financial reporting, but not for the purpose of expressing an opinion on the effectiveness of the Trust’s internal control over financial reporting. Accordingly, we express no such opinion.
Our audits included performing procedures to assess the risks of material misstatement of the financial statements, whether due to error or fraud, and performing procedures that respond to those risks. Such procedures included examining, on a test basis, evidence regarding the amounts and disclosures in the financial statements. Our procedures included confirmation of securities owned as of April 30, 2019, by correspondence with the custodian. Our audits also included evaluating the accounting principles used and significant estimates made by management, as well as evaluating the overall presentation of the financial statements. We believe that our audits provide a reasonable basis for our opinion.
 |
We have served as the auditor of one or more EquityCompass Strategies investment companies since 2014.
Philadelphia, Pennsylvania
June 24, 2019
26
QUALITY DIVIDEND FUND
Shareholder Tax Information
(Unaudited)
The Fund is required by Subchapter M of the Internal Revenue Code to advise its shareholders of the U.S. federal tax status of distributions received by the Fund’s shareholders in respect of such fiscal year. During the fiscal year ended April 30, 2019, the Fund paid $1,895,819 of ordinary income dividends and $3,318,293 of long-term capital gain dividends to its shareholders. Dividends from short-term capital gains are treated as ordinary income dividends for federal income tax purposes.
The Fund designates 100.00% of the ordinary income distribution as qualified dividend income pursuant to the Jobs and Growth Tax Relief Reconciliation Act of 2003.
The percentage of ordinary income dividends qualifying for the corporate dividends received deduction is 100.00%.
The percentage of qualified interest income related dividends not subject to withholding tax for non-resident aliens and foreign corporations is 0.06%.
All designations are based on financial information available as of the date of this annual report and, accordingly, are subject to change. For each item, it is the intention of the Fund to designate the maximum amount permitted under the Internal Revenue Code of 1986, as amended, and the regulations thereunder.
Because the Fund’s fiscal year is not the calendar year, another notification will be sent with respect to calendar year 2019. The second notification, which will reflect the amount, if any, to be used by calendar year taxpayers on their U.S. federal income tax returns, will be made in conjunction with Form1099-DIV and will be mailed in January 2020.
Foreign shareholders will generally be subject to U.S. withholding tax on the amount of their ordinary income dividends. They will generally not be entitled to a foreign tax credit or deduction for the withholding taxes paid by the Fund, if any.
In general, dividends received bytax-exempt recipients (e.g., IRAs and Keoghs) need not be reported as taxable income for U.S. federal income tax purposes. However, some retirement trusts (e.g., corporate, Keogh and 403(b)(7) plans) may need this information for their annual information reporting.
Shareholders are advised to consult their own tax advisers with respect to the tax consequences of their investment in the Fund.
27
QUALITY DIVIDEND FUND
Other Information
(Unaudited)
Proxy Voting
Policies and procedures that the Fund uses to determine how to vote proxies relating to portfolio securities as well as information regarding how the Fund voted proxies relating to portfolio securities for the most recent12-month period ended June 30 are available without charge, upon request, by calling (888)201-5799 and on the Securities and Exchange Commission’s (“SEC”) website athttp://www.sec.gov.
Quarterly Portfolio Schedules
The Trust files its complete schedule of portfolio holdings with the SEC for the first and third fiscal quarters of each fiscal year (quarters ended July 31 and January 31) on FormN-Q. The Trust’s FormsN-Q are available on the SEC’s website athttp://www.sec.gov.FormN-Q is being rescinded. Once FormN-Q is rescinded, disclosure of the Fund’s complete holdings will be required to be made monthly on FormN-PORT, with every third month made available to the public by the Commission upon filing.
28
QUALITY DIVIDEND FUND
Privacy Notice
(Unaudited)
The privacy of your personal financial information is extremely important to us. When you open an account with us, we collect a significant amount of information from you in order to properly invest and administer your account. We take very seriously the obligation to keep that information private and confidential, and we want you to know how we protect that important information.
We collect nonpublic personal information about you from applications or other forms you complete and from your transactions with us or our affiliates. We do not disclose information about you, or our former clients, to our affiliates or to service providers or other third parties, except as permitted by law. We share only the information required to properly administer your accounts, which enables us to send transaction confirmations,monthly or quarterly statements, financials and tax forms.Even within FundVantage Trust and its affiliated entities, a limited number of people who actually service accounts will have access to your personal financial information. Further, we do not share information about our current or former clients with any outside marketing groups or sales entities.
To ensure the highest degree of security and confidentiality, FundVantage Trust and its affiliates maintain various physical, electronic and procedural safeguards to protect your personal information. We also apply special measures for authentication of information you request or submit to us on our web site.
If you have questions or comments about our privacy practices, please call us at (888)201-5799.
29
QUALITY DIVIDEND FUND
Fund Management
(Unaudited)
FundVantage Trust (the “Trust”) is governed by a Board of Trustees (the “Trustees”). The primary responsibility of the Trustees is to represent the interest of the Trust’s shareholders and to provide oversight management of the Trust.
The following tables present certain information regarding the Trustees and officers of the Trust. None of the Trustees are an “interested person” of the Trust, the Adviser, another investment adviser of a series of the Trust, or Foreside Funds Distributors LLC, the principal underwriter of the Trust (“Underwriter”), within the meaning of the 1940 Act and each Trustee is referred to as an “Independent Trustee” and is listed under such heading below. Employees of certain service providers to the Trust serve as officers of the Trust; such persons are not compensated by the Fund. The address of each Trustee and officer as it relates to the Trust’s business is 301 Bellevue Parkway, 2nd Floor, Wilmington, DE 19809.
The Statement of Additional Information for the Fund contains additional information about the Trustees and is available, without charge, upon request by calling (888)201-5799.
Name and Date of Birth | Position(s) Held with Trust | Term of Office Time Served | Principal Occupation(s) During Past Five Years | Number of Funds in Trust Complex | Other Directorships | |||||
INDEPENDENT TRUSTEES
| ||||||||||
ROBERT J. CHRISTIAN Date of Birth: 2/49 | Trustee and Chairman of the Board | Shall serve until death, resignation or removal. Trustee and Chairman since 2007. | Retired since February 2006; Executive Vice President of Wilmington Trust Company from February 1996 to February 2006; President of Rodney Square Management Corporation (“RSMC”) (investment advisory firm) from 1996 to 2005; Vice President of RSMC from 2005 to 2006.
| 44 | Optimum Fund Trust (registered investment company with 6 portfolios). | |||||
IQBAL MANSUR Date of Birth: 6/55 | Trustee | Shall serve until death, resignation or removal. Trustee since 2007. | University Professor, Widener University. | 44 | None. | |||||
30
QUALITY DIVIDEND FUND
Fund Management (Continued)
(Unaudited)
Name and Date of Birth | Position(s) Held with Trust | Term of Office and Length of Time Served | Principal Occupation(s) During Past Five Years | Number of
| Other Directorships Held by Trustee | |||||
NICHOLAS M. MARSINI, JR. Date of Birth: 8/55 |
Trustee |
Shall serve until death, resignation or removal. Trustee since 2016. |
Retired since March 2016. President of PNC Bank Delaware from June 2011 to March 2016; Executive Vice President of Finance of BNY Mellon from July 2010 to January 2011; Executive Vice President and Chief Financial Officer of PNC Global Investment Servicing from September 1997 to July 2010. | 44 |
Brinker Capital Destinations Trust (registered investment company with 10 portfolios). | |||||
NANCY B. WOLCOTT Date of Birth: 11/54 |
Trustee |
Shall serve until death, resignation or removal. Trustee since 2011. |
Retired since May 2014; EVP, Head of GFI Client Service Delivery, BNY Mellon from January 2012 to May 2014; EVP, Head of US Funds Services, BNY Mellon from July 2010 to January 2012; President of PNC Global Investment Servicing from 2008 to July 2010; Chief Operating Officer of PNC Global Investment Servicing from 2007 to 2008; Executive Vice President of PFPC Worldwide Inc. from 2006 to 2007. |
44 |
Lincoln Variable Insurance Products Trust (registered investment company with 92 portfolios). | |||||
STEPHEN M. WYNNE Date of Birth: 1/55 |
Trustee | Shall serve until death, resignation or removal. Trustee since 2009. |
Retired since December 2010; Chief Executive Officer of US Funds Services, BNY Mellon Asset Servicing from July 2010 to December 2010; Chief Executive Officer of PNC Global Investment Servicing from March 2008 to July 2010; President, PNC Global Investment Servicing from 2003 to 2008. |
44 |
Copeland Trust (registered investment company with 2 portfolios). |
31
QUALITY DIVIDEND FUND
Fund Management (Concluded)
(Unaudited)
Name and Date of Birth | Position(s) Held with Trust |
Term of Office and Length of Time Served
| Principal Occupation(s) During Past Five Years | |||
EXECUTIVE OFFICERS | ||||||
JOEL L. WEISS Date of Birth: 1/63 |
President and Chief Executive Officer |
Shall serve until death, resignation or removal. Officer since 2007. |
President of JW Fund Management LLC since June 2016; Vice President and Managing Director of BNY Mellon Investment Servicing (US) Inc. and predecessor firms from 1993 to June 2016.
| |||
T. RICHARD KEYES Date of Birth: 1/57 |
Treasurer and Chief Financial Officer |
Shall serve until death, resignation or removal. Officer since 2016. |
President of TRK Fund Consulting LLC since July 2016; Head of Tax — U.S. Fund Services of BNY Mellon Investment Servicing (US) Inc. and predecessor firms from February 2006 to July 2016.
| |||
GABRIELLA MERCINCAVAGE Date of Birth: 6/68 |
Assistant Treasurer |
Shall serve until death, resignation or removal. Officer since 2019. |
Fund Administration Consultant since January 2019; Fund Accounting and Tax Compliance Accountant to financial services companies from November 2003 to July 2018.
| |||
VINCENZO A. SCARDUZIO Date of Birth: 4/72 |
Secretary |
Shall serve until death, resignation or removal. Officer since 2012. |
Director and Vice President Regulatory Administration of The Bank of New York Mellon and predecessor firms since 2001.
| |||
DAVID C. LEBISKY Date of Birth: 5/72 |
Chief Compliance Officer and Anti-Money Laundering Officer |
Shall serve until death, resignation or removal. Officer since 2015. |
President of Lebisky Compliance Consulting LLC since October 2015; Consultant, Duff & Phelps, LLC since 2016; Senior Consultant, Freeh Group International Solutions, LLC (a global risk management firm) from 2015 to 2018; Scotia Institutional Investments US, LP, Director of Regulatory Administration from 2010 to 2014.
| |||
32
[THIS PAGE INTENTIONALLY LEFT BLANK.]
[THIS PAGE INTENTIONALLY LEFT BLANK.]
[THIS PAGE INTENTIONALLY LEFT BLANK.]
Investment Adviser
EquityCompass Investment Management, LLC
501 North Broadway
St. Louis, MO 63102
Administrator
The Bank of New York Mellon
301 Bellevue Parkway
Wilmington, DE 19809
Transfer Agent
BNY Mellon Investment Servicing (US) Inc.
4400 Computer Drive
Westborough, MA 01581
Principal Underwriter
Foreside Funds Distributors LLC
400 Berwyn Park
899 Cassatt Road
Berwyn, PA 19312
Custodian
The Bank of New York Mellon
240 Greenwich Street
New York, NY 10286
Independent Registered Public Accounting Firm
Ernst & Young LLP
One Commerce Square
2005 Market Street, Suite 700
Philadelphia, PA 19103-7096
Legal Counsel
Pepper Hamilton LLP
3000 Two Logan Square
18th and Arch Streets
Philadelphia, PA 19103
QUA-0419

QUALITY DIVIDEND
FUND
of
FundVantage Trust
Class A (QDVAX)
Class C (QDVCX)
Institutional Class (QDVIX)
ANNUAL REPORT
April 30, 2019
IMPORTANT NOTE: Beginning on January 1, 2021, paper copies of the Quality Dividend Fund’s annual and semi-annual shareholder reports will no longer be sent by mail, unless you specifically request paper copies of the shareholder reports from the Quality Dividend Fund or from your financial intermediary. Instead, annual and semi-annual shareholder reports will be available on the Quality Dividend Fund’s website (www.equitycompass.com), and you will be notified by mail each time a report is posted and provided with a website link to access the report.
You may elect to receive all future annual and semi-annual shareholder reports in paper, free of charge. To elect to receive paper copies of shareholder reports through the mail or otherwise change your delivery method, contact your financial intermediary or, if you hold your shares directly through the Quality Dividend Fund, call the Quality Dividend Fund toll-free at(888)201-5799 or write to the Quality Dividend Fund at:
Quality Dividend Fund
FundVantage Trust
c/o BNY Mellon Investment Servicing
P.O. Box 9829
Providence, RI 02940-8029
This report is submitted for the general information of the shareholders of the Quality Dividend Fund. It is not authorized for distribution unless preceded or accompanied by a current prospectus for the Quality Dividend Fund.
SKYBRIDGE DIVIDEND VALUE FUND
Annual Investment Adviser’s Report
April 30, 2019
(Unaudited)
Dear Fellow Shareholder,
For the year ended April 30, 2019, the S&P 500 Index and Russell 1000 Value were up 13.50% and 9.06%, respectively. During the same time period, our SkyBridge Dividend Value Fund’s Class I (institutional shares, SKYIX) shares were down 0.51%; Class A Shares (SKYAX) were down 0.71%; and Class C Shares (SKYCX) were down 1.39%, in each case net of any relevant fees and expenses. Stock selection in the consumer discretionary and industrials sectors hurt relative performance. Underweighting the health care sector also hurt relative performance, as did the lack of exposure to utility companies pursuant to the Fund’s investment mandate.
The top three performing companies over the time period were Procter & Gamble Company, Merck & Co., Inc., and Cisco Systems, Inc. The bottom three performing companies were Signet Jewelers Limited, Tupperware Brands Corporation, and Kraft Heinz Company.
The Fund invests primarily in dividend yielding equity securities for which there is no guarantee that a company will increase or continue to pay dividends over time. The fund is subject to overall market risks which will cause its value to fluctuate over time as well as the Adviser’s ability to select securities to meet its objective.
Sincerely,
Brendan Voege
Portfolio Manager
Current and future portfolio holdings are subject to change and risk.
The performance data quoted represents past performance and does not guarantee future results. Current performance may be lower or higher. Performance data current to the most recentmonth-end may be obtained by calling (888)919-6885. The investment return and principal value of an investment will fluctuate so that shares, when redeemed, may be worth more or less than their original cost.
SKYBRIDGE DIVIDEND VALUE FUND
Annual Report
Performance Data
April 30, 2019
(Unaudited)
Comparison of Change in Value of $10,000 Investment in SkyBridge Dividend Value Fund’s
Class A Shares vs. S&P 500® Index
Class A Shares of an assumed $10,000 investment is adjusted for the maximum sales charge of 5.75%. This results in a net investment of $9,425. Performance of Class C Shares will vary from Class A Shares due to differences in class specific fees.
Comparison of Change in Value of $50,000 (investment minimum) Investment in SkyBridge Dividend Value Fund’s
Class I Shares vs. S&P 500® Index
2
SKYBRIDGE DIVIDEND VALUE FUND
Annual Report
Performance Data (Continued)
April 30, 2019
(Unaudited)
| Average Annual Total Returns for Periods Ended April 30, 2019 | ||||||||
| 1 Year | 3 Year | 5 Year | Since Inception | |||||
Class A Shares (with sales charge)* | -6.43% | 1.65% | N/A | 3.94% | ||||
Class A Shares (without sales charge)* | -0.71% | 3.68% | N/A | 5.21% | ||||
S&P 500®Index | 13.50% | 14.87% | N/A | 11.22%(a) | ||||
Class C Shares* | -1.39% | 2.88% | N/A | 5.83% | ||||
S&P 500®Index | 13.50% | 14.87% | N/A | 12.60%(a) | ||||
Class I Shares* | -0.51% | 3.87% | 5.82% | 6.20% | ||||
S&P 500®Index | 13.50% | 14.87% | 11.63% | 11.95%(a) | ||||
| * | Class A Shares, Class C Shares and Class I Shares of the SkyBridge Dividend Value Fund (the “Fund”) commenced operations on June 13, 2014, October 17, 2014 and April 7, 2014, respectively. |
| (a) | Benchmark performance is from inception date of the Class only and is not the inception date of the benchmark itself. |
The performance data quoted represents past performance and does not guarantee future results. The investment return and principal value of an investment in the Fund will fluctuate so that an investor’s shares, when redeemed, may be worth more or less than their original cost. The graphs and table do not reflect the deduction of taxes that a shareholder would pay on Fund distributions or redemption of Fund shares. Current performance may be lower or higher. Performance data current to the most recentmonth-end may be obtained by calling (888)919-6885.
The returns shown for Class A Shares reflect a deduction for the maximumfront-end sales charge of 5.75%. As stated in the current prospectus dated September 1, 2018, the Fund’s “Total Annual Fund Operating Expenses” are 1.25%, 2.00% and 1.00% for Class A Shares, Class C Shares and Class I Shares, respectively, of the Fund’s average daily net assets. These ratios may differ from the actual expenses incurred by the Fund for the period covered by this report. SkyBridge Capital II, LLC (“SkyBridge” or the “Adviser”) has contractually agreed to reduce its management fee and/or reimburse certain expenses of the Fund to the extent necessary to ensure that the Fund’s total operating expenses (excluding taxes, “Acquired Fund Fees and Expenses,” dividend and interest expense on securities sold short, interest, extraordinary items and brokerage commissions) do not exceed (on an annual basis) 1.25% with respect to Class A shares, 2.00% with respect to Class C shares and 1.00% with respect to Class I shares of average daily net assets of the Fund (the “Expense Limitation”). The Expense Limitation will remain in place until August 31, 2019, unless the Board of Trustees of FundVantage Trust (the “Trust”) approves its earlier termination. Total returns would be lower had such fees and/or expenses not been waived and/or reimbursed. The Adviser is entitled to recover, subject to approval by the Board of Trustees, such amounts reduced or reimbursed for a period of up to three (3) years from the date on which the Adviser reduced its compensation and/or assumed expenses for the Fund. The Adviser is permitted to seek reimbursement from the Fund subject to certain limitations, for fees it waived and Fund expenses it paid to the extent the total annual fund expenses do not exceed the limits described or any lesser limits in effect at the time of reimbursement. No recoupment will occur unless the Fund’s expenses are below the Expense Limitation amount.
Mutual fund investing involves risk including the possible loss of principal. The Fund’s long term “buy and hold” strategy under certain market conditions may cause it to be more susceptible to general market declines. The Fund
3
SKYBRIDGE DIVIDEND VALUE FUND
Annual Report
Performance Data (Concluded)
April 30, 2019
(Unaudited)
seeks to invest in securities with dividend yield potential with both growth and value characteristics. Value investing involves the risk that companies believed to be undervalued may not appreciate as anticipated. There are no guarantees a company will continue to pay or increase its dividend. The Fund may invest in small tomid-capitalization companies which may be more volatile and less liquid than stocks of larger companies.
The Fund intends to evaluate performance as compared to that of the Standard & Poor’s 500 (“S&P 500®”) Index. The S&P 500® Index is a widely recognized, unmanaged index of 500 common stocks which are generally representative of the U.S. stock market as a whole. It is not possible to invest in an index.
4
SKYBRIDGE DIVIDEND VALUE FUND
Fund Expense Disclosure
April 30, 2019
(Unaudited)
As a shareholder of the Fund, you incur two types of costs: (1) transaction costs including sales charges (loads) on purchase payments (if any) or redemption fees; and (2) ongoing costs, including management fees, distribution and/or service (Rule12b-1) fees (if any) and other Fund expenses. These examples are intended to help you understand your ongoing costs (in dollars) of investing in the Fund and to compare these costs with the ongoing costs of investing in other mutual funds.
These examples are based on an investment of $1,000 invested at the beginning of the six-month period from November 1, 2018 through April 30, 2019 and held for the entire period.
Actual Expenses
The first line of the accompanying table provides information about actual account values and actual expenses. You may use the information in this line, together with the amount you invested, to estimate the expenses that you paid over the period. Simply divide your account value by $1,000 (for example, an $8,600 account value divided by $1,000 = 8.6), then multiply the result by the number in the first line under the heading entitled “Expenses Paid During Period” to estimate the expenses you paid on your account during this period.
Hypothetical Examples for Comparison Purposes
The second line of the accompanying table provides information about hypothetical account values and hypothetical expenses based on the Fund’s actual expense ratio and an assumed rate of return of 5% per year before expenses, which is not your Fund’s actual return. The hypothetical account values and expenses may not be used to estimate the actual ending account balance or expenses you paid for the period. You may use this information to compare the ongoing costs of investing in the Fund and other funds. To do so, compare these 5% hypothetical examples with the 5% hypothetical examples that appear in the shareholder reports of other funds.
Please note that the expenses shown in the accompanying table are meant to highlight your ongoing costs only and do not reflect any transactional costs, such as sales charges (loads) on purchase payments (if any) or redemption fees. Therefore, the second line of the accompanying table is useful in comparing ongoing costs only, and will not help you determine the relative total costs of owning different funds. In addition, if these transactional costs were included, your costs would have been higher.
5
SKYBRIDGE DIVIDEND VALUE FUND
Fund Expense Disclosure (Concluded)
April 30, 2019
(Unaudited)
| SkyBridge Dividend Value Fund | |||||||||||||||
| Beginning Account Value November 1, 2018 | Ending Account Value April 30, 2019 | Expenses Paid During Period* | |||||||||||||
Class A | |||||||||||||||
Actual | $1,000.00 | $ 967.00 | $6.05 | ||||||||||||
Hypothetical (5% return before expenses) | 1,000.00 | 1,018.65 | 6.21 | ||||||||||||
Class C | |||||||||||||||
Actual | $1,000.00 | $ 963.80 | $9.74 | ||||||||||||
Hypothetical (5% return before expenses) | 1,000.00 | 1,014.88 | 9.99 | ||||||||||||
Class I | |||||||||||||||
Actual | $1,000.00 | $ 967.60 | $4.83 | ||||||||||||
Hypothetical (5% return before expenses) | 1,000.00 | 1,019.89 | 4.96 | ||||||||||||
| * | Expenses are equal to an annualized expense ratio for thesix-month period ended April 30, 2019 of 1.24%, 2.00% and 0.99% for Class A, Class C and Class I shares, respectively, for the Fund, multiplied by the average account value over the period, multiplied by the number of days in the most recent period (181), then divided by 365 to reflect the period. The Fund’s ending account values on the first line in the table are based on the actualsix-month total returns for the Fund of (3.30)%, (3.62)% and (3.24)% for Class A, Class C and Class I shares, respectively. |
6
SKYBRIDGE DIVIDEND VALUE FUND
Portfolio Holdings Summary Table
April 30, 2019
(Unaudited)
The following table presents a summary by sector of the portfolio holdings of the Fund:
| % of Net Assets | Value | |||||||
COMMON STOCKS: | ||||||||
Consumer Discretionary | 33.0 | % | $ | 30,088,073 | ||||
Consumer Staples | 20.0 | 18,263,236 | ||||||
Health Care | 19.8 | 18,061,339 | ||||||
Communication Services | 6.7 | 6,085,224 | ||||||
Energy | 6.3 | 5,798,040 | ||||||
Financials | 3.6 | 3,277,484 | ||||||
Materials | 3.3 | 2,984,278 | ||||||
Information Technology | 3.2 | 2,926,874 | ||||||
Industrials | 3.1 | 2,850,552 | ||||||
Short-Term Investments | 1.6 | 1,423,641 | ||||||
Liabilities in Excess of Other Assets | (0.6 | ) | (517,647 | ) | ||||
|
|
|
| |||||
NET ASSETS | 100.0 | % | $ | 91,241,094 | ||||
|
|
|
| |||||
Portfolio holdings are subject to change at any time.
The accompanying notes are an integral part of the financial statements.
7
SKYBRIDGE DIVIDEND VALUE FUND
Portfolio of Investments
April 30, 2019
| Number of Shares | Value | |||||||
COMMON STOCKS — 99.0% |
| |||||||
Communication Services — 6.7% |
| |||||||
Interpublic Group Of Cos, Inc. (The) | 137,183 | $ | 3,155,209 | |||||
Verizon Communications, Inc. | 51,233 | 2,930,015 | ||||||
|
| |||||||
| 6,085,224 | ||||||||
|
| |||||||
Consumer Discretionary — 33.0% |
| |||||||
Best Buy Co., Inc. | 40,554 | 3,017,623 | ||||||
Gap, Inc. (The) | 117,793 | 3,072,041 | ||||||
Kohl’s Corp. | 42,762 | 3,040,378 | ||||||
L Brands, Inc. | 112,873 | 2,894,064 | ||||||
Macy’s, Inc. | 123,362 | 2,903,941 | ||||||
Six Flags Entertainment Corp. | 59,504 | 3,159,067 | ||||||
Tapestry, Inc. | 91,191 | 2,942,734 | ||||||
Vail Resorts, Inc. | 13,788 | 3,155,384 | ||||||
Whirlpool Corp. | 21,473 | 2,980,882 | ||||||
Williams-Sonoma, Inc. | 51,110 | 2,921,959 | ||||||
|
| |||||||
| 30,088,073 | ||||||||
|
| |||||||
Consumer Staples — 20.0% |
| |||||||
Coca-Cola Co. (The) | 64,230 | 3,151,124 | ||||||
General Mills, Inc. | 58,188 | 2,994,936 | ||||||
Kraft Heinz Co. (The) | 90,943 | 3,022,945 | ||||||
Philip Morris International, Inc. | 35,085 | 3,036,958 | ||||||
Procter & Gamble Co. (The) | 28,642 | 3,049,800 | ||||||
Walgreens Boots Alliance, Inc. | 56,141 | 3,007,473 | ||||||
|
| |||||||
| 18,263,236 | ||||||||
|
| |||||||
Energy — 6.3% | ||||||||
Chevron Corp. | 23,813 | 2,858,989 | ||||||
Exxon Mobil Corp. | 36,610 | 2,939,051 | ||||||
|
| |||||||
| 5,798,040 | ||||||||
|
| |||||||
| Number of Shares | Value | |||||||
COMMON STOCKS — (Continued) |
| |||||||
Financials — 3.6% | ||||||||
JPMorgan Chase & Co. | 28,242 | $ | 3,277,484 | |||||
|
| |||||||
Health Care — 19.8% | ||||||||
Abbvie, Inc. | 37,177 | 2,951,482 | ||||||
Bristol-Myers Squibb Co. | 65,095 | 3,022,361 | ||||||
Cardinal Health, Inc. | 64,687 | 3,150,904 | ||||||
CVS Health Corp. | 56,941 | 3,096,452 | ||||||
Merck & Co., Inc. | 37,578 | 2,957,764 | ||||||
Pfizer, Inc. | 70,977 | 2,882,376 | ||||||
|
| |||||||
| 18,061,339 | ||||||||
|
| |||||||
Industrials — 3.1% | ||||||||
Nielsen Holdings PLC (Great Britain) | 111,655 | 2,850,552 | ||||||
|
| |||||||
Information Technology — 3.2% |
| |||||||
International Business Machines Corp. | 20,866 | 2,926,874 | ||||||
|
| |||||||
Materials — 3.3% | ||||||||
International Paper Co. | 63,753 | 2,984,278 | ||||||
|
| |||||||
TOTAL COMMON STOCKS |
| 90,335,100 | ||||||
|
| |||||||
The accompanying notes are an integral part of the financial statements
8
SKYBRIDGE DIVIDEND VALUE FUND
Portfolio of Investments (Concluded)
April 30, 2019
| Number of Shares | Value | |||||||
SHORT-TERM INVESTMENTS — 1.6% |
| |||||||
Dreyfus Government Cash Management Fund, Institutional Shares, 2.33%(a) | 1,423,641 | $ | 1,423,641 | |||||
|
| |||||||
TOTAL SHORT-TERM INVESTMENTS (Cost $1,423,641) |
| 1,423,641 | ||||||
|
| |||||||
TOTAL INVESTMENTS - 100.6% |
| 91,758,741 | ||||||
LIABILITIES IN EXCESS OF OTHER ASSETS - (0.6)% | (517,647 | ) | ||||||
|
| |||||||
NET ASSETS - 100.0% | $ | 91,241,094 | ||||||
|
| |||||||
| (a) | Rate periodically changes. Rate disclosed is the7-day yield at April 30, 2019. |
| PLC | Public Limited Company |
The accompanying notes are an integral part of the financial statements
9
SKYBRIDGE DIVIDEND VALUE FUND
Statement of Assets and Liabilities
April 30, 2019
Assets | ||||
Investments, at value (Cost $91,858,638) | $ | 91,758,741 | ||
Receivable for capital shares sold | 80,199 | |||
Dividends receivable | 197,883 | |||
Prepaid expenses and other assets | 33,648 | |||
|
| |||
Total assets | 92,070,471 | |||
|
| |||
Liabilities | ||||
Payable for capital shares redeemed | 609,952 | |||
Due to Custodian | 3,912 | |||
Payable for transfer agent fees | 54,673 | |||
Payable to Investment Adviser | 51,090 | |||
Payable for audit fees | 26,390 | |||
Payable for administration and accounting fees | 26,381 | |||
Payable for printing fees | 17,091 | |||
Payable for distribution fees | 15,377 | |||
Payable for legal fees | 12,175 | |||
Payable for custodian fees | 6,357 | |||
Accrued expenses | 5,979 | |||
|
| |||
Total liabilities | 829,377 | |||
|
| |||
Net Assets | $ | 91,241,094 | ||
|
| |||
Net Assets consisted of: | ||||
Capital stock, $0.01 par value | $ | 111,841 | ||
Paid-in capital | 110,695,037 | |||
Total distributable earnings | (19,565,784 | ) | ||
|
| |||
Net Assets | $ | 91,241,094 | ||
|
| |||
Class A Shares: | ||||
Net asset value, redemption price per share | $ | 8.19 | ||
|
| |||
Maximum offering price per share (100/94.25 of $8.19) | $ | 8.69 | ||
|
| |||
Class C Shares: | ||||
Net asset value, offering and redemption price per share | $ | 8.07 | ||
|
| |||
Class I Shares: | ||||
Net asset value, offering and redemption price per share | $ | 8.18 | ||
|
| |||
The accompanying notes are an integral part of the financial statements.
10
SKYBRIDGE DIVIDEND VALUE FUND
Statement of Operations
For the Year Ended April 30, 2019
Investment income | ||||
Dividends | $ | 6,676,302 | ||
|
| |||
Total investment income | 6,676,302 | |||
|
| |||
Expenses | ||||
Advisory fees (Note 2) | 1,163,245 | |||
Distribution fees (Class C shares) (Note 2) | 221,415 | |||
Transfer agent fees (Note 2) | 164,080 | |||
Administration and accounting fees (Note 2) | 96,826 | |||
Shareholder servicing fees (Class C shares) (Note 2) | 73,805 | |||
Registration and filing fees | 55,288 | |||
Distribution fees (Class A shares) (Note 2) | 51,770 | |||
Trustees’ and officers’ fees (Note 2) | 50,736 | |||
Legal fees | 41,834 | |||
Custodian fees (Note 2) | 30,299 | |||
Printing and shareholder reporting fees | 28,660 | |||
Audit fees | 26,007 | |||
Other expenses | 13,461 | |||
|
| |||
Total expenses before waivers and reimbursements | 2,017,426 | |||
|
| |||
Less: waivers and reimbursements (Note 2) | (124,108 | ) | ||
|
| |||
Net expenses after waivers and reimbursements | 1,893,318 | |||
|
| |||
Net investment income | 4,782,984 | |||
|
| |||
Net realized and unrealized gain/(loss) from investments: | ||||
Net realized loss from investments | (14,407,459 | ) | ||
Net change in unrealized appreciation/(depreciation) on investments | 7,971,035 | |||
|
| |||
Net realized and unrealized loss on investments | (6,436,424 | ) | ||
|
| |||
Net decrease in net assets resulting from operations | $ | (1,653,440 | ) | |
|
| |||
The accompanying notes are an integral part of the financial statements.
11
SKYBRIDGE DIVIDEND VALUE FUND
Statements of Changes in Net Assets
| For the Year Ended April 30, 2019 | For the Year Ended April 30, 2018 | |||||||||
Increase/(decrease) in net assets from operations: | ||||||||||
Net investment income | $ | 4,782,984 | $ | 8,800,559 | ||||||
Net realized gain/(loss) from investments | (14,407,459 | ) | 27,560,817 | |||||||
Net change in unrealized appreciation/(depreciation) on investments | 7,971,035 | (12,640,730 | ) | |||||||
|
|
|
| |||||||
Net increase/(decrease) in net assets resulting from operations | (1,653,440 | ) | 23,720,646 | |||||||
|
|
|
| |||||||
Less dividends and distributions to shareholders from: | ||||||||||
Total Distributable Earnings* | ||||||||||
Class A | (4,587,763 | ) | (6,095,902 | ) | ||||||
Class C | (7,264,897 | ) | (2,731,872 | ) | ||||||
Class I | (22,972,457 | ) | (12,971,650 | ) | ||||||
|
|
|
| |||||||
Net decrease in net assets from dividends and distributions to shareholders | (34,825,117 | ) | (21,799,424 | ) | ||||||
|
|
|
| |||||||
Decrease in net assets derived from capital share transactions (Note 4) | (64,017,680 | ) | (252,325,014 | ) | ||||||
|
|
|
| |||||||
Total increase/(decrease) in net assets | (100,496,237 | ) | (250,403,792 | ) | ||||||
|
|
|
| |||||||
Net assets | ||||||||||
Beginning of year | 191,737,331 | 442,141,123 | ||||||||
|
|
|
| |||||||
End of year** | $ | 91,241,094 | $ | 191,737,331 | ||||||
|
|
|
| |||||||
| * | Distributions from net investment income and from realized gains are no longer required to be separately disclosed. See Note 1. For the year ended April 30, 2018, distributions from net investment income were $2,168,611, $1,107,764 and $6,138,454 for Class A, Class C and Class I and net realized gains were $3,927,291, $1,624,108 and $6,833,196 for Class A, Class C and Class I, respectively. |
| ** | Parenthetical disclosure of accumulated net investment income/(loss) is no longer required. See Note 1. For the year ended April 30, 2018, end of year net assets included accumulated net investment of $58,384. |
The accompanying notes are an integral part of the financial statements.
12
SKYBRIDGE DIVIDEND VALUE FUND
Financial Highlights
Contained below is per share operating performance data for Class A shares outstanding, total investment return, ratios to average net assets and other supplemental data for the respective period. The total returns in the table represent the rate that an investor would have earned or lost on an investment in the Fund (assuming reinvestment of all dividends and distributions). This information has been derived from information provided in the financial statements and should be read in conjunction with the financial statements and the notes thereto.
| Class A Shares | |||||||||||||||||||||||||
| For the Year Ended April 30, 2019 | For the Year Ended April 30, 2018 | For the Year Ended April 30, 2017 | For the Year Ended April 30, 2016 |
For the Period | |||||||||||||||||||||
Per Share Operating Performance | |||||||||||||||||||||||||
Net asset value, beginning of period | $ | 11.12 | $ | 11.24 | $ | 11.31 | $ | 11.27 | $ | 10.47 | |||||||||||||||
|
|
|
|
|
|
|
|
|
| ||||||||||||||||
Net investment income(1) | 0.31 | 0.30 | 0.30 | 0.26 | 0.23 | ||||||||||||||||||||
Net realized and unrealized gain/(loss) on investments | (0.55 | ) | 0.42 | 0.30 | 0.24 | 0.78 | |||||||||||||||||||
|
|
|
|
|
|
|
|
|
| ||||||||||||||||
Net increase/(decrease) in net assets resulting from operations | (0.24 | ) | 0.72 | 0.60 | 0.50 | 1.01 | |||||||||||||||||||
|
|
|
|
|
|
|
|
|
| ||||||||||||||||
Dividends and distributions to shareholders from: | |||||||||||||||||||||||||
Net investment income | (0.32 | ) | (0.36 | ) | (0.29 | ) | (0.24 | ) | (0.19 | ) | |||||||||||||||
Net realized capital gains | (2.37 | ) | (0.48 | ) | (0.38 | ) | (0.22 | ) | (0.02 | ) | |||||||||||||||
|
|
|
|
|
|
|
|
|
| ||||||||||||||||
Total dividends and distributions to shareholders | (2.69 | ) | (0.84 | ) | (0.67 | ) | (0.46 | ) | (0.21 | ) | |||||||||||||||
|
|
|
|
|
|
|
|
|
| ||||||||||||||||
Net asset value, end of period | $ | 8.19 | $ | 11.12 | $ | 11.24 | $ | 11.31 | $ | 11.27 | |||||||||||||||
|
|
|
|
|
|
|
|
|
| ||||||||||||||||
Total investment return(2) | (0.71 | )% | 6.54 | % | 5.35 | % | 4.76 | % | 9.74 | % | |||||||||||||||
Ratio/Supplemental Data | |||||||||||||||||||||||||
Net assets, end of period (in thousands) | $ | 15,536 | $ | 25,384 | $ | 126,802 | $ | 57,175 | $ | 37,732 | |||||||||||||||
Ratio of expenses to average net assets | 1.25 | % | 1.25 | % | 1.25 | % | 1.25 | % | 1.25 | %(3) | |||||||||||||||
Ratio of expenses to average net assets without waivers and expense reimbursements or recoupment(4) | 1.33 | % | 1.23 | % | 1.19 | % | 1.28 | % | 1.76 | %(3) | |||||||||||||||
Ratio of net investment income to average net assets | 3.06 | % | 2.70 | % | 2.66 | % | 2.39 | % | 2.48 | %(3) | |||||||||||||||
Portfolio turnover rate | 42.76 | % | 47.08 | % | 72.84 | % | 103.97 | % | 122.00 | %(5) | |||||||||||||||
| * | Commencement of operations. |
| (1) | The selected per share data was calculated using the average shares outstanding method for the year. |
| (2) | Total investment return is calculated assuming a purchase of shares on the first day and a sale of shares on the last day of each period reported and includes reinvestment of dividends and distributions, if any. Total returns for periods less than one year are not annualized. Total investment return does not reflect the impact of the maximumfront-end sales load of 5.75%. If reflected, the return would be lower. |
| (3) | Annualized. |
| (4) | During the period, certain fees were waived and/or reimbursed; or recouped, if any. If such fee waivers and/or reimbursements or recoupments had not occurred, the ratios would have been as indicated (See Note 2). |
| (5) | Reflects portfolio turnover for the Fund for the year ended April 30, 2015. |
The accompanying notes are an integral part of the financial statements.
13
SKYBRIDGE DIVIDEND VALUE FUND
Financial Highlights (Continued)
Contained below is per share operating performance data for Class C shares outstanding, total investment return, ratios to average net assets and other supplemental data for the respective period. The total returns in the table represent the rate that an investor would have earned or lost on an investment in the Fund (assuming reinvestment of all dividends and distributions). This information has been derived from information provided in the financial statements and should be read in conjunction with the financial statements and the notes thereto.
| Class C Shares | |||||||||||||||||||||||||
| For the Year Ended April 30, 2019 | For the Year Ended April 30, 2018 | For the Year Ended April 30, 2017 | For the Year Ended April 30, 2016 |
For the Period | |||||||||||||||||||||
Per Share Operating Performance | |||||||||||||||||||||||||
Net asset value, beginning of period | $ | 11.01 | $ | 11.18 | $ | 11.26 | $ | 11.25 | $ | 9.95 | |||||||||||||||
|
|
|
|
|
|
|
|
|
| ||||||||||||||||
Net investment income(1) | 0.24 | 0.22 | 0.22 | 0.18 | 0.08 | ||||||||||||||||||||
Net realized and unrealized gain/(loss) on investments | (0.55 | ) | 0.39 | 0.30 | 0.23 | 1.33 | |||||||||||||||||||
|
|
|
|
|
|
|
|
|
| ||||||||||||||||
Net increase/(decrease) in net assets resulting from operations | (0.31 | ) | 0.61 | 0.52 | 0.41 | 1.41 | |||||||||||||||||||
|
|
|
|
|
|
|
|
|
| ||||||||||||||||
Dividends and distributions to shareholders from: | |||||||||||||||||||||||||
Net investment income | (0.26 | ) | (0.30 | ) | (0.22 | ) | (0.18 | ) | (0.09 | ) | |||||||||||||||
Net realized capital gains | (2.37 | ) | (0.48 | ) | (0.38 | ) | (0.22 | ) | (0.02 | ) | |||||||||||||||
|
|
|
|
|
|
|
|
|
| ||||||||||||||||
Total dividends and distributions to shareholders | (2.63 | ) | (0.78 | ) | (0.60 | ) | (0.40 | ) | (0.11 | ) | |||||||||||||||
|
|
|
|
|
|
|
|
|
| ||||||||||||||||
Net asset value, end of period | $ | 8.07 | $ | 11.01 | $ | 11.18 | $ | 11.26 | $ | 11.25 | |||||||||||||||
|
|
|
|
|
|
|
|
|
| ||||||||||||||||
Total investment return(2) | (1.39 | )% | 5.54 | % | 4.61 | % | 3.95 | % | 14.26 | % | |||||||||||||||
Ratios/Supplemental Data | |||||||||||||||||||||||||
Net assets, end of period (in thousands) | $ | 18,724 | $ | 35,621 | $ | 55,710 | $ | 43,537 | $ | 6,819 | |||||||||||||||
Ratio of expenses to average net assets | 2.00 | % | 2.00 | % | 2.00 | % | 2.00 | % | 2.00 | %(3) | |||||||||||||||
Ratio of expenses to average net assets without waivers and expense reimbursements or recoupment(4) | 2.08 | % | 2.00 | % | 1.94 | % | 2.03 | % | 2.32 | %(3) | |||||||||||||||
Ratio of net investment income to average net assets | 2.30 | % | 1.95 | % | 1.91 | % | 1.65 | % | 1.46 | %(3) | |||||||||||||||
Portfolio turnover rate | 42.76 | % | 47.08 | % | 72.84 | % | 103.97 | % | 122.00 | %(5) | |||||||||||||||
| * | Commencement of operations. |
| (1) | The selected per share data was calculated using the average shares outstanding method for the year. |
| (2) | Total investment return is calculated assuming a purchase of shares on the first day and a sale of shares on the last day of each period reported and includes reinvestment of dividends and distributions, if any. Total returns for periods less than one year are not annualized. Total return does not reflect any applicable sales charge. |
| (3) | Annualized. |
| (4) | During the period, certain fees were waived and/or reimbursed; or recouped, if any. If such fee waivers and/or reimbursements or recoupments had not occurred, the ratios would have been as indicated (See Note 2). |
| (5) | Reflects portfolio turnover for the Fund for the year ended April 30, 2015. |
The accompanying notes are an integral part of the financial statements.
14
SKYBRIDGE DIVIDEND VALUE FUND
Financial Highlights (Concluded)
Contained below is per share operating performance data for Class I shares outstanding, total investment return, ratios to average net assets and other supplemental data for the respective period. The total returns in the table represent the rate that an investor would have earned or lost on an investment in the Fund (assuming reinvestment of all dividends and distributions). This information has been derived from information provided in the financial statements and should be read in conjunction with the financial statements and the notes thereto.
| Class I Shares | |||||||||||||||||||||||||
| For the Year Ended April 30, 2019 | For the Year Ended April 30, 2018 | For the Year Ended April 30, 2017 | For the Year Ended April 30, 2016 | For the Year Ended April 30, 2015 | |||||||||||||||||||||
Per Share Operating Performance |
| ||||||||||||||||||||||||
Net asset value, beginning of year | $ | 11.11 | $ | 11.24 | $ | 11.31 | $ | 11.26 | $ | 10.23 | |||||||||||||||
|
|
|
|
|
|
|
|
|
| ||||||||||||||||
Net investment income(1) | 0.34 | 0.33 | 0.33 | 0.28 | 0.29 | ||||||||||||||||||||
Net realized and unrealized gain/(loss) on investments | (0.56 | ) | 0.41 | 0.29 | 0.25 | 0.98 | |||||||||||||||||||
|
|
|
|
|
|
|
|
|
| ||||||||||||||||
Net increase/(decrease) in net assets resulting from operations | (0.22 | ) | 0.74 | 0.62 | 0.53 | 1.27 | |||||||||||||||||||
|
|
|
|
|
|
|
|
|
| ||||||||||||||||
Dividends and distributions to shareholders from: | |||||||||||||||||||||||||
Net investment income | (0.34 | ) | (0.39 | ) | (0.31 | ) | (0.26 | ) | (0.22 | ) | |||||||||||||||
Net realized capital gains | (2.37 | ) | (0.48 | ) | (0.38 | ) | (0.22 | ) | (0.02 | ) | |||||||||||||||
|
|
|
|
|
|
|
|
|
| ||||||||||||||||
Total dividends and distributions to shareholders | (2.71 | ) | (0.87 | ) | (0.69 | ) | (0.48 | ) | (0.24 | ) | |||||||||||||||
|
|
|
|
|
|
|
|
|
| ||||||||||||||||
Net asset value, end of year | $ | 8.18 | $ | 11.11 | $ | 11.24 | $ | 11.31 | $ | 11.26 | |||||||||||||||
|
|
|
|
|
|
|
|
|
| ||||||||||||||||
Total investment return(2) | (0.51 | )% | 6.72 | % | 5.57 | % | 5.09 | % | 12.54 | % | |||||||||||||||
Ratios/Supplemental Data | |||||||||||||||||||||||||
Net assets, end of year (in thousands) | $ | 56,981 | $ | 130,732 | $ | 259,629 | $ | 223,510 | $ | 55,918 | |||||||||||||||
Ratio of expenses to average net assets | 1.00 | % | 1.00 | % | 1.00 | % | 1.00 | % | 1.00 | % | |||||||||||||||
Ratio of expenses to average net assets without waivers and expense reimbursements or recoupment(3) | 1.08 | % | 1.00 | % | 0.94 | % | 1.03 | % | 1.63 | % | |||||||||||||||
Ratio of net investment income to average net assets | 3.31 | % | 2.95 | % | 2.91 | % | 2.64 | % | 2.70 | % | |||||||||||||||
Portfolio turnover rate | 42.76 | % | 47.08 | % | 72.84 | % | 103.97 | % | 122.00 | % | |||||||||||||||
| (1) | The selected per share data was calculated using the average shares outstanding method for the year. |
| (2) | Total investment return is calculated assuming a purchase of shares on the first day and a sale of shares on the last day of each period reported and includes reinvestment of dividends and distributions, if any. |
| (3) | During the period, certain fees were waived and/or reimbursed; or recouped, if any. If such fee waivers and/or reimbursements or recoupments had not occurred, the ratios would have been as indicated (See Note 2). |
The accompanying notes are an integral part of the financial statements.
15
SKYBRIDGE DIVIDEND VALUE FUND
Notes to Financial Statements
April 30, 2019
1. Organization and Significant Accounting Policies
The SkyBridge Dividend Value Fund (the “Fund”) is a diversified,open-end management investment company registered under the Investment Company Act of 1940, as amended (the “1940 Act”), which commenced operations on April 7, 2014. The Fund is a separate series of FundVantage Trust (the “Trust”) which was organized as a Delaware statutory trust on August 28, 2006. The Trust is a “series trust” authorized to issue an unlimited number of separate series or classes of shares of beneficial interest. Each series is treated as a separate entity for certain matters under the 1940 Act, and for other purposes, and a shareholder of one series is not deemed to be a shareholder of any other series. The Fund offers Class A, Class C and Class I shares. Class A shares are sold subject to afront-end sales charge.Front-end sales charges may be reduced or waived under certain circumstances. A contingent deferred sales charge (“CDSC”) may be applicable to the purchase of Class A shares. A CDSC, as a percentage of the lower of the original purchase price or net asset value at redemption, of up to 1.00% may be imposed on full or partial redemptions of Class A shares made within eighteen months of purchase where: (i) $1 million or more of Class A shares were purchased without an initial sales charge and (ii) the selling broker-dealer received a commission for such sale.
Proposed Reorganization of the Fund— The Trust’s Board of Trustees has approved an Agreement and Plan of Reorganization (“Plan”) that provides for the reorganization (“Reorganization”) of the Fund into the Centre Global Infrastructure Fund (the “Successor Fund”), an existing series of the Centre Funds. If approved by the Fund’s shareholders, it is anticipated that the Reorganization will take place on or about July 19, 2019, at which time each shareholder’s investment in the Fund will, in effect, be exchanged for an investment with an equal aggregate net asset value in the Successor Fund.
The Reorganization is expected to betax-free, meaning that the Fund’s shareholders will become shareholders of the Successor Fund without realizing any gain or loss for federal tax purposes.
The Fund is an investment company and follows accounting and reporting guidance in the Financial Accounting Standards Board Accounting Standards Codification Topic 946.
Portfolio Valuation— The Fund’s net asset value (“NAV”) is calculated once daily at the close of regular trading hours on the New York Stock Exchange (“NYSE”) (typically 4:00 p.m. Eastern time) on each day the NYSE is open. Securities held by the Fund are valued using the closing price or the last sale price on a national securities exchange or the National Association of Securities Dealers Automatic Quotation System (“NASDAQ”) market system where they are primarily traded. Equity securities traded in theover-the-counter market are valued at their closing prices. If there were no transactions on that day, securities traded principally on an exchange or on NASDAQ will be valued at the mean of the last bid and ask prices prior to the market close. Fixed income securities having a remaining maturity of greater than 60 days are valued using an independent pricing service. Fixed income securities having a remaining maturity of 60 days or less are generally valued at amortized cost, provided such amount approximates
16
SKYBRIDGE DIVIDEND VALUE FUND
Notes to Financial Statements (Continued)
April 30, 2019
fair value. Investments in otheropen-end investment companies are valued based on the NAV of the investment companies (which may use fair value pricing as discussed in their prospectuses). If market quotations are unavailable or deemed unreliable, securities will be valued in accordance with procedures adopted by the Trust’s Board of Trustees (“Board of Trustees”). Relying on prices supplied by pricing services or dealers or using fair valuation may result in values that are higher or lower than the values used by other investment companies and investors to price the same investments. In the event that market quotes are not readily available, and the security or asset cannot be valued pursuant to one of the valuation methods, the value of the security or asset will be determined in good faith by the Adviser. The Trust has established a Valuation Committee which performs certain functions including the oversight of the Adviser’s fair valuation determinations.
Fair Value Measurements— The inputs and valuation techniques used to measure fair value of the Fund’s investments are summarized into three levels as described in the hierarchy below:
• Level 1 — | quoted prices in active markets for identical securities; | |
• Level 2 — | other significant observable inputs (including quoted prices for similar securities, interest rates, prepayment speeds, credit risk, etc.); and | |
• Level 3 — | significant unobservable inputs (including the Fund’s own assumptions in determining the fair value of investments). | |
The inputs or methodology used for valuing securities are not necessarily an indication of the risk associated with investing in those securities.
The following is a summary of the inputs used, as of April 30, 2019, in valuing the Fund’s investments carried at fair value:
| Total Value at 04/30/19 | Level 1 Quoted Prices | Level 2 Other Significant Observable Inputs | Level 3 Significant Unobservable Inputs | |||||||||||||
Common Stocks* | $ | 90,335,100 | $ | 90,335,100 | $ | — | $ | — | ||||||||
Short-Term Investments | 1,423,641 | 1,423,641 | — | — | ||||||||||||
|
|
|
|
|
|
|
| |||||||||
Total Investments | $ | 91,758,741 | $ | 91,758,741 | $ | — | $ | — | ||||||||
|
|
|
|
|
|
|
| |||||||||
| * | Please refer to Portfolio of Investments for further details on portfolio holdings. |
At the end of each quarter, management evaluates the classification of Levels 1, 2 and 3 assets and liabilities. Various factors are considered, such as changes in liquidity from the prior reporting period; whether or not a broker is willing to execute at the quoted price; the depth and consistency of prices
17
SKYBRIDGE DIVIDEND VALUE FUND
Notes to Financial Statements (Continued)
April 30, 2019
from third party pricing services; and the existence of contemporaneous, observable trades in the market. Additionally, management evaluates the classification of Level 1 and Level 2 assets and liabilities on a quarterly basis for changes in listings or delistings on national exchanges.
Due to the inherent uncertainty of determining the fair value of investments that do not have a readily available market value, the fair value of the Fund’s investments may fluctuate from period to period. Additionally, the fair value of investments may differ significantly from the values that would have been used had a ready market existed for such investments and may differ materially from the values the Fund may ultimately realize. Further, such investments may be subject to legal and other restrictions on resale or otherwise less liquid than publicly traded securities.
For fair valuations using significant unobservable inputs, U.S. generally accepted accounting principles (“U.S. GAAP”) require the Fund to present a reconciliation of the beginning to ending balances for reported market values that present changes attributable to total realized and unrealized gains or losses, purchase and sales, and transfers in and out of Level 3 during the period. A reconciliation of Level 3 investments is presented only when the Fund had an amount of Level 3 investments at the end of the reporting period that was meaningful in relation to its net assets. The amounts and reasons for all transfers in and out of each Level within the three-tier hierarchy are disclosed when the Fund had an amount of total transfers during the reporting period that was meaningful in relation to its net assets as of the end of the reporting period.
For the year ended April 30, 2019, there were no transfers between Levels.
Use of Estimates— The preparation of financial statements in conformity with U.S. GAAP requires management to make estimates and assumptions that affect the amounts reported in the financial statements and accompanying notes at the date of the financial statements and the reported amounts of revenues and expenses during the period. Actual results could differ from those estimates and those differences could be material.
Investment Transactions, Investment Income and Expenses— Investment transactions are recorded on trade date for financial statement preparation purposes. Realized gains and losses on investments sold are recorded on the identified cost basis. Interest income is recorded on the accrual basis. Dividends are recorded on theex-dividend date. Distribution(12b-1) fees and shareholder services fees relating to a specific class are charged directly to that class. Fund level expenses common to all classes, investment income and realized and unrealized gains and losses on investments are allocated to each class based upon relative daily net assets of each class. General expenses of the Trust are generally allocated to each fund in proportion to its relative daily net assets. Expenses directly attributable to a particular fund in the Trust are charged directly to that fund.
18
SKYBRIDGE DIVIDEND VALUE FUND
Notes to Financial Statements (Continued)
April 30, 2019
Dividends and Distributions to Shareholders— Dividends from net investment income and distributions from net realized capital gains, if any, are declared, recorded onex-date and paid at least annually to shareholders. Income dividends and capital gain distributions are determined in accordance with U.S. federal income tax regulations, which may differ from U.S. GAAP.
U.S. Tax Status— No provision is made for U.S. income taxes as it is the Fund’s intention to continue to qualify for and elect the tax treatment applicable to regulated investment companies under Subchapter M of the Internal Revenue Code of 1986, as amended (the “Internal Revenue Code”), and make the requisite distributions to its shareholders which will be sufficient to relieve it from U.S. income and excise taxes.
Other— In the normal course of business, the Fund may enter into contracts that provide general indemnifications. The Fund’s maximum exposure under these arrangements is dependent on claims that may be made against the Fund in the future, and therefore, cannot be estimated; however, based on experience, the risk of material loss for such claims is considered remote.
Recent Accounting Pronouncement — Effective November 5, 2018, the SEC amended existing rules intended to modernize reporting and disclosure of information. These amendments relate to RegulationS-X which sets forth the form and content of financial statements. The amendment requires collapsing the components of distributable earnings on the Statement of Assets and Liabilities and collapsing the distributions paid to shareholders on the Statements of Changes in Net Assets. Management has evaluated the implications of adopting these amendments and determined there is no significant impact on the financial statements and accompanying notes.
2. Transactions with Related Parties and Other Service Providers
SkyBridge Capital II, LLC (“SkyBridge” or the “Adviser”) serves as investment adviser to the Fund pursuant to an investment advisory agreement with the Trust (the “Advisory Agreement”). For its services, the Adviser is paid a monthly fee at the annual rate of 0.75% of the Fund’s average daily net assets. The Adviser has contractually agreed to reduce its management fee and/or reimburse certain expenses of the Fund to the extent necessary to ensure that the Fund’s total operating expenses (excluding taxes, “Acquired Fund Fees and Expenses,” dividend and interest expense on securities sold short, interest, extraordinary items and brokerage commissions) do not exceed (on an annual basis) 1.25% with respect to Class A shares, 2.00% with respect to Class C shares and 1.00% with respect to Class I shares of average daily net assets of the Fund (the “Expense Limitation”). The Expense Limitation will remain in place until August 31, 2019, unless the Board of Trustees approves its earlier termination. The Adviser is entitled to recover, subject to approval by the Board of Trustees, such amounts reduced or reimbursed for a period of up to three (3) years from the date on which the Adviser reduced its compensation and/or assumed expenses for the Fund. The Adviser is permitted to seek reimbursement from the Fund, subject
19
SKYBRIDGE DIVIDEND VALUE FUND
Notes to Financial Statements (Continued)
April 30, 2019
to certain limitations, for fees it waived and Fund expenses it paid to the extent the total annual fund expenses do not exceed the limits described above or any lesser limits in effect at the time of reimbursement. No recoupment will occur unless the Fund’s expenses are below the Expense Limitation amount. If the Proposed Reorganization as described in Note 1 is approved by the Fund’s shareholders, then the Adviser will not be entitled to seek reimbursement. As of April 30, 2019, the amount of potential recovery was as follows:
Expiration
|
4/30/2022 |
$124,108 |
For the year ended April 30, 2019, the Adviser earned advisory fees of $1,163,245 and waived fees of $124,108.
Other Service Providers
The Bank of New York Mellon (“BNY Mellon”) serves as administrator and custodian for the Fund. For providing administrative and accounting services, BNY Mellon is entitled to receive a monthly fee equal to an annual percentage rate of the Fund’s average daily net assets and is subject to certain minimum monthly fees. For providing certain custodial services, BNY Mellon is entitled to receive a monthly fee, subject to certain minimum, and out of pocket expenses.
BNY Mellon Investment Servicing (US) Inc. (the “Transfer Agent”) provides transfer agent services to the Fund. The Transfer Agent is entitled to receive a monthly fee, subject to certain minimum, and out of pocket expenses.
Foreside Funds Distributors LLC (the “Underwriter”) provides principal underwriting services to the Fund, pursuant of an underwriting agreement between the Trust and the Underwriter.
The Trust and the Underwriter are parties to an underwriting agreement. The Trust has adopted a distribution plan for Class A and Class C shares in accordance with Rule12b-1 under the 1940 Act. Pursuant to the Class A and Class C shares plan, the Fund compensates the Underwriter for direct and indirect costs and expenses incurred in connection with advertising, marketing and other distribution services in an amount not to exceed 0.25% and 1.00% (0.75% Rule12b-1 distribution fee and 0.25% shareholder service fee), respectively, on an annualized basis of the average daily net assets of the Fund’s Class A and Class C shares.
20
SKYBRIDGE DIVIDEND VALUE FUND
Notes to Financial Statements (Continued)
April 30, 2019
Trustees and Officers
The Trust is governed by its Board of Trustees. The Trustees receive compensation in the form of an annual retainer and per meeting fees for their services to the Trust. The remuneration paid to the Trustees by the Fund during the year ended April 30, 2019 was $12,163. An employee of BNY Mellon serves as the Secretary of the Trust and is not compensated by the Fund or the Trust.
JW Fund Management LLC (“JWFM”) provides a Principal Executive Officer and Principal Financial Officer to the Trust. Duff & Phelps, LLC (“D&P”) provides the Trust with a Chief Compliance Officer and an Anti-Money Laundering Officer. JWFM and D&P are compensated for their services provided to the Trust.
3. Investment in Securities
For the year ended April 30, 2019, aggregate purchases and sales of investment securities (excluding short-term investments) of the Fund were as follows:
| Purchases | Sales | |||||||
Investment Securities | $ | 65,422,911 | $ | 159,812,484 | ||||
4. Capital Share Transactions
For the years ended April 30, 2019 and 2018, transactions in capital shares (authorized shares unlimited) were as follows:
| For the Year Ended April 30, 2019 | For the Year Ended April 30, 2018 | |||||||||||||||
| Shares | Amount | Shares | Amount | |||||||||||||
Class A | ||||||||||||||||
Sales | 297,134 | $ | 2,531,383 | 1,027,348 | $ | 11,507,388 | ||||||||||
Reinvestments | 474,708 | 3,790,564 | 500,456 | 5,583,597 | ||||||||||||
Redemptions | (1,157,466 | ) | (11,597,944 | ) | (10,522,557 | ) | (122,765,352 | ) | ||||||||
|
|
|
|
|
|
|
| |||||||||
Net decrease | (385,624 | ) | $ | (5,275,997 | ) | (8,994,753 | ) | $ | (105,674,367 | ) | ||||||
|
|
|
|
|
|
|
| |||||||||
Class C | ||||||||||||||||
Sales | 489,961 | $ | 4,294,064 | 491,495 | $ | 5,572,609 | ||||||||||
Reinvestments | 496,076 | 3,877,631 | 118,067 | 1,310,141 | ||||||||||||
Redemptions | (1,899,186 | ) | (17,084,225 | ) | (2,359,620 | ) | (26,302,710 | ) | ||||||||
|
|
|
|
|
|
|
| |||||||||
Net decrease | (913,149 | ) | $ | (8,912,530 | ) | (1,750,058 | ) | $ | (19,419,960 | ) | ||||||
|
|
|
|
|
|
|
| |||||||||
21
SKYBRIDGE DIVIDEND VALUE FUND
Notes to Financial Statements (Continued)
April 30, 2019
| For the Year Ended April 30, 2019 | For the Year Ended April 30, 2018 | |||||||||||||||
| Shares | Amount | Shares | Amount | |||||||||||||
Class I | ||||||||||||||||
Sales | 5,029,022 | $ | 48,777,482 | 4,663,902 | $ | 52,622,672 | ||||||||||
Reinvestments | 2,575,422 | 20,616,324 | 774,985 | 8,661,457 | ||||||||||||
Redemptions | (12,409,819 | ) | (119,222,959 | ) | (16,764,779 | ) | (188,514,816 | ) | ||||||||
|
|
|
|
|
|
|
| |||||||||
Net decrease | (4,805,375 | ) | $ | (49,829,153 | ) | (11,325,892 | ) | $ | (127,230,687 | ) | ||||||
|
|
|
|
|
|
|
| |||||||||
Total Net Decrease | (6,104,148 | ) | $ | (64,017,680 | ) | (22,070,703 | ) | $ | (252,325,014 | ) | ||||||
|
|
|
|
|
|
|
| |||||||||
5. Federal Tax Information
The Fund has followed the authoritative guidance on accounting for and disclosure of uncertainty in tax positions, which requires the Fund to determine whether a tax position is more likely than not to be sustained upon examination, including resolution of any related appeals or litigation processes, based on the technical merits of the position. The Fund has determined that there was no effect on the financial statements from following this authoritative guidance. In the normal course of business, the Fund is subject to examination by federal, state and local jurisdictions, where applicable, for tax years for which applicable statutes of limitations have not expired.
Distributions are determined in accordance with federal income tax regulations, which may differ in amount or character from net investment income and realized gains for financial reporting purposes. Accordingly, the character of distributions and composition of net assets for tax purposes may differ from those reflected in the accompanying financial statements. To the extent these differences are permanent, such amounts are reclassified within the components of net assets based on the tax treatment; temporary differences do not require reclassifications. For the year ended April 30, 2019, there were no reclassifications.
For the year ended April 30, 2019, the tax character of distributions paid by the Fund was $4,673,386 of ordinary income dividends and $30,151,731 of long-term capital gains dividends. For the year ended April 30, 2018, the tax character of distributions paid by the fund was $17,518,041 of ordinary income dividends and $4,281,383 of long-term capital gains dividends. Distributions from short-term capital gains are treated as ordinary income for federal income tax purposes.
22
SKYBRIDGE DIVIDEND VALUE FUND
Notes to Financial Statements (Concluded)
April 30, 2019
As of April 30, 2019, the components of distributable earnings on a tax basis were as follows:
Capital Loss Carryforward | Undistributed Ordinary Income | Net Unrealized Depreciation | Total Distributable Earnings | |||
$(16,038,176) | $167,982 | $(3,695,590) | $(19,565,784) |
The differences between the book and tax basis components of distributable earnings relate primarily to the timing and recognition of income and gains for federal income tax purposes. Short-term capital gains are reported as ordinary income for federal income tax purposes.
As of April 30, 2019, the federal tax cost, aggregate gross unrealized appreciation and depreciation of securities held by the Fund were as follows:
Federal tax cost | $ | 95,454,331 | ||
|
| |||
Gross unrealized appreciation | $ | 5,693,962 | ||
Gross unrealized depreciation | (9,389,552 | ) | ||
|
| |||
Net unrealized depreciation | $ | (3,695,590 | ) | |
|
|
Pursuant to the federal income tax rules applicable to regulated investment companies, the Fund may elect to treat certain capital losses between November 1 and April 30 and late year ordinary losses ((i) ordinary losses between January 1 and April 30, and (ii) specified ordinary and currency losses between November 1 and April 30) as occurring on the first day of the following tax year. For the year ended April 30, 2019, the Fund had no short-term capital loss deferrals, long-term capital loss deferrals and ordinary late year loss deferrals.
Accumulated capital losses represent net capital loss carryforwards as of April 30, 2019 that may be available to offset future realized capital gains and thereby reduce future capital gains distributions. As of April 30, 2019, the Fund had capital loss carryforwards of $16,038,176, of which $10,493,861 are long-term losses and $5,544,315 are short-term losses and have an unlimited period of capital loss carryforward.
6. Subsequent Events
Management has evaluated the impact of all subsequent events on the Fund through the date the financial statements were issued, and has determined that there are no material subsequent events requiring recognition or disclosure in the financial statements.
23
SKYBRIDGE DIVIDEND VALUE FUND
Report of Independent Registered Public Accounting Firm
To the Board of Trustees of FundVantage Trust and Shareholders of SkyBridge Dividend Value Fund
Opinion on the Financial Statements
We have audited the accompanying statement of assets and liabilities, including the portfolio of investments, of SkyBridge Dividend Value Fund (one of the funds constituting FundVantage Trust, hereafter referred to as the “Fund”) as of April 30, 2019, the related statement of operations for the year ended April 30, 2019, the statements of changes in net assets for each of the two years in the period ended April 30, 2019, including the related notes, and the financial highlights for each of the three years in the period ended April 30, 2019 (collectively referred to as the “financial statements”). In our opinion, the financial statements present fairly, in all material respects, the financial position of the Fund as of April 30, 2019, the results of its operations for the year then ended, the changes in its net assets for each of the two years in the period ended April 30, 2019 and the financial highlights for each of the three years in the period ended April 30, 2019 in conformity with accounting principles generally accepted in the United States of America. The financial highlights for each of the periods ended on or before April 30, 2016 were audited by other auditors whose report, dated June 27, 2016, expressed an unqualified opinion on those financial highlights.
Basis for Opinion
These financial statements are the responsibility of the Fund’s management. Our responsibility is to express an opinion on the Fund’s financial statements based on our audits. We are a public accounting firm registered with the Public Company Accounting Oversight Board (United States) (PCAOB) and are required to be independent with respect to the Fund in accordance with the U.S. federal securities laws and the applicable rules and regulations of the Securities and Exchange Commission and the PCAOB.
We conducted our audits of these financial statements in accordance with the standards of the PCAOB. Those standards require that we plan and perform the audit to obtain reasonable assurance about whether the financial statements are free of material misstatement, whether due to error or fraud.
Our audits included performing procedures to assess the risks of material misstatement of the financial statements, whether due to error or fraud, and performing procedures that respond to those risks. Such procedures included examining, on a test basis, evidence regarding the amounts and disclosures in the financial statements. Our audits also included evaluating the accounting principles used and significant estimates made by management, as well as evaluating the overall presentation of the financial statements. Our procedures included confirmation of securities owned as of April 30, 2019 by correspondence with the custodian. We believe that our audits provide a reasonable basis for our opinion.
Subsequent Event
As discussed in Note 1 to the financial statements, FundVantage’s Board of Trustees has approved an Agreement and Plan of Reorganization that provides for the reorganization (“Reorganization”) of the Fund into the Centre Global Infrastructure Fund, an existing series of the Centre Funds. If approved by the Fund’s shareholders, it is anticipated that the Reorganization will take place on or about July 19, 2019. Our opinion is not modified with respect to this matter.
/s/PricewaterhouseCoopers LLP
Philadelphia, Pennsylvania
June 24, 2019
We have served as the auditor of one or more SkyBridge Capital II, LLC investment companies since 2017.
24
SKYBRIDGE DIVIDEND VALUE FUND
Shareholder Tax Information
(Unaudited)
The Fund is required by Subchapter M of the Internal Revenue Code, to advise its shareholders of the U.S. federal tax status of distributions received by the Fund’s shareholders in respect of such fiscal year. During the fiscal year ended April 30, 2019, the Fund paid $4,673,386 of ordinary income dividends and $30,151,731 of long-term capital gain dividends to its shareholders. Dividends from net investment income and short-term capital gains are treated as ordinary income dividends for federal income tax purposes.
The Fund designates 100.00% of the ordinary income distribution as qualified dividend income pursuant to the Jobs and Growth Tax Relief Reconciliation Act of 2003.
The percentage of ordinary income dividends qualifying for the corporate dividends received deduction is 100.00%.
The percentage of qualified interest income related dividends not subject to withholding tax for non-resident aliens and foreign corporations is 0.21%.
All designations are based on financial information available as of the date of this annual report and, accordingly, are subject to change. For each item, it is the intention of the Fund to designate the maximum amount permitted under the Internal Revenue Code of 1986, as amended, and the regulations thereunder.
Because the Fund’s fiscal year is not the calendar year, another notification will be sent with respect to calendar year 2019. The second notification, which will reflect the amount, if any, to be used by calendar year taxpayers on their U.S. federal income tax returns, will be made in conjunction with Form1099-DIV and will be mailed in January 2020.
Foreign shareholders will generally be subject to U.S. withholding tax on the amount of their ordinary income dividends. They will generally not be entitled to a foreign tax credit or deduction for the withholding taxes paid by the Fund, if any.
In general, dividends received bytax-exempt recipients (e.g., IRAs and Keoghs) need not be reported as taxable income for U.S. federal income tax purposes. However, some retirement trusts (e.g., corporate, Keogh and 403(b)(7) plans) may need this information for their annual information reporting.
Shareholders are advised to consult their own tax advisers with respect to the tax consequences of their investment in the Fund.
25
SKYBRIDGE DIVIDEND VALUE FUND
Other Information
(Unaudited)
Proxy Voting
Policies and procedures that the Fund uses to determine how to vote proxies relating to portfolio securities as well as information regarding how the Fund voted proxies relating to portfolio securities for the most recent12-month period ended June 30 are available without charge, upon request, by calling (888)919-6885 and on the Securities and Exchange Commission’s (“SEC”) website athttp:// www.sec.gov.
Quarterly Portfolio Schedules
The Trust files its complete schedule of portfolio holdings with the SEC for the first and third fiscal quarters of each fiscal year (quarters ended July 31 and January 31) on FormN-Q. The Trust’s FormsN-Q are available on the SEC’s website athttp://www.sec.gov.FormN-Q is being rescinded. Once FormN-Q is rescinded, disclosure of the Fund’s complete holdings will be required to be made monthly on FormN-PORT, with every third month made available to the public by the Commission upon filing.
Board Consideration of Investment Advisory Agreement
At anin-person meeting held on March12-13, 2019 (the “Meeting”), the Board of Trustees (the “Board” or “Trustees”) of FundVantage Trust (“Trust”), including a majority of the Trustees who are not “interested persons” as defined in the Investment Company Act of 1940, as amended (“1940 Act”) (the “Independent Trustees”), unanimously approved the continuation of the advisory agreement (the “SkyBridge Agreement”) between SkyBridge Capital II, LLC (“SkyBridge” or the “Adviser”) and the Trust on behalf of the SkyBridge Dividend Value Fund (“SkyBridge Fund”).
Before considering the SkyBridge Agreement, the Board, including the Independent Trustees, requested and received information about SkyBridge. In determining whether to approve the SkyBridge Agreement, the Trustees considered information provided by SkyBridge in accordance with Section 15(c) of the 1940 Act. The Trustees considered information that SkyBridge provided regarding (i) the services performed for the Fund, (ii) the size and qualifications of SkyBridge’s portfolio management staff, (iii) any potential or actual material conflicts of interest which may arise in connection with a portfolio manager’s management of the Fund, (iv) investment performance, (v) the capitalization and financial condition of SkyBridge, (vi) investment performance information, (vii) brokerage selection procedures (including soft dollar arrangements, if any), (viii) the procedures for allocating investment opportunities between the Fund and other clients, (ix) results of any independent audit or regulatory examination, including any recommendations or deficiencies noted, (x) any litigation, investigation or administrative proceeding which may have a material impact on SkyBridge’s ability to service the Fund, and (xi) compliance with the Fund’s investment objective, policies and practices (including codes of ethics and proxy voting policies), federal securities laws and other regulatory requirements. The Trustees noted the reports provided at Board meetings throughout the year covering matters such as the relative performance of the Fund; compliance with the investment objective, policies,
26
SKYBRIDGE DIVIDEND VALUE FUND
Other Information (Continued)
(Unaudited)
strategies and limitations for the Fund; the compliance of management personnel with the applicable code of ethics; and the adherence to pricing procedures as established by the Board.
The Board noted that representatives from SkyBridge joined the meeting via teleconference and discussed SkyBridge’s history, performance, investment strategy, and compliance program. Representatives of SkyBridge responded to questions from the Board. In addition to the information provided by SkyBridge as described above, the Trustees also considered all other factors they believed to be relevant to evaluating the SkyBridge Agreement, including the specific matters discussed below. In their deliberations, the Trustees did not identify any particular information that was controlling, and different Trustees may have attributed different weights to the various factors. However, the Trustees determined that the overall arrangements between the Fund and SkyBridge, as provided in the SkyBridge Agreement, including the advisory fees under the SkyBridge Agreement, are fair and reasonable in light of the services provided, expenses incurred and such other matters as the Trustees considered relevant.
The Trustees considered the services historically provided by SkyBridge to the Fund and its shareholders. In reviewing the nature, extent, and quality of services, the Board considered reports furnished to them during the year at regular Board meetings covering matters such as the relative performance of the Fund; compliance with the investment objectives, policies, strategies, and limitations for the Fund; the compliance of management personnel with the applicable code of ethics; and the adherence to pricing procedures as established by the Board. The Trustees considered SkyBridge’s personnel and the depth of SkyBridge’s personnel who possess the experience to provide investment management services to the Fund. Based on the information provided by SkyBridge, the Trustees concluded that (i) the nature, extent and quality of the services provided by SkyBridge are appropriate and consistent with the terms of the SkyBridge Agreement, (ii) that the quality of those services has been consistent with industry norms, (iii) the Fund is likely to benefit from the continued provision of those services, (iv) SkyBridge has sufficient personnel, with the appropriate education and experience, to serve the Fund effectively and has demonstrated its continuing ability to attract and retain qualified personnel, and (v) the satisfactory nature, extent, and quality of services currently provided to the Fund and its shareholders is likely to continue under the SkyBridge Agreement.
The Trustees considered the investment performance for the Fund and SkyBridge. The Trustees reviewed historical performance charts prepared by a third-party, which showed the performance of the Fund as compared to the Lipper Equity Income Funds Index and the S&P 500 Total Return Index, for the one year, two year, three year, and since inception periods ended December 31, 2018. The Trustees noted that the Class A, Class C and Class I shares of the Fund had each underperformed the Lipper Equity Income Index, the median of the Lipper Equity Income category, and the S&P 500 Total Return Index for the year to date, one year, two year, three year, and since inception periods ended December 31, 2018.
The Trustees also noted that they were provided information regarding SkyBridge’s advisory fees and an analysis of those fees in relation to the delivery of services to the Fund and any other ancillary
27
SKYBRIDGE DIVIDEND VALUE FUND
Other Information (Continued)
(Unaudited)
benefit resulting from the SkyBridge’s relationship with the Fund. The Trustees considered the fees that the SkyBridge charges to certain other clients advised by SkyBridge, and evaluated the explanations provided by SkyBridge as to differences in fees charged to the Fund and such accounts including that SkyBridge did not manage other accounts in a comparable manner as the Fund. The Trustees also reviewed a peer comparison of advisory fees and total expenses for the Fund versus a universe of funds in the Lipper Equity Income category with $250 million or less in assets (the “Expense Universe”). The Trustees noted that the contractual advisory fee of the Fund’s Class A shares and Class I was equal to the median of the contractual advisory fee of Expense Universe and that the contractual advisory fee of the Fund’s Class C shares was higher than the median of the contractual advisory fee of the Expense Universe. The Trustees further noted that the net total expense ratio of the Fund’s Class A shares was less than the median of the Expense Universe, and that the net total expense ratio of the Fund’s Class C and Class I shares were higher than the median of the Expense Universe. The Trustees concluded that the advisory fee and services provided by SkyBridge are sufficiently consistent with those of other advisers which manage mutual funds with investment objectives, strategies and policies similar to those of the Fund based on the information provided at the Board Meeting.
The Trustees considered the costs of the services provided by SkyBridge, the compensation and benefits received by SkyBridge in providing services to the Fund, and its profitability. The Trustees were provided with the SkyBridge’s unaudited balance sheet and statement of operations for the fiscal year ended December 31, 2018. In addition, the Trustees considered any direct or indirect revenues received by affiliates of SkyBridge. The Trustees noted that the level of profitability of SkyBridge in providing services to the Fund is an appropriate factor to consider, and the Trustees should be satisfied that SkyBridge’s profits are sufficient to continue as a healthy concern generally and an investment adviser of the Fund specifically. Based on the information provided, the Trustees concluded that SkyBridge’s fees and profits (if any) derived from its relationship with the Trust in light of the Fund’s expenses are reasonable in relation to the nature and quality of the services provided, taking into account the fees charged by other advisers for managing comparable mutual funds with similar strategies. The Trustees also concluded that the overall expense ratio of the Fund is reasonable, taking into account the size of the Fund, the quality of services provided by the adviser, the investment performance of the Fund and the expense limitations agreed to by SkyBridge.
The Trustees considered the extent to which economies of scale would be realized relative to fee levels as the Fund grows, and whether the advisory fee levels reflect these economies of scale for the benefit of shareholders. The Trustees considered and determined that economies of scale for the benefit of Fund shareholders should be achieved if assets of the Fund increase because fixed expenses will be spread across a larger asset base; however, the Trustees noted that the advisory fee does not include “breakpoint” reductions in the advisory fee rate at specific asset levels, but that shareholders do benefit from SkyBridge’s contractual Expense Limitation Agreement.
The Board concluded that the advisory fee rate under the SkyBridge Agreement is reasonable in relation to the services provided and that execution of such agreement is in the best interests of the
28
SKYBRIDGE DIVIDEND VALUE FUND
Other Information (Concluded)
(Unaudited)
shareholders of the Fund. The Trustees also concluded that the advisory fees and total expense ratios are at acceptable levels in light of the quality of services provided to the Fund and in comparison to those of the Fund’s respective peer groups; that the advisory fee schedule would not be increased for the Fund and economies of scale may be achieved at higher asset levels for the Fund for the benefit of Fund shareholders; and that the total expense ratio had not changed materially. In voting to approve the continuation of the SkyBridge Agreement for an additionalone-year period, the Trustees did not identify any single matter as controlling, but made their determination in light of all the circumstances.
29
SKYBRIDGE DIVIDEND VALUE FUND
Privacy Notice
(Unaudited)
The privacy of your personal financial information is extremely important to us. When you open an account with us, we collect a significant amount of information from you in order to properly invest and administer your account. We take very seriously the obligation to keep that information private and confidential, and we want you to know how we protect that important information.
We collect nonpublic personal information about you from applications or other forms you complete and from your transactions with us or our affiliates. We do not disclose information about you, or our former clients, to our affiliates or to service providers or other third parties, except as permitted by law. We share only the information required to properly administer your accounts, which enables us to send transaction confirmations, monthly or quarterly statements, financials and tax forms. Even within FundVantage Trust and its affiliated entities, a limited number of people who actually service accounts will have access to your personal financial information. Further, we do not share information about our current or former clients with any outside marketing groups or sales entities.
To ensure the highest degree of security and confidentiality, FundVantage Trust and its affiliates maintain various physical, electronic and procedural safeguards to protect your personal information. We also apply special measures for authentication of information you request or submit to us on our web site.
If you have questions or comments about our privacy practices, please call us at (888)919-6885.
30
SKYBRIDGE DIVIDEND VALUE FUND
Fund Management
(Unaudited)
FundVantage Trust (the “Trust”) is governed by a Board of Trustees (the “Trustees”). The primary responsibility of the Trustees is to represent the interest of the Trust’s shareholders and to provide oversight management of the Trust.
The following tables present certain information regarding the Trustees and officers of the Trust. None of the Trustees are an “interested person” of the Trust, the Adviser, another investment adviser of a series of the Trust, or Foreside Funds Distributors LLC, the principal underwriter of the Trust (“Underwriter”), within the meaning of the 1940 Act and each Trustee is referred to as an “Independent Trustee” and is listed under such heading below. Employees of certain service providers to the Trust serve as officers of the Trust; such persons are not compensated by the Fund. The address of each Trustee and Officer as it relates to the Trust’s business is 301 Bellevue Parkway, 2nd Floor, Wilmington, DE 19809.
The Statement of Additional Information for the Fund contains additional information about the Trustees and is available, without charge, upon request, by calling (888)919-6885.
Name and Date of Birth | Position (s) Held with Trust | Term of Office and Length of Time Served | Principal Occupation(s) During Past Five Years |
Number of Funds in Trust Complex
| Other Held by Trustee | |||||
INDEPENDENT TRUSTEES
| ||||||||||
ROBERT J. CHRISTIAN Date of Birth: 2/49 | Trustee and Chairman of the Board | Shall serve until death, resignation or removal. Trustee and Chairman since 2007. | Retired since February 2006; Executive Vice President of Wilmington Trust Company from February 1996 to February 2006; President of Rodney Square Management Corporation (“RSMC”) (investment advisory firm) from 1996 to 2005; Vice President of RSMC from 2005 to 2006. | 44 | Optimum Fund Trust (registered investment company with 6 portfolios). | |||||
IQBAL MANSUR Date of Birth: 6/55 | Trustee | Shall serve until death, resignation or removal. Trustee since 2007. | University Professor, Widener University. | 44 | None. | |||||
31
SKYBRIDGE DIVIDEND VALUE FUND
Fund Management (Continued)
(Unaudited)
Name and Date of Birth | Position(s) Held with Trust | Term of Office and Length of Time Served | Principal Occupation(s) During Past Five Years | Number of Funds in Trust Complex Overseen by Trustee | Other Directorships Held by Trustee | |||||
NICHOLAS M. MARSINI, JR. Date of Birth: 8/55 | Trustee | Shall serve until death, resignation or removal. Trustee since 2016. | Retired since March 2016. President of PNC Bank Delaware from June 2011 to March 2016; Executive Vice President of Finance of BNY Mellon from July 2010 to January 2011; Executive Vice President and Chief Financial Officer of PNC Global Investment Servicing from September 1997 to July 2010.
| 44 | Brinker Capital Destinations Trust (registered investment company with 10 portfolios). | |||||
NANCY B. WOLCOTT Date of Birth: 11/54 | Trustee | Shall serve until death, resignation or removal. Trustee since 2011. | Retired since May 2014; EVP, Head of GFI Client Service Delivery, BNY Mellon from January 2012 to May 2014; EVP, Head of US Funds Services, BNY Mellon from July 2010 to January 2012; President of PNC Global Investment Servicing from 2008 to July 2010; Chief Operating Officer of PNC Global Investment Servicing from 2007 to 2008; Executive Vice President of PFPC Worldwide Inc. from 2006 to 2007.
| 44 | Lincoln Variable Insurance Products Trust (registered investment company with 92 portfolios). | |||||
STEPHEN M. WYNNE Date of Birth: 1/55 | Trustee | Shall serve until death, resignation or removal. Trustee since 2009. | Retired since December 2010; Chief Executive Officer of US Funds Services, BNY Mellon Asset Servicing from July 2010 to December 2010; Chief Executive Officer of PNC Global Investment Servicing from March 2008 to July 2010; President, PNC Global Investment Servicing from 2003 to 2008.
| 44 | Copeland Trust (registered investment company with 2 portfolios). | |||||
32
SKYBRIDGE DIVIDEND VALUE FUND
Fund Management (Concluded)
(Unaudited)
Name and Date of Birth | Position(s) Held with Trust |
Term of Office and Length of Time Served
| Principal Occupation(s) During Past Five Years | |||
EXECUTIVE OFFICERS
| ||||||
JOEL L. WEISS Date of Birth: 1/63 | President and Chief Executive Officer | Shall serve until death, resignation or removal. Officer since 2007. | President of JW Fund Management LLC since June 2016; Vice President and Managing Director of BNY Mellon Investment Servicing (US) Inc. and predecessor firms from 1993 to June 2016.
| |||
T. RICHARD KEYES Date of Birth: 1/57 | Treasurer and Chief Financial Officer | Shall serve until death, resignation or removal. Officer since 2016. | President of TRK Fund Consulting LLC since July 2016; Head of Tax — U.S. Fund Services of BNY Mellon Investment Servicing (US) Inc. and predecessor firms from February 2006 to July 2016.
| |||
GABRIELLA MERCINCAVAGE Date of Birth: 6/68 | Assistant Treasurer | Shall serve until death, resignation or removal. Officer since 2019. | Fund Administration Consultant since January 2019; Fund Accounting and Tax Compliance Accountant to financial services companies from November 2003 to July 2018.
| |||
VINCENZO A. SCARDUZIO Date of Birth: 4/72 | Secretary | Shall serve until death, resignation or removal. Officer since 2012. | Director and Vice President Regulatory Administration of The Bank of New York Mellon and predecessor firms since 2001.
| |||
DAVID C. LEBISKY Date of Birth: 5/72 | Chief Compliance Officer and Anti-Money Laundering Officer | Shall serve until death, resignation or removal. Officer since 2015. | President of Lebisky Compliance Consulting LLC since October 2015; Consultant, Duff & Phelps, LLC since 2016; Senior Consultant, Freeh Group International Solutions, LLC (a global risk management firm) from 2015 to 2018; Scotia Institutional Investments US, LP, Director of Regulatory Administration from 2010 to 2014.
| |||
33
[THIS PAGE INTENTIONALLY LEFT BLANK.]
[THIS PAGE INTENTIONALLY LEFT BLANK.]
Investment Adviser
SkyBridge Capital II, LLC
527 Madison Avenue, 16th Floor
New York, New York 10022
Administrator
The Bank of New York Mellon
301 Bellevue Parkway
Wilmington, DE 19809
Transfer Agent
BNY Mellon Investment Servicing (US) Inc.
4400 Computer Drive
Westborough, MA 01581
Principal Underwriter
Foreside Funds Distributors LLC
400 Berwyn Park
899 Cassatt Road
Berwyn, PA 19312
Custodian
The Bank of New York Mellon
240 Greenwich Street
New York, NY 10286
Independent Registered Public Accounting Firm
PricewaterhouseCoopers LLP
Two Commerce Square, Suite 1800
2001 Market Street
Philadelphia, PA 19103-7042
Legal Counsel
Pepper Hamilton LLP
3000 Two Logan Square
2001 Market Street
Philadelphia, PA 19103-7042
SKY-0419

SkyBridge Dividend
Value Fund
of
FundVantage Trust
Class A Shares
Class C Shares
Class I Shares
ANNUAL REPORT
April 30, 2019
IMPORTANT NOTE: Beginning on January 1, 2021, paper copies of the SkyBridge Dividend Value Fund’s annual and semi-annual shareholder reports will no longer be sent by mail, unless you specifically request paper copies of the shareholder reports from the SkyBridge Dividend Value Fund or from your financial intermediary. Instead, annual and semi-annual shareholder reports will be available on the SkyBridge Dividend Value Fund’s website (www.skybridge.com), and you will be notified by mail each time a report is posted and provided with a website link to access the report.
You may elect to receive all future annual and semi-annual shareholder reports in paper, free of charge. To elect to receive paper copies of shareholder reports through the mail or otherwise change your delivery method, contact your financial intermediary or, if you hold your shares directly through the SkyBridge Dividend Value Fund, call the SkyBridge Dividend Value Fund toll-free at (888)919-6885 or write to the SkyBridge Dividend Value Fund at:
SkyBridge Dividend Value Fund
FundVantage Trust
c/o BNY Mellon Investment Servicing
P.O. Box 9829
Providence, RI 02940-8029
This report is submitted for the general information of the shareholders of the SkyBridge Dividend Value Fund. It is not authorized for distribution unless preceded or accompanied by a current prospectus for the SkyBridge Dividend Value Fund.
Item 2. Code of Ethics.
| (a) | The registrant, as of the end of the period covered by this report, has adopted a code of ethics that applies to the Registrant’s principal executive officer, principal financial officer, principal accounting officer or controller, or persons performing similar functions, regardless of whether these individuals are employed by the Registrant or a third party. |
| (c) | There have been no amendments, during the period covered by this report, to a provision of the code of ethics that applies to the Registrant’s principal executive officer, principal financial officer, principal accounting officer or controller, or persons performing similar functions, regardless of whether these individuals are employed by the Registrant or a third party, and that relates to any element of the code of ethics description. |
| (d) | The registrant has not granted any waivers, including an implicit waiver, from a provision of the code of ethics that applies to the Registrant’s principal executive officer, principal financial officer, principal accounting officer or controller, or persons performing similar functions, regardless of whether these individuals are employed by the Registrant or a third party, that relates to one or more of the items set forth in paragraph (b) of this item’s instructions. |
Item 3. Audit Committee Financial Expert.
The Audit Committee of the Board of Trustees currently is comprised of Nicholas Marsini, Iqbal Mansur and Stephen M. Wynne, each of whom is considered “independent” within the meaning set forth under Item 3 of FormN-CSR. The Board of Trustees has determined that each of Messrs. Mansur, Marsini and Wynne is an “audit committee financial expert” as such term is defined by Item 3 of FormN-CSR.
The Registrant’s Board of Trustees has determined that Dr. Mansur acquired the attributes necessary to be considered an audit committee financial expert through his experience as a university professor of finance and because he has authored over 25 finance-related articles in peer reviewed publications.
The Registrant’s Board of Trustees has determined that Mr. Wynne acquired the attributes necessary to be considered an audit committee financial expert through his experience as a chief executive officer (and other senior-level accounting and/or financial positions) of several large financial institutions and because he hasco-authored a text book on mutual fund accounting.
The Registrant’s Board of Trustees has determined that Mr. Marsini acquired the attributes necessary to be considered an audit committee financial expert through his experience as a chief executive officer
(and other senior-level positions) of several large financial institutions.
Item 4. Principal Accountant Fees and Services.
Audit Fees
| (a) | The aggregate fees billed for each of the last two fiscal years for professional services rendered by the principal accountant for the audit of the registrant’s annual financial statements or services that are normally provided by the accountant in connection with statutory and regulatory filings or engagements for those fiscal years were $430,022 for the fiscal year ending April 30, 2019 and $374,285 for the fiscal year ending April 30, 2018, as follows: |
Fiscal Year Ending April 30, 2019 | Fiscal Year Ending April 30, 2018 | |||
PricewaterhouseCoopers LLP
| $342,572
| $289,385
| ||
Ernst & Young LLP
| $87,450
| $84,900
| ||
Aggregate Fees
| $430,022
| $374,285
|
Audit-Related Fees
| (b) | The aggregate fees billed in each of the last two fiscal years for assurance and related services by the principal accountant that are reasonably related to the performance of the audit of the registrant’s financial statements and are not reported under paragraph (a) of this Item are $0 for the fiscal year ending April 30, 2019 and $0 for the fiscal year ending April 30, 2018. |
Tax Fees
| (c) | The aggregate fees billed in each of the last two fiscal years for professional services rendered by the principal accountant for tax compliance, tax advice, and tax planning were $6,702 for the fiscal year ending April 30, 2019 and $11,139 for the fiscal year ending April 30, 2018, as follows: |
Fiscal Year Ending April 30, 2019 | Fiscal Year Ending April 30, 2018 | |||
PricewaterhouseCoopers LLP
| $0
| $0
| ||
Ernst & Young LLP
| $6,702
| $11,139
| ||
Aggregate Fees
| $6,702
| $11,139
|
These fees were for (a) Passive Foreign Investment Company (PFIC) database tax services, (b) India tax compliance services, and (c) Pakistan tax compliance services.
All Other Fees
| (d) | The aggregate fees billed in each of the last two fiscal years for products and services provided by the principal accountant, other than the services reported in paragraphs (a) through (c) of this Item are $0 for the fiscal year ending April 30, 2019 and $0 for the fiscal year ending April 30, 2018. | |
| (e)(1) | Disclose the audit committee’spre-approval policies and procedures described in paragraph (c)(7) of Rule2-01 of RegulationS-X. | |
The Registrant’s Audit Committee Charter requires the Audit Committee to (i) (a) approve prior to appointment the engagement of independent registered public accounting firm to annually audit and provide their opinion on the Registrant’s financial statements, (b) recommend to the Independent Trustees the selection, retention or termination of the Registrant’s independent registered public accounting firm and, (c) in connection therewith, to review and evaluate matters potentially affecting the independence and capabilities of the independent registered public accounting firm; and (ii) to approve prior to appointment the engagement of the independent registered public accounting firm to provide other audit services to the Registrant, or to providenon-audit services to the Registrant, its series, an investment adviser to its series or any entity controlling, controlled by, or under common control with an investment adviser to its series (“adviser-affiliate”) that provides ongoing services to the Registrant if the engagement relates directly to the operations and financial reporting of the Registrant. The Audit Committee will not approvenon-audit services that the Audit Committee believes may impair the independence of the Registrant’s independent registered public accountant. The Audit Committee may delegate, to the extent permitted by law,pre-approved responsibilities to one or more members of the Audit Committee who shall report to the full Audit Committee. | ||
| (e)(2) | Not applicable. | |
| (f) | Not applicable. | |
| (g) | The aggregatenon-audit fees billed by the registrant’s accountant for services rendered to the registrant, and rendered to the registrant’s investment adviser (not including anysub-adviser whose role is primarily portfolio management and is subcontracted with or overseen by another investment adviser), and any entity controlling, controlled by, or under common control with the adviser that provides ongoing services to the registrant for each of the last two fiscal years of the registrant were $6,702 for the fiscal year ending April 30, 2019 and $11,139 for the fiscal year ending April 30, 2018, as follows: | |
Fiscal Year Ending April 30, 2019 | Fiscal Year Ending April 30, 2018 | |||
PricewaterhouseCoopers LLP
| $0
| $0
| ||
Ernst & Young LLP
| $6,702
| $11,139
| ||
Aggregate Fees
| $6,702
| $11,139
|
| (h) | Not applicable. | |
| Item 5. | Audit Committee of Listed Registrants. |
Not applicable.
| Item 6. | Investments. |
| (a) | Schedule of Investments in securities of unaffiliated issuers as of the close of the reporting period is included as part of the report to shareholders filed under Item 1 of this form. |
| (b) | Not applicable. |
| Item 7. | Disclosure of Proxy Voting Policies and Procedures forClosed-End Management Investment Companies. |
Not applicable.
| Item 8. | Portfolio Managers ofClosed-End Management Investment Companies. |
Not applicable.
| Item 9. | Purchases of Equity Securities byClosed-End Management Investment Company and Affiliated Purchasers. |
Not applicable.
| Item 10. Submission | of Matters to a Vote of Security Holders. |
There have been no material changes to the procedures by which the shareholders may recommend nominees to the registrant’s board of trustees, where those changes were implemented after the registrant last provided disclosure in response to the requirements of Item 407(c)(2)(iv) of RegulationS-K (17 CFR 229.407) (as required by Item 22(b)(15) of Schedule 14A (17 CFR240.14a-101)), or this Item.
| Item 11. Controls | and Procedures. |
| (a) | The registrant’s principal executive and principal financial officers, or persons performing similar functions, have concluded that the registrant’s disclosure controls and procedures (as defined in Rule30a-3(c) under the Investment Company Act of 1940, as amended (the “1940 Act”) (17 CFR270.30a-3(c))) are effective, as of a date within 90 days of the filing date of the report that includes the disclosure required by this paragraph, based on their evaluation of these controls and procedures required by Rule30a-3(b) under the 1940 Act (17 CFR270.30a-3(b)) and Rules13a-15(b) or15d-15(b) under the Securities Exchange Act of 1934, as amended (17 CFR240.13a-15(b) or240.15d-15(b)). |
| (b) | There were no changes in the registrant’s internal control over financial reporting (as defined in Rule30a-3(d) under the 1940 Act (17 CFR270.30a-3(d))) that occurred during the registrant’s last fiscal quarter that has materially affected, or is reasonably likely to materially affect, the registrant’s internal control over financial reporting. |
| Item 12. Disclosure | of Securities Lending Activities forClosed-End Management Investment Companies. |
Not applicable.
| Item 13. Exhibits. |
| (a)(1) | Code of ethics, or any amendment thereto, that is the subject of disclosure required by Item 2 is attached hereto. |
| (a)(2) | Certifications pursuant to Rule30a-2(a) under the 1940 Act and Section 302 of the Sarbanes-Oxley Act of 2002 are attached hereto. |
| (a)(3) | Not applicable. |
| (a)(4) | Not applicable. |
| (b) | Certifications pursuant to Rule30a-2(b) under the 1940 Act and Section 906 of the Sarbanes-Oxley Act of 2002 are attached hereto. |
SIGNATURES
Pursuant to the requirements of the Securities Exchange Act of 1934 and the Investment Company Act of 1940, the registrant has duly caused this report to be signed on its behalf by the undersigned, thereunto duly authorized.
(Registrant) FundVantage Trust
By (Signature and Title)* | /s/ Joel L. Weiss | |
Joel L. Weiss, President and | ||
Chief Executive Officer | ||
(principal executive officer) |
Date July 3, 2019
Pursuant to the requirements of the Securities Exchange Act of 1934 and the Investment Company Act of 1940, this report has been signed below by the following persons on behalf of the registrant and in the capacities and on the dates indicated.
By (Signature and Title)* | /s/ Joel L. Weiss | |
Joel L. Weiss, President and | ||
Chief Executive Officer | ||
(principal executive officer) | ||
Date July 3, 2019 | ||
By (Signature and Title)* | /s/ T. Richard Keyes | |
T. Richard Keyes, Treasurer and | ||
Chief Financial Officer | ||
(principal financial officer) | ||
Date July 3, 2019 | ||
* Print the name and title of each signing officer under his or her signature.