UNITED STATES
SECURITIES AND EXCHANGE COMMISSION
Washington, D.C. 20549
FORM N-CSR
CERTIFIED SHAREHOLDER REPORT OF REGISTERED MANAGEMENT
INVESTMENT COMPANIES
Investment Company Act file number 811-22027
FundVantage Trust
(Exact name of registrant as specified in charter)
301 Bellevue Parkway
Wilmington, DE 19809
(Address of principal executive offices) (Zip code)
Joel L. Weiss
JW Fund Management LLC
100 Springdale Rd., Suite A3-416
Cherry Hill, NJ 08003
(Name and address of agent for service)
Registrant’s telephone number, including area code: 856-528-3500
Date of fiscal year end: September 30
Date of reporting period: September 30, 2020
Form N-CSR is to be used by management investment companies to file reports with the Commission not later than 10 days after the transmission to stockholders of any report that is required to be transmitted to stockholders under Rule 30e-1 under the Investment Company Act of 1940 (17 CFR 270.30e-1). The Commission may use the information provided on Form N-CSR in its regulatory, disclosure review, inspection, and policymaking roles.
A registrant is required to disclose the information specified by Form N-CSR, and the Commission will make this information public. A registrant is not required to respond to the collection of information contained in Form N-CSR unless the Form displays a currently valid Office of Management and Budget (“OMB”) control number. Please direct comments concerning the accuracy of the information collection burden estimate and any suggestions for reducing the burden to Secretary, Securities and Exchange Commission, 450 Fifth Street, NW, Washington, DC 20549-0609. The OMB has reviewed this collection of information under the clearance requirements of 44 U.S.C. § 3507.
Item 1. Reports to Stockholders.
The Report to Shareholders is attached herewith.
GOTHAM FUNDS
of
FundVantage Trust
Gotham Absolute Return Fund
Gotham Enhanced Return Fund
Gotham Neutral Fund
Gotham Large Value Fund
Gotham Defensive Long 500 Fund
Gotham Total Return Fund
ANNUAL REPORT
September 30, 2020
Important Information on Paperless Delivery
Beginning on January 1, 2021, paper copies of the Funds’ shareholder reports will no longer be sent by mail, unless you specifically request paper copies of the shareholder reports from the Funds or from your financial intermediary. Instead, shareholder reports will be available on the Funds’ website (www.GothamFunds.com), and you will be notified by mail each time a report is posted and provided with a website link to access the report.
You may elect to receive all future shareholder reports in paper, free of charge. To elect to receive paper copies of shareholder reports through the mail or otherwise change your delivery method, contact your financial intermediary or, if you hold your shares directly through the Funds, call the Gotham Funds toll-free at 1 (877) 974-6852 or write to Gotham Funds, FundVantage Trust, c/o BNY Mellon Investment Servicing, P.O. Box 9829, Providence, RI 02940-8029. Your election to receive shareholder reports in paper will apply to all Gotham Funds that you hold through the financial intermediary, or directly with the Gotham Funds.
This report is submitted for the general information of shareholders and is not authorized for distribution to prospective investors unless preceded or accompanied by a current prospectus.
GOTHAM FUNDS
ANNUAL REPORT
AS OF SEPTEMBER 30, 2020
| 1 | ||||
| 2 | ||||
| 11 | ||||
| 18 | ||||
| 20 | ||||
| 26 | ||||
Financial Statements: | ||||
| 151 | ||||
| 153 | ||||
| 155 | ||||
| 158 | ||||
| 159 | ||||
| 166 | ||||
| 180 | ||||
| 181 | ||||
| 182 | ||||
| 186 | ||||
| 187 | ||||
Important Information
The performance data quoted in this report represents past performance and does not guarantee future results. The investment return and principal value of an investment in a Gotham Fund will fluctuate so that an investor’s shares, when redeemed, may be worth more or less than their original cost. Current performance may be lower or higher. Performance data current to the most recent month-end may be obtained by calling (877) 974-6852.
Each Gotham Fund covered by this report (each a “Fund”) compares its performance to an unmanaged index. An index does not reflect operational and transactional costs which apply to a mutual fund. It is not possible to invest directly in an index.
Mutual fund investing involves risks, including possible loss of principal. Each Fund except Gotham Large Value Fund will short securities. Short sales theoretically involve unlimited loss potential since the market price of securities sold short may continuously increase. Each Fund except Gotham Large Value Fund will also use leverage to make additional investments which could result in greater losses than if the Fund were not leveraged. Gotham Absolute Return Fund, Gotham Enhanced Return Fund, Gotham Neutral Fund and Gotham Defensive Long 500 Fund utilize one or more swap agreements in their investment programs. The use of derivatives such as swaps exposes a Fund to additional risks including increased volatility, lack of liquidity and possible losses greater than a Fund’s initial investments. Gotham Total Return Fund will primarily engage in short sales, leverage and swaps through its investments in underlying funds. Certain Funds may invest in securities of large-, mid- and small-cap companies. The securities issued by small-cap and mid-cap companies tend to be more volatile and less liquid than those of large-cap issuers. A Fund may have a high turnover of its portfolio securities. High turnover rates generally result in higher brokerage costs to a Fund. There can be no guarantee that a Fund will achieve its objectives.
A prospective investor should consider the investment objectives, risks, charges and expenses of a Fund carefully before investing. The prospectus and summary prospectus contains this and other information about the Funds, and should be read carefully before investing. A copy of the prospectus or summary prospectus is available at www.GothamFunds.com or by calling (877) 974-6852.
1
Annual Investment Adviser’s Report
September 30, 2020
(Unaudited)
Gotham Absolute Return Fund (GARIX)
Gotham Enhanced Return Fund (GENIX)
Gotham Neutral Fund (GONIX)
Gotham Large Value Fund (GVALX)
Gotham Defensive Long 500 Fund (GDLFX)
Gotham Total Return Fund (GTRFX)
Dear Shareholder,
Much of 2020 has been dictated by the COVID-19 pandemic, pushing the global economy and markets into uncharted territory. The disruption caused due to the pandemic and resulting lockdown has affected corporate cash flows in a way that is unprecedented. As companies release third quarter earnings over the coming weeks, we continue to examine in more detail how the pandemic has affected corporate cash flows. The results are messy and require extensive analysis. This is precisely the type of work our research team has focused on for over fifteen years. We believe that a strong ability to adjust as-reported financials to better reflect the true economics of a business should be especially beneficial during these unprecedented times. From a business standpoint, Gotham continues to operate effectively and without material impediment in the current remote environment.
As most of you are aware, Gotham manages value-oriented mutual funds with varying market cap universes and gross and net exposures. The funds share the same investment philosophy, process and research. Gotham offers actively managed strategies (long/short and long-only) as well as strategies that combine an index component and an actively managed long/short overlay. Gotham’s all-cap funds select long and short stock portfolios from a diverse capitalization universe of U.S. stocks. Our large-cap funds select stocks primarily from the S&P 500.
Our investment process begins with a research effort that seeks to value all of the companies in a fund’s respective investment universe. Our philosophy is simple. Although stock prices react to emotion over the short term, over the long term the market is very good at finding the fair value of stocks. Therefore, we believe that if we are good at valuing businesses (a share of stock represents a percentage ownership stake in a business), the market will agree with us...eventually. This is crucial. No investment strategy, regardless of how good or logical, works all the time.
The important thing for us is to stick to our strategy even if it is not working over shorter time periods. We have over 60 years of combined investment experience valuing and investing in publicly traded businesses. We know how to value businesses by using various measures of absolute and relative value. So, that’s how we invest. We buy companies that are at the biggest discount to our assessment of value and sell short (where applicable) those companies that are most expensive relative to our assessment of value. We do not plan to change this strategy or adopt other methodologies when short-term stock prices do not reflect the values that we see.
Together with our investment team (led by Director of Research, Adam Barth), we follow a systematic process of researching and valuing companies, investing in our long and short portfolios and adjusting positions daily to take advantage of changing stock prices and fundamental information. The funds are highly diversified and invest in hundreds of positions. Our positions are not equally weighted. The funds generally invest in the cheapest companies and short (where applicable) the most expensive based on our assessment of value and subject to our risk constraints. We manage our risks by, among other things, requiring substantial portfolio diversification, setting maximum limits for sector concentration and by maintaining overall gross and net exposures within carefully defined ranges.
Market Observations and Performance Commentary
The market volatility during much of 2020 was fueled by massive uncertainty surrounding the economy reopening following the pandemic induced lockdowns, vaccine news as well as US elections in November. After the initial shock in late February to March when markets plunged 25-30%, the subsequent rebound rally left market cap-weighted indexes expensive relative to our 30-year research history. As of September 30, 2020, the Russell 1000 was outperforming the Russell 1000 equal-weight benchmark by over 1000bps YTD. This has been a consistent headwind for actively managed strategies. We believe it has also created a more attractive opportunity set based on relative valuations going forward, as it presents stock pickers with a relatively attractive universe to choose from over the next several years relative to market-cap weighted indexes.
2
Annual Investment Adviser’s Report (Continued)
September 30, 2020
(Unaudited)
In September 2020, the S&P 500 was trading at 26x Gotham’s proprietary cash flow metric. This number is significantly skewed by the effect the COVID-19 pandemic has had on earnings for the second and third quarters. At the start of the year, the S&P 500 was in the 12th percentile towards expensive over the past 30 years based on 2019 corporate cash flows. This historically corresponded to 2-year cumulative forward returns of 6%-8%. With the index up 13% YTD1, we would expect 2-year cumulative forward returns for the S&P 500 to be 1%-3% if 2019 corporate cash flows are a good gauge for normalized earnings.
It is important to note that the above numbers are not adjusted for interest rates. If rates this low were to persist over a long time period, it would be reasonable to expect higher equity returns than our historical analysis suggests. At the same time, it is difficult to adjust these metrics which have been partially affected by the global pandemic. While some companies with the largest market capitalizations have benefited in a positive way, there are many companies within the index that have been negatively impacted.
In addition, the continued disparity between growth and value widened in 2020, as pandemic led tech heavy businesses dominated the market rally. Growth benchmarks are outperforming their value counterparts by significant margins over the trailing one-year, three-year and five-year periods, surpassing levels last seen during the 2nd quarter of 2000, the peak of the internet bubble.
We conducted a study to quantify the expensiveness of this period relative to history, particularly the internet bubble. Based on our research, only 1999 ranks worse than the first six months of 2020 for the returns of cheap stocks minus expensive, which was followed by 3 of the best years for cheap relative to expensive companies based on our assessment of value. We don’t know when the current value/growth divergence will revert, but the historical precedent is for it to be abrupt and significant when it happens.
In terms of performance, broadly speaking our short book has been challenged in this market environment resulting in negative long/short spreads. Though many of these shorts are growing quickly, they are very richly priced. Some are currently unprofitable, and others sell at 50 or 100 times corporate free cash flows. On the long side, though we cannot predict short-term market moves and the overall market remains expensive, we believe that there is an opportunity to exceed the positive returns we expect for large cap indexes. Given valuation levels and the disparity between stock returns and fundamentals, we are very optimistic about the opportunity set for our long/short spreads over the coming period.
We remain confident that the best way to construct portfolios in any period, and perhaps even more so during expensive markets, is to own stakes in quality businesses generating strong cash flows. The long portfolios in our strategies trade at significantly better valuations than the index. The short portfolios in these strategies are generally cash flow negative, with higher levels of leverage and weaker business fundamentals. Our risk management has helped to improve our long/short spreads in a period that has been exceptionally challenged for active management and value-oriented strategies in particular.
Although we can’t predict when this environment will end and the current value/growth cycle will turn, as we stated above, the historical precedent is that the transition is often abrupt and significant. Despite the added uncertainty surrounding the pandemic, we have consistently communicated to our partners that strong normalized cash flows, good franchises, and growth prospects are the key drivers to valuation over the long-term. It is also a process that should prove resilient in turbulent periods. Markets and businesses have generally recovered in reasonably short order after the initial shock from one-time events, including the outbreak of World War 2, the Cuban Missile Crisis, and the financial crisis of 2008. We believe the current headwinds will eventually subside and favoring cash flow generating companies with good returns on capital and strong balance sheets (and shorting the opposite) should provide a particularly attractive opportunity for outperformance.
3
Annual Investment Adviser’s Report (Continued)
September 30, 2020
(Unaudited)
Important Information
This letter is intended to assist shareholders in understanding how the Gotham Funds described herein performed during the period ended September 30, 2020, and reflects the views of the investment adviser at the time of this writing. Market and index valuations are based on Gotham’s valuation methodology. The views may change and do not guarantee the future performance of the Gotham Funds or the markets.
This letter contains forward-looking statements regarding future events, forecasts and expectations regarding equity markets and certain of Gotham’s strategies. Forward-looking statements may be identified terminology such terms as “may,” “expect,” “will,” “hope,” “believe” and/or comparable terminology. No assurance, representation, or warranty is made that any of Gotham’s expectations, views and/or objectives will be achieved and actual results may be significantly different than reflected herein.
The indices referenced herein are for comparison purposes only. The performance and volatility of the funds will be different than those of the indices. It is not possible to invest in the indices directly.
| 1 | As of November 17, 2020. |
4
Annual Investment Adviser’s Report (Continued)
September 30, 2020
(Unaudited)
Performance by Fund
Gotham Absolute Return Fund (GARIX)
| · | The Fund returned -4.13% (net) for the trailing twelve-month period, the HFRX Equity Hedge Index returned -0.39% and the S&P 500 Total Return Index returned +15.15% over the same time period. |
| · | The spread for the period was -10.22%2 . |
| · | The long portfolio contributed +7.96% for the trailing twelve-month period. The short portfolio detracted -10.08% for the period. |
| · | Top contributors and detractors by sector and stock positions are below: |
Sector Contributors/Detractors
| Average Contribution | Average Exposure | |||||||||
| Largest Contributors | ||||||||||
Long | Information Technology | 6.12% | 25.65% | |||||||
| Health Care | 4.12% | 17.78% | ||||||||
Short | Energy | 2.22% | -4.62% | |||||||
| Utilities | 0.54% | -2.49% | ||||||||
| Largest Detractors | ||||||||||
Long | Energy | -4.75% | 7.97% | |||||||
| Materials | -0.80% | 8.81% | ||||||||
Short | Information Technology | -3.68% | -12.40% | |||||||
| Industrials | -2.74% | -10.91% | ||||||||
Stock Contributors/Detractors
| Average Contribution | Average Exposure | |||||||||
| Largest Contributors | ||||||||||
Long | Apple Inc. | 1.32% | 1.58% | |||||||
| Facebook Inc. | 0.68% | 1.08% | ||||||||
Short | Diamondback Energy Inc. | 0.24% | -0.26% | |||||||
| Chesapeake Energy Corp. | 0.23% | -0.14% | ||||||||
| Largest Detractors | ||||||||||
Long | Raytheon Co. | -0.51% | 0.49% | |||||||
| Phillips 66 | -0.50% | 0.54% | ||||||||
Short | Sunrun Inc. | -1.04% | -0.42% | |||||||
| Enphase Energy Inc. | -0.72% | -0.51% | ||||||||
5
Annual Investment Adviser’s Report (Continued)
September 30, 2020
(Unaudited)
Gotham Enhanced Return Fund (GENIX)
| · | The Fund returned -6.81% (net) for the trailing twelve-month period and the S&P 500 Total Return Index returned +15.15% over the same time period. |
| · | The spread for the period was -10.67%2 . |
| · | The long portfolio contributed +6.86% for the trailing twelve-month period. The short portfolio detracted -10.76% for the period. |
| · | Top contributors and detractors by sector and stock positions are below: |
Sector Contributors/Detractors
| Average Contribution | Average Exposure | |||||||||
| Largest Contributors | ||||||||||
Long | Information Technology | 8.22% | 37.69% | |||||||
| Health Care | 4.94% | 25.23% | ||||||||
Short | Energy | 3.00% | -5.67% | |||||||
| Utilities | 0.65% | -2.98% | ||||||||
| Largest Detractors | ||||||||||
Long | Energy | -7.35% | 11.43% | |||||||
| Industrials | -1.66% | 31.95% | ||||||||
Short | Information Technology | -3.80% | -14.42% | |||||||
| Health Care | -2.85% | -12.16% | ||||||||
Stock Contributors/Detractors
| Average Contribution | Average Exposure | |||||||||
| Largest Contributors | ||||||||||
Long | Apple Inc. | 2.13% | 2.51% | |||||||
| Facebook Inc. | 1.02% | 1.76% | ||||||||
Short | Diamondback Energy Inc. | 0.39% | -0.50% | |||||||
| Chesapeake Energy Corp. | 0.32% | -0.19% | ||||||||
| Largest Detractors | ||||||||||
Long | Phillips 66 | -0.81% | 0.81% | |||||||
| Raytheon Co. | -0.79% | 0.76% | ||||||||
Short | Sunrun Inc. | -0.92% | -0.42% | |||||||
| Enphase Energy Inc. | -0.92% | -0.66% | ||||||||
6
Annual Investment Adviser’s Report (Continued)
September 30, 2020
(Unaudited)
Gotham Neutral Fund (GONIX)
| · | The Fund returned -11.21% (net) for the trailing twelve-month period. |
| · | The spread for the period was -12.21%2 . |
The long portfolio contributed +10.53% for the trailing twelve-month period. The short portfolio detracted -19.97% for the period.
| · | Top contributors and detractors by sector and stock positions are below: |
Sector Contributors/Detractors
| Average Contribution | Average Exposure | |||||||||
| Largest Contributors | ||||||||||
Long | Health Care | 5.42% | 19.07% | |||||||
| Information Technology | 5.40% | 23.34% | ||||||||
Short | Energy | 3.19% | -7.57% | |||||||
| Utilities | 0.67% | -3.50% | ||||||||
| Largest Detractors | ||||||||||
Long | Energy | -4.22% | 8.23% | |||||||
| Materials | -0.20% | 10.71% | ||||||||
Short | Information Technology | -6.74% | -21.85% | |||||||
| Health Care | -4.77% | -17.45% | ||||||||
Stock Contributors/Detractors
| Average Contribution | Average Exposure | |||||||||
| Largest Contributors | ||||||||||
Long | Novavax Inc. | 1.44% | 1.21% | |||||||
| RH | 0.61% | 0.56% | ||||||||
Short | Chesapeake Energy Corp. | 0.43% | -0.27% | |||||||
| Diamondback Energy Inc. | 0.38% | -0.44% | ||||||||
| Largest Detractors | ||||||||||
Long | Raytheon Co. | -0.34% | 0.32% | |||||||
| Southwest Airlines Co. | -0.33% | 0.49% | ||||||||
Short | Sunrun Inc. | -1.81% | -0.74% | |||||||
| Wayfair Inc. | -1.12% | -0.72% | ||||||||
7
Annual Investment Adviser’s Report (Continued)
September 30, 2020
(Unaudited)
Gotham Large Value Fund (GVALX)
· The Fund returned +0.04% (net) for the trailing twelve-month period and the S&P Total Return Index returned +15.15% over the same time period.
| · | Top contributors and detractors by sector and stock positions are below: |
Sector Contributors/Detractors
| Average Contribution | Average Exposure | |||||||||
| Largest Contributors | ||||||||||
Long | Health Care | 1.61% | 12.69% | |||||||
| Consumer Staples | 1.41% | 11.61% | ||||||||
| Largest Detractors | ||||||||||
Long | Energy | -3.62% | 6.26% | |||||||
| Financials | -1.59% | 13.97% | ||||||||
Stock Contributors/Detractors
| Average Contribution | Average Exposure | |||||||||
| Largest Contributors | ||||||||||
Long | Apple Inc. | 1.20% | 1.67% | |||||||
| Lowe’s Cos Inc. | 0.61% | 1.03% | ||||||||
| Largest Detractors | ||||||||||
Long | Chevron Corp. | -0.62% | 1.66% | |||||||
| Raytheon | -0.53% | 0.70% | ||||||||
8
Annual Investment Adviser’s Report (Continued)
September 30, 2020
(Unaudited)
Gotham Defensive Long 500 Fund (GDLFX)
● The Fund returned -7.95% (net) for the trailing twelve-month period and the S&P 500 Total Return Index returned +15.15% over the same time period.
● The spread for the period was -11.25%2 .
● The long portfolio contributed +5.71% for the trailing twelve-month period. The short portfolio detracted -12.79% for the period.
● Top contributors and detractors by sector and stock positions are below:
Sector Contributors/Detractors
| Average Contribution | Average Exposure | ||||||||||||||||
| Largest Contributors | |||||||||||||||||
Long | Consumer Discretionary | 4.36% | 23.16% | ||||||||||||||
| Information Technology | 3.90% | 23.94% | |||||||||||||||
Short | Financials | 0.81% | -8.13% | ||||||||||||||
| Energy | 0.56% | -5.93% | |||||||||||||||
| Largest Detractors | |||||||||||||||||
Long | Energy | -4.47% | 6.87% | ||||||||||||||
| Real Estate | -3.54% | 6.55% | |||||||||||||||
Short | Information Technology | -6.47% | -23.80% | ||||||||||||||
| Health Care | -3.90% | -15.16% | |||||||||||||||
Stock Contributors/Detractors
| Average Contribution | Average Exposure | ||||||||||||||||
| Largest Contributors | |||||||||||||||||
Long | Apple Inc. | 1.94% | 2.98% | ||||||||||||||
| Amazon.com Inc. | 1.83% | 2.06% | |||||||||||||||
Short | Boeing Co. | 1.23% | -1.57% | ||||||||||||||
| Citigroup Inc. | 0.61% | -0.57% | |||||||||||||||
| Largest Detractors | |||||||||||||||||
Long | Chevron Corp. | -1.15% | 2.38% | ||||||||||||||
| Intel Corp. | -0.96% | 1.01% | |||||||||||||||
Short | NVIDIA Corp. | -1.89% | -1.77% | ||||||||||||||
| Advanced Micro Devices Inc. | -1.40% | -1.29% | |||||||||||||||
9
Annual Investment Adviser’s Report (Concluded)
September 30, 2020
(Unaudited)
Gotham Total Return Fund (GTRFX)
● The Fund’s Institutional Class returned -6.54% (net) for the trailing twelve-month period and the HFRX Equity Hedge Index returned -0.39% over the same time period.
● The spread for the period was +1.80%2 .
● The long portfolio contributed +4.00% for the trailing twelve-month period. The short portfolio detracted -0.56% for the period.
● Top contributors and detractors by sector and stock positions are below:
Sector Contributors/Detractors
| Average Contribution | Average Exposure | |||||||||
| Largest Contributors | ||||||||||
Long | Information Technology | 1.61% | 21.00% | |||||||
| Consumer Staples | 1.01% | 18.87% | ||||||||
Short | Communication Services | 0.35% | -2.50% | |||||||
| Consumer Discretionary | 0.24% | -7.13% | ||||||||
| Largest Detractors | ||||||||||
Long | Financials | -0.36% | 9.15% | |||||||
| Real Estate | -0.23% | 3.23% | ||||||||
Short | Industrials | -0.26% | -8.60% | |||||||
| Energy | -0.23% | -5.04% | ||||||||
Stock Contributors/Detractors
| Average Contribution | Average Exposure | |||||||||
| Largest Contributors | ||||||||||
Long | Amazon.com Inc. | 0.44% | 1.79% | |||||||
| Microsoft Corp. | 0.41% | 2.15% | ||||||||
Short | PayPal Holdings Inc. | 0.14% | -0.37% | |||||||
| Salesforce.com Inc. | 0.10% | -0.62% | ||||||||
| Largest Detractors | ||||||||||
Long | Amgen Inc. | -0.20% | 0.53% | |||||||
| Bristol-Myers Squibb Co. | -0.15% | 1.54% | ||||||||
Short | Fidelity National Information Services Inc. | -0.09% | -0.70% | |||||||
| Gardner Denver Holdings Inc. | -0.09% | -0.89% | ||||||||
| 2 | The spread is defined as how much our long portfolio outperformed our short portfolio adjusted for leverage (i.e. 100% long the long portfolio less 100% long the short portfolio). |
10
Gotham Absolute Return Fund
Annual Report
Performance Data
September 30, 2020
(Unaudited)
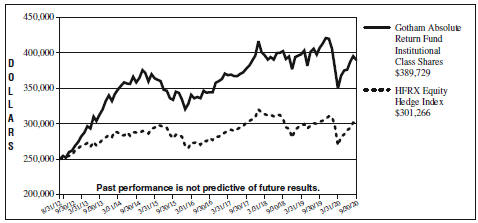
Comparison of Change in Value of $250,000 Investment in Gotham Absolute Return Fund Institutional Class Shares vs Hedge Fund Research Inc. (HFRX) Equity Hedge Index
| Average Annual Total Returns for the Periods Ended September 30, 2020 | ||||||||||||||||||||
| 1 Year | 3 Year | 5 Year | Since Inception |
| ||||||||||||||||
Institutional Class Shares | -4.13 | % | 1.06 | % | 3.17 | % | 5.65 | %* | ||||||||||||
HFRX Equity Hedge Index | -0.39 | % | -0.01 | % | 1.55 | % | 2.33 | %** | ||||||||||||
| * | The Gotham Absolute Return Fund (the “Fund”) commenced operations on August 31, 2012. |
| ** | Benchmark performance is from inception date of the Fund only and is not the inception date of the benchmark itself. |
Past performance does not guarantee future results. The graph and table do not reflect the deduction of taxes that a shareholder would pay on Fund distributions or redemption of Fund shares; nor a 1.00% fee applied by the Fund’s Institutional Class to the value of shares redeemed within 30 days of purchase.
As stated in the current prospectus dated February 1, 2020 (as supplemented on July 17, 2020), the “Total Annual Fund Operating Expenses” are 1.67% and the “Total Annual Fund Operating Expenses After Fee Waivers and/or Expense Reimbursements” are 1.50% for Institutional Class Shares of the Fund’s average daily net assets. These ratios may differ from the actual expense incurred by the Fund for the period covered by this report. Gotham Asset Management, LLC (“Gotham” or the “Adviser”) has contractually agreed to reduce its investment advisory fee and/or reimburse certain expenses of the Fund to the extent necessary to ensure that the Fund’s total operating expenses (exclusive of taxes, “Acquired Fund Fees and Expenses”, dividend and interest expense on securities sold short, interest, extraordinary items, and brokerage commissions) do not exceed 1.50% (on an annual basis) of average daily net assets of the Fund (the “Expense Limitation”). Prior to July 20, 2020, the Expense Limitation was 2.15%. The Expense Limitation will remain in place until January 31, 2022, unless the Board of Trustees of FundVantage Trust (the “Trust”) approves its earlier termination.
The Fund intends to evaluate performance as compared to that of the Hedge Fund Research Inc. Equity Hedge Index (“HFRX”). The HFRX is an index of quantitatively-selected hedge funds which maintain positions both long and short in primarily equity and equity derivative securities. Constituents of the HFRX report net of all fees returns.
11
GOTHAM FUNDS
Gotham Enhanced Return Fund
Annual Report
Performance Data
September 30, 2020
(Unaudited)
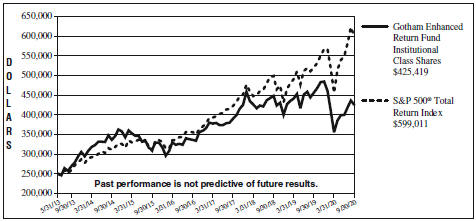
Comparison of Change in Value of $250,000 Investment in Gotham Enhanced Return Fund Institutional Class Shares vs the Standard & Poor’s 500® Total Return Index (“S&P 500® Total Return Index”)
| Average Annual Total Returns for the Periods Ended September 30, 2020 | ||||||||||||||||||||
| 1 Year | 3 Year | 5 Year | Since Inception | |||||||||||||||||
Institutional Class Shares | -6.81 | % | 2.88 | % | 6.45 | % | 7.52 | %* | ||||||||||||
S&P 500® Total Return Index | 15.15 | % | 12.27 | % | 14.14 | % | 12.64 | %** | ||||||||||||
| * | The Gotham Enhanced Return Fund (the “Fund”) commenced operations on May 31, 2013. |
| ** | Benchmark performance is from inception date of the Fund only and is not the inception date of the benchmark itself. |
Past performance does not guarantee future results. The graph and table do not reflect the deduction of taxes that a shareholder would pay on Fund distributions or redemption of Fund shares; nor a 1.00% fee applied by the Fund’s Institutional Class to the value of shares redeemed within 30 days of purchase.
As stated in the current prospectus dated February 1, 2020 (as supplemented on July 17, 2020), the “Total Annual Fund Operating Expenses” are 1.65% and the “Total Annual Fund Operating Expenses After Fee Waivers and/or Expense Reimbursements” are 1.50% for Institutional Class Shares of the Fund’s average daily net assets. These ratios may differ from the actual expense incurred by the Fund for the period covered by this report. Gotham Asset Management, LLC (“Gotham” or the “Adviser”) has contractually agreed to reduce its investment advisory fee and/or reimburse certain expenses of the Fund to the extent necessary to ensure that the Fund’s total operating expenses (exclusive of taxes, “Acquired Fund Fees and Expenses”, dividend and interest expense on securities sold short, interest, extraordinary items, and brokerage commissions) do not exceed 1.50% (on an annual basis) of average daily net assets of the Fund (the “Expense Limitation”). Prior to July 20, 2020, the Expense Limitation was 2.15%. The Expense Limitation will remain in place until January 31, 2022, unless the Board of Trustees of FundVantage Trust (the “Trust”) approves its earlier termination.
The Fund intends to evaluate performance as compared to that of the Standard & Poor’s 500® Total Return Index (“S&P 500® Total Return Index”). The S&P 500® Total Return Index is a market capitalization weighted index of 500 large-capitalization stocks commonly used to represent the U.S. equity market. Its returns reflect reinvested dividends.
12
GOTHAM FUNDS
Gotham Neutral Fund
Annual Report
Performance Data
September 30, 2020
(Unaudited)
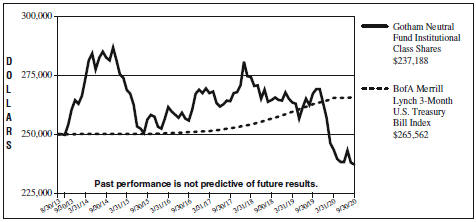
Comparison of Change in Value of $250,000 Investment in Gotham Neutral Fund Institutional Class Shares vs BofA Merrill Lynch 3-Month U.S. Treasury Bill Index
| Average Annual Total Returns for the Periods Ended September 30, 2020 | ||||||||||||||||||||
| 1 Year | 3 Year | 5 Year | Since Inception | |||||||||||||||||
Institutional Class Shares | -11.21 | % | -3.51 | % | -1.53 | % | -0.74% | * | ||||||||||||
BofA Merrill Lynch 3-Month | 1.10 | % | 1.69 | % | 1.20 | % | 0.86% | ** | ||||||||||||
| * | The Gotham Neutral Fund (the “Fund”) commenced operations on August 30, 2013. |
| ** | Benchmark performance is from inception date of the Fund only and is not the inception date of the benchmark itself. |
Past performance does not guarantee future results. The graph and table do not reflect the deduction of taxes that a shareholder would pay on Fund distributions or redemption of Fund shares; nor a 1.00% fee applied by the Fund’s Institutional Class to the value of shares redeemed within 30 days of purchase.
As stated in the current prospectus dated February 1, 2020 (as supplemented on July 17, 2020), the “Total Annual Fund Operating Expenses” are 1.64% and the “Total Annual Fund Operating Expenses After Fee Waivers and/or Expense Reimbursements” are 1.50% for Institutional Class Shares of the Fund’s average daily net assets. These ratios may differ from the actual expense incurred by the Fund for the period covered by this report. Gotham Asset Management, LLC (“Gotham” or the “Adviser”) has contractually agreed to reduce its investment advisory fee and/or reimburse certain expenses of the Fund to the extent necessary to ensure that the Fund’s total operating expenses (exclusive of taxes, “Acquired Fund Fees and Expenses”, dividend and interest expense on securities sold short, interest, extraordinary items, and brokerage commissions) do not exceed 1.50% (on an annual basis) of average daily net assets of the Fund (the “Expense Limitation”). Prior to July 20, 2020, the Expense Limitation was 2.15%. The Expense Limitation will remain in place until January 31, 2022, unless the Board of Trustees of FundVantage Trust (the “Trust”) approves its earlier termination.
The Fund intends to evaluate performance as compared to that of the BofA Merrill Lynch 3-Month U.S. Treasury Bill Index (the “Index”). The Index is an index comprised of a single Treasury bill issue purchased at the beginning of the month and held for a full month, then sold and rolled into a newly selected Treasury bill issue.
13
GOTHAM FUNDS
Gotham Large Value Fund
Annual Report
Performance Data
September 30, 2020
(Unaudited)
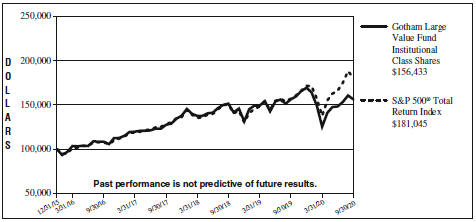
Comparison of Change in Value of $100,000 Investment in Gotham Large Value Fund Institutional Class Shares vs Standard & Poor’s 500® Total Return Index (“S&P 500® Total Return Index”)
| Average Annual Total Returns for the Periods Ended September 30, 2020 | ||||||||||||||||
| 1 Year | 3 Year | Since Inception | ||||||||||||||
Institutional Class Shares | 0.04 | % | 7.05 | % | 9.88% | * | ||||||||||
S&P 500® Total Return Index | 15.15 | % | 12.27 | % | 13.30% | ** | ||||||||||
| * | The Gotham Large Value Fund (the “Fund”) commenced operations on December 31, 2015. |
| ** | Benchmark performance is from inception date of the Fund only and is not the inception date of the benchmark itself. |
Past performance does not guarantee future results. The graph and table do not reflect the deduction of taxes that a shareholder would pay on Fund distributions or redemption of Fund shares; nor a 1.00% fee applied by the Fund’s Institutional Class to the value of shares redeemed within 30 days of purchase.
As stated in the current prospectus dated February 1, 2020 (as supplemented on July 17, 2020), the “Total Annual Fund Operating Expenses” are 1.05% and the “Total Annual Fund Operating Expenses After Fee Waivers and/or Expense Reimbursements” are 0.75% for Institutional Class Shares of the Fund’s average daily net assets. These ratios may differ from the actual expense incurred by the Fund for the period covered by this report. Gotham Asset Management, LLC (“Gotham” or the “Adviser”) has contractually agreed to reduce its investment advisory fee and/or reimburse certain expenses of the Fund to the extent necessary to ensure that the Fund’s total operating expenses (exclusive of taxes, “Acquired Fund Fees and Expenses”, dividend and interest expense on securities sold short, interest, extraordinary items, and brokerage commissions) do not exceed 0.75% (on an annual basis) of average daily net assets of the Fund (the “Expense Limitation”). The Expense Limitation will remain in place until January 31, 2022, unless the Board of Trustees of FundVantage Trust (the “Trust”) approves its earlier termination. The Adviser is entitled to recover, subject to approval by the Board of Trustees, such amounts reduced or reimbursed for a period of up to three (3) years from the date on which the Adviser reduced its compensation and/or assumed expenses for the Fund. The Adviser is permitted to seek reimbursement from the Fund, subject to certain limitations, for fees it waived and Fund expenses it paid to the extent the total annual fund expenses do not exceed the limits described above or any lesser limits in effect at the time of reimbursement. No recoupment will occur unless the Fund’s expenses are below the Expense Limitation.
The Fund intends to evaluate performance as compared to that of the Standard & Poor’s 500® Total Return Index (“S&P 500® Total Return Index”). The S&P 500® Total Return Index is a market capitalization weighted index of 500 large-capitalization stocks commonly used to represent the U.S. equity market. Its returns reflect reinvested dividends.
14
GOTHAM FUNDS
Gotham Defensive Long 500 Fund
Annual Report
Performance Data
September 30, 2020
(Unaudited)
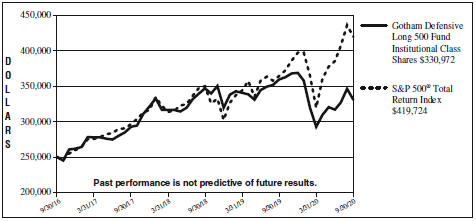
Comparison of Change in Value of $250,000 Investment in Gotham Defensive Long 500 Fund Institutional Class Shares vs Standard & Poor’s 500® Total Return Index (“S&P 500® Total Return Index”)
| Average Annual Total Returns for the Periods Ended September 30, 2020 | ||||||||||||||||
| 1 Year | 3 Year | Since Inception | ||||||||||||||
Institutional Class Shares | -7.95 | % | 4.18 | % | 7.27 | %* | ||||||||||
S&P 500® Total Return Index | 15.15 | % | 12.27 | % | 13.82 | %** | ||||||||||
| * | The Gotham Defensive Long 500 Fund (the “Fund”) commenced operations on September 30, 2016. |
| ** | Benchmark performance is from inception date of the Fund only and is not the inception date of the benchmark itself. |
Past performance does not guarantee future results. The graph and table do not reflect the deduction of taxes that a shareholder would pay on Fund distributions or redemption of Fund shares; nor a 1.00% fee applied by the Fund’s Institutional Class to the value of shares redeemed within 30 days of purchase.
As stated in the current prospectus dated February 1, 2020 (as supplemented on July 17, 2020), the “Total Annual Fund Operating Expenses” are 2.03% and the “Total Annual Fund Operating Expenses After Fee Waivers and/or Expense Reimbursements” are 1.35% for Institutional Class Shares of the Fund’s average daily net assets. These ratios may differ from the actual expense incurred by the Fund for the period covered by this report. Gotham Asset Management, LLC (“Gotham” or the “Adviser”) has contractually agreed to reduce its investment advisory fee and/or reimburse certain expenses of the Fund to the extent necessary to ensure that the Fund’s total operating expenses (exclusive of taxes, “Acquired Fund Fees and Expenses”, dividend and interest expense on securities sold short, interest, extraordinary items, and brokerage commissions) do not exceed 1.35% (on an annual basis) of average daily net assets of the Fund (the “Expense Limitation”). The Expense Limitation will remain in place until January 31, 2022, unless the Board of Trustees of FundVantage Trust (the “Trust”) approves its earlier termination.
The Fund intends to evaluate performance as compared to that of the Standard & Poor’s 500® Total Return Index (“S&P 500® Total Return Index”). The S&P 500® Total Return Index is a market capitalization weighted index of 500 large-capitalization stocks commonly used to represent the U.S. equity market. Its returns reflect reinvested dividends.
15
GOTHAM FUNDS
Gotham Total Return Fund
Annual Report
Performance Data
September 30, 2020
(Unaudited)
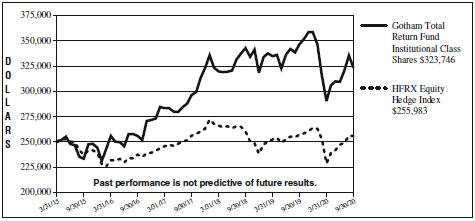
Comparison of Change in Value of $250,000 Investment in Gotham Total Return Fund Institutional Class Shares vs Hedge Fund Research Inc. (HFRX) Equity Hedge Index
| Average Annual Total Returns For the Periods Ended September 30, 2020 | ||||||||||||||||||||
| 1 Year | 3 years | 5 years | Since Inception |
| ||||||||||||||||
Institutional Class Shares | -6.54 | % | 3.01 | % | 6.78 | % | 4.81% | * | ||||||||||||
Investor Class Shares | -6.70 | % | N/A | N/A | -0.28% | * | ||||||||||||||
HFRX Equity Hedge Index | -0.39 | % | -0.01 | % | 1.55 | % | 0.43% | ** | ||||||||||||
| * | Institutional Class shares and Investor Class shares of the Gotham Total Return Fund (the “Fund”) incepted on March 31, 2015 and December 29, 2017, respectively. |
| ** | Benchmark performance is from inception date of the Fund’s Institutional Class shares only and is not the inception date of the benchmark itself. |
Past performance does not guarantee future results. The graph and table do not reflect the deduction of taxes that a shareholder would pay on Fund distributions or redemption of Fund shares; nor a 1.00% fee applied by the Fund’s Institutional Class and Investor Class to the value of the shares redeemed within 30 days of purchase.
As stated in the current prospectus dated February 1, 2020 (as supplemented on July 17, 2020), the “Total Annual Fund Operating Expenses” and the “Total Annual Fund Operating Expenses After Fee Waivers and/or Expense Reimbursements” are 2.16% and 1.47% for the Institutional Class shares, respectively, and 2.41% and 1.72% for the Investor Class shares, respectively, of the Fund’s average daily net assets. These ratios may differ from the actual expense incurred by the Fund for the period covered by this report. Gotham Asset Management, LLC (“Gotham” or the “Adviser”) has contractually agreed to reduce its investment advisory fee and/or reimburse certain expenses of the Fund to the extent necessary to ensure that the Fund’s total operating expenses (exclusive of taxes, “Acquired Fund Fees and Expenses”, dividend and interest expense on securities sold short, interest, extraordinary items, management fees (if any) and brokerage commissions), do not exceed 0.00% with respect to Institutional Class shares, (on an annual basis) and 0.25% with respect to Investor Class shares, (on an annual basis), of average daily net assets of the Fund (the “Expense Limitation”). The Expense Limitation will remain in place until January 31, 2022, unless the Board of Trustees of FundVantage Trust (the “Trust”) approves its earlier termination. The Adviser is entitled to recover, subject to approval by the Board of Trustees, such amounts reduced or reimbursed for a period of up to three (3) years from the date on which the Adviser reduced its compensation and/or assumed expenses for the Fund. The recoupment of fees waived or expenses reimbursed are limited to the lesser of (a) the Expense Limitation in effect at the time fees were waived or expenses were reimbursed, and (b) the Expense Limitation in effect at the time of recoupment.
The Fund intends to evaluate performance as compared to that of the Hedge Fund Research Inc. Equity Hedge Index (“HFRX”). The HFRX is an index of quantitatively-selected hedge funds which maintain positions both long and short in primarily equity and equity derivative securities. Constituents of the HFRX report net of all fees returns.
16
GOTHAM FUNDS
Gotham Total Return Fund
Annual Report
Performance Data
September 30, 2020
(Unaudited)
The Fund normally allocates the majority of its assets among mutual funds advised by Gotham. Therefore, the Fund’s shareholders will indirectly bear the Fund’s proportionate share of fees and expenses of the underlying funds in addition to the Fund’s own expenses. The Fund also is subject to the risks of the underlying funds, which may include any or all of the risks described in Important Information.
17
Fund Expense Disclosure
September 30, 2020
(Unaudited)
As a shareholder of a Fund, you incur two types of costs: (1) transaction costs, including redemption fees; and (2) ongoing costs, including management fees and other Fund expenses. This example is intended to help you understand your ongoing costs (in dollars) of investing in a Fund and to compare these costs with the ongoing costs of investing in other mutual funds.
These examples are based on an investment of $1,000 invested at the beginning of the six-month period from April 1, 2020, and held for the entire period through September 30, 2020.
Actual Expenses
The first line for each Fund in the accompanying table provides information about actual account values and actual expenses. You may use the information in this line, together with the amount you invested, to estimate the expenses that you paid over the period. Simply divide your account value by $1,000 (for example, an $8,600 account value divided by $1,000 = 8.6), then multiply the result by the number in the first line under the heading entitled “Expenses Paid During Period” to estimate the expenses you paid on your account during this period.
Hypothetical Example for Comparison Purposes
The second line for each Fund in the accompanying table provides information about hypothetical account values and hypothetical expenses based on the Fund’s actual expense ratio and an assumed rate of return of 5% per year before expenses, which is not your Fund’s actual return. The hypothetical account values and expenses may not be used to estimate the actual ending account balance or expenses you paid for the period. You may use this information to compare the ongoing costs of investing in the Fund and other funds. To do so, compare this 5% hypothetical example with the 5% hypothetical examples that appear in the shareholder reports of other funds.
Please note that the expenses shown in the accompanying table are meant to highlight your ongoing costs only and do not reflect any transactional costs, such as redemption fees. Therefore, the second line of the accompanying table is useful in comparing ongoing costs only, and will not help you determine the relative total costs of owning different funds. In addition, if these transactional costs were included, your costs would have been higher.
Beginning Account Value April 1, 2020 | Ending Account Value September 30, 2020 | Annualized Expense Ratio* | Expenses Paid During Period** | ||||||||||||||||||||||||||||||||
Gotham Absolute Return Fund | |||||||||||||||||||||||||||||||||||
Institutional Class | |||||||||||||||||||||||||||||||||||
Actual | $1,000.00 | $1,115.50 | 2.43 | % | $12.83 | ||||||||||||||||||||||||||||||
Hypothetical (5% return before expenses) | 1,000.00 | 1,012.87 | 2.43 | % | 12.21 | ||||||||||||||||||||||||||||||
Gotham Enhanced Return Fund | |||||||||||||||||||||||||||||||||||
Institutional Class | |||||||||||||||||||||||||||||||||||
Actual | $1,000.00 | $1,195.60 | 1.90 | % | $10.43 | ||||||||||||||||||||||||||||||
Hypothetical (5% return before expenses) | 1,000.00 | 1,015.50 | 1.90 | % | 9.57 | ||||||||||||||||||||||||||||||
Gotham Neutral Fund | |||||||||||||||||||||||||||||||||||
Institutional Class | |||||||||||||||||||||||||||||||||||
Actual | $1,000.00 | $974.50 | 3.14 | % | $15.50 | ||||||||||||||||||||||||||||||
Hypothetical (5% return before expenses) | 1,000.00 | 1,009.30 | 3.14 | % | 15.77 | ||||||||||||||||||||||||||||||
18
GOTHAM FUNDS
Fund Expense Disclosure (Concluded)
September 30, 2020
(Unaudited)
Beginning Account Value April 1, 2020 | Ending Account Value September 30, 2020 | Annualized Expense Ratio* | Expenses Paid During Period** | ||||||||||||||||||||||||||||||||
Gotham Large Value Fund | |||||||||||||||||||||||||||||||||||
Institutional Class | |||||||||||||||||||||||||||||||||||
Actual | $ | 1,000.00 | $ | 1,246.90 | 0.75 | % | $ | 4.21 | |||||||||||||||||||||||||||
Hypothetical (5% return before expenses) | 1,000.00 | 1,021.25 | 0.75 | % | 3.79 | ||||||||||||||||||||||||||||||
Gotham Defensive Long 500 Fund | |||||||||||||||||||||||||||||||||||
Institutional Class | |||||||||||||||||||||||||||||||||||
Actual | $ | 1,000.00 | $ | 1,131.30 | 1.35 | % | $ | 7.19 | |||||||||||||||||||||||||||
Hypothetical (5% return before expenses) | 1,000.00 | 1,018.25 | 1.35 | % | 6.81 | ||||||||||||||||||||||||||||||
Gotham Total Return Fund | |||||||||||||||||||||||||||||||||||
Institutional Class | |||||||||||||||||||||||||||||||||||
Actual | $ | 1,000.00 | $ | 1,115.40 | 0.00 | % | $ | — | |||||||||||||||||||||||||||
Hypothetical (5% return before expenses) | 1,000.00 | 1,025.00 | 0.00 | % | — | ||||||||||||||||||||||||||||||
Investor Class | |||||||||||||||||||||||||||||||||||
Actual | $ | 1,000.00 | $ | 1,114.60 | 0.25 | % | $ | 1.32 | |||||||||||||||||||||||||||
Hypothetical (5% return before expenses) | 1,000.00 | 1,023.75 | 0.25 | % | 1.26 | ||||||||||||||||||||||||||||||
| * | Annualized expense ratios include dividend expense on securities sold short and interest expense on securities sold short and borrowings, except for Gotham Large Value Fund, which does not short securities or use leverage. |
| ** | Expenses are equal to a Fund’s annualized expense ratio, in the table above, which include waived fees or reimbursement expenses for the six-month period ended September 30, 2020, multiplied by the average account value over the period, multiplied by the number of days in the most recent period, then divided by 366 to reflect the period. Hypothetical expenses are equal to the Fund’s annualized expense ratios, multiplied by the average account value over the period, multiplied by the number of days in the most recent six-month period, then divided by 366 to reflect the period. |
19
Portfolio Holdings Summary Tables
September 30, 2020
(Unaudited)
The following table presents a summary by industry group of the portfolio holdings of the Fund:
Gotham Absolute Return Fund
| % of Net Assets | Value | |||||||||
Common Stocks: | ||||||||||
Software & Services | 14.0 | % | $ | 70,578,717 | ||||||
Retailing | 10.7 | 54,200,591 | ||||||||
Capital Goods | 9.5 | 48,314,357 | ||||||||
Media & Entertainment | 8.2 | 41,347,025 | ||||||||
Health Care Equipment & Services | 7.3 | 36,907,300 | ||||||||
Technology Hardware & Equipment | 5.6 | 28,350,447 | ||||||||
Semiconductors & Semiconductor Equipment | 5.6 | 28,100,426 | ||||||||
Pharmaceuticals, Biotechnology & Life Sciences | 5.4 | 27,370,304 | ||||||||
Materials | 4.9 | 24,617,321 | ||||||||
Food, Beverage & Tobacco | 3.4 | 17,428,863 | ||||||||
Energy | 3.3 | 16,717,588 | ||||||||
Consumer Durables & Apparel | 3.1 | 15,443,271 | ||||||||
Consumer Services | 3.0 | 15,274,586 | ||||||||
Utilities | 1.9 | 9,741,050 | ||||||||
Transportation | 1.8 | 9,132,360 | ||||||||
Food & Staples Retailing | 1.7 | 8,835,752 | ||||||||
Commercial & Professional Services | 1.6 | 8,016,521 | ||||||||
Household & Personal Products | 1.5 | 7,818,615 | ||||||||
Automobiles & Components | 0.9 | 4,527,512 | ||||||||
Telecommunication Services | 0.8 | 4,080,536 | ||||||||
Diversified Financials | 0.7 | 3,405,281 | ||||||||
Corporate Bonds and Notes: | ||||||||||
Capital Goods | 0.0 | 785 | ||||||||
|
|
|
| |||||||
Total Investments | 94.9 | 480,209,208 | ||||||||
|
|
|
| |||||||
Other Assets in Excess of Liabilities | 5.1 | 25,780,058 | ||||||||
|
|
|
| |||||||
NET ASSETS | 100.0 | % | $ | 505,989,266 | ||||||
|
|
|
| |||||||
Portfolio holdings are subject to change at any time.
The accompanying notes are an integral part of the financial statements.
20
GOTHAM FUNDS
Portfolio Holdings Summary Tables
September 30, 2020
(Unaudited)
The following table presents a summary by industry group of the portfolio holdings of the Fund:
Gotham Enhanced Return Fund
| % of Net Assets | Value | |||||||||
Common Stocks: | ||||||||||
Software & Services | 14.1 | % | $ | 33,283,890 | ||||||
Retailing | 9.6 | 22,706,657 | ||||||||
Capital Goods | 8.2 | 19,383,187 | ||||||||
Media & Entertainment | 7.9 | 18,775,192 | ||||||||
Health Care Equipment & Services | 7.6 | 18,044,845 | ||||||||
Pharmaceuticals, Biotechnology & Life Sciences | 5.7 | 13,521,100 | ||||||||
Semiconductors & Semiconductor Equipment | 5.7 | 13,483,074 | ||||||||
Technology Hardware & Equipment | 5.0 | 11,863,059 | ||||||||
Materials | 4.7 | 11,140,648 | ||||||||
Food, Beverage & Tobacco | 3.5 | 8,267,856 | ||||||||
Consumer Durables & Apparel | 3.3 | 7,832,310 | ||||||||
Energy | 3.2 | 7,615,809 | ||||||||
Consumer Services | 2.9 | 6,854,632 | ||||||||
Utilities | 2.3 | 5,446,965 | ||||||||
Transportation | 2.1 | 5,011,985 | ||||||||
Food & Staples Retailing | 1.8 | 4,350,634 | ||||||||
Diversified Financials | 1.8 | 4,160,415 | ||||||||
Commercial & Professional Services | 1.6 | 3,792,484 | ||||||||
Telecommunication Services | 1.6 | 3,719,683 | ||||||||
Household & Personal Products | 1.4 | 3,359,298 | ||||||||
Automobiles & Components | 0.8 | 1,869,886 | ||||||||
|
|
|
| |||||||
Total Common Stocks | 94.8 | 224,483,609 | ||||||||
|
|
|
| |||||||
Other Assets in Excess of Liabilities | 5.2 | 12,241,074 | ||||||||
|
|
|
| |||||||
NET ASSETS | 100.0 | % | $ | 236,724,683 | ||||||
|
|
|
| |||||||
Portfolio holdings are subject to change at any time.
The accompanying notes are an integral part of the financial statements.
21
GOTHAM FUNDS
Portfolio Holdings Summary Tables
September 30, 2020
(Unaudited)
The following table presents a summary by industry group of the portfolio holdings of the Fund:
Gotham Neutral Fund
| % of Net Assets | Value | |||||||||
Common Stocks: | ||||||||||
Software & Services | 12.3 | % | $ | 6,818,085 | ||||||
Retailing | 11.9 | 6,621,499 | ||||||||
Capital Goods | 11.5 | 6,388,069 | ||||||||
Materials | 8.7 | 4,856,000 | ||||||||
Health Care Equipment & Services | 7.6 | 4,239,051 | ||||||||
Media & Entertainment | 5.6 | 3,117,945 | ||||||||
Pharmaceuticals, Biotechnology & Life Sciences | 5.2 | 2,881,969 | ||||||||
Semiconductors & Semiconductor Equipment | 4.6 | 2,553,474 | ||||||||
Technology Hardware & Equipment | 3.7 | 2,074,036 | ||||||||
Consumer Services | 3.5 | 1,959,193 | ||||||||
Consumer Durables & Apparel | 3.5 | 1,943,104 | ||||||||
Energy | 3.2 | 1,797,238 | ||||||||
Food, Beverage & Tobacco | 2.7 | 1,498,844 | ||||||||
Commercial & Professional Services | 2.3 | 1,279,314 | ||||||||
Transportation | 2.1 | 1,185,397 | ||||||||
Food & Staples Retailing | 1.8 | 1,021,721 | ||||||||
Household & Personal Products | 1.4 | 774,719 | ||||||||
Utilities | 1.2 | 655,149 | ||||||||
Automobiles & Components | 0.8 | 461,768 | ||||||||
Telecommunication Services | 0.6 | 335,474 | ||||||||
Diversified Financials | 0.4 | 213,172 | ||||||||
Corporate Bonds and Notes: | ||||||||||
Capital Goods | 0.0 | 715 | ||||||||
|
|
|
| |||||||
Total Investments | 94.6 | 52,675,936 | ||||||||
|
|
|
| |||||||
Other Assets in Excess of Liabilities | 5.4 | 2,999,354 | ||||||||
|
|
|
| |||||||
NET ASSETS | 100.0 | % | $ | 55,675,290 | ||||||
|
|
|
| |||||||
Portfolio holdings are subject to change at any time.
The accompanying notes are an integral part of the financial statements.
22
GOTHAM FUNDS
Portfolio Holdings Summary Tables
September 30, 2020
(Unaudited)
The following table presents a summary by industry group of the portfolio holdings of the Fund:
Gotham Large Value Fund
| % of Net Assets | Value | |||||||||
COMMON STOCKS: | ||||||||||
Capital Goods | 15.1 | % | $ | 10,551,252 | ||||||
Retailing | 10.1 | 7,047,043 | ||||||||
Food, Beverage & Tobacco | 7.9 | 5,538,522 | ||||||||
Health Care Equipment & Services | 7.6 | 5,314,881 | ||||||||
Materials | 6.0 | 4,224,425 | ||||||||
Software & Services | 5.7 | 3,956,557 | ||||||||
Technology Hardware & Equipment | 5.6 | 3,898,843 | ||||||||
Diversified Financials | 5.6 | 3,883,912 | ||||||||
Pharmaceuticals, Biotechnology & Life Sciences | 4.5 | 3,178,267 | ||||||||
Energy | 4.0 | 2,766,264 | ||||||||
Household & Personal Products | 3.9 | 2,703,314 | ||||||||
Banks | 3.4 | 2,410,057 | ||||||||
Food & Staples Retailing | 3.3 | 2,284,479 | ||||||||
Transportation | 3.0 | 2,130,539 | ||||||||
Telecommunication Services | 3.0 | 2,130,364 | ||||||||
Insurance | 2.7 | 1,893,851 | ||||||||
Media & Entertainment | 2.2 | 1,544,688 | ||||||||
Real Estate | 1.2 | 861,823 | ||||||||
Consumer Services | 1.1 | 784,520 | ||||||||
Consumer Durables & Apparel | 1.1 | 779,785 | ||||||||
Semiconductors & Semiconductor Equipment | 0.9 | 624,208 | ||||||||
Commercial & Professional Services | 0.8 | 551,575 | ||||||||
Automobiles & Components | 0.4 | 299,308 | ||||||||
Utilities | 0.4 | 288,922 | ||||||||
|
|
|
| |||||||
Total Common Stocks | 99.5 | 69,647,399 | ||||||||
|
|
|
| |||||||
Other Assets in Excess of Liabilities | 0.5 | 355,158 | ||||||||
|
|
|
| |||||||
NET ASSETS | 100.0 | % | $ | 70,002,557 | ||||||
|
|
|
| |||||||
Portfolio holdings are subject to change at any time.
The accompanying notes are an integral part of the financial statements.
23
GOTHAM FUNDS
Portfolio Holdings Summary Tables
September 30, 2020
(Unaudited)
The following table presents a summary by security group of the portfolio holdings of the Fund:
Gotham Defensive Long 500 Fund
| % of Net Assets | Value | |||||||||
COMMON STOCKS: | ||||||||||
Retailing | 14.4 | % | $ | 7,889,342 | ||||||
Food, Beverage & Tobacco | 11.2 | 6,144,268 | ||||||||
Capital Goods | 10.6 | 5,810,041 | ||||||||
Software & Services | 10.1 | 5,506,657 | ||||||||
Household & Personal Products | 6.6 | 3,581,636 | ||||||||
Materials | 5.2 | 2,831,501 | ||||||||
Pharmaceuticals, Biotechnology & Life Sciences | 5.1 | 2,805,851 | ||||||||
Technology Hardware & Equipment | 4.9 | 2,684,135 | ||||||||
Food & Staples Retailing | 4.7 | 2,579,984 | ||||||||
Media & Entertainment | 4.6 | 2,491,727 | ||||||||
Transportation | 4.0 | 2,159,671 | ||||||||
Telecommunication Services | 3.5 | 1,925,502 | ||||||||
Health Care Equipment & Services | 3.2 | 1,765,809 | ||||||||
Diversified Financials | 2.5 | 1,351,832 | ||||||||
Consumer Services | 1.2 | 663,400 | ||||||||
Consumer Durables & Apparel | 0.7 | 395,337 | ||||||||
Insurance | 0.7 | 363,419 | ||||||||
Energy | 0.6 | 337,863 | ||||||||
Automobiles & Components | 0.6 | 331,692 | ||||||||
Utilities | 0.4 | 211,307 | ||||||||
Commercial & Professional Services | 0.2 | 103,921 | ||||||||
Real Estate | 0.0 | 960 | ||||||||
|
|
|
| |||||||
Total Common Stocks | 95.0 | 51,935,855 | ||||||||
|
|
|
| |||||||
Other Assets in Excess of Liabilities | 5.0 | 2,739,502 | ||||||||
|
|
|
| |||||||
NET ASSETS | 100.0 | % | $ | 54,675,357 | ||||||
|
|
|
| |||||||
Portfolio holdings are subject to change at any time.
The accompanying notes are an integral part of the financial statements.
24
GOTHAM FUNDS
Portfolio Holdings Summary Tables
September 30, 2020
(Unaudited)
The following table presents a summary by security type of the portfolio holdings of the Fund:
Gotham Total Return Fund
| % of Net Assets | Value | |||||||||
Affiliated Equity Registered Investment Companies | 99.6 | % | $ | 28,510,056 | ||||||
Other Assets in Excess of Liabilities | 0.4 | 127,310 | ||||||||
|
|
|
| |||||||
NET ASSETS | 100.0 | % | $ | 28,637,366 | ||||||
|
|
|
| |||||||
Portfolio holdings are subject to change at any time.
The accompanying notes are an integral part of the financial statements.
25
Portfolio of Investments
September 30, 2020
| Number of Shares | Value | |||||||
COMMON STOCKS — 94.9% |
| |||||||
Automobiles & Components — 0.9% |
| |||||||
Adient PLC (Ireland)* | 12,013 | $ | 208,185 | |||||
American Axle & Manufacturing Holdings, Inc.* | 63,933 | 368,893 | ||||||
BorgWarner, Inc. | 1,878 | 72,754 | ||||||
Cooper Tire & Rubber Co. | 2,194 | 69,550 | ||||||
Dana, Inc. | 8,348 | 102,847 | ||||||
General Motors Co. | 18,203 | 538,627 | ||||||
Gentherm, Inc.* | 4,753 | 194,398 | ||||||
Magna International, Inc. (Canada) | 9,018 | 412,574 | ||||||
Standard Motor Products, Inc. | 238 | 10,627 | ||||||
Tenneco, Inc., Class A* | 37,820 | 262,471 | ||||||
Thor Industries, Inc.(a) | 20,383 | 1,941,685 | ||||||
Visteon Corp.(a)* | 4,812 | 333,087 | ||||||
XPEL, Inc.* | 453 | 11,814 | ||||||
|
| |||||||
| 4,527,512 | ||||||||
|
| |||||||
Capital Goods — 9.5% |
| |||||||
3M Co. | 11,539 | 1,848,317 | ||||||
Acuity Brands, Inc.(a) | 4,706 | 481,659 | ||||||
Advanced Drainage Systems, Inc. | 8,105 | 506,076 | ||||||
AECOM(a)* | 24,441 | 1,022,611 | ||||||
Albany International Corp., Class A | 1,968 | 97,436 | ||||||
AMETEK, Inc. | 9,544 | 948,674 | ||||||
Apogee Enterprises, Inc. | 3,140 | 67,102 | ||||||
Applied Industrial Technologies, Inc. | 1,841 | 101,439 | ||||||
Astec Industries, Inc. | 410 | 22,242 | ||||||
Atkore International Group, Inc.* | 6,758 | 153,609 | ||||||
Ballard Power Systems, Inc. | 6,674 | 100,777 | ||||||
Barnes Group, Inc. | 5,741 | 205,183 | ||||||
BWX Technologies, Inc. | 4,194 | 236,164 | ||||||
Chart Industries, Inc.* | 5,385 | 378,404 | ||||||
Colfax Corp.(a)* | 63,907 | 2,004,124 | ||||||
Comfort Systems USA, Inc. | 2,358 | 121,461 | ||||||
Cummins, Inc. | 356 | 75,173 | ||||||
Curtiss-Wright Corp. | 2,407 | 224,477 | ||||||
Deere & Co.(a) | 6,633 | 1,470,072 | ||||||
Douglas Dynamics, Inc. | 68 | 2,326 | ||||||
Dover Corp. | 18,444 | 1,998,223 | ||||||
Dycom Industries, Inc.(a)* | 11,170 | 589,999 | ||||||
Eaton Corp. PLC (Ireland) | 6,124 | 624,832 | ||||||
Emerson Electric Co. | 25,547 | 1,675,117 | ||||||
Encore Wire Corp. | 315 | 14,622 | ||||||
Enerpac Tool Group Corp. | 5,444 | 102,402 | ||||||
ESCO Technologies, Inc. | 266 | 21,429 | ||||||
| Number of Shares | Value | |||||||
COMMON STOCKS — (Continued) |
| |||||||
Capital Goods — (Continued) |
| |||||||
Evoqua Water Technologies Corp.* | 1,448 | $ | 30,727 | |||||
Federal Signal Corp. | 641 | 18,749 | ||||||
Flowserve Corp. | 24,359 | 664,757 | ||||||
Fortive Corp. | 2,342 | 178,484 | ||||||
Fortune Brands Home & Security, Inc. | 16,376 | 1,416,852 | ||||||
Foundation Building Materials, Inc.* | 1,115 | 17,528 | ||||||
Franklin Electric Co., Inc. | 4,376 | 257,440 | ||||||
FuelCell Energy, Inc.* | 74,750 | 159,965 | ||||||
General Dynamics Corp. | 5,737 | 794,173 | ||||||
Gibraltar Industries, Inc.(a)* | 7,506 | 488,941 | ||||||
GMS, Inc.* | 2,371 | 57,141 | ||||||
Griffon Corp. | 1,336 | 26,105 | ||||||
Herc Holdings, Inc.* | 971 | 38,461 | ||||||
Honeywell International, Inc. | 13,062 | 2,150,136 | ||||||
Howmet Aerospace, Inc. | 158,948 | 2,657,611 | ||||||
Hubbell, Inc. | 1,743 | 238,512 | ||||||
Huntington Ingalls Industries, Inc. | 671 | 94,443 | ||||||
Illinois Tool Works, Inc. | 5,244 | 1,013,193 | ||||||
ITT, Inc. | 1,340 | 79,127 | ||||||
John Bean Technologies Corp. | 2,300 | 211,347 | ||||||
Lockheed Martin Corp.(a) | 8,413 | 3,224,535 | ||||||
Masco Corp. | 40,518 | 2,233,757 | ||||||
Middleby Corp. (The)* | 2,512 | 225,352 | ||||||
MRC Global, Inc.* | 16,458 | 70,440 | ||||||
Mueller Industries, Inc. | 7,763 | 210,067 | ||||||
National Presto Industries, Inc. | 114 | 9,332 | ||||||
NOW, Inc.* | 29,657 | 134,643 | ||||||
nVent Electric PLC (Ireland) | 10,719 | 189,619 | ||||||
Otis Worldwide Corp. | 2,519 | 157,236 | ||||||
Owens Corning | 14,303 | 984,189 | ||||||
PACCAR, Inc. | 7,541 | 643,096 | ||||||
Parker-Hannifin Corp. | 530 | 107,240 | ||||||
Pentair PLC (Ireland) | 18,220 | 833,929 | ||||||
Quanta Services, Inc. | 27,677 | 1,463,006 | ||||||
RBC Bearings, Inc.* | 1,478 | 179,148 | ||||||
Regal Beloit Corp. | 1,660 | 155,824 | ||||||
Rexnord Corp. | 8,789 | 262,264 | ||||||
Roper Technologies, Inc. | 774 | 305,815 | ||||||
Shyft Group, Inc. (The) | 273 | 5,154 | ||||||
Simpson Manufacturing Co., Inc. | 8,826 | 857,534 | ||||||
SiteOne Landscape Supply, Inc.* | 2,911 | 354,996 | ||||||
Snap-on, Inc. | 3,339 | 491,267 | ||||||
SPX FLOW, Inc.* | 1,157 | 49,543 | ||||||
Teledyne Technologies, Inc.(a)* | 1,661 | 515,259 | ||||||
The accompanying notes are an integral part of the financial statements.
26
GOTHAM ABSOLUTE RETURN FUND
Portfolio of Investments (Continued)
September 30, 2020
| Number of Shares | Value | |||||||
COMMON STOCKS — (Continued) |
| |||||||
Capital Goods — (Continued) |
| |||||||
Tennant Co. | 8 | $ | 483 | |||||
Timken Co. (The) | 2,097 | 113,699 | ||||||
Toro Co. (The) | 1,202 | 100,908 | ||||||
TPI Composites, Inc.* | 6,613 | 191,512 | ||||||
Trane Technologies PLC (Ireland) | 9,851 | 1,194,434 | ||||||
TransDigm Group, Inc. | 4,138 | 1,966,047 | ||||||
TriMas Corp.* | 6 | 137 | ||||||
UFP Industries, Inc. | 18,423 | 1,041,084 | ||||||
United Rentals, Inc.* | 10,189 | 1,777,980 | ||||||
Univar Solutions, Inc.(a) * | 50,972 | 860,407 | ||||||
Valmont Industries, Inc. | 3,017 | 374,651 | ||||||
Wabash National Corp. | 10,568 | 126,393 | ||||||
Watsco, Inc. | 1,174 | 273,413 | ||||||
Watts Water Technologies, Inc., Class A | 1,420 | 142,213 | ||||||
Westinghouse Air Brake Technologies Corp. | 3,342 | 206,803 | ||||||
Woodward, Inc. | 5,688 | 455,950 | ||||||
WW Grainger, Inc. | 385 | 137,356 | ||||||
|
| |||||||
| 48,314,357 | ||||||||
|
| |||||||
Commercial & Professional Services — 1.6% |
| |||||||
ABM Industries, Inc. | 6,139 | 225,056 | ||||||
ASGN, Inc.* | 45 | 2,860 | ||||||
Cimpress PLC (Ireland)* | 6,853 | 515,071 | ||||||
Cintas Corp. | 755 | 251,287 | ||||||
Clarivate PLC (Jersey)* | 17,806 | 551,808 | ||||||
Clean Harbors, Inc.* | 3,298 | 184,787 | ||||||
Covanta Holding Corp. | 65,811 | 510,035 | ||||||
Deluxe Corp. | 523 | 13,457 | ||||||
Ennis, Inc. | 61 | 1,064 | ||||||
Equifax, Inc. | 762 | 119,558 | ||||||
Exponent, Inc. | 107 | 7,707 | ||||||
FTI Consulting, Inc.* | 21 | 2,225 | ||||||
Healthcare Services Group, Inc. | 37,850 | 814,910 | ||||||
Herman Miller, Inc. | 1,223 | 36,886 | ||||||
ICF International, Inc. | 69 | 4,246 | ||||||
IHS Markit Ltd. (Bermuda) | 7,470 | 586,470 | ||||||
KAR Auction Services, Inc. | 449 | 6,466 | ||||||
ManpowerGroup, Inc. | 6,134 | 449,806 | ||||||
MSA Safety, Inc. | 818 | 109,751 | ||||||
Nielsen Holdings PLC (United Kingdom) | 27,017 | 383,101 | ||||||
Republic Services, Inc. | 9,090 | 848,552 | ||||||
| Number of Shares | Value | |||||||
COMMON STOCKS — (Continued) |
| |||||||
Commercial & Professional Services — (Continued) |
| |||||||
Robert Half International, Inc. | 2,231 | $ | 118,109 | |||||
Stantec, Inc. (Canada) | 129 | 3,914 | ||||||
Steelcase, Inc., Class A | 16,530 | 167,118 | ||||||
Tetra Tech, Inc. | 2,715 | 259,282 | ||||||
TransUnion(a) | 7,867 | 661,851 | ||||||
TriNet Group, Inc.* | 5,943 | 352,539 | ||||||
TrueBlue, Inc.* | 205 | 3,175 | ||||||
UniFirst Corp. | 699 | 132,370 | ||||||
Verisk Analytics, Inc. | 1,903 | 352,645 | ||||||
Waste Management, Inc.(a) | 3,008 | 340,415 | ||||||
|
| |||||||
| 8,016,521 | ||||||||
|
| |||||||
Consumer Durables & Apparel — 3.1% |
| |||||||
Brunswick Corp. | 7,979 | 470,043 | ||||||
Capri Holdings Ltd. (British Virgin Islands)* | 59,634 | 1,073,412 | ||||||
Carter’s, Inc. | 3,132 | 271,169 | ||||||
Cavco Industries, Inc.* | 231 | 41,652 | ||||||
Deckers Outdoor Corp.* | 787 | 173,148 | ||||||
DR Horton, Inc.(a) | 15,903 | 1,202,744 | ||||||
Garmin Ltd. (Switzerland) | 6,882 | 652,827 | ||||||
G-III Apparel Group Ltd.* | 24,769 | 324,722 | ||||||
Gildan Activewear, Inc. (Canada) | 10,451 | 205,571 | ||||||
Hanesbrands, Inc. | 37,245 | 586,609 | ||||||
Helen of Troy Ltd. (Bermuda)* | 866 | 167,588 | ||||||
Kontoor Brands, Inc. | 13,252 | 320,698 | ||||||
La-Z-Boy, Inc. | 8,524 | 269,614 | ||||||
Leggett & Platt, Inc. | 775 | 31,907 | ||||||
Mattel, Inc.* | 10,639 | 124,476 | ||||||
Mohawk Industries, Inc.(a)* | 11,514 | 1,123,651 | ||||||
Nautilus, Inc.* | 7,807 | 133,968 | ||||||
Newell Brands, Inc. | 331 | 5,680 | ||||||
NIKE, Inc., Class B | 14,495 | 1,819,702 | ||||||
Polaris, Inc. | 15,726 | 1,483,591 | ||||||
PulteGroup, Inc. | 19,907 | 921,495 | ||||||
PVH Corp. | 14,916 | 889,590 | ||||||
Smith & Wesson Brands, Inc. | 21,687 | 336,582 | ||||||
Steven Madden Ltd. | 33,353 | 650,384 | ||||||
Sturm Ruger & Co., Inc. | 7,229 | 442,126 | ||||||
Tempur Sealy International, Inc.(a)* | 10,057 | 896,984 | ||||||
TopBuild Corp.* | 575 | 98,147 | ||||||
Tupperware Brands Corp. | 8,390 | 169,142 | ||||||
Whirlpool Corp. | 1,882 | 346,081 | ||||||
YETI Holdings, Inc.* | 4,633 | 209,968 | ||||||
|
| |||||||
| 15,443,271 | ||||||||
|
| |||||||
The accompanying notes are an integral part of the financial statements.
27
GOTHAM ABSOLUTE RETURN FUND
Portfolio of Investments (Continued)
September 30, 2020
| Number of Shares | Value | |||||||
COMMON STOCKS — (Continued) |
| |||||||
Consumer Services — 3.0% |
| |||||||
Adtalem Global Education, Inc.* | 12,815 | $ | 314,480 | |||||
Bloomin’ Brands, Inc.(a) | 58,306 | 890,333 | ||||||
Boyd Gaming Corp. | 20,370 | 625,155 | ||||||
Chipotle Mexican Grill, Inc.* | 167 | 207,700 | ||||||
Darden Restaurants, Inc. | 3,591 | 361,757 | ||||||
Dine Brands Global, Inc.(a) | 16,008 | 873,877 | ||||||
El Pollo Loco Holdings, Inc.* | 1,792 | 29,030 | ||||||
frontdoor, Inc.* | 178 | 6,926 | ||||||
Graham Holdings Co., Class B | 11 | 4,445 | ||||||
Grand Canyon Education, Inc.* | 2,495 | 199,450 | ||||||
Hilton Worldwide Holdings, Inc. | 2,537 | 216,457 | ||||||
Hyatt Hotels Corp., Class A | 9,195 | 490,737 | ||||||
Jack in the Box, Inc. | 2,793 | 221,513 | ||||||
Laureate Education, Inc., Class A* | 34,251 | 454,853 | ||||||
McDonald’s Corp.(a) | 4,632 | 1,016,678 | ||||||
MGM Resorts International | 87,049 | 1,893,316 | ||||||
Norwegian Cruise Line Holdings Ltd. (Bermuda)* | 36,552 | 625,405 | ||||||
Papa John’s International, Inc. | 12,338 | 1,015,171 | ||||||
Perdoceo Education Corp.* | 31,819 | 389,465 | ||||||
Red Rock Resorts, Inc., Class A | 32,865 | 561,992 | ||||||
Royal Caribbean Cruises Ltd. (Liberia) | 7,965 | 515,574 | ||||||
Service Corp. International | 5,753 | 242,662 | ||||||
Strategic Education, Inc.(a) | 5,333 | 487,810 | ||||||
Wingstop, Inc. | 13,740 | 1,877,571 | ||||||
Wyndham Hotels & Resorts, Inc. | 7,257 | 366,478 | ||||||
Yum! Brands, Inc. | 15,178 | 1,385,751 | ||||||
|
| |||||||
| 15,274,586 | ||||||||
|
| |||||||
Diversified Financials — 0.7% |
| |||||||
Berkshire Hathaway, Inc., Class B* | 1,200 | 255,528 | ||||||
BlackRock, Inc. | 974 | 548,898 | ||||||
DiamondPeak Holdings Corp., Class A* | 26 | 670 | ||||||
Federated Hermes, Inc. | 3,368 | 72,446 | ||||||
Franklin Resources, Inc. | 1,605 | 32,662 | ||||||
Intercontinental Exchange, Inc. | 78 | 7,804 | ||||||
Moody’s Corp. | 715 | 207,243 | ||||||
Nasdaq, Inc. | 3,096 | 379,910 | ||||||
S&P Global, Inc. | 3,942 | 1,421,485 | ||||||
Sprott, Inc. (Canada) | 114 | 3,892 | ||||||
T Rowe Price Group, Inc. | 3,448 | 442,103 | ||||||
| Number of Shares | Value | |||||||
COMMON STOCKS — (Continued) |
| |||||||
Diversified Financials — (Continued) |
| |||||||
Waddell & Reed Financial, Inc., Class A | 2,198 | $ | 32,640 | |||||
|
| |||||||
| 3,405,281 | ||||||||
|
| |||||||
Energy — 3.3% |
| |||||||
Antero Midstream Corp. | 74,003 | 397,396 | ||||||
Apache Corp. | 49,755 | 471,180 | ||||||
Cactus, Inc., Class A | 8,024 | 153,981 | ||||||
Canadian Natural Resources Ltd. (Canada) | 46,624 | 746,450 | ||||||
Cenovus Energy, Inc. (Canada) | 45,688 | 177,726 | ||||||
Cheniere Energy, Inc.* | 6,077 | 281,183 | ||||||
Chevron Corp.(a) | 50,756 | 3,654,432 | ||||||
Clean Energy Fuels Corp.* | 16,527 | 40,987 | ||||||
Concho Resources, Inc. | 3,366 | 148,508 | ||||||
ConocoPhillips | 53,315 | 1,750,865 | ||||||
Core Laboratories NV (Netherlands) | 9,409 | 143,581 | ||||||
Crescent Point Energy Corp. (Canada) | 496 | 605 | ||||||
DHT Holdings, Inc. (Marshall Islands) | 6,424 | 33,148 | ||||||
DMC Global, Inc. | 1,367 | 45,029 | ||||||
EOG Resources, Inc.(a) | 73,943 | 2,657,511 | ||||||
Halliburton Co.(a) | 73,485 | 885,494 | ||||||
HollyFrontier Corp. | 37,096 | 731,162 | ||||||
Kinder Morgan, Inc. | 42,355 | 522,237 | ||||||
Kosmos Energy Ltd. | 226,318 | 220,796 | ||||||
Magnolia Oil & Gas Corp., Class A* | 38,064 | 196,791 | ||||||
Marathon Petroleum Corp. | 3,387 | 99,375 | ||||||
Murphy Oil Corp. | 99,624 | 888,646 | ||||||
Nordic American Tankers Ltd. (Bermuda) | 110,891 | 387,010 | ||||||
Patterson-UTI Energy, Inc. | 5,223 | 14,886 | ||||||
Phillips 66 | 9,782 | 507,099 | ||||||
Range Resources Corp. | 33,847 | 224,067 | ||||||
Renewable Energy Group, Inc.* | 4,715 | 251,875 | ||||||
Schlumberger NV (Curacao) | 22,555 | 350,956 | ||||||
TechnipFMC PLC (United Kingdom) | 12,618 | 79,620 | ||||||
Williams Cos., Inc. (The) | 21,886 | 430,060 | ||||||
World Fuel Services Corp. | 10,615 | 224,932 | ||||||
|
| |||||||
| 16,717,588 | ||||||||
|
| |||||||
Food & Staples Retailing — 1.7% |
| |||||||
BJ’s Wholesale Club Holdings, Inc.* | 4,211 | 174,967 | ||||||
Casey’s General Stores, Inc. | 468 | 83,140 | ||||||
Costco Wholesale Corp. | 2,917 | 1,035,535 | ||||||
The accompanying notes are an integral part of the financial statements.
28
GOTHAM ABSOLUTE RETURN FUND
Portfolio of Investments (Continued)
September 30, 2020
| Number of Shares | Value | |||||||
COMMON STOCKS — (Continued) |
| |||||||
Food & Staples Retailing — (Continued) |
| |||||||
Kroger Co. (The)(a) | 22,090 | $ | 749,072 | |||||
SpartanNash Co. | 7,823 | 127,906 | ||||||
Sprouts Farmers Market, Inc.* | 33,026 | 691,234 | ||||||
Sysco Corp. | 6,604 | 410,901 | ||||||
United Natural Foods, Inc.* | 9,727 | 144,640 | ||||||
US Foods Holding Corp.* | 30,092 | 668,644 | ||||||
Walgreens Boots Alliance, Inc. | 5,544 | 199,140 | ||||||
Walmart, Inc.(a) | 32,525 | 4,550,573 | ||||||
|
| |||||||
| 8,835,752 | ||||||||
Food, Beverage & Tobacco — 3.4% |
| |||||||
Altria Group, Inc. | 26,008 | 1,004,949 | ||||||
Archer-Daniels-Midland Co. | 5,005 | 232,682 | ||||||
B&G Foods, Inc. | 3,425 | 95,112 | ||||||
Bunge Ltd. (Bermuda) | 615 | 28,106 | ||||||
Coca-Cola Co. (The) | 39,789 | 1,964,383 | ||||||
Coca-Cola Consolidated, Inc. | 177 | 42,600 | ||||||
Conagra Brands, Inc.(a) | 25,321 | 904,213 | ||||||
Constellation Brands, Inc., Class A | 9,169 | 1,737,617 | ||||||
Flowers Foods, Inc. | 3,187 | 77,540 | ||||||
General Mills, Inc. | 12,525 | 772,542 | ||||||
Hershey Co. (The) | 1,233 | 176,738 | ||||||
JM Smucker Co. (The)(a) | 10,406 | 1,202,101 | ||||||
Kellogg Co. | 2,506 | 161,863 | ||||||
Kraft Heinz Co. (The)(a) | 72,562 | 2,173,232 | ||||||
McCormick & Co., Inc., non-voting shares(a) | 3,119 | 605,398 | ||||||
Molson Coors Beverage Co., Class B | 615 | 20,639 | ||||||
Mondelez International, Inc., Class A | 4,151 | 238,475 | ||||||
Monster Beverage Corp.* | 5,346 | 428,749 | ||||||
National Beverage Corp.* | 2,346 | 159,551 | ||||||
PepsiCo, Inc. | 14,452 | 2,003,047 | ||||||
Philip Morris International, Inc. | 11,278 | 845,737 | ||||||
TreeHouse Foods, Inc.* | 6,371 | 258,217 | ||||||
Turning Point Brands, Inc. | 44 | 1,228 | ||||||
Tyson Foods, Inc., Class A | 38,570 | 2,294,144 | ||||||
|
| |||||||
| 17,428,863 | ||||||||
|
| |||||||
Health Care Equipment & Services — 7.3% |
| |||||||
Abbott Laboratories | 2,658 | 289,270 | ||||||
Allscripts Healthcare Solutions, Inc.* | 7,622 | 62,043 | ||||||
Anthem, Inc.(a) | 8,582 | 2,305,039 | ||||||
Cardinal Health, Inc. | 20,050 | 941,348 | ||||||
Centene Corp.* | 3,187 | 185,898 | ||||||
Cerner Corp. | 9,777 | 706,779 | ||||||
Cigna Corp. | 6,079 | 1,029,843 | ||||||
| Number of Shares | Value | |||||||
COMMON STOCKS — (Continued) |
| |||||||
Health Care Equipment & Services — (Continued) |
| |||||||
CONMED Corp. | 2,831 | $ | 222,715 | |||||
CVS Health Corp. | 8,161 | 476,602 | ||||||
Danaher Corp.(a) | 4,539 | 977,383 | ||||||
DaVita, Inc.* | 40,104 | 3,434,908 | ||||||
DENTSPLY SIRONA, Inc. | 10,727 | 469,092 | ||||||
Ensign Group, Inc. (The) | 1,491 | 85,076 | ||||||
Globus Medical, Inc., Class A* | 2,775 | 137,418 | ||||||
Hanger, Inc.* | 98 | 1,550 | ||||||
HCA Healthcare, Inc.(a) | 6,107 | 761,421 | ||||||
HealthStream, Inc.* | 37 | 743 | ||||||
Hill-Rom Holdings, Inc. | 1,899 | 158,585 | ||||||
HMS Holdings Corp.* | 677 | 16,214 | ||||||
Hologic, Inc.(a) * | 33,195 | 2,206,472 | ||||||
Humana, Inc.(a) | 6,248 | 2,585,985 | ||||||
IDEXX Laboratories, Inc.* | 2,225 | 874,670 | ||||||
Integer Holdings Corp.* | 4,917 | 290,152 | ||||||
Intuitive Surgical, Inc.* | 1,365 | 968,522 | ||||||
iRhythm Technologies, Inc.* | 1,524 | 362,880 | ||||||
Livongo Health, Inc.(a) * | 8,384 | 1,174,179 | ||||||
Magellan Health, Inc.* | 2,744 | 207,940 | ||||||
McKesson Corp. | 2,379 | 354,304 | ||||||
MEDNAX, Inc.* | 3,101 | 50,484 | ||||||
Medtronic PLC (Ireland) | 22,319 | 2,319,390 | ||||||
Molina Healthcare, Inc.* | 672 | 123,003 | ||||||
Natus Medical, Inc.* | 1,244 | 21,310 | ||||||
Neogen Corp.* | 266 | 20,814 | ||||||
NextGen Healthcare, Inc.* | 813 | 10,358 | ||||||
Omnicell, Inc.* | 1,856 | 138,569 | ||||||
Patterson Cos., Inc.(a) | 38,654 | 931,755 | ||||||
Providence Service Corp. (The)* | 883 | 82,040 | ||||||
Quidel Corp.* | 6,959 | 1,526,665 | ||||||
ResMed, Inc. | 7,426 | 1,273,039 | ||||||
Select Medical Holdings Corp.* | 23,212 | 483,274 | ||||||
STERIS PLC (Ireland) | 6,193 | 1,091,145 | ||||||
Stryker Corp. | 9,065 | 1,888,874 | ||||||
Teladoc Health, Inc.(a) * | 3,267 | 716,257 | ||||||
Teleflex, Inc. | 21 | 7,149 | ||||||
Tenet Healthcare Corp.* | 10,977 | 269,046 | ||||||
Tivity Health, Inc.* | 26,472 | 371,137 | ||||||
UnitedHealth Group, Inc. | 3,002 | 935,934 | ||||||
Universal Health Services, Inc., Class B | 10,932 | 1,169,943 | ||||||
Varian Medical Systems, Inc.* | 4,874 | 838,328 | ||||||
The accompanying notes are an integral part of the financial statements.
29
GOTHAM ABSOLUTE RETURN FUND
Portfolio of Investments (Continued)
September 30, 2020
| Number of Shares | Value | |||||||
COMMON STOCKS — (Continued) |
| |||||||
Health Care Equipment & Services — (Continued) |
| |||||||
West Pharmaceutical Services, Inc.(a) | 4,269 | $ | 1,173,548 | |||||
Zimmer Biomet Holdings, Inc. | 1,309 | 178,207 | ||||||
|
| |||||||
| 36,907,300 | ||||||||
|
| |||||||
Household & Personal Products — 1.5% |
| |||||||
Church & Dwight Co., Inc. | 646 | 60,537 | ||||||
Clorox Co. (The) | 1,620 | 340,475 | ||||||
Colgate-Palmolive Co. | 21,754 | 1,678,321 | ||||||
Edgewell Personal Care Co.* | 9,076 | 253,039 | ||||||
elf Beauty, Inc.* | 20,155 | 370,247 | ||||||
Estee Lauder Cos., Inc. (The), Class A | 2,479 | 541,042 | ||||||
Kimberly-Clark Corp. | 15,675 | 2,314,570 | ||||||
Procter & Gamble Co. (The) | 14,833 | 2,061,639 | ||||||
Spectrum Brands Holdings, Inc. | 3,477 | 198,745 | ||||||
|
| |||||||
| 7,818,615 | ||||||||
|
| |||||||
Materials — 4.9% | ||||||||
Allegheny Technologies, Inc.* | 50,616 | 441,372 | ||||||
Amcor PLC (Jersey) | 58,269 | 643,872 | ||||||
Avient Corp. | 44,746 | 1,183,979 | ||||||
Axalta Coating Systems Ltd. | 6,260 | 138,784 | ||||||
Boise Cascade Co. | 3,342 | 133,413 | ||||||
Cabot Corp. | 2,660 | 95,840 | ||||||
Carpenter Technology Corp. | 9,235 | 167,708 | ||||||
Celanese Corp. | 1,490 | 160,100 | ||||||
Century Aluminum Co.* | 2,769 | 19,715 | ||||||
CF Industries Holdings, Inc. | 41,213 | 1,265,651 | ||||||
Chase Corp. | 3 | 286 | ||||||
Chemours Co. (The) | 46,596 | 974,322 | ||||||
Commercial Metals Co. | 49,755 | 994,105 | ||||||
Compass Minerals International, Inc. | 5,643 | 334,912 | ||||||
Dow, Inc. | 21,301 | 1,002,212 | ||||||
DuPont de Nemours, Inc. | 9,532 | 528,835 | ||||||
Eastman Chemical Co. | 2,883 | 225,220 | ||||||
Ecolab, Inc.(a) | 8,557 | 1,710,031 | ||||||
Element Solutions, Inc.* | 11,551 | 121,401 | ||||||
Ferro Corp.* | 10,958 | 135,879 | ||||||
First Majestic Silver Corp. (Canada)* | 10,527 | 100,217 | ||||||
FMC Corp. | 10,951 | 1,159,820 | ||||||
Forterra, Inc.* | 591 | 6,986 | ||||||
Freeport-McMoRan, Inc.(a) | 46,166 | 722,036 | ||||||
FutureFuel Corp. | 51 | 580 | ||||||
| Number of Shares | Value | |||||||
COMMON STOCKS — (Continued) |
| |||||||
Materials — (Continued) | ||||||||
GCP Applied Technologies, Inc.* | 735 | $ | 15,398 | |||||
Golden Star Resources Ltd. (Canada)* | 1,677 | 7,228 | ||||||
Hecla Mining Co. | 121,216 | 615,777 | ||||||
IAMGOLD Corp. (Canada)* | 14,787 | 56,634 | ||||||
Ingevity Corp.(a) * | 8,289 | 409,808 | ||||||
Innospec, Inc. | 1,111 | 70,349 | ||||||
International Paper Co. | 4,772 | 193,457 | ||||||
Kaiser Aluminum Corp. | 1,101 | 59,003 | ||||||
Kraton Corp.* | 11,011 | 196,216 | ||||||
Linde PLC (Ireland) | 11,606 | 2,763,737 | ||||||
Louisiana-Pacific Corp. | 3,642 | 107,475 | ||||||
LyondellBasell Industries NV, Class A (Netherlands) | 9,418 | 663,875 | ||||||
Martin Marietta Materials, Inc. | 931 | 219,120 | ||||||
Mosaic Co. (The) | 6,794 | 124,126 | ||||||
Neenah, Inc. | 5 | 187 | ||||||
NewMarket Corp. | 725 | 248,182 | ||||||
Newmont Corp. | 19,700 | 1,249,965 | ||||||
Nucor Corp. | 18,578 | 833,409 | ||||||
Nutrien Ltd. (Canada) | 8,921 | 349,971 | ||||||
O-I Glass, Inc. | 68,238 | 722,640 | ||||||
Pan American Silver Corp. (Canada) | 19,678 | 632,648 | ||||||
PPG Industries, Inc. | 2,347 | 286,522 | ||||||
Pretium Resources, Inc. (Canada)* | 1,815 | 23,305 | ||||||
Reliance Steel & Aluminum Co. | 4,255 | 434,180 | ||||||
Sealed Air Corp. | 4,098 | 159,043 | ||||||
Sensient Technologies Corp. | 5,283 | 305,040 | ||||||
Sonoco Products Co.(a) | 10,373 | 529,749 | ||||||
Southern Copper Corp. | 2,488 | 112,632 | ||||||
SSR Mining, Inc. (Canada)* | 24,364 | 454,876 | ||||||
Stepan Co. | 59 | 6,431 | ||||||
Summit Materials, Inc., Class A* | 11,744 | 194,246 | ||||||
Tredegar Corp. | 148 | 2,201 | ||||||
Wheaton Precious Metals Corp. (Canada) | 2,187 | 107,316 | ||||||
Worthington Industries, Inc. | 3,829 | 156,147 | ||||||
Yamana Gold, Inc. (Canada) | 6,893 | 39,152 | ||||||
|
| |||||||
| 24,617,321 | ||||||||
|
| |||||||
Media & Entertainment — 8.2% | ||||||||
Activision Blizzard, Inc.(a) | 7,916 | 640,800 | ||||||
Alphabet, Inc., Class A(a)* | 5,373 | 7,874,669 | ||||||
Cargurus, Inc.* | 2,899 | 62,705 | ||||||
The accompanying notes are an integral part of the financial statements.
30
GOTHAM ABSOLUTE RETURN FUND
Portfolio of Investments (Continued)
September 30, 2020
| Number of Shares | Value | |||||||
COMMON STOCKS — (Continued) |
| |||||||
Media & Entertainment — (Continued) |
| |||||||
Charter Communications, Inc., Class A* | 5,035 | $ | 3,143,552 | |||||
Discovery, Inc., Class A* | 10,691 | 232,743 | ||||||
DISH Network Corp., Class A(a)* | 39,397 | 1,143,695 | ||||||
Electronic Arts, Inc.(a) * | 13,780 | 1,797,050 | ||||||
EverQuote, Inc., Class A* | 2,678 | 103,478 | ||||||
Facebook, Inc., Class A(a)* | 35,015 | 9,170,428 | ||||||
Fox Corp., Class A(a) | 48,287 | 1,343,827 | ||||||
Interpublic Group of Cos., Inc. (The) | 38,006 | 633,560 | ||||||
John Wiley & Sons, Inc., Class A | 1,609 | 51,021 | ||||||
Match Group, Inc.* | 2,199 | 243,319 | ||||||
MSG Networks, Inc., Class A* | 710 | 6,795 | ||||||
Netflix, Inc.* | 4,479 | 2,239,634 | ||||||
New York Times Co. (The), Class A | 68 | 2,910 | ||||||
News Corp., Class A | 107,894 | 1,512,674 | ||||||
Omnicom Group, Inc. | 4,572 | 226,314 | ||||||
Pinterest, Inc., Class A* | 15,121 | 627,673 | ||||||
Sirius XM Holdings, Inc. | 44,253 | 237,196 | ||||||
Take-Two Interactive Software, Inc.* | 5,162 | 852,866 | ||||||
Twitter, Inc.* | 60,956 | 2,712,542 | ||||||
Walt Disney Co. (The) | 30,071 | 3,731,210 | ||||||
Zillow Group, Inc., Class C* | 26,038 | 2,645,200 | ||||||
Zynga, Inc., Class A* | 12,189 | 111,164 | ||||||
|
| |||||||
| 41,347,025 | ||||||||
|
| |||||||
Pharmaceuticals, Biotechnology & Life Sciences — 5.4% |
| |||||||
Agilent Technologies, Inc.(a) | 7,144 | 721,115 | ||||||
Avantor, Inc.(a)* | 10,698 | 240,598 | ||||||
Biogen, Inc.* | 3,822 | 1,084,225 | ||||||
Bio-Rad Laboratories, Inc., Class A* | 636 | 327,833 | ||||||
Bristol Myers Squibb Co. | 4,137 | 249,420 | ||||||
Catalent, Inc.* | 1,057 | 90,543 | ||||||
Charles River Laboratories International, Inc.* | 1,155 | 261,550 | ||||||
Coherus Biosciences, Inc.* | 1,274 | 23,365 | ||||||
Corcept Therapeutics, Inc.* | 1,068 | 18,589 | ||||||
Denali Therapeutics, Inc.* | 546 | 19,563 | ||||||
Elanco Animal Health, Inc.* | 23,331 | 651,635 | ||||||
Emergent BioSolutions, Inc.* | 2,086 | 215,546 | ||||||
Gilead Sciences, Inc. | 5,005 | 316,266 | ||||||
Horizon Therapeutics PLC (Ireland)* | 7,486 | 581,512 | ||||||
Innoviva, Inc.* | 15,853 | 165,664 | ||||||
IQVIA Holdings, Inc.* | 2,873 | 452,871 | ||||||
Ironwood Pharmaceuticals, Inc.* | 441 | 3,967 | ||||||
| Number of Shares | Value | |||||||
COMMON STOCKS — (Continued) |
| |||||||
Pharmaceuticals, Biotechnology & Life Sciences — (Continued) |
| |||||||
Johnson & Johnson | 24,886 | $ | 3,705,028 | |||||
Kura Oncology, Inc.* | 201 | 6,159 | ||||||
Luminex Corp. | 4,184 | 109,830 | ||||||
Merck & Co., Inc. | 19,313 | 1,602,013 | ||||||
Mylan NV (Netherlands)* | 46,804 | 694,103 | ||||||
NantKwest, Inc.* | 344 | 2,386 | ||||||
Natera, Inc.(a)* | 22,997 | 1,661,303 | ||||||
Neurocrine Biosciences, Inc.* | 1,297 | 124,720 | ||||||
Novavax, Inc.(a)* | 46,725 | 5,062,654 | ||||||
PerkinElmer, Inc.(a) | 15,604 | 1,958,458 | ||||||
Pfizer, Inc. | 94,507 | 3,468,407 | ||||||
Phibro Animal Health Corp., Class A | 31 | 539 | ||||||
Prestige Consumer Healthcare, Inc.* | 8,727 | 317,837 | ||||||
Regeneron Pharmaceuticals, Inc.* | 144 | 80,608 | ||||||
TG Therapeutics, Inc.* | 15,046 | 402,631 | ||||||
Thermo Fisher Scientific, Inc. | 1,586 | 700,251 | ||||||
Trillium Therapeutics, Inc. | 3,940 | 55,987 | ||||||
United Therapeutics Corp.* | 5,914 | 597,314 | ||||||
Vanda Pharmaceuticals, Inc.* | 6,787 | 65,562 | ||||||
Waters Corp.* | 1,119 | 218,966 | ||||||
Zoetis, Inc. | 6,720 | 1,111,286 | ||||||
|
| |||||||
| 27,370,304 | ||||||||
|
| |||||||
Retailing — 10.7% | ||||||||
1-800-Flowers.com, Inc., Class A* | 5,153 | 128,516 | ||||||
Aaron’s, Inc.(a) | 20,242 | 1,146,709 | ||||||
Abercrombie & Fitch Co., Class A | 9,814 | 136,709 | ||||||
Advance Auto Parts, Inc. | 1,488 | 228,408 | ||||||
Amazon.com, Inc.(a)* | 2,738 | 8,621,223 | ||||||
Asbury Automotive Group, Inc.* | 37 | 3,606 | ||||||
At Home Group, Inc.* | 28,049 | 416,808 | ||||||
AutoNation, Inc.* | 5,439 | 287,886 | ||||||
AutoZone, Inc.(a)* | 1,024 | 1,205,903 | ||||||
Bed Bath & Beyond, Inc. | 31,727 | 475,270 | ||||||
Best Buy Co., Inc. | 17,630 | 1,962,043 | ||||||
Big Lots, Inc. | 1,672 | 74,571 | ||||||
Booking Holdings, Inc.(a) * | 2,641 | 4,517,906 | ||||||
Buckle, Inc. (The) | 8,726 | 177,923 | ||||||
Camping World Holdings, Inc., Class A | 1,100 | 32,725 | ||||||
CarParts.Com, Inc.* | 11,365 | 122,856 | ||||||
Dick’s Sporting Goods, Inc. | 2,050 | 118,654 | ||||||
Dollar General Corp. | 3,692 | 773,917 | ||||||
eBay, Inc.(a) | 74,207 | 3,866,185 | ||||||
The accompanying notes are an integral part of the financial statements.
31
GOTHAM ABSOLUTE RETURN FUND
Portfolio of Investments (Continued)
September 30, 2020
| Number of Shares | Value | |||||||
COMMON STOCKS — (Continued) |
| |||||||
Retailing — (Continued) |
| |||||||
Etsy, Inc.* | 9,339 | $ | 1,135,903 | |||||
Foot Locker, Inc. | 9,936 | 328,186 | ||||||
Gap, Inc. (The) | 52,964 | 901,977 | ||||||
Genuine Parts Co. | 5,464 | 520,009 | ||||||
Guess?, Inc. | 36,468 | 423,758 | ||||||
Hibbett Sports, Inc.* | 1,881 | 73,773 | ||||||
Home Depot, Inc. (The)(a) | 10,250 | 2,846,528 | ||||||
L Brands, Inc. | 62,987 | 2,003,616 | ||||||
Lithia Motors, Inc., Class A | 1,513 | 344,873 | ||||||
LKQ Corp.* | 31,050 | 861,016 | ||||||
Lowe’s Cos., Inc.(a) | 23,930 | 3,969,030 | ||||||
Lumber Liquidators Holdings, Inc.* | 15,627 | 344,575 | ||||||
Macy’s, Inc. | 258,523 | 1,473,581 | ||||||
MarineMax, Inc.* | 4,492 | 115,310 | ||||||
Michaels Cos., Inc. (The)* | 16,385 | 158,197 | ||||||
Murphy USA, Inc.(a)* | 5,237 | 671,750 | ||||||
National Vision Holdings, Inc.* | 14,984 | 572,988 | ||||||
ODP Corp. (The)(a) | 18,440 | 358,658 | ||||||
O’Reilly Automotive, Inc.* | 1,927 | 888,501 | ||||||
Pool Corp. | 591 | 197,713 | ||||||
Qurate Retail, Inc., Series A | 22,664 | 162,728 | ||||||
RH(a)* | 7,934 | 3,035,707 | ||||||
Ross Stores, Inc. | 1,858 | 173,389 | ||||||
Shoe Carnival, Inc. | 1,322 | 44,393 | ||||||
Shutterstock, Inc. | 2,469 | 128,487 | ||||||
Signet Jewelers Ltd. (Bermuda) | 69,980 | 1,308,626 | ||||||
Sleep Number Corp.* | 16,355 | 799,923 | ||||||
Sonic Automotive, Inc., Class A(a) | 28,655 | 1,150,785 | ||||||
Sportsman’s Warehouse Holdings, Inc.* | 10,210 | 146,105 | ||||||
Stamps.com, Inc.(a)* | 4,909 | 1,182,824 | ||||||
Target Corp. | 2,955 | 465,176 | ||||||
Tractor Supply Co. | 7,208 | 1,033,195 | ||||||
Urban Outfitters, Inc.* | 19,282 | 401,258 | ||||||
Williams-Sonoma, Inc.(a) | 15,734 | 1,422,983 | ||||||
Zumiez, Inc.* | 9,247 | 257,252 | ||||||
|
| |||||||
| 54,200,591 | ||||||||
|
| |||||||
Semiconductors & Semiconductor Equipment — 5.6% |
| |||||||
Advanced Micro Devices, Inc.* | 2,921 | 239,493 | ||||||
Amkor Technology, Inc.* | 36,775 | 411,880 | ||||||
Applied Materials, Inc. | 36,028 | 2,141,865 | ||||||
Axcelis Technologies, Inc.* | 12,369 | 272,118 | ||||||
Broadcom, Inc. | 2,631 | 958,526 | ||||||
| Number of Shares | Value | |||||||
COMMON STOCKS — (Continued) |
| |||||||
Semiconductors & Semiconductor Equipment — (Continued) |
| |||||||
Brooks Automation, Inc. | 1,861 | $ | 86,090 | |||||
CEVA, Inc.* | 535 | 21,063 | ||||||
Cirrus Logic, Inc.* | 10,145 | 684,280 | ||||||
Enphase Energy, Inc.(a)* | 7,824 | 646,184 | ||||||
First Solar, Inc.* | 11,615 | 768,913 | ||||||
Intel Corp.(a) | 90,514 | 4,686,815 | ||||||
KLA Corp.(a) | 6,865 | 1,330,025 | ||||||
Lam Research Corp. | 1,762 | 584,544 | ||||||
Lattice Semiconductor Corp.* | 23,792 | 689,016 | ||||||
MACOM Technology Solutions Holdings, Inc.(a)* | 28,237 | 960,340 | ||||||
Marvell Technology Group Ltd. (Bermuda) | 13,020 | 516,894 | ||||||
Maxim Integrated Products, Inc.(a) | 14,446 | 976,694 | ||||||
Microchip Technology, Inc. | 7,119 | 731,548 | ||||||
MKS Instruments, Inc. | 2,067 | 225,778 | ||||||
Monolithic Power Systems, Inc. | 1,825 | 510,288 | ||||||
NVIDIA Corp. | 6,668 | 3,608,855 | ||||||
PDF Solutions, Inc.* | 6 | 112 | ||||||
Power Integrations, Inc. | 5,246 | 290,628 | ||||||
Qorvo, Inc.* | 1,167 | 150,555 | ||||||
Skyworks Solutions, Inc.(a) | 18,006 | 2,619,873 | ||||||
Synaptics, Inc.* | 38,448 | 3,091,988 | ||||||
Texas Instruments, Inc. | 1,583 | 226,037 | ||||||
Ultra Clean Holdings, Inc.* | 31,222 | 670,024 | ||||||
|
| |||||||
| 28,100,426 | ||||||||
|
| |||||||
Software & Services — 14.0% |
| |||||||
A10 Networks, Inc.* | 1,260 | 8,026 | ||||||
Accenture PLC, Class A (Ireland) | 5,841 | 1,320,008 | ||||||
ACI Worldwide, Inc.* | 1,904 | 49,752 | ||||||
Adobe, Inc.* | 3,776 | 1,851,864 | ||||||
Agilysys, Inc.* | 204 | 4,929 | ||||||
Alarm.com Holdings, Inc.* | 1,724 | 95,251 | ||||||
Alliance Data Systems Corp. | 3,739 | 156,963 | ||||||
Anaplan, Inc.* | 6,360 | 398,009 | ||||||
Automatic Data Processing, Inc.(a) | 29,529 | 4,119,000 | ||||||
Black Knight, Inc.* | 3,365 | 292,923 | ||||||
Blackbaud, Inc. | 16,609 | 927,280 | ||||||
Broadridge Financial Solutions, Inc.(a) | 7,631 | 1,007,292 | ||||||
CACI International, Inc., Class A* | 454 | 96,775 | ||||||
Cadence Design Systems, Inc.* | 17,871 | 1,905,585 | ||||||
Cardtronics PLC, Class A (United Kingdom)* | 6,046 | 119,711 | ||||||
The accompanying notes are an integral part of the financial statements.
32
GOTHAM ABSOLUTE RETURN FUND
Portfolio of Investments (Continued)
September 30, 2020
| Number of Shares | Value | |||||||
COMMON STOCKS — (Continued) |
| |||||||
Software & Services — (Continued) |
| |||||||
CGI, Inc. (Canada)* | 1,976 | $ | 133,914 | |||||
Citrix Systems, Inc.(a) | 10,250 | 1,411,528 | ||||||
Cornerstone OnDemand, Inc.* | 8,248 | 299,897 | ||||||
Crowdstrike Holdings, Inc., Class A* | 1,591 | 218,476 | ||||||
Domo, Inc., Class B* | 4,925 | 188,775 | ||||||
Envestnet, Inc.* | 1,332 | 102,777 | ||||||
Evo Payments, Inc., Class A* | 12 | 298 | ||||||
Fair Isaac Corp.* | 427 | 181,637 | ||||||
Fiserv, Inc.* | 8,558 | 881,902 | ||||||
FleetCor Technologies, Inc.* | 7,155 | 1,703,606 | ||||||
Fortinet, Inc.* | 14,655 | 1,726,506 | ||||||
Gartner, Inc.(a) * | 9,505 | 1,187,650 | ||||||
Globant SA (Luxembourg)* | 482 | 86,384 | ||||||
GoDaddy, Inc., Class A* | 8,504 | 646,049 | ||||||
Guidewire Software, Inc.* | 2,625 | 273,709 | ||||||
International Business Machines Corp. | 16,794 | 2,043,326 | ||||||
International Money Express, Inc.* | 253 | 3,634 | ||||||
Intuit, Inc. | 10,203 | 3,328,321 | ||||||
Jack Henry & Associates, Inc.(a) | 3,415 | 555,245 | ||||||
Leidos Holdings, Inc. | 3,281 | 292,501 | ||||||
LiveRamp Holdings, Inc.* | 4,350 | 225,200 | ||||||
Mastercard, Inc., Class A(a) | 4,294 | 1,452,102 | ||||||
Microsoft Corp.(a) | 36,258 | 7,626,145 | ||||||
MicroStrategy, Inc., Class A* | 1,047 | 157,636 | ||||||
MobileIron, Inc.* | 547 | 3,834 | ||||||
Model N, Inc.* | 6,070 | 214,150 | ||||||
NortonLifeLock, Inc. | 89,011 | 1,854,989 | ||||||
Nuance Communications, Inc.* | 1,322 | 43,877 | ||||||
Oracle Corp.(a) | 137,276 | 8,195,377 | ||||||
Paychex, Inc. | 28,170 | 2,247,121 | ||||||
Paylocity Holding Corp.* | 220 | 35,512 | ||||||
PayPal Holdings, Inc.* | 18,277 | 3,601,117 | ||||||
Progress Software Corp. | 3,162 | 115,982 | ||||||
PTC, Inc.* | 17,511 | 1,448,510 | ||||||
QAD, Inc., Class A | 111 | 4,684 | ||||||
Qualys, Inc.* | 472 | 46,261 | ||||||
Sailpoint Technologies Holdings, Inc.(a)* | 37,117 | 1,468,720 | ||||||
salesforce.com, Inc.* | 2,228 | 559,941 | ||||||
Science Applications International Corp. | 6,903 | 541,333 | ||||||
ServiceNow, Inc.(a)* | 10,263 | 4,977,555 | ||||||
| Number of Shares | Value | |||||||
COMMON STOCKS — (Continued) |
| |||||||
Software & Services — (Continued) |
| |||||||
SPS Commerce, Inc.* | 634 | $ | 49,370 | |||||
SS&C Technologies Holdings, Inc. | 7,885 | 477,200 | ||||||
SVMK, Inc.* | 14,083 | 311,375 | ||||||
Synopsys, Inc.* | 10,549 | 2,257,275 | ||||||
Teradata Corp.* | 14,347 | 325,677 | ||||||
VeriSign, Inc.* | 1,865 | 382,045 | ||||||
Virtusa Corp.* | 4,362 | 214,436 | ||||||
Visa, Inc., Class A | 10,663 | 2,132,280 | ||||||
Western Union Co. (The) | 22,253 | 476,882 | ||||||
WEX, Inc.* | 1,942 | 269,880 | ||||||
Workday, Inc., Class A* | 4,671 | 1,004,872 | ||||||
Zoom Video Communications, Inc., Class A* | 506 | 237,876 | ||||||
|
| |||||||
| 70,578,717 | ||||||||
|
| |||||||
Technology Hardware & Equipment — 5.6% |
| |||||||
Amphenol Corp., Class A | 5,863 | 634,787 | ||||||
Apple, Inc.(a) | 92,956 | 10,765,234 | ||||||
Arrow Electronics, Inc.(a)* | 14,612 | 1,149,380 | ||||||
Avnet, Inc. | 1,680 | 43,411 | ||||||
Badger Meter, Inc. | 4,713 | 308,089 | ||||||
Belden, Inc. | 3,597 | 111,939 | ||||||
CDW Corp. | 1,059 | 126,582 | ||||||
Celestica, Inc. (Canada)* | 647 | 4,464 | ||||||
Cisco Systems, Inc. | 81,108 | 3,194,844 | ||||||
CommScope Holding Co., Inc.* | 7,315 | 65,835 | ||||||
Corning, Inc. | 30,412 | 985,653 | ||||||
Diebold Nixdorf, Inc.* | 26,843 | 205,081 | ||||||
EchoStar Corp., Class A* | 400 | 9,956 | ||||||
FLIR Systems, Inc.(a) | 20,508 | 735,212 | ||||||
Hewlett Packard Enterprise Co. | 47,696 | 446,912 | ||||||
HP, Inc. | 99,576 | 1,890,948 | ||||||
InterDigital, Inc. | 4,605 | 262,761 | ||||||
Jabil, Inc. | 3,221 | 110,351 | ||||||
Juniper Networks, Inc. | 20,129 | 432,774 | ||||||
Lumentum Holdings, Inc.* | 11,850 | 890,290 | ||||||
NCR Corp.* | 14,996 | 332,011 | ||||||
NetApp, Inc. | 12,363 | 541,994 | ||||||
NETGEAR, Inc.* | 532 | 16,396 | ||||||
OSI Systems, Inc.* | 208 | 16,143 | ||||||
PC Connection, Inc. | 84 | 3,449 | ||||||
Sanmina Corp.* | 11,238 | 303,988 | ||||||
Seagate Technology PLC (Ireland) | 16,955 | 835,373 | ||||||
SYNNEX Corp. | 7,459 | 1,044,708 | ||||||
TE Connectivity Ltd. (Switzerland) | 5,452 | 532,878 | ||||||
The accompanying notes are an integral part of the financial statements.
33
GOTHAM ABSOLUTE RETURN FUND
Portfolio of Investments (Continued)
September 30, 2020
| Number of Shares | Value | |||||||
COMMON STOCKS — (Continued) |
| |||||||
Technology Hardware & Equipment — (Continued) |
| |||||||
Trimble, Inc.* | 1,382 | $ | 67,303 | |||||
Ubiquiti, Inc.(a) | 2,925 | 487,480 | ||||||
Vishay Intertechnology, Inc. | 8,294 | 129,138 | ||||||
Western Digital Corp.(a) | 22,570 | 824,934 | ||||||
Xerox Holdings Corp. | 13,623 | 255,704 | ||||||
Zebra Technologies Corp., Class A* | 2,315 | 584,445 | ||||||
|
| |||||||
| 28,350,447 | ||||||||
|
| |||||||
Telecommunication Services — 0.8% |
| |||||||
AT&T, Inc. | 41,420 | 1,180,884 | ||||||
CenturyLink, Inc. | 17,732 | 178,916 | ||||||
Iridium Communications, Inc.* | 19,042 | 487,094 | ||||||
T-Mobile US, Inc.* | 7,758 | 887,205 | ||||||
Verizon Communications, Inc. | 22,633 | 1,346,437 | ||||||
|
| |||||||
| 4,080,536 | ||||||||
|
| |||||||
Transportation — 1.8% | ||||||||
Alaska Air Group, Inc. | 3,148 | 115,311 | ||||||
ArcBest Corp. | 476 | 14,785 | ||||||
Atlas Air Worldwide Holdings, Inc.* | 1,090 | 66,381 | ||||||
CH Robinson Worldwide, Inc.(a) | 8,301 | 848,279 | ||||||
CSX Corp. | 16,893 | 1,312,079 | ||||||
Expeditors International of Washington, Inc. | 4,897 | 443,276 | ||||||
FedEx Corp. | 3,050 | 767,136 | ||||||
Hub Group, Inc., Class A* | 2,249 | 112,889 | ||||||
JB Hunt Transport Services, Inc. | 2,880 | 363,974 | ||||||
Kansas City Southern | 846 | 152,982 | ||||||
Marten Transport Ltd. | 892 | 14,557 | ||||||
Norfolk Southern Corp.(a) | 15,078 | 3,226,541 | ||||||
Old Dominion Freight Line, Inc. | 1,297 | 234,653 | ||||||
Schneider National, Inc., Class B | 6,516 | 161,141 | ||||||
SkyWest, Inc. | 10,173 | 303,766 | ||||||
United Parcel Service, Inc., Class B | 3,794 | 632,194 | ||||||
Werner Enterprises, Inc. | 8,631 | 362,416 | ||||||
|
| |||||||
| 9,132,360 | ||||||||
|
| |||||||
Utilities — 1.9% | ||||||||
American Water Works Co., Inc. | 721 | 104,458 | ||||||
CenterPoint Energy, Inc. | 8,987 | 173,898 | ||||||
Dominion Energy, Inc.(a) | 33,200 | 2,620,476 | ||||||
Duke Energy Corp. | 4,219 | 373,635 | ||||||
Evergy, Inc. | 20,737 | 1,053,854 | ||||||
Exelon Corp.(a) | 27,664 | 989,265 | ||||||
FirstEnergy Corp. | 5,746 | 164,968 | ||||||
| Number of Shares | Value | |||||||
COMMON STOCKS — (Continued) |
| |||||||
Utilities — (Continued) |
| |||||||
MDU Resources Group, Inc. | 42,601 | $ | 958,522 | |||||
National Fuel Gas Co. | 9,839 | 399,365 | ||||||
NiSource, Inc. | 5,037 | 110,814 | ||||||
NRG Energy, Inc. | 5,923 | 182,073 | ||||||
OGE Energy Corp. | 8,978 | 269,250 | ||||||
PPL Corp. | 86,012 | 2,340,387 | ||||||
York Water Co. (The) | 2 | 85 | ||||||
|
| |||||||
| 9,741,050 | ||||||||
|
| |||||||
TOTAL COMMON STOCKS | 480,208,423 | |||||||
|
| |||||||
| Par Value | ||||||||
CORPORATE BONDS AND NOTES — 0.0% |
| |||||||
Capital Goods — 0.0% | ||||||||
Mueller Industries, Inc. 6.00%, 03/01/2027 | $ | 785 | 785 | |||||
|
| |||||||
TOTAL CORPORATE BONDS AND NOTES | ||||||||
(Cost $785) | 785 | |||||||
|
| |||||||
TOTAL INVESTMENTS - 94.9% | 480,209,208 | |||||||
|
| |||||||
(Cost $394,594,495) | ||||||||
OTHER ASSETS IN EXCESS OF LIABILITIES - 5.1% | 25,780,058 | |||||||
|
| |||||||
NET ASSETS - 100.0% | $ | 505,989,266 | ||||||
|
| |||||||
| (a) | Security position is either entirely or partially designated as collateral for total return swaps. |
| * | Non-income producing. |
PLC Public Limited Company
The accompanying notes are an integral part of the financial statements.
34
GOTHAM ABSOLUTE RETURN FUND
Portfolio of Investments (Continued)
September 30, 2020
Over-the-counter total return swaps outstanding as of September 30, 2020
The Fund maintains a portfolio of long and short positions and receives/pays a rebate based upon the Fed Funds 1-Day Rate less a specified spread as negotiated by the parties. The notional gain or loss, dividends payable and rebates are payable the earlier of maturity of the swaps or upon termination. The portfolio matures on July 23, 2025, however underlying individual contracts are entered into and closed (terminated) on a daily basis. The cash amounts payable/receivable due to individual contracts being closed are settled, on a net basis, once a week. The value of total return swaps represents (34.8)% of net assets as of September 30, 2020.
The following table represents the individual long and short positions and related values of total return swaps as of September 30, 2020:
Total Return Swaps
Reference Entity | Counterparty | Number of Contracts Long/(Short) | Notional Amount | Value | Unrealized Appreciation/ (Depreciation)* | |||||||||||||||||
Long | ||||||||||||||||||||||
Automobiles & Components | ||||||||||||||||||||||
Adient PLC (Ireland) | Morgan Stanley | 3,536 | $ | 61,694 | $ | 61,279 | $ | (1,361 | ) | |||||||||||||
American Axle & Manufacturing Holdings, Inc. | Morgan Stanley | 50,633 | 392,538 | 292,152 | (104,872 | ) | ||||||||||||||||
BorgWarner, Inc. | Morgan Stanley | 17,875 | 691,769 | 692,478 | 3,692 | |||||||||||||||||
Cooper Tire & Rubber Co. | Morgan Stanley | 7,045 | 242,707 | 223,327 | (18,812 | ) | ||||||||||||||||
General Motors Co. | Morgan Stanley | 8,967 | 241,296 | 265,334 | 24,038 | |||||||||||||||||
Gentherm, Inc. | Morgan Stanley | 216 | 8,644 | 8,834 | 190 | |||||||||||||||||
Standard Motor Products, Inc. | Morgan Stanley | 84 | 3,654 | 3,751 | 96 | |||||||||||||||||
Tenneco, Inc., Class A | Morgan Stanley | 18,981 | 147,131 | 131,728 | (16,117 | ) | ||||||||||||||||
Thor Industries, Inc. | Morgan Stanley | 3,629 | 370,016 | 345,698 | (29,124 | ) | ||||||||||||||||
XPEL, Inc. | Morgan Stanley | 147 | 3,613 | 3,834 | 221 | |||||||||||||||||
|
|
|
|
|
|
|
| |||||||||||||||
| 111,113 | 2,163,062 | 2,028,415 | (142,049 | ) | ||||||||||||||||||
|
|
|
|
|
|
|
| |||||||||||||||
Capital Goods | ||||||||||||||||||||||
3M Co. | Morgan Stanley | 2,972 | 476,954 | 476,055 | 2,417 | |||||||||||||||||
AAR Corp. | Morgan Stanley | 480 | 9,382 | 9,024 | (358 | ) | ||||||||||||||||
Acuity Brands, Inc. | Morgan Stanley | 593 | 58,785 | 60,694 | 1,909 | |||||||||||||||||
Advanced Drainage Systems, Inc. | Morgan Stanley | 2,136 | 120,766 | 133,372 | 13,014 | |||||||||||||||||
Albany International Corp., Class A | Morgan Stanley | 3,308 | 172,565 | 163,779 | (8,324 | ) | ||||||||||||||||
AMETEK, Inc. | Morgan Stanley | 2,766 | 258,534 | 274,940 | 16,880 | |||||||||||||||||
Apogee Enterprises, Inc. | Morgan Stanley | 2,910 | 64,205 | 62,187 | (2,018 | ) | ||||||||||||||||
Applied Industrial Technologies, Inc. | Morgan Stanley | 132 | 7,086 | 7,273 | 187 | |||||||||||||||||
Astec Industries, Inc. | Morgan Stanley | 1,162 | 61,064 | 63,039 | 1,997 | |||||||||||||||||
Atkore International Group, Inc. | Morgan Stanley | 9,310 | 257,072 | 211,616 | (45,456 | ) | ||||||||||||||||
Barnes Group, Inc. | Morgan Stanley | 978 | 36,364 | 34,954 | (1,400 | ) | ||||||||||||||||
BWX Technologies, Inc. | Morgan Stanley | 5,330 | 295,514 | 300,132 | 5,285 | |||||||||||||||||
Chart Industries, Inc. | Morgan Stanley | 1 | 64 | 70 | 6 | |||||||||||||||||
Comfort Systems USA, Inc. | Morgan Stanley | 2,293 | 118,543 | 118,112 | (341 | ) | ||||||||||||||||
Cummins, Inc. | Morgan Stanley | 7,562 | 1,436,326 | 1,596,792 | 175,456 | |||||||||||||||||
Curtiss-Wright Corp. | Morgan Stanley | 1,117 | 105,005 | 104,171 | (646 | ) | ||||||||||||||||
Deere & Co. | Morgan Stanley | 279 | 59,718 | 61,835 | 2,328 | |||||||||||||||||
Douglas Dynamics, Inc. | Morgan Stanley | 19 | 658 | 650 | (8 | ) | ||||||||||||||||
Dover Corp. | Morgan Stanley | 148 | 16,324 | 16,034 | (290 | ) | ||||||||||||||||
Dycom Industries, Inc. | Morgan Stanley | 8,431 | 371,276 | 445,325 | 74,049 | |||||||||||||||||
Emerson Electric Co. | Morgan Stanley | 174 | 10,934 | 11,409 | 562 | |||||||||||||||||
Encore Wire Corp. | Morgan Stanley | 94 | 4,536 | 4,363 | (172 | ) | ||||||||||||||||
Enerpac Tool Group Corp. | Morgan Stanley | 14 | 257 | 263 | 6 | |||||||||||||||||
The accompanying notes are an integral part of the financial statements.
35
GOTHAM ABSOLUTE RETURN FUND
Portfolio of Investments (Continued)
September 30, 2020
Total Return Swaps (continued)
Reference Entity | Counterparty | Number of Contracts Long/(Short) | Notional Amount | Value | Unrealized Appreciation/ (Depreciation)* | |||||||||||||||||
Capital Goods — (continued) | ||||||||||||||||||||||
ESCO Technologies, Inc. | Morgan Stanley | 145 | $ | 11,914 | $ | 11,681 | $ | (222 | ) | |||||||||||||
Evoqua Water Technologies Corp. | Morgan Stanley | 8,922 | 183,783 | 189,325 | 5,542 | |||||||||||||||||
Federal Signal Corp. | Morgan Stanley | 403 | 11,873 | 11,788 | (85 | ) | ||||||||||||||||
Flowserve Corp. | Morgan Stanley | 22 | 590 | 600 | 10 | |||||||||||||||||
Fortive Corp. | Morgan Stanley | 4,552 | 318,565 | 346,908 | 30,682 | |||||||||||||||||
Fortune Brands Home & Security, Inc. | Morgan Stanley | 710 | 57,237 | 61,429 | 4,296 | |||||||||||||||||
Foundation Building Materials, Inc. | Morgan Stanley | 937 | 14,845 | 14,730 | (115 | ) | ||||||||||||||||
Franklin Electric Co., Inc. | Morgan Stanley | 377 | 21,100 | 22,179 | 1,117 | |||||||||||||||||
Gibraltar Industries, Inc. | Morgan Stanley | 650 | 33,820 | 42,341 | 9,109 | |||||||||||||||||
GMS, Inc. | Morgan Stanley | 17,494 | 428,405 | 421,605 | (6,902 | ) | ||||||||||||||||
Griffon Corp. | Morgan Stanley | 1,088 | 23,211 | 21,260 | (1,932 | ) | ||||||||||||||||
Herc Holdings, Inc. | Morgan Stanley | 4,608 | 170,297 | 182,523 | 12,226 | |||||||||||||||||
Honeywell International, Inc. | Morgan Stanley | 30 | 5,073 | 4,938 | (135 | ) | ||||||||||||||||
Howmet Aerospace, Inc. | Morgan Stanley | 22,782 | 391,949 | 380,915 | (11,035 | ) | ||||||||||||||||
Hubbell, Inc. | Morgan Stanley | 706 | 94,298 | 96,609 | 2,941 | |||||||||||||||||
Huntington Ingalls Industries, Inc. | Morgan Stanley | 494 | 71,484 | 69,531 | (1,954 | ) | ||||||||||||||||
Illinois Tool Works, Inc. | Morgan Stanley | 1,399 | 275,020 | 270,301 | (3,125 | ) | ||||||||||||||||
ITT, Inc. | Morgan Stanley | 1,152 | 67,488 | 68,026 | 705 | |||||||||||||||||
John Bean Technologies Corp. | Morgan Stanley | 992 | 96,403 | 91,155 | (5,173 | ) | ||||||||||||||||
Lockheed Martin Corp. | Morgan Stanley | 1,221 | 464,896 | 467,985 | 6,005 | |||||||||||||||||
Masco Corp. | Morgan Stanley | 579 | 32,899 | 31,920 | (979 | ) | ||||||||||||||||
Middleby Corp. (The) | Morgan Stanley | 3 | 270 | 269 | (1 | ) | ||||||||||||||||
MRC Global, Inc. | Morgan Stanley | 64,279 | 397,886 | 275,114 | (123,626 | ) | ||||||||||||||||
Mueller Industries, Inc. | Morgan Stanley | 7,637 | 219,348 | 206,657 | (11,995 | ) | ||||||||||||||||
National Presto Industries, Inc. | Morgan Stanley | 30 | 2,662 | 2,456 | (206 | ) | ||||||||||||||||
NOW, Inc. | Morgan Stanley | 66,015 | 577,208 | 299,708 | (277,500 | ) | ||||||||||||||||
PACCAR, Inc. | Morgan Stanley | 1,993 | 171,752 | 169,963 | (1,587 | ) | ||||||||||||||||
Parker-Hannifin Corp. | Morgan Stanley | 140 | 27,697 | 28,328 | 630 | |||||||||||||||||
Pentair PLC (Ireland) | Morgan Stanley | 2,060 | 88,158 | 94,286 | 6,128 | |||||||||||||||||
Quanta Services, Inc. | Morgan Stanley | 881 | 42,991 | 46,570 | 3,623 | |||||||||||||||||
RBC Bearings, Inc. | Morgan Stanley | 1,169 | 149,338 | 141,694 | (7,643 | ) | ||||||||||||||||
Regal Beloit Corp. | Morgan Stanley | 809 | 75,035 | 75,941 | 1,498 | |||||||||||||||||
Rexnord Corp. | Morgan Stanley | 1 | 30 | 30 | — | |||||||||||||||||
Roper Technologies, Inc. | Morgan Stanley | 218 | 86,548 | 86,134 | (414 | ) | ||||||||||||||||
Shyft Group, Inc. (The) | Morgan Stanley | 116 | 2,150 | 2,190 | 40 | |||||||||||||||||
SiteOne Landscape Supply, Inc. | Morgan Stanley | 140 | 16,835 | 17,073 | 153 | |||||||||||||||||
Snap-on, Inc. | Morgan Stanley | 4,242 | 603,764 | 624,125 | 25,055 | |||||||||||||||||
SPX FLOW, Inc. | Morgan Stanley | 15,883 | 628,054 | 680,110 | 52,056 | |||||||||||||||||
Teledyne Technologies, Inc. | Morgan Stanley | 143 | 45,178 | 44,360 | (818 | ) | ||||||||||||||||
Tennant Co. | Morgan Stanley | 2 | 123 | 121 | (2 | ) | ||||||||||||||||
Timken Co. (The) | Morgan Stanley | 625 | 34,105 | 33,888 | (113 | ) | ||||||||||||||||
Toro Co. (The) | Morgan Stanley | 319 | 26,255 | 26,780 | 594 | |||||||||||||||||
Trane Technologies PLC (Ireland) | Morgan Stanley | 102 | 12,395 | 12,367 | (28 | ) | ||||||||||||||||
TransDigm Group, Inc. | Morgan Stanley | 125 | 61,723 | 59,390 | (2,334 | ) | ||||||||||||||||
TriMas Corp. | Morgan Stanley | 1 | 23 | 23 | — | |||||||||||||||||
UFP Industries, Inc. | Morgan Stanley | 1,112 | 62,882 | 62,839 | (5 | ) | ||||||||||||||||
United Rentals, Inc. | Morgan Stanley | 2,161 | 353,302 | 377,095 | 23,803 | |||||||||||||||||
The accompanying notes are an integral part of the financial statements.
36
GOTHAM ABSOLUTE RETURN FUND
Portfolio of Investments (Continued)
September 30, 2020
Total Return Swaps (continued)
Reference Entity | Counterparty | Number of Contracts Long/(Short) | Notional Amount | Value | Unrealized Appreciation/ (Depreciation)* | |||||||||||||||||
Capital Goods — (continued) | ||||||||||||||||||||||
Univar Solutions, Inc. | Morgan Stanley | 1,362 | $ | 23,794 | $ | 22,990 | $ | (898 | ) | |||||||||||||
Watsco, Inc. | Morgan Stanley | 334 | 77,789 | 77,785 | (4 | ) | ||||||||||||||||
Woodward, Inc. | Morgan Stanley | 1,648 | 135,257 | 132,104 | (3,128 | ) | ||||||||||||||||
WW Grainger, Inc. | Morgan Stanley | 112 | 39,141 | 39,958 | 817 | |||||||||||||||||
|
|
|
|
|
|
|
| |||||||||||||||
| 295,134 | 10,678,775 | 10,604,186 | (39,846 | ) | ||||||||||||||||||
|
|
|
|
|
|
|
| |||||||||||||||
Commercial & Professional Services | ||||||||||||||||||||||
ABM Industries, Inc. | Morgan Stanley | 7,996 | 290,219 | 293,133 | 4,350 | |||||||||||||||||
ASGN, Inc. | Morgan Stanley | 234 | 14,990 | 14,873 | (117 | ) | ||||||||||||||||
Cintas Corp. | Morgan Stanley | 1,786 | 553,411 | 594,434 | 41,023 | |||||||||||||||||
Clarivate PLC (Jersey) | Morgan Stanley | 1,865 | 43,772 | 57,796 | 17,402 | |||||||||||||||||
Clean Harbors, Inc. | Morgan Stanley | 419 | 25,387 | 23,477 | (2,505 | ) | ||||||||||||||||
Covanta Holding Corp. | Morgan Stanley | 8,170 | 79,205 | 63,318 | (15,340 | ) | ||||||||||||||||
Deluxe Corp. | Morgan Stanley | 7,795 | 170,061 | 200,565 | 32,763 | |||||||||||||||||
Ennis, Inc. | Morgan Stanley | 27 | 467 | 471 | 4 | |||||||||||||||||
Equifax, Inc. | Morgan Stanley | 108 | 17,837 | 16,945 | (849 | ) | ||||||||||||||||
Exponent, Inc. | Morgan Stanley | 77 | 5,609 | 5,546 | (63 | ) | ||||||||||||||||
FTI Consulting, Inc. | Morgan Stanley | 6 | 638 | 636 | (2 | ) | ||||||||||||||||
Healthcare Services Group, Inc. | Morgan Stanley | 705 | 14,676 | 15,179 | 511 | |||||||||||||||||
ICF International, Inc. | Morgan Stanley | 16 | 994 | 984 | (9 | ) | ||||||||||||||||
IHS Markit Ltd. (Bermuda) | Morgan Stanley | 2,510 | 203,358 | 197,060 | (6,298 | ) | ||||||||||||||||
KAR Auction Services, Inc. | Morgan Stanley | 117 | 1,658 | 1,685 | 27 | |||||||||||||||||
ManpowerGroup, Inc. | Morgan Stanley | 7,356 | 526,175 | 539,415 | 13,839 | |||||||||||||||||
Nielsen Holdings PLC (United Kingdom). | Morgan Stanley | 974 | 14,707 | 13,811 | (992 | ) | ||||||||||||||||
Republic Services, Inc. | Morgan Stanley | 4,377 | 378,361 | 408,593 | 32,092 | |||||||||||||||||
Robert Half International, Inc. | Morgan Stanley | 586 | 31,642 | 31,023 | (544 | ) | ||||||||||||||||
Stantec, Inc. (Canada) | Morgan Stanley | 39 | 1,176 | 1,183 | 10 | |||||||||||||||||
Steelcase, Inc., Class A | Morgan Stanley | 26,304 | 302,600 | 265,933 | (36,667 | ) | ||||||||||||||||
Tetra Tech, Inc. | Morgan Stanley | 731 | 67,296 | 69,811 | 2,589 | |||||||||||||||||
TriNet Group, Inc. | Morgan Stanley | 502 | 32,636 | 29,779 | (2,858 | ) | ||||||||||||||||
TrueBlue, Inc. | Morgan Stanley | 47 | 725 | 728 | 3 | |||||||||||||||||
UniFirst Corp. | Morgan Stanley | 99 | 18,162 | 18,748 | 1,051 | |||||||||||||||||
Verisk Analytics, Inc. | Morgan Stanley | 508 | 94,465 | 94,137 | (210 | ) | ||||||||||||||||
Waste Management, Inc. | Morgan Stanley | 32 | 3,559 | 3,621 | 62 | |||||||||||||||||
|
|
|
|
|
|
|
| |||||||||||||||
| 73,386 | 2,893,786 | 2,962,884 | 79,272 | |||||||||||||||||||
|
|
|
|
|
|
|
| |||||||||||||||
Consumer Durables & Apparel | ||||||||||||||||||||||
Capri Holdings Ltd. (British Virgin Islands) | Morgan Stanley | 4,972 | 73,239 | 89,496 | 16,256 | |||||||||||||||||
Carter’s, Inc. | Morgan Stanley | 9,972 | 805,616 | 863,376 | 57,400 | |||||||||||||||||
Cavco Industries, Inc. | Morgan Stanley | 309 | 58,357 | 55,716 | (2,642 | ) | ||||||||||||||||
Deckers Outdoor Corp. | Morgan Stanley | 931 | 191,961 | 204,829 | 15,064 | |||||||||||||||||
DR Horton, Inc. | Morgan Stanley | 122 | 8,685 | 9,227 | 542 | |||||||||||||||||
Garmin Ltd. (Switzerland) | Morgan Stanley | 1,178 | 112,709 | 111,745 | (901 | ) | ||||||||||||||||
G-III Apparel Group Ltd. | Morgan Stanley | 23,016 | 277,573 | 301,740 | 24,167 | |||||||||||||||||
Gildan Activewear, Inc. (Canada) | Morgan Stanley | 7,321 | 139,324 | 144,004 | 4,680 | |||||||||||||||||
Hanesbrands, Inc. | Morgan Stanley | 10,597 | 166,839 | 166,903 | 79 | |||||||||||||||||
Helen of Troy Ltd. (Bermuda) | Morgan Stanley | 947 | 185,768 | 183,263 | (2,505 | ) | ||||||||||||||||
The accompanying notes are an integral part of the financial statements.
37
GOTHAM ABSOLUTE RETURN FUND
Portfolio of Investments (Continued)
September 30, 2020
Total Return Swaps (continued)
Reference Entity | Counterparty | Number of Contracts Long/(Short) | Notional Amount | Value | Unrealized Appreciation/ (Depreciation)* | ||||||||||||||||||
Consumer Durables & Apparel — (continued) |
| ||||||||||||||||||||||
Kontoor Brands, Inc. | Morgan Stanley | 2,151 | $ | 46,831 | $ | 52,054 | $ | 5,262 | |||||||||||||||
La-Z-Boy, Inc. | Morgan Stanley | 1,331 | 42,782 | 42,100 | (660 | ) | |||||||||||||||||
Mohawk Industries, Inc. | Morgan Stanley | 1,792 | 150,464 | 174,881 | 24,417 | ||||||||||||||||||
Nautilus, Inc. | Morgan Stanley | 2,851 | 48,520 | 48,923 | 403 | ||||||||||||||||||
NIKE, Inc., Class B | Morgan Stanley | 3,936 | 469,937 | 494,125 | 24,188 | ||||||||||||||||||
Polaris, Inc. | Morgan Stanley | 4,197 | 430,849 | 395,945 | (32,951 | ) | |||||||||||||||||
PulteGroup, Inc. | Morgan Stanley | 5,445 | 224,824 | 252,049 | 28,657 | ||||||||||||||||||
PVH Corp. | Morgan Stanley | 11,233 | 605,533 | 669,936 | 64,403 | ||||||||||||||||||
Smith & Wesson Brands, Inc. | Morgan Stanley | 6,413 | 107,186 | 99,530 | (7,501 | ) | |||||||||||||||||
Steven Madden Ltd. | Morgan Stanley | 14,546 | 330,266 | 283,647 | (46,812 | ) | |||||||||||||||||
Sturm Ruger & Co., Inc. | Morgan Stanley | 2,020 | 146,760 | 123,543 | (20,382 | ) | |||||||||||||||||
Tempur Sealy International, Inc. | Morgan Stanley | 645 | 54,290 | 57,527 | 3,352 | ||||||||||||||||||
Tupperware Brands Corp. | Morgan Stanley | 2,262 | 31,764 | 45,602 | 13,837 | ||||||||||||||||||
Whirlpool Corp. | Morgan Stanley | 1,400 | 223,941 | 257,446 | 35,088 | ||||||||||||||||||
YETI Holdings, Inc. | Morgan Stanley | 1,216 | 55,262 | 55,109 | (153 | ) | |||||||||||||||||
|
|
|
|
|
|
|
| ||||||||||||||||
| 120,803 | 4,989,280 | 5,182,716 | 203,288 | ||||||||||||||||||||
|
|
|
|
|
|
|
| ||||||||||||||||
Consumer Services | |||||||||||||||||||||||
Adtalem Global Education, Inc. | Morgan Stanley | 4,007 | 106,367 | 98,332 | (8,035 | ) | |||||||||||||||||
Bloomin’ Brands, Inc. | Morgan Stanley | 485 | 7,484 | 7,406 | (78 | ) | |||||||||||||||||
Chipotle Mexican Grill, Inc. | Morgan Stanley | 206 | 256,782 | 256,204 | (578 | ) | |||||||||||||||||
Darden Restaurants, Inc. | Morgan Stanley | 5,335 | 447,716 | 537,448 | 97,930 | ||||||||||||||||||
El Pollo Loco Holdings, Inc. | Morgan Stanley | 578 | 9,218 | 9,364 | 146 | ||||||||||||||||||
frontdoor, Inc. | Morgan Stanley | 294 | 11,582 | 11,440 | (143 | ) | |||||||||||||||||
Graham Holdings Co., Class B | Morgan Stanley | 30 | 11,939 | 12,123 | 185 | ||||||||||||||||||
Grand Canyon Education, Inc. | Morgan Stanley | 172 | 14,705 | 13,750 | (955 | ) | |||||||||||||||||
Jack in the Box, Inc. | Morgan Stanley | 31 | 2,459 | 2,459 | — | ||||||||||||||||||
Laureate Education, Inc., Class A | Morgan Stanley | 16,941 | 191,010 | 224,976 | 33,967 | ||||||||||||||||||
McDonald’s Corp. | Morgan Stanley | 1,380 | 307,603 | 302,896 | (4,706 | ) | |||||||||||||||||
MGM Resorts International | Morgan Stanley | 5,587 | 123,498 | 121,517 | (3,096 | ) | |||||||||||||||||
Norwegian Cruise Line Holdings Ltd. (Bermuda) | Morgan Stanley | 10,405 | 160,684 | 178,030 | 17,346 | ||||||||||||||||||
Papa John’s International, Inc. | Morgan Stanley | 3,837 | 338,887 | 315,708 | (23,179 | ) | |||||||||||||||||
Perdoceo Education Corp. | Morgan Stanley | 3,908 | 55,089 | 47,834 | (7,255 | ) | |||||||||||||||||
Red Rock Resorts, Inc., Class A | Morgan Stanley | 24,736 | 268,461 | 422,986 | 163,816 | ||||||||||||||||||
Royal Caribbean Cruises Ltd. (Liberia) | Morgan Stanley | 2,166 | 137,973 | 140,205 | 2,232 | ||||||||||||||||||
Service Corp. International | Morgan Stanley | 655 | 26,556 | 27,628 | 1,084 | ||||||||||||||||||
Strategic Education, Inc. | Morgan Stanley | 86 | 8,002 | 7,866 | (133 | ) | |||||||||||||||||
Wingstop, Inc. | Morgan Stanley | 3,956 | 576,249 | 540,587 | (35,428 | ) | |||||||||||||||||
Yum! Brands, Inc. | Morgan Stanley | 10,292 | 957,351 | 939,660 | (13,458 | ) | |||||||||||||||||
|
|
|
|
|
|
|
| ||||||||||||||||
| 95,087 | 4,019,615 | 4,218,419 | 219,662 | ||||||||||||||||||||
|
|
|
|
|
|
|
| ||||||||||||||||
Diversified Financials | |||||||||||||||||||||||
Berkshire Hathaway, Inc., Class B | Morgan Stanley | 23,363 | 5,160,088 | 4,974,917 | (185,171 | ) | |||||||||||||||||
BlackRock, Inc. | Morgan Stanley | 1,634 | 904,079 | 920,841 | 16,761 | ||||||||||||||||||
Diamondpeak Holdings Corp., Class A | Morgan Stanley | 7 | 186 | 180 | 129 | ||||||||||||||||||
Federated Hermes, Inc. | Morgan Stanley | 1,640 | 35,367 | 35,276 | (90 | ) | |||||||||||||||||
Franklin Resources, Inc. | Morgan Stanley | 7,326 | 145,099 | 149,084 | 5,479 | ||||||||||||||||||
The accompanying notes are an integral part of the financial statements.
38
GOTHAM ABSOLUTE RETURN FUND
Portfolio of Investments (Continued)
September 30, 2020
Total Return Swaps (continued)
Reference Entity | Counterparty | Number of Contracts Long/(Short) | Notional Amount | Value | Unrealized Appreciation/ (Depreciation)* | |||||||||||||||||
Diversified Financials — (continued) | ||||||||||||||||||||||
Intercontinental Exchange, Inc. | Morgan Stanley | 21 | $ | 2,102 | $ | 2,101 | $ | (1 | ) | |||||||||||||
Moody’s Corp. | Morgan Stanley | 187 | 52,201 | 54,202 | 2,001 | |||||||||||||||||
Nasdaq, Inc. | Morgan Stanley | 979 | 120,893 | 120,133 | (760 | ) | ||||||||||||||||
S&P Global, Inc. | Morgan Stanley | 1,178 | 414,203 | 424,787 | 10,583 | |||||||||||||||||
Sprott, Inc. (Canada) | Morgan Stanley | 32 | 1,142 | 1,092 | (50 | ) | ||||||||||||||||
T Rowe Price Group, Inc. | Morgan Stanley | 1,029 | 129,795 | 131,938 | 2,144 | |||||||||||||||||
Waddell & Reed Financial, Inc., Class A | Morgan Stanley | 883 | 12,906 | 13,112 | 206 | |||||||||||||||||
|
|
|
|
|
|
|
| |||||||||||||||
| 38,279 | 6,978,061 | 6,827,663 | (148,769 | ) | ||||||||||||||||||
|
|
|
|
|
|
|
| |||||||||||||||
Energy | ||||||||||||||||||||||
Antero Midstream Corp. | Morgan Stanley | 36,592 | 205,272 | 196,499 | (8,773 | ) | ||||||||||||||||
Cactus, Inc., Class A | Morgan Stanley | 7,465 | 167,031 | 143,253 | (23,119 | ) | ||||||||||||||||
Canadian Natural Resources Ltd. (Canada) | Morgan Stanley | 97,409 | 1,879,523 | 1,559,518 | (297,250 | ) | ||||||||||||||||
Cheniere Energy, Inc. | Morgan Stanley | 302 | 15,925 | 13,974 | (1,951 | ) | ||||||||||||||||
Chevron Corp. | Morgan Stanley | 71 | 5,081 | 5,112 | 31 | |||||||||||||||||
Clean Energy Fuels Corp. | Morgan Stanley | 16,320 | 43,174 | 40,474 | (2,701 | ) | ||||||||||||||||
Concho Resources, Inc. | Morgan Stanley | 164 | 7,101 | 7,236 | 135 | |||||||||||||||||
ConocoPhillips | Morgan Stanley | 4,958 | 171,642 | 162,821 | (10,160 | ) | ||||||||||||||||
Core Laboratories NV (Netherlands) | Morgan Stanley | 161 | 2,594 | 2,457 | (138 | ) | ||||||||||||||||
Crescent Point Energy Corp. (Canada) | Morgan Stanley | 944 | 1,144 | 1,152 | 7 | |||||||||||||||||
DHT Holdings, Inc. (Marshall Islands) | Morgan Stanley | 35,917 | 199,147 | 185,332 | 2,330 | |||||||||||||||||
DMC Global, Inc. | Morgan Stanley | 1,423 | 41,552 | 46,874 | 5,825 | |||||||||||||||||
EOG Resources, Inc. | Morgan Stanley | 44,210 | 1,959,999 | 1,588,907 | (371,092 | ) | ||||||||||||||||
Halliburton Co. | Morgan Stanley | 2,907 | 36,361 | 35,029 | (1,332 | ) | ||||||||||||||||
HollyFrontier Corp. | Morgan Stanley | 10,270 | 242,024 | 202,422 | (38,600 | ) | ||||||||||||||||
Kinder Morgan, Inc. | Morgan Stanley | 81,850 | 1,186,007 | 1,009,211 | (154,923 | ) | ||||||||||||||||
Kosmos Energy Ltd. | Morgan Stanley | 61,092 | 108,624 | 59,601 | (49,730 | ) | ||||||||||||||||
Magnolia Oil & Gas Corp., Class A | Morgan Stanley | 1,566 | 9,378 | 8,096 | (1,282 | ) | ||||||||||||||||
Murphy Oil Corp. | Morgan Stanley | 29,037 | 356,352 | 259,010 | (96,673 | ) | ||||||||||||||||
Nordic American Tankers Ltd. (Bermuda) | Morgan Stanley | 99,570 | 424,787 | 347,499 | (58,636 | ) | ||||||||||||||||
Phillips 66. | Morgan Stanley | 3,032 | 179,628 | 157,179 | (22,450 | ) | ||||||||||||||||
Schlumberger NV (Curacao) | Morgan Stanley | 1,170 | 18,899 | 18,205 | (694 | ) | ||||||||||||||||
World Fuel Services Corp. | Morgan Stanley | 4,194 | 103,856 | 88,871 | (14,579 | ) | ||||||||||||||||
|
|
|
|
|
|
|
| |||||||||||||||
| 540,624 | 7,365,101 | 6,138,732 | (1,145,755 | ) | ||||||||||||||||||
|
|
|
|
|
|
|
| |||||||||||||||
Food & Staples Retailing | ||||||||||||||||||||||
BJ’s Wholesale Club Holdings, Inc. | Morgan Stanley | 4,161 | 173,296 | 172,890 | (407 | ) | ||||||||||||||||
Casey’s General Stores, Inc. | Morgan Stanley | 830 | 145,171 | 147,450 | 2,278 | |||||||||||||||||
Costco Wholesale Corp. | Morgan Stanley | 827 | 286,891 | 293,585 | 6,694 | |||||||||||||||||
Kroger Co. (The) | Morgan Stanley | 947 | 31,616 | 32,113 | 496 | |||||||||||||||||
SpartanNash Co. | Morgan Stanley | 101 | 2,127 | 1,651 | (456 | ) | ||||||||||||||||
Sprouts Farmers Market, Inc. | Morgan Stanley | 3,872 | 90,580 | 81,041 | (9,539 | ) | ||||||||||||||||
Sysco Corp. | Morgan Stanley | 1,755 | 113,417 | 109,196 | (4,733 | ) | ||||||||||||||||
US Foods Holding Corp. | Morgan Stanley | 8,460 | 197,482 | 187,981 | (9,501 | ) | ||||||||||||||||
Walgreens Boots Alliance, Inc. | Morgan Stanley | 14,056 | 565,146 | 504,891 | (53,818 | ) | ||||||||||||||||
The accompanying notes are an integral part of the financial statements.
39
GOTHAM ABSOLUTE RETURN FUND
Portfolio of Investments (Continued)
September 30, 2020
Total Return Swaps (continued)
Reference Entity | Counterparty | Number of Contracts Long/(Short) | Notional Amount | Value | Unrealized Appreciation/ (Depreciation)* | ||||||||||||||||||
Food & Staples Retailing — (continued) |
| ||||||||||||||||||||||
Walmart, Inc. | Morgan Stanley | 2,537 | $ | 333,879 | $ | 354,952 | $ | 24,966 | |||||||||||||||
|
|
|
|
|
|
|
| ||||||||||||||||
| 37,546 | 1,939,605 | 1,885,750 | (44,020 | ) | |||||||||||||||||||
|
|
|
|
|
|
|
| ||||||||||||||||
Food, Beverage & Tobacco | |||||||||||||||||||||||
Altria Group, Inc. | Morgan Stanley | 17,027 | 707,916 | 657,923 | (34,822 | ) | |||||||||||||||||
Archer-Daniels-Midland Co. | Morgan Stanley | 14,813 | 625,997 | 688,656 | 68,091 | ||||||||||||||||||
B&G Foods, Inc. | Morgan Stanley | 12,797 | 370,076 | 355,373 | (9,034 | ) | |||||||||||||||||
Brown-Forman Corp., Class B | Morgan Stanley | 97 | 7,311 | 7,306 | (5 | ) | |||||||||||||||||
Coca-Cola Co. (The) | Morgan Stanley | 2,252 | 109,545 | 111,181 | 1,636 | ||||||||||||||||||
Coca-Cola Consolidated, Inc. | Morgan Stanley | 395 | 104,928 | 95,069 | (9,859 | ) | |||||||||||||||||
Conagra Brands, Inc. | Morgan Stanley | 1,550 | 53,793 | 55,351 | 1,557 | ||||||||||||||||||
Constellation Brands, Inc., Class A | Morgan Stanley | 447 | 79,350 | 84,711 | 5,637 | ||||||||||||||||||
Flowers Foods, Inc. | Morgan Stanley | 4,863 | 118,826 | 118,317 | (43 | ) | |||||||||||||||||
General Mills, Inc. | Morgan Stanley | 4,978 | 295,858 | 307,043 | 11,185 | ||||||||||||||||||
JM Smucker Co. (The) | Morgan Stanley | 3,108 | 346,028 | 359,036 | 14,521 | ||||||||||||||||||
Kellogg Co. | Morgan Stanley | 2,352 | 162,564 | 151,916 | (9,405 | ) | |||||||||||||||||
Kraft Heinz Co. (The) | Morgan Stanley | 19,880 | 661,581 | 595,406 | (61,015 | ) | |||||||||||||||||
McCormick & Co., Inc., non-voting shares | Morgan Stanley | 190 | 36,315 | 36,879 | 563 | ||||||||||||||||||
Molson Coors Beverage Co., Class B | Morgan Stanley | 13,618 | 497,491 | 457,020 | (40,471 | ) | |||||||||||||||||
Monster Beverage Corp. | Morgan Stanley | 2,025 | 163,647 | 162,405 | (1,242 | ) | |||||||||||||||||
National Beverage Corp. | Morgan Stanley | 137 | 8,789 | 9,317 | 528 | ||||||||||||||||||
PepsiCo, Inc. | Morgan Stanley | 1,386 | 188,538 | 192,100 | 5,251 | ||||||||||||||||||
Philip Morris International, Inc. | Morgan Stanley | 2,964 | 230,639 | 222,270 | (5,129 | ) | |||||||||||||||||
TreeHouse Foods, Inc. | Morgan Stanley | 16,879 | 740,311 | 684,106 | (57,113 | ) | |||||||||||||||||
Turning Point Brands, Inc. | Morgan Stanley | 14 | 396 | 391 | (5 | ) | |||||||||||||||||
Tyson Foods, Inc., Class A | Morgan Stanley | 9,603 | 606,136 | 571,186 | (31,410 | ) | |||||||||||||||||
|
|
|
|
|
|
|
| ||||||||||||||||
| 131,375 | 6,116,035 | 5,922,962 | (150,584 | ) | |||||||||||||||||||
|
|
|
|
|
|
|
| ||||||||||||||||
Health Care Equipment & Services | |||||||||||||||||||||||
Abbott Laboratories | Morgan Stanley | 9,605 | 1,035,392 | 1,045,312 | 9,920 | ||||||||||||||||||
Allscripts Healthcare Solutions, Inc. | Morgan Stanley | 14,485 | 104,088 | 117,908 | 13,820 | ||||||||||||||||||
Anthem, Inc. | Morgan Stanley | 60 | 15,178 | 16,115 | 937 | ||||||||||||||||||
Centene Corp. | Morgan Stanley | 4,534 | 279,572 | 264,468 | (15,103 | ) | |||||||||||||||||
Cerner Corp. | Morgan Stanley | 269 | 18,278 | 19,446 | 1,232 | ||||||||||||||||||
Cigna Corp. | Morgan Stanley | 1,495 | 267,235 | 253,268 | (13,967 | ) | |||||||||||||||||
CVS Health Corp. | Morgan Stanley | 16,344 | 1,040,200 | 954,490 | (85,710 | ) | |||||||||||||||||
Danaher Corp. | Morgan Stanley | 2,237 | 455,028 | 481,693 | 27,094 | ||||||||||||||||||
DENTSPLY SIRONA, Inc. | Morgan Stanley | 46 | 2,013 | 2,012 | (2 | ) | |||||||||||||||||
Ensign Group, Inc. (The) | Morgan Stanley | 1,497 | 85,053 | 85,419 | 440 | ||||||||||||||||||
Globus Medical, Inc., Class A | Morgan Stanley | 1,628 | 80,425 | 80,619 | 194 | ||||||||||||||||||
Hanger, Inc. | Morgan Stanley | 50 | 812 | 791 | (22 | ) | |||||||||||||||||
HCA Healthcare, Inc. | Morgan Stanley | 521 | 64,710 | 64,958 | 248 | ||||||||||||||||||
HealthStream, Inc. | Morgan Stanley | 15 | 304 | 301 | (3 | ) | |||||||||||||||||
Hill-Rom Holdings, Inc. | Morgan Stanley | 1,024 | 85,062 | 85,514 | 525 | ||||||||||||||||||
HMS Holdings Corp. | Morgan Stanley | 671 | 15,897 | 16,070 | 173 | ||||||||||||||||||
Hologic, Inc. | Morgan Stanley | 6,371 | 378,684 | 423,480 | 46,134 | ||||||||||||||||||
Humana, Inc. | Morgan Stanley | 2,181 | 898,998 | 902,694 | 5,059 | ||||||||||||||||||
The accompanying notes are an integral part of the financial statements.
40
GOTHAM ABSOLUTE RETURN FUND
Portfolio of Investments (Continued)
September 30, 2020
Total Return Swaps (continued)
Reference Entity | Counterparty | Number of Contracts Long/(Short) | Notional Amount | Value | Unrealized Appreciation/ (Depreciation)* | ||||||||||||||||||
Health Care Equipment & Services — (continued) | |||||||||||||||||||||||
IDEXX Laboratories, Inc. | Morgan Stanley | 1,005 | $ | 374,804 | $ | 395,076 | $ | 20,475 | |||||||||||||||
Integer Holdings Corp. | Morgan Stanley | 1,744 | 124,812 | 102,913 | (23,375 | ) | |||||||||||||||||
Intuitive Surgical, Inc. | Morgan Stanley | 507 | 358,584 | 359,737 | 1,153 | ||||||||||||||||||
iRhythm Technologies, Inc. | Morgan Stanley | 552 | 120,311 | 131,437 | 11,125 | ||||||||||||||||||
Magellan Health, Inc. | Morgan Stanley | 115 | 8,649 | 8,715 | 65 | ||||||||||||||||||
McKesson Corp. | Morgan Stanley | 3,683 | 576,121 | 548,509 | (26,092 | ) | |||||||||||||||||
MEDNAX, Inc. | Morgan Stanley | 1,269 | 20,904 | 20,659 | (245 | ) | |||||||||||||||||
Molina Healthcare, Inc. | Morgan Stanley | 268 | 43,250 | 49,055 | 5,804 | ||||||||||||||||||
Natus Medical, Inc. | Morgan Stanley | 15,170 | 323,108 | 259,862 | (64,291 | ) | |||||||||||||||||
Neogen Corp. | Morgan Stanley | 170 | 13,000 | 13,303 | 303 | ||||||||||||||||||
NextGen Healthcare, Inc. | Morgan Stanley | 236 | 2,999 | 3,007 | 7 | ||||||||||||||||||
Omnicell, Inc. | Morgan Stanley | 2,302 | 155,221 | 171,867 | 16,766 | ||||||||||||||||||
Providence Service Corp. (The) | Morgan Stanley | 241 | 22,017 | 22,391 | 375 | ||||||||||||||||||
Quidel Corp. | Morgan Stanley | 1,842 | 294,356 | 404,098 | 105,334 | ||||||||||||||||||
ResMed, Inc. | Morgan Stanley | 1,745 | 317,936 | 299,145 | (18,332 | ) | |||||||||||||||||
Select Medical Holdings Corp. | Morgan Stanley | 469 | 9,178 | 9,764 | 586 | ||||||||||||||||||
Teladoc Health, Inc. | Morgan Stanley | 5 | 995 | 1,096 | 101 | ||||||||||||||||||
Teleflex, Inc. | Morgan Stanley | 5 | 1,702 | 1,702 | — | ||||||||||||||||||
Tivity Health, Inc. | Morgan Stanley | 197 | 2,753 | 2,762 | 9 | ||||||||||||||||||
UnitedHealth Group, Inc. | Morgan Stanley | 87 | 25,790 | 27,124 | 1,334 | ||||||||||||||||||
Universal Health Services, Inc., Class B | Morgan Stanley | 3,416 | 367,220 | 365,580 | (2,207 | ) | |||||||||||||||||
Varian Medical Systems, Inc. | Morgan Stanley | 1,280 | 221,574 | 220,160 | (1,415 | ) | |||||||||||||||||
West Pharmaceutical Services, Inc. | Morgan Stanley | 490 | 130,173 | 134,701 | 4,527 | ||||||||||||||||||
|
|
|
|
|
|
|
| ||||||||||||||||
| 99,831 | 8,342,386 | 8,367,221 | 22,976 | ||||||||||||||||||||
|
|
|
|
|
|
|
| ||||||||||||||||
Household & Personal Products | |||||||||||||||||||||||
Church & Dwight Co., Inc. | Morgan Stanley | 1,804 | 169,245 | 169,053 | 97 | ||||||||||||||||||
Clorox Co. (The) | Morgan Stanley | 3,222 | 715,174 | 677,168 | (38,006 | ) | |||||||||||||||||
Colgate-Palmolive Co. | Morgan Stanley | 6,524 | 484,352 | 503,327 | 18,975 | ||||||||||||||||||
Estee Lauder Cos., Inc. (The), Class A | Morgan Stanley | 666 | 141,531 | 145,355 | 3,824 | ||||||||||||||||||
Procter & Gamble Co. (The) | Morgan Stanley | 856 | 111,801 | 118,975 | 7,175 | ||||||||||||||||||
Spectrum Brands Holdings, Inc. | Morgan Stanley | 919 | 53,236 | 52,530 | (389 | ) | |||||||||||||||||
|
|
|
|
|
|
|
| ||||||||||||||||
| 13,991 | 1,675,339 | 1,666,408 | (8,324 | ) | |||||||||||||||||||
|
|
|
|
|
|
|
| ||||||||||||||||
Materials | |||||||||||||||||||||||
Amcor PLC (Jersey) | Morgan Stanley | 45,381 | 501,909 | 501,460 | 1,866 | ||||||||||||||||||
Avient Corp. | Morgan Stanley | 10,650 | 266,338 | 281,799 | 18,345 | ||||||||||||||||||
Boise Cascade Co. | Morgan Stanley | 549 | 23,039 | 21,916 | (1,108 | ) | |||||||||||||||||
Cabot Corp. | Morgan Stanley | 3,756 | 145,320 | 135,329 | (8,856 | ) | |||||||||||||||||
Carpenter Technology Corp. | Morgan Stanley | 9,924 | 215,949 | 180,220 | (34,467 | ) | |||||||||||||||||
Century Aluminum Co. | Morgan Stanley | 6,173 | 57,507 | 43,952 | (13,555 | ) | |||||||||||||||||
Chase Corp. | Morgan Stanley | 4 | 385 | 382 | (3 | ) | |||||||||||||||||
Chemours Co. (The) | Morgan Stanley | 593 | 12,070 | 12,400 | 329 | ||||||||||||||||||
Commercial Metals Co. | Morgan Stanley | 42,811 | 876,255 | 855,364 | (21,162 | ) | |||||||||||||||||
Compass Minerals International, Inc. | Morgan Stanley | 1,440 | 81,544 | 85,464 | 5,015 | ||||||||||||||||||
Dow, Inc. | Morgan Stanley | 161 | 7,598 | 7,575 | (23 | ) | |||||||||||||||||
Eastman Chemical Co. | Morgan Stanley | 569 | 43,563 | 44,450 | 1,218 | ||||||||||||||||||
Ecolab, Inc. | Morgan Stanley | 7,290 | 1,388,759 | 1,456,834 | 71,495 | ||||||||||||||||||
The accompanying notes are an integral part of the financial statements.
41
GOTHAM ABSOLUTE RETURN FUND
Portfolio of Investments (Continued)
September 30, 2020
Total Return Swaps (continued)
Reference Entity | Counterparty | Number of Contracts Long/(Short) | Notional Amount | Value | Unrealized Appreciation/ (Depreciation)* | |||||||||||||||||
Materials — (continued) | ||||||||||||||||||||||
Ferro Corp. | Morgan Stanley | 2,407 | $ | 28,935 | $ | 29,847 | $ | 1,039 | ||||||||||||||
FMC Corp. | Morgan Stanley | 9 | 953 | 953 | 4 | |||||||||||||||||
Forterra, Inc. | Morgan Stanley | 261 | 3,024 | 3,085 | 60 | |||||||||||||||||
Freeport-McMoRan, Inc. | Morgan Stanley | 555 | 8,940 | 8,680 | (260 | ) | ||||||||||||||||
FutureFuel Corp. | Morgan Stanley | 32 | 357 | 364 | 7 | |||||||||||||||||
GCP Applied Technologies, Inc. | Morgan Stanley | 376 | 7,817 | 7,877 | 60 | |||||||||||||||||
Golden Star Resources Ltd. (Canada) | Morgan Stanley | 1,141 | 5,216 | 4,918 | (298 | ) | ||||||||||||||||
Hecla Mining Co. | Morgan Stanley | 120,906 | 692,357 | 614,202 | (78,106 | ) | ||||||||||||||||
IAMGOLD Corp. (Canada) | Morgan Stanley | 4,879 | 18,565 | 18,687 | 122 | |||||||||||||||||
Innospec, Inc. | Morgan Stanley | 4,931 | 392,328 | 312,231 | (80,098 | ) | ||||||||||||||||
International Paper Co. | Morgan Stanley | 235 | 8,608 | 9,527 | 11,819 | |||||||||||||||||
Kaiser Aluminum Corp. | Morgan Stanley | 6,798 | 461,482 | 364,305 | (97,178 | ) | ||||||||||||||||
Linde PLC (Ireland) | Morgan Stanley | 3 | 709 | 714 | 5 | |||||||||||||||||
Louisiana-Pacific Corp. | Morgan Stanley | 1,552 | 49,068 | 45,800 | (3,141 | ) | ||||||||||||||||
LyondellBasell Industries NV, Class A (Netherlands) | Morgan Stanley | 3,284 | 225,414 | 231,489 | 9,745 | |||||||||||||||||
Mosaic Co. (The) | Morgan Stanley | 3,334 | 61,938 | 60,912 | (1,026 | ) | ||||||||||||||||
Neenah, Inc. | Morgan Stanley | 1 | 38 | 37 | (1 | ) | ||||||||||||||||
Newmont Corp. | Morgan Stanley | 3,817 | 243,295 | 242,189 | (738 | ) | ||||||||||||||||
Nucor Corp. | Morgan Stanley | 3,596 | 154,652 | 161,317 | 8,055 | |||||||||||||||||
Nutrien Ltd. (Canada) | Morgan Stanley | 1,270 | 48,007 | 49,822 | 2,300 | |||||||||||||||||
O-I Glass, Inc. | Morgan Stanley | 9,148 | 103,010 | 96,877 | (6,132 | ) | ||||||||||||||||
Pan American Silver Corp. (Canada) | Morgan Stanley | 1,441 | 45,621 | 46,328 | 707 | |||||||||||||||||
PPG Industries, Inc. | Morgan Stanley | 5,108 | 566,120 | 623,585 | 62,757 | |||||||||||||||||
Pretium Resources, Inc. (Canada) | Morgan Stanley | 643 | 8,128 | 8,256 | 128 | |||||||||||||||||
Reliance Steel & Aluminum Co. | Morgan Stanley | 5,216 | 525,847 | 532,241 | 9,689 | |||||||||||||||||
Sealed Air Corp. | Morgan Stanley | 511 | 19,591 | 19,832 | 300 | |||||||||||||||||
Sonoco Products Co. | Morgan Stanley | 1,389 | 73,170 | 70,936 | (1,730 | ) | ||||||||||||||||
Stepan Co. | Morgan Stanley | 27 | 2,963 | 2,943 | (20 | ) | ||||||||||||||||
Summit Materials, Inc., Class A | Morgan Stanley | 15,672 | 274,143 | 259,215 | (16,266 | ) | ||||||||||||||||
Tredegar Corp. | Morgan Stanley | 61 | 927 | 907 | (19 | ) | ||||||||||||||||
Wheaton Precious Metals Corp. (Canada) | Morgan Stanley | 614 | 29,639 | 30,129 | 490 | |||||||||||||||||
Worthington Industries, Inc. | Morgan Stanley | 605 | 24,281 | 24,672 | 391 | |||||||||||||||||
Yamana Gold, Inc. (Canada) | Morgan Stanley | 20,737 | 116,494 | 117,786 | 1,490 | |||||||||||||||||
|
|
|
|
|
|
|
| |||||||||||||||
| 349,860 | 7,821,873 | 7,627,808 | (156,751 | ) | ||||||||||||||||||
|
|
|
|
|
|
|
| |||||||||||||||
Media & Entertainment | ||||||||||||||||||||||
Activision Blizzard, Inc. | Morgan Stanley | 1,069 | 86,628 | 86,536 | (93 | ) | ||||||||||||||||
Alphabet, Inc., Class A | Morgan Stanley | 77 | 109,361 | 112,851 | 3,694 | |||||||||||||||||
Cargurus, Inc. | Morgan Stanley | 6,825 | 177,379 | 147,625 | (29,755 | ) | ||||||||||||||||
Charter Communications, Inc., Class A | Morgan Stanley | 41 | 24,791 | 25,598 | 807 | |||||||||||||||||
Clear Channel Outdoor Holdings, Inc. | Morgan Stanley | 462 | 455 | 462 | 7 | |||||||||||||||||
Discovery, Inc., Class A | Morgan Stanley | 16,762 | 360,709 | 364,909 | 4,159 | |||||||||||||||||
DISH Network Corp., Class A | Morgan Stanley | 21,972 | 726,263 | 637,847 | (88,416 | ) | ||||||||||||||||
Electronic Arts, Inc. | Morgan Stanley | 4,572 | 585,208 | 596,235 | 11,027 | |||||||||||||||||
Facebook, Inc., Class A | Morgan Stanley | 342 | 81,815 | 89,570 | 7,755 | |||||||||||||||||
The accompanying notes are an integral part of the financial statements.
42
GOTHAM ABSOLUTE RETURN FUND
Portfolio of Investments (Continued)
September 30, 2020
Total Return Swaps (continued)
Reference Entity | Counterparty | Number of Contracts Long/(Short) | Notional Amount | Value | Unrealized Appreciation/ (Depreciation)* | ||||||||||||||||||
Media & Entertainment — (continued) | |||||||||||||||||||||||
Fox Corp., Class A | Morgan Stanley | 10,601 | $ | 273,576 | $ | 295,026 | $ | 25,587 | |||||||||||||||
Interpublic Group of Cos., Inc. (The) | Morgan Stanley | 16,136 | 297,871 | 268,987 | (25,191 | ) | |||||||||||||||||
John Wiley & Sons, Inc., Class A | Morgan Stanley | 871 | 28,622 | 27,619 | (1,003 | ) | |||||||||||||||||
Match Group, Inc. | Morgan Stanley | 598 | 61,495 | 66,169 | 5,720 | ||||||||||||||||||
MSG Networks, Inc., Class A | Morgan Stanley | 11,610 | 119,448 | 111,108 | (8,472 | ) | |||||||||||||||||
Netflix, Inc. | Morgan Stanley | 977 | 474,559 | 488,529 | 13,971 | ||||||||||||||||||
New York Times Co. (The), Class A | Morgan Stanley | 18 | 765 | 770 | 5 | ||||||||||||||||||
News Corp., Class A | Morgan Stanley | 133 | 1,940 | 1,865 | (76 | ) | |||||||||||||||||
Omnicom Group, Inc. | Morgan Stanley | 269 | 13,509 | 13,316 | (169 | ) | |||||||||||||||||
Pinterest, Inc., Class A | Morgan Stanley | 3,972 | 153,496 | 164,878 | 11,381 | ||||||||||||||||||
Sirius XM Holdings, Inc. | Morgan Stanley | 11,623 | 59,761 | 62,299 | 2,538 | ||||||||||||||||||
Take-Two Interactive Software, Inc. | Morgan Stanley | 1,365 | 216,689 | 225,525 | 8,836 | ||||||||||||||||||
Walt Disney Co. (The) | Morgan Stanley | 2,099 | 275,352 | 260,444 | (14,909 | ) | |||||||||||||||||
Zillow Group, Inc., Class C | Morgan Stanley | 5,520 | 454,543 | 560,777 | 110,097 | ||||||||||||||||||
Zynga, Inc., Class A | Morgan Stanley | 3,511 | 31,848 | 32,020 | 39 | ||||||||||||||||||
|
|
|
|
|
|
|
| ||||||||||||||||
| 121,425 | 4,616,083 | 4,640,965 | 37,539 | ||||||||||||||||||||
|
|
|
|
|
|
|
| ||||||||||||||||
Pharmaceuticals, Biotechnology & Life Sciences | |||||||||||||||||||||||
Agilent Technologies, Inc. | Morgan Stanley | 10,331 | 1,011,332 | 1,042,811 | 31,479 | ||||||||||||||||||
Amneal Pharmaceuticals, Inc. | Morgan Stanley | 501 | 1,931 | 1,944 | 13 | ||||||||||||||||||
Biogen, Inc. | Morgan Stanley | 214 | 59,264 | 60,708 | 1,398 | ||||||||||||||||||
Bristol Myers Squibb Co. | Morgan Stanley | 31,119 | 1,854,418 | 1,876,165 | 21,746 | ||||||||||||||||||
Catalent, Inc. | Morgan Stanley | 603 | 50,640 | 51,653 | 1,013 | ||||||||||||||||||
Charles River Laboratories International, Inc. | Morgan Stanley | 904 | 194,779 | 204,711 | 11,366 | ||||||||||||||||||
Corcept Therapeutics, Inc. | Morgan Stanley | 6,924 | 90,018 | 120,512 | 32,436 | ||||||||||||||||||
Denali Therapeutics, Inc. | Morgan Stanley | 557 | 19,982 | 19,957 | (25 | ) | |||||||||||||||||
Elanco Animal Health, Inc. | Morgan Stanley | 14,230 | 360,613 | 397,444 | 36,831 | ||||||||||||||||||
Emergent BioSolutions, Inc. | Morgan Stanley | 3,171 | 324,862 | 327,659 | 2,794 | ||||||||||||||||||
Horizon Therapeutics PLC (Ireland) | Morgan Stanley | 3,295 | 239,769 | 255,956 | 17,347 | ||||||||||||||||||
Innoviva, Inc. | Morgan Stanley | 4,684 | 59,498 | 48,948 | (10,550 | ) | |||||||||||||||||
Ironwood Pharmaceuticals, Inc. | Morgan Stanley | 120 | 1,088 | 1,079 | (8 | ) | |||||||||||||||||
Johnson & Johnson | Morgan Stanley | 3,958 | 584,569 | 589,267 | 8,308 | ||||||||||||||||||
Kura Oncology, Inc. | Morgan Stanley | 93 | 2,733 | 2,850 | 117 | ||||||||||||||||||
Luminex Corp. | Morgan Stanley | 2,183 | 54,425 | 57,304 | 3,031 | ||||||||||||||||||
Merck & Co., Inc. | Morgan Stanley | 8,644 | 677,287 | 717,020 | 44,702 | ||||||||||||||||||
Mylan NV (Netherlands) | Morgan Stanley | 331 | 4,832 | 4,909 | 77 | ||||||||||||||||||
Neurocrine Biosciences, Inc. | Morgan Stanley | 355 | 35,126 | 34,137 | (990 | ) | |||||||||||||||||
PerkinElmer, Inc. | Morgan Stanley | 583 | 68,570 | 73,172 | 4,602 | ||||||||||||||||||
Pfizer, Inc. | Morgan Stanley | 4,880 | 177,488 | 179,096 | 1,608 | ||||||||||||||||||
Phibro Animal Health Corp., Class A | Morgan Stanley | 7 | 122 | 122 | (1 | ) | |||||||||||||||||
Prestige Consumer Healthcare, Inc. | Morgan Stanley | 2,439 | 92,146 | 88,828 | (3,318 | ) | |||||||||||||||||
Regeneron Pharmaceuticals, Inc. | Morgan Stanley | 51 | 28,513 | 28,549 | (320 | ) | |||||||||||||||||
Thermo Fisher Scientific, Inc. | Morgan Stanley | 363 | 147,685 | 160,272 | 12,666 | ||||||||||||||||||
Trillium Therapeutics, Inc. (Canada) | Morgan Stanley | 1,077 | 13,297 | 15,304 | 2,007 | ||||||||||||||||||
United Therapeutics Corp. | Morgan Stanley | 568 | 60,720 | 57,368 | (4,064 | ) | |||||||||||||||||
Vanda Pharmaceuticals, Inc. | Morgan Stanley | 4,339 | 47,243 | 41,915 | (5,670 | ) | |||||||||||||||||
The accompanying notes are an integral part of the financial statements.
43
GOTHAM ABSOLUTE RETURN FUND
Portfolio of Investments (Continued)
September 30, 2020
Total Return Swaps (continued)
Reference Entity | Counterparty | Number of Contracts Long/(Short) | Notional Amount | Value | Unrealized Appreciation/ (Depreciation)* | ||||||||||||||||||
Pharmaceuticals, Biotechnology & Life Sciences — (continued) |
| ||||||||||||||||||||||
Waters Corp. | Morgan Stanley | 307 | $ | 60,852 | $ | 60,074 | $ | (779 | ) | ||||||||||||||
Zoetis, Inc. | Morgan Stanley | 1,770 | 280,895 | 292,705 | 11,810 | ||||||||||||||||||
|
|
|
|
|
|
|
| ||||||||||||||||
| 108,601 | 6,604,697 | 6,812,439 | 219,626 | ||||||||||||||||||||
|
|
|
|
|
|
|
| ||||||||||||||||
Retailing | |||||||||||||||||||||||
1-800-Flowers.com, Inc., Class A | Morgan Stanley | 6,190 | 169,106 | 154,379 | (14,728 | ) | |||||||||||||||||
Aaron’s, Inc. | Morgan Stanley | 11,035 | 607,915 | 625,133 | 17,434 | ||||||||||||||||||
Abercrombie & Fitch Co., Class A | Morgan Stanley | 24,466 | 341,411 | 340,811 | (599 | ) | |||||||||||||||||
Advance Auto Parts, Inc. | Morgan Stanley | 7,688 | 1,184,938 | 1,180,108 | (4,167 | ) | |||||||||||||||||
Amazon.com, Inc. | Morgan Stanley | 42 | 126,294 | 132,247 | 5,953 | ||||||||||||||||||
Asbury Automotive Group, Inc. | Morgan Stanley | 1,975 | 200,898 | 192,464 | (8,435 | ) | |||||||||||||||||
At Home Group, Inc. | Morgan Stanley | 22,614 | 358,775 | 336,044 | (22,731 | ) | |||||||||||||||||
AutoNation, Inc. | Morgan Stanley | 8,620 | 467,492 | 456,257 | (11,236 | ) | |||||||||||||||||
AutoZone, Inc. | Morgan Stanley | 268 | 311,394 | 315,608 | 4,214 | ||||||||||||||||||
Best Buy Co., Inc. | Morgan Stanley | 3,482 | 334,551 | 387,512 | 54,901 | ||||||||||||||||||
Big Lots, Inc. | Morgan Stanley | 1,050 | 47,965 | 46,830 | (771 | ) | |||||||||||||||||
Booking Holdings, Inc. | Morgan Stanley | 162 | 283,032 | 277,130 | (5,902 | ) | |||||||||||||||||
Buckle, Inc. (The) | Morgan Stanley | 5,148 | 101,888 | 104,968 | 3,080 | ||||||||||||||||||
Camping World Holdings, Inc., Class A | Morgan Stanley | 1,341 | 38,817 | 39,895 | 1,078 | ||||||||||||||||||
CarParts.Com, Inc. | Morgan Stanley | 3,492 | 46,066 | 37,749 | (8,317 | ) | |||||||||||||||||
Dick’s Sporting Goods, Inc. | Morgan Stanley | 572 | 32,622 | 33,107 | 474 | ||||||||||||||||||
eBay, Inc. | Morgan Stanley | 1,389 | 74,310 | 72,367 | (1,730 | ) | |||||||||||||||||
Etsy, Inc. | Morgan Stanley | 5,569 | 714,467 | 677,357 | (37,110 | ) | |||||||||||||||||
Foot Locker, Inc. | Morgan Stanley | 22,023 | 687,735 | 727,420 | 39,684 | ||||||||||||||||||
Gap, Inc. (The) | Morgan Stanley | 30,002 | 521,871 | 510,934 | (11,377 | ) | |||||||||||||||||
Genuine Parts Co. | Morgan Stanley | 1,234 | 113,726 | 117,440 | 4,640 | ||||||||||||||||||
Hibbett Sports, Inc. | Morgan Stanley | 2,047 | 72,720 | 80,283 | 7,511 | ||||||||||||||||||
Home Depot, Inc. (The) | Morgan Stanley | 413 | 114,230 | 114,694 | 916 | ||||||||||||||||||
L Brands, Inc. | Morgan Stanley | 2,152 | 63,835 | 68,455 | 5,299 | ||||||||||||||||||
Lithia Motors, Inc., Class A | Morgan Stanley | 747 | 175,798 | 170,271 | (5,526 | ) | |||||||||||||||||
LKQ Corp. | Morgan Stanley | 16,666 | 469,315 | 462,148 | (7,310 | ) | |||||||||||||||||
Lowe’s Cos., Inc. | Morgan Stanley | 960 | 151,988 | 159,226 | 7,237 | ||||||||||||||||||
Lumber Liquidators Holdings, Inc. | Morgan Stanley | 5,186 | 116,057 | 114,351 | (1,705 | ) | |||||||||||||||||
Macy’s, Inc. | Morgan Stanley | 135,070 | 970,222 | 769,899 | (200,323 | ) | |||||||||||||||||
MarineMax, Inc. | Morgan Stanley | 2,701 | 77,818 | 69,335 | (8,484 | ) | |||||||||||||||||
Michaels Cos., Inc. (The) | Morgan Stanley | 8,829 | 90,354 | 85,244 | (5,766 | ) | |||||||||||||||||
Murphy USA, Inc. | Morgan Stanley | 168 | 22,521 | 21,549 | (972 | ) | |||||||||||||||||
ODP Corp. (The) | Morgan Stanley | 116 | 2,532 | 2,256 | (393 | ) | |||||||||||||||||
O’Reilly Automotive, Inc. | Morgan Stanley | 529 | 247,060 | 243,911 | (3,149 | ) | |||||||||||||||||
Pool Corp. | Morgan Stanley | 128 | 39,246 | 42,821 | 3,634 | ||||||||||||||||||
Qurate Retail, Inc., Series A | Morgan Stanley | 8,865 | 63,802 | 63,651 | (152 | ) | |||||||||||||||||
RH | Morgan Stanley | 1 | 283 | 383 | 100 | ||||||||||||||||||
Shoe Carnival, Inc. | Morgan Stanley | 477 | 17,163 | 16,018 | (1,145 | ) | |||||||||||||||||
Shutterstock, Inc. | Morgan Stanley | 651 | 32,684 | 33,878 | 1,289 | ||||||||||||||||||
Sportsman’s Warehouse Holdings, Inc. | Morgan Stanley | 796 | 11,223 | 11,391 | 40 | ||||||||||||||||||
Stamps.com, Inc. | Morgan Stanley | 1,190 | 277,403 | 286,731 | 8,405 | ||||||||||||||||||
The accompanying notes are an integral part of the financial statements.
44
GOTHAM ABSOLUTE RETURN FUND
Portfolio of Investments (Continued)
September 30, 2020
Total Return Swaps (continued)
Reference Entity | Counterparty | Number of Contracts Long/(Short) | Notional Amount | Value | Unrealized Appreciation/ (Depreciation)* | ||||||||||||||||||
Retailing — (continued) | |||||||||||||||||||||||
Target Corp. | Morgan Stanley | 1,256 | $ | 191,863 | $ | 197,719 | $ | 5,856 | |||||||||||||||
Tractor Supply Co. | Morgan Stanley | 1,960 | 282,993 | 280,946 | (1,824 | ) | |||||||||||||||||
Urban Outfitters, Inc. | Morgan Stanley | 6,776 | 149,149 | 141,008 | (8,140 | ) | |||||||||||||||||
Williams-Sonoma, Inc. | Morgan Stanley | 288 | 25,212 | 26,047 | 842 | ||||||||||||||||||
Zumiez, Inc. | Morgan Stanley | 3,321 | 90,612 | 92,390 | 1,778 | ||||||||||||||||||
|
|
|
|
|
|
|
| ||||||||||||||||
| 359,655 | 10,521,356 | 10,320,365 | (197,627 | ) | |||||||||||||||||||
|
|
|
|
|
|
|
| ||||||||||||||||
Semiconductors & Semiconductor Equipment | |||||||||||||||||||||||
Advanced Micro Devices, Inc. | Morgan Stanley | 5,387 | 437,077 | 441,680 | 4,603 | ||||||||||||||||||
Amkor Technology, Inc. | Morgan Stanley | 45,371 | 575,873 | 508,155 | (67,718 | ) | |||||||||||||||||
Applied Materials, Inc. | Morgan Stanley | 1,769 | 101,056 | 105,167 | 4,280 | ||||||||||||||||||
Axcelis Technologies, Inc. | Morgan Stanley | 4,670 | 117,809 | 102,740 | (15,069 | ) | |||||||||||||||||
Broadcom, Inc. | Morgan Stanley | 6,889 | 2,292,924 | 2,509,800 | 237,060 | ||||||||||||||||||
Brooks Automation, Inc. | Morgan Stanley | 165 | 7,414 | 7,633 | 228 | ||||||||||||||||||
CEVA, Inc. | Morgan Stanley | 1,331 | 54,574 | 52,401 | (2,172 | ) | |||||||||||||||||
First Solar, Inc. | Morgan Stanley | 5,631 | 375,154 | 372,772 | (2,382 | ) | |||||||||||||||||
Intel Corp. | Morgan Stanley | 6,793 | 330,628 | 351,742 | 23,163 | ||||||||||||||||||
KLA Corp. | Morgan Stanley | 847 | 155,308 | 164,098 | 8,993 | ||||||||||||||||||
Lam Research Corp. | Morgan Stanley | 531 | 174,008 | 176,159 | 1,599 | ||||||||||||||||||
MACOM Technology Solutions Holdings, Inc. | Morgan Stanley | 5,285 | 197,573 | 179,743 | (17,831 | ) | |||||||||||||||||
Marvell Technology Group Ltd. (Bermuda) | Morgan Stanley | 3,576 | 139,008 | 141,967 | 2,959 | ||||||||||||||||||
Maxim Integrated Products, Inc. | Morgan Stanley | 599 | 39,698 | 40,498 | 800 | ||||||||||||||||||
Microchip Technology, Inc. | Morgan Stanley | 3,716 | 376,238 | 381,856 | 6,811 | ||||||||||||||||||
MKS Instruments, Inc. | Morgan Stanley | 769 | 91,666 | 83,998 | (7,591 | ) | |||||||||||||||||
Monolithic Power Systems, Inc. | Morgan Stanley | 242 | 61,522 | 67,666 | 6,590 | ||||||||||||||||||
NVIDIA Corp. | Morgan Stanley | 52 | 25,189 | 28,143 | 2,954 | ||||||||||||||||||
PDF Solutions, Inc. | Morgan Stanley | 1 | 19 | 19 | (1 | ) | |||||||||||||||||
Power Integrations, Inc. | Morgan Stanley | 154 | 8,827 | 8,532 | (400 | ) | |||||||||||||||||
Qorvo, Inc. | Morgan Stanley | 10,292 | 1,215,970 | 1,327,771 | 113,080 | ||||||||||||||||||
Skyworks Solutions, Inc. | Morgan Stanley | 55 | 7,357 | 8,003 | 645 | ||||||||||||||||||
Synaptics, Inc. | Morgan Stanley | 9 | 714 | 724 | 10 | ||||||||||||||||||
Texas Instruments, Inc. | Morgan Stanley | 459 | 58,755 | 65,541 | 19,239 | ||||||||||||||||||
|
|
|
|
|
|
|
| ||||||||||||||||
| 104,593 | 6,844,361 | 7,126,808 | 319,850 | ||||||||||||||||||||
|
|
|
|
|
|
|
| ||||||||||||||||
Software & Services | |||||||||||||||||||||||
A10 Networks, Inc. | Morgan Stanley | 2,937 | 20,930 | 18,709 | (2,222 | ) | |||||||||||||||||
Accenture PLC, Class A (Ireland) | Morgan Stanley | 2,490 | 567,668 | 562,715 | (4,953 | ) | |||||||||||||||||
ACI Worldwide, Inc. | Morgan Stanley | 18,567 | 528,462 | 485,156 | (43,307 | ) | |||||||||||||||||
Adobe, Inc. | Morgan Stanley | 302 | 140,625 | 148,110 | 7,484 | ||||||||||||||||||
Agilysys, Inc. | Morgan Stanley | 921 | 23,046 | 22,251 | (795 | ) | |||||||||||||||||
Alarm.com Holdings, Inc. | Morgan Stanley | 1,758 | 100,042 | 97,130 | (3,177 | ) | |||||||||||||||||
Alliance Data Systems Corp. | Morgan Stanley | 11,278 | 504,800 | 473,450 | (28,928 | ) | |||||||||||||||||
Anaplan, Inc. | Morgan Stanley | 1,838 | 111,262 | 115,022 | 3,760 | ||||||||||||||||||
Automatic Data Processing, Inc. | Morgan Stanley | 525 | 68,313 | 73,232 | 4,919 | ||||||||||||||||||
Blackbaud, Inc. | Morgan Stanley | 4,855 | 275,680 | 271,055 | (4,626 | ) | |||||||||||||||||
Broadridge Financial Solutions, Inc. | Morgan Stanley | 1,409 | 188,131 | 185,988 | (1,819 | ) | |||||||||||||||||
The accompanying notes are an integral part of the financial statements.
45
GOTHAM ABSOLUTE RETURN FUND
Portfolio of Investments (Continued)
September 30, 2020
Total Return Swaps (continued)
Reference Entity | Counterparty | Number of Contracts Long/(Short) | Notional Amount | Value | Unrealized Appreciation/ (Depreciation)* | ||||||||||||||||||
Software & Services — (continued) |
| ||||||||||||||||||||||
CACI International, Inc., Class A | Morgan Stanley | 1,283 | $ | 269,256 | $ | 273,484 | $ | 4,229 | |||||||||||||||
Cadence Design Systems, Inc. | Morgan Stanley | 817 | 81,867 | 87,117 | 5,250 | ||||||||||||||||||
CDK Global, Inc. | Morgan Stanley | 3,377 | 155,913 | 147,203 | (8,260 | ) | |||||||||||||||||
CGI, Inc. (Canada) | Morgan Stanley | 1,685 | 117,524 | 114,192 | (3,332 | ) | |||||||||||||||||
Citrix Systems, Inc. | Morgan Stanley | 326 | 46,144 | 44,893 | (1,136 | ) | |||||||||||||||||
Cornerstone OnDemand, Inc. | Morgan Stanley | 1,870 | 67,677 | 67,993 | (18 | ) | |||||||||||||||||
Crowdstrike Holdings, Inc., Class A | Morgan Stanley | 644 | 89,026 | 88,434 | (593 | ) | |||||||||||||||||
Domo, Inc., Class B | Morgan Stanley | 29 | 937 | 1,112 | 1,757 | ||||||||||||||||||
Envestnet, Inc. | Morgan Stanley | 1,081 | 83,763 | 83,410 | (353 | ) | |||||||||||||||||
Evo Payments, Inc., Class A | Morgan Stanley | 122 | 3,070 | 3,032 | (38 | ) | |||||||||||||||||
Fiserv, Inc. | Morgan Stanley | 1,328 | 132,072 | 136,850 | 4,778 | ||||||||||||||||||
FleetCor Technologies, Inc. | Morgan Stanley | 4 | 932 | 952 | 20 | ||||||||||||||||||
Fortinet, Inc. | Morgan Stanley | 5 | 584 | 589 | 5 | ||||||||||||||||||
Globant SA (Luxembourg) | Morgan Stanley | 251 | 43,394 | 44,984 | 1,639 | ||||||||||||||||||
GoDaddy, Inc., Class A | Morgan Stanley | 8,904 | 626,498 | 676,437 | 49,939 | ||||||||||||||||||
Guidewire Software, Inc. | Morgan Stanley | 1,757 | 190,143 | 183,202 | (6,941 | ) | |||||||||||||||||
International Business Machines Corp. | Morgan Stanley | 5 | 597 | 608 | 11 | ||||||||||||||||||
International Money Express, Inc. | Morgan Stanley | 69 | 1,038 | 991 | (47 | ) | |||||||||||||||||
Intuit, Inc. | Morgan Stanley | 4,530 | 1,482,106 | 1,477,731 | (5,938 | ) | |||||||||||||||||
Jack Henry & Associates, Inc. | Morgan Stanley | 183 | 30,959 | 29,754 | (1,135 | ) | |||||||||||||||||
LiveRamp Holdings, Inc. | Morgan Stanley | 2,330 | 108,578 | 120,624 | 13,144 | ||||||||||||||||||
Mastercard, Inc., Class A | Morgan Stanley | 177 | 59,112 | 59,856 | 744 | ||||||||||||||||||
Microsoft Corp. | Morgan Stanley | 433 | 85,941 | 91,073 | 5,132 | ||||||||||||||||||
MicroStrategy, Inc., Class A | Morgan Stanley | 2,103 | 251,839 | 316,628 | 65,514 | ||||||||||||||||||
Mobileiron, Inc. | Morgan Stanley | 350 | 2,456 | 2,454 | (2 | ) | |||||||||||||||||
Model N, Inc. | Morgan Stanley | 923 | 33,505 | 32,563 | (997 | ) | |||||||||||||||||
NortonLifeLock, Inc. | Morgan Stanley | 2,034 | 42,368 | 42,389 | 20 | ||||||||||||||||||
Nuance Communications, Inc. | Morgan Stanley | 1 | 27 | 33 | 7 | ||||||||||||||||||
Paychex, Inc. | Morgan Stanley | 1,708 | 124,974 | 136,247 | 17,354 | ||||||||||||||||||
PayPal Holdings, Inc. | Morgan Stanley | 2,320 | 420,519 | 457,110 | 43,640 | ||||||||||||||||||
Progress Software Corp. | Morgan Stanley | 6,524 | 231,212 | 239,300 | 9,152 | ||||||||||||||||||
PTC, Inc. | Morgan Stanley | 903 | 75,029 | 74,696 | (333 | ) | |||||||||||||||||
QAD, Inc., Class A | Morgan Stanley | 35 | 1,463 | 1,477 | 16 | ||||||||||||||||||
Sailpoint Technologies Holding, Inc. | Morgan Stanley | 2,951 | 111,843 | 116,771 | 4,928 | ||||||||||||||||||
salesforce.com, Inc. | Morgan Stanley | 4,943 | 1,327,718 | 1,242,275 | (85,443 | ) | |||||||||||||||||
Science Applications International Corp. | Morgan Stanley | 567 | 42,933 | 44,464 | 3,218 | ||||||||||||||||||
ServiceNow, Inc. | Morgan Stanley | 30 | 13,659 | 14,550 | 891 | ||||||||||||||||||
SPS Commerce, Inc. | Morgan Stanley | 9,298 | 680,715 | 724,035 | 44,759 | ||||||||||||||||||
SS&C Technologies Holdings, Inc. | Morgan Stanley | 6,878 | 389,202 | 416,256 | 31,342 | ||||||||||||||||||
Synopsys, Inc. | Morgan Stanley | 647 | 133,592 | 138,445 | 5,201 | ||||||||||||||||||
Teradata Corp. | Morgan Stanley | 1,943 | 44,223 | 44,106 | (125 | ) | |||||||||||||||||
VeriSign, Inc. | Morgan Stanley | 2,820 | 579,317 | 577,677 | (1,636 | ) | |||||||||||||||||
Virtusa Corp. | Morgan Stanley | 1,485 | 52,263 | 73,003 | 20,834 | ||||||||||||||||||
Visa, Inc., Class A | Morgan Stanley | 156 | 30,593 | 31,195 | 602 | ||||||||||||||||||
Western Union Co. (The) | Morgan Stanley | 25,646 | 582,666 | 549,594 | (27,220 | ) | |||||||||||||||||
WEX, Inc. | Morgan Stanley | 66 | 9,299 | 9,172 | (127 | ) | |||||||||||||||||
The accompanying notes are an integral part of the financial statements.
46
GOTHAM ABSOLUTE RETURN FUND
Portfolio of Investments (Continued)
September 30, 2020
Total Return Swaps (continued)
Reference Entity | Counterparty | Number of Contracts Long/(Short) | Notional Amount | Value | Unrealized Appreciation/ (Depreciation)* | |||||||||||||||||
Software & Services — (continued) | ||||||||||||||||||||||
Workday, Inc., Class A | Morgan Stanley | 1,228 | $ | 273,934 | $ | 264,180 | $ | (9,754 | ) | |||||||||||||
Zoom Video Communications, Inc., Class A | Morgan Stanley | 268 | 96,085 | 125,989 | 29,904 | |||||||||||||||||
|
|
|
|
|
|
|
| |||||||||||||||
| 153,917 | 11,757,524 | 11,861,948 | 136,938 | |||||||||||||||||||
|
|
|
|
|
|
|
| |||||||||||||||
Technology Hardware & Equipment | ||||||||||||||||||||||
Apple, Inc. | Morgan Stanley | 2,546 | 261,898 | 294,852 | 33,176 | |||||||||||||||||
Avnet, Inc. | Morgan Stanley | 13,171 | 349,231 | 340,339 | (6,094 | ) | ||||||||||||||||
Badger Meter, Inc. | Morgan Stanley | 2,918 | 186,724 | 190,750 | 4,966 | |||||||||||||||||
Belden, Inc. | Morgan Stanley | 352 | 11,813 | 10,954 | (1,069 | ) | ||||||||||||||||
CDW Corp. | Morgan Stanley | 1,296 | 144,886 | 154,911 | 10,174 | |||||||||||||||||
Celestica, Inc. (Canada) | Morgan Stanley | 1,189 | 9,164 | 8,204 | (960 | ) | ||||||||||||||||
Ciena Corp. | Morgan Stanley | 84 | 3,360 | 3,334 | (26 | ) | ||||||||||||||||
Cisco Systems, Inc. | Morgan Stanley | 662 | 25,878 | 26,076 | 198 | |||||||||||||||||
CommScope Holding Co., Inc. | Morgan Stanley | 37,087 | 389,599 | 333,783 | (55,816 | ) | ||||||||||||||||
Corning, Inc. | Morgan Stanley | 13,769 | 432,948 | 446,253 | 16,099 | |||||||||||||||||
Diebold Nixdorf, Inc. | Morgan Stanley | 75,142 | 477,145 | 574,085 | 97,715 | |||||||||||||||||
EchoStar Corp., Class A | Morgan Stanley | 41,073 | 1,095,828 | 1,022,307 | (73,521 | ) | ||||||||||||||||
FLIR Systems, Inc. | Morgan Stanley | 10,626 | 442,446 | 380,942 | (61,261 | ) | ||||||||||||||||
Hewlett Packard Enterprise Co. | Morgan Stanley | 39,802 | 389,114 | 372,945 | (11,573 | ) | ||||||||||||||||
HP, Inc. | Morgan Stanley | 6,576 | 117,348 | 124,878 | 8,571 | |||||||||||||||||
InterDigital, Inc. | Morgan Stanley | 203 | 12,421 | 11,583 | (838 | ) | ||||||||||||||||
Jabil, Inc. | Morgan Stanley | 1,430 | 45,210 | 48,992 | 4,044 | |||||||||||||||||
Juniper Networks, Inc. | Morgan Stanley | 431 | 9,210 | 9,267 | 57 | |||||||||||||||||
Lumentum Holdings, Inc. | Morgan Stanley | 304 | 22,092 | 22,840 | 747 | |||||||||||||||||
NCR Corp. | Morgan Stanley | 20,882 | 391,147 | 462,327 | 71,414 | |||||||||||||||||
NetApp, Inc. | Morgan Stanley | 18,937 | 841,641 | 830,198 | (11,687 | ) | ||||||||||||||||
NETGEAR, Inc. | Morgan Stanley | 263 | 7,945 | 8,106 | 161 | |||||||||||||||||
OSI Systems, Inc. | Morgan Stanley | 1,607 | 110,478 | 124,719 | 15,748 | |||||||||||||||||
PC Connection, Inc. | Morgan Stanley | 75 | 3,092 | 3,079 | (12 | ) | ||||||||||||||||
Sanmina Corp. | Morgan Stanley | 6,953 | 183,168 | 188,079 | 5,009 | |||||||||||||||||
Seagate Technology PLC (Ireland) | Morgan Stanley | 7,519 | 375,714 | 370,461 | (385 | ) | ||||||||||||||||
SYNNEX Corp. | Morgan Stanley | 47 | 5,740 | 6,583 | 1,300 | |||||||||||||||||
TE Connectivity Ltd. (Switzerland) | Morgan Stanley | 122 | 11,500 | 11,924 | 425 | |||||||||||||||||
Trimble, Inc. | Morgan Stanley | 362 | 17,417 | 17,629 | 212 | |||||||||||||||||
Ubiquiti, Inc. | Morgan Stanley | 19 | 3,001 | 3,166 | 165 | |||||||||||||||||
Vishay Intertechnology, Inc. | Morgan Stanley | 2,190 | 34,328 | 34,098 | (189 | ) | ||||||||||||||||
Western Digital Corp. | Morgan Stanley | 1,917 | 71,350 | 70,066 | (1,284 | ) | ||||||||||||||||
Xerox Holdings Corp. | Morgan Stanley | 42,644 | 716,755 | 800,428 | 95,689 | |||||||||||||||||
Zebra Technologies Corp., Class A | Morgan Stanley | 295 | 74,689 | 74,476 | (213 | ) | ||||||||||||||||
|
|
|
|
|
|
|
| |||||||||||||||
| 352,493 | 7,274,280 | 7,382,634 | 140,942 | |||||||||||||||||||
|
|
|
|
|
|
|
| |||||||||||||||
Telecommunication Services | ||||||||||||||||||||||
AT&T, Inc. | Morgan Stanley | 71,352 | 2,131,908 | 2,034,246 | (97,663 | ) | ||||||||||||||||
CenturyLink, Inc. | Morgan Stanley | 11,294 | 119,024 | 113,956 | (2,993 | ) | ||||||||||||||||
Iridium Communications, Inc. | Morgan Stanley | 2,680 | 74,692 | 68,554 | (6,138 | ) | ||||||||||||||||
T-Mobile US, Inc. | Morgan Stanley | 1,624 | 181,019 | 185,721 | 4,701 | |||||||||||||||||
The accompanying notes are an integral part of the financial statements.
47
GOTHAM ABSOLUTE RETURN FUND
Portfolio of Investments (Continued)
September 30, 2020
Total Return Swaps (continued)
Reference Entity | Counterparty | Number of Contracts Long/(Short) | Notional Amount | Value | Unrealized Appreciation/ (Depreciation)* | ||||||||||||||||||
Telecommunication Services — (continued) | |||||||||||||||||||||||
Verizon Communications, Inc. | Morgan Stanley | 18,129 | $ | 1,013,522 | $ | 1,078,494 | $ | 64,972 | |||||||||||||||
|
|
|
|
|
|
|
| ||||||||||||||||
| 105,079 | 3,520,165 | 3,480,971 | (37,121 | ) | |||||||||||||||||||
|
|
|
|
|
|
|
| ||||||||||||||||
Transportation | |||||||||||||||||||||||
Alaska Air Group, Inc. | Morgan Stanley | 21,320 | 858,915 | 780,952 | (77,963 | ) | |||||||||||||||||
ArcBest Corp. | Morgan Stanley | 12,009 | 367,595 | 373,000 | 6,481 | ||||||||||||||||||
Atlas Air Worldwide Holdings, Inc. | Morgan Stanley | 6,936 | 403,114 | 422,402 | 19,313 | ||||||||||||||||||
CH Robinson Worldwide, Inc. | Morgan Stanley | 7,372 | 691,995 | 753,345 | 66,772 | ||||||||||||||||||
CSX Corp. | Morgan Stanley | 5,796 | 425,166 | 450,175 | 26,692 | ||||||||||||||||||
Echo Global Logistics, Inc. | Morgan Stanley | 5,806 | 151,595 | 149,621 | (1,974 | ) | |||||||||||||||||
Expeditors International of Washington, Inc. | Morgan Stanley | 11,269 | 905,915 | 1,020,070 | 115,626 | ||||||||||||||||||
FedEx Corp. | Morgan Stanley | 1,949 | 490,124 | 490,212 | 88 | ||||||||||||||||||
JB Hunt Transport Services, Inc. | Morgan Stanley | 3,636 | 477,791 | 459,518 | (17,384 | ) | |||||||||||||||||
Kansas City Southern | Morgan Stanley | 1 | 185 | 181 | (4 | ) | |||||||||||||||||
Marten Transport Ltd. | Morgan Stanley | 257 | 4,185 | 4,194 | 9 | ||||||||||||||||||
Norfolk Southern Corp. | Morgan Stanley | 16 | 3,411 | 3,424 | 12 | ||||||||||||||||||
Old Dominion Freight Line, Inc. | Morgan Stanley | 107 | 19,251 | 19,358 | 107 | ||||||||||||||||||
Schneider National, Inc., Class B | Morgan Stanley | 17,679 | 446,620 | 437,202 | (8,298 | ) | |||||||||||||||||
SkyWest, Inc. | Morgan Stanley | 19,106 | 554,267 | 570,505 | 16,952 | ||||||||||||||||||
United Parcel Service, Inc., Class B | Morgan Stanley | 1,050 | 164,085 | 174,961 | 11,797 | ||||||||||||||||||
Werner Enterprises, Inc. | Morgan Stanley | 622 | 26,749 | 26,118 | (632 | ) | |||||||||||||||||
|
|
|
|
|
|
|
| ||||||||||||||||
| 114,931 | 5,990,963 | 6,135,238 | 157,594 | ||||||||||||||||||||
|
|
|
|
|
|
|
| ||||||||||||||||
Utilities | |||||||||||||||||||||||
American Water Works Co., Inc. | Morgan Stanley | 604 | 85,270 | 87,508 | 2,237 | ||||||||||||||||||
CenterPoint Energy, Inc. | Morgan Stanley | 24,842 | 506,251 | 480,693 | (23,169 | ) | |||||||||||||||||
Dominion Energy, Inc. | Morgan Stanley | 33 | 2,554 | 2,605 | 50 | ||||||||||||||||||
Duke Energy Corp. | Morgan Stanley | 5,788 | 483,759 | 512,585 | 33,390 | ||||||||||||||||||
Exelon Corp. | Morgan Stanley | 10,288 | 383,193 | 367,899 | (13,598 | ) | |||||||||||||||||
FirstEnergy Corp. | Morgan Stanley | 36,491 | 1,002,108 | 1,047,657 | 59,394 | ||||||||||||||||||
MDU Resources Group, Inc. | Morgan Stanley | 7,576 | 173,732 | 170,460 | (2,238 | ) | |||||||||||||||||
National Fuel Gas Co. | Morgan Stanley | 2,724 | 120,778 | 110,567 | (9,030 | ) | |||||||||||||||||
NiSource, Inc. | Morgan Stanley | 1,365 | 30,289 | 30,030 | (259 | ) | |||||||||||||||||
NRG Energy, Inc. | Morgan Stanley | 30,018 | 995,924 | 922,753 | (64,401 | ) | |||||||||||||||||
OGE Energy Corp. | Morgan Stanley | 324 | 10,036 | 9,717 | (319 | ) | |||||||||||||||||
PPL Corp. | Morgan Stanley | 29,887 | 811,135 | 813,225 | 14,323 | ||||||||||||||||||
York Water Co. (The) | Morgan Stanley | 1 | 43 | 42 | 7 | ||||||||||||||||||
|
|
|
|
|
|
|
| ||||||||||||||||
| 149,941 | 4,605,072 | 4,555,741 | (3,613 | ) | |||||||||||||||||||
|
|
|
|
|
|
|
| ||||||||||||||||
Total Reference Entity — Long | 126,717,419 | 125,750,273 | (536,772 | ) | |||||||||||||||||||
|
|
|
|
|
| ||||||||||||||||||
Short | |||||||||||||||||||||||
Automobiles & Components | |||||||||||||||||||||||
Aptiv PLC (Jersey) | Morgan Stanley | (21,718 | ) | (1,880,735 | ) | (1,991,106 | ) | (111,506 | ) | ||||||||||||||
Dorman Products, Inc. | Morgan Stanley | (4,123 | ) | (300,649 | ) | (372,637 | ) | (72,688 | ) | ||||||||||||||
Fiat Chrysler Automobiles NV (Netherlands) | Morgan Stanley | (160,263 | ) | (1,775,202 | ) | (1,958,414 | ) | (185,188 | ) | ||||||||||||||
Ford Motor Co. | Morgan Stanley | (133,789 | ) | (950,638 | ) | (891,035 | ) | 90,068 | |||||||||||||||
The accompanying notes are an integral part of the financial statements.
48
GOTHAM ABSOLUTE RETURN FUND
Portfolio of Investments (Continued)
September 30, 2020
Total Return Swaps (continued)
Reference Entity | Counterparty | Number of Contracts Long/(Short) | Notional Amount | Value | Unrealized Appreciation/ (Depreciation)* | |||||||||||||||||
Automobiles & Components — (continued) | ||||||||||||||||||||||
Fox Factory Holding Corp. | Morgan Stanley | (12,875 | ) | $ | (1,109,053 | ) | $ | (956,999 | ) | $ | 157,890 | |||||||||||
Goodyear Tire & Rubber Co. (The) | Morgan Stanley | (126,982 | ) | (1,178,759 | ) | (973,952 | ) | 204,096 | ||||||||||||||
LCI Industries | Morgan Stanley | (11,767 | ) | (1,420,274 | ) | (1,250,714 | ) | 160,923 | ||||||||||||||
Lear Corp. | Morgan Stanley | (2,870 | ) | (345,740 | ) | (312,974 | ) | 32,920 | ||||||||||||||
|
|
|
|
|
|
|
| |||||||||||||||
| (474,387 | ) | (8,961,050 | ) | (8,707,831 | ) | 276,515 | ||||||||||||||||
|
|
|
|
|
|
|
| |||||||||||||||
Capital Goods | ||||||||||||||||||||||
A.O. Smith Corp. | Morgan Stanley | (2,024 | ) | (106,830 | ) | (106,867 | ) | (137 | ) | |||||||||||||
AAON, Inc. | Morgan Stanley | (140 | ) | (8,529 | ) | (8,435 | ) | 89 | ||||||||||||||
Alamo Group, Inc. | Morgan Stanley | (2,291 | ) | (236,294 | ) | (247,497 | ) | (11,540 | ) | |||||||||||||
Allison Transmission Holdings, Inc. | Morgan Stanley | (7,391 | ) | (277,296 | ) | (259,720 | ) | 16,203 | ||||||||||||||
Ameresco, Inc., Class A | Morgan Stanley | (3,952 | ) | (113,343 | ) | (131,997 | ) | (18,722 | ) | |||||||||||||
American Woodmark Corp. | Morgan Stanley | (1,779 | ) | (151,530 | ) | (139,723 | ) | 11,716 | ||||||||||||||
Argan, Inc. | Morgan Stanley | (4,739 | ) | (218,041 | ) | (198,611 | ) | 19,664 | ||||||||||||||
Armstrong World Industries, Inc. | Morgan Stanley | (13,781 | ) | (1,010,406 | ) | (948,271 | ) | 60,863 | ||||||||||||||
Axon Enterprise, Inc. | Morgan Stanley | (13,088 | ) | (1,093,767 | ) | (1,187,082 | ) | (93,975 | ) | |||||||||||||
Beacon Roofing Supply, Inc. | Morgan Stanley | (8,721 | ) | (256,739 | ) | (270,961 | ) | (15,719 | ) | |||||||||||||
Bloom Energy Corp., Class A | Morgan Stanley | (29,280 | ) | (439,174 | ) | (526,162 | ) | (87,253 | ) | |||||||||||||
Boeing Co. (The) | Morgan Stanley | (22,407 | ) | (3,763,211 | ) | (3,702,981 | ) | 56,796 | ||||||||||||||
Carrier Global Corp. | Morgan Stanley | (14,330 | ) | (428,536 | ) | (437,638 | ) | (9,937 | ) | |||||||||||||
Caterpillar, Inc. | Morgan Stanley | (11,972 | ) | (1,766,356 | ) | (1,785,624 | ) | (47,871 | ) | |||||||||||||
Construction Partners, Inc., Class A | Morgan Stanley | (10,415 | ) | (174,861 | ) | (189,553 | ) | (15,168 | ) | |||||||||||||
EMCOR Group, Inc. | Morgan Stanley | (2,473 | ) | (164,407 | ) | (167,447 | ) | (4,420 | ) | |||||||||||||
EnerSys | Morgan Stanley | (5,454 | ) | (363,618 | ) | (366,072 | ) | (3,846 | ) | |||||||||||||
Graco, Inc. | Morgan Stanley | (6,551 | ) | (379,276 | ) | (401,904 | ) | (22,857 | ) | |||||||||||||
Hillenbrand, Inc. | Morgan Stanley | (36,913 | ) | (1,063,587 | ) | (1,046,853 | ) | 8,212 | ||||||||||||||
Hyster-Yale Materials Handling, Inc. | Morgan Stanley | (4,046 | ) | (154,771 | ) | (150,309 | ) | 3,082 | ||||||||||||||
Ingersoll Rand, Inc. | Morgan Stanley | (43,415 | ) | (1,374,373 | ) | (1,545,574 | ) | (179,451 | ) | |||||||||||||
Jacobs Engineering Group, Inc. | Morgan Stanley | (19,673 | ) | (1,752,640 | ) | (1,825,064 | ) | (81,244 | ) | |||||||||||||
JELD-WEN Holding, Inc. | Morgan Stanley | (11,891 | ) | (225,960 | ) | (268,737 | ) | (43,165 | ) | |||||||||||||
Johnson Controls International PLC (Ireland) | Morgan Stanley | (10,731 | ) | (457,728 | ) | (438,361 | ) | 15,392 | ||||||||||||||
Kennametal, Inc. | Morgan Stanley | (49,807 | ) | (1,404,544 | ) | (1,441,415 | ) | (46,231 | ) | |||||||||||||
Kratos Defense & Security Solutions, Inc. | Morgan Stanley | (25,387 | ) | (485,113 | ) | (489,461 | ) | (4,665 | ) | |||||||||||||
MasTec, Inc. | Morgan Stanley | (7,289 | ) | (334,410 | ) | (307,596 | ) | 26,682 | ||||||||||||||
Mercury Systems, Inc. | Morgan Stanley | (2,821 | ) | (218,171 | ) | (218,515 | ) | (476 | ) | |||||||||||||
Meritor, Inc. | Morgan Stanley | (37,561 | ) | (879,679 | ) | (786,527 | ) | 92,621 | ||||||||||||||
Mueller Water Products, Inc., Class A | Morgan Stanley | (89,501 | ) | (911,121 | ) | (929,915 | ) | (24,449 | ) | |||||||||||||
Navistar International Corp. | Morgan Stanley | (10,041 | ) | (372,968 | ) | (437,185 | ) | (64,443 | ) | |||||||||||||
Nordson Corp. | Morgan Stanley | (3,331 | ) | (646,928 | ) | (638,952 | ) | 7,224 | ||||||||||||||
NV5 Global, Inc. | Morgan Stanley | (13,822 | ) | (765,186 | ) | (729,387 | ) | 36,144 | ||||||||||||||
Patrick Industries, Inc. | Morgan Stanley | (8,565 | ) | (553,592 | ) | (492,659 | ) | 58,578 | ||||||||||||||
PGT Innovations, Inc. | Morgan Stanley | (25,758 | ) | (437,076 | ) | (451,280 | ) | (14,516 | ) | |||||||||||||
Proto Labs, Inc. | Morgan Stanley | (11,739 | ) | (1,592,378 | ) | (1,520,201 | ) | 66,735 | ||||||||||||||
Raytheon Technologies Corp. | Morgan Stanley | (18,797 | ) | (1,179,543 | ) | (1,081,579 | ) | 103,138 | ||||||||||||||
Resideo Technologies, Inc. | Morgan Stanley | (52,238 | ) | (710,437 | ) | (574,618 | ) | 138,642 | ||||||||||||||
The accompanying notes are an integral part of the financial statements.
49
GOTHAM ABSOLUTE RETURN FUND
Portfolio of Investments (Continued)
September 30, 2020
Total Return Swaps (continued)
Reference Entity | Counterparty | Number of Contracts Long/(Short) | Notional Amount | Value | Unrealized Appreciation/ (Depreciation)* | |||||||||||||||||
Capital Goods — (continued) | ||||||||||||||||||||||
REV Group, Inc. | Morgan Stanley | (1,483 | ) | $ | (11,237 | ) | $ | (11,701 | ) | $ | (471 | ) | ||||||||||
Rockwell Automation, Inc. | Morgan Stanley | (1,264 | ) | (290,222 | ) | (278,939 | ) | 9,769 | ||||||||||||||
Sensata Technologies Holding PLC | ||||||||||||||||||||||
(United Kingdom) | Morgan Stanley | (15,439 | ) | (642,727 | ) | (666,038 | ) | (24,050 | ) | |||||||||||||
Spirit AeroSystems Holdings, Inc., Class A | Morgan Stanley | (97,467 | ) | (2,268,057 | ) | (1,843,101 | ) | 433,143 | ||||||||||||||
Stanley Black & Decker, Inc. | Morgan Stanley | (18,955 | ) | (2,912,277 | ) | (3,074,501 | ) | (175,801 | ) | |||||||||||||
Sunrun, Inc. | Morgan Stanley | (15,124 | ) | (642,165 | ) | (1,165,607 | ) | (606,965 | ) | |||||||||||||
Systemax, Inc. | Morgan Stanley | (20 | ) | (474 | ) | (479 | ) | (6 | ) | |||||||||||||
Trex Co., Inc. | Morgan Stanley | (33,100 | ) | (2,365,692 | ) | (2,369,960 | ) | (5,697 | ) | |||||||||||||
Vicor Corp. | Morgan Stanley | (5,612 | ) | (409,249 | ) | (436,221 | ) | (27,695 | ) | |||||||||||||
Vivint Solar, Inc. | Morgan Stanley | (10,694 | ) | (248,849 | ) | (452,891 | ) | (256,540 | ) | |||||||||||||
Welbilt, Inc. | Morgan Stanley | (16,956 | ) | (127,334 | ) | (104,449 | ) | 23,052 | ||||||||||||||
WESCO International, Inc. | Morgan Stanley | (45,210 | ) | (2,072,902 | ) | (1,990,144 | ) | 81,506 | ||||||||||||||
Xylem, Inc. | Morgan Stanley | (20,357 | ) | (1,624,610 | ) | (1,712,431 | ) | (91,186 | ) | |||||||||||||
|
|
|
|
|
|
|
| |||||||||||||||
| (925,795 | ) | (40,088,214 | ) | (40,557,195 | ) | (709,245 | ) | |||||||||||||||
|
|
|
|
|
|
|
| |||||||||||||||
Commercial & Professional Services | ||||||||||||||||||||||
Casella Waste Systems, Inc., Class A | Morgan Stanley | (8,281 | ) | (444,607 | ) | (462,494 | ) | (18,295 | ) | |||||||||||||
Harsco Corp. | Morgan Stanley | (13,649 | ) | (199,771 | ) | (189,858 | ) | 9,793 | ||||||||||||||
IAA, Inc. | Morgan Stanley | (3,724 | ) | (196,249 | ) | (193,909 | ) | 2,224 | ||||||||||||||
Insperity, Inc. | Morgan Stanley | (3,829 | ) | (257,462 | ) | (250,761 | ) | 5,107 | ||||||||||||||
Knoll, Inc. | Morgan Stanley | (1,515 | ) | (19,432 | ) | (18,271 | ) | 1,149 | ||||||||||||||
US Ecology, Inc. | Morgan Stanley | (27,278 | ) | (956,963 | ) | (891,172 | ) | 65,435 | ||||||||||||||
|
|
|
|
|
|
|
| |||||||||||||||
| (58,276 | ) | (2,074,484 | ) | (2,006,465 | ) | 65,413 | ||||||||||||||||
|
|
|
|
|
|
|
| |||||||||||||||
Consumer Durables & Apparel | ||||||||||||||||||||||
Acushnet Holdings Corp. | Morgan Stanley | (8,829 | ) | (307,475 | ) | (296,743 | ) | 9,658 | ||||||||||||||
BRP, Inc., sub-voting shares (Canada) | Morgan Stanley | (2,451 | ) | (107,580 | ) | (129,462 | ) | (22,639 | ) | |||||||||||||
Callaway Golf Co. | Morgan Stanley | (89,706 | ) | (1,732,920 | ) | (1,716,973 | ) | 14,901 | ||||||||||||||
Canada Goose Holdings, Inc. (Canada) | Morgan Stanley | (6 | ) | (190 | ) | (193 | ) | (3 | ) | |||||||||||||
Columbia Sportswear Co. | Morgan Stanley | (8,421 | ) | (688,753 | ) | (732,459 | ) | (45,415 | ) | |||||||||||||
Crocs, Inc. | Morgan Stanley | (12,752 | ) | (458,562 | ) | (544,893 | ) | (89,009 | ) | |||||||||||||
GoPro, Inc., Class A | Morgan Stanley | (93,395 | ) | (461,182 | ) | (423,079 | ) | 37,824 | ||||||||||||||
Hasbro, Inc. | Morgan Stanley | (11,071 | ) | (873,425 | ) | (915,793 | ) | (42,896 | ) | |||||||||||||
iRobot Corp. | Morgan Stanley | (3,123 | ) | (254,175 | ) | (237,036 | ) | 17,121 | ||||||||||||||
Levi Strauss & Co., Class A | Morgan Stanley | (26,364 | ) | (328,455 | ) | (353,278 | ) | (25,021 | ) | |||||||||||||
Malibu Boats, Inc., Class A | Morgan Stanley | (3,027 | ) | (154,251 | ) | (150,018 | ) | 4,135 | ||||||||||||||
Oxford Industries, Inc. | Morgan Stanley | (5,051 | ) | (230,173 | ) | (203,858 | ) | 26,688 | ||||||||||||||
Ralph Lauren Corp. | Morgan Stanley | (7,787 | ) | (583,336 | ) | (529,282 | ) | 54,965 | ||||||||||||||
Skechers U.S.A., Inc., Class A | Morgan Stanley | (28,148 | ) | (874,558 | ) | (850,633 | ) | 24,404 | ||||||||||||||
Tapestry, Inc. | Morgan Stanley | (46,637 | ) | (719,040 | ) | (728,936 | ) | (10,330 | ) | |||||||||||||
Under Armour, Inc., Class C | Morgan Stanley | (183,023 | ) | (1,742,403 | ) | (1,800,946 | ) | (59,595 | ) | |||||||||||||
VF Corp. | Morgan Stanley | (16,229 | ) | (1,054,777 | ) | (1,140,087 | ) | (96,573 | ) | |||||||||||||
Vista Outdoor, Inc. | Morgan Stanley | (11,580 | ) | (190,142 | ) | (233,684 | ) | (50,012 | ) | |||||||||||||
Wolverine World Wide, Inc. | Morgan Stanley | (9,810 | ) | (231,559 | ) | (253,490 | ) | (23,060 | ) | |||||||||||||
|
|
|
|
|
|
|
| |||||||||||||||
| (567,410 | ) | (10,992,956 | ) | (11,240,843 | ) | (274,857 | ) | |||||||||||||||
|
|
|
|
|
|
|
| |||||||||||||||
The accompanying notes are an integral part of the financial statements.
50
GOTHAM ABSOLUTE RETURN FUND
Portfolio of Investments (Continued)
September 30, 2020
Total Return Swaps (continued)
Reference Entity | Counterparty | Number of Contracts Long/(Short) | Notional Amount | Value | Unrealized Appreciation/ (Depreciation)* | |||||||||||||||||
Consumer Services | ||||||||||||||||||||||
Aramark | Morgan Stanley | (11,338 | ) | $ | (311,333 | ) | $ | (299,890 | ) | $ | 9,764 | |||||||||||
Bright Horizons Family Solutions, Inc. | Morgan Stanley | (8,432 | ) | (1,117,323 | ) | (1,282,001 | ) | (165,353 | ) | |||||||||||||
Carnival Corp. (Panama) | Morgan Stanley | (93,178 | ) | (1,445,476 | ) | (1,414,442 | ) | 30,161 | ||||||||||||||
Cheesecake Factory, Inc. (The) | Morgan Stanley | (43,777 | ) | (1,052,729 | ) | (1,214,374 | ) | (167,375 | ) | |||||||||||||
Choice Hotels International, Inc. | Morgan Stanley | (3,105 | ) | (296,404 | ) | (266,906 | ) | 29,050 | ||||||||||||||
Churchill Downs, Inc. | Morgan Stanley | (1,951 | ) | (274,307 | ) | (319,613 | ) | (45,472 | ) | |||||||||||||
Collectors Universe, Inc. | Morgan Stanley | (699 | ) | (36,357 | ) | (34,594 | ) | 1,742 | ||||||||||||||
Cracker Barrel Old Country Store, Inc. | Morgan Stanley | (3,562 | ) | (421,154 | ) | (408,419 | ) | 12,481 | ||||||||||||||
Dave & Buster’s Entertainment, Inc. | Morgan Stanley | (77,427 | ) | (1,042,028 | ) | (1,173,793 | ) | (132,395 | ) | |||||||||||||
Domino’s Pizza, Inc. | Morgan Stanley | (2,966 | ) | (1,227,309 | ) | (1,261,380 | ) | (34,812 | ) | |||||||||||||
Dunkin’ Brands Group, Inc. | Morgan Stanley | (6,560 | ) | (505,633 | ) | (537,330 | ) | (32,100 | ) | |||||||||||||
Everi Holdings, Inc. | Morgan Stanley | (33,461 | ) | (199,347 | ) | (276,053 | ) | (76,827 | ) | |||||||||||||
International Game Technology PLC (United Kingdom) | Morgan Stanley | (33,193 | ) | (365,969 | ) | (369,438 | ) | (3,690 | ) | |||||||||||||
K12, Inc. | Morgan Stanley | (40,012 | ) | (1,853,756 | ) | (1,053,916 | ) | 798,721 | ||||||||||||||
Las Vegas Sands Corp. | Morgan Stanley | (22,075 | ) | (1,017,319 | ) | (1,030,020 | ) | (16,209 | ) | |||||||||||||
Monarch Casino & Resort, Inc. | Morgan Stanley | (6,712 | ) | (234,335 | ) | (299,355 | ) | (65,314 | ) | |||||||||||||
Planet Fitness, Inc., Class A | Morgan Stanley | (96 | ) | (5,703 | ) | (5,915 | ) | (225 | ) | |||||||||||||
Restaurant Brands International, Inc. (Canada) | Morgan Stanley | (13,590 | ) | (760,960 | ) | (781,561 | ) | (24,685 | ) | |||||||||||||
ServiceMaster Global Holdings, Inc. | Morgan Stanley | (14,630 | ) | (561,296 | ) | (583,444 | ) | (23,243 | ) | |||||||||||||
Starbucks Corp. | Morgan Stanley | (6,809 | ) | (563,658 | ) | (585,029 | ) | (43,459 | ) | |||||||||||||
Texas Roadhouse, Inc. | Morgan Stanley | (14,028 | ) | (758,182 | ) | (852,762 | ) | (100,841 | ) | |||||||||||||
Twin River Worldwide Holdings, Inc. | Morgan Stanley | (365 | ) | (8,973 | ) | (9,588 | ) | (621 | ) | |||||||||||||
Wendy’s Co. (The) | Morgan Stanley | (5,067 | ) | (109,302 | ) | (112,969 | ) | (3,733 | ) | |||||||||||||
Wynn Resorts Ltd. | Morgan Stanley | (10,518 | ) | (805,402 | ) | (755,297 | ) | 49,618 | ||||||||||||||
|
|
|
|
|
|
|
| |||||||||||||||
| (453,551 | ) | (14,974,255 | ) | (14,928,089 | ) | (4,817 | ) | |||||||||||||||
|
|
|
|
|
|
|
| |||||||||||||||
Diversified Financials | ||||||||||||||||||||||
Assetmark Financial Holdings, Inc. | Morgan Stanley | (20 | ) | (449 | ) | (435 | ) | 13 | ||||||||||||||
Blucora, Inc. | Morgan Stanley | (113 | ) | (1,072 | ) | (1,064 | ) | 7 | ||||||||||||||
Invesco Ltd. (Bermuda) | Morgan Stanley | (13,411 | ) | (149,053 | ) | (153,020 | ) | (4,057 | ) | |||||||||||||
State Street Corp. | Morgan Stanley | (3,411 | ) | (198,929 | ) | (202,375 | ) | (5,339 | ) | |||||||||||||
|
|
|
|
|
|
|
| |||||||||||||||
| (16,955 | ) | (349,503 | ) | (356,894 | ) | (9,376 | ) | |||||||||||||||
|
|
|
|
|
|
|
| |||||||||||||||
Energy | ||||||||||||||||||||||
Cabot Oil & Gas Corp. | Morgan Stanley | (71,251 | ) | (1,393,331 | ) | (1,236,917 | ) | 157,399 | ||||||||||||||
ChampionX Corp. | Morgan Stanley | (63,131 | ) | (566,303 | ) | (504,417 | ) | 61,544 | ||||||||||||||
CNX Resources Corp. | Morgan Stanley | (63,766 | ) | (716,765 | ) | (601,951 | ) | 115,854 | ||||||||||||||
Comstock Resources, Inc. | Morgan Stanley | (1,939 | ) | (8,634 | ) | (8,493 | ) | 136 | ||||||||||||||
Continental Resources, Inc. | Morgan Stanley | (38,079 | ) | (691,429 | ) | (467,610 | ) | 224,840 | ||||||||||||||
Delek US Holdings, Inc. | Morgan Stanley | (152,256 | ) | (2,772,199 | ) | (1,694,609 | ) | 1,029,796 | ||||||||||||||
Diamondback Energy, Inc. | Morgan Stanley | (22,142 | ) | (861,744 | ) | (666,917 | ) | 187,682 | ||||||||||||||
Dril-Quip, Inc. | Morgan Stanley | (14,741 | ) | (441,906 | ) | (364,987 | ) | 76,652 | ||||||||||||||
Exxon Mobil Corp. | Morgan Stanley | (16,077 | ) | (685,481 | ) | (551,923 | ) | 124,829 | ||||||||||||||
Hess Corp. | Morgan Stanley | (24,335 | ) | (1,125,583 | ) | (996,032 | ) | 125,279 | ||||||||||||||
NexTier Oilfield Solutions, Inc. | Morgan Stanley | (53,466 | ) | (147,032 | ) | (98,912 | ) | 48,031 | ||||||||||||||
Occidental Petroleum Corp. | Morgan Stanley | (56,457 | ) | (850,583 | ) | (565,135 | ) | 284,484 | ||||||||||||||
The accompanying notes are an integral part of the financial statements.
51
GOTHAM ABSOLUTE RETURN FUND
Portfolio of Investments (Continued)
September 30, 2020
Total Return Swaps (continued)
Reference Entity | Counterparty | Number of Contracts Long/(Short) | Notional Amount | Value | Unrealized Appreciation/ (Depreciation)* | |||||||||||||||||
Energy — (continued) | ||||||||||||||||||||||
Oceaneering International, Inc. | Morgan Stanley | (34,068 | ) | $ | (197,946 | ) | $ | (119,919 | ) | $ | 77,907 | |||||||||||
ONEOK, Inc. | Morgan Stanley | (4,013 | ) | (106,441 | ) | (104,258 | ) | 2,119 | ||||||||||||||
Ovintiv, Inc. | Morgan Stanley | (73,048 | ) | (804,443 | ) | (596,072 | ) | 201,770 | ||||||||||||||
Parsley Energy, Inc., Class A | Morgan Stanley | (119,392 | ) | (1,366,044 | ) | (1,117,509 | ) | 241,971 | ||||||||||||||
PDC Energy, Inc. | Morgan Stanley | (41,293 | ) | (643,758 | ) | (511,827 | ) | 133,425 | ||||||||||||||
Pembina Pipeline Corp. (Canada) | Morgan Stanley | (58,108 | ) | (1,443,739 | ) | (1,233,633 | ) | 192,025 | ||||||||||||||
Pioneer Natural Resources Co. | Morgan Stanley | (3,547 | ) | (390,420 | ) | (305,006 | ) | 87,731 | ||||||||||||||
RPC, Inc. | Morgan Stanley | (106,277 | ) | (349,651 | ) | (280,571 | ) | 69,064 | ||||||||||||||
SFL Corp. Ltd. (Bermuda) | Morgan Stanley | (26,739 | ) | (229,504 | ) | (200,275 | ) | 23,270 | ||||||||||||||
Southwestern Energy Co. | Morgan Stanley | (1,061,374 | ) | (2,738,412 | ) | (2,494,229 | ) | 243,812 | ||||||||||||||
Suncor Energy, Inc. (Canada) | Morgan Stanley | (17,399 | ) | (286,353 | ) | (212,790 | ) | 72,846 | ||||||||||||||
TC Energy Corp. (Canada) | Morgan Stanley | (27,730 | ) | (1,237,313 | ) | (1,165,215 | ) | 55,706 | ||||||||||||||
Vermilion Energy, Inc. (Canada) | Morgan Stanley | (11,246 | ) | (49,433 | ) | (26,316 | ) | 23,088 | ||||||||||||||
WPX Energy, Inc. | Morgan Stanley | (147,267 | ) | (880,455 | ) | (721,608 | ) | 158,316 | ||||||||||||||
|
|
|
|
|
|
|
| |||||||||||||||
| (2,309,141 | ) | (20,984,902 | ) | (16,847,131 | ) | 4,019,576 | ||||||||||||||||
|
|
|
|
|
|
|
| |||||||||||||||
Food & Staples Retailing | ||||||||||||||||||||||
Grocery Outlet Holding Corp. | Morgan Stanley | (37,439 | ) | (1,531,563 | ) | (1,472,101 | ) | 58,537 | ||||||||||||||
Performance Food Group Co. | Morgan Stanley | (38,043 | ) | (1,068,657 | ) | (1,317,049 | ) | (257,550 | ) | |||||||||||||
Rite Aid Corp. | Morgan Stanley | (4,317 | ) | (44,774 | ) | (40,968 | ) | 3,779 | ||||||||||||||
|
|
|
|
|
|
|
| |||||||||||||||
| (79,799 | ) | (2,644,994 | ) | (2,830,118 | ) | (195,234 | ) | |||||||||||||||
|
|
|
|
|
|
|
| |||||||||||||||
Food, Beverage & Tobacco | ||||||||||||||||||||||
Beyond Meat, Inc. | Morgan Stanley | (1,981 | ) | (264,856 | ) | (328,965 | ) | (96,600 | ) | |||||||||||||
Calavo Growers, Inc. | Morgan Stanley | (10,062 | ) | (624,081 | ) | (666,809 | ) | (43,105 | ) | |||||||||||||
Campbell Soup Co. | Morgan Stanley | (3,647 | ) | (175,731 | ) | (176,405 | ) | (781 | ) | |||||||||||||
Freshpet, Inc. | Morgan Stanley | (1,822 | ) | (160,864 | ) | (203,426 | ) | (43,097 | ) | |||||||||||||
Hostess Brands, Inc. | Morgan Stanley | (31,611 | ) | (399,089 | ) | (389,764 | ) | 9,270 | ||||||||||||||
J&J Snack Foods Corp. | Morgan Stanley | (3,301 | ) | (437,053 | ) | (430,417 | ) | 4,462 | ||||||||||||||
Lamb Weston Holdings, Inc. | Morgan Stanley | (17,748 | ) | (1,180,108 | ) | (1,176,160 | ) | 3,235 | ||||||||||||||
MGP Ingredients, Inc. | Morgan Stanley | (14,078 | ) | (537,921 | ) | (559,460 | ) | (23,544 | ) | |||||||||||||
Pilgrim’s Pride Corp. | Morgan Stanley | (74,664 | ) | (1,196,163 | ) | (1,117,347 | ) | 78,094 | ||||||||||||||
Primo Water Corp. (Canada) | Morgan Stanley | (44,469 | ) | (623,455 | ) | (631,460 | ) | (11,278 | ) | |||||||||||||
Sanderson Farms, Inc. | Morgan Stanley | (16,309 | ) | (1,863,053 | ) | (1,923,973 | ) | (67,662 | ) | |||||||||||||
Simply Good Foods Co. (The) | Morgan Stanley | (22,110 | ) | (532,409 | ) | (487,525 | ) | 45,902 | ||||||||||||||
Universal Corp. | Morgan Stanley | (8,882 | ) | (372,134 | ) | (371,978 | ) | (35 | ) | |||||||||||||
|
|
|
|
|
|
|
| |||||||||||||||
| (250,684 | ) | (8,366,917 | ) | (8,463,689 | ) | (145,139 | ) | |||||||||||||||
|
|
|
|
|
|
|
| |||||||||||||||
Health Care Equipment & Services | ||||||||||||||||||||||
ABIOMED, Inc. | Morgan Stanley | (1,693 | ) | (500,459 | ) | (469,063 | ) | 32,937 | ||||||||||||||
Alcon, Inc. (Switzerland) | Morgan Stanley | (170 | ) | (9,710 | ) | (9,682 | ) | 23 | ||||||||||||||
Align Technology, Inc. | Morgan Stanley | (6,185 | ) | (1,903,913 | ) | (2,024,722 | ) | (128,066 | ) | |||||||||||||
Amedisys, Inc. | Morgan Stanley | (1,404 | ) | (303,274 | ) | (331,948 | ) | (32,180 | ) | |||||||||||||
AtriCure, Inc. | Morgan Stanley | (6,286 | ) | (257,240 | ) | (250,811 | ) | 6,273 | ||||||||||||||
Avanos Medical, Inc. | Morgan Stanley | (16,881 | ) | (543,737 | ) | (560,787 | ) | (17,422 | ) | |||||||||||||
Axogen, Inc. | Morgan Stanley | (34,274 | ) | (412,488 | ) | (398,607 | ) | 13,634 | ||||||||||||||
BioTelemetry, Inc. | Morgan Stanley | (13,851 | ) | (569,276 | ) | (631,329 | ) | (63,383 | ) | |||||||||||||
Boston Scientific Corp. | Morgan Stanley | (13,027 | ) | (520,797 | ) | (497,762 | ) | 24,437 | ||||||||||||||
The accompanying notes are an integral part of the financial statements.
52
GOTHAM ABSOLUTE RETURN FUND
Portfolio of Investments (Continued)
September 30, 2020
Total Return Swaps (continued)
Reference Entity | Counterparty | Number of Contracts Long/(Short) | Notional Amount | Value | Unrealized Appreciation/ (Depreciation)* | ||||||||||||||||||
Health Care Equipment & Services — (continued) | |||||||||||||||||||||||
Brookdale Senior Living, Inc. | Morgan Stanley | (57,207 | ) | $ | (154,532 | ) | $ | (145,306 | ) | $ | 9,218 | ||||||||||||
Cantel Medical Corp. | Morgan Stanley | (5,107 | ) | (267,760 | ) | (224,402 | ) | 44,509 | |||||||||||||||
Cardiovascular Systems, Inc. | Morgan Stanley | (9,543 | ) | (290,562 | ) | (375,517 | ) | (85,131 | ) | ||||||||||||||
Change Healthcare, Inc. | Morgan Stanley | (12,772 | ) | (150,532 | ) | (185,322 | ) | (38,203 | ) | ||||||||||||||
Cooper Cos., Inc. (The) | Morgan Stanley | (5,438 | ) | (1,628,787 | ) | (1,833,259 | ) | (205,455 | ) | ||||||||||||||
CorVel Corp. | Morgan Stanley | (699 | ) | (58,492 | ) | (59,716 | ) | (1,259 | ) | ||||||||||||||
Edwards Lifesciences Corp. | Morgan Stanley | (7,106 | ) | (568,757 | ) | (567,201 | ) | 503 | |||||||||||||||
Encompass Health Corp. | Morgan Stanley | (5,575 | ) | (371,574 | ) | (362,264 | ) | 8,585 | |||||||||||||||
Envista Holdings Corp. | Morgan Stanley | (9,164 | ) | (231,799 | ) | (226,168 | ) | 5,491 | |||||||||||||||
Evolent Health, Inc., Class A | Morgan Stanley | (17,230 | ) | (180,743 | ) | (213,824 | ) | (34,617 | ) | ||||||||||||||
Glaukos Corp. | Morgan Stanley | (24,444 | ) | (1,004,404 | ) | (1,210,467 | ) | (211,893 | ) | ||||||||||||||
Guardant Health, Inc. | Morgan Stanley | (7,043 | ) | (631,626 | ) | (787,267 | ) | (169,203 | ) | ||||||||||||||
Haemonetics Corp. | Morgan Stanley | (6,250 | ) | (557,712 | ) | (545,313 | ) | 12,063 | |||||||||||||||
HealthEquity, Inc. | Morgan Stanley | (21,928 | ) | (1,235,246 | ) | (1,126,441 | ) | 115,197 | |||||||||||||||
Henry Schein, Inc. | Morgan Stanley | (24,053 | ) | (1,601,996 | ) | (1,413,835 | ) | 194,047 | |||||||||||||||
Inovalon Holdings, Inc., Class A | Morgan Stanley | (7,705 | ) | (167,847 | ) | (203,797 | ) | (36,051 | ) | ||||||||||||||
Laboratory Corp. of America Holdings | Morgan Stanley | (7,200 | ) | (1,316,248 | ) | (1,355,544 | ) | (40,090 | ) | ||||||||||||||
Lantheus Holdings, Inc. | Morgan Stanley | (225 | ) | (2,804 | ) | (2,851 | ) | (49 | ) | ||||||||||||||
LHC Group, Inc. | Morgan Stanley | (5,506 | ) | (1,037,000 | ) | (1,170,355 | ) | (137,392 | ) | ||||||||||||||
LivaNova PLC (United Kingdom) | Morgan Stanley | (17,329 | ) | (1,001,789 | ) | (783,444 | ) | 222,526 | |||||||||||||||
Merit Medical Systems, Inc. | Morgan Stanley | (12,076 | ) | (506,588 | ) | (525,306 | ) | (19,859 | ) | ||||||||||||||
Mesa Laboratories, Inc. | Morgan Stanley | (2,456 | ) | (569,676 | ) | (625,691 | ) | (56,753 | ) | ||||||||||||||
NuVasive, Inc. | Morgan Stanley | (23,782 | ) | (1,249,170 | ) | (1,155,092 | ) | 93,289 | |||||||||||||||
OraSure Technologies, Inc. | Morgan Stanley | (63,338 | ) | (808,121 | ) | (770,823 | ) | 36,809 | |||||||||||||||
Penumbra, Inc. | Morgan Stanley | (6,003 | ) | (1,243,762 | ) | (1,166,863 | ) | 77,249 | |||||||||||||||
PetIQ, Inc. | Morgan Stanley | (39,700 | ) | (1,437,564 | ) | (1,306,924 | ) | 129,727 | |||||||||||||||
Phreesia, Inc. | Morgan Stanley | (4,922 | ) | (145,259 | ) | (158,144 | ) | (12,973 | ) | ||||||||||||||
Progyny, Inc. | Morgan Stanley | (2,487 | ) | (70,699 | ) | (73,192 | ) | (2,536 | ) | ||||||||||||||
RadNet, Inc. | Morgan Stanley | (27,968 | ) | (450,383 | ) | (429,309 | ) | 20,802 | |||||||||||||||
Simulations Plus, Inc. | Morgan Stanley | (365 | ) | (26,682 | ) | (27,506 | ) | (840 | ) | ||||||||||||||
SmileDirectClub, Inc. | Morgan Stanley | (83,276 | ) | (897,247 | ) | (972,664 | ) | (75,958 | ) | ||||||||||||||
STAAR Surgical Co. | Morgan Stanley | (11,005 | ) | (609,451 | ) | (622,443 | ) | (13,360 | ) | ||||||||||||||
Tabula Rasa HealthCare, Inc. | Morgan Stanley | (26,322 | ) | (1,431,774 | ) | (1,073,148 | ) | 357,761 | |||||||||||||||
Tactile Systems Technology, Inc. | Morgan Stanley | (9,735 | ) | (356,150 | ) | (356,204 | ) | (269 | ) | ||||||||||||||
US Physical Therapy, Inc. | Morgan Stanley | (1,177 | ) | (98,558 | ) | (102,258 | ) | (3,949 | ) | ||||||||||||||
Vapotherm, Inc. | Morgan Stanley | (8,562 | ) | (237,628 | ) | (248,298 | ) | (10,814 | ) | ||||||||||||||
Varex Imaging Corp. | Morgan Stanley | (1,399 | ) | (16,826 | ) | (17,795 | ) | (980 | ) | ||||||||||||||
Vocera Communications, Inc. | Morgan Stanley | (16,624 | ) | (395,984 | ) | (483,426 | ) | (89,140 | ) | ||||||||||||||
Wright Medical Group NV (Netherlands) | Morgan Stanley | (29,055 | ) | (881,259 | ) | (887,340 | ) | (6,613 | ) | ||||||||||||||
Zynex, Inc. | Morgan Stanley | (14,784 | ) | (294,451 | ) | (257,981 | ) | 36,292 | |||||||||||||||
|
|
|
|
|
|
|
| ||||||||||||||||
| (730,331 | ) | (29,208,336 | ) | (29,227,411 | ) | (53,066 | ) | ||||||||||||||||
|
|
|
|
|
|
|
| ||||||||||||||||
Household & Personal Products | |||||||||||||||||||||||
BellRing Brands, Inc., Class A | Morgan Stanley | (7,809 | ) | (157,953 | ) | (161,959 | ) | (4,101 | ) | ||||||||||||||
Central Garden & Pet Co., Class A | Morgan Stanley | (15,062 | ) | (517,380 | ) | (544,341 | ) | (27,614 | ) | ||||||||||||||
Coty, Inc., Class A | Morgan Stanley | (77,930 | ) | (250,285 | ) | (210,411 | ) | 39,723 | |||||||||||||||
Reynolds Consumer Products, Inc. | Morgan Stanley | (10,170 | ) | (330,784 | ) | (311,405 | ) | 18,651 | |||||||||||||||
The accompanying notes are an integral part of the financial statements.
53
GOTHAM ABSOLUTE RETURN FUND
Portfolio of Investments (Continued)
September 30, 2020
Total Return Swaps (continued)
Reference Entity | Counterparty | Number of Contracts Long/(Short) | Notional Amount | Value | Unrealized Appreciation/ (Depreciation)* | ||||||||||||||||||
Household & Personal Products — (continued) | |||||||||||||||||||||||
WD-40 Co. | Morgan Stanley | (4,681 | ) | $ | (894,324 | ) | $ | (886,160 | ) | $ | 7,676 | ||||||||||||
|
|
|
|
|
|
|
| ||||||||||||||||
| (115,652 | ) | (2,150,726 | ) | (2,114,276 | ) | 34,335 | |||||||||||||||||
|
|
|
|
|
|
|
| ||||||||||||||||
Materials | |||||||||||||||||||||||
Air Products & Chemicals, Inc. | Morgan Stanley | (866 | ) | (255,105 | ) | (257,947 | ) | (5,140 | ) | ||||||||||||||
Alamos Gold, Inc., Class A (Canada) | Morgan Stanley | (141,315 | ) | (1,416,295 | ) | (1,244,985 | ) | 168,802 | |||||||||||||||
Albemarle Corp. | Morgan Stanley | (8,937 | ) | (785,830 | ) | (797,895 | ) | (16,094 | ) | ||||||||||||||
Amyris, Inc. | Morgan Stanley | (41,661 | ) | (132,449 | ) | (121,650 | ) | 10,719 | |||||||||||||||
Avery Dennison Corp. | Morgan Stanley | (4,039 | ) | (504,352 | ) | (516,346 | ) | (12,299 | ) | ||||||||||||||
Balchem Corp. | Morgan Stanley | (2,434 | ) | (243,449 | ) | (237,631 | ) | 5,835 | |||||||||||||||
Ball Corp. | Morgan Stanley | (27,277 | ) | (2,112,848 | ) | (2,267,264 | ) | (173,215 | ) | ||||||||||||||
Barrick Gold Corp. (Canada) | Morgan Stanley | (21,073 | ) | (582,757 | ) | (592,362 | ) | (9,957 | ) | ||||||||||||||
Cleveland-Cliffs, Inc. | Morgan Stanley | (408,232 | ) | (2,348,216 | ) | (2,620,849 | ) | (274,051 | ) | ||||||||||||||
Corteva, Inc. | Morgan Stanley | (49,128 | ) | (1,432,835 | ) | (1,415,378 | ) | 16,592 | |||||||||||||||
Domtar Corp. | Morgan Stanley | (9,359 | ) | (272,876 | ) | (245,861 | ) | 27,006 | |||||||||||||||
Eagle Materials, Inc. | Morgan Stanley | (5,838 | ) | (470,279 | ) | (503,936 | ) | (33,942 | ) | ||||||||||||||
Equinox Gold Corp. (Canada) | Morgan Stanley | (80,558 | ) | (925,506 | ) | (943,334 | ) | (18,887 | ) | ||||||||||||||
Fortuna Silver Mines, Inc. (Canada) | Morgan Stanley | (186,545 | ) | (1,195,753 | ) | (1,186,426 | ) | 8,320 | |||||||||||||||
Graphic Packaging Holding Co. | Morgan Stanley | (40,126 | ) | (578,312 | ) | (565,375 | ) | 9,512 | |||||||||||||||
Greif, Inc., Class A | Morgan Stanley | (319 | ) | (11,446 | ) | (11,551 | ) | (67 | ) | ||||||||||||||
H.B. Fuller Co. | Morgan Stanley | (8,435 | ) | (378,962 | ) | (386,154 | ) | (7,421 | ) | ||||||||||||||
Hudbay Minerals, Inc. (Canada) | Morgan Stanley | (36,565 | ) | (125,784 | ) | (154,670 | ) | (29,316 | ) | ||||||||||||||
Kirkland Lake Gold Ltd. (Canada) | Morgan Stanley | (21,269 | ) | (1,011,128 | ) | (1,036,438 | ) | (30,471 | ) | ||||||||||||||
Livent Corp. | Morgan Stanley | (265,438 | ) | (1,868,684 | ) | (2,380,979 | ) | (519,731 | ) | ||||||||||||||
Methanex Corp. (Canada) | Morgan Stanley | (37,047 | ) | (734,642 | ) | (903,947 | ) | (172,238 | ) | ||||||||||||||
New Gold, Inc. (Canada) | Morgan Stanley | (72,765 | ) | (112,079 | ) | (123,701 | ) | (13,199 | ) | ||||||||||||||
Olin Corp. | Morgan Stanley | (83,939 | ) | (964,430 | ) | (1,039,165 | ) | (80,239 | ) | ||||||||||||||
Packaging Corp. of America | Morgan Stanley | (3,187 | ) | (348,695 | ) | (347,542 | ) | 942 | |||||||||||||||
Quaker Chemical Corp. | Morgan Stanley | (4,855 | ) | (991,835 | ) | (872,492 | ) | 118,744 | |||||||||||||||
Scotts Miracle-Gro Co. (The) | Morgan Stanley | (1,485 | ) | (252,969 | ) | (227,071 | ) | 18,089 | |||||||||||||||
Seabridge Gold, Inc. (Canada) | Morgan Stanley | (1,667 | ) | (30,667 | ) | (31,306 | ) | (658 | ) | ||||||||||||||
Silgan Holdings, Inc. | Morgan Stanley | (2,929 | ) | (111,783 | ) | (107,699 | ) | 3,820 | |||||||||||||||
Teck Resources Ltd., Class B (Canada) | Morgan Stanley | (17,321 | ) | (244,513 | ) | (241,108 | ) | 3,182 | |||||||||||||||
Tronox Holdings PLC, Class A (United Kingdom) | Morgan Stanley | (103,033 | ) | (789,233 | ) | (810,870 | ) | (29,839 | ) | ||||||||||||||
United States Steel Corp. | Morgan Stanley | (320,716 | ) | (2,460,577 | ) | (2,354,055 | ) | 102,455 | |||||||||||||||
Warrior Met Coal, Inc. | Morgan Stanley | (45,636 | ) | (728,607 | ) | (779,463 | ) | (52,834 | ) | ||||||||||||||
Westlake Chemical Corp. | Morgan Stanley | (3,866 | ) | (214,157 | ) | (244,408 | ) | (34,183 | ) | ||||||||||||||
|
|
|
|
|
|
|
| ||||||||||||||||
| (2,057,860 | ) | (24,637,053 | ) | (25,569,858 | ) | (1,019,763 | ) | ||||||||||||||||
|
|
|
|
|
|
|
| ||||||||||||||||
Media & Entertainment | |||||||||||||||||||||||
Cardlytics, Inc. | Morgan Stanley | (1,540 | ) | (101,409 | ) | (108,678 | ) | (7,330 | ) | ||||||||||||||
Cinemark Holdings, Inc. | Morgan Stanley | (82,069 | ) | (1,118,740 | ) | (820,690 | ) | 297,374 | |||||||||||||||
Comcast Corp., Class A | Morgan Stanley | (67,939 | ) | (3,098,220 | ) | (3,142,858 | ) | (65,598 | ) | ||||||||||||||
Eventbrite, Inc., Class A | Morgan Stanley | (23,610 | ) | (202,103 | ) | (256,169 | ) | (56,656 | ) | ||||||||||||||
EW Scripps Co. (The), Class A | Morgan Stanley | (15,041 | ) | (156,878 | ) | (172,069 | ) | (16,050 | ) | ||||||||||||||
Glu Mobile, Inc. | Morgan Stanley | (226,906 | ) | (1,824,483 | ) | (1,741,504 | ) | 81,647 | |||||||||||||||
iHeartMedia, Inc., Class A | Morgan Stanley | (19,408 | ) | (172,335 | ) | (157,593 | ) | 14,638 | |||||||||||||||
The accompanying notes are an integral part of the financial statements.
54
GOTHAM ABSOLUTE RETURN FUND
Portfolio of Investments (Continued)
September 30, 2020
Total Return Swaps (continued)
Reference Entity | Counterparty | Number of Contracts Long/(Short) | Notional Amount | Value | Unrealized Appreciation/ (Depreciation)* | ||||||||||||||||||
Media & Entertainment — (continued) | |||||||||||||||||||||||
Live Nation Entertainment, Inc. | Morgan Stanley | (15,760 | ) | $ | (846,296 | ) | $ | (849,149 | ) | $ | (3,364 | ) | |||||||||||
Madison Square Garden Entertainment Corp. | Morgan Stanley | (227 | ) | (16,799 | ) | (15,547 | ) | 1,243 | |||||||||||||||
Madison Square Garden Sports Corp. | Morgan Stanley | (2,561 | ) | (390,557 | ) | (385,379 | ) | 5,061 | |||||||||||||||
Meredith Corp. | Morgan Stanley | (3,622 | ) | (45,543 | ) | (47,521 | ) | (2,005 | ) | ||||||||||||||
Sciplay Corp., Class A | Morgan Stanley | (6,100 | ) | (95,272 | ) | (98,942 | ) | (3,727 | ) | ||||||||||||||
Sinclair Broadcast Group, Inc., Class A | Morgan Stanley | (18,165 | ) | (366,249 | ) | (349,313 | ) | 13,602 | |||||||||||||||
TEGNA, Inc. | Morgan Stanley | (14,068 | ) | (167,138 | ) | (165,299 | ) | 564 | |||||||||||||||
TripAdvisor, Inc. | Morgan Stanley | (108,078 | ) | (2,319,968 | ) | (2,117,248 | ) | 201,320 | |||||||||||||||
ViacomCBS, Inc., Class B | Morgan Stanley | (7,285 | ) | (199,602 | ) | (204,053 | ) | (7,038 | ) | ||||||||||||||
Yelp, Inc. | Morgan Stanley | (38,098 | ) | (841,240 | ) | (765,389 | ) | 75,344 | |||||||||||||||
|
|
|
|
|
|
|
| ||||||||||||||||
| (650,477 | ) | (11,962,832 | ) | (11,397,401 | ) | 529,025 | |||||||||||||||||
|
|
|
|
|
|
|
| ||||||||||||||||
Pharmaceuticals, Biotechnology & Life Sciences | |||||||||||||||||||||||
Adaptive Biotechnologies Corp. | Morgan Stanley | (25,012 | ) | (1,010,022 | ) | (1,216,334 | ) | (212,948 | ) | ||||||||||||||
Adverum Biotechnologies, Inc. | Morgan Stanley | (8,677 | ) | (140,697 | ) | (89,373 | ) | 51,239 | |||||||||||||||
Aerie Pharmaceuticals, Inc. | Morgan Stanley | (12,499 | ) | (155,979 | ) | (147,113 | ) | 8,800 | |||||||||||||||
Agios Pharmaceuticals, Inc. | Morgan Stanley | (1,393 | ) | (48,491 | ) | (48,755 | ) | (294 | ) | ||||||||||||||
Alector, Inc. | Morgan Stanley | (22,657 | ) | (500,880 | ) | (238,692 | ) | 261,886 | |||||||||||||||
Amicus Therapeutics, Inc. | Morgan Stanley | (394 | ) | (5,502 | ) | (5,563 | ) | (131 | ) | ||||||||||||||
ANI Pharmaceuticals, Inc. | Morgan Stanley | (590 | ) | (16,603 | ) | (16,644 | ) | (526 | ) | ||||||||||||||
Arcturus Therapeutics Holdings, Inc. | Morgan Stanley | (4,001 | ) | (163,633 | ) | (171,643 | ) | (8,109 | ) | ||||||||||||||
Arrowhead Pharmaceuticals, Inc. | Morgan Stanley | (719 | ) | (31,498 | ) | (30,960 | ) | 519 | |||||||||||||||
Arvinas, Inc. | Morgan Stanley | (21,575 | ) | (678,590 | ) | (509,386 | ) | 168,794 | |||||||||||||||
Aurinia Pharmaceuticals, Inc. (Canada) | Morgan Stanley | (19,554 | ) | (280,306 | ) | (288,030 | ) | (7,894 | ) | ||||||||||||||
Bausch Health Cos, Inc. (Canada) | Morgan Stanley | (107,657 | ) | (1,833,314 | ) | (1,672,990 | ) | 159,149 | |||||||||||||||
Bridgebio Pharma, Inc. | Morgan Stanley | (4,708 | ) | (145,154 | ) | (176,644 | ) | (33,541 | ) | ||||||||||||||
Castle Biosciences, Inc. | Morgan Stanley | (109 | ) | (5,458 | ) | (5,608 | ) | (154 | ) | ||||||||||||||
Codexis, Inc. | Morgan Stanley | (33,076 | ) | (399,558 | ) | (388,312 | ) | 11,005 | |||||||||||||||
Constellation Pharmaceuticals, Inc. | Morgan Stanley | (582 | ) | (11,233 | ) | (11,791 | ) | (565 | ) | ||||||||||||||
Cronos Group, Inc. (Canada) | Morgan Stanley | (28,099 | ) | (148,474 | ) | (140,776 | ) | 7,608 | |||||||||||||||
Dicerna Pharmaceuticals, Inc. | Morgan Stanley | (1,789 | ) | (40,266 | ) | (32,184 | ) | 8,051 | |||||||||||||||
Dynavax Technologies Corp. | Morgan Stanley | (19,090 | ) | (85,158 | ) | (82,469 | ) | 2,638 | |||||||||||||||
Epizyme, Inc. | Morgan Stanley | (13,796 | ) | (193,853 | ) | (164,586 | ) | 29,149 | |||||||||||||||
Exelixis, Inc. | Morgan Stanley | (3,114 | ) | (76,796 | ) | (76,137 | ) | 612 | |||||||||||||||
Flexion Therapeutics, Inc. | Morgan Stanley | (195 | ) | (2,045 | ) | (2,030 | ) | 14 | |||||||||||||||
Intersect ENT, Inc. | Morgan Stanley | (15,696 | ) | (275,151 | ) | (256,002 | ) | 19,094 | |||||||||||||||
Karuna Therapeutics, Inc. | Morgan Stanley | (101 | ) | (7,890 | ) | (7,809 | ) | 75 | |||||||||||||||
Medpace Holdings, Inc. | Morgan Stanley | (1,068 | ) | (130,763 | ) | (119,349 | ) | 11,122 | |||||||||||||||
Mettler-Toledo International, Inc. | Morgan Stanley | (244 | ) | (218,977 | ) | (235,643 | ) | (16,951 | ) | ||||||||||||||
Molecular Templates, Inc. | Morgan Stanley | (51 | ) | (537 | ) | (557 | ) | (38 | ) | ||||||||||||||
Myriad Genetics, Inc. | Morgan Stanley | (32,842 | ) | (408,313 | ) | (428,260 | ) | (20,613 | ) | ||||||||||||||
NanoString Technologies, Inc. | Morgan Stanley | (14,279 | ) | (512,583 | ) | (638,271 | ) | (126,970 | ) | ||||||||||||||
NeoGenomics, Inc. | Morgan Stanley | (18,838 | ) | (690,530 | ) | (694,934 | ) | (4,954 | ) | ||||||||||||||
NGM Biopharmaceuticals, Inc. | Morgan Stanley | (445 | ) | (7,183 | ) | (7,080 | ) | 99 | |||||||||||||||
OPKO Health, Inc. | Morgan Stanley | (21,997 | ) | (71,753 | ) | (81,169 | ) | (9,885 | ) | ||||||||||||||
Pacific Biosciences of California, Inc. | Morgan Stanley | (112,559 | ) | (441,231 | ) | (1,110,957 | ) | (685,772 | ) | ||||||||||||||
The accompanying notes are an integral part of the financial statements.
55
GOTHAM ABSOLUTE RETURN FUND
Portfolio of Investments (Continued)
September 30, 2020
Total Return Swaps (continued)
Reference Entity | Counterparty | Number of Contracts Long/(Short) | Notional Amount | Value | Unrealized Appreciation/ (Depreciation)* | ||||||||||||||||||
Pharmaceuticals, Biotechnology & Life Sciences — (continued) | |||||||||||||||||||||||
Pacira BioSciences, Inc. | Morgan Stanley | (17,944 | ) | $ | (1,051,655 | ) | $ | (1,078,793 | ) | $ | (29,082 | ) | |||||||||||
Perrigo Co. PLC (Ireland) | Morgan Stanley | (10,299 | ) | (580,761 | ) | (472,827 | ) | 114,042 | |||||||||||||||
PRA Health Sciences, Inc. | Morgan Stanley | (10,281 | ) | (1,071,351 | ) | (1,042,905 | ) | 28,177 | |||||||||||||||
PTC Therapeutics, Inc. | Morgan Stanley | (13,431 | ) | (643,761 | ) | (627,899 | ) | 15,580 | |||||||||||||||
Reata Pharmaceuticals, Inc., Class A | Morgan Stanley | (16,591 | ) | (2,058,044 | ) | (1,616,295 | ) | 440,506 | |||||||||||||||
REGENXBIO, Inc. | Morgan Stanley | (26,168 | ) | (955,443 | ) | (720,143 | ) | 234,716 | |||||||||||||||
Supernus Pharmaceuticals, Inc. | Morgan Stanley | (5,987 | ) | (142,643 | ) | (124,769 | ) | 18,448 | |||||||||||||||
Syneos Health, Inc. | Morgan Stanley | (4,799 | ) | (299,985 | ) | (255,115 | ) | 48,941 | |||||||||||||||
Theravance Biopharma, Inc. (Cayman Islands) | Morgan Stanley | (26,673 | ) | (539,415 | ) | (394,360 | ) | 144,730 | |||||||||||||||
Translate Bio, Inc. | Morgan Stanley | (3,553 | ) | (46,567 | ) | (48,356 | ) | (1,818 | ) | ||||||||||||||
Tricida, Inc. | Morgan Stanley | (16,860 | ) | (242,616 | ) | (152,752 | ) | 89,718 | |||||||||||||||
Vericel Corp. | Morgan Stanley | (336 | ) | (6,095 | ) | (6,226 | ) | (135 | ) | ||||||||||||||
Zogenix, Inc. | Morgan Stanley | (2,614 | ) | (47,202 | ) | (46,869 | ) | 304 | |||||||||||||||
Zymeworks, Inc. (Canada) | Morgan Stanley | (17,618 | ) | (538,433 | ) | (820,646 | ) | (290,082 | ) | ||||||||||||||
|
|
|
|
|
|
|
| ||||||||||||||||
| (720,560 | ) | (16,962,392 | ) | (16,504,006 | ) | 424,554 | |||||||||||||||||
|
|
|
|
|
|
|
| ||||||||||||||||
Retailing | |||||||||||||||||||||||
American Eagle Outfitters, Inc. | Morgan Stanley | (103,738 | ) | (1,508,165 | ) | (1,536,360 | ) | (29,105 | ) | ||||||||||||||
Boot Barn Holdings, Inc. | Morgan Stanley | (12,564 | ) | (248,709 | ) | (353,551 | ) | (115,072 | ) | ||||||||||||||
Burlington Stores, Inc. | Morgan Stanley | (19,408 | ) | (3,950,941 | ) | (3,999,795 | ) | (52,481 | ) | ||||||||||||||
CarMax, Inc. | Morgan Stanley | (3,989 | ) | (371,158 | ) | (366,629 | ) | 4,305 | |||||||||||||||
Core-Mark Holding Co., Inc. | Morgan Stanley | (9,495 | ) | (249,081 | ) | (274,690 | ) | (27,792 | ) | ||||||||||||||
Expedia Group, Inc. | Morgan Stanley | (36,466 | ) | (3,204,766 | ) | (3,343,568 | ) | (163,451 | ) | ||||||||||||||
Five Below, Inc. | Morgan Stanley | (1,067 | ) | (116,452 | ) | (135,509 | ) | (19,127 | ) | ||||||||||||||
Floor & Decor Holdings, Inc., Class A | Morgan Stanley | (38,711 | ) | (2,730,307 | ) | (2,895,583 | ) | (169,034 | ) | ||||||||||||||
Grubhub, Inc. | Morgan Stanley | (12,239 | ) | (856,080 | ) | (885,247 | ) | (32,074 | ) | ||||||||||||||
Hudson Ltd., Class A (Bermuda) | Morgan Stanley | (17,309 | ) | (127,495 | ) | (131,548 | ) | (4,131 | ) | ||||||||||||||
Monro, Inc. | Morgan Stanley | (43,085 | ) | (2,580,708 | ) | (1,747,958 | ) | 822,457 | |||||||||||||||
Nordstrom, Inc. | Morgan Stanley | (179,330 | ) | (2,592,389 | ) | (2,137,614 | ) | 453,211 | |||||||||||||||
Penske Automotive Group, Inc. | Morgan Stanley | (6,822 | ) | (318,583 | ) | (325,137 | ) | (6,746 | ) | ||||||||||||||
PetMed Express, Inc. | Morgan Stanley | (18,117 | ) | (604,484 | ) | (572,859 | ) | 30,493 | |||||||||||||||
Sally Beauty Holdings, Inc. | Morgan Stanley | (17,130 | ) | (234,510 | ) | (148,860 | ) | 85,508 | |||||||||||||||
Stitch Fix, Inc., Class A | Morgan Stanley | (80,342 | ) | (1,927,726 | ) | (2,179,678 | ) | (272,688 | ) | ||||||||||||||
Tiffany & Co. | Morgan Stanley | (7,787 | ) | (965,359 | ) | (902,124 | ) | 58,569 | |||||||||||||||
Ulta Beauty, Inc. | Morgan Stanley | (11,340 | ) | (2,682,286 | ) | (2,539,933 | ) | 145,853 | |||||||||||||||
|
|
|
|
|
|
|
| ||||||||||||||||
| (618,939 | ) | (25,269,199 | ) | (24,476,643 | ) | 708,695 | |||||||||||||||||
|
|
|
|
|
|
|
| ||||||||||||||||
Semiconductors & Semiconductor Equipment | |||||||||||||||||||||||
Advanced Energy Industries, Inc. | Morgan Stanley | (13,689 | ) | (983,144 | ) | (861,586 | ) | 122,326 | |||||||||||||||
Ambarella, Inc. (Cayman Islands) | Morgan Stanley | (5,429 | ) | (275,112 | ) | (283,285 | ) | (8,339 | ) | ||||||||||||||
Cohu, Inc. | Morgan Stanley | (33 | ) | (580 | ) | (567 | ) | 13 | |||||||||||||||
Cree, Inc. | Morgan Stanley | (47,633 | ) | (3,007,671 | ) | (3,036,127 | ) | (30,272 | ) | ||||||||||||||
Ichor Holdings Ltd. (Cayman Islands) | Morgan Stanley | (13,966 | ) | (396,859 | ) | (301,247 | ) | 95,373 | |||||||||||||||
MaxLinear, Inc. | Morgan Stanley | (7,391 | ) | (194,901 | ) | (171,767 | ) | 23,034 | |||||||||||||||
Onto Innovation, Inc. | Morgan Stanley | (15,019 | ) | (543,120 | ) | (447,266 | ) | 95,512 | |||||||||||||||
Photronics, Inc. | Morgan Stanley | (2,145 | ) | (21,324 | ) | (21,364 | ) | (53 | ) | ||||||||||||||
The accompanying notes are an integral part of the financial statements.
56
GOTHAM ABSOLUTE RETURN FUND
Portfolio of Investments (Continued)
September 30, 2020
Total Return Swaps (continued)
Reference Entity | Counterparty | Number of Contracts Long/(Short) | Notional Amount | Value | Unrealized Appreciation/ (Depreciation)* | ||||||||||||||||||
Semiconductors & Semiconductor Equipment — (continued) | |||||||||||||||||||||||
Universal Display Corp. | Morgan Stanley | (14,303 | ) | $ | (2,566,278 | ) | $ | (2,585,124 | ) | $ | (22,250 | ) | |||||||||||
|
|
|
|
|
|
|
| ||||||||||||||||
| (119,608 | ) | (7,988,989 | ) | (7,708,333 | ) | 275,344 | |||||||||||||||||
|
|
|
|
|
|
|
| ||||||||||||||||
Software & Services | |||||||||||||||||||||||
8x8, Inc. | Morgan Stanley | (149,179 | ) | (2,470,547 | ) | (2,319,733 | ) | 149,322 | |||||||||||||||
Akamai Technologies, Inc. | Morgan Stanley | (7,935 | ) | (893,796 | ) | (877,135 | ) | 15,958 | |||||||||||||||
Altair Engineering, Inc., Class A | Morgan Stanley | (17,311 | ) | (674,704 | ) | (726,716 | ) | (52,419 | ) | ||||||||||||||
Alteryx, Inc., Class A | Morgan Stanley | (33,588 | ) | (3,828,400 | ) | (3,813,917 | ) | 12,171 | |||||||||||||||
Avaya Holdings Corp. | Morgan Stanley | (16,725 | ) | (207,892 | ) | (254,220 | ) | (49,998 | ) | ||||||||||||||
BlackBerry Ltd. (Canada) | Morgan Stanley | (21,886 | ) | (103,740 | ) | (100,457 | ) | 3,456 | |||||||||||||||
Ceridian HCM Holding, Inc. | Morgan Stanley | (37,479 | ) | (2,872,638 | ) | (3,097,639 | ) | (226,736 | ) | ||||||||||||||
Cloudflare, Inc., Class A | Morgan Stanley | (12,166 | ) | (418,029 | ) | (499,536 | ) | (94,740 | ) | ||||||||||||||
CommVault Systems, Inc. | Morgan Stanley | (8,414 | ) | (324,780 | ) | (343,291 | ) | (19,598 | ) | ||||||||||||||
Conduent, Inc. | Morgan Stanley | (131,329 | ) | (269,224 | ) | (417,626 | ) | (151,413 | ) | ||||||||||||||
Coupa Software, Inc. | Morgan Stanley | (6,297 | ) | (1,564,031 | ) | (1,726,889 | ) | (165,329 | ) | ||||||||||||||
Datadog, Inc., Class A | Morgan Stanley | (2,687 | ) | (225,467 | ) | (274,504 | ) | (49,174 | ) | ||||||||||||||
Digital Turbine, Inc. | Morgan Stanley | (7,792 | ) | (145,549 | ) | (255,110 | ) | (109,649 | ) | ||||||||||||||
DXC Technology Co. | Morgan Stanley | (10,696 | ) | (187,501 | ) | (190,924 | ) | (4,203 | ) | ||||||||||||||
Euronet Worldwide, Inc. | Morgan Stanley | (2,452 | ) | (248,185 | ) | (223,377 | ) | 27,451 | |||||||||||||||
Everbridge, Inc. | Morgan Stanley | (12,490 | ) | (1,591,593 | ) | (1,570,368 | ) | 20,264 | |||||||||||||||
Fastly, Inc., Class A | Morgan Stanley | (9,280 | ) | (767,666 | ) | (869,350 | ) | (142,760 | ) | ||||||||||||||
Fidelity National Information Services, Inc. | Morgan Stanley | (3,255 | ) | (471,942 | ) | (479,169 | ) | (8,718 | ) | ||||||||||||||
Global Payments, Inc. | Morgan Stanley | (10,472 | ) | (1,859,114 | ) | (1,859,618 | ) | (2,043 | ) | ||||||||||||||
LivePerson, Inc. | Morgan Stanley | (4,455 | ) | (175,393 | ) | (231,615 | ) | (62,556 | ) | ||||||||||||||
Manhattan Associates, Inc. | Morgan Stanley | (5,723 | ) | (547,348 | ) | (546,489 | ) | 439 | |||||||||||||||
ManTech International Corp., Class A | Morgan Stanley | (4,786 | ) | (335,635 | ) | (329,660 | ) | 3,914 | |||||||||||||||
MAXIMUS, Inc. | Morgan Stanley | (8,023 | ) | (622,628 | ) | (548,853 | ) | 73,689 | |||||||||||||||
Medallia, Inc. | Morgan Stanley | (39,741 | ) | (1,209,990 | ) | (1,089,698 | ) | 121,555 | |||||||||||||||
New Relic, Inc. | Morgan Stanley | (34,354 | ) | (1,933,244 | ) | (1,936,191 | ) | (4,114 | ) | ||||||||||||||
Nutanix, Inc., Class A | Morgan Stanley | (35,245 | ) | (788,783 | ) | (781,734 | ) | 6,872 | |||||||||||||||
PagerDuty, Inc. | Morgan Stanley | (18,727 | ) | (456,165 | ) | (507,689 | ) | (51,800 | ) | ||||||||||||||
Paycom Software, Inc. | Morgan Stanley | (701 | ) | (213,039 | ) | (218,221 | ) | (5,311 | ) | ||||||||||||||
Ping Identity Holding Corp. | Morgan Stanley | (43,613 | ) | (1,407,100 | ) | (1,361,162 | ) | 45,089 | |||||||||||||||
Proofpoint, Inc. | Morgan Stanley | (4,753 | ) | (554,953 | ) | (501,679 | ) | 52,939 | |||||||||||||||
PROS Holdings, Inc. | Morgan Stanley | (20,112 | ) | (775,188 | ) | (642,377 | ) | 132,343 | |||||||||||||||
Sabre Corp. | Morgan Stanley | (213,377 | ) | (1,534,106 | ) | (1,389,084 | ) | 144,095 | |||||||||||||||
Slack Technologies, Inc., Class A | Morgan Stanley | (61,476 | ) | (1,865,905 | ) | (1,651,245 | ) | 226,592 | |||||||||||||||
Smartsheet, Inc., Class A | Morgan Stanley | (21,474 | ) | (1,008,426 | ) | (1,061,245 | ) | (56,454 | ) | ||||||||||||||
Splunk, Inc. | Morgan Stanley | (7,195 | ) | (1,442,321 | ) | (1,353,595 | ) | 77,538 | |||||||||||||||
Switch, Inc., Class A | Morgan Stanley | (78,355 | ) | (1,373,689 | ) | (1,223,122 | ) | 146,340 | |||||||||||||||
Tucows, Inc., Class A | Morgan Stanley | (3,864 | ) | (235,638 | ) | (266,230 | ) | (30,734 | ) | ||||||||||||||
Upland Software, Inc. | Morgan Stanley | (11,177 | ) | (395,286 | ) | (421,373 | ) | (26,326 | ) | ||||||||||||||
Verint Systems, Inc. | Morgan Stanley | (5,842 | ) | (275,452 | ) | (281,467 | ) | (8,472 | ) | ||||||||||||||
Verra Mobility Corp. | Morgan Stanley | (19,807 | ) | (217,426 | ) | (191,336 | ) | 25,959 | |||||||||||||||
Yext, Inc. | Morgan Stanley | (104,126 | ) | (1,699,561 | ) | (1,580,633 | ) | 117,902 | |||||||||||||||
The accompanying notes are an integral part of the financial statements.
57
GOTHAM ABSOLUTE RETURN FUND
Portfolio of Investments (Continued)
September 30, 2020
Total Return Swaps (continued)
Reference Entity | Counterparty | Number of Contracts Long/(Short) | Notional Amount | Value | Unrealized Appreciation/ (Depreciation)* | |||||||||||||||||
Software & Services — (continued) | ||||||||||||||||||||||
Zscaler, Inc. | Morgan Stanley | (9,308 | ) | $ | (1,215,009 | ) | $ | (1,309,542 | ) | $ | (107,478 | ) | ||||||||||
Zuora, Inc., Class A | Morgan Stanley | (82,713 | ) | (952,814 | ) | (855,252 | ) | 96,986 | ||||||||||||||
|
|
|
|
|
|
|
| |||||||||||||||
| (1,340,380 | ) | (40,359,897 | ) | (40,179,071 | ) | 70,849 | ||||||||||||||||
|
|
|
|
|
|
|
| |||||||||||||||
Technology Hardware & Equipment | ||||||||||||||||||||||
3D Systems Corp. | Morgan Stanley | (38,270 | ) | (209,983 | ) | (187,906 | ) | 21,951 | ||||||||||||||
ADTRAN, Inc. | Morgan Stanley | (3,058 | ) | (32,614 | ) | (31,360 | ) | 1,235 | ||||||||||||||
Fabrinet (Cayman Islands) | Morgan Stanley | (14,920 | ) | (1,034,053 | ) | (940,408 | ) | 93,842 | ||||||||||||||
Fitbit, Inc., Class A | Morgan Stanley | (108,705 | ) | (746,803 | ) | (756,587 | ) | (10,870 | ) | |||||||||||||
II-VI, Inc. | Morgan Stanley | (25,636 | ) | (987,638 | ) | (1,039,796 | ) | (52,774 | ) | |||||||||||||
Infinera Corp. | Morgan Stanley | (144,281 | ) | (1,125,392 | ) | (888,771 | ) | 239,220 | ||||||||||||||
Insight Enterprises, Inc. | Morgan Stanley | (33,971 | ) | (1,701,947 | ) | (1,922,079 | ) | (225,227 | ) | |||||||||||||
Itron, Inc. | Morgan Stanley | (7,772 | ) | (523,330 | ) | (472,071 | ) | 50,943 | ||||||||||||||
Keysight Technologies, Inc. | Morgan Stanley | (16,945 | ) | (1,655,374 | ) | (1,673,827 | ) | (19,453 | ) | |||||||||||||
Littelfuse, Inc. | Morgan Stanley | (791 | ) | (141,093 | ) | (140,276 | ) | 324 | ||||||||||||||
Methode Electronics, Inc. | Morgan Stanley | (585 | ) | (16,171 | ) | (16,673 | ) | (512 | ) | |||||||||||||
Motorola Solutions, Inc. | Morgan Stanley | (9,507 | ) | (1,472,167 | ) | (1,490,793 | ) | (20,795 | ) | |||||||||||||
nLight, Inc. | Morgan Stanley | (38,444 | ) | (876,523 | ) | (902,665 | ) | (26,731 | ) | |||||||||||||
Novanta, Inc. (Canada) | Morgan Stanley | (1,393 | ) | (145,304 | ) | (146,739 | ) | (1,635 | ) | |||||||||||||
Plantronics, Inc. | Morgan Stanley | (41,305 | ) | (803,765 | ) | (489,051 | ) | 314,229 | ||||||||||||||
Plexus Corp. | Morgan Stanley | (2,271 | ) | (172,823 | ) | (160,401 | ) | 12,798 | ||||||||||||||
Pure Storage, Inc., Class A | Morgan Stanley | (11,242 | ) | (164,113 | ) | (173,014 | ) | (9,001 | ) | |||||||||||||
Rogers Corp. | Morgan Stanley | (2,148 | ) | (278,033 | ) | (210,633 | ) | 70,511 | ||||||||||||||
Stratasys Ltd. (Israel) | Morgan Stanley | (75,339 | ) | (1,175,806 | ) | (939,477 | ) | 235,579 | ||||||||||||||
Super Micro Computer, Inc. | Morgan Stanley | (11,008 | ) | (288,310 | ) | (290,611 | ) | (2,476 | ) | |||||||||||||
ViaSat, Inc. | Morgan Stanley | (11,979 | ) | (455,801 | ) | (411,958 | ) | 44,331 | ||||||||||||||
|
|
|
|
|
|
|
| |||||||||||||||
| (599,570 | ) | (14,007,043 | ) | (13,285,096 | ) | 715,489 | ||||||||||||||||
|
|
|
|
|
|
|
| |||||||||||||||
Telecommunication Services | ||||||||||||||||||||||
Anterix, Inc. | Morgan Stanley | (243 | ) | (8,370 | ) | (7,949 | ) | 416 | ||||||||||||||
Boingo Wireless, Inc. | Morgan Stanley | (63,679 | ) | (920,806 | ) | (649,207 | ) | 271,042 | ||||||||||||||
Cogent Communications Holdings, Inc. | Morgan Stanley | (6,588 | ) | (454,435 | ) | (395,609 | ) | 57,131 | ||||||||||||||
Shenandoah Telecommunications Co. | Morgan Stanley | (7,266 | ) | (359,812 | ) | (322,865 | ) | 37,645 | ||||||||||||||
United States Cellular Corp. | Morgan Stanley | (7,051 | ) | (217,241 | ) | (208,216 | ) | 9,025 | ||||||||||||||
|
|
|
|
|
|
|
| |||||||||||||||
| (84,827 | ) | (1,960,664 | ) | (1,583,846 | ) | 375,259 | ||||||||||||||||
|
|
|
|
|
|
|
| |||||||||||||||
Transportation | ||||||||||||||||||||||
Air Transport Services Group, Inc. | Morgan Stanley | (39,942 | ) | (963,002 | ) | (1,000,947 | ) | (38,841 | ) | |||||||||||||
Allegiant Travel Co. | Morgan Stanley | (5,010 | ) | (569,987 | ) | (600,198 | ) | (30,961 | ) | |||||||||||||
Canadian Pacific Railway Ltd. (Canada) | Morgan Stanley | (999 | ) | (287,320 | ) | (304,126 | ) | (17,493 | ) | |||||||||||||
Hawaiian Holdings, Inc. | Morgan Stanley | (37,221 | ) | (503,738 | ) | (479,779 | ) | 23,655 | ||||||||||||||
Heartland Express, Inc. | Morgan Stanley | (13,347 | ) | (272,946 | ) | (248,254 | ) | 24,287 | ||||||||||||||
JetBlue Airways Corp. | Morgan Stanley | (1,180 | ) | (13,813 | ) | (13,369 | ) | 435 | ||||||||||||||
Lyft, Inc., Class A | Morgan Stanley | (98,391 | ) | (2,849,715 | ) | (2,710,672 | ) | 137,322 | ||||||||||||||
Matson, Inc. | Morgan Stanley | (17,268 | ) | (626,138 | ) | (692,274 | ) | (71,306 | ) | |||||||||||||
United Airlines Holdings, Inc. | Morgan Stanley | (1,988 | ) | (67,137 | ) | (69,083 | ) | (1,987 | ) | |||||||||||||
XPO Logistics, Inc. | Morgan Stanley | (20,884 | ) | (1,766,670 | ) | (1,768,039 | ) | (11,001 | ) | |||||||||||||
|
|
|
|
|
|
|
| |||||||||||||||
| (236,230 | ) | (7,920,466 | ) | (7,886,741 | ) | 14,110 | ||||||||||||||||
|
|
|
|
|
|
|
| |||||||||||||||
The accompanying notes are an integral part of the financial statements.
58
GOTHAM ABSOLUTE RETURN FUND
Portfolio of Investments (Concluded)
September 30, 2020
Total Return Swaps (concluded)
Reference Entity | Counterparty | Number of Contracts Long/(Short) | Notional Amount | Value | Unrealized Appreciation/ (Depreciation)* | |||||||||||||||||
Utilities | ||||||||||||||||||||||
ALLETE, Inc. | Morgan Stanley | (24,507 | ) | $ | (1,421,285 | ) | $ | (1,267,992 | ) | $ | 141,239 | |||||||||||
Ameren Corp. | Morgan Stanley | (482 | ) | (38,112 | ) | (38,117 | ) | (28 | ) | |||||||||||||
American Electric Power Co., Inc. | Morgan Stanley | (1,274 | ) | (109,016 | ) | (104,124 | ) | 3,926 | ||||||||||||||
Atmos Energy Corp. | Morgan Stanley | (738 | ) | (70,349 | ) | (70,545 | ) | (239 | ) | |||||||||||||
Avangrid, Inc. | Morgan Stanley | (3,349 | ) | (164,369 | ) | (168,991 | ) | (6,368 | ) | |||||||||||||
Black Hills Corp. | Morgan Stanley | (10,675 | ) | (660,783 | ) | (571,006 | ) | 83,640 | ||||||||||||||
California Water Service Group | Morgan Stanley | (4,562 | ) | (206,782 | ) | (198,219 | ) | 8,341 | ||||||||||||||
Clearway Energy, Inc., Class A | Morgan Stanley | (5,392 | ) | (123,502 | ) | (133,182 | ) | (11,441 | ) | |||||||||||||
CMS Energy Corp. | Morgan Stanley | (18,511 | ) | (1,130,733 | ) | (1,136,761 | ) | (6,710 | ) | |||||||||||||
Consolidated Edison, Inc. | Morgan Stanley | (28,774 | ) | (2,120,088 | ) | (2,238,617 | ) | (126,629 | ) | |||||||||||||
DTE Energy Co. | Morgan Stanley | (11,973 | ) | (1,382,507 | ) | (1,377,374 | ) | (7,114 | ) | |||||||||||||
Edison International | Morgan Stanley | (11,622 | ) | (650,980 | ) | (590,862 | ) | 53,190 | ||||||||||||||
Essential Utilities, Inc. | Morgan Stanley | (15,706 | ) | (699,939 | ) | (632,167 | ) | 64,242 | ||||||||||||||
Fortis, Inc. (Canada) | Morgan Stanley | (6,147 | ) | (242,745 | ) | (251,166 | ) | (10,880 | ) | |||||||||||||
New Jersey Resources Corp. | Morgan Stanley | (25,574 | ) | (813,676 | ) | (691,009 | ) | 114,004 | ||||||||||||||
NextEra Energy, Inc. | Morgan Stanley | (1,885 | ) | (535,254 | ) | (523,201 | ) | 8,906 | ||||||||||||||
Ormat Technologies, Inc. | Morgan Stanley | (460 | ) | (26,664 | ) | (27,191 | ) | (543 | ) | |||||||||||||
Otter Tail Corp. | Morgan Stanley | (97 | ) | (3,512 | ) | (3,508 | ) | 1 | ||||||||||||||
Portland General Electric Co. | Morgan Stanley | (10,824 | ) | (477,338 | ) | (384,252 | ) | 91,520 | ||||||||||||||
Public Service Enterprise Group, Inc. | Morgan Stanley | (23,358 | ) | (1,284,766 | ) | (1,282,588 | ) | (10,016 | ) | |||||||||||||
SJW Group. | Morgan Stanley | (4,338 | ) | (285,918 | ) | (264,011 | ) | 20,341 | ||||||||||||||
South Jersey Industries, Inc. | Morgan Stanley | (13,402 | ) | (324,596 | ) | (258,256 | ) | 64,339 | ||||||||||||||
Southern Co. (The) | Morgan Stanley | (42,746 | ) | (2,252,592 | ) | (2,317,688 | ) | (67,375 | ) | |||||||||||||
Southwest Gas Holdings, Inc. | Morgan Stanley | (6,588 | ) | (473,875 | ) | (415,703 | ) | 55,272 | ||||||||||||||
Spire, Inc. | Morgan Stanley | (4,294 | ) | (254,369 | ) | (228,441 | ) | 23,500 | ||||||||||||||
Sunnova Energy International, Inc. | Morgan Stanley | (13,352 | ) | (299,216 | ) | (406,034 | ) | (108,210 | ) | |||||||||||||
Unitil Corp. | Morgan Stanley | (209 | ) | (7,967 | ) | (8,076 | ) | (114 | ) | |||||||||||||
Xcel Energy, Inc. | Morgan Stanley | (8,215 | ) | (560,838 | ) | (566,917 | ) | (10,090 | ) | |||||||||||||
|
|
|
|
|
|
|
| |||||||||||||||
| (299,054 | ) | (16,621,771 | ) | (16,155,998 | ) | 366,704 | ||||||||||||||||
|
|
|
|
|
|
|
| |||||||||||||||
Total Reference Entity — Short | (308,486,643 | ) | (302,026,935 | ) | 5,464,371 | |||||||||||||||||
|
|
|
|
|
| |||||||||||||||||
Net Value of Reference Entity | $ | (181,769,224 | ) | $ | (176,276,662 | ) | $ | 4,927,599 | ||||||||||||||
|
|
|
|
|
| |||||||||||||||||
| * | Includes $(564,963) related to open trades, dividends receivables/payables and swap receivables/payables activities. |
The accompanying notes are an integral part of the financial statements.
59
GOTHAM ENHANCED RETURN FUND
Portfolio of Investments
September 30, 2020
| Number of Shares | Value | |||||||
LONG POSITIONS — 94.8% |
| |||||||
COMMON STOCKS — 94.8% |
| |||||||
Automobiles & Components — 0.8% |
| |||||||
Adient PLC (Ireland)* | 5,814 | $ | 100,757 | |||||
American Axle & Manufacturing Holdings, Inc.* | 54,775 | 316,052 | ||||||
BorgWarner, Inc. | 133 | 5,152 | ||||||
General Motors Co. | 10,324 | 305,487 | ||||||
Gentherm, Inc.* | 453 | 18,528 | ||||||
Harley-Davidson, Inc. | 163 | 4,000 | ||||||
Magna International, Inc. (Canada) | 2,478 | 113,368 | ||||||
Thor Industries, Inc. | 8,880 | 845,909 | ||||||
Visteon Corp.* | 2,269 | 157,060 | ||||||
XPEL, Inc.* | 137 | 3,573 | ||||||
|
| |||||||
| 1,869,886 | ||||||||
|
| |||||||
Capital Goods — 8.2% |
| |||||||
3M Co. | 6,149 | 984,947 | ||||||
AAR Corp. | 150 | 2,820 | ||||||
Acuity Brands, Inc. | 1,621 | 165,909 | ||||||
Advanced Drainage Systems, Inc. | 2,944 | 183,823 | ||||||
AECOM* | 8,145 | 340,787 | ||||||
Albany International Corp., Class A | 2,826 | 139,915 | ||||||
Altra Industrial Motion Corp. | 2,735 | 101,113 | ||||||
AMETEK, Inc. | 5,557 | 552,366 | ||||||
Apogee Enterprises, Inc. | 2,600 | 55,562 | ||||||
Applied Industrial Technologies, Inc. | 635 | 34,988 | ||||||
Atkore International Group, Inc.* | 4,622 | 105,058 | ||||||
Ballard Power Systems, Inc. (Canada)* | 1,489 | 22,484 | ||||||
Barnes Group, Inc. | 2,614 | 93,424 | ||||||
Bloom Energy Corp., Class A* | 3,640 | 65,411 | ||||||
BMC Stock Holdings, Inc.* | 1,262 | 54,051 | ||||||
BWX Technologies, Inc. | 3,606 | 203,054 | ||||||
Colfax Corp.* | 18,452 | 578,655 | ||||||
Comfort Systems USA, Inc. | 1,578 | 81,283 | ||||||
Crane Co. | 578 | 28,975 | ||||||
Cummins, Inc.(a) | 5,552 | 1,172,360 | ||||||
Curtiss-Wright Corp. | 1,445 | 134,761 | ||||||
Deere & Co. | 2,239 | 496,230 | ||||||
Douglas Dynamics, Inc. | 24 | 821 | ||||||
Dover Corp. | 1,571 | 170,202 | ||||||
Dycom Industries, Inc.* | 1,064 | 56,200 | ||||||
EMCOR Group, Inc. | 167 | 11,308 | ||||||
Emerson Electric Co.(a) | 12,167 | 797,790 | ||||||
Encore Wire Corp. | 82 | 3,806 | ||||||
Enerpac Tool Group Corp. | 24 | 451 | ||||||
| Number of Shares | Value | |||||||
COMMON STOCKS — (Continued) |
| |||||||
Capital Goods — (Continued) |
| |||||||
EnPro Industries, Inc. | 842 | $ | 47,497 | |||||
ESCO Technologies, Inc. | 105 | 8,459 | ||||||
Evoqua Water Technologies Corp.* | 4,347 | 92,243 | ||||||
Flowserve Corp. | 7,338 | 200,254 | ||||||
Fortive Corp. | 2,212 | 168,577 | ||||||
Fortune Brands Home & Security, Inc. | 5,209 | 450,683 | ||||||
Foundation Building Materials, Inc.* | 660 | 10,375 | ||||||
Franklin Electric Co., Inc. | 1,344 | 79,068 | ||||||
FuelCell Energy, Inc.* | 35,898 | 76,822 | ||||||
General Dynamics Corp.(a) | 1,744 | 241,422 | ||||||
Gibraltar Industries, Inc.* | 2,112 | 137,576 | ||||||
GMS, Inc.* | 3,274 | 78,903 | ||||||
GrafTech International Ltd. | 8,694 | 59,467 | ||||||
Griffon Corp. | 750 | 14,655 | ||||||
Herc Holdings, Inc.* | 2,070 | 81,993 | ||||||
Honeywell International, Inc.(a) | 4,723 | 777,453 | ||||||
Howmet Aerospace, Inc.(a) | 67,752 | 1,132,813 | ||||||
Hubbell, Inc. | 946 | 129,451 | ||||||
Huntington Ingalls Industries, Inc. | 395 | 55,596 | ||||||
Illinois Tool Works, Inc. | 2,811 | 543,113 | ||||||
ITT, Inc. | 1,303 | 76,942 | ||||||
John Bean Technologies Corp. | 1,229 | 112,933 | ||||||
Johnson Controls International PLC (Ireland) | 322 | 13,154 | ||||||
Lockheed Martin Corp.(a) | 4,207 | 1,612,459 | ||||||
Masco Corp. | 15,051 | 829,762 | ||||||
Middleby Corp. (The)* | 928 | 83,251 | ||||||
MRC Global, Inc.* | 15,052 | 64,423 | ||||||
Mueller Industries, Inc. | 4,243 | 114,816 | ||||||
National Presto Industries, Inc. | 17 | 1,392 | ||||||
NOW, Inc.* | 17,501 | 79,455 | ||||||
nVent Electric PLC (Ireland) | 4,811 | 85,107 | ||||||
Otis Worldwide Corp. | 712 | 44,443 | ||||||
Owens Corning | 4,055 | 279,025 | ||||||
PACCAR, Inc. | 3,769 | 321,420 | ||||||
Parker-Hannifin Corp. | 495 | 100,158 | ||||||
Pentair PLC (Ireland) | 7,665 | 350,827 | ||||||
Quanta Services, Inc. | 10,274 | 543,084 | ||||||
Regal Beloit Corp. | 145 | 13,611 | ||||||
Rexnord Corp. | 1,340 | 39,986 | ||||||
Roper Technologies, Inc. | 306 | 120,904 | ||||||
Shyft Group, Inc. (The) | 132 | 2,492 | ||||||
Simpson Manufacturing Co., Inc. | 2,568 | 249,507 | ||||||
The accompanying notes are an integral part of the financial statements.
60
GOTHAM ENHANCED RETURN FUND
Portfolio of Investments (Continued)
September 30, 2020
| Number of Shares | Value | |||||||
COMMON STOCKS — (Continued) |
| |||||||
Capital Goods — (Continued) |
| |||||||
SiteOne Landscape Supply, Inc.* | 1,050 | $ | 128,048 | |||||
Snap-on, Inc. | 834 | 122,706 | ||||||
SPX FLOW, Inc.* | 381 | 16,314 | ||||||
Systemax, Inc. | 1 | 24 | ||||||
Teledyne Technologies, Inc.* | 625 | 193,881 | ||||||
Tennant Co. | 3 | 181 | ||||||
Terex Corp. | 2,298 | 44,489 | ||||||
Timken Co. (The) | 1,497 | 81,167 | ||||||
Toro Co. (The) | 372 | 31,229 | ||||||
TPI Composites, Inc.* | 1,525 | 44,164 | ||||||
Trane Technologies PLC (Ireland) | 2,632 | 319,130 | ||||||
TransDigm Group, Inc. | 1,828 | 868,519 | ||||||
TriMas Corp.* | 6 | 137 | ||||||
UFP Industries, Inc. | 4,799 | 271,192 | ||||||
United Rentals, Inc.* | 1,226 | 213,937 | ||||||
Univar Solutions, Inc.* | 18,680 | 315,318 | ||||||
Valmont Industries, Inc. | 838 | 104,063 | ||||||
Vectrus, Inc.* | 7 | 266 | ||||||
Watsco, Inc. | 435 | 101,307 | ||||||
Watts Water Technologies, Inc., | 482 | 48,272 | ||||||
Westinghouse Air Brake Technologies Corp. | 878 | 54,331 | ||||||
Woodward, Inc. | 2,692 | 215,791 | ||||||
WW Grainger, Inc. | 125 | 44,596 | ||||||
|
| |||||||
| 19,383,187 | ||||||||
|
| |||||||
Commercial & Professional Services — 1.6% |
| |||||||
ABM Industries, Inc. | 5,336 | 195,618 | ||||||
ASGN, Inc.* | 87 | 5,530 | ||||||
Cimpress PLC (Ireland)* | 1,686 | 126,720 | ||||||
Cintas Corp. | 1,194 | 397,399 | ||||||
Clarivate PLC (Jersey)* | 5,463 | 169,298 | ||||||
Clean Harbors, Inc.* | 2,158 | 120,913 | ||||||
Deluxe Corp. | 5,453 | 140,306 | ||||||
Ennis, Inc. | 12 | 209 | ||||||
Equifax, Inc. | 274 | 42,991 | ||||||
Exponent, Inc. | 48 | 3,457 | ||||||
FTI Consulting, Inc.* | 6 | 636 | ||||||
Healthcare Services Group, Inc. | 11,006 | 236,959 | ||||||
IHS Markit Ltd. (Bermuda) | 4,426 | 347,485 | ||||||
KAR Auction Services, Inc. | 237 | 3,413 | ||||||
Kelly Services, Inc., Class A | 298 | 5,078 | ||||||
ManpowerGroup, Inc. | 5,533 | 405,735 | ||||||
MSA Safety, Inc. | 317 | 42,532 | ||||||
| Number of Shares | Value | |||||||
COMMON STOCKS — (Continued) | ||||||||
Commercial & Professional Services — (Continued) |
| |||||||
Nielsen Holdings PLC (United Kingdom) | 9,515 | $ | 134,923 | |||||
Republic Services, Inc. | 5,356 | 499,983 | ||||||
Robert Half International, Inc. | 797 | 42,193 | ||||||
Stantec, Inc. (Canada) | 33 | 1,001 | ||||||
Steelcase, Inc., Class A | 10,961 | 110,816 | ||||||
Tetra Tech, Inc. | 1,497 | 142,964 | ||||||
TransUnion | 2,280 | 191,816 | ||||||
TriNet Group, Inc.* | 1,614 | 95,742 | ||||||
TrueBlue, Inc.* | 34 | 527 | ||||||
UniFirst Corp. | 646 | 122,333 | ||||||
Verisk Analytics, Inc. | 840 | 155,660 | ||||||
Waste Management, Inc. | 444 | 50,247 | ||||||
|
| |||||||
| 3,792,484 | ||||||||
|
| |||||||
Consumer Durables & Apparel — 3.3% |
| |||||||
Brunswick Corp. | 1,294 | 76,230 | ||||||
Capri Holdings Ltd. (British Virgin Islands)* | 24,915 | 448,470 | ||||||
Carter’s, Inc. | 5,480 | 474,458 | ||||||
Cavco Industries, Inc.* | 400 | 72,124 | ||||||
Deckers Outdoor Corp.* | 765 | 168,308 | ||||||
DR Horton, Inc. | 4,207 | 318,175 | ||||||
Garmin Ltd. (Switzerland) | 2,946 | 279,458 | ||||||
Hanesbrands, Inc. | 15,346 | 241,700 | ||||||
Helen of Troy Ltd. (Bermuda)* | 663 | 128,304 | ||||||
Installed Building Products, Inc.* | 385 | 39,174 | ||||||
Kontoor Brands, Inc. | 5,688 | 137,650 | ||||||
La-Z-Boy, Inc. | 2,520 | 79,708 | ||||||
Leggett & Platt, Inc. | 401 | 16,509 | ||||||
Lululemon Athletica, Inc.* | 914 | 301,044 | ||||||
Mattel, Inc.* | 4,542 | 53,141 | ||||||
Meritage Homes Corp.* | 1,170 | 129,156 | ||||||
Mohawk Industries, Inc.* | 4,381 | 427,542 | ||||||
Nautilus, Inc.* | 3,394 | 58,241 | ||||||
Newell Brands, Inc.(a) | 3,593 | 61,656 | ||||||
NIKE, Inc., Class B | 9,826 | 1,233,556 | ||||||
Polaris, Inc. | 6,839 | 645,191 | ||||||
PulteGroup, Inc. | 8,285 | 383,513 | ||||||
PVH Corp. | 5,651 | 337,026 | ||||||
Skyline Champion Corp.* | 829 | 22,192 | ||||||
Smith & Wesson Brands, Inc. | 7,197 | 111,697 | ||||||
Steven Madden Ltd. | 14,791 | 288,424 | ||||||
Sturm Ruger & Co., Inc. | 2,719 | 166,294 | ||||||
The accompanying notes are an integral part of the financial statements.
61
GOTHAM ENHANCED RETURN FUND
Portfolio of Investments (Continued)
September 30, 2020
| Number of Shares | Value | |||||||
COMMON STOCKS — (Continued) |
| |||||||
Consumer Durables & Apparel — (Continued) |
| |||||||
Tempur Sealy International, Inc.* | 3,670 | $ | 327,327 | |||||
TopBuild Corp.(a)* | 998 | 170,349 | ||||||
Tupperware Brands Corp. | 5,035 | 101,506 | ||||||
Whirlpool Corp. | 2,431 | 447,037 | ||||||
YETI Holdings, Inc.* | 1,923 | 87,150 | ||||||
|
| |||||||
| 7,832,310 | ||||||||
|
| |||||||
Consumer Services — 2.9% |
| |||||||
Adtalem Global Education, Inc.* | 5,142 | 126,185 | ||||||
Bloomin’ Brands, Inc. | 26,567 | 405,678 | ||||||
Boyd Gaming Corp. | 9,313 | 285,816 | ||||||
Chipotle Mexican Grill, Inc.* | 93 | 115,665 | ||||||
Dine Brands Global, Inc. | 8,497 | 463,851 | ||||||
El Pollo Loco Holdings, Inc.* | 522 | 8,456 | ||||||
frontdoor, Inc.* | 138 | 5,370 | ||||||
Grand Canyon Education, Inc.* | 34 | 2,718 | ||||||
Hilton Worldwide Holdings, Inc. | 703 | 59,980 | ||||||
Hyatt Hotels Corp., Class A | 2,538 | 135,453 | ||||||
Jack in the Box, Inc. | 686 | 54,407 | ||||||
Laureate Education, Inc., Class A* | 15,023 | 199,505 | ||||||
Marriott International, Inc., Class A | 1,285 | 118,965 | ||||||
McDonald’s Corp.(a) | 3,546 | 778,312 | ||||||
MGM Resorts International | 32,595 | 708,941 | ||||||
Norwegian Cruise Line Holdings Ltd. (Bermuda)* | 11,236 | 192,248 | ||||||
Papa John’s International, Inc. | 5,070 | 417,160 | ||||||
Perdoceo Education Corp.* | 7,638 | 93,489 | ||||||
Royal Caribbean Cruises Ltd. (Liberia) | 2,157 | 139,623 | ||||||
Scientific Games Corp.* | 736 | 25,694 | ||||||
Service Corp. International | 1,549 | 65,337 | ||||||
Strategic Education, Inc. | 1,875 | 171,506 | ||||||
Wingstop, Inc. | 5,648 | 771,799 | ||||||
Wyndham Hotels & Resorts, Inc. | 2,168 | 109,484 | ||||||
Yum! Brands, Inc.(a) | 15,323 | 1,398,990 | ||||||
|
| |||||||
| 6,854,632 | ||||||||
|
| |||||||
Diversified Financials — 1.8% |
| |||||||
Berkshire Hathaway, Inc., | 10,235 | 2,179,441 | ||||||
BlackRock, Inc. | 924 | 520,720 | ||||||
Federated Hermes, Inc. | 1,408 | 30,286 | ||||||
Franklin Resources, Inc. | 3,018 | 61,416 | ||||||
Intercontinental Exchange, Inc. | 44 | 4,402 | ||||||
Moody’s Corp. | 319 | 92,462 | ||||||
Nasdaq, Inc. | 1,676 | 205,662 | ||||||
| Number of Shares | Value | |||||||
COMMON STOCKS — (Continued) |
| |||||||
Diversified Financials — (Continued) |
| |||||||
S&P Global, Inc. | 2,244 | $ | 809,186 | |||||
Sprott, Inc. (Canada) | 22 | 751 | ||||||
T Rowe Price Group, Inc. | 1,884 | 241,566 | ||||||
Waddell & Reed Financial, Inc., Class A | 978 | 14,523 | ||||||
|
| |||||||
| 4,160,415 | ||||||||
|
| |||||||
Energy — 3.2% | ||||||||
Antero Midstream Corp. | 32,176 | 172,785 | ||||||
Apache Corp. | 10,154 | 96,158 | ||||||
Cactus, Inc., Class A | 2,794 | 53,617 | ||||||
Canadian Natural Resources Ltd. (Canada) | 53,093 | 850,019 | ||||||
Cenovus Energy, Inc. (Canada) | 9,335 | 36,313 | ||||||
Cheniere Energy, Inc.* | 1,005 | 46,501 | ||||||
Chevron Corp.(a) | 17,099 | 1,231,128 | ||||||
Clean Energy Fuels Corp.* | 5,138 | 12,742 | ||||||
Concho Resources, Inc. | 730 | 32,208 | ||||||
ConocoPhillips(a) | 9,209 | 302,424 | ||||||
Core Laboratories NV (Netherlands) | 1,244 | 18,983 | ||||||
Crescent Point Energy Corp. (Canada) | 61,897 | 75,514 | ||||||
CVR Energy, Inc. | 8,668 | 107,310 | ||||||
DHT Holdings, Inc. (Marshall Islands) | 9,297 | 47,973 | ||||||
DMC Global, Inc. | 339 | 11,167 | ||||||
EOG Resources, Inc.(a) | 42,694 | 1,534,422 | ||||||
Halliburton Co. | 27,723 | 334,062 | ||||||
HollyFrontier Corp. | 14,248 | 280,828 | ||||||
Kinder Morgan, Inc.(a) | 58,264 | 718,395 | ||||||
Kosmos Energy Ltd. | 121,398 | 118,436 | ||||||
Magnolia Oil & Gas Corp., Class A* | 12,185 | 62,996 | ||||||
Marathon Petroleum Corp.(a) | 1,569 | 46,034 | ||||||
Murphy Oil Corp. | 42,868 | 382,383 | ||||||
Nordic American Tankers Ltd. (Bermuda) | 70,838 | 247,225 | ||||||
Patterson-UTI Energy, Inc. | 1,321 | 3,765 | ||||||
Phillips 66 | 2,712 | 140,590 | ||||||
Range Resources Corp. | 24,394 | 161,488 | ||||||
Renewable Energy Group, Inc.* | 2,986 | 159,512 | ||||||
Schlumberger NV (Curacao) | 8,107 | 126,145 | ||||||
TechnipFMC PLC (United Kingdom) | 179 | 1,130 | ||||||
Williams Cos., Inc. (The) | 7,083 | 139,181 | ||||||
World Fuel Services Corp. | 3,038 | 64,375 | ||||||
|
| |||||||
| 7,615,809 | ||||||||
|
| |||||||
The accompanying notes are an integral part of the financial statements.
62
GOTHAM ENHANCED RETURN FUND
Portfolio of Investments (Continued)
September 30, 2020
| Number of Shares | Value | |||||||
COMMON STOCKS — (Continued) |
| |||||||
Food & Staples Retailing — 1.8% |
| |||||||
BJ’s Wholesale Club Holdings, Inc.* | 2,006 | $ | 83,349 | |||||
Casey’s General Stores, Inc. | 362 | 64,309 | ||||||
Costco Wholesale Corp. | 1,837 | 652,135 | ||||||
Kroger Co. (The) | 6,510 | 220,754 | ||||||
Sprouts Farmers Market, Inc.* | 12,027 | 251,725 | ||||||
Sysco Corp. | 8,475 | 527,314 | ||||||
Walgreens Boots Alliance, Inc. | 6,456 | 231,900 | ||||||
Walmart, Inc.(a) | 16,576 | 2,319,148 | ||||||
|
| |||||||
| 4,350,634 | ||||||||
|
| |||||||
Food, Beverage & Tobacco — 3.5% |
| |||||||
Altria Group, Inc.(a) | 15,956 | 616,540 | ||||||
Archer-Daniels-Midland Co. | 2,582 | 120,037 | ||||||
B&G Foods, Inc. | 383 | 10,636 | ||||||
Brown-Forman Corp., Class B | 25 | 1,883 | ||||||
Coca-Cola Co. (The)(a) | 18,056 | 891,425 | ||||||
Coca-Cola Consolidated, Inc. | 177 | 42,600 | ||||||
Conagra Brands, Inc. | 7,731 | 276,074 | ||||||
Constellation Brands, Inc., | 3,480 | 659,495 | ||||||
Flowers Foods, Inc. | 2,250 | 54,742 | ||||||
General Mills, Inc. | 5,018 | 309,510 | ||||||
JM Smucker Co. (The) | 3,951 | 456,420 | ||||||
Kellogg Co. | 1,266 | 81,771 | ||||||
Kraft Heinz Co. (The) | 39,286 | 1,176,616 | ||||||
McCormick & Co., Inc., non-voting shares | 1,098 | 213,122 | ||||||
Molson Coors Beverage Co., Class B | 4,102 | 137,663 | ||||||
Monster Beverage Corp.* | 2,873 | 230,415 | ||||||
National Beverage Corp.* | 26 | 1,768 | ||||||
PepsiCo, Inc.(a) | 8,664 | 1,200,830 | ||||||
Philip Morris International, Inc. | 5,555 | 416,569 | ||||||
TreeHouse Foods, Inc.* | 6,925 | 280,670 | ||||||
Turning Point Brands, Inc. | 21 | 586 | ||||||
Tyson Foods, Inc., Class A | 18,300 | 1,088,484 | ||||||
|
| |||||||
| 8,267,856 | ||||||||
|
| |||||||
Health Care Equipment & Services — 7.6% |
| |||||||
Abbott Laboratories | 4,614 | 502,142 | ||||||
Allscripts Healthcare Solutions, Inc.* | 3,948 | 32,137 | ||||||
Anthem, Inc.(a) | 5,403 | 1,451,192 | ||||||
Cardinal Health, Inc. | 6,398 | 300,386 | ||||||
Centene Corp.* | 3,248 | 189,456 | ||||||
Cerner Corp. | 2,717 | 196,412 | ||||||
Cigna Corp.(a) | 3,315 | 561,594 | ||||||
CONMED Corp. | 1,263 | 99,360 | ||||||
Covetrus, Inc.* | 5,974 | 145,766 | ||||||
| Number of Shares | Value | |||||||
COMMON STOCKS — (Continued) |
| |||||||
Health Care Equipment & Services — (Continued) |
| |||||||
CVS Health Corp.(a) | 13,002 | $ | 759,317 | |||||
Danaher Corp. | 2,787 | 600,125 | ||||||
DaVita, Inc.(a)* | 10,203 | 873,887 | ||||||
DENTSPLY SIRONA, Inc. | 3,642 | 159,265 | ||||||
Ensign Group, Inc. (The) | 1,051 | 59,970 | ||||||
Globus Medical, Inc., Class A* | 1,416 | 70,120 | ||||||
Hanger, Inc.* | 37 | 585 | ||||||
HCA Healthcare, Inc. | 2,133 | 265,942 | ||||||
HealthStream, Inc.* | 12 | 241 | ||||||
Hill-Rom Holdings, Inc. | 944 | 78,833 | ||||||
HMS Holdings Corp.* | 320 | 7,664 | ||||||
Hologic, Inc.* | 14,465 | 961,489 | ||||||
Humana, Inc.(a) | 3,772 | 1,561,193 | ||||||
IDEXX Laboratories, Inc.* | 1,035 | 406,869 | ||||||
Integer Holdings Corp.* | 7,139 | 421,272 | ||||||
Intuitive Surgical, Inc.* | 752 | 533,574 | ||||||
iRhythm Technologies, Inc.* | 775 | 184,535 | ||||||
Livongo Health, Inc.* | 2,372 | 332,199 | ||||||
Magellan Health, Inc.* | 959 | 72,673 | ||||||
McKesson Corp. | 3,373 | 502,341 | ||||||
MEDNAX, Inc.* | 5,030 | 81,888 | ||||||
Medtronic PLC (Ireland) | 9,163 | 952,219 | ||||||
Molina Healthcare, Inc.* | 293 | 53,631 | ||||||
National Research Corp. | 5 | 246 | ||||||
Natus Medical, Inc.* | 8,418 | 144,200 | ||||||
Neogen Corp.* | 125 | 9,781 | ||||||
NextGen Healthcare, Inc.* | 598 | 7,619 | ||||||
Omnicell, Inc.* | 738 | 55,099 | ||||||
Patterson Cos., Inc. | 10,701 | 257,948 | ||||||
Quidel Corp.* | 2,719 | 596,494 | ||||||
ResMed, Inc. | 3,951 | 677,320 | ||||||
Select Medical Holdings Corp.* | 8,644 | 179,968 | ||||||
STERIS PLC (Ireland) | 2,632 | 463,732 | ||||||
Stryker Corp. | 3,612 | 752,632 | ||||||
Teladoc Health, Inc.* | 713 | 156,318 | ||||||
Teleflex, Inc. | 12 | 4,085 | ||||||
Tenet Healthcare Corp.* | 4,747 | 116,349 | ||||||
Tivity Health, Inc.* | 9,569 | 134,157 | ||||||
UnitedHealth Group, Inc.(a) | 1,300 | 405,301 | ||||||
Universal Health Services, Inc., Class B(a) | 6,766 | 724,097 | ||||||
Varian Medical Systems, Inc.* | 2,537 | 436,364 | ||||||
West Pharmaceutical Services, Inc. | 1,734 | 476,677 | ||||||
The accompanying notes are an integral part of the financial statements.
63
GOTHAM ENHANCED RETURN FUND
Portfolio of Investments (Continued)
September 30, 2020
| Number of Shares | Value | |||||||
COMMON STOCKS — (Continued) |
| |||||||
Health Care Equipment & Services — (Continued) |
| |||||||
Zimmer Biomet Holdings, Inc. | 207 | $ | 28,181 | |||||
|
| |||||||
| 18,044,845 | ||||||||
|
| |||||||
Household & Personal Products — 1.4% |
| |||||||
Church & Dwight Co., Inc. | 761 | 71,313 | ||||||
Clorox Co. (The) | 1,910 | 401,425 | ||||||
Colgate-Palmolive Co. | 6,724 | 518,757 | ||||||
Edgewell Personal Care Co.* | 3,069 | 85,564 | ||||||
elf Beauty, Inc.* | 4,515 | 82,941 | ||||||
Estee Lauder Cos., Inc. (The), Class A | 1,292 | 281,979 | ||||||
Kimberly-Clark Corp. | 6,488 | 958,018 | ||||||
Procter & Gamble Co. (The)(a) | 6,239 | 867,159 | ||||||
Spectrum Brands Holdings, Inc. | 1,612 | 92,142 | ||||||
|
| |||||||
| 3,359,298 | ||||||||
|
| |||||||
Materials — 4.7% | ||||||||
Allegheny Technologies, Inc.* | 17,963 | 156,637 | ||||||
Amcor PLC (Jersey) | 36,950 | 408,298 | ||||||
Ashland Global Holdings, Inc. | 27 | 1,915 | ||||||
Avient Corp. | 19,407 | 513,509 | ||||||
Axalta Coating Systems Ltd. | 1,030 | 22,835 | ||||||
Boise Cascade Co. | 1,039 | 41,477 | ||||||
Cabot Corp. | 266 | 9,584 | ||||||
Carpenter Technology Corp. | 6,368 | 115,643 | ||||||
Century Aluminum Co.* | 3,309 | 23,560 | ||||||
CF Industries Holdings, Inc. | 15,640 | 480,304 | ||||||
Chase Corp. | 1 | 95 | ||||||
Chemours Co. (The) | 10,624 | 222,148 | ||||||
Commercial Metals Co. | 26,895 | 537,362 | ||||||
Compass Minerals International, Inc. | 2,276 | 135,081 | ||||||
Dow, Inc. | 6,850 | 322,292 | ||||||
DuPont de Nemours, Inc. | 3,563 | 197,675 | ||||||
Eastman Chemical Co. | 779 | 60,855 | ||||||
Ecolab, Inc.(a) | 7,658 | 1,530,375 | ||||||
Ferro Corp.* | 3,961 | 49,116 | ||||||
First Majestic Silver Corp. (Canada)* | 409 | 3,894 | ||||||
FMC Corp. | 4,092 | 433,384 | ||||||
Forterra, Inc.* | 251 | 2,967 | ||||||
Freeport-McMoRan, Inc. | 17,942 | 280,613 | ||||||
FutureFuel Corp. | 26 | 296 | ||||||
Golden Star Resources Ltd. (Canada)* | 262 | 1,129 | ||||||
Hecla Mining Co. | 81,881 | 415,956 | ||||||
IAMGOLD Corp. (Canada)* | 5,474 | 20,965 | ||||||
| Number of Shares | Value | |||||||
COMMON STOCKS — (Continued) |
| |||||||
Materials — (Continued) | ||||||||
Ingevity Corp.* | 2,965 | $ | 146,590 | |||||
Innospec, Inc. | 3,534 | 223,773 | ||||||
International Paper Co. | 118 | 4,784 | ||||||
Kaiser Aluminum Corp. | 2,231 | 119,559 | ||||||
Kraton Corp.* | 3,530 | 62,905 | ||||||
Linde PLC (Ireland) | 3,592 | 855,363 | ||||||
LyondellBasell Industries NV, Class A (Netherlands) | 5,512 | 388,541 | ||||||
Martin Marietta Materials, Inc. | 591 | 139,098 | ||||||
Minerals Technologies, Inc. | 229 | 11,702 | ||||||
Mosaic Co. (The) | 12,091 | 220,903 | ||||||
Neenah, Inc. | 3 | 112 | ||||||
NewMarket Corp. | 336 | 115,020 | ||||||
Newmont Corp. | 7,870 | 499,352 | ||||||
Nucor Corp. | 7,870 | 353,048 | ||||||
Nutrien Ltd. (Canada) | 3,618 | 141,934 | ||||||
O-I Glass, Inc. | 6,050 | 64,070 | ||||||
Pan American Silver Corp. (Canada) | 3,892 | 125,128 | ||||||
PPG Industries, Inc. | 2,404 | 293,480 | ||||||
Pretium Resources, Inc. (Canada)* | 564 | 7,242 | ||||||
Reliance Steel & Aluminum Co. | 4,546 | 463,874 | ||||||
Sealed Air Corp. | 2,098 | 81,423 | ||||||
Sensient Technologies Corp. | 1,642 | 94,809 | ||||||
Sonoco Products Co. | 3,661 | 186,967 | ||||||
Southern Copper Corp. | 776 | 35,130 | ||||||
SSR Mining, Inc. (Canada)* | 4,533 | 84,631 | ||||||
Stepan Co. | 30 | 3,270 | ||||||
Summit Materials, Inc., Class A* | 19,237 | 318,180 | ||||||
Tredegar Corp. | 52 | 773 | ||||||
Trinseo SA (Luxembourg) | 412 | 10,564 | ||||||
Wheaton Precious Metals Corp. (Canada) | 152 | 7,459 | ||||||
Worthington Industries, Inc. | 1,276 | 52,035 | ||||||
Yamana Gold, Inc. (Canada) | 7,212 | 40,964 | ||||||
|
| |||||||
| 11,140,648 | ||||||||
|
| |||||||
Media & Entertainment — 7.9% | ||||||||
Activision Blizzard, Inc. | 2,455 | 198,732 | ||||||
Alphabet, Inc., Class A(a)* | 2,444 | 3,581,926 | ||||||
Cargurus, Inc.* | 4,412 | 95,432 | ||||||
Charter Communications, Inc., | 3,611 | 2,254,492 | ||||||
Clear Channel Outdoor Holdings, Inc.* | 241 | 241 | ||||||
The accompanying notes are an integral part of the financial statements.
64
GOTHAM ENHANCED RETURN FUND
Portfolio of Investments (Continued)
September 30, 2020
| Number of Shares | Value | |||||||
COMMON STOCKS — (Continued) |
| |||||||
Media & Entertainment — (Continued) |
| |||||||
Discovery, Inc., Class A* | 7,209 | $ | 156,940 | |||||
DISH Network Corp., Class A* | 25,913 | 752,254 | ||||||
Electronic Arts, Inc.* | 6,750 | 880,268 | ||||||
EverQuote, Inc., Class A* | 915 | 35,356 | ||||||
Facebook, Inc., Class A(a)* | 13,214 | 3,460,747 | ||||||
Fox Corp., Class A | 21,601 | 601,156 | ||||||
Interpublic Group of Cos., Inc. (The) | 17,791 | 296,576 | ||||||
John Wiley & Sons, Inc., Class A | 441 | 13,984 | ||||||
Match Group, Inc.* | 806 | 89,184 | ||||||
MSG Networks, Inc., Class A* | 4,065 | 38,902 | ||||||
Netflix, Inc.* | 2,520 | 1,260,076 | ||||||
New York Times Co. (The), Class A | 30 | 1,284 | ||||||
News Corp., Class A | 30,810 | 431,956 | ||||||
Omnicom Group, Inc. | 1,110 | 54,945 | ||||||
Pinterest, Inc., Class A* | 6,938 | 287,996 | ||||||
Sirius XM Holdings, Inc. | 15,973 | 85,615 | ||||||
Take-Two Interactive Software, Inc.* | 1,852 | 305,987 | ||||||
Twitter, Inc.* | 26,178 | 1,164,921 | ||||||
Walt Disney Co. (The)(a) | 13,084 | 1,623,463 | ||||||
Zillow Group, Inc., Class C* | 10,855 | 1,102,759 | ||||||
|
| |||||||
| 18,775,192 | ||||||||
|
| |||||||
Pharmaceuticals, Biotechnology & Life Sciences — 5.7% |
| |||||||
Agilent Technologies, Inc. | 11,125 | 1,122,958 | ||||||
Amneal Pharmaceuticals, Inc.* | 156 | 605 | ||||||
Avantor, Inc.* | 5,171 | 116,296 | ||||||
Biogen, Inc.* | 385 | 109,217 | ||||||
Bio-Rad Laboratories, Inc., | 1 | 515 | ||||||
Bristol Myers Squibb Co.(a) | 22,878 | 1,379,315 | ||||||
Catalent, Inc.* | 614 | 52,595 | ||||||
Charles River Laboratories International, Inc.* | 597 | 135,191 | ||||||
Coherus Biosciences, Inc.* | 3,074 | 56,377 | ||||||
Corcept Therapeutics, Inc.* | 1,660 | 28,892 | ||||||
Denali Therapeutics, Inc.* | 300 | 10,749 | ||||||
Elanco Animal Health, Inc.* | 11,303 | 315,693 | ||||||
Emergent BioSolutions, Inc.* | 2,919 | 301,620 | ||||||
Horizon Therapeutics PLC (Ireland)* | 3,261 | 253,314 | ||||||
Innoviva, Inc.* | 4,367 | 45,635 | ||||||
IQVIA Holdings, Inc.* | 1,130 | 178,122 | ||||||
Ironwood Pharmaceuticals, Inc.* | 71 | 639 | ||||||
Johnson & Johnson(a) | 12,576 | 1,872,315 | ||||||
Kura Oncology, Inc.* | 101 | 3,095 | ||||||
Merck & Co., Inc.(a) | 11,450 | 949,778 | ||||||
Mylan NV (Netherlands)* | 13,301 | 197,254 | ||||||
| Number of Shares | Value | |||||||
COMMON STOCKS — (Continued) |
| |||||||
Pharmaceuticals, Biotechnology & Life Sciences — (Continued) |
| |||||||
NantKwest, Inc.* | 106 | $ | 735 | |||||
Natera, Inc.* | 7,257 | 524,246 | ||||||
Neurocrine Biosciences, Inc.* | 671 | 64,523 | ||||||
Novavax, Inc.(a)* | 13,052 | 1,414,184 | ||||||
PerkinElmer, Inc. | 5,839 | 732,853 | ||||||
Pfizer, Inc.(a) | 42,346 | 1,554,098 | ||||||
Phibro Animal Health Corp., Class A | 12 | 209 | ||||||
Prestige Consumer Healthcare, Inc.* | 3,312 | 120,623 | ||||||
Regeneron Pharmaceuticals, Inc.* | 349 | 195,363 | ||||||
TG Therapeutics, Inc.* | 8,588 | 229,815 | ||||||
Thermo Fisher Scientific, Inc. | 678 | 299,351 | ||||||
Trillium Therapeutics, Inc. (Canada)* | 1,390 | 19,752 | ||||||
United Therapeutics Corp.* | 4,592 | 463,792 | ||||||
Vanda Pharmaceuticals, Inc.* | 5,707 | 55,130 | ||||||
Waters Corp.* | 694 | 135,802 | ||||||
Zoetis, Inc. | 3,510 | 580,449 | ||||||
|
| |||||||
| 13,521,100 | ||||||||
|
| |||||||
Retailing — 9.6% | ||||||||
1-800-Flowers.com, Inc., | 3,595 | 89,659 | ||||||
Aaron’s, Inc. | 14,786 | 837,627 | ||||||
Advance Auto Parts, Inc. | 3,072 | 471,552 | ||||||
Amazon.com, Inc.(a)* | 1,159 | 3,649,378 | ||||||
Asbury Automotive Group, Inc.* | 1,467 | 142,959 | ||||||
At Home Group, Inc.* | 18,364 | 272,889 | ||||||
AutoNation, Inc.* | 6,878 | 364,053 | ||||||
AutoZone, Inc.* | 483 | 568,800 | ||||||
Best Buy Co., Inc.(a) | 4,734 | 526,847 | ||||||
Big Lots, Inc. | 1,118 | 49,863 | ||||||
Booking Holdings, Inc.(a)* | 990 | 1,693,573 | ||||||
Buckle, Inc. (The) | 3,726 | 75,973 | ||||||
Camping World Holdings, Inc., Class A | 6,560 | 195,160 | ||||||
CarParts.Com, Inc.* | 4,800 | 51,888 | ||||||
Dick’s Sporting Goods, Inc. | 606 | 35,075 | ||||||
Dollar General Corp. | 1,231 | 258,042 | ||||||
eBay, Inc.(a) | 28,280 | 1,473,388 | ||||||
Etsy, Inc.* | 5,434 | 660,937 | ||||||
Foot Locker, Inc. | 17,198 | 568,050 | ||||||
Gap, Inc. (The) | 48,876 | 832,358 | ||||||
Genuine Parts Co. | 2,191 | 208,517 | ||||||
Guess?, Inc. | 12,633 | 146,795 | ||||||
Hibbett Sports, Inc.* | 893 | 35,023 | ||||||
The accompanying notes are an integral part of the financial statements.
65
GOTHAM ENHANCED RETURN FUND
Portfolio of Investments (Continued)
September 30, 2020
| Number of Shares | Value | |||||||
COMMON STOCKS — (Continued) |
| |||||||
Retailing — (Continued) | ||||||||
Home Depot, Inc. (The)(a) | 4,146 | $ | 1,151,386 | |||||
L Brands, Inc. | 17,233 | 548,182 | ||||||
Lithia Motors, Inc., Class A | 714 | 162,749 | ||||||
LKQ Corp.* | 7,988 | 221,507 | ||||||
Lowe’s Cos., Inc.(a) | 10,682 | 1,771,717 | ||||||
Lumber Liquidators Holdings, Inc.* | 7,427 | 163,765 | ||||||
Macy’s, Inc. | 117,470 | 669,579 | ||||||
MarineMax, Inc.* | 1,764 | 45,282 | ||||||
Michaels Cos., Inc. (The)* | 7,680 | 74,150 | ||||||
Murphy USA, Inc.* | 1,566 | 200,871 | ||||||
National Vision Holdings, Inc.* | 1,991 | 76,136 | ||||||
ODP Corp. (The) | 1,186 | 23,068 | ||||||
O’Reilly Automotive, Inc.* | 838 | 386,385 | ||||||
Pool Corp. | 178 | 59,548 | ||||||
Qurate Retail, Inc. | 10,453 | 75,053 | ||||||
RH* | 1,619 | 619,462 | ||||||
Ross Stores, Inc. | 2,395 | 223,501 | ||||||
Shoe Carnival, Inc. | 1,007 | 33,815 | ||||||
Shutterstock, Inc. | 696 | 36,220 | ||||||
Signet Jewelers Ltd. (Bermuda) | 20,707 | 387,221 | ||||||
Sleep Number Corp.* | 5,074 | 248,169 | ||||||
Sonic Automotive, Inc., Class A | 8,505 | 341,561 | ||||||
Sportsman’s Warehouse Holdings, Inc.* | 383 | 5,481 | ||||||
Stamps.com, Inc.* | 2,389 | 575,630 | ||||||
Target Corp. | 1,919 | 302,089 | ||||||
Tractor Supply Co. | 3,107 | 445,357 | ||||||
Williams-Sonoma, Inc. | 5,204 | 470,650 | ||||||
Zumiez, Inc.* | 6,460 | 179,717 | ||||||
|
| |||||||
| 22,706,657 | ||||||||
|
| |||||||
Semiconductors & Semiconductor Equipment — 5.7% |
| |||||||
Advanced Micro Devices, Inc.* | 3,715 | 304,593 | ||||||
Amkor Technology, Inc.* | 20,241 | 226,699 | ||||||
Analog Devices, Inc. | 127 | 14,826 | ||||||
Applied Materials, Inc. | 6,593 | 391,954 | ||||||
Axcelis Technologies, Inc.* | 6,752 | 148,544 | ||||||
Broadcom, Inc. | 4,168 | 1,518,486 | ||||||
Brooks Automation, Inc. | 289 | 13,369 | ||||||
CEVA, Inc.* | 44 | 1,732 | ||||||
Cirrus Logic, Inc.* | 2,817 | 190,007 | ||||||
Enphase Energy, Inc.* | 1,774 | 146,515 | ||||||
First Solar, Inc.* | 5,279 | 349,470 | ||||||
Intel Corp.(a) | 46,662 | 2,416,158 | ||||||
KLA Corp. | 3,117 | 603,888 | ||||||
| Number of Shares | Value | |||||||
COMMON STOCKS — (Continued) |
| |||||||
Semiconductors & Semiconductor Equipment — (Continued) |
| |||||||
Lam Research Corp. | 822 | $ | 272,698 | |||||
Lattice Semiconductor Corp.* | 5,292 | 153,256 | ||||||
MACOM Technology Solutions Holdings, Inc.* | 10,210 | 347,242 | ||||||
Marvell Technology Group Ltd. (Bermuda) | 5,578 | 221,447 | ||||||
Maxim Integrated Products, Inc. | 5,596 | 378,346 | ||||||
Microchip Technology, Inc. | 4,514 | 463,859 | ||||||
MKS Instruments, Inc. | 1,074 | 117,313 | ||||||
Monolithic Power Systems, Inc. | 852 | 238,228 | ||||||
NVIDIA Corp.(a) | 2,918 | 1,579,280 | ||||||
PDF Solutions, Inc.* | 6 | 112 | ||||||
Power Integrations, Inc. | 2,085 | 115,509 | ||||||
Qorvo, Inc.(a)* | 8,142 | 1,050,399 | ||||||
Skyworks Solutions, Inc. | 6,746 | 981,543 | ||||||
SMART Global Holdings, Inc. (Cayman Islands)* | 6,333 | 173,144 | ||||||
Synaptics, Inc.* | 9,083 | 730,455 | ||||||
Texas Instruments, Inc. | 1,014 | 144,789 | ||||||
Ultra Clean Holdings, Inc.* | 8,817 | 189,213 | ||||||
|
| |||||||
| 13,483,074 | ||||||||
|
| |||||||
Software & Services — 14.1% | ||||||||
A10 Networks, Inc.* | 762 | 4,854 | ||||||
Accenture PLC, Class A (Ireland) | 2,591 | 585,540 | ||||||
ACI Worldwide, Inc.* | 7,291 | 190,514 | ||||||
Adobe, Inc.(a)* | 1,713 | 840,107 | ||||||
Agilysys, Inc.* | 309 | 7,465 | ||||||
Alarm.com Holdings, Inc.* | 975 | 53,869 | ||||||
Alliance Data Systems Corp. | 2,174 | 91,265 | ||||||
Anaplan, Inc.* | 2,990 | 187,114 | ||||||
Appfolio, Inc., Class A* | 437 | 61,971 | ||||||
Automatic Data Processing, Inc.(a) | 13,174 | 1,837,641 | ||||||
Black Knight, Inc.* | 722 | 62,850 | ||||||
Blackbaud, Inc. | 8,045 | 449,152 | ||||||
Broadridge Financial Solutions, Inc. | 4,174 | 550,968 | ||||||
CACI International, Inc., Class A* | 910 | 193,976 | ||||||
Cadence Design Systems, Inc.* | 8,313 | 886,415 | ||||||
Cardtronics PLC, Class A (United Kingdom)* | 3,060 | 60,588 | ||||||
CDK Global, Inc. | 1,499 | 65,341 | ||||||
CGI, Inc. (Canada)* | 1,124 | 76,173 | ||||||
Citrix Systems, Inc. | 5,088 | 700,669 | ||||||
Cornerstone OnDemand, Inc.* | 3,384 | 123,042 | ||||||
Crowdstrike Holdings, Inc., | 444 | 60,970 | ||||||
The accompanying notes are an integral part of the financial statements.
66
GOTHAM ENHANCED RETURN FUND
Portfolio of Investments (Continued)
September 30, 2020
| Number of Shares | Value | |||||||
COMMON STOCKS — (Continued) |
| |||||||
Software & Services — (Continued) |
| |||||||
Domo, Inc., Class B* | 2,553 | $ | 97,857 | |||||
Envestnet, Inc.* | 747 | 57,639 | ||||||
Evo Payments, Inc., Class A* | 53 | 1,317 | ||||||
Fair Isaac Corp.* | 183 | 77,845 | ||||||
Fiserv, Inc.* | 3,427 | 353,152 | ||||||
FleetCor Technologies, Inc.* | 2,975 | 708,348 | ||||||
Fortinet, Inc.* | 5,955 | 701,559 | ||||||
Gartner, Inc.* | 3,460 | 432,327 | ||||||
Globant SA (Luxembourg)* | 401 | 71,867 | ||||||
GoDaddy, Inc., Class A* | 5,939 | 451,186 | ||||||
Guidewire Software, Inc.* | 1,383 | 144,205 | ||||||
International Business Machines Corp.(a) | 6,906 | 840,253 | ||||||
International Money Express, Inc.* | 82 | 1,178 | ||||||
Intuit, Inc.(a) | 5,668 | 1,848,958 | ||||||
Jack Henry & Associates, Inc. | 1,209 | 196,571 | ||||||
KBR, Inc. | 1,608 | 35,955 | ||||||
Leidos Holdings, Inc.(a) | 382 | 34,055 | ||||||
LiveRamp Holdings, Inc.* | 2,081 | 107,733 | ||||||
Mastercard, Inc., Class A | 1,847 | 624,600 | ||||||
Microsoft Corp.(a) | 18,087 | 3,804,239 | ||||||
MicroStrategy, Inc., Class A* | 611 | 91,992 | ||||||
MobileIron, Inc.* | 229 | 1,605 | ||||||
Model N, Inc.* | 2,208 | 77,898 | ||||||
NortonLifeLock, Inc.(a) | 30,719 | 640,184 | ||||||
Nuance Communications, Inc.* | 385 | 12,778 | ||||||
Oracle Corp.(a) | 59,168 | 3,532,330 | ||||||
Paychex, Inc. | 12,293 | 980,613 | ||||||
Paylocity Holding Corp.* | 255 | 41,162 | ||||||
PayPal Holdings, Inc.(a)* | 8,817 | 1,737,214 | ||||||
Progress Software Corp. | 1,524 | 55,900 | ||||||
PTC, Inc.* | 5,710 | 472,331 | ||||||
QAD, Inc., Class A | 30 | 1,266 | ||||||
Qualys, Inc.* | 108 | 10,585 | ||||||
Sailpoint Technologies Holdings, Inc.* | 13,398 | 530,159 | ||||||
salesforce.com, Inc.* | 2,974 | 747,426 | ||||||
Science Applications International Corp. | 2,475 | 194,090 | ||||||
ServiceNow, Inc.(a)* | 4,352 | 2,110,720 | ||||||
Shopify, Inc., Class A (Canada)* | 31 | 31,712 | ||||||
SPS Commerce, Inc.* | 3,700 | �� | 288,119 | |||||
SS&C Technologies Holdings, Inc. | 4,721 | 285,715 | ||||||
SVMK, Inc.* | 4,909 | 108,538 | ||||||
Synopsys, Inc.* | 4,384 | 938,088 | ||||||
| Number of Shares | Value | |||||||
COMMON STOCKS — (Continued) |
| |||||||
Software & Services — (Continued) |
| |||||||
Teradata Corp.* | 5,254 | $ | 119,266 | |||||
Verint Systems, Inc.* | 384 | 18,501 | ||||||
VeriSign, Inc.* | 1,675 | 343,124 | ||||||
Virtusa Corp.* | 1,573 | 77,329 | ||||||
Visa, Inc., Class A(a) | 5,535 | 1,106,834 | ||||||
Western Union Co. (The) | 23,112 | 495,290 | ||||||
WEX, Inc.* | 881 | 122,433 | ||||||
Workday, Inc., Class A* | 1,880 | 404,444 | ||||||
Zoom Video Communications, Inc., | 53 | 24,916 | ||||||
|
| |||||||
| 33,283,890 | ||||||||
|
| |||||||
Technology Hardware & Equipment — 5.0% |
| |||||||
Acacia Communications, Inc.(a)* | 4,243 | 285,978 | ||||||
Amphenol Corp., Class A | 749 | 81,094 | ||||||
Apple, Inc.(a) | 26,492 | 3,068,039 | ||||||
Arrow Electronics, Inc.* | 4,198 | 330,215 | ||||||
Avnet, Inc. | 4,907 | 126,797 | ||||||
Badger Meter, Inc. | 769 | 50,270 | ||||||
Belden, Inc. | 3,455 | 107,520 | ||||||
CDW Corp. | 931 | 111,282 | ||||||
Ciena Corp.* | 92 | 3,651 | ||||||
Cisco Systems, Inc.(a) | 30,584 | 1,204,704 | ||||||
Corning, Inc. | 18,782 | 608,725 | ||||||
Diebold Nixdorf, Inc.* | 57,986 | 443,013 | ||||||
EchoStar Corp., Class A* | 13,319 | 331,510 | ||||||
FLIR Systems, Inc. | 11,227 | 402,488 | ||||||
Hewlett Packard Enterprise Co. | 18,302 | 171,490 | ||||||
HP, Inc. | 45,550 | 864,994 | ||||||
InterDigital, Inc. | 1,408 | 80,340 | ||||||
Jabil, Inc. | 2,451 | 83,971 | ||||||
Juniper Networks, Inc. | 4,139 | 88,988 | ||||||
Lumentum Holdings, Inc.* | 2,886 | 216,825 | ||||||
NCR Corp.* | 18,023 | 399,029 | ||||||
NetApp, Inc. | 6,074 | 266,284 | ||||||
OSI Systems, Inc.* | 2,225 | 172,682 | ||||||
PC Connection, Inc. | 27 | 1,109 | ||||||
Rogers Corp.* | 12 | 1,177 | ||||||
Sanmina Corp.* | 5,286 | 142,986 | ||||||
Seagate Technology PLC (Ireland) | 9,550 | 470,528 | ||||||
SYNNEX Corp. | 2,237 | 313,314 | ||||||
TE Connectivity Ltd. (Switzerland) | 2,362 | 230,862 | ||||||
Trimble, Inc.* | 576 | 28,051 | ||||||
TTM Technologies, Inc.* | 3,788 | 43,221 | ||||||
The accompanying notes are an integral part of the financial statements.
67
GOTHAM ENHANCED RETURN FUND
Portfolio of Investments (Continued)
September 30, 2020
| Number of Shares | Value | |||||||
COMMON STOCKS — (Continued) |
| |||||||
Technology Hardware & Equipment — (Continued) |
| |||||||
Ubiquiti, Inc. | 993 | $ | 165,493 | |||||
Vishay Intertechnology, Inc. | 3,593 | 55,943 | ||||||
Xerox Holdings Corp.(a) | 33,672 | 632,023 | ||||||
Zebra Technologies Corp., Class A* | 1,103 | 278,463 | ||||||
|
| |||||||
| 11,863,059 | ||||||||
|
| |||||||
Telecommunication Services — 1.6% |
| |||||||
AT&T, Inc.(a) | 64,594 | 1,841,575 | ||||||
CenturyLink, Inc. | 9,733 | 98,206 | ||||||
Iridium Communications, Inc.* | 7,202 | 184,227 | ||||||
T-Mobile US, Inc.* | 5,198 | 594,443 | ||||||
Verizon Communications, Inc.(a) | 16,259 | 967,248 | ||||||
Vonage Holdings Corp.* | 3,322 | 33,984 | ||||||
|
| |||||||
| 3,719,683 | ||||||||
|
| |||||||
Transportation — 2.1% | ||||||||
Alaska Air Group, Inc. | 15,093 | 552,857 | ||||||
ArcBest Corp. | 1,416 | 43,981 | ||||||
Atlas Air Worldwide Holdings, Inc.* | 3,616 | 220,214 | ||||||
CH Robinson Worldwide, Inc. | 6,379 | 651,870 | ||||||
CSX Corp. | 8,402 | 652,583 | ||||||
Echo Global Logistics, Inc.* | 1 | 26 | ||||||
Expeditors International of Washington, Inc. | 2,797 | 253,184 | ||||||
FedEx Corp. | 1,870 | 470,342 | ||||||
Hub Group, Inc., Class A* | 135 | 6,776 | ||||||
JB Hunt Transport Services, Inc. | 2,487 | 314,307 | ||||||
Kansas City Southern(a) | 69 | 12,477 | ||||||
Marten Transport Ltd. | 272 | 4,439 | ||||||
Norfolk Southern Corp. | 4,892 | 1,046,839 | ||||||
Old Dominion Freight Line, Inc. | 452 | 81,776 | ||||||
Schneider National, Inc., Class B | 12,428 | 307,344 | ||||||
United Parcel Service, Inc., | 1,716 | 285,937 | ||||||
Werner Enterprises, Inc. | 2,549 | 107,033 | ||||||
|
| |||||||
| 5,011,985 | ||||||||
|
| |||||||
Utilities — 2.3% | ||||||||
American Water Works Co., Inc. | 281 | 40,711 | ||||||
Dominion Energy, Inc.(a) | 13,588 | 1,072,501 | ||||||
Duke Energy Corp. | 3,490 | 309,074 | ||||||
Evergy, Inc. | 6,855 | 348,371 | ||||||
Exelon Corp. | 16,928 | 605,345 | ||||||
FirstEnergy Corp. | 16,836 | 483,362 | ||||||
MDU Resources Group, Inc. | 16,123 | 362,768 | ||||||
National Fuel Gas Co. | 4,029 | 163,537 | ||||||
NiSource, Inc. | 2,218 | 48,796 | ||||||
| Number of Shares | Value | |||||||
COMMON STOCKS — (Continued) |
| |||||||
Utilities — (Continued) | ||||||||
Northwest Natural Holding Co. | 587 | $ | 26,644 | |||||
NRG Energy, Inc. | 21,903 | 673,298 | ||||||
OGE Energy Corp. | 2,883 | 86,461 | ||||||
PPL Corp. | 45,059 | 1,226,055 | ||||||
York Water Co. (The) | 1 | 42 | ||||||
|
| |||||||
| 5,446,965 | ||||||||
|
| |||||||
TOTAL COMMON STOCKS |
| 224,483,609 | ||||||
|
| |||||||
TOTAL LONG POSITIONS - 94.8% |
| 224,483,609 | ||||||
|
| |||||||
(Cost $195,848,608) | ||||||||
OTHER ASSETS IN EXCESS OF |
| 12,241,074 | ||||||
|
| |||||||
NET ASSETS - 100.0% |
| $ | 236,724,683 | |||||
|
| |||||||
| (a) | Security position is either entirely or partially designated as collateral for total return swaps. |
| * | Non-income producing. |
PLC Public Limited Company
The accompanying notes are an integral part of the financial statements.
68
GOTHAM ENHANCED RETURN FUND
Portfolio of Investments (Continued)
September 30, 2020
Over-the-counter total return swaps outstanding as of September 30, 2020
The Fund maintains a portfolio of long and short positions and receives/pays a rebate based upon the Fed Funds 1-Day Rate less a specified spread as negotiated by the parties. The notional gain or loss, dividends payable and rebates are payable the earlier of maturity of the swaps or upon termination. The portfolio matures on August 27, 2024, however underlying individual contracts are entered into and closed (terminated) on a daily basis. The cash amounts payable/receivable due to individual contracts being closed are settled, on a net basis, once a week. The value of total return swaps represents 4.3% of net assets as of September 30, 2020.
The following table represents the individual long and short positions and related values of total return swaps as of September 30, 2020:
Total Return Swaps
Reference Entity | Counterparty | Number of Contracts Long/(Short) | Notional Amount | Value | Unrealized Appreciation/ (Depreciation)* | |||||||||||||||||
Long | ||||||||||||||||||||||
Automobiles & Components | ||||||||||||||||||||||
Adient PLC (Ireland) | Morgan Stanley | 7,700 | $ | 112,880 | $ | 133,441 | $ | 20,139 | ||||||||||||||
American Axle & Manufacturing Holdings, Inc. | Morgan Stanley | 43,594 | 389,739 | 251,537 | (137,110 | ) | ||||||||||||||||
BorgWarner, Inc. | Morgan Stanley | 17,930 | 558,945 | 694,608 | 152,525 | |||||||||||||||||
General Motors Co. | Morgan Stanley | 8,243 | 216,498 | 243,910 | 28,029 | |||||||||||||||||
Gentherm, Inc. | Morgan Stanley | 3,897 | 139,351 | 159,387 | 20,441 | |||||||||||||||||
Harley-Davidson, Inc. | Morgan Stanley | 132 | 3,163 | 3,239 | 109 | |||||||||||||||||
Magna International, Inc. (Canada) | Morgan Stanley | 2,015 | 59,212 | 92,186 | 34,530 | |||||||||||||||||
Thor Industries, Inc. | Morgan Stanley | 7,180 | 736,126 | 683,967 | (56,540 | ) | ||||||||||||||||
Visteon Corp. | Morgan Stanley | 1,852 | 134,696 | 128,195 | (6,885 | ) | ||||||||||||||||
XPEL, Inc. | Morgan Stanley | 109 | 2,693 | 2,843 | 181 | |||||||||||||||||
|
|
|
|
|
|
|
| |||||||||||||||
| 92,652 | 2,353,303 | 2,393,313 | 55,419 | |||||||||||||||||||
|
|
|
|
|
|
|
| |||||||||||||||
Capital Goods | ||||||||||||||||||||||
3M Co. | Morgan Stanley | 5,004 | 755,290 | 801,541 | 60,333 | |||||||||||||||||
AAR Corp. | Morgan Stanley | 119 | 2,325 | 2,237 | (58 | ) | ||||||||||||||||
Acuity Brands, Inc. | Morgan Stanley | 1,720 | 146,289 | 176,042 | 30,429 | |||||||||||||||||
Advanced Drainage Systems, Inc. | Morgan Stanley | 2,401 | 135,835 | 149,918 | 14,701 | |||||||||||||||||
AECOM | Morgan Stanley | 5,943 | 204,442 | 248,655 | 45,776 | |||||||||||||||||
Albany International Corp., Class A | Morgan Stanley | 390 | 16,700 | 19,309 | 2,832 | |||||||||||||||||
Altra Industrial Motion Corp. | Morgan Stanley | 2,839 | 58,110 | 104,958 | 47,427 | |||||||||||||||||
AMETEK, Inc. | Morgan Stanley | 2,998 | 249,337 | 298,001 | 50,857 | |||||||||||||||||
Apogee Enterprises, Inc. | Morgan Stanley | 924 | 20,207 | 19,746 | (346 | ) | ||||||||||||||||
Applied Industrial Technologies, Inc. | Morgan Stanley | 490 | 24,986 | 26,999 | 2,357 | |||||||||||||||||
Atkore International Group, Inc. | Morgan Stanley | 4,573 | 143,919 | 103,944 | (39,557 | ) | ||||||||||||||||
Ballard Power Systems, Inc. (Canada) | Morgan Stanley | 2,652 | 21,306 | 40,045 | 18,821 | |||||||||||||||||
Barnes Group, Inc. | Morgan Stanley | 1,836 | 68,344 | 65,619 | (2,030 | ) | ||||||||||||||||
Bloom Energy Corp., Class A | Morgan Stanley | 10,462 | 63,607 | 188,002 | 124,593 | |||||||||||||||||
BMC Stock Holdings, Inc. | Morgan Stanley | 415 | 13,638 | 17,774 | 4,197 | |||||||||||||||||
BWX Technologies, Inc. | Morgan Stanley | 1,743 | 95,134 | 98,148 | 3,563 | |||||||||||||||||
Colfax Corp. | Morgan Stanley | 20,581 | 473,005 | 645,420 | 174,796 | |||||||||||||||||
Comfort Systems USA, Inc. | Morgan Stanley | 1,191 | 62,067 | 61,348 | (475 | ) | ||||||||||||||||
Crane Co. | Morgan Stanley | 548 | 25,933 | 27,471 | 2,106 | |||||||||||||||||
Cummins, Inc. | Morgan Stanley | 2 | 338 | 422 | 111 | |||||||||||||||||
Curtiss-Wright Corp. | Morgan Stanley | 919 | 83,597 | 85,706 | 2,559 | |||||||||||||||||
Deere & Co. | Morgan Stanley | 1,901 | 274,184 | 421,319 | 150,636 | |||||||||||||||||
Douglas Dynamics, Inc. | Morgan Stanley | 16 | 552 | 547 | 20 | |||||||||||||||||
The accompanying notes are an integral part of the financial statements.
69
GOTHAM ENHANCED RETURN FUND
Portfolio of Investments (Continued)
September 30, 2020
Total Return Swaps (continued)
Reference Entity | Counterparty | Number of Contracts Long/(Short) | Notional Amount | Value | Unrealized Appreciation/ (Depreciation)* | |||||||||||||||||
Capital Goods — (continued) | ||||||||||||||||||||||
Dover Corp. | Morgan Stanley | 10,348 | $ | 1,021,464 | $ | 1,121,102 | $ | 122,452 | ||||||||||||||
Dycom Industries, Inc. | Morgan Stanley | 1,037 | 57,537 | 54,774 | (2,582 | ) | ||||||||||||||||
EMCOR Group, Inc. | Morgan Stanley | 138 | 9,223 | 9,344 | 170 | |||||||||||||||||
Emerson Electric Co. | Morgan Stanley | 4,725 | 244,209 | 309,818 | 70,759 | |||||||||||||||||
Encore Wire Corp. | Morgan Stanley | 71 | 3,446 | 3,296 | (118 | ) | ||||||||||||||||
Enerpac Tool Group Corp. | Morgan Stanley | 18 | 330 | 338 | 33 | |||||||||||||||||
EnPro Industries, Inc. | Morgan Stanley | 684 | 32,139 | 38,584 | 6,779 | |||||||||||||||||
ESCO Technologies, Inc. | Morgan Stanley | 82 | 6,719 | 6,606 | (65 | ) | ||||||||||||||||
Evoqua Water Technologies Corp. | Morgan Stanley | 1,708 | 34,616 | 36,244 | 1,746 | |||||||||||||||||
Flowserve Corp. | Morgan Stanley | 6,594 | 155,712 | 179,950 | 27,732 | |||||||||||||||||
Fortive Corp. | Morgan Stanley | 1,803 | 126,033 | 137,407 | 12,211 | |||||||||||||||||
Fortune Brands Home & Security, Inc. | Morgan Stanley | 4,693 | 206,551 | 406,038 | 202,173 | |||||||||||||||||
Foundation Building Materials, Inc. | Morgan Stanley | 509 | 8,035 | 8,001 | 12 | |||||||||||||||||
Franklin Electric Co., Inc. | Morgan Stanley | 1,025 | 52,123 | 60,301 | 8,507 | |||||||||||||||||
Fuelcell Energy, Inc. | Morgan Stanley | 29,284 | 42,512 | 62,668 | 21,591 | |||||||||||||||||
General Dynamics Corp. | Morgan Stanley | 1,424 | 186,181 | 197,124 | 14,335 | |||||||||||||||||
Gibraltar Industries, Inc. | Morgan Stanley | 1,732 | 82,255 | 112,822 | 30,817 | |||||||||||||||||
GMS, Inc. | Morgan Stanley | 2,833 | 75,173 | 68,275 | (6,975 | ) | ||||||||||||||||
GrafTech International Ltd. | Morgan Stanley | 73 | 455 | 499 | 70 | |||||||||||||||||
Griffon Corp. | Morgan Stanley | 615 | 12,995 | 12,017 | (908 | ) | ||||||||||||||||
Herc Holdings, Inc. | Morgan Stanley | 3,672 | 138,486 | 145,448 | 7,365 | |||||||||||||||||
Honeywell International, Inc. | Morgan Stanley | 3,986 | 471,842 | 656,135 | 192,488 | |||||||||||||||||
Howmet Aerospace, Inc. | Morgan Stanley | 49,204 | 701,466 | 822,691 | 123,171 | |||||||||||||||||
Hubbell, Inc. | Morgan Stanley | 593 | 72,908 | 81,146 | 9,098 | |||||||||||||||||
Huntington Ingalls Industries, Inc. | Morgan Stanley | 326 | 47,136 | 45,885 | (1,099 | ) | ||||||||||||||||
Illinois Tool Works, Inc. | Morgan Stanley | 2,297 | 453,001 | 443,803 | (5,315 | ) | ||||||||||||||||
ITT, Inc. | Morgan Stanley | 1,053 | 56,386 | 62,180 | 6,167 | |||||||||||||||||
John Bean Technologies Corp. | Morgan Stanley | 991 | 97,243 | 91,063 | (5,819 | ) | ||||||||||||||||
Johnson Controls International PLC (Ireland) | Morgan Stanley | 261 | 6,618 | 10,662 | 4,221 | |||||||||||||||||
Lockheed Martin Corp. | Morgan Stanley | 3,368 | 1,252,978 | 1,290,887 | 51,118 | |||||||||||||||||
Masco Corp. | Morgan Stanley | 11,751 | 513,670 | 647,833 | 138,364 | |||||||||||||||||
Middleby Corp. (The) | Morgan Stanley | 705 | 34,372 | 63,246 | 28,991 | |||||||||||||||||
MRC Global, Inc. | Morgan Stanley | 29,004 | 325,036 | 124,137 | (200,765 | ) | ||||||||||||||||
Mueller Industries, Inc. | Morgan Stanley | 3,740 | 106,481 | 101,204 | (3,933 | ) | ||||||||||||||||
National Presto Industries, Inc. | Morgan Stanley | 8 | 707 | 655 | (27 | ) | ||||||||||||||||
NOW, Inc. | Morgan Stanley | 14,927 | 122,102 | 67,768 | (53,975 | ) | ||||||||||||||||
nVent Electric PLC (Ireland) | Morgan Stanley | 3,366 | 51,790 | 59,545 | 9,098 | |||||||||||||||||
Otis Worldwide Corp. | Morgan Stanley | 581 | 27,753 | 36,266 | 11,346 | |||||||||||||||||
Owens Corning | Morgan Stanley | 3,302 | 123,945 | 227,211 | 104,422 | |||||||||||||||||
PACCAR, Inc. | Morgan Stanley | 3,075 | 265,943 | 262,236 | (2,617 | ) | ||||||||||||||||
Parker-Hannifin Corp. | Morgan Stanley | 404 | 79,914 | 81,745 | 2,239 | |||||||||||||||||
Pentair PLC (Ireland) | Morgan Stanley | 6,237 | 244,216 | 285,467 | 43,166 | |||||||||||||||||
Quanta Services, Inc. | Morgan Stanley | 8,290 | 272,679 | 438,209 | 167,380 | |||||||||||||||||
Regal Beloit Corp. | Morgan Stanley | 5,279 | 362,088 | 495,540 | 145,598 | |||||||||||||||||
Rexnord Corp. | Morgan Stanley | 14,492 | 361,307 | 432,441 | 77,134 | |||||||||||||||||
Roper Technologies, Inc. | Morgan Stanley | 250 | 99,452 | 98,778 | (378 | ) | ||||||||||||||||
The accompanying notes are an integral part of the financial statements.
70
GOTHAM ENHANCED RETURN FUND
Portfolio of Investments (Continued)
September 30, 2020
Total Return Swaps (continued)
Reference Entity | Counterparty | Number of Contracts Long/(Short) | Notional Amount | Value | Unrealized Appreciation/ (Depreciation)* | |||||||||||||||||
Capital Goods — (continued) | ||||||||||||||||||||||
Shyft Group, Inc. (The) | Morgan Stanley | 76 | $ | 1,416 | $ | 1,435 | $ | 46 | ||||||||||||||
Simpson Manufacturing Co., Inc. | Morgan Stanley | 2,001 | 133,654 | 194,417 | 62,490 | |||||||||||||||||
SiteOne Landscape Supply, Inc. | Morgan Stanley | 834 | 63,411 | 101,706 | 38,485 | |||||||||||||||||
Snap-on, Inc. | Morgan Stanley | 4,157 | 616,146 | 611,619 | 13,773 | |||||||||||||||||
SPX FLOW, Inc. | Morgan Stanley | 10,769 | 342,642 | 461,128 | 119,449 | |||||||||||||||||
Systemax, Inc. | Morgan Stanley | 3,310 | 73,133 | 79,241 | 11,604 | |||||||||||||||||
Teledyne Technologies, Inc. | Morgan Stanley | 495 | 151,848 | 153,554 | 2,146 | |||||||||||||||||
Tennant Co. | Morgan Stanley | 4 | 245 | 241 | 20 | |||||||||||||||||
Terex Corp. | Morgan Stanley | 1,872 | 24,436 | 36,242 | 11,896 | |||||||||||||||||
Timken Co. (The) | Morgan Stanley | 2,205 | 102,027 | 119,555 | 19,513 | |||||||||||||||||
Toro Co. (The) | Morgan Stanley | 305 | 25,172 | 25,605 | 587 | |||||||||||||||||
TPI Composites, Inc. | Morgan Stanley | 1,240 | 16,496 | 35,910 | 19,483 | |||||||||||||||||
Trane Technologies PLC (Ireland) | Morgan Stanley | 2,122 | 171,850 | 257,293 | 88,058 | |||||||||||||||||
TransDigm Group, Inc. | Morgan Stanley | 1,334 | 462,735 | 633,810 | 172,366 | |||||||||||||||||
TriMas Corp. | Morgan Stanley | 3 | 68 | 68 | 24 | |||||||||||||||||
UFP Industries, Inc. | Morgan Stanley | 3,894 | 185,548 | 220,050 | 35,411 | |||||||||||||||||
United Rentals, Inc. | Morgan Stanley | 5,786 | 608,049 | 1,009,657 | 413,263 | |||||||||||||||||
Univar Solutions, Inc. | Morgan Stanley | 15,204 | 227,231 | 256,644 | 29,951 | |||||||||||||||||
Valmont Industries, Inc. | Morgan Stanley | 621 | 68,122 | 77,116 | 9,746 | |||||||||||||||||
Vectrus, Inc. | Morgan Stanley | 3 | 116 | 114 | 21 | |||||||||||||||||
Watsco, Inc. | Morgan Stanley | 345 | 80,037 | 80,347 | 553 | |||||||||||||||||
Watts Water Technologies, Inc., Class A. | Morgan Stanley | 399 | 30,626 | 39,960 | 10,967 | |||||||||||||||||
Westinghouse Air Brake Technologies Corp. | Morgan Stanley | 714 | 32,589 | 44,182 | 11,878 | |||||||||||||||||
Woodward, Inc. | Morgan Stanley | 2,192 | 180,502 | 175,711 | (4,238 | ) | ||||||||||||||||
WW Grainger, Inc. | Morgan Stanley | 104 | 36,506 | 37,104 | 722 | |||||||||||||||||
|
|
|
|
|
|
|
| |||||||||||||||
| 370,214 | 15,220,977 | 18,153,269 | 3,118,039 | |||||||||||||||||||
|
|
|
|
|
|
|
| |||||||||||||||
Commercial & Professional Services | ||||||||||||||||||||||
ABM Industries, Inc. | Morgan Stanley | 2,050 | 74,734 | 75,153 | 1,052 | |||||||||||||||||
ASGN, Inc. | Morgan Stanley | 74 | 4,741 | 4,703 | (1 | ) | ||||||||||||||||
Cimpress PLC (Ireland) | Morgan Stanley | 2,474 | 148,680 | 185,946 | 37,697 | |||||||||||||||||
Cintas Corp. | Morgan Stanley | 704 | 214,844 | 234,312 | 20,080 | |||||||||||||||||
Clarivate PLC (Jersey) | Morgan Stanley | 3,733 | 84,345 | 115,686 | 32,849 | |||||||||||||||||
Clean Harbors, Inc. | Morgan Stanley | 792 | 37,420 | 44,376 | 7,082 | |||||||||||||||||
Deluxe Corp. | Morgan Stanley | 261 | 7,082 | 6,716 | (312 | ) | ||||||||||||||||
Ennis, Inc. | Morgan Stanley | 15 | 261 | 262 | 25 | |||||||||||||||||
Equifax, Inc. | Morgan Stanley | 197 | 32,114 | 30,909 | (1,017 | ) | ||||||||||||||||
Exponent, Inc. | Morgan Stanley | 38 | 2,761 | 2,737 | 7 | |||||||||||||||||
FTI Consulting, Inc. | Morgan Stanley | 4 | 425 | 424 | 23 | |||||||||||||||||
Healthcare Services Group, Inc. | Morgan Stanley | 9,141 | 215,769 | 196,806 | (15,492 | ) | ||||||||||||||||
IHS Markit Ltd. (Bermuda) | Morgan Stanley | 3,065 | 248,692 | 240,633 | (7,307 | ) | ||||||||||||||||
KAR Auction Services, Inc. | Morgan Stanley | 196 | 2,800 | 2,822 | 54 | |||||||||||||||||
Kelly Services, Inc., Class A | Morgan Stanley | 260 | 4,649 | 4,430 | (183 | ) | ||||||||||||||||
ManpowerGroup, Inc. | Morgan Stanley | 1,410 | 86,025 | 103,395 | 18,934 | |||||||||||||||||
MSA Safety, Inc. | Morgan Stanley | 262 | 28,265 | 35,153 | 7,771 | |||||||||||||||||
Nielsen Holdings PLC (United Kingdom). | Morgan Stanley | 7,767 | 107,141 | 110,136 | 4,424 | |||||||||||||||||
The accompanying notes are an integral part of the financial statements.
71
GOTHAM ENHANCED RETURN FUND
Portfolio of Investments (Continued)
September 30, 2020
Total Return Swaps (continued)
Reference Entity | Counterparty | Number of Contracts Long/(Short) | Notional Amount | Value | Unrealized Appreciation/ (Depreciation)* | ||||||||||||||||||
Commercial & Professional Services — (continued) |
| ||||||||||||||||||||||
Republic Services, Inc. | Morgan Stanley | 4,266 | $ | 341,820 | $ | 398,231 | $ | 60,834 | |||||||||||||||
Robert Half International, Inc. | Morgan Stanley | 1,571 | 79,076 | 83,169 | 5,777 | ||||||||||||||||||
Stantec, Inc. (Canada) | Morgan Stanley | 21 | 631 | 637 | 33 | ||||||||||||||||||
Steelcase, Inc., Class A | Morgan Stanley | 9,228 | 134,258 | 93,295 | (38,764 | ) | |||||||||||||||||
Tetra Tech, Inc. | Morgan Stanley | 959 | 85,579 | 91,585 | 6,401 | ||||||||||||||||||
TransUnion | Morgan Stanley | 1,778 | 128,080 | 149,583 | 22,082 | ||||||||||||||||||
TriNet Group, Inc. | Morgan Stanley | 1,308 | 77,359 | 77,591 | 467 | ||||||||||||||||||
TrueBlue, Inc. | Morgan Stanley | 38 | 586 | 589 | 27 | ||||||||||||||||||
UniFirst Corp. | Morgan Stanley | 91 | 13,374 | 17,233 | 3,964 | ||||||||||||||||||
Verisk Analytics, Inc. | Morgan Stanley | 687 | 128,562 | 127,308 | (701 | ) | |||||||||||||||||
Waste Management, Inc. | Morgan Stanley | 385 | 34,533 | 43,570 | 9,555 | ||||||||||||||||||
|
|
|
|
|
|
|
| ||||||||||||||||
| 52,775 | 2,324,606 | 2,477,390 | 175,361 | ||||||||||||||||||||
|
|
|
|
|
|
|
| ||||||||||||||||
Consumer Durables & Apparel | |||||||||||||||||||||||
Brunswick Corp. | Morgan Stanley | 2,924 | 88,412 | 172,253 | 85,510 | ||||||||||||||||||
Capri Holdings Ltd. (British Virgin Islands) | Morgan Stanley | 18,998 | 255,104 | 341,964 | 87,805 | ||||||||||||||||||
Carter’s, Inc. | Morgan Stanley | 2,659 | 214,615 | 230,216 | 16,213 | ||||||||||||||||||
Cavco Industries, Inc. | Morgan Stanley | 336 | 53,854 | 60,584 | 6,902 | ||||||||||||||||||
Deckers Outdoor Corp. | Morgan Stanley | 599 | 122,778 | 131,786 | 9,737 | ||||||||||||||||||
DR Horton, Inc. | Morgan Stanley | 6,518 | 292,158 | 492,956 | 203,129 | ||||||||||||||||||
Garmin Ltd. (Switzerland) | Morgan Stanley | 2,272 | 174,348 | 215,522 | 43,801 | ||||||||||||||||||
Hanesbrands, Inc. | Morgan Stanley | 12,517 | 183,721 | 197,143 | 14,510 | ||||||||||||||||||
Helen of Troy Ltd. (Bermuda) | Morgan Stanley | 528 | 104,521 | 102,179 | (2,070 | ) | |||||||||||||||||
Installed Building Products, Inc. | Morgan Stanley | 315 | 27,681 | 32,051 | 4,823 | ||||||||||||||||||
Kontoor Brands, Inc. | Morgan Stanley | 4,456 | 88,006 | 107,835 | 20,094 | ||||||||||||||||||
La-Z-Boy, Inc. | Morgan Stanley | 1,921 | 50,558 | 60,761 | 10,455 | ||||||||||||||||||
Leggett & Platt, Inc. | Morgan Stanley | 330 | 8,201 | 13,586 | 5,695 | ||||||||||||||||||
Lululemon Athletica, Inc. | Morgan Stanley | 744 | 230,888 | 245,051 | 16,197 | ||||||||||||||||||
Mattel, Inc. | Morgan Stanley | 8,034 | 71,044 | 93,998 | 27,302 | ||||||||||||||||||
Meritage Homes Corp. | Morgan Stanley | 958 | 70,995 | 105,754 | 34,976 | ||||||||||||||||||
Mohawk Industries, Inc. | Morgan Stanley | 3,575 | 274,622 | 348,884 | 74,771 | ||||||||||||||||||
Nautilus, Inc. | Morgan Stanley | 2,768 | 47,040 | 47,499 | 611 | ||||||||||||||||||
Newell Brands, Inc. | Morgan Stanley | 41 | 660 | 704 | 73 | ||||||||||||||||||
NIKE, Inc., Class B | Morgan Stanley | 6,726 | 727,836 | 844,382 | 120,323 | ||||||||||||||||||
Polaris, Inc. | Morgan Stanley | 5,577 | 562,337 | 526,134 | (32,560 | ) | |||||||||||||||||
PulteGroup, Inc. | Morgan Stanley | 6,755 | 230,566 | 312,689 | 84,880 | ||||||||||||||||||
PVH Corp. | Morgan Stanley | 11,325 | 715,376 | 675,423 | (37,198 | ) | |||||||||||||||||
Skyline Champion Corp. | Morgan Stanley | 692 | 10,168 | 18,525 | 8,465 | ||||||||||||||||||
Smith & Wesson Brands, Inc. | Morgan Stanley | 5,852 | 97,597 | 90,823 | (6,339 | ) | |||||||||||||||||
Steven Madden Ltd. | Morgan Stanley | 12,050 | 289,608 | 234,975 | (53,419 | ) | |||||||||||||||||
Sturm Ruger & Co., Inc. | Morgan Stanley | 2,199 | 161,365 | 134,491 | (23,026 | ) | |||||||||||||||||
Tempur Sealy International, Inc. | Morgan Stanley | 2,989 | 153,114 | 266,589 | 113,952 | ||||||||||||||||||
TopBuild Corp. | Morgan Stanley | 31 | 2,278 | 5,291 | 3,043 | ||||||||||||||||||
Tupperware Brands Corp. | Morgan Stanley | 4,098 | 58,141 | 82,616 | 24,657 | ||||||||||||||||||
Whirlpool Corp. | Morgan Stanley | 136 | 14,286 | 25,009 | 11,051 | ||||||||||||||||||
The accompanying notes are an integral part of the financial statements.
72
GOTHAM ENHANCED RETURN FUND
Portfolio of Investments (Continued)
September 30, 2020
Total Return Swaps (continued)
Reference Entity | Counterparty | Number of Contracts Long/(Short) | Notional Amount | Value | Unrealized Appreciation/ (Depreciation)* | ||||||||||||||||||
Consumer Durables & Apparel — (continued) |
| ||||||||||||||||||||||
YETI Holdings, Inc. | Morgan Stanley | 1,567 | $ | 71,307 | $ | 71,016 | $ | (72 | ) | ||||||||||||||
|
|
|
|
|
|
|
| ||||||||||||||||
| 130,490 | 5,453,185 | 6,288,689 | 874,291 | ||||||||||||||||||||
|
|
|
|
|
|
|
| ||||||||||||||||
Consumer Services | |||||||||||||||||||||||
Adtalem Global Education, Inc. | Morgan Stanley | 3,718 | 111,908 | 91,240 | (20,338 | ) | |||||||||||||||||
Bloomin’ Brands, Inc. | Morgan Stanley | 20,652 | 192,406 | 315,356 | 123,501 | ||||||||||||||||||
Boyd Gaming Corp. | Morgan Stanley | 9,202 | 124,950 | 282,409 | 157,825 | ||||||||||||||||||
Chipotle Mexican Grill, Inc. | Morgan Stanley | 75 | 93,531 | 93,278 | 27 | ||||||||||||||||||
Dine Brands Global, Inc. | Morgan Stanley | 6,878 | 243,146 | 375,470 | 133,462 | ||||||||||||||||||
El Pollo Loco Holdings, Inc. | Morgan Stanley | 428 | 6,841 | 6,934 | 135 | ||||||||||||||||||
frontdoor, Inc. | Morgan Stanley | 114 | 4,477 | 4,436 | (5 | ) | |||||||||||||||||
Grand Canyon Education, Inc. | Morgan Stanley | 27 | 2,184 | 2,158 | 4 | ||||||||||||||||||
Hilton Worldwide Holdings, Inc. | Morgan Stanley | 574 | 29,485 | 48,974 | 19,593 | ||||||||||||||||||
Hyatt Hotels Corp., Class A | Morgan Stanley | 2,061 | 84,302 | 109,996 | 27,381 | ||||||||||||||||||
Jack in the Box, Inc. | Morgan Stanley | 556 | 15,798 | 44,096 | 28,568 | ||||||||||||||||||
Laureate Education, Inc., Class A | Morgan Stanley | 11,119 | 130,761 | 147,660 | 17,281 | ||||||||||||||||||
Marriott International, Inc., Class A | Morgan Stanley | 1,044 | 58,219 | 96,654 | 38,619 | ||||||||||||||||||
McDonald’s Corp. | Morgan Stanley | 2,890 | 492,838 | 634,326 | 147,859 | ||||||||||||||||||
MGM Resorts International | Morgan Stanley | 26,329 | 390,320 | 572,656 | 183,487 | ||||||||||||||||||
Norwegian Cruise Line Holdings Ltd. (Bermuda) | Morgan Stanley | 9,142 | 143,097 | 156,420 | 13,738 | ||||||||||||||||||
Papa John’s International, Inc. | Morgan Stanley | 4,034 | 358,289 | 331,918 | (25,366 | ) | |||||||||||||||||
Perdoceo Education Corp. | Morgan Stanley | 10,094 | 146,816 | 123,551 | (22,840 | ) | |||||||||||||||||
Royal Caribbean Cruises Ltd. (Liberia) | Morgan Stanley | 1,759 | 110,744 | 113,860 | 3,443 | ||||||||||||||||||
Scientific Games Corp. | Morgan Stanley | 3,622 | 59,689 | 126,444 | 77,599 | ||||||||||||||||||
Service Corp. International | Morgan Stanley | 1,108 | 42,951 | 46,735 | 4,084 | ||||||||||||||||||
Strategic Education, Inc. | Morgan Stanley | 1,523 | 190,392 | 139,309 | (47,789 | ) | |||||||||||||||||
Wingstop, Inc. | Morgan Stanley | 4,505 | 658,947 | 615,608 | (41,235 | ) | |||||||||||||||||
Wyndham Hotels & Resorts, Inc. | Morgan Stanley | 1,786 | 46,206 | 90,193 | 44,423 | ||||||||||||||||||
Yum! Brands, Inc. | Morgan Stanley | 3,097 | 270,547 | 282,756 | 14,567 | ||||||||||||||||||
|
|
|
|
|
|
|
| ||||||||||||||||
| 126,337 | 4,008,844 | 4,852,437 | 878,023 | ||||||||||||||||||||
|
|
|
|
|
|
|
| ||||||||||||||||
Diversified Financials | |||||||||||||||||||||||
Berkshire Hathaway, Inc., Class B | Morgan Stanley | 8,712 | 1,924,397 | 1,855,133 | (63,967 | ) | |||||||||||||||||
BlackRock, Inc. | Morgan Stanley | 1,146 | 632,566 | 645,828 | 15,019 | ||||||||||||||||||
Federated Hermes, Inc. | Morgan Stanley | 1,143 | 24,723 | 24,586 | (46 | ) | |||||||||||||||||
Franklin Resources, Inc. | Morgan Stanley | 2,490 | 49,264 | 50,672 | 2,076 | ||||||||||||||||||
Intercontinental Exchange, Inc. | Morgan Stanley | 36 | 3,604 | 3,602 | 31 | ||||||||||||||||||
Moody’s Corp. | Morgan Stanley | 261 | 73,262 | 75,651 | 2,613 | ||||||||||||||||||
Nasdaq, Inc. | Morgan Stanley | 1,366 | 168,574 | 167,622 | (467 | ) | |||||||||||||||||
S&P Global, Inc. | Morgan Stanley | 1,830 | 643,381 | 659,898 | 18,304 | ||||||||||||||||||
Sprott, Inc. (Canada) | Morgan Stanley | 16 | 571 | 546 | — | ||||||||||||||||||
T Rowe Price Group, Inc. | Morgan Stanley | 1,534 | 193,635 | 196,689 | 3,609 | ||||||||||||||||||
Waddell & Reed Financial, Inc., Class A | Morgan Stanley | 822 | 11,952 | 12,207 | 311 | ||||||||||||||||||
|
|
|
|
|
|
|
| ||||||||||||||||
| 19,356 | 3,725,929 | 3,692,434 | (22,517 | ) | |||||||||||||||||||
|
|
|
|
|
|
|
| ||||||||||||||||
Energy | |||||||||||||||||||||||
Antero Midstream Corp. | Morgan Stanley | 25,266 | 118,055 | 135,678 | 22,195 | ||||||||||||||||||
The accompanying notes are an integral part of the financial statements.
73
GOTHAM ENHANCED RETURN FUND
Portfolio of Investments (Continued)
September 30, 2020
Total Return Swaps (continued)
Reference Entity | Counterparty | Number of Contracts Long/(Short) | Notional Amount | Value | Unrealized Appreciation/ (Depreciation)* | |||||||||||||||||
Energy — (continued) | ||||||||||||||||||||||
Apache Corp. | Morgan Stanley | 19,152 | $ | 105,374 | $ | 181,369 | $ | 77,294 | ||||||||||||||
Cactus, Inc., Class A | Morgan Stanley | 4,820 | 107,304 | 92,496 | (13,042 | ) | ||||||||||||||||
Canadian Natural Resources Ltd. (Canada) | Morgan Stanley | 32,072 | 583,328 | 513,473 | (60,860 | ) | ||||||||||||||||
Cenovus Energy, Inc. (Canada) | Morgan Stanley | 12,845 | 26,888 | 49,967 | 23,327 | |||||||||||||||||
Cheniere Energy, Inc. | Morgan Stanley | 825 | 43,640 | 38,173 | (5,324 | ) | ||||||||||||||||
Chevron Corp. | Morgan Stanley | 23,506 | 1,714,054 | 1,692,432 | 38,117 | |||||||||||||||||
Clean Energy Fuels Corp. | Morgan Stanley | 4,752 | 12,529 | 11,785 | (686 | ) | ||||||||||||||||
Concho Resources, Inc. | Morgan Stanley | 2,132 | 76,459 | 94,064 | 18,683 | |||||||||||||||||
ConocoPhillips | Morgan Stanley | 23,413 | 727,808 | 768,883 | 59,589 | |||||||||||||||||
Core Laboratories NV (Netherlands) | Morgan Stanley | 2,687 | 26,302 | 41,004 | 14,807 | |||||||||||||||||
Crescent Point Energy Corp. (Canada) | Morgan Stanley | 34,102 | 94,286 | 41,604 | (51,730 | ) | ||||||||||||||||
DHT Holdings, Inc. (Marshall Islands) | Morgan Stanley | 6,869 | 39,809 | 35,444 | (964 | ) | ||||||||||||||||
DMC Global, Inc. | Morgan Stanley | 477 | 14,201 | 15,712 | 1,298 | |||||||||||||||||
EOG Resources, Inc. | Morgan Stanley | 33,218 | 1,476,498 | 1,193,855 | (277,072 | ) | ||||||||||||||||
Halliburton Co. | Morgan Stanley | 24,549 | 182,047 | 295,815 | 116,309 | |||||||||||||||||
HollyFrontier Corp. | Morgan Stanley | 4,161 | 89,363 | 82,013 | (6,431 | ) | ||||||||||||||||
Kinder Morgan, Inc. | Morgan Stanley | 30,064 | 444,646 | 370,689 | (63,280 | ) | ||||||||||||||||
Kosmos Energy Ltd. | Morgan Stanley | 99,929 | 169,851 | 97,491 | (71,959 | ) | ||||||||||||||||
Magnolia Oil & Gas Corp., Class A | Morgan Stanley | 9,916 | 59,175 | 51,266 | (7,767 | ) | ||||||||||||||||
Marathon Petroleum Corp. | Morgan Stanley | 1,278 | 21,414 | 37,497 | 17,647 | |||||||||||||||||
Murphy Oil Corp. | Morgan Stanley | 34,926 | 443,843 | 311,540 | (130,114 | ) | ||||||||||||||||
Nordic American Tankers Ltd. (Bermuda) | Morgan Stanley | 56,759 | 238,711 | 198,089 | (28,392 | ) | ||||||||||||||||
Patterson-UTI Energy, Inc. | Morgan Stanley | 1,102 | 2,209 | 3,141 | 1,085 | |||||||||||||||||
Phillips 66. | Morgan Stanley | 2,207 | 129,032 | 114,411 | (15,417 | ) | ||||||||||||||||
Range Resources Corp. | Morgan Stanley | 19,846 | 89,861 | 131,381 | 42,578 | |||||||||||||||||
Renewable Energy Group, Inc. | Morgan Stanley | 2,253 | 50,639 | 120,355 | 69,878 | |||||||||||||||||
Schlumberger NV (Curacao) | Morgan Stanley | 6,601 | 88,962 | 102,712 | 15,459 | |||||||||||||||||
TechnipFMC PLC (United Kingdom) | Morgan Stanley | 887 | 4,586 | 5,597 | 1,648 | |||||||||||||||||
Williams Cos., Inc. (The) | Morgan Stanley | 3,924 | 72,459 | 77,107 | 7,982 | |||||||||||||||||
World Fuel Services Corp. | Morgan Stanley | 2,443 | 61,097 | 51,767 | (8,898 | ) | ||||||||||||||||
|
|
|
|
|
|
|
| |||||||||||||||
| 526,981 | 7,314,430 | 6,956,810 | (214,040 | ) | ||||||||||||||||||
|
|
|
|
|
|
|
| |||||||||||||||
Food & Staples Retailing | ||||||||||||||||||||||
BJ’s Wholesale Club Holdings, Inc. | Morgan Stanley | 1,819 | 75,272 | 75,579 | 537 | |||||||||||||||||
Casey’s General Stores, Inc. | Morgan Stanley | 362 | 63,188 | 64,309 | 1,318 | |||||||||||||||||
Costco Wholesale Corp. | Morgan Stanley | 1,224 | 391,934 | 434,520 | 44,562 | |||||||||||||||||
Kroger Co. (The) | Morgan Stanley | 4,967 | 161,573 | 168,431 | 8,240 | |||||||||||||||||
Sprouts Farmers Market, Inc. | Morgan Stanley | 8,688 | 171,438 | 181,840 | 10,893 | |||||||||||||||||
Sysco Corp. | Morgan Stanley | 6,845 | 384,305 | 425,896 | 43,916 | |||||||||||||||||
Walgreens Boots Alliance, Inc. | Morgan Stanley | 5,093 | 209,502 | 182,941 | (21,386 | ) | ||||||||||||||||
Walmart, Inc. | Morgan Stanley | 10,486 | 1,263,933 | 1,467,096 | 217,075 | |||||||||||||||||
|
|
|
|
|
|
|
| |||||||||||||||
| 39,484 | 2,721,145 | 3,000,612 | 305,155 | |||||||||||||||||||
|
|
|
|
|
|
|
| |||||||||||||||
Food, Beverage & Tobacco | ||||||||||||||||||||||
Altria Group, Inc. | Morgan Stanley | 18,360 | 719,773 | 709,430 | 43,849 | |||||||||||||||||
Archer-Daniels-Midland Co. | Morgan Stanley | 10,795 | 453,119 | 501,860 | 64,499 | |||||||||||||||||
The accompanying notes are an integral part of the financial statements.
74
GOTHAM ENHANCED RETURN FUND
Portfolio of Investments (Continued)
September 30, 2020
Total Return Swaps (continued)
Reference Entity | Counterparty | Number of Contracts Long/(Short) | Notional Amount | Value | Unrealized Appreciation/ (Depreciation)* | |||||||||||||||||
Food, Beverage & Tobacco — (continued) | ||||||||||||||||||||||
B&G Foods, Inc. | Morgan Stanley | 312 | $ | 8,634 | $ | 8,664 | $ | (2,566 | ) | |||||||||||||
Brown-Forman Corp., Class B | Morgan Stanley | 20 | 1,507 | 1,506 | 27 | |||||||||||||||||
Bunge Ltd. (Bermuda) | Morgan Stanley | 71 | 2,286 | 3,245 | 1,060 | |||||||||||||||||
Coca-Cola Co. (The) | Morgan Stanley | 14,959 | 646,418 | 738,526 | 103,110 | |||||||||||||||||
Coca-Cola Consolidated, Inc. | Morgan Stanley | 117 | 30,738 | 28,160 | (2,471 | ) | ||||||||||||||||
Conagra Brands, Inc. | Morgan Stanley | 4,957 | 175,841 | 177,014 | 2,536 | |||||||||||||||||
Constellation Brands, Inc., Class A | Morgan Stanley | 2,772 | 355,201 | 525,322 | 174,956 | |||||||||||||||||
Flowers Foods, Inc. | Morgan Stanley | 1,889 | 46,202 | 45,959 | 124 | |||||||||||||||||
General Mills, Inc. | Morgan Stanley | 3,825 | 226,857 | 235,926 | 10,043 | |||||||||||||||||
JM Smucker Co. (The) | Morgan Stanley | 3,163 | 355,974 | 365,390 | 11,230 | |||||||||||||||||
Kellogg Co. | Morgan Stanley | 966 | 67,058 | 62,394 | (3,919 | ) | ||||||||||||||||
Kraft Heinz Co. (The) | Morgan Stanley | 31,732 | 1,055,081 | 950,373 | (91,868 | ) | ||||||||||||||||
McCormick & Co., Inc., non-voting shares | Morgan Stanley | 852 | 139,950 | 165,373 | 26,401 | |||||||||||||||||
Molson Coors Beverage Co., Class B | Morgan Stanley | 3,173 | 157,796 | 106,486 | (48,542 | ) | ||||||||||||||||
Monster Beverage Corp. | Morgan Stanley | 2,338 | 188,217 | 187,508 | (170 | ) | ||||||||||||||||
National Beverage Corp. | Morgan Stanley | 22 | 1,519 | 1,496 | 5 | |||||||||||||||||
PepsiCo, Inc. | Morgan Stanley | 3,454 | 448,449 | 478,724 | 38,124 | |||||||||||||||||
Philip Morris International, Inc. | Morgan Stanley | 4,487 | 348,921 | 336,480 | (6,481 | ) | ||||||||||||||||
TreeHouse Foods, Inc. | Morgan Stanley | 5,643 | 265,712 | 228,711 | (37,105 | ) | ||||||||||||||||
Turning Point Brands, Inc. | Morgan Stanley | 16 | 452 | 446 | 19 | |||||||||||||||||
Tyson Foods, Inc., Class A | Morgan Stanley | 14,684 | 920,607 | 873,404 | (38,971 | ) | ||||||||||||||||
|
|
|
|
|
|
|
| |||||||||||||||
| 128,607 | 6,616,312 | 6,732,397 | 243,890 | |||||||||||||||||||
|
|
|
|
|
|
|
| |||||||||||||||
Health Care Equipment & Services | ||||||||||||||||||||||
Abbott Laboratories | Morgan Stanley | 4,003 | 428,525 | 435,646 | 8,320 | |||||||||||||||||
Allscripts Healthcare Solutions, Inc. | Morgan Stanley | 15,847 | 138,810 | 128,994 | (9,411 | ) | ||||||||||||||||
Anthem, Inc. | Morgan Stanley | 917 | 239,749 | 246,297 | 8,733 | |||||||||||||||||
Cardinal Health, Inc. | Morgan Stanley | 5,402 | 275,839 | 253,624 | (16,189 | ) | ||||||||||||||||
Centene Corp. | Morgan Stanley | 1,813 | 110,204 | 105,752 | (4,127 | ) | ||||||||||||||||
Cerner Corp. | Morgan Stanley | 2,067 | 125,127 | 149,423 | 25,720 | |||||||||||||||||
Cigna Corp. | Morgan Stanley | 1,936 | 342,691 | 327,978 | (13,750 | ) | ||||||||||||||||
CONMED Corp. | Morgan Stanley | 1,112 | 65,112 | 87,481 | 23,008 | |||||||||||||||||
Covetrus, Inc. | Morgan Stanley | 4,741 | 104,880 | 115,680 | 11,116 | |||||||||||||||||
CVS Health Corp. | Morgan Stanley | 3,789 | 239,145 | 221,278 | (16,638 | ) | ||||||||||||||||
Danaher Corp. | Morgan Stanley | 2,100 | 409,962 | 452,193 | 43,768 | |||||||||||||||||
DaVita, Inc. | Morgan Stanley | 17,137 | 964,781 | 1,467,784 | 514,129 | |||||||||||||||||
DENTSPLY SIRONA, Inc. | Morgan Stanley | 2,973 | 106,434 | 130,009 | 24,761 | |||||||||||||||||
Ensign Group, Inc. (The) | Morgan Stanley | 801 | 45,220 | 45,705 | 672 | |||||||||||||||||
Globus Medical, Inc., Class A | Morgan Stanley | 1,152 | 56,953 | 57,047 | 273 | |||||||||||||||||
Hanger, Inc. | Morgan Stanley | 28 | 457 | 443 | 10 | |||||||||||||||||
HCA Healthcare, Inc. | Morgan Stanley | 1,621 | 147,662 | 202,106 | 54,872 | |||||||||||||||||
HealthStream, Inc. | Morgan Stanley | 9 | 182 | 181 | 23 | |||||||||||||||||
Hill-Rom Holdings, Inc. | Morgan Stanley | 775 | 64,345 | 64,720 | 611 | |||||||||||||||||
HMS Holdings Corp. | Morgan Stanley | 262 | 6,217 | 6,275 | 98 | |||||||||||||||||
Hologic, Inc. | Morgan Stanley | 11,805 | 614,126 | 784,678 | 174,780 | |||||||||||||||||
Humana, Inc. | Morgan Stanley | 2,821 | 1,149,161 | 1,167,584 | 23,508 | |||||||||||||||||
The accompanying notes are an integral part of the financial statements.
75
GOTHAM ENHANCED RETURN FUND
Portfolio of Investments (Continued)
September 30, 2020
Total Return Swaps (continued)
Reference Entity | Counterparty | Number of Contracts Long/(Short) | Notional Amount | Value | Unrealized Appreciation/ (Depreciation)* | ||||||||||||||||||
Health Care Equipment & Services — (continued) |
| ||||||||||||||||||||||
IDEXX Laboratories, Inc. | Morgan Stanley | 846 | $ | 313,661 | $ | 332,571 | $ | 20,096 | |||||||||||||||
Integer Holdings Corp. | Morgan Stanley | 86 | 4,608 | 5,075 | 502 | ||||||||||||||||||
Intuitive Surgical, Inc. | Morgan Stanley | 614 | 436,239 | 435,658 | 638 | ||||||||||||||||||
iRhythm Technologies, Inc. | Morgan Stanley | 600 | 125,743 | 142,866 | 17,490 | ||||||||||||||||||
Livongo Health, Inc. | Morgan Stanley | 1,914 | 123,055 | 268,056 | 145,361 | ||||||||||||||||||
Magellan Health, Inc. | Morgan Stanley | 737 | 52,965 | 55,850 | 3,053 | ||||||||||||||||||
McKesson Corp. | Morgan Stanley | 713 | 106,662 | 106,187 | 179 | ||||||||||||||||||
MEDNAX, Inc. | Morgan Stanley | 4,083 | 62,610 | 66,471 | 4,056 | ||||||||||||||||||
Medtronic PLC (Ireland) | Morgan Stanley | 7,491 | 667,982 | 778,465 | 121,915 | ||||||||||||||||||
Molina Healthcare, Inc. | Morgan Stanley | 239 | 38,463 | 43,747 | 5,412 | ||||||||||||||||||
National Research Corp. | Morgan Stanley | 8 | 382 | 394 | 36 | ||||||||||||||||||
Neogen Corp. | Morgan Stanley | 104 | 7,918 | 8,138 | 265 | ||||||||||||||||||
NextGen Healthcare, Inc. | Morgan Stanley | 10,830 | 163,493 | 137,974 | (25,047 | ) | |||||||||||||||||
Omnicell, Inc. | �� | Morgan Stanley | 601 | 40,865 | 44,871 | 4,197 | |||||||||||||||||
Patterson Cos., Inc. | Morgan Stanley | 8,602 | 130,071 | 207,351 | 80,661 | ||||||||||||||||||
Quidel Corp. | Morgan Stanley | 2,216 | 352,204 | 486,146 | 143,172 | ||||||||||||||||||
ResMed, Inc. | Morgan Stanley | 3,218 | 596,222 | 551,662 | (42,007 | ) | |||||||||||||||||
Select Medical Holdings Corp. | Morgan Stanley | 6,954 | 104,645 | 144,782 | 40,447 | ||||||||||||||||||
STERIS PLC (Ireland) | Morgan Stanley | 2,143 | 326,614 | 377,575 | 55,626 | ||||||||||||||||||
Stryker Corp. | Morgan Stanley | 2,822 | 509,854 | 588,020 | 83,818 | ||||||||||||||||||
Teladoc Health, Inc. | Morgan Stanley | 736 | 50,753 | 161,361 | 118,750 | ||||||||||||||||||
Teleflex, Inc. | Morgan Stanley | 9 | 3,064 | 3,064 | 32 | ||||||||||||||||||
Tenet Healthcare Corp. | Morgan Stanley | 3,867 | 71,459 | 94,780 | 23,552 | ||||||||||||||||||
Tivity Health, Inc. | Morgan Stanley | 7,747 | 80,751 | 108,613 | 28,107 | ||||||||||||||||||
UnitedHealth Group, Inc. | Morgan Stanley | 764 | 214,466 | 238,192 | 26,078 | ||||||||||||||||||
Universal Health Services, Inc., Class B | Morgan Stanley | 2,694 | 255,612 | 288,312 | 33,384 | ||||||||||||||||||
Varian Medical Systems, Inc. | Morgan Stanley | 2,073 | 358,907 | 356,556 | (1,344 | ) | |||||||||||||||||
West Pharmaceutical Services, Inc. | Morgan Stanley | 1,350 | 323,232 | 371,115 | 48,890 | ||||||||||||||||||
Zimmer Biomet Holdings, Inc. | Morgan Stanley | 168 | 14,243 | 22,872 | 8,812 | ||||||||||||||||||
|
|
|
|
|
|
|
| ||||||||||||||||
| 157,340 | 11,172,325 | 12,877,602 | 1,800,418 | ||||||||||||||||||||
|
|
|
|
|
|
|
| ||||||||||||||||
Household & Personal Products | |||||||||||||||||||||||
Church & Dwight Co., Inc. | Morgan Stanley | 244 | 22,627 | 22,865 | 349 | ||||||||||||||||||
Clorox Co. (The) | Morgan Stanley | 1,270 | 277,082 | 266,916 | (9,383 | ) | |||||||||||||||||
Colgate-Palmolive Co. | Morgan Stanley | 16,764 | 1,134,882 | 1,293,343 | 185,161 | ||||||||||||||||||
Edgewell Personal Care Co. | Morgan Stanley | 2,504 | 67,348 | 69,812 | 2,635 | ||||||||||||||||||
elf Beauty, Inc. | Morgan Stanley | 4,734 | 53,642 | 86,963 | 33,830 | ||||||||||||||||||
Estee Lauder Cos., Inc. (The), Class A | Morgan Stanley | 1,508 | 259,259 | 329,121 | 71,192 | ||||||||||||||||||
Kimberly-Clark Corp. | Morgan Stanley | 4,859 | 665,345 | 717,480 | 66,207 | ||||||||||||||||||
Procter & Gamble Co. (The) | Morgan Stanley | 4,393 | 488,366 | 610,583 | 129,667 | ||||||||||||||||||
Spectrum Brands Holdings, Inc. | Morgan Stanley | 1,300 | 75,387 | 74,308 | (409 | ) | |||||||||||||||||
|
|
|
|
|
|
|
| ||||||||||||||||
| 37,576 | 3,043,938 | 3,471,391 | 479,249 | ||||||||||||||||||||
|
|
|
|
|
|
|
| ||||||||||||||||
Materials | |||||||||||||||||||||||
Allegheny Technologies, Inc. | Morgan Stanley | 18,552 | 141,569 | 161,773 | 20,120 | ||||||||||||||||||
Amcor PLC (Jersey) | Morgan Stanley | 38,254 | 365,451 | 422,707 | 62,434 | ||||||||||||||||||
Ashland Global Holdings, Inc. | Morgan Stanley | 42 | 2,302 | 2,979 | 721 | ||||||||||||||||||
Avient Corp. | Morgan Stanley | 11,478 | 245,339 | 303,708 | 61,026 | ||||||||||||||||||
The accompanying notes are an integral part of the financial statements.
76
GOTHAM ENHANCED RETURN FUND
Portfolio of Investments (Continued)
September 30, 2020
Total Return Swaps (continued)
Reference Entity | Counterparty | Number of Contracts Long/(Short) | Notional Amount | Value | Unrealized Appreciation/ (Depreciation)* | |||||||||||||||||
Materials — (continued) | ||||||||||||||||||||||
Axalta Coating Systems Ltd. (Bermuda) | Morgan Stanley | 2,228 | $ | 31,767 | $ | 49,395 | $ | 17,738 | ||||||||||||||
Boise Cascade Co. | Morgan Stanley | 1,445 | 41,926 | 57,684 | 16,149 | |||||||||||||||||
Cabot Corp. | Morgan Stanley | 501 | 12,653 | 18,051 | 5,811 | |||||||||||||||||
Carpenter Technology Corp. | Morgan Stanley | 4,485 | 95,272 | 81,448 | (12,895 | ) | ||||||||||||||||
Celanese Corp. | Morgan Stanley | 86 | 5,825 | 9,241 | 3,561 | |||||||||||||||||
Century Aluminum Co. | Morgan Stanley | 1,970 | 17,950 | 14,026 | (3,851 | ) | ||||||||||||||||
CF Industries Holdings, Inc. | Morgan Stanley | 10,552 | 284,808 | 324,052 | 44,178 | |||||||||||||||||
Chase Corp. | Morgan Stanley | 2 | 193 | 191 | 22 | |||||||||||||||||
Chemours Co. (The) | Morgan Stanley | 23,464 | 276,293 | 490,632 | 226,387 | |||||||||||||||||
Commercial Metals Co. | Morgan Stanley | 27,916 | 527,576 | 557,762 | 36,764 | |||||||||||||||||
Compass Minerals International, Inc. | Morgan Stanley | 1,551 | 77,429 | 92,052 | 16,394 | |||||||||||||||||
Dow, Inc. | Morgan Stanley | 5,870 | 175,073 | 276,184 | 108,482 | |||||||||||||||||
DuPont de Nemours, Inc. | Morgan Stanley | 3,537 | 118,003 | 196,233 | 80,698 | |||||||||||||||||
Eastman Chemical Co. | Morgan Stanley | 5,313 | 332,665 | 415,052 | 100,898 | |||||||||||||||||
Ecolab, Inc. | Morgan Stanley | 4,621 | 888,805 | 923,461 | 39,298 | |||||||||||||||||
Element Solutions, Inc. | Morgan Stanley | 16,430 | 141,955 | 172,679 | 31,344 | |||||||||||||||||
Ferro Corp. | Morgan Stanley | 3,069 | 35,351 | 38,056 | 2,833 | |||||||||||||||||
First Majestic Silver Corp. (Canada) | Morgan Stanley | 1,798 | 11,130 | 17,117 | 9,868 | |||||||||||||||||
FMC Corp. | Morgan Stanley | 2,794 | 224,144 | 295,913 | 76,795 | |||||||||||||||||
Forterra, Inc. | Morgan Stanley | 212 | 2,448 | 2,506 | 88 | |||||||||||||||||
Freeport-McMoRan, Inc. | Morgan Stanley | 12,156 | 131,585 | 190,120 | 58,918 | |||||||||||||||||
FutureFuel Corp. | Morgan Stanley | 9 | 100 | 102 | 26 | |||||||||||||||||
Golden Star Resources Ltd. (Canada) | Morgan Stanley | 246 | 1,116 | 1,060 | (29 | ) | ||||||||||||||||
Hecla Mining Co. | Morgan Stanley | 66,621 | 379,920 | 338,435 | (40,392 | ) | ||||||||||||||||
IAMGOLD Corp. (Canada) | Morgan Stanley | 4,475 | 17,027 | 17,139 | 182 | |||||||||||||||||
Ingevity Corp. | Morgan Stanley | 2,417 | 114,848 | 119,496 | 4,982 | |||||||||||||||||
Innospec, Inc. | Morgan Stanley | 289 | 21,895 | 18,299 | (3,297 | ) | ||||||||||||||||
International Paper Co. | Morgan Stanley | 5,715 | 209,653 | 231,686 | 46,618 | |||||||||||||||||
Kaiser Aluminum Corp. | Morgan Stanley | 1,947 | 189,392 | 104,340 | (81,165 | ) | ||||||||||||||||
Kraton Corp. | Morgan Stanley | 2,883 | 43,586 | 51,375 | 7,962 | |||||||||||||||||
Linde PLC (Ireland) | Morgan Stanley | 5,086 | 917,446 | 1,211,129 | 314,094 | |||||||||||||||||
LyondellBasell Industries NV, Class A (Netherlands) | Morgan Stanley | 4,527 | 347,239 | 319,108 | (15,031 | ) | ||||||||||||||||
Martin Marietta Materials, Inc. | Morgan Stanley | 394 | 77,346 | 92,732 | 15,998 | |||||||||||||||||
Minerals Technologies, Inc. | Morgan Stanley | 4,002 | 181,687 | 204,502 | 24,616 | |||||||||||||||||
Mosaic Co. (The) | Morgan Stanley | 9,855 | 180,638 | 180,051 | (68 | ) | ||||||||||||||||
Neenah, Inc. | Morgan Stanley | 2 | 76 | 75 | 23 | |||||||||||||||||
NewMarket Corp. | Morgan Stanley | 24 | 9,499 | 8,216 | (1,425 | ) | ||||||||||||||||
Newmont Corp. | Morgan Stanley | 6,406 | 403,289 | 406,461 | 5,813 | |||||||||||||||||
Nucor Corp. | Morgan Stanley | 6,416 | 271,768 | 287,822 | 19,929 | |||||||||||||||||
Nutrien Ltd. (Canada) | Morgan Stanley | 2,849 | 98,373 | 111,766 | 15,312 | |||||||||||||||||
O-I Glass, Inc. | Morgan Stanley | 4,920 | 54,238 | 52,103 | (1,963 | ) | ||||||||||||||||
Pan American Silver Corp. (Canada) | Morgan Stanley | 3,168 | 79,561 | 101,851 | 22,640 | |||||||||||||||||
PPG Industries, Inc. | Morgan Stanley | 1,969 | 216,894 | 240,376 | 27,106 | |||||||||||||||||
Pretium Resources, Inc. (Canada) | Morgan Stanley | 454 | 5,768 | 5,829 | 100 | |||||||||||||||||
Reliance Steel & Aluminum Co. | Morgan Stanley | 1,138 | 111,070 | 116,122 | 6,146 | |||||||||||||||||
Sealed Air Corp. | Morgan Stanley | 1,657 | 47,859 | 64,308 | 17,038 | |||||||||||||||||
The accompanying notes are an integral part of the financial statements.
77
GOTHAM ENHANCED RETURN FUND
Portfolio of Investments (Continued)
September 30, 2020
Total Return Swaps (continued)
Reference Entity | Counterparty | Number of Contracts Long/(Short) | Notional Amount | Value | Unrealized Appreciation/ (Depreciation)* | |||||||||||||||||
Materials — (continued) | ||||||||||||||||||||||
Sensient Technologies Corp. | Morgan Stanley | 1,355 | $ | 62,043 | $ | 78,238 | $ | 17,687 | ||||||||||||||
Sonoco Products Co. | Morgan Stanley | 2,876 | 141,995 | 146,877 | 7,126 | |||||||||||||||||
Southern Copper Corp. | Morgan Stanley | 576 | 15,708 | 26,076 | 10,779 | |||||||||||||||||
SSR Mining, Inc. (Canada) | Morgan Stanley | 3,751 | 54,840 | 70,031 | 15,365 | |||||||||||||||||
Stepan Co. | Morgan Stanley | 25 | 2,734 | 2,725 | 22 | |||||||||||||||||
Summit Materials, Inc., Class A | Morgan Stanley | 2,225 | 27,888 | 36,802 | 8,819 | |||||||||||||||||
Tredegar Corp. | Morgan Stanley | 43 | 658 | 639 | 7 | |||||||||||||||||
Trinseo SA (Luxembourg) | Morgan Stanley | 6,003 | 183,104 | 153,917 | (19,297 | ) | ||||||||||||||||
Wheaton Precious Metals Corp. (Canada) | Morgan Stanley | 124 | 6,079 | 6,085 | 529 | |||||||||||||||||
Worthington Industries, Inc. | Morgan Stanley | 1,036 | 31,905 | 42,248 | 10,758 | |||||||||||||||||
Yamana Gold, Inc. (Canada) | Morgan Stanley | 5,872 | 32,929 | 33,353 | 596 | |||||||||||||||||
|
|
|
|
|
|
|
| |||||||||||||||
| 359,681 | 8,727,683 | 9,994,396 | 1,441,387 | |||||||||||||||||||
|
|
|
|
|
|
|
| |||||||||||||||
Media & Entertainment | ||||||||||||||||||||||
Activision Blizzard, Inc. | Morgan Stanley | 1,517 | 120,379 | 122,801 | 2,775 | |||||||||||||||||
Alphabet, Inc., Class A | Morgan Stanley | 1,810 | 2,238,493 | 2,652,736 | 420,401 | |||||||||||||||||
Cargurus, Inc. | Morgan Stanley | 2,034 | 50,954 | 43,995 | (6,796 | ) | ||||||||||||||||
Charter Communications, Inc., Class A . | Morgan Stanley | 196 | 115,750 | 122,371 | 6,961 | |||||||||||||||||
Clear Channel Outdoor Holdings, Inc. | Morgan Stanley | 230 | 225 | 230 | 29 | |||||||||||||||||
Discovery, Inc., Class A | Morgan Stanley | 5,799 | 120,525 | 126,244 | 6,053 | |||||||||||||||||
DISH Network Corp., Class A | Morgan Stanley | 19,231 | 576,586 | 558,276 | (16,706 | ) | ||||||||||||||||
Electronic Arts, Inc. | Morgan Stanley | 5,727 | 721,361 | 746,858 | 27,497 | |||||||||||||||||
EverQuote, Inc., Class A | Morgan Stanley | 861 | 25,553 | 33,269 | 7,810 | |||||||||||||||||
Facebook, Inc., Class A | Morgan Stanley | 14,078 | 2,466,428 | 3,687,028 | 1,227,383 | |||||||||||||||||
Fox Corp., Class A | Morgan Stanley | 17,632 | 450,949 | 490,699 | 45,042 | |||||||||||||||||
Interpublic Group of Cos., Inc. (The) | Morgan Stanley | 17,131 | 309,955 | 285,574 | (13,511 | ) | ||||||||||||||||
John Wiley & Sons, Inc., Class A | Morgan Stanley | 355 | 11,576 | 11,257 | (264 | ) | ||||||||||||||||
Match Group, Inc. | Morgan Stanley | 656 | 67,605 | 72,586 | 5,842 | |||||||||||||||||
MSG Networks, Inc., Class A | Morgan Stanley | 8,721 | 144,172 | 83,460 | (60,629 | ) | ||||||||||||||||
Netflix, Inc. | Morgan Stanley | 1,807 | 839,062 | 903,554 | 66,815 | |||||||||||||||||
New York Times Co. (The), Class A | Morgan Stanley | 25 | 1,063 | 1,070 | 34 | |||||||||||||||||
News Corp., Class A | Morgan Stanley | 24,727 | 235,117 | 346,673 | 114,951 | |||||||||||||||||
Omnicom Group, Inc. | Morgan Stanley | 870 | 44,598 | 43,065 | (576 | ) | ||||||||||||||||
Pinterest, Inc., Class A | Morgan Stanley | 5,660 | 220,510 | 234,947 | 15,064 | |||||||||||||||||
Sirius XM Holdings, Inc. | Morgan Stanley | 13,024 | 67,050 | 69,809 | 2,966 | |||||||||||||||||
Take-Two Interactive Software, Inc. | Morgan Stanley | 1,518 | 239,912 | 250,804 | 11,573 | |||||||||||||||||
Twitter, Inc. | Morgan Stanley | 21,341 | 631,373 | 949,675 | 320,055 | |||||||||||||||||
Walt Disney Co. (The) | Morgan Stanley | 12,702 | 1,327,940 | 1,576,064 | 251,235 | |||||||||||||||||
Zillow Group, Inc., Class C | Morgan Stanley | 8,259 | 634,751 | 839,032 | 208,949 | |||||||||||||||||
|
|
|
|
|
|
|
| |||||||||||||||
| 185,911 | 11,661,887 | 14,252,077 | 2,642,953 | |||||||||||||||||||
|
|
|
|
|
|
|
| |||||||||||||||
Pharmaceuticals, Biotechnology & Life Sciences | ||||||||||||||||||||||
AbbVie, Inc. | Morgan Stanley | 16 | 1,389 | 1,401 | 151 | |||||||||||||||||
Agilent Technologies, Inc. | Morgan Stanley | 2,404 | 231,665 | 242,660 | 11,686 | |||||||||||||||||
Alexion Pharmaceuticals, Inc. | Morgan Stanley | 74 | 8,372 | 8,468 | 145 | |||||||||||||||||
Amneal Pharmaceuticals, Inc. | Morgan Stanley | 131 | 505 | 508 | 28 | |||||||||||||||||
Avantor, Inc. | Morgan Stanley | 2,625 | 44,426 | 59,036 | 18,659 | |||||||||||||||||
The accompanying notes are an integral part of the financial statements.
78
GOTHAM ENHANCED RETURN FUND
Portfolio of Investments (Continued)
September 30, 2020
Total Return Swaps (continued)
Reference Entity | Counterparty | Number of Contracts Long/(Short) | Notional Amount | Value | Unrealized Appreciation/ (Depreciation)* | ||||||||||||||||||
Pharmaceuticals, Biotechnology & Life Sciences — (continued) |
| ||||||||||||||||||||||
Biogen, Inc. | Morgan Stanley | 3,940 | $ | 874,615 | $ | 1,117,699 | $ | 245,504 | |||||||||||||||
Bio-Rad Laboratories, Inc., Class A | Morgan Stanley | 115 | 37,137 | 59,278 | 41,871 | ||||||||||||||||||
Bristol Myers Squibb Co. | Morgan Stanley | 809 | 46,986 | 48,775 | 1,941 | ||||||||||||||||||
Catalent, Inc. | Morgan Stanley | 584 | 48,905 | 50,025 | 1,278 | ||||||||||||||||||
Charles River Laboratories International, Inc. | Morgan Stanley | 742 | 116,892 | 168,026 | 51,894 | ||||||||||||||||||
Coherus Biosciences, Inc. | Morgan Stanley | 2,294 | 37,484 | 42,072 | 4,972 | ||||||||||||||||||
Corcept Therapeutics, Inc. | Morgan Stanley | 1,034 | 13,419 | 17,997 | 5,128 | ||||||||||||||||||
Denali Therapeutics, Inc. | Morgan Stanley | 242 | 8,592 | 8,671 | 126 | ||||||||||||||||||
Elanco Animal Health, Inc. | Morgan Stanley | 11,103 | 287,337 | 310,107 | 23,581 | ||||||||||||||||||
Emergent BioSolutions, Inc. | Morgan Stanley | 2,388 | 248,120 | 246,752 | (664 | ) | |||||||||||||||||
Gilead Sciences, Inc. | Morgan Stanley | 1,621 | 99,827 | 102,431 | 13,712 | ||||||||||||||||||
Horizon Therapeutics PLC (Ireland) | Morgan Stanley | 2,677 | 194,818 | 207,949 | 15,125 | ||||||||||||||||||
Innoviva, Inc. | Morgan Stanley | 11,934 | 137,686 | 124,710 | (12,575 | ) | |||||||||||||||||
IQVIA Holdings, Inc. | Morgan Stanley | 1,112 | 138,980 | 175,285 | 41,475 | ||||||||||||||||||
Ironwood Pharmaceuticals, Inc. | Morgan Stanley | 74 | 671 | 666 | 20 | ||||||||||||||||||
Johnson & Johnson | Morgan Stanley | 9,697 | 1,295,587 | 1,443,689 | 167,966 | ||||||||||||||||||
Kura Oncology, Inc. | Morgan Stanley | 84 | 2,485 | 2,574 | 119 | ||||||||||||||||||
Merck & Co., Inc. | Morgan Stanley | 9,330 | 686,985 | 773,924 | 99,833 | ||||||||||||||||||
Mylan NV (Netherlands) | Morgan Stanley | 11,125 | 163,759 | 164,984 | 1,697 | ||||||||||||||||||
NantKwest, Inc. | Morgan Stanley | 86 | 384 | 596 | 236 | ||||||||||||||||||
Natera, Inc. | Morgan Stanley | 5,896 | 215,382 | 425,927 | 211,158 | ||||||||||||||||||
Neurocrine Biosciences, Inc. | Morgan Stanley | 548 | 54,144 | 52,696 | (1,277 | ) | |||||||||||||||||
Novavax, Inc. | Morgan Stanley | 10,565 | 348,303 | 1,144,718 | 797,393 | ||||||||||||||||||
PerkinElmer, Inc. | Morgan Stanley | 4,719 | 445,899 | 592,282 | 148,386 | ||||||||||||||||||
Pfizer, Inc. | Morgan Stanley | 34,171 | 1,116,526 | 1,254,076 | 158,220 | ||||||||||||||||||
Phibro Animal Health Corp., Class A | Morgan Stanley | 10 | 174 | 174 | 23 | ||||||||||||||||||
Prestige Consumer Healthcare, Inc. | Morgan Stanley | 2,715 | 101,557 | 98,880 | (2,409 | ) | |||||||||||||||||
Regeneron Pharmaceuticals, Inc. | Morgan Stanley | 304 | 168,775 | 170,173 | 1,606 | ||||||||||||||||||
TG Therapeutics, Inc. | Morgan Stanley | 3,842 | 48,271 | 102,812 | 54,697 | ||||||||||||||||||
Thermo Fisher Scientific, Inc. | Morgan Stanley | 492 | 200,669 | 217,228 | 17,250 | ||||||||||||||||||
Trillium Therapeutics, Inc. (Canada) | Morgan Stanley | 1,147 | 13,792 | 16,299 | 2,568 | ||||||||||||||||||
United Therapeutics Corp. | Morgan Stanley | 677 | 71,724 | 68,377 | (3,191 | ) | |||||||||||||||||
Vanda Pharmaceuticals, Inc. | Morgan Stanley | 1,221 | 12,570 | 11,795 | (795 | ) | |||||||||||||||||
Waters Corp. | Morgan Stanley | 508 | 97,269 | 99,405 | 2,426 | ||||||||||||||||||
Zoetis, Inc. | Morgan Stanley | 2,853 | 453,381 | 471,801 | 19,685 | ||||||||||||||||||
|
|
|
|
|
|
|
| ||||||||||||||||
| 145,909 | 8,075,462 | 10,104,926 | 2,139,648 | ||||||||||||||||||||
|
|
|
|
|
|
|
| ||||||||||||||||
Retailing | |||||||||||||||||||||||
1-800-Flowers.com, Inc., Class A | Morgan Stanley | 2,928 | 76,167 | 73,024 | (2,911 | ) | |||||||||||||||||
Aaron’s, Inc. | Morgan Stanley | 5,877 | 235,370 | 332,932 | 98,609 | ||||||||||||||||||
Advance Auto Parts, Inc. | Morgan Stanley | �� | 2,357 | 363,357 | 361,800 | (68 | ) | ||||||||||||||||
Amazon.com, Inc. | Morgan Stanley | 927 | 2,173,061 | 2,918,873 | 751,791 | ||||||||||||||||||
Asbury Automotive Group, Inc. | Morgan Stanley | 634 | 53,500 | 61,783 | 8,453 | ||||||||||||||||||
At Home Group, Inc. | Morgan Stanley | 14,963 | 232,198 | 222,350 | (9,188 | ) | |||||||||||||||||
AutoNation, Inc. | Morgan Stanley | 2,315 | 92,574 | 122,533 | 30,236 | ||||||||||||||||||
The accompanying notes are an integral part of the financial statements.
79
GOTHAM ENHANCED RETURN FUND
Portfolio of Investments (Continued)
September 30, 2020
Total Return Swaps (continued)
Reference Entity | Counterparty | Number of Contracts Long/(Short) | Notional Amount | Value | Unrealized Appreciation/ (Depreciation)* | |||||||||||||||||
Retailing — (continued) | ||||||||||||||||||||||
AutoZone, Inc. | Morgan Stanley | 347 | $ | 390,575 | $ | 408,641 | $ | 19,160 | ||||||||||||||
Best Buy Co., Inc. | Morgan Stanley | 6,844 | 399,683 | 761,669 | 400,244 | |||||||||||||||||
Big Lots, Inc. | Morgan Stanley | 1,151 | 52,617 | 51,335 | (840 | ) | ||||||||||||||||
Booking Holdings, Inc. | Morgan Stanley | 1,208 | 1,669,136 | 2,066,501 | 401,963 | |||||||||||||||||
Buckle, Inc. (The) | Morgan Stanley | 3,109 | 64,463 | 63,393 | (871 | ) | ||||||||||||||||
Camping World Holdings, Inc., Class A | Morgan Stanley | 6,437 | 78,798 | 191,501 | 116,372 | |||||||||||||||||
CarParts.Com, Inc. | Morgan Stanley | 3,905 | 52,480 | 42,213 | (10,100 | ) | ||||||||||||||||
Dick’s Sporting Goods, Inc. | Morgan Stanley | 552 | 31,369 | 31,950 | 690 | |||||||||||||||||
Dollar General Corp. | Morgan Stanley | 1,400 | 253,601 | 293,468 | 41,412 | |||||||||||||||||
eBay, Inc. | Morgan Stanley | 23,666 | 708,168 | 1,232,999 | 534,019 | |||||||||||||||||
Etsy, Inc. | Morgan Stanley | 4,343 | 559,517 | 528,239 | (30,788 | ) | ||||||||||||||||
Foot Locker, Inc. | Morgan Stanley | 13,400 | 445,229 | 442,602 | (1,384 | ) | ||||||||||||||||
Gap, Inc. (The) | Morgan Stanley | 39,916 | 616,849 | 679,769 | 64,224 | |||||||||||||||||
Genuine Parts Co. | Morgan Stanley | 1,744 | 130,530 | 165,976 | 38,010 | |||||||||||||||||
Guess?, Inc. | Morgan Stanley | 10,745 | 79,791 | 124,857 | 46,517 | |||||||||||||||||
Hibbett Sports, Inc. | Morgan Stanley | 733 | 26,081 | 28,748 | 2,762 | |||||||||||||||||
Home Depot, Inc. (The) | Morgan Stanley | 3,933 | 751,293 | 1,092,233 | 353,863 | |||||||||||||||||
L Brands, Inc. | Morgan Stanley | 13,792 | 385,094 | 438,724 | 55,679 | |||||||||||||||||
Lithia Motors, Inc., Class A | Morgan Stanley | 581 | 135,053 | 132,433 | (2,226 | ) | ||||||||||||||||
LKQ Corp. | Morgan Stanley | 28,111 | 705,359 | 779,518 | 77,940 | |||||||||||||||||
Lowe’s Cos., Inc. | Morgan Stanley | 7,592 | 877,184 | 1,259,209 | 388,172 | |||||||||||||||||
Lumber Liquidators Holdings, Inc. | Morgan Stanley | 6,047 | 136,561 | 133,336 | (2,872 | ) | ||||||||||||||||
Macy’s, Inc. | Morgan Stanley | 96,381 | 674,929 | 549,372 | (123,684 | ) | ||||||||||||||||
MarineMax, Inc. | Morgan Stanley | 1,338 | 38,836 | 34,346 | (4,421 | ) | ||||||||||||||||
Michaels Cos., Inc. (The) | Morgan Stanley | 6,261 | 63,348 | 60,450 | (2,701 | ) | ||||||||||||||||
Murphy USA, Inc. | Morgan Stanley | 1,191 | 133,108 | 152,770 | 20,050 | |||||||||||||||||
National Vision Holdings, Inc. | Morgan Stanley | 1,885 | 34,913 | 72,082 | 37,289 | |||||||||||||||||
ODP Corp. (The) | Morgan Stanley | 17,083 | 213,534 | 332,259 | 119,229 | |||||||||||||||||
O’Reilly Automotive, Inc. | Morgan Stanley | 684 | 319,000 | 315,379 | (2,724 | ) | ||||||||||||||||
Pool Corp. | Morgan Stanley | 148 | 45,151 | 49,512 | 4,727 | |||||||||||||||||
Qurate Retail, Inc. | Morgan Stanley | 8,537 | 60,803 | 61,296 | 683 | |||||||||||||||||
RH. | Morgan Stanley | 1,322 | 121,103 | 505,824 | 385,076 | |||||||||||||||||
Ross Stores, Inc. | Morgan Stanley | 1,974 | 172,797 | 184,214 | 12,063 | |||||||||||||||||
Shoe Carnival, Inc. | Morgan Stanley | 813 | 30,175 | 27,301 | (2,769 | ) | ||||||||||||||||
Shutterstock, Inc. | Morgan Stanley | 569 | 28,372 | 29,611 | 1,419 | |||||||||||||||||
Signet Jewelers Ltd. (Bermuda) | Morgan Stanley | 16,912 | 125,623 | 316,254 | 190,999 | |||||||||||||||||
Sleep Number Corp. | Morgan Stanley | 4,448 | 145,024 | 217,552 | 74,317 | |||||||||||||||||
Sonic Automotive, Inc., Class A | Morgan Stanley | 6,866 | 199,727 | 275,739 | 78,451 | |||||||||||||||||
Sportsman’s Warehouse Holdings, Inc. | Morgan Stanley | 322 | 4,358 | 4,608 | 285 | |||||||||||||||||
Stamps.com, Inc. | Morgan Stanley | 1,370 | 218,103 | 330,102 | 111,401 | |||||||||||||||||
Target Corp. | Morgan Stanley | 1,563 | 238,671 | 246,047 | 8,054 | |||||||||||||||||
Tractor Supply Co. | Morgan Stanley | 2,531 | 365,783 | 362,794 | (1,615 | ) | ||||||||||||||||
Williams-Sonoma, Inc. | Morgan Stanley | 4,244 | 244,903 | 383,827 | 142,684 | |||||||||||||||||
Zumiez, Inc. | Morgan Stanley | 2,020 | 51,975 | 56,196 | 4,388 | |||||||||||||||||
|
|
|
|
|
|
|
| |||||||||||||||
| 388,019 | 15,305,894 | 19,610,144 | 4,422,069 | |||||||||||||||||||
|
|
|
|
|
|
|
| |||||||||||||||
The accompanying notes are an integral part of the financial statements.
80
GOTHAM ENHANCED RETURN FUND
Portfolio of Investments (Continued)
September 30, 2020
Total Return Swaps (continued)
Reference Entity | Counterparty | Number of Contracts Long/(Short) | Notional Amount | Value | Unrealized Appreciation/ (Depreciation)* | ||||||||||||||||||
Semiconductors & Semiconductor Equipment |
| ||||||||||||||||||||||
Advanced Micro Devices, Inc. | Morgan Stanley | 1,852 | $ | 143,047 | $ | 151,845 | $ | 9,214 | |||||||||||||||
Amkor Technology, Inc. | Morgan Stanley | 29,106 | 263,382 | 325,987 | 63,351 | ||||||||||||||||||
Analog Devices, Inc. | Morgan Stanley | 318 | 37,080 | 37,123 | 380 | ||||||||||||||||||
Applied Materials, Inc. | Morgan Stanley | 12,085 | 520,833 | 718,453 | 204,163 | ||||||||||||||||||
Axcelis Technologies, Inc. | Morgan Stanley | 2,382 | 61,289 | 52,404 | (8,693 | ) | |||||||||||||||||
Broadcom, Inc. | Morgan Stanley | 3,000 | 1,035,360 | 1,092,960 | 68,677 | ||||||||||||||||||
Brooks Automation, Inc. | Morgan Stanley | 550 | 15,451 | 25,443 | 10,153 | ||||||||||||||||||
CEVA, Inc. | Morgan Stanley | 36 | 1,399 | 1,417 | 45 | ||||||||||||||||||
Cirrus Logic, Inc. | Morgan Stanley | 5,086 | 269,659 | 343,051 | 82,109 | ||||||||||||||||||
Diodes, Inc. | Morgan Stanley | 2,863 | 102,420 | 161,616 | 61,541 | ||||||||||||||||||
Enphase Energy, Inc. | Morgan Stanley | 1,446 | 37,382 | 119,425 | 82,169 | ||||||||||||||||||
First Solar, Inc. | Morgan Stanley | 4,304 | 283,467 | 284,925 | 2,258 | ||||||||||||||||||
Intel Corp. | Morgan Stanley | 30,826 | 1,533,611 | 1,596,170 | 86,697 | ||||||||||||||||||
KLA Corp. | Morgan Stanley | 2,341 | 414,736 | 453,545 | 42,281 | ||||||||||||||||||
Lam Research Corp. | Morgan Stanley | 668 | 224,683 | 221,609 | (2,703 | ) | |||||||||||||||||
Lattice Semiconductor Corp. | Morgan Stanley | 9,154 | 164,796 | 265,100 | 100,778 | ||||||||||||||||||
MACOM Technology Solutions Holdings, Inc. | Morgan Stanley | 8,280 | 289,780 | 281,603 | (7,359 | ) | |||||||||||||||||
Marvell Technology Group Ltd. (Bermuda) | Morgan Stanley | 4,552 | 176,808 | 180,714 | 4,414 | ||||||||||||||||||
Maxim Integrated Products, Inc. | Morgan Stanley | 4,529 | 250,413 | 306,206 | 59,847 | ||||||||||||||||||
Microchip Technology, Inc. | Morgan Stanley | 3,671 | 373,344 | 377,232 | 6,101 | ||||||||||||||||||
MKS Instruments, Inc. | Morgan Stanley | 887 | 106,211 | 96,887 | (8,922 | ) | |||||||||||||||||
Monolithic Power Systems, Inc. | Morgan Stanley | 617 | 136,556 | 172,519 | 37,245 | ||||||||||||||||||
NVIDIA Corp. | Morgan Stanley | 2,157 | 694,767 | 1,167,412 | 475,219 | ||||||||||||||||||
PDF Solutions, Inc. | Morgan Stanley | 5 | 96 | 94 | 21 | ||||||||||||||||||
Power Integrations, Inc. | Morgan Stanley | 1,680 | 91,329 | 93,072 | 2,208 | ||||||||||||||||||
Qorvo, Inc. | Morgan Stanley | 63 | 5,069 | 8,128 | 3,096 | ||||||||||||||||||
Skyworks Solutions, Inc. | Morgan Stanley | 4,551 | 433,489 | 662,171 | 234,053 | ||||||||||||||||||
SMART Global Holdings, Inc. (Cayman Islands) | Morgan Stanley | 1,463 | 34,336 | 39,998 | 5,862 | ||||||||||||||||||
Synaptics, Inc. | Morgan Stanley | 7,417 | 454,536 | 596,475 | 143,208 | ||||||||||||||||||
Texas Instruments, Inc. | Morgan Stanley | 826 | 105,881 | 117,945 | 19,622 | ||||||||||||||||||
Ultra Clean Holdings, Inc. | Morgan Stanley | 7,173 | 145,429 | 153,932 | 8,891 | ||||||||||||||||||
|
|
|
|
|
|
|
| ||||||||||||||||
| 153,888 | 8,406,639 | 10,105,461 | 1,785,926 | ||||||||||||||||||||
|
|
|
|
|
|
|
| ||||||||||||||||
Software & Services | |||||||||||||||||||||||
A10 Networks, Inc. | Morgan Stanley | 843 | 6,023 | 5,370 | (613 | ) | |||||||||||||||||
Accenture PLC, Class A (Ireland) | Morgan Stanley | 3,631 | 670,394 | 820,570 | 155,844 | ||||||||||||||||||
ACI Worldwide, Inc. | Morgan Stanley | 3,396 | 92,082 | 88,737 | (3,069 | ) | |||||||||||||||||
Adobe, Inc. | Morgan Stanley | 1,136 | 405,995 | 557,128 | 152,269 | ||||||||||||||||||
Agilysys, Inc. | Morgan Stanley | 332 | 8,277 | 8,021 | (210 | ) | |||||||||||||||||
Alarm.com Holdings, Inc. | Morgan Stanley | 254 | 13,873 | 14,034 | 222 | ||||||||||||||||||
Alliance Data Systems Corp. | Morgan Stanley | 7,323 | 735,285 | 307,420 | (413,181 | ) | |||||||||||||||||
Anaplan, Inc. | Morgan Stanley | 2,442 | 148,430 | 152,820 | 4,821 | ||||||||||||||||||
Automatic Data Processing, Inc. | Morgan Stanley | 10,401 | 1,426,238 | 1,450,835 | 47,194 | ||||||||||||||||||
Black Knight, Inc. | Morgan Stanley | 597 | 42,374 | 51,969 | 9,735 | ||||||||||||||||||
The accompanying notes are an integral part of the financial statements.
81
GOTHAM ENHANCED RETURN FUND
Portfolio of Investments (Continued)
September 30, 2020
Total Return Swaps (continued)
Reference Entity | Counterparty | Number of Contracts Long/(Short) | Notional Amount | Value | Unrealized Appreciation/ (Depreciation)* | |||||||||||||||||
Software & Services — (continued) | ||||||||||||||||||||||
Blackbaud, Inc. | Morgan Stanley | 4,235 | $ | 220,743 | $ | 236,440 | $ | 16,326 | ||||||||||||||
Broadridge Financial Solutions, Inc. | Morgan Stanley | 2,611 | 323,269 | 344,652 | 24,264 | |||||||||||||||||
CACI International, Inc., Class A | Morgan Stanley | 184 | 38,851 | 39,221 | 500 | |||||||||||||||||
Cadence Design Systems, Inc. | Morgan Stanley | 5,173 | 484,026 | 551,597 | 69,752 | |||||||||||||||||
Cardtronics PLC, Class A (United Kingdom) | Morgan Stanley | 3,113 | 58,695 | 61,637 | 3,067 | |||||||||||||||||
CDK Global, Inc. | Morgan Stanley | 423 | 19,555 | 18,439 | (969 | ) | ||||||||||||||||
CGI, Inc. (Canada) | Morgan Stanley | 899 | 62,534 | 60,925 | (1,414 | ) | ||||||||||||||||
Citrix Systems, Inc. | Morgan Stanley | 2,139 | 304,188 | 294,562 | (7,578 | ) | ||||||||||||||||
Cornerstone OnDemand, Inc. | Morgan Stanley | 2,714 | 96,743 | 98,681 | 1,940 | |||||||||||||||||
Crowdstrike Holdings, Inc., Class A | Morgan Stanley | 363 | 50,136 | 49,847 | (128 | ) | ||||||||||||||||
Domo, Inc., Class B | Morgan Stanley | 1,253 | 38,171 | 48,027 | 9,985 | |||||||||||||||||
Envestnet, Inc. | Morgan Stanley | 609 | 46,843 | 46,990 | 299 | |||||||||||||||||
Evo Payments, Inc., Class A | Morgan Stanley | 43 | 1,083 | 1,069 | 12 | |||||||||||||||||
Fair Isaac Corp. | Morgan Stanley | 143 | 57,933 | 60,829 | 3,168 | |||||||||||||||||
Fiserv, Inc. | Morgan Stanley | 2,781 | 274,640 | 286,582 | 12,927 | |||||||||||||||||
FleetCor Technologies, Inc. | Morgan Stanley | 2,258 | 485,131 | 537,630 | 53,852 | |||||||||||||||||
Fortinet, Inc. | Morgan Stanley | 4,820 | 519,797 | 567,844 | 49,495 | |||||||||||||||||
Gartner, Inc. | Morgan Stanley | 2,835 | 330,584 | 354,233 | 24,579 | |||||||||||||||||
Globant SA (Luxembourg) | Morgan Stanley | 330 | 57,405 | 59,143 | 1,996 | |||||||||||||||||
GoDaddy, Inc., Class A | Morgan Stanley | 4,504 | 309,714 | 342,169 | 33,327 | |||||||||||||||||
Guidewire Software, Inc. | Morgan Stanley | 1,128 | 121,457 | 117,617 | (3,484 | ) | ||||||||||||||||
International Business Machines Corp. | Morgan Stanley | 5,628 | 678,580 | 684,759 | 20,780 | |||||||||||||||||
International Money Express, Inc. | Morgan Stanley | 38 | 572 | 546 | (1 | ) | ||||||||||||||||
Intuit, Inc. | Morgan Stanley | 4,624 | 1,490,712 | 1,508,395 | 19,644 | |||||||||||||||||
Jack Henry & Associates, Inc. | Morgan Stanley | 887 | 154,124 | 144,217 | (9,082 | ) | ||||||||||||||||
KBR, Inc. | Morgan Stanley | 1,310 | 19,174 | 29,292 | 10,436 | |||||||||||||||||
Leidos Holdings, Inc. | Morgan Stanley | 1,259 | 97,902 | 112,240 | 16,131 | |||||||||||||||||
LiveRamp Holdings, Inc. | Morgan Stanley | 1,707 | 77,450 | 88,371 | 11,327 | |||||||||||||||||
Mastercard, Inc., Class A | Morgan Stanley | 1,267 | 331,479 | 428,461 | 98,333 | |||||||||||||||||
Microsoft Corp. | Morgan Stanley | 11,357 | 1,954,380 | 2,388,718 | 454,771 | |||||||||||||||||
MicroStrategy, Inc., Class A | Morgan Stanley | 499 | 60,061 | 75,129 | 15,326 | |||||||||||||||||
MobileIron, Inc. | Morgan Stanley | 179 | 1,258 | 1,255 | 24 | |||||||||||||||||
Model N, Inc. | Morgan Stanley | 1,791 | 58,701 | 63,186 | 4,611 | |||||||||||||||||
NortonLifeLock, Inc. | Morgan Stanley | 25,028 | 460,508 | 521,584 | 68,739 | |||||||||||||||||
Nuance Communications, Inc. | Morgan Stanley | 110 | 1,554 | 3,651 | 19,816 | |||||||||||||||||
Oracle Corp. | Morgan Stanley | 47,786 | 2,387,732 | 2,852,824 | 490,242 | |||||||||||||||||
Paychex, Inc. | Morgan Stanley | 10,036 | 608,854 | 800,572 | 208,725 | |||||||||||||||||
Paylocity Holding Corp. | Morgan Stanley | 205 | 20,135 | 33,091 | 14,151 | |||||||||||||||||
PayPal Holdings, Inc. | Morgan Stanley | 6,656 | 1,125,416 | 1,311,432 | 196,798 | |||||||||||||||||
Progress Software Corp. | Morgan Stanley | 5,885 | 228,804 | 215,862 | (8,939 | ) | ||||||||||||||||
PTC, Inc. | Morgan Stanley | 4,534 | 296,885 | 375,052 | 79,005 | |||||||||||||||||
QAD, Inc., Class A | Morgan Stanley | 16 | 673 | 675 | 28 | |||||||||||||||||
Qualys, Inc. | Morgan Stanley | 2,614 | 205,525 | 256,198 | 53,656 | |||||||||||||||||
Sailpoint Technologies Holding, Inc. | Morgan Stanley | 10,865 | 304,467 | 429,928 | 126,319 | |||||||||||||||||
salesforce.com, Inc. | Morgan Stanley | 2,258 | 600,216 | 567,481 | (31,067 | ) | ||||||||||||||||
The accompanying notes are an integral part of the financial statements.
82
GOTHAM ENHANCED RETURN FUND
Portfolio of Investments (Continued)
September 30, 2020
Total Return Swaps (continued)
Reference Entity | Counterparty | Number of Contracts Long/(Short) | Notional Amount | Value | Unrealized Appreciation/ (Depreciation)* | |||||||||||||||||
Software & Services — (continued) | ||||||||||||||||||||||
Science Applications International Corp. | Morgan Stanley | 2,019 | $ | 148,343 | $ | 158,330 | $ | 12,078 | ||||||||||||||
ServiceNow, Inc. | Morgan Stanley | 3,185 | 952,534 | 1,544,725 | 594,825 | |||||||||||||||||
Shopify, Inc., Class A (Canada) | Morgan Stanley | 26 | 23,785 | 26,597 | 2,901 | |||||||||||||||||
SPS Commerce, Inc. | Morgan Stanley | 995 | 50,135 | 77,481 | 31,331 | |||||||||||||||||
SS&C Technologies Holdings, Inc. | Morgan Stanley | 3,873 | 219,024 | 234,394 | 17,209 | |||||||||||||||||
SVMK, Inc. | Morgan Stanley | 3,113 | 46,922 | 68,828 | 22,059 | |||||||||||||||||
Synopsys, Inc. | Morgan Stanley | 3,523 | 670,166 | 753,852 | 85,768 | |||||||||||||||||
Teradata Corp. | Morgan Stanley | 4,282 | 92,211 | 97,201 | 5,258 | |||||||||||||||||
Verint Systems, Inc. | Morgan Stanley | 314 | 14,931 | 15,129 | 261 | |||||||||||||||||
VeriSign, Inc. | Morgan Stanley | 1,376 | 283,837 | 281,874 | (1,176 | ) | ||||||||||||||||
Virtusa Corp. | Morgan Stanley | 1,276 | 42,932 | 62,728 | 20,101 | |||||||||||||||||
Visa, Inc., Class A | Morgan Stanley | 2,707 | 438,614 | 541,319 | 105,524 | |||||||||||||||||
Western Union Co. (The) | Morgan Stanley | 7,850 | 152,189 | 168,226 | 19,933 | |||||||||||||||||
WEX, Inc. | Morgan Stanley | 718 | 72,099 | 99,780 | 27,903 | |||||||||||||||||
Workday, Inc., Class A | Morgan Stanley | 1,530 | 344,205 | 329,149 | (14,089 | ) | ||||||||||||||||
Zoom Video Communications, Inc., Class A | Morgan Stanley | 81 | 29,041 | 38,079 | 12,436 | |||||||||||||||||
|
|
|
|
|
|
|
| |||||||||||||||
| 256,320 | 22,196,599 | 25,025,649 | 3,047,023 | |||||||||||||||||||
|
|
|
|
|
|
|
| |||||||||||||||
Technology Hardware & Equipment | ||||||||||||||||||||||
Amphenol Corp., Class A | Morgan Stanley | 3,084 | 231,300 | 333,905 | 114,305 | |||||||||||||||||
Apple, Inc. | Morgan Stanley | 37,993 | 2,453,753 | 4,399,969 | 1,968,541 | |||||||||||||||||
Arrow Electronics, Inc. | Morgan Stanley | 3,459 | 201,113 | 272,085 | 71,681 | |||||||||||||||||
Avnet, Inc. | Morgan Stanley | 4,358 | 131,157 | 112,611 | (16,067 | ) | ||||||||||||||||
Badger Meter, Inc. | Morgan Stanley | 2,785 | 142,617 | 182,055 | 43,691 | |||||||||||||||||
Belden, Inc. | Morgan Stanley | 1,908 | 75,230 | 59,377 | (15,700 | ) | ||||||||||||||||
CDW Corp. | Morgan Stanley | 686 | 77,230 | 81,997 | 5,081 | |||||||||||||||||
Ciena Corp. | Morgan Stanley | 75 | 3,003 | 2,977 | 5 | |||||||||||||||||
Cisco Systems, Inc. | Morgan Stanley | 32,750 | 1,342,419 | 1,290,023 | (26,477 | ) | ||||||||||||||||
Corning, Inc. | Morgan Stanley | 13,160 | 369,767 | 426,516 | 61,296 | |||||||||||||||||
Diebold Nixdorf, Inc. | Morgan Stanley | 18,105 | 149,978 | 138,322 | (11,639 | ) | ||||||||||||||||
EchoStar Corp., Class A | Morgan Stanley | 8,407 | 308,070 | 209,250 | (97,953 | ) | ||||||||||||||||
FLIR Systems, Inc. | Morgan Stanley | 7,973 | 328,381 | 285,832 | (40,917 | ) | ||||||||||||||||
Hewlett Packard Enterprise Co. | Morgan Stanley | 55,441 | 704,858 | 519,482 | (153,828 | ) | ||||||||||||||||
HP, Inc. | Morgan Stanley | 37,959 | 592,493 | 720,841 | 144,432 | |||||||||||||||||
InterDigital, Inc. | Morgan Stanley | 1,040 | 50,096 | 59,342 | 9,822 | |||||||||||||||||
Jabil, Inc. | Morgan Stanley | 2,004 | 65,670 | 68,657 | 3,237 | |||||||||||||||||
Juniper Networks, Inc. | Morgan Stanley | 10,206 | 230,466 | 219,429 | (3,105 | ) | ||||||||||||||||
Lumentum Holdings, Inc. | Morgan Stanley | 3,893 | 210,436 | 292,481 | 82,645 | |||||||||||||||||
NCR Corp. | Morgan Stanley | 8,362 | 181,670 | 185,135 | 1,725 | |||||||||||||||||
NetApp, Inc. | Morgan Stanley | 14,429 | 695,477 | 632,567 | (40,386 | ) | ||||||||||||||||
OSI Systems, Inc. | Morgan Stanley | 536 | 50,727 | 41,599 | (9,817 | ) | ||||||||||||||||
PC Connection, Inc. | Morgan Stanley | 32 | 1,318 | 1,314 | 23 | |||||||||||||||||
Rogers Corp. | Morgan Stanley | 12 | 1,186 | 1,177 | 18 | |||||||||||||||||
Sanmina Corp. | Morgan Stanley | 4,322 | 111,107 | 116,910 | 6,055 | |||||||||||||||||
Seagate Technology PLC (Ireland) | Morgan Stanley | 7,792 | 382,523 | 383,912 | 11,811 | |||||||||||||||||
The accompanying notes are an integral part of the financial statements.
83
GOTHAM ENHANCED RETURN FUND
Portfolio of Investments (Continued)
September 30, 2020
Total Return Swaps (continued)
Reference Entity | Counterparty | Number of Contracts Long/(Short) | Notional Amount | Value | Unrealized Appreciation/ (Depreciation)* | ||||||||||||||||||
Technology Hardware & Equipment — (continued) |
| ||||||||||||||||||||||
SYNNEX Corp. | Morgan Stanley | 1,821 | $ | 197,009 | $ | 255,049 | $ | 59,263 | |||||||||||||||
TE Connectivity Ltd. (Switzerland) | Morgan Stanley | 1,923 | 113,938 | 187,954 | 76,345 | ||||||||||||||||||
Trimble, Inc. | Morgan Stanley | 468 | 22,590 | 22,792 | 287 | ||||||||||||||||||
TTM Technologies, Inc. | Morgan Stanley | 8,598 | 84,002 | 98,103 | 15,226 | ||||||||||||||||||
Ubiquiti, Inc. | Morgan Stanley | 809 | 141,723 | 134,828 | (6,191 | ) | |||||||||||||||||
Vishay Intertechnology, Inc. | Morgan Stanley | 13,079 | 192,769 | 203,640 | 16,355 | ||||||||||||||||||
Xerox Holdings Corp. | Morgan Stanley | 1,645 | 25,197 | 30,877 | 6,290 | ||||||||||||||||||
Zebra Technologies Corp., Class A | Morgan Stanley | 733 | 171,195 | 185,053 | 14,350 | ||||||||||||||||||
|
|
|
|
|
|
|
| ||||||||||||||||
| 309,847 | 10,040,468 | 12,156,061 | 2,290,404 | ||||||||||||||||||||
|
|
|
|
|
|
|
| ||||||||||||||||
Telecommunication Services | |||||||||||||||||||||||
AT&T, Inc. | Morgan Stanley | 21,559 | 622,997 | 614,647 | 14,187 | ||||||||||||||||||
CenturyLink, Inc. | Morgan Stanley | 7,392 | 76,147 | 74,585 | 105 | ||||||||||||||||||
Iridium Communications, Inc. | Morgan Stanley | 6,691 | 169,297 | 171,156 | 2,346 | ||||||||||||||||||
T-Mobile US, Inc. | Morgan Stanley | 2,299 | 222,234 | 262,914 | 41,312 | ||||||||||||||||||
Verizon Communications, Inc. | Morgan Stanley | 14,018 | 754,847 | 833,931 | 92,409 | ||||||||||||||||||
Vonage Holdings Corp. | Morgan Stanley | 2,736 | 28,027 | 27,989 | 62 | ||||||||||||||||||
|
|
|
|
|
|
|
| ||||||||||||||||
| 54,695 | 1,873,549 | 1,985,222 | 150,421 | ||||||||||||||||||||
|
|
|
|
|
|
|
| ||||||||||||||||
Transportation | |||||||||||||||||||||||
Alaska Air Group, Inc. | Morgan Stanley | 14,053 | 586,886 | 514,761 | (70,493 | ) | |||||||||||||||||
ArcBest Corp. | Morgan Stanley | 4,753 | 134,713 | 147,628 | 14,961 | ||||||||||||||||||
Atlas Air Worldwide Holdings, Inc. | Morgan Stanley | 1,166 | 66,346 | 71,009 | 4,868 | ||||||||||||||||||
CH Robinson Worldwide, Inc. | Morgan Stanley | 3,760 | 321,455 | 384,234 | 66,022 | ||||||||||||||||||
CSX Corp. | Morgan Stanley | 9,194 | 519,739 | 714,098 | 199,968 | ||||||||||||||||||
Echo Global Logistics, Inc. | Morgan Stanley | 11,903 | 228,895 | 306,740 | 78,575 | ||||||||||||||||||
Expeditors International of Washington, Inc. | Morgan Stanley | 8,054 | 563,695 | 729,048 | 176,994 | ||||||||||||||||||
FedEx Corp. | Morgan Stanley | 1,526 | 379,845 | 383,820 | 5,039 | ||||||||||||||||||
Hub Group, Inc., Class A | Morgan Stanley | 2,093 | 84,571 | 105,058 | 20,833 | ||||||||||||||||||
JB Hunt Transport Services, Inc. | Morgan Stanley | 2,027 | 269,891 | 256,172 | (12,521 | ) | |||||||||||||||||
Kansas City Southern | Morgan Stanley | 56 | 6,749 | 10,126 | 3,464 | ||||||||||||||||||
Marten Transport Ltd. | Morgan Stanley | 237 | 3,862 | 3,868 | 40 | ||||||||||||||||||
Norfolk Southern Corp. | Morgan Stanley | 3,986 | 576,757 | 852,964 | 284,966 | ||||||||||||||||||
Old Dominion Freight Line, Inc. | Morgan Stanley | 122 | 21,983 | 22,072 | 173 | ||||||||||||||||||
Schneider National, Inc., Class B | Morgan Stanley | 1,156 | 24,912 | 28,588 | 3,888 | ||||||||||||||||||
United Parcel Service, Inc., Class B | Morgan Stanley | 1,397 | 216,783 | 232,782 | 18,536 | ||||||||||||||||||
Werner Enterprises, Inc. | Morgan Stanley | 2,020 | 83,834 | 84,820 | 1,363 | ||||||||||||||||||
|
|
|
|
|
|
|
| ||||||||||||||||
| 67,503 | 4,090,916 | 4,847,788 | 796,676 | ||||||||||||||||||||
|
|
|
|
|
|
|
| ||||||||||||||||
Utilities | |||||||||||||||||||||||
American Water Works Co., Inc. | Morgan Stanley | 372 | 52,449 | 53,895 | 1,614 | ||||||||||||||||||
Dominion Energy, Inc. | Morgan Stanley | 11,461 | 886,189 | 904,617 | 40,146 | ||||||||||||||||||
Duke Energy Corp. | Morgan Stanley | 2,716 | 227,586 | 240,529 | 15,998 | ||||||||||||||||||
Evergy, Inc. | Morgan Stanley | 6,479 | 405,790 | 329,263 | (65,728 | ) | |||||||||||||||||
Exelon Corp. | Morgan Stanley | 11,506 | 425,117 | 411,455 | (9,714 | ) | |||||||||||||||||
FirstEnergy Corp. | Morgan Stanley | 14,473 | 575,307 | 415,520 | (150,496 | ) | |||||||||||||||||
MDU Resources Group, Inc. | Morgan Stanley | 12,401 | 277,277 | 279,023 | 5,561 | ||||||||||||||||||
The accompanying notes are an integral part of the financial statements.
84
GOTHAM ENHANCED RETURN FUND
Portfolio of Investments (Continued)
September 30, 2020
Total Return Swaps (continued)
Reference Entity | Counterparty | Number of Contracts Long/(Short) | Notional Amount | Value | Unrealized Appreciation/ (Depreciation)* | |||||||||||||||||
Utilities — (continued) | ||||||||||||||||||||||
National Fuel Gas Co. | Morgan Stanley | 3,281 | $ | 145,726 | $ | 133,176 | $ | (10,714 | ) | |||||||||||||
NiSource, Inc. | Morgan Stanley | 1,812 | 40,076 | 39,864 | (78 | ) | ||||||||||||||||
Northwest Natural Holding Co. | Morgan Stanley | 497 | 26,933 | 22,559 | (4,385 | ) | ||||||||||||||||
NRG Energy, Inc. | Morgan Stanley | 1,790 | 57,086 | 55,025 | (1,528 | ) | ||||||||||||||||
OGE Energy Corp. | Morgan Stanley | 2,343 | 70,176 | 70,267 | 981 | |||||||||||||||||
PPL Corp. | Morgan Stanley | 36,744 | 1,001,634 | 999,804 | 19,590 | |||||||||||||||||
York Water Co. (The) | Morgan Stanley | 1 | 43 | 42 | 27 | |||||||||||||||||
|
|
|
|
|
|
|
| |||||||||||||||
| 105,876 | 4,191,389 | 3,955,039 | (158,726 | ) | ||||||||||||||||||
|
|
|
|
|
|
|
| |||||||||||||||
Total Reference Entity — Long | 158,525,480 | 182,933,107 | 26,251,069 | |||||||||||||||||||
|
|
|
|
|
| |||||||||||||||||
Short | ||||||||||||||||||||||
Automobiles & Components | ||||||||||||||||||||||
Aptiv PLC (Jersey) | Morgan Stanley | (9,233 | ) | (802,367 | ) | (846,481 | ) | (46,357 | ) | |||||||||||||
Cooper Tire & Rubber Co. | Morgan Stanley | (1,515 | ) | (43,289 | ) | (48,026 | ) | (6,263 | ) | |||||||||||||
Dana, Inc. | Morgan Stanley | (16,221 | ) | (242,131 | ) | (199,843 | ) | 40,231 | ||||||||||||||
Delphi Technologies PLC (Jersey) | Morgan Stanley | (7,890 | ) | (136,061 | ) | (131,842 | ) | 4,208 | ||||||||||||||
Dorman Products, Inc. | Morgan Stanley | (6,795 | ) | (548,413 | ) | (614,132 | ) | (68,205 | ) | |||||||||||||
Fiat Chrysler Automobiles NV (Netherlands) | Morgan Stanley | (63,926 | ) | (716,207 | ) | (781,176 | ) | (66,968 | ) | |||||||||||||
Ford Motor Co. | Morgan Stanley | (79,816 | ) | (562,872 | ) | (531,575 | ) | 38,105 | ||||||||||||||
Fox Factory Holding Corp. | Morgan Stanley | (7,281 | ) | (558,631 | ) | (541,197 | ) | 15,129 | ||||||||||||||
Goodyear Tire & Rubber Co. (The) | Morgan Stanley | (56,556 | ) | (525,688 | ) | (433,785 | ) | 90,442 | ||||||||||||||
LCI Industries | Morgan Stanley | (4,875 | ) | (482,513 | ) | (518,164 | ) | (45,059 | ) | |||||||||||||
Lear Corp. | Morgan Stanley | (1,247 | ) | (150,334 | ) | (135,985 | ) | 14,033 | ||||||||||||||
Standard Motor Products, Inc. | Morgan Stanley | (1,686 | ) | (84,904 | ) | (75,280 | ) | 8,894 | ||||||||||||||
Tenneco, Inc., Class A | Morgan Stanley | (27,602 | ) | (364,898 | ) | (191,558 | ) | 173,313 | ||||||||||||||
Tesla, Inc. | Morgan Stanley | (150 | ) | (66,032 | ) | (64,352 | ) | 1,517 | ||||||||||||||
|
|
|
|
|
|
|
| |||||||||||||||
| (284,793 | ) | (5,284,340 | ) | (5,113,396 | ) | �� | 153,020 | |||||||||||||||
|
|
|
|
|
|
|
| |||||||||||||||
Capital Goods | ||||||||||||||||||||||
A.O. Smith Corp. | Morgan Stanley | (924 | ) | (48,826 | ) | (48,787 | ) | (82 | ) | |||||||||||||
AAON, Inc. | Morgan Stanley | (1,855 | ) | (89,713 | ) | (111,764 | ) | (22,809 | ) | |||||||||||||
Alamo Group, Inc. | Morgan Stanley | (1,939 | ) | (216,404 | ) | (209,470 | ) | 5,435 | ||||||||||||||
Allison Transmission Holdings, Inc. | Morgan Stanley | (12,930 | ) | (609,526 | ) | (454,360 | ) | 147,506 | ||||||||||||||
American Woodmark Corp. | Morgan Stanley | (4,172 | ) | (339,932 | ) | (327,669 | ) | 11,370 | ||||||||||||||
Argan, Inc. | Morgan Stanley | (4,578 | ) | (193,695 | ) | (191,864 | ) | (8,025 | ) | |||||||||||||
Armstrong World Industries, Inc. | Morgan Stanley | (6,063 | ) | (444,545 | ) | (417,195 | ) | 25,837 | ||||||||||||||
Astec Industries, Inc. | Morgan Stanley | (2,630 | ) | (81,375 | ) | (142,678 | ) | (64,383 | ) | |||||||||||||
Axon Enterprise, Inc. | Morgan Stanley | (5,552 | ) | (467,827 | ) | (503,566 | ) | (37,038 | ) | |||||||||||||
Beacon Roofing Supply, Inc. | Morgan Stanley | (13,559 | ) | (445,364 | ) | (421,278 | ) | 22,630 | ||||||||||||||
Boeing Co. (The) | Morgan Stanley | (10,409 | ) | (2,428,649 | ) | (1,720,191 | ) | 692,648 | ||||||||||||||
Carrier Global Corp. | Morgan Stanley | (6,707 | ) | (200,699 | ) | (204,832 | ) | (4,826 | ) | |||||||||||||
Caterpillar, Inc. | Morgan Stanley | (5,676 | ) | (833,685 | ) | (846,575 | ) | (25,299 | ) | |||||||||||||
Chart Industries, Inc. | Morgan Stanley | (2,564 | ) | (170,207 | ) | (180,172 | ) | (10,768 | ) | |||||||||||||
Construction Partners, Inc., Class A | Morgan Stanley | (3,793 | ) | (65,794 | ) | (69,033 | ) | (3,592 | ) | |||||||||||||
Cubic Corp. | Morgan Stanley | (2,170 | ) | (146,822 | ) | (126,229 | ) | 19,314 | ||||||||||||||
EnerSys | Morgan Stanley | (4,725 | ) | (313,723 | ) | (317,142 | ) | (8,564 | ) | |||||||||||||
The accompanying notes are an integral part of the financial statements.
85
GOTHAM ENHANCED RETURN FUND
Portfolio of Investments (Continued)
September 30, 2020
Total Return Swaps (continued)
Reference Entity | Counterparty | Number of Contracts Long/(Short) | Notional Amount | Value | Unrealized Appreciation/ (Depreciation)* | |||||||||||||||||
Capital Goods — (continued) | ||||||||||||||||||||||
Federal Signal Corp. | Morgan Stanley | (4,459 | ) | $ | (148,433 | ) | $ | (130,426 | ) | $ | 16,490 | |||||||||||
Gates Industrial Corp. PLC (United Kingdom) | Morgan Stanley | (8,590 | ) | (88,494 | ) | (95,521 | ) | (7,278 | ) | |||||||||||||
Graco, Inc. | Morgan Stanley | (3,181 | ) | (182,250 | ) | (195,154 | ) | (13,440 | ) | |||||||||||||
Helios Technologies, Inc. | Morgan Stanley | (2,636 | ) | (117,806 | ) | (95,950 | ) | 20,863 | ||||||||||||||
Hillenbrand, Inc. | Morgan Stanley | (10,597 | ) | (213,625 | ) | (300,531 | ) | (92,689 | ) | |||||||||||||
Hyster-Yale Materials Handling, Inc. | Morgan Stanley | (4,503 | ) | (250,524 | ) | (167,286 | ) | 76,998 | ||||||||||||||
Ingersoll Rand, Inc. | Morgan Stanley | (19,264 | ) | (603,504 | ) | (685,798 | ) | (88,352 | ) | |||||||||||||
Jacobs Engineering Group, Inc. | Morgan Stanley | (9,521 | ) | (848,992 | ) | (883,263 | ) | (40,257 | ) | |||||||||||||
JELD-WEN Holding, Inc. | Morgan Stanley | (12,002 | ) | (199,386 | ) | (271,245 | ) | (73,122 | ) | |||||||||||||
Kennametal, Inc. | Morgan Stanley | (19,451 | ) | (591,453 | ) | (562,912 | ) | 21,110 | ||||||||||||||
Kratos Defense & Security Solutions, Inc. | Morgan Stanley | (15,417 | ) | (304,742 | ) | (297,240 | ) | 6,660 | ||||||||||||||
Mercury Systems, Inc. | Morgan Stanley | (1,336 | ) | (103,356 | ) | (103,487 | ) | (399 | ) | |||||||||||||
Meritor, Inc. | Morgan Stanley | (20,867 | ) | (514,883 | ) | (436,955 | ) | 76,497 | ||||||||||||||
Moog, Inc., Class A | Morgan Stanley | (4,926 | ) | (433,736 | ) | (312,949 | ) | 116,767 | ||||||||||||||
Mueller Water Products, Inc., Class A | Morgan Stanley | (54,648 | ) | (568,697 | ) | (567,793 | ) | (12,171 | ) | |||||||||||||
Nordson Corp. | Morgan Stanley | (1,199 | ) | (231,835 | ) | (229,992 | ) | 1,212 | ||||||||||||||
NV5 Global, Inc. | Morgan Stanley | (6,456 | ) | (417,708 | ) | (340,683 | ) | 75,930 | ||||||||||||||
Patrick Industries, Inc. | Morgan Stanley | (5,689 | ) | (254,981 | ) | (327,231 | ) | (77,174 | ) | |||||||||||||
PGT Innovations, Inc. | Morgan Stanley | (25,662 | ) | (415,501 | ) | (449,598 | ) | (35,362 | ) | |||||||||||||
Primoris Services Corp. | Morgan Stanley | (8,731 | ) | (177,327 | ) | (157,507 | ) | 17,012 | ||||||||||||||
Proto Labs, Inc. | Morgan Stanley | (5,786 | ) | (766,740 | ) | (749,287 | ) | 11,440 | ||||||||||||||
Raytheon Technologies Corp. | Morgan Stanley | (8,476 | ) | (534,537 | ) | (487,709 | ) | 49,280 | ||||||||||||||
RBC Bearings, Inc. | Morgan Stanley | (1,107 | ) | (176,025 | ) | (134,179 | ) | 43,123 | ||||||||||||||
Resideo Technologies, Inc. | Morgan Stanley | (53,283 | ) | (643,519 | ) | (586,113 | ) | 56,262 | ||||||||||||||
REV Group, Inc. | Morgan Stanley | (14,364 | ) | (163,850 | ) | (113,332 | ) | 48,047 | ||||||||||||||
Rockwell Automation, Inc. | Morgan Stanley | (463 | ) | (107,757 | ) | (102,175 | ) | 4,895 | ||||||||||||||
Sensata Technologies Holding PLC (United Kingdom) | Morgan Stanley | (6,556 | ) | (273,077 | ) | (282,826 | ) | (10,598 | ) | |||||||||||||
Spirit AeroSystems Holdings, Inc., Class A | Morgan Stanley | (41,164 | ) | (1,004,498 | ) | (778,411 | ) | 225,127 | ||||||||||||||
Stanley Black & Decker, Inc. | Morgan Stanley | (8,388 | ) | (1,192,198 | ) | (1,360,534 | ) | (177,699 | ) | |||||||||||||
Sunrun, Inc. | Morgan Stanley | (5,502 | ) | (96,446 | ) | (424,039 | ) | (377,198 | ) | |||||||||||||
Trex Co., Inc. | Morgan Stanley | (14,546 | ) | (1,040,624 | ) | (1,041,494 | ) | (3,785 | ) | |||||||||||||
Vicor Corp. | Morgan Stanley | (4,791 | ) | (203,106 | ) | (372,404 | ) | (172,997 | ) | |||||||||||||
Wabash National Corp. | Morgan Stanley | (7,318 | ) | (76,619 | ) | (87,523 | ) | (12,103 | ) | |||||||||||||
WESCO International, Inc. | Morgan Stanley | (21,574 | ) | (1,004,159 | ) | (949,687 | ) | 51,659 | ||||||||||||||
Xylem, Inc. | Morgan Stanley | (9,485 | ) | (759,214 | ) | (797,878 | ) | (41,860 | ) | |||||||||||||
|
|
|
|
|
|
|
| |||||||||||||||
| (532,184 | ) | (21,806,388 | ) | (21,171,917 | ) | 422,242 | ||||||||||||||||
|
|
|
|
|
|
|
| |||||||||||||||
Commercial & Professional Services | ||||||||||||||||||||||
Brink’s Co. (The) | Morgan Stanley | (3,534 | ) | (291,491 | ) | (145,212 | ) | 144,419 | ||||||||||||||
Casella Waste Systems, Inc., Class A | Morgan Stanley | (4,896 | ) | (220,810 | ) | (273,442 | ) | (53,508 | ) | |||||||||||||
Covanta Holding Corp. | Morgan Stanley | (28,022 | ) | (477,072 | ) | (217,171 | ) | 236,620 | ||||||||||||||
Forrester Research, Inc. | Morgan Stanley | (3,180 | ) | (110,789 | ) | (104,272 | ) | 6,250 | ||||||||||||||
Harsco Corp. | Morgan Stanley | (5,606 | ) | (82,182 | ) | (77,979 | ) | 3,994 | ||||||||||||||
The accompanying notes are an integral part of the financial statements.
86
GOTHAM ENHANCED RETURN FUND
Portfolio of Investments (Continued)
September 30, 2020
Total Return Swaps (continued)
Reference Entity | Counterparty | Number of Contracts Long/(Short) | Notional Amount | Value | Unrealized Appreciation/ (Depreciation)* | ||||||||||||||||||
Commercial & Professional Services — (continued) |
| ||||||||||||||||||||||
HNI Corp. | Morgan Stanley | (4,978 | ) | $ | (170,094 | ) | $ | (156,210 | ) | $ | 7,330 | ||||||||||||
IAA, Inc. | Morgan Stanley | (1,731 | ) | (91,277 | ) | (90,133 | ) | 910 | |||||||||||||||
Insperity, Inc. | Morgan Stanley | (17,964 | ) | (1,659,162 | ) | (1,176,462 | ) | 456,509 | |||||||||||||||
Knoll, Inc. | Morgan Stanley | (642 | ) | (8,224 | ) | (7,743 | ) | 481 | |||||||||||||||
Korn Ferry | Morgan Stanley | (8,607 | ) | (363,653 | ) | (249,603 | ) | 110,343 | |||||||||||||||
US Ecology, Inc. | Morgan Stanley | (14,493 | ) | (762,239 | ) | (473,486 | ) | 285,040 | |||||||||||||||
|
|
|
|
|
|
|
| ||||||||||||||||
| (93,653 | ) | (4,236,993 | ) | (2,971,713 | ) | 1,198,388 | |||||||||||||||||
|
|
|
|
|
|
|
| ||||||||||||||||
Consumer Durables & Apparel | |||||||||||||||||||||||
Acushnet Holdings Corp. | Morgan Stanley | (4,319 | ) | (150,550 | ) | (145,161 | ) | 4,540 | |||||||||||||||
Callaway Golf Co. | Morgan Stanley | (44,362 | ) | (843,985 | ) | (849,089 | ) | (7,704 | ) | ||||||||||||||
Canada Goose Holdings, Inc. (Canada) | Morgan Stanley | (6,561 | ) | (284,006 | ) | (211,067 | ) | 74,595 | |||||||||||||||
Columbia Sportswear Co. | Morgan Stanley | (7,781 | ) | (734,325 | ) | (676,791 | ) | 50,885 | |||||||||||||||
G-III Apparel Group Ltd. | Morgan Stanley | (1,544 | ) | (42,736 | ) | (20,242 | ) | 22,397 | |||||||||||||||
Gildan Activewear, Inc. (Canada) | Morgan Stanley | (16,268 | ) | (592,379 | ) | (319,992 | ) | 275,552 | |||||||||||||||
GoPro, Inc., Class A | Morgan Stanley | (84,996 | ) | (390,021 | ) | (385,032 | ) | 3,911 | |||||||||||||||
Hasbro, Inc. | Morgan Stanley | (5,946 | ) | (470,690 | ) | (491,853 | ) | (22,469 | ) | ||||||||||||||
iRobot Corp. | Morgan Stanley | (5,169 | ) | (381,580 | ) | (392,327 | ) | (16,651 | ) | ||||||||||||||
Levi Strauss & Co., Class A | Morgan Stanley | (44,997 | ) | (811,456 | ) | (602,960 | ) | 198,006 | |||||||||||||||
Malibu Boats, Inc., Class A | Morgan Stanley | (1,390 | ) | (70,806 | ) | (68,888 | ) | 1,741 | |||||||||||||||
Oxford Industries, Inc. | Morgan Stanley | (2,283 | ) | (103,501 | ) | (92,142 | ) | 11,015 | |||||||||||||||
Ralph Lauren Corp. | Morgan Stanley | (1,689 | ) | (129,045 | ) | (114,801 | ) | 14,617 | |||||||||||||||
Skechers U.S.A., Inc., Class A | Morgan Stanley | (12,901 | ) | (473,106 | ) | (389,868 | ) | 82,223 | |||||||||||||||
Tapestry, Inc. | Morgan Stanley | (9,153 | ) | (147,497 | ) | (143,061 | ) | 3,843 | |||||||||||||||
Under Armour, Inc., Class C | Morgan Stanley | (79,497 | ) | (745,429 | ) | (782,250 | ) | (38,903 | ) | ||||||||||||||
VF Corp. | Morgan Stanley | (5,632 | ) | (366,917 | ) | (395,648 | ) | (34,431 | ) | ||||||||||||||
Vista Outdoor, Inc. | Morgan Stanley | (6,965 | ) | (113,294 | ) | (140,554 | ) | (30,489 | ) | ||||||||||||||
Wolverine World Wide, Inc. | Morgan Stanley | (37,484 | ) | (1,076,548 | ) | (968,587 | ) | 87,237 | |||||||||||||||
|
|
|
|
|
|
|
| ||||||||||||||||
| (378,937 | ) | (7,927,871 | ) | (7,190,313 | ) | 679,915 | |||||||||||||||||
|
|
|
|
|
|
|
| ||||||||||||||||
Consumer Services | |||||||||||||||||||||||
Aramark | Morgan Stanley | (17,444 | ) | (725,075 | ) | (461,394 | ) | 257,637 | |||||||||||||||
Bright Horizons Family Solutions, Inc. | Morgan Stanley | (3,740 | ) | (553,052 | ) | (568,630 | ) | (17,116 | ) | ||||||||||||||
Brinker International, Inc. | Morgan Stanley | (7,816 | ) | (364,293 | ) | (333,900 | ) | 24,062 | |||||||||||||||
Carnival Corp. (Panama) | Morgan Stanley | (38,074 | ) | (568,125 | ) | (577,963 | ) | (11,419 | ) | ||||||||||||||
Cheesecake Factory, Inc. (The) | Morgan Stanley | (16,104 | ) | (379,763 | ) | (446,725 | ) | (70,857 | ) | ||||||||||||||
Choice Hotels International, Inc. | Morgan Stanley | (1,525 | ) | (144,683 | ) | (131,089 | ) | 13,209 | |||||||||||||||
Churchill Downs, Inc. | Morgan Stanley | (730 | ) | (103,365 | ) | (119,589 | ) | (16,492 | ) | ||||||||||||||
Collectors Universe, Inc. | Morgan Stanley | (321 | ) | (16,691 | ) | (15,886 | ) | 781 | |||||||||||||||
Cracker Barrel Old Country Store, Inc. | Morgan Stanley | (1,722 | ) | (203,908 | ) | (197,445 | ) | 6,526 | |||||||||||||||
Darden Restaurants, Inc. | Morgan Stanley | (5,325 | ) | (639,436 | ) | (536,441 | ) | 101,213 | |||||||||||||||
Dave & Buster’s Entertainment, Inc. | Morgan Stanley | (24,536 | ) | (375,843 | ) | (371,966 | ) | 2,839 | |||||||||||||||
Domino’s Pizza, Inc. | Morgan Stanley | (1,583 | ) | (655,422 | ) | (673,218 | ) | (19,624 | ) | ||||||||||||||
Dunkin’ Brands Group, Inc. | Morgan Stanley | (3,082 | ) | (237,982 | ) | (252,447 | ) | (15,161 | ) | ||||||||||||||
Graham Holdings Co., Class B | Morgan Stanley | (437 | ) | (278,744 | ) | (176,596 | ) | 99,483 | |||||||||||||||
International Game Technology PLC (United Kingdom) | Morgan Stanley | (13,044 | ) | (145,104 | ) | (145,180 | ) | (462 | ) | ||||||||||||||
K12, Inc. | Morgan Stanley | (14,615 | ) | (385,794 | ) | (384,959 | ) | (2,059 | ) | ||||||||||||||
The accompanying notes are an integral part of the financial statements.
87
GOTHAM ENHANCED RETURN FUND
Portfolio of Investments (Continued)
September 30, 2020
Total Return Swaps (continued)
Reference Entity | Counterparty | Number of Contracts Long/(Short) | Notional Amount | Value | Unrealized Appreciation/ (Depreciation)* | |||||||||||||||||
Consumer Services — (continued) | ||||||||||||||||||||||
Las Vegas Sands Corp. | Morgan Stanley | (11,810 | ) | $ | (551,928 | ) | $ | (551,055 | ) | $ | (1,291 | ) | ||||||||||
Monarch Casino & Resort, Inc. | Morgan Stanley | (5,014 | ) | (220,064 | ) | (223,624 | ) | (4,168 | ) | |||||||||||||
Planet Fitness, Inc., Class A | Morgan Stanley | (42 | ) | (2,507 | ) | (2,588 | ) | (64 | ) | |||||||||||||
Red Rock Resorts, Inc., Class A | Morgan Stanley | (9,784 | ) | (216,458 | ) | (167,306 | ) | 46,384 | ||||||||||||||
Restaurant Brands International, Inc. (Canada) | Morgan Stanley | (6,055 | ) | (339,950 | ) | (348,223 | ) | (10,491 | ) | |||||||||||||
ServiceMaster Global Holdings, Inc. | Morgan Stanley | (8,290 | ) | (313,317 | ) | (330,605 | ) | (18,592 | ) | |||||||||||||
Starbucks Corp. | Morgan Stanley | (3,471 | ) | (291,395 | ) | (298,228 | ) | (15,128 | ) | |||||||||||||
Texas Roadhouse, Inc. | Morgan Stanley | (6,078 | ) | (344,662 | ) | (369,482 | ) | (27,877 | ) | |||||||||||||
Twin River Worldwide Holdings, Inc. | Morgan Stanley | (163 | ) | (4,022 | ) | (4,282 | ) | (248 | ) | |||||||||||||
Wendy’s Co. (The) | Morgan Stanley | (2,321 | ) | (50,339 | ) | (51,747 | ) | (1,526 | ) | |||||||||||||
Wynn Resorts Ltd. | Morgan Stanley | (5,106 | ) | (402,883 | ) | (366,662 | ) | 35,107 | ||||||||||||||
|
|
|
|
|
|
|
| |||||||||||||||
| (208,232 | ) | (8,514,805 | ) | (8,107,230 | ) | 354,666 | ||||||||||||||||
|
|
|
|
|
|
|
| |||||||||||||||
Diversified Financials | ||||||||||||||||||||||
Assetmark Financial Holdings, Inc. | Morgan Stanley | (8 | ) | (179 | ) | (174 | ) | 28 | ||||||||||||||
Blucora, Inc. | Morgan Stanley | (45 | ) | (427 | ) | (424 | ) | 25 | ||||||||||||||
Invesco Ltd. (Bermuda) | Morgan Stanley | (3,685 | ) | (41,960 | ) | (42,046 | ) | (181 | ) | |||||||||||||
State Street Corp. | Morgan Stanley | (1,473 | ) | (85,999 | ) | (87,393 | ) | (2,379 | ) | |||||||||||||
|
|
|
|
|
|
|
| |||||||||||||||
| (5,211 | ) | (128,565 | ) | (130,037 | ) | (2,507 | ) | |||||||||||||||
|
|
|
|
|
|
|
| |||||||||||||||
Energy | ||||||||||||||||||||||
Archrock, Inc. | Morgan Stanley | (23,186 | ) | (232,538 | ) | (124,741 | ) | 95,255 | ||||||||||||||
Cabot Oil & Gas Corp. | Morgan Stanley | (38,837 | ) | (777,578 | ) | (674,210 | ) | 99,927 | ||||||||||||||
ChampionX Corp. | Morgan Stanley | (25,749 | ) | (223,916 | ) | (205,735 | ) | 17,573 | ||||||||||||||
CNX Resources Corp. | Morgan Stanley | (35,386 | ) | (395,193 | ) | (334,044 | ) | 60,367 | ||||||||||||||
Comstock Resources, Inc. | Morgan Stanley | (1,367 | ) | (6,098 | ) | (5,987 | ) | 116 | ||||||||||||||
Continental Resources, Inc. | Morgan Stanley | (14,971 | ) | (272,051 | ) | (183,844 | ) | 88,159 | ||||||||||||||
Delek US Holdings, Inc. | Morgan Stanley | (63,093 | ) | (1,109,717 | ) | (702,225 | ) | 368,024 | ||||||||||||||
Diamondback Energy, Inc. | Morgan Stanley | (27,386 | ) | (2,510,684 | ) | (824,866 | ) | 1,643,948 | ||||||||||||||
Dril-Quip, Inc. | Morgan Stanley | (8,407 | ) | (247,284 | ) | (208,157 | ) | 38,451 | ||||||||||||||
EQT Corp. | Morgan Stanley | (6,264 | ) | (95,771 | ) | (80,994 | ) | 17,852 | ||||||||||||||
Equitrans Midstream Corp. | Morgan Stanley | (108,638 | ) | (1,510,378 | ) | (919,077 | ) | 467,774 | ||||||||||||||
Exxon Mobil Corp. | Morgan Stanley | (6,122 | ) | (262,856 | ) | (210,168 | ) | 48,022 | ||||||||||||||
Hess Corp. | Morgan Stanley | (16,789 | ) | (1,045,239 | ) | (687,174 | ) | 342,786 | ||||||||||||||
Marathon Oil Corp. | Morgan Stanley | (50,826 | ) | (517,636 | ) | (207,878 | ) | 308,319 | ||||||||||||||
Noble Energy, Inc. | Morgan Stanley | (29,737 | ) | (643,506 | ) | (254,251 | ) | 383,333 | ||||||||||||||
Occidental Petroleum Corp. | Morgan Stanley | (40,544 | ) | (1,210,983 | ) | (405,845 | ) | 769,512 | ||||||||||||||
ONEOK, Inc. | Morgan Stanley | (10,979 | ) | (748,257 | ) | (285,234 | ) | 433,559 | ||||||||||||||
Ovintiv, Inc. | Morgan Stanley | (28,751 | ) | (312,104 | ) | (234,608 | ) | 74,361 | ||||||||||||||
Parsley Energy, Inc., Class A | Morgan Stanley | (55,001 | ) | (567,897 | ) | (514,809 | ) | 48,491 | ||||||||||||||
PDC Energy, Inc. | Morgan Stanley | (9,578 | ) | (138,813 | ) | (118,719 | ) | 19,844 | ||||||||||||||
Pembina Pipeline Corp. (Canada) | Morgan Stanley | (23,871 | ) | (664,000 | ) | (506,781 | ) | 135,336 | ||||||||||||||
Pioneer Natural Resources Co. | Morgan Stanley | (4,165 | ) | (574,722 | ) | (358,148 | ) | 208,116 | ||||||||||||||
RPC, Inc. | Morgan Stanley | (55,780 | ) | (251,849 | ) | (147,259 | ) | 103,902 | ||||||||||||||
SFL Corp. Ltd. (Bermuda) | Morgan Stanley | (50,947 | ) | (697,587 | ) | (381,593 | ) | 235,339 | ||||||||||||||
Southwestern Energy Co. | Morgan Stanley | (541,764 | ) | (1,355,085 | ) | (1,273,145 | ) | 78,058 | ||||||||||||||
Suncor Energy, Inc. (Canada) | Morgan Stanley | (7,968 | ) | (133,654 | ) | (97,449 | ) | 35,357 | ||||||||||||||
The accompanying notes are an integral part of the financial statements.
88
GOTHAM ENHANCED RETURN FUND
Portfolio of Investments (Continued)
September 30, 2020
Total Return Swaps (continued)
Reference Entity | Counterparty | Number of Contracts Long/(Short) | Notional Amount | Value | Unrealized Appreciation/ (Depreciation)* | |||||||||||||||||
Energy — (continued) | ||||||||||||||||||||||
Talos Energy, Inc. | Morgan Stanley | (4,874 | ) | $ | (57,659 | ) | $ | (31,437 | ) | $ | 26,447 | |||||||||||
Targa Resources Corp. | Morgan Stanley | (23,078 | ) | (908,031 | ) | (323,784 | ) | 566,762 | ||||||||||||||
TC Energy Corp. (Canada) | Morgan Stanley | (12,228 | ) | (571,359 | ) | (513,821 | ) | 42,662 | ||||||||||||||
Vermilion Energy, Inc. (Canada) | Morgan Stanley | (1,181 | ) | (5,224 | ) | (2,764 | ) | 2,469 | ||||||||||||||
WPX Energy, Inc. | Morgan Stanley | (61,507 | ) | (521,319 | ) | (301,384 | ) | 218,485 | ||||||||||||||
|
|
|
|
|
|
|
| |||||||||||||||
| (1,388,974 | ) | (18,568,988 | ) | (11,120,131 | ) | 6,978,606 | ||||||||||||||||
|
|
|
|
|
|
|
| |||||||||||||||
Food & Staples Retailing | ||||||||||||||||||||||
Grocery Outlet Holding Corp. | Morgan Stanley | (18,717 | ) | (764,178 | ) | (735,952 | ) | 26,090 | ||||||||||||||
Performance Food Group Co. | Morgan Stanley | (7,931 | ) | (229,598 | ) | (274,571 | ) | (50,323 | ) | |||||||||||||
PriceSmart, Inc. | Morgan Stanley | (6,675 | ) | (419,145 | ) | (443,554 | ) | (30,881 | ) | |||||||||||||
Rite Aid Corp. | Morgan Stanley | (2,220 | ) | (23,129 | ) | (21,068 | ) | 2,019 | ||||||||||||||
United Natural Foods, Inc. | Morgan Stanley | (2,284 | ) | (39,350 | ) | (33,963 | ) | 5,299 | ||||||||||||||
US Foods Holding Corp. | Morgan Stanley | (17,530 | ) | (716,851 | ) | (389,517 | ) | 325,333 | ||||||||||||||
|
|
|
|
|
|
|
| |||||||||||||||
| (55,357 | ) | (2,192,251 | ) | (1,898,625 | ) | 277,537 | ||||||||||||||||
|
|
|
|
|
|
|
| |||||||||||||||
Food, Beverage & Tobacco | ||||||||||||||||||||||
Beyond Meat, Inc. | Morgan Stanley | (1,342 | ) | (179,423 | ) | (222,853 | ) | (59,237 | ) | |||||||||||||
Calavo Growers, Inc. | Morgan Stanley | (7,087 | ) | (507,130 | ) | (469,655 | ) | 33,259 | ||||||||||||||
Campbell Soup Co. | Morgan Stanley | (2,066 | ) | (99,543 | ) | (99,932 | ) | 225 | ||||||||||||||
Fresh Del Monte Produce, Inc. (Cayman Islands) | Morgan Stanley | (10,422 | ) | (276,913 | ) | (238,872 | ) | 34,630 | ||||||||||||||
Freshpet, Inc. | Morgan Stanley | (842 | ) | (42,477 | ) | (94,009 | ) | (52,057 | ) | |||||||||||||
Hostess Brands, Inc. | Morgan Stanley | (17,499 | ) | (212,356 | ) | (215,763 | ) | (4,182 | ) | |||||||||||||
J&J Snack Foods Corp. | Morgan Stanley | (2,379 | ) | (366,699 | ) | (310,198 | ) | 52,234 | ||||||||||||||
Lamb Weston Holdings, Inc. | Morgan Stanley | (8,730 | ) | (580,292 | ) | (578,537 | ) | 140 | ||||||||||||||
MGP Ingredients, Inc. | Morgan Stanley | (7,827 | ) | (391,431 | ) | (311,045 | ) | 75,703 | ||||||||||||||
Pilgrim’s Pride Corp. | Morgan Stanley | (34,136 | ) | (621,127 | ) | (510,845 | ) | 108,551 | ||||||||||||||
Primo Water Corp. (Canada) | Morgan Stanley | (35,319 | ) | (474,442 | ) | (501,530 | ) | (33,819 | ) | |||||||||||||
Sanderson Farms, Inc. | Morgan Stanley | (7,900 | ) | (950,812 | ) | (931,963 | ) | 13,691 | ||||||||||||||
Simply Good Foods Co. (The) | Morgan Stanley | (14,471 | ) | (357,291 | ) | (319,086 | ) | 37,944 | ||||||||||||||
Universal Corp. | Morgan Stanley | (3,718 | ) | (181,028 | ) | (155,710 | ) | 20,803 | ||||||||||||||
|
|
|
|
|
|
|
| |||||||||||||||
| (153,738 | ) | (5,240,964 | ) | (4,959,998 | ) | 227,885 | ||||||||||||||||
|
|
|
|
|
|
|
| |||||||||||||||
Health Care Equipment & Services | ||||||||||||||||||||||
ABIOMED, Inc. | Morgan Stanley | (908 | ) | (222,764 | ) | (251,570 | ) | (33,507 | ) | |||||||||||||
Alcon, Inc. (Switzerland) | Morgan Stanley | (112 | ) | (6,397 | ) | (6,378 | ) | 24 | ||||||||||||||
Align Technology, Inc. | Morgan Stanley | (2,633 | ) | (813,705 | ) | (861,939 | ) | (52,475 | ) | |||||||||||||
Amedisys, Inc. | Morgan Stanley | (762 | ) | (162,514 | ) | (180,160 | ) | (20,121 | ) | |||||||||||||
AMN Healthcare Services, Inc. | Morgan Stanley | (851 | ) | (47,465 | ) | (49,749 | ) | (2,842 | ) | |||||||||||||
AtriCure, Inc. | Morgan Stanley | (3,232 | ) | (132,349 | ) | (128,957 | ) | 3,042 | ||||||||||||||
Avanos Medical, Inc. | Morgan Stanley | (11,619 | ) | (422,051 | ) | (385,983 | ) | 34,911 | ||||||||||||||
Axogen, Inc. | Morgan Stanley | (24,206 | ) | (370,213 | ) | (281,516 | ) | 87,724 | ||||||||||||||
BioTelemetry, Inc. | Morgan Stanley | (6,570 | ) | (317,299 | ) | (299,461 | ) | 16,892 | ||||||||||||||
Boston Scientific Corp. | Morgan Stanley | (5,892 | ) | (234,430 | ) | (225,133 | ) | 9,031 | ||||||||||||||
Brookdale Senior Living, Inc. | Morgan Stanley | (36,186 | ) | (197,394 | ) | (91,912 | ) | 105,048 | ||||||||||||||
Cantel Medical Corp. | Morgan Stanley | (22,163 | ) | (1,878,145 | ) | (973,842 | ) | 902,212 | ||||||||||||||
Cardiovascular Systems, Inc. | Morgan Stanley | (7,476 | ) | (341,456 | ) | (294,181 | ) | 46,334 | ||||||||||||||
The accompanying notes are an integral part of the financial statements.
89
GOTHAM ENHANCED RETURN FUND
Portfolio of Investments (Continued)
September 30, 2020
Total Return Swaps (continued)
Reference Entity | Counterparty | Number of Contracts Long/(Short) | Notional Amount | Value | Unrealized Appreciation/ (Depreciation)* | ||||||||||||||||||||
Health Care Equipment & Services — (continued) |
| ||||||||||||||||||||||||
Change Healthcare, Inc. | Morgan Stanley | (5,385 | ) | $ | (63,518 | ) | $ | (78,136 | ) | $ | (16,159 | ) | |||||||||||||
Cooper Cos., Inc. (The) | Morgan Stanley | (2,560 | ) | (804,175 | ) | (863,027 | ) | (61,157 | ) | ||||||||||||||||
CorVel Corp. | Morgan Stanley | (302 | ) | (25,233 | ) | (25,800 | ) | (615 | ) | ||||||||||||||||
Edwards Lifesciences Corp. | Morgan Stanley | (3,448 | ) | (276,802 | ) | (275,219 | ) | 551 | |||||||||||||||||
Encompass Health Corp. | Morgan Stanley | (5,720 | ) | (450,113 | ) | (371,686 | ) | 72,296 | |||||||||||||||||
Envista Holdings Corp. | Morgan Stanley | (4,259 | ) | (108,094 | ) | (105,112 | ) | 2,700 | |||||||||||||||||
Evolent Health, Inc., Class A | Morgan Stanley | (14,237 | ) | (113,327 | ) | (176,681 | ) | (65,665 | ) | ||||||||||||||||
GenMark Diagnostics, Inc. | Morgan Stanley | (5,912 | ) | (57,981 | ) | (83,950 | ) | (26,903 | ) | ||||||||||||||||
Glaukos Corp. | Morgan Stanley | (20,782 | ) | (1,222,211 | ) | (1,029,125 | ) | 185,833 | |||||||||||||||||
Guardant Health, Inc. | Morgan Stanley | (3,506 | ) | (315,710 | ) | (391,901 | ) | (82,526 | ) | ||||||||||||||||
Haemonetics Corp. | Morgan Stanley | (3,030 | ) | (270,377 | ) | (264,368 | ) | 5,269 | |||||||||||||||||
HealthEquity, Inc. | Morgan Stanley | (12,165 | ) | (884,532 | ) | (624,916 | ) | 260,360 | |||||||||||||||||
ICU Medical, Inc. | Morgan Stanley | (314 | ) | (67,287 | ) | (57,387 | ) | 10,617 | |||||||||||||||||
Inovalon Holdings, Inc., Class A | Morgan Stanley | (4,602 | ) | (87,810 | ) | (121,723 | ) | (34,137 | ) | ||||||||||||||||
Laboratory Corp. of America Holdings | Morgan Stanley | (3,340 | ) | (611,030 | ) | (628,822 | ) | (19,494 | ) | ||||||||||||||||
Lantheus Holdings, Inc. | Morgan Stanley | (120 | ) | (1,494 | ) | (1,520 | ) | (7 | ) | ||||||||||||||||
LHC Group, Inc. | Morgan Stanley | (2,470 | ) | (401,519 | ) | (525,023 | ) | (127,774 | ) | ||||||||||||||||
LivaNova PLC (United Kingdom) | Morgan Stanley | (7,029 | ) | (378,608 | ) | (317,781 | ) | 60,712 | |||||||||||||||||
Merit Medical Systems, Inc. | Morgan Stanley | (8,192 | ) | (302,287 | ) | (356,352 | ) | (57,348 | ) | ||||||||||||||||
Mesa Laboratories, Inc. | Morgan Stanley | (1,145 | ) | (272,539 | ) | (291,700 | ) | (20,275 | ) | ||||||||||||||||
NuVasive, Inc. | Morgan Stanley | (10,987 | ) | (577,256 | ) | (533,638 | ) | 41,997 | |||||||||||||||||
OraSure Technologies, Inc. | Morgan Stanley | (28,420 | ) | (349,647 | ) | (345,871 | ) | 2,812 | |||||||||||||||||
Penumbra, Inc. | Morgan Stanley | (2,836 | ) | (502,253 | ) | (551,262 | ) | (50,762 | ) | ||||||||||||||||
PetIQ, Inc. | Morgan Stanley | (22,757 | ) | (691,716 | ) | (749,160 | ) | (59,587 | ) | ||||||||||||||||
Phreesia, Inc. | Morgan Stanley | (2,334 | ) | (68,931 | ) | (74,991 | ) | (6,232 | ) | ||||||||||||||||
Progyny, Inc. | Morgan Stanley | (1,230 | ) | (34,957 | ) | (36,199 | ) | (1,318 | ) | ||||||||||||||||
Providence Service Corp. (The) | Morgan Stanley | (3,844 | ) | (237,422 | ) | (357,146 | ) | (121,816 | ) | ||||||||||||||||
RadNet, Inc. | Morgan Stanley | (13,196 | ) | (189,989 | ) | (202,559 | ) | (13,083 | ) | ||||||||||||||||
Simulations Plus, Inc. | Morgan Stanley | (221 | ) | (16,186 | ) | (16,655 | ) | (491 | ) | ||||||||||||||||
SmileDirectClub, Inc. | Morgan Stanley | (37,152 | ) | (401,083 | ) | (433,935 | ) | (33,962 | ) | ||||||||||||||||
STAAR Surgical Co. | Morgan Stanley | (5,435 | ) | (233,046 | ) | (307,404 | ) | (74,992 | ) | ||||||||||||||||
Tabula Rasa HealthCare, Inc. | Morgan Stanley | (12,363 | ) | (673,809 | ) | (504,040 | ) | 167,890 | |||||||||||||||||
Tactile Systems Technology, Inc. | Morgan Stanley | (4,603 | ) | (171,079 | ) | (168,424 | ) | 2,195 | |||||||||||||||||
US Physical Therapy, Inc. | Morgan Stanley | (5,224 | ) | (686,745 | ) | (453,861 | ) | 230,360 | |||||||||||||||||
Vapotherm, Inc. | Morgan Stanley | (5,340 | ) | (149,261 | ) | (154,860 | ) | (5,998 | ) | ||||||||||||||||
Varex Imaging Corp. | Morgan Stanley | (667 | ) | (8,028 | ) | (8,484 | ) | (455 | ) | ||||||||||||||||
Vocera Communications, Inc. | Morgan Stanley | (18,868 | ) | (454,035 | ) | (548,681 | ) | (96,772 | ) | ||||||||||||||||
Wright Medical Group NV (Netherlands). | Morgan Stanley | (15,421 | ) | (467,717 | ) | (470,957 | ) | (4,538 | ) | ||||||||||||||||
Zynex, Inc. | Morgan Stanley | (8,767 | ) | (214,337 | ) | (152,984 | ) | 60,771 | |||||||||||||||||
|
|
|
|
|
|
|
| ||||||||||||||||||
| (430,793 | ) | (17,988,326 | ) | (16,692,121 | ) | 1,218,570 | |||||||||||||||||||
|
|
|
|
|
|
|
| ||||||||||||||||||
Household & Personal Products | |||||||||||||||||||||||||
BellRing Brands, Inc., Class A | Morgan Stanley | (3,798 | ) | (65,447 | ) | (78,771 | ) | (13,485 | ) | ||||||||||||||||
Central Garden & Pet Co., Class A | Morgan Stanley | (11,345 | ) | (306,590 | ) | (410,008 | ) | (105,932 | ) | ||||||||||||||||
Coty, Inc., Class A | Morgan Stanley | (30,763 | ) | (97,514 | ) | (83,060 | ) | 14,944 | |||||||||||||||||
Reynolds Consumer Products, Inc. | Morgan Stanley | (5,854 | ) | (190,471 | ) | (179,249 | ) | 10,417 | |||||||||||||||||
The accompanying notes are an integral part of the financial statements.
90
GOTHAM ENHANCED RETURN FUND
Portfolio of Investments (Continued)
September 30, 2020
Total Return Swaps (continued)
Reference Entity | Counterparty | Number of Contracts Long/(Short) | Notional Amount | Value | Unrealized Appreciation/ (Depreciation)* | ||||||||||||||||||
Household & Personal Products — (continued) |
| ||||||||||||||||||||||
WD-40 Co. | Morgan Stanley | (2,449 | ) | $ | (469,758 | ) | $ | (463,620 | ) | $ | 2,163 | ||||||||||||
|
|
|
|
|
|
|
| ||||||||||||||||
| (54,209 | ) | (1,129,780 | ) | (1,214,708 | ) | (91,893 | ) | ||||||||||||||||
|
|
|
|
|
| �� |
| ||||||||||||||||
Materials | |||||||||||||||||||||||
Air Products & Chemicals, Inc. | Morgan Stanley | (415 | ) | (120,165 | ) | (123,612 | ) | (6,082 | ) | ||||||||||||||
Alamos Gold, Inc., Class A (Canada) | Morgan Stanley | (75,957 | ) | (714,176 | ) | (669,181 | ) | 41,915 | |||||||||||||||
Albemarle Corp. | Morgan Stanley | (3,770 | ) | (318,835 | ) | (336,586 | ) | (23,337 | ) | ||||||||||||||
Amyris, Inc. | Morgan Stanley | (19,250 | ) | (61,530 | ) | (56,210 | ) | 5,170 | |||||||||||||||
Avery Dennison Corp. | Morgan Stanley | (1,983 | ) | (247,345 | ) | (253,507 | ) | (6,837 | ) | ||||||||||||||
Balchem Corp. | Morgan Stanley | (1,103 | ) | (111,199 | ) | (107,686 | ) | 3,236 | |||||||||||||||
Ball Corp. | Morgan Stanley | (12,722 | ) | (984,291 | ) | (1,057,453 | ) | (82,931 | ) | ||||||||||||||
Barrick Gold Corp. (Canada) | Morgan Stanley | (14,106 | ) | (390,324 | ) | (396,520 | ) | (7,275 | ) | ||||||||||||||
Cleveland-Cliffs, Inc. | Morgan Stanley | (189,253 | ) | (1,299,322 | ) | (1,215,004 | ) | 63,981 | |||||||||||||||
Corteva, Inc. | Morgan Stanley | (23,061 | ) | (673,337 | ) | (664,387 | ) | 7,071 | |||||||||||||||
Domtar Corp. | Morgan Stanley | (3,423 | ) | (100,026 | ) | (89,922 | ) | 9,924 | |||||||||||||||
Eagle Materials, Inc. | Morgan Stanley | (1,061 | ) | (88,491 | ) | (91,586 | ) | (3,321 | ) | ||||||||||||||
Equinox Gold Corp. (Canada) | Morgan Stanley | (43,920 | ) | (468,063 | ) | (514,303 | ) | (48,530 | ) | ||||||||||||||
Fortuna Silver Mines, Inc. (Canada) | Morgan Stanley | (103,021 | ) | (416,687 | ) | (655,214 | ) | (246,789 | ) | ||||||||||||||
GCP Applied Technologies, Inc. | Morgan Stanley | (7,216 | ) | (146,055 | ) | (151,175 | ) | (5,678 | ) | ||||||||||||||
Graphic Packaging Holding Co. | Morgan Stanley | (19,782 | ) | (284,965 | ) | (278,728 | ) | 3,956 | |||||||||||||||
Greif, Inc., Class A | Morgan Stanley | (353 | ) | (12,529 | ) | (12,782 | ) | (185 | ) | ||||||||||||||
H.B. Fuller Co. | Morgan Stanley | (2,554 | ) | (115,329 | ) | (116,922 | ) | (2,201 | ) | ||||||||||||||
Kirkland Lake Gold Ltd. (Canada) | Morgan Stanley | (11,751 | ) | (490,899 | ) | (572,626 | ) | (90,313 | ) | ||||||||||||||
Livent Corp. | Morgan Stanley | (119,792 | ) | (941,375 | ) | (1,074,534 | ) | (140,736 | ) | ||||||||||||||
Methanex Corp. (Canada) | Morgan Stanley | (9,809 | ) | (237,121 | ) | (239,340 | ) | (5,953 | ) | ||||||||||||||
New Gold, Inc. (Canada) | Morgan Stanley | (61,726 | ) | (77,481 | ) | (104,934 | ) | (30,262 | ) | ||||||||||||||
Olin Corp. | Morgan Stanley | (33,713 | ) | (388,393 | ) | (417,367 | ) | (31,874 | ) | ||||||||||||||
Packaging Corp. of America | Morgan Stanley | (1,632 | ) | (178,361 | ) | (177,970 | ) | (89 | ) | ||||||||||||||
PH Glatfelter Co. | Morgan Stanley | (9,685 | ) | (136,462 | ) | (133,362 | ) | (2,401 | ) | ||||||||||||||
Quaker Chemical Corp. | Morgan Stanley | (2,048 | ) | (353,561 | ) | (368,046 | ) | (16,982 | ) | ||||||||||||||
Scotts Miracle-Gro Co. (The) | Morgan Stanley | (734 | ) | (124,895 | ) | (112,236 | ) | 8,360 | |||||||||||||||
Seabridge Gold, Inc. (Canada) | Morgan Stanley | (806 | ) | (14,814 | ) | (15,137 | ) | (341 | ) | ||||||||||||||
Silgan Holdings, Inc. | Morgan Stanley | (1,858 | ) | (70,807 | ) | (68,319 | ) | 2,112 | |||||||||||||||
Teck Resources Ltd., Class B (Canada) | Morgan Stanley | (19,601 | ) | (339,741 | ) | (272,846 | ) | 63,537 | |||||||||||||||
Tronox Holdings PLC, Class A (United Kingdom) | Morgan Stanley | (57,097 | ) | (529,332 | ) | (449,353 | ) | 64,380 | |||||||||||||||
United States Steel Corp. | Morgan Stanley | (155,637 | ) | (1,524,788 | ) | (1,142,375 | ) | 371,475 | |||||||||||||||
Warrior Met Coal, Inc. | Morgan Stanley | (25,373 | ) | (400,848 | ) | (433,371 | ) | (34,981 | ) | ||||||||||||||
Westlake Chemical Corp. | Morgan Stanley | (2,246 | ) | (148,001 | ) | (141,992 | ) | 3,210 | |||||||||||||||
|
|
|
|
|
|
|
| ||||||||||||||||
| (1,036,458 | ) | (12,509,548 | ) | (12,514,586 | ) | (138,771 | ) | ||||||||||||||||
|
|
|
|
|
|
|
| ||||||||||||||||
Media & Entertainment | |||||||||||||||||||||||
Cardlytics, Inc. | Morgan Stanley | (553 | ) | (36,264 | ) | (39,025 | ) | (2,840 | ) | ||||||||||||||
Cinemark Holdings, Inc. | Morgan Stanley | (20,886 | ) | (284,368 | ) | (208,860 | ) | 74,689 | |||||||||||||||
Comcast Corp., Class A | Morgan Stanley | (34,205 | ) | (1,557,219 | ) | (1,582,323 | ) | (36,688 | ) | ||||||||||||||
Eventbrite, Inc., Class A | Morgan Stanley | (9,508 | ) | (91,905 | ) | (103,162 | ) | (12,578 | ) | ||||||||||||||
EW Scripps Co. (The), Class A | Morgan Stanley | (19,522 | ) | (243,269 | ) | (223,332 | ) | 14,738 | |||||||||||||||
Glu Mobile, Inc. | Morgan Stanley | (112,496 | ) | (922,443 | ) | (863,407 | ) | 56,455 | |||||||||||||||
The accompanying notes are an integral part of the financial statements.
91
GOTHAM ENHANCED RETURN FUND
Portfolio of Investments (Continued)
September 30, 2020
Total Return Swaps (continued)
Reference Entity | Counterparty | Number of Contracts Long/(Short) | Notional Amount | Value | Unrealized Appreciation/ (Depreciation)* | ||||||||||||||||||
Media & Entertainment — (continued) | |||||||||||||||||||||||
Gray Television, Inc. | Morgan Stanley | (3,150 | ) | $ | (55,263 | ) | $ | (43,376 | ) | $ | 12,346 | ||||||||||||
iHeartMedia, Inc., Class A | Morgan Stanley | (8,703 | ) | (77,269 | ) | (70,668 | ) | 6,406 | |||||||||||||||
Live Nation Entertainment, Inc. | Morgan Stanley | (1,785 | ) | (97,169 | ) | (96,176 | ) | 742 | |||||||||||||||
Madison Square Garden Sports Corp. | Morgan Stanley | (1,549 | ) | (293,753 | ) | (233,094 | ) | 69,048 | |||||||||||||||
Meredith Corp. | Morgan Stanley | (25,960 | ) | (868,627 | ) | (340,595 | ) | 504,821 | |||||||||||||||
Nexstar Media Group, Inc., Class A | Morgan Stanley | (10,465 | ) | (1,181,585 | ) | (941,117 | ) | 220,033 | |||||||||||||||
Sciplay Corp., Class A | Morgan Stanley | (3,170 | ) | (49,474 | ) | (51,417 | ) | (2,060 | ) | ||||||||||||||
Sinclair Broadcast Group, Inc., Class A | Morgan Stanley | (57,074 | ) | (1,960,077 | ) | (1,097,533 | ) | 818,807 | |||||||||||||||
TEGNA, Inc. | Morgan Stanley | (67,913 | ) | (1,153,991 | ) | (797,978 | ) | 339,184 | |||||||||||||||
TripAdvisor, Inc. | Morgan Stanley | (48,983 | ) | (1,055,930 | ) | (959,577 | ) | 93,394 | |||||||||||||||
ViacomCBS, Inc., Class B | Morgan Stanley | (2,675 | ) | (73,543 | ) | (74,927 | ) | (2,870 | ) | ||||||||||||||
WideOpenWest, Inc. | Morgan Stanley | (13,920 | ) | (79,224 | ) | (72,245 | ) | 6,807 | |||||||||||||||
World Wrestling Entertainment, Inc., Class A | Morgan Stanley | (31,662 | ) | (1,989,502 | ) | (1,281,361 | ) | 693,653 | |||||||||||||||
Yelp, Inc. | Morgan Stanley | (16,940 | ) | (372,925 | ) | (340,325 | ) | 31,571 | |||||||||||||||
|
|
|
|
|
|
|
| ||||||||||||||||
| (491,119 | ) | (12,443,800 | ) | (9,420,498 | ) | 2,885,658 | |||||||||||||||||
|
|
|
|
|
|
|
| ||||||||||||||||
Pharmaceuticals, Biotechnology & Life Sciences |
| ||||||||||||||||||||||
Adaptive Biotechnologies Corp. | Morgan Stanley | (11,689 | ) | (472,695 | ) | (568,436 | ) | (99,457 | ) | ||||||||||||||
Adverum Biotechnologies, Inc. | Morgan Stanley | (3,552 | ) | (60,314 | ) | (36,586 | ) | 23,582 | |||||||||||||||
Aerie Pharmaceuticals, Inc. | Morgan Stanley | (6,140 | ) | (85,503 | ) | (72,268 | ) | 13,017 | |||||||||||||||
Agios Pharmaceuticals, Inc. | Morgan Stanley | (373 | ) | (12,916 | ) | (13,055 | ) | (153 | ) | ||||||||||||||
Alector, Inc. | Morgan Stanley | (8,695 | ) | (215,444 | ) | (91,602 | ) | 123,257 | |||||||||||||||
Alkermes PLC (Ireland) | Morgan Stanley | (10 | ) | (166 | ) | (166 | ) | 24 | |||||||||||||||
ANI Pharmaceuticals, Inc. | Morgan Stanley | (1,934 | ) | (147,977 | ) | (54,558 | ) | 93,024 | |||||||||||||||
Arcturus Therapeutics Holdings, Inc. | Morgan Stanley | (1,388 | ) | (58,316 | ) | (59,545 | ) | (1,371 | ) | ||||||||||||||
Arrowhead Pharmaceuticals, Inc. | Morgan Stanley | (259 | ) | (11,327 | ) | (11,153 | ) | 166 | |||||||||||||||
Arvinas, Inc. | Morgan Stanley | (10,094 | ) | (310,612 | ) | (238,319 | ) | 71,438 | |||||||||||||||
Aurinia Pharmaceuticals, Inc. (Canada) | Morgan Stanley | (7,021 | ) | (106,413 | ) | (103,419 | ) | 2,717 | |||||||||||||||
Bausch Health Cos, Inc. (Canada) | Morgan Stanley | (48,563 | ) | (826,003 | ) | (754,669 | ) | 69,010 | |||||||||||||||
Castle Biosciences, Inc. | Morgan Stanley | (33 | ) | (1,656 | ) | (1,698 | ) | (24 | ) | ||||||||||||||
Codexis, Inc. | Morgan Stanley | (23,255 | ) | (324,237 | ) | (273,014 | ) | 50,323 | |||||||||||||||
Constellation Pharmaceuticals, Inc. | Morgan Stanley | (137 | ) | (2,719 | ) | (2,776 | ) | (41 | ) | ||||||||||||||
Cronos Group, Inc. (Canada) | Morgan Stanley | (13,629 | ) | (72,118 | ) | (68,281 | ) | 3,656 | |||||||||||||||
Dicerna Pharmaceuticals, Inc. | Morgan Stanley | (1,455 | ) | (34,196 | ) | (26,175 | ) | 7,943 | |||||||||||||||
Dynavax Technologies Corp. | Morgan Stanley | (6,065 | ) | (26,635 | ) | (26,201 | ) | 382 | |||||||||||||||
Endo International PLC (Ireland) | Morgan Stanley | (22,620 | ) | (141,805 | ) | (74,646 | ) | 66,782 | |||||||||||||||
Epizyme, Inc. | Morgan Stanley | (8,247 | ) | (162,029 | ) | (98,387 | ) | 63,208 | |||||||||||||||
Exelixis, Inc. | Morgan Stanley | (154 | ) | (3,755 | ) | (3,765 | ) | 3 | |||||||||||||||
Gossamer Bio, Inc. | Morgan Stanley | (3,479 | ) | (53,511 | ) | (43,174 | ) | 10,460 | |||||||||||||||
Intersect ENT, Inc. | Morgan Stanley | (6,321 | ) | (123,480 | ) | (103,096 | ) | 20,081 | |||||||||||||||
Kala Pharmaceuticals, Inc. | Morgan Stanley | (8,788 | ) | (78,175 | ) | (65,910 | ) | 12,066 | |||||||||||||||
Karuna Therapeutics, Inc. | Morgan Stanley | (36 | ) | (2,820 | ) | (2,784 | ) | 52 | |||||||||||||||
Ligand Pharmaceuticals, Inc. | Morgan Stanley | (2,855 | ) | (320,279 | ) | (272,139 | ) | 47,259 | |||||||||||||||
Mettler-Toledo International, Inc. | Morgan Stanley | (132 | ) | (118,271 | ) | (127,479 | ) | (9,519 | ) | ||||||||||||||
Molecular Templates, Inc. | Morgan Stanley | (67 | ) | (1,153 | ) | (732 | ) | 434 | |||||||||||||||
Myriad Genetics, Inc. | Morgan Stanley | (33,053 | ) | (987,793 | ) | (431,011 | ) | 558,297 | |||||||||||||||
The accompanying notes are an integral part of the financial statements.
92
GOTHAM ENHANCED RETURN FUND
Portfolio of Investments (Continued)
September 30, 2020
Total Return Swaps (continued)
Reference Entity | Counterparty | Number of Contracts Long/(Short) | Notional Amount | Value | Unrealized Appreciation/ (Depreciation)* | ||||||||||||||||||
Pharmaceuticals, Biotechnology & Life Sciences — (continued) |
| ||||||||||||||||||||||
NanoString Technologies, Inc. | Morgan Stanley | (6,789 | ) | $ | (181,836 | ) | $ | (303,468 | ) | $ | (123,208 | ) | |||||||||||
NeoGenomics, Inc. | Morgan Stanley | (7,758 | ) | (222,152 | ) | (286,193 | ) | (64,765 | ) | ||||||||||||||
NGM Biopharmaceuticals, Inc. | Morgan Stanley | (214 | ) | (3,439 | ) | (3,405 | ) | 48 | |||||||||||||||
OPKO Health, Inc. | Morgan Stanley | (4,649 | ) | (15,793 | ) | (17,155 | ) | (1,826 | ) | ||||||||||||||
Pacific Biosciences of California, Inc. | Morgan Stanley | (88,804 | ) | (487,534 | ) | (876,495 | ) | (398,068 | ) | ||||||||||||||
Pacira BioSciences, Inc. | Morgan Stanley | (8,285 | ) | (492,205 | ) | (498,094 | ) | (7,650 | ) | ||||||||||||||
Perrigo Co. PLC (Ireland) | Morgan Stanley | (6,189 | ) | (373,134 | ) | (284,137 | ) | 83,789 | |||||||||||||||
PRA Health Sciences, Inc. | Morgan Stanley | (4,251 | ) | (432,951 | ) | (431,221 | ) | (140 | ) | ||||||||||||||
PTC Therapeutics, Inc. | Morgan Stanley | (5,091 | ) | (256,758 | ) | (238,004 | ) | 18,345 | |||||||||||||||
Reata Pharmaceuticals, Inc., Class A | Morgan Stanley | (7,532 | ) | (941,167 | ) | (733,767 | ) | 204,765 | |||||||||||||||
REGENXBIO, Inc. | Morgan Stanley | (9,996 | ) | (378,090 | ) | (275,090 | ) | 101,951 | |||||||||||||||
Rubius Therapeutics, Inc. | Morgan Stanley | (3,718 | ) | (30,921 | ) | (18,627 | ) | 12,230 | |||||||||||||||
Sage Therapeutics, Inc. | Morgan Stanley | (1,901 | ) | (138,053 | ) | (116,189 | ) | 21,498 | |||||||||||||||
Supernus Pharmaceuticals, Inc. | Morgan Stanley | (3,136 | ) | (74,177 | ) | (65,354 | ) | 8,762 | |||||||||||||||
Syneos Health, Inc. | Morgan Stanley | (2,113 | ) | (138,179 | ) | (112,327 | ) | 25,486 | |||||||||||||||
Theravance Biopharma, Inc. (Cayman Islands) | Morgan Stanley | (11,388 | ) | (237,267 | ) | (168,371 | ) | 68,249 | |||||||||||||||
Translate Bio, Inc. | Morgan Stanley | (1,112 | ) | (14,652 | ) | (15,134 | ) | (500 | ) | ||||||||||||||
Tricida, Inc. | Morgan Stanley | (8,365 | ) | (290,686 | ) | (75,787 | ) | 214,101 | |||||||||||||||
Vericel Corp. | Morgan Stanley | (118 | ) | (2,141 | ) | (2,187 | ) | (29 | ) | ||||||||||||||
ZIOPHARM Oncology, Inc. | Morgan Stanley | (21,478 | ) | (95,356 | ) | (54,125 | ) | 41,989 | |||||||||||||||
Zogenix, Inc. | Morgan Stanley | (2,807 | ) | (59,789 | ) | (50,330 | ) | 9,314 | |||||||||||||||
Zymeworks, Inc. (Canada) | Morgan Stanley | (6,604 | ) | (250,885 | ) | (307,614 | ) | (59,656 | ) | ||||||||||||||
|
|
|
|
|
|
|
| ||||||||||||||||
| (442,342 | ) | (9,879,483 | ) | (8,558,118 | ) | 1,281,301 | |||||||||||||||||
|
|
|
|
|
|
|
| ||||||||||||||||
Retailing | |||||||||||||||||||||||
Abercrombie & Fitch Co., Class A | Morgan Stanley | (49,468 | ) | (869,028 | ) | (689,089 | ) | 159,140 | |||||||||||||||
American Eagle Outfitters, Inc. | Morgan Stanley | (23,613 | ) | (338,114 | ) | (349,709 | ) | (12,526 | ) | ||||||||||||||
Bed Bath & Beyond, Inc. | Morgan Stanley | (161,857 | ) | (2,121,726 | ) | (2,424,618 | ) | (328,810 | ) | ||||||||||||||
Boot Barn Holdings, Inc. | Morgan Stanley | (23,781 | ) | (1,018,830 | ) | (669,197 | ) | 346,778 | |||||||||||||||
Burlington Stores, Inc. | Morgan Stanley | (6,343 | ) | (1,320,341 | ) | (1,307,229 | ) | 9,407 | |||||||||||||||
CarMax, Inc. | Morgan Stanley | (1,982 | ) | (184,431 | ) | (182,166 | ) | 1,768 | |||||||||||||||
Core-Mark Holding Co., Inc. | Morgan Stanley | (5,150 | ) | (138,346 | ) | (148,990 | ) | (13,164 | ) | ||||||||||||||
Expedia Group, Inc. | Morgan Stanley | (15,112 | ) | (1,350,506 | ) | (1,385,619 | ) | (46,420 | ) | ||||||||||||||
Floor & Decor Holdings, Inc., Class A | Morgan Stanley | (17,479 | ) | (1,233,944 | ) | (1,307,429 | ) | (77,568 | ) | ||||||||||||||
Grubhub, Inc. | Morgan Stanley | (5,908 | ) | (406,751 | ) | (427,326 | ) | (23,504 | ) | ||||||||||||||
Hudson Ltd., Class A (Bermuda) | Morgan Stanley | (8,236 | ) | (61,165 | ) | (62,594 | ) | (1,578 | ) | ||||||||||||||
Kohl’s Corp. | Morgan Stanley | (5,192 | ) | (120,620 | ) | (96,208 | ) | 32,802 | |||||||||||||||
Monro, Inc. | Morgan Stanley | (21,252 | ) | (1,348,732 | ) | (862,194 | ) | 470,507 | |||||||||||||||
Nordstrom, Inc. | Morgan Stanley | (93,366 | ) | (1,360,117 | ) | (1,112,923 | ) | 244,689 | |||||||||||||||
Penske Automotive Group, Inc. | Morgan Stanley | (3,354 | ) | (156,884 | ) | (159,852 | ) | (3,393 | ) | ||||||||||||||
PetMed Express, Inc. | Morgan Stanley | (7,134 | ) | (241,819 | ) | (225,577 | ) | 15,582 | |||||||||||||||
Sally Beauty Holdings, Inc. | Morgan Stanley | (4,060 | ) | (57,112 | ) | (35,281 | ) | 21,693 | |||||||||||||||
Stitch Fix, Inc., Class A | Morgan Stanley | (36,866 | ) | (922,622 | ) | (1,000,175 | ) | (88,657 | ) | ||||||||||||||
Tiffany & Co. | Morgan Stanley | (4,524 | ) | (558,314 | ) | (524,105 | ) | 30,123 | |||||||||||||||
Ulta Beauty, Inc. | Morgan Stanley | (5,893 | ) | (1,399,512 | ) | (1,319,914 | ) | 79,701 | |||||||||||||||
The accompanying notes are an integral part of the financial statements.
93
GOTHAM ENHANCED RETURN FUND
Portfolio of Investments (Continued)
September 30, 2020
Total Return Swaps (continued)
Reference Entity | Counterparty | Number of Contracts Long/(Short) | Notional Amount | Value | Unrealized Appreciation/ (Depreciation)* | ||||||||||||||||||
Retailing — (continued) | |||||||||||||||||||||||
Urban Outfitters, Inc. | Morgan Stanley | (37,399 | ) | $ | (1,054,915 | ) | $ | (778,273 | ) | $ | 273,686 | ||||||||||||
|
|
|
|
|
|
|
| ||||||||||||||||
| (537,969 | ) | (16,263,829 | ) | (15,068,468 | ) | 1,090,256 | |||||||||||||||||
|
|
|
|
|
|
|
| ||||||||||||||||
Semiconductors & Semiconductor Equipment |
| ||||||||||||||||||||||
Advanced Energy Industries, Inc. | Morgan Stanley | (6,539 | ) | (444,550 | ) | (411,565 | ) | 31,734 | |||||||||||||||
Ambarella, Inc. (Cayman Islands) | Morgan Stanley | (2,529 | ) | (128,224 | ) | (131,963 | ) | (4,078 | ) | ||||||||||||||
Cohu, Inc. | Morgan Stanley | (25 | ) | (438 | ) | (430 | ) | 31 | |||||||||||||||
Cree, Inc. | Morgan Stanley | (20,870 | ) | (1,232,951 | ) | (1,330,254 | ) | (100,762 | ) | ||||||||||||||
Ichor Holdings Ltd. (Cayman Islands) | Morgan Stanley | (5,624 | ) | (142,689 | ) | (121,310 | ) | 20,999 | |||||||||||||||
MaxLinear, Inc. | Morgan Stanley | (13,691 | ) | (271,721 | ) | (318,179 | ) | (47,569 | ) | ||||||||||||||
Onto Innovation, Inc. | Morgan Stanley | (5,969 | ) | (202,721 | ) | (177,757 | ) | 24,415 | |||||||||||||||
Photronics, Inc. | Morgan Stanley | (957 | ) | (9,521 | ) | (9,532 | ) | (15 | ) | ||||||||||||||
Universal Display Corp. | Morgan Stanley | (6,438 | ) | (1,162,622 | ) | (1,163,604 | ) | (5,078 | ) | ||||||||||||||
|
|
|
|
|
|
|
| ||||||||||||||||
| (62,642 | ) | (3,595,437 | ) | (3,664,594 | ) | (80,323 | ) | ||||||||||||||||
|
|
|
|
|
|
|
| ||||||||||||||||
Software & Services | |||||||||||||||||||||||
8x8, Inc. | Morgan Stanley | (88,617 | ) | (2,036,771 | ) | (1,377,994 | ) | 653,048 | |||||||||||||||
Akamai Technologies, Inc. | Morgan Stanley | (4,327 | ) | (490,414 | ) | (478,306 | ) | 10,685 | |||||||||||||||
Altair Engineering, Inc., Class A | Morgan Stanley | (6,725 | ) | (252,686 | ) | (282,316 | ) | (30,320 | ) | ||||||||||||||
Alteryx, Inc., Class A | Morgan Stanley | (15,636 | ) | (1,781,273 | ) | (1,775,468 | ) | 797 | |||||||||||||||
Avaya Holdings Corp. | Morgan Stanley | (13,985 | ) | (194,346 | ) | (212,572 | ) | (19,894 | ) | ||||||||||||||
BlackBerry Ltd. (Canada) | Morgan Stanley | (89,558 | ) | (622,511 | ) | (411,071 | ) | 214,440 | |||||||||||||||
Ceridian HCM Holding, Inc. | Morgan Stanley | (17,729 | ) | (1,360,264 | ) | (1,465,302 | ) | (108,857 | ) | ||||||||||||||
Cloudflare, Inc., Class A | Morgan Stanley | (6,950 | ) | (238,566 | ) | (285,367 | ) | (51,720 | ) | ||||||||||||||
CommVault Systems, Inc. | Morgan Stanley | (3,770 | ) | (152,017 | ) | (153,816 | ) | (2,447 | ) | ||||||||||||||
Conduent, Inc. | Morgan Stanley | (140,731 | ) | (932,493 | ) | (447,525 | ) | 486,184 | |||||||||||||||
Coupa Software, Inc. | Morgan Stanley | (3,152 | ) | (782,591 | ) | (864,404 | ) | (84,001 | ) | ||||||||||||||
Datadog, Inc., Class A | Morgan Stanley | (1,743 | ) | (147,569 | ) | (178,065 | ) | (30,890 | ) | ||||||||||||||
DXC Technology Co. | Morgan Stanley | (5,102 | ) | (162,008 | ) | (91,071 | ) | 69,432 | |||||||||||||||
Euronet Worldwide, Inc. | Morgan Stanley | (755 | ) | (77,207 | ) | (68,781 | ) | 9,525 | |||||||||||||||
Everbridge, Inc. | Morgan Stanley | (6,621 | ) | (848,610 | ) | (832,458 | ) | 13,779 | |||||||||||||||
Fastly, Inc., Class A | Morgan Stanley | (4,346 | ) | (362,036 | ) | (407,133 | ) | (61,100 | ) | ||||||||||||||
Fidelity National Information Services, Inc. | Morgan Stanley | (1,374 | ) | (194,565 | ) | (202,267 | ) | (9,228 | ) | ||||||||||||||
Global Payments, Inc. | Morgan Stanley | (4,796 | ) | (851,246 | ) | (851,674 | ) | (2,965 | ) | ||||||||||||||
LivePerson, Inc. | Morgan Stanley | (1,154 | ) | (45,935 | ) | (59,996 | ) | (16,409 | ) | ||||||||||||||
Manhattan Associates, Inc. | Morgan Stanley | (2,089 | ) | (193,608 | ) | (199,479 | ) | (6,610 | ) | ||||||||||||||
ManTech International Corp., Class A | Morgan Stanley | (1,912 | ) | (143,268 | ) | (131,699 | ) | 10,340 | |||||||||||||||
MAXIMUS, Inc. | Morgan Stanley | (5,094 | ) | (392,538 | ) | (348,481 | ) | 41,274 | |||||||||||||||
Medallia, Inc. | Morgan Stanley | (19,220 | ) | (545,359 | ) | (527,012 | ) | 16,482 | |||||||||||||||
New Relic, Inc. | Morgan Stanley | (16,636 | ) | (937,279 | ) | (937,605 | ) | (2,950 | ) | ||||||||||||||
Nutanix, Inc., Class A | Morgan Stanley | (12,764 | ) | (300,523 | ) | (283,106 | ) | 16,683 | |||||||||||||||
PagerDuty, Inc. | Morgan Stanley | (9,247 | ) | (225,626 | ) | (250,686 | ) | (25,674 | ) | ||||||||||||||
Paycom Software, Inc. | Morgan Stanley | (351 | ) | (106,637 | ) | (109,266 | ) | (2,908 | ) | ||||||||||||||
Perficient, Inc. | Morgan Stanley | (2,327 | ) | (109,132 | ) | (99,456 | ) | 9,374 | |||||||||||||||
Ping Identity Holding Corp. | Morgan Stanley | (20,241 | ) | (637,826 | ) | (631,722 | ) | 4,327 | |||||||||||||||
Proofpoint, Inc. | Morgan Stanley | (2,660 | ) | (296,373 | ) | (280,763 | ) | 14,796 | |||||||||||||||
PROS Holdings, Inc. | Morgan Stanley | (8,092 | ) | (317,572 | ) | (258,458 | ) | 58,240 | |||||||||||||||
The accompanying notes are an integral part of the financial statements.
94
GOTHAM ENHANCED RETURN FUND
Portfolio of Investments (Continued)
September 30, 2020
Total Return Swaps (continued)
Reference Entity | Counterparty | Number of Contracts Long/(Short) | Notional Amount | Value | Unrealized Appreciation/ (Depreciation)* | |||||||||||||||||
Software & Services — (continued) | ||||||||||||||||||||||
Sabre Corp. | Morgan Stanley | (86,636 | ) | $ | (619,909 | ) | $ | (564,000 | ) | $ | 54,182 | |||||||||||
Slack Technologies, Inc., Class A | Morgan Stanley | (32,797 | ) | (1,042,919 | ) | (880,927 | ) | 158,829 | ||||||||||||||
Smartsheet, Inc., Class A | Morgan Stanley | (10,387 | ) | (498,014 | ) | (513,326 | ) | (18,414 | ) | |||||||||||||
Splunk, Inc. | Morgan Stanley | (3,488 | ) | (698,012 | ) | (656,197 | ) | 34,467 | ||||||||||||||
Switch, Inc., Class A | Morgan Stanley | (45,088 | ) | (731,742 | ) | (703,824 | ) | 20,307 | ||||||||||||||
Tucows, Inc., Class A | Morgan Stanley | (1,876 | ) | (99,691 | ) | (129,256 | ) | (29,824 | ) | |||||||||||||
Upland Software, Inc. | Morgan Stanley | (5,209 | ) | (181,019 | ) | (196,379 | ) | (15,849 | ) | |||||||||||||
Verra Mobility Corp. | Morgan Stanley | (9,263 | ) | (101,552 | ) | (89,480 | ) | 11,808 | ||||||||||||||
Yext, Inc. | Morgan Stanley | (47,337 | ) | (730,171 | ) | (718,576 | ) | 9,557 | ||||||||||||||
Zscaler, Inc. | Morgan Stanley | (5,114 | ) | (667,825 | ) | (719,489 | ) | (58,602 | ) | |||||||||||||
Zuora, Inc., Class A | Morgan Stanley | (49,312 | ) | (672,171 | ) | (509,886 | ) | 160,410 | ||||||||||||||
|
|
|
|
|
|
|
| |||||||||||||||
| (814,211 | ) | (21,781,874 | ) | (20,184,659 | ) | 1,500,304 | ||||||||||||||||
|
|
|
|
|
|
|
| |||||||||||||||
Technology Hardware & Equipment | ||||||||||||||||||||||
3D Systems Corp. | Morgan Stanley | (27,371 | ) | (177,444 | ) | (134,392 | ) | 42,574 | ||||||||||||||
ADTRAN, Inc. | Morgan Stanley | (12,948 | ) | (144,590 | ) | (132,782 | ) | 7,192 | ||||||||||||||
Celestica, Inc. (Canada) | Morgan Stanley | (16,916 | ) | (123,200 | ) | (116,720 | ) | 6,056 | ||||||||||||||
CommScope Holding Co., Inc. | Morgan Stanley | (12,998 | ) | (169,084 | ) | (116,982 | ) | 58,704 | ||||||||||||||
Extreme Networks, Inc. | Morgan Stanley | (36,515 | ) | (241,393 | ) | (146,790 | ) | 94,412 | ||||||||||||||
Fabrinet (Cayman Islands) | Morgan Stanley | (7,184 | ) | (465,344 | ) | (452,808 | ) | 11,078 | ||||||||||||||
Fitbit, Inc., Class A | Morgan Stanley | (62,228 | ) | (404,935 | ) | (433,107 | ) | (30,796 | ) | |||||||||||||
II-VI, Inc. | Morgan Stanley | (12,190 | ) | (469,881 | ) | (494,426 | ) | (25,849 | ) | |||||||||||||
Infinera Corp. | Morgan Stanley | (85,350 | ) | (469,008 | ) | (525,756 | ) | (58,794 | ) | |||||||||||||
Insight Enterprises, Inc. | Morgan Stanley | (16,415 | ) | (1,013,769 | ) | (928,761 | ) | 80,457 | ||||||||||||||
Itron, Inc. | Morgan Stanley | (1,991 | ) | (128,280 | ) | (120,933 | ) | 7,008 | ||||||||||||||
Keysight Technologies, Inc. | Morgan Stanley | (8,244 | ) | (805,626 | ) | (814,342 | ) | (10,968 | ) | |||||||||||||
Littelfuse, Inc. | Morgan Stanley | (3,403 | ) | (633,829 | ) | (603,488 | ) | 22,273 | ||||||||||||||
Methode Electronics, Inc. | Morgan Stanley | (275 | ) | (7,604 | ) | (7,838 | ) | (232 | ) | |||||||||||||
Motorola Solutions, Inc. | Morgan Stanley | (4,829 | ) | (748,231 | ) | (757,235 | ) | (11,728 | ) | |||||||||||||
MTS Systems Corp. | Morgan Stanley | (1,221 | ) | (54,402 | ) | (23,333 | ) | 30,572 | ||||||||||||||
NETGEAR, Inc. | Morgan Stanley | (1,634 | ) | (44,808 | ) | (50,360 | ) | (6,202 | ) | |||||||||||||
nLight, Inc. | Morgan Stanley | (18,377 | ) | (295,135 | ) | (431,492 | ) | (137,493 | ) | |||||||||||||
Novanta, Inc. (Canada) | Morgan Stanley | (1,265 | ) | (118,443 | ) | (133,255 | ) | (15,436 | ) | |||||||||||||
Plantronics, Inc. | Morgan Stanley | (15,128 | ) | (199,685 | ) | (179,116 | ) | 19,731 | ||||||||||||||
Plexus Corp. | Morgan Stanley | (2,270 | ) | (143,444 | ) | (160,330 | ) | (17,669 | ) | |||||||||||||
Pure Storage, Inc., Class A | Morgan Stanley | (4,942 | ) | (71,879 | ) | (76,057 | ) | (4,358 | ) | |||||||||||||
Stratasys Ltd. (Israel) | Morgan Stanley | (40,266 | ) | (836,858 | ) | (502,117 | ) | 332,401 | ||||||||||||||
Super Micro Computer, Inc. | Morgan Stanley | (5,204 | ) | (136,386 | ) | (137,386 | ) | (1,362 | ) | |||||||||||||
ViaSat, Inc. | Morgan Stanley | (4,664 | ) | (215,079 | ) | (160,395 | ) | 54,482 | ||||||||||||||
Western Digital Corp. | Morgan Stanley | (3,979 | ) | (249,979 | ) | (145,432 | ) | 100,409 | ||||||||||||||
|
|
|
|
|
|
|
| |||||||||||||||
| (407,807 | ) | (8,368,316 | ) | (7,785,633 | ) | 546,462 | ||||||||||||||||
|
|
|
|
|
|
|
| |||||||||||||||
Telecommunication Services | ||||||||||||||||||||||
Anterix, Inc. | Morgan Stanley | (114 | ) | (3,920 | ) | (3,729 | ) | 203 | ||||||||||||||
ATN International, Inc. | Morgan Stanley | (1,287 | ) | (76,057 | ) | (64,530 | ) | 10,304 | ||||||||||||||
Boingo Wireless, Inc. | Morgan Stanley | (31,217 | ) | (426,129 | ) | (318,257 | ) | 107,086 | ||||||||||||||
Cogent Communications Holdings, Inc. | Morgan Stanley | (3,371 | ) | (232,135 | ) | (202,429 | ) | 28,257 | ||||||||||||||
Shenandoah Telecommunications Co. | Morgan Stanley | (3,244 | ) | (151,264 | ) | (144,147 | ) | 6,663 | ||||||||||||||
The accompanying notes are an integral part of the financial statements.
95
GOTHAM ENHANCED RETURN FUND
Portfolio of Investments (Continued)
September 30, 2020
Total Return Swaps (continued)
Reference Entity | Counterparty | Number of Contracts Long/(Short) | Notional Amount | Value | Unrealized Appreciation/ (Depreciation)* | ||||||||||||||||||
Telecommunication Services — (continued) |
| ||||||||||||||||||||||
United States Cellular Corp. | Morgan Stanley | (3,083 | ) | $ | (96,354 | ) | $ | (91,041 | ) | $ | 5,050 | ||||||||||||
|
|
|
|
|
|
|
| ||||||||||||||||
| (42,316 | ) | (985,859 | ) | (824,133 | ) | 157,563 | |||||||||||||||||
|
|
|
|
|
|
|
| ||||||||||||||||
Transportation | |||||||||||||||||||||||
Air Transport Services Group, Inc. | Morgan Stanley | (19,651 | ) | (397,143 | ) | (492,454 | ) | (96,915 | ) | ||||||||||||||
Allegiant Travel Co. | Morgan Stanley | (1,595 | ) | (266,685 | ) | (191,081 | ) | 73,757 | |||||||||||||||
Canadian Pacific Railway Ltd. (Canada) | Morgan Stanley | (439 | ) | (125,917 | ) | (133,645 | ) | (8,231 | ) | ||||||||||||||
Hawaiian Holdings, Inc. | Morgan Stanley | (17,924 | ) | (485,382 | ) | (231,040 | ) | 248,748 | |||||||||||||||
Heartland Express, Inc. | Morgan Stanley | (6,800 | ) | (143,733 | ) | (126,480 | ) | 16,376 | |||||||||||||||
Lyft, Inc., Class A | Morgan Stanley | (46,275 | ) | (1,342,460 | ) | (1,274,876 | ) | 63,815 | |||||||||||||||
Matson, Inc. | Morgan Stanley | (10,613 | ) | (391,890 | ) | (425,475 | ) | (44,552 | ) | ||||||||||||||
Ryder System, Inc. | Morgan Stanley | (31,143 | ) | (1,504,733 | ) | (1,315,480 | ) | 118,374 | |||||||||||||||
Saia, Inc. | Morgan Stanley | (955 | ) | (93,098 | ) | (120,464 | ) | (29,316 | ) | ||||||||||||||
SkyWest, Inc. | Morgan Stanley | (5,833 | ) | (336,655 | ) | (174,173 | ) | 163,309 | |||||||||||||||
XPO Logistics, Inc. | Morgan Stanley | (8,398 | ) | (724,774 | ) | (710,975 | ) | 10,510 | |||||||||||||||
|
|
|
|
|
|
|
| ||||||||||||||||
| (149,626 | ) | (5,812,470 | ) | (5,196,143 | ) | 515,875 | |||||||||||||||||
|
|
|
|
|
|
|
| ||||||||||||||||
Utilities | |||||||||||||||||||||||
ALLETE, Inc. | Morgan Stanley | (11,327 | ) | (730,768 | ) | (586,059 | ) | 131,485 | |||||||||||||||
Ameren Corp. | Morgan Stanley | (261 | ) | (20,630 | ) | (20,640 | ) | (45 | ) | ||||||||||||||
American Electric Power Co., Inc. | Morgan Stanley | (877 | ) | (75,029 | ) | (71,677 | ) | 2,550 | |||||||||||||||
Atmos Energy Corp. | Morgan Stanley | (404 | ) | (38,514 | ) | (38,618 | ) | (190 | ) | ||||||||||||||
Avangrid, Inc. | Morgan Stanley | (3,736 | ) | (192,071 | ) | (188,519 | ) | (4,352 | ) | ||||||||||||||
Black Hills Corp. | Morgan Stanley | (12,871 | ) | (998,490 | ) | (688,470 | ) | 282,681 | |||||||||||||||
California Water Service Group | Morgan Stanley | (2,251 | ) | (102,182 | ) | (97,806 | ) | 4,063 | |||||||||||||||
CenterPoint Energy, Inc. | Morgan Stanley | (6,285 | ) | (185,244 | ) | (121,615 | ) | 57,615 | |||||||||||||||
CMS Energy Corp. | Morgan Stanley | (9,106 | ) | (556,371 | ) | (559,199 | ) | (4,376 | ) | ||||||||||||||
Consolidated Edison, Inc. | Morgan Stanley | (14,341 | ) | (1,056,149 | ) | (1,115,730 | ) | (65,865 | ) | ||||||||||||||
DTE Energy Co. | Morgan Stanley | (5,940 | ) | (744,791 | ) | (683,338 | ) | 45,036 | |||||||||||||||
Edison International | Morgan Stanley | (11,000 | ) | (791,491 | ) | (559,240 | ) | 200,007 | |||||||||||||||
Essential Utilities, Inc. | Morgan Stanley | (6,849 | ) | (291,310 | ) | (275,672 | ) | 13,508 | |||||||||||||||
Fortis, Inc. (Canada) | Morgan Stanley | (2,790 | ) | (106,991 | ) | (113,999 | ) | (8,870 | ) | ||||||||||||||
New Jersey Resources Corp. | Morgan Stanley | (10,255 | ) | (332,930 | ) | (277,090 | ) | 49,989 | |||||||||||||||
NextEra Energy, Inc. | Morgan Stanley | (927 | ) | (263,450 | ) | (257,298 | ) | 4,063 | |||||||||||||||
NorthWestern Corp. | Morgan Stanley | (2,593 | ) | (194,483 | ) | (126,124 | ) | 63,069 | |||||||||||||||
Ormat Technologies, Inc. | Morgan Stanley | (250 | ) | (14,540 | ) | (14,778 | ) | (255 | ) | ||||||||||||||
Otter Tail Corp. | Morgan Stanley | (88 | ) | (3,197 | ) | (3,183 | ) | 29 | |||||||||||||||
Portland General Electric Co. | Morgan Stanley | (4,506 | ) | (209,706 | ) | (159,963 | ) | 46,365 | |||||||||||||||
Public Service Enterprise Group, Inc. | Morgan Stanley | (11,216 | ) | (616,555 | ) | (615,871 | ) | (6,425 | ) | ||||||||||||||
SJW Group | Morgan Stanley | (1,634 | ) | (98,791 | ) | (99,445 | ) | (1,902 | ) | ||||||||||||||
South Jersey Industries, Inc. | Morgan Stanley | (5,514 | ) | (154,055 | ) | (106,255 | ) | 43,142 | |||||||||||||||
Southern Co. (The) | Morgan Stanley | (19,707 | ) | (1,035,999 | ) | (1,068,514 | ) | (35,529 | ) | ||||||||||||||
Southwest Gas Holdings, Inc. | Morgan Stanley | (7,008 | ) | (630,881 | ) | (442,205 | ) | 172,786 | |||||||||||||||
Spire, Inc. | Morgan Stanley | (5,054 | ) | (387,323 | ) | (268,873 | ) | 107,885 | |||||||||||||||
Sunnova Energy International, Inc. | Morgan Stanley | (4,505 | ) | (67,724 | ) | (136,997 | ) | (70,395 | ) | ||||||||||||||
Unitil Corp. | Morgan Stanley | (94 | ) | (3,586 | ) | (3,632 | ) | (32 | ) | ||||||||||||||
The accompanying notes are an integral part of the financial statements.
96
GOTHAM ENHANCED RETURN FUND
Portfolio of Investments (Concluded)
September 30, 2020
Total Return Swaps (concluded)
Reference Entity | Counterparty | Number of Contracts Long/(Short) | Notional Amount | Value | Unrealized Appreciation/ (Depreciation)* | |||||||||||||||||
Utilities — (continued) | ||||||||||||||||||||||
Xcel Energy, Inc. | Morgan Stanley | (4,306 | ) | $ | (281,511 | ) | $ | (297,157 | ) | $ | (20,015 | ) | ||||||||||
|
|
|
|
|
|
|
| |||||||||||||||
| (165,695 | ) | (10,184,762 | ) | (8,997,967 | ) | 1,006,022 | ||||||||||||||||
|
|
|
|
|
|
|
| |||||||||||||||
Total Reference Entity — Short | (194,844,649 | ) | (172,784,988 | ) | 20,180,776 | |||||||||||||||||
|
|
|
|
|
| |||||||||||||||||
Net Value of Reference Entity | $ | (36,319,169 | ) | $ | 10,148,119 | $ | 46,431,845 | |||||||||||||||
|
|
|
|
|
| |||||||||||||||||
| * | Includes $(35,443) related to open trades, dividends receivables/payables and swap receivables/payables activities. |
The accompanying notes are an integral part of the financial statements.
97
GOTHAM NEUTRAL FUND
Portfolio of Investments
September 30, 2020
| Number of Shares | Value | |||||||
COMMON STOCKS — 94.6% |
| |||||||
Automobiles & Components — 0.8% |
| |||||||
Adient PLC (Ireland)* | 2,345 | $ | 40,639 | |||||
American Axle & Manufacturing Holdings, Inc.(a)* | 9,593 | 55,352 | ||||||
BorgWarner, Inc.(a) | 881 | 34,130 | ||||||
Cooper Tire & Rubber Co. | 269 | 8,527 | ||||||
General Motors Co. | 609 | 18,020 | ||||||
Gentherm, Inc.(a)* | 1,108 | 45,317 | ||||||
Magna International, Inc. (Canada) | 2,291 | 104,813 | ||||||
Standard Motor Products, Inc. | 30 | 1,340 | ||||||
Tenneco, Inc., Class A(a)* | 7,746 | 53,757 | ||||||
Thor Industries, Inc. | 415 | 39,533 | ||||||
Visteon Corp.(a)* | 851 | 58,906 | ||||||
XPEL, Inc.* | 55 | 1,434 | ||||||
|
| |||||||
| 461,768 | ||||||||
|
| |||||||
Capital Goods — 11.5% | ||||||||
3M Co.(a) | 774 | 123,979 | ||||||
Acuity Brands, Inc. | 1,180 | 120,773 | ||||||
Advanced Drainage Systems, Inc. | 104 | 6,494 | ||||||
AECOM* | 4,258 | 178,155 | ||||||
Altra Industrial Motion Corp.(a) | 1,315 | 48,616 | ||||||
AMETEK, Inc.(a) | 609 | 60,535 | ||||||
Apogee Enterprises, Inc. | 27 | 577 | ||||||
Applied Industrial Technologies, Inc. | 21 | 1,157 | ||||||
Argan, Inc. | 23 | 964 | ||||||
Atkore International Group, Inc.(a)* | 1,726 | 39,232 | ||||||
Ballard Power Systems, Inc. (Canada)* | 4,351 | 65,700 | ||||||
Barnes Group, Inc. | 11 | 393 | ||||||
Bloom Energy Corp., Class A(a)* | 3,070 | 55,168 | ||||||
BMC Stock Holdings, Inc.(a)* | 1,215 | 52,038 | ||||||
Colfax Corp.(a)* | 15,380 | 482,317 | ||||||
Columbus McKinnon Corp.(a) | 1,174 | 38,859 | ||||||
Comfort Systems USA, Inc. | 52 | 2,679 | ||||||
Crane Co.(a) | 523 | 26,218 | ||||||
Cummins, Inc.(a) | 383 | 80,874 | ||||||
Curtiss-Wright Corp.(a) | 657 | 61,272 | ||||||
Deere & Co. | 132 | 29,255 | ||||||
Douglas Dynamics, Inc. | 6 | 205 | ||||||
Dover Corp. | 1,179 | 127,733 | ||||||
Dycom Industries, Inc.* | 320 | 16,902 | ||||||
EMCOR Group, Inc. | 102 | 6,906 | ||||||
Emerson Electric Co.(a) | 813 | 53,308 | ||||||
Encore Wire Corp. | 23 | 1,068 | ||||||
Enerpac Tool Group Corp. | 3 | 56 | ||||||
| Number of Shares | Value | |||||||
COMMON STOCKS — (Continued) |
| |||||||
Capital Goods — (Continued) |
| |||||||
ESCO Technologies, Inc. | 25 | $ | 2,014 | |||||
Evoqua Water Technologies Corp.* | 186 | 3,947 | ||||||
Federal Signal Corp. | 108 | 3,159 | ||||||
Flowserve Corp.(a) | 2,653 | 72,400 | ||||||
Fortive Corp. | 848 | 64,626 | ||||||
Fortune Brands Home & Security, | 2,914 | 252,119 | ||||||
Foundation Building Materials, Inc.* | 28 | 440 | ||||||
Franklin Electric Co., Inc.(a) | 766 | 45,064 | ||||||
FuelCell Energy, Inc.* | 43,483 | 93,054 | ||||||
General Dynamics Corp.(a) | 326 | 45,128 | ||||||
Gibraltar Industries, Inc.* | 2,186 | 142,396 | ||||||
GMS, Inc.* | 5,719 | 137,828 | ||||||
Griffon Corp. | 66 | 1,290 | ||||||
Hexcel Corp. | 115 | 3,858 | ||||||
Honeywell International, Inc.(a) | 774 | 127,408 | ||||||
Howmet Aerospace, Inc.(a) | 25,399 | 424,671 | ||||||
Hubbell, Inc.(a) | 533 | 72,936 | ||||||
Huntington Ingalls Industries, Inc. | 73 | 10,275 | ||||||
Illinois Tool Works, Inc. | 155 | 29,948 | ||||||
ITT, Inc.(a) | 623 | 36,788 | ||||||
JELD-WEN Holding, Inc.(a)* | 999 | 22,577 | ||||||
John Bean Technologies Corp. | 114 | 10,475 | ||||||
Lockheed Martin Corp. | 473 | 181,291 | ||||||
Masco Corp. | 4,486 | 247,313 | ||||||
MasTec, Inc.(a)* | 290 | 12,238 | ||||||
Middleby Corp. (The)(a)* | 196 | 17,583 | ||||||
Mueller Industries, Inc.(a) | 2,325 | 62,915 | ||||||
National Presto Industries, Inc. | 10 | 819 | ||||||
nVent Electric PLC (Ireland) | 2,846 | 50,346 | ||||||
Owens Corning | 3,928 | 270,286 | ||||||
PACCAR, Inc. | 288 | 24,561 | ||||||
Pentair PLC (Ireland) | 1,834 | 83,942 | ||||||
Quanta Services, Inc. | 3,130 | 165,452 | ||||||
RBC Bearings, Inc.* | 29 | 3,515 | ||||||
Regal Beloit Corp. | 1,023 | 96,029 | ||||||
Rexnord Corp.(a) | 2,101 | 62,694 | ||||||
Roper Technologies, Inc. | 133 | 52,550 | ||||||
Shyft Group, Inc. (The) | 46 | 868 | ||||||
Simpson Manufacturing Co., Inc. | 2,642 | 256,697 | ||||||
SiteOne Landscape Supply, Inc.(a)* | 935 | 114,023 | ||||||
Snap-on, Inc.(a) | 561 | 82,540 | ||||||
SPX FLOW, Inc.(a)* | 2,368 | 101,398 | ||||||
Teledyne Technologies, Inc.(a)* | 242 | 75,071 | ||||||
The accompanying notes are an integral part of the financial statements.
98
GOTHAM NEUTRAL FUND
Portfolio of Investments (Continued)
September 30, 2020
| Number of Shares | Value | |||||||
COMMON STOCKS — (Continued) |
| |||||||
Capital Goods — (Continued) |
| |||||||
Toro Co. (The) | 223 | $ | 18,721 | |||||
TPI Composites, Inc.(a)* | 1,095 | 31,711 | ||||||
Trane Technologies PLC (Ireland) | 1,335 | 161,869 | ||||||
TransDigm Group, Inc.(a) | 116 | 55,114 | ||||||
TriMas Corp.* | 2 | 46 | ||||||
UFP Industries, Inc. | 4,439 | 250,848 | ||||||
United Rentals, Inc.(a)* | 295 | 51,478 | ||||||
Univar Solutions, Inc.(a)* | 9,481 | 160,039 | ||||||
Valmont Industries, Inc.(a) | 644 | 79,972 | ||||||
Vectrus, Inc.* | 1 | 38 | ||||||
Wabash National Corp.(a) | 6,295 | 75,288 | ||||||
Watsco, Inc. | 167 | 38,893 | ||||||
Watts Water Technologies, Inc., | 1,034 | 103,555 | ||||||
Westinghouse Air Brake Technologies Corp.(a) | 1,144 | 70,791 | ||||||
Woodward, Inc. | 381 | 30,541 | ||||||
WW Grainger, Inc. | 37 | 13,200 | ||||||
|
| |||||||
| 6,388,069 | ||||||||
|
| |||||||
Commercial & Professional Services — 2.3% |
| |||||||
ABM Industries, Inc.(a) | 1,984 | 72,733 | ||||||
ASGN, Inc.* | 20 | 1,271 | ||||||
Cimpress PLC (Ireland)* | 1,363 | 102,443 | ||||||
Cintas Corp. | 56 | 18,638 | ||||||
Clarivate PLC (Jersey)* | 4,670 | 144,723 | ||||||
Clean Harbors, Inc.(a)* | 1,171 | 65,611 | ||||||
Covanta Holding Corp.(a) | 11,958 | 92,675 | ||||||
Deluxe Corp. | 5 | 129 | ||||||
Ennis, Inc. | 11 | 192 | ||||||
Exponent, Inc. | 40 | 2,881 | ||||||
FTI Consulting, Inc.* | 3 | 318 | ||||||
Healthcare Services Group, Inc. | 43 | 926 | ||||||
ICF International, Inc. | 21 | 1,292 | ||||||
IHS Markit Ltd. (Bermuda) | 273 | 21,433 | ||||||
KAR Auction Services, Inc. | 63 | 907 | ||||||
Kelly Services, Inc., Class A | 35 | 596 | ||||||
ManpowerGroup, Inc. | 3,071 | 225,196 | ||||||
MSA Safety, Inc.(a) | 258 | 34,616 | ||||||
Nielsen Holdings PLC (United Kingdom) | 1,793 | 25,425 | ||||||
Republic Services, Inc.(a) | 748 | 69,826 | ||||||
Robert Half International, Inc. | 117 | 6,194 | ||||||
Stantec, Inc. (Canada) | 23 | 698 | ||||||
Steelcase, Inc., Class A | 33 | 334 | ||||||
| Number of Shares | Value | |||||||
COMMON STOCKS — (Continued) |
| |||||||
Commercial & Professional Services — (Continued) |
| |||||||
Tetra Tech, Inc.(a) | 567 | $ | 54,149 | |||||
TransUnion | 1,417 | 119,212 | ||||||
TriNet Group, Inc.(a)* | 1,252 | 74,269 | ||||||
TrueBlue, Inc.* | 52 | 805 | ||||||
UniFirst Corp. | 617 | 116,841 | ||||||
Verisk Analytics, Inc. | 89 | 16,493 | ||||||
Waste Management, Inc. | 75 | 8,488 | ||||||
|
| |||||||
| 1,279,314 | ||||||||
|
| |||||||
Consumer Durables & Apparel — 3.5% |
| |||||||
Brunswick Corp.(a) | 1,562 | 92,017 | ||||||
Capri Holdings Ltd. (British Virgin Islands)* | 10,608 | 190,944 | ||||||
Carter’s, Inc. | 45 | 3,896 | ||||||
Cavco Industries, Inc.* | 22 | 3,967 | ||||||
Deckers Outdoor Corp.* | 127 | 27,941 | ||||||
DR Horton, Inc.(a) | 984 | 74,420 | ||||||
Garmin Ltd. (Switzerland) | 415 | 39,367 | ||||||
G-III Apparel Group Ltd.* | 2,062 | 27,033 | ||||||
Gildan Activewear, Inc. (Canada) | 757 | 14,890 | ||||||
Hanesbrands, Inc.(a) | 5,458 | 85,964 | ||||||
Helen of Troy Ltd. (Bermuda)* | 89 | 17,223 | ||||||
Kontoor Brands, Inc.(a) | 3,035 | 73,447 | ||||||
La-Z-Boy, Inc.(a) | 1,197 | 37,861 | ||||||
Leggett & Platt, Inc.(a) | 240 | 9,881 | ||||||
Lululemon Athletica, Inc.* | 338 | 111,327 | ||||||
Mattel, Inc.* | 8,664 | 101,369 | ||||||
Meritage Homes Corp.(a)* | 245 | 27,046 | ||||||
Mohawk Industries, Inc.* | 2,016 | 196,741 | ||||||
Nautilus, Inc.* | 1,400 | 24,024 | ||||||
NIKE, Inc., Class B | 189 | 23,727 | ||||||
Polaris, Inc. | 439 | 41,415 | ||||||
PulteGroup, Inc.(a) | 1,441 | 66,704 | ||||||
PVH Corp.(a) | 1,634 | 97,452 | ||||||
Smith & Wesson Brands, Inc.(a) | 4,702 | 72,975 | ||||||
Sonos, Inc.(a)* | 1,916 | 29,085 | ||||||
Steven Madden Ltd. | 776 | 15,132 | ||||||
Sturm Ruger & Co., Inc.(a) | 2,405 | 147,090 | ||||||
Tempur Sealy International, Inc.* | 1,989 | 177,399 | ||||||
TopBuild Corp.* | 307 | 52,402 | ||||||
Tupperware Brands Corp.(a) | 1,102 | 22,216 | ||||||
Whirlpool Corp. | 48 | 8,827 | ||||||
YETI Holdings, Inc.* | 647 | 29,322 | ||||||
|
| |||||||
| 1,943,104 | ||||||||
|
| |||||||
The accompanying notes are an integral part of the financial statements.
99
GOTHAM NEUTRAL FUND
Portfolio of Investments (Continued)
September 30, 2020
| Number of Shares | Value | |||||||
COMMON STOCKS — (Continued) |
| |||||||
Consumer Services — 3.5% |
| |||||||
Adtalem Global Education, Inc.(a)* | 2,242 | $ | 55,019 | |||||
Bloomin’ Brands, Inc. | 14,193 | 216,727 | ||||||
Boyd Gaming Corp.(a) | 1,258 | 38,608 | ||||||
Chipotle Mexican Grill, Inc.* | 47 | 58,454 | ||||||
Darden Restaurants, Inc. | 283 | 28,509 | ||||||
Dine Brands Global, Inc. | 3,298 | 180,038 | ||||||
El Pollo Loco Holdings, Inc.* | 334 | 5,411 | ||||||
frontdoor, Inc.* | 59 | 2,296 | ||||||
Graham Holdings Co., Class B | 3 | 1,212 | ||||||
Grand Canyon Education, Inc.(a)* | 315 | 25,181 | ||||||
Hyatt Hotels Corp., Class A(a) | 4,373 | 233,387 | ||||||
Jack in the Box, Inc.(a) | 227 | 18,003 | ||||||
Laureate Education, Inc., Class A* | 9,397 | 124,792 | ||||||
MGM Resorts International | 4,550 | 98,963 | ||||||
Norwegian Cruise Line Holdings Ltd. (Bermuda)* | 1,072 | 18,342 | ||||||
Papa John’s International, Inc. | 1,685 | 138,642 | ||||||
Perdoceo Education Corp.* | 208 | 2,546 | ||||||
Red Rock Resorts, Inc., Class A | 9,578 | 163,784 | ||||||
Royal Caribbean Cruises Ltd. (Liberia) | 435 | 28,158 | ||||||
Service Corp. International(a) | 1,571 | 66,265 | ||||||
Strategic Education, Inc. | 2 | 183 | ||||||
Wingstop, Inc. | 1,378 | 188,304 | ||||||
Wyndham Hotels & Resorts, Inc. | 2,344 | 118,372 | ||||||
Yum! Brands, Inc.(a) | 1,621 | 147,997 | ||||||
|
| |||||||
| 1,959,193 | ||||||||
|
| |||||||
Diversified Financials — 0.4% |
| |||||||
Berkshire Hathaway, Inc., Class B* | 65 | 13,841 | ||||||
BlackRock, Inc. | 87 | 49,029 | ||||||
DiamondPeak Holdings Corp., | 14 | 361 | ||||||
Federated Hermes, Inc. | 369 | 7,937 | ||||||
Franklin Resources, Inc. | 1,027 | 20,899 | ||||||
Moody’s Corp. | 27 | 7,826 | ||||||
Nasdaq, Inc. | 213 | 26,137 | ||||||
S&P Global, Inc. | 171 | 61,663 | ||||||
Sprott, Inc. (Canada) | 16 | 546 | ||||||
T Rowe Price Group, Inc. | 145 | 18,592 | ||||||
Waddell & Reed Financial, Inc., Class A | 427 | 6,341 | ||||||
|
| |||||||
| 213,172 | ||||||||
|
| |||||||
Energy — 3.2% |
| |||||||
Antero Midstream Corp. | 22,260 | 119,536 | ||||||
| Number of Shares | Value | |||||||
COMMON STOCKS — (Continued) |
| |||||||
Energy — (Continued) |
| |||||||
Apache Corp. | 8,631 | $ | 81,736 | |||||
Cactus, Inc., Class A(a) | 1,944 | 37,305 | ||||||
Canadian Natural Resources Ltd. (Canada) | 4,990 | 79,890 | ||||||
Cenovus Energy, Inc. (Canada) | 6,118 | 23,799 | ||||||
Cheniere Energy, Inc.* | 789 | 36,507 | ||||||
Chevron Corp.(a) | 5,401 | 388,872 | ||||||
Clean Energy Fuels Corp.* | 1,344 | 3,333 | ||||||
Concho Resources, Inc. | 1,555 | 68,607 | ||||||
ConocoPhillips | 3,796 | 124,661 | ||||||
Core Laboratories NV (Netherlands) | 1,380 | 21,059 | ||||||
Crescent Point Energy Corp. (Canada) | 96 | 117 | ||||||
DHT Holdings, Inc. (Marshall Islands) | 294 | 1,517 | ||||||
EOG Resources, Inc. | 3,115 | 111,953 | ||||||
Halliburton Co.(a) | 4,288 | 51,670 | ||||||
HollyFrontier Corp. | 5,857 | 115,441 | ||||||
Murphy Oil Corp. | 8,468 | 75,535 | ||||||
National Oilwell Varco, Inc.(a) | 858 | 7,773 | ||||||
Nordic American Tankers Ltd. (Bermuda) | 878 | 3,064 | ||||||
Patterson-UTI Energy, Inc. | 72 | 205 | ||||||
Phillips 66 | 495 | 25,661 | ||||||
Range Resources Corp. | 26,359 | 174,497 | ||||||
Renewable Energy Group, Inc.* | 3,284 | 175,431 | ||||||
Schlumberger NV (Curacao) | 1,840 | 28,630 | ||||||
TechnipFMC PLC (United Kingdom) | 3,702 | 23,360 | ||||||
World Fuel Services Corp. | 806 | 17,079 | ||||||
|
| |||||||
| 1,797,238 | ||||||||
|
| |||||||
Food & Staples Retailing — 1.8% |
| |||||||
BJ’s Wholesale Club Holdings, Inc.* | 1,225 | 50,899 | ||||||
Casey’s General Stores, Inc. | 123 | 21,851 | ||||||
Costco Wholesale Corp. | 78 | 27,690 | ||||||
Kroger Co. (The)(a) | 3,457 | 117,227 | ||||||
Sprouts Farmers Market, Inc.(a)* | 12,352 | 258,527 | ||||||
Sysco Corp. | 44 | 2,738 | ||||||
United Natural Foods, Inc.* | 6,534 | 97,161 | ||||||
US Foods Holding Corp.(a)* | 7,023 | 156,051 | ||||||
Walgreens Boots Alliance, Inc. | 852 | 30,604 | ||||||
Walmart, Inc. | 1,851 | 258,973 | ||||||
|
| |||||||
| 1,021,721 | ||||||||
|
| |||||||
Food, Beverage & Tobacco — 2.7% |
| |||||||
Altria Group, Inc.(a) | 2,342 | 90,495 | ||||||
Archer-Daniels-Midland Co.(a) | 1,118 | 51,976 | ||||||
The accompanying notes are an integral part of the financial statements.
100
GOTHAM NEUTRAL FUND
Portfolio of Investments (Continued)
September 30, 2020
| Number of Shares | Value | |||||||
COMMON STOCKS — (Continued) |
| |||||||
Food, Beverage & Tobacco — (Continued) |
| |||||||
B&G Foods, Inc. | 770 | $ | 21,383 | |||||
Bunge Ltd. (Bermuda) | 492 | 22,484 | ||||||
Coca-Cola Co. (The) | 804 | 39,693 | ||||||
Coca-Cola Consolidated, Inc. | 24 | 5,776 | ||||||
Conagra Brands, Inc. | 5,079 | 181,371 | ||||||
Constellation Brands, Inc., Class A | 734 | 139,100 | ||||||
Flowers Foods, Inc. | 240 | 5,839 | ||||||
Fresh Del Monte Produce, Inc. (Cayman Islands) | 3 | 69 | ||||||
General Mills, Inc. | 1,888 | 116,452 | ||||||
Hain Celestial Group, Inc. (The)(a)* | 381 | 13,068 | ||||||
JM Smucker Co. (The)(a) | 2,000 | 231,040 | ||||||
Kellogg Co. | 241 | 15,566 | ||||||
Kraft Heinz Co. (The) | 2,716 | 81,344 | ||||||
McCormick & Co., Inc., non-voting shares(a) | 474 | 92,003 | ||||||
Molson Coors Beverage Co., Class B . | 182 | 6,108 | ||||||
Monster Beverage Corp.* | 310 | 24,862 | ||||||
National Beverage Corp.* | 1,527 | 103,851 | ||||||
PepsiCo, Inc.(a) | 523 | 72,488 | ||||||
Philip Morris International, Inc. | 198 | 14,848 | ||||||
Turning Point Brands, Inc. | 9 | 251 | ||||||
Tyson Foods, Inc., Class A | 815 | 48,476 | ||||||
Vector Group Ltd. | 12,415 | 120,301 | ||||||
|
| |||||||
| 1,498,844 | ||||||||
|
| |||||||
Health Care Equipment & Services — 7.6% |
| |||||||
Abbott Laboratories | 552 | 60,074 | ||||||
Addus HomeCare Corp.* | 13 | 1,229 | ||||||
Allscripts Healthcare Solutions, Inc.* | 325 | 2,646 | ||||||
AMN Healthcare Services, Inc.* | 21 | 1,228 | ||||||
Anthem, Inc. | 596 | 160,080 | ||||||
Cardinal Health, Inc.(a) | 1,639 | 76,951 | ||||||
Centene Corp.* | 299 | 17,441 | ||||||
Cerner Corp.(a) | 933 | 67,447 | ||||||
Cigna Corp. | 11 | 1,864 | ||||||
CONMED Corp. | 1,382 | 108,722 | ||||||
CVS Health Corp.(a) | 1,538 | 89,819 | ||||||
Danaher Corp. | 290 | 62,446 | ||||||
DaVita, Inc.(a)* | 8,953 | 766,824 | ||||||
DENTSPLY SIRONA, Inc.(a) | 2,003 | 87,591 | ||||||
DexCom, Inc.* | 47 | 19,375 | ||||||
Ensign Group, Inc. (The) | 105 | 5,991 | ||||||
Globus Medical, Inc., Class A* | 629 | 31,148 | ||||||
Hanger, Inc.* | 10 | 158 | ||||||
| Number of Shares | Value | |||||||
COMMON STOCKS — (Continued) |
| |||||||
Health Care Equipment & Services — (Continued) |
| |||||||
HCA Healthcare, Inc.(a) | 433 | $ | 53,986 | |||||
HealthStream, Inc.* | 2 | 40 | ||||||
Hill-Rom Holdings, Inc. | 447 | 37,329 | ||||||
HMS Holdings Corp.(a)* | 701 | 16,789 | ||||||
Hologic, Inc.(a)* | 2,698 | 179,336 | ||||||
Humana, Inc. | 6 | 2,483 | ||||||
IDEXX Laboratories, Inc.* | 450 | 176,900 | ||||||
Integer Holdings Corp.* | 1,593 | 94,003 | ||||||
Intuitive Surgical, Inc.* | 64 | 45,411 | ||||||
iRhythm Technologies, Inc.* | 169 | 40,241 | ||||||
Livongo Health, Inc.* | 1,980 | 277,299 | ||||||
Magellan Health, Inc.(a)* | 1,067 | 80,857 | ||||||
McKesson Corp. | 95 | 14,148 | ||||||
MEDNAX, Inc.(a)* | 4,842 | 78,828 | ||||||
Medtronic PLC (Ireland) | 1,703 | 176,976 | ||||||
Molina Healthcare, Inc.* | 193 | 35,327 | ||||||
Neogen Corp.* | 53 | 4,147 | ||||||
Nevro Corp.(a)* | 113 | 15,741 | ||||||
NextGen Healthcare, Inc.(a)* | 4,220 | 53,763 | ||||||
Owens & Minor, Inc. | 277 | 6,955 | ||||||
Patterson Cos., Inc.(a) | 11,887 | 286,536 | ||||||
Providence Service Corp. | 36 | 3,345 | ||||||
Quidel Corp.* | 689 | 151,153 | ||||||
ResMed, Inc. | 65 | 11,143 | ||||||
Select Medical Holdings Corp.* | 7,717 | 160,668 | ||||||
STERIS PLC (Ireland) | 352 | 62,019 | ||||||
Stryker Corp.(a) | 386 | 80,431 | ||||||
Teladoc Health, Inc.(a)* | 351 | 76,953 | ||||||
Teleflex, Inc. | 3 | 1,021 | ||||||
Tenet Healthcare Corp.(a)* | 1,190 | 29,167 | ||||||
Tivity Health, Inc.(a)* | 2,925 | 41,009 | ||||||
UnitedHealth Group, Inc.(a) | 150 | 46,766 | ||||||
Universal Health Services, Inc., Class B | 1,375 | 147,152 | ||||||
Varian Medical Systems, Inc.* | 164 | 28,208 | ||||||
West Pharmaceutical Services, Inc.(a) | 526 | 144,597 | ||||||
Zimmer Biomet Holdings, Inc.(a) | 127 | 17,290 | ||||||
|
| |||||||
| 4,239,051 | ||||||||
|
| |||||||
Household & Personal Products — 1.4% |
| |||||||
Central Garden & Pet Co., Class A* | 121 | 4,373 | ||||||
Church & Dwight Co., Inc. | 216 | 20,241 | ||||||
Clorox Co. (The) | 244 | 51,281 | ||||||
Colgate-Palmolive Co. | 2,781 | 214,554 | ||||||
Edgewell Personal Care Co.* | 3,403 | 94,876 | ||||||
The accompanying notes are an integral part of the financial statements.
101
GOTHAM NEUTRAL FUND
Portfolio of Investments (Continued)
September 30, 2020
| Number of Shares | Value | |||||||
COMMON STOCKS — (Continued) |
| |||||||
Household & Personal Products — (Continued) |
| |||||||
elf Beauty, Inc.(a)* | 5,165 | $ | 94,881 | |||||
Kimberly-Clark Corp. | 1,332 | 196,683 | ||||||
Procter & Gamble Co. (The)(a) | 687 | 95,486 | ||||||
Spectrum Brands Holdings, Inc. | 41 | 2,344 | ||||||
|
| |||||||
| 774,719 | ||||||||
|
| |||||||
Materials — 8.7% |
| |||||||
Alamos Gold, Inc., Class A (Canada) | 11,849 | 104,390 | ||||||
Allegheny Technologies, Inc.* | 12,209 | 106,462 | ||||||
Amcor PLC (Jersey) | 2,947 | 32,564 | ||||||
Ashland Global Holdings, Inc.(a) | 611 | 43,332 | ||||||
Avient Corp.(a) | 10,801 | 285,794 | ||||||
Axalta Coating Systems Ltd. (Bermuda)* | 3,424 | 75,910 | ||||||
Boise Cascade Co.(a) | 364 | 14,531 | ||||||
Cabot Corp.(a) | 894 | 32,211 | ||||||
Carpenter Technology Corp. | 173 | 3,142 | ||||||
Century Aluminum Co.* | 379 | 2,698 | ||||||
CF Industries Holdings, Inc. | 4,727 | 145,166 | ||||||
Chemours Co. (The)(a) | 7,551 | 157,891 | ||||||
Commercial Metals Co.(a) | 20,676 | 413,106 | ||||||
Compass Minerals International, Inc.(a) | 1,238 | 73,475 | ||||||
Dow, Inc. | 160 | 7,528 | ||||||
DuPont de Nemours, Inc.(a) | 170 | 9,432 | ||||||
Ecolab, Inc.(a) | 777 | 155,276 | ||||||
Ferro Corp.(a)* | 1,972 | 24,453 | ||||||
First Majestic Silver Corp. | 21,687 | 206,460 | ||||||
FMC Corp. | 1,437 | 152,193 | ||||||
Forterra, Inc.* | 23 | 272 | ||||||
Freeport-McMoRan, Inc. | 314 | 4,911 | ||||||
FutureFuel Corp. | 7 | 80 | ||||||
Golden Star Resources Ltd. | 324 | 1,396 | ||||||
Hecla Mining Co.(a) | 39,454 | 200,426 | ||||||
IAMGOLD Corp. (Canada)* | 3,231 | 12,375 | ||||||
Ingevity Corp.* | 2,452 | 121,227 | ||||||
Innospec, Inc. | 1 | 63 | ||||||
Kinross Gold Corp. (Canada) | 1,657 | 14,615 | ||||||
Linde PLC (Ireland) | 490 | 116,684 | ||||||
New Gold, Inc. (Canada)* | 6,621 | 11,256 | ||||||
Newmont Corp. | 2,109 | 133,816 | ||||||
Nucor Corp.(a) | 2,497 | 112,015 | ||||||
Nutrien Ltd. (Canada) | 1,343 | 52,686 | ||||||
O-I Glass, Inc.(a) | 11,241 | 119,042 | ||||||
| Number of Shares | Value | |||||||
COMMON STOCKS — (Continued) |
| |||||||
Materials — (Continued) |
| |||||||
Pan American Silver Corp. (Canada) | 8,805 | $ | 283,081 | |||||
PPG Industries, Inc. | 95 | 11,598 | ||||||
Pretium Resources, Inc. (Canada)* | 5,430 | 69,721 | ||||||
Reliance Steel & Aluminum Co. | 2,198 | 224,284 | ||||||
Sealed Air Corp. | 8 | 310 | ||||||
Sensient Technologies Corp.(a) | 1,368 | 78,988 | ||||||
Sonoco Products Co. | 2,489 | 127,113 | ||||||
Southern Copper Corp.(a) | 720 | 32,594 | ||||||
SSR Mining, Inc. (Canada)* | 11,791 | 220,138 | ||||||
Stepan Co. | 13 | 1,417 | ||||||
Summit Materials, Inc., Class A* | 4,738 | 78,367 | ||||||
Tredegar Corp. | 8 | 119 | ||||||
Wheaton Precious Metals Corp. (Canada) | 570 | 27,970 | ||||||
Worthington Industries, Inc. | 160 | 6,525 | ||||||
Yamana Gold, Inc. (Canada) | 131,496 | 746,897 | ||||||
|
| |||||||
| 4,856,000 | ||||||||
|
| |||||||
Media & Entertainment — 5.6% |
| |||||||
Activision Blizzard, Inc. | 1,431 | 115,839 | ||||||
Alphabet, Inc., Class A(a)* | 235 | 344,416 | ||||||
ANGI Homeservices, Inc., Class A* | 762 | 8,454 | ||||||
Cargurus, Inc.* | 252 | 5,451 | ||||||
Charter Communications, Inc., Class A* | 263 | 164,201 | ||||||
DISH Network Corp., Class A(a)* | 4,546 | 131,970 | ||||||
Electronic Arts, Inc.(a)* | 1,219 | 158,970 | ||||||
EverQuote, Inc., Class A(a)* | 732 | 28,284 | ||||||
Facebook, Inc., Class A(a)* | 1,260 | 329,994 | ||||||
Fox Corp., Class A | 5,032 | 140,041 | ||||||
Interpublic Group of Cos., Inc. (The)(a) | 3,313 | 55,228 | ||||||
John Wiley & Sons, Inc., Class A | 244 | 7,737 | ||||||
Lions Gate Entertainment Corp., |
| |||||||
Class B (Canada)* | 67 | 584 | ||||||
Match Group, Inc.* | 395 | 43,707 | ||||||
Netflix, Inc.(a)* | 459 | 229,514 | ||||||
New York Times Co. (The), Class A | 104 | 4,450 | ||||||
News Corp., Class A(a) | 23,695 | 332,204 | ||||||
Omnicom Group, Inc. | 162 | 8,019 | ||||||
Pinterest, Inc., Class A* | 2,093 | 86,880 | ||||||
Sirius XM Holdings, Inc. | 7,520 | 40,307 | ||||||
Take-Two Interactive Software, Inc.* | 785 | 129,698 | ||||||
TEGNA, Inc. | 26 | 306 | ||||||
Twitter, Inc.(a)* | 2,667 | 118,682 | ||||||
The accompanying notes are an integral part of the financial statements.
102
GOTHAM NEUTRAL FUND
Portfolio of Investments (Continued)
September 30, 2020
| Number of Shares | Value | |||||||
COMMON STOCKS — (Continued) |
| |||||||
Media & Entertainment — (Continued) |
| |||||||
Walt Disney Co. (The) | 1,432 | $ | 177,683 | |||||
Zillow Group, Inc., Class C(a)* | 4,482 | 455,326 | ||||||
|
| |||||||
| 3,117,945 | ||||||||
|
| |||||||
Pharmaceuticals, Biotechnology & Life Sciences — 5.2% |
| |||||||
Agilent Technologies, Inc. | 237 | 23,923 | ||||||
Alexion Pharmaceuticals, Inc.* | 67 | 7,667 | ||||||
Amgen, Inc. | 23 | 5,846 | ||||||
Anika Therapeutics, Inc.(a) * | 81 | 2,867 | ||||||
Avantor, Inc.(a) * | 742 | 16,688 | ||||||
Biogen, Inc.* | 93 | 26,382 | ||||||
Bio-Rad Laboratories, Inc., Class A* | 279 | 143,813 | ||||||
Bristol Myers Squibb Co.(a) | 2,693 | 162,361 | ||||||
Catalent, Inc.* | 197 | 16,875 | ||||||
Charles River Laboratories International, Inc.(a)* | 436 | 98,732 | ||||||
ChemoCentryx, Inc.(a)* | 431 | 23,619 | ||||||
Coherus Biosciences, Inc.(a)* | 230 | 4,218 | ||||||
Denali Therapeutics, Inc.* | 164 | 5,876 | ||||||
Elanco Animal Health, Inc.(a)* | 5,374 | 150,096 | ||||||
Emergent BioSolutions, Inc.* | 410 | 42,365 | ||||||
Gilead Sciences, Inc. | 9 | 569 | ||||||
Horizon Therapeutics PLC (Ireland)* | 1,968 | 152,874 | ||||||
Illumina, Inc.* | 91 | 28,126 | ||||||
Innoviva, Inc.* | 164 | 1,714 | ||||||
Inovio Pharmaceuticals, Inc.(a)* | 4,215 | 48,894 | ||||||
Ironwood Pharmaceuticals, Inc.* | 114 | 1,025 | ||||||
Jazz Pharmaceuticals PLC (Ireland)* . | 83 | 11,835 | ||||||
Johnson & Johnson(a) | 1,464 | 217,960 | ||||||
Kura Oncology, Inc.* | 130 | 3,983 | ||||||
Luminex Corp. | 538 | 14,123 | ||||||
Medpace Holdings, Inc.(a)* | 265 | 29,614 | ||||||
Merck & Co., Inc.(a) | 1,613 | 133,798 | ||||||
Mylan NV (Netherlands)* | 4,660 | 69,108 | ||||||
Natera, Inc.* | 89 | 6,429 | ||||||
Neurocrine Biosciences, Inc.* | 439 | 42,214 | ||||||
Novavax, Inc.(a)* | 4,624 | 501,010 | ||||||
Pacira BioSciences, Inc.* | 2,091 | 125,711 | ||||||
PerkinElmer, Inc. | 1,839 | 230,813 | ||||||
Pfizer, Inc.(a) | 5,342 | 196,051 | ||||||
Phibro Animal Health Corp., Class A | 3 | 52 | ||||||
Prestige Consumer Healthcare, Inc.* | 70 | 2,549 | ||||||
Protagonist Therapeutics, Inc.* | 2 | 39 | ||||||
Regeneron Pharmaceuticals, Inc.* | 68 | 38,065 | ||||||
Sage Therapeutics, Inc.* | 141 | 8,618 | ||||||
| Number of Shares | Value | |||||||
COMMON STOCKS — (Continued) |
| |||||||
Pharmaceuticals, Biotechnology & Life Sciences — (Continued) |
| |||||||
Sorrento Therapeutics, Inc.* | 4,134 | $ | 46,094 | |||||
TG Therapeutics, Inc.(a)* | 3,651 | 97,701 | ||||||
Thermo Fisher Scientific, Inc.(a) | 152 | 67,111 | ||||||
Trillium Therapeutics, Inc. (Canada)* | 433 | 6,153 | ||||||
United Therapeutics Corp.(a)* | 123 | 12,423 | ||||||
Vanda Pharmaceuticals, Inc.* | 40 | 386 | ||||||
Waters Corp.* | 83 | 16,241 | ||||||
Zoetis, Inc. | 238 | 39,358 | ||||||
|
| |||||||
| 2,881,969 | ||||||||
|
| |||||||
Retailing — 11.9% |
| |||||||
1-800-Flowers.com, Inc., Class A* | 933 | 23,269 | ||||||
Aaron’s, Inc.(a) | 5,228 | 296,166 | ||||||
Abercrombie & Fitch Co., Class A | 2,557 | 35,619 | ||||||
Advance Auto Parts, Inc. | 358 | 54,953 | ||||||
Amazon.com, Inc.(a)* | 112 | 352,658 | ||||||
Asbury Automotive Group, Inc.(a)* | 286 | 27,871 | ||||||
At Home Group, Inc.* | 4,518 | 67,137 | ||||||
AutoNation, Inc.* | 3,392 | 179,539 | ||||||
AutoZone, Inc.(a)* | 89 | 104,810 | ||||||
Bed Bath & Beyond, Inc.(a) | 3,232 | 48,415 | ||||||
Best Buy Co., Inc.(a) | 5,559 | 618,661 | ||||||
Big Lots, Inc. | 194 | 8,652 | ||||||
Booking Holdings, Inc.* | 10 | 17,107 | ||||||
Buckle, Inc. (The)(a) | 2,905 | 59,233 | ||||||
Camping World Holdings, Inc., Class A | 114 | 3,392 | ||||||
CarParts.Com, Inc.* | 487 | 5,264 | ||||||
Core-Mark Holding Co., Inc. | 2 | 58 | ||||||
Dick’s Sporting Goods, Inc. | 290 | 16,785 | ||||||
Dollar General Corp. | 193 | 40,457 | ||||||
eBay, Inc.(a) | 4,937 | 257,218 | ||||||
Etsy, Inc.* | 100 | 12,163 | ||||||
Foot Locker, Inc.(a) | 5,061 | 167,165 | ||||||
Gap, Inc. (The)(a) | 10,245 | 174,472 | ||||||
Genuine Parts Co.(a) | 603 | 57,388 | ||||||
Guess?, Inc.(a) | 2,602 | 30,235 | ||||||
Hibbett Sports, Inc.* | 269 | 10,550 | ||||||
Home Depot, Inc. (The)(a) | 700 | 194,397 | ||||||
L Brands, Inc.(a) | 4,238 | 134,811 | ||||||
Lithia Motors, Inc., Class A | 247 | 56,301 | ||||||
LKQ Corp.* | 5,861 | 162,526 | ||||||
Lowe’s Cos., Inc.(a) | 1,524 | 252,771 | ||||||
Lumber Liquidators Holdings, Inc.* | 831 | 18,324 | ||||||
The accompanying notes are an integral part of the financial statements.
103
GOTHAM NEUTRAL FUND
Portfolio of Investments (Continued)
September 30, 2020
| Number of Shares | Value | |||||||
COMMON STOCKS — (Continued) |
| |||||||
Retailing — (Continued) |
| |||||||
Macy’s, Inc. | 49,719 | $ | 283,398 | |||||
MarineMax, Inc.* | 177 | 4,544 | ||||||
Michaels Cos., Inc. (The)* | 2,076 | 20,044 | ||||||
Murphy USA, Inc.* | 1,895 | 243,072 | ||||||
National Vision Holdings, Inc.(a)* | 1,687 | 64,511 | ||||||
ODP Corp. (The)(a) | 2,857 | 55,569 | ||||||
Ollie’s Bargain Outlet Holdings, Inc.* | 2 | 175 | ||||||
O’Reilly Automotive, Inc.(a)* | 179 | 82,533 | ||||||
Pool Corp. | 30 | 10,036 | ||||||
Qurate Retail, Inc., Series A | 4,276 | 30,702 | ||||||
RH(a)* | 1,784 | 682,594 | ||||||
Ross Stores, Inc. | 199 | 18,571 | ||||||
Shoe Carnival, Inc. | 199 | 6,682 | ||||||
Shutterstock, Inc. | 65 | 3,383 | ||||||
Signet Jewelers Ltd. (Bermuda) | 13,475 | 251,982 | ||||||
Sleep Number Corp.* | 3,743 | 183,070 | ||||||
Sonic Automotive, Inc., Class A | 4,652 | 186,824 | ||||||
Sportsman’s Warehouse Holdings, Inc.(a)* | 1,434 | 20,521 | ||||||
Stamps.com, Inc.(a)* | 1,437 | 346,245 | ||||||
Target Corp. | 48 | 7,556 | ||||||
Tractor Supply Co. | 1,065 | 152,657 | ||||||
Urban Outfitters, Inc.* | 3,809 | 79,265 | ||||||
Williams-Sonoma, Inc.(a) | 3,425 | 309,757 | ||||||
Zumiez, Inc.(a)* | 3,215 | 89,441 | ||||||
|
| |||||||
| 6,621,499 | ||||||||
|
| |||||||
Semiconductors & Semiconductor Equipment — 4.6% |
| |||||||
Advanced Micro Devices, Inc.* | 474 | 38,863 | ||||||
Amkor Technology, Inc.(a)* | 14,265 | 159,768 | ||||||
Applied Materials, Inc.(a) | 1,218 | 72,410 | ||||||
Axcelis Technologies, Inc.* | 51 | 1,122 | ||||||
Broadcom, Inc.(a) | 577 | 210,213 | ||||||
Cirrus Logic, Inc.* | 3,728 | 251,454 | ||||||
First Solar, Inc.(a)* | 2,443 | 161,727 | ||||||
Intel Corp. | 864 | 44,738 | ||||||
KLA Corp.(a) | 442 | 85,633 | ||||||
Lam Research Corp. | 75 | 24,881 | ||||||
Lattice Semiconductor Corp.* | 6,975 | 201,996 | ||||||
MACOM Technology Solutions Holdings, Inc.* | 497 | 16,903 | ||||||
Marvell Technology Group Ltd. (Bermuda) | 932 | 37,000 | ||||||
Maxim Integrated Products, Inc.(a) | 692 | 46,786 | ||||||
Microchip Technology, Inc.(a) | 338 | 34,733 | ||||||
| Number of Shares | Value | |||||||
COMMON STOCKS — (Continued) |
| |||||||
Semiconductors & Semiconductor Equipment — (Continued) |
| |||||||
MKS Instruments, Inc. | 83 | $ | 9,066 | |||||
Monolithic Power Systems, Inc. | 99 | 27,681 | ||||||
NVIDIA Corp. | 182 | 98,502 | ||||||
Photronics, Inc.* | 10 | 100 | ||||||
Power Integrations, Inc.(a) | 1,112 | 61,605 | ||||||
Qorvo, Inc.(a)* | 670 | 86,437 | ||||||
Skyworks Solutions, Inc.(a) | 628 | 91,374 | ||||||
Synaptics, Inc.(a)* | 8,635 | 694,427 | ||||||
Ultra Clean Holdings, Inc.(a)* | 4,476 | 96,055 | ||||||
|
| |||||||
| 2,553,474 | ||||||||
|
| |||||||
Software & Services — 12.3% |
| |||||||
A10 Networks, Inc.* | 290 | 1,847 | ||||||
Accenture PLC, Class A (Ireland) | 365 | 82,486 | ||||||
ACI Worldwide, Inc.* | 520 | 13,588 | ||||||
Adobe, Inc.(a)* | 218 | 106,914 | ||||||
Agilysys, Inc.* | 67 | 1,619 | ||||||
Alarm.com Holdings, Inc.(a)* | 686 | 37,902 | ||||||
Alliance Data Systems Corp.(a) | 823 | 34,550 | ||||||
Anaplan, Inc.* | 640 | 40,051 | ||||||
Automatic Data Processing, Inc. | 1,328 | 185,243 | ||||||
Black Knight, Inc.* | 947 | 82,436 | ||||||
Blackbaud, Inc. | 3,914 | 218,519 | ||||||
Blackline, Inc.(a)* | 318 | 28,502 | ||||||
Broadridge Financial Solutions, Inc.(a) | 493 | 65,076 | ||||||
CACI International, Inc., Class A* | 22 | 4,690 | ||||||
Cadence Design Systems, Inc.(a)* | 1,239 | 132,115 | ||||||
Cardtronics PLC, Class A (United Kingdom)* | 1,934 | 38,293 | ||||||
CDK Global, Inc.(a) | 1,336 | 58,236 | ||||||
CGI, Inc. (Canada)* | 127 | 8,607 | ||||||
Citrix Systems, Inc.(a) | 699 | 96,259 | ||||||
Crowdstrike Holdings, Inc., Class A* | 344 | 47,238 | ||||||
CSG Systems International, Inc. | 39 | 1,597 | ||||||
Domo, Inc., Class B(a)* | 860 | 32,964 | ||||||
Evo Payments, Inc., Class A* | 11 | 273 | ||||||
Fiserv, Inc.* | 103 | 10,614 | ||||||
FleetCor Technologies, Inc.(a)* | 314 | 74,763 | ||||||
Fortinet, Inc.* | 760 | 89,536 | ||||||
Gartner, Inc.* | 821 | 102,584 | ||||||
Globant SA (Luxembourg)* | 38 | 6,810 | ||||||
GoDaddy, Inc., Class A* | 3,225 | 245,003 | ||||||
Guidewire Software, Inc.* | 622 | 64,856 | ||||||
International Business Machines | 776 | 94,416 | ||||||
The accompanying notes are an integral part of the financial statements.
104
GOTHAM NEUTRAL FUND
Portfolio of Investments (Continued)
September 30, 2020
| Number of Shares | Value | |||||||
COMMON STOCKS — (Continued) |
| |||||||
Software & Services — (Continued) |
| |||||||
International Money Express, Inc.* | 37 | $ | 532 | |||||
Intuit, Inc.(a) | 1,255 | 409,394 | ||||||
Jack Henry & Associates, Inc. | 3 | 488 | ||||||
LiveRamp Holdings, Inc.* | 1,340 | 69,372 | ||||||
Mastercard, Inc., Class A(a) | 161 | 54,445 | ||||||
Microsoft Corp.(a) | 1,456 | 306,240 | ||||||
MicroStrategy, Inc., Class A* | 783 | 117,888 | ||||||
MobileIron, Inc.* | 84 | 589 | ||||||
Model N, Inc.(a)* | 1,466 | 51,720 | ||||||
NIC, Inc.(a) | 4,908 | 96,688 | ||||||
NortonLifeLock, Inc.(a) | 17,406 | 362,741 | ||||||
Oracle Corp.(a) | 5,975 | 356,708 | ||||||
Paychex, Inc. | 1,655 | 132,019 | ||||||
Paylocity Holding Corp.(a)* | 138 | 22,276 | ||||||
PayPal Holdings, Inc.(a)* | 1,345 | 265,005 | ||||||
Progress Software Corp. | 3,138 | 115,102 | ||||||
PTC, Inc.(a)* | 4,834 | 399,868 | ||||||
QAD, Inc., Class A | 4 | 169 | ||||||
Qualys, Inc.* | 863 | 84,583 | ||||||
Sailpoint Technologies Holdings, | 7,685 | 304,095 | ||||||
salesforce.com, Inc.* | 322 | 80,925 | ||||||
Science Applications International Corp. | 2,131 | 167,113 | ||||||
SecureWorks Corp., Class A* | 1 | 11 | ||||||
ServiceNow, Inc.(a)* | 364 | 176,540 | ||||||
SPS Commerce, Inc.* | 2,277 | 177,310 | ||||||
SS&C Technologies Holdings, Inc. | 2,868 | 173,571 | ||||||
SVMK, Inc.* | 4,762 | 105,288 | ||||||
Synopsys, Inc.(a)* | 959 | 205,207 | ||||||
Teradata Corp.(a)* | 3,834 | 87,032 | ||||||
VeriSign, Inc.(a)* | 373 | 76,409 | ||||||
Virtusa Corp.(a)* | 877 | 43,113 | ||||||
Visa, Inc., Class A | 482 | 96,386 | ||||||
Western Union Co. (The)(a) | 2,981 | 63,883 | ||||||
WEX, Inc.* | 5 | 695 | ||||||
Workday, Inc., Class A* | 495 | 106,489 | ||||||
Zoom Video Communications, Inc., Class A* | 214 | 100,604 | ||||||
|
| |||||||
| 6,818,085 | ||||||||
|
| |||||||
Technology Hardware & Equipment — 3.7% |
| |||||||
Acacia Communications, Inc.(a)* | 222 | 14,963 | ||||||
Amphenol Corp., Class A(a) | 218 | 23,603 | ||||||
Apple, Inc.(a) | 2,964 | 343,261 | ||||||
| Number of Shares | Value | |||||||
COMMON STOCKS — (Continued) |
| |||||||
Technology Hardware & Equipment — (Continued) |
| |||||||
Arrow Electronics, Inc.* | 3,420 | $ | 269,017 | |||||
Badger Meter, Inc. | 1,803 | 117,862 | ||||||
CDW Corp. | 64 | 7,650 | ||||||
Celestica, Inc. (Canada)* | 54 | 373 | ||||||
Ciena Corp.* | 141 | 5,596 | ||||||
Cisco Systems, Inc. | 3,905 | 153,818 | ||||||
CommScope Holding Co., Inc.* | 352 | 3,168 | ||||||
Corning, Inc.(a) | 3,083 | 99,920 | ||||||
Diebold Nixdorf, Inc.(a)* | 7,544 | 57,636 | ||||||
HP, Inc.(a) | 3,628 | 68,896 | ||||||
InterDigital, Inc.(a) | 698 | 39,828 | ||||||
Jabil, Inc. | 433 | 14,835 | ||||||
Juniper Networks, Inc.(a) | 2,757 | 59,276 | ||||||
Knowles Corp.* | 66 | 983 | ||||||
Lumentum Holdings, Inc.(a)* | 892 | 67,016 | ||||||
NCR Corp.* | 69 | 1,528 | ||||||
NetApp, Inc. | 2,453 | 107,540 | ||||||
NETGEAR, Inc.* | 276 | 8,506 | ||||||
PC Connection, Inc. | 16 | 657 | ||||||
Sanmina Corp.(a)* | 3,782 | 102,303 | ||||||
Seagate Technology PLC (Ireland) | 121 | 5,962 | ||||||
SYNNEX Corp. | 1,692 | 236,982 | ||||||
TE Connectivity Ltd. (Switzerland) | 262 | 25,608 | ||||||
Trimble, Inc.* | 260 | 12,662 | ||||||
TTM Technologies, Inc.(a)* | 3,986 | 45,480 | ||||||
Ubiquiti, Inc. | 603 | 100,496 | ||||||
Vishay Intertechnology, Inc. | 853 | 13,281 | ||||||
Western Digital Corp. | 254 | 9,284 | ||||||
Zebra Technologies Corp., Class A* | 222 | 56,046 | ||||||
|
| |||||||
| 2,074,036 | ||||||||
|
| |||||||
Telecommunication Services — 0.6% |
| |||||||
AT&T, Inc. | 2,025 | 57,733 | ||||||
CenturyLink, Inc. | 1,088 | 10,978 | ||||||
Iridium Communications, Inc.(a)* | 3,925 | 100,402 | ||||||
Verizon Communications, Inc. | 2,554 | 151,937 | ||||||
Vonage Holdings Corp.* | 1,410 | 14,424 | ||||||
|
| |||||||
| 335,474 | ||||||||
|
| |||||||
Transportation — 2.1% |
| |||||||
Alaska Air Group, Inc. | 1,498 | 54,872 | ||||||
Atlas Air Worldwide Holdings, Inc.* | 140 | 8,526 | ||||||
CH Robinson Worldwide, Inc. | 1,609 | 164,424 | ||||||
CSX Corp. | 289 | 22,447 | ||||||
Echo Global Logistics, Inc.(a)* | 3,151 | 81,201 | ||||||
The accompanying notes are an integral part of the financial statements.
105
GOTHAM NEUTRAL FUND
Portfolio of Investments (Continued)
September 30, 2020
| Number of Shares | Value | |||||||
COMMON STOCKS — (Continued) |
| |||||||
Transportation — (Continued) |
| |||||||
Expeditors International of Washington, Inc. | 1,195 | $ | 108,171 | |||||
FedEx Corp. | 572 | 143,869 | ||||||
Hub Group, Inc., Class A(a)* | 1,226 | 61,539 | ||||||
JB Hunt Transport Services, Inc.(a) | 578 | 73,048 | ||||||
Kansas City Southern(a) | 216 | 39,059 | ||||||
Marten Transport Ltd. | 124 | 2,024 | ||||||
Norfolk Southern Corp.(a) | 373 | 79,818 | ||||||
Old Dominion Freight Line, Inc. | 115 | 20,806 | ||||||
Schneider National, Inc., Class B | 6,156 | 152,238 | ||||||
SkyWest, Inc. | 3,325 | 99,285 | ||||||
Werner Enterprises, Inc.(a) | 1,764 | 74,070 | ||||||
|
| |||||||
| 1,185,397 | ||||||||
|
| |||||||
Utilities — 1.2% |
| |||||||
American Water Works Co., Inc. | 103 | 14,923 | ||||||
CenterPoint Energy, Inc. | 549 | 10,623 | ||||||
Dominion Energy, Inc. | 1,637 | 129,208 | ||||||
Duke Energy Corp. | 358 | 31,704 | ||||||
Evergy, Inc. | 53 | 2,693 | ||||||
Exelon Corp.(a) | 1,699 | 60,756 | ||||||
FirstEnergy Corp. | 253 | 7,264 | ||||||
MDU Resources Group, Inc.(a) | 8,691 | 195,548 | ||||||
National Fuel Gas Co. | 416 | 16,885 | ||||||
NiSource, Inc. | 249 | 5,478 | ||||||
NRG Energy, Inc.(a) | 2,887 | 88,746 | ||||||
OGE Energy Corp.(a) | 2,478 | 74,315 | ||||||
PPL Corp. | 625 | 17,006 | ||||||
|
| |||||||
| 655,149 | ||||||||
|
| |||||||
TOTAL COMMON STOCKS |
| 52,675,221 | ||||||
|
| |||||||
| Par Value | Value | |||||||
CORPORATE BONDS AND NOTES — 0.0% |
| |||||||
Capital Goods — 0.0% |
| |||||||
Mueller Industries, Inc. |
| |||||||
6.00%, 03/01/2027 | $ | 715 | $ | 715 | ||||
|
| |||||||
TOTAL CORPORATE BONDS AND NOTES |
| 715 | ||||||
|
| |||||||
TOTAL INVESTMENTS - 94.6% |
| 52,675,936 | ||||||
|
| |||||||
(Cost $41,677,142) | ||||||||
OTHER ASSETS IN EXCESS OF LIABILITIES - 5.4% | 2,999,354 | |||||||
|
| |||||||
NET ASSETS - 100.0% |
| $ | 55,675,290 | |||||
|
| |||||||
| (a) | Security position is either entirely or partially designated as collateral for total return swaps. |
| * | Non-income producing. |
PLC Public Limited Company
The accompanying notes are an integral part of the financial statements.
106
GOTHAM NEUTRAL FUND
Portfolio of Investments (Continued)
September 30, 2020
Over-the-counter total return swaps outstanding as of September 30, 2020
The Fund maintains a portfolio of long and short positions and receives/pays a rebate based upon the Fed Funds 1-Day Rate less a specified spread as negotiated by the parties. The notional gain or loss, dividends payable and rebates are payable the earlier of maturity of the swaps or upon termination. The portfolio matures on August 31, 2022, however underlying individual contracts are entered into and closed (terminated) on a daily basis. The cash amounts payable/receivable due to individual contracts being closed are settled, on a net basis, once a week. The value of total return swaps represents (69.5)% of net assets as of September 30, 2020.
The following table represents the individual long and help short positions and related values of total return swaps as of September 30, 2020:
Total Return Swaps
Reference Entity | Counterparty | Number of Contracts Long/(Short) | Notional Amount | Value | Unrealized Appreciation/ (Depreciation)* | |||||||||||||||||
Long | ||||||||||||||||||||||
Automobiles & Components | ||||||||||||||||||||||
BorgWarner, Inc. | Morgan Stanley | 63 | $ | 2,392 | $ | 2,441 | $ | 49 | ||||||||||||||
Cooper Tire & Rubber Co. | Morgan Stanley | 900 | 32,342 | 28,530 | (3,812 | ) | ||||||||||||||||
General Motors Co. | Morgan Stanley | 493 | 14,898 | 14,588 | (332 | ) | ||||||||||||||||
Gentherm, Inc. | Morgan Stanley | 4 | 159 | 164 | 5 | |||||||||||||||||
Standard Motor Products, Inc. | Morgan Stanley | 11 | 474 | 491 | 17 | |||||||||||||||||
Thor Industries, Inc. | Morgan Stanley | 2,945 | 277,534 | 280,541 | 3,110 | |||||||||||||||||
XPEL, Inc. | Morgan Stanley | 7 | 169 | 182 | 14 | |||||||||||||||||
|
|
|
|
|
|
|
| |||||||||||||||
| 4,423 | 327,968 | 326,937 | (949 | ) | ||||||||||||||||||
|
|
|
|
|
|
|
| |||||||||||||||
Capital Goods | ||||||||||||||||||||||
3M Co. | Morgan Stanley | 36 | 5,829 | 5,766 | (63 | ) | ||||||||||||||||
AAR Corp. | Morgan Stanley | 28 | 550 | 526 | (24 | ) | ||||||||||||||||
Acuity Brands, Inc. | Morgan Stanley | 50 | 4,896 | 5,118 | 264 | |||||||||||||||||
Advanced Drainage Systems, Inc. | Morgan Stanley | 965 | 56,332 | 60,255 | 4,014 | |||||||||||||||||
Albany International Corp., Class A | Morgan Stanley | 1,474 | 76,501 | 72,978 | (3,271 | ) | ||||||||||||||||
AMETEK, Inc. | Morgan Stanley | 10 | 964 | 994 | 33 | |||||||||||||||||
Apogee Enterprises, Inc. | Morgan Stanley | 481 | 10,330 | 10,279 | (51 | ) | ||||||||||||||||
Applied Industrial Technologies, Inc. | Morgan Stanley | 232 | 14,211 | 12,783 | (1,428 | ) | ||||||||||||||||
Argan, Inc. | Morgan Stanley | 12 | 509 | �� | 503 | (6 | ) | |||||||||||||||
Atkore International Group, Inc. | Morgan Stanley | 43 | 1,099 | 977 | (122 | ) | ||||||||||||||||
Barnes Group, Inc. | Morgan Stanley | 922 | 34,465 | 32,952 | (1,536 | ) | ||||||||||||||||
BMC Stock Holdings, Inc. | Morgan Stanley | 12 | 474 | 514 | 40 | |||||||||||||||||
BWX Technologies, Inc. | Morgan Stanley | 2,412 | 137,572 | 135,820 | (1,743 | ) | ||||||||||||||||
Comfort Systems USA, Inc. | Morgan Stanley | 492 | 26,170 | 25,343 | (827 | ) | ||||||||||||||||
Cummins, Inc. | Morgan Stanley | 5 | 1,029 | 1,056 | 26 | |||||||||||||||||
Curtiss-Wright Corp. | Morgan Stanley | 105 | 9,996 | 9,792 | (186 | ) | ||||||||||||||||
Deere & Co. | Morgan Stanley | 106 | 22,492 | 23,493 | 1,082 | |||||||||||||||||
Douglas Dynamics, Inc. | Morgan Stanley | 4 | 138 | 137 | (2 | ) | ||||||||||||||||
Dycom Industries, Inc. | Morgan Stanley | 431 | 25,673 | 22,765 | (2,908 | ) | ||||||||||||||||
EMCOR Group, Inc. | Morgan Stanley | 29 | 1,955 | 1,964 | 9 | |||||||||||||||||
Emerson Electric Co. | Morgan Stanley | 18 | 1,189 | 1,180 | (9 | ) | ||||||||||||||||
Encore Wire Corp. | Morgan Stanley | 8 | 392 | 371 | (21 | ) | ||||||||||||||||
ESCO Technologies, Inc. | Morgan Stanley | 10 | 813 | 806 | (6 | ) | ||||||||||||||||
Evoqua Water Technologies Corp. | Morgan Stanley | 635 | 13,522 | 13,475 | (61 | ) | ||||||||||||||||
Federal Signal Corp. | Morgan Stanley | 29 | 851 | 848 | (3 | ) | ||||||||||||||||
Fortune Brands Home & Security, Inc. | Morgan Stanley | 6 | 498 | 519 | 21 | |||||||||||||||||
Foundation Building Materials, Inc. | Morgan Stanley | 63 | 1,049 | 990 | (58 | ) | ||||||||||||||||
The accompanying notes are an integral part of the financial statements.
107
GOTHAM NEUTRAL FUND
Portfolio of Investments (Continued)
September 30, 2020
Total Return Swaps (continued)
Reference Entity | Counterparty | Number of Contracts Long/(Short) | Notional Amount | Value | Unrealized Appreciation/ (Depreciation)* | |||||||||||||||||
Capital Goods — (continued) | ||||||||||||||||||||||
Franklin Electric Co., Inc. | Morgan Stanley | 3 | $ | 171 | $ | 176 | $ | 7 | ||||||||||||||
General Dynamics Corp. | Morgan Stanley | 6 | 824 | 831 | 6 | |||||||||||||||||
Griffon Corp. | Morgan Stanley | 60 | 1,317 | 1,172 | (145 | ) | ||||||||||||||||
Hexcel Corp. | Morgan Stanley | 32 | 1,065 | 1,074 | 9 | |||||||||||||||||
Honeywell International, Inc. | Morgan Stanley | 28 | 4,482 | 4,609 | 127 | |||||||||||||||||
Howmet Aerospace, Inc. | Morgan Stanley | 1,098 | 19,236 | 18,359 | (877 | ) | ||||||||||||||||
Hubbell, Inc. | Morgan Stanley | 3 | 398 | 411 | 13 | |||||||||||||||||
Huntington Ingalls Industries, Inc. | Morgan Stanley | 50 | 7,332 | 7,038 | (295 | ) | ||||||||||||||||
Illinois Tool Works, Inc. | Morgan Stanley | 22 | 4,258 | 4,251 | 17 | |||||||||||||||||
ITT, Inc. | Morgan Stanley | 28 | 1,649 | 1,653 | 4 | |||||||||||||||||
John Bean Technologies Corp. | Morgan Stanley | 176 | 18,555 | 16,173 | (2,382 | ) | ||||||||||||||||
Lockheed Martin Corp. | Morgan Stanley | 8 | 3,055 | 3,066 | 7 | |||||||||||||||||
Masco Corp. | Morgan Stanley | 39 | 2,145 | 2,150 | 5 | |||||||||||||||||
MRC Global, Inc. | Morgan Stanley | 11,234 | 63,921 | 48,082 | (15,956 | ) | ||||||||||||||||
Mueller Industries, Inc. | Morgan Stanley | 4 | 107 | 108 | 1 | |||||||||||||||||
National Presto Industries, Inc. | Morgan Stanley | 4 | 351 | 327 | (23 | ) | ||||||||||||||||
NOW, Inc. | Morgan Stanley | 17,325 | 125,953 | 78,656 | (47,297 | ) | ||||||||||||||||
PACCAR, Inc. | Morgan Stanley | 211 | 18,233 | 17,994 | (239 | ) | ||||||||||||||||
Quanta Services, Inc. | Morgan Stanley | 2 | 103 | 106 | 3 | |||||||||||||||||
RBC Bearings, Inc. | Morgan Stanley | 398 | 51,854 | 48,242 | (3,612 | ) | ||||||||||||||||
Roper Technologies, Inc. | Morgan Stanley | 28 | 11,149 | 11,063 | (86 | ) | ||||||||||||||||
Shyft Group, Inc. (The) | Morgan Stanley | 15 | 276 | 283 | 7 | |||||||||||||||||
SPX FLOW, Inc. | Morgan Stanley | 7 | 303 | 300 | (3 | ) | ||||||||||||||||
Timken Co. (The) | Morgan Stanley | 331 | 18,993 | 17,947 | (1,075 | ) | ||||||||||||||||
Toro Co. (The) | Morgan Stanley | 52 | 4,253 | 4,365 | 124 | |||||||||||||||||
Trane Technologies PLC (Ireland) | Morgan Stanley | 27 | 3,237 | 3,274 | 37 | |||||||||||||||||
TransDigm Group, Inc. | Morgan Stanley | 2 | 984 | 950 | (34 | ) | ||||||||||||||||
Tutor Perini Corp. | Morgan Stanley | 1,736 | 21,387 | 19,322 | (2,066 | ) | ||||||||||||||||
UFP Industries, Inc. | Morgan Stanley | 9 | 498 | 508 | 11 | |||||||||||||||||
United Rentals, Inc. | Morgan Stanley | 1 | 165 | 175 | 10 | |||||||||||||||||
Watsco, Inc. | Morgan Stanley | 163 | 38,960 | 37,961 | (999 | ) | ||||||||||||||||
Woodward, Inc. | Morgan Stanley | 771 | 64,400 | 61,803 | (2,596 | ) | ||||||||||||||||
WW Grainger, Inc. | Morgan Stanley | 6 | 2,069 | 2,141 | 71 | |||||||||||||||||
|
|
|
|
|
|
|
| |||||||||||||||
| 42,497 | 941,182 | 856,774 | (84,062 | ) | ||||||||||||||||||
|
|
|
|
|
|
|
| |||||||||||||||
Commercial & Professional Services | ||||||||||||||||||||||
ABM Industries, Inc. | Morgan Stanley | 193 | 7,172 | 7,075 | (64 | ) | ||||||||||||||||
Advanced Disposal Services, Inc. | Morgan Stanley | 2,117 | 63,616 | 63,997 | 387 | |||||||||||||||||
ASGN, Inc. | Morgan Stanley | 11 | 706 | 699 | (6 | ) | ||||||||||||||||
Brady Corp., Class A | Morgan Stanley | 349 | 16,738 | 13,967 | (2,787 | ) | ||||||||||||||||
Cintas Corp. | Morgan Stanley | 10 | 3,206 | 3,328 | 123 | |||||||||||||||||
Deluxe Corp. | Morgan Stanley | 3,644 | 103,487 | 93,760 | (9,797 | ) | ||||||||||||||||
Ennis, Inc. | Morgan Stanley | 1 | 18 | 17 | — | |||||||||||||||||
Equifax, Inc. | Morgan Stanley | 112 | 18,911 | 17,573 | (1,338 | ) | ||||||||||||||||
Exponent, Inc. | Morgan Stanley | 19 | 1,380 | 1,369 | (12 | ) | ||||||||||||||||
FTI Consulting, Inc. | Morgan Stanley | 1 | 106 | 106 | — | |||||||||||||||||
Healthcare Services Group, Inc. | Morgan Stanley | 7,812 | 162,486 | 168,192 | 5,744 | |||||||||||||||||
The accompanying notes are an integral part of the financial statements.
108
GOTHAM NEUTRAL FUND
Portfolio of Investments (Continued)
September 30, 2020
Total Return Swaps (continued)
Reference Entity | Counterparty | Number of Contracts Long/(Short) | Notional Amount | Value | Unrealized Appreciation/ (Depreciation)* | ||||||||||||||||||||
Commercial & Professional Services — (continued) |
| ||||||||||||||||||||||||
ICF International, Inc. | Morgan Stanley | 4 | $ | 248 | $ | 246 | $ | (2 | ) | ||||||||||||||||
IHS Markit Ltd. (Bermuda) | Morgan Stanley | 161 | 13,079 | 12,640 | (439 | ) | |||||||||||||||||||
KAR Auction Services, Inc. | Morgan Stanley | 18 | 255 | 259 | 4 | ||||||||||||||||||||
Kelly Services, Inc., Class A | Morgan Stanley | 45 | 846 | 767 | (80 | ) | |||||||||||||||||||
Republic Services, Inc. | Morgan Stanley | 18 | 1,682 | 1,680 | 6 | ||||||||||||||||||||
Robert Half International, Inc. | Morgan Stanley | 49 | 2,575 | 2,594 | 19 | ||||||||||||||||||||
SP Plus Corp. | Morgan Stanley | 2,334 | 48,057 | 41,895 | (6,207 | ) | |||||||||||||||||||
Stantec, Inc. (Canada) | Morgan Stanley | 22 | 695 | 667 | (26 | ) | |||||||||||||||||||
Steelcase, Inc., Class A | Morgan Stanley | 8,919 | 93,196 | 90,171 | (3,025 | ) | |||||||||||||||||||
Tetra Tech, Inc. | Morgan Stanley | 32 | 2,945 | 3,056 | 111 | ||||||||||||||||||||
TriNet Group, Inc. | Morgan Stanley | 23 | 1,485 | 1,364 | (121 | ) | |||||||||||||||||||
TrueBlue, Inc. | Morgan Stanley | 14 | 218 | 217 | (1 | ) | |||||||||||||||||||
Verisk Analytics, Inc. | Morgan Stanley | 41 | 7,651 | 7,598 | (46 | ) | |||||||||||||||||||
Waste Management, Inc. | Morgan Stanley | 20 | 2,232 | 2,263 | 32 | ||||||||||||||||||||
|
|
|
|
|
|
|
| ||||||||||||||||||
| 25,969 | 552,990 | 535,500 | (17,525 | ) | |||||||||||||||||||||
|
|
|
|
|
|
|
| ||||||||||||||||||
Consumer Durables & Apparel | |||||||||||||||||||||||||
Carter’s, Inc. | Morgan Stanley | 2,163 | 169,385 | 187,273 | 18,155 | ||||||||||||||||||||
Cavco Industries, Inc. | Morgan Stanley | 25 | 4,848 | 4,508 | (340 | ) | |||||||||||||||||||
Deckers Outdoor Corp. | Morgan Stanley | 121 | 24,814 | 26,621 | 2,298 | ||||||||||||||||||||
DR Horton, Inc. | Morgan Stanley | 20 | 1,458 | 1,513 | 55 | ||||||||||||||||||||
Garmin Ltd. (Switzerland) | Morgan Stanley | 120 | 11,615 | 11,383 | (215 | ) | |||||||||||||||||||
G-III Apparel Group Ltd. | Morgan Stanley | 1,821 | 23,045 | 23,873 | 828 | ||||||||||||||||||||
Gildan Activewear, Inc. (Canada) | Morgan Stanley | 1,520 | 31,212 | 29,898 | (1,313 | ) | |||||||||||||||||||
Hanesbrands, Inc. | Morgan Stanley | 876 | 13,901 | 13,797 | (104 | ) | |||||||||||||||||||
Helen of Troy Ltd. (Bermuda) | Morgan Stanley | 200 | 40,593 | 38,704 | (1,962 | ) | |||||||||||||||||||
Kontoor Brands, Inc. | Morgan Stanley | 47 | 1,052 | 1,137 | 85 | ||||||||||||||||||||
La-Z-Boy, Inc. | Morgan Stanley | 79 | 2,550 | 2,499 | (49 | ) | |||||||||||||||||||
Lululemon Athletica, Inc. | Morgan Stanley | 119 | 37,114 | 39,195 | 2,163 | ||||||||||||||||||||
Nautilus, Inc. | Morgan Stanley | 384 | 6,508 | 6,589 | 81 | ||||||||||||||||||||
NIKE, Inc., Class B | Morgan Stanley | 52 | 6,496 | 6,528 | 32 | ||||||||||||||||||||
Polaris, Inc. | Morgan Stanley | 2,445 | 252,834 | 230,661 | (22,645 | ) | |||||||||||||||||||
PulteGroup, Inc. | Morgan Stanley | 13 | 580 | 602 | 22 | ||||||||||||||||||||
PVH Corp. | Morgan Stanley | 559 | 35,559 | 33,339 | (2,221 | ) | |||||||||||||||||||
Smith & Wesson Brands, Inc. | Morgan Stanley | 1,114 | 19,214 | 17,289 | (1,895 | ) | |||||||||||||||||||
Steven Madden Ltd. | Morgan Stanley | 10,183 | 215,403 | 198,568 | (16,835 | ) | |||||||||||||||||||
Sturm Ruger & Co., Inc. | Morgan Stanley | 159 | 10,617 | 9,724 | (892 | ) | |||||||||||||||||||
Tupperware Brands Corp. | Morgan Stanley | 22 | 451 | 443 | (8 | ) | |||||||||||||||||||
Universal Electronics, Inc. | Morgan Stanley | 419 | 16,881 | 15,813 | (1,083 | ) | |||||||||||||||||||
Whirlpool Corp. | Morgan Stanley | 13 | 2,303 | 2,390 | 88 | ||||||||||||||||||||
YETI Holdings, Inc. | Morgan Stanley | 151 | 6,850 | 6,843 | (7 | ) | |||||||||||||||||||
|
|
|
|
|
|
|
| ||||||||||||||||||
| 22,625 | 935,283 | 909,190 | (25,762 | ) | |||||||||||||||||||||
|
|
|
|
|
|
|
| ||||||||||||||||||
Consumer Services | |||||||||||||||||||||||||
Adtalem Global Education, Inc. | Morgan Stanley | 131 | 3,413 | 3,215 | (199 | ) | |||||||||||||||||||
Chipotle Mexican Grill, Inc. | Morgan Stanley | 8 | 10,017 | 9,950 | (67 | ) | |||||||||||||||||||
Darden Restaurants, Inc. | Morgan Stanley | 408 | 37,300 | 41,102 | 6,915 | ||||||||||||||||||||
El Pollo Loco Holdings, Inc. | Morgan Stanley | 82 | 1,312 | 1,328 | 17 | ||||||||||||||||||||
The accompanying notes are an integral part of the financial statements.
109
GOTHAM NEUTRAL FUND
Portfolio of Investments (Continued)
September 30, 2020
Total Return Swaps (continued)
Reference Entity | Counterparty | Number of Contracts Long/(Short) | Notional Amount | Value | Unrealized Appreciation/ (Depreciation)* | ||||||||||||||||||||
Consumer Services — (continued) | |||||||||||||||||||||||||
frontdoor, Inc. | Morgan Stanley | 16 | $ | 630 | $ | 623 | $ | (7 | ) | ||||||||||||||||
Graham Holdings Co., Class B | Morgan Stanley | 1 | 397 | 404 | 7 | ||||||||||||||||||||
Grand Canyon Education, Inc. | Morgan Stanley | 8 | 656 | 640 | (16 | ) | |||||||||||||||||||
Jack in the Box, Inc. | Morgan Stanley | 5 | 396 | 397 | — | ||||||||||||||||||||
MGM Resorts International | Morgan Stanley | 1,517 | 34,451 | 32,995 | (2,348 | ) | |||||||||||||||||||
Norwegian Cruise Line Holdings Ltd. (Bermuda) | Morgan Stanley | 356 | 5,510 | 6,091 | 582 | ||||||||||||||||||||
Papa John’s International, Inc. | Morgan Stanley | 1,684 | 152,661 | 138,560 | (14,101 | ) | |||||||||||||||||||
Perdoceo Education Corp. | Morgan Stanley | 7,493 | 110,028 | 91,714 | (18,313 | ) | |||||||||||||||||||
Royal Caribbean Cruises Ltd. (Liberia) | Morgan Stanley | 128 | 7,922 | 8,285 | 364 | ||||||||||||||||||||
Service Corp. International | Morgan Stanley | 45 | 1,812 | 1,898 | 97 | ||||||||||||||||||||
Strategic Education, Inc. | Morgan Stanley | 1,173 | 120,305 | 107,294 | (12,352 | ) | |||||||||||||||||||
Wingstop, Inc. | Morgan Stanley | 1,714 | 253,172 | 234,218 | (18,954 | ) | |||||||||||||||||||
Yum! Brands, Inc. | Morgan Stanley | 295 | 27,620 | 26,933 | (719 | ) | |||||||||||||||||||
|
|
|
|
|
|
|
| ||||||||||||||||||
| 15,064 | 767,602 | 705,647 | (59,094 | ) | |||||||||||||||||||||
|
|
|
|
|
|
|
| ||||||||||||||||||
Diversified Financials | |||||||||||||||||||||||||
Berkshire Hathaway, Inc., Class B | Morgan Stanley | 1,060 | 234,139 | 225,716 | (8,635 | ) | |||||||||||||||||||
BlackRock, Inc. | Morgan Stanley | 23 | 12,564 | 12,962 | 397 | ||||||||||||||||||||
Diamondpeak Holdings Corp., Class A | Morgan Stanley | 3 | 80 | 77 | 59 | ||||||||||||||||||||
Federated Hermes, Inc. | Morgan Stanley | 93 | 2,015 | 2,000 | (14 | ) | |||||||||||||||||||
Franklin Resources, Inc. | Morgan Stanley | 817 | 16,215 | 16,626 | 584 | ||||||||||||||||||||
Moody’s Corp. | Morgan Stanley | 6 | 1,663 | 1,739 | 76 | ||||||||||||||||||||
Nasdaq, Inc. | Morgan Stanley | 49 | 5,994 | 6,013 | 19 | ||||||||||||||||||||
S&P Global, Inc. | Morgan Stanley | 40 | 13,946 | 14,424 | 478 | ||||||||||||||||||||
Sprott, Inc. (Canada) | Morgan Stanley | 3 | 106 | 102 | (4 | ) | |||||||||||||||||||
T Rowe Price Group, Inc. | Morgan Stanley | 36 | 4,494 | 4,616 | 122 | ||||||||||||||||||||
Waddell & Reed Financial, Inc., Class A | Morgan Stanley | 116 | 1,687 | 1,723 | 36 | ||||||||||||||||||||
|
|
|
|
|
|
|
| ||||||||||||||||||
| 2,246 | 292,903 | 285,998 | (6,882 | ) | |||||||||||||||||||||
|
|
|
|
|
|
|
| ||||||||||||||||||
Energy | |||||||||||||||||||||||||
Antero Midstream Corp. | Morgan Stanley | 1,966 | 10,840 | 10,557 | (282 | ) | |||||||||||||||||||
Cactus, Inc., Class A | Morgan Stanley | 25 | 548 | 480 | (68 | ) | |||||||||||||||||||
Canadian Natural Resources Ltd. (Canada) | Morgan Stanley | 17,688 | 343,474 | 283,185 | (55,790 | ) | |||||||||||||||||||
Clean Energy Fuels Corp. | Morgan Stanley | 1,591 | 4,227 | 3,946 | (281 | ) | |||||||||||||||||||
Concho Resources, Inc. | Morgan Stanley | 29 | 1,256 | 1,279 | 24 | ||||||||||||||||||||
ConocoPhillips | Morgan Stanley | 4,530 | 157,279 | 148,765 | (8,514 | ) | |||||||||||||||||||
Core Laboratories NV (Netherlands) | Morgan Stanley | 2 | 31 | 31 | (1 | ) | |||||||||||||||||||
Crescent Point Energy Corp. (Canada) | Morgan Stanley | 63 | 78 | 77 | (1 | ) | |||||||||||||||||||
CVR Energy, Inc. | Morgan Stanley | 2,271 | 37,085 | 28,115 | (9,208 | ) | |||||||||||||||||||
DHT Holdings, Inc. (Marshall Islands) | Morgan Stanley | 12,765 | 66,485 | 65,867 | (617 | ) | |||||||||||||||||||
DMC Global, Inc. | Morgan Stanley | 1,392 | 50,502 | 45,852 | (4,701 | ) | |||||||||||||||||||
EOG Resources, Inc. | Morgan Stanley | 12,784 | 557,311 | 459,457 | (97,854 | ) | |||||||||||||||||||
Halliburton Co. | Morgan Stanley | 420 | 5,276 | 5,061 | (215 | ) | |||||||||||||||||||
HollyFrontier Corp. | Morgan Stanley | 553 | 12,246 | 10,900 | (1,346 | ) | |||||||||||||||||||
Kinder Morgan, Inc. | Morgan Stanley | 8,045 | 111,343 | 99,195 | (12,148 | ) | |||||||||||||||||||
Kosmos Energy Ltd. | Morgan Stanley | 55,507 | 80,485 | 54,153 | (26,551 | ) | |||||||||||||||||||
The accompanying notes are an integral part of the financial statements.
110
GOTHAM NEUTRAL FUND
Portfolio of Investments (Continued)
September 30, 2020
Total Return Swaps (continued)
Reference Entity | Counterparty | Number of Contracts Long/(Short) | Notional Amount | Value | Unrealized Appreciation/ (Depreciation)* | ||||||||||||||||||||
Energy — (continued) | |||||||||||||||||||||||||
Magnolia Oil & Gas Corp., Class A | Morgan Stanley | 4,928 | $ | 29,814 | $ | 25,478 | $ | (4,352 | ) | ||||||||||||||||
Murphy Oil Corp. | Morgan Stanley | 12,370 | 163,441 | 110,340 | (53,101 | ) | |||||||||||||||||||
Nordic American Tankers Ltd. (Bermuda) | Morgan Stanley | 41,186 | 164,698 | 143,739 | (20,959 | ) | |||||||||||||||||||
Patterson-UTI Energy, Inc. | Morgan Stanley | 76 | 220 | 217 | 1 | ||||||||||||||||||||
Phillips 66 | Morgan Stanley | 161 | 8,712 | 8,346 | (366 | ) | |||||||||||||||||||
Schlumberger NV (Curacao) | Morgan Stanley | 142 | 2,290 | 2,210 | (80 | ) | |||||||||||||||||||
World Fuel Services Corp. | Morgan Stanley | 711 | 18,450 | 15,066 | (3,315 | ) | |||||||||||||||||||
|
|
|
|
|
|
|
| ||||||||||||||||||
| 179,205 | 1,826,091 | 1,522,316 | (299,725 | ) | |||||||||||||||||||||
|
|
|
|
|
|
|
| ||||||||||||||||||
Food & Staples Retailing | |||||||||||||||||||||||||
BJ’s Wholesale Club Holdings, Inc. | Morgan Stanley | 743 | 31,183 | 30,872 | (311 | ) | |||||||||||||||||||
Casey’s General Stores, Inc. | Morgan Stanley | 116 | 20,323 | 20,607 | 284 | ||||||||||||||||||||
Costco Wholesale Corp. | Morgan Stanley | 21 | 7,400 | 7,455 | 55 | ||||||||||||||||||||
Kroger Co. (The) | Morgan Stanley | 418 | 13,974 | 14,174 | 200 | ||||||||||||||||||||
SpartanNash Co. | Morgan Stanley | 1,842 | 37,245 | 30,117 | (6,766 | ) | |||||||||||||||||||
Sprouts Farmers Market, Inc. | Morgan Stanley | 39 | 840 | 816 | (24 | ) | |||||||||||||||||||
Sysco Corp. | Morgan Stanley | 12 | 737 | 747 | 10 | ||||||||||||||||||||
US Foods Holding Corp. | Morgan Stanley | 562 | 14,233 | 12,488 | (1,746 | ) | |||||||||||||||||||
Walgreens Boots Alliance, Inc. | Morgan Stanley | 426 | 15,529 | 15,302 | (227 | ) | |||||||||||||||||||
Walmart, Inc. | Morgan Stanley | 65 | 8,863 | 9,094 | 264 | ||||||||||||||||||||
Weis Markets, Inc. | Morgan Stanley | 379 | 18,825 | 18,192 | (636 | ) | |||||||||||||||||||
|
|
|
|
|
|
|
| ||||||||||||||||||
| 4,623 | 169,152 | 159,864 | (8,897 | ) | |||||||||||||||||||||
|
|
|
|
|
|
|
| ||||||||||||||||||
Food, Beverage & Tobacco | |||||||||||||||||||||||||
Altria Group, Inc. | Morgan Stanley | 110 | 4,257 | 4,250 | (6 | ) | |||||||||||||||||||
Archer-Daniels-Midland Co. | Morgan Stanley | 12 | 546 | 558 | 12 | ||||||||||||||||||||
B&G Foods, Inc. | Morgan Stanley | 3,325 | 99,353 | 92,335 | (5,473 | ) | |||||||||||||||||||
Brown-Forman Corp., Class B | Morgan Stanley | 1 | 75 | 75 | — | ||||||||||||||||||||
Coca-Cola Co. (The) | Morgan Stanley | 219 | 10,811 | 10,812 | (30 | ) | |||||||||||||||||||
Coca-Cola Consolidated, Inc. | Morgan Stanley | 190 | 52,503 | 45,729 | (6,774 | ) | |||||||||||||||||||
Conagra Brands, Inc. | Morgan Stanley | 179 | 6,207 | 6,392 | 185 | ||||||||||||||||||||
Constellation Brands, Inc., Class A | Morgan Stanley | 12 | 2,211 | 2,274 | 63 | ||||||||||||||||||||
Flowers Foods, Inc. | Morgan Stanley | 1,061 | 25,863 | 25,814 | (51 | ) | |||||||||||||||||||
Fresh Del Monte Produce, Inc. (Cayman Islands) | Morgan Stanley | 634 | 14,695 | 14,531 | (164 | ) | |||||||||||||||||||
General Mills, Inc. | Morgan Stanley | 1,148 | 70,120 | 70,809 | 689 | ||||||||||||||||||||
JM Smucker Co. (The) | Morgan Stanley | 228 | 26,264 | 26,339 | 75 | ||||||||||||||||||||
John B. Sanfilippo & Son, Inc. | Morgan Stanley | 313 | 25,184 | 23,594 | (1,610 | ) | |||||||||||||||||||
Kellogg Co. | Morgan Stanley | 466 | 32,474 | 30,099 | (2,375 | ) | |||||||||||||||||||
Kraft Heinz Co. (The) | Morgan Stanley | 3,405 | 115,167 | 101,980 | (13,188 | ) | |||||||||||||||||||
McCormick & Co., Inc., non-voting shares | Morgan Stanley | 28 | 5,341 | 5,435 | 94 | ||||||||||||||||||||
Molson Coors Beverage Co., Class B | Morgan Stanley | 844 | 31,811 | 28,325 | (3,486 | ) | |||||||||||||||||||
Monster Beverage Corp. | Morgan Stanley | 71 | 5,598 | 5,694 | 96 | ||||||||||||||||||||
National Beverage Corp. | Morgan Stanley | 4 | 282 | 272 | (10 | ) | |||||||||||||||||||
PepsiCo, Inc. | Morgan Stanley | 50 | 6,604 | 6,930 | 326 | ||||||||||||||||||||
Philip Morris International, Inc. | Morgan Stanley | 55 | 4,163 | 4,124 | (227 | ) | |||||||||||||||||||
The accompanying notes are an integral part of the financial statements.
111
GOTHAM NEUTRAL FUND
Portfolio of Investments (Continued)
September 30, 2020
Total Return Swaps (continued)
Reference Entity | Counterparty | Number of Contracts Long/(Short) | Notional Amount | Value | Unrealized Appreciation/ (Depreciation)* | ||||||||||||||||||||
Food, Beverage & Tobacco — (continued) | |||||||||||||||||||||||||
Tootsie Roll Industries, Inc. | Morgan Stanley | 445 | $ | 14,173 | $ | 13,750 | $ | (435 | ) | ||||||||||||||||
TreeHouse Foods, Inc. | Morgan Stanley | 6,011 | 257,331 | 243,626 | (13,889 | ) | |||||||||||||||||||
Turning Point Brands, Inc. | Morgan Stanley | 1 | 29 | 28 | (1 | ) | |||||||||||||||||||
Tyson Foods, Inc., Class A | Morgan Stanley | 4,347 | 271,448 | 258,559 | (12,888 | ) | |||||||||||||||||||
|
|
|
|
|
|
|
| ||||||||||||||||||
| 23,159 | 1,082,510 | 1,022,334 | (59,067 | ) | |||||||||||||||||||||
|
|
|
|
|
|
|
| ||||||||||||||||||
Health Care Equipment & Services | |||||||||||||||||||||||||
Abbott Laboratories | Morgan Stanley | 218 | 22,952 | 23,725 | 775 | ||||||||||||||||||||
Addus HomeCare Corp. | Morgan Stanley | 5 | 461 | 473 | 12 | ||||||||||||||||||||
Allscripts Healthcare Solutions, Inc. | Morgan Stanley | 7,835 | 70,044 | 63,777 | (6,267 | ) | |||||||||||||||||||
AMN Healthcare Services, Inc. | Morgan Stanley | 409 | 22,808 | 23,910 | 1,113 | ||||||||||||||||||||
Anthem, Inc. | Morgan Stanley | 2 | 501 | 537 | 36 | ||||||||||||||||||||
Centene Corp. | Morgan Stanley | 85 | 4,950 | 4,958 | 8 | ||||||||||||||||||||
Cerner Corp. | Morgan Stanley | 62 | 4,228 | 4,482 | 308 | ||||||||||||||||||||
Cigna Corp. | Morgan Stanley | 387 | 70,179 | 65,562 | (4,816 | ) | |||||||||||||||||||
CVS Health Corp. | Morgan Stanley | 37 | 2,119 | 2,161 | 42 | ||||||||||||||||||||
Danaher Corp. | Morgan Stanley | 173 | 34,765 | 37,252 | 2,534 | ||||||||||||||||||||
DENTSPLY SIRONA, Inc. | Morgan Stanley | 11 | 481 | 481 | — | ||||||||||||||||||||
DexCom, Inc. | Morgan Stanley | 52 | 21,828 | 21,436 | (2,960 | ) | |||||||||||||||||||
Ensign Group, Inc. (The) | Morgan Stanley | 240 | 14,215 | 13,694 | (514 | ) | |||||||||||||||||||
Globus Medical, Inc., Class A | Morgan Stanley | 171 | 8,452 | 8,468 | 16 | ||||||||||||||||||||
Hanger, Inc. | Morgan Stanley | 3 | 50 | 47 | (2 | ) | |||||||||||||||||||
HCA Healthcare, Inc. | Morgan Stanley | 49 | 5,860 | 6,109 | 249 | ||||||||||||||||||||
HealthStream, Inc. | Morgan Stanley | 5 | 101 | 100 | (1 | ) | |||||||||||||||||||
Hill-Rom Holdings, Inc. | Morgan Stanley | 105 | 8,717 | 8,769 | 57 | ||||||||||||||||||||
HMS Holdings Corp. | Morgan Stanley | 65 | 1,566 | 1,557 | (9 | ) | |||||||||||||||||||
Hologic, Inc. | Morgan Stanley | 1,157 | 69,129 | 76,906 | 9,469 | ||||||||||||||||||||
Humana, Inc. | Morgan Stanley | 440 | 188,068 | 182,112 | (5,902 | ) | |||||||||||||||||||
IDEXX Laboratories, Inc. | Morgan Stanley | 36 | 13,049 | 14,152 | 1,103 | ||||||||||||||||||||
Intuitive Surgical, Inc. | Morgan Stanley | 20 | 13,940 | 14,191 | 223 | ||||||||||||||||||||
iRhythm Technologies, Inc. | Morgan Stanley | 200 | 43,681 | 47,622 | 3,941 | ||||||||||||||||||||
McKesson Corp. | Morgan Stanley | 224 | 34,432 | 33,360 | (1,072 | ) | |||||||||||||||||||
MEDNAX, Inc. | Morgan Stanley | 147 | 2,587 | 2,393 | (194 | ) | |||||||||||||||||||
Medtronic PLC (Ireland) | Morgan Stanley | 31 | 3,209 | 3,222 | 31 | ||||||||||||||||||||
Molina Healthcare, Inc. | Morgan Stanley | 44 | 7,167 | 8,054 | 887 | ||||||||||||||||||||
Natus Medical, Inc. | Morgan Stanley | 5,129 | 93,143 | 87,860 | (5,324 | ) | |||||||||||||||||||
Neogen Corp. | Morgan Stanley | 15 | 1,143 | 1,174 | 31 | ||||||||||||||||||||
NextGen Healthcare, Inc. | Morgan Stanley | 5 | 66 | 64 | (2 | ) | |||||||||||||||||||
Omnicell, Inc. | Morgan Stanley | 1,223 | 83,055 | 91,309 | 8,392 | ||||||||||||||||||||
Owens & Minor, Inc. | Morgan Stanley | 602 | 9,807 | 15,116 | 6,130 | ||||||||||||||||||||
Providence Service Corp. (The) | Morgan Stanley | 65 | 5,946 | 6,039 | 93 | ||||||||||||||||||||
Quidel Corp. | Morgan Stanley | 857 | 144,270 | 188,009 | 52,895 | ||||||||||||||||||||
ResMed, Inc. | Morgan Stanley | 390 | 71,201 | 66,858 | (4,343 | ) | |||||||||||||||||||
Teladoc Health, Inc. | Morgan Stanley | 62 | 12,542 | 13,593 | 1,051 | ||||||||||||||||||||
Teleflex, Inc. | Morgan Stanley | 1 | 340 | 340 | 13 | ||||||||||||||||||||
Tivity Health, Inc. | Morgan Stanley | 5 | 71 | 70 | (1 | ) | |||||||||||||||||||
UnitedHealth Group, Inc. | Morgan Stanley | 17 | 5,000 | 5,300 | 300 | ||||||||||||||||||||
The accompanying notes are an integral part of the financial statements.
112
GOTHAM NEUTRAL FUND
Portfolio of Investments (Continued)
September 30, 2020
Total Return Swaps (continued)
Reference Entity | Counterparty | Number of Contracts Long/(Short) | Notional Amount | Value | Unrealized Appreciation/ (Depreciation)* | ||||||||||||||||||||
Health Care Equipment & Services — (continued) |
| ||||||||||||||||||||||||
Vapotherm, Inc. | Morgan Stanley | 1,571 | $ | 48,874 | $ | 45,559 | $ | (3,515 | ) | ||||||||||||||||
Varian Medical Systems, Inc. | Morgan Stanley | 117 | 20,349 | 20,124 | (225 | ) | |||||||||||||||||||
West Pharmaceutical Services, Inc. | Morgan Stanley | 13 | 3,425 | 3,574 | 149 | ||||||||||||||||||||
|
|
|
|
|
|
|
| ||||||||||||||||||
| 22,285 | 1,168,771 | 1,214,499 | 54,711 | ||||||||||||||||||||||
|
|
|
|
|
|
|
| ||||||||||||||||||
Household & Personal Products | |||||||||||||||||||||||||
Central Garden & Pet Co., Class A | Morgan Stanley | 157 | 5,745 | 5,674 | (71 | ) | |||||||||||||||||||
Church & Dwight Co., Inc. | Morgan Stanley | 35 | 3,203 | 3,280 | 77 | ||||||||||||||||||||
Clorox Co. (The) | Morgan Stanley | 337 | 74,778 | 70,827 | (3,950 | ) | |||||||||||||||||||
Colgate-Palmolive Co. | Morgan Stanley | 40 | 3,026 | 3,086 | 60 | ||||||||||||||||||||
Procter & Gamble Co. (The) | Morgan Stanley | 75 | 10,278 | 10,424 | 148 | ||||||||||||||||||||
Spectrum Brands Holdings, Inc. | Morgan Stanley | 685 | 40,708 | 39,155 | (1,553 | ) | |||||||||||||||||||
|
|
|
|
|
|
|
| ||||||||||||||||||
| 1,329 | 137,738 | 132,446 | (5,289 | ) | |||||||||||||||||||||
|
|
|
|
|
|
|
| ||||||||||||||||||
Materials | |||||||||||||||||||||||||
Amcor PLC (Jersey) | Morgan Stanley | 3,754 | 41,474 | 41,482 | 24 | ||||||||||||||||||||
Ashland Global Holdings, Inc. | Morgan Stanley | 3 | 206 | 213 | 12 | ||||||||||||||||||||
Boise Cascade Co. | Morgan Stanley | 11 | 429 | 439 | 10 | ||||||||||||||||||||
Carpenter Technology Corp. | Morgan Stanley | 1,924 | 41,138 | 34,940 | (6,198 | ) | |||||||||||||||||||
Century Aluminum Co. | Morgan Stanley | 744 | 7,301 | 5,297 | (2,004 | ) | |||||||||||||||||||
Chase Corp. | Morgan Stanley | 1 | 96 | 95 | — | ||||||||||||||||||||
Compass Minerals International, Inc. | Morgan Stanley | 13 | 736 | 772 | 36 | ||||||||||||||||||||
Dow, Inc. | Morgan Stanley | 374 | 18,083 | 17,597 | (488 | ) | |||||||||||||||||||
Forterra, Inc. | Morgan Stanley | 1 | 11 | 12 | 1 | ||||||||||||||||||||
Freeport-McMoRan, Inc. | Morgan Stanley | 19 | 289 | 297 | 8 | ||||||||||||||||||||
FutureFuel Corp. | Morgan Stanley | 2 | 22 | 23 | 1 | ||||||||||||||||||||
Golden Star Resources Ltd. (Canada) | Morgan Stanley | 146 | 657 | 629 | (28 | ) | |||||||||||||||||||
Hecla Mining Co. | Morgan Stanley | 6,093 | 34,424 | 30,952 | (3,472 | ) | |||||||||||||||||||
IAMGOLD Corp. (Canada) | Morgan Stanley | 879 | 3,348 | 3,367 | 19 | ||||||||||||||||||||
Innospec, Inc. | Morgan Stanley | 753 | 57,635 | 47,680 | (9,955 | ) | |||||||||||||||||||
Kaiser Aluminum Corp. | Morgan Stanley | 1,705 | 109,597 | 91,371 | (18,290 | ) | |||||||||||||||||||
Kinross Gold Corp. (Canada) | Morgan Stanley | 3,059 | 26,859 | 26,980 | 122 | ||||||||||||||||||||
Kraton Corp. | Morgan Stanley | 1,205 | 17,882 | 21,473 | 3,742 | ||||||||||||||||||||
Linde PLC (Ireland) | Morgan Stanley | 20 | 4,697 | 4,763 | 65 | ||||||||||||||||||||
Minerals Technologies, Inc. | Morgan Stanley | 489 | 24,714 | 24,988 | 298 | ||||||||||||||||||||
New Gold, Inc. (Canada) | Morgan Stanley | 2,780 | 4,768 | 4,726 | (42 | ) | |||||||||||||||||||
NewMarket Corp. | Morgan Stanley | �� | 504 | 187,735 | 172,529 | (14,399 | ) | ||||||||||||||||||
Newmont Corp. | Morgan Stanley | 1,582 | 104,467 | 100,378 | (3,901 | ) | |||||||||||||||||||
Nucor Corp. | Morgan Stanley | 72 | 3,253 | 3,230 | (14 | ) | |||||||||||||||||||
Nutrien Ltd. (Canada) | Morgan Stanley | 269 | 10,046 | 10,553 | 610 | ||||||||||||||||||||
O-I Glass, Inc. | Morgan Stanley | 506 | 5,616 | 5,359 | (257 | ) | |||||||||||||||||||
Pan American Silver Corp. (Canada) | Morgan Stanley | 63 | 1,967 | 2,025 | 58 | ||||||||||||||||||||
PPG Industries, Inc. | Morgan Stanley | 204 | 24,992 | 24,904 | (88 | ) | |||||||||||||||||||
Pretium Resources, Inc. (Canada) | Morgan Stanley | 79 | 996 | 1,014 | 18 | ||||||||||||||||||||
Sealed Air Corp. | Morgan Stanley | 3 | 113 | 116 | 4 | ||||||||||||||||||||
Sonoco Products Co. | Morgan Stanley | 33 | 1,646 | 1,685 | 39 | ||||||||||||||||||||
Stepan Co. | Morgan Stanley | 3 | 329 | 327 | (2 | ) | |||||||||||||||||||
Tredegar Corp. | Morgan Stanley | 2 | 30 | 30 | — | ||||||||||||||||||||
The accompanying notes are an integral part of the financial statements.
113
GOTHAM NEUTRAL FUND
Portfolio of Investments (Continued)
September 30, 2020
Total Return Swaps (continued)
Reference Entity | Counterparty | Number of Contracts Long/(Short) | Notional Amount | Value | Unrealized Appreciation/ (Depreciation)* | ||||||||||||||||||||
Materials — (continued) | |||||||||||||||||||||||||
Vulcan Materials Co. | Morgan Stanley | 148 | $ | 18,054 | $ | 20,060 | $ | 2,479 | |||||||||||||||||
Wheaton Precious Metals Corp. (Canada) | Morgan Stanley | 158 | 7,623 | 7,753 | 129 | ||||||||||||||||||||
Worthington Industries, Inc. | Morgan Stanley | 44 | 1,749 | 1,794 | 46 | ||||||||||||||||||||
Yamana Gold, Inc. (Canada) | Morgan Stanley | 862 | 4,842 | 4,896 | 66 | ||||||||||||||||||||
|
|
|
|
|
|
|
| ||||||||||||||||||
| 28,507 | 767,824 | 714,749 | (51,351 | ) | |||||||||||||||||||||
|
|
|
|
|
|
|
| ||||||||||||||||||
Media & Entertainment | |||||||||||||||||||||||||
Activision Blizzard, Inc. | Morgan Stanley | 123 | 9,923 | 9,957 | 34 | ||||||||||||||||||||
Alphabet, Inc., Class A | Morgan Stanley | 18 | 25,995 | 26,381 | 386 | ||||||||||||||||||||
ANGI Homeservices, Inc., Class A | Morgan Stanley | 426 | 4,374 | 4,726 | 352 | ||||||||||||||||||||
Cargurus, Inc. | Morgan Stanley | 1,944 | 48,160 | 42,049 | (6,111 | ) | |||||||||||||||||||
Charter Communications, Inc., Class A . | Morgan Stanley | 12 | 7,369 | 7,492 | 123 | ||||||||||||||||||||
Discovery, Inc., Class A | Morgan Stanley | 2,698 | 58,813 | 58,735 | (78 | ) | |||||||||||||||||||
DISH Network Corp., Class A | Morgan Stanley | 1,018 | 32,202 | 29,553 | (2,650 | ) | |||||||||||||||||||
Electronic Arts, Inc. | Morgan Stanley | 568 | 73,337 | 74,073 | 736 | ||||||||||||||||||||
Facebook, Inc., Class A | Morgan Stanley | 103 | 25,332 | 26,976 | 1,644 | ||||||||||||||||||||
Fox Corp., Class A | Morgan Stanley | 86 | 2,238 | 2,393 | 193 | ||||||||||||||||||||
Gray Television, Inc. | Morgan Stanley | 854 | 12,255 | 11,760 | (512 | ) | |||||||||||||||||||
John Wiley & Sons, Inc., Class A | Morgan Stanley | 67 | 2,195 | 2,125 | (70 | ) | |||||||||||||||||||
Lions Gate Entertainment Corp., Class B (Canada) | Morgan Stanley | 1,856 | 15,960 | 16,184 | 224 | ||||||||||||||||||||
Match Group, Inc. | Morgan Stanley | 44 | 4,556 | 4,869 | 330 | ||||||||||||||||||||
MSG Networks, Inc., Class A | Morgan Stanley | 9,633 | 93,825 | 92,188 | (1,637 | ) | |||||||||||||||||||
Netflix, Inc. | Morgan Stanley | 86 | 42,233 | 43,003 | 769 | ||||||||||||||||||||
New York Times Co. (The), Class A | Morgan Stanley | 278 | 12,095 | 11,896 | (199 | ) | |||||||||||||||||||
News Corp., Class A | Morgan Stanley | 23 | 333 | 322 | (10 | ) | |||||||||||||||||||
Omnicom Group, Inc. | Morgan Stanley | 41 | 2,037 | 2,029 | (5 | ) | |||||||||||||||||||
Pinterest, Inc., Class A | Morgan Stanley | 547 | 21,744 | 22,706 | 962 | ||||||||||||||||||||
Sirius XM Holdings, Inc. | Morgan Stanley | 1,852 | 9,482 | 9,927 | 437 | ||||||||||||||||||||
Take-Two Interactive Software, Inc. | Morgan Stanley | 285 | 46,699 | 47,088 | 389 | ||||||||||||||||||||
TEGNA, Inc. | Morgan Stanley | 1 | 12 | 12 | — | ||||||||||||||||||||
Twitter, Inc. | Morgan Stanley | 101 | 4,239 | 4,494 | 239 | ||||||||||||||||||||
Walt Disney Co. (The) | Morgan Stanley | 862 | 113,786 | 106,957 | (6,829 | ) | |||||||||||||||||||
Zillow Group, Inc., Class C | Morgan Stanley | 331 | 28,096 | 33,626 | 5,530 | ||||||||||||||||||||
Zynga, Inc., Class A | Morgan Stanley | 4,783 | 43,363 | 43,621 | 378 | ||||||||||||||||||||
|
|
|
|
|
|
|
| ||||||||||||||||||
| 28,640 | 740,653 | 735,142 | (5,375 | ) | |||||||||||||||||||||
|
|
|
|
|
|
|
| ||||||||||||||||||
Pharmaceuticals, Biotechnology & Life Sciences | |||||||||||||||||||||||||
Agilent Technologies, Inc. | Morgan Stanley | 515 | 51,243 | 51,984 | 741 | ||||||||||||||||||||
Biogen, Inc. | Morgan Stanley | 19 | 5,165 | 5,390 | 225 | ||||||||||||||||||||
Bristol Myers Squibb Co. | Morgan Stanley | 288 | 16,946 | 17,364 | 417 | ||||||||||||||||||||
Catalent, Inc. | Morgan Stanley | 63 | 5,266 | 5,397 | 131 | ||||||||||||||||||||
Charles River Laboratories International, Inc. | Morgan Stanley | 11 | 2,333 | 2,491 | 158 | ||||||||||||||||||||
Corcept Therapeutics, Inc. | Morgan Stanley | 946 | 17,734 | 16,465 | (1,418 | ) | |||||||||||||||||||
Denali Therapeutics, Inc. | Morgan Stanley | 59 | 2,079 | 2,114 | 35 | ||||||||||||||||||||
Elanco Animal Health, Inc. | Morgan Stanley | 984 | 26,545 | 27,483 | 938 | ||||||||||||||||||||
The accompanying notes are an integral part of the financial statements.
114
GOTHAM NEUTRAL FUND
Portfolio of Investments (Continued)
September 30, 2020
Total Return Swaps (continued)
Reference Entity | Counterparty | Number of Contracts Long/(Short) | Notional Amount | Value | Unrealized Appreciation/ (Depreciation)* | ||||||||||||||||||||
Pharmaceuticals, Biotechnology & Life Sciences — (continued) |
| ||||||||||||||||||||||||
Emergent BioSolutions, Inc. | Morgan Stanley | 174 | $ | 17,855 | $ | 17,979 | $ | 125 | |||||||||||||||||
Gilead Sciences, Inc. | Morgan Stanley | 77 | 4,800 | 4,866 | 66 | ||||||||||||||||||||
Horizon Therapeutics PLC (Ireland) | Morgan Stanley | 13 | 923 | 1,010 | 87 | ||||||||||||||||||||
Illumina, Inc. | Morgan Stanley | 31 | 8,538 | 9,581 | 1,043 | ||||||||||||||||||||
Innoviva, Inc. | Morgan Stanley | 7,076 | 84,579 | 73,944 | (10,635 | ) | |||||||||||||||||||
Ironwood Pharmaceuticals, Inc. | Morgan Stanley | 19 | 174 | 171 | (3 | ) | |||||||||||||||||||
Johnson & Johnson | Morgan Stanley | 92 | 13,383 | 13,697 | 314 | ||||||||||||||||||||
Kura Oncology, Inc. | Morgan Stanley | 35 | 1,039 | 1,072 | 34 | ||||||||||||||||||||
Luminex Corp. | Morgan Stanley | 601 | 15,609 | 15,776 | 219 | ||||||||||||||||||||
Merck & Co., Inc. | Morgan Stanley | 109 | 9,070 | 9,042 | (28 | ) | |||||||||||||||||||
Mylan NV (Netherlands) | Morgan Stanley | 39 | 563 | 578 | 16 | ||||||||||||||||||||
Natera, Inc. | Morgan Stanley | 24 | 1,710 | 1,734 | 24 | ||||||||||||||||||||
Neurocrine Biosciences, Inc. | Morgan Stanley | 121 | 11,874 | 11,635 | (239 | ) | |||||||||||||||||||
PerkinElmer, Inc. | Morgan Stanley | 1 | 114 | 126 | 11 | ||||||||||||||||||||
Pfizer, Inc. | Morgan Stanley | 487 | 17,517 | 17,873 | 289 | ||||||||||||||||||||
Prestige Consumer Healthcare, Inc. | Morgan Stanley | 2,481 | 90,656 | 90,358 | (301 | ) | |||||||||||||||||||
Regeneron Pharmaceuticals, Inc. | Morgan Stanley | 19 | 10,638 | 10,636 | (19 | ) | |||||||||||||||||||
Sage Therapeutics, Inc. | Morgan Stanley | 42 | 2,515 | 2,567 | 52 | ||||||||||||||||||||
Sorrento Therapeutics, Inc. | Morgan Stanley | 1,129 | 11,586 | 12,588 | 1,002 | ||||||||||||||||||||
Thermo Fisher Scientific, Inc. | Morgan Stanley | 11 | 4,638 | 4,857 | 225 | ||||||||||||||||||||
Trillium Therapeutics, Inc. (Canada) | Morgan Stanley | 92 | 1,254 | 1,307 | 53 | ||||||||||||||||||||
United Therapeutics Corp. | Morgan Stanley | 34 | 3,411 | 3,434 | 23 | ||||||||||||||||||||
Vanda Pharmaceuticals, Inc. | Morgan Stanley | 12 | 113 | 116 | 3 | ||||||||||||||||||||
Waters Corp. | Morgan Stanley | 17 | 3,335 | 3,326 | (9 | ) | |||||||||||||||||||
Zoetis, Inc. | Morgan Stanley | 196 | 32,069 | 32,412 | 343 | ||||||||||||||||||||
|
|
|
|
|
|
|
| ||||||||||||||||||
| 15,817 | 475,274 | 469,373 | (6,078 | ) | |||||||||||||||||||||
|
|
|
|
|
|
|
| ||||||||||||||||||
Retailing | |||||||||||||||||||||||||
1-800-Flowers.com, Inc., Class A | Morgan Stanley | 785 | 22,010 | 19,578 | (2,432 | ) | |||||||||||||||||||
Aaron’s, Inc. | Morgan Stanley | 88 | 4,950 | 4,985 | 38 | ||||||||||||||||||||
Abercrombie & Fitch Co., Class A | Morgan Stanley | 4,236 | 59,761 | 59,007 | (754 | ) | |||||||||||||||||||
Advance Auto Parts, Inc. | Morgan Stanley | 1,016 | 158,197 | 155,956 | (2,178 | ) | |||||||||||||||||||
Amazon.com, Inc. | Morgan Stanley | 4 | 11,890 | 12,595 | 705 | ||||||||||||||||||||
Asbury Automotive Group, Inc. | Morgan Stanley | 33 | 3,141 | 3,216 | 74 | ||||||||||||||||||||
At Home Group, Inc. | Morgan Stanley | 2,364 | 38,277 | 35,129 | (3,148 | ) | |||||||||||||||||||
AutoNation, Inc. | Morgan Stanley | 24 | 1,231 | 1,270 | 39 | ||||||||||||||||||||
AutoZone, Inc. | Morgan Stanley | 19 | 21,865 | 22,375 | 510 | ||||||||||||||||||||
Best Buy Co., Inc. | Morgan Stanley | 17 | 1,795 | 1,892 | 96 | ||||||||||||||||||||
Big Lots, Inc. | Morgan Stanley | 61 | 2,817 | 2,721 | (81 | ) | |||||||||||||||||||
Booking Holdings, Inc. | Morgan Stanley | 50 | 83,489 | 85,534 | 2,045 | ||||||||||||||||||||
Buckle, Inc. (The) | Morgan Stanley | 500 | 10,441 | 10,195 | (246 | ) | |||||||||||||||||||
Camping World Holdings, Inc., Class A . | Morgan Stanley | 59 | 1,689 | 1,755 | 66 | ||||||||||||||||||||
CarParts.Com, Inc. | Morgan Stanley | 1,883 | 22,489 | 20,355 | (2,134 | ) | |||||||||||||||||||
Core-Mark Holding Co., Inc. | Morgan Stanley | 1 | 30 | 29 | 1,992 | ||||||||||||||||||||
Dick’s Sporting Goods, Inc. | Morgan Stanley | 128 | 7,364 | 7,409 | 44 | ||||||||||||||||||||
eBay, Inc. | Morgan Stanley | 187 | 9,129 | 9,743 | 524 | ||||||||||||||||||||
The accompanying notes are an integral part of the financial statements.
115
GOTHAM NEUTRAL FUND
Portfolio of Investments (Continued)
September 30, 2020
Total Return Swaps (continued)
Reference Entity | Counterparty | Number of Contracts Long/(Short) | Notional Amount | Value | Unrealized Appreciation/ (Depreciation)* | ||||||||||||||||||||
Retailing — (continued) | |||||||||||||||||||||||||
Etsy, Inc. | Morgan Stanley | 1,461 | $ | 174,882 | $ | 177,701 | $ | 4,127 | |||||||||||||||||
Foot Locker, Inc. | Morgan Stanley | 1,986 | 64,454 | 65,598 | 1,143 | ||||||||||||||||||||
Gap, Inc. (The) | Morgan Stanley | 2,898 | 49,975 | 49,353 | (903 | ) | |||||||||||||||||||
Genuine Parts Co. | Morgan Stanley | 13 | 1,255 | 1,237 | (20 | ) | |||||||||||||||||||
Hibbett Sports, Inc. | Morgan Stanley | 187 | 6,645 | 7,334 | 689 | ||||||||||||||||||||
Home Depot, Inc. (The) | Morgan Stanley | 54 | 14,536 | 14,996 | 460 | ||||||||||||||||||||
L Brands, Inc. | Morgan Stanley | 326 | 9,646 | 10,370 | 821 | ||||||||||||||||||||
Lithia Motors, Inc., Class A | Morgan Stanley | 51 | 11,675 | 11,625 | (50 | ) | |||||||||||||||||||
Lowe’s Cos., Inc. | Morgan Stanley | 15 | 2,343 | 2,488 | 145 | ||||||||||||||||||||
Lumber Liquidators Holdings, Inc. | Morgan Stanley | 1,942 | 43,462 | 42,821 | (701 | ) | |||||||||||||||||||
Macy’s, Inc. | Morgan Stanley | 19,058 | 135,187 | 108,631 | (26,556 | ) | |||||||||||||||||||
MarineMax, Inc. | Morgan Stanley | 502 | 14,552 | 12,886 | (1,738 | ) | |||||||||||||||||||
Michaels Cos., Inc. (The) | Morgan Stanley | 612 | 5,995 | 5,909 | (86 | ) | |||||||||||||||||||
O’Reilly Automotive, Inc. | Morgan Stanley | 1 | 445 | 461 | 16 | ||||||||||||||||||||
Pool Corp. | Morgan Stanley | 53 | 16,405 | 17,731 | 1,465 | ||||||||||||||||||||
Qurate Retail, Inc., Series A | Morgan Stanley | 1,100 | 7,841 | 7,898 | 57 | ||||||||||||||||||||
Ross Stores, Inc. | Morgan Stanley | 71 | 6,349 | 6,626 | 298 | ||||||||||||||||||||
Shoe Carnival, Inc. | Morgan Stanley | 56 | 2,065 | 1,880 | (185 | ) | |||||||||||||||||||
Shutterstock, Inc. | Morgan Stanley | 332 | 16,865 | 17,277 | 417 | ||||||||||||||||||||
Sportsman’s Warehouse Holdings, Inc. | Morgan Stanley | 170 | 2,521 | 2,433 | (89 | ) | |||||||||||||||||||
Stamps.com, Inc. | Morgan Stanley | 9 | 1,989 | 2,168 | 136 | ||||||||||||||||||||
Target Corp. | Morgan Stanley | 73 | 10,927 | 11,492 | 564 | ||||||||||||||||||||
Urban Outfitters, Inc. | Morgan Stanley | 946 | 20,533 | 19,686 | (847 | ) | |||||||||||||||||||
Williams-Sonoma, Inc. | Morgan Stanley | 1 | 87 | 90 | 44 | ||||||||||||||||||||
Zumiez, Inc. | Morgan Stanley | 89 | 2,575 | 2,476 | (99 | ) | |||||||||||||||||||
|
|
|
|
|
|
|
| ||||||||||||||||||
| 43,461 | 1,083,774 | 1,054,911 | (25,732 | ) | |||||||||||||||||||||
|
|
|
|
|
|
|
| ||||||||||||||||||
Semiconductors & Semiconductor Equipment | |||||||||||||||||||||||||
Advanced Micro Devices, Inc. | Morgan Stanley | 42 | 3,170 | 3,444 | 273 | ||||||||||||||||||||
Amkor Technology, Inc. | Morgan Stanley | 78 | 937 | 874 | (63 | ) | |||||||||||||||||||
Applied Materials, Inc. | Morgan Stanley | 181 | 10,542 | 10,760 | 218 | ||||||||||||||||||||
Axcelis Technologies, Inc. | Morgan Stanley | 2,030 | 49,052 | 44,660 | (4,392 | ) | |||||||||||||||||||
Broadcom, Inc. | Morgan Stanley | 336 | 121,910 | 122,412 | 1,305 | ||||||||||||||||||||
First Solar, Inc. | Morgan Stanley | 609 | 40,758 | 40,316 | (442 | ) | |||||||||||||||||||
Intel Corp. | Morgan Stanley | 3,482 | 176,561 | 180,298 | 4,034 | ||||||||||||||||||||
KLA Corp. | Morgan Stanley | 27 | 4,793 | 5,231 | 438 | ||||||||||||||||||||
Lam Research Corp. | Morgan Stanley | 28 | 9,176 | 9,289 | (1 | ) | |||||||||||||||||||
MACOM Technology Solutions Holdings, Inc. | Morgan Stanley | 2,784 | 102,618 | 94,684 | (7,935 | ) | |||||||||||||||||||
Marvell Technology Group Ltd. (Bermuda) | Morgan Stanley | 2,192 | 86,484 | 87,022 | 483 | ||||||||||||||||||||
Maxim Integrated Products, Inc. | Morgan Stanley | 62 | 4,056 | 4,192 | 136 | ||||||||||||||||||||
Microchip Technology, Inc. | Morgan Stanley | 13 | 1,283 | 1,336 | 53 | ||||||||||||||||||||
MKS Instruments, Inc. | Morgan Stanley | 134 | 16,152 | 14,637 | (1,541 | ) | |||||||||||||||||||
Monolithic Power Systems, Inc. | Morgan Stanley | 104 | 28,099 | 29,079 | 895 | ||||||||||||||||||||
NVIDIA Corp. | Morgan Stanley | 33 | 16,270 | 17,860 | 1,632 | ||||||||||||||||||||
Photronics, Inc. | Morgan Stanley | 1,158 | 12,101 | 11,534 | (591 | ) | |||||||||||||||||||
The accompanying notes are an integral part of the financial statements.
116
GOTHAM NEUTRAL FUND
Portfolio of Investments (Continued)
September 30, 2020
Total Return Swaps (continued)
Reference Entity | Counterparty | Number of Contracts Long/(Short) | Notional Amount | Value | Unrealized Appreciation/ (Depreciation)* | ||||||||||||||||||||
Semiconductors & Semiconductor Equipment — (continued) |
| ||||||||||||||||||||||||
Power Integrations, Inc. | Morgan Stanley | 21 | $ | 1,169 | $ | 1,163 | $ | (6 | ) | ||||||||||||||||
Qorvo, Inc. | Morgan Stanley | 2 | 257 | 258 | 1 | ||||||||||||||||||||
Skyworks Solutions, Inc. | Morgan Stanley | 23 | 3,116 | 3,346 | 230 | ||||||||||||||||||||
|
|
|
|
|
|
|
| ||||||||||||||||||
| 13,339 | 688,504 | 682,395 | (5,273 | ) | |||||||||||||||||||||
|
|
|
|
|
|
|
| ||||||||||||||||||
Software & Services | |||||||||||||||||||||||||
A10 Networks, Inc. | Morgan Stanley | 164 | 1,186 | 1,045 | (142 | ) | |||||||||||||||||||
Accenture PLC, Class A (Ireland) | Morgan Stanley | 34 | 7,516 | 7,684 | 168 | ||||||||||||||||||||
ACI Worldwide, Inc. | Morgan Stanley | 1,849 | 53,596 | 48,314 | (5,282 | ) | |||||||||||||||||||
Agilysys, Inc. | Morgan Stanley | 86 | 2,176 | 2,078 | (99 | ) | |||||||||||||||||||
Alarm.com Holdings, Inc. | Morgan Stanley | 21 | 1,145 | 1,160 | 15 | ||||||||||||||||||||
Anaplan, Inc. | Morgan Stanley | 633 | 38,692 | 39,613 | 921 | ||||||||||||||||||||
Automatic Data Processing, Inc. | Morgan Stanley | 13 | 1,712 | 1,813 | 101 | ||||||||||||||||||||
Blackbaud, Inc. | Morgan Stanley | 65 | 3,705 | 3,629 | (76 | ) | |||||||||||||||||||
Broadridge Financial Solutions, Inc. | Morgan Stanley | 148 | 19,364 | 19,536 | 174 | ||||||||||||||||||||
CACI International, Inc., Class A | Morgan Stanley | 55 | 11,855 | 11,724 | (131 | ) | |||||||||||||||||||
Cadence Design Systems, Inc. | Morgan Stanley | 82 | 8,267 | 8,744 | 518 | ||||||||||||||||||||
CGI, Inc. (Canada) | Morgan Stanley | 470 | 34,356 | 31,852 | (2,504 | ) | |||||||||||||||||||
Citrix Systems, Inc. | Morgan Stanley | 17 | 2,286 | 2,341 | 55 | ||||||||||||||||||||
Cornerstone OnDemand, Inc. | Morgan Stanley | 2,709 | 94,273 | 98,499 | 4,301 | ||||||||||||||||||||
Crowdstrike Holdings, Inc., Class A | Morgan Stanley | 119 | 16,529 | 16,341 | (188 | ) | |||||||||||||||||||
CSG Systems International, Inc. | Morgan Stanley | 945 | 40,063 | 38,698 | (1,148 | ) | |||||||||||||||||||
Evo Payments, Inc., Class A | Morgan Stanley | 3 | 76 | 75 | (1 | ) | |||||||||||||||||||
Fiserv, Inc. | Morgan Stanley | 352 | 36,232 | 36,274 | 54 | ||||||||||||||||||||
FleetCor Technologies, Inc. | Morgan Stanley | 2 | 463 | 476 | 13 | ||||||||||||||||||||
Fortinet, Inc. | Morgan Stanley | 4 | 463 | 471 | 9 | ||||||||||||||||||||
Globant SA (Luxembourg) | Morgan Stanley | 92 | 15,793 | 16,488 | 892 | ||||||||||||||||||||
GoDaddy, Inc., Class A | Morgan Stanley | 182 | 13,374 | 13,827 | 453 | ||||||||||||||||||||
Guidewire Software, Inc. | Morgan Stanley | 182 | 19,727 | 18,977 | (750 | ) | |||||||||||||||||||
International Business Machines Corp. | Morgan Stanley | 58 | 6,986 | 7,057 | 71 | ||||||||||||||||||||
International Money Express, Inc. | Morgan Stanley | 7 | 105 | 101 | (5 | ) | |||||||||||||||||||
Intuit, Inc. | Morgan Stanley | 430 | 145,140 | 140,270 | (6,199 | ) | |||||||||||||||||||
Jack Henry & Associates, Inc. | Morgan Stanley | 559 | 91,872 | 90,888 | (752 | ) | |||||||||||||||||||
Mastercard, Inc., Class A | Morgan Stanley | 19 | 6,223 | 6,425 | 202 | ||||||||||||||||||||
Microsoft Corp. | Morgan Stanley | 129 | 26,096 | 27,133 | 1,037 | ||||||||||||||||||||
Mobileiron, Inc. | Morgan Stanley | 24 | 169 | 168 | — | ||||||||||||||||||||
NIC, Inc. | Morgan Stanley | 10 | 196 | 197 | 1 | ||||||||||||||||||||
NortonLifeLock, Inc. | Morgan Stanley | 202 | 4,286 | 4,210 | (76 | ) | |||||||||||||||||||
Oracle Corp. | Morgan Stanley | 90 | 5,335 | 5,373 | 39 | ||||||||||||||||||||
Paychex, Inc. | Morgan Stanley | 1 | 76 | 80 | 4 | ||||||||||||||||||||
PayPal Holdings, Inc. | Morgan Stanley | 168 | 30,312 | 33,101 | 4,092 | ||||||||||||||||||||
Perspecta, Inc. | Morgan Stanley | 892 | 18,331 | 17,349 | (1,063 | ) | |||||||||||||||||||
Progress Software Corp. | Morgan Stanley | 5 | 177 | 183 | 7 | ||||||||||||||||||||
PTC, Inc. | Morgan Stanley | 31 | 2,556 | 2,564 | 9 | ||||||||||||||||||||
QAD, Inc., Class A | Morgan Stanley | 4 | 166 | 169 | 3 | ||||||||||||||||||||
Sailpoint Technologies Holding, Inc. | Morgan Stanley | 182 | 7,049 | 7,202 | 152 | ||||||||||||||||||||
The accompanying notes are an integral part of the financial statements.
117
GOTHAM NEUTRAL FUND
Portfolio of Investments (Continued)
September 30, 2020
Total Return Swaps (continued)
Reference Entity | Counterparty | Number of Contracts Long/(Short) | Notional Amount | Value | Unrealized Appreciation/ (Depreciation)* | ||||||||||||||||||||
Software & Services — (continued) | |||||||||||||||||||||||||
salesforce.com, Inc. | Morgan Stanley | 61 | $ | 15,383 | $ | 15,331 | $ | (425 | ) | ||||||||||||||||
SecureWorks Corp., Class A | Morgan Stanley | 5 | 59 | 57 | (2 | ) | |||||||||||||||||||
ServiceNow, Inc. | Morgan Stanley | 11 | 5,061 | 5,335 | 291 | ||||||||||||||||||||
SPS Commerce, Inc. | Morgan Stanley | 7 | 504 | 545 | 41 | ||||||||||||||||||||
Synopsys, Inc. | Morgan Stanley | 59 | 11,960 | 12,625 | 665 | ||||||||||||||||||||
Teradata Corp. | Morgan Stanley | 242 | 5,536 | 5,493 | (90 | ) | |||||||||||||||||||
VeriSign, Inc. | Morgan Stanley | 8 | 1,591 | 1,639 | 48 | ||||||||||||||||||||
Virtusa Corp. | Morgan Stanley | 9 | 356 | 442 | 86 | ||||||||||||||||||||
Visa, Inc., Class A | Morgan Stanley | 43 | 8,456 | 8,599 | 135 | ||||||||||||||||||||
Western Union Co. (The) | Morgan Stanley | 33 | 714 | 707 | (7 | ) | |||||||||||||||||||
WEX, Inc. | Morgan Stanley | 2 | 283 | 278 | (5 | ) | |||||||||||||||||||
Workday, Inc., Class A | Morgan Stanley | 536 | 124,281 | 115,310 | (8,972 | ) | |||||||||||||||||||
Workiva, Inc. | Morgan Stanley | 214 | 12,033 | 11,933 | (86 | ) | |||||||||||||||||||
Xperi Holding Corp. | Morgan Stanley | 1,751 | 21,082 | 20,119 | (1,046 | ) | |||||||||||||||||||
|
|
|
|
|
|
|
| ||||||||||||||||||
| 14,019 | 975,223 | 960,542 | (14,492 | ) | |||||||||||||||||||||
|
|
|
|
|
|
|
| ||||||||||||||||||
Technology Hardware & Equipment | |||||||||||||||||||||||||
Avnet, Inc. | Morgan Stanley | 3,781 | 104,015 | 97,701 | (5,595 | ) | |||||||||||||||||||
Belden, Inc. | Morgan Stanley | 1,659 | 58,330 | 51,628 | (6,721 | ) | |||||||||||||||||||
CDW Corp. | Morgan Stanley | 17 | 1,874 | 2,032 | 158 | ||||||||||||||||||||
Celestica, Inc. (Canada) | Morgan Stanley | 53 | 428 | 366 | (63 | ) | |||||||||||||||||||
Ciena Corp. | Morgan Stanley | 84 | 3,320 | 3,334 | 14 | ||||||||||||||||||||
Cisco Systems, Inc. | Morgan Stanley | 137 | 5,353 | 5,396 | 40 | ||||||||||||||||||||
CommScope Holding Co., Inc. | Morgan Stanley | 6,112 | 65,106 | 55,008 | (10,097 | ) | |||||||||||||||||||
Corning, Inc. | Morgan Stanley | 170 | 5,289 | 5,510 | 221 | ||||||||||||||||||||
EchoStar Corp., Class A | Morgan Stanley | 5,682 | 166,937 | 141,425 | (26,661 | ) | |||||||||||||||||||
FLIR Systems, Inc. | Morgan Stanley | 5,313 | 196,050 | 190,471 | (5,722 | ) | |||||||||||||||||||
HP, Inc. | Morgan Stanley | 462 | 8,733 | 8,773 | 82 | ||||||||||||||||||||
InterDigital, Inc. | Morgan Stanley | 23 | 1,341 | 1,312 | (29 | ) | |||||||||||||||||||
Jabil, Inc. | Morgan Stanley | 210 | 7,094 | 7,195 | (144 | ) | |||||||||||||||||||
Juniper Networks, Inc. | Morgan Stanley | 145 | 3,114 | 3,118 | 3 | ||||||||||||||||||||
Knowles Corp. | Morgan Stanley | 2,031 | 30,257 | 30,262 | 9 | ||||||||||||||||||||
Lumentum Holdings, Inc. | Morgan Stanley | 77 | 5,566 | 5,785 | 172 | ||||||||||||||||||||
NCR Corp. | Morgan Stanley | 4,618 | 92,545 | 102,243 | 10,062 | ||||||||||||||||||||
NetApp, Inc. | Morgan Stanley | 101 | 4,177 | 4,428 | 250 | ||||||||||||||||||||
NETGEAR, Inc. | Morgan Stanley | 108 | 3,418 | 3,329 | (89 | ) | |||||||||||||||||||
OSI Systems, Inc. | Morgan Stanley | 1,059 | 83,396 | 82,189 | (1,229 | ) | |||||||||||||||||||
PC Connection, Inc. | Morgan Stanley | 7 | 285 | 287 | 2 | ||||||||||||||||||||
Sanmina Corp. | Morgan Stanley | 7 | 187 | 189 | 3 | ||||||||||||||||||||
Seagate Technology PLC (Ireland) | Morgan Stanley | 1,285 | 62,411 | 63,312 | 1,723 | ||||||||||||||||||||
TE Connectivity Ltd. (Switzerland) | Morgan Stanley | 10 | 937 | 977 | 40 | ||||||||||||||||||||
Trimble, Inc. | Morgan Stanley | 70 | 3,369 | 3,409 | 40 | ||||||||||||||||||||
Ubiquiti, Inc. | Morgan Stanley | 1 | 160 | 167 | 7 | ||||||||||||||||||||
Vishay Intertechnology, Inc. | Morgan Stanley | 509 | 8,172 | 7,925 | (260 | ) | |||||||||||||||||||
Western Digital Corp. | Morgan Stanley | 74 | 2,773 | 2,705 | (68 | ) | |||||||||||||||||||
Xerox Holdings Corp. | Morgan Stanley | 6,610 | 123,871 | 124,070 | 1,882 | ||||||||||||||||||||
The accompanying notes are an integral part of the financial statements.
118
GOTHAM NEUTRAL FUND
Portfolio of Investments (Continued)
September 30, 2020
Total Return Swaps (continued)
Reference Entity | Counterparty | Number of Contracts Long/(Short) | Notional Amount | Value | Unrealized Appreciation/ (Depreciation)* | ||||||||||||||||||
Technology Hardware & Equipment — (continued) |
| ||||||||||||||||||||||
Zebra Technologies Corp., Class A | Morgan Stanley | 45 | $ | 11,395 | $ | 11,361 | $ | (97 | ) | ||||||||||||||
|
|
|
|
|
|
|
| ||||||||||||||||
| 40,460 | 1,059,903 | 1,015,907 | (42,067 | ) | |||||||||||||||||||
|
|
|
|
|
|
|
| ||||||||||||||||
Telecommunication Services | |||||||||||||||||||||||
AT&T, Inc. | Morgan Stanley | 3,936 | 116,404 | 112,215 | (4,460 | ) | |||||||||||||||||
CenturyLink, Inc. | Morgan Stanley | 312 | 3,261 | 3,148 | (113 | ) | |||||||||||||||||
Iridium Communications, Inc. | Morgan Stanley | 74 | 2,002 | 1,893 | (109 | ) | |||||||||||||||||
Verizon Communications, Inc. | Morgan Stanley | 132 | 7,820 | 7,853 | 6 | ||||||||||||||||||
Vonage Holdings Corp. | Morgan Stanley | 261 | 2,650 | 2,670 | 12 | ||||||||||||||||||
|
|
|
|
|
|
|
| ||||||||||||||||
| 4,715 | 132,137 | 127,779 | (4,664 | ) | |||||||||||||||||||
|
|
|
|
|
|
|
| ||||||||||||||||
Transportation | |||||||||||||||||||||||
Alaska Air Group, Inc. | Morgan Stanley | 1,611 | 67,996 | 59,011 | (9,260 | ) | |||||||||||||||||
ArcBest Corp. | Morgan Stanley | 3,931 | 132,946 | 122,097 | (10,894 | ) | |||||||||||||||||
Atlas Air Worldwide Holdings, Inc. | Morgan Stanley | 1,192 | 68,282 | 72,593 | 4,383 | ||||||||||||||||||
CSX Corp. | Morgan Stanley | 558 | 42,241 | 43,340 | 1,099 | ||||||||||||||||||
FedEx Corp. | Morgan Stanley | 222 | 55,445 | 55,837 | 392 | ||||||||||||||||||
JB Hunt Transport Services, Inc. | Morgan Stanley | 26 | 3,415 | 3,286 | (129 | ) | |||||||||||||||||
Marten Transport Ltd. | Morgan Stanley | 40 | 654 | 653 | (1 | ) | |||||||||||||||||
Norfolk Southern Corp. | Morgan Stanley | 16 | 3,442 | 3,424 | (18 | ) | |||||||||||||||||
Old Dominion Freight Line, Inc. | Morgan Stanley | 30 | 5,419 | 5,428 | 9 | ||||||||||||||||||
Schneider National, Inc., Class B | Morgan Stanley | 36 | 912 | 890 | (22 | ) | |||||||||||||||||
Werner Enterprises, Inc. | Morgan Stanley | 86 | 3,689 | 3,611 | (78 | ) | |||||||||||||||||
|
|
|
|
|
|
|
| ||||||||||||||||
| 7,748 | 384,441 | 370,170 | (14,519 | ) | |||||||||||||||||||
|
|
|
|
|
|
|
| ||||||||||||||||
Utilities | |||||||||||||||||||||||
American Water Works Co., Inc. | Morgan Stanley | 24 | 3,391 | 3,477 | 87 | ||||||||||||||||||
CenterPoint Energy, Inc. | Morgan Stanley | 553 | 11,196 | 10,701 | (496 | ) | |||||||||||||||||
Dominion Energy, Inc. | Morgan Stanley | 17 | 1,311 | 1,342 | 32 | ||||||||||||||||||
Duke Energy Corp. | Morgan Stanley | 233 | 18,964 | 20,634 | 1,670 | ||||||||||||||||||
Evergy, Inc. | Morgan Stanley | 838 | 44,118 | 42,587 | (1,552 | ) | |||||||||||||||||
Exelon Corp. | Morgan Stanley | 108 | 3,850 | 3,862 | 12 | ||||||||||||||||||
FirstEnergy Corp. | Morgan Stanley | 1,598 | 45,665 | 45,879 | 214 | ||||||||||||||||||
MDU Resources Group, Inc. | Morgan Stanley | 313 | 7,231 | 7,043 | (156 | ) | |||||||||||||||||
National Fuel Gas Co. | Morgan Stanley | 1,731 | 77,537 | 70,261 | (6,511 | ) | |||||||||||||||||
NiSource, Inc. | Morgan Stanley | 1,346 | 29,806 | 29,612 | (194 | ) | |||||||||||||||||
Northwest Natural Holding Co. | Morgan Stanley | 344 | 17,152 | 15,614 | (1,652 | ) | |||||||||||||||||
NRG Energy, Inc. | Morgan Stanley | 63 | 1,842 | 1,937 | 95 | ||||||||||||||||||
OGE Energy Corp. | Morgan Stanley | 9 | 258 | 270 | 12 | ||||||||||||||||||
PPL Corp. | Morgan Stanley | 12,441 | 341,080 | 338,520 | 2,530 | ||||||||||||||||||
|
|
|
|
|
|
|
| ||||||||||||||||
| 19,618 | 603,401 | 591,739 | (5,909 | ) | |||||||||||||||||||
|
|
|
|
|
|
|
| ||||||||||||||||
Total Reference Entity — Long | 15,113,324 | 14,394,212 | (688,001 | ) | |||||||||||||||||||
|
|
|
|
|
| ||||||||||||||||||
Short | |||||||||||||||||||||||
Automobiles & Components | |||||||||||||||||||||||
Aptiv PLC (Jersey) | Morgan Stanley | (4,063 | ) | (351,254 | ) | (372,496 | ) | (21,328 | ) | ||||||||||||||
Dorman Products, Inc. | Morgan Stanley | (735 | ) | (64,702 | ) | (66,429 | ) | (1,767 | ) | ||||||||||||||
The accompanying notes are an integral part of the financial statements.
119
GOTHAM NEUTRAL FUND
Portfolio of Investments (Continued)
September 30, 2020
Total Return Swaps (continued)
Reference Entity | Counterparty | Number of Contracts Long/(Short) | Notional Amount | Value | Unrealized Appreciation/ (Depreciation)* | |||||||||||||||||
Automobiles & Components — (continued) | ||||||||||||||||||||||
Fiat Chrysler Automobiles NV (Netherlands) | Morgan Stanley | (19,748 | ) | $ | (223,292 | ) | $ | (241,321 | ) | $ | (18,101 | ) | ||||||||||
Ford Motor Co. | Morgan Stanley | (32,234 | ) | (223,156 | ) | (214,678 | ) | 11,196 | ||||||||||||||
Fox Factory Holding Corp. | Morgan Stanley | (2,967 | ) | (298,320 | ) | (220,537 | ) | 80,366 | ||||||||||||||
Goodyear Tire & Rubber Co. (The) | Morgan Stanley | (18,904 | ) | (179,447 | ) | (144,994 | ) | 34,409 | ||||||||||||||
LCI Industries | Morgan Stanley | (2,103 | ) | (241,981 | ) | (223,528 | ) | 16,927 | ||||||||||||||
Lear Corp. | Morgan Stanley | (345 | ) | (41,540 | ) | (37,622 | ) | 4,026 | ||||||||||||||
|
|
|
|
|
|
|
| |||||||||||||||
| (81,099 | ) | (1,623,692 | ) | (1,521,605 | ) | 105,728 | ||||||||||||||||
|
|
|
|
|
|
|
| |||||||||||||||
Capital Goods | ||||||||||||||||||||||
AAON, Inc. | Morgan Stanley | (9 | ) | (548 | ) | (542 | ) | 6 | ||||||||||||||
Allison Transmission Holdings, Inc. | Morgan Stanley | (733 | ) | (27,210 | ) | (25,758 | ) | 1,412 | ||||||||||||||
American Woodmark Corp. | Morgan Stanley | (210 | ) | (17,786 | ) | (16,493 | ) | 1,288 | ||||||||||||||
Armstrong World Industries, Inc. | Morgan Stanley | (1,959 | ) | (143,520 | ) | (134,799 | ) | 8,686 | ||||||||||||||
Astec Industries, Inc. | Morgan Stanley | (1,602 | ) | (86,348 | ) | (86,909 | ) | (583 | ) | |||||||||||||
Axon Enterprise, Inc. | Morgan Stanley | (2,358 | ) | (202,515 | ) | (213,871 | ) | (11,441 | ) | |||||||||||||
Beacon Roofing Supply, Inc. | Morgan Stanley | (2,126 | ) | (74,803 | ) | (66,055 | ) | 9,034 | ||||||||||||||
Boeing Co. (The) | Morgan Stanley | (3,850 | ) | (659,160 | ) | (636,251 | ) | 21,578 | ||||||||||||||
Carrier Global Corp. | Morgan Stanley | (1,791 | ) | (53,525 | ) | (54,697 | ) | (1,333 | ) | |||||||||||||
Caterpillar, Inc. | Morgan Stanley | (1,787 | ) | (267,942 | ) | (266,531 | ) | 226 | ||||||||||||||
Construction Partners, Inc., Class A | Morgan Stanley | (1,800 | ) | (34,110 | ) | (32,760 | ) | 1,351 | ||||||||||||||
Cubic Corp. | Morgan Stanley | (879 | ) | (42,227 | ) | (51,131 | ) | (9,252 | ) | |||||||||||||
EnerSys | Morgan Stanley | (2,016 | ) | (147,556 | ) | (135,314 | ) | 12,053 | ||||||||||||||
Graco, Inc. | Morgan Stanley | (571 | ) | (34,457 | ) | (35,031 | ) | (582 | ) | |||||||||||||
Helios Technologies, Inc. | Morgan Stanley | (955 | ) | (40,759 | ) | (34,762 | ) | 6,059 | ||||||||||||||
Hillenbrand, Inc. | Morgan Stanley | (4,476 | ) | (143,469 | ) | (126,939 | ) | 15,664 | ||||||||||||||
Hyster-Yale Materials Handling, Inc. | Morgan Stanley | (1,088 | ) | (44,336 | ) | (40,419 | ) | 3,934 | ||||||||||||||
Ingersoll Rand, Inc. | Morgan Stanley | (7,322 | ) | (263,252 | ) | (260,663 | ) | 2,109 | ||||||||||||||
Jacobs Engineering Group, Inc. | Morgan Stanley | (3,289 | ) | (299,289 | ) | (305,121 | ) | (6,358 | ) | |||||||||||||
Johnson Controls International PLC (Ireland) | Morgan Stanley | (1,347 | ) | (57,464 | ) | (55,025 | ) | 1,933 | ||||||||||||||
Kennametal, Inc. | Morgan Stanley | (8,002 | ) | (237,365 | ) | (231,578 | ) | 5,697 | ||||||||||||||
Kratos Defense & Security Solutions, Inc. | Morgan Stanley | (6,872 | ) | (137,618 | ) | (132,492 | ) | 5,075 | ||||||||||||||
Maxar Technologies, Inc. | Morgan Stanley | (1,468 | ) | (38,021 | ) | (36,612 | ) | 1,412 | ||||||||||||||
Mercury Systems, Inc. | Morgan Stanley | (394 | ) | (30,405 | ) | (30,519 | ) | (122 | ) | |||||||||||||
Meritor, Inc. | Morgan Stanley | (7,668 | ) | (178,439 | ) | (160,568 | ) | 17,828 | ||||||||||||||
Mueller Water Products, Inc., Class A | Morgan Stanley | (13,125 | ) | (143,795 | ) | (136,369 | ) | 7,451 | ||||||||||||||
Navistar International Corp. | Morgan Stanley | (1,629 | ) | (61,621 | ) | (70,927 | ) | (9,320 | ) | |||||||||||||
Nordson Corp. | Morgan Stanley | (677 | ) | (131,774 | ) | (129,862 | ) | 1,880 | ||||||||||||||
NV5 Global, Inc. | Morgan Stanley | (1,526 | ) | (79,413 | ) | (80,527 | ) | (1,249 | ) | |||||||||||||
Patrick Industries, Inc. | Morgan Stanley | (1,650 | ) | (98,196 | ) | (94,908 | ) | 3,264 | ||||||||||||||
PGT Innovations, Inc. | Morgan Stanley | (2,584 | ) | (49,170 | ) | (45,272 | ) | 3,899 | ||||||||||||||
Proto Labs, Inc. | Morgan Stanley | (2,248 | ) | (341,490 | ) | (291,116 | ) | 51,203 | ||||||||||||||
Raven Industries, Inc. | Morgan Stanley | (847 | ) | (21,937 | ) | (18,227 | ) | 3,804 | ||||||||||||||
Raytheon Technologies Corp. | Morgan Stanley | (2,982 | ) | (186,676 | ) | (171,584 | ) | 19,037 | ||||||||||||||
Resideo Technologies, Inc. | Morgan Stanley | (12,304 | ) | (169,940 | ) | (135,344 | ) | 35,052 | ||||||||||||||
The accompanying notes are an integral part of the financial statements.
120
GOTHAM NEUTRAL FUND
Portfolio of Investments (Continued)
September 30, 2020
Total Return Swaps (continued)
Reference Entity | Counterparty | Number of Contracts Long/(Short) | Notional Amount | Value | Unrealized Appreciation/ (Depreciation)* | |||||||||||||||||
Capital Goods — (continued) | ||||||||||||||||||||||
REV Group, Inc. | Morgan Stanley | (4,149 | ) | $ | (33,209 | ) | $ | (32,736 | ) | $ | 465 | |||||||||||
Rockwell Automation, Inc. | Morgan Stanley | (163 | ) | (38,680 | ) | (35,971 | ) | 3,561 | ||||||||||||||
Sensata Technologies Holding PLC (United Kingdom) | Morgan Stanley | (2,176 | ) | (93,229 | ) | (93,873 | ) | (765 | ) | |||||||||||||
Spirit AeroSystems Holdings, Inc., Class A | Morgan Stanley | (19,038 | ) | (390,752 | ) | (360,008 | ) | 31,334 | ||||||||||||||
Stanley Black & Decker, Inc. | Morgan Stanley | (3,450 | ) | (562,329 | ) | (559,590 | ) | 2,602 | ||||||||||||||
Sunrun, Inc. | Morgan Stanley | (2,854 | ) | (166,303 | ) | (219,958 | ) | (65,887 | ) | |||||||||||||
Systemax, Inc. | Morgan Stanley | (3 | ) | (67 | ) | (72 | ) | (5 | ) | |||||||||||||
Textainer Group Holdings Ltd. (Bermuda) | Morgan Stanley | (1,287 | ) | (15,521 | ) | (18,224 | ) | (2,776 | ) | |||||||||||||
Trex Co., Inc. | Morgan Stanley | (5,578 | ) | (424,369 | ) | (399,385 | ) | 24,881 | ||||||||||||||
Vicor Corp. | Morgan Stanley | (3,585 | ) | (314,092 | ) | (278,662 | ) | 35,813 | ||||||||||||||
Vivint Solar, Inc. | Morgan Stanley | (1,899 | ) | (60,578 | ) | (80,423 | ) | (24,413 | ) | |||||||||||||
WESCO International, Inc. | Morgan Stanley | (7,451 | ) | (345,902 | ) | (327,993 | ) | 17,824 | ||||||||||||||
Xylem, Inc. | Morgan Stanley | (3,302 | ) | (275,896 | ) | (277,764 | ) | (1,936 | ) | |||||||||||||
|
|
|
|
|
|
|
| |||||||||||||||
| (159,079 | ) | (7,267,063 | ) | (7,029,635 | ) | 221,393 | ||||||||||||||||
|
|
|
|
|
|
|
| |||||||||||||||
Commercial & Professional Services | ||||||||||||||||||||||
Casella Waste Systems, Inc., Class A | Morgan Stanley | (898 | ) | (52,533 | ) | (50,153 | ) | 2,399 | ||||||||||||||
Forrester Research, Inc. | Morgan Stanley | (776 | ) | (28,107 | ) | (25,445 | ) | 2,682 | ||||||||||||||
Harsco Corp. | Morgan Stanley | (4,710 | ) | (68,131 | ) | (65,516 | ) | 2,598 | ||||||||||||||
IAA, Inc. | Morgan Stanley | (610 | ) | (32,116 | ) | (31,763 | ) | 350 | ||||||||||||||
Insperity, Inc. | Morgan Stanley | (1,713 | ) | (116,297 | ) | (112,184 | ) | 3,433 | ||||||||||||||
Knoll, Inc. | Morgan Stanley | (194 | ) | (2,494 | ) | (2,340 | ) | 154 | ||||||||||||||
US Ecology, Inc. | Morgan Stanley | (4,029 | ) | (150,862 | ) | (131,627 | ) | 19,294 | ||||||||||||||
|
|
|
|
|
|
|
| |||||||||||||||
| (12,930 | ) | (450,540 | ) | (419,028 | ) | 30,910 | ||||||||||||||||
|
|
|
|
|
|
|
| |||||||||||||||
Consumer Durables & Apparel | ||||||||||||||||||||||
Acushnet Holdings Corp. | Morgan Stanley | (816 | ) | (28,625 | ) | (27,426 | ) | 1,118 | ||||||||||||||
Callaway Golf Co. | Morgan Stanley | (11,921 | ) | (246,929 | ) | (228,168 | ) | 18,700 | ||||||||||||||
Columbia Sportswear Co. | Morgan Stanley | (1,490 | ) | (135,262 | ) | (129,600 | ) | 5,862 | ||||||||||||||
Crocs, Inc. | Morgan Stanley | (1,861 | ) | (74,570 | ) | (79,521 | ) | (5,094 | ) | |||||||||||||
GoPro, Inc., Class A | Morgan Stanley | (28,428 | ) | (124,964 | ) | (128,779 | ) | (3,845 | ) | |||||||||||||
Hasbro, Inc. | Morgan Stanley | (3,345 | ) | (269,126 | ) | (276,698 | ) | (7,638 | ) | |||||||||||||
iRobot Corp. | Morgan Stanley | (1,056 | ) | (84,222 | ) | (80,150 | ) | 4,007 | ||||||||||||||
Levi Strauss & Co., Class A | Morgan Stanley | (1,896 | ) | (24,542 | ) | (25,406 | ) | (870 | ) | |||||||||||||
Malibu Boats, Inc., Class A | Morgan Stanley | (351 | ) | (17,714 | ) | (17,396 | ) | 303 | ||||||||||||||
Newell Brands, Inc. | Morgan Stanley | (2,262 | ) | (39,446 | ) | (38,816 | ) | 621 | ||||||||||||||
Oxford Industries, Inc. | Morgan Stanley | (317 | ) | (16,725 | ) | (12,794 | ) | 4,232 | ||||||||||||||
Skechers U.S.A., Inc., Class A | Morgan Stanley | (3,445 | ) | (104,694 | ) | (104,108 | ) | 641 | ||||||||||||||
Tapestry, Inc. | Morgan Stanley | (12,890 | ) | (193,784 | ) | (201,471 | ) | (8,180 | ) | |||||||||||||
Under Armour, Inc., Class C | Morgan Stanley | (33,721 | ) | (304,793 | ) | (331,815 | ) | (27,096 | ) | |||||||||||||
VF Corp. | Morgan Stanley | (3,200 | ) | (213,129 | ) | (224,800 | ) | (14,504 | ) | |||||||||||||
Vista Outdoor, Inc. | Morgan Stanley | (1,329 | ) | (25,823 | ) | (26,819 | ) | (1,113 | ) | |||||||||||||
Wolverine World Wide, Inc. | Morgan Stanley | (974 | ) | (25,581 | ) | (25,168 | ) | 304 | ||||||||||||||
|
|
|
|
|
|
|
| |||||||||||||||
| (109,302 | ) | (1,929,929 | ) | (1,958,935 | ) | (32,552 | ) | |||||||||||||||
|
|
|
|
|
|
|
| |||||||||||||||
The accompanying notes are an integral part of the financial statements.
121
GOTHAM NEUTRAL FUND
Portfolio of Investments (Continued)
September 30, 2020
Total Return Swaps (continued)
Reference Entity | Counterparty | Number of Contracts Long/(Short) | Notional Amount | Value | Unrealized Appreciation/ (Depreciation)* | |||||||||||||||||
Consumer Services | ||||||||||||||||||||||
Aramark | Morgan Stanley | (1,361 | ) | $ | (39,392 | ) | $ | (35,998 | ) | $ | 3,616 | |||||||||||
Bright Horizons Family Solutions, Inc. | Morgan Stanley | (2,213 | ) | (306,012 | ) | (336,465 | ) | (30,527 | ) | |||||||||||||
Carnival Corp. (Panama) | Morgan Stanley | (21,954 | ) | (368,936 | ) | (333,262 | ) | 33,957 | ||||||||||||||
Cheesecake Factory, Inc. (The) | Morgan Stanley | (8,577 | ) | (261,272 | ) | (237,926 | ) | 23,915 | ||||||||||||||
Choice Hotels International, Inc. | Morgan Stanley | (429 | ) | (42,746 | ) | (36,877 | ) | 6,118 | ||||||||||||||
Churchill Downs, Inc. | Morgan Stanley | (243 | ) | (43,810 | ) | (39,808 | ) | 4,142 | ||||||||||||||
Collectors Universe, Inc. | Morgan Stanley | (80 | ) | (4,167 | ) | (3,959 | ) | 207 | ||||||||||||||
Cracker Barrel Old Country Store, Inc. | Morgan Stanley | (576 | ) | (67,646 | ) | (66,044 | ) | 1,585 | ||||||||||||||
Dave & Buster’s Entertainment, Inc. | Morgan Stanley | (16,440 | ) | (286,041 | ) | (249,230 | ) | 36,740 | ||||||||||||||
Domino’s Pizza, Inc. | Morgan Stanley | (433 | ) | (179,973 | ) | (184,146 | ) | (4,217 | ) | |||||||||||||
Dunkin’ Brands Group, Inc. | Morgan Stanley | (981 | ) | (75,950 | ) | (80,354 | ) | (4,422 | ) | |||||||||||||
Everi Holdings, Inc. | Morgan Stanley | (4,864 | ) | (39,690 | ) | (40,128 | ) | (456 | ) | |||||||||||||
International Game Technology PLC (United Kingdom) | Morgan Stanley | (4,474 | ) | (52,592 | ) | (49,796 | ) | 2,783 | ||||||||||||||
K12, Inc. | Morgan Stanley | (3,340 | ) | (128,294 | ) | (87,976 | ) | 43,210 | ||||||||||||||
Las Vegas Sands Corp. | Morgan Stanley | (1,061 | ) | (54,499 | ) | (49,506 | ) | 6,219 | ||||||||||||||
McDonald’s Corp. | Morgan Stanley | (667 | ) | (146,418 | ) | (146,400 | ) | (1,293 | ) | |||||||||||||
Monarch Casino & Resort, Inc. | Morgan Stanley | (1,532 | ) | (72,004 | ) | (68,327 | ) | 3,677 | ||||||||||||||
Planet Fitness, Inc., Class A | Morgan Stanley | (12 | ) | (714 | ) | (739 | ) | (34 | ) | |||||||||||||
Restaurant Brands International, Inc. (Canada) | Morgan Stanley | (1,856 | ) | (104,320 | ) | (106,739 | ) | (2,804 | ) | |||||||||||||
ServiceMaster Global Holdings, Inc. | Morgan Stanley | (1,948 | ) | (83,452 | ) | (77,686 | ) | 5,937 | ||||||||||||||
Shake Shack, Inc., Class A | Morgan Stanley | (171 | ) | (11,647 | ) | (11,026 | ) | 792 | ||||||||||||||
Starbucks Corp. | Morgan Stanley | (421 | ) | (36,537 | ) | (36,172 | ) | 522 | ||||||||||||||
Texas Roadhouse, Inc. | Morgan Stanley | (1,755 | ) | (112,461 | ) | (106,686 | ) | 5,939 | ||||||||||||||
Twin River Worldwide Holdings, Inc. | Morgan Stanley | (18 | ) | (437 | ) | (473 | ) | (36 | ) | |||||||||||||
Wendy’s Co. (The) | Morgan Stanley | (823 | ) | (17,805 | ) | (18,349 | ) | (548 | ) | |||||||||||||
Wynn Resorts Ltd. | Morgan Stanley | (861 | ) | (65,717 | ) | (61,828 | ) | 3,868 | ||||||||||||||
|
|
|
|
|
|
|
| |||||||||||||||
| (77,090 | ) | (2,602,532 | ) | (2,465,900 | ) | 138,890 | ||||||||||||||||
|
|
|
|
|
|
|
| |||||||||||||||
Diversified Financials | ||||||||||||||||||||||
Ameriprise Financial, Inc. | Morgan Stanley | (99 | ) | (14,839 | ) | (15,257 | ) | (426 | ) | |||||||||||||
Blucora, Inc. | Morgan Stanley | (4 | ) | (38 | ) | (38 | ) | — | ||||||||||||||
Invesco Ltd. (Bermuda) | Morgan Stanley | (2,980 | ) | (33,121 | ) | (34,002 | ) | (889 | ) | |||||||||||||
State Street Corp. | Morgan Stanley | (644 | ) | (37,607 | ) | (38,209 | ) | (1,044 | ) | |||||||||||||
|
|
|
|
|
|
|
| |||||||||||||||
| (3,727 | ) | (85,605 | ) | (87,506 | ) | (2,359 | ) | |||||||||||||||
|
|
|
|
|
|
|
| |||||||||||||||
Energy | ||||||||||||||||||||||
Archrock, Inc. | Morgan Stanley | (12,695 | ) | (82,771 | ) | (68,299 | ) | 14,497 | ||||||||||||||
Cabot Oil & Gas Corp. | Morgan Stanley | (8,877 | ) | (168,590 | ) | (154,105 | ) | 15,496 | ||||||||||||||
ChampionX Corp. | Morgan Stanley | (3,844 | ) | (32,126 | ) | (30,714 | ) | 1,404 | ||||||||||||||
CNX Resources Corp. | Morgan Stanley | (8,562 | ) | (88,272 | ) | (80,825 | ) | 7,770 | ||||||||||||||
Comstock Resources, Inc. | Morgan Stanley | (49 | ) | (222 | ) | (215 | ) | 7 | ||||||||||||||
Continental Resources, Inc. | Morgan Stanley | (6,650 | ) | (114,161 | ) | (81,662 | ) | 33,795 | ||||||||||||||
Delek US Holdings, Inc. | Morgan Stanley | (25,523 | ) | (394,809 | ) | (284,071 | ) | 110,674 | ||||||||||||||
Diamondback Energy, Inc. | Morgan Stanley | (3,671 | ) | (127,328 | ) | (110,571 | ) | 16,726 | ||||||||||||||
Dril-Quip, Inc. | Morgan Stanley | (1,364 | ) | (39,865 | ) | (33,773 | ) | 6,082 | ||||||||||||||
EQT Corp. | Morgan Stanley | (2,395 | ) | (38,009 | ) | (30,967 | ) | 10,314 | ||||||||||||||
The accompanying notes are an integral part of the financial statements.
122
GOTHAM NEUTRAL FUND
Portfolio of Investments (Continued)
September 30, 2020
Total Return Swaps (continued)
Reference Entity | Counterparty | Number of Contracts Long/(Short) | Notional Amount | Value | Unrealized Appreciation/ (Depreciation)* | |||||||||||||||||
Energy — (continued) | ||||||||||||||||||||||
Exxon Mobil Corp. | Morgan Stanley | (1,257 | ) | $ | (47,676 | ) | $ | (43,153 | ) | $ | 6,012 | |||||||||||
Hess Corp. | Morgan Stanley | (3,650 | ) | (156,787 | ) | (149,395 | ) | 7,128 | ||||||||||||||
Marathon Petroleum Corp. | Morgan Stanley | (2,790 | ) | (84,104 | ) | (81,859 | ) | 2,225 | ||||||||||||||
NexTier Oilfield Solutions, Inc. | Morgan Stanley | (8,971 | ) | (22,158 | ) | (16,596 | ) | 5,561 | ||||||||||||||
Occidental Petroleum Corp. | Morgan Stanley | (7,393 | ) | (82,911 | ) | (74,004 | ) | 8,835 | ||||||||||||||
Oceaneering International, Inc. | Morgan Stanley | (6,478 | ) | (33,688 | ) | (22,802 | ) | 10,882 | ||||||||||||||
ONEOK, Inc. | Morgan Stanley | (1,500 | ) | (39,179 | ) | (38,970 | ) | 200 | ||||||||||||||
Ovintiv, Inc. | Morgan Stanley | (14,948 | ) | (161,854 | ) | (121,976 | ) | 38,628 | ||||||||||||||
Parsley Energy, Inc., Class A | Morgan Stanley | (22,742 | ) | (244,043 | ) | (212,865 | ) | 30,206 | ||||||||||||||
PDC Energy, Inc. | Morgan Stanley | (10,443 | ) | (159,369 | ) | (129,441 | ) | 30,415 | ||||||||||||||
Pembina Pipeline Corp. (Canada) | Morgan Stanley | (15,092 | ) | (373,339 | ) | (320,403 | ) | 50,455 | ||||||||||||||
Pioneer Natural Resources Co. | Morgan Stanley | (239 | ) | (24,861 | ) | (20,552 | ) | 5,560 | ||||||||||||||
RPC, Inc. | Morgan Stanley | (7,893 | ) | (24,074 | ) | (20,838 | ) | 3,257 | ||||||||||||||
SFL Corp. Ltd. (Bermuda) | Morgan Stanley | (971 | ) | (8,321 | ) | (7,273 | ) | 923 | ||||||||||||||
Southwestern Energy Co. | Morgan Stanley | (215,689 | ) | (591,733 | ) | (506,869 | ) | 85,566 | ||||||||||||||
Suncor Energy, Inc. (Canada) | Morgan Stanley | (2,221 | ) | (35,358 | ) | (27,163 | ) | 8,572 | ||||||||||||||
TC Energy Corp. (Canada) | Morgan Stanley | (6,307 | ) | (294,236 | ) | (265,020 | ) | 26,234 | ||||||||||||||
WPX Energy, Inc. | Morgan Stanley | (32,139 | ) | (179,137 | ) | (157,481 | ) | 21,613 | ||||||||||||||
|
|
|
|
|
|
|
| |||||||||||||||
| (434,353 | ) | (3,648,981 | ) | (3,091,862 | ) | 559,037 | ||||||||||||||||
|
|
|
|
|
|
|
| |||||||||||||||
Food & Staples Retailing | ||||||||||||||||||||||
Grocery Outlet Holding Corp. | Morgan Stanley | (6,244 | ) | (254,846 | ) | (245,514 | ) | 9,269 | ||||||||||||||
Performance Food Group Co. | Morgan Stanley | (8,445 | ) | (308,511 | ) | (292,366 | ) | 16,526 | ||||||||||||||
Rite Aid Corp. | Morgan Stanley | (552 | ) | (5,742 | ) | (5,238 | ) | 502 | ||||||||||||||
|
|
|
|
|
|
|
| |||||||||||||||
| (15,241 | ) | (569,099 | ) | (543,118 | ) | 26,297 | ||||||||||||||||
|
|
|
|
|
|
|
| |||||||||||||||
Food, Beverage & Tobacco | ||||||||||||||||||||||
Beyond Meat, Inc. | Morgan Stanley | (315 | ) | (42,793 | ) | (52,309 | ) | (20,138 | ) | |||||||||||||
Calavo Growers, Inc. | Morgan Stanley | (1,456 | ) | (93,303 | ) | (96,489 | ) | (3,209 | ) | |||||||||||||
Campbell Soup Co. | Morgan Stanley | (263 | ) | (12,738 | ) | (12,721 | ) | 13 | ||||||||||||||
Freshpet, Inc. | Morgan Stanley | (329 | ) | (37,542 | ) | (36,733 | ) | 840 | ||||||||||||||
J&J Snack Foods Corp. | Morgan Stanley | (315 | ) | (43,463 | ) | (41,073 | ) | 2,199 | ||||||||||||||
Lamb Weston Holdings, Inc. | Morgan Stanley | (3,338 | ) | (221,790 | ) | (221,209 | ) | 526 | ||||||||||||||
MGP Ingredients, Inc. | Morgan Stanley | (1,851 | ) | (71,430 | ) | (73,559 | ) | (2,146 | ) | |||||||||||||
Pilgrim’s Pride Corp. | Morgan Stanley | (7,724 | ) | (124,021 | ) | (115,590 | ) | 8,401 | ||||||||||||||
Primo Water Corp. (Canada) | Morgan Stanley | (4,617 | ) | (65,192 | ) | (65,561 | ) | (391 | ) | |||||||||||||
Sanderson Farms, Inc. | Morgan Stanley | (2,862 | ) | (337,596 | ) | (337,630 | ) | (234 | ) | |||||||||||||
Simply Good Foods Co. (The) | Morgan Stanley | (1,755 | ) | (43,682 | ) | (38,698 | ) | 5,239 | ||||||||||||||
Universal Corp. | Morgan Stanley | (727 | ) | (30,759 | ) | (30,447 | ) | 321 | ||||||||||||||
|
|
|
|
|
|
|
| |||||||||||||||
| (25,552 | ) | (1,124,309 | ) | (1,122,019 | ) | (8,579 | ) | |||||||||||||||
|
|
|
|
|
|
|
| |||||||||||||||
Health Care Equipment & Services | ||||||||||||||||||||||
Acadia Healthcare Co., Inc. | Morgan Stanley | (885 | ) | (27,541 | ) | (26,090 | ) | 1,570 | ||||||||||||||
Alcon, Inc. (Switzerland) | Morgan Stanley | (1 | ) | (57 | ) | (57 | ) | — | ||||||||||||||
Align Technology, Inc. | Morgan Stanley | (1,024 | ) | (316,374 | ) | (335,217 | ) | (20,755 | ) | |||||||||||||
Amedisys, Inc. | Morgan Stanley | (372 | ) | (89,978 | ) | (87,952 | ) | 2,220 | ||||||||||||||
AtriCure, Inc. | Morgan Stanley | (884 | ) | (37,793 | ) | (35,272 | ) | 2,513 | ||||||||||||||
Avanos Medical, Inc. | Morgan Stanley | (749 | ) | (24,455 | ) | (24,882 | ) | (437 | ) | |||||||||||||
The accompanying notes are an integral part of the financial statements.
123
GOTHAM NEUTRAL FUND
Portfolio of Investments (Continued)
September 30, 2020
Total Return Swaps (continued)
Reference Entity | Counterparty | Number of Contracts Long/(Short) | Notional Amount | Value | Unrealized Appreciation/ (Depreciation)* | ||||||||||||||||||
Health Care Equipment & Services — (continued) |
| ||||||||||||||||||||||
Axogen, Inc. | Morgan Stanley | (5,786 | ) | $ | (68,969 | ) | $ | (67,291 | ) | $ | 1,672 | ||||||||||||
BioTelemetry, Inc. | Morgan Stanley | (2,584 | ) | (101,422 | ) | (117,779 | ) | (16,660 | ) | ||||||||||||||
Boston Scientific Corp. | Morgan Stanley | (1,169 | ) | (49,117 | ) | (44,667 | ) | 5,777 | |||||||||||||||
Brookdale Senior Living, Inc. | Morgan Stanley | (9,908 | ) | (29,427 | ) | (25,166 | ) | 4,290 | |||||||||||||||
Cantel Medical Corp. | Morgan Stanley | (1,401 | ) | (74,127 | ) | (61,560 | ) | 12,841 | |||||||||||||||
Cardiovascular Systems, Inc. | Morgan Stanley | (1,937 | ) | (65,335 | ) | (76,221 | ) | (10,969 | ) | ||||||||||||||
Change Healthcare, Inc. | Morgan Stanley | (3,738 | ) | (54,313 | ) | (54,238 | ) | 100 | |||||||||||||||
Cooper Cos., Inc. (The) | Morgan Stanley | (802 | ) | (256,866 | ) | (270,370 | ) | (13,708 | ) | ||||||||||||||
CorVel Corp. | Morgan Stanley | (59 | ) | (5,005 | ) | (5,040 | ) | (37 | ) | ||||||||||||||
Covetrus, Inc. | Morgan Stanley | (1,853 | ) | (43,175 | ) | (45,213 | ) | (2,190 | ) | ||||||||||||||
Edwards Lifesciences Corp. | Morgan Stanley | (674 | ) | (58,645 | ) | (53,799 | ) | 5,412 | |||||||||||||||
Encompass Health Corp. | Morgan Stanley | (1,692 | ) | (110,769 | ) | (109,946 | ) | 436 | |||||||||||||||
Envista Holdings Corp. | Morgan Stanley | (1,757 | ) | (44,397 | ) | (43,363 | ) | 984 | |||||||||||||||
Evolent Health, Inc., Class A | Morgan Stanley | (11,633 | ) | (165,879 | ) | (144,366 | ) | 21,785 | |||||||||||||||
Glaukos Corp. | Morgan Stanley | (5,352 | ) | (249,896 | ) | (265,031 | ) | (15,975 | ) | ||||||||||||||
Guardant Health, Inc. | Morgan Stanley | (1,199 | ) | (114,972 | ) | (134,024 | ) | (20,818 | ) | ||||||||||||||
Haemonetics Corp. | Morgan Stanley | (959 | ) | (86,124 | ) | (83,673 | ) | 2,425 | |||||||||||||||
HealthEquity, Inc. | Morgan Stanley | (5,245 | ) | (307,752 | ) | (269,436 | ) | 39,962 | |||||||||||||||
Henry Schein, Inc. | Morgan Stanley | (4,184 | ) | (276,291 | ) | (245,936 | ) | 31,840 | |||||||||||||||
Inovalon Holdings, Inc., Class A | Morgan Stanley | (948 | ) | (24,645 | ) | (25,075 | ) | (435 | ) | ||||||||||||||
Laboratory Corp. of America Holdings | Morgan Stanley | (1,283 | ) | (234,469 | ) | (241,550 | ) | (7,139 | ) | ||||||||||||||
Lantheus Holdings, Inc. | Morgan Stanley | (21 | ) | (261 | ) | (266 | ) | (5 | ) | ||||||||||||||
LHC Group, Inc. | Morgan Stanley | (1,338 | ) | (278,829 | ) | (284,405 | ) | (5,832 | ) | ||||||||||||||
LivaNova PLC (United Kingdom) | Morgan Stanley | (3,748 | ) | (174,465 | ) | (169,447 | ) | 5,112 | |||||||||||||||
Merit Medical Systems, Inc. | Morgan Stanley | (2,994 | ) | (147,977 | ) | (130,239 | ) | 18,171 | |||||||||||||||
Mesa Laboratories, Inc. | Morgan Stanley | (331 | ) | (83,376 | ) | (84,326 | ) | (974 | ) | ||||||||||||||
NuVasive, Inc. | Morgan Stanley | (4,484 | ) | (233,643 | ) | (217,788 | ) | 15,781 | |||||||||||||||
OraSure Technologies, Inc. | Morgan Stanley | (7,409 | ) | (83,486 | ) | (90,167 | ) | (6,702 | ) | ||||||||||||||
Penumbra, Inc. | Morgan Stanley | (1,167 | ) | (246,851 | ) | (226,841 | ) | 20,361 | |||||||||||||||
PetIQ, Inc. | Morgan Stanley | (7,208 | ) | (254,244 | ) | (237,287 | ) | 17,052 | |||||||||||||||
Phreesia, Inc. | Morgan Stanley | (535 | ) | (15,750 | ) | (17,190 | ) | (1,443 | ) | ||||||||||||||
Progyny, Inc. | Morgan Stanley | (1,462 | ) | (41,214 | ) | (43,027 | ) | (1,822 | ) | ||||||||||||||
RadNet, Inc. | Morgan Stanley | (3,862 | ) | (58,664 | ) | (59,282 | ) | (632 | ) | ||||||||||||||
Simulations Plus, Inc. | Morgan Stanley | (68 | ) | (4,943 | ) | (5,124 | ) | (182 | ) | ||||||||||||||
SmileDirectClub, Inc. | Morgan Stanley | (14,158 | ) | (152,455 | ) | (165,365 | ) | (12,948 | ) | ||||||||||||||
STAAR Surgical Co. | Morgan Stanley | (1,111 | ) | (59,405 | ) | (62,838 | ) | (3,448 | ) | ||||||||||||||
Surgery Partners, Inc. | Morgan Stanley | (1,932 | ) | (38,524 | ) | (42,311 | ) | (3,877 | ) | ||||||||||||||
Tabula Rasa HealthCare, Inc. | Morgan Stanley | (5,255 | ) | (266,275 | ) | (214,246 | ) | 51,964 | |||||||||||||||
Tactile Systems Technology, Inc. | Morgan Stanley | (956 | ) | (34,179 | ) | (34,980 | ) | (809 | ) | ||||||||||||||
US Physical Therapy, Inc. | Morgan Stanley | (315 | ) | (29,657 | ) | (27,367 | ) | 2,369 | |||||||||||||||
Varex Imaging Corp. | Morgan Stanley | (155 | ) | (1,852 | ) | (1,972 | ) | (120 | ) | ||||||||||||||
Vocera Communications, Inc. | Morgan Stanley | (1,101 | ) | (32,733 | ) | (32,017 | ) | 746 | |||||||||||||||
Wright Medical Group NV (Netherlands). | Morgan Stanley | (4,859 | ) | (148,063 | ) | (148,394 | ) | (367 | ) | ||||||||||||||
Zynex, Inc. | Morgan Stanley | (1,867 | ) | (27,891 | ) | (32,579 | ) | (4,695 | ) | ||||||||||||||
|
|
|
|
|
|
|
| ||||||||||||||||
| (134,414 | ) | (5,332,530 | ) | (5,220,672 | ) | 112,404 | |||||||||||||||||
|
|
|
|
|
|
|
| ||||||||||||||||
The accompanying notes are an integral part of the financial statements.
124
GOTHAM NEUTRAL FUND
Portfolio of Investments (Continued)
September 30, 2020
Total Return Swaps (continued)
Reference Entity | Counterparty | Number of Contracts Long/(Short) | Notional Amount | Value | Unrealized Appreciation/ (Depreciation)* | |||||||||||||||||
Household & Personal Products | ||||||||||||||||||||||
BellRing Brands, Inc., Class A | Morgan Stanley | (11 | ) | $ | (224 | ) | $ | (228 | ) | $ | (4 | ) | ||||||||||
Coty, Inc., Class A | Morgan Stanley | (13,659 | ) | (43,631 | ) | (36,879 | ) | 6,741 | ||||||||||||||
Reynolds Consumer Products, Inc. | Morgan Stanley | (1,264 | ) | (41,403 | ) | (38,704 | ) | 2,690 | ||||||||||||||
WD-40 Co. | Morgan Stanley | (830 | ) | (169,983 | ) | (157,127 | ) | 13,094 | ||||||||||||||
|
|
|
|
|
|
|
| |||||||||||||||
| (15,764 | ) | (255,241 | ) | (232,938 | ) | 22,521 | ||||||||||||||||
|
|
|
|
|
|
|
| |||||||||||||||
Materials | ||||||||||||||||||||||
Air Products & Chemicals, Inc. | Morgan Stanley | (81 | ) | (24,730 | ) | (24,127 | ) | 620 | ||||||||||||||
Albemarle Corp. | Morgan Stanley | (822 | ) | (81,912 | ) | (73,388 | ) | 8,425 | ||||||||||||||
Amyris, Inc. | Morgan Stanley | (4,113 | ) | (12,821 | ) | (12,010 | ) | 808 | ||||||||||||||
Avery Dennison Corp. | Morgan Stanley | (711 | ) | (88,641 | ) | (90,894 | ) | (2,275 | ) | |||||||||||||
Balchem Corp. | Morgan Stanley | (383 | ) | (38,273 | ) | (37,392 | ) | 902 | ||||||||||||||
Ball Corp. | Morgan Stanley | (4,638 | ) | (377,981 | ) | (385,511 | ) | (8,393 | ) | |||||||||||||
Barrick Gold Corp. (Canada) | Morgan Stanley | (3,552 | ) | (98,310 | ) | (99,847 | ) | (1,561 | ) | |||||||||||||
Cleveland-Cliffs, Inc. | Morgan Stanley | (91,106 | ) | (607,758 | ) | (584,901 | ) | 22,734 | ||||||||||||||
Corteva, Inc. | Morgan Stanley | (8,937 | ) | (263,351 | ) | (257,475 | ) | 5,811 | ||||||||||||||
Domtar Corp. | Morgan Stanley | (1,098 | ) | (32,165 | ) | (28,844 | ) | 3,338 | ||||||||||||||
Eagle Materials, Inc. | Morgan Stanley | (413 | ) | (35,267 | ) | (35,650 | ) | (402 | ) | |||||||||||||
Eastman Chemical Co. | Morgan Stanley | (513 | ) | (41,878 | ) | (40,076 | ) | 1,553 | ||||||||||||||
Equinox Gold Corp. (Canada) | Morgan Stanley | (10,201 | ) | (131,358 | ) | (119,454 | ) | 11,788 | ||||||||||||||
Fortuna Silver Mines, Inc. (Canada) | Morgan Stanley | (20,708 | ) | (150,057 | ) | (131,703 | ) | 18,917 | ||||||||||||||
GCP Applied Technologies, Inc. | Morgan Stanley | (1,590 | ) | (42,517 | ) | (33,311 | ) | 9,463 | ||||||||||||||
Graphic Packaging Holding Co. | Morgan Stanley | (5,620 | ) | (81,546 | ) | (79,186 | ) | 1,949 | ||||||||||||||
Greif, Inc., Class A | Morgan Stanley | (101 | ) | (3,579 | ) | (3,657 | ) | (79 | ) | |||||||||||||
H.B. Fuller Co. | Morgan Stanley | (251 | ) | (11,513 | ) | (11,491 | ) | 20 | ||||||||||||||
Hudbay Minerals, Inc. (Canada) | Morgan Stanley | (6,486 | ) | (29,446 | ) | (27,436 | ) | 1,966 | ||||||||||||||
International Paper Co. | Morgan Stanley | (807 | ) | (33,006 | ) | (32,716 | ) | 207 | ||||||||||||||
Kirkland Lake Gold Ltd. (Canada) | Morgan Stanley | (2,618 | ) | (139,292 | ) | (127,575 | ) | 12,325 | ||||||||||||||
Livent Corp. | Morgan Stanley | (43,439 | ) | (380,674 | ) | (389,648 | ) | (9,416 | ) | |||||||||||||
Martin Marietta Materials, Inc. | Morgan Stanley | (92 | ) | (20,726 | ) | (21,653 | ) | (932 | ) | |||||||||||||
Methanex Corp. (Canada) | Morgan Stanley | (7,702 | ) | (175,932 | ) | (187,929 | ) | (12,703 | ) | |||||||||||||
Mosaic Co. (The) | Morgan Stanley | (4,700 | ) | (87,890 | ) | (85,869 | ) | 2,050 | ||||||||||||||
Olin Corp. | Morgan Stanley | (13,361 | ) | (160,590 | ) | (165,409 | ) | (4,859 | ) | |||||||||||||
Packaging Corp. of America | Morgan Stanley | (548 | ) | (59,970 | ) | (59,759 | ) | 196 | ||||||||||||||
Quaker Chemical Corp. | Morgan Stanley | (751 | ) | (146,974 | ) | (134,962 | ) | 11,976 | ||||||||||||||
Scotts Miracle-Gro Co. (The) | Morgan Stanley | (270 | ) | (45,846 | ) | (41,286 | ) | 5,247 | ||||||||||||||
Seabridge Gold, Inc. (Canada) | Morgan Stanley | (175 | ) | (3,214 | ) | (3,286 | ) | (73 | ) | |||||||||||||
Teck Resources Ltd., Class B (Canada) . | Morgan Stanley | (3,510 | ) | (49,142 | ) | (48,859 | ) | 250 | ||||||||||||||
Tronox Holdings PLC, Class A (United Kingdom) | Morgan Stanley | (21,653 | ) | (200,216 | ) | (170,409 | ) | 29,998 | ||||||||||||||
United States Steel Corp. | Morgan Stanley | (61,408 | ) | (479,311 | ) | (450,735 | ) | 28,427 | ||||||||||||||
Warrior Met Coal, Inc. | Morgan Stanley | (5,698 | ) | (91,566 | ) | (97,322 | ) | (5,778 | ) | |||||||||||||
Westlake Chemical Corp. | Morgan Stanley | (1,565 | ) | (97,906 | ) | (98,939 | ) | (1,115 | ) | |||||||||||||
|
|
|
|
|
|
|
| |||||||||||||||
| (329,621 | ) | (4,325,358 | ) | (4,192,709 | ) | 131,384 | ||||||||||||||||
|
|
|
|
|
|
|
| |||||||||||||||
Media & Entertainment | ||||||||||||||||||||||
Cardlytics, Inc. | Morgan Stanley | (301 | ) | (19,768 | ) | (21,242 | ) | (1,478 | ) | |||||||||||||
Cinemark Holdings, Inc. | Morgan Stanley | (4,407 | ) | (46,479 | ) | (44,070 | ) | 2,398 | ||||||||||||||
The accompanying notes are an integral part of the financial statements.
125
GOTHAM NEUTRAL FUND
Portfolio of Investments (Continued)
September 30, 2020
Total Return Swaps (continued)
Reference Entity | Counterparty | Number of Contracts Long/(Short) | Notional Amount | Value | Unrealized Appreciation/ (Depreciation)* | |||||||||||||||||
Media & Entertainment — (continued) | ||||||||||||||||||||||
Comcast Corp., Class A | Morgan Stanley | (12,173 | ) | $ | (554,917 | ) | $ | (563,123 | ) | $ | (13,344 | ) | ||||||||||
Eventbrite, Inc., Class A | Morgan Stanley | (5,900 | ) | (66,198 | ) | (64,015 | ) | 2,201 | ||||||||||||||
EW Scripps Co. (The), Class A | Morgan Stanley | (5,848 | ) | (66,141 | ) | (66,901 | ) | (1,084 | ) | |||||||||||||
Glu Mobile, Inc. | Morgan Stanley | (29,844 | ) | (234,601 | ) | (229,053 | ) | 5,490 | ||||||||||||||
iHeartMedia, Inc., Class A | Morgan Stanley | (2,140 | ) | (19,167 | ) | (17,377 | ) | 1,785 | ||||||||||||||
IMAX Corp. (Canada) | Morgan Stanley | (112 | ) | (1,475 | ) | (1,340 | ) | 134 | ||||||||||||||
Live Nation Entertainment, Inc. | Morgan Stanley | (3,618 | ) | (203,327 | ) | (194,938 | ) | 8,340 | ||||||||||||||
Madison Square Garden Entertainment Corp. | Morgan Stanley | (28 | ) | (2,053 | ) | (1,918 | ) | 134 | ||||||||||||||
Madison Square Garden Sports Corp. | Morgan Stanley | (779 | ) | (128,236 | ) | (117,224 | ) | 11,935 | ||||||||||||||
Meredith Corp. | Morgan Stanley | (981 | ) | (12,945 | ) | (12,871 | ) | 71 | ||||||||||||||
Sciplay Corp., Class A | Morgan Stanley | (670 | ) | (10,456 | ) | (10,867 | ) | (414 | ) | |||||||||||||
Sinclair Broadcast Group, Inc., Class A | Morgan Stanley | (4,727 | ) | (97,102 | ) | (90,900 | ) | 6,181 | ||||||||||||||
TripAdvisor, Inc. | Morgan Stanley | (19,202 | ) | (434,500 | ) | (376,167 | ) | 58,227 | ||||||||||||||
ViacomCBS, Inc., Class B | Morgan Stanley | (1,423 | ) | (39,631 | ) | (39,858 | ) | (1,288 | ) | |||||||||||||
Yelp, Inc. | Morgan Stanley | (5,891 | ) | (129,861 | ) | (118,350 | ) | 11,479 | ||||||||||||||
|
|
|
|
|
|
|
| |||||||||||||||
| (98,044 | ) | (2,066,857 | ) | (1,970,214 | ) | 90,767 | ||||||||||||||||
|
|
|
|
|
|
|
| |||||||||||||||
Pharmaceuticals, Biotechnology & Life Sciences | ||||||||||||||||||||||
Adaptive Biotechnologies Corp. | Morgan Stanley | (4,101 | ) | (169,792 | ) | (199,432 | ) | (31,326 | ) | |||||||||||||
Adverum Biotechnologies, Inc. | Morgan Stanley | (624 | ) | (6,590 | ) | (6,427 | ) | 161 | ||||||||||||||
Aerie Pharmaceuticals, Inc. | Morgan Stanley | (1,066 | ) | (11,833 | ) | (12,547 | ) | (737 | ) | |||||||||||||
Agios Pharmaceuticals, Inc. | Morgan Stanley | (506 | ) | (17,504 | ) | (17,710 | ) | (210 | ) | |||||||||||||
Alector, Inc. | Morgan Stanley | (375 | ) | (4,144 | ) | (3,951 | ) | 193 | ||||||||||||||
Alkermes PLC (Ireland) | Morgan Stanley | (226 | ) | (3,723 | ) | (3,745 | ) | (23 | ) | |||||||||||||
Amicus Therapeutics, Inc. | Morgan Stanley | (466 | ) | (6,546 | ) | (6,580 | ) | (36 | ) | |||||||||||||
Amneal Pharmaceuticals, Inc. | Morgan Stanley | (4,218 | ) | (16,281 | ) | (16,366 | ) | (90 | ) | |||||||||||||
ANI Pharmaceuticals, Inc. | Morgan Stanley | (631 | ) | (19,738 | ) | (17,801 | ) | 1,940 | ||||||||||||||
Apellis Pharmaceuticals, Inc. | Morgan Stanley | (55 | ) | (1,644 | ) | (1,659 | ) | (15 | ) | |||||||||||||
Aprea Therapeutics, Inc. | Morgan Stanley | (19 | ) | (422 | ) | (457 | ) | (36 | ) | |||||||||||||
Arcturus Therapeutics Holdings, Inc. | Morgan Stanley | (674 | ) | (27,014 | ) | (28,915 | ) | (1,907 | ) | |||||||||||||
Arrowhead Pharmaceuticals, Inc. | Morgan Stanley | (735 | ) | (32,295 | ) | (31,649 | ) | 638 | ||||||||||||||
Arvinas, Inc. | Morgan Stanley | (3,246 | ) | (83,016 | ) | (76,638 | ) | 6,357 | ||||||||||||||
Atara Biotherapeutics, Inc. | Morgan Stanley | (53 | ) | (695 | ) | (687 | ) | 7 | ||||||||||||||
Aurinia Pharmaceuticals, Inc. (Canada) | Morgan Stanley | (772 | ) | (11,038 | ) | (11,372 | ) | (337 | ) | |||||||||||||
Bausch Health Cos, Inc. (Canada) | Morgan Stanley | (20,344 | ) | (332,692 | ) | (316,146 | ) | 16,415 | ||||||||||||||
Biohaven Pharmaceutical Holding Co. Ltd. (British Virgin Islands) | Morgan Stanley | (13 | ) | (843 | ) | (845 | ) | (57 | ) | |||||||||||||
Castle Biosciences, Inc. | Morgan Stanley | (61 | ) | (3,047 | ) | (3,138 | ) | (92 | ) | |||||||||||||
Codexis, Inc. | Morgan Stanley | (5,892 | ) | (81,427 | ) | (69,172 | ) | 12,384 | ||||||||||||||
Constellation Pharmaceuticals, Inc. | Morgan Stanley | (241 | ) | (4,626 | ) | (4,883 | ) | (258 | ) | |||||||||||||
Cronos Group, Inc. (Canada) | Morgan Stanley | (5,347 | ) | (28,179 | ) | (26,788 | ) | 1,383 | ||||||||||||||
Dicerna Pharmaceuticals, Inc. | Morgan Stanley | (322 | ) | (5,887 | ) | (5,793 | ) | 93 | ||||||||||||||
Dynavax Technologies Corp. | Morgan Stanley | (4,314 | ) | (19,015 | ) | (18,636 | ) | 374 | ||||||||||||||
Eidos Therapeutics, Inc. | Morgan Stanley | (15 | ) | (692 | ) | (758 | ) | (66 | ) | |||||||||||||
Epizyme, Inc. | Morgan Stanley | (2,762 | ) | (35,659 | ) | (32,951 | ) | 2,699 | ||||||||||||||
Exact Sciences Corp. | Morgan Stanley | (199 | ) | (17,299 | ) | (20,288 | ) | (2,993 | ) | |||||||||||||
The accompanying notes are an integral part of the financial statements.
126
GOTHAM NEUTRAL FUND
Portfolio of Investments (Continued)
September 30, 2020
Total Return Swaps (continued)
Reference Entity | Counterparty | Number of Contracts Long/(Short) | Notional Amount | Value | Unrealized Appreciation/ (Depreciation)* | ||||||||||||||||||
Pharmaceuticals, Biotechnology & Life Sciences — (continued) |
| ||||||||||||||||||||||
Exelixis, Inc. | Morgan Stanley | (1,466 | ) | $ | (35,000 | ) | $ | (35,844 | ) | $ | (852 | ) | |||||||||||
Flexion Therapeutics, Inc. | Morgan Stanley | (120 | ) | (1,278 | ) | (1,249 | ) | 29 | |||||||||||||||
Frequency Therapeutics, Inc. | Morgan Stanley | (4 | ) | (77 | ) | (77 | ) | — | |||||||||||||||
Heron Therapeutics, Inc. | Morgan Stanley | (48 | ) | (714 | ) | (711 | ) | (93 | ) | ||||||||||||||
Intersect ENT, Inc. | Morgan Stanley | (3,077 | ) | (59,448 | ) | (50,186 | ) | 9,319 | |||||||||||||||
Karuna Therapeutics, Inc. | Morgan Stanley | (84 | ) | (6,469 | ) | (6,495 | ) | (27 | ) | ||||||||||||||
Krystal Biotech, Inc. | Morgan Stanley | (16 | ) | (668 | ) | (689 | ) | (21 | ) | ||||||||||||||
Mettler-Toledo International, Inc. | Morgan Stanley | (18 | ) | (18,093 | ) | (17,384 | ) | 755 | |||||||||||||||
Molecular Templates, Inc. | Morgan Stanley | (115 | ) | (1,200 | ) | (1,256 | ) | (56 | ) | ||||||||||||||
Myriad Genetics, Inc. | Morgan Stanley | (6,003 | ) | (82,239 | ) | (78,279 | ) | 3,941 | |||||||||||||||
NanoString Technologies, Inc. | Morgan Stanley | (2,302 | ) | (95,924 | ) | (102,899 | ) | (7,098 | ) | ||||||||||||||
NeoGenomics, Inc. | Morgan Stanley | (3,388 | ) | (132,680 | ) | (124,983 | ) | 7,558 | |||||||||||||||
NGM Biopharmaceuticals, Inc. | Morgan Stanley | (95 | ) | (1,684 | ) | (1,511 | ) | 172 | |||||||||||||||
OPKO Health, Inc. | Morgan Stanley | (12,596 | ) | (40,666 | ) | (46,479 | ) | (5,823 | ) | ||||||||||||||
Pacific Biosciences of California, Inc. | Morgan Stanley | (21,001 | ) | (144,434 | ) | (207,280 | ) | (64,442 | ) | ||||||||||||||
Perrigo Co. PLC (Ireland) | Morgan Stanley | (2,597 | ) | (135,262 | ) | (119,228 | ) | 16,959 | |||||||||||||||
PRA Health Sciences, Inc. | Morgan Stanley | (1,973 | ) | (209,962 | ) | (200,141 | ) | 9,953 | |||||||||||||||
PTC Therapeutics, Inc. | Morgan Stanley | (2,691 | ) | (133,052 | ) | (125,804 | ) | 7,210 | |||||||||||||||
Reata Pharmaceuticals, Inc., Class A | Morgan Stanley | (2,455 | ) | (256,020 | ) | (239,166 | ) | 16,791 | |||||||||||||||
REGENXBIO, Inc. | Morgan Stanley | (4,446 | ) | (134,991 | ) | (122,354 | ) | 12,604 | |||||||||||||||
Revance Therapeutics, Inc. | Morgan Stanley | (845 | ) | (24,125 | ) | (21,243 | ) | 2,995 | |||||||||||||||
Syneos Health, Inc. | Morgan Stanley | (1,988 | ) | (124,690 | ) | (105,682 | ) | 19,802 | |||||||||||||||
Theravance Biopharma, Inc. (Cayman Islands) | Morgan Stanley | (5,618 | ) | (105,019 | ) | (83,062 | ) | 21,931 | |||||||||||||||
Translate Bio, Inc. | Morgan Stanley | (769 | ) | (10,074 | ) | (10,466 | ) | (395 | ) | ||||||||||||||
Tricida, Inc. | Morgan Stanley | (2,554 | ) | (28,579 | ) | (23,139 | ) | 5,559 | |||||||||||||||
Vericel Corp. | Morgan Stanley | (224 | ) | (4,108 | ) | (4,151 | ) | (44 | ) | ||||||||||||||
Zogenix, Inc. | Morgan Stanley | (1,550 | ) | (34,504 | ) | (27,791 | ) | 6,704 | |||||||||||||||
Zymeworks, Inc. (Canada) | Morgan Stanley | (1,498 | ) | (48,565 | ) | (69,777 | ) | (21,398 | ) | ||||||||||||||
|
|
|
|
|
|
|
| ||||||||||||||||
| (136,818 | ) | (2,811,166 | ) | (2,762,660 | ) | 46,494 | |||||||||||||||||
|
|
|
|
|
|
|
| ||||||||||||||||
Retailing | |||||||||||||||||||||||
American Eagle Outfitters, Inc. | Morgan Stanley | (17,772 | ) | (252,454 | ) | (263,203 | ) | (10,812 | ) | ||||||||||||||
Boot Barn Holdings, Inc. | Morgan Stanley | (4,524 | ) | (128,771 | ) | (127,305 | ) | 1,649 | |||||||||||||||
Burlington Stores, Inc. | Morgan Stanley | (2,976 | ) | (616,842 | ) | (613,324 | ) | 3,234 | |||||||||||||||
CarMax, Inc. | Morgan Stanley | (996 | ) | (93,422 | ) | (91,542 | ) | 1,857 | |||||||||||||||
Expedia Group, Inc. | Morgan Stanley | (8,254 | ) | (813,066 | ) | (756,809 | ) | 56,825 | |||||||||||||||
Five Below, Inc. | Morgan Stanley | (101 | ) | (11,825 | ) | (12,827 | ) | (1,005 | ) | ||||||||||||||
Floor & Decor Holdings, Inc., Class A | Morgan Stanley | (7,292 | ) | (538,886 | ) | (545,442 | ) | (7,124 | ) | ||||||||||||||
Grubhub, Inc. | Morgan Stanley | (1,846 | ) | (129,612 | ) | (133,521 | ) | (4,679 | ) | ||||||||||||||
Hudson Ltd., Class A (Bermuda) | Morgan Stanley | (2,059 | ) | (15,618 | ) | (15,648 | ) | (35 | ) | ||||||||||||||
Kohl’s Corp. | Morgan Stanley | (1,175 | ) | (27,708 | ) | (21,773 | ) | 11,378 | |||||||||||||||
Monro, Inc. | Morgan Stanley | (6,347 | ) | (294,047 | ) | (257,498 | ) | 36,477 | |||||||||||||||
Nordstrom, Inc. | Morgan Stanley | (30,872 | ) | (443,145 | ) | (367,994 | ) | 75,042 | |||||||||||||||
Penske Automotive Group, Inc. | Morgan Stanley | (1,225 | ) | (59,520 | ) | (58,384 | ) | 1,122 | |||||||||||||||
PetMed Express, Inc. | Morgan Stanley | (1,962 | ) | (65,795 | ) | (62,038 | ) | 3,741 | |||||||||||||||
The accompanying notes are an integral part of the financial statements.
127
GOTHAM NEUTRAL FUND
Portfolio of Investments (Continued)
September 30, 2020
Total Return Swaps (continued)
Reference Entity | Counterparty | Number of Contracts Long/(Short) | Notional Amount | Value | Unrealized Appreciation/ (Depreciation)* | |||||||||||||||||
Retailing — (continued) | ||||||||||||||||||||||
Sally Beauty Holdings, Inc. | Morgan Stanley | (3,346 | ) | $ | (38,479 | ) | $ | (29,077 | ) | $ | 9,450 | |||||||||||
Stitch Fix, Inc., Class A | Morgan Stanley | (13,989 | ) | (358,742 | ) | (379,522 | ) | (23,426 | ) | |||||||||||||
Tiffany & Co. | Morgan Stanley | (805 | ) | (99,280 | ) | (93,259 | ) | 5,532 | ||||||||||||||
Ulta Beauty, Inc. | Morgan Stanley | (1,960 | ) | (463,638 | ) | (439,001 | ) | 25,899 | ||||||||||||||
|
|
|
|
|
|
|
| |||||||||||||||
| (107,501 | ) | (4,450,850 | ) | (4,268,167 | ) | 185,125 | ||||||||||||||||
|
|
|
|
|
|
|
| |||||||||||||||
Semiconductors & Semiconductor Equipment | ||||||||||||||||||||||
Advanced Energy Industries, Inc. | Morgan Stanley | (3,299 | ) | (244,387 | ) | (207,639 | ) | 37,133 | ||||||||||||||
Ambarella, Inc. (Cayman Islands) | Morgan Stanley | (922 | ) | (46,766 | ) | (48,110 | ) | (1,356 | ) | |||||||||||||
Brooks Automation, Inc. | Morgan Stanley | (1,431 | ) | (75,600 | ) | (66,198 | ) | 9,586 | ||||||||||||||
Cabot Microelectronics Corp. | Morgan Stanley | (316 | ) | (50,873 | ) | (45,128 | ) | 5,874 | ||||||||||||||
CEVA, Inc. | Morgan Stanley | (1,517 | ) | (64,746 | ) | (59,724 | ) | 5,082 | ||||||||||||||
Cohu, Inc. | Morgan Stanley | (159 | ) | (2,724 | ) | (2,732 | ) | (8 | ) | |||||||||||||
Cree, Inc. | Morgan Stanley | (9,133 | ) | (572,554 | ) | (582,137 | ) | (9,723 | ) | |||||||||||||
Enphase Energy, Inc. | Morgan Stanley | (2,388 | ) | (183,837 | ) | (197,225 | ) | (13,432 | ) | |||||||||||||
Ichor Holdings Ltd. (Cayman Islands) | Morgan Stanley | (1,694 | ) | (43,483 | ) | (36,540 | ) | 6,932 | ||||||||||||||
MaxLinear, Inc. | Morgan Stanley | (830 | ) | (20,850 | ) | (19,289 | ) | 1,569 | ||||||||||||||
Onto Innovation, Inc. | Morgan Stanley | (2,316 | ) | (76,089 | ) | (68,970 | ) | 7,081 | ||||||||||||||
Semtech Corp. | Morgan Stanley | (1,014 | ) | (61,611 | ) | (53,701 | ) | 8,445 | ||||||||||||||
Universal Display Corp. | Morgan Stanley | (2,454 | ) | (429,291 | ) | (443,536 | ) | (14,661 | ) | |||||||||||||
|
|
|
|
|
|
|
| |||||||||||||||
| (27,473 | ) | (1,872,811 | ) | (1,830,929 | ) | 42,522 | ||||||||||||||||
|
|
|
|
|
|
|
| |||||||||||||||
Software & Services | ||||||||||||||||||||||
8x8, Inc. | Morgan Stanley | (26,141 | ) | (450,845 | ) | (406,493 | ) | 44,719 | ||||||||||||||
Akamai Technologies, Inc. | Morgan Stanley | (864 | ) | (101,020 | ) | (95,507 | ) | 5,408 | ||||||||||||||
Altair Engineering, Inc., Class A | Morgan Stanley | (3,064 | ) | (132,699 | ) | (128,627 | ) | 4,040 | ||||||||||||||
Alteryx, Inc., Class A | Morgan Stanley | (6,106 | ) | (727,827 | ) | (693,336 | ) | 34,099 | ||||||||||||||
Avaya Holdings Corp. | Morgan Stanley | (10,655 | ) | (170,798 | ) | (161,956 | ) | 8,927 | ||||||||||||||
BlackBerry Ltd. (Canada) | Morgan Stanley | (5,127 | ) | (28,218 | ) | (23,533 | ) | 4,727 | ||||||||||||||
Cerence, Inc. | Morgan Stanley | (303 | ) | (17,665 | ) | (14,808 | ) | 3,104 | ||||||||||||||
Ceridian HCM Holding, Inc. | Morgan Stanley | (7,019 | ) | (556,375 | ) | (580,120 | ) | (23,881 | ) | |||||||||||||
Cloudflare, Inc., Class A | Morgan Stanley | (1,744 | ) | (59,939 | ) | (71,609 | ) | (15,792 | ) | |||||||||||||
CommVault Systems, Inc. | Morgan Stanley | (1,446 | ) | (63,176 | ) | (58,997 | ) | 4,307 | ||||||||||||||
Conduent, Inc. | Morgan Stanley | (29,663 | ) | (106,490 | ) | (94,328 | ) | 12,291 | ||||||||||||||
Coupa Software, Inc. | Morgan Stanley | (1,147 | ) | (286,278 | ) | (314,553 | ) | (30,264 | ) | |||||||||||||
Datadog, Inc., Class A | Morgan Stanley | (406 | ) | (34,401 | ) | (41,477 | ) | (9,490 | ) | |||||||||||||
Digital Turbine, Inc. | Morgan Stanley | (3,293 | ) | (91,744 | ) | (107,813 | ) | (17,347 | ) | |||||||||||||
DXC Technology Co. | Morgan Stanley | (10,299 | ) | (206,262 | ) | (183,837 | ) | 23,908 | ||||||||||||||
Envestnet, Inc. | Morgan Stanley | (148 | ) | (12,562 | ) | (11,420 | ) | 1,463 | ||||||||||||||
Euronet Worldwide, Inc. | Morgan Stanley | (379 | ) | (38,999 | ) | (34,527 | ) | 5,112 | ||||||||||||||
Everbridge, Inc. | Morgan Stanley | (2,074 | ) | (285,063 | ) | (260,764 | ) | 24,229 | ||||||||||||||
Fastly, Inc., Class A | Morgan Stanley | (1,180 | ) | (98,296 | ) | (110,542 | ) | (24,231 | ) | |||||||||||||
Fidelity National Information Services, Inc. | Morgan Stanley | (102 | ) | (15,888 | ) | (15,015 | ) | 868 | ||||||||||||||
Global Payments, Inc. | Morgan Stanley | (1,930 | ) | (342,000 | ) | (342,729 | ) | (1,149 | ) | |||||||||||||
Leidos Holdings, Inc. | Morgan Stanley | (2,401 | ) | (216,939 | ) | (214,049 | ) | 2,837 | ||||||||||||||
LivePerson, Inc. | Morgan Stanley | (1,178 | ) | (71,163 | ) | (61,244 | ) | 10,727 | ||||||||||||||
Manhattan Associates, Inc. | Morgan Stanley | (1,384 | ) | (135,740 | ) | (132,158 | ) | 3,582 | ||||||||||||||
The accompanying notes are an integral part of the financial statements.
128
GOTHAM NEUTRAL FUND
Portfolio of Investments (Continued)
September 30, 2020
Total Return Swaps (continued)
Reference Entity | Counterparty | Number of Contracts Long/(Short) | Notional Amount | Value | Unrealized Appreciation/ (Depreciation)* | |||||||||||||||||
Software & Services — (continued) | ||||||||||||||||||||||
ManTech International Corp., Class A | Morgan Stanley | (510 | ) | $ | (38,775 | ) | $ | (35,129 | ) | $ | 3,563 | |||||||||||
MAXIMUS, Inc. | Morgan Stanley | (1,080 | ) | (85,521 | ) | (73,883 | ) | 11,892 | ||||||||||||||
Medallia, Inc. | Morgan Stanley | (7,798 | ) | (290,455 | ) | (213,821 | ) | 78,763 | ||||||||||||||
New Relic, Inc. | Morgan Stanley | (6,257 | ) | (371,770 | ) | (352,645 | ) | 19,035 | ||||||||||||||
Nuance Communications, Inc. | Morgan Stanley | (5,505 | ) | (177,623 | ) | (182,711 | ) | (5,944 | ) | |||||||||||||
Nutanix, Inc., Class A | Morgan Stanley | (8,900 | ) | (254,841 | ) | (197,402 | ) | 60,710 | ||||||||||||||
PagerDuty, Inc. | Morgan Stanley | (3,536 | ) | (86,213 | ) | (95,861 | ) | (10,030 | ) | |||||||||||||
Paycom Software, Inc. | Morgan Stanley | (128 | ) | (38,862 | ) | (39,846 | ) | (994 | ) | |||||||||||||
Ping Identity Holding Corp. | Morgan Stanley | (6,114 | ) | (205,228 | ) | (190,818 | ) | 14,360 | ||||||||||||||
Proofpoint, Inc. | Morgan Stanley | (489 | ) | (53,264 | ) | (51,614 | ) | 1,637 | ||||||||||||||
PROS Holdings, Inc. | Morgan Stanley | (3,365 | ) | (130,725 | ) | (107,478 | ) | 23,215 | ||||||||||||||
Sabre Corp. | Morgan Stanley | (41,393 | ) | (278,949 | ) | (269,468 | ) | 9,412 | ||||||||||||||
Slack Technologies, Inc., Class A | Morgan Stanley | (9,603 | ) | (320,022 | ) | (257,936 | ) | 63,562 | ||||||||||||||
Smartsheet, Inc., Class A | Morgan Stanley | (3,612 | ) | (210,024 | ) | (178,505 | ) | 32,762 | ||||||||||||||
Splunk, Inc. | Morgan Stanley | (1,389 | ) | (278,795 | ) | (261,312 | ) | 14,641 | ||||||||||||||
Switch, Inc., Class A | Morgan Stanley | (14,746 | ) | (248,043 | ) | (230,185 | ) | 17,797 | ||||||||||||||
Upland Software, Inc. | Morgan Stanley | (1,157 | ) | (45,466 | ) | (43,619 | ) | 1,836 | ||||||||||||||
Verint Systems, Inc. | Morgan Stanley | (680 | ) | (33,605 | ) | (32,762 | ) | 888 | ||||||||||||||
Verra Mobility Corp. | Morgan Stanley | (2,164 | ) | (23,045 | ) | (20,904 | ) | 2,134 | ||||||||||||||
Yext, Inc. | Morgan Stanley | (19,003 | ) | (380,014 | ) | (288,466 | ) | 91,636 | ||||||||||||||
Zscaler, Inc. | Morgan Stanley | (1,524 | ) | (199,208 | ) | (214,411 | ) | (18,810 | ) | |||||||||||||
Zuora, Inc., Class A | Morgan Stanley | (18,046 | ) | (256,457 | ) | (186,596 | ) | 69,798 | ||||||||||||||
|
|
|
|
|
|
|
| |||||||||||||||
| (275,052 | ) | (8,257,292 | ) | (7,684,814 | ) | 554,057 | ||||||||||||||||
|
|
|
|
|
|
|
| |||||||||||||||
Technology Hardware & Equipment | ||||||||||||||||||||||
3D Systems Corp. | Morgan Stanley | (11,117 | ) | (60,764 | ) | (54,584 | ) | 6,153 | ||||||||||||||
ADTRAN, Inc. | Morgan Stanley | (305 | ) | (3,214 | ) | (3,128 | ) | 86 | ||||||||||||||
Fabrinet (Cayman Islands) | Morgan Stanley | (2,936 | ) | (202,686 | ) | (185,056 | ) | 17,759 | ||||||||||||||
FARO Technologies, Inc. | Morgan Stanley | (778 | ) | (46,906 | ) | (47,442 | ) | (551 | ) | |||||||||||||
Fitbit, Inc., Class A | Morgan Stanley | (21,975 | ) | (139,422 | ) | (152,946 | ) | (14,312 | ) | |||||||||||||
Hewlett Packard Enterprise Co. | Morgan Stanley | (4,956 | ) | (47,610 | ) | (46,438 | ) | 808 | ||||||||||||||
II-VI, Inc. | Morgan Stanley | (5,197 | ) | (202,638 | ) | (210,790 | ) | (8,386 | ) | |||||||||||||
Infinera Corp. | Morgan Stanley | (30,545 | ) | (222,285 | ) | (188,157 | ) | 34,610 | ||||||||||||||
Insight Enterprises, Inc. | Morgan Stanley | (4,136 | ) | (247,633 | ) | (234,015 | ) | 13,812 | ||||||||||||||
Itron, Inc. | Morgan Stanley | (830 | ) | (50,789 | ) | (50,414 | ) | 363 | ||||||||||||||
Keysight Technologies, Inc. | Morgan Stanley | (2,920 | ) | (287,664 | ) | (288,438 | ) | (844 | ) | |||||||||||||
Littelfuse, Inc. | Morgan Stanley | (336 | ) | (62,456 | ) | (59,586 | ) | 2,877 | ||||||||||||||
Methode Electronics, Inc. | Morgan Stanley | (65 | ) | (1,791 | ) | (1,853 | ) | (62 | ) | |||||||||||||
Motorola Solutions, Inc. | Morgan Stanley | (1,799 | ) | (278,417 | ) | (282,101 | ) | (4,063 | ) | |||||||||||||
nLight, Inc. | Morgan Stanley | (4,469 | ) | (107,077 | ) | (104,932 | ) | 2,126 | ||||||||||||||
Novanta, Inc. (Canada) | Morgan Stanley | (446 | ) | (47,762 | ) | (46,982 | ) | 762 | ||||||||||||||
Plantronics, Inc. | Morgan Stanley | (5,707 | ) | (70,082 | ) | (67,571 | ) | 2,497 | ||||||||||||||
Plexus Corp. | Morgan Stanley | (494 | ) | (38,270 | ) | (34,891 | ) | 3,486 | ||||||||||||||
Pure Storage, Inc., Class A | Morgan Stanley | (3,510 | ) | (51,788 | ) | (54,019 | ) | (2,320 | ) | |||||||||||||
Rogers Corp. | Morgan Stanley | (645 | ) | (78,064 | ) | (63,249 | ) | 15,191 | ||||||||||||||
Stratasys Ltd. (Israel) | Morgan Stanley | (15,471 | ) | (230,061 | ) | (192,923 | ) | 37,240 | ||||||||||||||
Super Micro Computer, Inc. | Morgan Stanley | (1,111 | ) | (29,468 | ) | (29,330 | ) | 130 | ||||||||||||||
The accompanying notes are an integral part of the financial statements.
129
GOTHAM NEUTRAL FUND
Portfolio of Investments (Continued)
September 30, 2020
Total Return Swaps (continued)
Reference Entity | Counterparty | Number of Contracts Long/(Short) | Notional Amount | Value | Unrealized Appreciation/ (Depreciation)* | ||||||||||||||||||
Technology Hardware & Equipment — (continued) |
| ||||||||||||||||||||||
ViaSat, Inc. | Morgan Stanley | (3,467 | ) | $ | (137,173 | ) | $ | (119,230 | ) | $ | 18,232 | ||||||||||||
|
|
|
|
|
|
|
| ||||||||||||||||
| (123,215 | ) | (2,644,020 | ) | (2,518,075 | ) | 125,594 | |||||||||||||||||
|
|
|
|
|
|
|
| ||||||||||||||||
Telecommunication Services | |||||||||||||||||||||||
Anterix, Inc. | Morgan Stanley | (28 | ) | (970 | ) | (916 | ) | 54 | |||||||||||||||
Boingo Wireless, Inc. | Morgan Stanley | (7,511 | ) | (100,873 | ) | (76,575 | ) | 24,408 | |||||||||||||||
Cogent Communications Holdings, Inc. | Morgan Stanley | (894 | ) | (60,736 | ) | (53,685 | ) | 7,237 | |||||||||||||||
Shenandoah Telecommunications Co. | Morgan Stanley | (992 | ) | (55,334 | ) | (44,079 | ) | 11,558 | |||||||||||||||
T-Mobile US, Inc. | Morgan Stanley | (1,093 | ) | (127,701 | ) | (124,995 | ) | 3,441 | |||||||||||||||
United States Cellular Corp. | Morgan Stanley | (902 | ) | (32,923 | ) | (26,636 | ) | 6,443 | |||||||||||||||
|
|
|
|
|
|
|
| ||||||||||||||||
| (11,420 | ) | (378,537 | ) | (326,886 | ) | 53,141 | |||||||||||||||||
|
|
|
|
|
|
|
| ||||||||||||||||
Transportation | |||||||||||||||||||||||
Air Transport Services Group, Inc. | Morgan Stanley | (6,408 | ) | (164,098 | ) | (160,584 | ) | 3,474 | |||||||||||||||
Allegiant Travel Co. | Morgan Stanley | (819 | ) | (105,322 | ) | (98,116 | ) | 7,259 | |||||||||||||||
Canadian Pacific Railway Ltd. (Canada) | Morgan Stanley | (85 | ) | (25,512 | ) | (25,877 | ) | (408 | ) | ||||||||||||||
Hawaiian Holdings, Inc. | Morgan Stanley | (5,983 | ) | (82,809 | ) | (77,121 | ) | 5,668 | |||||||||||||||
Lyft, Inc., Class A | Morgan Stanley | (19,166 | ) | (562,280 | ) | (528,023 | ) | 34,119 | |||||||||||||||
Matson, Inc. | Morgan Stanley | (4,152 | ) | (168,079 | ) | (166,454 | ) | 1,574 | |||||||||||||||
Union Pacific Corp. | Morgan Stanley | (71 | ) | (14,414 | ) | (13,978 | ) | 1,015 | |||||||||||||||
United Airlines Holdings, Inc. | Morgan Stanley | (331 | ) | (11,039 | ) | (11,502 | ) | (466 | ) | ||||||||||||||
United Parcel Service, Inc., Class B | Morgan Stanley | (19 | ) | (3,191 | ) | (3,166 | ) | 261 | |||||||||||||||
XPO Logistics, Inc. | Morgan Stanley | (4,124 | ) | (368,838 | ) | (349,138 | ) | 20,128 | |||||||||||||||
|
|
|
|
|
|
|
| ||||||||||||||||
| (41,158 | ) | (1,505,582 | ) | (1,433,959 | ) | 72,624 | |||||||||||||||||
|
|
|
|
|
|
|
| ||||||||||||||||
Utilities | |||||||||||||||||||||||
Algonquin Power & Utilities Corp. (Canada) | Morgan Stanley | (940 | ) | (13,339 | ) | (13,668 | ) | (495 | ) | ||||||||||||||
ALLETE, Inc. | Morgan Stanley | (4,858 | ) | (260,178 | ) | (251,353 | ) | 8,762 | |||||||||||||||
Ameren Corp. | Morgan Stanley | (23 | ) | (1,814 | ) | (1,819 | ) | (5 | ) | ||||||||||||||
Atmos Energy Corp. | Morgan Stanley | (388 | ) | (37,969 | ) | (37,089 | ) | 871 | |||||||||||||||
Black Hills Corp. | Morgan Stanley | (1,955 | ) | (109,773 | ) | (104,573 | ) | 5,226 | |||||||||||||||
California Water Service Group | Morgan Stanley | (585 | ) | (26,047 | ) | �� | (25,418 | ) | 623 | ||||||||||||||
CMS Energy Corp. | Morgan Stanley | (3,007 | ) | (183,865 | ) | (184,660 | ) | (887 | ) | ||||||||||||||
Consolidated Edison, Inc. | Morgan Stanley | (4,502 | ) | (323,718 | ) | (350,256 | ) | (26,617 | ) | ||||||||||||||
DTE Energy Co. | Morgan Stanley | (1,830 | ) | (215,719 | ) | (210,523 | ) | 3,342 | |||||||||||||||
Edison International | Morgan Stanley | (485 | ) | (24,842 | ) | (24,657 | ) | 81 | |||||||||||||||
Essential Utilities, Inc. | Morgan Stanley | (1,982 | ) | (82,108 | ) | (79,776 | ) | 2,269 | |||||||||||||||
New Jersey Resources Corp. | Morgan Stanley | (4,967 | ) | (148,873 | ) | (134,208 | ) | 13,010 | |||||||||||||||
NextEra Energy, Inc. | Morgan Stanley | (56 | ) | (16,143 | ) | (15,543 | ) | 764 | |||||||||||||||
Ormat Technologies, Inc. | Morgan Stanley | (48 | ) | (2,771 | ) | (2,837 | ) | (67 | ) | ||||||||||||||
Otter Tail Corp. | Morgan Stanley | (59 | ) | (2,142 | ) | (2,134 | ) | 7 | |||||||||||||||
Portland General Electric Co. | Morgan Stanley | (2,540 | ) | (95,733 | ) | (90,170 | ) | 4,663 | |||||||||||||||
Public Service Enterprise Group, Inc. | Morgan Stanley | (3,158 | ) | (163,955 | ) | (173,406 | ) | (11,625 | ) | ||||||||||||||
SJW Group. | Morgan Stanley | (500 | ) | (31,620 | ) | (30,430 | ) | 1,184 | |||||||||||||||
South Jersey Industries, Inc. | Morgan Stanley | (3,344 | ) | (73,902 | ) | (64,439 | ) | 8,738 | |||||||||||||||
Southern Co. (The) | Morgan Stanley | (8,178 | ) | (427,638 | ) | (443,411 | ) | (16,714 | ) | ||||||||||||||
Southwest Gas Holdings, Inc. | Morgan Stanley | (856 | ) | (53,697 | ) | (54,014 | ) | (326 | ) | ||||||||||||||
The accompanying notes are an integral part of the financial statements.
130
GOTHAM NEUTRAL FUND
Portfolio of Investments (Concluded)
September 30, 2020
Total Return Swaps (concluded)
Reference Entity | Counterparty | Number of Contracts Long/(Short) | Notional Amount | Value | Unrealized Appreciation/ (Depreciation)* | |||||||||||||||||
Utilities — (continued) | ||||||||||||||||||||||
Spire, Inc. | Morgan Stanley | (646 | ) | $ | (36,273 | ) | $ | (34,367 | ) | $ | 1,607 | |||||||||||
Sunnova Energy International, Inc. | Morgan Stanley | (1,854 | ) | (44,642 | ) | (56,380 | ) | (12,061 | ) | |||||||||||||
Unitil Corp. | Morgan Stanley | (24 | ) | (914 | ) | (927 | ) | (14 | ) | |||||||||||||
Xcel Energy, Inc. | Morgan Stanley | (363 | ) | (25,973 | ) | (25,051 | ) | 843 | ||||||||||||||
|
|
|
|
|
|
|
| |||||||||||||||
| (47,148 | ) | (2,403,648 | ) | (2,411,109 | ) | (16,821 | ) | |||||||||||||||
|
|
|
|
|
|
|
| |||||||||||||||
Total Reference Entity — Short | (55,605,642 | ) | (53,092,740 | ) | 2,458,577 | |||||||||||||||||
|
|
|
|
|
| |||||||||||||||||
Net Value of Reference Entity | $ | (40,492,318 | ) | $ | (38,698,528 | ) | $ | 1,770,576 | ||||||||||||||
|
|
|
|
|
| |||||||||||||||||
| * | Includes $(23,214) related to open trades, dividends receivables/payables and swap receivables/payables activities. |
The accompanying notes are an integral part of the financial statements.
131
GOTHAM LARGE VALUE FUND
Portfolio of Investments
September 30, 2020
| Number of Shares | Value | |||||||
COMMON STOCKS — 99.5% |
| |||||||
Automobiles & Components — 0.4% |
| |||||||
Aptiv PLC (Jersey) | 1,989 | $ | 182,352 | |||||
BorgWarner, Inc. | 3,019 | 116,956 | ||||||
|
| |||||||
| 299,308 | ||||||||
|
| |||||||
Banks — 3.4% | ||||||||
Bank of America Corp. | 11,839 | 285,202 | ||||||
Citigroup, Inc. | 24,281 | 1,046,754 | ||||||
Fifth Third Bancorp | 10,298 | 219,553 | ||||||
M&T Bank Corp. | 1,739 | 160,145 | ||||||
People’s United Financial, Inc. | 5,015 | 51,705 | ||||||
US Bancorp | 18,039 | 646,698 | ||||||
|
| |||||||
| 2,410,057 | ||||||||
|
| |||||||
Capital Goods — 15.1% | ||||||||
3M Co. | 5,506 | 881,951 | ||||||
AMETEK, Inc. | 3,225 | 320,565 | ||||||
Carrier Global Corp. | 8,976 | 274,127 | ||||||
Caterpillar, Inc. | 1,866 | 278,314 | ||||||
Cummins, Inc. | 2,186 | 461,596 | ||||||
Deere & Co. | 1,175 | 260,415 | ||||||
Dover Corp. | 2,127 | 230,439 | ||||||
Eaton Corp. PLC (Ireland) | 4,111 | 419,445 | ||||||
Emerson Electric Co. | 8,883 | 582,458 | ||||||
Flowserve Corp. | 1,909 | 52,097 | ||||||
Fortive Corp. | 1,326 | 101,054 | ||||||
Fortune Brands Home & Security, Inc. | 1,654 | 143,104 | ||||||
General Dynamics Corp. | 2,700 | 373,761 | ||||||
Honeywell International, Inc. | 7,269 | 1,196,550 | ||||||
Howmet Aerospace, Inc. | 6,328 | 105,804 | ||||||
Huntington Ingalls Industries, Inc. | 484 | 68,123 | ||||||
IDEX Corp. | 786 | 143,374 | ||||||
Illinois Tool Works, Inc. | 3,025 | 584,460 | ||||||
Johnson Controls International PLC (Ireland) | 11,168 | 456,213 | ||||||
Lockheed Martin Corp. | 2,731 | 1,046,738 | ||||||
Masco Corp. | 3,995 | 220,244 | ||||||
Otis Worldwide Corp. | 3,158 | 197,122 | ||||||
PACCAR, Inc. | 4,143 | 353,315 | ||||||
Pentair PLC (Ireland) | 1,987 | 90,945 | ||||||
Quanta Services, Inc. | 2,081 | 110,002 | ||||||
Raytheon Technologies Corp. | 2,611 | 150,237 | ||||||
Rockwell Automation, Inc. | 449 | 99,085 | ||||||
Snap-on, Inc. | 795 | 116,968 | ||||||
Teledyne Technologies, Inc.* | 376 | 116,639 | ||||||
Trane Technologies PLC (Ireland) | 2,862 | 347,018 | ||||||
TransDigm Group, Inc. | 758 | 360,141 | ||||||
| Number of Shares | Value | |||||||
COMMON STOCKS — (Continued) |
| |||||||
Capital Goods — (Continued) |
| |||||||
United Rentals, Inc.* | 1,033 | $ | 180,258 | |||||
WW Grainger, Inc. | 641 | 228,690 | ||||||
|
| |||||||
| 10,551,252 | ||||||||
|
| |||||||
Commercial & Professional Services — 0.8% |
| |||||||
Cintas Corp. | 231 | 76,884 | ||||||
Republic Services, Inc. | 3,679 | 343,435 | ||||||
Robert Half International, Inc. | 1,372 | 72,634 | ||||||
Waste Management, Inc. | 518 | 58,622 | ||||||
|
| |||||||
| 551,575 | ||||||||
|
| |||||||
Consumer Durables & Apparel — 1.1% |
| |||||||
DR Horton, Inc. | 2,495 | 188,697 | ||||||
Garmin Ltd. (Switzerland) | 1,114 | 105,674 | ||||||
Hanesbrands, Inc. | 1,454 | 22,900 | ||||||
Hasbro, Inc. | 617 | 51,038 | ||||||
Leggett & Platt, Inc. | 518 | 21,326 | ||||||
Mohawk Industries, Inc.* | 1,048 | 102,274 | ||||||
Newell Brands, Inc. | 894 | 15,341 | ||||||
PulteGroup, Inc. | 867 | 40,133 | ||||||
PVH Corp. | 1,057 | 63,039 | ||||||
Whirlpool Corp. | 921 | 169,363 | ||||||
|
| |||||||
| 779,785 | ||||||||
|
| |||||||
Consumer Services — 1.1% |
| |||||||
Darden Restaurants, Inc. | 1,284 | 129,350 | ||||||
McDonald’s Corp. | 757 | 166,154 | ||||||
MGM Resorts International | 7,355 | 159,971 | ||||||
Yum! Brands, Inc. | 3,604 | 329,045 | ||||||
|
| |||||||
| 784,520 | ||||||||
|
| |||||||
Diversified Financials — 5.6% |
| |||||||
Berkshire Hathaway, Inc., Class B* | 2,614 | 556,625 | ||||||
BlackRock, Inc. | 1,826 | 1,029,042 | ||||||
Cboe Global Markets, Inc. | 705 | 61,857 | ||||||
Discover Financial Services | 3,669 | 211,995 | ||||||
Franklin Resources, Inc. | 7,274 | 148,026 | ||||||
Intercontinental Exchange, Inc. | 2,817 | 281,841 | ||||||
Invesco Ltd. (Bermuda) | 6,662 | 76,013 | ||||||
Moody’s Corp. | 26 | 7,536 | ||||||
Nasdaq, Inc. | 2,100 | 257,691 | ||||||
S&P Global, Inc. | 1,872 | 675,043 | ||||||
Synchrony Financial | 5,403 | 141,397 | ||||||
T Rowe Price Group, Inc. | 3,407 | 436,846 | ||||||
|
| |||||||
| 3,883,912 | ||||||||
|
| |||||||
Energy — 4.0% |
| |||||||
Apache Corp. | 550 | 5,209 | ||||||
The accompanying notes are an integral part of the financial statements.
132
GOTHAM LARGE VALUE FUND
Portfolio of Investments (Continued)
September 30, 2020
| Number of Shares | Value | |||||||
COMMON STOCKS — (Continued) |
| |||||||
Energy — (Continued) |
| |||||||
Baker Hughes Co. | 7,850 | $ | 104,327 | �� | ||||
Chevron Corp. | 11,073 | 797,256 | ||||||
ConocoPhillips | 10,992 | 360,977 | ||||||
EOG Resources, Inc. | 6,972 | 250,574 | ||||||
Halliburton Co. | 12,835 | 154,662 | ||||||
Kinder Morgan, Inc. | 33,056 | 407,580 | ||||||
National Oilwell Varco, Inc. | 4,776 | 43,271 | ||||||
Schlumberger NV (Curacao) | 20,290 | 315,712 | ||||||
TechnipFMC PLC (United Kingdom) | 6,542 | 41,280 | ||||||
Williams Cos., Inc. (The) | 14,525 | 285,416 | ||||||
|
| |||||||
| 2,766,264 | ||||||||
|
| |||||||
Food & Staples Retailing — 3.3% |
| |||||||
Costco Wholesale Corp. | 220 | 78,100 | ||||||
Kroger Co. (The) | 9,729 | 329,910 | ||||||
Sysco Corp. | 7,438 | 462,792 | ||||||
Walgreens Boots Alliance, Inc. | 10,420 | 374,286 | ||||||
Walmart, Inc. | 7,429 | 1,039,391 | ||||||
|
| |||||||
| 2,284,479 | ||||||||
|
| |||||||
Food, Beverage & Tobacco — 7.9% |
| |||||||
Altria Group, Inc. | 22,255 | 859,933 | ||||||
Archer-Daniels-Midland Co. | 8,143 | 378,568 | ||||||
Campbell Soup Co. | 4,411 | 213,360 | ||||||
Coca-Cola Co. (The) | 9,265 | 457,413 | ||||||
Conagra Brands, Inc. | 5,830 | 208,189 | ||||||
Constellation Brands, Inc., Class A | 2,309 | 437,579 | ||||||
General Mills, Inc. | 8,332 | 513,918 | ||||||
Hershey Co. (The) | 141 | 20,211 | ||||||
Hormel Foods Corp. | 503 | 24,592 | ||||||
JM Smucker Co. (The) | 1,667 | 192,572 | ||||||
Kellogg Co. | 4,202 | 271,407 | ||||||
Kraft Heinz Co. (The) | 14,646 | 438,648 | ||||||
Lamb Weston Holdings, Inc. | 823 | 54,540 | ||||||
McCormick & Co., Inc., non-voting shares | 1,043 | 202,446 | ||||||
Molson Coors Beverage Co., Class B | 2,593 | 87,021 | ||||||
Mondelez International, Inc., Class A | 1,250 | 71,812 | ||||||
PepsiCo, Inc. | 1,477 | 204,712 | ||||||
Philip Morris International, Inc. | 8,556 | 641,614 | ||||||
Tyson Foods, Inc., Class A | 4,371 | 259,987 | ||||||
|
| |||||||
| 5,538,522 | ||||||||
|
| |||||||
Health Care Equipment & Services — 7.6% |
| |||||||
AmerisourceBergen Corp. | 1,794 | 173,874 | ||||||
Anthem, Inc. | 2,585 | 694,305 | ||||||
| Number of Shares | Value | |||||||
COMMON STOCKS — (Continued) |
| |||||||
Health Care Equipment & Services — (Continued) |
| |||||||
Cardinal Health, Inc. | 3,718 | $ | 174,560 | |||||
Centene Corp.* | 5,983 | 348,988 | ||||||
Cigna Corp. | 2,738 | 463,845 | ||||||
CVS Health Corp. | 14,643 | 855,151 | ||||||
DaVita, Inc.* | 1,840 | 157,596 | ||||||
HCA Healthcare, Inc. | 3,677 | 458,448 | ||||||
Hologic, Inc.* | 3,098 | 205,924 | ||||||
Humana, Inc. | 1,585 | 656,016 | ||||||
Laboratory Corp. of America Holdings* | 524 | 98,653 | ||||||
McKesson Corp. | 1,939 | 288,775 | ||||||
Medtronic PLC (Ireland) | 1,570 | 163,154 | ||||||
Quest Diagnostics, Inc. | 522 | 59,764 | ||||||
UnitedHealth Group, Inc. | 1,222 | 380,983 | ||||||
Universal Health Services, Inc., Class B | 1,260 | 134,845 | ||||||
|
| |||||||
| 5,314,881 | ||||||||
|
| |||||||
Household & Personal Products — 3.9% |
| |||||||
Church & Dwight Co., Inc. | 2,950 | 276,445 | ||||||
Clorox Co. (The) | 1,512 | 317,777 | ||||||
Colgate-Palmolive Co. | 9,530 | 735,240 | ||||||
Kimberly-Clark Corp. | 4,850 | 716,151 | ||||||
Procter & Gamble Co. (The) | 4,732 | 657,701 | ||||||
|
| |||||||
| 2,703,314 | ||||||||
|
| |||||||
Insurance — 2.7% |
| |||||||
Aflac, Inc. | 4,913 | 178,588 | ||||||
American International Group, Inc. | 7,687 | 211,623 | ||||||
Aon PLC, Class A (Ireland) | 2,275 | 469,332 | ||||||
Arthur J Gallagher & Co. | 1,748 | 184,554 | ||||||
Cincinnati Financial Corp. | 2,350 | 183,230 | ||||||
Globe Life, Inc. | 440 | 35,156 | ||||||
Lincoln National Corp. | 2,285 | 71,589 | ||||||
Marsh & McLennan Cos., Inc. | 2,631 | 301,776 | ||||||
MetLife, Inc. | 2,258 | 83,930 | ||||||
Principal Financial Group, Inc. | 1,077 | 43,371 | ||||||
Prudential Financial, Inc. | 1,981 | 125,833 | ||||||
Travelers Cos., Inc. (The) | 45 | 4,869 | ||||||
|
| |||||||
| 1,893,851 | ||||||||
|
| |||||||
Materials — 6.0% |
| |||||||
Amcor PLC (Jersey) | 18,783 | 207,552 | ||||||
Celanese Corp. | 631 | 67,801 | ||||||
CF Industries Holdings, Inc. | 3,158 | 96,982 | ||||||
Dow, Inc. | 8,766 | 412,440 | ||||||
The accompanying notes are an integral part of the financial statements.
133
GOTHAM LARGE VALUE FUND
Portfolio of Investments (Continued)
September 30, 2020
| Number of Shares | Value | |||||||
COMMON STOCKS — (Continued) |
| |||||||
Materials — (Continued) |
| |||||||
DuPont de Nemours, Inc. | 10,728 | $ | 595,189 | |||||
Eastman Chemical Co. | 1,987 | 155,224 | ||||||
Ecolab, Inc. | 3,418 | 683,053 | ||||||
FMC Corp. | 44 | 4,660 | ||||||
International Paper Co. | 5,732 | 232,375 | ||||||
Linde PLC (Ireland) | 2,102 | 500,549 | ||||||
LyondellBasell Industries NV, Class A | ||||||||
(Netherlands) | 3,997 | 281,749 | ||||||
Mosaic Co. (The) | 4,539 | 82,928 | ||||||
Nucor Corp. | 3,623 | 162,528 | ||||||
Packaging Corp. of America | 1,135 | 123,772 | ||||||
PPG Industries, Inc. | 3,458 | 422,153 | ||||||
Sealed Air Corp. | 2,259 | 87,672 | ||||||
Westrock Co. | 3,103 | 107,798 | ||||||
|
| |||||||
| 4,224,425 | ||||||||
|
| |||||||
Media & Entertainment — 2.2% |
| |||||||
Charter Communications, Inc., Class A* | 1,049 | 654,933 | ||||||
Discovery, Inc., Class A* | 10,017 | 218,070 | ||||||
DISH Network Corp., Class A* | 1,852 | 53,764 | ||||||
Electronic Arts, Inc.* | 1,093 | 142,538 | ||||||
Fox Corp., Class A | 7,802 | 217,130 | ||||||
Interpublic Group of Cos., Inc. (The) | 5,696 | 94,952 | ||||||
News Corp., Class A | 459 | 6,435 | ||||||
Omnicom Group, Inc. | 3,169 | 156,866 | ||||||
|
| |||||||
| 1,544,688 | ||||||||
|
| |||||||
Pharmaceuticals, Biotechnology & Life Sciences — 4.5% |
| |||||||
AbbVie, Inc. | 649 | 56,846 | ||||||
Alexion Pharmaceuticals, Inc.* | 858 | 98,181 | ||||||
Biogen, Inc.* | 1,984 | 562,821 | ||||||
Gilead Sciences, Inc. | 2,277 | 143,884 | ||||||
Johnson & Johnson | 4,561 | 679,042 | ||||||
Merck & Co., Inc. | 7,487 | 621,047 | ||||||
Pfizer, Inc. | 19,368 | 710,806 | ||||||
Regeneron Pharmaceuticals, Inc.* | 546 | 305,640 | ||||||
|
| |||||||
| 3,178,267 | ||||||||
|
| |||||||
Real Estate — 1.2% |
| |||||||
Alexandria Real Estate Equities, Inc., REIT | 400 | 64,000 | ||||||
Apartment Investment & Management Co., Class A, REIT | 38 | 1,281 | ||||||
AvalonBay Communities, Inc., REIT | 1,247 | 186,227 | ||||||
Mid-America Apartment Communities, Inc., REIT | 4 | 464 | ||||||
| Number of Shares | Value | |||||||
COMMON STOCKS — (Continued) |
| |||||||
Real Estate — (Continued) |
| |||||||
Public Storage, REIT | 498 | $ | 110,915 | |||||
Simon Property Group, Inc., REIT | 12 | 776 | ||||||
Ventas, Inc., REIT | 4,467 | 187,435 | ||||||
Weyerhaeuser Co., REIT | 10,895 | 310,725 | ||||||
|
| |||||||
| 861,823 | ||||||||
|
| |||||||
Retailing — 10.1% |
| |||||||
Advance Auto Parts, Inc. | 828 | 127,098 | ||||||
AutoZone, Inc.* | 297 | 349,759 | ||||||
Best Buy Co., Inc. | 3,089 | 343,775 | ||||||
CarMax, Inc.* | 1,948 | 179,041 | ||||||
Dollar General Corp. | 3,206 | 672,042 | ||||||
Dollar Tree, Inc.* | 2,841 | 259,497 | ||||||
eBay, Inc. | 10,666 | 555,699 | ||||||
Genuine Parts Co. | 2,126 | 202,331 | ||||||
Home Depot, Inc. (The) | 4,334 | 1,203,595 | ||||||
L Brands, Inc. | 4,034 | 128,322 | ||||||
LKQ Corp.* | 4,484 | 124,341 | ||||||
Lowe’s Cos., Inc. | 8,055 | 1,336,002 | ||||||
O’Reilly Automotive, Inc.* | 887 | 408,978 | ||||||
Target Corp. | 5,991 | 943,103 | ||||||
Tractor Supply Co. | 1,472 | 210,996 | ||||||
Ulta Beauty, Inc.* | 11 | 2,464 | ||||||
|
| |||||||
| 7,047,043 | ||||||||
|
| |||||||
Semiconductors & Semiconductor Equipment — 0.9% |
| |||||||
Intel Corp. | 12,055 | 624,208 | ||||||
|
| |||||||
Software & Services — 5.7% |
| |||||||
Accenture PLC, Class A (Ireland) | 2,960 | 668,930 | ||||||
Automatic Data Processing, Inc. | 1,686 | 235,180 | ||||||
Broadridge Financial Solutions, Inc. | 1,378 | 181,896 | ||||||
Gartner, Inc.* | 1,137 | 142,068 | ||||||
International Business Machines Corp. | 6,839 | 832,101 | ||||||
NortonLifeLock, Inc. | 8,932 | 186,143 | ||||||
Oracle Corp. | 19,448 | 1,161,046 | ||||||
Paychex, Inc. | 5,243 | 418,234 | ||||||
Western Union Co. (The) | 6,111 | 130,959 | ||||||
|
| |||||||
| 3,956,557 | ||||||||
|
| |||||||
Technology Hardware & Equipment — 5.6% |
| |||||||
Amphenol Corp., Class A | 705 | 76,330 | ||||||
Apple, Inc. | 11,776 | 1,363,779 | ||||||
CDW Corp. | 366 | 43,748 | ||||||
Cisco Systems, Inc. | 28,381 | 1,117,928 | ||||||
Corning, Inc. | 9,089 | 294,574 | ||||||
The accompanying notes are an integral part of the financial statements.
134
GOTHAM LARGE VALUE FUND
Portfolio of Investments (Concluded)
September 30, 2020
| Number of Shares | Value | |||||||
COMMON STOCKS — (Continued) |
| |||||||
Technology Hardware & Equipment — (Continued) |
| |||||||
F5 Networks, Inc.* | 732 | $ | 89,868 | |||||
FLIR Systems, Inc. | 1,609 | 57,683 | ||||||
HP, Inc. | 20,953 | 397,897 | ||||||
Juniper Networks, Inc. | 4,879 | 104,898 | ||||||
NetApp, Inc. | 3,134 | 137,395 | ||||||
Seagate Technology PLC (Ireland) | 3,073 | 151,407 | ||||||
TE Connectivity Ltd. (Switzerland) | 648 | 63,336 | ||||||
|
| |||||||
| 3,898,843 | ||||||||
|
| |||||||
Telecommunication Services — 3.0% |
| |||||||
AT&T, Inc. | 37,685 | 1,074,399 | ||||||
CenturyLink, Inc. | 96 | 969 | ||||||
Verizon Communications, Inc. | 17,734 | 1,054,996 | ||||||
|
| |||||||
| 2,130,364 | ||||||||
|
| |||||||
Transportation — 3.0% |
| |||||||
CH Robinson Worldwide, Inc. | 1,617 | 165,241 | ||||||
CSX Corp. | 7,070 | 549,127 | ||||||
Expeditors International of Washington, Inc. | 2,479 | 224,399 | ||||||
JB Hunt Transport Services, Inc. | 1,264 | 159,744 | ||||||
| Number of Shares | Value | |||||||
COMMON STOCKS — (Continued) |
| |||||||
Transportation — (Continued) |
| |||||||
Kansas City Southern | 235 | $ | 42,495 | |||||
Norfolk Southern Corp. | 3,022 | 646,678 | ||||||
Old Dominion Freight Line, Inc. | 1,129 | 204,259 | ||||||
Union Pacific Corp. | 704 | 138,596 | ||||||
|
| |||||||
| 2,130,539 | ||||||||
|
| |||||||
Utilities — 0.4% |
| |||||||
NRG Energy, Inc. | 3,640 | 111,894 | ||||||
PPL Corp. | 6,506 | 177,028 | ||||||
|
| |||||||
| 288,922 | ||||||||
|
| |||||||
TOTAL COMMON STOCKS | 69,647,399 | |||||||
|
| |||||||
OTHER ASSETS IN EXCESS OF LIABILITIES - 0.5% | 355,158 | |||||||
|
| |||||||
NET ASSETS - 100.0% | $ | 70,002,557 | ||||||
|
| |||||||
| * | Non-income producing. |
PLC Public Limited Company
REIT Real Estate Investment Trust
The accompanying notes are an integral part of the financial statements.
135
GOTHAM DEFENSIVE LONG 500 FUND
Portfolio of Investments
September 30, 2020
| Number of Shares | Value | |||||||
COMMON STOCKS — 95.0% |
| |||||||
Automobiles & Components — 0.6% |
| |||||||
BorgWarner, Inc.(a) | 8,562 | $ | 331,692 | |||||
|
| |||||||
Capital Goods — 10.6% |
| |||||||
3M Co.(b) | 2,790 | 446,902 | ||||||
A.O. Smith Corp.(a) | 46 | 2,429 | ||||||
AMETEK, Inc. | 1,245 | 123,753 | ||||||
Carrier Global Corp. | 3,557 | 108,631 | ||||||
Caterpillar, Inc. | 681 | 101,571 | ||||||
Cummins, Inc.(b) | 2,030 | 428,655 | ||||||
Dover Corp. | 414 | 44,853 | ||||||
Eaton Corp. PLC (Ireland) | 530 | 54,076 | ||||||
Emerson Electric Co. | 4,152 | 272,247 | ||||||
Flowserve Corp.(a) | 2,181 | 59,519 | ||||||
Fortive Corp. | 306 | 23,320 | ||||||
Fortune Brands Home & Security, Inc. | 6 | 519 | ||||||
General Dynamics Corp.(b) | 128 | 17,719 | ||||||
Honeywell International, Inc.(b) | 3,867 | 636,547 | ||||||
Howmet Aerospace, Inc. | 6,960 | 116,371 | ||||||
Huntington Ingalls Industries, Inc. | 352 | 49,544 | ||||||
Illinois Tool Works, Inc. | 130 | 25,117 | ||||||
Johnson Controls International PLC (Ireland) | 6,411 | 261,889 | ||||||
Lockheed Martin Corp.(b) | 1,074 | 411,643 | ||||||
Masco Corp.(b) | 13,850 | 763,550 | ||||||
Northrop Grumman Corp. | 127 | 40,067 | ||||||
PACCAR, Inc. | 2,289 | 195,206 | ||||||
Pentair PLC (Ireland) | 5,262 | 240,842 | ||||||
Quanta Services, Inc. | 6,108 | 322,869 | ||||||
Raytheon Technologies Corp.(b) | 3,126 | 179,870 | ||||||
Roper Technologies, Inc. | 77 | 30,423 | ||||||
Snap-on, Inc. | 1,841 | 270,866 | ||||||
Stanley Black & Decker, Inc. | 34 | 5,515 | ||||||
Trane Technologies PLC (Ireland) | 3,736 | 452,990 | ||||||
TransDigm Group, Inc. | 125 | 59,390 | ||||||
WW Grainger, Inc. | 177 | 63,148 | ||||||
|
| |||||||
| 5,810,041 | ||||||||
|
| |||||||
Commercial & Professional Services — 0.2% |
| |||||||
Republic Services, Inc. | 93 | 8,682 | ||||||
Robert Half International, Inc. | 1,799 | 95,239 | ||||||
|
| |||||||
| 103,921 | ||||||||
|
| |||||||
Consumer Durables & Apparel — 0.7% |
| |||||||
Garmin Ltd. (Switzerland) | 1,217 | 115,445 | ||||||
Hanesbrands, Inc.(a) | 5,044 | 79,443 | ||||||
Leggett & Platt, Inc.(a) | 109 | 4,487 | ||||||
| Number of Shares | Value | |||||||
COMMON STOCKS — (Continued) |
| |||||||
Consumer Durables & Apparel — (Continued) |
| |||||||
Mohawk Industries, Inc.* | 3 | $ | 293 | |||||
PVH Corp. | 327 | 19,502 | ||||||
Whirlpool Corp. | 958 | 176,167 | ||||||
|
| |||||||
| 395,337 | ||||||||
|
| |||||||
Consumer Services — 1.2% |
| |||||||
McDonald’s Corp.(b) | 1,559 | 342,185 | ||||||
MGM Resorts International(a) | 10,575 | 230,006 | ||||||
Yum! Brands, Inc. | 999 | 91,209 | ||||||
|
| |||||||
| 663,400 | ||||||||
|
| |||||||
Diversified Financials — 2.5% |
| |||||||
Berkshire Hathaway, Inc., Class B* | 791 | 168,436 | ||||||
BlackRock, Inc. | 580 | 326,859 | ||||||
Franklin Resources, Inc. | 14,456 | 294,180 | ||||||
Invesco Ltd. (Bermuda)(a) | 1,663 | 18,975 | ||||||
Nasdaq, Inc. | 2,494 | 306,039 | ||||||
S&P Global, Inc. | 5 | 1,803 | ||||||
T Rowe Price Group, Inc.(b) | 1,837 | 235,540 | ||||||
|
| |||||||
| 1,351,832 | ||||||||
|
| |||||||
Energy — 0.6% |
| |||||||
Chevron Corp.(b) | 1,368 | 98,496 | ||||||
ConocoPhillips | 443 | 14,548 | ||||||
Kinder Morgan, Inc. | 9,386 | 115,729 | ||||||
Schlumberger NV (Curacao) | 5,515 | 85,813 | ||||||
TechnipFMC PLC (United Kingdom) | 421 | 2,657 | ||||||
Valero Energy Corp. | 476 | 20,620 | ||||||
|
| |||||||
| 337,863 | ||||||||
|
| |||||||
Food & Staples Retailing — 4.7% |
| |||||||
Costco Wholesale Corp. | 461 | 163,655 | ||||||
Kroger Co. (The)(b) | 29,881 | 1,013,265 | ||||||
Sysco Corp. | 3,222 | 200,473 | ||||||
Walgreens Boots Alliance, Inc. | 5,821 | 209,090 | ||||||
Walmart, Inc.(b) | 7,101 | 993,501 | ||||||
|
| |||||||
| 2,579,984 | ||||||||
|
| |||||||
Food, Beverage & Tobacco — 11.2% |
| |||||||
Altria Group, Inc. | 13,068 | 504,948 | ||||||
Archer-Daniels-Midland Co. | 6,091 | 283,171 | ||||||
Campbell Soup Co.(a)(b) | 16,196 | 783,401 | ||||||
Coca-Cola Co. (The) | 4,758 | 234,902 | ||||||
Conagra Brands, Inc. | 9,170 | 327,461 | ||||||
Constellation Brands, Inc., Class A | 1,822 | 345,287 | ||||||
General Mills, Inc.(b) | 11,909 | 734,547 | ||||||
Hormel Foods Corp. | 2,944 | 143,932 | ||||||
JM Smucker Co. (The)(b) | 7,149 | 825,852 | ||||||
The accompanying notes are an integral part of the financial statements.
136
GOTHAM DEFENSIVE LONG 500 FUND
Portfolio of Investments (Continued)
September 30, 2020
| Number of Shares | Value | |||||||
COMMON STOCKS — (Continued) |
| |||||||
Food, Beverage & Tobacco — (Continued) |
| |||||||
Kellogg Co.(b) | 10,719 | $ | 692,340 | |||||
Kraft Heinz Co. (The) | 10,988 | 329,091 | ||||||
Lamb Weston Holdings, Inc. | 6 | 398 | ||||||
McCormick & Co., Inc., non-voting shares | 417 | 80,940 | ||||||
Mondelez International, Inc., Class A . | 726 | 41,709 | ||||||
Philip Morris International, Inc. | 3,136 | 235,169 | ||||||
Tyson Foods, Inc., Class A(b) | 9,770 | 581,120 | ||||||
|
| |||||||
| 6,144,268 | ||||||||
|
| |||||||
Health Care Equipment & Services — 3.2% |
| |||||||
Abbott Laboratories | 1,514 | 164,769 | ||||||
CVS Health Corp.(b) | 6,668 | 389,411 | ||||||
Danaher Corp. | 564 | 121,446 | ||||||
DaVita, Inc.(b)* | 4,867 | 416,859 | ||||||
Hologic, Inc.* | 2,874 | 191,035 | ||||||
Humana, Inc. | 908 | 375,812 | ||||||
Medtronic PLC (Ireland) | 693 | 72,017 | ||||||
Universal Health Services, Inc., Class B | 322 | 34,460 | ||||||
|
| |||||||
| 1,765,809 | ||||||||
|
| |||||||
Household & Personal Products — 6.6% |
| |||||||
Church & Dwight Co., Inc. | 5,645 | 528,993 | ||||||
Clorox Co. (The)(b) | 4,859 | 1,021,216 | ||||||
Colgate-Palmolive Co.(b) | 8,134 | 627,538 | ||||||
Kimberly-Clark Corp.(b) | 4,980 | 735,347 | ||||||
Procter & Gamble Co. (The)(b) | 4,810 | 668,542 | ||||||
|
| |||||||
| 3,581,636 | ||||||||
|
| |||||||
Insurance — 0.7% |
| |||||||
Aflac, Inc. | 30 | 1,090 | ||||||
Allstate Corp. (The) | 34 | 3,201 | ||||||
Aon PLC, Class A (Ireland) | 1,266 | 261,176 | ||||||
Cincinnati Financial Corp. | 504 | 39,297 | ||||||
Marsh & McLennan Cos., Inc. | 316 | 36,245 | ||||||
Travelers Cos., Inc. (The) | 167 | 18,068 | ||||||
WR Berkley Corp. | 71 | 4,342 | ||||||
|
| |||||||
| 363,419 | ||||||||
|
| |||||||
Materials — 5.2% |
| |||||||
Amcor PLC (Jersey) | 42,926 | 474,332 | ||||||
Celanese Corp. | 351 | 37,715 | ||||||
CF Industries Holdings, Inc. | 3,422 | 105,090 | ||||||
DuPont de Nemours, Inc. | 6,030 | 334,544 | ||||||
Eastman Chemical Co. | 1,183 | 92,416 | ||||||
Ecolab, Inc. | 1,660 | 331,734 | ||||||
| Number of Shares | Value | |||||||
COMMON STOCKS — (Continued) |
| |||||||
Materials — (Continued) |
| |||||||
International Paper Co. | 1,557 | $ | 63,121 | |||||
Linde PLC (Ireland) | 446 | 106,206 | ||||||
LyondellBasell Industries NV, Class A (Netherlands) | 1,060 | 74,719 | ||||||
Newmont Corp. | 2,668 | 169,285 | ||||||
Nucor Corp. | 4,659 | 209,003 | ||||||
PPG Industries, Inc.(b) | 3,326 | 406,038 | ||||||
Sealed Air Corp. | 11,010 | 427,298 | ||||||
|
| |||||||
| 2,831,501 | ||||||||
|
| |||||||
Media & Entertainment — 4.6% |
| |||||||
Activision Blizzard, Inc. | 663 | 53,670 | ||||||
Alphabet, Inc., Class A(b)* | 295 | 432,352 | ||||||
Charter Communications, Inc., Class A(b)* | 1,080 | 674,287 | ||||||
Electronic Arts, Inc.* | 3,310 | 431,657 | ||||||
Facebook, Inc., Class A(b)* | 2,290 | 599,751 | ||||||
Fox Corp., Class A | 9,907 | 275,712 | ||||||
Interpublic Group of Cos., Inc. (The) | 635 | 10,585 | ||||||
Take-Two Interactive Software, Inc.* | 83 | 13,713 | ||||||
|
| |||||||
| 2,491,727 | ||||||||
|
| |||||||
Pharmaceuticals, Biotechnology & Life Sciences — 5.1% |
| |||||||
Alexion Pharmaceuticals, Inc.* | 1,011 | 115,689 | ||||||
Biogen, Inc.(b)* | 1,012 | 287,084 | ||||||
Gilead Sciences, Inc.(b) | 8,465 | 534,903 | ||||||
Illumina, Inc.* | 118 | 36,471 | ||||||
Johnson & Johnson | 2,497 | 371,753 | ||||||
Merck & Co., Inc.(b) | 3,498 | 290,159 | ||||||
Pfizer, Inc.(b) | 14,898 | 546,757 | ||||||
Regeneron Pharmaceuticals, Inc.(b)* | 1,113 | 623,035 | ||||||
|
| |||||||
| 2,805,851 | ||||||||
|
| |||||||
Real Estate — 0.0% |
| |||||||
Alexandria Real Estate Equities, Inc., REIT | 6 | 960 | ||||||
|
| |||||||
Retailing — 14.4% |
| |||||||
Advance Auto Parts, Inc. | 2,042 | 313,447 | ||||||
Amazon.com, Inc.(b)* | 246 | 774,588 | ||||||
AutoZone, Inc.(b)* | 496 | 584,109 | ||||||
Best Buy Co., Inc. | 1,128 | 125,535 | ||||||
Booking Holdings, Inc.* | 8 | 13,685 | ||||||
Dollar General Corp.(b) | 5,056 | 1,059,839 | ||||||
eBay, Inc.(b) | 23,947 | 1,247,639 | ||||||
Expedia Group, Inc. | 17 | 1,559 | ||||||
Gap, Inc. (The) | 269 | 4,581 | ||||||
The accompanying notes are an integral part of the financial statements.
137
GOTHAM DEFENSIVE LONG 500 FUND
Portfolio of Investments (Continued)
September 30, 2020
| Number of Shares | Value | |||||||
COMMON STOCKS — (Continued) |
| |||||||
Retailing — (Continued) |
| |||||||
Genuine Parts Co. | 3,503 | $ | 333,381 | |||||
Home Depot, Inc. (The) | 1,880 | 522,095 | ||||||
LKQ Corp.* | 3,913 | 108,507 | ||||||
Lowe’s Cos., Inc.(b) | 3,990 | 661,781 | ||||||
O’Reilly Automotive, Inc.* | 726 | 334,744 | ||||||
Target Corp.(b) | 4,948 | 778,914 | ||||||
Tractor Supply Co.(b) | 6,741 | 966,255 | ||||||
Ulta Beauty, Inc.* | 262 | 58,683 | ||||||
|
| |||||||
| 7,889,342 | ||||||||
|
| |||||||
Software & Services — 10.1% |
| |||||||
Accenture PLC, Class A (Ireland) | 840 | 189,832 | ||||||
Broadridge Financial Solutions, Inc. | 2,616 | 345,312 | ||||||
Citrix Systems, Inc.(b) | 3,531 | 486,254 | ||||||
Gartner, Inc.* | 888 | 110,956 | ||||||
International Business Machines | 4,072 | 495,440 | ||||||
Mastercard, Inc., Class A | 483 | 163,336 | ||||||
Microsoft Corp.(b) | 4,206 | 884,648 | ||||||
NortonLifeLock, Inc.(b) | 30,981 | 645,644 | ||||||
Oracle Corp.(b) | 13,125 | 783,562 | ||||||
Paychex, Inc.(b) | 6,019 | 480,136 | ||||||
PayPal Holdings, Inc.* | 841 | 165,702 | ||||||
Visa, Inc., Class A | 1,503 | 300,555 | ||||||
Western Union Co. (The)(a)(b) | 21,245 | 455,280 | ||||||
|
| |||||||
| 5,506,657 | ||||||||
|
| |||||||
Technology Hardware & Equipment — 4.9% |
| |||||||
Apple, Inc.(b) | 10,820 | 1,253,064 | ||||||
Cisco Systems, Inc.(b) | 16,276 | 641,112 | ||||||
F5 Networks, Inc.* | 383 | 47,021 | ||||||
FLIR Systems, Inc. | 7,361 | 263,892 | ||||||
HP, Inc. | 13,455 | 255,510 | ||||||
Juniper Networks, Inc. | 10,397 | 223,536 | ||||||
|
| |||||||
| 2,684,135 | ||||||||
|
| |||||||
Telecommunication Services — 3.5% |
| |||||||
AT&T, Inc.(b) | 25,177 | 717,796 | ||||||
Verizon Communications, Inc.(b) | 20,301 | 1,207,706 | ||||||
|
| |||||||
| 1,925,502 | ||||||||
|
| |||||||
Transportation — 4.0% |
| |||||||
CH Robinson Worldwide, Inc.(a) | 8,653 | 884,250 | ||||||
Expeditors International of Washington, Inc.(b) | 7,424 | 672,020 | ||||||
JB Hunt Transport Services, Inc. | 3,480 | 439,802 | ||||||
Norfolk Southern Corp. | 368 | 78,748 | ||||||
| Number of Shares | Value | |||||||
COMMON STOCKS — (Continued) |
| |||||||
Transportation — (Continued) |
| |||||||
Old Dominion Freight Line, Inc. | 469 | $ | 84,851 | |||||
|
| |||||||
| 2,159,671 | ||||||||
|
| |||||||
Utilities — 0.4% |
| |||||||
NRG Energy, Inc. | 6,874 | 211,307 | ||||||
|
| |||||||
TOTAL COMMON STOCKS | 51,935,855 | |||||||
|
| |||||||
OTHER ASSETS IN EXCESS OF LIABILITIES - 5.0% | 2,739,502 | |||||||
|
| |||||||
NET ASSETS - 100.0% | $ | 54,675,357 | ||||||
|
| |||||||
| (a) | The security or a portion of this security is on loan at September 30, 2020. The total value of securities on loan at September 30, 2020 was $1,397,470, which was collateralized $1,432,261 of collateral in the form of U.S.Government Treasury Securities, interest rates ranging from 0.00% - 8.00%, and maturity dates ranging from 10/8/2020 - 2/15/2050. (See Note 5 of the Notes to Financial Statements) |
| (b) | Security position is either entirely or partially designated as collateral for total return swaps. |
| * | Non-income producing. |
PLC Public Limited Company
REIT Real Estate Investment Trust
The accompanying notes are an integral part of the financial statements.
138
GOTHAM DEFENSIVE LONG 500 FUND
Portfolio of Investments (Continued)
September 30, 2020
Over-the-counter total return swaps outstanding as of September 30, 2020
The Fund maintains a portfolio of long and short positions and receives/pays a rebate based upon the Fed Funds 1-Day Rate less a specified spread as negotiated by the parties. The notional gain or loss, dividends payable and rebates are payable the earlier of maturity of the swaps or upon termination. The portfolio matures on August 29, 2024, however underlying individual contracts are entered into and closed (terminated) on a daily basis. The cash amounts payable/receivable due to individual contracts being closed are settled, on a net basis, once a week. The value of total return swaps represents 4.3% of net assets as of September 30, 2020.
The following table represents the individual long and short positions and related values of total return swaps as of September 30, 2020:
Total Return Swaps
Reference Entity | Counterparty | Number of Contracts Long/(Short) | Notional Amount | Value | Unrealized Appreciation/ (Depreciation)* | |||||||||||||||||
Long | ||||||||||||||||||||||
Automobiles & Components | ||||||||||||||||||||||
BorgWarner, Inc. | Morgan Stanley | 8,413 | $ | 235,108 | $ | 325,920 | $ | 93,940 | ||||||||||||||
|
|
|
|
|
|
|
| |||||||||||||||
Capital Goods | ||||||||||||||||||||||
3M Co. | Morgan Stanley | 2,721 | 401,380 | 435,850 | 40,933 | |||||||||||||||||
A.O. Smith Corp. | Morgan Stanley | 51 | 1,896 | 2,693 | 813 | |||||||||||||||||
AMETEK, Inc. | Morgan Stanley | 1,105 | 89,069 | 109,837 | 21,337 | |||||||||||||||||
Carrier Global Corp. | Morgan Stanley | 4,639 | 59,420 | 141,675 | 82,687 | |||||||||||||||||
Caterpillar, Inc. | Morgan Stanley | 855 | 80,370 | 127,523 | 49,002 | |||||||||||||||||
Cummins, Inc. | Morgan Stanley | 1,992 | 314,156 | 420,631 | 112,037 | |||||||||||||||||
Dover Corp. | Morgan Stanley | 410 | 34,491 | 44,419 | 10,363 | |||||||||||||||||
Eaton Corp. PLC (Ireland) | Morgan Stanley | 524 | 34,856 | 53,464 | 19,240 | |||||||||||||||||
Emerson Electric Co. | Morgan Stanley | 4,340 | 198,260 | 284,574 | 90,791 | |||||||||||||||||
Flowserve Corp. | Morgan Stanley | 2,161 | 48,700 | 58,974 | 11,565 | |||||||||||||||||
Fortive Corp. | Morgan Stanley | 778 | 33,402 | 59,291 | 26,028 | |||||||||||||||||
Fortune Brands Home & Security, Inc. | Morgan Stanley | 6 | 225 | 519 | 286 | |||||||||||||||||
General Dynamics Corp. | Morgan Stanley | 126 | 15,572 | 17,442 | 2,252 | |||||||||||||||||
Honeywell International, Inc. | Morgan Stanley | 3,822 | 448,468 | 629,139 | 187,593 | |||||||||||||||||
Howmet Aerospace, Inc. | Morgan Stanley | 6,904 | 78,730 | 115,435 | 36,790 | |||||||||||||||||
Huntington Ingalls Industries, Inc. | Morgan Stanley | 356 | 50,941 | 50,107 | (782 | ) | ||||||||||||||||
Illinois Tool Works, Inc. | Morgan Stanley | 125 | 24,175 | 24,151 | 114 | |||||||||||||||||
Johnson Controls International PLC (Ireland) | Morgan Stanley | 5,699 | 184,706 | 232,804 | 50,955 | |||||||||||||||||
Lockheed Martin Corp. | Morgan Stanley | 1,063 | 380,504 | 407,427 | 32,492 | |||||||||||||||||
Masco Corp. | Morgan Stanley | 13,692 | 582,494 | 754,840 | 175,561 | |||||||||||||||||
Northrop Grumman Corp. | Morgan Stanley | 103 | 33,886 | 32,495 | (1,212 | ) | ||||||||||||||||
PACCAR, Inc. | Morgan Stanley | 2,271 | 194,785 | 193,671 | (321 | ) | ||||||||||||||||
Pentair PLC (Ireland) | Morgan Stanley | 5,043 | 197,576 | 230,818 | 33,918 | |||||||||||||||||
Quanta Services, Inc. | Morgan Stanley | 6,010 | 208,709 | 317,689 | 109,805 | |||||||||||||||||
Raytheon Technologies Corp. | Morgan Stanley | 3,087 | 139,333 | 177,626 | 41,266 | |||||||||||||||||
Roper Technologies, Inc. | Morgan Stanley | 67 | 26,667 | 26,472 | (140 | ) | ||||||||||||||||
Snap-on, Inc. | Morgan Stanley | 1,813 | 213,930 | 266,747 | 56,983 | |||||||||||||||||
Stanley Black & Decker, Inc. | Morgan Stanley | 33 | 2,470 | 5,353 | 2,920 | |||||||||||||||||
Trane Technologies PLC (Ireland) | Morgan Stanley | 3,687 | 304,732 | 447,049 | 146,547 | |||||||||||||||||
TransDigm Group, Inc. | Morgan Stanley | 127 | 41,380 | 60,340 | 19,000 | |||||||||||||||||
The accompanying notes are an integral part of the financial statements.
139
GOTHAM DEFENSIVE LONG 500 FUND
Portfolio of Investments (Continued)
September 30, 2020
Total Return Swaps (continued)
Reference Entity | Counterparty | Number of Contracts Long/(Short) | Notional Amount | Value | Unrealized Appreciation/ (Depreciation)* | |||||||||||||||||
Capital Goods — (continued) | ||||||||||||||||||||||
WW Grainger, Inc. | Morgan Stanley | 174 | $ | 61,042 | $ | 62,078 | $ | 1,100 | ||||||||||||||
|
|
|
|
|
|
|
| |||||||||||||||
| 73,784 | 4,486,325 | 5,791,133 | 1,359,923 | |||||||||||||||||||
|
|
|
|
|
|
|
| |||||||||||||||
Commercial & Professional Services | ||||||||||||||||||||||
Republic Services, Inc. | Morgan Stanley | 90 | 8,018 | 8,402 | 598 | |||||||||||||||||
Robert Half International, Inc. | Morgan Stanley | 1,627 | 86,038 | 86,133 | 506 | |||||||||||||||||
|
|
|
|
|
|
|
| |||||||||||||||
| 1,717 | 94,056 | 94,535 | 1,104 | |||||||||||||||||||
|
|
|
|
|
|
|
| |||||||||||||||
Consumer Durables & Apparel | ||||||||||||||||||||||
Garmin Ltd. (Switzerland) | Morgan Stanley | 1,203 | 84,251 | 114,117 | 31,425 | |||||||||||||||||
Hanesbrands, Inc. | Morgan Stanley | 4,981 | 42,374 | 78,451 | 37,612 | |||||||||||||||||
Leggett & Platt, Inc. | Morgan Stanley | 109 | 2,859 | 4,488 | 1,709 | |||||||||||||||||
Mohawk Industries, Inc. | Morgan Stanley | 3 | 195 | 293 | 87 | |||||||||||||||||
PVH Corp. | Morgan Stanley | 338 | 10,950 | 20,158 | 9,212 | |||||||||||||||||
Whirlpool Corp. | Morgan Stanley | 942 | 118,999 | 173,224 | 55,893 | |||||||||||||||||
|
|
|
|
|
|
|
| |||||||||||||||
| 7,576 | 259,628 | 390,731 | 135,938 | |||||||||||||||||||
|
|
|
|
|
|
|
| |||||||||||||||
Consumer Services | ||||||||||||||||||||||
McDonald’s Corp. | Morgan Stanley | 1,542 | 217,192 | 338,454 | 125,371 | |||||||||||||||||
MGM Resorts International | Morgan Stanley | 10,792 | 146,572 | 234,726 | 88,375 | |||||||||||||||||
Yum! Brands, Inc. | Morgan Stanley | 954 | 79,339 | 87,100 | 9,009 | |||||||||||||||||
|
|
|
|
|
|
|
| |||||||||||||||
| 13,288 | 443,103 | 660,280 | 222,755 | |||||||||||||||||||
|
|
|
|
|
|
|
| |||||||||||||||
Diversified Financials | ||||||||||||||||||||||
Berkshire Hathaway, Inc., Class B | Morgan Stanley | 642 | 109,259 | 136,707 | 27,570 | |||||||||||||||||
BlackRock, Inc. | Morgan Stanley | 450 | 207,799 | 253,597 | 47,853 | |||||||||||||||||
Franklin Resources, Inc. | Morgan Stanley | 16,481 | 289,367 | 335,388 | 55,567 | |||||||||||||||||
Invesco Ltd. (Bermuda) | Morgan Stanley | 1,643 | 11,189 | 18,747 | 7,815 | |||||||||||||||||
Nasdaq, Inc. | Morgan Stanley | 2,460 | 301,252 | 301,867 | 2,400 | |||||||||||||||||
S&P Global, Inc. | Morgan Stanley | 6 | 2,070 | 2,164 | 313 | |||||||||||||||||
T Rowe Price Group, Inc. | Morgan Stanley | 1,821 | 194,266 | 233,489 | 45,338 | |||||||||||||||||
|
|
|
|
|
|
|
| |||||||||||||||
| 23,503 | 1,115,202 | 1,281,959 | 186,856 | |||||||||||||||||||
|
|
|
|
|
|
|
| |||||||||||||||
Energy | ||||||||||||||||||||||
Chevron Corp. | Morgan Stanley | 1,354 | 79,252 | 97,488 | 23,164 | |||||||||||||||||
ConocoPhillips | Morgan Stanley | 442 | 11,089 | 14,515 | 3,800 | |||||||||||||||||
Kinder Morgan, Inc. | Morgan Stanley | 9,391 | 134,156 | 115,791 | (15,827 | ) | ||||||||||||||||
Schlumberger NV (Curacao) | Morgan Stanley | 5,458 | 75,353 | 84,926 | 12,823 | |||||||||||||||||
TechnipFMC PLC (United Kingdom) | Morgan Stanley | 404 | 2,207 | 2,549 | 387 | |||||||||||||||||
Valero Energy Corp. | Morgan Stanley | 470 | 15,661 | 20,360 | 5,629 | |||||||||||||||||
|
|
|
|
|
|
|
| |||||||||||||||
| 17,519 | 317,718 | 335,629 | 29,976 | |||||||||||||||||||
|
|
|
|
|
|
|
| |||||||||||||||
Food & Staples Retailing | ||||||||||||||||||||||
Costco Wholesale Corp. | Morgan Stanley | 441 | 145,822 | 156,555 | 10,987 | |||||||||||||||||
Kroger Co. (The) | Morgan Stanley | 28,919 | 930,044 | 980,643 | 55,922 | |||||||||||||||||
Sysco Corp. | Morgan Stanley | 3,349 | 149,619 | 208,375 | 60,572 | |||||||||||||||||
Walgreens Boots Alliance, Inc. | Morgan Stanley | 5,759 | 204,739 | 206,863 | 2,363 | |||||||||||||||||
The accompanying notes are an integral part of the financial statements.
140
GOTHAM DEFENSIVE LONG 500 FUND
Portfolio of Investments (Continued)
September 30, 2020
Total Return Swaps (continued)
Reference Entity | Counterparty | Number of Contracts Long/(Short) | Notional Amount | Value | Unrealized Appreciation/ (Depreciation)* | |||||||||||||||||
Food & Staples Retailing — (continued) | ||||||||||||||||||||||
Walmart, Inc. | Morgan Stanley | 7,016 | $ | 826,293 | $ | 981,609 | $ | 162,824 | ||||||||||||||
|
|
|
|
|
|
|
| |||||||||||||||
| 45,484 | 2,256,517 | 2,534,045 | 292,668 | |||||||||||||||||||
|
|
|
|
|
|
|
| |||||||||||||||
Food, Beverage & Tobacco | ||||||||||||||||||||||
Altria Group, Inc. | Morgan Stanley | 12,301 | 483,111 | 475,311 | 14,377 | |||||||||||||||||
Archer-Daniels-Midland Co. | Morgan Stanley | 6,645 | 240,392 | 308,926 | 73,228 | |||||||||||||||||
Campbell Soup Co. | Morgan Stanley | 19,121 | 945,065 | 924,883 | (9,260 | ) | ||||||||||||||||
Coca-Cola Co. (The) | Morgan Stanley | 4,727 | 205,882 | 233,372 | 30,174 | |||||||||||||||||
Conagra Brands, Inc. | Morgan Stanley | 8,023 | 288,258 | 286,501 | (312 | ) | ||||||||||||||||
Constellation Brands, Inc., Class A | Morgan Stanley | 1,803 | 255,662 | 341,686 | 89,164 | |||||||||||||||||
General Mills, Inc. | Morgan Stanley | 11,794 | 681,619 | 727,454 | 59,338 | |||||||||||||||||
Hormel Foods Corp. | Morgan Stanley | 2,408 | 120,001 | 117,727 | (2,138 | ) | ||||||||||||||||
JM Smucker Co. (The) | Morgan Stanley | 6,983 | 777,841 | 806,676 | 38,747 | |||||||||||||||||
Kellogg Co. | Morgan Stanley | 10,467 | 684,891 | 676,064 | (509 | ) | ||||||||||||||||
Kraft Heinz Co. (The) | Morgan Stanley | 10,861 | 364,453 | 325,287 | (35,349 | ) | ||||||||||||||||
Lamb Weston Holdings, Inc. | Morgan Stanley | 6 | 288 | 398 | 102 | |||||||||||||||||
McCormick & Co., Inc., non-voting shares | Morgan Stanley | 378 | 67,187 | 73,370 | 6,392 | |||||||||||||||||
Mondelez International, Inc., Class A | Morgan Stanley | 719 | 33,629 | 41,307 | 8,295 | |||||||||||||||||
Philip Morris International, Inc. | Morgan Stanley | 2,058 | 158,707 | 154,329 | (2,289 | ) | ||||||||||||||||
Tyson Foods, Inc., Class A | Morgan Stanley | 9,324 | 585,530 | 554,592 | (26,537 | ) | ||||||||||||||||
|
|
|
|
|
|
|
| |||||||||||||||
| 107,618 | 5,892,516 | 6,047,883 | 243,423 | |||||||||||||||||||
|
|
|
|
|
|
|
| |||||||||||||||
Health Care Equipment & Services | ||||||||||||||||||||||
Abbott Laboratories | Morgan Stanley | 929 | 83,658 | 101,103 | 17,897 | |||||||||||||||||
CVS Health Corp. | Morgan Stanley | 6,293 | 357,947 | 367,511 | 16,111 | |||||||||||||||||
Danaher Corp. | Morgan Stanley | 415 | 69,551 | 89,362 | 20,102 | |||||||||||||||||
DaVita, Inc. | Morgan Stanley | 4,633 | 340,833 | 396,816 | 56,388 | |||||||||||||||||
Hologic, Inc. | Morgan Stanley | 2,295 | 147,062 | 152,549 | 5,226 | |||||||||||||||||
Humana, Inc. | Morgan Stanley | 878 | 359,544 | 363,395 | 4,828 | |||||||||||||||||
Medtronic PLC (Ireland) | Morgan Stanley | 687 | 52,461 | 71,393 | 20,154 | |||||||||||||||||
Universal Health Services, Inc., Class B . | Morgan Stanley | 318 | 29,057 | 34,032 | 5,000 | |||||||||||||||||
|
|
|
|
|
|
|
| |||||||||||||||
| 16,448 | 1,440,113 | 1,576,161 | 145,706 | |||||||||||||||||||
|
|
|
|
|
|
|
| |||||||||||||||
Household & Personal Products | ||||||||||||||||||||||
Church & Dwight Co., Inc. | Morgan Stanley | 4,394 | 391,609 | 411,762 | 21,368 | |||||||||||||||||
Clorox Co. (The) | Morgan Stanley | 4,493 | 941,280 | 944,294 | 6,728 | |||||||||||||||||
Colgate-Palmolive Co. | Morgan Stanley | 7,945 | 541,902 | 612,957 | 77,380 | |||||||||||||||||
Kimberly-Clark Corp. | Morgan Stanley | 5,660 | 770,229 | 835,756 | 82,476 | |||||||||||||||||
Procter & Gamble Co. (The) | Morgan Stanley | 4,766 | 525,722 | 662,426 | 142,900 | |||||||||||||||||
|
|
|
|
|
|
|
| |||||||||||||||
| 27,258 | 3,170,742 | 3,467,195 | 330,852 | |||||||||||||||||||
|
|
|
|
|
|
|
| |||||||||||||||
Insurance | ||||||||||||||||||||||
Aflac, Inc. | Morgan Stanley | 30 | 821 | 1,090 | 277 | |||||||||||||||||
Allstate Corp. (The) | Morgan Stanley | 33 | 2,401 | 3,107 | 733 | |||||||||||||||||
Aon PLC, Class A (Ireland) | Morgan Stanley | 1,253 | 236,087 | 258,494 | 23,880 | |||||||||||||||||
The accompanying notes are an integral part of the financial statements.
141
GOTHAM DEFENSIVE LONG 500 FUND
Portfolio of Investments (Continued)
September 30, 2020
Total Return Swaps (continued)
Reference Entity | Counterparty | Number of Contracts Long/(Short) | Notional Amount | Value | Unrealized Appreciation/ (Depreciation)* | |||||||||||||||||
Insurance — (continued) | ||||||||||||||||||||||
Cincinnati Financial Corp. | Morgan Stanley | 455 | $ | 22,400 | $ | 35,476 | $ | 13,638 | ||||||||||||||
Marsh & McLennan Cos., Inc. | Morgan Stanley | 305 | 34,313 | 34,984 | 635 | |||||||||||||||||
Travelers Cos., Inc. (The) | Morgan Stanley | 164 | 14,551 | 17,743 | 3,478 | |||||||||||||||||
WR Berkley Corp. | Morgan Stanley | 68 | 3,177 | 4,158 | 990 | |||||||||||||||||
|
|
|
|
|
|
|
| |||||||||||||||
| 2,308 | 313,750 | 355,052 | 43,631 | |||||||||||||||||||
|
|
|
|
|
|
|
| |||||||||||||||
Materials | ||||||||||||||||||||||
Amcor PLC (Jersey) | Morgan Stanley | 26,480 | 293,295 | 292,604 | 1,031 | |||||||||||||||||
Celanese Corp. | Morgan Stanley | 425 | 27,545 | 45,666 | 18,671 | |||||||||||||||||
CF Industries Holdings, Inc. | Morgan Stanley | 3,189 | 86,013 | 97,934 | 13,080 | |||||||||||||||||
DuPont de Nemours, Inc. | Morgan Stanley | 6,132 | 232,738 | 340,203 | 111,417 | |||||||||||||||||
Eastman Chemical Co. | Morgan Stanley | 1,289 | 56,240 | 100,697 | 46,340 | |||||||||||||||||
Ecolab, Inc. | Morgan Stanley | 1,632 | 308,813 | 326,139 | 18,462 | |||||||||||||||||
International Paper Co. | Morgan Stanley | 1,548 | 46,777 | 62,756 | 17,611 | |||||||||||||||||
Linde PLC (Ireland) | Morgan Stanley | 509 | 90,811 | 121,208 | 31,430 | |||||||||||||||||
LyondellBasell Industries NV, Class A (Netherlands) | Morgan Stanley | 1,049 | 42,330 | 73,944 | 33,858 | |||||||||||||||||
Newmont Corp. | Morgan Stanley | 2,646 | 169,873 | 167,889 | (1,479 | ) | ||||||||||||||||
Nucor Corp. | Morgan Stanley | 4,590 | 198,850 | 205,907 | 9,118 | |||||||||||||||||
PPG Industries, Inc. | Morgan Stanley | 3,288 | 299,145 | 401,399 | 105,267 | |||||||||||||||||
Sealed Air Corp. | Morgan Stanley | 10,894 | 321,898 | 422,796 | 104,512 | |||||||||||||||||
|
|
|
|
|
|
|
| |||||||||||||||
| 63,671 | 2,174,328 | 2,659,142 | 509,318 | |||||||||||||||||||
|
|
|
|
|
|
|
| |||||||||||||||
Media & Entertainment | ||||||||||||||||||||||
Activision Blizzard, Inc. | Morgan Stanley | 400 | 27,412 | 32,380 | 5,014 | |||||||||||||||||
Alphabet, Inc., Class A | Morgan Stanley | 647 | 740,082 | 948,243 | 209,177 | |||||||||||||||||
Charter Communications, Inc., Class A . | Morgan Stanley | 616 | 332,986 | 384,593 | 52,002 | |||||||||||||||||
Electronic Arts, Inc. | Morgan Stanley | 3,121 | 407,552 | 407,010 | (983 | ) | ||||||||||||||||
Facebook, Inc., Class A | Morgan Stanley | 1,642 | 377,356 | 430,040 | 53,319 | |||||||||||||||||
Fox Corp., Class A | Morgan Stanley | 8,860 | 225,343 | 246,574 | 23,609 | |||||||||||||||||
Interpublic Group of Cos., Inc. (The) | Morgan Stanley | 628 | 9,232 | 10,469 | 2,092 | |||||||||||||||||
Take-Two Interactive Software, Inc. | Morgan Stanley | 75 | 9,659 | 12,392 | 2,742 | |||||||||||||||||
|
|
|
|
|
|
|
| |||||||||||||||
| 15,989 | 2,129,622 | 2,471,701 | 346,972 | |||||||||||||||||||
|
|
|
|
|
|
|
| |||||||||||||||
Pharmaceuticals, Biotechnology & Life Sciences | ||||||||||||||||||||||
Alexion Pharmaceuticals, Inc. | Morgan Stanley | 1,183 | 95,001 | 135,371 | 40,475 | |||||||||||||||||
Biogen, Inc. | Morgan Stanley | 963 | 221,725 | 273,184 | 54,642 | |||||||||||||||||
Gilead Sciences, Inc. | Morgan Stanley | 5,203 | 336,121 | 328,778 | 1,911 | |||||||||||||||||
Illumina, Inc. | Morgan Stanley | 84 | 29,937 | 25,963 | (4,003 | ) | ||||||||||||||||
Johnson & Johnson | Morgan Stanley | 6,058 | 768,084 | 901,915 | 157,321 | |||||||||||||||||
Merck & Co., Inc. | Morgan Stanley | 2,699 | 202,035 | 223,882 | 25,906 | |||||||||||||||||
Pfizer, Inc. | Morgan Stanley | 14,269 | 493,003 | 523,672 | 39,330 | |||||||||||||||||
Regeneron Pharmaceuticals, Inc. | Morgan Stanley | 1,079 | 641,324 | 604,003 | (39,543 | ) | ||||||||||||||||
|
|
|
|
|
|
|
| |||||||||||||||
| 31,538 | 2,787,230 | 3,016,768 | 276,039 | |||||||||||||||||||
|
|
|
|
|
|
|
| |||||||||||||||
The accompanying notes are an integral part of the financial statements.
142
GOTHAM DEFENSIVE LONG 500 FUND
Portfolio of Investments (Continued)
September 30, 2020
Total Return Swaps (continued)
Reference Entity | Counterparty | Number of Contracts Long/(Short) | Notional Amount | Value | Unrealized Appreciation/ (Depreciation)* | |||||||||||||||||
Real Estate | ||||||||||||||||||||||
Alexandria Real Estate Equities, Inc., REIT | Morgan Stanley | 4 | $ | 530 | $ | 640 | $ | 113 | ||||||||||||||
|
|
|
|
|
|
|
| |||||||||||||||
Retailing | ||||||||||||||||||||||
Advance Auto Parts, Inc. | Morgan Stanley | 1,310 | 158,036 | 201,085 | 43,667 | |||||||||||||||||
Amazon.com, Inc. | Morgan Stanley | 450 | 794,191 | 1,416,928 | 623,694 | |||||||||||||||||
AutoZone, Inc. | Morgan Stanley | 421 | 467,101 | 495,786 | 29,244 | |||||||||||||||||
Best Buy Co., Inc. | Morgan Stanley | 1,161 | 63,358 | 129,208 | 67,273 | |||||||||||||||||
Booking Holdings, Inc. | Morgan Stanley | 7 | 8,661 | 11,975 | 3,313 | |||||||||||||||||
Dollar General Corp. | Morgan Stanley | 4,825 | 893,475 | 1,011,416 | 120,736 | |||||||||||||||||
eBay, Inc. | Morgan Stanley | 23,838 | 872,732 | 1,241,960 | 377,544 | |||||||||||||||||
Expedia Group, Inc. | Morgan Stanley | 15 | 687 | 1,375 | 678 | |||||||||||||||||
Gap, Inc. (The) | Morgan Stanley | 264 | 1,482 | 4,496 | 3,005 | |||||||||||||||||
Genuine Parts Co. | Morgan Stanley | 3,318 | 300,797 | 315,774 | 18,001 | |||||||||||||||||
Home Depot, Inc. (The) | Morgan Stanley | 1,795 | 434,809 | 498,489 | 69,211 | |||||||||||||||||
LKQ Corp. | Morgan Stanley | 4,097 | 75,855 | 113,610 | 37,837 | |||||||||||||||||
Lowe’s Cos., Inc. | Morgan Stanley | 3,836 | 471,496 | 636,239 | 167,417 | |||||||||||||||||
O’Reilly Automotive, Inc. | Morgan Stanley | 712 | 331,746 | 328,289 | (3,063 | ) | ||||||||||||||||
Target Corp. | Morgan Stanley | 4,208 | 640,571 | 662,423 | 22,697 | |||||||||||||||||
Tractor Supply Co. | Morgan Stanley | 6,654 | 841,631 | 953,784 | 115,867 | |||||||||||||||||
Ulta Beauty, Inc. | Morgan Stanley | 260 | 38,967 | 58,235 | 19,304 | |||||||||||||||||
|
|
|
|
|
|
|
| |||||||||||||||
| 57,171 | 6,395,595 | 8,081,072 | 1,716,425 | |||||||||||||||||||
|
|
|
|
|
|
|
| |||||||||||||||
Software & Services | ||||||||||||||||||||||
Accenture PLC, Class A (Ireland) | Morgan Stanley | 924 | 154,526 | 208,815 | 56,052 | |||||||||||||||||
Broadridge Financial Solutions, Inc. | Morgan Stanley | 1,852 | 254,276 | 244,464 | (8,644 | ) | ||||||||||||||||
Citrix Systems, Inc. | Morgan Stanley | 3,116 | 413,407 | 429,104 | 19,056 | |||||||||||||||||
Gartner, Inc. | Morgan Stanley | 856 | 105,650 | 106,957 | 1,425 | |||||||||||||||||
International Business Machines Corp. | Morgan Stanley | 4,214 | 423,317 | 512,717 | 103,643 | |||||||||||||||||
Mastercard, Inc., Class A | Morgan Stanley | 903 | 228,865 | 305,368 | 77,507 | |||||||||||||||||
Microsoft Corp. | Morgan Stanley | 6,238 | 919,337 | 1,312,039 | 400,901 | |||||||||||||||||
NortonLifeLock, Inc. | Morgan Stanley | 30,618 | 622,560 | 638,079 | 24,802 | |||||||||||||||||
Oracle Corp. | Morgan Stanley | 12,751 | 658,705 | 761,235 | 107,129 | |||||||||||||||||
Paychex, Inc. | Morgan Stanley | 5,878 | 383,623 | 468,888 | 91,157 | |||||||||||||||||
PayPal Holdings, Inc. | Morgan Stanley | 778 | 121,627 | 153,289 | 31,864 | |||||||||||||||||
Visa, Inc., Class A | Morgan Stanley | 1,434 | 234,771 | 286,757 | 53,129 | |||||||||||||||||
Western Union Co. (The) | Morgan Stanley | 21,007 | 397,556 | 450,180 | 63,225 | |||||||||||||||||
|
|
|
|
|
|
|
| |||||||||||||||
| 90,569 | 4,918,220 | 5,877,892 | 1,021,246 | |||||||||||||||||||
|
|
|
|
|
|
|
| |||||||||||||||
Technology Hardware & Equipment | ||||||||||||||||||||||
Apple, Inc. | Morgan Stanley | 13,143 | 880,410 | 1,522,091 | 647,804 | |||||||||||||||||
Cisco Systems, Inc. | Morgan Stanley | 20,262 | 792,913 | 798,120 | 16,699 | |||||||||||||||||
F5 Networks, Inc. | Morgan Stanley | 336 | 39,886 | 41,251 | 1,402 | |||||||||||||||||
FLIR Systems, Inc. | Morgan Stanley | 7,133 | 276,764 | 255,718 | (19,561 | ) | ||||||||||||||||
HP, Inc. | Morgan Stanley | 12,777 | 189,324 | 242,635 | 58,034 | |||||||||||||||||
The accompanying notes are an integral part of the financial statements.
143
GOTHAM DEFENSIVE LONG 500 FUND
Portfolio of Investments (Continued)
September 30, 2020
Total Return Swaps (continued)
Reference Entity | Counterparty | Number of Contracts Long/(Short) | Notional Amount | Value | Unrealized Appreciation/ (Depreciation)* | ||||||||||||||||||
Technology Hardware & Equipment — (continued) |
| ||||||||||||||||||||||
Juniper Networks, Inc. | Morgan Stanley | 10,259 | $ | 231,715 | $ | 220,569 | $ | (7,007 | ) | ||||||||||||||
|
|
|
|
|
|
|
| ||||||||||||||||
| 63,910 | 2,411,012 | 3,080,384 | 697,371 | ||||||||||||||||||||
|
|
|
|
|
|
|
| ||||||||||||||||
Telecommunication Services | |||||||||||||||||||||||
AT&T, Inc. | Morgan Stanley | 14,950 | 436,583 | 426,224 | (4,590 | ) | |||||||||||||||||
Verizon Communications, Inc. | Morgan Stanley | 11,462 | 638,099 | 681,874 | 51,066 | ||||||||||||||||||
|
|
|
|
|
|
|
| ||||||||||||||||
| 26,412 | 1,074,682 | 1,108,098 | 46,476 | ||||||||||||||||||||
|
|
|
|
|
|
|
| ||||||||||||||||
Transportation | |||||||||||||||||||||||
CH Robinson Worldwide, Inc. | Morgan Stanley | 7,132 | 687,899 | 728,819 | 44,366 | ||||||||||||||||||
Expeditors International of Washington, Inc. | Morgan Stanley | 7,385 | 536,668 | 668,490 | 135,178 | ||||||||||||||||||
JB Hunt Transport Services, Inc. | Morgan Stanley | 3,186 | 425,938 | 402,647 | (22,325 | ) | |||||||||||||||||
Norfolk Southern Corp. | Morgan Stanley | 363 | 58,877 | 77,678 | 19,204 | ||||||||||||||||||
Old Dominion Freight Line, Inc. | Morgan Stanley | 468 | 87,042 | 84,671 | (2,277 | ) | |||||||||||||||||
|
|
|
|
|
|
|
| ||||||||||||||||
| 18,534 | 1,796,424 | 1,962,305 | 174,146 | ||||||||||||||||||||
|
|
|
|
|
|
|
| ||||||||||||||||
Utilities | |||||||||||||||||||||||
NRG Energy, Inc. | Morgan Stanley | 6,710 | 217,109 | 206,265 | (8,588 | ) | |||||||||||||||||
|
|
|
|
|
|
|
| ||||||||||||||||
Total Reference Entity — Long | 43,929,530 | 51,324,790 | 7,866,290 | ||||||||||||||||||||
|
|
|
|
|
| ||||||||||||||||||
Short | |||||||||||||||||||||||
Automobiles & Components | |||||||||||||||||||||||
Ford Motor Co. | Morgan Stanley | (12,485 | ) | (86,200 | ) | (83,150 | ) | 2,879 | |||||||||||||||
|
|
|
|
|
|
|
| ||||||||||||||||
Banks | |||||||||||||||||||||||
Bank of America Corp. | Morgan Stanley | (11,394 | ) | (395,830 | ) | (274,481 | ) | 114,448 | |||||||||||||||
Citizens Financial Group, Inc. | Morgan Stanley | (424 | ) | (15,421 | ) | (10,719 | ) | 2,697 | |||||||||||||||
Comerica, Inc. | Morgan Stanley | (139 | ) | (9,223 | ) | (5,317 | ) | 2,266 | |||||||||||||||
Fifth Third Bancorp | Morgan Stanley | (3,138 | ) | (93,332 | ) | (66,902 | ) | 24,551 | |||||||||||||||
First Republic Bank | Morgan Stanley | (2,154 | ) | (246,830 | ) | (234,915 | ) | 11,407 | |||||||||||||||
Huntington Bancshares, Inc. | Morgan Stanley | (1,905 | ) | (28,336 | ) | (17,469 | ) | 8,610 | |||||||||||||||
KeyCorp. | Morgan Stanley | (1,954 | ) | (36,550 | ) | (23,311 | ) | 10,474 | |||||||||||||||
M&T Bank Corp. | Morgan Stanley | (1,322 | ) | (222,871 | ) | (121,743 | ) | 96,340 | |||||||||||||||
People’s United Financial, Inc. | Morgan Stanley | (684 | ) | (10,074 | ) | (7,052 | ) | 2,845 | |||||||||||||||
Regions Financial Corp. | Morgan Stanley | (989 | ) | (16,071 | ) | (11,403 | ) | 5,447 | |||||||||||||||
SVB Financial Group | Morgan Stanley | (1,381 | ) | (301,026 | ) | (332,296 | ) | (32,900 | ) | ||||||||||||||
Truist Financial Corp. | Morgan Stanley | (7,234 | ) | (283,992 | ) | (275,254 | ) | 5,768 | |||||||||||||||
Wells Fargo & Co. | Morgan Stanley | (379 | ) | (20,551 | ) | (8,910 | ) | 11,167 | |||||||||||||||
Zions Bancorp NA | Morgan Stanley | (163 | ) | (7,275 | ) | (4,763 | ) | 1,813 | |||||||||||||||
|
|
|
|
|
|
|
| ||||||||||||||||
| (33,260 | ) | (1,687,382 | ) | (1,394,535 | ) | 264,933 | |||||||||||||||||
|
|
|
|
|
|
|
| ||||||||||||||||
Capital Goods | |||||||||||||||||||||||
Boeing Co. (The) | Morgan Stanley | (1,867 | ) | (644,813 | ) | (308,540 | ) | 327,183 | |||||||||||||||
General Electric Co. | Morgan Stanley | (11,006 | ) | (109,260 | ) | (68,567 | ) | 39,485 | |||||||||||||||
Ingersoll Rand, Inc. | Morgan Stanley | (25,199 | ) | (764,990 | ) | (897,084 | ) | (136,881 | ) | ||||||||||||||
Jacobs Engineering Group, Inc. | Morgan Stanley | (3,546 | ) | (317,547 | ) | (328,962 | ) | (13,669 | ) | ||||||||||||||
The accompanying notes are an integral part of the financial statements.
144
GOTHAM DEFENSIVE LONG 500 FUND
Portfolio of Investments (Continued)
September 30, 2020
Total Return Swaps (continued)
Reference Entity | Counterparty | Number of Contracts Long/(Short) | Notional Amount | Value | Unrealized Appreciation/ (Depreciation)* | |||||||||||||||||
Capital Goods — (continued) | ||||||||||||||||||||||
L3Harris Technologies, Inc. | Morgan Stanley | (976 | ) | $ | (176,698 | ) | $ | (165,764 | ) | $ | 10,667 | |||||||||||
Textron, Inc. | Morgan Stanley | (227 | ) | (11,879 | ) | (8,192 | ) | 3,601 | ||||||||||||||
Xylem, Inc. | Morgan Stanley | (2,228 | ) | (176,324 | ) | (187,419 | ) | (11,835 | ) | |||||||||||||
|
|
|
|
|
|
|
| |||||||||||||||
| (45,049 | ) | (2,201,511 | ) | (1,964,528 | ) | 218,551 | ||||||||||||||||
|
|
|
|
|
|
|
| |||||||||||||||
Commercial & Professional Services | ||||||||||||||||||||||
Copart, Inc. | Morgan Stanley | (3,242 | ) | (302,436 | ) | (340,929 | ) | (39,067 | ) | |||||||||||||
|
|
|
|
|
|
|
| |||||||||||||||
Consumer Durables & Apparel | ||||||||||||||||||||||
Hasbro, Inc. | Morgan Stanley | (124 | ) | (14,835 | ) | (10,257 | ) | 3,555 | ||||||||||||||
NVR, Inc. | Morgan Stanley | (34 | ) | (130,658 | ) | (138,826 | ) | (8,422 | ) | |||||||||||||
Ralph Lauren Corp. | Morgan Stanley | (844 | ) | (60,933 | ) | (57,367 | ) | 3,443 | ||||||||||||||
Tapestry, Inc. | Morgan Stanley | (4,382 | ) | (71,311 | ) | (68,491 | ) | 2,677 | ||||||||||||||
Under Armour, Inc., Class C | Morgan Stanley | (6,103 | ) | (58,423 | ) | (60,054 | ) | (1,750 | ) | |||||||||||||
|
|
|
|
|
|
|
| |||||||||||||||
| (11,487 | ) | (336,160 | ) | (334,995 | ) | (497 | ) | |||||||||||||||
|
|
|
|
|
|
|
| |||||||||||||||
Consumer Services | ||||||||||||||||||||||
Carnival Corp. (Panama) | Morgan Stanley | (13,717 | ) | (222,513 | ) | (208,224 | ) | 13,864 | ||||||||||||||
Chipotle Mexican Grill, Inc. | Morgan Stanley | (160 | ) | (199,159 | ) | (198,994 | ) | (741 | ) | |||||||||||||
Darden Restaurants, Inc. | Morgan Stanley | (1,216 | ) | (135,199 | ) | (122,500 | ) | 11,353 | ||||||||||||||
Domino’s Pizza, Inc. | Morgan Stanley | (677 | ) | (272,052 | ) | (287,915 | ) | (18,204 | ) | |||||||||||||
Hilton Worldwide Holdings, Inc. | Morgan Stanley | (1,883 | ) | (163,515 | ) | (160,658 | ) | 2,542 | ||||||||||||||
Las Vegas Sands Corp. | Morgan Stanley | (5,420 | ) | (299,116 | ) | (252,897 | ) | 39,476 | ||||||||||||||
Marriott International, Inc., Class A | Morgan Stanley | (1,533 | ) | (219,336 | ) | (141,925 | ) | 76,256 | ||||||||||||||
Norwegian Cruise Line Holdings Ltd. (Bermuda) | Morgan Stanley | (8,648 | ) | (218,888 | ) | (147,967 | ) | 70,503 | ||||||||||||||
Royal Caribbean Cruises Ltd. (Liberia) | Morgan Stanley | (3,400 | ) | (316,971 | ) | (220,082 | ) | 91,622 | ||||||||||||||
Starbucks Corp. | Morgan Stanley | (4,668 | ) | (385,223 | ) | (401,075 | ) | (17,318 | ) | |||||||||||||
Wynn Resorts Ltd. | Morgan Stanley | (3,474 | ) | (318,330 | ) | (249,468 | ) | 66,052 | ||||||||||||||
|
|
|
|
|
|
|
| |||||||||||||||
| (44,796 | ) | (2,750,302 | ) | (2,391,705 | ) | 335,405 | ||||||||||||||||
|
|
|
|
|
|
|
| |||||||||||||||
Diversified Financials | ||||||||||||||||||||||
Ameriprise Financial, Inc. | Morgan Stanley | (834 | ) | (128,131 | ) | (128,528 | ) | (1,787 | ) | |||||||||||||
Capital One Financial Corp. | Morgan Stanley | (203 | ) | (21,672 | ) | (14,588 | ) | 6,851 | ||||||||||||||
Charles Schwab Corp. (The) | Morgan Stanley | (3,771 | ) | (183,936 | ) | (136,623 | ) | 44,923 | ||||||||||||||
MarketAxess Holdings, Inc. | Morgan Stanley | (588 | ) | (300,235 | ) | (283,175 | ) | 17,059 | ||||||||||||||
MSCI, Inc. | Morgan Stanley | (2,720 | ) | (908,403 | ) | (970,442 | ) | (68,203 | ) | |||||||||||||
Northern Trust Corp. | Morgan Stanley | (2,009 | ) | (212,225 | ) | (156,642 | ) | 50,732 | ||||||||||||||
Raymond James Financial, Inc. | Morgan Stanley | (1,761 | ) | (143,515 | ) | (128,130 | ) | 13,461 | ||||||||||||||
State Street Corp. | Morgan Stanley | (763 | ) | (53,832 | ) | (45,269 | ) | 8,055 | ||||||||||||||
Synchrony Financial | Morgan Stanley | (179 | ) | (5,963 | ) | (4,684 | ) | 1,178 | ||||||||||||||
|
|
|
|
|
|
|
| |||||||||||||||
| (12,828 | ) | (1,957,912 | ) | (1,868,081 | ) | 72,269 | ||||||||||||||||
|
|
|
|
|
|
|
| |||||||||||||||
Energy | ||||||||||||||||||||||
Apache Corp. | Morgan Stanley | (431 | ) | (5,145 | ) | (4,082 | ) | 1,398 | ||||||||||||||
Cabot Oil & Gas Corp. | Morgan Stanley | (12,691 | ) | (254,690 | ) | (220,316 | ) | 32,281 | ||||||||||||||
Devon Energy Corp. | Morgan Stanley | (24,844 | ) | (290,012 | ) | (235,024 | ) | 49,898 | ||||||||||||||
The accompanying notes are an integral part of the financial statements.
145
GOTHAM DEFENSIVE LONG 500 FUND
Portfolio of Investments (Continued)
September 30, 2020
Total Return Swaps (continued)
Reference Entity | Counterparty | Number of Contracts Long/(Short) | Notional Amount | Value | Unrealized Appreciation/ (Depreciation)* | |||||||||||||||||
Energy — (continued) | ||||||||||||||||||||||
Diamondback Energy, Inc. | Morgan Stanley | (6,039 | ) | $ | (324,995 | ) | $ | (181,895 | ) | $ | 139,113 | |||||||||||
Hess Corp. | Morgan Stanley | (7,443 | ) | (399,332 | ) | (304,642 | ) | 89,072 | ||||||||||||||
Marathon Petroleum Corp. | Morgan Stanley | (6,973 | ) | (242,638 | ) | (204,588 | ) | 35,967 | ||||||||||||||
Noble Energy, Inc. | Morgan Stanley | (51,324 | ) | (546,090 | ) | (438,820 | ) | 103,530 | ||||||||||||||
Occidental Petroleum Corp. | Morgan Stanley | (37,134 | ) | (874,298 | ) | (371,711 | ) | 485,916 | ||||||||||||||
ONEOK, Inc. | Morgan Stanley | (5,465 | ) | (341,904 | ) | (141,981 | ) | 183,411 | ||||||||||||||
Pioneer Natural Resources Co. | Morgan Stanley | (3,070 | ) | (350,769 | ) | (263,989 | ) | 80,978 | ||||||||||||||
|
|
|
|
|
|
|
| |||||||||||||||
| (155,414 | ) | (3,629,873 | ) | (2,367,048 | ) | 1,201,564 | ||||||||||||||||
|
|
|
|
|
|
|
| |||||||||||||||
Health Care Equipment & Services | ||||||||||||||||||||||
ABIOMED, Inc. | Morgan Stanley | (1,187 | ) | (286,083 | ) | (328,870 | ) | (43,330 | ) | |||||||||||||
Align Technology, Inc. | Morgan Stanley | (1,730 | ) | (441,465 | ) | (566,333 | ) | (126,605 | ) | |||||||||||||
Baxter International, Inc. | Morgan Stanley | (508 | ) | (45,417 | ) | (40,853 | ) | 5,471 | ||||||||||||||
Boston Scientific Corp. | Morgan Stanley | (7,184 | ) | (307,298 | ) | (274,501 | ) | 33,068 | ||||||||||||||
Cooper Cos., Inc. (The) | Morgan Stanley | (1,413 | ) | (441,824 | ) | (476,351 | ) | (35,690 | ) | |||||||||||||
DexCom, Inc. | Morgan Stanley | (2,307 | ) | (925,308 | ) | (951,015 | ) | (29,568 | ) | |||||||||||||
Edwards Lifesciences Corp. | Morgan Stanley | (6,220 | ) | (472,708 | ) | (496,480 | ) | (24,663 | ) | |||||||||||||
Henry Schein, Inc. | Morgan Stanley | (39 | ) | (2,330 | ) | (2,292 | ) | 13 | ||||||||||||||
IDEXX Laboratories, Inc. | Morgan Stanley | (1,194 | ) | (376,329 | ) | (469,373 | ) | (97,842 | ) | |||||||||||||
Intuitive Surgical, Inc. | Morgan Stanley | (160 | ) | (109,405 | ) | (113,526 | ) | (4,336 | ) | |||||||||||||
ResMed, Inc. | Morgan Stanley | (349 | ) | (61,597 | ) | (59,829 | ) | 1,373 | ||||||||||||||
Teleflex, Inc. | Morgan Stanley | (922 | ) | (336,961 | ) | (313,867 | ) | 22,045 | ||||||||||||||
West Pharmaceutical Services, Inc. | Morgan Stanley | (395 | ) | (107,795 | ) | (108,586 | ) | (1,369 | ) | |||||||||||||
|
|
|
|
|
|
|
| |||||||||||||||
| (23,608 | ) | (3,914,520 | ) | (4,201,876 | ) | (301,433 | ) | |||||||||||||||
|
|
|
|
|
|
|
| |||||||||||||||
Household & Personal Products | ||||||||||||||||||||||
Estee Lauder Cos., Inc. (The), Class A | Morgan Stanley | (477 | ) | (104,773 | ) | (104,105 | ) | 388 | ||||||||||||||
|
|
|
|
|
|
|
| |||||||||||||||
Insurance | ||||||||||||||||||||||
American International Group, Inc. | Morgan Stanley | (2,498 | ) | (123,268 | ) | (68,770 | ) | 51,860 | ||||||||||||||
Lincoln National Corp. | Morgan Stanley | (248 | ) | (15,015 | ) | (7,770 | ) | 6,241 | ||||||||||||||
Principal Financial Group, Inc. | Morgan Stanley | (1,206 | ) | (68,831 | ) | (48,566 | ) | 16,391 | ||||||||||||||
Prudential Financial, Inc. | Morgan Stanley | (2,261 | ) | (206,854 | ) | (143,619 | ) | 52,813 | ||||||||||||||
Unum Group | Morgan Stanley | (207 | ) | (6,128 | ) | (3,484 | ) | 1,937 | ||||||||||||||
|
|
|
|
|
|
|
| |||||||||||||||
| (6,420 | ) | (420,096 | ) | (272,209 | ) | 129,242 | ||||||||||||||||
|
|
|
|
|
|
|
| |||||||||||||||
Materials | ||||||||||||||||||||||
Air Products & Chemicals, Inc. | Morgan Stanley | (180 | ) | (52,731 | ) | (53,615 | ) | (1,277 | ) | |||||||||||||
Albemarle Corp. | Morgan Stanley | (5,439 | ) | (370,197 | ) | (485,594 | ) | (120,766 | ) | |||||||||||||
Ball Corp. | Morgan Stanley | (5,660 | ) | (424,551 | ) | (470,459 | ) | (49,793 | ) | |||||||||||||
Corteva, Inc. | Morgan Stanley | (16,187 | ) | (437,382 | ) | (466,347 | ) | (30,815 | ) | |||||||||||||
Freeport-McMoRan, Inc. | Morgan Stanley | (45,139 | ) | (465,811 | ) | (705,974 | ) | (246,285 | ) | |||||||||||||
International Flavors & Fragrances, Inc. | Morgan Stanley | (133 | ) | (16,875 | ) | (16,286 | ) | 551 | ||||||||||||||
|
|
|
|
|
|
|
| |||||||||||||||
| (72,738 | ) | (1,767,547 | ) | (2,198,275 | ) | (448,385 | ) | |||||||||||||||
|
|
|
|
|
|
|
| |||||||||||||||
The accompanying notes are an integral part of the financial statements.
146
GOTHAM DEFENSIVE LONG 500 FUND
Portfolio of Investments (Continued)
September 30, 2020
Total Return Swaps (continued)
Reference Entity | Counterparty | Number of Contracts Long/(Short) | Notional Amount | Value | Unrealized Appreciation/ (Depreciation)* | |||||||||||||||||
Media & Entertainment | ||||||||||||||||||||||
Live Nation Entertainment, Inc. | Morgan Stanley | (6,252 | ) | $ | (359,935 | ) | $ | (336,858 | ) | $ | 22,396 | |||||||||||
|
|
|
|
|
|
|
| |||||||||||||||
Pharmaceuticals, Biotechnology & Life Sciences | ||||||||||||||||||||||
Bio-Rad Laboratories, Inc., Class A | Morgan Stanley | (1,054 | ) | (488,497 | ) | (543,295 | ) | (57,381 | ) | |||||||||||||
Catalent, Inc. | Morgan Stanley | (4,599 | ) | (385,154 | ) | (393,950 | ) | (9,523 | ) | |||||||||||||
IQVIA Holdings, Inc. | Morgan Stanley | (1,422 | ) | (225,666 | ) | (224,150 | ) | 938 | ||||||||||||||
Mettler-Toledo International, Inc. | Morgan Stanley | (328 | ) | (266,641 | ) | (316,766 | ) | (54,784 | ) | |||||||||||||
Perrigo Co. PLC (Ireland) | Morgan Stanley | (6,754 | ) | (369,403 | ) | (310,076 | ) | 56,598 | ||||||||||||||
Vertex Pharmaceuticals, Inc. | Morgan Stanley | (2,080 | ) | (592,437 | ) | (566,010 | ) | 25,773 | ||||||||||||||
|
|
|
|
|
|
|
| |||||||||||||||
| (16,237 | ) | (2,327,798 | ) | (2,354,247 | ) | (38,379 | ) | |||||||||||||||
|
|
|
|
|
|
|
| |||||||||||||||
Real Estate | ||||||||||||||||||||||
Digital Realty Trust, Inc., REIT | Morgan Stanley | (2,335 | ) | (361,426 | ) | (342,685 | ) | 15,325 | ||||||||||||||
Equinix, Inc., REIT | Morgan Stanley | (1,207 | ) | (842,311 | ) | (917,477 | ) | (82,520 | ) | |||||||||||||
Healthpeak Properties, Inc., REIT | Morgan Stanley | (14,844 | ) | (408,450 | ) | (403,015 | ) | 415 | ||||||||||||||
Host Hotels & Resorts, Inc., REIT | Morgan Stanley | (3,106 | ) | (52,810 | ) | (33,514 | ) | 17,790 | ||||||||||||||
Iron Mountain, Inc., REIT | Morgan Stanley | (8 | ) | (273 | ) | (214 | ) | 28 | ||||||||||||||
Prologis, Inc., REIT | Morgan Stanley | (527 | ) | (55,493 | ) | (53,027 | ) | 3,046 | ||||||||||||||
|
|
|
|
|
|
|
| |||||||||||||||
| (22,027 | ) | (1,720,763 | ) | (1,749,932 | ) | (45,916 | ) | |||||||||||||||
|
|
|
|
|
|
|
| |||||||||||||||
Retailing | ||||||||||||||||||||||
Dollar Tree, Inc. | Morgan Stanley | (2,415 | ) | (279,521 | ) | (220,586 | ) | 58,403 | ||||||||||||||
Etsy, Inc. | Morgan Stanley | (7,630 | ) | (873,020 | ) | (928,037 | ) | (56,652 | ) | |||||||||||||
Ross Stores, Inc. | Morgan Stanley | (1,827 | ) | (166,210 | ) | (170,496 | ) | (4,605 | ) | |||||||||||||
TJX Cos., Inc. (The) | Morgan Stanley | (6,896 | ) | (380,981 | ) | (383,762 | ) | (3,673 | ) | |||||||||||||
|
|
|
|
|
|
|
| |||||||||||||||
| (18,768 | ) | (1,699,732 | ) | (1,702,881 | ) | (6,527 | ) | |||||||||||||||
|
|
|
|
|
|
|
| |||||||||||||||
Semiconductors & Semiconductor Equipment | ||||||||||||||||||||||
Advanced Micro Devices, Inc. | Morgan Stanley | (12,317 | ) | (727,710 | ) | (1,009,871 | ) | (290,309 | ) | |||||||||||||
Analog Devices, Inc. | Morgan Stanley | (3,125 | ) | (368,602 | ) | (364,813 | ) | 526 | ||||||||||||||
Microchip Technology, Inc. | Morgan Stanley | (4,444 | ) | (439,881 | ) | (456,665 | ) | (20,634 | ) | |||||||||||||
NVIDIA Corp. | Morgan Stanley | (1,587 | ) | (729,330 | ) | (858,916 | ) | (131,137 | ) | |||||||||||||
Qorvo, Inc. | Morgan Stanley | (3,731 | ) | (470,791 | ) | (481,336 | ) | (11,432 | ) | |||||||||||||
QUALCOMM, Inc. | Morgan Stanley | (5,305 | ) | (521,870 | ) | (624,292 | ) | (112,279 | ) | |||||||||||||
Teradyne, Inc. | Morgan Stanley | (4,702 | ) | (362,340 | ) | (373,621 | ) | (11,966 | ) | |||||||||||||
Xilinx, Inc. | Morgan Stanley | (4,562 | ) | (479,747 | ) | (475,543 | ) | 1,956 | ||||||||||||||
|
|
|
|
|
|
|
| |||||||||||||||
| (39,773 | ) | (4,100,271 | ) | (4,645,057 | ) | (575,275 | ) | |||||||||||||||
|
|
|
|
|
|
|
| |||||||||||||||
Software & Services | ||||||||||||||||||||||
Akamai Technologies, Inc. | Morgan Stanley | (7,892 | ) | (829,485 | ) | (872,382 | ) | (45,061 | ) | |||||||||||||
DXC Technology Co. | Morgan Stanley | (8,557 | ) | (194,639 | ) | (152,742 | ) | 40,398 | ||||||||||||||
Fidelity National Information Services, Inc. | Morgan Stanley | (6,825 | ) | (948,623 | ) | (1,004,708 | ) | (63,775 | ) | |||||||||||||
Fiserv, Inc. | Morgan Stanley | (5,919 | ) | (637,483 | ) | (609,953 | ) | 25,550 | ||||||||||||||
Fortinet, Inc. | Morgan Stanley | (8,584 | ) | (1,148,170 | ) | (1,011,281 | ) | 134,741 | ||||||||||||||
Global Payments, Inc. | Morgan Stanley | (6,327 | ) | (1,126,739 | ) | (1,123,549 | ) | (1,691 | ) | |||||||||||||
Intuit, Inc. | Morgan Stanley | (910 | ) | (288,725 | ) | (296,851 | ) | (11,974 | ) | |||||||||||||
The accompanying notes are an integral part of the financial statements.
147
GOTHAM DEFENSIVE LONG 500 FUND
Portfolio of Investments (Continued)
September 30, 2020
Total Return Swaps (continued)
Reference Entity | Counterparty | Number of Contracts Long/(Short) | Notional Amount | Value | Unrealized Appreciation/ (Depreciation)* | |||||||||||||||||
Software & Services — (continued) | ||||||||||||||||||||||
Jack Henry & Associates, Inc. | Morgan Stanley | (702 | ) | $ | (130,027 | ) | $ | (114,138 | ) | $ | 17,682 | |||||||||||
Leidos Holdings, Inc. | Morgan Stanley | (1,743 | ) | (163,675 | ) | (155,388 | ) | 7,354 | ||||||||||||||
Paycom Software, Inc. | Morgan Stanley | (3,799 | ) | (1,052,376 | ) | (1,182,629 | ) | (132,222 | ) | |||||||||||||
Tyler Technologies, Inc. | Morgan Stanley | (2,387 | ) | (833,487 | ) | (832,013 | ) | (367 | ) | |||||||||||||
VeriSign, Inc. | Morgan Stanley | (2,986 | ) | (633,734 | ) | (611,682 | ) | 20,887 | ||||||||||||||
|
|
|
|
|
|
|
| |||||||||||||||
| (56,631 | ) | (7,987,163 | ) | (7,967,316 | ) | (8,478 | ) | |||||||||||||||
|
|
|
|
|
|
|
| |||||||||||||||
Technology Hardware & Equipment | ||||||||||||||||||||||
Arista Networks, Inc. | Morgan Stanley | (138 | ) | (35,659 | ) | (28,556 | ) | 7,026 | ||||||||||||||
IPG Photonics Corp. | Morgan Stanley | (2,204 | ) | (357,655 | ) | (374,614 | ) | (17,635 | ) | |||||||||||||
Keysight Technologies, Inc. | Morgan Stanley | (6,213 | ) | (632,997 | ) | (613,720 | ) | 17,849 | ||||||||||||||
Western Digital Corp. | Morgan Stanley | (28,382 | ) | (1,245,697 | ) | (1,037,362 | ) | 199,389 | ||||||||||||||
Zebra Technologies Corp., Class A | Morgan Stanley | (188 | ) | (52,701 | ) | (47,462 | ) | 5,228 | ||||||||||||||
|
|
|
|
|
|
|
| |||||||||||||||
| (37,125 | ) | (2,324,709 | ) | (2,101,714 | ) | 211,857 | ||||||||||||||||
|
|
|
|
|
|
|
| |||||||||||||||
Telecommunication Services | ||||||||||||||||||||||
T-Mobile US, Inc. | Morgan Stanley | (8,883 | ) | (1,020,711 | ) | (1,015,860 | ) | 2,976 | ||||||||||||||
|
|
|
|
|
|
|
| |||||||||||||||
Transportation | ||||||||||||||||||||||
Alaska Air Group, Inc. | Morgan Stanley | (749 | ) | (28,496 | ) | (27,436 | ) | 996 | ||||||||||||||
American Airlines Group, Inc. | Morgan Stanley | (2,557 | ) | (38,465 | ) | (31,425 | ) | 6,957 | ||||||||||||||
Southwest Airlines Co. | Morgan Stanley | (2,005 | ) | (76,292 | ) | (75,188 | ) | 951 | ||||||||||||||
United Airlines Holdings, Inc. | Morgan Stanley | (820 | ) | (36,762 | ) | (28,495 | ) | 8,187 | ||||||||||||||
|
|
|
|
|
|
|
| |||||||||||||||
| (6,131 | ) | (180,015 | ) | (162,544 | ) | 17,091 | ||||||||||||||||
|
|
|
|
|
|
|
| |||||||||||||||
Utilities | ||||||||||||||||||||||
Alliant Energy Corp. | Morgan Stanley | (6,320 | ) | (329,150 | ) | (326,428 | ) | 1,217 | ||||||||||||||
Ameren Corp. | Morgan Stanley | (9,564 | ) | (737,082 | ) | (756,321 | ) | (29,310 | ) | |||||||||||||
American Electric Power Co., Inc. | Morgan Stanley | (5,196 | ) | (443,755 | ) | (424,669 | ) | 15,433 | ||||||||||||||
American Water Works Co., Inc. | Morgan Stanley | (4,429 | ) | (588,460 | ) | (641,674 | ) | (57,831 | ) | |||||||||||||
Atmos Energy Corp. | Morgan Stanley | (4,422 | ) | (441,419 | ) | (422,699 | ) | 15,779 | ||||||||||||||
CenterPoint Energy, Inc. | Morgan Stanley | (3,621 | ) | (108,553 | ) | (70,066 | ) | 35,075 | ||||||||||||||
CMS Energy Corp. | Morgan Stanley | (5,758 | ) | (346,432 | ) | (353,599 | ) | (9,569 | ) | |||||||||||||
Consolidated Edison, Inc. | Morgan Stanley | (3,743 | ) | (277,693 | ) | (291,205 | ) | (16,451 | ) | |||||||||||||
DTE Energy Co. | Morgan Stanley | (1,991 | ) | (250,795 | ) | (229,045 | ) | 13,860 | ||||||||||||||
Duke Energy Corp. | Morgan Stanley | (507 | ) | (51,977 | ) | (44,900 | ) | 6,002 | ||||||||||||||
Edison International | Morgan Stanley | (14,212 | ) | (855,177 | ) | (722,538 | ) | 110,288 | ||||||||||||||
Entergy Corp. | Morgan Stanley | (4,137 | ) | (436,305 | ) | (407,619 | ) | 21,092 | ||||||||||||||
Evergy, Inc. | Morgan Stanley | (7,864 | ) | (423,159 | ) | (399,648 | ) | 19,997 | ||||||||||||||
Eversource Energy | Morgan Stanley | (8,439 | ) | (729,438 | ) | (705,078 | ) | 17,437 | ||||||||||||||
Exelon Corp. | Morgan Stanley | (9,761 | ) | (482,568 | ) | (349,053 | ) | 121,529 | ||||||||||||||
FirstEnergy Corp. | Morgan Stanley | (8,002 | ) | (298,878 | ) | (229,737 | ) | 63,274 | ||||||||||||||
NextEra Energy, Inc. | Morgan Stanley | (1,362 | ) | (373,773 | ) | (378,037 | ) | (6,319 | ) | |||||||||||||
NiSource, Inc. | Morgan Stanley | (6,490 | ) | (175,012 | ) | (142,780 | ) | 28,718 | ||||||||||||||
Pinnacle West Capital Corp. | Morgan Stanley | (7,632 | ) | (616,282 | ) | (568,966 | ) | 43,828 | ||||||||||||||
PPL Corp. | Morgan Stanley | (7,656 | ) | (266,216 | ) | (208,320 | ) | 46,822 | ||||||||||||||
The accompanying notes are an integral part of the financial statements.
148
GOTHAM DEFENSIVE LONG 500 FUND
Portfolio of Investments (Concluded)
September 30, 2020
Total Return Swaps (concluded)
Reference Entity | Counterparty | Number of Contracts Long/(Short) | Notional Amount | Value | Unrealized Appreciation/ (Depreciation)* | |||||||||||||||||
Utilities — (continued) | ||||||||||||||||||||||
Public Service Enterprise Group, Inc. | Morgan Stanley | (241 | ) | $ | (12,482 | ) | $ | (13,233 | ) | $ | (796 | ) | ||||||||||
Sempra Energy | Morgan Stanley | (4,118 | ) | (527,876 | ) | (487,406 | ) | 34,861 | ||||||||||||||
Southern Co. (The) | Morgan Stanley | (5,171 | ) | (279,507 | ) | (280,372 | ) | (3,362 | ) | |||||||||||||
WEC Energy Group, Inc. | Morgan Stanley | (3,771 | ) | (350,402 | ) | (365,410 | ) | (18,559 | ) | |||||||||||||
Xcel Energy, Inc. | Morgan Stanley | (8,674 | ) | (579,814 | ) | (598,593 | ) | (28,376 | ) | |||||||||||||
|
|
|
|
|
|
|
| |||||||||||||||
| (143,081 | ) | (9,982,205 | ) | (9,417,396 | ) | 424,639 | ||||||||||||||||
|
|
|
|
|
|
|
| |||||||||||||||
Total Reference Entity — Short | (50,862,014 | ) | (48,975,241 | ) | 1,440,233 | |||||||||||||||||
|
|
|
|
|
| |||||||||||||||||
Net Value of Reference Entity | $ | (6,932,484 | ) | $ | 2,349,549 | $ | 9,306,523 | |||||||||||||||
|
|
|
|
|
| |||||||||||||||||
| * | Includes $24,490 related to open trades, dividends receivables/payables and swap receivables/payables activities. |
The accompanying notes are an integral part of the financial statements.
149
GOTHAM TOTAL RETURN FUND
Portfolio of Investments
September 30, 2020
| Number of Shares | Value | |||||||
AFFILIATED EQUITY REGISTERED INVESTMENT COMPANIES(a) — 99.6% |
| |||||||
Gotham Defensive Long 500 Fund | 1,077,135 | $ | 12,904,078 | |||||
Gotham Hedged Core Fund | 301,062 | 3,411,033 | ||||||
Gotham Index Plus Fund | 357,634 | 5,790,088 | ||||||
Gotham Large Value Fund | 81,815 | 1,061,959 | ||||||
Gotham Neutral Fund* | 463,120 | 4,256,076 | ||||||
Gotham Short Strategies Fund | 146,472 | 1,086,822 | ||||||
|
| |||||||
TOTAL AFFILIATED EQUITY REGISTERED INVESTMENT COMPANIES (Cost $26,060,092) | 28,510,056 | |||||||
|
| |||||||
OTHER ASSETS IN EXCESS OF LIABILITIES - 0.4% | 127,310 | |||||||
|
| |||||||
NET ASSETS - 100.0% | $ | 28,637,366 | ||||||
|
| |||||||
| (a) | All affiliated fund investments are in Institutional Class shares. The financial statements of the affiliated funds are publicly available on the Securities and Exchange Commission’s website. |
| * | Non-income producing. |
The accompanying notes are an integral part of the financial statements.
150
Statements of Assets and Liabilities
September 30, 2020
| Gotham Absolute Return Fund | Gotham Enhanced Return Fund | Gotham Neutral Fund | |||||||||||||
Assets | |||||||||||||||
Non-affiliated investments, at value1,2 | $ | 480,209,208 | $ | 224,483,609 | $ | 52,675,936 | |||||||||
Swaps, at value(a) | 4,927,599 | 46,431,845 | 1,770,576 | ||||||||||||
Cash | 18,798,020 | 869,757 | 917,576 | ||||||||||||
Due from broker | 64,459 | 754,329 | 114,486 | ||||||||||||
Receivables: | |||||||||||||||
Investments sold | 6,710,632 | 2,884,335 | 1,824,645 | ||||||||||||
Capital shares sold | 265,299 | 60,272 | 23,057 | ||||||||||||
Dividends and interest | 396,140 | 200,760 | 38,491 | ||||||||||||
Prepaid expenses and other assets | 24,071 | 12,581 | 13,621 | ||||||||||||
|
|
|
|
|
| ||||||||||
Total assets | 511,395,428 | 275,697,488 | 57,378,388 | ||||||||||||
|
|
|
|
|
| ||||||||||
Liabilities | |||||||||||||||
Obligation to return cash collateral on swap contracts (Note 1) | — | 35,430,000 | — | ||||||||||||
Payables: | |||||||||||||||
Investments purchased | 3,234,027 | 2,775,986 | 678,741 | ||||||||||||
Dividends and fees on securities sold short | — | — | 776 | ||||||||||||
Capital shares redeemed | 1,352,033 | 346,521 | 794,453 | ||||||||||||
Investment adviser | 602,614 | 283,854 | 52,987 | ||||||||||||
Administration and accounting fees | 56,128 | 33,432 | 21,649 | ||||||||||||
Accrued expenses | 161,360 | 103,012 | 154,492 | ||||||||||||
|
|
|
|
|
| ||||||||||
Total liabilities | 5,406,162 | 38,972,805 | 1,703,098 | ||||||||||||
|
|
|
|
|
| ||||||||||
Net Assets | $ | 505,989,266 | $ | 236,724,683 | $ | 55,675,290 | |||||||||
|
|
|
|
|
| ||||||||||
Net Assets Consisted of: | |||||||||||||||
Capital stock, $0.01 par value | $ | 351,546 | $ | 231,912 | $ | 60,603 | |||||||||
Paid-in capital | 557,970,565 | 188,272,774 | 127,068,197 | ||||||||||||
Total distributable earnings (loss) | (52,332,845 | ) | 48,219,997 | (71,453,510 | ) | ||||||||||
|
|
|
|
|
| ||||||||||
Net Assets | $ | 505,989,266 | $ | 236,724,683 | $ | 55,675,290 | |||||||||
|
|
|
|
|
| ||||||||||
Institutional Class Shares: | |||||||||||||||
Net assets | $ | 505,989,266 | $ | 236,724,683 | $ | 55,675,290 | |||||||||
|
|
|
|
|
| ||||||||||
Shares outstanding | 35,154,598 | 23,191,238 | 6,060,316 | ||||||||||||
|
|
|
|
|
| ||||||||||
Net asset value, offering and redemption price per share | $ | 14.39 | $ | 10.21 | $ | 9.19 | |||||||||
|
|
|
|
|
| ||||||||||
1Non-affiliated investments, at cost | $ | 394,594,495 | $ | 195,848,608 | $ | 41,677,142 | |||||||||
2Includes market value of securities designated as collateral for swaps | $ | 135,010,421 | $ | 73,099,488 | $ | 21,467,530 | |||||||||
| (a) | Primary risk exposure is equity contracts. |
The accompanying notes are an integral part of the financial statements.
151
GOTHAM FUNDS
Statements of Assets and Liabilities (Concluded)
September 30, 2020
| Gotham Large Value Fund | Gotham Defensive Long 500 Fund | Gotham Total Return Fund | |||||||||||||
Assets | |||||||||||||||
Non-affiliated investments, at value1,2,3 | $ | 69,647,399 | $ | 51,935,855 | $ | — | |||||||||
Affiliated investments, at value4 | — | — | 28,510,056 | ||||||||||||
Swaps, at value(a) | — | 9,306,523 | — | ||||||||||||
Cash | 243,842 | 426,978 | 142,063 | ||||||||||||
Due from broker | — | 131,991 | — | ||||||||||||
Receivables: | |||||||||||||||
Investments sold | 358,423 | 363,710 | — | ||||||||||||
Capital shares sold | 17,500 | — | 267 | ||||||||||||
Dividends and interest | 97,133 | 46,023 | — | ||||||||||||
Investment adviser | — | — | 24,460 | ||||||||||||
Prepaid expenses and other assets | 5,555 | 10,308 | 14,214 | ||||||||||||
|
|
|
|
|
| ||||||||||
Total assets | 70,369,852 | 62,221,388 | 28,691,060 | ||||||||||||
|
|
|
|
|
| ||||||||||
Liabilities | |||||||||||||||
Due to broker | — | 15,395 | — | ||||||||||||
Obligation to return cash collateral on swap contracts (Note 1) | — | 7,350,000 | — | ||||||||||||
Payables: | |||||||||||||||
Investments purchased | 270,835 | 105,047 | — | ||||||||||||
Capital shares redeemed | 36,720 | — | — | ||||||||||||
Investment adviser | 9,701 | 30,221 | — | ||||||||||||
Administration and accounting fees | 9,031 | 10,311 | 11,256 | ||||||||||||
12b-1 distribution fees (Investor Class) | — | — | 551 | ||||||||||||
Accrued expenses | 41,008 | 35,057 | 41,887 | ||||||||||||
|
|
|
|
|
| ||||||||||
Total liabilities | 367,295 | 7,546,031 | 53,694 | ||||||||||||
|
|
|
|
|
| ||||||||||
Net Assets | $ | 70,002,557 | $ | 54,675,357 | $ | 28,637,366 | |||||||||
|
|
|
|
|
| ||||||||||
Net Assets Consisted of: | |||||||||||||||
Capital stock, $0.01 par value | $ | 53,915 | $ | 45,625 | $ | 24,480 | |||||||||
Paid-in capital | 70,782,974 | 59,444,677 | 28,348,712 | ||||||||||||
Total distributable earnings/(loss) | (834,332 | ) | (4,814,945 | ) | 264,174 | ||||||||||
|
|
|
|
|
| ||||||||||
Net Assets | $ | 70,002,557 | $ | 54,675,357 | $ | 28,637,366 | |||||||||
|
|
|
|
|
| ||||||||||
Institutional Class Shares: | |||||||||||||||
Net assets | $ | 70,002,557 | $ | 54,675,357 | $ | 25,967,133 | |||||||||
|
|
|
|
|
| ||||||||||
Shares outstanding | 5,391,540 | 4,562,474 | 2,219,179 | ||||||||||||
|
|
|
|
|
| ||||||||||
Net asset value, offering and redemption price per share | $ | 12.98 | $ | 11.98 | $ | 11.70 | |||||||||
|
|
|
|
|
| ||||||||||
Investor Class Shares: | |||||||||||||||
Net assets | N/A | N/A | $ | 2,670,233 | |||||||||||
|
|
|
|
|
| ||||||||||
Shares outstanding | N/A | N/A | 228,866 | ||||||||||||
|
|
|
|
|
| ||||||||||
Net asset value, offering and redemption price per share | N/A | N/A | $ | 11.67 | |||||||||||
|
|
|
|
|
| ||||||||||
1Non-affiliated investments, at cost | $ | 63,901,583 | $ | 45,198,437 | $ | — | |||||||||
2Includes market value of securities designated as collateral for swaps | $ | — | $ | 22,460,162 | $ | — | |||||||||
3Includes market value of securities on loan | $ | — | $ | 1,397,470 | $ | — | |||||||||
4Affiliated investments, at cost | $ | — | $ | — | $ | 26,060,092 | |||||||||
| (a) | Primary risk exposure is equity price risk. |
The accompanying notes are an integral part of the financial statements.
152
Statements of Operations
For the Year Ended September 30, 2020
| Gotham Absolute Return Fund | Gotham Enhanced Return Fund | Gotham Neutral Fund | ||||||||||||||||||
Investment Income | ||||||||||||||||||||
Dividend income | $ | 14,521,628 | $ | 6,143,652 | $ | 2,344,109 | ||||||||||||||
Less: taxes withheld | (25,577 | ) | (8,893 | ) | (10,438 | ) | ||||||||||||||
Interest | 17,241 | 54,338 | 9,413 | |||||||||||||||||
|
|
|
|
|
| |||||||||||||||
Total investment income | 14,513,292 | 6,189,097 | 2,343,084 | |||||||||||||||||
|
|
|
|
|
| |||||||||||||||
Expenses | ||||||||||||||||||||
Advisory fees (Note 2) | 12,889,385 | 6,826,522 | 2,478,236 | |||||||||||||||||
Administration and accounting fees (Note 2) | 240,977 | 179,660 | 100,783 | |||||||||||||||||
Dividends and fees on securities sold short (Note 1) | 3,380,789 | 214,417 | 895,184 | |||||||||||||||||
Transfer agent fees (Note 2) | 531,991 | 245,250 | 2,545 | |||||||||||||||||
Custodian fees (Note 2) | 67,624 | 56,775 | 15,809 | |||||||||||||||||
Trustees’ and officers’ fees (Note 2) | 158,580 | 86,803 | 31,524 | |||||||||||||||||
Printing and shareholder reporting fees | 132,170 | 48,402 | 45,260 | |||||||||||||||||
Registration and filing fees | 56,165 | 27,859 | 27,085 | |||||||||||||||||
Legal fees | 165,677 | 87,740 | 36,518 | |||||||||||||||||
Audit fees | 74,677 | 51,556 | 32,809 | |||||||||||||||||
Other expenses | 64,415 | 39,614 | 18,640 | |||||||||||||||||
|
|
|
|
|
| |||||||||||||||
Total expenses before recoupments, waivers and/or reimbursements | 17,762,450 | 7,864,598 | 3,684,393 | |||||||||||||||||
|
|
|
|
|
| |||||||||||||||
Recoupments, waivers and/or reimbursements (Note 2) | (641,837 | ) | (367,258 | ) | (138,566 | ) | ||||||||||||||
|
|
|
|
|
| |||||||||||||||
Net expenses after recoupments, waivers and/or reimbursements | 17,120,613 | 7,497,340 | 3,545,827 | |||||||||||||||||
|
|
|
|
|
| |||||||||||||||
Net investment loss | (2,607,321 | ) | (1,308,243 | ) | (1,202,743 | ) | ||||||||||||||
|
|
|
|
|
| |||||||||||||||
Net realized and unrealized gain/(loss) from investments: | ||||||||||||||||||||
Net realized gain/(loss) from non-affiliated investments | (10,296,762 | ) | 59,512,077 | 2,550,316 | ||||||||||||||||
Net realized gain/(loss) from securities sold short | 5,844,110 | 11,806 | (1,920,768 | ) | ||||||||||||||||
Net realized loss on swaps | (10,615,564 | )(a) | (67,889,799 | )(a) | (75,297 | )(a) | ||||||||||||||
Net change in unrealized appreciation/(depreciation) on non-affiliated investments | 3,997,827 | (60,679,313 | ) | (3,308,603 | ) | |||||||||||||||
Net change in unrealized appreciation/(depreciation) on securities sold short | (39,712,418 | ) | (15,983 | ) | (14,986,073 | ) | ||||||||||||||
Net change in unrealized appreciation/(depreciation) on swaps | 4,927,599 | (a) | 33,766,037 | (a) | 1,770,576 | (a) | ||||||||||||||
|
|
|
|
|
| |||||||||||||||
Net realized and unrealized loss on investments | (45,855,208 | ) | (35,295,175 | ) | (15,969,849 | ) | ||||||||||||||
|
|
|
|
|
| |||||||||||||||
Net decrease in net assets resulting from operations | $ | (48,462,529 | ) | $ | (36,603,418 | ) | $ | (17,172,592 | ) | |||||||||||
|
|
|
|
|
| |||||||||||||||
| (a) | Primary risk exposure is equity contracts. |
The accompanying notes are an integral part of the financial statements.
153
GOTHAM FUNDS
Statements of Operations (Concluded)
For the Year Ended September 30, 2020
| Gotham Large Value Fund | Gotham Defensive Long 500 Fund | Gotham Total Return Fund | |||||||||||||
Investment Income | |||||||||||||||
Dividends from non-affiliated investments | $ | 1,748,634 | $ | 1,359,503 | $ | — | |||||||||
Dividends from affiliated investments | — | — | 294,464 | ||||||||||||
Interest | 3,163 | 24,535 | 3,191 | ||||||||||||
Income from securities loaned (Note 5) | — | 1,339 | — | ||||||||||||
|
|
|
|
|
| ||||||||||
Total investment income | 1,751,797 | 1,385,377 | 297,655 | ||||||||||||
|
|
|
|
|
| ||||||||||
Expenses | |||||||||||||||
Advisory fees (Note 2) | 487,123 | 759,506 | — | ||||||||||||
Administration and accounting fees (Note 2) | 31,220 | 50,071 | 42,685 | ||||||||||||
Distribution fees (Investor Class) | — | — | 7,163 | ||||||||||||
Transfer agent fees (Note 2) | 34,711 | 9,073 | 32,509 | ||||||||||||
Custodian fees (Note 2) | 4,215 | 9,996 | 11,748 | ||||||||||||
Trustees’ and officers’ fees (Note 2) | 14,061 | 9,313 | 7,007 | ||||||||||||
Printing and shareholder reporting fees | 23,896 | 25,311 | 22,436 | ||||||||||||
Registration and filing fees | 26,487 | 15,739 | 31,254 | ||||||||||||
Legal fees | 14,940 | 17,702 | 9,182 | ||||||||||||
Audit fees | 25,775 | 27,250 | 22,865 | ||||||||||||
Other expenses | 9,314 | 8,033 | 8,250 | ||||||||||||
|
|
|
|
|
| ||||||||||
Total expenses before waivers and/or reimbursements | 671,742 | 931,994 | 195,099 | ||||||||||||
|
|
|
|
|
| ||||||||||
Recoupments and/or waivers, reimbursements (Note 2) | (184,619 | ) | (172,488 | ) | (187,936 | ) | |||||||||
|
|
|
|
|
| ||||||||||
Net expenses after waivers and/or reimbursements | 487,123 | 759,506 | 7,163 | ||||||||||||
|
|
|
|
|
| ||||||||||
Net investment income | 1,264,674 | 625,871 | 290,492 | ||||||||||||
|
|
|
|
|
| ||||||||||
Net realized and unrealized gain/(loss) from investments: | |||||||||||||||
Net realized loss from non-affiliated investments | (5,960,490 | ) | (5,031,097 | ) | — | ||||||||||
Net realized loss from affiliated investments | — | — | (2,193,483 | ) | |||||||||||
Net realized loss on swaps | — | (14,900,273 | )(a) | — | |||||||||||
Capital gain distributions from affiliated investments | — | — | 87,211 | ||||||||||||
Net change in unrealized appreciation/(depreciation) on non-affiliated investments | 2,488,169 | 3,705,817 | — | ||||||||||||
Net change in unrealized appreciation/(depreciation) on affiliated investments | — | — | (861,238 | ) | |||||||||||
Net change in unrealized appreciation/(depreciation) on swaps | — | 8,812,391 | (a) | — | |||||||||||
|
|
|
|
|
| ||||||||||
Net realized and unrealized loss on investments | (3,472,321 | ) | (7,413,162 | ) | (2,967,510 | ) | |||||||||
|
|
|
|
|
| ||||||||||
Net decrease in net assets resulting from operations | $ | (2,207,647 | ) | $ | (6,787,291 | ) | $ | (2,677,018 | ) | ||||||
|
|
|
|
|
| ||||||||||
| (a) | Primary risk exposure is equity price risk. |
The accompanying notes are an integral part of the financial statements.
154
Statements of Changes in Net Assets
| Gotham Absolute Return Fund | Gotham Enhanced Return Fund | |||||||||||||||||||
| For the Year Ended September 30, 2020 | For the Year Ended September 30, 2019 | For the Year Ended September 30, 2020 | For the Year Ended September 30, 2019 | |||||||||||||||||
Net increase/(decrease) in net assets from operations: | ||||||||||||||||||||
Net investment loss | $ | (2,607,321 | ) | $ | (170,085 | ) | $ | (1,308,243 | ) | $ | (3,582,506 | ) | ||||||||
Net realized gain/(loss) from investments, securities sold short and swaps | (15,068,216 | ) | 3,181,003 | (8,365,916 | ) | 164,430,741 | ||||||||||||||
Net change in unrealized appreciation/ (depreciation) on investments, securities sold short and swaps | (30,786,992 | ) | 867,308 | (26,929,259 | ) | (164,513,716 | ) | |||||||||||||
|
|
|
|
|
|
|
| |||||||||||||
Net increase/(decrease) in net assets resulting from operations | (48,462,529 | ) | 3,878,226 | (36,603,418 | ) | (3,665,481 | ) | |||||||||||||
|
|
|
|
|
|
|
| |||||||||||||
Less Dividends and Distributions to Shareholders from: | ||||||||||||||||||||
Institutional Class Shares: | ||||||||||||||||||||
Total distributable earnings | — | — | (124,087,944 | ) | (64,015,741 | ) | ||||||||||||||
|
|
|
|
|
|
|
| |||||||||||||
Net decrease in net assets from dividends and distributions to shareholders | — | — | (124,087,944 | ) | (64,015,741 | ) | ||||||||||||||
|
|
|
|
|
|
|
| |||||||||||||
Decrease in Net Assets from Capital Share Transactions (Note 4) | (302,795,097 | ) | (215,675,985 | ) | (121,651,134 | ) | (259,084,560 | ) | ||||||||||||
|
|
|
|
|
|
|
| |||||||||||||
Total decrease in net assets | (351,257,626 | ) | (211,797,759 | ) | (282,342,496 | ) | (326,765,782 | ) | ||||||||||||
|
|
|
|
|
|
|
| |||||||||||||
Net assets | ||||||||||||||||||||
Beginning of year | 857,246,892 | 1,069,044,651 | 519,067,179 | 845,832,961 | ||||||||||||||||
|
|
|
|
|
|
|
| |||||||||||||
End of year | $ | 505,989,266 | $ | 857,246,892 | $ | 236,724,683 | $ | 519,067,179 | ||||||||||||
|
|
|
|
|
|
|
| |||||||||||||
The accompanying notes are an integral part of the financial statements.
155
GOTHAM FUNDS
Statements of Changes in Net Assets (Continued)
| Gotham Neutral Fund | Gotham Large Value Fund | |||||||||||||||||||
| For the Year Ended September 30, 2020 | For the Year Ended September 30, 2019 | For the Year Ended September 30, 2020 | For the Year Ended September 30, 2019 | |||||||||||||||||
Net increase/(decrease) in net assets from operations: | ||||||||||||||||||||
Net investment income/(loss) | $ | (1,202,743 | ) | $ | 276,397 | $ | 1,264,674 | $ | 836,287 | |||||||||||
Net realized gain/(loss) from investments, securities sold short and swaps | 554,251 | 7,379,264 | (5,960,490 | ) | (966,077 | ) | ||||||||||||||
Net change in unrealized appreciation/ (depreciation) on investments, securities sold short and swaps | (16,524,100 | ) | (6,399,575 | ) | 2,488,169 | 2,655,043 | ||||||||||||||
|
|
|
|
|
|
|
| |||||||||||||
Net increase/(decrease) in net assets resulting from operations | (17,172,592 | ) | 1,256,086 | (2,207,647 | ) | 2,525,253 | ||||||||||||||
|
|
|
|
|
|
|
| |||||||||||||
Less Dividends and Distributions to Shareholders from: | ||||||||||||||||||||
Institutional Class Shares: | ||||||||||||||||||||
Total distributable earnings | — | — | (1,610,912 | ) | (487,128 | ) | ||||||||||||||
|
|
|
|
|
|
|
| |||||||||||||
Net decrease in net assets from dividends and distributions to shareholders | — | — | (1,610,912 | ) | (487,128 | ) | ||||||||||||||
|
|
|
|
|
|
|
| |||||||||||||
Increase/(decrease) in Net Assets from Capital Share Transactions (Note 4) | (108,565,570 | ) | (176,514,391 | ) | 14,843,066 | 25,621,728 | ||||||||||||||
|
|
|
|
|
|
|
| |||||||||||||
Total increase/(decrease) in net assets | (125,738,162 | ) | (175,258,305 | ) | 11,024,507 | 27,659,853 | ||||||||||||||
|
|
|
|
|
|
|
| |||||||||||||
Net assets | ||||||||||||||||||||
Beginning of year | 181,413,452 | 356,671,757 | 58,978,050 | 31,318,197 | ||||||||||||||||
|
|
|
|
|
|
|
| |||||||||||||
End of year | $ | 55,675,290 | $ | 181,413,452 | $ | 70,002,557 | $ | 58,978,050 | ||||||||||||
|
|
|
|
|
|
|
| |||||||||||||
The accompanying notes are an integral part of the financial statements.
156
GOTHAM FUNDS
Statements of Changes in Net Assets (Concluded)
| Gotham Defensive Long 500 Fund | Gotham Total Return Fund | |||||||||||||||||||
| For the Year Ended September 30, 2020 | For the Year Ended September 30, 2019 | For the Year Ended September 30, 2020 | For the Year Ended September 30, 2019 | |||||||||||||||||
Net increase/(decrease) in net assets from operations: | ||||||||||||||||||||
Net investment income | $ | 625,871 | $ | 147,263 | $ | 290,492 | $ | 103,865 | ||||||||||||
Net realized gain/(loss) from investments and swaps | (19,931,370 | ) | (344,861 | ) | (2,106,272 | ) | 1,729,577 | |||||||||||||
Net change in unrealized appreciation/ (depreciation) on investments and swaps | 12,518,208 | 1,532,731 | (861,238 | ) | (1,461,636 | ) | ||||||||||||||
|
|
|
|
|
|
|
| |||||||||||||
Net increase/(decrease) in net assets resulting from operations | (6,787,291 | ) | 1,335,133 | (2,677,018 | ) | 371,806 | ||||||||||||||
|
|
|
|
|
|
|
| |||||||||||||
Less Dividends and Distributions to Shareholders from: | ||||||||||||||||||||
Institutional Class Shares: | ||||||||||||||||||||
Total distributable earnings | (878,804 | ) | (877,426 | ) | (1,914,251 | ) | (384,983 | ) | ||||||||||||
|
|
|
|
|
|
|
| |||||||||||||
Investor Class Shares: | ||||||||||||||||||||
Total distributable earnings | — | — | (178,991 | ) | (28,675 | ) | ||||||||||||||
|
|
|
|
|
|
|
| |||||||||||||
Net decrease in net assets from dividends and distributions to shareholders | (878,804 | ) | (877,426 | ) | (2,093,242 | ) | (413,658 | ) | ||||||||||||
|
|
|
|
|
|
|
| |||||||||||||
Increase/(decrease) in Net Assets from Capital Share Transactions (Note 4) | 2,973,681 | 47,878,679 | (1,481,855 | ) | 6,603,654 | |||||||||||||||
|
|
|
|
|
|
|
| |||||||||||||
Total increase/(decrease) in net assets | (4,692,414 | ) | 48,336,386 | (6,252,115 | ) | 6,561,802 | ||||||||||||||
|
|
|
|
|
|
|
| |||||||||||||
Net assets | ||||||||||||||||||||
Beginning of year | 59,367,771 | 11,031,385 | 34,889,481 | 28,327,679 | ||||||||||||||||
|
|
|
|
|
|
|
| |||||||||||||
End of year | $ | 54,675,357 | $ | 59,367,771 | $ | 28,637,366 | $ | 34,889,481 | ||||||||||||
|
|
|
|
|
|
|
| |||||||||||||
The accompanying notes are an integral part of the financial statements.
157
Statement of Cash Flow
| Gotham Absolute Return Fund | Gotham Neutral Fund | |||||||||
| For the Year Ended September 30, 2020 | For the Year Ended September 30, 2020 | |||||||||
Cash flows provided by (used in) operating activities: | ||||||||||
Net decrease in net assets resulting from operations | $ | (48,462,529 | ) | $ | (17,172,592 | ) | ||||
Adjustments to reconcile net decrease in net assets resulting from operations to net cash provided by (used in) operating activities: | ||||||||||
Purchases of long-term portfolio investments | (2,026,770,272 | ) | (540,610,027 | ) | ||||||
Proceeds from disposition of long-term portfolio investments | 2,568,782,215 | 707,721,904 | ||||||||
Purchases to cover securities sold short | (1,784,121,217 | ) | (675,171,562 | ) | ||||||
Proceeds from securities sold short | 1,236,066,469 | 483,302,276 | ||||||||
Net payments received from (made to) counterparties for derivative contracts | (10,617,489 | ) | (73,637 | ) | ||||||
Net realized gain (loss) on investments, securities sold short, swaps and foreign currency | 15,068,216 | (554,251 | ) | |||||||
Net change in unrealized appreciation/(depreciation) on investments, securities sold short and swaps | 30,786,992 | 16,524,100 | ||||||||
Return of capital received from real estate investment trusts | 34,061 | 36,442 | ||||||||
Decrease in receivable for securities sold. | 18,032,026 | 6,557,953 | ||||||||
Decrease in dividend and interest receivable | 786,289 | 208,791 | ||||||||
Decrease in prepaid expenses and other assets | 3,892 | 3,662 | ||||||||
Increase in receivable from Investment Advisor | (958,335 | ) | (387,991 | ) | ||||||
Decrease in payable for investments purchased | (19,974,319 | ) | (7,278,248 | ) | ||||||
Decrease in due to broker | (64,459 | ) | (114,486 | ) | ||||||
Increase/(decrease) in payable for dividends on securities sold short | 37,761 | (46,046 | ) | |||||||
Class action settlement proceeds | 104,047 | 106,819 | ||||||||
Decrease in accrued expense payable | (43,745 | ) | (119,241 | ) | ||||||
|
|
|
| |||||||
Net cash provided by operating activities | (21,310,397 | ) | (27,066,134 | ) | ||||||
|
|
|
| |||||||
Cash flows from financing activities: | ||||||||||
Proceeds from shares sold | 111,960,141 | 22,937,648 | ||||||||
Payment of shares redeemed | (413,922,799 | ) | (131,164,110 | ) | ||||||
|
|
|
| |||||||
Net cash used in financing activities | (301,962,658 | ) | (108,226,462 | ) | ||||||
|
|
|
| |||||||
Net decrease in cash and restricted cash | (323,273,055 | ) | (135,292,596 | ) | ||||||
Cash and restricted cash: | ||||||||||
Beginning of Year: | 342,071,075 | 136,210,172 | ||||||||
End of Year: | 18,798,020 | 917,576 | ||||||||
Reconciliation of restricted and unrestricted cash at the beginning of the year to the statements of assets and liabilities: | ||||||||||
Cash | 2,286,893 | 396,767 | ||||||||
Restricted cash | 339,784,182 | 135,813,405 | ||||||||
Reconciliation of restricted and unrestricted cash at the end of the year to the statements of assets and liabilities: | ||||||||||
Cash | $ | 18,798,020 | $ | 917,576 | ||||||
|
|
|
| |||||||
Restricted cash | $ | — | $ | — | ||||||
|
|
|
| |||||||
Supplemental disclosure of cash flow information: | ||||||||||
Cash received during the year for financing charges | $ | (546,056 | ) | $ | (444,576 | ) | ||||
The accompanying notes are an integral part of the financial statements.
158
Financial Highlights
Contained below is per share operating performance data for Institutional Class shares outstanding, total investment return, ratios to average net assets and other supplemental data for the respective period. The total returns in the table represent the rate that an investor would have earned or lost on an investment in a Fund (assuming reinvestment of all dividends and distributions). This information has been derived from information provided in the financial statements and should be read in conjunction with the financial statements and the notes thereto.
| Gotham Absolute Return Fund Institutional Class Shares | |||||||||||||||||||||||||
| Year Ended September 30, 2020 | Year Ended September 30, 2019 | Year Ended September 30, 2018 | Year Ended September 30, 2017 | Year Ended September 30, 2016 | |||||||||||||||||||||
Per Share Operating Performance | |||||||||||||||||||||||||
Net asset value, beginning of year | $ | 15.01 | $ | 14.86 | $ | 13.94 | $ | 12.70 | $ | 12.48 | |||||||||||||||
|
|
|
|
|
|
|
|
|
| ||||||||||||||||
Net investment loss(1) | (0.06 | ) | (0.00 | )(2) | (0.09 | ) | (0.12 | ) | (0.07 | ) | |||||||||||||||
Net realized and unrealized gain/(loss) on investments | (0.56 | ) | 0.15 | 1.01 | 1.36 | 0.46 | |||||||||||||||||||
|
|
|
|
|
|
|
|
|
| ||||||||||||||||
Total from investment operations | (0.62 | ) | 0.15 | 0.92 | 1.24 | 0.39 | |||||||||||||||||||
|
|
|
|
|
|
|
|
|
| ||||||||||||||||
Dividends and distributions to shareholders from: | |||||||||||||||||||||||||
Net realized capital gains | — | — | — | — | (0.17 | ) | |||||||||||||||||||
|
|
|
|
|
|
|
|
|
| ||||||||||||||||
Total dividends and distributions to shareholders | — | — | — | — | (0.17 | ) | |||||||||||||||||||
|
|
|
|
|
|
|
|
|
| ||||||||||||||||
Redemption fees | 0.00 | (3) | 0.00 | (3) | 0.00 | (3) | 0.00 | (3) | 0.00 | (3) | |||||||||||||||
|
|
|
|
|
|
|
|
|
| ||||||||||||||||
Net asset value, end of year | $ | 14.39 | $ | 15.01 | $ | 14.86 | $ | 13.94 | $ | 12.70 | |||||||||||||||
|
|
|
|
|
|
|
|
|
| ||||||||||||||||
Total investment return(4) | (4.13 | )% | 1.01 | % | 6.60 | % | 9.76 | % | 3.14 | % | |||||||||||||||
Ratio/Supplemental Data | |||||||||||||||||||||||||
Net assets, end of year (in 000s) | $ | 505,989 | $ | 857,247 | $ | 1,069,045 | $ | 884,205 | $ | 982,987 | |||||||||||||||
Ratio of expenses to average net assets with waivers, expense reimbursements, and recoupments if any (including dividend and interest expense)(5) | 2.55 | % | 2.58 | % | 2.56 | % | 2.81 | % | 3.09 | % | |||||||||||||||
Ratio of expenses to average net assets without waivers, expense reimbursements, and recoupments if any(5)(6) | 2.65 | % | 2.60 | % | 2.63 | % | 2.95 | % | 3.09 | % | |||||||||||||||
Ratio of net investment loss to average net assets (including dividend and interest expense) | (0.39 | )% | | (0.02 | )%(7) | (0.58 | )% | (0.88 | )% | (0.56 | )% | ||||||||||||||
Portfolio turnover rate | 259 | % | 233 | % | 258 | % | 238 | % | 272 | % | |||||||||||||||
| (1) | The selected per share data was calculated using the average shares outstanding method for the period. |
| (2) | Amount is less than $(0.005) per share. |
| (3) | Amount is less than $0.005 per share. |
| (4) | Total investment return is calculated assuming a purchase of shares on the first day and a sale of shares on the last day of each period reported and includes reinvestment of dividends and distributions, if any. Total returns for periods less than one year are not annualized. |
| (5) | Expense ratio includes dividend and fees on securities sold short and fees on cash collateral. Excluding such dividend and fees on securities sold short and fees on cash collateral, the ratio of expenses to average net assets including waivers, reimbursement, and recoupments for the Fund would be 2.05%, 2.15%, 2.15%, 2.15% and 2.20% for the years ended September 30, 2020, 2019, 2018, 2017 and 2016, respectively. |
| (6) | During the period, certain fees were reduced or expenses were recouped. If such fee reductions or recoupments had not occurred, the ratios would have been as shown (See Note 2). |
| (7) | Net rebate income on securities sold short exceeded dividends and fees on securities sold short during the period. (See Note 1). |
The accompanying notes are an integral part of the financial statements.
159
GOTHAM FUNDS
Financial Highlights (Continued)
Contained below is per share operating performance data for Institutional Class shares outstanding, total investment return, ratios to average net assets and other supplemental data for the respective period. The total returns in the table represent the rate that an investor would have earned or lost on an investment in a Fund (assuming reinvestment of all dividends and distributions). This information has been derived from information provided in the financial statements and should be read in conjunction with the financial statements and the notes thereto.
| Gotham Enhanced Return Fund Institutional Class Shares | |||||||||||||||||||||||||
| Year Ended September 30, 2020 | Year Ended September 30, 2019 | Year Ended September 30, 2018 | Year Ended September 30, 2017 | Year Ended September 30, 2016 | |||||||||||||||||||||
Per Share Operating Performance | |||||||||||||||||||||||||
Net asset value, beginning of year | $ | 14.51 | $ | 15.55 | $ | 13.68 | $ | 11.79 | $ | 11.10 | |||||||||||||||
|
|
|
|
|
|
|
|
|
| ||||||||||||||||
Net investment income/(loss)(1) | (0.04 | ) | (0.08 | ) | (0.13 | ) | (0.07 | ) | 0.02 | ||||||||||||||||
Net realized and unrealized gain/(loss) on investments | (0.48 | ) | 0.26 | 2.14 | 1.96 | 0.87 | |||||||||||||||||||
|
|
|
|
|
|
|
|
|
| ||||||||||||||||
Total from investment operations | (0.52 | ) | 0.18 | 2.01 | 1.89 | 0.89 | |||||||||||||||||||
|
|
|
|
|
|
|
|
|
| ||||||||||||||||
Dividends and distributions to shareholders from: | |||||||||||||||||||||||||
Net realized capital gains | (3.78 | ) | (1.22 | ) | (0.14 | ) | — | (0.20 | ) | ||||||||||||||||
|
|
|
|
|
|
|
|
|
| ||||||||||||||||
Total dividends and distributions to shareholders | (3.78 | ) | (1.22 | ) | (0.14 | ) | — | (0.20 | ) | ||||||||||||||||
|
|
|
|
|
|
|
|
|
| ||||||||||||||||
Redemption fees | 0.00 | (2) | 0.00 | (2) | 0.00 | (2) | 0.00 | (2) | 0.00 | (2) | |||||||||||||||
|
|
|
|
|
|
|
|
|
| ||||||||||||||||
Net asset value, end of year | $ | 10.21 | $ | 14.51 | $ | 15.55 | $ | 13.68 | $ | 11.79 | |||||||||||||||
|
|
|
|
|
|
|
|
|
| ||||||||||||||||
Total investment return(3) | (6.81 | )% | 1.79 | % | 14.79 | % | 16.03 | % | 8.18 | % | |||||||||||||||
Ratio/Supplemental Data | |||||||||||||||||||||||||
Net assets, end of year (in 000s) | $ | 236,725 | $ | 519,067 | $ | 845,833 | $ | 897,371 | $ | 950,202 | |||||||||||||||
Ratio of expenses to average net assets with waivers, expense reimbursements, and recoupments if any (including dividend and interest expense)(4) | 2.12 | % | 3.56 | % | 3.63 | % | 3.55 | % | 3.58 | % | |||||||||||||||
Ratio of expenses to average net assets without waivers, expense reimbursements, and recoupments if any(4)(5) | 2.22 | % | 3.56 | % | 3.67 | % | 3.56 | % | 3.58 | % | |||||||||||||||
Ratio of net investment income/(loss) to average net assets (including dividend and interest expense) | (0.37 | )% | (0.56 | )% | (0.84 | )% | (0.51 | )% | 0.16 | % | |||||||||||||||
Portfolio turnover rate | 213 | % | 204 | % | 197 | % | 196 | % | 248 | % | |||||||||||||||
| (1) | The selected per share data was calculated using the average shares outstanding method for the period. |
| (2) | Amount is less than $0.005 per share. |
| (3) | Total investment return is calculated assuming a purchase of shares on the first day and a sale of shares on the last day of each period reported and includes reinvestment of dividends and distributions, if any. Total returns for periods less than one year are not annualized. |
| (4) | Expense ratio includes dividend and fees on securities sold short and fees on cash collateral. Excluding such dividend and fees on securities sold short and fees on cash collateral, the ratio of expenses to average net assets including waivers, reimbursement, and recoupments for the Fund would be 2.06%, 2.15%, 2.15%, 2.15% and 2.15% for years ended September 30, 2020, 2019, 2018, 2017 and 2016, respectively. |
| (5) | During the period, certain fees were reduced or expenses were recouped. If such fee reductions or recoupments had not occurred, the ratios would have been as shown (See Note 2). |
The accompanying notes are an integral part of the financial statements.
160
GOTHAM FUNDS
Financial Highlights (Continued)
Contained below is per share operating performance data for Institutional Class shares outstanding, total investment return, ratios to average net assets and other supplemental data for the respective period. The total returns in the table represent the rate that an investor would have earned or lost on an investment in a Fund (assuming reinvestment of all dividends and distributions). This information has been derived from information provided in the financial statements and should be read in conjunction with the financial statements and the notes thereto.
| Gotham Neutral Fund Institutional Class Shares | |||||||||||||||||||||||||
| Year Ended September 30, 2020 | Year Ended September 30, 2019 | Year Ended September 30, 2018 | Year Ended September 30, 2017 | Year Ended September 30, 2016 | |||||||||||||||||||||
Per Share Operating Performance | |||||||||||||||||||||||||
Net asset value, beginning of year | $ | 10.35 | $ | 10.25 | $ | 10.23 | $ | 9.91 | $ | 9.99 | |||||||||||||||
|
|
|
|
|
|
|
|
|
| ||||||||||||||||
Net investment income/(loss)(1) | (0.09 | ) | 0.01 | (0.09 | ) | (0.13 | ) | (0.10 | ) | ||||||||||||||||
Net realized and unrealized gain/(loss) on investments | (1.07 | ) | 0.09 | 0.11 | 0.45 | 0.08 | |||||||||||||||||||
|
|
|
|
|
|
|
|
|
| ||||||||||||||||
Total from investment operations | (1.16 | ) | 0.10 | 0.02 | 0.32 | (0.02 | ) | ||||||||||||||||||
|
|
|
|
|
|
|
|
|
| ||||||||||||||||
Dividends and distributions to shareholders from: | |||||||||||||||||||||||||
Net realized capital gains | — | — | — | — | (0.06 | ) | |||||||||||||||||||
|
|
|
|
|
|
|
|
|
| ||||||||||||||||
Total dividends and distributions to shareholders | — | — | — | — | (0.06 | ) | |||||||||||||||||||
|
|
|
|
|
|
|
|
|
| ||||||||||||||||
Redemption fees | 0.00 | (2) | 0.00 | (2) | 0.00 | (2) | 0.00 | (2) | 0.00 | (2) | |||||||||||||||
|
|
|
|
|
|
|
|
|
| ||||||||||||||||
Net asset value, end of year | $ | 9.19 | $ | 10.35 | $ | 10.25 | $ | 10.23 | $ | 9.91 | |||||||||||||||
|
|
|
|
|
|
|
|
|
| ||||||||||||||||
Total investment return(3) | (11.21 | )% | 0.98 | % | 0.20 | % | 3.23 | % | (0.16 | )% | |||||||||||||||
Ratio/Supplemental Data | |||||||||||||||||||||||||
Net assets, end of year (in 000s) | $ | 55,675 | $ | 181,413 | $ | 356,672 | $ | 669,540 | $ | 783,024 | |||||||||||||||
Ratio of expenses to average net assets with waivers, expense reimbursements, and recoupments if any (including dividend and interest expense)(4) | 2.79 | % | 2.34 | % | 2.61 | % | 3.10 | % | 3.56 | % | |||||||||||||||
Ratio of expenses to average net assets without waivers, expense reimbursements, and recoupments if any(4)(5) | 2.90 | % | 2.33 | % | 2.73 | % | 3.14 | % | 3.56 | % | |||||||||||||||
Ratio of net investment income/(loss) to average net assets (including dividend and interest expense) | (0.95 | )% | 0.11 | %(6) | (0.87 | )% | (1.31 | )% | (1.02 | )% | |||||||||||||||
Portfolio turnover rate | 356 | % | 331 | % | 274 | % | 261 | % | 303 | % | |||||||||||||||
| (1) | The selected per share data was calculated using the average shares outstanding method for the period. |
| (2) | Amount is less than $0.005 per share. |
| (3) | Total investment return is calculated assuming a purchase of shares on the first day and a sale of shares on the last day of each period reported and includes reinvestment of dividends and distributions, if any. Total returns for periods less than one year are not annualized. |
| (4) | Expense ratio includes dividend and fees on securities sold short and fees on cash collateral. Excluding such dividend and fees on securities sold short and fees on cash collateral, the ratio of expenses to average net assets including waivers, reimbursement, and recoupments for the Fund would be 2.09%, 2.15%, 2.15%, 2.15% and 2.16% for the years ended September 30, 2020, 2019, 2018, 2017 and 2016, respectively. |
| (5) | During the period, certain fees were reduced or expenses were recouped. If such fee reductions or recoupments had not occurred, the ratios would have been as shown (See Note 2). |
| (6) | Net rebate income on securities sold short exceeded dividends and fees on securities sold short during the period. (See Note 1). |
The accompanying notes are an integral part of the financial statements.
161
GOTHAM FUNDS
Financial Highlights (Continued)
Contained below is per share operating performance data for Institutional Class shares outstanding, total investment return, ratios to average net assets and other supplemental data for the respective period. The total returns in the table represent the rate that an investor would have earned or lost on an investment in a Fund (assuming reinvestment of all dividends and distributions). This information has been derived from information provided in the financial statements and should be read in conjunction with the financial statements and the notes thereto.
| Gotham Large Value Fund Institutional Class Shares | |||||||||||||||||||||||||
| Year Ended September 30, 2020 | Year Ended September 30, 2019 | Year Ended September 30, 2018 | Year Ended September 30, 2017 | Period Ended September 30, 2016* | |||||||||||||||||||||
Per Share Operating Performance | |||||||||||||||||||||||||
Net asset value, beginning of year/period | $ | 13.29 | $ | 13.02 | $ | 12.46 | $ | 10.87 | $ | 10.00 | |||||||||||||||
|
|
|
|
|
|
|
|
|
| ||||||||||||||||
Net investment income(1) | 0.25 | 0.20 | 0.14 | 0.14 | 0.11 | ||||||||||||||||||||
Net realized and unrealized gain/(loss) on investments | (0.22 | ) | 0.18 | 2.03 | 1.71 | 0.76 | |||||||||||||||||||
|
|
|
|
|
|
|
|
|
| ||||||||||||||||
Total from investment operations | 0.03 | 0.38 | 2.17 | 1.85 | 0.87 | ||||||||||||||||||||
|
|
|
|
|
|
|
|
|
| ||||||||||||||||
Dividends and distributions to shareholders from: | |||||||||||||||||||||||||
Net investment income | (0.23 | ) | (0.01 | ) | (0.28 | ) | (0.26 | ) | — | ||||||||||||||||
Net realized capital gains | (0.11 | ) | (0.10 | ) | (1.33 | ) | — | — | |||||||||||||||||
|
|
|
|
|
|
|
|
|
| ||||||||||||||||
Total dividends and distributions to shareholders | (0.34 | ) | (0.11 | ) | (1.61 | ) | (0.26 | ) | — | ||||||||||||||||
|
|
|
|
|
|
|
|
|
| ||||||||||||||||
Redemption fees | 0.00 | (2) | — | — | — | — | |||||||||||||||||||
|
|
|
|
|
|
|
|
|
| ||||||||||||||||
Net asset value, end of year/period | $ | 12.98 | $ | 13.29 | $ | 13.02 | $ | 12.46 | $ | 10.87 | |||||||||||||||
|
|
|
|
|
|
|
|
|
| ||||||||||||||||
Total investment return(3) | 0.04 | % | 3.11 | % | 18.93 | % | 17.31 | % | 8.70 | % | |||||||||||||||
Ratio/Supplemental Data | |||||||||||||||||||||||||
Net assets, end of year/period (in 000s) | $ | 70,003 | $ | 58,978 | $ | 31,318 | $ | 2,627 | $ | 2,236 | |||||||||||||||
Ratio of expenses to average net assets with waivers, expense reimbursements, and recoupments if any | 0.75 | % | 0.75 | % | 0.88 | % | 0.95 | % | 0.95 | %(4) | |||||||||||||||
Ratio of expenses to average net assets without waivers, expense reimbursements, and recoupments if any(5) | 1.03 | % | 1.05 | % | 2.19 | % | 4.40 | % |
| 4.90 | %(4) | ||||||||||||||
Ratio of net investment income to average net assets | 1.95 | % | 1.61 | % | 1.12 | % | 1.19 | % |
| 1.41 | %(4) | ||||||||||||||
Portfolio turnover rate | 406 | % | 316 | % | 670 | % | 169 | % | 244 | %(6) | |||||||||||||||
| * | Commencement of operations. Initial seed capital was issued at $10.00 per share on December 31, 2015. |
| (1) | The selected per share data was calculated using the average shares outstanding method for the period. |
| (2) | Amount is less than $0.005 per share. |
| (3) | Total investment return is calculated assuming a purchase of shares on the first day and a sale of shares on the last day of each period reported and includes reinvestment of dividends and distributions, if any. Total returns for periods less than one year are not annualized. |
| (4) | Annualized. |
| (5) | During the period, certain fees were reduced or expenses were recouped. If such fee reductions or recoupments had not occurred, the ratios would have been as shown (See Note 2). |
| (6) | Not annualized. |
The accompanying notes are an integral part of the financial statements.
162
GOTHAM FUNDS
Financial Highlights (Continued)
Contained below is per share operating performance data for Institutional Class shares outstanding, total investment return, ratios to average net assets and other supplemental data for the respective period. The total returns in the table represent the rate that an investor would have earned or lost on an investment in a Fund (assuming reinvestment of all dividends and distributions). This information has been derived from information provided in the financial statements and should be read in conjunction with the financial statements and the notes thereto.
| Gotham Defensive Long 500 Fund Institutional Class Shares | |||||||||||||||||||||||||
| Year Ended September 30, 2020 | Year Ended September 30, 2019 | Year Ended September 30, 2018 | Year Ended September 30, 2017 | Period Ended September 30, 2016* | |||||||||||||||||||||
Per Share Operating Performance | |||||||||||||||||||||||||
Net asset value, beginning of year/period | $ | 13.20 | $ | 13.78 | $ | 11.71 | $ | 9.99 | $ | 10.00 | |||||||||||||||
|
|
|
|
|
|
|
|
|
| ||||||||||||||||
Net investment income(1) | 0.14 | 0.13 | 0.09 | 0.04 | — | ||||||||||||||||||||
Net realized and unrealized gain/(loss) on investments | (1.17 | ) | 0.32 | 2.06 | 1.68 | (0.01 | ) | ||||||||||||||||||
|
|
|
|
|
|
|
|
|
| ||||||||||||||||
Total from investment operations | (1.03 | ) | 0.45 | 2.15 | 1.72 | (0.01 | ) | ||||||||||||||||||
|
|
|
|
|
|
|
|
|
| ||||||||||||||||
Dividends and distributions to shareholders from: | |||||||||||||||||||||||||
Net investment income | (0.08 | ) | (0.07 | ) | (0.08 | ) | — | — | |||||||||||||||||
Net realized capital gains | (0.11 | ) | (0.96 | ) | — | — | — | ||||||||||||||||||
|
|
|
|
|
|
|
|
|
| ||||||||||||||||
Total dividends and distributions to shareholders | (0.19 | ) | (1.03 | ) | (0.08 | ) | — | — | |||||||||||||||||
|
|
|
|
|
|
|
|
|
| ||||||||||||||||
Redemption fees | 0.00 | (2) | — | — | — | — | |||||||||||||||||||
|
|
|
|
|
|
|
|
|
| ||||||||||||||||
Net asset value, end of year/period | $ | 11.98 | $ | 13.20 | $ | 13.78 | $ | 11.71 | $ | 9.99 | |||||||||||||||
|
|
|
|
|
|
|
|
|
| ||||||||||||||||
Total investment return(3) | (7.95 | )% | 3.71 | % | 18.42 | % | 17.10 | % | (0.10 | )% | |||||||||||||||
Ratio/Supplemental Data | |||||||||||||||||||||||||
Net assets, end of year/period (in 000s) | $ | 54,675 | $ | 59,368 | $ | 11,031 | $ | 7,940 | $ | 1,999 | |||||||||||||||
Ratio of expenses to average net assets with waivers, expense reimbursements, and recoupments if any (including dividend and interest expense)(4) | 1.35 | % | 3.21 | % | 3.51 | % | 3.80 | % | — | ||||||||||||||||
Ratio of expenses to average net assets without waivers, expense reimbursements, and recoupments if any(4)(5) | 1.66 | % | 3.81 | % | 4.08 | % | 5.01 | % | — | ||||||||||||||||
Ratio of net investment income to average net assets (including dividend and interest expense) | 1.11 | % | 1.03 | % | 0.73 | % | 0.39 | % | — | ||||||||||||||||
Portfolio turnover rate | 294 | % | 429 | % | 220 | % | 259 | % | — | ||||||||||||||||
| * | Commencement of operations. Initial seed capital was issued at $10.00 per share on September 30, 2016. |
| (1) | The selected per share data was calculated using the average shares outstanding method for the period. |
| (2) | Amount is less than $0.005 per share. |
| (3) | Total investment return is calculated assuming a purchase of shares on the first day and a sale of shares on the last day of each period reported and includes reinvestment of dividends and distributions, if any. Total returns for periods less than one year are not annualized. |
| (4) | Expense ratio includes dividend and fees on securities sold short. Excluding such dividend and fees on securities sold short, the ratio of expenses to average net assets including waivers, reimbursements, and recoupments for the Fund would be 1.42%, 1.50% and 1.50% for the years ended September 30, 2019, 2018 and 2017, respectively. |
| (5) | During the period, certain fees were reduced or expenses were recouped. If such fee reductions or recoupments had not occurred, the ratios would have been as shown (See Note 2). |
The accompanying notes are an integral part of the financial statements.
163
GOTHAM FUNDS
Financial Highlights (Continued)
Contained below is per share operating performance data for Institutional Class shares outstanding, total investment return, ratios to average net assets and other supplemental data for the respective period. The total returns in the table represent the rate that an investor would have earned or lost on an investment in a Fund (assuming reinvestment of all dividends and distributions). This information has been derived from information provided in the financial statements and should be read in conjunction with the financial statements and the notes thereto.
| Gotham Total Return Fund Institutional Class Shares | |||||||||||||||||||||||||
| Year Ended September 30, 2020 | Year Ended September 30, 2019 | Year Ended September 30, 2018 | Year Ended September 30, 2017 | Year Ended September 30, 2016 | |||||||||||||||||||||
Per Share Operating Performance | |||||||||||||||||||||||||
Net asset value, beginning of year | $ | 13.28 | $ | 13.38 | $ | 11.60 | $ | 10.02 | $ | 9.33 | |||||||||||||||
|
|
|
|
|
|
|
|
|
| ||||||||||||||||
Net investment income(1) | 0.11 | 0.05 | 0.03 | 0.01 | 0.17 | ||||||||||||||||||||
Net realized and unrealized gain/(loss) on investments | (0.91 | ) | 0.03 | 1.80 | 1.58 | 0.72 | |||||||||||||||||||
|
|
|
|
|
|
|
|
|
| ||||||||||||||||
Total from investment operations | (0.80 | ) | 0.08 | 1.83 | 1.59 | 0.89 | |||||||||||||||||||
|
|
|
|
|
|
|
|
|
| ||||||||||||||||
Dividends and distributions to shareholders from: | |||||||||||||||||||||||||
Net investment income | (0.11 | ) | (0.05 | ) | (0.04 | ) | (0.01 | ) | (0.18 | ) | |||||||||||||||
Net realized capital gains | (0.67 | ) | (0.13 | ) | (0.01 | ) | — | (0.02 | ) | ||||||||||||||||
|
|
|
|
|
|
|
|
|
| ||||||||||||||||
Total dividends and distributions to shareholders | (0.78 | ) | (0.18 | ) | (0.05 | ) | (0.01 | ) | (0.20 | ) | |||||||||||||||
|
|
|
|
|
|
|
|
|
| ||||||||||||||||
Redemption fees | 0.00 | (2) | 0.00 | (2) | — | — | — | ||||||||||||||||||
|
|
|
|
|
|
|
|
|
| ||||||||||||||||
Net asset value, end of year | $ | 11.70 | $ | 13.28 | $ | 13.38 | $ | 11.60 | $ | 10.02 | |||||||||||||||
|
|
|
|
|
|
|
|
|
| ||||||||||||||||
Total investment return(3) | (6.54 | )% | 0.67 | % | 15.73 | % | 15.82 | % | 9.65 | % | |||||||||||||||
Ratio/Supplemental Data | |||||||||||||||||||||||||
Net assets, end of year (in 000s) | $ | 25,967 | $ | 32,167 | $ | 26,218 | $ | 18,539 | $ | 8,062 | |||||||||||||||
Ratio of expenses to average net assets with waivers, expense reimbursements, and recoupments if any | 0.00 | % | 0.00 | % | 0.00 | % | 0.02 | % | 0.17 | % | |||||||||||||||
Ratio of expenses to average net assets without waivers, expense reimbursements, and recoupments if any(4) | 0.59 | % | 0.69 | % | 0.51 | % | 0.74 | % | 1.55 | % | |||||||||||||||
Ratio of net investment income to average net assets | 0.94 | % | 0.35 | % | 0.27 | % | 0.09 | % | 1.78 | % | |||||||||||||||
Portfolio turnover rate | 55 | % | 3 | % | 1 | % | 27 | % | 6 | % | |||||||||||||||
| (1) | The selected per share data was calculated using the average shares outstanding method for the period. |
| (2) | Amount is less than $0.005 per share. |
| (3) | Total investment return is calculated assuming a purchase of shares on the first day and a sale of shares on the last day of each period reported and includes reinvestment of dividends and distributions, if any. Total returns for periods less than one year are not annualized. |
| (4) | During the period, certain fees were reduced or expenses were recouped. If such fee reductions or recoupments had not occurred, the ratios would have been as shown (See Note 2). |
The accompanying notes are an integral part of the financial statements.
164
GOTHAM FUNDS
Financial Highlights (Concluded)
Contained below is per share operating performance data for Investor Class shares outstanding, total investment return, ratios to average net assets and other supplemental data for the respective period. The total returns in the table represent the rate that an investor would have earned or lost on an investment in a Fund (assuming reinvestment of all dividends and distributions). This information has been derived from information provided in the financial statements and should be read in conjunction with the financial statements and the notes thereto.
| Gotham Total Return Fund Investor Class Shares | |||||||||||||||
| Year Ended September 30, 2020 | Year Ended September 30, 2019 | Period Ended September 30, 2018* | |||||||||||||
Per Share Operating Performance | |||||||||||||||
Net asset value, beginning of year/period | $ | 13.24 | $ | 13.35 | $ | 12.60 | |||||||||
|
|
|
|
|
| ||||||||||
Net investment income/(loss)(1) | 0.08 | 0.01 | (0.02 | ) | |||||||||||
Net realized and unrealized gain/(loss) on investments | (0.90 | ) | 0.03 | 0.77 | |||||||||||
|
|
|
|
|
| ||||||||||
Total from investment operations | (0.82 | ) | 0.04 | 0.75 | |||||||||||
|
|
|
|
|
| ||||||||||
Dividends and distributions to shareholders from: | |||||||||||||||
Net investment income | (0.08 | ) | (0.02 | ) | — | ||||||||||
Net realized capital gains | (0.67 | ) | (0.13 | ) | — | ||||||||||
|
|
|
|
|
| ||||||||||
Total dividends and distributions to shareholders | (0.75 | ) | (0.15 | ) | — | ||||||||||
|
|
|
|
|
| ||||||||||
Redemption fees | 0.00 | (2) | 0.00 | (2) | — | ||||||||||
|
|
|
|
|
| ||||||||||
Net asset value, end of year/period | $ | 11.67 | $ | 13.24 | $ | 13.35 | |||||||||
|
|
|
|
|
| ||||||||||
Total investment return(3) | (6.70 | )% | 0.40 | % | 5.95 | % | |||||||||
Ratio/Supplemental Data | |||||||||||||||
Net assets, end of year/period (in 000s) | $ | 2,670 | $ | 2,723 | $ | 2,110 | |||||||||
Ratio of expenses to average net assets with waivers, expense reimbursements, and recoupments if any | 0.25 | % | 0.25 | % | 0.25 | %(4) | |||||||||
Ratio of expenses to average net assets without waivers, expense reimbursements, and recoupments if any(5) | 0.84 | % | 0.93 | % |
| 0.76 | %(4) | ||||||||
Ratio of net investment income/(loss) to average net assets | 0.67 | % | 0.08 | % |
| (0.24 | )%(4) | ||||||||
Portfolio turnover rate | 55 | % | 3 | % | 1 | %(6) | |||||||||
| * | Investor Class commenced operations on January 2, 2018. Total return is calculated based on inception date of December 29, 2017, when initial seed capital was issued at $12.60 per share. |
| (1) | The selected per share data was calculated using the average shares outstanding method for the period. |
| (2) | Amount is less than $0.005 per share. |
| (3) | Total investment return is calculated assuming a purchase of shares on the first day and a sale of shares on the last day of each period reported and includes reinvestment of dividends and distributions, if any. Total returns for periods less than one year are not annualized. |
| (4) | Annualized. |
| (5) | During the period, certain fees were reduced or expenses were recouped. If such fee reductions or recoupments had not occurred, the ratios would have been as shown (See Note 2). |
| (6) | Not annualized. |
The accompanying notes are an integral part of the financial statements.
165
Notes to Financial Statements
September 30, 2020
1. Organization and Significant Accounting Policies
The Gotham Absolute Return Fund, the Gotham Enhanced Return Fund, the Gotham Neutral Fund, the Gotham Large Value Fund, the Gotham Defensive Long 500 Fund and the Gotham Total Return Fund (each a “Fund” and together, the “Funds”) are each a diversified, open-end management investment company registered under the Investment Company Act of 1940, as amended (the “1940 Act”). The Funds are each a separate series of FundVantage Trust (the “Trust”) which was organized as a Delaware statutory trust on August 28, 2006. The Trust is a “series trust” authorized to issue an unlimited number of separate series or classes of shares of beneficial interest. Each series is treated as a separate entity for certain matters under the 1940 Act, and for other purposes, and a shareholder of one series is not deemed to be a shareholder of any other series. Each of the Funds, except for the Gotham Total Return Fund, offers one class of shares, Institutional Class. The Gotham Total Return Fund offers two classes of shares, Institutional Class and Investor Class. The Funds’ commencement of operations are as follows:
Gotham Absolute Return Fund (“Absolute Return”) | August 31, 2012 | |
Gotham Enhanced Return Fund (“Enhanced Return”) | May 31, 2013 | |
Gotham Neutral Fund (“Neutral”) | August 30, 2013 | |
Gotham Large Value Fund (“Large Value”) | December 31, 2015 | |
Gotham Defensive Long 500 Fund (“Defensive Long 500”) | September 30, 2016 | |
Gotham Total Return Fund (“Total Return”) | March 31, 2015 |
All the Funds except for Large Value and Total Return seek to achieve their investment objectives by primarily investing in long and short positions of U.S. equity securities. Equity securities include common and preferred stocks. Large Value seeks to achieve its investment objective by primarily investing in long positions of U.S. large capitalization equity securities with market capitalization similar to companies in the S&P 500® Index or Russell 1000® Index, but may invest in other large capitalization companies. Total Return seeks to achieve its investment objective by primarily investing in the other funds advised by Gotham.
The Funds are investment companies and follow accounting and reporting guidance in the Financial Accounting Standards Board Accounting Standards Codification Topic 946.
Portfolio Valuation — Each Fund’s net asset value (“NAV”) is calculated once daily at the close of regular trading hours on the New York Stock Exchange (“NYSE”) (typically 4:00 p.m. Eastern time) on each business day the NYSE is open. Each Fund’s equity securities, including exchange-traded funds, listed on any national or foreign exchange market system will be valued at the last sale price. Equity securities traded in the over-the-counter market are valued at their closing sale or official closing price. If there were no transactions on that day, securities traded principally on an exchange will be valued at the mean of the last bid and ask prices prior to the market close. Prices for equity securities normally are supplied by an independent pricing service approved by the Board of Trustees (the “Board”). Any assets held by a Fund that are denominated in foreign currencies are valued daily in U.S. dollars at the foreign currency exchange rates that are prevailing at the time that a Fund determines the daily NAV per share. Foreign securities may trade on weekends or other days when a Fund does not calculate NAV. As a result, the market value of these investments may change on days when you cannot buy or sell shares of a Fund. Certain Funds invest in securities of other investment companies, which are valued at their respective NAVs as determined by those investment companies each business day. Over the Counter (“OTC”) investments (including swap agreements) are generally valued by approved pricing services that use evaluated prices from various observable market factors. Securities that do not have a readily available current market value are valued in good faith under the direction of the Board. The Board has adopted methods for valuing securities and other assets in circumstances where market quotes are not readily available and has delegated to Gotham Asset Management, LLC (“Gotham” or “the Adviser”) the responsibility for applying the valuation methods. In the event that market quotes are not readily available, and the security or asset cannot be valued pursuant to one of the valuation methods, the value of the security, asset or liability will be determined in good faith by the Adviser. The Trust has established a Valuation Committee which performs certain functions including the oversight of the Adviser’s fair valuation determinations.
Fair Value Measurements — The inputs and valuation techniques used to measure fair value of a Fund’s investments are summarized into three levels as described in the hierarchy below:
| · | Level 1 — quoted prices in active markets for identical securities; |
166
GOTHAM FUNDS
Notes to Financial Statements (Continued)
September 30, 2020
· Level 2 | — | other significant observable inputs (including quoted prices for similar securities, interest rates, prepayment speeds, credit risk, etc.); and | ||
· Level 3 | — | significant unobservable inputs (including the Fund’s own assumptions in determining the fair value of investments). | ||
The inputs or methodology used for valuing securities are not necessarily an indication of the risk associated with investing in those securities.
All financial instruments listed in the Portfolio of Investments are considered Level 1, measured at fair value on a recurring basis based on quoted prices for identical assets in active markets, except for the following: a corporate debt security with an end of period value of $785 and $715 held by Absolute Return and Neutral, respectively; and total return swaps with an end of period unrealized appreciation of $4,927,599, $46,431,845, $1,770,576 and $9,306,523 held by Absolute Return, Enhanced Return, Neutral and Defensive Long 500, respectively. These securities are considered Level 2 as of and for the year ended September 30, 2020.
At the end of each quarter, management evaluates the classification of Levels 1, 2 and 3 assets and liabilities. Various factors are considered, such as changes in liquidity from the prior reporting period; whether or not a broker is willing to execute at the quoted price; the depth and consistency of prices from third party pricing services; and the existence of contemporaneous, observable trades in the market. Additionally, management evaluates the classification of Level 1 and Level 2 assets and liabilities on a quarterly basis for changes in listings or delistings on national exchanges.
Due to the inherent uncertainty of determining the fair value of investments that do not have a readily available market value, the fair value of a Fund’s investments may fluctuate from period to period. Additionally, the fair value of investments may differ significantly from the values that would have been used had a ready market existed for such investments and may differ materially from the values the Funds may ultimately realize. Further, such investments may be subject to legal and other restrictions on resale or otherwise less liquid than publicly traded securities.
For fair valuations using significant unobservable inputs, U.S. generally accepted accounting principles (“U.S. GAAP”) require the Funds to present a reconciliation of the beginning to ending balances for reported market values that presents changes attributable to total realized and unrealized gains or losses, purchase and sales, and transfers in and out of Level 3 during the period. A reconciliation of Level 3 investments is presented only when the Funds had an amount of Level 3 investments at the end of the reporting period that was meaningful in relation to its net assets. The amounts and reasons for all transfers in and out of Level 3 are disclosed when the Funds had an amount of transfers during the reporting period that was meaningful in relation to its net assets as of the end of the reporting period.
For the year ended September 30, 2020, there were no transfers in or out of Level 3 for the Funds.
Use of Estimates — The preparation of financial statements in conformity with U.S. GAAP requires management to make estimates and assumptions that affect the amounts reported in the financial statements and accompanying notes at the date of the financial statements and the reported amounts of revenues and expenses during the period. Actual results could differ from those estimates and those differences could be material.
Cash — Cash comprises U.S. Dollar and foreign currency deposits held at a custodian bank(s) which may exceed insured limits. The Funds are subject to risk to the extent that the institutions may be unable to fulfill their obligations.
Due to/from Brokers — Due to/from brokers represents cash balances on deposit with, or cash balances owed to, the Funds’ prime brokers and counterparties. The Funds are subject to credit risk should the prime brokers and counterparties be unable to meet their obligations to the Funds.
Investment Transactions, Investment Income and Expenses — Investment transactions are recorded on trade date for financial statement preparation purposes. Realized gains and losses on investments sold are recorded on the identified cost basis. Interest income is recorded on the accrual basis. Dividends are recorded on the ex-dividend date. Distribution (12b-1) fees and shareholder services fees relating to a specific class are charged directly to that class. The Fund records as dividend income the amount characterized as ordinary income and records as realized gain the amount characterized by a REIT as long-term capital gain in the Statement of Operations. The amount characterized as return of capital is a reduction to the cost of investments in the Statement of Assets and
167
GOTHAM FUNDS
Notes to Financial Statements (Continued)
September 30, 2020
Liabilities if the security is still held; otherwise it is recorded as an adjustment to realized gain/(loss) from investment transactions in the statement of Operations. These characterizations are reflected in the accompanying financial statements. General expenses of the Trust are generally allocated to each Fund under methodologies approved by the Board of Trustees. Expenses directly attributable to a particular Fund in the Trust are charged directly to that Fund.
Dividends and Distributions to Shareholders — Dividends from net investment income and distributions from net realized capital gains, if any, are declared, recorded on ex-date and paid at least annually to shareholders. Income dividends and capital gain distributions are determined in accordance with U.S. federal income tax regulations, which may differ from U.S. GAAP. These differences include the treatment of non-taxable dividends, losses deferred due to wash sales and excise tax regulations. Permanent book and tax basis differences relating to shareholder distributions will result in reclassifications within the components of net assets.
U.S. Tax Status — No provision is made for U.S. income taxes as it is each Fund’s intention to continue to qualify for and elect the tax treatment applicable to regulated investment companies under Subchapter M of the Code, as amended, and make the requisite distributions to its shareholders which will be sufficient to relieve it from U.S. income and excise taxes.
Other — In the normal course of business, the Funds may enter into contracts that provide general indemnifications. A Fund’s maximum exposure under these arrangements is dependent on claims that may be made against the Fund in the future, and, therefore, cannot be estimated; however, based on experience, the risk of material loss for such claims is considered remote.
Market disruptions associated with the COVID-19 pandemic have had a global impact, and uncertainty exists as to its long-term implications. The COVID-19 pandemic could adversely affect the value and liquidity of the Funds’ investments, impair the Funds’ ability to satisfy redemption requests, and negatively impact the Funds’ performance. In addition, the outbreak of COVID-19, and measures taken to mitigate its effects, could result in disruptions to the services provided to the Funds by its service providers. Fund management is continuing to monitor this development and evaluate its impact on the Funds.
Short Sales — All Funds except for Large Value may sell securities short. Total Return indirectly invests in short sales through its underlying securities. A short sale involves the sale by a Fund of a security that it does not own with the anticipation of purchasing the same security at a later date at a lower price. If the price of the security has increased during this time, then the Fund will incur a loss equal to the increase in price from the time that the short sale was entered into plus any premiums and interest paid to the third party. Therefore, short sales involve the risk that losses may be exaggerated, potentially losing more money than the actual cost of the investment. Also, there is the risk that the third party to the short sale may fail to honor its contract terms, causing a loss to the Fund. There can be no assurance that a Fund will be able to close out a short position at any particular time or at an acceptable price. Although a Fund’s gain is limited to the amount at which it sold a security short, its potential loss is unlimited. The Funds will comply with guidelines established by the Securities and Exchange Commission and other applicable regulatory bodies with respect to coverage of short sales. Effective July 24, 2020 and September 3, 2020, Absolute Return and Neutral, respectively, discontinued investing in short securities directly and may obtain short and long exposure through the use of swap agreements.
As of September 30, 2020, there are no securities sold short, securities pledged as collateral and deposits with brokers for securities sold short.
In accordance with the terms of its prime brokerage agreements, the Funds may receive rebate income or be charged fees on securities sold short. Such income or fee is calculated on a daily basis based upon the market value of securities sold short and a variable rate that is dependent upon the availability of such security. These amounts are included in dividends and fees on securities sold short on the Statement of Operations. In those instances where rebate income is in excess of dividends on securities sold short and finance charges, the net amount is shown in the Investment Income section on the Statement of Operations. On the ex-dividend date, dividends on short sales are recorded as an expense to the Fund. The following Funds had net charges as shown in the table below for the year ended September 30, 2020:
| Dividends on Securities Sold Short | Rebate (Income)/Fees | |||||||||
Absolute Return | $3,926,845 | $(2,289,395 | ) | |||||||
Neutral | 1,339,760 | (788,888 | ) | |||||||
168
GOTHAM FUNDS
Notes to Financial Statements (Continued)
September 30, 2020
The following Funds utilized short sales proceeds and incurred financing charges to finance purchases of long securities in order to accomplish the Funds’ respective investment objectives. A financing fee is charged to the Funds based on the Federal Funds rate plus an agreed upon spread. These fees are included in dividends and fees on securities sold short on the Statement of Operations and are as follows for the year ended September 30, 2020:
| Short Sales (Deposits) Proceeds | Financing Charges | |||||||
Absolute Return | $ | 116,939,252 | $ | 1,743,339 | ||||
Neutral | 26,256,159 | 344,312 | ||||||
Swap Agreements — A swap agreement is a bilateral financial instrument that involves the exchange of cash flows between two parties on specified dates (settlement dates), where the cash flows are based on valuation changes to market referenced securities. The nominal amount on which the cash flows are calculated is called the notional amount.
Swap agreements may increase or decrease the overall volatility of the investments of a Fund and its share price. The performance of swap agreements will be affected by a change in the market value of the referenced underlying securities that determine the amounts of payments due to and from a Fund. If a swap agreement calls for payments by a Fund, the Fund must be prepared to make such payments when due. In addition, if the counterparty’s creditworthiness declined, the value of a swap agreement would be likely to decline, potentially resulting in losses.
Generally, swap agreements have a fixed maturity date that will be agreed upon by the parties. The agreement can be terminated before the maturity date, in whole or part, under certain circumstances, such as default by one of the parties or insolvency, among others, and can be transferred by a party only with the prior written consent of the other party. A Fund may be able to eliminate its exposure under a swap agreement either by assignment or by other disposition, or by entering into an offsetting swap agreement with the same party or a similarly creditworthy party. If the counterparty is unable to meet its obligations under the contract, declares bankruptcy, defaults or becomes insolvent, a Fund may not be able to recover the money it expected to receive under the swap agreement. A Fund will not enter into any swap agreement unless the Adviser believes that the counterparty to the transaction is creditworthy.
A swap agreement can be a form of leverage, which can magnify a Fund’s gains or losses. In order to reduce the risk associated with leveraging, a Fund may cover its current obligations under swap agreements according to guidelines established by the SEC. If a Fund enters into a swap agreement on a net basis, it will segregate assets with a daily value at least equal to the excess, if any, of a Fund’s accrued obligations under the swap agreement over the accrued amount a Fund is entitled to receive under the agreement. If a Fund enters into a swap agreement on other than a net basis, it will segregate assets with a value equal to the full amount of a Fund’s accrued obligations under the swap agreement.
Total Return Swaps: Total return swaps are contracts in which both parties agree to make payments of the total return from a reference instrument during a specified period. The total return includes appreciation or depreciation on the underlying asset, plus any interest or dividend accruals or payments. The unrealized appreciation or depreciation also includes interest charges and credits (“financing fees”) related to the notional values of the long and short positions and cash balances within the swap. These interest charges and credits are based on a specified benchmark rate, such as the U.S. effective federal funds rate (“EFFR”). Payments under the swap are based upon an agreed upon principal amount but, since the principal amount is not exchanged, it represents neither an asset nor a liability to either counterparty, and is referred to as notional. Total return swaps are marked to market daily using different sources, including quotations from counterparties, pricing services, brokers or market makers. The unrealized appreciation or depreciation related to the change in the valuation of the notional amount of the swap is combined with the amount due to or from the Fund at termination or settlement. The primary risks associated with total return swaps are credit risks (if the counterparty fails to meet its obligations) and market risk (if there is no liquid market for the swap or unfavorable changes occur to the underlying reference instrument). As of and for the year ended September 30, 2020, only Absolute Return, Enhanced Return, Neutral and Defensive Long 500 held total return swaps.
169
GOTHAM FUNDS
Notes to Financial Statements (Continued)
September 30, 2020
For the period ended September 30, 2020, the average volume of the total return swaps for each Fund were as follows:
| Notional Amount | ||||
Absolute Return (three month average since inception of total return swaps on July 24, 2020) | $(180,094,634) | |||
Enhanced Return (quarterly average of total return swaps for the full fiscal year) | (14,258,518) | |||
Neutral (daily average since inception of total return swaps on September 2, 2020) | (39,436,568) | |||
Defensive Long 500 (quarterly average of total return swaps for the full fiscal year) | (2,125,102) | |||
Counterparty Risk — During the year ended September 30, 2020, Absolute Return, Enhanced Return, Neutral and Defensive Long 500 were subject to counterparty risk. Certain of the derivatives entered into by the Funds may not be traded on an exchange but instead will be privately negotiated in the over-the-counter market. This means that these instruments are traded between counterparties based on contractual relationships. Relying on a counterparty exposes the Funds to the risk that a counterparty will not settle a transaction in accordance with its terms and conditions because of a dispute over the terms of the contract (whether or not bona fide) or because of a credit or liquidity problem, thus causing the Funds to suffer a loss. If a counterparty defaults on its payment obligations to the Funds, this default will cause the value of an investment in the Funds to decrease. In addition, to the extent the Funds deal with a limited number of counterparties, it will be more susceptible to the credit risks associated with those counterparties. The Funds are neither restricted from dealing with any particular counterparty nor from concentrating any or all of its transactions with one counterparty. The ability of the Funds to transact business with any one or number of counterparties and the absence of a regulated market to facilitate settlement may increase the potential for losses by the Funds.
The Funds are subject to the risk that issuers of the instruments in which it invests and trades may default on their obligations, and that certain events may occur that have an immediate and significant adverse effect on the value of those instruments. There can be no assurance that an issuer will not default, or that an event that has an immediate and significant adverse effect on the value of an instrument will not occur, and that the Funds will not sustain a loss on a transaction as a result.
Liquidity Risk — During the year ended September 30, 2020, Absolute Return, Enhanced Return, Neutral and Defensive Long 500 were subject to liquidity risk. The Funds may be subject to liquidity risk primarily due to investments in derivatives. The Funds may invest up to 15% of its net assets in illiquid securities or instruments. Certain derivatives, such as swaps, forward contracts and options may not be readily marketable and, therefore, may be deemed to be illiquid. An asset is not readily marketable if it cannot be sold within seven business days in the ordinary course of business for approximately the amount at which it is valued. Investments in illiquid assets involve the risk that the Funds may be unable to sell the asset or sell it at a reasonable price. In addition, the Funds may be required to liquidate positions or close out derivatives on unfavorable terms at a time contrary to the interests of the Funds in order to raise cash to pay redemptions.
An investment in derivatives is also subject to the risk that the Funds may not be able to terminate the derivatives effective on whatever date it chooses, or that the settlement of any early termination may depend on subsequent market movements. As a result, the Funds may be exposed to the risk of additional losses due to such delays.
Master Netting Agreement — During the year ended September 30, 2020, Absolute Return, Enhanced Return, Neutral and Defensive Long 500 were subject to a Master Netting agreement. In order to define their contractual rights and to secure rights that will help mitigate their counterparty risk, the Funds have entered into an International Swaps and Derivatives Association, Inc. Master Agreement (“ISDA Master Agreement”). An ISDA Master Agreement is a bilateral agreement between the Funds and the counterparty that governs certain OTC derivatives and typically contains, among other things, collateral posting terms and netting provisions in the event of a default and/or termination event. Under an ISDA Master Agreement, the Funds may, under certain circumstances, offset with the counterparty certain derivative financial instruments’ payables and/or receivables with collateral held and/or posted and create one single net payment. The provisions of the ISDA Master Agreement typically permit a single net payment in the event of default including the bankruptcy or insolvency of the counterparty. Bankruptcy or insolvency laws of a particular jurisdiction may restrict or prohibit the right of offset in bankruptcy, insolvency or other events. In addition, certain ISDA Master Agreements allow counterparties to terminate derivative contracts prior to maturity in the event the Funds’ net assets decline by a stated percentage or the Funds fail to meet the terms of its ISDA Master Agreements. The result would cause the Funds to accelerate payment of any net liability owed to the counterparty.
LIBOR Phase-out Risk — The United Kingdom’s Financial Conduct Authority, which regulates London Interbank Overnight Rates (“LIBOR”), has announced plans to phase out the use of LIBOR by the end of 2021. There remains uncertainty regarding the
170
GOTHAM FUNDS
Notes to Financial Statements (Continued)
September 30, 2020
future use of LIBOR and the nature of any replacement rate. The transition process away from LIBOR may involve, among other things, increased volatility or illiquidity in markets for instruments that currently rely on LIBOR. The transition process may also result in a reduction in the value of certain instruments held by the Funds or reduce the effectiveness of related Fund transactions such as hedges. Volatility, the potential reduction in value, and/or the hedge effectiveness of financial instruments may be heightened for financial instruments that do not include fallback provisions that address the cessation of LIBOR. Any potential effects of the transition away from LIBOR on any of the Funds or on financial instruments in which the Funds invest, as well as other unforeseen effects, could result in losses to the Funds.
Collateral Requirements — During the year ended September 30, 2020, Absolute Return, Enhanced Return, Neutral and Defensive Long 500 were subject to collateral requirements. For derivatives traded under an ISDA Master Agreement, the collateral requirements are typically calculated by netting the mark-to-market amount for each transaction under such agreement and comparing that amount to the value of any collateral currently pledged by the Funds and the counterparty. Cash collateral that has been pledged to cover obligations of the Funds and cash collateral received from the counterparty, if any, is reported separately on the Statement of Assets and Liabilities as cash pledged as collateral and cash received as collateral, respectively. Non-cash collateral pledged by the Funds, if any, is noted in the Schedule of Investments. Generally, the amount of collateral due from or to a counterparty is subject to a certain minimum transfer amount threshold before a transfer is required, which is determined at the close of business of the Funds. Any additional required collateral is delivered to/pledged by the Funds on the next business day. Typically, the counterparty is not permitted to sell, re-pledge or use cash and non-cash collateral it receives. The Funds generally agree not to use non-cash collateral that they receive but may, absent default or certain other circumstances defined in the underlying ISDA Master Agreement, be permitted to use cash collateral received. In such cases, interest may be paid pursuant to the collateral arrangement with the counterparty. To the extent amounts due to the Funds from their counterparties are not fully collateralized, they bear the risk of loss from counterparty non-performance. Likewise, to the extent the Funds have delivered collateral to a counterparty and stands ready to perform under the terms of its agreement with such counterparty, they bear the risk of loss from a counterparty in the amount of the value of the collateral in the event the counterparty fails to return such collateral. Based on the terms of agreements, collateral may not be required for all derivative contracts. For financial reporting purposes, the Funds do not offset derivative assets and derivative liabilities that are subject to netting arrangements, if any, in the Statement of Assets and Liabilities.
| Gross Amount Not Offset in the Statement of Assets and Liabilities | ||||||||||||||||||||||||||||||
| Gross Amounts | Net Amounts of | |||||||||||||||||||||||||||||
| Offset in the | Assets Presented | |||||||||||||||||||||||||||||
| Gross Amounts | Statement of | in the Statement | ||||||||||||||||||||||||||||
| of Recognized | Assets and | of Assets and | Financial | Collateral | Net | |||||||||||||||||||||||||
| Assets/(Liabilities) | Liabilities | Liabilities | Instruments | Pledged/(Received)* | Amount** | |||||||||||||||||||||||||
Absolute Return | $ | 4,927,599 | $ | — | $ | 4,927,599 | $ | — | $ | — | $ | 4,927,599 | ||||||||||||||||||
Enhanced Return | 46,431,845 | — | 46,431,845 | — | (35,430,000 | ) | $ | 11,001,845 | ||||||||||||||||||||||
Neutral | 1,770,576 | — | 1,770,576 | — | — | 1,770,576 | ||||||||||||||||||||||||
Defensive Long 500 | 9,306,523 | — | 9,306,523 | — | (7,350,000 | ) | 1,956,523 | |||||||||||||||||||||||
| * | Amount disclosed is limited to the amount of assets presented in each Statement of Assets and Liabilities. Actual collateral pledged/(received) may be more than the amount shown. |
| ** | Net amount represents the net receivable from the counterparty in the event of a default. |
2. Transactions with Related Parties and Other Service Providers
Gotham Asset Management, LLC (“Gotham” or the “Adviser”) serves as investment adviser to the Funds pursuant to an investment advisory agreement with the Trust (the “Advisory Agreement”). For its services as the investment adviser, each Fund pays the Adviser a fee, which is computed and accrued daily and paid monthly, at an annual rate based on average daily net assets of each Fund as shown in the table below:
171
GOTHAM FUNDS
Notes to Financial Statements (Continued)
September 30, 2020
Absolute Return(1) | 1.50 | % | ||
Enhanced Return(1) | 1.50 | % | ||
Neutral(1) | 1.50 | % | ||
Large Value | 0.75 | % | ||
Defensive Long 500 | 1.35 | % | ||
Total Return(2) | — | % |
| (1) | Prior to July 20, 2020, the investment advisory fee was 2.00%. |
| (2) | For Total Return (the “Fund”), Gotham is not entitled to receive an investment advisory fee on assets invested in mutual funds advised by Gotham (each an “underlying fund” and collectively, the “underlying funds”), but is entitled to receive an investment advisory fee of 1.00% of the Fund’s average net assets invested in investments other than an underlying fund. Gotham does not receive an investment advisory fee from the Fund on assets invested in an underlying fund, but does receive an investment advisory fee from each underlying fund as investment adviser to such funds. The Fund does not currently expect to invest in assets other than underlying funds; however, to the extent it does, the Fund will pay an investment advisory fee on such assets. |
The Adviser contractually agreed to reduce its investment advisory fee and/or reimburse certain expenses of each Fund to the extent necessary to ensure that the Fund’s total operating expenses (exclusive of taxes, “Acquired Fund Fees and Expenses,” dividend and interest expense on securities sold short, interest, extraordinary items, and brokerage commissions) and for Total Return, exclusive of management fees, if any, do not exceed the percentages set forth in the table below (on an annual basis) of each Fund’s average daily net assets (the “Expense Limitation”). The Expense Limitation will remain in place until the termination date set forth below, unless the Board approves its earlier termination. The table below reflects the Expense Limitation amounts, as a percentage of average daily net assets, in effect during the year ended September 30, 2020.
| Institutional Class | Investor Class | Termination Date | ||||
Absolute Return(1) | 1.50% | N/A | January 31, 2022 | |||
Enhanced Return(1) | 1.50% | N/A | January 31, 2022 | |||
Neutral(1) | 1.50% | N/A | January 31, 2022 | |||
Large Value | 0.75% | N/A | January 31, 2022 | |||
Defensive Long 500 | 1.35% | N/A | January 31, 2022 | |||
Total Return(2) | 0.00% | 0.25% | January 31, 2022 |
| (1) | Prior to July 20, 2020, the Expense Limitation was 2.15%. |
| (2) | Per the Expense Limitation agreement for the Fund, the expenses subject to the expense limitation are also exclusive of management fees, if any. |
For the year ended September 30, 2020, investment advisory fees accrued and waivers were as follows:
| Gross Advisory Fee | Waiver/ Reimbursements | Net Advisory Fee/ (Reimbursement) | |||||||||||||
Absolute Return | $12,889,385 | $(641,837 | ) | $12,247,548 | |||||||||||
Enhanced Return | 6,826,522 | (367,258 | ) | 6,459,264 | |||||||||||
Neutral | 2,478,236 | (138,566 | ) | 2,339,670 | |||||||||||
Large Value | 487,123 | (184,619 | ) | 302,504 | |||||||||||
Defensive Long 500 | 759,506 | (172,488 | ) | 587,018 | |||||||||||
Total Return | — | (187,936 | ) | (187,936 | ) | ||||||||||
For all Funds, except for Absolute Return, Enhanced Return, Neutral and Defensive Long 500, the Adviser is entitled to recover, subject to approval by the Board, such amounts reduced or reimbursed for a period of up to three (3) years from the date on which the Adviser reduced its compensation and/or assumed expenses for the Fund. The Adviser is permitted to seek reimbursement from the Fund, subject to certain limitations, for fees it waived and Fund expenses it paid to the extent the total annual fund expenses do not exceed the limits described above or any lesser limits in effect at the time of reimbursement. No recoupment will occur unless a Fund’s expenses are below the Expense Limitation amount. As of September 30, 2020, the amounts of potential reimbursement from the Funds to the Adviser are as follows:
172
GOTHAM FUNDS
Notes to Financial Statements (Continued)
September 30, 2020
| Expiration | Expiration | Expiration | |||||||||||||
| 09/30/2021 | 09/30/2022 | 09/30/2023 | |||||||||||||
Large Value | $ | 54,224 | $ | 156,711 | $ | 184,619 | |||||||||
Total Return | |||||||||||||||
Institutional Class | 113,536 | 200,356 | 170,911 | ||||||||||||
Investor Class | 6,451 | 18,489 | 17,025 | ||||||||||||
Other Service Providers
The Bank of New York Mellon (“BNY Mellon”) serves as administrator and custodian for the Funds. For providing administrative and accounting services, BNY Mellon is entitled to receive a monthly fee equal to an annual percentage rate of the Funds’ average daily net assets and is subject to certain minimum monthly fees. For providing certain custodial services, BNY Mellon is entitled to receive a monthly fee, subject to certain minimum, and out of pocket expenses.
BNY Mellon Investment Servicing (US) Inc. (the “Transfer Agent”) provides transfer agent services to the Funds. The Transfer Agent is entitled to receive a monthly fee, subject to certain minimum, and out of pocket expenses.
The Trust, on behalf of the Funds, has entered into agreements with financial intermediaries to provide recordkeeping, processing, shareholder communications and other services to customers of the intermediaries investing in the Funds and has agreed to compensate the intermediaries for providing those services. The fees incurred by the Funds for these services are included in transfer agent fees in the Statement of Operations.
Pershing LLC provides prime brokerage services to the Funds under an Agreement for Prime Brokerage Services. Pershing LLC is a wholly owned subsidiary of The Bank of New York Mellon Corporation.
Foreside Funds Distributors LLC (the “Underwriter”) provides principal underwriting services to the Funds pursuant to an underwriting agreement between the Trust and the Underwriter.
The Trust has adopted a distribution plan for Investor Class shares of Total Return, in accordance with Rule 12b-1 under the 1940 Act. Pursuant to the Investor Class shares plan, Total Return compensates the Underwriter for direct and indirect costs and expenses incurred in connection with advertising, marketing and other distribution services in an amount not to exceed 0.25%, on an annualized basis of the Investor Class shares of Total Return’s average daily net assets.
Trustees and Officers
The Trust is governed by its Board of Trustees. The Trustees receive compensation in the form of an annual retainer and per meeting fees for their services to the Trust. An employee of BNY Mellon serves as the Secretary of the Trust and is not compensated by the Funds or the Trust.
JW Fund Management LLC (“JWFM”) provides a Principal Executive Officer and Principal Financial Officer, respectively, to the Trust. Effective October 1, 2020, Alaric Compliance Services LLC (“Alaric”) provides the Trust with a Chief Compliance Officer and an Anti-Money Laundering Officer. Prior to October 1, 2020, Duff & Phelps, LLC provided the Trust with a Chief Compliance Officer and an Anti-Money Laundering Officer. JWFM and Alaric are compensated for their services provided to the Trust.
173
GOTHAM FUNDS
Notes to Financial Statements (Continued)
September 30, 2020
Investment in Affiliated Funds
The following table lists each issuer owned by Total Return that may be deemed an “affiliated company” under the 1940 Act, as well as transactions that occurred in the security of such issuers during the year ended September 30, 2020:
Total Return | ||||||||||||||||||||||||||||||||||||||||
| Change in | ||||||||||||||||||||||||||||||||||||||||
| Net | Unrealized | Shares | ||||||||||||||||||||||||||||||||||||||
| Value at | Purchase | Sales | Realized | Appreciation/ | Value at | Held at | Dividend | |||||||||||||||||||||||||||||||||
Name of Issuer | 9/30/19 | Cost | Proceeds | Gain/(Loss) | (Depreciation) | 9/30/20 | 9/30/20 | Income | ||||||||||||||||||||||||||||||||
Gotham Absolute 500 Fund | $ | 6,887,852 | $ | 923,839 | $ | 6,842,094 | $ (733,901 | ) | $(235,696 | ) | $ | — | — | $ | 51,610 | |||||||||||||||||||||||||
Defensive Long 500 | 10,383,799 | 5,945,666 | 2,674,256 | (271,700 | ) | (479,431 | ) | 12,904,078 | 1,077,135 | 63,539 | ||||||||||||||||||||||||||||||
Gotham Enhanced 500 Fund | 5,233,419 | 951,896 | 4,899,011 | (979,319 | ) | (306,985 | ) | — | — | 77,622 | ||||||||||||||||||||||||||||||
Gotham Hedged Core Fund | — | 3,372,409 | 193,778 | 8,423 | 223,979 | 3,411,033 | 301,062 | — | ||||||||||||||||||||||||||||||||
Gotham Index Plus Fund | 6,920,209 | 1,042,458 | 2,495,611 | (79,412 | ) | 402,444 | 5,790,088 | 357,634 | 101,693 | |||||||||||||||||||||||||||||||
Large Value | — | 1,092,120 | 256,779 | 30,262 | 196,356 | 1,061,959 | 81,815 | — | ||||||||||||||||||||||||||||||||
Neutral | 5,137,920 | 1,492,630 | 1,781,158 | (113,096 | ) | (480,220 | ) | 4,256,076 | 463,120 | — | ||||||||||||||||||||||||||||||
Gotham Short Strategies Fund | — | 2,501,689 | 1,178,442 | (54,740 | ) | (181,685 | ) | 1,086,822 | 146,472 | — | ||||||||||||||||||||||||||||||
|
|
|
|
|
|
|
|
|
| |||||||||||||||||||||||||||||||
Total | $ | 34,563,199 | $ | (2,193,483 | ) | $(861,238 | ) | $ | 28,510,056 | $ | 294,464 | |||||||||||||||||||||||||||||
|
|
|
|
|
|
|
|
|
| |||||||||||||||||||||||||||||||
3. Investment in Securities
For the year ended September 30, 2020, for all Funds, aggregated purchases and sales of investment securities (excluding short-term investments) of the Funds were as follows:
| Purchases | Sales | |||||||||
Absolute Return | $ | 1,993,555,354 | $ | 2,535,441,500 | ||||||
Enhanced Return | 716,964,665 | 983,578,493 | ||||||||
Neutral | 534,665,042 | 701,737,140 | ||||||||
Large Value | 276,846,169 | 262,351,222 | ||||||||
Defensive Long 500 | 156,957,967 | 160,114,987 | ||||||||
Total Return | 17,322,706 | 20,321,128 | ||||||||
For the year ended September 30, 2020, the Funds had no purchases and sales of U.S. Government securities.
174
GOTHAM FUNDS
Notes to Financial Statements (Continued)
September 30, 2020
4. Capital Share Transactions
For the years ended September 30, 2020 and September 30, 2019, transactions in capital shares of the Funds (authorized shares unlimited) were as follows:
| For the Year Ended | For the Year Ended | |||||||||||||||
| September 30, 2020 | September 30, 2019 | |||||||||||||||
| Shares | Value | Shares | Value | |||||||||||||
Absolute Return: | ||||||||||||||||
Institutional Class Shares: | ||||||||||||||||
Sales | 7,707,089 | $ | 111,825,830 | 14,309,396 | $ | 206,479,369 | ||||||||||
Reinvestments | — | — | — | — | ||||||||||||
Redemption Fees* | — | 10,202 | — | 10,377 | ||||||||||||
Redemptions | (29,654,254 | ) | (414,631,129 | ) | (29,136,005 | ) | (422,165,731 | ) | ||||||||
|
|
|
|
|
|
|
| |||||||||
Net Decrease | (21,947,165 | ) | $ | (302,795,097 | ) | (14,826,609 | ) | $ | (215,675,985 | ) | ||||||
|
|
|
|
|
|
|
| |||||||||
Enhanced Return: | ||||||||||||||||
Institutional Class Shares: | ||||||||||||||||
Sales | 3,340,058 | $ | 36,819,281 | 3,172,276 | $ | 43,580,814 | ||||||||||
Reinvestments | 9,276,386 | 108,069,892 | 4,190,556 | 56,279,168 | ||||||||||||
Redemption Fees* | — | 482 | — | 2,518 | ||||||||||||
Redemptions | (25,210,356 | ) | (266,540,789 | ) | (25,966,835 | ) | (358,947,060 | ) | ||||||||
|
|
|
|
|
|
|
| |||||||||
Net Decrease | (12,593,912 | ) | $ | (121,651,134 | ) | (18,604,003 | ) | $ | (259,084,560 | ) | ||||||
|
|
|
|
|
|
|
| |||||||||
Neutral: | ||||||||||||||||
Institutional Class Shares: | ||||||||||||||||
Sales | 2,313,773 | $ | 22,882,144 | 6,130,108 | $ | 62,670,787 | ||||||||||
Reinvestments | — | — | — | — | ||||||||||||
Redemption Fees* | — | 481 | — | 2,651 | ||||||||||||
Redemptions | (13,785,607 | ) | (131,448,195 | ) | (23,391,750 | ) | (239,187,829 | ) | ||||||||
|
|
|
|
|
|
|
| |||||||||
Net Decrease | (11,471,834 | ) | $ | (108,565,570 | ) | (17,261,642 | ) | $ | (176,514,391 | ) | ||||||
|
|
|
|
|
|
|
| |||||||||
Large Value: | ||||||||||||||||
Institutional Class Shares: | ||||||||||||||||
Sales | 5,096,192 | $ | 60,440,115 | 1,995,981 | $ | 25,210,691 | ||||||||||
Reinvestments | 115,810 | 1,610,911 | 41,282 | 487,128 | ||||||||||||
Redemption Fees* | — | 59 | — | — | ||||||||||||
Redemptions | (4,257,287 | ) | (47,208,019 | ) | (5,921 | ) | (76,091 | ) | ||||||||
|
|
|
|
|
|
|
| |||||||||
Net Increase | 954,715 | $ | 14,843,066 | 2,031,342 | $ | 25,621,728 | ||||||||||
|
|
|
|
|
|
|
| |||||||||
175
GOTHAM FUNDS
Notes to Financial Statements (Continued)
September 30, 2020
| For the Year Ended | For the Year Ended | |||||||||||||||
| September 30, 2020 | September 30, 2019 | |||||||||||||||
| Shares | Value | Shares | Value | |||||||||||||
Defensive Long 500: | ||||||||||||||||
Institutional Class Shares: | ||||||||||||||||
Sales | 1,785,878 | $ | 21,079,978 | 3,662,688 | $ | 47,464,192 | ||||||||||
Reinvestments | 66,026 | 878,804 | 70,194 | 877,426 | ||||||||||||
Redemption Fees* | — | 2,017 | — | — | ||||||||||||
Redemptions | (1,785,995 | ) | (18,987,118 | ) | (36,724 | ) | (462,939 | ) | ||||||||
|
|
|
|
|
|
|
| |||||||||
Net Increase | 65,909 | $ | 2,973,681 | 3,696,158 | $ | 47,878,679 | ||||||||||
|
|
|
|
|
|
|
| |||||||||
Total Return: | ||||||||||||||||
Institutional Class Shares: | ||||||||||||||||
Sales | 325,525 | $ | 4,134,781 | 460,369 | $ | 5,955,390 | ||||||||||
Reinvestments | 127,914 | 1,652,650 | 30,505 | 384,983 | ||||||||||||
Redemption Fees* | — | 82 | — | 1,854 | ||||||||||||
Redemptions | (657,113 | ) | (7,623,112 | ) | (27,333 | ) | (346,828 | ) | ||||||||
|
|
|
|
|
|
|
| |||||||||
Net Increase (Decrease) | (203,674 | ) | $ | (1,835,599 | ) | 463,541 | $ | 5,995,399 | ||||||||
|
|
|
|
|
|
|
| |||||||||
Investor Class Shares: | ||||||||||||||||
Sales | 92,479 | $ | 1,150,847 | 140,929 | $ | 1,795,879 | ||||||||||
Reinvestments | 13,865 | 178,991 | 2,272 | 28,675 | ||||||||||||
Redemption Fees* | — | 8 | — | 176 | ||||||||||||
Redemptions | (83,091 | ) | (976,102 | ) | (95,595 | ) | (1,216,475 | ) | ||||||||
|
|
|
|
|
|
|
| |||||||||
Net Increase | 23,253 | $ | 353,744 | 47,606 | $ | 608,255 | ||||||||||
|
|
|
|
|
|
|
| |||||||||
| * | There is a 1.00% redemption fee that may be charged on shares redeemed within 30 days of purchase. The redemption fees are retained by each Fund for the benefit of the remaining shareholders and recorded as paid-in-capital. |
Significant Shareholders
As of September 30, 2020, the below Funds had shareholders that held 10% or more of the outstanding shares of the respective Fund. Transactions by these shareholders may have a material impact on the Fund.
Neutral | ||||
Affiliated Fund | 9 | % | ||
Large Value | ||||
Affiliated Fund | 2 | % | ||
Defensive Long 500 | ||||
Affiliated Fund | 24 | % | ||
Non-affiliated Shareholders | 67 | % | ||
Total Return | ||||
Affiliated Shareholders | 31 | % | ||
Non-affiliated Shareholders | 47 | % |
176
GOTHAM FUNDS
Notes to Financial Statements (Continued)
September 30, 2020
5. Securities Lending
All Funds, except for Large Value, may lend securities to financial institutions, such as broker-dealers, and are required to be secured continuously by collateral in cash, cash equivalents, letter of credit or U.S. Government securities maintained on a current basis at an amount at least equal to the market value of the securities loaned. Cash collateral received, pursuant to investment guidelines established by the Funds and approved by the Board, is invested in short-term investments and/or securities consistent with the Fund’s investment objective. Securities purchased with cash collateral are included in market value of securities designated as collateral for securities on loan on the Statements of Assets and Liabilities. All such investments are made at the risk of the Funds and, as such, the Funds are liable for investment losses. The Funds pay a fee on the cash collateral received by the Funds at a rate equal to the Federal Funds (Open) rate plus 40 basis points with respect to the cash collateral received on those securities on loan that have a rebate that equals or exceeds the greater of either the Federal Funds (Open) rate minus 10 basis points or zero. These fees are included in the fees on cash collateral on the Statements of Operations. Such loans would involve risks of delay in receiving additional collateral in the event the value of the collateral decreased below the value of the securities loaned or of delay in recovering the securities loaned or even loss of rights in the collateral should the borrower of the securities fail financially. However, loans will be made only to borrowers deemed by the Adviser to be of good standing and only when, in the Adviser’s judgment, the income to be earned from the loans justifies the attendant risks. Any loans of a Fund’s securities will be fully collateralized and marked to market daily. When the collateral falls below specified amounts, the lending agent will use its best effort to obtain additional collateral on the next business day to meet required amounts under the security lending agreement. Securities on loan are not used as collateral for swaps or as collateral for short securities, if any. During the year ended September 30, 2020, the Funds listed below each had securities lending programs. The income generated from the programs during the year ended September 30, 2020 with respect to such loans was as follows:
| Market Value | Market Value | Income Received | ||||||||||||||||||
| of Securities | Cash Collateral | of Non-cash | from Securities | |||||||||||||||||
| Loaned | Received | Collateral | Lending | |||||||||||||||||
Defensive Long 500 | $ | 1,397,470 | $ | — | $ | 1,432,261 | $ | 1,339 | ||||||||||||
Securities lending transactions are entered into by the Funds under a Master Securities Lending Agreement (“MSLA”) which permits the Funds, under certain circumstances including an event of default (such as bankruptcy or insolvency), to offset amounts payable by the Funds to the same counterparty against amounts to be received from that counterparty and create one single net payment due to or from the Funds. The following table is a summary of each of the Fund’s open securities lending transactions which are subject to a MSLA as of September 30, 2020:
| Gross Amount Not Offset in the | ||||||||||||||||||||||||||||||
Statement of Assets and Liabilities | ||||||||||||||||||||||||||||||
| Gross Amounts | Net Amounts of | |||||||||||||||||||||||||||||
| Offset in the | Assets Presented | Cash | ||||||||||||||||||||||||||||
| Statement of | in the Statement | and Non-Cash | ||||||||||||||||||||||||||||
| Gross Amounts of | Assets and | of Assets and | Financial | Collateral | Net | |||||||||||||||||||||||||
| Recognized Assets | Liabilities | Liabilities | Instruments | Received* | Amount** | |||||||||||||||||||||||||
Defensive Long 500 | $ | 1,397,470 | $ | — | $ | 1,397,470 | $ | — | $ | (1,397,470 | ) | — | ||||||||||||||||||
| * | Amount disclosed is limited to the amount of assets presented in each Statement of Assets and Liabilities. Actual collateral received may be more than the amount shown. |
| ** | Net amount represents the net receivable from the counterparty in the event of a default. |
6. Federal Tax Information
The Funds have followed the authoritative guidance on accounting for and disclosure of uncertainty in tax positions, which requires the Funds to determine whether a tax position is more likely than not to be sustained upon examination, including resolution of any related appeals or litigation processes, based on the technical merits of the position. The Funds had determined that there was no
177
GOTHAM FUNDS
Notes to Financial Statements (Continued)
September 30, 2020
effect on the financial statements from following this authoritative guidance. In the normal course of business, the Funds are subject to examination by federal, state and local jurisdictions, where applicable, for tax years for which applicable statutes of limitations have not expired.
Distributions are determined in accordance with federal income tax regulations, which may differ in amount or character from net investment income and realized gains for financial reporting purposes. Accordingly, the character of distributions and composition of net assets for tax purposes may differ from those reflected in the accompanying financial statements. To the extent these differences are permanent, such amounts are reclassified within the components of net assets based on the tax treatment; temporary differences do not require reclassifications. Net assets were not affected by these adjustments. The following permanent differences as of September 30, 2020, were primarily attributed to capitalized dividends on short sales, net operating loss write-off, redesignation of dividends paid, equalization utilized and foreign currency reclassifications were reclassified among the following accounts:
| Increase/(Decrease) | ||||||||||
| Total | Increase/(Decease) | |||||||||
| Distributable | Additional | |||||||||
| Earnings | Paid-In Capital | |||||||||
Absolute Return | $ | 379,725 | $ | (379,725 | ) | |||||
Enhanced Return | (6 | ) | 6 | |||||||
Neutral | 131,981 | (131,981 | ) | |||||||
The tax character of distributions paid by the Funds during the year ended September 30, 2020 were as follows:
| Ordinary | Long-Term | ||||||||||||||
| Income | Capital Gain | Return | |||||||||||||
| Dividend | Dividend | of Capital | |||||||||||||
Enhanced Return | $ | — | $ | 124,087,944 | $ | — | |||||||||
Large Value | 1,230,886 | 380,026 | — | ||||||||||||
Defensive Long 500 | 370,405 | 508,399 | — | ||||||||||||
Total Return | 309,540 | 1,783,702 | — | ||||||||||||
The tax character of distributions paid by the Funds during the year ended September 30, 2019 were as follows:
| Ordinary | Long-Term | ||||||||||||||
| Income | Capital Gain | Return | |||||||||||||
| Dividend | Dividend | of Capital | |||||||||||||
Enhanced Return | $ | — | $ | 64,015,741 | $ | — | |||||||||
Large Value | 145,644 | 341,484 | — | ||||||||||||
Defensive Long 500 | 60,991 | 816,435 | — | ||||||||||||
Total Return | 105,899 | 307,759 | — | ||||||||||||
Distributions from net investment income and short-term capital gains are treated as ordinary income for federal income tax purposes.
As of September 30, 2020, the components of distributable earnings on a tax basis were as follows:
| Undistributed | Undistributed | Unrealized | Qualified | Other | ||||||||||||||||||||||||||
| Capital Loss | Ordinary | Long-Term | Appreciation/ | Late-Year | Temporary | |||||||||||||||||||||||||
| Carryforward | Income | Gain | (Depreciation) | Losses | Differences | |||||||||||||||||||||||||
Absolute Return | $ | (60,941,538 | ) | $ | — | $ | — | $ | 55,732,434 | $ | (47,123,741 | ) | $ | — | ||||||||||||||||
Enhanced Return | (12,671,992 | ) | 334,833 | — | 62,029,864 | (1,472,708 | ) | — | ||||||||||||||||||||||
Neutral | (64,998,761 | ) | — | — | 8,451,885 | (14,906,632 | ) | (2 | ) | |||||||||||||||||||||
Large Value | — | 845,953 | — | 473,717 | (2,154,002 | ) | — | |||||||||||||||||||||||
Defensive Long 500 | (18,916,490 | ) | 427,111 | — | 13,674,434 | — | — | |||||||||||||||||||||||
Total Return | (1,969,312 | ) | — | — | 2,235,059 | (1,573 | ) | — | ||||||||||||||||||||||
The differences between the book and tax basis components of distributable earnings relate primarily to the timing and recognition of income and gains for federal income tax purposes. The other temporary differences as of September 30, 2020, were primarily
178
GOTHAM FUNDS
Notes to Financial Statements (Concluded)
September 30, 2020
attributed to wash sales on unsettled short sales, deferral of loss on unsettled trades, realized gain/loss on unsettled swaps, straddle losses outstanding, wash sales, amortization of organizational costs, qualified late year losses deferred, capital loss carryforwards not yet utilized and deferred interest expense. Foreign currency and short-term capital gains are reported as ordinary income for federal income tax purposes.
As of September 30, 2020, the federal tax cost, aggregate gross unrealized appreciation and depreciation of securities held by the Funds were as follows:
| Net Unrealized | ||||||||||||||||
| Federal | Unrealized | Unrealized | Appreciation/ | |||||||||||||
| Tax Cost | Appreciation | (Depreciation) | (Depreciation) | |||||||||||||
Absolute Return | $ | 429,404,373 | $ | 117,560,129 | $ | (61,827,695 | ) | $55,732,434 | ||||||||
Enhanced Return | 208,885,590 | 138,026,020 | (75,996,156 | ) | 62,029,864 | |||||||||||
Neutral | 45,994,627 | 16,661,846 | (8,209,961 | ) | 8,451,885 | |||||||||||
Large Value | 69,173,682 | 7,504,384 | (7,030,667 | ) | 473,717 | |||||||||||
Defensive Long 500 | 47,567,944 | 28,266,852 | (14,592,418 | ) | 13,674,434 | |||||||||||
Total Return | 26,274,997 | 3,080,547 | (845,488 | ) | 2,235,059 | |||||||||||
Pursuant to federal income tax rules applicable to regulated investment companies, the Funds may elect to treat certain capital losses between November 1 and September 30 and late year ordinary losses ((i) ordinary losses between January 1 and September 30 or (ii) specified ordinary losses between November 1 and September 30) as occurring on the first day of the following tax year. For the year ended September 30, 2020, any amount of losses elected within the tax return will not be recognized for federal income tax purposes until October 1, 2020. For the year ended September 30, 2020, the Funds deferred to October 1, 2020 the following losses:
| Late-Year Ordinary | Short-Term Capital | Long-Term Capital | |||||||||||||
| Losses Deferral | Loss Deferral | Loss Deferral | |||||||||||||
Absolute Return | $ | 1,735,629 | $ | 95,429,591 | $ | (50,041,479 | ) | ||||||||
Enhanced Return | 1,472,708 | — | — | ||||||||||||
Neutral | 855,813 | 21,230,678 | (7,179,859 | ) | |||||||||||
Large Value | — | 4,754,359 | (2,600,357 | ) | |||||||||||
Total Return | 1,573 | — | — | ||||||||||||
Accumulated capital losses represent net capital loss carryforwards as of September 30, 2019 that may be available to offset future realized capital gains and thereby reduce future capital gains distributions. The Funds are permitted to carry forward capital losses for an unlimited period. Capital losses that are ocarried forward will retain their character as either short-term or long-term capital losses. As of September 30, 2020, the following Funds had long-term and short-term capital loss carryforwards in the following amounts:
| Capital Losses | |||||
| Carryforwards | |||||
Absolute Return | $ | 60,941,538 | |||
Enhanced Return | 12,671,992 | ||||
Neutral | 64,998,761 | ||||
Defensive Long 500 | 18,916,490 | ||||
Total Return | 1,969,312 | ||||
For the year ended September 30, 2020, the Funds did not utilized capital losses.
7. Subsequent Events
Management has evaluated the impact of all subsequent events on the Funds through the date the financial statements were available to be issued, and has determined that there are no material subsequent events requiring recognition or disclosure in the financial statements.
179
Report of Independent Registered Public Accounting Firm
To the Board of Trustees of FundVantage Trust and Shareholders of Gotham Absolute Return Fund, Gotham Enhanced Return Fund, Gotham Neutral Fund, Gotham Large Value Fund, Gotham Defensive Long 500 Fund and Gotham Total Return Fund
Opinions on the Financial Statements
We have audited the accompanying statements of assets and liabilities, including the portfolios of investments, of Gotham Absolute Return Fund, Gotham Enhanced Return Fund, Gotham Neutral Fund, Gotham Large Value Fund, Gotham Defensive Long 500 Fund and Gotham Total Return Fund (six of the funds constituting FundVantage Trust, referred to hereafter collectively as the “Funds”) as of September 30, 2020, the related statements of operations for the year ended September 30, 2020, the statements of changes in net assets for each of the two years in the period ended September 30, 2020, and for Gotham Absolute Return Fund and Gotham Neutral Fund, the statements of cash flows for the year ended September 30, 2020, including the related notes, and the financial highlights for each of the periods indicated therein (collectively referred to as the “financial statements”). In our opinion, the financial statements present fairly, in all material respects, the financial position of each of the Funds as of September 30, 2020, the results of each of their operations for the year then ended, the changes in each of their net assets for each of the two years in the period ended September 30, 2020, for Gotham Absolute Return Fund and Gotham Neutral Fund, the results of each of their cash flows for the year then ended and each of the financial highlights for each of the periods indicated therein in conformity with accounting principles generally accepted in the United States of America.
Basis for Opinions
These financial statements are the responsibility of the Funds’ management. Our responsibility is to express an opinion on the Funds’ financial statements based on our audits. We are a public accounting firm registered with the Public Company Accounting Oversight Board (United States) (PCAOB) and are required to be independent with respect to the Funds in accordance with the U.S. federal securities laws and the applicable rules and regulations of the Securities and Exchange Commission and the PCAOB.
We conducted our audits of these financial statements in accordance with the standards of the PCAOB. Those standards require that we plan and perform the audit to obtain reasonable assurance about whether the financial statements are free of material misstatement, whether due to error or fraud.
Our audits included performing procedures to assess the risks of material misstatement of the financial statements, whether due to error or fraud, and performing procedures that respond to those risks. Such procedures included examining, on a test basis, evidence regarding the amounts and disclosures in the financial statements. Our audits also included evaluating the accounting principles used and significant estimates made by management, as well as evaluating the overall presentation of the financial statements. Our procedures included confirmation of securities owned as of September 30, 2020 by correspondence with the custodian, transfer agent and brokers; when replies were not received from brokers, we performed other auditing procedures. We believe that our audits provide a reasonable basis for our opinions.
/s/ PricewaterhouseCoopers LLP
Philadelphia, PA
November 23, 2020
We have served as the auditor of one or more investment companies in Gotham Asset Management LLC since 2011.
180
Shareholder Tax Information
(Unaudited)
Certain tax information regarding each Fund is required to be provided to shareholders based upon each Fund’s income and distributions for the taxable year ended September 30, 2020. The information and distributions reported herein may differ from information and distributions taxable to the shareholders for the calendar year ending December 31, 2020. During the fiscal year ended September 30, 2020 the following dividends and distributions were paid by each of the Funds:
| Ordinary Income | Long-Term Capital Gain | |||||||
Enhanced Return | $ | — | $ | 124,087,944 | ||||
Large Value | 1,230,886 | 380,026 | ||||||
Defensive Long 500 | 370,405 | 508,399 | ||||||
Total Return | 309,540 | 1,783,702 | ||||||
Where appropriate, all designations are based on financial information available as of the date of this annual report and, accordingly, are subject to change. For each item, it is the intention of each Fund to designate the maximum amount permitted under the Internal Revenue Code of 1986, as amended, and the regulations thereunder.
Under the Jobs and Growth Tax Relief Reconciliation Act of 2003, the following percentages of ordinary dividends paid during the fiscal year ended September 30, 2020 were designated as “qualified dividend income”, as defined in the Act, and are subject to reduced tax rates:
Large Value | 100.00 | % | ||
Defensive Long 500 | 100.00 | % | ||
Total Return | 99.33 | % |
The percentage of total ordinary income dividends paid qualifying for the corporate dividends received deduction for each Fund is as follows:
Large Value | 100.00 | % | ||
Defensive Long 500 | 100.00 | % | ||
Total Return | 99.33 | % |
The percentage of qualified interest income related dividends not subject to withholding tax for non-resident aliens and foreign corporations is as follows:
Large Value | 0.25 | % | ||
Defensive Long 500 | 0.54 | % | ||
Total Return | 1.07 | % |
The percentage of ordinary income distributions designated as qualified short-term gains pursuant to the American Job Creation Act of 2004 is as follows:
Total Return | 100.00 | % |
Because the Funds’ fiscal year is not the calendar year, another notification will be sent with respect to calendar year 2020. The second notification, which will reflect the amount, if any, to be used by calendar year taxpayers on their U.S. federal income tax returns will be made in conjunction with Form 1099-DIV and will be mailed in January 2021.
Foreign shareholders will generally be subject to U.S. withholding tax on the amount of their ordinary income dividends. They will generally not be entitled to a foreign tax credit or deduction for the withholding taxes paid by a Fund, if any.
In general, dividends received by tax-exempt recipients (e.g., IRAs and Keoghs) need not be reported as taxable income for U.S. federal income tax purposes. However, some retirement trusts (e.g., corporate, Keogh and 403(b)(7) plans) may need this information for their annual information reporting.
Shareholders are advised to consult their own tax advisers with respect to the tax consequences of their investment in a Fund.
181
Other Information
(Unaudited)
Proxy Voting
Policies and procedures that the Funds use to determine how to vote proxies relating to portfolio securities as well as information regarding how a Fund voted proxies relating to portfolio securities for the most recent 12-month period ended June 30 are available without charge, upon request, by calling (877) 974-6852 and on the Securities and Exchange Commission’s (“SEC”) website at http:// www.sec.gov.
Quarterly Portfolio Schedules
The Trust files its complete schedule of portfolio holdings with the SEC for the first and third fiscal quarters of each fiscal year (quarters ended December 31 and June 30) as an exhibit to their reports on Form N-PORT. The Trust’s portfolio holdings on Form N-PORT are available on the SEC’s website at http://www.sec.gov.
Board Consideration of Investment Advisory Agreement
At a videoconference meeting held on June 22-23, 2020 (the “Meeting”), the Board of Trustees (the “Board” or the “Trustees”) of FundVantage Trust (the “Trust”), including a majority of the Trustees who are not “interested persons” within the meaning of Section 2(a)(19) of the Investment Company Act of 1940, as amended (the “1940 Act”) (the “Independent Trustees”), unanimously approved the continuation of the Investment Advisory Agreement between Gotham Asset Management, LLC (“Gotham” or the “Adviser”) and the Trust (the “Gotham Agreement”) on behalf of the Gotham Absolute Return Fund, Gotham Enhanced Return Fund, Gotham Neutral Fund, Gotham Large Value Fund, Gotham Defensive Long 500 Fund and Gotham Total Return Fund (together, the “Gotham Funds”). At the Meeting, the Board considered the continuation of the Gotham Agreement with respect to the Gotham Funds for an additional one year period.
In determining whether to continue the Gotham Agreement for an additional one-year period, the Trustees, including the Independent Trustees, considered information provided by Gotham in response to a request for information in accordance with Section 15(c) of the 1940 Act (the “Gotham 15(c)Response”) regarding (i) the services performed for the Gotham Funds, (ii) the size and qualifications of Gotham’s portfolio management staff, (iii) any potential or actual material conflicts of interest which may arise in connection with a portfolio manager’s management of the Gotham Funds, (iv) investment performance, (v) the financial condition of Gotham, (vi) brokerage selection procedures (including soft dollar arrangements, if any), (vii) the procedures for allocating investment opportunities between the Gotham Funds and other clients, (viii) results of any regulatory examination, including any recommendations or deficiencies noted, (ix) any litigation, investigation or administrative proceeding which may have a material impact on Gotham’s ability to service the Gotham Funds, and (x) compliance with the Gotham Funds’ investment objectives, policies and practices (including codes of ethics and proxy voting policies), federal securities laws and other regulatory requirements. In addition to the Gotham 15(c) Response, the Trustees received reports at Board meetings throughout the year covering matters such as the relative performance of the Gotham Funds, compliance with the Funds’ respective investment objectives, policies, strategies and limitations, compliance of portfolio management personnel with the applicable code of ethics, and adherence to pricing procedures as established by the Board (each, as applicable).
The Board noted that representatives of Gotham joined the Meeting by videoconference and discussed Gotham’s history, performance, investment strategy, and compliance program. Representatives of Gotham responded to questions from the Board. In addition to the Gotham 15(c) Response, the Trustees also considered other factors they believed to be relevant to considering the continuation of the Gotham Agreement, including the matters discussed below. In their deliberations, the Trustees did not identify any particular information that was controlling, and different Trustees may have attributed different weights to the various factors. After deliberating, the Trustees determined that the overall arrangement between the Gotham Funds and Gotham, as provided by the terms of the Gotham Agreement, including the advisory fees under the Gotham Agreement, are fair and reasonable in light of the services provided, expenses incurred and such other matters as the Trustees considered relevant.
The Trustees considered the services provided by Gotham to the Gotham Funds. The Trustees considered Gotham’s personnel and the depth of Gotham’s personnel who provide investment management services to the Gotham Funds and the depth of their experience. Based on the Gotham 15(c) Response, the Trustees concluded that (i) the nature, extent and quality of the services provided by Gotham are appropriate and consistent with the terms of the Gotham Agreement, (ii) that the quality of those services has been, and continues to be, consistent with industry norms, (iii) the Gotham Funds are likely to benefit from the continued provision of those
182
GOTHAM FUNDS
Other Information (Continued)
(Unaudited)
services, (iv) Gotham has sufficient personnel, with the appropriate skills and experience, to serve the Gotham Funds effectively and has demonstrated its continuing ability to attract and retain qualified personnel, and (v) the satisfactory nature, extent, and quality of services currently provided to the Gotham Funds is likely to continue under the Gotham Agreement.
The Board discussed Gotham’s business continuity plan, and its ability to continue to manage the Gotham Funds effectively in light of the recent volatility in financial markets as a result of the COVID-19 virus outbreak.
The Trustees considered the investment performance for the Gotham Funds and Gotham. The Trustees reviewed historical performance charts which showed the performance of the Gotham Funds as compared to their respective benchmark indices and Lipper categories for the since inception, year-to-date, one year, two year, three year, five year and ten year periods ended March 31, 2020 as applicable. The Trustees considered the short term and long term performance of the Gotham Funds, as applicable. The Trustees noted that they considered performance reports provided at Board meetings throughout the year.
Gotham Absolute Return Fund. The Trustees noted that the Gotham Absolute Return Fund underperformed the HFRX Equity Hedge Index for the year-to-date and one year periods ended March 31, 2020 and outperformed the HFRX Equity Hedge Index for the two year, three year, five year and since inception periods ended March 31, 2020. The Trustees further noted that the Gotham Absolute Return Fund outperformed the Lipper Absolute Return Funds Index for the since inception period ended March 31, 2020 and underperformed the Lipper Absolute Return Funds Index for the year-to-date, one year, two year, three year and five year periods ended March 31, 2020.
Gotham Enhanced Return Fund. The Trustees noted that the Gotham Enhanced Return Fund outperformed the Lipper Alternative Long/Short Equity Funds Index for the five year and since inception periods ended March 31, 2020 and underperformed the Lipper Alternative Long/Short Equity Funds Index year-to-date, one year, two year and three year periods ended March 31, 2020. The Trustees further noted that the Gotham Enhanced Return Fund underperformed the S&P 500 Total Return Index for the year-to-date, one year, two year, three year, five year and since inception periods ended March 31, 2020.
Gotham Large Value Fund. The Trustees noted that the Gotham Large Value Fund underperformed the Lipper Multi-Cap Core Funds Index and S&P 500 Total Return Index for the year-to-date, one year, two year, three year and since inception periods ended March 31, 2020.
Gotham Neutral Fund. The Trustees noted that the Gotham Neutral Fund underperformed the ICE BofAML US 3-Month Treasury Bill Index and Lipper Alternative Equity Market Neutral Funds Index for the year to date, one year, two year, three year, five year and since inception periods ended March 31, 2020.
Gotham Defensive Long 500 Fund. The Trustees noted that the Gotham Defensive Long 500 Fund underperformed the S&P 500 Total Return Index for the year-to-date, one year, two year, three year and since inception periods ended March 31, 2020. The Trustees further noted that the Gotham Defensive Long 500 Fund outperformed the Lipper Alternative Long/Short Equity Funds Index for the three year and since inception periods ended March 31, 2020, underperformed the Lipper Alternative Long/Short Equity Funds Index for the year-to-date and one year periods ended March 31, 2020, and performed in line with the Lipper Alternative Long/Short Equity Funds Index for the two year period ended March 31, 2020.
Gotham Total Return Fund. The Trustees noted that the Gotham Total Return Fund Institutional Class shares outperformed the Lipper Alternative Long/Short Equity Funds Index for the three year, five year and since inception periods ended March 31, 2020 and underperformed the Lipper Alternative Long/Short Equity Funds Index for the year-to-date, one year and two year periods ended March 31, 2020. They further noted that the Gotham Total Return Fund Institutional Class shares outperformed the HFRX Equity Hedge Index for the two year, three year, five year and since inception periods ended March 31, 2020 and underperformed the HFRX Equity Hedge Index for the year-to-date and one year periods ended March 31, 2020.
The Trustees concluded that the performance of each of the Gotham Funds was within an acceptable range of performance relative to other mutual funds with similar investment objectives, strategies and policies based on the information provided at the Meeting.
183
GOTHAM FUNDS
Other Information (Continued)
(Unaudited)
The Trustees noted that the representatives of Gotham had provided information regarding its advisory fees and an analysis of these fees in relation to the services provided to the Funds and any other ancillary benefit resulting from the Gotham’s relationship with the Funds.
The Trustees also reviewed information regarding the fees Gotham charges to certain other clients and evaluated explanations provided by Gotham as to differences in fees charged to the Funds and other similarly managed accounts, where applicable. The Trustees also reviewed a peer comparison of advisory fees and total expenses for each Gotham Fund versus those funds in the Fund’s applicable Lipper category (the “Peer Group”). The Trustees concluded that the advisory fees and services provided by Gotham are consistent with those of other advisers that manage mutual funds with investment objectives, strategies and policies similar to those of the Funds as measured by the information provided by Gotham.
The Board considered, among other data, the specific factors and related conclusions set forth below with respect to each Fund:
Gotham Absolute Return Fund. The contractual advisory fee and net total expense ratio for the Gotham Absolute Return Fund’s Institutional Class shares were higher than the median contractual advisory fee and net total expense ratio for those funds in the Gotham Absolute Return Fund’s Peer Group.
Gotham Enhanced Return Fund. The contractual advisory fee and net total expense ratio for the Gotham Enhanced Return Fund’s Institutional Class shares were higher than the median contractual advisory fee and net total expense ratio for those funds in the Gotham Enhanced Return Fund’s Peer Group with $250 million or less in assets.
Gotham Large Value Fund. The contractual advisory fee and net total expense ratio for the Gotham Large Value Fund’s Institutional Class shares were higher than and lower than, respectively, the median contractual advisory fee and net total expense ratio for those funds in the Gotham Large Value Fund’s Peer Group with $250 million or less in assets.
Gotham Neutral Fund. The contractual advisory fee and net total expense ratio for the Gotham Neutral Fund’s Institutional Class shares were higher than the median contractual advisory fee and net total expense ratio for those funds in the Gotham Neutral Fund’s Peer Group with $250 million or less in assets.
Gotham Defensive Long 500 Fund. The contractual advisory fee and net total expense ratio for the Gotham Defensive Long 500 Fund’s Institutional Class shares were higher than the median contractual advisory fee and net total expense ratio for those funds in the Gotham Defensive Long 500 Fund’s Peer Group with $250 million or less in assets.
Gotham Total Return Fund. The net advisory fee and net total expense ratio for the Gotham Total Return Fund’s Institutional Class shares were lower than the median net advisory fee and net total expense ratio for those funds in the Gotham Total Return Fund’s Peer Group with $250 million or less in assets. The Trustees discussed that the Gotham Total Return Fund is a “fund of funds,” and that there is no advisory fee in respect of assets invested in other funds advised by Gotham. The Trustees noted that the Gotham Total Return Fund does not collect an advisory fee because it invests only in other series of the Trust advised by Gotham.
The Trustees also discussed the limitations of the comparative expense information provided with respect to each Gotham Fund’s Peer Group, given the potential varying nature, extent and quality of the services provided by the advisors of other portfolios included in each of the Peer Groups. Based upon their review, the Trustees concluded that the respective advisory fees for the Gotham Funds were reasonable in light of the high quality of services received by the Funds from Gotham.
The Trustees considered the costs of the services provided by Gotham, the compensation and benefits received by Gotham in providing services to the Gotham Funds, its profitability and certain additional information related to Gotham’s financial condition. In addition, the Trustees considered any direct or indirect revenues received by affiliates of Gotham.
The Trustees considered the extent to which economies of scale may be realized relative to fee levels, and whether the advisory fee levels reflect these economies of scale for the benefit of shareholders. The Board noted Gotham’s representation that none of the Funds have reached an asset size at which economies of scale would traditionally be considered to exist, and Gotham’s belief that breakpoints are not appropriate at this time. The Board further considered Gotham’s representation that the nature of various of the Funds’ investment strategies were such that future capacity was constrained based on Gotham’s ability to implement the strategy above certain asset levels, and as such the Funds’ ability to achieve future economies of scale were limited relative to more traditional
184
GOTHAM FUNDS
Other Information (Concluded)
(Unaudited)
asset classes. Based on the foregoing information, the Board concluded that economies of scale did not yet exist for the Funds and that therefore it was not yet necessary to consider whether the fee structure of the Funds provided an adequate mechanism for sharing the benefit of any such economies.
At the Meeting, after consideration of all the factors and taking into consideration the information presented, the Board, including the Independent Trustees, unanimously approved the continuation of the Gotham Agreement for an additional one-year period. In arriving at their decision, the Trustees did not identify any single matter as controlling, but made their determination in light of all the circumstances.
185
Privacy Notice
(Unaudited)
The privacy of your personal financial information is extremely important to us. When you open an account with us, we collect a significant amount of information from you in order to properly invest and administer your account. We take very seriously the obligation to keep that information private and confidential, and we want you to know how we protect that important information.
We collect nonpublic personal information about you from applications or other forms you complete and from your transactions with us or our affiliates. We do not disclose information about you, or our former clients, to our affiliates or to service providers or other third parties, except as permitted by law. We share only the information required to properly administer your accounts, which enables us to send transaction confirmations, monthly or quarterly statements, financials and tax forms. Even within FundVantage Trust and its affiliated entities, a limited number of people who actually service accounts will have access to your personal financial information. Further, we do not share information about our current or former clients with any outside marketing groups or sales entities.
To ensure the highest degree of security and confidentiality, FundVantage Trust and its affiliates maintain various physical, electronic and procedural safeguards to protect your personal information. We also apply special measures for authentication of information you request or submit to us on our web site www.gothamfunds.com.
If you have questions or comments about our privacy practices, please call us at (877) 974-6852.
186
Fund Management
(Unaudited)
FundVantage Trust (the “Trust”) is governed by a Board of Trustees (the “Board” or the “Trustees”). The primary responsibility of the Trustees is to represent the interest of the Trust’s shareholders and to provide oversight management of the Trust.
The following tables present certain information regarding the Board of Trustees and officers of the Trust. None of the Trustees are an “interested person” of the Trust, the Adviser, another investment adviser of a series of the Trust, or Foreside Funds Distributors LLC, the principal underwriter of the Trust (“Underwriter”), within the meaning of the 1940 Act and each Trustee is referred to as an “Independent Trustee” and is listed under such heading below. Employees of certain service providers to the Trust serve as officers of the Trust; such persons are not compensated by the Fund. The address of each Trustee and officer as it relates to the Trust’s business is 301 Bellevue Parkway, 2nd Floor, Wilmington, DE 19809.
The Statement of Additional Information for the Funds contains additional information about the Trustees and is available, without charge, upon request, by calling (877) 974-6852.
Name and Date of Birth | Position(s) Held with Trust | Term of Office and Length of Time Served | Principal Occupation(s) During Past Five Years |
Number of Funds in Trust Complex Overseen by Trustee
| Other Directorships Held by Trustee | |||||
| INDEPENDENT TRUSTEES | ||||||||||
ROBERT J. CHRISTIAN Date of Birth: 2/49 | Trustee | Shall serve until death, resignation or removal. Trustee since 2007. Chairman from 2007 until September 30, 2019. | Retired since February 2006; Executive Vice President of Wilmington Trust Company from February 1996 to February 2006; President of Rodney Square Management Corporation (“RSMC”) (investment advisory firm) from 1996 to 2005; Vice President of RSMC from 2005 to 2006. | 38 | Optimum Fund Trust (registered investment company with 6 portfolios); Third Avenue Trust (registered investment company with 3 portfolios); Third Avenue Variable Series Trust (registered investment company with 1 portfolio). | |||||
IQBAL MANSUR Date of Birth: 6/55 | Trustee | Shall serve until death, resignation or removal. Trustee since 2007. | Retired since September 2020; Professor of Finance, Widener University from 1998 to August 2020. | 38 | Third Avenue Trust (registered investment company with 3 portfolios); Third Avenue Variable Series Trust (registered investment company with 1 portfolio). | |||||
187
GOTHAM FUNDS
Fund Management (Continued)
(Unaudited)
Name and Date of Birth | Position(s) Held with Trust | Term of Office and Length of Time Served | Principal Occupation(s) During Past Five Years |
Number of Funds in Trust Complex Overseen by Trustee
| Other Directorships Held by Trustee | |||||
NICHOLAS M. MARSINI, JR. Date of Birth: 8/55 | Trustee and Chairman of the Board | Shall serve until death, resignation or removal. Trustee since 2016. Chairman since October 1, 2019. | Retired since March 2016. President of PNC Bank Delaware from June 2011 to March 2016; Executive Vice President of Finance of BNY Mellon from July 2010 to January 2011; Executive Vice President and Chief Financial Officer of PNC Global Investment Servicing from September 1997 to July 2010. | 38 | Brinker Capital Destinations Trust (registered investment company with 10 portfolios); Third Avenue Trust (registered investment company with 3 portfolios); Third Avenue Variable Series Trust (registered investment company with 1 portfolio). | |||||
NANCY B. WOLCOTT Date of Birth: 11/54 | Trustee | Shall serve until death, resignation or removal. Trustee since 2011. | Retired since May 2014; EVP, Head of GFI Client Service Delivery, BNY Mellon from January 2012 to May 2014; EVP, Head of US Funds Services, BNY Mellon from July 2010 to January 2012; President of PNC Global Investment Servicing from 2008 to July 2010; Chief Operating Officer of PNC Global Investment Servicing from 2007 to 2008; Executive Vice President of PFPC Worldwide Inc. from 2006 to 2007. | 38 | Lincoln Variable Insurance Products Trust (registered investment company with 97 portfolios); Third Avenue Trust (registered investment company with 3 portfolios); Third Avenue Variable Series Trust (registered investment company with 1 portfolio). | |||||
188
GOTHAM FUNDS
Fund Management (Concluded)
(Unaudited)
Name and Date of Birth | Position(s) Held with Trust | Term of Office and Length of Time Served | Principal Occupation(s) During Past Five Years |
Number of Funds in Trust Complex Overseen by Trustee
| Other Directorships Held by Trustee | |||||
STEPHEN M. WYNNE Date of Birth: 1/55 | Trustee | Shall serve until death, resignation or removal. Trustee since 2009. | Retired since December 2010; Chief Executive Officer of US Funds Services, BNY Mellon Asset Servicing from July 2010 to December 2010; Chief Executive Officer of PNC Global Investment Servicing from March 2008 to July 2010; President, PNC Global Investment Servicing from 2003 to 2008. | 38 | Copeland Trust (registered investment company with 3 portfolios); Third Avenue Trust (registered investment company with 3 portfolios); Third Avenue Variable Series Trust (registered investment company with 1 portfolio). | |||||
Name and Date of Birth | Position(s) Held with Trust | Term of Office and Length of Time Served | Principal Occupation(s) During Past Five Years | |||
| EXECUTIVE OFFICERS | ||||||
JOEL L. WEISS Date of Birth: 1/63 | President and Chief Executive Officer | Shall serve until death, resignation or removal. Officer since 2007. | President of JW Fund Management LLC since June 2016; Vice President and Managing Director of BNY Mellon Investment Servicing (US) Inc. and predecessor firms from 1993 to June 2016. | |||
T. RICHARD KEYES Date of Birth: 1/57 | Treasurer and Chief Financial Officer | Shall serve until death, resignation or removal. Officer since 2016. | President of TRK Fund Consulting LLC since July 2016; Head of Tax - U.S. Fund Services of BNY Mellon Investment Servicing (US) Inc. and predecessor firms from February 2006 to July 2016. | |||
GABRIELLA MERCINCAVAGE Date of Birth: 6/68 | Assistant Treasurer | Shall serve until death, resignation or removal. Officer since 2019. | Fund Administration Consultant since January 2019; Fund Accounting and Tax Compliance Accountant to financial services companies from November 2003 to July 2018. | |||
VINCENZO A. SCARDUZIO Date of Birth: 4/72 | Secretary | Shall serve until death, resignation or removal. Officer since 2012. | Director and Vice President Regulatory Administration of The Bank of New York Mellon and predecessor firms since 2001. | |||
GUY F. TALARICO Date of Birth: 8/55 | Chief Compliance Officer and Anti-Money Laundering Officer | Shall serve until death, resignation or removal. Officer since 2020. | Chief Executive Officer of Alaric Compliance Services LLC since June 2004. | |||
189
Investment Adviser
Gotham Asset Management, LLC
535 Madison Avenue, 30th Floor
New York, NY 10022
Administrator
The Bank of New York Mellon
301 Bellevue Parkway
Wilmington, DE 19809
Transfer Agent
BNY Mellon Investment Servicing (US) Inc.
4400 Computer Drive
Westborough, MA 01581
Principal Underwriter
Foreside Funds Distributors LLC
400 Berwyn Park
899 Cassatt Road
Berwyn, PA 19312
Custodian
The Bank of New York Mellon
240 Greenwich Street
New York, NY 10286
Independent Registered Public Accounting Firm
PricewaterhouseCoopers LLP
Two Commerce Square, Suite 1800
2001 Market Street
Philadelphia, PA 19103-7042
Legal Counsel
Troutman Pepper Hamilton Sanders LLP
3000 Two Logan Square
18th and Arch Streets
Philadelphia, PA 19103
GOTI-0920
GOTHAM FUNDS
of
FundVantage Trust
Gotham Index Plus Fund
Gotham Enhanced 500 Plus Fund
Gotham Enhanced S&P 500 Index Fund
ANNUAL REPORT
September 30, 2020
Important Information on Paperless Delivery
Beginning on January 1, 2021, paper copies of the Funds’ shareholder reports will no longer be sent by mail, unless you specifically request paper copies of the shareholder reports from the Funds or from your financial intermediary. Instead, shareholder reports will be available on the Funds’ website (www.GothamFunds.com), and you will be notified by mail each time a report is posted and provided with a website link to access the report.
You may elect to receive all future shareholder reports in paper, free of charge. To elect to receive paper copies of shareholder reports through the mail or otherwise change your delivery method, contact your financial intermediary or, if you hold your shares directly through the Funds, call the Gotham Funds toll-free at 1 (877) 974-6852 or write to Gotham Funds, FundVantage Trust, c/o BNY Mellon Investment Servicing, P.O. Box 9829, Providence, RI 02940-8029. Your election to receive shareholder reports in paper will apply to all Gotham Funds that you hold through the financial intermediary, or directly with the Gotham Funds.
This report is submitted for the general information of shareholders and is not authorized for distribution to prospective shareholders unless preceded or accompanied by a current prospectus.
GOTHAM FUNDS
ANNUAL REPORT
AS OF SEPTEMBER 30, 2020
TABLE OF CONTENTS | ||||
| 1 | ||||
| 2 | ||||
| 8 | ||||
| 11 | ||||
| 13 | ||||
| 16 | ||||
Financial Statements: | ||||
| 50 | ||||
| 51 | ||||
| 52 | ||||
| 54 | ||||
| 55 | ||||
| 59 | ||||
| 71 | ||||
| 72 | ||||
| 73 | ||||
| 76 | ||||
| 77 | ||||
Important Information
The performance data quoted in this report represents past performance and does not guarantee future results. The investment return and principal value of an investment in a Gotham Fund will fluctuate so that an investor’s shares, when redeemed, may be worth more or less than their original cost. Current performance may be lower or higher. Performance data current to the most recent month-end may be obtained by calling (877) 974-6852.
Each Gotham Fund covered by this report (each, a “Fund”) compares its performance to an unmanaged index. An index does not reflect operational and transactional costs which apply to a mutual fund. It is not possible to invest directly in an index.
Mutual fund investing involves risks, including possible loss of principal. Each Fund except Gotham Enhanced S&P 500 Index Fund will short securities. Short sales theoretically involve unlimited loss potential since the market price of securities sold short may continuously increase. Each Fund except Gotham Enhanced S&P 500 Index Fund will also use of leverage to make additional investments which could result in greater losses than if a Fund were not leveraged. The Gotham Index Plus Fund utilizes one or more swap agreements in its investment program. The use of derivatives such as swaps exposes a Fund to additional risks including increased volatility, lack of liquidity and possible losses greater than the Fund’s initial investment. The securities issued by small-cap and mid-cap companies tend to be more volatile and less liquid than those of large-cap issuers. Each Fund may have a high turnover of its portfolio securities. High turnover rates generally result in higher brokerage costs to a Fund. There can be no guarantee that a Fund will achieve its objectives.
A prospective investor should consider the investment objectives, risks, charges and expenses of a Fund carefully before investing. The prospectus and summary prospectus contains this and other information about the Funds, and should be read carefully before investing. A copy of the prospectus or summary prospectus is available at www.GothamFunds.com or by calling (877) 974-6852.
1
Annual Investment Adviser’s Report
September 30, 2020
(Unaudited)
Gotham Index Plus Fund (GINDX)
Gotham Enhanced 500 Plus Fund (GEFPX)
Gotham Enhanced S&P 500 Index Fund (GSPFX)
Dear Shareholder,
Much of 2020 has been dictated by the COVID-19 pandemic, pushing the global economy and markets into uncharted territory. The disruption caused due to the pandemic and resulting lockdown has affected corporate cash flows in a way that is unprecedented. As companies release third quarter earnings over the coming weeks, we continue to examine in more detail how the pandemic has affected corporate cash flows. The results are messy and require extensive analysis. This is precisely the type of work our research team has focused on for over fifteen years. We believe that a strong ability to adjust as-reported financials to better reflect the true economics of a business should be especially beneficial during these unprecedented times. From a business standpoint, Gotham continues to operate effectively and without material impediment in the current remote environment.
As most of you are aware, Gotham manages value-oriented mutual funds with varying market cap universes and gross and net exposures. The funds share the same investment philosophy, process and research. Gotham offers actively managed strategies (long/short and long-only) as well as strategies that combine an index component and an actively managed long/short overlay. Gotham’s all-cap funds select long and short stock portfolios from a diverse capitalization universe of U.S. stocks. Our large-cap funds select stocks primarily from the S&P 500.
Our investment process begins with a research effort that seeks to value all of the companies in a fund’s respective investment universe. Our philosophy is simple. Although stock prices react to emotion over the short term, over the long term the market is very good at finding the fair value of stocks. Therefore, we believe that if we are good at valuing businesses (a share of stock represents a percentage ownership stake in a business), the market will agree with us...eventually. This is crucial. No investment strategy, regardless of how good or logical, works all the time.
The important thing for us is to stick to our strategy even if it is not working over shorter time periods. We have over 60 years of combined investment experience valuing and investing in publicly traded businesses. We know how to value businesses by using various measures of absolute and relative value. So, that’s how we invest. We buy companies that are at the biggest discount to our assessment of value and sell short (where applicable) those companies that are most expensive relative to our assessment of value. We do not plan to change this strategy or adopt other methodologies when short-term stock prices do not reflect the values that we see.
Together with our investment team (led by Director of Research, Adam Barth), we follow a systematic process of researching and valuing companies, investing in our long and short portfolios and adjusting positions daily to take advantage of changing stock prices and fundamental information. The funds are highly diversified and invest in hundreds of positions. Our positions are not equally weighted. The funds generally invest in the cheapest companies and short (where applicable) the most expensive based on our assessment of value and subject to our risk constraints. We manage our risks by, among other things, requiring substantial portfolio diversification, setting maximum limits for sector concentration and by maintaining overall gross and net exposures within carefully defined ranges.
Market Observations and Performance Commentary
The market volatility during much of 2020 was fueled by massive uncertainty surrounding the economy reopening following the pandemic induced lockdowns, vaccine news as well as US elections in November. After the initial shock in late February to March when markets plunged 25-30%, the subsequent rebound rally left market cap-weighted indexes expensive relative to our 30-year research history. As of September 30, 2020, the Russell 1000 was outperforming the Russell 1000 equal-weight benchmark by over 1000bps YTD. This has been a consistent headwind for actively managed strategies. We believe it has also created a more attractive opportunity set based on relative valuations going forward, as it presents stock pickers with a relatively attractive universe to choose from over the next several years relative to market-cap weighted indexes.
2
Annual Investment Adviser’s Report (Continued)
September 30, 2020
(Unaudited)
In September 2020, the S&P 500 was trading at 26x Gotham’s proprietary cash flow metric. This number is significantly skewed by the effect the COVID-19 pandemic has had on earnings for the 2nd and 3rd quarters. At the start of the year, the S&P 500 was in the 12th percentile towards expensive over the past 30 years based on 2019 corporate cash flows. This historically corresponded to 2-year cumulative forward returns of 6%-8%. With the index up 13% YTD1, we would expect 2-year cumulative forward returns for the S&P 500 to be 1%-3% if 2019 corporate cash flows are a good gauge for normalized earnings.
It is important to note that the above numbers are not adjusted for interest rates. If rates this low were to persist over a long time period, it would be reasonable to expect higher equity returns than our historical analysis suggests. At the same time, it is difficult to adjust these metrics which have been partially affected by the global pandemic. While some companies with the largest market capitalizations have benefited in a positive way, there are many companies within the index that have been negatively impacted.
In addition, the continued disparity between growth and value widened in 2020, as pandemic led tech heavy businesses dominated the market rally. Growth benchmarks are outperforming their value counterparts by significant margins over the trailing one-year, three-year and five-year periods, surpassing levels last seen during the 2nd quarter of 2000, the peak of the internet bubble.
We conducted a study to quantify the expensiveness of this period relative to history, particularly the internet bubble. Based on our research, only 1999 ranks worse than the first six months of 2020 for the returns of cheap stocks minus expensive, which was followed by 3 of the best years for cheap relative to expensive companies based on our assessment of value. We don’t know when the current value/growth divergence will revert, but the historical precedent is for it to be abrupt and significant when it happens.
In terms of performance, broadly speaking our short book has been challenged in this market environment resulting in negative long/short spreads. Though many of these shorts are growing quickly, they are very richly priced. Some are currently unprofitable, and others sell at 50 or 100 times corporate free cash flows. On the long side, though we cannot predict short-term market moves and the overall market remains expensive, we believe that there is an opportunity to exceed the positive returns we expect for large cap indexes. Given valuation levels and the disparity between stock returns and fundamentals, we are very optimistic about the opportunity set for our long/short spreads over the coming period.
We remain confident that the best way to construct portfolios in any period, and perhaps even more so during expensive markets, is to own stakes in quality businesses generating strong cash flows. The long portfolios in our strategies trade at significantly better valuations than the index. The short portfolios in these strategies are generally cash flow negative, with higher levels of leverage and weaker business fundamentals. Our risk management has helped to improve our long/short spreads in a period that has been exceptionally challenged for active management and value-oriented strategies in particular.
Although we can’t predict when this environment will end and the current value/growth cycle will turn, as we stated above, the historical precedent is that the transition is often abrupt and significant. Despite the added uncertainty surrounding the pandemic, we have consistently communicated to our partners that strong normalized cash flows, good franchises, and growth prospects are the key drivers to valuation over the long-term. It is also a process that should prove resilient in turbulent periods. Markets and businesses have generally recovered in reasonably short order after the initial shock from one-time events, including the outbreak of World War 2, the Cuban Missile Crisis, and the financial crisis of 2008. We believe the current headwinds will eventually subside and favoring cash flow generating companies with good returns on capital and strong balance sheets (and shorting the opposite) should provide a particularly attractive opportunity for outperformance.
3
Annual Investment Adviser’s Report (Continued)
September 30, 2020
(Unaudited)
Important Information
This letter is intended to assist shareholders in understanding how the Gotham Funds described herein performed during the period ended September 30, 2020, and reflects the views of the investment adviser at the time of this writing. Market and index valuations are based on Gotham’s valuation methodology. The views may change and do not guarantee the future performance of the Gotham Funds or the markets.
This letter contains forward-looking statements regarding future events, forecasts and expectations regarding equity markets and certain of Gotham’s strategies. Forward-looking statements may be identified terminology such terms as “may,” “expect,” “will,” “hope,” “believe” and/or comparable terminology. No assurance, representation, or warranty is made that any of Gotham’s expectations, views and/or objectives will be achieved and actual results may be significantly different than reflected herein.
The indices referenced herein are for comparison purposes only. The performance and volatility of the funds will be different than those of the indices. It is not possible to invest in the indices directly.
| 1 | As of November 17, 2020. |
4
Annual Investment Adviser’s Report (Continued)
September 30, 2020
(Unaudited)
Performance by Fund
Gotham Index Plus (GINDX)
| · | The Fund’s Institutional Class returned +8.14% (net) for the trailing twelve-month period and the S&P 500 Total Return Index returned +15.15% over the same time period. |
| · | The spread for the period was -0.40%2. |
| · | The long portfolio contributed +19.51% for the trailing twelve-month period. The short portfolio detracted -9.78% for the period. |
| · | Top contributors and detractors by sector and stock positions are below: |
Sector Contributors/Detractors | ||||||||||||||||
| Average Contribution | Average Exposure | |||||||||||||||
| Largest Contributors | ||||||||||||||||
Long | Information Technology | 10.25% | 35.68% | |||||||||||||
| Industrials | 3.80% | 27.70% | ||||||||||||||
Short | Energy | 3.09% | -7.23% | |||||||||||||
| Financials | 1.06% | -8.03% | ||||||||||||||
| Largest Detractors | ||||||||||||||||
Long | Energy | -5.64% | 9.73% | |||||||||||||
| Financials | -0.75% | 22.05% | ||||||||||||||
Short | Information Technology | -4.24% | -14.86% | |||||||||||||
| Health Care | -3.66% | -13.74% | ||||||||||||||
|
| |||||||||||||||
Stock Contributors/Detractors | ||||||||||||||||
| Average Contribution | Average Exposure | |||||||||||||||
| Largest Contributors | ||||||||||||||||
Long | Apple Inc. | 5.52% | 6.62% | |||||||||||||
| Amazon.com Inc. | 2.45% | 3.88% | ||||||||||||||
Short | Occidental Petroleum Corp. | 1.00% | -0.91% | |||||||||||||
| American Airlines Group Inc. | 0.82% | -0.70% | ||||||||||||||
| Largest Detractors | ||||||||||||||||
Long | Chevron Corp. | -0.72% | 1.97% | |||||||||||||
| Carnival Corp. | -0.66% | 0.32% | ||||||||||||||
Short | NVIDIA Corp. | -0.73% | -1.44% | |||||||||||||
| FedEx Corp. | -0.62% | -0.77% | ||||||||||||||
5
Annual Investment Adviser’s Report (Continued)
September 30, 2020
(Unaudited)
Gotham Enhanced 500 Plus Fund (GEFPX)
| · | The Fund returned +4.95% (net) for the trailing twelve-month period and the S&P 500 Total Return Index returned +15.15% over the same time period. |
| · | The spread for the period was -5.67%2. |
| · | The long portfolio contributed +12.72% for the trailing twelve-month period. The short portfolio detracted -6.17% for the period. |
| · | Top contributors and detractors by sector and stock positions are below: |
Sector Contributors/Detractors | ||||||||||||||||
| Average Contribution | Average Exposure | |||||||||||||||
| Largest Contributors | ||||||||||||||||
Long | Information Technology | 6.52% | 27.05% | |||||||||||||
| Consumer Discretionary | 4.54% | 17.18% | ||||||||||||||
Short | Energy | 0.87% | -1.53% | |||||||||||||
| Utilities | 0.40% | -6.04% | ||||||||||||||
| Largest Detractors | ||||||||||||||||
Long | Energy | -3.39% | 6.35% | |||||||||||||
| Financials | -1.20% | 12.11% | ||||||||||||||
Short | Information Technology | -3.49% | -9.08% | |||||||||||||
| Health Care | -1.76% | -7.96% | ||||||||||||||
|
| |||||||||||||||
Stock Contributors/Detractors |
| |||||||||||||||
| Average Contribution | Average Exposure | |||||||||||||||
| Largest Contributors | ||||||||||||||||
Long | Apple Inc. | 5.05% | 6.91% | |||||||||||||
| Amazon.com Inc. | 2.65% | 4.07% | ||||||||||||||
Short | Boeing Co. | 0.64% | -0.82% | |||||||||||||
| Occidental Petroleum Corp. | 0.23% | -0.19% | ||||||||||||||
| Largest Detractors | ||||||||||||||||
Long | Intel Corp. | -1.13% | 0.79% | |||||||||||||
| Cisco Systems Inc. | -0.81% | 3.40% | ||||||||||||||
Short | NVIDIA Corp. | -0.77% | -0.54% | |||||||||||||
| Advanced Micro Devices Inc. | -0.42% | -0.45% | ||||||||||||||
6
Annual Investment Adviser’s Report (Concluded)
September 30, 2020
(Unaudited)
Gotham Enhanced S&P 500 Index (GSPFX)
| · | The Fund returned +11.53% (net) for the trailing twelve-month period and the S&P 500 Total Return Index returned +15.15% over the same time period. |
| · | Top contributors and detractors by sector and stock positions are below: |
Sector Contributors/Detractors | ||||||||||||||||
| Average Contribution | Average Exposure | |||||||||||||||
| Largest Contributors | ||||||||||||||||
Long | Information Technology | 6.68% | 22.04% | |||||||||||||
| Consumer Discretionary | 4.07% | 12.29% | ||||||||||||||
| Largest Detractors | ||||||||||||||||
Long | Energy | -2.19% | 3.93% | |||||||||||||
| Financials | -1.06% | 7.09% | ||||||||||||||
|
| |||||||||||||||
Stock Contributors/Detractors | ||||||||||||||||
| Average Contribution | Average Exposure | |||||||||||||||
| Largest Contributors | ||||||||||||||||
Long | Apple Inc. | 4.62% | 6.09% | |||||||||||||
| Amazon.com Inc. | 2.87% | 4.39% | ||||||||||||||
| Largest Detractors | ||||||||||||||||
Long | Intel Corp. | -0.89% | 0.52% | |||||||||||||
| Berkshire Hathaway Inc. | -0.67% | 1.53% | ||||||||||||||
| 2 | The spread is defined as how much our long portfolio outperformed our short portfolio adjusted for leverage (i.e. 100% long the long portfolio less 100% long the short portfolio). |
7
Gotham Index Plus Fund
Annual Report
Performance Data
September 30, 2020
(Unaudited)
Comparison of Change in Value of $250,000 Investment in Gotham Index Plus Fund Institutional Class Shares
vs Standard & Poor’s 500® Total Return Index (“S&P 500® Total Return Index”)
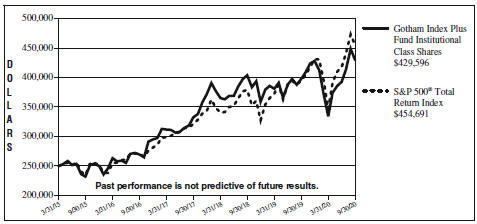
| Average Annual Total Returns for the Periods Ended September 30, 2020 |
| |||||||||||||||||||
| 1 Year | 3 Year | 5 Year | Since Inception | |||||||||||||||||
Institutional Class Shares | 8.14 | % | 8.96 | % | 13.11 | % | 10.34%* | |||||||||||||
Investor Class Shares | 7.94 | % | N/A | N/A | 5.17%* | |||||||||||||||
S&P 500® Total Return Index | 15.15 | % | 12.27 | % | 14.14 | % | 11.47%** | |||||||||||||
| * | Institutional Class shares and Investor Class shares of the Gotham Index Plus Fund (the “Fund”) incepted on March 31, 2015 and December 29, 2017, respectively. |
| ** | Benchmark performance is from inception date of the Fund’s Institutional Class shares only and is not the inception date of the benchmark itself. |
Past performance does not guarantee future results. The graph and table do not reflect the deduction of taxes that a shareholder would pay on Fund distributions or redemption of Fund shares; nor a 1.00% fee applied by the Fund’s Institutional Class and Investor Class to the value of shares redeemed within 30 days of purchase.
As stated in the current prospectus dated February 1, 2020 (as supplemented on July 1, 2020), the “Total Annual Fund Operating Expenses” and the “Total Annual Fund Operating Expenses After Fee Waivers and/or Expense Reimbursements” are 1.20% and 1.15% for Institutional Class shares, respectively, and 1.45% and 1.40% for Investor Class shares, respectively, of the Fund’s average daily net assets. These ratios may differ from the actual expense incurred by the Fund for the period covered by this report. Gotham Asset Management, LLC (“Gotham” or the “Adviser”) has contractually agreed to reduce its investment advisory fee and/or reimburse certain expenses of the Fund to the extent necessary to ensure that the Fund’s total operating expenses (exclusive of taxes, “Acquired Fund Fees and Expenses”, dividend and interest expense on securities sold short, interest, extraordinary items, and brokerage commissions) do not exceed 1.15% with respect to Institutional Class shares (on an annual basis) and 1.40% with respect to Investor Class shares (on an annual basis), of average daily net assets of the Fund (the “Expense Limitation”). The Expense Limitation will remain in place until January 31, 2022, unless the Board of Trustees of FundVantage Trust (the “Trust”) approves its earlier termination. The Adviser is entitled to recover, subject to approval by the Board of Trustees, such amounts reduced or reimbursed for a period of up to three (3) years from the date on which the Adviser reduced its compensation and/or assumed expenses for the Fund. The Adviser is permitted to seek reimbursement from the Fund, subject to certain limitations, for fees it waived and Fund expenses it paid to the extent the total annual fund expenses do not exceed the limits described above or any lesser limits in effect at the time of reimbursement. No recoupment will occur unless the Fund’s expenses are below the Expense Limitation.
The Fund intends to evaluate performance as compared to that of the Standard & Poor’s 500® Total Return Index (“S&P 500® Total Return Index”). The S&P 500® Total Return Index is a market capitalization weighted index of 500 large-capitalization stocks commonly used to represent the U.S. equity market. Its returns reflect reinvested dividends.
8
GOTHAM FUNDS
Gotham Enhanced 500 Plus Fund
Annual Report
Performance Data
September 30, 2020
(Unaudited)
Comparison of Change in Value of $250,000 Investment in Gotham Enhanced 500 Plus Fund Institutional Class Shares
vs Standard & Poor’s 500® Total Return Index (“S&P 500® Total Return Index”)
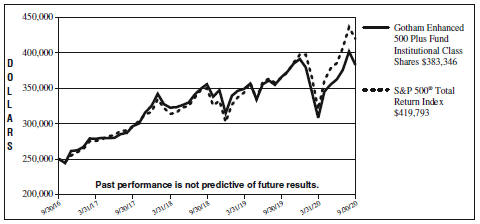
| Average Annual Total Returns for the Periods Ended September 30, 2020 | ||||||||||||||||
| 1 Year | 3 Year | Since Inception | ||||||||||||||
Institutional Class Shares | 4.95 | % | 8.94 | % | 11.28% | * | ||||||||||
S&P 500® Total Return Index | 15.15 | % | 12.27 | % | 13.82% | ** | ||||||||||
| * | The Gotham Enhanced 500 Plus Fund (the “Fund”) commenced operations on September 30, 2016. |
| ** | Benchmark performance is from inception date of the Fund only and is not the inception date of the benchmark itself. |
Past performance does not guarantee future results. The graph and table do not reflect the deduction of taxes that a shareholder would pay on Fund distributions or redemption of Fund shares; nor a 1.00% fee applied by the Fund’s Institutional Class to the value of shares redeemed within 30 days of purchase.
As stated in the current prospectus dated February 1, 2020 (as supplemented on July 1, 2020), the “Total Annual Fund Operating Expenses” are 5.23% and the “Total Annual Fund Operating Expenses After Fee Waivers and/or Expense Reimbursements” are 2.20% for Institutional Class Shares of the Fund’s average daily net assets. These ratios may differ from the actual expense incurred by the Fund for the period covered by this report. Gotham Asset Management, LLC (“Gotham” or the “Adviser”) has contractually agreed to reduce its investment advisory fee and/or reimburse certain expenses of the Fund to the extent necessary to ensure that the Fund’s total operating expenses (exclusive of taxes, “Acquired Fund Fees and Expenses”, dividend and interest expense on securities sold short, interest, extraordinary items, and brokerage commissions) do not exceed 1.15% (on an annual basis) of average daily net assets of the Fund (the “Expense Limitation”). The Expense Limitation will remain in place until January 31, 2021, unless the Board of Trustees of FundVantage Trust (the “Trust”) approves its earlier termination. The Adviser is entitled to recover, subject to approval by the Board of Trustees, such amounts reduced or reimbursed for a period of up to three (3) years from the date on which the Adviser reduced its compensation and/or assumed expenses for the Fund. The Adviser is permitted to seek reimbursement from the Fund, subject to certain limitations, for fees it waived and Fund expenses it paid to the extent the total annual fund expenses do not exceed the limits described above or any lesser limits in effect at the time of reimbursement. No recoupment will occur unless the Fund’s expenses are below the Expense Limitation.
The Fund intends to evaluate performance as compared to that of the Standard & Poor’s 500® Total Return Index (“S&P 500® Total Return Index”). The S&P 500® Total Return Index is a market capitalization weighted index of 500 large-capitalization stocks commonly used to represent the U.S. equity market. Its returns reflect reinvested dividends.
9
GOTHAM FUNDS
Gotham Enhanced S&P 500 Index Fund
Annual Report
Performance Data
September 30, 2020
(Unaudited)
Comparison of Change in Value of $10,000 Investment in Gotham Enhanced S&P 500 Index Fund Institutional Class Shares
vs Standard & Poor’s 500® Total Return Index (“S&P 500® Total Return Index”)
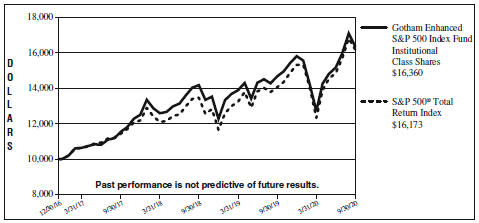
| Average Annual Total Returns for the Periods Ended September 30, 2020 | ||||||||||||||||
| 1 Year | 3 Year | Since Inception | ||||||||||||||
Institutional Class Shares | 11.53 | % | 12.37 | % | 14.02% | * | ||||||||||
S&P 500® Total Return Index | 15.15 | % | 12.27 | % | 13.70% | ** | ||||||||||
| * | The Gotham Enhanced S&P 500 Index Fund (the “Fund”) commenced operations on December 30, 2016. |
| ** | Benchmark performance is from inception date of the Fund only and is not the inception date of the benchmark itself. |
Past performance does not guarantee future results. The graph and table do not reflect the deduction of taxes that a shareholder would pay on Fund distributions or redemption of Fund shares; nor a 1.00% fee applied by the Fund’s Institutional Class to the value of shares redeemed within 30 days of purchase.
As stated in the current prospectus dated February 1, 2020 (as supplemented on July 1, 2020), the “Total Annual Fund Operating Expenses” are 3.20% and the “Total Annual Fund Operating Expenses After Fee Waivers and/or Expense Reimbursements” are 0.50% for Institutional Class shares of the Fund’s average daily net assets. These ratios may differ from the actual expense incurred by the Fund for the period covered by this report. Gotham Asset Management, LLC (“Gotham” or the “Adviser”) has contractually agreed to reduce its investment advisory fee and/or reimburse certain expenses of the Fund to the extent necessary to ensure that the Fund’s total operating expenses (exclusive of taxes, “Acquired Fund Fees and Expenses”), dividend and interest expense on securities sold short, interest, extraordinary items, and brokerage commissions) do not exceed 0.50% (on an annual basis) of average daily net assets of the Fund (the “Expense Limitation”). The Expense Limitation will remain in place until January 31, 2023, unless the Board of Trustees of FundVantage Trust (the “Trust”) approves its earlier termination.
The Fund intends to evaluate performance as compared to that of the Standard & Poor’s 500® Total Return Index (“S&P 500® Total Return Index”). The S&P 500® Total Return Index is a market capitalization weighted index of 500 large-capitalization stocks commonly used to represent the U.S. equity market. Its returns reflect reinvested dividends.
10
Fund Expense Disclosure
September 30, 2020
(Unaudited)
As a shareholder of a Fund, you incur two types of costs: (1) transaction costs, including redemption fees; and (2) ongoing costs, including management fees and other Fund expenses. This example is intended to help you understand your ongoing costs (in dollars) of investing in a Fund and to compare these costs with the ongoing costs of investing in other mutual funds.
These examples are based on an investment of $1,000 invested at the beginning of the six-month period from April 1, 2020, and held for the entire period through September 30, 2020.
Actual Expenses
The first line for each Fund in the accompanying table provides information about actual account values and actual expenses. You may use the information in this line, together with the amount you invested, to estimate the expenses that you paid over the period. Simply divide your account value by $1,000 (for example, an $8,600 account value divided by $1,000 = 8.6), then multiply the result by the number in the first line under the heading entitled “Expenses Paid During Period” to estimate the expenses you paid on your account during this period.
Hypothetical Example for Comparison Purposes
The second line for each Fund in the accompanying table provides information about hypothetical account values and hypothetical expenses based on the Fund’s actual expense ratio and an assumed rate of return of 5% per year before expenses, which is not your Fund’s actual return. The hypothetical account values and expenses may not be used to estimate the actual ending account balance or expenses you paid for the period. You may use this information to compare the ongoing costs of investing in the Fund and other funds. To do so, compare this 5% hypothetical example with the 5% hypothetical examples that appear in the shareholder reports of other funds.
Please note that the expenses shown in the accompanying table are meant to highlight your ongoing costs only and do not reflect any transactional costs, such as redemption fees. Therefore, the second line of the accompanying table is useful in comparing ongoing costs only, and will not help you determine the relative total costs of owning different funds. In addition, if these transactional costs were included, your costs would have been higher.
|
|
| ||||||||||||||
Beginning Account Value April 1, 2020 | Ending Account Value September 30, 2020 | Annualized Expense Ratio* | Expenses Paid During Period** | |||||||||||||
|
|
|
|
|
|
|
|
|
|
| ||||||
Gotham Index Plus Fund | ||||||||||||||||
Institutional Class | ||||||||||||||||
Actual | $1,000.00 | $1,287.00 | 1.15 | % | $6.58 | |||||||||||
Hypothetical (5% return before expenses) | 1,000.00 | 1,019.25 | 1.15 | % | 5.81 | |||||||||||
Investor Class | ||||||||||||||||
Actual | $1,000.00 | $1,285.80 | 1.40 | % | $8.00 | |||||||||||
Hypothetical (5% return before expenses) | 1,000.00 | 1,018.00 | 1.40 | % | 7.06 | |||||||||||
Gotham Enhanced 500 Plus Fund | ||||||||||||||||
Institutional Class | ||||||||||||||||
Actual | $1,000.00 | $1,244.00 | 2.08 | % | $11.64 | |||||||||||
Hypothetical (5% return before expenses) | 1,000.00 | 1,014.62 | 2.08 | % | 10.45 | |||||||||||
11
GOTHAM FUNDS
Fund Expense Disclosure (Concluded)
September 30, 2020
(Unaudited)
|
|
| ||||||||||||||
Beginning Account Value April 1, 2020 | Ending Account Value September 30, 2020 | Annualized Expense Ratio* | Expenses Paid During Period** | |||||||||||||
|
|
|
|
|
|
|
|
|
|
| ||||||
Gotham Enhanced S&P 500 Index Fund | ||||||||||||||||
Institutional Class | ||||||||||||||||
Actual | $1,000.00 | $1,287.30 | 0.50 | % | $2.86 | |||||||||||
Hypothetical (5% return before expenses) | 1,000.00 | 1,022.50 | 0.50 | % | 2.53 | |||||||||||
| * | Annualized expense ratios include dividend expense on securities sold short and interest expense on securities sold short and borrowings, except for the Gotham Enhanced S&P 500 Index Fund which does not short securities or use leverage. |
| ** | Expenses are equal to a Fund’s annualized expense ratio, in the table above, which include waived fees or reimbursement expenses for the six-month period ended September 30, 2020, multiplied by the average account value over the period, multiplied by the number of days in the most recent period, then divided by 366 to reflect the period. Hypothetical expenses are equal to the Fund’s annualized expense ratios, multiplied by the average account value over the period, multiplied by the number of days in the most recent six-month period, then divided by 366 to reflect the period. |
12
Portfolio Holdings Summary Tables
September 30, 2020
(Unaudited)
The following table presents a summary by industry group of the portfolio holdings of the Fund:
Gotham Index Plus Fund
| % of Net Assets | Value | |||||||||
COMMON STOCKS: | ||||||||||
Software & Services | 13.6 | % | $ | 54,978,914 | ||||||
Capital Goods | 10.3 | 41,783,751 | ||||||||
Retailing | 8.3 | 33,769,136 | ||||||||
Materials | 5.8 | 23,363,726 | ||||||||
Media & Entertainment | 5.5 | 22,423,815 | ||||||||
Health Care Equipment & Services | 4.9 | 19,991,334 | ||||||||
Energy | 4.9 | 19,683,083 | ||||||||
Pharmaceuticals, Biotechnology & Life Sciences | 4.4 | 17,803,324 | ||||||||
Food, Beverage & Tobacco | 4.1 | 16,453,645 | ||||||||
Real Estate | 3.8 | 15,498,452 | ||||||||
Diversified Financials | 3.8 | 15,468,388 | ||||||||
Technology Hardware & Equipment | 3.2 | 12,802,185 | ||||||||
Semiconductors & Semiconductor Equipment | 2.8 | 11,162,260 | ||||||||
Consumer Durables & Apparel | 2.6 | 10,547,077 | ||||||||
Banks | 2.5 | 9,896,402 | ||||||||
Insurance | 2.4 | 9,649,083 | ||||||||
Transportation | 2.3 | 9,313,908 | ||||||||
Household & Personal Products | 1.9 | 7,767,264 | ||||||||
Utilities | 1.9 | 7,759,586 | ||||||||
Consumer Services | 1.9 | 7,546,082 | ||||||||
Telecommunication Services | 1.6 | 6,573,662 | ||||||||
Food & Staples Retailing | 1.4 | 5,745,032 | ||||||||
Commercial & Professional Services | 1.2 | 4,981,445 | ||||||||
Automobiles & Components | 0.5 | 2,113,063 | ||||||||
|
|
|
| |||||||
Total Common Stocks | 95.6 | 387,074,617 | ||||||||
|
|
|
| |||||||
Other Assets in Excess of Liabilities | 4.4 | 17,976,149 | ||||||||
|
|
|
| |||||||
NET ASSETS | 100.0 | % | $ | 405,050,766 | ||||||
|
|
|
| |||||||
Portfolio holdings are subject to change at any time.
The accompanying notes are an integral part of the financial statements.
13
GOTHAM FUNDS
Portfolio Holdings Summary Tables
September 30, 2020
(Unaudited)
The following table presents a summary by industry group of the portfolio holdings of the Fund:
Gotham Enhanced 500 Plus Fund
| % of Net Assets | Value | |||||||||
LONG POSITIONS: | ||||||||||
Common Stocks: | ||||||||||
Retailing | 19.9 | % | $ | 576,575 | ||||||
Software & Services | 19.7 | 568,858 | ||||||||
Capital Goods | 15.6 | 451,518 | ||||||||
Technology Hardware & Equipment | 12.2 | 352,269 | ||||||||
Media & Entertainment | 9.6 | 276,617 | ||||||||
Pharmaceuticals, Biotechnology & Life Sciences | 7.7 | 222,959 | ||||||||
Food, Beverage & Tobacco | 7.3 | 212,199 | ||||||||
Telecommunication Services | 6.3 | 181,050 | ||||||||
Materials | 6.0 | 174,443 | ||||||||
Diversified Financials | 6.0 | 173,258 | ||||||||
Health Care Equipment & Services. | 5.8 | 168,069 | ||||||||
Food & Staples Retailing | 4.8 | 137,466 | ||||||||
Energy | 4.2 | 121,649 | ||||||||
Household & Personal Products | 3.5 | 101,615 | ||||||||
Transportation | 2.6 | 75,445 | ||||||||
Real Estate | 2.0 | 57,020 | ||||||||
Insurance | 1.6 | 46,441 | ||||||||
Consumer Services | 1.2 | 35,645 | ||||||||
Semiconductors & Semiconductor Equipment | 1.2 | 33,864 | ||||||||
Consumer Durables & Apparel | 1.0 | 29,299 | ||||||||
Automobiles & Components | 0.6 | 17,098 | ||||||||
Commercial & Professional Services | 0.6 | 15,786 | ||||||||
Banks. | 0.3 | 7,479 | ||||||||
Utilities | 0.2 | 7,038 | ||||||||
|
|
|
| |||||||
Total Long Positions | 139.9 | 4,043,660 | ||||||||
|
|
|
| |||||||
| % of Net Assets | Value | |||||||||
SHORT POSITIONS: | ||||||||||
Common Stocks: | ||||||||||
Automobiles & Components | (0.2 | )% | $ | (5,528 | ) | |||||
Food, Beverage & Tobacco | (0.4 | ) | (10,601 | ) | ||||||
Household & Personal Products | (0.6 | ) | (16,805 | ) | ||||||
Transportation | (0.6 | ) | (17,448 | ) | ||||||
Commercial & Professional Services | (0.8 | ) | (22,750 | ) | ||||||
Insurance | (0.8 | ) | (22,888 | ) | ||||||
Technology Hardware & Equipment | (0.8 | ) | (23,974 | ) | ||||||
Telecommunication Services | (0.9 | ) | (26,188 | ) | ||||||
Media & Entertainment | (1.0 | ) | (27,790 | ) | ||||||
Retailing | (1.1 | ) | (32,239 | ) | ||||||
Consumer Durables & Apparel | (1.1 | ) | (32,356 | ) | ||||||
Banks | (1.5 | ) | (44,200 | ) | ||||||
Energy | (1.6 | ) | (46,210 | ) | ||||||
Diversified Financials | (1.6 | ) | (46,896 | ) | ||||||
Materials | (1.7 | ) | (49,450 | ) | ||||||
Capital Goods | (2.1 | ) | (59,234 | ) | ||||||
Consumer Services | (2.1 | ) | (61,655 | ) | ||||||
Real Estate | (2.2 | ) | (64,547 | ) | ||||||
Pharmaceuticals, Biotechnology & Life Sciences | (3.0 | ) | (86,475 | ) | ||||||
Software & Services | (3.0 | ) | (87,646 | ) | ||||||
Semiconductors & Semiconductor Equipment | (3.7 | ) | (107,052 | ) | ||||||
Health Care Equipment & Services | (5.2 | ) | (149,093 | ) | ||||||
Utilities | (5.7 | ) | (164,041 | ) | ||||||
|
|
|
| |||||||
Total Short Positions | (41.7 | ) | (1,205,066 | ) | ||||||
|
|
|
| |||||||
Other Assets in Excess of Liabilities | 1.8 | 52,266 | ||||||||
|
|
|
| |||||||
NET ASSETS | 100.0 | % | $ | 2,890,860 | ||||||
|
|
|
| |||||||
Portfolio holdings are subject to change at any time.
The accompanying notes are an integral part of the financial statements.
14
GOTHAM FUNDS
Portfolio Holdings Summary Tables
September 30, 2020
(Unaudited)
The following table presents a summary by industry group type of the portfolio holdings of the Fund:
Gotham Enhanced S&P 500 Index Fund
| % of Net Assets | Value | |||||||||
COMMON STOCKS: | ||||||||||
Software & Services | 17.1 | % | $ | 1,081,717 | ||||||
Retailing | 14.7 | 935,120 | ||||||||
Technology Hardware & Equipment | 9.5 | 605,514 | ||||||||
Capital Goods | 8.9 | 565,537 | ||||||||
Media & Entertainment | 8.9 | 562,248 | ||||||||
Pharmaceuticals, Biotechnology & Life Sciences | 6.3 | 402,207 | ||||||||
Telecommunication Services | 4.6 | 292,943 | ||||||||
Food, Beverage & Tobacco | 4.3 | 271,842 | ||||||||
Diversified Financials | 3.8 | 240,117 | ||||||||
Health Care Equipment & Services | 3.5 | 223,880 | ||||||||
Materials | 3.4 | 215,408 | ||||||||
Food & Staples Retailing | 3.1 | 197,510 | ||||||||
Energy | 2.3 | 148,181 | ||||||||
Household & Personal Products | 2.0 | 124,933 | ||||||||
Transportation | 1.4 | 89,446 | ||||||||
Real Estate | 1.4 | 87,409 | ||||||||
Semiconductors & Semiconductor Equipment | 1.2 | 76,175 | ||||||||
Consumer Durables & Apparel | 0.6 | 38,034 | ||||||||
Consumer Services | 0.6 | 36,367 | ||||||||
Utilities | 0.5 | 31,155 | ||||||||
Banks | 0.4 | 25,548 | ||||||||
Insurance | 0.4 | 25,352 | ||||||||
Automobiles & Components | 0.3 | 21,642 | ||||||||
Commercial & Professional Services | 0.2 | 11,753 | ||||||||
|
|
|
| |||||||
Total Common Stocks | 99.4 | 6,310,038 | ||||||||
|
|
|
| |||||||
Other Assets in Excess of Liabilities | 0.6 | 36,069 | ||||||||
|
|
|
| |||||||
NET ASSETS | 100.0 | % | $ | 6,346,107 | ||||||
|
|
|
| |||||||
Portfolio holdings are subject to change at any time.
The accompanying notes are an integral part of the financial statements.
15
Portfolio of Investments
September 30, 2020
| Number of Shares | Value | |||||||
COMMON STOCKS — 95.6% | ||||||||
Automobiles & Components — 0.5% |
| |||||||
BorgWarner, Inc. | 46,595 | $ | 1,805,090 | |||||
General Motors Co. | 10,408 | 307,973 | ||||||
|
| |||||||
| 2,113,063 | ||||||||
|
| |||||||
Banks — 2.5% | ||||||||
Bank of America Corp.(a) | 89,672 | 2,160,198 | ||||||
Citigroup, Inc. | 10,679 | 460,372 | ||||||
Fifth Third Bancorp(a) | 87,307 | 1,861,385 | ||||||
First Republic Bank | 358 | 39,043 | ||||||
JPMorgan Chase & Co.(a) | 14,675 | 1,412,762 | ||||||
PNC Financial Services Group, Inc. (The)(a) | 16,443 | 1,807,250 | ||||||
Truist Financial Corp. | 9,335 | 355,197 | ||||||
US Bancorp | 10,407 | 373,091 | ||||||
Wells Fargo & Co. | 60,702 | 1,427,104 | ||||||
|
| |||||||
| 9,896,402 | ||||||||
|
| |||||||
Capital Goods — 10.3% |
| |||||||
3M Co. | 10,001 | 1,601,960 | ||||||
AMETEK, Inc. | 10,694 | 1,062,984 | ||||||
Carrier Global Corp. | 26,743 | 816,731 | ||||||
Caterpillar, Inc. | 7,080 | 1,055,982 | ||||||
Cummins, Inc. | 4,946 | 1,044,397 | ||||||
Deere & Co. | 2,964 | 656,911 | ||||||
Dover Corp. | 13,681 | 1,482,200 | ||||||
Eaton Corp. PLC (Ireland) | 8,684 | 886,029 | ||||||
Emerson Electric Co.(a) | 21,172 | 1,388,248 | ||||||
Flowserve Corp.(a) | 59,216 | 1,616,005 | ||||||
Fortive Corp. | 7,105 | 541,472 | ||||||
Fortune Brands Home & Security, Inc. | 17,323 | 1,498,786 | ||||||
General Dynamics Corp. | 8,347 | 1,155,475 | ||||||
Honeywell International, Inc.(a) | 11,856 | 1,951,616 | ||||||
Howmet Aerospace, Inc.(a) | 148,589 | 2,484,408 | ||||||
Illinois Tool Works, Inc. | 8,008 | 1,547,226 | ||||||
Johnson Controls International PLC (Ireland) | 10,465 | 427,495 | ||||||
Lockheed Martin Corp.(a) | 8,090 | 3,100,735 | ||||||
Masco Corp.(a) | 35,404 | 1,951,823 | ||||||
Northrop Grumman Corp. | 1,261 | 397,833 | ||||||
Otis Worldwide Corp. | 10,893 | 679,941 | ||||||
PACCAR, Inc. | 11,108 | 947,290 | ||||||
Pentair PLC (Ireland) | 44,451 | 2,034,522 | ||||||
Quanta Services, Inc.(a) | 60,924 | 3,220,443 | ||||||
Raytheon Technologies Corp. | 6,140 | 353,296 | ||||||
Roper Technologies, Inc. | 751 | 296,728 | ||||||
Snap-on, Inc.(a) | 13,442 | 1,977,721 | ||||||
| Number of Shares | Value | |||||||
COMMON STOCKS — (Continued) |
| |||||||
Capital Goods — (Continued) |
| |||||||
Stanley Black & Decker, Inc. | 183 | $ | 29,683 | |||||
Trane Technologies PLC (Ireland) | 7,498 | 909,132 | ||||||
TransDigm Group, Inc.(a) | 5,232 | 2,485,828 | ||||||
United Rentals, Inc.* | 7,047 | 1,229,702 | ||||||
WW Grainger, Inc. | 2,666 | 951,149 | ||||||
|
| |||||||
| 41,783,751 | ||||||||
|
| |||||||
Commercial & Professional Services — 1.2% |
| |||||||
Cintas Corp.(a) | 4,505 | 1,499,399 | ||||||
IHS Markit Ltd. (Bermuda) | 13,546 | 1,063,496 | ||||||
Republic Services, Inc. | 12,346 | 1,152,499 | ||||||
Robert Half International, Inc. | 8,797 | 465,713 | ||||||
Waste Management, Inc. | 7,072 | 800,338 | ||||||
|
| |||||||
| 4,981,445 | ||||||||
|
| |||||||
Consumer Durables & Apparel — 2.6% |
| |||||||
DR Horton, Inc. | 14,825 | 1,121,215 | ||||||
Garmin Ltd. (Switzerland) | 3,019 | 286,382 | ||||||
Hanesbrands, Inc. | 32,778 | 516,254 | ||||||
Leggett & Platt, Inc. | 8,567 | 352,703 | ||||||
Lennar Corp., Class A | 1,600 | 130,688 | ||||||
Mohawk Industries, Inc.* | 8,110 | 791,455 | ||||||
Newell Brands, Inc. | 10,570 | 181,381 | ||||||
NIKE, Inc., Class B | 9,040 | 1,134,882 | ||||||
PulteGroup, Inc. | 29,654 | 1,372,684 | ||||||
PVH Corp.(a) | 63,817 | 3,806,046 | ||||||
Tapestry, Inc. | 2,656 | 41,513 | ||||||
Whirlpool Corp. | 4,415 | 811,874 | ||||||
|
| |||||||
| 10,547,077 | ||||||||
|
| |||||||
Consumer Services — 1.9% |
| |||||||
Hilton Worldwide Holdings, Inc. | 2,864 | 244,356 | ||||||
McDonald’s Corp.(a) | 13,023 | 2,858,418 | ||||||
MGM Resorts International | 75,811 | 1,648,889 | ||||||
Yum! Brands, Inc.(a) | 30,607 | 2,794,419 | ||||||
|
| |||||||
| 7,546,082 | ||||||||
|
| |||||||
Diversified Financials — 3.8% |
| |||||||
American Express Co. | 5,218 | 523,104 | ||||||
Berkshire Hathaway, Inc., Class B* | 714 | 152,039 | ||||||
BlackRock, Inc. | 702 | 395,612 | ||||||
Discover Financial Services(a) | 34,628 | 2,000,806 | ||||||
Franklin Resources, Inc.(a) | 84,385 | 1,717,235 | ||||||
Goldman Sachs Group, Inc. (The)(a) | 8,296 | 1,667,247 | ||||||
Intercontinental Exchange, Inc. | 11,404 | 1,140,970 | ||||||
Invesco Ltd. (Bermuda) | 188,620 | 2,152,154 | ||||||
Moody’s Corp. | 2,798 | 811,000 | ||||||
The accompanying notes are an integral part of the financial statements.
16
GOTHAM INDEX PLUS FUND
Portfolio of Investments (Continued)
September 30, 2020
| Number of Shares | Value | |||||||
COMMON STOCKS — (Continued) |
| |||||||
Diversified Financials — (Continued) |
| |||||||
Nasdaq, Inc. | 10,363 | $ | 1,271,644 | |||||
S&P Global, Inc.(a) | 7,594 | 2,738,396 | ||||||
T Rowe Price Group, Inc. | 7,005 | 898,181 | ||||||
|
| |||||||
| 15,468,388 | ||||||||
|
| |||||||
Energy — 4.9% | ||||||||
Apache Corp.(a) | 201,105 | 1,904,464 | ||||||
Baker Hughes Co. | 61,861 | 822,133 | ||||||
Chevron Corp.(a) | 73,219 | 5,271,768 | ||||||
Concho Resources, Inc. | 1,392 | 61,415 | ||||||
ConocoPhillips(a) | 79,448 | 2,609,072 | ||||||
EOG Resources, Inc.(a) | 84,842 | 3,049,221 | ||||||
Halliburton Co. | 98,092 | 1,182,009 | ||||||
Kinder Morgan, Inc.(a) | 156,496 | 1,929,596 | ||||||
Marathon Petroleum Corp. | 3,765 | 110,465 | ||||||
National Oilwell Varco, Inc. | 62,997 | 570,753 | ||||||
Phillips 66 | 4,676 | 242,404 | ||||||
TechnipFMC PLC (United Kingdom) | 144,425 | 911,322 | ||||||
Valero Energy Corp. | 851 | 36,865 | ||||||
Williams Cos., Inc. (The) | 49,954 | 981,596 | ||||||
|
| |||||||
| 19,683,083 | ||||||||
|
| |||||||
Food & Staples Retailing — 1.4% | ||||||||
Costco Wholesale Corp. | 687 | 243,885 | ||||||
Kroger Co. (The) | 10,263 | 348,018 | ||||||
Sysco Corp. | 14,078 | 875,933 | ||||||
Walgreens Boots Alliance, Inc. | 15,335 | 550,833 | ||||||
Walmart, Inc.(a) | 26,634 | 3,726,363 | ||||||
|
| |||||||
| 5,745,032 | ||||||||
|
| |||||||
Food, Beverage & Tobacco — 4.1% |
| |||||||
Altria Group, Inc.(a) | 43,006 | 1,661,752 | ||||||
Archer-Daniels-Midland Co. | 10,913 | 507,345 | ||||||
Campbell Soup Co.(a) | 10,845 | 524,573 | ||||||
Coca-Cola Co. (The)(a) | 69,440 | 3,428,253 | ||||||
Constellation Brands, Inc., | 10,754 | 2,037,991 | ||||||
General Mills, Inc. | 16,329 | 1,007,173 | ||||||
JM Smucker Co. (The) | 8,377 | 967,711 | ||||||
Kellogg Co. | 12,412 | 801,691 | ||||||
Kraft Heinz Co. (The)(a) | 58,179 | 1,742,461 | ||||||
Molson Coors Beverage Co., Class B | 11,216 | 376,409 | ||||||
Mondelez International, Inc., Class A | 9,011 | 517,682 | ||||||
PepsiCo, Inc. | 2,841 | 393,763 | ||||||
Philip Morris International, Inc. | 10,986 | 823,840 | ||||||
Tyson Foods, Inc., Class A | 27,959 | 1,663,001 | ||||||
|
| |||||||
| 16,453,645 | ||||||||
|
| |||||||
| Number of Shares | Value | |||||||
COMMON STOCKS — (Continued) |
| |||||||
Health Care Equipment & Services — 4.9% |
| |||||||
Abbott Laboratories | 11,842 | $ | 1,288,765 | |||||
Anthem, Inc.(a) | 4,404 | 1,182,870 | ||||||
Cardinal Health, Inc. | 17,377 | 815,850 | ||||||
Cigna Corp. | 4,992 | 845,695 | ||||||
CVS Health Corp. | 21,874 | 1,277,442 | ||||||
Danaher Corp. | 3,552 | 764,852 | ||||||
DaVita, Inc.* | 3,135 | 268,513 | ||||||
DENTSPLY SIRONA, Inc. | 17,524 | 766,324 | ||||||
HCA Healthcare, Inc. | 499 | 62,215 | ||||||
Henry Schein, Inc.* | 983 | 57,781 | ||||||
Hologic, Inc.(a) * | 34,908 | 2,320,335 | ||||||
Humana, Inc. | 2,695 | 1,115,434 | ||||||
Intuitive Surgical, Inc.* | 305 | 216,410 | ||||||
McKesson Corp. | 5,167 | 769,521 | ||||||
Medtronic PLC (Ireland) | 20,859 | 2,167,667 | ||||||
Quest Diagnostics, Inc. | 3,711 | 424,872 | ||||||
ResMed, Inc. | 4,590 | 786,864 | ||||||
STERIS PLC (Ireland) | 4,241 | 747,222 | ||||||
Stryker Corp. | 4,228 | 880,988 | ||||||
UnitedHealth Group, Inc. | 1,992 | 621,046 | ||||||
Universal Health Services, Inc., Class B | 8,977 | 960,719 | ||||||
Varian Medical Systems, Inc.* | 5,706 | 981,432 | ||||||
West Pharmaceutical Services, Inc. | 2,417 | 664,433 | ||||||
Zimmer Biomet Holdings, Inc. | 30 | 4,084 | ||||||
|
| |||||||
| 19,991,334 | ||||||||
|
| |||||||
Household & Personal Products — 1.9% |
| |||||||
Clorox Co. (The) | 1,786 | 375,364 | ||||||
Colgate-Palmolive Co. | 18,250 | 1,407,988 | ||||||
Estee Lauder Cos., Inc. (The), Class A | 1,549 | 338,069 | ||||||
Kimberly-Clark Corp. | 8,280 | 1,222,625 | ||||||
Procter & Gamble Co. (The)(a) | 31,824 | 4,423,218 | ||||||
|
| |||||||
| 7,767,264 | ||||||||
|
| |||||||
Insurance — 2.4% |
| |||||||
Aflac, Inc. | 33,055 | 1,201,549 | ||||||
Aon PLC, Class A (Ireland) | 7,002 | 1,444,513 | ||||||
Arthur J Gallagher & Co. | 695 | 73,378 | ||||||
Assurant, Inc. | 1,936 | 234,856 | ||||||
Cincinnati Financial Corp.(a) | 17,822 | 1,389,581 | ||||||
Globe Life, Inc. | 3,653 | 291,875 | ||||||
Hartford Financial Services Group, Inc. (The) | 14,918 | 549,877 | ||||||
The accompanying notes are an integral part of the financial statements.
17
GOTHAM INDEX PLUS FUND
Portfolio of Investments (Continued)
September 30, 2020
| Number of Shares | Value | |||||||
COMMON STOCKS — (Continued) |
| |||||||
Insurance — (Continued) |
| |||||||
Loews Corp. | 3,355 | $ | 116,586 | |||||
Marsh & McLennan Cos., Inc. | 9,266 | 1,062,810 | ||||||
MetLife, Inc. | 30,848 | 1,146,620 | ||||||
Prudential Financial, Inc. | 15,882 | 1,008,825 | ||||||
Travelers Cos., Inc. (The) | 6,230 | 674,024 | ||||||
WR Berkley Corp. | 7,434 | 454,589 | ||||||
|
| |||||||
| 9,649,083 | ||||||||
|
| |||||||
Materials — 5.8% |
| |||||||
Amcor PLC (Jersey) | 134,289 | 1,483,893 | ||||||
Avery Dennison Corp. | 326 | 41,676 | ||||||
Celanese Corp. | 14,013 | 1,505,697 | ||||||
CF Industries Holdings, Inc.(a) | 96,790 | 2,972,421 | ||||||
Dow, Inc. | 11,930 | 561,306 | ||||||
DuPont de Nemours, Inc.(a) | 54,046 | 2,998,472 | ||||||
Eastman Chemical Co. | 7,544 | 589,337 | ||||||
Ecolab, Inc.(a) | 10,853 | 2,168,864 | ||||||
FMC Corp. | 4,114 | 435,714 | ||||||
International Paper Co. | 23,461 | 951,109 | ||||||
Linde PLC (Ireland) | 10,606 | 2,525,607 | ||||||
LyondellBasell Industries NV, Class A (Netherlands) | 12,082 | 851,660 | ||||||
Martin Marietta Materials, Inc. | 2,100 | 494,256 | ||||||
Mosaic Co. (The) | 74,496 | 1,361,042 | ||||||
Newmont Corp. | 4,830 | 306,464 | ||||||
Nucor Corp. | 13,976 | 626,963 | ||||||
PPG Industries, Inc.(a) | 11,422 | 1,394,398 | ||||||
Sealed Air Corp.(a) | 53,977 | 2,094,847 | ||||||
|
| |||||||
| 23,363,726 | ||||||||
|
| |||||||
Media & Entertainment — 5.5% |
| |||||||
Activision Blizzard, Inc. | 5,628 | 455,587 | ||||||
Alphabet, Inc., Class A(a) * | 2,855 | 4,184,288 | ||||||
Charter Communications, Inc., Class A* | 82 | 51,196 | ||||||
Comcast Corp., Class A(a) | 30,641 | 1,417,453 | ||||||
Discovery, Inc., Class A* | 27,803 | 605,271 | ||||||
Electronic Arts, Inc.* | 5,781 | 753,900 | ||||||
Facebook, Inc., Class A(a) * | 35,083 | 9,188,238 | ||||||
Fox Corp., Class A | 53,231 | 1,481,419 | ||||||
Interpublic Group of Cos., Inc. (The) | 19,678 | 328,032 | ||||||
Netflix, Inc.* | 3,042 | 1,521,091 | ||||||
Omnicom Group, Inc. | 7,900 | 391,050 | ||||||
Take-Two Interactive Software, Inc.* | 832 | 137,463 | ||||||
Twitter, Inc.* | 5,618 | 250,001 | ||||||
| Number of Shares | Value | |||||||
COMMON STOCKS — (Continued) |
| |||||||
Media & Entertainment — (Continued) |
| |||||||
Walt Disney Co. (The)(a) | 13,369 | $ | 1,658,826 | |||||
|
| |||||||
| 22,423,815 | ||||||||
|
| |||||||
Pharmaceuticals, Biotechnology & Life Sciences — 4.4% |
| |||||||
AbbVie, Inc. | 14,374 | 1,259,019 | ||||||
Agilent Technologies, Inc. | 12,990 | 1,311,211 | ||||||
Alexion Pharmaceuticals, Inc.* | 6,748 | 772,174 | ||||||
Amgen, Inc. | 2,052 | 521,536 | ||||||
Biogen, Inc.* | 738 | 209,356 | ||||||
Bristol Myers Squibb Co.(a) | 20,120 | 1,213,035 | ||||||
Gilead Sciences, Inc. | 9,535 | 602,517 | ||||||
Illumina, Inc.* | 1,064 | 328,861 | ||||||
Incyte Corp.* | 1,638 | 146,994 | ||||||
Johnson & Johnson | 10,606 | 1,579,021 | ||||||
Merck & Co., Inc.(a) | 41,512 | 3,443,420 | ||||||
PerkinElmer, Inc. | 7,748 | 972,451 | ||||||
Pfizer, Inc.(a) | 82,292 | 3,020,116 | ||||||
Regeneron Pharmaceuticals, Inc.* | 2,129 | 1,191,772 | ||||||
Thermo Fisher Scientific, Inc. | 2,790 | 1,231,841 | ||||||
|
| |||||||
| 17,803,324 | ||||||||
|
| |||||||
Real Estate — 3.8% |
| |||||||
Alexandria Real Estate Equities, Inc., REIT | 5,715 | 914,400 | ||||||
American Tower Corp., REIT | 3,288 | 794,808 | ||||||
Apartment Investment & Management Co., Class A, REIT | 26,030 | 877,732 | ||||||
AvalonBay Communities, Inc., REIT | 10,028 | 1,497,582 | ||||||
Boston Properties, Inc., REIT | 11,026 | 885,388 | ||||||
CBRE Group, Inc., Class A* | 4,285 | 201,266 | ||||||
Crown Castle International Corp., | ||||||||
REIT | 3,160 | 526,140 | ||||||
Duke Realty Corp., REIT | 12,558 | 463,390 | ||||||
Extra Space Storage, Inc., REIT | 136 | 14,551 | ||||||
Federal Realty Investment Trust, REIT | 2,073 | 152,241 | ||||||
Mid-America Apartment Communities, Inc., REIT | 8,059 | 934,441 | ||||||
Prologis, Inc., REIT | 1,141 | 114,807 | ||||||
Public Storage, REIT | 3,369 | 750,344 | ||||||
Realty Income Corp., REIT | 9,900 | 601,425 | ||||||
SBA Communications Corp., REIT | 827 | 263,383 | ||||||
Simon Property Group, Inc., REIT | 13,998 | 905,391 | ||||||
Welltower, Inc., REIT | 23,398 | 1,288,996 | ||||||
Weyerhaeuser Co., REIT(a) | 151,198 | 4,312,167 | ||||||
|
| |||||||
| 15,498,452 | ||||||||
|
| |||||||
The accompanying notes are an integral part of the financial statements.
18
GOTHAM INDEX PLUS FUND
Portfolio of Investments (Continued)
September 30, 2020
| Number of Shares | Value | |||||||
COMMON STOCKS — (Continued) |
| |||||||
Retailing — 8.3% | ||||||||
Amazon.com, Inc.(a) * | 4,716 | $ | 14,849,411 | |||||
AutoZone, Inc.* | 1,031 | 1,214,147 | ||||||
Best Buy Co., Inc. | 5,248 | 584,050 | ||||||
Booking Holdings, Inc.* | 182 | 311,344 | ||||||
CarMax, Inc.* | 3,018 | 277,384 | ||||||
Dollar General Corp. | 6,007 | 1,259,187 | ||||||
eBay, Inc.(a) | 44,000 | 2,292,400 | ||||||
Gap, Inc. (The) | 33,699 | 573,894 | ||||||
Genuine Parts Co. | 5,686 | 541,137 | ||||||
Home Depot, Inc. (The)(a) | 14,504 | 4,027,906 | ||||||
L Brands, Inc. | 22,524 | 716,488 | ||||||
LKQ Corp.* | 32,443 | 899,644 | ||||||
Lowe’s Cos., Inc. | 10,104 | 1,675,849 | ||||||
O’Reilly Automotive, Inc.* | 1,804 | 831,788 | ||||||
Target Corp. | 6,118 | 963,096 | ||||||
Tractor Supply Co.(a) | 19,195 | 2,751,411 | ||||||
|
| |||||||
| 33,769,136 | ||||||||
|
| |||||||
Semiconductors & Semiconductor Equipment — 2.8% |
| |||||||
Applied Materials, Inc. | 19,968 | 1,187,098 | ||||||
Broadcom, Inc.(a) | 6,896 | 2,512,351 | ||||||
Intel Corp. | 21,310 | 1,103,432 | ||||||
KLA Corp. | 3,766 | 729,625 | ||||||
Lam Research Corp. | 1,213 | 402,413 | ||||||
Maxim Integrated Products, Inc. | 9,544 | 645,270 | ||||||
Micron Technology, Inc.* | 8,087 | 379,766 | ||||||
NVIDIA Corp.(a) | 3,874 | 2,096,686 | ||||||
Qorvo, Inc.* | 1,509 | 194,676 | ||||||
Skyworks Solutions, Inc. | 8,899 | 1,294,804 | ||||||
Texas Instruments, Inc. | 4,315 | 616,139 | ||||||
|
| |||||||
| 11,162,260 | ||||||||
|
| |||||||
Software & Services — 13.6% |
| |||||||
Accenture PLC, Class A (Ireland) | 13,027 | 2,943,972 | ||||||
Adobe, Inc.(a) * | 4,588 | 2,250,093 | ||||||
ANSYS, Inc.* | 623 | 203,864 | ||||||
Autodesk, Inc.* | 2,953 | 682,173 | ||||||
Automatic Data Processing, Inc.(a) | 16,062 | 2,240,488 | ||||||
Broadridge Financial Solutions, Inc. | 10,356 | 1,366,992 | ||||||
Cadence Design Systems, Inc.* | 3,038 | 323,942 | ||||||
Citrix Systems, Inc.(a) | 10,437 | 1,437,279 | ||||||
Cognizant Technology Solutions Corp., Class A | 1,189 | 82,540 | ||||||
FleetCor Technologies, Inc.* | 949 | 225,957 | ||||||
Gartner, Inc.* | 8,503 | 1,062,450 | ||||||
| Number of Shares | Value | |||||||
COMMON STOCKS — (Continued) |
| |||||||
Software & Services — (Continued) |
| |||||||
International Business Machines | 17,724 | $ | 2,156,479 | |||||
Intuit, Inc. | 3,850 | 1,255,908 | ||||||
Mastercard, Inc., Class A(a) | 10,269 | 3,472,668 | ||||||
Microsoft Corp.(a) | 88,665 | 18,648,909 | ||||||
NortonLifeLock, Inc. | 16,875 | 351,675 | ||||||
Oracle Corp.(a) | 47,032 | 2,807,810 | ||||||
Paychex, Inc.(a) | 37,522 | 2,993,130 | ||||||
PayPal Holdings, Inc.(a) * | 8,795 | 1,732,879 | ||||||
salesforce.com, Inc.(a) * | 8,955 | 2,250,571 | ||||||
ServiceNow, Inc.* | 1,386 | 672,210 | ||||||
Synopsys, Inc.* | 2,497 | 534,308 | ||||||
VeriSign, Inc.* | 2,358 | 483,036 | ||||||
Visa, Inc., Class A(a) | 13,439 | 2,687,397 | ||||||
Western Union Co. (The)(a) | 98,562 | 2,112,184 | ||||||
|
| |||||||
| 54,978,914 | ||||||||
|
| |||||||
Technology Hardware & Equipment — 3.2% |
| |||||||
Amphenol Corp., Class A | 6,804 | 736,669 | ||||||
Apple, Inc. | 3,924 | 454,438 | ||||||
CDW Corp. | 2,353 | 281,254 | ||||||
Cisco Systems, Inc.(a) | 66,243 | 2,609,312 | ||||||
Corning, Inc. | 19,464 | 630,828 | ||||||
F5 Networks, Inc.* | 5,477 | 672,411 | ||||||
FLIR Systems, Inc.(a) | 53,847 | 1,930,415 | ||||||
HP, Inc. | 65,513 | 1,244,092 | ||||||
Juniper Networks, Inc. | 31,268 | 672,262 | ||||||
NetApp, Inc. | 25,529 | 1,119,191 | ||||||
Seagate Technology PLC (Ireland) | 20,754 | 1,022,550 | ||||||
TE Connectivity Ltd. (Switzerland) | 14,618 | 1,428,763 | ||||||
|
| |||||||
| 12,802,185 | ||||||||
|
| |||||||
Telecommunication Services — 1.6% |
| |||||||
AT&T, Inc.(a) | 132,787 | 3,785,757 | ||||||
CenturyLink, Inc. | 10,417 | 105,108 | ||||||
T-Mobile US, Inc.* | 5,233 | 598,446 | ||||||
Verizon Communications, Inc.(a) | 35,037 | 2,084,351 | ||||||
|
| |||||||
| 6,573,662 | ||||||||
|
| |||||||
Transportation — 2.3% | ||||||||
Alaska Air Group, Inc. | 11,929 | 436,959 | ||||||
CH Robinson Worldwide, Inc. | 16,526 | 1,688,792 | ||||||
CSX Corp. | 17,237 | 1,338,798 | ||||||
Expeditors International of Washington, Inc.(a) | 25,096 | 2,271,690 | ||||||
JB Hunt Transport Services, Inc. | 10,911 | 1,378,932 | ||||||
The accompanying notes are an integral part of the financial statements.
19
GOTHAM INDEX PLUS FUND
Portfolio of Investments (Continued)
September 30, 2020
| Number of Shares | Value | |||||||
COMMON STOCKS — (Continued) |
| |||||||
Transportation — (Continued) |
| |||||||
Norfolk Southern Corp. | 7,618 | $ | 1,630,176 | |||||
Union Pacific Corp. | 2,888 | 568,561 | ||||||
|
| |||||||
| 9,313,908 | ||||||||
|
| |||||||
Utilities — 1.9% |
| |||||||
AES Corp. (The) | 857 | 15,520 | ||||||
CenterPoint Energy, Inc. | 34,133 | 660,474 | ||||||
Dominion Energy, Inc.(a) | 31,245 | 2,466,168 | ||||||
Duke Energy Corp. | 10,627 | 941,127 | ||||||
Evergy, Inc. | 4,428 | 225,031 | ||||||
NextEra Energy, Inc. | 6 | 1,665 | ||||||
NRG Energy, Inc.(a) | 100,494 | 3,089,186 | ||||||
Public Service Enterprise Group, Inc. | 5,836 | 320,455 | ||||||
Southern Co. (The) | 737 | 39,960 | ||||||
|
| |||||||
| 7,759,586 | ||||||||
|
| |||||||
TOTAL COMMON STOCKS |
| 387,074,617 | ||||||
|
| |||||||
OTHER ASSETS IN EXCESS OF |
| 17,976,149 | ||||||
|
| |||||||
NET ASSETS - 100.0% | $ | 405,050,766 | ||||||
|
| |||||||
| (a) | Security position is either entirely or partially designated as collateral for total return swaps. |
| * | Non-income producing. |
PLC Public Limited Company
REIT Real Estate Investment Trust
The accompanying notes are an integral part of the financial statements.
20
GOTHAM INDEX PLUS FUND
Portfolio of Investments (Continued)
September 30, 2020
Over-the-counter total return swaps outstanding as of September 30, 2020
The Fund maintains a portfolio of long and short positions and receives/pays a rebate based upon the Fed Funds 1-Day Rate less a specified spread as negotiated by the parties. The notional gain or loss, dividends payable and rebates are payable the earlier of maturity of the swaps or upon termination. The portfolio matures on July 29, 2024, however underlying individual contracts are entered into and closed (terminated) on a daily basis. The cash amounts payable/receivable due to individual contracts being closed are settled, on a net basis, once a week. The value of total return swaps represents 4.0% of net assets as of September 30, 2020.
The following table represents the individual long and short positions and related values of total return swaps as of September 30, 2020:
Total Return Swaps
Reference Entity | Counterparty | Number of Contracts Long/(Short) | Notional Amount | Value | Unrealized Appreciation/ (Depreciation)* | ||||||||||||||||||||
Long | |||||||||||||||||||||||||
Automobiles & Components | |||||||||||||||||||||||||
BorgWarner, Inc. | Morgan Stanley | 38,662 | $ | 1,351,359 | $ | 1,497,766 | $ | 159,498 | |||||||||||||||||
General Motors Co. | Morgan Stanley | 8,439 | 242,158 | 249,710 | 8,086 | ||||||||||||||||||||
|
|
|
|
|
|
|
| ||||||||||||||||||
| 47,101 | 1,593,517 | 1,747,476 | 167,584 | ||||||||||||||||||||||
|
|
|
|
|
|
|
| ||||||||||||||||||
Banks | |||||||||||||||||||||||||
Bank of America Corp. | Morgan Stanley | 66,968 | 1,531,718 | 1,613,259 | 102,222 | ||||||||||||||||||||
Citigroup, Inc. | Morgan Stanley | 7,221 | 314,527 | 311,297 | (5,957 | ) | |||||||||||||||||||
Fifth Third Bancorp | Morgan Stanley | 68,553 | 1,478,562 | 1,461,550 | (4,515 | ) | |||||||||||||||||||
First Republic Bank | Morgan Stanley | 365 | 27,631 | 39,807 | 12,398 | ||||||||||||||||||||
JPMorgan Chase & Co. | Morgan Stanley | 5,429 | 495,066 | 522,650 | 32,256 | ||||||||||||||||||||
PNC Financial Services Group, Inc. (The) | Morgan Stanley | 10,606 | 1,067,456 | 1,165,705 | 116,406 | ||||||||||||||||||||
Truist Financial Corp. | Morgan Stanley | 8,143 | 236,345 | 309,841 | 83,542 | ||||||||||||||||||||
US Bancorp | Morgan Stanley | 10,596 | 354,588 | 379,867 | 34,340 | ||||||||||||||||||||
Wells Fargo & Co. | Morgan Stanley | 61,948 | 1,549,655 | 1,456,397 | (81,202 | ) | |||||||||||||||||||
|
|
|
|
|
|
|
| ||||||||||||||||||
| 239,829 | 7,055,548 | 7,260,373 | 289,490 | ||||||||||||||||||||||
|
|
|
|
|
|
|
| ||||||||||||||||||
Capital Goods | |||||||||||||||||||||||||
3M Co. | Morgan Stanley | 14,925 | 2,224,468 | 2,390,687 | 221,562 | ||||||||||||||||||||
AMETEK, Inc. | Morgan Stanley | 7,151 | 469,891 | 710,809 | 244,519 | ||||||||||||||||||||
Carrier Global Corp. | Morgan Stanley | 4,103 | 49,618 | 125,306 | 76,136 | ||||||||||||||||||||
Caterpillar, Inc. | Morgan Stanley | 871 | 104,064 | 129,910 | 27,180 | ||||||||||||||||||||
Cummins, Inc. | Morgan Stanley | 6,412 | 879,425 | 1,353,958 | 518,508 | ||||||||||||||||||||
Deere & Co. | Morgan Stanley | 3,028 | 604,087 | 671,096 | 70,713 | ||||||||||||||||||||
Dover Corp. | Morgan Stanley | 17,244 | 1,547,650 | 1,868,215 | 344,786 | ||||||||||||||||||||
Eaton Corp. PLC (Ireland) | Morgan Stanley | 8,856 | 603,772 | 903,578 | 312,927 | ||||||||||||||||||||
Emerson Electric Co. | Morgan Stanley | 21,164 | 1,065,037 | 1,387,723 | 346,862 | ||||||||||||||||||||
Flowserve Corp. | Morgan Stanley | 55,017 | 1,244,320 | 1,501,414 | 289,293 | ||||||||||||||||||||
Fortive Corp. | Morgan Stanley | 6,238 | 324,811 | 475,398 | 153,697 | ||||||||||||||||||||
Fortune Brands Home & Security, Inc. | Morgan Stanley | 18,423 | 1,187,585 | 1,593,958 | 414,604 | ||||||||||||||||||||
General Dynamics Corp. | Morgan Stanley | 8,486 | 1,069,759 | 1,174,717 | 125,892 | ||||||||||||||||||||
Honeywell International, Inc. | Morgan Stanley | 12,507 | 1,601,201 | 2,058,777 | 481,212 | ||||||||||||||||||||
Howmet Aerospace, Inc. | Morgan Stanley | 151,143 | 2,208,394 | 2,527,111 | 323,183 | ||||||||||||||||||||
Illinois Tool Works, Inc. | Morgan Stanley | 7,822 | 1,483,939 | 1,511,289 | 41,105 | ||||||||||||||||||||
Johnson Controls International PLC (Ireland) | Morgan Stanley | 12,311 | 423,673 | 502,904 | 86,850 | ||||||||||||||||||||
The accompanying notes are an integral part of the financial statements.
21
GOTHAM INDEX PLUS FUND
Portfolio of Investments (Continued)
September 30, 2020
Total Return Swaps (continued)
Reference Entity | Counterparty | Number of Contracts Long/(Short) | Notional Amount | Value | Unrealized Appreciation/ (Depreciation)* | ||||||||||||||||||||
Capital Goods — (continued) | |||||||||||||||||||||||||
Lockheed Martin Corp. | Morgan Stanley | 5,019 | $ | 1,873,397 | $ | 1,923,682 | $ | 73,724 | |||||||||||||||||
Masco Corp. | Morgan Stanley | 32,548 | 1,301,470 | 1,794,371 | 502,416 | ||||||||||||||||||||
Northrop Grumman Corp. | Morgan Stanley | 1,006 | 340,325 | 317,383 | (20,912 | ) | |||||||||||||||||||
Otis Worldwide Corp. | Morgan Stanley | 9,190 | 412,262 | 573,640 | 165,904 | ||||||||||||||||||||
PACCAR, Inc. | Morgan Stanley | 11,325 | 988,886 | 965,796 | (20,187 | ) | |||||||||||||||||||
Pentair PLC (Ireland) | Morgan Stanley | 45,346 | 1,577,012 | 2,075,486 | 509,888 | ||||||||||||||||||||
Quanta Services, Inc. | Morgan Stanley | 55,448 | 1,832,584 | 2,930,981 | 1,109,957 | ||||||||||||||||||||
Raytheon Technologies Corp. | Morgan Stanley | 6,266 | 285,132 | 360,546 | 81,174 | ||||||||||||||||||||
Roper Technologies, Inc. | Morgan Stanley | 669 | 258,774 | 264,329 | 6,527 | ||||||||||||||||||||
Snap-on, Inc. | Morgan Stanley | 13,712 | 1,587,456 | 2,017,447 | 462,890 | ||||||||||||||||||||
Stanley Black & Decker, Inc. | Morgan Stanley | 100 | 7,486 | 16,220 | 8,908 | ||||||||||||||||||||
Trane Technologies PLC (Ireland) | Morgan Stanley | 7,661 | 680,162 | 928,896 | 256,507 | ||||||||||||||||||||
TransDigm Group, Inc. | Morgan Stanley | 5,332 | 1,635,554 | 2,533,340 | 901,099 | ||||||||||||||||||||
United Rentals, Inc. | Morgan Stanley | 11,501 | 1,195,556 | 2,006,925 | 837,679 | ||||||||||||||||||||
WW Grainger, Inc. | Morgan Stanley | 2,631 | 838,618 | 938,662 | 104,443 | ||||||||||||||||||||
|
|
|
|
|
|
|
| ||||||||||||||||||
| 563,455 | 31,906,368 | 40,534,554 | 9,059,046 | ||||||||||||||||||||||
|
|
|
|
|
|
|
| ||||||||||||||||||
Commercial & Professional Services | |||||||||||||||||||||||||
Cintas Corp. | Morgan Stanley | 4,219 | 806,167 | 1,404,210 | 599,686 | ||||||||||||||||||||
IHS Markit Ltd. (Bermuda) | Morgan Stanley | 14,692 | 1,125,847 | 1,153,469 | 30,698 | ||||||||||||||||||||
Republic Services, Inc. | Morgan Stanley | 12,588 | 1,008,464 | 1,175,090 | 180,736 | ||||||||||||||||||||
Robert Half International, Inc. | Morgan Stanley | 9,058 | 431,990 | 479,530 | 52,184 | ||||||||||||||||||||
Waste Management, Inc. | Morgan Stanley | 7,114 | 697,537 | 805,091 | 115,896 | ||||||||||||||||||||
|
|
|
|
|
|
|
| ||||||||||||||||||
| 47,671 | 4,070,005 | 5,017,390 | 979,200 | ||||||||||||||||||||||
|
|
|
|
|
|
|
| ||||||||||||||||||
Consumer Durables & Apparel | |||||||||||||||||||||||||
DR Horton, Inc. | Morgan Stanley | 12,832 | 757,219 | 970,484 | 216,655 | ||||||||||||||||||||
Garmin Ltd. (Switzerland) | Morgan Stanley | 3,023 | 242,324 | 286,762 | 47,961 | ||||||||||||||||||||
Hanesbrands, Inc. | Morgan Stanley | 27,060 | 266,681 | 426,195 | 164,850 | ||||||||||||||||||||
Leggett & Platt, Inc. | Morgan Stanley | 8,750 | 236,470 | 360,238 | 131,264 | ||||||||||||||||||||
Lennar Corp., Class A | Morgan Stanley | 2,603 | 126,224 | 212,613 | 88,733 | ||||||||||||||||||||
Mohawk Industries, Inc. | Morgan Stanley | 7,537 | 615,308 | 735,536 | 121,487 | ||||||||||||||||||||
Newell Brands, Inc. | Morgan Stanley | 10,755 | 135,865 | 184,556 | 53,932 | ||||||||||||||||||||
NIKE, Inc., Class B | Morgan Stanley | 8,322 | 782,705 | 1,044,744 | 266,985 | ||||||||||||||||||||
PulteGroup, Inc. | Morgan Stanley | 30,218 | 758,641 | 1,398,791 | 648,548 | ||||||||||||||||||||
PVH Corp. | Morgan Stanley | 65,120 | 3,021,004 | 3,883,757 | 869,044 | ||||||||||||||||||||
Tapestry, Inc. | Morgan Stanley | 2,692 | 28,541 | 42,076 | 13,613 | ||||||||||||||||||||
Whirlpool Corp. | Morgan Stanley | 4,505 | 417,387 | 828,424 | 422,054 | ||||||||||||||||||||
|
|
|
|
|
|
|
| ||||||||||||||||||
| 183,417 | 7,388,369 | 10,374,176 | 3,045,126 | ||||||||||||||||||||||
|
|
|
|
|
|
|
| ||||||||||||||||||
Consumer Services | |||||||||||||||||||||||||
McDonald’s Corp. | Morgan Stanley | 11,700 | 2,093,096 | 2,568,033 | 507,419 | ||||||||||||||||||||
MGM Resorts International | Morgan Stanley | 76,103 | 626,117 | 1,655,240 | 1,030,783 | ||||||||||||||||||||
Yum! Brands, Inc. | Morgan Stanley | 22,964 | 1,898,832 | 2,096,613 | 217,540 | ||||||||||||||||||||
|
|
|
|
|
|
|
| ||||||||||||||||||
| 110,767 | 4,618,045 | 6,319,886 | 1,755,742 | ||||||||||||||||||||||
|
|
|
|
|
|
|
| ||||||||||||||||||
Diversified Financials | |||||||||||||||||||||||||
American Express Co. | Morgan Stanley | 2,061 | 167,792 | 206,615 | 39,962 | ||||||||||||||||||||
The accompanying notes are an integral part of the financial statements.
22
GOTHAM INDEX PLUS FUND
Portfolio of Investments (Continued)
September 30, 2020
Total Return Swaps (continued)
Reference Entity | Counterparty | Number of Contracts Long/(Short) | Notional Amount | Value | Unrealized Appreciation/ (Depreciation)* | ||||||||||||||||||||
Diversified Financials — (continued) | |||||||||||||||||||||||||
Berkshire Hathaway, Inc., Class B | Morgan Stanley | 34,119 | $ | 6,726,080 | $ | 7,265,300 | $ | 556,136 | |||||||||||||||||
BlackRock, Inc. | Morgan Stanley | 8,005 | 3,371,306 | 4,511,218 | 1,274,159 | ||||||||||||||||||||
Discover Financial Services | Morgan Stanley | 29,605 | 1,100,570 | 1,710,577 | 632,646 | ||||||||||||||||||||
Franklin Resources, Inc. | Morgan Stanley | 59,425 | 1,166,556 | 1,209,299 | 84,987 | ||||||||||||||||||||
Goldman Sachs Group, Inc. (The) | Morgan Stanley | 8,206 | 1,406,054 | 1,649,160 | 263,190 | ||||||||||||||||||||
Intercontinental Exchange, Inc. | Morgan Stanley | 13,282 | 1,139,885 | 1,328,864 | 199,340 | ||||||||||||||||||||
Invesco Ltd. (Bermuda) | Morgan Stanley | 194,907 | 1,682,152 | 2,223,889 | 597,772 | ||||||||||||||||||||
Moody’s Corp. | Morgan Stanley | 2,822 | 781,227 | 817,957 | 39,618 | ||||||||||||||||||||
Nasdaq, Inc. | Morgan Stanley | 23,864 | 2,438,601 | 2,928,351 | 537,110 | ||||||||||||||||||||
S&P Global, Inc. | Morgan Stanley | 4,569 | 1,491,564 | 1,647,581 | 162,999 | ||||||||||||||||||||
T Rowe Price Group, Inc. | Morgan Stanley | 21,692 | 2,325,906 | 2,781,348 | 531,518 | ||||||||||||||||||||
|
|
|
|
|
|
|
| ||||||||||||||||||
| 402,557 | 23,797,693 | 28,280,159 | 4,919,437 | ||||||||||||||||||||||
|
|
|
|
|
|
|
| ||||||||||||||||||
Energy | |||||||||||||||||||||||||
Apache Corp. | Morgan Stanley | 141,897 | 701,448 | 1,343,765 | 652,049 | ||||||||||||||||||||
Baker Hughes Co. | Morgan Stanley | 59,420 | 843,773 | 789,692 | (52,362 | ) | |||||||||||||||||||
Chevron Corp. | Morgan Stanley | 21,647 | 1,659,117 | 1,558,584 | (66,291 | ) | |||||||||||||||||||
ConocoPhillips | Morgan Stanley | 77,318 | 2,514,166 | 2,539,123 | 73,994 | ||||||||||||||||||||
EOG Resources, Inc. | Morgan Stanley | 81,634 | 3,397,173 | 2,933,926 | (439,274 | ) | |||||||||||||||||||
Halliburton Co. | Morgan Stanley | 95,656 | 872,112 | 1,152,655 | 289,637 | ||||||||||||||||||||
Kinder Morgan, Inc. | Morgan Stanley | 163,909 | 2,650,207 | 2,020,998 | (551,322 | ) | |||||||||||||||||||
Marathon Petroleum Corp. | Morgan Stanley | 3,834 | 67,575 | 112,490 | 49,518 | ||||||||||||||||||||
National Oilwell Varco, Inc. | Morgan Stanley | 63,093 | 721,215 | 571,623 | (148,120 | ) | |||||||||||||||||||
Phillips 66. | Morgan Stanley | 4,775 | 235,418 | 247,536 | 17,472 | ||||||||||||||||||||
TechnipFMC PLC (United Kingdom) | Morgan Stanley | 143,737 | 1,012,982 | 906,980 | (93,885 | ) | |||||||||||||||||||
Valero Energy Corp. | Morgan Stanley | 865 | 28,824 | 37,472 | 10,422 | ||||||||||||||||||||
Williams Cos., Inc. (The) | Morgan Stanley | 50,947 | 1,094,880 | 1,001,109 | (71,966 | ) | |||||||||||||||||||
|
|
|
|
|
|
|
| ||||||||||||||||||
| 908,732 | 15,798,890 | 15,215,953 | (330,128 | ) | |||||||||||||||||||||
|
|
|
|
|
|
|
| ||||||||||||||||||
Food & Staples Retailing | |||||||||||||||||||||||||
Costco Wholesale Corp. | Morgan Stanley | 670 | 228,404 | 237,850 | 9,926 | ||||||||||||||||||||
Kroger Co. (The) | Morgan Stanley | 17,290 | 470,483 | 586,304 | 128,570 | ||||||||||||||||||||
Sysco Corp. | Morgan Stanley | 14,352 | 570,295 | 892,981 | 332,940 | ||||||||||||||||||||
Walgreens Boots Alliance, Inc. | Morgan Stanley | 15,514 | 613,433 | 557,263 | (46,220 | ) | |||||||||||||||||||
Walmart, Inc. | Morgan Stanley | 28,128 | 3,121,470 | 3,935,388 | 887,313 | ||||||||||||||||||||
|
|
|
|
|
|
|
| ||||||||||||||||||
| 75,954 | 5,004,085 | 6,209,786 | 1,312,529 | ||||||||||||||||||||||
|
|
|
|
|
|
|
| ||||||||||||||||||
Food, Beverage & Tobacco | |||||||||||||||||||||||||
Altria Group, Inc. | Morgan Stanley | 18,919 | 725,440 | 731,030 | 42,511 | ||||||||||||||||||||
Archer-Daniels-Midland Co. | Morgan Stanley | 18,294 | 749,380 | 850,488 | 123,792 | ||||||||||||||||||||
Campbell Soup Co. | Morgan Stanley | 16,260 | 752,485 | 786,496 | 49,639 | ||||||||||||||||||||
Coca-Cola Co. (The) | Morgan Stanley | 26,556 | 1,215,289 | 1,311,070 | 114,999 | ||||||||||||||||||||
Constellation Brands, Inc., Class A | Morgan Stanley | 10,835 | 1,517,983 | 2,053,341 | 553,843 | ||||||||||||||||||||
General Mills, Inc. | Morgan Stanley | 16,587 | 960,446 | 1,023,086 | 73,804 | ||||||||||||||||||||
JM Smucker Co. (The) | Morgan Stanley | 8,531 | 940,882 | 985,501 | 58,236 | ||||||||||||||||||||
Kellogg Co. | Morgan Stanley | 15,642 | 1,080,315 | 1,010,317 | (61,895 | ) | |||||||||||||||||||
Kraft Heinz Co. (The) | Morgan Stanley | 54,356 | 1,793,602 | 1,627,962 | (140,716 | ) | |||||||||||||||||||
Molson Coors Beverage Co., Class B | Morgan Stanley | 11,440 | 414,754 | 383,926 | (30,301 | ) | |||||||||||||||||||
The accompanying notes are an integral part of the financial statements.
23
GOTHAM INDEX PLUS FUND
Portfolio of Investments (Continued)
September 30, 2020
Total Return Swaps (continued)
Reference Entity | Counterparty | Number of Contracts Long/(Short) | Notional Amount | Value | Unrealized Appreciation/ (Depreciation)* | ||||||||||||||||||||
Food, Beverage & Tobacco — (continued) |
| ||||||||||||||||||||||||
Mondelez International, Inc., Class A | Morgan Stanley | 8,533 | $ | 408,152 | $ | 490,221 | $ | 89,640 | |||||||||||||||||
PepsiCo, Inc. | Morgan Stanley | 19,808 | 2,465,094 | 2,745,389 | 401,604 | ||||||||||||||||||||
Philip Morris International, Inc. | Morgan Stanley | 11,230 | 815,632 | 842,138 | 46,820 | ||||||||||||||||||||
Tyson Foods, Inc., Class A | Morgan Stanley | 28,101 | 1,603,826 | 1,671,447 | 86,541 | ||||||||||||||||||||
|
|
|
|
|
|
|
| ||||||||||||||||||
| 265,092 | 15,443,280 | 16,512,412 | 1,408,517 | ||||||||||||||||||||||
|
|
|
|
|
|
|
| ||||||||||||||||||
Health Care Equipment & Services | |||||||||||||||||||||||||
Abbott Laboratories | Morgan Stanley | 18,876 | 1,515,867 | 2,054,275 | 552,868 | ||||||||||||||||||||
Anthem, Inc. | Morgan Stanley | 4,007 | 822,259 | 1,076,240 | 262,927 | ||||||||||||||||||||
Cardinal Health, Inc. | Morgan Stanley | 10,078 | 531,132 | 473,162 | (49,970 | ) | |||||||||||||||||||
Cigna Corp. | Morgan Stanley | 3,416 | 588,170 | 578,705 | (8,261 | ) | |||||||||||||||||||
CVS Health Corp. | Morgan Stanley | 30,121 | 1,763,185 | �� | 1,759,066 | 32,737 | |||||||||||||||||||
Danaher Corp. | Morgan Stanley | 9,540 | 1,416,051 | 2,054,248 | 656,540 | ||||||||||||||||||||
DaVita, Inc. | Morgan Stanley | 15,740 | 973,280 | 1,348,131 | 376,830 | ||||||||||||||||||||
DENTSPLY SIRONA, Inc. | Morgan Stanley | 17,858 | 789,974 | 780,930 | (5,694 | ) | |||||||||||||||||||
HCA Healthcare, Inc. | Morgan Stanley | 509 | 63,495 | 63,462 | 1,598 | ||||||||||||||||||||
Henry Schein, Inc. | Morgan Stanley | 1,002 | 44,056 | 58,898 | 14,950 | ||||||||||||||||||||
Hologic, Inc. | Morgan Stanley | 30,383 | 1,789,311 | 2,019,558 | 232,807 | ||||||||||||||||||||
Humana, Inc. | Morgan Stanley | 5,443 | 2,232,751 | 2,252,803 | 27,957 | ||||||||||||||||||||
Intuitive Surgical, Inc. | Morgan Stanley | 312 | 214,826 | 221,376 | 6,119 | ||||||||||||||||||||
McKesson Corp. | Morgan Stanley | 4,260 | 648,502 | 634,442 | (10,821 | ) | |||||||||||||||||||
Medtronic PLC (Ireland) | Morgan Stanley | 19,095 | 1,803,921 | 1,984,352 | 205,564 | ||||||||||||||||||||
Quest Diagnostics, Inc. | Morgan Stanley | 3,188 | 246,289 | 364,994 | 122,620 | ||||||||||||||||||||
ResMed, Inc. | Morgan Stanley | 4,682 | 813,083 | 802,635 | (7,588 | ) | |||||||||||||||||||
STERIS PLC (Ireland) | Morgan Stanley | 4,323 | 666,817 | 761,669 | 98,038 | ||||||||||||||||||||
Stryker Corp. | Morgan Stanley | 4,312 | 795,029 | 898,491 | 109,774 | ||||||||||||||||||||
UnitedHealth Group, Inc. | Morgan Stanley | 9,740 | 2,107,321 | 3,036,640 | 985,203 | ||||||||||||||||||||
Universal Health Services, Inc., Class B | Morgan Stanley | 9,155 | 780,525 | 979,768 | 200,822 | ||||||||||||||||||||
Varian Medical Systems, Inc. | Morgan Stanley | 5,818 | 1,008,194 | 1,000,696 | (5,448 | ) | |||||||||||||||||||
West Pharmaceutical Services, Inc. | Morgan Stanley | 2,459 | 511,005 | 675,979 | 166,416 | ||||||||||||||||||||
Zimmer Biomet Holdings, Inc. | Morgan Stanley | 1 | 111 | 136 | 46 | ||||||||||||||||||||
|
|
|
|
|
|
|
| ||||||||||||||||||
| 214,318 | 22,125,154 | 25,880,656 | 3,966,034 | ||||||||||||||||||||||
|
|
|
|
|
|
|
| ||||||||||||||||||
Household & Personal Products | |||||||||||||||||||||||||
Clorox Co. (The) | Morgan Stanley | 1,821 | 380,806 | 382,720 | 2,700 | ||||||||||||||||||||
Colgate-Palmolive Co. | Morgan Stanley | 14,414 | 960,854 | 1,112,040 | 172,457 | ||||||||||||||||||||
Estee Lauder Cos., Inc. (The), Class A | Morgan Stanley | 1,548 | 237,505 | 337,851 | 101,587 | ||||||||||||||||||||
Kimberly-Clark Corp. | Morgan Stanley | 8,168 | 1,129,366 | 1,206,087 | 96,393 | ||||||||||||||||||||
Procter & Gamble Co. (The) | Morgan Stanley | 3,671 | 397,636 | 510,232 | 118,432 | ||||||||||||||||||||
|
|
|
|
|
|
|
| ||||||||||||||||||
| 29,622 | 3,106,167 | 3,548,930 | 491,569 | ||||||||||||||||||||||
|
|
|
|
|
|
|
| ||||||||||||||||||
Insurance | |||||||||||||||||||||||||
Aflac, Inc. | Morgan Stanley | 19,495 | 812,978 | 708,643 | (93,742 | ) | |||||||||||||||||||
Aon PLC, Class A (Ireland) | Morgan Stanley | 5,297 | 953,706 | 1,092,771 | 146,436 | ||||||||||||||||||||
Arthur J Gallagher & Co. | Morgan Stanley | 709 | 74,699 | 74,856 | 412 | ||||||||||||||||||||
Assurant, Inc. | Morgan Stanley | 1,667 | 179,581 | 202,224 | 29,909 | ||||||||||||||||||||
Cincinnati Financial Corp. | Morgan Stanley | 14,110 | 835,752 | 1,100,157 | 280,646 | ||||||||||||||||||||
Globe Life, Inc. | Morgan Stanley | 8,820 | 774,142 | 704,718 | (63,725 | ) | |||||||||||||||||||
The accompanying notes are an integral part of the financial statements.
24
GOTHAM INDEX PLUS FUND
Portfolio of Investments (Continued)
September 30, 2020
Total Return Swaps (continued)
Reference Entity | Counterparty | Number of Contracts Long/(Short) | Notional Amount | Value | Unrealized Appreciation/ (Depreciation)* | ||||||||||||||||||||
Insurance — (continued) | |||||||||||||||||||||||||
Hartford Financial Services Group, Inc. (The) | Morgan Stanley | 11,609 | $ | 403,985 | $ | 427,908 | $ | 30,717 | |||||||||||||||||
Loews Corp. | Morgan Stanley | 3,423 | 105,519 | 118,949 | 13,750 | ||||||||||||||||||||
Marsh & McLennan Cos., Inc. | Morgan Stanley | 9,333 | 965,264 | 1,070,495 | 110,234 | ||||||||||||||||||||
MetLife, Inc. | Morgan Stanley | 23,807 | 766,272 | 884,906 | 135,941 | ||||||||||||||||||||
Prudential Financial, Inc. | Morgan Stanley | 16,201 | 848,817 | 1,029,087 | 213,647 | ||||||||||||||||||||
Travelers Cos., Inc. (The) | Morgan Stanley | 6,345 | 598,307 | 686,466 | 101,453 | ||||||||||||||||||||
WR Berkley Corp. | Morgan Stanley | 7,575 | 400,198 | 463,211 | 65,508 | ||||||||||||||||||||
|
|
|
|
|
|
|
| ||||||||||||||||||
| 128,391 | 7,719,220 | 8,564,391 | 971,186 | ||||||||||||||||||||||
|
|
|
|
|
|
|
| ||||||||||||||||||
Materials | |||||||||||||||||||||||||
Amcor PLC (Jersey) | Morgan Stanley | 101,598 | 941,946 | 1,122,658 | 197,150 | ||||||||||||||||||||
Avery Dennison Corp. | Morgan Stanley | 132 | 11,279 | 16,875 | 5,792 | ||||||||||||||||||||
Celanese Corp. | Morgan Stanley | 10,633 | 777,202 | 1,142,516 | 379,646 | ||||||||||||||||||||
CF Industries Holdings, Inc. | Morgan Stanley | 30,725 | 927,976 | 943,565 | 25,943 | ||||||||||||||||||||
Dow, Inc. | Morgan Stanley | 9,489 | 385,564 | 446,457 | 69,150 | ||||||||||||||||||||
DuPont de Nemours, Inc. | Morgan Stanley | 49,839 | 1,805,916 | 2,765,068 | 992,711 | ||||||||||||||||||||
Eastman Chemical Co. | Morgan Stanley | 7,466 | 390,243 | 583,244 | 206,595 | ||||||||||||||||||||
Ecolab, Inc. | Morgan Stanley | 11,186 | 2,164,376 | 2,235,410 | 81,036 | ||||||||||||||||||||
FMC Corp. | Morgan Stanley | 4,199 | 336,594 | 444,716 | 113,515 | ||||||||||||||||||||
International Paper Co. | Morgan Stanley | 23,823 | 751,579 | 965,784 | 239,658 | ||||||||||||||||||||
Linde PLC (Ireland) | Morgan Stanley | 8,428 | 1,469,366 | 2,006,960 | 556,091 | ||||||||||||||||||||
LyondellBasell Industries NV, Class A (Netherlands) | Morgan Stanley | 9,914 | 417,333 | 698,838 | 303,225 | ||||||||||||||||||||
Martin Marietta Materials, Inc. | Morgan Stanley | 2,114 | 367,965 | 497,551 | 136,115 | ||||||||||||||||||||
Mosaic Co. (The) | Morgan Stanley | 75,992 | 1,375,852 | 1,388,374 | 18,960 | ||||||||||||||||||||
Newmont Corp. | Morgan Stanley | 3,749 | 245,236 | 237,874 | (6,315 | ) | |||||||||||||||||||
Nucor Corp. | Morgan Stanley | 13,409 | 572,565 | 601,528 | 35,532 | ||||||||||||||||||||
PPG Industries, Inc. | Morgan Stanley | 11,658 | 1,055,464 | 1,423,209 | 380,911 | ||||||||||||||||||||
Sealed Air Corp. | Morgan Stanley | 53,665 | 1,336,426 | 2,082,739 | 766,197 | ||||||||||||||||||||
|
|
|
|
|
|
|
| ||||||||||||||||||
| 428,019 | 15,332,882 | 19,603,366 | 4,501,912 | ||||||||||||||||||||||
|
|
|
|
|
|
|
| ||||||||||||||||||
Media & Entertainment | |||||||||||||||||||||||||
Activision Blizzard, Inc. | Morgan Stanley | 4,843 | 340,785 | 392,041 | 52,415 | ||||||||||||||||||||
Alphabet, Inc., Class A | Morgan Stanley | 7,361 | 8,606,002 | 10,788,282 | 2,197,904 | ||||||||||||||||||||
Charter Communications, Inc., Class A | Morgan Stanley | 6,524 | 2,492,000 | 4,073,194 | 1,586,231 | ||||||||||||||||||||
Comcast Corp., Class A | Morgan Stanley | 31,178 | 1,170,701 | 1,442,294 | 282,326 | ||||||||||||||||||||
Discovery, Inc., Class A | Morgan Stanley | 18,568 | 381,665 | 404,225 | 23,693 | ||||||||||||||||||||
Electronic Arts, Inc. | Morgan Stanley | 1,665 | 215,301 | 217,133 | 2,285 | ||||||||||||||||||||
Facebook, Inc., Class A | Morgan Stanley | 11,423 | 2,222,583 | 2,991,684 | 773,352 | ||||||||||||||||||||
Fox Corp., Class A | Morgan Stanley | 50,890 | 1,296,293 | 1,416,269 | 134,311 | ||||||||||||||||||||
Interpublic Group of Cos., Inc. (The) | Morgan Stanley | 25,095 | 431,221 | 418,334 | (1,005 | ) | |||||||||||||||||||
Netflix, Inc. | Morgan Stanley | 2,841 | 1,197,341 | 1,420,585 | 226,852 | ||||||||||||||||||||
Omnicom Group, Inc. | Morgan Stanley | 7,811 | 409,269 | 386,645 | (15,735 | ) | |||||||||||||||||||
Take-Two Interactive Software, Inc. | Morgan Stanley | 722 | 96,488 | 119,289 | 23,096 | ||||||||||||||||||||
Twitter, Inc. | Morgan Stanley | 5,006 | 153,829 | 222,767 | 69,770 | ||||||||||||||||||||
The accompanying notes are an integral part of the financial statements.
25
GOTHAM INDEX PLUS FUND
Portfolio of Investments (Continued)
September 30, 2020
Total Return Swaps (continued)
Reference Entity | Counterparty | Number of Contracts Long/(Short) | Notional Amount | Value | Unrealized Appreciation/ (Depreciation)* | ||||||||||||||||||||
Media & Entertainment — (continued) |
| ||||||||||||||||||||||||
Walt Disney Co. (The) | Morgan Stanley | 11,527 | $ | 1,101,459 | $ | 1,430,270 | $ | 331,049 | |||||||||||||||||
|
|
|
|
|
|
|
| ||||||||||||||||||
| 185,454 | 20,114,937 | 25,723,012 | 5,686,544 | ||||||||||||||||||||||
|
|
|
|
|
|
|
| ||||||||||||||||||
Pharmaceuticals, Biotechnology & Life Sciences |
| ||||||||||||||||||||||||
AbbVie, Inc. | Morgan Stanley | 7,401 | 656,890 | 648,254 | (7,293 | ) | |||||||||||||||||||
Agilent Technologies, Inc. | Morgan Stanley | 13,075 | 1,275,074 | 1,319,791 | 47,304 | ||||||||||||||||||||
Alexion Pharmaceuticals, Inc. | Morgan Stanley | 4,047 | 390,519 | 463,098 | 73,385 | ||||||||||||||||||||
Amgen, Inc. | Morgan Stanley | 3,630 | 744,087 | 922,601 | 213,473 | ||||||||||||||||||||
Biogen, Inc. | Morgan Stanley | 10,188 | 2,447,805 | 2,890,132 | 446,587 | ||||||||||||||||||||
Bristol Myers Squibb Co. | Morgan Stanley | 23,509 | 1,243,577 | 1,417,358 | 206,354 | ||||||||||||||||||||
Gilead Sciences, Inc. | Morgan Stanley | 16,497 | 1,082,466 | 1,042,445 | (15,560 | ) | |||||||||||||||||||
Illumina, Inc. | Morgan Stanley | 922 | 337,132 | 284,972 | (52,009 | ) | |||||||||||||||||||
Incyte Corp. | Morgan Stanley | 1,295 | 131,185 | 116,213 | (14,865 | ) | |||||||||||||||||||
Johnson & Johnson | Morgan Stanley | 47,553 | 6,215,994 | 7,079,691 | 1,067,228 | ||||||||||||||||||||
Merck & Co., Inc. | Morgan Stanley | 18,665 | 1,375,226 | 1,548,262 | 194,555 | ||||||||||||||||||||
PerkinElmer, Inc. | Morgan Stanley | 7,575 | 671,997 | 950,738 | 282,834 | ||||||||||||||||||||
Pfizer, Inc. | Morgan Stanley | 79,855 | 2,670,077 | 2,930,679 | 314,764 | ||||||||||||||||||||
Regeneron Pharmaceuticals, Inc. | Morgan Stanley | 1,741 | 948,398 | 974,577 | 18,580 | ||||||||||||||||||||
Thermo Fisher Scientific, Inc. | Morgan Stanley | 2,593 | 1,052,667 | 1,144,861 | 95,128 | ||||||||||||||||||||
|
|
|
|
|
|
|
| ||||||||||||||||||
| 238,546 | 21,243,094 | 23,733,672 | 2,870,465 | ||||||||||||||||||||||
|
|
|
|
|
|
|
| ||||||||||||||||||
Real Estate | |||||||||||||||||||||||||
Alexandria Real Estate Equities, Inc., REIT | Morgan Stanley | 6,385 | 978,585 | 1,021,600 | 62,696 | ||||||||||||||||||||
American Tower Corp., REIT | Morgan Stanley | 2,684 | 689,588 | 648,803 | (33,601 | ) | |||||||||||||||||||
Apartment Investment & Management Co., Class A, REIT | Morgan Stanley | 15,729 | 518,079 | 530,382 | 22,658 | ||||||||||||||||||||
AvalonBay Communities, Inc., REIT | Morgan Stanley | 6,943 | 1,024,498 | 1,036,868 | 33,234 | ||||||||||||||||||||
Boston Properties, Inc., REIT | Morgan Stanley | 6,426 | 527,861 | 516,008 | 803 | ||||||||||||||||||||
CBRE Group, Inc., Class A | Morgan Stanley | 4,300 | 172,116 | 201,971 | 30,222 | ||||||||||||||||||||
Crown Castle International Corp., REIT | Morgan Stanley | 2,454 | 413,677 | 408,591 | 1,474 | ||||||||||||||||||||
Duke Realty Corp., REIT | Morgan Stanley | 9,486 | 354,702 | 350,033 | (2,194 | ) | |||||||||||||||||||
Extra Space Storage, Inc., REIT | Morgan Stanley | 139 | 10,691 | 14,872 | 4,473 | ||||||||||||||||||||
Federal Realty Investment Trust, REIT | Morgan Stanley | 2,102 | 144,566 | 154,371 | 14,585 | ||||||||||||||||||||
Mid-America Apartment Communities, Inc., REIT | Morgan Stanley | 4,865 | 553,555 | 564,097 | 14,032 | ||||||||||||||||||||
Prologis, Inc., REIT | Morgan Stanley | 1,161 | 99,064 | 116,820 | 18,741 | ||||||||||||||||||||
Public Storage, REIT | Morgan Stanley | 3,434 | 619,029 | 764,820 | 160,023 | ||||||||||||||||||||
Realty Income Corp., REIT | Morgan Stanley | 9,857 | 466,955 | 598,813 | 146,510 | ||||||||||||||||||||
SBA Communications Corp., REIT | Morgan Stanley | 680 | 210,523 | 216,566 | 6,826 | ||||||||||||||||||||
Simon Property Group, Inc., REIT | Morgan Stanley | 15,087 | 881,246 | 975,827 | 106,317 | ||||||||||||||||||||
Welltower, Inc., REIT | Morgan Stanley | 21,260 | 975,190 | 1,171,213 | 217,326 | ||||||||||||||||||||
Weyerhaeuser Co., REIT | Morgan Stanley | 154,260 | 2,665,893 | 4,399,495 | 1,738,989 | ||||||||||||||||||||
|
|
|
|
|
|
|
| ||||||||||||||||||
| 267,252 | 11,305,818 | 13,691,150 | 2,543,114 | ||||||||||||||||||||||
|
|
|
|
|
|
|
| ||||||||||||||||||
Retailing | |||||||||||||||||||||||||
Amazon.com, Inc. | Morgan Stanley | 3,460 | 6,962,892 | 10,894,606 | 3,946,049 | ||||||||||||||||||||
AutoZone, Inc. | Morgan Stanley | 1,147 | 1,098,131 | 1,350,753 | 254,853 | ||||||||||||||||||||
The accompanying notes are an integral part of the financial statements.
26
GOTHAM INDEX PLUS FUND
Portfolio of Investments (Continued)
September 30, 2020
Total Return Swaps (continued)
Reference Entity | Counterparty | Number of Contracts Long/(Short) | Notional Amount | Value | Unrealized Appreciation/ (Depreciation)* | ||||||||||||||||||||
Retailing — (continued) | |||||||||||||||||||||||||
Best Buy Co., Inc. | Morgan Stanley | 6,908 | $ | 520,599 | $ | 768,791 | $ | 257,691 | |||||||||||||||||
Booking Holdings, Inc. | Morgan Stanley | 185 | 221,890 | 316,476 | 95,053 | ||||||||||||||||||||
CarMax, Inc. | Morgan Stanley | 233 | 20,809 | 21,415 | 4,167 | ||||||||||||||||||||
Dollar General Corp. | Morgan Stanley | 6,722 | 1,331,698 | 1,409,066 | 80,069 | ||||||||||||||||||||
eBay, Inc. | Morgan Stanley | 44,367 | 1,292,818 | 2,311,521 | 1,035,523 | ||||||||||||||||||||
Gap, Inc. (The) | Morgan Stanley | 34,380 | 387,872 | 585,491 | 198,420 | ||||||||||||||||||||
Genuine Parts Co. | Morgan Stanley | 5,779 | 435,300 | 549,987 | 122,284 | ||||||||||||||||||||
Home Depot, Inc. (The) | Morgan Stanley | 2,210 | 494,916 | 613,739 | 124,848 | ||||||||||||||||||||
L Brands, Inc. | Morgan Stanley | 9,691 | 282,015 | 308,271 | 26,844 | ||||||||||||||||||||
LKQ Corp. | Morgan Stanley | 32,547 | 706,535 | 902,528 | 197,435 | ||||||||||||||||||||
Lowe’s Cos., Inc. | Morgan Stanley | 10,512 | 1,276,777 | 1,743,520 | 475,116 | ||||||||||||||||||||
O’Reilly Automotive, Inc. | Morgan Stanley | 1,203 | 515,120 | 554,679 | 40,616 | ||||||||||||||||||||
Target Corp. | Morgan Stanley | 11,589 | 1,381,832 | 1,824,340 | 504,763 | ||||||||||||||||||||
Tractor Supply Co. | Morgan Stanley | 18,113 | 2,474,668 | 2,596,317 | 130,529 | ||||||||||||||||||||
|
|
|
|
|
|
|
| ||||||||||||||||||
| 189,046 | 19,403,872 | 26,751,500 | 7,494,260 | ||||||||||||||||||||||
|
|
|
|
|
|
|
| ||||||||||||||||||
Semiconductors & Semiconductor Equipment |
| ||||||||||||||||||||||||
Applied Materials, Inc. | Morgan Stanley | 12,530 | 497,369 | 744,909 | 254,074 | ||||||||||||||||||||
Broadcom, Inc. | Morgan Stanley | 4,423 | 1,523,614 | 1,611,387 | 105,248 | ||||||||||||||||||||
Intel Corp. | Morgan Stanley | 111,926 | 5,254,153 | 5,795,528 | 727,777 | ||||||||||||||||||||
KLA Corp. | Morgan Stanley | 3,634 | 649,711 | 704,051 | 57,347 | ||||||||||||||||||||
Lam Research Corp. | Morgan Stanley | 1,061 | 290,630 | 351,987 | 64,429 | ||||||||||||||||||||
Maxim Integrated Products, Inc. | Morgan Stanley | 9,731 | 648,142 | 657,913 | 11,096 | ||||||||||||||||||||
Micron Technology, Inc. | Morgan Stanley | 7,030 | 329,304 | 330,129 | 1,645 | ||||||||||||||||||||
NVIDIA Corp. | Morgan Stanley | 3,107 | 905,327 | 1,681,571 | 778,896 | ||||||||||||||||||||
Qorvo, Inc. | Morgan Stanley | 1,537 | 119,311 | 198,288 | 79,238 | ||||||||||||||||||||
Skyworks Solutions, Inc. | Morgan Stanley | 8,059 | 885,603 | 1,172,585 | 294,344 | ||||||||||||||||||||
Texas Instruments, Inc. | Morgan Stanley | 4,399 | 580,585 | 628,133 | 51,320 | ||||||||||||||||||||
|
|
|
|
|
|
|
| ||||||||||||||||||
| 167,437 | 11,683,749 | 13,876,481 | 2,425,414 | ||||||||||||||||||||||
|
|
|
|
|
|
|
| ||||||||||||||||||
Software & Services | |||||||||||||||||||||||||
Accenture PLC, Class A (Ireland) | Morgan Stanley | 6,103 | 1,205,817 | 1,379,217 | 180,324 | ||||||||||||||||||||
Adobe, Inc. | Morgan Stanley | 2,096 | 702,050 | 1,027,941 | 327,325 | ||||||||||||||||||||
ANSYS, Inc. | Morgan Stanley | 532 | 151,078 | 174,086 | 23,333 | ||||||||||||||||||||
Automatic Data Processing, Inc. | Morgan Stanley | 5,656 | 767,104 | 788,955 | 27,614 | ||||||||||||||||||||
Broadridge Financial Solutions, Inc. | Morgan Stanley | 15,723 | 2,192,473 | 2,075,436 | (103,745 | ) | |||||||||||||||||||
Cadence Design Systems, Inc. | Morgan Stanley | 3,014 | 286,652 | 321,383 | 35,328 | ||||||||||||||||||||
Citrix Systems, Inc. | Morgan Stanley | 5,732 | 670,703 | 789,354 | 124,946 | ||||||||||||||||||||
Cognizant Technology Solutions Corp., Class A | Morgan Stanley | 6,107 | 372,592 | 423,948 | 58,314 | ||||||||||||||||||||
FleetCor Technologies, Inc. | Morgan Stanley | 915 | 164,753 | 217,862 | 53,460 | ||||||||||||||||||||
Gartner, Inc. | Morgan Stanley | 11,180 | 1,456,701 | 1,396,941 | (56,808 | ) | |||||||||||||||||||
International Business Machines Corp. | Morgan Stanley | 18,028 | 1,991,349 | 2,193,467 | 258,003 | ||||||||||||||||||||
Intuit, Inc. | Morgan Stanley | 3,930 | 1,297,969 | 1,282,005 | (13,331 | ) | |||||||||||||||||||
Mastercard, Inc., Class A | Morgan Stanley | 3,384 | 957,703 | 1,144,367 | 190,286 | ||||||||||||||||||||
Microsoft Corp. | Morgan Stanley | 34,876 | 5,603,376 | 7,335,469 | 1,826,320 | ||||||||||||||||||||
NortonLifeLock, Inc. | Morgan Stanley | 16,772 | 321,351 | 349,528 | 33,654 | ||||||||||||||||||||
Oracle Corp. | Morgan Stanley | 47,978 | 2,234,792 | 2,864,287 | 654,193 | ||||||||||||||||||||
The accompanying notes are an integral part of the financial statements.
27
GOTHAM INDEX PLUS FUND
Portfolio of Investments (Continued)
September 30, 2020
Total Return Swaps (continued)
Reference Entity | Counterparty | Number of Contracts Long/(Short) | Notional Amount | Value | Unrealized Appreciation/ (Depreciation)* | ||||||||||||||||||||
Software & Services — (continued) | |||||||||||||||||||||||||
Paychex, Inc. | Morgan Stanley | 38,256 | $ | 2,273,728 | $ | 3,051,681 | $ | 829,545 | |||||||||||||||||
PayPal Holdings, Inc. | Morgan Stanley | 8,751 | 1,320,230 | 1,724,210 | 406,756 | ||||||||||||||||||||
salesforce.com, Inc. | Morgan Stanley | 4,272 | 631,313 | 1,073,639 | 443,617 | ||||||||||||||||||||
ServiceNow, Inc. | Morgan Stanley | 1,197 | 457,831 | 580,545 | 124,202 | ||||||||||||||||||||
Synopsys, Inc. | Morgan Stanley | 2,405 | 473,559 | 514,622 | 42,055 | ||||||||||||||||||||
VeriSign, Inc. | Morgan Stanley | 2,406 | 500,698 | 492,869 | (6,874 | ) | |||||||||||||||||||
Visa, Inc., Class A | Morgan Stanley | 16,068 | 2,742,711 | 3,213,118 | 496,545 | ||||||||||||||||||||
Western Union Co. (The) | Morgan Stanley | 31,681 | 647,432 | 678,924 | 47,547 | ||||||||||||||||||||
|
|
|
|
|
|
|
| ||||||||||||||||||
| 287,062 | 29,423,965 | 35,093,854 | 6,002,609 | ||||||||||||||||||||||
|
|
|
|
|
|
|
| ||||||||||||||||||
Technology Hardware & Equipment | |||||||||||||||||||||||||
Amphenol Corp., Class A | Morgan Stanley | 4,806 | 339,722 | 520,346 | 183,731 | ||||||||||||||||||||
Apple, Inc. | Morgan Stanley | 241,430 | 12,297,233 | 27,960,008 | 16,021,630 | ||||||||||||||||||||
CDW Corp. | Morgan Stanley | 2,873 | 287,358 | 343,410 | 58,470 | ||||||||||||||||||||
Cisco Systems, Inc. | Morgan Stanley | 95,068 | 4,067,801 | 3,744,728 | (266,962 | ) | |||||||||||||||||||
Corning, Inc. | Morgan Stanley | 19,844 | 640,651 | 643,144 | 6,840 | ||||||||||||||||||||
F5 Networks, Inc. | Morgan Stanley | 5,589 | 565,419 | 686,161 | 121,910 | ||||||||||||||||||||
FLIR Systems, Inc. | Morgan Stanley | 57,744 | 2,090,606 | 2,070,122 | (4,149 | ) | |||||||||||||||||||
HP, Inc. | Morgan Stanley | 107,345 | 1,742,591 | 2,038,482 | 328,635 | ||||||||||||||||||||
Juniper Networks, Inc. | Morgan Stanley | 49,494 | 1,032,698 | 1,064,121 | 49,841 | ||||||||||||||||||||
NetApp, Inc. | Morgan Stanley | 25,109 | 1,054,752 | �� | 1,100,779 | 48,134 | |||||||||||||||||||
Seagate Technology PLC (Ireland) | Morgan Stanley | 21,151 | 994,990 | 1,042,110 | 60,763 | ||||||||||||||||||||
TE Connectivity Ltd. (Switzerland) | Morgan Stanley | 14,647 | 862,128 | 1,431,598 | 585,959 | ||||||||||||||||||||
|
|
|
|
|
|
|
| ||||||||||||||||||
| 645,100 | 25,975,949 | 42,645,009 | 17,194,802 | ||||||||||||||||||||||
|
|
|
|
|
|
|
| ||||||||||||||||||
Telecommunication Services | |||||||||||||||||||||||||
AT&T, Inc. | Morgan Stanley | 4,939 | 145,113 | 140,811 | (1,440 | ) | |||||||||||||||||||
CenturyLink, Inc. | Morgan Stanley | 29,854 | 322,819 | 301,227 | (14,003 | ) | |||||||||||||||||||
T-Mobile US, Inc. | Morgan Stanley | 2,800 | 234,831 | 320,208 | 85,870 | ||||||||||||||||||||
Verizon Communications, Inc. | Morgan Stanley | 32,593 | 1,725,730 | 1,938,958 | 247,933 | ||||||||||||||||||||
|
|
|
|
|
|
|
| ||||||||||||||||||
| 70,186 | 2,428,493 | 2,701,204 | 318,360 | ||||||||||||||||||||||
|
|
|
|
|
|
|
| ||||||||||||||||||
Transportation | |||||||||||||||||||||||||
Alaska Air Group, Inc. | Morgan Stanley | 9,064 | 263,957 | 332,014 | 68,609 | ||||||||||||||||||||
CH Robinson Worldwide, Inc. | Morgan Stanley | 10,689 | 991,605 | 1,092,309 | 108,356 | ||||||||||||||||||||
CSX Corp. | Morgan Stanley | 17,585 | 936,113 | 1,365,827 | 440,763 | ||||||||||||||||||||
Expeditors International of Washington, Inc. | Morgan Stanley | 24,400 | 1,598,763 | 2,208,688 | 625,201 | ||||||||||||||||||||
JB Hunt Transport Services, Inc. | Morgan Stanley | 8,213 | 1,083,436 | 1,037,959 | (41,112 | ) | |||||||||||||||||||
Norfolk Southern Corp. | Morgan Stanley | 5,187 | 881,279 | 1,109,966 | 238,588 | ||||||||||||||||||||
Union Pacific Corp. | Morgan Stanley | 2,868 | 551,738 | 564,623 | 16,322 | ||||||||||||||||||||
|
|
|
|
|
|
|
| ||||||||||||||||||
| 78,006 | 6,306,891 | 7,711,386 | 1,456,727 | ||||||||||||||||||||||
|
|
|
|
|
|
|
| ||||||||||||||||||
Utilities | |||||||||||||||||||||||||
AES Corp. (The) | Morgan Stanley | 8,095 | 123,075 | 146,600 | 28,436 | ||||||||||||||||||||
CenterPoint Energy, Inc. | Morgan Stanley | 34,836 | 678,977 | 674,077 | (3,513 | ) | |||||||||||||||||||
Dominion Energy, Inc. | Morgan Stanley | 24,407 | 1,816,687 | 1,926,444 | 151,764 | ||||||||||||||||||||
Duke Energy Corp. | Morgan Stanley | 11,003 | 909,621 | 974,426 | 72,842 | ||||||||||||||||||||
The accompanying notes are an integral part of the financial statements.
28
GOTHAM INDEX PLUS FUND
Portfolio of Investments (Continued)
September 30, 2020
Total Return Swaps (continued)
Reference Entity | Counterparty | Number of Contracts Long/(Short) | Notional Amount | Value | Unrealized Appreciation/ (Depreciation)* | ||||||||||||||||||||
Utilities — (continued) | |||||||||||||||||||||||||
Evergy, Inc. | Morgan Stanley | 4,514 | $ | 246,332 | $ | 229,401 | $ | (12,582 | ) | ||||||||||||||||
NextEra Energy, Inc. | Morgan Stanley | 5 | 1,011 | 1,388 | 413 | ||||||||||||||||||||
NRG Energy, Inc. | Morgan Stanley | 125,729 | 3,789,008 | 3,864,909 | 150,453 | ||||||||||||||||||||
Public Service Enterprise Group, Inc. | Morgan Stanley | 5,751 | 229,494 | 315,787 | 92,412 | ||||||||||||||||||||
Southern Co. (The) | Morgan Stanley | 1,606 | 83,724 | 87,077 | 4,321 | ||||||||||||||||||||
|
|
|
|
|
|
|
| ||||||||||||||||||
| 215,946 | 7,877,929 | 8,220,109 | 484,546 | ||||||||||||||||||||||
|
|
|
|
|
|
|
| ||||||||||||||||||
Total Reference Entity — Long | 320,723,920 | 395,216,885 | 79,014,085 | ||||||||||||||||||||||
|
|
|
|
|
| ||||||||||||||||||||
Short | |||||||||||||||||||||||||
Automobiles & Components | |||||||||||||||||||||||||
Aptiv PLC (Jersey) | Morgan Stanley | (28,228 | ) | (2,306,737 | ) | (2,587,943 | ) | (297,939 | ) | ||||||||||||||||
Ford Motor Co. | Morgan Stanley | (215,321 | ) | (1,459,704 | ) | (1,434,038 | ) | 20,686 | |||||||||||||||||
|
|
|
|
|
|
|
| ||||||||||||||||||
| (243,549 | ) | (3,766,441 | ) | (4,021,981 | ) | (277,253 | ) | ||||||||||||||||||
|
|
|
|
|
|
|
| ||||||||||||||||||
Banks | |||||||||||||||||||||||||
Citizens Financial Group, Inc. | Morgan Stanley | (51,381 | ) | (2,022,235 | ) | (1,298,912 | ) | 661,178 | |||||||||||||||||
Comerica, Inc. | Morgan Stanley | (7,192 | ) | (475,317 | ) | (275,094 | ) | 265,230 | |||||||||||||||||
Huntington Bancshares, Inc. | Morgan Stanley | (178,080 | ) | (2,337,798 | ) | (1,632,994 | ) | 589,069 | |||||||||||||||||
KeyCorp. | Morgan Stanley | (55,222 | ) | (1,073,673 | ) | (658,798 | ) | 380,569 | |||||||||||||||||
M&T Bank Corp. | Morgan Stanley | (15,667 | ) | (2,665,080 | ) | (1,442,774 | ) | 1,161,495 | |||||||||||||||||
People’s United Financial, Inc. | Morgan Stanley | (183,198 | ) | (2,029,444 | ) | (1,888,771 | ) | 116,674 | |||||||||||||||||
Regions Financial Corp. | Morgan Stanley | (60,624 | ) | (948,472 | ) | (698,995 | ) | 205,840 | |||||||||||||||||
SVB Financial Group | Morgan Stanley | (5,575 | ) | (1,191,393 | ) | (1,341,457 | ) | (158,363 | ) | ||||||||||||||||
Zions Bancorp NA | Morgan Stanley | (22,767 | ) | (1,064,449 | ) | (665,252 | ) | 376,458 | |||||||||||||||||
|
|
|
|
|
|
|
| ||||||||||||||||||
| (579,706 | ) | (13,807,861 | ) | (9,903,047 | ) | 3,598,150 | |||||||||||||||||||
|
|
|
|
|
|
|
| ||||||||||||||||||
Capital Goods | |||||||||||||||||||||||||
A.O. Smith Corp. | Morgan Stanley | (48,511 | ) | (2,164,697 | ) | (2,561,381 | ) | (434,090 | ) | ||||||||||||||||
Allegion PLC (Ireland) | Morgan Stanley | (28,286 | ) | (2,833,667 | ) | (2,797,768 | ) | 17,380 | |||||||||||||||||
Boeing Co. (The) | Morgan Stanley | (16,551 | ) | (5,517,244 | ) | (2,735,218 | ) | 2,739,124 | |||||||||||||||||
Fastenal Co. | Morgan Stanley | (58,324 | ) | (2,343,947 | ) | (2,629,829 | ) | (316,228 | ) | ||||||||||||||||
General Electric Co. | Morgan Stanley | (500,335 | ) | (4,129,494 | ) | (3,117,087 | ) | 987,797 | |||||||||||||||||
Huntington Ingalls Industries, Inc. | Morgan Stanley | (4,302 | ) | (867,276 | ) | (605,507 | ) | 253,878 | |||||||||||||||||
IDEX Corp. | Morgan Stanley | (2,823 | ) | (502,660 | ) | (514,943 | ) | (15,270 | ) | ||||||||||||||||
Ingersoll Rand, Inc. | Morgan Stanley | (186,962 | ) | (5,471,804 | ) | (6,655,847 | ) | (1,208,762 | ) | ||||||||||||||||
Jacobs Engineering Group, Inc. | Morgan Stanley | (55,041 | ) | (5,116,726 | ) | (5,106,154 | ) | (24,807 | ) | ||||||||||||||||
L3Harris Technologies, Inc. | Morgan Stanley | (18,084 | ) | (3,318,565 | ) | (3,071,387 | ) | 219,901 | |||||||||||||||||
Parker-Hannifin Corp. | Morgan Stanley | (1,821 | ) | (336,541 | ) | (368,461 | ) | (35,217 | ) | ||||||||||||||||
Rockwell Automation, Inc. | Morgan Stanley | (7,171 | ) | (1,487,406 | ) | (1,582,496 | ) | (125,463 | ) | ||||||||||||||||
Teledyne Technologies, Inc. | Morgan Stanley | (194 | ) | (64,446 | ) | (60,181 | ) | 4,669 | |||||||||||||||||
Textron, Inc. | Morgan Stanley | (117,913 | ) | (5,677,077 | ) | (4,255,480 | ) | 1,394,515 | |||||||||||||||||
Westinghouse Air Brake Technologies Corp. | Morgan Stanley | (31,260 | ) | (2,006,546 | ) | (1,934,369 | ) | 61,672 | |||||||||||||||||
Xylem, Inc. | Morgan Stanley | (61,796 | ) | (4,510,412 | ) | (5,198,280 | ) | (728,077 | ) | ||||||||||||||||
|
|
|
|
|
|
|
| ||||||||||||||||||
| (1,139,374 | ) | (46,348,508 | ) | (43,194,388 | ) | 2,791,022 | |||||||||||||||||||
|
|
|
|
|
|
|
| ||||||||||||||||||
Commercial & Professional Services | |||||||||||||||||||||||||
Copart, Inc. | Morgan Stanley | (25,097 | ) | (2,580,133 | ) | (2,639,200 | ) | (67,887 | ) | ||||||||||||||||
The accompanying notes are an integral part of the financial statements.
29
GOTHAM INDEX PLUS FUND
Portfolio of Investments (Continued)
September 30, 2020
Total Return Swaps (continued)
Reference Entity | Counterparty | Number of Contracts Long/(Short) | Notional Amount | Value | Unrealized Appreciation/ (Depreciation)* | ||||||||||||||||||||
Commercial & Professional Services — (continued) |
| ||||||||||||||||||||||||
Equifax, Inc. | Morgan Stanley | (6,273 | ) | $ | (1,037,268 | ) | $ | (984,234 | ) | $ | 47,570 | ||||||||||||||
Nielsen Holdings PLC (United Kingdom). | Morgan Stanley | (71,562 | ) | (1,049,232 | ) | (1,014,749 | ) | 30,908 | |||||||||||||||||
Rollins, Inc. | Morgan Stanley | (43,331 | ) | (1,766,102 | ) | (2,348,107 | ) | (595,947 | ) | ||||||||||||||||
Verisk Analytics, Inc. | Morgan Stanley | (1,849 | ) | (334,997 | ) | (342,638 | ) | (9,322 | ) | ||||||||||||||||
|
|
|
|
|
|
|
| ||||||||||||||||||
| (148,112 | ) | (6,767,732 | ) | (7,328,928 | ) | (594,678 | ) | ||||||||||||||||||
|
|
|
|
|
|
|
| ||||||||||||||||||
Consumer Durables & Apparel | |||||||||||||||||||||||||
Hasbro, Inc. | Morgan Stanley | (11,026 | ) | (1,059,668 | ) | (912,071 | ) | 114,061 | |||||||||||||||||
NVR, Inc. | Morgan Stanley | (856 | ) | (3,286,193 | ) | (3,495,151 | ) | (220,195 | ) | ||||||||||||||||
Ralph Lauren Corp. | Morgan Stanley | (53,452 | ) | (3,632,266 | ) | (3,633,132 | ) | (13,290 | ) | ||||||||||||||||
Under Armour, Inc., Class C | Morgan Stanley | (398,297 | ) | (3,513,864 | ) | (3,919,242 | ) | (424,799 | ) | ||||||||||||||||
VF Corp. | Morgan Stanley | (34,452 | ) | (2,097,611 | ) | (2,420,253 | ) | (352,245 | ) | ||||||||||||||||
|
|
|
|
|
|
|
| ||||||||||||||||||
| (498,083 | ) | (13,589,602 | ) | (14,379,849 | ) | (896,468 | ) | ||||||||||||||||||
|
|
|
|
|
|
|
| ||||||||||||||||||
Consumer Services | |||||||||||||||||||||||||
Carnival Corp. (Panama) | Morgan Stanley | (28,282 | ) | (448,613 | ) | (429,321 | ) | 16,209 | |||||||||||||||||
Chipotle Mexican Grill, Inc. | Morgan Stanley | (364 | ) | (449,924 | ) | (452,710 | ) | (5,905 | ) | ||||||||||||||||
Darden Restaurants, Inc. | Morgan Stanley | (52,892 | ) | (6,325,891 | ) | (5,328,340 | ) | 962,767 | |||||||||||||||||
Domino’s Pizza, Inc. | Morgan Stanley | (5,514 | ) | (2,178,652 | ) | (2,344,994 | ) | (188,370 | ) | ||||||||||||||||
Las Vegas Sands Corp. | Morgan Stanley | (22,706 | ) | (1,323,307 | ) | (1,059,462 | ) | 232,099 | |||||||||||||||||
Marriott International, Inc., Class A | Morgan Stanley | (9,949 | ) | (950,331 | ) | (921,078 | ) | 26,017 | |||||||||||||||||
Norwegian Cruise Line Holdings Ltd. (Bermuda) | Morgan Stanley | (88,147 | ) | (3,143,578 | ) | (1,508,195 | ) | 1,624,633 | |||||||||||||||||
Royal Caribbean Cruises Ltd. (Liberia) | Morgan Stanley | (9,743 | ) | (1,108,295 | ) | (630,664 | ) | 466,696 | |||||||||||||||||
Starbucks Corp. | Morgan Stanley | (12,540 | ) | (978,243 | ) | (1,077,437 | ) | (113,983 | ) | ||||||||||||||||
Wynn Resorts Ltd. | Morgan Stanley | (19,755 | ) | (2,124,832 | ) | (1,418,607 | ) | 655,931 | |||||||||||||||||
|
|
|
|
|
|
|
| ||||||||||||||||||
| (249,892 | ) | (19,031,666 | ) | (15,170,808 | ) | 3,676,094 | |||||||||||||||||||
|
|
|
|
|
|
|
| ||||||||||||||||||
Diversified Financials | |||||||||||||||||||||||||
Ameriprise Financial, Inc. | Morgan Stanley | (14,993 | ) | (2,179,504 | ) | (2,310,571 | ) | (169,101 | ) | ||||||||||||||||
Bank of New York Mellon Corp. (The) | Morgan Stanley | (38,668 | ) | (1,652,975 | ) | (1,327,859 | ) | 303,946 | |||||||||||||||||
Capital One Financial Corp. | Morgan Stanley | (7,800 | ) | (548,797 | ) | (560,508 | ) | (15,771 | ) | ||||||||||||||||
Cboe Global Markets, Inc. | Morgan Stanley | (7,658 | ) | (959,884 | ) | (671,913 | ) | 275,972 | |||||||||||||||||
Charles Schwab Corp. (The) | Morgan Stanley | (27,489 | ) | (1,303,197 | ) | (995,926 | ) | 289,664 | |||||||||||||||||
CME Group, Inc. | Morgan Stanley | (4,104 | ) | (822,061 | ) | (686,640 | ) | 119,361 | |||||||||||||||||
MarketAxess Holdings, Inc. | Morgan Stanley | (4,987 | ) | (2,449,613 | ) | (2,401,689 | ) | (10,163 | ) | ||||||||||||||||
MSCI, Inc. | Morgan Stanley | (11,252 | ) | (4,056,893 | ) | (4,014,489 | ) | 21,718 | |||||||||||||||||
Northern Trust Corp. | Morgan Stanley | (43,253 | ) | (4,361,788 | ) | (3,372,436 | ) | 889,863 | |||||||||||||||||
Raymond James Financial, Inc. | Morgan Stanley | (14,505 | ) | (1,054,561 | ) | (1,055,384 | ) | (10,810 | ) | ||||||||||||||||
State Street Corp. | Morgan Stanley | (55,541 | ) | (4,238,765 | ) | (3,295,248 | ) | 850,958 | |||||||||||||||||
Synchrony Financial | Morgan Stanley | (49,548 | ) | (1,668,727 | ) | (1,296,671 | ) | 344,558 | |||||||||||||||||
|
|
|
|
|
|
|
| ||||||||||||||||||
| (279,798 | ) | (25,296,765 | ) | (21,989,334 | ) | 2,890,195 | |||||||||||||||||||
|
|
|
|
|
|
|
| ||||||||||||||||||
Energy | |||||||||||||||||||||||||
Cabot Oil & Gas Corp. | Morgan Stanley | (229,310 | ) | (4,416,687 | ) | (3,980,822 | ) | 376,412 | |||||||||||||||||
Devon Energy Corp. | Morgan Stanley | (222,478 | ) | (2,427,223 | ) | (2,104,642 | ) | 288,398 | |||||||||||||||||
Diamondback Energy, Inc. | Morgan Stanley | (88,383 | ) | (6,284,188 | ) | (2,662,096 | ) | 3,515,281 | |||||||||||||||||
Exxon Mobil Corp. | Morgan Stanley | (22,225 | ) | (824,008 | ) | (762,984 | ) | 58,221 | |||||||||||||||||
The accompanying notes are an integral part of the financial statements.
30
GOTHAM INDEX PLUS FUND
Portfolio of Investments (Continued)
September 30, 2020
Total Return Swaps (continued)
Reference Entity | Counterparty | Number of Contracts Long/(Short) | Notional Amount | Value | Unrealized Appreciation/ (Depreciation)* | ||||||||||||||||||||
Energy — (continued) | |||||||||||||||||||||||||
Hess Corp. | Morgan Stanley | (81,137 | ) | $ | (5,197,636 | ) | $ | (3,320,937 | ) | $ | 1,798,060 | ||||||||||||||
HollyFrontier Corp. | Morgan Stanley | (37,156 | ) | (771,695 | ) | (732,345 | ) | 36,727 | |||||||||||||||||
Marathon Oil Corp. | Morgan Stanley | (450,422 | ) | (4,856,095 | ) | (1,842,226 | ) | 2,978,773 | |||||||||||||||||
Noble Energy, Inc. | Morgan Stanley | (244,581 | ) | (4,925,558 | ) | (2,091,168 | ) | 2,836,934 | |||||||||||||||||
Occidental Petroleum Corp. | Morgan Stanley | (277,661 | ) | (9,769,985 | ) | (2,779,387 | ) | 6,713,580 | |||||||||||||||||
ONEOK, Inc. | Morgan Stanley | (165,725 | ) | (6,998,415 | ) | (4,305,536 | ) | 2,438,501 | |||||||||||||||||
Pioneer Natural Resources Co. | Morgan Stanley | (22,803 | ) | (3,033,396 | ) | (1,960,830 | ) | 1,029,040 | |||||||||||||||||
Schlumberger NV (Curacao) | Morgan Stanley | (55,434 | ) | (1,910,828 | ) | (862,553 | ) | 1,027,890 | |||||||||||||||||
|
|
|
|
|
|
|
| ||||||||||||||||||
| (1,897,315 | ) | (51,415,714 | ) | (27,405,526 | ) | 23,097,817 | |||||||||||||||||||
|
|
|
|
|
|
|
| ||||||||||||||||||
Food, Beverage & Tobacco | |||||||||||||||||||||||||
Brown-Forman Corp., Class B | Morgan Stanley | (36,646 | ) | (2,321,006 | ) | (2,760,177 | ) | (486,146 | ) | ||||||||||||||||
Conagra Brands, Inc. | Morgan Stanley | (27,271 | ) | (1,008,656 | ) | (973,847 | ) | 28,418 | |||||||||||||||||
Hershey Co. (The) | Morgan Stanley | (8,489 | ) | (1,237,581 | ) | (1,216,813 | ) | 11,041 | |||||||||||||||||
Hormel Foods Corp. | Morgan Stanley | (31,982 | ) | (1,546,562 | ) | (1,563,600 | ) | (35,723 | ) | ||||||||||||||||
Lamb Weston Holdings, Inc. | Morgan Stanley | (17,617 | ) | (1,677,495 | ) | (1,167,479 | ) | 496,186 | |||||||||||||||||
McCormick & Co., Inc., non-voting shares | Morgan Stanley | (3,611 | ) | (684,622 | ) | (700,895 | ) | (38,712 | ) | ||||||||||||||||
Monster Beverage Corp. | Morgan Stanley | (14,238 | ) | (1,017,331 | ) | (1,141,888 | ) | (141,615 | ) | ||||||||||||||||
|
|
|
|
|
|
|
| ||||||||||||||||||
| (139,854 | ) | (9,493,253 | ) | (9,524,699 | ) | (166,551 | ) | ||||||||||||||||||
|
|
|
|
|
|
|
| ||||||||||||||||||
Health Care Equipment & Services | |||||||||||||||||||||||||
ABIOMED, Inc. | Morgan Stanley | (12,161 | ) | (2,400,742 | ) | (3,369,327 | ) | (976,789 | ) | ||||||||||||||||
Align Technology, Inc. | Morgan Stanley | (5,487 | ) | (1,545,783 | ) | (1,796,224 | ) | (261,213 | ) | ||||||||||||||||
AmerisourceBergen Corp. | Morgan Stanley | (6,860 | ) | (690,573 | ) | (664,871 | ) | 20,635 | |||||||||||||||||
Baxter International, Inc. | Morgan Stanley | (14,106 | ) | (1,181,882 | ) | (1,134,404 | ) | 40,320 | |||||||||||||||||
Becton Dickinson and Co. | Morgan Stanley | (6,241 | ) | (1,580,211 | ) | (1,452,156 | ) | 116,763 | |||||||||||||||||
Boston Scientific Corp. | Morgan Stanley | (52,091 | ) | (2,038,516 | ) | (1,990,397 | ) | 41,155 | |||||||||||||||||
Centene Corp. | Morgan Stanley | (13,439 | ) | (863,721 | ) | (783,897 | ) | 79,263 | |||||||||||||||||
Cerner Corp. | Morgan Stanley | (4,272 | ) | (299,957 | ) | (308,823 | ) | (10,531 | ) | ||||||||||||||||
Cooper Cos., Inc. (The) | Morgan Stanley | (8,362 | ) | (2,638,925 | ) | (2,818,997 | ) | (189,371 | ) | ||||||||||||||||
DexCom, Inc. | Morgan Stanley | (6,496 | ) | (2,691,093 | ) | (2,677,846 | ) | 2,229 | |||||||||||||||||
Edwards Lifesciences Corp. | Morgan Stanley | (33,583 | ) | (2,600,910 | ) | (2,680,595 | ) | (88,575 | ) | ||||||||||||||||
IDEXX Laboratories, Inc. | Morgan Stanley | (3,749 | ) | (1,257,501 | ) | (1,473,769 | ) | (228,912 | ) | ||||||||||||||||
Laboratory Corp. of America Holdings | Morgan Stanley | (10,288 | ) | (1,950,940 | ) | (1,936,922 | ) | 6,700 | |||||||||||||||||
Teleflex, Inc. | Morgan Stanley | (6,383 | ) | (2,295,242 | ) | (2,172,901 | ) | 107,089 | |||||||||||||||||
|
|
|
|
|
|
|
| ||||||||||||||||||
| (183,518 | ) | (24,035,996 | ) | (25,261,129 | ) | (1,341,237 | ) | ||||||||||||||||||
|
|
|
|
|
|
|
| ||||||||||||||||||
Household & Personal Products | |||||||||||||||||||||||||
Church & Dwight Co., Inc. | Morgan Stanley | (12,004 | ) | (990,355 | ) | (1,124,895 | ) | (141,635 | ) | ||||||||||||||||
|
|
|
|
|
|
|
| ||||||||||||||||||
Insurance | |||||||||||||||||||||||||
Allstate Corp. (The) | Morgan Stanley | (4,741 | ) | (448,146 | ) | (446,318 | ) | (1,572 | ) | ||||||||||||||||
American International Group, Inc. | Morgan Stanley | (22,545 | ) | (1,115,777 | ) | (620,664 | ) | 469,668 | |||||||||||||||||
Chubb Ltd. (Switzerland) | Morgan Stanley | (6,637 | ) | (771,918 | ) | (770,688 | ) | 99 | |||||||||||||||||
Everest Re Group Ltd. (Bermuda) | Morgan Stanley | (1,223 | ) | (244,866 | ) | (241,591 | ) | 3,163 | |||||||||||||||||
Lincoln National Corp. | Morgan Stanley | (49,380 | ) | (2,996,888 | ) | (1,547,075 | ) | 1,400,062 | |||||||||||||||||
Principal Financial Group, Inc. | Morgan Stanley | (34,750 | ) | (1,728,117 | ) | (1,399,383 | ) | 284,816 | |||||||||||||||||
Progressive Corp. (The) | Morgan Stanley | (13,821 | ) | (1,167,885 | ) | (1,308,434 | ) | (162,232 | ) | ||||||||||||||||
The accompanying notes are an integral part of the financial statements.
31
GOTHAM INDEX PLUS FUND
Portfolio of Investments (Continued)
September 30, 2020
Total Return Swaps (continued)
Reference Entity | Counterparty | Number of Contracts Long/(Short) | Notional Amount | Value | Unrealized Appreciation/ (Depreciation)* | ||||||||||||||||||||
Insurance — (continued) | |||||||||||||||||||||||||
Unum Group | Morgan Stanley | (77,208 | ) | $ | (2,255,987 | ) | $ | (1,299,411 | ) | $ | 909,029 | ||||||||||||||
Willis Towers Watson PLC (Ireland) | Morgan Stanley | (9,738 | ) | (1,979,264 | ) | (2,033,489 | ) | (70,282 | ) | ||||||||||||||||
|
|
|
|
|
|
|
| ||||||||||||||||||
| (220,043 | ) | (12,708,848 | ) | (9,667,053 | ) | 2,832,751 | |||||||||||||||||||
|
|
|
|
|
|
|
| ||||||||||||||||||
Materials | |||||||||||||||||||||||||
Air Products & Chemicals, Inc. | Morgan Stanley | (6,425 | ) | (1,680,028 | ) | (1,913,751 | ) | (255,751 | ) | ||||||||||||||||
Albemarle Corp. | Morgan Stanley | (66,865 | ) | (5,863,676 | ) | (5,969,707 | ) | (197,590 | ) | ||||||||||||||||
Ball Corp. | Morgan Stanley | (9,903 | ) | (756,237 | ) | (823,137 | ) | (72,895 | ) | ||||||||||||||||
Corteva, Inc. | Morgan Stanley | (195,431 | ) | (5,202,228 | ) | (5,630,367 | ) | (473,096 | ) | ||||||||||||||||
Freeport-McMoRan, Inc. | Morgan Stanley | (36,306 | ) | (446,505 | ) | (567,826 | ) | (128,004 | ) | ||||||||||||||||
International Flavors & Fragrances, Inc. | Morgan Stanley | (36,182 | ) | (4,470,944 | ) | (4,430,486 | ) | (26,771 | ) | ||||||||||||||||
Packaging Corp. of America | Morgan Stanley | (17,732 | ) | (1,714,243 | ) | (1,933,675 | ) | (246,247 | ) | ||||||||||||||||
Sherwin-Williams Co. (The) | Morgan Stanley | (663 | ) | (405,876 | ) | (461,939 | ) | (64,287 | ) | ||||||||||||||||
Vulcan Materials Co. | Morgan Stanley | (11,961 | ) | (1,730,118 | ) | (1,621,194 | ) | 89,181 | |||||||||||||||||
Westrock Co. | Morgan Stanley | (40,917 | ) | (1,241,040 | ) | (1,421,457 | ) | (202,309 | ) | ||||||||||||||||
|
|
|
|
|
|
|
| ||||||||||||||||||
| (422,385 | ) | (23,510,895 | ) | (24,773,539 | ) | (1,577,769 | ) | ||||||||||||||||||
|
|
|
|
|
|
|
| ||||||||||||||||||
Media & Entertainment | |||||||||||||||||||||||||
DISH Network Corp., Class A | Morgan Stanley | (59,279 | ) | (2,451,237 | ) | (1,720,869 | ) | 721,991 | |||||||||||||||||
Live Nation Entertainment, Inc. | Morgan Stanley | (42,179 | ) | (3,011,119 | ) | (2,272,604 | ) | 727,120 | |||||||||||||||||
News Corp., Class A | Morgan Stanley | (42,905 | ) | (654,658 | ) | (601,528 | ) | 48,393 | |||||||||||||||||
ViacomCBS, Inc., Class B | Morgan Stanley | (56,820 | ) | (1,504,992 | ) | (1,591,528 | ) | (133,452 | ) | ||||||||||||||||
|
|
|
|
|
|
|
| ||||||||||||||||||
| (201,183 | ) | (7,622,006 | ) | (6,186,529 | ) | 1,364,052 | |||||||||||||||||||
|
|
|
|
|
|
|
| ||||||||||||||||||
Pharmaceuticals, Biotechnology & Life Sciences |
| ||||||||||||||||||||||||
Bio-Rad Laboratories, Inc., Class A | Morgan Stanley | (6,148 | ) | (2,947,955 | ) | (3,169,048 | ) | (231,172 | ) | ||||||||||||||||
Catalent, Inc. | Morgan Stanley | (26,676 | ) | (2,234,972 | ) | (2,285,066 | ) | (57,731 | ) | ||||||||||||||||
Eli Lilly & Co. | Morgan Stanley | (1,235 | ) | (200,892 | ) | (182,805 | ) | 14,861 | |||||||||||||||||
IQVIA Holdings, Inc. | Morgan Stanley | (5,767 | ) | (923,258 | ) | (909,052 | ) | 10,057 | |||||||||||||||||
Mettler-Toledo International, Inc. | Morgan Stanley | (2,117 | ) | (1,672,779 | ) | (2,044,493 | ) | (390,163 | ) | ||||||||||||||||
Mylan NV (Netherlands) | Morgan Stanley | (38,752 | ) | (644,812 | ) | (574,692 | ) | 72,153 | |||||||||||||||||
Perrigo Co. PLC (Ireland) | Morgan Stanley | (83,017 | ) | (4,926,216 | ) | (3,811,310 | ) | 1,042,887 | |||||||||||||||||
Vertex Pharmaceuticals, Inc. | Morgan Stanley | (10,562 | ) | (2,953,589 | ) | (2,874,131 | ) | 69,359 | |||||||||||||||||
Waters Corp. | Morgan Stanley | (1,755 | ) | (396,368 | ) | (343,418 | ) | 59,130 | |||||||||||||||||
Zoetis, Inc. | Morgan Stanley | (1,269 | ) | (204,743 | ) | (209,855 | ) | (11,976 | ) | ||||||||||||||||
|
|
|
|
|
|
|
| ||||||||||||||||||
| (177,298 | ) | (17,105,584 | ) | (16,403,870 | ) | 577,405 | |||||||||||||||||||
|
|
|
|
|
|
|
| ||||||||||||||||||
Real Estate | |||||||||||||||||||||||||
Digital Realty Trust, Inc., REIT | Morgan Stanley | (19,015 | ) | (2,797,596 | ) | (2,790,641 | ) | (36,344 | ) | ||||||||||||||||
Equinix, Inc., REIT | Morgan Stanley | (5,612 | ) | (3,789,417 | ) | (4,265,850 | ) | (511,406 | ) | ||||||||||||||||
Equity Residential, REIT | Morgan Stanley | (34,183 | ) | (2,010,322 | ) | (1,754,613 | ) | 217,770 | |||||||||||||||||
Essex Property Trust, Inc., REIT | Morgan Stanley | (7,982 | ) | (1,801,783 | ) | (1,602,706 | ) | 173,963 | |||||||||||||||||
Healthpeak Properties, Inc., REIT | Morgan Stanley | (78,805 | ) | (2,138,475 | ) | (2,139,556 | ) | (36,703 | ) | ||||||||||||||||
Host Hotels & Resorts, Inc., REIT | Morgan Stanley | (64,088 | ) | (801,518 | ) | (691,509 | ) | 101,609 | |||||||||||||||||
Iron Mountain, Inc., REIT | Morgan Stanley | (48,128 | ) | (1,614,571 | ) | (1,289,349 | ) | 230,409 | |||||||||||||||||
Kimco Realty Corp., REIT | Morgan Stanley | (79,917 | ) | (969,818 | ) | (899,865 | ) | 58,535 | |||||||||||||||||
Regency Centers Corp., REIT | Morgan Stanley | (59,390 | ) | (3,497,647 | ) | (2,258,008 | ) | 1,134,380 | |||||||||||||||||
SL Green Realty Corp., REIT | Morgan Stanley | (36,764 | ) | (2,245,362 | ) | (1,704,747 | ) | 485,176 | |||||||||||||||||
The accompanying notes are an integral part of the financial statements.
32
GOTHAM INDEX PLUS FUND
Portfolio of Investments (Continued)
September 30, 2020
Total Return Swaps (continued)
Reference Entity | Counterparty | Number of Contracts Long/(Short) | Notional Amount | Value | Unrealized Appreciation/ (Depreciation)* | ||||||||||||||||||||
Real Estate — (continued) | |||||||||||||||||||||||||
UDR, Inc., REIT | Morgan Stanley | �� | (53,611 | ) | $ | (1,870,163 | ) | $ | (1,748,255 | ) | $ | 115,521 | |||||||||||||
Ventas, Inc., REIT | Morgan Stanley | (12,634 | ) | (915,686 | ) | (530,123 | ) | 351,052 | |||||||||||||||||
Vornado Realty Trust, REIT | Morgan Stanley | (45,949 | ) | (2,258,711 | ) | (1,548,941 | ) | 650,546 | |||||||||||||||||
|
|
|
|
|
|
|
| ||||||||||||||||||
| (546,078 | ) | (26,711,069 | ) | (23,224,163 | ) | 2,934,508 | |||||||||||||||||||
|
|
|
|
|
|
|
| ||||||||||||||||||
Retailing | |||||||||||||||||||||||||
Advance Auto Parts, Inc. | Morgan Stanley | (195 | ) | (30,002 | ) | (29,933 | ) | (849 | ) | ||||||||||||||||
Dollar Tree, Inc. | Morgan Stanley | (17,687 | ) | (2,007,427 | ) | (1,615,531 | ) | 385,040 | |||||||||||||||||
Etsy, Inc. | Morgan Stanley | (30,876 | ) | (3,514,370 | ) | (3,755,448 | ) | (253,098 | ) | ||||||||||||||||
Expedia Group, Inc. | Morgan Stanley | (44,997 | ) | (5,073,282 | ) | (4,125,775 | ) | 896,983 | |||||||||||||||||
Ross Stores, Inc. | Morgan Stanley | (16,482 | ) | (1,510,981 | ) | (1,538,100 | ) | (32,276 | ) | ||||||||||||||||
Tiffany & Co. | Morgan Stanley | (24,577 | ) | (2,995,145 | ) | (2,847,245 | ) | 116,758 | |||||||||||||||||
TJX Cos., Inc. (The) | Morgan Stanley | (32,071 | ) | (1,749,674 | ) | (1,784,751 | ) | (41,051 | ) | ||||||||||||||||
Ulta Beauty, Inc. | Morgan Stanley | (12,013 | ) | (2,806,060 | ) | (2,690,672 | ) | 105,333 | |||||||||||||||||
|
|
|
|
|
|
|
| ||||||||||||||||||
| (178,898 | ) | (19,686,941 | ) | (18,387,455 | ) | 1,176,840 | |||||||||||||||||||
|
|
|
|
|
|
|
| ||||||||||||||||||
Semiconductors & Semiconductor Equipment |
| ||||||||||||||||||||||||
Advanced Micro Devices, Inc. | Morgan Stanley | (14,814 | ) | (1,206,239 | ) | (1,214,600 | ) | (27,928 | ) | ||||||||||||||||
Analog Devices, Inc. | Morgan Stanley | (10,756 | ) | (1,321,391 | ) | (1,255,655 | ) | 46,755 | |||||||||||||||||
Microchip Technology, Inc. | Morgan Stanley | (9,434 | ) | (984,708 | ) | (969,438 | ) | 7,134 | |||||||||||||||||
QUALCOMM, Inc. | Morgan Stanley | (5,863 | ) | (609,976 | ) | (689,958 | ) | (84,626 | ) | ||||||||||||||||
Teradyne, Inc. | Morgan Stanley | (25,534 | ) | (1,959,367 | ) | (2,028,932 | ) | (76,257 | ) | ||||||||||||||||
Xilinx, Inc. | Morgan Stanley | (29,994 | ) | (3,124,552 | ) | (3,126,575 | ) | (24,188 | ) | ||||||||||||||||
|
|
|
|
|
|
|
| ||||||||||||||||||
| (96,395 | ) | (9,206,233 | ) | (9,285,158 | ) | (159,110 | ) | ||||||||||||||||||
|
|
|
|
|
|
|
| ||||||||||||||||||
Software & Services | |||||||||||||||||||||||||
Akamai Technologies, Inc. | Morgan Stanley | (20,949 | ) | (2,166,467 | ) | (2,315,702 | ) | (156,638 | ) | ||||||||||||||||
DXC Technology Co. | Morgan Stanley | (118,184 | ) | (2,926,066 | ) | (2,109,584 | ) | 794,841 | |||||||||||||||||
Fidelity National Information Services, Inc. | Morgan Stanley | (23,473 | ) | (3,258,721 | ) | (3,455,460 | ) | (221,613 | ) | ||||||||||||||||
Fiserv, Inc. | Morgan Stanley | (21,788 | ) | (2,273,972 | ) | (2,245,253 | ) | 19,556 | |||||||||||||||||
Fortinet, Inc. | Morgan Stanley | (48,504 | ) | (6,293,624 | ) | (5,714,256 | ) | 557,632 | |||||||||||||||||
Global Payments, Inc. | Morgan Stanley | (21,894 | ) | (3,820,975 | ) | (3,887,936 | ) | (90,057 | ) | ||||||||||||||||
Jack Henry & Associates, Inc. | Morgan Stanley | (14,516 | ) | (2,555,747 | ) | (2,360,156 | ) | 177,002 | |||||||||||||||||
Leidos Holdings, Inc. | Morgan Stanley | (39,246 | ) | (3,567,474 | ) | (3,498,781 | ) | 43,155 | |||||||||||||||||
Paycom Software, Inc. | Morgan Stanley | (11,312 | ) | (3,478,471 | ) | (3,521,426 | ) | (62,086 | ) | ||||||||||||||||
Tyler Technologies, Inc. | Morgan Stanley | (12,777 | ) | (4,412,144 | ) | (4,453,551 | ) | (56,503 | ) | ||||||||||||||||
|
|
|
|
|
|
|
| ||||||||||||||||||
| (332,643 | ) | (34,753,661 | ) | (33,562,105 | ) | 1,005,289 | |||||||||||||||||||
|
|
|
|
|
|
|
| ||||||||||||||||||
Technology Hardware & Equipment | |||||||||||||||||||||||||
Arista Networks, Inc. | Morgan Stanley | (11,092 | ) | (2,582,020 | ) | (2,295,268 | ) | 277,927 | |||||||||||||||||
Hewlett Packard Enterprise Co. | Morgan Stanley | (227,278 | ) | (2,137,850 | ) | (2,129,595 | ) | (3,631 | ) | ||||||||||||||||
IPG Photonics Corp. | Morgan Stanley | (18,547 | ) | (2,366,229 | ) | (3,152,434 | ) | (798,525 | ) | ||||||||||||||||
Keysight Technologies, Inc. | Morgan Stanley | (32,938 | ) | (3,270,890 | ) | (3,253,616 | ) | 6,089 | |||||||||||||||||
Motorola Solutions, Inc. | Morgan Stanley | (19,817 | ) | (2,917,038 | ) | (3,107,504 | ) | (216,158 | ) | ||||||||||||||||
Western Digital Corp. | Morgan Stanley | (125,510 | ) | (8,055,354 | ) | (4,587,391 | ) | 3,353,310 | |||||||||||||||||
Xerox Holdings Corp. | Morgan Stanley | (46,560 | ) | (841,599 | ) | (873,931 | ) | (52,100 | ) | ||||||||||||||||
The accompanying notes are an integral part of the financial statements.
33
GOTHAM INDEX PLUS FUND
Portfolio of Investments (Concluded)
September 30, 2020
Total Return Swaps (concluded)
Reference Entity | Counterparty | Number of Contracts Long/(Short) | Notional Amount | Value | Unrealized Appreciation/ (Depreciation)* | ||||||||||||||||||||
Technology Hardware & Equipment — (continued) |
| ||||||||||||||||||||||||
Zebra Technologies Corp., Class A | Morgan Stanley | (4,439 | ) | $ | (1,231,324 | ) | $ | (1,120,670 | ) | $ | 107,226 | ||||||||||||||
|
|
|
|
|
|
|
| ||||||||||||||||||
| (486,181 | ) | (23,402,304 | ) | (20,520,409 | ) | 2,674,138 | |||||||||||||||||||
|
|
|
|
|
|
|
| ||||||||||||||||||
Transportation | |||||||||||||||||||||||||
American Airlines Group, Inc. | Morgan Stanley | (242,001 | ) | (4,081,427 | ) | (2,974,192 | ) | 1,093,273 | |||||||||||||||||
Delta Air Lines, Inc. | Morgan Stanley | (20,602 | ) | (603,107 | ) | (630,009 | ) | (37,166 | ) | ||||||||||||||||
FedEx Corp. | Morgan Stanley | (7,020 | ) | (1,203,818 | ) | (1,765,670 | ) | (575,534 | ) | ||||||||||||||||
Kansas City Southern | Morgan Stanley | (5,418 | ) | (1,008,081 | ) | (979,737 | ) | 22,554 | |||||||||||||||||
Old Dominion Freight Line, Inc. | Morgan Stanley | (5,043 | ) | (953,237 | ) | (912,380 | ) | 37,005 | |||||||||||||||||
Southwest Airlines Co. | Morgan Stanley | (29,512 | ) | (1,056,417 | ) | (1,106,700 | ) | (54,142 | ) | ||||||||||||||||
United Airlines Holdings, Inc. | Morgan Stanley | (15,313 | ) | (925,110 | ) | (532,127 | ) | 389,733 | |||||||||||||||||
United Parcel Service, Inc., Class B | Morgan Stanley | (2,133 | ) | (343,537 | ) | (355,422 | ) | (13,041 | ) | ||||||||||||||||
|
|
|
|
|
|
|
| ||||||||||||||||||
| (327,042 | ) | (10,174,734 | ) | (9,256,237 | ) | 862,682 | |||||||||||||||||||
|
|
|
|
|
|
|
| ||||||||||||||||||
Utilities | |||||||||||||||||||||||||
Alliant Energy Corp. | Morgan Stanley | (33,437 | ) | (1,757,076 | ) | (1,727,021 | ) | 3,759 | |||||||||||||||||
Ameren Corp. | Morgan Stanley | (33,591 | ) | (2,595,763 | ) | (2,656,376 | ) | (126,281 | ) | ||||||||||||||||
American Electric Power Co., Inc. | Morgan Stanley | (22,367 | ) | (1,971,654 | ) | (1,828,055 | ) | 80,168 | |||||||||||||||||
American Water Works Co., Inc. | Morgan Stanley | (5,779 | ) | (755,825 | ) | (837,261 | ) | (89,187 | ) | ||||||||||||||||
Atmos Energy Corp. | Morgan Stanley | (10,527 | ) | (1,112,365 | ) | (1,006,276 | ) | 83,099 | |||||||||||||||||
CMS Energy Corp. | Morgan Stanley | (29,836 | ) | (1,871,077 | ) | (1,832,229 | ) | 13,863 | |||||||||||||||||
Consolidated Edison, Inc. | Morgan Stanley | (26,639 | ) | (2,021,777 | ) | (2,072,514 | ) | (85,722 | ) | ||||||||||||||||
DTE Energy Co. | Morgan Stanley | (8,929 | ) | (1,173,751 | ) | (1,027,192 | ) | 102,059 | |||||||||||||||||
Edison International | Morgan Stanley | (48,334 | ) | (3,419,488 | ) | (2,457,301 | ) | 819,950 | |||||||||||||||||
Entergy Corp. | Morgan Stanley | (14,023 | ) | (1,455,091 | ) | (1,381,686 | ) | 27,351 | |||||||||||||||||
Eversource Energy | Morgan Stanley | (25,021 | ) | (2,087,773 | ) | (2,090,505 | ) | (41,119 | ) | ||||||||||||||||
Exelon Corp. | Morgan Stanley | (52,015 | ) | (2,509,500 | ) | (1,860,056 | ) | 584,632 | |||||||||||||||||
FirstEnergy Corp. | Morgan Stanley | (3,073 | ) | (140,418 | ) | (88,226 | ) | 49,334 | |||||||||||||||||
NiSource, Inc. | Morgan Stanley | (41,916 | ) | (1,248,574 | ) | (922,152 | ) | 305,249 | |||||||||||||||||
Pinnacle West Capital Corp. | Morgan Stanley | (24,406 | ) | (2,180,587 | ) | (1,819,467 | ) | 328,159 | |||||||||||||||||
PPL Corp. | Morgan Stanley | (20,334 | ) | (722,037 | ) | (553,288 | ) | 140,980 | |||||||||||||||||
Sempra Energy | Morgan Stanley | (7,815 | ) | (931,465 | ) | (924,983 | ) | (3,864 | ) | ||||||||||||||||
WEC Energy Group, Inc. | Morgan Stanley | (16,533 | ) | (1,470,252 | ) | (1,602,048 | ) | (170,418 | ) | ||||||||||||||||
Xcel Energy, Inc. | Morgan Stanley | (26,412 | ) | (1,662,490 | ) | (1,822,692 | ) | (212,149 | ) | ||||||||||||||||
|
|
|
|
|
|
|
| ||||||||||||||||||
| (450,987 | ) | (31,086,963 | ) | (28,509,328 | ) | 1,809,863 | |||||||||||||||||||
|
|
|
|
|
|
|
| ||||||||||||||||||
Total Reference Entity — Short | (430,513,131 | ) | (379,080,430 | ) | 46,136,105 | ||||||||||||||||||||
| �� |
|
|
|
|
|
| |||||||||||||||||||
Net Value of Reference Entity | $ | (109,789,211 | ) | $ | 16,136,455 | $ | 125,150,190 | ||||||||||||||||||
|
|
|
|
|
| ||||||||||||||||||||
| * | Includes $(775,476) related to open trades, dividends receivables/payables and swap receivables/payables activities. |
The accompanying notes are an integral part of the financial statements.
34
GOTHAM ENHANCED 500 PLUS FUND
Portfolio of Investments
September 30, 2020
| Number of Shares | Value | |||||||
LONG POSITIONS — 139.9% | ||||||||
COMMON STOCKS — 139.9% | ||||||||
Automobiles & Components — 0.6% |
| |||||||
Aptiv PLC (Jersey) | 90 | $ | 8,251 | |||||
BorgWarner, Inc.(a) | 126 | 4,882 | ||||||
General Motors Co. | 134 | 3,965 | ||||||
|
| |||||||
| 17,098 | ||||||||
|
| |||||||
Banks — 0.3% | ||||||||
Bank of America Corp. | 104 | 2,505 | ||||||
Citigroup, Inc. | 31 | 1,336 | ||||||
Citizens Financial Group, Inc. | 2 | 51 | ||||||
Fifth Third Bancorp | 103 | 2,196 | ||||||
US Bancorp† | 6 | 215 | ||||||
Wells Fargo & Co. | 50 | 1,176 | ||||||
|
| |||||||
| 7,479 | ||||||||
|
| |||||||
Capital Goods — 15.6% | ||||||||
3M Co.† | 351 | 56,223 | ||||||
AMETEK, Inc.† | 141 | 14,015 | ||||||
Carrier Global Corp. | 139 | 4,245 | ||||||
Caterpillar, Inc.† | 40 | 5,966 | ||||||
Cummins, Inc.† | 90 | 19,004 | ||||||
Deere & Co. | 20 | 4,433 | ||||||
Dover Corp.† | 48 | 5,200 | ||||||
Eaton Corp. PLC (Ireland)† | 107 | 10,917 | ||||||
Emerson Electric Co.† | 372 | 24,392 | ||||||
Flowserve Corp.(a) | 41 | 1,119 | ||||||
Fortive Corp.† | 71 | 5,411 | ||||||
Fortune Brands Home & Security, Inc. | 86 | 7,441 | ||||||
General Dynamics Corp.† | 32 | 4,430 | ||||||
Honeywell International, Inc.† | 448 | 73,745 | ||||||
Howmet Aerospace, Inc. | 309 | 5,167 | ||||||
Huntington Ingalls Industries, Inc. | 25 | 3,519 | ||||||
Illinois Tool Works, Inc.† | 126 | 24,344 | ||||||
Johnson Controls International PLC (Ireland)† | 523 | 21,365 | ||||||
Lockheed Martin Corp.† | 161 | 61,708 | ||||||
Masco Corp.† | 185 | 10,199 | ||||||
Northrop Grumman Corp. | 16 | 5,048 | ||||||
Otis Worldwide Corp. | 38 | 2,372 | ||||||
PACCAR, Inc. | 103 | 8,784 | ||||||
Parker-Hannifin Corp. | 1 | 202 | ||||||
Pentair PLC (Ireland) | 110 | 5,035 | ||||||
Quanta Services, Inc. | 97 | 5,127 | ||||||
Raytheon Technologies Corp.† | 131 | 7,538 | ||||||
Rockwell Automation, Inc. | 2 | 441 | ||||||
Roper Technologies, Inc. | 10 | 3,951 | ||||||
| Number of Shares | Value | |||||||
COMMON STOCKS — (Continued) |
| |||||||
Capital Goods — (Continued) |
| |||||||
Snap-on, Inc. | 38 | $ | 5,591 | |||||
Stanley Black & Decker, Inc.† | 8 | 1,298 | ||||||
Trane Technologies PLC (Ireland)† | 81 | 9,821 | ||||||
TransDigm Group, Inc.† | 37 | 17,579 | ||||||
United Rentals, Inc.(a) * | 45 | 7,853 | ||||||
Westinghouse Air Brake Technologies Corp.† | 3 | 186 | ||||||
WW Grainger, Inc. | 22 | 7,849 | ||||||
|
| |||||||
| 451,518 | ||||||||
|
| |||||||
Commercial & Professional Services — 0.6% |
| |||||||
Cintas Corp.† | 23 | 7,655 | ||||||
Republic Services, Inc. | 39 | 3,640 | ||||||
Robert Half International, Inc. | 72 | 3,812 | ||||||
Waste Management, Inc. | 6 | 679 | ||||||
|
| |||||||
| 15,786 | ||||||||
|
| |||||||
Consumer Durables & Apparel — 1.0% |
| |||||||
DR Horton, Inc. | 7 | 529 | ||||||
Garmin Ltd. (Switzerland) | 31 | 2,941 | ||||||
Hanesbrands, Inc.(a) | 34 | 535 | ||||||
Hasbro, Inc. | 22 | 1,820 | ||||||
Leggett & Platt, Inc.(a) | 4 | 165 | ||||||
Lennar Corp., Class A | 30 | 2,450 | ||||||
Mohawk Industries, Inc.* | 45 | 4,392 | ||||||
Newell Brands, Inc.(a) | 139 | 2,385 | ||||||
PulteGroup, Inc. | 65 | 3,009 | ||||||
PVH Corp. | 50 | 2,982 | ||||||
Whirlpool Corp. | 44 | 8,091 | ||||||
|
| |||||||
| 29,299 | ||||||||
|
| |||||||
Consumer Services — 1.2% | ||||||||
Darden Restaurants, Inc. | 85 | 8,563 | ||||||
McDonald’s Corp.† | 60 | 13,169 | ||||||
MGM Resorts International(a) | 350 | 7,613 | ||||||
Yum! Brands, Inc.† | 69 | 6,300 | ||||||
|
| |||||||
| 35,645 | ||||||||
|
| |||||||
Diversified Financials — 6.0% | ||||||||
American Express Co.† | 46 | 4,611 | ||||||
Berkshire Hathaway, Inc., Class B†* | 207 | 44,079 | ||||||
BlackRock, Inc.† | 94 | 52,974 | ||||||
Capital One Financial Corp. | 8 | 575 | ||||||
Cboe Global Markets, Inc. | 1 | 88 | ||||||
Discover Financial Services† | 165 | 9,534 | ||||||
Franklin Resources, Inc.† | 352 | 7,163 | ||||||
Goldman Sachs Group, Inc. (The) | 5 | 1,005 | ||||||
The accompanying notes are an integral part of the financial statements.
35
GOTHAM ENHANCED 500 PLUS FUND
Portfolio of Investments (Continued)
September 30, 2020
| Number of Shares | Value | |||||||
COMMON STOCKS — (Continued) |
| |||||||
Diversified Financials — (Continued) |
| |||||||
Intercontinental Exchange, Inc. | 7 | $ | 700 | |||||
Invesco Ltd. (Bermuda)(a) | 325 | 3,708 | ||||||
Moody’s Corp. | 2 | 580 | ||||||
Morgan Stanley | 20 | 967 | ||||||
Nasdaq, Inc. | 101 | 12,394 | ||||||
S&P Global, Inc.† | 37 | 13,342 | ||||||
Synchrony Financial | 142 | 3,716 | ||||||
T Rowe Price Group, Inc.† | 139 | 17,822 | ||||||
|
| |||||||
| 173,258 | ||||||||
|
| |||||||
Energy — 4.2% | ||||||||
Apache Corp. | 8 | 76 | ||||||
Baker Hughes Co. | 402 | 5,342 | ||||||
Chevron Corp.† | 579 | 41,688 | ||||||
ConocoPhillips† | 279 | 9,162 | ||||||
EOG Resources, Inc.† | 357 | 12,831 | ||||||
Halliburton Co.† | 547 | 6,591 | ||||||
Kinder Morgan, Inc.† | 1,608 | 19,827 | ||||||
Marathon Petroleum Corp.† | 36 | 1,056 | ||||||
National Oilwell Varco, Inc. | 241 | 2,183 | ||||||
Schlumberger NV (Curacao)† | 987 | 15,358 | ||||||
TechnipFMC PLC (United Kingdom) | 319 | 2,013 | ||||||
Williams Cos., Inc. (The) | 281 | 5,522 | ||||||
|
| |||||||
| 121,649 | ||||||||
|
| |||||||
Food & Staples Retailing — 4.8% |
| |||||||
Costco Wholesale Corp. | 5 | 1,775 | ||||||
Kroger Co. (The)† | 367 | 12,445 | ||||||
Sysco Corp.† | 360 | 22,399 | ||||||
Walgreens Boots Alliance, Inc.† | 490 | 17,601 | ||||||
Walmart, Inc.† | 595 | 83,246 | ||||||
|
| |||||||
| 137,466 | ||||||||
|
| |||||||
Food, Beverage & Tobacco — 7.3% |
| |||||||
Altria Group, Inc.† | 1,161 | 44,861 | ||||||
Archer-Daniels-Midland Co.† | 346 | 16,086 | ||||||
Campbell Soup Co.†(a) | 91 | 4,402 | ||||||
Coca-Cola Co. (The)† | 451 | 22,266 | ||||||
Conagra Brands, Inc. | 5 | 179 | ||||||
Constellation Brands, Inc., Class A† | 121 | 22,931 | ||||||
General Mills, Inc. | 180 | 11,102 | ||||||
Hershey Co. (The) | 2 | 287 | ||||||
Hormel Foods Corp. | 7 | 342 | ||||||
JM Smucker Co. (The) | 70 | 8,086 | ||||||
Kellogg Co. | 120 | 7,751 | ||||||
Kraft Heinz Co. (The)† | 760 | 22,762 | ||||||
| Number of Shares | Value | |||||||
COMMON STOCKS — (Continued) |
| |||||||
Food, Beverage & Tobacco — (Continued) |
| |||||||
Lamb Weston Holdings, Inc. | 30 | $ | 1,988 | |||||
McCormick & Co., Inc., non-voting shares | 3 | 582 | ||||||
Molson Coors Beverage Co., Class B | 86 | 2,886 | ||||||
Mondelez International, Inc., Class A† | 18 | 1,034 | ||||||
PepsiCo, Inc.† | 17 | 2,356 | ||||||
Philip Morris International, Inc.† | 384 | 28,796 | ||||||
Tyson Foods, Inc., Class A† | 227 | 13,502 | ||||||
|
| |||||||
| 212,199 | ||||||||
|
| |||||||
Health Care Equipment & Services — 5.8% |
| |||||||
AmerisourceBergen Corp. | 2 | 194 | ||||||
Anthem, Inc.† | 49 | 13,161 | ||||||
Cardinal Health, Inc. | 70 | 3,287 | ||||||
Centene Corp.* | 35 | 2,042 | ||||||
Cigna Corp. | 37 | 6,268 | ||||||
CVS Health Corp.† | 666 | 38,894 | ||||||
Danaher Corp.† | 69 | 14,858 | ||||||
DaVita, Inc.†* | 41 | 3,512 | ||||||
HCA Healthcare, Inc.† | 81 | 10,099 | ||||||
Henry Schein, Inc.* | 7 | 411 | ||||||
Hologic, Inc.* | 49 | 3,257 | ||||||
Humana, Inc.† | 82 | 33,939 | ||||||
Laboratory Corp. of America Holdings* | 25 | 4,707 | ||||||
McKesson Corp. | 28 | 4,170 | ||||||
Medtronic PLC (Ireland)† | 126 | 13,094 | ||||||
Quest Diagnostics, Inc.† | 19 | 2,175 | ||||||
UnitedHealth Group, Inc. | 25 | 7,794 | ||||||
Universal Health Services, Inc., Class B† | 58 | 6,207 | ||||||
|
| |||||||
| 168,069 | ||||||||
|
| |||||||
Household & Personal Products — 3.5% |
| |||||||
Church & Dwight Co., Inc. | 2 | 188 | ||||||
Clorox Co. (The) | 42 | 8,827 | ||||||
Colgate-Palmolive Co.† | 276 | 21,293 | ||||||
Kimberly-Clark Corp.† | 209 | 30,861 | ||||||
Procter & Gamble Co. (The)† | 291 | 40,446 | ||||||
|
| |||||||
| 101,615 | ||||||||
|
| |||||||
Insurance — 1.6% | ||||||||
Aflac, Inc.† | 47 | 1,708 | ||||||
Allstate Corp. (The)† | 4 | 377 | ||||||
American International Group, Inc.† | 218 | 6,001 | ||||||
The accompanying notes are an integral part of the financial statements.
36
GOTHAM ENHANCED 500 PLUS FUND
Portfolio of Investments (Continued)
September 30, 2020
| Number of Shares | Value | |||||||
COMMON STOCKS — (Continued) |
| |||||||
Insurance — (Continued) |
| |||||||
Aon PLC, Class A (Ireland) | 33 | $ | 6,808 | |||||
Arthur J Gallagher & Co. | 2 | 211 | ||||||
Assurant, Inc. | 3 | 364 | ||||||
Cincinnati Financial Corp.† | 43 | 3,353 | ||||||
Globe Life, Inc. | 8 | 639 | ||||||
Hartford Financial Services Group, Inc. (The)† | 16 | 590 | ||||||
Lincoln National Corp. | 4 | 125 | ||||||
Marsh & McLennan Cos., Inc. | 15 | 1,720 | ||||||
MetLife, Inc.† | 283 | 10,519 | ||||||
Principal Financial Group, Inc. | 65 | 2,617 | ||||||
Prudential Financial, Inc.† | 54 | 3,430 | ||||||
Travelers Cos., Inc. (The)† | 56 | 6,059 | ||||||
Unum Group | 2 | 34 | ||||||
Willis Towers Watson PLC (Ireland) | 2 | 418 | ||||||
WR Berkley Corp. | 24 | 1,468 | ||||||
|
| |||||||
| 46,441 | ||||||||
|
| |||||||
Materials — 6.0% | ||||||||
Amcor PLC (Jersey)† | 969 | 10,707 | ||||||
Avery Dennison Corp. | 3 | 384 | ||||||
Celanese Corp.† | 23 | 2,471 | ||||||
CF Industries Holdings, Inc. | 151 | 4,637 | ||||||
Dow, Inc. | 242 | 11,386 | ||||||
DuPont de Nemours, Inc.† | 487 | 27,019 | ||||||
Eastman Chemical Co. | 84 | 6,562 | ||||||
Ecolab, Inc.† | 178 | 35,572 | ||||||
FMC Corp.† | 28 | 2,965 | ||||||
International Paper Co. | 279 | 11,311 | ||||||
Linde PLC (Ireland)† | 49 | 11,668 | ||||||
LyondellBasell Industries NV, Class A (Netherlands)† | 203 | 14,309 | ||||||
Mosaic Co. (The) | 235 | 4,293 | ||||||
Nucor Corp. | 189 | 8,479 | ||||||
Packaging Corp. of America | 2 | 218 | ||||||
PPG Industries, Inc.† | 134 | 16,359 | ||||||
Sealed Air Corp. | 108 | 4,192 | ||||||
Westrock Co. | 55 | 1,911 | ||||||
|
| |||||||
| 174,443 | ||||||||
|
| |||||||
Media & Entertainment — 9.6% |
| |||||||
Activision Blizzard, Inc. | 75 | 6,071 | ||||||
Alphabet, Inc., Class A†* | 73 | 106,989 | ||||||
Charter Communications, Inc., Class A†* | 37 | 23,101 | ||||||
Comcast Corp., Class A | 65 | 3,007 | ||||||
| Number of Shares | Value | |||||||
COMMON STOCKS — (Continued) |
| |||||||
Media & Entertainment — (Continued) |
| |||||||
Discovery, Inc., Class A* | 169 | $ | 3,679 | |||||
DISH Network Corp., Class A* | 6 | 174 | ||||||
Electronic Arts, Inc.* | 28 | 3,652 | ||||||
Facebook, Inc., Class A†* | 329 | 86,165 | ||||||
Fox Corp., Class A(a) | 427 | 11,883 | ||||||
Interpublic Group of Cos., Inc. (The) | 125 | 2,084 | ||||||
Netflix, Inc.†* | 42 | 21,001 | ||||||
Omnicom Group, Inc.† | 69 | 3,416 | ||||||
Take-Two Interactive Software, Inc.* | 11 | 1,817 | ||||||
Twitter, Inc.* | 76 | 3,382 | ||||||
ViacomCBS, Inc., Class B(a) | 7 | 196 | ||||||
|
| |||||||
| 276,617 | ||||||||
|
| |||||||
Pharmaceuticals, Biotechnology & Life Sciences — 7.7% |
| |||||||
AbbVie, Inc. | 22 | 1,927 | ||||||
Alexion Pharmaceuticals, Inc.†* | 21 | 2,403 | ||||||
Amgen, Inc. | 5 | 1,271 | ||||||
Biogen, Inc.†* | 32 | 9,078 | ||||||
Bristol Myers Squibb Co.† | 40 | 2,412 | ||||||
Gilead Sciences, Inc. | 15 | 948 | ||||||
Illumina, Inc.* | 14 | 4,327 | ||||||
Incyte Corp.* | 21 | 1,884 | ||||||
Johnson & Johnson† | 385 | 57,319 | ||||||
Merck & Co., Inc.† | 839 | 69,595 | ||||||
Pfizer, Inc.† | 1,758 | 64,518 | ||||||
Regeneron Pharmaceuticals, Inc.†* | 13 | 7,277 | ||||||
|
| |||||||
| 222,959 | ||||||||
|
| |||||||
Real Estate — 2.0% | ||||||||
Alexandria Real Estate Equities, Inc., REIT† | 21 | 3,360 | ||||||
American Tower Corp., REIT | 43 | 10,394 | ||||||
Apartment Investment & Management Co., Class A, REIT | 19 | 641 | ||||||
AvalonBay Communities, Inc., REIT† | 23 | 3,435 | ||||||
Boston Properties, Inc., REIT | 1 | 80 | ||||||
Crown Castle International Corp., REIT | 40 | 6,660 | ||||||
Kimco Realty Corp., REIT | 23 | 259 | ||||||
Mid-America Apartment Communities, Inc., REIT† | 6 | 696 | ||||||
Public Storage, REIT† | 17 | 3,786 | ||||||
Realty Income Corp., REIT† | 53 | 3,220 | ||||||
SBA Communications Corp., REIT | 11 | 3,503 | ||||||
Simon Property Group, Inc., REIT† | 5 | 323 | ||||||
Ventas, Inc., REIT† | 123 | 5,161 | ||||||
The accompanying notes are an integral part of the financial statements.
37
GOTHAM ENHANCED 500 PLUS FUND
Portfolio of Investments (Continued)
September 30, 2020
| Number of Shares | Value | |||||||
COMMON STOCKS — (Continued) |
| |||||||
Real Estate — (Continued) |
| |||||||
Welltower, Inc., REIT† | 7 | $ | 386 | |||||
Weyerhaeuser Co., REIT† | 530 | 15,116 | ||||||
|
| |||||||
| 57,020 | ||||||||
|
| |||||||
Retailing — 19.9% | ||||||||
Advance Auto Parts, Inc. | 46 | 7,061 | ||||||
Amazon.com, Inc.†* | 58 | 182,626 | ||||||
AutoZone, Inc.†* | 15 | 17,665 | ||||||
Best Buy Co., Inc.† | 160 | 17,807 | ||||||
Booking Holdings, Inc.†* | 2 | 3,421 | ||||||
CarMax, Inc.(a) * | 53 | 4,871 | ||||||
Dollar General Corp.† | 167 | 35,007 | ||||||
Dollar Tree, Inc.* | 57 | 5,206 | ||||||
eBay, Inc.† | 499 | 25,998 | ||||||
Genuine Parts Co.† | 90 | 8,565 | ||||||
Home Depot, Inc. (The)† | 359 | 99,698 | ||||||
L Brands, Inc. | 172 | 5,471 | ||||||
LKQ Corp.* | 215 | 5,962 | ||||||
Lowe’s Cos., Inc.† | 501 | 83,096 | ||||||
O’Reilly Automotive, Inc.* | 38 | 17,521 | ||||||
Target Corp.† | 276 | 43,448 | ||||||
Tractor Supply Co. | 73 | 10,464 | ||||||
Ulta Beauty, Inc.†* | 12 | 2,688 | ||||||
|
| |||||||
| 576,575 | ||||||||
|
| |||||||
Semiconductors & Semiconductor Equipment — 1.2% |
| |||||||
Applied Materials, Inc.† | 87 | 5,172 | ||||||
Broadcom, Inc. | 4 | 1,457 | ||||||
Intel Corp.† | 268 | 13,877 | ||||||
KLA Corp. | 15 | 2,906 | ||||||
Lam Research Corp. | 15 | 4,976 | ||||||
Micron Technology, Inc.* | 108 | 5,072 | ||||||
Qorvo, Inc.* | 2 | 258 | ||||||
Skyworks Solutions, Inc. | 1 | 146 | ||||||
|
| |||||||
| 33,864 | ||||||||
|
| |||||||
Software & Services — 19.7% | ||||||||
Accenture PLC, Class A (Ireland)† | 141 | 31,865 | ||||||
Adobe, Inc.†* | 46 | 22,560 | ||||||
ANSYS, Inc.* | 8 | 2,618 | ||||||
Autodesk, Inc.* | 21 | 4,851 | ||||||
Automatic Data Processing, Inc.† | 5 | 697 | ||||||
Broadridge Financial Solutions, Inc. | 28 | 3,696 | ||||||
Cadence Design Systems, Inc.* | 27 | 2,879 | ||||||
Cognizant Technology Solutions Corp., Class A | 51 | 3,540 | ||||||
| Number of Shares | Value | |||||||
COMMON STOCKS — (Continued) |
| |||||||
Software & Services — (Continued) |
| |||||||
Gartner, Inc.* | 29 | $ | 3,624 | |||||
International Business Machines Corp.† | 390 | 47,451 | ||||||
Mastercard, Inc., Class A† | 97 | 32,802 | ||||||
Microsoft Corp.† | 873 | 183,618 | ||||||
NortonLifeLock, Inc.† | 174 | 3,626 | ||||||
Oracle Corp.† | 1,709 | 102,027 | ||||||
Paychex, Inc.† | 254 | 20,262 | ||||||
PayPal Holdings, Inc.†* | 125 | 24,629 | ||||||
salesforce.com, Inc.†* | 87 | 21,865 | ||||||
ServiceNow, Inc.* | 19 | 9,215 | ||||||
Synopsys, Inc.* | 15 | 3,210 | ||||||
Visa, Inc., Class A† | 205 | 40,994 | ||||||
Western Union Co. (The)† | 132 | 2,829 | ||||||
|
| |||||||
| 568,858 | ||||||||
|
| |||||||
Technology Hardware & Equipment — 12.2% |
| |||||||
Amphenol Corp., Class A | 5 | 541 | ||||||
Apple, Inc.† | 1,918 | 222,124 | ||||||
CDW Corp. | 2 | 239 | ||||||
Cisco Systems, Inc.† | 2,296 | 90,439 | ||||||
Corning, Inc. | 463 | 15,006 | ||||||
F5 Networks, Inc.* | 4 | 491 | ||||||
FLIR Systems, Inc. | 32 | 1,147 | ||||||
HP, Inc.† | 873 | 16,578 | ||||||
Juniper Networks, Inc. | 94 | 2,021 | ||||||
NetApp, Inc. | 47 | 2,061 | ||||||
Seagate Technology PLC (Ireland) | 23 | 1,133 | ||||||
TE Connectivity Ltd. (Switzerland) | 5 | 489 | ||||||
|
| |||||||
| 352,269 | ||||||||
|
| |||||||
Telecommunication Services — 6.3% |
| |||||||
AT&T, Inc.† | 3,147 | 89,721 | ||||||
CenturyLink, Inc.(a) | 13 | 131 | ||||||
Verizon Communications, Inc.† | 1,533 | 91,198 | ||||||
|
| |||||||
| 181,050 | ||||||||
|
| |||||||
Transportation — 2.6% | ||||||||
CH Robinson Worldwide, Inc.(a) | 83 | 8,482 | ||||||
CSX Corp. | 201 | 15,612 | ||||||
Expeditors International of Washington, Inc. | 103 | 9,323 | ||||||
JB Hunt Transport Services, Inc. | 66 | 8,341 | ||||||
Kansas City Southern† | 8 | 1,446 | ||||||
Norfolk Southern Corp.† | 131 | 28,033 | ||||||
Old Dominion Freight Line, Inc. | 3 | 543 | ||||||
The accompanying notes are an integral part of the financial statements.
38
GOTHAM ENHANCED 500 PLUS FUND
Portfolio of Investments (Continued)
September 30, 2020
| Number of Shares | Value | |||||||
COMMON STOCKS — (Continued) |
| |||||||
Transportation — (Continued) |
| |||||||
Union Pacific Corp. | 11 | $ | 2,165 | |||||
United Parcel Service, Inc., Class B | 9 | 1,500 | ||||||
|
| |||||||
| 75,445 | ||||||||
|
| |||||||
Utilities — 0.2% | ||||||||
AES Corp. | 64 | 1,159 | ||||||
Dominion Energy, Inc.† | 4 | 316 | ||||||
NRG Energy, Inc. | 173 | 5,318 | ||||||
PPL Corp. | 9 | 245 | ||||||
|
| |||||||
| 7,038 | ||||||||
|
| |||||||
TOTAL COMMON STOCKS | 4,043,660 | |||||||
|
| |||||||
TOTAL LONG POSITIONS - 139.9% |
| 4,043,660 | ||||||
|
| |||||||
(Cost $3,432,992) | ||||||||
SHORT POSITIONS — (41.7)% |
| |||||||
COMMON STOCKS — (41.7)% |
| |||||||
Automobiles & Components — (0.2)% |
| |||||||
Ford Motor Co. | (830 | ) | (5,528 | ) | ||||
|
| |||||||
Banks — (1.5)% | ||||||||
Comerica, Inc. | (31 | ) | (1,186 | ) | ||||
First Republic Bank | (38 | ) | (4,144 | ) | ||||
Huntington Bancshares, Inc. | (227 | ) | (2,082 | ) | ||||
JPMorgan Chase & Co. | (127 | ) | (12,226 | ) | ||||
KeyCorp. | (212 | ) | (2,529 | ) | ||||
M&T Bank Corp. | (28 | ) | (2,579 | ) | ||||
People’s United Financial, Inc. | (91 | ) | (938 | ) | ||||
PNC Financial Services Group, Inc. (The) | (11 | ) | (1,209 | ) | ||||
Regions Financial Corp. | (214 | ) | (2,467 | ) | ||||
SVB Financial Group* | (12 | ) | (2,888 | ) | ||||
Truist Financial Corp. | (288 | ) | (10,958 | ) | ||||
Zions Bancorp NA | (34 | ) | (994 | ) | ||||
|
| |||||||
| (44,200 | ) | |||||||
|
| |||||||
Capital Goods — (2.1)% | ||||||||
A.O. Smith Corp. | (3 | ) | (158 | ) | ||||
Allegion PLC (Ireland) | (19 | ) | (1,879 | ) | ||||
Boeing Co. (The) | (127 | ) | (20,988 | ) | ||||
Fastenal Co. | (115 | ) | (5,185 | ) | ||||
General Electric Co. | (1,911 | ) | (11,906 | ) | ||||
Ingersoll Rand, Inc.* | (92 | ) | (3,275 | ) | ||||
Jacobs Engineering Group, Inc. | (29 | ) | (2,690 | ) | ||||
L3Harris Technologies, Inc. | (47 | ) | (7,983 | ) | ||||
Textron, Inc. | (50 | ) | (1,805 | ) | ||||
| Number of Shares | Value | |||||||
COMMON STOCKS — (Continued) |
| |||||||
Capital Goods — (Continued) |
| |||||||
Xylem, Inc. | (40 | ) | $ | (3,365 | ) | |||
|
| |||||||
| (59,234 | ) | |||||||
|
| |||||||
Commercial & Professional Services — (0.8)% |
| |||||||
Copart, Inc.* | (54 | ) | (5,679 | ) | ||||
Equifax, Inc. | (27 | ) | (4,236 | ) | ||||
IHS Markit Ltd. (Bermuda) | (8 | ) | (628 | ) | ||||
Nielsen Holdings PLC | (77 | ) | (1,092 | ) | ||||
Rollins, Inc. | (82 | ) | (4,444 | ) | ||||
Verisk Analytics, Inc. | (36 | ) | (6,671 | ) | ||||
|
| |||||||
| (22,750 | ) | |||||||
|
| |||||||
Consumer Durables & Apparel — (1.1)% |
| |||||||
NIKE, Inc., Class B | (155 | ) | (19,459 | ) | ||||
NVR, Inc.* | (1 | ) | (4,083 | ) | ||||
Ralph Lauren Corp. | (16 | ) | (1,087 | ) | ||||
Tapestry, Inc. | (59 | ) | (922 | ) | ||||
Under Armour, Inc., Class C* | (99 | ) | (974 | ) | ||||
VF Corp. | (83 | ) | (5,831 | ) | ||||
|
| |||||||
| (32,356 | ) | |||||||
|
| |||||||
Consumer Services — (2.1)% | ||||||||
Carnival Corp. (Panama) | (161 | ) | (2,444 | ) | ||||
Chipotle Mexican Grill, Inc.* | (7 | ) | (8,706 | ) | ||||
Domino’s Pizza, Inc. | (9 | ) | (3,828 | ) | ||||
Hilton Worldwide Holdings, Inc. | (60 | ) | (5,119 | ) | ||||
Las Vegas Sands Corp. | (162 | ) | (7,559 | ) | ||||
Marriott International, Inc., Class A | (72 | ) | (6,666 | ) | ||||
Norwegian Cruise Line Holdings Ltd. (Bermuda)* | (56 | ) | (958 | ) | ||||
Royal Caribbean Cruises | (47 | ) | (3,042 | ) | ||||
Starbucks Corp. | (249 | ) | (21,394 | ) | ||||
Wynn Resorts Ltd. | (27 | ) | (1,939 | ) | ||||
|
| |||||||
| (61,655 | ) | |||||||
|
| |||||||
Diversified Financials — (1.6)% |
| |||||||
Ameriprise Financial, Inc. | (28 | ) | (4,315 | ) | ||||
Bank of New York Mellon | (16 | ) | (550 | ) | ||||
Charles Schwab Corp. (The) | (291 | ) | (10,543 | ) | ||||
CME Group, Inc. | (49 | ) | (8,198 | ) | ||||
E*TRADE Financial Corp. | (51 | ) | (2,553 | ) | ||||
MarketAxess Holdings, Inc. | (9 | ) | (4,334 | ) | ||||
MSCI, Inc. | (17 | ) | (6,065 | ) | ||||
Northern Trust Corp. | (46 | ) | (3,587 | ) | ||||
Raymond James Financial, Inc. | (30 | ) | (2,183 | ) | ||||
The accompanying notes are an integral part of the financial statements.
39
GOTHAM ENHANCED 500 PLUS FUND
Portfolio of Investments (Continued)
September 30, 2020
| Number of Shares | Value | |||||||
COMMON STOCKS — (Continued) |
| |||||||
Diversified Financials — (Continued) |
| |||||||
State Street Corp. | (77 | ) | $ | (4,568 | ) | |||
|
| |||||||
| (46,896 | ) | |||||||
|
| |||||||
Energy — (1.6)% | ||||||||
Cabot Oil & Gas Corp. | (89 | ) | (1,545 | ) | ||||
Concho Resources, Inc. | (42 | ) | (1,853 | ) | ||||
Devon Energy Corp. | (81 | ) | (766 | ) | ||||
Diamondback Energy, Inc. | (41 | ) | (1,235 | ) | ||||
Exxon Mobil Corp. | (524 | ) | (17,989 | ) | ||||
Hess Corp. | (76 | ) | (3,111 | ) | ||||
HollyFrontier Corp. | (35 | ) | (690 | ) | ||||
Marathon Oil Corp. | (198 | ) | (810 | ) | ||||
Noble Energy, Inc. | (121 | ) | (1,035 | ) | ||||
Occidental Petroleum Corp. | (222 | ) | (2,222 | ) | ||||
ONEOK, Inc. | (105 | ) | (2,728 | ) | ||||
Phillips 66 | (91 | ) | (4,717 | ) | ||||
Pioneer Natural Resources Co. | (44 | ) | (3,784 | ) | ||||
Valero Energy Corp. | (86 | ) | (3,725 | ) | ||||
|
| |||||||
| (46,210 | ) | |||||||
|
| |||||||
Food, Beverage & Tobacco — (0.4)% |
| |||||||
Brown-Forman Corp., Class B | (112 | ) | (8,436 | ) | ||||
Monster Beverage Corp.* | (27 | ) | (2,165 | ) | ||||
|
| |||||||
| (10,601 | ) | |||||||
|
| |||||||
Health Care Equipment & Services — (5.2)% |
| |||||||
Abbott Laboratories | (8 | ) | (871 | ) | ||||
ABIOMED, Inc.* | (11 | ) | (3,048 | ) | ||||
Align Technology, Inc.* | (19 | ) | (6,220 | ) | ||||
Baxter International, Inc. | (111 | ) | (8,927 | ) | ||||
Becton Dickinson and Co. | (62 | ) | (14,426 | ) | ||||
Boston Scientific Corp.* | (312 | ) | (11,921 | ) | ||||
Cerner Corp. | (67 | ) | (4,843 | ) | ||||
Cooper Cos., Inc. (The) | (13 | ) | (4,382 | ) | ||||
DENTSPLY SIRONA, Inc. | (46 | ) | (2,011 | ) | ||||
DexCom, Inc.* | (20 | ) | (8,245 | ) | ||||
Edwards Lifesciences Corp.* | (141 | ) | (11,255 | ) | ||||
IDEXX Laboratories, Inc.* | (22 | ) | (8,648 | ) | ||||
Intuitive Surgical, Inc.* | (29 | ) | (20,577 | ) | ||||
ResMed, Inc. | (32 | ) | (5,486 | ) | ||||
STERIS PLC (Ireland) | (19 | ) | (3,348 | ) | ||||
Stryker Corp. | (78 | ) | (16,253 | ) | ||||
Teleflex, Inc. | (12 | ) | (4,085 | ) | ||||
Varian Medical Systems, Inc.* | (21 | ) | (3,612 | ) | ||||
West Pharmaceutical | (17 | ) | (4,673 | ) | ||||
| Number of Shares | Value | |||||||
COMMON STOCKS — (Continued) |
| |||||||
Health Care Equipment & Services — (Continued) |
| |||||||
Zimmer Biomet Holdings, Inc. | (46 | ) | $ | (6,262 | ) | |||
|
| |||||||
| (149,093 | ) | |||||||
|
| |||||||
Household & Personal Products — (0.6)% |
| |||||||
Estee Lauder Cos., Inc. (The), Class A | (77 | ) | (16,805 | ) | ||||
|
| |||||||
Insurance — (0.8)% | ||||||||
Chubb Ltd. (Switzerland) | (62 | ) | (7,200 | ) | ||||
Everest Re Group Ltd. (Bermuda) | (8 | ) | (1,580 | ) | ||||
Loews Corp. | (60 | ) | (2,085 | ) | ||||
Progressive Corp. (The) | (127 | ) | (12,023 | ) | ||||
|
| |||||||
| (22,888 | ) | |||||||
|
| |||||||
Materials — (1.7)% | ||||||||
Air Products & Chemicals, Inc. | (49 | ) | (14,595 | ) | ||||
Albemarle Corp. | (26 | ) | (2,321 | ) | ||||
Ball Corp. | (73 | ) | (6,068 | ) | ||||
Corteva, Inc. | (159 | ) | (4,581 | ) | ||||
Freeport-McMoRan, Inc. | (364 | ) | (5,693 | ) | ||||
International Flavors & Fragrances, Inc. | (24 | ) | (2,939 | ) | ||||
Martin Marietta Materials, Inc. | (14 | ) | (3,295 | ) | ||||
Newmont Corp. | (95 | ) | (6,028 | ) | ||||
Vulcan Materials Co. | (29 | ) | (3,930 | ) | ||||
|
| |||||||
| (49,450 | ) | |||||||
|
| |||||||
Media & Entertainment — (1.0)% |
| |||||||
Live Nation Entertainment, Inc.* | (48 | ) | (2,586 | ) | ||||
News Corp., Class A | (125 | ) | (1,753 | ) | ||||
Walt Disney Co. (The) | (189 | ) | (23,451 | ) | ||||
|
| |||||||
| (27,790 | ) | |||||||
|
| |||||||
Pharmaceuticals, Biotechnology & Life Sciences — (3.0)% |
| |||||||
Agilent Technologies, Inc. | (23 | ) | (2,322 | ) | ||||
Bio-Rad Laboratories, Inc., Class A* | (6 | ) | (3,093 | ) | ||||
Catalent, Inc.* | (35 | ) | (2,998 | ) | ||||
Eli Lilly & Co. | (109 | ) | (16,134 | ) | ||||
IQVIA Holdings, Inc.* | (51 | ) | (8,039 | ) | ||||
Mettler-Toledo International, Inc.* | (4 | ) | (3,863 | ) | ||||
Mylan NV (Netherlands)* | (91 | ) | (1,350 | ) | ||||
PerkinElmer, Inc. | (24 | ) | (3,012 | ) | ||||
Perrigo Co. PLC (Ireland) | (34 | ) | (1,561 | ) | ||||
Thermo Fisher Scientific, Inc. | (37 | ) | (16,336 | ) | ||||
Vertex Pharmaceuticals, Inc.* | (57 | ) | (15,511 | ) | ||||
Waters Corp.* | (17 | ) | (3,326 | ) | ||||
Zoetis, Inc. | (54 | ) | (8,930 | ) | ||||
|
| |||||||
| (86,475 | ) | |||||||
|
| |||||||
The accompanying notes are an integral part of the financial statements.
40
GOTHAM ENHANCED 500 PLUS FUND
Portfolio of Investments (Continued)
September 30, 2020
| Number of Shares | Value | |||||||
COMMON STOCKS — (Continued) |
| |||||||
Real Estate — (2.2)% | ||||||||
CBRE Group, Inc., Class A* | (38 | ) | $ | (1,785 | ) | |||
Digital Realty Trust, Inc., REIT | (59 | ) | (8,659 | ) | ||||
Duke Realty Corp., REIT | (74 | ) | (2,731 | ) | ||||
Equinix, Inc., REIT | (22 | ) | (16,723 | ) | ||||
Equity Residential, REIT | (80 | ) | (4,106 | ) | ||||
Essex Property Trust, Inc., REIT | (15 | ) | (3,012 | ) | ||||
Extra Space Storage, Inc., REIT | (28 | ) | (2,996 | ) | ||||
Federal Realty Investment Trust, REIT | (17 | ) | (1,248 | ) | ||||
Healthpeak Properties, Inc., REIT | (116 | ) | (3,149 | ) | ||||
Host Hotels & Resorts, Inc., REIT | (161 | ) | (1,737 | ) | ||||
Iron Mountain, Inc., REIT | (64 | ) | (1,715 | ) | ||||
Prologis, Inc., REIT | (110 | ) | (11,068 | ) | ||||
Regency Centers Corp., REIT | (37 | ) | (1,407 | ) | ||||
SL Green Realty Corp., REIT | (16 | ) | (742 | ) | ||||
UDR, Inc., REIT | (64 | ) | (2,087 | ) | ||||
Vornado Realty Trust, REIT | (41 | ) | (1,382 | ) | ||||
|
| |||||||
| (64,547 | ) | |||||||
|
| |||||||
Retailing — (1.1)% | ||||||||
Etsy, Inc.* | (28 | ) | (3,406 | ) | ||||
Expedia Group, Inc. | (31 | ) | (2,842 | ) | ||||
Gap, Inc. (The) | (80 | ) | (1,362 | ) | ||||
Ross Stores, Inc. | (76 | ) | (7,092 | ) | ||||
Tiffany & Co. | (26 | ) | (3,012 | ) | ||||
TJX Cos., Inc. (The) | (261 | ) | (14,525 | ) | ||||
|
| |||||||
| (32,239 | ) | |||||||
|
| |||||||
Semiconductors & Semiconductor Equipment — (3.7)% |
| |||||||
Advanced Micro Devices, Inc.* | (271 | ) | (22,219 | ) | ||||
Analog Devices, Inc. | (84 | ) | (9,806 | ) | ||||
Maxim Integrated | (56 | ) | (3,786 | ) | ||||
Microchip Technology, Inc. | (67 | ) | (6,885 | ) | ||||
NVIDIA Corp. | (26 | ) | (14,072 | ) | ||||
QUALCOMM, Inc. | (240 | ) | (28,243 | ) | ||||
Teradyne, Inc. | (35 | ) | (2,781 | ) | ||||
Texas Instruments, Inc. | (94 | ) | (13,422 | ) | ||||
Xilinx, Inc. | (56 | ) | (5,838 | ) | ||||
|
| |||||||
| (107,052 | ) | |||||||
|
| |||||||
Software & Services — (3.0)% |
| |||||||
Akamai Technologies, Inc.* | (41 | ) | (4,532 | ) | ||||
DXC Technology Co. | (55 | ) | (982 | ) | ||||
Fidelity National Information Services, Inc. | (134 | ) | (19,726 | ) | ||||
Fiserv, Inc.* | (143 | ) | (14,736 | ) | ||||
| Number of Shares | Value | |||||||
COMMON STOCKS — (Continued) |
| |||||||
Software & Services — (Continued) |
| |||||||
FleetCor Technologies, Inc.* | (19 | ) | $ | (4,524 | ) | |||
Fortinet, Inc.* | (43 | ) | (5,066 | ) | ||||
Global Payments, Inc. | (66 | ) | (11,720 | ) | ||||
Intuit, Inc. | (23 | ) | (7,503 | ) | ||||
Jack Henry & Associates, Inc. | (17 | ) | (2,764 | ) | ||||
Leidos Holdings, Inc. | (31 | ) | (2,764 | ) | ||||
Paycom Software, Inc.* | (13 | ) | (4,047 | ) | ||||
Tyler Technologies, Inc.* | (9 | ) | (3,137 | ) | ||||
VeriSign, Inc.* | (30 | ) | (6,145 | ) | ||||
|
| |||||||
| (87,646 | ) | |||||||
|
| |||||||
Technology Hardware & Equipment — (0.8)% |
| |||||||
Arista Networks, Inc.* | (17 | ) | (3,518 | ) | ||||
Hewlett Packard Enterprise Co. | (271 | ) | (2,539 | ) | ||||
IPG Photonics Corp.* | (12 | ) | (2,040 | ) | ||||
Keysight Technologies, Inc.* | (43 | ) | (4,247 | ) | ||||
Motorola Solutions, Inc. | (37 | ) | (5,802 | ) | ||||
Western Digital Corp. | (74 | ) | (2,705 | ) | ||||
Xerox Holdings Corp. | (5 | ) | (94 | ) | ||||
Zebra Technologies Corp., Class A* | (12 | ) | (3,029 | ) | ||||
|
| |||||||
| (23,974 | ) | |||||||
|
| |||||||
Telecommunication Services — (0.9)% |
| |||||||
T-Mobile US, Inc.* | (229 | ) | (26,188 | ) | ||||
|
| |||||||
Transportation — (0.6)% | ||||||||
Alaska Air Group, Inc. | (27 | ) | (989 | ) | ||||
American Airlines Group, Inc. | (91 | ) | (1,118 | ) | ||||
Delta Air Lines, Inc. | (138 | ) | (4,220 | ) | ||||
FedEx Corp. | (17 | ) | (4,276 | ) | ||||
Southwest Airlines Co. | (126 | ) | (4,725 | ) | ||||
United Airlines Holdings, Inc.* | (61 | ) | (2,120 | ) | ||||
|
| |||||||
| (17,448 | ) | |||||||
|
| |||||||
Utilities — (5.7)% | ||||||||
Alliant Energy Corp. | (61 | ) | (3,151 | ) | ||||
Ameren Corp. | (62 | ) | (4,903 | ) | ||||
American Electric Power | (124 | ) | (10,134 | ) | ||||
American Water Works Co., Inc. | (41 | ) | (5,940 | ) | ||||
Atmos Energy Corp. | (30 | ) | (2,868 | ) | ||||
CenterPoint Energy, Inc. | (126 | ) | (2,438 | ) | ||||
CMS Energy Corp. | (70 | ) | (4,299 | ) | ||||
Consolidated Edison, Inc. | (82 | ) | (6,380 | ) | ||||
DTE Energy Co. | (46 | ) | (5,292 | ) | ||||
Duke Energy Corp. | (163 | ) | (14,435 | ) | ||||
Edison International | (90 | ) | (4,576 | ) | ||||
Entergy Corp. | (50 | ) | (4,926 | ) | ||||
The accompanying notes are an integral part of the financial statements.
41
GOTHAM ENHANCED 500 PLUS FUND
Portfolio of Investments (Concluded)
September 30, 2020
| Number of Shares | Value | |||||||
COMMON STOCKS — (Continued) |
| |||||||
Utilities — (Continued) |
| |||||||
Evergy, Inc. | (50 | ) | $ | (2,541 | ) | |||
Eversource Energy | (82 | ) | (6,851 | ) | ||||
Exelon Corp. | (219 | ) | (7,831 | ) | ||||
FirstEnergy Corp. | (136 | ) | (3,905 | ) | ||||
NextEra Energy, Inc. | (96 | ) | (26,646 | ) | ||||
NiSource, Inc. | (94 | ) | (2,068 | ) | ||||
Pinnacle West Capital Corp. | (26 | ) | (1,938 | ) | ||||
Public Service Enterprise Group, Inc. | (110 | ) | (6,040 | ) | ||||
Sempra Energy | (64 | ) | (7,575 | ) | ||||
Southern Co. (The) | (230 | ) | (12,471 | ) | ||||
WEC Energy Group, Inc. | (79 | ) | (7,655 | ) | ||||
Xcel Energy, Inc. | (133 | ) | (9,178 | ) | ||||
|
| |||||||
| (164,041 | ) | |||||||
|
| |||||||
TOTAL COMMON STOCKS |
| (1,205,066 | ) | |||||
|
| |||||||
TOTAL SECURITES SOLD SHORT - (41.7)% |
| (1,205,066 | ) | |||||
|
| |||||||
(Proceeds $1,163,065) |
| |||||||
OTHER ASSETS IN EXCESS OF |
| 52,266 | ||||||
|
| |||||||
NET ASSETS - 100.0% | $ | 2,890,860 | ||||||
|
| |||||||
| † | Security position is either entirely or partially held in a segregated account as collateral for securities sold short. (See Note 1 of the Notes to Financial Statements) |
| (a) | The security or a portion of this security is on loan at September 30, 2020. The total value of securities on loan at September 30, 2020 was $48,125, which was collateralized by $49,074 of collateral in the form of U.S. Government Treasury Securities, interest rates ranging from 0.00% - 8.00%, and maturity dates ranging from 10/8/2020 - 2/15/2050. (See Note 5 of the Notes to Financial Statements) |
| * | Non-income producing. |
PLC Public Limited Company
REIT Real Estate Investment Trust
The accompanying notes are an integral part of the financial statements.
42
GOTHAM ENHANCED S&P 500 INDEX FUND
Portfolio of Investments
September 30, 2020
| Number of Shares | Value | |||||||
COMMON STOCKS — 99.4% |
| |||||||
Automobiles & Components — 0.3% |
| |||||||
Aptiv PLC (Jersey) | 56 | $ | 5,134 | |||||
BorgWarner, Inc. | 174 | 6,741 | ||||||
Ford Motor Co. | 147 | 979 | ||||||
General Motors Co. | 297 | 8,788 | ||||||
|
| |||||||
| 21,642 | ||||||||
|
| |||||||
Banks — 0.4% | ||||||||
Bank of America Corp. | 231 | 5,565 | ||||||
Citigroup, Inc. | 55 | 2,371 | ||||||
Citizens Financial Group, Inc. | 11 | 278 | ||||||
Comerica, Inc. | 3 | 115 | ||||||
Fifth Third Bancorp | 27 | 576 | ||||||
First Republic Bank | 4 | 436 | ||||||
Huntington Bancshares, Inc. | 27 | 248 | ||||||
JPMorgan Chase & Co. | 81 | 7,798 | ||||||
KeyCorp. | 26 | 310 | ||||||
M&T Bank Corp. | 3 | 276 | ||||||
People’s United Financial, Inc. | 11 | 113 | ||||||
PNC Financial Services Group, Inc. (The) | 11 | 1,209 | ||||||
Regions Financial Corp. | 25 | 288 | ||||||
SVB Financial Group* | 2 | 481 | ||||||
Truist Financial Corp. | 36 | 1,370 | ||||||
US Bancorp | 40 | 1,434 | ||||||
Wells Fargo & Co. | 109 | 2,563 | ||||||
Zions Bancorp NA | 4 | 117 | ||||||
|
| |||||||
| 25,548 | ||||||||
|
| |||||||
Capital Goods — 8.9% | ||||||||
3M Co. | 488 | 78,168 | ||||||
A.O. Smith Corp. | 4 | 211 | ||||||
Allegion PLC (Ireland) | 3 | 297 | ||||||
AMETEK, Inc. | 194 | 19,284 | ||||||
Boeing Co. (The) | 16 | 2,644 | ||||||
Carrier Global Corp. | 218 | 6,658 | ||||||
Caterpillar, Inc. | 65 | 9,695 | ||||||
Cummins, Inc. | 106 | 22,383 | ||||||
Deere & Co. | 8 | 1,773 | ||||||
Dover Corp. | 7 | 758 | ||||||
Eaton Corp. PLC (Ireland) | 99 | 10,101 | ||||||
Emerson Electric Co. | 507 | 33,244 | ||||||
Fastenal Co. | 15 | 676 | ||||||
Flowserve Corp. | 3 | 82 | ||||||
Fortive Corp. | 87 | 6,630 | ||||||
Fortune Brands Home & | 117 | 10,123 | ||||||
General Dynamics Corp. | 8 | 1,107 | ||||||
| Number of Shares | Value | |||||||
COMMON STOCKS — (Continued) |
| |||||||
Capital Goods — (Continued) |
| |||||||
General Electric Co. | 233 | $ | 1,452 | |||||
Honeywell International, Inc. | 625 | 102,881 | ||||||
Howmet Aerospace, Inc. | 387 | 6,471 | ||||||
Huntington Ingalls Industries, Inc. | 34 | 4,785 | ||||||
IDEX Corp. | 2 | 365 | ||||||
Illinois Tool Works, Inc. | 111 | 21,446 | ||||||
Ingersoll Rand, Inc.* | 11 | 392 | ||||||
Jacobs Engineering Group, Inc. | 4 | 371 | ||||||
Johnson Controls International PLC (Ireland) | 662 | 27,043 | ||||||
L3Harris Technologies, Inc. | 5 | 849 | ||||||
Lockheed Martin Corp. | 222 | 85,088 | ||||||
Masco Corp. | 233 | 12,845 | ||||||
Northrop Grumman Corp. | 36 | 11,358 | ||||||
Otis Worldwide Corp. | 16 | 999 | ||||||
PACCAR, Inc. | 12 | 1,023 | ||||||
Parker-Hannifin Corp. | 3 | 607 | ||||||
Pentair PLC (Ireland) | 141 | 6,454 | ||||||
Quanta Services, Inc. | 122 | 6,449 | ||||||
Raytheon Technologies Corp. | 42 | 2,417 | ||||||
Rockwell Automation, Inc. | 3 | 662 | ||||||
Roper Technologies, Inc. | 23 | 9,088 | ||||||
Snap-on, Inc. | 48 | 7,062 | ||||||
Stanley Black & Decker, Inc. | 4 | 649 | ||||||
Teledyne Technologies, Inc.* | 1 | 310 | ||||||
Textron, Inc. | 6 | 217 | ||||||
Trane Technologies PLC (Ireland) | 63 | 7,639 | ||||||
TransDigm Group, Inc. | 48 | 22,806 | ||||||
United Rentals, Inc.* | 61 | 10,644 | ||||||
Westinghouse Air Brake Technologies Corp. | 7 | 433 | ||||||
WW Grainger, Inc. | 24 | 8,562 | ||||||
Xylem, Inc. | 4 | 336 | ||||||
|
| |||||||
| 565,537 | ||||||||
|
| |||||||
Commercial & Professional Services — 0.2% |
| |||||||
Cintas Corp. | 4 | 1,331 | ||||||
Copart, Inc.* | 7 | 736 | ||||||
Equifax, Inc. | 3 | 471 | ||||||
IHS Markit Ltd. (Bermuda) | 10 | 785 | ||||||
Nielsen Holdings PLC | 9 | 128 | ||||||
Republic Services, Inc. | 8 | 747 | ||||||
Robert Half International, Inc. | 97 | 5,135 | ||||||
Rollins, Inc. | 8 | 434 | ||||||
The accompanying notes are an integral part of the financial statements.
43
GOTHAM ENHANCED S&P 500 INDEX FUND
Portfolio of Investments (Continued)
September 30, 2020
| Number of Shares | Value | |||||||
COMMON STOCKS — (Continued) |
| |||||||
Commercial & Professional Services — (Continued) |
| |||||||
Verisk Analytics, Inc. | 4 | $ | 741 | |||||
Waste Management, Inc. | 11 | 1,245 | ||||||
|
| |||||||
| 11,753 | ||||||||
|
| |||||||
Consumer Durables & Apparel — 0.6% |
| |||||||
DR Horton, Inc. | 9 | 681 | ||||||
Garmin Ltd. (Switzerland) | 7 | 664 | ||||||
Hanesbrands, Inc. | 9 | 142 | ||||||
Hasbro, Inc. | 5 | 414 | ||||||
Leggett & Platt, Inc. | 3 | 124 | ||||||
Lennar Corp., Class A | 66 | 5,391 | ||||||
Mohawk Industries, Inc.* | 60 | 5,855 | ||||||
Newell Brands, Inc. | 15 | 257 | ||||||
NIKE, Inc., Class B | 41 | 5,147 | ||||||
NVR, Inc.* | 1 | 4,083 | ||||||
PulteGroup, Inc. | 7 | 324 | ||||||
PVH Corp. | 63 | 3,757 | ||||||
Ralph Lauren Corp. | 2 | 136 | ||||||
Tapestry, Inc. | 8 | 125 | ||||||
Under Armour, Inc., Class C* | 12 | 118 | ||||||
VF Corp. | 10 | 702 | ||||||
Whirlpool Corp. | 55 | 10,114 | ||||||
|
| |||||||
| 38,034 | ||||||||
|
| |||||||
Consumer Services — 0.6% |
| |||||||
Carnival Corp. (Panama) | 20 | 304 | ||||||
Chipotle Mexican Grill, Inc.* | 1 | 1,244 | ||||||
Darden Restaurants, Inc. | 114 | 11,484 | ||||||
Domino’s Pizza, Inc. | 1 | 425 | ||||||
Hilton Worldwide Holdings, Inc. | 11 | 939 | ||||||
Las Vegas Sands Corp. | 21 | 980 | ||||||
Marriott International, Inc., Class A | 8 | 741 | ||||||
McDonald’s Corp. | 30 | 6,585 | ||||||
MGM Resorts International | 439 | 9,548 | ||||||
Norwegian Cruise Line Holdings Ltd. (Bermuda)* | 7 | 120 | ||||||
Royal Caribbean Cruises | 6 | 388 | ||||||
Starbucks Corp. | 31 | 2,664 | ||||||
Wynn Resorts Ltd. | 3 | 215 | ||||||
Yum! Brands, Inc. | 8 | 730 | ||||||
|
| |||||||
| 36,367 | ||||||||
|
| |||||||
Diversified Financials — 3.8% |
| |||||||
American Express Co. | 21 | 2,105 | ||||||
Ameriprise Financial, Inc. | 3 | 462 | ||||||
| Number of Shares | Value | |||||||
COMMON STOCKS — (Continued) |
| |||||||
Diversified Financials — (Continued) |
| |||||||
Bank of New York Mellon Corp. (The) | 23 | $ | 790 | |||||
Berkshire Hathaway, Inc., Class B* | 378 | 80,491 | ||||||
BlackRock, Inc. | 130 | 73,261 | ||||||
Capital One Financial Corp. | 17 | 1,222 | ||||||
Cboe Global Markets, Inc. | 3 | 263 | ||||||
Charles Schwab Corp. (The) | 34 | 1,232 | ||||||
CME Group, Inc. | 9 | 1,506 | ||||||
Discover Financial Services | 172 | 9,938 | ||||||
E*TRADE Financial Corp. | 5 | 250 | ||||||
Franklin Resources, Inc. | 441 | 8,974 | ||||||
Goldman Sachs Group, Inc. (The) | 9 | 1,809 | ||||||
Intercontinental Exchange, Inc. | 14 | 1,401 | ||||||
Invesco Ltd. (Bermuda) | 405 | 4,621 | ||||||
MarketAxess Holdings, Inc. | 1 | 482 | ||||||
Moody’s Corp. | 5 | 1,449 | ||||||
Morgan Stanley | 42 | 2,031 | ||||||
MSCI, Inc. | 3 | 1,070 | ||||||
Nasdaq, Inc. | 140 | 17,179 | ||||||
Northern Trust Corp. | 5 | 390 | ||||||
Raymond James Financial, Inc. | 3 | 218 | ||||||
S&P Global, Inc. | 9 | 3,245 | ||||||
State Street Corp. | 9 | 534 | ||||||
Synchrony Financial | 22 | 576 | ||||||
T Rowe Price Group, Inc. | 192 | 24,618 | ||||||
|
| |||||||
| 240,117 | ||||||||
|
| |||||||
Energy — 2.3% | ||||||||
Apache Corp. | 10 | 95 | ||||||
Baker Hughes Co. | 557 | 7,403 | ||||||
Cabot Oil & Gas Corp. | 10 | 174 | ||||||
Chevron Corp. | 570 | 41,040 | ||||||
Concho Resources, Inc. | 5 | 221 | ||||||
ConocoPhillips | 33 | 1,084 | ||||||
Devon Energy Corp. | 10 | 95 | ||||||
Diamondback Energy, Inc. | 4 | 120 | ||||||
EOG Resources, Inc. | 494 | 17,754 | ||||||
Exxon Mobil Corp. | 519 | 17,817 | ||||||
Halliburton Co. | 745 | 8,977 | ||||||
Hess Corp. | 9 | 368 | ||||||
HollyFrontier Corp. | 4 | 79 | ||||||
Kinder Morgan, Inc. | 2,014 | 24,833 | ||||||
Marathon Oil Corp. | 21 | 86 | ||||||
Marathon Petroleum Corp. | 17 | 499 | ||||||
National Oilwell Varco, Inc. | 329 | 2,981 | ||||||
Noble Energy, Inc. | 13 | 111 | ||||||
The accompanying notes are an integral part of the financial statements.
44
GOTHAM ENHANCED S&P 500 INDEX FUND
Portfolio of Investments (Continued)
September 30, 2020
| Number of Shares | Value | |||||||
COMMON STOCKS — (Continued) |
| |||||||
Energy — (Continued) |
| |||||||
Occidental Petroleum Corp. | 25 | $ | 250 | |||||
ONEOK, Inc. | 11 | 286 | ||||||
Phillips 66 | 12 | 622 | ||||||
Pioneer Natural Resources Co. | 5 | 430 | ||||||
Schlumberger NV (Curacao) | 1,236 | 19,232 | ||||||
TechnipFMC PLC | 399 | 2,518 | ||||||
Valero Energy Corp. | 11 | 477 | ||||||
Williams Cos., Inc. (The) | 32 | 629 | ||||||
|
| |||||||
| 148,181 | ||||||||
|
| |||||||
Food & Staples Retailing — 3.1% |
| |||||||
Costco Wholesale Corp. | 11 | 3,905 | ||||||
Kroger Co. (The) | 358 | 12,140 | ||||||
Sysco Corp. | 451 | 28,061 | ||||||
Walgreens Boots Alliance, Inc. | 660 | 23,707 | ||||||
Walmart, Inc. | 927 | 129,697 | ||||||
|
| |||||||
| 197,510 | ||||||||
|
| |||||||
Food, Beverage & Tobacco — 4.3% |
| |||||||
Altria Group, Inc. | 1,578 | 60,974 | ||||||
Archer-Daniels-Midland Co. | 472 | 21,943 | ||||||
Brown-Forman Corp., Class B | 12 | 904 | ||||||
Campbell Soup Co. | 9 | 435 | ||||||
Coca-Cola Co. (The) | 642 | 31,696 | ||||||
Conagra Brands, Inc. | 13 | 464 | ||||||
Constellation Brands, Inc., Class A | 163 | 30,890 | ||||||
General Mills, Inc. | 113 | 6,970 | ||||||
Hershey Co. (The) | 5 | 717 | ||||||
Hormel Foods Corp. | 14 | 684 | ||||||
JM Smucker Co. (The) | 97 | 11,205 | ||||||
Kellogg Co. | 86 | 5,555 | ||||||
Kraft Heinz Co. (The) | 1,039 | 31,118 | ||||||
Lamb Weston Holdings, Inc. | 5 | 331 | ||||||
McCormick & Co., Inc., non-voting shares | 5 | 970 | ||||||
Molson Coors Beverage Co., Class B | 78 | 2,618 | ||||||
Mondelez International, Inc., Class A | 38 | 2,183 | ||||||
Monster Beverage Corp.* | 14 | 1,123 | ||||||
PepsiCo, Inc. | 37 | 5,128 | ||||||
Philip Morris International, Inc. | 500 | 37,495 | ||||||
Tyson Foods, Inc., Class A | 310 | 18,439 | ||||||
|
| |||||||
| 271,842 | ||||||||
|
| |||||||
Health Care Equipment & Services — 3.5% |
| |||||||
Abbott Laboratories | 378 | 41,138 | ||||||
ABIOMED, Inc.* | 2 | 554 | ||||||
| Number of Shares | Value | |||||||
COMMON STOCKS — (Continued) |
| |||||||
Health Care Equipment & Services — (Continued) |
| |||||||
Align Technology, Inc.* | 3 | $ | 982 | |||||
AmerisourceBergen Corp. | 5 | 485 | ||||||
Anthem, Inc. | 6 | 1,612 | ||||||
Baxter International, Inc. | 13 | 1,045 | ||||||
Becton Dickinson and Co. | 7 | 1,629 | ||||||
Boston Scientific Corp.* | 37 | 1,414 | ||||||
Cardinal Health, Inc. | 7 | 329 | ||||||
Centene Corp.* | 16 | 933 | ||||||
Cerner Corp. | 8 | 578 | ||||||
Cigna Corp. | 9 | 1,525 | ||||||
Cooper Cos., Inc. (The) | 1 | 337 | ||||||
CVS Health Corp. | 802 | 46,837 | ||||||
Danaher Corp. | 152 | 32,730 | ||||||
DaVita, Inc.* | 31 | 2,655 | ||||||
DENTSPLY SIRONA, Inc. | 8 | 350 | ||||||
DexCom, Inc.* | 2 | 824 | ||||||
Edwards Lifesciences Corp.* | 17 | 1,357 | ||||||
HCA Healthcare, Inc. | 13 | 1,621 | ||||||
Henry Schein, Inc.* | 3 | 176 | ||||||
Hologic, Inc.* | 6 | 399 | ||||||
Humana, Inc. | 113 | 46,770 | ||||||
IDEXX Laboratories, Inc.* | 2 | 786 | ||||||
Intuitive Surgical, Inc.* | 4 | 2,838 | ||||||
Laboratory Corp. of America Holdings* | 3 | 565 | ||||||
McKesson Corp. | 4 | 596 | ||||||
Medtronic PLC (Ireland) | 41 | 4,261 | ||||||
Quest Diagnostics, Inc. | 41 | 4,694 | ||||||
ResMed, Inc. | 3 | 514 | ||||||
STERIS PLC (Ireland) | 2 | 352 | ||||||
Stryker Corp. | 10 | 2,084 | ||||||
Teleflex, Inc. | 2 | 681 | ||||||
UnitedHealth Group, Inc. | 36 | 11,224 | ||||||
Universal Health Services, Inc., Class B | 72 | 7,705 | ||||||
Varian Medical Systems, Inc.* | 2 | 344 | ||||||
West Pharmaceutical Services, Inc. | 1 | 275 | ||||||
Zimmer Biomet Holdings, Inc. | 5 | 681 | ||||||
|
| |||||||
| 223,880 | ||||||||
|
| |||||||
Household & Personal Products — 2.0% |
| |||||||
Church & Dwight Co., Inc. | 6 | 562 | ||||||
Clorox Co. (The) | 29 | 6,095 | ||||||
Colgate-Palmolive Co. | 286 | 22,065 | ||||||
The accompanying notes are an integral part of the financial statements.
45
GOTHAM ENHANCED S&P 500 INDEX FUND
Portfolio of Investments (Continued)
September 30, 2020
| Number of Shares | Value | |||||||
COMMON STOCKS — (Continued) |
| |||||||
Household & Personal Products — (Continued) |
| |||||||
Estee Lauder Cos., Inc. (The), Class A | 9 | $ | 1,964 | |||||
Kimberly-Clark Corp. | 290 | 42,821 | ||||||
Procter & Gamble Co. (The) | 370 | 51,426 | ||||||
|
| |||||||
| 124,933 | ||||||||
|
| |||||||
Insurance — 0.4% | ||||||||
Aflac, Inc. | 19 | 691 | ||||||
Allstate Corp. (The) | 8 | 753 | ||||||
American International Group, Inc. | 28 | 771 | ||||||
Aon PLC, Class A (Ireland) | 6 | 1,238 | ||||||
Arthur J Gallagher & Co. | 5 | 528 | ||||||
Assurant, Inc. | 1 | 121 | ||||||
Chubb Ltd. (Switzerland) | 15 | 1,742 | ||||||
Cincinnati Financial Corp. | 4 | 312 | ||||||
Everest Re Group Ltd. (Bermuda) | 1 | 198 | ||||||
Globe Life, Inc. | 3 | 240 | ||||||
Hartford Financial Services Group, Inc. (The) | 9 | 332 | ||||||
Lincoln National Corp. | 5 | 157 | ||||||
Loews Corp. | 7 | 243 | ||||||
Marsh & McLennan Cos., Inc. | 13 | 1,491 | ||||||
MetLife, Inc. | 33 | 1,227 | ||||||
Principal Financial Group, Inc. | 7 | 282 | ||||||
Progressive Corp. (The) | 15 | 1,420 | ||||||
Prudential Financial, Inc. | 15 | 953 | ||||||
Travelers Cos., Inc. (The) | 107 | 11,576 | ||||||
Unum Group | 5 | 84 | ||||||
Willis Towers Watson PLC (Ireland) | 3 | 626 | ||||||
WR Berkley Corp. | 6 | 367 | ||||||
|
| |||||||
| 25,352 | ||||||||
|
| |||||||
Materials — 3.4% | ||||||||
Air Products & Chemicals, Inc. | 6 | 1,787 | ||||||
Albemarle Corp. | 3 | 268 | ||||||
Amcor PLC (Jersey) | 1,332 | 14,719 | ||||||
Avery Dennison Corp. | 3 | 384 | ||||||
Ball Corp. | 9 | 748 | ||||||
Celanese Corp. | 4 | 430 | ||||||
CF Industries Holdings, Inc. | 190 | 5,835 | ||||||
Corteva, Inc. | 20 | 576 | ||||||
Dow, Inc. | 174 | 8,187 | ||||||
DuPont de Nemours, Inc. | 653 | 36,228 | ||||||
Eastman Chemical Co. | 114 | 8,906 | ||||||
Ecolab, Inc. | 242 | 48,361 | ||||||
FMC Corp. | 5 | 530 | ||||||
| Number of Shares | Value | |||||||
COMMON STOCKS — (Continued) |
| |||||||
Materials — (Continued) |
| |||||||
Freeport-McMoRan, Inc. | 39 | $ | 610 | |||||
International Flavors & Fragrances, Inc. | 3 | 367 | ||||||
International Paper Co. | 349 | 14,148 | ||||||
Linde PLC (Ireland) | 35 | 8,335 | ||||||
LyondellBasell Industries NV, Class A (Netherlands) | 283 | 19,949 | ||||||
Martin Marietta Materials, Inc. | 1 | 235 | ||||||
Mosaic Co. (The) | 321 | 5,865 | ||||||
Newmont Corp. | 21 | 1,332 | ||||||
Nucor Corp. | 257 | 11,529 | ||||||
Packaging Corp. of America | 2 | 218 | ||||||
PPG Industries, Inc. | 152 | 18,556 | ||||||
Sealed Air Corp. | 133 | 5,162 | ||||||
Sherwin-Williams Co. (The) | 2 | 1,393 | ||||||
Vulcan Materials Co. | 4 | 542 | ||||||
Westrock Co. | 6 | 208 | ||||||
|
| |||||||
| 215,408 | ||||||||
|
| |||||||
Media & Entertainment — 8.9% |
| |||||||
Activision Blizzard, Inc. | 165 | 13,357 | ||||||
Alphabet, Inc., Class A* | 161 | 235,962 | ||||||
Charter Communications, Inc., Class A* | 44 | 27,471 | ||||||
Comcast Corp., Class A | 121 | 5,597 | ||||||
Discovery, Inc., Class A* | 18 | 392 | ||||||
DISH Network Corp., Class A* | 13 | 377 | ||||||
Electronic Arts, Inc.* | 62 | 8,085 | ||||||
Facebook, Inc., Class A* | 730 | 191,187 | ||||||
Fox Corp., Class A | 532 | 14,806 | ||||||
Interpublic Group of Cos., | 10 | 167 | ||||||
Live Nation Entertainment, Inc.* | 6 | 323 | ||||||
Netflix, Inc.* | 92 | 46,003 | ||||||
News Corp., Class A | 15 | 210 | ||||||
Omnicom Group, Inc. | 7 | 346 | ||||||
Take-Two Interactive | 25 | 4,130 | ||||||
Twitter, Inc.* | 167 | 7,431 | ||||||
ViacomCBS, Inc., Class B | 16 | 448 | ||||||
Walt Disney Co. (The) | 48 | 5,956 | ||||||
|
| |||||||
| 562,248 | ||||||||
|
| |||||||
Pharmaceuticals, Biotechnology & Life Sciences — 6.3% |
| |||||||
AbbVie, Inc. | 50 | 4,379 | ||||||
Agilent Technologies, Inc. | 8 | 808 | ||||||
Alexion Pharmaceuticals, Inc.* | 46 | 5,264 | ||||||
Amgen, Inc. | 15 | 3,812 | ||||||
The accompanying notes are an integral part of the financial statements.
46
GOTHAM ENHANCED S&P 500 INDEX FUND
Portfolio of Investments (Continued)
September 30, 2020
| Number of Shares | Value | |||||||
COMMON STOCKS — (Continued) |
| |||||||
Pharmaceuticals, Biotechnology & Life Sciences — (Continued) |
| |||||||
Biogen, Inc.* | 4 | $ | 1,135 | |||||
Bio-Rad Laboratories, Inc., Class A* | 2 | 1,031 | ||||||
Bristol Myers Squibb Co. | 70 | 4,220 | ||||||
Catalent, Inc.* | 3 | 257 | ||||||
Eli Lilly & Co. | 26 | 3,849 | ||||||
Gilead Sciences, Inc. | 35 | 2,212 | ||||||
Illumina, Inc.* | 32 | 9,891 | ||||||
Incyte Corp.* | 46 | 4,128 | ||||||
IQVIA Holdings, Inc.* | 5 | 788 | ||||||
Johnson & Johnson | 660 | 98,261 | ||||||
Merck & Co., Inc. | 1,836 | 152,296 | ||||||
Mettler-Toledo International, Inc.* | 2 | 1,931 | ||||||
Mylan NV (Netherlands)* | 13 | 193 | ||||||
PerkinElmer, Inc. | 3 | 377 | ||||||
Perrigo Co. PLC (Ireland) | 4 | 184 | ||||||
Pfizer, Inc. | 2,311 | 84,814 | ||||||
Regeneron Pharmaceuticals, Inc.* | 24 | 13,435 | ||||||
Thermo Fisher Scientific, Inc. | 11 | 4,857 | ||||||
Vertex Pharmaceuticals, Inc.* | 7 | 1,905 | ||||||
Waters Corp.* | 1 | 196 | ||||||
Zoetis, Inc. | 12 | 1,984 | ||||||
|
| |||||||
| 402,207 | ||||||||
|
| |||||||
Real Estate — 1.4% |
| |||||||
Alexandria Real Estate Equities, Inc., REIT | 4 | 640 | ||||||
American Tower Corp., REIT | 94 | 22,723 | ||||||
Apartment Investment & Management Co., Class A, REIT | 22 | 742 | ||||||
AvalonBay Communities, Inc., REIT | 23 | 3,435 | ||||||
Boston Properties, Inc., REIT | 4 | 321 | ||||||
CBRE Group, Inc., Class A* | 9 | 423 | ||||||
Crown Castle International Corp., REIT | 88 | 14,652 | ||||||
Digital Realty Trust, Inc., REIT | 7 | 1,027 | ||||||
Duke Realty Corp., REIT | 9 | 332 | ||||||
Equinix, Inc., REIT | 3 | 2,280 | ||||||
Equity Residential, REIT | 9 | 462 | ||||||
Essex Property Trust, | 2 | 402 | ||||||
Extra Space Storage, Inc., REIT | 3 | 321 | ||||||
Federal Realty Investment | 2 | 147 | ||||||
Healthpeak Properties, | 14 | 380 | ||||||
Host Hotels & Resorts, | 18 | 194 | ||||||
| Number of Shares | Value | |||||||
COMMON STOCKS — (Continued) |
| |||||||
Real Estate — (Continued) |
| |||||||
Iron Mountain, Inc., REIT | 7 | $ | 188 | |||||
Kimco Realty Corp., REIT | 16 | 180 | ||||||
Mid-America Apartment Communities, Inc., REIT | 3 | 348 | ||||||
Prologis, Inc., REIT | 19 | 1,912 | ||||||
Public Storage, REIT | 30 | 6,682 | ||||||
Realty Income Corp., REIT | 12 | 729 | ||||||
Regency Centers Corp., REIT | 4 | 152 | ||||||
SBA Communications | 23 | 7,325 | ||||||
Simon Property Group, Inc., REIT | 8 | 517 | ||||||
SL Green Realty Corp., REIT | 2 | 93 | ||||||
UDR, Inc., REIT | 7 | 228 | ||||||
Ventas, Inc., REIT | 14 | 587 | ||||||
Vornado Realty Trust, REIT | 5 | 169 | ||||||
Welltower, Inc., REIT | 16 | 881 | ||||||
Weyerhaeuser Co., REIT | 664 | 18,937 | ||||||
|
| |||||||
| 87,409 | ||||||||
|
| |||||||
Retailing — 14.7% |
| |||||||
Advance Auto Parts, Inc. | 61 | 9,363 | ||||||
Amazon.com, Inc.* | 129 | 406,186 | ||||||
AutoZone, Inc.* | 20 | 23,553 | ||||||
Best Buy Co., Inc. | 219 | 24,372 | ||||||
Booking Holdings, Inc.* | 2 | 3,421 | ||||||
CarMax, Inc.* | 6 | 551 | ||||||
Dollar General Corp. | 211 | 44,230 | ||||||
Dollar Tree, Inc.* | 6 | 548 | ||||||
eBay, Inc. | 624 | 32,510 | ||||||
Etsy, Inc.* | 2 | 243 | ||||||
Expedia Group, Inc. | 4 | 367 | ||||||
Gap, Inc. (The) | 10 | 170 | ||||||
Genuine Parts Co. | 123 | 11,706 | ||||||
Home Depot, Inc. (The) | 551 | 153,018 | ||||||
L Brands, Inc. | 222 | 7,062 | ||||||
LKQ Corp.* | 270 | 7,487 | ||||||
Lowe’s Cos., Inc. | 668 | 110,794 | ||||||
O’Reilly Automotive, Inc.* | 49 | 22,593 | ||||||
Ross Stores, Inc. | 10 | 933 | ||||||
Target Corp. | 376 | 59,190 | ||||||
Tiffany & Co. | 3 | 348 | ||||||
TJX Cos., Inc. (The) | 33 | 1,836 | ||||||
Tractor Supply Co. | 99 | 14,191 | ||||||
Ulta Beauty, Inc.* | 2 | 448 | ||||||
|
| |||||||
| 935,120 | ||||||||
|
| |||||||
The accompanying notes are an integral part of the financial statements.
47
GOTHAM ENHANCED S&P 500 INDEX FUND
Portfolio of Investments (Continued)
September 30, 2020
| Number of Shares | Value | |||||||
COMMON STOCKS — (Continued) |
| |||||||
Semiconductors & Semiconductor Equipment — 1.2% |
| |||||||
Advanced Micro Devices, Inc.* | 33 | $ | 2,706 | |||||
Analog Devices, Inc. | 9 | 1,051 | ||||||
Applied Materials, Inc. | 193 | 11,474 | ||||||
Broadcom, Inc. | 10 | 3,643 | ||||||
Intel Corp. | 199 | 10,304 | ||||||
KLA Corp. | 32 | 6,200 | ||||||
Lam Research Corp. | 32 | 10,616 | ||||||
Maxim Integrated Products, Inc. | 7 | 473 | ||||||
Microchip Technology, Inc. | 8 | 822 | ||||||
Micron Technology, Inc.* | 238 | 11,176 | ||||||
NVIDIA Corp. | 16 | 8,660 | ||||||
Qorvo, Inc.* | 3 | 387 | ||||||
QUALCOMM, Inc. | 31 | 3,648 | ||||||
Skyworks Solutions, Inc. | 4 | 582 | ||||||
Teradyne, Inc. | 3 | 238 | ||||||
Texas Instruments, Inc. | 25 | 3,570 | ||||||
Xilinx, Inc. | 6 | 625 | ||||||
|
| |||||||
| 76,175 | ||||||||
|
| |||||||
Software & Services — 17.1% |
| |||||||
Accenture PLC, Class A (Ireland) | 183 | 41,356 | ||||||
Adobe, Inc.* | 101 | 49,533 | ||||||
Akamai Technologies, Inc.* | 4 | 442 | ||||||
ANSYS, Inc.* | 18 | 5,890 | ||||||
Autodesk, Inc.* | 46 | 10,626 | ||||||
Automatic Data Processing, Inc. | 11 | 1,534 | ||||||
Broadridge Financial | 7 | 924 | ||||||
Cadence Design Systems, Inc.* | 59 | 6,291 | ||||||
Citrix Systems, Inc. | 3 | 413 | ||||||
Cognizant Technology Solutions Corp., Class A | 115 | 7,983 | ||||||
DXC Technology Co. | 6 | 107 | ||||||
Fidelity National Information Services, Inc. | 17 | 2,503 | ||||||
Fiserv, Inc.* | 18 | 1,855 | ||||||
FleetCor Technologies, Inc.* | 2 | 476 | ||||||
Fortinet, Inc.* | 5 | 589 | ||||||
Gartner, Inc.* | 21 | 2,624 | ||||||
Global Payments, Inc. | 8 | 1,421 | ||||||
International Business | 507 | 61,687 | ||||||
Intuit, Inc. | 7 | 2,283 | ||||||
Jack Henry & Associates, Inc. | 2 | 325 | ||||||
Leidos Holdings, Inc. | 3 | 267 | ||||||
Mastercard, Inc., Class A | 215 | 72,707 | ||||||
| Number of Shares | Value | |||||||
COMMON STOCKS — (Continued) |
| |||||||
Software & Services — (Continued) |
| |||||||
Microsoft Corp. | 1,938 | $ | 407,620 | |||||
NortonLifeLock, Inc. | 19 | 396 | ||||||
Oracle Corp. | 2,597 | 155,041 | ||||||
Paychex, Inc. | 319 | 25,447 | ||||||
Paycom Software, Inc.* | 1 | 311 | ||||||
PayPal Holdings, Inc.* | 276 | 54,380 | ||||||
salesforce.com, Inc.* | 192 | 48,253 | ||||||
ServiceNow, Inc.* | 40 | 19,400 | ||||||
Synopsys, Inc.* | 32 | 6,847 | ||||||
Tyler Technologies, Inc.* | 1 | 349 | ||||||
VeriSign, Inc.* | 3 | 615 | ||||||
Visa, Inc., Class A | 455 | 90,986 | ||||||
Western Union Co. (The) | 11 | 236 | ||||||
|
| |||||||
| 1,081,717 | ||||||||
|
| |||||||
Technology Hardware & Equipment — 9.5% |
| |||||||
Amphenol Corp., Class A | 8 | 866 | ||||||
Apple, Inc. | 3,655 | 423,286 | ||||||
Arista Networks, Inc.* | 3 | 621 | ||||||
CDW Corp. | 3 | 359 | ||||||
Cisco Systems, Inc. | 3,461 | 136,329 | ||||||
Corning, Inc. | 644 | 20,872 | ||||||
F5 Networks, Inc.* | 2 | 246 | ||||||
FLIR Systems, Inc. | 3 | 108 | ||||||
Hewlett Packard Enterprise Co. | 39 | 365 | ||||||
HP, Inc. | 993 | 18,857 | ||||||
IPG Photonics Corp.* | 2 | 340 | ||||||
Juniper Networks, Inc. | 8 | 172 | ||||||
Keysight Technologies, Inc.* | 5 | 494 | ||||||
Motorola Solutions, Inc. | 4 | 627 | ||||||
NetApp, Inc. | 5 | 219 | ||||||
Seagate Technology PLC (Ireland) | 6 | 296 | ||||||
TE Connectivity Ltd. (Switzerland) | 8 | 782 | ||||||
Western Digital Corp. | 9 | 329 | ||||||
Xerox Holdings Corp. | 5 | 94 | ||||||
Zebra Technologies Corp., Class A* | 1 | 252 | ||||||
|
| |||||||
| 605,514 | ||||||||
|
| |||||||
Telecommunication Services — 4.6% |
| |||||||
AT&T, Inc. | 4,825 | 137,561 | ||||||
CenturyLink, Inc. | 29 | 293 | ||||||
T-Mobile US, Inc.* | 26 | 2,973 | ||||||
Verizon Communications, Inc. | 2,557 | 152,116 | ||||||
|
| |||||||
| 292,943 | ||||||||
|
| |||||||
The accompanying notes are an integral part of the financial statements.
48
GOTHAM ENHANCED S&P 500 INDEX FUND
Portfolio of Investments (Concluded)
September 30, 2020
| Number of Shares | Value | |||||||
COMMON STOCKS — (Continued) |
| |||||||
Transportation — 1.4% | ||||||||
Alaska Air Group, Inc. | 3 | $ | 110 | |||||
American Airlines Group, Inc. | 11 | 135 | ||||||
CH Robinson Worldwide, Inc. | 115 | 11,752 | ||||||
CSX Corp. | 79 | 6,136 | ||||||
Delta Air Lines, Inc. | 17 | 520 | ||||||
Expeditors International of Washington, Inc. | 141 | 12,763 | ||||||
FedEx Corp. | 7 | 1,761 | ||||||
JB Hunt Transport Services, Inc. | 90 | 11,374 | ||||||
Kansas City Southern | 2 | 362 | ||||||
Norfolk Southern Corp. | 167 | 35,736 | ||||||
Old Dominion Freight Line, Inc. | 3 | 543 | ||||||
Southwest Airlines Co. | 16 | 600 | ||||||
Union Pacific Corp. | 18 | 3,544 | ||||||
United Airlines Holdings, Inc.* | 8 | 278 | ||||||
United Parcel Service, Inc., Class B | 23 | 3,832 | ||||||
|
| |||||||
| 89,446 | ||||||||
|
| |||||||
Utilities — 0.5% | ||||||||
AES Corp. | 141 | 2,553 | ||||||
Alliant Energy Corp. | 7 | 362 | ||||||
Ameren Corp. | 7 | 554 | ||||||
American Electric Power Co., Inc. | 14 | 1,144 | ||||||
American Water Works Co., Inc. | 5 | 724 | ||||||
Atmos Energy Corp. | 4 | 382 | ||||||
CenterPoint Energy, Inc. | 13 | 252 | ||||||
CMS Energy Corp. | 8 | 491 | ||||||
Consolidated Edison, Inc. | 8 | 622 | ||||||
Dominion Energy, Inc. | 22 | 1,736 | ||||||
DTE Energy Co. | 6 | 690 | ||||||
Duke Energy Corp. | 19 | 1,683 | ||||||
Edison International | 10 | 508 | ||||||
| Number of Shares | Value | |||||||
COMMON STOCKS — (Continued) |
| |||||||
Utilities — (Continued) |
| |||||||
Entergy Corp. | 6 | $ | 591 | |||||
Evergy, Inc. | 6 | 305 | ||||||
Eversource Energy | 9 | 752 | ||||||
Exelon Corp. | 26 | 930 | ||||||
FirstEnergy Corp. | 14 | 402 | ||||||
NextEra Energy, Inc. | 14 | 3,886 | ||||||
NiSource, Inc. | 10 | 220 | ||||||
NRG Energy, Inc. | 218 | 6,701 | ||||||
Pinnacle West Capital Corp. | 3 | 224 | ||||||
PPL Corp. | 20 | 544 | ||||||
Public Service Enterprise Group, Inc. | 13 | 714 | ||||||
Sempra Energy | 7 | 829 | ||||||
Southern Co. (The) | 28 | 1,518 | ||||||
WEC Energy Group, Inc. | 9 | 872 | ||||||
Xcel Energy, Inc. | 14 | 966 | ||||||
|
| |||||||
| 31,155 | ||||||||
|
| |||||||
TOTAL COMMON STOCKS |
| 6,310,038 | ||||||
|
| |||||||
TOTAL INVESTMENTS - 99.4% |
| 6,310,038 | ||||||
|
| |||||||
OTHER ASSETS IN EXCESS OF |
| 36,069 | ||||||
|
| |||||||
NET ASSETS - 100.0% | $ | 6,346,107 | ||||||
|
| |||||||
| * | Non-income producing. |
PLC | Public Limited Company | |
REIT | Real Estate Investment Trust |
The accompanying notes are an integral part of the financial statements.
49
Statements of Assets and Liabilities
September 30, 2020
| Gotham Index Plus Fund | Gotham Enhanced 500 Plus Fund | Gotham Enhanced S&P 500 Index Fund | |||||||||||||
Assets | |||||||||||||||
Investments, at value1,2,3 | $ | 387,074,617 | $ | 4,043,660 | $ | 6,310,038 | |||||||||
Swaps, at value(a) | 125,150,190 | — | — | ||||||||||||
Cash | 620,421 | 47,723 | 94,996 | ||||||||||||
Due from broker | 892,439 | — | — | ||||||||||||
Deposits with brokers for securities sold short | — | 30,022 | — | ||||||||||||
Receivables: | |||||||||||||||
Investments sold | 2,298,311 | 21,738 | 4,372 | ||||||||||||
Capital shares sold | 135,719 | — | 5,011 | ||||||||||||
Dividends and interest | 371,049 | 4,061 | 5,357 | ||||||||||||
Investment adviser | — | 6,580 | 15,885 | ||||||||||||
Prepaid expenses and other assets | 14,263 | 526 | 14,232 | ||||||||||||
|
|
|
|
|
| ||||||||||
Total assets | 516,557,009 | 4,154,310 | 6,449,891 | ||||||||||||
|
|
|
|
|
| ||||||||||
Liabilities | |||||||||||||||
Securities sold short, at value4 | — | 1,205,066 | — | ||||||||||||
Due to broker | 216,692 | — | — | ||||||||||||
Obligation to return cash collateral on swap contracts (Note 1) | 107,950,000 | — | — | ||||||||||||
Payables: | |||||||||||||||
Investments purchased | 1,319,587 | 21,848 | 60,610 | ||||||||||||
Dividends and fees on securities sold short | — | 1,247 | — | ||||||||||||
Capital shares redeemed | 1,473,184 | — | 46 | ||||||||||||
Investment adviser | 340,808 | — | — | ||||||||||||
Administration and accounting fees | 59,117 | 6,582 | 7,359 | ||||||||||||
12b-1 distribution fees (Investor Class) | 2,121 | — | — | ||||||||||||
Audit fees | 59,083 | 20,189 | 20,566 | ||||||||||||
Accrued expenses | 85,651 | 8,518 | 15,203 | ||||||||||||
|
|
|
|
|
| ||||||||||
Total liabilities | 111,506,243 | 1,263,450 | 103,784 | ||||||||||||
|
|
|
|
|
| ||||||||||
Net Assets | $ | 405,050,766 | $ | 2,890,860 | $ | 6,346,107 | |||||||||
|
|
|
|
|
| ||||||||||
Net Assets Consisted of: | |||||||||||||||
Capital stock, $0.01 par value | $ | 250,140 | $ | 2,521 | $ | 4,933 | |||||||||
Paid-in capital | 338,134,116 | 2,557,492 | 5,779,329 | ||||||||||||
Total distributable loss | 66,666,510 | 330,847 | 561,845 | ||||||||||||
|
|
|
|
|
| ||||||||||
Net Assets | $ | 405,050,766 | $ | 2,890,860 | $ | 6,346,107 | |||||||||
|
|
|
|
|
| ||||||||||
Institutional Class Shares: | |||||||||||||||
Net assets | $ | 394,773,151 | $ | 2,890,860 | $ | 6,346,107 | |||||||||
|
|
|
|
|
| ||||||||||
Shares outstanding | 24,377,475 | 252,115 | 493,349 | ||||||||||||
|
|
|
|
|
| ||||||||||
Net asset value, offering and redemption price per share | $ | 16.19 | $ | 11.47 | $ | 12.86 | |||||||||
|
|
|
|
|
| ||||||||||
Investor Class Shares: | |||||||||||||||
Net assets | $ | 10,277,615 | N/A | N/A | |||||||||||
|
|
|
|
|
| ||||||||||
Shares outstanding | 636,554 | N/A | N/A | ||||||||||||
|
|
|
|
|
| ||||||||||
Net asset value, offering and redemption price per share | $ | 16.15 | N/A | N/A | |||||||||||
|
|
|
|
|
| ||||||||||
1Investments, at cost | $ | 323,406,185 | $ | 3,432,992 | $ | 5,388,095 | |||||||||
2Includes market value of securities designated as collateral for swaps | $ | 180,054,510 | $ | — | $ | — | |||||||||
3Includes market value of securities on loan | $ | — | $ | 48,125 | $ | — | |||||||||
4Proceeds received, securities sold short | $ | — | $ | 1,163,065 | $ | — | |||||||||
| (a) | Primary risk exposure is equity contracts. |
The accompanying notes are an integral part of the financial statements.
50
Statements of Operations
For the Year Ended September 30, 2020
| Gotham Index Plus Fund | Gotham Enhanced 500 Plus Fund | Gotham Enhanced S&P 500 Index Fund | ||||||||||||||||||||||||||
Investment Income | ||||||||||||||||||||||||||||
Dividend income | $ | 10,494,784 | $ | 94,090 | $ | 151,832 | ||||||||||||||||||||||
Interest | 119,907 | 269 | 456 | |||||||||||||||||||||||||
Income from securities loaned (Note 5) | — | 78 | — | |||||||||||||||||||||||||
|
|
|
|
|
| |||||||||||||||||||||||
Total investment income | 10,614,691 | 94,437 | 152,288 | |||||||||||||||||||||||||
|
|
|
|
|
| |||||||||||||||||||||||
Expenses | ||||||||||||||||||||||||||||
Advisory fees (Note 2) | 5,145,575 | 28,029 | 33,892 | |||||||||||||||||||||||||
Administration and accounting fees (Note 2) | 171,928 | 31,574 | 31,499 | |||||||||||||||||||||||||
Dividends and fees on securities sold short (Note 1) | 103,024 | 29,849 | — | |||||||||||||||||||||||||
Distribution fees (Investor Class) | 32,894 | — | — | |||||||||||||||||||||||||
Transfer agent fees (Note 2) | 405,869 | 3,584 | 7,804 | |||||||||||||||||||||||||
Custodian fees (Note 2) | 95,060 | 435 | 627 | |||||||||||||||||||||||||
Trustees’ and officers’ fees (Note 2) | 121,941 | 623 | 1,468 | |||||||||||||||||||||||||
Printing and shareholder reporting fees | 103,047 | 19,840 | 19,368 | |||||||||||||||||||||||||
Registration and filing fees | 68,423 | 546 | 15,712 | |||||||||||||||||||||||||
Legal fees | 122,861 | 709 | 7,556 | |||||||||||||||||||||||||
Audit fees | 62,235 | 20,646 | 21,058 | |||||||||||||||||||||||||
Other expenses | 53,799 | 5,403 | 5,691 | |||||||||||||||||||||||||
|
|
|
|
|
| |||||||||||||||||||||||
Total expenses before waivers and reimbursements | 6,486,656 | 141,238 | 144,675 | |||||||||||||||||||||||||
|
|
|
|
|
| |||||||||||||||||||||||
Recoupments and/or waivers, reimbursements (Note 2) | (433,326 | ) | (79,156 | ) | (110,782 | ) | ||||||||||||||||||||||
|
|
|
|
|
| |||||||||||||||||||||||
Net expenses after waivers and reimbursements | 6,053,330 | 62,082 | 33,893 | |||||||||||||||||||||||||
|
|
|
|
|
| |||||||||||||||||||||||
Net investment income | 4,561,361 | 32,355 | 118,395 | |||||||||||||||||||||||||
|
|
|
|
|
| |||||||||||||||||||||||
Net realized and unrealized gain/(loss) from investments: | ||||||||||||||||||||||||||||
Net realized gain/(loss) from investments | 43,624,720 | (16,278 | ) | (338,005 | ) | |||||||||||||||||||||||
Net realized loss from securities sold short | — | (126,826 | ) | — | ||||||||||||||||||||||||
Net realized loss on swaps | (126,531,370 | )(a) | — | — | ||||||||||||||||||||||||
Net change in unrealized appreciation/(depreciation) on investments | (36,986,466 | ) | 283,051 | 497,653 | ||||||||||||||||||||||||
Net change in unrealized appreciation/(depreciation) on securities sold short | — | (22,293 | ) | — | ||||||||||||||||||||||||
Net change in unrealized appreciation/(depreciation) on swaps | 125,728,374 | (a) | — | — | ||||||||||||||||||||||||
|
|
|
|
|
| |||||||||||||||||||||||
Net realized and unrealized gain on investments | 5,835,258 | 117,654 | 159,648 | |||||||||||||||||||||||||
|
|
|
|
|
| |||||||||||||||||||||||
Net increase in net assets resulting from operations | $ | 10,396,619 | $ | 150,009 | $ | 278,043 | ||||||||||||||||||||||
|
|
|
|
|
| |||||||||||||||||||||||
| (a) | Primary risk exposure is equity contracts. |
The accompanying notes are an integral part of the financial statements.
51
Statements of Changes in Net Assets
| Gotham Index Plus Fund | Gotham Enhanced 500 Plus Fund | |||||||||||||||||||
| For the Year Ended September 30, 2020 | For the Year Ended September 30, 2019 | For the Year Ended September 30, 2020 | For the Year Ended September 30, 2019 | |||||||||||||||||
Net increase/(decrease) in net assets from operations: | ||||||||||||||||||||
Net investment income | $ | 4,561,361 | $ | 6,170,466 | $ | 32,355 | $ | 25,161 | ||||||||||||
Net realized gain/(loss) from investments, securities sold short and swaps | (82,906,650 | ) | (13,695,200 | ) | (143,104 | ) | 170,607 | |||||||||||||
Net change in unrealized appreciation/ (depreciation) on investments, securities sold short and swaps | 88,741,908 | (3,416,314 | ) | 260,758 | (117,197 | ) | ||||||||||||||
|
|
|
|
|
|
|
| |||||||||||||
Net increase/(decrease) in net assets resulting from operations | 10,396,619 | (10,941,048 | ) | 150,009 | 78,571 | |||||||||||||||
|
|
|
|
|
|
|
| |||||||||||||
Less Dividends and Distributions to Shareholders from: | ||||||||||||||||||||
Institutional Class Shares: | ||||||||||||||||||||
Total distributable earnings | (9,228,671 | ) | (13,022,222 | ) | (246,579 | ) | (473,685 | ) | ||||||||||||
Investor Class Shares: | ||||||||||||||||||||
Total distributable earnings | (203,551 | ) | (295,007 | ) | N/A | N/A | ||||||||||||||
|
|
|
|
|
|
|
| |||||||||||||
Net decrease in net assets from dividends and distributions to shareholders | (9,432,222 | ) | (13,317,229 | ) | (246,579 | ) | (473,685 | ) | ||||||||||||
|
|
|
|
|
|
|
| |||||||||||||
Increase/(Decrease) in Net Assets from Capital Share Transactions (Note 4) | (260,792,812 | ) | 43,674,800 | 27,241 | 474,185 | |||||||||||||||
|
|
|
|
|
|
|
| |||||||||||||
Total increase/(decrease) in net assets | (259,828,415 | ) | 19,416,523 | (69,329 | ) | 79,071 | ||||||||||||||
|
|
|
|
|
|
|
| |||||||||||||
Net assets | ||||||||||||||||||||
Beginning of year | 664,879,181 | 645,462,658 | 2,960,189 | 2,881,118 | ||||||||||||||||
|
|
|
|
|
|
|
| |||||||||||||
End of year | $ | 405,050,766 | $ | 664,879,181 | $ | 2,890,860 | $ | 2,960,189 | ||||||||||||
|
|
|
|
|
|
|
| |||||||||||||
The accompanying notes are an integral part of the financial statements.
52
GOTHAM FUNDS
Statements of Changes in Net Assets (Concluded)
| Gotham Enhanced S&P | ||||||||||
| 500 Index Fund | ||||||||||
| For the Year Ended September 30, 2020 | For the Year Ended September 30, 2019 | |||||||||
Net increase/(decrease) in net assets from operations: | ||||||||||
Net investment income | $ | 118,395 | $ | 67,791 | ||||||
Net realized gain/(loss) from investments | (338,005 | ) | 101,122 | |||||||
Net change in unrealized appreciation/(depreciation) on investments | 497,653 | (20,472 | ) | |||||||
|
|
|
| |||||||
Net increase in net assets resulting from operations | 278,043 | 148,441 | ||||||||
|
|
|
| |||||||
Less Dividends and Distributions to Shareholders from: | ||||||||||
Institutional Class Shares: | ||||||||||
Total distributable earnings | (269,329 | ) | (516,389 | ) | ||||||
|
|
|
| |||||||
Net decrease in net assets from dividends and distributions to shareholders | (269,329 | ) | (516,389 | ) | ||||||
|
|
|
| |||||||
Increase/(Decrease) in Net Assets from Capital Share Transactions (Note 4) | (297,232 | ) | 3,474,017 | |||||||
|
|
|
| |||||||
Total increase/(decrease) in net assets | (288,518 | ) | 3,106,069 | |||||||
|
|
|
| |||||||
Net assets | ||||||||||
Beginning of year | 6,634,625 | 3,528,556 | ||||||||
|
|
|
| |||||||
End of year | $ | 6,346,107 | $ | 6,634,625 | ||||||
|
|
|
| |||||||
The accompanying notes are an integral part of the financial statements.
53
Statements of Cash Flow
| Gotham Enhanced 500 Plus Fund | |||||
| For the Year Ended September 30, 2020 | |||||
Cash flows provided by operating activities: | |||||
Net increase in net assets resulting from operations | $ | 150,009 | |||
Adjustments to reconcile net increase in net assets resulting from operations to net cash provided by operating activities: | |||||
Purchases of long-term portfolio investments | (10,536,867 | ) | |||
Proceeds from disposition of long-term portfolio investments | 10,924,541 | ||||
Purchases to cover securities sold short | (3,182,007 | ) | |||
Proceeds from securities sold short | 3,008,999 | ||||
Net realized loss on investments and securities sold short | 143,104 | ||||
Net change in unrealized appreciation/(depreciation) on investments and securities sold short | (260,758 | ) | |||
Decrease in securities lending collateral | 141 | ||||
Decrease in receivable for securities sold | 33,246 | ||||
Decrease in dividend and interest receivable | 622 | ||||
Decrease in receivable from investment advisor | 3,347 | ||||
Increase in prepaid expenses and other assets | (376 | ) | |||
Decrease in due to broker | (7,029 | ) | |||
Decrease in payable for investments purchased | (33,146 | ) | |||
Decrease in payable for dividends on securities sold short | (267 | ) | |||
Decrease in payable for securities lending collateral | (141 | ) | |||
Decrease in accrued expenses | (7,999 | ) | |||
|
| ||||
Net cash provided by operating activities | 235,419 | ||||
|
| ||||
Cash flows from financing activities: | |||||
Proceeds from shares sold | 23,898 | ||||
Payment of shares redeemed | (243,236 | ) | |||
|
| ||||
Net cash used in financing activities | (219,338 | ) | |||
|
| ||||
Net increase in cash and restricted cash | 16,081 | ||||
Cash and restricted cash: | |||||
Beginning of Year: | 61,664 | ||||
End of Year: | 77,745 | ||||
Reconciliation of restricted and unrestricted cash at the beginning of the period to the statements of assets and liabilities: | |||||
Cash | 61,664 | ||||
Restricted cash | — | ||||
Reconciliation of restricted and unrestricted cash at the end of the period to the statements of assets and liabilities: | |||||
Cash | $ | 47,723 | |||
|
| ||||
Restricted cash | $ | 30,022 | |||
|
| ||||
Supplemental disclosure of cash flow information: | |||||
Cash paid during the year for financing charges | $ | 7,986 | |||
The accompanying notes are an integral part of the financial statements.
54
Financial Highlights
Contained below is per share operating performance data for Institutional Class shares outstanding, total investment return, ratios to average net assets and other supplemental data for the respective period. The total returns in the table represent the rate that an investor would have earned or lost on an investment in a Fund (assuming reinvestment of all dividends and distributions). This information has been derived from information provided in the financial statements and should be read in conjunction with the financial statements and the notes thereto.
| Gotham Index Plus Fund | |||||||||||||||||||||||||
| Institutional Class Shares | |||||||||||||||||||||||||
| For the Year Ended September 30, 2020 | For the Year Ended September 30, 2019 | For the Year Ended September 30, 2018 | For the Year Ended September 30, 2017 | For the Year Ended September 30, 2016 | |||||||||||||||||||||
Per Share Operating Performance | |||||||||||||||||||||||||
Net asset value, beginning of year | $ | 15.18 | $ | 15.73 | $ | 13.00 | $ | 10.59 | $ | 9.28 | |||||||||||||||
|
|
|
|
|
|
|
|
|
| ||||||||||||||||
Net investment income(1) | 0.14 | 0.13 | 0.10 | 0.06 | 0.07 | ||||||||||||||||||||
Net realized and unrealized gain/(loss) on investments | 1.09 | (0.39 | ) | 2.68 | 2.41 | 1.42 | |||||||||||||||||||
|
|
|
|
|
|
|
|
|
| ||||||||||||||||
Total from investment operations | 1.23 | (0.26 | ) | 2.78 | 2.47 | 1.49 | |||||||||||||||||||
|
|
|
|
|
|
|
|
|
| ||||||||||||||||
Dividends and distributions to shareholders from: | |||||||||||||||||||||||||
Net investment income | (0.22 | ) | (0.06 | ) | (0.05 | ) | (0.06 | ) | (0.07 | ) | |||||||||||||||
Net realized capital gains | — | (0.23 | ) | — | — | (0.11 | ) | ||||||||||||||||||
|
|
|
|
|
|
|
|
|
| ||||||||||||||||
Total dividends and distributions to shareholders | (0.22 | ) | (0.29 | ) | (0.05 | ) | (0.06 | ) | (0.18 | ) | |||||||||||||||
|
|
|
|
|
|
|
|
|
| ||||||||||||||||
Redemption fees | 0.00 | (2) | 0.00 | (2) | 0.00 | (2) | 0.00 | (2) | 0.00 | (2) | |||||||||||||||
|
|
|
|
|
|
|
|
|
| ||||||||||||||||
Net asset value, end of year | $ | 16.19 | $ | 15.18 | $ | 15.73 | $ | 13.00 | $ | 10.59 | |||||||||||||||
|
|
|
|
|
|
|
|
|
| ||||||||||||||||
Total investment return(3) | 8.14 | % | (1.57 | )% | 21.45 | % | 23.25 | % | 16.14 | % | |||||||||||||||
Ratio/Supplemental Data | |||||||||||||||||||||||||
Net assets, end of year (in 000s) | $ | 394,773 | $ | 647,415 | $ | 631,060 | $ | 199,796 | $ | 44,190 | |||||||||||||||
Ratio of expenses to average net assets with waivers, expense reimbursements, and recoupments if any (including dividend and interest expense)(4) | 1.17 | % | 2.99 | % | 3.39 | % | 3.61 | % | 3.41 | % | |||||||||||||||
Ratio of expenses to average net assets without waivers, expense reimbursements, and recoupments if any(4)(5) | 1.25 | % | 3.04 | % | 3.39 | % | 3.62 | % | 3.80 | % | |||||||||||||||
Ratio of net investment income to average net assets (including dividend and interest expense) | 0.89 | % | 0.89 | % | 0.69 | % | 0.46 | % | 0.72 | % | |||||||||||||||
Portfolio turnover rate | 224 | % | 253 | % | 218 | % | 204 | % | 234 | % | |||||||||||||||
| (1) | The selected per share data was calculated using the average shares outstanding method for the period. |
| (2) | Amount is less than $0.005 per share. |
| (3) | Total investment return is calculated assuming a purchase of shares on the first day and a sale of shares on the last day of each period reported and includes reinvestment of dividends and distributions, if any. Total returns for periods less than one year are not annualized. |
| (4) | Expense ratio includes dividend and fees on securities sold short and fees on cash collateral. Excluding such dividend and fees on securities sold short and fees on cash collateral, the ratio of expenses to average net assets including waivers, reimbursement, and recoupments for the Fund’s Institutional Class Shares would be 1.15%, 1.15%, 1.15%, 1.15% and 1.18% for the years ended September 30, 2020, 2019, 2018, 2017 and 2016, respectively. |
| (5) | During the period, certain fees were reduced or expenses were recouped. If such fee reductions or recoupments had not occurred, the ratios would have been as shown (See Note 2). |
The accompanying notes are an integral part of the financial statements.
55
GOTHAM FUNDS
Financial Highlights (Continued)
Contained below is per share operating performance data for Investor Class shares outstanding, total investment return, ratios to average net assets and other supplemental data for the respective period. The total returns in the table represent the rate that an investor would have earned or lost on an investment in a Fund (assuming reinvestment of all dividends and distributions). This information has been derived from information provided in the financial statements and should be read in conjunction with the financial statements and the notes thereto.
| Gotham Index Plus Fund Investor Class Shares | |||||||||||||||
| For the Year Ended September 30, 2020 | For the Year Ended September 30, 2019 | For the Period Ended September 30, 2018* | |||||||||||||
Per Share Operating Performance | |||||||||||||||
Net asset value, beginning of year/period | $ | 15.13 | $ | 15.70 | $ | 14.48 | |||||||||
|
|
|
|
|
| ||||||||||
Net investment income/(loss)(1) | 0.10 | (0.06 | ) | 0.05 | |||||||||||
Net realized and unrealized gain/(loss) on investments | 1.10 | (0.24 | ) | 1.17 | |||||||||||
|
|
|
|
|
| ||||||||||
Total from investment operations | 1.20 | (0.30 | ) | 1.22 | |||||||||||
|
|
|
|
|
| ||||||||||
Dividends and distributions to shareholders from: | |||||||||||||||
Net investment income | (0.18 | ) | (0.04 | ) | — | ||||||||||
Net realized capital gains | — | (0.23 | ) | — | |||||||||||
|
|
|
|
|
| ||||||||||
Total dividends and distributions to shareholders | (0.18 | ) | (0.27 | ) | — | ||||||||||
|
|
|
|
|
| ||||||||||
Redemption fees | 0.00 | (2) | 0.00 | (2) | 0.00 | (2) | |||||||||
|
|
|
|
|
| ||||||||||
Net asset value, end of year/period | $ | 16.15 | $ | 15.13 | $ | 15.70 | |||||||||
|
|
|
|
|
| ||||||||||
Total investment return(3) | 7.94 | % | (1.82 | )% | 8.43 | % | |||||||||
Ratio/Supplemental Data | |||||||||||||||
Net assets, end of year/period (in 000s) | $ | 10,278 | $ | 17,464 | $ | 14,403 | |||||||||
Ratio of expenses to average net assets with waivers, expense reimbursements, and recoupments if any (including dividend and interest expense)(4) | 1.42 | % | 4.28 | % | | 3.64 | %(5) | ||||||||
Ratio of expenses to average net assets without waivers, expense reimbursements, and recoupments if any(4)(6) | 1.50 | % | 4.34 | % | | 3.64 | %(5) | ||||||||
Ratio of net investment income/(loss) to average net assets (including dividend and interest expense) | 0.64 | % | (0.40 | )% | | 0.49 | %(5) | ||||||||
Portfolio turnover rate | 224 | % | 253 | % | 218 | %(7) | |||||||||
| * | Investor Class commenced operations on January 2, 2018. Total return is calculated based on inception date of December 29, 2017, when initial seed capital was issued at $14.48 per share. |
| (1) | The selected per share data was calculated using the average shares outstanding method for the period. |
| (2) | Amount is less than $0.005 per share. |
| (3) | Total investment return is calculated assuming a purchase of shares on the first day and a sale of shares on the last day of each period reported and includes reinvestment of dividends and distributions, if any. Total returns for periods less than one year are not annualized. |
| (4) | Expense ratio includes dividend and fees on securities sold short and fees on cash collateral. Excluding such dividend and fees on securities sold short and fees on cash collateral, the ratio of expenses to average net assets including waivers, reimbursement, and recoupments for the Fund’s Investor Class Shares would be 1.40%, 1.40% and 1.40% for the years ended September 30, 2020, 2019 and the period ended September 30, 2018, respectively. |
| (5) | Annualized. |
| (6) | During the period, certain fees were reduced or expenses were recouped. If such fee reductions or recoupments had not occurred, the ratios would have been as shown (See Note 2). |
| (7) | Reflects portfolio turnover of the Fund for the year ended September 30, 2018. |
The accompanying notes are an integral part of the financial statements.
56
GOTHAM FUNDS
Financial Highlights (Continued)
Contained below is per share operating performance data for Institutional Class shares outstanding, total investment return, ratios to average net assets and other supplemental data for the respective period. The total returns in the table represent the rate that an investor would have earned or lost on an investment in a Fund (assuming reinvestment of all dividends and distributions). This information has been derived from information provided in the financial statements and should be read in conjunction with the financial statements and the notes thereto.
| Gotham Enhanced 500 Plus Fund | |||||||||||||||||||||||||
| Institutional Class Shares | |||||||||||||||||||||||||
| For the Year Ended September 30, 2020 | For the Year Ended September 30, 2019 | For the Year Ended September 30, 2018 | For the Year Ended September 30, 2017 | For the Period Ended September 30, 2016* | |||||||||||||||||||||
Per Share Operating Performance | |||||||||||||||||||||||||
Net asset value, beginning of year/period | $ | 11.86 | $ | 13.99 | $ | 11.86 | $ | 9.99 | $ | 10.00 | |||||||||||||||
|
|
|
|
|
|
|
|
|
| ||||||||||||||||
Net investment income(1) | 0.13 | 0.10 | 0.13 | 0.09 | — | ||||||||||||||||||||
Net realized and unrealized gain/(loss) on investments | 0.47 | 0.07 | 2.20 | 1.78 | (0.01 | ) | |||||||||||||||||||
|
|
|
|
|
|
|
|
|
| ||||||||||||||||
Total from investment operations | 0.60 | 0.17 | 2.33 | 1.87 | (0.01 | ) | |||||||||||||||||||
|
|
|
|
|
|
|
|
|
| ||||||||||||||||
Dividends and distributions to shareholders from: | |||||||||||||||||||||||||
Net investment income | (0.14 | ) | (0.12 | ) | (0.16 | ) | — | — | |||||||||||||||||
Net realized capital gains | (0.85 | ) | (2.18 | ) | (0.04 | ) | — | — | |||||||||||||||||
|
|
|
|
|
|
|
|
|
| ||||||||||||||||
Total dividends and distributions to shareholders | (0.99 | ) | (2.30 | ) | (0.20 | ) | — | — | |||||||||||||||||
|
|
|
|
|
|
|
|
|
| ||||||||||||||||
Redemption fees | — | — | — | — | — | ||||||||||||||||||||
|
|
|
|
|
|
|
|
|
| ||||||||||||||||
Net asset value, end of year/period | $ | 11.47 | $ | 11.86 | $ | 13.99 | $ | 11.86 | $ | 9.99 | |||||||||||||||
|
|
|
|
|
|
|
|
|
| ||||||||||||||||
Total investment return(2) | 4.95 | % | 2.78 | % | 19.86 | % | 18.60 | % | (0.10 | )% | |||||||||||||||
Ratio/Supplemental Data | |||||||||||||||||||||||||
Net assets, end of year/period (in 000s) | $ | 2,891 | $ | 2,960 | $ | 2,881 | $ | 2,399 | $ | 1,999 | |||||||||||||||
Ratio of expenses to average net assets with waivers, expense reimbursements, and recoupments if any (including dividend and interest expense)(3) | 2.21 | % | 2.20 | % | 2.10 | % | 2.21 | % | — | ||||||||||||||||
Ratio of expenses to average net assets without waivers, expense reimbursements, and recoupments if any(3)(4) | 5.04 | % | 5.23 | % | 4.24 | % | 5.28 | % | — | ||||||||||||||||
Ratio of net investment income to average net assets (including dividend and interest expense) | 1.15 | % | 0.90 | % | 0.97 | % | 0.83 | % | — | ||||||||||||||||
Portfolio turnover rate | 263 | % | 274 | % | 224 | % | 237 | % | — | ||||||||||||||||
| * | Commencement of operations. Initial seed capital was issued at $10.00 per share on September 30, 2016. |
| (1) | The selected per share data was calculated using the average shares outstanding method for the period. |
| (2) | Total investment return is calculated assuming a purchase of shares on the first day and a sale of shares on the last day of each period reported and includes reinvestment of dividends and distributions, if any. Total returns for periods less than one year are not annualized. |
| (3) | Expense ratio includes dividend and fees on securities sold short. Excluding such dividend and fees on securities sold short, the ratio of expenses to average net assets including waivers, reimbursements, and recoupments for the Fund would be 1.15%, 1.15%, 1.15% and 1.15% for the years ended September 30, 2020, 2019, 2018 and 2017, respectively. |
| (4) | During the period, certain fees were reduced or expenses were recouped. If such fee reductions or recoupments had not occurred, the ratios would have been as shown (See Note 2). |
The accompanying notes are an integral part of the financial statements.
57
GOTHAM FUNDS
Financial Highlights (Concluded)
Contained below is per share operating performance data for Institutional Class shares outstanding, total investment return, ratios to average net assets and other supplemental data for the respective period. The total returns in the table represent the rate that an investor would have earned or lost on an investment in a Fund (assuming reinvestment of all dividends and distributions). This information has been derived from information provided in the financial statements and should be read in conjunction with the financial statements and the notes thereto.
| Gotham Enhanced S&P 500 Index Fund | ||||||||||||||||||||
| Institutional Class Shares | ||||||||||||||||||||
| For the Year Ended September 30, 2020 | For the Year Ended September 30, 2019 | For the Year Ended September 30, 2018 | For the Period Ended September 30, 2017 * | |||||||||||||||||
Per Share Operating Performance | ||||||||||||||||||||
Net asset value, beginning of year/period | $ | 11.93 | $ | 13.70 | $ | 11.53 | $ | 10.00 | ||||||||||||
|
|
|
|
|
|
|
| |||||||||||||
Net investment income(1) | 0.21 | 0.19 | 0.20 | 0.13 | ||||||||||||||||
Net realized and unrealized gain on investments | 1.14 | 0.03 | 2.39 | 1.40 | ||||||||||||||||
|
|
|
|
|
|
|
| |||||||||||||
Total from investment operations | 1.35 | 0.22 | 2.59 | 1.53 | ||||||||||||||||
|
|
|
|
|
|
|
| |||||||||||||
Dividends and distributions to shareholders from: | ||||||||||||||||||||
Net investment income | (0.15 | ) | (0.21 | ) | (0.16 | ) | — | |||||||||||||
Net realized capital gains | (0.27 | ) | (1.78 | ) | (0.26 | ) | — | |||||||||||||
|
|
|
|
|
|
|
| |||||||||||||
Total dividends and distributions to shareholders | (0.42 | ) | (1.99 | ) | (0.42 | ) | — | |||||||||||||
|
|
|
|
|
|
|
| |||||||||||||
Redemption fees | 0.00 | (2) | 0.00 | (2) | — | — | ||||||||||||||
|
|
|
|
|
|
|
| |||||||||||||
Net asset value, end of year/period | $ | 12.86 | $ | 11.93 | $ | 13.70 | $ | 11.53 | ||||||||||||
|
|
|
|
|
|
|
| |||||||||||||
Total investment return(3) | 11.53 | % | 3.46 | % | 22.97 | % | 15.30 | % | ||||||||||||
Ratio/Supplemental Data | ||||||||||||||||||||
Net assets, end of year/period (in 000s) | $ | 6,346 | $ | 6,635 | $ | 3,529 | $ | 2,931 | ||||||||||||
Ratio of expenses to average net assets with waivers, expense reimbursements, and recoupments if any | 0.50 | % | 0.50 | % | 0.50 | % | 0.50 | %(4) | ||||||||||||
Ratio of expenses to average net assets without waivers, expense reimbursements, and recoupments if any(5) | 2.13 | % | 3.20 | % | 2.55 | % | 3.61 | %(4) | ||||||||||||
Ratio of net investment income to average net assets | 1.75 | % | 1.65 | % | 1.59 | % | 1.66 | %(4) | ||||||||||||
Portfolio turnover rate | 345 | % | 328 | % | 230 | % | 268 | %(6) | ||||||||||||
| * | Commencement of operations. Initial seed capital was issued at $10.00 per share on December 30, 2016. |
| (1) | The selected per share data was calculated using the average shares outstanding method for the period. |
| (2) | Amount is less than $0.005 per share. |
| (3) | Total investment return is calculated assuming a purchase of shares on the first day and a sale of shares on the last day of each period reported and includes reinvestment of dividends and distributions, if any. Total returns for periods less than one year are not annualized. |
| (4) | Annualized. |
| (5) | During the period, certain fees were reduced or expenses were recouped. If such fee reductions or recoupments had not occurred, the ratios would have been as shown (See Note 2). |
| (6) | Not annualized. |
The accompanying notes are an integral part of the financial statements.
58
Notes to Financial Statements
September 30, 2020
1. Organization and Significant Accounting Policies
The Gotham Index Plus Fund, the Gotham Enhanced 500 Plus Fund and the Gotham Enhanced S&P 500 Index Fund (each a “Fund” and together, the “Funds”) are each a diversified, open-end management investment company registered under the Investment Company Act of 1940, as amended (the “1940 Act”). The Funds are each a separate series of FundVantage Trust (the “Trust”) which was organized as a Delaware statutory trust on August 28, 2006. The Trust is a “series trust” authorized to issue an unlimited number of separate series or classes of shares of beneficial interest. Each series is treated as a separate entity for certain matters under the 1940 Act, and for other purposes, and a shareholder of one series is not deemed to be a shareholder of any other series. Each of the Funds, except for the Gotham Index Plus Fund, offers one class of shares, Institutional Class. The Gotham Index Plus Fund offers two classes of shares, Institutional Class and Investor Class. The Funds’ commencement of operations are as follows:
Gotham Index Plus Fund (“Index Plus”) | March 31, 2015 | |
Gotham Enhanced 500 Plus Fund (“Enhanced 500 Plus”) | September 30, 2016 | |
Gotham Enhanced S&P 500 Index Fund (“Enhanced S&P 500 Index”) | December 30, 2016 |
All the Funds except for Enhanced S&P 500 Index seek to achieve their investment objectives by primarily investing in long and short positions of U.S. equity securities. Equity securities include common and preferred stocks. Enhanced S&P 500 Index seeks to achieve its investment objective by generally investing at least 80% of its assets in U.S. equity securities listed in the S&P 500® Index.
The Funds are investment companies and follow accounting and reporting guidance in the Financial Accounting Standards Board Accounting Standards Codification Topic 946.
Portfolio Valuation — Each Fund’s net asset value (“NAV”) is calculated once daily at the close of regular trading hours on the New York Stock Exchange (“NYSE”) (typically 4:00 p.m. Eastern time) on each business day the NYSE is open. Each Fund’s equity securities, including exchange-traded funds, listed on any national or foreign exchange market system will be valued at the last sale price. Equity securities traded in the over-the-counter market are valued at their closing sale or official closing price. If there were no transactions on that day, securities traded principally on an exchange will be valued at the mean of the last bid and ask prices prior to the market close. Prices for equity securities normally are supplied by an independent pricing service approved by the Board of Trustees (the “Board”). Any assets held by a Fund that are denominated in foreign currencies are valued daily in U.S. dollars at the foreign currency exchange rates that are prevailing at the time that a Fund determines the daily NAV per share. Foreign securities may trade on weekends or other days when a Fund does not calculate NAV. As a result, the market value of these investments may change on days when you cannot buy or sell shares of a Fund. Certain Funds invest in securities of other investment companies, which are valued at their respective NAVs as determined by those investment companies each business day. Over the Counter investments (including swap agreements) are generally valued by approved pricing services that use evaluated prices from various observable market factors. Securities that do not have a readily available current market value are valued in good faith under the direction of the Board. The Board has adopted methods for valuing securities and other assets in circumstances where market quotes are not readily available and has delegated to Gotham Asset Management, LLC (“Gotham” or “the Adviser”) the responsibility for applying the valuation methods. In the event that market quotes are not readily available, and the security or asset cannot be valued pursuant to one of the valuation methods, the value of the security, asset or liability will be determined in good faith by the Adviser. The Trust has established a Valuation Committee which performs certain functions including the oversight of the Adviser’s fair valuation determinations.
Fair Value Measurements — The inputs and valuation techniques used to measure fair value of a Fund’s investments are summarized into three levels as described in the hierarchy below:
· Level 1 | — | quoted prices in active markets for identical securities; | ||||
· Level 2 | — | other significant observable inputs (including quoted prices for similar securities, interest rates, prepayment speeds, credit risk, etc.); and | ||||
· Level 3 | — | significant unobservable inputs (including the Fund’s own assumptions in determining the fair value of investments). | ||||
The inputs or methodology used for valuing securities are not necessarily an indication of the risk associated with investing in those securities.
59
GOTHAM FUNDS
Notes to Financial Statements (Continued)
September 30, 2020
All financial instruments listed in the Portfolio of Investments are considered Level 1, measured at fair value on a recurring basis based on quoted prices for identical assets in active markets, except for total return swaps with end of period unrealized appreciation of $125,150,190 held by Index Plus. These securities are considered Level 2 as of and for the year ended September 30, 2020.
At the end of each quarter, management evaluates the classification of Levels 1, 2 and 3 assets and liabilities. Various factors are considered, such as changes in liquidity from the prior reporting period; whether or not a broker is willing to execute at the quoted price; the depth and consistency of prices from third party pricing services; and the existence of contemporaneous, observable trades in the market. Additionally, management evaluates the classification of Level 1 and Level 2 assets and liabilities on a quarterly basis for changes in listings or delistings on national exchanges.
Due to the inherent uncertainty of determining the fair value of investments that do not have a readily available market value, the fair value of a Fund’s investments may fluctuate from period to period. Additionally, the fair value of investments may differ significantly from the values that would have been used had a ready market existed for such investments and may differ materially from the values the Funds may ultimately realize. Further, such investments may be subject to legal and other restrictions on resale or otherwise less liquid than publicly traded securities.
For fair valuations using significant unobservable inputs, U.S. generally accepted accounting principles (“U.S. GAAP”) require the Funds to present a reconciliation of the beginning to ending balances for reported market values that presents changes attributable to total realized and unrealized gains or losses, purchase and sales, and transfers in and out of Level 3 during the period. A reconciliation of Level 3 investments is presented only when the Funds had an amount of Level 3 investments at the end of the reporting period that was meaningful in relation to its net assets. The amounts and reasons for all transfers in and out of Level 3 are disclosed when the Funds had an amount of transfers during the reporting period that was meaningful in relation to its net assets as of the end of the reporting period.
For the year ended September 30, 2020, there were no transfers in or out of Level 3 for the Funds.
Use of Estimates — The preparation of financial statements in conformity with U.S. GAAP requires management to make estimates and assumptions that affect the amounts reported in the financial statements and accompanying notes at the date of the financial statements and the reported amounts of revenues and expenses during the period. Actual results could differ from those estimates and those differences could be material.
Cash — Cash comprises U.S. Dollar and foreign currency deposits held at a custodian bank(s) which may exceed insured limits. The Funds are subject to risk to the extent that the institutions may be unable to fulfill their obligations.
Due to/from Brokers — Due to/from brokers represents cash balances on deposit with, or cash balances owed to, the Funds’ prime brokers and counterparties. The Funds are subject to credit risk should the prime brokers and counterparties be unable to meet their obligations to the Funds.
Investment Transactions, Investment Income and Expenses — Investment transactions are recorded on trade date for financial statement preparation purposes. Realized gains and losses on investments sold are recorded on the identified cost basis. Interest income is recorded on the accrual basis. Dividends are recorded on the ex-dividend date. Distribution (12b-1) fees and shareholder service fees relating to a specific class are charged directly to that class. The Fund records as dividend income the amount characterized as ordinary income and records as realized gain the amount characterized by a REIT as long-term capital gain in the Statement of Operations. The amount characterized as return of capital is a reduction to the cost of investments in the Statement of Assets and Liabilities if the security is still held; otherwise it is recorded as an adjustment to realized gain/(loss) from investment transactions in the Statement of Operations. These characterizations are reflected in the accompanying financial statements. General expenses of the Trust are generally allocated to each Fund under methodologies approved by the Board of Trustees. Expenses directly attributable to a particular Fund in the Trust are charged directly to that Fund.
60
GOTHAM FUNDS
Notes to Financial Statements (Continued)
September 30, 2020
Dividends and Distributions to Shareholders — Dividends from net investment income and distributions from net realized capital gains, if any, are declared, recorded on ex-date and paid at least annually to shareholders. Income dividends and capital gain distributions are determined in accordance with U.S. federal income tax regulations, which may differ from U.S. GAAP. These differences include the treatment of non-taxable dividends, capitalized dividends on short sales, losses deferred due to wash sales and excise tax regulations. Permanent book and tax basis differences relating to shareholder distributions will result in reclassifications within the components of net assets.
U.S. Tax Status — No provision is made for U.S. income taxes as it is each Fund’s intention to continue to qualify for and elect the tax treatment applicable to regulated investment companies under Subchapter M of the Code, as amended, and make the requisite distributions to its shareholders which will be sufficient to relieve it from U.S. income and excise taxes.
Other — In the normal course of business, the Funds may enter into contracts that provide general indemnifications. A Fund’s maximum exposure under these arrangements is dependent on claims that may be made against the Fund in the future, and, therefore, cannot be estimated; however, based on experience, the risk of material loss for such claims is considered remote.
Market disruptions associated with the COVID-19 pandemic have had a global impact, and uncertainty exists as to its long-term implications. The COVID-19 pandemic could adversely affect the value and liquidity of the Funds’ investments, impair the Funds’ ability to satisfy redemption requests, and negatively impact the Funds’ performance. In addition, the outbreak of COVID-19, and measures taken to mitigate its effects, could result in disruptions to the services provided to the Funds by its service providers. Fund management is continuing to monitor this development and evaluate its impact on the Funds.
Short Sales — All Funds except for Enhanced S&P 500 Index may sell securities short. A short sale involves the sale by a Fund of a security that it does not own with the anticipation of purchasing the same security at a later date at a lower price. If the price of the security has increased during this time, then the Fund will incur a loss equal to the increase in price from the time that the short sale was entered into plus any premiums and interest paid to the third party. Therefore, short sales involve the risk that losses may be exaggerated, potentially losing more money than the actual cost of the investment. Also, there is the risk that the third party to the short sale may fail to honor its contract terms, causing a loss to the Fund. There can be no assurance that a Fund will be able to close out a short position at any particular time or at an acceptable price. Although a Fund’s gain is limited to the amount at which it sold a security short, its potential loss is unlimited. The Funds will comply with guidelines established by the Securities and Exchange Commission and other applicable regulatory bodies with respect to coverage of short sales.
As of September 30, 2020, the following Fund had securities sold short, securities pledged as collateral and deposits with brokers for securities sold short:
Value of Securities Sold Short | Securities Pledged as Collateral | Deposits with Brokers for Securities Sold Short | ||||||||
Enhanced 500 Plus | $ | (1,205,066 | ) | $ | 3,007,829 | $30,022 | ||||
In accordance with the terms of its prime brokerage agreements, the Funds may receive rebate income or be charged fees on securities sold short. Such income or fee is calculated on a daily basis based upon the market value of securities sold short and a variable rate that is dependent upon the availability of such security. These amounts are included in dividends and fees on securities sold short on the Statement of Operations. On the ex-dividend date, dividends on short sales are recorded as an expense to the Fund. The following Fund had net charges as shown in the table below for the year ended September 30, 2020:
Dividends on Securities Sold Short | Rebate (Income)/Fees | |||
Enhanced 500 Plus | $21,863 | $(5,985) |
61
GOTHAM FUNDS
Notes to Financial Statements (Continued)
September 30, 2020
The following Fund utilized short sales proceeds and incurred financing charges to finance purchases of long securities in order to accomplish the Fund’s respective investment objectives. A financing fee is charged to the Fund based on the Federal Funds rate plus an agreed upon spread. These fees are included in dividends and fees on securities sold short on the Statement of Operations and are as follows for the year ended September 30, 2020:
| Short Sales Proceeds | Financing Charges | |||
Enhanced 500 Plus | $1,175,378 | $13,971 |
Swap Agreements — A swap agreement is a bilateral financial instrument that involves the exchange of cash flows between two parties on specified dates (settlement dates), where the cash flows are based on valuation changes to market referenced securities. The nominal amount on which the cash flows are calculated is called the notional amount.
Swap agreements may increase or decrease the overall volatility of the investments of a Fund and its share price. The performance of swap agreements will be affected by a change in the market value of the referenced underlying securities that determine the amounts of payments due to and from a Fund. If a swap agreement calls for payments by a Fund, the Fund must be prepared to make such payments when due. In addition, if the counterparty’s creditworthiness declined, the value of a swap agreement would be likely to decline, potentially resulting in losses.
Generally, swap agreements have a fixed maturity date that will be agreed upon by the parties. The agreement can be terminated before the maturity date, in whole or part, under certain circumstances, such as default by one of the parties or insolvency, among others, and can be transferred by a party only with the prior written consent of the other party. A Fund may be able to eliminate its exposure under a swap agreement either by assignment or by other disposition, or by entering into an offsetting swap agreement with the same party or a similarly creditworthy party. If the counterparty is unable to meet its obligations under the contract, declares bankruptcy, defaults or becomes insolvent, a Fund may not be able to recover the money it expected to receive under the swap agreement. A Fund will not enter into any swap agreement unless the Adviser believes that the counterparty to the transaction is creditworthy.
A swap agreement can be a form of leverage, which can magnify a Fund’s gains or losses. In order to reduce the risk associated with leveraging, a Fund may cover its current obligations under swap agreements according to guidelines established by the SEC. If a Fund enters into a swap agreement on a net basis, it will segregate assets with a daily value at least equal to the excess, if any, of a Fund’s accrued obligations under the swap agreement over the accrued amount a Fund is entitled to receive under the agreement. If a Fund enters into a swap agreement on other than a net basis, it will segregate assets with a value equal to the full amount of a Fund’s accrued obligations under the swap agreement.
Total Return Swaps: Total return swaps are contracts in which both parties agree to make payments of the total return from a reference instrument during a specified period. The total return includes appreciation or depreciation on the underlying asset, plus any interest or dividend accruals or payments. The unrealized appreciation or depreciation also includes interest charges and credits (“financing fees”) related to the notional values of the long and short positions and cash balances within the swap. These interest charges and credits are based on a specified benchmark rate, such as the U.S. effective federal funds rate (“EFFR”). Payments under the swap are based upon an agreed upon principal amount but, since the principal amount is not exchanged, it represents neither an asset nor a liability to either counterparty, and is referred to as notional. Total return swaps are marked to market daily using different sources, including quotations from counterparties, pricing services, brokers or market makers. The unrealized appreciation or depreciation related to the change in the valuation of the notional amount of the swap is combined with the amount due to or from the Fund at termination or settlement. The primary risks associated with total return swaps are credit risks (if the counterparty fails to meet its obligations) and market risk (if there is no liquid market for the swap or unfavorable changes occur to the underlying reference instrument). As of and for the year ended September 30, 2020, only Index Plus held total return swaps.
For the year ended September 30, 2020, the quarterly average volume of the total return swaps for the following Fund was as follows:
Notional Amount | ||
Index Plus | $(53,102,840) |
62
GOTHAM FUNDS
Notes to Financial Statements (Continued)
September 30, 2020
Counterparty Risk — During the year ended September 30, 2020, Index Plus was subject to counterparty risk. Certain of the derivatives entered into by the Fund may not be traded on an exchange but instead will be privately negotiated in the over-the-counter market. This means that these instruments are traded between counterparties based on contractual relationships. Relying on a counterparty exposes the Fund to the risk that a counterparty will not settle a transaction in accordance with its terms and conditions because of a dispute over the terms of the contract (whether or not bona fide) or because of a credit or liquidity problem, thus causing the Fund to suffer a loss. If a counterparty defaults on its payment obligations to the Fund, this default will cause the value of an investment in the Fund to decrease. In addition, to the extent the Fund deals with a limited number of counterparties, it will be more susceptible to the credit risks associated with those counterparties. The Fund is neither restricted from dealing with any particular counterparty nor from concentrating any or all of its transactions with one counterparty. The ability of the Fund to transact business with any one or number of counterparties and the absence of a regulated market to facilitate settlement may increase the potential for losses by the Fund.
The Fund is subject to the risk that issuers of the instruments in which it invests and trades may default on their obligations, and that certain events may occur that have an immediate and significant adverse effect on the value of those instruments. There can be no assurance that an issuer will not default, or that an event that has an immediate and significant adverse effect on the value of an instrument will not occur, and that the Fund will not sustain a loss on a transaction as a result.
Liquidity Risk — During the year ended September 30, 2020, Index Plus was subject to liquidity risk. The Fund may be subject to liquidity risk primarily due to investments in derivatives. The Fund may invest up to 15% of its net assets in illiquid securities or instruments. Certain derivatives, such as swaps, forward contracts and options may not be readily marketable and, therefore, may be deemed to be illiquid. An asset is not readily marketable if it cannot be sold within seven business days in the ordinary course of business for approximately the amount at which it is valued. Investments in illiquid assets involve the risk that the Fund may be unable to sell the asset or sell it at a reasonable price. In addition, the Fund may be required to liquidate positions or close out derivatives on unfavorable terms at a time contrary to the interests of the Fund in order to raise cash to pay redemptions.
An investment in derivatives is also subject to the risk that the Fund may not be able to terminate the derivatives effective on whatever date it chooses, or that the settlement of any early termination may depend on subsequent market movements. As a result, the Fund may be exposed to the risk of additional losses due to such delays.
Master Netting Agreement — During the year ended September 30, 2020, Index Plus was subject to a Master Netting agreement. In order to define its contractual rights and to secure rights that will help mitigate its counterparty risk, the Fund has entered into an International Swaps and Derivatives Association, Inc. Master Agreement (“ISDA Master Agreement”). An ISDA Master Agreement is a bilateral agreement between the Fund and the counterparty that governs certain OTC derivatives and typically contains, among other things, collateral posting terms and netting provisions in the event of a default and/or termination event. Under an ISDA Master Agreement, the Fund may, under certain circumstances, offset with the counterparty certain derivative financial instruments’ payables and/or receivables with collateral held and/or posted and create one single net payment. The provisions of the ISDA Master Agreement typically permit a single net payment in the event of default including the bankruptcy or insolvency of the counterparty. Bankruptcy or insolvency laws of a particular jurisdiction may restrict or prohibit the right of offset in bankruptcy, insolvency or other events. In addition, certain ISDA Master Agreements allow counterparties to terminate derivative contracts prior to maturity in the event the Fund’s net assets decline by a stated percentage or the Fund fails to meet the terms of its ISDA Master Agreements. The result would cause the Fund to accelerate payment of any net liability owed to the counterparty.
LIBOR Phase-out Risk — The United Kingdom’s Financial Conduct Authority, which regulates London Interbank Overnight Rates (“LIBOR”), has announced plans to phase out the use of LIBOR by the end of 2021. There remains uncertainty regarding the future use of LIBOR and the nature of any replacement rate. The transition process away from LIBOR may involve, among other things, increased volatility or illiquidity in markets for instruments that currently rely on LIBOR. The transition process may also result in a reduction in the value of certain instruments held by a Fund or reduce the effectiveness of related Fund transactions such as hedges. Volatility, the potential reduction in value, and/or the hedge effectiveness of financial instruments may be heightened for financial instruments that do not include fallback provisions that address the cessation of LIBOR. Any potential effects of the transition away from LIBOR on the Fund or on financial instruments in which a Fund invests, as well as other unforeseen effects, could result in losses to the Fund.
Collateral Requirements — During the year ended September 30, 2020, Index Plus was subject to collateral requirements. For derivatives traded under an ISDA Master Agreement, the collateral requirements are typically calculated by netting the mark-to-market
63
GOTHAM FUNDS
Notes to Financial Statements (Continued)
September 30, 2020
amount for each transaction under such agreement and comparing that amount to the value of any collateral currently pledged by the Fund and the counterparty. Cash collateral that has been pledged to cover obligations of the Fund and cash collateral received from the counterparty, if any, is reported separately on the Statement of Assets and Liabilities as cash pledged as collateral and cash received as collateral, respectively. Non-cash collateral pledged by the Fund, if any, is noted in the Schedule of Investments. Generally, the amount of collateral due from or to a counterparty is subject to a certain minimum transfer amount threshold before a transfer is required, which is determined at the close of business of the Fund. Any additional required collateral is delivered to/pledged by the Fund on the next business day. Typically, the counterparty is not permitted to sell, re-pledge or use cash and non-cash collateral it receives. The Fund generally agrees not to use non-cash collateral that it receives but may, absent default or certain other circumstances defined in the underlying ISDA Master Agreement, be permitted to use cash collateral received. In such cases, interest may be paid pursuant to the collateral arrangement with the counterparty. To the extent amounts due to the Fund from its counterparties are not fully collateralized, they bear the risk of loss from counterparty non-performance. Likewise, to the extent the Fund has delivered collateral to a counterparty and stands ready to perform under the terms of its agreement with such counterparty, it bears the risk of loss from a counterparty in the amount of the value of the collateral in the event the counterparty fails to return such collateral. Based on the terms of agreements, collateral may not be required for all derivative contracts. For financial reporting purposes, the Fund does not offset derivative assets and derivative liabilities that are subject to netting arrangements, if any, in the Statement of Assets and Liabilities.
Gross Amount Not Offset in the Statement of Assets and Liabilities | ||||||||||||||||||||
Gross Amounts of Recognized Assets/(Liabilities) | Gross Amounts Statement of Assets and Liabilities | Net Amounts of Assets Presented in the Statement of Assets and Liabilities | Financial Instruments | Collateral Pledged/ (Received)* | Net Amount** | |||||||||||||||
Index Plus | $ | 125,150,190 | $— | $ | 125,150,190 | $— | $ | (107,950,000 | ) | $ | 17,200,190 | |||||||||
| * | Amount disclosed is limited to the amount of assets presented in each Statement of Assets and Liabilities. Actual collateral pledged/(received) may be more than the amount shown. |
| ** | Net amount represents the net receivable from the counterparty in the event of a default. |
2. Transactions with Related Parties and Other Service Providers
Gotham Asset Management, LLC (“Gotham” or the “Adviser”) serves as investment adviser to the Funds pursuant to an investment advisory agreement with the Trust (the “Advisory Agreement”). For its services as the investment adviser, each Fund pays the Adviser a fee, which is computed and accrued daily and paid monthly, at an annual rate based on average daily net assets of each Fund as shown in the table below:
Index Plus | 1.00 | % | ||
Enhanced 500 Plus | 1.00 | % | ||
Enhanced S&P 500 Index | 0.50 | % |
The Adviser contractually agreed to reduce its investment advisory fee and/or reimburse certain expenses of each Fund to the extent necessary to ensure that the Fund’s total operating expenses (exclusive of taxes, “Acquired Fund Fees and Expenses,” dividend and interest expense on securities sold short, interest, extraordinary items, and brokerage commissions do not exceed the percentages set forth in the table below (on an annual basis) of each Fund’s average daily net assets (the “Expense Limitation”). The Expense Limitation will remain in place until the termination date set forth below, unless the Board approves its earlier termination. The table below reflects the Expense Limitation amounts, as a percentage of average daily net assets, in effect during the year ended September 30, 2020.
| Institutional Class | Investor Class | Termination Date | ||||
Index Plus | 1.15% | 1.40% | January 31, 2022 | |||
Enhanced 500 Plus | 1.15% | N/A | January 31, 2021 | |||
Enhanced S&P 500 Index | 0.50% | N/A | January 31, 2023 |
64
GOTHAM FUNDS
Notes to Financial Statements (Continued)
September 30, 2020
For the year ended September 30, 2020, investment advisory fees accrued and waivers were as follows:
Gross Advisory Fee | Waiver/ Reimbursements | Net Advisory Fee/ | |||||||||||||
Index Plus | $5,145,575 | $(433,326) | $4,712,249 | ||||||||||||
Enhanced 500 Plus | 28,029 | (79,156 | ) | (51,127 | ) | ||||||||||
Enhanced S&P 500 Index | 33,892 | (110,782 | ) | (76,890 | ) | ||||||||||
For all Funds, except for Enhanced S&P 500 Index, the Adviser is entitled to recover, subject to approval by the Board, such amounts reduced or reimbursed for a period of up to three (3) years from the date on which the Adviser reduced its compensation and/or assumed expenses for the Fund. The Adviser is permitted to seek reimbursement from the Fund, subject to certain limitations, for fees it waived and Fund expenses it paid to the extent the total annual Fund expenses do not exceed the limits described above or any lesser limits in effect at the time of reimbursement. No recoupment will occur unless a Fund’s expenses are below the Expense Limitation amount. As of September 30, 2020, the amounts of potential reimbursement from the Funds to the Adviser are as follows:
Expiration | Expiration | Expiration | ||||||||||
Index Plus | ||||||||||||
Institutional Class | $ | 9,077 | $ | 383,317 | $ | 422,424 | ||||||
Investor Class | 110 | 11,648 | 10,902 | |||||||||
Enhanced 500 Plus | 56,635 | 84,996 | 79,156 | |||||||||
Other Service Providers
The Bank of New York Mellon (“BNY Mellon”) serves as administrator and custodian for the Funds. For providing administrative and accounting services, BNY Mellon is entitled to receive a monthly fee equal to an annual percentage rate of the Funds’ average daily net assets and is subject to certain minimum monthly fees. For providing certain custodial services, BNY Mellon is entitled to receive a monthly fee, subject to certain minimum, and out of pocket expenses.
BNY Mellon Investment Servicing (US) Inc. (the “Transfer Agent”) provides transfer agent services to the Funds. The Transfer Agent is entitled to receive a monthly fee, subject to certain minimum, and out of pocket expenses.
The Trust, on behalf of the Funds, has entered into agreements with financial intermediaries to provide recordkeeping, processing, shareholder communications and other services to customers of the intermediaries investing in the Funds and has agreed to compensate the intermediaries for providing those services. The fees incurred by the Funds for these services are included in transfer agent fees in the Statement of Operations.
Pershing LLC provides prime brokerage services to the Funds under an Agreement for Prime Brokerage Services. Pershing LLC is a wholly owned subsidiary of The Bank of New York Mellon Corporation.
Foreside Funds Distributors LLC (the “Underwriter”) provides principal underwriting services to the Funds pursuant to an underwriting agreement between the Trust and the Underwriter.
The Trust has adopted a distribution plan for Investor Class shares of Index Plus, in accordance with Rule 12b-1 under the 1940 Act. Pursuant to the Investor Class shares plan, Index Plus compensates the Underwriter for direct and indirect costs and expenses incurred in connection with advertising, marketing and other distribution services in an amount not to exceed 0.25%, on an annualized basis of the Investor Class shares of Index Plus’ average daily net assets.
Trustees and Officers
The Trust is governed by its Board of Trustees. The Trustees receive compensation in the form of an annual retainer and per meeting fees for their services to the Trust. An employee of BNY Mellon serves as the Secretary of the Trust and is not compensated by the Funds or the Trust.
65
GOTHAM FUNDS
Notes to Financial Statements (Continued)
September 30, 2020
JW Fund Management LLC (“JWFM”) provides a Principal Executive Officer and Principal Financial Officer, respectively, to the Trust. Effective October 1, 2020, Alaric Compliance Services LLC (“Alaric”) provides the Trust with a Chief Compliance Officer and an Anti-Money Laundering Officer. Prior to October 1, 2020, Duff & Phelps, LLC provided the Trust with a Chief Compliance Officer and an Anti-Money Laundering Officer. JWFM and Alaric are compensated for their services provided to the Trust.
3. Investments in Securities
For the year ended September 30, 2020 for all Funds, aggregated purchases and sales of investment securities (excluding short-term investments) of the Funds were as follows:
| Purchases | Sales | |||||||
Index Plus | $ | 1,090,023,373 | $ | 1,348,797,736 | ||||
Enhanced 500 Plus | 10,368,975 | 10,755,526 | ||||||
Enhanced S&P 500 Index | 23,108,779 | 23,515,884 | ||||||
For the year ended September 30, 2020, the Funds had no purchases or sales of U.S. Government securities.
4. Capital Share Transactions
For the years ended September 30, 2020 and September 30, 2019, transactions in capital shares of the Funds (authorized shares unlimited) were as follows:
| For the Year Ended September 30, 2020 | For the Year Ended September 30, 2019 | |||||||||||||||
| Shares | Value | Shares | Value | |||||||||||||
Index Plus: | ||||||||||||||||
Institutional Class Shares: | ||||||||||||||||
Sales | 8,500,444 | $ | 128,551,226 | 30,939,866 | $ | 448,118,312 | ||||||||||
Reinvestments | 420,842 | 6,754,520 | 694,592 | 10,008,109 | ||||||||||||
Redemption Fees* | — | 14,426 | — | 10,033 | ||||||||||||
Redemptions | (27,196,363 | ) | (388,757,413 | ) | (29,109,307 | ) | (417,955,994 | ) | ||||||||
|
|
|
|
|
|
|
| |||||||||
Net Increase/(Decrease) | (18,275,077 | ) | $ | (253,437,241 | ) | 2,525,151 | $ | 40,180,460 | ||||||||
|
|
|
|
|
|
|
| |||||||||
Investor Class Shares: | ||||||||||||||||
Sales | 193,502 | $ | 2,999,496 | 1,220,065 | $ | 17,860,458 | ||||||||||
Reinvestments | 12,613 | 202,195 | 20,501 | 295,007 | ||||||||||||
Redemption Fees* | — | 388 | — | 772 | ||||||||||||
Redemptions | (723,732 | ) | (10,557,650 | ) | (1,003,916 | ) | (14,661,897 | ) | ||||||||
|
|
|
|
|
|
|
| |||||||||
Net Increase/(Decrease) | (517,617 | ) | $ | (7,355,571 | ) | 236,650 | $ | 3,494,340 | ||||||||
|
|
|
|
|
|
|
| |||||||||
Enhanced 500 Plus: | ||||||||||||||||
Institutional Class Shares: | ||||||||||||||||
Sales | 2,136 | $ | 23,898 | 38 | $ | 500 | ||||||||||
Reinvestments | 21,275 | 246,579 | 43,739 | 473,685 | ||||||||||||
Redemption Fees* | — | — | — | — | ||||||||||||
Redemptions | (20,986 | ) | (243,236 | ) | — | — | ||||||||||
|
|
|
|
|
|
|
| |||||||||
Net Increase | 2,425 | $ | 27,241 | 43,777 | $ | 474,185 | ||||||||||
|
|
|
|
|
|
|
| |||||||||
66
GOTHAM FUNDS
Notes to Financial Statements (Continued)
September 30, 2020
| For the Year Ended September 30, 2020 | For the Year Ended September 30, 2019 | |||||||||||||||
| Shares | Value | Shares | Value | |||||||||||||
Enhanced S&P 500 Index: | ||||||||||||||||
Institutional Class Shares: | ||||||||||||||||
Sales | 371,473 | $ | 4,535,175 | 295,873 | $ | 3,503,498 | ||||||||||
Reinvestments | 22,022 | 269,329 | 48,854 | 516,389 | ||||||||||||
Redemption Fees* | — | 413 | — | 100 | ||||||||||||
Redemptions | (456,234 | ) | (5,102,149 | ) | (46,213 | ) | (545,970 | ) | ||||||||
|
|
|
|
|
|
|
| |||||||||
Net Increase/(Decrease) | (62,739 | ) | $ | (297,232 | ) | 298,514 | $ | 3,474,017 | ||||||||
|
|
|
|
|
|
|
| |||||||||
| * | There is a 1.00% redemption fee that may be charged on shares redeemed within 30 days of purchase. The redemption fees are retained by each Fund for the benefit of the remaining shareholders and recorded as paid-in-capital. |
Significant Shareholders
As of September 30, 2020, the below Funds had shareholders that held 10% or more of the outstanding shares of the respective Fund. Transactions by these shareholders may have a material impact on the Fund.
Index Plus | ||||
Affiliated Fund | 1 | % | ||
Affiliated Shareholders | 1 | % | ||
Enhanced 500 Plus | ||||
Non-affiliated Shareholders | 98 | % | ||
Enhanced S&P 500 Index | ||||
Affiliated Shareholders | 1 | % | ||
Non-affiliated Shareholders | 50 | % |
5. Securities Lending
All Funds, except for Enhanced S&P 500 Index, may lend securities to financial institutions, such as broker-dealers, and are required to be secured continuously by collateral in cash, cash equivalents, letter of credit or U.S. Government securities maintained on a current basis at an amount at least equal to the market value of the securities loaned. Cash collateral received, pursuant to investment guidelines established by the Funds and approved by the Board, is invested in short-term investments and/or securities consistent with the Fund’s investment objective. Securities purchased with cash collateral are included in market value of securities designated as collateral for securities on loan on the Statements of Assets and Liabilities. All such investments are made at the risk of the Funds and, as such, the Funds are liable for investment losses. The Funds pay a fee on the cash collateral received by the Funds at a rate equal to the Federal Funds (Open) rate plus 40 basis points with respect to the cash collateral received on those securities on loan that have a rebate that equals or exceeds the greater of either the Federal Funds (Open) rate minus 10 basis points or zero. These fees are included in the fees on cash collateral on the Statements of Operations. Such loans would involve risks of delay in receiving additional collateral in the event the value of the collateral decreased below the value of the securities loaned or of delay in recovering the securities loaned or even loss of rights in the collateral should the borrower of the securities fail financially. However, loans will be made only to borrowers deemed by the Adviser to be of good standing and only when, in the Adviser’s judgment, the income to be earned from the loans justifies the attendant risks. Any loans of a Fund’s securities will be fully collateralized and marked to market daily. When the collateral falls below specified amounts, the lending agent will use its best effort to obtain additional collateral on the next business day to meet required amounts under the security lending agreement. Securities on loan are not used as collateral for swaps or as collateral for short securities, if any. During the year ended September 30, 2020, only Enhanced 500 Plus entered into the securities lending program. The market value of securities on loan and cash collateral received as of September 30, 2020 and the income generated from the program during the year ended September 30, 2020, with respect to such loans is as follows:
67
GOTHAM FUNDS
Notes to Financial Statements (Continued)
September 30, 2020
Market Value of Securities Loaned | Cash Collateral Received | Market Value of Non-cash Collateral | Income Received from Securities Lending | |||||
Enhanced 500 Plus | $48,125 | $— | $49,074 | $78 |
Securities lending transactions are entered into by the Funds under a Master Securities Lending Agreement (“MSLA”) which permits the Funds, under certain circumstances including an event of default (such as bankruptcy or insolvency), to offset amounts payable by the Funds to the same counterparty against amounts to be received from that counterparty and create one single net payment due to or from the Funds. The following table is a summary of the Fund’s open securities lending transactions which are subject to a MSLA as of September 30, 2020:
Gross Amount Not Offset in the Statement of Assets and Liabilities | ||||||||||||
Gross Amounts of | Gross Amounts Statement of Assets and Liabilities | Net Amounts of Assets Presented in the Statement of Assets and Liabilities | Financial Instruments | Cash and Non-Cash Collateral Received* | Net Amount** | |||||||
Enhanced 500 Plus | $48,125 | $— | $48,125 | $— | $(48,125) | $— | ||||||
| * | Amount disclosed is limited to the amount of assets presented in each Statement of Assets and Liabilities. Actual collateral received may be more than the amount shown. |
| ** | Net amount represents the net receivable from the counterparty in the event of a default. |
6. Federal Tax Information
The Funds have followed the authoritative guidance on accounting for and disclosure of uncertainty in tax positions, which requires the Funds to determine whether a tax position is more likely than not to be sustained upon examination, including resolution of any related appeals or litigation processes, based on the technical merits of the position. The Funds had determined that there was no effect on the financial statements from following this authoritative guidance. In the normal course of business, the Funds are subject to examination by federal, state and local jurisdictions, where applicable, for tax years for which applicable statutes of limitations have not expired.
Distributions are determined in accordance with federal income tax regulations, which may differ in amount or character from net investment income and realized gains for financial reporting purposes. Accordingly, the character of distributions and composition of net assets for tax purposes may differ from those reflected in the accompanying financial statements. To the extent these differences are permanent, such amounts are reclassified within the components of net assets based on the tax treatment; temporary differences do not require reclassifications. Net assets were not affected by these adjustments. The permanent differences as of September 30, 2020, were primarily attributed to redesignation of dividends paid and equalization utilized.
The tax character of distributions paid by the Funds during the year ended September 30, 2020 were as follows:
Ordinary Income Dividend | Long-Term Capital Gain Dividend | Return of Capital | ||||||||
Index Plus | $9,432,222 | $ | — | $— | ||||||
Enhanced 500 Plus | 40,676 | 205,903 | — | |||||||
Enhanced S&P 500 Index | 113,277 | 156,052 | — | |||||||
68
GOTHAM FUNDS
Notes to Financial Statements (Continued)
September 30, 2020
The tax character of distributions paid by the Funds during the year ended September 30, 2019 were as follows:
| Ordinary Income Dividend | Long-Term Capital Gain Dividend | Return | ||||||||
Index Plus | $ | 2,617,482 | $ | 10,699,747 | $— | |||||
Enhanced 500 Plus | 25,689 | 447,996 | — | |||||||
Enhanced S&P 500 Index | 102,992 | 413,397 | — | |||||||
Distributions from net investment income and short-term capital gains are treated as ordinary income for federal income tax purposes.
As of September 30, 2020, the components of distributable earnings on a tax basis were as follows:
Capital Loss Carryforward | Undistributed Ordinary Income | Undistributed Long-Term Gain | Unrealized | Qualified Late-Year Losses | Other | |||||||||||||||||||||||||
Index Plus | $ | (23,491,546 | ) | $ | 4,544,442 | $— | $ | 154,488,033 | $ | (65,075,244 | ) | $ | (3,799,175 | ) | ||||||||||||||||
Enhanced 500 Plus | — | 24,938 | — | 354,241 | (48,332 | ) | — | |||||||||||||||||||||||
Enhanced S&P 500 Index | — | 87,555 | — | 662,379 | (188,089 | ) | — | |||||||||||||||||||||||
The differences between the book and tax basis components of distributable earnings relate primarily to the timing and recognition of income and gains for federal income tax purposes. The other temporary differences as of September 30, 2020 were primarily attributed to qualified late-year losses deferred, deferral of loss on unsettled trades, wash sales on unsettled short sales, wash sales, realized gain/loss on unsettled swap agreements, deferred interest expense and capital loss carryforwards not yet utilized. Foreign currency and short-term capital gains are reported as ordinary income for federal income tax purposes.
As of September 30, 2020, the federal tax cost, aggregate gross unrealized appreciation and depreciation of securities held by the Funds were as follows:
| Federal Tax Cost | Unrealized | Unrealized | Net Unrealized | |||||||||||||
Index Plus | $ | 357,736,774 | $ | 336,692,509 | $ | (182,204,476 | ) | $ | 154,488,033 | |||||||
Enhanced 500 Plus | 3,647,418 | 806,377 | (452,136 | ) | 354,241 | |||||||||||
Enhanced S&P 500 Index | 5,647,659 | 1,026,290 | (363,911 | ) | 662,379 | |||||||||||
Pursuant to federal income tax rules applicable to regulated investment companies, the Funds may elect to treat certain capital losses between November 1 and September 30 and late year ordinary losses ((i) ordinary losses between January 1 and September 30 or (ii) specified ordinary losses between November 1 and September 30) as occurring on the first day of the following tax year. For the year ended September 30, 2020, any amount of losses elected within the tax return will not be recognized for federal income tax purposes until October 1, 2020. For the year ended September 30, 2020, the Funds deferred to October 1, 2020 the following losses:
| Late-Year Ordinary Losses Deferral | Short-Term Capital Loss Deferral | Long-Term Capital Loss Deferral | |||||||||||||
Index Plus | $— | $167,663,118 | $(102,587,874 | ) | |||||||||||
Enhanced 500 Plus | — | 308,215 | (259,883 | ) | |||||||||||
Enhanced S&P 500 Index | — | 663,020 | (474,931 | ) | |||||||||||
Accumulated capital losses represent net capital loss carryforwards as of September 30, 2020 that may be available to offset future realized capital gains and thereby reduce future capital gains distributions. The Funds are permitted to carry forward capital losses for an unlimited period. Capital losses that are carried forward will retain their character as either short-term or long-term capital losses. As of September 30, 2020, the following Funds had long-term and short-term capital loss carryforwards in the following amounts:
69
GOTHAM FUNDS
Notes to Financial Statements (Concluded)
September 30, 2020
Capital Losses Carryforwards | ||||
Index Plus | $23,491,546 | |||
For the year ended September 30, 2020, the following Funds utilized capital losses as follows:
| Capital Losses Utilized | ||
Index Plus | $3,630,987 |
7. Subsequent Events
Management has evaluated the impact of all subsequent events on the Funds through the date the financial statements were available to be issued, and has determined that there was the following subsequent event:
Effective November 1, 2020, the Gotham Enhanced S&P 500 Index Fund (“Fund”) entered into a Support, Service and Fee Assumption Agreement (“Agreement”) with Gotham Asset Management, LLC (“Gotham”), whereby Gotham will assume and undertake to pay substantially all Fund expenses, except investment advisory fees. Under the Agreement, Gotham is entitled to a fee, computed daily and payable monthly, equal to the lesser of (i) the annualized rate of 0.15% of the Fund’s average daily net assets, or (ii) the actual amount of Gotham’s payment obligation under the Agreement.
70
Report of Independent Registered Public Accounting Firm
To the Board of Trustees of FundVantage Trust and Shareholders of Gotham Index Plus Fund, Gotham Enhanced 500 Plus Fund and Gotham Enhanced S&P 500 Index Fund
Opinions on the Financial Statements
We have audited the accompanying statements of assets and liabilities, including the portfolios of investments, of Gotham Index Plus Fund, Gotham Enhanced 500 Plus Fund and Gotham Enhanced S&P 500 Index Fund (three of the funds constituting FundVantage Trust, referred to hereafter collectively as the “Funds”) as of September 30, 2020, the related statements of operations for the year ended September 30, 2020, the statements of changes in net assets for each of the two years in the period ended September 30, 2020, and for Gotham Enhanced 500 Plus Fund, the statement of cash flows for the year ended September 30, 2020, including the related notes, and the financial highlights for each of the periods indicated therein (collectively referred to as the “financial statements”). In our opinion, the financial statements present fairly, in all material respects, the financial position of each of the Funds as of September 30, 2020, the results of each of their operations for the year then ended, the changes in each of their net assets for each of the two years in the period ended September 30, 2020, for Gotham Enhanced 500 Plus Fund, the results of its cash flows for the year then ended and each of the financial highlights for each of the periods indicated therein in conformity with accounting principles generally accepted in the United States of America.
Basis for Opinions
These financial statements are the responsibility of the Funds’ management. Our responsibility is to express an opinion on the Funds’ financial statements based on our audits. We are a public accounting firm registered with the Public Company Accounting Oversight Board (United States) (PCAOB) and are required to be independent with respect to the Funds in accordance with the U.S. federal securities laws and the applicable rules and regulations of the Securities and Exchange Commission and the PCAOB.
We conducted our audits of these financial statements in accordance with the standards of the PCAOB. Those standards require that we plan and perform the audit to obtain reasonable assurance about whether the financial statements are free of material misstatement, whether due to error or fraud.
Our audits included performing procedures to assess the risks of material misstatement of the financial statements, whether due to error or fraud, and performing procedures that respond to those risks. Such procedures included examining, on a test basis, evidence regarding the amounts and disclosures in the financial statements. Our audits also included evaluating the accounting principles used and significant estimates made by management, as well as evaluating the overall presentation of the financial statements. Our procedures included confirmation of securities owned as of September 30, 2020 by correspondence with the custodian and brokers; when replies were not received from brokers, we performed other auditing procedures. We believe that our audits provide a reasonable basis for our opinions.
/s/ PricewaterhouseCoopers LLP
Philadelphia, PA
November 23, 2020
We have served as the auditor of one or more investment companies in Gotham Asset Management LLC since 2011.
71
Shareholder Tax Information
(Unaudited)
Certain tax information regarding each Fund is required to be provided to shareholders based upon each Fund’s income and distributions for the taxable year ended September 30, 2020. The information and distributions reported herein may differ from information and distributions taxable to the shareholders for the calendar year ending December 31, 2020. During the fiscal year ended September 30, 2020, the following dividends and distributions were paid by each of the Funds:
| Ordinary Income | Long-Term | |||||||
Index Plus | $9,432,222 | $ — | ||||||
Enhanced 500 Plus | 40,676 | 205,903 | ||||||
Enhanced S&P 500 Index | 113,277 | 156,052 | ||||||
Distributions from net investment income and short-term capital gains are treated as ordinary income for federal income tax purposes. Index Plus had $116,102 attributable to equalization utilized.
Where appropriate, all designations are based on financial information available as of the date of this annual report and, accordingly, are subject to change. For each item, it is the intention of each Fund to designate the maximum amount permitted under the Internal Revenue Code of 1986, as amended, and the regulations thereunder.
Under the Jobs and Growth Tax Relief Reconciliation Act of 2003, the following percentages of ordinary dividends paid during the fiscal year ended September 30, 2020 were designated as “qualified dividend income”, as defined in the Act, and are subject to reduced tax rates:
Index Plus | 100.00 | % | ||
Enhanced 500 Plus | 100.00 | % | ||
Enhanced S&P 500 Index | 97.13 | % |
The percentage of total ordinary income dividends paid qualifying for the corporate dividends received deduction for each Fund is as follows:
Index Plus | 100.00 | % | ||
Enhanced 500 Plus | 100.00 | % | ||
Enhanced S&P 500 Index | 97.47 | % |
The percentage of qualified interest income related dividends not subject to withholding tax for non-resident aliens and foreign corporations is as follows:
Index Plus | 0.51 | % | ||
Enhanced S&P 500 Index | 0.21 | % |
The percentage of ordinary income distributions designated as qualified short-term gains pursuant to the American Job Creation Act of 2004 is as follows:
Enhanced 500 Plus | 100.00 | % | ||
Enhanced S&P 500 Index | 100.00 | % |
Because the Funds’ fiscal year is not the calendar year, another notification will be sent with respect to calendar year 2020. The second notification, which will reflect the amount, if any, to be used by calendar year taxpayers on their U.S. federal income tax returns will be made in conjunction with Form 1099-DIV and will be mailed in January 2021.
Foreign shareholders will generally be subject to U.S. withholding tax on the amount of their ordinary income dividends. They will generally not be entitled to a foreign tax credit or deduction for the withholding taxes paid by a Fund, if any.
In general, dividends received by tax-exempt recipients (e.g., IRAs and Keoghs) need not be reported as taxable income for U.S. federal income tax purposes. However, some retirement trusts (e.g., corporate, Keogh and 403(b)(7) plans) may need this information for their annual information reporting.
Shareholders are advised to consult their own tax advisers with respect to the tax consequences of their investment in a Fund.
72
Other Information
(Unaudited)
Proxy Voting
Policies and procedures that the Funds use to determine how to vote proxies relating to portfolio securities as well as information regarding how a Fund voted proxies relating to portfolio securities for the most recent 12-month period ended June 30 are available without charge, upon request, by calling (877) 974-6852 and on the Securities and Exchange Commission’s (“SEC”) website at http://www.sec.gov.
Quarterly Portfolio Schedules
The Trust files its complete schedule of portfolio holdings with the SEC for the first and third fiscal quarters of each fiscal year (quarters ended December 31 and June 30) as an exhibit to their reports on Form N-PORT. The Trust’s portfolio holdings on Form N-PORT are available on the SEC’s website at http://www.sec.gov.
Board Consideration of Investment Advisory Agreement
At a videoconference meeting held on June 22-23, 2020 (the “Meeting”), the Board of Trustees (the “Board” or the “Trustees”) of FundVantage Trust (the “Trust”), including a majority of the Trustees who are not “interested persons” within the meaning of Section 2(a)(19) of the Investment Company Act of 1940, as amended (the “1940 Act”) (the “Independent Trustees”), unanimously approved the continuation of the Investment Advisory Agreement between Gotham Asset Management, LLC (“Gotham” or the “Adviser”) and the Trust (the “Gotham Agreement”) on behalf of the Gotham Index Plus Fund, Gotham Enhanced 500 Plus Fund and Gotham Enhanced S&P 500 Index Fund (together, the “Gotham Funds”). At the Meeting, the Board considered the continuation of the Gotham Agreement with respect to the Gotham Funds for an additional one year period.
In determining whether to continue the Gotham Agreement for an additional one-year period, the Trustees, including the Independent Trustees, considered information provided by Gotham in response to a request for information in accordance with Section 15(c) of the 1940 Act (the “Gotham 15(c)Response”) regarding (i) the services performed for the Gotham Funds, (ii) the size and qualifications of Gotham’s portfolio management staff, (iii) any potential or actual material conflicts of interest which may arise in connection with a portfolio manager’s management of the Gotham Funds, (iv) investment performance, (v) the financial condition of Gotham, (vi) brokerage selection procedures (including soft dollar arrangements, if any), (vii) the procedures for allocating investment opportunities between the Gotham Funds and other clients, (viii) results of any regulatory examination, including any recommendations or deficiencies noted, (ix) any litigation, investigation or administrative proceeding which may have a material impact on Gotham’s ability to service the Gotham Funds, and (x) compliance with the Gotham Funds’ investment objectives, policies and practices (including codes of ethics and proxy voting policies), federal securities laws and other regulatory requirements. In addition to the Gotham 15(c) Response, the Trustees received reports at Board meetings throughout the year covering matters such as the relative performance of the Gotham Funds, compliance with the Funds’ respective investment objectives, policies, strategies and limitations, compliance of portfolio management personnel with the applicable code of ethics, and adherence to pricing procedures as established by the Board (each, as applicable).
The Board noted that representatives of Gotham joined the Meeting by videoconference and discussed Gotham’s history, performance, investment strategy, and compliance program. Representatives of Gotham responded to questions from the Board. In addition to the Gotham 15(c) Response, the Trustees also considered other factors they believed to be relevant to considering the continuation of the Gotham Agreement, including the matters discussed below. In their deliberations, the Trustees did not identify any particular information that was controlling, and different Trustees may have attributed different weights to the various factors. After deliberating, the Trustees determined that the overall arrangement between the Gotham Funds and Gotham, as provided by the terms of the Gotham Agreement, including the advisory fees under the Gotham Agreement, are fair and reasonable in light of the services provided, expenses incurred and such other matters as the Trustees considered relevant.
The Trustees considered the services provided by Gotham to the Gotham Funds. The Trustees considered Gotham’s personnel and the depth of Gotham’s personnel who provide investment management services to the Gotham Funds and the depth of their experience. Based on the Gotham 15(c) Response, the Trustees concluded that (i) the nature, extent and quality of the services provided by Gotham are appropriate and consistent with the terms of the Gotham Agreement, (ii) that the quality of those services has been, and continues to be, consistent with industry norms, (iii) the Gotham Funds are likely to benefit from the continued provision of those services, (iv) Gotham has sufficient personnel, with the appropriate skills and experience, to serve the Gotham Funds effectively and
73
GOTHAM FUNDS
Other Information (Continued)
(Unaudited)
has demonstrated its continuing ability to attract and retain qualified personnel, and (v) the satisfactory nature, extent, and quality of services currently provided to the Gotham Funds is likely to continue under the Gotham Agreement.
The Board discussed Gotham’s business continuity plan, and its ability to continue to manage the Gotham Funds effectively in light of the recent volatility in financial markets as a result of the COVID-19 virus outbreak.
The Trustees considered the investment performance for the Gotham Funds and Gotham. The Trustees reviewed historical performance charts which showed the performance of the Gotham Funds as compared to their respective benchmark indices and Lipper categories for the since inception, year-to-date, one year, two year, three year, five year and ten year periods ended March 31, 2020 as applicable. The Trustees considered the short term and long term performance of the Gotham Funds, as applicable. The Trustees noted that they considered performance reports provided at Board meetings throughout the year.
Gotham Enhanced 500 Plus Fund. The Trustees noted that the Gotham Enhanced 500 Plus Fund underperformed the S&P 500 Total Return Index for the year-to-date, one year, two year, three year and since inception periods ended March 31, 2020. They further noted that the Gotham Enhanced 500 Plus Fund outperformed the Lipper Alternative Long/Short Equity Funds Index for the two year, three year and since inception periods ended March 31, 2020 and underperformed the Lipper Alternative Long/Short Equity Funds Index for the year to date and one year periods ended March 31, 2020.
Gotham Enhanced S&P 500 Index Fund. The Trustees noted that the Gotham Enhanced S&P 500 Index Fund outperformed the Lipper Large-Cap Core Funds Index for the year to date, one year, two year, three year, and since inception periods ended March 31, 2020. They further noted that the Gotham Enhanced S&P 500 Index Fund outperformed the S&P 500 Total Return Index for the three year and since inception periods ended March 31, 2020 and underperformed the S&P 500 Total Return Index for the year-to-date, one year and two year periods ended March 31, 2020.
Gotham Index Plus Fund. The Trustees noted that the Gotham Index Plus Fund Institutional Class shares underperformed the S&P 500 Total Return Index for the year-to-date, one year, two year, three year, five year and since inception periods ended March 31, 2020. They further noted that the Gotham Index Plus Fund Institutional Class shares outperformed the Lipper Large-Cap Core Funds Index for the five year and since inception periods ended March 31, 2020 and underperformed the Lipper Large-Cap Core Funds Index for the year-to-date, one year, two year and three year periods ended March 31, 2020.
The Trustees concluded that the performance of each of the Gotham Funds was within an acceptable range of performance relative to other mutual funds with similar investment objectives, strategies and policies based on the information provided at the Meeting.
The Trustees noted that the representatives of Gotham had provided information regarding its advisory fees and an analysis of these fees in relation to the services provided to the Funds and any other ancillary benefit resulting from the Gotham’s relationship with the Funds.
The Trustees also reviewed information regarding the fees Gotham charges to certain other clients and evaluated explanations provided by Gotham as to differences in fees charged to the Funds and other similarly managed accounts, where applicable. The Trustees also reviewed a peer comparison of advisory fees and total expenses for each Gotham Fund versus those funds in the Fund’s applicable Lipper category (the “Peer Group”). The Trustees concluded that the advisory fees and services provided by Gotham are consistent with those of other advisers that manage mutual funds with investment objectives, strategies and policies similar to those of the Funds as measured by the information provided by Gotham.
The Board considered, among other data, the specific factors and related conclusions set forth below with respect to each Fund:
Gotham Enhanced 500 Plus Fund. The contractual advisory fee and net total expense ratio for the Gotham Enhanced 500 Plus Fund’s Institutional Class shares were equal to and lower than, respectively, the median contractual advisory fee and net total expense ratio for those funds in the Gotham Enhanced 500 Plus Fund’s Peer Group with $250 million or less in assets.
74
GOTHAM FUNDS
Other Information (Concluded)
(Unaudited)
Gotham Enhanced S&P 500 Index Fund. The contractual advisory fee and net total expense ratio for the Gotham Enhanced S&P 500 Index Fund’s Institutional Class shares were higher than and lower than, respectively, the median contractual advisory fee and net total expense ratio for those funds in the Gotham Enhanced S&P 500 Index Fund’s Peer Group with $250 million or less in assets.
Gotham Index Plus Fund. The contractual advisory fee and net total expense ratio for the Gotham Index Plus Fund’s Institutional Class shares were higher than the median contractual advisory fee and net total expense ratio for those funds in the Gotham Index Plus Fund’s Peer Group.
The Trustees also discussed the limitations of the comparative expense information provided with respect to each Gotham Fund’s Peer Group, given the potential varying nature, extent and quality of the services provided by the advisors of other portfolios included in each of the Peer Groups. Based upon their review, the Trustees concluded that the respective advisory fees for the Gotham Funds were reasonable in light of the high quality of services received by the Funds from Gotham.
The Trustees considered the costs of the services provided by Gotham, the compensation and benefits received by Gotham in providing services to the Gotham Funds, its profitability and certain additional information related to Gotham’s financial condition. In addition, the Trustees considered any direct or indirect revenues received by affiliates of Gotham.
The Trustees considered the extent to which economies of scale may be realized relative to fee levels, and whether the advisory fee levels reflect these economies of scale for the benefit of shareholders. The Board noted Gotham’s representation that none of the Funds have reached an asset size at which economies of scale would traditionally be considered to exist, and Gotham’s belief that breakpoints are not appropriate at this time. The Board further considered Gotham’s representation that the nature of various of the Funds’ investment strategies were such that future capacity was constrained based on Gotham’s ability to implement the strategy above certain asset levels, and as such the Funds’ ability to achieve future economies of scale were limited relative to more traditional asset classes. Based on the foregoing information, the Board concluded that economies of scale did not yet exist for the Funds and that therefore it was not yet necessary to consider whether the fee structure of the Funds provided an adequate mechanism for sharing the benefit of any such economies.
At the Meeting, after consideration of all the factors and taking into consideration the information presented, the Board, including the Independent Trustees, unanimously approved the continuation of the Gotham Agreement for an additional one-year period. In arriving at their decision, the Trustees did not identify any single matter as controlling, but made their determination in light of all the circumstances.
75
Privacy Notice
(Unaudited)
The privacy of your personal financial information is extremely important to us. When you open an account with us, we collect a significant amount of information from you in order to properly invest and administer your account. We take very seriously the obligation to keep that information private and confidential, and we want you to know how we protect that important information.
We collect nonpublic personal information about you from applications or other forms you complete and from your transactions with us or our affiliates. We do not disclose information about you, or our former clients, to our affiliates or to service providers or other third parties, except as permitted by law. We share only the information required to properly administer your accounts, which enables us to send transaction confirmations, monthly or quarterly statements, financials and tax forms. Even within FundVantage Trust and its affiliated entities, a limited number of people who actually service accounts will have access to your personal financial information. Further, we do not share information about our current or former clients with any outside marketing groups or sales entities.
To ensure the highest degree of security and confidentiality, FundVantage Trust and its affiliates maintain various physical, electronic and procedural safeguards to protect your personal information. We also apply special measures for authentication of information you request or submit to us on our web site www.gothamfunds.com.
If you have questions or comments about our privacy practices, please call us at (877) 974-6852.
76
Fund Management
(Unaudited)
FundVantage Trust (the “Trust”) is governed by a Board of Trustees (the “Board” or the “Trustees”). The primary responsibility of the Trustees is to represent the interest of the Trust’s shareholders and to provide oversight management of the Trust.
The following tables present certain information regarding the Board of Trustees and officers of the Trust. None of the Trustees are an “interested person” of the Trust, the Adviser, another investment adviser of a series of the Trust, or Foreside Funds Distributors LLC, the principal underwriter of the Trust (“Underwriter”), within the meaning of the 1940 Act and each Trustee is referred to as an “Independent Trustee” and is listed under such heading below. Employees of certain service providers to the Trust serve as officers of the Trust; such persons are not compensated by the Fund. The address of each Trustee and officer as it relates to the Trust’s business is 301 Bellevue Parkway, 2nd Floor, Wilmington, DE 19809.
The Statement of Additional Information for the Funds contains additional information about the Trustees and is available, without charge, upon request, by calling (877) 974-6852.
Name and Date of Birth | Position(s) Held with Trust | Term of Office and Length of Time Served | Principal Occupation(s) During Past Five Years |
Number of Funds in Trust Complex Overseen by Trustee | Other Directorships Held by Trustee | |||||
| INDEPENDENT TRUSTEES | ||||||||||
ROBERT J. CHRISTIAN Date of Birth: 2/49 | Trustee | Shall serve until death, resignation or removal. Trustee since 2007. Chairman from 2007 until September 30, 2019. | Retired since February 2006; Executive Vice President of Wilmington Trust Company from February 1996 to February 2006; President of Rodney Square Management Corporation (“RSMC”) (investment advisory firm) from 1996 to 2005; Vice President of RSMC from 2005 to 2006. | 38 | Optimum Fund Trust (registered investment company with 6 portfolios); Third Avenue Trust (registered investment company with 3 portfolios); Third Avenue Variable Series Trust (registered investment company with 1 portfolio).
| |||||
IQBAL MANSUR Date of Birth: 6/55 | Trustee | Shall serve until death, resignation or removal. Trustee since 2007. | Retired since September 2020; Professor of Finance, Widener University from 1998 to August 2020. | 38 | Third Avenue Trust (registered investment company with 3 portfolios); Third Avenue Variable Series Trust (registered investment company with 1 portfolio).
| |||||
77
GOTHAM FUNDS
Fund Management (Continued)
(Unaudited)
Name and Date of Birth | Position(s) Held with Trust | Term of Office and Length of Time Served | Principal Occupation(s) During Past Five Years |
Number of Funds in Trust Complex Overseen by Trustee | Other Directorships Held by Trustee | |||||
NICHOLAS M. MARSINI, JR. Date of Birth: 8/55 | Trustee and Chairman of the Board | Shall serve until death, resignation or removal. Trustee since 2016. Chairman since October 1, 2019. | Retired since March 2016. President of PNC Bank Delaware from June 2011 to March 2016; Executive Vice President of Finance of BNY Mellon from July 2010 to January 2011; Executive Vice President and Chief Financial Officer of PNC Global Investment Servicing from September 1997 to July 2010. | 38 | Brinker Capital Destinations Trust (registered investment company with 10 portfolios); Third Avenue Trust (registered investment company with 3 portfolios); Third Avenue Variable Series Trust (registered investment company with 1 portfolio). | |||||
NANCY B. WOLCOTT Date of Birth: 11/54 | Trustee | Shall serve until death, resignation or removal. Trustee since 2011. | Retired since May 2014; EVP, Head of GFI Client Service Delivery, BNY Mellon from January 2012 to May 2014; EVP, Head of US Funds Services, BNY Mellon from July 2010 to January 2012; President of PNC Global Investment Servicing from 2008 to July 2010; Chief Operating Officer of PNC Global Investment Servicing from 2007 to 2008; Executive Vice President of PFPC Worldwide Inc. from 2006 to 2007. | 38 | Lincoln Variable Insurance Products Trust (registered investment company with 97 portfolios); Third Avenue Trust (registered investment company with 3 portfolios); Third Avenue Variable Series Trust (registered investment company with 1 portfolio).
| |||||
78
GOTHAM FUNDS
Fund Management (Concluded)
(Unaudited)
Name and Date of Birth | Position(s) Held with Trust | Term of Office and Length of Time Served | Principal Occupation(s) During Past Five Years |
Number of Funds in Trust Complex Overseen by Trustee
| Other Directorships Held by Trustee | |||||
STEPHEN M. WYNNE Date of Birth: 1/55 | Trustee | Shall serve until death, resignation or removal. Trustee since 2009. | Retired since December 2010; Chief Executive Officer of US Funds Services, BNY Mellon Asset Servicing from July 2010 to December 2010; Chief Executive Officer of PNC Global Investment Servicing from March 2008 to July 2010; President, PNC Global Investment Servicing from 2003 to 2008. | 38 | Copeland Trust (registered investment company with 3 portfolios); Third Avenue Trust (registered investment company with 3 portfolios); Third Avenue Variable Series Trust (registered investment company with 1 portfolio). | |||||
Name and Date of Birth
| Position(s) Held with Trust
|
Term of Office and Length of Time Served
| Principal Occupation(s) During Past Five Years
| |||
| EXECUTIVE OFFICERS | ||||||
JOEL L. WEISS Date of Birth: 1/63 | President and Chief Executive Officer | Shall serve until death, resignation or removal. Officer since 2007. | President of JW Fund Management LLC since June 2016; Vice President and Managing Director of BNY Mellon Investment Servicing (US) Inc. and predecessor firms from 1993 to June 2016. | |||
T. RICHARD KEYES Date of Birth: 1/57 | Treasurer and Chief Financial Officer | Shall serve until death, resignation or removal. Officer since 2016. | President of TRK Fund Consulting LLC since July 2016; Head of Tax - U.S. Fund Services of BNY Mellon Investment Servicing (US) Inc. and predecessor firms from February 2006 to July 2016. | |||
GABRIELLA MERCINCAVAGE Date of Birth: 6/68 | Assistant Treasurer | Shall serve until death, resignation or removal. Officer since 2019. | Fund Administration Consultant since January 2019; Fund Accounting and Tax Compliance Accountant to financial services companies from November 2003 to July 2018. | |||
VINCENZO A. SCARDUZIO Date of Birth: 4/72 | Secretary | Shall serve until death, resignation or removal. Officer since 2012. | Director and Vice President Regulatory Administration of The Bank of New York Mellon and predecessor firms since 2001. | |||
GUY F. TALARICO Date of Birth: 8/55 | Chief Compliance Officer and Anti-Money Laundering Officer | Shall serve until death, resignation or removal. Officer since 2020. | Chief Executive Officer of Alaric Compliance Services LLC since June 2004. | |||
79
Investment Adviser
Gotham Asset Management, LLC
535 Madison Avenue, 30th Floor
New York, NY 10022
Administrator
The Bank of New York Mellon
301 Bellevue Parkway
Wilmington, DE 19809
Transfer Agent
BNY Mellon Investment Servicing (US) Inc.
4400 Computer Drive
Westborough, MA 01581
Principal Underwriter
Foreside Funds Distributors LLC
400 Berwyn Park
899 Cassatt Road
Berwyn, PA 19312
Custodian
The Bank of New York Mellon
240 Greenwich Street
New York, NY 10286
Independent Registered Public Accounting Firm
PricewaterhouseCoopers LLP
Two Commerce Square, Suite 1800
2001 Market Street
Philadelphia, PA 19103-7042
Legal Counsel
Troutman Pepper Hamilton Sanders LLP
3000 Two Logan Square
18th and Arch Streets
Philadelphia, PA 19103
GOTII-0920
GOTHAM FUNDS
of
FundVantage Trust
Gotham Neutral 500 Fund
Gotham Hedged Plus Fund
Gotham Hedged Core Fund
Gotham Short Strategies Fund
Gotham Master Neutral Fund
Gotham ESG Large Value Fund
ANNUAL REPORT
September 30, 2020
Important Information on Paperless Delivery
Beginning on January 1, 2021, paper copies of the Funds’ shareholder reports will no longer be sent by mail, unless you specifically request paper copies of the shareholder reports from the Funds or from your financial intermediary. Instead, shareholder reports will be available on the Funds’ website (www.GothamFunds.com),and you will be notified by mail each time a report is posted and provided with a website link to access the report.
You may elect to receive all future shareholder reports in paper, free of charge. To elect to receive paper copies of shareholder reports through the mail or otherwise change your delivery method, contact your financial intermediary or, if you hold your shares directly through the Funds, call the Gotham Funds toll-free at 1 (877) 974-6852 or write to Gotham Funds, FundVantage Trust, c/o BNY Mellon Investment Servicing, P.O. Box 9829, Providence, RI 02940-8029. Your election to receive shareholder reports in paper will apply to all Gotham Funds that you hold through the financial intermediary, or directly with the Gotham Funds.
This report is submitted for the general information of shareholders and is not authorized for distribution to prospective shareholders unless preceded or accompanied by a current prospectus.
GOTHAM FUNDS
ANNUAL REPORT
AS OF SEPTEMBER 30, 2020
| TABLE OF CONTENTS | ||||
| 1 | ||||
| 2 | ||||
| 11 | ||||
| 17 | ||||
| 19 | ||||
| 25 | ||||
Financial Statements: | ||||
| 68 | ||||
| 70 | ||||
| 72 | ||||
| 75 | ||||
| 77 | ||||
| 83 | ||||
| 97 | ||||
| 99 | ||||
| 101 | ||||
| 105 | ||||
| 106 | ||||
Important Information
The performance data quoted in this report represents past performance and does not guarantee future results. The investment return and principal value of an investment in a Gotham Fund will fluctuate so that an investor’s shares, when redeemed, may be worth more or less than their original cost. Current performance may be lower or higher. Performance data current to the most recent month-end may be obtained by calling (877) 974-6852.
Each Gotham Fund covered by this report (each a, “Fund”) compares its performance to an unmanaged index. An index does not reflect operational and transactional costs which apply to a mutual fund. It is not possible to invest directly in an index.
Mutual fund investing involves risks, including possible loss of principal. Each Fund except Gotham ESG Large Value Fund will short securities. Short sales theoretically involve unlimited loss potential since the market price of securities sold short may continuously increase. Each Fund except Gotham ESG Large Value Fund will also use leverage to make additional investments which could result in greater losses than if the Fund were not leveraged. The Gotham Short Strategies Fund utilizes one or more swap agreements in its investment program. The use of derivatives such as swaps exposes a Fund to additional risks including increased volatility, lack of liquidity and possible losses greater than the Fund’s initial investment. The securities issued by small-cap and mid-cap companies tend to be more volatile and less liquid than those of large-cap issuers. Each Fund may have a high turnover of its portfolio securities. High turnover rates generally result in higher brokerage costs to a Fund. There can be no guarantee that a Fund will achieve its objectives.
A prospective investor should consider the investment objectives, risks, charges and expenses of a Fund carefully before investing. The prospectus and summary prospectus contains this and other information about the Funds, and should be read carefully before investing. A copy of the prospectus or summary prospectus is available at www.GothamFunds.com or by calling (877) 974-6852.
1
Annual Investment Adviser’s Report
September 30, 2020
(Unaudited)
Gotham Neutral 500 Fund (GONFX)
Gotham Hedged Plus Fund (GHPLX)
Gotham Hedged Core Fund (GCHDX)
Gotham Short Strategies Fund (GSSFX)
Gotham Master Neutral Fund (GMNFX)
Gotham ESG Large Value Fund (GESGX)
Dear Shareholder,
Much of 2020 has been dictated by the COVID-19 pandemic, pushing the global economy and markets into uncharted territory. The disruption caused due to the pandemic and resulting lockdown has affected corporate cash flows in a way that is unprecedented. As companies release third quarter earnings over the coming weeks, we continue to examine in more detail how the pandemic has affected corporate cash flows. The results are messy and require extensive analysis. This is precisely the type of work our research team has focused on for over fifteen years. We believe that a strong ability to adjust as-reported financials to better reflect the true economics of a business should be especially beneficial during these unprecedented times. From a business standpoint, Gotham continues to operate effectively and without material impediment in the current remote environment.
As most of you are aware, Gotham manages value-oriented mutual funds with varying market cap universes and gross and net exposures. The funds share the same investment philosophy, process and research. Gotham offers actively managed strategies (long/short and long-only) as well as strategies that combine an index component and an actively managed long/short overlay. Gotham’s all-cap funds select long and short stock portfolios from a diverse capitalization universe of U.S. stocks. Our large-cap funds select stocks primarily from the S&P 500.
Our investment process begins with a research effort that seeks to value all of the companies in a fund’s respective investment universe. Our philosophy is simple. Although stock prices react to emotion over the short term, over the long term the market is very good at finding the fair value of stocks. Therefore, we believe that if we are good at valuing businesses (a share of stock represents a percentage ownership stake in a business), the market will agree with us...eventually. This is crucial. No investment strategy, regardless of how good or logical, works all the time.
The important thing for us is to stick to our strategy even if it is not working over shorter time periods. We have over 60 years of combined investment experience valuing and investing in publicly traded businesses. We know how to value businesses by using various measures of absolute and relative value. So, that’s how we invest. We buy companies that are at the biggest discount to our assessment of value and sell short (where applicable) those companies that are most expensive relative to our assessment of value. We do not plan to change this strategy or adopt other methodologies when short-term stock prices do not reflect the values that we see.
Together with our investment team (led by Director of Research, Adam Barth), we follow a systematic process of researching and valuing companies, investing in our long and short portfolios and adjusting positions daily to take advantage of changing stock prices and fundamental information. The funds are highly diversified and invest in hundreds of positions. Our positions are not equally weighted. The funds generally invest in the cheapest companies and short (where applicable) the most expensive based on our assessment of value and subject to our risk constraints. We manage our risks by, among other things, requiring substantial portfolio diversification, setting maximum limits for sector concentration and by maintaining overall gross and net exposures within carefully defined ranges.
Market Observations and Performance Commentary
The market volatility during much of 2020 was fueled by massive uncertainty surrounding the economy reopening following the pandemic induced lockdowns, vaccine news as well as US elections in November. After the initial shock in late February to March when markets plunged 25-30%, the subsequent rebound rally left market cap-weighted indexes expensive relative to our 30-year research history. As of September 30, 2020, the Russell 1000 was outperforming the Russell 1000 equal-weight benchmark by over 1000bps YTD. This has been a consistent headwind for actively managed strategies. We believe it has also created a more attractive opportunity set based on relative valuations going forward, as it presents stock pickers with a relatively attractive universe to choose from over the next several years relative to market-cap weighted indexes.
2
Annual Investment Adviser’s Report (Continued)
September 30, 2020
(Unaudited)
In September 2020, the S&P 500 was trading at 26x Gotham’s proprietary cash flow metric. This number is significantly skewed by the effect the COVID-19 pandemic has had on earnings for the 2nd and 3rd quarters. At the start of the year, the S&P 500 was in the 12th percentile towards expensive over the past 30 years based on 2019 corporate cash flows. This historically corresponded to 2-year cumulative forward returns of 6%-8%. With the index up 13% YTD1 , we would expect 2-year cumulative forward returns for the S&P 500 to be 1%-3% if 2019 corporate cash flows are a good gauge for normalized earnings.
It is important to note that the above numbers are not adjusted for interest rates. If rates this low were to persist over a long time period, it would be reasonable to expect higher equity returns than our historical analysis suggests. At the same time, it is difficult to adjust these metrics which have been partially affected by the global pandemic. While some companies with the largest market capitalizations have benefited in a positive way, there are many companies within the index that have been negatively impacted.
In addition, the continued disparity between growth and value widened in 2020, as pandemic led tech heavy businesses dominated the market rally. Growth benchmarks are outperforming their value counterparts by significant margins over the trailing one-year, three-year and five-year periods, surpassing levels last seen during the 2nd quarter of 2000, the peak of the internet bubble.
We conducted a study to quantify the expensiveness of this period relative to history, particularly the internet bubble. Based on our research, only 1999 ranks worse than the first six months of 2020 for the returns of cheap stocks minus expensive, which was followed by 3 of the best years for cheap relative to expensive companies based on our assessment of value. We don’t know when the current value/growth divergence will revert, but the historical precedent is for it to be abrupt and significant when it happens.
In terms of performance, broadly speaking our short book has been challenged in this market environment resulting in negative long/short spreads. Though many of these shorts are growing quickly, they are very richly priced. Some are currently unprofitable, and others sell at 50 or 100 times corporate free cash flows. On the long side, though we cannot predict short-term market moves and the overall market remains expensive, we believe that there is an opportunity to exceed the positive returns we expect for large cap indexes. Given valuation levels and the disparity between stock returns and fundamentals, we are very optimistic about the opportunity set for our long/short spreads over the coming period.
We remain confident that the best way to construct portfolios in any period, and perhaps even more so during expensive markets, is to own stakes in quality businesses generating strong cash flows. The long portfolios in our strategies trade at significantly better valuations than the index. The short portfolios in these strategies are generally cash flow negative, with higher levels of leverage and weaker business fundamentals. Our risk management has helped to improve our long/short spreads in a period that has been exceptionally challenged for active management and value-oriented strategies in particular.
Although we can’t predict when this environment will end and the current value/growth cycle will turn, as we stated above, the historical precedent is that the transition is often abrupt and significant. Despite the added uncertainty surrounding the pandemic, we have consistently communicated to our partners that strong normalized cash flows, good franchises, and growth prospects are the key drivers to valuation over the long-term. It is also a process that should prove resilient in turbulent periods. Markets and businesses have generally recovered in reasonably short order after the initial shock from one-time events, including the outbreak of World War II, the Cuban Missile Crisis, and the financial crisis of 2008. We believe the current headwinds will eventually subside and favoring cash flow generating companies with good returns on capital and strong balance sheets (and shorting the opposite) should provide a particularly attractive opportunity for outperformance.
3
Annual Investment Adviser’s Report (Continued)
September 30, 2020
(Unaudited)
Important Information
This letter is intended to assist shareholders in understanding how the Gotham Funds described herein performed during the period ended September 30, 2020, and reflects the views of the investment adviser at the time of this writing. Market and index valuations are based on Gotham’s valuation methodology. The views may change and do not guarantee the future performance of the Gotham Funds or the markets.
This letter contains forward-looking statements regarding future events, forecasts and expectations regarding equity markets and certain of Gotham’s strategies. Forward-looking statements may be identified terminology such terms as “may,” “expect,” “will,” “hope,” “believe” and/or comparable terminology. No assurance, representation, or warranty is made that any of Gotham’s expectations, views and/or objectives will be achieved and actual results may be significantly different than reflected herein.
The indices referenced herein are for comparison purposes only. The performance and volatility of the funds will be different than those of the indices. It is not possible to invest in the indices directly.
| 1 | As of November 17, 2020. |
4
Annual Investment Adviser’s Report (Continued)
September 30, 2020
(Unaudited)
Performance by Fund
Gotham Neutral 500 Fund (GONFX)
| · | The Fund returned -7.68% (net) for the trailing twelve-month period and the BofA Merrill Lynch 3-Month U.S. Treasury Bill Index returned +1.10% over the same time period. |
| · | The spread for the period was -8.94%2. |
| · | The long portfolio contributed +9.86% for the trailing twelve-month period. The short portfolio detracted -16.41% for the period. |
| · | Top contributors and detractors by sector and stock positions are below: |
Sector Contributors/Detractors
Average Contribution | Average Exposure | |||||||||||||
| Largest Contributors | ||||||||||||||
Long | Consumer Discretionary | 4.13 | % | 16.70 | % | |||||||||
| Information Technology | 2.97 | % | 14.96 | % | |||||||||
Short | Energy | 1.64 | % | -7.70 | % | |||||||||
| Utilities | 0.60 | % | -14.09 | % | ||||||||||
| Largest Detractors | ||||||||||||||
Long | Energy | -3.63 | % | 7.30 | % | |||||||||
| Financials | -0.92 | % | 11.48 | % | ||||||||||
Short | Information Technology | �� | -5.41 | % | -18.79 | % | ||||||||
| Health Care | -3.95 | % | -15.27 | % | ||||||||||
| ||||||||||||||
Stock Contributors/Detractors |
| |||||||||||||
Average Contribution | Average Exposure | |||||||||||||
| Largest Contributors | ||||||||||||||
Long | Apple, Inc. | 2.07 | % | 2.62 | % | |||||||||
| Weyerhaeuser Co. | 0.87 | % | 0.97 | % | ||||||||||
Short | Boeing Co. | 1.53 | % | -1.62 | % | |||||||||
| Occidental Petroleum Corp. | 0.56 | % | -1.03 | % | ||||||||||
| Largest Detractors | ||||||||||||||
Long | Raytheon Co. | -0.62 | % | 0.97 | % | |||||||||
| Intel Corp. | -0.60 | % | 0.88 | % | ||||||||||
Short | NVIDIA Corp. | -1.39 | % | -1.25 | % | |||||||||
| Advanced Micro Devices, Inc. | -1.19 | % | -1.00 | % | ||||||||||
5
Annual Investment Adviser’s Report (Continued)
September 30, 2020
(Unaudited)
Gotham Hedged Plus Fund (GHPLX)
| · | The Fund returned -0.82% (net) for the trailing twelve-month period and the HFRX Equity Hedge Index returned -0.39% over the same time period. |
| · | The spread for the period was -7.33%2. |
| · | The long portfolio contributed +14.76% for the trailing twelve-month period. The short portfolio detracted -14.19% for the period. |
| · | Top contributors and detractors by sector and stock positions are below: |
Sector Contributors/Detractors
Average Contribution | Average Exposure | |||||||||||||
| Largest Contributors | ||||||||||||||
Long | Information Technology | 6.23 | % | 27.86 | % | |||||||||
| Health Care | 3.69 | % | 19.46 | % | |||||||||
Short | Energy | 2.74 | % | -6.76 | % | |||||||||
| Financials | 0.89 | % | -4.95 | % | ||||||||||
| Largest Detractors | ||||||||||||||
Long | Energy | -3.14 | % | 6.59 | % | |||||||||
| Financials | -0.87 | % | 14.55 | % | ||||||||||
Short | Information Technology | -6.03 | % | -15.54 | % | |||||||||
| Health Care | -5.90 | % | -17.89 | % | ||||||||||
Stock Contributors/Detractors | ||||||||||||||
Average Contribution | Average Exposure | |||||||||||||
| Largest Contributors | ||||||||||||||
| Long | Apple, Inc. | 3.34 | % | 4.19 | % | ||||||||
| Microsoft Corp. | 1.39 | % | 3.27 | % | ||||||||||
Short | Occidental Petroleum Corp. | 0.90 | % | -0.81 | % | |||||||||
| Boeing Co. | 0.71 | % | -1.16 | % | ||||||||||
| Largest Detractors | ||||||||||||||
Long | Carnival Corp. | -0.59 | % | 0.25 | % | |||||||||
| AT&T, Inc. | -0.51 | % | 2.14 | % | ||||||||||
Short | NVIDIA Corp. | -0.78 | % | -1.51 | % | |||||||||
| Freeport-McMoRan, Inc. | -0.67 | % | -0.54 | % | ||||||||||
6
Annual Investment Adviser’s Report (Continued)
September 30, 2020
(Unaudited)
Gotham Hedged Core Fund (GCHDX)
| · | The Fund returned +7.59% (net) for the trailing twelve-month period and the HFRX Equity Hedge Index returned -0.39% over the same time period. |
| · | The spread for the period was -2.63%2. |
| · | The long portfolio contributed +14.45% for the trailing twelve-month period. The short portfolio detracted -6.01% for the period. |
| · | Top contributors and detractors by sector and stock positions are below: |
Sector Contributors/Detractors | ||||||||||||
Average Contribution | Average Exposure | |||||||||||
Largest Contributors | ||||||||||||
| Long | Information Technology | 5.60% | 19.99% | |||||||||
| Consumer Discretionary | 2.83% | 14.07% | ||||||||||
| Short | Energy | 0.85% | -2.77% | |||||||||
| Financials | 0.21% | -3.03% | ||||||||||
| Largest Detractors | |||||||||||
| Long | Energy | -1.96% | 3.69% | |||||||||
| Financials | -0.67% | 9.25% | ||||||||||
| Short | Health Care | -2.34% | -6.65% | |||||||||
| Information Technology | -2.15% | -8.09% | ||||||||||
|
| |||||||||||
Stock Contributors/Detractors |
| |||||||||||
Average Contribution | Average Exposure | |||||||||||
| Largest Contributors | ||||||||||||
| Long | Apple, Inc. | 3.08% | 3.70% | |||||||||
| Amazon.com, Inc. | 1.60% | 2.43% | ||||||||||
| Short | Western Digital Corp. | 0.33% | -0.51% | |||||||||
| American Airlines Group, Inc. | 0.29% | -0.29% | ||||||||||
| Largest Detractors | ||||||||||||
| Long | Carnival Corp. | -0.37% | 0.14% | |||||||||
| Kinder Morgan, Inc. | -0.29% | 0.45% | ||||||||||
| Short | Advanced Micro Devices, Inc. | -0.55% | -0.38% | |||||||||
| Freeport-McMoRan, Inc. | -0.41% | -0.33% | ||||||||||
7
Annual Investment Adviser’s Report (Continued)
September 30, 2020
(Unaudited)
Gotham Short Strategies Fund (GSSFX)
| · | The Fund returned -15.27% (net) for the trailing twelve-month period and the 50% Inverse of S&P 500 returned -8.71% over the same time period. |
| · | The spread for the period was -5.10%2. |
| · | The long portfolio contributed +14.47% for the trailing twelve-month period. The short portfolio detracted -29.43% for the period. |
| · | Top contributors and detractors by sector and stock positions are below: |
Sector Contributors/Detractors | ||||||||||||
Average Contribution | Average Exposure | |||||||||||
Largest Contributors | ||||||||||||
| Long | Health Care | 4.90% | 11.51% | |||||||||
| Information Technology | 4.67% | 18.06% | ||||||||||
| Short | Energy | 2.98% | -11.90% | |||||||||
| Utilities | 1.08% | -12.64% | ||||||||||
| Largest Detractors | ||||||||||||
| Long | Energy | -3.49% | 8.88% | |||||||||
| Utilities | -0.08% | 0.56% | ||||||||||
| Short | Information Technology | -10.67% | -28.11% | |||||||||
| Consumer Discretionary | -9.13% | -28.02% | ||||||||||
|
| |||||||||||
Stock Contributors/Detractors |
| |||||||||||
Average Contribution | Average Exposure | |||||||||||
| Largest Contributors | ||||||||||||
| Long | Biogen, Inc. | 0.79% | 0.66% | |||||||||
| United Rentals, Inc. | 0.68% | 0.71% | ||||||||||
| Short | L Brands, Inc. | 0.97% | -1.27% | |||||||||
| Phillips 66 | 0.78% | -0.89% | ||||||||||
| Largest Detractors | ||||||||||||
| Long | Southwest Airlines Co. | -0.78% | 0.84% | |||||||||
| Alaska Air Group, Inc. | -0.75% | 0.38% | ||||||||||
| Short | Wayfair, Inc. | -3.68% | -2.01% | |||||||||
| United Airlines Holdings, Inc. | -1.67% | -2.88% | ||||||||||
8
Annual Investment Adviser’s Report (Continued)
September 30, 2020
(Unaudited)
Gotham Master Neutral Fund (GMNFX)
| · | The Fund returned -5.38% (net) for the trailing twelve-month period and the BofA Merrill Lynch 3-Month U.S. Treasury Bill Index returned +1.10% over the same time period. |
| · | The spread for the period was -0.94%2. |
| · | The long portfolio detracted -1.11% for the trailing twelve-month period. The short portfolio contributed +0.12% for the period. |
| · | Top contributors and detractors by sector and stock positions are below: |
Sector Contributors/Detractors | ||||||||||||
Average Contribution | Average Exposure | |||||||||||
Largest Contributors | ||||||||||||
| Long | Information Technology | 0.81% | 16.68% | |||||||||
| Consumer Discretionary | 0.69% | 16.63% | ||||||||||
| Short | Energy | 1.00% | -6.70% | ||||||||
| Utilities | 0.72% | -8.89% | ||||||||||
| Largest Detractors | ||||||||||||
| Long | Energy | -1.31% | 6.60% | |||||||||
| Consumer Staples | -0.75% | 8.90% | ||||||||||
| Short | Information Technology | -0.88% | -17.94% | |||||||||
| Consumer Discretionary | -0.45% | -11.37% | ||||||||||
|
| |||||||||||
Stock Contributors/Detractors |
| |||||||||||
Average Contribution | Average Exposure | |||||||||||
| Largest Contributors | ||||||||||||
| Long | Tesla, Inc. | 0.33% | 0.20% | |||||||||
| Williams-Sonoma, Inc. | 0.22% | 0.24% | ||||||||||
| Short | Encana Corp. | 0.15% | -0.09% | |||||||||
| Boeing Co. | 0.14% | -0.91% | ||||||||||
| Largest Detractors | ||||||||||||
| Long | Alaska Air Group, Inc. | -0.16% | 0.18% | |||||||||
| Intel Corp. | -0.16% | 0.31% | ||||||||||
| Short | Wayfair, Inc. | -0.34% | -0.40% | |||||||||
| Thor Industries, Inc. | -0.28% | -0.20% | ||||||||||
9
Annual Investment Adviser’s Report (Concluded)
September 30, 2020
(Unaudited)
Gotham ESG Large Value Fund (GESGX)
| · | The Fund returned -0.17% (net) for the trailing twelve-month period and the S&P 500 Total Return Index returned +15.15% over the same time period. |
| · | Top contributors and detractors by sector and stock positions are below: |
Sector Contributors/Detractors | ||||||||||||
| Average Contribution | Average Exposure | |||||||||||
| Largest Contributors | ||||||||||||
| Long | Health Care | 1.49% | 11.05% | ||||||||
| Consumer Discretionary | 1.32% | 12.06% | ||||||||||
| Largest Detractors | ||||||||||||
| Long | Energy | -3.28% | 4.59% | |||||||||
| Financials | -1.31% | 14.57% | ||||||||||
Stock Contributors/Detractors |
| |||||||||||
| Average Contribution | Average Exposure | |||||||||||
| Largest Contributors |
| |||||||||||
| Long | Apple, Inc. | 1.09% | 1.52% | |||||||||
| Lowe’s Cos., Inc. | 0.63% | 1.08% | ||||||||||
| Largest Detractors | ||||||||||||
| Long | Raytheon Co. | -0.65% | 0.56% | |||||||||
| Phillips 66 | -0.51% | 0.76% | ||||||||||
| 2 | The spread is defined as how much our long portfolio outperformed our short portfolio adjusted for leverage (i.e. 100% long the long portfolio less 100% long the short portfolio). |
10
Gotham Neutral 500 Fund
Annual Report
Performance Data
September 30, 2020
(Unaudited)
Comparison of Change in Value of $250,000 Investment in Gotham Neutral 500 Fund Institutional Class Shares
vs BofA Merrill Lynch 3-Month U.S. Treasury Bill Index
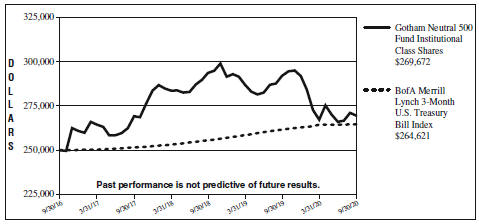
| Average Annual Total Returns for the Periods Ended September 30, 2020 | ||||||||||||||||
| 1 Year | 3 Year | Since Inception | ||||||||||||||
Institutional Class Shares | -7.68 | % | 0.05 | % | 1.91%* | |||||||||||
BofA Merrill Lynch 3-Month U.S. | 1.10 | % | 1.69 | % | 1.43%** | |||||||||||
| * | The Gotham Neutral 500 Fund (the “Fund”) commenced operations on October 1, 2016. The Fund’s inception date was September 30, 2016. |
| ** | Benchmark performance is from inception date of the Fund only and is not the inception date of the benchmark itself. |
Past performance does not guarantee future results. The graph and table do not reflect the deduction of taxes that a shareholder would pay on Fund distributions or redemption of Fund shares; nor a 1.00% fee applied by the Fund’s Institutional Class to the value of shares redeemed within 30 days of purchase.
As stated in the current prospectus dated February 1, 2020 (as supplemented on July 1, 2020), the “Total Annual Fund Operating Expenses” are 2.82% and the “Total Annual Fund Operating Expenses After Fee Waivers and/or Expense Reimbursements” are 1.82% for Institutional Class Shares of the Fund’s average daily net assets. These ratios may differ from the actual expense incurred by the Fund for the period covered by this report. Gotham Asset Management, LLC (“Gotham” or the “Adviser”) has contractually agreed to reduce its investment advisory fee and/or reimburse certain expenses of the Fund to the extent necessary to ensure that the Fund’s total operating expenses (exclusive of taxes, “Acquired Fund Fees and Expenses”, dividend and interest expense on securities sold short, interest, extraordinary items, and brokerage commissions) do not exceed 1.35% (on an annual basis) of average daily net assets of the Fund (the “Expense Limitation”). The Expense Limitation will remain in place until January 31, 2021, unless the Board of Trustees of FundVantage Trust (the “Trust”) approves its earlier termination. The Adviser is entitled to recover, subject to approval by the Board of Trustees, such amounts reduced or reimbursed for a period of up to three (3) years from the date on which the Adviser reduced its compensation and/or assumed expenses for the Fund. The Adviser is permitted to seek reimbursement from the Fund, subject to certain limitations, for fees it waived and Fund expenses it paid to the extent the total annual fund expenses do not exceed the limits described above or any lesser limits in effect at the time of reimbursement. No recoupment will occur unless the Fund’s expenses are below the Expense Limitation.
The Fund intends to evaluate performance as compared to that of the BofA Merrill Lynch 3-Month U.S. Treasury Bill Index (the “Index”). The Index is an index comprised of a single Treasury bill issue purchased at the beginning of the month and held for a full month, then sold and rolled into a newly selected Treasury bill issue.
11
GOTHAM FUNDS
Gotham Hedged Plus Fund
Annual Report
Performance Data
September 30, 2020
(Unaudited)
Comparison of Change in Value of $250,000 Investment in Gotham Hedged Plus Fund Institutional Class Shares
vs Hedge Fund Research Inc. (HFRX) Equity Hedge Index
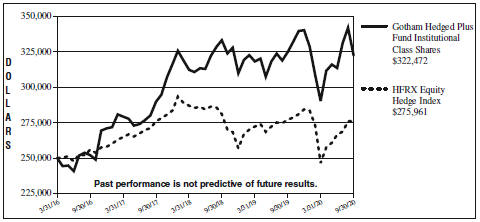
| Average Annual Total Returns for the Periods Ended September 30, 2020 | ||||||||||||||||
| 1 Year | 3 Year | Since Inception | ||||||||||||||
Institutional Class Shares | -0.82 | % | 3.62 | % | 5.82%* | |||||||||||
HFRX Equity Hedge Index | -0.39 | % | -0.01 | % | 2.22%** | |||||||||||
| * | The Gotham Hedged Plus Fund (the “Fund”) commenced operations on March 31, 2016. |
| ** | Benchmark performance is from inception date of the Fund only and is not the inception date of the benchmark itself. |
Past performance does not guarantee future results. The graph and table do not reflect the deduction of taxes that a shareholder would pay on Fund distributions or redemption of Fund shares; nor a 1.00% fee applied by the Fund’s Institutional Class to the value of shares redeemed within 30 days of purchase.
As stated in the current prospectus dated February 1, 2020 (as supplemented on July 1, 2020), the “Total Annual Fund Operating Expenses” are 6.97% and the “Total Annual Fund Operating Expenses After Fee Waivers and/or Expense Reimbursements” are 2.68% for Institutional Class Shares of the Fund’s average daily net assets. These ratios may differ from the actual expense incurred by the Fund for the period covered by this report. Gotham Asset Management, LLC (“Gotham” or the “Adviser”) has contractually agreed to reduce its investment advisory fee and/or reimburse certain expenses of the Fund to the extent necessary to ensure that the Fund’s total operating expenses (exclusive of taxes, “Acquired Fund Fees and Expenses”, dividend and interest expense on securities sold short, interest, extraordinary items, and brokerage commissions) do not exceed 1.15% (on an annual basis) of average daily net assets of the Fund (the “Expense Limitation”). The Expense Limitation will remain in place until January 31, 2021, unless the Board of Trustees of FundVantage Trust (the “Trust”) approves its earlier termination. The Adviser is entitled to recover, subject to approval by the Board of Trustees, such amounts reduced or reimbursed for a period of up to three (3) years from the date on which the Adviser reduced its compensation and/or assumed expenses for the Fund. The Adviser is permitted to seek reimbursement from the Fund, subject to certain limitations, for fees it waived and Fund expenses it paid to the extent the total annual fund expenses do not exceed the limits described above or any lesser limits in effect at the time of reimbursement. No recoupment will occur unless the Fund’s expenses are below the Expense Limitation.
The Fund intends to evaluate performance as compared to that of the Hedge Fund Research Inc. Equity Hedge Index (“HFRX”). The HFRX is an index of quantitatively-selected hedge funds which maintain positions both long and short in primarily equity and equity derivative securities. Constituents of the HFRX report net of all fees returns.
12
GOTHAM FUNDS
Gotham Hedged Core Fund
Annual Report
Performance Data
September 30, 2020
(Unaudited)
Comparison of Change in Value of $250,000 Investment in Gotham Hedged Core Fund Institutional Class Shares
vs Hedge Fund Research Inc. (HFRX) Equity Hedge Index
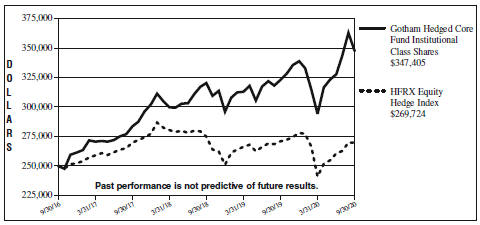
| Average Annual Total Returns for the Periods Ended September 30, 2020 | ||||||||||||||||
| 1 year | 3 Year | Since Inception | ||||||||||||||
Institutional Class Shares | 7.59 | % | 7.01 | % | 8.57%* | |||||||||||
HFRX Equity Hedge Index | -0.39 | % | -0.01 | % | 1.92%** | |||||||||||
| * | The Gotham Hedged Core Fund (the “Fund”) commenced operations on September 30, 2016. |
| ** | Benchmark performance is from inception date of the Fund only and is not the inception date of the benchmark itself. |
Past performance does not guarantee future results. The graph and table do not reflect the deduction of taxes that a shareholder would pay on Fund distributions or redemption of Fund shares; nor a 1.00% fee applied by the Fund’s Institutional Class to the value of shares redeemed within 30 days of purchase.
As stated in the current prospectus dated February 1, 2020 (as supplemented on July 1, 2020), the “Total Annual Fund Operating Expenses” are 4.05% and the “Total Annual Fund Operating Expenses After Fee Waivers and/or Expense Reimbursements” are 1.00% for Institutional Class Shares of the Fund’s average daily net assets. These ratios may differ from the actual expense incurred by the Fund for the period covered by this report. Gotham Asset Management, LLC (“Gotham” or the “Adviser”) has contractually agreed to reduce its investment advisory fee and/or reimburse certain expenses of the Fund to the extent necessary to ensure that the Fund’s total operating expenses (exclusive of taxes, “Acquired Fund Fees and Expenses”, dividend and interest expense on securities sold short, interest, extraordinary items, and brokerage commissions) do not exceed 0.85% (on an annual basis) of average daily net assets of the Fund (the “Expense Limitation”). The Expense Limitation will remain in place until January 31, 2021, unless the Board of Trustees of FundVantage Trust (the “Trust”) approves its earlier termination. The Adviser is entitled to recover, subject to approval by the Board of Trustees, such amounts reduced or reimbursed for a period of up to three (3) years from the date on which the Adviser reduced its compensation and/or assumed expenses for the Fund. The Adviser is permitted to seek reimbursement from the Fund, subject to certain limitations, for fees it waived and Fund expenses it paid to the extent the total annual fund expenses do not exceed the limits described above or any lesser limits in effect at the time of reimbursement. No recoupment will occur unless the Fund’s expenses are below the Expense Limitation.
The Fund intends to evaluate performance as compared to that of the Hedge Fund Research Inc. Equity Hedge Index (“HFRX”). The HFRX is an index of quantitatively-selected hedge funds which maintain positions both long and short in primarily equity and equity derivative securities. Constituents of the HFRX report net of all fees returns.
13
GOTHAM FUNDS
Gotham Short Strategies Fund
Annual Report
Performance Data
September 30, 2020
(Unaudited)
Comparison of Change in Value of $250,000 Investment in Gotham Short Strategies Fund Institutional Class Shares
vs the 50% Inverse of the Standard & Poor’s 500® Total Return Index (“50% Inverse of the S&P 500®”)
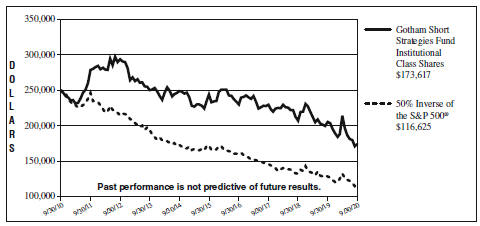
| Average Annual Total Returns for the Periods Ended September 30, 2020 | ||||||||||||||||||||
1 year | 3 Year | 5 Year | 10 Year | |||||||||||||||||
Institutional Class Shares* | -15.27 | % | -8.85 | % | -6.55% | -3.58% | ||||||||||||||
50% Inverse of the S&P 500® | -8.71 | % | -7.05 | % | -7.46% | -7.34% | ||||||||||||||
| * | A privately offered fund (the “Predecessor Fund”) managed by Gotham Asset Management, LLC was reorganized into the Gotham Short Strategies Fund (the “Fund” or “GSSFX”) on July 31, 2017, the date GSSFX commenced operations. The Predecessor Fund was organized and commenced operations in February 2008 and had an investment objective, investment policies and restrictions that were, in all material respects, equivalent to those of GSSFX. However, the Predecessor Fund was not registered as an investment company under the Investment Company Act of 1940, as amended (the “1940 Act”). In addition, this Predecessor Fund was not subject to certain investment limitations, diversification requirements, liquidity requirements, and other restrictions imposed by the 1940 Act and the Internal Revenue Code of 1986, as amended, which, if applicable, might have adversely affected its performance. GSSFX’s performance for periods prior to the commencement of operations on July 31, 2017 is that of the Predecessor Fund adjusted to reflect GSSFX’s fee structure. |
Past performance does not guarantee future results. The graph and table do not reflect the deduction of taxes that a shareholder would pay on Fund distributions or redemption of Fund shares; nor a 1.00% fee applied by the Fund’s Institutional Class to the value of shares redeemed within 30 days of purchase.
As stated in the current prospectus dated February 1, 2020 (as supplemented on July 1, 2020), the “Total Annual Fund Operating Expenses” are 2.20% and the “Total Annual Fund Operating Expenses After Fee waivers and/or Expense Reimbursements” are 1.35% for Institutional Class Shares of the Fund’s average daily net assets. These ratios may differ from the actual expense incurred by the Fund for the period covered by this report. Gotham Asset Management, LLC (“Gotham” or the “Adviser”) has contractually agreed to reduce its investment advisory fee and/or reimburse certain expenses of the Fund to the extent necessary to ensure that the Fund’s total operating expenses (exclusive of taxes, “Acquired Fund Fees and Expenses”, dividend and interest expense on securities sold short, interest, extraordinary items, and brokerage commissions) do not exceed 1.35% (on an annual basis) of average daily net assets of the Fund (the “Expense Limitation”). The Expense Limitation will remain in place until January 31, 2021, unless the Board of Trustees of FundVantage Trust (the “Trust”) approves its earlier termination.
The 50% Inverse of the S&P 500® reflects the return of the S&P 500® adjusted to show the negative 50% targeted net short exposure of the Predecessor Fund. Its returns reflect reinvested dividends.
14
GOTHAM FUNDS
Gotham Master Neutral Fund
Annual Report
Performance Data
September 30, 2020
(Unaudited)
Comparison of Change in Value of $250,000 Investment in Gotham Master Neutral Fund Institutional Class Shares
vs BofA Merrill Lynch 3-Month U.S. Treasury Bill Index
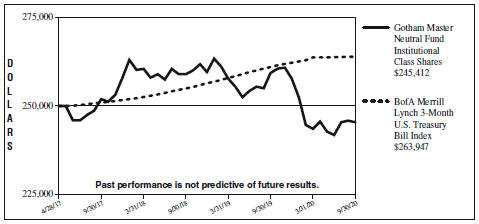
| Average Annual Total Returns for the Periods Ended September 30, 2020 | ||||||||||||||||
| 1 Year | 3 Year | Since Inception | ||||||||||||||
Institutional Class Shares | -5.38 | % | -0.88 | % | -0.54%* | |||||||||||
BofA Merrill Lynch 3-Month U.S. | 1.10 | % | 1.69 | % | 1.60%** | |||||||||||
| * | The Gotham Master Neutral Fund (the “Fund”) commenced operations on April 28, 2017. |
| ** | Benchmark performance is from inception date of the Fund only and is not the inception date of the benchmark itself. |
Past performance does not guarantee future results. The graph and table do not reflect the deduction of taxes that a shareholder would pay on Fund distributions or redemption of Fund shares; nor a 1.00% fee applied by the Fund’s Institutional Class to the value of shares redeemed within 30 days of purchase.
As stated in the current prospectus dated February 1, 2020 (as supplemented on July 1, 2020), the “Total Annual Fund Operating Expenses” are 2.72% and the “Total Annual Fund Operating Expenses After Fee Waivers and/or Expense Reimbursement” are 1.39% for Institutional Class Shares of the Fund’s average daily net assets. These ratios may differ from the actual expense incurred by the Fund for the period covered by this report. Gotham Asset Management, LLC (“Gotham” or the “Adviser”) has contractually agreed to waive its investment advisory fees at an annual rate in the amount of 0.30% (the “Advisory Fee Waiver”), effectively reducing the investment advisory fee from 0.75% to 0.45%. In addition to the Advisory Fee Waiver, the Advisor has contractually agreed to reduce its investment advisory fee and/or reimburse certain expenses of the Fund to the extent necessary to ensure that the Fund’s total operating expenses (exclusive of taxes, “Acquired Fund Fees and Expenses”, dividend and interest expense on securities sold short, interest, extraordinary items, management fees (if any), and brokerage commissions) do not exceed 0.00% (on an annual basis) of average daily net assets of the Fund (the “Expense Limitation”). The Advisory Fee Waiver will remain in place until January 31, 2021, and the Expense Limitation will remain in place until January 31, 2021, unless the Board of Trustees of FundVantage Trust (the “Trust”) approves its earlier termination.
The Fund intends to evaluate performance as compared to that of the BofA Merrill Lynch 3-Month U.S. Treasury Bill Index (the “Index”). The Index is an index comprised of a single Treasury bill issue purchased at the beginning of the month and held for a full month, then sold and rolled into a newly selected Treasury bill issue.
15
GOTHAM FUNDS
Gotham ESG Large Value Fund
Annual Report
Performance Data
September 30, 2020
(Unaudited)
Comparison of Change in Value of $100,000 Investment in Gotham ESG Large Value Fund Institutional Class Shares
vs Standard & Poor’s 500® Total Return Index (“S&P 500® Total Return Index”)
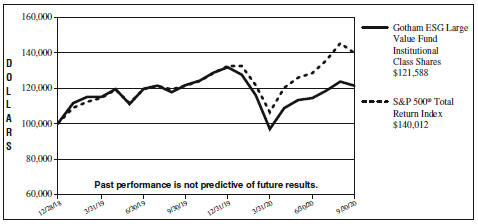
| Average Annual Total Returns for the Periods Ended September 30, 2020 | ||||||||||||||||
| 1 Year | Since Inception | |||||||||||||||
Institutional Class Shares | -0.17 | % | 11.77%* | |||||||||||||
S&P 500® Total Return Index | 15.15 | % | 21.09%** | |||||||||||||
| * | The Gotham ESG Large Value Fund (the “Fund”) incepted on December 28, 2018. |
| ** | Benchmark performance is from inception date of the Fund only and is not the inception date of the benchmark itself. |
Past performance does not guarantee future results. The graph and table do not reflect the deduction of taxes that a shareholder would pay on Fund distributions or redemption of Fund shares; nor a 1.00% fee applied by the Fund’s Institutional Class to the value of shares redeemed within 30 days of purchase.
As stated in the current prospectus dated February 1, 2020 (as supplemented on July 1, 2020), the “Total Annual Fund Operating Expenses” are 6.59% and the “Total Annual Fund Operating Expenses After Fee Waivers and/or Expense Reimbursement” are 0.75% for Institutional Class Shares of the Fund’s average daily net assets. These ratios may differ from the actual expense incurred by the Fund for the period covered by this report. Gotham Asset Management, LLC (“Gotham” or the “Adviser”) has contractually agreed to reduce its investment advisory fee and/or reimburse certain expenses of the Fund to the extent necessary to ensure that the Fund’s total operating expenses (exclusive of taxes, “Acquired Fund Fees and Expenses”, dividend and interest expense on securities sold short, interest, extraordinary items, and brokerage commissions) do not exceed 0.75% (on an annual basis) of average daily net assets of the Fund (the “Expense Limitation”). The Expense Limitation will remain in place until January 31, 2021, unless the Board of Trustees of FundVantage Trust (the “Trust”) approves its earlier termination. The Adviser is entitled to recover, subject to approval by the Board of Trustees, such amounts reduced or reimbursed for a period of up to three (3) years from the date on which the Adviser reduced its compensation and/or assumed expenses for the Fund. The Adviser is permitted to seek reimbursement from the Fund, subject to certain limitations, for fees it waived and Fund expenses it paid to the extent the total annual fund expenses do not exceed the limits described above or any lesser limits in effect at the time of reimbursement. No recoupment will occur unless the Fund’s expenses are below the Expense Limitation.
The Fund intends to evaluate performance as compared to that of the Standard & Poor’s 500® Total Return Index (“S&P 500® Total Return Index”). The S&P 500® Total Return Index is a market capitalization weighted index of 500 large-capitalization stocks commonly used to represent the U.S. equity market. Its returns reflect reinvested dividends.
16
Fund Expense Disclosure
September 30, 2020
(Unaudited)
As a shareholder of a Fund, you incur two types of costs: (1) transaction costs, including redemption fees; and (2) ongoing costs, including management fees and other Fund expenses. This example is intended to help you understand your ongoing costs (in dollars) of investing in a Fund and to compare these costs with the ongoing costs of investing in other mutual funds.
These examples are based on an investment of $1,000 invested at the beginning of the six-month period from April 1, 2020, and held for the entire period through September 30, 2020.
Actual Expenses
The first line for each Fund in the accompanying table provides information about actual account values and actual expenses. You may use the information in this line, together with the amount you invested, to estimate the expenses that you paid over the period. Simply divide your account value by $1,000 (for example, an $8,600 account value divided by $1,000 = 8.6), then multiply the result by the number in the first line under the heading entitled “Expenses Paid During Period” to estimate the expenses you paid on your account during this period.
Hypothetical Example for Comparison Purposes
The second line for each Fund in the accompanying table provides information about hypothetical account values and hypothetical expenses based on the Fund’s actual expense ratio and an assumed rate of return of 5% per year before expenses, which is not your Fund’s actual return. The hypothetical account values and expenses may not be used to estimate the actual ending account balance or expenses you paid for the period. You may use this information to compare the ongoing costs of investing in the Fund and other funds. To do so, compare this 5% hypothetical example with the 5% hypothetical examples that appear in the shareholder reports of other funds.
Please note that the expenses shown in the accompanying table are meant to highlight your ongoing costs only and do not reflect any transactional costs, such as redemption fees. Therefore, the second line of the accompanying table is useful in comparing ongoing costs only, and will not help you determine the relative total costs of owning different funds. In addition, if these transactional costs were included, your costs would have been higher.
| Institutional Class | ||||||||||||||||||||
| Beginning Account Value April 1, 2020 | Ending Account Value September 30, 2020 | Annualized Expense Ratio* | Expenses Paid During Period** | |||||||||||||||||
Gotham Neutral 500 Fund | ||||||||||||||||||||
Actual | $ | 1,000.00 | $ | 1,008.70 | 3.18 | % | $ | 15.96 | ||||||||||||
Hypothetical (5% return before expenses) | 1,000.00 | 1,009.11 | 3.18 | % | 15.96 | |||||||||||||||
Gotham Hedged Plus Fund | ||||||||||||||||||||
Actual | $ | 1,000.00 | $ | 1,111.30 | 2.21 | % | $ | 11.66 | ||||||||||||
Hypothetical (5% return before expenses) | 1,000.00 | 1,013.96 | 2.21 | % | 11.12 | |||||||||||||||
Gotham Hedged Core Fund | ||||||||||||||||||||
Actual | $ | 1,000.00 | $ | 1,181.40 | 1.60 | % | $ | 8.72 | ||||||||||||
Hypothetical (5% return before expenses) | 1,000.00 | 1,017.01 | 1.60 | % | 8.06 | |||||||||||||||
Gotham Short Strategies Fund | ||||||||||||||||||||
Actual | $ | 1,000.00 | $ | 811.80 | 1.35 | % | $ | 6.11 | ||||||||||||
Hypothetical (5% return before expenses) | 1,000.00 | 1,018.25 | 1.35 | % | 6.81 | |||||||||||||||
17
GOTHAM FUNDS
Fund Expense Disclosure (Concluded)
September 30, 2020
(Unaudited)
| Institutional Class | ||||||||||||||||||||
| Beginning Account Value April 1, 2020 | Ending Account Value September 30, 2020 | Annualized Expense Ratio* | Expenses Paid During Period** | |||||||||||||||||
Gotham Master Neutral Fund | ||||||||||||||||||||
Actual | $ | 1,000.00 | $ | 1,007.40 | 0.61 | % | $ | 3.08 | ||||||||||||
Hypothetical (5% return before expenses) | 1,000.00 | 1,021.93 | 0.61 | % | 3.11 | |||||||||||||||
Gotham ESG Large Value Fund | ||||||||||||||||||||
Actual | $ | 1,000.00 | $ | 1,253.60 | 0.75 | % | $ | 4.23 | ||||||||||||
Hypothetical (5% return before expenses) | 1,000.00 | 1,021.25 | 0.75 | % | 3.79 | |||||||||||||||
| * | Annualized expense ratios include dividend expense on securities sold short and interest expense on securities sold short and borrowings, except for the Gotham ESG Large Value Fund which does not short securities or use leverage. |
| ** | Expenses are equal to a Fund’s annualized expense ratio, in the table above, which include waived fees or reimbursement expenses for the six-month period ended September 30, 2020, multiplied by the average account value over the period, multiplied by the number of days in the most recent period, then divided by 366 to reflect the period. Hypothetical expenses are equal to the Fund’s annualized expense ratios, multiplied by the average account value over the period, multiplied by the number of days in the most recent six-month period, then divided by 366 to reflect the period. |
18
Portfolio Holdings Summary Tables
September 30, 2020
(Unaudited)
The following table presents a summary by industry group of the portfolio holdings of the Fund:
Gotham Neutral 500 Fund
| % of Net Assets | Value | |||||||||
LONG POSITIONS: | ||||||||||
Common Stocks: | ||||||||||
Capital Goods | 23.3 | % | $ | 679,993 | ||||||
Retailing | 13.5 | 395,036 | ||||||||
Materials | 12.1 | 354,198 | ||||||||
Food, Beverage & Tobacco | 9.2 | 268,185 | ||||||||
Software & Services | 6.6 | 191,892 | ||||||||
Energy | 6.5 | 190,972 | ||||||||
Diversified Financials | 5.8 | 168,914 | ||||||||
Consumer Durables & Apparel | 5.4 | 156,483 | ||||||||
Technology Hardware & Equipment | 5.0 | 146,548 | ||||||||
Food & Staples Retailing | 4.3 | 126,145 | ||||||||
Consumer Services | 4.2 | 122,155 | ||||||||
Transportation | 3.5 | 103,078 | ||||||||
Health Care Equipment & Services | 3.4 | 97,901 | ||||||||
Real Estate | 2.9 | 84,138 | ||||||||
Household & Personal Products | 2.6 | 77,197 | ||||||||
Telecommunication Services | 2.6 | 74,636 | ||||||||
Automobiles & Components | 2.4 | 71,279 | ||||||||
Insurance | 2.0 | 59,667 | ||||||||
Pharmaceuticals, Biotechnology & Life Sciences | 1.9 | 55,642 | ||||||||
Media & Entertainment | 1.8 | 52,221 | ||||||||
Commercial & Professional Services | 0.8 | 24,780 | ||||||||
Utilities | 0.7 | 20,473 | ||||||||
|
|
|
| |||||||
Total Long Positions | 120.5 | 3,521,533 | ||||||||
|
|
|
| |||||||
| % of Net Assets | Value | |||||||||
SHORT POSITIONS: | ||||||||||
Common Stocks: | ||||||||||
Insurance | (0.3 | )% | $ | (7,313 | ) | |||||
Household & Personal Products | (0.3 | ) | (8,730 | ) | ||||||
Commercial & Professional Services | (0.7 | ) | (21,201 | ) | ||||||
Automobiles & Components | (0.9 | ) | (26,773 | ) | ||||||
Media & Entertainment | (1.3 | ) | (36,348 | ) | ||||||
Telecommunication Services | (1.4 | ) | (42,085 | ) | ||||||
Semiconductors & Semiconductor Equipment | (2.1 | ) | (61,387 | ) | ||||||
Pharmaceuticals, Biotechnology & Life Sciences | (2.5 | ) | (72,204 | ) | ||||||
Technology Hardware & Equipment | (2.7 | ) | (78,679 | ) | ||||||
Diversified Financials | (2.9 | ) | (83,420 | ) | ||||||
Real Estate | (3.1 | ) | (91,287 | ) | ||||||
Retailing | (3.2 | ) | (94,403 | ) | ||||||
Consumer Durables & Apparel | (3.7 | ) | (109,390 | ) | ||||||
Materials | (4.7 | ) | (136,460 | ) | ||||||
Capital Goods | (4.9 | ) | (141,755 | ) | ||||||
Banks | (5.0 | ) | (147,358 | ) | ||||||
Transportation | (5.5 | ) | (161,942 | ) | ||||||
Health Care Equipment & Services | (5.6 | ) | (164,850 | ) | ||||||
Consumer Services | (7.0 | ) | (205,761 | ) | ||||||
Software & Services | (8.7 | ) | (253,999 | ) | ||||||
Energy | (9.6 | ) | (279,194 | ) | ||||||
Utilities | (19.2 | ) | (561,382 | ) | ||||||
|
|
|
| |||||||
Total Short Positions | (95.3 | ) | (2,785,921 | ) | ||||||
|
|
|
| |||||||
Other Assets in Excess of Liabilities | 74.8 | 2,186,821 | ||||||||
|
|
|
| |||||||
NET ASSETS | 100.0 | % | $ | 2,922,433 | ||||||
|
|
|
| |||||||
Portfolio holdings are subject to change at any time.
The accompanying notes are an integral part of the financial statements.
19
GOTHAM FUNDS
Portfolio Holdings Summary Tables
September 30, 2020
(Unaudited)
The following table presents a summary by industry group of the portfolio holdings of the Fund:
Gotham Hedged Plus Fund
| % of Net Assets | Value | |||||||||
LONG POSITIONS: | ||||||||||
Common Stocks: | ||||||||||
Retailing | 32.1 | % | $ | 2,956,081 | ||||||
Food, Beverage & Tobacco | 20.1 | 1,844,375 | ||||||||
Software & Services | 19.9 | 1,827,670 | ||||||||
Capital Goods | 13.9 | 1,275,872 | ||||||||
Household & Personal Products | 10.8 | 991,133 | ||||||||
Technology Hardware & Equipment | 10.1 | 929,639 | ||||||||
Food & Staples Retailing | 8.9 | 818,642 | ||||||||
Media & Entertainment | 8.1 | 749,839 | ||||||||
Materials | 8.1 | 741,681 | ||||||||
Pharmaceuticals, Biotechnology & Life Sciences | 7.4 | 677,393 | ||||||||
Telecommunication Services | 7.2 | 662,692 | ||||||||
Health Care Equipment & Services | 6.2 | 569,171 | ||||||||
Transportation | 5.3 | 487,105 | ||||||||
Diversified Financials | 4.7 | 429,691 | ||||||||
Utilities | 2.0 | 184,817 | ||||||||
Consumer Services | 1.2 | 113,715 | ||||||||
Commercial & Professional Services | 1.2 | 108,452 | ||||||||
Energy | 1.2 | 106,424 | ||||||||
Consumer Durables & Apparel | 1.1 | 100,954 | ||||||||
Real Estate | 0.9 | 83,082 | ||||||||
Insurance | 0.8 | 77,094 | ||||||||
Automobiles & Components | 0.8 | 70,197 | ||||||||
Semiconductors & Semiconductor Equipment | 0.2 | 22,597 | ||||||||
Banks | 0.1 | 10,261 | ||||||||
|
|
|
| |||||||
Total Long Positions | 172.3 | 15,838,577 | ||||||||
|
|
|
| |||||||
| % of Net Assets | Value | |||||||||
SHORT POSITIONS: | ||||||||||
Common Stocks: | ||||||||||
Automobiles & Components | (0.2 | )% | $ | (13,246 | ) | |||||
Real Estate | (0.2 | ) | (17,285 | ) | ||||||
Banks | (0.2 | ) | (18,020 | ) | ||||||
Commercial & Professional Services | (0.2 | ) | (21,519 | ) | ||||||
Food & Staples Retailing | (0.3 | ) | (23,243 | ) | ||||||
Food, Beverage & Tobacco | (1.1 | ) | (104,156 | ) | ||||||
Semiconductors & Semiconductor Equipment | (1.2 | ) | (111,411 | ) | ||||||
Consumer Durables & Apparel | (1.2 | ) | (111,888 | ) | ||||||
Media & Entertainment | (1.4 | ) | (127,225 | ) | ||||||
Utilities | (1.4 | ) | (128,816 | ) | ||||||
Technology Hardware & Equipment | (1.4 | ) | (131,642 | ) | ||||||
Materials | (1.8 | ) | (165,545 | ) | ||||||
Retailing | (3.2 | ) | (295,348 | ) | ||||||
Transportation | (4.8 | ) | (442,642 | ) | ||||||
Consumer Services | (5.0 | ) | (462,306 | ) | ||||||
Health Care Equipment & Services | (5.4 | ) | (491,735 | ) | ||||||
Capital Goods | (5.5 | ) | (501,069 | ) | ||||||
Energy | (5.5 | ) | (507,943 | ) | ||||||
Software & Services | (13.4 | ) | (1,231,872 | ) | ||||||
Pharmaceuticals, Biotechnology & Life Sciences | (20.4 | ) | (1,876,562 | ) | ||||||
|
|
|
| |||||||
Total Short Positions | (73.8 | ) | (6,783,473 | ) | ||||||
|
|
|
| |||||||
Other Assets in Excess of Liabilities | 1.5 | 138,857 | ||||||||
|
|
|
| |||||||
NET ASSETS | 100.0 | % | $ | 9,193,961 | ||||||
|
|
|
| |||||||
Portfolio holdings are subject to change at any time.
The accompanying notes are an integral part of the financial statements.
20
GOTHAM FUNDS
Portfolio Holdings Summary Tables
September 30, 2020
(Unaudited)
The following table presents a summary by industry group of the portfolio holdings of the Fund:
Gotham Hedged Core Fund
| % of Net Assets | Value | |||||||||
LONG POSITIONS: | ||||||||||
Common Stocks: | ||||||||||
Retailing | 21.0 | % | $ | 1,845,612 | ||||||
Food, Beverage & Tobacco | 20.4 | 1,796,806 | ||||||||
Capital Goods | 13.6 | 1,196,618 | ||||||||
Software & Services | 13.5 | 1,190,613 | ||||||||
Household & Personal Products | 9.7 | 849,387 | ||||||||
Food & Staples Retailing | 8.0 | 706,891 | ||||||||
Pharmaceuticals, Biotechnology & Life Sciences | 7.8 | 686,615 | ||||||||
Technology Hardware & Equipment | 7.7 | 676,164 | ||||||||
Media & Entertainment | 7.6 | 670,981 | ||||||||
Materials | 6.6 | 580,068 | ||||||||
Transportation | 5.6 | 497,245 | ||||||||
Telecommunication Services | 4.7 | 412,607 | ||||||||
Health Care Equipment & Services | 4.2 | 370,237 | ||||||||
Diversified Financials | 2.3 | 205,420 | ||||||||
Energy | 0.9 | 75,484 | ||||||||
Insurance | 0.8 | 74,551 | ||||||||
Commercial & Professional Services | 0.8 | 67,139 | ||||||||
Automobiles & Components | 0.7 | 63,727 | ||||||||
Utilities | 0.6 | 50,318 | ||||||||
Consumer Services | 0.5 | 47,470 | ||||||||
Consumer Durables & Apparel | 0.5 | 46,289 | ||||||||
Real Estate | 0.5 | 41,329 | ||||||||
Semiconductors & Semiconductor Equipment | 0.2 | 14,940 | ||||||||
Banks | 0.1 | 6,696 | ||||||||
|
|
|
| |||||||
Total Long Positions | 138.3 | 12,173,207 | ||||||||
|
|
|
| |||||||
| % of Net Assets | Value | |||||||||
SHORT POSITIONS: | ||||||||||
Common Stocks: | ||||||||||
Automobiles & Components | (0.0 | )% | $ | (1,467 | ) | |||||
Household & Personal Products | (0.0 | ) | (1,746 | ) | ||||||
Insurance | (0.0 | ) | (2,727 | ) | ||||||
Consumer Durables & Apparel | (0.2 | ) | (12,249 | ) | ||||||
Media & Entertainment | (0.2 | ) | (20,474 | ) | ||||||
Commercial & Professional Services | (0.3 | ) | (25,273 | ) | ||||||
Banks | (0.7 | ) | (64,062 | ) | ||||||
Telecommunication Services | (0.8 | ) | (72,962 | ) | ||||||
Retailing | (1.3 | ) | (112,584 | ) | ||||||
Real Estate | (1.5 | ) | (135,479 | ) | ||||||
Consumer Services | (1.7 | ) | (148,593 | ) | ||||||
Capital Goods | (1.8 | ) | (159,306 | ) | ||||||
Technology Hardware & Equipment | (1.8 | ) | (161,455 | ) | ||||||
Energy | (1.9 | ) | (163,349 | ) | ||||||
Diversified Financials | (1.9 | ) | (166,810 | ) | ||||||
Materials | (1.9 | ) | (167,136 | ) | ||||||
Pharmaceuticals, Biotechnology & Life Sciences | (2.3 | ) | (197,354 | ) | ||||||
Health Care Equipment & Services | (3.5 | ) | (306,670 | ) | ||||||
Semiconductors & Semiconductor Equipment | (3.5 | ) | (307,670 | ) | ||||||
Software & Services | (7.1 | ) | (625,692 | ) | ||||||
Utilities | (7.3 | ) | (641,963 | ) | ||||||
|
|
|
| |||||||
Total Short Positions | (39.7 | ) | (3,495,021 | ) | ||||||
|
|
|
| |||||||
Other Assets in Excess of Liabilities | 1.4 | 125,356 | ||||||||
|
|
|
| |||||||
NET ASSETS | 100.0 | % | $ | 8,803,542 | ||||||
|
|
|
| |||||||
Portfolio holdings are subject to change at any time.
The accompanying notes are an integral part of the financial statements.
21
GOTHAM FUNDS
Portfolio Holdings Summary Tables
September 30, 2020
(Unaudited)
The following table presents a summary by industry group of the portfolio holdings of the Fund:
Gotham Short Strategies Fund
| % of Net Assets | Value | |||||||||
COMMON STOCKS: | ||||||||||
Retailing | 22.7 | % | $ | 8,541,495 | ||||||
Software & Services | 9.5 | 3,561,660 | ||||||||
Capital Goods | 8.1 | 3,028,391 | ||||||||
Energy | 6.9 | 2,599,385 | ||||||||
Semiconductors & Semiconductor Equipment | 6.3 | 2,378,814 | ||||||||
Materials | 5.8 | 2,180,361 | ||||||||
Health Care Equipment & Services | 5.4 | 2,027,568 | ||||||||
Technology Hardware & Equipment | 4.6 | 1,730,330 | ||||||||
Media & Entertainment | 4.1 | 1,552,363 | ||||||||
Food, Beverage & Tobacco | 4.1 | 1,549,062 | ||||||||
Consumer Durables & Apparel | 3.6 | 1,341,780 | ||||||||
Commercial & Professional Services | 3.2 | 1,221,218 | ||||||||
Transportation | 2.7 | 999,395 | ||||||||
Food & Staples Retailing | 2.3 | 871,500 | ||||||||
Pharmaceuticals, Biotechnology & Life Sciences | 2.1 | 773,311 | ||||||||
Automobiles & Components | 1.3 | 506,845 | ||||||||
Household & Personal Products | 1.2 | 468,394 | ||||||||
Utilities | 1.0 | 358,293 | ||||||||
Consumer Services | 0.8 | 301,424 | ||||||||
Telecommunication Services | 0.4 | 161,462 | ||||||||
|
|
|
| |||||||
Total Common Stocks | 96.1 | 36,153,051 | ||||||||
|
|
|
| |||||||
Other Assets in Excess of Liabilities | 3.9 | 1,465,486 | ||||||||
|
|
|
| |||||||
NET ASSETS | 100.0 | % | $ | 37,618,537 | ||||||
|
|
|
| |||||||
Portfolio holdings are subject to change at any time.
The accompanying notes are an integral part of the financial statements.
22
GOTHAM FUNDS
Portfolio Holdings Summary Tables
September 30, 2020
(Unaudited)
The following table presents a summary by industry group of the portfolio holdings of the Fund:
Gotham Master Neutral Fund
| % of Net Assets | Value | |||||||||
LONG POSITIONS: | ||||||||||
Common Stocks: | ||||||||||
Retailing | 4.2 | % | $ | 93,959 | ||||||
Capital Goods | 3.7 | 81,726 | ||||||||
Software & Services | 3.1 | 67,991 | ||||||||
Consumer Durables & Apparel | 2.5 | 55,775 | ||||||||
Materials | 1.8 | 40,922 | ||||||||
Pharmaceuticals, Biotechnology & Life Sciences | 1.7 | 38,494 | ||||||||
Energy | 1.7 | 37,144 | ||||||||
Technology Hardware & Equipment | 1.5 | 33,620 | ||||||||
Commercial & Professional Services | 1.4 | 31,652 | ||||||||
Semiconductors & Semiconductor Equipment | 1.4 | 31,541 | ||||||||
Consumer Services | 1.2 | 27,786 | ||||||||
Food, Beverage & Tobacco | 1.1 | 24,945 | ||||||||
Health Care Equipment & Services | 1.1 | 23,596 | ||||||||
Automobiles & Components | 0.9 | 20,799 | ||||||||
Media & Entertainment | 0.8 | 17,644 | ||||||||
Transportation | 0.6 | 12,711 | ||||||||
Food & Staples Retailing | 0.5 | 10,795 | ||||||||
Household & Personal Products | 0.3 | 6,297 | ||||||||
Utilities | 0.2 | 4,331 | ||||||||
Telecommunication Services | 0.1 | 3,196 | ||||||||
Affiliated Equity Registered Investment Companies | 60.0 | 1,339,911 | ||||||||
U.S. Treasury Obligations | 9.0 | 200,727 | ||||||||
|
|
|
| |||||||
Total Long Positions | 98.8 | 2,205,562 | ||||||||
|
|
|
| |||||||
| % of Net Assets | Value | |||||||||
SHORT POSITIONS: | ||||||||||
Common Stocks: | ||||||||||
Commercial & Professional Services | (0.0 | )% | $ | (417 | ) | |||||
Food & Staples Retailing | (0.1 | ) | (2,792 | ) | ||||||
Telecommunication Services | (0.2 | ) | (4,505 | ) | ||||||
Household & Personal Products | (0.3 | ) | (7,028 | ) | ||||||
Semiconductors & Semiconductor Equipment | (0.5 | ) | (10,697 | ) | ||||||
Media & Entertainment | (0.6 | ) | (12,750 | ) | ||||||
Automobiles & Components | (0.7 | ) | (15,234 | ) | ||||||
Food, Beverage & Tobacco | (0.7 | ) | (15,277 | ) | ||||||
Technology Hardware & Equipment | (0.9 | ) | (20,183 | ) | ||||||
Retailing | (1.0 | ) | (22,780 | ) | ||||||
Consumer Durables & Apparel | (1.7 | ) | (38,200 | ) | ||||||
Transportation | (1.8 | ) | (40,802 | ) | ||||||
Materials | (1.9 | ) | (42,063 | ) | ||||||
Energy | (2.1 | ) | (47,847 | ) | ||||||
Health Care Equipment & Services | (2.2 | ) | (49,077 | ) | ||||||
Capital Goods | (2.4 | ) | (52,518 | ) | ||||||
Software & Services | (2.4 | ) | (53,030 | ) | ||||||
Consumer Services | (2.9 | ) | (65,901 | ) | ||||||
Utilities | (3.4 | ) | (75,221 | ) | ||||||
Pharmaceuticals, Biotechnology & Life Sciences | (3.9 | ) | (86,655 | ) | ||||||
|
|
|
| |||||||
Total Short Positions | (29.7 | ) | (662,977 | ) | ||||||
|
|
|
| |||||||
Other Assets in Excess of Liabilities | 30.9 | 690,011 | ||||||||
|
|
|
| |||||||
NET ASSETS | 100.0 | % | $ | 2,232,596 | ||||||
|
|
|
| |||||||
Portfolio holdings are subject to change at any time.
The accompanying notes are an integral part of the financial statements.
23
GOTHAM FUNDS
Portfolio Holdings Summary Tables
September 30, 2020
(Unaudited)
The following table presents a summary by industry group of the portfolio holdings of the Fund:
Gotham ESG Large Value Fund
| % of Net Assets | Value | |||||||||
COMMON STOCKS: | ||||||||||
Capital Goods | 13.8 | % | $ | 161,407 | ||||||
Retailing | 11.0 | 129,173 | ||||||||
Health Care Equipment & Services | 6.9 | 80,961 | ||||||||
Materials | 6.8 | 79,338 | ||||||||
Software & Services | 6.6 | 76,848 | ||||||||
Diversified Financials | 6.4 | 74,363 | ||||||||
Technology Hardware & Equipment | 6.1 | 70,863 | ||||||||
Food, Beverage & Tobacco | 5.4 | 63,604 | ||||||||
Household & Personal Products | 4.2 | 49,485 | ||||||||
Pharmaceuticals, Biotechnology & Life Sciences | 4.0 | 47,109 | ||||||||
Telecommunication Services | 3.2 | 37,116 | ||||||||
Insurance | 3.1 | 36,867 | ||||||||
Banks | 3.0 | 35,540 | ||||||||
Transportation | 3.0 | 34,754 | ||||||||
Media & Entertainment | 2.7 | 31,162 | ||||||||
Real Estate | 2.4 | 28,156 | ||||||||
Energy | 2.2 | 25,495 | ||||||||
Food & Staples Retailing | 1.8 | 21,129 | ||||||||
Semiconductors & Semiconductor Equipment | 1.5 | 17,553 | ||||||||
Commercial & Professional | ||||||||||
Services | 1.4 | 16,787 | ||||||||
Consumer Durables & Apparel | 1.2 | 14,588 | ||||||||
Consumer Services | 1.2 | 14,375 | ||||||||
Automobiles & Components | 0.4 | 4,670 | ||||||||
Utilities | 0.1 | 1,197 | ||||||||
|
|
|
| |||||||
Total Common Stocks | 98.4 | 1,152,540 | ||||||||
|
|
|
| |||||||
Other Assets in Excess of Liabilities | 1.6 | 18,388 | ||||||||
|
|
|
| |||||||
NET ASSETS | 100.0 | % | $ | 1,170,928 | ||||||
|
|
|
| |||||||
Portfolio holdings are subject to change at any time.
The accompanying notes are an integral part of the financial statements.
24
Portfolio of Investments
September 30, 2020
| Number of Shares | Value | |||||||
LONG POSITIONS — 120.5% |
| |||||||
COMMON STOCKS — 120.5% |
| |||||||
Automobiles & Components — 2.4% |
| |||||||
Aptiv PLC (Jersey)† | 319 | $ | 29,246 | |||||
BorgWarner, Inc.† | 1,085 | 42,033 | ||||||
|
| |||||||
| 71,279 | ||||||||
|
| |||||||
Capital Goods — 23.3% | ||||||||
3M Co.† | 184 | 29,473 | ||||||
AMETEK, Inc.† | 225 | 22,365 | ||||||
Carrier Global Corp.† | 582 | 17,774 | ||||||
Caterpillar, Inc.† | 192 | 28,637 | ||||||
Cummins, Inc.† | 103 | 21,750 | ||||||
Dover Corp.† | 48 | 5,200 | ||||||
Eaton Corp. PLC (Ireland)† | 334 | 34,078 | ||||||
Emerson Electric Co.† | 414 | 27,146 | ||||||
Flowserve Corp.† | 254 | 6,932 | ||||||
Fortive Corp.† | 346 | 26,369 | ||||||
Fortune Brands Home & Security, Inc.† | 250 | 21,630 | ||||||
Honeywell International, Inc.† | 392 | 64,527 | ||||||
Howmet Aerospace, Inc.† | 2,977 | 49,776 | ||||||
Huntington Ingalls Industries, Inc.† | 51 | 7,178 | ||||||
Illinois Tool Works, Inc.† | 75 | 14,491 | ||||||
Johnson Controls International PLC (Ireland)† | 508 | 20,752 | ||||||
Lockheed Martin Corp.† | 63 | 24,147 | ||||||
Masco Corp.† | 770 | 42,450 | ||||||
Otis Worldwide Corp.† | 125 | 7,802 | ||||||
PACCAR, Inc.† | 180 | 15,350 | ||||||
Pentair PLC (Ireland)† | 703 | 32,176 | ||||||
Quanta Services, Inc.† | 802 | 42,394 | ||||||
Raytheon Technologies Corp.† | 458 | 26,353 | ||||||
Snap-on, Inc.† | 157 | 23,099 | ||||||
Stanley Black & Decker, Inc.† | 13 | 2,109 | ||||||
Trane Technologies PLC (Ireland)† | 194 | 23,522 | ||||||
TransDigm Group, Inc.† | 27 | 12,828 | ||||||
United Rentals, Inc.†* | 119 | 20,766 | ||||||
WW Grainger, Inc.† | 25 | 8,919 | ||||||
|
| |||||||
| 679,993 | ||||||||
|
| |||||||
Commercial & Professional Services — 0.8% |
| |||||||
Cintas Corp.† | 14 | 4,660 | ||||||
Republic Services, Inc. | 4 | 373 | ||||||
Robert Half International, Inc.† | 373 | 19,747 | ||||||
|
| |||||||
| 24,780 | ||||||||
|
| |||||||
Consumer Durables & Apparel — 5.4% |
| |||||||
Garmin Ltd. (Switzerland)† | 156 | 14,798 | ||||||
| Number of Shares | Value | |||||||
COMMON STOCKS — (Continued) |
| |||||||
Consumer Durables & Apparel — (Continued) |
| |||||||
Hanesbrands, Inc.† | 891 | $ | 14,033 | |||||
Hasbro, Inc.† | 129 | 10,671 | ||||||
Leggett & Platt, Inc.† | 388 | 15,974 | ||||||
Mohawk Industries, Inc.†* | 236 | 23,031 | ||||||
Newell Brands, Inc.† | 58 | 995 | ||||||
PVH Corp.† | 449 | 26,779 | ||||||
Whirlpool Corp.† | 273 | 50,202 | ||||||
|
| |||||||
| 156,483 | ||||||||
|
| |||||||
Consumer Services — 4.2% |
| |||||||
Darden Restaurants, Inc.† | 278 | 28,006 | ||||||
McDonald’s Corp.† | 254 | 55,750 | ||||||
MGM Resorts International†(a) | 1,543 | 33,560 | ||||||
Yum! Brands, Inc.† | 53 | 4,839 | ||||||
|
| |||||||
| 122,155 | ||||||||
|
| |||||||
Diversified Financials — 5.8% |
| |||||||
Berkshire Hathaway, Inc., Class B†* | 24 | 5,111 | ||||||
BlackRock, Inc.† | 69 | 38,885 | ||||||
Franklin Resources, Inc.† | 1,012 | 20,594 | ||||||
Invesco Ltd. (Bermuda)† | 5,662 | 64,603 | ||||||
Nasdaq, Inc.† | 142 | 17,425 | ||||||
S&P Global, Inc. | 8 | 2,885 | ||||||
Synchrony Financial† | 46 | 1,204 | ||||||
T Rowe Price Group, Inc.† | 142 | 18,207 | ||||||
|
| |||||||
| 168,914 | ||||||||
|
| |||||||
Energy — 6.5% | ||||||||
Apache Corp.† | 388 | 3,674 | ||||||
Baker Hughes Co.† | 1,598 | 21,237 | ||||||
Chevron Corp.† | 324 | 23,328 | ||||||
EOG Resources, Inc.† | 584 | 20,989 | ||||||
Halliburton Co.† | 1,858 | 22,389 | ||||||
Kinder Morgan, Inc.† | 2,377 | 29,308 | ||||||
Marathon Petroleum Corp.† | 53 | 1,555 | ||||||
National Oilwell Varco, Inc.† | 1,347 | 12,204 | ||||||
Schlumberger NV (Curacao)† | 2,235 | 34,777 | ||||||
TechnipFMC PLC (United Kingdom)† | 3,409 | 21,511 | ||||||
|
| |||||||
| 190,972 | ||||||||
|
| |||||||
Food & Staples Retailing — 4.3% |
| |||||||
Kroger Co. (The)† | 745 | 25,263 | ||||||
Sysco Corp.† | 900 | 55,998 | ||||||
Walgreens Boots Alliance, Inc.† | 416 | 14,943 | ||||||
Walmart, Inc.† | 214 | 29,941 | ||||||
|
| |||||||
| 126,145 | ||||||||
|
| |||||||
The accompanying notes are an integral part of the financial statements.
25
GOTHAM NEUTRAL 500 FUND
Portfolio of Investments (Continued)
September 30, 2020
| Number of Shares | Value | |||||||
COMMON STOCKS — (Continued) |
| |||||||
Food, Beverage & Tobacco — 9.2% |
| |||||||
Altria Group, Inc.† | 748 | $ | 28,903 | |||||
Archer-Daniels-Midland Co.† | 566 | 26,313 | ||||||
Campbell Soup Co.† | 359 | 17,365 | ||||||
Coca-Cola Co. (The)† | 283 | 13,972 | ||||||
Constellation Brands, Inc., Class A† | 171 | 32,406 | ||||||
General Mills, Inc.† | 308 | 18,997 | ||||||
JM Smucker Co. (The)† | 201 | 23,220 | ||||||
Kellogg Co.† | 314 | 20,281 | ||||||
Kraft Heinz Co. (The)† | 787 | 23,571 | ||||||
McCormick & Co., Inc., non-voting shares | 1 | 194 | ||||||
Molson Coors Beverage Co., Class B† | 346 | 11,612 | ||||||
Philip Morris International, Inc.† | 216 | 16,198 | ||||||
Tyson Foods, Inc., Class A† | 591 | 35,153 | ||||||
|
| |||||||
| 268,185 | ||||||||
|
| |||||||
Health Care Equipment & Services — 3.4% |
| |||||||
Anthem, Inc. | 1 | 269 | ||||||
CVS Health Corp.† | 324 | 18,922 | ||||||
DaVita, Inc.†* | 164 | 14,047 | ||||||
HCA Healthcare, Inc.† | 25 | 3,117 | ||||||
Hologic, Inc.* | 13 | 864 | ||||||
Humana, Inc.† | 59 | 24,420 | ||||||
Laboratory Corp. of America Holdings†* | 127 | 23,910 | ||||||
Quest Diagnostics, Inc. | 6 | 687 | ||||||
Universal Health Services, Inc., Class B† | 109 | 11,665 | ||||||
|
| |||||||
| 97,901 | ||||||||
|
| |||||||
Household & Personal Products — 2.6% |
| |||||||
Church & Dwight Co., Inc. | 13 | 1,218 | ||||||
Clorox Co. (The)† | 105 | 22,068 | ||||||
Colgate-Palmolive Co.† | 249 | 19,210 | ||||||
Kimberly-Clark Corp.† | 187 | 27,612 | ||||||
Procter & Gamble Co. (The)† | 51 | 7,089 | ||||||
|
| |||||||
| 77,197 | ||||||||
|
| |||||||
Insurance — 2.0% |
| |||||||
American International Group, Inc.† | 225 | 6,194 | ||||||
Aon PLC, Class A (Ireland)† | 39 | 8,046 | ||||||
Cincinnati Financial Corp.† | 291 | 22,689 | ||||||
Marsh & McLennan Cos., Inc.† | 40 | 4,588 | ||||||
MetLife, Inc.† | 70 | 2,602 | ||||||
Principal Financial Group, Inc.† | 170 | 6,846 | ||||||
| Number of Shares | Value | |||||||
COMMON STOCKS — (Continued) |
| |||||||
Insurance — (Continued) |
| |||||||
Prudential Financial, Inc.† | 137 | $ | 8,702 | |||||
|
| |||||||
| 59,667 | ||||||||
|
| |||||||
Materials — 12.1% |
| |||||||
Amcor PLC (Jersey)† | 3,122 | 34,498 | ||||||
Celanese Corp.† | 13 | 1,397 | ||||||
CF Industries Holdings, Inc.† | 1,045 | 32,092 | ||||||
Dow, Inc.† | 209 | 9,833 | ||||||
DuPont de Nemours, Inc.† | 1,479 | 82,055 | ||||||
Eastman Chemical Co.† | 307 | 23,983 | ||||||
Ecolab, Inc.† | 162 | 32,374 | ||||||
FMC Corp.† | 10 | 1,059 | ||||||
International Paper Co.† | 229 | 9,284 | ||||||
Linde PLC (Ireland)† | 133 | 31,671 | ||||||
LyondellBasell Industries NV, Class A (Netherlands)† | 96 | 6,767 | ||||||
Mosaic Co. (The)† | 151 | 2,759 | ||||||
Nucor Corp.† | 711 | 31,895 | ||||||
PPG Industries, Inc.† | 193 | 23,561 | ||||||
Sealed Air Corp.† | 798 | 30,970 | ||||||
|
| |||||||
| 354,198 | ||||||||
|
| |||||||
Media & Entertainment — 1.8% |
| |||||||
Charter Communications, Inc., Class A†* | 23 | 14,360 | ||||||
Discovery, Inc., Class A†(a)* | 111 | 2,416 | ||||||
Fox Corp., Class A† | 897 | 24,964 | ||||||
Interpublic Group of Cos., Inc. (The)† | 26 | 433 | ||||||
Omnicom Group, Inc.† | 203 | 10,048 | ||||||
|
| |||||||
| 52,221 | ||||||||
|
| |||||||
Pharmaceuticals, Biotechnology & Life Sciences — 1.9% |
| |||||||
Biogen, Inc.†* | 27 | 7,659 | ||||||
Gilead Sciences, Inc.† | 23 | 1,453 | ||||||
Johnson & Johnson† | 153 | 22,779 | ||||||
Merck & Co., Inc.† | 15 | 1,244 | ||||||
Pfizer, Inc.† | 537 | 19,708 | ||||||
Regeneron Pharmaceuticals, Inc.* | 5 | 2,799 | ||||||
|
| |||||||
| 55,642 | ||||||||
|
| |||||||
Real Estate — 2.9% |
| |||||||
Ventas, Inc., REIT† | 30 | 1,259 | ||||||
Weyerhaeuser Co., REIT† | 2,906 | 82,879 | ||||||
|
| |||||||
| 84,138 | ||||||||
|
| |||||||
Retailing — 13.5% |
| |||||||
Advance Auto Parts, Inc.† | 152 | 23,332 | ||||||
Amazon.com, Inc.†* | 1 | 3,149 | ||||||
The accompanying notes are an integral part of the financial statements.
26
GOTHAM NEUTRAL 500 FUND
Portfolio of Investments (Continued)
September 30, 2020
| Number of Shares | Value | |||||||
COMMON STOCKS — (Continued) |
| |||||||
Retailing — (Continued) |
| |||||||
AutoZone, Inc.†* | 22 | $ | 25,908 | |||||
Best Buy Co., Inc.† | 138 | 15,358 | ||||||
CarMax, Inc.†* | 36 | 3,309 | ||||||
Dollar General Corp.† | 144 | 30,185 | ||||||
Dollar Tree, Inc.†* | 65 | 5,937 | ||||||
eBay, Inc.† | 1,493 | 77,785 | ||||||
Expedia Group, Inc. | 2 | 183 | ||||||
Genuine Parts Co.† | 414 | 39,400 | ||||||
Home Depot, Inc. (The)† | 101 | 28,049 | ||||||
L Brands, Inc.† | 21 | 668 | ||||||
LKQ Corp.†* | 1,381 | 38,295 | ||||||
Lowe’s Cos., Inc.† | 179 | 29,689 | ||||||
O’Reilly Automotive, Inc.†* | 27 | 12,449 | ||||||
Target Corp.† | 159 | 25,030 | ||||||
Tractor Supply Co.† | 233 | 33,398 | ||||||
Ulta Beauty, Inc.†* | 13 | 2,912 | ||||||
|
| |||||||
| 395,036 | ||||||||
|
| |||||||
Software & Services — 6.6% |
| |||||||
Accenture PLC, Class A (Ireland)† | 279 | 63,051 | ||||||
Broadridge Financial Solutions, Inc.† | 75 | 9,900 | ||||||
Gartner, Inc.†* | 130 | 16,244 | ||||||
International Business Machines Corp.† | 163 | 19,832 | ||||||
NortonLifeLock, Inc.† | 334 | 6,961 | ||||||
Oracle Corp.† | 648 | 38,686 | ||||||
Paychex, Inc.† | 354 | 28,239 | ||||||
Western Union Co. (The)† | 419 | 8,979 | ||||||
|
| |||||||
| 191,892 | ||||||||
|
| |||||||
Technology Hardware & Equipment — 5.0% |
| |||||||
Apple, Inc.† | 662 | 76,666 | ||||||
Cisco Systems, Inc.† | 1,004 | 39,548 | ||||||
Corning, Inc.† | 435 | 14,098 | ||||||
FLIR Systems, Inc.† | 229 | 8,210 | ||||||
HP, Inc.† | 297 | 5,640 | ||||||
Juniper Networks, Inc.† | 111 | 2,386 | ||||||
|
| |||||||
| 146,548 | ||||||||
|
| |||||||
Telecommunication Services — 2.6% |
| |||||||
AT&T, Inc.† | 1,272 | 36,265 | ||||||
Verizon Communications, Inc.† | 645 | 38,371 | ||||||
|
| |||||||
| 74,636 | ||||||||
|
| |||||||
Transportation — 3.5% |
| |||||||
CH Robinson Worldwide, Inc.†(a) | 326 | 33,314 | ||||||
CSX Corp.† | 111 | 8,621 | ||||||
| Number of Shares | Value | |||||||
COMMON STOCKS — (Continued) |
| |||||||
Transportation — (Continued) |
| |||||||
Expeditors International of Washington, Inc.† | 219 | $ | 19,824 | |||||
JB Hunt Transport Services, Inc.† | 204 | 25,782 | ||||||
Norfolk Southern Corp.† | 65 | 13,909 | ||||||
Old Dominion Freight Line, Inc. | 9 | 1,628 | ||||||
|
| |||||||
| 103,078 | ||||||||
|
| |||||||
Utilities — 0.7% |
| |||||||
NRG Energy, Inc.† | 666 | 20,473 | ||||||
|
| |||||||
TOTAL COMMON STOCKS |
| 3,521,533 | ||||||
|
| |||||||
TOTAL LONG POSITIONS - 120.5% |
| 3,521,533 | ||||||
|
| |||||||
(Cost $2,779,150) |
| |||||||
SHORT POSITIONS — (95.3)% |
| |||||||
COMMON STOCKS — (95.3)% |
| |||||||
Automobiles & Components — (0.9)% |
| |||||||
Ford Motor Co. | (4,020 | ) | (26,773 | ) | ||||
|
| |||||||
Banks — (5.0)% |
| |||||||
Citizens Financial Group, Inc. | (145 | ) | (3,666 | ) | ||||
First Republic Bank | (187 | ) | (20,394 | ) | ||||
Huntington Bancshares, Inc. | (2,154 | ) | (19,752 | ) | ||||
JPMorgan Chase & Co. | (24 | ) | (2,310 | ) | ||||
KeyCorp. | (415 | ) | (4,951 | ) | ||||
M&T Bank Corp. | (51 | ) | (4,697 | ) | ||||
People’s United Financial, Inc. | (2,125 | ) | (21,909 | ) | ||||
Regions Financial Corp. | (1,458 | ) | (16,811 | ) | ||||
SVB Financial Group* | (94 | ) | (22,618 | ) | ||||
Truist Financial Corp. | (795 | ) | (30,250 | ) | ||||
|
| |||||||
| (147,358 | ) | |||||||
|
| |||||||
Capital Goods — (4.9)% |
| |||||||
Boeing Co. (The) | (159 | ) | (26,276 | ) | ||||
General Electric Co. | (956 | ) | (5,956 | ) | ||||
Ingersoll Rand, Inc.* | (1,474 | ) | (52,474 | ) | ||||
Jacobs Engineering Group, Inc. | (232 | ) | (21,523 | ) | ||||
L3Harris Technologies, Inc. | (67 | ) | (11,379 | ) | ||||
Textron, Inc. | (105 | ) | (3,790 | ) | ||||
Xylem, Inc. | (242 | ) | (20,357 | ) | ||||
|
| |||||||
| (141,755 | ) | |||||||
|
| |||||||
Commercial & Professional Services — (0.7)% |
| |||||||
Copart, Inc.* | (159 | ) | (16,720 | ) | ||||
Nielsen Holdings PLC (United Kingdom) | (316 | ) | (4,481 | ) | ||||
|
| |||||||
| (21,201 | ) | |||||||
|
| |||||||
The accompanying notes are an integral part of the financial statements.
27
GOTHAM NEUTRAL 500 FUND
Portfolio of Investments (Continued)
September 30, 2020
| Number | ||||||||
| of Shares | Value | |||||||
COMMON STOCKS — (Continued) |
| |||||||
Consumer Durables & Apparel — (3.7)% |
| |||||||
NVR, Inc.* | (3 | ) | $ | (12,250 | ) | |||
Ralph Lauren Corp. | (365 | ) | (24,809 | ) | ||||
Tapestry, Inc. | (1,491 | ) | (23,304 | ) | ||||
Under Armour, Inc., Class C* | (3,269 | ) | (32,167 | ) | ||||
VF Corp. | (240 | ) | (16,860 | ) | ||||
|
| |||||||
| (109,390 | ) | |||||||
|
| |||||||
Consumer Services — (7.0)% |
| |||||||
Carnival Corp. (Panama) | (2,452 | ) | (37,221 | ) | ||||
Domino’s Pizza, Inc. | (22 | ) | (9,356 | ) | ||||
Hilton Worldwide Holdings, Inc. | (261 | ) | (22,269 | ) | ||||
Las Vegas Sands Corp. | (297 | ) | (13,858 | ) | ||||
Marriott International, Inc., Class A | (187 | ) | (17,312 | ) | ||||
Norwegian Cruise Line Holdings Ltd. (Bermuda)* | (2,288 | ) | (39,148 | ) | ||||
Royal Caribbean Cruises Ltd. (Liberia) | (534 | ) | (34,566 | ) | ||||
Starbucks Corp. | (214 | ) | (18,387 | ) | ||||
Wynn Resorts Ltd. | (190 | ) | (13,644 | ) | ||||
|
| |||||||
| (205,761 | ) | |||||||
|
| |||||||
Diversified Financials — (2.9)% |
| |||||||
Ameriprise Financial, Inc. | (28 | ) | (4,315 | ) | ||||
Charles Schwab Corp. (The) | (319 | ) | (11,557 | ) | ||||
E*TRADE Financial Corp. | (179 | ) | (8,959 | ) | ||||
MSCI, Inc. | (76 | ) | (27,115 | ) | ||||
Northern Trust Corp. | (40 | ) | (3,119 | ) | ||||
Raymond James Financial, Inc. | (247 | ) | (17,972 | ) | ||||
State Street Corp. | (175 | ) | (10,383 | ) | ||||
|
| |||||||
| (83,420 | ) | |||||||
|
| |||||||
Energy — (9.6)% |
| |||||||
Cabot Oil & Gas Corp. | (1,542 | ) | (26,769 | ) | ||||
Concho Resources, Inc. | (221 | ) | (9,751 | ) | ||||
Devon Energy Corp. | (2,818 | ) | (26,658 | ) | ||||
Diamondback Energy, Inc. | (1,011 | ) | (30,451 | ) | ||||
Exxon Mobil Corp. | (208 | ) | (7,141 | ) | ||||
Hess Corp. | (803 | ) | (32,867 | ) | ||||
Marathon Oil Corp. | (3,715 | ) | (15,194 | ) | ||||
Noble Energy, Inc. | (3,748 | ) | (32,046 | ) | ||||
Occidental Petroleum Corp. | (3,382 | ) | (33,854 | ) | ||||
ONEOK, Inc. | (1,047 | ) | (27,201 | ) | ||||
Pioneer Natural Resources Co. | (255 | ) | (21,927 | ) | ||||
Valero Energy Corp. | (354 | ) | (15,335 | ) | ||||
|
| |||||||
| (279,194 | ) | |||||||
|
| |||||||
| Number | ||||||||
| of Shares | Value | |||||||
COMMON STOCKS — (Continued) |
| |||||||
Health Care Equipment & Services — (5.6)% |
| |||||||
ABIOMED, Inc.* | (57 | ) | $ | (15,792 | ) | |||
Align Technology, Inc.* | (82 | ) | (26,844 | ) | ||||
Baxter International, Inc. | (19 | ) | (1,528 | ) | ||||
Becton Dickinson and Co. | (2 | ) | (465 | ) | ||||
Boston Scientific Corp.* | (451 | ) | (17,233 | ) | ||||
Cooper Cos., Inc. (The) | (76 | ) | (25,621 | ) | ||||
DexCom, Inc.* | (60 | ) | (24,734 | ) | ||||
Edwards Lifesciences Corp.* | (298 | ) | (23,786 | ) | ||||
Henry Schein, Inc.* | (92 | ) | (5,408 | ) | ||||
IDEXX Laboratories, Inc.* | (12 | ) | (4,717 | ) | ||||
Teleflex, Inc. | (41 | ) | (13,957 | ) | ||||
Zimmer Biomet Holdings, Inc. | (35 | ) | (4,765 | ) | ||||
|
| |||||||
| (164,850 | ) | |||||||
|
| |||||||
Household & Personal Products — (0.3)% |
| |||||||
Estee Lauder Cos., Inc. (The), Class A | (40 | ) | (8,730 | ) | ||||
|
| |||||||
Insurance — (0.3)% |
| |||||||
Everest Re Group Ltd. (Bermuda) | (17 | ) | (3,358 | ) | ||||
Unum Group | (235 | ) | (3,955 | ) | ||||
|
| |||||||
| (7,313 | ) | |||||||
|
| |||||||
Materials — (4.7)% |
| |||||||
Albemarle Corp. | (385 | ) | (34,373 | ) | ||||
Ball Corp. | (304 | ) | (25,268 | ) | ||||
Corteva, Inc. | (967 | ) | (27,859 | ) | ||||
Freeport-McMoRan, Inc. | (1,878 | ) | (29,372 | ) | ||||
International Flavors & Fragrances, Inc. | (66 | ) | (8,082 | ) | ||||
Martin Marietta Materials, Inc. | (8 | ) | (1,883 | ) | ||||
Vulcan Materials Co. | (71 | ) | (9,623 | ) | ||||
|
| |||||||
| (136,460 | ) | |||||||
|
| |||||||
Media & Entertainment — (1.3)% |
| |||||||
Live Nation Entertainment, Inc.* | (584 | ) | (31,466 | ) | ||||
News Corp., Class A | (304 | ) | (4,262 | ) | ||||
Walt Disney Co. (The) | (5 | ) | (620 | ) | ||||
|
| |||||||
| (36,348 | ) | |||||||
|
| |||||||
Pharmaceuticals, Biotechnology & Life Sciences — (2.5)% |
| |||||||
Bio-Rad Laboratories, Inc., Class A* | (36 | ) | (18,557 | ) | ||||
Catalent, Inc.* | (114 | ) | (9,765 | ) | ||||
IQVIA Holdings, Inc.* | (40 | ) | (6,305 | ) | ||||
Mettler-Toledo International, Inc.* | (13 | ) | (12,555 | ) | ||||
Perrigo Co. PLC (Ireland) | (385 | ) | (17,675 | ) | ||||
Vertex Pharmaceuticals, Inc.* | (27 | ) | (7,347 | ) | ||||
|
| |||||||
| (72,204 | ) | |||||||
|
| |||||||
The accompanying notes are an integral part of the financial statements.
28
GOTHAM NEUTRAL 500 FUND
Portfolio of Investments (Continued)
September 30, 2020
| Number | ||||||||
| of Shares | Value | |||||||
COMMON STOCKS — (Continued) |
| |||||||
Real Estate — (3.1)% |
| |||||||
Digital Realty Trust, Inc., REIT | (82 | ) | $ | (12,034 | ) | |||
Equinix, Inc., REIT | (46 | ) | (34,966 | ) | ||||
Healthpeak Properties, Inc., REIT | (923 | ) | (25,060 | ) | ||||
Host Hotels & Resorts, Inc., REIT | (791 | ) | (8,535 | ) | ||||
Regency Centers Corp., REIT | (98 | ) | (3,726 | ) | ||||
SL Green Realty Corp., REIT | (120 | ) | (5,564 | ) | ||||
UDR, Inc., REIT | (43 | ) | (1,402 | ) | ||||
|
| |||||||
| (91,287 | ) | |||||||
|
| |||||||
Retailing — (3.2)% |
| |||||||
Booking Holdings, Inc.* | (10 | ) | (17,107 | ) | ||||
Etsy, Inc.* | (154 | ) | (18,731 | ) | ||||
Gap, Inc. (The) | (967 | ) | (16,468 | ) | ||||
Ross Stores, Inc. | (175 | ) | (16,331 | ) | ||||
TJX Cos., Inc. (The) | (463 | ) | (25,766 | ) | ||||
|
| |||||||
| (94,403 | ) | |||||||
|
| |||||||
Semiconductors & Semiconductor Equipment — (2.1)% |
| |||||||
Advanced Micro Devices, Inc.* | (166 | ) | (13,610 | ) | ||||
Analog Devices, Inc. | (50 | ) | (5,837 | ) | ||||
Microchip Technology, Inc. | (66 | ) | (6,782 | ) | ||||
NVIDIA Corp. | (1 | ) | (541 | ) | ||||
Qorvo, Inc.* | (36 | ) | (4,645 | ) | ||||
QUALCOMM, Inc. | (90 | ) | (10,591 | ) | ||||
Teradyne, Inc. | (55 | ) | (4,370 | ) | ||||
Xilinx, Inc. | (144 | ) | (15,011 | ) | ||||
|
| |||||||
| (61,387 | ) | |||||||
|
| |||||||
Software & Services — (8.7)% |
| |||||||
Akamai Technologies, Inc.* | (275 | ) | (30,398 | ) | ||||
DXC Technology Co. | (543 | ) | (9,693 | ) | ||||
Fidelity National Information Services, Inc. | (253 | ) | (37,244 | ) | ||||
Fiserv, Inc.* | (183 | ) | (18,858 | ) | ||||
Fortinet, Inc.* | (192 | ) | (22,620 | ) | ||||
Global Payments, Inc. | (251 | ) | (44,573 | ) | ||||
Leidos Holdings, Inc. | (47 | ) | (4,190 | ) | ||||
Paycom Software, Inc.* | (151 | ) | (47,006 | ) | ||||
Tyler Technologies, Inc.* | (79 | ) | (27,536 | ) | ||||
VeriSign, Inc.* | (58 | ) | (11,881 | ) | ||||
|
| |||||||
| (253,999 | ) | |||||||
|
| |||||||
Technology Hardware & Equipment — (2.7)% |
| |||||||
IPG Photonics Corp.* | (80 | ) | (13,598 | ) | ||||
Keysight Technologies, Inc.* | (193 | ) | (19,065 | ) | ||||
Western Digital Corp. | (1,259 | ) | (46,016 | ) | ||||
|
| |||||||
| (78,679 | ) | |||||||
|
| |||||||
| Number | ||||||||
| of Shares | Value | |||||||
COMMON STOCKS — (Continued) |
| |||||||
Telecommunication Services — (1.4)% |
| |||||||
T-Mobile US, Inc.* | (368 | ) | $ | (42,085 | ) | |||
|
| |||||||
Transportation — (5.5)% |
| |||||||
Alaska Air Group, Inc. | (812 | ) | (29,744 | ) | ||||
American Airlines Group, Inc. | (3,017 | ) | (37,079 | ) | ||||
Delta Air Lines, Inc. | (992 | ) | (30,335 | ) | ||||
Southwest Airlines Co. | (749 | ) | (28,088 | ) | ||||
United Airlines Holdings, Inc.* | (1,056 | ) | (36,696 | ) | ||||
|
| |||||||
| (161,942 | ) | |||||||
|
| |||||||
Utilities — (19.2)% |
| |||||||
Alliant Energy Corp. | (466 | ) | (24,069 | ) | ||||
Ameren Corp. | (487 | ) | (38,512 | ) | ||||
American Electric Power Co., Inc. | (351 | ) | (28,687 | ) | ||||
American Water Works Co., Inc. | (228 | ) | (33,033 | ) | ||||
Atmos Energy Corp. | (287 | ) | (27,434 | ) | ||||
CenterPoint Energy, Inc. | (585 | ) | (11,320 | ) | ||||
CMS Energy Corp. | (375 | ) | (23,029 | ) | ||||
Consolidated Edison, Inc. | (327 | ) | (25,441 | ) | ||||
DTE Energy Co. | (170 | ) | (19,557 | ) | ||||
Duke Energy Corp. | (48 | ) | (4,251 | ) | ||||
Edison International | (869 | ) | (44,180 | ) | ||||
Entergy Corp. | (253 | ) | (24,928 | ) | ||||
Evergy, Inc. | (381 | ) | (19,362 | ) | ||||
Eversource Energy | (440 | ) | (36,762 | ) | ||||
Exelon Corp. | (343 | ) | (12,266 | ) | ||||
FirstEnergy Corp. | (278 | ) | (7,981 | ) | ||||
NextEra Energy, Inc. | (78 | ) | (21,650 | ) | ||||
NiSource, Inc. | (553 | ) | (12,166 | ) | ||||
Pinnacle West Capital Corp. | (439 | ) | (32,727 | ) | ||||
Public Service Enterprise Group, Inc. | (233 | ) | (12,794 | ) | ||||
Sempra Energy | (229 | ) | (27,104 | ) | ||||
Southern Co. (The) | (375 | ) | (20,332 | ) | ||||
WEC Energy Group, Inc. | (229 | ) | (22,190 | ) | ||||
Xcel Energy, Inc. | (458 | ) | (31,607 | ) | ||||
|
| |||||||
| (561,382 | ) | |||||||
|
| |||||||
TOTAL COMMON STOCK |
| (2,785,921 | ) | |||||
|
| |||||||
TOTAL SECURITES SOLD SHORT - (95.3)% |
| (2,785,921 | ) | |||||
|
| |||||||
(Proceeds $3,068,004) | ||||||||
OTHER ASSETS IN EXCESS OF |
| 2,186,821 | ||||||
|
| |||||||
NET ASSETS - 100.0% |
| $ | 2,922,433 | |||||
|
| |||||||
The accompanying notes are an integral part of the financial statements.
29
GOTHAM NEUTRAL 500 FUND
Portfolio of Investments (Concluded)
September 30, 2020
| † | Security position is either entirely or partially held in a segregated account as collateral for securities sold short. (See Note 1 of the Notes to Financial Statements) |
| (a) | The security or a portion of this security is on loan at September 30, 2020. The total value of securities on loan at September 30, 2020 was $4,810, which was collateralized by $312 in cash and $4,650 of collateral in the form of U.S. Government Treasury Securities, interest rates ranging from 0.00% - 8.00%, and maturity dates ranging from 10/31/2020 - 2/15/2050. (See Note 5 of the Notes to Financial Statements) |
| * | Non-income producing. |
| PLC | Public Limited Company |
| REIT | Real Estate Investment Trust |
The accompanying notes are an integral part of the financial statements.
30
GOTHAM HEDGED PLUS FUND
Portfolio of Investments
September 30, 2020
| Number | ||||||||
| of Shares | Value | |||||||
LONG POSITIONS — 172.3% |
| |||||||
COMMON STOCKS — 172.3% |
| |||||||
Automobiles & Components — 0.8% |
| |||||||
BorgWarner, Inc.† | 1,812 | $ | 70,197 | |||||
|
| |||||||
Banks — 0.1% |
| |||||||
Citigroup, Inc.† | 37 | 1,595 | ||||||
Fifth Third Bancorp† | 386 | 8,230 | ||||||
First Republic Bank† | 4 | 436 | ||||||
|
| |||||||
| 10,261 | ||||||||
|
| |||||||
Capital Goods — 13.9% |
| |||||||
3M Co.† | 339 | 54,301 | ||||||
AECOM* | 7 | 293 | ||||||
Allison Transmission Holdings, Inc.† | 1,885 | 66,239 | ||||||
AMETEK, Inc.† | 85 | 8,449 | ||||||
Carrier Global Corp.† | 45 | 1,374 | ||||||
Caterpillar, Inc.† | 33 | 4,922 | ||||||
Cummins, Inc.† | 473 | 99,879 | ||||||
Curtiss-Wright Corp.† | 12 | 1,119 | ||||||
Dover Corp.† | 78 | 8,450 | ||||||
Eaton Corp. PLC (Ireland)† | 91 | 9,285 | ||||||
EMCOR Group, Inc. | 26 | 1,760 | ||||||
Emerson Electric Co.† | 259 | 16,983 | ||||||
Flowserve Corp.† | 570 | 15,555 | ||||||
Fortive Corp.† | 53 | 4,039 | ||||||
Fortune Brands Home & Security, Inc.† | 94 | 8,133 | ||||||
General Dynamics Corp.† | 57 | 7,891 | ||||||
Honeywell International, Inc.† | 444 | 73,087 | ||||||
Howmet Aerospace, Inc.† | 2,241 | 37,470 | ||||||
Hubbell, Inc. | 189 | 25,863 | ||||||
Huntington Ingalls Industries, Inc. | 7 | 985 | ||||||
Johnson Controls International PLC (Ireland)† | 1,808 | 73,857 | ||||||
Lockheed Martin Corp.† | 334 | 128,016 | ||||||
Masco Corp.† | 4,196 | 231,325 | ||||||
Northrop Grumman Corp.† | 39 | 12,304 | ||||||
Otis Worldwide Corp.† | 52 | 3,246 | ||||||
Pentair PLC (Ireland)† | 1,197 | 54,787 | ||||||
Quanta Services, Inc.† | 1,624 | 85,845 | ||||||
Raytheon Technologies Corp.† | 90 | 5,179 | ||||||
Regal Beloit Corp. | 71 | 6,665 | ||||||
Roper Technologies, Inc.† | 24 | 9,483 | ||||||
Sensata Technologies Holding PLC (United Kingdom)†* | 234 | 10,095 | ||||||
Snap-on, Inc.† | 203 | 29,867 | ||||||
Stanley Black & Decker, Inc.† | 4 | 649 | ||||||
| Number | ||||||||
| of Shares | Value | |||||||
COMMON STOCKS — (Continued) |
| |||||||
Capital Goods — (Continued) |
| |||||||
Trane Technologies PLC (Ireland)† | 537 | $ | 65,111 | |||||
TransDigm Group, Inc.† | 54 | 25,656 | ||||||
United Rentals, Inc.†* | 87 | 15,182 | ||||||
Watsco, Inc. | 267 | 62,182 | ||||||
WW Grainger, Inc.† | 29 | 10,346 | ||||||
|
| |||||||
| 1,275,872 | ||||||||
|
| |||||||
Commercial & Professional Services — 1.2% |
| |||||||
Cintas Corp.† | 35 | 11,649 | ||||||
CoreLogic, Inc. | 2 | 135 | ||||||
ManpowerGroup, Inc.† | 672 | 49,278 | ||||||
Republic Services, Inc.† | 8 | 747 | ||||||
Ritchie Bros Auctioneers, Inc. (Canada) | 5 | 296 | ||||||
Robert Half International, Inc.† | 248 | 13,129 | ||||||
TriNet Group, Inc.†* | 518 | 30,728 | ||||||
Waste Management, Inc.† | 22 | 2,490 | ||||||
|
| |||||||
| 108,452 | ||||||||
|
| |||||||
Consumer Durables & Apparel — 1.1% |
| |||||||
Garmin Ltd. (Switzerland)† | 22 | 2,087 | ||||||
Gildan Activewear, Inc. (Canada) | 529 | 10,405 | ||||||
Hanesbrands, Inc.† | 151 | 2,378 | ||||||
Hasbro, Inc.† | 15 | 1,241 | ||||||
Helen of Troy Ltd. (Bermuda)* | 4 | 774 | ||||||
Leggett & Platt, Inc.† | 118 | 4,858 | ||||||
Newell Brands, Inc.† | 120 | 2,059 | ||||||
NIKE, Inc., Class B† | 4 | 502 | ||||||
PulteGroup, Inc.† | 242 | 11,202 | ||||||
PVH Corp.† | 131 | 7,813 | ||||||
Tapestry, Inc.† | 32 | 500 | ||||||
Tempur Sealy International, Inc.* | 20 | 1,784 | ||||||
Whirlpool Corp.† | 301 | 55,351 | ||||||
|
| |||||||
| 100,954 | ||||||||
|
| |||||||
Consumer Services — 1.2% |
| |||||||
Darden Restaurants, Inc.† | 266 | 26,797 | ||||||
Grand Canyon Education, Inc.†* | 479 | 38,291 | ||||||
Hilton Worldwide Holdings, Inc.† | 4 | 341 | ||||||
McDonald’s Corp.† | 46 | 10,097 | ||||||
MGM Resorts International† | 1,017 | 22,120 | ||||||
Yum! Brands, Inc.† | 176 | 16,069 | ||||||
|
| |||||||
| 113,715 | ||||||||
|
| |||||||
Diversified Financials — 4.7% |
| |||||||
American Express Co.† | 8 | 802 | ||||||
BlackRock, Inc.† | 223 | 125,672 | ||||||
The accompanying notes are an integral part of the financial statements.
31
GOTHAM HEDGED PLUS FUND
Portfolio of Investments (Continued)
September 30, 2020
| Number | ||||||||
| of Shares | Value | |||||||
COMMON STOCKS — (Continued) |
| |||||||
Diversified Financials — (Continued) |
| |||||||
Discover Financial Services† | 208 | $ | 12,018 | |||||
Franklin Resources, Inc.† | 438 | 8,913 | ||||||
Goldman Sachs Group, Inc. (The)† | 39 | 7,838 | ||||||
Intercontinental Exchange, Inc.† | 52 | 5,203 | ||||||
Invesco Ltd. (Bermuda)† | 4,667 | 53,250 | ||||||
Moody’s Corp.† | 1 | 290 | ||||||
Morgan Stanley† | 234 | 11,314 | ||||||
Nasdaq, Inc.† | 947 | 116,206 | ||||||
S&P Global, Inc.† | 23 | 8,294 | ||||||
SEI Investments Co.† | 556 | 28,200 | ||||||
Synchrony Financial† | 35 | 916 | ||||||
T Rowe Price Group, Inc.† | 396 | 50,775 | ||||||
|
| |||||||
| 429,691 | ||||||||
|
| |||||||
Energy — 1.2% |
| |||||||
Apache Corp.† | 1,909 | 18,078 | ||||||
Chevron Corp.† | 76 | 5,472 | ||||||
Concho Resources, Inc.† | 23 | 1,015 | ||||||
ConocoPhillips† | 333 | 10,936 | ||||||
EOG Resources, Inc.† | 217 | 7,799 | ||||||
Halliburton Co.† | 294 | 3,543 | ||||||
Kinder Morgan, Inc.† | 4,121 | 50,812 | ||||||
Phillips 66† | 16 | 829 | ||||||
Schlumberger NV (Curacao)† | 387 | 6,022 | ||||||
TechnipFMC PLC (United Kingdom)† | 201 | 1,268 | ||||||
Valero Energy Corp.† | 15 | 650 | ||||||
|
| |||||||
| 106,424 | ||||||||
|
| |||||||
Food & Staples Retailing — 8.9% |
| |||||||
BJ’s Wholesale Club Holdings, Inc.†* | 4,641 | 192,833 | ||||||
Kroger Co. (The)† | 6,836 | 231,809 | ||||||
Sysco Corp.† | 308 | 19,164 | ||||||
Walgreens Boots Alliance, Inc. | 203 | 7,292 | ||||||
Walmart, Inc.† | 2,627 | 367,544 | ||||||
|
| |||||||
| 818,642 | ||||||||
|
| |||||||
Food, Beverage & Tobacco — 20.1% |
| |||||||
Altria Group, Inc.† | 3,875 | 149,730 | ||||||
Archer-Daniels-Midland Co.† | 1,274 | 59,228 | ||||||
Bunge Ltd. (Bermuda)† | 2,660 | 121,562 | ||||||
Campbell Soup Co.† | 5,567 | 269,276 | ||||||
Coca-Cola Co. (The)† | 488 | 24,092 | ||||||
Conagra Brands, Inc. | 176 | 6,285 | ||||||
Constellation Brands, Inc., Class A† | 434 | 82,247 | ||||||
Flowers Foods, Inc. | 1,220 | 29,683 | ||||||
General Mills, Inc.† | 3,387 | 208,910 | ||||||
| Number | ||||||||
| of Shares | Value | |||||||
COMMON STOCKS — (Continued) |
| |||||||
Food, Beverage & Tobacco — (Continued) |
| |||||||
Hershey Co. (The)† | 2 | $ | 287 | |||||
Hormel Foods Corp. | 75 | 3,667 | ||||||
Ingredion, Inc.† | 841 | 63,647 | ||||||
JM Smucker Co. (The)† | 2,099 | 242,476 | ||||||
Kellogg Co.† | 2,531 | 163,477 | ||||||
Keurig Dr Pepper, Inc.† | 5,280 | 145,728 | ||||||
Kraft Heinz Co. (The)† | 3,517 | 105,334 | ||||||
Lamb Weston Holdings, Inc.† | 102 | 6,760 | ||||||
McCormick & Co., Inc., non-voting shares | 10 | 1,941 | ||||||
Mondelez International, Inc., Class A† | 155 | 8,905 | ||||||
PepsiCo, Inc.† | 11 | 1,525 | ||||||
Philip Morris International, Inc. | 12 | 900 | ||||||
Post Holdings, Inc.* | 23 | 1,978 | ||||||
Tyson Foods, Inc., Class A† | 2,467 | 146,737 | ||||||
|
| |||||||
| 1,844,375 | ||||||||
|
| |||||||
Health Care Equipment & Services — 6.2% |
| |||||||
Abbott Laboratories† | 407 | 44,294 | ||||||
Anthem, Inc.† | 25 | 6,715 | ||||||
CVS Health Corp.† | 1,461 | 85,322 | ||||||
Danaher Corp.† | 163 | 35,099 | ||||||
DaVita, Inc.†* | 1,534 | 131,387 | ||||||
DENTSPLY SIRONA, Inc.† | 257 | 11,239 | ||||||
Henry Schein, Inc.†* | 19 | 1,117 | ||||||
Hologic, Inc.* | 570 | 37,888 | ||||||
Humana, Inc. | 280 | 115,889 | ||||||
Medtronic PLC (Ireland)† | 531 | 55,182 | ||||||
Quest Diagnostics, Inc.† | 30 | 3,435 | ||||||
Stryker Corp.† | 35 | 7,293 | ||||||
UnitedHealth Group, Inc.† | 38 | 11,847 | ||||||
Universal Health Services, Inc., Class B† | 201 | 21,511 | ||||||
Zimmer Biomet Holdings, Inc.† | 7 | 953 | ||||||
|
| |||||||
| 569,171 | ||||||||
|
| |||||||
Household & Personal Products — 10.8% |
| |||||||
Church & Dwight Co., Inc.† | 971 | 90,992 | ||||||
Clorox Co. (The)† | 1,283 | 269,648 | ||||||
Colgate-Palmolive Co.† | 2,861 | 220,726 | ||||||
Kimberly-Clark Corp.† | 1,590 | 234,779 | ||||||
Procter & Gamble Co. (The)† | 1,259 | 174,988 | ||||||
|
| |||||||
| 991,133 | ||||||||
|
| |||||||
The accompanying notes are an integral part of the financial statements.
32
GOTHAM HEDGED PLUS FUND
Portfolio of Investments (Continued)
September 30, 2020
| Number | ||||||||
| of Shares | Value | |||||||
COMMON STOCKS — (Continued) |
| |||||||
Insurance — 0.8% |
| |||||||
Aflac, Inc.† | 49 | $ | 1,781 | |||||
Aon PLC, Class A (Ireland)† | 236 | 48,687 | ||||||
Chubb Ltd. (Switzerland)† | 23 | 2,671 | ||||||
Cincinnati Financial Corp.† | 39 | 3,041 | ||||||
Everest Re Group Ltd. (Bermuda)† | 5 | 988 | ||||||
Hartford Financial Services Group, Inc. (The)† | 20 | 737 | ||||||
Marsh & McLennan Cos., Inc.† | 42 | 4,817 | ||||||
MetLife, Inc.† | 131 | 4,869 | ||||||
Prudential Financial, Inc.† | 56 | 3,557 | ||||||
Travelers Cos., Inc. (The)† | 51 | 5,518 | ||||||
WR Berkley Corp.† | 7 | 428 | ||||||
|
| |||||||
| 77,094 | ||||||||
|
| |||||||
Materials — 8.1% |
| |||||||
Amcor PLC (Jersey)† | 8,563 | 94,621 | ||||||
Ashland Global Holdings, Inc. | 10 | 709 | ||||||
Avery Dennison Corp.† | 5 | 639 | ||||||
Celanese Corp.† | 99 | 10,637 | ||||||
CF Industries Holdings, Inc.† | 1,385 | 42,533 | ||||||
DuPont de Nemours, Inc.† | 537 | 29,793 | ||||||
Eastman Chemical Co.† | 82 | 6,406 | ||||||
Ecolab, Inc.† | 557 | 111,311 | ||||||
FMC Corp.† | 54 | 5,719 | ||||||
International Paper Co.† | 139 | 5,635 | ||||||
Linde PLC (Ireland)† | 94 | 22,384 | ||||||
LyondellBasell Industries NV, Class A (Netherlands)† | 122 | 8,600 | ||||||
NewMarket Corp.† | 125 | 42,790 | ||||||
Nucor Corp. | 279 | 12,516 | ||||||
Nutrien Ltd. (Canada)† | 2,176 | 85,364 | ||||||
PPG Industries, Inc.† | 652 | 79,596 | ||||||
Reliance Steel & Aluminum Co. | 30 | 3,061 | ||||||
Sealed Air Corp.† | 2,966 | 115,110 | ||||||
Sonoco Products Co.† | 277 | 14,146 | ||||||
Southern Copper Corp. | 3 | 136 | ||||||
Teck Resources Ltd., Class B | 2,170 | 30,206 | ||||||
Valvoline, Inc. | 217 | 4,132 | ||||||
Yamana Gold, Inc. (Canada) | 2,753 | 15,637 | ||||||
|
| |||||||
| 741,681 | ||||||||
|
| |||||||
Media & Entertainment — 8.1% |
| |||||||
Activision Blizzard, Inc.† | 177 | 14,328 | ||||||
Alphabet, Inc., Class A†* | 157 | 230,099 | ||||||
| Number | ||||||||
| of Shares | Value | |||||||
COMMON STOCKS — (Continued) |
| |||||||
Media & Entertainment — (Continued) |
| |||||||
Charter Communications, Inc., Class A†* | 242 | $ | 151,090 | |||||
Comcast Corp., Class A† | 64 | 2,961 | ||||||
Electronic Arts, Inc.†* | 592 | 77,203 | ||||||
Facebook, Inc., Class A†* | 655 | 171,544 | ||||||
Fox Corp., Class A† | 2,147 | 59,751 | ||||||
Interpublic Group of Cos., Inc. (The)† | 96 | 1,600 | ||||||
Shaw Communications, Inc., Class B (Canada) | 1,731 | 31,591 | ||||||
Take-Two Interactive Software, Inc.†* | 27 | 4,461 | ||||||
Walt Disney Co. (The)† | 42 | 5,211 | ||||||
|
| |||||||
| 749,839 | ||||||||
|
| |||||||
Pharmaceuticals, Biotechnology & Life Sciences — 7.4% |
| |||||||
AbbVie, Inc. | 13 | 1,139 | ||||||
Alexion Pharmaceuticals, Inc.†* | 79 | 9,040 | ||||||
Gilead Sciences, Inc.† | 1,000 | 63,190 | ||||||
Illumina, Inc.†* | 34 | 10,509 | ||||||
Jazz Pharmaceuticals PLC (Ireland)†* | 217 | 30,942 | ||||||
Johnson & Johnson† | 1,139 | 169,574 | ||||||
Merck & Co., Inc.† | 628 | 52,093 | ||||||
PerkinElmer, Inc.† | 55 | 6,903 | ||||||
Pfizer, Inc.† | 3,565 | 130,836 | ||||||
QIAGEN NV (Netherlands)* | 56 | 2,927 | ||||||
Regeneron Pharmaceuticals, Inc.†* | 285 | 159,537 | ||||||
United Therapeutics Corp.†* | 403 | 40,703 | ||||||
|
| |||||||
| 677,393 | ||||||||
|
| |||||||
Real Estate — 0.9% |
| |||||||
Alexandria Real Estate Equities, Inc., REIT† | 6 | 960 | ||||||
AvalonBay Communities, Inc., REIT† | 9 | 1,344 | ||||||
CBRE Group, Inc., Class A†* | 34 | 1,597 | ||||||
Kimco Realty Corp., REIT† | 113 | 1,272 | ||||||
Realty Income Corp., REIT† | 41 | 2,491 | ||||||
Simon Property Group, Inc., REIT† | 20 | 1,294 | ||||||
Ventas, Inc., REIT† | 394 | 16,532 | ||||||
Welltower, Inc., REIT† | 24 | 1,322 | ||||||
Weyerhaeuser Co., REIT† | 1,973 | 56,270 | ||||||
|
| |||||||
| 83,082 | ||||||||
|
| |||||||
Retailing — 32.1% |
| |||||||
Aaron’s, Inc. | 23 | 1,303 | ||||||
Advance Auto Parts, Inc.† | 454 | 69,689 | ||||||
Amazon.com, Inc.†* | 116 | 365,253 | ||||||
The accompanying notes are an integral part of the financial statements.
33
GOTHAM HEDGED PLUS FUND
Portfolio of Investments (Continued)
September 30, 2020
| Number | ||||||||
| of Shares | Value | |||||||
COMMON STOCKS — (Continued) |
| |||||||
Retailing — (Continued) |
| |||||||
AutoNation, Inc.* | 390 | $ | 20,643 | |||||
AutoZone, Inc.†* | 166 | 195,488 | ||||||
Best Buy Co., Inc.† | 296 | 32,942 | ||||||
Dick’s Sporting Goods, Inc. | 840 | 48,619 | ||||||
Dollar General Corp.† | 1,546 | 324,072 | ||||||
Dollar Tree, Inc.* | 759 | 69,327 | ||||||
eBay, Inc.† | 6,664 | 347,194 | ||||||
Expedia Group, Inc.† | 116 | 10,636 | ||||||
Gap, Inc. (The)† | 217 | 3,696 | ||||||
Genuine Parts Co.† | 875 | 83,274 | ||||||
Home Depot, Inc. (The)† | 782 | 217,169 | ||||||
Kohl’s Corp.† | 442 | 8,190 | ||||||
Lithia Motors, Inc., Class A | 44 | 10,029 | ||||||
LKQ Corp.†* | 510 | 14,142 | ||||||
Lowe’s Cos., Inc.† | 1,398 | 231,872 | ||||||
Murphy USA, Inc.* | 177 | 22,704 | ||||||
Ollie’s Bargain Outlet Holdings, Inc.* | 42 | 3,669 | ||||||
O’Reilly Automotive, Inc.†* | 263 | 121,264 | ||||||
Target Corp.† | 1,520 | 239,278 | ||||||
Tractor Supply Co.† | 2,270 | 325,382 | ||||||
Ulta Beauty, Inc.†* | 104 | 23,294 | ||||||
Williams-Sonoma, Inc.† | 1,846 | 166,952 | ||||||
|
| |||||||
| 2,956,081 | ||||||||
|
| |||||||
Semiconductors & Semiconductor Equipment — 0.2% |
| |||||||
Applied Materials, Inc.† | 98 | 5,826 | ||||||
NVIDIA Corp.† | 7 | 3,789 | ||||||
Qorvo, Inc.†* | 51 | 6,580 | ||||||
Skyworks Solutions, Inc.† | 44 | 6,402 | ||||||
|
| |||||||
| 22,597 | ||||||||
|
| |||||||
Software & Services — 19.9% |
| |||||||
Accenture PLC, Class A (Ireland)† | 185 | 41,808 | ||||||
Amdocs, Ltd. (Guernsey)† | 2,524 | 144,903 | ||||||
Automatic Data Processing, Inc.† | 4 | 558 | ||||||
Broadridge Financial Solutions, Inc. | 434 | 57,288 | ||||||
CDK Global, Inc.† | 1,775 | 77,372 | ||||||
CGI, Inc. (Canada)* | 656 | 44,457 | ||||||
Citrix Systems, Inc.† | 899 | 123,801 | ||||||
FleetCor Technologies, Inc.†* | 9 | 2,143 | ||||||
Gartner, Inc.* | 25 | 3,124 | ||||||
International Business Machines Corp.† | 339 | 41,246 | ||||||
Leidos Holdings, Inc.† | 22 | 1,961 | ||||||
Mastercard, Inc., Class A† | 231 | 78,117 | ||||||
Microsoft Corp.† | 1,739 | 365,764 | ||||||
| Number | ||||||||
| of Shares | Value | |||||||
COMMON STOCKS — (Continued) |
| |||||||
Software & Services — (Continued) |
| |||||||
NortonLifeLock, Inc.† | 12,018 | $ | 250,455 | |||||
Oracle Corp.† | 4,354 | 259,934 | ||||||
Paychex, Inc.† | 1,341 | 106,972 | ||||||
PayPal Holdings, Inc.†* | 270 | 53,198 | ||||||
SS&C Technologies Holdings, Inc. | 1,080 | 65,362 | ||||||
Visa, Inc., Class A† | 489 | 97,785 | ||||||
Western Union Co. (The)† | 533 | 11,422 | ||||||
|
| |||||||
| 1,827,670 | ||||||||
|
| |||||||
Technology Hardware & Equipment — 10.1% |
| |||||||
Apple, Inc.† | 3,620 | 419,232 | ||||||
Arrow Electronics, Inc.†* | 1,918 | 150,870 | ||||||
CDW Corp.† | 13 | 1,554 | ||||||
Cisco Systems, Inc.† | 4,736 | 186,551 | ||||||
F5 Networks, Inc.†* | 42 | 5,156 | ||||||
FLIR Systems, Inc.† | 1,225 | 43,916 | ||||||
HP, Inc.† | 592 | 11,242 | ||||||
Jabil, Inc. | 565 | 19,357 | ||||||
Juniper Networks, Inc.† | 235 | 5,052 | ||||||
NetApp, Inc.† | 10 | 438 | ||||||
SYNNEX Corp. | 505 | 70,730 | ||||||
TE Connectivity Ltd. (Switzerland)† | 159 | 15,541 | ||||||
|
| |||||||
| 929,639 | ||||||||
|
| |||||||
Telecommunication Services — 7.2% |
| |||||||
AT&T, Inc.† | 5,981 | 170,518 | ||||||
BCE, Inc. (Canada)† | 3,267 | 135,482 | ||||||
Rogers Communications, Inc., Class B (Canada)† | 1,367 | 54,202 | ||||||
TELUS Corp. (Canada)(a) | 287 | 5,054 | ||||||
T-Mobile US, Inc.†* | 16 | 1,830 | ||||||
Verizon Communications, Inc.† | 4,969 | 295,606 | ||||||
|
| |||||||
| 662,692 | ||||||||
|
| |||||||
Transportation — 5.3% |
| |||||||
Alaska Air Group, Inc.† | 21 | 769 | ||||||
CH Robinson Worldwide, Inc.† | 1,764 | 180,263 | ||||||
CSX Corp.† | 152 | 11,806 | ||||||
Expeditors International of Washington, Inc.† | 1,552 | 140,487 | ||||||
JB Hunt Transport Services, Inc.† | 871 | 110,077 | ||||||
Kansas City Southern† | 6 | 1,085 | ||||||
Norfolk Southern Corp.† | 24 | 5,136 | ||||||
Old Dominion Freight Line, Inc. | 15 | 2,714 | ||||||
Schneider National, Inc., Class B | 1,367 | 33,806 | ||||||
The accompanying notes are an integral part of the financial statements.
34
GOTHAM HEDGED PLUS FUND
Portfolio of Investments (Continued)
September 30, 2020
| Number | ||||||||
| of Shares | Value | |||||||
COMMON STOCKS — (Continued) |
| |||||||
Transportation — (Continued) |
| |||||||
TFI International, Inc. (Canada) | 23 | $ | 962 | |||||
|
| |||||||
| 487,105 | ||||||||
|
| |||||||
Utilities — 2.0% |
| |||||||
Dominion Energy, Inc.† | 33 | 2,605 | ||||||
NRG Energy, Inc.† | 2,398 | 73,715 | ||||||
Public Service Enterprise Group, Inc.† | 3 | 165 | ||||||
Vistra Corp.† | 5,744 | 108,332 | ||||||
|
| |||||||
| 184,817 | ||||||||
|
| |||||||
TOTAL COMMON STOCKS |
| 15,838,577 | ||||||
|
| |||||||
TOTAL LONG POSITIONS - 172.3% |
| 15,838,577 | ||||||
|
| |||||||
(Cost $14,622,340) | ||||||||
SHORT POSITIONS — (73.8)% |
| |||||||
COMMON STOCKS — (73.8)% |
| |||||||
Automobiles & Components — (0.2)% |
| |||||||
Ford Motor Co. | (1,654 | ) | (11,016 | ) | ||||
Fox Factory Holding Corp.* | (30 | ) | (2,230 | ) | ||||
|
| |||||||
| (13,246 | ) | |||||||
|
| |||||||
Banks — (0.2)% |
| |||||||
First Financial Bankshares, Inc. | (46 | ) | (1,284 | ) | ||||
Prosperity Bancshares, Inc. | (2 | ) | (104 | ) | ||||
TCF Financial Corp. | (712 | ) | (16,632 | ) | ||||
|
| |||||||
| (18,020 | ) | |||||||
|
| |||||||
Capital Goods — (5.5)% |
| |||||||
Axon Enterprise, Inc.* | (772 | ) | (70,020 | ) | ||||
Ballard Power Systems, Inc. | (514 | ) | (7,761 | ) | ||||
Boeing Co. (The) | (129 | ) | (21,319 | ) | ||||
Ingersoll Rand, Inc.* | (2,508 | ) | (89,285 | ) | ||||
Mercury Systems, Inc.* | (664 | ) | (51,433 | ) | ||||
Parsons Corp.* | (729 | ) | (24,451 | ) | ||||
Plug Power, Inc.* | (6,438 | ) | (86,334 | ) | ||||
Sunrun, Inc.* | (999 | ) | (76,993 | ) | ||||
Trex Co., Inc.* | (398 | ) | (28,497 | ) | ||||
Vivint Solar, Inc.* | (1,062 | ) | (44,976 | ) | ||||
|
| |||||||
| (501,069 | ) | |||||||
|
| |||||||
Commercial & Professional Services — (0.2)% |
| |||||||
Clarivate PLC (Jersey)* | (667 | ) | (20,670 | ) | ||||
CoStar Group, Inc.* | (1 | ) | (849 | ) | ||||
|
| |||||||
| (21,519 | ) | |||||||
|
| |||||||
| Number | ||||||||
| of Shares | Value | |||||||
COMMON STOCKS — (Continued) |
| |||||||
Consumer Durables & Apparel — (1.2)% |
| |||||||
Mattel, Inc.* | (1,162 | ) | $ | (13,595 | ) | |||
Ralph Lauren Corp. | (143 | ) | (9,720 | ) | ||||
Skechers U.S.A., Inc., Class A* | (1,833 | ) | (55,393 | ) | ||||
Under Armour, Inc., Class C* | (3,372 | ) | (33,180 | ) | ||||
|
| |||||||
| (111,888 | ) | |||||||
|
| |||||||
Consumer Services — (5.0)% |
| |||||||
Carnival Corp. (Panama) | (7,437 | ) | (112,894 | ) | ||||
Churchill Downs, Inc. | (65 | ) | (10,648 | ) | ||||
Las Vegas Sands Corp. | (652 | ) | (30,422 | ) | ||||
Norwegian Cruise Line Holdings Ltd. (Bermuda)* | (8,105 | ) | (138,677 | ) | ||||
Royal Caribbean Cruises Ltd. (Liberia) | (1,491 | ) | (96,512 | ) | ||||
Texas Roadhouse, Inc. | (634 | ) | (38,541 | ) | ||||
Wynn Resorts Ltd. | (482 | ) | (34,612 | ) | ||||
|
| |||||||
| (462,306 | ) | |||||||
|
| |||||||
Energy — (5.5)% |
| |||||||
Cabot Oil & Gas Corp. | (575 | ) | (9,982 | ) | ||||
Cenovus Energy, Inc. (Canada) | (4,537 | ) | (17,649 | ) | ||||
Continental Resources, Inc. | (3,366 | ) | (41,334 | ) | ||||
Devon Energy Corp. | (702 | ) | (6,641 | ) | ||||
Diamondback Energy, Inc. | (2,057 | ) | (61,957 | ) | ||||
Hess Corp. | (2,177 | ) | (89,105 | ) | ||||
Marathon Petroleum Corp. | (459 | ) | (13,467 | ) | ||||
Noble Energy, Inc. | (8,767 | ) | (74,958 | ) | ||||
Occidental Petroleum Corp. | (7,287 | ) | (72,943 | ) | ||||
Parsley Energy, Inc., Class A | (7,831 | ) | (73,298 | ) | ||||
WPX Energy, Inc.* | (9,512 | ) | (46,609 | ) | ||||
|
| |||||||
| (507,943 | ) | |||||||
|
| |||||||
Food & Staples Retailing — (0.3)% |
| |||||||
Grocery Outlet Holding Corp.* | (209 | ) | (8,218 | ) | ||||
Performance Food Group Co.* | (434 | ) | (15,025 | ) | ||||
|
| |||||||
| (23,243 | ) | |||||||
|
| |||||||
Food, Beverage & Tobacco — (1.1)% |
| |||||||
Beyond Meat, Inc.* | (443 | ) | (73,564 | ) | ||||
Freshpet, Inc.* | (274 | ) | (30,592 | ) | ||||
|
| |||||||
| (104,156 | ) | |||||||
|
| |||||||
Health Care Equipment & Services — (5.4)% |
| |||||||
Change Healthcare, Inc.* | (3,704 | ) | (53,745 | ) | ||||
Guardant Health, Inc.* | (756 | ) | (84,506 | ) | ||||
HealthEquity, Inc.* | (952 | ) | (48,904 | ) | ||||
Inovalon Holdings, Inc., Class A* | (59 | ) | (1,561 | ) | ||||
Insulet Corp.* | (192 | ) | (45,425 | ) | ||||
The accompanying notes are an integral part of the financial statements.
35
GOTHAM HEDGED PLUS FUND
Portfolio of Investments (Continued)
September 30, 2020
| Number of Shares | Value | |||||||
COMMON STOCKS — (Continued) |
| |||||||
Health Care Equipment & Services — (Continued) |
| |||||||
Livongo Health, Inc.* | (206 | ) | $ | (28,850 | ) | |||
Neogen Corp.* | (238 | ) | (18,624 | ) | ||||
Nevro Corp.* | (305 | ) | (42,486 | ) | ||||
Novocure Ltd. (Jersey)* | (718 | ) | (79,921 | ) | ||||
Penumbra, Inc.* | (148 | ) | (28,768 | ) | ||||
SmileDirectClub, Inc.* | (460 | ) | (5,373 | ) | ||||
Tandem Diabetes Care, Inc.* | (472 | ) | (53,572 | ) | ||||
|
| |||||||
| (491,735 | ) | |||||||
|
| |||||||
Materials — (1.8)% | ||||||||
Alamos Gold, Inc., Class A (Canada) | (993 | ) | (8,748 | ) | ||||
Albemarle Corp. | (485 | ) | (43,301 | ) | ||||
Freeport-McMoRan, Inc. | (1,436 | ) | (22,459 | ) | ||||
Kirkland Lake Gold Ltd. (Canada) | (1,836 | ) | (89,468 | ) | ||||
Novagold Resources, Inc. (Canada)* | (132 | ) | (1,569 | ) | ||||
|
| |||||||
| (165,545 | ) | |||||||
|
| |||||||
Media & Entertainment — (1.4)% |
| |||||||
Live Nation Entertainment, Inc.* | (1,450 | ) | (78,126 | ) | ||||
Pinterest, Inc., Class A* | (305 | ) | (12,661 | ) | ||||
Roku, Inc.* | (193 | ) | (36,438 | ) | ||||
|
| |||||||
| (127,225 | ) | |||||||
|
| |||||||
Pharmaceuticals, Biotechnology & Life Sciences — (20.4)% |
| |||||||
10X Genomics, Inc., Class A* | (79 | ) | (9,850 | ) | ||||
ACADIA Pharmaceuticals, Inc.* | (2,193 | ) | (90,461 | ) | ||||
Acceleron Pharma, Inc.* | (258 | ) | (29,033 | ) | ||||
Adaptive Biotechnologies Corp.* | (1,056 | ) | (51,353 | ) | ||||
Agios Pharmaceuticals, Inc.* | (291 | ) | (10,185 | ) | ||||
Allakos, Inc.* | (463 | ) | (37,711 | ) | ||||
Allogene Therapeutics, Inc.* | (1,562 | ) | (58,903 | ) | ||||
Alnylam Pharmaceuticals, Inc.* | (568 | ) | (82,701 | ) | ||||
Amicus Therapeutics, Inc.* | (3,214 | ) | (45,382 | ) | ||||
Arrowhead Pharmaceuticals, Inc.* | (691 | ) | (29,754 | ) | ||||
Biohaven Pharmaceutical Holding Co. Ltd. (British Virgin Islands)* | (1,501 | ) | (97,580 | ) | ||||
BioMarin Pharmaceutical, Inc.* | (140 | ) | (10,651 | ) | ||||
Bluebird Bio, Inc.* | (925 | ) | (49,904 | ) | ||||
Blueprint Medicines Corp.* | (1,153 | ) | (106,883 | ) | ||||
Bridgebio Pharma, Inc.* | (1,067 | ) | (40,034 | ) | ||||
ChemoCentryx, Inc.* | (1,055 | ) | (57,814 | ) | ||||
Deciphera Pharmaceuticals, Inc.* | (35 | ) | (1,796 | ) | ||||
Denali Therapeutics, Inc.* | (274 | ) | (9,817 | ) | ||||
Exact Sciences Corp.* | (687 | ) | (70,040 | ) | ||||
FibroGen, Inc.* | (997 | ) | (40,997 | ) | ||||
Global Blood Therapeutics, Inc.* | (1,422 | ) | (78,409 | ) | ||||
| Number of Shares | Value | |||||||
COMMON STOCKS — (Continued) |
| |||||||
Pharmaceuticals, Biotechnology & Life |
| |||||||
Halozyme Therapeutics, Inc.* | (304 | ) | $ | (7,989 | ) | |||
Immunomedics, Inc.* | (271 | ) | (23,043 | ) | ||||
Invitae Corp.* | (1,733 | ) | (75,126 | ) | ||||
Ionis Pharmaceuticals, Inc.* | (148 | ) | (7,023 | ) | ||||
Iovance Biotherapeutics, Inc.* | (2,647 | ) | (87,139 | ) | ||||
Mirati Therapeutics, Inc.* | (451 | ) | (74,889 | ) | ||||
Moderna, Inc.* | (694 | ) | (49,100 | ) | ||||
Momenta Pharmaceuticals, Inc.* | (1,126 | ) | (59,092 | ) | ||||
MyoKardia, Inc.* | (385 | ) | (52,487 | ) | ||||
Natera, Inc.* | (613 | ) | (44,283 | ) | ||||
Nektar Therapeutics* | (3,042 | ) | (50,467 | ) | ||||
NeoGenomics, Inc.* | (872 | ) | (32,168 | ) | ||||
Novavax, Inc.* | (606 | ) | (65,660 | ) | ||||
OPKO Health, Inc.* | (741 | ) | (2,734 | ) | ||||
PTC Therapeutics, Inc.* | (312 | ) | (14,586 | ) | ||||
Reata Pharmaceuticals, Inc., Class A* | (457 | ) | (44,521 | ) | ||||
Sarepta Therapeutics, Inc.* | (563 | ) | (79,062 | ) | ||||
Ultragenyx Pharmaceutical, Inc.* | (994 | ) | (81,697 | ) | ||||
Vir Biotechnology, Inc.* | (473 | ) | (16,238 | ) | ||||
|
| |||||||
| (1,876,562 | ) | |||||||
|
| |||||||
Real Estate — (0.2)% |
| |||||||
Rayonier, Inc. | (497 | ) | (13,141 | ) | ||||
Redfin Corp.* | (83 | ) | (4,144 | ) | ||||
|
| |||||||
| (17,285 | ) | |||||||
|
| |||||||
Retailing — (3.2)% |
| |||||||
Carvana Co.* | (250 | ) | (55,765 | ) | ||||
Chewy, Inc., Class A* | (667 | ) | (36,572 | ) | ||||
Five Below, Inc.* | (152 | ) | (19,304 | ) | ||||
Grubhub, Inc.* | (1,283 | ) | (92,799 | ) | ||||
Nordstrom, Inc. | (2,402 | ) | (28,632 | ) | ||||
Wayfair, Inc., Class A* | (214 | ) | (62,276 | ) | ||||
|
| |||||||
| (295,348 | ) | |||||||
|
| |||||||
Semiconductors & Semiconductor Equipment — (1.2)% |
| |||||||
Cree, Inc.* | (929 | ) | (59,214 | ) | ||||
Enphase Energy, Inc.* | (128 | ) | (10,572 | ) | ||||
Inphi Corp.* | (329 | ) | (36,930 | ) | ||||
Lattice Semiconductor Corp.* | (129 | ) | (3,736 | ) | ||||
Power Integrations, Inc. | (12 | ) | (665 | ) | ||||
Silicon Laboratories, Inc.* | (3 | ) | (294 | ) | ||||
|
| |||||||
| (111,411 | ) | |||||||
|
| |||||||
The accompanying notes are an integral part of the financial statements.
36
GOTHAM HEDGED PLUS FUND
Portfolio of Investments (Concluded)
September 30, 2020
| Number | ||||||||
| of Shares | Value | |||||||
COMMON STOCKS — (Continued) |
| |||||||
Software & Services — (13.4)% |
| |||||||
Alteryx, Inc., Class A* | (312 | ) | $ | (35,428 | ) | |||
Anaplan, Inc.* | (1,332 | ) | (83,356 | ) | ||||
Appfolio, Inc., Class A* | (271 | ) | (38,430 | ) | ||||
Appian Corp.* | (736 | ) | (47,656 | ) | ||||
Atlassian Corp. PLC, Class A (United Kingdom)* | (141 | ) | (25,632 | ) | ||||
Avalara, Inc.* | (240 | ) | (30,562 | ) | ||||
Blackline, Inc.* | (125 | ) | (11,204 | ) | ||||
Ceridian HCM Holding, Inc.* | (160 | ) | (13,224 | ) | ||||
Cloudera, Inc.* | (2,428 | ) | (26,441 | ) | ||||
Cloudflare, Inc., Class A* | (721 | ) | (29,604 | ) | ||||
Datadog, Inc., Class A* | (122 | ) | (12,464 | ) | ||||
Dropbox, Inc., Class A* | (2,949 | ) | (56,798 | ) | ||||
Dynatrace, Inc.* | (580 | ) | (23,792 | ) | ||||
Elastic NV (Netherlands)* | (358 | ) | (38,625 | ) | ||||
Envestnet, Inc.* | (130 | ) | (10,031 | ) | ||||
Everbridge, Inc.* | (35 | ) | (4,401 | ) | ||||
Fastly, Inc., Class A* | (515 | ) | (48,245 | ) | ||||
Global Payments, Inc. | (9 | ) | (1,598 | ) | ||||
Globant SA (Luxembourg)* | (12 | ) | (2,151 | ) | ||||
Guidewire Software, Inc.* | (73 | ) | (7,612 | ) | ||||
Medallia, Inc.* | (2,159 | ) | (59,200 | ) | ||||
MongoDB, Inc.* | (244 | ) | (56,488 | ) | ||||
New Relic, Inc.* | (125 | ) | (7,045 | ) | ||||
Nutanix, Inc., Class A* | (3,923 | ) | (87,012 | ) | ||||
Okta, Inc.* | (65 | ) | (13,900 | ) | ||||
Paycom Software, Inc.* | (98 | ) | (30,507 | ) | ||||
Paylocity Holding Corp.* | (126 | ) | (20,339 | ) | ||||
Pegasystems, Inc. | (101 | ) | (12,225 | ) | ||||
Proofpoint, Inc.* | (662 | ) | (69,874 | ) | ||||
Q2 Holdings, Inc.* | (717 | ) | (65,433 | ) | ||||
RingCentral, Inc., Class A* | (78 | ) | (21,420 | ) | ||||
Slack Technologies, Inc., Class A* | (2,390 | ) | (64,195 | ) | ||||
Smartsheet, Inc., Class A* | (1,230 | ) | (60,787 | ) | ||||
SolarWinds Corp.* | (491 | ) | (9,987 | ) | ||||
Switch, Inc., Class A | (2,494 | ) | (38,931 | ) | ||||
Tenable Holdings, Inc.* | (299 | ) | (11,287 | ) | ||||
Zendesk, Inc.* | (544 | ) | (55,988 | ) | ||||
|
| |||||||
| (1,231,872 | ) | |||||||
|
| |||||||
Technology Hardware & Equipment — (1.4)% |
| |||||||
Novanta, Inc. (Canada)* | (100 | ) | (10,534 | ) | ||||
| Number | ||||||||
| of Shares | Value | |||||||
COMMON STOCKS — (Continued) |
| |||||||
Technology Hardware & Equipment — (Continued) |
| |||||||
Pure Storage, Inc., Class A* | (4,086 | )$ | (62,884 | ) | ||||
Western Digital Corp. | (1,593 | ) | (58,224 | ) | ||||
|
| |||||||
| (131,642 | ) | |||||||
|
| |||||||
Transportation — (4.8)% |
| |||||||
American Airlines Group, Inc. | (9,284 | ) | (114,100 | ) | ||||
Delta Air Lines, Inc. | (1,674 | ) | (51,191 | ) | ||||
JetBlue Airways Corp.* | (2,483 | ) | (28,132 | ) | ||||
Lyft, Inc., Class A* | (2,974 | ) | (81,934 | ) | ||||
Southwest Airlines Co. | (369 | ) | (13,838 | ) | ||||
Uber Technologies, Inc.* | (1,361 | ) | (49,649 | ) | ||||
United Airlines Holdings, Inc.* | (2,987 | ) | (103,798 | ) | ||||
|
| |||||||
| (442,642 | ) | |||||||
|
| |||||||
Utilities — (1.4)% |
| |||||||
Black Hills Corp. | (408 | ) | (21,824 | ) | ||||
Edison International | (727 | ) | (36,961 | ) | ||||
Essential Utilities, Inc. | (1,292 | ) | (52,003 | ) | ||||
ONE Gas, Inc. | (157 | ) | (10,835 | ) | ||||
Southwest Gas Holdings, Inc. | (114 | ) | (7,193 | ) | ||||
|
| |||||||
| (128,816 | ) | |||||||
|
| |||||||
TOTAL COMMON STOCK |
| (6,783,473 | ) | |||||
|
| |||||||
TOTAL SECURITES SOLD SHORT - (73.8)% |
| (6,783,473 | ) | |||||
|
| |||||||
(Proceeds $6,860,074) |
| |||||||
OTHER ASSETS IN EXCESS OF |
| 138,857 | ||||||
|
| |||||||
NET ASSETS - 100.0% |
| $ | 9,193,961 | |||||
|
| |||||||
| † | Security position is either entirely or partially held in a segregated account as collateral for securities sold short. |
(See Note 1 of the Notes to Financial Statements) |
| (a) | The security or a portion of this security is on loan at September 30, 2020. The total value of securities on loan at September 30, 2020 was $863 which was collateralized by $894 in cash. (See Note 5 of the Notes to Financial Statements) |
| * | Non-income producing. |
| PLC | Public Limited Company |
| REIT | Real Estate Investment Trust |
The accompanying notes are an integral part of the financial statements.
37
GOTHAM HEDGED CORE FUND
Portfolio of Investment
September 30, 2020
| Number | ||||||||
| of Shares | Value | |||||||
LONG POSITIONS — 138.3% |
| |||||||
COMMON STOCKS — 138.3% |
| |||||||
Automobiles & Components — 0.7% |
| |||||||
BorgWarner, Inc.(a) | 1,645 | $ | 63,727 | |||||
|
| |||||||
Banks — 0.1% |
| |||||||
Citigroup, Inc.† | 13 | 560 | ||||||
Fifth Third Bancorp† | 252 | 5,373 | ||||||
First Republic Bank† | 7 | 763 | ||||||
|
| |||||||
| 6,696 | ||||||||
|
| |||||||
Capital Goods — 13.6% |
| |||||||
3M Co.† | 737 | 118,053 | ||||||
AMETEK, Inc.† | 45 | 4,473 | ||||||
Carrier Global Corp.† | 25 | 763 | ||||||
Caterpillar, Inc.† | 20 | 2,983 | ||||||
Cummins, Inc.† | 727 | 153,513 | ||||||
Dover Corp.† | 61 | 6,609 | ||||||
Eaton Corp. PLC (Ireland)† | 50 | 5,102 | ||||||
Emerson Electric Co.† | 310 | 20,327 | ||||||
Flowserve Corp.† | 256 | 6,986 | ||||||
Fortive Corp.† | 25 | 1,905 | ||||||
Fortune Brands Home & Security, Inc.† | 51 | 4,413 | ||||||
General Dynamics Corp.† | 17 | 2,353 | ||||||
Honeywell International, Inc.† | 366 | 60,247 | ||||||
Howmet Aerospace, Inc.† | 609 | 10,182 | ||||||
Huntington Ingalls Industries, Inc. | 201 | 28,291 | ||||||
Illinois Tool Works, Inc. | 22 | 4,251 | ||||||
Johnson Controls International PLC (Ireland)† | 1,848 | 75,491 | ||||||
Lockheed Martin Corp.† | 301 | 115,367 | ||||||
Masco Corp.† | 2,811 | 154,970 | ||||||
Northrop Grumman Corp.† | 37 | 11,673 | ||||||
Otis Worldwide Corp.† | 23 | 1,436 | ||||||
PACCAR, Inc. | 621 | 52,959 | ||||||
Pentair PLC (Ireland)† | 1,257 | 57,533 | ||||||
Quanta Services, Inc.† | 1,831 | 96,787 | ||||||
Raytheon Technologies Corp.† | 31 | 1,784 | ||||||
Roper Technologies, Inc.† | 23 | 9,088 | ||||||
Snap-on, Inc.† | 253 | 37,224 | ||||||
Trane Technologies PLC (Ireland)† | 1,000 | 121,250 | ||||||
TransDigm Group, Inc.† | 31 | 14,729 | ||||||
United Rentals, Inc.†(a)* | 46 | 8,027 | ||||||
WW Grainger, Inc.† | 22 | 7,849 | ||||||
|
| |||||||
| 1,196,618 | ||||||||
|
| |||||||
| Number | ||||||||
| of Shares | Value | |||||||
COMMON STOCKS — (Continued) |
| |||||||
Commercial & Professional Services — 0.8% |
| |||||||
Cintas Corp.† | 23 | $ | 7,655 | |||||
Republic Services, Inc.† | 171 | 15,963 | ||||||
Robert Half International, Inc.† | 790 | 41,823 | ||||||
Waste Management, Inc.† | 15 | 1,698 | ||||||
|
| |||||||
| 67,139 | ||||||||
|
| |||||||
Consumer Durables & Apparel — 0.5% |
| |||||||
DR Horton, Inc.† | 17 | 1,286 | ||||||
Garmin Ltd. (Switzerland)† | 10 | 949 | ||||||
Hanesbrands, Inc.†(a) | 166 | 2,614 | ||||||
Hasbro, Inc.† | 10 | 827 | ||||||
Leggett & Platt, Inc.† | 32 | 1,317 | ||||||
Newell Brands, Inc.(a) | 63 | 1,081 | ||||||
PulteGroup, Inc.† | 147 | 6,805 | ||||||
PVH Corp.† | 78 | 4,652 | ||||||
Tapestry, Inc.† | 6 | 94 | ||||||
Whirlpool Corp. | 145 | 26,664 | ||||||
|
| |||||||
| 46,289 | ||||||||
|
| |||||||
Consumer Services — 0.5% |
| |||||||
Darden Restaurants, Inc.† | 157 | 15,816 | ||||||
McDonald’s Corp.† | 19 | 4,170 | ||||||
MGM Resorts International† | 529 | 11,506 | ||||||
Yum! Brands, Inc.† | 175 | 15,978 | ||||||
|
| |||||||
| 47,470 | ||||||||
|
| |||||||
Diversified Financials — 2.3% |
| |||||||
Berkshire Hathaway, Inc., Class B†* | 183 | 38,968 | ||||||
BlackRock, Inc.† | 68 | 38,321 | ||||||
Discover Financial Services† | 117 | 6,760 | ||||||
Franklin Resources, Inc.† | 1,205 | 24,522 | ||||||
Goldman Sachs Group, Inc. (The)† | 24 | 4,823 | ||||||
Intercontinental Exchange, Inc.† | 19 | 1,901 | ||||||
Invesco Ltd. (Bermuda)† | 571 | 6,515 | ||||||
Morgan Stanley† | 150 | 7,252 | ||||||
Nasdaq, Inc.† | 477 | 58,533 | ||||||
S&P Global, Inc.† | 5 | 1,803 | ||||||
Synchrony Financial† | 137 | 3,585 | ||||||
T Rowe Price Group, Inc.† | 97 | 12,437 | ||||||
|
| |||||||
| 205,420 | ||||||||
|
| |||||||
Energy — 0.9% |
| |||||||
Apache Corp. | 1,136 | 10,758 | ||||||
Chevron Corp.† | 42 | 3,024 | ||||||
ConocoPhillips† | 179 | 5,878 | ||||||
EOG Resources, Inc.† | 109 | 3,917 | ||||||
Halliburton Co.† | 161 | 1,940 | ||||||
The accompanying notes are an integral part of the financial statements.
38
GOTHAM HEDGED CORE FUND
Portfolio of Investment (Continued)
September 30, 2020
| Number | ||||||||
| of Shares | Value | |||||||
COMMON STOCKS — (Continued) |
| |||||||
Energy — (Continued) |
| |||||||
Kinder Morgan, Inc.† | 3,602 | $ | 44,413 | |||||
Marathon Petroleum Corp.† | 12 | 352 | ||||||
Phillips 66† | 2 | 104 | ||||||
Schlumberger NV (Curacao)† | 239 | 3,719 | ||||||
TechnipFMC PLC (United Kingdom)† | 143 | 902 | ||||||
Valero Energy Corp.† | 11 | 477 | ||||||
|
| |||||||
| 75,484 | ||||||||
|
| |||||||
Food & Staples Retailing — 8.0% |
| |||||||
Costco Wholesale Corp.† | 99 | 35,145 | ||||||
Kroger Co. (The)† | 8,364 | 283,623 | ||||||
Sysco Corp.† | 248 | 15,431 | ||||||
Walgreens Boots Alliance, Inc. | 2,383 | 85,597 | ||||||
Walmart, Inc.† | 2,052 | 287,095 | ||||||
|
| |||||||
| 706,891 | ||||||||
|
| |||||||
Food, Beverage & Tobacco — 20.4% |
| |||||||
Altria Group, Inc.† | 3,973 | 153,517 | ||||||
Archer-Daniels-Midland Co.† | 1,864 | 86,657 | ||||||
Campbell Soup Co.†(a) | 4,679 | 226,323 | ||||||
Coca-Cola Co. (The)† | 1,415 | 69,859 | ||||||
Conagra Brands, Inc. | 3,295 | 117,664 | ||||||
Constellation Brands, Inc., Class A† | 483 | 91,533 | ||||||
General Mills, Inc.† | 3,387 | 208,910 | ||||||
Hormel Foods Corp. | 1,229 | 60,086 | ||||||
JM Smucker Co. (The)† | 1,971 | 227,690 | ||||||
Kellogg Co. | 3,026 | 195,449 | ||||||
Kraft Heinz Co. (The) | 2,951 | 88,382 | ||||||
Lamb Weston Holdings, Inc.† | 69 | 4,573 | ||||||
McCormick & Co., Inc., non-voting shares | 99 | 19,216 | ||||||
Molson Coors Beverage Co., Class B | 1,024 | 34,365 | ||||||
Mondelez International, Inc., Class A† | 56 | 3,217 | ||||||
Philip Morris International, Inc.† | 713 | 53,468 | ||||||
Tyson Foods, Inc., Class A† | 2,621 | 155,897 | ||||||
|
| |||||||
| 1,796,806 | ||||||||
|
| |||||||
Health Care Equipment & Services — 4.2% |
| |||||||
Abbott Laboratories† | 392 | 42,661 | ||||||
Anthem, Inc.† | 23 | 6,178 | ||||||
CVS Health Corp.† | 1,847 | 107,865 | ||||||
Danaher Corp.† | 157 | 33,807 | ||||||
DaVita, Inc.†* | 1,004 | 85,993 | ||||||
DENTSPLY SIRONA, Inc.† | 87 | 3,805 | ||||||
Henry Schein, Inc.†* | 14 | 823 | ||||||
| Number | ||||||||
| of Shares | Value | |||||||
COMMON STOCKS — (Continued) |
| |||||||
Health Care Equipment & Services — (Continued) |
| |||||||
Hologic, Inc.* | 122 | $ | 8,109 | |||||
Humana, Inc. | 135 | 55,875 | ||||||
Medtronic PLC (Ireland)† | 34 | 3,533 | ||||||
Quest Diagnostics, Inc.† | 20 | 2,290 | ||||||
Stryker Corp.† | 12 | 2,500 | ||||||
UnitedHealth Group, Inc.† | 35 | 10,912 | ||||||
Universal Health Services, Inc., Class B† | 55 | 5,886 | ||||||
|
| |||||||
| 370,237 | ||||||||
|
| |||||||
Household & Personal Products — 9.7% |
| |||||||
Church & Dwight Co., Inc. | 1,255 | 117,606 | ||||||
Clorox Co. (The)† | 1,217 | 255,777 | ||||||
Colgate-Palmolive Co.† | 1,882 | 145,196 | ||||||
Kimberly-Clark Corp.† | 1,364 | 201,408 | ||||||
Procter & Gamble Co. (The)† | 931 | 129,400 | ||||||
|
| |||||||
| 849,387 | ||||||||
|
| |||||||
Insurance — 0.8% |
| |||||||
Aflac, Inc.† | 37 | 1,345 | ||||||
Aon PLC, Class A (Ireland)† | 293 | 60,446 | ||||||
Cincinnati Financial Corp.† | 20 | 1,559 | ||||||
Hartford Financial Services Group, Inc. (The)† | 14 | 516 | ||||||
Marsh & McLennan Cos., Inc.† | 21 | 2,409 | ||||||
MetLife, Inc.† | 89 | 3,308 | ||||||
Prudential Financial, Inc.† | 36 | 2,287 | ||||||
Travelers Cos., Inc. (The)† | 18 | 1,947 | ||||||
WR Berkley Corp.† | 12 | 734 | ||||||
|
| |||||||
| 74,551 | ||||||||
|
| |||||||
Materials — 6.6% |
| |||||||
Amcor PLC (Jersey)† | 9,225 | 101,936 | ||||||
Celanese Corp.† | 67 | 7,199 | ||||||
CF Industries Holdings, Inc.† | 1,079 | 33,136 | ||||||
Dow, Inc.† | 10 | 470 | ||||||
DuPont de Nemours, Inc.† | 292 | 16,200 | ||||||
Eastman Chemical Co.† | 212 | 16,561 | ||||||
Ecolab, Inc. | 344 | 68,745 | ||||||
FMC Corp.† | 23 | 2,436 | ||||||
International Paper Co.† | 89 | 3,608 | ||||||
Linde PLC (Ireland)† | 49 | 11,668 | ||||||
LyondellBasell Industries NV, Class A (Netherlands)† | 63 | 4,441 | ||||||
Newmont Corp. | 929 | 58,945 | ||||||
Nucor Corp. | 1,172 | 52,576 | ||||||
The accompanying notes are an integral part of the financial statements.
39
GOTHAM HEDGED CORE FUND
Portfolio of Investment (Continued)
September 30, 2020
| Number | ||||||||
| of Shares | Value | |||||||
COMMON STOCKS — (Continued) |
| |||||||
Materials — (Continued) |
| |||||||
PPG Industries, Inc.† | 650 | $ | 79,352 | |||||
Sealed Air Corp.† | 3,164 | 122,795 | ||||||
|
| |||||||
| 580,068 | ||||||||
|
| |||||||
Media & Entertainment — 7.6% |
| |||||||
Activision Blizzard, Inc.† | 171 | 13,842 | ||||||
Alphabet, Inc., Class A†* | 151 | 221,306 | ||||||
Charter Communications, Inc., | 185 | 115,503 | ||||||
Discovery, Inc., Class A(a)* | 10 | 218 | ||||||
Electronic Arts, Inc.†* | 446 | 58,163 | ||||||
Facebook, Inc., Class A†* | 630 | 164,997 | ||||||
Fox Corp., Class A†(a) | 3,099 | 86,245 | ||||||
Interpublic Group of Cos., Inc. (The)† | 52 | 867 | ||||||
Omnicom Group, Inc.† | 112 | 5,544 | ||||||
Take-Two Interactive Software, Inc.†* | 26 | 4,296 | ||||||
|
| |||||||
| 670,981 | ||||||||
|
| |||||||
Pharmaceuticals, Biotechnology & Life Sciences — 7.8% |
| |||||||
AbbVie, Inc. | 10 | 876 | ||||||
Alexion Pharmaceuticals, Inc.†* | 126 | 14,418 | ||||||
Amgen, Inc.† | 1 | 254 | ||||||
Biogen, Inc.†* | 216 | 61,275 | ||||||
Bristol Myers Squibb Co.† | 233 | 14,048 | ||||||
Gilead Sciences, Inc.† | 1,827 | 115,448 | ||||||
Illumina, Inc.†* | 33 | 10,200 | ||||||
Johnson & Johnson† | 1,018 | 151,560 | ||||||
Merck & Co., Inc.† | 717 | 59,475 | ||||||
PerkinElmer, Inc.† | 25 | 3,138 | ||||||
Pfizer, Inc.† | 3,572 | 131,092 | ||||||
Regeneron Pharmaceuticals, Inc.* | 223 | 124,831 | ||||||
|
| |||||||
| 686,615 | ||||||||
|
| |||||||
Real Estate — 0.5% |
| |||||||
Alexandria Real Estate Equities, Inc., REIT† | 2 | 320 | ||||||
AvalonBay Communities, Inc., REIT† | 4 | 597 | ||||||
CBRE Group, Inc., Class A†* | 10 | 470 | ||||||
Kimco Realty Corp., REIT† | 88 | 991 | ||||||
Prologis, Inc., REIT† | 1 | 101 | ||||||
Public Storage, REIT | 12 | 2,673 | ||||||
Realty Income Corp., REIT† | 21 | 1,276 | ||||||
Simon Property Group, Inc., REIT† | 1 | 65 | ||||||
Ventas, Inc., REIT† | 171 | 7,175 | ||||||
Welltower, Inc., REIT† | 16 | 881 | ||||||
| Number | ||||||||
| of Shares | Value | |||||||
COMMON STOCKS — (Continued) |
| |||||||
Real Estate — (Continued) |
| |||||||
Weyerhaeuser Co., REIT† | 939 | $ | 26,780 | |||||
|
| |||||||
| 41,329 | ||||||||
| �� |
|
| ||||||
Retailing — 21.0% |
| |||||||
Advance Auto Parts, Inc.† | 380 | 58,330 | ||||||
Amazon.com, Inc.†* | 111 | 349,509 | ||||||
AutoZone, Inc.†* | 106 | 124,830 | ||||||
Best Buy Co., Inc.† | 24 | 2,671 | ||||||
Dollar General Corp.† | 1,219 | 255,527 | ||||||
Dollar Tree, Inc.†* | 813 | 74,259 | ||||||
eBay, Inc.† | 4,811 | 250,653 | ||||||
Expedia Group, Inc.† | 59 | 5,410 | ||||||
Gap, Inc. (The)† | 71 | 1,209 | ||||||
Genuine Parts Co.† | 829 | 78,896 | ||||||
Home Depot, Inc. (The)† | 308 | 85,535 | ||||||
LKQ Corp.†* | 557 | 15,446 | ||||||
Lowe’s Cos., Inc.† | 523 | 86,745 | ||||||
O’Reilly Automotive, Inc.†* | 114 | 52,563 | ||||||
Target Corp. | 1,126 | 177,255 | ||||||
Tractor Supply Co. | 1,493 | 214,007 | ||||||
Ulta Beauty, Inc.†* | 57 | 12,767 | ||||||
|
| |||||||
| 1,845,612 | ||||||||
|
| |||||||
Semiconductors & Semiconductor Equipment — 0.2% |
| |||||||
Applied Materials, Inc.† | 68 | 4,043 | ||||||
Broadcom, Inc.† | 4 | 1,457 | ||||||
NVIDIA Corp.† | 5 | 2,706 | ||||||
Qorvo, Inc.†* | 24 | 3,096 | ||||||
Skyworks Solutions, Inc.† | 25 | 3,638 | ||||||
|
| |||||||
| 14,940 | ||||||||
|
| |||||||
Software & Services — 13.5% |
| |||||||
Accenture PLC, Class A (Ireland)† | 33 | 7,458 | ||||||
Automatic Data Processing, Inc.† | 8 | 1,116 | ||||||
Broadridge Financial Solutions, Inc. | 562 | 74,184 | ||||||
Citrix Systems, Inc.† | 535 | 73,675 | ||||||
FleetCor Technologies, Inc.†* | 5 | 1,190 | ||||||
Gartner, Inc.†* | 192 | 23,990 | ||||||
International Business Machines Corp.† | 448 | 54,508 | ||||||
Mastercard, Inc., Class A† | 222 | 75,074 | ||||||
Microsoft Corp.† | 1,673 | 351,882 | ||||||
NortonLifeLock, Inc.† | 7,547 | 157,279 | ||||||
Oracle Corp.† | 2,733 | 163,160 | ||||||
Paychex, Inc.† | 215 | 17,151 | ||||||
PayPal Holdings, Inc.†* | 260 | 51,228 | ||||||
The accompanying notes are an integral part of the financial statements.
40
GOTHAM HEDGED CORE FUND
Portfolio of Investment (Continued)
September 30, 2020
| Number | ||||||||
| of Shares | Value | |||||||
COMMON STOCKS — (Continued) |
| |||||||
Software & Services — (Continued) |
| |||||||
Visa, Inc., Class A† | 471 | $ | 94,186 | |||||
Western Union Co. (The)† | 2,078 | 44,532 | ||||||
|
| |||||||
| 1,190,613 | ||||||||
|
| |||||||
Technology Hardware & Equipment — 7.7% |
| |||||||
Apple, Inc.† | 3,426 | 396,765 | ||||||
CDW Corp.† | 7 | 837 | ||||||
Cisco Systems, Inc.† | 3,368 | 132,666 | ||||||
F5 Networks, Inc.†* | 113 | 13,873 | ||||||
FLIR Systems, Inc.† | 1,790 | 64,171 | ||||||
HP, Inc.† | 611 | 11,603 | ||||||
Juniper Networks, Inc.† | 2,351 | 50,546 | ||||||
NetApp, Inc.† | 3 | 132 | ||||||
TE Connectivity Ltd. (Switzerland)† | 57 | 5,571 | ||||||
|
| |||||||
| 676,164 | ||||||||
|
| |||||||
Telecommunication Services — 4.7% |
| |||||||
AT&T, Inc.† | 5,408 | 154,182 | ||||||
Verizon Communications, Inc.† | 4,344 | 258,425 | ||||||
|
| |||||||
| 412,607 | ||||||||
|
| |||||||
Transportation — 5.6% |
| |||||||
CH Robinson Worldwide, Inc.†(a) | 2,183 | 223,081 | ||||||
CSX Corp.† | 93 | 7,223 | ||||||
Expeditors International of Washington, Inc.† | 1,697 | 153,612 | ||||||
JB Hunt Transport Services, Inc.† | 825 | 104,263 | ||||||
Norfolk Southern Corp.† | 22 | 4,708 | ||||||
Old Dominion Freight Line, Inc. | 23 | 4,161 | ||||||
Union Pacific Corp.† | 1 | 197 | ||||||
|
| |||||||
| 497,245 | ||||||||
|
| |||||||
Utilities — 0.6% |
| |||||||
Dominion Energy, Inc.† | 28 | 2,210 | ||||||
NRG Energy, Inc.† | 1,565 | 48,108 | ||||||
|
| |||||||
| 50,318 | ||||||||
|
| |||||||
TOTAL COMMON STOCKS |
| 12,173,207 | ||||||
|
| |||||||
TOTAL LONG POSITIONS - 138.3% |
| 12,173,207 | ||||||
|
| |||||||
(Cost $11,207,462) | ||||||||
SHORT POSITIONS — (39.7)% |
| |||||||
COMMON STOCKS — (39.7)% |
| |||||||
Automobiles & Components — 0.0% |
| |||||||
Aptiv PLC (Jersey) | (16 | ) | (1,467 | ) | ||||
|
| |||||||
| Number | ||||||||
| of Shares | Value | |||||||
COMMON STOCKS — (Continued) |
| |||||||
Banks — (0.7)% |
| |||||||
Regions Financial Corp. | (156 | ) | $ | (1,799 | ) | |||
SVB Financial Group* | (140 | ) | (33,687 | ) | ||||
Truist Financial Corp. | (751 | ) | (28,576 | ) | ||||
|
| |||||||
| (64,062 | ) | |||||||
|
| |||||||
Capital Goods — (1.8)% |
| |||||||
Boeing Co. (The) | (171 | ) | (28,259 | ) | ||||
Ingersoll Rand, Inc.* | (1,843 | ) | (65,611 | ) | ||||
Jacobs Engineering Group, Inc. | (241 | ) | (22,358 | ) | ||||
L3Harris Technologies, Inc. | (82 | ) | (13,927 | ) | ||||
Stanley Black & Decker, Inc. | (104 | ) | (16,869 | ) | ||||
Xylem, Inc. | (146 | ) | (12,282 | ) | ||||
|
| |||||||
| (159,306 | ) | |||||||
|
| |||||||
Commercial & Professional Services — (0.3)% |
| |||||||
Copart, Inc.* | (228 | ) | (23,976 | ) | ||||
Verisk Analytics, Inc. | (7 | ) | (1,297 | ) | ||||
|
| |||||||
| (25,273 | ) | |||||||
|
| |||||||
Consumer Durables & Apparel — (0.2)% |
| |||||||
NVR, Inc.* | (3 | ) | (12,249 | ) | ||||
|
| |||||||
Consumer Services — (1.7)% |
| |||||||
Carnival Corp. (Panama) | (1,290 | ) | (19,582 | ) | ||||
Chipotle Mexican Grill, Inc.* | (14 | ) | (17,412 | ) | ||||
Domino’s Pizza, Inc. | (34 | ) | (14,460 | ) | ||||
Hilton Worldwide Holdings, Inc. | (20 | ) | (1,706 | ) | ||||
Las Vegas Sands Corp. | (309 | ) | (14,418 | ) | ||||
Norwegian Cruise Line Holdings Ltd. (Bermuda)* | (940 | ) | (16,083 | ) | ||||
Royal Caribbean Cruises Ltd. (Liberia) | (288 | ) | (18,642 | ) | ||||
Starbucks Corp. | (334 | ) | (28,697 | ) | ||||
Wynn Resorts Ltd. | (245 | ) | (17,593 | ) | ||||
|
| |||||||
| (148,593 | ) | |||||||
|
| |||||||
Diversified Financials — (1.9)% |
| |||||||
Ameriprise Financial, Inc. | (157 | ) | (24,195 | ) | ||||
E*TRADE Financial Corp. | (431 | ) | (21,572 | ) | ||||
MarketAxess Holdings, Inc. | (48 | ) | (23,116 | ) | ||||
Moody’s Corp. | (12 | ) | (3,478 | ) | ||||
MSCI, Inc. | (207 | ) | (73,853 | ) | ||||
Raymond James Financial, Inc. | (195 | ) | (14,188 | ) | ||||
State Street Corp. | (108 | ) | (6,408 | ) | ||||
|
| |||||||
| (166,810 | ) | |||||||
|
| |||||||
Energy — (1.9)% |
| |||||||
Cabot Oil & Gas Corp. | (303 | ) | (5,260 | ) | ||||
Devon Energy Corp. | (2,535 | ) | (23,981 | ) | ||||
The accompanying notes are an integral part of the financial statements.
41
GOTHAM HEDGED CORE FUND
Portfolio of Investment (Continued)
September 30, 2020
| Number | ||||||||
| of Shares | Value | |||||||
COMMON STOCKS — (Continued) |
| |||||||
Energy — (Continued) |
| |||||||
Diamondback Energy, Inc. | (440 | ) | $ | (13,253 | ) | |||
Hess Corp. | (550 | ) | (22,512 | ) | ||||
Noble Energy, Inc. | (4,903 | ) | (41,921 | ) | ||||
Occidental Petroleum Corp. | (1,958 | ) | (19,600 | ) | ||||
ONEOK, Inc. | (527 | ) | (13,691 | ) | ||||
Pioneer Natural Resources Co. | (269 | ) | (23,131 | ) | ||||
|
| |||||||
| (163,349 | ) | |||||||
|
| |||||||
Health Care Equipment & Services — (3.5)% |
| |||||||
ABIOMED, Inc.* | (56 | ) | (15,515 | ) | ||||
Align Technology, Inc.* | (142 | ) | (46,485 | ) | ||||
Boston Scientific Corp.* | (428 | ) | (16,354 | ) | ||||
Cooper Cos., Inc. (The) | (90 | ) | (30,341 | ) | ||||
DexCom, Inc.* | (181 | ) | (74,614 | ) | ||||
Edwards Lifesciences Corp.* | (421 | ) | (33,604 | ) | ||||
IDEXX Laboratories, Inc.* | (95 | ) | (37,345 | ) | ||||
Intuitive Surgical, Inc.* | (18 | ) | (12,772 | ) | ||||
ResMed, Inc. | (50 | ) | (8,572 | ) | ||||
Teleflex, Inc. | (63 | ) | (21,446 | ) | ||||
West Pharmaceutical Services, Inc. | (35 | ) | (9,622 | ) | ||||
|
| |||||||
| (306,670 | ) | |||||||
|
| |||||||
Household & Personal Products — 0.0% |
| |||||||
Estee Lauder Cos., Inc. (The), Class A | (8 | ) | (1,746 | ) | ||||
|
| |||||||
Insurance — 0.0% |
| |||||||
Lincoln National Corp. | (72 | ) | (2,256 | ) | ||||
Unum Group | (28 | ) | (471 | ) | ||||
|
| |||||||
| (2,727 | ) | |||||||
|
| |||||||
Materials — (1.9)% |
| |||||||
Air Products & Chemicals, Inc. | (18 | ) | (5,361 | ) | ||||
Albemarle Corp. | (390 | ) | (34,819 | ) | ||||
Ball Corp. | (347 | ) | (28,843 | ) | ||||
Corteva, Inc. | (1,208 | ) | (34,802 | ) | ||||
Freeport-McMoRan, Inc. | (4,048 | ) | (63,311 | ) | ||||
|
| |||||||
| (167,136 | ) | |||||||
|
| |||||||
Media & Entertainment — (0.2)% |
| |||||||
Live Nation Entertainment, Inc.* | (380 | ) | (20,474 | ) | ||||
|
| |||||||
Pharmaceuticals, Biotechnology & Life Sciences — (2.3)% |
| |||||||
Bio-Rad Laboratories, Inc., Class A* | (72 | ) | (37,113 | ) | ||||
Catalent, Inc.* | (608 | ) | (52,081 | ) | ||||
IQVIA Holdings, Inc.* | (139 | ) | (21,911 | ) | ||||
Mettler-Toledo International, Inc.* | (23 | ) | (22,212 | ) | ||||
Perrigo Co. PLC (Ireland) | (305 | ) | (14,003 | ) | ||||
Thermo Fisher Scientific, Inc. | (3 | ) | (1,325 | ) | ||||
| Number | ||||||||
| of Shares | Value | |||||||
COMMON STOCKS — (Continued) |
| |||||||
Pharmaceuticals, Biotechnology & Life |
| |||||||
Vertex Pharmaceuticals, Inc.* | (179 | ) | $ | (48,709 | ) | |||
|
| |||||||
| (197,354 | ) | |||||||
|
| |||||||
Real Estate — (1.5)% |
| |||||||
Digital Realty Trust, Inc., REIT | (188 | ) | (27,591 | ) | ||||
Equinix, Inc., REIT | (93 | ) | (70,692 | ) | ||||
Healthpeak Properties, Inc., REIT | (1,370 | ) | (37,196 | ) | ||||
|
| |||||||
| (135,479 | ) | |||||||
|
| |||||||
Retailing — (1.3)% |
| |||||||
Booking Holdings, Inc.* | (3 | ) | (5,132 | ) | ||||
Etsy, Inc.* | (606 | ) | (73,708 | ) | ||||
Ross Stores, Inc. | (101 | ) | (9,425 | ) | ||||
TJX Cos., Inc. (The) | (437 | ) | (24,319 | ) | ||||
|
| |||||||
| (112,584 | ) | |||||||
|
| |||||||
Semiconductors & Semiconductor Equipment — (3.5)% |
| |||||||
Advanced Micro Devices, Inc.* | (986 | ) | (80,842 | ) | ||||
Analog Devices, Inc. | (309 | ) | (36,073 | ) | ||||
Microchip Technology, Inc. | (466 | ) | (47,886 | ) | ||||
QUALCOMM, Inc. | (484 | ) | (56,957 | ) | ||||
Teradyne, Inc. | (625 | ) | (49,663 | ) | ||||
Texas Instruments, Inc. | (2 | ) | (286 | ) | ||||
Xilinx, Inc. | (345 | ) | (35,963 | ) | ||||
|
| |||||||
| (307,670 | ) | |||||||
|
| |||||||
Software & Services — (7.1)% |
| |||||||
Akamai Technologies, Inc.* | (560 | ) | (61,902 | ) | ||||
DXC Technology Co. | (1,693 | ) | (30,220 | ) | ||||
Fidelity National Information Services, Inc. | (517 | ) | (76,108 | ) | ||||
Fiserv, Inc.* | (540 | ) | (55,647 | ) | ||||
Fortinet, Inc.* | (611 | ) | (71,982 | ) | ||||
Global Payments, Inc. | (433 | ) | (76,892 | ) | ||||
Intuit, Inc. | (116 | ) | (37,840 | ) | ||||
Jack Henry & Associates, Inc. | (40 | ) | (6,504 | ) | ||||
Leidos Holdings, Inc. | (166 | ) | (14,799 | ) | ||||
Paycom Software, Inc.* | (269 | ) | (83,740 | ) | ||||
Tyler Technologies, Inc.* | (170 | ) | (59,255 | ) | ||||
VeriSign, Inc.* | (248 | ) | (50,803 | ) | ||||
|
| |||||||
| (625,692 | ) | |||||||
|
| |||||||
Technology Hardware & Equipment — (1.8)% |
| |||||||
IPG Photonics Corp.* | (163 | ) | (27,705 | ) | ||||
Keysight Technologies, Inc.* | (484 | ) | (47,810 | ) | ||||
Western Digital Corp. | (2,151 | ) | (78,619 | ) | ||||
The accompanying notes are an integral part of the financial statements.
42
GOTHAM HEDGED CORE FUND
Portfolio of Investment (Concluded)
September 30, 2020
| Number | ||||||||
| of Shares | Value | |||||||
COMMON STOCKS — (Continued) |
| |||||||
Technology Hardware & Equipment — (Continued) |
| |||||||
Zebra Technologies Corp., Class A* | (29 | ) | $ | (7,321 | ) | |||
|
| |||||||
| (161,455 | ) | |||||||
|
| |||||||
Telecommunication Services — (0.8)% |
| |||||||
T-Mobile US, Inc.* | (638 | ) | (72,962 | ) | ||||
|
| |||||||
Utilities — (7.3)% |
| |||||||
Alliant Energy Corp. | (421 | ) | (21,745 | ) | ||||
Ameren Corp. | (689 | ) | (54,486 | ) | ||||
American Electric Power Co., Inc. | (295 | ) | (24,110 | ) | ||||
American Water Works Co., Inc. | (316 | ) | (45,782 | ) | ||||
Atmos Energy Corp. | (336 | ) | (32,118 | ) | ||||
CenterPoint Energy, Inc. | (433 | ) | (8,379 | ) | ||||
CMS Energy Corp. | (373 | ) | (22,906 | ) | ||||
Consolidated Edison, Inc. | (165 | ) | (12,837 | ) | ||||
DTE Energy Co. | (129 | ) | (14,840 | ) | ||||
Edison International | (1,011 | ) | (51,399 | ) | ||||
Entergy Corp. | (310 | ) | (30,544 | ) | ||||
Evergy, Inc. | (659 | ) | (33,490 | ) | ||||
Eversource Energy | (614 | ) | (51,300 | ) | ||||
Exelon Corp. | (549 | ) | (19,632 | ) | ||||
FirstEnergy Corp. | (681 | ) | (19,552 | ) | ||||
NextEra Energy, Inc. | (84 | ) | (23,315 | ) | ||||
NiSource, Inc. | (480 | ) | (10,560 | ) | ||||
Pinnacle West Capital Corp. | (600 | ) | (44,730 | ) | ||||
Sempra Energy | (326 | ) | (38,585 | ) | ||||
Southern Co. (The) | (332 | ) | (18,001 | ) | ||||
WEC Energy Group, Inc. | (231 | ) | (22,384 | ) | ||||
Xcel Energy, Inc. | (598 | ) | (41,268 | ) | ||||
|
| |||||||
| (641,963 | ) | |||||||
|
| |||||||
TOTAL COMMON STOCKS |
| (3,495,021 | ) | |||||
|
| |||||||
TOTAL SECURITES SOLD SHORT - (39.7)% |
| (3,495,021 | ) | |||||
|
| |||||||
(Proceeds $3,510,265) | ||||||||
OTHER ASSETS IN EXCESS OF |
| 125,356 | ||||||
|
| |||||||
NET ASSETS - 100.0% |
| $ | 8,803,542 | |||||
|
| |||||||
| † | Security position is either entirely or partially held in a segregated account as collateral for securities sold short. |
(See Note 1 of the Notes to Financial Statements) |
| (a) | The security or a portion of this security is on loan at September 30, 2020. The total value of securities on loan at September 30, 2020 was $348,125 which was collateralized by $178 in cash and $356,729 of collateral in the form of U.S. Government Treasury Securities, interest rates ranging from 0.00% - 8.00%, and maturity dates ranging from 10/20/2020 - 2/15/2050. (See Note 5 of the Notes to Financial Statements) |
| * | Non-income producing. |
| PLC | Public Limited Company |
| REIT | Real Estate Investment Trust |
The accompanying notes are an integral part of the financial statements.
43
GOTHAM SHORT STRATEGIES FUND
Portfolio of Investments
September 30, 2020
| Number | ||||||||
| of Shares | Value | |||||||
COMMON STOCKS — 96.1% |
| |||||||
Automobiles & Components — 1.3% |
| |||||||
Fox Factory Holding Corp.* | 254 | $ | 18,880 | |||||
Harley-Davidson, Inc. | 60 | 1,472 | ||||||
Thor Industries, Inc.(a) | 5,107 | 486,493 | ||||||
|
| |||||||
| 506,845 | ||||||||
|
| |||||||
Capital Goods — 8.1% |
| |||||||
Acuity Brands, Inc. | 302 | 30,910 | ||||||
Advanced Drainage Systems, Inc. | 2,723 | 170,024 | ||||||
AECOM(a) * | 9,928 | 415,387 | ||||||
BWX Technologies, Inc. | 579 | 32,603 | ||||||
Curtiss-Wright Corp. | 50 | 4,663 | ||||||
EMCOR Group, Inc. | 2,552 | 172,796 | ||||||
EnerSys. | 1,072 | 71,953 | ||||||
Franklin Electric Co., Inc. | 246 | 14,472 | ||||||
HD Supply Holdings, Inc.* | 403 | 16,620 | ||||||
Howmet Aerospace, Inc.(a) | 27,456 | 459,064 | ||||||
Hubbell, Inc. | 18 | 2,463 | ||||||
ITT, Inc. | 629 | 37,142 | ||||||
John Bean Technologies Corp. | 1,136 | 104,387 | ||||||
Lincoln Electric Holdings, Inc. | 22 | 2,025 | ||||||
Quanta Services, Inc.(a) | 5,051 | 266,996 | ||||||
RBC Bearings, Inc.* | 669 | 81,089 | ||||||
Roper Technologies, Inc. | 67 | 26,472 | ||||||
SiteOne Landscape Supply, Inc.* | 1,176 | 143,413 | ||||||
Timken Co. (The) | 683 | 37,032 | ||||||
Toro Co. (The) | 1,467 | 123,155 | ||||||
UFP Industries, Inc. | 2,287 | 129,238 | ||||||
United Rentals, Inc.* | 43 | 7,504 | ||||||
Univar Solutions, Inc.(a)* | 18,749 | 316,483 | ||||||
Watsco, Inc. | 885 | 206,108 | ||||||
Woodward, Inc. | 1,951 | 156,392 | ||||||
|
| |||||||
| 3,028,391 | ||||||||
|
| |||||||
Commercial & Professional Services — 3.2% |
| |||||||
ASGN, Inc.* | 1,900 | 120,764 | ||||||
Clarivate PLC (Jersey)* | 4,704 | 145,777 | ||||||
Copart, Inc.* | 174 | 18,298 | ||||||
Exponent, Inc. | 250 | 18,008 | ||||||
FTI Consulting, Inc.* | 476 | 50,442 | ||||||
ManpowerGroup, Inc.(a) | 4,732 | 346,998 | ||||||
Robert Half International, Inc. | 1,501 | 79,463 | ||||||
Rollins, Inc. | 511 | 27,691 | ||||||
Stantec, Inc. (Canada) | 517 | 15,686 | ||||||
Tetra Tech, Inc. | 1,613 | 154,042 | ||||||
TransUnion | 806 | 67,809 | ||||||
| Number | ||||||||
| of Shares | Value | |||||||
COMMON STOCKS — (Continued) |
| |||||||
Commercial & Professional Services — (Continued) |
| |||||||
TriNet Group, Inc.* | 2,971 | $ | 176,240 | |||||
|
| |||||||
| 1,221,218 | ||||||||
|
| |||||||
Consumer Durables & Apparel — 3.6% |
| |||||||
BRP, Inc., sub-voting shares (Canada) | 17 | 898 | ||||||
Carter’s, Inc. | 496 | 42,944 | ||||||
Garmin Ltd. (Switzerland) | 57 | 5,407 | ||||||
Gildan Activewear, Inc. (Canada) | 1,614 | 31,747 | ||||||
Helen of Troy Ltd. (Bermuda)* | 1,174 | 227,192 | ||||||
Meritage Homes Corp.* | 50 | 5,520 | ||||||
Mohawk Industries, Inc.* | 674 | 65,776 | ||||||
NIKE, Inc., Class B | 86 | 10,796 | ||||||
Polaris, Inc.(a) | 6,399 | 603,682 | ||||||
PVH Corp. | 403 | 24,035 | ||||||
Tempur Sealy International, Inc.* | 2,614 | 233,143 | ||||||
YETI Holdings, Inc.* | 2,000 | 90,640 | ||||||
|
| |||||||
| 1,341,780 | ||||||||
|
| |||||||
Consumer Services — 0.8% |
| |||||||
frontdoor, Inc.* | 7 | 272 | ||||||
Grand Canyon Education, Inc.* | 234 | 18,706 | ||||||
Papa John’s International, Inc. | 130 | 10,696 | ||||||
Service Corp. International | 269 | 11,346 | ||||||
Strategic Education, Inc. | 476 | 43,540 | ||||||
Wingstop, Inc. | 1,587 | 216,864 | ||||||
|
| |||||||
| 301,424 | ||||||||
|
| |||||||
Energy — 6.9% |
| |||||||
Antero Midstream Corp. | 9,471 | 50,859 | ||||||
Baker Hughes Co. | 601 | 7,987 | ||||||
Canadian Natural Resources Ltd. (Canada) | 20,918 | 334,897 | ||||||
Cheniere Energy, Inc.* | 2,610 | 120,765 | ||||||
EOG Resources, Inc.(a) | 8,175 | 293,810 | ||||||
Halliburton Co.(a) | 59,146 | 712,709 | ||||||
Kinder Morgan, Inc. | 8,670 | 106,901 | ||||||
National Oilwell Varco, Inc.(a) | 26,227 | 237,617 | ||||||
Schlumberger NV (Curacao) | 43,025 | 669,469 | ||||||
TechnipFMC PLC (United Kingdom) | 772 | 4,871 | ||||||
Williams Cos., Inc. (The) | 3,028 | 59,500 | ||||||
|
| |||||||
| 2,599,385 | ||||||||
|
| |||||||
Food & Staples Retailing — 2.3% |
| |||||||
BJ’s Wholesale Club Holdings, Inc.* | 3,596 | 149,414 | ||||||
Casey’s General Stores, Inc. | 289 | 51,341 | ||||||
Costco Wholesale Corp. | 312 | 110,760 | ||||||
The accompanying notes are an integral part of the financial statements.
44
GOTHAM SHORT STRATEGIES FUND
Portfolio of Investments (Continued)
September 30, 2020
| Number of Shares | Value | |||||||
COMMON STOCKS — (Continued) |
| |||||||
Food & Staples Retailing — (Continued) |
| |||||||
Kroger Co. (The) | 1,846 | $ | 62,598 | |||||
Sprouts Farmers Market, Inc.* | 1,987 | 41,588 | ||||||
US Foods Holding Corp.(a) * | 20,513 | 455,799 | ||||||
|
| |||||||
| 871,500 | ||||||||
|
| |||||||
Food, Beverage & Tobacco — 4.1% |
| |||||||
Boston Beer Co., Inc. (The), | 133 | 117,487 | ||||||
Conagra Brands, Inc.(a) | 8,246 | 294,465 | ||||||
Flowers Foods, Inc. | 699 | 17,007 | ||||||
General Mills, Inc. | 2,290 | 141,247 | ||||||
JM Smucker Co. (The) | 1,670 | 192,918 | ||||||
Kraft Heinz Co. (The) | 3,591 | 107,550 | ||||||
McCormick & Co., Inc., non-voting shares | 317 | 61,530 | ||||||
Molson Coors Beverage Co., Class B | 3,360 | 112,762 | ||||||
National Beverage Corp.* | 125 | 8,501 | ||||||
TreeHouse Foods, Inc.* | 2,451 | 99,339 | ||||||
Tyson Foods, Inc., Class A(a) | 6,662 | 396,256 | ||||||
|
| |||||||
| 1,549,062 | ||||||||
|
| |||||||
Health Care Equipment & Services — 5.4% |
| |||||||
AMN Healthcare Services, Inc.* | 20 | 1,169 | ||||||
Anthem, Inc.(a) | 2,122 | 569,948 | ||||||
Cigna Corp.(a) | 1,357 | 229,889 | ||||||
Ensign Group, Inc. (The) | 2,600 | 148,356 | ||||||
Globus Medical, Inc., Class A* | 84 | 4,160 | ||||||
HCA Healthcare, Inc.(a) | 4,688 | 584,500 | ||||||
HealthEquity, Inc.* | 14 | 719 | ||||||
Humana, Inc.(a) | 830 | 343,529 | ||||||
Molina Healthcare, Inc.* | 454 | 83,100 | ||||||
Quidel Corp.(a) * | 164 | 35,978 | ||||||
Universal Health Services, Inc., Class B | 245 | 26,220 | ||||||
|
| |||||||
| 2,027,568 | ||||||||
|
| |||||||
Household & Personal Products — 1.2% |
| |||||||
Clorox Co. (The) | 530 | 111,390 | ||||||
Energizer Holdings, Inc. | 3,915 | 153,233 | ||||||
Kimberly-Clark Corp.(a) | 1,380 | 203,771 | ||||||
|
| |||||||
| 468,394 | ||||||||
|
| |||||||
Materials — 5.8% | ||||||||
Amcor PLC (Jersey) | 774 | 8,553 | ||||||
CF Industries Holdings, Inc.(a) | 10,063 | 309,035 | ||||||
Chemours Co. (The) | 608 | 12,713 | ||||||
Hecla Mining Co. | 43,406 | 220,502 | ||||||
| Number of Shares | Value | |||||||
COMMON STOCKS — (Continued) |
| |||||||
Materials — (Continued) |
| |||||||
Kinross Gold Corp. (Canada) | 583 | $ | 5,142 | |||||
Louisiana-Pacific Corp.(a) | 9,997 | 295,011 | ||||||
Mosaic Co. (The)(a) | 29,033 | 530,433 | ||||||
Newmont Corp. | 1,722 | 109,261 | ||||||
Norbord, Inc. (Canada) | 231 | 6,814 | ||||||
Nucor Corp. | 3,414 | 153,152 | ||||||
Nutrien Ltd. (Canada) | 5,906 | 231,692 | ||||||
Pan American Silver Corp. (Canada) | 2,226 | 71,566 | ||||||
Reliance Steel & Aluminum Co. | 1,030 | 105,101 | ||||||
Sonoco Products Co. | 1,555 | 79,414 | ||||||
Wheaton Precious Metals Corp. (Canada) | 320 | 15,702 | ||||||
Yamana Gold, Inc. (Canada) | 4,625 | 26,270 | ||||||
|
| |||||||
| 2,180,361 | ||||||||
|
| |||||||
Media & Entertainment — 4.1% |
| |||||||
Activision Blizzard, Inc.(a) | 322 | 26,066 | ||||||
Altice USA, Inc., Class A* | 216 | 5,616 | ||||||
ANGI Homeservices, Inc., Class A* | 1 | 11 | ||||||
DISH Network Corp., Class A(a) * | 9,007 | 261,473 | ||||||
Electronic Arts, Inc.* | 800 | 104,328 | ||||||
Madison Square Garden Sports Corp.* | 725 | 109,098 | ||||||
New York Times Co. (The), Class A | 30 | 1,284 | ||||||
Pinterest, Inc., Class A* | 493 | 20,464 | ||||||
Shaw Communications, Inc., Class B (Canada) | 2,291 | 41,811 | ||||||
Sirius XM Holdings, Inc. | 6,210 | 33,286 | ||||||
Take-Two Interactive Software, Inc.* | 1,023 | 169,020 | ||||||
Zillow Group, Inc., Class C(a) * | 7,677 | 779,906 | ||||||
|
| |||||||
| 1,552,363 | ||||||||
|
| |||||||
Pharmaceuticals, Biotechnology & Life Sciences — 2.1% |
| |||||||
Denali Therapeutics, Inc.* | 307 | 11,000 | ||||||
Elanco Animal Health, Inc.* | 2,168 | 60,552 | ||||||
Emergent BioSolutions, Inc.(a) * | 4,436 | 458,372 | ||||||
Neurocrine Biosciences, Inc.* | 517 | 49,715 | ||||||
PerkinElmer, Inc.(a) | 737 | 92,501 | ||||||
Regeneron Pharmaceuticals, Inc.* | 51 | 28,549 | ||||||
Sage Therapeutics, Inc.* | 5 | 306 | ||||||
United Therapeutics Corp.* | 716 | 72,316 | ||||||
|
| |||||||
| 773,311 | ||||||||
|
| |||||||
Retailing — 22.7% | ||||||||
Aaron’s, Inc.(a) | 6,971 | 394,907 | ||||||
Advance Auto Parts, Inc.(a) | 2,888 | 443,308 | ||||||
The accompanying notes are an integral part of the financial statements.
45
GOTHAM SHORT STRATEGIES FUND
Portfolio of Investments (Continued)
September 30, 2020
| Number of Shares | Value | |||||||
COMMON STOCKS — (Continued) |
| |||||||
Retailing — (Continued) |
| |||||||
AutoNation, Inc.* | 4,723 | $ | 249,988 | |||||
AutoZone, Inc.* | 127 | 149,560 | ||||||
Dick’s Sporting Goods, Inc.(a) | 10,081 | 583,488 | ||||||
Dollar General Corp.(a) | 1,751 | 367,045 | ||||||
Dollar Tree, Inc.* | 47 | 4,293 | ||||||
eBay, Inc. | 3,391 | 176,671 | ||||||
Etsy, Inc.(a) * | 3,657 | 444,801 | ||||||
Foot Locker, Inc.(a) | 11,211 | 370,299 | ||||||
Gap, Inc. (The)(a) | 19,952 | 339,783 | ||||||
Genuine Parts Co.(a) | 3,642 | 346,609 | ||||||
Home Depot, Inc. (The)(a) | 2,326 | 645,953 | ||||||
Lithia Motors, Inc., Class A(a) | 1,341 | 305,668 | ||||||
LKQ Corp.* | 4,361 | 120,931 | ||||||
Lowe’s Cos., Inc.(a) | 4,618 | 765,941 | ||||||
Murphy USA, Inc.(a) * | 1,947 | 249,742 | ||||||
Ollie’s Bargain Outlet Holdings, Inc.(a) * | 3,399 | 296,903 | ||||||
O’Reilly Automotive, Inc.(a) * | 572 | 263,738 | ||||||
Pool Corp.(a) | 1,010 | 337,885 | ||||||
Qurate Retail, Inc., Series A | 6,477 | 46,505 | ||||||
Stamps.com, Inc.(a) * | 1,264 | 304,561 | ||||||
Target Corp.(a) | 2,902 | 456,833 | ||||||
Tractor Supply Co.(a) | 3,773 | 540,822 | ||||||
Williams-Sonoma, Inc.(a) | 3,707 | 335,261 | ||||||
|
| |||||||
| 8,541,495 | ||||||||
|
| |||||||
Semiconductors & Semiconductor Equipment — 6.3% |
| |||||||
Amkor Technology, Inc.* | 10,557 | 118,238 | ||||||
Applied Materials, Inc.(a) | 3,793 | 225,494 | ||||||
Broadcom, Inc.(a) | 1,338 | 487,460 | ||||||
Brooks Automation, Inc. | 443 | 20,493 | ||||||
First Solar, Inc.* | 4,436 | 293,663 | ||||||
KLA Corp.(a) | 2,114 | 409,566 | ||||||
MACOM Technology Solutions Holdings, Inc.* | 906 | 30,813 | ||||||
Marvell Technology Group Ltd. (Bermuda) | 2,896 | 114,971 | ||||||
MKS Instruments, Inc.(a) | 2,751 | 300,492 | ||||||
Monolithic Power Systems, Inc. | 183 | 51,169 | ||||||
Power Integrations, Inc. | 1,853 | 102,656 | ||||||
Semtech Corp.* | 670 | 35,483 | ||||||
Synaptics, Inc.* | 823 | 66,186 | ||||||
Teradyne, Inc. | 1,537 | 122,130 | ||||||
|
| |||||||
| 2,378,814 | ||||||||
|
| |||||||
| Number of Shares | Value | |||||||
COMMON STOCKS — (Continued) |
| |||||||
Software & Services — 9.5% |
| |||||||
ACI Worldwide, Inc.* | 4,012 | $ | 104,833 | |||||
Alliance Data Systems Corp. | 530 | 22,249 | ||||||
Anaplan, Inc.* | 114 | 7,134 | ||||||
Blackbaud, Inc. | 1,870 | 104,402 | ||||||
BlackBerry Ltd. (Canada)* | 520 | 2,387 | ||||||
Broadridge Financial Solutions, Inc. | 155 | 20,460 | ||||||
CACI International, Inc., Class A* | 399 | 85,051 | ||||||
Cadence Design Systems, Inc.* | 147 | 15,675 | ||||||
CGI, Inc. (Canada)* | 1,123 | 76,106 | ||||||
Crowdstrike Holdings, Inc., Class A* | 188 | 25,816 | ||||||
Descartes Systems Group, Inc. (The) (Canada)* | 163 | 9,288 | ||||||
DXC Technology Co. | 9,648 | 172,217 | ||||||
Envestnet, Inc.* | 1,516 | 116,975 | ||||||
GoDaddy, Inc., Class A* | 1,903 | 144,571 | ||||||
Guidewire Software, Inc.* | 289 | 30,134 | ||||||
Intuit, Inc.(a) | 2,465 | 804,108 | ||||||
KBR, Inc. | 198 | 4,427 | ||||||
NortonLifeLock, Inc. | 3,806 | 79,317 | ||||||
PayPal Holdings, Inc.(a) * | 3,119 | 614,537 | ||||||
PTC, Inc.(a) * | 2,932 | 242,535 | ||||||
Sailpoint Technologies Holdings, Inc.(a) * | 7,593 | 300,455 | ||||||
SS&C Technologies Holdings, Inc.(a) | 3,590 | 217,267 | ||||||
Synopsys, Inc.* | 746 | 159,629 | ||||||
Verint Systems, Inc.* | 2,157 | 103,924 | ||||||
WEX, Inc.* | 50 | 6,948 | ||||||
Workday, Inc., Class A* | 424 | 91,215 | ||||||
|
| |||||||
| 3,561,660 | ||||||||
|
| |||||||
Technology Hardware & Equipment — 4.6% |
| |||||||
Apple, Inc.(a) | 514 | 59,526 | ||||||
Ciena Corp.* | 2,933 | 116,411 | ||||||
Cisco Systems, Inc. | 5,783 | 227,792 | ||||||
Corning, Inc.(a) | 11,497 | 372,618 | ||||||
EchoStar Corp., Class A* | 2,412 | 60,035 | ||||||
FLIR Systems, Inc.(a) | 3,152 | 112,999 | ||||||
Juniper Networks, Inc. | 3,532 | 75,938 | ||||||
Lumentum Holdings, Inc.(a) * | 3,951 | 296,839 | ||||||
Novanta, Inc. (Canada)* | 22 | 2,317 | ||||||
SYNNEX Corp.(a) | 1,805 | 252,808 | ||||||
Ubiquiti, Inc. | 882 | 146,994 | ||||||
Viavi Solutions, Inc.* | 516 | 6,053 | ||||||
|
| |||||||
| 1,730,330 | ||||||||
|
| |||||||
The accompanying notes are an integral part of the financial statements.
46
GOTHAM SHORT STRATEGIES FUND
Portfolio of Investments (Continued)
September 30, 2020
| Number of Shares | Value | |||||||
COMMON STOCKS — (Continued) |
| |||||||
Telecommunication Services — 0.4% |
| |||||||
Iridium Communications, Inc.* | 6,110 | $ | 156,294 | |||||
United States Cellular Corp.* | 175 | 5,168 | ||||||
|
| |||||||
| 161,462 | ||||||||
|
| |||||||
Transportation — 2.7% | ||||||||
CH Robinson Worldwide, Inc. | 2,289 | 233,913 | ||||||
FedEx Corp. | 976 | 245,484 | ||||||
JB Hunt Transport Services, Inc.(a) | 1,646 | 208,021 | ||||||
Knight-Swift Transportation Holdings, Inc. | 4 | 163 | ||||||
Old Dominion Freight Line, Inc. | 477 | 86,299 | ||||||
Schneider National, Inc., Class B | 2,611 | 64,570 | ||||||
TFI International, Inc. (Canada) | 540 | 22,588 | ||||||
Werner Enterprises, Inc. | 3,295 | 138,357 | ||||||
|
| |||||||
| 999,395 | ||||||||
|
| |||||||
Utilities — 1.0% | ||||||||
MDU Resources Group, Inc. | 5,138 | 115,605 | ||||||
National Fuel Gas Co. | 533 | 21,634 | ||||||
PPL Corp.(a) | 8,124 | 221,054 | ||||||
|
| |||||||
| 358,293 | ||||||||
|
| |||||||
TOTAL COMMON STOCKS (Cost $36,007,429) | 36,153,051 | |||||||
|
| |||||||
OTHER ASSETS IN EXCESS OF | 1,465,486 | |||||||
|
| |||||||
NET ASSETS - 100.0% | $ | 37,618,537 | ||||||
|
| |||||||
| (a) | Security position is either entirely or partially designated as collateral for total return swaps. |
| * | Non-income producing. |
PLC Public Limited Company
The accompanying notes are an integral part of the financial statements.
47
GOTHAM SHORT STRATEGIES FUND
Portfolio of Investments (Continued)
September 30, 2020
Over-the-counter total return swaps outstanding as of September 30, 2020
The Fund maintains a portfolio of short positions and receives/pays a rebate based upon the Fed Funds 1-Day Rate less a specified spread as negotiated by the parties. The notional gain or loss, dividends payable and rebates are payable the earlier of maturity of the swaps or upon termination. The portfolio matures between June 3, 2021 and May 4, 2022, however underlying individual contracts are entered into and closed (terminated) on a daily basis. The cash amounts payable/receivable due to individual contracts being closed are settled, on a net basis, once a week. The value of total return swaps represents (144.8)% of net assets as of September 30. 2020.
The following table represents the individual short positions and related values of total return swaps as of September 30, 2020:
Total Return Swaps
Reference Entity | Counterparty | Number of Contracts (Short) | Notional Amount | Value | Unrealized Appreciation/ (Depreciation)* | ||||||||||||||||||||
Short | |||||||||||||||||||||||||
Automobiles & Components | |||||||||||||||||||||||||
Aptiv PLC (Jersey) | Morgan Stanley | (5,040 | ) | $ | (425,400 | ) | $ | (462,067 | ) | $ | (36,843 | ) | |||||||||||||
Fiat Chrysler Automobiles NV (Netherlands) | Morgan Stanley | (29,864 | ) | (318,222 | ) | (364,938 | ) | (46,854 | ) | ||||||||||||||||
Ford Motor Co. | Morgan Stanley | (86,856 | ) | (584,849 | ) | (578,461 | ) | 6,155 | |||||||||||||||||
LCI Industries | Morgan Stanley | (867 | ) | (102,124 | ) | (92,153 | ) | 9,219 | |||||||||||||||||
Lear Corp. | Morgan Stanley | (788 | ) | (93,634 | ) | (85,931 | ) | 8,897 | |||||||||||||||||
|
|
|
|
|
|
|
| ||||||||||||||||||
| (123,415 | ) | (1,524,229 | ) | (1,583,550 | ) | (59,426 | ) | ||||||||||||||||||
|
|
|
|
|
|
|
| ||||||||||||||||||
Capital Goods | |||||||||||||||||||||||||
A.O. Smith Corp. | Morgan Stanley | (65 | ) | (3,441 | ) | (3,432 | ) | (17 | ) | ||||||||||||||||
AAON, Inc. | Morgan Stanley | (46 | ) | (2,634 | ) | (2,772 | ) | (163 | ) | ||||||||||||||||
Allison Transmission Holdings, Inc. | Morgan Stanley | (1,520 | ) | (57,272 | ) | (53,413 | ) | 3,566 | |||||||||||||||||
Armstrong World Industries, Inc. | Morgan Stanley | (1,817 | ) | (133,694 | ) | (125,028 | ) | 8,482 | |||||||||||||||||
Axon Enterprise, Inc. | Morgan Stanley | (1,581 | ) | (130,655 | ) | (143,397 | ) | (12,812 | ) | ||||||||||||||||
Ballard Power Systems, Inc. (Canada) | Morgan Stanley | (3,817 | ) | (54,630 | ) | (57,637 | ) | (3,051 | ) | ||||||||||||||||
Boeing Co. (The) | Morgan Stanley | (7,211 | ) | (1,158,055 | ) | (1,191,690 | ) | (34,071 | ) | ||||||||||||||||
Carrier Global Corp. | Morgan Stanley | (1,825 | ) | (54,120 | ) | (55,736 | ) | (1,660 | ) | ||||||||||||||||
Caterpillar, Inc. | Morgan Stanley | (5,202 | ) | (734,874 | ) | (775,878 | ) | (41,291 | ) | ||||||||||||||||
Graco, Inc. | Morgan Stanley | (144 | ) | (8,574 | ) | (8,834 | ) | (288 | ) | ||||||||||||||||
Mercury Systems, Inc. | Morgan Stanley | (379 | ) | (29,032 | ) | (29,357 | ) | (361 | ) | ||||||||||||||||
Navistar International Corp. | Morgan Stanley | (1,151 | ) | (47,519 | ) | (50,115 | ) | (2,638 | ) | ||||||||||||||||
Nordson Corp. | Morgan Stanley | (174 | ) | (33,829 | ) | (33,377 | ) | 415 | |||||||||||||||||
Owens Corning | Morgan Stanley | (397 | ) | (26,274 | ) | (27,318 | ) | (1,078 | ) | ||||||||||||||||
Proto Labs, Inc. | Morgan Stanley | (778 | ) | (114,547 | ) | (100,751 | ) | 13,078 | |||||||||||||||||
Raytheon Technologies Corp. | Morgan Stanley | (5,946 | ) | (358,491 | ) | (342,133 | ) | 14,290 | |||||||||||||||||
Sensata Technologies Holding PLC (United Kingdom) | Morgan Stanley | (632 | ) | (26,411 | ) | (27,264 | ) | (888 | ) | ||||||||||||||||
Spirit AeroSystems Holdings, Inc., Class A | Morgan Stanley | (10,489 | ) | (290,138 | ) | (198,347 | ) | 91,503 | |||||||||||||||||
Stanley Black & Decker, Inc. | Morgan Stanley | (5,212 | ) | (593,297 | ) | (845,386 | ) | (258,978 | ) | ||||||||||||||||
Trex Co., Inc. | Morgan Stanley | (4,578 | ) | (329,839 | ) | (327,785 | ) | 1,912 | |||||||||||||||||
Xylem, Inc. | Morgan Stanley | (1,814 | ) | (151,425 | ) | (152,594 | ) | (1,247 | ) | ||||||||||||||||
|
|
|
|
|
|
|
| ||||||||||||||||||
| (54,778 | ) | (4,338,751 | ) | (4,552,244 | ) | (225,297 | ) | ||||||||||||||||||
|
|
|
|
|
|
|
| ||||||||||||||||||
The accompanying notes are an integral part of the financial statements.
48
GOTHAM SHORT STRATEGIES FUND
Portfolio of Investments (Continued)
September 30, 2020
Total Return Swaps (continued)
Reference Entity | Counterparty | Number of Contracts (Short) | Notional Amount | Value | Unrealized Appreciation/ (Depreciation)* | ||||||||||||||||||||
Consumer Durables & Apparel | |||||||||||||||||||||||||
Canada Goose Holdings, Inc. (Canada) | Morgan Stanley | (313 | ) | $ | (8,847 | ) | $ | (10,069 | ) | $ | (1,250 | ) | |||||||||||||
Columbia Sportswear Co. | Morgan Stanley | (1,137 | ) | (99,582 | ) | (98,896 | ) | 398 | |||||||||||||||||
Hasbro, Inc. | Morgan Stanley | (5,973 | ) | (430,629 | ) | (494,087 | ) | (70,336 | ) | ||||||||||||||||
Leggett & Platt, Inc. | Morgan Stanley | (2,830 | ) | (119,760 | ) | (116,511 | ) | 2,285 | |||||||||||||||||
Levi Strauss & Co., Class A | Morgan Stanley | (8,828 | ) | (110,989 | ) | (118,295 | ) | (7,371 | ) | ||||||||||||||||
Mattel, Inc. | Morgan Stanley | (2,370 | ) | (26,957 | ) | (27,729 | ) | (806 | ) | ||||||||||||||||
Newell Brands, Inc. | Morgan Stanley | (4,486 | ) | (77,452 | ) | (76,980 | ) | 346 | |||||||||||||||||
Ralph Lauren Corp. | Morgan Stanley | (7,562 | ) | (536,224 | ) | (513,989 | ) | 22,016 | |||||||||||||||||
Skechers U.S.A., Inc., Class A | Morgan Stanley | (3,864 | ) | (127,907 | ) | (116,770 | ) | 11,071 | |||||||||||||||||
Tapestry, Inc. | Morgan Stanley | (21,392 | ) | (337,381 | ) | (334,357 | ) | 2,879 | |||||||||||||||||
Under Armour, Inc., Class C | Morgan Stanley | (55,705 | ) | (503,543 | ) | (548,137 | ) | (44,798 | ) | ||||||||||||||||
VF Corp. | Morgan Stanley | (8,812 | ) | (573,388 | ) | (619,043 | ) | (48,647 | ) | ||||||||||||||||
|
|
|
|
|
|
|
| ||||||||||||||||||
| (123,272 | ) | (2,952,659 | ) | (3,074,863 | ) | (134,213 | ) | ||||||||||||||||||
|
|
|
|
|
|
|
| ||||||||||||||||||
Consumer Services | |||||||||||||||||||||||||
Aramark | Morgan Stanley | (3,870 | ) | (105,807 | ) | (102,362 | ) | 3,340 | |||||||||||||||||
Bright Horizons Family Solutions, Inc. | Morgan Stanley | (83 | ) | (11,649 | ) | (12,619 | ) | (1,000 | ) | ||||||||||||||||
Carnival Corp. (Panama) | Morgan Stanley | (50,047 | ) | (772,782 | ) | (759,713 | ) | 12,769 | |||||||||||||||||
Chipotle Mexican Grill, Inc. | Morgan Stanley | (598 | ) | (762,284 | ) | (743,739 | ) | 18,250 | |||||||||||||||||
Choice Hotels International, Inc. | Morgan Stanley | (1,397 | ) | (133,642 | ) | (120,086 | ) | 13,508 | |||||||||||||||||
Churchill Downs, Inc. | Morgan Stanley | (110 | ) | (17,353 | ) | (18,020 | ) | (773 | ) | ||||||||||||||||
Cracker Barrel Old Country Store, Inc. | Morgan Stanley | (789 | ) | (95,288 | ) | (90,467 | ) | 4,762 | |||||||||||||||||
Darden Restaurants, Inc. | Morgan Stanley | (6,114 | ) | (454,864 | ) | (615,924 | ) | (161,247 | ) | ||||||||||||||||
Domino’s Pizza, Inc. | Morgan Stanley | (1,274 | ) | (525,938 | ) | (541,807 | ) | (16,081 | ) | ||||||||||||||||
Dunkin’ Brands Group, Inc. | Morgan Stanley | (2,278 | ) | (174,381 | ) | (186,591 | ) | (12,362 | ) | ||||||||||||||||
Hilton Worldwide Holdings, Inc. | Morgan Stanley | (1,312 | ) | (114,998 | ) | (111,940 | ) | 2,682 | |||||||||||||||||
Hyatt Hotels Corp., Class A | Morgan Stanley | (1,515 | ) | (86,093 | ) | (80,856 | ) | 5,188 | |||||||||||||||||
Las Vegas Sands Corp. | Morgan Stanley | (6,347 | ) | (283,097 | ) | (296,151 | ) | (13,235 | ) | ||||||||||||||||
McDonald’s Corp. | Morgan Stanley | (5,292 | ) | (1,090,355 | ) | (1,161,541 | ) | (76,591 | ) | ||||||||||||||||
Norwegian Cruise Line Holdings Ltd. (Bermuda) | Morgan Stanley | (43,038 | ) | (827,798 | ) | (736,380 | ) | 91,098 | |||||||||||||||||
Planet Fitness, Inc., Class A | Morgan Stanley | (7,700 | ) | (442,149 | ) | (474,474 | ) | (32,507 | ) | ||||||||||||||||
Restaurant Brands International, Inc. (Canada) | Morgan Stanley | (4,868 | ) | (270,217 | ) | (279,959 | ) | (11,254 | ) | ||||||||||||||||
Scientific Games Corp. | Morgan Stanley | (109 | ) | (3,501 | ) | (3,805 | ) | (331 | ) | ||||||||||||||||
Starbucks Corp. | Morgan Stanley | (9,163 | ) | (714,748 | ) | (787,285 | ) | (75,605 | ) | ||||||||||||||||
Texas Roadhouse, Inc. | Morgan Stanley | (8,887 | ) | (438,920 | ) | (540,241 | ) | (101,888 | ) | ||||||||||||||||
Vail Resorts, Inc. | Morgan Stanley | (48 | ) | (10,477 | ) | (10,271 | ) | 177 | |||||||||||||||||
Wendy’s Co. (The) | Morgan Stanley | (3,628 | ) | (78,586 | ) | (80,886 | ) | (2,353 | ) | ||||||||||||||||
Wyndham Hotels & Resorts, Inc. | Morgan Stanley | (4,023 | ) | (206,135 | ) | (203,162 | ) | 2,588 | |||||||||||||||||
Wynn Resorts Ltd. | Morgan Stanley | (4,086 | ) | (321,511 | ) | (293,416 | ) | 27,905 | |||||||||||||||||
|
|
|
|
|
|
|
| ||||||||||||||||||
| (166,576 | ) | (7,942,573 | ) | (8,251,695 | ) | (322,960 | ) | ||||||||||||||||||
|
|
|
|
|
|
|
| ||||||||||||||||||
Energy | |||||||||||||||||||||||||
Cabot Oil & Gas Corp. | Morgan Stanley | (43,795 | ) | (853,740 | ) | (760,281 | ) | 88,707 | |||||||||||||||||
Continental Resources, Inc. | Morgan Stanley | (8,873 | ) | (151,610 | ) | (108,960 | ) | 42,571 | |||||||||||||||||
Diamondback Energy, Inc. | Morgan Stanley | (8,361 | ) | (300,943 | ) | (251,833 | ) | 47,492 | |||||||||||||||||
Exxon Mobil Corp. | Morgan Stanley | (8,873 | ) | (392,981 | ) | (304,610 | ) | 85,310 | |||||||||||||||||
The accompanying notes are an integral part of the financial statements.
49
GOTHAM SHORT STRATEGIES FUND
Portfolio of Investments (Continued)
September 30, 2020
Total Return Swaps (continued)
Reference Entity | Counterparty | Number of Contracts (Short) | Notional Amount | Value | Unrealized Appreciation/ (Depreciation)* | ||||||||||||||||||||
Energy — (continued) | |||||||||||||||||||||||||
Hess Corp. | Morgan Stanley | (12,952 | ) | $ | (763,847 | ) | $ | (530,125 | ) | $ | 224,247 | ||||||||||||||
HollyFrontier Corp. | Morgan Stanley | (4,611 | ) | (120,145 | ) | (90,883 | ) | 29,886 | |||||||||||||||||
Imperial Oil Ltd. (Canada) | Morgan Stanley | (373 | ) | (6,275 | ) | (4,461 | ) | 2,431 | |||||||||||||||||
Marathon Petroleum Corp. | Morgan Stanley | (19,062 | ) | (664,106 | ) | (559,279 | ) | 100,727 | |||||||||||||||||
Occidental Petroleum Corp. | Morgan Stanley | (3,200 | ) | (125,735 | ) | (32,032 | ) | 80,097 | |||||||||||||||||
Ovintiv, Inc. | Morgan Stanley | (6,999 | ) | (80,241 | ) | (57,112 | ) | 22,419 | |||||||||||||||||
Parsley Energy, Inc., Class A | Morgan Stanley | (54,485 | ) | (525,264 | ) | (509,980 | ) | 10,786 | |||||||||||||||||
Pembina Pipeline Corp. (Canada) | Morgan Stanley | (5,669 | ) | (148,647 | ) | (120,353 | ) | 23,407 | |||||||||||||||||
Phillips 66 | Morgan Stanley | (9,709 | ) | (596,951 | ) | (503,315 | ) | 89,295 | |||||||||||||||||
Valero Energy Corp. | Morgan Stanley | (2,548 | ) | (140,790 | ) | (110,379 | ) | 31,055 | |||||||||||||||||
WPX Energy, Inc. | Morgan Stanley | (23,468 | ) | (184,006 | ) | (114,993 | ) | 68,922 | |||||||||||||||||
|
|
|
|
|
|
|
| ||||||||||||||||||
| (212,978 | ) | (5,055,281 | ) | (4,058,596 | ) | 947,352 | |||||||||||||||||||
|
|
|
|
|
|
|
| ||||||||||||||||||
Food & Staples Retailing | |||||||||||||||||||||||||
Grocery Outlet Holding Corp. | Morgan Stanley | (5,631 | ) | (233,029 | ) | (221,411 | ) | 11,510 | |||||||||||||||||
|
|
|
|
|
|
|
| ||||||||||||||||||
Food, Beverage & Tobacco | |||||||||||||||||||||||||
Campbell Soup Co. | Morgan Stanley | (938 | ) | (43,224 | ) | (45,371 | ) | (2,187 | ) | ||||||||||||||||
Lamb Weston Holdings, Inc. | Morgan Stanley | (2,119 | ) | (140,520 | ) | (140,426 | ) | 19 | |||||||||||||||||
Pilgrim’s Pride Corp. | Morgan Stanley | (11,609 | ) | (221,635 | ) | (173,729 | ) | 47,802 | |||||||||||||||||
Sanderson Farms, Inc. | Morgan Stanley | (1,023 | ) | (126,267 | ) | (120,683 | ) | 5,184 | |||||||||||||||||
|
|
|
|
|
|
|
| ||||||||||||||||||
| (15,689 | ) | (531,646 | ) | (480,209 | ) | 50,818 | |||||||||||||||||||
|
|
|
|
|
|
|
| ||||||||||||||||||
Health Care Equipment & Services | |||||||||||||||||||||||||
Alcon, Inc. (Switzerland) | Morgan Stanley | (242 | ) | (13,776 | ) | (13,782 | ) | (35 | ) | ||||||||||||||||
Align Technology, Inc. | Morgan Stanley | (2,614 | ) | (766,318 | ) | (855,719 | ) | (89,698 | ) | ||||||||||||||||
AmerisourceBergen Corp. | Morgan Stanley | (128 | ) | (12,109 | ) | (12,406 | ) | (326 | ) | ||||||||||||||||
Cooper Cos., Inc. (The) | Morgan Stanley | (2,234 | ) | (671,260 | ) | (753,126 | ) | (82,181 | ) | ||||||||||||||||
Envista Holdings Corp. | Morgan Stanley | (1,164 | ) | (29,662 | ) | (28,728 | ) | 899 | |||||||||||||||||
Haemonetics Corp. | Morgan Stanley | (920 | ) | (83,143 | ) | (80,270 | ) | 2,819 | |||||||||||||||||
Henry Schein, Inc. | Morgan Stanley | (2,667 | ) | (179,520 | ) | (156,766 | ) | 28,214 | |||||||||||||||||
Inovalon Holdings, Inc., Class A | Morgan Stanley | (383 | ) | (8,697 | ) | (10,130 | ) | (1,461 | ) | ||||||||||||||||
Laboratory Corp. of America Holdings | Morgan Stanley | (747 | ) | (135,148 | ) | (140,638 | ) | (5,563 | ) | ||||||||||||||||
Penumbra, Inc. | Morgan Stanley | (1,975 | ) | (344,870 | ) | (383,901 | ) | (39,178 | ) | ||||||||||||||||
SmileDirectClub, Inc. | Morgan Stanley | (22,629 | ) | (240,239 | ) | (264,307 | ) | (24,178 | ) | ||||||||||||||||
STERIS PLC (Ireland) | Morgan Stanley | (828 | ) | (140,434 | ) | (145,885 | ) | (5,526 | ) | ||||||||||||||||
Stryker Corp. | Morgan Stanley | (263 | ) | (52,570 | ) | (54,801 | ) | (2,426 | ) | ||||||||||||||||
Wright Medical Group NV (Netherlands) | Morgan Stanley | (8,757 | ) | (265,574 | ) | (267,439 | ) | (1,984 | ) | ||||||||||||||||
Zimmer Biomet Holdings, Inc. | Morgan Stanley | (4,253 | ) | (585,261 | ) | (579,003 | ) | 4,877 | |||||||||||||||||
|
|
|
|
|
|
|
| ||||||||||||||||||
| (49,804 | ) | (3,528,581 | ) | (3,746,901 | ) | (215,747 | ) | ||||||||||||||||||
|
|
|
|
|
|
|
| ||||||||||||||||||
Household & Personal Products | |||||||||||||||||||||||||
Coty, Inc., Class A | Morgan Stanley | (4,101 | ) | (15,682 | ) | (11,073 | ) | 2,124 | |||||||||||||||||
Estee Lauder Cos., Inc. (The), Class A | Morgan Stanley | (3,834 | ) | (815,347 | ) | (836,771 | ) | (22,479 | ) | ||||||||||||||||
Reynolds Consumer Products, Inc. | Morgan Stanley | (17 | ) | (537 | ) | (521 | ) | (11 | ) | ||||||||||||||||
|
|
|
|
|
|
|
| ||||||||||||||||||
| (7,952 | ) | (831,566 | ) | (848,365 | ) | (20,366 | ) | ||||||||||||||||||
|
|
|
|
|
|
|
| ||||||||||||||||||
Materials | |||||||||||||||||||||||||
Alamos Gold, Inc., Class A (Canada) | Morgan Stanley | (32,430 | ) | (300,355 | ) | (285,708 | ) | 13,929 | |||||||||||||||||
The accompanying notes are an integral part of the financial statements.
50
GOTHAM SHORT STRATEGIES FUND
Portfolio of Investments (Continued)
September 30, 2020
Total Return Swaps (continued)
Reference Entity | Counterparty | Number of Contracts (Short) | Notional Amount | Value | Unrealized Appreciation/ (Depreciation)* | ||||||||||||||||||||
Materials — (continued) | |||||||||||||||||||||||||
Avery Dennison Corp. | Morgan Stanley | (918 | ) | $ | (113,316 | ) | $ | (117,357 | ) | $ | (4,106 | ) | |||||||||||||
Ball Corp. | Morgan Stanley | (5,982 | ) | (469,229 | ) | (497,224 | ) | (28,683 | ) | ||||||||||||||||
Barrick Gold Corp. (Canada) | Morgan Stanley | (3,302 | ) | (91,975 | ) | (92,819 | ) | (901 | ) | ||||||||||||||||
Eagle Materials, Inc. | Morgan Stanley | (1,453 | ) | (101,081 | ) | (125,423 | ) | (24,403 | ) | ||||||||||||||||
Eastman Chemical Co. | Morgan Stanley | (1,180 | ) | (94,886 | ) | (92,182 | ) | 2,018 | |||||||||||||||||
Equinox Gold Corp. (Canada) | Morgan Stanley | (1,860 | ) | (22,472 | ) | (21,781 | ) | 659 | |||||||||||||||||
Graphic Packaging Holding Co. | Morgan Stanley | (9,012 | ) | (128,797 | ) | (126,979 | ) | 1,134 | |||||||||||||||||
International Paper Co. | Morgan Stanley | (3,865 | ) | (155,057 | ) | (156,687 | ) | (1,710 | ) | ||||||||||||||||
Kirkland Lake Gold Ltd. (Canada) | Morgan Stanley | (3,805 | ) | (162,608 | ) | (185,418 | ) | (24,248 | ) | ||||||||||||||||
Martin Marietta Materials, Inc. | Morgan Stanley | (4 | ) | (882 | ) | (941 | ) | (85 | ) | ||||||||||||||||
NewMarket Corp. | Morgan Stanley | (32 | ) | (12,174 | ) | (10,954 | ) | 2,008 | |||||||||||||||||
Packaging Corp. of America | Morgan Stanley | (900 | ) | (96,643 | ) | (98,145 | ) | (1,789 | ) | ||||||||||||||||
Quaker Chemical Corp. | Morgan Stanley | (164 | ) | (30,141 | ) | (29,472 | ) | 633 | |||||||||||||||||
Teck Resources Ltd., Class B (Canada) | Morgan Stanley | (1,499 | ) | (21,086 | ) | (20,866 | ) | (51 | ) | ||||||||||||||||
|
|
|
|
|
|
|
| ||||||||||||||||||
| (66,406 | ) | (1,800,702 | ) | (1,861,956 | ) | (65,595 | ) | ||||||||||||||||||
|
|
|
|
|
|
|
| ||||||||||||||||||
Media & Entertainment | |||||||||||||||||||||||||
Comcast Corp., Class A | Morgan Stanley | (13,997 | ) | (629,760 | ) | (647,501 | ) | (17,990 | ) | ||||||||||||||||
Live Nation Entertainment, Inc. | Morgan Stanley | (11,968 | ) | (521,216 | ) | (644,836 | ) | (123,830 | ) | ||||||||||||||||
TripAdvisor, Inc. | Morgan Stanley | (17,962 | ) | (399,601 | ) | (351,876 | ) | 47,558 | |||||||||||||||||
ViacomCBS, Inc., Class B | Morgan Stanley | (2,845 | ) | (82,562 | ) | (79,688 | ) | 2,799 | |||||||||||||||||
|
|
|
|
|
|
|
| ||||||||||||||||||
| (46,772 | ) | (1,633,139 | ) | (1,723,901 | ) | (91,463 | ) | ||||||||||||||||||
|
|
|
|
|
|
|
| ||||||||||||||||||
Pharmaceuticals, Biotechnology & Life Sciences | |||||||||||||||||||||||||
AbbVie, Inc. | Morgan Stanley | (5,723 | ) | (548,508 | ) | (501,278 | ) | 53,418 | |||||||||||||||||
Acceleron Pharma, Inc. | Morgan Stanley | (1,733 | ) | (163,071 | ) | (195,014 | ) | (32,026 | ) | ||||||||||||||||
Adaptive Biotechnologies Corp. | Morgan Stanley | (2,702 | ) | (107,713 | ) | (131,398 | ) | (23,749 | ) | ||||||||||||||||
Agios Pharmaceuticals, Inc. | Morgan Stanley | (338 | ) | (15,078 | ) | (11,830 | ) | 3,217 | |||||||||||||||||
Alkermes PLC (Ireland) | Morgan Stanley | (5,409 | ) | (90,704 | ) | (89,627 | ) | 1,019 | |||||||||||||||||
Allogene Therapeutics, Inc. | Morgan Stanley | (728 | ) | (25,665 | ) | (27,453 | ) | (1,822 | ) | ||||||||||||||||
Amicus Therapeutics, Inc. | Morgan Stanley | (885 | ) | (11,988 | ) | (12,496 | ) | (537 | ) | ||||||||||||||||
Apellis Pharmaceuticals, Inc. | Morgan Stanley | (993 | ) | (31,901 | ) | (29,959 | ) | 1,906 | |||||||||||||||||
Arrowhead Pharmaceuticals, Inc. | Morgan Stanley | (12,182 | ) | (419,351 | ) | (524,557 | ) | (105,380 | ) | ||||||||||||||||
Bausch Health Cos, Inc. (Canada) | Morgan Stanley | (20,602 | ) | (342,633 | ) | (320,155 | ) | 22,331 | |||||||||||||||||
Biohaven Pharmaceutical Holding Co. Ltd. (British Virgin Islands) | Morgan Stanley | (375 | ) | (22,951 | ) | (24,379 | ) | (1,461 | ) | ||||||||||||||||
BioMarin Pharmaceutical, Inc. | Morgan Stanley | (221 | ) | (16,566 | ) | (16,814 | ) | (279 | ) | ||||||||||||||||
Blueprint Medicines Corp. | Morgan Stanley | (319 | ) | (24,242 | ) | (29,571 | ) | (8,008 | ) | ||||||||||||||||
Bridgebio Pharma, Inc. | Morgan Stanley | (3,849 | ) | (120,571 | ) | (144,414 | ) | (24,473 | ) | ||||||||||||||||
Deciphera Pharmaceuticals, Inc. | Morgan Stanley | (32 | ) | (1,698 | ) | (1,642 | ) | 31 | |||||||||||||||||
Exact Sciences Corp. | Morgan Stanley | (3,945 | ) | (310,996 | ) | (402,193 | ) | (91,332 | ) | ||||||||||||||||
Exelixis, Inc. | Morgan Stanley | (5,159 | ) | (131,863 | ) | (126,138 | ) | 5,654 | |||||||||||||||||
FibroGen, Inc. | Morgan Stanley | (2,240 | ) | (87,206 | ) | (92,109 | ) | (6,554 | ) | ||||||||||||||||
Global Blood Therapeutics, Inc. | Morgan Stanley | (264 | ) | (14,054 | ) | (14,557 | ) | (533 | ) | ||||||||||||||||
Ionis Pharmaceuticals, Inc. | Morgan Stanley | (4,076 | ) | (239,253 | ) | (193,406 | ) | 58,397 | |||||||||||||||||
Iovance Biotherapeutics, Inc. | Morgan Stanley | (4,332 | ) | (128,378 | ) | (142,609 | ) | (14,302 | ) | ||||||||||||||||
Karuna Therapeutics, Inc. | Morgan Stanley | (46 | ) | (4,263 | ) | (3,557 | ) | 680 | |||||||||||||||||
NeoGenomics, Inc. | Morgan Stanley | (2,407 | ) | (70,183 | ) | (88,794 | ) | (18,661 | ) | ||||||||||||||||
The accompanying notes are an integral part of the financial statements.
51
GOTHAM SHORT STRATEGIES FUND
Portfolio of Investments (Continued)
September 30, 2020
Total Return Swaps (continued)
Reference Entity | Counterparty | Number of Contracts (Short) | Notional Amount | Value | Unrealized Appreciation/ (Depreciation)* | ||||||||||||||||||||
Pharmaceuticals, Biotechnology & Life Sciences — (continued) |
| ||||||||||||||||||||||||
PRA Health Sciences, Inc. | Morgan Stanley | (78 | ) | $ | (8,291 | ) | $ | (7,912 | ) | $ | 945 | ||||||||||||||
PTC Therapeutics, Inc. | Morgan Stanley | (6,538 | ) | (314,420 | ) | (305,652 | ) | 8,632 | |||||||||||||||||
Reata Pharmaceuticals, Inc., Class A | Morgan Stanley | (2,728 | ) | (362,278 | ) | (265,762 | ) | 96,363 | |||||||||||||||||
Seattle Genetics, Inc. | Morgan Stanley | (2,600 | ) | (407,768 | ) | (508,794 | ) | (101,195 | ) | ||||||||||||||||
|
|
|
|
|
|
|
| ||||||||||||||||||
| (90,504 | ) | (4,021,593 | ) | (4,212,070 | ) | (177,719 | ) | ||||||||||||||||||
|
|
|
|
|
|
|
| ||||||||||||||||||
Retailing | |||||||||||||||||||||||||
Burlington Stores, Inc. | Morgan Stanley | (4,220 | ) | (880,065 | ) | (869,700 | ) | 10,028 | |||||||||||||||||
CarMax, Inc. | Morgan Stanley | (616 | ) | (58,801 | ) | (56,617 | ) | 2,138 | |||||||||||||||||
Expedia Group, Inc. | Morgan Stanley | (12,452 | ) | (1,016,419 | ) | (1,141,724 | ) | (125,691 | ) | ||||||||||||||||
Floor & Decor Holdings, Inc., Class A | Morgan Stanley | (3,082 | ) | (214,451 | ) | (230,534 | ) | (16,184 | ) | ||||||||||||||||
Grubhub, Inc. | Morgan Stanley | (237 | ) | (16,628 | ) | (17,142 | ) | (545 | ) | ||||||||||||||||
National Vision Holdings, Inc. | Morgan Stanley | (1,695 | ) | (64,014 | ) | (64,817 | ) | (851 | ) | ||||||||||||||||
Nordstrom, Inc. | Morgan Stanley | (14,623 | ) | (265,921 | ) | (174,306 | ) | 91,495 | |||||||||||||||||
Stitch Fix, Inc., Class A | Morgan Stanley | (337 | ) | (9,987 | ) | (9,143 | ) | 4,138 | |||||||||||||||||
|
|
|
|
|
|
|
| ||||||||||||||||||
| (37,262 | ) | (2,526,286 | ) | (2,563,983 | ) | (35,472 | ) | ||||||||||||||||||
|
|
|
|
|
|
|
| ||||||||||||||||||
Semiconductors & Semiconductor Equipment | |||||||||||||||||||||||||
Cirrus Logic, Inc. | Morgan Stanley | (121 | ) | (7,571 | ) | (8,161 | ) | (618 | ) | ||||||||||||||||
Cree, Inc. | Morgan Stanley | (4,032 | ) | (246,268 | ) | (257,000 | ) | (10,845 | ) | ||||||||||||||||
Lattice Semiconductor Corp. | Morgan Stanley | (1,843 | ) | (56,782 | ) | (53,373 | ) | 3,364 | |||||||||||||||||
Universal Display Corp. | Morgan Stanley | (1,667 | ) | (303,840 | ) | (301,294 | ) | 2,201 | |||||||||||||||||
|
|
|
|
|
|
|
| ||||||||||||||||||
| (7,663 | ) | (614,461 | ) | (619,828 | ) | (5,898 | ) | ||||||||||||||||||
|
|
|
|
|
|
|
| ||||||||||||||||||
Software & Services | |||||||||||||||||||||||||
Akamai Technologies, Inc. | Morgan Stanley | (518 | ) | (57,323 | ) | (57,260 | ) | 18 | |||||||||||||||||
Altair Engineering, Inc., Class A | Morgan Stanley | (23 | ) | (963 | ) | (965 | ) | (28 | ) | ||||||||||||||||
Alteryx, Inc., Class A | Morgan Stanley | (5,261 | ) | (594,033 | ) | (597,386 | ) | (3,590 | ) | ||||||||||||||||
Ceridian HCM Holding, Inc. | Morgan Stanley | (5,266 | ) | (402,820 | ) | (435,235 | ) | (32,583 | ) | ||||||||||||||||
Coupa Software, Inc. | Morgan Stanley | (489 | ) | (123,521 | ) | (134,103 | ) | (10,652 | ) | ||||||||||||||||
Digital Turbine, Inc. | Morgan Stanley | (426 | ) | (13,510 | ) | (13,947 | ) | (467 | ) | ||||||||||||||||
Everbridge, Inc. | Morgan Stanley | (2,011 | ) | (254,641 | ) | (252,843 | ) | 1,682 | |||||||||||||||||
Fastly, Inc., Class A | Morgan Stanley | (3,291 | ) | (281,442 | ) | (308,301 | ) | (26,984 | ) | ||||||||||||||||
Global Payments, Inc. | Morgan Stanley | (1,049 | ) | (183,930 | ) | (186,281 | ) | (2,442 | ) | ||||||||||||||||
Leidos Holdings, Inc. | Morgan Stanley | (1,581 | ) | (142,039 | ) | (140,946 | ) | 1,017 | |||||||||||||||||
MAXIMUS, Inc. | Morgan Stanley | (149 | ) | (11,681 | ) | (10,193 | ) | 2,861 | |||||||||||||||||
Medallia, Inc. | Morgan Stanley | (5,627 | ) | (158,768 | ) | (154,292 | ) | 4,394 | |||||||||||||||||
New Relic, Inc. | Morgan Stanley | (4,610 | ) | (257,070 | ) | (259,820 | ) | (2,865 | ) | ||||||||||||||||
Nuance Communications, Inc. | Morgan Stanley | (1,813 | ) | (57,825 | ) | (60,173 | ) | (2,394 | ) | ||||||||||||||||
Paychex, Inc. | Morgan Stanley | (192 | ) | (14,529 | ) | (15,316 | ) | (816 | ) | ||||||||||||||||
Paycom Software, Inc. | Morgan Stanley | (3 | ) | (901 | ) | (934 | ) | (59 | ) | ||||||||||||||||
Slack Technologies, Inc., Class A | Morgan Stanley | (23,132 | ) | (659,195 | ) | (621,326 | ) | 37,610 | |||||||||||||||||
Smartsheet, Inc., Class A | Morgan Stanley | (1,031 | ) | (51,894 | ) | (50,952 | ) | 859 | |||||||||||||||||
Splunk, Inc. | Morgan Stanley | (555 | ) | (98,104 | ) | (104,412 | ) | (6,368 | ) | ||||||||||||||||
Switch, Inc., Class A | Morgan Stanley | (8,707 | ) | (131,734 | ) | (135,916 | ) | (4,801 | ) | ||||||||||||||||
Zscaler, Inc. | Morgan Stanley | (610 | ) | (81,060 | ) | (85,821 | ) | (4,814 | ) | ||||||||||||||||
|
|
|
|
|
|
|
| ||||||||||||||||||
| (66,344 | ) | (3,576,983 | ) | (3,626,422 | ) | (50,422 | ) | ||||||||||||||||||
|
|
|
|
|
|
|
| ||||||||||||||||||
The accompanying notes are an integral part of the financial statements.
52
GOTHAM SHORT STRATEGIES FUND
Portfolio of Investments (Continued)
September 30, 2020
Total Return Swaps (continued)
Reference Entity | Counterparty | Number of Contracts (Short) | Notional Amount | Value | Unrealized Appreciation/ (Depreciation)* | ||||||||||||||||||||
Technology Hardware & Equipment | |||||||||||||||||||||||||
Dell Technologies, Inc., Class A | Morgan Stanley | (338 | ) | $ | (22,089 | ) | $ | (22,879 | ) | $ | (823 | ) | |||||||||||||
Hewlett Packard Enterprise Co. | Morgan Stanley | (11,449 | ) | (107,706 | ) | (107,277 | ) | (64 | ) | ||||||||||||||||
II-VI, Inc. | Morgan Stanley | (2,905 | ) | (111,193 | ) | (117,827 | ) | (6,698 | ) | ||||||||||||||||
Keysight Technologies, Inc. | Morgan Stanley | (2,901 | ) | (282,238 | ) | (286,561 | ) | (4,448 | ) | ||||||||||||||||
Pure Storage, Inc., Class A | Morgan Stanley | (4,987 | ) | (72,797 | ) | (76,750 | ) | (4,004 | ) | ||||||||||||||||
Seagate Technology PLC (Ireland) | Morgan Stanley | (240 | ) | (11,453 | ) | (11,825 | ) | (526 | ) | ||||||||||||||||
TE Connectivity Ltd. (Switzerland) | Morgan Stanley | (3,278 | ) | (304,795 | ) | (320,392 | ) | (16,807 | ) | ||||||||||||||||
Xerox Holdings Corp. | Morgan Stanley | (569 | ) | (10,675 | ) | (10,680 | ) | (176 | ) | ||||||||||||||||
|
|
|
|
|
|
|
| ||||||||||||||||||
| (26,667 | ) | (922,946 | ) | (954,191 | ) | (33,546 | ) | ||||||||||||||||||
|
|
|
|
|
|
|
| ||||||||||||||||||
Telecommunication Services | |||||||||||||||||||||||||
T-Mobile US, Inc. | Morgan Stanley | (6,429 | ) | (744,618 | ) | (735,220 | ) | 9,108 | |||||||||||||||||
|
|
|
|
|
|
|
| ||||||||||||||||||
Transportation | |||||||||||||||||||||||||
Alaska Air Group, Inc. | Morgan Stanley | (15,966 | ) | (531,870 | ) | (584,835 | ) | (53,179 | ) | ||||||||||||||||
American Airlines Group, Inc. | Morgan Stanley | (58,463 | ) | (901,624 | ) | (718,510 | ) | 182,769 | |||||||||||||||||
Canadian National Railway Co. (Canada) | Morgan Stanley | (14 | ) | (1,477 | ) | (1,490 | ) | (274 | ) | ||||||||||||||||
Canadian Pacific Railway Ltd. (Canada) | Morgan Stanley | (80 | ) | (23,917 | ) | (24,354 | ) | (471 | ) | ||||||||||||||||
CSX Corp. | Morgan Stanley | (711 | ) | (54,776 | ) | (55,223 | ) | (492 | ) | ||||||||||||||||
Delta Air Lines, Inc. | Morgan Stanley | (13,221 | ) | (367,852 | ) | (404,298 | ) | (42,000 | ) | ||||||||||||||||
JetBlue Airways Corp. | Morgan Stanley | (63,640 | ) | (682,835 | ) | (721,041 | ) | (38,474 | ) | ||||||||||||||||
Lyft, Inc., Class A | Morgan Stanley | (6,384 | ) | (183,860 | ) | (175,879 | ) | 7,891 | |||||||||||||||||
Norfolk Southern Corp. | Morgan Stanley | (426 | ) | (88,513 | ) | (91,160 | ) | (3,335 | ) | ||||||||||||||||
Southwest Airlines Co. | Morgan Stanley | (28,706 | ) | (932,512 | ) | (1,076,475 | ) | (144,320 | ) | ||||||||||||||||
Union Pacific Corp. | Morgan Stanley | (475 | ) | (92,365 | ) | (93,513 | ) | (1,206 | ) | ||||||||||||||||
United Airlines Holdings, Inc. | Morgan Stanley | (34,733 | ) | (1,106,892 | ) | (1,206,972 | ) | (100,498 | ) | ||||||||||||||||
XPO Logistics, Inc. | Morgan Stanley | (225 | ) | (20,339 | ) | (19,049 | ) | (18 | ) | ||||||||||||||||
|
|
|
|
|
|
|
| ||||||||||||||||||
| (223,044 | ) | (4,988,832 | ) | (5,172,799 | ) | (193,607 | ) | ||||||||||||||||||
|
|
|
|
|
|
|
| ||||||||||||||||||
Utilities | |||||||||||||||||||||||||
ALLETE, Inc. | Morgan Stanley | (4,044 | ) | (243,727 | ) | (209,236 | ) | 30,667 | |||||||||||||||||
Alliant Energy Corp. | Morgan Stanley | (56 | ) | (2,783 | ) | (2,892 | ) | (135 | ) | ||||||||||||||||
Ameren Corp. | Morgan Stanley | (727 | ) | (56,234 | ) | (57,491 | ) | (1,326 | ) | ||||||||||||||||
American Water Works Co., Inc. | Morgan Stanley | (6,357 | ) | (785,063 | ) | (921,002 | ) | (139,584 | ) | ||||||||||||||||
Atmos Energy Corp. | Morgan Stanley | (1,493 | ) | (151,985 | ) | (142,716 | ) | 8,378 | |||||||||||||||||
Black Hills Corp. | Morgan Stanley | (879 | ) | (51,763 | ) | (47,018 | ) | 4,288 | |||||||||||||||||
California Water Service Group | Morgan Stanley | (281 | ) | (13,526 | ) | (12,209 | ) | 1,168 | |||||||||||||||||
CMS Energy Corp. | Morgan Stanley | (6,066 | ) | (368,959 | ) | (372,513 | ) | (3,710 | ) | ||||||||||||||||
Consolidated Edison, Inc. | Morgan Stanley | (9,449 | ) | (694,637 | ) | (735,132 | ) | (42,096 | ) | ||||||||||||||||
DTE Energy Co. | Morgan Stanley | (7,870 | ) | (869,285 | ) | (905,365 | ) | (58,185 | ) | ||||||||||||||||
Edison International | Morgan Stanley | (7,110 | ) | (467,642 | ) | (361,472 | ) | 90,229 | |||||||||||||||||
Essential Utilities, Inc. | Morgan Stanley | (11,078 | ) | (469,269 | ) | (445,890 | ) | 20,792 | |||||||||||||||||
Eversource Energy | Morgan Stanley | (1,687 | ) | (140,665 | ) | (140,949 | ) | (1,011 | ) | ||||||||||||||||
FirstEnergy Corp. | Morgan Stanley | (2,335 | ) | (67,194 | ) | (67,038 | ) | (534 | ) | ||||||||||||||||
New Jersey Resources Corp. | Morgan Stanley | (3,041 | ) | (103,416 | ) | (82,168 | ) | 19,348 | |||||||||||||||||
NextEra Energy, Inc. | Morgan Stanley | (1,520 | ) | (425,518 | ) | (421,891 | ) | 1,323 | |||||||||||||||||
Ormat Technologies, Inc. | Morgan Stanley | (810 | ) | (49,243 | ) | (47,879 | ) | 1,306 | |||||||||||||||||
The accompanying notes are an integral part of the financial statements.
53
GOTHAM SHORT STRATEGIES FUND
Portfolio of Investments (Concluded)
September 30, 2020
Total Return Swaps (concluded)
Reference Entity | Counterparty | Number of Contracts (Short) | Notional Amount | Value | Unrealized Appreciation/ (Depreciation)* | ||||||||||||||||||||
Utilities — (continued) | |||||||||||||||||||||||||
Public Service Enterprise Group, Inc. | Morgan Stanley | (6,171 | ) | $ | (335,365 | ) | $ | (338,850 | ) | $ | (5,989 | ) | |||||||||||||
Southern Co. (The) | Morgan Stanley | (15,443 | ) | (822,824 | ) | (837,319 | ) | (17,029 | ) | ||||||||||||||||
Spire, Inc. | Morgan Stanley | (590 | ) | (35,614 | ) | (31,388 | ) | 3,821 | |||||||||||||||||
|
|
|
|
|
|
|
| ||||||||||||||||||
| (87,007 | ) | (6,154,712 | ) | (6,180,418 | ) | (88,279 | ) | ||||||||||||||||||
|
|
|
|
|
|
|
| ||||||||||||||||||
Total Reference Entity — Short | $ | (53,922,587 | ) | $ | (54,468,622 | ) | $ | (701,222 | ) | ||||||||||||||||
|
|
|
|
|
| ||||||||||||||||||||
| * | Includes $(155,187) related to open trades, dividends receivables/payables and swap receivables/payables activities. |
The accompanying notes are an integral part of the financial statements.
54
GOTHAM MASTER NEUTRAL FUND
Portfolio of Investments
September 30, 2020
| Number of Shares | Value | |||||||
LONG POSITIONS — 98.8% |
| |||||||
COMMON STOCKS — 29.8% |
| |||||||
Automobiles & Components — 0.9% |
| |||||||
Aptiv PLC (Jersey)† | 67 | $ | 6,143 | |||||
Fox Factory Holding Corp.* | 4 | 297 | ||||||
Harley-Davidson, Inc. | 4 | 98 | ||||||
Magna International, Inc. | 94 | 4,300 | ||||||
Tesla, Inc.†* | 19 | 8,151 | ||||||
Thor Industries, Inc.† | 19 | 1,810 | ||||||
|
| |||||||
| 20,799 | ||||||||
|
| |||||||
Capital Goods — 3.7% | ||||||||
Acuity Brands, Inc.† | 6 | 614 | ||||||
Advanced Drainage Systems, Inc.† | 40 | 2,498 | ||||||
AECOM†* | 133 | 5,565 | ||||||
AerCap Holdings NV (Netherlands)†* | 3 | 76 | ||||||
AMETEK, Inc. | 1 | 99 | ||||||
BWX Technologies, Inc.† | 13 | 732 | ||||||
CAE, Inc. (Canada)† | 18 | 263 | ||||||
Colfax Corp.†* | 255 | 7,997 | ||||||
Curtiss-Wright Corp. | 2 | 187 | ||||||
EMCOR Group, Inc.† | 32 | 2,167 | ||||||
EnerSys† | 10 | 671 | ||||||
Fortune Brands Home & Security, Inc.† | 106 | 9,171 | ||||||
Franklin Electric Co., Inc.† | 50 | 2,941 | ||||||
HD Supply Holdings, Inc.* | 11 | 454 | ||||||
Howmet Aerospace, Inc.† | 212 | 3,545 | ||||||
Hubbell, Inc.† | 1 | 137 | ||||||
ITT, Inc.† | 11 | 650 | ||||||
John Bean Technologies Corp.† | 10 | 919 | ||||||
Masco Corp. | 3 | 165 | ||||||
Middleby Corp. (The)†* | 45 | 4,037 | ||||||
nVent Electric PLC (Ireland)† | 19 | 336 | ||||||
Owens Corning† | 103 | 7,087 | ||||||
Pentair PLC (Ireland)† | 13 | 595 | ||||||
Quanta Services, Inc.† | 51 | 2,696 | ||||||
RBC Bearings, Inc.†* | 9 | 1,091 | ||||||
Roper Technologies, Inc. | 3 | 1,185 | ||||||
Simpson Manufacturing Co., Inc.† | 31 | 3,012 | ||||||
SiteOne Landscape Supply, Inc.†* | 8 | 976 | ||||||
Timken Co. (The)† | 10 | 542 | ||||||
Toro Co. (The) | 23 | 1,931 | ||||||
Trex Co., Inc.†* | 120 | 8,592 | ||||||
UFP Industries, Inc.† | 32 | 1,808 | ||||||
United Rentals, Inc.†* | 4 | 698 | ||||||
Univar Solutions, Inc.†* | 142 | 2,397 | ||||||
| Number of Shares | Value | |||||||
COMMON STOCKS — (Continued) |
| |||||||
Capital Goods — (Continued) | ||||||||
Valmont Industries, Inc.† | 7 | $ | 869 | |||||
Watsco, Inc.† | 14 | 3,260 | ||||||
Woodward, Inc.† | 22 | 1,763 | ||||||
|
| |||||||
| 81,726 | ||||||||
|
| |||||||
Commercial & Professional Services — 1.4% |
| |||||||
ASGN, Inc.†* | 23 | 1,462 | ||||||
Clarivate PLC (Jersey)†* | 129 | 3,998 | ||||||
Copart, Inc.* | 7 | 736 | ||||||
CoreLogic, Inc.† | 133 | 9,000 | ||||||
Equifax, Inc. | 2 | 314 | ||||||
Exponent, Inc. | 4 | 288 | ||||||
FTI Consulting, Inc.†* | 12 | 1,272 | ||||||
ManpowerGroup, Inc.† | 47 | 3,447 | ||||||
Robert Half International, Inc.† | 27 | 1,429 | ||||||
Rollins, Inc.† | 14 | 759 | ||||||
Stantec, Inc. (Canada)† | 29 | 880 | ||||||
Tetra Tech, Inc.† | 17 | 1,624 | ||||||
Thomson Reuters Corp. (Canada) | 3 | 239 | ||||||
TransUnion† | 11 | 925 | ||||||
TriNet Group, Inc.†* | 89 | 5,279 | ||||||
|
| |||||||
| 31,652 | ||||||||
|
| |||||||
Consumer Durables & Apparel — 2.5% |
| |||||||
Brunswick Corp.† | 136 | 8,012 | ||||||
Carter’s, Inc.† | 11 | 952 | ||||||
Deckers Outdoor Corp.†* | 40 | 8,800 | ||||||
DR Horton, Inc.† | 120 | 9,076 | ||||||
Garmin Ltd. (Switzerland) | 2 | 190 | ||||||
Gildan Activewear, Inc. (Canada) | 22 | 433 | ||||||
Hanesbrands, Inc.† | 393 | 6,190 | ||||||
Helen of Troy Ltd. (Bermuda)†* | 18 | 3,483 | ||||||
Mohawk Industries, Inc.†* | 8 | 781 | ||||||
NIKE, Inc., Class B | 7 | 879 | ||||||
Polaris, Inc.† | 44 | 4,151 | ||||||
PVH Corp. | 6 | 358 | ||||||
Tempur Sealy International, Inc.†* | 22 | 1,962 | ||||||
Whirlpool Corp.† | 50 | 9,194 | ||||||
YETI Holdings, Inc.* | 29 | 1,314 | ||||||
|
| |||||||
| 55,775 | ||||||||
|
| |||||||
Consumer Services — 1.2% | ||||||||
Darden Restaurants, Inc.† | 90 | 9,067 | ||||||
frontdoor, Inc.* | 1 | 39 | ||||||
Grand Canyon Education, Inc.* | 5 | 400 | ||||||
MGM Resorts International† | 131 | 2,849 | ||||||
The accompanying notes are an integral part of the financial statements.
55
GOTHAM MASTER NEUTRAL FUND
Portfolio of Investments (Continued)
September 30, 2020
| Number of Shares | Value | |||||||
COMMON STOCKS — (Continued) |
| |||||||
Consumer Services — (Continued) |
| |||||||
Papa John’s International, Inc.† | 6 | $ | 494 | |||||
Service Corp. International | 16 | 675 | ||||||
Strategic Education, Inc.† | 37 | 3,384 | ||||||
Wingstop, Inc.† | 19 | 2,596 | ||||||
Wyndham Hotels & Resorts, Inc.† | 164 | 8,282 | ||||||
|
| |||||||
| 27,786 | ||||||||
|
| |||||||
Energy — 1.7% | ||||||||
Antero Midstream Corp.† | 213 | 1,144 | ||||||
Apache Corp.† | 556 | 5,265 | ||||||
Baker Hughes Co. | 19 | 253 | ||||||
Canadian Natural Resources Ltd. (Canada)† | 265 | 4,243 | ||||||
Cenovus Energy, Inc. (Canada)† | 1,585 | 6,166 | ||||||
Cheniere Energy, Inc.†* | 32 | 1,481 | ||||||
EOG Resources, Inc.† | 60 | 2,156 | ||||||
Halliburton Co.† | 545 | 6,567 | ||||||
Imperial Oil Ltd. (Canada)† | 105 | 1,256 | ||||||
Kinder Morgan, Inc.† | 56 | 690 | ||||||
Marathon Petroleum Corp.† | 34 | 997 | ||||||
National Oilwell Varco, Inc.† | 235 | 2,129 | ||||||
Schlumberger NV (Curacao)† | 219 | 3,408 | ||||||
TechnipFMC PLC (United Kingdom) | 24 | 151 | ||||||
Williams Cos., Inc. (The)† | 63 | 1,238 | ||||||
|
| |||||||
| 37,144 | ||||||||
|
| |||||||
Food & Staples Retailing — 0.5% |
| |||||||
BJ’s Wholesale Club Holdings, Inc.†* | 60 | 2,493 | ||||||
Casey’s General Stores, Inc. | 5 | 888 | ||||||
Costco Wholesale Corp. | 4 | 1,420 | ||||||
Kroger Co. (The) | 55 | 1,865 | ||||||
Sprouts Farmers Market, Inc.†* | 43 | 900 | ||||||
US Foods Holding Corp.†* | 139 | 3,089 | ||||||
Walmart, Inc.† | 1 | 140 | ||||||
|
| |||||||
| 10,795 | ||||||||
|
| |||||||
Food, Beverage & Tobacco — 1.1% |
| |||||||
Altria Group, Inc. | 13 | 502 | ||||||
Boston Beer Co., Inc. (The), | 1 | 883 | ||||||
Conagra Brands, Inc.† | 69 | 2,464 | ||||||
Constellation Brands, Inc., | 13 | 2,464 | ||||||
Flowers Foods, Inc.† | 29 | 706 | ||||||
General Mills, Inc.† | 39 | 2,406 | ||||||
JM Smucker Co. (The) | 26 | 3,004 | ||||||
Keurig Dr Pepper, Inc. | 5 | 138 | ||||||
| Number of Shares | Value | |||||||
COMMON STOCKS — (Continued) |
| |||||||
Food, Beverage & Tobacco — (Continued) |
| |||||||
Kraft Heinz Co. (The)† | 52 | $ | 1,557 | |||||
McCormick & Co., Inc., non-voting shares† | 7 | 1,359 | ||||||
Molson Coors Beverage Co., | 47 | 1,577 | ||||||
National Beverage Corp.* | 4 | 272 | ||||||
TreeHouse Foods, Inc.†* | 113 | 4,580 | ||||||
Tyson Foods, Inc., Class A† | 51 | 3,033 | ||||||
|
| |||||||
| 24,945 | ||||||||
|
| |||||||
Health Care Equipment & Services — 1.1% |
| |||||||
AMN Healthcare Services, Inc.†* | 3 | 175 | ||||||
Anthem, Inc.† | 13 | 3,492 | ||||||
Cigna Corp.† | 7 | 1,186 | ||||||
CVS Health Corp.† | 10 | 584 | ||||||
DexCom, Inc.†* | 7 | 2,886 | ||||||
Ensign Group, Inc. (The)† | 38 | 2,168 | ||||||
Globus Medical, Inc., Class A* | 3 | 149 | ||||||
HCA Healthcare, Inc.† | 27 | 3,366 | ||||||
HealthEquity, Inc.* | 1 | 51 | ||||||
Humana, Inc.† | 4 | 1,656 | ||||||
Livongo Health, Inc.†* | 12 | 1,681 | ||||||
Molina Healthcare, Inc.†* | 7 | 1,281 | ||||||
Quidel Corp.†* | 9 | 1,974 | ||||||
Teladoc Health, Inc.†* | 11 | 2,412 | ||||||
Universal Health Services, Inc., Class B | 5 | 535 | ||||||
|
| |||||||
| 23,596 | ||||||||
|
| |||||||
Household & Personal Products — 0.3% |
| |||||||
Clorox Co. (The)† | 11 | 2,312 | ||||||
Energizer Holdings, Inc.† | 49 | 1,918 | ||||||
Kimberly-Clark Corp.† | 14 | 2,067 | ||||||
|
| |||||||
| 6,297 | ||||||||
|
| |||||||
Materials — 1.8% |
| |||||||
Amcor PLC (Jersey) | 33 | 365 | ||||||
CF Industries Holdings, Inc.† | 43 | 1,321 | ||||||
Chemours Co. (The)† | 13 | 272 | ||||||
Franco-Nevada Corp. (Canada) | 1 | 140 | ||||||
Hecla Mining Co.† | 442 | 2,245 | ||||||
Kinross Gold Corp. (Canada)† | 69 | 609 | ||||||
Louisiana-Pacific Corp. | 82 | 2,420 | ||||||
Mosaic Co. (The)† | 197 | 3,599 | ||||||
Newmont Corp.† | 35 | 2,221 | ||||||
Norbord, Inc. (Canada) | 3 | 88 | ||||||
The accompanying notes are an integral part of the financial statements.
56
GOTHAM MASTER NEUTRAL FUND
Portfolio of Investments (Continued)
September 30, 2020
| Number of Shares | Value | |||||||
COMMON STOCKS — (Continued) |
| |||||||
Materials — (Continued) |
| |||||||
Nucor Corp.† | 33 | $ | 1,480 | |||||
Nutrien Ltd. (Canada) | 70 | 2,746 | ||||||
Pan American Silver Corp. (Canada)† | 237 | 7,620 | ||||||
Reliance Steel & Aluminum Co.† | 12 | 1,224 | ||||||
Sonoco Products Co.† | 26 | 1,328 | ||||||
Valvoline, Inc.† | 257 | 4,893 | ||||||
Wheaton Precious Metals Corp. (Canada) | 13 | 638 | ||||||
Yamana Gold, Inc. (Canada)† | 1,358 | 7,713 | ||||||
|
| |||||||
| 40,922 | ||||||||
|
| |||||||
Media & Entertainment — 0.8% | ||||||||
Activision Blizzard, Inc.† | 13 | 1,052 | ||||||
Altice USA, Inc., Class A†* | 29 | 754 | ||||||
ANGI Homeservices, Inc., Class A* | 7 | 78 | ||||||
DISH Network Corp., | 72 | 2,090 | ||||||
Electronic Arts, Inc.* | 11 | 1,434 | ||||||
Facebook, Inc., Class A* | 4 | 1,048 | ||||||
Madison Square Garden Sports Corp.* | 10 | 1,505 | ||||||
Match Group, Inc.* | 6 | 664 | ||||||
New York Times Co. (The), Class A† | 7 | 299 | ||||||
Pinterest, Inc., Class A* | 13 | 540 | ||||||
Shaw Communications, Inc., Class B (Canada)† | 43 | 785 | ||||||
Sirius XM Holdings, Inc. | 164 | 879 | ||||||
Take-Two Interactive Software, Inc.* | 13 | 2,148 | ||||||
Zillow Group, Inc., Class C†* | 43 | 4,368 | ||||||
|
| |||||||
| 17,644 | ||||||||
|
| |||||||
Pharmaceuticals, Biotechnology & Life |
| |||||||
Charles River Laboratories | ||||||||
International, Inc.†* | 41 | 9,284 | ||||||
Denali Therapeutics, Inc.†* | 9 | 322 | ||||||
Elanco Animal Health, Inc.†* | 45 | 1,257 | ||||||
Emergent BioSolutions, Inc.†* | 36 | 3,720 | ||||||
Horizon Therapeutics PLC (Ireland)* | 10 | 777 | ||||||
Incyte Corp.†* | 2 | 179 | ||||||
Moderna, Inc.†* | 121 | 8,561 | ||||||
Natera, Inc.†* | 53 | 3,829 | ||||||
Neurocrine Biosciences, Inc.†* | 10 | 962 | ||||||
Novavax, Inc.†* | 52 | 5,634 | ||||||
PerkinElmer, Inc.† | 11 | 1,381 | ||||||
Regeneron Pharmaceuticals, Inc.†* | 3 | 1,679 | ||||||
United Therapeutics Corp.†* | 9 | 909 | ||||||
|
| |||||||
| 38,494 | ||||||||
|
| |||||||
| Number of Shares | Value | |||||||
COMMON STOCKS — (Continued) |
| |||||||
Retailing — 4.2% | ||||||||
Aaron’s, Inc.† | 68 | $ | 3,852 | |||||
Advance Auto Parts, Inc.† | 56 | 8,596 | ||||||
AutoNation, Inc.†* | 56 | 2,964 | ||||||
AutoZone, Inc.* | 1 | 1,178 | ||||||
Dick’s Sporting Goods, Inc.† | 99 | 5,730 | ||||||
Dollar General Corp.† | 11 | 2,306 | ||||||
Dollar Tree, Inc.* | 11 | 1,005 | ||||||
eBay, Inc.† | 40 | 2,084 | ||||||
Etsy, Inc.†* | 22 | 2,676 | ||||||
Foot Locker, Inc. | 104 | 3,435 | ||||||
Gap, Inc. (The)† | 237 | 4,036 | ||||||
Genuine Parts Co.† | 29 | 2,760 | ||||||
Home Depot, Inc. (The)† | 12 | 3,333 | ||||||
Lithia Motors, Inc., Class A† | 15 | 3,419 | ||||||
LKQ Corp.†* | 163 | 4,520 | ||||||
Lowe’s Cos., Inc.† | 25 | 4,146 | ||||||
Murphy USA, Inc.†* | 17 | 2,181 | ||||||
Ollie’s Bargain Outlet Holdings, Inc.* | 36 | 3,145 | ||||||
O’Reilly Automotive, Inc.†* | 2 | 922 | ||||||
Pool Corp.† | 10 | 3,345 | ||||||
Qurate Retail, Inc., Series A | 127 | 912 | ||||||
RH†* | 23 | 8,800 | ||||||
Stamps.com, Inc.†* | 13 | 3,132 | ||||||
Target Corp.† | 20 | 3,148 | ||||||
Tractor Supply Co.† | 28 | 4,014 | ||||||
Williams-Sonoma, Inc.† | 92 | 8,320 | ||||||
|
| |||||||
| 93,959 | ||||||||
|
| |||||||
Semiconductors & Semiconductor Equipment — 1.4% |
| |||||||
Amkor Technology, Inc.†* | 187 | 2,094 | ||||||
Analog Devices, Inc.† | 2 | 234 | ||||||
Applied Materials, Inc. | 19 | 1,130 | ||||||
Broadcom, Inc. | 10 | 3,643 | ||||||
Brooks Automation, Inc. | 7 | 324 | ||||||
Enphase Energy, Inc.†* | 111 | 9,168 | ||||||
First Solar, Inc.†* | 47 | 3,111 | ||||||
KLA Corp.† | 11 | 2,131 | ||||||
MACOM Technology Solutions Holdings, Inc.†* | 20 | 680 | ||||||
Marvell Technology Group Ltd. (Bermuda) | 43 | 1,707 | ||||||
MKS Instruments, Inc.† | 21 | 2,294 | ||||||
Monolithic Power Systems, Inc.† | 2 | 559 | ||||||
Power Integrations, Inc.† | 25 | 1,385 | ||||||
Semtech Corp.†* | 13 | 688 | ||||||
The accompanying notes are an integral part of the financial statements.
57
GOTHAM MASTER NEUTRAL FUND
Portfolio of Investments (Continued)
September 30, 2020
| Number of Shares | Value | |||||||
COMMON STOCKS — (Continued) |
| |||||||
Semiconductors & Semiconductor |
| |||||||
Synaptics, Inc.†* | 10 | $ | 804 | |||||
Teradyne, Inc. | 20 | 1,589 | ||||||
|
| |||||||
| 31,541 | ||||||||
|
| |||||||
Software & Services — 3.1% |
| |||||||
ACI Worldwide, Inc.†* | 56 | 1,463 | ||||||
Anaplan, Inc.* | 5 | 313 | ||||||
Blackbaud, Inc.† | 24 | 1,340 | ||||||
BlackBerry Ltd. (Canada)* | 15 | 69 | ||||||
Broadridge Financial Solutions, Inc. | 4 | 528 | ||||||
CACI International, Inc., Class A†* | 3 | 639 | ||||||
Cadence Design Systems, Inc.* | 11 | 1,173 | ||||||
CGI, Inc. (Canada)†* | 21 | 1,423 | ||||||
Coupa Software, Inc.†* | 27 | 7,404 | ||||||
Crowdstrike Holdings, Inc., Class A* | 6 | 824 | ||||||
Descartes Systems Group, Inc. (The) (Canada)* | 4 | 228 | ||||||
DocuSign, Inc.†* | 33 | 7,103 | ||||||
DXC Technology Co. | 98 | 1,749 | ||||||
Envestnet, Inc.†* | 16 | 1,235 | ||||||
FireEye, Inc.†* | 16 | 198 | ||||||
GoDaddy, Inc., Class A†* | 37 | 2,811 | ||||||
Guidewire Software, Inc.* | 7 | 730 | ||||||
Intuit, Inc. | 16 | 5,219 | ||||||
KBR, Inc. | 5 | 112 | ||||||
LiveRamp Holdings, Inc.†* | 7 | 362 | ||||||
NortonLifeLock, Inc. | 81 | 1,688 | ||||||
Nuance Communications, Inc.†* | 2 | 66 | ||||||
Open Text Corp. (Canada) | 1 | 42 | ||||||
PayPal Holdings, Inc.†* | 17 | 3,350 | ||||||
PTC, Inc.†* | 44 | 3,640 | ||||||
Sailpoint Technologies Holdings, Inc.†* | 78 | 3,086 | ||||||
Square, Inc., Class A†* | 55 | 8,940 | ||||||
SS&C Technologies Holdings, Inc.† | 36 | 2,179 | ||||||
Synopsys, Inc.†* | 10 | 2,140 | ||||||
Verint Systems, Inc.* | 35 | 1,686 | ||||||
WEX, Inc.†* | 24 | 3,335 | ||||||
Workday, Inc., Class A* | 7 | 1,506 | ||||||
Zoom Video Communications, Inc., Class A* | 3 | 1,410 | ||||||
|
| |||||||
| 67,991 | ||||||||
|
| |||||||
Technology Hardware & Equipment — 1.5% |
| |||||||
Apple, Inc. | 17 | 1,969 | ||||||
Arrow Electronics, Inc.†* | 33 | 2,596 | ||||||
| Number of Shares | Value | |||||||
COMMON STOCKS — (Continued) |
| |||||||
Technology Hardware & Equipment — (Continued) |
| |||||||
Ciena Corp.* | 42 | $ | 1,667 | |||||
Cisco Systems, Inc.† | 48 | 1,891 | ||||||
Corning, Inc. | 81 | 2,625 | ||||||
Dolby Laboratories, Inc., Class A | 1 | 66 | ||||||
EchoStar Corp., Class A†* | 91 | 2,265 | ||||||
FLIR Systems, Inc.† | 15 | 538 | ||||||
Juniper Networks, Inc. | 66 | 1,419 | ||||||
Lumentum Holdings, Inc.* | 45 | 3,381 | ||||||
Novanta, Inc. (Canada)†* | 8 | 843 | ||||||
SYNNEX Corp.† | 16 | 2,241 | ||||||
Trimble, Inc.†* | 170 | 8,279 | ||||||
Ubiquiti, Inc.† | 21 | 3,500 | ||||||
Viavi Solutions, Inc.†* | 29 | 340 | ||||||
|
| |||||||
| 33,620 | ||||||||
|
| |||||||
Telecommunication Services — 0.1% |
| |||||||
Iridium Communications, Inc.†* | 78 | 1,995 | ||||||
Rogers Communications, Inc., | 1 | 40 | ||||||
Verizon Communications, Inc.† | 19 | 1,130 | ||||||
Vonage Holdings Corp.†* | 3 | 31 | ||||||
|
| |||||||
| 3,196 | ||||||||
|
| |||||||
Transportation — 0.6% | ||||||||
CH Robinson Worldwide, Inc.† | 24 | 2,453 | ||||||
FedEx Corp. | 7 | 1,761 | ||||||
JB Hunt Transport Services, Inc.† | 15 | 1,896 | ||||||
Knight-Swift Transportation Holdings, Inc. | 7 | 285 | ||||||
Old Dominion Freight Line, Inc. | 8 | 1,447 | ||||||
Schneider National, Inc., Class B† | 112 | 2,770 | ||||||
TFI International, Inc. (Canada)† | 3 | 125 | ||||||
Werner Enterprises, Inc.† | 47 | 1,974 | ||||||
|
| |||||||
| 12,711 | ||||||||
|
| |||||||
Utilities — 0.2% | ||||||||
MDU Resources Group, Inc.† | 69 | 1,552 | ||||||
National Fuel Gas Co.† | 15 | 609 | ||||||
NRG Energy, Inc. | 1 | 31 | ||||||
OGE Energy Corp.† | 6 | 180 | ||||||
PPL Corp.† | 72 | 1,959 | ||||||
|
| |||||||
| 4,331 | ||||||||
|
| |||||||
TOTAL COMMON STOCKS | 664,924 | |||||||
|
| |||||||
The accompanying notes are an integral part of the financial statements.
58
GOTHAM MASTER NEUTRAL FUND
Portfolio of Investments (Continued)
September 30, 2020
| Number of Shares | Value | |||||||
AFFILIATED EQUITY REGISTERED INVESTMENT COMPANIES(a) — 60.0% |
| |||||||
Gotham Neutral 500 Fund | 75,773 | $ | 789,559 | |||||
Gotham Neutral Fund* | 59,886 | 550,352 | ||||||
|
| |||||||
TOTAL AFFILIATED EQUITY REGISTERED INVESTMENT COMPANIES |
| 1,339,911 | ||||||
|
| |||||||
| Par Value | ||||||||
U.S. TREASURY OBLIGATIONS — 9.0% |
| |||||||
U.S. Treasury Note — 9.0% |
| |||||||
United States Treasury Note 0.38%, 03/31/2022† | $ | 200,000 | 200,727 | |||||
|
| |||||||
TOTAL U.S. TREASURY OBLIGATIONS |
| 200,727 | ||||||
|
| |||||||
TOTAL LONG POSITIONS - 98.8% |
| 2,205,562 | ||||||
|
| |||||||
(Cost $2,089,218) | ||||||||
| Number of Shares | ||||||||
SHORT POSITIONS — (29.7)% |
| |||||||
COMMON STOCKS — (29.7)% |
| |||||||
Automobiles & Components — (0.7)% |
| |||||||
Fiat Chrysler Automobiles NV (Netherlands)* | (500) | (6,110 | ) | |||||
Ford Motor Co. | (436) | (2,904 | ) | |||||
LCI Industries | (38) | (4,039 | ) | |||||
Lear Corp. | (20) | (2,181 | ) | |||||
|
| |||||||
| (15,234 | ) | |||||||
|
| |||||||
Capital Goods — (2.4)% |
| |||||||
A.O. Smith Corp. | (5) | (264 | ) | |||||
AAON, Inc. | (2) | (120 | ) | |||||
Allison Transmission Holdings, Inc. | (46) | (1,617 | ) | |||||
Armstrong World Industries, Inc. | (33) | (2,271 | ) | |||||
Axon Enterprise, Inc.* | (29) | (2,630 | ) | |||||
Ballard Power Systems, Inc. (Canada)* | (141) | (2,129 | ) | |||||
Boeing Co. (The) | (31) | (5,123 | ) | |||||
Carrier Global Corp. | (39) | (1,191 | ) | |||||
Caterpillar, Inc. | (29) | (4,325 | ) | |||||
Cummins, Inc. | (1) | (211 | ) | |||||
Eaton Corp. PLC (Ireland) | (3) | (306 | ) | |||||
General Electric Co. | (5) | (31 | ) | |||||
Graco, Inc. | (15) | (920 | ) | |||||
Honeywell International, Inc. | (6) | (988 | ) | |||||
| Number of Shares | Value | |||||||
COMMON STOCKS — (Continued) | ||||||||
Capital Goods — (Continued) | ||||||||
Illinois Tool Works, Inc. | (7) | $ | (1,353 | ) | ||||
Jacobs Engineering Group, Inc. | (16) | (1,484 | ) | |||||
Johnson Controls International PLC (Ireland) | (52) | (2,124 | ) | |||||
L3Harris Technologies, Inc. | (1) | (170 | ) | |||||
Mercury Systems, Inc.* | (15) | (1,162 | ) | |||||
Navistar International Corp.* | (29) | (1,263 | ) | |||||
Nordson Corp. | (5) | (959 | ) | |||||
Otis Worldwide Corp. | (4) | (250 | ) | |||||
Plug Power, Inc.* | (18) | (241 | ) | |||||
Proto Labs, Inc.* | (15) | (1,942 | ) | |||||
Raytheon Technologies Corp. | (61) | (3,510 | ) | |||||
Sensata Technologies Holding PLC (United Kingdom)* | (29) | (1,251 | ) | |||||
Spirit AeroSystems Holdings, Inc., Class A | (267) | (5,049 | ) | |||||
Stanley Black & Decker, Inc. | (33) | (5,353 | ) | |||||
Sunrun, Inc.* | (15) | (1,156 | ) | |||||
Watts Water Technologies, Inc., Class A | (6) | (601 | ) | |||||
Xylem, Inc. | (30) | (2,524 | ) | |||||
|
| |||||||
| (52,518 | ) | |||||||
|
| |||||||
Commercial & Professional Services — 0.0% |
| |||||||
Dun & Bradstreet Holdings, Inc.* | (9) | (231 | ) | |||||
IAA, Inc.* | (1) | (52 | ) | |||||
MSA Safety, Inc. | (1) | (134 | ) | |||||
|
| |||||||
| (417 | ) | |||||||
|
| |||||||
Consumer Durables & Apparel — (1.7)% |
| |||||||
Canada Goose Holdings, Inc. (Canada)* | (20) | (643 | ) | |||||
Columbia Sportswear Co. | (39) | (3,392 | ) | |||||
Hasbro, Inc. | (46) | (3,805 | ) | |||||
Leggett & Platt, Inc. | (67) | (2,758 | ) | |||||
Levi Strauss & Co., Class A | (189) | (2,533 | ) | |||||
Mattel, Inc.* | (98) | (1,147 | ) | |||||
Newell Brands, Inc. | (129) | (2,214 | ) | |||||
Ralph Lauren Corp. | (58) | (3,942 | ) | |||||
Skechers U.S.A., Inc., Class A* | (84) | (2,538 | ) | |||||
Tapestry, Inc. | (252) | (3,939 | ) | |||||
Under Armour, Inc., Class C* | (726) | (7,144 | ) | |||||
VF Corp. | (59) | (4,145 | ) | |||||
|
| |||||||
| (38,200 | ) | |||||||
|
| |||||||
Consumer Services — (2.9)% | ||||||||
Aramark | (98) | (2,592 | ) | |||||
The accompanying notes are an integral part of the financial statements.
59
GOTHAM MASTER NEUTRAL FUND
Portfolio of Investments (Continued)
September 30, 2020
| Number of Shares | Value | |||||
COMMON STOCKS — (Continued) |
| |||||
Consumer Services — (Continued) |
| |||||
Bright Horizons Family Solutions, Inc.* | (7) | $ | (1,064 | ) | ||
Caesars Entertainment, Inc.* | (29) | (1,626 | ) | |||
Carnival Corp. (Panama) | (305) | (4,630 | ) | |||
Chipotle Mexican Grill, Inc.* | (2) | (2,487 | ) | |||
Choice Hotels International, Inc. | (23) | (1,977 | ) | |||
Churchill Downs, Inc. | (10) | (1,638 | ) | |||
Cracker Barrel Old Country Store, Inc. | (18) | (2,064 | ) | |||
Domino’s Pizza, Inc. | (9) | (3,828 | ) | |||
Dunkin’ Brands Group, Inc. | (39) | (3,195 | ) | |||
Hilton Worldwide Holdings, Inc. | (26) | (2,218 | ) | |||
Hyatt Hotels Corp., Class A | (37) | (1,975 | ) | |||
Las Vegas Sands Corp. | (32) | (1,493 | ) | |||
McDonald’s Corp. | (21) | (4,609 | ) | |||
Norwegian Cruise Line Holdings Ltd. (Bermuda)* | (220) | (3,764 | ) | |||
Planet Fitness, Inc., Class A* | (68) | (4,190 | ) | |||
Restaurant Brands International, Inc. (Canada) | (61) | (3,508 | ) | |||
Royal Caribbean Cruises Ltd. (Liberia) | (38) | (2,460 | ) | |||
Scientific Games Corp.* | (13) | (454 | ) | |||
Starbucks Corp. | (56) | (4,812 | ) | |||
Texas Roadhouse, Inc. | (86) | (5,228 | ) | |||
Vail Resorts, Inc. | (4) | (856 | ) | |||
Wendy’s Co. (The) | (113) | (2,519 | ) | |||
Wynn Resorts Ltd. | (20) | (1,436 | ) | |||
Yum! Brands, Inc. | (14) | (1,278 | ) | |||
|
| |||||
| (65,901 | ) | |||||
|
| |||||
Energy — (2.1)% | ||||||
Cabot Oil & Gas Corp. | (231) | (4,010 | ) | |||
Cameco Corp. (Canada) | (94) | (949 | ) | |||
ConocoPhillips | (10) | (328 | ) | |||
Continental Resources, Inc. | (193) | (2,370 | ) | |||
Diamondback Energy, Inc. | (103) | (3,102 | ) | |||
Exxon Mobil Corp. | (96) | (3,296 | ) | |||
Hess Corp. | (88) | (3,602 | ) | |||
HollyFrontier Corp. | (126) | (2,484 | ) | |||
Marathon Oil Corp. | (238) | (973 | ) | |||
Noble Energy, Inc. | (107) | (915 | ) | |||
Occidental Petroleum Corp. | (198) | (1,982 | ) | |||
ONEOK, Inc. | (12) | (312 | ) | |||
Ovintiv, Inc. | (250) | (2,040 | ) | |||
| Number of Shares | Value | |||||
COMMON STOCKS — (Continued) |
| |||||
Energy — (Continued) |
| |||||
Parsley Energy, Inc., Class A | (465) | $ | (4,352 | ) | ||
Pembina Pipeline Corp. (Canada) | (207) | (4,395 | ) | |||
Phillips 66 | (69) | (3,577 | ) | |||
Pioneer Natural Resources Co. | (23) | (1,978 | ) | |||
Suncor Energy, Inc. (Canada) | (94) | (1,150 | ) | |||
TC Energy Corp. (Canada) | (7) | (294 | ) | |||
Valero Energy Corp. | (56) | (2,426 | ) | |||
WPX Energy, Inc.* | (676) | (3,312 | ) | |||
|
| |||||
| (47,847 | ) | |||||
|
| |||||
Food & Staples Retailing — (0.1)% |
| |||||
Grocery Outlet Holding Corp.* | (71) | (2,792 | ) | |||
|
| |||||
Food, Beverage & Tobacco — (0.7)% |
| |||||
Beyond Meat, Inc.* | (9) | (1,495 | ) | |||
Campbell Soup Co. | (32) | (1,548 | ) | |||
Coca-Cola Co. (The) | (1) | (49 | ) | |||
Hain Celestial Group, Inc. (The)* | (4) | (137 | ) | |||
Lamb Weston Holdings, Inc. | (36) | (2,386 | ) | |||
PepsiCo, Inc. | (1) | (139 | ) | |||
Pilgrim’s Pride Corp.* | (321) | (4,804 | ) | |||
Sanderson Farms, Inc. | (40) | (4,719 | ) | |||
|
| |||||
| (15,277 | ) | |||||
|
| |||||
Health Care Equipment & Services — (2.2)% |
| |||||
Abbott Laboratories | (3) | (326 | ) | |||
Alcon, Inc. (Switzerland)* | (23) | (1,310 | ) | |||
Align Technology, Inc.* | (13) | (4,256 | ) | |||
AmerisourceBergen Corp. | (5) | (485 | ) | |||
Cooper Cos., Inc. (The) | (21) | (7,080 | ) | |||
Envista Holdings Corp.* | (60) | (1,481 | ) | |||
Glaukos Corp.* | (16) | (792 | ) | |||
Guardant Health, Inc.* | (6) | (671 | ) | |||
Haemonetics Corp.* | (23) | (2,007 | ) | |||
Henry Schein, Inc.* | (37) | (2,175 | ) | |||
Inovalon Holdings, Inc., | (101) | (2,671 | ) | |||
Integra LifeSciences Holdings Corp.* | (2) | (94 | ) | |||
Laboratory Corp. of America Holdings* | (12) | (2,259 | ) | |||
LivaNova PLC | (2) | (90 | ) | |||
Masimo Corp.* | (3) | (708 | ) | |||
Medtronic PLC (Ireland) | (5) | (520 | ) | |||
Penumbra, Inc.* | (36) | (6,998 | ) | |||
SmileDirectClub, Inc.* | (349) | (4,076 | ) | |||
STERIS PLC (Ireland) | (13) | (2,290 | ) | |||
Stryker Corp. | (9) | (1,875 | ) | |||
The accompanying notes are an integral part of the financial statements.
60
GOTHAM MASTER NEUTRAL FUND
Portfolio of Investments (Continued)
September 30, 2020
| Number of Shares | Value | |||||||
COMMON STOCKS — (Continued) |
| |||||||
Health Care Equipment & Services — (Continued) |
| |||||||
Wright Medical Group NV (Netherlands)* | (106) | $ | (3,237 | ) | ||||
Zimmer Biomet Holdings, Inc. | (27) | (3,676 | ) | |||||
|
| |||||||
| (49,077 | ) | |||||||
|
| |||||||
Household & Personal Products — (0.3)% |
| |||||||
Coty, Inc., Class A | (113) | (305 | ) | |||||
Estee Lauder Cos., Inc. (The), Class A | (20) | (4,365 | ) | |||||
Reynolds Consumer Products, Inc. | (9) | (276 | ) | |||||
WD-40 Co. | (11) | (2,082 | ) | |||||
|
| |||||||
| (7,028 | ) | |||||||
|
| |||||||
Materials — (1.9)% |
| |||||||
Air Products and Chemicals, Inc. | (6) | (1,787 | ) | |||||
Alamos Gold, Inc., Class A (Canada) | (525) | (4,625 | ) | |||||
Albemarle Corp. | (2) | (179 | ) | |||||
Avery Dennison Corp. | (17) | (2,173 | ) | |||||
Axalta Coating Systems Ltd. (Bermuda)* | (38) | (843 | ) | |||||
Ball Corp. | (42) | (3,491 | ) | |||||
Barrick Gold Corp. (Canada) | (44) | (1,237 | ) | |||||
Celanese Corp. | (3) | (322 | ) | |||||
Corteva, Inc. | (27) | (778 | ) | |||||
Crown Holdings, Inc.* | (1) | (77 | ) | |||||
DuPont de Nemours, Inc. | (26) | (1,443 | ) | |||||
Eagle Materials, Inc. | (60) | (5,179 | ) | |||||
Eastman Chemical Co. | (27) | (2,109 | ) | |||||
Equinox Gold Corp. (Canada)* | (52) | (609 | ) | |||||
Graphic Packaging Holding Co. | (183) | (2,579 | ) | |||||
International Paper Co. | (63) | (2,554 | ) | |||||
Kirkland Lake Gold Ltd. (Canada) | (18) | (877 | ) | |||||
LyondellBasell Industries NV, Class A (Netherlands) | (25) | (1,762 | ) | |||||
Martin Marietta Materials, Inc. | (3) | (706 | ) | |||||
Methanex Corp. (Canada) | (81) | (1,976 | ) | |||||
NewMarket Corp. | (4) | (1,369 | ) | |||||
Packaging Corp. of America | (19) | (2,072 | ) | |||||
Quaker Chemical Corp. | (6) | (1,078 | ) | |||||
Steel Dynamics, Inc. | (31) | (888 | ) | |||||
Teck Resources Ltd., Class B (Canada) | (97) | (1,350 | ) | |||||
|
| |||||||
| (42,063 | ) | |||||||
|
| |||||||
Media & Entertainment — (0.6)% |
| |||||||
Comcast Corp., Class A | (81) | (3,747 | ) | |||||
Live Nation Entertainment, Inc.* | (63) | (3,394 | ) | |||||
| Number of Shares | Value | |||||
COMMON STOCKS — (Continued) |
| |||||
Media & Entertainment — (Continued) |
| |||||
TripAdvisor, Inc. | (179) | $ | (3,507 | ) | ||
ViacomCBS, Inc., Class B | (73) | (2,045 | ) | |||
Warner Music Group Corp., Class A | (2) | (57 | ) | |||
|
| |||||
| (12,750 | ) | |||||
|
| |||||
Pharmaceuticals, Biotechnology & Life Sciences — (3.9)% |
| |||||
AbbVie, Inc. | (37) | (3,241 | ) | |||
ACADIA Pharmaceuticals, Inc.* | (16) | (660 | ) | |||
Acceleron Pharma, Inc.* | (28) | (3,151 | ) | |||
Adaptive Biotechnologies Corp.* | (62) | (3,015 | ) | |||
Agilent Technologies, Inc. | (1) | (101 | ) | |||
Agios Pharmaceuticals, Inc.* | (19) | (665 | ) | |||
Alkermes PLC (Ireland)* | (278) | (4,606 | ) | |||
Allogene Therapeutics, Inc.* | (44) | (1,659 | ) | |||
Alnylam Pharmaceuticals, Inc.* | (8) | (1,165 | ) | |||
Amicus Therapeutics, Inc.* | (144) | (2,033 | ) | |||
Apellis Pharmaceuticals, Inc.* | (192) | (5,793 | ) | |||
Arrowhead Pharmaceuticals, Inc.* | (124) | (5,339 | ) | |||
Bausch Health Cos, Inc. (Canada)* | (243) | (3,776 | ) | |||
Biohaven Pharmaceutical Holding Co. Ltd. (British Virgin Islands)* | (21) | (1,365 | ) | |||
BioMarin Pharmaceutical, Inc.* | (16) | (1,217 | ) | |||
Bio-Rad Laboratories, Inc., Class A* | (2) | (1,031 | ) | |||
Bio-Techne Corp. | (2) | (495 | ) | |||
Bluebird Bio, Inc.* | (3) | (162 | ) | |||
Blueprint Medicines Corp.* | (25) | (2,318 | ) | |||
Bridgebio Pharma, Inc.* | (126) | (4,728 | ) | |||
Bristol Myers Squibb Co. | (13) | (784 | ) | |||
Deciphera Pharmaceuticals, Inc.* | (18) | (923 | ) | |||
Exact Sciences Corp.* | (42) | (4,282 | ) | |||
Exelixis, Inc.* | (92) | (2,249 | ) | |||
FibroGen, Inc.* | (75) | (3,084 | ) | |||
Global Blood Therapeutics, Inc.* | (18) | (993 | ) | |||
Ionis Pharmaceuticals, Inc.* | (32) | (1,518 | ) | |||
Iovance Biotherapeutics, Inc.* | (140) | (4,609 | ) | |||
Karuna Therapeutics, Inc.* | (6) | (464 | ) | |||
NeoGenomics, Inc.* | (97) | (3,578 | ) | |||
OPKO Health, Inc.* | (107) | (395 | ) | |||
PRA Health Sciences, Inc.* | (16) | (1,623 | ) | |||
PTC Therapeutics, Inc.* | (143) | (6,685 | ) | |||
Reata Pharmaceuticals, Inc., Class A* | (46) | (4,481 | ) | |||
Seattle Genetics, Inc.* | (21) | (4,109 | ) | |||
TG Therapeutics, Inc.* | (1) | (27 | ) | |||
The accompanying notes are an integral part of the financial statements.
61
GOTHAM MASTER NEUTRAL FUND
Portfolio of Investments (Continued)
September 30, 2020
| Number of Shares | Value | |||||
COMMON STOCKS — (Continued) |
| |||||
Pharmaceuticals, Biotechnology & Life |
| |||||
Zoetis, Inc. | (2) | $ | (331 | ) | ||
|
| |||||
| (86,655 | ) | |||||
|
| |||||
Retailing — (1.0)% |
| |||||
Burlington Stores, Inc.* | (20) | (4,122 | ) | |||
CarMax, Inc.* | (21) | (1,930 | ) | |||
Expedia Group, Inc. | (51) | (4,676 | ) | |||
Floor & Decor Holdings, Inc., Class A* | (42) | (3,142 | ) | |||
Grubhub, Inc.* | (20) | (1,447 | ) | |||
National Vision Holdings, Inc.* | (54) | (2,065 | ) | |||
Nordstrom, Inc. | (328) | (3,910 | ) | |||
Penske Automotive Group, Inc. | (13) | (620 | ) | |||
Stitch Fix, Inc., Class A* | (32) | (868 | ) | |||
|
| |||||
| (22,780 | ) | |||||
|
| |||||
Semiconductors & Semiconductor Equipment — (0.5)% |
| |||||
Cirrus Logic, Inc.* | (13) | (877 | ) | |||
Cree, Inc.* | (55) | (3,506 | ) | |||
Lattice Semiconductor Corp.* | (66) | (1,911 | ) | |||
NVIDIA Corp. | (1) | (541 | ) | |||
Texas Instruments, Inc. | (3) | (428 | ) | |||
Universal Display Corp. | (19) | (3,434 | ) | |||
|
| |||||
| (10,697 | ) | |||||
|
| |||||
Software & Services — (2.4)% |
| |||||
Akamai Technologies, Inc.* | (13) | (1,437 | ) | |||
Altair Engineering, Inc., | (2) | (84 | ) | |||
Alteryx, Inc., Class A* | (34) | (3,861 | ) | |||
Aspen Technology, Inc.* | (4) | (506 | ) | |||
Ceridian HCM Holding, Inc.* | (50) | (4,132 | ) | |||
Cloudflare, Inc., Class A* | (34) | (1,396 | ) | |||
Datadog, Inc., Class A* | (16) | (1,635 | ) | |||
Digital Turbine, Inc.* | (25) | (818 | ) | |||
Everbridge, Inc.* | (21) | (2,640 | ) | |||
Fastly, Inc., Class A* | (26) | (2,436 | ) | |||
Fidelity National Information Services, Inc. | (9) | (1,325 | ) | |||
Global Payments, Inc. | (15) | (2,664 | ) | |||
Leidos Holdings, Inc. | (28) | (2,496 | ) | |||
ManTech International Corp., Class A | (3) | (207 | ) | |||
MAXIMUS, Inc. | (18) | (1,231 | ) | |||
Medallia, Inc.* | (114) | (3,126 | ) | |||
MongoDB, Inc.* | (1) | (232 | ) | |||
New Relic, Inc.* | (55) | (3,100 | ) | |||
| Number of Shares | Value | |||||
COMMON STOCKS — (Continued) |
| |||||
Software & Services — (Continued) |
| |||||
Paychex, Inc. | (15) | $ | (1,197 | ) | ||
Paycom Software, Inc.* | (2) | (623 | ) | |||
Paylocity Holding Corp.* | (1) | (161 | ) | |||
Ping Identity Holding Corp.* | (4) | (125 | ) | |||
Proofpoint, Inc.* | (11) | (1,161 | ) | |||
Q2 Holdings, Inc.* | (1) | (91 | ) | |||
RingCentral, Inc., Class A* | (1) | (275 | ) | |||
Slack Technologies, Inc., | (140) | (3,760 | ) | |||
Smartsheet, Inc., Class A* | (52) | (2,570 | ) | |||
Splunk, Inc.* | (11) | (2,069 | ) | |||
SVMK, Inc.* | (6) | (133 | ) | |||
Switch, Inc., Class A | (359) | (5,604 | ) | |||
Twilio, Inc., Class A* | (1) | (247 | ) | |||
Zscaler, Inc.* | (12) | (1,688 | ) | |||
|
| |||||
| (53,030 | ) | |||||
|
| |||||
Technology Hardware & Equipment — (0.9)% |
| |||||
Dell Technologies, Inc., | (25) | (1,692 | ) | |||
Hewlett Packard Enterprise Co. | (271) | (2,539 | ) | |||
II-VI, Inc.* | (60) | (2,434 | ) | |||
Jabil, Inc. | (6) | (206 | ) | |||
Keysight Technologies, Inc.* | (36) | (3,556 | ) | |||
Motorola Solutions, Inc. | (4) | (627 | ) | |||
Pure Storage, Inc., Class A* | (146) | (2,247 | ) | |||
Seagate Technology PLC (Ireland) | (20) | (985 | ) | |||
TE Connectivity Ltd. (Switzerland) | (32) | (3,128 | ) | |||
Western Digital Corp. | (28) | (1,023 | ) | |||
Xerox Holdings Corp. | (93) | (1,746 | ) | |||
|
| |||||
| (20,183 | ) | |||||
|
| |||||
Telecommunication Services — (0.2)% |
| |||||
Cogent Communications Holdings, Inc. | (5) | �� | (300 | ) | ||
TELUS Corp. (Canada) | (5) | (88 | ) | |||
T-Mobile US, Inc.* | (36) | (4,117 | ) | |||
|
| |||||
| (4,505 | ) | |||||
|
| |||||
Transportation — (1.8)% |
| |||||
Alaska Air Group, Inc. | (144) | (5,275 | ) | |||
American Airlines Group, Inc. | (367) | (4,510 | ) | |||
Canadian National Railway Co. (Canada) | (4) | (426 | ) | |||
Canadian Pacific Railway Ltd. (Canada) | (4) | (1,218 | ) | |||
CSX Corp. | (21) | (1,631 | ) | |||
Delta Air Lines, Inc. | (110) | (3,364 | ) | |||
The accompanying notes are an integral part of the financial statements.
62
GOTHAM MASTER NEUTRAL FUND
Portfolio of Investments (Concluded)
September 30, 2020
| Number of Shares | Value | |||||
COMMON STOCKS — (Continued) |
| |||||
Transportation — (Continued) |
| |||||
Expeditors International of Washington, Inc. | (3) | $ | (272 | ) | ||
JetBlue Airways Corp.* | (367) | (4,158 | ) | |||
Kansas City Southern | (2) | (362 | ) | |||
Kirby Corp.* | (11) | (398 | ) | |||
Lyft, Inc., Class A* | (97) | (2,672 | ) | |||
Norfolk Southern Corp. | (10) | (2,140 | ) | |||
Southwest Airlines Co. | (150) | (5,625 | ) | |||
Union Pacific Corp. | (9) | (1,772 | ) | |||
United Airlines Holdings, Inc.* | (140) | (4,865 | ) | |||
United Parcel Service, Inc., Class B | (1) | (167 | ) | |||
XPO Logistics, Inc.* | (23) | (1,947 | ) | |||
|
| |||||
| (40,802 | ) | |||||
|
| |||||
Utilities — (3.4)% | ||||||
Algonquin Power & Utilities Corp. (Canada) | (86) | (1,251 | ) | |||
ALLETE, Inc. | (99) | (5,122 | ) | |||
Alliant Energy Corp. | (11) | (568 | ) | |||
Ameren Corp. | (24) | (1,898 | ) | |||
American Water Works Co., Inc. | (42) | (6,085 | ) | |||
Atmos Energy Corp. | (28) | (2,677 | ) | |||
Avangrid, Inc. | (10) | (505 | ) | |||
Black Hills Corp. | (78) | (4,172 | ) | |||
California Water Service Group | (80) | (3,476 | ) | |||
Clearway Energy, Inc., Class A | (6) | (148 | ) | |||
CMS Energy Corp. | (59) | (3,623 | ) | |||
Consolidated Edison, Inc. | (60) | (4,668 | ) | |||
DTE Energy Co. | (49) | (5,637 | ) | |||
Edison International | (48) | (2,440 | ) | |||
Essential Utilities, Inc. | (153) | (6,158 | ) | |||
Eversource Energy | (25) | (2,089 | ) | |||
FirstEnergy Corp. | (70) | (2,010 | ) | |||
Fortis, Inc. (Canada) | (55) | (2,247 | ) | |||
New Jersey Resources Corp. | (153) | (4,134 | ) | |||
NextEra Energy, Inc. | (13) | (3,608 | ) | |||
NorthWestern Corp. | (5) | (243 | ) | |||
ONE Gas, Inc. | (2) | (138 | ) | |||
Ormat Technologies, Inc. | (30) | (1,773 | ) | |||
PNM Resources, Inc. | (2) | (83 | ) | |||
Public Service Enterprise Group, Inc. | (62) | (3,405 | ) | |||
Southern Co. (The) | (88) | (4,771 | ) | |||
Southwest Gas Holdings, Inc. | (14) | (883 | ) | |||
| Number of Shares | Value | |||||
COMMON STOCKS — (Continued) |
| |||||
Utilities — (Continued) |
| |||||
Spire, Inc. | (20) | $ | (1,064 | ) | ||
Xcel Energy, Inc. | (5) | (345 | ) | |||
|
| |||||
| (75,221 | ) | |||||
|
| |||||
TOTAL COMMON STOCK | (662,977 | ) | ||||
|
| |||||
TOTAL SECURITES SOLD SHORT - (29.7)% | (662,977 | ) | ||||
|
| |||||
(Proceeds $685,556) | ||||||
OTHER ASSETS IN EXCESS OF | 690,011 | |||||
|
| |||||
NET ASSETS - 100.0% | $ | 2,232,596 | ||||
|
| |||||
| † | Security position is either entirely or partially held in a segregated account as collateral for securities sold short. (See Note 1 of the Notes to Financial Statements) |
| (a) | All affiliated fund investments are in Institutional Class shares. The financial statements of the affiliated funds are publicly available on the Securities and Exchange Commission’s website. |
| * | Non-income producing. |
PLC Public Limited Company
The accompanying notes are an integral part of the financial statements.
63
GOTHAM ESG LARGE VALUE FUND
Portfolio of Investments
September 30, 2020
| Number of Shares | Value | |||||||
COMMON STOCKS — 98.4% |
| |||||||
Automobiles & Components — 0.4% |
| |||||||
Aptiv PLC (Jersey) | 26 | $ | 2,384 | |||||
BorgWarner, Inc. | 59 | 2,286 | ||||||
|
| |||||||
| 4,670 | ||||||||
|
| |||||||
Banks — 3.0% | ||||||||
Bank of America Corp. | 396 | 9,540 | ||||||
Fifth Third Bancorp | 191 | 4,072 | ||||||
JPMorgan Chase & Co. | 15 | 1,444 | ||||||
KeyCorp. | 173 | 2,064 | ||||||
M&T Bank Corp. | 31 | 2,855 | ||||||
People’s United Financial, Inc. | 97 | 1,000 | ||||||
Truist Financial Corp. | 53 | 2,017 | ||||||
US Bancorp | 350 | 12,548 | ||||||
|
| |||||||
| 35,540 | ||||||||
|
| |||||||
Capital Goods — 13.8% | ||||||||
3M Co. | 72 | 11,533 | ||||||
AMETEK, Inc. | 54 | 5,368 | ||||||
Carrier Global Corp. | 163 | 4,978 | ||||||
Cummins, Inc. | 45 | 9,502 | ||||||
Deere & Co. | 28 | 6,206 | ||||||
Dover Corp. | 41 | 4,442 | ||||||
Eaton Corp. PLC (Ireland) | 39 | 3,979 | ||||||
Emerson Electric Co. | 171 | 11,212 | ||||||
Flowserve Corp. | 33 | 901 | ||||||
Fortive Corp. | 17 | 1,296 | ||||||
Fortune Brands Home & Security, Inc. | 40 | 3,461 | ||||||
General Dynamics Corp. | 21 | 2,907 | ||||||
Honeywell International, Inc. | 98 | 16,132 | ||||||
Howmet Aerospace, Inc. | 107 | 1,789 | ||||||
IDEX Corp. | 14 | 2,554 | ||||||
Illinois Tool Works, Inc. | 54 | 10,433 | ||||||
Johnson Controls International PLC (Ireland) | 184 | 7,516 | ||||||
Lockheed Martin Corp. | 41 | 15,714 | ||||||
Masco Corp. | 80 | 4,410 | ||||||
Otis Worldwide Corp. | 91 | 5,680 | ||||||
PACCAR, Inc. | 48 | 4,093 | ||||||
Pentair PLC (Ireland) | 39 | 1,785 | ||||||
Quanta Services, Inc. | 36 | 1,903 | ||||||
Raytheon Technologies Corp. | 43 | 2,474 | ||||||
Rockwell Automation, Inc. | 16 | 3,531 | ||||||
Roper Technologies, Inc. | 2 | 790 | ||||||
Snap-on, Inc. | 14 | 2,060 | ||||||
Trane Technologies PLC (Ireland) | 59 | 7,154 | ||||||
United Rentals, Inc.* | 17 | 2,966 | ||||||
| Number of Shares | Value | |||||||
COMMON STOCKS — (Continued) |
| |||||||
Capital Goods — (Continued) |
| |||||||
WW Grainger, Inc. | 13 | $ | 4,638 | |||||
|
| |||||||
| 161,407 | ||||||||
|
| |||||||
Commercial & Professional Services — 1.4% |
| |||||||
Cintas Corp. | 15 | 4,992 | ||||||
Republic Services, Inc. | 48 | 4,481 | ||||||
Robert Half International, Inc. | 27 | 1,429 | ||||||
Waste Management, Inc. | 52 | 5,885 | ||||||
|
| |||||||
| 16,787 | ||||||||
|
| |||||||
Consumer Durables & Apparel — 1.2% |
| |||||||
DR Horton, Inc. | 46 | 3,479 | ||||||
Garmin Ltd. (Switzerland) | 38 | 3,605 | ||||||
Hasbro, Inc. | 8 | 662 | ||||||
Mohawk Industries, Inc.* | 21 | 2,049 | ||||||
PulteGroup, Inc. | 5 | 231 | ||||||
PVH Corp. | 21 | 1,252 | ||||||
Whirlpool Corp. | 18 | 3,310 | ||||||
|
| |||||||
| 14,588 | ||||||||
|
| |||||||
Consumer Services — 1.2% |
| |||||||
Darden Restaurants, Inc. | 29 | 2,921 | ||||||
McDonald’s Corp. | 11 | 2,414 | ||||||
MGM Resorts International | 126 | 2,740 | ||||||
Yum! Brands, Inc. | 69 | 6,300 | ||||||
|
| |||||||
| 14,375 | ||||||||
|
| |||||||
Diversified Financials — 6.4% |
| |||||||
Berkshire Hathaway, Inc., | 53 | 11,286 | ||||||
BlackRock, Inc. | 33 | 18,597 | ||||||
Cboe Global Markets, Inc. | 24 | 2,106 | ||||||
Discover Financial Services | 71 | 4,102 | ||||||
Franklin Resources, Inc. | 148 | 3,012 | ||||||
Intercontinental Exchange, Inc. | 61 | 6,103 | ||||||
Invesco Ltd. (Bermuda) | 128 | 1,460 | ||||||
Moody’s Corp. | 2 | 580 | ||||||
Nasdaq, Inc. | 40 | 4,908 | ||||||
S&P Global, Inc. | 30 | 10,818 | ||||||
Synchrony Financial | 107 | 2,800 | ||||||
T Rowe Price Group, Inc. | 67 | 8,591 | ||||||
|
| |||||||
| 74,363 | ||||||||
|
| |||||||
Energy — 2.2% | ||||||||
Apache Corp. | 24 | 227 | ||||||
Baker Hughes Co. | 149 | 1,980 | ||||||
ConocoPhillips | 98 | 3,218 | ||||||
Halliburton Co. | 227 | 2,735 | ||||||
Kinder Morgan, Inc. | 555 | 6,843 | ||||||
The accompanying notes are an integral part of the financial statements.
64
GOTHAM ESG LARGE VALUE FUND
Portfolio of Investments (Continued)
September 30, 2020
| Number of Shares | Value | |||||||
COMMON STOCKS — (Continued) |
| |||||||
Energy — (Continued) |
| |||||||
National Oilwell Varco, Inc. | 90 | $ | 815 | |||||
Schlumberger NV (Curacao) | 341 | 5,306 | ||||||
TechnipFMC PLC | 126 | 795 | ||||||
Williams Cos., Inc. (The) | 182 | 3,576 | ||||||
|
| |||||||
| 25,495 | ||||||||
|
| |||||||
Food & Staples Retailing — 1.8% |
| |||||||
Kroger Co. (The) | 184 | 6,239 | ||||||
Sysco Corp. | 125 | 7,778 | ||||||
Walgreens Boots Alliance, Inc. | 198 | 7,112 | ||||||
|
| |||||||
| 21,129 | ||||||||
|
| |||||||
Food, Beverage & Tobacco — 5.4% |
| |||||||
Archer-Daniels-Midland Co. | 144 | 6,695 | ||||||
Campbell Soup Co. | 82 | 3,966 | ||||||
Coca-Cola Co. (The) | 115 | 5,678 | ||||||
Conagra Brands, Inc. | 53 | 1,893 | ||||||
Constellation Brands, Inc., Class A | 45 | 8,528 | ||||||
General Mills, Inc. | 149 | 9,190 | ||||||
Hormel Foods Corp. | 13 | 636 | ||||||
JM Smucker Co. (The) | 28 | 3,235 | ||||||
Kellogg Co. | 84 | 5,426 | ||||||
Kraft Heinz Co. (The) | 281 | 8,416 | ||||||
Lamb Weston Holdings, Inc. | 20 | 1,325 | ||||||
McCormick & Co., Inc., non-voting shares | 11 | 2,135 | ||||||
Molson Coors Beverage Co., Class B | 52 | 1,745 | ||||||
Mondelez International, Inc., Class A | 39 | 2,241 | ||||||
PepsiCo, Inc. | 18 | 2,495 | ||||||
|
| |||||||
| 63,604 | ||||||||
|
| |||||||
Health Care Equipment & Services — 6.9% |
| |||||||
AmerisourceBergen Corp. | 29 | 2,811 | ||||||
Anthem, Inc. | 38 | 10,206 | ||||||
Cardinal Health, Inc. | 71 | 3,333 | ||||||
Centene Corp.* | 95 | 5,541 | ||||||
Cigna Corp. | 47 | 7,962 | ||||||
CVS Health Corp. | 212 | 12,381 | ||||||
DaVita, Inc.* | 37 | 3,169 | ||||||
HCA Healthcare, Inc. | 56 | 6,982 | ||||||
Hologic, Inc.* | 59 | 3,922 | ||||||
Humana, Inc. | 31 | 12,831 | ||||||
Laboratory Corp. of America Holdings* | 15 | 2,824 | ||||||
Medtronic PLC (Ireland) | 24 | 2,494 | ||||||
UnitedHealth Group, Inc. | 14 | 4,365 | ||||||
| Number of Shares | Value | |||||||
COMMON STOCKS — (Continued) |
| |||||||
Health Care Equipment & Services — (Continued) |
| |||||||
Universal Health Services, Inc., Class B | 20 | $ | 2,140 | |||||
|
| |||||||
| 80,961 | ||||||||
|
| |||||||
Household & Personal Products — 4.2% |
| |||||||
Church & Dwight Co., Inc. | 56 | 5,248 | ||||||
Clorox Co. (The) | 29 | 6,095 | ||||||
Colgate-Palmolive Co. | 186 | 14,350 | ||||||
Kimberly-Clark Corp. | 83 | 12,256 | ||||||
Procter & Gamble Co. (The) | 83 | 11,536 | ||||||
|
| |||||||
| 49,485 | ||||||||
|
| |||||||
Insurance — 3.1% | ||||||||
Aflac, Inc. | 80 | 2,908 | ||||||
American International Group, Inc. | 117 | 3,221 | ||||||
Aon PLC, Class A (Ireland) | 45 | 9,284 | ||||||
Arthur J Gallagher & Co. | 22 | 2,323 | ||||||
Cincinnati Financial Corp. | 39 | 3,041 | ||||||
Globe Life, Inc. | 29 | 2,317 | ||||||
Lincoln National Corp. | 8 | 251 | ||||||
Marsh & McLennan Cos., Inc. | 57 | 6,538 | ||||||
MetLife, Inc. | 74 | 2,751 | ||||||
Principal Financial Group, Inc. | 17 | 685 | ||||||
Prudential Financial, Inc. | 52 | 3,303 | ||||||
WR Berkley Corp. | 4 | 245 | ||||||
|
| |||||||
| 36,867 | ||||||||
|
| |||||||
Materials — 6.8% | ||||||||
Amcor PLC (Jersey) | 358 | 3,956 | ||||||
Avery Dennison Corp. | 19 | 2,429 | ||||||
Celanese Corp. | 14 | 1,504 | ||||||
CF Industries Holdings, Inc. | 49 | 1,505 | ||||||
Dow, Inc. | 83 | 3,905 | ||||||
DuPont de Nemours, Inc. | 134 | 7,434 | ||||||
Eastman Chemical Co. | 38 | 2,969 | ||||||
Ecolab, Inc. | 65 | 12,990 | ||||||
International Paper Co. | 111 | 4,500 | ||||||
Linde PLC (Ireland) | 56 | 13,335 | ||||||
LyondellBasell Industries NV, Class A (Netherlands) | 76 | 5,357 | ||||||
Mosaic Co. (The) | 87 | 1,589 | ||||||
Nucor Corp. | 70 | 3,140 | ||||||
Packaging Corp. of America | 27 | 2,944 | ||||||
PPG Industries, Inc. | 67 | 8,179 | ||||||
Sealed Air Corp. | 40 | 1,552 | ||||||
The accompanying notes are an integral part of the financial statements.
65
GOTHAM ESG LARGE VALUE FUND
Portfolio of Investments (Continued)
September 30, 2020
| Number of Shares | Value | |||||||
COMMON STOCKS — (Continued) |
| |||||||
Materials — (Continued) |
| |||||||
Westrock Co. | 59 | $ | 2,050 | |||||
|
| |||||||
| 79,338 | ||||||||
|
| |||||||
Media & Entertainment — 2.7% |
| |||||||
Charter Communications, Inc., Class A* | 17 | 10,614 | ||||||
Comcast Corp., Class A | 39 | 1,804 | ||||||
Discovery, Inc., Class A* | 177 | 3,853 | ||||||
Electronic Arts, Inc.* | 37 | 4,825 | ||||||
Fox Corp., Class A | 149 | 4,147 | ||||||
Interpublic Group of Cos., Inc. (The) | 110 | 1,834 | ||||||
News Corp., Class A | 69 | 967 | ||||||
Omnicom Group, Inc. | 63 | 3,118 | ||||||
|
| |||||||
| 31,162 | ||||||||
|
| |||||||
Pharmaceuticals, Biotechnology & Life Sciences — 4.0% |
| |||||||
AbbVie, Inc. | 9 | 788 | ||||||
Alexion Pharmaceuticals, Inc.* | 21 | 2,403 | ||||||
Amgen, Inc. | 4 | 1,017 | ||||||
Biogen, Inc.* | 33 | 9,361 | ||||||
Gilead Sciences, Inc. | 41 | 2,591 | ||||||
Merck & Co., Inc. | 99 | 8,212 | ||||||
Pfizer, Inc. | 467 | 17,139 | ||||||
Regeneron Pharmaceuticals, Inc.* | 10 | 5,598 | ||||||
|
| |||||||
| 47,109 | ||||||||
|
| |||||||
Real Estate — 2.4% |
| |||||||
Alexandria Real Estate Equities, Inc., REIT | 32 | 5,120 | ||||||
Apartment Investment & Management Co., Class A, REIT | 36 | 1,214 | ||||||
AvalonBay Communities, Inc., REIT | 34 | 5,078 | ||||||
Boston Properties, Inc., REIT | 22 | 1,767 | ||||||
CBRE Group, Inc., Class A* | 2 | 94 | ||||||
Duke Realty Corp., REIT | 1 | 37 | ||||||
Mid-America Apartment Communities, Inc., REIT | 20 | 2,319 | ||||||
Public Storage, REIT | 13 | 2,895 | ||||||
Simon Property Group, Inc., REIT | 6 | 388 | ||||||
Ventas, Inc., REIT | 90 | 3,776 | ||||||
Welltower, Inc., REIT | 4 | 220 | ||||||
Weyerhaeuser Co., REIT | 184 | 5,248 | ||||||
|
| |||||||
| 28,156 | ||||||||
|
| |||||||
Retailing — 11.0% |
| |||||||
Advance Auto Parts, Inc. | 16 | 2,456 | ||||||
AutoZone, Inc.* | 6 | 7,066 | ||||||
| Number of Shares | Value | |||||||
COMMON STOCKS — (Continued) |
| |||||||
Retailing — (Continued) |
| |||||||
Best Buy Co., Inc. | 63 | $ | 7,011 | |||||
CarMax, Inc.* | 37 | 3,401 | ||||||
Dollar General Corp. | 62 | 12,996 | ||||||
Dollar Tree, Inc.* | 56 | 5,115 | ||||||
eBay, Inc. | 193 | 10,055 | ||||||
Genuine Parts Co. | 42 | 3,997 | ||||||
Home Depot, Inc. (The) | 71 | 19,717 | ||||||
L Brands, Inc. | 69 | 2,195 | ||||||
LKQ Corp.* | 85 | 2,357 | ||||||
Lowe’s Cos., Inc. | 133 | 22,059 | ||||||
O’Reilly Automotive, Inc.* | 17 | 7,838 | ||||||
Ross Stores, Inc. | 29 | 2,706 | ||||||
Target Corp. | 100 | 15,742 | ||||||
Tractor Supply Co. | 28 | 4,014 | ||||||
Ulta Beauty, Inc.* | 2 | 448 | ||||||
|
| |||||||
| 129,173 | ||||||||
|
| |||||||
Semiconductors & Semiconductor Equipment — 1.5% |
| |||||||
Applied Materials, Inc. | 75 | 4,459 | ||||||
Intel Corp. | 193 | 9,994 | ||||||
KLA Corp. | 16 | 3,100 | ||||||
|
| |||||||
| 17,553 | ||||||||
|
| |||||||
Software & Services — 6.6% |
| |||||||
Accenture PLC, Class A (Ireland) | 54 | 12,203 | ||||||
Automatic Data Processing, Inc. | 64 | 8,927 | ||||||
Broadridge Financial Solutions, Inc. | 27 | 3,564 | ||||||
Citrix Systems, Inc. | 15 | 2,066 | ||||||
Gartner, Inc.* | 21 | 2,624 | ||||||
International Business Machines Corp. | 125 | 15,209 | ||||||
NortonLifeLock, Inc. | 158 | 3,293 | ||||||
Oracle Corp. | 324 | 19,343 | ||||||
Paychex, Inc. | 87 | 6,940 | ||||||
Western Union Co. (The) | 125 | 2,679 | ||||||
|
| |||||||
| 76,848 | ||||||||
|
| |||||||
Technology Hardware & Equipment — 6.1% |
| |||||||
Amphenol Corp., Class A | 14 | 1,516 | ||||||
Apple, Inc. | 144 | 16,677 | ||||||
CDW Corp. | 33 | 3,945 | ||||||
Cisco Systems, Inc. | 457 | 18,001 | ||||||
Corning, Inc. | 173 | 5,607 | ||||||
F5 Networks, Inc.* | 14 | 1,719 | ||||||
FLIR Systems, Inc. | 31 | 1,111 | ||||||
HP, Inc. | 421 | 7,995 | ||||||
The accompanying notes are an integral part of the financial statements.
66
GOTHAM ESG LARGE VALUE FUND
Portfolio of Investments (Concluded)
September 30, 2020
| Number of Shares | Value | |||||||
COMMON STOCKS — (Continued) |
| |||||||
Technology Hardware & Equipment — (Continued) |
| |||||||
Juniper Networks, Inc. | 91 | $ | 1,956 | |||||
NetApp, Inc. | 59 | 2,587 | ||||||
Seagate Technology PLC (Ireland) | 61 | 3,005 | ||||||
TE Connectivity Ltd. (Switzerland) | 69 | 6,744 | ||||||
|
| |||||||
| 70,863 | ||||||||
|
| |||||||
Telecommunication Services — 3.2% |
| |||||||
AT&T, Inc. | 607 | 17,306 | ||||||
Verizon Communications, Inc. | 333 | 19,810 | ||||||
|
| |||||||
| 37,116 | ||||||||
|
| |||||||
Transportation — 3.0% | ||||||||
CH Robinson Worldwide, Inc. | 31 | 3,168 | ||||||
CSX Corp. | 88 | 6,835 | ||||||
Expeditors International of Washington, Inc. | 41 | 3,711 | ||||||
JB Hunt Transport Services, Inc. | 25 | 3,160 | ||||||
Kansas City Southern | 2 | 362 | ||||||
Norfolk Southern Corp. | 47 | 10,058 | ||||||
Old Dominion Freight Line, Inc. | 26 | 4,704 | ||||||
Union Pacific Corp. | 14 | 2,756 | ||||||
|
| |||||||
| 34,754 | ||||||||
|
| |||||||
Utilities — 0.1% | ||||||||
PPL Corp. | 44 | 1,197 | ||||||
|
| |||||||
TOTAL COMMON STOCKS | 1,152,540 | |||||||
|
| |||||||
OTHER ASSETS IN EXCESS OF | 18,388 | |||||||
|
| |||||||
NET ASSETS - 100.0% | $ | 1,170,928 | ||||||
|
| |||||||
| * | Non-income producing. |
PLC Public Limited Company
REIT Real Estate Investment Trust
The accompanying notes are an integral part of the financial statements.
67
Statements of Assets and Liabilities
September 30, 2020
| Gotham Neutral 500 Fund | Gotham Hedged Plus Fund | Gotham Hedged Core Fund | |||||||||||||
Assets | |||||||||||||||
Non-affiliated investments, at value1,2 | $ | 3,521,533 | $ | 15,838,577 | $ | 12,173,207 | |||||||||
Cash | 205,538 | 114,994 | 129,076 | ||||||||||||
Deposits with brokers for securities sold short | 2,013,798 | 34,215 | 18,569 | ||||||||||||
Securities lending cash collateral | 312 | 894 | 178 | ||||||||||||
Receivables: | |||||||||||||||
Investments sold | 32,048 | 181,313 | 77,391 | ||||||||||||
Dividends and interest | 3,688 | 14,692 | 10,496 | ||||||||||||
Investment adviser | 7,041 | 11,510 | 11,433 | ||||||||||||
Prepaid expenses and other assets | 857 | 8,730 | 320 | ||||||||||||
|
|
|
|
|
| ||||||||||
Total assets | 5,784,815 | 16,204,925 | 12,420,670 | ||||||||||||
|
|
|
|
|
| ||||||||||
Liabilities | |||||||||||||||
Securities sold short, at value3 | 2,785,921 | 6,783,473 | 3,495,021 | ||||||||||||
Payables: | |||||||||||||||
Securities lending cash collateral | 312 | 894 | 178 | ||||||||||||
Investments purchased | 36,844 | 182,345 | 77,612 | ||||||||||||
Dividends and fees on securities sold short | 3,141 | 2,833 | 3,113 | ||||||||||||
Administration and accounting fees | 6,795 | 7,717 | 7,696 | ||||||||||||
Audit fees | 20,593 | 20,168 | 20,171 | ||||||||||||
Printing fees | 6,354 | 6,262 | 6,257 | ||||||||||||
Accrued expenses | 2,422 | 7,272 | 7,080 | ||||||||||||
|
|
|
|
|
| ||||||||||
Total liabilities | 2,862,382 | 7,010,964 | 3,617,128 | ||||||||||||
|
|
|
|
|
| ||||||||||
Net Assets | $ | 2,922,433 | $ | 9,193,961 | $ | 8,803,542 | |||||||||
|
|
|
|
|
| ||||||||||
Net Assets Consisted of: | |||||||||||||||
Capital stock, $0.01 par value | $ | 2,804 | $ | 8,692 | $ | 7,771 | |||||||||
Paid-in capital | 3,394,530 | 8,961,638 | 8,094,709 | ||||||||||||
Total distributable earnings/(loss) | (474,901 | ) | 223,631 | 701,062 | |||||||||||
|
|
|
|
|
| ||||||||||
Net Assets | $ | 2,922,433 | $ | 9,193,961 | $ | 8,803,542 | |||||||||
|
|
|
|
|
| ||||||||||
Institutional Class Shares: | |||||||||||||||
Net assets | $ | 2,922,433 | $ | 9,193,961 | $ | 8,803,542 | |||||||||
|
|
|
|
|
| ||||||||||
Shares outstanding | 280,394 | 869,186 | 777,129 | ||||||||||||
|
|
|
|
|
| ||||||||||
Net asset value, offering and redemption price per share | $ | 10.42 | $ | 10.58 | $ | 11.33 | |||||||||
|
|
|
|
|
| ||||||||||
1Non-affiliated investments, at cost | $ | 2,779,150 | $ | 14,622,340 | $ | 11,207,462 | |||||||||
2Includes market value of securities on loan | $ | 4,810 | $ | 863 | $ | 348,125 | |||||||||
3Proceeds received, securities sold short | $ | 3,068,004 | $ | 6,860,074 | $ | 3,510,265 | |||||||||
The accompanying notes are an integral part of the financial statements.
68
GOTHAM FUNDS
Statements of Assets and Liabilities (Concluded)
September 30, 2020
| Gotham Short Strategies Fund | Gotham Master Neutral Fund | Gotham ESG Large Value Fund | |||||||||||||
Assets | |||||||||||||||
Non-affiliated investments, at value1,2 | $ | 36,153,051 | $ | 865,651 | $ | 1,152,540 | |||||||||
Affiliated investments, at value3 | — | 1,339,911 | — | ||||||||||||
Cash | 1,899,760 | 103,921 | 43,862 | ||||||||||||
Due from broker | 121,108 | — | — | ||||||||||||
Deposits with brokers for securities sold short | — | 610,037 | — | ||||||||||||
Receivables: | |||||||||||||||
Investments sold | 1,486,924 | 18,500 | 8,051 | ||||||||||||
Dividends and interest | 26,033 | 325 | 1,316 | ||||||||||||
Investment adviser | — | 18,773 | 5,289 | ||||||||||||
Prepaid expenses and other assets | 14,099 | 3,948 | — | ||||||||||||
|
|
|
|
|
| ||||||||||
Total assets | 39,700,975 | 2,961,066 | 1,211,058 | ||||||||||||
|
|
|
|
|
| ||||||||||
Liabilities | |||||||||||||||
Securities sold short, at value4 | — | 662,977 | — | ||||||||||||
Swaps, at value(a) | 701,222 | — | — | ||||||||||||
Payables: | |||||||||||||||
Investments purchased | 1,318,525 | 15,488 | 8,036 | ||||||||||||
Dividends and fees on securities sold short | — | 573 | — | ||||||||||||
Investment adviser | 17,664 | — | — | ||||||||||||
Administration and accounting fees | 8,769 | 15,775 | 3,065 | ||||||||||||
Audit fees | 21,945 | 21,249 | 20,080 | ||||||||||||
Printing fees | 6,888 | 6,485 | 6,980 | ||||||||||||
Accrued expenses | 7,425 | 5,923 | 1,969 | ||||||||||||
|
|
|
|
|
| ||||||||||
Total liabilities | 2,082,438 | 728,470 | 40,130 | ||||||||||||
|
|
|
|
|
| ||||||||||
Net Assets | $ | 37,618,537 | $ | 2,232,596 | $ | 1,170,928 | |||||||||
|
|
|
|
|
| ||||||||||
Net Assets Consisted of: | |||||||||||||||
Capital stock, $0.01 par value | $ | 50,717 | $ | 2,348 | $ | 1,039 | |||||||||
Paid-in capital | 46,461,799 | 3,692,616 | 1,046,623 | ||||||||||||
Total distributable earnings/(loss) | (8,893,979 | ) | (1,462,368 | ) | 123,266 | ||||||||||
|
|
|
|
|
| ||||||||||
Net Assets | $ | 37,618,537 | $ | 2,232,596 | $ | 1,170,928 | |||||||||
|
|
|
|
|
| ||||||||||
Institutional Class Shares: | |||||||||||||||
Net assets | $ | 37,618,537 | $ | 2,232,596 | $ | 1,170,928 | |||||||||
|
|
|
|
|
| ||||||||||
Shares outstanding | 5,071,694 | 234,809 | 103,943 | ||||||||||||
|
|
|
|
|
| ||||||||||
Net asset value, offering and redemption price per share | $ | 7.42 | $ | 9.51 | $ | 11.27 | |||||||||
|
|
|
|
|
| ||||||||||
1Non-affiliated investments, at cost | $ | 36,007,429 | $ | 680,487 | $ | 1,043,377 | |||||||||
2Includes market value of securities designated as collateral for swaps | $ | 19,219,473 | $ | — | $ | — | |||||||||
3Affiliated investments, at cost | $ | — | $ | 1,408,731 | $ | — | |||||||||
4Proceeds received, securities sold short | $ | — | $ | 685,556 | $ | — | |||||||||
| (a) | Primary risk exposure is equity contracts. |
The accompanying notes are an integral part of the financial statements.
69
Statements of Operations
For the Year Ended September 30, 2020
| Gotham Neutral 500 Fund | Gotham Hedged Plus Fund | Gotham Hedged Core Fund | |||||||||||||
Investment Income | |||||||||||||||
Dividend income | $ | 214,785 | $ | 171,903 | $ | 116,757 | |||||||||
Less: taxes withheld | — | (1,372 | ) | — | |||||||||||
Interest | 2,062 | 1,190 | 877 | ||||||||||||
Income from securities loaned (Note 5) | 48 | 27 | 125 | ||||||||||||
|
|
|
|
|
| ||||||||||
Total investment income | 216,895 | 171,748 | 117,759 | ||||||||||||
|
|
|
|
|
| ||||||||||
Expenses | |||||||||||||||
Advisory fees (Note 2) | 93,735 | 47,465 | 30,386 | ||||||||||||
Administration and accounting fees (Note 2) | 30,520 | 35,712 | 34,454 | ||||||||||||
Dividends and fees on securities sold short (Note 1) | 106,651 | 64,483 | 28,919 | ||||||||||||
Transfer agent fees (Note 2) | 3,171 | 3,492 | 3,404 | ||||||||||||
Custodian fees (Note 2) | 1,151 | 491 | 412 | ||||||||||||
Trustees’ and officers’ fees (Note 2) | 1,643 | 961 | 857 | ||||||||||||
Printing and shareholder reporting fees | 18,272 | 18,531 | 18,558 | ||||||||||||
Registration and filing fees | 1,743 | 25,084 | 468 | ||||||||||||
Legal fees | 1,958 | 6,078 | 6,975 | ||||||||||||
Audit fees | 21,037 | 20,641 | 20,644 | ||||||||||||
Other expenses | 5,708 | 5,459 | 5,467 | ||||||||||||
|
|
|
|
|
| ||||||||||
Total expenses before waivers and/or reimbursements | 285,589 | 228,397 | 150,544 | ||||||||||||
|
|
|
|
|
| ||||||||||
Waivers and/or reimbursements (Note 2) | (85,202 | ) | (109,329 | ) | (84,728 | ) | |||||||||
|
|
|
|
|
| ||||||||||
Net expenses after waivers and/or reimbursements | 200,387 | 119,068 | 65,816 | ||||||||||||
|
|
|
|
|
| ||||||||||
Net investment income | 16,508 | 52,680 | 51,943 | ||||||||||||
|
|
|
|
|
| ||||||||||
Net realized and unrealized gain/(loss) from investments: |
| ||||||||||||||
Net realized gain from non-affiliated investments | 518,046 | 318,995 | 148,445 | ||||||||||||
Net realized loss from securities sold short | (1,295,667 | ) | (1,246,139 | ) | (369,684 | ) | |||||||||
Net change in unrealized appreciation/(depreciation) on non-affiliated investments | (407,767 | ) | 852,855 | 728,921 | |||||||||||
Net change in unrealized appreciation/(depreciation) on securities sold short | 427,600 | 134,475 | 35,148 | ||||||||||||
|
|
|
|
|
| ||||||||||
Net realized and unrealized gain/(loss) on investments | (757,788 | ) | 60,186 | 542,830 | |||||||||||
|
|
|
|
|
| ||||||||||
Net increase/(decrease) in net assets resulting from operations | $ | (741,280 | ) | $ | 112,866 | $ | 594,773 | ||||||||
|
|
|
|
|
| ||||||||||
The accompanying notes are an integral part of the financial statements.
70
GOTHAM FUNDS
Statements of Operations (Concluded)
For the Year Ended September 30, 2020
| Gotham Short Strategies Fund | Gotham Master Neutral Fund | Gotham ESG Large Value Fund | |||||||||||||
Investment Income | |||||||||||||||
Dividend income | $ | 466,024 | $ | 53,564 | $ | 28,739 | |||||||||
Dividends from affiliated securities | — | 79,267 | — | ||||||||||||
Less: taxes withheld | (2,911 | ) | (455 | ) | — | ||||||||||
Interest | 13,866 | 17,225 | 99 | ||||||||||||
|
|
|
|
|
| ||||||||||
Total investment income | 476,979 | 149,601 | 28,838 | ||||||||||||
|
|
|
|
|
| ||||||||||
Expenses | |||||||||||||||
Advisory fees (Note 2) | 438,067 | 38,246 | 8,671 | ||||||||||||
Administration and accounting fees (Note 2) | 41,675 | 80,476 | 17,591 | ||||||||||||
Dividends and fees on securities sold short (Note 1) | — | 32,884 | — | ||||||||||||
Transfer agent fees (Note 2) | 35,750 | 16,556 | 3,926 | ||||||||||||
Custodian fees (Note 2) | 3,293 | 12,320 | 253 | ||||||||||||
Trustees’ and officers’ fees (Note 2) | 6,977 | 2,818 | 255 | ||||||||||||
Printing and shareholder reporting fees | 19,762 | 20,267 | 17,868 | ||||||||||||
Registration and filing fees | 25,535 | 25,305 | 1,963 | ||||||||||||
Legal fees | 6,889 | 811 | 253 | ||||||||||||
Audit fees | 23,213 | 22,619 | 20,460 | ||||||||||||
Other expenses | 9,596 | 5,904 | 3,490 | ||||||||||||
|
|
|
|
|
| ||||||||||
Total expenses before waivers and/or reimbursements | 610,757 | 258,206 | 74,730 | ||||||||||||
|
|
|
|
|
| ||||||||||
Waivers and/or reimbursements (Note 2) | (172,690 | ) | (202,376 | ) | (66,060 | ) | |||||||||
|
|
|
|
|
| ||||||||||
Net expenses after waivers and/or reimbursements | 438,067 | 55,830 | 8,670 | ||||||||||||
|
|
|
|
|
| ||||||||||
Net investment income | 38,912 | 93,771 | 20,168 | ||||||||||||
|
|
|
|
|
| ||||||||||
Net realized and unrealized gain/(loss) from investments: |
| ||||||||||||||
Net realized gain from non-affiliated investments | 6,700,623 | 339,916 | 11,636 | ||||||||||||
Net realized loss from affiliated investments | — | (938,267 | ) | — | |||||||||||
Net realized loss from securities sold short | — | (248,120 | ) | — | |||||||||||
Net realized loss on swaps | (11,771,733 | )(a) | — | — | |||||||||||
Capital gain distributions from affiliated investments | — | 2,391 | — | ||||||||||||
Net change in unrealized appreciation/(depreciation) on non-affiliated investments | (281,879 | ) | (198,787 | ) | (30,743 | ) | |||||||||
Net change in unrealized appreciation/(depreciation) on affiliated investments | — | (211,804 | ) | — | |||||||||||
Net change in unrealized appreciation/(depreciation) on securities sold short | — | (66,171 | ) | — | |||||||||||
Net change in unrealized appreciation/(depreciation) on swaps | (605,317 | )(a) | — | — | |||||||||||
|
|
|
|
|
| ||||||||||
Net realized and unrealized loss on investments | (5,958,306 | ) | (1,320,842 | ) | (19,107 | ) | |||||||||
|
|
|
|
|
| ||||||||||
Net increase/(decrease) in net assets resulting from operations | $ | (5,919,394 | ) | $ | (1,227,071 | ) | $ | 1,061 | |||||||
|
|
|
|
|
| ||||||||||
| (a) | Primary risk exposure is equity contracts. |
The accompanying notes are an integral part of the financial statements.
71
Statements of Changes in Net Assets
| Gotham Neutral 500 Fund | Gotham Hedged Plus Fund | |||||||||||||||||||
| For the Year Ended September 30, 2020 | For the Year Ended September 30, 2019 | For the Year Ended September 30, 2020 | For the Year Ended September 30, 2019 | |||||||||||||||||
Net increase/(decrease) in net assets from operations: | ||||||||||||||||||||
Net investment income | $ | 16,508 | $ | 99,451 | $ | 52,680 | $ | 23,721 | ||||||||||||
Net realized gain/(loss) from investments and securities sold short | (777,621 | ) | (396,933 | ) | (927,144 | ) | 81,677 | |||||||||||||
Net change in unrealized appreciation/(depreciation) on investments and securities sold short | 19,833 | 220,328 | 987,330 | (162,849 | ) | |||||||||||||||
|
|
|
|
|
|
|
| |||||||||||||
Net increase/decrease in net assets resulting from operations | (741,280 | ) | (77,154 | ) | 112,866 | (57,451 | ) | |||||||||||||
|
|
|
|
|
|
|
| |||||||||||||
Less Dividends and Distributions to Shareholders from: | ||||||||||||||||||||
Institutional Class Shares: | ||||||||||||||||||||
Total distributable earnings | (109,182 | ) | (116,253 | ) | (174,499 | ) | (284,968 | ) | ||||||||||||
|
|
|
|
|
|
|
| |||||||||||||
Net decrease in net assets from dividends and distributions to shareholders | (109,182 | ) | (116,253 | ) | (174,499 | ) | (284,968 | ) | ||||||||||||
|
|
|
|
|
|
|
| |||||||||||||
Increase/(decrease) in Net Assets from Capital Share Transactions (Note 4) | (5,562,713 | ) | 3,379,642 | 6,327,746 | 604,833 | |||||||||||||||
|
|
|
|
|
|
|
| |||||||||||||
Total increase/(decrease) in net assets | (6,413,175 | ) | 3,186,235 | 6,266,113 | 262,414 | |||||||||||||||
|
|
|
|
|
|
|
| |||||||||||||
Net assets | ||||||||||||||||||||
Beginning of year | 9,335,608 | 6,149,373 | 2,927,848 | 2,665,434 | ||||||||||||||||
|
|
|
|
|
|
|
| |||||||||||||
End of year | $ | 2,922,433 | $ | 9,335,608 | $ | 9,193,961 | $ | 2,927,848 | ||||||||||||
|
|
|
|
|
|
|
| |||||||||||||
The accompanying notes are an integral part of the financial statements.
72
GOTHAM FUNDS
Statements of Changes in Net Assets (Continued)
| Gotham Hedged Core Fund | Gotham Short Strategies Fund | |||||||||||||||||||
| For the Year Ended September 30, 2020 | For the Year Ended September 30, 2019 | For the Year Ended September 30, 2020 | For the Year Ended September 30, 2019 | |||||||||||||||||
Net increase/(decrease) in net assets from operations: | ||||||||||||||||||||
Net investment income | $ | 51,943 | $ | 32,221 | $ | 38,912 | $ | 78,462 | ||||||||||||
Net realized gain/(loss) from investments, securities sold short and swaps | (221,239 | ) | 78,180 | (5,071,110 | ) | (3,130,012 | ) | |||||||||||||
Net change in unrealized appreciation/ (depreciation) on investments, securities sold short and swaps | 764,069 | (89,107 | ) | (887,196 | ) | 476,313 | ||||||||||||||
|
|
|
|
|
|
|
| |||||||||||||
Net increase/(decrease) in net assets resulting from operations | 594,773 | 21,294 | (5,919,394 | ) | (2,575,237 | ) | ||||||||||||||
|
|
|
|
|
|
|
| |||||||||||||
Less Dividends and Distributions to Shareholders from: | ||||||||||||||||||||
Institutional Class Shares: | ||||||||||||||||||||
Total distributable earnings | (152,049 | ) | (299,822 | ) | (70,055 | ) | (47,319 | ) | ||||||||||||
Return of capital | — | — | (8,407 | ) | — | |||||||||||||||
|
|
|
|
|
|
|
| |||||||||||||
Net decrease in net assets from dividends and distributions to shareholders | (152,049 | ) | (299,822 | ) | (78,462 | ) | (47,319 | ) | ||||||||||||
|
|
|
|
|
|
|
| |||||||||||||
Increase in Net Assets from Capital Share Transactions (Note 4) | 5,778,631 | 299,822 | 11,540,824 | 33,106,684 | ||||||||||||||||
|
|
|
|
|
|
|
| |||||||||||||
Total increase in net assets | 6,221,355 | 21,294 | 5,542,968 | 30,484,128 | ||||||||||||||||
|
|
|
|
|
|
|
| |||||||||||||
Net assets | ||||||||||||||||||||
Beginning of year | 2,582,187 | 2,560,893 | 32,075,569 | 1,591,441 | ||||||||||||||||
|
|
|
|
|
|
|
| |||||||||||||
End of year | $ | 8,803,542 | $ | 2,582,187 | $ | 37,618,537 | $ | 32,075,569 | ||||||||||||
|
|
|
|
|
|
|
| |||||||||||||
The accompanying notes are an integral part of the financial statements.
73
GOTHAM FUNDS
Statements of Changes in Net Assets (Concluded)
| Gotham Master Neutral Fund | Gotham ESG Large Value Fund | |||||||||||||||||||
| For the Year Ended September 30, 2020 | For the Year Ended September 30, 2019 | For the Year Ended September 30, 2020 | For the Period Ended September 30, 2019* | |||||||||||||||||
Net increase/(decrease) in net assets from operations: | ||||||||||||||||||||
Net investment income | $ | 93,771 | $ | 111,473 | $ | 20,168 | $ | 12,926 | ||||||||||||
Net realized gain/(loss) from investments and securities sold short | (844,080 | ) | (650,576 | ) | 11,636 | 64,706 | ||||||||||||||
Net change in unrealized appreciation/ (depreciation) on investments and securities sold short | (476,762 | ) | 452,570 | (30,743 | ) | 139,906 | ||||||||||||||
|
|
|
|
|
|
|
| |||||||||||||
Net increase/(decrease) in net assets resulting from operations | (1,227,071 | ) | (86,533 | ) | 1,061 | 217,538 | ||||||||||||||
|
|
|
|
|
|
|
| |||||||||||||
Less Dividends and Distributions to Shareholders from: | ||||||||||||||||||||
Institutional Class Shares: | ||||||||||||||||||||
Total distributable earnings | (205,134 | ) | (26,546 | ) | (95,342 | ) | — | |||||||||||||
|
|
|
|
|
|
|
| |||||||||||||
Net decrease in net assets from dividends and distributions to shareholders | (205,134 | ) | (26,546 | ) | (95,342 | ) | — | |||||||||||||
|
|
|
|
|
|
|
| |||||||||||||
Increase/(decrease) in Net Assets from Capital Share Transactions (Note 4) | (15,648,596 | ) | 15,505,486 | 47,671 | 1,000,000 | |||||||||||||||
|
|
|
|
|
|
|
| |||||||||||||
Total increase/(decrease) in net assets | (17,080,801 | ) | 15,392,407 | (46,610 | ) | 1,217,538 | ||||||||||||||
|
|
|
|
|
|
|
| |||||||||||||
Net assets | ||||||||||||||||||||
Beginning of year | 19,313,397 | 3,920,990 | 1,217,538 | — | ||||||||||||||||
|
|
|
|
|
|
|
| |||||||||||||
End of year | $ | 2,232,596 | $ | 19,313,397 | $ | 1,170,928 | $ | 1,217,538 | ||||||||||||
|
|
|
|
|
|
|
| |||||||||||||
| * | The Fund incepted on December 28, 2018. |
The accompanying notes are an integral part of the financial statements.
74
Statements of Cash Flow
Gotham Neutral 500 Fund | Gotham Hedged Plus Fund | |||||||||
For the Year Ended September 30, 2020 | For the Year Ended September 30, 2020 | |||||||||
Cash flows provided by (used in) operating activities: | ||||||||||
Net increase/(decrease) in net assets resulting from operations | $ | (741,280 | ) | $ | 112,866 | |||||
Adjustments to reconcile net increase/(decrease) in net assets resulting from operations to net cash provided by (used in) operating activities: | ||||||||||
Purchases of long-term portfolio investments | (28,708,119 | ) | (38,107,413 | ) | ||||||
Proceeds from disposition of long-term portfolio investments | 36,626,308 | 27,925,193 | ||||||||
Purchases to cover securities sold short | (30,529,447 | ) | (19,740,023 | ) | ||||||
Proceeds from securities sold short | 23,458,292 | 22,698,256 | ||||||||
Net realized loss on investments and securities sold short. | 777,621 | 927,144 | ||||||||
Net change in unrealized appreciation/(depreciation) on investments and securities sold short | (19,833 | ) | (987,330 | ) | ||||||
Return of capital received from real estate investment trusts | 1,749 | 295 | ||||||||
Increase/(decrease) in receivable for securities sold | 163,966 | (118,027 | ) | |||||||
Increase/(decrease) in cash collateral for securities lending | (312 | ) | 654 | |||||||
Increase/(decrease) in dividend and interest receivable | 12,293 | (9,271 | ) | |||||||
Increase/(decrease) in receivable from investment advisor | 582 | (2,668 | ) | |||||||
Increase in prepaid expenses and other assets | (243 | ) | (1,061 | ) | ||||||
Increase/(decrease) in payable for investment purchased | (137,053 | ) | 122,807 | |||||||
Increase/(decrease) in use of cash collateral from securities lending | 312 | (654 | ) | |||||||
Increase/(decrease) in dividends and fees payable for securities sold short | (2,679 | ) | 200 | |||||||
Decrease in accrued expense payable | (6,731 | ) | (1,315 | ) | ||||||
|
|
|
| |||||||
Net cash provided by (used in) operating activities | 895,426 | (7,180,347 | ) | |||||||
|
|
|
| |||||||
Cash flows from financing activities: | ||||||||||
Proceeds from shares sold | 385,431 | 6,650,000 | ||||||||
Payment of shares redeemed. | (6,057,326 | ) | (496,753 | ) | ||||||
|
|
|
| |||||||
Net cash provided by financing activities | (5,671,895 | ) | 6,153,247 | |||||||
|
|
|
| |||||||
Net decrease in cash and restricted cash | (4,776,469 | ) | (1,027,100 | ) | ||||||
Cash and restricted cash: | ||||||||||
Beginning of year: | 6,995,805 | 1,176,309 | ||||||||
End of year: | 2,219,336 | 149,209 | ||||||||
Reconciliation of restricted and unrestricted cash at the beginning of the year to the statements of assets and liabilities: | ||||||||||
Cash | 31,868 | 116,565 | ||||||||
Restricted cash | 6,963,937 | 1,059,744 | ||||||||
Reconciliation of restricted and unrestricted cash at the end of the year to the statements of assets and liabilities: | ||||||||||
Cash | $ | 205,538 | $ | 114,994 | ||||||
|
|
|
| |||||||
Restricted cash | $ | 2,013,798 | $ | 34,215 | ||||||
|
|
|
| |||||||
Supplemental disclosure of cash flow information: | ||||||||||
Cash paid/(received) during the year for financing charges | $ | (20,830 | ) | $ | 20,107 | |||||
The accompanying notes are an integral part of the financial statements.
75
GOTHAM FUNDS
Statements of Cash Flow (Concluded)
| Gotham Hedged Core Fund | |||||
| For the Year Ended September 30, 2020 | |||||
Cash flows provided by (used in) operating activities: | |||||
Net increase in net assets resulting from operations | $ | 594,773 | |||
Adjustments to reconcile net increase in net assets resulting from operations to net cash provided by (used in) operating activities: | |||||
Purchases of long-term portfolio investments | (23,390,787 | ) | |||
Proceeds from disposition of long-term portfolio investments | 14,660,247 | ||||
Purchases to cover securities sold short | (6,624,248 | ) | |||
Proceeds from securities sold short | 8,789,397 | ||||
Net realized loss on investments and securities sold short | 221,239 | ||||
Net change in unrealized appreciation/(depreciation) on investments and securities sold short | (764,069 | ) | |||
Return of capital received from real estate investment trusts | 202 | ||||
Increase in receivable for securities sold | (42,083 | ) | |||
Decrease in cash collateral for securities lending | 454 | ||||
Increase in dividend and interest receivable | (7,586 | ) | |||
Increase in receivable from investment advisor | (8,015 | ) | |||
Increase in prepaid expenses and other assets | (179 | ) | |||
Increase in payable for investments purchased | 42,974 | ||||
Decrease in use of cash collateral from securities lending. | (454 | ) | |||
Increase in dividends and fees payable for securities sold short | 2,278 | ||||
Decrease in accrued expense payable | (1,317 | ) | |||
|
| ||||
Net cash used in operating activities | (6,527,174 | ) | |||
|
| ||||
Cash flows from financing activities: | |||||
Proceeds from shares sold | 5,972,409 | ||||
Payment of shares redeemed. | (345,827 | ) | |||
|
| ||||
Net cash provided by (used in) financing activities | 5,626,582 | ||||
|
| ||||
Net decrease in cash and restricted cash | (900,592 | ) | |||
Cash and restricted cash: | |||||
Beginning of year: | 1,048,237 | ||||
End of year: | 147,645 | ||||
Reconciliation of restricted and unrestricted cash at the beginning of the year to the statements of assets and liabilities: | |||||
Cash | 977,053 | ||||
Restricted cash | 71,184 | ||||
Reconciliation of restricted and unrestricted cash at the end of the year to the statements of assets and liabilities: | |||||
Cash | $ | 129,076 | |||
|
| ||||
Restricted cash | $ | 18,569 | |||
|
| ||||
Supplemental disclosure of cash flow information: | |||||
Cash received during the year for financing charges | $ | 2,657 | |||
The accompanying notes are an integral part of the financial statements.
76
Financial Highlights
Contained below is per share operating performance data for Institutional Class shares outstanding, total investment return, ratios to average net assets and other supplemental data for the respective period. The total returns in the table represent the rate that an investor would have earned or lost on an investment in a Fund (assuming reinvestment of all dividends and distributions). This information has been derived from information provided in the financial statements and should be read in conjunction with the financial statements and the notes thereto.
| Gotham Neutral 500 Fund Institutional Class Shares | ||||||||||||||||||||
| For the | For the | For the | For the | |||||||||||||||||
| Year | Year | Year | Year | |||||||||||||||||
| Ended | Ended | Ended | Ended | |||||||||||||||||
| September 30, | September 30, | September 30, | September 30, | |||||||||||||||||
| 2020 | 2019 | 2018 | 2017* | |||||||||||||||||
Per Share Operating Performance | ||||||||||||||||||||
Net asset value, beginning of year | $ | 11.42 | $ | 11.69 | $ | 10.77 | $ | 10.00 | ||||||||||||
|
|
|
|
|
|
|
| |||||||||||||
Net investment income/(loss)(1) | 0.03 | 0.12 | 0.03 | (0.07 | ) | |||||||||||||||
Net realized and unrealized gain/(loss) on investments | (0.90 | ) | (0.18 | ) | 0.95 | 0.84 | ||||||||||||||
|
|
|
|
|
|
|
| |||||||||||||
Total from investment operations | (0.87 | ) | (0.06 | ) | 0.98 | 0.77 | ||||||||||||||
|
|
|
|
|
|
|
| |||||||||||||
Dividends and distributions to shareholders from: | ||||||||||||||||||||
Net investment income | (0.13 | ) | (0.04 | ) | (0.01 | ) | — | |||||||||||||
Net realized capital gains | (0.00 | )(2) | (0.17 | ) | (0.05 | ) | — | |||||||||||||
|
|
|
|
|
|
|
| |||||||||||||
Total dividends and distributions to shareholders | (0.13 | ) | (0.21 | ) | (0.06 | ) | — | |||||||||||||
|
|
|
|
|
|
|
| |||||||||||||
Redemption fees | — | — | — | — | ||||||||||||||||
|
|
|
|
|
|
|
| |||||||||||||
Net asset value, end of year | $ | 10.42 | $ | 11.42 | $ | 11.69 | $ | 10.77 | ||||||||||||
|
|
|
|
|
|
|
| |||||||||||||
Total investment return(3) | (7.68 | )% | (0.56 | )% | 9.09 | % | 7.70 | % | ||||||||||||
Ratio/Supplemental Data | ||||||||||||||||||||
Net assets, end of year (in 000s) | $ | 2,922 | $ | 9,336 | $ | 6,149 | $ | 3,593 | ||||||||||||
Ratio of expenses to average net assets with waivers, expense reimbursements, and recoupments if any (including dividend and interest expense)(4) | 2.88 | % | 1.86 | % | 2.43 | % | 3.24 | % | ||||||||||||
Ratio of expenses to average net assets without waivers, expense reimbursements, and recoupments if any(4)(5) | 4.11 | % | 2.82 | % | 3.45 | % | 6.02 | % | ||||||||||||
Ratio of net investment income/(loss) to average net assets (including dividend and interest expense) | 0.24 | % | 1.09 | % | 0.26 | % | (0.64 | )% | ||||||||||||
Portfolio turnover rate | 336 | % | 273 | % | 269 | % | 202 | % | ||||||||||||
| * | Commencement of operations. Initial seed capital was issued at $10.00 per share on September 30, 2016. |
| (1) | The selected per share data was calculated using the average shares outstanding method for the period. |
| (2) | Amount is less than $(0.005) per share. |
| (3) | Total investment return is calculated assuming a purchase of shares on the first day and a sale of shares on the last day of each period reported and includes reinvestment of dividends and distributions, if any. Total returns for periods less than one year are not annualized. |
| (4) | Expense ratio includes dividend and fees on securities sold short. Excluding such dividend and fees on securities sold short, the ratio of expenses to average net assets including waivers, reimbursements, and recoupments for the Fund would be 1.35%, 1.39%, 1.50% and 1.50% for the years ended September 30, 2020, 2019, 2018 and 2017, respectively. |
| (5) | During the period, certain fees were reduced or expenses were recouped. If such fee reductions or recoupments had not occurred, the ratios would have been as shown (See Note 2). |
The accompanying notes are an integral part of the financial statements.
77
GOTHAM FUNDS
Financial Highlights (Continued)
Contained below is per share operating performance data for Institutional Class shares outstanding, total investment return, ratios to average net assets and other supplemental data for the respective period. The total returns in the table represent the rate that an investor would have earned or lost on an investment in a Fund (assuming reinvestment of all dividends and distributions). This information has been derived from information provided in the financial statements and should be read in conjunction with the financial statements and the notes thereto.
| Gotham Hedged Plus Fund Institutional Class Shares | |||||||||||||||||||||||||
| For the | For the | For the | For the | For the | |||||||||||||||||||||
| Year | Year | Year | Year | Period | |||||||||||||||||||||
| Ended | Ended | Ended | Ended | Ended | |||||||||||||||||||||
| September 30, | September 30, | September 30, | September 30, | September 30, | |||||||||||||||||||||
| 2020 | 2019 | 2018 | 2017 | 2016* | |||||||||||||||||||||
Per Share Operating Performance | |||||||||||||||||||||||||
Net asset value, beginning of year/period | $ | 11.31 | $ | 12.87 | $ | 11.43 | $ | 10.08 | $ | 10.00 | |||||||||||||||
|
|
|
|
|
|
|
|
|
| ||||||||||||||||
Net investment income(1) | 0.12 | 0.10 | 0.06 | 0.01 | 0.00 | (2) | |||||||||||||||||||
Net realized and unrealized gain/(loss) on investments | (0.17 | ) | (0.44 | ) | 1.64 | 1.49 | 0.08 | ||||||||||||||||||
|
|
|
|
|
|
|
|
|
| ||||||||||||||||
Total from investment operations | (0.05 | ) | (0.34 | ) | 1.70 | 1.50 | 0.08 | ||||||||||||||||||
|
|
|
|
|
|
|
|
|
| ||||||||||||||||
Dividends and distributions to shareholders from: | |||||||||||||||||||||||||
Net investment income | (0.12 | ) | (0.06 | ) | (0.09 | ) | (0.11 | ) | — | ||||||||||||||||
Net realized capital gains | (0.56 | ) | (1.16 | ) | (0.17 | ) | (0.04 | ) | — | ||||||||||||||||
|
|
|
|
|
|
|
|
|
| ||||||||||||||||
Total dividends and distributions to shareholders | (0.68 | ) | (1.22 | ) | (0.26 | ) | (0.15 | ) | — | ||||||||||||||||
|
|
|
|
|
|
|
|
|
| ||||||||||||||||
Redemption fees | — | — | — | — | — | ||||||||||||||||||||
|
|
|
|
|
|
|
|
|
| ||||||||||||||||
Net asset value, end of year/period | $ | 10.58 | $ | 11.31 | $ | 12.87 | $ | 11.43 | $ | 10.08 | |||||||||||||||
|
|
|
|
|
|
|
|
|
| ||||||||||||||||
Total investment return(3) | (0.82 | )% | (2.45 | )% | 15.00 | % | 15.01 | % | 0.80 | % | |||||||||||||||
Ratio/Supplemental Data | |||||||||||||||||||||||||
Net assets, end of year/period (in 000s) | $ | 9,194 | $ | 2,928 | $ | 2,665 | $ | 2,319 | $ | 2,015 | |||||||||||||||
Ratio of expenses to average net assets with waivers, expense reimbursements, and recoupments if any (including dividend and interest expense)(4) | 2.51 | % | 2.68 | % | 2.71 | % | 3.10 | % | 3.13 | %(5) | |||||||||||||||
Ratio of expenses to average net assets without waivers, expense reimbursements, and recoupments if any(4)(6) | 4.81 | % | 6.97 | % | 5.57 | % | 8.46 | % | 8.17 | %(5) | |||||||||||||||
Ratio of net investment income to average net assets (including dividend and interest expense) | 1.11 | % | 0.84 | % | 0.48 | % | 0.09 | % | 0.00 | %(5)(7) | |||||||||||||||
Portfolio turnover rate | 353 | % | 239 | % | 227 | % | 183 | % | 152 | %(8) | |||||||||||||||
| * | Commencement of operations. Initial seed capital was issued at $10.00 per share on March 31, 2016. |
| (1) | The selected per share data was calculated using the average shares outstanding method for the period. |
| (2) | Amount is less than $0.005 per share. |
| (3) | Total investment return is calculated assuming a purchase of shares on the first day and a sale of shares on the last day of each period reported and includes reinvestment of dividends and distributions, if any. Total returns for periods less than one year are not annualized. |
| (4) | Expense ratio includes dividend and fees on securities sold short. Excluding such dividend and fees on securities sold short, the ratio of expenses to average net assets including waivers, reimbursements, and recoupments for the Fund would be 1.15%, 1.15%, 1.15%, 1.15% and 1.15% for the years ended September 30, 2020, 2019, 2018 and 2017 and the period ended September 30, 2016, respectively. |
| (5) | Annualized. |
| (6) | During the period, certain fees were reduced or expenses were recouped. If such fee reductions or recoupments had not occurred, the ratios would have been as shown (See Note 2). |
| (7) | Amount is less than 0.005%. |
| (8) | Not annualized. |
The accompanying notes are an integral part of the financial statements.
78
GOTHAM FUNDS
Financial Highlights (Continued)
Contained below is per share operating performance data for Institutional Class shares outstanding, total investment return, ratios to average net assets and other supplemental data for the respective period. The total returns in the table represent the rate that an investor would have earned or lost on an investment in a Fund (assuming reinvestment of all dividends and distributions). This information has been derived from information provided in the financial statements and should be read in conjunction with the financial statements and the notes thereto.
| Gotham Hedged Core Fund Institutional Class Shares | |||||||||||||||||||||||||
| For the | For the | For the | For the | For the | |||||||||||||||||||||
| Year | Year | Year | Year | Period | |||||||||||||||||||||
| Ended | Ended | Ended | Ended | Ended | |||||||||||||||||||||
| September 30, | September 30, | September 30, | September 30, | September 30, | |||||||||||||||||||||
| 2020 | 2019 | 2018 | 2017 | 2016* | |||||||||||||||||||||
Per Share Operating Performance | |||||||||||||||||||||||||
Net asset value, beginning of year/period | $ | 11.16 | $ | 12.61 | $ | 11.34 | $ | 10.00 | $ | 10.00 | |||||||||||||||
|
|
|
|
|
|
|
|
|
| ||||||||||||||||
Net investment income(1) | 0.13 | 0.14 | 0.11 | 0.07 | — | ||||||||||||||||||||
Net realized and unrealized gain/(loss) on investments | 0.70 | (0.11 | ) | 1.35 | 1.27 | (0.00 | )(2) | ||||||||||||||||||
|
|
|
|
|
|
|
|
|
| ||||||||||||||||
Total from investment operations | 0.83 | 0.03 | 1.46 | 1.34 | (0.00 | )(2) | |||||||||||||||||||
|
|
|
|
|
|
|
|
|
| ||||||||||||||||
Dividends and distributions to shareholders from: | |||||||||||||||||||||||||
Net investment income | (0.17 | ) | (0.07 | ) | (0.18 | ) | — | — | |||||||||||||||||
Net realized capital gains | (0.49 | ) | (1.41 | ) | (0.01 | ) | — | — | |||||||||||||||||
|
|
|
|
|
|
|
|
|
| ||||||||||||||||
Total dividends and distributions to shareholders | (0.66 | ) | (1.48 | ) | (0.19 | ) | — | — | |||||||||||||||||
|
|
|
|
|
|
|
|
|
| ||||||||||||||||
Redemption fees | — | — | — | — | — | ||||||||||||||||||||
|
|
|
|
|
|
|
|
|
| ||||||||||||||||
Net asset value, end of year/period | $ | 11.33 | $ | 11.16 | $ | 12.61 | $ | 11.34 | $ | 10.00 | |||||||||||||||
|
|
|
|
|
|
|
|
|
| ||||||||||||||||
Total investment return(3) | 7.59 | % | 0.86 | % | 12.93 | % | 13.40 | % | 0.00 | % | |||||||||||||||
Ratio/Supplemental Data | |||||||||||||||||||||||||
Net assets, end of year/period (in 000s) | $ | 8,804 | $ | 2,582 | $ | 2,561 | $ | 2,267 | $ | 1,999 | |||||||||||||||
Ratio of expenses to average net assets with waivers, expense reimbursements, and recoupments if any (including dividend and interest expense)(4) | 1.52 | % | 1.00 | % | 1.16 | % | 1.40 | % | — | ||||||||||||||||
Ratio of expenses to average net assets without waivers, expense reimbursements, and recoupments if any(4)(5) | 3.47 | % | 4.05 | % | 3.85 | % | 4.91 | % | — | ||||||||||||||||
Ratio of net investment income to average net assets (including dividend and interest expense) | 1.20 | % | 1.29 | % | 0.91 | % | 0.66 | % | — | ||||||||||||||||
Portfolio turnover rate | 267 | % | 228 | % | 221 | % | 249 | % | — | ||||||||||||||||
| * | Commencement of operations. Initial seed capital was issued at $10.00 per share on September 30, 2016. |
| (1) | The selected per share data was calculated using the average shares outstanding method for the period. |
| (2) | Amount is less than $0.005 per share. |
| (3) | Total investment return is calculated assuming a purchase of shares on the first day and a sale of shares on the last day of each period reported and includes reinvestment of dividends and distributions, if any. Total returns for periods less than one year are not annualized. |
| (4) | Expense ratio includes dividend and fees on securities sold short. Excluding such dividend and fees on securities sold short, the ratio of expenses to average net assets including waivers, reimbursements, and recoupments for the Fund would be 0.85%, 0.85%, 0.85% and 0.85% for the years ended September 30, 2020, 2019, 2018 and 2017, respectively. |
| (5) | During the period, certain fees were reduced or expenses were recouped. If such fee reductions or recoupments had not occurred, the ratios would have been as shown (See Note 2). |
The accompanying notes are an integral part of the financial statements.
79
GOTHAM FUNDS
Financial Highlights (Continued)
Contained below is per share operating performance data for Institutional Class shares outstanding, total investment return, ratios to average net assets and other supplemental data for the respective period. The total returns in the table represent the rate that an investor would have earned or lost on an investment in a Fund (assuming reinvestment of all dividends and distributions). This information has been derived from information provided in the financial statements and should be read in conjunction with the financial statements and the notes thereto.
| Gotham Short Strategies Fund Institutional Class Shares | ||||||||||||||||||||
| For the | For the | For the | For the | |||||||||||||||||
| Year | Year | Year | Period | |||||||||||||||||
| Ended | Ended | Ended | Ended | |||||||||||||||||
| September 30, | September 30, | September 30, | September 30, | |||||||||||||||||
| 2020 | 2019 | 2018 | 2017* | |||||||||||||||||
Per Share Operating Performance | ||||||||||||||||||||
Net asset value, beginning of year/period | $ | 8.78 | $ | 9.05 | $ | 10.07 | $ | 10.00 | ||||||||||||
|
|
|
|
|
|
|
| |||||||||||||
Net investment income/(loss)(1) | 0.01 | 0.03 | (0.03 | ) | 0.02 | |||||||||||||||
Net realized and unrealized gain/(loss) on investments | (1.35 | ) | (0.09 | ) | (0.97 | ) | 0.05 | |||||||||||||
|
|
|
|
|
|
|
| |||||||||||||
Total from investment operations | (1.34 | ) | (0.06 | ) | (1.00 | ) | 0.07 | |||||||||||||
|
|
|
|
|
|
|
| |||||||||||||
Dividends and distributions to shareholders from: | ||||||||||||||||||||
Net investment income | (0.02 | ) | — | (0.02 | ) | — | ||||||||||||||
Net realized capital gains | — | (0.21 | ) | — | — | |||||||||||||||
Return of capital | 0.00 | (2) | — | — | — | |||||||||||||||
|
|
|
|
|
|
|
| |||||||||||||
Total dividends and distributions to shareholders | (0.02 | ) | (0.21 | ) | (0.02 | ) | — | |||||||||||||
|
|
|
|
|
|
|
| |||||||||||||
Redemption fees | 0.00 | (2) | 0.00 | (2) | — | — | ||||||||||||||
|
|
|
|
|
|
|
| |||||||||||||
Net asset value, end of year/period | $ | 7.42 | $ | 8.78 | $ | 9.05 | $ | 10.07 | ||||||||||||
|
|
|
|
|
|
|
| |||||||||||||
Total investment return(3) | (15.27 | )% | (0.81 | )% | (9.90 | )% | 0.70 | % | ||||||||||||
Ratio/Supplemental Data | ||||||||||||||||||||
Net assets, end of year/period (in 000s) | $ | 37,619 | $ | 32,076 | $ | 1,591 | $ | 18,328 | ||||||||||||
Ratio of expenses to average net assets with waivers and expense reimbursements, if any | 1.35 | % | 1.35 | % | 1.35 | % | 1.35 | %(4) | ||||||||||||
Ratio of expenses to average net assets without waivers and expense reimbursements, if any(5) | 1.88 | % | 2.20 | % | 2.49 | % | 3.06 | %(4) | ||||||||||||
Ratio of net investment income/(loss) to average net assets | 0.12 | % | 0.39 | % | (0.30 | )% | 1.19 | %(4) | ||||||||||||
Portfolio turnover rate | 692 | % | 616 | % | 591 | % | 165 | %(6)(7) | ||||||||||||
| * | Commencement of operations. Initial seed capital was issued at $10.00 per share on July 31, 2017. |
| (1) | The selected per share data was calculated using the average shares outstanding method for the period. |
| (2) | Amount is less than $0.005 per share. |
| (3) | Total investment return is calculated assuming a purchase of shares on the first day and a sale of shares on the last day of each period reported and includes reinvestment of dividends and distributions, if any. Total returns for periods less than one year are not annualized. |
| (4) | Annualized. |
| (5) | During the period, certain fees were reduced. If such fee reductions had not occurred, the ratios would have been shown (See Note 2). |
| (6) | Portfolio turnover rate excludes securities received from processing a subscription due to a reorganization. |
| (7) | Not annualized. |
The accompanying notes are an integral part of the financial statements.
80
GOTHAM FUNDS
Financial Highlights (Continued)
Contained below is per share operating performance data for Institutional Class shares outstanding, total investment return, ratios to average net assets and other supplemental data for the respective period. The total returns in the table represent the rate that an investor would have earned or lost on an investment in a Fund (assuming reinvestment of all dividends and distributions). This information has been derived from information provided in the financial statements and should be read in conjunction with the financial statements and the notes thereto.
| Gotham Master Neutral Fund Institutional Class Shares | ||||||||||||||||||||
| For the | For the | For the | For the | |||||||||||||||||
| Year | Year | Year | Period | |||||||||||||||||
| Ended | Ended | Ended | Ended | |||||||||||||||||
| September 30, | September 30, | September 30, | September 30, | |||||||||||||||||
| 2020 | 2019 | 2018 | 2017* | |||||||||||||||||
Per Share Operating Performance | ||||||||||||||||||||
Net asset value, beginning of year/period | $ | 10.16 | $ | 10.21 | $ | 10.08 | $ | 10.00 | ||||||||||||
|
|
|
|
|
|
|
| |||||||||||||
Net investment income(1) | 0.07 | 0.07 | 0.03 | 0.01 | ||||||||||||||||
Net realized and unrealized gain/(loss) on investments | (0.61 | ) | (0.06 | ) | 0.24 | 0.07 | ||||||||||||||
|
|
|
|
|
|
|
| |||||||||||||
Total from investment operations | (0.54 | ) | 0.01 | 0.27 | 0.08 | |||||||||||||||
|
|
|
|
|
|
|
| |||||||||||||
Dividends and distributions to shareholders from: | ||||||||||||||||||||
Net investment income | (0.10 | ) | (0.06 | ) | (0.02 | ) | — | |||||||||||||
Net realized capital gains | (0.01 | ) | — | (0.12 | ) | — | ||||||||||||||
|
|
|
|
|
|
|
| |||||||||||||
Total dividends and distributions to shareholders | (0.11 | ) | (0.06 | ) | (0.14 | ) | — | |||||||||||||
|
|
|
|
|
|
|
| |||||||||||||
Redemption fees | — | — | — | — | ||||||||||||||||
|
|
|
|
|
|
|
| |||||||||||||
Net asset value, end of year/period | $ | 9.51 | $ | 10.16 | $ | 10.21 | $ | 10.08 | ||||||||||||
|
|
|
|
|
|
|
| |||||||||||||
Total investment return(2) | (5.38 | )% | 0.13 | % | 2.79 | % | 0.80 | % | ||||||||||||
Ratio/Supplemental Data | ||||||||||||||||||||
Net assets, end of year/period (in 000s) | $ | 2,233 | $ | 19,313 | $ | 3,921 | $ | 4,075 | ||||||||||||
Ratio of expenses to average net assets with waivers and expense reimbursements, if any (including dividend and interest expense)(3) | 0.42 | % | 0.20 | % | 0.28 | % | 0.31 | %(4) | ||||||||||||
Ratio of expenses to average net assets without waivers and expense reimbursements, if any(3)(5) | 1.96 | % | 1.53 | % | 3.05 | % | 4.60 | %(4) | ||||||||||||
Ratio of net investment income to average net assets (including dividend and interest expense) | 0.71 | % | 0.71 | %(6) | 0.28 | % | 0.35 | %(4) | ||||||||||||
Portfolio turnover rate | 171 | % | 166 | % | 170 | % | 97 | %(7) | ||||||||||||
| * | Commencement of operations. Initial seed capital was issued at $10.00 per share on April 28, 2017. |
| (1) | The selected per share data was calculated using the average shares outstanding method for the period. |
| (2) | Total investment return is calculated assuming a purchase of shares on the first day and a sale of shares on the last day of each period reported and includes reinvestment of dividends and distributions, if any. Total returns for periods less than one year are not annualized. |
| (3) | Expense ratio includes dividend and fees on securities sold short. Excluding such dividend and fees on securities sold short, the ratio of expenses to average net assets including waivers, reimbursement, and recoupments for the Fund would be 0.17%, 0.20%, 0.26% and 0.31% for the years ended September 30, 2020, 2019, 2018 and the period ended September 30, 2017, respectively. |
| (4) | Annualized. |
| (5) | During the period, certain fees were reduced or expenses were recouped. If such fee reductions or recoupments had not occurred, the ratios would have been as shown (See Note 2). |
| (6) | Net rebate income on securities sold short exceeded dividends and fees on securities sold short during the period. (See Note 1). |
| (7) | Not annualized. |
The accompanying notes are an integral part of the financial statements.
81
GOTHAM FUNDS
Financial Highlights (Concluded)
Contained below is per share operating performance data for Institutional Class shares outstanding, total investment return, ratios to average net assets and other supplemental data for the respective period. The total returns in the table represent the rate that an investor would have earned or lost on an investment in a Fund (assuming reinvestment of all dividends and distributions). This information has been derived from information provided in the financial statements and should be read in conjunction with the financial statements and the notes thereto.
| Gotham ESG Large Value Fund Institutional Class Shares | ||||||||||
| For the | For the | |||||||||
| Year | Period | |||||||||
| Ended | Ended | |||||||||
| September 30, | September 30, | |||||||||
| 2020 | 2019* | |||||||||
Per Share Operating Performance | ||||||||||
Net asset value, beginning of year/period | $ | 12.18 | $ | 10.00 | ||||||
|
|
|
| |||||||
Net investment income(1) | 0.20 | 0.13 | ||||||||
Net realized and unrealized gain/(loss) on investments | (0.16 | ) | 2.05 | |||||||
|
|
|
| |||||||
Total from investment operations | 0.04 | 2.18 | ||||||||
|
|
|
| |||||||
Dividends and distributions to shareholders from: | ||||||||||
Net investment income | (0.18 | ) | — | |||||||
Net realized capital gains | (0.77 | ) | — | |||||||
|
|
|
| |||||||
Total dividends and distributions to shareholders | (0.95 | ) | — | |||||||
|
|
|
| |||||||
Redemption fees | — | — | ||||||||
|
|
|
| |||||||
Net asset value, end of year/period | $ | 11.27 | $ | 12.18 | ||||||
|
|
|
| |||||||
Total investment return(2) | (0.17 | )% | 21.80 | % | ||||||
Ratio/Supplemental Data | ||||||||||
Net assets, end of year/period (in 000s) | $ | 1,171 | $ | 1,218 | ||||||
Ratio of expenses to average net assets with waivers, expense reimbursements, and recoupments if any | 0.75 | % | 0.75 | %(3) | ||||||
Ratio of expenses to average net assets without waivers, expense reimbursements, and recoupments if | 6.46 | % | 6.59 | %(3) | ||||||
Ratio of net investment income to average net assets | 1.74 | % | 1.49 | %(3) | ||||||
Portfolio turnover rate | 284 | % | 169 | %(5) | ||||||
| * | Institutional class commenced operations on December 31, 2018. Total return is calculated based on inception date of December 28, 2018, when initial seed capital was issued at $10.00 per share. |
| (1) | The selected per share data was calculated using the average shares outstanding method for the period. |
| (2) | Total investment return is calculated assuming a purchase of shares on the first day and a sale of shares on the last day of each period reported and includes reinvestment of dividends and distributions, if any. Total returns for periods less than one year are not annualized. |
| (3) | Annualized. |
| (4) | During the period, certain fees were reduced or expenses were recouped. If such fee reductions or recoupments had not occurred, the ratios would have been as shown (See Note 2). |
| (5) | Not annualized. |
The accompanying notes are an integral part of the financial statements.
82
Notes to Financial Statements
September 30, 2020
1. Organization and Significant Accounting Policies
The Gotham Neutral 500 Fund, the Gotham Hedged Plus Fund, the Gotham Hedged Core Fund, the Gotham Short Strategies Fund, the Gotham Master Neutral Fund and the Gotham ESG Large Value Fund (each a “Fund” and together, the “Funds”) are each a diversified, open-end management investment company registered under the Investment Company Act of 1940, as amended (the “1940 Act”). The Funds are each a separate series of FundVantage Trust (the “Trust”) which was organized as a Delaware statutory trust on August 28, 2006. The Trust is a “series trust” authorized to issue an unlimited number of separate series or classes of shares of beneficial interest. Each series is treated as a separate entity for certain matters under the 1940 Act, and for other purposes, and a shareholder of one series is not deemed to be a shareholder of any other series. Each of the Funds offers one class of shares, Institutional Class. The Funds’ commencement of operations are as follows:
Gotham Neutral 500 Fund (“Neutral 500”) | October 1, 2016 | |
Gotham Hedged Plus Fund (“Hedged Plus”) | March 31, 2016 | |
Gotham Hedged Core Fund (“Hedged Core”) | September 30, 2016 | |
Gotham Short Strategies Fund (“Short Strategies”) | July 31, 2017 | |
Gotham Master Neutral Fund (“Master Neutral”) | April 28, 2017 | |
Gotham ESG Large Value Fund (“ESG Large Value”) | December 31, 2018 |
All the Funds, except for ESG Large Value and Master Neutral, seek to achieve their investment objectives by primarily investing in long and short positions of U.S. equity securities. Equity securities include common and preferred stocks. Master Neutral seeks to achieve its investment objective by primarily investing in other funds advised by Gotham, but also in long and short positions of U.S. equity securities. ESG Large Value seeks to achieve its investment objective by primarily investing in long positions of equity securities.
The Funds are investment companies and follow accounting and reporting guidance in the Financial Accounting Standards Board Accounting Standards Codification Topic 946.
Portfolio Valuation — Each Fund’s net asset value (“NAV”) is calculated once daily at the close of regular trading hours on the New York Stock Exchange (“NYSE”) (typically 4:00 p.m. Eastern time) on each business day the NYSE is open. Each Fund’s equity securities, including exchange-traded funds, listed on any national or foreign exchange market system will be valued at the last sale price. Equity securities traded in the over-the-counter market are valued at their closing sale or official closing price. If there were no transactions on that day, securities traded principally on an exchange will be valued at the mean of the last bid and ask prices prior to the market close. Prices for equity securities normally are supplied by an independent pricing service approved by the Board of Trustees (the “Board”). Any assets held by a Fund that are denominated in foreign currencies are valued daily in U.S. dollars at the foreign currency exchange rates that are prevailing at the time that a Fund determines the daily NAV per share. Foreign securities may trade on weekends or other days when a Fund does not calculate NAV. As a result, the market value of these investments may change on days when you cannot buy or sell shares of a Fund. Certain Funds invest in securities of other investment companies, which are valued at their respective NAVs as determined by those investment companies each business day. Over the Counter (“OTC”) investments (including swap agreements) are generally valued by approved pricing services that use evaluated prices from various observable market factors. Securities that do not have a readily available current market value are valued in good faith under the direction of the Board. The Board has adopted methods for valuing securities and other assets in circumstances where market quotes are not readily available and has delegated to Gotham Asset Management, LLC (“Gotham” or “the Adviser”) the responsibility for applying the valuation methods. In the event that market quotes are not readily available, and the security or asset cannot be valued pursuant to one of the valuation methods, the value of the security, asset or liability will be determined in good faith by the Adviser. The Trust has established a Valuation Committee which performs certain functions including the oversight of the Adviser’s fair valuation determinations.
Fair Value Measurements — The inputs and valuation techniques used to measure fair value of a Fund’s investments are summarized into three levels as described in the hierarchy below:
· Level 1 | — | quoted prices in active markets for identical securities; | ||
· Level 2 | — | other significant observable inputs (including quoted prices for similar securities, interest rates, prepayment speeds, credit risk, etc.); and | ||
83
GOTHAM FUNDS
Notes to Financial Statements (Continued)
September 30, 2020
· Level 3 | — | quoted significant unobservable inputs (including the Fund’s own assumptions in determining the fair value of investments). |
The inputs or methodology used for valuing securities are not necessarily an indication of the risk associated with investing in those securities.
All financial instruments listed in the Portfolio of Investments are considered Level 1, measured at fair value on a recurring basis based on quoted prices for identical assets in active markets, except for the following: total return swaps with end of period unrealized depreciation of $(701,222) held by Short Strategies; and a U.S. Treasury Obligation with the end of period value of $200,727 held by Master Neutral. These securities are considered Level 2 as of and for the year ended September 30, 2020.
At the end of each quarter, management evaluates the classification of Levels 1, 2 and 3 assets and liabilities. Various factors are considered, such as changes in liquidity from the prior reporting period; whether or not a broker is willing to execute at the quoted price; the depth and consistency of prices from third party pricing services; and the existence of contemporaneous, observable trades in the market. Additionally, management evaluates the classification of Level 1 and Level 2 assets and liabilities on a quarterly basis for changes in listings or delistings on national exchanges.
Due to the inherent uncertainty of determining the fair value of investments that do not have a readily available market value, the fair value of a Fund’s investments may fluctuate from period to period. Additionally, the fair value of investments may differ significantly from the values that would have been used had a ready market existed for such investments and may differ materially from the values the Funds may ultimately realize. Further, such investments may be subject to legal and other restrictions on resale or otherwise less liquid than publicly traded securities.
For fair valuations using significant unobservable inputs, U.S. generally accepted accounting principles (“U.S. GAAP”) require the Funds to present a reconciliation of the beginning to ending balances for reported market values that presents changes attributable to total realized and unrealized gains or losses, purchase and sales, and transfers in and out of Level 3 during the period. A reconciliation of Level 3 investments is presented only when the Funds had an amount of Level 3 investments at the end of the reporting period that was meaningful in relation to its net assets. The amounts and reasons for all transfers in and out of Level 3 are disclosed when the Funds had an amount of transfers during the reporting period that was meaningful in relation to its net assets as of the end of the reporting period.
For the year ended September 30, 2020, there were no transfers in or out of Level 3 for the Funds.
Use of Estimates — The preparation of financial statements in conformity with U.S. GAAP requires management to make estimates and assumptions that affect the amounts reported in the financial statements and accompanying notes at the date of the financial statements and the reported amounts of revenues and expenses during the period. Actual results could differ from those estimates and those differences could be material.
Cash — Cash comprises U.S. Dollar and foreign currency deposits held at a custodian bank(s) which may exceed insured limits. The Funds are subject to risk to the extent that the institutions may be unable to fulfill their obligations.
Due to/from Brokers — Due to/from brokers represents cash balances on deposit with, or cash balances owed to, the Funds’ prime brokers and counterparties. The Funds are subject to credit risk should the prime brokers and counterparties be unable to meet their obligations to the Funds.
Investment Transactions, Investment Income and Expenses — Investment transactions are recorded on trade date for financial statement preparation purposes. Realized gains and losses on investments sold are recorded on the identified cost basis. Interest income is recorded on the accrual basis. Dividends are recorded on the ex-dividend date. The Fund records as dividend income the amount characterized as ordinary income and records as realized gain the amount characterized by a REIT as long-term capital gain in the Statement of Operations. The amount characterized as return of capital is a reduction to the cost of investments in the Statement of Assets and Liabilities if the security is still held; otherwise it is recorded as an adjustment to realized gain/(loss) from investment transactions in the statement of Operations. These characterizations are reflected in the accompanying financial statements. General expenses of the Trust are generally allocated to each Fund under methodologies approved by the Board of Trustees. Expenses directly attributable to a particular Fund in the Trust are charged directly to that Fund.
84
GOTHAM FUNDS
Notes to Financial Statements (Continued)
September 30, 2020
Dividends and Distributions to Shareholders — Dividends from net investment income and distributions from net realized capital gains, if any, are declared, recorded on ex-date and paid at least annually to shareholders. Income dividends and capital gain distributions are determined in accordance with U.S. federal income tax regulations, which may differ from U.S. GAAP. These differences include the treatment of non-taxable dividends, capitalized dividends on short sales, losses deferred due to wash sales and excise tax regulations. Permanent book and tax basis differences relating to shareholder distributions will result in reclassifications within the components of net assets.
U.S. Tax Status — No provision is made for U.S. income taxes as it is each Fund’s intention to continue to qualify for and elect the tax treatment applicable to regulated investment companies under Subchapter M of the Code, as amended, and make the requisite distributions to its shareholders which will be sufficient to relieve it from U.S. income and excise taxes.
Other — In the normal course of business, the Funds may enter into contracts that provide general indemnifications. A Fund’s maximum exposure under these arrangements is dependent on claims that may be made against the Fund in the future, and, therefore, cannot be estimated; however, based on experience, the risk of material loss for such claims is considered remote.
Market disruptions associated with the COVID-19 pandemic have had a global impact, and uncertainty exists as to its long-term implications. The COVID-19 pandemic could adversely affect the value and liquidity of the Funds’ investments, impair the Funds’ ability to satisfy redemption requests, and negatively impact the Funds’ performance. In addition, the outbreak of COVID-19, and measures taken to mitigate its effects, could result in disruptions to the services provided to the Funds by its service providers. Fund management is continuing to monitor this development and evaluate its impact on the Funds.
Short Sales — All Funds except ESG Large Value may sell securities short. A short sale involves the sale by a Fund of a security that it does not own with the anticipation of purchasing the same security at a later date at a lower price. If the price of the security has increased during this time, then the Fund will incur a loss equal to the increase in price from the time that the short sale was entered into plus any premiums and interest paid to the third party. Therefore, short sales involve the risk that losses may be exaggerated, potentially losing more money than the actual cost of the investment. Also, there is the risk that the third party to the short sale may fail to honor its contract terms, causing a loss to the Fund. There can be no assurance that a Fund will be able to close out a short position at any particular time or at an acceptable price. Although a Fund’s gain is limited to the amount at which it sold a security short, its potential loss is unlimited. The Funds will comply with guidelines established by the Securities and Exchange Commission and other applicable regulatory bodies with respect to coverage of short sales.
As of September 30, 2020, the following Funds had securities sold short, securities pledged as collateral and deposits with brokers for securities sold short:
| Value of Securities Sold Short | Securities Pledged as Collateral | Deposits with Brokers for Securities Sold Short | |||||||||||||
Neutral 500 | $ | 2,785,921 | $ | 3,316,547 | $ | 2,013,798 | |||||||||
Hedged Plus | 6,783,473 | 12,414,244 | 34,215 | ||||||||||||
Hedged Core | 3,495,021 | 6,955,672 | 18,569 | ||||||||||||
Master Neutral | 662,977 | 711,458 | 610,037 | ||||||||||||
In accordance with the terms of its prime brokerage agreements, the Funds may receive rebate income or be charged fees on securities sold short. Such income or fee is calculated on a daily basis based upon the market value of securities sold short and a variable rate that is dependent upon the availability of such security. These amounts are included in dividends and fees on securities sold short on the Statement of Operations. In those instances where rebate income is in excess of dividends on securities sold short and finance charges, the net amount is shown in the Investment Income section of the Statement of Operations. On the ex-dividend date, dividends on short sales are recorded as an expense to the Fund. The following Funds had net charges as shown in the table below for the year ended September 30, 2020:
85
GOTHAM FUNDS
Notes to Financial Statements (Continued)
September 30, 2020
| Dividends on Securities Sold Short | Rebate (Income)/Fees | |||||||||
Neutral 500 | $ | 127,482 | $ | (44,314 | ) | |||||
Hedged Plus | 44,375 | (6,773 | ) | |||||||
Hedged Core | 26,262 | (2,852 | ) | |||||||
Master Neutral | 56,102 | (25,586 | ) | |||||||
The following Funds utilized short sales proceeds and incurred financing charges to finance purchases of long securities in order to accomplish the Funds’ respective investment objectives. A financing fee is charged to the Funds based on the Federal Funds rate plus an agreed upon spread. These fees are included in dividends and fees on securities sold short on the Statement of Operations and are as follows for the year ended September 30, 2020:
| Short Sales (Deposits) Proceeds | Financing Charges | |||||||||
Neutral 500 | $ | 779,158 | $ | 23,483 | ||||||
Hedged Plus | 6,814,449 | 26,881 | ||||||||
Hedged Core | 3,492,149 | 5,509 | ||||||||
Master Neutral | 48,024 | 2,368 | ||||||||
Swap Agreements — A swap agreement is a bilateral financial instrument that involves the exchange of cash flows between two parties on specified dates (settlement dates), where the cash flows are based on valuation changes to market referenced securities. The nominal amount on which the cash flows are calculated is called the notional amount.
Swap agreements may increase or decrease the overall volatility of the investments of a Fund and its share price. The performance of swap agreements will be affected by a change in the market value of the referenced underlying securities that determine the amounts of payments due to and from a Fund. If a swap agreement calls for payments by a Fund, the Fund must be prepared to make such payments when due. In addition, if the counterparty’s creditworthiness declined, the value of a swap agreement would be likely to decline, potentially resulting in losses.
Generally, swap agreements have a fixed maturity date that will be agreed upon by the parties. The agreement can be terminated before the maturity date, in whole or part, under certain circumstances, such as default by one of the parties or insolvency, among others, and can be transferred by a party only with the prior written consent of the other party. A Fund may be able to eliminate its exposure under a swap agreement either by assignment or by other disposition, or by entering into an offsetting swap agreement with the same party or a similarly creditworthy party. If the counterparty is unable to meet its obligations under the contract, declares bankruptcy, defaults or becomes insolvent, a Fund may not be able to recover the money it expected to receive under the swap agreement. A Fund will not enter into any swap agreement unless the Adviser believes that the counterparty to the transaction is creditworthy.
A swap agreement can be a form of leverage, which can magnify a Fund’s gains or losses. In order to reduce the risk associated with leveraging, a Fund may cover its current obligations under swap agreements according to guidelines established by the SEC. If a Fund enters into a swap agreement on a net basis, it will segregate assets with a daily value at least equal to the excess, if any, of a Fund’s accrued obligations under the swap agreement over the accrued amount a Fund is entitled to receive under the agreement. If a Fund enters into a swap agreement on other than a net basis, it will segregate assets with a value equal to the full amount of a Fund’s accrued obligations under the swap agreement.
Total Return Swaps: Total return swaps are contracts in which both parties agree to make payments of the total return from a reference instrument during a specified period. The total return includes appreciation or depreciation on the underlying asset, plus any interest or dividend accruals or payments. The unrealized appreciation or depreciation also includes interest charges and credits (“financing fees”) related to the notional values of the long and short positions and cash balances within the swap. These interest charges and credits are based on a specified benchmark rate, such as the U.S. effective federal funds rate (“EFFR”). Payments under the swap are based upon an agreed upon principal amount but, since the principal amount is not exchanged, it represents neither an asset nor a liability to either counterparty, and is referred to as notional. Total return swaps are marked to market daily using different sources, including quotations from counterparties, pricing services, brokers or market makers. The unrealized appreciation or depreciation
86
GOTHAM FUNDS
Notes to Financial Statements (Continued)
September 30, 2020
related to the change in the valuation of the notional amount of the swap is combined with the amount due to or from the Fund at termination or settlement. The primary risks associated with total return swaps are credit risks (if the counterparty fails to meet its obligations) and market risk (if there is no liquid market for the swap or unfavorable changes occur to the underlying reference instrument). As of and for the year ended September 30, 2020, only Short Strategies held total return swaps.
For the year ended September 30, 2020, the quarterly average volume of the total return swaps for the following Fund was as follows:
| Notional Amount | |||||
Short Strategies | $ | (49,210,101 | ) | ||
Counterparty Risk — During the year ended September 30, 2020, Short Strategies was subject to counterparty risk. Certain of the derivatives entered into by the Fund may not be traded on an exchange but instead will be privately negotiated in the over-the-counter market. This means that these instruments are traded between counterparties based on contractual relationships. Relying on a counterparty exposes the Fund to the risk that a counterparty will not settle a transaction in accordance with its terms and conditions because of a dispute over the terms of the contract (whether or not bona fide) or because of a credit or liquidity problem, thus causing the Fund to suffer a loss. If a counterparty defaults on its payment obligations to the Fund, this default will cause the value of an investment in the Fund to decrease. In addition, to the extent the Fund deals with a limited number of counterparties, it will be more susceptible to the credit risks associated with those counterparties. The Fund is neither restricted from dealing with any particular counterparty nor from concentrating any or all of its transactions with one counterparty. The ability of the Fund to transact business with any one or number of counterparties and the absence of a regulated market to facilitate settlement may increase the potential for losses by the Fund.
The Fund is subject to the risk that issuers of the instruments in which it invests and trades may default on their obligations, and that certain events may occur that have an immediate and significant adverse effect on the value of those instruments. There can be no assurance that an issuer will not default, or that an event that has an immediate and significant adverse effect on the value of an instrument will not occur, and that the Fund will not sustain a loss on a transaction as a result.
Liquidity Risk — During the year ended September 30, 2020, Short Strategies was subject to liquidity risk. The Fund may be subject to liquidity risk primarily due to investments in derivatives. The Fund may invest up to 15% of its net assets in illiquid securities or instruments. Certain derivatives, such as swaps, forward contracts and options may not be readily marketable and, therefore, may be deemed to be illiquid. An asset is not readily marketable if it cannot be sold within seven business days in the ordinary course of business for approximately the amount at which it is valued. Investments in illiquid assets involve the risk that the Fund may be unable to sell the asset or sell it at a reasonable price. In addition, the Fund may be required to liquidate positions or close out derivatives on unfavorable terms at a time contrary to the interests of the Fund in order to raise cash to pay redemptions.
An investment in derivatives is also subject to the risk that the Fund may not be able to terminate the derivatives effective on whatever date it chooses, or that the settlement of any early termination may depend on subsequent market movements. As a result, the Fund may be exposed to the risk of additional losses due to such delays.
Master Netting Agreement — During year ended September 30, 2020, Short Strategies was subject to a Master Netting agreement. In order to define its contractual rights and to secure rights that will help mitigate its counterparty risk, the Fund has entered into an International Swaps and Derivatives Association, Inc. Master Agreement (“ISDA Master Agreement”). An ISDA Master Agreement is a bilateral agreement between the Fund and the counterparty that governs certain OTC derivatives and typically contains, among other things, collateral posting terms and netting provisions in the event of a default and/or termination event. Under an ISDA Master Agreement, the Fund may, under certain circumstances, offset with the counterparty certain derivative financial instruments’ payables and/or receivables with collateral held and/or posted and create one single net payment. The provisions of the ISDA Master Agreement typically permit a single net payment in the event of default including the bankruptcy or insolvency of the counterparty. Bankruptcy or insolvency laws of a particular jurisdiction may restrict or prohibit the right of offset in bankruptcy, insolvency or other events. In addition, certain ISDA Master Agreements allow counterparties to terminate derivative contracts prior to maturity in the event the Fund’s net assets decline by a stated percentage or the Fund fail to meet the terms of its ISDA Master Agreements. The result would cause the Fund to accelerate payment of any net liability owed to the counterparty.
87
GOTHAM FUNDS
Notes to Financial Statements (Continued)
September 30, 2020
LIBOR Phase-out Risk — The United Kingdom’s Financial Conduct Authority, which regulates London Interbank Overnight Rates (“LIBOR”), has announced plans to phase out the use of LIBOR by the end of 2021. There remains uncertainty regarding the future use of LIBOR and the nature of any replacement rate. The transition process away from LIBOR may involve, among other things, increased volatility or illiquidity in markets for instruments that currently rely on LIBOR. The transition process may also result in a reduction in the value of certain instruments held by a Fund or reduce the effectiveness of related Fund transactions such as hedges. Volatility, the potential reduction in value, and/or the hedge effectiveness of financial instruments may be heightened for financial instruments that do not include fallback provisions that address the cessation of LIBOR. Any potential effects of the transition away from LIBOR on the Fund or on financial instruments in which a Fund invests, as well as other unforeseen effects, could result in losses to the Fund.
Collateral Requirements — During the year ended September 30, 2020, Short Strategies was subject to collateral requirements. For derivatives traded under an ISDA Master Agreement, the collateral requirements are typically calculated by netting the mark-to-market amount for each transaction under such agreement and comparing that amount to the value of any collateral currently pledged by the Fund and the counterparty. Cash collateral that has been pledged to cover obligations of the Fund and cash collateral received from the counterparty, if any, is reported separately on the Statement of Assets and Liabilities as cash pledged as collateral and cash received as collateral, respectively. Non-cash collateral pledged by the Fund, if any, is noted in the Schedule of Investments. Generally, the amount of collateral due from or to a counterparty is subject to a certain minimum transfer amount threshold before a transfer is required, which is determined at the close of business of the Fund. Any additional required collateral is delivered to/pledged by the Fund on the next business day. Typically, the counterparty is not permitted to sell, re-pledge or use cash and non-cash collateral it receives. The Fund generally agrees not to use non-cash collateral that they receive but may, absent default or certain other circumstances defined in the underlying ISDA Master Agreement, be permitted to use cash collateral received. In such cases, interest may be paid pursuant to the collateral arrangement with the counterparty. To the extent amounts due to the Fund from its counterparties are not fully collateralized, they bear the risk of loss from counterparty non-performance. Likewise, to the extent the Fund has delivered collateral to a counterparty and stands ready to perform under the terms of its agreement with such counterparty, it bears the risk of loss from a counterparty in the amount of the value of the collateral in the event the counterparty fails to return such collateral. Based on the terms of agreements, collateral may not be required for all derivative contracts. For financial reporting purposes, the Fund does not offset derivative assets and derivative liabilities that are subject to netting arrangements, if any, in the Statement of Assets and Liabilities.
| Gross Amount Not Offset in the | ||||||||||||||||||||||||||||||
| Statement of Assets and Liabilities | ||||||||||||||||||||||||||||||
| Gross Amounts of Recognized Assets/(Liabilities) | Gross Amounts Offset in the Statement of Assets and Liabilities | Net Amounts of Assets Presented in the Statement of Assets and Liabilities | Financial Instruments | Collateral Pledged/(Received)* | Net Amount** | |||||||||||||||||||||||||
Short Strategies | $ | (701,222 | ) | $ | — | $ | (701,222 | ) | $ | — | $ | 701,222 | $ | — | ||||||||||||||||
| * | Amount disclosed is limited to the amount of assets presented in each Statement of Assets and Liabilities. Actual collateral pledged/(received) may be more than the amount shown. |
| ** | Net amount represents the net receivable from the counterparty in the event of a default. |
88
GOTHAM FUNDS
Notes to Financial Statements (Continued)
September 30, 2020
2. Transactions with Related Parties and Other Service Providers
Gotham Asset Management, LLC (“Gotham” or the “Adviser”) serves as investment adviser to the Funds pursuant to an investment advisory agreement with the Trust (the “Advisory Agreement”). For its services as the investment adviser, each Fund pays the Adviser a fee, which is computed and accrued daily and paid monthly, at an annual rate based on average daily net assets of each Fund as shown in the table below:
Neutral 500 | 1.35 | % | |||
Hedged Plus | 1.00 | % | |||
Hedged Core | 0.70 | % | |||
Short Strategies | 1.35 | % | |||
Master Neutral(1) | 0.29 | % | |||
ESG Large Value | 0.75 | % |
| (1) | For Master Neutral (the “Fund”), effective February 1, 2019, Gotham has contractually agreed to waive its investment advisory fee at an annual rate in the amount of 0.30% for the period through January 31, 2021 (the “Advisory Fee Waiver”). Gotham is entitled to receive an investment advisory fee of 0.75% of the Fund’s average net assets excluding assets invested in other mutual funds advised by Gotham (each an “underlying fund” and collectively, the “underlying funds”), effectively reducing the investment advisory fee from 0.75% to 0.45%. Gotham does not receive an investment advisory fee from the Fund on assets invested in an underlying fund, but does receive an investment advisory fee from each underlying fund as investment adviser to such funds. The Fund will pay an investment advisory fee on directly invested assets, in effect during the period ended September 30, 2020. |
The Adviser contractually agreed to reduce its investment advisory fee and/or reimburse certain expenses of each Fund to the extent necessary to ensure that the Fund’s total operating expenses (exclusive of taxes, “Acquired Fund Fees and Expenses,” dividend and interest expense on securities sold short, interest, extraordinary items, and brokerage commissions and for Master Neutral, exclusive of management fees, if any), do not exceed the percentages set forth in the table below (on an annual basis) of each Fund’s average daily net assets (the “Expense Limitation”). The Expense Limitation will remain in place until the termination date set forth below, unless the Board approves its earlier termination. The table below reflects the Expense Limitation amounts, as a percentage of average daily net assets, in effect during the year ended September 30, 2020.
| Termination Date | ||||||||
Neutral 500 | 1.35 | % | January 31, 2021 | |||||
Hedged Plus | 1.15 | % | January 31, 2021 | |||||
Hedged Core | 0.85 | % | January 31, 2021 | |||||
Short Strategies | 1.35 | % | January 31, 2021 | |||||
Master Neutral(1) | 0.00 | % | January 31, 2021 | |||||
ESG Large Value | 0.75 | % | January 31, 2021 | |||||
| (1) | Per the Expense Limitation agreement for the Fund, the expenses subject to the expense limitation are also exclusive of management fees, if any. |
For the year ended September 30, 2020, investment advisory fees accrued and waivers were as follows:
| Gross Advisory Fee | Waiver/ Reimbursements | Net Advisory Fee/ (Reimbursement) | |||||||||||||
Neutral 500 | $ | 93,735 | $ | (85,202 | ) | $ | 8,533 | ||||||||
Hedged Plus | 47,465 | (109,329 | ) | (61,864 | ) | ||||||||||
Hedged Core | 30,386 | (84,728 | ) | (54,342 | ) | ||||||||||
Short Strategies | 438,067 | (172,690 | ) | 265,377 | |||||||||||
Master Neutral | 38,246 | (202,376 | ) | (164,130 | ) | ||||||||||
ESG Large Value | 8,671 | (66,060 | ) | (57,389 | ) | ||||||||||
For all Funds, except for Short Strategies and Master Neutral, the Adviser is entitled to recover, subject to approval by the Board, such amounts reduced or reimbursed for a period of up to three (3) years from the date on which the Adviser reduced its compensation and/or assumed expenses for the Fund. The Adviser is permitted to seek reimbursement from the Fund, subject to certain limitations,
89
GOTHAM FUNDS
Notes to Financial Statements (Continued)
September 30, 2020
for fees it waived and Fund expenses it paid to the extent the total annual fund expenses do not exceed the limits described above or any lesser limits in effect at the time of reimbursement. No recoupment will occur unless a Fund’s expenses are below the Expense Limitation amount. As of September 30, 2020, the amounts of potential reimbursement from the Funds to the Adviser are as follows:
| Expiration 09/30/2021 | Expiration 09/30/2022 | Expiration 09/30/2023 | |||||||||||||
Neutral 500 | $ | 53,846 | $ | 87,928 | $ | 85,202 | |||||||||
Hedged Plus | 71,946 | 120,723 | 109,329 | ||||||||||||
Hedged Core | 65,442 | 76,059 | 84,728 | ||||||||||||
ESG Large Value | N/A | 50,745 | 66,060 | ||||||||||||
Other Service Providers
The Bank of New York Mellon (“BNY Mellon”) serves as administrator and custodian for the Funds. For providing administrative and accounting services, BNY Mellon is entitled to receive a monthly fee equal to an annual percentage rate of the Funds’ average daily net assets and is subject to certain minimum monthly fees. For providing certain custodial services, BNY Mellon is entitled to receive a monthly fee, subject to certain minimum, and out of pocket expenses.
BNY Mellon Investment Servicing (US) Inc. (the “Transfer Agent”) provides transfer agent services to the Funds. The Transfer Agent is entitled to receive a monthly fee, subject to certain minimum, and out of pocket expenses.
The Trust, on behalf of the Funds, has entered into agreements with financial intermediaries to provide recordkeeping, processing, shareholder communications and other services to customers of the intermediaries investing in the Funds and has agreed to compensate the intermediaries for providing those services. The fees incurred by the Funds for these services are included in transfer agent fees in the Statement of Operations.
Pershing LLC provides prime brokerage services to the Funds under an Agreement for Prime Brokerage Services. Pershing LLC is a wholly owned subsidiary of The Bank of New York Mellon Corporation.
Foreside Funds Distributors LLC (the “Underwriter”) provides principal underwriting services to the Funds pursuant to an underwriting agreement between the Trust and the Underwriter.
Trustees and Officers
The Trust is governed by its Board of Trustees. The Trustees receive compensation in the form of an annual retainer and per meeting fees for their services to the Trust. An employee of BNY Mellon serves as the Secretary of the Trust and is not compensated by the Funds or the Trust.
JW Fund Management LLC (“JWFM”) provides a Principal Executive Officer and Principal Financial Officer, respectively, to the Trust. Effective October 1, 2020, Alaric Compliance Services LLC (“Alaric”) provides the Trust with a Chief Compliance Officer and an Anti-Money Laundering Officer. Prior to October 1, 2020, Duff & Phelps, LLC provided the Trust with a Chief Compliance Officer and an Anti-Money Laundering Officer. JWFM and Alaric are compensated for their services provided to the Trust.
90
GOTHAM FUNDS
Notes to Financial Statements (Continued)
September 30, 2020
Investment in Affiliated Funds
The following table lists each issuer owned by Master Neutral that may be deemed an “affiliated company” under the 1940 Act, as well as transactions that occurred in the security of such issuers during the year ended September 30, 2020:
Master Neutral | ||||||||||||||||||||||||||||||||||||||||
Name of Issuer | Value at 9/30/19 | Purchase Cost | Sales Proceeds | Net Realized Loss | Change in Unrealized Appreciation/ (Depreciation) | Value at 9/30/20 | Shares Held at 9/30/20 | Dividend Income | ||||||||||||||||||||||||||||||||
Neutral 500 | $ | 6,989,950 | $ | 467,090 | $ | 6,029,803 | $ | (524,844 | ) | $ | (112,834 | ) | $ | 789,559 | 75,773 | $ | 79,267 | |||||||||||||||||||||||
Gotham Neutral Fund | 4,931,764 | 275,290 | 4,144,309 | (413,423 | ) | (98,970 | ) | 550,352 | 59,886 | — | ||||||||||||||||||||||||||||||
|
|
|
|
|
|
|
|
|
| |||||||||||||||||||||||||||||||
Total | $ | 11,921,714 | $ | (938,267 | ) | $ | (211,804 | ) | $ | 1,339,911 | $ | 79,267 | ||||||||||||||||||||||||||||
|
|
|
|
|
|
|
|
|
| |||||||||||||||||||||||||||||||
3. Investment in Securities
For the year ended September 30, 2020 for all Funds, aggregated purchases and sales of investment securities (excluding short-term investments) of the Funds were as follows:
| Purchases | Sales | |||||||
Neutral 500 | $ | 28,141,883 | $ | 36,055,202 | ||||
Hedged Plus | 37,986,648 | 27,803,252 | ||||||
Hedged Core | 23,321,488 | 14,590,384 | ||||||
Short Strategies | 219,303,071 | 220,729,520 | ||||||
Master Neutral | 20,298,845 | 34,502,088 | ||||||
ESG Large Value | 3,268,492 | 3,328,261 | ||||||
For the year ended September 30, 2020, Master Neutral had purchases and sales of U.S. Government securities in the amount of $200,602 and $0, respectively.
4. Capital Share Transactions
For the year ended September 30, 2020 and the period ended September 30, 2019, transactions in capital shares of the Funds (authorized shares unlimited) were as follows:
| For the Year Ended September 30, 2020 | For the Period Ended September 30, 2019 | |||||||||||||||
| Shares | Value | Shares | Value | |||||||||||||
Neutral 500: | ||||||||||||||||
Institutional Class Shares: | ||||||||||||||||
Sales | 35,785 | $ | 385,431 | 540,420 | $ | 6,165,369 | ||||||||||
Reinvestments | 9,603 | 109,182 | 10,022 | 116,253 | ||||||||||||
Redemption Fees* | — | — | — | — | ||||||||||||
Redemptions | (582,768 | ) | (6,057,326 | ) | (258,857 | ) | (2,901,980 | ) | ||||||||
|
|
|
|
|
|
|
| |||||||||
Net Increase (Decrease) | (537,380 | ) | $ | (5,562,713 | ) | 291,585 | $ | 3,379,642 | ||||||||
|
|
|
|
|
|
|
| |||||||||
91
GOTHAM FUNDS
Notes to Financial Statements (Continued)
September 30, 2020
| For the Year Ended September 30, 2020 | For the Period Ended September 30, 2019 | |||||||||||||||
| Shares | Value | Shares | Value | |||||||||||||
Hedged Plus: | ||||||||||||||||
Institutional Class Shares: | ||||||||||||||||
Sales | 639,213 | $ | 6,650,000 | 26,091 | $ | 319,885 | ||||||||||
Reinvestments | 15,608 | 174,499 | 25,673 | 284,968 | ||||||||||||
Redemption Fees* | — | — | — | — | ||||||||||||
Redemptions | (44,569 | ) | (496,753 | ) | (2 | ) | (20 | ) | ||||||||
|
|
|
|
|
|
|
| |||||||||
Net Increase | 610,252 | $ | 6,327,746 | 51,762 | $ | 604,833 | ||||||||||
|
|
|
|
|
|
|
| |||||||||
Hedged Core: | ||||||||||||||||
Institutional Class Shares: | ||||||||||||||||
Sales | 563,090 | $ | 5,972,409 | — | $ | — | ||||||||||
Reinvestments | 13,822 | 152,049 | 28,366 | 299,822 | ||||||||||||
Redemption Fees* | — | — | — | — | ||||||||||||
Redemptions | (31,260 | ) | (345,827 | ) | — | — | ||||||||||
|
|
|
|
|
|
|
| |||||||||
Net Increase | 545,652 | $ | 5,778,631 | 28,366 | $ | 299,822 | ||||||||||
|
|
|
|
|
|
|
| |||||||||
Short Strategies: | ||||||||||||||||
Institutional Class Shares: | ||||||||||||||||
Sales | 2,164,344 | $ | 17,640,696 | 3,598,015 | $ | 34,168,627 | ||||||||||
Reinvestments | 9,232 | 76,810 | 4,981 | 47,319 | ||||||||||||
Redemption Fees* | — | 404 | — | 1,287 | ||||||||||||
Redemptions | (754,740 | ) | (6,177,086 | ) | (125,977 | ) | (1,110,549 | ) | ||||||||
|
|
|
|
|
|
|
| |||||||||
Net Increase | 1,418,836 | $ | 11,540,824 | 3,477,019 | $ | 33,106,684 | ||||||||||
|
|
|
|
|
|
|
| |||||||||
Master Neutral: | ||||||||||||||||
Institutional Class Shares: | ||||||||||||||||
Sales | 228,812 | $ | 2,204,500 | 1,723,432 | $ | 17,593,505 | ||||||||||
Reinvestments | 20,351 | 205,134 | 2,600 | 26,546 | ||||||||||||
Redemption Fees* | — | — | — | — | ||||||||||||
Redemptions | (1,914,603 | ) | (18,058,230 | ) | (209,699 | ) | (2,114,565 | ) | ||||||||
|
|
|
|
|
|
|
| |||||||||
Net Increase (Decrease) | (1,665,440 | ) | $ | (15,648,596 | ) | 1,516,333 | $ | 15,505,486 | ||||||||
|
|
|
|
|
|
|
| |||||||||
ESG Large Value:(1) | ||||||||||||||||
Institutional Class Shares: | ||||||||||||||||
Sales | — | $ | — | 100,000 | $ | 1,000,000 | ||||||||||
Reinvestments | 3,943 | 47,671 | — | — | ||||||||||||
Redemption Fees* | — | — | — | — | ||||||||||||
Redemptions | — | — | — | — | ||||||||||||
|
|
|
|
|
|
|
| |||||||||
Net Increase | 3,943 | $ | 47,671 | 100,000 | $ | 1,000,000 | ||||||||||
|
|
|
|
|
|
|
| |||||||||
| * | There is a 1.00% redemption fee that may be charged on shares redeemed within 30 days of purchase. The redemption fees are retained by each Fund for the benefit of the remaining shareholders and recorded as paid-in-capital. |
| (1) | The Fund incepted on December 28, 2018. The Fund commenced operations on December 31, 2018. |
92
GOTHAM FUNDS
Notes to Financial Statements (Continued)
September 30, 2020
Significant Shareholders
As of September 30, 2020, the below Funds had shareholders that held 10% or more of the outstanding shares of the respective Fund. Transactions by these shareholders may have a material impact on the Fund.
Neutral 500 | ||||
Affiliated Fund | 27 | % | ||
Non-affiliated Shareholders | 73 | % | ||
Hedged Plus | ||||
Non-affiliated Shareholders | 96 | % | ||
Hedged Core | ||||
Affiliated Fund | 39 | % | ||
Non-affiliated Shareholders | 61 | % | ||
Short Strategies | ||||
Affiliated Fund | 3 | % | ||
Affiliated Shareholders | 3 | % | ||
Master Neutral | ||||
Non-affiliated Shareholders | 84 | % | ||
ESG Large Value | ||||
Affiliated Shareholders | 100 | % |
5. Securities Lending
All Funds may lend securities to financial institutions, such as broker-dealers, and are required to be secured continuously by collateral in cash, cash equivalents, letter of credit or U.S. Government securities maintained on a current basis at an amount at least equal to the market value of the securities loaned. Cash collateral received, pursuant to investment guidelines established by the Funds and approved by the Board, is invested in short-term investments and/or securities consistent with the Fund’s investment objective. Securities purchased with cash collateral are included in market value of securities designated as collateral for securities on loan on the Statements of Assets and Liabilities. All such investments are made at the risk of the Funds and, as such, the Funds are liable for investment losses. The Funds pay a fee on the cash collateral received by the Funds at a rate equal to the Federal Funds (Open) rate plus 40 basis points with respect to the cash collateral received on those securities on loan that have a rebate that equals or exceeds the greater of either the Federal Funds (Open) rate minus 10 basis points or zero. These fees are included in the fees on cash collateral on the Statements of Operations. Such loans would involve risks of delay in receiving additional collateral in the event the value of the collateral decreased below the value of the securities loaned or of delay in recovering the securities loaned or even loss of rights in the collateral should the borrower of the securities fail financially. However, loans will be made only to borrowers deemed by the Adviser to be of good standing and only when, in the Adviser’s judgment, the income to be earned from the loans justifies the attendant risks. Any loans of a Fund’s securities will be fully collateralized and marked to market daily. When the collateral falls below specified amounts, the lending agent will use its best effort to obtain additional collateral on the next business day to meet required amounts under the security lending agreement. Securities on loan are not used as collateral for swaps or as collateral for short securities, if any. During the year ended September 30, 2020, the Funds listed below each had securities lending programs. The market value of securities on loan and cash collateral received as of September 30, 2020 and the income generated from the programs during the year ended September 30, 2020, with respect to such loans were as follows:
| Market Value of Securities Loaned | Cash Collateral Received | Market Value of Non-cash Collateral | Income Received from Securities Lending | |||||||||||||||||
Neutral 500 | $ 4,810 | $312 | $ 4,650 | $ 48 | ||||||||||||||||
Hedged Plus | 863 | 894 | — | 27 | ||||||||||||||||
Hedged Core | 348,125 | 178 | 356,729 | 125 | ||||||||||||||||
Securities lending transactions are entered into by the Funds under a Master Securities Lending Agreement (“MSLA”) which permits the Funds, under certain circumstances including an event of default (such as bankruptcy or insolvency), to offset amounts payable by the Funds to the same counterparty against amounts to be received from that counterparty and create one single net
93
GOTHAM FUNDS
Notes to Financial Statements (Continued)
September 30, 2020
payment due to or from the Funds. The following table is a summary of each of the Fund’s open securities lending transactions which are subject to a MSLA as of September 30, 2020:
| Gross Amount Not Offset in the Statement of Assets and Liabilities | ||||||||||||||||||||||||||||||
| Gross Amounts of Recognized Assets | Gross Amounts Offset in the Statement of Assets and Liabilities | Net Amounts of Assets Presented in the Statement of Assets and Liabilities | Financial Instruments | Cash and Non-Cash Collateral Received* | Net Amount** | |||||||||||||||||||||||||
Neutral 500 | $ | 4,810 | $ | — | $ | 4,810 | $ | — | $ | (4,810 | ) | $ | — | |||||||||||||||||
Hedged Plus | 863 | — | 863 | — | (863 | ) | — | |||||||||||||||||||||||
Hedged Core | 348,125 | — | 348,125 | — | (348,125 | ) | — | |||||||||||||||||||||||
| * | Amount disclosed is limited to the amount of assets presented in each Statement of Assets and Liabilities. Actual collateral received may be more than the amount shown. |
| ** | Net amount represents the net receivable from the counterparty in the event of a default. |
6. Federal Tax Information
The Funds have followed the authoritative guidance on accounting for and disclosure of uncertainty in tax positions, which requires the Funds to determine whether a tax position is more likely than not to be sustained upon examination, including resolution of any related appeals or litigation processes, based on the technical merits of the position. The Funds had determined that there was no effect on the financial statements from following this authoritative guidance. In the normal course of business, the Funds are subject to examination by federal, state and local jurisdictions, where applicable, for tax years for which applicable statutes of limitations have not expired.
Distributions are determined in accordance with federal income tax regulations, which may differ in amount or character from net investment income and realized gains for financial reporting purposes. Accordingly, the character of distributions and composition of net assets for tax purposes may differ from those reflected in the accompanying financial statements. To the extent these differences are permanent, such amounts are reclassified within the components of net assets based on the tax treatment; temporary differences do not require reclassifications. Net assets were not affected by these adjustments. The following permanent differences as of September 30, 2020, were primarily attributed to non-deductible expenses, net operating loss, return of capital, redesignation of dividends paid and capitalized dividends on short sales were reclassified among the following accounts:
| Increase/(Decrease) Total Distributable Earnings | Increase/(Decrease) Additional Paid-In Capital | |||||||||
Neutral 500 | $ | 295 | $ | (295 | ) | |||||
Short Strategies | 8,407 | (8,407 | ) | |||||||
The tax character of distributions paid by the Funds during the year ended September 30, 2020 were as follows:
| Ordinary Income Dividend | Long-Term Capital Gain Dividend | Return of Capital | |||||||||||||
Neutral 500 | $ | 109,182 | $ | — | $ | — | |||||||||
Hedged Plus | 30,340 | 144,159 | — | ||||||||||||
Hedged Core | 39,601 | 112,448 | — | ||||||||||||
Short Strategies | 70,055 | — | 8,407 | ||||||||||||
Master Neutral | 205,134 | — | — | ||||||||||||
ESG Large Value | 95,326 | 16 | — | ||||||||||||
94
GOTHAM FUNDS
Notes to Financial Statements (Continued)
September 30, 2020
The tax character of distributions paid by the Funds during the year ended September 30, 2019 were as follows:
| Ordinary Income Dividend | Long-Term Capital Gain Dividend | Return of Capital | |||||||||||||
Neutral 500 | $ | 35,534 | $ | 80,719 | $ | — | |||||||||
Hedged Plus | 13,994 | 270,974 | — | ||||||||||||
Hedged Core | 13,625 | 286,197 | — | ||||||||||||
Short Strategies | 47,319 | — | — | ||||||||||||
Master Neutral | 26,546 | — | — | ||||||||||||
Distributions from net investment income and short-term capital gains are treated as ordinary income for federal income tax purposes.
As of September 30, 2020, the components of distributable earnings on a tax basis were as follows:
| Capital Loss Carryforward | Undistributed Ordinary Income | Undistributed Long-Term Gain | Unrealized Appreciation/ (Depreciation) | Qualified Late-Year Losses | Other Temporary Differences | |||||||||||||||||||||||||
Neutral 500 | $ | (178,688 | ) | $ | 18,391 | $ | — | $ | 479,141 | $ | (793,745 | ) | $ | — | ||||||||||||||||
Hedged Plus | — | 52,838 | — | 548,307 | (377,514 | ) | — | |||||||||||||||||||||||
Hedged Core | — | 48,368 | 18,962 | 633,732 | — | — | ||||||||||||||||||||||||
Short Strategies | (8,114,687 | ) | — | — | (779,292 | ) | — | — | ||||||||||||||||||||||
Master Neutral | (1,540,817 | ) | 3,739 | — | 74,710 | — | — | |||||||||||||||||||||||
ESG Large Value | — | 9,437 | 47,496 | 66,333 | — | — | ||||||||||||||||||||||||
The differences between the book and tax basis components of distributable earnings relate primarily to the timing and recognition of income and gains for federal income tax purposes. The other temporary differences as of September 30, 2020 were primarily attributed to wash sales on unsettled short sales, deferral of loss on unsettled trades, realized gain/loss on unsettled swaps, net dividend receivable and payable on unsettled swaps, wash sales loss outstanding, qualified late year losses deferred and capital loss carryforwards not yet utilized. Foreign currency and short-term capital gains are reported as ordinary income for federal income tax purposes.
As of September 30, 2020, the federal tax cost, aggregate gross unrealized appreciation and depreciation of securities held by the Funds were as follows:
| Federal Tax Cost | Unrealized Appreciation | Unrealized (Depreciation) | Net Unrealized Appreciation/ (Depreciation) | |||||||||||||||||
Neutral 500 | $ | 3,324,475 | $ | 1,426,711 | $ | (947,570 | ) | $ | 479,141 | |||||||||||
Hedged Plus | 15,366,871 | 2,089,466 | (1,541,159 | ) | 548,307 | |||||||||||||||
Hedged Core | 11,554,719 | 1,282,795 | (649,063 | ) | 633,732 | |||||||||||||||
Short Strategies | 36,231,120 | 4,308,296 | (5,087,588 | ) | (779,292 | ) | ||||||||||||||
Master Neutral | 2,153,431 | 274,509 | (199,799 | ) | 74,710 | |||||||||||||||
ESG Large Value | 1,086,207 | 149,043 | (82,710 | ) | 66,333 | |||||||||||||||
95
GOTHAM FUNDS
Notes to Financial Statements (Concluded)
September 30, 2020
Pursuant to federal income tax rules applicable to regulated investment companies, the Funds may elect to treat certain capital losses between November 1 and September 30 and late year ordinary losses ((i) ordinary losses between January 1 and September 30 or (ii) specified ordinary losses between November 1 and September 30) as occurring on the first day of the following tax year. For the period ended September 30, 2020, any amount of losses elected within the tax return will not be recognized for federal income tax purposes until October 1, 2020. For the year ended September 30, 2020, the Funds deferred to October 1, 2020 the following losses:
| Late-Year Ordinary Losses Deferral | Short-Term Capital Loss Deferral | Long-Term Capital Loss Deferral | |||||||||||||
Neutral 500 | $ | — | $ | 1,789,918 | $ | (996,173 | ) | ||||||||
Hedged Plus | — | 769,872 | (392,358 | ) | |||||||||||
Accumulated capital losses represent net capital loss carryforwards as of September 30, 2020 that may be available to offset future realized capital gains and thereby reduce future capital gains distributions. For Short Strategies, the future use of available capital loss carryforwards may be subject to limitation under Internal Revenue Code Section 382. The Funds are permitted to carry forward capital losses for an unlimited period. Capital losses that are carried forward will retain their character as either short-term or long-term capital losses. As of September 30, 2020, the following Funds had long-term and short-term capital loss carryforwards in the following amounts:
| Capital Losses Carryforwards | |||||
Neutral 500 | $ | 178,688 | |||
Short Strategies | 8,114,687 | ||||
Master Neutral | 1,540,817 | ||||
For the year ended September 30, 2020, the Funds did not utilize capital losses.
7. Subsequent Events
Management has evaluated the impact of all subsequent events on the Funds through the date the financial statements were available to be issued, and has determined that there was the following subsequent event:
On November 3, 2020, the Board approved a plan to liquidate and terminate Master Neutral, which is expected to occur on or about December 15, 2020.
96
Report of Independent Registered Public Accounting Firm
To the Board of Trustees of FundVantage Trust and Shareholders of each of the six funds listed in the table below
Opinions on the Financial Statements
We have audited the accompanying statements of assets and liabilities, including the portfolios of investments, of each of the funds listed in the table below (six of the funds constituting FundVantage Trust, referred to hereafter collectively as the “Funds”) as of September 30, 2020, the related statements of operations and of changes in net assets for each of the periods indicated in the table below and for the three funds designated with an asterisk in the table below, the statements of cash flows for the period indicated in the table below, including the related notes, and the financial highlights for each of the periods indicated therein (collectively referred to as the “financial statements”). In our opinion, the financial statements present fairly, in all material respects, the financial position of each of the Funds as of September 30, 2020, the results of each of their operations, the changes in each of their net assets, and for the three funds designated with an asterisk in the table below, the results of each of their cash flows for the periods indicated in the table below and each of the financial highlights for each of the periods indicated therein in conformity with accounting principles generally accepted in the United States of America.
Gotham Neutral 500 Fund*, Gotham Hedged Plus Fund* and Gotham Hedged Core Fund* | Statements of operations and cash flows for the year ended September 30, 2020 and the statements of changes in net assets for each of the two years in the period ended September 30, 2020 | |
Gotham Short Strategies Fund and Gotham Master Neutral Fund | Statements of operations for the year ended September 30, 2020 and the statements of changes in net assets for each of the two years in the period ended September 30, 2020 | |
Gotham ESG Large Value Fund | Statement of operations for the year ended September 30, 2020 and the statement of changes in net assets for the year ended September 30, 2020 and for the period December 28, 2018 (inception) through September 30, 2019 |
Basis for Opinions
These financial statements are the responsibility of the Funds’ management. Our responsibility is to express an opinion on the Funds’ financial statements based on our audits. We are a public accounting firm registered with the Public Company Accounting Oversight Board (United States) (PCAOB) and are required to be independent with respect to the Funds in accordance with the U.S. federal securities laws and the applicable rules and regulations of the Securities and Exchange Commission and the PCAOB.
We conducted our audits of these financial statements in accordance with the standards of the PCAOB. Those standards require that we plan and perform the audit to obtain reasonable assurance about whether the financial statements are free of material misstatement, whether due to error or fraud.
97
GOTHAM FUNDS
Report of Independent Registered Public Accounting Firm (Concluded)
Our audits included performing procedures to assess the risks of material misstatement of the financial statements, whether due to error or fraud, and performing procedures that respond to those risks. Such procedures included examining, on a test basis, evidence regarding the amounts and disclosures in the financial statements. Our audits also included evaluating the accounting principles used and significant estimates made by management, as well as evaluating the overall presentation of the financial statements. Our procedures included confirmation of securities owned as of September 30, 2020 by correspondence with the custodian, transfer agent and brokers; when replies were not received from brokers, we performed other auditing procedures. We believe that our audits provide a reasonable basis for our opinions.
/s/ PricewaterhouseCoopers LLP
Philadelphia, PA
November 23, 2020
We have served as the auditor of one or more investment companies in Gotham Asset Management LLC since 2011.
98
Shareholder Tax Information
(Unaudited)
Certain tax information regarding each Fund is required to be provided to shareholders based upon each Fund’s income and distributions for the taxable year ended September 30, 2020. The information and distributions reported herein may differ from information and distributions taxable to the shareholders for the calendar year ending December 31, 2020. During the fiscal year ended September 30, 2020, the following dividends and distributions were paid by each of the Funds:
| Ordinary Income | Long-Term Capital Gain | |||||||||
Neutral 500 | $ | 109,182 | $ | — | ||||||
Hedged Plus | 30,340 | 144,159 | ||||||||
Hedged Core | 39,601 | 112,448 | ||||||||
Short Strategies | 70,055 | — | ||||||||
Master Neutral | 205,134 | — | ||||||||
ESG Large Value | 95,326 | 16 | ||||||||
Distributions from net investment income and short-term capital gains are treated as ordinary income for federal income tax purposes.
Where appropriate, all designations are based on financial information available as of the date of this annual report and, accordingly, are subject to change. For each item, it is the intention of each Fund to designate the maximum amount permitted under the Internal Revenue Code of 1986, as amended, and the regulations thereunder.
Under the Jobs and Growth Tax Relief Reconciliation Act of 2003, the following percentages of ordinary dividends paid during the fiscal year ended September 30, 2020 were designated as “qualified dividend income”, as defined in the Act, and are subject to reduced tax rates:
Neutral 500 | 100.00 | % | ||
Hedged Plus | 100.00 | % | ||
Hedged Core | 100.00 | % | ||
Short Strategies | 100.00 | % | ||
Master Neutral | 22.57 | % | ||
ESG Large Value | 28.48 | % |
The percentage of total ordinary income dividends paid qualifying for the corporate dividends received deduction for each Fund is as follows:
Neutral 500 | 100.00 | % | ||
Hedged Plus | 100.00 | % | ||
Hedged Core | 100.00 | % | ||
Short Strategies | 100.00 | % | ||
Master Neutral | 22.95 | % | ||
ESG Large Value | 27.72 | % |
The percentage of qualified interest income related dividends not subject to withholding tax for non-resident aliens and foreign corporations is as follows:
Neutral 500 | 1.25 | % | ||
Hedged Plus | 0.12 | % | ||
Hedged Core | 2.82 | % | ||
Short Strategies | 2.81 | % | ||
Master Neutral | 8.91 | % | ||
ESG Large Value | 36.23 | % |
99
GOTHAM FUNDS
Shareholder Tax Information (Concluded)
(Unaudited)
The percentage of ordinary income distributions designated as qualified short-term gains pursuant to the American Job Creation Act of 2004 is as follows:
Neutral 500 | 100.00 | % | ||
ESG Large Value | 100.00 | % |
Because the Funds’ fiscal year is not the calendar year, another notification will be sent with respect to calendar year 2020. The second notification, which will reflect the amount, if any, to be used by calendar year taxpayers on their U.S. federal income tax returns will be made in conjunction with Form 1099-DIV and will be mailed in January 2021.
Foreign shareholders will generally be subject to U.S. withholding tax on the amount of their ordinary income dividends. They will generally not be entitled to a foreign tax credit or deduction for the withholding taxes paid by a Fund, if any.
In general, dividends received by tax-exempt recipients (e.g., IRAs and Keoghs) need not be reported as taxable income for U.S. federal income tax purposes. However, some retirement trusts (e.g., corporate, Keogh and 403(b)(7) plans) may need this information for their annual information reporting.
Shareholders are advised to consult their own tax advisers with respect to the tax consequences of their investment in a Fund.
100
Other Information
(Unaudited)
Proxy Voting
Policies and procedures that the Funds use to determine how to vote proxies relating to portfolio securities as well as information regarding how a Fund voted proxies relating to portfolio securities for the most recent 12-month period ended June 30 are available without charge, upon request, by calling (877) 974-6852 and on the Securities and Exchange Commission’s (“SEC”) website at http://www.sec.gov.
Quarterly Portfolio Schedules
The Trust files its complete schedule of portfolio holdings with the SEC for the first and third fiscal quarters of each fiscal year (quarters ended December 31 and June 30) as an exhibit to their reports on Form N-PORT. The Trust’s portfolio holdings on Form N-PORT are available on the SEC’s website at http://www.sec.gov.
Board Consideration of Investment Advisory Agreement
At a videoconference meeting held on June 22-23, 2020 (the “Meeting”), the Board of Trustees (the “Board” or the “Trustees”) of FundVantage Trust (the “Trust”), including a majority of the Trustees who are not “interested persons” within the meaning of Section 2(a)(19) of the Investment Company Act of 1940, as amended (the “1940 Act”) (the “Independent Trustees”), unanimously approved the continuation of the Investment Advisory Agreement between Gotham Asset Management, LLC (“Gotham” or the “Adviser”) and the Trust (the “Gotham Agreement”) on behalf of the Gotham Neutral 500 Fund, Gotham Hedged Plus Fund, Gotham Hedged Core Fund, Gotham Short Strategies Fund, Gotham Master Neutral Fund and Gotham ESG Large Value Fund (together, the “Gotham Funds”). At the Meeting, the Board considered the continuation of the Gotham Agreement with respect to the Gotham Funds for an additional one year period.
In determining whether to continue the Gotham Agreement for an additional one-year period, the Trustees, including the Independent Trustees, considered information provided by Gotham in response to a request for information in accordance with Section 15(c) of the 1940 Act (the “Gotham 15(c)Response”) regarding (i) the services performed for the Gotham Funds, (ii) the size and qualifications of Gotham’s portfolio management staff, (iii) any potential or actual material conflicts of interest which may arise in connection with a portfolio manager’s management of the Gotham Funds, (iv) investment performance, (v) the financial condition of Gotham, (vi) brokerage selection procedures (including soft dollar arrangements, if any), (vii) the procedures for allocating investment opportunities between the Gotham Funds and other clients, (viii) results of any regulatory examination, including any recommendations or deficiencies noted, (ix) any litigation, investigation or administrative proceeding which may have a material impact on Gotham’s ability to service the Gotham Funds, and (x) compliance with the Gotham Funds’ investment objectives, policies and practices (including codes of ethics and proxy voting policies), federal securities laws and other regulatory requirements. In addition to the Gotham 15(c) Response, the Trustees received reports at Board meetings throughout the year covering matters such as the relative performance of the Gotham Funds, compliance with the Fund’s respective investment objectives, policies, strategies and limitations, compliance of portfolio management personnel with the applicable code of ethics, and adherence to pricing procedures as established by the Board (each, as applicable).
The Board noted that representatives of Gotham joined the Meeting by videoconference and discussed Gotham’s history, performance, investment strategy, and compliance program. Representatives of Gotham responded to questions from the Board. In addition to the Gotham 15(c) Response, the Trustees also considered other factors they believed to be relevant to considering the continuation of the Gotham Agreement, including the matters discussed below. In their deliberations, the Trustees did not identify any particular information that was controlling, and different Trustees may have attributed different weights to the various factors. After deliberating, the Trustees determined that the overall arrangement between the Gotham Funds and Gotham, as provided by the terms of the Gotham Agreement, including the advisory fees under the Gotham Agreement, are fair and reasonable in light of the services provided, expenses incurred and such other matters as the Trustees considered relevant.
The Trustees considered the services provided by Gotham to the Gotham Funds. The Trustees considered Gotham’s personnel and the depth of Gotham’s personnel who provide investment management services to the Gotham Funds and the depth of their experience. Based on the Gotham 15(c) Response, the Trustees concluded that (i) the nature, extent and quality of the services provided by Gotham are appropriate and consistent with the terms of the Gotham Agreement, (ii) that the quality of those services has been, and continues to be, consistent with industry norms, (iii) the Gotham Funds are likely to benefit from the continued provision of those
101
GOTHAM FUNDS
Other Information (Continued)
(Unaudited)
services, (iv) Gotham has sufficient personnel, with the appropriate skills and experience, to serve the Gotham Funds effectively and has demonstrated its continuing ability to attract and retain qualified personnel, and (v) the satisfactory nature, extent, and quality of services currently provided to the Gotham Funds is likely to continue under the Gotham Agreement.
The Board discussed Gotham’s business continuity plan, and its ability to continue to manage the Gotham Funds effectively in light of the recent volatility in financial markets as a result of the COVID-19 virus outbreak.
The Trustees considered the investment performance for the Gotham Funds and Gotham. The Trustees reviewed historical performance charts which showed the performance of the Gotham Funds as compared to their respective benchmark indices and Lipper categories for the since inception, year-to-date, one year, two year, three year, five year and ten year periods ended March 31, 2020 as applicable. The Trustees considered the short term and long term performance of the Gotham Funds, as applicable. The Trustees noted that they considered performance reports provided at Board meetings throughout the year.
Gotham ESG Large Value Fund. The Trustees noted that the Gotham ESG Large Value Fund underperformed the Lipper Multi-Cap Core Funds Index and S&P 500 Total Return Index for the year to date, one year and since inception periods ended March 31, 2020.
Gotham Hedged Core Fund. The Trustees noted that the Gotham Hedged Core Fund outperformed the Lipper Alternative Long/Short Equity Funds Index for the one year, two year, three year and since inception periods ended March 31, 2020 and underperformed for the year to date period. They also noted that the Gotham Hedged Core Fund outperformed the HFRX Equity Hedge Index for the year to date, one year, two year, three year and since inception periods ended March 31, 2020.
Gotham Hedged Plus Fund. The Trustees noted that the Gotham Hedged Plus Fund outperformed the Lipper Alternative Long/Short Equity Funds Index and HFRX Equity Hedge Index for the two year, three year and since inception periods ended March 31, 2020 and underperformed each index for the year to date period. The Trustees further noted that the Gotham Hedged Plus Fund outperformed the HFRX Equity Hedge Index and underperformed the Lipper Alternative Long/Short Equity Funds Index for the one year period ended March 31, 2020.
Gotham Master Neutral Fund. The Trustees noted that the Gotham Master Neutral Fund outperformed the HFRX Equity Hedge Index for the year to date, one year, two year and since inception periods ended March 31, 2020. They further noted that that the Gotham Master Neutral Fund underperformed the Lipper Alternative Equity Market Neutral Funds Index for the year-to-date and one year periods ended March 31, 2020 and outperformed the Lipper Alternative Equity Market Neutral Funds Index for the two year and since inception periods ended March 31, 2020.
Gotham Neutral 500 Fund. The Trustees noted that the Gotham Neutral 500 Fund underperformed the ICE BofAML US 3-Month Treasury Bill Index for the year-to-date, one year, two year and three year periods ended March 31, 2020 and outperformed the ICE BofAML US 3-Month Treasury Bill Index for the since inception period ended March 31, 2020. The Trustees further noted that the Gotham Neutral 500 Fund outperformed the Lipper Alternative Equity Market Neutral Funds Index for the two year, three year and since inception periods ended March 31, 2020 and underperformed the Lipper Alternative Equity Market Neutral Funds Index for the year-to-date and one year periods ended March 31, 2020.
Gotham Short Strategies Fund. The Trustees noted that that the Gotham Short Strategies Fund outperformed the Lipper Alternative Long/Short Equity Index for the year-to-date, one year and two year periods ended March 31, 2020 and underperformed the Lipper Alternative Long/Short Equity Index for the three year, five year, ten year and since inception periods ended March 31, 2020. The Trustees further noted that the Gotham Short Strategies Fund outperformed the S&P 500 Inverse 50% Index for the year-to-date, one year, three year, five year, ten year and since inception periods ended March 31, 2020 and underperformed the S&P 500 Inverse 50% Index for the two year period ended March 31, 2020.
The Trustees concluded that the performance of each of the Gotham Funds was within an acceptable range of performance relative to other mutual funds with similar investment objectives, strategies and policies based on the information provided at the Meeting.
The Trustees noted that the representatives of Gotham had provided information regarding its advisory fees and an analysis of these fees in relation to the services provided to the Funds and any other ancillary benefit resulting from the Gotham’s relationship with the Funds.
102
GOTHAM FUNDS
Other Information (Continued)
(Unaudited)
The Trustees also reviewed information regarding the fees Gotham charges to certain other clients and evaluated explanations provided by Gotham as to differences in fees charged to the Funds and other similarly managed accounts, where applicable. The Trustees also reviewed a peer comparison of advisory fees and total expenses for each Gotham Fund versus those funds in the Fund’s applicable Lipper category (the “Peer Group”). The Trustees concluded that the advisory fees and services provided by Gotham are consistent with those of other advisers that manage mutual funds with investment objectives, strategies and policies similar to those of the Funds as measured by the information provided by Gotham.
The Board considered, among other data, the specific factors and related conclusions set forth below with respect to each Fund:
Gotham Hedged Core Fund. The contractual advisory fee and net total expense ratio for the Gotham Hedged Core Fund’s Institutional Class shares were lower than the median contractual advisory fee and net total expense ratio for those funds in the Gotham Hedged Core Fund’s Peer Group with $250 million or less in assets.
Gotham Hedged Plus Fund. The contractual advisory fee and the net total expense ratio for the Gotham Hedged Plus Fund’s Institutional Class shares were equal to and lower than, respectively, the median gross advisory fee and net total expense ratio for those funds in the Gotham Hedged Plus Fund’s Peer Group with $250 million or less in assets.
Gotham Master Neutral Fund. The net advisory fee and net total expense ratio for the Gotham Master Neutral Fund’s Institutional Class shares were lower than the median net advisory fee and net total expense ratio for those funds in the Gotham Master Neutral Fund’s Peer Group with $250 million or less in assets. The Trustees discussed that the Gotham Master Neutral Fund is a “fund of funds,” and that there is no advisory fee in respect of assets invested in other funds advised by Gotham.
Gotham Neutral 500 Fund. The contractual advisory fee and net total expense ratio for the Gotham Neutral 500 Fund’s Institutional Class shares were higher than the median contractual advisory fee and net total expense ratio for those funds in the Gotham Neutral 500 Fund’s Peer Group with $250 million or less in assets.
Gotham Short Strategies Fund. The contractual advisory fee and net total expense ratio for the Gotham Short Strategy Fund’s Institutional Class shares were higher and substantially in line with, respectively, the median contractual advisory fee and net total expense ratio for those funds in the Gotham Short Strategies Fund’s Peer Group with $250 million or less in assets.
Gotham ESG Large Value Fund. The contractual advisory fee and net total expense ratio for the Gotham ESG Large Value Fund’s Institutional Class shares were higher than and lower than, respectively, the median of the contractual advisory fee and net total expense ratio for those funds in the Gotham ESG Large Value Fund’s Peer Group with $250 million or less in assets.
The Trustees also discussed the limitations of the comparative expense information provided with respect to each Gotham Fund’s Peer Group, given the potential varying nature, extent and quality of the services provided by the advisors of other portfolios included in each of the Peer Groups. Based upon their review, the Trustees concluded that the respective advisory fees for the Gotham Funds were reasonable in light of the high quality of services received by the Funds from Gotham.
The Trustees considered the costs of the services provided by Gotham, the compensation and benefits received by Gotham in providing services to the Gotham Funds, its profitability and certain additional information related to Gotham’s financial condition. In addition, the Trustees considered any direct or indirect revenues received by affiliates of Gotham.
The Trustees considered the extent to which economies of scale may be realized relative to fee levels, and whether the advisory fee levels reflect these economies of scale for the benefit of shareholders. The Board noted Gotham’s representation that none of the Funds have reached an asset size at which economies of scale would traditionally be considered to exist, and Gotham’s belief that breakpoints are not appropriate at this time. The Board further considered Gotham’s representation that the nature of various of the Funds’ investment strategies were such that future capacity was constrained based on Gotham’s ability to implement the strategy above certain asset levels, and as such the Funds’ ability to achieve future economies of scale were limited relative to more traditional asset classes. Based on the foregoing information, the Board concluded that economies of scale did not yet exist for the Funds and that therefore it was not yet necessary to consider whether the fee structure of the Funds provided an adequate mechanism for sharing the benefit of any such economies.
103
GOTHAM FUNDS
Other Information (Concluded)
(Unaudited)
At the Meeting, after consideration of all the factors and taking into consideration the information presented, the Board, including the Independent Trustees, unanimously approved the continuation of the Gotham Agreement for an additional one-year period. In arriving at their decision, the Trustees did not identify any single matter as controlling, but made their determination in light of all the circumstances.
104
Privacy Notice
(Unaudited)
The privacy of your personal financial information is extremely important to us. When you open an account with us, we collect a significant amount of information from you in order to properly invest and administer your account. We take very seriously the obligation to keep that information private and confidential, and we want you to know how we protect that important information.
We collect nonpublic personal information about you from applications or other forms you complete and from your transactions with us or our affiliates. We do not disclose information about you, or our former clients, to our affiliates or to service providers or other third parties, except as permitted by law. We share only the information required to properly administer your accounts, which enables us to send transaction confirmations, monthly or quarterly statements, financials and tax forms. Even within FundVantage Trust and its affiliated entities, a limited number of people who actually service accounts will have access to your personal financial information. Further, we do not share information about our current or former clients with any outside marketing groups or sales entities.
To ensure the highest degree of security and confidentiality, FundVantage Trust and its affiliates maintain various physical, electronic and procedural safeguards to protect your personal information. We also apply special measures for authentication of information you request or submit to us on our web site www.gothamfunds.com.
If you have questions or comments about our privacy practices, please call us at (877) 974-6852.
105
Fund Management
(Unaudited)
FundVantage Trust (the “Trust”) is governed by a Board of Trustees (the “Board” or the “Trustees”). The primary responsibility of the Trustees is to represent the interest of the Trust’s shareholders and to provide oversight management of the Trust.
The following tables present certain information regarding the Board of Trustees and officers of the Trust. None of the Trustees are an “interested person” of the Trust, the Adviser, another investment adviser of a series of the Trust, or Foreside Funds Distributors LLC, the principal underwriter of the Trust (“Underwriter”), within the meaning of the 1940 Act and each Trustee is referred to as an “Independent Trustee” and is listed under such heading below. Employees of certain service providers to the Trust serve as officers of the Trust; such persons are not compensated by the Funds. The address of each Trustee and officer as it relates to the Trust’s business is 301 Bellevue Parkway, 2nd Floor, Wilmington, DE 19809.
The Statement of Additional Information for the Funds contains additional information about the Trustees and is available, without charge, upon request, by calling (877) 974-6852.
Name and Date of Birth | Position(s) Held with Trust | Term of Office and Length of Time Served | Principal Occupation(s) During Past Five Years |
Number of Funds in Trust Complex Overseen by Trustee
| Other Directorships Held by Trustee | |||||
| INDEPENDENT TRUSTEES | ||||||||||
ROBERT J. CHRISTIAN Date of Birth: 2/49 | Trustee | Shall serve until death, resignation or removal. Trustee since 2007. Chairman from 2007 until September 30, 2019. | Retired since February 2006; Executive Vice President of Wilmington Trust Company from February 1996 to February 2006; President of Rodney Square Management Corporation (“RSMC”) (investment advisory firm) from 1996 to 2005; Vice President of RSMC from 2005 to 2006. | 38 | Optimum Fund Trust (registered investment company with 6 portfolios); Third Avenue Trust (registered investment company with 3 portfolios); Third Avenue Variable Series Trust (registered investment company with 1 portfolio). | |||||
IQBAL MANSUR Date of Birth: 6/55 | Trustee | Shall serve until death, resignation or removal. Trustee since 2007. | Retired since September 2020; Professor of Finance, Widener University from 1998 to August 2020. | 38 | Third Avenue Trust (registered investment company with 3 portfolios); Third Avenue Variable Series Trust (registered investment company with 1 portfolio). | |||||
106
GOTHAM FUNDS
Fund Management (Continued)
(Unaudited)
Name and Date of Birth | Position(s) Held with Trust | Term of Office and Length of Time Served | Principal Occupation(s) During Past Five Years |
Number of Funds in Trust Complex Overseen by Trustee
| Other Directorships Held by Trustee | |||||
NICHOLAS M. MARSINI, JR. Date of Birth: 8/55 | Trustee and Chairman of the Board | Shall serve until death, resignation or removal. Trustee since 2016. Chairman since October 1, 2019. | Retired since March 2016. President of PNC Bank Delaware from June 2011 to March 2016; Executive Vice President of Finance of BNY Mellon from July 2010 to January 2011; Executive Vice President and Chief Financial Officer of PNC Global Investment Servicing from September 1997 to July 2010. | 38 | Brinker Capital Destinations Trust (registered investment company with 10 portfolios); Third Avenue Trust (registered investment company with 3 portfolios); Third Avenue Variable Series Trust (registered investment company with 1 portfolio). | |||||
NANCY B. WOLCOTT Date of Birth: 11/54 | Trustee | Shall serve until death, resignation or removal. Trustee since 2011. | Retired since May 2014; EVP, Head of GFI Client Service Delivery, BNY Mellon from January 2012 to May 2014; EVP, Head of US Funds Services, BNY Mellon from July 2010 to January 2012; President of PNC Global Investment Servicing from 2008 to July 2010; Chief Operating Officer of PNC Global Investment Servicing from 2007 to 2008; Executive Vice President of PFPC Worldwide Inc. from 2006 to 2007. | 38 | Lincoln Variable Insurance Products Trust (registered investment company with 97 portfolios); Third Avenue Trust (registered investment company with 3 portfolios); Third Avenue Variable Series Trust (registered investment company with 1 portfolio). | |||||
107
GOTHAM FUNDS
Fund Management (Concluded)
(Unaudited)
Name and Date of Birth | Position(s) Held with Trust | Term of Office and Length of Time Served | Principal Occupation(s) During Past Five Years |
Number of Funds in Trust Complex Overseen by Trustee
| Other Directorships Held by Trustee | |||||
STEPHEN M. WYNNE Date of Birth: 1/55 | Trustee | Shall serve until death, resignation or removal. Trustee since 2009. | Retired since December 2010; Chief Executive Officer of US Funds Services, BNY Mellon Asset Servicing from July 2010 to December 2010; Chief Executive Officer of PNC Global Investment Servicing from March 2008 to July 2010; President, PNC Global Investment Servicing from 2003 to 2008. | 38 | Copeland Trust (registered investment company with 3 portfolios); Third Avenue Trust (registered investment company with 3 portfolios); Third Avenue Variable Series Trust (registered investment company with 1 portfolio). | |||||
Name and Date of Birth | Position(s) Held with Trust | Term of Office and Length of Time Served | Principal Occupation(s) During Past Five Years | |||
| EXECUTIVE OFFICERS | ||||||
JOEL L. WEISS Date of Birth: 1/63 | President and Chief Executive Officer | Shall serve until death, resignation or removal. Officer since 2007. | President of JW Fund Management LLC since June 2016; Vice President and Managing Director of BNY Mellon Investment Servicing (US) Inc. and predecessor firms from 1993 to June 2016. | |||
T. RICHARD KEYES Date of Birth: 1/57 | Treasurer and Chief Financial Officer | Shall serve until death, resignation or removal. Officer since 2016. | President of TRK Fund Consulting LLC since July 2016; Head of Tax - U.S. Fund Services of BNY Mellon Investment Servicing (US) Inc. and predecessor firms from February 2006 to July 2016. | |||
GABRIELLA MERCINCAVAGE Date of Birth: 6/68 | Assistant Treasurer | Shall serve until death, resignation or removal. Officer since 2019. | Fund Administration Consultant since January 2019; Fund Accounting and Tax Compliance Accountant to financial services companies from November 2003 to July 2018. | |||
VINCENZO A. SCARDUZIO Date of Birth: 4/72 | Secretary | Shall serve until death, resignation or removal. Officer since 2012. | Director and Vice President Regulatory Administration of The Bank of New York Mellon and predecessor firms since 2001. | |||
GUY F. TALARICO Date of Birth: 8/55 | Chief Compliance Officer and Anti-Money Laundering Officer | Shall serve until death, resignation or removal. Officer since 2020. | Chief Executive Officer of Alaric Compliance Services LLC since June 2004. | |||
108
Investment Adviser
Gotham Asset Management, LLC
535 Madison Avenue, 30th Floor
New York, NY 10022
Administrator
The Bank of New York Mellon
301 Bellevue Parkway
Wilmington, DE 19809
Transfer Agent
BNY Mellon Investment Servicing (US) Inc.
4400 Computer Drive
Westborough, MA 01581
Principal Underwriter
Foreside Funds Distributors LLC
400 Berwyn Park
899 Cassatt Road
Berwyn, PA 19312
Custodian
The Bank of New York Mellon
240 Greenwich Street
New York, NY 10286
Independent Registered Public Accounting Firm
PricewaterhouseCoopers LLP
Two Commerce Square, Suite 1800
2001 Market Street
Philadelphia, PA 19103-7042
Legal Counsel
Troutman Pepper Hamilton Sanders LLP
3000 Two Logan Square
18th and Arch Streets
Philadelphia, PA 19103
GOTIII-0920
SIRIOS LONG/SHORT FUND
Annual Investment Adviser’s Report
September 30, 2020
(Unaudited)
Dear Fellow Shareholder:
Sirios Long/Short Fund Class I shares (SLHIX) returned -5.13% net of expenses for the fiscal year ended September 30, 2020, while the HFRX Equity Hedge Index returned -0.39%.
The Sirios Long/Short Fund is a liquid, long/short strategy that seeks to achieve long-term capital appreciation. The Fund’s long exposure is comprised of companies exhibiting earnings growth potential and attractive valuation. Meanwhile, short exposure includes sector and index hedges, as well as mega-capitalization, single-stock positions. Single-stock and index put options may also be utilized.
Portfolio Review
For the fiscal year, long positions contributed 4.25% to gross performance, while short positions detracted 7.50%. Other income, expenses, and currency hedges detracted 1.88%. Geographically, North America and Europe detracted 2.97% and 0.28%, respectively, from gross performance. The most significant individual positive long contributors (+6.35%) were Cellnex Telecom (Spain), Lowe’s, Varonis Systems, AbbottLaboratories, and Qualcomm. The most significant long detractors (-5.95%) were Airbus (France), WWE, J.P. Morgan, American Express, and Truist Financial.
Exposure Analysis
Total net exposure as of fiscal year-end was 62%, as compared to 57% for the prior fiscal year-end, as gross long exposure increased by 5% and gross short exposure was consistent with the prior fiscal year-end. Net exposure is balanced across the Technology/Communications (+23%), Health Care (+22%), Consumer (+15%), Energy/Industrials (+10%), and Financials/Real Estate (+10%) sectors. During the fiscal year, net exposure increased in the Technology/Communications (+11%), Consumer (+6%), and Health Care (+3%) sectors, while declining in the Financials/Real Estate (-6%) and Energy/Industrials (-2%) sectors.
Net exposure remains primarily focused on North America (+44%), with positive net exposure to Europe (+18%) and no direct exposure to Asia as of fiscal year-end. Net exposure to North America and Europe increased by 2% and 3%, respectively, during the fiscal year, both driven by higher gross long exposure.
Market Overview
The U.S. economy continued to demonstrate stable, yet more moderate growth through the end of 2019, leading to strong, broad-based equity market gains in the fourth quarter of 2019. However, the onset of the COVID-19 global pandemic led to expectations for a sharp global recession and a global equity market sell-off in the first quarter of 2020. After rising by 2.1% in the fourth quarter of 2019, U.S. real GDP declined by 5% in the first quarter of 2020 and by 31.7% in the second quarter of 2020, before bouncing back sharply in the third quarter of 2020. The pandemic caused significant stress on the U.S. labor market, as payroll employment declined by 20.5 million in April and the unemployment rate jumped to 14.7%,
SIRIOS LONG/SHORT FUND
Annual Investment Adviser’s Report (Continued)
September 30, 2020
(Unaudited)
before rebounding sharply in May and continuing to decline to 8.4% in August. The U.S. housing market also staged a strong recovery after dipping in March and April, with new home sales, existing home sales, and mortgage applications all surging. The manufacturing sector continued to rebound, with the ISM Manufacturing Index, Empire Manufacturing Index, and the Richmond Fed Manufacturing Index all increasing more than expected and climbing into positive territory during the third quarter of 2020. After approximately 36% of S&P 500 companies had pulled earnings guidance in the first quarter of 2020, corporate earnings trends were largely better than feared in the second quarter of 2020. S&P 500 EPS declined by roughly 31% year-over-year in the second quarter of 2020 (compared to the 44% decline anticipated by consensus at the beginning of earnings season), with approximately 80% of companies exceeding earnings estimates by a median of 22% and 66% of companies topping revenue estimates by an average of 8%.
Monetary and fiscal policy both eased dramatically beginning in March 2020 in an effort to combat the economic impact from the pandemic. The Federal Reserve (“Fed”) lowered the target range for the federal funds rate to 0.00% – 0.25% and began to utilize several other tools to battle the pandemic, including injections into the Treasury and Agency Residential Mortgage-Backed Securities markets, cutting the discount window rate, and subsequently uncapping asset purchases and new facilities to support credit flow to employers, consumers, and businesses. At the conclusion of the September 2020 Federal Open Market Committee meeting, the committee left the target range for the federal funds rate unchanged at 0.00% - 0.25% and provided aggressive new forward guidance stating that it doesn’t expect to raise interest rates until the economy reaches full employment and inflation has climbed to 2 percent and is on track to moderately exceed 2 percent for some time. Based upon the committee’s actions and guidance, the median projected path for the policy rate to stay at zero is through 2023. The U.S. House and Senate agreed to a $2 trillion CARES Act, the largest fiscal rescue package in U.S. history, which was signed into law on March 27th. Congress continued to debate an additional coronavirus fiscal stimulus plan through the third quarter of 2020, with House Democrats and the U.S. Treasury Secretary both unveiling new proposals in late September.
Outlook
Economic growth is likely to be quite robust during the third quarter as the economy begins to recover from the COVID-induced second quarter contraction. The combination of extraordinary stimulus, provided through fiscal and monetary tools, along with major advancements in COVID testing, treatments, and vaccines should buoy economic optimism and a return toward normalcy as we enter 2021. Testing capacity is set to ramp to over 150M per month in the U.S., including new rapid antigen tests, which can provide accurate results in 15 minutes at the point of care. Advancements in the treatment regime has reduced the risk of fatality and significantly lowered the length of hospital stay across all age cohorts. Vaccine capacity is expected to ramp to over 160M in the fourth quarter and over 1.3B in 2021, once FDA approval is received. The US has made tremendous progress in just a matter of months despite initial expectations that vaccines and treatments would take years.
2
SIRIOS LONG/SHORT FUND
Annual Investment Adviser’s Report (Concluded)
September 30, 2020
(Unaudited)
As COVID-related expectations begin to shift to a more optimistic outlook, the bifurcation in the stock market is likely to see a dramatic reversal. Interest rates could also reset back to higher levels, especially given the heightened Fed focus on moving the rate of inflation above the 2% long-term target. The combination of economic optimism and higher rates could severely affect the “COVID-proof” segments of the market where earnings certainty has pushed valuations to levels we feel are unsustainable. With the major indices now loaded with extremely overvalued technology, new media, and internet stocks, the reversal could be quite abrupt. Communications+Amazon+Technology (CAT) now account for over 45% of the companies that comprise the S&P 500 index and are valued at 34x forward earnings. We remain positioned in sectors and companies that we feel are attractively valued on normalized earnings and should outperform as COVID fears abate and the economy and social behavior returns to normal.
Thank you for your continued confidence in Sirios Capital Management.
Sincerely,
John F. Brennan, Jr.
Managing Director
This letter is intended to assist shareholders in understanding how the Sirios Long/Short Fund performed during the year ended September 30, 2020. Any statements of opinion constitute only past opinions of Sirios Capital Management, L.P. (“Sirios”), which may have changed and which Sirios does not undertake to update. Past performance is no guarantee of future results of any fund or account managed by Sirios.
The above commentary is for informational purposes only and is not intended as investment advice or securities recommendations, either explicit or implicit.
Sector exposures and holdings are subject to change. Exposures are expressed as a percentage of net assets and exclude cash and cash equivalents.
3
SIRIOS LONG/SHORT FUND
Annual Report
Performance Data
September 30, 2020
(Unaudited)
Comparison of Change in Value of $100,000 (investment minimum) Investment in Sirios Long/Short Fund Institutional Class
vs. HFRX Equity Hedge Index
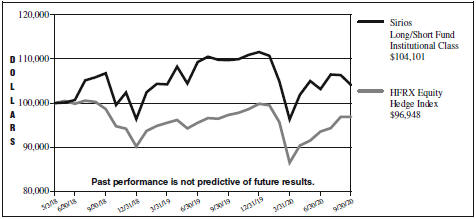
| Average Annual Total Returns for the Period Ended September 30, 2020 |
| |||||||||
| 1 Year | Since Inception | |||||||||
Institutional Class | -5.13% | 1.68%* | ||||||||
HFRX Equity Hedge Index | -0.39% | -1.28%** | ||||||||
| * | The Sirios Long/Short Fund (the “Fund”) Institutional Class shares commenced operations on May 3, 2018. |
| ** | Benchmark performance is from the commencement date of the Fund Class only and is not the commencement date of the benchmark itself. |
The performance data quoted represents past performance and does not guarantee future results. Current performance may be lower or higher. Performance data current to the most recent month-end may be obtained by calling (866) 640-5704. The investment return and principal value of an investment will fluctuate so that shares, when redeemed, may be worth more or less than their original cost. The graph and table do not reflect the deduction of taxes that a shareholder would pay on Fund distributions or the redemption of Fund shares.
The Fund’s total annual gross and net operating expenses, as stated in the current prospectus dated February 1, 2020 are 2.72% and 1.60%, respectively, for Institutional Class shares of the Fund’s average daily net assets. These rates may fluctuate and may differ from the actual expenses incurred by the Fund for the period covered by this report. Sirios Capital Management, L.P. (the “Adviser”) has contractually agreed to reduce its compensation and/or reimburse certain expenses of the Fund to the extent necessary to ensure that the Fund’s total operating expenses, excluding taxes, interest, extraordinary items, brokerage commissions, fees and expenses attributable to a distribution or service plan adopted by the Trust, dividend and interest expense on short sales of securities, and “Acquired Fund Fees and Expenses,” as defined in Form N-1A, do not exceed 1.60% (on an annual basis) of the Fund’s average daily net assets (the “Expense Limitation”). The Expense Limitation will remain in place until April 30, 2021, unless
4
SIRIOS LONG/SHORT FUND
Annual Report
Performance Data (Concluded)
September 30, 2020
(Unaudited)
the Board of Trustees of the Trust approves its earlier termination. This agreement may be terminated only by the Fund’s Board of Trustees. The Adviser is entitled to recover, subject to approval by the Board of Trustees, such amounts reduced or reimbursed for a period of up to three (3) years from the date on which the Adviser reduced its compensation and/or assumed expenses for the Fund. The Adviser is permitted to seek recoupment from the Fund, for fees it waived and Fund expenses it paid to the extent the total annual fund expenses do not exceed the limits described above or any lesser limits in effect at the time of the reimbursement. No reimbursement will occur unless the Fund’s expenses are below the Expense Limitation.
The Fund intends to evaluate performance as compared to that of the HFRX Equity Hedge Index (“HFRX Index”). Hedge Fund Research, Inc. constructs the HFRX Index methodology. The HFRX Index is comprised of long/short equity hedge funds. The HFRX Index is unmanaged and its returns (i) do not include sales charges or fees, which would lower performance; and (ii) are subject to a variety of material distortions, as investments in hedge funds typically involve substantial risks, including the “risk of ruin.” It is impossible to invest directly in an index.
The Fund is non-diversified and invests in a limited number of securities. As a result, the Fund’s investment performance may be more volatile, as it may be more susceptible to risks associated with a single economic, political, or regulatory event than a fund that invests in a greater number of issuers.
Short sales theoretically involve unlimited loss potential since the market price of securities sold short may continuously increase. Mutual Fund investing involves risk, including loss of principal.
5
SIRIOS LONG/SHORT FUND
Fund Expense Disclosure
September 30, 2020
(Unaudited)
As a shareholder of the Fund, you incur two types of costs: (1) transaction costs, including redemption fees; and (2) ongoing costs, including management fees, distribution and/or service (Rule 12b-1) fees (if any) and other Fund expenses. This example is intended to help you understand your ongoing costs (in dollars) of investing in the Fund and to compare these costs with the ongoing costs of investing in other mutual funds.
This example is based on an investment of $1,000 invested at the beginning of the six-month period from April 1, 2020 through September 30, 2020 and held for the entire period.
Actual Expenses
The first line of the accompanying table provides information about actual account values and actual expenses. You may use the information in this line, together with the amount you invested, to estimate the expenses that you paid over the period. Simply divide your account value by $1,000 (for example, an $8,600 account value divided by $1,000 = 8.6), then multiply the result by the number in the first line under the heading entitled “Expenses Paid During Period” to estimate the expenses you paid on your account during this period.
Hypothetical Example for Comparison Purposes
The second line of the accompanying table provides information about hypothetical account values and hypothetical expenses based on a Fund’s actual expense ratio and an assumed rate of return of 5% per year before expenses, which is not your Fund’s actual return. The hypothetical account values and expenses may not be used to estimate the actual ending account balance or expenses you paid for the period. You may use this information to compare the ongoing costs of investing in the Fund and other funds. To do so, compare this 5% hypothetical example with the 5% hypothetical examples that appear in the shareholder reports of other funds.
Please note that the expenses shown in the accompanying table are meant to highlight your ongoing costs only and do not reflect any transactional costs, such as redemption fees. Therefore, the second line of the accompanying table is useful in comparing ongoing costs only and will not help you determine the relative total costs of owning different funds. In addition, if these transactional costs were included, your costs would have been higher.
6
SIRIOS LONG/SHORT FUND
Fund Expense Disclosure (Concluded)
September 30, 2020
(Unaudited)
| Sirios Long/Short Fund | |||||||||||||||
| Beginning Account Value April 1, 2020 | Ending Account Value September 30, 2020 | Expenses Paid During Period* | |||||||||||||
Institutional Class | |||||||||||||||
Actual | $ | 1,000.00 | $ | 1,080.60 | $ | 8.32 | |||||||||
Hypothetical (5% return before expenses) | 1,000.00 | 1,017.00 | 8.07 | ||||||||||||
| * | Expenses are equal to the annualized expense ratio for the six-month period ended September 30, 2020 of 1.60% for Institutional Class shares, multiplied by the average account value over the period, multiplied by the number of days in the most recent period (183), then divided by 366 to reflect the period. The Institutional Class shares ending account values on the first line of the table is based on the actual six-month total return for the Fund of 8.06%. |
7
SIRIOS LONG/SHORT FUND
Portfolio Holdings Summary Table
September 30, 2020
(Unaudited)
The following table presents a summary by sector of the portfolio holdings of the Fund:
| % of Net Assets | Value | |||||||
LONG POSITIONS: | ||||||||
Common Stocks: | ||||||||
Healthcare-Products | 14.7 | % | $ | 3,746,474 | ||||
Software | 8.9 | 2,277,789 | ||||||
Pharmaceuticals | 7.2 | 1,829,610 | ||||||
Aerospace & Defense | 6.2 | 1,589,495 | ||||||
Banks | 6.1 | 1,541,517 | ||||||
Retail | 6.0 | 1,540,947 | ||||||
Semiconductors | 5.1 | 1,310,538 | ||||||
Electronics | 4.7 | 1,185,667 | ||||||
Insurance | 3.2 | 819,394 | ||||||
Healthcare-Services | 2.9 | 742,514 | ||||||
Telecommunications | 2.9 | 727,841 | ||||||
Chemicals | 2.7 | 698,117 | ||||||
Commercial Services | 2.4 | 622,812 | ||||||
Beverages | 2.1 | 527,217 | ||||||
Lodging | 1.8 | 469,680 | ||||||
Transportation | 1.7 | 442,367 | ||||||
Building Materials | 1.5 | 393,775 | ||||||
Computers | 1.3 | 318,213 | ||||||
Toys/Games/Hobbies | 1.2 | 299,198 | ||||||
Media | 1.2 | 296,321 | ||||||
Leisure Time | 1.1 | 280,058 | ||||||
Home Builders | 1.1 | 272,797 | ||||||
Airlines | 1.0 | 256,425 | ||||||
Housewares | 1.0 | 254,536 | ||||||
Environmental Control | 0.8 | 199,296 | ||||||
Diversified Financial Services | 0.8 | 192,270 | ||||||
Industrials | 0.6 | 140,638 | ||||||
Food | 0.5 | 129,528 | ||||||
Oil & Gas | 0.4 | 102,724 | ||||||
Machinery-Diversified | 0.2 | 63,231 | ||||||
Short-Term Investments | 8.0 | 2,034,969 | ||||||
|
|
|
| |||||
Total Long Positions | 99.3 | 25,305,958 | ||||||
|
|
|
| |||||
SHORT POSITIONS: | ||||||||
Corporate Bonds and Notes: | ||||||||
Retail | (0.2 | ) | (46,900 | ) | ||||
|
|
|
| |||||
Total Short Positions | (0.2 | ) | (46,900 | ) | ||||
|
|
|
| |||||
Other Assets In Excess of Liabilities | 0.9 | % | 226,701 | |||||
|
|
|
| |||||
NET ASSETS | 100.0 | % | $ | 25,485,759 | ||||
|
|
|
| |||||
Portfolio holdings are subject to change at any time.
The accompanying notes are an integral part of the financial statements.
8
SIRIOS LONG/SHORT FUND
Portfolio of Investments
September 30, 2020
| Number of Shares | Value | |||||||
LONG POSITIONS — 99.3% |
| |||||||
COMMON STOCKS — 91.3% |
| |||||||
Aerospace & Defense — 6.2% |
| |||||||
Airbus SE (France)* | 8,124 | $ | 589,202 | |||||
HEICO Corp., Class A | 1,918 | 170,050 | ||||||
Raytheon Technologies Corp. | 10,963 | 630,811 | ||||||
Safran SA (France)* | 2,027 | 199,432 | ||||||
|
| |||||||
| 1,589,495 | ||||||||
|
| |||||||
Airlines — 1.0% | ||||||||
Southwest Airlines Co. | 6,838 | 256,425 | ||||||
|
| |||||||
Banks — 6.1% | ||||||||
JPMorgan Chase & Co. | 10,385 | 999,764 | ||||||
KeyCorp. | 45,411 | 541,753 | ||||||
|
| |||||||
| 1,541,517 | ||||||||
|
| |||||||
Beverages — 2.1% | ||||||||
Constellation Brands, Inc., Class A | 2,782 | 527,217 | ||||||
|
| |||||||
Building Materials — 1.5% |
| |||||||
AZEK Co., Inc. (The)* | 7,543 | 262,572 | ||||||
Vulcan Materials Co. | 968 | 131,203 | ||||||
|
| |||||||
| 393,775 | ||||||||
|
| |||||||
Chemicals — 2.7% | ||||||||
Sherwin-Williams Co. (The) | 672 | 468,209 | ||||||
Valvoline, Inc. | 12,075 | 229,908 | ||||||
|
| |||||||
| 698,117 | ||||||||
|
| |||||||
Commercial Services — 2.4% |
| |||||||
PayPal Holdings, Inc.* | 3,161 | 622,812 | ||||||
|
| |||||||
Computers — 1.3% | ||||||||
Varonis Systems, Inc.* | 2,757 | 318,213 | ||||||
|
| |||||||
| Number of Shares | Value | |||||||
COMMON STOCKS — (Continued) |
| |||||||
Diversified Financial Services — 0.8% |
| |||||||
Tradeweb Markets, Inc., Class A | 3,315 | $ | 192,270 | |||||
|
| |||||||
Electronics — 4.7% | ||||||||
Garmin Ltd (Switzerland) | 1,632 | 154,812 | ||||||
Keysight Technologies, Inc.* | 5,192 | 512,866 | ||||||
Roper Technologies, Inc. | 1,311 | 517,989 | ||||||
|
| |||||||
| 1,185,667 | ||||||||
|
| |||||||
Environmental Control — 0.8% |
| |||||||
Waste Connections, Inc. | 1,920 | 199,296 | ||||||
|
| |||||||
Food — 0.5% | ||||||||
General Mills, Inc. | 2,100 | 129,528 | ||||||
|
| |||||||
Healthcare-Products — 14.7% |
| |||||||
Abbott Laboratories | 9,873 | 1,074,479 | ||||||
Alcon, Inc., (Switzerland)* | 31,064 | 1,769,095 | ||||||
Boston Scientific Corp.* | 13,123 | 501,430 | ||||||
Danaher Corp. | 961 | 206,932 | ||||||
Medtronic PLC (Iran) | 1,872 | 194,538 | ||||||
|
| |||||||
| 3,746,474 | ||||||||
|
| |||||||
Healthcare-Services — 2.9% |
| |||||||
HCA Healthcare Inc. | 4,485 | 559,190 | ||||||
IQVIA Holdings Inc.* | 1,163 | 183,324 | ||||||
|
| |||||||
| 742,514 | ||||||||
|
| |||||||
Home Builders — 1.1% | ||||||||
DR Horton Inc. | 3,607 | 272,797 | ||||||
|
| |||||||
Housewares — 1.0% | ||||||||
Toro Co. (The) | 3,032 | 254,536 | ||||||
|
| |||||||
Industrials — 0.6% | ||||||||
3M Co. | 878 | 140,638 | ||||||
|
| |||||||
Insurance — 3.2% | ||||||||
Arthur J Gallagher & Co. | 1,315 | 138,838 | ||||||
The accompanying notes are an integral part of the financial statements.
9
SIRIOS LONG/SHORT FUND
Portfolio of Investments (Continued)
September 30, 2020
| Number of Shares | Value | |||||||
COMMON STOCKS — (Continued) |
| |||||||
Insurance — (Continued) |
| |||||||
Berkshire Hathaway, Inc., Class B* | 3,196 | $ | 680,556 | |||||
|
| |||||||
| 819,394 | ||||||||
|
| |||||||
Leisure Time — 1.1% | ||||||||
Brunswick Corp. | 4,754 | 280,058 | ||||||
|
| |||||||
Lodging — 1.8% | ||||||||
Las Vegas Sands Corp. | 10,066 | 469,680 | ||||||
|
| |||||||
Machinery-Diversified — 0.2% |
| |||||||
Otis Worldwide Corp. | 1,013 | 63,231 | ||||||
|
| |||||||
Media — 1.2% | ||||||||
World Wrestling Entertainment, Inc., Class A | 7,322 | 296,321 | ||||||
|
| |||||||
Oil & Gas — 0.4% | ||||||||
ConocoPhillips | 3,128 | 102,724 | ||||||
|
| |||||||
Pharmaceuticals — 7.2% | ||||||||
Covetrus, Inc.* | 9,291 | 226,700 | ||||||
Eli Lilly and Co. | 5,506 | 814,998 | ||||||
Pfizer, Inc. | 21,469 | 787,912 | ||||||
|
| |||||||
| 1,829,610 | ||||||||
|
| |||||||
Retail — 6.0% | ||||||||
BJ’s Wholesale Club Holdings, Inc.* | 6,621 | 275,103 | ||||||
Lowe’s Cos, Inc. | 5,397 | 895,146 | ||||||
TJX Cos, Inc. (The) | 1,750 | 97,388 | ||||||
Williams-Sonoma, Inc. | 3,022 | 273,310 | ||||||
|
| |||||||
| 1,540,947 | ||||||||
|
| |||||||
Semiconductors — 5.1% | ||||||||
Analog Devices, Inc. | 2,604 | 303,991 | ||||||
Qorvo, Inc.* | 522 | 67,343 | ||||||
QUALCOMM, Inc. | 7,981 | 939,204 | ||||||
|
| |||||||
| 1,310,538 | ||||||||
|
| |||||||
| Number of Shares | Value | |||||||
COMMON STOCKS — (Continued) |
| |||||||
Software — 8.9% | ||||||||
Autodesk, Inc.* | 2,211 | $ | 510,763 | |||||
Dropbox, Inc., Class A* | 29,236 | 563,085 | ||||||
Electronic Arts, Inc.* | 2,588 | 337,501 | ||||||
Microsoft Corp. | 1,340 | 281,842 | ||||||
PTC, Inc.* | 4,076 | 337,167 | ||||||
Verra Mobility Corp.* | 25,614 | 247,431 | ||||||
|
| |||||||
| 2,277,789 | ||||||||
|
| |||||||
Telecommunications — 2.9% |
| |||||||
Nokia Oyj, SP ADR (Finland)* | 62,395 | 243,964 | ||||||
Telefonaktiebolaget LM Ericsson, Class B (Sweden) | 23,453 | 256,652 | ||||||
Vodafone Group PLC | 171,434 | 227,225 | ||||||
|
| |||||||
| 727,841 | ||||||||
|
| |||||||
Toys/Games/Hobbies — 1.2% |
| |||||||
Hasbro Inc. | 3,617 | 299,198 | ||||||
|
| |||||||
Transportation — 1.7% | ||||||||
Union Pacific Corp. | 2,247 | 442,367 | ||||||
|
| |||||||
TOTAL COMMON STOCKS | 23,270,989 | |||||||
|
| |||||||
SHORT-TERM INVESTMENTS — 8.0% |
| |||||||
Dreyfus Treasury & Cash Management, Institutional Shares, 0.01%(a) | 2,034,969 | 2,034,969 | ||||||
|
| |||||||
TOTAL LONG POSITIONS - 99.3% |
| $ | 25,305,958 | |||||
|
| |||||||
The accompanying notes are an integral part of the financial statements.
10
SIRIOS LONG/SHORT FUND
Portfolio of Investments (Continued)
September 30, 2020
| Number of Shares | Value | |||||||
SHORT POSITIONS — (0.2)% |
| |||||||
CORPORATE BONDS AND NOTES — (0.2)% |
| |||||||
Retail — (0.2)% | ||||||||
Kohl’s Corp., 5.550%, 07/17/2045 | (51,000 | ) | $ | (46,900 | ) | |||
|
| |||||||
TOTAL CORPORATE BONDS AND NOTES | (46,900 | ) | ||||||
|
| |||||||
TOTAL SHORT POSITIONS - (0.2)% |
| (46,900 | ) | |||||
|
| |||||||
OTHER ASSETS IN EXCESS OF LIABILITIES - 0.9% | 226,701 | |||||||
|
| |||||||
NET ASSETS - 100.0% |
| $ | 25,485,759 | |||||
|
| |||||||
| * | Non-income producing. |
| (a) | Rate disclosed is the 7-day yield at September 30, 2020. |
Forward foreign currency contracts outstanding as of September 30, 2020 were as follows:
| Currency Purchased | Currency Sold | Expiration | Counterparty | Unrealized Appreciation (Depreciation) | ||||||||||||||||||||||||||||
| EUR | 95,000 | USD | 111,450 | 12/16/20 | MS | $ 131 | ||||||||||||||||||||||||||
| GBP | 11,000 | USD | 14,222 | 12/16/20 | MS | (21 | ) | |||||||||||||||||||||||||
| USD | 2,147,940 | EUR | 1,808,000 | 12/16/20 | MS | 24,382 | ||||||||||||||||||||||||||
| USD | 242,084 | GBP | 188,000 | 12/16/20 | MS | (625 | ) | |||||||||||||||||||||||||
| USD | 257,511 | SEK | 2,256,000 | 12/16/20 | MS | 5,357 | ||||||||||||||||||||||||||
| $29,224 | ||||||||||||||||||||||||||||||||
The accompanying notes are an integral part of the financial statements.
11
SIRIOS LONG/SHORT FUND
Portfolio of Investments (Continued)
September 30, 2020
The following table represents Total Return Swaps - Long positions and their related values as of September 30, 2020.
Reference Entity/Index (Receive) | Pay | Payment Frequency | Counter- Party | Expiration Date | Notional Amount | Value and Unrealized Appreciation | ||||||||||||||||||||||||
Cellnex Telecom SA | | U.S. Fed Funds +0.550% | Maturity | MS | 11/15/22 | $ | 853,634 | $ | 345,701 | |||||||||||||||||||||
Becton Dickinson and Co | | U.S. Fed Funds +0.500% | Maturity | MS | 02/07/23 | 129,168 | 16,264 | |||||||||||||||||||||||
|
| |||||||||||||||||||||||||||||
| $ | 361,965 | |||||||||||||||||||||||||||||
|
| |||||||||||||||||||||||||||||
The following table represents Total Return Swaps - Short positions and their related values as of September 30, 2020.
Reference Entity/Index (Pay) | Receive | Payment Frequency | Counter- Party | Expiration Date | Notional Amount | Value and Unrealized Appreciation (Depreciation) | ||||||||||||||||||||||||||
| Dow Jones U.S. Real Estate Index | U.S. Fed Funds -0.200% | Maturity | MS | 10/31/22 | $ | 113,104 | $ | 13,158 | ||||||||||||||||||||||||
| Gilead Sciences Inc | U.S. Fed Funds -0.300% | Maturity | MS | 10/31/22 | 117,611 | 16,978 | ||||||||||||||||||||||||||
| S&P 500 Index | U.S. Fed Funds -0.250% | Maturity | MS | 10/31/22 | 3,627,582 | (1,035,102 | ) | |||||||||||||||||||||||||
| S&P 500 Index Consumer Discretionary Select Sector | U.S. Fed Funds -0.250% | Maturity | MS | 10/31/22 | 759,108 | (199,175 | ) | |||||||||||||||||||||||||
| S&P 500 Index Financial Sector | U.S. Fed Funds -0.350% | Maturity | MS | 10/31/22 | 571,866 | 104,062 | ||||||||||||||||||||||||||
| S&P 500 Index Health Care Select Sector | U.S. Fed Funds -0.250% | Maturity | MS | 10/31/22 | 690,313 | (117,438 | ) | |||||||||||||||||||||||||
| S&P 500 Index Industrial Select Sector | U.S. Fed Funds -0.350% | Maturity | MS | 10/31/22 | 744,127 | (217,215 | ) | |||||||||||||||||||||||||
| S&P 500 Index Technology Select Sector | U.S. Fed Funds -0.100% | Maturity | MS | 10/31/22 | 834,746 | (168,253 | ) | |||||||||||||||||||||||||
|
| |||||||||||||||||||||||||||||||
| $ | (1,602,985 | ) | ||||||||||||||||||||||||||||||
|
| |||||||||||||||||||||||||||||||
Total Swap Contracts | $ | (1,241,020 | ) | |||||||||||||||||||||||||||||
|
| |||||||||||||||||||||||||||||||
The accompanying notes are an integral part of the financial statements.
12
SIRIOS LONG/SHORT FUND
Portfolio of Investments (Concluded)
September 30, 2020
| Legend | ||
|
EUR | Euro | |
GBP | British Pound | |
MS | Morgan Stanley | |
PLC | Public Limited Company | |
SEK | Swedish Krona | |
SP ADR | Sponsored American Depository Receipt | |
USD | United States Dollar | |
The accompanying notes are an integral part of the financial statements.
13
SIRIOS LONG/SHORT FUND
Statement of Assets and Liabilities
September 30, 2020
Assets | ||||
Investments, at value (Cost $23,894,592) | $ | 25,305,958 | ||
Cash | 2,990,000 | |||
Unrealized appreciation on swap contracts | 496,163 | |||
Receivable for investments sold | 47,510 | |||
Unrealized appreciation on forward foreign currency contracts | 29,870 | |||
Dividends and interest receivable | 4,293 | |||
Receivable from Investment Adviser | 2,073 | |||
Prepaid expenses and other assets | 11,879 | |||
|
| |||
Total assets | 28,887,746 | |||
|
| |||
Liabilities | ||||
Securities sold short, at value (Proceeds received $46,920) | 46,900 | |||
Unrealized depreciation on swap contracts | 1,737,183 | |||
Payable for investments purchased | 1,490,885 | |||
Swap contracts settlement | 61,191 | |||
Payable for audit fees | 29,875 | |||
Payable for administration and accounting fees | 14,166 | |||
Payable for printing fees | 9,925 | |||
Payable for transfer agent fees | 5,100 | |||
Payable for custodian fees | 2,919 | |||
Payable for legal fees | 2,366 | |||
Unrealized depreciation on forward foreign currency contracts | 646 | |||
Interest payable on securities sold short | 590 | |||
Accrued expenses | 241 | |||
|
| |||
Total liabilities | 3,401,987 | |||
|
| |||
Net Assets | $ | 25,485,759 | ||
|
| |||
Net Assets Consisted of: | ||||
Capital stock, $0.01 par value | $ | 25,329 | ||
Paid-in capital | 25,519,212 | |||
Total distributable earnings | (58,782 | ) | ||
|
| |||
Net Assets | $ | 25,485,759 | ||
|
| |||
Institutional Class: | ||||
Shares outstanding | 2,532,884 | |||
|
| |||
Net asset value, offering and redemption price per share ($25,485,759 / 2,532,884 shares) | $ | 10.06 | ||
|
|
The accompanying notes are an integral part of the financial statements.
14
SIRIOS LONG/SHORT FUND
Statement of Operations
For the Year Ended September 30, 2020
Investment Income | ||||
Dividends | $ | 244,402 | ||
Less: foreign taxes withheld | (178 | ) | ||
|
| |||
Total investment income | 244,224 | |||
|
| |||
Expenses | ||||
Advisory fees (Note 2) | 352,430 | |||
Administration and accounting fees (Note 2) | 65,511 | |||
Trustees’ and officers’ fees (Note 2) | 43,422 | |||
Legal fees | 39,658 | |||
Transfer agent fees (Note 2) | 33,018 | |||
Audit fees | 30,150 | |||
Registration and filing fees | 27,889 | |||
Printing and shareholder reporting fees | 23,293 | |||
Custodian fees (Note 2) | 22,906 | |||
Other expenses | 10,570 | |||
|
| |||
Total expenses before waivers and reimbursements | 648,847 | |||
|
| |||
Less: waivers and reimbursements (Note 2) | (231,152 | ) | ||
|
| |||
Net expenses after waivers and reimbursements | 417,695 | |||
|
| |||
Net investment loss | (173,471 | ) | ||
|
| |||
Net realized and unrealized gain/(loss) from investments | ||||
Net realized gain from investments | 462,213 | |||
Net realized loss from foreign currency transactions | (3,765 | ) | ||
Net realized loss from forward foreign currency contracts | (113,679 | ) | ||
Net realized loss from swap contracts | (253,154 | ) | ||
Net change in unrealized appreciation/(depreciation) on investments | (85,509 | ) | ||
Net change in unrealized appreciation/(depreciation) on securities sold short | 20 | |||
Net change in unrealized appreciation/(depreciation) on foreign currency transactions | 249 | |||
Net change in unrealized appreciation/(depreciation) on forward foreign currency contracts | (3,581 | ) | ||
Net change in unrealized appreciation/(depreciation) on swap contracts | (1,203,134 | ) | ||
|
| |||
Net realized and unrealized loss on investments | (1,200,340 | ) | ||
|
| |||
Net decrease in net assets resulting from operations | $ | (1,373,811 | ) | |
|
|
The accompanying notes are an integral part of the financial statements.
15
SIRIOS LONG/SHORT FUND
Statements of Changes in Net Assets
| For the Year Ended September 30, 2020 | For the Year Ended September 30, 2019 | |||||||||
Increase/(decrease) in net assets from operations: | ||||||||||
Net investment loss | $ | (173,471 | ) | $ | (43,160 | ) | ||||
Net realized gain from investments, securities sold short, forward foreign currency contracts, foreign currency transactions and swap contracts | 91,615 | 88,014 | ||||||||
Net change in unrealized appreciation/(depreciation) on investments, securities sold short, forward foreign currency contracts, foreign currency transactions and swap contracts | (1,291,955 | ) | 1,006,055 | |||||||
|
|
|
| |||||||
Net increase/(decrease) in net assets resulting from operations | (1,373,811 | ) | 1,050,909 | |||||||
|
|
|
| |||||||
Less Dividends and Distributions to Shareholders From: | ||||||||||
Total distributable earnings | (144,660 | ) | (270,428 | ) | ||||||
|
|
|
| |||||||
Decrease in net assets from dividends and distributions to shareholders | (144,660 | ) | (270,428 | ) | ||||||
|
|
|
| |||||||
Increase in net assets derived from capital share transactions (Note 4) | 58,988 | 15,485,553 | ||||||||
|
|
|
| |||||||
Total increase/(decrease) in net assets | (1,459,483 | ) | 16,266,034 | |||||||
|
|
|
| |||||||
Net assets | ||||||||||
Beginning of year | 26,945,242 | 10,679,208 | ||||||||
|
|
|
| |||||||
End of year | $ | 25,485,759 | $ | 26,945,242 | ||||||
|
|
|
| |||||||
The accompanying notes are an integral part of the financial statements.
16
SIRIOS LONG/SHORT FUND
Financial Highlights
Contained below is per share operating performance data for Institutional Class shares outstanding, total investment return, ratios to average net assets and other supplemental data for the respective period. The total return in the table represents the rate that an investor would have earned or lost on an investment in the Fund (assuming reinvestment of all dividends and distributions). This information has been derived from information provided in the financial statements and should be read in conjunction with the financial statements and the notes thereto.
| Institutional Class | |||||||||||||||
| For the Year Ended September 30, 2020 | For the Year Ended September 30, 2019 | For the Period May 3, 2018* to September 30, 2018 | |||||||||||||
Per Share Operating Performance | |||||||||||||||
Net asset value, beginning of period | $ | 10.66 | $ | 10.68 | $ | 10.00 | |||||||||
|
|
|
|
|
| ||||||||||
Net investment loss(1) | (0.07 | ) | (0.02 | ) | (0.01 | ) | |||||||||
Net realized and unrealized gain/(loss) on investments | (0.47 | ) | 0.27 | 0.69 | |||||||||||
|
|
|
|
|
| ||||||||||
Net increase/(decrease) in net assets resulting from operations | (0.54 | ) | 0.25 | 0.68 | |||||||||||
|
|
|
|
|
| ||||||||||
Dividends and distributions to shareholders from: | |||||||||||||||
Net investment income | (0.06 | ) | (0.01 | ) | — | ||||||||||
Net realized capital gains | — | (0.26 | ) | — | |||||||||||
|
|
|
|
|
| ||||||||||
Total dividends and distributions to shareholders | (0.06 | ) | (0.27 | ) | — | ||||||||||
|
|
|
|
|
| ||||||||||
Net asset value, end of period | $ | 10.06 | $ | 10.66 | $ | 10.68 | |||||||||
|
|
|
|
|
| ||||||||||
Total investment return(2) | (5.13 | )% | 2.74 | % | 6.80 | % | |||||||||
Ratios/Supplemental Data | |||||||||||||||
Net assets, end of period (in thousands) | $ | 25,486 | $ | 26,945 | $ | 10,679 | |||||||||
Ratio of expenses to average net assets | 1.60 | % | 2.21 | %(3) | 2.10 | %(3)(4) | |||||||||
Ratio of expenses to average net assets without waivers and expense reimbursements(5) | 2.49 | % | 3.33 | % | 4.57 | %(4) | |||||||||
Ratio of net investment loss to average net assets | (0.66 | )% | (0.22 | )% | (0.19 | )%(4) | |||||||||
Portfolio turnover rate | 153 | % | 134 | % | 49 | %(6) | |||||||||
| * | Commencement of operations. |
| (1) | The selected per share data was calculated using the average shares outstanding method for the period. |
| (2) | Total investment return is calculated assuming a purchase of shares on the first day and a sale of shares on the last day of each period reported and includes reinvestments of dividends and distributions, if any. Total returns for periods less than one year are not annualized. |
| (3) | Ratio of expenses to average net assets with waivers and expense reimbursement, excluding short-sale dividend expense, was 1.60% for the year ended September 30, 2019 and for the period ended September 30, 2018. |
| (4) | Annualized. |
| (5) | During the period, certain fees were waived and/or reimbursed. If such fee waivers and/or reimbursements had not occurred, the ratios would have been as indicated (See Note 2). |
| (6) | Not annualized. |
The accompanying notes are an integral part of the financial statements.
17
SIRIOS LONG/SHORT FUND
Notes to Financial Statements
September 30, 2020
1. Organization and Significant Accounting Policies
The Sirios Long/Short Fund (the “Fund”) is a non-diversified, open-end management investment company registered under the Investment Company Act of 1940, as amended (the “1940 Act”), which commenced investment operations on May 3, 2018. The Fund is a separate series of FundVantage Trust (the “Trust”) which was organized as a Delaware statutory trust on August 28, 2006. The Trust is a “series trust” authorized to issue an unlimited number of separate series or classes of shares of beneficial interest. Each series is treated as a separate entity for certain matters under the 1940 Act, and for other purposes, and a shareholder of one series is not deemed to be a shareholder of any other series. The Fund offers Class A, Advisor Class, Institutional Class and Retail Class shares. As of September 30, 2020, Class A, Advisor Class and Retail Class shares have not been issued.
The Fund is an investment company and follows accounting and reporting guidance in the Financial Accounting Standards Board Accounting Standards Codification Topic 946.
Portfolio Valuation — The Fund’s net asset value (“NAV”) is calculated once daily at the close of regular trading hours on the New York Stock Exchange (“NYSE”) (typically 4:00 p.m. Eastern time) on each day the NYSE is open. Securities held by the Fund are valued using the closing price or the last sale price on a national securities exchange or the National Association of Securities Dealers Automatic Quotation System (“NASDAQ”) market system where they are primarily traded. The Fund’s equity securities listed on any national exchange market system will be valued at the last sale price. Equity securities traded in the over-the-counter market are valued at their closing price. If there were no transactions on that day, securities traded principally on an exchange will be valued at the mean of the last bid and ask prices prior to the market close. Prices for equity securities normally are supplied by an independent pricing service approved by the Trust’s Board of Trustees (“Board of Trustees”). Fixed income securities are valued based on market quotations, which are furnished by an independent pricing service. Fixed income securities having remaining maturities of 60 days or less are generally valued at amortized cost, provided such amount approximates market value. Any assets held by the Fund that are denominated in foreign currencies are valued daily in U.S. dollars at the foreign currency exchange rates that are prevailing at the time that the Fund determines the daily NAV per share. Foreign securities may trade on weekends or other days when the Fund does not calculate NAV. As a result, the market value of these investments may change on days when you cannot buy or sell shares of the Fund. Foreign securities are valued based on prices from the primary market in which they are traded and are translated from the local currency into U.S. dollars using current exchange rates. Forward foreign currency contracts are valued at the forward rate. Investments in any mutual fund are valued at their respective NAVs as determined by those mutual funds each business day (which may use fair value pricing as disclosed in their prospectuses). Over the Counter (“OTC”) investments (including swap contracts) are generally valued by approved pricing services that use evaluated prices from various observable market factors. Securities that do not have a readily available current market value are valued in accordance with procedures adopted by the Trust’s Board of Trustees. The Board of Trustees has adopted methods for valuing securities and other assets in circumstances
18
SIRIOS LONG/SHORT FUND
Notes to Financial Statements (Continued)
September 30, 2020
where market quotes are not readily available and has delegated to Sirios Capital Management, L.P. (“Sirios” or the “Adviser”) the responsibility for applying the valuation methods. Relying on prices supplied by pricing services or dealers or using fair valuation may result in values that are higher or lower than the values used by other investment companies and investors to price the same investments. In the event that market quotes are not readily available, and the security or asset cannot be valued pursuant to one of the valuation methods, the value of the security or asset will be determined in good faith by the Adviser. The Trust has established a Valuation Committee which performs certain functions including the oversight of the Adviser’s fair valuation determinations.
Fair Value Measurements — The inputs and valuations techniques used to measure fair value of the Fund’s net assets are summarized into three levels as described in the hierarchy below:
| · | Level 1 — quoted prices in active markets for identical securities; |
| · | Level 2 — other significant observable inputs (including quoted prices for similar securities, interest rates, prepayment speeds, credit risk, etc.); and |
| · | Level 3 — significant unobservable inputs (including the Fund’s own assumptions in determining the fair value of investments). |
The inputs or methodology used for valuing securities are not necessarily an indication of the risk associated with investing in those securities.
Securities listed on a non-U.S. exchange are generally fair valued daily by an independent fair value pricing service approved by the Board of Trustees and categorized as Level 2 investments within the hierarchy. The fair valuations for these securities may not be the same as quoted or published prices of the securities on their primary markets. Securities for which daily fair value prices from the independent fair value pricing service are not available are generally valued at the last quoted sale price at the close of an exchange on which the security is traded and categorized as Level 1 investments within the hierarchy. Values of foreign securities, currencies, and other assets and liabilities denominated in foreign currencies are translated into U.S. dollars at the exchange rate of said currencies against the U.S. dollar, as of valuation time, as provided by an independent pricing service approved by the Board of Trustees.
19
SIRIOS LONG/SHORT FUND
Notes to Financial Statements (Continued)
September 30, 2020
The following is a summary of the inputs used, as of September 30, 2020, in valuing the Fund’s assets and liabilities carried at fair value:
Assets | Total Value at 09/30/20 | Level 1 Quoted Price | Level 2 Other Significant Observable Inputs | Level 3 Significant Unobservable Inputs | ||||||||||||
Long Positions: | ||||||||||||||||
Common Stocks: | ||||||||||||||||
Aerospace & Defense | $ | 1,589,495 | $ | 800,861 | $ | 788,634 | $ | — | ||||||||
Airlines | 256,425 | 256,425 | — | — | ||||||||||||
Banks | 1,541,517 | 1,541,517 | — | — | ||||||||||||
Beverages | 527,217 | 527,217 | — | — | ||||||||||||
Building Materials | 393,775 | 393,775 | — | — | ||||||||||||
Chemicals | 698,117 | 698,117 | — | — | ||||||||||||
Commercial Services | 622,812 | 622,812 | — | — | ||||||||||||
Computers | 318,213 | 318,213 | — | — | ||||||||||||
Diversified Financial Services | 192,270 | 192,270 | — | — | ||||||||||||
Electronics | 1,185,667 | 1,185,667 | — | — | ||||||||||||
Environmental Control | 199,296 | 199,296 | — | — | ||||||||||||
Food | 129,528 | 129,528 | — | — | ||||||||||||
Healthcare-Products | 3,746,474 | 3,746,474 | — | — | ||||||||||||
Healthcare-Services | 742,514 | 742,514 | — | — | ||||||||||||
Home Builders | 272,797 | 272,797 | — | — | ||||||||||||
Housewares | 254,536 | 254,536 | — | — | ||||||||||||
Industrials | 140,638 | 140,638 | — | — | ||||||||||||
Insurance | 819,394 | 819,394 | — | — | ||||||||||||
Leisure Time | 280,058 | 280,058 | — | — | ||||||||||||
Lodging | 469,680 | 469,680 | — | — | ||||||||||||
Machinery-Diversified | 63,231 | 63,231 | — | — | ||||||||||||
Media | 296,321 | 296,321 | — | — | ||||||||||||
Oil & Gas | 102,724 | 102,724 | — | — | ||||||||||||
Pharmaceuticals | 1,829,610 | 1,829,610 | — | — | ||||||||||||
Retail | 1,540,947 | 1,540,947 | — | — | ||||||||||||
Semiconductors | 1,310,538 | 1,310,538 | — | — | ||||||||||||
Software | 2,277,789 | 2,277,789 | — | — | ||||||||||||
Telecommunications | 727,841 | 243,964 | 483,877 | — | ||||||||||||
Toys/Games/Hobbies | 299,198 | 299,198 | — | — | ||||||||||||
Transportation | 442,367 | 442,367 | — | — | ||||||||||||
Short-Term Investments | 2,034,969 | 2,034,969 | — | — | ||||||||||||
20
SIRIOS LONG/SHORT FUND
Notes to Financial Statements (Continued)
September 30, 2020
Assets | Total Value at 09/30/20 | Level 1 Quoted Price | Level 2 Other Significant Observable Inputs | Level 3 Significant Unobservable Inputs | ||||||||||||
Derivatives: | ||||||||||||||||
Foreign Currency Contracts | ||||||||||||||||
Forward Foreign Currency Contracts | $ | 29,870 | $ | — | $ | 29,870 | $ | — | ||||||||
Equity Contracts | ||||||||||||||||
Total Return Swap Contracts | 496,163 | — | 496,163 | — | ||||||||||||
|
|
|
|
|
|
|
| |||||||||
Total Assets | $ | 25,831,991 | $ | 24,033,447 | $ | 1,798,544 | $ | — | ||||||||
|
|
|
|
|
|
|
| |||||||||
Liabilities | Total Value at 09/30/20 | Level 1 Quoted Price | Level 2 Other Significant Observable Inputs | Level 3 Significant Unobservable Inputs | ||||||||||||
Short Positions: | ||||||||||||||||
Corporate Bonds and Notes Retail | $ | (46,900 | ) | $ | — | $ | (46,900 | ) | $ | — | ||||||
Derivatives: | ||||||||||||||||
Foreign Currency Contracts | ||||||||||||||||
Forward Foreign Currency Contracts | (646 | ) | — | (646 | ) | — | ||||||||||
Equity Contracts | ||||||||||||||||
Total Return Swap Contracts | (1,737,183 | ) | — | (1,737,183 | ) | — | ||||||||||
|
|
|
|
|
|
|
| |||||||||
Total Liabilities | $ | (1,784,729 | ) | $ | — | $ | (1,784,729 | ) | $ | — | ||||||
|
|
|
|
|
|
|
| |||||||||
At the end of each quarter, management evaluates the classification of Levels 1, 2 and 3 assets and liabilities. Various factors are considered, such as changes in liquidity from the prior reporting period; whether or not a broker is willing to execute at the quoted price; the depth and consistency of prices from third party pricing services; and the existence of contemporaneous, observable trades in the market. Additionally, management evaluates the classification of Level 1 and Level 2 assets and liabilities on a quarterly basis for changes in listings or delistings on national exchanges.
Due to the inherent uncertainty of determining the fair value of investments that do not have a readily available market value, the fair value of the Fund’s investments may fluctuate from period to period. Additionally, the fair value of investments may differ significantly from the values that would have been
21
SIRIOS LONG/SHORT FUND
Notes to Financial Statements (Continued)
September 30, 2020
used had a ready market existed for such investments and may differ materially from the values the Fund may ultimately realize. Further, such investments may be subject to legal and other restrictions on resale or otherwise less liquid than publicly traded securities.
For fair valuations using significant unobservable inputs, U.S. generally accepted accounting principles (“U.S. GAAP”) require the Fund to present a reconciliation of the beginning to ending balances for reported market values that presents changes attributable to total realized and unrealized gains or losses, purchase and sales, and transfers in and out of Level 3 during the period. A reconciliation of Level 3 investments is presented only when the Fund had an amount of Level 3 investments at the end of the reporting period that was meaningful in relation to its net assets. The amounts and reasons for all transfers in and out of Level 3 are disclosed when the Fund had an amount of transfers during the reporting period that was meaningful in relation to its net assets as of the end of the reporting period.
For the year ended September 30, 2020, there were no transfers in or out of Level 3.
Use of Estimates — The preparation of financial statements in conformity with U.S. GAAP requires management to make estimates and assumptions that affect the amounts reported in the financial statements and accompanying notes at the date of the financial statements and the reported amounts of revenues and expenses during the period. Actual results could differ from those estimates and those differences could be material.
Investment Transactions, Investment Income and Expenses — Investment transactions are recorded on trade date for financial statement preparation purposes. Realized gains and losses on investments sold are recorded on the identified cost basis. Interest income is recorded on the accrual basis. Accretion of discounts and amortization of premiums are recorded on a daily basis using the effective yield method except for short-term securities, which records discounts and premiums on a straight-line basis. Dividends are recorded on the ex-dividend date. Estimated components of distributions received from real estate investment trusts may be considered income, return of capital distributions or capital gain distributions. Return of capital distributions are recorded as a reduction of cost of the related investments. The Fund may be subject to taxes imposed by countries in which it invests. Such taxes are generally based on income and/or capital gains earned or repatriated. Taxes are accrued and applied to net investment income, net realized gains and net unrealized appreciation/depreciation as such income and/or gains are earned. General expenses of the Trust are generally allocated to each fund under methodologies approved by the Board of Trustees. Expenses directly attributable to a particular fund in the Trust are charged directly to that fund.
Cash and Cash Equivalents — Cash and cash equivalents include cash and overnight investments in interest-bearing demand deposits with a financial institution with original maturities of three months or less. The Fund maintains deposits with a high quality financial institution in an amount that is in excess of federally insured limits.
22
SIRIOS LONG/SHORT FUND
Notes to Financial Statements (Continued)
September 30, 2020
Foreign Currency Translation — Assets and liabilities initially expressed in non-U.S. currencies are translated into U.S. dollars based on the applicable exchange rates at the date of the last business day of the financial statement period. Purchases and sales of securities, interest income, dividends, variation margin received and expenses denominated in foreign currencies are translated into U.S. dollars at the exchange rates in effect on the transaction date.
The Fund does not separately report the effect of changes in foreign exchange rates from changes in market prices of securities held. Such changes are included with the net realized gain or loss and change in unrealized appreciation or depreciation on investments in the Statement of Operations. Other foreign currency transactions resulting in realized and unrealized gain or loss are reported separately as net realized gain or loss and change in unrealized appreciation or depreciation on foreign currency transactions in the Statement of Operations.
Dividends and Distributions to Shareholders — Dividends from net investment income and distributions from net realized capital gains, if any, are declared, recorded on ex-date and paid at least annually to shareholders. Income dividends and capital gain distributions are determined in accordance with U.S. federal income tax regulations, which may differ from U.S. GAAP.
U.S. Tax Status — No provision is made for U.S. income taxes as it is the Fund’s intention to continue to qualify for and elect the tax treatment applicable to regulated investment companies under Subchapter M of the Internal Revenue Code of 1986, as amended, and make the requisite distributions to its shareholders which will be sufficient to relieve it from U.S. income and excise taxes.
Other — In the normal course of business, the Fund may enter into contracts that provide general indemnifications. The Fund’s maximum exposure under these arrangements is dependent on claims that may be made against the Fund in the future, and therefore, cannot be estimated; however, based on experience, the risk of material loss for such claims is considered remote.
Market disruptions associated with the COVID-19 pandemic have had a global impact, and uncertainty exists as to its long-term implications. The COVID-19 pandemic could adversely affect the value and liquidity of the Fund’s investments, impair the Fund’s ability to satisfy redemption requests, and negatively impact the Fund’s performance. In addition, the outbreak of COVID-19, and measures taken to mitigate its effects, could result in disruptions to the services provided to the Fund by its service providers. Fund management is continuing to monitor this development and evaluate its impact on the Fund.
Forward Foreign Currency Contracts — A forward foreign currency contract (“Forward Contract”) is a commitment to buy or sell a specific amount of a foreign currency at a negotiated price on a specified future date. Forward Contracts can help a fund manage the risk of changes in currency exchange rates. These contracts are marked-to-market daily at the applicable forward currency translation rates. The Fund records realized gains or losses at the time the Forward Contract is closed. A Forward Contract is
23
SIRIOS LONG/SHORT FUND
Notes to Financial Statements (Continued)
September 30, 2020
extinguished through a closing transaction or upon delivery of the currency or entering an offsetting contract. The Fund’s maximum risk of loss from counterparty credit risk related to Forward Contracts is the fair value of the contract.
The Fund utilized Forward Contracts for hedging purposes to protect the Fund’s returns against adverse currency movements.
For the year ended September 30, 2020, the Fund’s average monthly volume of forward foreign currency contracts was as follows:
Forward Foreign Currency Contracts - Purchased | Forward Foreign Currency Contracts - Sold | |
$710,452 | $3,495,380 |
Purchased Options — The Funds may purchase option contracts. They are subject to interest rate and other risk exposure in the normal course of pursuing their investment objectives. The risk associated with purchasing an option is that the Funds pay a premium whether or not the option is exercised. Additionally, the Funds bear the risk of loss of premium and change in market value should the counterparty not perform under the contract. Put and call options are accounted for in the same manner as other securities owned. The cost of securities acquired through the exercise of call options is increased by the premiums paid. The proceeds from securities sold through the exercise of put options are decreased by the premiums paid.
For the year ended September 30, 2020, the quarterly average volume of purchased options was as follows:
Purchased Options (Cost) |
$13,601 |
Total Return Swaps — Total return swaps are contracts in which both parties agree to make payments of the total return from a reference instrument during a specified period. The total return includes appreciation or depreciation on the underlying asset, plus any interest or dividend payments. The unrealized appreciation or depreciation also includes interest charges and credits (“financing fees”) related to the notional values of the long and short positions and cash balances within the swap. These interest charges and credits are based on a specified benchmark rate, such as the U.S. effective federal funds rate (“EFFR”). Payments under the swap are based upon an agreed upon principal amount but, since the principal amount is not exchanged, it represents neither an asset nor a liability to either counterparty, and is referred to as notional. Total return swaps are marked to market daily using different sources, including quotations from counterparties, pricing services, brokers or market makers. The unrealized appreciation or depreciation related to the
24
SIRIOS LONG/SHORT FUND
Notes to Financial Statements (Continued)
September 30, 2020
change in the valuation of the notional amount of the swap is combined with the amount due to the Fund at termination or settlement. The primary risks associated with total return swaps are credit risks (if the counterparty fails to meet its obligations) and market risk (if there is no liquid market for the swap or unfavorable changes occur to the underlying reference instrument).
The Fund used total return swaps to enhance returns, obtain short exposure as part of the Fund’s strategy and for market exposure.
For the year ended September 30, 2020, the quarterly average volume of the total return swaps were as follows:
Notional Amount – Long | Notional Amount – Short | |
$1,375,670 | $9,346,110 |
Counterparty Risk — Certain of the derivatives entered into by the Fund may not be traded on an exchange but instead will be privately negotiated in the over-the-counter market. This means that these instruments are traded between counterparties based on contractual relationships. Relying on a counterparty exposes the Fund to the risk that a counterparty will not settle a transaction in accordance with its terms and conditions because of a dispute over the terms of the contract (whether or not bona fide) or because of a credit or liquidity problem, thus causing the Fund to suffer a loss. If a counterparty defaults on its payment obligations to the Fund, this default will cause the value of an investment in the Fund to decrease. In addition, to the extent the Fund deals with a limited number of counterparties, it will be more susceptible to the credit risks associated with those counterparties. The Fund is neither restricted from dealing with any particular counterparty nor from concentrating any or all of its transactions with one counterparty. The ability of the Fund to transact business with any one or number of counterparties and the absence of a regulated market to facilitate settlement may increase the potential for losses by the Fund.
The Fund is subject to the risk that issuers of the instruments in which it invests and trades may default on their obligations, and that certain events may occur that have an immediate and significant adverse effect on the value of those instruments. There can be no assurance that an issuer will not default, or that an event that has an immediate and significant adverse effect on the value of an instrument will not occur, and that the Fund will not sustain a loss on a transaction as a result.
Liquidity Risk — The Fund may be subject to liquidity risk primarily due to investments in derivatives. The Fund may invest up to 15% of its net assets in illiquid securities or instruments. Certain derivatives, such as swaps, Forward Contracts and options may not be readily marketable and, therefore, may be deemed to be illiquid. An asset is not readily marketable if it cannot be sold within seven business days in the ordinary course of business for approximately the amount at which it is valued. Investments in illiquid assets involve the risk that the Fund may be unable to sell the asset or sell it at a reasonable
25
SIRIOS LONG/SHORT FUND
Notes to Financial Statements (Continued)
September 30, 2020
price. In addition, the Fund may be required to liquidate positions or close out derivatives on unfavorable terms at a time contrary to the interests of the Fund in order to raise cash to pay redemptions.
An investment in derivatives is also subject to the risk that the Fund may not be able to terminate the derivatives effective on whatever date it chooses, or that the settlement of any early termination may depend on subsequent market movements. As a result, the Fund may be exposed to the risk of additional losses due to such delays.
Master Netting Agreement — In order to define its contractual rights and to secure rights that will help mitigate its counterparty risk, the Fund has entered into an International Swaps and Derivatives Association, Inc. Master Agreement (“ISDA Master Agreement”). An ISDA Master Agreement is a bilateral agreement between the Fund and a counterparty that governs certain OTC derivatives and typically contains, among other things, collateral posting terms and netting provisions in the event of a default and/or termination event. Under an ISDA Master Agreement, the Fund may, under certain circumstances, offset with the counterparty certain derivative financial instruments’ payables and/or receivables with collateral held and/or posted and create one single net payment. The provisions of the ISDA Master Agreement typically permit a single net payment in the event of default including the bankruptcy or insolvency of the counterparty. Bankruptcy or insolvency laws of a particular jurisdiction may restrict or prohibit the right of offset in bankruptcy, insolvency or other events. In addition, certain ISDA Master Agreements allow counterparties to terminate derivative contracts prior to maturity in the event the Fund’s net assets decline by a stated percentage or the Fund fails to meet the terms of its ISDA Master Agreements. The result would cause the Fund to accelerate payment of any net liability owed to the counterparty.
Collateral Requirements — For derivatives traded under an ISDA Master Agreement, the collateral requirements are typically calculated by netting the mark-to-market amount for each transaction under such agreement and comparing that amount to the value of any collateral currently pledged by the Fund and the counterparty. Cash collateral that has been pledged to cover obligations of the Fund and cash collateral received from the counterparty, if any, is reported separately on the Statement of Assets and Liabilities as cash pledged as collateral and cash received as collateral, respectively. Non-cash collateral pledged by the Fund, if any, is noted in the Schedule of Investments. Generally, the amount of collateral due from or to a counterparty is subject to a certain minimum transfer amount threshold before a transfer is required, which is determined at the close of business of the Fund. Any additional required collateral is delivered to/pledged by the Fund on the next business day. Typically, the counterparty is not permitted to sell, re-pledge or use cash and non-cash collateral it receives. A Fund generally agrees not to use non-cash collateral that it receives but may, absent default or certain other circumstances defined in the underlying ISDA Master Agreement, be permitted to use cash collateral received. In such cases, interest may be paid pursuant to the collateral arrangement with the counterparty. To the extent amounts due to the Fund from its counterparties are not fully collateralized, they bear the risk of loss from counterparty non-performance. Likewise, to the extent the Fund has delivered collateral to a counterparty and stands ready to perform under the terms of its agreement with such counterparty, it bears the risk of loss from
26
SIRIOS LONG/SHORT FUND
Notes to Financial Statements (Continued)
September 30, 2020
a counterparty in the amount of the value of the collateral in the event the counterparty fails to return such collateral. Based on the terms of agreements, collateral may not be required for all derivative contracts. For financial reporting purposes, the Fund does not offset derivative assets and derivative liabilities that are subject to netting arrangements, if any, in the Statement of Assets and Liabilities.
The following tables present derivative assets and liabilities net of amounts available for offset under a master netting agreement and any related collateral received or posted by the Fund for forward foreign currency contracts and total return swaps as of September 30, 2020:
| Counterparty | Derivative Assets – Gross | Derivative Available for Offset | Collateral Received | Derivative Assets – Net* | |||||||||||||||||||||
Morgan Stanley | $526,033 | $(526,033 | ) | $— | $— | ||||||||||||||||||||
| Counterparty | Derivative Liabilities–Gross | Derivative Available for Offset | Collateral Posted | Derivative Liabilities–Net** | |||||||||||||||||||||
Morgan Stanley | $(1,737,829 | ) | $526,033 | $— | $(1,211,796 | ) | |||||||||||||||||||
| * | Net amount represents the net receivable from the counterparty in the event of a default. |
| ** | Net amount represents the net payable to the counterparty in the event of a default. |
Currency Risk — The Fund invests in securities of foreign issuers, including American Depositary Receipts. These markets are subject to special risks associated with foreign investments not typically associated with investing in U.S. markets. Because the foreign securities in which the Fund may invest generally trade in currencies other than the U.S. dollar, changes in currency exchange rates will affect the Fund’s NAV, the value of dividends and interest earned and gains and losses realized on the sale of securities. Because the NAV for the Fund is determined on the basis of U.S. dollars, the Fund may lose money by investing in a foreign security if the local currency of a foreign market depreciates against the U.S. dollar, even if the local currency value of the Fund’s holdings goes up. Generally, a strong U.S. dollar relative to these other currencies will adversely affect the value of the Fund’s holdings in foreign securities.
Foreign Securities Market Risk — Securities of many non-U.S. companies may be less liquid and their prices more volatile than securities of comparable U.S. companies. Securities of companies traded in many countries outside the U.S., particularly emerging markets countries, may be subject to further risks due to the inexperience of local investment professionals and financial institutions, the possibility of permanent or temporary termination of trading and greater spreads between bid and asked prices of securities. In addition, non-U.S. stock exchanges and investment professionals are subject to less governmental regulation, and commissions may be higher than in the United States. Also, there may be delays in the settlement of non-U.S. stock exchange transactions.
27
SIRIOS LONG/SHORT FUND
Notes to Financial Statements (Continued)
September 30, 2020
Short Sales — The Fund may sell securities short. A short sale involves the sale by the Fund of a security that it does not own with the anticipation of purchasing the same security at a later date at a lower price. If the price of the security has increased during this time, then the Fund will incur a loss equal to the increase in price from the time that the short sale was entered into plus any premiums and interest paid to the third party. Therefore, short sales involve the risk that losses may be exaggerated, potentially losing more money than the actual cost of the investment. Also, there is the risk that the third party to the short sale may fail to honor its contract terms, causing a loss to the Fund. There can be no assurance that the Fund will be able to close out a short position at any particular time or at an acceptable price. Although the Fund’s gain is limited to the amount at which it sold a security short, its potential loss is unlimited. The Fund complies with guidelines established by the Securities and Exchange Commission and other applicable regulatory bodies with respect to coverage of short sales.
As of September 30, 2020, the Fund had securities sold short totaling $46,900.
In accordance with the terms of its prime brokerage agreements, the Fund may receive rebate income or be charged fees on securities sold short. Such income or fee is calculated on a daily basis based upon the market value of securities sold short and a variable rate that is dependent upon the availability of such security.
Disclosures About Derivative Instruments and Hedging Activities
The following tables provide quantitative disclosures about fair value amounts of, gains and losses on, the Fund’s derivative instruments as of September 30, 2020.
The following table lists the fair values of the Fund’s derivative holdings as of September 30, 2020 grouped by contract type and risk exposure category.
| Derivative Type | Location Statement of Assets and Liabilities | Equity Risk | Foreign Currency Risk | Total | ||||||||
| ||||||||||||
| Asset Derivatives | ||||||||||||
| ||||||||||||
Forward Foreign Currency Contracts | Unrealized appreciation on forward foreign currency contracts | $ | — | $29,870 | $ | 29,870 | ||||||
| ||||||||||||
| Swap Contracts | Unrealized appreciation on swap contracts | 496,163 | — | 496,163 | ||||||||
| ||||||||||||
| Total Value - Assets | $ | 496,163 | $29,870 | $ | 526,033 | |||||||
| ||||||||||||
| Liability Derivatives | ||||||||||||
| ||||||||||||
Forward Foreign Currency Contracts | Unrealized depreciation on forward foreign currency contracts | $ | — | $ (646) | $ | (646 | ) | |||||
| ||||||||||||
| Swap Contracts | Unrealized depreciation on swap contracts | (1,737,183 | ) | — | (1,737,183 | ) | ||||||
| ||||||||||||
| Total Value - Liabilities | $ | (1,737,183 | ) | $ (646) | $ | (1,737,829 | ) | |||||
| ||||||||||||
28
SIRIOS LONG/SHORT FUND
Notes to Financial Statements (Continued)
September 30, 2020
The following table lists the amounts of realized gains or losses included in net decrease in net assets resulting from operations for the fiscal year ended September 30, 2020, grouped by contract type and risk exposure.
| Derivative Type | Location Statement of Operations | Equity Risk | Foreign Currency Risk | Total | ||||||||
| ||||||||||||
| Realized Gain (Loss) | ||||||||||||
| ||||||||||||
| Forward Foreign Currency Contracts | Net realized loss from forward foreign currency contracts | $ | — | $(113,679) | $(113,679 | ) | ||||||
| ||||||||||||
| Purchased Options | Net realized loss from investments | (67,673 | ) | — | (67,673 | ) | ||||||
| ||||||||||||
| Swap Contracts | Net realized loss from swap contracts | (253,154 | ) | — | (253,154 | ) | ||||||
| ||||||||||||
Total Realized Loss | $(320,827 | ) | $(113,679) | $(434,506 | ) | |||||||
| ||||||||||||
The following table lists the amounts of change in unrealized appreciation (depreciation) included in net decrease in net assets resulting from operations for the fiscal year ended September 30, 2020, grouped by contract type and risk exposure.
| Derivative Type | Location Statement of Operations | Equity Risk | Foreign Currency Risk | Total | ||||||||||
| ||||||||||||||
| Change in appreciation (depreciation) |
| |||||||||||||
| ||||||||||||||
| Forward Foreign Currency Contracts | Net change in unrealized appreciation (depreciation) on forward foreign currency contracts | $ | — | $(3,581) | $ | (3,581 | ) | |||||||
| ||||||||||||||
| Swap Contracts | Net change in unrealized appreciation (depreciation) on swap contracts | (1,203,134 | ) | — | (1,203,134 | ) | ||||||||
| ||||||||||||||
| Total change in appreciation (depreciation) | $ | (1,203,134 | ) | $(3,581) | $ | (1,206,715 | ) | |||||||
| ||||||||||||||
2. Transactions with Affiliates and Related Parties and Other Service Providers
Sirios Capital Management, L.P. (“Sirios”) serves as the investment adviser to the Fund pursuant to an investment advisory agreement with the Trust. For its services, the Adviser earns a monthly fee at the annual rate of 1.35% of the Fund’s average daily net assets. The Adviser has contractually agreed to reduce its compensation and/or reimburse certain expenses of the Fund to the extent necessary to ensure that the Fund’s total operating expenses, excluding taxes, interest, extraordinary items, brokerage commissions, fees and expenses attributable to a distribution or service plan adopted by the Trust, dividend and interest expense on short sales of securities and “Acquired Fund Fees and Expenses,” as defined in Form N-1A, do not exceed 1.60% (on an annual basis) of the Fund’s average daily net assets (the “Expense Limitation”). The Expense Limitation will remain in place until April 30, 2021, unless the Board of Trustees approves its earlier termination. This agreement may be terminated only by the Fund’s Board of Trustees. The Adviser is entitled to recover, subject to approval by the Board of Trustees, such amounts
29
SIRIOS LONG/SHORT FUND
Notes to Financial Statements (Continued)
September 30, 2020
reduced or reimbursed for a period of up to three (3) years from the date on which the Adviser reduced its compensation and/or assumed expenses for the Fund. The Adviser is permitted to seek recoupment from the Fund for fees it waived and Fund expenses it paid to the extent the total annual fund expenses do not exceed the limits described above or any lesser limits in effect at the time of the reimbursement. No reimbursement will occur unless the Fund’s expenses are below the Expense Limitation. As of September 30, 2020, the amount of potential recovery was as follows:
| Expiration | ||||||||||||
| ||||||||||||
September 30, 2021 | September 30, 2022 | September 30, 2023 | Total | |||||||||
$71,400 | $202,406 | $231,152 | $504,958 | |||||||||
For the year ended September 30, 2020, the Adviser earned advisory fees of $352,430 and waived fees and/or reimbursed expenses of $231,152.
Other Service Providers
The Bank of New York Mellon (“BNY Mellon”) serves as administrator and custodian for the Fund. For providing administrative and accounting services, BNY Mellon is entitled to receive a monthly fee equal to an annual percentage rate of the Fund’s average daily net assets and is subject to certain minimum monthly fees. For providing certain custodial services, BNY Mellon is entitled to receive a monthly fee, subject to certain minimum, and out of pocket expenses.
BNY Mellon Investment Servicing (US) Inc. (the “Transfer Agent”) provides transfer agent services to the Fund. The Transfer Agent is entitled to receive a monthly fee, subject to certain minimum, and out of pocket expenses.
BNY Mellon and the Transfer Agent have the ability to recover such amounts previously waived, if the Fund terminates its agreements with BNY Mellon and the Transfer Agent within three years of commencing operations. As of September 30, 2020, the amount of potential recovery was $54,771. The ability to recover such amounts previously waived expires on May 3, 2021.
The Trust, on behalf of the Fund, has entered into agreements with financial intermediaries to provide recordkeeping, processing, shareholder communications and other services to customers of the intermediaries investing in the Fund and has agreed to compensate the intermediaries for providing those services. The fees incurred by the Fund for these services are included in Transfer Agent fees in the Statement of Operations.
Foreside Funds Distributors LLC (the “Underwriter”) provides principal underwriting services to the Fund pursuant to an underwriting agreement between the Trust and the Underwriter.
30
SIRIOS LONG/SHORT FUND
Notes to Financial Statements (Continued)
September 30, 2020
Trustees and Officers
The Trust is governed by its Board of Trustees. The Trustees receive compensation in the form of an annual retainer and per meeting fees for their services to the Trust. An employee of BNY Mellon serves as the Secretary of the Trust and is not compensated by the Fund or the Trust.
JW Fund Management LLC (“JWFM”) provides a Principal Executive Officer and Principal Financial Officer, respectively, to the Trust. Effective October 1, 2020, Alaric Compliance Services LLC (“Alaric”) provides the Trust with a Chief Compliance Officer and an Anti-Money Laundering Officer. Prior to October 1, 2020, Duff & Phelps, LLC provided the Trust with a Chief Compliance Officer and an Anti-Money Laundering Officer. JWFM and Alaric are compensated for their services provided to the Trust.
3. Investment in Securities
For the year ended September 30, 2020, aggregate purchases and sales of investment securities (excluding short-term investments) of the Fund were as follows:
| Purchases | Sales | |||||||
Investment Securities | $ | 33,946,175 | $ | 35,749,415 | ||||
4. Capital Share Transactions
For the years ended September 30, 2020 and 2019, transactions in capital shares (authorized shares unlimited) were as follows:
| For the Year Ended | For the Year Ended | |||||||||||||||
| September 30, 2020 | September 30, 2019 | |||||||||||||||
| Shares | Value | Shares | Value | |||||||||||||
Institutional Class | ||||||||||||||||
Sales | 9,524 | $ | 101,517 | 1,505,710 | $ | 15,290,625 | ||||||||||
Reinvestments | 13,436 | 144,436 | 29,331 | 270,428 | ||||||||||||
Redemptions | (17,953 | ) | (186,965 | ) | (7,164 | ) | (75,500 | ) | ||||||||
|
|
|
|
|
|
|
| |||||||||
Net Increase | 5,007 | $ | 58,988 | 1,527,877 | $ | 15,485,553 | ||||||||||
|
|
|
|
|
|
|
| |||||||||
5. Federal Tax Information
The Fund has followed the authoritative guidance on accounting for and disclosure of uncertainty in tax positions, which requires the Fund to determine whether a tax position is more likely than not to be sustained upon examination, including resolution of any related appeals or litigation processes, based on the technical merits of the position. Tax positions not deemed to meet the more-likely-than-not threshold
31
SIRIOS LONG/SHORT FUND
Notes to Financial Statements (Continued)
September 30, 2020
would be recorded as tax benefit or expense in the current year. The Fund has determined that there was no effect on the financial statements from following this authoritative guidance. In the normal course of business, the Fund is subject to examination by federal, state, and local jurisdictions, where applicable, for tax years for which applicable statutes of limitations have not expired.
Distributions are determined in accordance with federal income tax regulations, which may differ in amount or character from net investment income and realized gains for financial reporting purposes. Accordingly, the character of distributions and composition of net assets for tax purposes may differ from those reflected in the accompanying financial statements. To the extent these differences are permanent, such amounts are reclassified within the components of net assets based on the tax treatment; temporary differences do not require reclassifications. For the year ended September 30, 2020, there were no reclassifications.
For the year ended September 30, 2020, the tax character of distributions paid by the Fund was $144,660 of ordinary income dividends. For the year ended September 30, 2019, the tax character of distributions paid by the Fund was $270,428 of ordinary income dividends.
As of September 30, 2020, the components of distributable earnings on a tax basis were as follows:
Undistributed Long-Term Capital Gains | Undistributed Ordinary Income | Unrealized Depreciation | ||
$9,678 | $180,958 | $(249,418) |
The differences between the book and tax basis components of distributable earnings relate primarily to the timing and recognition of income and gains for federal income tax purposes. Short-term capital gains are reported as ordinary income for federal income tax purposes.
As of September 30, 2020, the federal tax cost, aggregate gross unrealized appreciation and depreciation of securities held by the Fund were as follows:
Federal tax cost | $ | 24,314,568 | ||||
|
| |||||
Gross unrealized appreciation on investments | 1,459,305 | |||||
Gross unrealized depreciation on investments | (1,708,723 | ) | ||||
|
| |||||
Net unrealized depreciation | $ | (249,418 | ) | |||
|
| |||||
Pursuant to federal income tax rules applicable to regulated investment companies, the Fund may elect to treat certain capital losses between November 1 and September 30 and late year ordinary losses ((i) ordinary losses between January 1 and September 30, and (ii) specified ordinary and currency losses between November 1 and September 30) as occurring on the first day of the following tax year. For the year ended September 30, 2020, any amount of losses elected within the tax return will not be recognized
32
SIRIOS LONG/SHORT FUND
Notes to Financial Statements (Concluded)
September 30, 2020
for federal income tax purposes until October 1, 2020. For the year ended September 30, 2020, the Fund had no capital loss deferrals and no late year ordinary loss deferrals.
Accumulated capital losses represent net capital loss carry forwards as of September 30, 2020 that may be available to offset future realized capital gains and thereby reduce future capital gains distributions. As of September 30, 2020, the Fund did not have any capital loss carryforwards.
During the year ended September 30, 2020, the Fund utilized $97,301 of prior year capital loss carryforwards.
6. Subsequent Events
Management has evaluated the impact of all subsequent events on the Fund through the date the financial statements were issued, and has determined that there are no subsequent events requiring recognition or disclosure in the financial statements.
33
SIRIOS LONG/SHORT FUND
Report of Independent Registered Public Accounting Firm
To the Board of Trustees of FundVantage Trust and
Shareholders of Sirios Long/Short Fund
Opinion on the Financial Statements
We have audited the accompanying statement of assets and liabilities of Sirios Long/Short Fund (the “Fund”) (one of the series constituting FundVantage Trust (the “Trust”)), including the portfolio of investments, as of September 30, 2020, and the related statement of operations for the year then ended, the statements of changes in net assets for each of the two years in the period then ended, the financial highlights for each of the two years in the period then ended and the period from May 3, 2018 (commencement of operations) to September 30, 2018 and the related notes (collectively referred to as the “financial statements”). In our opinion, the financial statements present fairly, in all material respects, the financial position of the Fund (one of the series constituting FundVantage Trust) at September 30, 2020, the results of its operations for the year then ended, the changes in its net assets for each of the two years in the period then ended and its financial highlights for each of the two years in the period then ended and the period from May 3, 2018 (commencement of operations) to September 30, 2018, in conformity with U.S. generally accepted accounting principles.
Basis for Opinion
These financial statements are the responsibility of the Trust’s management. Our responsibility is to express an opinion on the Fund’s financial statements based on our audits. We are a public accounting firm registered with the Public Company Accounting Oversight Board (United States) (“PCAOB”) and are required to be independent with respect to the Trust in accordance with the U.S. federal securities laws and the applicable rules and regulations of the Securities and Exchange Commission and the PCAOB.
We conducted our audits in accordance with the standards of the PCAOB. Those standards require that we plan and perform the audit to obtain reasonable assurance about whether the financial statements are free of material misstatement, whether due to error or fraud. The Trust is not required to have, nor were we engaged to perform, an audit of the Trust’s internal control over financial reporting. As part of our audits we are required to obtain an understanding of internal control over financial reporting but not for the purpose of expressing an opinion on the effectiveness of the Trust’s internal control over financial reporting. Accordingly, we express no such opinion.
Our audits included performing procedures to assess the risks of material misstatement of the financial statements, whether due to error or fraud, and performing procedures that respond to those risks. Such procedures included examining, on a test basis, evidence regarding the amounts and disclosures in the financial statements. Our procedures included confirmation of securities owned as of September 30, 2020, by correspondence with the custodian and brokers or by other appropriate auditing procedures
34
SIRIOS LONG/SHORT FUND
Report of Independent Registered Public Accounting Firm
where replies from brokers were not received. Our audits also included evaluating the accounting principles used and significant estimates made by management, as well as evaluating the overall presentation of the financial statements. We believe that our audits provide a reasonable basis for our opinion.

We have served as the auditor of one or more Sirios investment companies since 2018.
Philadelphia, Pennsylvania
November 25, 2020
35
SIRIOS LONG/SHORT FUND
Shareholder Tax Information
(Unaudited)
The Fund is required by Subchapter M of the Internal Revenue Code of 1986, as amended, to advise its shareholders of the U.S. federal tax status of distributions received by the Fund’s shareholders in respect of such fiscal year. During the year ended September 30, 2020, the Fund paid ordinary income distributions of $144,660. Dividends from net investment income and short-term capital gains are treated as ordinary income dividends for federal income tax purposes.
The Fund designates 100.00% of the ordinary income distribution as qualified dividend income pursuant to the Jobs and Growth Tax Relief Reconciliation Act of 2003.
The percentage of qualified interest income related dividends not subject to withholding tax for non-resident aliens and foreign corporations is 6.36%.
The percentage of ordinary income dividends qualifying for the corporate dividends received deduction is 100.00%.
The percentage of ordinary income distributions as qualified short-term gain pursuant to the American Jobs Creation Act of 2004 is 100.00%.
All designations are based on financial information available as of the date of this annual report and, accordingly, are subject to change. For each item, it is the intention of the Fund to designate the maximum amount permitted under the Internal Revenue Code of 1986, as amended, and the regulations thereunder.
Because the Fund’s fiscal year is not the calendar year, another notification will be sent with respect to calendar year 2020. The second notification, which will reflect the amount, if any, to be used by calendar year taxpayers on their U.S. federal income tax returns, will be made in conjunction with Form 1099-DIV and will be mailed in January 2021.
Foreign shareholders will generally be subject to U.S. withholding tax on the amount of their ordinary income dividends. They will generally not be entitled to a foreign tax credit or deduction for the withholding taxes paid by the Fund, if any.
In general, dividends received by tax-exempt recipients (e.g., IRAs and Keoghs) need not be reported as taxable income for U.S. federal income tax purposes. However, some retirement trusts (e.g., corporate, Keogh and 403(b)(7) plans) may need this information for their annual information reporting.
Shareholders are advised to consult their own tax advisers with respect to the tax consequences of their investment in the Fund.
36
SIRIOS LONG/SHORT FUND
Statement Regarding Liquidity Risk Management Program
(Unaudited)
On October 16, 2016, the Securities and Exchange Commission adopted Rule 22e-4 under the Investment Company Act of 1940, as amended (the “Liquidity Rule”) to promote effective liquidity risk management throughout the open-end investment company industry, thereby reducing the risk that funds will be unable to meet their redemption obligations and mitigating dilution of the interests of fund shareholders.
The Board of Trustees (the “Board”) of FundVantage Trust, on behalf of the Sirios Long/Short Fund (the “Fund”), met on September 22-23, 2020 (the “Meeting”) to review the liquidity risk management program (the “Program”) applicable to the Fund, pursuant to the Liquidity Rule. The Board has appointed a committee of individuals to serve as the program administrator for the Fund’s Program (the “Program Committee”). At the Meeting, the Program Committee provided the Board with a report that addressed the operation of the Program and assessed its adequacy and effectiveness of implementation and any material changes to the Program as of June 30, 2020 (the “Report”).
The Report described the Program’s liquidity classification methodology. It also described the Program Committee’s methodology in determining whether a Highly Liquid Investment Minimum (a “HLIM”) is necessary and noted that, given the composition of the Fund’s portfolio holdings, a HLIM was not currently required for the Fund.
The Report noted that the Program complied with the key factors for consideration under the Liquidity Rule for assessing, managing and periodically reviewing liquidity risk, as follow:
A. The Fund’s investment strategy and liquidity of Fund investments during both normal and reasonably foreseeable stressed conditions: As part of the Report, the Program Committee reviewed the Fund’s strategy and its determination that the strategy remains appropriate for an open-end fund structure. This determination was based on the Fund’s holdings of Highly Liquid Investments, the diversification of holdings and the related average position size of the holdings.
B. Short-term and long-term cash flow projections during both normal and reasonably foreseeable stressed conditions: As part of the Report, the Program Committee reviewed historical net redemption activity and noted that it used this information as a component to establish the Fund’s reasonably anticipated trading size. The Fund has adopted an in-kind redemption policy which may be utilized to meet larger redemption requests. The Program Committee also took into consideration the Fund’s shareholder ownership concentration and the fact that the shares of the Fund are offered through intermediaries. The intermediary agreements increase the likelihood of large unanticipated redemptions, meaning a Fund may not have the ability to conduct an orderly sale of portfolio securities. The amount of assets a Fund has on these platforms is a significant factor in the ability of the Fund to meet redemption expectations. In light of the Fund’s holdings, it was noted that the Fund maintains a high level of liquidity to meet shareholder redemptions under both normal and stressed market conditions.
37
SIRIOS LONG/SHORT FUND
Statement Regarding Liquidity Risk Management Program (Concluded)
(Unaudited)
C. Holdings of cash and cash equivalents, as well as borrowing arrangements: As part of the Report, the Program Committee reviewed any changes in the Fund’s cash and cash equivalents positions in response to current/anticipated redemption activity or market conditions. It was noted that the Fund do not currently have a borrowing or other credit funding arrangement.
38
SIRIOS LONG/SHORT FUND
Other Information
(Unaudited)
Proxy Voting
Policies and procedures that the Fund uses to determine how to vote proxies relating to portfolio securities as well as information regarding how the Fund voted proxies relating to portfolio securities for the most recent 12-month period ended June 30 are available without charge, upon request, by calling (866) 640-5704 and on the Securities and Exchange Commission’s (“SEC”) website at http://www.sec.gov.
Quarterly Portfolio Schedules
The Trust files its complete schedule of portfolio holdings with the SEC for the first and third fiscal quarters of each fiscal year (quarters ended December 31 and June 30) as an exhibit to their reports on Form N-PORT. The Trust’s portfolio holdings on Form N-PORT are available on the SEC’s website at http://www.sec.gov.
39
SIRIOS LONG/SHORT FUND
Privacy Notice
(Unaudited)
The privacy of your personal financial information is extremely important to us. When you open an account with us, we collect a significant amount of information from you in order to properly invest and administer your account. We take very seriously the obligation to keep that information private and confidential, and we want you to know how we protect that important information.
We collect nonpublic personal information about you from applications or other forms you complete and from your transactions with us or our affiliates. We do not disclose information about you, or our former clients, to our affiliates or to service providers or other third parties, except as permitted by law. We share only the information required to properly administer your accounts, which enables us to send transaction confirmations, monthly or quarterly statements, financials and tax forms. Even within FundVantage Trust and its affiliated entities, a limited number of people who actually service accounts will have access to your personal financial information. Further, we do not share information about our current or former clients with any outside marketing groups or sales entities.
To ensure the highest degree of security and confidentiality, FundVantage Trust and its affiliates maintain various physical, electronic and procedural safeguards to protect your personal information. We also apply special measures for authentication of information you request or submit to us on our web site.
If you have questions or comments about our privacy practices, please call us at (866) 640-5704.
40
SIRIOS LONG/SHORT FUND
Fund Management
(Unaudited)
FundVantage Trust (the “Trust”) is governed by a Board of Trustees (the “Trustees”). The primary responsibility of the Trustees is to represent the interest of the Trust’s shareholders and to provide oversight management of the Trust.
The following tables present certain information regarding the Board of Trustees and officers of the Trust. None of the Trustees are an “interested person” of the Trust, the Adviser, another investment adviser of a series of the Trust, or Foreside Funds Distributors LLC, the principal underwriter of the Trust (“Underwriter”), within the meaning of the 1940 Act and each Trustee is referred to as an “Independent Trustee” and is listed under such heading below. Employees of certain service providers to the Trust serve as officers of the Trust; such persons are not compensated by the Fund. The address of each Trustee and Officer as it relates to the Trust’s business is 301 Bellevue Parkway, 2nd Floor, Wilmington, DE 19809.
The Statement of Additional Information for the Fund contains additional information about the Trustees and is available, without charge, upon request by calling (866) 640-5704.
Name and Date of Birth | Position(s) Held with Trust | Term of Office and Length of Time Served | Principal Occupation(s) During Past Five Years |
Number of Funds in Trust Complex Overseen by Trustee | Other Directorships Held by Trustee | |||||
| INDEPENDENT TRUSTEES | ||||||||||
ROBERT J. CHRISTIAN Date of Birth: 2/49 | Trustee | Shall serve until death, resignation or removal. Trustee since 2007. Chairman from 2007 until September 30, 2019. | Retired since February 2006; Executive Vice President of Wilmington Trust Company from February 1996 to February 2006; President of Rodney Square Management Corporation (“RSMC”) (investment advisory firm) from 1996 to 2005; Vice President of RSMC from 2005 to 2006. | 38 | Optimum Fund Trust (registered investment company with 6 portfolios); Third Avenue Trust (registered investment company with 3 portfolios); Third Avenue Variable Series Trust (registered investment company with 1 portfolio). | |||||
41
SIRIOS LONG/SHORT FUND
Fund Management (Continued)
(Unaudited)
Name and Date of Birth | Position(s) Held with Trust | Term of Office and Length of Time Served | Principal Occupation(s) During Past Five Years |
Number of Funds in Trust Complex Overseen by Trustee | Other Directorships Held by Trustee | |||||
IQBAL MANSUR Date of Birth: 6/55 | Trustee | Shall serve until death, resignation or removal. Trustee since 2007. | Retired since September 2020; Professor of Finance, Widener University from 1998 to August 2020. | 38 | Third Avenue Trust (registered investment company with 3 portfolios); Third Avenue Variable Series Trust (registered investment company with 1 portfolio). | |||||
NICHOLAS M. MARSINI, JR. Date of Birth: 8/55 | Trustee and Chairman of the Board | Shall serve until death, resignation or removal. Trustee since 2016. Chairman since October 1, 2019. | Retired since March 2016. President of PNC Bank Delaware from June 2011 to March 2016; Executive Vice President of Finance of BNY Mellon from July 2010 to January 2011; Executive Vice President and Chief Financial Officer of PNC Global Investment Servicing from September 1997 to July 2010. | 38 | Brinker Capital Destinations Trust (registered investment company with 10 portfolios); Third Avenue Trust (registered investment company with 3 portfolios); Third Avenue Variable Series Trust (registered investment company with 1 portfolio). | |||||
42
SIRIOS LONG/SHORT FUND
Fund Management (Continued)
(Unaudited)
Name and Date of Birth | Position(s) Held with Trust | Term of Office and Length of Time Served | Principal Occupation(s) During Past Five Years |
Number of Funds in Trust Complex Overseen by Trustee | Other Directorships Held by Trustee | |||||
NANCY B. WOLCOTT Date of Birth: 11/54 | Trustee | Shall serve until death, resignation or removal. Trustee since 2011. | Retired since May 2014; EVP, Head of GFI Client Service Delivery, BNY Mellon from January 2012 to May 2014; EVP, Head of US Funds Services, BNY Mellon from July 2010 to January 2012; President of PNC Global Investment Servicing from 2008 to July 2010; Chief Operating Officer of PNC Global Investment Servicing from 2007 to 2008; Executive Vice President of PFPC Worldwide Inc. from 2006 to 2007. | 38 | Lincoln Variable Insurance Products Trust (registered investment company with 97 portfolios); Third Avenue Trust (registered investment company with 3 portfolios); Third Avenue Variable Series Trust (registered investment company with 1 portfolio). | |||||
STEPHEN M. WYNNE Date of Birth: 1/55 | Trustee | Shall serve until death, resignation or removal. Trustee since 2009. | Retired since December 2010; Chief Executive Officer of US Funds Services, BNY Mellon Asset Servicing from July 2010 to December 2010; Chief Executive Officer of PNC Global Investment Servicing from March 2008 to July 2010; President, PNC Global Investment Servicing from 2003 to 2008. | 38 | Copeland Trust (registered investment company with 3 portfolios); Third Avenue Trust (registered investment company with 3 portfolios); Third Avenue Variable Series Trust (registered investment company with 1 portfolio). | |||||
43
SIRIOS LONG/SHORT FUND
Fund Management (Concluded)
(Unaudited)
Name and Date of Birth | Position(s) Held with Trust |
Term of Office and Length of Time Served | Principal Occupation(s) During Past Five Years | |||
EXECUTIVE OFFICERS
| ||||||
JOEL L. WEISS Date of Birth: 1/63 | President and Chief Executive Officer | Shall serve until death, resignation or removal. Officer since 2007. | President of JW Fund Management LLC since June 2016; Vice President and Managing Director of BNY Mellon Investment Servicing (US) Inc. and predecessor firms from 1993 to June 2016. | |||
T. RICHARD KEYES Date of Birth: 1/57 | Treasurer and Chief Financial Officer | Shall serve until death, resignation or removal. Officer since 2016. | President of TRK Fund Consulting LLC since July 2016; Head of Tax — U.S. Fund Services of BNY Mellon Investment Servicing (US) Inc. and predecessor firms from February 2006 to July 2016. | |||
GABRIELLA MERCINCAVAGE Date of Birth: 6/68 | Assistant Treasurer | Shall serve until death, resignation or removal. Officer since 2019. | Fund Administration Consultant since January 2019; Fund Accounting and Tax Compliance Accountant to financial services companies from November 2003 to July 2018. | |||
VINCENZO A. SCARDUZIO Date of Birth: 4/72 | Secretary | Shall serve until death, resignation or removal. Officer since 2012. | Director and Vice President Regulatory Administration of The Bank of New York Mellon and predecessor firms since 2001. | |||
GUY F. TALARICO Date of Birth: 8/55 | Chief Compliance Officer and Anti-Money Laundering Officer | Shall serve until death, resignation or removal. Officer since 2020. | Chief Executive Officer of Alaric Compliance Services LLC since June 2004. | |||
44
Investment Adviser
Sirios Capital Management, L.P.
One International Place
Boston, MA 02110
Administrator
The Bank of New York Mellon
301 Bellevue Parkway
Wilmington, DE 19809
Transfer Agent
BNY Mellon Investment Servicing (US) Inc.
4400 Computer Drive
Westborough, MA 01581
Principal Underwriter
Foreside Funds Distributors LLC
400 Berwyn Park
899 Cassatt Road
Berwyn, PA 19312
Custodian
The Bank of New York Mellon
240 Greenwich Street
New York, NY 10286
Independent Registered Public Accounting Firm
Ernst & Young LLP
One Commerce Square
2005 Market Street, Suite 700
Philadelphia, PA 19103-7096
Legal Counsel
Troutman Pepper Hamilton Sanders LLP
3000 Two Logan Square
18th and Arch Streets
Philadelphia, PA 19103

SIRIOS LONG/
SHORT FUND
of
FundVantage Trust
Institutional Class
ANNUAL REPORT
September 30, 2020
IMPORTANT NOTE: Beginning on January 1, 2021, paper copies of the Fund’s shareholder reports will no longer be sent by mail, unless you specifically request paper copies of the shareholder reports from the Fund or from your financial intermediary. Instead, the shareholder reports will be available on the Fund’s website (www.sirioslp.com), and you will be notified by mail each time a report is posted and provided with a website link to access the report.
You may elect to receive all future shareholder reports in paper, free of charge. To elect to receive paper copies of shareholder reports through the mail or otherwise change your delivery method, contact your financial intermediary or, if you hold your shares directly through the Fund, call Shareholder Services toll-free at (866) 640-5704 or write to the Fund at:
Sirios Long/Short Fund
FundVantage Trust
c/o BNY Mellon Investment Servicing
P.O. Box 9829
Providence, RI 02940-8029
This report is submitted for the general information of shareholders and is not authorized for distribution to prospective investors unless preceded or accompanied by a current prospectus.
SIR-0920
TOBAM EMERGING MARKETS FUND
Annual Investment Adviser’s Report
September 30, 2020
(Unaudited)
Dear Shareholders,
Portfolio Performance
Since September 30, 2019, the return of the TOBAM Emerging Markets Fund (the “Fund”) was 5.30%, corresponding to an underperformance of 5.24% over the return of Morgan Stanley Capital International (“MSCI®”) Emerging Markets Net Total Return Index (“MSCI® EM Index”).
| * Net return | ||||||
| Start of the period | End of the period | |||||
Date Fund’s return | 09/30/2019 5.30% | Benchmark’s return | 09/30/2020 10.54% | |||
| * Volatility | ||||||
| Start of the period | End of the period | |||||
Date Fund’s volatility | 09/30/2019 25.96% | Benchmark’s volatility | 09/30/2020 23.97% | |||
Performance data quoted here represents past performance. Past performance is no guarantee of future results. Investment return and principal value will fluctuate, so that an investor’s shares, when redeemed, may be worth more or less than their original cost. Current performance may be lower or higher than the performance information quoted. To obtain performance information current to the most recent month-end please call (844) 282-6161.
Over the last quarter of 2019, equity markets saw strong growth with the MSCI® EM Index up a staggering +11.8%. Implied volatility ranged from 10-20% for the S&P 500® Total Return Index, far below the peak of late 2018 with most of the volatility over the year being related to US China trade negotiations. The US growth resisted the global growth synchronized slow-down, and the trade tensions relaxed by year’s end with the announcement of a deal between US and China.
After the devastating sell-off in the first quarter of 2020, investors quickly returned to risky assets as central banks and governments made unprecedented efforts to maintain market liquidity and economic stability. However, the actual economic impact of the lockdown resultant from the COVID-19 pandemic is still difficult to estimate and new lockdowns or other measures that might impede economic activity represent an important potential downside risk to markets. Even if central banks and governments continue their “whatever it takes” rhetoric, “zombie company”* economies in the developed world and a deep consumer crisis in emerging markets are a scenario that increasingly preoccupy investors.
* A zombie company is a company that needs bailouts in order to operate, or an indebted company that is able to repay the interest on its debts but not repay the principal.
TOBAM EMERGING MARKETS FUND
Annual Investment Adviser’s Report (Continued)
September 30, 2020
(Unaudited)
Most emerging markets countries do not have the fiscal and monetary policy forces to provide rescue packages like that of the developed markets. These packages in developed markets helped compensate for most of the impact of the COVID-19 lockdowns and the somewhat subdued economic activity. As a consequence, the overall impact on emerging markets economies is much more severe than for developed markets economies. Additionally, within emerging markets, social disparity is increasing dramatically.
However, the picture is quite heterogeneous from one country to the other with MSCI® Brazil Net Total Return Index still being down by more than -40% year to date and the MSCI® China Net Total Return Index being back in the positive territory. The variance between countries is due to two main reasons in our opinion. First, the ability of each country to respond to the COVID-19 pandemic. Countries such as China, Korea or Taiwan have clearly been much better at managing the outbreak than countries like Brazil or India. Second, the dependence of each country on the economic consequences of the worldwide lockdown measures and the oil price war.
Management Policy of the Fund
The Adviser seeks to enhance the Fund’s portfolio diversification in terms of various risk metrics by applying a systematic, quantitative investment approach designed to identify securities of emerging market issuers included in the MSCI® EM Index that have the lowest possible correlation to each other for inclusion in the Fund’s portfolio.
From September 30, 2019 to September 30, 2020, the relative return of the Fund was -5.24%. Over the year, the MSCI® EM Index remained significantly biased toward Financials, Energy, Communication Services and Information Technology. The MSCI® EM Index biases toward Financials and Energy were not rewarded and this was beneficial for our strategy. However, the benchmark’s biases toward the Information Technology and Communication services sectors, specifically, the mega caps within these sectors, were rewarded. The benchmark’s bias to its top 5 holdings was the primary reason for the underperformance of the strategy and has led an even more concentrated benchmark.
The high market concentration into the mega caps provides an environment that is adverse to the Fund we feel the persistent uncertainty and dispersion in emerging markets provides outperformance opportunities for a diversified portfolio.
Since commencement of operations (April 25, 2017), the Fund underperformed the MSCI® EM Index by -3.96% as a result of the benchmark’s biases.
Portfolio Changes
The strategy is rebalanced on a quarterly basis. For the fiscal year ended September 30, 2020, the Fund’s portfolio turnover has been 42%.
Dividend Distribution
The Fund will distribute a dividend for the 2020 fiscal year according to the following schedule:
| Distribution | Record Date | Ex-Date | Payment Date | |||
| Ordinary income | December 9, 2020 | December 10, 2020 | December 11, 2020 | |||
2
TOBAM EMERGING MARKETS FUND
Annual Investment Adviser’s Report (Concluded)
September 30, 2020
(Unaudited)
Outlook
We don’t expect any major change in the management of the Fund in the coming months.
Sincerely,
TOBAM, Investment Adviser
This letter is intended to assist shareholders in understanding how the Fund performed during the fiscal year ended September 30, 2020 and reflects the views of the investment adviser at the time of this writing. Of course, these views may change and do not guarantee the future performance of the Fund or the markets.
The above commentary is for informational purposes only and does not represent an offer, recommendation or solicitation to buy, hold or sell any security.
Portfolio composition is subject to change. The current and future portfolio holdings of the Fund are subject to investment risk.
TOBAM’s quantitative investment process is supported by extensive proprietary computer code. TOBAM’s researchers, software developers, and IT teams follow a structured design, development, testing, change control, and review process during the development of its systems and the implementation within our investment process. These controls and their effectiveness are subject to regular internal reviews. However, despite these extensive controls it is possible that errors may occur in coding and within the investment process, as is the case with any complex software or data-driven model, and no guarantee or warranty can be provided that any quantitative investment model is completely free of errors. Any such errors could have a negative impact on investment results.
Mega cap is a designation for the largest companies in the investment universe as measured by market capitalization. There can be no guarantee that any strategy (risk management or otherwise) will be successful. All investing involves risk, including potential loss of principal.
Investments in foreign markets entail special risks such as currency, political, economic and market risks. The risks of investing in emerging market countries are greater than the risks generally associated with foreign investments.
3
TOBAM EMERGING MARKETS FUND
Annual Report
Performance Data
September 30, 2020
(Unaudited)
Comparison of Change in Value of $500,000 (investment minimum) Investment in
TOBAM Emerging Markets Fund’s Class I vs.
Morgan Stanley Capital International (“MSCI®”) Emerging Markets Net Total Return Index (“MSCI® EM Net TR Index”)
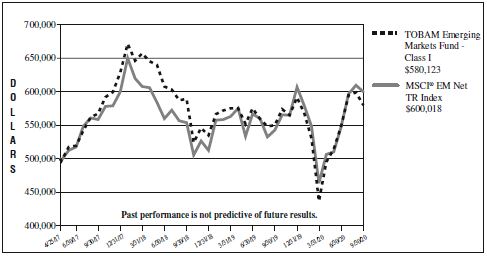
| Average Annual Total Returns for the Periods Ended September 30, 2020 | ||||||||
| 1 Year | 3 Years | Since Inception | ||||||
Class I | 5.30% | 0.74% | 4.42%* | |||||
MSCI® EM Net TR Index | 10.54% | 2.42% | 5.45% | |||||
| * | The TOBAM Emerging Markets Fund (the “Fund”) Class I shares commenced operations on April 25, 2017. |
| ** | Benchmark performance is from the commencement date of the Fund Class only and is not the commencement date of the benchmark itself. |
The performance data quoted represents past performance and does not guarantee future results. Current performance may be lower or higher. Performance data current to the most recent month-end may be obtained by calling (844) 282-6161. The investment return and principal value of an investment in the Fund will fluctuate so that an investor’s shares, when redeemed, may be worth more or less than their original cost. The graph and table do not reflect the deduction of taxes that a shareholder would pay on Fund distributions or redemption of Fund shares.
The Fund’s “Total Annual Fund Operating Expenses” and “Total Annual Fund Operating Expenses After Fee Waiver and/or Expense Reimbursement” are 1.20% and 1.10%, respectively, of the Fund’s average daily net assets for Class I shares. These ratios are stated in the current prospectus dated February 1, 2020, and may differ from the actual expenses incurred by the Fund for the period covered by this report. TOBAM (“TOBAM” or the “Adviser”) has contractually agreed to waive fees and/or reimburse certain expenses of the Fund to the extent necessary to ensure
4
TOBAM EMERGING MARKETS FUND
Annual Report
Performance Data (Concluded)
September 30, 2020
(Unaudited)
that the Fund’s total operating expenses (excluding taxes, “Acquired Fund Fees and Expenses” (as defined in Form N-1A), dividend and interest expense on securities sold short, interest, extraordinary items and brokerage commissions) do not exceed (on an annual basis): (a) from the commencement of operations through April 30, 2018, 0.85% with respect to Class I shares, of average daily net assets and (b) from May 1, 2018 through January 31, 2021, 1.10% with respect to Class I shares, of average daily net assets (the “Expense Limitation”), unless the Board of Trustees of FundVantage Trust (the “Trust”) approves its earlier termination. The Adviser may recoup, subject to approval by the Board of Trustees, any expenses or fees it has waived or reimbursed within a three-year period from the date on which the Adviser reduced its compensation and/or assumed expenses of the Fund. No recoupment will occur unless the Fund’s expenses are below the Expense Limitation amount.
A 1.00% redemption fee applies to shares redeemed within 30 days of purchase. The redemption fee is not reflected in the returns shown above.
The Fund intends to evaluate performance as compared to that of the MSCI® EM Net TR Index. The MSCI® EM Net TR Index is a free float-adjusted, market capitalization-weighted index designed to measure the equity performance of emerging market countries in Africa, Asia, Europe, Latin America, and the Middle East. An index is unmanaged and it is not possible to invest in an index.
5
TOBAM EMERGING MARKETS FUND
Fund Expense Disclosure
September 30, 2020
(Unaudited)
As a shareholder of the Fund, you incur two types of costs: (1) transaction costs, including redemption fees; and (2) ongoing costs, including management fees, distribution and/or service (Rule 12b-1) fees (if any) and other Fund expenses. This example is intended to help you understand your ongoing costs (in dollars) of investing in the Fund and to compare these costs with the ongoing costs of investing in other mutual funds.
This example is based on an investment of $1,000 invested at the beginning of the six-month period from April 1, 2020 through September 30, 2020 and held for the entire period.
Actual Expenses
The first line of the accompanying table provides information about actual account values and actual expenses. You may use the information in this line, together with the amount you invested, to estimate the expenses that you paid over the period. Simply divide your account value by $1,000 (for example, an $8,600 account value divided by $1,000 = 8.6), then multiply the result by the number in the first line under the heading entitled “Expenses Paid During Period” to estimate the expenses you paid on your account during this period.
Hypothetical Example for Comparison Purposes
The second line of the accompanying table provides information about hypothetical account values and hypothetical expenses based on a Fund’s actual expense ratio and an assumed rate of return of 5% per year before expenses, which is not your Fund’s actual return. The hypothetical account values and expenses may not be used to estimate the actual ending account balance or expenses you paid for the period. You may use this information to compare the ongoing costs of investing in the Fund and other funds. To do so, compare this 5% hypothetical example with the 5% hypothetical examples that appear in the shareholder reports of other funds.
Please note that the expenses shown in the accompanying table are meant to highlight your ongoing costs only and do not reflect any transactional costs, such as redemption fees. Therefore, the second line of the accompanying table is useful in comparing ongoing costs only and will not help you determine the relative total costs of owning different funds. In addition, if these transactional costs were included, your costs would have been higher.
6
TOBAM EMERGING MARKETS FUND
Fund Expense Disclosure (Concluded)
September 30, 2020
(Unaudited)
| TOBAM Emerging Markets Fund | |||||||||||||||
| Beginning Account Value April 1, 2020 | Ending Account Value September 30, 2020 | Expenses Paid During Period* | |||||||||||||
Class I | |||||||||||||||
Actual | $ | 1,000.00 | $ | 1,328.40 | $ | 6.40 | |||||||||
Hypothetical (5% return before expenses) | 1,000.00 | 1,019.50 | 5.55 | ||||||||||||
| * | Expenses are equal to the annualized expense ratio for the six-month period ended September 30, 2020 of 1.10% for Class I shares, multiplied by the average account value over the period, multiplied by the number of days in the most recent period (183), then divided by 366 to reflect the period. The Fund’s ending account value on the first line in the table is based on the actual six-month total return for the Fund of 32.84% for Class I shares. |
7
TOBAM EMERGING MARKETS FUND
Portfolio Holdings Summary Table
September 30, 2020
(Unaudited)
The following table presents a summary by industry group of the portfolio holdings of the Fund:
| % of Net Assets | Value | |||||||
Common Stocks: | ||||||||
Pharmaceuticals | 10.7 | % | $ | 11,286,727 | ||||
Telecommunications | 9.9 | 10,377,778 | ||||||
Food | 6.7 | 7,087,406 | ||||||
Software | 6.1 | 6,430,991 | ||||||
Retail | 6.0 | 6,310,803 | ||||||
Mining | 5.1 | 5,307,378 | ||||||
Internet | 4.7 | 4,971,207 | ||||||
Computers | 4.3 | 4,493,449 | ||||||
Healthcare-Products | 3.0 | 3,165,350 | ||||||
Commercial Services | 2.8 | 2,889,207 | ||||||
Gas | 2.7 | 2,827,758 | ||||||
Apparel | 2.6 | 2,716,681 | ||||||
Auto Manufacturers | 2.5 | 2,595,495 | ||||||
Electronics | 2.3 | 2,461,321 | ||||||
Biotechnology | 2.3 | 2,427,898 | ||||||
Oil & Gas | 2.3 | 2,422,492 | ||||||
Semiconductors | 1.9 | 1,944,578 | ||||||
Transportation | 1.8 | 1,902,085 | ||||||
Healthcare-Services | 1.8 | 1,902,029 | ||||||
Agriculture | 1.7 | 1,762,155 | ||||||
Banks | 1.7 | 1,745,226 | ||||||
Energy-Alternate Sources | 1.3 | 1,409,575 | ||||||
Beverages | 1.3 | 1,372,840 | ||||||
Home Furnishings | 1.0 | 1,089,952 | ||||||
Forest Products & Paper | 1.0 | 1,068,024 | ||||||
Miscellaneous Manufacturers | 0.9 | 903,384 | ||||||
Insurance | 0.9 | 901,701 | ||||||
Shipbuilding | 0.8 | 856,054 | ||||||
Media | 0.8 | 853,709 | ||||||
| % of Net Assets | Value | |||||||||||||||
Common Stocks: (Continued) |
| |||||||||||||||
Water | 0.8 | % | $ | 788,632 | ||||||||||||
Chemicals | 0.7 | 694,763 | ||||||||||||||
Diversified Financial Services | 0.7 | 693,336 | ||||||||||||||
Auto Parts & Equipment | 0.6 | 592,766 | ||||||||||||||
Iron/Steel | 0.5 | 558,196 | ||||||||||||||
Housewares | 0.5 | 525,802 | ||||||||||||||
Airlines | 0.5 | 523,071 | ||||||||||||||
Leisure Time | 0.5 | 509,341 | ||||||||||||||
Engineering & Construction | 0.3 | 373,999 | ||||||||||||||
Electric | 0.3 | 320,893 | ||||||||||||||
Household Products/Wares | 0.3 | 287,128 | ||||||||||||||
Electrical | ||||||||||||||||
Components & Equipment | 0.2 | 262,100 | ||||||||||||||
Cosmetics/Personal Care | 0.2 | 256,821 | ||||||||||||||
Lodging | 0.2 | 226,741 | ||||||||||||||
Investment Companies | 0.2 | 216,545 | ||||||||||||||
Entertainment | 0.2 | 159,541 | ||||||||||||||
Aerospace/Defense | 0.1 | 145,320 | ||||||||||||||
Preferred Stocks: | ||||||||||||||||
Auto Manufacturers | 0.2 | 241,362 | ||||||||||||||
Other Assets in Excess of Liabilities | 2.1 | 2,171,098 | ||||||||||||||
|
|
|
|
| ||||||||||||
NET ASSETS | 100.0 | % | $ | 105,030,708 | ||||||||||||
|
|
|
|
| ||||||||||||
Portfolio holdings are subject to change at any time.
The accompanying notes are an integral part of the financial statements.
8
TOBAM EMERGING MARKETS FUND
Portfolio of Investments
September 30, 2020
| Number of Shares | Value | |||||||
COMMON STOCKS — 97.7% |
| |||||||
Argentina — 0.2% | ||||||||
Globant SA* | 1,257 | $ | 225,280 | |||||
|
| |||||||
Brazil — 4.2% | ||||||||
Atacadao Sa | 97,600 | 354,015 | ||||||
B2W Cia Digital* | 44,700 | 719,782 | ||||||
BB Seguridade Participacoes SA | 30,300 | 131,432 | ||||||
CCR SA | 138,000 | 313,061 | ||||||
Cielo SA | 434,700 | 305,751 | ||||||
IRB Brasil Resseguros SA | 137,977 | 184,022 | ||||||
Magazine Luiza SA | 16,100 | 256,727 | ||||||
Raia Drogasil SA | 248,500 | 1,042,515 | ||||||
Suzano SA* | 132,200 | 1,068,024 | ||||||
|
| |||||||
| 4,375,329 | ||||||||
|
| |||||||
China — 29.8% | ||||||||
AK Medical Holdings Ltd. | 78,000 | 200,738 | ||||||
ANTA Sports Products, Ltd. | 104,000 | 1,085,388 | ||||||
Autohome, Inc., ADR | 3,433 | 329,568 | ||||||
Bosideng International Holdings, Ltd. | 1,070,000 | 333,830 | ||||||
Brilliance China Automotive Holdings, Ltd. | 126,000 | 119,078 | ||||||
CanSino Biologics, Inc., Class H* | 19,600 | 417,837 | ||||||
Changchun High & New Technology Industry Group, Inc., Class A | 6,400 | 348,421 | ||||||
China Communications Services Corp., Ltd., Class H | 320,000 | 188,914 | ||||||
China Greatwall Technology Group Co. Ltd., Class A | 61,400 | 145,361 | ||||||
China Literature Ltd.* | 24,000 | 180,996 | ||||||
| Number of Shares | Value | |||||||
COMMON STOCKS — (Continued) |
| |||||||
China — (Continued) | ||||||||
China Mengniu Dairy Co., Ltd. | 126,000 | $ | 594,310 | |||||
China Merchants Energy Shipping Co. Ltd., Class A | 136,600 | 115,988 | ||||||
China National Medicines Corp. Ltd., Class A | 15,400 | 98,758 | ||||||
China National Software & Service Co. Ltd., Class A | 9,700 | 118,894 | ||||||
China Northern Rare Earth Group High-Tech Co., Ltd., Class A* | 61,700 | 97,803 | ||||||
China Resources Beer Holdings Co., Ltd. | 120,000 | 737,026 | ||||||
China Resources Gas Group, Ltd. | 282,000 | 1,266,162 | ||||||
Chongqing Zhifei Biological Products Co., Ltd., Class A | 28,488 | 584,458 | ||||||
COSCO SHIPPING Energy Transportation Co. Ltd., Class H | 382,000 | 159,337 | ||||||
Dawning Information Industry Co. Ltd., Class A | 24,300 | 135,268 | ||||||
ENN Energy Holdings, Ltd. | 120,600 | 1,323,374 | ||||||
Eve Energy Co. Ltd., Class A | 35,798 | 262,100 | ||||||
G-bits Network Technology Xiamen Co. Ltd., Class A | 1,311 | 120,350 | ||||||
Gigadevice Semiconductor Beijing, Inc., Class A | 8,500 | 217,073 | ||||||
The accompanying notes are an integral part of the financial statements.
9
TOBAM EMERGING MARKETS FUND
Portfolio of Investments (Continued)
September 30, 2020
| Number of Shares | Value | |||||||
COMMON STOCKS — (Continued) |
| |||||||
China — (Continued) | ||||||||
GOME Retail Holdings, Ltd.* | 3,147,000 | $ | 416,827 | |||||
GSX Techedu, Inc., ADR* . | 9,683 | 872,535 | ||||||
Guangdong Investment, Ltd. | 496,000 | 788,632 | ||||||
Heilongjiang Agriculture Co. Ltd., Class A | 35,000 | 95,403 | ||||||
Hengan International Group Co., Ltd. | 72,000 | 527,045 | ||||||
Innovent Biologics, Inc.* | 24,000 | 178,973 | ||||||
Jiangsu Yuyue Medical Equipment & Supply Co. Ltd., Class A | 19,600 | 94,553 | ||||||
Jiangxi Zhengbang Technology Co., Ltd., Class A | 52,200 | 139,831 | ||||||
Kingdee International Software Group Co., Ltd. | 324,000 | 845,090 | ||||||
Koolearn Technology Holding Ltd.* | 61,500 | 264,237 | ||||||
Lingyi iTech Guangdong Co., Class A | 107,200 | 177,616 | ||||||
LONGi Green Energy Technology Co., Ltd., Class A | 71,500 | 791,054 | ||||||
Meituan Dianping, Class B* | 28,300 | 891,487 | ||||||
Muyuan Foodstuff Co., Ltd., Class A | 75,189 | 820,091 | ||||||
NAURA Technology Group Co. Ltd., Class A | 9,800 | 231,257 | ||||||
New Hope Liuhe Co., Ltd., Class A | 85,500 | 348,889 | ||||||
NIO, Inc., ADR* | 41,464 | 879,866 | ||||||
| Number of Shares | Value | |||||||
COMMON STOCKS — (Continued) |
| |||||||
China — (Continued) | ||||||||
Perfect World Co., Ltd., Class A | 35,650 | $ | 174,961 | |||||
Pinduoduo, Inc., ADR* | 12,855 | 953,198 | ||||||
Ping An Healthcare And Technology Co. Ltd.* | 56,700 | 731,592 | ||||||
Sanan Optoelectronics Co., Ltd., Class A | 91,200 | 329,930 | ||||||
Sangfor Technologies, Inc., Class A | 5,496 | 171,415 | ||||||
SG Micro Corp., Class A | 2,850 | 125,775 | ||||||
Shandong Gold Mining Co., Ltd., Class A | 70,168 | 261,198 | ||||||
Shandong Weigao Group Medical Polymer Co., Ltd., Class H | 632,000 | 1,264,520 | ||||||
Shengyi Technology Co., Ltd., Class A | 47,000 | 162,063 | ||||||
Shenzhen Goodix Technology Co., Ltd., Class A | 8,800 | 204,517 | ||||||
Shenzhen Kaifa Technology Co. Ltd., Class A | 25,900 | 79,116 | ||||||
Shenzhen Kangtai Biological Products Co., Ltd., Class A | 12,400 | 332,490 | ||||||
Shenzhou International Group Holdings, Ltd | 63,900 | 1,088,146 | ||||||
Silergy Corp. | 3,000 | 177,861 | ||||||
TAL Education Group, ADR* | 17,131 | 1,302,641 | ||||||
Thunder Software Technology Co. Ltd., Class A | 8,200 | 104,348 | ||||||
The accompanying notes are an integral part of the financial statements.
10
TOBAM EMERGING MARKETS FUND
Portfolio of Investments (Continued)
September 30, 2020
| Number of Shares | Value | |||||||
COMMON STOCKS — (Continued) |
| |||||||
China — (Continued) | ||||||||
Tianjin 712 Communication & Broadcasting Co. Ltd., Class A | 14,900 | $ | 98,526 | |||||
Tianjin Zhonghuan Semiconductor Co. Ltd., Class A | 63,400 | 207,106 | ||||||
Tianshui Huatian Technology Co. Ltd., Class A | 51,700 | 104,608 | ||||||
Tingyi Cayman Islands Holding Corp. | 664,000 | 1,175,741 | ||||||
Unigroup Guoxin Microelectronics Co. Ltd., Class A | 11,500 | 202,494 | ||||||
Vipshop Holdings, Ltd., ADR* | 29,986 | 468,981 | ||||||
Walvax Biotechnology Co., Ltd., Class A | 29,400 | 220,411 | ||||||
Want Want China Holdings, Ltd. | 1,492,000 | 1,042,579 | ||||||
Wens Foodstuffs Group Co., Ltd., Class A | 124,320 | 357,941 | ||||||
Will Semiconductor, Ltd., Class A | 10,841 | 284,302 | ||||||
Wingtech Technology Co. Ltd., Class A | 19,300 | 333,016 | ||||||
Wuhu Sanqi Interactive Entertainment Network Technology Group Co. Ltd., Class A | 39,400 | 230,744 | ||||||
WUS Printed Circuit Kunshan Co. Ltd., Class A | 34,500 | 95,859 | ||||||
| Number of Shares | Value | |||||||
COMMON STOCKS — (Continued) |
| |||||||
China — (Continued) | ||||||||
Yonyou Network Technology Co., Ltd., Class A | 66,690 | $ | 375,975 | |||||
Zai Lab Ltd., ADR* | 5,100 | 424,167 | ||||||
Zhaojin Mining Industry Co., Ltd. | 356,000 | 437,838 | ||||||
Zhejiang NHU Co. Ltd., Class A | 43,800 | 192,462 | ||||||
|
| |||||||
| 31,260,939 | ||||||||
|
| |||||||
Colombia — 0.2% | ||||||||
Grupo de Inversiones Suramericana SA | 40,190 | 216,545 | ||||||
|
| |||||||
Czech Republic — 0.1% | ||||||||
Komercni banka AS* | 5,861 | 123,495 | ||||||
|
| |||||||
Greece — 0.6% | ||||||||
JUMBO SA | 26,678 | 467,089 | ||||||
OPAP SA | 16,824 | 159,541 | ||||||
|
| |||||||
| 626,630 | ||||||||
|
| |||||||
Hong Kong — 0.8% | ||||||||
Sun Art Retail Group, Ltd. | 794,000 | 881,543 | ||||||
|
| |||||||
India — 18.6% | ||||||||
Aurobindo Pharma, Ltd. | 77,294 | 837,002 | ||||||
Avenue Supermarts Ltd.* | 8,371 | 250,260 | ||||||
Bajaj Finance, Ltd. | 12,214 | 547,211 | ||||||
Bandhan Bank Ltd.* | 139,542 | 521,023 | ||||||
Bharat Petroleum Corp., Ltd. | 205,117 | 981,712 | ||||||
Bharti Airtel, Ltd. | 133,357 | 762,474 | ||||||
Bharti Infratel, Ltd. | 104,800 | 249,597 | ||||||
Cipla, Ltd. | 100,853 | 1,059,850 | ||||||
Container Corp Of India, Ltd. | 46,757 | 233,235 | ||||||
The accompanying notes are an integral part of the financial statements.
11
TOBAM EMERGING MARKETS FUND
Portfolio of Investments (Continued)
September 30, 2020
| Number of Shares | Value | |||||||
COMMON STOCKS — (Continued) |
| |||||||
India — (Continued) | ||||||||
Dr Reddy’s Laboratories, Ltd. | 26,454 | $ | 1,852,646 | |||||
Eicher Motors Ltd. | 26,450 | 789,700 | ||||||
HCL Technologies, Ltd. | 145,102 | 1,599,765 | ||||||
Hero MotoCorp, Ltd. | 11,933 | 509,341 | ||||||
Hindustan Petroleum Corp., Ltd. | 204,706 | 501,097 | ||||||
Indian Oil Corp., Ltd. | 357,531 | 358,440 | ||||||
Infosys, Ltd. | 48,832 | 671,447 | ||||||
InterGlobe Aviation, Ltd.* | 30,999 | 523,071 | ||||||
Lupin, Ltd. | 73,563 | 1,005,798 | ||||||
Piramal Enterprises, Ltd. | 8,575 | 146,125 | ||||||
Sun Pharmaceutical Industries, Ltd. | 220,257 | 1,497,777 | ||||||
Tata Consultancy Services, Ltd. | 45,805 | 1,549,695 | ||||||
Tech Mahindra, Ltd. | 123,764 | 1,332,014 | ||||||
United Spirits, Ltd.* | 90,840 | 635,814 | ||||||
Wipro, Ltd. | 52,818 | 224,771 | ||||||
Zee Entertainment Enterprises, Ltd. | 300,333 | 853,709 | ||||||
|
| |||||||
| 19,493,574 | ||||||||
|
| |||||||
Indonesia — 0.8% | ||||||||
Perusahaan Gas Negara Tbk PT | 3,807,600 | 238,222 | ||||||
Telekomunikasi Indonesia Persero Tbk PT | 2,056,900 | 355,152 | ||||||
Unilever Indonesia Tbk PT | 526,200 | 287,128 | ||||||
|
| |||||||
| 880,502 | ||||||||
|
| |||||||
Malaysia — 3.4% | ||||||||
Axiata Group Bhd | 743,685 | 529,677 | ||||||
Hartalega Holdings Bhd | 59,700 | 233,827 | ||||||
Kossan Rubber Industries | 47,800 | 158,062 | ||||||
| Number of Shares | Value | |||||||
COMMON STOCKS — (Continued) |
| |||||||
Malaysia — (Continued) | ||||||||
Maxis Bhd | 611,300 | $ | 748,446 | |||||
Public Bank Bhd | 87,800 | 332,074 | ||||||
Supermax Corp. Bhd* | 251,000 | 511,495 | ||||||
Top Glove Corp. Bhd | 537,900 | 1,078,494 | ||||||
|
| |||||||
| 3,592,075 | ||||||||
|
| |||||||
Mexico — 0.3% | ||||||||
Grupo Financiero Banorte SAB de CV, Class O* | 77,500 | 267,744 | ||||||
|
| |||||||
Peru — 0.8% | ||||||||
Cia de Minas Buenaventura SAA, ADR | 71,477 | 873,449 | ||||||
|
| |||||||
Poland — 0.8% | ||||||||
Orange Polska SA* | 218,094 | 385,986 | ||||||
Polski Koncern Naftowy ORLEN SA | 35,605 | 422,564 | ||||||
|
| |||||||
| 808,550 | ||||||||
|
| |||||||
Russia — 1.8% | ||||||||
Alrosa PJSC | 307,650 | 291,808 | ||||||
PhosAgro PJSC, GDR | 41,695 | 501,201 | ||||||
Polyus PJSC | 4,777 | 999,899 | ||||||
Severstal PJSC | 11,061 | 140,970 | ||||||
|
| |||||||
| 1,933,878 | ||||||||
|
| |||||||
South Africa — 2.2% | ||||||||
AngloGold Ashanti, Ltd. | 34,685 | 907,349 | ||||||
Gold Fields, Ltd. | 73,386 | 897,775 | ||||||
Harmony Gold Mining Co. Ltd.* | 32,207 | 170,492 | ||||||
Sibanye Stillwater Ltd. | 133,231 | 369,767 | ||||||
|
| |||||||
| 2,345,383 | ||||||||
|
| |||||||
South Korea — 14.9% | ||||||||
Alteogen, Inc.* | 3,806 | 584,002 | ||||||
The accompanying notes are an integral part of the financial statements.
12
TOBAM EMERGING MARKETS FUND
Portfolio of Investments (Continued)
September 30, 2020
| Number of Shares | Value | |||||||
COMMON STOCKS — (Continued) |
| |||||||
South Korea — (Continued) |
| |||||||
Amorepacific Corp. | 1,158 | $ | 161,437 | |||||
AMOREPACIFIC Group | 2,289 | 95,384 | ||||||
Celltrion Healthcare Co. Ltd.* | 13,960 | 1,047,170 | ||||||
Celltrion Pharm, Inc.* | 5,523 | 533,593 | ||||||
Celltrion, Inc.* | 2,385 | 524,614 | ||||||
Coway Co., Ltd. | 16,026 | 1,089,952 | ||||||
Fila Korea, Ltd. | 5,671 | 177,219 | ||||||
Hanmi Pharm Co., Ltd. | 1,990 | 465,235 | ||||||
Hanon Systems | 56,135 | 592,766 | ||||||
HLB, Inc.* | 9,711 | 856,054 | ||||||
Hyundai Glovis Co., Ltd. | 5,428 | 667,404 | ||||||
Hyundai Marine & Fire | ||||||||
Insurance Co., Ltd. | 20,531 | 392,763 | ||||||
Kangwon Land, Inc. | 12,333 | 226,741 | ||||||
Kia Motors Corp. | 20,120 | 806,851 | ||||||
KMW Co., Ltd.* | 8,805 | 588,491 | ||||||
Korea Aerospace Industries, Ltd. | 7,493 | 145,320 | ||||||
LG Uplus Corp. | 52,152 | 512,376 | ||||||
NCSoft Corp. | 2,071 | 1,427,195 | ||||||
Netmarble Corp.* | 4,639 | 656,315 | ||||||
Orion Corp. | 7,790 | 872,882 | ||||||
Samsung Biologics Co. Ltd.* | 416 | 245,248 | ||||||
Samsung Fire & Marine Insurance Co., Ltd. | 1,242 | 193,484 | ||||||
Seegene, Inc. | 3,724 | 829,183 | ||||||
Shinsegae, Inc. | 835 | 151,083 | ||||||
SK Telecom Co., Ltd. | 6,660 | 1,353,855 | ||||||
Yuhan Corp. | 7,912 | 434,530 | ||||||
|
| |||||||
| 15,631,147 | ||||||||
|
| |||||||
| Number of Shares | Value | |||||||
COMMON STOCKS — (Continued) |
| |||||||
Taiwan — 9.0% | ||||||||
Accton Technology Corp. | 91,000 | $ | 704,038 | |||||
ASMedia Technology, Inc. | 4,000 | 202,809 | ||||||
Asustek Computer, Inc. | 44,000 | 387,122 | ||||||
AU Optronics Corp.* | 1,029,000 | 400,769 | ||||||
Eclat Textile Co., Ltd. | 54,660 | 683,445 | ||||||
Far EasTone Telecommuni-cations Co., Ltd. | 523,000 | 1,104,616 | ||||||
Feng TAY Enterprise Co., Ltd. | 127,200 | 767,871 | ||||||
Inventec Corp. | 690,000 | 537,503 | ||||||
Micro-Star International Co., Ltd. | 72,000 | 332,393 | ||||||
Nien Made Enterprise Co., Ltd. | 44,000 | 525,802 | ||||||
President Chain Store Corp. | 92,000 | 837,395 | ||||||
Taiwan High Speed Rail Corp. | 662,000 | 726,121 | ||||||
Taiwan Mobile Co., Ltd. | 364,000 | 1,216,593 | ||||||
United Microelectronics Corp. | 248,000 | 244,622 | ||||||
Wiwynn Corp. | 26,000 | 590,948 | ||||||
Yageo Corp. | 12,000 | 147,352 | ||||||
|
| |||||||
| 9,409,399 | ||||||||
|
| |||||||
Thailand — 7.6% | ||||||||
Advanced Info Service PCL | 255,500 | 1,384,173 | ||||||
Airports of Thailand PCL | 103,300 | 185,085 | ||||||
Bangkok Bank PCL | 38,700 | 117,919 | ||||||
Bangkok Dusit Medical Services PCL | 1,908,900 | 1,170,437 | ||||||
Bangkok Expressway & Metro PCL | 2,592,000 | 703,517 | ||||||
Berli Jucker PCL | 415,900 | 484,858 | ||||||
The accompanying notes are an integral part of the financial statements.
13
TOBAM EMERGING MARKETS FUND
Portfolio of Investments (Continued)
September 30, 2020
| Number of Shares | Value | |||||||
COMMON STOCKS — (Continued) |
| |||||||
Thailand — (Continued) | ||||||||
Charoen Pokphand Foods PCL | 1,260,920 | $ | 1,117,616 | |||||
CP ALL PCL* | 254,100 | 484,391 | ||||||
Energy Absolute PCL | 496,600 | 618,521 | ||||||
Global Power Synergy PCL | 176,000 | 320,893 | ||||||
Indorama Ventures PCL | 289,000 | 193,562 | ||||||
Kasikornbank PCL | 84,100 | 205,408 | ||||||
Thai Union Group PCL | 1,032,200 | 458,848 | ||||||
TMB Bank PCL | 6,288,300 | 177,563 | ||||||
True Corp. PCL | 3,903,600 | 383,778 | ||||||
|
| |||||||
| 8,006,569 | ||||||||
|
| |||||||
Turkey — 1.6% | ||||||||
BIM Birlesik Magazalar AS | 121,603 | 1,090,312 | ||||||
Eregli Demir ve Celik Fabrikalari TAS | 340,398 | 417,226 | ||||||
Tupras Turkiye Petrol Rafinerileri AS* | 15,467 | 158,679 | ||||||
|
| |||||||
| 1,666,217 | ||||||||
|
| |||||||
TOTAL COMMON STOCKS | 102,618,248 | |||||||
|
| |||||||
| Number of Shares | Value | |||||||
PREFERRED STOCKS — 0.2% |
| |||||||
South Korea — 0.2% | ||||||||
Hyundai Motor Co.(a) | 3,198 | $ | 241,362 | |||||
|
| |||||||
TOTAL PREFERRED STOCKS | 241,362 | |||||||
|
| |||||||
TOTAL INVESTMENTS - 97.9% |
| 102,859,610 | ||||||
OTHER ASSETS IN EXCESS OF LIABILITIES - 2.1% | 2,171,098 | |||||||
|
| |||||||
NET ASSETS - 100.0% | $ | 105,030,708 | ||||||
|
| |||||||
| * | Non-income producing. |
| (a) | Preferred stocks are shares that carry certain preferential rights. The dividend rate may not be consistent each pay period and could be zero for a particular year. |
| ADR | American Depository Receipt |
| GDR | Global Depository Receipt |
| PCL | Public Company Limited |
The accompanying notes are an integral part of the financial statements.
14
TOBAM EMERGING MARKETS FUND
Portfolio of Investments (Concluded)
September 30, 2020
At September 30, 2020, the Fund held the following open positions in futures contracts:
Long Futures Outstanding | Expiration Date | Number of Contracts | Notional Cost | Notional Amount | Value and Unrealized Depreciation | ||||||||||||||||||||
MSCI® Emerging Markets Index | 12/18/20 | 43 | $ | 2,396,820 | $ | 2,340,275 | $ | (56,545 | ) | ||||||||||||||||
|
| ||||||||||||||||||||||||
| $ | (56,545 | ) | |||||||||||||||||||||||
|
| ||||||||||||||||||||||||
The accompanying notes are an integral part of the financial statements.
15
TOBAM EMERGING MARKETS FUND
Statement of Assets and Liabilities
September 30, 2020
Assets | ||||
Investments, at value (Cost $92,916,968) | $ | 102,859,610 | ||
Cash | 1,210,095 | |||
Foreign currency (Cost $137,338) | 135,084 | |||
Dividends receivable | 54,606 | |||
Deposits for futures contracts* | 1,061,853 | |||
Prepaid expenses and other assets | 10,823 | |||
|
| |||
Total assets | 105,332,071 | |||
|
| |||
Liabilities | ||||
Payable to Investment Adviser | 196,009 | |||
Payable for audit fees | 30,560 | |||
Payable for administration and accounting fees | 23,703 | |||
Payable for custodian fees | 19,454 | |||
Deferred foreign capital gains tax | 14,297 | |||
Payable for printing fees | 6,848 | |||
Payable for transfer agent fees | 6,008 | |||
Payable for legal fees | 2,380 | |||
Accrued expenses | 2,104 | |||
|
| |||
Total liabilities | 301,363 | |||
|
| |||
Net Assets | $ | 105,030,708 | ||
|
| |||
Net Assets consisted of: | ||||
Capital stock, $0.01 par value | $ | 98,312 | ||
Paid-in capital | 101,802,388 | |||
Total distributable earnings/(loss) | 3,130,008 | |||
|
| |||
Net Assets | $ | 105,030,708 | ||
|
| |||
Class I: | ||||
Shares outstanding | 9,831,212 | |||
|
| |||
Net asset value, offering and redemption price per share ($105,030,708 / 9,831,212 shares) | $ | 10.68 | ||
|
|
| * | Primary risk exposure is equity index contracts. |
The accompanying notes are an integral part of the financial statements.
16
TOBAM EMERGING MARKETS FUND
Statement of Operations
For the Year Ended September 30, 2020
Investment income | ||||
Dividends | $ | 2,005,730 | ||
Less: foreign taxes withheld | (228,818 | ) | ||
|
| |||
Total investment income | 1,776,912 | |||
|
| |||
Expenses | ||||
Advisory fees (Note 2) | 798,042 | |||
Custodian fees (Note 2) | 104,722 | |||
Administration and accounting fees (Note 2) | 83,887 | |||
Trustees’ and officers’ fees (Note 2) | 46,707 | |||
Audit fees | 34,577 | |||
Registration and filing fees | 27,525 | |||
Transfer agent fees (Note 2) | 23,877 | |||
Legal fees | 17,403 | |||
Printing and shareholder reporting fees | 16,108 | |||
Other expenses | 10,500 | |||
|
| |||
Total expenses before waivers and reimbursements | 1,163,348 | |||
|
| |||
Less: waivers and reimbursements (Note 2) | (64,807 | ) | ||
|
| |||
Net expenses after waivers and reimbursements | 1,098,541 | |||
|
| |||
Net investment income | 678,371 | |||
|
| |||
Net realized and unrealized gain/(loss) from investments | ||||
Net realized loss from investments* | (3,232,435 | ) | ||
Net realized loss from foreign currency transactions | (56,209 | ) | ||
Net realized gain from futures contracts** | 881,660 | |||
Net change in unrealized appreciation/(depreciation) on investments*** | 7,129,808 | |||
Net change in unrealized appreciation/(depreciation) on foreign currency transactions | 611 | |||
Net change in unrealized appreciation/(depreciation) on futures contracts** | (44,335 | ) | ||
|
| |||
Net realized and unrealized gain on investments | 4,679,100 | |||
|
| |||
Net increase in net assets resulting from operations. | $ | 5,357,471 | ||
|
| |||
| * | Net realized loss from investments includes foreign capital gains tax of $2,006. |
| ** | Primary risk exposure is equity index contracts. |
| *** | Includes net increase in deferred foreign capital gains tax of $14,297. |
The accompanying notes are an integral part of the financial statements.
17
TOBAM EMERGING MARKETS FUND
Statements of Changes in Net Assets
| For the Year Ended September 30, 2020 | For the Year Ended September 30, 2019 | |||||||||
Increase/(decrease) in net assets from operations: | ||||||||||
Net investment income | $ | 678,371 | $ | 1,236,436 | ||||||
Net realized gain/(loss) from investments, futures contracts and foreign currency transactions | (2,406,984 | ) | (4,832,608 | ) | ||||||
Net change in unrealized appreciation/(depreciation) on investments, futures contracts and foreign currency transactions | 7,086,084 | (697,768 | ) | |||||||
|
|
|
| |||||||
Net increase/(decrease) in net assets resulting from operations | 5,357,471 | (4,293,940 | ) | |||||||
|
|
|
| |||||||
Less dividends and distributions to shareholders from: | ||||||||||
Total distributable earnings | (1,093,800 | ) | (3,514,086 | ) | ||||||
|
|
|
| |||||||
Net decrease in net assets from dividends and distributions to shareholders | (1,093,800 | ) | (3,514,086 | ) | ||||||
|
|
|
| |||||||
Increase in net assets derived from capital share transactions (Note 4) | 1,093,620 | 57,659,751 | ||||||||
|
|
|
| |||||||
Total increase in net assets | 5,357,291 | 49,851,725 | ||||||||
|
|
|
| |||||||
Net assets | ||||||||||
Beginning of year | 99,673,417 | 49,821,692 | ||||||||
|
|
|
| |||||||
End of year | $ | 105,030,708 | $ | 99,673,417 | ||||||
|
|
|
| |||||||
The accompanying notes are an integral part of the financial statements.
18
TOBAM EMERGING MARKETS FUND
Financial Highlights
Contained below is per share operating performance data for Class I shares outstanding, total investment return, ratios to average net assets and other supplemental data for the respective period. The total returns in the table represent the rate that an investor would have earned or lost on an investment in the Fund (assuming reinvestment of all dividends and distributions). This information has been derived from information provided in the financial statements and should be read in conjunction with the financial statements and the notes thereto.
| Class I | ||||||||||||||||||||
| For the Year Ended September 30, 2020 | For the Year Ended September 30, 2019 | For the Year Ended September 30, 2018 | For the Period April 25, 2017* to September 30, 2017 | |||||||||||||||||
Per Share Operating Performance | ||||||||||||||||||||
Net asset value, beginning of period | $ | 10.25 | $ | 11.58 | $ | 11.35 | $ | 10.00 | ||||||||||||
|
|
|
|
|
|
|
| |||||||||||||
Net investment income(1) | 0.07 | 0.15 | 0.16 | 0.15 | ||||||||||||||||
Net realized and unrealized gain/(loss) on investments | 0.47 | (0.91 | ) | 0.27 | 1.20 | |||||||||||||||
|
|
|
|
|
|
|
| |||||||||||||
Net increase/(decrease) in net assets resulting from operations | 0.54 | (0.76 | ) | 0.43 | 1.35 | |||||||||||||||
|
|
|
|
|
|
|
| |||||||||||||
Dividends and distributions to shareholders from: | ||||||||||||||||||||
Net investment income | (0.11 | ) | (0.12 | ) | (0.19 | ) | — | |||||||||||||
Net realized gains | — | (0.45 | ) | (0.01 | ) | — | ||||||||||||||
|
|
|
|
|
|
|
| |||||||||||||
Total dividends and distributions to shareholders. | (0.11 | ) | (0.57 | ) | (0.20 | ) | — | |||||||||||||
|
|
|
|
|
|
|
| |||||||||||||
Net asset value, end of period | $ | 10.68 | $ | 10.25 | $ | 11.58 | $ | 11.35 | ||||||||||||
|
|
|
|
|
|
|
| |||||||||||||
Total investment return(2) | 5.30 | % | (6.47 | )% | 3.79 | % | 13.50 | % | ||||||||||||
Ratios/Supplemental Data | ||||||||||||||||||||
Net assets, end of period (in thousands) | $ | 105,031 | $ | 99,673 | $ | 49,822 | $ | 48,020 | ||||||||||||
Ratio of expenses to average net assets | 1.10 | % | 1.10 | % | 0.95 | % | 0.85 | %(3) | ||||||||||||
Ratio of expenses to average net assets without waivers and expense reimbursements(4) | 1.17 | % | 1.20 | % | 1.44 | % | 1.66 | %(3) | ||||||||||||
Ratio of net investment income to average net assets | 0.68 | % | 1.48 | % | 1.27 | % | 3.29 | %(3) | ||||||||||||
Portfolio turnover rate | 42 | % | 42 | % | 33 | % | 14 | %(5) | ||||||||||||
| * | Commencement of operations. |
| (1) | The selected per share data was calculated using the average shares outstanding method for the period. |
| (2) | Total investment return is calculated assuming a purchase of shares on the first day and a sale of shares on the last day of each period reported and includes reinvestment of dividends and distributions, if any. Total returns for periods less than one year are not annualized. |
| (3) | Annualized. |
| (4) | During the period, certain fees were waived and/or reimbursed. If such fee waivers and/or reimbursements had not occurred, the ratios would have been as indicated (See Note 2). |
| (5) | Not annualized. |
The accompanying notes are an integral part of the financial statements.
19
TOBAM EMERGING MARKETS FUND
Notes to Financial Statements
September 30, 2020
1. Organization and Significant Accounting Policies
The TOBAM Emerging Markets Fund (the “Fund”) is a diversified, open-end management investment company registered under the Investment Company Act of 1940, as amended, (the “1940 Act”), and commenced investment operations on April 25, 2017. The Fund is a separate series of FundVantage Trust (the “Trust”) which was organized as a Delaware statutory trust on August 28, 2006. The Trust is a “series trust” authorized to issue an unlimited number of separate series or classes of shares of beneficial interest. Each series is treated as a separate entity for certain matters under the 1940 Act, and for other purposes, and a shareholder of one series is not deemed to be a shareholder of any other series. The Fund offers separate classes of shares: Class A, Class C and Class I Shares. As of September 30, 2020, Class A and Class C shares have not been issued.
The Fund is an investment company and follows accounting and reporting guidance in the Financial Accounting Standards Board Accounting Standards Codification Topic 946.
Portfolio Valuation — The Fund’s net asset value (“NAV”) is calculated once daily at the close of regular trading hours on the New York Stock Exchange (“NYSE”) (typically 4:00 p.m. Eastern time) on each day the NYSE is open. Securities held by the Fund are valued using the closing price or the last sale price on a national securities exchange or the National Association of Securities Dealers Automatic Quotation System (“NASDAQ”) market system where they are primarily traded. The Fund’s equity securities listed on any national exchange market system will be valued at the last sale price. Equity securities traded in the over-the-counter market are valued at their closing sale or official closing price. If there were no transactions on that day, securities traded principally on an exchange will be valued at the mean of the last bid and ask prices prior to the market close. Securities that do not have a readily available current market value are valued in accordance with procedures adopted by the Trust’s Board of Trustees. The Board of Trustees has adopted methods for valuing securities and other assets in circumstances where market quotes are not readily available and has delegated to TOBAM (“TOBAM” or the “Adviser”) the responsibility for applying the valuation methods. Relying on prices supplied by pricing services or dealers or using fair valuation may result in values that are higher or lower than the values used by other investment companies and investors to price the same investments. In the event that market quotes are not readily available, and the security or asset cannot be valued pursuant to one of the valuation methods, the value of the security or asset will be determined in good faith by the Adviser. The Trust has established a Valuation Committee which performscertain functions including the oversight of the Adviser’s fair valuation determinations. Prices for equity securities normally are supplied by an independent pricing service approved by the Trust’s Board of Trustees. Fixed income securities are valued based on market quotations, which are furnished by an independent pricing service. Fixed income securities having remaining maturities of 60 days or less are generally valued at amortized cost, provided such amount approximates fair value. Any assets held by the Fund that are denominated in foreign currencies are valued daily in U.S. dollars at the foreign currency exchange rates that are prevailing at the time that the Fund determines the daily NAV per share. Foreign securities may trade on weekends or other days when the Fund does not calculate
20
TOBAM EMERGING MARKETS FUND
Notes to Financial Statements (Continued)
September 30, 2020
NAV. As a result, the market value of these investments may change on days when you cannot buy or sell shares of the Fund. Investments in other open-end investment companies are valued based on the NAV of such investment companies (which may use fair value pricing as disclosed in their prospectuses). Exchange traded futures contracts are generally valued using the settlement price determined by the relevant exchange. Exchange traded futures contracts for which no settlement price is reported, are generally valued at the mean between the most recent bid and ask prices obtained from approved pricing services, established market makers, or from broker-dealers.
Fair Value Measurements — The inputs and valuation techniques used to measure fair value of the Fund’s investments are summarized into three levels as described in the hierarchy below:
| • | Level 1 — | quoted prices in active markets for identical securities; | |||
• | Level 2 — | other significant observable inputs (including quoted prices for similar securities, interest rates, prepayment speeds, credit risk, etc.); and | ||||
• | Level 3 — | significant unobservable inputs (including the Fund’s own assumptions in determining the fair value of investments). | ||||
The inputs or methodology used for valuing securities are not necessarily an indication of the risk associated with investing in those securities.
Securities listed on a non-U.S. exchange are generally fair valued daily by an independent fair value pricing service approved by the Board of Trustees and categorized as Level 2 investments within the hierarchy. The fair valuations for these securities may not be the same as quoted or published prices of the securities on their primary markets. Securities for which daily fair value prices from the independent fair value pricing service are not available are generally valued at the last quoted sale price at the close of an exchange on which the security is traded and categorized as Level 1 investments within the hierarchy. Values of foreign securities, currencies, and other assets and liabilities denominated in foreign currencies are translated into U.S. dollars at the exchange rate of said currencies against the U.S. dollar, as of valuation time, as provided by an independent pricing service approved by the Board of Trustees.
21
TOBAM EMERGING MARKETS FUND
Notes to Financial Statements (Continued)
September 30, 2020
The following is a summary of the inputs used, as of September 30, 2020, in valuing the Fund’s investments carried at fair value:
Assets | Total Value at 09/30/20 | Level 1 Quoted Price | Level 2 Other Significant Observable Inputs | Level 3 Significant Unobservable Inputs | ||||||||||||
Common Stocks: | ||||||||||||||||
Argentina | $ | 225,280 | $ | 225,280 | $ | — | $ | — | ||||||||
Brazil | 4,375,329 | 4,375,329 | — | — | ||||||||||||
China | 31,260,939 | 5,230,956 | 26,029,983 | — | ||||||||||||
Colombia | 216,545 | 216,545 | — | — | ||||||||||||
Czech Republic | 123,495 | — | 123,495 | — | ||||||||||||
Greece | 626,630 | — | 626,630 | — | ||||||||||||
Hong Kong | 881,543 | — | 881,543 | — | ||||||||||||
India | 19,493,574 | 789,700 | 18,703,874 | — | ||||||||||||
Indonesia | 880,502 | — | 880,502 | — | ||||||||||||
Malaysia | 3,592,075 | — | 3,592,075 | — | ||||||||||||
Mexico | 267,744 | 267,744 | — | — | ||||||||||||
Peru | 873,449 | 873,449 | — | — | ||||||||||||
Poland | 808,550 | — | 808,550 | — | ||||||||||||
Russia | 1,933,878 | — | 1,933,878 | — | ||||||||||||
South Africa | 2,345,383 | — | 2,345,383 | — | ||||||||||||
South Korea | 15,631,147 | 829,183 | 14,801,964 | — | ||||||||||||
Taiwan | 9,409,399 | — | 9,409,399 | — | ||||||||||||
Thailand | 8,006,569 | — | 8,006,569 | — | ||||||||||||
Turkey | 1,666,217 | — | 1,666,217 | — | ||||||||||||
Preferred Stocks: | ||||||||||||||||
South Korea | 241,362 | — | 241,362 | — | ||||||||||||
|
|
|
|
|
|
|
| |||||||||
Total Assets | $ | 102,859,610 | $ | 12,808,186 | $ | 90,051,424 | $ | — | ||||||||
|
|
|
|
|
|
|
| |||||||||
Liabilities | ||||||||||||||||
Derivatives: | ||||||||||||||||
Equity Contracts: | ||||||||||||||||
Futures Contracts | (56,545 | ) | (56,545 | ) | — | — | ||||||||||
|
|
|
|
|
|
|
| |||||||||
Total Liabilities | $ | (56,545 | ) | $ | (56,545 | ) | $ | — | $ | — | ||||||
|
|
|
|
|
|
|
| |||||||||
At the end of each quarter, management evaluates the classification of Levels 1, 2 and 3 assets and liabilities. Various factors are considered, such as changes in liquidity from the prior reporting period;
22
TOBAM EMERGING MARKETS FUND
Notes to Financial Statements (Continued)
September 30, 2020
whether or not a broker is willing to execute at the quoted price; the depth and consistency of prices from third party pricing services; and the existence of contemporaneous, observable trades in the market. Additionally, management evaluates the classification of Level 1 and Level 2 assets and liabilities on a quarterly basis for changes in listings or delistings on national exchanges.
Due to the inherent uncertainty of determining the fair value of investments that do not have a readily available market value, the fair value of the Fund’s investments may fluctuate from period to period. Additionally, the fair value of investments may differ significantly from the values that would have been used had a ready market existed for such investments and may differ materially from the values the Fund may ultimately realize. Further, such investments may be subject to legal and other restrictions on resale or otherwise less liquid than publicly traded securities.
For fair valuations using significant unobservable inputs, U.S. generally accepted accounting principles (“U.S. GAAP”) require the Fund to present a reconciliation of the beginning to ending balances for reported market values that present changes attributable to total realized and unrealized gains or losses, purchase and sales, and transfers in and out of Level 3 during the period. A reconciliation of Level 3 investments is presented only when the Fund had an amount of Level 3 investments at the end of the reporting period that was meaningful in relation to its net assets. The amounts and reasons for all transfers in and out of Level 3 are disclosed when the Fund had an amount of transfers during the reporting period that was meaningful in relation to its net assets as of the end of the reporting period.
For the year ended September 30, 2020, there were no transfers in or out of Level 3.
Futures Contracts — The Fund may use futures contracts for hedging or speculative purposes consistent with its investment objective. Upon entering into a futures contract, the Fund must deposit initial margin in addition to segregating cash or liquid assets sufficient to meet its obligation to purchase or provide securities, or to pay the amount owed at the expiration of an index-based futures contract. Such liquid assets may consist of cash, cash equivalents, liquid debt or equity securities or other acceptable assets. Pursuant to the futures contract, the Fund agrees to receive from, or pay to the broker, an amount of cash equal to the daily fluctuation in value of the contract. Such a receipt of payment is known as “variation margin” and is recorded by the Fund as unrealized appreciation or depreciation. When the contract is closed, the Fund records a realized gain or loss equal to the difference between the proceeds from (or cost of) the closing transactions and the Fund’s basis in the contract. Futures contracts have market risks, including the risk that the change in the value of the contract may not correlate with changes in the value of the underlying securities. Use of long futures contracts subjects the Fund to risk of loss in excess of the amount shown on the Statement of Assets and Liabilities, up to the notional value of the futures contract. Use of short futures contracts subjects the Fund to unlimited risk of loss.
During the reporting period, the Fund entered into futures contracts to gain exposure to various markets, as part of the Fund’s investment strategy.
23
TOBAM EMERGING MARKETS FUND
Notes to Financial Statements (Continued)
September 30, 2020
For the year ended September 30, 2020, the TOBAM Emerging Markets Fund’s monthly average volume of futures was as follows:
Long Futures Notional Cost |
$ 1,263,991 |
Use of Estimates — The preparation of financial statements in conformity with U.S. GAAP requires management to make estimates and assumptions that affect the amounts reported in the financial statements and accompanying notes at the date of the financial statements and the reported amounts of revenues and expenses during the period. Actual results could differ from those estimates and those differences could be material.
Investment Transactions, Investment Income and Expenses — Investment transactions are recorded on trade date for financial statement preparation purposes. Realized gains and losses on investments sold are recorded on the identified cost basis. Interest income is recorded on the accrual basis. Dividends are recorded on the ex-dividend date. The Fund may be subject to taxes imposed by countries in which it invests. Such taxes are generally based on income and/or capital gains earned or repatriated. Taxes are accrued and applied to net investment income, net realized gains and net unrealized appreciation/ depreciation as such income and/or gains are earned. General expenses of the Trust are generally allocated to each fund under methodologies approved by the Board of Trustees. Expenses directly attributable to a particular fund in the Trust are charged directly to that fund.
Foreign Currency Translation — Assets and liabilities initially expressed in non-U.S. currencies are translated into U.S. dollars based on the applicable exchange rates at the date of the last business day of the financial statement period. Purchases and sales of securities, interest income, dividends, variation margin received and expenses denominated in foreign currencies are translated into U.S. dollars at the exchange rates in effect on the transaction date.
The Fund does not separately report the effect of changes in foreign exchange rates from changes in market prices of securities held. Such changes are included with the net realized gain or loss and change in unrealized appreciation or depreciation on investments in the Statement of Operations. Other foreign currency transactions resulting in realized and unrealized gain or loss are reported separately as net realized gain or loss and change in unrealized appreciation or depreciation on foreign currency transactions in the Statement of Operations.
Dividends and Distributions to Shareholders — Dividends from net investment income and distributions from net realized capital gains, if any, are declared, recorded on ex-date and paid at least annually to shareholders. Income dividends and capital gain distributions are determined in accordance with U.S. federal income tax regulations, which may differ from U.S. GAAP.
24
TOBAM EMERGING MARKETS FUND
Notes to Financial Statements (Continued)
September 30, 2020
U.S. Tax Status — No provision is made for U.S. income taxes as it is the Fund’s intention to continue to qualify for and elect the tax treatment applicable to regulated investment companies under Subchapter M of the Internal Revenue Code of 1986, as amended (the “Internal Revenue Code”), and make the requisite distributions to its shareholders which will be sufficient to relieve it from U.S. income and excise taxes.
Other — In the normal course of business, the Fund may enter into contracts that provide general indemnifications. The Fund’s maximum exposure under these arrangements is dependent on claims that may be made against the Fund in the future, and, therefore, cannot be estimated; however, based on experience, the risk of material loss for such claims is considered remote.
Market disruptions associated with the COVID-19 pandemic have had a global impact, and uncertainty exists as to its long-term implications. The COVID-19 pandemic could adversely affect the value and liquidity of the Fund’s investments, impair the Fund’s ability to satisfy redemption requests, and negatively impact the Fund’s performance. In addition, the outbreak of COVID-19, and measures taken to mitigate its effects, could result in disruptions to the services provided to the Fund by its service providers. Fund management is continuing to monitor this development and evaluate its impact on the Fund.
Currency Risk — The Fund invests in securities of foreign issuers, including American Depository Receipts. These markets are subject to special risks associated with foreign investments not typically associated with investing in U.S. markets. Because the foreign securities in which the Fund may invest generally trade in currencies other than the U.S. dollar, changes in currency exchange rates will affect the Fund’s NAV, the value of dividends and interest earned and gains and losses realized on the sale of securities. Because the NAV for the Fund is determined on the basis of U.S. dollars, the Fund may lose money by investing in a foreign security if the local currency of a foreign market depreciates against the U.S. dollar, even if the local currency value of the Fund’s holdings goes up. Generally, a strong U.S. dollar relative to these other currencies will adversely affect the value of the Fund’s holdings in foreign securities.
Foreign Securities Market Risk — Securities of many non-U.S. companies may be less liquid and their prices more volatile than securities of comparable U.S. companies. Securities of companies traded in many countries outside the U.S., particularly emerging markets countries, may be subject to further risks due to the inexperience of local investment professionals and financial institutions, the possibility of permanent or temporary termination of trading and greater spreads between bid and asked prices of securities. In addition, non-U.S. stock exchanges and investment professionals are subject to less governmental regulation, and commissions may be higher than in the United States. Also, there may be delays in the settlement of non-U.S. stock exchange transactions.
Emerging Markets Risk — The Fund invests in emerging market instruments which are subject to certain credit and market risks. The securities and currency markets of emerging market countries
25
TOBAM EMERGING MARKETS FUND
Notes to Financial Statements (Continued)
September 30, 2020
are generally smaller, less developed, less liquid and more volatile than the securities and currency markets of the United States and other developed markets. Disclosure and regulatory standards in many respects are less stringent than in other developed markets. There also may be a lower level of monitoring and regulation of securities markets in emerging market countries and the activities of investors in such markets and enforcement of existing regulations may be extremely limited. Political and economic structures in many of these countries may be in their infancy and developing rapidly, and such countries may lack the social, political and economic stability characteristics of more developed countries.
2. Transactions with Related Parties and Other Service Providers
TOBAM serves as investment adviser to the Fund. For its services, the Adviser is paid a monthly fee at the annual rate of 0.80% of the Fund’s average daily net assets. The Adviser has contractually agreed to waive fees and/or reimburse certain expenses of the Fund to the extent necessary to ensure that the Fund’s total operating expenses (exclusive of taxes, “Acquired Fund Fees and Expenses” (as defined in Form N-1A), dividend and interest expense on securities sold short, interest, extraordinary items and brokerage commissions) do not exceed 1.10% (on an annual basis), with respect to Class I shares, of average daily net assets (the “Expense Limitation”). The Expense Limitation will remain in place until January 31, 2021, unless the Board of Trustees of the Trust approves its earlier termination. The Adviser may recoup, subject to approval by the Board of Trustees, any expenses or fees it has waived or reimbursed within a three-year period from the date on which the Adviser reduced its compensation and/or assumed expenses of the Fund. No recoupment will occur unless the Fund’s expenses are below the Expense Limitation amount. As of September 30, 2020, the amount of potential recovery was as follows:
Expiration | ||||||
September 30, 2021 | September 30, 2022 | September 30, 2023 | Total | |||
$254,667 | $88,642 | $64,807 | $408,116 | |||
For the year ended September 30, 2020, the Adviser earned advisory fees of $798,042 and waived fees of $64,807.
Other Service Providers
The Bank of New York Mellon (“BNY Mellon”) serves as administrator and custodian for the Fund. For providing administrative and accounting services, BNY Mellon is entitled to receive a monthly fee equal to an annual percentage rate of the Fund’s average daily net assets and is subject to certain minimum monthly fees. For providing certain custodial services, BNY Mellon is entitled to receive a monthly fee, subject to certain minimum, and out of pocket expenses.
26
TOBAM EMERGING MARKETS FUND
Notes to Financial Statements (Continued)
September 30, 2020
BNY Mellon Investment Servicing (US) Inc. (the “Transfer Agent”) provides transfer agent services to the Fund. The Transfer Agent is entitled to receive a monthly fee, subject to certain minimum, and out of pocket expenses.
The Trust, on behalf of the Fund, has entered into agreements with financial intermediaries to provide recordkeeping, processing, shareholder communications and other services to customers of the intermediaries investing in the Fund and has agreed to compensate the intermediaries for providing those services. The fees incurred by the Fund for these services are included in Transfer Agent fees in the Statement of Operations.
Foreside Funds Distributors LLC (the “Underwriter”) provides principal underwriting services to the Fund pursuant to an underwriting agreement between the Trust and the Underwriter.
Trustees and Officers
The Trust is governed by its Board of Trustees. The Trustees receive compensation in the form of an annual retainer and per meeting fees for their services to the Trust. An employee of BNY Mellon serves as the Secretary of the Trust and is not compensated by the Fund or the Trust.
JW Fund Management LLC (“JWFM”) provides a Principal Executive Officer and Principal Financial Officer, respectively, to the Trust. Effective October 1, 2020, Alaric Compliance Services LLC (“Alaric”) provides the Trust with a Chief Compliance Officer and an Anti-Money Laundering Officer. Prior to October 1, 2020, Duff & Phelps, LLC provided the Trust with a Chief Compliance Officer and an Anti-Money Laundering Officer. JWFM and Alaric are compensated for their services provided to the Trust.
3. Investment in Securities
For the year ended September 30, 2020, aggregate purchases and sales of investment securities (excluding short-term investments) of the Fund were as follows:
| Purchases | Sales | |||||||
Investment Securities | $ | 40,889,546 | $ | 40,972,417 | ||||
27
TOBAM EMERGING MARKETS FUND
Notes to Financial Statements (Continued)
September 30, 2020
4. Capital Share Transactions
For the years ended September 30, 2020 and 2019, transactions in capital shares (authorized shares unlimited) were as follows:
| For the Year Ended | For the Year Ended | |||||||||||||||
| September 30, 2020 | September 30, 2019 | |||||||||||||||
| Shares | Amount | Shares | Amount | |||||||||||||
Sales | — | $ | — | 5,074,137 | $ | 54,145,846 | ||||||||||
Reinvestments | 103,269 | 1,093,620 | 350,689 | 3,513,905 | ||||||||||||
|
|
|
|
|
|
|
| |||||||||
Net increase | 103,269 | $ | 1,093,620 | 5,424,826 | $ | 57,659,751 | ||||||||||
|
|
|
|
|
|
|
| |||||||||
There is a 1.00% redemption fee that may be charged on shares redeemed which have been held for 30 days or less. The redemption fee is retained by the Fund for the benefit of the remaining shareholders and recorded as paid-in capital.
5. Federal Tax Information
The Fund has followed the authoritative guidance on accounting for and disclosure of uncertainty in tax positions, which requires the Fund to determine whether a tax position is more likely than not to be sustained upon examination, including resolution of any related appeals or litigation processes, based on the technical merits of the position. Tax positions not deemed to meet the more-likely-than-not threshold would be recorded as tax benefit or expense in the current year. The Fund has determined that there was no effect on the financial statements from following this authoritative guidance. In the normal course of business, the Fund is subject to examination by federal, state and local jurisdictions, where applicable, for tax years for which applicable statutes of limitations have not expired.
Distributions are determined in accordance with federal income tax regulations, which may differ in amount or character from net investment income and realized gains for financial reporting purposes. Accordingly, the character of distributions and composition of net assets for tax purposes may differ from those reflected in the accompanying financial statements. To the extent these differences are permanent, such amounts are reclassified within the components of net assets based on the tax treatment; temporary differences do not require reclassifications. Net investment income, net realized gains and net assets are not affected by these adjustments. For the year ended September 30, 2020, there were no reclassifications.
For the year ended September 30, 2020, the tax character of distributions paid by the Fund was $1,093,800 of ordinary income dividends. For the year ended September 30, 2019, the tax character of distributions paid by the Fund was $2,805,167 of ordinary income dividends and $708,919 of long-term
28
TOBAM EMERGING MARKETS FUND
Notes to Financial Statements (Concluded)
September 30, 2020
capital gains distributions. Distributions from net investment income and short-term gains are treated as ordinary income for federal income tax purposes.
As of September 30, 2020, the components of distributable earnings/(loss) on a tax basis were as follows:
| Capital Loss | Undistributed | Unrealized | Qualified Late-Year | |||
Carryforward | Ordinary Income | Appreciation | Losses | |||
| $(4,555,650) | $405,752 | $9,751,406 | $2,471,500 |
The differences between the book and tax basis components of distributable earnings relate primarily to the timing and recognition of income and gains for federal income tax purposes.
As of September 30, 2020, the federal tax cost, aggregate gross unrealized appreciation and depreciation of securities held by the Fund were as follows:
Federal tax cost | $ | 93,091,391 | ||||
|
| |||||
Gross unrealized appreciation | 21,906,484 | |||||
| Gross unrealized depreciation | (12,155,078 | ) | |||
|
| |||||
Net unrealized appreciation | $ | 9,751,406 | ||||
|
|
Pursuant to federal income tax rules applicable to regulated investment companies, the Fund may elect to treat certain net capital losses between November 1 and September 30 and late year ordinary losses ((i) ordinary losses between January 1 and September 30, and (ii) specified ordinary and currency losses between November 1 and September 30) as occurring on the first day of the following tax year. For the year ended September 30, 2020, any amount of losses elected within the tax return will not be recognized for federal income tax purposes until October 1, 2020. As of September 30, 2020, the Fund had long-term capital loss deferrals of $713,109 and short-term capital loss deferrals of $1,758,391.
Accumulated capital losses represent net capital loss carryforwards as of September 30, 2020 that may be available to offset future realized capital gains and thereby reduce future capital gains distributions. As of September 30, 2020, the Fund had capital loss carryforward of $4,555,650, of which $1,845,687 are long-term losses and $2,709,963 are short-term losses and have an unlimited period of capital loss carryforward.
6. Subsequent Events
Management has evaluated the impact of all subsequent events on the Fund through the date the financial statements were issued, and has determined that there are no subsequent events requiring recognition or disclosure in the financial statements.
29
TOBAM EMERGING MARKETS FUND
Report of Independent Registered Public Accounting Firm
To the Board of Trustees of FundVantage Trust and
Shareholders of TOBAM Emerging Markets Fund
Opinion on the Financial Statements
We have audited the accompanying statement of assets and liabilities of TOBAM Emerging Markets Fund (the “Fund”) (one of the series constituting FundVantage Trust (the “Trust”)), including the portfolio of investments, as of September 30, 2020, and the related statement of operations for the year then ended, the statements of changes in net assets for each of the two years in the period then ended, the financial highlights for each of the three years in the period then ended and the period from April 25, 2017 (commencement of operations) to September 30, 2017 and the related notes (collectively referred to as the “financial statements”). In our opinion, the financial statements present fairly, in all material respects, the financial position of the Fund (one of the series constituting FundVantage Trust) at September 30, 2020, the results of its operations for the year then ended, the changes in its net assets for each of the two years in the period then ended and its financial highlights for each of the three years in the period then ended and the period from April 25, 2017 (commencement of operations) to September 30, 2017, in conformity with U.S. generally accepted accounting principles.
Basis for Opinion
These financial statements are the responsibility of the Trust’s management. Our responsibility is to express an opinion on the Fund’s financial statements based on our audits. We are a public accounting firm registered with the Public Company Accounting Oversight Board (United States) (“PCAOB”) and are required to be independent with respect to the Trust in accordance with the U.S. federal securities laws and the applicable rules and regulations of the Securities and Exchange Commission and the PCAOB.
We conducted our audits in accordance with the standards of the PCAOB. Those standards require that we plan and perform the audit to obtain reasonable assurance about whether the financial statements are free of material misstatement, whether due to error or fraud. The Trust is not required to have, nor were we engaged to perform, an audit of the Trust’s internal control over financial reporting. As part of our audits we are required to obtain an understanding of internal control over financial reporting but not for the purpose of expressing an opinion on the effectiveness of the Trust’s internal control over financial reporting. Accordingly, we express no such opinion.
Our audits included performing procedures to assess the risks of material misstatement of the financial statements, whether due to error or fraud, and performing procedures that respond to those risks. Such procedures included examining, on a test basis, evidence regarding the amounts and disclosures in the financial statements. Our procedures included confirmation of securities owned as of September 30, 2020, by correspondence with the custodian and brokers. Our audits also included evaluating the accounting principles used and significant estimates made by management, as well as evaluating the overall presentation of the financial statements. We believe that our audits provide a reasonable basis for our opinion.

We have served as the auditor of one or more TOBAM investment companies since 2017.
Philadelphia, Pennsylvania
November 25, 2020
30
TOBAM EMERGING MARKETS FUND
Shareholder Tax Information
(Unaudited)
The Fund is required by Subchapter M of the Internal Revenue Code to advise its shareholders of the U.S. federal tax status of distributions received by the Fund’s shareholders in respect of such fiscal year. During the year ended September 30, 2020, the Fund paid $1,093,800 of ordinary income dividends to its shareholders. Dividends from net investment income and short-term capital gains are treated as ordinary income dividends for federal income tax purposes.
The Fund designates 96.05% of the ordinary income distribution as qualified dividend income pursuant to the Jobs and Growth Tax Relief Reconciliation Act of 2003.
The percentage of qualified interest income related dividends not subject to withholding tax for non-resident aliens and foreign corporations is 0.01%.
The TOBAM Emerging Markets Fund paid foreign taxes and recognized foreign source income as follows:
| Foreign Taxes Paid | Foreign Source Income | |
| $129,641 | $2,007,229 |
All designations are based on financial information available as of the date of this annual report and, accordingly, are subject to change. For each item, it is the intention of the Fund to designate the maximum amount permitted under the Internal Revenue Code of 1986, as amended, and the regulations thereunder.
Because the Fund’s fiscal year is not the calendar year, another notification will be sent with respect to calendar year 2020. The second notification, which will reflect the amount, if any, to be used by calendar year taxpayers on their U.S. federal income tax returns, will be made in conjunction with Form 1099-DIV and will be mailed in January 2021.
Foreign shareholders will generally be subject to U.S. withholding tax on the amount of their ordinary income dividends. They will generally not be entitled to a foreign tax credit or deduction for the withholding taxes paid by the Fund, if any.
In general, dividends received by tax-exempt recipients (e.g., IRAs and Keoghs) need not be reported as taxable income for U.S. federal income tax purposes. However, some retirement trusts (e.g., corporate, Keogh and 403(b)(7) plans) may need this information for their annual information reporting.
Shareholders are advised to consult their own tax advisers with respect to the tax consequences of their investment in the Fund.
31
TOBAM EMERGING MARKETS FUND
Statement Regarding Liquidity Risk Management Program
(Unaudited)
On October 16, 2016, the Securities and Exchange Commission adopted Rule 22e-4 under the Investment Company Act of 1940, as amended (the “Liquidity Rule”) to promote effective liquidity risk management throughout the open-end investment company industry, thereby reducing the risk that funds will be unable to meet their redemption obligations and mitigating dilution of the interests of fund shareholders.
The Board of Trustees (the “Board”) of FundVantage Trust, on behalf of the TOBAM Emerging Markets Fund (the “Fund”), met on September 22-23, 2020 (the “Meeting”) to review the liquidity risk management program (the “Program”) applicable to the Fund, pursuant to the Liquidity Rule. The Board has appointed a committee of individuals to serve as the program administrator for the Fund’s Program (the “Program Committee”). At the Meeting, the Program Committee provided the Board with a report that addressed the operation of the Program and assessed its adequacy and effectiveness of implementation and any material changes to the Program as of June 30, 2020 (the “Report”).
The Report described the Program’s liquidity classification methodology. It also described the Program Committee’s methodology in determining whether a Highly Liquid Investment Minimum (a “HLIM”) is necessary and noted that, given the composition of the Fund’s portfolio holdings, a HLIM was not currently required for the Fund.
The Report noted that the Program complied with the key factors for consideration under the Liquidity Rule for assessing, managing and periodically reviewing liquidity risk, as follow:
A. The Fund’s investment strategy and liquidity of Fund investments during both normal and reasonably foreseeable stressed conditions: As part of the Report, the Program Committee reviewed the Fund’s strategy and its determination that the strategy remains appropriate for an open-end fund structure. This determination was based on the Fund’s holdings of Highly Liquid Investments, the diversification of holdings and the related average position size of the holdings.
B. Short-term and long-term cash flow projections during both normal and reasonably foreseeable stressed conditions: As part of the Report, the Program Committee reviewed historical net redemption activity and noted that it used this information as a component to establish the Fund’s reasonably anticipated trading size. The Fund has adopted an in-kind redemption policy which may be utilized to meet larger redemption requests. The Program Committee also took into consideration the Fund’s shareholder ownership concentration and the fact that the shares of the Fund are offered through intermediaries. The intermediary agreements increase the likelihood of large unanticipated redemptions, meaning a Fund may not have the ability to conduct an orderly sale of portfolio securities. The amount of assets a Fund has on these platforms is a significant factor in the ability of the Fund to meet redemption expectations. In light of the Fund’s holdings, it was noted that the Fund maintains a high level of liquidity to meet shareholder redemptions under both normal and stressed market conditions.
32
TOBAM EMERGING MARKETS FUND
Statement Regarding Liquidity Risk Management Program (Concluded)
(Unaudited)
C. Holdings of cash and cash equivalents, as well as borrowing arrangements: As part of the Report, the Program Committee reviewed any changes in the Fund’s cash and cash equivalents positions in response to current/anticipated redemption activity or market conditions. It was noted that the Fund do not currently have a borrowing or other credit funding arrangement.
33
TOBAM EMERGING MARKETS FUND
Other Information
(Unaudited)
Proxy Voting
Policies and procedures that the Fund uses to determine how to vote proxies relating to portfolio securities as well as information regarding how the Fund voted proxies relating to portfolio securities for the most recent 12-month period ended June 30 are available without charge, upon request, by calling (844) 282-6161 and on the Securities and Exchange Commission’s (“SEC”) website at http:// www.sec.gov.
Quarterly Portfolio Schedules
The Trust files its complete schedule of portfolio holdings with the SEC for the first and third fiscal quarters of each fiscal year (quarters ended December 31 and June 30) as an exhibit to their reports on Form N-PORT. The Trust’s portfolio holdings on Form N-PORT are available on the SEC’s website at http://www.sec.gov.
34
TOBAM EMERGING MARKETS FUND
Privacy Notice
(Unaudited)
The privacy of your personal financial information is extremely important to us. When you open an account with us, we collect a significant amount of information from you in order to properly invest and administer your account. We take very seriously the obligation to keep that information private and confidential, and we want you to know how we protect that important information.
We collect nonpublic personal information about you from applications or other forms you complete and from your transactions with us or our affiliates. We do not disclose information about you, or our former clients, to our affiliates or to service providers or other third parties, except as permitted by law. We share only the information required to properly administer your accounts, which enables us to send transaction confirmations, monthly or quarterly statements, financials and tax forms. Even within FundVantage Trust and its affiliated entities, a limited number of people who actually service accounts will have access to your personal financial information. Further, we do not share information about our current or former clients with any outside marketing groups or sales entities.
To ensure the highest degree of security and confidentiality, FundVantage Trust and its affiliates maintain various physical, electronic and procedural safeguards to protect your personal information. We also apply special measures for authentication of information you request or submit to us on our web site.
If you have questions or comments about our privacy practices, please call us at (844) 282-6161.
35
TOBAM EMERGING MARKETS FUND
Fund Management
(Unaudited)
FundVantage Trust (the “Trust”) is governed by a Board of Trustees (the “Trustees”). The primary responsibility of the Trustees is to represent the interest of the Trust’s shareholders and to provide oversight management of the Trust.
The following tables present certain information regarding the Board of Trustees and officers of the Trust. None of the Trustees are an “interested person” of the Trust, the Adviser, another investment adviser of a series of the Trust, or Foreside Funds Distributors LLC, the principal underwriter of the Trust (“Underwriter”), within the meaning of the 1940 Act and each Trustee is referred to as an “Independent Trustee” and is listed under such heading below. Employees of certain service providers to the Trust serve as officers of the Trust; such persons are not compensated by the Fund. The address of each Trustee and Officer as it relates to the Trust’s business is 301 Bellevue Parkway, 2nd Floor, Wilmington, DE 19809.
The Statement of Additional Information for the Fund contains additional information about the Trustees and is available, without charge, upon request by calling (844) 282-6161.
Name and Date of Birth | Position(s) Held with Trust | Term of Office and Length of Time Served | Principal Occupation(s) During Past Five Years |
Number of Funds in Trust Complex Overseen by Trustee | Other Directorships Held by Trustee | |||||
| INDEPENDENT TRUSTEES | ||||||||||
ROBERT J. CHRISTIAN Date of Birth: 2/49 | Trustee | Shall serve until death, resignation or removal. Trustee since 2007. Chairman from 2007 until September 30, 2019. | Retired since February 2006; Executive Vice President of Wilmington Trust Company from February 1996 to February 2006; President of Rodney Square Management Corporation (“RSMC”) (investment advisory firm) from 1996 to 2005; Vice President of RSMC from 2005 to 2006. | 38 | Optimum Fund Trust (registered investment company with 6 portfolios); Third Avenue Trust (registered investment company with 3 portfolios); Third Avenue Variable Series Trust (registered investment company with 1 portfolio).
| |||||
36
TOBAM EMERGING MARKETS FUND
Fund Management (Continued)
(Unaudited)
Name and Date of Birth | Position(s) Held with Trust | Term of Office and Length of Time Served | Principal Occupation(s) During Past Five Years |
Number of Funds in Trust Complex Overseen by Trustee | Other Directorships Held by Trustee | |||||
IQBAL MANSUR Date of Birth: 6/55 | Trustee | Shall serve until death, resignation or removal. Trustee since 2007. | Retired since September 2020; Professor of Finance, Widener University from 1998 to August 2020. | 38 | Third Avenue Trust (registered investment company with 3 portfolios); Third Avenue Variable Series Trust (registered investment company with 1 portfolio). | |||||
NICHOLAS M. MARSINI, JR. Date of Birth: 8/55 | Trustee and Chairman of the Board | Shall serve until death, resignation or removal. Trustee since 2016. Chairman since October 1, 2019. | Retired since March 2016. President of PNC Bank Delaware from June 2011 to March 2016; Executive Vice President of Finance of BNY Mellon from July 2010 to January 2011; Executive Vice President and Chief Financial Officer of PNC Global Investment Servicing from September 1997 to July 2010. | 38 | Brinker Capital Destinations Trust (registered investment company with 10 portfolios); Third Avenue Trust (registered investment company with 3 portfolios); Third Avenue Variable Series Trust (registered investment company with 1 portfolio). | |||||
37
TOBAM EMERGING MARKETS FUND
Fund Management (Continued)
(Unaudited)
Name and Date of Birth | Position(s) Held with Trust | Term of Office and Length of Time Served | Principal Occupation(s) During Past Five Years |
Number of Funds in Trust Complex Overseen by Trustee | Other Directorships Held by Trustee | |||||
NANCY B. WOLCOTT Date of Birth: 11/54 | Trustee | Shall serve until death, resignation or removal. Trustee since 2011. | Retired since May 2014; EVP, Head of GFI Client Service Delivery, BNY Mellon from January 2012 to May 2014; EVP, Head of US Funds Services, BNY Mellon from July 2010 to January 2012; President of PNC Global Investment Servicing from 2008 to July 2010; Chief Operating Officer of PNC Global Investment Servicing from 2007 to 2008; Executive Vice President of PFPC Worldwide Inc. from 2006 to 2007. | 38 | Lincoln Variable Insurance Products Trust (registered investment company with 97 portfolios); Third Avenue Trust (registered investment company with 3 portfolios); Third Avenue Variable Series Trust (registered investment company with 1 portfolio). | |||||
STEPHEN M. WYNNE Date of Birth: 1/55 | Trustee | Shall serve until death, resignation or removal. Trustee since 2009. | Retired since December 2010; Chief Executive Officer of US Funds Services, BNY Mellon Asset Servicing from July 2010 to December 2010; Chief Executive Officer of PNC Global Investment Servicing from March 2008 to July 2010; President, PNC Global Investment Servicing from 2003 to 2008. | 38 | Copeland Trust (registered investment company with 3 portfolios); Third Avenue Trust (registered investment company with 3 portfolios); Third Avenue Variable Series Trust (registered investment company with 1 portfolio). | |||||
38
TOBAM EMERGING MARKETS FUND
Fund Management (Concluded)
(Unaudited)
Name and Date of Birth | Position(s) Held with Trust |
Term of Office and Length of Time Served | Principal Occupation(s) During Past Five Years | |||
| EXECUTIVE OFFICERS | ||||||
JOEL L. WEISS Date of Birth: 1/63 | President and Chief Executive Officer | Shall serve until death, resignation or removal. Officer since 2007. | President of JW Fund Management LLC since June 2016; Vice President and Managing Director of BNY Mellon Investment Servicing (US) Inc. and predecessor firms from 1993 to June 2016. | |||
T. RICHARD KEYES Date of Birth: 1/57 | Treasurer and Chief Financial Officer | Shall serve until death, resignation or removal. Officer since 2016. | President of TRK Fund Consulting LLC since July 2016; Head of Tax — U.S. Fund Services of BNY Mellon Investment Servicing (US) Inc. and predecessor firms from February 2006 to July 2016. | |||
GABRIELLA MERCINCAVAGE Date of Birth: 6/68 | Assistant Treasurer | Shall serve until death, resignation or removal. Officer since 2019. | Fund Administration Consultant since January 2019; Fund Accounting and Tax Compliance Accountant to financial services companies from November 2003 to July 2018. | |||
VINCENZO A. SCARDUZIO Date of Birth: 4/72 | Secretary | Shall serve until death, resignation or removal. Officer since 2012. | Director and Vice President Regulatory Administration of The Bank of New York Mellon and predecessor firms since 2001. | |||
GUY F. TALARICO Date of Birth: 8/55 | Chief Compliance Officer and Anti-Money Laundering Officer | Shall serve until death, resignation or removal. Officer since 2020. | Chief Executive Officer of Alaric Compliance Services LLC since June 2004. | |||
39
Investment Adviser
TOBAM
49-53, Avenue des Champs-Élysées
75008 Paris, France
Administrator
The Bank of New York Mellon
301 Bellevue Parkway
Wilmington, DE 19809
Transfer Agent
BNY Mellon Investment Servicing (US) Inc.
4400 Computer Drive
Westborough, MA 01581
Principal Underwriter
Foreside Funds Distributors LLC
400 Berwyn Park
899 Cassatt Road
Berwyn, PA 19312
Custodian
The Bank of New York Mellon
240 Greenwich Street
New York, NY 10286
Independent Registered Public Accounting Firm
Ernst & Young LLP
One Commerce Square
2005 Market Street, Suite 700
Philadelphia, PA 19103-7096
Legal Counsel
Troutman Pepper Hamilton Sanders LLP
3000 Two Logan Square
18th and Arch Streets
Philadelphia, PA 19103

TOBAM EMERGING MARKETS FUND
of
FundVantage Trust
Class I
ANNUAL REPORT
September 30, 2020
IMPORTANT NOTE: Beginning on January 1, 2021, paper copies of the Fund’s shareholder reports will no longer be sent by mail, unless you specifically request paper copies of the shareholder reports from the Fund or from your financial intermediary. Instead, shareholder reports will be available on a website, and you will be notified by mail each time a report is posted and provided with awebsite link to access the report.
You may elect to receive all future shareholder reports in paper, free of charge. To elect to receive paper copies of shareholder reports through the mail or otherwise change your delivery method, contact your financial intermediary or, if you hold your shares directly through the Fund, call Shareholder Services toll-free at (844) 282-6161 or write to:
TOBAM Emerging Markets Fund
FundVantage Trust
c/o BNY Mellon Investment Servicing
P.O. Box 9829
Providence, RI 02940-8029
This report is submitted for the general information of shareholders and is not authorized for distribution to prospective investors unless preceded or accompanied by a current prospectus.
TOB-0920
VERPLANCK BALANCED FUND
of
FundVantage Trust
ANNUAL REPORT
September 30, 2020
This report is submitted for the general information of the shareholders of the Verplanck Balanced Fund. It is not authorized for distribution unless preceded or accompanied by a current prospectus for the Verplanck Balanced Fund.

VERPLANCK BALANCED FUND
Investment Adviser’s Annual Report
September 30, 2020
(Unaudited)
Dear Shareholder,
After a strong fourth quarter of 2019, when the S&P 500® rose 9.07%, the spread of COVID-19 led to an acute deterioration in sentiment as markets priced in the threat of a global recession. Efforts to slow the pandemic effectively shut down the global economy with many countries restricting their borders and ordering citizens to shelter in place. Risk assets tumbled, with the S&P 500 falling 19.6% in the first quarter of 2020. To offset the negative economic impact of the COVID-19 pandemic, the Federal Reserve (“Fed”) cut rates from 1.75% to 0.00% and the government passed a $2 trillion fiscal stimulus bill called the Coronavirus Aid, Relief and Economic Security Act (the “CARES Act”). It focuses on four main areas: (1) $500 billion in loans to distressed companies, (2) $350 billion in aid to small businesses, (3) $250 billion to individuals through direct payments and unemployment insurance, and (4) $150 billion in funding to health care providers. The Fed also restarted asset purchases and for the first time started buying investment grade corporate debt and commercial mortgage backed securities — all to provide order and liquidity to markets. During the second quarter, the easing of COVID-19 lockdowns and early signs of economic recovery saw risk appetite rebound. The S&P 500 Index rose 20.54%, making up all of the first quarter’s losses. US equities continued to gain through the third quarter of 2020, supported by accommodative monetary policies from global central banks, a strong recovery in global growth and growing hopes for a COVID-19 vaccine. For the period, the S&P 500® Index gained 15.15%.
The Bloomberg Barclays U.S. Aggregate Index rose 6.98% for the past year as interest rates fell. Excess returns were -0.27%. The spread of COVID-19 led investors to seek safe havens, driving U.S. Treasury yields to all-time lows. The yield on the 10-year Treasury note fell 100 basis points to 0.67%. Corporate spreads widened due to the sharp increase in risk aversion, underperforming Treasuries.
The Fund closely tracked the benchmark during the third quarter of 2020. Modest underperformance relative to its blended 45% S&P 500/55% Bloomberg Barclays US Aggregate benchmark during the quarter was driven by three factors. The portfolio’s overall allocation was slightly different than the benchmark’s 45/55 allocation (though within the acceptable tolerances), which detracted by -0.73. The equity index portfolio underperformed the S&P 500 by 0.18%. Finally, the bond allocation modestly underperformed the Bloomberg Barclays US Aggregate Bond Index by 0.12%.
Verplanck Balanced Fund
This letter is intended to assist shareholders in understanding how the Fund performed during the year ended September 30, 2020 and reflects the views of the investment adviser at the time of this writing. Of course, these views may change and do not guarantee the future performance of the Fund or the markets.
Portfolio composition is subject to change. The current and future portfolio holdings of the Fund are subject to investment risks.
1
VERPLANCK BALANCED FUND
Annual Report
Performance Data
September 30, 2020
(Unaudited)
Comparison of Change in Value of $10,000 (investment minimum) in the Verplanck Balanced Fund vs. Bloomberg Barclays U.S. Aggregate Bond Index and S&P 500® Index
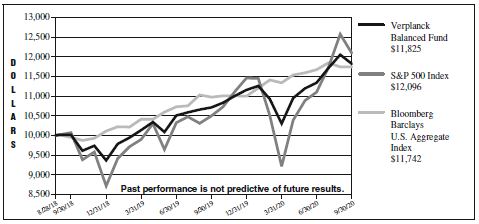
| Average Annual Total Returns for the Period Ended September 30, 2020 | ||||
| 1 Year | Since Inception | |||
Verplanck Balanced Fund | 10.39% | 8.35%* | ||
| Bloomberg Barclays U.S. Aggregate Bond Index | 6.98% | 7.93%** | ||
S&P 500® Index | 15.15% | 9.52%** | ||
* The Verplanck Balanced Fund (the “Fund”) commenced operations on August 28, 2018.
** Benchmark performance is from inception date of the Fund only and is not the inception date of the benchmark itself.
The performance data quoted represents past performance and does not guarantee future results. The investment return and principal value of an investment in the Fund will fluctuate so that an investor’s shares, when redeemed, may be worth more or less than their original cost. The graph and table do not reflect the deduction of taxes that a shareholder would pay on Fund distributions or redemption of Fund shares. Current performance may be lower or higher. Performance data current to the most recent month-end may be obtained by calling (844) 741-5050.
The Fund intends to evaluate performance as compared to that of the Bloomberg Barclays U.S. Aggregate Bond Index and the S&P 500® Index. The Bloomberg Barclays U.S. Aggregate Bond Index is an unmanaged index which represents the U.S. investment grade bond market and the S&P 500® Index is a widely recognized, unmanaged index of 500 common stocks which are generally representative of the U.S. stock market as a whole. References to an index over a specific period are provided for your information only and should not be considered indicative of an investment in the Verplanck Balanced Fund. Note that an index is unmanaged and the information contained herein does not reflect any investment management fees or transaction costs. It is impossible to invest directly in an index.
All mutual fund investing involves risk, including possible loss of principal. The Fund is subject to the risks of the fixed-income securities in its portfolio such as credit, prepayment and interest rate risk. As interest rates rise, the value of bond prices will decline and an investor may lose money.
2
VERPLANCK BALANCED FUND
Fund Expense Disclosure
September 30, 2020
(Unaudited)
As a shareholder of the Fund, you incur two types of costs: (1) transaction costs; and (2) ongoing costs, including management fees and other Fund expenses. This example is intended to help you understand your ongoing costs (in dollars) of investing in the Fund and to compare these costs with the ongoing costs of investing in other mutual funds.
This example is based on an investment of $1,000 invested at the beginning of the six-month period from April 1, 2020 through September 30, 2020 and held for the entire period.
Actual Expenses
The first line of the accompanying table provides information about actual account values and actual expenses. You may use the information in this line, together with the amount you invested, to estimate the expenses that you paid over the period. Simply divide your account value by $1,000 (for example, an $8,600 account value divided by $1,000 = 8.6), then multiply the result by the number in the first line under the heading entitled “Expenses Paid During Period” to estimate the expenses you paid on your account during this period.
Hypothetical Example for Comparison Purposes
The second line of the accompanying table provides information about hypothetical account values and hypothetical expenses based on the Fund’s actual expense ratio and an assumed rate of return of 5% per year before expenses, which is not your Fund’s actual return. The hypothetical account values and expenses may not be used to estimate the actual ending account balance or expenses you paid for the period. You may use this information to compare the ongoing costs of investing in the Fund and other funds. To do so, compare this 5% hypothetical example with the 5% hypothetical examples that appear in the shareholder reports of other funds.
Please note that the expenses shown in the accompanying table are meant to highlight your ongoing costs only and do not reflect any transactional costs, such as redemption fees. Therefore, the second line of the accompanying table is useful in comparing ongoing costs only, and will not help you determine the relative total costs of owning different funds. In addition, if these transactional costs were included, your costs would have been higher.
| Verplanck Balanced Fund | |||||||||||||||
| Beginning Account Value April 1, 2020 | Ending Account Value September 30, 2020 | Expenses Paid During Period* | |||||||||||||
Actual | $ | 1,000.00 | $ | 1,147.60 | $ | 0.75 | |||||||||
Hypothetical (5% return before expenses) | 1,000.00 | 1,024.30 | 0.71 | ||||||||||||
| * | Expenses are equal to an annualized expense ratio for the six-month period ended September 30, 2020 of 0.14% for the Verplanck Fund, multiplied by the average account value over the period, multiplied by the number of days in the most recent period (183), then divided by 366 to reflect the period. The Fund’s ending account value on the first line in the table is based on the actual six-month total return for the Fund of 14.76%. |
3
VERPLANCK BALANCED FUND
Portfolio Holdings Summary Table
September 30, 2020
(Unaudited)
The following table presents a summary by security type of the portfolio holdings of the Fund:
| % of Net Assets | Value | |||||||||||||||
Common Stocks: | ||||||||||||||||
Information Technology | 13.2 | % | $ | 130,747,586 | ||||||||||||
Health Care | 6.6 | 65,503,633 | ||||||||||||||
Consumer Discretionary | 5.4 | 53,026,644 | ||||||||||||||
Communication Services | 5.0 | 49,524,349 | ||||||||||||||
Financials | 4.6 | 45,500,002 | ||||||||||||||
Industrials | 3.8 | 37,597,739 | ||||||||||||||
Consumer Staples. | 3.3 | 32,697,102 | ||||||||||||||
Real Estate | 1.3 | 12,826,385 | ||||||||||||||
Materials | 1.2 | 12,251,781 | ||||||||||||||
Utilities | 1.2 | 12,200,587 | ||||||||||||||
Energy | 1.0 | 9,442,078 | ||||||||||||||
U.S. Treasury Obligations | 19.7 | 195,314,340 | ||||||||||||||
Corporate Bonds and Notes | 15.4 | 152,443,232 | ||||||||||||||
Mortgage-Backed Securities | 14.2 | 140,722,858 | ||||||||||||||
Commercial Mortgage-Backed Securities | 1.2 | 12,591,706 | ||||||||||||||
Foreign Government Bonds and Notes | 0.9 | 8,984,840 | ||||||||||||||
U.S. Government Agency Obligations | 0.6 | 6,053,730 | ||||||||||||||
Municipal Bonds | 0.5 | 4,931,092 | ||||||||||||||
Asset-Backed Securities | 0.2 | 1,845,890 | ||||||||||||||
Short-Term Investments. | 4.4 | 43,333,952 | ||||||||||||||
TBA Sale Commitments | (0.1 | ) | (592,758 | ) | ||||||||||||
Liabilities in excess of other assets | (3.6 | ) | (35,546,725 | ) | ||||||||||||
|
|
|
| |||||||||||||
NET ASSETS | 100.0 | % | $ | 991,400,043 | ||||||||||||
|
|
|
| |||||||||||||
Portfolio holdings are subject to change at any time.
The accompanying notes are an integral part of the financial statements.
4
VERPLANCK BALANCED FUND
Portfolio of Investments
September 30, 2020
Coupon Rate % | Maturity Date | Principal Amount $ /Shares | Value $ | |||||||||
Asset-Backed Securities — 0.19% | ||||||||||||
Ally Auto Receivables Trust 2019-2 | 2.26 | 08/15/2024 | 250,000 | 259,945 | ||||||||
BMW Vehicle Owner Trust 2018-A | 2.51 | 06/25/2024 | 300,000 | 305,780 | ||||||||
Capital One Multi-Asset Execution Trust | 2.84 | 12/15/2024 | 325,000 | 336,434 | ||||||||
CarMax Auto Owner Trust 2018-3 | 3.27 | 03/15/2024 | 200,000 | 209,821 | ||||||||
Carmax Auto Owner Trust 2019-4 | 2.02 | 11/15/2024 | 100,000 | 102,845 | ||||||||
Discover Card Execution Note Trust | 2.39 | 07/15/2024 | 250,000 | 256,879 | ||||||||
Ford Credit Floorplan Master Owner Trust A | 2.23 | 09/15/2024 | 65,000 | 67,191 | ||||||||
Toyota Auto Receivables 2019-A Owner Trust | 2.91 | 07/17/2023 | 100,000 | 102,211 | ||||||||
World Omni Auto Receivables Trust 2019-A | 3.04 | 05/15/2024 | 200,000 | 204,784 | ||||||||
|
| |||||||||||
Total Asset-Backed Securities (Cost $1,801,463) | 1,845,890 | |||||||||||
|
| |||||||||||
Common Stocks — 46.53% | ||||||||||||
Communication Services — 4.99% | ||||||||||||
Activision Blizzard Inc | 12,357 | 1,000,299 | ||||||||||
Alphabet Inc - Class A * | 4,859 | 7,121,350 | ||||||||||
Alphabet Inc - Class C * | 4,983 | 7,323,017 | ||||||||||
AT&T Inc | 120,169 | 3,426,018 | ||||||||||
CenturyLink Inc | 15,642 | 157,828 | ||||||||||
Charter Communications Inc - Class A * | 2,883 | 1,799,972 | ||||||||||
Comcast Corp - Class A | 73,889 | 3,418,105 | ||||||||||
Discovery Inc - Class A * | 3,073 | 66,899 | ||||||||||
Discovery Inc - Class C * | 5,396 | 105,762 | ||||||||||
DISH Network Corp - Class A * | 2,108 | 61,195 | ||||||||||
Electronic Arts Inc * | 4,889 | 637,574 | ||||||||||
Facebook Inc - Class A * | 39,424 | 10,325,146 | ||||||||||
Fox Corp - Class A | 7,353 | 204,634 | ||||||||||
Fox Corp - Class B | 154 | 4,307 | ||||||||||
Interpublic Group of Cos Inc/The | 4,016 | 66,947 | ||||||||||
Live Nation Entertainment Inc * | 1,621 | 87,339 | ||||||||||
Netflix Inc * | 7,226 | 3,613,217 | ||||||||||
News Corp - Class A | 7,587 | 106,370 | ||||||||||
News Corp - Class B | 1,496 | 20,914 | ||||||||||
Omnicom Group Inc | 3,801 | 188,150 | ||||||||||
Take-Two Interactive Software Inc * | 1,815 | 299,874 | ||||||||||
T-Mobile US Inc * | 9,116 | 1,042,506 | ||||||||||
Twitter Inc * | 12,131 | 539,830 | ||||||||||
Verizon Communications Inc | 68,004 | 4,045,558 | ||||||||||
ViacomCBS Inc - Class B | 8,817 | 246,964 | ||||||||||
Walt Disney Co/The | 29,131 | 3,614,574 | ||||||||||
|
| |||||||||||
| 49,524,349 | ||||||||||||
|
| |||||||||||
Consumer Discretionary — 5.35% | ||||||||||||
Advance Auto Parts Inc | 826 | 126,791 | ||||||||||
Amazon.com Inc * | 7,019 | 22,100,936 | ||||||||||
The accompanying notes are an integral part of the financial statements.
5
VERPLANCK BALANCED FUND
Portfolio of Investments (Continued)
September 30, 2020
| Shares | Value $ | |||||||||||
Common Stocks — 46.53% | ||||||||||||
Consumer Discretionary — 5.35% | ||||||||||||
Aptiv PLC | 4,400 | 403,392 | ||||||||||
AutoZone Inc * | 406 | 478,122 | ||||||||||
Best Buy Co Inc | 3,776 | 420,231 | ||||||||||
Booking Holdings Inc * | 731 | 1,250,507 | ||||||||||
BorgWarner Inc | 2,434 | 94,293 | ||||||||||
CarMax Inc * | 2,139 | 196,595 | ||||||||||
Carnival Corp | 6,627 | 100,598 | ||||||||||
Chipotle Mexican Grill Inc * | 393 | 488,778 | ||||||||||
Darden Restaurants Inc | 1,512 | 152,319 | ||||||||||
Dollar General Corp | 4,234 | 887,531 | ||||||||||
Dollar Tree Inc * | 3,557 | 324,896 | ||||||||||
Domino’s Pizza Inc | 633 | 269,202 | ||||||||||
DR Horton Inc | 4,740 | 358,486 | ||||||||||
eBay Inc | 13,741 | 715,906 | ||||||||||
Etsy Inc * | 1,670 | 203,122 | ||||||||||
Expedia Group Inc | 2,190 | 200,801 | ||||||||||
Ford Motor Co | 58,040 | 386,546 | ||||||||||
Gap Inc/The | 1,652 | 28,134 | ||||||||||
Garmin Ltd | 1,769 | 167,807 | ||||||||||
General Motors Co | 19,012 | 562,565 | ||||||||||
Genuine Parts Co | 2,343 | 222,983 | ||||||||||
Hanesbrands Inc | 4,191 | 66,008 | ||||||||||
Hasbro Inc | 1,824 | 150,881 | ||||||||||
Hilton Worldwide Holdings Inc | 4,724 | 403,052 | ||||||||||
Home Depot Inc/The | 18,395 | 5,108,475 | ||||||||||
L Brands Inc | 3,454 | 109,872 | ||||||||||
Las Vegas Sands Corp | 5,176 | 241,512 | ||||||||||
Leggett & Platt Inc | 1,921 | 79,088 | ||||||||||
Lennar Corp - Class A | 2,860 | 233,605 | ||||||||||
LKQ Corp * | 5,292 | 146,747 | ||||||||||
Lowe’s Cos Inc | 13,011 | 2,158,004 | ||||||||||
Marriott International Inc - Class A | 4,970 | 460,123 | ||||||||||
McDonald’s Corp | 12,528 | 2,749,771 | ||||||||||
MGM Resorts International | 8,552 | 186,006 | ||||||||||
Mohawk Industries Inc * | 843 | 82,268 | ||||||||||
Newell Brands Inc | 6,537 | 112,175 | ||||||||||
NIKE Inc - Class B | 20,701 | 2,598,804 | ||||||||||
Norwegian Cruise Line Holdings Ltd * | 3,169 | 54,222 | ||||||||||
NVR Inc * | 50 | 204,156 | ||||||||||
O’Reilly Automotive Inc * | 1,277 | 588,799 | ||||||||||
PulteGroup Inc | 4,484 | 207,564 | ||||||||||
PVH Corp | 970 | 57,851 | ||||||||||
Ralph Lauren Corp | 804 | 54,648 | ||||||||||
Ross Stores Inc | 6,307 | 588,569 | ||||||||||
The accompanying notes are an integral part of the financial statements.
6
VERPLANCK BALANCED FUND
Portfolio of Investments (Continued)
September 30, 2020
| Shares | Value $ | |||||||||||
Common Stocks — 46.53% | ||||||||||||
Consumer Discretionary — 5.35% | ||||||||||||
Royal Caribbean Cruises Ltd | 2,416 | 156,388 | ||||||||||
Starbucks Corp | 20,325 | 1,746,324 | ||||||||||
Tapestry Inc | 2,090 | 32,667 | ||||||||||
Target Corp | 8,557 | 1,347,043 | ||||||||||
Tiffany & Co | 1,629 | 188,720 | ||||||||||
TJX Cos Inc/The | 20,693 | 1,151,565 | ||||||||||
Tractor Supply Co | 1,548 | 221,890 | ||||||||||
Ulta Beauty Inc * | 911 | 204,046 | ||||||||||
Under Armour Inc - Class A * | 2,701 | 30,332 | ||||||||||
Under Armour Inc - Class C * | 3,871 | 38,091 | ||||||||||
VF Corp | 5,479 | 384,900 | ||||||||||
Whirlpool Corp | 955 | 175,615 | ||||||||||
Wynn Resorts Ltd | 1,509 | 108,361 | ||||||||||
Yum! Brands Inc | 5,016 | 457,961 | ||||||||||
|
| |||||||||||
| 53,026,644 | ||||||||||||
|
| |||||||||||
Consumer Staples — 3.30% | ||||||||||||
Altria Group Inc | 30,942 | 1,195,599 | ||||||||||
Archer-Daniels-Midland Co | 9,541 | 443,561 | ||||||||||
Brown-Forman Corp - Class B | 3,501 | 263,695 | ||||||||||
Campbell Soup Co | 3,277 | 158,508 | ||||||||||
Church & Dwight Co Inc | 3,977 | 372,685 | ||||||||||
Clorox Co/The | 2,159 | 453,757 | ||||||||||
Coca-Cola Co/The | 63,486 | 3,134,304 | ||||||||||
Colgate-Palmolive Co | 14,696 | 1,133,796 | ||||||||||
Conagra Brands Inc | 7,710 | 275,324 | ||||||||||
Constellation Brands Inc - Class A | 2,900 | 549,579 | ||||||||||
Costco Wholesale Corp | 7,146 | 2,536,830 | ||||||||||
Estee Lauder Cos Inc/The - Class A | 3,696 | 806,652 | ||||||||||
General Mills Inc | 9,898 | 610,509 | ||||||||||
Hershey Co/The | 2,571 | 368,527 | ||||||||||
Hormel Foods Corp | 5,337 | 260,926 | ||||||||||
JM Smucker Co/The | 1,850 | 213,712 | ||||||||||
Kellogg Co | 4,570 | 295,176 | ||||||||||
Kimberly-Clark Corp | 5,750 | 849,045 | ||||||||||
Kraft Heinz Co/The | 9,361 | 280,362 | ||||||||||
Kroger Co/The | 13,944 | 472,841 | ||||||||||
Lamb Weston Holdings Inc | 2,411 | 159,777 | ||||||||||
McCormick & Co Inc | 2,068 | 401,399 | ||||||||||
Molson Coors Brewing Co - Class B | 3,017 | 101,251 | ||||||||||
Mondelez International Inc - Class A | 24,002 | 1,378,915 | ||||||||||
Monster Beverage Corp * | 6,434 | 516,007 | ||||||||||
PepsiCo Inc | 23,336 | 3,234,370 | ||||||||||
Philip Morris International Inc | 25,772 | 1,932,642 | ||||||||||
Procter & Gamble Co/The | 41,310 | 5,741,677 | ||||||||||
The accompanying notes are an integral part of the financial statements.
7
VERPLANCK BALANCED FUND
Portfolio of Investments (Continued)
September 30, 2020
| Shares | Value $ | |||||||||||
Common Stocks — 46.53% | ||||||||||||
Consumer Staples — 3.30% | ||||||||||||
Sysco Corp | 8,377 | 521,217 | ||||||||||
Tyson Foods Inc - Class A | 4,665 | 277,474 | ||||||||||
Walgreens Boots Alliance Inc | 13,118 | 471,199 | ||||||||||
Walmart Inc | 23,485 | 3,285,786 | ||||||||||
|
| |||||||||||
| 32,697,102 | ||||||||||||
|
| |||||||||||
Energy — 0.95% | ||||||||||||
Apache Corp | 6,869 | 65,049 | ||||||||||
Baker Hughes Co | 9,397 | 124,886 | ||||||||||
Cabot Oil & Gas Corp | 7,023 | 121,919 | ||||||||||
Chevron Corp | 31,059 | 2,236,248 | ||||||||||
Concho Resources Inc | 3,289 | 145,111 | ||||||||||
ConocoPhillips | 18,453 | 605,997 | ||||||||||
Devon Energy Corp | 6,779 | 64,129 | ||||||||||
Diamondback Energy Inc | 2,574 | 77,529 | ||||||||||
EOG Resources Inc | 9,520 | 342,149 | ||||||||||
Exxon Mobil Corp | 68,894 | 2,365,131 | ||||||||||
Halliburton Co | 13,765 | 165,868 | ||||||||||
Hess Corp | 4,139 | 169,409 | ||||||||||
HollyFrontier Corp | 2,526 | 49,787 | ||||||||||
Kinder Morgan Inc | 30,514 | 376,238 | ||||||||||
Marathon Oil Corp | 13,331 | 54,524 | ||||||||||
Marathon Petroleum Corp | 10,904 | 319,923 | ||||||||||
National Oilwell Varco Inc | 6,357 | 57,594 | ||||||||||
Noble Energy Inc | 7,980 | 68,229 | ||||||||||
Occidental Petroleum Corp | 13,347 | 133,603 | ||||||||||
ONEOK Inc | 8,561 | 222,415 | ||||||||||
Phillips 66 | 7,179 | 372,159 | ||||||||||
Pioneer Natural Resources Co | 2,783 | 239,310 | ||||||||||
Schlumberger NV | 22,305 | 347,066 | ||||||||||
TechnipFMC PLC (United Kingdom) | 6,670 | 42,088 | ||||||||||
Valero Energy Corp | 6,768 | 293,190 | ||||||||||
Williams Cos Inc/The | 19,467 | 382,527 | ||||||||||
|
| |||||||||||
| 9,442,078 | ||||||||||||
|
| |||||||||||
Financials — 4.59% | ||||||||||||
Aflac Inc | 13,161 | 478,402 | ||||||||||
Allstate Corp/The | 5,766 | 542,811 | ||||||||||
American Express Co | 11,479 | 1,150,770 | ||||||||||
American International Group Inc | 14,484 | 398,745 | ||||||||||
Ameriprise Financial Inc | 2,298 | 354,145 | ||||||||||
Aon PLC - Class A | 3,979 | 820,868 | ||||||||||
Arthur J Gallagher & Co | 3,047 | 321,702 | ||||||||||
Assurant Inc | 1,042 | 126,405 | ||||||||||
Bank of America Corp | 140,185 | 3,377,057 | ||||||||||
The accompanying notes are an integral part of the financial statements.
8
VERPLANCK BALANCED FUND
Portfolio of Investments (Continued)
September 30, 2020
| Shares | Value $ | |||||||||||
Common Stocks — 46.53% | ||||||||||||
Financials — 4.59% | ||||||||||||
Bank of New York Mellon Corp/The 1 | 10,606 | 364,210 | ||||||||||
Berkshire Hathaway Inc - Class B * | 32,092 | 6,833,670 | ||||||||||
BlackRock Inc | 2,379 | 1,340,685 | ||||||||||
Capital One Financial Corp | 7,827 | 562,448 | ||||||||||
Cboe Global Markets Inc | 1,542 | 135,295 | ||||||||||
Charles Schwab Corp/The | 19,638 | 711,485 | ||||||||||
Chubb Ltd | 7,657 | 889,131 | ||||||||||
Cincinnati Financial Corp | 2,397 | 186,894 | ||||||||||
Citigroup Inc | 38,018 | 1,638,956 | ||||||||||
Citizens Financial Group Inc | 7,966 | 201,380 | ||||||||||
CME Group Inc | 5,663 | 947,477 | ||||||||||
Comerica Inc | 1,280 | 48,960 | ||||||||||
Discover Financial Services | 5,474 | 316,288 | ||||||||||
E*TRADE Financial Corp | 3,699 | 185,135 | ||||||||||
Everest Re Group Ltd | 724 | 143,019 | ||||||||||
Fifth Third Bancorp | 7,966 | 169,835 | ||||||||||
First Republic Bank/CA | 2,813 | 306,786 | ||||||||||
Franklin Resources Inc | 5,310 | 108,058 | ||||||||||
Globe Life Inc | 1,993 | 159,241 | ||||||||||
Goldman Sachs Group Inc/The | 5,665 | 1,138,495 | ||||||||||
Hartford Financial Services Group Inc/The | 3,716 | 136,972 | ||||||||||
Huntington Bancshares Inc/OH | 9,923 | 90,994 | ||||||||||
Intercontinental Exchange Inc | 8,811 | 881,541 | ||||||||||
Invesco Ltd | �� | 5,721 | 65,277 | |||||||||
JPmorgan Chase & Co | 53,343 | 5,135,331 | ||||||||||
KeyCorp | 13,874 | 165,517 | ||||||||||
Lincoln National Corp | 3,645 | 114,198 | ||||||||||
Loews Corp | 4,736 | 164,576 | ||||||||||
M&T Bank Corp | 2,407 | 221,661 | ||||||||||
MarketAxess Holdings Inc | 549 | 264,393 | ||||||||||
Marsh & McLennan Cos Inc | 8,390 | 962,333 | ||||||||||
MetLife Inc | 16,667 | 619,512 | ||||||||||
Moody’s Corp | 2,751 | 797,377 | ||||||||||
Morgan Stanley | 21,352 | 1,032,369 | ||||||||||
MSCI Inc | 1,339 | 477,728 | ||||||||||
Nasdaq Inc | 2,026 | 248,610 | ||||||||||
Northern Trust Corp | 3,680 | 286,930 | ||||||||||
People’s United Financial Inc | 8,936 | 92,130 | ||||||||||
PNC Financial Services Group Inc/The | 7,556 | 830,480 | ||||||||||
Principal Financial Group Inc | 4,456 | 179,443 | ||||||||||
Progressive Corp/The | 9,526 | 901,826 | ||||||||||
Prudential Financial Inc | 6,915 | 439,241 | ||||||||||
Raymond James Financial Inc | 2,029 | 147,630 | ||||||||||
Regions Financial Corp | 14,772 | 170,321 | ||||||||||
The accompanying notes are an integral part of the financial statements.
9
VERPLANCK BALANCED FUND
Portfolio of Investments (Continued)
September 30, 2020
| Shares | Value $ | |||||||||||
Common Stocks — 46.53% | ||||||||||||
Financials — 4.59% | ||||||||||||
S&P Global Inc | 4,130 | 1,489,278 | ||||||||||
State Street Corp | 5,929 | 351,768 | ||||||||||
SVB Financial Group * | 543 | 130,657 | ||||||||||
Synchrony Financial | 10,893 | 285,070 | ||||||||||
T Rowe Price Group Inc | 4,082 | 523,394 | ||||||||||
Travelers Cos Inc/The | 4,515 | 488,478 | ||||||||||
Truist Financial Corp | 19,747 | 751,373 | ||||||||||
Unum Group | 3,405 | 57,306 | ||||||||||
US Bancorp | 25,103 | 899,943 | ||||||||||
Wells Fargo & Co | 67,395 | 1,584,456 | ||||||||||
Willis Towers Watson PLC | 1,907 | 398,220 | ||||||||||
WR Berkley Corp | 2,053 | 125,541 | ||||||||||
Zions Bancorp NA | 1,019 | 29,775 | ||||||||||
|
| |||||||||||
| 45,500,002 | ||||||||||||
|
| |||||||||||
Health Care — 6.61% | ||||||||||||
Abbott Laboratories | 29,198 | 3,177,618 | ||||||||||
AbbVie Inc | 28,645 | 2,509,016 | ||||||||||
ABIOMED Inc * | 648 | 179,535 | ||||||||||
Agilent Technologies Inc | 5,079 | 512,674 | ||||||||||
Alexion Pharmaceuticals Inc * | 3,583 | 410,003 | ||||||||||
Align Technology Inc * | 1,160 | 379,738 | ||||||||||
AmerisourceBergen Corp | 2,637 | 255,578 | ||||||||||
Amgen Inc | 10,041 | 2,552,021 | ||||||||||
Anthem Inc | 4,150 | 1,114,648 | ||||||||||
Baxter International Inc | 8,261 | 664,350 | ||||||||||
Becton Dickinson and Co | 4,684 | 1,089,873 | ||||||||||
Biogen Inc * | 3,172 | 899,833 | ||||||||||
Bio-Rad Laboratories Inc - Class A * | 271 | 139,690 | ||||||||||
Boston Scientific Corp * | 22,458 | 858,120 | ||||||||||
Bristol Myers Squibb Co | 38,625 | 2,328,701 | ||||||||||
Cardinal Health Inc | 5,188 | 243,577 | ||||||||||
Catalent Inc * | 1,989 | 170,378 | ||||||||||
Centene Corp * | 9,413 | 549,060 | ||||||||||
Cerner Corp | 5,005 | 361,811 | ||||||||||
Cigna Corp | 6,214 | 1,052,714 | ||||||||||
Cooper Cos Inc/The | 774 | 260,931 | ||||||||||
CVS Health Corp | 21,116 | 1,233,174 | ||||||||||
Danaher Corp | 10,252 | 2,207,563 | ||||||||||
DaVita Inc * | 2,123 | 181,835 | ||||||||||
DENTSPLY SIRONA Inc | 3,752 | 164,075 | ||||||||||
DexCom Inc * | 1,582 | 652,148 | ||||||||||
Edwards Lifesciences Corp * | 10,263 | 819,193 | ||||||||||
Eli Lilly and Co | 14,147 | 2,094,039 | ||||||||||
Gilead Sciences Inc | 20,628 | 1,303,483 | ||||||||||
The accompanying notes are an integral part of the financial statements.
10
VERPLANCK BALANCED FUND
Portfolio of Investments (Continued)
September 30, 2020
| Shares | Value $ | |||||||||||
Common Stocks — 46.53% | ||||||||||||
Health Care — 6.61% | ||||||||||||
HCA Healthcare Inc | 4,282 | 533,880 | ||||||||||
Henry Schein Inc * | 2,057 | 120,910 | ||||||||||
Hologic Inc * | 4,289 | 285,090 | ||||||||||
Humana Inc | 2,205 | 912,627 | ||||||||||
IDEXX Laboratories Inc * | 1,431 | 562,540 | ||||||||||
Illumina Inc * | 2,380 | 735,610 | ||||||||||
Incyte Corp * | 2,815 | 252,618 | ||||||||||
Intuitive Surgical Inc * | 1,925 | 1,365,864 | ||||||||||
IQVIA Holdings Inc * | 2,690 | 424,025 | ||||||||||
Johnson & Johnson | 43,805 | 6,521,688 | ||||||||||
Laboratory Corp of America Holdings * | 1,572 | 295,960 | ||||||||||
McKesson Corp | 3,198 | 476,278 | ||||||||||
Medtronic PLC | 21,891 | 2,274,913 | ||||||||||
Merck & Co Inc | 42,380 | 3,515,421 | ||||||||||
Mettler-Toledo International Inc * | 409 | 394,992 | ||||||||||
Mylan NV * | 5,973 | 88,580 | ||||||||||
PerkinElmer Inc | 1,071 | 134,421 | ||||||||||
Perrigo Co PLC | 2,112 | 96,962 | ||||||||||
Pfizer Inc | 90,696 | 3,328,543 | ||||||||||
Quest Diagnostics Inc | 2,174 | 248,901 | ||||||||||
Regeneron Pharmaceuticals Inc * | 1,634 | 914,681 | ||||||||||
ResMed Inc | 2,288 | 392,232 | ||||||||||
STERIS PLC | 1,258 | 221,647 | ||||||||||
Stryker Corp | 5,215 | 1,086,650 | ||||||||||
Teleflex Inc | 772 | 262,804 | ||||||||||
Thermo Fisher Scientific Inc | 6,613 | 2,919,772 | ||||||||||
UnitedHealth Group Inc | 15,654 | 4,880,448 | ||||||||||
Universal Health Services Inc - Class B | 1,348 | 144,263 | ||||||||||
Varian Medical Systems Inc * | 1,460 | 251,120 | ||||||||||
Vertex Pharmaceuticals Inc * | 4,282 | 1,165,218 | ||||||||||
Waters Corp * | 1,155 | 226,010 | ||||||||||
West Pharmaceutical Services Inc | 1,226 | 337,027 | ||||||||||
Zimmer Biomet Holdings Inc | 3,341 | 454,844 | ||||||||||
Zoetis Inc | 7,932 | 1,311,715 | ||||||||||
|
| |||||||||||
| 65,503,633 | ||||||||||||
|
| |||||||||||
Industrials — 3.79% | ||||||||||||
3M Co | 9,420 | 1,508,896 | ||||||||||
Alaska Air Group Inc | 2,101 | 76,960 | ||||||||||
Allegion PLC | 1,305 | 129,078 | ||||||||||
American Airlines Group Inc | 4,489 | 55,170 | ||||||||||
AMETEK Inc | 3,474 | 345,316 | ||||||||||
AO Smith Corp | 2,169 | 114,523 | ||||||||||
Boeing Co/The | 8,573 | 1,416,774 | ||||||||||
Carrier Global Corp | 13,211 | 403,464 | ||||||||||
The accompanying notes are an integral part of the financial statements.
11
VERPLANCK BALANCED FUND
Portfolio of Investments (Continued)
September 30, 2020
| Shares | Value $ | |||||||||||
Common Stocks — 46.53% | ||||||||||||
Industrials — 3.79% | ||||||||||||
Caterpillar Inc | 9,453 | 1,409,915 | ||||||||||
CH Robinson Worldwide Inc | 2,236 | 228,497 | ||||||||||
Cintas Corp | 1,361 | 452,982 | ||||||||||
Copart Inc * | 3,013 | 316,847 | ||||||||||
CSX Corp | 12,631 | 981,050 | ||||||||||
Cummins Inc | 2,443 | 515,864 | ||||||||||
Deere & Co | 5,220 | 1,156,909 | ||||||||||
Delta Air Lines Inc | 10,366 | 316,992 | ||||||||||
Dover Corp | 2,014 | 218,197 | ||||||||||
Eaton Corp PLC | 6,913 | 705,333 | ||||||||||
Emerson Electric Co | 10,361 | 679,371 | ||||||||||
Equifax Inc | 1,995 | 313,016 | ||||||||||
Expeditors International of Washington Inc | 2,869 | 259,702 | ||||||||||
Fastenal Co | 7,042 | 317,524 | ||||||||||
FedEx Corp | 3,783 | 951,500 | ||||||||||
Flowserve Corp | 1,861 | 50,787 | ||||||||||
Fortive Corp | 4,702 | 358,339 | ||||||||||
Fortune Brands Home & Security Inc | 2,157 | 186,624 | ||||||||||
General Dynamics Corp | 4,521 | 625,842 | ||||||||||
General Electric Co | 141,480 | 881,420 | ||||||||||
Honeywell International Inc | 11,994 | 1,974,332 | ||||||||||
Howmet Aerospace Inc | 4,127 | 69,003 | ||||||||||
Huntington Ingalls Industries Inc | 662 | 93,176 | ||||||||||
IDEX Corp | 1,106 | 201,745 | ||||||||||
IHS Markit Ltd | 6,067 | 476,320 | ||||||||||
Illinois Tool Works Inc | 5,060 | 977,643 | ||||||||||
Ingersoll Rand Inc * | 4,896 | 174,298 | ||||||||||
Jacobs Engineering Group Inc | 1,101 | 102,140 | ||||||||||
JB Hunt Transport Services Inc | 808 | 102,115 | ||||||||||
Johnson Controls International PLC | 15,230 | 622,146 | ||||||||||
Kansas City Southern | 1,617 | 292,402 | ||||||||||
L3Harris Technologies Inc | 3,555 | 603,781 | ||||||||||
Lockheed Martin Corp | 4,024 | 1,542,319 | ||||||||||
Masco Corp | 4,789 | 264,018 | ||||||||||
Nielsen Holdings PLC | 4,458 | 63,214 | ||||||||||
Norfolk Southern Corp | 4,366 | 934,280 | ||||||||||
Northrop Grumman Corp | 2,790 | 880,217 | ||||||||||
Old Dominion Freight Line Inc | 1,393 | 252,022 | ||||||||||
Otis Worldwide Corp | 6,605 | 412,284 | ||||||||||
PACCAR Inc | 6,065 | 517,223 | ||||||||||
Parker-Hannifin Corp | 2,101 | 425,116 | ||||||||||
Pentair PLC | 2,511 | 114,928 | ||||||||||
Quanta Services Inc | 2,585 | 136,643 | ||||||||||
Raytheon Technologies Corp | 24,042 | 1,383,377 | ||||||||||
The accompanying notes are an integral part of the financial statements.
12
VERPLANCK BALANCED FUND
Portfolio of Investments (Continued)
September 30, 2020
| Shares | Value $ | |||||||||||
Common Stocks — 46.53% | ||||||||||||
Industrials — 3.79% | ||||||||||||
Republic Services Inc | 4,522 | 422,129 | ||||||||||
Robert Half International Inc | 1,941 | 102,757 | ||||||||||
Rockwell Automation Inc | 2,024 | 446,656 | ||||||||||
Rollins Inc | 1,551 | 84,049 | ||||||||||
Roper Technologies Inc | 1,577 | 623,088 | ||||||||||
Snap-on Inc | 653 | 96,076 | ||||||||||
Southwest Airlines Co | 8,352 | 313,200 | ||||||||||
Stanley Black & Decker Inc | 2,383 | 386,523 | ||||||||||
Teledyne Technologies Inc * | 254 | 78,793 | ||||||||||
Textron Inc | 3,184 | 114,911 | ||||||||||
Trane Technologies PLC | 3,746 | 454,202 | ||||||||||
TransDigm Group Inc | 775 | 368,218 | ||||||||||
Union Pacific Corp | 11,867 | 2,336,256 | ||||||||||
United Airlines Holdings Inc * | 3,800 | 132,050 | ||||||||||
United Parcel Service Inc - Class B | 11,528 | 1,920,911 | ||||||||||
United Rentals Inc * | 1,245 | 217,252 | ||||||||||
Verisk Analytics Inc | 2,484 | 460,310 | ||||||||||
Waste Management Inc | 7,074 | 800,565 | ||||||||||
Westinghouse Air Brake Technologies Corp | 2,382 | 147,398 | ||||||||||
WW Grainger Inc | 717 | 255,804 | ||||||||||
Xylem Inc/NY | 2,912 | 244,957 | ||||||||||
|
| |||||||||||
| 37,597,739 | ||||||||||||
|
| |||||||||||
Information Technology — 13.19% | ||||||||||||
Accenture PLC - Class A | 10,479 | 2,368,149 | ||||||||||
Adobe Inc * | 7,956 | 3,901,861 | ||||||||||
Advanced Micro Devices Inc * | 18,659 | 1,529,851 | ||||||||||
Akamai Technologies Inc * | 2,462 | 272,149 | ||||||||||
Amphenol Corp - Class A | 5,207 | 563,762 | ||||||||||
Analog Devices Inc | 5,285 | 616,971 | ||||||||||
ANSYS Inc * | 1,369 | 447,978 | ||||||||||
Apple Inc | 274,232 | 31,758,808 | ||||||||||
Applied Materials Inc | 15,590 | 926,826 | ||||||||||
Arista Networks Inc * | 787 | 162,854 | ||||||||||
Autodesk Inc * | 3,520 | 813,155 | ||||||||||
Automatic Data Processing Inc | 7,191 | 1,003,073 | ||||||||||
Broadcom Inc | 6,448 | 2,349,135 | ||||||||||
Broadridge Financial Solutions Inc | 1,867 | 246,444 | ||||||||||
Cadence Design Systems Inc * | 4,387 | 467,786 | ||||||||||
CDW Corp | 2,025 | 242,048 | ||||||||||
Cisco Systems Inc | 71,890 | 2,831,747 | ||||||||||
Citrix Systems Inc | 2,124 | 292,496 | ||||||||||
Cognizant Technology Solutions Corp - Class A | 9,388 | 651,715 | ||||||||||
Corning Inc | 13,126 | 425,414 | ||||||||||
DXC Technology Co | 2,266 | 40,448 | ||||||||||
The accompanying notes are an integral part of the financial statements.
13
VERPLANCK BALANCED FUND
Portfolio of Investments (Continued)
September 30, 2020
| Shares | Value $ | |||||||||||
Common Stocks — 46.53% | ||||||||||||
Information Technology — 13.19% | ||||||||||||
F5 Networks Inc * | 1,005 | 123,384 | ||||||||||
Fidelity National Information Services Inc | 9,666 | 1,422,932 | ||||||||||
Fiserv Inc * | 9,035 | 931,057 | ||||||||||
FleetCor Technologies Inc * | 1,404 | 334,292 | ||||||||||
FLIR Systems Inc | 2,258 | 80,949 | ||||||||||
Fortinet Inc * | 2,373 | 279,563 | ||||||||||
Gartner Inc * | 1,583 | 197,796 | ||||||||||
Global Payments Inc | 4,541 | 806,391 | ||||||||||
Hewlett Packard Enterprise Co | 22,998 | 215,491 | ||||||||||
HP Inc | 25,487 | 483,998 | ||||||||||
Intel Corp | 73,100 | 3,785,118 | ||||||||||
International Business Machines Corp | 14,679 | 1,785,994 | ||||||||||
Intuit Inc | 4,223 | 1,377,585 | ||||||||||
IPG Photonics Corp * | 677 | 115,070 | ||||||||||
Jack Henry & Associates Inc | 1,120 | 182,101 | ||||||||||
Juniper Networks Inc | 6,274 | 134,891 | ||||||||||
Keysight Technologies Inc * | 2,585 | 255,346 | ||||||||||
KLA Corp | 2,572 | 498,299 | ||||||||||
Lam Research Corp | 2,346 | 778,286 | ||||||||||
Leidos Holdings Inc | 2,095 | 186,769 | ||||||||||
Mastercard Inc - Class A | 14,741 | 4,984,964 | ||||||||||
Maxim Integrated Products Inc | 4,372 | 295,591 | ||||||||||
Microchip Technology Inc | 4,032 | 414,328 | ||||||||||
Micron Technology Inc * | 17,953 | 843,073 | ||||||||||
Microsoft Corp | 125,748 | 26,448,577 | ||||||||||
Motorola Solutions Inc | 2,683 | 420,721 | ||||||||||
NetApp Inc | 3,670 | 160,893 | ||||||||||
NortonLifeLock Inc | 9,946 | 207,275 | ||||||||||
NVIDIA Corp | 9,986 | 5,404,623 | ||||||||||
Oracle Corp | 42,051 | 2,510,445 | ||||||||||
Paychex Inc | 5,228 | 417,038 | ||||||||||
Paycom Software Inc * | 734 | 228,494 | ||||||||||
PayPal Holdings Inc * | 19,026 | 3,748,693 | ||||||||||
Qorvo Inc * | 1,784 | 230,154 | ||||||||||
QUALCOMM Inc | 19,576 | 2,303,704 | ||||||||||
salesforce.com Inc * | 14,501 | 3,644,391 | ||||||||||
Seagate Technology PLC | 4,409 | 217,231 | ||||||||||
ServiceNow Inc * | 3,055 | 1,481,675 | ||||||||||
Skyworks Solutions Inc | 3,015 | 438,682 | ||||||||||
Synopsys Inc * | 2,385 | 510,342 | ||||||||||
TE Connectivity Ltd | 4,800 | 469,152 | ||||||||||
Teradyne Inc | 1,143 | 90,823 | ||||||||||
Texas Instruments Inc | 15,441 | 2,204,820 | ||||||||||
Tyler Technologies Inc * | 491 | 171,143 | ||||||||||
The accompanying notes are an integral part of the financial statements.
14
VERPLANCK BALANCED FUND
Portfolio of Investments (Continued)
September 30, 2020
| Shares | Value $ | |||||||||||
Common Stocks — 46.53% | ||||||||||||
Information Technology — 13.19% | ||||||||||||
VeriSign Inc * | 1,587 | 325,097 | ||||||||||
Visa Inc - Class A | 28,594 | 5,717,942 | ||||||||||
Western Digital Corp | 4,312 | 157,604 | ||||||||||
Western Union Co/The | 8,365 | 179,262 | ||||||||||
Xerox Holdings Corp | 1,674 | 31,421 | ||||||||||
Xilinx Inc | 4,043 | 421,442 | ||||||||||
Zebra Technologies Corp - Class A * | 713 | 180,004 | ||||||||||
|
| |||||||||||
| 130,747,586 | ||||||||||||
|
| |||||||||||
Materials — 1.24% | ||||||||||||
Air Products & Chemicals Inc | 3,596 | 1,071,105 | ||||||||||
Albemarle Corp | 1,675 | 149,544 | ||||||||||
Amcor PLC | 28,462 | 314,505 | ||||||||||
Avery Dennison Corp | 1,384 | 176,931 | ||||||||||
Ball Corp | 5,148 | 427,902 | ||||||||||
Celanese Corp | 2,168 | 232,952 | ||||||||||
CF Industries Holdings Inc | 3,678 | 112,951 | ||||||||||
Corteva Inc | 12,684 | 365,426 | ||||||||||
Dow Inc | 12,252 | 576,457 | ||||||||||
DuPont de Nemours Inc | 12,018 | 666,759 | ||||||||||
Eastman Chemical Co | 2,033 | 158,818 | ||||||||||
Ecolab Inc | 4,348 | 868,904 | ||||||||||
FMC Corp | 1,745 | 184,813 | ||||||||||
Freeport-McMoRan Inc | 22,406 | 350,430 | ||||||||||
International Flavors & Fragrances Inc | 1,442 | 176,573 | ||||||||||
International Paper Co | 6,958 | 282,077 | ||||||||||
Linde PLC (United Kingdom) | 9,081 | 2,162,459 | ||||||||||
LyondellBasell Industries NV - Class A | 5,109 | 360,133 | ||||||||||
Martin Marietta Materials Inc | 1,015 | 238,890 | ||||||||||
Mosaic Co/The | 4,828 | 88,208 | ||||||||||
Newmont Goldcorp Corp | 14,801 | 939,124 | ||||||||||
Nucor Corp | 4,926 | 220,980 | ||||||||||
Packaging Corp of America | 1,664 | 181,459 | ||||||||||
PPG Industries Inc | 3,983 | 486,245 | ||||||||||
Sealed Air Corp | 2,182 | 84,683 | ||||||||||
Sherwin-Williams Co/The | 1,355 | 944,083 | ||||||||||
Vulcan Materials Co | 2,199 | 298,053 | ||||||||||
Westrock Co | 3,780 | 131,317 | ||||||||||
|
| |||||||||||
| 12,251,781 | ||||||||||||
|
| |||||||||||
Real Estate — 1.29% | ||||||||||||
Alexandria Real Estate Equities Inc REIT | 2,138 | 342,080 | ||||||||||
American Tower Corp REIT | 7,483 | 1,808,866 | ||||||||||
Apartment Investment & Management Co - Class A REIT | 3,224 | 108,713 | ||||||||||
AvalonBay Communities Inc REIT | 2,468 | 368,571 | ||||||||||
The accompanying notes are an integral part of the financial statements.
15
VERPLANCK BALANCED FUND
Portfolio of Investments (Continued)
September 30, 2020
| Shares | Value $ | |||||||||||
Common Stocks — 46.53% | ||||||||||||
Real Estate — 1.29% | ||||||||||||
Boston Properties Inc REIT | 2,823 | 226,687 | ||||||||||
CBRE Group Inc - Class A * | 5,698 | 267,635 | ||||||||||
Crown Castle International Corp REIT | 7,244 | 1,206,126 | ||||||||||
Digital Realty Trust Inc REIT | 4,737 | 695,202 | ||||||||||
Duke Realty Corp REIT | 7,181 | 264,979 | ||||||||||
Equinix Inc REIT | 1,626 | 1,235,971 | ||||||||||
Equity Residential REIT | 6,504 | 333,850 | ||||||||||
Essex Property Trust Inc REIT | 1,235 | 247,976 | ||||||||||
Extra Space Storage Inc REIT | 2,210 | 236,448 | ||||||||||
Federal Realty Investment Trust REIT | 1,337 | 98,189 | ||||||||||
Healthpeak Properties Inc REIT | 8,394 | 227,897 | ||||||||||
Host Hotels & Resorts Inc REIT | 9,476 | 102,246 | ||||||||||
Iron Mountain Inc REIT | 4,712 | 126,234 | ||||||||||
Kimco Realty Corp REIT | 7,784 | 87,648 | ||||||||||
Mid-America Apartment Communities Inc REIT | 2,110 | 244,654 | ||||||||||
Prologis Inc REIT | 11,991 | 1,206,534 | ||||||||||
Public Storage REIT | 2,716 | 604,908 | ||||||||||
Realty Income Corp REIT | 5,655 | 343,541 | ||||||||||
Regency Centers Corp REIT | 3,413 | 129,762 | ||||||||||
SBA Communications Corp REIT | 1,912 | 608,934 | ||||||||||
Simon Property Group Inc REIT | 5,367 | 347,138 | ||||||||||
SL Green Realty Corp REIT | 1,747 | 81,008 | ||||||||||
UDR Inc REIT | 5,067 | 165,235 | ||||||||||
Ventas Inc REIT | 6,057 | 254,152 | ||||||||||
Vornado Realty Trust REIT | 3,086 | 104,029 | ||||||||||
Welltower Inc REIT | 6,897 | 379,956 | ||||||||||
Weyerhaeuser Co REIT | 13,016 | 371,216 | ||||||||||
|
| |||||||||||
| 12,826,385 | ||||||||||||
|
| |||||||||||
Utilities — 1.23% | ||||||||||||
AES Corp | 33,720 | 610,669 | ||||||||||
Alliant Energy Corp | 21,411 | 1,105,878 | ||||||||||
American Water Works Co Inc | 7,154 | 1,036,472 | ||||||||||
Atmos Energy Corp | 5,570 | 532,436 | ||||||||||
CenterPoint Energy Inc | 21,832 | 422,449 | ||||||||||
CMS Energy Corp | 17,490 | 1,074,061 | ||||||||||
Consolidated Edison Inc | 14,694 | 1,143,193 | ||||||||||
Eversource Energy | 16,821 | 1,405,395 | ||||||||||
FirstEnergy Corp | 23,120 | 663,775 | ||||||||||
NiSource Inc | 24,183 | 532,026 | ||||||||||
PPL Corp | 40,740 | 1,108,535 | ||||||||||
Sempra Energy | 9,084 | 1,075,182 | ||||||||||
The accompanying notes are an integral part of the financial statements.
16
VERPLANCK BALANCED FUND
Portfolio of Investments (Continued)
September 30, 2020
Coupon Rate % | Maturity Date | Shares/ Principal Amount $ | Value $ | |||||||||
Common Stocks — 46.53% | ||||||||||||
Utilities — 1.23% | ||||||||||||
WEC Energy Group Inc | 15,382 | 1,490,516 | ||||||||||
|
| |||||||||||
| 12,200,587 | ||||||||||||
|
| |||||||||||
Total Common Stocks (Cost $396,636,954) | 461,317,886 | |||||||||||
|
| |||||||||||
Corporate Bonds and Notes — 15.38% | ||||||||||||
Agencies — 0.03% | ||||||||||||
Private Export Funding Corp | 2.80 | 05/15/2022 | 284,000 | 295,224 | ||||||||
|
| |||||||||||
Basic Industry — 0.36% | ||||||||||||
Air Products & Chemicals Inc | 3.35 | 07/31/2024 | 100,000 | 109,659 | ||||||||
Barrick North America Finance LLC (Canada) | 5.70 | 05/30/2041 | 10,000 | 14,123 | ||||||||
Barrick North America Finance LLC (Canada) | 5.75 | 05/01/2043 | 25,000 | 36,403 | ||||||||
BHP Billiton Finance USA Ltd (Australia) | 5.00 | 09/30/2043 | 142,000 | 199,618 | ||||||||
Dow Chemical Co/The | 5.25 | 11/15/2041 | 30,000 | 36,923 | ||||||||
DowDuPont Inc | 5.32 | 11/15/2038 | 235,000 | 298,205 | ||||||||
DowDuPont Inc | 5.42 | 11/15/2048 | 40,000 | 53,486 | ||||||||
Eastman Chemical Co | 3.80 | 03/15/2025 | 150,000 | 165,553 | ||||||||
Ecolab Inc | 2.38 | 08/10/2022 | 150,000 | 155,440 | ||||||||
Ecolab Inc | 1.30 | 01/30/2031 | 200,000 | 195,829 | ||||||||
Fmc Corp | 4.50 | 10/01/2049 | 100,000 | 123,099 | ||||||||
Georgia-Pacific LLC | 8.88 | 05/15/2031 | 75,000 | 121,249 | ||||||||
International Paper Co | 4.80 | 06/15/2044 | 100,000 | 123,752 | ||||||||
LyondellBasell Industries NV | 4.63 | 02/26/2055 | 140,000 | 159,243 | ||||||||
Mosaic Co/The | 4.25 | 11/15/2023 | 30,000 | 32,561 | ||||||||
Mosaic Co/The | 4.88 | 11/15/2041 | 95,000 | 99,633 | ||||||||
Newmont Goldcorp Corp | 2.80 | 10/01/2029 | 100,000 | 107,696 | ||||||||
Newmont Goldcorp Corp | 6.25 | 10/01/2039 | 100,000 | 148,855 | ||||||||
Nutrien Ltd (Canada) | 4.00 | 12/15/2026 | 150,000 | 174,120 | ||||||||
Nutrien Ltd (Canada) | 2.95 | 05/13/2030 | 100,000 | 109,411 | ||||||||
Nutrien Ltd (Canada) | 4.90 | 06/01/2043 | 100,000 | 123,741 | ||||||||
Praxair Inc | 3.20 | 01/30/2026 | 92,000 | 103,289 | ||||||||
Rio Tinto Alcan Inc (Canada) | 6.13 | 12/15/2033 | 67,000 | 97,470 | ||||||||
Sherwin-Williams Co/The | 3.45 | 06/01/2027 | 190,000 | 213,373 | ||||||||
Sherwin-Williams Co/The | 4.55 | 08/01/2045 | 242,000 | 293,689 | ||||||||
Southern Copper Corp (Peru) | 6.75 | 04/16/2040 | 100,000 | 143,959 | ||||||||
Vale Overseas Ltd (Brazil) | 6.88 | 11/21/2036 | 100,000 | 130,169 | ||||||||
|
| |||||||||||
| 3,570,548 | ||||||||||||
|
| |||||||||||
Capital Goods — 0.84% | ||||||||||||
3M Co | 2.25 | 09/19/2026 | 242,000 | 261,746 | ||||||||
3M Co | 2.88 | 10/15/2027 | 300,000 | 333,123 | ||||||||
3M Co | 3.70 | 04/15/2050 | 100,000 | 121,057 | ||||||||
The accompanying notes are an integral part of the financial statements.
17
VERPLANCK BALANCED FUND
Portfolio of Investments (Continued)
September 30, 2020
Coupon Rate % | Maturity Date | Principal Amount $ | Value $ | |||||||||
Corporate Bonds and Notes — 15.38% | ||||||||||||
Capital Goods — 0.84% | ||||||||||||
Boeing Co/The | 4.88 | 05/01/2025 | 130,000 | 141,456 | ||||||||
Boeing Co/The | 5.15 | 05/01/2030 | 115,000 | 129,261 | ||||||||
Boeing Co/The | 5.88 | 02/15/2040 | 75,000 | 85,214 | ||||||||
Boeing Co/The | 3.90 | 05/01/2049 | 100,000 | 92,169 | ||||||||
Boeing Co/The | 5.93 | 05/01/2060 | 180,000 | 222,775 | ||||||||
Caterpillar Inc | 5.30 | 09/15/2035 | 67,000 | 92,238 | ||||||||
Caterpillar Inc | 4.30 | 05/15/2044 | 100,000 | 130,038 | ||||||||
Caterpillar Inc | 3.25 | 09/19/2049 | 200,000 | 223,646 | ||||||||
Deere & Co | 2.60 | 06/08/2022 | 200,000 | 206,812 | ||||||||
Deere & Co | 3.90 | 06/09/2042 | 73,000 | 93,220 | ||||||||
Eaton Corp | 3.10 | 09/15/2027 | 100,000 | 111,576 | ||||||||
Fortive Corp | 3.15 | 06/15/2026 | 35,000 | 38,675 | ||||||||
Fortive Corp | 4.30 | 06/15/2046 | 100,000 | 119,091 | ||||||||
General Dynamics Corp | 2.25 | 11/15/2022 | 159,000 | 164,613 | ||||||||
General Dynamics Corp | 3.25 | 04/01/2025 | 100,000 | 110,715 | ||||||||
General Electric Co | 3.45 | 05/01/2027 | 150,000 | 158,818 | ||||||||
General Electric Co | 3.63 | 05/01/2030 | 150,000 | 155,342 | ||||||||
General Electric Co | 6.75 | 03/15/2032 | 142,000 | 178,641 | ||||||||
General Electric Co | 5.88 | 01/14/2038 | 121,000 | 141,492 | ||||||||
General Electric Co | 4.25 | 05/01/2040 | 150,000 | 152,184 | ||||||||
General Electric Co | 4.35 | 05/01/2050 | 150,000 | 152,942 | ||||||||
Honeywell International Inc | 1.35 | 06/01/2025 | 200,000 | 206,207 | ||||||||
Honeywell International Inc | 1.95 | 06/01/2030 | 200,000 | 210,461 | ||||||||
Hubbell Inc | 3.35 | 03/01/2026 | 142,000 | 153,420 | ||||||||
Illinois Tool Works Inc | 2.65 | 11/15/2026 | 142,000 | 157,475 | ||||||||
Ingersoll-Rand Global Holding Co Ltd | 3.75 | 08/21/2028 | 160,000 | 183,859 | ||||||||
John Deere Capital Corp | 2.95 | 04/01/2022 | 100,000 | 103,919 | ||||||||
John Deere Capital Corp | 2.80 | 03/06/2023 | 200,000 | 211,730 | ||||||||
Johnson Controls International PLC | 5.13 | 09/14/2045 | 19,000 | 25,083 | ||||||||
L3Harris Technologies Inc | 4.40 | 06/15/2028 | 150,000 | 178,802 | ||||||||
Lockheed Martin Corp | 4.09 | 09/15/2052 | 150,000 | 193,145 | ||||||||
Masco Corp | 5.95 | 03/15/2022 | 100,000 | 107,290 | ||||||||
Northrop Grumman Corp | 2.93 | 01/15/2025 | 150,000 | 163,208 | ||||||||
Northrop Grumman Corp | 3.25 | 01/15/2028 | 300,000 | 337,072 | ||||||||
Northrop Grumman Corp | 4.03 | 10/15/2047 | 100,000 | 122,434 | ||||||||
Owens Corning | 4.20 | 12/01/2024 | 100,000 | 110,218 | ||||||||
Parker-Hannifin Corp | 4.00 | 06/14/2049 | 20,000 | 24,054 | ||||||||
Raytheon Technologies Corp | 2.25 | 07/01/2030 | 100,000 | 105,764 | ||||||||
Republic Services Inc | 3.55 | 06/01/2022 | 200,000 | 208,650 | ||||||||
Roper Technologies Inc | 1.40 | 09/15/2027 | 300,000 | 303,057 | ||||||||
Roper Technologies Inc | 4.20 | 09/15/2028 | 200,000 | 238,606 | ||||||||
Snap-on Inc | 3.25 | 03/01/2027 | 100,000 | 110,159 | ||||||||
Sonoco Products Co | 3.13 | 05/01/2030 | 150,000 | 162,592 | ||||||||
United Technologies Corp | 3.13 | 05/04/2027 | 30,000 | 33,256 | ||||||||
The accompanying notes are an integral part of the financial statements.
18
VERPLANCK BALANCED FUND
Portfolio of Investments (Continued)
September 30, 2020
Coupon Rate % | Maturity Date | Principal Amount $ | Value $ | |||||||||
Corporate Bonds and Notes — 15.38% | ||||||||||||
Capital Goods — 0.84% | ||||||||||||
United Technologies Corp | 4.50 | 06/01/2042 | 100,000 | 126,253 | ||||||||
United Technologies Corp | 4.05 | 05/04/2047 | 100,000 | 119,407 | ||||||||
United Technologies Corp | 4.63 | 11/16/2048 | 35,000 | 45,713 | ||||||||
Waste Connections Inc | 3.50 | 05/01/2029 | 100,000 | 113,856 | ||||||||
Waste Management Inc | 3.15 | 11/15/2027 | 100,000 | 111,842 | ||||||||
Waste Management Inc | 4.15 | 07/15/2049 | 100,000 | 127,230 | ||||||||
Westinghouse Air Brake Technologies Corp | 4.95 | 09/15/2028 | 300,000 | 349,594 | ||||||||
WW Grainger Inc | 3.75 | 05/15/2046 | 97,000 | 109,295 | ||||||||
|
| |||||||||||
| 8,370,495 | ||||||||||||
|
| |||||||||||
Communications — 1.17% | ||||||||||||
Activision Blizzard Inc | 3.40 | 06/15/2027 | 100,000 | 113,044 | ||||||||
Activision Blizzard Inc | 1.35 | 09/15/2030 | 100,000 | 97,754 | ||||||||
America Movil SAB de CV (Mexico) | 3.63 | 04/22/2029 | 200,000 | 226,354 | ||||||||
America Movil SAB de CV (Mexico) | 6.13 | 03/30/2040 | 100,000 | 144,132 | ||||||||
America Movil SAB de CV (Mexico) | 4.38 | 04/22/2049 | 200,000 | 249,140 | ||||||||
American Tower Corp | 3.00 | 06/15/2023 | 100,000 | 105,906 | ||||||||
American Tower Corp | 3.80 | 08/15/2029 | 40,000 | 45,791 | ||||||||
AT&T Inc | 3.00 | 06/30/2022 | 100,000 | 103,998 | ||||||||
AT&T Inc | 4.45 | 04/01/2024 | 240,000 | 268,075 | ||||||||
AT&T Inc | 2.95 | 07/15/2026 | 20,000 | 21,853 | ||||||||
AT&T Inc | 3.80 | 02/15/2027 | 520,000 | 586,683 | ||||||||
AT&T Inc | 4.25 | 03/01/2027 | 270,000 | 313,481 | ||||||||
AT&T Inc | 4.35 | 03/01/2029 | 60,000 | 70,626 | ||||||||
AT&T Inc | 4.85 | 03/01/2039 | 40,000 | 48,262 | ||||||||
AT&T Inc | 4.85 | 07/15/2045 | 150,000 | 178,968 | ||||||||
AT&T Inc | 4.75 | 05/15/2046 | 180,000 | 211,458 | ||||||||
AT&T Inc | 4.55 | 03/09/2049 | 153,000 | 174,161 | ||||||||
AT&T Inc | 3.50 | 02/01/2061 | 500,000 | 476,091 | ||||||||
Charter Communications Operating LLC / Charter Communications Operating Capital | 4.91 | 07/23/2025 | 300,000 | 346,867 | ||||||||
Charter Communications Operating LLC / Charter Communications Operating Capital | 5.38 | 05/01/2047 | 300,000 | 356,208 | ||||||||
Comcast Corp | 3.70 | 04/15/2024 | 110,000 | 121,472 | ||||||||
Comcast Corp | 3.15 | 03/01/2026 | 100,000 | 111,674 | ||||||||
Comcast Corp | 3.55 | 05/01/2028 | 20,000 | 23,156 | ||||||||
Comcast Corp | 1.50 | 02/15/2031 | 100,000 | 99,064 | ||||||||
Comcast Corp | 3.20 | 07/15/2036 | 250,000 | 277,642 | ||||||||
Comcast Corp | 6.45 | 03/15/2037 | 108,000 | 163,109 | ||||||||
Comcast Corp | 3.90 | 03/01/2038 | 25,000 | 29,666 | ||||||||
Comcast Corp | 4.60 | 10/15/2038 | 100,000 | 127,815 | ||||||||
Comcast Corp | 4.60 | 08/15/2045 | 85,000 | 109,650 | ||||||||
Comcast Corp | 4.00 | 03/01/2048 | 185,000 | 224,769 | ||||||||
The accompanying notes are an integral part of the financial statements.
19
VERPLANCK BALANCED FUND
Portfolio of Investments (Continued)
September 30, 2020
Coupon Rate % | Maturity Date | Principal Amount $ | Value $ | |||||||||
Corporate Bonds and Notes — 15.38% | ||||||||||||
Communications — 1.17% | ||||||||||||
Comcast Corp | 4.70 | 10/15/2048 | 135,000 | 180,036 | ||||||||
Crown Castle International Corp | 4.45 | 02/15/2026 | 150,000 | 171,909 | ||||||||
Crown Castle International Corp | 3.25 | 01/15/2051 | 75,000 | 74,499 | ||||||||
Deutsche Telekom International Finance BV (Germany) | 8.75 | 06/15/2030 | 100,000 | 155,373 | ||||||||
Discovery Communications LLC | 2.95 | 03/20/2023 | 63,000 | 66,369 | ||||||||
Discovery Communications LLC | 4.13 | 05/15/2029 | 50,000 | 57,520 | ||||||||
Discovery Communications LLC | 5.20 | 09/20/2047 | 120,000 | 145,363 | ||||||||
Discovery Communications LLC | 5.30 | 05/15/2049 | 50,000 | 61,102 | ||||||||
Fox Corp | 5.58 | 01/25/2049 | 100,000 | 138,136 | ||||||||
Grupo Televisa SAB (Mexico) | 6.63 | 03/18/2025 | 150,000 | 180,656 | ||||||||
Interpublic Group of Cos Inc/The | 3.75 | 10/01/2021 | 150,000 | 154,737 | ||||||||
Interpublic Group of Cos Inc/The | 4.65 | 10/01/2028 | 150,000 | 177,793 | ||||||||
Interpublic Group of Cos Inc/The | 5.40 | 10/01/2048 | 100,000 | 117,723 | ||||||||
Moody’s Corp | 2.55 | 08/18/2060 | 200,000 | 184,962 | ||||||||
Omnicom Group Inc | 2.45 | 04/30/2030 | 100,000 | 102,861 | ||||||||
Rogers Communications Inc (Canada) | 4.30 | 02/15/2048 | 15,000 | 18,205 | ||||||||
Rogers Communications Inc (Canada) | 4.35 | 05/01/2049 | 200,000 | 242,022 | ||||||||
S&P Global Inc | 1.25 | 08/15/2030 | 100,000 | 98,385 | ||||||||
Telefonica Emisiones SA (Spain) | 5.21 | 03/08/2047 | 270,000 | 320,829 | ||||||||
Time Warner Cable LLC | 7.30 | 07/01/2038 | 150,000 | 212,297 | ||||||||
TWDC Enterprises 18 Corp | 2.35 | 12/01/2022 | 150,000 | 155,879 | ||||||||
TWDC Enterprises 18 Corp | 4.13 | 06/01/2044 | 125,000 | 150,944 | ||||||||
Verizon Communications Inc | 5.15 | 09/15/2023 | 100,000 | 113,321 | ||||||||
Verizon Communications Inc | 4.13 | 03/16/2027 | 290,000 | 342,868 | ||||||||
Verizon Communications Inc | 4.02 | 12/03/2029 | 85,000 | 101,784 | ||||||||
Verizon Communications Inc | 4.50 | 08/10/2033 | 160,000 | 202,934 | ||||||||
Verizon Communications Inc | 4.86 | 08/21/2046 | 76,000 | 103,778 | ||||||||
Verizon Communications Inc | 5.01 | 04/15/2049 | 110,000 | 158,330 | ||||||||
Verizon Communications Inc | 4.67 | 03/15/2055 | 200,000 | 277,107 | ||||||||
ViacomCBS Inc | 4.00 | 01/15/2026 | 15,000 | 16,844 | ||||||||
ViacomCBS Inc | 3.38 | 02/15/2028 | 150,000 | 165,527 | ||||||||
ViacomCBS Inc | 4.20 | 05/19/2032 | 100,000 | 114,436 | ||||||||
ViacomCBS Inc | 6.88 | 04/30/2036 | 200,000 | 275,202 | ||||||||
ViacomCBS Inc | 4.95 | 05/19/2050 | 100,000 | 117,336 | ||||||||
Vodafone Group PLC (United Kingdom) | 3.75 | 01/16/2024 | 150,000 | 163,755 | ||||||||
Vodafone Group PLC (United Kingdom) | 4.38 | 05/30/2028 | 75,000 | 88,777 | ||||||||
Vodafone Group PLC (United Kingdom) | 5.00 | 05/30/2038 | 60,000 | 74,790 | ||||||||
Vodafone Group PLC (United Kingdom) | 5.25 | 05/30/2048 | 60,000 | 77,569 | ||||||||
Vodafone Group PLC (United Kingdom) | 4.25 | 09/17/2050 | 30,000 | 34,794 | ||||||||
Vodafone Group PLC (United Kingdom) | 5.13 | 06/19/2059 | 50,000 | 63,681 | ||||||||
Walt Disney Co/The | 1.75 | 08/30/2024 | 65,000 | 67,669 | ||||||||
Walt Disney Co/The | 2.00 | 09/01/2029 | 125,000 | 129,057 | ||||||||
Walt Disney Co/The | 2.75 | 09/01/2049 | 100,000 | 97,511 | ||||||||
The accompanying notes are an integral part of the financial statements.
20
VERPLANCK BALANCED FUND
Portfolio of Investments (Continued)
September 30, 2020
Coupon Rate % | Maturity Date | Principal Amount $ | Value $ | |||||||||
Corporate Bonds and Notes — 15.38% | ||||||||||||
Communications — 1.17% | ||||||||||||
Walt Disney Co/The | 3.80 | 05/13/2060 | 200,000 | 231,036 | ||||||||
|
| |||||||||||
| 11,612,575 | ||||||||||||
|
| |||||||||||
Consumer, Cyclical — 1.02% | ||||||||||||
Alibaba Group Holding Ltd (China) | 3.60 | 11/28/2024 | 285,000 | 313,022 | ||||||||
Alibaba Group Holding Ltd (China) | 4.00 | 12/06/2037 | 200,000 | 238,213 | ||||||||
Amazon.com Inc | 5.20 | 12/03/2025 | 200,000 | 243,493 | ||||||||
Amazon.com Inc | 1.50 | 06/03/2030 | 50,000 | 51,028 | ||||||||
Amazon.com Inc | 4.25 | 08/22/2057 | 250,000 | 341,310 | ||||||||
Amazon.com Inc | 2.70 | 06/03/2060 | 75,000 | 77,743 | ||||||||
American Honda Finance Corp | 3.45 | 07/14/2023 | 50,000 | 53,906 | ||||||||
Automatic Data Processing Inc | 3.38 | 09/15/2025 | 150,000 | 169,266 | ||||||||
Booking Holdings Inc | 4.10 | 04/13/2025 | 150,000 | 168,783 | ||||||||
Costco Wholesale Corp | 3.00 | 05/18/2027 | 30,000 | 33,631 | ||||||||
Costco Wholesale Corp | 1.60 | 04/20/2030 | 200,000 | 203,346 | ||||||||
Cummins Inc | 4.88 | 10/01/2043 | 10,000 | 13,674 | ||||||||
Daimler Finance North America LLC (Germany) | 8.50 | 01/18/2031 | 100,000 | 154,887 | ||||||||
Darden Restaurants Inc | 4.55 | 02/15/2048 | 5,000 | 4,972 | ||||||||
Dollar Tree Inc | 4.20 | 05/15/2028 | 30,000 | 35,281 | ||||||||
eBay Inc | 3.80 | 03/09/2022 | 10,000 | 10,457 | ||||||||
eBay Inc | 3.60 | 06/05/2027 | 10,000 | 11,285 | ||||||||
General Motors Co | 5.15 | 04/01/2038 | 150,000 | 159,295 | ||||||||
General Motors Co | 5.20 | 04/01/2045 | 10,000 | 10,772 | ||||||||
General Motors Co | 6.75 | 04/01/2046 | 155,000 | 190,801 | ||||||||
General Motors Financial Co Inc | 3.55 | 07/08/2022 | 100,000 | 103,322 | ||||||||
General Motors Financial Co Inc | 4.30 | 07/13/2025 | 25,000 | 27,197 | ||||||||
General Motors Financial Co Inc | 4.35 | 01/17/2027 | 250,000 | 271,379 | ||||||||
Home Depot Inc/The | 3.00 | 04/01/2026 | 150,000 | 168,353 | ||||||||
Home Depot Inc/The | 3.30 | 04/15/2040 | 200,000 | 227,203 | ||||||||
Home Depot Inc/The | 4.88 | 02/15/2044 | 200,000 | 273,286 | ||||||||
Home Depot Inc/The | 3.50 | 09/15/2056 | 24,000 | 28,246 | ||||||||
IHS Markit Ltd | 3.63 | 05/01/2024 | 74,000 | 79,987 | ||||||||
Lear Corp | 3.50 | 05/30/2030 | 200,000 | 204,741 | ||||||||
Lowe’s Cos Inc | 3.65 | 04/05/2029 | 100,000 | 115,487 | ||||||||
Lowe’s Cos Inc | 3.70 | 04/15/2046 | 150,000 | 172,014 | ||||||||
Lowe’s Cos Inc | 4.55 | 04/05/2049 | 100,000 | 128,317 | ||||||||
Marriott International Inc | 4.15 | 12/01/2023 | 75,000 | 79,286 | ||||||||
Marriott International Inc | 3.13 | 06/15/2026 | 15,000 | 14,964 | ||||||||
Marriott International Inc | 4.65 | 12/01/2028 | 75,000 | 80,036 | ||||||||
Mastercard Inc | 3.38 | 04/01/2024 | 100,000 | 110,039 | ||||||||
McDonald’s Corp | 4.70 | 12/09/2035 | 25,000 | 31,970 | ||||||||
McDonald’s Corp | 3.63 | 09/01/2049 | 20,000 | 22,457 | ||||||||
McDonald’s Corp | 4.20 | 04/01/2050 | 300,000 | 365,129 | ||||||||
NIKE Inc | 2.25 | 05/01/2023 | 73,000 | 76,361 | ||||||||
The accompanying notes are an integral part of the financial statements.
21
VERPLANCK BALANCED FUND
Portfolio of Investments (Continued)
September 30, 2020
Coupon Rate % | Maturity Date | Principal Amount $ | Value $ | |||||||||
Corporate Bonds and Notes — 15.38% | ||||||||||||
Consumer, Cyclical — 1.02% | ||||||||||||
NIKE Inc | 3.88 | 11/01/2045 | 71,000 | 88,428 | ||||||||
O’Reilly Automotive Inc | 1.75 | 03/15/2031 | 400,000 | 395,361 | ||||||||
PACCAR Financial Corp | 2.30 | 08/10/2022 | 150,000 | 155,130 | ||||||||
Starbucks Corp | 2.70 | 06/15/2022 | 142,000 | 146,623 | ||||||||
Starbucks Corp | 2.45 | 06/15/2026 | 92,000 | 99,532 | ||||||||
Starbucks Corp | 4.00 | 11/15/2028 | 100,000 | 117,773 | ||||||||
Starbucks Corp | 3.55 | 08/15/2029 | 100,000 | 114,662 | ||||||||
Starbucks Corp | 2.55 | 11/15/2030 | 100,000 | 106,175 | ||||||||
Starbucks Corp | 4.45 | 08/15/2049 | 100,000 | 120,727 | ||||||||
Target Corp | 4.00 | 07/01/2042 | 140,000 | 183,492 | ||||||||
Toyota Motor Credit Corp | 3.30 | 01/12/2022 | 242,000 | 250,754 | ||||||||
Toyota Motor Credit Corp | 0.50 | 08/14/2023 | 200,000 | 200,431 | ||||||||
Toyota Motor Credit Corp | 2.00 | 10/07/2024 | 80,000 | 83,771 | ||||||||
Toyota Motor Credit Corp | 1.15 | 08/13/2027 | 300,000 | 299,475 | ||||||||
Toyota Motor Credit Corp | 2.15 | 02/13/2030 | 150,000 | 158,089 | ||||||||
VF Corp | 2.95 | 04/23/2030 | 100,000 | 108,872 | ||||||||
Visa Inc | 2.80 | 12/14/2022 | 135,000 | 141,828 | ||||||||
Visa Inc | 0.75 | 08/15/2027 | 300,000 | 297,729 | ||||||||
Visa Inc | 1.10 | 02/15/2031 | 150,000 | 147,246 | ||||||||
Visa Inc | 4.30 | 12/14/2045 | 146,000 | 193,922 | ||||||||
Visa Inc | 3.65 | 09/15/2047 | 20,000 | 24,528 | ||||||||
Visa Inc | 2.00 | 08/15/2050 | 140,000 | 128,493 | ||||||||
Walgreen Co | 3.10 | 09/15/2022 | 320,000 | 335,015 | ||||||||
Walgreens Boots Alliance Inc | 3.45 | 06/01/2026 | 90,000 | 98,339 | ||||||||
Walmart Inc | 3.40 | 06/26/2023 | 85,000 | 91,832 | ||||||||
Walmart Inc | 3.30 | 04/22/2024 | 242,000 | 264,043 | ||||||||
Walmart Inc | 2.85 | 07/08/2024 | 50,000 | 54,327 | ||||||||
Walmart Inc | 3.70 | 06/26/2028 | 215,000 | 254,230 | ||||||||
Walmart Inc | 3.25 | 07/08/2029 | 100,000 | 116,586 | ||||||||
Walmart Inc | 3.95 | 06/28/2038 | 30,000 | 37,603 | ||||||||
Walmart Inc | 4.05 | 06/29/2048 | 160,000 | 208,814 | ||||||||
|
| |||||||||||
| 10,088,769 | ||||||||||||
|
| |||||||||||
Consumer, Non-cyclical — 2.56% | ||||||||||||
Abbott Laboratories | 2.55 | 03/15/2022 | 81,000 | 83,740 | ||||||||
Abbott Laboratories | 2.95 | 03/15/2025 | 228,000 | 249,111 | ||||||||
Abbott Laboratories | 3.75 | 11/30/2026 | 311,000 | 361,037 | ||||||||
AbbVie Inc | 3.20 | 05/14/2026 | 270,000 | 297,250 | ||||||||
AbbVie Inc | 4.25 | 11/14/2028 | 240,000 | 284,695 | ||||||||
AbbVie Inc | 4.50 | 05/14/2035 | 200,000 | 243,423 | ||||||||
AbbVie Inc | 4.70 | 05/14/2045 | 140,000 | 172,382 | ||||||||
AbbVie Inc | 4.45 | 05/14/2046 | 130,000 | 154,816 | ||||||||
AbbVie Inc | 4.88 | 11/14/2048 | 30,000 | 38,096 | ||||||||
Altria Group Inc | 3.80 | 02/14/2024 | 50,000 | 54,651 | ||||||||
Altria Group Inc | 4.40 | 02/14/2026 | 50,000 | 57,758 | ||||||||
The accompanying notes are an integral part of the financial statements.
22
VERPLANCK BALANCED FUND
Portfolio of Investments (Continued)
September 30, 2020
Coupon Rate % | Maturity Date | Principal Amount $ | Value $ | |||||||||
Corporate Bonds and Notes — 15.38% | ||||||||||||
Consumer, Non-cyclical — 2.56% | ||||||||||||
Altria Group Inc | 4.80 | 02/14/2029 | 65,000 | 77,129 | ||||||||
Altria Group Inc | 5.80 | 02/14/2039 | 40,000 | 51,188 | ||||||||
Altria Group Inc | 5.38 | 01/31/2044 | 135,000 | 167,935 | ||||||||
Altria Group Inc | 6.20 | 02/14/2059 | 55,000 | 75,203 | ||||||||
AmerisourceBergen Corp | 3.45 | 12/15/2027 | 150,000 | 170,990 | ||||||||
Amgen Inc | 3.63 | 05/15/2022 | 25,000 | 26,130 | ||||||||
Amgen Inc | 3.20 | 11/02/2027 | 100,000 | 112,002 | ||||||||
Amgen Inc | 2.45 | 02/21/2030 | 30,000 | 31,798 | ||||||||
Amgen Inc | 3.15 | 02/21/2040 | 25,000 | 26,596 | ||||||||
Amgen Inc | 4.40 | 05/01/2045 | 140,000 | 173,445 | ||||||||
Amgen Inc | 3.38 | 02/21/2050 | 25,000 | 26,868 | ||||||||
Amgen Inc | 4.66 | 06/15/2051 | 100,000 | 130,184 | ||||||||
Anheuser-Busch Cos LLC / Anheuser-Busch InBev Worldwide Inc (Belgium) | 3.65 | 02/01/2026 | 100,000 | 112,100 | ||||||||
Anheuser-Busch Cos LLC / Anheuser-Busch InBev Worldwide Inc (Belgium) | 4.90 | 02/01/2046 | 100,000 | 123,303 | ||||||||
Anheuser-Busch InBev Worldwide Inc (Belgium) | 4.00 | 04/13/2028 | 150,000 | 173,809 | ||||||||
Anheuser-Busch InBev Worldwide Inc (Belgium) | 4.75 | 01/23/2029 | 105,000 | 128,144 | ||||||||
Anheuser-Busch InBev Worldwide Inc (Belgium) | 3.50 | 06/01/2030 | 150,000 | 170,660 | ||||||||
Anheuser-Busch InBev Worldwide Inc (Belgium) | 5.45 | 01/23/2039 | 45,000 | 58,259 | ||||||||
Anheuser-Busch InBev Worldwide Inc (Belgium) | 4.35 | 06/01/2040 | 150,000 | 175,322 | ||||||||
Anheuser-Busch InBev Worldwide Inc (Belgium) | 3.75 | 07/15/2042 | 200,000 | 213,005 | ||||||||
Anheuser-Busch InBev Worldwide Inc (Belgium) | 4.60 | 04/15/2048 | 100,000 | 119,245 | ||||||||
Anheuser-Busch InBev Worldwide Inc (Belgium) | 5.80 | 01/23/2059 | 110,000 | 157,237 | ||||||||
Anheuser-Busch InBev Worldwide Inc (Belgium) | 4.60 | 06/01/2060 | 150,000 | 180,691 | ||||||||
Archer-Daniels-Midland Co | 2.50 | 08/11/2026 | 150,000 | 162,542 | ||||||||
Ascension Health | 3.11 | 11/15/2039 | 100,000 | 107,341 | ||||||||
Ascension Health | 3.95 | 11/15/2046 | 15,000 | 18,726 | ||||||||
Ascension Health | 4.85 | 11/15/2053 | 44,000 | 63,890 | ||||||||
AstraZeneca PLC (United Kingdom) | 1.38 | 08/06/2030 | 100,000 | 97,270 | ||||||||
AstraZeneca PLC (United Kingdom) | 6.45 | 09/15/2037 | 135,000 | 205,090 | ||||||||
BAT Capital Corp (United Kingdom) | 4.39 | 08/15/2037 | 100,000 | 108,129 | ||||||||
BAT Capital Corp (United Kingdom) | 3.98 | 09/25/2050 | 100,000 | 98,603 | ||||||||
The accompanying notes are an integral part of the financial statements.
23
VERPLANCK BALANCED FUND
Portfolio of Investments (Continued)
September 30, 2020
Coupon Rate % | Maturity Date | Principal Amount $ | Value $ | |||||||||
Corporate Bonds and Notes — 15.38% | ||||||||||||
Consumer, Non-cyclical — 2.56% | ||||||||||||
BAT International Finance PLC (United Kingdom) | 1.67 | 03/25/2026 | 300,000 | 301,020 | ||||||||
Baxalta Inc | 4.00 | 06/23/2025 | 260,000 | 294,484 | ||||||||
Becton Dickinson and Co | 3.13 | 11/08/2021 | 90,000 | 92,505 | ||||||||
Becton Dickinson and Co | 3.73 | 12/15/2024 | 250,000 | 275,922 | ||||||||
Becton Dickinson and Co | 4.67 | 06/06/2047 | 120,000 | 148,176 | ||||||||
Biogen Inc | 4.05 | 09/15/2025 | 250,000 | 284,415 | ||||||||
Boston Scientific Corp | 3.85 | 05/15/2025 | 16,000 | 18,151 | ||||||||
Boston Scientific Corp | 1.90 | 06/01/2025 | 100,000 | 104,495 | ||||||||
Boston Scientific Corp | 2.65 | 06/01/2030 | 100,000 | 106,126 | ||||||||
Bristol-Myers Squibb Co | 2.00 | 08/01/2022 | 209,000 | 215,446 | ||||||||
Bristol-Myers Squibb Co | 3.25 | 02/27/2027 | 50,000 | 57,205 | ||||||||
Bristol-Myers Squibb Co | 4.13 | 06/15/2039 | 170,000 | 214,904 | ||||||||
Bristol-Myers Squibb Co | 3.25 | 08/01/2042 | 300,000 | 344,024 | ||||||||
Bunge Ltd Finance Corp | 3.00 | 09/25/2022 | 300,000 | 311,858 | ||||||||
Campbell Soup Co | 2.50 | 08/02/2022 | 100,000 | 103,693 | ||||||||
Campbell Soup Co | 4.15 | 03/15/2028 | 30,000 | 34,908 | ||||||||
Campbell Soup Co | 2.38 | 04/24/2030 | 150,000 | 155,978 | ||||||||
Cardinal Health Inc | 3.08 | 06/15/2024 | 130,000 | 139,780 | ||||||||
Cardinal Health Inc | 3.41 | 06/15/2027 | 120,000 | 133,597 | ||||||||
Church & Dwight Co Inc | 3.15 | 08/01/2027 | 125,000 | 138,053 | ||||||||
Church & Dwight Co Inc | 3.95 | 08/01/2047 | 220,000 | 258,882 | ||||||||
Cigna Corp | 3.75 | 07/15/2023 | 200,000 | 216,734 | ||||||||
Cigna Corp | 4.50 | 02/25/2026 | 90,000 | 105,138 | ||||||||
Cigna Corp | 2.40 | 03/15/2030 | 100,000 | 103,712 | ||||||||
Cigna Corp | 4.80 | 08/15/2038 | 300,000 | 372,410 | ||||||||
Clorox Co/The | 1.80 | 05/15/2030 | 100,000 | 102,949 | ||||||||
Coca-Cola Co/The | 2.50 | 04/01/2023 | 50,000 | 52,618 | ||||||||
Coca-Cola Co/The | 2.95 | 03/25/2025 | 100,000 | 109,903 | ||||||||
Coca-Cola Co/The | 3.38 | 03/25/2027 | 100,000 | 114,707 | ||||||||
Coca-Cola Co/The | 1.00 | 03/15/2028 | 200,000 | 199,824 | ||||||||
Coca-Cola Co/The | 3.45 | 03/25/2030 | 100,000 | 117,930 | ||||||||
Coca-Cola Co/The | 1.38 | 03/15/2031 | 200,000 | 199,026 | ||||||||
Coca-Cola Femsa SAB de CV (Mexico) | 2.75 | 01/22/2030 | 150,000 | 159,531 | ||||||||
Conagra Brands Inc | 3.80 | 10/22/2021 | 150,000 | 155,105 | ||||||||
Conagra Brands Inc | 5.30 | 11/01/2038 | 20,000 | 25,784 | ||||||||
Conagra Brands Inc | 5.40 | 11/01/2048 | 20,000 | 27,215 | ||||||||
Constellation Brands Inc | 2.70 | 05/09/2022 | 150,000 | 154,866 | ||||||||
CVS Health Corp | 2.75 | 12/01/2022 | 250,000 | 260,712 | ||||||||
CVS Health Corp | 3.88 | 07/20/2025 | 150,000 | 168,996 | ||||||||
CVS Health Corp | 2.88 | 06/01/2026 | 140,000 | 151,591 | ||||||||
CVS Health Corp | 4.30 | 03/25/2028 | 210,000 | 245,799 | ||||||||
CVS Health Corp | 3.25 | 08/15/2029 | 40,000 | 44,000 | ||||||||
CVS Health Corp | 1.75 | 08/21/2030 | 100,000 | 97,724 | ||||||||
The accompanying notes are an integral part of the financial statements.
24
VERPLANCK BALANCED FUND
Portfolio of Investments (Continued)
September 30, 2020
Coupon Rate % | Maturity Date | Principal Amount $ | Value $ | |||||||||
Corporate Bonds and Notes — 15.38% | ||||||||||||
Consumer, Non-cyclical — 2.56% | ||||||||||||
CVS Health Corp | 4.78 | 03/25/2038 | 100,000 | 121,839 | ||||||||
CVS Health Corp | 2.70 | 08/21/2040 | 100,000 | 95,308 | ||||||||
CVS Health Corp | 5.13 | 07/20/2045 | 160,000 | 202,158 | ||||||||
CVS Health Corp | 5.05 | 03/25/2048 | 160,000 | 204,225 | ||||||||
Diageo Capital PLC (United Kingdom) | 2.13 | 10/24/2024 | 200,000 | 212,061 | ||||||||
Diageo Capital PLC (United Kingdom) | 2.38 | 10/24/2029 | 300,000 | 319,149 | ||||||||
Diageo Capital PLC (United Kingdom) | 3.88 | 04/29/2043 | 50,000 | 60,012 | ||||||||
Diageo Investment Corp (United Kingdom) | 2.88 | 05/11/2022 | 100,000 | 103,944 | ||||||||
Eli Lilly and Co | 2.75 | 06/01/2025 | 32,000 | 34,979 | ||||||||
Eli Lilly and Co | 3.95 | 03/15/2049 | 150,000 | 188,034 | ||||||||
Eli Lilly and Co | 2.25 | 05/15/2050 | 100,000 | 94,224 | ||||||||
Eli Lilly and Co | 2.50 | 09/15/2060 | 150,000 | 142,505 | ||||||||
Estee Lauder Cos Inc/The | 2.00 | 12/01/2024 | 20,000 | 21,071 | ||||||||
Estee Lauder Cos Inc/The | 4.15 | 03/15/2047 | 13,000 | 16,350 | ||||||||
Estee Lauder Cos Inc/The | 3.13 | 12/01/2049 | 100,000 | 110,103 | ||||||||
Fomento Economico Mexicano SAB de CV (Mexico) | 3.50 | 01/16/2050 | 150,000 | 159,564 | ||||||||
General Mills Inc | 3.15 | 12/15/2021 | 200,000 | 205,289 | ||||||||
General Mills Inc | 3.20 | 02/10/2027 | 100,000 | 112,287 | ||||||||
Gilead Sciences Inc | 3.25 | 09/01/2022 | 100,000 | 104,715 | ||||||||
Gilead Sciences Inc | 2.95 | 03/01/2027 | 50,000 | 55,012 | ||||||||
Gilead Sciences Inc | 1.20 | 10/01/2027 | 150,000 | 150,452 | ||||||||
Gilead Sciences Inc | 1.65 | 10/01/2030 | 200,000 | 199,652 | ||||||||
Gilead Sciences Inc | 4.75 | 03/01/2046 | 136,000 | 177,171 | ||||||||
Gilead Sciences Inc | 4.15 | 03/01/2047 | 224,000 | 273,139 | ||||||||
GlaxoSmithKline Capital Inc (United Kingdom) | 3.38 | 05/15/2023 | 45,000 | 48,449 | ||||||||
GlaxoSmithKline Capital Inc (United Kingdom) | 3.88 | 05/15/2028 | 140,000 | 166,399 | ||||||||
GlaxoSmithKline Capital Inc (United Kingdom) | 6.38 | 05/15/2038 | 100,000 | 154,316 | ||||||||
GlaxoSmithKline Capital PLC (United Kingdom) | 2.85 | 05/08/2022 | 242,000 | 251,781 | ||||||||
GlaxoSmithKline Capital PLC (United Kingdom) | 2.88 | 06/01/2022 | 200,000 | 207,653 | ||||||||
GlaxoSmithKline Capital PLC (United Kingdom) | 3.00 | 06/01/2024 | 200,000 | 216,286 | ||||||||
HCA Inc | 5.00 | 03/15/2024 | 200,000 | 224,064 | ||||||||
HCA Inc | 4.50 | 02/15/2027 | 200,000 | 224,639 | ||||||||
HCA Inc | 4.13 | 06/15/2029 | 40,000 | 45,242 | ||||||||
HCA Inc | 5.13 | 06/15/2039 | 20,000 | 24,271 | ||||||||
HCA Inc | 5.25 | 06/15/2049 | 40,000 | 48,966 | ||||||||
Johnson & Johnson | 3.63 | 03/03/2037 | 30,000 | 36,639 | ||||||||
Johnson & Johnson | 4.50 | 12/05/2043 | 200,000 | 274,230 | ||||||||
Johnson & Johnson | 3.70 | 03/01/2046 | 27,000 | 33,796 | ||||||||
The accompanying notes are an integral part of the financial statements.
25
VERPLANCK BALANCED FUND
Portfolio of Investments (Continued)
September 30, 2020
Coupon Rate % | Maturity Date | Principal Amount $ | Value $ | |||||||||
Corporate Bonds and Notes — 15.38% | ||||||||||||
Consumer, Non-cyclical — 2.56% | ||||||||||||
Kaiser Foundation Hospitals | 3.50 | 04/01/2022 | 300,000 | 312,610 | ||||||||
Keurig Dr Pepper Inc | 4.06 | 05/25/2023 | 150,000 | 163,053 | ||||||||
Keurig Dr Pepper Inc | 3.20 | 05/01/2030 | 150,000 | 168,291 | ||||||||
Keurig Dr Pepper Inc | 4.42 | 12/15/2046 | 100,000 | 123,174 | ||||||||
Kimberly-Clark Corp | 3.90 | 05/04/2047 | 5,000 | 6,421 | ||||||||
Kroger Co/The | 5.40 | 07/15/2040 | 100,000 | 128,929 | ||||||||
Kroger Co/The | 4.45 | 02/01/2047 | 120,000 | 147,269 | ||||||||
McCormick & Co Inc | 2.70 | 08/15/2022 | 240,000 | 249,921 | ||||||||
McKesson Corp | 3.95 | 02/16/2028 | 10,000 | 11,658 | ||||||||
Medtronic Inc | 3.50 | 03/15/2025 | 392,000 | 441,636 | ||||||||
Medtronic Inc | 4.63 | 03/15/2045 | 82,000 | 112,882 | ||||||||
Merck & Co Inc | 2.40 | 09/15/2022 | 218,000 | 226,121 | ||||||||
Merck & Co Inc | 3.40 | 03/07/2029 | 100,000 | 116,507 | ||||||||
Merck & Co Inc | 1.45 | 06/24/2030 | 50,000 | 50,699 | ||||||||
Merck & Co Inc | 3.90 | 03/07/2039 | 50,000 | 62,041 | ||||||||
Merck & Co Inc | 2.35 | 06/24/2040 | 75,000 | 76,108 | ||||||||
Merck & Co Inc | 3.70 | 02/10/2045 | 53,000 | 63,725 | ||||||||
Merck & Co Inc | 4.00 | 03/07/2049 | 50,000 | 63,120 | ||||||||
Merck & Co Inc | 2.45 | 06/24/2050 | 75,000 | 75,285 | ||||||||
Molson Coors Brewing Co | 3.00 | 07/15/2026 | 100,000 | 106,612 | ||||||||
Molson Coors Brewing Co | 4.20 | 07/15/2046 | 100,000 | 105,484 | ||||||||
Mondelez International Inc | 2.13 | 04/13/2023 | 100,000 | 103,780 | ||||||||
Mylan NV | 3.95 | 06/15/2026 | 100,000 | 112,503 | ||||||||
Mylan NV | 5.25 | 06/15/2046 | 135,000 | 167,549 | ||||||||
New York and Presbyterian Hospital/The | 4.02 | 08/01/2045 | 78,000 | 97,761 | ||||||||
New York and Presbyterian Hospital/The | 3.95 | 08/01/2119 | 50,000 | 53,961 | ||||||||
Novartis Capital Corp (Switzerland) | 3.00 | 11/20/2025 | 100,000 | 111,255 | ||||||||
Novartis Capital Corp (Switzerland) | 2.20 | 08/14/2030 | 40,000 | 43,188 | ||||||||
Novartis Capital Corp (Switzerland) | 4.40 | 05/06/2044 | 100,000 | 134,510 | ||||||||
Novartis Capital Corp (Switzerland) | 2.75 | 08/14/2050 | 25,000 | 26,849 | ||||||||
Partners Healthcare System Inc | 4.12 | 07/01/2055 | 164,000 | 205,065 | ||||||||
PepsiCo Inc | 2.25 | 05/02/2022 | 200,000 | 205,647 | ||||||||
PepsiCo Inc | 2.25 | 03/19/2025 | 100,000 | 107,114 | ||||||||
PepsiCo Inc | 2.75 | 03/19/2030 | 100,000 | 111,936 | ||||||||
PepsiCo Inc | 4.45 | 04/14/2046 | 100,000 | 133,105 | ||||||||
PepsiCo Inc | 3.45 | 10/06/2046 | 121,000 | 140,262 | ||||||||
Pfizer Inc | 7.20 | 03/15/2039 | 170,000 | 281,900 | ||||||||
Pfizer Inc | 4.20 | 09/15/2048 | 50,000 | 64,370 | ||||||||
Pfizer Inc | 4.00 | 03/15/2049 | 50,000 | 63,591 | ||||||||
Philip Morris International Inc | 3.38 | 08/11/2025 | 50,000 | 55,646 | ||||||||
Philip Morris International Inc | 3.13 | 03/02/2028 | 100,000 | 110,599 | ||||||||
Philip Morris International Inc | 3.88 | 08/21/2042 | 50,000 | 56,670 | ||||||||
Philip Morris International Inc | 4.25 | 11/10/2044 | 100,000 | 120,867 | ||||||||
Procter & Gamble Co/The | 1.70 | 11/03/2021 | 100,000 | 101,623 | ||||||||
The accompanying notes are an integral part of the financial statements.
26
VERPLANCK BALANCED FUND
Portfolio of Investments (Continued)
September 30, 2020
Coupon Rate % | Maturity Date | Principal Amount $ | Value $ | |||||||||
Corporate Bonds and Notes — 15.38% | ||||||||||||
Consumer, Non-cyclical — 2.56% | ||||||||||||
Procter & Gamble Co/The | 2.45 | 11/03/2026 | 100,000 | 110,268 | ||||||||
Providence St Joseph Health Obligated Group | 3.74 | 10/01/2047 | 10,000 | 11,541 | ||||||||
Quest Diagnostics Inc | 2.80 | 06/30/2031 | 100,000 | 107,708 | ||||||||
Reynolds American Inc (United Kingdom) | 4.45 | 06/12/2025 | 100,000 | 112,534 | ||||||||
Reynolds American Inc (United Kingdom) | 6.15 | 09/15/2043 | 100,000 | 125,956 | ||||||||
Stryker Corp | 3.65 | 03/07/2028 | 100,000 | 116,453 | ||||||||
Sysco Corp | 2.60 | 06/12/2022 | 100,000 | 103,349 | ||||||||
Sysco Corp | 4.50 | 04/01/2046 | 100,000 | 109,730 | ||||||||
Thermo Fisher Scientific Inc | 4.15 | 02/01/2024 | 100,000 | 110,481 | ||||||||
Thermo Fisher Scientific Inc | 4.50 | 03/25/2030 | 100,000 | 123,712 | ||||||||
Tyson Foods Inc | 4.55 | 06/02/2047 | 100,000 | 125,993 | ||||||||
Unilever Capital Corp (United Kingdom) | 5.90 | 11/15/2032 | 142,000 | 208,948 | ||||||||
Wyeth LLC | 6.45 | 02/01/2024 | 364,000 | 433,484 | ||||||||
Zoetis Inc | 4.70 | 02/01/2043 | 150,000 | 197,514 | ||||||||
Zoetis Inc | 3.00 | 05/15/2050 | 200,000 | 214,316 | ||||||||
|
| |||||||||||
| 25,412,947 | ||||||||||||
|
| |||||||||||
Energy — 1.24% | ||||||||||||
Baker Hughes A Ge Co LLC / Baker Hughes Co-Obligor Inc | 2.77 | 12/15/2022 | 35,000 | 36,597 | ||||||||
Baker Hughes A Ge Co LLC / Baker Hughes Co-Obligor Inc | 3.34 | 12/15/2027 | 25,000 | 26,568 | ||||||||
Baker Hughes A Ge Co LLC / Baker Hughes Co-Obligor Inc | 4.08 | 12/15/2047 | 25,000 | 24,997 | ||||||||
BP Capital Markets America Inc | 2.75 | 05/10/2023 | 200,000 | 211,014 | ||||||||
BP Capital Markets America Inc | 3.12 | 05/04/2026 | 200,000 | 220,801 | ||||||||
BP Capital Markets America Inc | 3.00 | 02/24/2050 | 100,000 | 96,259 | ||||||||
BP Capital Markets PLC (United Kingdom) | 2.50 | 11/06/2022 | 200,000 | 208,016 | ||||||||
BP Capital Markets PLC (United Kingdom) | 3.28 | 09/19/2027 | 35,000 | 38,856 | ||||||||
Burlington Resources Finance Co | 7.20 | 08/15/2031 | 94,000 | 136,095 | ||||||||
Canadian Natural Resources Ltd (Canada) | 2.95 | 01/15/2023 | 100,000 | 104,011 | ||||||||
Canadian Natural Resources Ltd (Canada) | 3.85 | 06/01/2027 | 280,000 | 301,480 | ||||||||
Canadian Natural Resources Ltd (Canada) | 6.45 | 06/30/2033 | 100,000 | 122,015 | ||||||||
Canadian Natural Resources Ltd (Canada) | 6.50 | 02/15/2037 | 75,000 | 88,802 | ||||||||
Cheniere Corpus Christi Holdings LLC | 5.88 | 03/31/2025 | 75,000 | 85,488 | ||||||||
Chevron Corp | 2.95 | 05/16/2026 | 200,000 | 222,865 | ||||||||
Chevron Corp | 2.00 | 05/11/2027 | 155,000 | 163,947 | ||||||||
Chevron Corp | 3.08 | 05/11/2050 | 200,000 | 213,804 | ||||||||
Chevron USA Inc | 2.34 | 08/12/2050 | 100,000 | 94,703 | ||||||||
Cimarex Energy Co | 3.90 | 05/15/2027 | 100,000 | 100,783 | ||||||||
Concho Resources Inc | 4.88 | 10/01/2047 | 100,000 | 110,490 | ||||||||
Conocophillips | 6.50 | 02/01/2039 | 122,000 | 178,469 | ||||||||
Devon Energy Corp | 4.75 | 05/15/2042 | 25,000 | 23,231 | ||||||||
Dominion Energy Gas Holdings LLC | 3.55 | 11/01/2023 | 200,000 | 215,963 | ||||||||
The accompanying notes are an integral part of the financial statements.
27
VERPLANCK BALANCED FUND
Portfolio of Investments (Continued)
September 30, 2020
Coupon Rate % | Maturity Date | Principal Amount $ | Value $ | |||||||||
Corporate Bonds and Notes — 15.38% | ||||||||||||
Energy — 1.24% | ||||||||||||
Enable Midstream Partners LP | 5.00 | 05/15/2044 | 135,000 | 113,216 | ||||||||
Enbridge Inc (Canada) | 3.13 | 11/15/2029 | 400,000 | 425,005 | ||||||||
Enbridge Inc (Canada) | 5.50 | 12/01/2046 | 60,000 | 78,928 | ||||||||
Energy Transfer Operating LP | 3.60 | 02/01/2023 | 15,000 | 15,436 | ||||||||
Energy Transfer Operating LP | 4.05 | 03/15/2025 | 200,000 | 210,216 | ||||||||
Energy Transfer Operating LP | 4.75 | 01/15/2026 | 270,000 | 287,537 | ||||||||
Energy Transfer Operating LP | 3.75 | 05/15/2030 | 30,000 | 29,055 | ||||||||
Energy Transfer Operating LP | 6.25 | 04/15/2049 | 35,000 | 36,173 | ||||||||
Energy Transfer Operating LP | 5.00 | 05/15/2050 | 45,000 | 41,666 | ||||||||
Energy Transfer Partners LP / Regency Energy Finance Corp | 5.88 | 03/01/2022 | 100,000 | 104,459 | ||||||||
Enterprise Products Operating LLC | 3.13 | 07/31/2029 | 300,000 | 326,994 | ||||||||
Enterprise Products Operating LLC | 4.90 | 05/15/2046 | 200,000 | 225,399 | ||||||||
Enterprise Products Operating LLC | 4.25 | 02/15/2048 | 15,000 | 15,925 | ||||||||
Enterprise Products Operating LLC | 4.95 | 10/15/2054 | 75,000 | 87,684 | ||||||||
Enterprise Products Operating LLC | 3.95 | 01/31/2060 | 40,000 | 39,471 | ||||||||
Exxon Mobil Corp | 2.40 | 03/06/2022 | 112,000 | 114,974 | ||||||||
Exxon Mobil Corp | 2.28 | 08/16/2026 | 50,000 | 53,648 | ||||||||
Exxon Mobil Corp | 2.61 | 10/15/2030 | 395,000 | 426,959 | ||||||||
Exxon Mobil Corp | 4.11 | 03/01/2046 | 142,000 | 168,732 | ||||||||
Exxon Mobil Corp | 3.10 | 08/16/2049 | 30,000 | 30,678 | ||||||||
Exxon Mobil Corp | 3.45 | 04/15/2051 | 60,000 | 65,925 | ||||||||
Halliburton Co | 3.25 | 11/15/2021 | 453,000 | 462,342 | ||||||||
Halliburton Co | 6.70 | 09/15/2038 | 53,000 | 63,709 | ||||||||
Husky Energy Inc (Canada) | 6.80 | 09/15/2037 | 75,000 | 93,004 | ||||||||
Kinder Morgan Energy Partners LP | 4.15 | 03/01/2022 | 275,000 | 287,826 | ||||||||
Kinder Morgan Energy Partners LP | 6.50 | 02/01/2037 | 75,000 | 93,319 | ||||||||
Kinder Morgan Energy Partners LP | 5.00 | 08/15/2042 | 130,000 | 144,366 | ||||||||
Kinder Morgan Inc | 3.15 | 01/15/2023 | 70,000 | 73,520 | ||||||||
MPLX LP | 3.38 | 03/15/2023 | 90,000 | 94,819 | ||||||||
MPLX LP | 4.00 | 03/15/2028 | 65,000 | 70,739 | ||||||||
MPLX LP | 4.50 | 04/15/2038 | 135,000 | 138,206 | ||||||||
MPLX LP | 4.70 | 04/15/2048 | 30,000 | 30,447 | ||||||||
MPLX LP | 5.50 | 02/15/2049 | 30,000 | 33,694 | ||||||||
MPLX LP | 4.90 | 04/15/2058 | 25,000 | 25,370 | ||||||||
Noble Energy Inc | 4.95 | 08/15/2047 | 100,000 | 131,120 | ||||||||
ONEOK Inc | 4.00 | 07/13/2027 | 200,000 | 208,085 | ||||||||
ONEOK Inc | 3.10 | 03/15/2030 | 200,000 | 192,391 | ||||||||
ONEOK Partners LP | 5.00 | 09/15/2023 | 100,000 | 108,431 | ||||||||
Phillips 66 | 3.90 | 03/15/2028 | 100,000 | 112,908 | ||||||||
Phillips 66 | 4.88 | 11/15/2044 | 50,000 | 59,435 | ||||||||
Plains All American Pipeline LP / PAA Finance Corp | 4.50 | 12/15/2026 | 20,000 | 21,265 | ||||||||
The accompanying notes are an integral part of the financial statements.
28
VERPLANCK BALANCED FUND
Portfolio of Investments (Continued)
September 30, 2020
Coupon Rate % | Maturity Date | Principal Amount $ | Value $ | |||||||||
Corporate Bonds and Notes — 15.38% | ||||||||||||
Energy — 1.24% | ||||||||||||
Plains All American Pipeline LP / PAA Finance Corp | 5.15 | 06/01/2042 | 200,000 | 188,762 | ||||||||
Sabine Pass Liquefaction LLC | 6.25 | 03/15/2022 | 830,000 | 880,801 | ||||||||
Schlumberger Investment SA | 3.65 | 12/01/2023 | 192,000 | 206,630 | ||||||||
Shell International Finance BV (Netherlands) | 3.25 | 05/11/2025 | 100,000 | 110,625 | ||||||||
Shell International Finance BV (Netherlands) | 2.75 | 04/06/2030 | 150,000 | 164,024 | ||||||||
Shell International Finance BV (Netherlands) | 5.50 | 03/25/2040 | 150,000 | 210,319 | ||||||||
Shell International Finance BV (Netherlands) | 3.75 | 09/12/2046 | 145,000 | 161,780 | ||||||||
Suncor Energy Inc (Canada) | 6.80 | 05/15/2038 | 105,000 | 137,354 | ||||||||
Suncor Energy Inc (Canada) | 6.50 | 06/15/2038 | 110,000 | 140,832 | ||||||||
Suncor Energy Inc (Canada) | 4.00 | 11/15/2047 | 20,000 | 20,466 | ||||||||
Sunoco Logistics Partners Operations LP | 4.25 | 04/01/2024 | 150,000 | 157,505 | ||||||||
Sunoco Logistics Partners Operations LP | 5.35 | 05/15/2045 | 15,000 | 13,959 | ||||||||
Sunoco Logistics Partners Operations LP | 5.40 | 10/01/2047 | 250,000 | 236,042 | ||||||||
Total Capital Canada Ltd (France) | 2.75 | 07/15/2023 | 50,000 | 53,213 | ||||||||
Total Capital International SA (France) | 2.83 | 01/10/2030 | 70,000 | 77,501 | ||||||||
Total Capital International SA (France) | 3.46 | 07/12/2049 | 100,000 | 109,230 | ||||||||
TransCanada Pipelines Ltd (Canada) | 4.88 | 01/15/2026 | 100,000 | 117,456 | ||||||||
TransCanada Pipelines Ltd (Canada) | 6.20 | 10/15/2037 | 168,000 | 224,543 | ||||||||
TransCanada Pipelines Ltd (Canada) | 4.88 | 05/15/2048 | 120,000 | 149,228 | ||||||||
Valero Energy Corp | 4.00 | 04/01/2029 | 150,000 | 164,355 | ||||||||
Williams Cos Inc/The | 3.35 | 08/15/2022 | 15,000 | 15,561 | ||||||||
Williams Cos Inc/The | 4.00 | 09/15/2025 | 15,000 | 16,629 | ||||||||
Williams Cos Inc/The | 3.50 | 11/15/2030 | 75,000 | 81,581 | ||||||||
Williams Cos Inc/The | 7.50 | 01/15/2031 | 80,000 | 105,381 | ||||||||
Williams Cos Inc/The | 8.75 | 03/15/2032 | 70,000 | 99,778 | ||||||||
Williams Cos Inc/The | 5.10 | 09/15/2045 | 100,000 | 112,145 | ||||||||
|
| |||||||||||
| 12,324,030 | ||||||||||||
|
| |||||||||||
Finance — 4.31% | ||||||||||||
AerCap Ireland Capital DAC / AerCap Global Aviation Trust (Ireland) | 3.95 | 02/01/2022 | 910,000 | 921,306 | ||||||||
Aetna Inc | 3.88 | 08/15/2047 | 200,000 | 223,421 | ||||||||
Aflac Inc | 3.63 | 11/15/2024 | 167,000 | 186,451 | ||||||||
Air Lease Corp | 2.88 | 01/15/2026 | 200,000 | 196,542 | ||||||||
Alexandria Real Estate Equities Inc | 4.00 | 01/15/2024 | 150,000 | 165,172 | ||||||||
Alexandria Real Estate Equities Inc | 2.75 | 12/15/2029 | 50,000 | 54,384 | ||||||||
Alleghany Corp | 4.95 | 06/27/2022 | 100,000 | 106,303 | ||||||||
Ally Financial Inc | 3.05 | 06/05/2023 | 300,000 | 311,737 | ||||||||
American Campus Communities Operating Partnership LP | 3.88 | 01/30/2031 | 100,000 | 109,199 | ||||||||
The accompanying notes are an integral part of the financial statements.
29
VERPLANCK BALANCED FUND
Portfolio of Investments (Continued)
September 30, 2020
Coupon Rate % | Maturity Date | Principal Amount $ | Value $ | |||||||||
Corporate Bonds and Notes — 15.38% | ||||||||||||
Finance — 4.31% | ||||||||||||
American Express Co | 2.75 | 05/20/2022 | 100,000 | 103,555 | ||||||||
American Express Co | 3.00 | 10/30/2024 | 400,000 | 433,977 | ||||||||
American Homes 4 Rent LP | 4.25 | 02/15/2028 | 10,000 | 11,335 | ||||||||
American International Group Inc | 4.13 | 02/15/2024 | 390,000 | 432,226 | ||||||||
American International Group Inc | 4.20 | 04/01/2028 | 30,000 | 34,791 | ||||||||
American International Group Inc | 3.40 | 06/30/2030 | 200,000 | 221,473 | ||||||||
American International Group Inc | 4.80 | 07/10/2045 | 100,000 | 124,013 | ||||||||
American International Group Inc | 4.75 | 04/01/2048 | 20,000 | 24,503 | ||||||||
American International Group Inc | 5.75 | 04/01/2048 | 100,000 | 109,229 | ||||||||
Ameriprise Financial Inc | 4.00 | 10/15/2023 | 146,000 | 161,320 | ||||||||
Anthem Inc | 3.50 | 08/15/2024 | 25,000 | 27,408 | ||||||||
Anthem Inc | 4.10 | 03/01/2028 | 125,000 | 145,363 | ||||||||
Anthem Inc | 4.63 | 05/15/2042 | 130,000 | 163,284 | ||||||||
Anthem Inc | 4.38 | 12/01/2047 | 30,000 | 36,745 | ||||||||
Anthem Inc | 3.13 | 05/15/2050 | 200,000 | 203,844 | ||||||||
Aon PLC | 4.60 | 06/14/2044 | 125,000 | 158,619 | ||||||||
AvalonBay Communities Inc | 3.30 | 06/01/2029 | 50,000 | 56,850 | ||||||||
AvalonBay Communities Inc | 3.90 | 10/15/2046 | 142,000 | 172,218 | ||||||||
AvalonBay Communities Inc | 4.15 | 07/01/2047 | 50,000 | 62,955 | ||||||||
Banco Santander SA (Spain) | 3.85 | 04/12/2023 | 200,000 | 213,523 | ||||||||
BancorpSouth Bank | 4.13 | 11/20/2029 | 200,000 | 201,843 | ||||||||
Bank of America Corp | 2.50 | 10/21/2022 | 280,000 | 286,014 | ||||||||
Bank of America Corp | 4.00 | 04/01/2024 | 280,000 | 310,305 | ||||||||
Bank of America Corp | 4.20 | 08/26/2024 | 150,000 | 167,046 | ||||||||
Bank of America Corp | 3.95 | 04/21/2025 | 150,000 | 166,625 | ||||||||
Bank of America Corp | 3.25 | 10/21/2027 | 150,000 | 165,942 | ||||||||
Bank of America Corp | 6.11 | 01/29/2037 | 230,000 | 324,680 | ||||||||
Bank of America Corp | 3.00 | 12/20/2023 | 630,000 | 661,371 | ||||||||
Bank of America Corp | 3.86 | 07/23/2024 | 50,000 | 54,149 | ||||||||
Bank of America Corp | 3.46 | 03/15/2025 | 100,000 | 108,410 | ||||||||
Bank of America Corp | 2.50 | 02/13/2031 | 75,000 | 78,852 | ||||||||
Bank of America Corp | 3.97 | 03/05/2029 | 50,000 | 57,368 | ||||||||
Bank of America Corp | 3.19 | 07/23/2030 | 50,000 | 55,008 | ||||||||
Bank of America Corp | 3.95 | 01/23/2049 | 25,000 | 30,445 | ||||||||
Bank of America Corp | 4.27 | 07/23/2029 | 60,000 | 70,384 | ||||||||
The accompanying notes are an integral part of the financial statements.
30
VERPLANCK BALANCED FUND
Portfolio of Investments (Continued)
September 30, 2020
Coupon Rate % | Maturity Date | Principal Amount $ | Value $ | |||||||||
Corporate Bonds and Notes — 15.38% | ||||||||||||
Finance — 4.31% | ||||||||||||
Bank of America Corp | 3.59 | 07/21/2028 | 140,000 | 157,228 | ||||||||
Bank of America Corp | 4.33 | 03/15/2050 | 55,000 | 69,925 | ||||||||
Bank of America Corp | 3.82 | 01/20/2028 | 143,000 | 161,629 | ||||||||
Bank of America Corp | 4.44 | 01/20/2048 | 48,000 | 62,494 | ||||||||
Bank of America Corp | 4.08 | 03/20/2051 | 400,000 | 495,336 | ||||||||
Bank of America Corp | 1.32 | 06/19/2026 | 65,000 | 65,490 | ||||||||
Bank of America Corp | 1.90 | 07/23/2031 | 60,000 | 59,641 | ||||||||
Bank of America Corp | 2.68 | 06/19/2041 | 75,000 | 76,581 | ||||||||
Bank of America Corp | 2.59 | 04/29/2031 | 200,000 | 212,784 | ||||||||
Bank of Nova Scotia/The (Canada) | 1.95 | 02/01/2023 | 100,000 | 103,354 | ||||||||
Bank of Nova Scotia/The (Canada) | 1.63 | 05/01/2023 | 200,000 | 205,217 | ||||||||
Bank of Nova Scotia/The (Canada) | 2.20 | 02/03/2025 | 100,000 | 105,550 | ||||||||
Barclays PLC (United Kingdom) | 4.95 | 01/10/2047 | 200,000 | 255,955 | ||||||||
Barclays PLC (United Kingdom) | 2.85 | 05/07/2026 | 200,000 | 208,018 | ||||||||
BB&T Corp | 2.50 | 08/01/2024 | 200,000 | 212,895 | ||||||||
Berkshire Hathaway Finance Corp | 4.25 | 01/15/2049 | 100,000 | 130,124 | ||||||||
Berkshire Hathaway Inc | 3.40 | 01/31/2022 | 235,000 | 244,518 | ||||||||
Berkshire Hathaway Inc | 3.13 | 03/15/2026 | 235,000 | 262,351 | ||||||||
BlackRock Inc | 3.38 | 06/01/2022 | 200,000 | 210,001 | ||||||||
Boston Properties LP | 3.13 | 09/01/2023 | 100,000 | 105,776 | ||||||||
Boston Properties LP | 4.50 | 12/01/2028 | 200,000 | 235,255 | ||||||||
Brixmor Operating Partnership LP | 4.05 | 07/01/2030 | 100,000 | 106,959 | ||||||||
Brookfield Finance Inc (Canada) | 4.85 | 03/29/2029 | 200,000 | 238,625 | ||||||||
Canadian Imperial Bank of Commerce (Canada) | 2.25 | 01/28/2025 | 100,000 | 105,469 | ||||||||
Capital One Financial Corp | 3.75 | 03/09/2027 | 400,000 | 444,138 | ||||||||
Chubb Corp/The | 6.00 | 05/11/2037 | 85,000 | 126,692 | ||||||||
Chubb INA Holdings Inc | 2.70 | 03/13/2023 | 119,000 | 125,209 | ||||||||
Chubb INA Holdings Inc | 4.35 | 11/03/2045 | 27,000 | 35,382 | ||||||||
Citigroup Inc | 4.05 | 07/30/2022 | 100,000 | 106,194 | ||||||||
Citigroup Inc | 3.38 | 03/01/2023 | 100,000 | 106,331 | ||||||||
Citigroup Inc | 3.88 | 10/25/2023 | 25,000 | 27,377 | ||||||||
Citigroup Inc | 3.75 | 06/16/2024 | 100,000 | 110,377 | ||||||||
Citigroup Inc | 4.45 | 09/29/2027 | 170,000 | 197,131 | ||||||||
Citigroup Inc | 4.13 | 07/25/2028 | 130,000 | 149,736 | ||||||||
The accompanying notes are an integral part of the financial statements.
31
VERPLANCK BALANCED FUND
Portfolio of Investments (Continued)
September 30, 2020
Coupon Rate % | Maturity Date | Principal Amount $ | Value $ | |||||||||
Corporate Bonds and Notes — 15.38% | ||||||||||||
Finance — 4.31% | ||||||||||||
Citigroup Inc | 4.75 | 05/18/2046 | 120,000 | 150,598 | ||||||||
Citigroup Inc | 4.65 | 07/23/2048 | 50,000 | 65,940 | ||||||||
Citigroup Inc | 2.88 | 07/24/2023 | 400,000 | 415,069 | ||||||||
Citigroup Inc | 3.88 | 01/24/2039 | 20,000 | 23,310 | ||||||||
Citigroup Inc | 4.08 | 04/23/2029 | 40,000 | 46,265 | ||||||||
Citigroup Inc | 3.98 | 03/20/2030 | 200,000 | 230,231 | ||||||||
Citigroup Inc | 3.67 | 07/24/2028 | 180,000 | 202,340 | ||||||||
Citigroup Inc | 3.89 | 01/10/2028 | 148,000 | 167,520 | ||||||||
Citigroup Inc | 4.28 | 04/24/2048 | 20,000 | 25,106 | ||||||||
Citigroup Inc | 5.32 | 03/26/2041 | 300,000 | 407,957 | ||||||||
CME Group Inc | 3.00 | 03/15/2025 | 135,000 | 147,871 | ||||||||
CNA Financial Corp | 3.45 | 08/15/2027 | 100,000 | 112,350 | ||||||||
Cooperatieve Rabobank UA (Netherlands) | 3.88 | 02/08/2022 | 100,000 | 104,753 | ||||||||
Cooperatieve Rabobank UA (Netherlands) | 3.75 | 07/21/2026 | 485,000 | 540,141 | ||||||||
Cooperatieve Rabobank UA (Netherlands) | 5.25 | 05/24/2041 | 32,000 | 47,068 | ||||||||
Credit Suisse AG/New York NY (Switzerland) | 2.10 | 11/12/2021 | 250,000 | 254,730 | ||||||||
Credit Suisse AG/New York NY (Switzerland) | 2.80 | 04/08/2022 | 250,000 | 258,882 | ||||||||
Credit Suisse AG/New York NY (Switzerland) | 1.00 | 05/05/2023 | 300,000 | 303,144 | ||||||||
Credit Suisse AG/New York NY (Switzerland) | 3.63 | 09/09/2024 | 250,000 | 276,583 | ||||||||
Credit Suisse AG/New York NY (Switzerland) | 2.95 | 04/09/2025 | 250,000 | 272,940 | ||||||||
Credit Suisse Group Funding Guernsey Ltd (Switzerland) | 3.80 | 06/09/2023 | 480,000 | 516,395 | ||||||||
Deutsche Bank AG/New York NY (Germany) | 4.25 | 10/14/2021 | 90,000 | 92,648 | ||||||||
Deutsche Bank AG/New York NY | 3.55 | 09/18/2031 | 200,000 | 202,088 | ||||||||
Discover Bank | 3.45 | 07/27/2026 | 250,000 | 273,674 | ||||||||
Discover Financial Services | 5.20 | 04/27/2022 | 100,000 | 106,734 | ||||||||
Duke Realty LP | 1.75 | 07/01/2030 | 100,000 | 99,541 | ||||||||
E*TRADE Financial Corp | 3.80 | 08/24/2027 | 150,000 | 168,638 | ||||||||
ERP Operating LP | 4.63 | 12/15/2021 | 146,000 | 151,774 | ||||||||
ERP Operating LP | 3.38 | 06/01/2025 | 100,000 | 110,677 | ||||||||
The accompanying notes are an integral part of the financial statements.
32
VERPLANCK BALANCED FUND
Portfolio of Investments (Continued)
September 30, 2020
Coupon Rate % | Maturity Date | Principal Amount $ | Value $ | |||||||||
Corporate Bonds and Notes — 15.38% | ||||||||||||
Finance — 4.31% | ||||||||||||
ERP Operating LP | 3.50 | 03/01/2028 | 10,000 | 11,310 | ||||||||
Fifth Third BanCorp | 4.30 | 01/16/2024 | 150,000 | 165,484 | ||||||||
GE Capital International Funding Co Unlimited Co | 4.42 | 11/15/2035 | 328,000 | 346,223 | ||||||||
Goldman Sachs Group Inc/The | 5.75 | 01/24/2022 | 61,000 | 65,167 | ||||||||
Goldman Sachs Group Inc/The | 4.25 | 10/21/2025 | 100,000 | 113,770 | ||||||||
Goldman Sachs Group Inc/The | 3.85 | 01/26/2027 | 48,000 | 54,039 | ||||||||
Goldman Sachs Group Inc/The | 5.15 | 05/22/2045 | 200,000 | 263,584 | ||||||||
Goldman Sachs Group Inc/The | 3.81 | 04/23/2029 | 50,000 | 56,906 | ||||||||
Goldman Sachs Group Inc/The | 4.22 | 05/01/2029 | 70,000 | 81,635 | ||||||||
Goldman Sachs Group Inc/The | 4.41 | 04/23/2039 | 30,000 | 36,626 | ||||||||
Goldman Sachs Group Inc/The | 3.69 | 06/05/2028 | 400,000 | 448,372 | ||||||||
Hartford Financial Services Group Inc/The | 3.60 | 08/19/2049 | 200,000 | 223,381 | ||||||||
Healthcare Trust of America Holdings LP | 3.10 | 02/15/2030 | 50,000 | 53,804 | ||||||||
Healthpeak Properties Inc | 4.25 | 11/15/2023 | 2,000 | 2,183 | ||||||||
Healthpeak Properties Inc | 3.88 | 08/15/2024 | 100,000 | 110,860 | ||||||||
Healthpeak Properties Inc | 2.88 | 01/15/2031 | 100,000 | 105,556 | ||||||||
Highwoods Realty LP | 3.05 | 02/15/2030 | 50,000 | 51,725 | ||||||||
HSBC Holdings PLC (United Kingdom) | 6.50 | 09/15/2037 | 300,000 | 407,101 | ||||||||
HSBC Holdings PLC (United Kingdom) | 3.26 | 03/13/2023 | 300,000 | 310,147 | ||||||||
HSBC Holdings PLC (United Kingdom) | 4.29 | 09/12/2026 | 200,000 | 223,298 | ||||||||
HSBC Holdings PLC (United Kingdom) | 1.65 | 04/18/2026 | 200,000 | 199,234 | ||||||||
HSBC Holdings PLC (United Kingdom) | 2.36 | 08/18/2031 | 200,000 | 196,909 | ||||||||
Humana Inc | 3.13 | 08/15/2029 | 200,000 | 221,282 | ||||||||
Huntington Bancshares Inc/OH | 2.30 | 01/14/2022 | 100,000 | 102,220 | ||||||||
ING Groep NV (Netherlands) | 4.05 | 04/09/2029 | 200,000 | 234,783 | ||||||||
Intercontinental Exchange Inc | 2.65 | 09/15/2040 | 100,000 | 100,148 | ||||||||
Intercontinental Exchange Inc | 3.00 | 09/15/2060 | 100,000 | 101,381 | ||||||||
Jefferies Group LLC / Jefferies Group Capital Finance Inc | 4.85 | 01/15/2027 | 150,000 | 169,412 | ||||||||
JPMorgan Chase & Co | 3.25 | 09/23/2022 | 242,000 | 255,789 | ||||||||
JPMorgan Chase & Co | 3.63 | 05/13/2024 | 143,000 | 157,846 | ||||||||
JPMorgan Chase & Co | 3.88 | 09/10/2024 | 260,000 | 288,388 | ||||||||
JPMorgan Chase & Co | 5.60 | 07/15/2041 | 385,000 | 564,600 | ||||||||
JPMorgan Chase & Co | 3.80 | 07/23/2024 | 40,000 | 43,331 | ||||||||
The accompanying notes are an integral part of the financial statements.
33
VERPLANCK BALANCED FUND
Portfolio of Investments (Continued)
September 30, 2020
Coupon Rate % | Maturity Date | Principal Amount $ | Value $ | |||||||||
Corporate Bonds and Notes — 15.38% | ||||||||||||
Finance — 4.31% | ||||||||||||
JPMorgan Chase & Co | 2.78 | 04/25/2023 | 300,000 | 310,249 | ||||||||
JPMorgan Chase & Co | 3.51 | 01/23/2029 | 45,000 | 50,617 | ||||||||
JPMorgan Chase & Co | 4.01 | 04/23/2029 | 45,000 | 52,209 | ||||||||
JPMorgan Chase & Co | 3.90 | 01/23/2049 | 35,000 | 42,119 | ||||||||
JPMorgan Chase & Co | 4.20 | 07/23/2029 | 50,000 | 59,181 | ||||||||
JPMorgan Chase & Co | 3.96 | 11/15/2048 | 50,000 | 60,759 | ||||||||
JPMorgan Chase & Co | 2.30 | 10/15/2025 | 100,000 | 105,213 | ||||||||
JPMorgan Chase & Co | 2.74 | 10/15/2030 | 90,000 | 96,420 | ||||||||
JPMorgan Chase & Co | 2.08 | 04/22/2026 | 200,000 | 209,156 | ||||||||
JPMorgan Chase & Co | 2.52 | 04/22/2031 | 200,000 | 212,815 | ||||||||
JPMorgan Chase & Co | 3.11 | 04/22/2051 | 200,000 | 214,624 | ||||||||
JPMorgan Chase & Co | 3.11 | 04/22/2041 | 100,000 | 108,474 | ||||||||
Kilroy Realty LP | 3.05 | 02/15/2030 | 50,000 | 52,349 | ||||||||
Kimco Realty Corp | 3.80 | 04/01/2027 | 125,000 | 136,380 | ||||||||
Lincoln National Corp | 3.80 | 03/01/2028 | 10,000 | 11,512 | ||||||||
Lincoln National Corp | 4.35 | 03/01/2048 | 10,000 | 11,441 | ||||||||
Lloyds Banking Group PLC (United Kingdom) | 4.45 | 05/08/2025 | 250,000 | 282,619 | ||||||||
Lloyds Banking Group PLC (United Kingdom) | 4.58 | 12/10/2025 | 276,000 | 303,363 | ||||||||
Lloyds Banking Group PLC (United Kingdom) | 4.38 | 03/22/2028 | 250,000 | 290,039 | ||||||||
Loews Corp | 6.00 | 02/01/2035 | 142,000 | 198,972 | ||||||||
Markel Corp | 3.50 | 11/01/2027 | 200,000 | 219,194 | ||||||||
Markel Corp | 4.30 | 11/01/2047 | 100,000 | 118,477 | ||||||||
Marsh & McLennan Cos Inc | 4.38 | 03/15/2029 | 200,000 | 242,156 | ||||||||
Marsh & McLennan Cos Inc | 4.90 | 03/15/2049 | 25,000 | 34,878 | ||||||||
Mercury General Corp | 4.40 | 03/15/2027 | 100,000 | 108,305 | ||||||||
MetLife Inc | 4.05 | 03/01/2045 | 242,000 | 296,391 | ||||||||
Mitsubishi UFJ Financial Group Inc (Japan) | 2.62 | 07/18/2022 | 200,000 | 207,258 | ||||||||
Mitsubishi UFJ Financial Group Inc (Japan) | 2.67 | 07/25/2022 | 150,000 | 155,505 | ||||||||
Mitsubishi UFJ Financial Group Inc (Japan) | 3.85 | 03/01/2026 | 235,000 | 268,167 | ||||||||
Mitsubishi UFJ Financial Group Inc (Japan) | 3.29 | 07/25/2027 | 150,000 | 167,480 | ||||||||
The accompanying notes are an integral part of the financial statements.
34
VERPLANCK BALANCED FUND
Portfolio of Investments (Continued)
September 30, 2020
Coupon Rate % | Maturity Date | Principal Amount $ | Value $ | |||||||||
Corporate Bonds and Notes — 15.38% | ||||||||||||
Finance — 4.31% | ||||||||||||
Mitsubishi UFJ Financial Group Inc (Japan) | 2.56 | 02/25/2030 | 200,000 | 210,220 | ||||||||
Mizuho Financial Group Inc (Japan) | 2.95 | 02/28/2022 | 242,000 | 250,363 | ||||||||
Morgan Stanley | 3.13 | 01/23/2023 | 50,000 | 52,864 | ||||||||
Morgan Stanley | 3.75 | 02/25/2023 | 500,000 | 536,658 | ||||||||
Morgan Stanley | 3.63 | 01/20/2027 | 73,000 | 82,728 | ||||||||
Morgan Stanley | 3.95 | 04/23/2027 | 270,000 | 306,064 | ||||||||
Morgan Stanley | 4.38 | 01/22/2047 | 53,000 | 68,747 | ||||||||
Morgan Stanley | 3.77 | 01/24/2029 | 60,000 | 68,485 | ||||||||
Morgan Stanley | 3.97 | 07/22/2038 | 200,000 | 237,001 | ||||||||
Morgan Stanley | 2.70 | 01/22/2031 | 75,000 | 79,890 | ||||||||
Morgan Stanley | 2.72 | 07/22/2025 | 200,000 | 212,454 | ||||||||
National Australia Bank Ltd/New York (Australia) | 2.50 | 07/12/2026 | 300,000 | 327,246 | ||||||||
National Retail Properties Inc | 3.50 | 10/15/2027 | 100,000 | 106,546 | ||||||||
Natwest Group PLC (United Kingdom) | 4.45 | 05/08/2030 | 200,000 | 231,447 | ||||||||
Nomura Holdings Inc (Japan) | 2.65 | 01/16/2025 | 200,000 | 210,618 | ||||||||
Northern Trust Corp | 3.38 | 05/08/2032 | 150,000 | 164,044 | ||||||||
Omega Healthcare Investors Inc | 4.50 | 01/15/2025 | 75,000 | 79,643 | ||||||||
Omega Healthcare Investors Inc | 5.25 | 01/15/2026 | 125,000 | 136,539 | ||||||||
Omega Healthcare Investors Inc | 3.63 | 10/01/2029 | 50,000 | 50,665 | ||||||||
ORIX Corp (Japan) | 2.90 | 07/18/2022 | 100,000 | 103,514 | ||||||||
PNC Bank NA | 3.25 | 06/01/2025 | 310,000 | 343,725 | ||||||||
PNC Financial Services Group Inc/The | 3.45 | 04/23/2029 | 200,000 | 230,204 | ||||||||
PNC Financial Services Group Inc/The | 2.55 | 01/22/2030 | 100,000 | 108,316 | ||||||||
Progressive Corp/The | 3.70 | 01/26/2045 | 142,000 | 169,359 | ||||||||
Progressive Corp/The | 4.13 | 04/15/2047 | 20,000 | 25,433 | ||||||||
Prologis LP | 2.25 | 04/15/2030 | 30,000 | 31,886 | ||||||||
Prologis LP | 3.00 | 04/15/2050 | 15,000 | 16,108 | ||||||||
Prudential Financial Inc | 3.70 | 03/13/2051 | 180,000 | 198,515 | ||||||||
Prudential Financial Inc | 5.70 | 09/15/2048 | 50,000 | 56,528 | ||||||||
Prudential Financial Inc | 5.88 | 09/15/2042 | 200,000 | 210,642 | ||||||||
Prudential PLC (United Kingdom) | 3.13 | 04/14/2030 | 75,000 | 83,288 | ||||||||
Realty Income Corp | 3.65 | 01/15/2028 | 150,000 | 169,537 | ||||||||
Royal Bank of Canada (Canada) | 1.95 | 01/17/2023 | 100,000 | 103,442 | ||||||||
Santander Holdings USA Inc | 4.50 | 07/17/2025 | 300,000 | 332,770 | ||||||||
Santander UK PLC (United Kingdom) | 4.00 | 03/13/2024 | 100,000 | 110,384 | ||||||||
Simon Property Group LP | 2.35 | 01/30/2022 | 90,000 | 91,589 | ||||||||
The accompanying notes are an integral part of the financial statements.
35
VERPLANCK BALANCED FUND
Portfolio of Investments (Continued)
September 30, 2020
Coupon Rate % | Maturity Date | Principal Amount $ | Value $ | |||||||||
Corporate Bonds and Notes — 15.38% | ||||||||||||
Finance — 4.31% | ||||||||||||
Simon Property Group LP | 2.75 | 06/01/2023 | 50,000 | 52,321 | ||||||||
Simon Property Group LP | 3.30 | 01/15/2026 | 50,000 | 54,168 | ||||||||
Simon Property Group LP | 4.25 | 11/30/2046 | 100,000 | 107,195 | ||||||||
Simon Property Group LP | 3.25 | 09/13/2049 | 25,000 | 22,928 | ||||||||
SL Green Operating Partnership LP | 3.25 | 10/15/2022 | 200,000 | 204,081 | ||||||||
Spirit Realty LP | 3.20 | 01/15/2027 | 50,000 | 50,641 | ||||||||
Spirit Realty LP | 3.40 | 01/15/2030 | 50,000 | 49,712 | ||||||||
State Street Corp | 2.40 | 01/24/2030 | 100,000 | 109,521 | ||||||||
State Street Corp | 3.03 | 11/01/2034 | 100,000 | 109,003 | ||||||||
Sumitomo Mitsui Banking Corp (Japan) | 3.20 | 07/18/2022 | 300,000 | 313,876 | ||||||||
Sumitomo Mitsui Financial Group Inc (Japan) | 3.01 | 10/19/2026 | 242,000 | 266,827 | ||||||||
Sumitomo Mitsui Financial Group Inc (Japan) | 3.45 | 01/11/2027 | 48,000 | 53,434 | ||||||||
Toronto-Dominion Bank/The (Canada) | 0.75 | 06/12/2023 | 300,000 | 301,950 | ||||||||
Toronto-Dominion Bank/The (Canada) | 3.63 | 09/15/2031 | 100,000 | 112,392 | ||||||||
Travelers Cos Inc/The | 4.60 | 08/01/2043 | 15,000 | 19,577 | ||||||||
Travelers Cos Inc/The | 3.75 | 05/15/2046 | 142,000 | 166,504 | ||||||||
UnitedHealth Group Inc | 3.35 | 07/15/2022 | 200,000 | 210,880 | ||||||||
UnitedHealth Group Inc | 3.75 | 07/15/2025 | 100,000 | 114,137 | ||||||||
UnitedHealth Group Inc | 3.38 | 04/15/2027 | 200,000 | 228,313 | ||||||||
UnitedHealth Group Inc | 2.95 | 10/15/2027 | 140,000 | 156,239 | ||||||||
UnitedHealth Group Inc | 4.63 | 07/15/2035 | 220,000 | 289,737 | ||||||||
UnitedHealth Group Inc | 6.63 | 11/15/2037 | 100,000 | 158,075 | ||||||||
UnitedHealth Group Inc | 4.20 | 01/15/2047 | 17,000 | 21,531 | ||||||||
UnitedHealth Group Inc | 4.25 | 06/15/2048 | 25,000 | 31,875 | ||||||||
UnitedHealth Group Inc | 4.45 | 12/15/2048 | 20,000 | 26,488 | ||||||||
US Bancorp | 3.00 | 03/15/2022 | 242,000 | 250,980 | ||||||||
US Bancorp | 3.15 | 04/27/2027 | 200,000 | 225,625 | ||||||||
US Bank NA/Cincinnati OH | 2.05 | 01/21/2025 | 250,000 | 264,037 | ||||||||
Ventas Realty LP | 3.85 | 04/01/2027 | 200,000 | 217,909 | ||||||||
Ventas Realty LP | 4.00 | 03/01/2028 | 15,000 | 16,335 | ||||||||
Voya Financial Inc | 3.13 | 07/15/2024 | 200,000 | 215,507 | ||||||||
Wells Fargo & Co | 3.30 | 09/09/2024 | 200,000 | 217,861 | ||||||||
Wells Fargo & Co | 3.55 | 09/29/2025 | 200,000 | 222,658 | ||||||||
Wells Fargo & Co | 4.30 | 07/22/2027 | 247,000 | 283,004 | ||||||||
Wells Fargo & Co | 4.15 | 01/24/2029 | 50,000 | 58,804 | ||||||||
Wells Fargo & Co | 5.38 | 02/07/2035 | 200,000 | 273,675 | ||||||||
Wells Fargo & Co | 4.40 | 06/14/2046 | 117,000 | 139,762 | ||||||||
Wells Fargo & Co | 4.75 | 12/07/2046 | 97,000 | 120,795 | ||||||||
Wells Fargo & Co | 2.16 | 02/11/2026 | 65,000 | 67,494 | ||||||||
The accompanying notes are an integral part of the financial statements.
36
VERPLANCK BALANCED FUND
Portfolio of Investments (Continued)
September 30, 2020
Coupon Rate % | Maturity Date | Principal Amount $ | Value $ | |||||||||
Corporate Bonds and Notes — 15.38% | ||||||||||||
Finance — 4.31% | ||||||||||||
Wells Fargo & Co | 2.57 | 02/11/2031 | 65,000 | 68,238 | ||||||||
Wells Fargo & Co | 2.19 | 04/30/2026 | 200,000 | 208,606 | ||||||||
Wells Fargo Bank NA | 3.63 | 10/22/2021 | 250,000 | 257,777 | ||||||||
Wells Fargo Bank NA | 5.85 | 02/01/2037 | �� | 250,000 | 341,219 | |||||||
Welltower Inc | 4.13 | 03/15/2029 | 150,000 | 170,207 | ||||||||
Welltower Inc | 2.75 | 01/15/2031 | 100,000 | 103,047 | ||||||||
Westpac Banking Corp (Australia) | 2.35 | 02/19/2025 | 200,000 | 213,432 | ||||||||
Westpac Banking Corp (Australia) | 2.85 | 05/13/2026 | 135,000 | 149,924 | ||||||||
|
| |||||||||||
| 42,713,476 | ||||||||||||
|
| |||||||||||
Industrial Other — 0.09% | ||||||||||||
Leland Stanford Junior University/The | 3.65 | 05/01/2048 | 110,000 | 135,558 | ||||||||
President & Fellows of Harvard College | 4.88 | 10/15/2040 | 194,000 | 270,781 | ||||||||
President & Fellows of Harvard College | 3.15 | 07/15/2046 | 100,000 | 113,826 | ||||||||
University of Southern California | 3.03 | 10/01/2039 | 125,000 | 135,266 | ||||||||
Yale University | 2.40 | 04/15/2050 | 200,000 | 204,567 | ||||||||
|
| |||||||||||
| 859,998 | ||||||||||||
|
| |||||||||||
Sovereign — 0.92% | ||||||||||||
African Development Bank | 0.50 | 04/22/2022 | 150,000 | 150,627 | ||||||||
African Development Bank | 2.13 | 11/16/2022 | 150,000 | 155,921 | ||||||||
Asian Development Bank | 1.88 | 02/18/2022 | 200,000 | 204,485 | ||||||||
Asian Development Bank | 1.88 | 07/19/2022 | 150,000 | 154,403 | ||||||||
Asian Development Bank | 1.75 | 09/13/2022 | 100,000 | 102,956 | ||||||||
Asian Development Bank | 2.75 | 03/17/2023 | 70,000 | 74,268 | ||||||||
Asian Development Bank | 1.50 | 10/18/2024 | 100,000 | 104,619 | ||||||||
Asian Development Bank | 0.63 | 04/29/2025 | 100,000 | 100,929 | ||||||||
Asian Development Bank | 2.75 | 01/19/2028 | 180,000 | 206,756 | ||||||||
Asian Development Bank | 1.88 | 01/24/2030 | 45,000 | 49,132 | ||||||||
Ecopetrol SA (Columbia) | 5.88 | 09/18/2023 | 200,000 | 220,000 | ||||||||
Ecopetrol SA (Columbia) | 4.13 | 01/16/2025 | 200,000 | 210,002 | ||||||||
Equinor ASA (Norway) | 3.70 | 03/01/2024 | 142,000 | 156,843 | ||||||||
Equinor ASA (Norway) | 3.95 | 05/15/2043 | 132,000 | 153,590 | ||||||||
European Bank for Reconstruction & Development | 2.13 | 03/07/2022 | 150,000 | 153,999 | ||||||||
European Investment Bank | 2.25 | 03/15/2022 | 397,000 | 408,751 | ||||||||
European Investment Bank | 2.63 | 05/20/2022 | 300,000 | 311,803 | ||||||||
European Investment Bank | 2.50 | 03/15/2023 | 300,000 | 316,546 | ||||||||
European Investment Bank | 3.13 | 12/14/2023 | 200,000 | 218,216 | ||||||||
European Investment Bank | 2.25 | 06/24/2024 | 60,000 | 64,345 | ||||||||
European Investment Bank | 1.63 | 03/14/2025 | 85,000 | 89,627 | ||||||||
European Investment Bank | 0.38 | 12/15/2025 | 100,000 | 99,785 | ||||||||
European Investment Bank | 1.63 | 10/09/2029 | 100,000 | 107,185 | ||||||||
European Investment Bank | 0.88 | 05/17/2030 | 100,000 | 100,468 | ||||||||
The accompanying notes are an integral part of the financial statements.
37
VERPLANCK BALANCED FUND
Portfolio of Investments (Continued)
September 30, 2020
Coupon Rate % | Maturity Date | Principal Amount $ | Value $ | |||||||||
Corporate Bonds and Notes — 15.38% | ||||||||||||
Sovereign — 0.92% | ||||||||||||
FMS Wertmanagement (Germany) | 2.75 | 01/30/2024 | 200,000 | 216,041 | ||||||||
Inter-American Development Bank | 2.50 | 01/18/2023 | 100,000 | 105,126 | ||||||||
Inter-American Development Bank | 3.00 | 02/21/2024 | 200,000 | 218,020 | ||||||||
Inter-American Development Bank | 1.75 | 03/14/2025 | 65,000 | 68,838 | ||||||||
Inter-American Development Bank | 2.00 | 06/02/2026 | 485,000 | 524,310 | ||||||||
Inter-American Development Bank | 2.00 | 07/23/2026 | 200,000 | 216,291 | ||||||||
International Bank for Reconstruction & Development | 1.63 | 02/10/2022 | 328,000 | 334,209 | ||||||||
International Bank for Reconstruction & Development | 2.13 | 07/01/2022 | 300,000 | 309,920 | ||||||||
International Bank for Reconstruction & Development | 3.00 | 09/27/2023 | 250,000 | 270,448 | ||||||||
International Bank for Reconstruction & Development | 2.50 | 11/25/2024 | 250,000 | 272,097 | ||||||||
International Bank for Reconstruction & Development | 1.63 | 01/15/2025 | 75,000 | 78,888 | ||||||||
International Bank for Reconstruction & Development | 0.75 | 03/11/2025 | 100,000 | 101,541 | ||||||||
International Bank for Reconstruction & Development | 0.63 | 04/22/2025 | 175,000 | 176,630 | ||||||||
International Bank for Reconstruction & Development | 0.88 | 05/14/2030 | 100,000 | 100,222 | ||||||||
International Finance Corp | 1.38 | 10/16/2024 | 100,000 | 104,125 | ||||||||
Kreditanstalt fuer Wiederaufbau | 0.38 | 07/18/2025 | 110,000 | 109,749 | ||||||||
Kreditanstalt fuer Wiederaufbau (Germany) | 2.13 | 03/07/2022 | 121,000 | 124,320 | ||||||||
Kreditanstalt fuer Wiederaufbau (Germany) | 2.13 | 06/15/2022 | 100,000 | 103,239 | ||||||||
Kreditanstalt fuer Wiederaufbau (Germany) | 1.75 | 08/22/2022 | 400,000 | 411,559 | ||||||||
Kreditanstalt fuer Wiederaufbau (Germany) | 2.38 | 12/29/2022 | 100,000 | 104,811 | ||||||||
Kreditanstalt fuer Wiederaufbau (Germany) 3 | 0.00 | 06/29/2037 | 285,000 | 231,027 | ||||||||
Landwirtschaftliche Rentenbank (Germany) | 1.75 | 07/27/2026 | 200,000 | 213,899 | ||||||||
Nexen Inc (China) | 6.40 | 05/15/2037 | 114,000 | 168,702 | ||||||||
Nordic Investment Bank | 2.13 | 02/01/2022 | 200,000 | 204,989 | ||||||||
Nordic Investment Bank | 1.38 | 10/17/2022 | 200,000 | 204,644 | ||||||||
Syngenta Finance NV (Switzerland) | 3.13 | 03/28/2022 | 235,000 | 239,291 | ||||||||
|
| |||||||||||
| 9,128,192 | ||||||||||||
|
| |||||||||||
Technology — 1.22% | ||||||||||||
Alphabet Inc | 2.00 | 08/15/2026 | 200,000 | 214,452 | ||||||||
Alphabet Inc | 1.10 | 08/15/2030 | 100,000 | 99,558 | ||||||||
Alphabet Inc | 1.90 | 08/15/2040 | 100,000 | 96,207 | ||||||||
Analog Devices Inc | 3.90 | 12/15/2025 | 200,000 | 228,670 | ||||||||
Apple Inc | 2.50 | 02/09/2022 | 97,000 | 99,746 | ||||||||
Apple Inc | 2.70 | 05/13/2022 | 330,000 | 342,707 | ||||||||
Apple Inc | 1.80 | 09/11/2024 | 55,000 | 57,561 | ||||||||
The accompanying notes are an integral part of the financial statements.
38
VERPLANCK BALANCED FUND
Portfolio of Investments (Continued)
September 30, 2020
Coupon Rate % | Maturity Date | Principal Amount $ | Value $ | |||||||||
Corporate Bonds and Notes — 15.38% | ||||||||||||
Technology — 1.22% | ||||||||||||
Apple Inc | 1.13 | 05/11/2025 | 60,000 | 61,401 | ||||||||
Apple Inc | 3.35 | 02/09/2027 | 50,000 | 57,187 | ||||||||
Apple Inc | 3.20 | 05/11/2027 | 100,000 | 113,761 | ||||||||
Apple Inc | 2.20 | 09/11/2029 | 50,000 | 53,771 | ||||||||
Apple Inc | 1.65 | 05/11/2030 | 40,000 | 41,434 | ||||||||
Apple Inc | 4.45 | 05/06/2044 | 285,000 | 386,976 | ||||||||
Apple Inc | 3.85 | 08/04/2046 | 50,000 | 62,261 | ||||||||
Apple Inc | 3.75 | 11/13/2047 | 200,000 | 245,698 | ||||||||
Apple Inc | 2.95 | 09/11/2049 | 30,000 | 32,838 | ||||||||
Apple Inc | 2.65 | 05/11/2050 | 55,000 | 57,634 | ||||||||
Applied Materials Inc | 3.30 | 04/01/2027 | 200,000 | 227,345 | ||||||||
Arrow Electronics Inc | 3.50 | 04/01/2022 | 100,000 | 103,396 | ||||||||
Autodesk Inc | 3.50 | 06/15/2027 | 150,000 | 170,169 | ||||||||
Broadcom Corp / Broadcom Cayman Finance Ltd | 3.00 | 01/15/2022 | 150,000 | 154,304 | ||||||||
Broadcom Corp / Broadcom Cayman Finance Ltd | 3.63 | 01/15/2024 | 100,000 | 107,554 | ||||||||
Broadcom Corp / Broadcom Cayman Finance Ltd | 3.88 | 01/15/2027 | 200,000 | 221,581 | ||||||||
Broadcom Corp / Broadcom Cayman Finance Ltd | 3.50 | 01/15/2028 | 90,000 | 97,241 | ||||||||
Cisco Systems Inc | 2.50 | 09/20/2026 | 146,000 | 160,718 | ||||||||
Citrix Systems Inc | 4.50 | 12/01/2027 | 135,000 | 154,693 | ||||||||
Corning Inc | 3.90 | 11/15/2049 | 200,000 | 229,149 | ||||||||
Corning Inc | 4.38 | 11/15/2057 | 20,000 | 24,216 | ||||||||
DXC Technology Co | 4.13 | 04/15/2025 | 100,000 | 108,048 | ||||||||
DXC Technology Co | 4.75 | 04/15/2027 | 90,000 | 100,294 | ||||||||
Fiserv Inc | 3.80 | 10/01/2023 | 100,000 | 109,113 | ||||||||
Fiserv Inc | 2.75 | 07/01/2024 | 80,000 | 85,462 | ||||||||
Fiserv Inc | 4.20 | 10/01/2028 | 100,000 | 118,761 | ||||||||
Fiserv Inc | 3.50 | 07/01/2029 | 80,000 | 91,193 | ||||||||
Fiserv Inc | 4.40 | 07/01/2049 | 40,000 | 50,176 | ||||||||
Hewlett Packard Enterprise Co | 3.50 | 10/05/2021 | 100,000 | 102,846 | ||||||||
Hewlett Packard Enterprise Co | 4.40 | 10/15/2022 | 121,000 | 129,303 | ||||||||
Hewlett Packard Enterprise Co | 4.45 | 10/02/2023 | 100,000 | 109,893 | ||||||||
Hewlett Packard Enterprise Co | 4.65 | 10/01/2024 | 100,000 | 113,080 | ||||||||
HP Inc | 6.00 | 09/15/2041 | 150,000 | 183,874 | ||||||||
Intel Corp | 3.30 | 10/01/2021 | 114,000 | 117,379 | ||||||||
Intel Corp | 3.15 | 05/11/2027 | 50,000 | 56,163 | ||||||||
Intel Corp | 3.90 | 03/25/2030 | 300,000 | 363,212 | ||||||||
Intel Corp | 4.90 | 07/29/2045 | 100,000 | 139,504 | ||||||||
Intel Corp | 4.10 | 05/11/2047 | 50,000 | 63,273 | ||||||||
Intel Corp | 3.25 | 11/15/2049 | 30,000 | 33,591 | ||||||||
International Business Machines Corp | 3.45 | 02/19/2026 | 306,000 | 347,532 | ||||||||
The accompanying notes are an integral part of the financial statements.
39
VERPLANCK BALANCED FUND
Portfolio of Investments (Continued)
September 30, 2020
Coupon Rate % | Maturity Date | Principal Amount $ | Value $ | |||||||||
Corporate Bonds and Notes — 15.38% | ||||||||||||
Technology — 1.22% | ||||||||||||
International Business Machines Corp | 3.30 | 05/15/2026 | 250,000 | 281,528 | ||||||||
International Business Machines Corp | 3.50 | 05/15/2029 | 100,000 | 115,255 | ||||||||
International Business Machines Corp | 4.70 | 02/19/2046 | 146,000 | 198,422 | ||||||||
International Business Machines Corp | 4.25 | 05/15/2049 | 200,000 | 250,741 | ||||||||
Juniper Networks Inc | 5.95 | 03/15/2041 | 100,000 | 126,733 | ||||||||
Micron Technology Inc | 2.50 | 04/24/2023 | 100,000 | 103,845 | ||||||||
Microsoft Corp | 2.40 | 02/06/2022 | 194,000 | 199,381 | ||||||||
Microsoft Corp | 3.13 | 11/03/2025 | 242,000 | 270,602 | ||||||||
Microsoft Corp | 3.30 | 02/06/2027 | 107,000 | 122,257 | ||||||||
Microsoft Corp | 4.20 | 11/03/2035 | 242,000 | 317,782 | ||||||||
Microsoft Corp | 4.10 | 02/06/2037 | 68,000 | 88,156 | ||||||||
Microsoft Corp | 2.53 | 06/01/2050 | 200,000 | 209,164 | ||||||||
Microsoft Corp | 3.95 | 08/08/2056 | 218,000 | 287,139 | ||||||||
Microsoft Corp | 2.68 | 06/01/2060 | 46,000 | 48,524 | ||||||||
NVIDIA Corp | 2.85 | 04/01/2030 | 200,000 | 224,701 | ||||||||
Oracle Corp | 2.50 | 10/15/2022 | 542,000 | 565,687 | ||||||||
Oracle Corp | 2.40 | 09/15/2023 | 150,000 | 157,765 | ||||||||
Oracle Corp | 3.25 | 11/15/2027 | 80,000 | 90,501 | ||||||||
Oracle Corp | 5.38 | 07/15/2040 | 200,000 | 278,947 | ||||||||
Oracle Corp | 4.13 | 05/15/2045 | 104,000 | 124,055 | ||||||||
Oracle Corp | 4.00 | 07/15/2046 | 209,000 | 247,734 | ||||||||
Oracle Corp | 4.00 | 11/15/2047 | 50,000 | 59,276 | ||||||||
Oracle Corp | 3.60 | 04/01/2050 | 200,000 | 225,434 | ||||||||
PayPal Holdings Inc | 2.30 | 06/01/2030 | 250,000 | 264,386 | ||||||||
PayPal Holdings Inc | 3.25 | 06/01/2050 | 300,000 | 331,864 | ||||||||
QUALCOMM Inc | 4.65 | 05/20/2035 | 242,000 | 325,277 | ||||||||
Texas Instruments Inc | 4.15 | 05/15/2048 | 25,000 | 32,693 | ||||||||
Verisk Analytics Inc | 4.13 | 03/15/2029 | 150,000 | 176,894 | ||||||||
|
| |||||||||||
| 12,049,668 | ||||||||||||
|
| |||||||||||
Transportation — 0.51% | ||||||||||||
American Airlines 2014-1 - Class A Pass Through Trust | 3.70 | 04/01/2028 | 136,105 | 113,070 | ||||||||
American Airlines 2016-1 - Class AA Pass Through Trust | 3.58 | 07/15/2029 | 157,018 | 150,679 | ||||||||
Burlington Northern Santa Fe LLC | 3.85 | 09/01/2023 | 242,000 | 263,655 | ||||||||
Burlington Northern Santa Fe LLC | 4.38 | 09/01/2042 | 138,000 | 174,093 | ||||||||
Canadian National Railway Co (Canada) | 3.65 | 02/03/2048 | 10,000 | 12,081 | ||||||||
Canadian National Railway Co (Canada) | 4.45 | 01/20/2049 | 150,000 | 204,331 | ||||||||
Canadian Pacific Railway Co (Canada) | 2.90 | 02/01/2025 | 100,000 | 108,188 | ||||||||
Canadian Pacific Railway Co (Canada) | 4.00 | 06/01/2028 | 100,000 | 117,626 | ||||||||
CSX Corp | 3.40 | 08/01/2024 | 200,000 | 218,865 | ||||||||
CSX Corp | 3.25 | 06/01/2027 | 140,000 | 158,150 | ||||||||
CSX Corp | 3.80 | 03/01/2028 | 15,000 | 17,583 | ||||||||
CSX Corp | 4.30 | 03/01/2048 | 15,000 | 18,683 | ||||||||
The accompanying notes are an integral part of the financial statements.
40
VERPLANCK BALANCED FUND
Portfolio of Investments (Continued)
September 30, 2020
Coupon Rate % | Maturity Date | Principal Amount $ | Value $ | |||||||||
Corporate Bonds and Notes — 15.38% | ||||||||||||
Transportation — 0.51% | ||||||||||||
CSX Corp | 4.50 | 08/01/2054 | 100,000 | 130,812 | ||||||||
FedEx Corp | 3.25 | 04/01/2026 | 100,000 | 111,277 | ||||||||
FedEx Corp | 3.30 | 03/15/2027 | 200,000 | 222,182 | ||||||||
FedEx Corp | 4.55 | 04/01/2046 | 80,000 | 96,472 | ||||||||
FedEx Corp | 4.40 | 01/15/2047 | 35,000 | 41,346 | ||||||||
JetBlue 2019-1 Class AA Pass Through Trust | 2.75 | 11/15/2033 | 98,781 | 96,721 | ||||||||
Kansas City Southern | 4.70 | 05/01/2048 | 100,000 | 111,183 | ||||||||
Norfolk Southern Corp | 2.90 | 02/15/2023 | 90,000 | 94,650 | ||||||||
Norfolk Southern Corp | 3.15 | 06/01/2027 | 100,000 | 111,648 | ||||||||
Norfolk Southern Corp | 3.05 | 05/15/2050 | 200,000 | 212,553 | ||||||||
Southwest Airlines Co | 5.13 | 06/15/2027 | 300,000 | 327,935 | ||||||||
Southwest Airlines Co | 2.63 | 02/10/2030 | 100,000 | 94,805 | ||||||||
Spirit Airlines Pass Through Trust 2015-1A | 4.10 | 10/01/2029 | 105,442 | 94,640 | ||||||||
Union Pacific Corp | 4.16 | 07/15/2022 | 142,000 | 150,236 | ||||||||
Union Pacific Corp | 2.15 | 02/05/2027 | 200,000 | 212,610 | ||||||||
Union Pacific Corp | 3.00 | 04/15/2027 | 100,000 | 110,812 | ||||||||
Union Pacific Corp | 3.95 | 09/10/2028 | 435,000 | 513,078 | ||||||||
Union Pacific Corp | 2.40 | 02/05/2030 | 200,000 | 215,277 | ||||||||
Union Pacific Corp | 3.55 | 08/15/2039 | 200,000 | 228,979 | ||||||||
Union Pacific Corp | 4.30 | 03/01/2049 | 20,000 | 25,849 | ||||||||
United Parcel Service Inc | 2.40 | 11/15/2026 | 146,000 | 160,313 | ||||||||
United Parcel Service Inc | 3.75 | 11/15/2047 | 100,000 | 120,840 | ||||||||
|
| |||||||||||
| 5,041,222 | ||||||||||||
|
| |||||||||||
Utilities — 1.11% | ||||||||||||
AEP Texas Inc | 3.45 | 01/15/2050 | 100,000 | 109,394 | ||||||||
American Electric Power Co Inc | 2.95 | 12/15/2022 | 80,000 | 83,681 | ||||||||
American Water Capital Corp | 3.75 | 09/01/2047 | 50,000 | 59,048 | ||||||||
Atmos Energy Corp | 4.13 | 10/15/2044 | 117,000 | 144,999 | ||||||||
CMS Energy Corp (U.S. Treasury + 4.116%) 2 | 4.75 | 06/01/2050 | 200,000 | 212,042 | ||||||||
Commonwealth Edison Co | 3.65 | 06/15/2046 | 242,000 | 282,622 | ||||||||
Commonwealth Edison Co | 4.00 | 03/01/2048 | 5,000 | 6,151 | ||||||||
Consolidated Edison Co of New York Inc | 4.00 | 12/01/2028 | 250,000 | 297,063 | ||||||||
Consolidated Edison Co of New York Inc | 6.30 | 08/15/2037 | 142,000 | 207,684 | ||||||||
Consumers Energy Co | 4.35 | 04/15/2049 | 100,000 | 131,922 | ||||||||
Consumers Energy Co | 3.50 | 08/01/2051 | 100,000 | 117,055 | ||||||||
Dominion Energy Inc | 7.00 | 06/15/2038 | 75,000 | 113,699 | ||||||||
DTE Electric Co | 3.70 | 03/15/2045 | 121,000 | 141,556 | ||||||||
DTE Electric Co | 2.95 | 03/01/2050 | 100,000 | 105,495 | ||||||||
Duke Energy Carolinas LLC | 2.95 | 12/01/2026 | 100,000 | 111,751 | ||||||||
Duke Energy Corp | 3.15 | 08/15/2027 | 100,000 | 110,383 | ||||||||
Duke Energy Corp | 3.75 | 09/01/2046 | 80,000 | 91,329 | ||||||||
Duke Energy Florida LLC | 6.40 | 06/15/2038 | 242,000 | 369,348 | ||||||||
The accompanying notes are an integral part of the financial statements.
41
VERPLANCK BALANCED FUND
Portfolio of Investments (Continued)
September 30, 2020
Coupon Rate % | Maturity Date | Principal Amount $ | Value $ | |||||||||
Corporate Bonds and Notes — 15.38% | ||||||||||||
Utilities — 1.11% | ||||||||||||
Duke Energy Indiana LLC | 3.75 | 05/15/2046 | 12,000 | 14,108 | ||||||||
Edison International | 2.40 | 09/15/2022 | 100,000 | 101,939 | ||||||||
Emera US Finance LP (Canada) | 3.55 | 06/15/2026 | 25,000 | 27,916 | ||||||||
Eversource Energy | 3.30 | 01/15/2028 | 100,000 | 111,669 | ||||||||
Exelon Generation Co LLC | 3.40 | 03/15/2022 | 200,000 | 207,309 | ||||||||
Exelon Generation Co LLC | 3.25 | 06/01/2025 | 100,000 | 109,324 | ||||||||
Exelon Generation Co LLC | 6.25 | 10/01/2039 | 200,000 | 247,923 | ||||||||
Exelon Generation Co LLC | 5.60 | 06/15/2042 | 15,000 | 17,679 | ||||||||
Florida Power & Light Co | 2.85 | 04/01/2025 | 200,000 | 219,274 | ||||||||
Florida Power & Light Co | 3.13 | 12/01/2025 | 142,000 | 158,173 | ||||||||
Florida Power & Light Co | 5.95 | 02/01/2038 | 142,000 | 210,152 | ||||||||
Florida Power & Light Co | 3.70 | 12/01/2047 | 20,000 | 24,333 | ||||||||
Georgia Power Co | 3.25 | 03/30/2027 | 150,000 | 165,348 | ||||||||
Georgia Power Co | 4.30 | 03/15/2042 | 242,000 | 289,655 | ||||||||
Indiana Michigan Power Co | 3.85 | 05/15/2028 | 200,000 | 229,423 | ||||||||
ITC Holdings Corp | 3.35 | 11/15/2027 | 100,000 | 111,896 | ||||||||
MidAmerican Energy Co | 3.50 | 10/15/2024 | 182,000 | 201,288 | ||||||||
MidAmerican Energy Co | 3.15 | 04/15/2050 | 200,000 | 221,631 | ||||||||
National Rural Utilities Cooperative Finance Corp | 3.40 | 02/07/2028 | 165,000 | 190,351 | ||||||||
NextEra Energy Capital Holdings Inc | 3.55 | 05/01/2027 | 85,000 | 96,071 | ||||||||
NextEra Energy Capital Holdings Inc | 2.25 | 06/01/2030 | 100,000 | 103,553 | ||||||||
NiSource Inc | 5.25 | 02/15/2043 | 100,000 | 131,100 | ||||||||
NorthWestern Corp | 4.18 | 11/15/2044 | 150,000 | 176,248 | ||||||||
Ohio Edison Co | 6.88 | 07/15/2036 | 100,000 | 141,086 | ||||||||
Ohio Power Co | 2.60 | 04/01/2030 | 200,000 | 219,418 | ||||||||
Pacific Gas and Electric Co | 3.15 | 01/01/2026 | 160,000 | 164,183 | ||||||||
Pacific Gas and Electric Co | 2.10 | 08/01/2027 | 175,000 | 169,325 | ||||||||
Pacific Gas and Electric Co | 4.50 | 07/01/2040 | 95,000 | 96,612 | ||||||||
Pacific Gas and Electric Co | 4.95 | 07/01/2050 | 110,000 | 117,378 | ||||||||
Pacific Gas and Electric Co | 3.50 | 08/01/2050 | 75,000 | 67,622 | ||||||||
PacifiCorp | 5.75 | 04/01/2037 | 158,000 | 216,798 | ||||||||
PacifiCorp | 4.13 | 01/15/2049 | 170,000 | 212,280 | ||||||||
PECO Energy Co | 3.90 | 03/01/2048 | 5,000 | 6,185 | ||||||||
Piedmont Natural Gas Co Inc | 3.64 | 11/01/2046 | 6,000 | 6,816 | ||||||||
PPL Electric Utilities Corp | 4.75 | 07/15/2043 | 242,000 | 323,228 | ||||||||
Progress Energy Inc | 3.15 | 04/01/2022 | 57,000 | 58,859 | ||||||||
Public Service Co of Colorado | 3.70 | 06/15/2028 | 150,000 | 175,054 | ||||||||
Public Service Co of Colorado | 4.10 | 06/15/2048 | 65,000 | 83,537 | ||||||||
Puget Sound Energy Inc | 3.25 | 09/15/2049 | 75,000 | 84,008 | ||||||||
San Diego Gas & Electric Co | 2.50 | 05/15/2026 | 142,000 | 153,163 | ||||||||
San Diego Gas & Electric Co | 4.50 | 08/15/2040 | 117,000 | 142,613 | ||||||||
Sempra Energy | 2.90 | 02/01/2023 | 100,000 | 104,699 | ||||||||
Sempra Energy | 3.80 | 02/01/2038 | 145,000 | 162,333 | ||||||||
The accompanying notes are an integral part of the financial statements.
42
VERPLANCK BALANCED FUND
Portfolio of Investments (Continued)
September 30, 2020
Coupon Rate % | Maturity Date | Principal Amount $ | Value $ | |||||||||
Corporate Bonds and Notes — 15.38% | ||||||||||||
Utilities — 1.11% | ||||||||||||
Sempra Energy | 4.00 | 02/01/2048 | 15,000 | 16,916 | ||||||||
Southern California Edison Co | 4.20 | 03/01/2029 | 200,000 | 228,920 | ||||||||
Southern California Edison Co | 6.00 | 01/15/2034 | 92,000 | 121,439 | ||||||||
Southern California Edison Co | 5.55 | 01/15/2037 | 132,000 | 162,922 | ||||||||
Southern Co Gas Capital Corp | 5.88 | 03/15/2041 | 100,000 | 137,824 | ||||||||
Southern Co/The | 4.25 | 07/01/2036 | 100,000 | 116,037 | ||||||||
Southern Power Co | 5.25 | 07/15/2043 | 100,000 | 116,644 | ||||||||
Southwestern Electric Power Co | 3.90 | 04/01/2045 | 125,000 | 137,336 | ||||||||
Tucson Electric Power Co | 1.50 | 08/01/2030 | 200,000 | 198,245 | ||||||||
Virginia Electric & Power Co | 3.15 | 01/15/2026 | 92,000 | 102,198 | ||||||||
Virginia Electric & Power Co | 8.88 | 11/15/2038 | 117,000 | 215,914 | ||||||||
Wisconsin Electric Power Co | 4.30 | 10/15/2048 | 100,000 | 127,645 | ||||||||
Wisconsin Power & Light Co | 3.00 | 07/01/2029 | 150,000 | 169,036 | ||||||||
Xcel Energy Inc | 2.60 | 03/15/2022 | 125,000 | 128,526 | ||||||||
Xcel Energy Inc | 3.40 | 06/01/2030 | 200,000 | 229,704 | ||||||||
|
| |||||||||||
| 10,976,088 | ||||||||||||
|
| |||||||||||
Total Corporate Bonds and Notes (Cost $140,951,238) | 152,443,232 | |||||||||||
|
| |||||||||||
Foreign Government Bonds and Notes — 0.91% | ||||||||||||
Canada Government International Bond (Canada) | 1.63 | 01/22/2025 | 150,000 | 157,832 | ||||||||
Chile Government International Bond (Chile) | 3.13 | 01/21/2026 | 388,000 | 430,098 | ||||||||
Colombia Government International Bond (Colombia) | 6.13 | 01/18/2041 | 300,000 | 384,750 | ||||||||
Development Bank of Japan Inc (Japan) | 2.00 | 10/19/2021 | 350,000 | 355,629 | ||||||||
Export-Import Bank of Korea (South Korea) | 2.38 | 04/21/2027 | 300,000 | 320,112 | ||||||||
Hungary Government International Bond (Hungary) | 5.75 | 11/22/2023 | 200,000 | 229,246 | ||||||||
Indonesia Government International Bond (Indonesia) | 5.35 | 02/11/2049 | 200,000 | 264,674 | ||||||||
Indonesia Government International Bond (Indonesia) | 3.50 | 02/14/2050 | 200,000 | 211,595 | ||||||||
Israel Government Aid Bond (Israel) | 5.50 | 12/04/2023 | 19,000 | 22,016 | ||||||||
Israel Government Aid Bond (Israel) | 5.50 | 04/26/2024 | 51,000 | 60,529 | ||||||||
Israel Government Aid Bond (Israel) | 5.50 | 09/18/2033 | 291,000 | 436,092 | ||||||||
Israel Government International Bond (Israel) | 4.00 | 06/30/2022 | 200,000 | 212,148 | ||||||||
Israel Government International Bond (Israel) | 3.88 | 07/03/2050 | 200,000 | 240,000 | ||||||||
Japan Bank for International Cooperation (Japan) | 2.38 | 07/21/2022 | 200,000 | 207,209 | ||||||||
Japan Bank for International Cooperation (Japan) | 1.88 | 07/21/2026 | 300,000 | 319,854 | ||||||||
The accompanying notes are an integral part of the financial statements.
43
VERPLANCK BALANCED FUND
Portfolio of Investments (Continued)
September 30, 2020
Coupon Rate % | Maturity Date | Principal Amount $ | Value $ | |||||||||
Foreign Government Bonds and Notes — 0.91% | ||||||||||||
Japan Bank for International Cooperation (Japan) | 3.50 | 10/31/2028 | 200,000 | 240,496 | ||||||||
Japan Bank for International Cooperation (Japan) | 2.00 | 10/17/2029 | 200,000 | 218,586 | ||||||||
Korea Development Bank/The (South Korea) | 3.00 | 01/13/2026 | 242,000 | 267,269 | ||||||||
Korea International Bond (South Korea) | 2.75 | 01/19/2027 | 200,000 | 219,664 | ||||||||
Mexico Government International Bond (Mexico) | 4.00 | 10/02/2023 | 300,000 | 325,953 | ||||||||
Mexico Government International Bond (Mexico) | 4.50 | 04/22/2029 | 200,000 | 224,302 | ||||||||
Mexico Government International Bond (Mexico) | 6.05 | 01/11/2040 | 300,000 | 375,450 | ||||||||
Mexico Government International Bond (Mexico) | 4.60 | 02/10/2048 | 300,000 | 319,500 | ||||||||
Mexico Government International Bond (Mexico) | 5.00 | 04/27/2051 | 200,000 | 224,000 | ||||||||
Panama Government International Bond (Panama) | 3.75 | 03/16/2025 | 200,000 | 218,302 | ||||||||
Panama Government International Bond (Panama) | 6.70 | 01/26/2036 | 100,000 | 145,126 | ||||||||
Panama Government International Bond (Panama) | 4.50 | 04/16/2050 | 200,000 | 249,802 | ||||||||
Peruvian Government International Bond (Peru) | 4.13 | 08/25/2027 | 200,000 | 233,252 | ||||||||
Philippine Government International Bond (Philippines) | 9.50 | 02/02/2030 | 200,000 | 329,469 | ||||||||
Philippine Government International Bond (Philippines) | 3.95 | 01/20/2040 | 200,000 | 236,558 | ||||||||
Province of Alberta Canada (Canada) | 3.30 | 03/15/2028 | 30,000 | 34,994 | ||||||||
Province of Manitoba Canada (Canada) | 2.60 | 04/16/2024 | 100,000 | 107,348 | ||||||||
Province of Ontario Canada (Canada) | 3.40 | 10/17/2023 | 50,000 | 54,487 | ||||||||
Province of Ontario Canada (Canada) | 2.50 | 04/27/2026 | 242,000 | 265,399 | ||||||||
Republic of Italy Government International Bond (Italy) | 5.38 | 06/15/2033 | 150,000 | 189,121 | ||||||||
Republic of Poland Government International Bond (Poland) | 3.25 | 04/06/2026 | 142,000 | 160,119 | ||||||||
State of Israel (Israel) | 2.50 | 01/15/2030 | 200,000 | 216,307 | ||||||||
Uruguay Government International Bond (Uruguay) | 4.38 | 10/27/2027 | 200,000 | 231,002 | ||||||||
Uruguay Government International Bond (Uruguay) | 4.98 | 04/20/2055 | 35,000 | 46,550 | ||||||||
|
| |||||||||||
Total Foreign Government Bonds and Notes (Cost $8,223,110) | 8,984,840 | |||||||||||
|
| |||||||||||
Municipal Bonds — 0.50% | ||||||||||||
Bay Area Toll Authority | 6.26 | 04/01/2049 | 95,000 | 161,852 | ||||||||
The accompanying notes are an integral part of the financial statements.
44
VERPLANCK BALANCED FUND
Portfolio of Investments (Continued)
September 30, 2020
Coupon Rate % | Maturity Date | Principal Amount $ | Value $ | |||||||||
Municipal Bonds — 0.50% | ||||||||||||
City of New York NY | 6.27 | 12/01/2037 | 100,000 | 148,049 | ||||||||
Commonwealth of Massachusetts | 4.20 | 12/01/2021 | 180,000 | 185,000 | ||||||||
Commonwealth of Massachusetts Transportation Fund Revenue | 5.73 | 06/01/2040 | 25,000 | 36,145 | ||||||||
Dallas Area Rapid Transit | 6.00 | 12/01/2044 | 100,000 | 154,100 | ||||||||
East Bay Municipal Utility District Water System Revenue | 5.87 | 06/01/2040 | 145,000 | 226,141 | ||||||||
Los Angeles Unified School District/CA | 5.75 | 07/01/2034 | 100,000 | 139,624 | ||||||||
New Jersey Economic Development Authority | 7.43 | 02/15/2029 | 164,000 | 204,067 | ||||||||
New Jersey Turnpike Authority | 7.41 | 01/01/2040 | 165,000 | 279,881 | ||||||||
New York State Dormitory Authority | 5.60 | 03/15/2040 | 200,000 | 287,836 | ||||||||
Ohio State University/The | 4.91 | 06/01/2040 | 140,000 | 194,992 | ||||||||
Ohio State University/The | 4.80 | 06/01/2111 | 53,000 | 77,599 | ||||||||
Ohio Water Development Authority Water Pollution Control Loan Fund | 4.88 | 12/01/2034 | 50,000 | 59,957 | ||||||||
Permanent University Fund - Texas A&M University System | 3.66 | 07/01/2047 | 200,000 | 220,092 | ||||||||
Port Authority of New York & New Jersey | 4.46 | 10/01/2062 | 95,000 | 121,519 | ||||||||
Salt River Project Agricultural Improvement & Power District | 4.84 | 01/01/2041 | 175,000 | 246,022 | ||||||||
South Carolina Public Service Authority | 2.39 | 12/01/2023 | 182,000 | 190,982 | ||||||||
State of California | 5.70 | 11/01/2021 | 200,000 | 211,520 | ||||||||
State of California | 3.38 | 04/01/2025 | 300,000 | 334,503 | ||||||||
State of California | 3.50 | 04/01/2028 | 30,000 | 34,804 | ||||||||
State of California | 7.30 | 10/01/2039 | 240,000 | 394,142 | ||||||||
State of Connecticut | 5.85 | 03/15/2032 | 100,000 | 139,542 | ||||||||
State of Illinois | 5.10 | 06/01/2033 | 200,000 | 202,118 | ||||||||
Texas Transportation Commission State Highway Fund | 5.18 | 04/01/2030 | 200,000 | 256,634 | ||||||||
University of California | 4.60 | 05/15/2031 | 200,000 | 241,998 | ||||||||
University of Pittsburgh-of the Commonwealth System of Higher Education | 3.56 | 09/15/2119 | 150,000 | 181,973 | ||||||||
|
| |||||||||||
Total Municipal Bonds (Cost $4,535,512) | 4,931,092 | |||||||||||
|
| |||||||||||
Commercial Mortgage-Backed Securities — 1.27% | ||||||||||||
Bank 2019-Bnk21 | 2.85 | 10/17/2052 | 200,000 | 221,268 | ||||||||
Benchmark 2019-B10 Mortgage Trust | 3.72 | 03/15/2062 | 350,000 | 409,112 | ||||||||
Benchmark 2020-IG1 Mortgage Trust | 2.69 | 09/15/2043 | 200,000 | 219,299 | ||||||||
Citigroup Commercial Mortgage Trust 2018-C6 | 4.41 | 11/10/2051 | 300,000 | 360,515 | ||||||||
COMM 2013-CR9 Mortgage Trust2 | 4.36 | 07/10/2045 | 109,000 | 116,875 | ||||||||
COMM 2014-LC17 Mortgage Trust | 3.92 | 10/10/2047 | 702,000 | 770,023 | ||||||||
COMM 2014-UBS4 Mortgage Trust | 3.42 | 08/10/2047 | 582,000 | 622,368 | ||||||||
Fannie Mae-Aces2 | 2.51 | 11/25/2022 | 310,282 | 318,695 | ||||||||
The accompanying notes are an integral part of the financial statements.
45
VERPLANCK BALANCED FUND
Portfolio of Investments (Continued)
September 30, 2020
Coupon Rate % | Maturity Date | Principal Amount $ | Value $ | |||||||||
Commercial Mortgage-Backed Securities — 1.27% | ||||||||||||
Fannie Mae-Aces2 | 2.96 | 02/25/2027 | 647,000 | 723,770 | ||||||||
Fannie Mae-Aces2 | 3.08 | 12/25/2027 | 200,000 | 225,833 | ||||||||
Fannie Mae-Aces2 | 3.15 | 03/25/2028 | 200,000 | 228,178 | ||||||||
Freddie Mac Multifamily Structured Pass Through Certificates | 3.06 | 12/25/2024 | 500,000 | 548,585 | ||||||||
Freddie Mac Multifamily Structured Pass Through Certificates | 2.21 | 06/25/2025 | 222,060 | 232,130 | ||||||||
Freddie Mac Multifamily Structured Pass Through Certificates | 3.24 | 08/25/2027 | 750,000 | 862,665 | ||||||||
Freddie Mac Multifamily Structured Pass Through Certificates2 | 3.92 | 09/25/2028 | 100,000 | 120,742 | ||||||||
Freddie Mac Multifamily Structured Pass Through Certificates | 3.77 | 12/25/2028 | 300,000 | 359,881 | ||||||||
Freddie Mac Multifamily Structured Pass Through Certificates | 3.51 | 03/25/2029 | 200,000 | 236,345 | ||||||||
Freddie Mac Multifamily Structured Pass Through Certificates | 3.30 | 04/25/2029 | 200,000 | 233,562 | ||||||||
Freddie Mac Multifamily Structured Pass Through Certificates | 1.78 | 05/25/2029 | 298,551 | 313,761 | ||||||||
Freddie Mac Multifamily Structured Pass Through Certificates | 2.26 | 06/25/2029 | 197,140 | 212,621 | ||||||||
Freddie Mac Multifamily Structured Pass Through Certificates | 2.65 | 11/25/2029 | 400,000 | 450,864 | ||||||||
Freddie Mac Multifamily Structured Pass Through Certificates | 1.72 | 05/25/2035 | 300,000 | 306,024 | ||||||||
GS Mortgage Securities Corp 2015-GC30 | 3.12 | 05/10/2050 | 238,714 | 254,169 | ||||||||
GS Mortgage Securities Trust 2016-GS2 | 3.05 | 05/10/2049 | 728,000 | 789,154 | ||||||||
GS Mortgage Securities Trust 2019-GC42 | 3.00 | 09/01/2052 | 200,000 | 223,403 | ||||||||
JPMBB Commercial Mortgage Securities Trust 2015-C29 | 3.30 | 05/15/2048 | 445,135 | 467,977 | ||||||||
Morgan Stanley Capital I Trust 2015-UBS8 | 3.54 | 12/15/2048 | 470,000 | 518,511 | ||||||||
Morgan Stanley Capital I Trust 2017-H1 | 3.26 | 06/15/2050 | 500,000 | 555,877 | ||||||||
UBS Commercial Mortgage Trust 2018-C12 | 4.30 | 08/15/2051 | 500,000 | 597,042 | ||||||||
UBS-Barclays Commercial Mortgage Trust 2012-C4 | 2.79 | 12/10/2045 | 504,000 | 517,841 | ||||||||
UBS-Barclays Commercial Mortgage Trust 2013-C6 | 3.24 | 04/10/2046 | 209,691 | 219,615 | ||||||||
Wells Fargo Commercial Mortgage Trust 2018-C44 | 4.21 | 05/15/2051 | 200,000 | 235,057 | ||||||||
Wells Fargo Commercial Mortgage Trust 2018-C47 | 4.44 | 09/15/2061 | 100,000 | 119,944 | ||||||||
|
| |||||||||||
Total Commercial Mortgage-Backed Securities (Cost $11,987,282) | 12,591,706 | |||||||||||
|
| |||||||||||
Mortgage-Backed Securities — 14.19% | ||||||||||||
Fannie Mae or Freddie Mac 4 | 2.00 | 10/01/2035 | 1,175,000 | 1,221,633 | ||||||||
The accompanying notes are an integral part of the financial statements.
46
VERPLANCK BALANCED FUND
Portfolio of Investments (Continued)
September 30, 2020
Coupon Rate % | Maturity Date | Principal Amount $ | Value $ | |||||||||
Mortgage-Backed Securities — 14.19% | ||||||||||||
Fannie Mae or Freddie Mac 4 | 2.50 | 10/01/2035 | 250,000 | 261,055 | ||||||||
Fannie Mae or Freddie Mac 4 | 3.00 | 10/01/2035 | 1,325,000 | 1,390,422 | ||||||||
Fannie Mae or Freddie Mac 4 | 3.50 | 10/01/2035 | 525,000 | 555,618 | ||||||||
Fannie Mae or Freddie Mac 4 | 1.50 | 11/01/2035 | 200,000 | 204,492 | ||||||||
Fannie Mae or Freddie Mac 4 | 2.00 | 11/01/2035 | 575,000 | 597,572 | ||||||||
Fannie Mae or Freddie Mac 4 | 2.50 | 11/01/2035 | 125,000 | 130,473 | ||||||||
Fannie Mae or Freddie Mac 4 | 2.00 | 10/01/2050 | 2,600,000 | 2,688,156 | ||||||||
Fannie Mae or Freddie Mac 4 | 2.50 | 10/01/2050 | 7,375,000 | 7,735,972 | ||||||||
Fannie Mae or Freddie Mac 4 | 3.00 | 10/01/2050 | 2,275,000 | 2,383,196 | ||||||||
Fannie Mae or Freddie Mac 4 | 3.50 | 10/01/2050 | 2,925,000 | 3,083,933 | ||||||||
Fannie Mae or Freddie Mac 4 | 4.00 | 10/01/2050 | 2,825,000 | 3,012,984 | ||||||||
Fannie Mae or Freddie Mac 4 | 4.50 | 10/01/2050 | 725,000 | 784,246 | ||||||||
Fannie Mae or Freddie Mac 4 | 5.00 | 10/01/2050 | 150,000 | 164,361 | ||||||||
Fannie Mae or Freddie Mac 4 | 1.50 | 11/01/2050 | 75,000 | 75,344 | ||||||||
Fannie Mae or Freddie Mac 4 | 2.00 | 11/01/2050 | 2,150,000 | 2,219,168 | ||||||||
Fannie Mae or Freddie Mac 4 | 2.50 | 11/01/2050 | 1,500,000 | 1,571,283 | ||||||||
Fannie Mae or Freddie Mac 4 | 3.00 | 11/01/2050 | 25,000 | 26,194 | ||||||||
Fannie Mae Pool | 4.00 | 03/01/2022 | 6 | 7 | ||||||||
Fannie Mae Pool | 4.00 | 04/01/2024 | 19,275 | 20,420 | ||||||||
Fannie Mae Pool | 4.00 | 07/01/2024 | 24,626 | 26,102 | ||||||||
Fannie Mae Pool | 4.50 | 05/01/2025 | 72,452 | 76,907 | ||||||||
Fannie Mae Pool | 4.00 | 09/01/2025 | 43,093 | 45,654 | ||||||||
Fannie Mae Pool | 3.50 | 10/01/2025 | 96,821 | 102,459 | ||||||||
Fannie Mae Pool | 3.50 | 10/01/2025 | 41,462 | 43,888 | ||||||||
Fannie Mae Pool | 3.50 | 12/01/2025 | 76,631 | 81,088 | ||||||||
Fannie Mae Pool | 3.50 | 01/01/2026 | 16,084 | 17,035 | ||||||||
Fannie Mae Pool | 3.50 | 02/01/2026 | 17,289 | 18,307 | ||||||||
Fannie Mae Pool | 3.50 | 06/01/2026 | 3,490 | 3,695 | ||||||||
Fannie Mae Pool | 3.00 | 11/01/2026 | 72,159 | 75,799 | ||||||||
Fannie Mae Pool | 4.00 | 02/01/2027 | 70,274 | 74,495 | ||||||||
Fannie Mae Pool | 3.00 | 05/01/2027 | 43,847 | 46,652 | ||||||||
Fannie Mae Pool | 3.00 | 08/01/2027 | 61,598 | 64,742 | ||||||||
Fannie Mae Pool | 3.50 | 08/01/2027 | 95,303 | 100,918 | ||||||||
Fannie Mae Pool | 2.50 | 01/01/2028 | 143,033 | 149,704 | ||||||||
Fannie Mae Pool | 3.00 | 02/01/2028 | 159,243 | 167,320 | ||||||||
Fannie Mae Pool | 2.50 | 05/01/2028 | 73,610 | 77,039 | ||||||||
Fannie Mae Pool | 3.00 | 08/01/2028 | 53,548 | 56,262 | ||||||||
Fannie Mae Pool | 2.50 | 09/01/2028 | 70,998 | 74,314 | ||||||||
Fannie Mae Pool | 4.50 | 03/01/2029 | 1,084 | 1,170 | ||||||||
Fannie Mae Pool | 4.00 | 07/01/2029 | 27,462 | 29,106 | ||||||||
Fannie Mae Pool | 4.50 | 08/01/2029 | 60,404 | 65,840 | ||||||||
Fannie Mae Pool | 2.50 | 09/01/2029 | 243,512 | 254,392 | ||||||||
Fannie Mae Pool | 2.50 | 08/01/2030 | 127,704 | 133,464 | ||||||||
Fannie Mae Pool | 3.50 | 11/01/2030 | 20,510 | 21,708 | ||||||||
Fannie Mae Pool | 3.00 | 02/01/2031 | 114,868 | 120,645 | ||||||||
The accompanying notes are an integral part of the financial statements.
47
VERPLANCK BALANCED FUND
Portfolio of Investments (Continued)
September 30, 2020
Coupon Rate % | Maturity Date | Principal Amount $ | Value $ | |||||||||
Mortgage-Backed Securities — 14.19% | ||||||||||||
Fannie Mae Pool | 4.00 | 03/01/2031 | 64,440 | 68,490 | ||||||||
Fannie Mae Pool | 4.00 | 03/01/2031 | 14,719 | 15,594 | ||||||||
Fannie Mae Pool | 2.50 | 07/01/2031 | 113,298 | 118,567 | ||||||||
Fannie Mae Pool | 3.00 | 07/01/2031 | 115,385 | 121,307 | ||||||||
Fannie Mae Pool | 2.00 | 08/01/2031 | 189,528 | 197,971 | ||||||||
Fannie Mae Pool | 2.50 | 09/01/2031 | 313,044 | 332,243 | ||||||||
Fannie Mae Pool | 2.50 | 10/01/2031 | 38,426 | 40,176 | ||||||||
Fannie Mae Pool | 2.00 | 11/01/2031 | 30,688 | 32,070 | ||||||||
Fannie Mae Pool | 2.50 | 11/01/2031 | 323,388 | 338,500 | ||||||||
Fannie Mae Pool | 2.50 | 12/01/2031 | 123,995 | 129,578 | ||||||||
Fannie Mae Pool | 2.50 | 01/01/2032 | 169,420 | 177,343 | ||||||||
Fannie Mae Pool | 2.50 | 01/01/2032 | 40,653 | 42,591 | ||||||||
Fannie Mae Pool | 2.00 | 02/01/2032 | 43,413 | 45,360 | ||||||||
Fannie Mae Pool | 2.50 | 02/01/2032 | 170,382 | 178,324 | ||||||||
Fannie Mae Pool | 2.50 | 02/01/2032 | 50,940 | 53,307 | ||||||||
Fannie Mae Pool | 3.00 | 02/01/2032 | 36,215 | 37,993 | ||||||||
Fannie Mae Pool | 3.00 | 04/01/2032 | 46,633 | 50,204 | ||||||||
Fannie Mae Pool | 3.00 | 07/01/2032 | 188,307 | 197,556 | ||||||||
Fannie Mae Pool | 3.00 | 08/01/2032 | 33,805 | 35,569 | ||||||||
Fannie Mae Pool | 3.50 | 08/01/2032 | 36,969 | 39,937 | ||||||||
Fannie Mae Pool | 2.50 | 12/01/2032 | 142,003 | 148,364 | ||||||||
Fannie Mae Pool | 2.50 | 01/01/2033 | 70,415 | 73,571 | ||||||||
Fannie Mae Pool | 3.00 | 01/01/2033 | 70,220 | 73,674 | ||||||||
Fannie Mae Pool | 3.00 | 01/01/2033 | 14,671 | 15,394 | ||||||||
Fannie Mae Pool | 3.00 | 04/01/2033 | 97,868 | 102,719 | ||||||||
Fannie Mae Pool | 3.00 | 05/01/2033 | 98,624 | 103,431 | ||||||||
Fannie Mae Pool | 3.50 | 05/01/2033 | 55,006 | 58,532 | ||||||||
Fannie Mae Pool | 5.50 | 06/01/2033 | 9,824 | 11,530 | ||||||||
Fannie Mae Pool | 4.00 | 07/01/2033 | 63,660 | 67,478 | ||||||||
Fannie Mae Pool | 2.50 | 08/01/2033 | 80,493 | 84,263 | ||||||||
Fannie Mae Pool | 3.50 | 08/01/2033 | 133,385 | 143,470 | ||||||||
Fannie Mae Pool | 5.50 | 08/01/2033 | 63,079 | 74,222 | ||||||||
Fannie Mae Pool | 3.50 | 09/01/2033 | 33,387 | 35,324 | ||||||||
Fannie Mae Pool | 3.50 | 10/01/2033 | 11,070 | 11,711 | ||||||||
Fannie Mae Pool | 4.00 | 10/01/2033 | 160,702 | 175,276 | ||||||||
Fannie Mae Pool | 5.50 | 11/01/2033 | 774 | 911 | ||||||||
Fannie Mae Pool | 5.50 | 02/01/2034 | 39,945 | 47,044 | ||||||||
Fannie Mae Pool | 3.00 | 04/01/2034 | 45,604 | 47,819 | ||||||||
Fannie Mae Pool | 3.50 | 04/01/2034 | 146,095 | 154,479 | ||||||||
Fannie Mae Pool | 3.00 | 05/01/2034 | 257,801 | 273,098 | ||||||||
Fannie Mae Pool | 3.00 | 05/01/2034 | 49,427 | 51,830 | ||||||||
Fannie Mae Pool | 5.50 | 05/01/2034 | 107,598 | 126,678 | ||||||||
Fannie Mae Pool | 2.50 | 08/01/2034 | 32,218 | 33,642 | ||||||||
Fannie Mae Pool | 2.50 | 09/01/2034 | 50,447 | 52,677 | ||||||||
Fannie Mae Pool | 3.00 | 11/01/2034 | 14,737 | 15,603 | ||||||||
The accompanying notes are an integral part of the financial statements.
48
VERPLANCK BALANCED FUND
Portfolio of Investments (Continued)
September 30, 2020
Coupon Rate % | Maturity Date | Principal Amount $ | Value $ | |||||||||
Mortgage-Backed Securities — 14.19% | ||||||||||||
Fannie Mae Pool | 2.50 | 01/01/2035 | 83,713 | 87,413 | ||||||||
Fannie Mae Pool | 3.50 | 01/01/2035 | 130,990 | 141,213 | ||||||||
Fannie Mae Pool | 2.50 | 02/01/2035 | 102,821 | 107,366 | ||||||||
Fannie Mae Pool | 3.00 | 02/01/2035 | 105,211 | 110,311 | ||||||||
Fannie Mae Pool | 3.00 | 02/01/2035 | 46,306 | 49,086 | ||||||||
Fannie Mae Pool | 4.50 | 02/01/2035 | 309,049 | 340,569 | ||||||||
Fannie Mae Pool | 2.50 | 03/01/2035 | 74,993 | 78,308 | ||||||||
Fannie Mae Pool | 5.00 | 03/01/2035 | 143,525 | 164,909 | ||||||||
Fannie Mae Pool | 2.50 | 05/01/2035 | 149,997 | 156,679 | ||||||||
Fannie Mae Pool | 2.50 | 05/01/2035 | 95,765 | 100,028 | ||||||||
Fannie Mae Pool | 2.50 | 07/01/2035 | 296,982 | 310,857 | ||||||||
Fannie Mae Pool | 5.00 | 07/01/2035 | 17,808 | 20,470 | ||||||||
Fannie Mae Pool | 3.50 | 11/01/2035 | 19,109 | 20,627 | ||||||||
Fannie Mae Pool | 2.50 | 08/01/2036 | 38,348 | 40,374 | ||||||||
Fannie Mae Pool | 2.50 | 10/01/2036 | 34,956 | 36,818 | ||||||||
Fannie Mae Pool | 3.00 | 11/01/2036 | 14,146 | 14,888 | ||||||||
Fannie Mae Pool | 3.00 | 12/01/2036 | 70,664 | 74,401 | ||||||||
Fannie Mae Pool | 3.00 | 12/01/2036 | 55,254 | 58,179 | ||||||||
Fannie Mae Pool | 3.00 | 12/01/2036 | 39,565 | 41,642 | ||||||||
Fannie Mae Pool | 3.00 | 02/01/2037 | 44,038 | 46,345 | ||||||||
Fannie Mae Pool | 3.00 | 02/01/2037 | 31,183 | 32,820 | ||||||||
Fannie Mae Pool | 3.50 | 02/01/2037 | 39,832 | 42,197 | ||||||||
Fannie Mae Pool | 3.00 | 04/01/2037 | 42,509 | 44,740 | ||||||||
Fannie Mae Pool | 3.00 | 09/01/2037 | 72,683 | 76,106 | ||||||||
Fannie Mae Pool | 5.50 | 09/01/2037 | 81,744 | 94,967 | ||||||||
Fannie Mae Pool | 3.50 | 11/01/2037 | 27,270 | 28,760 | ||||||||
Fannie Mae Pool | 3.00 | 01/01/2038 | 146,372 | 153,988 | ||||||||
Fannie Mae Pool | 3.50 | 01/01/2038 | 57,877 | 61,112 | ||||||||
Fannie Mae Pool | 5.50 | 02/01/2038 | 53,771 | 63,092 | ||||||||
Fannie Mae Pool | 4.00 | 03/01/2038 | 40,578 | 43,817 | ||||||||
Fannie Mae Pool | 6.00 | 05/01/2038 | 97,577 | 114,959 | ||||||||
Fannie Mae Pool | 4.00 | 07/01/2038 | 12,697 | 13,619 | ||||||||
Fannie Mae Pool | 5.50 | 10/01/2038 | 41,949 | 48,982 | ||||||||
Fannie Mae Pool | 4.00 | 12/01/2038 | 76,172 | 81,748 | ||||||||
Fannie Mae Pool | 5.00 | 01/01/2039 | 89,000 | 102,032 | ||||||||
Fannie Mae Pool | 4.00 | 02/01/2039 | 11,492 | 12,243 | ||||||||
Fannie Mae Pool | 4.50 | 03/01/2039 | 1,094 | 1,227 | ||||||||
Fannie Mae Pool | 3.50 | 04/01/2039 | 92,496 | 97,793 | ||||||||
Fannie Mae Pool | 5.50 | 04/01/2039 | 26,003 | 30,082 | ||||||||
Fannie Mae Pool | 3.50 | 06/01/2039 | 54,901 | 59,330 | ||||||||
Fannie Mae Pool | 2.50 | 09/01/2039 | 67,010 | 70,345 | ||||||||
Fannie Mae Pool | 4.50 | 09/01/2039 | 36,814 | 41,273 | ||||||||
Fannie Mae Pool | 3.00 | 10/01/2039 | 51,598 | 54,028 | ||||||||
Fannie Mae Pool | 6.00 | 10/01/2039 | 38,103 | 45,037 | ||||||||
Fannie Mae Pool | 2.50 | 11/01/2039 | 18,771 | 19,705 | ||||||||
The accompanying notes are an integral part of the financial statements.
49
VERPLANCK BALANCED FUND
Portfolio of Investments (Continued)
September 30, 2020
Coupon Rate % | Maturity Date | Principal Amount $ | Value $ | |||||||||
Mortgage-Backed Securities — 14.19% | ||||||||||||
Fannie Mae Pool | 3.00 | 11/01/2039 | �� | 56,500 | 59,161 | |||||||
Fannie Mae Pool | 5.00 | 12/01/2039 | 39,540 | 45,406 | ||||||||
Fannie Mae Pool | 3.00 | 01/01/2040 | 20,755 | 21,732 | ||||||||
Fannie Mae Pool | 3.00 | 02/01/2040 | 43,091 | 45,120 | ||||||||
Fannie Mae Pool | 4.00 | 02/01/2040 | 12,407 | 13,663 | ||||||||
Fannie Mae Pool | 4.50 | 02/01/2040 | 46,024 | 51,739 | ||||||||
Fannie Mae Pool | 2.50 | 03/01/2040 | 107,310 | 112,651 | ||||||||
Fannie Mae Pool | 3.00 | 03/01/2040 | 175,943 | 184,229 | ||||||||
Fannie Mae Pool | 4.50 | 04/01/2040 | 75,354 | 84,542 | ||||||||
Fannie Mae Pool | 2.50 | 05/01/2040 | 71,186 | 74,729 | ||||||||
Fannie Mae Pool | 4.50 | 05/01/2040 | 150,768 | 169,386 | ||||||||
Fannie Mae Pool | 2.00 | 07/01/2040 | 49,210 | 50,907 | ||||||||
Fannie Mae Pool | 4.00 | 07/01/2040 | 32,216 | 35,526 | ||||||||
Fannie Mae Pool | 4.50 | 07/01/2040 | 33,295 | 37,484 | ||||||||
Fannie Mae Pool | 2.00 | 08/01/2040 | 98,949 | 102,362 | ||||||||
Fannie Mae Pool | 5.00 | 08/01/2040 | 56,732 | 65,362 | ||||||||
Fannie Mae Pool | 2.00 | 09/01/2040 | 124,562 | 128,859 | ||||||||
Fannie Mae Pool | 5.00 | 09/01/2040 | 85,694 | 98,725 | ||||||||
Fannie Mae Pool | 3.50 | 01/01/2041 | 147,439 | 159,515 | ||||||||
Fannie Mae Pool | 4.00 | 01/01/2041 | 157,665 | 174,026 | ||||||||
Fannie Mae Pool | 5.00 | 02/01/2041 | 111,968 | 128,961 | ||||||||
Fannie Mae Pool | 5.00 | 02/01/2041 | 71,463 | 82,208 | ||||||||
Fannie Mae Pool | 3.50 | 03/01/2041 | 126,163 | 136,118 | ||||||||
Fannie Mae Pool | 5.00 | 04/01/2041 | 148,314 | 170,676 | ||||||||
Fannie Mae Pool | 3.00 | 05/01/2041 | 176,194 | 186,393 | ||||||||
Fannie Mae Pool | 4.00 | 01/01/2042 | 589,137 | 650,734 | ||||||||
Fannie Mae Pool | 4.00 | 01/01/2042 | 157,235 | 173,304 | ||||||||
Fannie Mae Pool | 4.00 | 01/01/2042 | 105,260 | 115,930 | ||||||||
Fannie Mae Pool | 5.50 | 02/01/2042 | 106,448 | 123,688 | ||||||||
Fannie Mae Pool | 3.50 | 05/01/2042 | 187,873 | 203,201 | ||||||||
Fannie Mae Pool | 5.00 | 05/01/2042 | 69,396 | 79,815 | ||||||||
Fannie Mae Pool | 3.50 | 09/01/2042 | 190,108 | 206,207 | ||||||||
Fannie Mae Pool | 3.50 | 10/01/2042 | 157,943 | 170,884 | ||||||||
Fannie Mae Pool | 3.00 | 11/01/2042 | 108,459 | 115,616 | ||||||||
Fannie Mae Pool | 3.50 | 11/01/2042 | 410,580 | 445,486 | ||||||||
Fannie Mae Pool | 3.50 | 11/01/2042 | 123,492 | 133,990 | ||||||||
Fannie Mae Pool | 3.00 | 01/01/2043 | 260,093 | 277,170 | ||||||||
Fannie Mae Pool | 3.00 | 01/01/2043 | 156,743 | 168,117 | ||||||||
Fannie Mae Pool | 3.00 | 01/01/2043 | 53,671 | 57,574 | ||||||||
Fannie Mae Pool | 3.00 | 04/01/2043 | 243,997 | 259,923 | ||||||||
Fannie Mae Pool | 3.00 | 04/01/2043 | 51,457 | 54,849 | ||||||||
Fannie Mae Pool | 3.00 | 05/01/2043 | 36,995 | 39,937 | ||||||||
Fannie Mae Pool | 3.50 | 05/01/2043 | 196,069 | 211,513 | ||||||||
Fannie Mae Pool | 3.00 | 06/01/2043 | 246,598 | 261,969 | ||||||||
Fannie Mae Pool | 3.00 | 07/01/2043 | 308,762 | 328,906 | ||||||||
The accompanying notes are an integral part of the financial statements.
50
VERPLANCK BALANCED FUND
Portfolio of Investments (Continued)
September 30, 2020
Coupon Rate % | Maturity Date | Principal Amount $ | Value $ | |||||||||
Mortgage-Backed Securities — 14.19% | ||||||||||||
Fannie Mae Pool | 3.00 | 07/01/2043 | 260,014 | 277,787 | ||||||||
Fannie Mae Pool | 3.50 | 07/01/2043 | 225,378 | 244,343 | ||||||||
Fannie Mae Pool | 3.00 | 08/01/2043 | 438,391 | 473,247 | ||||||||
Fannie Mae Pool | 3.00 | 08/01/2043 | 128,791 | 138,160 | ||||||||
Fannie Mae Pool | 3.00 | 08/01/2043 | 125,397 | 133,591 | ||||||||
Fannie Mae Pool | 3.50 | 08/01/2043 | 166,613 | 180,247 | ||||||||
Fannie Mae Pool | 4.00 | 09/01/2043 | 144,197 | 158,170 | ||||||||
Fannie Mae Pool | 4.00 | 09/01/2043 | 98,820 | 109,921 | ||||||||
Fannie Mae Pool | 3.00 | 10/01/2043 | 285,196 | 303,882 | ||||||||
Fannie Mae Pool | 3.00 | 10/01/2043 | 254,050 | 270,619 | ||||||||
Fannie Mae Pool | 5.00 | 11/01/2043 | 32,897 | 36,525 | ||||||||
Fannie Mae Pool | 5.50 | 05/01/2044 | 58,704 | 67,380 | ||||||||
Fannie Mae Pool | 4.00 | 06/01/2044 | 110,344 | 120,102 | ||||||||
Fannie Mae Pool | 4.00 | 08/01/2044 | 113,530 | 124,243 | ||||||||
Fannie Mae Pool | 3.50 | 10/01/2044 | 261,964 | 287,550 | ||||||||
Fannie Mae Pool | 4.00 | 10/01/2044 | 61,306 | 66,600 | ||||||||
Fannie Mae Pool | 4.00 | 10/01/2044 | 7,611 | 8,250 | ||||||||
Fannie Mae Pool | 3.50 | 12/01/2044 | 238,586 | 261,875 | ||||||||
Fannie Mae Pool | 4.00 | 12/01/2044 | 119,875 | 130,277 | ||||||||
Fannie Mae Pool | 3.00 | 01/01/2045 | 256,505 | 273,244 | ||||||||
Fannie Mae Pool | 3.50 | 02/01/2045 | 352,539 | 384,704 | ||||||||
Fannie Mae Pool | 3.50 | 02/01/2045 | 173,499 | 185,221 | ||||||||
Fannie Mae Pool | 4.00 | 03/01/2045 | 16,709 | 18,285 | ||||||||
Fannie Mae Pool | 3.50 | 06/01/2045 | 99,024 | 105,534 | ||||||||
Fannie Mae Pool | 3.50 | 08/01/2045 | 330,288 | 352,045 | ||||||||
Fannie Mae Pool | 3.50 | 08/01/2045 | 139,070 | 148,369 | ||||||||
Fannie Mae Pool | 3.50 | 09/01/2045 | 189,765 | 202,313 | ||||||||
Fannie Mae Pool | 4.50 | 09/01/2045 | 53,356 | 58,337 | ||||||||
Fannie Mae Pool | 4.00 | 10/01/2045 | 39,701 | 42,950 | ||||||||
Fannie Mae Pool | 4.00 | 10/01/2045 | 25,941 | 28,211 | ||||||||
Fannie Mae Pool | 3.00 | 11/01/2045 | 555,138 | 583,828 | ||||||||
Fannie Mae Pool | 3.50 | 11/01/2045 | 127,742 | 136,843 | ||||||||
Fannie Mae Pool | 3.50 | 11/01/2045 | 79,092 | 84,307 | ||||||||
Fannie Mae Pool | 4.00 | 11/01/2045 | 332,204 | 361,330 | ||||||||
Fannie Mae Pool | 4.00 | 11/01/2045 | 11,099 | 12,113 | ||||||||
Fannie Mae Pool | 4.50 | 11/01/2045 | 96,806 | 107,777 | ||||||||
Fannie Mae Pool | 3.00 | 12/01/2045 | 396,295 | 416,653 | ||||||||
Fannie Mae Pool | 3.50 | 12/01/2045 | 213,801 | 228,059 | ||||||||
Fannie Mae Pool | 3.50 | 12/01/2045 | 166,406 | 177,379 | ||||||||
Fannie Mae Pool | 4.50 | 12/01/2045 | 85,985 | 94,578 | ||||||||
Fannie Mae Pool | 3.00 | 01/01/2046 | 150,840 | 158,787 | ||||||||
Fannie Mae Pool | 3.50 | 01/01/2046 | 212,041 | 225,597 | ||||||||
Fannie Mae Pool | 3.50 | 01/01/2046 | 200,570 | 213,995 | ||||||||
Fannie Mae Pool | 4.00 | 01/01/2046 | 157,708 | 170,318 | ||||||||
Fannie Mae Pool | 3.50 | 02/01/2046 | 200,989 | 214,402 | ||||||||
The accompanying notes are an integral part of the financial statements.
51
VERPLANCK BALANCED FUND
Portfolio of Investments (Continued)
September 30, 2020
Coupon Rate % | Maturity Date | Principal Amount $ | Value $ | |||||||||
Mortgage-Backed Securities — 14.19% | ||||||||||||
Fannie Mae Pool | 4.00 | 02/01/2046 | 151,276 | 163,808 | ||||||||
Fannie Mae Pool | 3.50 | 03/01/2046 | 201,841 | 215,905 | ||||||||
Fannie Mae Pool | 3.50 | 03/01/2046 | 193,529 | 206,256 | ||||||||
Fannie Mae Pool | 3.50 | 03/01/2046 | 192,642 | 205,229 | ||||||||
Fannie Mae Pool | 3.50 | 03/01/2046 | 188,386 | 200,809 | ||||||||
Fannie Mae Pool | 3.50 | 03/01/2046 | 182,705 | 194,640 | ||||||||
Fannie Mae Pool | 3.50 | 03/01/2046 | 176,009 | 187,597 | ||||||||
Fannie Mae Pool | 4.00 | 03/01/2046 | 131,288 | 142,025 | ||||||||
Fannie Mae Pool | 3.00 | 04/01/2046 | 109,054 | 115,161 | ||||||||
Fannie Mae Pool | 3.00 | 05/01/2046 | 265,254 | 278,981 | ||||||||
Fannie Mae Pool | 3.00 | 06/01/2046 | 152,437 | 160,177 | ||||||||
Fannie Mae Pool | 4.00 | 07/01/2046 | 100,151 | 106,986 | ||||||||
Fannie Mae Pool | 4.00 | 07/01/2046 | 76,102 | 81,937 | ||||||||
Fannie Mae Pool | 2.50 | 08/01/2046 | 122,248 | 129,202 | ||||||||
Fannie Mae Pool | 2.50 | 08/01/2046 | 18,895 | 20,114 | ||||||||
Fannie Mae Pool | 3.00 | 08/01/2046 | 90,508 | 95,080 | ||||||||
Fannie Mae Pool | 4.50 | 08/01/2046 | 141,558 | 153,077 | ||||||||
Fannie Mae Pool | 2.50 | 09/01/2046 | 19,350 | 20,597 | ||||||||
Fannie Mae Pool | 3.00 | 09/01/2046 | 240,437 | 252,789 | ||||||||
Fannie Mae Pool | 3.00 | 09/01/2046 | 239,352 | 251,358 | ||||||||
Fannie Mae Pool | 3.00 | 09/01/2046 | 56,976 | 59,915 | ||||||||
Fannie Mae Pool | 3.00 | 10/01/2046 | 220,086 | 231,270 | ||||||||
Fannie Mae Pool | 3.00 | 10/01/2046 | 197,688 | 207,950 | ||||||||
Fannie Mae Pool | 3.00 | 10/01/2046 | 15,878 | 16,709 | ||||||||
Fannie Mae Pool | 3.00 | 10/01/2046 | 14,872 | 15,624 | ||||||||
Fannie Mae Pool | 3.00 | 11/01/2046 | 196,499 | 206,665 | ||||||||
Fannie Mae Pool | 3.00 | 11/01/2046 | 63,630 | 66,883 | ||||||||
Fannie Mae Pool | 3.00 | 11/01/2046 | 57,284 | 60,216 | ||||||||
Fannie Mae Pool | 3.00 | 11/01/2046 | 28,579 | 29,972 | ||||||||
Fannie Mae Pool | 4.50 | 11/01/2046 | 39,943 | 43,952 | ||||||||
Fannie Mae Pool | 2.50 | 12/01/2046 | 18,473 | 19,680 | ||||||||
Fannie Mae Pool | 3.00 | 12/01/2046 | 189,038 | 198,819 | ||||||||
Fannie Mae Pool | 3.00 | 12/01/2046 | 160,682 | 169,624 | ||||||||
Fannie Mae Pool | 3.00 | 12/01/2046 | 137,504 | 144,620 | ||||||||
Fannie Mae Pool | 3.50 | 12/01/2046 | 120,774 | 128,571 | ||||||||
Fannie Mae Pool | 3.00 | 01/01/2047 | 122,358 | 128,623 | ||||||||
Fannie Mae Pool | 4.50 | 01/01/2047 | 17,124 | 18,612 | ||||||||
Fannie Mae Pool | 3.00 | 02/01/2047 | 211,293 | 222,103 | ||||||||
Fannie Mae Pool | 3.50 | 02/01/2047 | 30,708 | 32,772 | ||||||||
Fannie Mae Pool | 4.50 | 03/01/2047 | 120,127 | 131,037 | ||||||||
Fannie Mae Pool | 4.50 | 03/01/2047 | 78,078 | 85,119 | ||||||||
Fannie Mae Pool | 3.00 | 04/01/2047 | 221,958 | 233,224 | ||||||||
Fannie Mae Pool | 4.50 | 04/01/2047 | 103,277 | 112,880 | ||||||||
Fannie Mae Pool | 3.50 | 05/01/2047 | 205,447 | 217,587 | ||||||||
Fannie Mae Pool | 4.00 | 05/01/2047 | 118,349 | 127,484 | ||||||||
The accompanying notes are an integral part of the financial statements.
52
VERPLANCK BALANCED FUND
Portfolio of Investments (Continued)
September 30, 2020
Coupon Rate % | Maturity Date | Principal Amount $ | Value $ | |||||||||
Mortgage-Backed Securities — 14.19% | ||||||||||||
Fannie Mae Pool | 4.00 | 05/01/2047 | 114,898 | 123,160 | ||||||||
Fannie Mae Pool | 4.00 | 06/01/2047 | 125,148 | 134,133 | ||||||||
Fannie Mae Pool | 3.50 | 07/01/2047 | 125,181 | 132,429 | ||||||||
Fannie Mae Pool | 3.50 | 07/01/2047 | 118,455 | 125,361 | ||||||||
Fannie Mae Pool | 3.50 | 08/01/2047 | 226,518 | 240,646 | ||||||||
Fannie Mae Pool | 3.50 | 08/01/2047 | 28,333 | 29,993 | ||||||||
Fannie Mae Pool | 4.00 | 08/01/2047 | 94,587 | 101,162 | ||||||||
Fannie Mae Pool | 4.00 | 08/01/2047 | 51,732 | 55,400 | ||||||||
Fannie Mae Pool | 4.00 | 08/01/2047 | 40,753 | 43,703 | ||||||||
Fannie Mae Pool | 3.50 | 09/01/2047 | 194,309 | 205,651 | ||||||||
Fannie Mae Pool | 4.00 | 09/01/2047 | 108,026 | 115,670 | ||||||||
Fannie Mae Pool | 4.50 | 10/01/2047 | 64,205 | 69,740 | ||||||||
Fannie Mae Pool | 3.50 | 11/01/2047 | 206,146 | 217,964 | ||||||||
Fannie Mae Pool | 3.50 | 11/01/2047 | 87,614 | 92,887 | ||||||||
Fannie Mae Pool | 3.00 | 12/01/2047 | 241,719 | 253,777 | ||||||||
Fannie Mae Pool | 3.50 | 12/01/2047 | 318,367 | 337,448 | ||||||||
Fannie Mae Pool | 3.50 | 12/01/2047 | 175,916 | 186,181 | ||||||||
Fannie Mae Pool | 3.50 | 12/01/2047 | 161,622 | 170,610 | ||||||||
Fannie Mae Pool | 4.00 | 12/01/2047 | 183,625 | 196,766 | ||||||||
Fannie Mae Pool | 3.00 | 01/01/2048 | 99,591 | 104,281 | ||||||||
Fannie Mae Pool | 3.50 | 01/01/2048 | 261,449 | 276,016 | ||||||||
Fannie Mae Pool | 4.00 | 01/01/2048 | 137,278 | 147,177 | ||||||||
Fannie Mae Pool | 4.50 | 01/01/2048 | 27,301 | 29,656 | ||||||||
Fannie Mae Pool | 3.50 | 02/01/2048 | 211,017 | 223,368 | ||||||||
Fannie Mae Pool | 4.00 | 02/01/2048 | 271,037 | 289,609 | ||||||||
Fannie Mae Pool | 4.50 | 02/01/2048 | 96,929 | 105,164 | ||||||||
Fannie Mae Pool | 3.50 | 03/01/2048 | 183,012 | 194,162 | ||||||||
Fannie Mae Pool | 4.00 | 03/01/2048 | 66,355 | 71,036 | ||||||||
Fannie Mae Pool | 3.00 | 04/01/2048 | 125,302 | 131,611 | ||||||||
Fannie Mae Pool | 3.50 | 04/01/2048 | 105,008 | 111,038 | ||||||||
Fannie Mae Pool | 4.00 | 04/01/2048 | 126,291 | 135,356 | ||||||||
Fannie Mae Pool | 3.50 | 05/01/2048 | 68,287 | 72,152 | ||||||||
Fannie Mae Pool | 4.50 | 05/01/2048 | 251,753 | 272,640 | ||||||||
Fannie Mae Pool | 4.50 | 05/01/2048 | 167,136 | 181,986 | ||||||||
Fannie Mae Pool | 4.50 | 05/01/2048 | 51,031 | 55,166 | ||||||||
Fannie Mae Pool | 4.00 | 06/01/2048 | 152,887 | 163,343 | ||||||||
Fannie Mae Pool | 4.00 | 06/01/2048 | 126,559 | 135,033 | ||||||||
Fannie Mae Pool | 4.00 | 06/01/2048 | 100,030 | 106,963 | ||||||||
Fannie Mae Pool | 4.00 | 06/01/2048 | 98,280 | 104,908 | ||||||||
Fannie Mae Pool | 4.50 | 06/01/2048 | 40,317 | 43,636 | ||||||||
Fannie Mae Pool | 3.50 | 07/01/2048 | 144,542 | 154,057 | ||||||||
Fannie Mae Pool | 4.00 | 07/01/2048 | 84,025 | 89,496 | ||||||||
Fannie Mae Pool | 4.00 | 07/01/2048 | 61,574 | 65,651 | ||||||||
Fannie Mae Pool | 4.00 | 07/01/2048 | 44,234 | 47,162 | ||||||||
Fannie Mae Pool | 3.50 | 08/01/2048 | 7,115 | 7,529 | ||||||||
The accompanying notes are an integral part of the financial statements.
53
VERPLANCK BALANCED FUND
Portfolio of Investments (Continued)
September 30, 2020
Coupon Rate % | Maturity Date | Principal Amount $ | Value $ | |||||||||
Mortgage-Backed Securities — 14.19% | ||||||||||||
Fannie Mae Pool | 4.00 | 08/01/2048 | 78,508 | 83,805 | ||||||||
Fannie Mae Pool | 5.00 | 08/01/2048 | 44,955 | 49,496 | ||||||||
Fannie Mae Pool | 4.00 | 09/01/2048 | 151,499 | 161,647 | ||||||||
Fannie Mae Pool | 4.00 | 09/01/2048 | 75,805 | 80,747 | ||||||||
Fannie Mae Pool | 3.50 | 10/01/2048 | 43,231 | 45,671 | ||||||||
Fannie Mae Pool | 3.50 | 10/01/2048 | 12,726 | 13,438 | ||||||||
Fannie Mae Pool | 4.00 | 10/01/2048 | 133,199 | 141,870 | ||||||||
Fannie Mae Pool | 3.00 | 11/01/2048 | 220,673 | 231,066 | ||||||||
Fannie Mae Pool | 3.50 | 11/01/2048 | 209,534 | 221,788 | ||||||||
Fannie Mae Pool | 3.50 | 11/01/2048 | 205,457 | 217,504 | ||||||||
Fannie Mae Pool | 3.50 | 11/01/2048 | 132,483 | 140,190 | ||||||||
Fannie Mae Pool | 3.50 | 11/01/2048 | 117,751 | 124,178 | ||||||||
Fannie Mae Pool | 4.00 | 11/01/2048 | 112,537 | 119,918 | ||||||||
Fannie Mae Pool | 4.50 | 11/01/2048 | 45,964 | 49,847 | ||||||||
Fannie Mae Pool | 4.00 | 12/01/2048 | 134,701 | 143,561 | ||||||||
Fannie Mae Pool | 4.00 | 12/01/2048 | 125,529 | 133,765 | ||||||||
Fannie Mae Pool | 4.00 | 12/01/2048 | 108,920 | 116,107 | ||||||||
Fannie Mae Pool | 4.00 | 12/01/2048 | 105,416 | 112,430 | ||||||||
Fannie Mae Pool | 4.00 | 12/01/2048 | 82,915 | 88,298 | ||||||||
Fannie Mae Pool | 4.50 | 12/01/2048 | 79,716 | 86,152 | ||||||||
Fannie Mae Pool | 4.50 | 12/01/2048 | 31,149 | 33,686 | ||||||||
Fannie Mae Pool | 4.00 | 01/01/2049 | 99,816 | 106,362 | ||||||||
Fannie Mae Pool | 4.00 | 01/01/2049 | 74,605 | 79,489 | ||||||||
Fannie Mae Pool | 4.50 | 01/01/2049 | 164,478 | 178,389 | ||||||||
Fannie Mae Pool | 4.50 | 01/01/2049 | 35,569 | 38,463 | ||||||||
Fannie Mae Pool | 3.00 | 02/01/2049 | 139,207 | 146,616 | ||||||||
Fannie Mae Pool | 3.50 | 02/01/2049 | 60,233 | 63,673 | ||||||||
Fannie Mae Pool | 3.50 | 02/01/2049 | 43,587 | 45,927 | ||||||||
Fannie Mae Pool | 3.50 | 02/01/2049 | 20,955 | 22,075 | ||||||||
Fannie Mae Pool | 4.00 | 02/01/2049 | 56,833 | 60,534 | ||||||||
Fannie Mae Pool | 4.00 | 02/01/2049 | 52,476 | 55,954 | ||||||||
Fannie Mae Pool | 4.00 | 02/01/2049 | 32,691 | 34,818 | ||||||||
Fannie Mae Pool | 4.50 | 02/01/2049 | 57,009 | 61,609 | ||||||||
Fannie Mae Pool | 3.50 | 03/01/2049 | 80,879 | 85,232 | ||||||||
Fannie Mae Pool | 4.00 | 03/01/2049 | 135,212 | 144,037 | ||||||||
Fannie Mae Pool | 4.00 | 03/01/2049 | 74,726 | 79,636 | ||||||||
Fannie Mae Pool | 4.00 | 03/01/2049 | 47,692 | 51,134 | ||||||||
Fannie Mae Pool | 4.00 | 03/01/2049 | 26,164 | 27,884 | ||||||||
Fannie Mae Pool | 5.00 | 03/01/2049 | 54,445 | 59,639 | ||||||||
Fannie Mae Pool | 3.50 | 04/01/2049 | 44,131 | 46,515 | ||||||||
Fannie Mae Pool | 3.50 | 04/01/2049 | 11,970 | 12,632 | ||||||||
Fannie Mae Pool | 4.50 | 04/01/2049 | 48,975 | 52,958 | ||||||||
Fannie Mae Pool | 3.50 | 05/01/2049 | 172,195 | 181,459 | ||||||||
Fannie Mae Pool | 3.50 | 05/01/2049 | 156,062 | 164,508 | ||||||||
Fannie Mae Pool | 3.50 | 05/01/2049 | 77,432 | 81,577 | ||||||||
The accompanying notes are an integral part of the financial statements.
54
VERPLANCK BALANCED FUND
Portfolio of Investments (Continued)
September 30, 2020
Coupon Rate % | Maturity Date | Principal Amount $ | Value $ | |||||||||
Mortgage-Backed Securities — 14.19% | ||||||||||||
Fannie Mae Pool | 3.50 | 06/01/2049 | 135,504 | 142,881 | ||||||||
Fannie Mae Pool | 3.50 | 06/01/2049 | 123,968 | 130,584 | ||||||||
Fannie Mae Pool | 4.00 | 06/01/2049 | 187,970 | 200,240 | ||||||||
Fannie Mae Pool | 4.50 | 06/01/2049 | 177,397 | 191,746 | ||||||||
Fannie Mae Pool | 3.00 | 07/01/2049 | 124,632 | 130,501 | ||||||||
Fannie Mae Pool | 3.00 | 07/01/2049 | 76,929 | 80,552 | ||||||||
Fannie Mae Pool | 3.50 | 07/01/2049 | 113,036 | 119,040 | ||||||||
Fannie Mae Pool | 3.00 | 08/01/2049 | 218,950 | 229,261 | ||||||||
Fannie Mae Pool | 3.00 | 08/01/2049 | 205,319 | 214,989 | ||||||||
Fannie Mae Pool | 3.50 | 08/01/2049 | 122,528 | 129,133 | ||||||||
Fannie Mae Pool | 4.00 | 08/01/2049 | 203,366 | 216,900 | ||||||||
Fannie Mae Pool | 2.50 | 09/01/2049 | 221,700 | 232,735 | ||||||||
Fannie Mae Pool | 3.00 | 09/01/2049 | 221,948 | 232,401 | ||||||||
Fannie Mae Pool | 3.00 | 09/01/2049 | 197,815 | 207,131 | ||||||||
Fannie Mae Pool | 3.00 | 09/01/2049 | 42,878 | 44,912 | ||||||||
Fannie Mae Pool | 3.50 | 09/01/2049 | 193,664 | 204,005 | ||||||||
Fannie Mae Pool | 2.50 | 10/01/2049 | 58,259 | 61,159 | ||||||||
Fannie Mae Pool | 3.00 | 10/01/2049 | 192,605 | 201,675 | ||||||||
Fannie Mae Pool | 3.00 | 10/01/2049 | 191,439 | 200,454 | ||||||||
Fannie Mae Pool | 2.50 | 11/01/2049 | 80,992 | 85,024 | ||||||||
Fannie Mae Pool | 3.50 | 11/01/2049 | 138,936 | 146,379 | ||||||||
Fannie Mae Pool | 3.00 | 12/01/2049 | 90,779 | 95,884 | ||||||||
Fannie Mae Pool | 3.00 | 12/01/2049 | 90,505 | 94,767 | ||||||||
Fannie Mae Pool | 2.50 | 01/01/2050 | 362,989 | 381,057 | ||||||||
Fannie Mae Pool | 3.00 | 01/01/2050 | 190,731 | 200,327 | ||||||||
Fannie Mae Pool | 3.00 | 01/01/2050 | 162,939 | 170,612 | ||||||||
Fannie Mae Pool | 3.00 | 01/01/2050 | 144,721 | 151,537 | ||||||||
Fannie Mae Pool | 3.50 | 01/01/2050 | 228,931 | 241,218 | ||||||||
Fannie Mae Pool | 3.00 | 03/01/2050 | 221,907 | 232,358 | ||||||||
Fannie Mae Pool | 3.00 | 03/01/2050 | 185,118 | 194,115 | ||||||||
Fannie Mae Pool | 2.50 | 04/01/2050 | 331,920 | 348,442 | ||||||||
Fannie Mae Pool | 3.00 | 04/01/2050 | 305,835 | 320,295 | ||||||||
Fannie Mae Pool | 3.00 | 04/01/2050 | 190,094 | 199,333 | ||||||||
Fannie Mae Pool | 3.50 | 04/01/2050 | 174,061 | 183,480 | ||||||||
Fannie Mae Pool | 3.00 | 05/01/2050 | 344,304 | 361,246 | ||||||||
Fannie Mae Pool | 3.00 | 05/01/2050 | 335,407 | 351,364 | ||||||||
Fannie Mae Pool | 3.00 | 05/01/2050 | 322,299 | 337,965 | ||||||||
Fannie Mae Pool | 3.00 | 06/01/2050 | 339,866 | 356,773 | ||||||||
Fannie Mae Pool | 3.00 | 06/01/2050 | 95,820 | 100,720 | ||||||||
Fannie Mae Pool | 2.50 | 07/01/2050 | 198,234 | 208,102 | ||||||||
Fannie Mae Pool | 2.50 | 07/01/2050 | 197,058 | 206,866 | ||||||||
Fannie Mae Pool | 3.00 | 07/01/2050 | 196,437 | 206,522 | ||||||||
Fannie Mae Pool | 3.00 | 07/01/2050 | 194,641 | 204,092 | ||||||||
Freddie Mac Gold Pool | 4.00 | 10/01/2020 | 2 | 2 | ||||||||
Freddie Mac Gold Pool | 3.50 | 10/01/2025 | 11,963 | 12,671 | ||||||||
The accompanying notes are an integral part of the financial statements.
55
VERPLANCK BALANCED FUND
Portfolio of Investments (Continued)
September 30, 2020
Coupon Rate % | Maturity Date | Principal Amount $ | Value $ | |||||||||
Mortgage-Backed Securities — 14.19% | ||||||||||||
Freddie Mac Gold Pool | 3.50 | 11/01/2025 | 80,711 | 85,523 | ||||||||
Freddie Mac Gold Pool | 5.50 | 12/01/2025 | 498 | 552 | ||||||||
Freddie Mac Gold Pool | 3.50 | 07/01/2026 | 35,588 | 37,679 | ||||||||
Freddie Mac Gold Pool | 4.00 | 07/01/2026 | 27,883 | 29,650 | ||||||||
Freddie Mac Gold Pool | 3.50 | 01/01/2027 | 63,107 | 66,903 | ||||||||
Freddie Mac Gold Pool | 3.00 | 02/01/2027 | 47,991 | 51,156 | ||||||||
Freddie Mac Gold Pool | 2.50 | 11/01/2027 | 62,007 | 65,493 | ||||||||
Freddie Mac Gold Pool | 3.00 | 02/01/2029 | 115,359 | 121,322 | ||||||||
Freddie Mac Gold Pool | 3.00 | 06/01/2029 | 142,684 | 152,736 | ||||||||
Freddie Mac Gold Pool | 2.50 | 09/01/2029 | 63,939 | 66,861 | ||||||||
Freddie Mac Gold Pool | 3.00 | 02/01/2031 | 136,966 | 144,094 | ||||||||
Freddie Mac Gold Pool | 4.50 | 03/01/2031 | 99,498 | 109,787 | ||||||||
Freddie Mac Gold Pool | 2.50 | 11/01/2031 | 162,041 | 173,035 | ||||||||
Freddie Mac Gold Pool | 2.50 | 11/01/2031 | 34,444 | 36,067 | ||||||||
Freddie Mac Gold Pool | 2.50 | 12/01/2031 | 142,788 | 149,512 | ||||||||
Freddie Mac Gold Pool | 2.00 | 01/01/2032 | 143,649 | 150,125 | ||||||||
Freddie Mac Gold Pool | 2.50 | 02/01/2032 | 134,938 | 141,103 | ||||||||
Freddie Mac Gold Pool | 3.00 | 02/01/2032 | 67,067 | 70,458 | ||||||||
Freddie Mac Gold Pool | 2.50 | 11/01/2032 | 204,605 | 213,940 | ||||||||
Freddie Mac Gold Pool | 3.00 | 12/01/2032 | 125,630 | 131,880 | ||||||||
Freddie Mac Gold Pool | 2.50 | 01/01/2033 | 61,160 | 65,008 | ||||||||
Freddie Mac Gold Pool | 3.00 | 02/01/2033 | 244,398 | 256,633 | ||||||||
Freddie Mac Gold Pool | 2.50 | 03/01/2033 | 155,986 | 163,334 | ||||||||
Freddie Mac Gold Pool | 2.50 | 04/01/2033 | 70,037 | 73,230 | ||||||||
Freddie Mac Gold Pool | 2.50 | 05/01/2033 | 64,725 | 67,645 | ||||||||
Freddie Mac Gold Pool | 2.50 | 06/01/2033 | 121,152 | 126,616 | ||||||||
Freddie Mac Gold Pool | 2.50 | 07/01/2033 | 118,864 | 124,283 | ||||||||
Freddie Mac Gold Pool | 3.50 | 09/01/2033 | 56,904 | 60,209 | ||||||||
Freddie Mac Gold Pool | 3.00 | 12/01/2033 | 53,309 | 55,937 | ||||||||
Freddie Mac Gold Pool | 3.50 | 12/01/2033 | 32,602 | 34,541 | ||||||||
Freddie Mac Gold Pool | 3.00 | 04/01/2034 | 49,166 | 51,613 | ||||||||
Freddie Mac Gold Pool | 3.00 | 12/01/2034 | 282,128 | 298,620 | ||||||||
Freddie Mac Gold Pool | 3.50 | 03/01/2035 | 122,384 | 132,279 | ||||||||
Freddie Mac Gold Pool | 3.00 | 04/01/2035 | 32,839 | 34,438 | ||||||||
Freddie Mac Gold Pool | 3.50 | 05/01/2035 | 109,050 | 117,889 | ||||||||
Freddie Mac Gold Pool | 4.00 | 10/01/2035 | 109,412 | 119,346 | ||||||||
Freddie Mac Gold Pool | 5.50 | 03/01/2036 | 51,553 | 59,852 | ||||||||
Freddie Mac Gold Pool | 4.50 | 06/01/2036 | 317,504 | 350,497 | ||||||||
Freddie Mac Gold Pool | 3.00 | 11/01/2036 | 55,800 | 58,769 | ||||||||
Freddie Mac Gold Pool | 3.00 | 02/01/2037 | 57,218 | 60,229 | ||||||||
Freddie Mac Gold Pool | 5.00 | 02/01/2037 | 55,255 | 63,561 | ||||||||
Freddie Mac Gold Pool | 3.50 | 06/01/2037 | 25,607 | 27,175 | ||||||||
Freddie Mac Gold Pool | 5.50 | 06/01/2037 | 38,856 | 45,140 | ||||||||
Freddie Mac Gold Pool | 5.50 | 12/01/2037 | 78,208 | 90,934 | ||||||||
Freddie Mac Gold Pool | 5.50 | 07/01/2038 | 36,605 | 42,373 | ||||||||
The accompanying notes are an integral part of the financial statements.
56
VERPLANCK BALANCED FUND
Portfolio of Investments (Continued)
September 30, 2020
Coupon Rate % | Maturity Date | Principal Amount $ | Value $ | |||||||||
Mortgage-Backed Securities — 14.19% | ||||||||||||
Freddie Mac Gold Pool | 5.00 | 10/01/2038 | 36,165 | 41,596 | ||||||||
Freddie Mac Gold Pool | 5.50 | 03/01/2039 | 35,548 | 41,144 | ||||||||
Freddie Mac Gold Pool | 5.00 | 04/01/2039 | 22,579 | 24,748 | ||||||||
Freddie Mac Gold Pool | 4.50 | 06/01/2039 | 26,557 | 29,648 | ||||||||
Freddie Mac Gold Pool | 4.50 | 10/01/2039 | 44,254 | 49,651 | ||||||||
Freddie Mac Gold Pool | 4.00 | 11/01/2039 | 83,213 | 91,856 | ||||||||
Freddie Mac Gold Pool | 5.50 | 12/01/2039 | 38,783 | 43,013 | ||||||||
Freddie Mac Gold Pool | 5.50 | 03/01/2040 | 119,518 | 137,945 | ||||||||
Freddie Mac Gold Pool | 4.00 | 12/01/2040 | 144,174 | 158,839 | ||||||||
Freddie Mac Gold Pool | 4.00 | 12/01/2040 | 111,950 | 123,568 | ||||||||
Freddie Mac Gold Pool | 4.50 | 12/01/2040 | 67,275 | 75,737 | ||||||||
Freddie Mac Gold Pool | 5.50 | 06/01/2041 | 49,718 | 57,786 | ||||||||
Freddie Mac Gold Pool | 5.50 | 06/01/2041 | 48,376 | 56,052 | ||||||||
Freddie Mac Gold Pool | 3.50 | 11/01/2041 | 167,723 | 181,319 | ||||||||
Freddie Mac Gold Pool | 4.00 | 11/01/2041 | 193,831 | 215,570 | ||||||||
Freddie Mac Gold Pool | 3.50 | 04/01/2042 | 229,878 | 248,113 | ||||||||
Freddie Mac Gold Pool | 3.50 | 06/01/2042 | 82,178 | 88,704 | ||||||||
Freddie Mac Gold Pool | 3.50 | 09/01/2042 | 84,705 | 91,637 | ||||||||
Freddie Mac Gold Pool | 3.50 | 09/01/2042 | 82,616 | 91,180 | ||||||||
Freddie Mac Gold Pool | 3.00 | 10/01/2042 | 295,195 | 314,645 | ||||||||
Freddie Mac Gold Pool | 3.00 | 10/01/2042 | 47,456 | 50,524 | ||||||||
Freddie Mac Gold Pool | 3.00 | 12/01/2042 | 83,057 | 88,506 | ||||||||
Freddie Mac Gold Pool | 3.00 | 01/01/2043 | 374,615 | 399,099 | ||||||||
Freddie Mac Gold Pool | 2.50 | 02/01/2043 | 28,680 | 30,560 | ||||||||
Freddie Mac Gold Pool | 3.00 | 02/01/2043 | 95,609 | 103,234 | ||||||||
Freddie Mac Gold Pool | 3.00 | 03/01/2043 | 70,901 | 75,546 | ||||||||
Freddie Mac Gold Pool | 3.50 | 06/01/2043 | 92,374 | 100,039 | ||||||||
Freddie Mac Gold Pool | 3.50 | 07/01/2043 | 9,545 | 10,351 | ||||||||
Freddie Mac Gold Pool | 3.00 | 08/01/2043 | 225,896 | 240,757 | ||||||||
Freddie Mac Gold Pool | 3.50 | 08/01/2043 | 152,898 | 164,397 | ||||||||
Freddie Mac Gold Pool | 4.50 | 11/01/2043 | 113,443 | 127,281 | ||||||||
Freddie Mac Gold Pool | 3.50 | 01/01/2044 | 102,165 | 110,575 | ||||||||
Freddie Mac Gold Pool | 4.50 | 05/01/2044 | 5,512 | 5,969 | ||||||||
Freddie Mac Gold Pool | 3.50 | 06/01/2044 | 47,738 | 51,079 | ||||||||
Freddie Mac Gold Pool | 5.00 | 06/01/2044 | 56,632 | 63,253 | ||||||||
Freddie Mac Gold Pool | 4.00 | 01/01/2045 | 104,393 | 114,031 | ||||||||
Freddie Mac Gold Pool | 3.50 | 02/01/2045 | 91,329 | 97,997 | ||||||||
Freddie Mac Gold Pool | 4.50 | 03/01/2045 | 136,195 | 150,303 | ||||||||
Freddie Mac Gold Pool | 3.00 | 09/01/2045 | 241,275 | 254,293 | ||||||||
Freddie Mac Gold Pool | 3.50 | 11/01/2045 | 43,132 | 46,061 | ||||||||
Freddie Mac Gold Pool | 4.00 | 12/01/2045 | 209,485 | 228,836 | ||||||||
Freddie Mac Gold Pool | 3.50 | 01/01/2046 | 190,393 | 204,170 | ||||||||
Freddie Mac Gold Pool | 4.00 | 01/01/2046 | 155,966 | 169,044 | ||||||||
Freddie Mac Gold Pool | 3.00 | 03/01/2046 | 315,937 | 332,238 | ||||||||
Freddie Mac Gold Pool | 4.00 | 03/01/2046 | 12,874 | 13,989 | ||||||||
The accompanying notes are an integral part of the financial statements.
57
VERPLANCK BALANCED FUND
Portfolio of Investments (Continued)
September 30, 2020
Coupon Rate % | Maturity Date | Principal Amount $ | Value $ | |||||||||
Mortgage-Backed Securities — 14.19% | ||||||||||||
Freddie Mac Gold Pool | 4.00 | 04/01/2046 | 581,544 | 631,162 | ||||||||
Freddie Mac Gold Pool | 4.50 | 04/01/2046 | 30,800 | 33,901 | ||||||||
Freddie Mac Gold Pool | 3.00 | 05/01/2046 | 251,656 | 264,574 | ||||||||
Freddie Mac Gold Pool | 3.50 | 06/01/2046 | 154,895 | 164,051 | ||||||||
Freddie Mac Gold Pool | 2.50 | 09/01/2046 | 29,585 | 31,518 | ||||||||
Freddie Mac Gold Pool | 2.50 | 12/01/2046 | 25,329 | 26,977 | ||||||||
Freddie Mac Gold Pool | 4.50 | 03/01/2047 | 130,205 | 142,420 | ||||||||
Freddie Mac Gold Pool | 5.00 | 03/01/2047 | 143,186 | 158,571 | ||||||||
Freddie Mac Gold Pool | 4.50 | 11/01/2047 | 131,678 | 143,284 | ||||||||
Freddie Mac Gold Pool | 3.00 | 12/01/2047 | 43,565 | 46,904 | ||||||||
Freddie Mac Gold Pool | 3.50 | 12/01/2047 | 29,158 | 30,896 | ||||||||
Freddie Mac Gold Pool | 4.00 | 12/01/2047 | 154,557 | 165,543 | ||||||||
Freddie Mac Gold Pool | 5.00 | 02/01/2048 | 16,418 | 18,173 | ||||||||
Freddie Mac Gold Pool | 3.00 | 03/01/2048 | 125,723 | 131,671 | ||||||||
Freddie Mac Gold Pool | 3.50 | 03/01/2048 | 35,304 | 37,363 | ||||||||
Freddie Mac Gold Pool | 3.00 | 04/01/2048 | 136,010 | 142,444 | ||||||||
Freddie Mac Gold Pool | 3.50 | 05/01/2048 | 67,549 | 71,268 | ||||||||
Freddie Mac Gold Pool | 4.50 | 05/01/2048 | 43,656 | 47,286 | ||||||||
Freddie Mac Gold Pool | 5.00 | 05/01/2048 | 67,316 | 74,052 | ||||||||
Freddie Mac Gold Pool | 3.50 | 07/01/2048 | 205,662 | 216,699 | ||||||||
Freddie Mac Gold Pool | 4.50 | 07/01/2048 | 81,923 | 88,743 | ||||||||
Freddie Mac Gold Pool | 5.00 | 07/01/2048 | 13,366 | 14,684 | ||||||||
Freddie Mac Gold Pool | 3.50 | 08/01/2048 | 42,803 | 45,184 | ||||||||
Freddie Mac Gold Pool | 4.00 | 09/01/2048 | 81,200 | 87,026 | ||||||||
Freddie Mac Gold Pool | 4.00 | 09/01/2048 | 53,163 | 56,771 | ||||||||
Freddie Mac Gold Pool | 4.00 | 09/01/2048 | 39,665 | 42,281 | ||||||||
Freddie Mac Gold Pool | 4.50 | 09/01/2048 | 40,881 | 44,201 | ||||||||
Freddie Mac Gold Pool | 3.50 | 11/01/2048 | 43,694 | 46,052 | ||||||||
Freddie Mac Gold Pool | 4.50 | 11/01/2048 | 45,647 | 49,377 | ||||||||
Freddie Mac Pool | 4.00 | 03/01/2034 | 45,253 | 48,018 | ||||||||
Freddie Mac Pool | 3.00 | 05/01/2034 | 79,858 | 83,786 | ||||||||
Freddie Mac Pool | 2.50 | 08/01/2034 | 55,100 | 57,558 | ||||||||
Freddie Mac Pool | 2.50 | 02/01/2035 | 63,426 | 66,261 | ||||||||
Freddie Mac Pool | 2.50 | 05/01/2035 | 117,201 | 122,448 | ||||||||
Freddie Mac Pool | 2.50 | 07/01/2035 | 199,849 | 208,844 | ||||||||
Freddie Mac Pool | 2.00 | 09/01/2035 | 297,963 | 309,971 | ||||||||
Freddie Mac Pool | 2.50 | 04/01/2040 | 247,493 | 259,812 | ||||||||
Freddie Mac Pool | 2.50 | 06/01/2040 | 72,965 | 76,597 | ||||||||
Freddie Mac Pool | 3.00 | 02/01/2043 | 168,418 | 179,485 | ||||||||
Freddie Mac Pool | 3.00 | 08/01/2043 | 303,346 | 323,098 | ||||||||
Freddie Mac Pool | 4.00 | 07/01/2044 | 164,401 | 179,462 | ||||||||
Freddie Mac Pool | 3.50 | 01/01/2045 | 125,624 | 134,745 | ||||||||
Freddie Mac Pool | 3.50 | 07/01/2045 | 228,690 | 242,654 | ||||||||
Freddie Mac Pool | 3.50 | 12/01/2045 | 372,148 | 397,122 | ||||||||
Freddie Mac Pool | 4.00 | 12/01/2045 | 108,062 | 117,539 | ||||||||
The accompanying notes are an integral part of the financial statements.
58
VERPLANCK BALANCED FUND
Portfolio of Investments (Continued)
September 30, 2020
Coupon Rate % | Maturity Date | Principal Amount $ | Value $ | |||||||||
Mortgage-Backed Securities — 14.19% | ||||||||||||
Freddie Mac Pool | 3.50 | 03/01/2046 | 188,303 | 200,743 | ||||||||
Freddie Mac Pool | 3.00 | 04/01/2046 | 235,968 | 248,063 | ||||||||
Freddie Mac Pool | 3.50 | 04/01/2046 | 202,662 | 217,190 | ||||||||
Freddie Mac Pool | 3.00 | 09/01/2046 | 160,476 | 168,751 | ||||||||
Freddie Mac Pool | 3.00 | 11/01/2046 | 444,708 | 467,148 | ||||||||
Freddie Mac Pool | 3.00 | 11/01/2046 | 167,430 | 176,061 | ||||||||
Freddie Mac Pool | 3.00 | 12/01/2046 | 274,261 | 288,500 | ||||||||
Freddie Mac Pool | 3.00 | 01/01/2047 | 306,309 | 322,546 | ||||||||
Freddie Mac Pool | 3.00 | 03/01/2047 | 55,052 | 57,810 | ||||||||
Freddie Mac Pool | 4.00 | 03/01/2047 | 133,233 | 143,559 | ||||||||
Freddie Mac Pool | 3.00 | 04/01/2047 | 81,790 | 85,759 | ||||||||
Freddie Mac Pool | 3.50 | 04/01/2047 | 143,484 | 151,968 | ||||||||
Freddie Mac Pool | 3.50 | 11/01/2047 | 209,117 | 221,148 | ||||||||
Freddie Mac Pool | 3.50 | 11/01/2047 | 188,041 | 198,536 | ||||||||
Freddie Mac Pool | 3.50 | 12/01/2047 | 175,715 | 186,025 | ||||||||
Freddie Mac Pool | 3.50 | 12/01/2047 | 175,181 | 185,405 | ||||||||
Freddie Mac Pool | 3.50 | 03/01/2048 | 89,375 | 94,431 | ||||||||
Freddie Mac Pool | 3.00 | 06/01/2048 | 83,310 | 87,233 | ||||||||
Freddie Mac Pool | 3.50 | 06/01/2048 | 92,142 | 97,192 | ||||||||
Freddie Mac Pool | 4.00 | 07/01/2048 | 116,685 | 124,364 | ||||||||
Freddie Mac Pool | 4.00 | 08/01/2048 | 191,332 | 203,888 | ||||||||
Freddie Mac Pool | 4.00 | 09/01/2048 | 72,763 | 77,573 | ||||||||
Freddie Mac Pool | 3.50 | 10/01/2048 | 78,911 | 83,127 | ||||||||
Freddie Mac Pool | 4.00 | 10/01/2048 | 116,541 | 124,190 | ||||||||
Freddie Mac Pool | 4.00 | 11/01/2048 | 37,365 | 39,818 | ||||||||
Freddie Mac Pool | 4.50 | 11/01/2048 | 41,647 | 45,040 | ||||||||
Freddie Mac Pool | 4.50 | 02/01/2049 | 697,505 | 753,866 | ||||||||
Freddie Mac Pool | 3.50 | 03/01/2049 | 55,812 | 58,775 | ||||||||
Freddie Mac Pool | 4.00 | 03/01/2049 | 109,554 | 116,782 | ||||||||
Freddie Mac Pool | 5.00 | 03/01/2049 | 257,557 | 281,995 | ||||||||
Freddie Mac Pool | 3.50 | 04/01/2049 | 77,858 | 82,103 | ||||||||
Freddie Mac Pool | 4.00 | 04/01/2049 | 31,415 | 33,503 | ||||||||
Freddie Mac Pool | 3.50 | 05/01/2049 | 86,804 | 91,443 | ||||||||
Freddie Mac Pool | 4.00 | 05/01/2049 | 257,480 | 274,418 | ||||||||
Freddie Mac Pool | 3.00 | 07/01/2049 | 207,101 | 217,073 | ||||||||
Freddie Mac Pool | 3.50 | 07/01/2049 | 174,654 | 183,996 | ||||||||
Freddie Mac Pool | 3.00 | 09/01/2049 | 199,853 | 209,265 | ||||||||
Freddie Mac Pool | 5.00 | 10/01/2049 | 96,816 | 106,048 | ||||||||
Freddie Mac Pool | 3.00 | 11/01/2049 | 290,887 | 304,586 | ||||||||
Freddie Mac Pool | 4.00 | 01/01/2050 | 267,597 | 285,214 | ||||||||
Freddie Mac Pool | 3.00 | 03/01/2050 | 94,149 | 98,664 | ||||||||
Freddie Mac Pool | 2.50 | 04/01/2050 | 276,341 | 290,096 | ||||||||
Freddie Mac Pool | 3.00 | 04/01/2050 | 270,449 | 283,185 | ||||||||
Freddie Mac Pool | 3.00 | 04/01/2050 | 182,549 | 191,351 | ||||||||
Freddie Mac Pool | 4.00 | 04/01/2050 | 265,552 | 283,223 | ||||||||
The accompanying notes are an integral part of the financial statements.
59
VERPLANCK BALANCED FUND
Portfolio of Investments (Continued)
September 30, 2020
Coupon Rate % | Maturity Date | Principal Amount $ | Value $ | |||||||||
Mortgage-Backed Securities — 14.19% | ||||||||||||
Freddie Mac Pool | 4.50 | 04/01/2050 | 307,124 | 332,592 | ||||||||
Freddie Mac Pool | 2.50 | 05/01/2050 | 334,155 | 350,788 | ||||||||
Freddie Mac Pool | 2.50 | 05/01/2050 | 293,341 | 307,942 | ||||||||
Freddie Mac Pool | 3.00 | 05/01/2050 | 151,856 | 159,007 | ||||||||
Freddie Mac Pool | 2.50 | 06/01/2050 | 341,529 | 358,529 | ||||||||
Freddie Mac Pool | 3.00 | 06/01/2050 | 336,535 | 352,532 | ||||||||
Freddie Mac Pool | 3.00 | 07/01/2050 | 197,229 | 206,816 | ||||||||
Freddie Mac Pool | 3.00 | 07/01/2050 | 196,348 | 205,891 | ||||||||
Freddie Mac Pool | 2.50 | 08/01/2050 | 222,789 | 233,879 | ||||||||
Ginnie Mae 4 | 2.50 | 10/20/2050 | 3,200,000 | 3,360,625 | ||||||||
Ginnie Mae 4 | 3.00 | 10/20/2050 | 3,300,000 | 3,455,268 | ||||||||
Ginnie Mae 4 | 3.50 | 10/20/2050 | 150,000 | 157,939 | ||||||||
Ginnie Mae 4 | 4.00 | 10/20/2050 | 550,000 | 584,364 | ||||||||
Ginnie Mae 4 | 2.00 | 11/20/2050 | 250,000 | 259,219 | ||||||||
Ginnie Mae 4 | 2.50 | 11/20/2050 | 725,000 | 760,060 | ||||||||
Ginnie Mae I Pool | 5.50 | 07/15/2038 | 87,013 | 100,880 | ||||||||
Ginnie Mae I Pool | 5.50 | 12/15/2038 | 46,146 | 53,035 | ||||||||
Ginnie Mae I Pool | 5.00 | 03/15/2039 | 29,863 | 34,243 | ||||||||
Ginnie Mae I Pool | 5.00 | 04/15/2039 | 135,595 | 154,373 | ||||||||
Ginnie Mae I Pool | 5.00 | 07/15/2039 | 21,982 | 25,166 | ||||||||
Ginnie Mae I Pool | 4.50 | 11/15/2039 | 54,913 | 60,669 | ||||||||
Ginnie Mae I Pool | 5.00 | 12/15/2039 | 2,088 | 2,339 | ||||||||
Ginnie Mae I Pool | 4.50 | 05/15/2040 | 12,887 | 14,245 | ||||||||
Ginnie Mae I Pool | 4.50 | 08/15/2040 | 3,647 | 4,043 | ||||||||
Ginnie Mae I Pool | 5.00 | 12/15/2040 | 23,340 | 26,726 | ||||||||
Ginnie Mae I Pool | 5.00 | 04/15/2041 | 21,881 | 24,107 | ||||||||
Ginnie Mae I Pool | 5.00 | 05/15/2041 | 72,455 | 81,541 | ||||||||
Ginnie Mae I Pool | 3.00 | 11/15/2042 | 88,307 | 94,904 | ||||||||
Ginnie Mae I Pool | 3.00 | 05/15/2043 | 10,439 | 10,893 | ||||||||
Ginnie Mae I Pool | 3.50 | 11/15/2044 | 11,959 | 12,582 | ||||||||
Ginnie Mae I Pool | 3.50 | 02/15/2045 | 137,070 | 144,568 | ||||||||
Ginnie Mae I Pool | 3.00 | 03/15/2045 | 80,017 | 83,352 | ||||||||
Ginnie Mae I Pool | 3.50 | 03/15/2045 | 31,066 | 32,867 | ||||||||
Ginnie Mae I Pool | 4.00 | 07/15/2045 | 10,973 | 11,597 | ||||||||
Ginnie Mae I Pool | 3.00 | 08/15/2045 | 98,676 | 102,717 | ||||||||
Ginnie Mae I Pool | 4.00 | 12/15/2045 | 16,797 | 17,997 | ||||||||
Ginnie Mae I Pool | 4.00 | 03/15/2046 | 89,869 | 96,157 | ||||||||
Ginnie Mae I Pool | 4.00 | 03/15/2046 | 22,484 | 24,050 | ||||||||
Ginnie Mae I Pool | 4.00 | 05/15/2046 | 26,370 | 27,872 | ||||||||
Ginnie Mae I Pool | 3.50 | 06/15/2046 | 111,145 | 117,090 | ||||||||
Ginnie Mae I Pool | 4.50 | 08/15/2046 | 130,249 | 143,686 | ||||||||
Ginnie Mae I Pool | 4.50 | 08/15/2046 | 68,291 | 75,641 | ||||||||
Ginnie Mae I Pool | 2.50 | 09/15/2046 | 32,535 | 34,198 | ||||||||
Ginnie Mae I Pool | 4.50 | 10/15/2046 | 40,376 | 44,280 | ||||||||
Ginnie Mae I Pool | 4.00 | 07/15/2047 | 51,062 | 53,991 | ||||||||
The accompanying notes are an integral part of the financial statements.
60
VERPLANCK BALANCED FUND
Portfolio of Investments (Continued)
September 30, 2020
Coupon Rate % | Maturity Date | Principal Amount $ | Value $ | |||||||||
Mortgage-Backed Securities — 14.19% | ||||||||||||
Ginnie Mae I Pool | 4.50 | 12/15/2047 | 38,790 | 42,558 | ||||||||
Ginnie Mae II Pool | 3.00 | 01/20/2027 | 139,526 | 145,892 | ||||||||
Ginnie Mae II Pool | 2.50 | 08/20/2027 | 18,943 | 19,597 | ||||||||
Ginnie Mae II Pool | 2.50 | 03/20/2028 | 18,099 | 18,911 | ||||||||
Ginnie Mae II Pool | 3.00 | 10/20/2028 | 18,625 | 19,524 | ||||||||
Ginnie Mae II Pool | 3.50 | 07/20/2030 | 34,153 | 36,201 | ||||||||
Ginnie Mae II Pool | 2.50 | 12/20/2030 | 96,840 | 100,983 | ||||||||
Ginnie Mae II Pool | 3.00 | 07/20/2032 | 25,144 | 26,362 | ||||||||
Ginnie Mae II Pool | 5.50 | 02/20/2034 | 11,512 | 13,654 | ||||||||
Ginnie Mae II Pool | 5.00 | 06/20/2040 | 22,306 | 25,475 | ||||||||
Ginnie Mae II Pool | 4.00 | 08/20/2040 | 36,510 | 40,144 | ||||||||
Ginnie Mae II Pool | 5.00 | 09/20/2040 | 47,350 | 54,034 | ||||||||
Ginnie Mae II Pool | 4.00 | 10/20/2040 | 37,821 | 41,283 | ||||||||
Ginnie Mae II Pool | 4.50 | 10/20/2040 | 27,851 | 30,912 | ||||||||
Ginnie Mae II Pool | 4.00 | 01/20/2041 | 34,886 | 38,367 | ||||||||
Ginnie Mae II Pool | 4.00 | 04/20/2041 | 34,040 | 37,152 | ||||||||
Ginnie Mae II Pool | 4.50 | 04/20/2041 | 22,415 | 24,878 | ||||||||
Ginnie Mae II Pool | 5.00 | 04/20/2041 | 4,543 | 5,182 | ||||||||
Ginnie Mae II Pool | 4.50 | 05/20/2041 | 91,838 | 101,957 | ||||||||
Ginnie Mae II Pool | 4.50 | 08/20/2041 | 172,222 | 191,206 | ||||||||
Ginnie Mae II Pool | 4.00 | 10/20/2041 | 38,390 | 42,213 | ||||||||
Ginnie Mae II Pool | 3.50 | 04/20/2042 | 28,798 | 31,235 | ||||||||
Ginnie Mae II Pool | 4.00 | 04/20/2042 | 36,919 | 40,598 | ||||||||
Ginnie Mae II Pool | 3.50 | 05/20/2042 | 194,126 | 210,625 | ||||||||
Ginnie Mae II Pool | 3.00 | 08/20/2042 | 71,345 | 75,270 | ||||||||
Ginnie Mae II Pool | 3.50 | 08/20/2042 | 109,932 | 119,276 | ||||||||
Ginnie Mae II Pool | 3.00 | 09/20/2042 | 172,460 | 181,948 | ||||||||
Ginnie Mae II Pool | 3.50 | 09/20/2042 | 58,112 | 63,051 | ||||||||
Ginnie Mae II Pool | 3.50 | 10/20/2042 | 174,983 | 189,856 | ||||||||
Ginnie Mae II Pool | 3.00 | 11/20/2042 | 208,822 | 220,229 | ||||||||
Ginnie Mae II Pool | 3.00 | 01/20/2043 | 216,569 | 228,409 | ||||||||
Ginnie Mae II Pool | 3.50 | 01/20/2043 | 248,490 | 269,611 | ||||||||
Ginnie Mae II Pool | 3.50 | 03/20/2043 | 80,729 | 87,591 | ||||||||
Ginnie Mae II Pool | 3.50 | 04/20/2043 | 79,894 | 86,685 | ||||||||
Ginnie Mae II Pool | 3.50 | 05/20/2043 | 111,812 | 121,159 | ||||||||
Ginnie Mae II Pool | 3.50 | 08/20/2043 | 126,778 | 137,391 | ||||||||
Ginnie Mae II Pool | 3.50 | 09/20/2043 | 131,177 | 142,488 | ||||||||
Ginnie Mae II Pool | 3.00 | 11/20/2043 | 176,531 | 186,209 | ||||||||
Ginnie Mae II Pool | 5.00 | 12/20/2043 | 9,520 | 10,873 | ||||||||
Ginnie Mae II Pool | 3.50 | 02/20/2044 | 166,855 | 181,063 | ||||||||
Ginnie Mae II Pool | 3.50 | 07/20/2044 | 136,699 | 147,390 | ||||||||
Ginnie Mae II Pool | 4.50 | 07/20/2044 | 7,005 | 7,784 | ||||||||
Ginnie Mae II Pool | 3.50 | 10/20/2044 | 175,626 | 189,552 | ||||||||
Ginnie Mae II Pool | 4.50 | 10/20/2044 | 9,079 | 10,086 | ||||||||
Ginnie Mae II Pool | 3.00 | 02/20/2045 | 109,907 | 116,043 | ||||||||
The accompanying notes are an integral part of the financial statements.
61
VERPLANCK BALANCED FUND
Portfolio of Investments (Continued)
September 30, 2020
Coupon Rate % | Maturity Date | Principal Amount $ | Value $ | |||||||||
Mortgage-Backed Securities — 14.19% | ||||||||||||
Ginnie Mae II Pool | 3.50 | 02/20/2045 | 188,077 | 201,249 | ||||||||
Ginnie Mae II Pool | 3.50 | 03/20/2045 | 157,135 | 167,735 | ||||||||
Ginnie Mae II Pool | 4.50 | 03/20/2045 | 100,809 | 111,984 | ||||||||
Ginnie Mae II Pool | 5.50 | 03/20/2045 | 76,526 | 90,446 | ||||||||
Ginnie Mae II Pool | 3.00 | 04/20/2045 | 271,077 | 287,339 | ||||||||
Ginnie Mae II Pool | 3.50 | 04/20/2045 | 153,433 | 163,789 | ||||||||
Ginnie Mae II Pool | 3.50 | 07/20/2045 | 230,994 | 246,630 | ||||||||
Ginnie Mae II Pool | 3.50 | 09/20/2045 | 175,374 | 187,512 | ||||||||
Ginnie Mae II Pool | 4.00 | 10/20/2045 | 122,836 | 132,630 | ||||||||
Ginnie Mae II Pool | 3.00 | 11/20/2045 | 227,563 | 238,975 | ||||||||
Ginnie Mae II Pool | 3.50 | 11/20/2045 | 116,598 | 124,479 | ||||||||
Ginnie Mae II Pool | 4.00 | 11/20/2045 | 181,512 | 195,667 | ||||||||
Ginnie Mae II Pool | 3.50 | 12/20/2045 | 177,060 | 189,040 | ||||||||
Ginnie Mae II Pool | 3.50 | 01/20/2046 | 146,934 | 156,848 | ||||||||
Ginnie Mae II Pool | 3.00 | 03/20/2046 | 119,232 | 125,800 | ||||||||
Ginnie Mae II Pool | 3.50 | 03/20/2046 | 173,584 | 185,339 | ||||||||
Ginnie Mae II Pool | 4.00 | 03/20/2046 | 136,939 | 147,572 | ||||||||
Ginnie Mae II Pool | 3.00 | 04/20/2046 | 119,370 | 126,368 | ||||||||
Ginnie Mae II Pool | 3.50 | 04/20/2046 | 185,944 | 198,861 | ||||||||
Ginnie Mae II Pool | 5.00 | 04/20/2046 | 62,095 | 70,840 | ||||||||
Ginnie Mae II Pool | 3.00 | 05/20/2046 | 211,843 | 224,089 | ||||||||
Ginnie Mae II Pool | 3.50 | 05/20/2046 | 191,084 | 203,919 | ||||||||
Ginnie Mae II Pool | 4.50 | 05/20/2046 | 88,143 | 97,927 | ||||||||
Ginnie Mae II Pool | 3.00 | 06/20/2046 | 219,977 | 231,083 | ||||||||
Ginnie Mae II Pool | 3.50 | 06/20/2046 | 130,049 | 140,111 | ||||||||
Ginnie Mae II Pool | 5.00 | 06/20/2046 | 57,845 | 66,013 | ||||||||
Ginnie Mae II Pool | 3.00 | 07/20/2046 | 478,000 | 504,952 | ||||||||
Ginnie Mae II Pool | 3.50 | 07/20/2046 | 131,749 | 140,642 | ||||||||
Ginnie Mae II Pool | 4.00 | 07/20/2046 | 60,134 | 64,716 | ||||||||
Ginnie Mae II Pool | 4.50 | 07/20/2046 | 54,388 | 60,390 | ||||||||
Ginnie Mae II Pool | 3.00 | 08/20/2046 | 206,848 | 218,914 | ||||||||
Ginnie Mae II Pool | 3.50 | 08/20/2046 | 136,341 | 145,878 | ||||||||
Ginnie Mae II Pool | 5.00 | 08/20/2046 | 62,702 | 71,536 | ||||||||
Ginnie Mae II Pool | 3.00 | 09/20/2046 | 219,752 | 232,491 | ||||||||
Ginnie Mae II Pool | 3.00 | 10/20/2046 | 292,964 | 308,862 | ||||||||
Ginnie Mae II Pool | 3.50 | 10/20/2046 | 108,242 | 115,735 | ||||||||
Ginnie Mae II Pool | 5.50 | 10/20/2046 | 33,474 | 39,436 | ||||||||
Ginnie Mae II Pool | 2.50 | 11/20/2046 | 57,225 | 60,287 | ||||||||
Ginnie Mae II Pool | 3.00 | 11/20/2046 | 211,324 | 223,649 | ||||||||
Ginnie Mae II Pool | 3.00 | 11/20/2046 | 147,241 | 157,189 | ||||||||
Ginnie Mae II Pool | 3.50 | 11/20/2046 | 132,468 | 140,760 | ||||||||
Ginnie Mae II Pool | 4.50 | 11/20/2046 | 87,280 | 96,868 | ||||||||
Ginnie Mae II Pool | 2.50 | 12/20/2046 | 73,136 | 77,057 | ||||||||
Ginnie Mae II Pool | 3.00 | 12/20/2046 | 150,270 | 158,916 | ||||||||
Ginnie Mae II Pool | 3.50 | 12/20/2046 | 138,459 | 147,217 | ||||||||
The accompanying notes are an integral part of the financial statements.
62
VERPLANCK BALANCED FUND
Portfolio of Investments (Continued)
September 30, 2020
Coupon Rate % | Maturity Date | Principal Amount $ | Value $ | |||||||||
Mortgage-Backed Securities — 14.19% | ||||||||||||
Ginnie Mae II Pool | 4.50 | 12/20/2046 | 40,930 | 45,416 | ||||||||
Ginnie Mae II Pool | 2.50 | 01/20/2047 | 19,406 | 20,434 | ||||||||
Ginnie Mae II Pool | 3.00 | 01/20/2047 | 235,530 | 248,011 | ||||||||
Ginnie Mae II Pool | 3.50 | 01/20/2047 | 35,895 | 38,311 | ||||||||
Ginnie Mae II Pool | 4.00 | 01/20/2047 | 97,384 | 104,986 | ||||||||
Ginnie Mae II Pool | 4.50 | 01/20/2047 | 102,053 | 112,342 | ||||||||
Ginnie Mae II Pool | 3.00 | 02/20/2047 | 213,628 | 223,880 | ||||||||
Ginnie Mae II Pool | 3.50 | 02/20/2047 | 140,199 | 148,907 | ||||||||
Ginnie Mae II Pool | 4.00 | 02/20/2047 | 116,643 | 125,163 | ||||||||
Ginnie Mae II Pool | 3.50 | 06/20/2047 | 99,125 | 104,962 | ||||||||
Ginnie Mae II Pool | 4.00 | 06/20/2047 | 44,259 | 47,597 | ||||||||
Ginnie Mae II Pool | 3.50 | 07/20/2047 | 206,902 | 219,688 | ||||||||
Ginnie Mae II Pool | 4.00 | 07/20/2047 | 274,547 | 295,615 | ||||||||
Ginnie Mae II Pool | 4.00 | 08/20/2047 | 45,642 | 49,148 | ||||||||
Ginnie Mae II Pool | 3.50 | 09/20/2047 | 57,205 | 61,050 | ||||||||
Ginnie Mae II Pool | 3.00 | 10/20/2047 | 113,252 | 119,376 | ||||||||
Ginnie Mae II Pool | 3.50 | 10/20/2047 | 319,522 | 340,910 | ||||||||
Ginnie Mae II Pool | 4.50 | 10/20/2047 | 18,592 | 20,127 | ||||||||
Ginnie Mae II Pool | 3.00 | 11/20/2047 | 14,394 | 15,207 | ||||||||
Ginnie Mae II Pool | 3.50 | 11/20/2047 | 329,966 | 352,019 | ||||||||
Ginnie Mae II Pool | 4.00 | 11/20/2047 | 164,299 | 175,908 | ||||||||
Ginnie Mae II Pool | 3.00 | 12/20/2047 | 165,125 | 173,967 | ||||||||
Ginnie Mae II Pool | 3.50 | 12/20/2047 | 149,155 | 158,900 | ||||||||
Ginnie Mae II Pool | 4.00 | 12/20/2047 | 158,328 | 169,770 | ||||||||
Ginnie Mae II Pool | 3.00 | 01/20/2048 | 140,841 | 148,751 | ||||||||
Ginnie Mae II Pool | 3.50 | 01/20/2048 | 338,404 | 359,874 | ||||||||
Ginnie Mae II Pool | 4.00 | 01/20/2048 | 53,245 | 57,044 | ||||||||
Ginnie Mae II Pool | 3.00 | 02/20/2048 | 181,113 | 189,601 | ||||||||
Ginnie Mae II Pool | 3.50 | 02/20/2048 | 234,353 | 249,523 | ||||||||
Ginnie Mae II Pool | 3.00 | 03/20/2048 | 242,852 | 254,444 | ||||||||
Ginnie Mae II Pool | 3.50 | 03/20/2048 | 269,414 | 285,425 | ||||||||
Ginnie Mae II Pool | 4.00 | 03/20/2048 | 157,480 | 168,312 | ||||||||
Ginnie Mae II Pool | 4.50 | 03/20/2048 | 22,589 | 24,353 | ||||||||
Ginnie Mae II Pool | 5.00 | 03/20/2048 | 35,398 | 38,836 | ||||||||
Ginnie Mae II Pool | 3.00 | 04/20/2048 | 147,820 | 154,873 | ||||||||
Ginnie Mae II Pool | 3.50 | 04/20/2048 | 314,459 | 333,973 | ||||||||
Ginnie Mae II Pool | 4.50 | 05/20/2048 | 39,531 | 42,761 | ||||||||
Ginnie Mae II Pool | 3.50 | 06/20/2048 | 103,854 | 110,175 | ||||||||
Ginnie Mae II Pool | 4.00 | 06/20/2048 | 23,278 | 24,868 | ||||||||
Ginnie Mae II Pool | 4.00 | 07/20/2048 | 102,576 | 109,373 | ||||||||
Ginnie Mae II Pool | 4.00 | 08/20/2048 | 149,392 | 159,669 | ||||||||
Ginnie Mae II Pool | 4.50 | 08/20/2048 | 174,265 | 187,751 | ||||||||
Ginnie Mae II Pool | 5.00 | 08/20/2048 | 20,453 | 22,281 | ||||||||
Ginnie Mae II Pool | 4.00 | 09/20/2048 | 148,175 | 158,529 | ||||||||
Ginnie Mae II Pool | 4.50 | 09/20/2048 | 109,612 | 118,513 | ||||||||
The accompanying notes are an integral part of the financial statements.
63
VERPLANCK BALANCED FUND
Portfolio of Investments (Continued)
September 30, 2020
Coupon Rate % | Maturity Date | Principal Amount $ | Value $ | |||||||||
Mortgage-Backed Securities — 14.19% | ||||||||||||
Ginnie Mae II Pool | 4.50 | 10/20/2048 | 121,370 | 131,020 | ||||||||
Ginnie Mae II Pool | 5.00 | 10/20/2048 | 39,729 | 43,480 | ||||||||
Ginnie Mae II Pool | 4.00 | 11/20/2048 | 122,882 | 131,380 | ||||||||
Ginnie Mae II Pool | 5.00 | 11/20/2048 | 87,040 | 94,787 | ||||||||
Ginnie Mae II Pool | 4.50 | 12/20/2048 | 76,907 | 82,735 | ||||||||
Ginnie Mae II Pool | 5.00 | 12/20/2048 | 19,469 | 21,159 | ||||||||
Ginnie Mae II Pool | 3.50 | 01/20/2049 | 267,829 | 283,911 | ||||||||
Ginnie Mae II Pool | 4.00 | 01/20/2049 | 101,218 | 107,738 | ||||||||
Ginnie Mae II Pool | 4.50 | 01/20/2049 | 121,643 | 130,699 | ||||||||
Ginnie Mae II Pool | 5.00 | 01/20/2049 | 17,912 | 19,476 | ||||||||
Ginnie Mae II Pool | 3.50 | 02/20/2049 | 147,780 | 156,720 | ||||||||
Ginnie Mae II Pool | 4.50 | 02/20/2049 | 256,680 | 275,827 | ||||||||
Ginnie Mae II Pool | 5.00 | 02/20/2049 | 39,465 | 42,959 | ||||||||
Ginnie Mae II Pool | 3.50 | 03/20/2049 | 278,906 | 294,689 | ||||||||
Ginnie Mae II Pool | 4.50 | 03/20/2049 | 147,601 | 158,650 | ||||||||
Ginnie Mae II Pool | 5.00 | 03/20/2049 | 22,294 | 24,248 | ||||||||
Ginnie Mae II Pool | 3.50 | 04/20/2049 | 101,803 | 107,151 | ||||||||
Ginnie Mae II Pool | 4.00 | 04/20/2049 | 305,731 | 324,663 | ||||||||
Ginnie Mae II Pool | 4.50 | 04/20/2049 | 26,705 | 28,698 | ||||||||
Ginnie Mae II Pool | 4.00 | 05/20/2049 | 154,521 | 164,278 | ||||||||
Ginnie Mae II Pool | 4.50 | 05/20/2049 | 33,967 | 36,368 | ||||||||
Ginnie Mae II Pool | 5.00 | 05/20/2049 | 81,055 | 88,294 | ||||||||
Ginnie Mae II Pool | 3.50 | 06/20/2049 | 163,631 | 172,126 | ||||||||
Ginnie Mae II Pool | 4.00 | 06/20/2049 | 104,334 | 110,896 | ||||||||
Ginnie Mae II Pool | 4.50 | 06/20/2049 | 220,141 | 235,757 | ||||||||
Ginnie Mae II Pool | 5.00 | 06/20/2049 | 45,258 | 49,215 | ||||||||
Ginnie Mae II Pool | 3.50 | 07/20/2049 | 181,384 | 190,792 | ||||||||
Ginnie Mae II Pool | 4.00 | 07/20/2049 | 308,701 | 327,839 | ||||||||
Ginnie Mae II Pool | 3.00 | 08/20/2049 | 140,962 | 147,568 | ||||||||
Ginnie Mae II Pool | 4.00 | 08/20/2049 | 373,548 | 396,781 | ||||||||
Ginnie Mae II Pool | 4.00 | 09/20/2049 | 85,302 | 90,522 | ||||||||
Ginnie Mae II Pool | 4.00 | 10/20/2049 | 275,594 | 292,714 | ||||||||
Ginnie Mae II Pool | 3.00 | 11/20/2049 | 170,564 | 178,558 | ||||||||
Ginnie Mae II Pool | 4.00 | 11/20/2049 | 19,185 | 20,359 | ||||||||
Ginnie Mae II Pool | 3.50 | 12/20/2049 | 249,878 | 262,605 | ||||||||
Ginnie Mae II Pool | 3.00 | 01/20/2050 | 392,628 | 411,030 | ||||||||
Ginnie Mae II Pool | 3.50 | 01/20/2050 | 233,979 | 245,976 | ||||||||
Ginnie Mae II Pool | 3.00 | 02/20/2050 | 342,044 | 358,137 | ||||||||
Ginnie Mae II Pool | 3.50 | 02/20/2050 | 240,158 | 252,564 | ||||||||
Ginnie Mae II Pool | 3.50 | 03/20/2050 | 249,217 | 262,354 | ||||||||
Ginnie Mae II Pool | 3.00 | 05/20/2050 | 246,156 | 258,702 | ||||||||
Ginnie Mae II Pool | 3.00 | 06/20/2050 | 198,148 | 208,675 | ||||||||
Ginnie Mae II Pool | 3.50 | 06/20/2050 | 247,638 | 263,401 | ||||||||
Ginnie Mae II Pool | 3.00 | 07/20/2050 | 198,944 | 209,871 | ||||||||
The accompanying notes are an integral part of the financial statements.
64
VERPLANCK BALANCED FUND
Portfolio of Investments (Continued)
September 30, 2020
Coupon Rate % | Maturity Date | Principal Amount $ | Value $ | |||||||||
Mortgage-Backed Securities — 14.19% | ||||||||||||
Ginnie Mae II Pool | 3.00 | 08/20/2050 | 299,295 | 316,286 | ||||||||
|
| |||||||||||
Total Mortgage-Backed Securities (Cost $137,681,763) | 140,722,858 | |||||||||||
|
| |||||||||||
U.S. Government Agency Obligations — 0.61% | ||||||||||||
Federal Home Loan Banks | 0.13 | 08/12/2022 | 500,000 | 499,701 | ||||||||
Federal Home Loan Banks | 2.50 | 02/13/2024 | 200,000 | 215,119 | ||||||||
Federal Home Loan Banks | 2.88 | 09/13/2024 | 400,000 | 442,235 | ||||||||
Federal Home Loan Banks | 5.50 | 07/15/2036 | 120,000 | 186,782 | ||||||||
Federal Home Loan Mortgage Corp | 2.38 | 01/13/2022 | 485,000 | 499,000 | ||||||||
Federal Home Loan Mortgage Corp | 2.75 | 06/19/2023 | 500,000 | 533,801 | ||||||||
Federal Home Loan Mortgage Corp | 0.38 | 07/21/2025 | 500,000 | 500,082 | ||||||||
Federal Home Loan Mortgage Corp | 6.25 | 07/15/2032 | 242,000 | 379,412 | ||||||||
Federal National Mortgage Association | 1.38 | 10/07/2021 | 500,000 | 506,184 | ||||||||
Federal National Mortgage Association | 2.63 | 09/06/2024 | 485,000 | 529,895 | ||||||||
Federal National Mortgage Association | 6.25 | 05/15/2029 | 109,000 | 157,750 | ||||||||
Federal National Mortgage Association | 0.88 | 08/05/2030 | 300,000 | 296,218 | ||||||||
Federal National Mortgage Association | 6.63 | 11/15/2030 | 485,000 | 745,182 | ||||||||
Tennessee Valley Authority | 2.88 | 09/15/2024 | 65,000 | 71,630 | ||||||||
Tennessee Valley Authority | 7.13 | 05/01/2030 | 73,000 | 113,466 | ||||||||
Tennessee Valley Authority | 5.25 | 09/15/2039 | 107,000 | 165,043 | ||||||||
Tennessee Valley Authority | 4.63 | 09/15/2060 | 97,000 | 152,904 | ||||||||
Tennessee Valley Authority | 4.25 | 09/15/2065 | 39,000 | 59,326 | ||||||||
|
| |||||||||||
Total U.S. Government Agency Obligations (Cost $5,740,730) | 6,053,730 | |||||||||||
|
| |||||||||||
U.S. Treasury Obligations — 19.70% | ||||||||||||
United States Treasury Bill5 | 0.086 | 12/31/2020 | 47,000 | 46,988 | ||||||||
United States Treasury Bill5 | 0.146 | 02/25/2021 | 359,000 | 358,852 | ||||||||
United States Treasury Note/Bond | 1.25 | 10/31/2021 | 673,000 | 681,150 | ||||||||
United States Treasury Note/Bond | 1.50 | 10/31/2021 | 850,000 | 862,551 | ||||||||
United States Treasury Note/Bond | 2.00 | 10/31/2021 | 823,000 | 839,524 | ||||||||
United States Treasury Note/Bond | 2.00 | 11/15/2021 | 460,000 | 469,631 | ||||||||
United States Treasury Note/Bond | 8.00 | 11/15/2021 | 182,000 | 198,039 | ||||||||
United States Treasury Note/Bond | 1.50 | 11/30/2021 | 1,535,000 | 1,559,104 | ||||||||
United States Treasury Note/Bond | 1.75 | 11/30/2021 | 824,000 | 839,514 | ||||||||
United States Treasury Note/Bond | 1.88 | 11/30/2021 | 289,000 | 294,848 | ||||||||
United States Treasury Note/Bond | 1.63 | 12/31/2021 | 850,000 | 865,805 | ||||||||
United States Treasury Note/Bond | 2.00 | 12/31/2021 | 444,000 | 454,302 | ||||||||
United States Treasury Note/Bond | 2.13 | 12/31/2021 | 56,000 | 57,387 | ||||||||
United States Treasury Note/Bond | 1.38 | 01/31/2022 | 845,000 | 859,028 | ||||||||
United States Treasury Note/Bond | 1.50 | 01/31/2022 | 575,000 | 585,467 | ||||||||
United States Treasury Note/Bond | 1.88 | 01/31/2022 | 219,000 | 224,099 | ||||||||
United States Treasury Note/Bond | 2.00 | 02/15/2022 | 130,000 | 133,346 | ||||||||
United States Treasury Note/Bond | 2.50 | 02/15/2022 | 535,000 | 552,388 | ||||||||
United States Treasury Note/Bond | 1.13 | 02/28/2022 | 1,250,000 | 1,267,578 | ||||||||
United States Treasury Note/Bond | 1.75 | 02/28/2022 | 680,000 | 695,566 | ||||||||
The accompanying notes are an integral part of the financial statements.
65
VERPLANCK BALANCED FUND
Portfolio of Investments (Continued)
September 30, 2020
Coupon Rate % | Maturity Date | Principal Amount $ | Value $ | |||||||||
U.S. Treasury Obligations — 19.70% | ||||||||||||
United States Treasury Note/Bond | 1.88 | 02/28/2022 | 665,000 | 681,391 | ||||||||
United States Treasury Note/Bond | 2.38 | 03/15/2022 | 735,000 | 758,974 | ||||||||
United States Treasury Note/Bond | 1.75 | 03/31/2022 | 478,000 | 489,614 | ||||||||
United States Treasury Note/Bond | 1.88 | 03/31/2022 | 715,000 | 733,685 | ||||||||
United States Treasury Note/Bond | 2.25 | 04/15/2022 | 1,390,000 | 1,435,392 | ||||||||
United States Treasury Note/Bond | 0.13 | 04/30/2022 | 930,000 | 930,036 | ||||||||
United States Treasury Note/Bond | 1.75 | 04/30/2022 | 370,000 | 379,467 | ||||||||
United States Treasury Note/Bond | 1.88 | 04/30/2022 | 670,000 | 688,477 | ||||||||
United States Treasury Note/Bond | 1.75 | 05/15/2022 | 300,000 | 307,875 | ||||||||
United States Treasury Note/Bond | 2.13 | 05/15/2022 | 250,000 | 258,105 | ||||||||
United States Treasury Note/Bond | 0.13 | 05/31/2022 | 965,000 | 964,925 | ||||||||
United States Treasury Note/Bond | 1.75 | 05/31/2022 | 845,000 | 867,808 | ||||||||
United States Treasury Note/Bond | 1.88 | 05/31/2022 | 345,000 | 355,027 | ||||||||
United States Treasury Note/Bond | 1.75 | 06/15/2022 | 915,000 | 940,198 | ||||||||
United States Treasury Note/Bond | 0.13 | 06/30/2022 | 1,000,000 | 1,000,000 | ||||||||
United States Treasury Note/Bond | 1.75 | 06/30/2022 | 840,000 | 863,789 | ||||||||
United States Treasury Note/Bond | 2.13 | 06/30/2022 | 600,000 | 620,883 | ||||||||
United States Treasury Note/Bond | 1.75 | 07/15/2022 | 615,000 | 632,873 | ||||||||
United States Treasury Note/Bond | 0.13 | 07/31/2022 | 1,450,000 | 1,450,000 | ||||||||
United States Treasury Note/Bond | 1.88 | 07/31/2022 | 335,000 | 345,704 | ||||||||
United States Treasury Note/Bond | 2.00 | 07/31/2022 | 236,000 | 244,066 | ||||||||
United States Treasury Note/Bond | 1.50 | 08/15/2022 | 1,300,000 | 1,333,516 | ||||||||
United States Treasury Note/Bond | 1.63 | 08/15/2022 | 650,000 | 668,256 | ||||||||
United States Treasury Note/Bond | 0.13 | 08/31/2022 | 800,000 | 799,969 | ||||||||
United States Treasury Note/Bond | 1.63 | 08/31/2022 | 835,000 | 858,908 | ||||||||
United States Treasury Note/Bond | 1.88 | 08/31/2022 | 396,000 | 409,195 | ||||||||
United States Treasury Note/Bond | 1.50 | 09/15/2022 | 945,000 | 970,360 | ||||||||
United States Treasury Note/Bond | 0.13 | 09/30/2022 | 900,000 | 899,965 | ||||||||
United States Treasury Note/Bond | 1.38 | 10/15/2022 | 257,000 | 263,515 | ||||||||
United States Treasury Note/Bond | 1.88 | 10/31/2022 | 1,050,000 | 1,087,980 | ||||||||
United States Treasury Note/Bond | 2.00 | 10/31/2022 | 790,000 | 820,705 | ||||||||
United States Treasury Note/Bond | 1.63 | 11/15/2022 | 700,000 | 722,094 | ||||||||
United States Treasury Note/Bond | 2.00 | 11/30/2022 | 620,000 | 645,018 | ||||||||
United States Treasury Note/Bond | 1.63 | 12/15/2022 | 805,000 | 831,477 | ||||||||
United States Treasury Note/Bond | 2.13 | 12/31/2022 | 1,104,000 | 1,153,335 | ||||||||
United States Treasury Note/Bond | 1.50 | 01/15/2023 | 805,000 | 829,968 | ||||||||
United States Treasury Note/Bond | 1.75 | 01/31/2023 | 1,470,000 | 1,525,068 | ||||||||
United States Treasury Note/Bond | 2.38 | 01/31/2023 | 680,000 | 715,434 | ||||||||
United States Treasury Note/Bond | 1.38 | 02/15/2023 | 195,000 | 200,690 | ||||||||
United States Treasury Note/Bond | 2.00 | 02/15/2023 | 762,000 | 795,367 | ||||||||
United States Treasury Note/Bond | 7.13 | 02/15/2023 | 125,000 | 145,752 | ||||||||
United States Treasury Note/Bond | 1.50 | 02/28/2023 | 900,000 | 929,566 | ||||||||
United States Treasury Note/Bond | 2.63 | 02/28/2023 | 1,000,000 | 1,059,922 | ||||||||
United States Treasury Note/Bond | 2.50 | 03/31/2023 | 1,150,000 | 1,217,742 | ||||||||
United States Treasury Note/Bond | 0.25 | 04/15/2023 | 885,000 | 887,385 | ||||||||
The accompanying notes are an integral part of the financial statements.
66
VERPLANCK BALANCED FUND
Portfolio of Investments (Continued)
September 30, 2020
Coupon Rate % | Maturity Date | Principal Amount $ | Value $ | |||||||||
U.S. Treasury Obligations — 19.70% | ||||||||||||
United States Treasury Note/Bond | 1.63 | 04/30/2023 | 1,223,000 | 1,269,722 | ||||||||
United States Treasury Note/Bond | 2.75 | 04/30/2023 | 1,500,000 | 1,600,547 | ||||||||
United States Treasury Note/Bond | 0.13 | 05/15/2023 | 920,000 | 919,497 | ||||||||
United States Treasury Note/Bond | 1.75 | 05/15/2023 | 1,740,000 | 1,813,066 | ||||||||
United States Treasury Note/Bond | 1.63 | 05/31/2023 | 641,000 | 666,289 | ||||||||
United States Treasury Note/Bond | 2.75 | 05/31/2023 | 900,000 | 962,332 | ||||||||
United States Treasury Note/Bond | 0.25 | 06/15/2023 | 960,000 | 962,550 | ||||||||
United States Treasury Note/Bond | 1.38 | 06/30/2023 | 1,110,000 | 1,147,549 | ||||||||
United States Treasury Note/Bond | 2.63 | 06/30/2023 | 1,200,000 | 1,281,469 | ||||||||
United States Treasury Note/Bond | 0.13 | 07/15/2023 | 995,000 | 994,300 | ||||||||
United States Treasury Note/Bond | 1.25 | 07/31/2023 | 38,000 | 39,177 | ||||||||
United States Treasury Note/Bond | 2.75 | 07/31/2023 | 410,000 | 440,109 | ||||||||
United States Treasury Note/Bond | 0.13 | 08/15/2023 | 1,300,000 | 1,298,984 | ||||||||
United States Treasury Note/Bond | 2.50 | 08/15/2023 | 724,000 | 772,700 | ||||||||
United States Treasury Note/Bond | 1.38 | 08/31/2023 | 1,000,000 | 1,035,625 | ||||||||
United States Treasury Note/Bond | 2.75 | 08/31/2023 | 730,000 | 785,064 | ||||||||
United States Treasury Note/Bond | 0.13 | 09/15/2023 | 900,000 | 899,227 | ||||||||
United States Treasury Note/Bond | 1.38 | 09/30/2023 | 1,300,000 | 1,347,430 | ||||||||
United States Treasury Note/Bond | 2.88 | 09/30/2023 | 1,040,000 | 1,124,297 | ||||||||
United States Treasury Note/Bond | 1.63 | 10/31/2023 | 800,000 | 836,156 | ||||||||
United States Treasury Note/Bond | 2.88 | 10/31/2023 | 760,000 | 823,234 | ||||||||
United States Treasury Note/Bond | 2.75 | 11/15/2023 | 1,176,000 | 1,270,539 | ||||||||
United States Treasury Note/Bond | 2.13 | 11/30/2023 | 182,000 | 193,254 | ||||||||
United States Treasury Note/Bond | 2.88 | 11/30/2023 | 1,100,000 | 1,193,930 | ||||||||
United States Treasury Note/Bond | 2.25 | 12/31/2023 | 589,000 | 628,711 | ||||||||
United States Treasury Note/Bond | 2.63 | 12/31/2023 | 850,000 | 917,436 | ||||||||
United States Treasury Note/Bond | 2.25 | 01/31/2024 | 679,000 | 725,814 | ||||||||
United States Treasury Note/Bond | 2.50 | 01/31/2024 | 475,000 | 511,683 | ||||||||
United States Treasury Note/Bond | 2.75 | 02/15/2024 | 625,000 | 679,224 | ||||||||
United States Treasury Note/Bond | 2.13 | 02/29/2024 | 598,000 | 637,641 | ||||||||
United States Treasury Note/Bond | 2.38 | 02/29/2024 | 1,192,000 | 1,281,074 | ||||||||
United States Treasury Note/Bond | 2.13 | 03/31/2024 | 2,000,000 | 2,135,469 | ||||||||
United States Treasury Note/Bond | 2.00 | 04/30/2024 | 640,000 | 681,400 | ||||||||
United States Treasury Note/Bond | 2.25 | 04/30/2024 | 785,000 | 842,802 | ||||||||
United States Treasury Note/Bond | 2.50 | 05/15/2024 | 1,042,000 | 1,128,779 | ||||||||
United States Treasury Note/Bond | 2.00 | 05/31/2024 | 1,035,000 | 1,103,286 | ||||||||
United States Treasury Note/Bond | 1.75 | 06/30/2024 | 880,000 | 931,150 | ||||||||
United States Treasury Note/Bond | 2.00 | 06/30/2024 | 790,000 | 843,263 | ||||||||
United States Treasury Note/Bond | 1.75 | 07/31/2024 | 880,000 | 932,113 | ||||||||
United States Treasury Note/Bond | 2.13 | 07/31/2024 | 690,000 | 740,699 | ||||||||
United States Treasury Note/Bond | 2.38 | 08/15/2024 | 886,000 | 960,237 | ||||||||
United States Treasury Note/Bond | 1.25 | 08/31/2024 | 1,300,000 | 1,352,762 | ||||||||
United States Treasury Note/Bond | 1.88 | 08/31/2024 | 345,000 | 367,465 | ||||||||
United States Treasury Note/Bond | 1.50 | 09/30/2024 | 870,000 | 914,689 | ||||||||
United States Treasury Note/Bond | 2.13 | 09/30/2024 | 590,000 | 635,034 | ||||||||
The accompanying notes are an integral part of the financial statements.
67
VERPLANCK BALANCED FUND
Portfolio of Investments (Continued)
September 30, 2020
Coupon Rate % | Maturity Date | Principal Amount $ | Value $ | |||||||||
U.S. Treasury Obligations — 19.70% | ||||||||||||
United States Treasury Note/Bond | 1.50 | 10/31/2024 | 870,000 | 915,335 | ||||||||
United States Treasury Note/Bond | 2.25 | 10/31/2024 | 1,000,000 | 1,082,695 | ||||||||
United States Treasury Note/Bond | 2.25 | 11/15/2024 | 939,000 | 1,016,981 | ||||||||
United States Treasury Note/Bond | 1.50 | 11/30/2024 | 1,800,000 | 1,895,344 | ||||||||
United States Treasury Note/Bond | 1.75 | 12/31/2024 | 870,000 | 926,040 | ||||||||
United States Treasury Note/Bond | 2.25 | 12/31/2024 | 165,000 | 179,096 | ||||||||
United States Treasury Note/Bond | 1.38 | 01/31/2025 | 1,525,000 | 1,599,999 | ||||||||
United States Treasury Note/Bond | 2.50 | 01/31/2025 | 560,000 | 614,863 | ||||||||
United States Treasury Note/Bond | 2.00 | 02/15/2025 | 1,763,000 | 1,898,049 | ||||||||
United States Treasury Note/Bond | 1.13 | 02/28/2025 | 655,000 | 680,663 | ||||||||
United States Treasury Note/Bond | 2.75 | 02/28/2025 | 830,000 | 921,721 | ||||||||
United States Treasury Note/Bond | 0.38 | 04/30/2025 | 1,150,000 | 1,156,783 | ||||||||
United States Treasury Note/Bond | 2.88 | 04/30/2025 | 840,000 | 940,538 | ||||||||
United States Treasury Note/Bond | 2.13 | 05/15/2025 | 971,000 | 1,054,445 | ||||||||
United States Treasury Note/Bond | 0.25 | 05/31/2025 | 985,000 | 985,115 | ||||||||
United States Treasury Note/Bond | 2.88 | 05/31/2025 | 800,000 | 897,250 | ||||||||
United States Treasury Note/Bond | 0.25 | 06/30/2025 | 278,000 | 277,902 | ||||||||
United States Treasury Note/Bond | 0.25 | 07/31/2025 | 815,000 | 814,427 | ||||||||
United States Treasury Note/Bond | 2.88 | 07/31/2025 | 340,000 | 382,580 | ||||||||
United States Treasury Note/Bond | 2.00 | 08/15/2025 | 703,000 | 761,849 | ||||||||
United States Treasury Note/Bond | 0.25 | 08/31/2025 | 2,000,000 | 1,998,438 | ||||||||
United States Treasury Note/Bond | 2.75 | 08/31/2025 | 895,000 | 1,003,204 | ||||||||
United States Treasury Note/Bond | 0.25 | 09/30/2025 | 700,000 | 699,234 | ||||||||
United States Treasury Note/Bond | 3.00 | 09/30/2025 | 600,000 | 681,000 | ||||||||
United States Treasury Note/Bond | 3.00 | 10/31/2025 | 86,000 | 97,768 | ||||||||
United States Treasury Note/Bond | 2.25 | 11/15/2025 | 1,830,000 | 2,011,856 | ||||||||
United States Treasury Note/Bond | 2.88 | 11/30/2025 | 625,000 | 707,690 | ||||||||
United States Treasury Note/Bond | 2.63 | 12/31/2025 | 1,500,000 | 1,681,465 | ||||||||
United States Treasury Note/Bond | 2.63 | 01/31/2026 | 560,000 | 628,600 | ||||||||
United States Treasury Note/Bond | 1.63 | 02/15/2026 | 1,250,000 | 1,337,207 | ||||||||
United States Treasury Note/Bond | 2.25 | 03/31/2026 | 565,000 | 624,215 | ||||||||
United States Treasury Note/Bond | 2.38 | 04/30/2026 | 425,000 | 473,012 | ||||||||
United States Treasury Note/Bond | 1.63 | 05/15/2026 | 1,700,000 | 1,821,723 | ||||||||
United States Treasury Note/Bond | 2.13 | 05/31/2026 | 600,000 | 660,000 | ||||||||
United States Treasury Note/Bond | 1.88 | 06/30/2026 | 685,000 | 744,483 | ||||||||
United States Treasury Note/Bond | 1.88 | 07/31/2026 | 215,000 | 233,838 | ||||||||
United States Treasury Note/Bond | 1.38 | 08/31/2026 | 803,000 | 850,490 | ||||||||
United States Treasury Note/Bond | 1.63 | 09/30/2026 | 319,000 | 342,726 | ||||||||
United States Treasury Note/Bond | 1.63 | 10/31/2026 | 382,000 | 410,650 | ||||||||
United States Treasury Note/Bond | 2.00 | 11/15/2026 | 1,232,000 | 1,352,553 | ||||||||
United States Treasury Note/Bond | 1.63 | 11/30/2026 | 680,000 | 731,319 | ||||||||
United States Treasury Note/Bond | 1.75 | 12/31/2026 | 300,000 | 325,219 | ||||||||
United States Treasury Note/Bond | 1.50 | 01/31/2027 | 675,000 | 721,512 | ||||||||
United States Treasury Note/Bond | 2.25 | 02/15/2027 | 1,029,000 | 1,149,023 | ||||||||
United States Treasury Note/Bond | 6.63 | 02/15/2027 | 290,000 | 404,120 | ||||||||
The accompanying notes are an integral part of the financial statements.
68
VERPLANCK BALANCED FUND
Portfolio of Investments (Continued)
September 30, 2020
Coupon Rate % | Maturity Date | Principal Amount $ | Value $ | |||||||||
U.S. Treasury Obligations — 19.70% | ||||||||||||
United States Treasury Note/Bond | 0.63 | 03/31/2027 | 685,000 | 693,991 | ||||||||
United States Treasury Note/Bond | 0.50 | 04/30/2027 | 775,000 | 778,754 | ||||||||
United States Treasury Note/Bond | 2.38 | 05/15/2027 | 470,000 | 529,907 | ||||||||
United States Treasury Note/Bond | 0.50 | 05/31/2027 | 835,000 | 838,588 | ||||||||
United States Treasury Note/Bond | 0.50 | 06/30/2027 | 895,000 | 898,461 | ||||||||
United States Treasury Note/Bond | 0.38 | 07/31/2027 | 955,000 | 950,225 | ||||||||
United States Treasury Note/Bond | 2.25 | 08/15/2027 | 1,000,000 | 1,121,836 | ||||||||
United States Treasury Note/Bond | 0.50 | 08/31/2027 | 800,000 | 802,250 | ||||||||
United States Treasury Note/Bond | 0.38 | 09/30/2027 | 1,000,000 | 993,906 | ||||||||
United States Treasury Note/Bond | 2.25 | 11/15/2027 | 1,090,000 | 1,225,909 | ||||||||
United States Treasury Note/Bond | 2.75 | 02/15/2028 | 880,000 | 1,024,066 | ||||||||
United States Treasury Note/Bond | 2.88 | 05/15/2028 | 1,351,000 | 1,590,169 | ||||||||
United States Treasury Note/Bond | 2.88 | 08/15/2028 | 633,000 | 747,558 | ||||||||
United States Treasury Note/Bond | 3.13 | 11/15/2028 | 2,530,000 | 3,049,045 | ||||||||
United States Treasury Note/Bond | 5.25 | 11/15/2028 | 72,500 | 99,775 | ||||||||
United States Treasury Note/Bond | 2.63 | 02/15/2029 | 15,000 | 17,528 | ||||||||
United States Treasury Note/Bond | 2.38 | 05/15/2029 | 156,000 | 179,577 | ||||||||
United States Treasury Note/Bond | 1.63 | 08/15/2029 | 419,000 | 456,317 | ||||||||
United States Treasury Note/Bond | 6.13 | 08/15/2029 | 949,000 | 1,406,522 | ||||||||
United States Treasury Note/Bond | 1.75 | 11/15/2029 | 1,765,000 | 1,944,189 | ||||||||
United States Treasury Note/Bond | 1.50 | 02/15/2030 | 529,000 | 570,989 | ||||||||
United States Treasury Note/Bond | 0.63 | 05/15/2030 | 475,000 | 473,590 | ||||||||
United States Treasury Note/Bond | 6.25 | 05/15/2030 | 1,000,000 | 1,527,344 | ||||||||
United States Treasury Note/Bond | 0.63 | 08/15/2030 | 1,668,000 | 1,659,660 | ||||||||
United States Treasury Note/Bond | 5.38 | 02/15/2031 | 868,000 | 1,279,724 | ||||||||
United States Treasury Note/Bond | 3.50 | 02/15/2039 | 300,000 | 421,676 | ||||||||
United States Treasury Note/Bond | 4.25 | 05/15/2039 | 748,000 | 1,149,027 | ||||||||
United States Treasury Note/Bond | 4.50 | 08/15/2039 | 166,000 | 262,831 | ||||||||
United States Treasury Note/Bond | 4.38 | 11/15/2039 | 509,000 | 796,386 | ||||||||
United States Treasury Note/Bond | 4.63 | 02/15/2040 | 257,000 | 414,412 | ||||||||
United States Treasury Note/Bond | 1.13 | 05/15/2040 | 1,140,000 | 1,124,147 | ||||||||
United States Treasury Note/Bond | 4.38 | 05/15/2040 | 275,000 | 432,395 | ||||||||
United States Treasury Note/Bond | 1.13 | 08/15/2040 | 175,000 | 172,074 | ||||||||
United States Treasury Note/Bond | 3.88 | 08/15/2040 | 365,000 | 541,084 | ||||||||
United States Treasury Note/Bond | 4.75 | 02/15/2041 | 447,000 | 738,406 | ||||||||
United States Treasury Note/Bond | 3.75 | 08/15/2041 | 425,000 | 624,833 | ||||||||
United States Treasury Note/Bond | 3.13 | 11/15/2041 | 393,000 | 531,947 | ||||||||
United States Treasury Note/Bond | 3.13 | 02/15/2042 | 120,000 | 162,839 | ||||||||
United States Treasury Note/Bond | 3.00 | 05/15/2042 | 490,000 | 652,580 | ||||||||
United States Treasury Note/Bond | 2.75 | 11/15/2042 | 625,000 | 801,782 | ||||||||
United States Treasury Note/Bond | 3.13 | 02/15/2043 | 715,000 | 970,585 | ||||||||
United States Treasury Note/Bond | 2.88 | 05/15/2043 | 677,000 | 885,574 | ||||||||
United States Treasury Note/Bond | 3.63 | 08/15/2043 | 674,000 | 984,435 | ||||||||
United States Treasury Note/Bond | 3.75 | 11/15/2043 | 531,000 | 790,236 | ||||||||
United States Treasury Note/Bond | 3.63 | 02/15/2044 | 279,000 | 408,473 | ||||||||
The accompanying notes are an integral part of the financial statements.
69
VERPLANCK BALANCED FUND
Portfolio of Investments (Continued)
September 30, 2020
Coupon Rate % | Maturity Date | Principal Amount $ | Value $ | |||||||||
U.S. Treasury Obligations — 19.70% | ||||||||||||
United States Treasury Note/Bond | 3.38 | 05/15/2044 | 1,451,000 | 2,051,635 | ||||||||
United States Treasury Note/Bond | 3.00 | 11/15/2044 | 1,013,000 | 1,356,272 | ||||||||
United States Treasury Note/Bond | 2.50 | 02/15/2045 | 873,000 | 1,076,791 | ||||||||
United States Treasury Note/Bond | 3.00 | 05/15/2045 | 830,000 | 1,113,594 | ||||||||
United States Treasury Note/Bond | 2.88 | 08/15/2045 | 122,000 | 160,625 | ||||||||
United States Treasury Note/Bond | 3.00 | 11/15/2045 | 815,000 | 1,097,226 | ||||||||
United States Treasury Note/Bond | 2.50 | 02/15/2046 | 953,000 | 1,179,375 | ||||||||
United States Treasury Note/Bond | 2.50 | 05/15/2046 | 1,036,000 | 1,282,819 | ||||||||
United States Treasury Note/Bond | 2.25 | 08/15/2046 | 1,011,000 | 1,196,692 | ||||||||
United States Treasury Note/Bond | 2.88 | 11/15/2046 | 727,000 | 963,048 | ||||||||
United States Treasury Note/Bond | 3.00 | 02/15/2047 | 620,000 | 840,609 | ||||||||
United States Treasury Note/Bond | 3.00 | 05/15/2047 | 430,000 | 583,859 | ||||||||
United States Treasury Note/Bond | 2.75 | 08/15/2047 | 610,000 | 793,548 | ||||||||
United States Treasury Note/Bond | 2.75 | 11/15/2047 | 795,000 | 1,035,705 | ||||||||
United States Treasury Note/Bond | 3.00 | 02/15/2048 | 690,000 | 939,909 | ||||||||
United States Treasury Note/Bond | 3.13 | 05/15/2048 | 1,055,000 | 1,470,489 | ||||||||
United States Treasury Note/Bond | 3.00 | 08/15/2048 | 1,730,000 | 2,363,410 | ||||||||
United States Treasury Note/Bond | 3.38 | 11/15/2048 | 870,000 | 1,269,112 | ||||||||
United States Treasury Note/Bond | 3.00 | 02/15/2049 | 449,000 | 615,358 | ||||||||
United States Treasury Note/Bond | 2.88 | 05/15/2049 | 344,000 | 461,833 | ||||||||
United States Treasury Note/Bond | 2.25 | 08/15/2049 | 1,122,000 | 1,338,204 | ||||||||
United States Treasury Note/Bond | 2.38 | 11/15/2049 | 1,000,000 | 1,224,453 | ||||||||
United States Treasury Note/Bond | 2.00 | 02/15/2050 | 1,359,000 | 1,541,828 | ||||||||
United States Treasury Note/Bond | 1.38 | 08/15/2050 | 1,780,000 | 1,746,903 | ||||||||
|
| |||||||||||
Total U.S. Treasury Obligations (Cost $180,756,236) | 195,314,340 | |||||||||||
|
| |||||||||||
SHORT-TERM INVESTMENTS — 4.37% | ||||||||||||
Money Market Fund — 4.37% | ||||||||||||
Goldman Sachs Financial Square Government Fund - Institutional Shares | 0.007 | 43,333,952 | 43,333,952 | |||||||||
|
| |||||||||||
Total Short-Term Investments (Cost $43,333,952) | 43,333,952 | |||||||||||
|
| |||||||||||
Total Investments (Cost $931,648,240) — 103.65% | 1,027,539,526 | |||||||||||
TBA SALES COMMITMENTS — (0.06%) | ||||||||||||
Mortgage-Backed Securities — (0.06%) | ||||||||||||
Ginnie Mae | 4.50 | 10/20/2050 | (350,000 | ) | (375,047 | ) | ||||||
Ginnie Mae | 5.00 | 10/20/2050 | (200,000 | ) | (217,711 | ) | ||||||
|
| |||||||||||
Total TBA SALES COMMITMENTS (Proceeds $591,359) | (592,758 | ) | ||||||||||
|
| |||||||||||
Liabilities in excess of other assets — (3.59%) | (35,546,725 | ) | ||||||||||
|
| |||||||||||
Net Assets — 100.00% | $ | 991,400,043 | ||||||||||
|
| |||||||||||
The accompanying notes are an integral part of the financial statements.
70
VERPLANCK BALANCED FUND
Portfolio of Investments (Concluded)
September 30, 2020
| * | Non-income producing. |
| 1 | “Affiliated company” as defined by the Investment Company Act of 1940. |
| 2 | Variable rate investments. The rate shown is based on the latest available information as of September 30, 2020. Certain variable rate securities are not based on a published reference rate and spread but are determined by the issuer or agent and are based on current market conditions. These securities do not indicate a reference rate or spread in their description. |
| 3 | Zero coupon bond. |
| 4 | TBA - To be announced. |
| 5 | As of September 30, 2020, an investment with a value of $405,840 was fully segregated with the broker as collateral for open futures contracts. |
| 6 | Rate represents annualized yield at date of purchase. |
| 7 | Rate disclosed is the 7-day yield at September 30, 2020. |
Legend | ||
LIBOR | London Inter-bank Offered Rate | |
LLC | Limited Liability Company | |
LP | Limited Partnership | |
Ltd | Limited | |
PLC | Public Limited Company | |
REIT | Real Estate Investment Trust | |
SOFR | Secured Overnight Funding Rate | |
TBA | To Be Announced | |
At September 30, 2020, the Fund held the following open positions in futures contracts:
Long Futures Outstanding | Expiration Month | Number of Contracts | Notional Cost | Notional Amount | Value and Unrealized Depreciation(1) | |||||
S&P500 E-Mini | 12/18/20 | 30 | $5,058,375 | $5,028,000 | $(30,375) | |||||
| ||||||||||
| $(30,375) |
| (1) | Only variation margin receivable/payable at period end is reported within the Statement of Assets and Liabilities. This amount reflects cumulative unrealized appreciation/(depreciation) on future contracts. |
The accompanying notes are an integral part of the financial statements.
71
VERPLANCK BALANCED FUND
Statement of Assets and Liabilities
September 30, 2020
Assets | ||||
Investments, at value (Cost $931,648,240)(a) | $ | 1,027,539,526 | ||
Cash | 1,985 | |||
Receivable for investments sold | 5,999,063 | |||
Dividends and interest receivable | 2,972,196 | |||
Deposits for futures contracts* | 27,450 | |||
Prepaid expenses and other assets | 47 | |||
|
| |||
Total assets | 1,036,540,267 | |||
|
| |||
Liabilities | ||||
TBA sale commitments at value (Proceeds $591,359) | 592,758 | |||
Payable for investments purchased | 44,291,754 | |||
Payable for administration and accounting fees | 92,136 | |||
Payable for audit fees | 65,455 | |||
Payable to Investment Adviser | 43,323 | |||
Payable for custodian fees | 27,953 | |||
Payable for printing fees | 13,674 | |||
Payable for transfer agent fees | 5,558 | |||
Payable for legal fees | 2,588 | |||
Accrued expenses | 5,025 | |||
|
| |||
Total liabilities | 45,140,224 | |||
|
| |||
Net Assets | $ | 991,400,043 | ||
|
| |||
Net Assets Consisted of: | ||||
Capital stock, $0.01 par value | $ | 86,321 | ||
Paid-in capital | 878,287,490 | |||
Total distributable earnings | 113,026,232 | |||
|
| |||
Net Assets | $ | 991,400,043 | ||
|
| |||
Shares outstanding | 8,632,082 | |||
Net asset value, offering and redemption price per share ($991,400,043 / 8,632,082 shares) | $ 114.85 |
| * | Primary risk exposure is equity contracts. |
| (a) | Includes investment in affiliated issuer with market value of $364,210 and cost of $526,554. |
The accompanying notes are an integral part of the financial statements.
72
VERPLANCK BALANCED FUND
Statement of Operations
For the Year Ended September 30, 2020
Investment Income | ||||
Interest | $ | 11,292,000 | ||
Dividends(a) | 8,037,478 | |||
Less: foreign taxes withheld | (4,616 | ) | ||
|
| |||
Total investment income | 19,324,862 | |||
|
| |||
Expenses | ||||
Advisory fees (Note 2) | 517,115 | |||
Administration and accounting fees (Note 2) | 376,059 | |||
Trustees’ and officers’ fees (Note 2) | 139,664 | |||
Custodian fees (Note 2) | 107,975 | |||
Audit fees | 66,578 | |||
Legal fees | 38,509 | |||
Printing and shareholder reporting fees | 31,781 | |||
Transfer agent fees (Note 2) | 19,808 | |||
Other expenses | 28,269 | |||
|
| |||
Total expenses | 1,325,758 | |||
|
| |||
Net investment income | 17,999,104 | |||
|
| |||
Net realized and unrealized gain/(loss) from investments: | ||||
Net realized gain from investments | 4,028,835 | |||
Net realized loss from TBA sale commitments | (13,468 | ) | ||
Net realized gain from futures contracts* | 299,180 | |||
Net change in unrealized appreciation/(depreciation) on investments(a) | 71,049,360 | |||
Net change in unrealized appreciation/(depreciation) on TBA sale commitments | (1,315 | ) | ||
Net change in unrealized appreciation/(depreciation) on futures contracts* | (11,916 | ) | ||
|
| |||
Net realized and unrealized gain on investments | 75,350,676 | |||
|
| |||
Net increase in net assets resulting from operations | $ | 93,349,780 | ||
|
| |||
| * | Primary risk exposure is equity contracts. |
| (a) | Dividend income and change in unrealized depreciation from affiliated issuer was $13,151 and $(115,287), respectively. |
The accompanying notes are an integral part of the financial statements.
73
VERPLANCK BALANCED FUND
Statements of Changes in Net Assets
| For the Year Ended September 30, 2020 | For the Year Ended September 30, 2019 | |||||||||
Increase in net assets from operations: | ||||||||||
Net investment income | $ | 17,999,104 | $ | 18,574,358 | ||||||
Net realized gain from investments, TBA sale commitments and futures contracts | 4,314,547 | 772,375 | ||||||||
Net change in unrealized appreciation/(depreciation) on investments, futures contracts and TBA sale commitments | 71,036,129 | 39,513,147 | ||||||||
|
|
|
| |||||||
Net increase in net assets resulting from operations | 93,349,780 | 58,859,880 | ||||||||
|
|
|
| |||||||
Distributions to Shareholders From: | ||||||||||
Total distributable earnings | (19,679,923 | ) | (6,153,555 | ) | ||||||
|
|
|
| |||||||
Decrease in net assets from distributions to shareholders | (19,679,923 | ) | (6,153,555 | ) | ||||||
|
|
|
| |||||||
Increase/(Decrease) in Net Assets Derived from Capital Share Transactions (Note 5) | 19,591,770 | (5,900,130 | ) | |||||||
|
|
|
| |||||||
Total increase in net assets | 93,261,627 | 46,806,195 | ||||||||
|
|
|
| |||||||
Net assets | ||||||||||
Beginning of year | 898,138,416 | 851,332,221 | ||||||||
|
|
|
| |||||||
End of year | $ | 991,400,043 | $ | 898,138,416 | ||||||
|
|
|
| |||||||
The accompanying notes are an integral part of the financial statements.
74
VERPLANCK BALANCED FUND
Financial Highlights
Contained below is per share operating performance data for the Verplanck Balanced Fund, total investment return, ratios to average net assets and other supplemental data for the respective period. The total return in the table represents the rate that an investor would have earned or lost on an investment in the Fund (assuming reinvestment of all dividends and distributions). This information has been derived from information provided in the financial statements and should be read in conjunction with the financial statements and the notes thereto.
| For the Year Ended September 30, 2020 | For the Year Ended September 30, 2019 | For the Period August 28, 2018* to September 30, 2018 | |||||||||||||||||||||||
Per Share Operating Performance | |||||||||||||||||||||||||
Net asset value, beginning of period | $ | 106.28 | $ | 100.16 | $ | 100.00 | |||||||||||||||||||
|
|
|
|
|
| ||||||||||||||||||||
Net investment income(1) | 2.09 | 2.18 | 0.18 | ||||||||||||||||||||||
Net realized and unrealized gain/(loss) on investments | 8.81 | 4.66 | (0.02 | ) | |||||||||||||||||||||
|
|
|
|
|
| ||||||||||||||||||||
Net increase in net assets resulting from operations | 10.90 | 6.84 | 0.16 | ||||||||||||||||||||||
|
|
|
|
|
| ||||||||||||||||||||
Dividends and distributions to shareholders from: | |||||||||||||||||||||||||
Net investment income | (2.33 | ) | (0.72 | ) | — | ||||||||||||||||||||
|
|
|
|
|
| ||||||||||||||||||||
Total dividends and distributions to shareholders | (2.33 | ) | (0.72 | ) | — | ||||||||||||||||||||
|
|
|
|
|
| ||||||||||||||||||||
Net asset value, end of period | $ | 114.85 | $ | 106.28 | $ | 100.16 | |||||||||||||||||||
|
|
|
|
|
| ||||||||||||||||||||
Total investment return(2) | 10.39 | % | 6.94 | % | 0.16 | % | |||||||||||||||||||
Ratio/Supplemental Data | |||||||||||||||||||||||||
Net assets, end of period (in thousands) | $ | 991,400 | $ | 898,138 | $ | 851,332 | |||||||||||||||||||
Ratio of expenses to average net assets | 0.14 | % | 0.16 | % | 0.17 | %(3) | |||||||||||||||||||
Ratio of net investment income to average net assets | 1.92 | % | 2.18 | % | 2.00 | %(3) | |||||||||||||||||||
Portfolio turnover rate | 55 | % | 57 | % | 5 | %(4)(5) | |||||||||||||||||||
| * | Commencement of operations. |
| (1) | The selected per share data was calculated using the average shares outstanding method for the period. |
| (2) | Total investment return is calculated assuming a purchase of shares on the first day and a sale of shares on the last day of each period reported and includes reinvestment of dividends and distributions, if any. Total returns for periods less than one year are not annualized. |
| (3) | Annualized. |
| (4) | Portfolio turnover rate excludes securities received from a subscription-in-kind. |
| (5) | Not annualized. |
The accompanying notes are an integral part of the financial statements.
75
VERPLANCK BALANCED FUND
Notes to Financial Statements
September 30, 2020
1. Organization and Significant Accounting Policies
Verplanck Balanced Fund, (the “Fund”) is a diversified, open-end management investment company registered under the Investment Company Act of 1940, as amended (the “1940 Act”), which commenced investment operations on August 28, 2018. The Fund is a separate series of FundVantage Trust (the “Trust”) which was organized as a Delaware statutory trust on August 28, 2006. However, beneficial interests of the Fund are not registered under the Securities Act of 1933, as amended (the “1933 Act”) because such interests will be issued solely through private placement transactions that do not involve any “public offering” within the meaning of Section 4(a)(2) of the 1933 Act. The Trust is a “series trust” authorized to issue an unlimited number of separate series or classes of shares of beneficial interest. Each series is treated as a separate entity for certain matters under the 1940 Act, and for other purposes, and a shareholder of one series is not deemed to be a shareholder of any other series.
The Fund is an investment company and follows accounting and reporting guidance in the Financial Accounting Standards Board Accounting Standards Codification Topic 946.
On August 28, 2018, the Fund, as the result of a reorganization, acquired substantially all of the assets of a privately offered common trust fund (“Predecessor Fund”) managed by Mellon Investments Corporation (the “Adviser”), in exchange for shares of the Fund. The Predecessor Fund was not registered as an investment company under the 1940 Act and was not subject to certain investment limitations, diversification requirements, liquidity requirements imposed by the 1940 Act and the Internal Revenue Code of 1986, as amended (the “Code”). This reorganization transaction was structured to qualify as a non-taxable transaction under the Code. In connection with this reorganization, the Predecessor Fund valued its securities pursuant to the Fund’s valuation procedures. The assets acquired were comprised of $815,927,402 of securities, $2,247,805 of interest receivable and $31,804,938 of cash. For financial statement purposes, assets received and shares issued by the Fund were recorded at fair value, and the Fund recorded the cost of such investments at their historical cost as recorded by the Predecessor Fund. The cost basis of the investments received from the Predecessor Fund was carried forward to align ongoing reporting of the Fund’s unrealized depreciation at the time of reorganization (the Fund had no assets or liabilities prior to the reorganization) as follows:
| Predecessor Fund net assets at time of reorganization | Predecessor Fund unrealized (depreciation) at time of reorganization | Net assets of the Fund immediately after reorganization | |||||||||||
| $849,980,145 | $ | (14,817,997 | ) | $ | 849,980,145 | ||||||||
Portfolio Valuation — The Fund’s net asset value (“NAV”) is calculated once daily at the close of regular trading hours on the New York Stock Exchange (“NYSE”) (typically 4:00 p.m. Eastern time) on each day the NYSE is open. Securities held by the Fund are valued using the closing price or the last sale price on a national securities exchange or the National Association of Securities Dealers Automatic Quotation System (“NASDAQ”) market system where they are primarily traded. Equity securities listed on any national exchange market system will be valued at the last sale price. Equity securities traded in the over-the-counter market are valued at their closing price. If there were no transactions on that day, securities traded principally on an exchange will be valued at the mean of the last bid and ask prices prior to the market close. Prices for equity securities normally are supplied by an independent pricing service approved by the Trust’s Board of Trustees (“Board of Trustees”). Fixed income securities are valued based on market quotations, which are furnished by an independent pricing service approved by the Board of Trustees. Fixed income securities having remaining maturities of 60 days or less are generally valued at amortized cost, provided such amounts approximates market value. Debt securities are valued on the basis of broker quotations or valuations provided by a pricing service, which utilizes information with respect to recent sales, market transactions in comparable securities, quotations from dealers, and various relationships between securities in determining value. Due to continued volatility in the current market, valuations developed through pricing techniques may materially vary from the actual amounts realized upon sale of the securities. Any assets held by the Fund that are denominated in foreign currencies are valued daily in U.S. dollars at the foreign currency exchange rates that are prevailing at the time that the Fund determines the daily NAV per share. Foreign securities may trade on weekends or other days when the Fund does not calculate the NAV. As a result, the market value of these investments may change on days when you cannot buy or sell shares of the Fund. Foreign securities are valued based on prices from the primary market in which they are traded and are translated from the local currency into U.S. dollars using current exchange rates. Exchange traded futures contracts are generally valued using the settlement price determined by the relevant exchange. Exchange traded futures contracts for which no settlement price is reported, are generally valued at the mean between the most recent bid and ask prices obtained from approved pricing services, established market makers, or from broker-dealers. Securities
76
VERPLANCK BALANCED FUND
Notes to Financial Statements (Continued)
September 30, 2020
that do not have a readily available current market value are valued in accordance with the procedures adopted by the Board of Trustees. The Board of Trustees has adopted methods for valuing securities and other assets in circumstances where market quotes are not readily available and has delegated to the Adviser the responsibility for applying the valuation methods. Relying on prices supplied by pricing services or dealers or using fair valuation may result in values that are higher or lower than the values used by other investment companies and investors to price the same investments. In the event that market quotes are not readily available, and the security or asset cannot be valued pursuant to one of the valuation methods, the value of the security or asset will be determined in good faith by the Adviser. The Trust has established a Valuation Committee which performs certain functions including the oversight of the Adviser’s fair valuation determinations.
Fair Value Measurements — The inputs and valuation techniques used to measure fair value of the Fund’s investments are summarized into three levels as described in the hierarchy below:
· Level 1 — | quoted prices in active markets for identical securities; | |
· Level 2 — | other significant observable inputs (including quoted prices for similar securities, interest rates, prepayment speeds, credit risk, etc.); and | |
· Level 3 — | significant unobservable inputs (including the Fund’s own assumptions in determining the fair value of investments). | |
The inputs or methodology used for valuing securities are not necessarily an indication of the risk associated with investing in those securities. Transfers in and out are recognized at the value at the end of the period.
The fair value of the Fund’s bonds are generally based on the quotes received from brokers or independent pricing services. Bonds with quotes that are based on actual trades with a sufficient level of activity on or near the measurement date are classified as Level 2 assets.
Significant events (such as movement in the U.S. securities market, or other regional and local developments) may occur between the time that foreign markets close (where the security is principally traded) and the time that the Fund calculates its NAV (generally, the close of the NYSE) that may impact the value of securities traded in these foreign markets. As a result, the Fund fair values foreign securities using an independent pricing service approved by the Board of Trustees which considers the correlation of the trading patterns of the foreign security to the intraday trading in the U.S. markets for investments such as American Depositary Receipts, financial futures, exchange traded funds and certain indexes as well as prices for similar securities. Such fair valuations are categorized as Level 2 within the hierarchy.
Securities listed on a non-U.S. exchange are generally fair valued daily by an independent fair value pricing service approved by the Board of Trustees and categorized as Level 2 investments within the hierarchy. The fair valuations for these securities may not be the same as quoted or published prices of the securities on their primary markets. Securities for which daily fair value prices from the independent fair value pricing service are not available are generally valued at the last quoted sale price at the close of an exchange on which the security is traded and categorized as Level 1 investments within the hierarchy. Values of foreign securities, currencies, and other assets and liabilities denominated in foreign currencies are translated into U.S. dollars at the exchange rate of said currencies against the U.S. dollar, as of valuation time, as provided by an independent pricing service approved by the Board of Trustees.
The following is a summary of the inputs used, as of September 30, 2020, in valuing the Fund’s investments carried at fair value:
| Total Value at 09/30/20 | Level 1 Quoted Prices | Level 2 Other Significant Observable Inputs | Level 3 Significant Unobservable Inputs | |||||||||||||
Assets | ||||||||||||||||
Asset-Backed Securities | $ | 1,845,890 | $ | — | $ | 1,845,890 | $ | — | ||||||||
Common Stocks | 461,317,886 | 461,317,886 | — | — | ||||||||||||
Corporate Bonds and Notes | 152,443,232 | — | 152,443,232 | — | ||||||||||||
Foreign Government Bonds and Notes | 8,984,840 | — | 8,984,840 | — | ||||||||||||
77
VERPLANCK BALANCED FUND
Notes to Financial Statements (Continued)
September 30, 2020
| Total Value at 09/30/20 | Level 1 Quoted Prices | Level 2 Other Significant Observable Inputs | Level 3 Significant Unobservable Inputs | |||||||||||||
Municipal Bonds | $ | 4,931,092 | $ | — | $ | 4,931,092 | $ | — | ||||||||
Commercial Mortgage-Backed Securities | 12,591,706 | — | 12,591,706 | — | ||||||||||||
Mortgage-Backed Securities | 140,722,858 | — | 140,722,858 | — | ||||||||||||
U.S. Government Agency Obligations | 6,053,730 | — | 6,053,730 | — | ||||||||||||
U.S. Treasury Obligations | 195,314,340 | — | 195,314,340 | — | ||||||||||||
Short-Term Investments | 43,333,952 | 43,333,952 | — | — | ||||||||||||
|
|
|
|
|
|
|
| |||||||||
Total Assets | $ | 1,027,539,526 | $ | 504,651,838 | $ | 522,887,688 | $ | — | ||||||||
|
|
|
|
|
|
|
| |||||||||
Liabilities | ||||||||||||||||
TBA Sale Commitments | $ | (592,758 | ) | $ | — | $ | (592,758 | ) | $ | — | ||||||
Derivatives: | ||||||||||||||||
Equity Contracts | ||||||||||||||||
Futures Contracts | (30,375 | ) | (30,375 | ) | — | — | ||||||||||
|
|
|
|
|
|
|
| |||||||||
Total Liabilities | $ | (623,133 | ) | $ | (30,375 | ) | $ | (592,758 | ) | $ | — | |||||
|
|
|
|
|
|
|
| |||||||||
At the end of each quarter, management evaluates the classification of Levels 1, 2 and 3 assets and liabilities. Various factors are considered, such as changes in liquidity from the prior reporting period; whether or not a broker is willing to execute at the quoted price; the depth and consistency of prices from third party pricing services; and the existence of contemporaneous, observable trades in the market. Additionally, management evaluates the classification of Level 1 and Level 2 assets and liabilities on a quarterly basis for changes in listings or delistings on national exchanges.
Due to the inherent uncertainty of determining the fair value of investments that do not have readily available market value, the fair value of the Fund’s investments may fluctuate from period to period. Additionally, the fair value of investments may differ significantly from the values that would have been used had a ready market existed for such investments and may differ materially from the values the Fund may ultimately realize. Further, such investments may be subject to legal and other restrictions on resale or otherwise less liquid than publicly traded securities.
For fair valuations using significant unobservable inputs, U.S. generally accepted accounting principles (“U.S. GAAP”) require the Fund to present a reconciliation of the beginning to ending balances for reported market values that present changes attributable to total realized and unrealized gains or losses, purchase and sales, and transfers in and out of Level 3 during the period. A reconciliation of Level 3 investments is presented only when the Fund had an amount of Level 3 investments at the end of the reporting period that was meaningful in relation to its net assets. The amounts and reasons for all transfers in and out of Level 3 are disclosed when the Fund had an amount of transfers during the reporting period that was meaningful in relation to its net assets as of the end of the reporting period.
For the year ended September 30, 2020, there were no transfers in or out of Level 3.
Use of Estimates — The preparation of financial statements in conformity with U.S. GAAP requires management to make estimates and assumptions that affect the amounts reported in the financial statements and accompanying notes at the date of the financial statements and the reported amounts of revenues and expenses during the period. Actual results could differ from those estimates and those differences could be material.
Investment Transactions, Investment Income and Expenses — Investment transactions are recorded on trade date for financial statement preparation purposes. Realized gains and losses on investments sold are recorded on the identified cost basis. Gains and losses on principal paydowns from mortgage backed securities are recorded as interest income on the Statement of Operations. Interest income is recorded on the accrual basis. Accretion of discounts and amortization of premiums are recorded on a daily basis using the effective yield method except for short-term securities, which records discounts and premiums on a straight-line basis. Dividends
78
VERPLANCK BALANCED FUND
Notes to Financial Statements (Continued)
September 30, 2020
are recorded on the ex-dividend date. Estimated components of distributions received from real estate investment trusts may be considered income, return of capital distributions or capital gain distributions. Return of capital distributions are recorded as a reduction of costs of the related investments. General expenses of the Trust are generally allocated to the Fund under methodologies approved by the Board of Trustees. Expenses directly attributable to a particular fund in the Trust are charged directly to that fund.
Futures Contracts — The Fund may use futures contracts for hedging or speculative purposes consistent with its investment objective. Upon entering into a futures contract, the Fund must deposit initial margin in addition to segregating cash or liquid assets sufficient to meet its obligation to purchase or provide securities, or to pay the amount owed at the expiration of an index-based futures contract. Such liquid assets may consist of cash, cash equivalents, liquid debt or equity securities or other acceptable assets. Pursuant to the futures contract, the Fund agrees to receive from, or pay to the broker, an amount of cash equal to daily fluctuation in value of the contract. Such a receipt of payment is known as “variation margin” and is recorded by the Fund as unrealized appreciation or depreciation. When the contract is closed, the Fund records a realized gain or loss equal to the difference between the proceeds from (or cost of) the closing transactions and the Fund’s basis in the contract. Futures contracts have market risks, including the risk that the change in the value of the contract may not correlate with changes in the value of the underlying securities. Use of long futures contracts subjects the Fund to risk of loss in excess of the amount shown on the Statement of Assets and Liabilities, up to the notional value of the futures contract. Use of short futures contracts subjects the Fund to unlimited risk of loss.
During the reporting period, the Fund used futures contracts for purposes of liquidity.
For the year ended September 30, 2020, the Fund’s quarterly average volume of derivatives was as follows:
| Long Futures | |||
| Contracts | |||
| (Notional) | |||
| $3,561,010 | |||
Dividends and Distributions to Shareholders — Dividends from net investment income are declared and paid annually to shareholders. Distributions from net realized capital gains, if any, are declared and paid annually to shareholders. Income dividends and capital gain distributions are determined in accordance with U.S. federal income tax regulations, which may differ from U.S. GAAP.
U.S. Tax Status — No provision is made for U.S. income taxes as it is the Fund’s intention to continue to qualify for and elect the tax treatment applicable to regulated investment companies under Subchapter M of the Code, and make the requisite distributions to its shareholders which will be sufficient to relieve it from U.S. income and excise taxes.
Other — In the normal course of business, the Fund may enter into contracts that provide general indemnifications. The Fund’s maximum exposure under these arrangements is dependent on claims that may be made against the Fund in the future, and, therefore, cannot be estimated; however, based on experience, the risk of material loss for such claims is considered remote.
Market disruptions associated with the COVID-19 pandemic have had a global impact, and uncertainty exists as to its long-term implications. The COVID-19 pandemic could adversely affect the value and liquidity of the Fund’s investments, impair the Fund’s ability to satisfy redemption requests, and negatively impact the Fund’s performance. In addition, the outbreak of COVID-19, and measures taken to mitigate its effects, could result in disruptions to the services provided to the Fund by its service providers. Fund management is continuing to monitor this development and evaluate its impact on the Fund.
Mortgage-Related And Other Asset-Backed Securities Risk — Mortgage-related and asset-backed securities are subject to certain other risks. The value of these securities will be influenced by the factors affecting the housing market and the assets underlying such securities. As a result, during periods of declining asset value, difficult or frozen credit markets, swings in interest rates, or deteriorating economic conditions, mortgage-related and asset-backed securities may decline in value, face valuation difficulties, become more volatile and/or become illiquid.
Debt Investment Risk — Debt investments are affected primarily by the financial condition of the companies or other entities that have issued them and by changes in interest rates. There is a risk that an issuer of the Fund’s debt investments may not be able to meet its financial obligations (e.g., may not be able to make principal and/or interest payments when they are due or otherwise default on other financial terms) and/or go bankrupt. Securities such as high-yield/high-risk bonds, e.g., bonds with low credit ratings
79
VERPLANCK BALANCED FUND
Notes to Financial Statements (Continued)
September 30, 2020
by Moody’s (Ba or lower) or Standard & Poor’s (BB and lower) or if unrated are of comparable quality as determined by the manager, are especially subject to credit risk during periods of economic uncertainty or during economic downturns and are more likely to default on their interest and/or principal payments than higher rated securities. Debt investments may be affected by changes in interest rates. Debt investments with longer durations tend to be more sensitive to changes in interest rates, making them more volatile than debt investments with shorter durations or floating or adjustable interest rates. The value of debt investments may fall when interest rates rise.
LIBOR Phase-out Risk — The United Kingdom’s Financial Conduct Authority, which regulates London Interbank Overnight Rates (“LIBOR”), has announced plans to phase out the use of LIBOR by the end of 2021. There remains uncertainty regarding the future use of LIBOR and the nature of any replacement rate. The transition process away from LIBOR may involve, among other things, increased volatility or illiquidity in markets for instruments that currently rely on LIBOR. The transition process may also result in a reduction in the value of certain instruments held by a Fund or reduce the effectiveness of related Fund transactions such as hedges. Volatility, the potential reduction in value, and/or the hedge effectiveness of financial instruments may be heightened for financial instruments that do not include fallback provisions that address the cessation of LIBOR. Any potential effects of the transition away from LIBOR on any of the Funds or on financial instruments in which a Fund invests, as well as other unforeseen effects, could result in losses to the Fund.
TBA Purchase and Sale Commitments — The Fund may enter into to-be-announced (“TBA”) purchase or sale commitments (collectively, “TBA transactions”), pursuant to which it agrees to purchase or sell, respectively, mortgage-backed securities for a fixed unit price, with payment and delivery at a scheduled future date beyond the customary settlement period for such securities. With TBA transactions, the particular securities to be received or delivered by the Fund are not identified at the trade date; however, the securities must meet specified terms, including issuer, rate, and mortgage term, and be within industry-accepted “good delivery” standards. The Fund may enter into TBA transactions with the intention of taking possession of or relinquishing the underlying securities, may elect to extend the settlement by “rolling” the transaction, and/or may use TBA transactions to gain or reduce interim exposure to underlying securities. Until settlement, the Fund maintains liquid assets sufficient to settle its commitment to purchase a TBA or, in the case of a sale commitment, the Fund maintains an entitlement to the security to be sold.
To mitigate counterparty risk, the Fund has entered into agreements with TBA counterparties that provide for collateral and the right to offset amounts due to or from those counterparties under specified conditions. Subject to minimum transfer amounts, collateral requirements are determined and transfers made based on the net aggregate unrealized gain or loss on all TBA commitments with a particular counterparty. At any time, the Fund’s risk of loss from a particular counterparty related to its TBA commitments is the aggregate unrealized gain on appreciated TBAs in excess of unrealized loss on depreciated TBAs and collateral received, if any, from such counterparty. As of September 30, 2020, no collateral was pledged by the Fund or counterparties for TBAs.
2. Transactions with Related Parties and Other Service Providers
Mellon Investments Corporation (the “Adviser”) serves as investment adviser to the Fund pursuant to an investment advisory agreement with the Trust. For its services, the Adviser is paid a monthly fee at the annual rate of 0.12% (12 basis points) on the first $250 million average daily net assets of the Fund, 0.10% of the next $100 million average daily net assets of the Fund, and 0.02% on average daily net assets of the Fund in excess of $350 million.
For the year ended September 30, 2020, the Adviser earned advisory fees of $517,115.
Other Service Providers
The Bank of New York Mellon (“BNY Mellon”) serves as administrator and custodian for the Fund. For providing administrative and accounting services, BNY Mellon is entitled to receive a monthly fee equal to an annual percentage rate of the Fund’s average daily net assets and is subject to certain minimum monthly fees. For providing certain custodial services, BNY Mellon is entitled to receive a monthly fee, subject to certain minimum, and out of pocket expenses.
BNY Mellon Investment Servicing (US) Inc. (the “Transfer Agent”) provides transfer agent services to the Fund. The Transfer Agent is entitled to receive a monthly fee, subject to certain minimum, and out of pocket expenses.
80
VERPLANCK BALANCED FUND
Notes to Financial Statements (Continued)
September 30, 2020
Trustees and Officers
The Trust is governed by its Board of Trustees. The Trustees receive compensation in the form of an annual retainer and per meeting fees for their services to the Trust. An employee of BNY Mellon serves as the Secretary of the Trust and is not compensated by the Fund or the Trust.
JW Fund Management LLC (“JWFM”) provides a Principal Executive Officer and Principal Financial Officer, respectively, to the Trust. Effective October 1, 2020, Alaric Compliance Services LLC (“Alaric”) provides the Trust with a Chief Compliance Officer and an Anti-Money Laundering Officer. Prior to October 1, 2020, Duff & Phelps, LLC provided the Trust with a Chief Compliance Officer and an Anti-Money Laundering Officer. JWFM and Alaric are compensated for their services provided to the Trust.
Investment in Affiliated Company
The following table lists the issuer owned by Fund that may be deemed an “affiliated company” under the 1940 Act, as well as transactions that occurred in the security of such issuers during the year ended September 30, 2020:
Name of Issuer | Value at 09/30/19 | Purchase Cost | Sales Proceeds | Change in Unrealized Depreciation | Value at 09/30/20 | Dividend Income | Net Realized Gain (Loss) | Shares Held at 09/30/20 | ||||||||||||||||||||||||||||||||
| Bank of New York Mellon Corp/The | $479,497 | $— | $— | $(115,287) | $364,210 | $13,151 | $— | 10,606 | ||||||||||||||||||||||||||||||||
3. Investment in Securities
For the year ended September 30, 2020, aggregate purchases and sales of investment securities (excluding short-term investments) of the Fund were as follows:
| Purchases | Sales | |||||||
Investment Securities | $ | 55,498,728 | $ | 35,387,928 | ||||
U.S. Government Securities | 474,646,778 | 475,929,086 | ||||||
4. Capital Share Transactions
For the years ended September 30, 2020 and 2019, transactions in capital shares (authorized shares unlimited) were as follows:
| For the Year Ended | For the Year Ended | |||||||||||||||
| September 30, 2020 | September 30, 2019 | |||||||||||||||
| Shares | Amount | Shares | Amount | |||||||||||||
Verplanck Balanced Fund: | ||||||||||||||||
Reinvestments | 182,458 | $ | 19,679,923 | 66,781 | $ | 6,153,555 | ||||||||||
Redemptions | (812 | ) | (88,153 | ) | (116,146 | ) | (12,053,685 | ) | ||||||||
|
|
|
|
|
|
|
| |||||||||
Net increase/(decrease) | 181,646 | $ | 19,591,770 | (49,365 | ) | $ | (5,900,130 | ) | ||||||||
|
|
|
|
|
|
|
| |||||||||
5. Federal Tax Information
The Fund has followed the authoritative guidance on accounting for and disclosure of uncertainty in tax positions, which requires the Fund to determine whether a tax position is more likely than not to be sustained upon examination, including resolution of any related appeals or litigation processes, based on the technical merits of the position. Tax positions not deemed to meet the more-likely-than-not threshold would be recorded as tax benefit or expense in the current year. The Fund has determined that there was no effect on the financial statements from following this authoritative guidance. In the normal course of business, the Fund is subject to examination by federal, state and local jurisdictions, where applicable, for tax years for which applicable statutes of limitations have not expired.
Distributions are determined in accordance with federal income tax regulations, which may differ in amount or character from net investment income and realized gains for financial reporting purposes. Accordingly, the character of distributions and composition of net assets for tax purposes may differ from those reflected in the accompanying financial statements. To the extent these differences
81
VERPLANCK BALANCED FUND
Notes to Financial Statements (Concluded)
September 30, 2020
are permanent, such amounts are reclassified within the components of net assets based on the tax treatment; temporary differences do not require reclassifications. For the year ended September 30, 2020, there were no reclassifications.
For the year ended September 30, 2020, the tax character of distributions paid by the Fund was $19,679,923 of ordinary income dividends. For the year ended September 30, 2019, the tax character of distributions paid by the Fund was $6,153,555 of ordinary income dividends. Distributions from net investment income and short-term capital gains are treated as ordinary income for federal income tax purposes.
As of September 30, 2020, the components of distributable earnings on a tax basis were as follows:
| Undistributed | |||||||||||||
| Long-Term | Undistributed | Unrealized | |||||||||||
| Capital Gains | Ordinary Income | Appreciation | |||||||||||
| $1,591,395 | $ | 15,882,628 | $ | 95,552,209 | |||||||||
The differences between the book and tax basis components of distributable earnings relate primarily to the timing and recognition of income and gains for federal income tax purposes. Short-term capital gains are reported as ordinary income for federal income tax purposes.
As of September 30, 2020, the federal tax cost, aggregate gross unrealized appreciation and depreciation of securities held by the Fund were as follows:
Federal tax cost | $ | 931,985,918 | ||||
|
| |||||
Gross unrealized appreciation | 140,018,882 | |||||
Gross unrealized depreciation | (44,466,673 | ) | ||||
|
| |||||
Net unrealized appreciation | $ | 95,552,209 | ||||
|
|
Pursuant to federal income tax rules applicable to regulated investment companies, the Fund may elect to treat certain capital losses between November 1 and September 30 and late year ordinary losses ((i) ordinary losses between January 1 and September 30, and (ii) specified ordinary and currency losses between November 1 and September 30) as occurring on the first day of the following tax year. For the year ended September 30, 2020, any amount of losses elected within the tax return will not be recognized for federal income tax purposes until October 1, 2020. For the year ended September 30, 2020, the Fund had no capital loss deferrals and no late year ordinary loss deferrals.
During the year ended September 30, 2020, the Fund utilized $80,244 of prior year capital loss carryforwards.
6. Subsequent Events
Management has evaluated the impact of all subsequent events on the Fund through the date the financial statements were available to be issued, and has determined that there was the following subsequent event:
On October 26, 2020, the Board approved a plan to liquidate and terminate the Fund, which is expected to occur on or about December 31, 2020.
82
VERPLANCK BALANCED FUND
Report of Independent Registered Public Accounting Firm
To the Board of Trustees of FundVantage Trust and
Shareholders of the Verplanck Balanced Fund
Opinion on the Financial Statements
We have audited the accompanying statement of assets and liabilities of Verplanck Balanced Fund (the “Fund”) (one of the series constituting FundVantage Trust (the “Trust”)), including the portfolio of investments, as of September 30, 2020, and the related statement of operations for the year then ended, the statements of changes in net assets for each of the two years in the period then ended, the financial highlights for each of the two years in the period then ended and the period from August 28, 2018 (commencement of operations) to September 30, 2018 and the related notes (collectively referred to as the “financial statements”). In our opinion, the financial statements present fairly, in all material respects, the financial position of the Fund (one of the series constituting FundVantage Trust) at September 30, 2020, the results of its operations for the year then ended, the changes in its net assets for each of the two years in the period then ended and its financial highlights for each of the two years in the period then ended and the period from August 28, 2018 (commencement of operations) to September 30, 2018, in conformity with U.S. generally accepted accounting principles.
Basis for Opinion
These financial statements are the responsibility of the Trust’s management. Our responsibility is to express an opinion on the Fund’s financial statements based on our audits. We are a public accounting firm registered with the Public Company Accounting Oversight Board (United States) (“PCAOB”) and are required to be independent with respect to the Trust in accordance with the U.S. federal securities laws and the applicable rules and regulations of the Securities and Exchange Commission and the PCAOB.
We conducted our audits in accordance with the standards of the PCAOB. Those standards require that we plan and perform the audit to obtain reasonable assurance about whether the financial statements are free of material misstatement, whether due to error or fraud. The Trust is not required to have, nor were we engaged to perform, an audit of the Trust’s internal control over financial reporting. As part of our audits we are required to obtain an understanding of internal control over financial reporting but not for the purpose of expressing an opinion on the effectiveness of the Trust’s internal control over financial reporting. Accordingly, we express no such opinion.
Our audits included performing procedures to assess the risks of material misstatement of the financial statements, whether due to error or fraud, and performing procedures that respond to those risks. Such procedures included examining, on a test basis, evidence regarding the amounts and disclosures in the financial statements. Our procedures included confirmation of securities owned as of September 30, 2020, by correspondence with the custodian and brokers or by other appropriate auditing procedures where replies from brokers were not received. Our audits also included evaluating the accounting principles used and significant estimates made by management, as well as evaluating the overall presentation of the financial statements. We believe that our audits provide a reasonable basis for our opinion.
We have served as the auditor of one or more Verplanck investment companies since 2018.
Philadelphia, Pennsylvania
November 25, 2020
83
VERPLANCK BALANCED FUND
Shareholder Tax Information
(Unaudited)
The Fund is required by Subchapter M of the Internal Revenue Code to advise its shareholders of the U.S. federal tax status of distributions received by the Fund’s shareholders in respect of such fiscal year. During the fiscal year ended September 30, 2020, the Fund paid $19,679,923 of ordinary income dividends to its shareholders. Dividends from net investment income and short-term capital gains are treated as ordinary income dividends for federal income tax purposes.
The Fund designates 40.39% of the ordinary income distribution as qualified dividend income pursuant to the Jobs and Growth Tax Relief Reconciliation Act of 2003.
The percentage of ordinary income dividends qualifying for corporate dividends received deduction is 31.43%.
The percentage of qualified interest income related dividends not subject to withholding tax for non-resident aliens and foreign corporations is 56.22%.
A total of 17.98% of the dividends distributed during the fiscal year was derived from interest on U.S. government securities, which is generally exempt from state income tax.
All designations are based on financial information available as of the date of this annual report and, accordingly, are subject to change. For each item, it is the intention of the Fund to designate the maximum amount permitted under the Internal Revenue Code of 1986, as amended, and the regulations thereunder.
Because the Fund’s fiscal year is not the calendar year, another notification will be sent with respect to calendar year 2020. The second notification, which will reflect the amount, if any, to be used by calendar year taxpayers on their U.S. federal income tax returns, will be made in conjunction with Form 1099-DIV and will be mailed in January 2021.
Foreign shareholders will generally be subject to U.S. withholding tax on the amount of their ordinary income dividends. They will generally not be entitled to a foreign tax credit or deduction for the withholding taxes paid by the Fund, if any.
In general, dividends received by tax-exempt recipients (e.g., IRAs and Keoghs) need not be reported as taxable income for U.S. federal income tax purposes. However, some retirement trusts (e.g., corporate, Keogh and 403(b)(7) plans) may need this information for their annual information reporting.
Shareholders are advised to consult their own tax advisers with respect to the tax consequences of their investment in the Fund.
84
VERPLANCK BALANCED FUND
Statement Regarding Liquidity Risk Management Program
(Unaudited)
On October 16, 2016, the Securities and Exchange Commission adopted Rule 22e-4 under the Investment Company Act of 1940, as amended (the “Liquidity Rule”) to promote effective liquidity risk management throughout the open-end investment company industry, thereby reducing the risk that funds will be unable to meet their redemption obligations and mitigating dilution of the interests of fund shareholders.
The Board of Trustees (the “Board”) of FundVantage Trust, on behalf of the Verplanck Balanced Fund (the “Fund”), met on September 22-23, 2020 (the “Meeting”) to review the liquidity risk management program (the “Program”) applicable to the Fund, pursuant to the Liquidity Rule. The Board has appointed a committee of individuals to serve as the program administrator for the Fund’s Program (the “Program Committee”). At the Meeting, the Program Committee provided the Board with a report that addressed the operation of the Program and assessed its adequacy and effectiveness of implementation and any material changes to the Program as of June 30, 2020 (the “Report”).
The Report described the Program’s liquidity classification methodology. It also described the Program Committee’s methodology in determining whether a Highly Liquid Investment Minimum (a “HLIM”) is necessary and noted that, given the composition of the Fund’s portfolio holdings, a HLIM was not currently required for the Fund.
The Report noted that the Program complied with the key factors for consideration under the Liquidity Rule for assessing, managing and periodically reviewing liquidity risk, as follow:
A. The Fund’s investment strategy and liquidity of Fund investments during both normal and reasonably foreseeable stressed conditions: As part of the Report, the Program Committee reviewed the Fund’s strategy and its determination that the strategy remains appropriate for an open-end fund structure. This determination was based on the Fund’s holdings of Highly Liquid Investments, the diversification of holdings and the related average position size of the holdings.
B. Short-term and long-term cash flow projections during both normal and reasonably foreseeable stressed conditions: As part of the Report, the Program Committee reviewed historical net redemption activity and noted that it used this information as a component to establish the Fund’s reasonably anticipated trading size. The Fund has adopted an in-kind redemption policy which may be utilized to meet larger redemption requests. The Program Committee also took into consideration the Fund’s shareholder ownership concentration and the fact that the shares of the Fund are offered through intermediaries. The intermediary agreements increase the likelihood of large unanticipated redemptions, meaning a Fund may not have the ability to conduct an orderly sale of portfolio securities. The amount of assets a Fund has on these platforms is a significant factor in the ability of the Fund to meet redemption expectations. In light of the Fund’s holdings, it was noted that the Fund maintains a high level of liquidity to meet shareholder redemptions under both normal and stressed market conditions.
C. Holdings of cash and cash equivalents, as well as borrowing arrangements: As part of the Report, the Program Committee reviewed any changes in the Fund’s cash and cash equivalents positions in response to current/anticipated redemption activity or market conditions. It was noted that the Fund do not currently have a borrowing or other credit funding arrangement.
85
VERPLANCK BALANCED FUND
Other Information
(Unaudited)
Proxy Voting
Policies and procedures that the Fund uses to determine how to vote proxies relating to portfolio securities as well as information regarding how the Fund voted proxies relating to portfolio securities for the most recent 12-month period ended June 30 are available without charge, upon request, by calling (844) 741-5050 and on the Securities and Exchange Commission’s (“SEC”) website at http://www.sec.gov.
Quarterly Portfolio Schedules
The Trust files its complete schedule of portfolio holdings with the SEC for the first and third fiscal quarters of each fiscal year (quarters ended December 31 and June 30) as an exhibit to their reports on Form N-PORT. The Trust’s portfolio holdings on Form N-PORT are available on the SEC’s website at http://www.sec.gov.
Board Consideration of Investment Advisory Agreement
At a video conference meeting held on June 22-23, 2020 (the “Meeting”), the Board of Trustees (the “Board” or the “Trustees”) of FundVantage Trust (the “Trust”), including a majority of the Trustees who are not “interested persons” within the meaning of Section 2(a)(19) of the Investment Company Act of 1940, as amended (the ��1940 Act”) (the “Independent Trustees”), unanimously approved the continuation of the Investment Advisory Agreement between Mellon Investments Corporation (“Mellon” or the “Adviser”) and the Trust (the “Mellon Agreement”) on behalf of the Verplanck Balanced Fund (“Verplanck Fund”). At the Meeting, the Board considered the continuation of the Mellon Agreement with respect to the Verplanck Fund for an additional one year period.
In determining whether to continue the Mellon Agreement for an additional one-year period, the Trustees, including the Independent Trustees, considered information provided by Mellon in response to a request for information in accordance with Section 15(c) of the 1940 Act (the “Mellon 15(c)Response”) regarding (i) the services performed for the Verplanck Fund, (ii) the size and qualifications of Mellon’s portfolio management staff, (iii) any potential or actual material conflicts of interest which may arise in connection with a portfolio manager’s management of the Verplanck Fund, (iv) investment performance, (v) the financial condition of Mellon and Mellon’s parent company, (vi) brokerage selection procedures (including soft dollar arrangements, if any), (vii) the procedures for allocating investment opportunities between the Verplanck Fund and other clients, (viii) results of any regulatory examination, including any recommendations or deficiencies noted, (ix) any litigation, investigation or administrative proceeding which may have a material impact on Mellon’s ability to service the Verplanck Fund, and (x) compliance with the Verplanck Fund’s investment objectives, policies and practices (including codes of ethics and proxy voting policies), federal securities laws and other regulatory requirements. The Trustees were informed by reports provided at Board meetings throughout the year covering matters such as the relative performance of the Verplanck Fund, compliance with the Fund’s investment objective, policies, strategies and limitations, compliance of portfolio management personnel with the applicable code of ethics, and adherence to pricing procedures as established by the Board (each, as applicable).
The Board noted that representatives of Mellon joined the Meeting by videoconference and discussed Mellon’s history, performance, investment strategy, and compliance program. Representatives of Mellon responded to questions from the Board. In addition to the Mellon 15(c) Response, the Trustees also considered other factors they believed to be relevant to considering the continuation of the Mellon Agreement, including the matters discussed below. In their deliberations, the Trustees did not identify any particular information that was controlling, and different Trustees may have attributed different weights to the various factors. After deliberating, the Trustees determined that the overall arrangement between the Verplanck Fund and Mellon, as provided by the terms of the Mellon Agreement, including the advisory fees under the Mellon Agreement, are fair and reasonable in light of the services provided, expenses incurred and such other matters as the Trustees considered relevant.
The Trustees considered the services provided by Mellon to the Verplanck Fund. The Trustees considered Mellon’s personnel and the depth of Mellon’s personnel who provide investment management services to the Verplanck Fund and the depth of their experience. Based on the Mellon 15(c) Response, the Trustees concluded that (i) the nature, extent and quality of the services provided by Mellon are appropriate and consistent with the terms of the Mellon Agreement, (ii) that the quality of those services has been, and continues to be, consistent with industry norms, (iii) the Fund is likely to benefit from the continued provision of those services, (iv) Mellon has sufficient personnel, with the appropriate skills and experience, to serve the Verplanck Fund effectively and has demonstrated
86
VERPLANCK BALANCED FUND
Other Information
(Unaudited) (Concluded)
its continuing ability to attract and retain qualified personnel, and (v) the satisfactory nature, extent, and quality of services currently provided to the Fund is likely to continue under the Mellon Agreement.
The Board discussed Mellon’s business continuity plan, and its ability to continue to manage the Verplanck Fund effectively in light of the recent volatility in financial markets as a result of the COVID-19 virus outbreak.
The Trustees considered the investment performance for the Verplanck Fund and Mellon. The Trustees reviewed historical performance charts prepared by a third-party, which showed the performance of the Verplanck Fund as compared to the following blended indexes for the year-to-date, one year and since inception periods ended March 31, 2020: (i) a 50% weighting to the S&P 500 and a 50% weighting to the Bloomberg Barclays U.S. Aggregate Bond Index (“Bloomberg Index”) (the “50/50 Index”); and (ii) 45% weighting to the S&P 500 and 55% weighting to the Bloomberg Index (the “45/55 Index”). The Trustees noted that the Verplanck Fund outperformed the 50/50 Index for the year-to-date and one-year periods and underperformed the 50/50 Index for the since inception period ended March 31, 2020. The Trustees further noted that the Verplanck Fund underperformed the 45/55 Index for the year-to-date, one year and since inception periods ended March 31, 2020, and concluded that Mellon had adequately explained the factors contributing to the Fund’s performance over such periods.
The Trustees also considered information regarding Mellon’s advisory fee and an analysis of this fee in relation to the delivery of services to the Verplanck Fund and any other ancillary benefit resulting from Mellon’s relationship with the Fund. The Trustees considered Mellon’s representation that it did not manage comparable accounts to the Verplanck Fund among its Strategic Asset Allocation strategies. The Trustees also reviewed a peer comparison of advisory fees and total expenses for the Verplanck Fund versus those funds in the Fund’s applicable Lipper category regardless of asset size (the “Peer Group”). The Trustees noted that the contractual advisory fee and net total expense ratio for the Fund were each lower than the median of the contractual advisory fee and net total expense ratio of the Peer Group. The Trustees concluded that the advisory fee and services provided by Mellon are sufficiently consistent with those of other advisers which manage mutual funds with investment objectives, strategies and policies similar to those of the Verplanck Fund based on the information provided at the Board Meeting.
The Trustees considered the costs of the services provided by Mellon, the compensation and benefits received by Mellon in providing services to the Verplanck Fund, its profitability and certain additional information related to the financial condition of Mellon and the Bank of New York Mellon, Mellon’s parent company. In addition, the Trustees considered any direct or indirect revenues received by affiliates of Mellon.
The Trustees considered the extent to which economies of scale may be realized relative to fee levels, and whether the advisory fee levels reflect these economies of scale for the benefit of shareholders. The Board noted that the advisory fee structure included breakpoint reductions in advisory fee levels relative to asset levels, and that breakpoint reductions were currently in use due to the Fund’s asset levels.
At the Meeting, after consideration of all the factors and taking into consideration the information presented, the Board, including the Independent Trustees, unanimously approved the continuation of the Mellon Agreement for an additional one-year period. In arriving at their decision, the Trustees did not identify any single matter as controlling, but made their determination in light of all the circumstances.
87
VERPLANCK BALANCED FUND
Privacy Notice
(Unaudited)
The privacy of your personal financial information is extremely important to us. When you open an account with us, we collect a significant amount of information from you in order to properly invest and administer your account. We take very seriously the obligation to keep that information private and confidential, and we want you to know how we protect that important information.
We collect nonpublic personal information about you from applications or other forms you complete and from your transactions with us or our affiliates. We do not disclose information about you, or our former clients, to our affiliates or to service providers or other third parties, except as permitted by law. We share only the information required to properly administer your accounts, which enables us to send transaction confirmations, monthly or quarterly statements, financials and tax forms. Even within FundVantage Trust and its affiliated entities, a limited number of people who actually service accounts will have access to your personal financial information. Further, we do not share information about our current or former clients with any outside marketing groups or sales entities.
To ensure the highest degree of security and confidentiality, FundVantage Trust and its affiliates maintain various physical, electronic and procedural safeguards to protect your personal information. We also apply special measures for authentication of information you request or submit to us on our web site.
If you have questions or comments about our privacy practices, please call us at (844) 741-5050.
88
VERPLANCK BALANCED FUND
Fund Management
(Unaudited)
FundVantage Trust (the “Trust”) is governed by a Board of Trustees (the “Trustees”). The primary responsibility of the Trustees is to represent the interest of the Trust’s shareholders and to provide oversight management of the Trust.
The following tables present certain information regarding the Board of Trustees and officers of the Trust. None of the Trustees are an “interested person” of the Trust, the Adviser, another investment adviser of a series of the Trust, the principal underwriter of the Trust (“Underwriter”), within the meaning of the 1940 Act and each Trustee is referred to as an “Independent Trustee” and is listed under such heading below. Employees of certain service providers to the Trust serve as officers of the Trust; such persons are not compensated by the Fund. The address of each Trustee and Officer as it relates to the Trust’s business is 301 Bellevue Parkway, 2nd Floor, Wilmington, DE 19809.
The Statement of Additional Information for the Fund contains additional information about the Trustees and is available, without charge, upon request by calling (844) 741-5050.
Name and Date of Birth | Position(s) Held with Trust | Term of Office and Length of Time Served | Principal Occupation(s) During Past Five Years | Number of
| Other Directorships Held by Trustee | |||||
| INDEPENDENT TRUSTEES | ||||||||||
ROBERT J. CHRISTIAN Date of Birth: 2/49 | Trustee | Shall serve until death, resignation or removal. Trustee since 2007. Chairman from 2007 until September 30, 2019. | Retired since February 2006; Executive Vice President of Wilmington Trust Company from February 1996 to February 2006; President of Rodney Square Management Corporation (“RSMC”) (investment advisory firm) from 1996 to 2005; Vice President of RSMC from 2005 to 2006. | 38 | Optimum Fund Trust (registered investment company with 6 portfolios); Third Avenue Trust (registered investment company with 3 portfolios); Third Avenue Variable Series Trust (registered investment company with 1 portfolio).
| |||||
IQBAL MANSUR Date of Birth: 6/55 | Trustee | Shall serve until death, resignation or removal. Trustee since 2007. | Retired since September 2020; Professor of Finance, Widener University from 1998 to August 2020. | 38 | Third Avenue Trust (registered investment company with 3 portfolios); Third Avenue Variable Series Trust (registered investment company with 1 portfolio).
| |||||
89
VERPLANCK BALANCED FUND
Fund Management (Continued)
(Unaudited)
Name and Date of Birth | Position(s) Held with Trust | Term of Office and Length of Time Served | Principal Occupation(s) During Past Five Years | Number of
| Other Directorships Held by Trustee | |||||
NICHOLAS M. MARSINI, JR. Date of Birth: 8/55 | Trustee and Chairman of the Board | Shall serve until death, resignation or removal. Trustee since 2016. Chairman since October 1, 2019. | Retired since March 2016. President of PNC Bank Delaware from June 2011 to March 2016; Executive Vice President of Finance of BNY Mellon from July 2010 to January 2011; Executive Vice President and Chief Financial Officer of PNC Global Investment Servicing from September 1997 to July 2010. | 38 | Brinker Capital Destinations Trust (registered investment company with 10 portfolios); Third Avenue Trust (registered investment company with 3 portfolios); Third Avenue Variable Series Trust (registered investment company with 1 portfolio).
| |||||
NANCY B. WOLCOTT Date of Birth: 11/54 | Trustee | Shall serve until death, resignation or removal. Trustee since 2011. | Retired since May 2014; EVP, Head of GFI Client Service Delivery, BNY Mellon from January 2012 to May 2014; EVP, Head of US Funds Services, BNY Mellon from July 2010 to January 2012; President of PNC Global Investment Servicing from 2008 to July 2010; Chief Operating Officer of PNC Global Investment Servicing from 2007 to 2008; Executive Vice President of PFPC Worldwide Inc. from 2006 to 2007. | 38 | Lincoln Variable Insurance Products Trust (registered investment company with 97 portfolios); Third Avenue Trust (registered investment company with 3 portfolios); Third Avenue Variable Series Trust (registered investment company with 1 portfolio).
| |||||
90
VERPLANCK BALANCED FUND
Fund Management (Continued)
(Unaudited)
Name and Date of Birth | Position(s) Held with Trust | Term of Office and Length of Time Served | Principal Occupation(s) During Past Five Years | Number of
| Other Directorships Held by Trustee | |||||
STEPHEN M. WYNNE Date of Birth: 1/55 | Trustee | Shall serve until death, resignation or removal. Trustee since 2009. | Retired since December 2010; Chief Executive Officer of US Funds Services, BNY Mellon Asset Servicing from July 2010 to December 2010; Chief Executive Officer of PNC Global Investment Servicing from March 2008 to July 2010; President, PNC Global Investment Servicing from 2003 to 2008. | 38 | Copeland Trust (registered investment company with 3 portfolios); Third Avenue Trust (registered investment company with 3 portfolios); Third Avenue Variable Series Trust (registered investment company with 1 portfolio).
| |||||
91
VERPLANCK BALANCED FUND
Fund Management (Concluded)
(Unaudited)
Name and Date of Birth | Position(s) Held with Trust |
Term of Office and Length of Time Served
| Principal Occupation(s) During Past Five Years | |||
EXECUTIVE OFFICERS
| ||||||
JOEL L. WEISS Date of Birth: 1/63 | President and Chief Executive Officer | Shall serve until death, resignation or removal. Officer since 2007. | President of JW Fund Management LLC since June 2016; Vice President and Managing Director of BNY Mellon Investment Servicing (US) Inc. and predecessor firms from 1993 to June 2016. | |||
T. RICHARD KEYES Date of Birth: 1/57 | Treasurer and Chief Financial Officer | Shall serve until death, resignation or removal. Officer since 2016. | President of TRK Fund Consulting LLC since July 2016; Head of Tax — U.S. Fund Services of BNY Mellon Investment Servicing (US) Inc. and predecessor firms from February 2006 to July 2016. | |||
GABRIELLA MERCINCAVAGE Date of Birth: 6/68 | Assistant Treasurer | Shall serve until death, resignation or removal. Officer since 2019. | Fund Administration Consultant since January 2019; Fund Accounting and Tax Compliance Accountant to financial services companies from November 2003 to July 2018. | |||
VINCENZO A. SCARDUZIO Date of Birth: 4/72 | Secretary | Shall serve until death, resignation or removal. Officer since 2012. | Director and Vice President Regulatory Administration of The Bank of New York Mellon and predecessor firms since 2001. | |||
GUY F. TALARICO Date of Birth: 8/55 | Chief Compliance Officer and Anti-Money Laundering Officer | Shall serve until death, resignation or removal. Officer since 2020. | Chief Executive Officer of Alaric Compliance Services LLC since June 2004. | |||
92
Investment Adviser
Mellon Investments Corporation
One Boston Place,
201 Washington Street,
Boston, MA 02108
Administrator
The Bank of New York Mellon
301 Bellevue Parkway
Wilmington, DE 19809
Transfer Agent
BNY Mellon Investment Servicing (US) Inc.
4400 Computer Drive
Westborough, MA 01581
Custodian
The Bank of New York Mellon
240 Greenwich Street
New York, NY 10286
Independent Registered Public Accounting Firm
Ernst & Young LLP
One Commerce Square
2005 Market Street, Suite 700
Philadelphia, PA 19103-7096
Legal Counsel
Troutman Pepper Hamilton Sanders LLP
3000 Two Logan Square
18th and Arch Streets
Philadelphia, PA 19103
VBF-0920
Item 2. Code of Ethics.
| (a) | The registrant, as of the end of the period covered by this report, has adopted a code of ethics that applies to the Registrant’s principal executive officer, principal financial officer, principal accounting officer or controller, or persons performing similar functions, regardless of whether these individuals are employed by the registrant or a third party. |
| (c) | There have been no amendments, during the period covered by this report, to a provision of the code of ethics that applies to the Registrant’s principal executive officer, principal financial officer, principal accounting officer or controller, or persons performing similar functions, regardless of whether these individuals are employed by the Registrant or a third party, and that relates to any element of the code of ethics description. |
| (d) | The registrant has not granted any waivers, including an implicit waiver, from a provision of the code of ethics that applies to the registrant’s principal executive officer, principal financial officer, principal accounting officer or controller, or persons performing similar functions, regardless of whether these individuals are employed by the registrant or a third party, that relates to one or more of the items set forth in paragraph (b) of this item’s instructions. |
Item 3. Audit Committee Financial Expert.
The Audit Committee of the Board of Trustees currently is comprised of Robert J. Christian, Iqbal Mansur and Stephen M. Wynne, each of whom is considered “independent” within the meaning set forth under Item 3 of Form N-CSR. The Board of Trustees has determined that Mr. Wynne is an “audit committee financial expert” as such term is defined by Item 3 of Form N-CSR.
The Registrant’s Board of Trustees has determined that Mr. Wynne acquired the attributes necessary to be considered an audit committee financial expert through his experience as a chief executive officer (and other senior-level accounting and/or financial positions) of several large financial institutions and because he has co-authored a text book on mutual fund accounting.
Item 4. Principal Accountant Fees and Services.
Audit Fees
| (a) | The aggregate fees billed for each of the last two fiscal years for professional services rendered by the principal accountant for the audit of the registrant’s annual financial statements or services that are normally provided by the accountant in connection with statutory and regulatory filings or |
engagements for those fiscal years were $574,682 for the fiscal year ending September 30, 2020, and $766,917 for the fiscal year ending September 30, 2019, as follows: |
Fiscal Year Ending September 30, 2020
| Fiscal Year Ending September 30, 2019
| |||
PricewaterhouseCoopers LLP | $448,792 | $614,922 | ||
Ernst & Young LLP | $125,890 | $151,995 | ||
Aggregate Fees | $574,682 | $766,917 |
Audit-Related Fees
| (b) | The aggregate fees billed in each of the last two fiscal years for assurance and related services by the principal accountant that are reasonably related to the performance of the audit of the registrant’s financial statements and are not reported under paragraph (a) of this Item are $0 for the fiscal year ending September 30, 2020, and $0 for the fiscal year ending September 30, 2019. |
Tax Fees
| (c) | The aggregate fees billed in each of the last two fiscal years for professional services rendered by the principal accountant for tax compliance, tax advice, and tax planning were $24,869 for the fiscal year ending September 30, 2020, and $21,298 for the fiscal year ending September 30, 2019, as follows: |
Fiscal Year Ending September 30, 2020
| Fiscal Year Ending September 30, 2019
| |||
PricewaterhouseCoopers LLP | $0 | $0 | ||
Ernst & Young LLP | $24,869 | $21,298 | ||
Aggregate Fees | $24,869 | $21,298 |
These fees were for Passive Foreign Investment Company (PFIC) database tax services.
All Other Fees
| (d) | The aggregate fees billed in each of the last two fiscal years for products and services provided by the principal accountant, other than the services reported in paragraphs (a) through (c) of this Item are $0 for the fiscal year ending September 30, 2020, and $0 for the fiscal year ending September 30, 2019. |
| (e)(1) | Disclose the audit committee’s pre-approval policies and procedures described in paragraph (c)(7) of Rule 2-01 of Regulation S-X. |
The Registrant’s Audit Committee Charter requires the Audit Committee to (i) (a) approve prior to appointment the engagement of independent registered public accounting firm to annually audit and provide their opinion on the Registrant’s financial statements, (b) recommend to the Independent Trustees the selection, retention or termination of the Registrant’s independent registered public accounting firm and, (c) in connection therewith, to review and evaluate matters potentially affecting the independence and capabilities of the independent registered public accounting firm; and (ii) to approve prior to appointment the engagement of the independent registered public accounting firm to provide other audit services to the Registrant, or to provide non-audit services to the Registrant, its series, an investment adviser to its series or any entity controlling, controlled by, or under common control with an investment adviser to its series (“adviser-affiliate”) that provides ongoing services to the Registrant if the engagement relates directly to the operations and financial reporting of the Registrant. The Audit Committee will not approve non-audit services that the Audit Committee believes may impair the independence of the Registrant’s independent registered public accountant. The Audit Committee may delegate, to the extent permitted by law, pre-approved responsibilities to one or more members of the Audit Committee who shall report to the full Audit Committee.
| (e)(2) | Not applicable. |
| (f) | Not applicable. |
| (g) | The aggregate non-audit fees billed by the registrant’s accountant for services rendered to the registrant, and rendered to the registrant’s investment adviser (not including any sub-adviser whose role is primarily portfolio management and is subcontracted with or overseen by another investment adviser), and any entity controlling, controlled by, or under common control with the adviser that provides ongoing services to the registrant for each of the last two fiscal years of the registrant were $1,425,069 for the fiscal year ending September 30, 2020, and $886,701 for the fiscal year ending September 30, 2019, as follows: |
Fiscal Year Ending September 30, 2020 | Fiscal Year Ending September 30, 2019 | |||
PricewaterhouseCoopers LLP
| $0
| $0
| ||
Ernst & Young LLP
| $1,425,069
| $886,701
| ||
Aggregate Fees
| $1,425,069
| $886,701
|
| (h) | Not applicable. |
Item 5. Audit Committee of Listed Registrants.
Not applicable.
Item 6. Investments.
| (a) | Schedule of Investments in securities of unaffiliated issuers as of the close of the reporting period is included as part of the report to shareholders filed under Item 1 of this form. |
| (b) | Not applicable. |
Item 7. Disclosure of Proxy Voting Policies and Procedures for Closed-End Management Investment Companies.
Not applicable.
Item 8. Portfolio Managers of Closed-End Management Investment Companies.
Not applicable.
Item 9. Purchases of Equity Securities by Closed-End Management Investment Company and Affiliated Purchasers.
Not applicable.
Item 10. Submission of Matters to a Vote of Security Holders.
There have been no material changes to the procedures by which the shareholders may recommend nominees to the registrant’s board of trustees, where those changes were implemented after the registrant last provided disclosure in response to the requirements of Item 407(c)(2)(iv) of Regulation S-K (17 CFR 229.407) (as required by Item 22(b)(15) of Schedule 14A (17 CFR 240.14a-101)), or this Item.
Item 11. Controls and Procedures.
| (a) | The registrant’s principal executive and principal financial officers, or persons performing similar functions, have concluded that the registrant’s disclosure controls and procedures (as defined in Rule 30a-3(c) under the Investment Company Act of 1940, as amended (the “1940 Act”) (17 CFR 270.30a-3(c))) are effective, as of a date within 90 days of the filing date of the report that includes the disclosure required by this paragraph, based on their evaluation of these controls and procedures required by Rule 30a-3(b) under the 1940 Act (17 CFR 270.30a-3(b)) and Rules 13a-15(b) or 15d-15(b) under the Securities Exchange Act of 1934, as amended (17 CFR 240.13a-15(b) or 240.15d-15(b)). |
| (b) | There were no changes in the registrant’s internal control over financial reporting (as defined in Rule 30a-3(d) under the 1940 Act (17 CFR 270.30a-3(d)) that occurred during the period covered by this report that has materially affected, or is reasonably likely to materially affect, the registrant’s internal control over financial reporting. |
Item 12. Disclosure of Securities Lending Activities for Closed-End Management Investment Companies.
Not applicable.
Item 13. Exhibits.
SIGNATURES
Pursuant to the requirements of the Securities Exchange Act of 1934 and the Investment Company Act of 1940, the registrant has duly caused this report to be signed on its behalf by the undersigned, thereunto duly authorized.
(Registrant) FundVantage Trust
By (Signature and Title)* /s/ Joel L. Weiss
Joel L. Weiss, President and
Chief Executive Officer
(principal executive officer)
Date December 7, 2020
Pursuant to the requirements of the Securities Exchange Act of 1934 and the Investment Company Act of 1940, this report has been signed below by the following persons on behalf of the registrant and in the capacities and on the dates indicated.
By (Signature and Title)* /s/ Joel L. Weiss
Joel L. Weiss, President and
Chief Executive Officer
(principal executive officer)
Date December 7, 2020
By (Signature and Title)* /s/ T. Richard Keyes
T. Richard Keyes, Treasurer and
Chief Financial Officer
(principal financial officer)
Date December 7, 2020
* Print the name and title of each signing officer under his or her signature.