UNITED STATES
SECURITIES AND EXCHANGE COMMISSION
Washington, D.C. 20549
FORM N-CSR
CERTIFIED SHAREHOLDER REPORT OF REGISTERED MANAGEMENT
INVESTMENT COMPANIES
Investment Company Act file number 811-22027
FundVantage Trust
(Exact name of registrant as specified in charter)
301 Bellevue Parkway
Wilmington, DE 19809
(Address of principal executive offices) (Zip code)
Joel L. Weiss
JW Fund Management LLC
100 Springdale Rd., Suite A3-416
Cherry Hill, NJ 08003
(Name and address of agent for service)
Registrant’s telephone number, including area code: 856-528-3500
Date of fiscal year end: April 30
Date of reporting period: April 30, 2020
Form N-CSR is to be used by management investment companies to file reports with the Commission not later than 10 days after the transmission to stockholders of any report that is required to be transmitted to stockholders under Rule 30e-1 under the Investment Company Act of 1940 (17 CFR 270.30e-1). The Commission may use the information provided on Form N-CSR in its regulatory, disclosure review, inspection, and policymaking roles.
A registrant is required to disclose the information specified by Form N-CSR, and the Commission will make this information public. A registrant is not required to respond to the collection of information contained in Form N-CSR unless the Form displays a currently valid Office of Management and Budget (“OMB”) control number. Please direct comments concerning the accuracy of the information collection burden estimate and any suggestions for reducing the burden to Secretary, Securities and Exchange Commission, 100 F Street, NE, Washington, DC 20549-0609. The OMB has reviewed this collection of information under the clearance requirements of 44 U.S.C. § 3507.
Item 1. Reports to Stockholders.
The Reports to Shareholders are attached herewith.
DUPONT CAPITAL EMERGING MARKETS FUND
Annual Investment Adviser’s Report
April 30, 2020
(Unaudited)
Dear Fund Shareholder,
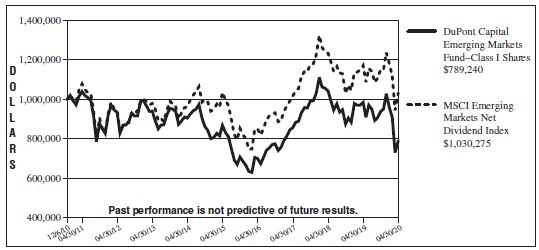
The DuPont Capital Emerging Markets Fund (the “Fund”) declined -19.80%, net of fees, for the twelve-month period ending April 30, 2020. The MSCI Emerging Markets Net Dividend Index “the Index”) fell -12.00% over the trailing twelve-months ending April 30, 2020.
After strong returns during calendar year 2019, the Fund sold off sharply due to the COVID-19 global health pandemic. The temporary closing of multiple economies across the globe caused economic activity to contract at the fastest pace on record. Federal governments and central banks reacted quickly with forceful fiscal and monetary policy. These policies were intended to supplement incomes and funnel liquidity into banks and financial markets to prevent a sharp credit contraction. So far, it would appear that these policies have been successful in thwarting a worst-case scenario from an economic perspective.
China, South Korea and Taiwan were among the better performing countries during this period. While each country was negatively impacted by the COVID-19 virus, they were reportedly able to quickly contain the outbreak and economic activity has been returning to pre-pandemic levels. Brazil, Mexico and South Africa have been among the hardest hit countries. Each of these countries was producing low levels of growth prior to the pandemic, which made the subsequent negative economic hit from the pandemic even more pernicious.
The health care and technology sectors performed the best, as their businesses have been less impacted or have benefited from the pandemic impacts. The technology sector has performed particularly well due to the widespread home-isolation measures. Energy, materials and financials were the worst performing economic sectors. Commodities fell into a tailspin due to collapsing demand and over-production, particularly in the oil industry. Financials were hurt by fears of large credit impairments stemming from the sharp decrease in employment and economic activity.
The Fund fell more than the benchmark due to its positioning in more economically sensitive companies and its value-oriented investment style, which has performed poorly due to investors current strong preference for companies with high growth rates.
From a country perspective the Fund has been negatively impacted by unfavorable stock selection in Russia, South Africa and South Korea. The underlying driver of negative relative performance within these countries were positions that have a higher degree of economic sensitivity. Russia was negatively impacted by a position in an energy company and a position in the country’s largest bank. Both companies are very profitable and extremely well capitalized, however their near-term earnings are expected to be negatively impacted by the current economic environment. Stock selection in South Korea was negatively impacted by a holding in an airline, which has since been sold, and positions in auto manufacturers. The Korean auto manufacturers held in the portfolio have experienced negative order levels, however their product portfolios are very strong and should perform well as the industry recovers. An energy producer and
1
DUPONT CAPITAL EMERGING MARKETS FUND
Annual Investment Adviser’s Report (Continued)
April 30, 2020
(Unaudited)
financial companies within South Africa detracted from relative performance due to weak energy prices and weakness in the South African economy. Partially offsetting these negative relative performance impacts were under allocations to India and Saudi Arabia. The Indian economy has struggled with problems within its financial sector and containment of COVID-19, while Saudi Arabia has been negatively impacted by falling oil prices.
The Fund’s investment strategy is to build a portfolio of companies that has better characteristics such as profitability, financial position and dividend potential than the benchmark, at a lower valuation. While characteristics such as lower debt levels aided relative performance, the Fund’s overallocation to economically sensitive areas of the market and under allocation to companies with the highest expected growth rates negatively impacted performance.
Investment Environment and Outlook
While the current outlook is uncertain due to the global health pandemic, there are signs of improvement and reasons for optimism regarding emerging market equities. Economic activity is returning to normal in countries such as China, South Korea and Taiwan that were the first to experience and exit the COVID-19 pandemic. These countries may provide helpful tools and templates for countries that are still in the midst of battling this health crisis. Many of the countries still battling the crisis are showing signs of stabilizing case loads and mortality rates. Additionally, the massive investment in health care across the globe should lead to better disease treatment and prevention not only for this pandemic but other current and future diseases.
We believe as economic activity progresses to normal levels emerging market equites and the Fund’s relative performance will improve. Valuation metrics within emerging market equites appear very attractive relative to long-term averages, which should provide a favorable starting point for returns going forward. The Fund’s valuation metrics are lower than the benchmark with better financial characteristics, and we believe this will lead to favorable performance as we exit this global health pandemic.
We appreciate your investment in the Fund and look forward to communicating with you in the future.
DuPont Capital Management Corporation
This letter is intended to assist shareholders in understanding how the Fund performed over the past twelve months from April 30, 2019 through April 30, 2020 and reflects the views of the investment adviser at the time of this writing. These views may change and do not guarantee future performance of the Fund or the markets.
2
DUPONT CAPITAL EMERGING MARKETS FUND
Annual Investment Adviser’s Report (Concluded)
April 30, 2020
(Unaudited)
Portfolio composition is subject to change. The current and future portfolio holdings of the Fund are subject to investment risks. The investment return and principal value of an investment in the Fund will fluctuate so that an investor’s shares, when redeemed, may be worth more or less than their original cost.
Mutual fund investing involves risks, including possible loss of principal. The Fund invests primarily in markets of emerging countries which are riskier than more developed markets and may be considered speculative. Emerging markets are riskier than more developed markets because they tend to develop unevenly or may never fully develop. Emerging markets are more likely to experience hyperinflation and currency valuations, which adversely affect returns to U.S. investors. In addition, many emerging markets have far lower trading volumes and less liquidity than developed markets.
Foreign securities are subject to political, social, and economic risks including instability in the country of the issuer of a security, variation in international trade patterns, the possibility of the imposition of exchange controls, expropriation, confiscatory taxation, limits on movement to currency or other assets and nationalization of assets.
3
DUPONT CAPITAL EMERGING MARKETS FUND
Annual Report
Performance Data
April 30, 2020
(Unaudited)
Comparison of Change in Value of $1,000,000 (investment minimum) Investment in the DuPont Capital Emerging
Markets Fund
Class I Shares vs MSCI Emerging Markets Net Dividend Index
| Average Annual Total Returns for the Periods Ended April 30, 2020 |
| |||||||||||||||||||
| 1 Year | 3 Year | 5 Year | Since Inception* | |||||||||||||||||
Class I Shares | -19.80 | % | -2.61 | % | -1.85 | % | -2.49 | % | ||||||||||||
MSCI Emerging Markets Net Dividend Index | -12.00 | % | 0.57 | % | -0.10 | % | 0.31 | %** | ||||||||||||
| * | The DuPont Capital Emerging Markets Fund (the “Fund”) commenced operations on December 6, 2010. |
| ** | Benchmark performance is from inception date of the Fund only and is not the inception date of the benchmark itself. |
The performance data quoted represents past performance and does not guarantee future results. The investment return and principal value of an investment in the Fund will fluctuate so that an investor’s shares, when redeemed, may be worth more or less than their original cost. The graph and table do not reflect the deduction of taxes that a shareholder would pay on Fund distributions or redemption of Fund shares. Current performance may be lower or higher. Performance data current to the most recent month-end may be obtained by calling (888) 447-0014.
As stated in the current prospectus dated September 1, 2019, the Fund’s “Total Annual Fund Operating Expenses” and “Total Annual Fund Operating Expenses After Fee Waiver and/or Expense Reimbursement” are 2.38% and 1.28%, respectively of the Fund’s average daily net assets, which may differ from the actual expenses incurred by the Fund for the period covered by this report. DuPont Capital Management Corporation (the “Adviser”) has contractually agreed to reduce its investment advisory fee and/or reimburse certain expenses of the Fund to the extent necessary
4
DUPONT CAPITAL EMERGING MARKETS FUND
Annual Report
Performance Data (Concluded)
April 30, 2020
(Unaudited)
to ensure that the Fund’s total operating expenses, excluding taxes, fees and expenses attributable to a distribution or service plan adopted by FundVantage Trust (the “Trust”), “Acquired Fund Fees and Expenses,” interest, extraordinary items, and brokerage commissions do not exceed 1.27% (on an annual basis) of the Fund’s average daily net assets (the “Expense Limitation”). The Expense Limitation will remain in place until August 31, 2020, unless the Board of Trustees (“Board of Trustees”) of the Trust approves its earlier termination. The Adviser is entitled to recover, subject to approval by the Board of Trustees, amounts reduced or reimbursed for a period of up to three (3) years from the date on which the Adviser reduced its compensation and/or assumed expenses for the Fund. The Adviser is permitted to seek reimbursement from the Fund, subject to certain limitations, for fees it waived and Fund expenses it paid to the extent the total annual fund operating expenses do not exceed the limits described above or any lesser limits in effect at the time of reimbursement. No recoupment will occur unless the Fund’s expenses are below the Expense Limitation amount. Total returns would be lower had such fees and expenses not been waived and/or reimbursed.
A 2.00% redemption fee applies to shares redeemed within 60 days of purchase. The redemption fee is not reflected in the returns shown above.
The Fund intends to evaluate performance as compared to that of the MSCI Emerging Markets Net Dividend Index. This index is a free float-adjusted market capitalization index and is designed to measure equity market performance of emerging markets. This index is net total return which reinvests dividends after the deduction of withholding taxes. The returns for this index do not include any transaction costs, management fees or other costs. It is impossible to invest directly in an index.
5
DUPONT CAPITAL EMERGING MARKETS DEBT FUND
Annual Investment Adviser’s Report
April 30, 2020
(Unaudited)
Dear Fund Shareholder,
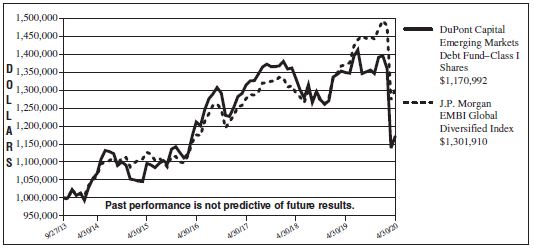
The DuPont Capital Emerging Markets Debt Fund (the “Fund”) returned -13.14%, net of fees, for the twelve-month period ending April 30, 2020. The J.P. Morgan Emerging Markets Bond Index Global Diversified Index (“the Index”) returned -4.97% over the trailing twelve-months ending April 30, 2020.
The U.S. economy was very healthy and grew moderately for the first ten months of the period until the global spread of COVID-19 decimated global economies in March and April. The rapidly spreading COVID-19 virus resulted in unprecedented lockdowns in most countries which essentially stopped many sectors of the global economy. Equity markets saw massive declines and gave up the strong gains of 2019. Yields on U.S. Treasuries moved to all-time lows and Central Banks across the globe moved quickly and aggressively to provide liquidity. The Federal Reserve cut rates by 150 bps points in less than two weeks to take the Funds Rate back to 0%. They also restarted Quantitative Easing by purchasing bonds, but this time also included investment grade corporate bonds. U.S. interest rates declined significantly over the twelve-month reporting period. The two-year Treasury declined by 207 basis points and closed at 0.20%, while the ten-year treasury fell 187 basis bps to 0.64%.
Emerging markets debt (“EMD”) performed very well in 2019 but experienced a sudden and massive decline in March due to the virus. The Fund’s index was down -13.85% just in March and returned -4.97% for the entire twelve-month period. EMD was supported by the monetary and fiscal stimulus but could not overcome the significant decline in global economic activity due to the virus. Oil prices were very volatile and collapsed in the 1st quarter of 2020. The decline was caused by a combination of much lower demand due to the weaker economy and a price war between Saudi Arabia and Russia. Over the last twelve months, the price per barrel fell from $63.9 to $18.8, a remarkable 70% decline. Overall commodity prices were much lower for the period. Local Currency EMD performed better than Hard Currency EMD, but both segments had negative returns.
Within U.S. Dollar EMD, investment grade sovereigns significantly outperformed lower quality sovereigns, partly due to the rise in Treasury prices. The best performing countries within US Dollar EMD included Russia, Qatar, Kuwait and Uruguay with returns above +10%. Lebanon, Ecuador, Argentina and Venezuela were the worst performing countries over the past twelve months which all experienced significant problems and will eventually restructure their debts. Europe was the strongest performing region. Spreads in EMD widened by 266 basis points during the last twelve months to 610 basis points over Treasuries, while the yield of the Index rose by 79 basis points and closed at 6.80%. The much wider spreads were partly offset by the much lower U.S. Treasury yields.
With regard to the performance of the Fund, the main negative drivers were overweights and positioning in Argentina, Venezuela and Lebanon. Our underweight to several higher quality countries also detracted from performance as these countries held much better when the market declined. In addition, our local
6
DUPONT CAPITAL EMERGING MARKETS DEBT FUND
Annual Investment Adviser’s Report (Continued)
April 30, 2020
(Unaudited)
currency position in Brazil hurt returns. An overweight and positioning in Brazil and Israel added to returns as did local currency positions in Poland and Russia.
Investment Environment and Outlook
EMD performed well in 2019, but suffered greatly in 2020, mostly due to COVID-19. Over the last twelve months, spreads have widened by 266 basis points while yields rose by 79 basis points to 6.80%. At current levels, we feel that valuations are very attractive, but the coronavirus creates significant uncertainty that can’t be measured. Economic growth has been decimated across the world and will remain weak for at least the next several months. Central Banks have responded in unprecedented ways with the Federal Reserve cutting rates back to 0% and also by providing a massive injection of liquidity. The U.S. government has also stepped in to provide the largest stimulus plan in history, estimated at over $2 trillion. We believe that EMD will recover and provide strong returns, but the timing is uncertain due to the impact of the virus, the volatility of oil prices and country specific events. We are gradually adding positions to the portfolio, mostly in US dollar sovereigns in higher quality countries in which we were underweight. Historically, our portfolios often lag the benchmark in the beginning stage of a recovery phase because higher quality credits (in which we are underweight) tend to rally first. As the rally has taken hold and has become more sustainable, the more attractive lower quality credits (that we are overweight) have risen strongly. This happened in the financial crisis of 2008/2009 and we are hopeful this situation will occur in 2020/2021.
Heading into May, the primary overweight exposures in the Fund include Brazil, Ukraine, Egypt, Argentina and Israel. In local currency bonds, the main positions are in Mexico, Poland and Brazil and the Fund’s total local currency exposure is close to 12%. The Fund is underweight several higher quality countries that the investment team believes are overvalued including Qatar, Panama, UAE, and the Philippines. The Fund has a large yield advantage when compared to the benchmark and a shorter duration.1
| 1 | Duration: Duration, expressed in years, is a measure of the average time-to-maturity of a bond. It is calculated as the weighted average of the time-to-maturity of its cashflows, weighted by the cashflows’ present value. Duration is also a useful measure of the sensitivity of a bond’s price to interest rate movements. As an example, if interest rates rise (fall) by 1%, a bond with a duration of 2 years will experience an approximate price decline (increase) of 2%, and a bond with a duration of 3 years will experience an approximate price decline (increase) of 3%. |
7
DUPONT CAPITAL EMERGING MARKETS DEBT FUND
Annual Investment Adviser’s Report (Concluded)
April 30, 2020
(Unaudited)
We appreciate your investment in the Fund and look forward to communicating with you in the future.
DuPont Capital Management Corporation
This letter is intended to assist shareholders in understanding how the Fund performed over the past twelve months from April 30, 2019 through April 30, 2020 and reflects the views of the investment adviser at the time of this writing. These views may change and do not guarantee future performance of the Fund or the markets.
Portfolio composition is subject to change. The current and future portfolio holdings of the Fund are subject to investment risks. The investment return and principal value of an investment in the Fund will fluctuate so that an investor’s shares, when redeemed, may be worth more or less than their original cost.
Mutual fund investing involves risks, including possible loss of principal. The Fund invests primarily in markets of emerging countries which are riskier than more developed markets and may be considered speculative. Emerging markets are riskier than more developed markets because they tend to develop unevenly or may never fully develop. Emerging markets are more likely to experience hyperinflation and currency valuations, which adversely affect returns to U.S. investors. In addition, many emerging markets have far lower trading volumes and less liquidity than developed markets. The Fund is non-diversified, which means that a large portion of the Fund’s assets may be invested in one or few companies or sectors. The Fund could fluctuate in value more than a diversified fund. Investing in foreign securities entails special risks, such as fluctuations in currency exchange rates and possible lax regulation of securities markets and accounting practices.
Foreign securities are subject to political, social, and economic risks including instability in the country of the issuer of a security, variation in international trade patterns, the possibility of the imposition of exchange controls, expropriation, confiscatory taxation, limits on movement to currency or other assets and nationalization of assets. The value of debt securities generally falls when interest rates rise. The Fund may invest without limit in below-investment grade debt securities commonly called “high yield” securities or “junk bonds.” Such securities may have greater default risk, less liquidity, and greater price volatility than investment-grade bonds.
8
DUPONT CAPITAL EMERGING MARKETS DEBT FUND
Annual Report
Performance Data
April 30, 2020
(Unaudited)
Comparison of Change in Value of $1,000,000 (investment minimum) Investment in the DuPont Capital Emerging
Markets Debt Fund
Class I Shares vs J.P. Morgan EMBI Global Diversified Index
| Average Annual Total Returns for the Periods Ended April 30, 2020 |
| |||||||||||||||||||
| 1 Year | 3 Year | 5 Year | Since Inception* | |||||||||||||||||
Class I Shares | -13.14 | % | -3.76 | % | 1.35 | % | 2.42 | % | ||||||||||||
J.P. Morgan EMBI Global Diversified Index | -4.97 | % | 0.67 | % | 2.94 | % | 4.10 | %** | ||||||||||||
| * | The DuPont Capital Emerging Markets Debt Fund (the “Fund”) commenced operations on September 27, 2013. |
| ** | Benchmark performance is from inception date of the Fund only and is not the inception date of the benchmark itself. |
The performance data quoted represents past performance and does not guarantee future results. The investment return and principal value of an investment in the Fund will fluctuate so that an investor’s shares, when redeemed, may be worth more or less than their original cost. The graph and table do not reflect the deduction of taxes that a shareholder would pay on Fund distributions or redemption of Fund shares. Current performance may be lower or higher. Performance data current to the most recent month-end may be obtained by calling (888) 447-0014.
As stated in the current prospectus dated September 1, 2019, the Fund’s “Total Annual Fund Operating Expenses” and “Total Annual Fund Operating Expenses After Fee Waiver and/or Expense Reimbursement” are 3.92% and 0.89%, respectively, of the Fund’s average daily net assets, which may differ from the actual expenses incurred by the Fund for the period covered by this report. DuPont Capital Management Corporation (the “Adviser”) has contractually agreed to reduce its investment advisory fee and/or reimburse certain expenses of the Fund to the extent necessary
9
DUPONT CAPITAL EMERGING MARKETS DEBT FUND
Annual Report
Performance Data (Concluded)
April 30, 2020
(Unaudited)
to ensure that the Fund’s total operating expenses, excluding taxes, fees and expenses attributable to a distribution or service plan adopted by FundVantage Trust (the “Trust”), “Acquired Fund Fees and Expenses,” interest, extraordinary items, and brokerage commissions do not exceed 0.89% (on an annual basis) of the Fund’s average daily net assets (the “Expense Limitation”). The Expense Limitation will remain in place until August 31, 2020, unless the Board of Trustees (“Board of Trustees”) of the Trust approves its earlier termination. The Adviser is entitled to recover, subject to approval by the Board of Trustees, amounts reduced or reimbursed for a period of up to three (3) years from the date on which the Adviser reduced its compensation and/or assumed expenses for the Fund. The Adviser is permitted to seek reimbursement from the Fund, subject to certain limitations, for fees it waived and Fund expenses it paid to the extent the total annual fund operating expenses do not exceed the limits described above or any lesser limits in effect at the time of reimbursement. No recoupment will occur unless the Fund’s expenses are below the Expense Limitation amount. Total returns would be lower had such fees and expenses not been waived and/or reimbursed.
A 2.00% redemption fee applies to shares redeemed within 60 days of purchase. The redemption fee is not reflected in the returns shown above.
The Fund intends to evaluate performance as compared to that of the J.P. Morgan Emerging Markets Bond Index Global Diversified (EMBI Global Diversified) Index. This index tracks the traded market for U.S.-dollar-denominated debt instruments issued by emerging market sovereign and quasi-sovereign entities and includes Brady bonds, loans, Eurobonds and external debt instruments. It limits the weights of those Index countries with larger debt stock by only including specified portions of these countries eligible current face amounts of debt outstanding. The returns for the index do not include any transaction costs, management fees or other costs. It is impossible to invest directly in an index.
10
DUPONT CAPITAL FUNDS
Fund Expense Disclosure
April 30, 2020
(Unaudited)
As a shareholder of the Fund(s), you incur two types of costs: (1) transaction costs, including redemption fees; and (2) ongoing costs, including management fees and other Fund expenses. These examples are intended to help you understand your ongoing costs (in dollars) of investing in the Fund and to compare these costs with the ongoing costs of investing in other mutual funds.
These examples are based on an investment of $1,000 invested at the beginning of the period from November 1, 2019 through April 30, 2020 and held for the entire period.
Actual Expenses
The first line for each Fund in the accompanying table provides information about actual account values and actual expenses. You may use the information in this line, together with the amount you invested, to estimate the expenses that you paid over the period. Simply divide your account value by $1,000 (for example, an $8,600 account value divided by $1,000 = 8.6), then multiply the result by the number in the first line under the heading entitled “Expenses Paid During Period” to estimate the expenses you paid on your account during this period.
Hypothetical Example for Comparison Purposes
The second line for each Fund in the accompanying table provides information about hypothetical account values and hypothetical expenses based on each Fund’s actual expense ratio and an assumed rate of return of 5% per year before expenses, which is not your Fund’s actual return. The hypothetical account values and expenses may not be used to estimate the actual ending account balance or expenses you paid for the period. You may use this information to compare the ongoing costs of investing in the Funds and other funds. To do so, compare this 5% hypothetical example with the 5% hypothetical examples that appear in the shareholder reports of other funds.
Please note that the expenses shown in the accompanying table are meant to highlight your ongoing costs only and do not reflect any transactional costs, such as redemption fees. Therefore, the second line of the accompanying table is useful in comparing ongoing costs only and will not help you determine the relative total costs of owning different funds. In addition, if these transactional costs were included, your costs would have been higher.
11
DUPONT CAPITAL FUNDS
Fund Expense Disclosure (Concluded)
April 30, 2020
(Unaudited)
| DuPont Capital Emerging Markets Fund | |||||||||||||||
| Beginning Account Value November 1, 2019 | Ending Account Value April 30, 2020 | Expenses Paid During Period* | |||||||||||||
Class I | |||||||||||||||
Actual | $ | 1,000.00 | $ | 840.90 | $ | 5.81 | |||||||||
Hypothetical (5% return before expenses) | 1,000.00 | 1,018.55 | 6.37 | ||||||||||||
| DuPont Capital Emerging Markets Debt Fund | |||||||||||||||
| Beginning Account Value November 1, 2019 | Ending Account Value April 30, 2020 | Expenses Paid During Period** | |||||||||||||
Class I | |||||||||||||||
Actual | $ | 1,000.00 | $ | 864.20 | $ | 4.13 | |||||||||
Hypothetical (5% return before expenses) | 1,000.00 | 1,020.44 | 4.47 | ||||||||||||
| * | Expenses are equal to an annualized expense ratio for the six-month period ended April 30, 2020 of 1.27% for Class I Shares of the DuPont Capital Emerging Markets Fund, multiplied by the average account value over the period, multiplied by the number of days in the most recent period (182), then divided by 366 to reflect the period. The DuPont Capital Emerging Markets Fund’s ending account value on the first line in the table is based on the actual total return for the six-month period ended April 30, 2020 for the Fund of (15.91)%. |
| ** | Expenses are equal to an annualized expense ratio for the six-month period ended April 30, 2020 of 0.89% for Class I Shares of the DuPont Capital Emerging Markets Debt Fund, multiplied by the average account value over the period, multiplied by the number of days in the most recent period (182), then divided by 366 to reflect the period. The DuPont Capital Emerging Markets Debt Fund’s ending account value on the first line in the table is based on the actual total return for the six-month period ended April 30, 2020 for the Fund of (13.58)%. |
12
DUPONT CAPITAL EMERGING MARKETS FUND
Portfolio Holdings Summary Table
April 30, 2020
(Unaudited)
The following table presents a summary by industry of the portfolio holdings of the Fund:
| % of Net Assets | Value | |||||||||
INDUSTRY CATEGORIES: | ||||||||||
Commercial Banks | 17.2 | % | $ | 3,724,282 | ||||||
Internet & Catalog Retail | 11.9 | 2,574,659 | ||||||||
Semiconductors & Semiconductor Equipment | 7.4 | 1,594,883 | ||||||||
Oil, Gas & Consumable Fuels | 6.6 | 1,415,724 | ||||||||
Technology Hardware, Storage & Peripherals | 6.2 | 1,335,005 | ||||||||
Interactive Media & Services | 6.0 | 1,298,010 | ||||||||
Insurance | 4.2 | 915,136 | ||||||||
Automobiles | 3.0 | 656,428 | ||||||||
Food Products | 2.5 | 546,530 | ||||||||
Construction & Engineering | 2.5 | 532,991 | ||||||||
Electronic Equipment, Instruments & Components | 2.4 | 519,555 | ||||||||
Machinery | 2.4 | 519,488 | ||||||||
Real Estate Management & Development | 2.3 | 502,377 | ||||||||
IT Services | 2.1 | 443,030 | ||||||||
Household Durables | 1.9 | 407,606 | ||||||||
Metals & Mining | 1.8 | 392,709 | ||||||||
Food & Staples Retailing | 1.8 | 391,304 | ||||||||
Building Products | 1.8 | 391,201 | ||||||||
Media | 1.7 | 363,477 | ||||||||
Specialty Retail | 1.6 | 336,934 | ||||||||
Auto Components | 1.4 | 299,161 | ||||||||
Pharmaceuticals | 1.2 | 254,332 | ||||||||
Wireless Telecommunication Services | 1.2 | 247,918 | ||||||||
Air Freight & Logistics | 0.9 | 204,974 | ||||||||
Industrial Conglomerates | 0.9 | 198,537 | ||||||||
Beverages | 0.7 | 151,073 | ||||||||
Entertainment | 0.5 | 110,025 | ||||||||
Consumer Finance | 0.5 | 96,810 | ||||||||
Chemicals | 0.3 | 72,029 | ||||||||
Personal Products | 0.3 | 70,212 | ||||||||
Diversified Consumer Services | 0.3 | 61,736 | ||||||||
Thrifts & Mortgage Finance | 0.2 | 32,828 | ||||||||
Hotels, Restaurants & Leisure | 0.1 | 18,579 | ||||||||
Exchange Traded Fund | 2.9 | 622,880 | ||||||||
Other Assets in Excess of Liabilities | 1.3 | 289,638 | ||||||||
|
|
|
| |||||||
NET ASSETS | 100.0 | % | $ | 21,592,061 | ||||||
|
|
|
| |||||||
Portfolio holdings are subject to change at any time.
The accompanying notes are an integral part of the financial statements.
13
DUPONT CAPITAL EMERGING MARKETS FUND
Portfolio of Investments
April 30, 2020
| Number of Shares | Value | |||||||
COMMON STOCKS — 93.3% |
| |||||||
Brazil — 2.2% | ||||||||
Banco do Brasil SA* | 53,900 | $ | 280,805 | |||||
Cia Brasileira de Distribuicao | 15,400 | 189,318 | ||||||
|
| |||||||
| 470,123 | ||||||||
|
| |||||||
China — 38.2% | ||||||||
Alibaba Group Holding, Ltd., SP ADR* | 8,426 | 1,707,697 | ||||||
China Communications Services Corp., Ltd., Class H | 590,000 | 420,560 | ||||||
China Construction Bank Corp., Class H | 836,000 | 671,027 | ||||||
China Lesso Group Holdings, Ltd. | 273,000 | 391,201 | ||||||
China Maple Leaf Educational Systems, Ltd. | 210,000 | 61,736 | ||||||
China Oriental Group Co., Ltd. | 638,000 | 192,814 | ||||||
China Overseas Land & Investment, Ltd. | 136,000 | 502,377 | ||||||
CNOOC, Ltd. | 314,000 | 347,165 | ||||||
Dali Foods Group Co., Ltd.(a) | 293,500 | 181,319 | ||||||
Dongfeng Motor Group Co., Ltd., Class H | 322,000 | 213,570 | ||||||
Haier Electronics Group Co., Ltd. | 148,000 | 407,606 | ||||||
Haitian International Holdings, Ltd. | 116,001 | 205,246 | ||||||
Industrial & Commercial Bank of China, Ltd., Class H | 236,000 | 158,240 | ||||||
JOYY, Inc., ADR* | 3,022 | 184,221 | ||||||
| Number of Shares | Value | |||||||
COMMON STOCKS — (Continued) |
| |||||||
China — (Continued) | ||||||||
LexinFintech Holdings, Ltd., ADR* | 11,484 | $ | 96,810 | |||||
Livzon Pharmaceutical Group, Inc., Class H | 57,070 | 254,332 | ||||||
Lonking Holdings, Ltd. | 515,000 | 174,491 | ||||||
PICC Property & Casualty Co., Ltd., Class H | 341,000 | 326,319 | ||||||
Ping An Insurance Group Co., of China Ltd., Class H | 46,000 | 468,108 | ||||||
Sinopec Engineering Group Co., Ltd., Class H | 234,500 | 112,431 | ||||||
Sinotrans, Ltd., Class H | 845,000 | 204,974 | ||||||
Tencent Holdings, Ltd. | 18,400 | 967,278 | ||||||
|
| |||||||
| 8,249,522 | ||||||||
|
| |||||||
Czech Republic — 0.8% | ||||||||
Komercni banka AS* | 7,937 | 168,064 | ||||||
|
| |||||||
Greece — 1.2% | ||||||||
JUMBO SA | 16,171 | 253,076 | ||||||
|
| |||||||
India — 5.4% | ||||||||
HCL Technologies, Ltd. | 61,773 | 443,030 | ||||||
ICICI Bank, Ltd., SP ADR | 15,798 | 154,188 | ||||||
Indiabulls Housing Finance, Ltd. | 18,852 | 32,828 | ||||||
Just Dial, Ltd.* | 27,308 | 146,511 | ||||||
Reliance Industries, Ltd., SP | 10,343 | 392,481 | ||||||
|
| |||||||
| 1,169,038 | ||||||||
|
| |||||||
Indonesia — 1.4% | ||||||||
Bank Rakyat Indonesia Persero Tbk PT | 634,484 | 115,405 | ||||||
The accompanying notes are an integral part of the financial statements.
14
DUPONT CAPITAL EMERGING MARKETS FUND
Portfolio of Investments (Continued)
April 30, 2020
| Number of Shares | Value | |||||||
COMMON STOCKS — (Continued) |
| |||||||
Indonesia — (Continued) | ||||||||
Media Nusantara Citra Tbk PT | 3,101,500 | $ | 189,143 | |||||
|
| |||||||
| 304,548 | ||||||||
|
| |||||||
Kazakhstan — 0.9% | ||||||||
Halyk Savings Bank of Kazakhstan JSC, GDR | 21,126 | 190,176 | ||||||
|
| |||||||
Malaysia — 0.9% | ||||||||
Bermaz Auto Bhd | 266,200 | 83,858 | ||||||
Malayan Banking Bhd | 58,860 | 103,303 | ||||||
|
| |||||||
| 187,161 | ||||||||
|
| |||||||
Mexico — 1.7% | ||||||||
Grupo Financiero Banorte SAB de CV, Class O | 59,100 | 161,795 | ||||||
Ternium SA, SP ADR | 14,709 | 199,895 | ||||||
|
| |||||||
| 361,690 | ||||||||
|
| |||||||
Russia — 3.9% | ||||||||
Ros Agro PLC, GDR | 16,726 | 141,095 | ||||||
Sberbank of Russia PJSC, SP ADR | 41,820 | 443,980 | ||||||
Tatneft PJSC, SP ADR | 5,952 | 265,153 | ||||||
|
| |||||||
| 850,228 | ||||||||
|
| |||||||
Saudi Arabia — 1.6% | ||||||||
Saudi British Bank (The) | 17,738 | 115,866 | ||||||
Saudia Dairy & Foodstuff Co. | 5,600 | 224,116 | ||||||
|
| |||||||
| 339,982 | ||||||||
|
| |||||||
South Africa — 7.7% | ||||||||
Absa Group, Ltd. | 25,401 | 125,358 | ||||||
Bid Corp., Ltd. | 15,499 | 201,986 | ||||||
MultiChoice Group, Ltd.* | 37,196 | 174,334 | ||||||
Naspers, Ltd., N Shares | 5,570 | 866,962 | ||||||
Nedbank Group, Ltd. | 14,162 | 82,330 | ||||||
| Number of Shares | Value | |||||||
COMMON STOCKS — (Continued) |
| |||||||
South Africa — (Continued) |
| |||||||
Old Mutual, Ltd. | 166,288 | $ | 120,709 | |||||
Sasol, Ltd.* | 15,177 | 72,029 | ||||||
Tsogo Sun Gaming, Ltd. | 131,399 | 18,579 | ||||||
|
| |||||||
| 1,662,287 | ||||||||
|
| |||||||
South Korea — 11.6% | ||||||||
Hyundai Mipo Dockyard Co., Ltd. | 5,524 | 139,751 | ||||||
Hyundai Mobis Co., Ltd. | 2,116 | 299,161 | ||||||
Hyundai Motor Co. | 3,200 | 247,336 | ||||||
Samsung Electronics Co., Ltd. | 32,468 | 1,335,005 | ||||||
Shinhan Financial Group Co., Ltd. | 13,696 | 347,229 | ||||||
SK Innovation Co., Ltd. | 1,858 | 149,884 | ||||||
|
| |||||||
| 2,518,366 | ||||||||
|
| |||||||
Taiwan — 11.9% | ||||||||
CTBC Financial Holding Co., Ltd. | 578,918 | 385,787 | ||||||
Hon Hai Precision Industry Co., Ltd. | 202,164 | 519,555 | ||||||
Novatek Microelectronics Corp. | 53,692 | 333,908 | ||||||
Taiwan Semiconductor Manufacturing Co., Ltd. | 125,000 | 1,260,975 | ||||||
TCI Co., Ltd. | 9,191 | 70,212 | ||||||
|
| |||||||
| 2,570,437 | ||||||||
|
| |||||||
Thailand — 0.9% | ||||||||
Kasikornbank PCL, NVDR | 34,071 | 89,324 | ||||||
Major Cineplex Group PCL | 245,900 | 110,025 | ||||||
|
| |||||||
| 199,349 | ||||||||
|
| |||||||
Turkey — 3.0% | ||||||||
KOC Holding AS | 90,481 | 198,537 | ||||||
The accompanying notes are an integral part of the financial statements.
15
DUPONT CAPITAL EMERGING MARKETS FUND
Portfolio of Investments (Concluded)
April 30, 2020
| Number of Shares | Value | |||||||
COMMON STOCKS — (Continued) |
| |||||||
Turkey — (Continued) | ||||||||
Tofas Turk Otomobil Fabrikasi AS | 61,190 | $ | 195,522 | |||||
Turkcell Iletisim Hizmetleri AS | 124,446 | 247,918 | ||||||
|
| |||||||
| 641,977 | ||||||||
|
| |||||||
TOTAL COMMON STOCKS (Cost $21,054,232) |
| 20,136,024 | ||||||
|
| |||||||
PREFERRED STOCKS — 2.5% |
| |||||||
Brazil — 1.8% | ||||||||
Itau Unibanco Holding SA | 31,163 | 131,405 | ||||||
Petroleo Brasileiro SA | 78,600 | 261,041 | ||||||
|
| |||||||
| 392,446 | ||||||||
|
| |||||||
Chile — 0.7% | ||||||||
Embotelladora Andina SA, Class B | 63,255 | 151,073 | ||||||
|
| |||||||
TOTAL PREFERRED STOCKS (Cost $651,604) |
| 543,519 | ||||||
|
| |||||||
EXCHANGE TRADED FUND — 2.9% |
| |||||||
iShares MSCI Emerging Market Index Fund | 17,000 | 622,880 | ||||||
|
| |||||||
TOTAL EXCHANGE TRADED FUND (Cost $620,939) |
| 622,880 | ||||||
|
| |||||||
| Value | ||||
TOTAL INVESTMENTS - 98.7% | $ | 21,302,423 | ||
OTHER ASSETS IN EXCESS OF | 289,638 | |||
|
| |||
NET ASSETS - 100.0% | $ | 21,592,061 | ||
|
| |||
| * | Non-income producing. |
| (a) | Securities exempt from registration under Rule 144A of the Securities Act of 1933, as amended. These securities were purchased in accordance with the guidelines approved by the Fund’s Board of Trustees and may be resold, in transactions exempt from registration, to qualified institutional buyers. At April 30, 2020, these securities amounted to $573,800 or 2.66% of net assets. These securities have been determined by the Adviser to be liquid securities. |
ADR | American Depository Receipt | |
GDR | Global Depository Receipt | |
JSC | Joint Stock Company | |
NVDR | Non-voting Depository Receipt | |
PCL | Public Company Limited | |
PJSC | Public Joint Stock Company | |
PLC | Public Limited Company | |
SP ADR | Sponsored American Depository Receipt | |
SP GDR | Sponsored Global Depository Receipt |
The accompanying notes are an integral part of the financial statements.
16
DUPONT CAPITAL EMERGING MARKETS DEBT FUND
Portfolio Holdings Summary Table
April 30, 2020
(Unaudited)
The following table presents a summary by security type of the portfolio holdings of the Fund:
| % of Net Assets | Value | |||||||||
SECURITY TYPE: | ||||||||||
Foreign Government Bonds and Notes | 66.4 | % | $ | 4,173,286 | ||||||
Corporate Bonds and Notes | 17.9 | 1,124,305 | ||||||||
U.S. Treasury Obligations | 7.2 | 450,188 | ||||||||
Common Stocks | 0.0 | 88 | ||||||||
Other Assets in Excess of Liabilities | 8.5 | 531,856 | ||||||||
|
|
|
| |||||||
NET ASSETS | 100.0 | % | $ | 6,279,723 | ||||||
|
|
|
| |||||||
Portfolio holdings are subject to change at any time.
The accompanying notes are an integral part of the financial statements.
17
DUPONT CAPITAL EMERGING MARKETS DEBT FUND
Portfolio of Investments
April 30, 2020
Par* Value | Value | |||||||
CORPORATE BONDS AND NOTES — 17.9% |
| |||||||
Austria — 0.0% | ||||||||
OGX Austria GmbH | $ 200,000 | $ | 2 | |||||
|
| |||||||
China — 4.8% |
| |||||||
China Evergrande Group | 250,000 | 197,290 | ||||||
Sinochem Overseas Capital Co. Ltd. | 100,000 | 101,033 | ||||||
|
| |||||||
| 298,323 | ||||||||
|
| |||||||
Israel — 3.6% |
| |||||||
Israel Electric Corp., Ltd. | 200,000 | 224,024 | ||||||
|
| |||||||
Netherlands — 3.4% |
| |||||||
Petrobras Global Finance BV | 100,000 | 105,450 | ||||||
Petrobras Global Finance BV | 100,000 | 98,500 | ||||||
Petrobras Global Finance BV | 10,000 | 9,350 | ||||||
|
| |||||||
| 213,300 | ||||||||
|
| |||||||
Russia — 5.7% |
| |||||||
Gazprom PJSC Via Gaz Capital SA | 150,000 | 220,847 | ||||||
Russian Railways Via RZD Capital PLC | RUB | 10,000,000 | 139,684 | |||||
|
| |||||||
| 360,531 | ||||||||
|
| |||||||
Venezuela — 0.4% |
| |||||||
Petroleos de Venezuela SA | 300,000 | 11,250 | ||||||
Petroleos de Venezuela SA | 100,000 | 3,750 | ||||||
Par* Value | Value | |||||||
CORPORATE BONDS AND NOTES — (Continued) |
| |||||||
Venezuela — (Continued) |
| |||||||
Petroleos de Venezuela SA | $ 350,000 | $ | 13,125 | |||||
|
| |||||||
| 28,125 | ||||||||
|
| |||||||
TOTAL CORPORATE BONDS AND NOTES | 1,124,305 | |||||||
|
| |||||||
FOREIGN GOVERNMENT BONDS AND NOTES — 66.4% |
| |||||||
Argentina — 2.9% |
| |||||||
Argentine Republic Government International Bond 6.88%, 01/26/2027 | 460,000 | 115,005 | ||||||
Argentine Republic Government International Bond 5.88%, 01/11/2028 | 70,000 | 17,606 | ||||||
Argentine Republic Government International Bond 7.63%, 04/22/2046 | 190,000 | 46,552 | ||||||
|
| |||||||
| 179,163 | ||||||||
|
| |||||||
Brazil — 4.0% |
| |||||||
Brazil Notas Do Tesouro Nacional Serie F 10.00%, 01/01/2021 | BRL | 1,000,000 | 192,220 | |||||
Brazil Notas Do Tesouro Nacional Serie F 10.00%, 01/01/2027 | BRL | 290,000 | 60,960 | |||||
|
| |||||||
| 253,180 | ||||||||
|
| |||||||
The accompanying notes are an integral part of the financial statements.
18
DUPONT CAPITAL EMERGING MARKETS DEBT FUND
Portfolio of Investments (Continued)
April 30, 2020
Par* Value | Value | |||||||
FOREIGN GOVERNMENT BONDS AND NOTES — (Continued) |
| |||||||
Costa Rica — 2.8% | ||||||||
Costa Rica Government International Bond 4.25%, 01/26/2023 | $ 200,000 | $ | 177,500 | |||||
|
| |||||||
Croatia — 3.5% | ||||||||
Croatia Government International Bond 6.00%, 01/26/2024 | 200,000 | 222,623 | ||||||
|
| |||||||
Dominican Republic — 2.9% |
| |||||||
Dominican Republic International Bond 7.45%, 04/30/2044 | 200,000 | 181,500 | ||||||
|
| |||||||
Ecuador — 0.9% |
| |||||||
Ecuador Government International Bond 7.88%, 01/23/2028 | 200,000 | 56,752 | ||||||
|
| |||||||
Egypt — 7.7% | ||||||||
Egypt Government International Bond 6.88%, 04/30/2040 | 100,000 | 82,752 | ||||||
Egypt Government International Bond 8.70%, 03/01/2049(c) | 250,000 | 224,048 | ||||||
Egypt Government International Bond 8.70%, 03/01/2049 | 200,000 | 179,239 | ||||||
|
| |||||||
| 486,039 | ||||||||
|
| |||||||
Hungary — 1.3% | ||||||||
Hungary Government International Bond 7.63%, 03/29/2041 | 50,000 | 80,000 | ||||||
|
| |||||||
Par* Value | Value | |||||||
FOREIGN GOVERNMENT BONDS AND NOTES — (Continued) |
| |||||||
Jordan — 3.0% |
| |||||||
Jordan Government International Bond 7.38%, 10/10/2047 | $ 200,000 | $ | 184,996 | |||||
|
| |||||||
Lebanon — 0.7% |
| |||||||
Lebanon Government International Bond 6.38%, 03/09/2020(b) | 50,000 | 7,875 | ||||||
Lebanon Government International Bond 6.00%, 01/27/2023(b) | 70,000 | 11,025 | ||||||
Lebanon Government International Bond 6.20%, 02/26/2025(b) | 175,000 | 27,562 | ||||||
|
| |||||||
| 46,462 | ||||||||
|
| |||||||
Malaysia — 0.6% |
| |||||||
Malaysia Government Bond 3.89%, 08/15/2029 | MYR | 150,000 | 37,735 | |||||
|
| |||||||
Mexico — 9.2% |
| |||||||
Mexican Bonos 10.00%, 12/05/2024 | MXN | 1,200,000 | 58,685 | |||||
Mexican Bonos 8.50%, 05/31/2029 | MXN | 500,000 | 23,420 | |||||
Mexican Bonos 10.00%, 11/20/2036 | MXN | 1,000,000 | 51,975 | |||||
Petroleos Mexicanos 6.50%, 06/02/2041 | 125,000 | 83,594 | ||||||
Petroleos Mexicanos 5.50%, 06/27/2044 | 200,000 | 128,500 | ||||||
Petroleos Mexicanos 5.63%, 01/23/2046 | 50,000 | 32,500 | ||||||
Petroleos Mexicanos 6.75%, 09/21/2047 | 25,000 | 17,187 | ||||||
The accompanying notes are an integral part of the financial statements.
19
DUPONT CAPITAL EMERGING MARKETS DEBT FUND
Portfolio of Investments (Continued)
April 30, 2020
Par* Value | Value | |||||||
FOREIGN GOVERNMENT BONDS AND NOTES — (Continued) |
| |||||||
Mexico — (Continued) |
| |||||||
Petroleos Mexicanos 7.69%, 01/23/2050 | $ | 250,000 | $ | 183,750 | ||||
|
| |||||||
| 579,611 | ||||||||
|
| |||||||
Morocco — 3.3% | ||||||||
Morocco Government International Bond 4.25%, 12/11/2022(c) | 200,000 | 207,899 | ||||||
|
| |||||||
Nigeria — 2.4% | ||||||||
Nigeria Government International Bond 6.50%, 11/28/2027(c) | 200,000 | 151,000 | ||||||
|
| |||||||
Oman — 2.4% | ||||||||
Oman Government International Bond 4.75%, 06/15/2026 | 200,000 | 152,170 | ||||||
|
| |||||||
Pakistan — 1.4% | ||||||||
Pakistan Government International Bond 7.88%, 03/31/2036 | 100,000 | 84,500 | ||||||
|
| |||||||
Romania — 0.9% | ||||||||
Romanian Government International Bond 6.13%, 01/22/2044 | 50,000 | 59,274 | ||||||
|
| |||||||
Saudi Arabia — 2.9% | ||||||||
Saudi Government International Bond 3.75%, 01/21/2055(c) | 200,000 | 183,484 | ||||||
|
| |||||||
South Africa — 2.4% | ||||||||
Eskom Holdings SOC Ltd. 6.75%, 08/06/2023 | 200,000 | 149,500 | ||||||
|
| |||||||
Par* Value | Value | |||||||
FOREIGN GOVERNMENT BONDS AND NOTES — (Continued) |
| |||||||
Turkey — 4.4% |
| |||||||
Turkey Government International Bond 7.38%, 02/05/2025 | $ | 100,000 | $ | 101,595 | ||||
Turkey Government International Bond 5.13%, 02/17/2028 | 200,000 | 173,460 | ||||||
|
| |||||||
| 275,055 | ||||||||
|
| |||||||
Ukraine — 6.7% | ||||||||
Privatbank CJSC Via UK SPV Credit Finance PLC 10.25%, 01/23/2018(b) | 160,000 | 43,440 | ||||||
Ukraine Government International Bond 0.00%, 05/31/2040(c)(d) | 50,000 | 36,902 | ||||||
Ukreximbank Via Biz Finance PLC, 6-M LIBOR + 7.00%, 8.75%, 02/09/2023(c)(d) | 105,000 | 98,721 | ||||||
Ukreximbank Via Biz Finance PLC 9.75%, 01/22/2025(c) | 250,000 | 241,780 | ||||||
|
| |||||||
| 420,843 | ||||||||
|
| |||||||
Venezuela — 0.1% | ||||||||
Venezuela Government International Bond 7.00%, 12/01/2018(a)(b) | 50,000 | 4,000 | ||||||
|
| |||||||
TOTAL FOREIGN GOVERNMENT BONDS AND NOTES | 4,173,286 | |||||||
|
| |||||||
The accompanying notes are an integral part of the financial statements.
20
DUPONT CAPITAL EMERGING MARKETS DEBT FUND
Portfolio of Investments (Continued)
April 30, 2020
Par* Value | Value | |||||||
U.S. TREASURY OBLIGATIONS — 7.2% |
| |||||||
U.S. Treasury Notes — 7.2% | ||||||||
2.25%, 08/15/2027 | $ | 200,000 | $ | 224,766 | ||||
2.25%, 11/15/2027 | 200,000 | 225,422 | ||||||
TOTAL U.S. TREASURY OBLIGATIONS (Cost $396,359) | 450,188 | |||||||
|
| |||||||
| Number of Shares | ||||||||
COMMON STOCKS — 0.0% | ||||||||
Brazil — 0.0% | ||||||||
Dommo Energia SA, SP ADR(a) | 31 | 88 | ||||||
|
| |||||||
TOTAL COMMON STOCKS |
| 88 | ||||||
|
| |||||||
TOTAL INVESTMENTS - 91.5% |
| 5,747,867 | ||||||
OTHER ASSETS IN EXCESS OF LIABILITIES - 8.5% |
| 531,856 | ||||||
|
| |||||||
NET ASSETS - 100.0% | $ | 6,279,723 | ||||||
|
| |||||||
| * | Par amount denominated in USD unless otherwise noted. |
| (a) | Security is deemed illiquid at April 30, 2020 (Unaudited). |
| (b) | Securities are currently in default. Investments with a total aggregate value of $122,029 or 1.94% of net assets were in default as of April 30, 2020. |
| (c) | Securities exempt from registration under Rule 144A of the Securities Act of 1933, as amended. These securities were purchased in accordance with the guidelines approved by the Fund’s Board of Trustees and may be resold, in transactions exempt from registration, to qualified institutional buyers. At April 30, 2020 these securities amounted to $1,379,108 or 21.96% of net assets. These securities have been determined by the Adviser to be liquid securities. |
| (d) | Variable rate investments. The rate shown is based on the latest available information as of April 30, 2020. Certain variable rate securities are not based on a published reference rate and spread but are determined by the issuer or agent and are based on current market conditions. These securities do not indicate a reference rate or spread in their description. |
The accompanying notes are an integral part of the financial statements.
21
DUPONT CAPITAL EMERGING MARKETS DEBT FUND
Portfolio of Investments (Concluded)
April 30, 2020
Forward foreign currency contracts outstanding as of April 30, 2020 were as follows:
Currency Purchased | Currency Sold | Expiration | Counterparty | Unrealized | ||||||||
USD | 68,029 | EUR | 62,409 | 06/10/20 | CIBC | $(417) | ||||||
BRL | Brazilian Real | |
CIBC | Canadian Imperial Bank of Commerce | |
CJSC | Closed Joint Stock Company | |
EUR | Euro | |
LIBOR | London Interbank Offered Rate | |
MXN | Mexican Peso | |
MYR | Malaysian Ringgit | |
PJSC | Public Joint Stock Company | |
PLC | Public Limited Company | |
RUB | Russian Ruble | |
SP ADR | Sponsored American Depository Receipt | |
USD | United States Dollar | |
6-M | Six Months |
The accompanying notes are an integral part of the financial statements.
22
DUPONT CAPITAL FUNDS
Statements of Assets and Liabilities
April 30, 2020
| DuPont Capital Emerging Markets Fund | DuPont Capital Emerging Markets Debt Fund | |||||||||
Assets | ||||||||||
Investments, at value (Cost $22,326,775 and $7,848,317, respectively) | $ | 21,302,423 | $ | 5,747,867 | ||||||
Cash | — | 229,597 | ||||||||
Foreign currency (Cost $89,946 and $246,289, respectively) | 90,341 | 228,023 | ||||||||
Receivable for investments sold | 914,536 | — | ||||||||
Dividends and interest receivable | 41,034 | 114,355 | ||||||||
Receivable from Investment Adviser | 19,544 | 10,962 | ||||||||
Prepaid expenses and other assets | 23,076 | 9,145 | ||||||||
|
|
|
| |||||||
Total assets | 22,390,954 | 6,339,949 | ||||||||
|
|
|
| |||||||
Liabilities | ||||||||||
Due to Custodian | 718,173 | — | ||||||||
Payable for audit fees | 30,981 | 26,127 | ||||||||
Payable for custodian fees | 15,824 | 7,926 | ||||||||
Payable for administration and accounting fees | 13,499 | 12,726 | ||||||||
Payable for transfer agent fees | 10,356 | 9,410 | ||||||||
Payable for printing fees | 4,912 | 1,460 | ||||||||
Payable for legal fees | 3,470 | 1,175 | ||||||||
Payable for investments purchased | 1,472 | — | ||||||||
Unrealized depreciation on forward foreign currency contracts* | — | 417 | ||||||||
Accrued expenses | 206 | 985 | ||||||||
|
|
|
| |||||||
Total liabilities | 798,893 | 60,226 | ||||||||
|
|
|
| |||||||
Net Assets | $ | 21,592,061 | $ | 6,279,723 | ||||||
|
|
|
| |||||||
Net Assets consisted of: | ||||||||||
Capital stock, $0.01 par value | $ | 30,978 | $ | 8,682 | ||||||
Paid-in capital | 109,258,767 | 8,419,809 | ||||||||
Total distributable loss | (87,697,684 | ) | (2,148,768 | ) | ||||||
|
|
|
| |||||||
Net Assets | $ | 21,592,061 | $ | 6,279,723 | ||||||
|
|
|
| |||||||
Class I: | ||||||||||
Net asset value, offering and redemption price per share ($21,592,061 / 3,097,763 shares) and ($6,279,723 / 868,241 shares), respectively | $6.97 | $7.23 | ||||||||
| * | Primary risk exposure is foreign currency. |
The accompanying notes are an integral part of the financial statements.
23
DUPONT CAPITAL FUNDS
Statements of Operations
For the Year Ended April 30, 2020
| DuPont Capital Emerging Markets Fund | DuPont Capital Emerging Markets Debt Fund | |||||||||
Investment income | ||||||||||
Dividends | $ | 871,475 | $ | 1,516 | ||||||
Interest | — | 484,071 | ||||||||
Less: foreign taxes withheld | (98,344 | ) | — | |||||||
|
|
|
| |||||||
Total investment income | 773,131 | 485,587 | ||||||||
|
|
|
| |||||||
Expenses | ||||||||||
Advisory fees (Note 2) | 258,943 | 43,192 | ||||||||
Administration and accounting fees (Note 2) | 105,832 | 69,243 | ||||||||
Custodian fees (Note 2) | 42,673 | 22,847 | ||||||||
Legal fees | 40,801 | 12,187 | ||||||||
Trustees’ and officers’ fees | 38,590 | 18,352 | ||||||||
Audit fees | 36,048 | 26,898 | ||||||||
Transfer agent fees (Note 2) | 24,230 | 29,314 | ||||||||
Registration and filing fees | 16,820 | 22,171 | ||||||||
Printing and shareholder reporting fees | 1,213 | 8,130 | ||||||||
Other expenses | 18,056 | 11,588 | ||||||||
|
|
|
| |||||||
Total expenses before waivers and reimbursements | 583,206 | 263,922 | ||||||||
|
|
|
| |||||||
Less: waivers and reimbursements (Note 2) | (270,007 | ) | (199,854 | ) | ||||||
|
|
|
| |||||||
Net expenses after waivers and reimbursements | 313,199 | 64,068 | ||||||||
|
|
|
| |||||||
Net investment income | 459,932 | 421,519 | ||||||||
|
|
|
| |||||||
Net realized and unrealized gain/(loss) from investments | ||||||||||
Net realized gain/(loss) from investments(a) | (357,331 | ) | 1,219 | |||||||
Net realized gain/(loss) from foreign currency transactions | (17,368 | ) | 943 | |||||||
Net realized gain from forward foreign currency contracts* | — | 3,731 | ||||||||
Net change in unrealized appreciation/(depreciation) from investments(b) | (5,632,937 | ) | (1,352,148 | ) | ||||||
Net change in unrealized appreciation/(depreciation) from foreign currency translations | 983 | (19,705 | ) | |||||||
Net change in unrealized appreciation/(depreciation) from forward foreign currency contracts* | — | (1,324 | ) | |||||||
|
|
|
| |||||||
Net realized and unrealized loss from investments | (6,006,653 | ) | (1,367,284 | ) | ||||||
|
|
|
| |||||||
Net decrease in net assets resulting from operations | $ | (5,546,721 | ) | $ | (945,765 | ) | ||||
|
|
|
| |||||||
| * | Primary risk exposure is foreign currency. |
| (a) | Net realized gain (loss) on investments for the DuPont Capital Emerging Markets Fund was net of foreign capital gains tax withheld of $5,958. |
| (b) | Change in net unrealized appreciation/(depreciation) on investments for the DuPont Capital Emerging Markets Fund was net of a decrease in deferred foreign capital gains tax of $430. |
The accompanying notes are an integral part of the financial statements.
24
DUPONT CAPITAL EMERGING MARKETS FUND
Statements of Changes in Net Assets
| For the Year Ended April 30, 2020 | For the Year Ended April 30, 2019 | |||||||||
Increase/(decrease) in net assets from operations: | ||||||||||
Net investment income | $ | 459,932 | $ | 489,745 | ||||||
Net realized gain/(loss) from investments and foreign currency transactions | (374,699 | ) | 858,588 | |||||||
Net change in unrealized appreciation/(depreciation) from investments and foreign currency translations | (5,631,954 | ) | (2,863,680 | ) | ||||||
|
|
|
| |||||||
Net decrease in net assets resulting from operations | (5,546,721 | ) | (1,515,347 | ) | ||||||
|
|
|
| |||||||
Less dividends and distributions to shareholders from: | ||||||||||
Total distributable earnings | (485,243 | ) | (436,646 | ) | ||||||
|
|
|
| |||||||
Decrease in net assets from dividends and distributions to shareholders | (485,243 | ) | (436,646 | ) | ||||||
|
|
|
| |||||||
Increase/(decrease) in net assets derived from capital share transactions (Note 4) | 2,162,193 | (1,590,174 | ) | |||||||
|
|
|
| |||||||
Total decrease in net assets | (3,869,771 | ) | (3,542,167 | ) | ||||||
|
|
|
| |||||||
Net assets | ||||||||||
Beginning of year | 25,461,832 | 29,003,999 | ||||||||
|
|
|
| |||||||
End of year | $ | 21,592,061 | $ | 25,461,832 | ||||||
|
|
|
| |||||||
The accompanying notes are an integral part of the financial statements.
25
DUPONT CAPITAL EMERGING MARKETS DEBT FUND
Statements of Changes in Net Assets
| For the Year Ended April 30, 2020 | For the Year Ended April 30, 2019 | |||||||||
Increase/(decrease) in net assets from operations: | ||||||||||
Net investment income | $ | 421,519 | $ | 372,619 | ||||||
Net realized gain from investments, forward foreign currency contracts and foreign currency transactions | 5,893 | 18,638 | ||||||||
Net change in unrealized appreciation/(depreciation) from investments, forward foreign currency contracts and foreign currency translations | (1,373,177 | ) | (291,306 | ) | ||||||
|
|
|
| |||||||
Net increase/(decrease) in net assets resulting from operations | (945,765 | ) | 99,951 | |||||||
|
|
|
| |||||||
Less dividends and distributions to shareholders from: | ||||||||||
Total distributable earnings | (500,338 | ) | (388,320 | ) | ||||||
|
|
|
| |||||||
Decrease in net assets from dividends and distributions to shareholders | (500,338 | ) | (388,320 | ) | ||||||
|
|
|
| |||||||
Increase in net assets derived from capital share transactions (Note 4) | 466,072 | 976,392 | ||||||||
|
|
|
| |||||||
Total increase/(decrease) in net assets | (980,031 | ) | 688,023 | |||||||
|
|
|
| |||||||
Net Assets | ||||||||||
Beginning of year | 7,259,754 | 6,571,731 | ||||||||
|
|
|
| |||||||
End of year | $ | 6,279,723 | $ | 7,259,754 | ||||||
|
|
|
| |||||||
The accompanying notes are an integral part of the financial statements.
26
DUPONT CAPITAL EMERGING MARKETS FUND
Financial Highlights
Contained below is per share operating performance data for Class I shares outstanding, total investment return, ratios to average net assets and other supplemental data for the respective period. The total returns in the table represent the rate that an investor would have earned or lost on an investment in the Fund (assuming reinvestment of all dividends and distributions). This information has been derived from information provided in the financial statements and should be read in conjunction with the financial statements and the notes thereto.
| Class I | ||||||||||||||||||||
| For the Year Ended | ||||||||||||||||||||
| April 30, 2020 | April 30, 2019 | April 30, 2018 | April 30, 2017 | April 30, 2016 | ||||||||||||||||
Per Share Operating Performance | ||||||||||||||||||||
Net asset value, beginning of year | $ | 8.85 | $ | 9.55 | $ | 7.97 | $ | 6.64 | $ | 8.28 | ||||||||||
|
|
|
|
|
|
|
|
|
| |||||||||||
Net investment income(1) | 0.15 | 0.18 | 0.14 | 0.11 | 0.13 | |||||||||||||||
Net realized and unrealized gain/(loss) on investments | (1.88 | ) | (0.72 | ) | 1.59 | 1.32 | (1.73 | ) | ||||||||||||
|
|
|
|
|
|
|
|
|
| |||||||||||
Net increase/(decrease) in net assets resulting from operations | (1.73 | ) | (0.54 | ) | 1.73 | 1.43 | (1.60 | ) | ||||||||||||
|
|
|
|
|
|
|
|
|
| |||||||||||
Dividends and distributions to shareholders from: | ||||||||||||||||||||
Net investment income | (0.15 | ) | (0.16 | ) | (0.15 | ) | (0.10 | ) | (0.04 | ) | ||||||||||
|
|
|
|
|
|
|
|
|
| |||||||||||
Net asset value, end of year | $ | 6.97 | $ | 8.85 | $ | 9.55 | $ | 7.97 | $ | 6.64 | ||||||||||
|
|
|
|
|
|
|
|
|
| |||||||||||
Total investment return(2) | (19.80 | )% | (5.46 | )% | 21.82 | % | 21.77 | % | (19.23 | )% | ||||||||||
Ratios/Supplemental Data | ||||||||||||||||||||
Net assets, end of year (in thousands) | $ | 21,592 | $ | 25,462 | $ | 29,004 | $ | 30,816 | $ | 54,137 | ||||||||||
Ratio of expenses to average net assets | 1.27 | % | 1.27 | % | 1.27 | % | 1.39 | % | 1.60 | % | ||||||||||
Ratio of expenses to average net assets without waivers and expense | 2.36 | % | 2.37 | % | 2.17 | % | 2.06 | % | 1.63 | % | ||||||||||
Ratio of net investment income to average net assets | 1.86 | % | 2.05 | % | 1.52 | % | 1.51 | % | 1.81 | % | ||||||||||
Portfolio turnover rate | 53 | % | 35 | % | 65 | % | 28 | % | 53 | % | ||||||||||
| (1) | The selected per share data was calculated using the average shares outstanding method for the year. |
| (2) | Total investment return is calculated assuming a purchase of shares on the first day and a sale of shares on the last day of each period reported and includes reinvestment of dividends and distributions, if any. |
| (3) | During the period, certain fees were waived and/or reimbursed. If such fee waivers and/or reimbursements had not occurred, the ratios would have been as indicated (See Note 2). |
The accompanying notes are an integral part of the financial statements.
27
DUPONT CAPITAL EMERGING MARKETS DEBT FUND
Financial Highlights
Contained below is per share operating performance data for Class I shares outstanding, total investment return, ratios to average net assets and other supplemental data for the respective period. The total returns in the table represent the rate that an investor would have earned or lost on an investment in the Fund (assuming reinvestment of all dividends and distributions). This information has been derived from information provided in the financial statements and should be read in conjunction with the financial statements and the notes thereto.
| Class I | |||||||||||||||||||||||||
| For the Year Ended | |||||||||||||||||||||||||
| April 30, 2020 | April 30, 2019 | April 30, 2018 | April 30, 2017 | April 30, 2016 | |||||||||||||||||||||
Per Share Operating Performance | |||||||||||||||||||||||||
Net asset value, beginning of year | $ | 8.91 | $ | 9.35 | $ | 9.79 | $ | 9.56 | $ | 9.77 | |||||||||||||||
|
|
|
|
|
|
|
|
|
| ||||||||||||||||
Net investment income(1) | 0.50 | 0.48 | 0.53 | 0.66 | 0.74 | ||||||||||||||||||||
Net realized and unrealized gain/(loss) on investments | (1.58 | ) | (0.40 | ) | (0.38 | ) | 0.11 | 0.21 | |||||||||||||||||
|
|
|
|
|
|
|
|
|
| ||||||||||||||||
Net increase/(decrease) in net assets resulting from operations | (1.08 | ) | 0.08 | 0.15 | 0.77 | 0.95 | |||||||||||||||||||
|
|
|
|
|
|
|
|
|
| ||||||||||||||||
Dividends and distributions to shareholders from: | |||||||||||||||||||||||||
Net investment income | (0.60 | ) | (0.52 | ) | (0.59 | ) | (0.52 | ) | (0.98 | ) | |||||||||||||||
Net realized capital gains | (0.00 | )(2) | — | — | (0.02 | ) | (0.18 | ) | |||||||||||||||||
|
|
|
|
|
|
|
|
|
| ||||||||||||||||
Total dividends and distributions to shareholders | (0.60 | ) | (0.52 | ) | (0.59 | ) | (0.54 | ) | (1.16 | ) | |||||||||||||||
|
|
|
|
|
|
|
|
|
| ||||||||||||||||
Net asset value, end of year | $ | 7.23 | $ | 8.91 | $ | 9.35 | $ | 9.79 | $ | 9.56 | |||||||||||||||
|
|
|
|
|
|
|
|
|
| ||||||||||||||||
Total investment return(3) | (13.14 | )% | 1.16 | % | 1.46 | % | 8.45 | % | 10.82 | % | |||||||||||||||
Ratios/Supplemental Data | |||||||||||||||||||||||||
Net assets, end of year (in thousands) | $ | 6,280 | $ | 7,260 | $ | 6,572 | $ | 6,145 | $ | 5,810 | |||||||||||||||
Ratio of expenses to average net assets | 0.89 | % | 0.89 | % | 0.89 | % | 0.89 | % | 0.89 | % | |||||||||||||||
Ratio of expenses to average net assets without waivers and expense reimbursements(4) | 3.67 | % | 3.92 | % | 3.46 | % | 3.70 | % | 3.34 | % | |||||||||||||||
Ratio of net investment income to average net assets | 5.86 | % | 5.45 | % | 5.45 | % | 6.84 | % | 7.93 | % | |||||||||||||||
Portfolio turnover rate | 5 | % | 10 | % | 17 | % | 18 | % | 25 | % | |||||||||||||||
| (1) | The selected per share data was calculated using the average shares outstanding method for the year. |
| (2) | Amount is less than $0.005 per share. |
| (3) | Total investment return is calculated assuming a purchase of shares on the first day and a sale of shares on the last day of each period reported and includes reinvestment of dividends and distributions, if any. |
| (4) | During the period, certain fees were waived and/or reimbursed. If such fee waivers and/or reimbursements had not occurred, the ratios would have been as indicated (See Note 2). |
The accompanying notes are an integral part of the financial statements.
28
DUPONT CAPITAL FUNDS
Notes to Financial Statements
April 30, 2020
1. Organization and Significant Accounting Policies
The DuPont Capital Emerging Markets Fund is a diversified, open-end management investment company registered under the Investment Company Act of 1940, as amended (the “1940 Act”). The DuPont Capital Emerging Markets Debt Fund is a non-diversified, open-end management investment company registered under the 1940 Act (the DuPont Capital Emerging Markets Fund and the DuPont Capital Emerging Markets Debt Fund are each a “Fund”, and together, the “Funds”). The DuPont Capital Emerging Markets Fund commenced operations on December 6, 2010 and the DuPont Capital Emerging Markets Debt Fund commenced operations on September 27, 2013. The Funds are each a separate series of FundVantage Trust (the “Trust”) which was organized as a Delaware statutory trust on August 28, 2006. The Trust is a “series trust” authorized to issue an unlimited number of separate series or classes of shares of beneficial interest. Each series is treated as a separate entity for certain matters under the 1940 Act, and for other purposes, and a shareholder of one series is not deemed to be a shareholder of any other series. The Funds are each authorized to issue and offer Class I Shares.
The Funds are investment companies and follow accounting and reporting guidance in the Financial Accounting Standards Board Accounting Standards Codification Topic 946.
Portfolio Valuation — Each Fund’s net asset value (“NAV”) is calculated once daily at the close of regular trading hours on the New York Stock Exchange (“NYSE”) (typically 4:00 p.m. Eastern time) on each day the NYSE is open. Securities held by each Fund are valued using the closing price or the last sale price on a national securities exchange or the National Association of Securities Dealers Automatic Quotation System (“NASDAQ”) market system where they are primarily traded. Equity securities listed on any national or foreign exchange market system will be valued at the last sale price. Equity securities traded in the over-the-counter market are valued at their closing price. If there were no transactions on that day, securities traded principally on an exchange will be valued at the mean of the last bid and ask prices prior to the market close. Prices for equity securities normally are supplied by an independent pricing service approved by the Trust’s Board of Trustees (“Board of Trustees”). Fixed income securities are valued based on market quotations, which are furnished by an independent pricing service approved by the FundVantage Board of Trustees. Fixed income securities having remaining maturities of 60 days or less are generally valued at amortized cost, provided such amounts approximates market value. Debt securities are valued on the basis of broker quotations or valuations provided by a pricing service, which utilizes information with respect to recent sales, market transactions in comparable securities, quotations from dealers, and various relationships between securities in determining value. Due to continued volatility in the current market, valuations developed through pricing techniques may materially vary from the actual amounts realized upon sale of the securities. Any assets held by the Funds that are denominated in foreign currencies are valued daily in U.S. dollars at the foreign currency exchange rates that are prevailing at the time that the Funds determine the daily NAV per share. Foreign securities may trade on weekends or other days when the Funds do not calculate NAV. As a result, the market value of these investments may change on days when you cannot buy or sell shares of the Funds. Foreign securities are valued
29
DUPONT CAPITAL FUNDS
Notes to Financial Statements (Continued)
April 30, 2020
based on prices from the primary market in which they are traded and are translated from the local currency into U.S. dollars using current exchange rates. Forward exchange contracts are valued at the forward rate. Investments in any mutual fund are valued at their respective NAVs as determined by those mutual funds each business day (which may use fair value pricing as disclosed in their prospectuses). If market quotations are unavailable or deemed unreliable, securities will be valued in accordance with procedures adopted by the Board of Trustees. Relying on prices supplied by pricing services or dealers or using fair valuation may result in values that are higher or lower than the values used by other investment companies and investors to price the same investments. In the event that market quotes are not readily available, and the security or asset cannot be valued pursuant to one of the valuation methods, the value of the security or asset will be determined in good faith by the Adviser. The Trust has established a Valuation Committee which performs certain functions including the oversight of the Adviser’s fair valuation determinations.
Fair Value Measurements — The inputs and valuation techniques used to measure fair value of each Fund’s investments are summarized into three levels as described in the hierarchy below:
● Level 1 | — | quoted prices in active markets for identical securities; | ||
● Level 2 | — | other significant observable inputs (including quoted prices for similar securities, interest rates, prepayment speeds, credit risk, etc.); and | ||
● Level 3 | — | significant unobservable inputs (including each Fund’s own assumptions in determining the fair value of investments). | ||
The fair value of each Fund’s bonds is generally based on quotes received from brokers or independent pricing services. Bonds with quotes that are based on actual trades with a sufficient level of activity on or near the measurement date are classified as Level 2 assets.
The inputs or methodology used for valuing securities are not necessarily an indication of the risk associated with investing in those securities. Transfers in and out are recognized at the value at the end of the period.
Significant events (such as movement in the U.S. securities market, or other regional and local developments) may occur between the time that foreign markets close (where the security is principally traded) and the time that each Fund calculates its NAV (generally, the close of the NYSE) that may impact the value of securities traded in these foreign markets. As a result, each Fund fair values foreign securities using an independent pricing service which considers the correlation of the trading patterns of the foreign security to the intraday trading in the U.S. markets for investments such as American Depositary Receipts, financial futures, exchange traded funds and certain indexes as well as prices for similar securities. Such fair valuations are categorized as Level 2 in the hierarchy.
30
DUPONT CAPITAL FUNDS
Notes to Financial Statements (Continued)
April 30, 2020
Securities listed on a non-U.S. exchange are generally fair valued daily by an independent fair value pricing service approved by the Board of Trustees and categorized as Level 2 investments within the hierarchy. The fair valuations for these securities may not be the same as quoted or published prices of the securities on their primary markets. Securities for which daily fair value prices from the independent fair value pricing service are not available are generally valued at the last quoted sale price at the close of an exchange on which the security is traded and categorized as Level 1 investments within the hierarchy. Values of foreign securities, currencies, and other assets and liabilities denominated in foreign currencies are translated into U.S. dollars at the exchange rate of said currencies against the U.S. dollar, as of valuation time, as provided by an independent pricing service approved by the Board of Trustees.
The following is a summary of the inputs used, as of April 30, 2020, in valuing each Fund’s investments carried at fair value:
| DuPont Capital Emerging Markets Fund | ||||||||||||||||
Assets | Total Value at 04/30/20 | Level 1 Quoted Prices | Level 2 Other Significant Observable Inputs | Level 3 Significant Unobservable Inputs | ||||||||||||
Common Stocks | ||||||||||||||||
Brazil | $ | 470,123 | $ | 470,123 | $ | — | $ | — | ||||||||
China | 8,249,522 | 1,988,728 | 6,260,794 | — | ||||||||||||
Czech Republic | 168,064 | — | 168,064 | — | ||||||||||||
Greece | 253,076 | — | 253,076 | — | ||||||||||||
India | 1,169,038 | 154,188 | 1,014,850 | — | ||||||||||||
Indonesia | 304,548 | — | 304,548 | — | ||||||||||||
Kazakhstan | 190,176 | — | 190,176 | — | ||||||||||||
Malaysia | 187,161 | — | 187,161 | — | ||||||||||||
Mexico | 361,690 | 361,690 | — | — | ||||||||||||
Russia | 850,228 | — | 850,228 | — | ||||||||||||
Saudi Arabia | 339,982 | — | 339,982 | — | ||||||||||||
South Africa | 1,662,287 | — | 1,662,287 | — | ||||||||||||
South Korea | 2,518,366 | — | 2,518,366 | — | ||||||||||||
Taiwan | 2,570,437 | — | 2,570,437 | — | ||||||||||||
Thailand | 199,349 | — | 199,349 | — | ||||||||||||
Turkey | 641,977 | — | 641,977 | — | ||||||||||||
Preferred Stocks | 543,519 | 543,519 | — | — | ||||||||||||
Exchange Traded Fund | 622,880 | 622,880 | — | — | ||||||||||||
|
|
|
|
|
|
|
| |||||||||
Total Investments | $ | 21,302,423 | $ | 4,141,128 | $ | 17,161,295 | $ | — | ||||||||
|
|
|
|
|
|
|
| |||||||||
31
DUPONT CAPITAL FUNDS
Notes to Financial Statements (Continued)
April 30, 2020
| DuPont Capital Emerging Markets Debt Fund | ||||||||||||||||
Assets | Total Value at 04/30/20 | Level 1 Quoted Price | Level 2 Other Significant Observable Inputs | Level 3 Significant Unobservable Inputs | ||||||||||||
Corporate Bonds and Notes | $ | 1,124,305 | $ | — | $ | 1,124,305 | $ | — | ||||||||
Foreign Government Bonds and Notes | 4,173,286 | — | 4,173,286 | — | ||||||||||||
U.S. Treasury Obligations | 450,188 | — | 450,188 | — | ||||||||||||
Common Stocks | 88 | 88 | — | |||||||||||||
|
|
|
|
|
|
|
| |||||||||
Total Assets | $ | 5,747,867 | $ | — | $ | 5,747,867 | $ | — | ||||||||
|
|
|
|
|
|
|
| |||||||||
Liabilities | Total Value at 04/30/20 | Level 1 Quoted Price | Level 2 Other Significant Observable Inputs | Level 3 Significant Unobservable Inputs | ||||||||||||
Derivatives: | ||||||||||||||||
Foreign Currency Contracts | ||||||||||||||||
Forward Foreign Currency Contracts | $ | (417 | ) | $ | — | $ | (417 | ) | $ | — | ||||||
|
|
|
|
|
|
|
| |||||||||
Total Liabilities | $ | (417 | ) | $ | — | $ | (417 | ) | $ | — | ||||||
|
|
|
|
|
|
|
| |||||||||
At the end of each quarter, management evaluates the classification of Levels 1, 2 and 3 assets and liabilities. Various factors are considered, such as changes in liquidity from the prior reporting period; whether or not a broker is willing to execute at the quoted price; the depth and consistency of prices from third party pricing services; and the existence of contemporaneous, observable trades in the market. Additionally, management evaluates the classification of Level 1 and Level 2 assets and liabilities on a quarterly basis for changes in listings or delistings on national exchanges.
Due to the inherent uncertainty of determining the fair value of investments that do not have readily available market value, the fair value of each Fund’s investments may fluctuate from period to period. Additionally, the fair value of investments may differ significantly from the values that would have been used had a ready market existed for such investments and may differ materially from the values each Fund may ultimately realize. Further, such investments may be subject to legal and other restrictions on resale or otherwise less liquid than publicly traded securities.
For fair valuations using significant unobservable inputs, U.S. generally accepted accounting principles (“U.S. GAAP”) require each Fund to present a reconciliation of the beginning to ending balances for reported market values that present changes attributable to total realized and unrealized gains or losses, purchase and sales, and transfers in and out of Level 3 during the period. A reconciliation of Level 3
32
DUPONT CAPITAL FUNDS
Notes to Financial Statements (Continued)
April 30, 2020
investments is presented only when each Fund had an amount of Level 3 investments at the end of the reporting period that was meaningful in relation to its net assets. The amounts and reasons for all transfers in and out of each Level within the three-tier hierarchy are disclosed when each Fund had an amount of total transfers during the reporting period that was meaningful in relation to its net assets as of the end of the reporting period.
For the year ended April 30, 2020, there were no transfers in or out of Level 3.
Use of Estimates — The preparation of financial statements in conformity with U.S. GAAP requires management to make estimates and assumptions that affect the amounts reported in the financial statements and accompanying notes at the date of the financial statements and the reported amounts of revenues and expenses during the period. Actual results could differ from those estimates and those differences could be material.
Investment Transactions, Investment Income and Expenses — Investment transactions are recorded on trade date for financial statement preparation purposes. Realized gains and losses on investments sold are recorded on the identified cost basis. Interest income is recorded on the accrual basis. Accretion of discounts and amortization of premiums are recorded on a daily basis using the effective yield method except for short term securities, which records discounts and premiums on a straight-line basis. Dividends are recorded on the ex-dividend date. Estimated components of distributions received from real estate investment trusts may be considered income, return of capital distributions or capital gain distributions. Return of capital distributions are recorded as a reduction of cost of the related investments. General expenses of the Trust are generally allocated to each fund in proportion to its relative daily net assets. Expenses directly attributable to a particular fund in the Trust are charged directly to that fund.
Foreign Currency Translation — Assets and liabilities initially expressed in non-U.S. currencies are translated into U.S. dollars based on the applicable exchange rates at the date of the last business day of the financial statement period. Purchases and sales of securities, interest income, dividends, variation margin received and expenses denominated in foreign currencies are translated into U.S. dollars at the exchange rates in effect on the transaction date.
Each Fund does not separately report the effect of changes in foreign exchange rates from changes in market prices of securities held. Such changes are included with the net realized gain or loss and change in unrealized appreciation or depreciation on investment securities in the Statement of Operations. Other foreign currency transactions resulting in realized and unrealized gain or loss are reported separately as net realized gain or loss and change in unrealized appreciation or depreciation on foreign currencies in the Statement of Operations.
33
DUPONT CAPITAL FUNDS
Notes to Financial Statements (Continued)
April 30, 2020
Dividends and Distributions to Shareholders — Dividends from net investment income, if any, are declared and paid at least annually to shareholders of the DuPont Capital Emerging Markets Fund and dividends from net investment income are declared daily and paid semi-annually to shareholders of the DuPont Capital Emerging Markets Debt Fund. Distributions from net realized capital gains, if any, will be declared and paid at least annually to shareholders and recorded on ex-date for both Funds. Income dividends and capital gain distributions are determined in accordance with U.S. federal income tax regulations, which may differ from U.S. GAAP.
U.S. Tax Status — No provision is made for U.S. income taxes as it is each Fund’s intention to continue to qualify for and elect the tax treatment applicable to regulated investment companies under Subchapter M of the Internal Revenue Code of 1986, as amended (the “Internal Revenue Code”), and make the requisite distributions to its shareholders which will be sufficient to relieve it from U.S. income and excise taxes.
Other — In the normal course of business, each Fund may enter into contracts that provide general indemnifications. Each Fund’s maximum exposure under these arrangements is dependent on claims that may be made against each Fund in the future, and, therefore, cannot be estimated; however, based on experience, the risk of material loss for such claims is considered remote.
The Alternative Reference Rates Committee of the U.S. Federal Reserve Board of Governors has identified the Secured Overnight Financing Rate (“SOFR”) as the replacement for USD LIBOR. The transition to SOFR is slated to occur by the end of December 2021.
Markets disruptions associated with the COVID-19 pandemic have had a global impact, and uncertainty exists as to its long-term implications. The COVID-19 pandemic could adversely affect the value and liquidity of the Funds’ investments, impair the Funds’ ability to satisfy redemption requests, and negatively impact the Funds’ performance. In addition, the outbreak of COVID-19, and measures taken to mitigate its effects, could result in disruptions to the services provided to the Funds by their service providers. Fund management is continuing to monitor this development and evaluate its impact on the Funds.
Forward Foreign Currency Contracts — A forward foreign currency contract (“Forward Contract”) is a commitment to buy or sell a specific amount of a foreign currency at a negotiated price on a specified future date. Forward Contracts can help a fund manage the risk of changes in currency exchange rates. These contracts are marked-to-market daily at the applicable forward currency translation rates. A fund records realized gains or losses at the time the Forward Contract is closed. A Forward Contract is extinguished through a closing transaction or upon delivery of the currency or entering an offsetting contract. The Fund’s maximum risk of loss from counterparty credit risk related to Forward Contracts is the fair value of the contract.
34
DUPONT CAPITAL FUNDS
Notes to Financial Statements (Continued)
April 30, 2020
For the year ended April 30, 2020, the average monthly volume of forward foreign currency contracts of the DuPont Capital Emerging Markets Debt Fund was as follows:
| Forward Foreign | |||
| Currency | |||
Contracts - Sold | |||
| $69,411 | |||
Sovereign Debt Risk — The DuPont Capital Emerging Markets Debt Fund invests predominantly in sovereign debt securities issued or guaranteed by governments of emerging market countries, their agencies or instrumentalities, or other government-related entities. Investments in sovereign debt are subject to risks including, but are not limited to, the risk that a governmental entity may delay or refuse, or otherwise be unable, to pay interest or repay the principal on its sovereign debt. There may also be no legal process for collecting sovereign debt that a government does not pay or bankruptcy proceedings through which all or part of such sovereign debt may be collected.
Currency Risk — Each Fund invests in securities of foreign issuers, including American Depositary Receipts. These markets are subject to special risks associated with foreign investments not typically associated with investing in U.S. markets. Because the foreign securities in which each Fund may invest generally trade in currencies other than the U.S. dollar, changes in currency exchange rates will affect each Fund’s NAV, the value of dividends and interest earned and gains and losses realized on the sale of securities. Because the NAV for each Fund is determined on the basis of U.S. dollars, each Fund may lose money by investing in a foreign security if the local currency of a foreign market depreciates against the U.S. dollar, even if the local currency value of each Fund’s holdings goes up. Generally, a strong U.S. dollar relative to these other currencies will adversely affect the value of each Fund’s holdings in foreign securities.
Foreign Securities Market Risk — Securities of many non-U.S. companies may be less liquid and their prices more volatile than securities of comparable U.S. companies. Securities of companies traded in many countries outside the U.S., particularly emerging markets countries, may be subject to further risks due to the inexperience of local investment professionals and financial institutions, the possibility of permanent or temporary termination of trading and greater spreads between bid and asked prices of securities. In addition, non-U.S. stock exchanges and investment professionals are subject to less governmental regulation, and commissions may be higher than in the United States. Also, there may be delays in the settlement of non-U.S. stock exchange transactions.
Emerging Markets Risk — Each Fund invests in emerging market instruments which are subject to certain credit and market risks. The securities and currency markets of emerging market countries are generally smaller, less developed, less liquid and more volatile than the securities and currency markets of the United States and other developed markets. Disclosure and regulatory standards in many respects are less stringent than in other developed markets. There also may be a lower level of monitoring and
35
DUPONT CAPITAL FUNDS
Notes to Financial Statements (Continued)
April 30, 2020
regulation of securities markets in emerging market countries and the activities of investors in such markets and enforcement of existing regulations may be extremely limited. Political and economic structures in many of these countries may be in their infancy and developing rapidly, and such countries may lack the social, political and economic stability characteristics of more developed countries.
Debt Investment Risk — Debt investments are affected primarily by the financial condition of the companies or other entities that have issued them and by changes in interest rates. There is a risk that an issuer of a Fund’s debt investments may not be able to meet its financial obligations (e.g., may not be able to make principal and/or interest payments when they are due or otherwise default on other financial terms) and/or go bankrupt. Securities such as high-yield/high-risk bonds, e.g., bonds with low credit ratings by Moody’s (Ba or lower) or Standard & Poor’s (BB and lower) or if unrated are of comparable quality as determined by the manager, are especially subject to credit risk during periods of economic uncertainty or during economic downturns and are more likely to default on their interest and/or principal payments than higher rated securities. Debt investments may be affected by changes in interest rates. Debt investments with longer durations tend to be more sensitive to changes in interest rates, making them more volatile than debt investments with shorter durations or floating or adjustable interest rates. The value of debt investments may fall when interest rates rise.
Recent Regulatory Reporting Update and Accounting Pronouncements — In March 2020, the Financial Accounting Standards Board issued Accounting Standards Update (“ASU”) 2020-04, Reference Rate Reform (Topic 848) - Facilitation of the Effects of Reference Rate Reform on Financial Reporting. The amendments in ASU 2020-04 provides optional temporary financial reporting relief from the effect of certain types of contract modifications due to the planned discontinuation of the London Interbank Offered Rate (“LIBOR”) and other interbank-offered based reference rates as of the end of 2021. ASU 2020-04 is effective for certain reference rate-related contract modifications that occur during the period March 12, 2020 through December 31, 2022. Management is currently evaluating the impact, if any, of applying this ASU.
In March 2017, the Financial Accounting Standards Board issued ASU 2017-08, Premium Amortization on Purchased Callable debt Securities (Subtopic 310-20). This ASU was issued to clarify the Subtopic 310-20, and to amend the amortization period for certain purchased callable debt securities held at a premium. The DuPont Capital Emerging Markets Debt Fund adopted ASU 2017-08 during the current fiscal year; this adoption did not have a material impact on the Fund’s financial statements.
2. Transactions with Related Parties and Other Service Providers
DuPont Capital Management Corporation (“DuPont Capital” or the “Adviser”) serves as investment adviser to each Fund pursuant to an investment advisory agreement with the Trust. For its services, the Adviser is paid a monthly fee at the annual rate of 1.05% of the DuPont Capital Emerging Markets Fund’s average daily net assets; and 0.60% of the DuPont Capital Emerging Markets Debt Fund’s average daily
36
DUPONT CAPITAL FUNDS
Notes to Financial Statements (Continued)
April 30, 2020
net assets. The Adviser has contractually agreed to reduce its investment advisory fee and/or reimburse certain expenses of each Fund to the extent necessary to ensure that the Funds’ total operating expenses, excluding taxes, fees and expenses attributable to a distribution or service plan adopted by the Trust, “Acquired Fund Fees and Expenses,” interest, extraordinary items, and brokerage commissions, do not exceed 1.27% and 0.89%, respectively, (on an annual basis) of the DuPont Capital Emerging Markets Fund and the DuPont Capital Emerging Markets Debt Fund’s average daily net assets (the “Expense Limitation”), respectively. The Expense Limitations will each remain in place until August 31, 2020, unless the Board of Trustees approves their earlier termination. The Adviser is entitled to recover, subject to approval by the Board of Trustees, such amounts reduced or reimbursed for a period of up to three (3) years from the date on which the Adviser reduced its compensation and/or assumed expenses for each Fund. The Adviser is permitted to seek reimbursement from the Funds, subject to certain limitations, for fees it waived and Fund expenses it paid to the extent the total annual fund expenses do not exceed the limits described above or any lesser limits in effect at the time of reimbursement. No recoupment will occur unless each Fund’s expenses are below the respective Expense Limitation amounts.
For the year ended April 30, 2020, the Adviser earned advisory fees of $258,943 and $43,192 for the DuPont Capital Emerging Markets Fund and the DuPont Capital Emerging Markets Debt Fund, respectively. For the year ended April 30, 2020, the Adviser waived and reimbursed fees and expenses of $270,007 and $199,854 for the DuPont Capital Emerging Markets Fund and the DuPont Capital Emerging Markets Debt Fund, respectively.
As of April 30, 2020, the amount of potential recoupment by the Adviser was as follows:
| Expiration 04/30/2021 | Expiration 04/30/2022 | Expiration 04/30/2023 | Total | |||||||||||||||||
DuPont Capital Emerging Markets Fund | $ | 295,495 | $ | 261,409 | $ | 270,007 | $ | 826,911 | ||||||||||||
DuPont Capital Emerging Markets Debt Fund | 166,742 | 207,576 | 199,854 | 574,172 | ||||||||||||||||
Other Service Providers
The Bank of New York Mellon (“BNY Mellon”) serves as administrator and custodian for the Funds. For providing administrative and accounting services, BNY Mellon is entitled to receive a monthly fee equal to an annual percentage rate of the Funds’ average daily net assets and is subject to certain minimum monthly fees. For providing certain custodial services, BNY Mellon is entitled to receive a monthly fee, subject to certain minimum, and out of pocket expenses.
BNY Mellon Investment Servicing (US) Inc. (the “Transfer Agent”) provides transfer agent services to the Funds. The Transfer Agent is entitled to receive a monthly fee, subject to certain minimum, and out of pocket expenses.
37
DUPONT CAPITAL FUNDS
Notes to Financial Statements (Continued)
April 30, 2020
The Trust, on behalf of the Funds, has entered into agreements with financial intermediaries to provide recordkeeping, processing, shareholder communications and other services to customers of the intermediaries investing in the Funds and have agreed to compensate the intermediaries for providing those services. The fees incurred by the Funds for these services are included in Transfer agent fees in the Statements of Operations.
Foreside Funds Distributors LLC (the “Underwriter”) provides principal underwriting services to the Funds pursuant to an underwriting agreement between the Trust and the Underwriter.
Trustees and Officers
The Trust is governed by its Board of Trustees. The Trustees of the Trust receive compensation in the form of an annual retainer and per meeting fees for their services to the Trust. An employee of BNY Mellon serves as the Secretary of the Trust and is not compensated by the Funds or the Trust.
JW Fund Management LLC (“JWFM”) provides a Principal Executive Officer and Principal Financial Officer, respectively, to the Trust. Duff & Phelps, LLC (“D&P”) provides the Trust with a Chief Compliance Officer and an Anti-Money Laundering Officer. JWFM and D&P are compensated for their services provided to the Trust.
3. Investment in Securities
For the year ended April 30, 2020, aggregate purchases and sales of investment securities (excluding U.S. Government and agency short-term investments and other short-term investments) of the Funds were as follows:
| Purchases | Sales | |||||||||
DuPont Capital Emerging Markets Fund Investment Securities | $ | 14,813,495 | $ | 12,847,243 | ||||||
DuPont Capital Emerging Markets Debt Fund Investment Securities | $ | 488,799 | $ | 307,633 | ||||||
38
DUPONT CAPITAL FUNDS
Notes to Financial Statements (Continued)
April 30, 2020
4. Capital Share Transactions
For the years ended April 30, 2020 and 2019, transactions in capital shares (authorized shares unlimited) were as follows:
DuPont Capital Emerging Markets Fund | ||||||||||||||||||||||||||
For the Year Ended April 30, 2020 | For the Year Ended April 30, 2019 | |||||||||||||||||||||||||
Shares | Amount | Shares | Amount | |||||||||||||||||||||||
Class I | ||||||||||||||||||||||||||
Sales | 576,370 | $ | 4,815,660 | 108,199 | $ | 942,412 | ||||||||||||||||||||
Reinvestments | 57,766 | 485,243 | 54,923 | 436,646 | ||||||||||||||||||||||
Redemptions | (413,410) | (3,138,710 | ) | (322,209 | ) | (2,969,232 | ) | |||||||||||||||||||
|
|
|
|
|
|
| ||||||||||||||||||||
Net increase/(decrease) | 220,726 | $ | 2,162,193 | (159,087 | ) | $ | (1,590,174 | ) | ||||||||||||||||||
|
|
|
|
|
|
| ||||||||||||||||||||
DuPont Capital Emerging Markets Debt Fund | ||||||||||||||||||||||||||||
For the Year Ended April 30, 2020 | For the Year Ended April 30, 2019 | |||||||||||||||||||||||||||
Shares | Amount | Shares | Amount | |||||||||||||||||||||||||
Class I | ||||||||||||||||||||||||||||
Sales | 801 | $ | 6,950 | 66,855 | $ | 588,072 | ||||||||||||||||||||||
Reinvestments | 57,223 | 500,338 | 45,552 | 388,320 | ||||||||||||||||||||||||
Redemptions | (4,722) | (41,216 | ) | — | — | |||||||||||||||||||||||
|
|
|
|
|
|
| ||||||||||||||||||||||
Net increase | 53,302 | $ | 466,072 | 112,407 | $ | 976,392 | ||||||||||||||||||||||
|
|
|
|
|
|
| ||||||||||||||||||||||
As of April 30, 2020, the Funds below had shareholders that held 10% or more of the outstanding shares of each respective Fund. Transactions by these shareholders may have a material impact on each respective Fund.
DuPont Capital Emerging Markets Fund Affiliated Shareholders | 99 | % | ||
DuPont Capital Emerging Markets Debt Fund Affiliated Shareholders | 100 | % |
39
DUPONT CAPITAL FUNDS
Notes to Financial Statements (Continued)
April 30, 2020
5. Federal Tax Information
The Funds have followed the authoritative guidance on accounting for and disclosure of uncertainty in tax positions, which requires the Funds to determine whether a tax position is more likely than not to be sustained upon examination, including resolution of any related appeals or litigation processes, based on the technical merits of the position. Each Fund has determined that there was no effect on the financial statements from following this authoritative guidance. In the normal course of business, the Funds are subject to examination by federal, state and local jurisdictions, where applicable, for tax years for which applicable statutes of limitations have not expired.
Distributions are determined in accordance with federal income tax regulations, which may differ in amount or character from net investment income and realized gains for financial reporting purposes. Accordingly, the character of distributions and composition of net assets for tax purposes may differ from those reflected in the accompanying financial statements. To the extent these differences are permanent, such amounts are reclassified within the components of net assets based on the tax treatment; temporary differences do not require reclassifications. For the year ended April 30, 2020, there were no reclassifications.
For the year ended April 30, 2020, the tax character of distributions paid by the DuPont Capital Emerging Markets Fund was $485,243 of ordinary income dividends. The tax character of distributions paid by the DuPont Capital Emerging Markets Debt Fund were $499,417 of ordinary income dividends and $921 of long-term capital gains dividends. For the year ended April 30, 2019, the tax character of distributions paid by the DuPont Capital Emerging Markets Fund and the DuPont Capital Emerging Markets Debt Fund were $436,646 and $388,320 of ordinary income dividends, respectively. Distributions from net investment income and short-term capital gains are treated as ordinary income for federal income tax purposes.
As of April 30, 2020, the components of distributable earnings on a tax basis were as follows:
| Capital Loss Carryforward | Undistributed Ordinary Income | Undistributed Long-Term Gain | Unrealized Appreciation/ (Depreciation) | Qualified Late-Year Losses | Total Distributable Earnings | |||||||||||||||||||||||||
DuPont Capital Emerging Markets Fund | $ | (84,735,143 | ) | $ | 22,110 | $ | — | $ | (1,868,334 | ) | $ | (1,116,317 | ) | $ | (87,697,684 | ) | ||||||||||||||
DuPont Capital Emerging Markets Debt Fund | $ | — | $ | 142,252 | $ | 20,067 | $ | (2,311,087 | ) | $ | — | $ | (2,148,768 | ) | ||||||||||||||||
40
DUPONT CAPITAL FUNDS
Notes to Financial Statements (Continued)
April 30, 2020
The differences between the book and tax basis components of distributable earnings relate primarily to the timing and recognition of income and gains, and foreign capital gains tax for federal income tax purposes.
At April 30, 2020, the federal tax cost, aggregate gross unrealized appreciation and depreciation of securities held by the Funds were as follows:
| Federal Tax Cost | Unrealized Appreciation | Unrealized Depreciation | Net Unrealized (Depreciation) | |||||||||||||
DuPont Capital Emerging Markets Fund | $ | 23,171,258 | $ | 3,517,763 | $ | (5,386,598 | ) | $ | (1,868,835 | ) | ||||||
DuPont Capital Emerging Markets Debt Fund | 8,037,756 | 276,942 | (2,566,831 | ) | (2,289,889 | ) | ||||||||||
Pursuant to federal income tax rules applicable to regulated investment companies, the Funds may elect to treat certain net capital losses between November 1 and April 30 and late year ordinary losses ((i) ordinary losses between January 1 and April 30 and (ii) specified ordinary and currency losses between November 1 and April 30) as occurring on the first day of the following tax year. For the year ended April 30, 2020, any amount of losses elected within the tax return will not be recognized for federal income tax purposes until May 1, 2020. For the year ended April 30, 2020, the DuPont Capital Emerging Markets Fund had short-term capital loss deferrals of $330,055, long-term capital loss deferrals of $786,262, and no ordinary late-year loss deferrals. The DuPont Capital Emerging Markets Debt Fund had no capital loss or late year ordinary loss deferrals.
Accumulated capital losses represent net capital loss carryforwards as of April 30, 2020 that may be available to offset future realized capital gains and thereby reduce future capital gains distributions. As of April 30, 2020, the DuPont Capital Emerging Markets Fund had capital loss carryforwards of $84,735,143, of which $60,023,153 are long-term losses and $24,711,990 are short-term losses and have an unlimited period of capital loss carryforward. As of April 30, 2020, the DuPont Capital Emerging Markets Debt Fund had no capital loss carryforwards. On November 27, 2015, the DuPont Capital Emerging Markets Fund experienced a more than 50% change of ownership as defined by Internal Revenue Code Section 382(g) giving rise to an annual capital loss carryforward limitation on the use of pre-ownership change capital losses. At the time of the change the DuPont Capital Emerging Markets Fund had $83,500,000 of capital loss carryforwards impacted by the ownership change and the use of those losses against capital gains will be limited to $1,618,329 per tax year. The permitted annual capital loss, if not applied to capital gains in the tax year, will accumulate and be available in the next year for use.
During the year ended April 30, 2020, the DuPont Capital Emerging Markets Fund utilized $338,680 of prior year capital loss carryforwards.
41
DUPONT CAPITAL FUNDS
Notes to Financial Statements (Concluded)
April 30, 2020
6. Subsequent Events
Management has evaluated the impact of all subsequent events on each Fund through the date the financial statements were issued, and has determined that there are no subsequent events requiring recognition or disclosure in the financial statements.
42
DUPONT CAPITAL FUNDS
Report of Independent Registered Public Accounting Firm
To the Board of Trustees of FundVantage Trust and Shareholders of DuPont Capital Emerging Markets Fund and DuPont Capital Emerging Markets Debt Fund
Opinions on the Financial Statements
We have audited the accompanying statements of assets and liabilities, including the portfolios of investments, of DuPont Capital Emerging Markets Fund and DuPont Capital Emerging Markets Debt Fund (two of the funds constituting FundVantage Trust, hereafter collectively referred to as the “Funds”) as of April 30, 2020, the related statements of operations for the year ended April 30, 2020, the statements of changes in net assets for each of the two years in the period ended April 30, 2020, including the related notes, and the financial highlights for each of the five years in the period ended April 30, 2020 (collectively referred to as the “financial statements”). In our opinion, the financial statements present fairly, in all material respects, the financial position of each of the Funds as of April 30, 2020, the results of each of their operations for the year then ended, the changes in each of their net assets for each of the two years in the period ended April 30, 2020 and each of the financial highlights for each of the five years in the period ended April 30, 2020 in conformity with accounting principles generally accepted in the United States of America.
Basis for Opinions
These financial statements are the responsibility of the Funds’ management. Our responsibility is to express an opinion on the Funds’ financial statements based on our audits. We are a public accounting firm registered with the Public Company Accounting Oversight Board (United States) (PCAOB) and are required to be independent with respect to the Funds in accordance with the U.S. federal securities laws and the applicable rules and regulations of the Securities and Exchange Commission and the PCAOB.
We conducted our audits of these financial statements in accordance with the standards of the PCAOB. Those standards require that we plan and perform the audit to obtain reasonable assurance about whether the financial statements are free of material misstatement, whether due to error or fraud.
Our audits included performing procedures to assess the risks of material misstatement of the financial statements, whether due to error or fraud, and performing procedures that respond to those risks. Such procedures included examining, on a test basis, evidence regarding the amounts and disclosures in the financial statements. Our audits also included evaluating the accounting principles used and significant estimates made by management, as well as evaluating the overall presentation of the financial statements. Our procedures included confirmation of securities owned as of April 30, 2020 by correspondence with the custodian and broker. We believe that our audits provide a reasonable basis for our opinions.
/s/ PricewaterhouseCoopers LLP
Philadelphia, Pennsylvania
June 24, 2020
We have served as the auditor of one or more DuPont Capital Management Corporation investment companies since 2011.
43
DUPONT CAPITAL FUNDS
Shareholder Tax Information
(Unaudited)
The DuPont Capital Emerging Markets Fund and the DuPont Capital Emerging Markets Debt Fund are required by Subchapter M of the Internal Revenue Code to advise its shareholders of the U.S. federal tax status of distributions received by the Funds’ shareholders in respect of such fiscal year. During the fiscal year ended April 30, 2020, the DuPont Capital Emerging Markets Fund paid $485,243 of ordinary income dividends to its shareholders. The DuPont Capital Emerging Markets Debt Fund paid $499,417 of ordinary income dividends and $921 of long-term capital gains dividend to its shareholders. Dividends from net investment income and short-term capital gains are treated as ordinary income dividends for federal income tax purposes.
The DuPont Capital Emerging Markets Fund and the DuPont Capital Emerging Markets Debt Fund designate 100.00% and 0.00%, respectively, of the ordinary income distribution as qualified dividend income pursuant to the Jobs and Growth Tax Relief Reconciliation Act of 2003.
The percentage of qualified interest income related dividends not subject to withholding tax for non-resident aliens and foreign corporations for the DuPont Capital Emerging Markets Fund and the DuPont Capital Emerging Markets Debt Fund is 0.14% and 2.09%, respectively.
The percentage of ordinary income dividends qualifying for the corporate dividends received deduction for the DuPont Capital Emerging Markets Fund and the DuPont Capital Emerging Markets Debt Fund is 0.00% and 0.00%, respectively.
The DuPont Capital Emerging Markets Fund and the DuPont Capital Emerging Markets Debt Fund designate 100.00% of the ordinary income distributions as qualified short-term gain pursuant to the American Jobs Creation Act of 2004.
The percentage of the ordinary income distribution paid by the DuPont Capital Emerging Markets Debt Fund during 2020 which was derived from U.S. Treasury securities was 1.73%. Such income is exempt from state and local tax in all states. However, many states, including New York and California, allow a tax exemption for a portion of the income earned only if a mutual fund has invested at least 50% of its assets at the end of each quarter of the Fund’s fiscal year in U.S. Government securities. The Fund did not meet this strict requirement in 2020. Due to the diversity in state and local tax law, it is recommended that you consult your personal tax adviser as to the applicability of the information provided to your specific situation.
The DuPont Capital Emerging Markets Fund paid foreign taxes and recognized foreign source income as follows:
| Foreign Taxes Paid | Foreign Source Income | |
| $53,315 | $853,781 | |
44
DUPONT CAPITAL FUNDS
Shareholder Tax Information
(Unaudited)
All designations are based on financial information available as of the date of this annual report and, accordingly, are subject to change. For each item, it is the intention of the DuPont Capital Emerging Markets Fund and the DuPont Capital Emerging Markets Debt Fund to designate the maximum amount permitted under the Internal Revenue Code of 1986, as amended, and the regulations thereunder.
Because the Funds’ fiscal year is not the calendar year, another notification will be sent with respect to calendar year 2020. The second notification, which will reflect the amount, if any, to be used by calendar year taxpayers on their U.S. federal income tax returns, will be made in conjunction with Form 1099-DIV and will be mailed in January 2021.
Foreign shareholders will generally be subject to U.S. withholding tax on the amount of their ordinary income dividends. They will generally not be entitled to a foreign tax credit or deduction for the withholding taxes paid by the Funds, if any.
In general, dividends received by tax-exempt recipients (e.g., IRAs and Keoghs) need not be reported as taxable income for U.S. federal income tax purposes. However, some retirement trusts (e.g., corporate, Keogh and 403(b)(7) plans) may need this information for their annual information reporting.
Shareholders are advised to consult their own tax advisers with respect to the tax consequences of their investment in the Funds.
45
DUPONT CAPITAL FUNDS
Other Information
(Unaudited)
Proxy Voting
Policies and procedures that the Funds use to determine how to vote proxies relating to portfolio securities as well as information regarding how the Funds voted proxies relating to portfolio securities for the most recent 12-month period ended June 30 are available without charge, upon request, by calling (888) 447-0014 and on the Securities and Exchange Commission’s (“SEC”) website at http://www.sec.gov.
Quarterly Portfolio Schedules
The Trust files its complete schedule of portfolio holdings with the SEC for the first and third fiscal quarters of each fiscal year (quarters ended July 31 and January 31) as an exhibit to their reports on Form N-PORT. The Trust’s portfolio holdings on Form N-PORT are available on the SEC’s website at http://www.sec.gov.
46
DUPONT CAPITAL FUNDS
Privacy Notice
(Unaudited)
The privacy of your personal financial information is extremely important to us. When you open an account with us, we collect a significant amount of information from you in order to properly invest and administer your account. We take very seriously the obligation to keep that information private and confidential, and we want you to know how we protect that important information.
We collect nonpublic personal information about you from applications or other forms you complete and from your transactions with us or our affiliates. We do not disclose information about you, or our former clients, to our affiliates or to service providers or other third parties, except as permitted by law. We share only the information required to properly administer your accounts, which enables us to send transaction confirmations, monthly or quarterly statements, financials and tax forms. Even within FundVantage Trust and its affiliated entities, a limited number of people who actually service accounts will have access to your personal financial information. Further, we do not share information about our current or former clients with any outside marketing groups or sales entities.
To ensure the highest degree of security and confidentiality, FundVantage Trust and its affiliates maintain various physical, electronic and procedural safeguards to protect your personal information. We also apply special measures for authentication of information you request or submit to us on our web site.
If you have questions or comments about our privacy practices, please call us at (888) 447-0014.
47
DUPONT CAPITAL FUNDS
Fund Management
(Unaudited)
FundVantage Trust (the “Trust”) is governed by a Board of Trustees (the “Trustees”). The primary responsibility of the Trustees is to represent the interest of the Trust’s shareholders and to provide oversight management of the Trust.
The following tables present certain information regarding the Trustees and officers of the Trust. None of the Trustees are an “interested person” of the Trust, the Adviser, another investment adviser of a series of the Trust, or Foreside Funds Distributors LLC, the principal underwriter of the Trust (“Underwriter”), within the meaning of the 1940 Act and each Trustee is referred to as an “Independent Trustee” and is listed under such heading below. Employees of certain service providers to the Trust serve as officers of the Trust; such persons are not compensated by the Funds. The address of each Trustee and Officer as it relates to the Trust’s business is 301 Bellevue Parkway, 2nd Floor, Wilmington, DE 19809.
The Statement of Additional Information for each Fund contains additional information about the Trustees and is available, without charge, upon request by calling (888) 447-0014.
Name and Date of Birth | Position(s) Held with Trust | Term of Office and Length of Time Served | Principal Occupation(s) During Past Five Years |
Number of Funds in Trust Complex Overseen by Trustee | Other Directorships Held by Trustee | |||||
INDEPENDENT TRUSTEES
| ||||||||||
ROBERT J. CHRISTIAN Date of Birth: 2/49 | Trustee | Shall serve until death, resignation or removal. Trustee since 2007. Chairman from 2007 until September 30, 2019. | Retired since February 2006; Executive Vice President of Wilmington Trust Company from February 1996 to February 2006; President of Rodney Square Management Corporation (“RSMC”) (investment advisory firm) from 1996 to 2005; Vice President of RSMC from 2005 to 2006.
| 39 | Optimum Fund Trust (registered investment company with 6 portfolios); Third Avenue Trust (registered investment company with 3 portfolios); Third Avenue Variable Series Trust (registered investment company with 1 portfolio).
| |||||
48
DUPONT CAPITAL FUNDS
Fund Management (Continued)
(Unaudited)
Name and Date of Birth | Position(s) Held with Trust | Term of Office and Length of Time Served | Principal Occupation(s) During Past Five Years | Number of Funds in Trust Complex Overseen by Trustee | Other Directorships Held by Trustee | |||||
IQBAL MANSUR Date of Birth: 6/55 |
Trustee |
Shall serve until death, resignation or removal. Trustee since 2007. |
University Professor, Widener University. |
39 |
Third Avenue Trust (registered investment company with 3 portfolios); Third Avenue Variable Series Trust (registered investment company with 1 portfolio).
| |||||
NICHOLAS M. MARSINI, JR. Date of Birth: 8/55 |
Trustee and Chairman of the Board |
Shall serve until death, resignation or removal. Trustee since 2016. Chairman since October 1, 2019. |
Retired since March 2016. President of PNC Bank Delaware from June 2011 to March 2016; Executive Vice President of Finance of BNY Mellon from July 2010 to January 2011; Executive Vice President and Chief Financial Officer of PNC Global Investment Servicing from September 1997 to July 2010.
|
39 |
Brinker Capital Destinations Trust (registered investment company with 10 portfolios); Third Avenue Trust (registered investment company with 3 portfolios); Third Avenue Variable Series Trust (registered investment company with 1 portfolio).
| |||||
49
DUPONT CAPITAL FUNDS
Fund Management (Continued)
(Unaudited)
Name and Date of Birth | Position(s) Held with Trust | Term of Office and Length of Time Served | Principal Occupation(s) During Past Five Years | Number of Funds in Trust Complex Overseen by Trustee | Other Directorships Held by Trustee | |||||
NANCY B. WOLCOTT Date of Birth: 11/54 |
Trustee |
Shall serve until death, resignation or removal. Trustee since 2011. |
Retired since May 2014; EVP, Head of GFI Client Service Delivery, BNY Mellon from January 2012 to May 2014; EVP, Head of US Funds Services, BNY Mellon from July 2010 to January 2012; President of PNC Global Investment Servicing from 2008 to July 2010; Chief Operating Officer of PNC Global Investment Servicing from 2007 to 2008; Executive Vice President of PFPC Worldwide Inc. from 2006 to 2007.
|
39 |
Lincoln Variable Insurance Products Trust (registered investment company with 97 portfolios); Third Avenue Trust (registered investment company with 3 portfolios); Third Avenue Variable Series Trust (registered investment company with 1 portfolio). | |||||
STEPHEN M. WYNNE Date of Birth: 1/55 |
Trustee |
Shall serve until death, resignation or removal. Trustee since 2009. |
Retired since December 2010; Chief Executive Officer of US Funds Services, BNY Mellon Asset Servicing from July 2010 to December 2010; Chief Executive Officer of PNC Global Investment Servicing from March 2008 to July 2010; President, PNC Global Investment Servicing from 2003 to 2008.
|
39 |
Copeland Trust (registered investment company with 3 portfolios); Third Avenue Trust (registered investment company with 3 portfolios); Third Avenue Variable Series Trust (registered investment company with 1 portfolio).
| |||||
50
DUPONT CAPITAL FUNDS
Fund Management (Concluded)
(Unaudited)
Name and Date of Birth | Position(s) Held with Trust | Term of Office and Length of Time Served | Principal Occupation(s) During Past Five Years | |||
EXECUTIVE OFFICERS
| ||||||
JOEL L. WEISS Date of Birth: 1/63 |
President and Chief Executive Officer |
Shall serve until death, resignation or removal. Officer since 2007. |
President of JW Fund Management LLC since June 2016; Vice President and Managing Director of BNY Mellon Investment Servicing (US) Inc. and predecessor firms from 1993 to June 2016.
| |||
T. RICHARD KEYES Date of Birth: 1/57 |
Treasurer and Chief Financial Officer |
Shall serve until death, resignation or removal. Officer since 2016. |
President of TRK Fund Consulting LLC since July 2016; Head of Tax — U.S. Fund Services of BNY Mellon Investment Servicing (US) Inc. and predecessor firms from February 2006 to July 2016.
| |||
GABRIELLA MERCINCAVAGE Date of Birth: 6/68 |
Assistant Treasurer |
Shall serve until death, resignation or removal. Officer since 2019. | Fund Administration Consultant since January 2019; Fund Accounting and Tax Compliance Accountant to financial services companies from November 2003 to July 2018.
| |||
VINCENZO A. SCARDUZIO Date of Birth: 4/72 |
Secretary |
Shall serve until death, resignation or removal. Officer since 2012.
|
Director and Vice President Regulatory Administration of The Bank of New York Mellon and predecessor firms since 2001. | |||
DAVID C. LEBISKY Date of Birth: 5/72 |
Chief Compliance Officer and Anti-Money Laundering Officer |
Shall serve until death, resignation or removal. Officer since 2015. |
President of Lebisky Compliance Consulting LLC since October 2015; Consultant, Duff & Phelps, LLC since 2016; Senior Consultant, Freeh Group International Solutions, LLC (a global risk management firm) from 2015 to 2018; Scotia Institutional Investments US, LP, Director of Regulatory Administration from 2010 to 2014.
| |||
51
Investment Adviser
DuPont Capital Management Corporation
One Righter Parkway
Suite 3200
Wilmington, DE 19803
Administrator
The Bank of New York Mellon
301 Bellevue Parkway
Wilmington, DE 19809
Transfer Agent
BNY Mellon Investment Servicing (US) Inc.
4400 Computer Drive
Westborough, MA 01581
Principal Underwriter
Foreside Funds Distributors LLC
400 Berwyn Park
899 Cassatt Road
Berwyn, PA 19312
Custodian
The Bank of New York Mellon
240 Greenwich Street
New York, NY 10286
Independent Registered Public Accounting Firm
PricewaterhouseCoopers LLP
Two Commerce Square, Suite 1800
2001 Market Street
Philadelphia, PA 19103-7042
Legal Counsel
Pepper Hamilton LLP
3000 Two Logan Square
18th and Arch Streets
Philadelphia, PA 19103
DUP-0420
DUPONT CAPITAL EMERGING
MARKETS FUND
DUPONT CAPITAL EMERGING
MARKETS DEBT FUND
of
FundVantage Trust
Class I
ANNUAL REPORT
April 30, 2020
IMPORTANT NOTE: Beginning on January 1, 2021, paper copies of the Funds’ shareholder reports will no longer be sent by mail, unless you specifically request paper copies of the shareholder reports from the Funds or from your financial intermediary. Instead, shareholder reports will be available on the DuPont Funds’ website (www.mutualfunds.dupontcapital.com), and you will be notified by mail each time a report is posted and provided with a website link to access the report.
You may elect to receive all future shareholder reports in paper, free of charge. To elect to receive paper copies of shareholder reports through the mail or otherwise change your delivery method, contact your financial intermediary or, if you hold your shares directly through the Funds, call toll-free at (888) 447-0014 or write to:
DuPont Funds
FundVantage Trust
c/o BNY Mellon Investment Servicing
P.O. Box 9829
Providence, RI 02940-8029
Your election to receive shareholder reports in paper will apply to all DuPont Funds that you hold through the financial intermediary, or directly with DuPont Funds.
This report is submitted for the general information of shareholders and is not authorized for distribution to prospective investors unless preceded or accompanied by a current prospectus.

EIC VALUE FUND
Annual Investment Adviser’s Report
April 30, 2020
(Unaudited)
Dear Fellow Shareholder,
Thank you for reviewing our annual report. In it, we discuss our perspective on the market, the EIC Value Fund’s (the “Fund”) performance, and some of the recent purchase and sale activity in the Fund. A listing of the Fund’s investments and other financial information follow our comments.
First and foremost, we hope that you, your family, and friends are healthy and safe. We’ve been lucky – to date, no one at our firm has contracted COVID-19. Many of us have been working remotely, though we continue to have staff take turns in the office. Overall, we’ve had no material disruptions to our daily activities and duties.
Perspective on the Market
During these unprecedented times, it seems fitting to open our report with a discussion of the pandemic’s effect on the capital markets.
The stock market decline in the first quarter of 2020 was extraordinary in both its speed and breadth. During 2007-2008, it took 250 trading days for the S&P 500 to drop 30%, but in the first quarter of 2020, that decline happened in just 22 trading days.1 Through Friday, March 27th, the average absolute daily change for stocks in the Dow Jones Industrial Average® over the preceding 25 days was 4.99%, a number that was matched only once in a comparable period in 1929. For comparison, the worst volatility during the 2008-2009 financial crisis saw a high reading of only about 4% a day.2 The median stock in the Russell 3000 Index fell 32.5% in the first quarter and plummeted nearly 43% from its 52-week high.3 In short, the market’s fall was fast, brutal, and painful.
The COVID-19 pandemic and its impact on the economy and corporate earnings were the proximate cause of the markets’ troubles, starting in the equity markets and spreading to mortgage bonds, investment-grade and high-yield corporates, and even affecting Treasuries at one point. We believe the ferocity of the first quarter volatility was, in part, a rapid and partial unwind of a decade of complacency. Post financial crisis and with only a few brief exceptions, the last decade, fueled by low interest rates and improving economic conditions, has been one of very low volatility. Into that environment stepped unregulated financial companies looking to harness that low volatility, with leverage, of course, to augment returns. For example, mortgage REITs active in private label or commercial mortgages
| 1 | Source: Bank of America Research. As seen in Carlson, Ben, “The Corona Crisis vs. The Great Depression.” 31 March 2020. https://awealthofcommonsense.com/2020/03/the-corona-crisis-vs-the-great-depression, 07 April 2020. |
| 2 | Source: Batnick, Michael, @michaelbatnick, 27 March 2020. https://twitter.com/michaelbatnick/status/ 1243631709503053824. As seen in Carlson, Ben, “The Corona Crisis vs. The Great Depression.” 31 March 2020. https://awealthofcommonsense.com/2020/03/the-corona-crisis-vs-the-great-depression, 07 April 2020. |
| 3 | Data Source: S&P Global Market Intelligence. Russell 3000 constituents, March 31, 2020 closing price, December 31, 2019 closing price, 52-week high price as of March 31, 2020. |
1
EIC VALUE FUND
Annual Investment Adviser’s Report (Continued)
April 30, 2020
(Unaudited)
and funds buying leveraged loans, Treasury futures, or pursuing risk parity or quantitative/algorithmic trading strategies employed leverage to amplify small returns with an implicit bet that conditions would stay calm or at least within reasonable historical bounds. Beyond that, non-financial corporate balance sheets were levered up too, with the irresistible pull of low interest rates that made transactions accretive to earnings. The exogenous shock of COVID-19, social distancing, and the mad dash for liquidity led to an immediate reassessment of the wisdom of all those risks at once. We observed fierce selling that shattered many historical trading relationships, forced deleveraging, further amplifying selling pressure. The Federal Reserve moved in during March and mostly calmed the short-term debt and mortgage markets, but conditions elsewhere still signal heightened risk, with the CBOE Volatility Index and bond spreads still elevated by historical standards.4,5
One of the unique aspects of the stock market action was the extreme outperformance of growth over value during the period. While our valuation model allows us to pay a premium for growth characteristics, we ultimately have limits regardless of the merits of the business. The future is uncertain, and we don’t believe we can forecast cash flows as far into the future as necessary to justify owning expensive growth stocks. Rather, our historic pattern of returns has been generated by building a diversified portfolio of quality companies trading at reasonable valuations. So far this year, many of the most expensive stocks not only outperformed as the bull market continued into February but held up the best by far during the steep decline, despite entering the period with historically high valuations.
Though some of these stocks with high valuations are thematically on point in this current environment (e.g., online retail, cloud platforms, and data centers, remote-work software, etc.), we find that many in the group have either significant economic sensitivity, poor business models that even in good times cannot earn their cost of capital, or are simply too expensive to deliver decent forward returns. We believe this realization should become more apparent as we move forward.
We have written previously of the valuation similarities between today and the tech bubble of the late 1990s, and this quarter has only accentuated that. As shown in the following chart, value stocks are trading nearly as cheaply relative to growth as they did at the height of the bubble.
| 4 | Data Source: Chicago Board Options Exchange, CBOE Volatility Index: VIX [VIXCLS], March 2020, end of period, retrieved from FRED, Federal Reserve Bank of St. Louis; https://fred.stlouisfed.org/series/VIXCLS, April 7, 2020. |
| 5 | Federal Reserve Bank of St. Louis, Moody’s Seasoned Baa Corporate Bond Yield Relative to Yield on 10-Year Treasury Constant Maturity [BAA10Y], March 2020, end of period, retrieved from FRED, Federal Reserve Bank of St. Louis; https://fred.stlouisfed.org/series/BAA10Y, April 7, 2020. |
2
EIC VALUE FUND
Annual Investment Adviser’s Report (Continued)
April 30, 2020
(Unaudited)
Data Source: S&P Global Market Intelligence, Russell 1000® Index.6 Indices are unmanaged and cannot be invested in directly. Past performance does not guarantee future results.
Within the value space, we believe that inexpensive but high-quality stocks (our chief focus) are priced for good forward returns, while more expensive growth stocks are collectively priced for mediocre or worse returns. To reinforce this point and the merits of value investing, we prepared the following chart showing the relationship between prospective returns and the spread between growth and value Cyclically Adjusted Price-to-Earnings (CAPE) ratios. If past is prologue, then the current 12.7x growth-stock premium suggests that value stocks could outperform growth stocks by 4% to 6% per annum over the coming decade.
| 6 | The Russell 1000 Value trailing Price/Earnings (P/E) premium relative to the Russell 1000 Growth trailing P/E calculated each month-end January 31, 1998 to April 30, 2020. Trailing earnings are defined as the ratio of index prices to trailing annual index level earnings before taxes (EBT) calculated on a time-weighted basis. Annual index level EBT is imputed by dividing the year-end index price by an aggregated price to EBT multiple of index constituents. Price to EBT is calculated by aggregating the available year-end market value of index constituents to the available adjusted trailing twelve months EBT (excluding unusual items) of index constituent. The Russell 1000 Index measures the performance of the large-cap segment of the US equity universe. The Russell 1000 Value includes those Russell 1000 Index companies with lower price-to-book ratios and lower expected growth values. The Russell 1000 Growth includes those Russell 1000 companies with higher price-to-book ratios and higher forecasted growth values. |
3
EIC VALUE FUND
Annual Investment Adviser’s Report (Continued)
April 30, 2020
(Unaudited)
Data Source: S&P Global Market Intelligence, Russell 1000® Index.7 Indices are unmanaged and cannot be invested in directly. Past performance does not guarantee future results.
| 7 | The Russell 1000 Growth modified CAPE premium over the Russell 1000 Value modified CAPE (x-axis) for each month-end January 31, 1990 to April 30, 2020, plotted against the subsequent annualized 10-year forward total return difference between the Russell 1000 Growth and Russell 1000 Value (y-axis) for each month-end January 31, 2000 to April 30, 2020. Modified CAPE is the ratio of index prices to trailing 10-year average index level earnings before taxes (EBT) calculated on a time-weighted basis. Annual index level EBT is imputed by dividing the year-end index price by an aggregated price to EBT multiple of index constituents. |
4
EIC VALUE FUND
Annual Investment Adviser’s Report (Continued)
April 30, 2020
(Unaudited)
Of course, we do not know the length of this economic downturn, nor the timing or trajectory of an eventual recovery. But we have seen crises before and expect to see them again. While certain aspects of this crisis seem worse –for instance, the likely depth of Gross Domestic Product and employment declines – there are other aspects that we believe are noticeably better. For example, the shutdown and attendant declines in demand were self-imposed, and before this the economy was in good shape. Thus, the worst declines should be relatively short-term in nature, though aftereffects may linger. The Federal Reserve is providing extra short-term liquidity, and the regulated banking system is well positioned, with high capital levels, generally good loans-to-assets ratios, and significant bank liquidity. As we read in a recent strategy piece, “In the financial crisis, banks were part of the problem. Now, they can be part of the solution.”8
This all stands in contrast to the Financial Crisis of 2007-2008 when banks were highly leveraged and had significant concentrations in bad loans, chiefly overleveraged mortgages on overpriced homes, which resulted in a rolling crisis. It seemed then as if the unwind would never end. Finally, unlike during the Financial Crisis, Congress has acted with surprising bipartisan speed. More government intervention may eventually be needed, and there will surely be winners and losers, as well as a lag before the effects are felt. Still, the CARES (Coronavirus Aid, Relief, and Economic Security) Act spends, on an inflation-adjusted basis, roughly half the amount as the United States government spent on all of World War II, and there are already indications there may be more spending to come.9,10 Every week we gain additional insight into COVID-19, including possible treatments, and get closer to a vaccine and a bending of the curve, both in the United States and worldwide. On the other side of this crisis may lie an economy not ruined by war or laden with bad assets, but one with its productive assets in place and a population ready to get back to work.
| 8 | Mayo, Michael, Wells Fargo Securities LLC. Quoted in Bary, Andrew, “Big Banks Are Facing Their First Major Test Since the Financial Crisis.” Barron’s, 20 March 2020. https://www.barrons.com/articles/big-banks-have-their-real-life-stress-test-why-they-will-persevere-51584743591, 07 April 2020. |
| 9 | Data Source: Committee for a Responsible Federal Budget. What’s in the $2 Trillion Coronavirus Relief Package? 25 March 2020. http://www.crfb.org/blogs/whats-2-trillion-coronavirus-relief-package“, 08 April 2020. |
| 10 | Data Source: Daggett, Stephen, Congressional Research Service. Costs of Major U.S. Wars. 29 June 2010. https://fas.org/sgp/crs/natsec/RS22926.pdf, 07 April 2020. |
5
EIC VALUE FUND
Annual Investment Adviser’s Report (Continued)
April 30, 2020
(Unaudited)
Fund Performance
Performance for the Fund’s Institutional Class shares (net of expenses) over the twelve months ended April 30, 2020, is presented below:
| Month | EIC
Value Fund | Russell 3000®
Value Index | S&P 500®
Index | |||||||||
May | -5.73 | % | -6.55 | % | -6.35 | % | ||||||
June | 5.47 | % | 7.12 | % | 7.05 | % | ||||||
July | 0.43 | % | 0.78 | % | 1.44 | % | ||||||
August | -1.08 | % | -3.12 | % | -1.58 | % | ||||||
September | 3.26 | % | 3.67 | % | 1.87 | % | ||||||
October | -0.56 | % | 1.47 | % | 2.17 | % | ||||||
November | 3.60 | % | 3.04 | % | 3.63 | % | ||||||
December | 2.36 | % | 2.80 | % | 3.02 | % | ||||||
January | -4.09 | % | -2.37 | % | -0.04 | % | ||||||
February | -8.24 | % | -9.69 | % | -8.23 | % | ||||||
March | -13.63 | % | -17.58 | % | -12.35 | % | ||||||
April | 10.87 | % | 11.31 | % | 12.82 | % | ||||||
Twelve Months | -9.36 | % | -11.89 | % | 0.86 | % | ||||||
Data source: Morningstar DirectSM. Indices are unmanaged and cannot be invested in directly. Past performance does not guarantee future results.
The results shown in the table are over a relatively short period of time; thus, we caution against drawing sweeping conclusions. Nevertheless, the Fund’s return pattern was generally consistent with its performance history of declining less in down markets, while not keeping up with the indices during periods of strong upward movements. This combination led to outperformance relative to the Russell 3000 Value Index over the full twelve-month period.
The performance data quoted represents past performance and may not be indicative of future results. The investment return and principal value of an investment in the Fund will fluctuate so that an investor’s shares, when redeemed, may be worth more or less than original cost. Current performance may be lower or higher. Performance data current to the most recent month-end may be obtained by calling (855) 430-6487.
6
EIC VALUE FUND
Annual Investment Adviser’s Report (Continued)
April 30, 2020
(Unaudited)
Performance attribution for the twelve months follows. Fund results are compared to the Russell 3000 Value Index.
The Fund’s outperformance relative to its benchmark was primarily attributable to its cash position and stock selection in the consumer discretionary sector.
Over the twelve months, the Fund’s cash position (including short-term investments) continued to be relatively high, averaging 11.5%. Notably, we do not allocate to cash tactically; the Fund’s cash position is a residual of the stock-selection process and is primarily a function of the availability of undervalued stocks. We prefer to keep the Fund’s cash levels low, in the single digits if possible, but they can build up when attractive investment opportunities are difficult to find, as they were for much of 2019. With the recent dislocation in the equity market, however, we were able to purchase several stocks that we think are attractively valued, deploying cash in the process. As a result, we reduced the Fund’s cash position to 4.9% as of April 30, 2020.
Similarly, we don’t target sector weightings, either in an absolute sense or relative to market indices; they too are principally a residual of stock selection. Nevertheless, it is at times instructive to see how sector allocations affected returns. On balance, they hurt Fund performance over the trailing twelve months.
Only three of the eleven sectors in the Russell 3000 Value Index posted positive returns for the twelve months ended April 30, 2020. Health care and consumer staples were the top-performing sectors, gaining 12.4% and 3.2%, respectively. Information technology was next in line, rising 0.8%. Relative to the index, the Fund was overweight in health care but underweight in consumer staples and information technology.
In contrast, energy and financials were the two worst performing sectors in the Russell 3000 Value Index, declining 40.1% and 20.9%, respectively. Consumer discretionary was also weak, dropping 19.8%. Unfortunately, the Fund had more exposure to each of these sectors than the index did, significantly so in the case of consumer discretionary.
Fortunately, our stock selection in the consumer discretionary sector helped offset the negative effects of our sector allocations. To that end, the Fund’s holdings in this sector posted a collective return of -0.9%, while the index’s consumer discretionary stocks fell nearly 20%. Target, up 45.8%, was the Fund’s top performer, and eBay, up 4.4%, also performed reasonably well.
Securities in the Fund do not match those in the index and performance of the Fund will differ. Indices are unmanaged, do not incur management fees, costs and expenses, and cannot be invested in directly.
Sectors are determined using the Global Industry Classification Standard (“GICS”). GICS® was developed by, and is the exclusive property of, Standard & Poor’s Financial Services LLC (“S&P”) and MSCI Inc. (“MSCI”). GICS is the trademark of S&P and MSCI. “Global Industry Classification Standard (GICS)” and “GICS Direct” are service marks of S&P and MSCI.
7
EIC VALUE FUND
Annual Investment Adviser’s Report (Continued)
April 30, 2020
(Unaudited)
Our stock selection in the communication services sector also positively impacted returns. The Fund’s holdings in this sector decreased a combined 0.4%, versus a 6.0% decline for the index’s communication services stocks. Strong performance by Facebook, up 5.8%, and Verizon, up 4.8%, offset weak results from Discovery, Inc., which dropped
19.1%.
Other notable Fund holdings included Medtronic, up 42.9%, The Williams Companies, up 36.9%, Kroger, up 25.6%, Sysco Corp., up 24.7%, AmerisourceBergen, up 22.2%, and McKesson, up 19.9%.
On the other hand, our security selection in the financials sector adversely affected Fund performance. Fund holdings decreased a combined 24.9%, trailing the index’s financials, which fell 20.9%. In particular, Franklin Resources, down 49.7%, Wells Fargo, down 37.5%, Truist Financial, down 33.2%, and US Bancorp, down 29.2%, were the Fund’s poorest performers in this sector.
Many of the Fund’s worst-performing holdings were in the energy sector, where Schlumberger plummeted 66.5%, Cimarex tumbled 56.5%, and Exxon Mobil sank 39.1%. Several other Fund holdings also detracted from performance, including Alliance Data Systems, down 78.5%, Molson Coors, down 36.6%, and Mohawk Industries, down 35.6%.
Portfolio Activity
Our portfolio turnover tends to increase in periods of heightened stock-market volatility. The first four months of 2020 were no exception, with the Fund’s turnover approaching the highest levels seen since its inception in 2011. Our playbook in intense and volatile periods such as these remains the same:
| ● | Dispassionately assess the unfolding new reality, in this case, a deep recession of uncertain duration, especially concentrated in particular segments of the economy, coupled with increasing, broad credit concerns; |
| ● | Identify for purchase companies that we believe are 1) attractively priced on a conservative assessment of normalized earnings with 2) favorable ownership economics, 3) capital structures to see them through an extended period of difficulty without the need to raise dilutive equity capital, and 4) debt maturity schedules that won’t leave them beholden to displaced credit markets; |
| ● | Triage positions we think are most vulnerable to the changing realities; and |
| ● | Further fund new purchases with trims and sales of stocks that have held up relatively well, especially those that are expected to benefit from the near-term landscape but whose prospects haven’t improved over the longer-term. |
8
EIC VALUE FUND
Annual Investment Adviser’s Report (Continued)
April 30, 2020
(Unaudited)
A summary of some of our recent trades, including our opinion of the stocks, is discussed below:
New Positions Purchased
Cisco Systems Inc. (CSCO) – Rated AA- with net cash position and market leadership in high margin categories (routers and switches). We previously owned and sold shares in early 2019 in the mid-$50s based on valuation. Bought back in March 2020 near the high-$30s. Attractively priced and high quality.
General Dynamics Corporation (GD) – High-quality and well-managed defense and aerospace businesses. A rated and well-capitalized. Diversified defense businesses with multiple years of revenue in funded backlog. Inexpensive even under the assumption that aerospace business (Gulfstream) is not profitable due to recession. GD’s earnings multiple is on par with other large defense contractors. But Gulfstream is best-in-class and highly valuable, despite near-term earnings uncertainty.
Medtronic plc (MDT) – Diversified, high-quality medical devices business with particular strength in cardiovascular. A rated and has significantly de-levered since Covidien transaction in early 2015. We sold the majority of our shares in January 2020 at $120 based on valuation. Two months later, we repurchased it below $79.
National Fuel Gas Company (NFG) – A diversified natural gas company that derives over half its profits from a gas utility and pipelines, both fairly stable businesses with little commodity-price exposure. (In fact, NFG is classified as a utility.) Conservatively managed and prudently capitalized, NFG has seen its share price decline sharply despite its relative lack of commodity price exposure, thus creating an attractive entry point.
PPL Corp (PPL) – Regulated utility operating in Pennsylvania, Kentucky, and the United Kingdom. Primarily engages in the distribution and transmission of electricity, but also owns coal power plants in Kentucky. Returns for all of the company’s assets are regulated, providing a reasonable amount of stability amid the uncertain economic outlook. PPL earns attractive returns on capital and maintains a strong balance sheet (rated A-). Shares trade at a significant discount to the broader market and its utility peers, and offer an attractive dividend yield.
The Charles Schwab Corporation (SCHW) – An industry leader that has been consistently taking market share, reinforcing its dominant position in RIA-custody. Very high-quality balance sheet. Levered to short-term interest rates, so with rate declines, earnings will be depressed (as they were for much of the last decade, including during our previous ownership). The TD Ameritrade acquisition, if permitted by regulators, should be highly accretive to earnings and thus very positive.
Sysco Corporation (SYY) – Dominant market leader in wholesale food distribution to restaurants and institutions, a business placed largely on hold during COVID-19 shelter-in-place orders. The share price declined 60% – we purchased it in March 2020 in the mid-$30s. Upon return to a more normal economic environment, it’s a very good, high-margin business, likely to continue gaining share and increasing margins. Was rated A- before the pandemic crisis, downgraded to BBB- on shutdown but with a sound capital structure and having already addressed near-term debt maturities.
Credit-quality ratings represent Standard & Poor’s (S&P) opinion as to the quality of the securities they rate. The ratings range from AAA (extremely strong capacity to meet its financial commitments) to D (in default). Ratings are relative and subjective and are not absolute standards of quality. The ratings provided relate to the underlying securities within the Fund and not the Fund itself. S&P Global Market Intelligence as of April 17, 2020.
9
EIC VALUE FUND
Annual Investment Adviser’s Report (Continued)
April 30, 2020
(Unaudited)
The Williams Companies Inc. (WMB) – Collection of interstate gas pipelines, gathering and processing businesses. Notwithstanding long-term contracts that are relatively unaffected by the commodity price, WMB’s share price has fallen in concert with other energy stocks. Despite persistently low gas prices, gas production and usage continues to be in a secular rise. Rated BBB and highly cash generative with high dividend yield.
Additions to Existing Positions
The market’s decline allowed us to add to a number of the Fund’s existing high quality-positions at what we think are very attractive valuations, including Hartford Financial Group (HIG), Johnson & Johnson (JNJ), Truist Financial (TFC), Target (TGT), Total SA (TOT), Travelers (TRV), Verizon (VZ), Wells Fargo (WFC), Cimarex Energy (XEC), and Exxon Mobil (XOM).
Sales and Trims of Positions
In addition to deploying cash, we funded purchases with sales of Alliance Data Systems (ADS), Franklin Resources (BEN), Schlumberger (SLB), and Molson Coors (TAP), as well as trims of eBay (EBAY), Facebook (FB), Globe Life (GL), Honda Motor (HMC), Kroger (KR), National Grid plc (NGG), PepsiCo (PEP) and Sysco (SYY). We believe these sales and trims in aggregate upgraded the quality of the Fund’s portfolio, eliminated some businesses with value-trap characteristics, and opportunistically took advantage of relative price strength during the market’s pullback.
We think that the net result of our recent trading activity is 1) an improvement in the overall quality of the Fund’s portfolio, 2) a decrease in exposure to some holdings that have balance-sheet risks or value-trap characteristics, and 3) a reduction in the Fund’s cash level to 4.9%. As value investors, we also continued to focus on what we consider to be attractively valued investment opportunities. In our view, the Fund’s portfolio is a high-quality one, and its holdings have sound balance sheets, which should enable it to weather an extended economic downturn. Over the longer term, we think the economy and capital markets will prove resilient and believe the Fund is positioned to deliver solid absolute and relative returns.
There can be no guarantee that any strategy will be successful. All investing involves risk, including potential loss of principal.
This letter is intended to assist shareholders in understanding how the Fund performed during the fiscal year ended April 30, 2020, and reflects the views of the investment adviser at the time of this writing. Of course, these views may change and do not guarantee the future performance of the Fund or the markets.
The above commentary is for informational purposes only and does not represent an offer, recommendation, or solicitation to buy, hold, or sell any security. The specific securities identified and described do not represent all of the securities purchased or sold and you should not assume that investments in the securities identified and discussed will be profitable.
Portfolio composition is subject to change. The current and future portfolio holdings of the Fund are subject to investment risk.
10
EIC VALUE FUND
Annual Investment Adviser’s Report (Concluded)
April 30, 2020
(Unaudited)
London Stock Exchange Group PLC (“LSE Group”) is the source and owner of FTSE Russell index data. FTSE Russell is a trading name of certain of the LSE Group companies. “Russell®” is a trade mark of the relevant LSE Group companies and is used by any other LSE Group company under license. All rights in the FTSE Russell indexes or data vest in the relevant LSE Group company which owns the index or the data. Neither LSE Group nor its licensors accept any liability for any errors or omissions in the indexes or data and no party may rely on any indexes or data contained in this communication. No further distribution of data from the LSE Group is permitted without the relevant LSE Group company’s express written consent. The LSE Group does not promote, sponsor or endorse the content of this communication.
11
EIC VALUE FUND
Annual Report
Performance Data
April 30, 2020
(Unaudited)
Comparison of Change in Value of $10,000 Investment in EIC Value Fund’s Class A
vs. Russell 3000® Value Index and S&P 500® Index
Class A of an assumed $10,000 investment is adjusted for the maximum sales charge of 5.50%. This results in a net investment of $9,450. Performance of Class C will vary from Class A due to differences in class-specific fees.
| Average Annual Total Returns for the Periods Ended April 30, 2020 |
| |||||||||||||||
| 1 Year | 3 Years | 5 Years | Since Inception* | |||||||||||||
Class A (with sales charge) | -14.55% | -0.01% | 1.42% | 5.52% | ||||||||||||
Class A (without sales charge) | -9.54% | 1.90% | 2.57% | 6.18% | ||||||||||||
Russell 3000® Value Index | -11.89% | 0.92% | 3.67% | 7.81% | ** | |||||||||||
S&P 500® Index | 0.86% | 9.04% | 9.12% | 11.35% | ** | |||||||||||
Class C (with CDSC charge) | -11.14% | 1.10% | 1.79% | 5.66% | ||||||||||||
Class C (without CDSC charge) | -10.30% | 1.10% | 1.79% | 5.66% | ||||||||||||
Russell 3000® Value Index | -11.89% | 0.92% | 3.67% | 8.31% | ** | |||||||||||
S&P 500® Index | 0.86% | 9.04% | 9.12% | 11.77% | ** | |||||||||||
| * | Class A and Class C of the EIC Value Fund (the “Fund”) commenced operations on May 19, 2011 and July 18, 2011, respectively. |
| ** | Benchmark performance is from commencement date of the Class only and is not the commencement date of the benchmark itself. |
The performance data quoted represents past performance and does not guarantee future results. The investment return and principal value of an investment in the Fund will fluctuate so that an investor’s shares, when redeemed, may be worth more or less than their original cost. The graph and table do not reflect the deduction of taxes that a shareholder would pay on Fund distributions or redemption of Fund shares. Current performance may be lower or higher. Performance data current to the most recent month-end may be obtained by calling (855) 430-6487.
12
EIC VALUE FUND
Annual Report
Performance Data (Continued)
April 30, 2020
(Unaudited)
Comparison of Change in Value of $100,000 (investment minimum) Investment in
EIC Value Fund’s Institutional Class
vs. Russell 3000® Value Index and S&P 500® Index
| Average Annual Total Returns for the Periods Ended April 30, 2020 |
| |||||||||||||||
| 1 Year | 3 Years | 5 Years | Since Inception* | |||||||||||||
Institutional Class | -9.36% | 2.14% | 2.83% | 6.41% | ||||||||||||
Russell 3000® Value Index | -11.89% | 0.92% | 3.67% | 7.57% | ** | |||||||||||
S&P500® Index | 0.86% | 9.04% | 9.12% | 11.10% | ** | |||||||||||
| * | Institutional Class shares of the EIC Value Fund (the “Fund”) inception date was April 29, 2011. Operations commenced on May 1, 2011. |
| ** | Benchmark performance is from commencement date of the Class only and is not the commencement date of the benchmark itself. |
The performance data quoted represents past performance and does not guarantee future results. The investment return and principal value of an investment in the Fund will fluctuate so that an investor’s shares, when redeemed, may be worth more or less than their original cost. The graph and table do not reflect the deduction of taxes that a shareholder would pay on Fund distributions or redemption of Fund shares. Current performance may be lower or higher. Performance data current to the most recent month-end may be obtained by calling (855) 430-6487.
The returns shown for Class A shares reflect a deduction for the maximum front-end sales charge of 5.50%. The returns shown for Class C shares reflect a maximum deferred sales charge of 1.00%. All of the Fund’s share classes apply a 2.00% fee to the value of shares redeemed within 30 days of purchase. This redemption fee is not reflected in the returns shown above. As stated in the current prospectus dated September 1, 2019, the Fund’s “Total Annual Fund Operating Expenses” are 1.30%, 2.05% and 1.05%, and the Fund’s “Total Annual Fund Operating Expenses After Fee Waiver and/or Expense Reimbursement” are 1.21%, 1.96% and 0.96% for Class A shares, Class C shares and Institutional Class Shares, respectively, of the Fund Class’ average daily net assets. The ratios may differ from
13
EIC VALUE FUND
Annual Report
Performance Data (Concluded)
April 30, 2020
(Unaudited)
the actual expenses incurred by the Fund for the period covered by this report. Equity Investment Corporation (the “Adviser”) has contractually agreed to waive or otherwise reduce its annual compensation received from the Fund to the extent necessary to ensure that the Fund’s “Total Annual Fund Operating Expenses,” excluding taxes, fees and expenses attributable to a distribution or service plan adopted by FundVantage Trust (the “Trust”), “Acquired Fund Fees and Expenses,” interest, extraordinary items and brokerage commissions, do not exceed 0.90% of average daily net assets of the Fund (the “Expense Limitation”). The Expense Limitation will remain in place until August 31, 2020, unless the Board of Trustees of the Trust approves its earlier termination. Subject to approval by the Board of Trustees, the Adviser may recoup any expenses or fees it has reimbursed within a three-year period from the date on which the Adviser reduced its compensation and/or assumed expenses of the Fund. The Adviser is permitted to seek reimbursement from the Fund, subject to certain limitations, for fees it waived and Fund expenses it paid to the extent the total annual fund operating expenses do not exceed the limits described above or any lesser limits in effect at the time of reimbursement. No recoupment will occur unless the Fund’s expenses are below the Expense Limitation amount. Total returns would be lower had such fees and expenses not been waived and/or reimbursed.
Mutual fund investing involves risk, including possible loss of principal. Value investing involves the risk that the Fund’s investing in companies believed to be undervalued will not appreciate as anticipated. The Fund may invest in the stocks of smaller-and medium-sized companies which may be more vulnerable to adverse business or economic events than larger, more established companies.
The Fund intends to evaluate performance as compared to that of the Standard & Poor’s 500 (“S&P 500®”) Index and the Russell 3000® Value Index. The S&P 500® is a widely recognized, unmanaged index of 500 common stocks which are generally representative of the U.S. stock market as a whole. The Russell 3000® Value Index is an unmanaged index that measures the performance of the broad value segment of the U.S. equity value universe. It includes those Russell 3000® Index companies with lower price-to-book ratios and lower forecasted growth rates.
14
EIC VALUE FUND
Fund Expense Disclosure
April 30, 2020
(Unaudited)
As a shareholder of the Fund, you incur two types of costs: (1) transaction costs including sales charges (loads) on purchase payments (if any) or redemption fees; and (2) ongoing costs, including management fees, distribution and/or service (Rule 12b-1) fees (if any) and other Fund expenses. These examples are intended to help you understand your ongoing costs (in dollars) of investing in the Fund and to compare these costs with the ongoing costs of investing in other mutual funds.
These examples are based on an investment of $1,000 invested at the beginning of the six-month period from November 1, 2019 through April 30, 2020 and held for the entire period.
Actual Expenses
The first line of each accompanying table provides information about actual account values and actual expenses. You may use the information in this line, together with the amount you invested, to estimate the expenses that you paid over the period. Simply divide your account value by $1,000 (for example, an $8,600 account value divided by $1,000 = 8.6), then multiply the result by the number in the first line under the heading entitled “Expenses Paid During Period” to estimate the expenses you paid on your account during this period.
Hypothetical Examples for Comparison Purposes
The second line of each accompanying table provides information about hypothetical account values and hypothetical expenses based on the Fund’s actual expense ratio and an assumed rate of return of 5% per year before expenses, which is not your Fund’s actual return. The hypothetical account values and expenses may not be used to estimate the actual ending account balance or expenses you paid for the period. You may use this information to compare the ongoing costs of investing in the Fund and other funds. To do so, compare these 5% hypothetical examples with the 5% hypothetical examples that appear in the shareholder reports of other funds.
Please note that the expenses shown in the accompanying tables are meant to highlight your ongoing costs only and do not reflect any transactional costs, such as sales charges (loads) on purchase payments (if any) or redemption fees. Therefore, the second line of each accompanying table is useful in comparing ongoing costs only, and will not help you determine the relative total costs of owning different funds. In addition, if these transactional costs were included, your costs would have been higher.
15
EIC VALUE FUND
Fund Expense Disclosure (Concluded)
April 30, 2020
(Unaudited)
| EIC Value Fund | |||||||||||||||
| Beginning Account Value November 1, 2019 | Ending Account Value April 30, 2020 | Expenses Paid During Period* | |||||||||||||
Class A | |||||||||||||||
Actual | $1,000.00 | $ 892.40 | $5.41 | ||||||||||||
Hypothetical (5% return before expenses) | 1,000.00 | 1,019.14 | 5.77 | ||||||||||||
Class C | |||||||||||||||
Actual | $1,000.00 | $ 888.60 | $8.92 | ||||||||||||
Hypothetical (5% return before expenses) | 1,000.00 | 1,015.42 | 9.52 | ||||||||||||
Institutional Class | |||||||||||||||
Actual | $1,000.00 | $ 893.60 | $4.24 | ||||||||||||
Hypothetical (5% return before expenses) | 1,000.00 | 1,020.39 | 4.52 | ||||||||||||
| * | Expenses are equal to the Fund’s annualized expense ratio for the six-month period ended April 30, 2020 of 1.15%, 1.90%, and 0.90% for Class A, Class C, and Institutional Class shares, respectively, multiplied by the average account value over the period, multiplied by the number of days in the most recent period (182), then divided by 366 to reflect the period. The Fund’s ending account values on the first line in each table are based on the actual six-month total returns for the Fund of (10.76)%, (11.14)%, and (10.64)% for Class A, Class C, and Institutional Class shares, respectively. |
16
EIC VALUE FUND
Portfolio Holdings Summary Table
April 30, 2020
(Unaudited)
The following table presents a summary by sector of the portfolio holdings of the Fund:
| % of Net Assets | Value | |||||||
COMMON STOCKS: | ||||||||
Financial | 25.4 | % | $ | 35,484,105 | ||||
Consumer, Non-cyclical | 22.4 | 31,320,850 | ||||||
Communications | 13.7 | 19,155,397 | ||||||
Energy | 9.3 | 12,920,095 | ||||||
Consumer, Cyclical | 9.0 | 12,509,479 | ||||||
Utilities | 8.1 | 11,307,611 | ||||||
Industrial | 5.6 | 7,845,446 | ||||||
Basic Materials | 2.3 | 3,151,801 | ||||||
Short-Term Investments | 4.9 | 6,907,908 | ||||||
Liabilities in Excess of Other Assets | (0.7 | ) | (1,037,979 | ) | ||||
|
|
|
| |||||
NET ASSETS | 100.0 | % | $ | 139,564,713 | ||||
|
|
|
| |||||
Portfolio holdings are subject to change at any time.
The accompanying notes are an integral part of the financial statements.
17
EIC VALUE FUND
Portfolio of Investments
April 30, 2020
| Number of Shares | Value | |||||||
COMMON STOCKS — 95.8% |
| |||||||
Basic Materials — 2.3% |
| |||||||
PPG Industries, Inc. | 34,700 | $ | 3,151,801 | |||||
|
| |||||||
Communications — 13.7% |
| |||||||
Cisco Systems, Inc. | 75,475 | 3,198,630 | ||||||
Discovery, Inc., Class C* | 123,175 | 2,514,002 | ||||||
eBay, Inc. | 78,645 | 3,132,430 | ||||||
Facebook, Inc., Class A* | 18,590 | 3,805,559 | ||||||
Verizon Communications, Inc. | 113,225 | 6,504,776 | ||||||
|
| |||||||
| 19,155,397 | ||||||||
|
| |||||||
Consumer, Cyclical — 9.0% |
| |||||||
Booking Holdings, Inc.* | 1,708 | 2,528,814 | ||||||
Honda Motor Co. Ltd., SP ADR | 43,825 | 1,053,991 | ||||||
Lowe’s Cos, Inc. | 28,185 | 2,952,379 | ||||||
Mohawk Industries, Inc.* | 22,175 | 1,945,191 | ||||||
Target Corp. | 36,715 | 4,029,104 | ||||||
|
| |||||||
| 12,509,479 | ||||||||
|
| |||||||
Consumer, Non-cyclical — 22.4% |
| |||||||
AmerisourceBergen Corp. | 46,250 | 4,146,775 | ||||||
GlaxoSmithKline PLC, SP ADR | 141,130 | 5,937,339 | ||||||
Johnson & Johnson | 32,335 | 4,851,543 | ||||||
Kroger Co. (The) | 58,275 | 1,842,073 | ||||||
McKesson Corp. | 23,500 | 3,319,375 | ||||||
Medtronic PLC | 31,525 | 3,077,786 | ||||||
PepsiCo, Inc. | 19,075 | 2,523,432 | ||||||
Sanofi SA, SP ADR | 72,075 | 3,375,272 | ||||||
Sysco Corp. | 39,937 | 2,247,255 | ||||||
|
| |||||||
| 31,320,850 | ||||||||
|
| |||||||
Energy — 9.3% | ||||||||
Cimarex Energy Co. | 77,175 | 1,961,788 | ||||||
ConocoPhillips | 45,990 | 1,936,179 | ||||||
| Number of Shares | Value | |||||||
COMMON STOCKS — (Continued) |
| |||||||
Energy — (Continued) | ||||||||
Exxon Mobil Corp. | 50,125 | $ | 2,329,309 | |||||
TOTAL SA, SP ADR | 84,575 | 2,972,811 | ||||||
Williams Cos, Inc. (The) | 192,050 | 3,720,008 | ||||||
|
| |||||||
| 12,920,095 | ||||||||
|
| |||||||
Financial — 25.4% | ||||||||
AGNC Investment Corp. REIT | 213,050 | 2,646,081 | ||||||
American Express Co. | 44,800 | 4,088,000 | ||||||
Charles Schwab Corp. (The) | 82,025 | 3,093,983 | ||||||
Globe Life, Inc. | 29,947 | 2,465,836 | ||||||
Hartford Financial Services Group, Inc. (The) | 87,175 | 3,311,778 | ||||||
PNC Financial Services Group, Inc. (The) | 18,500 | 1,973,395 | ||||||
Travelers Cos, Inc. (The) | 43,280 | 4,380,369 | ||||||
Truist Financial Corp. | 141,853 | 5,293,954 | ||||||
US Bancorp | 114,890 | 4,193,485 | ||||||
Wells Fargo & Co. | 138,975 | 4,037,224 | ||||||
|
| |||||||
| 35,484,105 | ||||||||
|
| |||||||
Industrial — 5.6% | ||||||||
General Dynamics Corp. | 19,625 | 2,563,418 | ||||||
United Parcel Service, Inc., Class B | 55,800 | 5,282,028 | ||||||
|
| |||||||
| 7,845,446 | ||||||||
|
| |||||||
Utilities — 8.1% | ||||||||
Exelon Corp. | 91,610 | 3,396,899 | ||||||
National Fuel Gas Co. | 55,500 | 2,275,500 | ||||||
National Grid PLC, SP ADR | 47,775 | 2,797,704 | ||||||
The accompanying notes are an integral part of the financial statements.
18
EIC VALUE FUND
Portfolio of Investments (Concluded)
April 30, 2020
| Number of Shares | Value | |||||||
COMMON STOCKS — (Continued) |
| |||||||
Utilities — (Continued) | ||||||||
PPL Corp. | 111,625 | $ | 2,837,508 | |||||
|
| |||||||
| 11,307,611 | ||||||||
|
| |||||||
TOTAL COMMON STOCKS |
| 133,694,784 | ||||||
|
| |||||||
SHORT-TERM INVESTMENTS — 4.9% |
| |||||||
Money Market Fund — 4.9% |
| |||||||
Dreyfus Institutional Treasury Securities Cash Advantage Fund, Premier Shares 0.01%(a) | 6,907,908 | 6,907,908 | ||||||
|
| |||||||
TOTAL SHORT-TERM INVESTMENTS | 6,907,908 | |||||||
|
| |||||||
TOTAL INVESTMENTS - 100.7% |
| 140,602,692 | ||||||
LIABILITIES IN EXCESS OF OTHER ASSETS - (0.7)% |
| (1,037,979 | ) | |||||
|
| |||||||
NET ASSETS - 100.0% | $ | 139,564,713 | ||||||
|
| |||||||
| * | Non-income producing. |
| (a) | Rate periodically changes. Rate disclosed is the 7-day yield at April 30, 2020. |
ADR | American Depository Receipt | |
PLC | Public Limited Company | |
REIT | Real Estate Investment Trust | |
SP ADR | Sponsored American Depository Receipt |
The accompanying notes are an integral part of the financial statements.
19
EIC VALUE FUND
Statement of Assets and Liabilities
April 30, 2020
Assets | |||||
Investments, at value (Cost $122,140,990) | $ | 140,602,692 | |||
Receivable for investments sold | 427,306 | ||||
Receivable for capital shares sold | 102,381 | ||||
Dividends receivable | 312,708 | ||||
Prepaid expenses and other assets | 31,744 | ||||
|
| ||||
Total assets | 141,476,831 | ||||
|
| ||||
Liabilities | |||||
Payable for capital shares redeemed | 1,720,307 | ||||
Payable to Adviser | 73,851 | ||||
Payable for transfer agent fees | 38,826 | ||||
Payable for audit fees | 30,226 | ||||
Payable for administration and accounting fees | 16,892 | ||||
Payable for distribution fees | 12,314 | ||||
Payable for printing fees | 8,162 | ||||
Payable for custodian fees | 5,942 | ||||
Payable for shareholder servicing fees | 3,555 | ||||
Payable for legal fees | 1,837 | ||||
Accrued expenses | 206 | ||||
|
| ||||
Total liabilities | 1,912,118 | ||||
|
| ||||
Net Assets | $ | 139,564,713 | |||
|
| ||||
Net Assets consisted of: | |||||
Capital stock, $0.01 par value | $ | 119,268 | |||
Paid-in capital | 120,530,032 | ||||
Total distributable earnings | 18,915,413 | ||||
|
| ||||
Net Assets | $ | 139,564,713 | |||
|
|
Class A: | |||||
Net asset value, redemption price per share | $ | 11.75 | |||
|
| ||||
Maximum offering price per share (100/94.5 of $11.75) | $ | 12.43 | |||
|
| ||||
Class C: | |||||
Net asset value, offering and redemption price per share | $ | 11.52 | |||
|
| ||||
Institutional Class: | |||||
Net asset value, offering and redemption price per share | $ | 11.73 | |||
|
|
The accompanying notes are an integral part of the financial statements.
20
EIC VALUE FUND
Statement of Operations
For the Year Ended April 30, 2020
Investment income | ||||
Dividends | $ | 5,541,611 | ||
Less: foreign taxes withheld | (78,831 | ) | ||
|
| |||
Total investment income | 5,462,780 | |||
|
| |||
Expenses | ||||
Advisory fees (Note 2) | 1,455,487 | |||
Distribution fees (Class C) (Note 2) | 173,867 | |||
Transfer agent fees (Note 2) | 137,931 | |||
Administration and accounting fees (Note 2) | 112,969 | |||
Shareholder servicing fees (Class C) (Note 2) | 57,956 | |||
Trustees’ and officers’ fees | 54,844 | |||
Registration and filing fees | 52,058 | |||
Distribution fees (Class A) (Note 2) | 30,949 | |||
Audit fees | 30,806 | |||
Custodian fees (Note 2) | 23,441 | |||
Legal fees | 22,170 | |||
Printing and shareholder reporting fees | 19,971 | |||
Other expenses | 15,303 | |||
|
| |||
Total expenses | 2,187,752 | |||
|
| |||
Less: waivers and reimbursements (Note 2) | (178,396 | ) | ||
|
| |||
Net expenses after waivers and reimbursements | 2,009,356 | |||
|
| |||
Net investment income. | 3,453,424 | |||
|
| |||
Net realized and unrealized gain/(loss) from investments: | ||||
Net realized gain from investments | 5,602,295 | |||
Net change in unrealized appreciation/(depreciation) from investments | (26,646,296 | ) | ||
|
| |||
Net realized and unrealized loss from investments | (21,044,001 | ) | ||
|
| |||
Net decrease in net assets resulting from operations | $ | (17,590,577 | ) | |
|
|
The accompanying notes are an integral part of the financial statements.
21
EIC VALUE FUND
Statements of Changes in Net Assets
| For the Year Ended April 30, 2020 | For the Year Ended April 30, 2019 | |||||||
Increase/(decrease) in net assets from operations: | ||||||||
Net investment income | $ | 3,453,424 | $ | 3,543,641 | ||||
Net realized gain from investments | 5,602,295 | 15,100,484 | ||||||
Net change in unrealized appreciation/(depreciation) from investments | (26,646,296 | ) | (5,445,416 | ) | ||||
|
|
|
| |||||
Net increase/(decrease) in net assets resulting from operations | (17,590,577 | ) | 13,198,709 | |||||
|
|
|
| |||||
Less dividends and distributions to shareholders from: | ||||||||
Total distributable earnings | ||||||||
Class A | (895,393 | ) | (1,467,856 | ) | ||||
Class C | (1,543,147 | ) | (2,431,876 | ) | ||||
Institutional Class | (12,414,744 | ) | (16,589,140 | ) | ||||
|
|
|
| |||||
Net decrease in net assets from dividends and distributions to shareholders | (14,853,284 | ) | (20,488,872 | ) | ||||
|
|
|
| |||||
Decrease in net assets derived from capital share transactions (Note 4) | (43,885,547 | ) | (20,476,467 | ) | ||||
|
|
|
| |||||
Total decrease in net assets | (76,329,408 | ) | (27,766,630 | ) | ||||
|
|
|
| |||||
Net assets | ||||||||
Beginning of year | 215,894,121 | 243,660,751 | ||||||
|
|
|
| |||||
End of year | $ | 139,564,713 | $ | 215,894,121 | ||||
|
|
|
| |||||
The accompanying notes are an integral part of the financial statements.
22
EIC VALUE FUND
Financial Highlights
Contained below is per share operating performance data for Class A shares outstanding, total investment return, ratios to average net assets and other supplemental data for the respective period. The total returns in the table represent the rate that an investor would have earned or lost on an investment in the Fund (assuming reinvestment of all dividends and distributions). This information has been derived from information provided in the financial statements and should be read in conjunction with the financial statements and the notes thereto.
| Class A | ||||||||||||||||||||
| For the Year Ended April 30, 2020 | For the Year Ended April 30, 2019 | For the Year Ended April 30, 2018 | For the Year Ended April 30, 2017 | For the Year Ended April 30, 2016 | ||||||||||||||||
Per Share Operating Performance | ||||||||||||||||||||
Net asset value, beginning of year | $ | 13.98 | $ | 14.33 | $ | 14.22 | $ | 13.02 | $ | 13.91 | ||||||||||
|
|
|
|
|
|
|
|
|
| |||||||||||
Net investment income(1) | 0.23 | 0.21 | 0.17 | 0.13 | 0.11 | |||||||||||||||
Net realized and unrealized gain/(loss) on investments | (1.42 | ) | 0.68 | 1.15 | 1.32 | (0.60 | ) | |||||||||||||
|
|
|
|
|
|
|
|
|
| |||||||||||
Net increase/(decrease) in net assets resulting from operations | (1.19 | ) | 0.89 | 1.32 | 1.45 | (0.49 | ) | |||||||||||||
|
|
|
|
|
|
|
|
|
| |||||||||||
Dividends and distributions to shareholders from: | ||||||||||||||||||||
Net investment income | (0.21 | ) | (0.16 | ) | (0.15 | ) | (0.11 | ) | (0.14 | ) | ||||||||||
Net realized capital gains | (0.83 | ) | (1.08 | ) | (1.06 | ) | (0.14 | ) | (0.26 | ) | ||||||||||
|
|
|
|
|
|
|
|
|
| |||||||||||
Total dividends and distributions to shareholders | (1.04 | ) | (1.24 | ) | (1.21 | ) | (0.25 | ) | (0.40 | ) | ||||||||||
|
|
|
|
|
|
|
|
|
| |||||||||||
Redemption fees | 0.00 | (2) | 0.00 | (2) | 0.00 | (2) | — | 0.00 | (2) | |||||||||||
|
|
|
|
|
|
|
|
|
| |||||||||||
Net asset value, end of year | $ | 11.75 | $ | 13.98 | $ | 14.33 | $ | 14.22 | $ | 13.02 | ||||||||||
|
|
|
|
|
|
|
|
|
| |||||||||||
Total investment return(3) | (9.54 | )% | 6.86 | % | 9.45 | % | 11.13 | % | (3.44 | )% | ||||||||||
Ratios/Supplemental Data | ||||||||||||||||||||
Net assets, end of year (in thousands) | $ | 8,347 | $ | 15,019 | $ | 47,274 | $ | 52,845 | $ | 65,882 | ||||||||||
Ratio of expenses to average net assets | 1.15 | % | 1.18 | % | 1.24 | % | 1.20 | % | 1.25 | % | ||||||||||
Ratio of expenses to average net assets without waivers, expense reimbursements, and/or recoupments, if any | 1.24 | %(4) | 1.23 | %(4) | 1.24 | % | 1.20 | % | 1.21 | %(4) | ||||||||||
Ratio of net investment income to average net assets | 1.67 | % | 1.47 | % | 1.16 | % | 0.98 | % | 0.85 | % | ||||||||||
Portfolio turnover rate | 36 | % | 42 | % | 33 | % | 29 | % | 34 | % | ||||||||||
| (1) | The selected per share data was calculated using the average shares outstanding method for the year. |
| (2) | Amount is less than $0.005 per share. |
| (3) | Total investment return is calculated assuming a purchase of shares on the first day and a sale of shares on the last day of each period reported and includes reinvestment of dividends and distributions, if any. Total investment return does not reflect the impact of the maximum front-end sales load of 5.50%. If reflected, the return would be lower. |
| (4) | During the period, certain fees were waived, reimbursed, and/or recouped. If such fee waivers, reimbursements, and/or recoupments had not occurred, the ratios would have been as indicated (See Note 2). |
The accompanying notes are an integral part of the financial statements.
22
EIC VALUE FUND
Financial Highlights
Contained below is per share operating performance data for Class C shares outstanding, total investment return, ratios to average net assets and other supplemental data for the respective period. The total returns in the table represent the rate that an investor would have earned or lost on an investment in the Fund (assuming reinvestment of all dividends and distributions). This information has been derived from information provided in the financial statements and should be read in conjunction with the financial statements and the notes thereto.
| Class C | ||||||||||||||||||||
| For the Year Ended April 30, 2020 | For the Year Ended April 30, 2019 | For the Year Ended April 30, 2018 | For the Year Ended April 30, 2017 | For the Year Ended April 30, 2016 | ||||||||||||||||
Per Share Operating Performance | ||||||||||||||||||||
Net asset value, beginning of year | $ | 13.73 | $ | 14.12 | $ | 14.06 | $ | 12.87 | $ | 13.75 | ||||||||||
|
|
|
|
|
|
|
|
|
| |||||||||||
Net investment income(1) | 0.12 | 0.10 | 0.06 | 0.03 | 0.01 | |||||||||||||||
Net realized and unrealized gain/(loss) on investments | (1.41 | ) | 0.67 | 1.13 | 1.30 | (0.60 | ) | |||||||||||||
|
|
|
|
|
|
|
|
|
| |||||||||||
Net increase/(decrease) in net assets resulting from operations | (1.29 | ) | 0.77 | 1.19 | 1.33 | (0.59 | ) | |||||||||||||
|
|
|
|
|
|
|
|
|
| |||||||||||
Dividends and distributions to shareholders from: | ||||||||||||||||||||
Net investment income | (0.09 | ) | (0.08 | ) | (0.07 | ) | (0.00 | )(2) | (0.03 | ) | ||||||||||
Net realized capital gains | (0.83 | ) | (1.08 | ) | (1.06 | ) | (0.14 | ) | (0.26 | ) | ||||||||||
|
|
|
|
|
|
|
|
|
| |||||||||||
Total dividends and distributions to shareholders | (0.92 | ) | (1.16 | ) | (1.13 | ) | (0.14 | ) | (0.29 | ) | ||||||||||
|
|
|
|
|
|
|
|
|
| |||||||||||
Redemption fees | 0.00 | (2) | 0.00 | (2) | 0.00 | (2) | — | 0.00 | (2) | |||||||||||
|
|
|
|
|
|
|
|
|
| |||||||||||
Net asset value, end of year | $ | 11.52 | $ | 13.73 | $ | 14.12 | $ | 14.06 | $ | 12.87 | ||||||||||
|
|
|
|
|
|
|
|
|
| |||||||||||
Total investment return(3) | (10.30 | )% | 6.05 | % | 8.63 | % | 10.35 | % | (4.17 | )% | ||||||||||
Ratios/Supplemental Data | ||||||||||||||||||||
Net assets, end of year (in thousands) | $ | 17,926 | $ | 27,407 | $ | 35,488 | $ | 45,071 | $ | 51,146 | ||||||||||
Ratio of expenses to average net assets | 1.90 | % | 1.93 | % | 1.99 | % | 1.95 | % | 2.00 | % | ||||||||||
Ratio of expenses to average net assets without waivers, expense reimbursements, and/or recoupments, if any | 1.99 | %(4) | 1.98 | %(4) | 1.99 | % | 1.95 | % | 1.96 | %(4) | ||||||||||
Ratio of net investment income to average net assets | 0.92 | % | 0.71 | % | 0.41 | % | 0.23 | % | 0.10 | % | ||||||||||
Portfolio turnover rate | 36 | % | 42 | % | 33 | % | 29 | % | 34 | % | ||||||||||
| (1) | The selected per share data was calculated using the average shares outstanding method for the year. |
| (2) | Amount is less than $0.005 per share. |
| (3) | Total investment return is calculated assuming a purchase of shares on the first day and a sale of shares on the last day of each period reported and includes reinvestments of dividends and distributions, if any. Total investment return does not reflect any applicable sales charge. |
| (4) | During the period, certain fees were waived, reimbursed, and/or recouped. If such fee waivers, reimbursements, and/or recoupments had not occurred, the ratios would have been as indicated (See Note 2). |
The accompanying notes are an integral part of the financial statements.
24
EIC VALUE FUND
Financial Highlights
Contained below is per share operating performance data for Institutional Class shares outstanding, total investment return, ratios to average net assets and other supplemental data for the respective period. The total returns in the table represent the rate that an investor would have earned or lost on an investment in the Fund (assuming reinvestment of all dividends and distributions). This information has been derived from information provided in the financial statements and should be read in conjunction with the financial statements and the notes thereto.
| Institutional Class | ||||||||||||||||||||
| For the Year Ended April 30, 2020 | For the Year Ended April 30, 2019 | For the Year Ended April 30, 2018 | For the Year Ended April 30, 2017 | For the Year Ended April 30, 2016 | ||||||||||||||||
Per Share Operating Performance | ||||||||||||||||||||
Net asset value, beginning of year | $ | 13.97 | $ | 14.37 | $ | 14.26 | $ | 13.06 | $ | 13.95 | ||||||||||
|
|
|
|
|
|
|
|
|
| |||||||||||
Net investment income(1) | 0.26 | 0.24 | 0.21 | 0.17 | 0.14 | |||||||||||||||
Net realized and unrealized gain/(loss) on investments | (1.42 | ) | 0.69 | 1.14 | 1.32 | (0.60 | ) | |||||||||||||
|
|
|
|
|
|
|
|
|
| |||||||||||
Net increase/(decrease) in net assets resulting from operations | (1.16 | ) | 0.93 | 1.35 | 1.49 | (0.46 | ) | |||||||||||||
|
|
|
|
|
|
|
|
|
| |||||||||||
Dividends and distributions to shareholders from: | ||||||||||||||||||||
Net investment income | (0.25 | ) | (0.25 | ) | (0.18 | ) | (0.15 | ) | (0.17 | ) | ||||||||||
Net realized capital gains | (0.83 | ) | (1.08 | ) | (1.06 | ) | (0.14 | ) | (0.26 | ) | ||||||||||
|
|
|
|
|
|
|
|
|
| |||||||||||
Total dividends and distributions to shareholders | (1.08 | ) | (1.33 | ) | (1.24 | ) | (0.29 | ) | (0.43 | ) | ||||||||||
|
|
|
|
|
|
|
|
|
| |||||||||||
Redemption fees | 0.00 | (2) | 0.00 | (2) | 0.00 | (2) | — | 0.00 | (2) | |||||||||||
|
|
|
|
|
|
|
|
|
| |||||||||||
Net asset value, end of year | $ | 11.73 | $ | 13.97 | $ | 14.37 | $ | 14.26 | $ | 13.06 | ||||||||||
|
|
|
|
|
|
|
|
|
| |||||||||||
Total investment return(3) | (9.36 | )% | 7.16 | % | 9.70 | % | 11.40 | % | (3.15 | )% | ||||||||||
Ratios/Supplemental Data | ||||||||||||||||||||
Net assets, end of year (in thousands) | $ | 113,292 | $ | 173,468 | $ | 160,899 | $ | 171,105 | $ | 196,785 | ||||||||||
Ratio of expenses to average net assets | 0.90 | % | 0.93 | % | 0.99 | % | 0.96 | % | 1.00 | % | ||||||||||
Ratio of expenses to average net assets without waivers, expense reimbursements, and/or recoupments, if any | 0.99 | %(4) | 0.99 | %(4) | 0.99 | % | 0.96 | % | 0.96 | %(4) | ||||||||||
Ratio of net investment income to average net assets | 1.91 | % | 1.72 | % | 1.41 | % | 1.23 | % | 1.10 | % | ||||||||||
Portfolio turnover rate | 36 | % | 42 | % | 33 | % | 29 | % | 34 | % | ||||||||||
| (1) | The selected per share data was calculated using the average shares outstanding method for the year. |
| (2) | Amount is less than $0.005 per share. |
| (3) | Total investment return is calculated assuming a purchase of shares on the first day and a sale of shares on the last day of each period reported and includes reinvestment of dividends and distributions, if any. |
| (4) | During the period, certain fees were waived, reimbursed, and/or recouped. If such fee waivers, reimbursements, and/or recoupments had not occurred, the ratios would have been as indicated (See Note 2). |
The accompanying notes are an integral part of the financial statements.
25
EIC VALUE FUND
Notes to Financial Statements
April 30, 2020
1. Organization and Significant Accounting Policies
The EIC Value Fund (the “Fund”) is a diversified, open-end management investment company registered under the Investment Company Act of 1940, as amended (the “1940 Act”), which commenced operations on May 1, 2011. The Fund is a separate series of FundVantage Trust (the “Trust”) which was organized as a Delaware statutory trust on August 28, 2006. The Trust is a “series trust” authorized to issue an unlimited number of separate series or classes of shares of beneficial interest. Each series is treated as a separate entity for certain matters under the 1940 Act, and for other purposes, and a shareholder of one series is not deemed to be a shareholder of any other series. The Fund offers separate classes of shares: Class A, Class C, Institutional Class and Retail Class shares. Class A shares are sold subject to a front-end sales charge of 5.50%. Front-end sales charges may be reduced or waived under certain circumstances. A contingent deferred sales charge (“CDSC”) may be applicable to the redemption of Class A shares. A CDSC, as a percentage of the lower of the original purchase price or net asset value at redemption, of up to 1.00% may be imposed on full or partial redemptions of Class A shares made within eighteen months of purchase where: (i) $1 million or more of Class A shares were purchased without an initial sales charge, and (ii) the Fund’s principal underwriter, Foreside Funds Distributors LLC (the “Underwriter”), paid a commission to the selling broker-dealer for such sale. A CDSC of up to 1.00% is assessed on redemptions of Class C Shares made within eighteen months after a purchase where the broker-dealer was paid a commission for such sale. As of April 30, 2020, the Retail Class Shares have not been issued.
The Fund is an investment company and follows accounting and reporting guidance in the Financial Accounting Standards Board Accounting Standards Codification Topic 946.
Portfolio Valuation — The Fund’s net asset value (“NAV”) is calculated once daily at the close of regular trading hours on the New York Stock Exchange (“NYSE”) (typically 4:00 p.m. Eastern time) on each day the NYSE is open. Securities held by the Fund are valued using the closing price or the last sale price on a national securities exchange or the National Association of Securities Dealers Automatic Quotation System (“NASDAQ”) market system where they are primarily traded. Equity securities traded in the over-the-counter market are valued at their closing prices. If there were no transactions on that day, securities traded principally on an exchange or on NASDAQ will be valued at the mean of the last bid and ask prices prior to the market close. Investments in other open-end investment companies are valued based on the NAV of the investment companies (which may use fair value pricing as discussed in their prospectuses). If market quotations are unavailable or deemed unreliable, securities will be valued in accordance with procedures adopted by the Trust’s Board of Trustees (“Board of Trustees”). Relying on prices supplied by pricing services or dealers or using fair valuation may result in values that are higher or lower than the values used by other investment companies and investors to price the same investments. In the event that market quotes are not readily available, and the security or asset cannot be valued pursuant to one of the valuation methods, the value of the security or asset will be determined
26
EIC VALUE FUND
Notes to Financial Statements (Continued)
April 30, 2020
in good faith by the Adviser. The Trust has established a Valuation Committee which performs certain functions including the oversight of the Adviser’s fair valuation determinations.
Fair Value Measurements — The inputs and valuation techniques used to measure fair value of the Fund’s investments are summarized into three levels as described in the hierarchy below:
● Level 1 | — | quoted prices in active markets for identical securities; | ||
● Level 2 | — | other significant observable inputs (including quoted prices for similar securities, interest rates, prepayment speeds, credit risk, etc.); and | ||
● Level 3 | — | significant unobservable inputs (including the Fund’s own assumptions in determining the fair value of investments). | ||
The inputs or methodology used for valuing securities are not necessarily an indication of the risk associated with investing in those securities.
The following is a summary of the inputs used, as of April 30, 2020, in valuing the Fund’s investments carried at fair value:
| Total Value at 04/30/20 | Level 1 Quoted Prices | Level 2 Other Significant Observable Inputs | Level 3 Significant Unobservable Inputs | |||||||||||||
Common Stocks* | $ | 133,694,784 | $ | 133,694,784 | $ | — | $ | — | ||||||||
Short-Term Investments* | 6,907,908 | 6,907,908 | — | — | ||||||||||||
|
|
|
|
|
|
|
| |||||||||
Total Investments | $ | 140,602,692 | $ | 140,602,692 | $ | — | $ | — | ||||||||
|
|
|
|
|
|
|
| |||||||||
| * | Please refer to Portfolio of Investments for further details on portfolio holdings. |
At the end of each quarter, management evaluates the classification of Levels 1, 2 and 3 assets and liabilities. Various factors are considered, such as changes in liquidity from the prior reporting period; whether or not a broker is willing to execute at the quoted price; the depth and consistency of prices from third party pricing services; and the existence of contemporaneous, observable trades in the market. Additionally, management evaluates the classification of Level 1 and Level 2 assets and liabilities on a quarterly basis for changes in listings or delistings on national exchanges.
Due to the inherent uncertainty of determining the fair value of investments that do not have a readily available market value, the fair value of the Fund’s investments may fluctuate from period to period. Additionally, the fair value of investments may differ significantly from the values that would have been used had a ready market existed for such investments and may differ materially from the values the Fund
27
EIC VALUE FUND
Notes to Financial Statements (Continued)
April 30, 2020
may ultimately realize. Further, such investments may be subject to legal and other restrictions on resale or are otherwise less liquid than publicly traded securities.
For fair valuations using significant unobservable inputs, U.S. generally accepted accounting principles (“U.S. GAAP”) require the Fund to present a reconciliation of the beginning to ending balances for reported market values that present changes attributable to total realized and unrealized gains or losses, purchase and sales, and transfers in and out of Level 3 during the period. A reconciliation of Level 3 investments is presented only when the Fund had an amount of Level 3 investments at the end of the reporting period that was meaningful in relation to its net assets. The amounts and reasons for all transfers in and out of each Level within the three-tier hierarchy are disclosed when the Fund had an amount of total transfers during the reporting period that was meaningful in relation to its net assets as of the end of the reporting period.
For the year ended April 30, 2020, there were no transfers in or out of Level 3.
Use of Estimates — The preparation of financial statements in conformity with U.S. GAAP requires management to make estimates and assumptions that affect the amounts reported in the financial statements and accompanying notes at the date of the financial statements and the reported amounts of revenues and expenses during the period. Actual results could differ from those estimates and those differences could be material.
Investment Transactions, Investment Income and Expenses — Investment transactions are recorded on trade date for financial statement preparation purposes. Realized gains and losses on investments sold are recorded on the identified cost basis. Interest income is recorded on the accrual basis. Dividends are recorded on the ex-dividend date. Estimated components of distributions received from real estate investment trusts may be considered income, return of capital distributions or capital gain distributions. Return of capital distributions are recorded as a reduction of cost of the related investments. Distribution (12b-1) fees and shareholder services fees relating to a specific class are charged directly to that class. Fund level expenses common to all classes, investment income and realized and unrealized gains and losses on investments are allocated to each class based upon relative daily net assets of each class. General expenses of the Trust are generally allocated to each fund in proportion to its relative daily net assets. Expenses directly attributable to a particular fund in the Trust are charged directly to that fund.
Dividends and Distributions to Shareholders — Dividends from net investment income and distributions from net realized capital gains, if any, are declared, recorded on ex-date and paid at least annually to shareholders. Income dividends and capital gain distributions are determined in accordance with U.S. federal income tax regulations, which may differ from U.S. GAAP.
U.S. Tax Status — No provision is made for U.S. income taxes as it is the Fund’s intention to continue to qualify for and elect the tax treatment applicable to regulated investment companies under Subchapter
28
EIC VALUE FUND
Notes to Financial Statements (Continued)
April 30, 2020
M of the Internal Revenue Code of 1986, as amended (the “Internal Revenue Code”), and make the requisite distributions to its shareholders which will be sufficient to relieve it from U.S. income and excise taxes.
Other — In the normal course of business, the Fund may enter into contracts that provide general indemnifications. The Fund’s maximum exposure under these arrangements is dependent on claims that may be made against the Fund in the future, and therefore, cannot be estimated; however, based on experience, the risk of material loss for such claims is considered remote.
Market disruptions associated with the COVID-19 pandemic have had a global impact, and uncertainty exists as to its long-term implications. The COVID-19 pandemic could adversely affect the value and liquidity of the Fund’s investments, impair the Fund’s ability to satisfy redemption requests, and negatively impact the Fund’s performance. In addition, the outbreak of COVID-19, and measures taken to mitigate its effects, could result in disruptions to the services provided to the Fund by its service providers. Fund management is continuing to monitor this development and evaluate its impact on the Fund.
2. Transactions with Related Parties and Other Service Providers
Equity Investment Corporation (“EIC” or the “Adviser”) serves as investment adviser to the Fund pursuant to an investment advisory agreement with the Trust (the “Advisory Agreement”). For its services, the Adviser is paid a monthly fee at the annual rate of 0.75% of the Fund’s average daily net assets under $500 million; 0.65% of the Fund’s average daily net assets of $500 million or more but less than $1 billion; and 0.50% of the Fund’s average daily net assets of $1 billion and over. The Adviser has contractually agreed to waive or otherwise reduce its annual compensation received from the Fund to the extent necessary to ensure that the Fund’s “Total Annual Fund Operating Expenses”, excluding taxes, fees and expenses attributable to a distribution or service plan adopted by the Trust, “Acquired Fund Fees and Expenses,” interest, extraordinary items and brokerage commissions, do not exceed 0.90% of average daily net assets of the Fund (the “Expense Limitation”). The Expense Limitation will remain in place until August 31, 2020, unless the Board of Trustees approves its earlier termination. Subject to approval by the Board of Trustees, the Adviser may recoup any expenses or fees it has reimbursed within a three-year period from the date on which the Adviser reduced its compensation and/or assumed expenses of the Fund. The Adviser is permitted to seek reimbursement from the Fund, subject to certain limitations, for fees it waived and Fund expenses it paid to the extent the total annual fund operating expenses do not exceed the limits described above or any lesser limits in effect at the time of reimbursement. No recoupment will occur unless the Fund’s expenses are below the Expense Limitation amount.
29
EIC VALUE FUND
Notes to Financial Statements (Continued)
April 30, 2020
As of April 30, 2020, the amount of potential recovery was as follows:
| Expiration | ||||
4/30/2022 |
4/30/2023 |
Total | ||
$118,185 | $178,396 | $296,581 | ||
For the year ended April 30, 2020, the Adviser earned advisory fees of $1,455,487 and waived fees of $178,396.
Other Service Providers
The Bank of New York Mellon (“BNY Mellon”) serves as administrator and custodian for the Fund. For providing administrative and accounting services, BNY Mellon is entitled to receive a monthly fee equal to an annual percentage rate of the Fund’s average daily net assets and is subject to certain minimum monthly fees. For providing certain custodial services, BNY Mellon is entitled to receive a monthly fee, subject to certain minimum, and out of pocket expenses.
BNY Mellon Investment Servicing (US) Inc. (the “Transfer Agent”) provides transfer agent services to the Fund. The Transfer Agent is entitled to receive a monthly fee, subject to certain minimum, and out of pocket expenses.
The Trust, on behalf of the Fund, has entered into agreements with financial intermediaries to provide recordkeeping, processing, shareholder communications and other services to customers of the intermediaries investing in the Fund and have agreed to compensate the intermediaries for providing those services. The fees incurred by the Fund for these services are included in Transfer agent fees in the Statement of Operations.
Foreside Funds Distributors LLC (the “Underwriter”) provides principal underwriting services to the Fund pursuant to an underwriting agreement between the Trust and the Underwriter.
The Trust and the Underwriter are parties to an underwriting agreement. The Trust has adopted a distribution plan for Class A and Class C shares in accordance with Rule 12b-1 under the 1940 Act. Pursuant to the Class A and Class C shares plan, the Fund compensates the Underwriter for direct and indirect costs and expenses incurred in connection with advertising, marketing and other distribution services in an amount not to exceed 0.25% and 1.00% (0.75% Rule 12b-1 distribution fee and 0.25% shareholder service fee) on an annualized basis of the average daily net assets of the Fund’s Class A and Class C shares, respectively.
30
EIC VALUE FUND
Notes to Financial Statements (Continued)
April 30, 2020
Trustees and Officers
The Trust is governed by its Board of Trustees. The Trustees receive compensation in the form of an annual retainer and per meeting fees for their services to the Trust. An employee of BNY Mellon serves as the Secretary of the Trust and is not compensated by the Fund or the Trust.
JW Fund Management LLC (“JWFM”) provides a Principal Executive Officer and Principal Financial Officer, respectively, to the Trust. Duff & Phelps, LLC (“D&P”) provides the Trust with a Chief Compliance Officer and an Anti-Money Laundering Officer. JWFM and D&P are compensated for their services provided to the Trust.
3. Investment in Securities
For the year ended April 30, 2020, aggregate purchases and sales of investment securities (excluding short-term investments) of the Fund were as follows:
| Purchases | Sales | |||||||||
Investment Securities | $ | 64,576,686 | $ | 111,310,219 | ||||||
4. Capital Share Transactions
For the years ended April 30, 2020 and 2019, transactions in capital shares (authorized shares unlimited) were as follows:
| For the Year Ended April 30, 2020 | For the Year Ended April 30, 2019 | |||||||||||||||
| Shares | Amount | Shares | Amount | |||||||||||||
Class A | ||||||||||||||||
Sales | 16,403 | $ | 216,555 | 107,434 | $ | 1,538,913 | ||||||||||
Reinvestments | 61,064 | 826,809 | 89,030 | 1,155,614 | ||||||||||||
Redemption Fees* | — | 156 | — | 351 | ||||||||||||
Redemptions | (440,971 | ) | (5,754,321 | ) | (2,420,969 | ) | (35,638,291 | ) | ||||||||
|
|
|
|
|
|
|
| |||||||||
Net decrease | (363,504 | ) | $ | (4,710,801 | ) | (2,224,505 | ) | $ | (32,943,413 | ) | ||||||
|
|
|
|
|
|
|
| |||||||||
Class C | ||||||||||||||||
Sales | 48,732 | $ | 653,407 | 69,363 | $ | 977,102 | ||||||||||
Reinvestments | 110,817 | 1,476,081 | 180,955 | 2,312,609 | ||||||||||||
Redemption Fees* | — | 312 | — | 565 | ||||||||||||
Redemptions | (600,283 | ) | (7,793,106 | ) | (767,907 | ) | (10,657,230 | ) | ||||||||
|
|
|
|
|
|
|
| |||||||||
Net decrease | (440,734 | ) | $ | (5,663,306 | ) | (517,589 | ) | $ | (7,366,954 | ) | ||||||
|
|
|
|
|
|
|
| |||||||||
31
EIC VALUE FUND
Notes to Financial Statements (Continued)
April 30, 2020
| For the Year Ended April 30, 2020 | For the Year Ended April 30, 2019 | |||||||||||||||
| Shares | Amount | Shares | Amount | |||||||||||||
Institutional Class | ||||||||||||||||
Sales | 1,218,237 | $ | 16,025,747 | 4,091,856 | $ | 58,852,083 | ||||||||||
Reinvestments | 898,253 | 12,126,430 | 1,258,074 | 16,292,060 | ||||||||||||
Redemption Fees* | — | 2,094 | — | 3,288 | ||||||||||||
Redemptions | (4,875,860 | ) | (61,665,711 | ) | (4,125,916 | ) | (55,313,531 | ) | ||||||||
|
|
|
|
|
|
|
| |||||||||
Net increase/(decrease) | (2,759,370 | ) | $ | (33,511,440 | ) | 1,224,014 | $ | 19,833,900 | ||||||||
|
|
|
|
|
|
|
| |||||||||
Total Net Decrease | (3,563,608 | ) | $ | (43,885,547 | ) | (1,518,080 | ) | $ | (20,476,467 | ) | ||||||
|
|
|
|
|
|
|
| |||||||||
| * | There is a 2.00% redemption fee that may be charged on shares redeemed which have been held for 30 days or less. The redemption fees are retained by the Fund for the benefit of the remaining shareholders and recorded as paid-in-capital. |
5. Federal Tax Information
The Fund has followed the authoritative guidance on accounting for and disclosure of uncertainty in tax positions, which requires the Fund to determine whether a tax position is more likely than not to be sustained upon examination, including resolution of any related appeals or litigation processes, based on the technical merits of the position. The Fund has determined that there was no effect on the financial statements from following this authoritative guidance. In the normal course of business, the Fund is subject to examination by federal, state and local jurisdictions, where applicable, for tax years for which applicable statutes of limitations have not expired.
Distributions are determined in accordance with federal income tax regulations, which may differ in amount or character from net investment income and realized gains for financial reporting purposes. Accordingly, the character of distributions and composition of net assets for tax purposes may differ from those reflected in the accompanying financial statements. To the extent these differences are permanent, such amounts are reclassified within the components of net assets based on the tax treatment; temporary differences do not require reclassifications. For the year ended April 30, 2020, these adjustments were to increase paid-in capital by $345,342 and decrease total distributable earnings by $345,342. These permanent differences were primarily attributable to the utilization of earnings and profits on shareholder redemptions (a tax accounting practice known as equalization). Net investment income, net realized gains and net assets were not affected by these adjustments.
For the year ended April 30, 2020, the tax character of distributions paid by the Fund was $3,190,381 of ordinary income dividends and $11,662,903 of long-term capital gains dividends. For the year ended April 30, 2019, the tax character of distributions paid by the fund was $3,467,250 of ordinary income dividends and $17,021,622 of long-term capital gains dividends. Distributions from net investment income and short-term gains are treated as ordinary income for federal income tax purposes.
32
EIC VALUE FUND
Notes to Financial Statements (Concluded)
April 30, 2020
As of April 30, 2020, the components of distributable earnings on a tax basis were as follows:
Undistributed Ordinary Income | Net Unrealized Appreciation | Qualified Late-Year Losses | Total Distributable Earnings | |||
$738,614 | $18,293,542 | $(116,743) | $18,915,413 |
The differences between the book and tax basis components of distributable earnings relate primarily to the timing and recognition of income and gains for federal income tax purposes.
As of April 30, 2020, the federal tax cost, aggregate gross unrealized appreciation and depreciation of securities held by the Fund were as follows:
| Federal tax cost | $ | 122,309,150 | |||||
|
| |||||||
Gross unrealized appreciation | $ | 24,914,087 | ||||||
Gross unrealized depreciation | (6,620,545 | ) | ||||||
|
| |||||||
Net unrealized appreciation | $ | 18,293,542 | ||||||
|
|
Pursuant to federal income tax rules applicable to regulated investment companies, the Fund may elect to treat certain capital losses between November 1 and April 30 and late year ordinary losses ((i) ordinary losses between January 1 and April 30, and (ii) specified ordinary and currency losses between November 1 and April 30) as occurring on the first day of the following tax year. For the year ended April 30, 2020, any amount of losses elected within the tax return will not be recognized for federal income tax purposes until May 1, 2020. For the year ended April 30, 2020, the Fund had short-term capital loss deferrals of $5,727,692 and long-term capital gain deferrals of $5,610,949.
Accumulated capital losses represent net capital loss carry forwards as of April 30, 2020 that may be available to offset future realized capital gains and thereby reduce future capital gains distributions. As of April 30, 2020, the Fund did not have any capital loss carryforwards.
6. Subsequent Events
Management has evaluated the impact of all subsequent events on the Fund through the date the financial statements were issued, and has determined that there are no subsequent events requiring recognition or disclosure in the financial statements.
33
EIC VALUE FUND
Report of Independent Registered Public Accounting Firm
To the Board of Trustees of FundVantage Trust and
Shareholders of EIC Value Fund
Opinion on the Financial Statements
We have audited the accompanying statement of assets and liabilities of EIC Value Fund (the “Fund”) (one of the series constituting FundVantage Trust (the “Trust”)), including the portfolio of investments, as of April 30, 2020, and the related statement of operations for the year then ended, the statements of changes in net assets for each of the two years in the period then ended, the financial highlights for each of the five years in the period then ended and the related notes (collectively referred to as the “financial statements”). In our opinion, the financial statements present fairly, in all material respects, the financial position of the Fund (one of the series constituting FundVantage Trust) at April 30, 2020, the results of its operations for the year then ended, the changes in its net assets for each of the two years in the period then ended and its financial highlights for each of the five years in the period then ended, in conformity with U.S. generally accepted accounting principles.
Basis for Opinion
These financial statements are the responsibility of the Trust’s management. Our responsibility is to express an opinion on the Fund’s financial statements based on our audits. We are a public accounting firm registered with the Public Company Accounting Oversight Board (United States) (“PCAOB”) and are required to be independent with respect to the Trust in accordance with the U.S. federal securities laws and the applicable rules and regulations of the Securities and Exchange Commission and the PCAOB.
We conducted our audits in accordance with the standards of the PCAOB. Those standards require that we plan and perform the audit to obtain reasonable assurance about whether the financial statements are free of material misstatement, whether due to error or fraud. The Trust is not required to have, nor were we engaged to perform, an audit of the Trust’s internal control over financial reporting. As part of our audits we are required to obtain an understanding of internal control over financial reporting but not for the purpose of expressing an opinion on the effectiveness of the Trust’s internal control over financial reporting. Accordingly, we express no such opinion.
Our audits included performing procedures to assess the risks of material misstatement of the financial statements, whether due to error or fraud, and performing procedures that respond to those risks. Such procedures included examining, on a test basis, evidence regarding the amounts and disclosures in the financial statements. Our procedures included confirmation of securities owned as of April 30, 2020, by correspondence with the custodian. Our audits also included evaluating the accounting principles used and significant estimates made by management, as well as evaluating the overall presentation of the financial statements. We believe that our audits provide a reasonable basis for our opinion.

We have served as the auditor of one or more Equity Investment Corporation investment companies since 2012.
Philadelphia, Pennsylvania
June 25, 2020
34
EIC VALUE FUND
Shareholder Tax Information
(Unaudited)
The Fund is required by Subchapter M of the Internal Revenue Code to advise its shareholders of the U.S. federal tax status of distributions received by the Fund’s shareholders in respect of such fiscal year. During the fiscal year ended April 30, 2020, the Fund paid $3,190,381 of ordinary income dividends and $11,662,903 of long-term capital gain dividends to its shareholders. Dividends from net investment income and short-term capital gains are treated as ordinary income dividends for federal income tax purposes.
The Fund designates 100.00% of the ordinary income distribution as qualified dividend income pursuant to the Jobs and Growth Tax Relief Reconciliation Act of 2003.
The percentage of ordinary income dividends qualifying for the corporate dividends received deduction is 100.00%.
The percentage of qualified interest income related dividends not subject to withholding tax for non-resident aliens and foreign corporations received is 4.06%.
The percentage of the ordinary income distribution paid by the EIC Value Fund during 2020 which was derived from U.S. Treasury securities was 0.26%. Such income is exempt from state and local tax in all states. However, many states, including New York and California, allow a tax exemption for a portion of the income earned only if a mutual fund has invested at least 50% of its assets at the end of each quarter of the Fund’s fiscal year in U.S. Government securities. The Fund did not meet this strict requirement in 2020. Due to the diversity in state and local tax law, it is recommended that you consult your personal tax adviser as to the applicability of the information provided to your specific situation.
All designations are based on financial information available as of the date of this annual report and, accordingly, are subject to change. For each item, it is the intention of the Fund to designate the maximum amount permitted under the Internal Revenue Code of 1986, as amended, and the regulations thereunder.
Because the Fund’s fiscal year is not the calendar year, another notification will be sent with respect to calendar year 2020. The second notification, which will reflect the amount, if any, to be used by calendar year taxpayers on their U.S. federal income tax returns, will be made in conjunction with Form 1099-DIV and will be mailed in January 2021.
Foreign shareholders will generally be subject to U.S. withholding tax on the amount of their ordinary income dividends. They will generally not be entitled to a foreign tax credit or deduction for the withholding taxes paid by the Fund, if any.
35
EIC VALUE FUND
Shareholder Tax Information
(Unaudited)
In general, dividends received by tax-exempt recipients (e.g., IRAs and Keoghs) need not be reported as taxable income for U.S. federal income tax purposes. However, some retirement trusts (e.g., corporate, Keogh and 403(b)(7) plans) may need this information for their annual information reporting.
Shareholders are advised to consult their own tax advisers with respect to the tax consequences of their investment in the Fund.
36
EIC VALUE FUND
Other Information
(Unaudited)
Proxy Voting
Policies and procedures that the Fund uses to determine how to vote proxies relating to portfolio securities as well as information regarding how the Fund voted proxies relating to portfolio securities for the most recent 12-month period ended June 30 are available without charge, upon request, by calling (855) 430-6487 and on the Securities and Exchange Commission’s (“SEC”) website at http:// www.sec.gov.
Quarterly Portfolio Schedules
The Trust files its complete schedule of portfolio holdings with the SEC for the first and third fiscal quarters of each fiscal year (quarters ended July 31 and January 31) as an exhibit to their reports on Form N-PORT on Form N-PORT. The Trust’s portfolio holdings on Form N-PORT are available on the SEC’s website at http://www.sec.gov.
Board Consideration of Investment Advisory Agreement
At an in-person meeting held on December 9-10, 2019 (the “Meeting”), the Board of Trustees (the “Board” or “Trustees”) of FundVantage Trust (the “Trust”), including a majority of the Trustees who are not “interested persons” within the meaning of Section 2(a)(19) of the Investment Company Act of 1940, as amended (the “1940 Act”) (the “Independent Trustees”) ,unanimously approved the continuation of the Investment Advisory Agreement (the “EIC Agreement”) between Equity Investment Corporation (“EIC” or the “Adviser”) and the Trust on behalf of the EIC Value Fund (the “EIC Fund”). At the Meeting, the Board considered the continuation of the EIC Agreement with respect to the EIC Fund for an additional one year period.
In determining whether to approve the EIC Agreement, the Trustees, including the Independent Trustees, considered information provided by EIC in response to a request for information in accordance with Section 15(c) of the 1940 Act (the “EIC 15(c) Response”) regarding: (i) services performed or to be performed by EIC for the EIC Fund, (ii) the size and qualifications of EIC’s portfolio management staff, (iii) any potential or actual material conflicts of interest that may arise in connection with a portfolio manager’s management of the EIC Fund, (iv) investment performance of the EIC Fund, (v) EIC’s financial condition, (vi) brokerage selection procedures(including soft dollar arrangements, if any), (vii) the procedures for allocating investment opportunities between the EIC Fund and other clients of EIC, (viii) results of any regulatory examination, including any recommendations or deficiencies noted, (ix) any litigation, investigation or administrative proceeding that may have a material impact on EIC’s ability to service the EIC Fund, (x) compliance with the EIC Fund’s investment objectives, policies and procedures (including codes of ethics and proxy voting policies) and compliance with federal securities laws and other regulatory requirements. The Trustees noted the reports and discussions with portfolio managers as provided at the Board meetings
37
EIC VALUE FUND
Other Information (Continued)
(Unaudited)
throughout the year covering matters such as the relative performance of the EIC Fund, compliance with the EIC Fund’s investment objectives, policies, strategies and limitations, the compliance of portfolio management personnel with the Trust’s code of ethics; and the adherence to the Trust’s pricing procedures as established by the Board.
The Trustees considered the services provided by EIC to the EIC Fund. The Trustees considered EIC’s personnel and the depth of EIC’s personnel who possess the experience to provide investment management services to the EIC Fund. Based on the EIC 15(c) Response, the Trustees concluded that (i) the nature, extent and quality of the services provided by EIC are appropriate and consistent with the terms of the EIC Agreement, (ii) that the quality of those services has been consistent with industry norms, (iii) the EIC Fund is likely to benefit from the continued provision of those services, (iv) EIC has sufficient personnel, with the appropriate education and experience, to serve the EIC Fund effectively and has demonstrated its continuing ability to attract and retain qualified personnel, and (v) the satisfactory nature, extent, and quality of services currently provided to the EIC Fund and its shareholders is likely to continue under the EIC Agreement.
The Board considered the overall investment performance of EIC and the EIC Fund. Although the Trustees gave consideration to performance reports and discussions with portfolio managers at Board meetings throughout the year, the Trustees gave significant weight to their review of investment performance presented in connection with the approval of the EIC Agreement at the Meeting. The Trustees considered the investment performance for the EIC Fund and EIC. The Trustees reviewed the historical performance of the EIC Fund as compared to the Lipper Large-Cap Value Funds Index (the “Lipper Index”), the Russell 3000 Value Total Return Index (the “Russell Index”), and the S&P 500 Total Return Index (the “S&P 500 Index”) for the year-to-date, one year, two year, three year, five year and since inception periods ended September 30, 2019.
The Trustees noted that the EIC Fund’s Institutional Class shares underperformed the Lipper Index, Russell Index and the S&P 500 Index for the year-to-date, three year, five year, and since inception periods ended September 30, 2019. The Trustees also noted that the EIC Fund’s Institutional Class shares out performed the Lipper Index and Russell Index, but underperformed the S&P Index, for the one year and two year periods ended September 30, 2019. The Trustees considered that, although the EIC Fund underperformed certain benchmarks during certain periods, that the EIC Fund performed in line with expectations given the parameters of the EIC Fund’s investment strategy and the macroeconomic environment.
The Board noted that EIC had provided information regarding its advisory fees and an analysis of these fees in relation to the delivery of services to the EIC Fund and any other ancillary benefit resulting from EIC’s relationship with the EIC Fund. The Trustees considered the fees that EIC charges to the EIC Fund as compared to the median fees charged to comparable funds with $250 million or less in assets (the “Lipper Peer Group”). The Board also evaluated the explanations provided by EIC as to differences in fees charged to the EIC Fund and EIC’s institutional clients.
38
EIC VALUE FUND
Other Information (Concluded)
(Unaudited)
The Trustees noted that the EIC Fund’s Class C and Institutional Class Net Total Expense Ratio, Contractual Advisory Fee, and Net Advisory Fee were each higher than the respective medians of the Class C and Institutional Class Shares of the funds in the EIC Fund’s Lipper Peer Group, while the EIC Fund’s Class A Net Total Expense Ratio was equal to the median and the Contractual Advisory Fee and Net Advisory Fee were each higher than the respective medians of the funds in the EIC Fund’s Lipper Peer Group. The Trustees concluded that EIC’s contractual advisory fee level was reasonable in relation to the nature and quality of the services provided, taking into account the fees charged by other advisers for managing comparable mutual funds with similar strategies. The Trustees also concluded that the overall expense ratio of the EIC Fund was reasonable, taking into account the size of the EIC Fund, the quality of services provided by EIC, the investment performance of the EIC Fund and the expense limitations agreed to by EIC.
The Trustees considered the costs of the services provided by EIC, the compensation and benefits received by EIC in providing services to the EIC Fund, EIC’s profitability and certain additional information related to EIC’s financial condition.
The Trustees considered the extent to which economies of scale would be realized relative to fee levels as the EIC Fund grows, and whether the advisory fee levels reflect these economies of scale for the benefit of shareholders. The Trustees considered and determined that economies of scale for the benefit of EIC Fund shareholders should be achieved as assets of the EIC Fund increase as a result of breakpoint reductions in the Advisory fee rate at specific asset levels which are reflected in the fee schedule of the EIC Agreement. In addition, the Trustees also considered the Adviser’s efforts to grow the EIC Fund’s assets as economies of scale may be achieved due to the ability of the EIC Fund to spread its fixed costs across a larger asset base.
At the Meeting, the Trustees unanimously approved the EIC Agreement for an additional one-year period. In voting to approve the EIC Agreement, the Board considered all factors it deemed relevant and the information presented to the Board by EIC. In arriving at its decision, the Board did not identify any single factor as being controlling and each member of the Board gave varying weights to each factor according to his or her own judgment. The Board determined that the approval of the EIC Agreement would be in the best interests of the EIC Fund and its shareholders.
39
EIC VALUE FUND
Privacy Notice
(Unaudited)
The privacy of your personal financial information is extremely important to us. When you open an account with us, we collect a significant amount of information from you in order to properly invest and administer your account. We take very seriously the obligation to keep that information private and confidential, and we want you to know how we protect that important information.
We collect nonpublic personal information about you from applications or other forms you complete and from your transactions with us or our affiliates. We do not disclose information about you, or our former clients, to our affiliates or to service providers or other third parties, except as permitted by law. We share only the information required to properly administer your accounts, which enables us to send transaction confirmations, monthly or quarterly statements, financials and tax forms. Even within FundVantage Trust and its affiliated entities, a limited number of people who actually service accounts will have access to your personal financial information. Further, we do not share information about our current or former clients with any outside marketing groups or sales entities.
To ensure the highest degree of security and confidentiality, FundVantage Trust and its affiliates maintain various physical, electronic and procedural safeguards to protect your personal information. We also apply special measures for authentication of information you request or submit to us on our web site.
If you have questions or comments about our privacy practices, please call us at (855) 430-6487.
40
EIC VALUE FUND
Fund Management
(Unaudited)
FundVantage Trust (the “Trust”) is governed by a Board of Trustees (the “Trustees”). The primary responsibility of the Trustees is to represent the interest of the Trust’s shareholders and to provide oversight management of the Trust.
The following tables present certain information regarding the Trustees and officers of the Trust. None of the Trustees are an “interested person” of the Trust, the Adviser, another investment adviser of a series of the Trust, or Foreside Funds Distributors LLC, the principal underwriter of the Trust (“Underwriter”), within the meaning of the 1940 Act and each Trustee is referred to as an “Independent Trustee” and is listed under such heading below. Employees of certain service providers to the Trust serve as officers of the Trust; such persons are not compensated by the Fund. The address of each Trustee and officer as it relates to the Trust’s business is 301 Bellevue Parkway, 2nd Floor, Wilmington, DE 19809.
The Statement of Additional Information for the Fund contains additional information about the Trustees and is available, without charge, upon request, by calling (855) 430-6487.
Name and Date of Birth | Position(s) Held with Trust | Term of Office and Length of Time Served | Principal Occupation(s) During Past Five Years |
Number of Funds in Trust Complex Overseen by | Other Held by Trustee | |||||
| INDEPENDENT TRUSTEES | ||||||||||
ROBERT J. CHRISTIAN Date of Birth: 2/49 | Trustee | Shall serve until death, resignation or removal. Trustee since 2007. Chairman from 2007 until September 30, 2019. | Retired since February 2006; Executive Vice President of Wilmington Trust Company from February 1996 to February 2006; President of Rodney Square Management Corporation (“RSMC”) (investment advisory firm) from 1996 to 2005; Vice President of RSMC from 2005 to 2006. | 39 | Optimum Fund Trust (registered investment company with 6 portfolios); Third Avenue Trust (registered investment company with 3 portfolios); Third Avenue Variable Series Trust (registered investment company with 1 portfolio).
| |||||
41
EIC VALUE FUND
Fund Management (Continued)
(Unaudited)
Name and Date of Birth | Position(s) Held with Trust | Term of Office and Length of Time Served | Principal Occupation(s) During Past Five Years |
Number of Funds in Trust Complex Overseen by | Other Held by Trustee | |||||
IQBAL MANSUR Date of Birth: 6/55 | Trustee | Shall serve until death, resignation or removal. Trustee since 2007. | University Professor, Widener University. | 39 | Third Avenue Trust (registered investment company with 3 portfolios); Third Avenue Variable Series Trust (registered investment company with 1 portfolio).
| |||||
NICHOLAS M. MARSINI, JR. Date of Birth: 8/55 | Trustee and Chairman of the Board | Shall serve until death, resignation or removal. Trustee since 2016. Chairman since October 1, 2019. | Retired since March 2016. President of PNC Bank Delaware from June 2011 to March 2016; Executive Vice President of Finance of BNY Mellon from July 2010 to January 2011; Executive Vice President and Chief Financial Officer of PNC Global Investment Servicing from September 1997 to July 2010. | 39 | Brinker Capital Destinations Trust (registered investment company with 10 portfolios); Third Avenue Trust (registered investment company with 3 portfolios); Third Avenue Variable Series Trust (registered investment company with 1 portfolio).
| |||||
42
EIC VALUE FUND
Fund Management (Continued)
(Unaudited)
Name and Date of Birth | Position(s) Held with Trust | Term of Office and Length of Time Served | Principal Occupation(s) During Past Five Years |
Number of Funds in Trust Complex Overseen by | Other Held by Trustee | |||||
NANCY B. WOLCOTT Date of Birth: 11/54 | Trustee | Shall serve until death, resignation or removal. Trustee since 2011. | Retired since May 2014; EVP, Head of GFI Client Service Delivery, BNY Mellon from January 2012 to May 2014; EVP, Head of US Funds Services, BNY Mellon from July 2010 to January 2012; President of PNC Global Investment Servicing from 2008 to July 2010; Chief Operating Officer of PNC Global Investment Servicing from 2007 to 2008; Executive Vice President of PFPC Worldwide Inc. from 2006 to 2007. | 39 | Lincoln Variable Insurance Products Trust (registered investment company with 97 portfolios); Third Avenue Trust (registered investment company with 3 portfolios); Third Avenue Variable Series Trust (registered investment company with 1 portfolio).
| |||||
STEPHEN M. WYNNE Date of Birth: 1/55 | Trustee | Shall serve until death, resignation or removal. Trustee since 2009. | Retired since December 2010; Chief Executive Officer of US Funds Services, BNY Mellon Asset Servicing from July 2010 to December 2010; Chief Executive Officer of PNC Global Investment Servicing from March 2008 to July 2010; President, PNC Global Investment Servicing from 2003 to 2008. | 39 | Copeland Trust (registered investment company with 3 portfolios); Third Avenue Trust (registered investment company with 3 portfolios); Third Avenue Variable Series Trust (registered investment company with 1 portfolio).
| |||||
43
EIC VALUE FUND
Fund Management (Concluded)
(Unaudited)
Name and Date of Birth | Position(s) Held with Trust |
Term of Office and Length of Time Served | Principal Occupation(s) During Past Five Years | |||
EXECUTIVE OFFICERS
| ||||||
JOEL L. WEISS Date of Birth: 1/63 | President and Chief Executive Officer | Shall serve until death, resignation or removal. Officer since 2007. | President of JW Fund Management LLC since June 2016; Vice President and Managing Director of BNY Mellon Investment Servicing (US) Inc. and predecessor firms from 1993 to June 2016.
| |||
T. RICHARD KEYES Date of Birth: 1/57 | Treasurer and Chief Financial Officer | Shall serve until death, resignation or removal. Officer since 2016. | President of TRK Fund Consulting LLC since July 2016; Head of Tax — U.S. Fund Services of BNY Mellon Investment Servicing (US) Inc. and predecessor firms from February 2006 to July 2016.
| |||
GABRIELLA MERCINCAVAGE Date of Birth: 6/68 | Assistant Treasurer | Shall serve until death, resignation or removal. Officer since 2019. | Fund Administration Consultant since January 2019; Fund Accounting and Tax Compliance Accountant to financial services companies from November 2003 to July 2018.
| |||
VINCENZO A. SCARDUZIO Date of Birth: 4/72 | Secretary | Shall serve until death, resignation or removal. Officer since 2012. | Director and Vice President Regulatory Administration of The Bank of New York Mellon and predecessor firms since 2001.
| |||
DAVID C. LEBISKY Date of Birth: 5/72 | Chief Compliance Officer and Anti-Money Laundering Officer | Shall serve until death, resignation or removal. Officer since 2015. | President of Lebisky Compliance Consulting LLC since October 2015; Consultant, Duff & Phelps, LLC since 2016; Senior Consultant, Freeh Group International Solutions, LLC (a global risk management firm) from 2015 to 2018; Scotia Institutional Investments US, LP, Director of Regulatory Administration from 2010 to 2014.
| |||
44
[THIS PAGE INTENTIONALLY LEFT BLANK.]
[THIS PAGE INTENTIONALLY LEFT BLANK.]
[THIS PAGE INTENTIONALLY LEFT BLANK.]
Investment Adviser
Equity Investment Corporation
1776 Peachtree Street, NW
Suite 600S
Atlanta, GA 30309
Administrator
The Bank of New York Mellon
301 Bellevue Parkway
Wilmington, DE 19809
Transfer Agent
BNY Mellon Investment Servicing (US) Inc.
4400 Computer Drive
Westborough, MA 01581
Principal Underwriter
Foreside Funds Distributors LLC
400 Berwyn Park
899 Cassatt Road
Berwyn, PA 19312
Custodian
The Bank of New York Mellon
240 Greenwich Street
New York, NY 10286
Independent Registered Public Accounting Firm
Ernst & Young LLP
One Commerce Square
2005 Market Street, Suite 700
Philadelphia, PA 19103-7096
Legal Counsel
Pepper Hamilton LLP 3000
Two Logan Square
18th and Arch Streets
Philadelphia, PA 19103

of
FundVantage Trust
Class A
Class C
Institutional Class
ANNUAL REPORT
April 30, 2020
IMPORTANT NOTE: Beginning on January 1, 2021, paper copies of the Fund’s shareholder reports will no longer be sent by mail, unless you specifically request paper copies of the shareholder reports from the Fund or from your financial intermediary. Instead, shareholder reports will be available on the EIC Value Fund’s website (www.eicvalue.com), and you will be notified by mail each time a report is posted and provided with a website link to access the report.
You may elect to receive all future shareholder reports in paper, free of charge. To elect to receive paper copies of shareholder reports through the mail or otherwise change your delivery method, contact your financial intermediary or, if you hold your shares directly through the Fund, call the Fund toll-free at (855) 430-6487 or write to:
EIC Value Fund
FundVantage Trust
c/o BNY Mellon Investment Servicing
P.O. Box 9829
Providence, RI 02940-8029
This report is submitted for the general information of shareholders and is not authorized for distribution to prospective investors unless preceded or accompanied by a current prospectus.
EIC-0420
LATEEF FOCUSED SUSTAINABLE GROWTH FUND
(formerly Lateef Focused Growth Fund)
Annual Investment Adviser’s Report
April 30, 2020
(Unaudited)
Dear Shareholders,
At Lateef Investment Management, we strive to construct concentrated portfolios of high-quality companies that have shown the potential to compound earnings and cash flows over the long term. Often, this takes the form of companies with improving fundamentals that can be purchased at reasonable valuations. As part of our process, we have always considered corporate governance and shareholder rights before adding any new company to the portfolio. And, ever more so in recent years, we have looked for tailwinds in companies that can help combat global warming. Last year, we took the natural next step and instilled full environmental, social, and governance (ESG) integration into our investment process. On February 6, 2020 we also updated the name of the Lateef Focused Growth Fund to the Lateef Focused Sustainable Growth Fund. We believe this change reflects our journey as investors searching for companies whose business models enable them to grow in a responsible and sustainable manner. *We believe that by adding a layer of ESG consideration to our robust fundamental analysis, we not only strengthen our process but improve our ability to identify long-tailed risk and secular growth opportunities, all with the goal of delivering more consistent return above the benchmark.
Over the last year, U.S. equity markets have presented significant opportunities and experienced severe challenges, most notably during the first quarter of 2020 due to COVID-19. We are pleased with how our process and portfolio performed during this period. For the 12-month period ending April 30, 2020, the Lateef Focused Sustainable Growth Fund returned 2.40% (I-Shares) versus the S&P 500’s return of
0.86%.
Calendar year 2019 was our fund’s highest absolute return since inception and our return of 41.81% (I-Shares) delivered over 10% of outperformance for our clients. We believe the strong equity market returns in 2019 were driven in part by the Federal Reserve’s decision to reverse course from a tightening to an easing monetary policy. During 2019, the Federal Reserve cut the Fed Funds Rate three times (it subsequently made another two cuts in March 2020 bringing the target rate between 0.00%-0.25%). These policy decisions helped change the discussion from a potential U.S. slowdown to one of stable growth for the period. Equity markets were also boosted by cooling tensions in the U.S. trade war with China, the lower probability of more progressive candidates winning the Democratic nomination, a strong U.S. consumer base, and healthy employment trends.
Returns shown are historical and do not guarantee future results. Current performance may be lower or higher than the performance data quoted. Call (866) 499-2151 for the most recent month-end returns. Investment return and principal value will fluctuate so that an investor’s shares, when redeemed, may be worth more or less than their original cost.
| * | There can be no guarantee that any strategy (risk management or otherwise) will be successful. All investing involves risk, including potential loss of principal. |
1
LATEEF FOCUSED SUSTAINABLE GROWTH FUND
(formerly Lateef Focused Growth Fund)
Annual Investment Adviser’s Report (Continued)
April 30, 2020
(Unaudited)
In the first quarter of 2020, our nation was dealt two powerful punches that roiled equity markets around the world. First, the COVID-19 virus reached our shores wreaking havoc in major cities and challenging the limitations of our healthcare system as we lacked available testing and protective equipment for healthcare workers and first responders, leaving our local and federal governments scrambling to respond. Our country and economy have effectively been placed in a self-induced coma to slow the spread of the virus and allow our healthcare system the time it needs to care for patients. Second, Saudi Arabia embarked on an oil price war after coming to an impasse with Russia over export reductions, dramatically increasing daily production and lowering future delivery prices. This is the second time in the past decade that Saudi Arabia has actively challenged the U.S. shale oil industry as fracking had lowered our dependence on foreign oil while making the U.S. the world’s leader in oil production. But rather than commiserate, we are focusing on what we can control – actively managing our portfolio to sow the seeds for future growth potential. We believe the federal government’s fiscal and monetary stimulus plans are appropriate and necessary. We are also seeing encouraging developments in the testing of therapeutic treatments and vaccines to combat COVID-19.
These are certainly unprecedented times. While we don’t know how long the shelter in place will last or the full extent of the economic damage from the forced shut downs, We do know that there will not be an “all clear” bell rung on the New York Stock Exchange to mark the beginning of a recovery. Historically markets tend to bottom well before strategists and commentators realize. Some metrics that we are acutely watching are the rates of increase for new infections, admissions to intensive care units, mortality, and recovery. We are seeing positive trends on these metrics in the epicenters of the virus, especially those that shut down first. We cannot nor do we try to time the bottom of the market. However, we do try to take advantage of these broad market sell offs by selectively adding to our holdings and purchasing shares of sound companies that we have long admired but deemed too expensive.
2
LATEEF FOCUSED SUSTAINABLE GROWTH FUND
(formerly Lateef Focused Growth Fund)
Annual Investment Adviser’s Report (Continued)
April 30, 2020
(Unaudited)
This pandemic is affecting every country. The global response has been remarkable, and we are confident that therapeutic solutions and, ultimately, vaccines will be found to win the battle against COVID-19. Over 260 global fiscal stimulus programs have been put in place just over the past month. In the U.S. alone, the $2 trillion CARES Act coupled with the Federal Reserve Chairman Jerome Powell’s resolve to do whatever is necessary to mitigate financial disruption equals to about 20% of the U.S.’s annual Gross Domestic Product (“GDP”). This is an incredible increase in money supply that we believe will go a long way to offset the financial damage from the shutdowns.
However, not every business or industry will recover at the same rate as the unwinding of shelter in place will likely be gradual. Further, this shock to our norms and everyday lives will likely accelerate business trends in both positive and negative trajectories. For instance, we believe store-based retailers will continue their decline as online businesses gain more market share and delivery businesses see a pull forward in adoption.
We believe that fiscal stimulus also won’t work unless people are able and confident to return to work, resuming some normalcy in their lives. For this, we look towards some of the countries that were earliest hit and took early action with containment, many of which have returned – at least – to work. We are also encouraged by the global resources being brought to bear to combat and beat this pandemic, which has led us to think that perhaps a healthcare solution will arrive to help solve this healthcare problem.
On the healthcare front, we see three vectors to attack the COVID-19 virus: anti-viral treatments, anti-inflammatory treatments, and vaccines. We’ve observed that dozens of companies are working on each vector to treat infected patients and ultimately offer vaccines for preventative care. Our research gives us confidence that a few of the anti-viral and anti-inflammatory drugs in development will be approved, providing a bridge that enables us to begin to resume our lives until vaccines are safely developed.
Portfolio Changes
During periods of dramatic market drawdowns, we employ a 3-step response. Our 3-step process is as follows:
• First, we reassess every position to understand exposures to the concerns that are driving the market down.
• Second, we make adjustments to address any concerns.
• Third, we hunt for other high-quality companies whose stock we believe now present an attractive entry point for our clients.
3
LATEEF FOCUSED SUSTAINABLE GROWTH FUND
(formerly Lateef Focused Growth Fund)
Annual Investment Adviser’s Report (Continued)
April 30, 2020
(Unaudited)
Trims & Sells
As we analyzed our holdings for their exposures to China, shelter in place, energy, aerospace, and other macro concerns, we trimmed our positions in Starbucks (SBUX), Aptiv (APTV), Fiserv (FISV), and Arconic (ARNC) during February and the beginning of March.
We also sold our positions in AMERCO (UHAL), Instructure (INST), Guidewire Software (GWRE), Howmet Aerospace (HWM), and Woodward (WWD) to raise cash for other investments with better risk-reward potential.
Starbucks and Aptiv have significant exposure to China, and we thought it would be prudent to reduce our positioning in early February, ahead of the drawdown. With the drawdown that ensued and their long-term opportunities intact, we took advantage of the opportunity and re-added to both in late March and early April.
Starbucks CEO, Kevin Johnson, shared that the company’s experience in China directly informs Starbucks on how to manage the store closures and adjustments in North America. As of April 30, 2020, we note that 95% of Starbucks stores in China have re-opened, albeit with reduced hours and limited seating, and comparable sales trends are improving. We believe Starbucks U.S. operations remain a few months behind that of China and management will follow their successful China roadmap. While Starbucks business will certainly be down the second quarter of 2020, we believe the company will resume to growth after we get COVID-19 under control. Incidentally, Starbucks dividend yield is about 2%. In other words, shareholders enjoy a dividend that is higher than fixed income securities like the U.S. Treasury’s 10-year bonds (yielding
0.63% at the end of April). Over a three- to five-year time horizon, we believe owning stocks like Starbucks should give you an attractive total return (dividend + stock appreciation) for the risk you are taking.
Aptiv is a leading electronics and active safety component supplier to the automotive industry. Our analysis suggests that Aptiv’s solutions improve automobile’s active safety, environmental impact, and ultimately reduces tragic auto fatalities. However, China is the largest auto market in the world, and we think it’ll take some time for automotive demand to return to prior levels.
We also trimmed Fiserv and Arconic in early March, increasing our cash balance so that we could be more opportunistic with investments. Note that Arconic finally completed its planned separation into Arconic Corp and Howmet Aerospace on April 1.
Fiserv is a leading financial services company whose products help banks, merchants, and consumers with banking software and processing services. Last year, Fiserv acquired First Data, a company we owned. We support the combined company’s competitive positioning and decided to keep the stock. As such, this position had become a large weight in the Fund’s portfolio and we thought it would be a good
4
LATEEF FOCUSED SUSTAINABLE GROWTH FUND
(formerly Lateef Focused Growth Fund)
Annual Investment Adviser’s Report (Continued)
April 30, 2020
(Unaudited)
time to take some profits. We do anticipate some near-term headwinds for Fiserv as financial transactions decline during our economic shut down, but we see its core competitive positioning unchanged going forward.
Arconic is a leading aluminum and engineered products manufacturer serving the aerospace and industrial markets. Going into this year, we had a positive view on the aerospace replacement cycle as we estimated that ~50% of global commercial aircrafts would be replaced over the next twenty years. Given the demand destruction for air travel, we trimmed Arconic (combined) in early March and ultimately sold the Fund’s positions in both Arconic Corp and Howmet Aerospace after the first quarter of 2020. Due to similar concerns, we also sold Woodward, which broke off its planned merger with Hexcel due to COVID-19. If conditions improve in the future, we may revisit our longer-term thesis in aerospace.
In addition to these trims and sells, we also sold our positions in AMERCO (U-Haul), Instructure, and Guidewire to raise more cash in March for new opportunities.
New Buys
We redeployed the capital from our trims and sells to start positions for the Fund in Catalent (CTLT), Twitter (TWTR), and Microsoft (MSFT). We have monitored each of these companies for quite some time and the market drawdown finally gave us an attractive entry point.
Catalent is a leading manufacturing of advanced delivery technologies for drugs and biologics. When the FDA approves a drug, it includes the drug manufacturing process into the approval. As such, we feel Catalent’s competitive moat is quite strong as they are literally written into FDA approvals. Over the next few years, we believe that Catalent’s exposure to biologics, through its drugs substance manufacturing and drug delivery technologies, will increase from 30% of revenues today to nearly 50%. This also includes the emerging growth areas of cell and gene therapy. Catalent’s quality of business and growth opportunity led to it trading at a Price to Earning Ratio (“P/E”) of nearly 30x earlier this year. With this selloff, Catalent’s valuation dropped to about 22x earnings. After following Catalent’s story for over two years, meeting and speaking with senior management several times along the way, we finally told them that we are now shareholders.
Microsoft is another company that we have followed for many years but didn’t buy because of valuation. We believe Microsoft is well positioned to serve the computing needs of corporate enterprises, especially as large enterprises move computing workloads into the cloud. In fact, during this period of working from home, we believe Microsoft is gaining share. Office 365 has an application called Microsoft Teams, which is a collaboration tool we have implemented within our own research process. Its features include secure chats, audio calls, and video meetings that enables employees to work remotely yet still be connected. Additionally, files are hosted on Microsoft’s cloud servers, enabling users to access the files they need,
5
LATEEF FOCUSED SUSTAINABLE GROWTH FUND
(formerly Lateef Focused Growth Fund)
Annual Investment Adviser’s Report (Continued)
April 30, 2020
(Unaudited)
when they need them. During the wider market drawdown, Microsoft’s forward P/E multiple contracted from 30x to 23x, presenting a buying opportunity.
Finally, we also added Twitter during the quarter. We estimate that Twitter reaches over 2 billion people but only has about 150 million daily active users. We believe Twitter has the opportunity to keep growing this daily active user base, expand into new ad formats and categories like direct response, and improve its monetization models with more personalization. Additionally, with heightened focus from shareholders, we suspect Twitter’s governance and business execution will improve very soon. While ad spending may contract during the shutdown, we are seeing an offset in engagement as the use of Twitter is strong and accelerating in these uncertain times. These trends should help Twitter emerge with a stronger foundation from which to grow.
Outlook
As long-term investors, we try to look past the dip in earnings over the short term and towards a more normalized state of revenue and earnings over the next three to five years, provided that there are no balance sheet or funding issues over the near term. As we think about the Fund’s portfolio, we expect that every company will be affected by the economic shutdown but that our investments will navigate through this storm and maybe even emerge stronger than before. Given these uncertain times, we thought it’d be helpful to break down how we think about the Fund’s portfolio.
We think about our holdings along the following categories:
| Subscription Businesses or Highly Recurring Revenues | ||
| Alphabet | Provides critical tools like search, YouTube, G-Suite, maps, etc. While advertising rates and spend will decline this quarter, the company’s relevance and importance increases. | |
| Clarivate | Indexing and analytics related to scientific journal and intellectual property. 85% recurring revenue with 90%+ renewal rates. | |
| Equinix | Data center real estate investment trust that should see demand increase with more cloud and workloads outside of internal networks. Should emerge stronger. | |
| Fiserv | Software & processing for financial service companies with 40% share of North American merchants. Revenue headwinds will persist until shelter in place is lifted. Solutions helping banks with core digital transformation perhaps accelerates. | |
| Microsoft | Subscription and software-as-a-service revenue model. Provides essential business tools. May see an acceleration in business stemming from work-from-home and cloud services. | |
6
LATEEF FOCUSED SUSTAINABLE GROWTH FUND
(formerly Lateef Focused Growth Fund)
Annual Investment Adviser’s Report (Continued)
April 30, 2020
(Unaudited)
| New York Times | Continuing to successfully pivot to subscription model with over 5 million digital subscribers. News and pandemic could increase subscriptions but faces lower advertising revenues. | |
| Palo Alto Networks | Leading cyber security software company with 60% of revenues from subscriptions and services. Work at home increases demand for securing network outside of the traditional enterprise. | |
| PTC | Industrial software company with over 80% of revenues recurring through subscriptions. High revenue visibility. | |
| Visa | Credit and debit card processing and volumes will be down this quarter. But Visa has 70%+ market share for online transactions vs. 40% for physical transactions.
| |
| Healthcare Services | ||
| Catalent | Manufactures drug substance for traditional small molecule and large molecule biologics. Provides advanced drug delivery solutions. Potentially strong moat with secular tailwinds. | |
| Danaher | Life science, diagnostics, and environmental testing and solutions company. 70% of revenues are from consumables and recurring. High demand for products. | |
| Elanco | 40% of revenues from companion animal therapeutics and disease prevention and 60% of revenues from food animal disease prevention. Defensive end-markets with secular tailwinds. | |
| IQVIA | Provides data and analytic solutions as well as contract research services to the life sciences industry. Half of revenues comes from subscription-based data analytic solutions and half from clinical trials. While clinical trials are temporarily delayed, the business should return when shelter in place is lifted. | |
| Secular Growth Stories | ||
| Ball Corp | Manufactures aluminum cans with ~45% volume from specialty-sized cans. Deemed as an essential service with all plants running. Secular shift from plastic to renewable cans continues. | |
| Crown Holdings | Manufactures aluminum cans with more international presence than Ball. Undergoing a strategic review of its more cyclical transit packaging business but may not be able to sell non-core assets in the current environment. | |
7
LATEEF FOCUSED SUSTAINABLE GROWTH FUND
(formerly Lateef Focused Growth Fund)
Annual Investment Adviser’s Report (Continued)
April 30, 2020
(Unaudited)
| Starbucks | Leading specialty coffee retailer. Core customers visit over 20x per month. While revenues will be hit with the economic shut down, but customers will likely return given its strong brand and commitment to service and quality. Recent accounting scandal at Luckin Coffee could slow its largest competitor in China. | |
| Business & Consumer Services | ||
| Aon | Global insurance broker that helps clients manage risks. Risks are increasingly becoming more complex. Announced merger with Willis Towers Watson during the first quarter of 2020. | |
| Progressive | Provides auto and homeowners insurance. Seeing less severity and frequency of claims as a result of shelter in place. However, hurt by a lower interest rates environment. | |
| Cyclicals & Other | ||
| Aptiv | Leading electronic and active safety supplier to the automotive industry. Will likely face headwinds from decrease in automotive demand in the near term but continues to grow at above-industry rates given focus on safe, green, and connectivity. | |
| Keysight | Leading provider of test and measurement for electronics and the 5G investment wave. Near term revenue headwinds but 5G investment cycle remains in place. | |
| Martin Marietta | Leading aggregates company (crushed stone, sand, gravel), which are essential components for surface construction. Headwinds from near-term work stoppage should be offset by long-term tailwind from infrastructure. | |
| SVB Financial | Boutique bank serving venture-backed startup companies. Will likely see pressure in core business as interest income is highly sensitive to interest rates. | |
Global platform for modern news consumption. Opportunity to improve reach and monetization. Likely reduction in advertising revenue due to fewer events and pullback in spend on brand advertising. | ||
As we distill the flood of information and changing macro risks, we have made adjustments and added new companies to our mix. We have constructed our portfolio with mostly companies that we consider secular compounders, ones with a goal to grow and compound revenues and earnings for a long time. These include companies like Visa, Google, Equinix, and most recently Microsoft. With leading positions in businesses that serve essential needs, these companies should emerge from this period even stronger.
8
LATEEF FOCUSED SUSTAINABLE GROWTH FUND
(formerly Lateef Focused Growth Fund)
Annual Investment Adviser’s Report (Continued)
April 30, 2020
(Unaudited)
We also have some investments in more cyclical companies where our research indicates they have a service or product that is in the early stages of their business cycle. These companies include Martin Marietta, Aptiv, and SVB Financial. Finally, we have several healthcare companies that provide services that are more important now than ever. These include Danaher, IQVIA, and now Catalent.
This has been a very difficult year for our country and the stock market so far, and we think about the human toll of COVID-19 every day. Both fiscal and healthcare responses are needed to combat this pandemic. Fortunately, we are seeing positive developments on both fronts plus a multi-country oil production agreement, which is helping clear the fog of uncertainty. We are still a long way away from getting this pandemic under control and winning this battle, but we are perhaps seeing the light at the end of the tunnel.
As we learn more about COVID-19’s treatments and other developments, we will gladly share our knowledge with you. We are deeply appreciative of your trust in us to manage your portfolio through these uncertain times. We have managed through periods of dramatic drawdowns before, and we will manage through this one too.
Thank you for your trust and please contact us if you have any questions. For additional insight into your portfolio, please contact our office at (415) 461-3800.
Sincerely,
 |  |  | ||
Quoc K. Tran Chief Investment Officer & Portfolio Manager |
Michael Im Associate Portfolio Manager & Director of Research | Eric A. Winterhalter Chief Operating Officer |
All opinions and data included in this commentary are as of April 30, 2020, unless otherwise noted, and are subject to change without notice. The opinions and views expressed herein are of Lateef Investment Management, L.P. (Lateef) and are not intended to be seen as fact, a forecast of future events, or a guarantee of future results. The information in this publication has been developed internally and/or obtained from sources believed to be reliable, but the accuracy or completeness of this information cannot be guaranteed. This publication is provided for informational purposes only and does not does constitute a solicitation, investment advice or recommendation for any particular investment product or strategy. Economic forecasts and estimated data reflect subjective judgments and assumptions and unexpected events may occur. Therefore, there can be no assurance that developments will transpire as may be forecasted in this publication. This information should not be used as the sole basis to make any investment decision. No investment strategy can assure a profit or protect against loss. Past performance is not a guarantee or indication of future performance. Current and future portfolio holdings are subject to change and risk.
9
LATEEF FOCUSED SUSTAINABLE GROWTH FUND
(formerly Lateef Focused Growth Fund)
Annual Investment Adviser’s Report (Continued)
April 30, 2020
(Unaudited)
Lateef Focused Sustainable Growth Leaders and Laggards from 4/30/2019 through 4/30/2020
Our top contributors over the past year were Equinix, Clarivate Analytics, and Catalent.
Equinix (EQIX) outperformed as the company delivered strong and consistent results in the back half of 2019. EQIX shares, along with those of other Real Estate Investment Trusts (“REITS”), also benefited from the Fed cutting its target for the Fed Funds Rate three times from July to October 2019 (and again in March 2020 when the target rate was cut twice to 0%-0.25%). Eqinix also outperformed through the first four months of 2020 as the company’s base of highly recurring revenues led to less of a sell off than the market. Shelter-in-place policies also sparked greater demand and highlighted the value of the company’s distributed network of data centers as businesses had to adapt to employees to work from home. We believe Equinix will likely continue to benefit as COVID-19 pulls forward digital transformation and more companies shift from on-premise IT architectures to cloud and hybrid clouds.
Clarivate Analytics (CCC) was a new addition to our portfolio. Clarivate is a leading information services and analytics company that was previously embedded within Thomson Reuters. The company’s core business is to organize and index scientific publications and discoveries. As a subscription-based business, approximately 85% of revenues were recurring. Clarivate is led by CEO Jerre Stead, an experienced executive who most recently led IHS Markit (IHS) for over ten years and produced outstanding returns for shareholders. Over the past year, Clarivate has already started executing on its plan of reinvesting to develop more value-added products, lowering churn, and increasing pricing. The company has also undertaken cost savings measures to improve margins. Compared to the first quarter of 2019, Clarivate has increased pricing by 2.1-2.2% and Adjusted Earnings Before Interest, Taxes, Depreciation and Amortization (“EBITDA”) margins by 700 basis points to 32.5%. With continued strong execution, we believe Clarivate will reach its stated goals of 6-8% organic growth and 37-40% EBITDA margins exiting 2021.
Catalent (CTLT) was also a new addition to our portfolio. Catalent is a leading manufacturing of advanced delivery technologies for drugs and biologics. When the FDA approves a drug, it includes the manufacturing process into the approval. As such, Catalent’s competitive moat has been quite strong as they are literally written into FDA approvals. While many industries have suffered from extended shelter-in-place policies and shutdowns related to COVID-19, drug discovery and development has not slowed as it has been boosted by increased activity related to potential treatments and vaccines for COVID-19. Catalent has signed 30+ deals related to COVID-19, providing drug substance and drug product manufacturing for clinical trials, which would pave way for more commercialization. Longer term, we believe that Catalent has a long pathway of growth driven by its exposure to biologics, which is expected to increase from 30% of revenues today to nearly 50%.
10
LATEEF FOCUSED SUSTAINABLE GROWTH FUND
(formerly Lateef Focused Growth Fund)
Annual Investment Adviser’s Report (Continued)
April 30, 2020
(Unaudited)
Our largest detractors over the past year were Hexcel, Howmet Aerospace, and Elanco Animal Health.
Hexcel (HXL) underperformed in the back-half of 2019 due to the grounding and halt in production of Boeing’s 737 Max aircrafts. We sold our position in Hexcel at the beginning of 2020 to lower our exposure in aerospace as Hexcel’s key business was supplying carbon fiber honeycomb and carbon fiber parts to the aerospace industry, but repurchased after the company announced a deal to merge with Woodward. Hexcel, like other aerospace suppliers, underperformed as travel restrictions and COVID-19 led to a decline in air travel, pressuring the airline industry and the aerospace supply chain. We sold our position in Hexcel in March.
Howmet Aerospace (HWM) split off from Arconic Corp on April 1, 2020. Like other aerospace companies, Howmet shares suffered as a decline in air travel pressured the airline industry and the aerospace supply chain. We sold our position in Howmet in April.
Elanco Animal Health (ELAN) underperformed starting in August 2019 after announcing its intention to acquire Bayer’s Animal Health business for $7.6 billion. To finance the deal, Elanco raised both debt and equity, diluting existing equity holders and increasing balance sheet risk. Management’s rationale for the deal was scale and cost savings, which we viewed benefited positively given that the acquisition would vault Elanco into the clear #2 position in an industry that benefits from scale. Bayer also provided better access to big box retailers and online, which were of growing importance as pet owners shifting buying away from vet clinics. Despite this longer-term opportunity, Elanco continued to be plagued by mis-execution internally and competition externally. We subsequently sold our position in Elanco at the beginning of May 2020.
*The list of top three and bottom three holdings should not be considered a recommendation to purchase or sell a particular security, represents only part of the Fund and the securities purchased for advisory clients, and may not remain in the Fund at the time you receive this letter. You should not assume that investments in the securities identified were, or will be, profitable or that decisions we make in the future will be profitable.
This letter is intended to assist shareholders in understanding how the Fund performed during the fiscal year ended April 30, 2020, and reflects the views of the investment adviser at the time of this writing. Of course, these views may change and do not guarantee the future performance of the Fund, its holdings or the markets. Discussion of particular Fund holdings is not intended as a recommendation to buy, hold or sell those securities. The Fund’s portfolio composition is subject to change. Current and future portfolio holdings are subject to investment risks. Since the Fund is non-diversified and may invest a larger portion of its assets in the securities of a single issuer than a diversified fund, an investment in the Fund could fluctuate in value more than an investment in a diversified fund. Actual events may differ from the earnings
11
LATEEF FOCUSED SUSTAINABLE GROWTH FUND
(formerly Lateef Focused Growth Fund)
Annual Investment Adviser’s Report (Concluded)
April 30, 2020
(Unaudited)
projections and other forward looking statements presented herein. Visit www.lateef.com to see the Fund’s most recently published holdings list.
All mutual fund investing involves risk, including possible loss of principal.
The Lateef Focused Sustainable Growth Fund is distributed by Foreside Funds Distributors LLC.
12
LATEEF FOCUSED SUSTAINABLE GROWTH FUND
(formerly Lateef Focused Growth Fund)
Annual Report
Performance Data
April 30, 2020
(Unaudited)
Comparison of Change in Value of $10,000 in Lateef Focused Sustainable Growth Fund’s Class A Shares vs. Russell 3000® Index and S&P 500® Index
Class A Shares growth of an assumed $10,000 investment is adjusted for the maximum sales charge of 5.00%. This results in a net initial investment of $9,500.
Comparison of Change in Value of $100,000 (Class I investment minimum) in Lateef Focused Sustainable Growth Fund’s Class I Shares vs. Russell 3000® Index and S&P 500® Index
13
LATEEF FOCUSED SUSTAINABLE GROWTH FUND
(formerly Lateef Focused Growth Fund)
Annual Report
Performance Data (Concluded)
April 30, 2020
(Unaudited)
| Average Annual Total Returns for the Periods Ended April 30, 2020 | ||||||||||||||||||||
| 1 Year | 3 Years | 5 Years | 10 years | |||||||||||||||||
Class A Shares (with sales charge) | -3.03 | % | 7.99 | % | 6.74 | % | 9.76 | % | ||||||||||||
Class A Shares (without sales charge) | 2.11 | % | 9.85 | % | 7.84 | % | 10.33 | % | ||||||||||||
Class I Shares | 2.40 | % | 10.13 | % | 8.11 | % | 10.61 | % | ||||||||||||
Russell 3000® Index | -1.04 | % | 8.02 | % | 8.33 | % | 11.29 | % | ||||||||||||
S&P 500® Index | 0.86 | % | 9.04 | % | 9.12 | % | 11.69 | % | ||||||||||||
The performance data quoted represents past performance and does not guarantee future results. The investment return and principal value of an investment in the Fund will fluctuate so that an investor’s shares, when redeemed, may be worth more or less than their original cost. The graphs and table do not reflect the deduction of taxes that a shareholder would pay on Fund distributions or redemption of Fund shares. Current performance may be lower or higher. Performance data current to the most recent month-end may be obtained by calling (866) 499-2151.
The returns shown for Class A Shares reflect a deduction for the maximum front-end sales charge of 5.00%. All of the Fund’s share classes apply a 2.00% redemption fee to the value of shares redeemed within 30 days of purchase. This redemption fee is not reflected in the returns shown above. As stated in the current prospectus dated September 1, 2019, the Fund’s “Total Annual Fund Operating Expenses” are 1.69% and 1.44%, and the Fund’s “Total Annual Fund Operating Expenses After Fee Waiver and/or Expense Reimbursement” are 1.10% and 0.85% for Class A and Class I Shares, respectively, of the Fund’s average daily net assets. These rates may fluctuate and may differ from the actual expenses incurred by the Fund for the period covered by this report. Lateef Investment Management, L.P. (“the Adviser”) has contractually agreed to reduce its investment advisory fee and/or reimburse certain expenses of the Fund to the extent necessary to ensure that the Fund’s total operating expenses (excluding taxes, fees and expenses attributable to a distribution or service plan adopted by FundVantage Trust (the “Trust”), interest, extraordinary items, “Acquired Fund Fees and Expenses,“ and brokerage commissions) do not exceed 0.85% (on an annual basis) of the Fund’s average daily net assets (the “Expense Limitation”). The Expense Limitation shall remain in effect until August 31, 2020, unless the Board of Trustees of FundVantage Trust (”the Trust“) approves its earlier termination. Total returns would be lower had such fees and/or expenses not been waived and/or reimbursed.
All mutual fund investing involves risk, including possible loss of principal. The Fund is non-diversified, which means that a portion of the Fund’s assets may be invested in one or few companies or sectors. The Fund could fluctuate in value more than a diversified fund.
The Fund intends to evaluate performance as compared to that of the Standard & Poor’s 500® Index (“S&P 500®”) and the Russell 3000® Index. The S&P 500® is a widely recognized, unmanaged index of 500 common stocks which are generally representative of the U.S. stock market as a whole. The Russell 3000® Index is an unmanaged index that measures the performance of the 3,000 largest U.S. stocks, representing about 98% of the total capitalization of the entire U.S. stock market. It is impossible to invest directly in an index.
14
LATEEF FOCUSED SUSTAINABLE GROWTH FUND
(formerly Lateef Focused Growth Fund)
Fund Expense Disclosure
April 30, 2020
(Unaudited)
As a shareholder of the Fund, you incur two types of costs: (1) transaction costs including sales charges (loads) on purchase payments (if any) or redemption fees; and (2) ongoing costs, including management fees, distribution and/or service (Rule 12b-1) fees (if any) and other Fund expenses. These examples are intended to help you understand your ongoing costs (in dollars) of investing in the Fund and to compare these costs with the ongoing costs of investing in other mutual funds.
These examples are based on an investment of $1,000 invested at the beginning of the six-month period from November 1, 2019 through April 30, 2020 and held for the entire period.
Actual Expenses
The first line of the accompanying table provides information about actual account values and actual expenses. You may use the information in this line, together with the amount you invested, to estimate the expenses that you paid over the period. Simply divide your account value by $1,000 (for example, an $8,600 account value divided by $1,000 = 8.6), then multiply the result by the number in the first line under the heading entitled “Expenses Paid During Period” to estimate the expenses you paid on your account during this period.
Hypothetical Examples for Comparison Purposes
The second line of the accompanying table provides information about hypothetical account values and hypothetical expenses based on the Fund’s actual expense ratio and an assumed rate of return of 5% per year before expenses, which is not your Fund’s actual return. The hypothetical account values and expenses may not be used to estimate the actual ending account balance or expenses you paid for the period. You may use this information to compare the ongoing costs of investing in the Fund and other funds. To do so, compare these 5% hypothetical examples with the 5% hypothetical examples that appear in the shareholder reports of other funds.
Please note that the expenses shown in the accompanying table are meant to highlight your ongoing costs only and do not reflect any transactional costs, such as sales charges (loads) on purchase payments (if any) or redemption fees. Therefore, each hypothetical line of the accompanying table is useful in comparing ongoing costs only and will not help you determine the relative total costs of owning different funds. In addition, if these transactional costs were included, your costs would have been higher.
15
LATEEF FOCUSED SUSTAINABLE GROWTH FUND
(formerly Lateef Focused Growth Fund)
Fund Expense Disclosure (Concluded)
April 30, 2020
(Unaudited)
| Lateef Focused Sustainable Growth Fund | ||||||||||||
| Beginning Account Value | Ending Account Value | Expenses Paid | ||||||||||
| November 1, 2019 | April 30, 2020 | During Period* | ||||||||||
Class A | ||||||||||||
Actual | $1,000.00 | $ 962.60 | $5.37 | |||||||||
Hypothetical (5% return before expenses) | 1,000.00 | 1,019.39 | 5.52 | |||||||||
Class I | ||||||||||||
Actual | $1,000.00 | $963.40 | $4.15 | |||||||||
Hypothetical (5% return before expenses) | 1,000.00 | 1,020.64 | 4.27 | |||||||||
| * | Expenses are equal to an annualized expense ratio for the six-month period ended April 30, 2020 of 1.10% and 0.85% for Class A and Class I shares, respectively, for the Fund, multiplied by the average account value over the period, multiplied by the number of days in the most recent period (182), then divided by 366 to reflect the period. The Fund’s ending account values on the first line in the table are based on the actual six-month total returns for the Fund of (3.74)% and (3.66)% for Class A and Class I shares, respectively. |
16
LATEEF FOCUSED SUSTAINABLE GROWTH FUND
(formerly Lateef Focused Growth Fund)
Portfolio Holdings Summary Table
April 30, 2020
(Unaudited)
The following table presents a summary by sector of the portfolio holdings of the Fund:
| % of Net | ||||||||
| Assets | Value | |||||||
COMMON STOCKS: | ||||||||
Technology | 32.1 | % | $ | 12,962,269 | ||||
Consumer, Non-cyclical | 25.2 | 10,199,051 | ||||||
Industrial | 16.1 | 6,520,649 | ||||||
Financial | 15.7 | 6,368,013 | ||||||
Consumer, Cyclical | 7.7 | 3,097,504 | ||||||
Other Assets in Excess of Liabilities | 3.2 | 1,291,906 | ||||||
|
|
|
| |||||
NET ASSETS | 100.0 | % | $ | 40,439,392 | ||||
|
|
|
| |||||
Portfolio holdings are subject to change at any time.
17
LATEEF FOCUSED SUSTAINABLE GROWTH FUND
(formerly Lateef Focused Growth Fund)
Portfolio of Investments
April 30, 2020
| Number | ||||||||
| of Shares | Value | |||||||
COMMON STOCKS — 96.8% |
| |||||||
Consumer, Cyclical — 7.7% |
| |||||||
Aptiv PLC | 20,573 | $ | 1,430,852 | |||||
Starbucks Corp. | 21,721 | 1,666,652 | ||||||
|
| |||||||
| 3,097,504 | ||||||||
|
| |||||||
Consumer, Non-cyclical — 25.2% |
| |||||||
Catalent, Inc.* | 22,016 | 1,522,406 | ||||||
Clarivate Analytics PLC* | 90,355 | 2,076,358 | ||||||
Danaher Corp. | 15,701 | 2,566,485 | ||||||
Elanco Animal Health, Inc.* | 64,281 | 1,588,384 | ||||||
IQVIA Holdings, Inc.* | 17,150 | 2,445,418 | ||||||
|
| |||||||
| 10,199,051 | ||||||||
|
| |||||||
Financial — 15.7% | ||||||||
Aon PLC | 7,777 | 1,342,855 | ||||||
Equinix, Inc. | 2,553 | 1,723,786 | ||||||
Progressive Corp. (The) | 25,958 | 2,006,553 | ||||||
SVB Financial Group* | 6,703 | 1,294,819 | ||||||
|
| |||||||
| 6,368,013 | ||||||||
|
| |||||||
Industrial — 16.1% | ||||||||
Ball Corp. | 28,614 | 1,876,792 | ||||||
Crown Holdings, Inc.* | 19,947 | 1,284,786 | ||||||
Keysight Technologies, Inc.* | 14,419 | 1,395,327 | ||||||
Martin Marietta Materials, Inc. | 10,323 | 1,963,744 | ||||||
|
| |||||||
| 6,520,649 | ||||||||
|
| |||||||
| Number | ||||||||
| of Shares | Value | |||||||
COMMON STOCKS — (Continued) |
| |||||||
Technology — 32.1% | ||||||||
Alphabet, Inc., Class A* | 1,168 | $ | 1,572,946 | |||||
Fiserv, Inc.* | 16,274 | 1,677,198 | ||||||
Microsoft Corp. | 11,037 | 1,977,941 | ||||||
New York Times Co. (The), Class A | 44,155 | 1,435,921 | ||||||
Palo Alto Networks, Inc.* | 5,764 | �� | 1,132,684 | |||||
PTC, Inc.* | 29,007 | 2,008,735 | ||||||
Twitter Inc* | 40,783 | 1,169,656 | ||||||
Visa, Inc., Class A | 11,119 | 1,987,188 | ||||||
|
| |||||||
| 12,962,269 | ||||||||
|
| |||||||
TOTAL COMMON STOCKS |
| 39,147,486 | ||||||
|
| |||||||
TOTAL INVESTMENTS - 96.8% (Cost $30,024,196) | 39,147,486 | |||||||
|
| |||||||
OTHER ASSETS IN EXCESS OF LIABILITIES - 3.2% | 1,291,906 | |||||||
|
| |||||||
NET ASSETS - 100.0% | $ | 40,439,392 | ||||||
|
| |||||||
| * | Non-income producing. |
PLC Public Limited Company
The accompanying notes are an integral part of the financial statements.
18
LATEEF FOCUSED SUSTAINABLE GROWTH FUND
(formerly Lateef Focused Growth Fund)
Statement of Assets and Liabilities
April 30, 2020
Assets | ||||
Investments, at value (Cost $30,024,196) | $ | 39,147,486 | ||
Cash | 1,896,193 | |||
Receivable for capital shares sold | 72,770 | |||
Dividends and interest receivable | 3,422 | |||
Receivable from Investment Adviser | 17,848 | |||
Prepaid expenses and other assets | 15,136 | |||
|
| |||
Total assets | 41,152,855 | |||
|
| |||
Liabilities | ||||
Payable for capital shares redeemed | 171,854 | |||
Payable for investments purchased | 456,717 | |||
Payable for audit fees | 27,540 | |||
Payable for transfer agent fees | 24,525 | |||
Payable for administration and accounting fees | 11,994 | |||
Payable for custodian fees | 6,598 | |||
Payable for distribution fees | 4,107 | |||
Accrued expenses | 10,128 | |||
|
| |||
Total liabilities | 713,463 | |||
|
| |||
Net Assets | $ | 40,439,392 | ||
|
| |||
Net Assets consisted of: | ||||
Capital stock, $0.01 par value | $ | 58,438 | ||
Paid-in capital | 24,754,335 | |||
Total distributable earnings. | 15,626,619 | |||
|
| |||
Net Assets | $ | 40,439,392 | ||
|
|
Class A Shares: | ||||
Net asset value and redemption price per share | $6.74 | |||
|
| |||
Maximum offering price per share (100/95 of $6.74) | $7.09 | |||
|
| |||
Class I Shares: | ||||
Net asset value, offering and redemption price per share | $7.16 | |||
|
| |||
The accompanying notes are an integral part of the financial statements.
19
LATEEF FOCUSED SUSTAINABLE GROWTH FUND
(formerly Lateef Focused Growth Fund)
Statement of Operations
For the Year Ended April 30, 2020
Investment income | ||||
Dividends | $ | 333,518 | ||
|
| |||
Total investment income | 333,518 | |||
|
| |||
Expenses | ||||
Advisory fees (Note 2) | 409,069 | |||
Transfer agent fees (Note 2) | 116,505 | |||
Administration and accounting fees (Note 2) | 63,913 | |||
Distribution fees (Class A) (Note 2) | 57,435 | |||
Registration and filing fees | 50,329 | |||
Legal fees | 40,444 | |||
Trustees’ and officers’ fees | 39,925 | |||
Distribution fees (Class C) (Note 2) | 29,276 | |||
Audit fees | 27,978 | |||
Printing and shareholder reporting fees | 20,775 | |||
Custodian fees (Note 2) | 18,564 | |||
Shareholder services fees | 9,759 | |||
Other expenses | 18,116 | |||
|
| |||
Total expenses before waivers | 902,088 | |||
|
| |||
Less: waivers (Note 2) | (397,634 | ) | ||
|
| |||
Net expenses after waivers | 504,454 | |||
|
| |||
Net investment loss. | (170,936 | ) | ||
|
| |||
Net realized and unrealized gain/(loss) from investments: | ||||
Net realized gain from investments | 7,659,560 | |||
Net realized gain from written options* | 157,357 | |||
Net change in unrealized appreciation/(depreciation) from investments | (6,108,104 | ) | ||
|
| |||
Net realized and unrealized gain from investments | 1,708,813 | |||
|
| |||
Net increase in net assets resulting from operations | $ | 1,537,877 | ||
|
|
| * | Primary risk exposure is equity contracts. |
The accompanying notes are an integral part of the financial statements.
20
LATEEF FOCUSED SUSTAINABLE GROWTH FUND
(formerly Lateef Focused Growth Fund)
Statements of Changes in Net Assets
| For the | For the | |||||||
| Year Ended | Year Ended | |||||||
| April 30, 2020 | April 30, 2019 | |||||||
Increase/(decrease) in net assets from operations: | ||||||||
Net investment loss | $ | (170,936 | ) | $ | (160,643 | ) | ||
Net realized gain from investments and written options | 7,816,917 | 9,611,109 | ||||||
Net change in unrealized appreciation/(depreciation) from investments | (6,108,104 | ) | (3,876,905 | ) | ||||
|
|
|
| |||||
Net increase in net assets resulting from operations: | 1,537,877 | 5,573,561 | ||||||
|
|
|
| |||||
Less dividends and distributions to shareholders from: | ||||||||
Total distributable earnings | ||||||||
Class A | (4,036,640 | ) | (3,422,289 | ) | ||||
Class C | — | (2,775,002 | ) | |||||
Class I | (2,910,487 | ) | (5,884,973 | ) | ||||
|
|
|
| |||||
Net decrease in net assets from dividends and distributions to shareholders | (6,947,127 | ) | (12,082,264 | ) | ||||
|
|
|
| |||||
Decrease in net assets derived from capital share transactions (Note 4) | (6,256,502 | ) | (19,034,933 | ) | ||||
|
|
|
| |||||
Total decrease in net assets | (11,665,752 | ) | (25,543,636 | ) | ||||
|
|
|
| |||||
Net assets | ||||||||
Beginning of year | 52,105,144 | 77,648,780 | ||||||
|
|
|
| |||||
End of year | $ | 40,439,392 | $ | 52,105,144 | ||||
|
|
|
| |||||
The accompanying notes are an integral part of the financial statements.
21
LATEEF FOCUSED SUSTAINABLE GROWTH FUND
(formerly Lateef Focused Growth Fund)
Financial Highlights
Contained below is per share operating performance data for Class A shares outstanding, total investment return, ratios to average net assets and other supplemental data for the respective period. The total returns in the table represent the rate that an investor would have earned or lost on an investment in the Fund (assuming reinvestment of all dividends and distributions). This information has been derived from information provided in the financial statements and should be read in conjunction with the financial statements and the notes thereto.
| Class A Shares* | ||||||||||||||||||||
| For the | For the | For the | For the | For the | ||||||||||||||||
| Year | Year | Year | Year | Year | ||||||||||||||||
| Ended | Ended | Ended | Ended | Ended | ||||||||||||||||
| April 30, | April 30, | April 30, | April 30, | April 30, | ||||||||||||||||
| 2020 | 2019 | 2018 | 2017 | 2016 | ||||||||||||||||
Per Share Operating Performance | ||||||||||||||||||||
Net asset value, beginning of year | $ | 7.73 | $ | 8.60 | $ | 9.54 | $ | 10.77 | $ | 14.00 | ||||||||||
|
|
|
|
|
|
|
|
|
| |||||||||||
Net investment loss(1) | (0.03 | ) | (0.02 | ) | (0.04 | ) | (0.04 | ) | (0.05 | ) | ||||||||||
Net realized and unrealized gain/(loss) on investments | 0.27 | 0.79 | 1.40 | 1.25 | (0.19 | ) | ||||||||||||||
|
|
|
|
|
|
|
|
|
| |||||||||||
Net increase/(decrease) in net assets resulting from operations | 0.24 | 0.77 | 1.36 | 1.21 | (0.24 | ) | ||||||||||||||
|
|
|
|
|
|
|
|
|
| |||||||||||
Dividends and distributions to shareholders from: | ||||||||||||||||||||
Net investment income | — | — | — | — | (0.02 | ) | ||||||||||||||
Net realized capital gains | (1.23 | ) | (1.64 | ) | (2.30 | ) | (2.44 | ) | (2.97 | ) | ||||||||||
|
|
|
|
|
|
|
|
|
| |||||||||||
Total dividends and distributions to shareholders | (1.23 | ) | (1.64 | ) | (2.30 | ) | (2.44 | ) | (2.99 | ) | ||||||||||
|
|
|
|
|
|
|
|
|
| |||||||||||
Redemption fees | 0.00 | (2) | 0.00 | (2) | 0.00 | (2) | — | 0.00 | (2) | |||||||||||
|
|
|
|
|
|
|
|
|
| |||||||||||
Net asset value, end of year | $ | 6.74 | $ | 7.73 | $ | 8.60 | $ | 9.54 | $ | 10.77 | ||||||||||
|
|
|
|
|
|
|
|
|
| |||||||||||
Total investment return(3) | 2.11 | % | 12.62 | % | 15.26 | % | 12.64 | % | (2.31 | )% | ||||||||||
Ratios/Supplemental Data | ||||||||||||||||||||
Net assets, end of year (in thousands) | $ | 22,395 | $ | 17,375 | $ | 20,580 | $ | 24,460 | $ | 56,657 | ||||||||||
Ratio of expenses to average net assets | 1.10 | % | 1.10 | % | 1.14 | % | 1.24 | % | 1.24 | % | ||||||||||
Ratio of expenses to average net assets without waivers and expense | 1.94 | % | 1.69 | % | 1.65 | % | 1.57 | % | 1.42 | % | ||||||||||
Ratio of net investment loss to average net assets | (0.43 | )% | (0.23 | )% | (0.38 | )% | (0.35 | )% | (0.37 | )% | ||||||||||
Portfolio turnover rate | 58 | % | 51 | % | 50 | % | 42 | % | 65 | % | ||||||||||
| * | Class C Shares were converted to Class A Shares on August 30, 2019 (See Note 4). |
| (1) | The selected per share data was calculated using the average shares outstanding method for the year. |
| (2) | Amount is less than $0.005 per share. |
| (3) | Total investment return is calculated assuming a purchase of shares on the first day and a sale of shares on the last day of each period reported and includes reinvestments of dividends and distributions, if any. Total investment return does not reflect the impact of the maximum front-end sales load of 5.00%. If reflected, the return would be lower. |
| (4) | During the period, certain fees were waived. If such fee waivers had not occurred, the ratios would have been as indicated (See Note 2). |
The accompanying notes are an integral part of the financial statements.
22
LATEEF FOCUSED SUSTAINABLE GROWTH FUND
(formerly Lateef Focused Growth Fund)
Financial Highlights
Contained below is per share operating performance data for Class I shares outstanding, total investment return, ratios to average net assets and other supplemental data for the respective period. The total returns in the table represent the rate that an investor would have earned or lost on an investment in the Fund (assuming reinvestment of all dividends and distributions). This information has been derived from information provided in the financial statements and should be read in conjunction with the financial statements and the notes thereto.
| Class I Shares | ||||||||||||||||||||
| For the | For the | For the | For the | For the | ||||||||||||||||
| Year | Year | Year | Year | Year | ||||||||||||||||
| Ended | Ended | Ended | Ended | Ended | ||||||||||||||||
| April 30, | April 30, | April 30, | April 30, | April 30, | ||||||||||||||||
| 2020 | 2019 | 2018 | 2017 | 2016 | ||||||||||||||||
Per Share Operating Performance | ||||||||||||||||||||
Net asset value, beginning of year | $ | 8.12 | $ | 8.93 | $ | 9.80 | $ | 10.98 | $ | 14.22 | ||||||||||
|
|
|
|
|
|
|
|
|
| |||||||||||
Net investment income/(loss)(1) | (0.01 | ) | 0.00 | (2) | (0.01 | ) | (0.01 | ) | (0.02 | ) | ||||||||||
Net realized and unrealized gain/(loss) on investments | 0.28 | 0.83 | 1.44 | 1.27 | (0.19 | ) | ||||||||||||||
|
|
|
|
|
|
|
|
|
| |||||||||||
Net increase/(decrease) in net assets resulting from operations | 0.27 | 0.83 | 1.43 | 1.26 | (0.21 | ) | ||||||||||||||
|
|
|
|
|
|
|
|
|
| |||||||||||
Dividends and distributions to shareholders from: | ||||||||||||||||||||
Net investment income | — | — | — | — | (0.06 | ) | ||||||||||||||
Net realized capital gains | (1.23 | ) | (1.64 | ) | (2.30 | ) | (2.44 | ) | (2.97 | ) | ||||||||||
|
|
|
|
|
|
|
|
|
| |||||||||||
Total dividends and distributions to shareholders | (1.23 | ) | (1.64 | ) | (2.30 | ) | (2.44 | ) | (3.03 | ) | ||||||||||
|
|
|
|
|
|
|
|
|
| |||||||||||
Redemption fees | 0.00 | (2) | 0.00 | (2) | 0.00 | (2) | — | 0.00 | (2) | |||||||||||
|
|
|
|
|
|
|
|
|
| |||||||||||
Net asset value, end of year | $ | 7.16 | $ | 8.12 | $ | 8.93 | $ | 9.80 | $ | 10.98 | ||||||||||
|
|
|
|
|
|
|
|
|
| |||||||||||
Total investment return(3) | 2.40 | % | 12.85 | % | 15.59 | % | 12.86 | % | (2.04 | )% | ||||||||||
Ratios/Supplemental Data | ||||||||||||||||||||
Net assets, end of year (in thousands) | $ | 18,045 | $ | 23,167 | $ | 41,982 | $ | 66,969 | $ | 358,492 | ||||||||||
Ratio of expenses to average net assets | 0.85 | % | 0.85 | % | 0.89 | % | 0.99 | % | 0.99 | % | ||||||||||
Ratio of expenses to average net assets without waivers and expense | 1.68 | % | 1.44 | % | 1.41 | % | 1.28 | % | 1.16 | % | ||||||||||
Ratio of net investment income/(loss) to average net assets | (0.16 | )% | 0.02 | % | (0.14 | )% | (0.09 | )% | (0.12 | )% | ||||||||||
Portfolio turnover rate | 58 | % | 51 | % | 50 | % | 42 | % | 65 | % | ||||||||||
| (1) | The selected per share data was calculated using the average shares outstanding method for the year. |
| (2) | Amount is less than $0.005 per share. |
| (3) | Total investment return is calculated assuming a purchase of shares on the first day and a sale of shares on the last day of each period reported and includes reinvestment of dividends and distributions, if any. |
| (4) | During the period, certain fees were waived. If such fee waivers had not occurred, the ratios would have been as indicated (See Note 2). |
The accompanying notes are an integral part of the financial statements.
23
LATEEF FOCUSED SUSTAINABLE GROWTH FUND
(formerly Lateef Focused Growth Fund)
Notes to Financial Statements
April 30, 2020
1. Organization and Significant Accounting Policies
The Lateef Focused Sustainable Growth Fund (the “Fund”) is a non-diversified, open-end management investment company registered under the Investment Company Act of 1940, as amended (the “1940 Act”), which commenced investment operations on September 6, 2007. The Fund is a separate series of FundVantage Trust (the “Trust”) which was organized as a Delaware statutory trust on August 28, 2006. The Trust is a “series trust” authorized to issue an unlimited number of separate series or classes of shares of beneficial interest. Each series is treated as a separate entity for certain matters under the 1940 Act, and for other purposes, and a shareholder of one series is not deemed to be a shareholder of any other series. The Fund offers separate classes of shares, Class A and Class I shares. Class A shares are sold subject to a front-end sales charge. Front-end sales charges may be reduced or waived under certain circumstances. A contingent deferred sales charge (“CDSC”) may be applicable to the purchase of Class A shares. A CDSC, as a percentage of the lower of the original purchase price or net asset value at redemption, of up to 1.00% may be imposed on full or partial redemptions of Class A shares made within eighteen months of purchase where: (i) $1 million or more of Class A shares were purchased without an initial sales charge and (ii) the selling broker-dealer received a commission for such sale. Effective August 30, 2019, Class C Shares were converted to Class A Shares, and Class C Shares were concurrently terminated.
The Fund is an investment company and follows accounting and reporting guidance in the Financial Accounting Standards Board Accounting Standards Codification Topic 946.
Portfolio Valuation — The Fund’s net asset value (“NAV”) is calculated once daily at the close of regular trading hours on the New York Stock Exchange (“NYSE”) (typically 4:00 p.m. Eastern time) on each day the NYSE is open. Securities held by the Fund are valued using the closing price or the last sale price on a national securities exchange or the National Association of Securities Dealers Automatic Quotation System (“NASDAQ”) market system where they are primarily traded. Equity securities traded in the over-the-counter market are valued at their closing prices. If there were no transactions on that day, securities traded principally on an exchange or on NASDAQ will be valued at the mean of the last bid and ask prices prior to the market close. Fixed income securities having a remaining maturity of greater than 60 days are valued using an independent pricing service. Fixed income securities having a remaining maturity of 60 days or less are generally valued at amortized cost, provided such amount approximates fair value. Foreign securities are valued based on prices from the primary market in which they are traded and are translated from the local currency into U.S. dollars using current exchange rates. Investments in other open-end investment companies are valued based on the NAV of the investment companies (which may use fair value pricing as discussed in their prospectuses). If market quotations are unavailable or deemed unreliable, securities will be valued in accordance with procedures adopted by the Trust’s Board of Trustees (“Board of Trustees”). Options are valued at last sale price. Relying on prices supplied by pricing services or dealers or using fair valuation may result in values that are higher or lower than the values used by other investment companies and investors to price the same investments. In the event
24
LATEEF FOCUSED SUSTAINABLE GROWTH FUND
(formerly Lateef Focused Growth Fund)
Notes to Financial Statements (Continued)
April 30, 2020
that market quotes are not readily available, and the security or asset cannot be valued pursuant to one of the valuation methods, the value of the security or asset will be determined in good faith by the Adviser. The Trust has established a Valuation Committee which performs certain functions including the oversight of the Adviser’s fair valuation determinations.
Fair Value Measurements — The inputs and valuation techniques used to measure fair value of the Fund’s investments are summarized into three levels as described in the hierarchy below:
| · Level 1 — | quoted prices in active markets for identical securities; |
| · Level 2 — | other significant observable inputs (including quoted prices for similar securities, interest rates, prepayment speeds, credit risk, etc.); and |
| · Level 3 — | significant unobservable inputs (including the Fund’s own assumptions in determining the fair value of investments). |
The inputs or methodology used for valuing securities are not necessarily an indication of the risk associated with investing in those securities.
The following is a summary of the inputs used, as of April 30, 2020, in valuing the Fund’s investments carried at fair value:
| Level 2 | Level 3 | |||||||||||||||
| Level 1 | Other Significant | Significant | ||||||||||||||
| Total Value at | Quoted | Observable | Unobservable | |||||||||||||
| 04/30/20 | Price | Inputs | Inputs | |||||||||||||
Investments in Securities* | $ | 39,147,486 | $ | 39,147,486 | $ | — | $ | — | ||||||||
|
|
|
|
|
|
|
| |||||||||
| * | Please refer to Portfolio of Investments for further details on portfolio holdings. |
At the end of each quarter, management evaluates the classification of Levels 1, 2 and 3 assets and liabilities. Various factors are considered, such as changes in liquidity from the prior reporting period; whether or not a broker is willing to execute at the quoted price; the depth and consistency of prices from third party pricing services; and the existence of contemporaneous, observable trades in the market. Additionally, management evaluates the classification of Level 1 and Level 2 assets and liabilities on a quarterly basis for changes in listings or delistings on national exchanges.
Due to the inherent uncertainty of determining the fair value of investments that do not have a readily available market value, the fair value of the Fund’s investments may fluctuate from period to period. Additionally, the fair value of investments may differ significantly from the values that would have been used had a ready market existed for such investments and may differ materially from the values the Fund
25
LATEEF FOCUSED SUSTAINABLE GROWTH FUND
(formerly Lateef Focused Growth Fund)
Notes to Financial Statements (Continued)
April 30, 2020
may ultimately realize. Further, such investments may be subject to legal and other restrictions on resale or are otherwise less liquid than publicly traded securities.
For fair valuations using significant unobservable inputs, U.S. generally accepted accounting principles (“U.S. GAAP”) require the Fund to present a reconciliation of the beginning to ending balances for reported market values that present changes attributable to total realized and unrealized gains or losses, purchase and sales, and transfers in and out of Level 3 during the period. A reconciliation of Level 3 investments is presented only when the Fund had an amount of Level 3 investments at the end of the reporting period that was meaningful in relation to its net assets. The amounts and reasons for all transfers in and out of each Level within the three-tier hierarchy are disclosed when the Fund had an amount of total transfers during the reporting period that was meaningful in relation to its net assets as of the end of the reporting period.
For the year ended April 30, 2020, there were no transfers in or out of Level 3.
Use of Estimates — The preparation of financial statements in conformity with U.S. GAAP requires management to make estimates and assumptions that affect the amounts reported in the financial statements and accompanying notes at the date of the financial statements and the reported amounts of revenues and expenses during the period. Actual results could differ from those estimates and those differences could be material.
Investment Transactions, Investment Income and Expenses — Investment transactions are recorded on trade date for financial statement preparation purposes. Realized gains and losses on investments sold are recorded on the identified cost basis. Interest income is recorded on the accrual basis. Dividends are recorded on the ex-dividend date. Distribution (12b-1) fees and shareholder services fees relating to a specific class are charged directly to that class. Fund level expenses common to all classes, investment income and realized and unrealized gains and losses on investments are allocated to each class based upon the relative daily net assets of each class. General expenses of the Trust are generally allocated to each fund in proportion to its relative daily net assets. Expenses directly attributable to a particular fund in the Trust are charged directly to that fund.
Cash and Cash Equivalent — Cash and cash equivalents include cash and overnight investments in interest-bearing demand deposits with a financial institution with original maturities of three months or less. The Fund maintains deposits with a high quality financial institution in an amount that is in excess of federally insured limits.
Dividends and Distributions to Shareholders — Dividends from net investment income and distributions from net realized capital gains, if any, are declared, recorded on ex-date and paid at least annually to shareholders. Income dividends and capital gain distributions are determined in accordance with U.S. federal income tax regulations, which may differ from U.S. GAAP.
26
LATEEF FOCUSED SUSTAINABLE GROWTH FUND
(formerly Lateef Focused Growth Fund)
Notes to Financial Statements (Continued)
April 30, 2020
U.S. Tax Status — No provision is made for U.S. income taxes as it is the Fund’s intention to continue to qualify for and elect the tax treatment applicable to regulated investment companies under Subchapter M of the Internal Revenue Code of 1986, as amended (the “Internal Revenue Code”), and make the requisite distributions to its shareholders which will be sufficient to relieve it from U.S. income and excise taxes.
Other — In the normal course of business, the Fund may enter into contracts that provide general indemnifications. The Fund’s maximum exposure under these arrangements is dependent on claims that may be made against the Fund in the future, and therefore, cannot be estimated; however, based on experience, the risk of material loss for such claims is considered remote.
Market disruptions associated with the COVID-19 pandemic have had a global impact, and uncertainty exists as to its long-term implications. The COVID-19 pandemic could adversely affect the value and liquidity of the Fund’s investments, impair the Fund’s ability to satisfy redemption requests, and negatively impact the Fund’s performance. In addition, the outbreak of COVID-19, and measures taken to mitigate its effects, could result in disruptions to the services provided to the Fund by its service providers. Fund management is continuing to monitor this development and evaluate its impact on the Fund.
Currency Risk — The Fund invests in securities of foreign issuers, including American Depositary Receipts. These markets are subject to special risks associated with foreign investments not typically associated with investing in U.S. markets. Because the foreign securities in which the Fund may invest generally trade in currencies other than the U.S. dollar, changes in currency exchange rates will affect the Fund’s NAV, the value of dividends and interest earned and gains and losses realized on the sale of securities. Because the NAV for the Fund is determined on the basis of U.S. dollars, the Fund may lose money by investing in a foreign security if the local currency of a foreign market depreciates against the U.S. dollar, even if the local currency value of the Fund’s holdings goes up. Generally, a strong U.S. dollar relative to these other currencies will adversely affect the value of the Fund’s holdings in foreign securities.
Written Options — The Fund is subject to equity and other risk exposure in the normal course of pursuing its investment objectives and may enter into options written to hedge against changes in interest rates, foreign exchange rates and values of equities. Such options may relate to particular securities or domestic stock indices, and may or may not be listed on a domestic securities exchange or issued by the Options Clearing Corporation. An option contract is a commitment that gives the purchaser of the contract the right, but not the obligation, to buy or sell an underlying asset at a specific price on or before a specified future date. On the other hand, the writer of an option contract is obligated, upon the exercise of the option, to buy or sell an underlying asset at a specific price on or before a specified future date. The maximum risk of loss associated with writing put options is limited to the exercised fair value of the option contract. The maximum risk of loss associated with writing call options is potentially unlimited. The Fund also has the additional risk of being unable to enter into a closing transaction at an acceptable
27
LATEEF FOCUSED SUSTAINABLE GROWTH FUND
(formerly Lateef Focused Growth Fund)
Notes to Financial Statements (Continued)
April 30, 2020
price if a liquid secondary market does not exist. The Fund also may write over-the-counter options where completing the obligation depends upon the credit standing of the other party. Option contracts also involve the risk that they may result in loss due to unanticipated developments in market conditions or other causes. Written options are initially recorded as liabilities to the extent of premiums received and subsequently marked to market to reflect the current value of the option written. Gains or losses are realized when the option transaction expires or closes. When an option is exercised, the proceeds on sales for a written call option or the purchase cost for a written put option is adjusted by the amount of the premium received. Listed option contracts present minimal counterparty credit risk since they are exchange traded and the exchange’s clearinghouse, as counterparty to all exchange-traded options, guarantees the options against default. The Fund’s maximum risk of loss from counterparty credit risk related to OTC option contracts is limited to the premium paid. As of April 30, 2020, the Fund had no written options.
For the year ended April 30, 2020, the Fund’s quarterly average volume of derivatives is as follows:
| Written |
| Options |
| Proceeds |
$18,287 |
2. Transactions with Related Parties and Other Service Providers
Lateef Investment Management, L.P. (“Lateef” or the “Adviser”) serves as investment adviser to the Fund pursuant to an investment advisory agreement with the Trust. For its services, the Advisor is entitled to receive an annual investment advisory fee, paid monthly, comprising 0.85% of the average daily net assets of the Fund. The Adviser has contractually agreed to reduce its investment advisory fee and/or reimburse certain expenses of the Fund to the extent necessary to ensure that the Fund’s total operating expenses (excluding taxes, fees and expenses attributable to a distribution or service plan adopted by the Trust, interest, extraordinary items, “Acquired Fund Fees and Expenses ” and brokerage commissions) do not exceed 0.85% (on an annual basis) of the Fund’s average daily net assets (the “Expense Limitation”). The Expense Limitation shall remain in effect until August 31, 2020, unless the Board of Trustees of the Trust approves its earlier termination. Each class of shares of the Fund pays its respective pro-rata portion of the advisory fee payable by the Fund.
For the year ended April 30, 2020, the Adviser earned advisory fees of $409,069 and waived fees of $397,634.
28
LATEEF FOCUSED SUSTAINABLE GROWTH FUND
(formerly Lateef Focused Growth Fund)
Notes to Financial Statements (Continued)
April 30, 2020
Other Service Providers
The Bank of New York Mellon (“BNY Mellon”) serves as administrator and custodian for the Fund. For providing administrative and accounting services, BNY Mellon is entitled to receive a monthly fee equal to an annual percentage rate of the Fund’s average daily net assets and is subject to certain minimum monthly fees. For providing certain custodial services, BNY Mellon is entitled to receive a monthly fee, subject to certain minimum, and out of pocket expenses.
BNY Mellon Investment Servicing (US) Inc. (the “Transfer Agent”) provides transfer agent services to the Fund. The Transfer Agent is entitled to receive a monthly fee, subject to certain minimum, and out of pocket expenses.
The Trust, on behalf of the Fund, has entered into agreements with financial intermediaries to provide recordkeeping, processing, shareholder communications and other services to customers of the intermediaries investing in the Fund and have agreed to compensate the intermediaries for providing those services. The fees incurred by the Fund for these services are included in Transfer agent fees in the Statement of Operations.
Foreside Funds Distributors LLC (the “Underwriter”) provides principal underwriting services to the Fund pursuant to an underwriting agreement between the Trust and the Underwriter.
The Trust and the Underwriter are parties to an underwriting agreement. The Trust has adopted a distribution plan for Class A Shares in accordance with Rule 12b-1 under the 1940 Act. Pursuant to the Class A Shares plan, the Fund compensates the Underwriter for direct and indirect costs and expenses incurred in connection with advertising, marketing and other distribution services in an amount not to exceed 0.25% and 1.00% (0.75% Rule 12b-1 distribution fee and 0.25% shareholder service fee), respectively, on an annualized basis of the average daily net assets of the Fund’s Class A Shares.
Trustees and Officers
The Trust is governed by its Board of Trustees. The Trustees receive compensation in the form of an annual retainer and per meeting fees for their services to the Trust. An employee of BNY Mellon serves as the Secretary of the Trust and is not compensated by the Fund or the Trust.
JW Fund Management LLC (“JWFM”) provides a Principal Executive Officer and Principal Financial Officer, respectively, to the Trust. Duff & Phelps, LLC (“D&P”) provides the Trust with a Chief Compliance Officer and an Anti-Money Laundering Officer. JWFM and D&P are compensated for their services provided to the Trust.
29
LATEEF FOCUSED SUSTAINABLE GROWTH FUND
(formerly Lateef Focused Growth Fund)
Notes to Financial Statements (Continued)
April 30, 2020
3. Investment in Securities
For the year ended April 30, 2020, aggregate purchases and sales of investment securities (excluding short-term investments) of the Fund were as follows:
| Purchases | Sales | |||||||
Investment Securities | $ | 27,008,556 | $ | 41,192,199 | ||||
4. Capital Share Transactions
For the years ended April 30, 2020 and 2019, transactions in capital shares (authorized shares unlimited) were as follows:
| For the Year Ended | For the Year Ended | |||||||||||||||
| April 30, 2020 | April 30, 2019 | |||||||||||||||
| Shares | Amount | Shares | Amount | |||||||||||||
Class A* | ||||||||||||||||
Sales | 222,924 | $ | 1,665,845 | 191,257 | $ | 1,383,540 | ||||||||||
Reinvestments | 464,711 | 3,350,569 | 482,695 | 3,127,861 | ||||||||||||
Redemption Fees** | — | 72 | — | 7 | ||||||||||||
Redemptions | (1,048,204 | ) | (7,987,793 | ) | (820,032 | ) | (6,208,686 | ) | ||||||||
Converted from Class C Shares | 1,436,082 | 11,804,592 | — | — | ||||||||||||
|
|
|
|
|
|
|
| |||||||||
Net increase/(decrease) | 1,075,513 | $ | 8,833,285 | (146,080 | ) | $ | (1,697,278 | ) | ||||||||
|
|
|
|
|
|
|
| |||||||||
Class C* | ||||||||||||||||
Sales | — | $ | — | 121,882 | $ | 636,092 | ||||||||||
Reinvestments | — | — | 403,047 | 2,079,723 | ||||||||||||
Redemption Fees** | — | — | — | 5 | ||||||||||||
Redemptions | (70,155 | ) | (453,329 | ) | (727,258 | ) | (4,731,618 | ) | ||||||||
Converted to Class A Shares | (1,813,636 | ) | (11,804,592 | ) | — | — | ||||||||||
|
|
|
|
|
|
|
| |||||||||
Net decrease | (1,883,791 | ) | $ | (12,257,921 | ) | (202,329 | ) | $ | (2,015,798 | ) | ||||||
|
|
|
|
|
|
|
| |||||||||
30
LATEEF FOCUSED SUSTAINABLE GROWTH FUND
(formerly Lateef Focused Growth Fund)
Notes to Financial Statements (Continued)
April 30, 2020
| For the Year Ended | For the Year Ended | |||||||||||||||
| April 30, 2020 | April 30, 2019 | |||||||||||||||
| Shares | Amount | Shares | Amount | |||||||||||||
Class I | ||||||||||||||||
Sales | 400,496 | $ | 3,230,558 | 274,897 | $ | 2,164,802 | ||||||||||
Reinvestments | 341,550 | 2,612,858 | 798,399 | 5,429,111 | ||||||||||||
Redemption Fees** | — | 60 | — | 11 | ||||||||||||
Redemptions | (1,073,266 | ) | (8,675,342 | ) | (2,924,137 | ) | (22,915,781 | ) | ||||||||
|
|
|
|
|
|
|
| |||||||||
Net decrease | (331,220 | ) | $ | (2,831,866 | ) | (1,850,841 | ) | $ | (15,321,857 | ) | ||||||
|
|
|
|
|
|
|
| |||||||||
Total Net decrease | (1,139,498 | ) | $ | (6,256,502 | ) | (2,199,250 | ) | $ | (19,034,933 | ) | ||||||
|
|
|
|
|
|
|
| |||||||||
| * | Class C Shares were converted to Class A Shares on August 30, 2019. |
| ** | There is a 2.00% redemption fee that may be charged on shares redeemed which have been held 30 days or less. The redemption fees are retained by the Fund for the benefit of the remaining shareholders and recorded as paid-in capital. |
5. Federal Tax Information
The Fund has followed the authoritative guidance on accounting for and disclosure of uncertainty in tax positions, which requires the Fund to determine whether a tax position is more likely than not to be sustained upon examination, including resolution of any related appeals or litigation processes, based on the technical merits of the position. The Fund has determined that there was no effect on the financial statements from following this authoritative guidance. In the normal course of business, the Fund is subject to examination by federal, state and local jurisdictions, where applicable, for tax years for which applicable statutes of limitations have not expired.
Distributions are determined in accordance with federal income tax regulations, which may differ in amount or character from net investment income and realized gains for financial reporting purposes. Accordingly, the character of distributions and composition of net assets for tax purposes may differ from those reflected in the accompanying financial statements. To the extent these differences are permanent, such amounts are reclassified within the components of net assets based on the tax treatment; temporary differences do not require reclassifications. For the year ended April 30, 2020, these adjustments were to decrease total distributable earnings by $1,123,730 and increase paid-in capital by $1,123,730. These permanent differences were primarily attributable to net operating loss write-off and the utilization of equalization debits. Net assets were not affected by these adjustments.
For the year ended April 30, 2020, the tax character of distributions paid by the Fund was $6,947,127 of long-term capital gains dividends. For the year ended April 30, 2019, the tax character of distributions paid by the Fund was $12,082,264 of long-term capital gains dividends.
31
LATEEF FOCUSED SUSTAINABLE GROWTH FUND
(formerly Lateef Focused Growth Fund)
Notes to Financial Statements (Concluded)
April 30, 2020
As of April 30, 2020, the components of distributable earnings on a tax basis were as follows:
Undistributed | Net Appreciation | Qualified Late-Year | Total | |||
| $6,526,732 | $9,123,290 | $(23,403) | $15,626,619 |
The differences between the book and tax basis components of distributable earnings relate primarily to the timing and recognition of income and gains for federal income tax purposes. Short term capital gains are reported as ordinary income for federal income tax purposes.
As of April 30, 2020, the federal tax cost, aggregate gross unrealized appreciation and depreciation of securities held by the Fund were as follows:
Federal tax cost | $ | 30,024,196 | ||||
|
| |||||
Gross unrealized appreciation | $ | 10,113,954 | ||||
Gross unrealized depreciation | (990,664 | ) | ||||
|
| |||||
Net unrealized appreciation | $ | 9,123,290 | ||||
|
|
Pursuant to federal income tax rules applicable to regulated investment companies, the Fund may elect to treat certain capital losses between November 1 and April 30 and late year ordinary losses ((i) ordinary losses between January 1 and April 30, and (ii) specified ordinary and currency losses between November 1 and April 30) as occurring on the first day of the following tax year. For the year ended April 30, 2020 any amount of losses elected within the tax return will not be recognized for federal income tax purposes until May 1, 2020. For the year ended April 30, 2020, the Fund had no short-term capital loss deferrals, long-term capital loss deferrals and ordinary late year loss deferrals.
Accumulated capital losses represent net capital loss carry forwards as of April 30, 2020 that may be available to offset future realized capital gains and thereby reduce future capital gains distributions. As of April 30, 2020, the Fund did not have any capital loss carry forwards.
6. Subsequent Events
Management has evaluated the impact of all subsequent events on the Fund through the date the financial statements were issued, and has determined that there are no subsequent events requiring recognition or disclosure in the financial statements.
32
LATEEF FOCUSED SUSTAINABLE GROWTH FUND
(formerly Lateef Focused Growth Fund)
Report of Independent Registered Public Accounting Firm
To the Board of Trustees of FundVantage Trust and Shareholders of Lateef Focused Sustainable Growth Fund
Opinion on the Financial Statements
We have audited the accompanying statement of assets and liabilities, including the portfolio of investments, of Lateef Focused Sustainable Growth Fund (formerly known as Lateef Focused Growth Fund) (one of the funds constituting FundVantage Trust, hereafter referred to as the “Fund”) as of April 30, 2020, the related statement of operations for the year ended April 30, 2020, the statements of changes in net assets for each of the two years in the period ended April 30, 2020, including the related notes, and the financial highlights for each of the five years in the period ended April 30, 2020 (collectively referred to as the “financial statements”). In our opinion, the financial statements present fairly, in all material respects, the financial position of the Fund as of April 30, 2020, the results of its operations for the year then ended, the changes in its net assets for each of the two years in the period ended April 30, 2020 and the financial highlights for each of the five years in the period ended April 30, 2020 in conformity with accounting principles generally accepted in the United States of America.
Basis for Opinion
These financial statements are the responsibility of the Fund’s management. Our responsibility is to express an opinion on the Fund’s financial statements based on our audits. We are a public accounting firm registered with the Public Company Accounting Oversight Board (United States) (PCAOB) and are required to be independent with respect to the Fund in accordance with the U.S. federal securities laws and the applicable rules and regulations of the Securities and Exchange Commission and the PCAOB.
We conducted our audits of these financial statements in accordance with the standards of the PCAOB. Those standards require that we plan and perform the audit to obtain reasonable assurance about whether the financial statements are free of material misstatement, whether due to error or fraud.
Our audits included performing procedures to assess the risks of material misstatement of the financial statements, whether due to error or fraud, and performing procedures that respond to those risks. Such procedures included examining, on a test basis, evidence regarding the amounts and disclosures in the financial statements. Our audits also included evaluating the accounting principles used and significant estimates made by management, as well as evaluating the overall presentation of the financial statements. Our procedures included confirmation of securities owned as of April 30, 2020 by correspondence with the custodian and broker; when reply was not received from broker, we performed other auditing procedures. We believe that our audits provide a reasonable basis for our opinion.
/s/ PricewaterhouseCoopers LLP
Philadelphia, Pennsylvania
June 24, 2020
We have served as the auditor of one or more Lateef Investment Management, L.P. investment companies since 2008.
33
LATEEF FOCUSED SUSTAINABLE GROWTH FUND
(formerly Lateef Focused Growth Fund)
Shareholder Tax Information
(Unaudited)
The Fund is required by Subchapter M of the Internal Revenue Code to advise its shareholders of the U.S. federal tax status of distributions received by the Fund’s shareholders in respect of such fiscal year. During the fiscal year ended April 30, 2020, the Fund paid $6,947,127 of long-term capital gain dividends to its shareholders of which $1,271,263 is from the utilization of equalization debits. Dividends from net investment income and short-term capital gains are treated as ordinary income dividends for federal income tax purposes.
All designations are based on financial information available as of the date of this annual report and, accordingly, are subject to change. For each item, it is the intention of the Fund to designate the maximum amount permitted under the Internal Revenue Code of 1986, as amended, and the regulations thereunder.
Because the Fund’s fiscal year is not the calendar year, another notification will be sent with respect to calendar year 2020. The second notification, which will reflect the amount, if any, to be used by calendar year taxpayers on their U.S. federal income tax returns, will be made in conjunction with Form 1099-DIV and will be mailed in January 2021.
Foreign shareholders will generally be subject to U.S. withholding tax on the amount of their ordinary income dividends. They will generally not be entitled to a foreign tax credit or deduction for the withholding taxes paid by the Fund, if any.
In general, dividends received by tax-exempt recipients (e.g., IRAs and Keoghs) need not be reported as taxable income for U.S. federal income tax purposes. However, some retirement trusts (e.g., corporate, Keogh and 403(b)(7) plans) may need this information for their annual information reporting.
Shareholders are advised to consult their own tax advisers with respect to the tax consequences of their investment in the Fund.
34
LATEEF FOCUSED SUSTAINABLE GROWTH FUND
(formerly Lateef Focused Growth Fund)
Other Information
(Unaudited)
Proxy Voting
Policies and procedures that the Fund uses to determine how to vote proxies relating to portfolio securities as well as information regarding how the Fund voted proxies relating to portfolio securities for the most recent 12-month period ended June 30 are available without charge, upon request, by calling (866) 499-2151 and on the Securities and Exchange Commission’s (“SEC”) website at http:// www.sec.gov.
Quarterly Portfolio Schedules
The Trust files its complete schedule of portfolio holdings with the SEC for the first and third fiscal quarters of each fiscal year (quarters ended July 31 and January 31) as an exhibit to their reports on Form N-PORT. The Trust’s portfolio holdings on Form N-PORT are available on the SEC’s website at http://www.sec.gov.
35
LATEEF FOCUSED SUSTAINABLE GROWTH FUND
(formerly Lateef Focused Growth Fund)
Privacy Notice
(Unaudited)
The privacy of your personal financial information is extremely important to us. When you open an account with us, we collect a significant amount of information from you in order to properly invest and administer your account. We take very seriously the obligation to keep that information private and confidential, and we want you to know how we protect that important information.
We collect nonpublic personal information about you from applications or other forms you complete and from your transactions with us or our affiliates. We do not disclose information about you, or our former clients, to our affiliates or to service providers or other third parties, except as permitted by law. We share only the information required to properly administer your accounts, which enables us to send transaction confirmations, monthly or quarterly statements, financials and tax forms. Even within FundVantage Trust and its affiliated entities, a limited number of people who actually service accounts will have access to your personal financial information. Further, we do not share information about our current or former clients with any outside marketing groups or sales entities.
To ensure the highest degree of security and confidentiality, FundVantage Trust and its affiliates maintain various physical, electronic and procedural safeguards to protect your personal information. We also apply special measures for authentication of information you request or submit to us on our web site.
If you have questions or comments about our privacy practices, please call us at (866) 499-2151.
36
LATEEF FOCUSED SUSTAINABLE GROWTH FUND
(formerly Lateef Focused Growth Fund)
Fund Management
(Unaudited)
FundVantage Trust (the “Trust”) is governed by a Board of Trustees (the “Trustees”). The primary responsibility of the Trustees is to represent the interest of the Trust’s shareholders and to provide oversight management of the Trust.
The following tables present certain information regarding the Trustees and officers of the Trust. None of the Trustees are an “interested person” of the Trust, the Adviser, another investment adviser of a series of the Trust, or Foreside Funds Distributors LLC, the principal underwriter of the Trust (“Underwriter”), within the meaning of the 1940 Act and each Trustee is referred to as an “Independent Trustee” and is listed under such heading below. Employees of certain service providers to the Trust serve as officers of the Trust; such persons are not compensated by the Fund. The address of each Trustee and officer as it relates to the Trust’s business is 301 Bellevue Parkway, 2nd Floor, Wilmington, DE 19809.
The Statement of Additional Information for the Fund contains additional information about the Trustees and is available, without charge, upon request, by calling (866) 499-2151.
Name and Date of Birth | Position(s) Held with Trust | Term of Office and Length of Time Served | Principal Occupation(s) During Past Five Years |
Number of Funds in Trust Complex Overseen by Trustee
| Other Directorships Held by Trustee | |||||
INDEPENDENT TRUSTEES
| ||||||||||
ROBERT J. CHRISTIAN Date of Birth: 2/49 | Trustee | Shall serve until death, resignation or removal. Trustee since 2007. Chairman from 2007 until September 30, 2019. | Retired since February 2006; Executive Vice President of Wilmington Trust Company from February 1996 to February 2006; President of Rodney Square Management Corporation (“RSMC”) (investment advisory firm) from 1996 to 2005; Vice President of RSMC from 2005 to 2006. | 39 | Optimum Fund Trust (registered investment company with 6 portfolios); Third Avenue Trust (registered investment company with 3 portfolios); Third Avenue Variable Series Trust (registered investment company with 1 portfolio). | |||||
37
LATEEF FOCUSED SUSTAINABLE GROWTH FUND
(formerly Lateef Focused Growth Fund)
Fund Management (Continued)
(Unaudited)
Name and Date of Birth | Position(s) Held with Trust | Term of Office and Length of Time Served | Principal Occupation(s) During Past Five Years |
Number of Funds in Trust Complex Overseen by Trustee
| Other Directorships Held by Trustee | |||||
IQBAL MANSUR Date of Birth: 6/55 | Trustee | Shall serve until death, resignation or removal. Trustee since 2007. | University Professor, Widener University. | 39 | Third Avenue Trust (registered investment company with 3 portfolios); Third Avenue Variable Series Trust (registered investment company with 1 portfolio). | |||||
NICHOLAS M. MARSINI, JR. Date of Birth: 8/55 | Trustee and Chairman of the Board | Shall serve until death, resignation or removal. Trustee since 2016. Chairman since October 1, 2019. | Retired since March 2016. President of PNC Bank Delaware from June 2011 to March 2016; Executive Vice President of Finance of BNY Mellon from July 2010 to January 2011; Executive Vice President and Chief Financial Officer of PNC Global Investment Servicing from September 1997 to July 2010. | 39 | Brinker Capital Destinations Trust (registered investment company with 10 portfolios); Third Avenue Trust (registered investment company with 3 portfolios); Third Avenue Variable Series Trust (registered investment company with 1 portfolio). | |||||
38
LATEEF FOCUSED SUSTAINABLE GROWTH FUND
(formerly Lateef Focused Growth Fund)
Fund Management (Continued)
(Unaudited)
Name and Date of Birth | Position(s) Held with Trust | Term of Office and Length of Time Served | Principal Occupation(s) During Past Five Years |
Number of Funds in Trust Complex Overseen by Trustee
| Other Directorships Held by Trustee | |||||
NANCY B. WOLCOTT Date of Birth: 11/54 | Trustee | Shall serve until death, resignation or removal. Trustee since 2011. | Retired since May 2014; EVP, Head of GFI Client Service Delivery, BNY Mellon from January 2012 to May 2014; EVP, Head of US Funds Services, BNY Mellon from July 2010 to January 2012; President of PNC Global Investment Servicing from 2008 to July 2010; Chief Operating Officer of PNC Global Investment Servicing from 2007 to 2008; Executive Vice President of PFPC Worldwide Inc. from 2006 to 2007. | 39 | Lincoln Variable Insurance Products Trust (registered investment company with 97 portfolios); Third Avenue Trust (registered investment company with 3 portfolios); Third Avenue Variable Series Trust (registered investment company with 1 portfolio). | |||||
STEPHEN M. WYNNE Date of Birth: 1/55 | Trustee | Shall serve until death, resignation or removal. Trustee since 2009. | Retired since December 2010; Chief Executive Officer of US Funds Services, BNY Mellon Asset Servicing from July 2010 to December 2010; Chief Executive Officer of PNC Global Investment Servicing from March 2008 to July 2010; President, PNC Global Investment Servicing from 2003 to 2008. | 39 | Copeland Trust (registered investment company with 3 portfolios); Third Avenue Trust (registered investment company with 3 portfolios); Third Avenue Variable Series Trust (registered investment company with 1 portfolio). | |||||
39
LATEEF FOCUSED SUSTAINABLE GROWTH FUND
(formerly Lateef Focused Growth Fund)
Fund Management (Concluded)
(Unaudited)
Name and Date of Birth | Position(s) Held with Trust |
Term of Office and Length of Time Served
| Principal Occupation(s) During Past Five Years | |||
EXECUTIVE OFFICERS
| ||||||
JOEL L. WEISS Date of Birth: 1/63 | President and Chief Executive Officer | Shall serve until death, resignation or removal. Officer since 2007. | President of JW Fund Management LLC since June 2016; Vice President and Managing Director of BNY Mellon Investment Servicing (US) Inc. and predecessor firms from 1993 to June 2016. | |||
T. RICHARD KEYES Date of Birth: 1/57 | Treasurer and Chief Financial Officer | Shall serve until death, resignation or removal. Officer since 2016. | President of TRK Fund Consulting LLC since July 2016; Head of Tax — U.S. Fund Services of BNY Mellon Investment Servicing (US) Inc. and predecessor firms from February 2006 to July 2016. | |||
GABRIELLA MERCINCAVAGE Date of Birth: 6/68 | Assistant Treasurer | Shall serve until death, resignation or removal. Officer since 2019. | Fund Administration Consultant since January 2019; Fund Accounting and Tax Compliance Accountant to financial services companies from November 2003 to July 2018. | |||
VINCENZO A. SCARDUZIO Date of Birth: 4/72 | Secretary | Shall serve until death, resignation or removal. Officer since 2012. | Director and Vice President Regulatory Administration of The Bank of New York Mellon and predecessor firms since 2001. | |||
DAVID C. LEBISKY Date of Birth: 5/72 | Chief Compliance Officer and Anti-Money Laundering Officer | Shall serve until death, resignation or removal. Officer since 2015. | President of Lebisky Compliance Consulting LLC since October 2015; Consultant, Duff & Phelps, LLC since 2016; Senior Consultant, Freeh Group International Solutions, LLC (a global risk management firm) from 2015 to 2018; Scotia Institutional Investments US, LP, Director of Regulatory Administration from 2010 to 2014. | |||
40
[THIS PAGE INTENTIONALLY LEFT BLANK.]
[THIS PAGE INTENTIONALLY LEFT BLANK.]
[THIS PAGE INTENTIONALLY LEFT BLANK.]
Investment Adviser
Lateef Investment Management, L.P.
1000 Fourth Street
Suite 800
San Rafael, CA 94901
Administrator
The Bank of New York Mellon
301 Bellevue Parkway
Wilmington, DE 19809
Transfer Agent
BNY Mellon Investment Servicing (US) Inc.
4400 Computer Drive
Westborough, MA 01581
Principal Underwriter
Foreside Funds Distributors LLC
400 Berwyn Park
899 Cassatt Road
Berwyn, PA 19312
Custodian
The Bank of New York Mellon
240 Greenwich Street
New York, NY 10286
Independent Registered Public Accounting Firm
PricewaterhouseCoopers LLP
Two Commerce Square, Suite 1800
2001 Market Street
Philadelphia, PA 19103-7042
Legal Counsel
Pepper Hamilton LLP
3000 Two Logan Square
18th and Arch Streets
Philadelphia, PA 19103
LATEEF FOCUSED
SUSTAINABLE GROWTH Fund
(formerly Lateef Focused Growth Fund)
of
FundVantage Trust
Class A Shares
Class I Shares
ANNUAL REPORT
April 30, 2020
IMPORTANT NOTE: Beginning on January 1, 2021, paper copies of the Fund’s shareholder reports will no longer be sent by mail, unless you specifically request paper copies of the shareholder reports from the Fund or from your financial intermediary. Instead, shareholder reports will be available on the Lateef Focused Sustainable Growth Fund’s website (www.lateef.com/lateef-focused-growth-fund), and you will be notified by mail each time a report is posted and provided with a website link to access the report.
You may elect to receive all future shareholder reports in paper, free of charge. To elect to receive paper copies of shareholder reports through the mail or otherwise change your delivery method, contact your financial intermediary or, if you hold your shares directly through the Fund, call the Fund toll-free at (866) 499-2151 or write to:
Lateef Focused Sustainable Growth Fund
FundVantage Trust
c/o BNY Mellon Investment Servicing
P.O. Box 9829
Providence, RI 02940-8029
This report is submitted for the general information of shareholders and is not authorized for distribution to prospective investors unless preceded or accompanied by a current prospectus.
LAT-0420
PACIFIC CAPITAL FUNDS
Pacific Capital Tax-Free Securities Fund
Pacific Capital Tax-Free Short Intermediate Securities Fund
Annual Investment Adviser’s Report
April 30, 2020 (Unaudited)
Dear Shareholder:
U.S. Economy
The U.S. stock market staged a broad-based rally in the final months of 2019 to end the year in record territory. All major segments of the fixed income market posted strong returns as well, benefitting from falling interest rates and narrowing credit spreads. The U.S. economy performed surprisingly well in 2019 given trade-related uncertainties that dragged on global economic growth while stirring recession fears. The U.S. economy grew at 2.4% in the first three quarters of the year. This helped to push the unemployment rate to a 50-year low while lifting wage growth above 3%. Despite the tight labor market, inflation pressures remained muted, providing the Federal Reserve with the flexibility to lower short term interest rates. The U.S. economic expansion through 2019 was the longest on record.
The COVID-19 pandemic threw global financial markets into a downward spiral during the first quarter of 2020 as countries around the world went into lockdown mode in an effort to contain the outbreak. As the crisis unfolded worldwide, central banks and governments began implementing unprecedentedly large support programs directed at stabilizing businesses, households, and the financial system. These measures generated optimism amongst investors and brought some relief to financial markets beginning in late March.
In the United States, the Federal Reserve cut the federal funds rate twice in March to a range of 0% to 0.25% and announced that it would commence large scale purchases of government and corporate bonds and municipal bonds to bolster liquidity in fixed income markets. President Trump signed into law a massive $2 trillion stimulus package, which included $250 billion of direct payments to households, $500 billion for loans to distressed companies, and $350 billion for small business loans.
A sustainable recovery in the economy awaits the development of an effective strategy for unwinding social distancing without re-accelerating the spread of COVID-19. A slowing in the growth of the number of deaths and eventual contraction will provide hope that the worst is over and that businesses will be given the greenlight to reopen. Estimates for the timing of the return of employees to the workplace are highly varied. At this point it appears that it will be staged, with a gradual recovery in the economy beginning in the third quarter with significant improvements expected to occur during the fourth quarter.
Hawaii Economy
With a strong economy behind them in 2019, local issuers started 2020 financially well positioned. Record revenues allowed issuers to build rainy day funds to cushion future challenges. At fiscal year-end June 30, 2019, the State closed its books with a $752 million cash surplus. It also had balances in its Emergency and Hurricane Relief Funds of almost $400 million and $180 million, respectively.
Globally and in Hawaii, the economy will experience a severe setback for at least several months as the effects of COVID-19 are felt. Tourism will suffer until travel restrictions are eased. While Hawaii is a tourist dependent economy, it has become less so over the years as other sectors have grown in importance. In 2019, tourism represented approximately 19% of the state’s economy. Fortunately, Hawaii was fairly quick to implement social distancing measures and early indications suggest that the state’s population has a low rate of COVID-19 infection. This bodes well for the timing of the state’s economic recovery. In the meantime, the CARES relief bill and the Fed’s opening of its liquidity facility have provided timely support that has helped to stabilize the municipal market.
1
PACIFIC CAPITAL FUNDS
Pacific Capital Tax-Free Securities Fund
Pacific Capital Tax-Free Short Intermediate Securities Fund
Annual Investment Adviser’s Report (Continued)
April 30, 2020 (Unaudited)
Municipal Market and Fund Performance
2019 was a great year for all segments of the fixed income market as interest rates fell sharply and credit spreads tightened. The US municipal bond market posted solid positive returns, as did both of the Pacific Capital Tax Free Funds. The strength of fixed income returns came as quite a surprise, given consensus expectations at the start of 2019 called for an upward trend in longer-term interest rates. Positive performance continued into 2020 until COVID-19 reached pandemic status, economies were disrupted by attempts to contain the virus, and oil prices plummeted on reduced demand compounded by a price war. The pandemic has had a shockingly swift and profound impact on the global economy, businesses, healthcare, daily life, and the financial markets. While the equity market began reacting to the COVID-19 threat in a dramatic fashion beginning in late February, fixed income markets initially benefited as investors fled to safe haven assets. However, by Mid-March, the municipal bond market came under pressure as investors rushed to raise cash from all sources including the traditionally safest portions of their portfolios. This came about as a result of a number of factors including increasing personal cash needs due to income disruptions, portfolio rebalancing and - in some cases - outright panic. A flood of supply hit the municipal market as mutual funds rushed to meet soaring shareholder redemptions. With liquidity diminishing rapidly in the marketplace as natural buyers went into retreat, fund managers were forced to sell their most liquid and typically highest quality holdings. The tumbling of municipal bond prices was largely due to a technical supply imbalance rather than an underlying deterioration of issuer financial strength. The market moves were so exaggerated that the Fed opened up its liquidity facility and began transacting in municipal paper. Market conditions quickly stabilized afterwards as value savvy investors were drawn to the sector, particularly at the shorter end of the curve. While valuations have improved, municipal bonds remained deeply discounted relative to U.S. Treasury securities as of mid-April.
The Pacific Capital Tax-Free Short Intermediate Securities Fund (PTFSX) was still able to generate a positive return year-to-date despite the recent volatility due to COVID-19. PTFSX had a total return of 1.98% for the year ended April 30, 2020 but underperformed the Bloomberg Barclays Capital Hawaii 3-Year Municipal Bond Index return of 2.79% for the same period. The underperformance was due to being invested in securities that were both longer and shorter than the index to diversify the fund’s holdings, reduce credit exposure and pick up additional yield. However, the shorter securities did not offset the underperformance in the longer securities during this period. The Pacific Capital Tax-Free Securities Fund (PTXFX) had a total return of 3.14% the year ended April 30, 2020 and slightly outperformed the Bloomberg Barclays Capital Hawaii Municipal Bond Index return of 3.03% for the same period. The Fund’s higher quality and pre-refunded bond holdings contributed to the Fund’s out-performance. Pre-refunded bonds were oversold in March and their prices recovered to pre-pandemic levels by the end of April. Total return reflects the market fluctuation of the share price as well as reinvested dividends.
Outlook and Strategy
At present, we remain comfortable with the credit standing of our Hawaii issuers. However, given the uncertainties associated with the pandemic, volatility in the municipal bond market could remain elevated in the near term. This may create opportunities to purchase attractively priced bonds with bonds maturities or net cash inflows. We continue to be invested in high quality municipal issues that should be able to weather the pandemic well. Should the generally favorable outlook for Hawaii change, the Trust’s prospectus provides flexibility to invest a portion of its assets in U.S. Treasury securities or in tax-exempt municipal bonds issued by other states.
2
PACIFIC CAPITAL FUNDS
Pacific Capital Tax-Free Securities Fund
Pacific Capital Tax-Free Short Intermediate Securities Fund
Annual Investment Adviser’s Report (Concluded)
April 30, 2020 (Unaudited)
These comments reflect the investment advisor’s views in general regarding the market and the economy and are compiled from Asset Management Group of Bank of Hawaii (“AMG”) research. These comments reflect opinions as of the date written and are subject to change.
This letter is intended to assist shareholders in understanding how the funds performed for the period ending April 30, 2020 and reflects the views of the investment advisor as of the date written. Of course, these views may change and do not guarantee the future performance of the funds or the markets.
Portfolio composition is subject to change. The current and future portfolio holdings of the funds are subject to investment risk.
All mutual fund investing involves risk, including possible loss of principal. The funds are non-diversified, which means that a portion of the funds’ assets may be invested in one or fewer companies or sectors. The funds could fluctuate in value more than a diversified fund.
3
PACIFIC CAPITAL FUNDS
Pacific Capital U.S. Government Money Market Fund
Annual Investment Adviser’s Report
April 30, 2020 (Unaudited)
Dear Shareholder:
U.S. Economy
The U.S. stock market staged a broad-based rally in the final months of 2019 to end the year in record territory. All major segments of the fixed income market posted strong returns as well, benefitting from falling interest rates and narrowing credit spreads. The U.S. economy performed surprisingly well in 2019 given trade-related uncertainties that dragged on global economic growth while stirring recession fears. The U.S. economy grew at 2.4% in the first three quarters of the year. This helped to push the unemployment rate to a 50-year low while lifting wage growth above 3%. Despite the tight labor market, inflation pressures remained muted, providing the Federal Reserve with the flexibility to lower short term interest rates. The U.S. economic expansion through 2019 was the longest on record.
The COVID-19 pandemic threw global financial markets into a downward spiral during the first quarter of 2020 as countries around the world went into lockdown mode in an effort to contain the outbreak. As the crisis unfolded worldwide, central banks and governments began implementing unprecedentedly large support programs directed at stabilizing businesses, households, and the financial system. These measures generated optimism amongst investors and brought some relief to financial markets beginning in late March.
In the United States, the Federal Reserve cut the federal funds rate twice in March to a range of 0% to 0.25% and announced that it would commence large scale purchases of government and corporate bonds to bolster liquidity in fixed income markets. President Trump signed into law a massive $2 trillion stimulus package, which included $250 billion of direct payments to households, $500 billion for loans to distressed companies, and $350 billion for small business loans.
A sustainable recovery in the economy awaits the development of an effective strategy for unwinding social distancing without re-accelerating the spread of COVID-19. A slowing in the growth of the number of deaths and eventual contraction will provide hope that the worst is over and that businesses will be given the greenlight to reopen. Estimates for the timing of the return of employees to the workplace are highly varied. At this point it appears that it will be staged, with a gradual recovery in the economy beginning in the third quarter with significant improvements expected to occur during the fourth quarter.
Fund Performance
For the one year period ending April 30, 2020, the yield on the Pacific Capital U.S. Government Money Market Fund (“PCUXX”) declined from a peak of 2.08% on May 3, 2019 to a low of 0.01% on April 17, 2020 through the end of the month. PCUXX’s yield reflects Fed Funds target rate decreases totaling 225 basis points directed by the Federal Open Market Committee (FOMC) during the year ending April 30, 2020.
Outlook and Strategy
The global pandemic continues to dominate the headlines and drive the short term markets. The FOMC cut its target overnight lending rate by 150 basis points in March 2020 in an emergency response to the stalling of the economy caused by COVID19. The FOMC’s reduced target rate of 0-0.25%, effectively zero, caused many short government notes to temporarily trade at negative yields. In this environment it is difficult to make direct government investments providing higher yields than those that are available through investing in the PCUXX’s institutional sweep vehicle.
4
PACIFIC CAPITAL FUNDS
Pacific Capital U.S. Government Money Market Fund
Annual Investment Adviser’s Report (Concluded)
April 30, 2020 (Unaudited)
The Fund’s significant investment into its sweep vehicle, the institutional cash management fund, addresses two key current market circumstances: extraordinarily low short term interest rates and large anticipated shareholder liquidations. A normal laddered construct is not appropriate when custody sweep rates are equal or higher than longer term rates. Many PCUXX shareholders are expected to redeem shares, directing proceeds towards higher yielding bank deposit offerings.
Once the short term government market rebounds and expected shareholder redemptions ease, the Fund will return to its normal laddered portfolio construct. Signals that the market has rebounded would include an increased federal funds target rate range and a reasonable rate spread between short-term risk-free instruments and other government debt with durations of up twelve months.
As investment advisors to the Pacific Capital U.S. Government Money Market Fund, we wish to highlight our efforts to remain focused on delivering shareholders competitive yields while maintaining top quality standards. The fund remains, in our opinion, prudently invested in accordance with the SAI and prospectus.
These comments reflect the investment advisor’s views in general regarding the market and the economy and are compiled from Asset Management Group of Bank of Hawaii (“AMG”) research. These comments reflect opinions as of the date written and are subject to change.
This letter is intended to assist shareholders in understanding how the fund performed for the period ending April 30, 2020 and reflects the views of the investment advisor as of the date written. Of course, these views may change and do not guarantee the future performance of the fund or the markets.
Portfolio composition is subject to change. The current and future portfolio holdings of the fund are subject to investment risk.
All mutual fund investing involves risk, including possible loss of principal. An investment in the Fund is not insured or guaranteed by the Federal Deposit Insurance Corporation or any other government agency. Although the Fund seeks to preserve the value of your investment at $1.00 per share, it is possible to lose money by investing in the Fund.
5
PACIFIC CAPITAL FUNDS
Pacific Capital Tax-Free Securities Fund
Annual Report
Performance Data
April 30, 2020 (Unaudited)
Credit Quality as of April 30, 2020 (as a percentage of total investments) | Investment Style
High-quality, intermediate-term, tax-exempt | |||
Credit quality ratings are primarily sourced from Moody’s but in the event that Moody’s has not assigned a rating, the Fund will use S&P or Fitch. If these ratings are in conflict, S&P will be used before Fitch. If none of the major rating agencies have assigned a rating, the Fund will assign a rating of NR (non-rated security). The ratings represent their (Moody’s, S&P, and Fitch) opinions as to the quality of the underlying securities in the Fund, and not the Fund itself. The ratings range from AAA (extremely strong capacity to meet financial commitment) to D (in default). Ratings are relative and subjective and are not absolute standards of quality. A pre-refunded bond is secured by an escrow fund of U.S. government obligations (i.e. Treasury securities) and assumes the superior credit rating of the government obligation. The ratings do not predict performance and are subject to change. |
Investment Objective | |||
The Pacific Capital Tax-Free Securities Fund (the “Fund”) seeks high current income that is exempt from federal and Hawaii income tax by normally investing at least 80% of its net assets in investment grade municipal obligations. The Fund normally invests greater than 50% of its assets in Hawaii municipal obligations — debt securities issued by or on behalf of the State of Hawaii and its political subdivisions, agencies and instrumentalities that pay interest which is exempt from Hawaii income tax as well as federal income tax. | ||||
Investment Considerations | ||||
Income received from the Fund may be subject to certain state and local taxes and, depending on one’s tax status, to the federal alternative minimum tax. Bonds offer a relatively stable level of income, although bond prices will fluctuate, providing the potential for principal gain or loss. Generally, bond prices and values fall when interest rates rise, and vice versa. The longer the average maturity of the Fund’s portfolio, the greater the fluctuation in value. Since the Fund invests significantly in securities of issuers in Hawaii, it will also be affected by a variety of Hawaii’s economic and political factors. The values of any of the Fund’s investments may also decline in response to events affecting the issuer or its credit rating. | ||||
Investment Process
| ||||
· Top-down macroeconomic analysis of interest rate trends | ||||
· Bottom-up credit research to identify high quality bonds | ||||
Investment Management | ||||
Advised by Asset Management Group of Bank of Hawaii (“AMG”) | ||||
· As of April 30, 2020, AMG manages $1.31 billion in mutual fund assets. In addition, AMG personnel also manage approximately $1.56 billion in assets on behalf of Bank of Hawaii clients. | ||||
6
PACIFIC CAPITAL FUNDS
Pacific Capital Tax-Free Securities Fund
Annual Report
Performance Data (Continued)
April 30, 2020 (Unaudited)
| Average Annual Total Returns for the Periods Ended April 30, 2020 | ||||||||||||||||||||
| 1 Year | 3 Year | 5 Year | 10 Year | |||||||||||||||||
Class Y | 3.14 | % | 3.00 | % | 2.70 | % | 3.34% | |||||||||||||
Bloomberg Barclays Capital Hawaii Municipal Bond Index | 3.03 | % | 3.21 | % | 2.95 | % | 3.68% | |||||||||||||
Past performance does not guarantee future results. The performance data quoted represents past performance and current returns may be lower or higher. The investment return and principal value will fluctuate so that an investor’s shares, when redeemed, may be worth more or less than the original cost; and current performance may be lower or higher than the performance data quoted. The table does not reflect the deduction of taxes that a shareholder would pay on Fund distributions or the redemption of Fund shares. To obtain performance information current to the most recent month end, please call (888) 678-6034.
As stated in the current prospectus dated September 1, 2019, the Fund’s “Total Annual Fund Operating Expenses” are 0.31%, and the Fund’s “Total Annual Fund Operating Expenses After Fee Waiver” are 0.11%, of the Fund’s average daily net assets. These rates may fluctuate and may differ from the actual expenses incurred by the Fund for the period covered in this report. The Adviser has contractually agreed to waive its advisory fee (the “Waiver”) until August 31, 2021. The Waiver may not be terminated at any time prior to that date without the consent of the Board of Trustees (“Board of Trustees”) of FundVantage Trust (the “Trust”).
Before the Fund commenced operations, all of the assets of the Tax-Free Securities Fund, a series of Pacific Capital Funds (the “Predecessor Fund”), were transferred to the Fund in a tax-free reorganization (the “Reorganization”). Performance presented prior to June 28, 2010 reflects the performance of the Predecessor Fund.
7
PACIFIC CAPITAL FUNDS
Pacific Capital Tax-Free Securities Fund
Annual Report
Performance Data (Concluded)
April 30, 2020 (Unaudited)
Total returns reflect the waiver of advisory fees. Had these waivers not been in effect, performance quoted would have been lower.
The performance of the Fund is measured against the Bloomberg Barclays Capital Hawaii Municipal Bond Index, a rules-based, market-value weighted index engineered for the long-term tax-exempt Hawaii bond market. The index has four main sectors: general obligation bonds, revenue bonds, insured bonds and prerefunded bonds. The index is unmanaged and does not reflect the deduction of fees associated with a mutual fund, such as investment management and fund accounting fees. The Fund’s performance reflects the deduction of fees for these services. Investors cannot invest directly in an index.
The Fund is distributed by Foreside Funds Distributors LLC.
All mutual fund investing involves risk, including possible loss of principal. The Fund is non-diversified, which means that a portion of the Fund’s assets may be invested in one or few companies or sectors. The Fund could fluctuate in value more than a diversified fund.
8
PACIFIC CAPITAL FUNDS
Pacific Capital Tax-Free Short Intermediate Securities Fund
Annual Report
Performance Data
April 30, 2020 (Unaudited)
Credit Quality as of April 30, 2020 (as a percentage of total investments) | Investment Style High-quality, short-intermediate term, tax-exempt | |||
Credit quality ratings are primarily sourced from Moody’s but in the event that Moody’s has not assigned a rating, the Fund will use S&P or Fitch. If these ratings are in conflict, S&P will be used before Fitch. If none of the major rating agencies have assigned a rating, the Fund will assign a rating of NR (non-rated security). The ratings represent their (Moody’s, S&P, and Fitch) opinions as to the quality of the underlying securities in the Fund, and not the Fund itself. The ratings range from AAA (extremely strong capacity to meet financial commitment) to D (in default). Ratings are relative and subjective and are not absolute standards of quality. A pre-refunded bond is secured by an escrow fund of U.S. government obligations (i.e. Treasury securities) and assumes the superior credit rating of the government obligation. The ratings do not predict performance and are subject to change. |
Investment Objective | |||
The Pacific Capital Tax-Free Short Intermediate Securities Fund (the “Fund”) seeks high current income that is exempt from federal and Hawaii income tax by normally investing at least 80% of its net assets in investment grade municipal obligations. The Fund normally invests greater than 50% of its assets in Hawaii municipal obligations — debt securities issued by or on behalf of the State of Hawaii and its political subdivisions, agencies and instrumentalities that pay interest which is exempt from Hawaii income tax as well as federal income tax. The Fund seeks to provide greater price stability than a long-term bond fund. | ||||
Investment Considerations | ||||
Income received from the Fund may be subject to certain state and local taxes and, depending on one’s tax status, to the federal alternative minimum tax. Bonds offer a relatively stable level of income, although bond prices will fluctuate, providing the potential for principal gain or loss. Generally, bond prices and values fall when interest rates rise, and vice versa. Intermediate term, higher-quality bonds generally offer less risk than longer-term bonds and a lower rate of return. Since the Fund invests significantly in securities of issuers in Hawaii, it will also be affected by a variety of Hawaii’s economic and political factors. The values of any of the Fund’s investments may also decline in response to events affecting the issuer or its credit rating. | ||||
Investment Process | ||||
· Top-down macroeconomic analysis of interest rate trends | ||||
· Bottom-up credit research to identify high quality bonds | ||||
Investment Management | ||||
Advised by Asset Management Group of Bank of Hawaii (“AMG”) | ||||
· As of April 30, 2020, AMG manages $1.31 billion in mutual fund assets. In addition, AMG personnel also manage approximately $1.56 billion in assets on behalf of Bank of Hawaii clients. | ||||
9
PACIFIC CAPITAL FUNDS
Pacific Capital Tax-Free Short Intermediate Securities Fund
Annual Report
Performance Data (Continued)
April 30, 2020 (Unaudited)
| Average Annual Total Returns for the Periods Ended April 30, 2020 | ||||||||||||||||||||
| 1 Year | 3 Year | 5 Year | 10 Year | |||||||||||||||||
Class Y | 1.98 | % | 1.49 | % | 1.32 | % | 1.29% | |||||||||||||
Bloomberg Barclays Capital Hawaii 3-Year Municipal Bond Index | 2.79 | % | 1.79 | % | 1.59 | % | 1.60% | |||||||||||||
Past performance does not guarantee future results. The performance data quoted represents past performance and current returns may be lower or higher. The investment return and principal value will fluctuate so that an investor’s shares, when redeemed, may be worth more or less than the original cost; and current performance may be lower or higher than the performance data quoted. The table does not reflect the deduction of taxes that a shareholder would pay on Fund distributions or the redemption of Fund shares. To obtain performance information current to the most recent month end, please call (888) 678-6034.
As stated in the current prospectus dated September 1, 2019, the Fund’s “Total Annual Fund Operating Expenses” are 0.54%, and the Fund’s “Total Annual Fund Operating Expense After Fee Waiver” are 0.34%, of the Fund’s average daily net assets. These rates may fluctuate and may differ from the actual expenses incurred by the Fund for the period covered in this report. The Adviser has contractually agreed to waive its advisory fee (the “Waiver”) until August 31, 2021. The Waiver may not be terminated at any time prior to that date without the consent of the Board of Trustees (“Board of Trustees”) of FundVantage Trust (the “Trust”).
Before the Fund commenced operations, all of the assets of the Tax-Free Short Intermediate Securities Fund, a series of Pacific Capital Funds (the “Predecessor Fund”), were transferred to the Fund in a tax-free reorganization (the “Reorganization”). Performance presented prior to June 28, 2010 reflects the performance of the Predecessor Fund.
10
PACIFIC CAPITAL FUNDS
Pacific Capital Tax-Free Short Intermediate Securities Fund
Annual Report
Performance Data (Concluded)
April 30, 2020 (Unaudited)
Total returns reflect the waiver of advisory fees. Had these waivers not been in effect, performance quoted would have been lower.
The performance of the Fund is measured against the Bloomberg Barclays Capital Hawaii 3-Year Municipal Bond Index, which is the 2-4 year component of the Bloomberg Barclays Capital Hawaii Municipal Bond Index and is a rules-based, market-value weighted index engineered for the Hawaii tax-exempt bond market. The index has four main sectors: general obligation bonds, revenue bonds, insured bonds, and prerefunded bonds. The index is unmanaged and does not reflect the deduction of fees associated with a mutual fund, such as investment management and fund accounting fees. The Fund’s performance reflects the deduction of fees for these services. Investors cannot invest directly in an index.
The Fund is distributed by Foreside Funds Distributors LLC.
All mutual fund investing involves risk, including possible loss of principal. The Fund is non-diversified, which means that a portion of the Fund’s assets may be invested in one or few companies or sectors. The Fund could fluctuate in value more than a diversified fund.
11
PACIFIC CAPITAL FUNDS
Fund Expense Disclosure
April 30, 2020
(Unaudited)
As a shareholder of the Fund(s), you incur two types of costs: (1) transaction costs, and (2) ongoing costs, including management fees, distribution and/or service (Rule 12b-1) fees (if any) and other Fund expenses. These examples are intended to help you understand your ongoing costs (in dollars) of investing in the Fund and to compare these costs with the ongoing costs of investing in other mutual funds.
These examples are based on an investment of $1,000 invested at the beginning of the six-month period from November 1, 2019 through April 30, 2020 and held for the entire period.
Actual Expenses
The first line for each Fund in the accompanying table provides information about actual account values and actual expenses. You may use the information in this line, together with the amount you invested, to estimate the expenses that you paid over the period. Simply divide your account value by $1,000 (for example, an $8,600 account value divided by $1,000 = 8.6), then multiply the result by the number in the first line of the table under the heading entitled “Expenses Paid During Period” to estimate the expenses you paid on your account during this period.
Hypothetical Examples for Comparison Purposes
The second line for each Fund in the accompanying table provides information about hypothetical account values and hypothetical expenses based on each Fund’s actual expense ratio and an assumed rate of return of 5% per year before expenses, which is not the Fund’s actual return. The hypothetical account values and expenses may not be used to estimate the actual ending account balance or expenses you paid for the period. You may use this information to compare the ongoing costs of investing in the Fund(s) and other funds. To do so, compare these 5% hypothetical examples with the 5% hypothetical examples that appear in the shareholder reports of other funds.
Please note that the expenses shown in the table are meant to highlight your ongoing costs only and do not reflect any transactional costs. Therefore, the second line of the accompanying table is useful in comparing ongoing costs only, and will not help you determine the relative total costs of owning different funds. In addition, if these transactional costs were included, your costs would have been higher.
12
PACIFIC CAPITAL FUNDS
Fund Expense Disclosure (Concluded)
April 30, 2020
(Unaudited)
| Beginning Account Value November 1, 2019 | Ending Account Value April 30, 2020 | Expenses Paid During Period* | Expense Ratio During Period** | |||||||||||||||
Pacific Capital Tax-Free Securities Fund | ||||||||||||||||||
Actual Fund Return | Class Y | $1,000.00 | $ 999.10 | $0.40 | 0.08% | |||||||||||||
Hypothetical Fund Return (5% return before expenses) | Class Y | 1,000.00 | 1,024.47 | 0.40 | 0.08% | |||||||||||||
Pacific Capital Tax-Free Short Intermediate Securities Fund | ||||||||||||||||||
Actual Fund Return | Class Y | $1,000.00 | $1,003.10 | $1.15 | 0.23% | |||||||||||||
Hypothetical Fund Return (5% return before expenses) | Class Y | 1,000.00 | 1,023.72 | 1.16 | 0.23% | |||||||||||||
Pacific Capital U.S. Government Money Market Fund | ||||||||||||||||||
Actual Fund Return | Investor Class | $1,000.00 | $1,004.60 | $2.44 | 0.49% | |||||||||||||
Hypothetical Fund Return (5% return before expenses) | Investor Class | 1,000.00 | 1,022.43 | 2.46 | 0.49% | |||||||||||||
| * | Expense are equal to an annualized expense ratio for the six-month period ended April 30, 2020, multiplied by average account value over the period, multiplied by the number of days in the most recent period (182), then divided by 366 to reflect the period. The Funds’ ending account values on the first line in each table are based on the actual six-month total returns of (0.09)% for the Pacific Capital Tax-Free Securities Fund, 0.31% for the Pacific Capital Tax-Free Short Intermediate Securities Fund and 0.46% for the Pacific Capital U.S. Government Money Market Fund. |
| ** | Annualized. |
13
PACIFIC CAPITAL FUNDS
Pacific Capital Tax-Free Securities Fund
Portfolio of Investments
April 30, 2020
| Principal Amount ($) | Value ($) | |||||||
MUNICIPAL BONDS — 98.6% |
| |||||||
Arizona — 2.5% | ||||||||
Phoenix Civic Improvement Corp., Civic Plaza, Convertible CAB, OID, Series B, | 5,000,000 | 6,562,150 | ||||||
|
| |||||||
California — 1.6% | ||||||||
Norwalk-La Mirada Unified School District GO, CAB, OID, Series B, | 5,000,000 | 4,397,400 | ||||||
|
| |||||||
Hawaii — 92.1% | ||||||||
Hawaii County GO, Series A, Callable 03/01/27 at 100, | 5,045,000 | 6,086,338 | ||||||
Hawaii County GO, Series A, Callable 03/01/27 at 100, | 4,775,000 | 5,679,815 | ||||||
Hawaii Housing Finance & Development Corp., Hale-Kewalo Apartments, Series A, Callable 05/27/20 at 100, | 2,910,000 | 2,914,510 | ||||||
Hawaii Housing Finance & Development Corp., Multi-Family Housing, Iwilei Apartments, Series A, Callable 07/01/22 at 100, | 3,120,000 | 3,227,047 | ||||||
| �� | Principal Amount ($) | Value ($) | ||||||
MUNICIPAL BONDS — (Continued) |
| |||||||
Hawaii — (Continued) | ||||||||
Hawaii Housing Finance & Development Corp., Series B, Callable 07/01/21 at 100, | 2,135,000 | 2,182,418 | ||||||
Hawaii State Airports System Revenue, AMT, OID, Callable 08/01/23 at 100, | 400,000 | 432,496 | ||||||
Hawaii State Airports System Revenue, Series A, Callable 07/01/20 at 100, | 1,000,000 | 1,005,850 | ||||||
Hawaii State Airports System Revenue, Series A, Callable 07/01/20 at 100, | 1,010,000 | 1,016,918 | ||||||
Hawaii State Airports System Revenue, AMT, Callable 07/01/21 at 100, | 2,000,000 | 2,074,800 | ||||||
Hawaii State Airports System Revenue, AMT, Callable 07/01/28 at 100, | 500,000 | 572,325 | ||||||
Hawaii State Airports System Revenue, AMT, Callable 07/01/28 at 100, | 1,500,000 | 1,658,130 | ||||||
The accompanying notes are an integral part of the financial statements.
14
PACIFIC CAPITAL FUNDS
Pacific Capital Tax-Free Securities Fund
Portfolio of Investments (Continued)
April 30, 2020
| Principal Amount ($) | Value ($) | |||||||
MUNICIPAL BONDS — (Continued) |
| |||||||
Hawaii — (Continued) | ||||||||
Hawaii State Airports System Revenue, Series A, Callable 07/01/20 at 100, | 375,000 | 377,569 | ||||||
Hawaii State Airports System Revenue, Series A, Callable 07/01/20 at 100, | 4,065,000 | 4,092,845 | ||||||
Hawaii State Department of Budget & Finance Revenue, Hawaii Pacific Health Obligation, OID, | 500,000 | 532,110 | ||||||
Hawaii State Department of Budget & Finance Revenue, Hawaii Pacific Projects, Refunding, | 225,000 | 246,901 | ||||||
Hawaii State Department of Budget & Finance Revenue, Hawaii Pacific Projects, Refunding, Callable 01/01/30 at 100, | 250,000 | 271,380 | ||||||
Hawaii State Department of Budget & Finance Revenue, Hawaiian Electric Company, AMT, MWC, | 3,500,000 | 3,571,400 | ||||||
| Principal Amount ($) | Value ($) | |||||||
MUNICIPAL BONDS — (Continued) |
| |||||||
Hawaii — (Continued) | ||||||||
Hawaii State Department of Budget & Finance Revenue, Hawaiian Electric Company, AMT, MWC, Callable 03/01/27 at 100, | 1,500,000 | 1,537,320 | ||||||
Hawaii State Department of Budget & Finance Revenue, Hawaiian Electric Company, AMT, MWC, Callable 10/01/24 at 100, | 2,750,000 | 2,594,982 | ||||||
Hawaii State Department of Budget & Finance Revenue, Hawaiian Electric Company, MWC, Refunding, Callable 07/01/29 at 100, | 6,275,000 | 5,947,382 | ||||||
Hawaii State Department of Budget & Finance, Hawaii Pacific Health Obligation, Callable 07/01/23 at 100, | 1,330,000 | 1,445,670 | ||||||
Hawaii State Department of Budget & Finance, Special Purpose Revenue, Kahala Nui, Callable 11/15/22 at 100, | 1,790,000 | 1,931,195 | ||||||
Hawaii State Department of Budget & Finance, Special Purpose Revenue, Kahala Nui, Callable 11/15/22 at 100, | 550,000 | 588,242 | ||||||
The accompanying notes are an integral part of the financial statements.
15
PACIFIC CAPITAL FUNDS
Pacific Capital Tax-Free Securities Fund
Portfolio of Investments (Continued)
April 30, 2020
| Principal Amount ($) | Value ($) | |||||||
MUNICIPAL BONDS — (Continued) |
| |||||||
Hawaii — (Continued) | ||||||||
Hawaii State Department of Budget & Finance, Series A, Queens Health System, Callable 07/01/25 at 100, | 10,000,000 | 11,001,000 | ||||||
Hawaii State Department of Hawaiian Home Lands Revenue, Refunding, | 1,370,000 | 1,421,074 | ||||||
Hawaii State Department of Hawaiian Home Lands Revenue, Refunding, | 500,000 | 571,280 | ||||||
Hawaii State Department of Hawaiian Home Lands Revenue, Refunding, Callable 04/01/27 at 100, | 945,000 | 1,155,858 | ||||||
Hawaii State Department of Hawaiian Home Lands Revenue, Refunding, Callable 04/01/27 at 100, | 335,000 | 401,075 | ||||||
Hawaii State Department of Hawaiian Home Lands, Kapolei Office Facility, Series A, Refunding, Callable 11/01/27 at 100, | 1,170,000 | 1,452,239 | ||||||
Hawaii State Department of Hawaiian Home Lands, Kapolei Office Facility, Series A, Refunding, Callable 11/01/27 at 100, | 800,000 | 981,720 | ||||||
| Principal Amount ($) | Value ($) | |||||||
MUNICIPAL BONDS — (Continued) |
| |||||||
Hawaii — (Continued) | ||||||||
Hawaii State Department of Hawaiian Home Lands, Kapolei Office Facility, Series A, Refunding, Callable 11/01/27 at 100, | 815,000 | 991,130 | ||||||
Hawaii State GO, Series DZ, Prerefunded 12/01/21 at 100, | 155,000 | 165,472 | ||||||
Hawaii State GO, Series DZ, Prerefunded 12/01/21 at 100, | 895,000 | 955,466 | ||||||
Hawaii State GO, Series DZ, Prerefunded 12/01/21 at 100, | 1,155,000 | 1,233,032 | ||||||
Hawaii State GO, Series DZ, Prerefunded 12/01/21 at 100, | 1,120,000 | 1,195,667 | ||||||
Hawaii State GO, Series DZ, Prerefunded 12/01/21 at 100, | 805,000 | 859,386 | ||||||
Hawaii State GO, Series DZ, Prerefunded 12/01/21 at 100, | 1,730,000 | 1,846,879 | ||||||
Hawaii State GO, Series DZ, Unrefunded portion, Callable 12/01/21 at 100, | 300,000 | 320,514 | ||||||
Hawaii State GO, Series DZ, Unrefunded portion, Callable 12/01/21 at 100, | 1,235,000 | 1,319,449 | ||||||
The accompanying notes are an integral part of the financial statements.
16
PACIFIC CAPITAL FUNDS
Pacific Capital Tax-Free Securities Fund
Portfolio of Investments (Continued)
April 30, 2020
| Principal Amount ($) | Value ($) | |||||||
MUNICIPAL BONDS — (Continued) |
| |||||||
Hawaii — (Continued) | ||||||||
Hawaii State GO, Series DZ, Unrefunded portion, Callable 12/01/21 at 100, | 1,095,000 | 1,169,876 | ||||||
Hawaii State GO, Series EE, Prerefunded 11/01/22 at 100, | 55,000 | 60,788 | ||||||
Hawaii State GO, Series EE, Prerefunded 11/01/22 at 100, | 90,000 | 99,472 | ||||||
Hawaii State GO, Series EE, Prerefunded 11/01/22 at 100, | 1,000,000 | 1,105,240 | ||||||
Hawaii State GO, Series EE, Prerefunded 11/01/22 at 100, | 90,000 | 99,472 | ||||||
Hawaii State GO, Series EE, Prerefunded 11/01/22 at 100, | 740,000 | 817,878 | ||||||
Hawaii State GO, Series EE, Prerefunded 11/01/22 at 100, | 20,000 | 22,105 | ||||||
Hawaii State GO, Series EE, Unrefunded portion, Callable 11/01/22 at 100, | 100,000 | 110,524 | ||||||
Hawaii State GO, Series EE, Unrefunded portion, Callable 11/01/22 at 100, | 1,365,000 | 1,508,653 | ||||||
Hawaii State GO, Series EE, Unrefunded portion, Callable 11/01/22 at 100, | 345,000 | 381,308 | ||||||
| Principal Amount ($) | Value ($) | |||||||
MUNICIPAL BONDS — (Continued) |
| |||||||
Hawaii — (Continued) | ||||||||
Hawaii State GO, Series EE, Unrefunded portion, Callable 11/01/22 at 100, | 340,000 | 375,782 | ||||||
Hawaii State GO, Series EH, Prerefunded 08/01/23 at 100, | 305,000 | 344,440 | ||||||
Hawaii State GO, Series EH, Prerefunded, ETM, | 445,000 | 502,543 | ||||||
Hawaii State GO, Series EH, Prerefunded, ETM, | 110,000 | 124,224 | ||||||
Hawaii State GO, Series EH, Unrefunded portion, | 345,000 | 387,608 | ||||||
Hawaii State GO, Series EH, Unrefunded portion, Callable 08/01/23 at 100, | 895,000 | 1,004,620 | ||||||
Hawaii State GO, Series EL, | 1,000,000 | 1,123,500 | ||||||
Hawaii State GO, Series EO, Callable 08/01/24 at 100, | 1,285,000 | 1,461,148 | ||||||
Hawaii State GO, Series EO, Prerefunded 08/01/24 at 100, | 140,000 | 163,771 | ||||||
Hawaii State GO, Series EO, Unrefunded portion, Callable 08/01/24 at 100, | 2,660,000 | 3,074,295 | ||||||
Hawaii State GO, Series EP, | 1,000,000 | 1,155,750 | ||||||
The accompanying notes are an integral part of the financial statements.
17
PACIFIC CAPITAL FUNDS
Pacific Capital Tax-Free Securities Fund
Portfolio of Investments (Continued)
April 30, 2020
| Principal Amount ($) | Value ($) | |||||||
MUNICIPAL BONDS — (Continued) |
| |||||||
Hawaii — (Continued) | ||||||||
Hawaii State GO, Series EY, Callable 10/01/25 at 100, | 3,040,000 | 3,623,558 | ||||||
Hawaii State GO, Series EZ, | 1,340,000 | 1,418,256 | ||||||
Hawaii State GO, Series FB, | 5,000,000 | 5,882,100 | ||||||
Hawaii State GO, Series FB, Callable 04/01/26 at 100, | 2,000,000 | 2,262,520 | ||||||
Hawaii State GO, Series FG, Callable 10/01/26 at 100, | 10,000,000 | 12,023,000 | ||||||
Hawaii State GO, Series FG, Callable 10/01/26 at 100, | 1,000,000 | 1,100,040 | ||||||
Hawaii State GO, Series FK, Callable 05/01/27 at 100, | 2,500,000 | 2,990,450 | ||||||
Hawaii State GO, Series FK, Callable 05/01/27 at 100, | 2,000,000 | 2,205,800 | ||||||
Hawaii State GO, Series FN, | 2,500,000 | 3,049,925 | ||||||
Hawaii State GO, Series FT, Callable 01/01/28 at 100, | 1,950,000 | 2,322,021 | ||||||
Hawaii State GO, Series FT, Callable 01/01/28 at 100, | 4,000,000 | 4,792,720 | ||||||
Hawaii State GO, Series FW, Callable 01/01/29 at 100, | 2,000,000 | 2,280,800 | ||||||
| Principal Amount ($) | Value ($) | |||||||
MUNICIPAL BONDS — (Continued) |
| |||||||
Hawaii — (Continued) | ||||||||
Hawaii State Harbor System Revenue, OID, Series A, Callable 07/01/20 at 100, | 220,000 | 221,298 | ||||||
Hawaii State Harbor System Revenue, OID, Series A, Callable 07/01/20 at 100, | 4,125,000 | 4,147,564 | ||||||
Hawaii State Highway Fund Revenue, Series A, Callable 07/01/24 at 100, | 1,085,000 | 1,234,893 | ||||||
Hawaii State Highway Fund Revenue, Series A, Callable 01/01/29 at 100, | 3,500,000 | 4,260,235 | ||||||
Hawaii State Highway Fund Revenue, Series A, Prerefunded 01/01/22 at 100, | 5,490,000 | 5,875,672 | ||||||
Hawaii State Highway Fund Revenue, Series A, Prerefunded 01/01/22 at 100, | 1,120,000 | 1,198,680 | ||||||
Hawaii State Highway Fund Revenue, Series B, Callable 07/01/26 at 100, | 5,000,000 | 6,010,400 | ||||||
Honolulu City & County Board of Water Supply System Revenue, Refunding, Series A, Callable 07/01/24 at 100, | 1,500,000 | 1,726,845 | ||||||
The accompanying notes are an integral part of the financial statements.
18
PACIFIC CAPITAL FUNDS
Pacific Capital Tax-Free Securities Fund
Portfolio of Investments (Continued)
April 30, 2020
| Principal Amount ($) | Value ($) | |||||||
MUNICIPAL BONDS — (Continued) |
| |||||||
Hawaii — (Continued) | ||||||||
Honolulu City & County Board of Water Supply System Revenue, Refunding, Series A, Callable 07/01/22 at 100, | 250,000 | 272,252 | ||||||
Honolulu City & County Board of Water Supply System Revenue, Refunding, Series A, Callable 07/01/22 at 100, | 3,125,000 | 3,403,156 | ||||||
Honolulu City & County Board of Water Supply System Revenue, Refunding, Series A, Callable 07/01/24 at 100, | 850,000 | 975,570 | ||||||
Honolulu City & County Board of Water Supply System Revenue, Series A, Callable 07/01/30 at 100, | 1,770,000 | 2,024,597 | ||||||
Honolulu City & County GO, Series A, Callable 09/01/27 at 100, | 1,235,000 | 1,458,325 | ||||||
Honolulu City & County GO, Series A, Callable 11/01/22 at 100, | 1,355,000 | 1,495,825 | ||||||
Honolulu City & County GO, Series A, Callable 11/01/22 at 100, | 1,000,000 | 1,103,930 | ||||||
| Principal Amount ($) | Value ($) | |||||||
MUNICIPAL BONDS — (Continued) |
| |||||||
Hawaii — (Continued) | ||||||||
Honolulu City & County GO, | 2,175,000 | 2,553,994 | ||||||
Honolulu City & County GO, | 450,000 | 496,768 | ||||||
Honolulu City & County GO, | 1,970,000 | 2,174,742 | ||||||
Honolulu City & County GO, | 3,000,000 | 3,477,240 | ||||||
Honolulu City & County GO, | 1,000,000 | 1,153,520 | ||||||
Honolulu City & County GO, | 1,040,000 | 1,196,780 | ||||||
Honolulu City & County GO, | 1,000,000 | 1,148,540 | ||||||
Honolulu City & County GO, | 2,000,000 | 2,207,860 | ||||||
Honolulu City & County GO, | 1,000,000 | 1,043,060 | ||||||
The accompanying notes are an integral part of the financial statements.
19
PACIFIC CAPITAL FUNDS
Pacific Capital Tax-Free Securities Fund
Portfolio of Investments (Continued)
April 30, 2020
| Principal Amount ($) | Value ($) | |||||||
MUNICIPAL BONDS — (Continued) |
| |||||||
Hawaii — (Continued) | ||||||||
Honolulu City & County GO, Series B, Callable 11/01/22 at 100, | 2,050,000 | 2,249,096 | ||||||
Honolulu City & County GO, Series B, Callable 12/01/20 at 100, | 280,000 | 287,059 | ||||||
Honolulu City & County GO, Series B, Refunding, | 1,000,000 | 1,094,340 | ||||||
Honolulu City & County GO, Series B, Refunding, | 2,300,000 | 2,737,529 | ||||||
Honolulu City & County GO, Series B, Refunding, Callable 10/01/25 at 100, | 500,000 | 595,690 | ||||||
Honolulu City & County GO, Series B, Refunding, Honolulu Rail Transit Project, | 1,215,000 | 1,401,976 | ||||||
Honolulu City & County GO, Series C, Callable 08/01/29 at 100, | 1,400,000 | 1,589,854 | ||||||
Honolulu City & County GO, Series C, Callable 08/01/29 at 100, | 2,000,000 | 2,209,680 | ||||||
Honolulu City & County GO, Series C, Refunding, Callable 10/01/25 at 100, | 2,000,000 | 2,383,920 | ||||||
| Principal Amount ($) | Value ($) | |||||||
MUNICIPAL BONDS — (Continued) |
| |||||||
Hawaii — (Continued) | ||||||||
Honolulu City & County GO, | 4,115,000 | 4,869,485 | ||||||
Honolulu City & County GO, | 1,500,000 | 1,840,860 | ||||||
Honolulu City & County Wastewater System Revenue, 1st Bond Resolution, Series A, Callable 07/01/29 at 100, | 2,845,000 | 3,246,430 | ||||||
Honolulu City & County Wastewater System Revenue, Refunding, Junior Series A, Callable 07/01/25 at 100, | 4,000,000 | 4,669,520 | ||||||
Honolulu City & County Wastewater System Revenue, Senior 1st Bond Resolution, Refunding, Callable 07/01/25 at 100, | 1,000,000 | 1,180,960 | ||||||
Honolulu City & County Wastewater System Revenue, Senior 1st Bond Resolution, Refunding, Callable 07/01/25 at 100, | 325,000 | 384,170 | ||||||
Honolulu City & County Wastewater System Revenue, Senior 1st Bond Resolution, Series A, Callable 07/01/25 at 100, | 395,000 | 464,113 | ||||||
The accompanying notes are an integral part of the financial statements.
20
PACIFIC CAPITAL FUNDS
Pacific Capital Tax-Free Securities Fund
Portfolio of Investments (Continued)
April 30, 2020
| Principal Amount ($) | Value ($) | |||||||
MUNICIPAL BONDS — (Continued) |
| |||||||
Hawaii — (Continued) | ||||||||
Honolulu City & County Wastewater System Revenue, Senior 1st Bond Resolution, Series A, Callable 01/01/28 at 100, | 2,000,000 | 2,399,800 | ||||||
Honolulu City & County Wastewater System Revenue, Senior Series B, Refunding, Callable 07/01/26 at 100, | 125,000 | 146,649 | ||||||
Kauai County GO, | 395,000 | 443,111 | ||||||
Kauai County GO, | 250,000 | 310,965 | ||||||
Kauai County GO, Callable 08/01/27 at 100, | 250,000 | 304,720 | ||||||
Kauai County GO, Callable 08/01/27 at 100, | 270,000 | 301,563 | ||||||
Kauai County GO, Callable 08/01/27 at 100, | 775,000 | 912,152 | ||||||
Kauai County GO, Series A, Refunding, | 400,000 | 435,100 | ||||||
Kauai County GO, OID, Series A, Callable 08/01/21 at 100, | 1,195,000 | 1,227,181 | ||||||
Kauai County GO, OID, Series A, Callable 08/01/22 at 100, | 1,300,000 | 1,349,556 | ||||||
| Principal Amount ($) | Value ($) | |||||||
MUNICIPAL BONDS — (Continued) |
| |||||||
Hawaii — (Continued) | ||||||||
Maui County GO, Refunding, | 150,000 | 156,696 | ||||||
Maui County GO, Refunding, | 300,000 | 335,280 | ||||||
Maui County GO, Refunding, | 975,000 | 1,240,229 | ||||||
Maui County GO, Refunding, Callable 09/01/28 at 100, | 5,305,000 | 6,170,033 | ||||||
Maui County GO, Refunding, Callable 09/01/25 at 100, | 195,000 | 202,065 | ||||||
University of Hawaii Revenue, Series B, Refunding, | 165,000 | 184,549 | ||||||
University of Hawaii Revenue, Series B, Refunding, Callable 10/01/25 at 100, | 1,000,000 | 1,149,660 | ||||||
University of Hawaii Revenue, Series E, Refunding, | 3,000,000 | 3,483,780 | �� | |||||
University of Hawaii Revenue, Series E, Refunding, Callable 10/01/26 at 100, | 1,000,000 | 1,207,710 | ||||||
University of Hawaii Revenue, Series F, Refunding, Callable 10/01/27 at 100, | 3,000,000 | 3,590,370 | ||||||
University of Hawaii Revenue, Series F, Refunding, Callable 10/01/27 at 100, | 2,000,000 | 2,386,780 | ||||||
|
| |||||||
| 244,907,448 | ||||||||
|
| |||||||
The accompanying notes are an integral part of the financial statements.
21
PACIFIC CAPITAL FUNDS
Pacific Capital Tax-Free Securities Fund
Portfolio of Investments (Concluded)
April 30, 2020
| Principal Amount ($) | Value ($) | |||||||
MUNICIPAL BONDS — (Continued) |
| |||||||
Illinois — 0.8% | ||||||||
Illinois Municipal Electric Agency Power Supply Revenue, Series C, | 2,000,000 | 2,061,560 | ||||||
|
| |||||||
Texas — 1.6% | ||||||||
Galveston County GO, CAB, OID, Series RD, | 2,630,000 | 2,502,682 | ||||||
Houston Combined Utility System Revenue, Unrefunded Balance CAB, OID, Junior Series A, | 2,000,000 | 1,754,080 | ||||||
|
| |||||||
| 4,256,762 | ||||||||
|
| |||||||
TOTAL MUNICIPAL BONDS | 262,185,320 | |||||||
|
| |||||||
| Shares | ||||||||
REGISTERED INVESTMENT COMPANY — 0.5% |
| |||||||
Dreyfus Government Cash Management Fund, Institutional Shares, | 1,463,774 | 1,463,774 | ||||||
|
| |||||||
TOTAL REGISTERED INVESTMENT COMPANY | 1,463,774 | |||||||
|
| |||||||
| Value ($) | ||||
TOTAL INVESTMENTS - 99.1% | 263,649,094 | |||
OTHER ASSETS IN EXCESS OF LIABILITIES - 0.9% | 2,344,263 | |||
|
| |||
NET ASSETS - 100.0% | $ | 265,993,357 | ||
|
| |||
| (a) | Rate periodically changes. Rate disclosed is the 7-day yield at April 30, 2020. |
Portfolio holdings are subject to change at any time.
| AGM | Assured Guaranty Municipal Corp. | |
| AGM-CR | Assured Guaranty Municipal Corp. | |
| Custodial Receipts | ||
| AMT | Alternative Minimum Tax | |
| CAB | Capital Appreciation Bond | |
| ETM | Escrowed to Maturity | |
| FGIC | Financial Guaranty Insurance Co. | |
| FHLMC | Federal Home Loan Mortgage Corp. | |
| FNMA | Federal National Mortgage Association | |
| GNMA | Government National Mortgage | |
| Association | ||
| GO | General Obligation | |
| MWC | Make Whole Callable | |
| NATL-RE | National Reinsurance Corp. | |
| OID | Original Issue Discount |
The accompanying notes are an integral part of the financial statements.
22
PACIFIC CAPITAL FUNDS
Pacific Capital Tax-Free Short Intermediate Securities Fund
Portfolio of Investments
April 30, 2020
| Principal Amount ($) | Value ($) | |||||||
MUNICIPAL BONDS — 96.1% |
| |||||||
Arizona — 1.8% |
| |||||||
Tempe City Excise Tax Revenue, Series A, Callable 07/01/21 at 100, | 900,000 | 942,489 | ||||||
|
| |||||||
Hawaii — 92.0% |
| |||||||
Hawaii County GO, Series A, | 550,000 | 557,678 | ||||||
Hawaii County GO, Series A, Callable 03/01/26 at 100, | 200,000 | 241,654 | ||||||
Hawaii County GO, Series D, Refunding, | 500,000 | 580,230 | ||||||
Hawaii Housing Finance & Development Corp., Hale-Kewalo Apartments, Series A, Callable 05/27/20 at 100, | 2,175,000 | 2,178,371 | ||||||
Hawaii Pacific Health Revenue, Series A, OID, Prerefunded, Callable 07/01/20 at 100, | 685,000 | 690,240 | ||||||
Hawaii Pacific Health Revenue, Series B, ETM, | 175,000 | 176,201 | ||||||
Hawaii State Airports System Revenue, AMT, Callable 08/01/23 at 100, | 260,000 | 281,629 | ||||||
Hawaii State Airports System Revenue, Refunding, AMT, | 2,000,000 | 2,081,700 | ||||||
| Principal Amount ($) | Value ($) | |||||||
MUNICIPAL BONDS — (Continued) |
| |||||||
Hawaii — (Continued) |
| |||||||
Hawaii State Airports System Revenue, Refunding, AMT, Callable 07/01/21 at 100, | 500,000 | 518,760 | ||||||
Hawaii State Airports System Revenue, Refunding, AMT, OID, Callable 07/01/21 at 100, | 500,000 | 512,830 | ||||||
Hawaii State Airports System Revenue, Series A, Callable 07/01/20 at 100, | 500,000 | 503,280 | ||||||
Hawaii State Airports System Revenue, Series B, | 1,010,000 | 1,195,103 | ||||||
Hawaii State Department of Budget & Finance Revenue, Hawaiian Electric Company, AMT, MWC, | 500,000 | 515,155 | ||||||
Hawaii State Department of Budget & Finance Revenue, Hawaiian Electric Company, AMT, MWC, | 2,520,000 | 2,571,408 | ||||||
Hawaii State Department of Budget & Finance, Pacific Health Obligation, | 120,000 | 125,413 | ||||||
Hawaii State Department of Budget & Finance, Pacific Health Obligation, | 220,000 | 234,775 | ||||||
The accompanying notes are an integral part of the financial statements.
23
PACIFIC CAPITAL FUNDS
Pacific Capital Tax-Free Short Intermediate Securities Fund
Portfolio of Investments (Continued)
April 30, 2020
| Principal Amount ($) | Value ($) | |||||||
MUNICIPAL BONDS — (Continued) |
| |||||||
Hawaii — (Continued) |
| |||||||
Hawaii State Department of Budget & Finance, Pacific Health Obligation, | 165,000 | 176,081 | ||||||
Hawaii State Department of Budget & Finance, Pacific Health Obligation, Callable 07/01/23 at 100, | 200,000 | 217,394 | ||||||
Hawaii State Department of Budget & Finance, Series A, Queens Health System, | 240,000 | 255,538 | ||||||
Hawaii State Department of Budget & Finance, Series A, Queens Health System, | 525,000 | 584,740 | ||||||
Hawaii State Department of Budget & Finance, Series A, Queens Health System, | 510,000 | 579,646 | ||||||
Hawaii State Department of Budget & Finance, Series A, Queens Health System, Callable 07/01/25 at 100, | 300,000 | 339,384 | ||||||
Hawaii State GO, Series DZ, Prerefunded, Callable 12/01/21 at 100, | 290,000 | 309,592 | ||||||
Hawaii State GO, Series DZ, Prerefunded, Callable 12/01/21 at 100, | 190,000 | 202,836 | ||||||
| Principal Amount ($) | Value ($) | |||||||
MUNICIPAL BONDS — (Continued) |
| |||||||
Hawaii — (Continued) |
| |||||||
Hawaii State GO, Series DZ, Prerefunded, Callable 12/01/21 at 100, | 1,110,000 | 1,184,992 | ||||||
Hawaii State GO, Series DZ, Refunding, ETM, | 505,000 | 517,585 | ||||||
Hawaii State GO, Series DZ, Unrefunded portion, Callable 12/01/21 at 100, | 360,000 | 384,617 | ||||||
Hawaii State GO, Series EA, Refunding, Callable 12/01/21 at 100, | 1,070,000 | 1,136,789 | ||||||
Hawaii State GO, Series EE, ETM, | 1,315,000 | 1,420,976 | ||||||
Hawaii State GO, Series EE, Prerefunded, Callable 11/01/22 at 100, | 45,000 | 49,736 | ||||||
Hawaii State GO, Series EE, Prerefunded, Callable 11/01/22 at 100, | 25,000 | 27,631 | ||||||
Hawaii State GO, Series EE, Prerefunded, Callable 11/01/22 at 100, | 760,000 | 839,982 | ||||||
Hawaii State GO, Series EF, Refunding, Callable 11/01/22 at 100, | 1,080,000 | 1,184,328 | ||||||
The accompanying notes are an integral part of the financial statements.
24
PACIFIC CAPITAL FUNDS
Pacific Capital Tax-Free Short Intermediate Securities Fund
Portfolio of Investments (Continued)
April 30, 2020
| Principal Amount ($) | Value ($) | |||||||
MUNICIPAL BONDS — (Continued) |
| |||||||
Hawaii — (Continued) | ||||||||
Hawaii State GO, Series EH, Prerefunded, Callable 08/01/23 at 100, | 270,000 | 304,914 | ||||||
Hawaii State GO, Series EH, Unrefunded, Callable 08/01/23 at 100, | 830,000 | 931,658 | ||||||
Hawaii State GO, Series EP, Refunding, | 1,100,000 | 1,197,042 | ||||||
Hawaii State GO, Series FB, | 495,000 | 513,681 | ||||||
Hawaii State GO, Series FG, | 410,000 | 448,679 | ||||||
Hawaii State GO, Series FT, | 1,000,000 | 1,050,560 | ||||||
Hawaii State GO, Series FW, | 510,000 | 562,443 | ||||||
Hawaii State Harbor System Revenue, Refunding, AMT, Series B, Callable 07/01/20 at 100, | 520,000 | 523,609 | ||||||
Hawaii State Harbor System Revenue, Series A, Callable 07/01/20 at 100, | 600,000 | 603,732 | ||||||
Hawaii State Harbor System Revenue, Series A, OID, | 50,000 | 50,259 | ||||||
Hawaii State Harbor System Revenue, Series A, OID, Callable 07/01/20 at 100, | 60,000 | 60,339 | ||||||
| Principal Amount ($) | Value ($) | |||||||
MUNICIPAL BONDS — (Continued) |
| |||||||
Hawaii — (Continued) | ||||||||
Hawaii State Highway Fund Revenue, Series A, | 500,000 | 549,285 | ||||||
Hawaii State Highway Fund Revenue, Series A, Callable 01/01/22 at 100, | 500,000 | 522,530 | ||||||
Hawaii State Highway Fund Revenue, Series A, Callable 01/01/22 at 100, | 300,000 | 313,206 | ||||||
Honolulu City & County GO, Series A, Prerefunded, Callable 08/01/21 at 100, | 715,000 | 753,574 | ||||||
Honolulu City & County Board of Water Supply System Revenue, Refunding, Series A, | 300,000 | 314,352 | ||||||
Honolulu City & County Board of Water Supply System Revenue, Refunding, Series A, | 720,000 | 780,170 | ||||||
Honolulu City & County Board of Water Supply System Revenue, Refunding, Series A, | 515,000 | 576,234 | ||||||
Honolulu City & County Board of Water Supply System Revenue, Refunding, Series A, Callable 07/01/24 at 100, | 125,000 | 143,630 | ||||||
The accompanying notes are an integral part of the financial statements.
25
PACIFIC CAPITAL FUNDS
Pacific Capital Tax-Free Short Intermediate Securities Fund
Portfolio of Investments (Continued)
April 30, 2020
| Principal Amount ($) | Value ($) | |||||||
MUNICIPAL BONDS — (Continued) |
| |||||||
Hawaii — (Continued) | ||||||||
Honolulu City & County Board of Water Supply System Revenue, Refunding, Series A, Callable 07/01/24 at 100, | 235,000 | 269,717 | ||||||
Honolulu City & County Board of Water Supply System Revenue, Series A, | 500,000 | 575,395 | ||||||
Honolulu City & County GO, Honolulu Rail Transit Project, Series A, | 615,000 | 712,484 | ||||||
Honolulu City & County GO, Honolulu Rail Transit Project, Series B, Refunding, | 900,000 | 926,037 | ||||||
Honolulu City & County GO, Honolulu Rail Transit Project, Series B, Refunding, | 500,000 | 545,640 | ||||||
Honolulu City & County GO, Honolulu Rail Transit Project, Series B, Refunding, | 1,000,000 | 1,172,230 | ||||||
Honolulu City & County GO, Series A, OID, Prerefunded, Callable 08/01/21 at 100, | 20,000 | 20,832 | ||||||
Honolulu City & County GO, Series B, | 1,000,000 | 1,091,280 | ||||||
Honolulu City & County GO, Series C, | 800,000 | 852,888 | ||||||
| Principal Amount ($) | Value ($) | |||||||
MUNICIPAL BONDS — (Continued) |
| |||||||
Hawaii — (Continued) | ||||||||
Honolulu City & County GO, Series C, | 1,200,000 | 1,310,100 | ||||||
Honolulu City & County GO, Series D, Refunding, | 500,000 | 563,225 | ||||||
Honolulu City & County Wastewater System Revenue, 1st Bond Resolution, Senior Series A, Prerefunded, Callable 07/01/22 at 100, | 500,000 | 546,195 | ||||||
Honolulu City & County Wastewater System Revenue, 1st Bond Resolution, Series A, | 500,000 | 541,785 | ||||||
Honolulu City & County Wastewater System Revenue, 1st Bond Resolution, Series A, | 1,000,000 | 1,118,900 | ||||||
Honolulu City & County Wastewater System Revenue, Refunding, Junior Series A, | 500,000 | 575,395 | ||||||
Honolulu City & County Wastewater System Revenue, Senior Series A, | 1,005,000 | 1,040,336 | ||||||
The accompanying notes are an integral part of the financial statements.
26
PACIFIC CAPITAL FUNDS
Pacific Capital Tax-Free Short Intermediate Securities Fund
Portfolio of Investments (Continued)
April 30, 2020
| Principal Amount ($) | Value ($) | |||||||
MUNICIPAL BONDS — (Continued) |
| |||||||
Hawaii — (Continued) | ||||||||
Honolulu City & County Wastewater System Revenue, Senior Series A, Prerefunded, Callable 07/01/21 at 100, | 35,000 | 36,842 | ||||||
Kauai Country GO, | 305,000 | 306,696 | ||||||
Kauai County GO, Refunding, Series A, | 70,000 | 70,558 | ||||||
Kauai County GO, Refunding, Series A, | 345,000 | 346,918 | ||||||
Maui County GO, Refunding, | 1,225,000 | 1,279,684 | ||||||
Maui County GO, Refunding, | 35,000 | 36,924 | ||||||
Maui County GO, Refunding, | 1,000,000 | 1,126,450 | ||||||
University of Hawaii Revenue, Refunding, Series B, | 525,000 | 574,859 | ||||||
University of Hawaii Revenue, Refunding, Series B, | 500,000 | 559,240 | ||||||
University of Hawaii Revenue, Refunding, Series F, | 500,000 | 529,055 | ||||||
|
| |||||||
| 49,305,836 | ||||||||
|
| |||||||
| Principal Amount ($) | Value ($) | |||||||
MUNICIPAL BONDS — (Continued) |
| |||||||
Texas — 2.3% | ||||||||
Houston Independent School District GO, Refunding, Callable 02/15/24 at 100, | 600,000 | 661,596 | ||||||
Needville Independent School District GO, Refunding, | 140,000 | 141,691 | ||||||
Pflugerville Independent School District GO, Refunding, Callable 02/15/24 at 100, | 400,000 | 456,436 | ||||||
|
| |||||||
| 1,259,723 | ||||||||
|
| |||||||
TOTAL MUNICIPAL BONDS | 51,508,048 | |||||||
|
| |||||||
| Shares | ||||||||
REGISTERED INVESTMENT COMPANY — 2.7% |
| |||||||
Dreyfus Government Cash Management Fund, Institutional Shares, 0.17%(a) | 1,461,210 | 1,461,210 | ||||||
|
| |||||||
TOTAL REGISTERED INVESTMENT COMPANY | 1,461,210 | |||||||
|
| |||||||
The accompanying notes are an integral part of the financial statements.
27
PACIFIC CAPITAL FUNDS
Pacific Capital Tax-Free Short Intermediate Securities Fund
Portfolio of Investments (Concluded)
April 30, 2020
| Value ($) | ||||
TOTAL INVESTMENTS - 98.8% | 52,969,258 | |||
OTHER ASSETS IN EXCESS OF LIABILITIES - 1.2% | 629,964 | |||
|
| |||
NET ASSETS - 100.0% | $ | 53,599,222 | ||
|
| |||
| (a) | Rate periodically changes. Rate disclosed is the 7-day yield at April 30, 2020. |
Portfolio holdings are subject to change at any time.
AMT | Alternative Minimum Tax | |
ETM | Escrowed To Maturity | |
GNMA | Government National Mortgage | |
| Association | ||
GO | General Obligation | |
MWC | Make Whole Callable | |
OID | Original Issue Discount | |
PSF-GTD | Permanent School Fund Guaranteed |
The accompanying notes are an integral part of the financial statements.
28
PACIFIC CAPITAL FUNDS
Pacific Capital U.S. Government Money Market Fund
Portfolio Holdings Summary Table
April 30, 2020
(Unaudited)
The following table presents a summary by security type of the portfolio holdings of the Fund:
| % of Net Assets | Value | |||||||
SECURITY TYPE: | ||||||||
Registered Investment Company | 91.4 | % | $ | 325,699,112 | ||||
U.S. Government Agency Obligations | 4.4 | 15,645,238 | ||||||
U.S. Treasury Obligations | 4.2 | 14,996,187 | ||||||
Other Assets in Excess of Liabilities | 0.0 | 6,859 | ||||||
|
|
|
| |||||
NET ASSETS | 100.0 | % | $ | 356,347,396 | ||||
|
|
|
| |||||
Portfolio holdings are subject to change at any time.
The accompanying notes are an integral part of the financial statements.
29
PACIFIC CAPITAL FUNDS
Pacific Capital U.S. Government Money Market Fund
Portfolio of Investments
April 30, 2020
| Principal Amount ($) | Value ($) | |||||||
U.S. GOVERNMENT AGENCY OBLIGATION — 4.4% |
| |||||||
Federal Home Loan Bank — 4.4% |
| |||||||
1.57%, 05/08/2020(a) | 15,650,000 | 15,645,238 | ||||||
|
| |||||||
TOTAL U.S. GOVERNMENT AGENCY OBLIGATION | 15,645,238 | |||||||
|
| |||||||
U.S. TREASURY OBLIGATION — 4.2% |
| |||||||
U.S. Treasury Bill — 4.2% |
| |||||||
1.33%, 05/07/2020(b) | 15,000,000 | 14,996,187 | ||||||
|
| |||||||
TOTAL U.S. TREASURY OBLIGATION | 14,996,187 | |||||||
|
| |||||||
| Shares | ||||||||
REGISTERED INVESTMENT COMPANY — 91.4% |
| |||||||
Dreyfus Government Cash Management Fund, Institutional Shares, | 325,699,112 | 325,699,112 | ||||||
|
| |||||||
TOTAL REGISTERED INVESTMENT COMPANY | 325,699,112 | |||||||
|
| |||||||
TOTAL INVESTMENTS - 100.0% |
| 356,340,537 | ||||||
OTHER ASSETS IN EXCESS OF LIABILITIES - 0.0% | 6,859 | |||||||
|
| |||||||
NET ASSETS - 100.0% | $ | 356,347,396 | ||||||
|
| |||||||
| (a) | Interest rate disclosed represents the discount rate at the time of purchase. |
| (b) | Rate disclosed represents the yield-to-maturity as of April 30, 2020. |
| (c) | Rate periodically changes. Rate disclosed is the 7-day yield at April 30, 2020. |
Portfolio holdings are subject to change at any time.
The accompanying notes are an integral part of the financial statements.
30
PACIFIC CAPITAL FUNDS
Statements of Assets and Liabilities
April 30, 2020
| Pacific Capital Tax-Free Securities Fund | Pacific Capital Tax-Free Short Intermediate Securities Fund | Pacific Capital U.S. Government Money Market Fund | |||||||||||||
Assets | |||||||||||||||
Investments, at value* | $ | 263,649,094 | $ | 52,969,258 | $ | 356,340,537 | |||||||||
Cash | 46,759 | 9,563 | — | ||||||||||||
Receivable for capital shares sold | 131,772 | 82,001 | — | ||||||||||||
Interest receivable | 2,886,364 | 704,086 | 43,732 | ||||||||||||
Receivable from Investment Adviser | — | — | 62,450 | ||||||||||||
Prepaid expenses and other assets | 4,552 | 962 | 23,416 | ||||||||||||
|
|
|
|
|
| ||||||||||
Total assets | 266,718,541 | 53,765,870 | 356,470,135 | ||||||||||||
|
|
|
|
|
| ||||||||||
Liabilities | |||||||||||||||
Payable for distributions to shareholders | 566,683 | 63,917 | — | ||||||||||||
Payable for capital shares redeemed | 95,784 | 36,485 | — | ||||||||||||
Payable for audit fees | 29,365 | 29,186 | 27,857 | ||||||||||||
Payable for administration and accounting fees | 13,220 | 13,997 | 16,876 | ||||||||||||
Payable for transfer agent fees | 8,039 | 8,030 | 7,352 | ||||||||||||
Payable for custodian fees | 5,214 | 6,861 | 6,314 | ||||||||||||
Payable for legal fees | 3,540 | 2,813 | 2,242 | ||||||||||||
Payable for printing fees | 3,046 | 5,005 | 1,723 | ||||||||||||
Payable for distribution fees | — | — | 60,114 | ||||||||||||
Accrued expenses | 293 | 354 | 261 | ||||||||||||
|
|
|
|
|
| ||||||||||
Total liabilities | 725,184 | 166,648 | 122,739 | ||||||||||||
|
|
|
|
|
| ||||||||||
Net Assets | $ | 265,993,357 | $ | 53,599,222 | $ | 356,347,396 | |||||||||
|
|
|
|
|
| ||||||||||
Net Assets consisted of: | |||||||||||||||
Capital stock, $0.01 par value | $ | 258,361 | $ | 52,942 | $ | 3,563,874 | |||||||||
Paid-in capital | 257,070,493 | 53,049,127 | 352,775,728 | ||||||||||||
Total distributable earnings | 8,664,503 | 497,153 | 7,794 | ||||||||||||
|
|
|
|
|
| ||||||||||
Net Assets | $ | 265,993,357 | $ | 53,599,222 | $ | 356,347,396 | |||||||||
|
|
|
|
|
| ||||||||||
Class Y: | |||||||||||||||
Net assets | $ | 265,993,357 | $ | 53,599,222 | $ | — | |||||||||
|
|
|
|
|
| ||||||||||
Shares outstanding | 25,836,149 | 5,294,235 | — | ||||||||||||
|
|
|
|
|
| ||||||||||
Net asset value, offering and redemption price per share | $ | 10.30 | $ | 10.12 | $ | — | |||||||||
|
|
|
|
|
| ||||||||||
Investor Class: | |||||||||||||||
Net assets | $ | — | $ | — | $ | 356,347,396 | |||||||||
|
|
|
|
|
| ||||||||||
Shares outstanding | — | — | 356,387,379 | ||||||||||||
|
|
|
|
|
| ||||||||||
Net asset value, offering and redemption price per share | $ | — | $ | — | $ | 1.00 | |||||||||
|
|
|
|
|
| ||||||||||
* Investments, at cost | $ | 253,693,322 | $ | 52,370,724 | $ | 356,340,537 | |||||||||
The accompanying notes are an integral part of the financial statements.
31
PACIFIC CAPITAL FUNDS
Statements of Operations
For the Year Ended April 30, 2020
| Pacific Capital Tax-Free Securities Fund | Pacific Capital Tax-Free Short Intermediate Securities Fund | Pacific Capital U.S. Government Money Market Fund | |||||||||||||
Investment income | |||||||||||||||
Interest | $ | 7,280,569 | $ | 1,033,759 | $ | 5,618,952 | |||||||||
Dividends | 45,282 | 37,057 | 359,388 | ||||||||||||
|
|
|
|
|
| ||||||||||
Total investment income | 7,325,851 | 1,070,816 | 5,978,340 | ||||||||||||
|
|
|
|
|
| ||||||||||
Expenses | |||||||||||||||
Advisory fees (Note 2) | 563,279 | 112,539 | 1,340,727 | ||||||||||||
Administration and accounting fees | 72,478 | 45,571 | 73,217 | ||||||||||||
Trustees’ and officers’ fees | 55,230 | 15,973 | 63,940 | ||||||||||||
Audit fees | 30,217 | 30,038 | 27,357 | ||||||||||||
Legal fees | 22,248 | 4,191 | 40,162 | ||||||||||||
Transfer agent fees (Note 2) | 20,897 | 20,687 | 20,437 | ||||||||||||
Custodian fees (Note 2) | 18,528 | 6,218 | 31,315 | ||||||||||||
Printing and shareholder reporting fees | 2,594 | 8,226 | 6,415 | ||||||||||||
Registration and filing fees | 174 | 100 | 14,229 | ||||||||||||
Distribution fees (Investor Class) (Note 2) | — | — | 837,955 | ||||||||||||
Offering expenses | — | — | 15,459 | ||||||||||||
Other expenses | 29,388 | 3,492 | 54,550 | ||||||||||||
|
|
|
|
|
| ||||||||||
Total expenses before waivers and reimbursements | 815,033 | 247,035 | 2,525,763 | ||||||||||||
|
|
|
|
|
| ||||||||||
Less: waivers and reimbursements (Note 2) | (563,279 | ) | (112,539 | ) | (1,096,347 | ) | |||||||||
|
|
|
|
|
| ||||||||||
Net expenses after waivers and reimbursements | 251,754 | 134,496 | 1,429,416 | ||||||||||||
|
|
|
|
|
| ||||||||||
Net investment income | 7,074,097 | 936,320 | 4,548,924 | ||||||||||||
|
|
|
|
|
| ||||||||||
Net realized and unrealized gain from investments | |||||||||||||||
Net realized gain from investments | 414,256 | 76,666 | 8,984 | ||||||||||||
Net change in unrealized appreciation/(depreciation) from investments | 1,402,833 | 89,116 | — | ||||||||||||
|
|
|
|
|
| ||||||||||
Net realized and unrealized gain from investments | 1,817,089 | 165,782 | 8,984 | ||||||||||||
|
|
|
|
|
| ||||||||||
Net increase in net assets resulting from operations | $ | 8,891,186 | $ | 1,102,102 | $ | 4,557,908 | |||||||||
|
|
|
|
|
| ||||||||||
The accompanying notes are an integral part of the financial statements.
32
PACIFIC CAPITAL FUNDS
Pacific Capital Tax-Free Securities Fund
Statements of Changes in Net Assets
| Year Ended April 30, 2020 | Year Ended April 30, 2019 | |||||||
Increase in net assets from operations: | ||||||||
Net investment income | $ | 7,074,097 | $ | 7,051,847 | ||||
Net realized gain from investments | 414,256 | 20,043 | ||||||
Net change in unrealized appreciation/(depreciation) from investments | 1,402,833 | 7,540,470 | ||||||
|
|
|
| |||||
Net increase in net assets resulting from operations | 8,891,186 | 14,612,360 | ||||||
|
|
|
| |||||
Less dividends and distributions to shareholders from: | ||||||||
Total distributable earnings | (7,074,128 | ) | (7,051,814 | ) | ||||
|
|
|
| |||||
Decrease in net assets from dividends and distributions to shareholders | (7,074,128 | ) | (7,051,814 | ) | ||||
|
|
|
| |||||
Decrease in net assets derived from capital share transactions (Note 4) | (17,438,683 | ) | (15,114,487 | ) | ||||
|
|
|
| |||||
Total decrease in net assets | (15,621,625 | ) | (7,553,941 | ) | ||||
|
|
|
| |||||
Net assets | ||||||||
Beginning of year | 281,614,982 | 289,168,923 | ||||||
|
|
|
| |||||
End of year | $ | 265,993,357 | $ | 281,614,982 | ||||
|
|
|
| |||||
The accompanying notes are an integral part of the financial statements.
33
PACIFIC CAPITAL FUNDS
Pacific Capital Tax-Free Short Intermediate Securities Fund
Statements of Changes in Net Assets
| Year Ended April 30, 2020 | Year Ended April 30, 2019 | |||||||
Increase/(decrease) in net assets from operations: | ||||||||
Net investment income | $ | 936,320 | $ | 790,040 | ||||
Net realized gain/(loss) from investments | 76,666 | (106,437 | ) | |||||
Net change in unrealized appreciation/(depreciation) from investments | 89,116 | 849,209 | ||||||
|
|
|
| |||||
Net increase in net assets resulting from operations | 1,102,102 | 1,532,812 | ||||||
|
|
|
| |||||
Less dividends and distributions to shareholders from: | ||||||||
Total distributable earnings | (936,322 | ) | (790,089 | ) | ||||
|
|
|
| |||||
Decrease in net assets from dividends and distributions to shareholders | (936,322 | ) | (790,089 | ) | ||||
|
|
|
| |||||
Increase/(decrease) in net assets derived from capital share transactions (Note 4) | (46,031 | ) | 374,072 | |||||
|
|
|
| |||||
Total increase in net assets | 119,749 | 1,116,795 | ||||||
|
|
|
| |||||
Net assets | ||||||||
Beginning of year | 53,479,473 | 52,362,678 | ||||||
|
|
|
| |||||
End of year | $ | 53,599,222 | $ | 53,479,473 | ||||
|
|
|
| |||||
The accompanying notes are an integral part of the financial statements.
34
PACIFIC CAPITAL FUNDS
Pacific Capital U.S. Government Money Market Fund
Statements of Changes in Net Assets
| Year Ended April 30, 2020 | For the Period June 14, 2018* to April 30, 2019 | |||||||
Increase/(decrease) in net assets from operations: | ||||||||
Net investment income | $ | 4,548,924 | $ | 5,428,253 | ||||
Net realized gain/(loss) from investments | 8,984 | (1,077 | ) | |||||
|
|
|
| |||||
Net increase in net assets resulting from operations | 4,557,908 | 5,427,176 | ||||||
|
|
|
| |||||
Less dividends and distributions to shareholders from: | ||||||||
Total distributable earnings | (4,596,818 | ) | (5,428,253 | ) | ||||
|
|
|
| |||||
Decrease in net assets from dividends and distributions to shareholders | (4,596,818 | ) | (5,428,253 | ) | ||||
|
|
|
| |||||
Increase in net assets derived from capital share transactions (Note 4) | 32,493,834 | 323,893,549 | ||||||
|
|
|
| |||||
Total increase in net assets | 32,454,924 | 323,892,472 | ||||||
|
|
|
| |||||
Net assets | ||||||||
Beginning of year | 323,892,472 | — | ||||||
|
|
|
| |||||
End of year | $ | 356,347,396 | $ | 323,892,472 | ||||
|
|
|
| |||||
| * | Commencement of operations. |
The accompanying notes are an integral part of the financial statements.
35
PACIFIC CAPITAL FUNDS
Pacific Capital Tax-Free Securities Fund
Financial Highlights
Contained below is per share operating performance data for Class Y shares outstanding, total investment return, ratios to average net assets and other supplemental data for the respective periods. The total returns in the table represent the rate that an investor would have earned or lost on an investment in the Fund (assuming reinvestment of all dividends and distributions). This information has been derived from information provided in the financial statements and should be read in conjunction with the financial statements and the notes thereto.
Class Y shares | For the Year Ended April 30, 2020 | For the Year Ended April 30, 2019 | For the Year Ended April 30, 2018 | For the Year Ended April 30, 2017 | For the Year Ended April 30, 2016 | |||||||||||||||
Per Share Operating Performance | ||||||||||||||||||||
Net asset value, beginning of year | $ | 10.24 | $ | 9.97 | $ | 10.15 | $ | 10.41 | $ | 10.24 | ||||||||||
|
|
|
|
|
|
|
|
|
| |||||||||||
Net investment income | 0.26 | 0.25 | 0.25 | 0.25 | 0.30 | |||||||||||||||
Net realized and unrealized gain/(loss) from investments | 0.06 | 0.27 | (0.18 | ) | (0.26 | ) | 0.17 | |||||||||||||
|
|
|
|
|
|
|
|
|
| |||||||||||
Net increase/(decrease) in net assets resulting from operations | 0.32 | 0.52 | 0.07 | (0.01 | ) | 0.47 | ||||||||||||||
|
|
|
|
|
|
|
|
|
| |||||||||||
Dividends and distributions to shareholders from: | ||||||||||||||||||||
Net investment income | (0.26 | ) | (0.25 | ) | (0.25 | ) | (0.25 | ) | (0.30 | ) | ||||||||||
|
|
|
|
|
|
|
|
|
| |||||||||||
Net asset value, end of year | $ | 10.30 | $ | 10.24 | $ | 9.97 | $ | 10.15 | $ | 10.41 | ||||||||||
|
|
|
|
|
|
|
|
|
| |||||||||||
Total investment return(1) | 3.14 | % | 5.30 | % | 0.63 | % | (0.10 | )% | 4.63 | % | ||||||||||
Ratios/Supplemental Data | ||||||||||||||||||||
Net assets, end of year (in thousands) | $ | 265,993 | $ | 281,615 | $ | 289,169 | $ | 314,733 | $ | 300,517 | ||||||||||
Ratio of expenses to average net assets | 0.09 | % | 0.11 | % | 0.10 | % | 0.10 | % | 0.10 | % | ||||||||||
Ratio of expenses to average net assets without waivers(2) | 0.29 | % | 0.31 | % | 0.30 | % | 0.30 | % | 0.30 | % | ||||||||||
Ratio of net investment income to average net assets | 2.51 | % | 2.50 | % | 2.41 | % | 2.42 | % | 2.87 | % | ||||||||||
Portfolio turnover rate | 10 | % | 11 | % | 22 | % | 15 | % | 18 | % | ||||||||||
| (1) | Total investment return is calculated assuming a purchase of shares on the first day and a sale of shares on the last day of each period reported and includes reinvestment of dividends and distributions, if any. |
| (2) | During the period, certain fees were waived. If such fee waivers had not occurred, the ratios would have been as indicated (See Note 2). |
The accompanying notes are an integral part of the financial statements.
36
PACIFIC CAPITAL FUNDS
Pacific Capital Tax-Free Short Intermediate Securities Fund
Financial Highlights
Contained below is per share operating performance data for Class Y shares outstanding, total investment return, ratios to average net assets and other supplemental data for the respective periods. The total returns in the table represent the rate that an investor would have earned or lost on an investment in the Fund (assuming reinvestment of all dividends and distributions). This information has been derived from information provided in the financial statements and should be read in conjunction with the financial statements and the notes thereto.
Class Y shares | For the Year Ended April 30, 2020 | For the Year Ended April 30, 2019 | For the Year Ended April 30, 2018 | For the Year Ended April 30, 2017 | For the Year Ended April 30, 2016 | |||||||||||||||
Per Share Operating Performance | ||||||||||||||||||||
Net asset value, beginning of year | $ | 10.09 | $ | 9.95 | $ | 10.14 | $ | 10.27 | $ | 10.19 | ||||||||||
|
|
|
|
|
|
|
|
|
| |||||||||||
Net investment income | 0.17 | 0.16 | 0.14 | 0.13 | 0.12 | |||||||||||||||
Net realized and unrealized gain/(loss) from investments | 0.03 | 0.14 | (0.19 | ) | (0.10 | ) | 0.08 | |||||||||||||
|
|
|
|
|
|
|
|
|
| |||||||||||
Net increase/(decrease) in net assets resulting from operations | 0.20 | 0.30 | (0.05 | ) | 0.03 | 0.20 | ||||||||||||||
|
|
|
|
|
|
|
|
|
| |||||||||||
Dividends and distributions to shareholders from: | ||||||||||||||||||||
Net investment income | (0.17 | ) | (0.16 | ) | (0.14 | ) | (0.13 | ) | (0.12 | ) | ||||||||||
Net realized gains | — | — | (0.00 | )(1) | (0.03 | ) | — | |||||||||||||
|
|
|
|
|
|
|
|
|
| |||||||||||
Total dividends and distributions and shareholders | (0.17 | ) | (0.16 | ) | (0.14 | ) | (0.16 | ) | (0.12 | ) | ||||||||||
|
|
|
|
|
|
|
|
|
| |||||||||||
Net asset value, end of year | $ | 10.12 | $ | 10.09 | $ | 9.95 | $ | 10.14 | $ | 10.27 | ||||||||||
|
|
|
|
|
|
|
|
|
| |||||||||||
Total investment return(2) | 1.98 | % | 3.01 | % | (0.49 | )% | 0.24 | % | 1.93 | % | ||||||||||
Ratios/Supplemental Data | ||||||||||||||||||||
Net assets, end of year (in thousands) | $ | 53,599 | $ | 53,479 | $ | 52,363 | $ | 68,075 | $ | 90,438 | ||||||||||
Ratio of expenses to average net assets | 0.24 | % | 0.34 | % | 0.25 | % | 0.25 | % | 0.15 | % | ||||||||||
Ratio of expenses to average net assets without waivers(3) | 0.44 | % | 0.54 | % | 0.45 | % | 0.45 | % | 0.35 | % | ||||||||||
Ratio of net investment income to average net assets | 1.66 | % | 1.57 | % | 1.36 | % | 1.24 | % | 1.12 | % | ||||||||||
Portfolio turnover rate | 30 | % | 34 | % | 27 | % | 19 | % | 19 | % | ||||||||||
| (1) | Amount is less than $0.005 per share. |
| (2) | Total investment return is calculated assuming a purchase of shares on the first day and a sale of shares on the last day of each period reported and includes reinvestment of dividends and distributions, if any. |
| (3) | During the period, certain fees were waived. If such fee waivers had not occurred, the ratios would have been as indicated (See Note 2). |
The accompanying notes are an integral part of the financial statements.
37
PACIFIC CAPITAL FUNDS
Pacific Capital U.S. Government Money Market Fund
Financial Highlights
Contained below is per share operating performance data for Investor Class shares outstanding, total investment return, ratios to average net assets and other supplemental data for the respective periods. The total returns in the table represent the rate that an investor would have earned or lost on an investment in the Fund (assuming reinvestment of all dividends and distributions). This information has been derived from information provided in the financial statements and should be read in conjunction with the financial statements and the notes thereto.
Investor Class shares | For the Year Ended April 30, 2020 | For the Period June 14, 2018(1) to April 30, 2019 | ||||||||
|
| |||||||||
Per Share Operating Performance | ||||||||||
Net asset value, beginning of year/period | $ | 1.00 | $ 1.00 | |||||||
|
|
|
| |||||||
Net investment income | 0.0136 | 0.0162 | ||||||||
Net realized gain/(loss) from investments | 0.0001 | (0.0000 | )(2) | |||||||
|
|
|
| |||||||
Net increase in net assets resulting from operations | 0.0137 | 0.0162 | ||||||||
|
|
|
| |||||||
Dividends and distributions to shareholders from: | ||||||||||
Net investment income | (0.0137 | ) | (0.0162 | ) | ||||||
|
|
|
| |||||||
Net asset value, end of year/period | $ | 1.00 | $ 1.00 | |||||||
|
|
|
| |||||||
Total investment return(3) | 1.38 | % | 1.64 | % | ||||||
Ratios/Supplemental Data | ||||||||||
Net assets, end of year/period (in thousands) | $ | 356,347 | $323,892 | |||||||
Ratio of expenses to average net assets | 0.43 | % | 0.33 | %* | ||||||
Ratio of expenses to average net assets without waivers(4) | 0.75 | % | 0.77 | %* | ||||||
Ratio of net investment income to average net assets | 1.36 | % | 1.88 | %* | ||||||
| * | Annualized. |
| (1) | Commencement of operations. |
| (2) | Amount is less than $0.00005 per share. |
| (3) | Total investment return is calculated assuming a purchase of shares on the first day and a sale of shares on the last day of each period reported and includes reinvestment of dividends and distributions, if any. Total returns for periods less than one year are not annualized. |
| (4) | During the period, certain fees were waived and/or reimbursed. If such fee waivers and/or reimbursements had not occurred, the ratios would have been as indicated (See Note 2). |
The accompanying notes are an integral part of the financial statements.
38
PACIFIC CAPITAL FUNDS
Notes to Financial Statements
April 30, 2020
1. Organization and Significant Accounting Policies
The Pacific Capital Tax-Free Securities Fund, the Pacific Capital Tax-Free Short Intermediate Securities Fund and the Pacific Capital U.S. Government Money Market Fund (each a “Fund” and together the “Funds”) are open-end management investment companies registered under the Investment Company Act of 1940, as amended (the “1940 Act”). The Pacific Capital Tax-Free Securities Fund and the Pacific Capital Tax-Free Short Intermediate Securities Fund are non-diversified. The Pacific Capital U.S. Government Money Market Fund is diversified. The Funds are each a separate series of FundVantage Trust (the “Trust”) which was organized as a Delaware statutory trust on August 28, 2006. The Trust is a “series trust” authorized to issue an unlimited number of separate series or classes of shares of beneficial interest. Each series is treated as a separate entity for certain matters under the 1940 Act, and for other purposes, and a shareholder of one series is not deemed to be a shareholder of any other series. The Pacific Capital Tax-Free Securities Fund and the Pacific Capital Tax-Free Short Intermediate Securities Fund are each authorized to issue and offer Class Y shares. The Pacific Capital U.S. Government Money Market Fund commenced investment operations on June 14, 2018, and is authorized to issue and offer Investor Class and Institutional Class shares.
The Funds are investment companies and follow accounting and reporting guidance in the Financial Accounting Standards Board Accounting Standards Codification Topic 946.
Portfolio Valuation — Each Fund’s net asset value (“NAV”) is calculated once daily at the close of regular trading hours on the New York Stock Exchange (“NYSE”) (typically 4:00 p.m. Eastern time) on each day the NYSE is open. Fixed income securities having a remaining maturity of greater than 60 days are valued using an independent pricing service. Fixed income securities having a remaining maturity of 60 days or less are generally valued at amortized cost, provided such amount approximates fair value. Debt securities are valued on the basis of broker quotations or valuations provided by a pricing service, which utilizes information with respect to recent sales, market transactions in comparable securities, quotations from dealers, and various relationships between securities in determining value. Valuations developed through pricing techniques may materially vary from the actual amounts realized upon sale of the securities. Investments in other open-end investment companies are valued based on the NAV of such investment companies (which may use fair value pricing as discussed in their prospectuses). If market quotations are unavailable or deemed unreliable, securities will be valued in accordance with procedures adopted by the Trust’s Board of Trustees (“Board of Trustees”). Relying on prices supplied by pricing services or dealers or using fair valuation may result in values that are higher or lower than the values used by other investment companies and investors to price the same investments. In the event that market quotes are not readily available, and the security or asset cannot be valued pursuant to one of the valuation methods, the value of the security or asset will be determined in good faith by the Adviser. The Trust has established a Valuation Committee which performs certain functions including the oversight of the Adviser’s fair valuation determinations.
39
PACIFIC CAPITAL FUNDS
Notes to Financial Statements (Continued)
April 30, 2020
The Pacific Capital U.S. Government Money Market Fund operates as a “government money market fund” and accordingly: (1) invests at least 99.5% of its total assets in: (i) cash; (ii) securities or instruments issued or guaranteed as to principal and interest by the United States or certain U.S. Government agencies or instrumentalities; and/or (iii) repurchase agreements that are collateralized fully by U.S. Government obligations or cash; (2) uses amortized cost, which approximates fair value, to value its portfolio securities and seeks to transact at a stable $1.00 NAV per share; and (3) has elected not to provide for the imposition of liquidity fees and redemption gates at this time as permitted under Rule 2a-7 of the 1940 Act. There is no assurance, however, that the Fund will be able to maintain a constant NAV per share of $1.00.
Fair Value Measurements — The inputs and valuation techniques used to measure fair value of the Funds’ investments are summarized into three levels as described in the hierarchy below:
● Level 1 | — | quoted prices in active markets for identical securities; | ||
● Level 2 | — | other significant observable inputs (including quoted prices for similar securities, interest rates, prepayment speeds, credit risk, etc.); and | ||
● Level 3 | — | significant unobservable inputs (including a Fund’s own assumptions in determining the fair value of investments). | ||
The fair value of a Fund’s bonds are generally based on quotes received from brokers or independent pricing services. Bonds with quotes that are based on actual trades with a sufficient level of activity on or near the measurement date are classified as Level 2 assets.
Securities held within the Pacific Capital U.S. Government Money Market Fund are generally valued at amortized cost, which approximates fair value, in accordance with Rule 2a-7 under the 1940 Act. Generally, amortized cost approximates the current fair value of a security, but since the value is not obtained from a quoted price in an active market, such securities are reflected as Level 2.
The inputs or methodology used for valuing securities are not necessarily an indication of the risk associated with investing in those securities.
40
PACIFIC CAPITAL FUNDS
Notes to Financial Statements (Continued)
April 30, 2020
The following is a summary of the inputs used, as of April 30, 2020, in valuing the Funds’ investments carried at fair value:
Funds | Total Value at 04/30/20 | Level 1 Quoted Price | Level 2 Other Significant Observable Inputs | Level 3 Significant Unobservable Inputs | ||||||||||||
Pacific Capital Tax-Free Securities Fund | ||||||||||||||||
Municipal Bonds | $ | 262,185,320 | $ | — | $ | 262,185,320 | $ | — | ||||||||
Registered Investment Company | 1,463,774 | 1,463,774 | — | — | ||||||||||||
|
|
|
|
|
|
|
| |||||||||
Total | $ | 263,649,094 | $ | 1,463,774 | $ | 262,185,320 | $ | — | ||||||||
|
|
|
|
|
|
|
| |||||||||
Pacific Capital Tax-Free Short Intermediate Securities Fund | ||||||||||||||||
Municipal Bonds | $ | 51,508,048 | $ | — | $ | 51,508,048 | $ | — | ||||||||
Registered Investment Company | 1,461,210 | 1,461,210 | — | — | ||||||||||||
|
|
|
|
|
|
|
| |||||||||
Total | $ | 52,969,258 | $ | 1,461,210 | $ | 51,508,048 | $ | — | ||||||||
|
|
|
|
|
|
|
| |||||||||
Pacific Capital U.S. Government Money Market Fund | ||||||||||||||||
U.S. Government Agency Obligation | $ | 15,645,238 | $ | — | $ | 15,645,238 | $ | — | ||||||||
U.S. Treasury Obligation | 14,996,187 | — | 14,996,187 | — | ||||||||||||
Registered Investment Company | 325,699,112 | 325,699,112 | — | — | ||||||||||||
|
|
|
|
|
|
|
| |||||||||
Total | $ | 356,340,537 | $ | 325,699,112 | $ | 30,641,425 | $ | — | ||||||||
|
|
|
|
|
|
|
| |||||||||
At the end of each quarter, management evaluates the classification of Levels 1, 2 and 3 assets and liabilities. Various factors are considered, such as changes in liquidity from the prior reporting period; whether or not a broker is willing to execute at the quoted price; the depth and consistency of prices from third party pricing services; and the existence of contemporaneous, observable trades in the market. Additionally, management evaluates the classification of Level 1 and Level 2 assets and liabilities on a quarterly basis for changes in listings or delistings on national exchanges.
Due to the inherent uncertainty of determining the fair value of investments that do not have a readily available market value, the fair value of a Fund’s investments may fluctuate from period to period. Additionally, the fair value of investments may differ significantly from the values that would have been used had a ready market existed for such investments and may differ materially from the values a Fund may ultimately
41
PACIFIC CAPITAL FUNDS
Notes to Financial Statements (Continued)
April 30, 2020
realize. Further, such investments may be subject to legal and other restrictions on resale or otherwise less liquid than publicly traded securities.
For fair valuations using significant unobservable inputs, U.S. generally accepted accounting principles (“U.S. GAAP”) require the Funds to present a reconciliation of the beginning to ending balances for reported market values that present changes attributable to total realized and unrealized gains or losses, purchase and sales, and transfers in and out of Level 3 during the period. A reconciliation of Level 3 investments is presented only when the Funds have an amount of Level 3 investments at the end of the reporting period that was meaningful in relation to its net assets. The amounts and reasons for all transfers in and out of each Level within the three-tier hierarchy are disclosed when the Funds have an amount of total transfers during the reporting period that was meaningful in relation to its net assets as of the end of the reporting period.
For the year ended April 30, 2020, there were no transfers in or out of Level 3.
Use of Estimates — The preparation of financial statements in conformity with U.S. GAAP requires management to make estimates and assumptions that affect the amounts reported in the financial statements and accompanying notes at the date of the financial statements and the reported amounts of revenues and expenses during the period. Actual results could differ from those estimates and those differences could be material.
Investment Transactions, Investment Income and Expenses — Investment transactions are recorded on trade date for financial statement preparation purposes. Realized gains and losses on investments sold are recorded on the identified cost basis. Interest income is recorded on the accrual basis. Accretion of discounts and amortization of premiums are recorded on a daily basis using the effective yield method except for short term securities, which records discounts and premiums on a straight-line basis. Dividends are recorded on the ex-dividend date. Distribution (12b-1) fees and shareholder services fees relating to a specific class are charged directly to that class. General expenses of the Trust are generally allocated to each fund in proportion to its relative daily net assets. Expenses directly attributable to a particular fund in the Trust are charged directly to that fund.
Deferred Offering Costs — For the Pacific Capital U.S. Government Money Market Fund, offering costs, including costs of printing initial prospectus and legal fees, are amortized over twelve-months from inception of the Fund. As of April 30, 2020, the Fund has fully amortized all offering costs.
Dividends and Distributions to Shareholders — Dividends from net investment income for each Fund are declared daily and paid monthly to shareholders. Distributions, if any, of net short-term capital gain and net capital gain (the excess of net long-term capital gain over the short-term capital loss) realized by a Fund, after deducting any available capital loss carryovers are declared and paid to its shareholders
42
PACIFIC CAPITAL FUNDS
Notes to Financial Statements (Continued)
April 30, 2020
annually. Income dividends and capital gain distributions are determined in accordance with U.S. federal income tax regulations, which may differ from U.S. GAAP.
U.S. Tax Status — No provision is made for U.S. income taxes as it is each Fund’s intention to continue to qualify for and elect the tax treatment applicable to regulated investment companies under Subchapter M of the Internal Revenue Code of 1986, as amended (“Internal Revenue Code”), and make the requisite distributions to such Fund’s shareholders, which will be sufficient to relieve it from U.S. income and excise taxes.
Other — In the normal course of business, a Fund may enter into contracts that provide general indemnifications. A Fund’s maximum exposure under these arrangements is dependent on claims that may be made against it in the future, and, therefore, cannot be estimated; however, based on experience, the risk of material loss for such claims is considered remote.
Market disruptions associated with the COVID-19 pandemic have had a global impact, and uncertainty exists as to its long-term implications. The COVID-19 pandemic could adversely affect the value and liquidity of the Funds’ investments, impair the Funds’ ability to satisfy redemption requests, and negatively impact the Funds’ performance. In addition, the outbreak of COVID-19, and measures taken to mitigate its effects, could result in disruptions to the services provided to the Funds by their service providers. Fund management is continuing to monitor this development and evaluate its impact on the Funds.
Recent Regulatory Reporting Update and Accounting Pronouncement — In March 2017, the Financial Accounting Standards Board issued Accounting Standards Update (“ASU”) 2017-08, Premium Amortization on Purchased Callable debt Securities (Subtopic 310-20). This ASU was issued to clarify the Subtopic 310-20, and to amend the amortization period for certain purchased callable debt securities held at a premium. The Funds adopted ASU 2017-08 during the current fiscal year; this adoption did not have a material impact on the Funds’ financial statements.
2. Transactions with Related Parties and Other Service Providers
Investment advisory services are provided to the Funds by the Asset Management Group of Bank of Hawaii (the “Adviser”). Under terms of an advisory agreement, the Pacific Capital Tax-Free Securities Fund and the Pacific Capital Tax-Free Short Intermediate Securities Fund are charged an annual fee of 0.20% which is computed daily and paid monthly based upon average daily net assets. The Adviser has contractually agreed to waive its advisory fee (the “Waiver”). The Waiver will remain in effect until August 31, 2021. The Waiver may not be terminated at any time prior to that date without the consent of the Board of Trustees of FundVantage Trust (the “Trust”). While the Adviser is currently waiving its entire investment advisory fee, investors who invest in a Fund through a bank trust account may be subject to account level fees applicable to such amount charged by affiliates of the Adviser, including Bank of Hawaii’s Trust Services Group.
43
PACIFIC CAPITAL FUNDS
Notes to Financial Statements (Continued)
April 30, 2020
Fee rates for the year ended April 30, 2020, were as follows:
| Maximum Annual Advisory Fee | Net Annual Fees Paid After Contractual Waivers | |||||||
Pacific Capital Tax-Free Securities Fund | 0.20 | % | 0.00 | % | ||||
Pacific Capital Tax-Free Short Intermediate Securities Fund | 0.20 | % | 0.00 | % | ||||
For the Pacific Capital U.S. Government Money Market Fund, under terms of an advisory agreement, the Fund is charged an annual fee of 0.40% which is computed daily and paid monthly based upon average daily net assets. The Adviser has voluntarily agreed to reduce its advisory fee and/or reimburse certain expenses of the Fund to the extent necessary to maintain a minimum daily net yield for the Fund (the “MMF Waiver”). The MMF Waiver may be discontinued at any time at the discretion of the Adviser. For the year ended April 30, 2020, the Adviser earned advisory fees of $1,340,727 and waived fees of $911,875 and reimbursed fees and expenses of $184,472.
Other Service Providers
The Bank of New York Mellon (“BNY Mellon”) serves as administrator and custodian for the Funds. For providing administrative and accounting services, BNY Mellon is entitled to receive a monthly fee equal to an annual percentage rate of the Funds’ average daily net assets and is subject to certain minimum monthly fees. For providing certain custodial services, BNY Mellon is entitled to receive a monthly fee, subject to certain minimum, and out of pocket expenses.
BNY Mellon Investment Servicing (US) Inc. (the “Transfer Agent”) provides transfer agent services to the Funds. The Transfer Agent is entitled to receive a monthly fee, subject to certain minimum, and out of pocket expenses.
The Trust, on behalf of the Funds, has entered into agreements with financial intermediaries to provide recordkeeping, processing, shareholder communications and other services to customers of the intermediaries investing in the Funds and have agreed to compensate the intermediaries for providing those services. The fees incurred by the Funds for these services are included in Transfer agent fees in the Statements of Operations.
Foreside Funds Distributors LLC (the “Underwriter”) provides principal underwriting services to the Funds pursuant to an underwriting agreement between the Trust and the Underwriter.
The Trust and the Underwriter are parties to an underwriting agreement. The Trust has adopted a distribution plan for Investor Class shares of the Pacific Capital U.S. Government Money Market Fund in accordance with Rule 12b-1 under the 1940 Act. Pursuant to the distribution plan, the Fund compensates
44
PACIFIC CAPITAL FUNDS
Notes to Financial Statements (Continued)
April 30, 2020
the Underwriter for direct and indirect costs and expenses incurred in connection with advertising, marketing and other distribution services in an amount not to exceed 0.25% on an annualized basis of the average daily net assets of the Fund’s Investor Class shares.
Trustees and Officers
The Trust is governed by its Board of Trustees. The Trustees receive compensation in the form of an annual retainer and per meeting fees for their services to the Trust. An employee of BNY Mellon serves as the Secretary of the Trust and is not compensated by the Funds or the Trust.
JW Fund Management LLC (“JWFM”) provides a Principal Executive Officer and Principal Financial Officer, respectively, to the Trust. Duff & Phelps, LLC (“D&P”) provides the Trust with a Chief Compliance Officer and an Anti-Money Laundering Officer. JWFM and D&P are compensated for their services provided to the Trust.
3. Investment in Securities
For the year ended April 30, 2020, aggregate purchases and sales of investment securities (excluding short-term investments) of the Funds were as follows:
| Purchases | Sales | |||||||
Pacific Capital Tax-Free Securities Fund | $ | 27,538,543 | $ | 39,945,584 | ||||
Pacific Capital Tax-Free Short Intermediate Securities Fund | 17,114,485 | 15,889,125 | ||||||
The Funds are permitted to purchase or sell securities from or to certain other affiliated funds under specified conditions outlined in the procedures adopted by the Board of Trustees of the Funds. The procedures have been designed to provide assurances that any purchase or sale of securities by the Funds from or to another fund that is or could be considered an affiliate by virtue of having a common investment adviser (or affiliated investment adviser), common Trustees and/or common officers complies with Rule 17a-7 under the 1940 Act. Further, as defined under the procedures, each transaction is effective at the current market price.
For the year ended April 30, 2020, the Pacific Capital Tax-Free Securities Fund and the Pacific Capital Tax-Free Short Intermediate Securities Fund engaged in security transactions with affiliated funds under Rule 17a-7. The Pacific Capital Tax-Free Securities Fund engaged in security sales with proceeds of $952,097 and net realized gain of $2,209. The Pacific Capital Tax-Free Short Intermediate Securities Fund engaged in security purchases of $2,843,639 under Rule 17a-7.
45
PACIFIC CAPITAL FUNDS
Notes to Financial Statements (Continued)
April 30, 2020
4. Capital Share Transactions
For the year ended April 30, 2020 and for the year or period ended April 30, 2019, transactions in capital shares (authorized shares unlimited) were as follows:
| For the Year Ended April 30, 2020 | For the Year Ended April 30, 2019 | |||||||||||||||
Shares | Amount | Shares | Amount | |||||||||||||
Pacific Capital Tax-Free Securities Fund | ||||||||||||||||
Class Y | ||||||||||||||||
Sales | 2,439,852 | $ | 25,444,848 | 2,640,506 | $ | 26,536,650 | ||||||||||
Reinvestments | 3,961 | 41,389 | 4,609 | 46,316 | ||||||||||||
Redemptions | (4,115,980 | ) | (42,924,920 | ) | (4,154,968 | ) | (41,697,453 | ) | ||||||||
|
|
|
|
|
|
|
| |||||||||
Net decrease | (1,672,167 | ) | $ | (17,438,683 | ) | (1,509,853 | ) | $ | (15,114,487 | ) | ||||||
|
|
|
|
|
|
|
| |||||||||
| For the Year Ended April 30, 2020 | For the Year Ended April 30, 2019 | |||||||||||||||
Shares | Amount | Shares | Amount | |||||||||||||
Pacific Capital Tax-Free Short Intermediate Securities Fund | ||||||||||||||||
Class Y | ||||||||||||||||
Sales | 946,792 | $ | 9,619,312 | 1,102,203 | $ | 11,045,479 | ||||||||||
Reinvestments | 496 | 5,043 | 478 | 4,783 | ||||||||||||
Redemptions | (953,287 | ) | (9,670,386 | ) | (1,067,544 | ) | (10,676,190 | ) | ||||||||
|
|
|
|
|
|
|
| |||||||||
Net increase/(decrease) | (5,999 | ) | $ | (46,031 | ) | 35,137 | $ | 374,072 | ||||||||
|
|
|
|
|
|
|
| |||||||||
| For the Year Ended April 30, 2020 | For the Period June 14, 2018* to April 30, 2019 | |||||||||||||||
Shares | Amount | Shares | Amount | |||||||||||||
Pacific Capital U.S. Government Money Market Fund | ||||||||||||||||
Investor Class | ||||||||||||||||
Sales | 2,129,308,303 | $ | 2,129,308,303 | 2,343,451,670 | $ | 2,343,451,670 | ||||||||||
Reinvestments | 4,596,820 | 4,596,818 | 5,426,754 | 5,426,760 | ||||||||||||
Redemptions | (2,101,411,287 | ) | (2,101,411,287 | ) | (2,024,984,881 | ) | (2,024,984,881 | ) | ||||||||
|
|
|
|
|
|
|
| |||||||||
Net increase | 32,493,836 | $ | 32,493,834 | 323,893,543 | $ | 323,893,549 | ||||||||||
|
|
|
|
|
|
|
| |||||||||
| * | Commencement of operations. |
46
PACIFIC CAPITAL FUNDS
Notes to Financial Statements (Continued)
April 30, 2020
5. Federal Tax Information
The Funds have followed the authoritative guidance on accounting for and disclosure of uncertainty in tax positions, which requires the Funds to determine whether a tax position is more likely than not to be sustained upon examination, including resolution of any related appeals or litigation processes, based on the technical merits of the position. The Funds have determined that there was no effect on the financial statements from following this authoritative guidance. In the normal course of business, the Funds are subject to examination by federal, state, and local jurisdictions, where applicable, for tax years for which applicable statutes of limitations have not expired.
Distributions are determined in accordance with federal income tax regulations, which may differ in amount or character from net investment income and realized gains for financial reporting purposes. Accordingly, the character of distributions and composition of net assets for tax purposes may differ from those reflected in the accompanying financial statements. To the extent these differences are permanent, such amounts are reclassified within the components of net assets based on the tax treatment; temporary differences do not require reclassifications. Net assets were not affected by these adjustments. The following permanent difference as of April 30, 2020, primarily attributed to the disallowance of stock offering costs and redesignation of dividends paid, were reclassified among the following accounts:
| Increase/(Decrease) Total Distributable Earnings | Increase/(Decrease) Additional Paid-In Capital | |||||||||||
Pacific Capital Tax-Free Securities Fund | $ | — | $ | — | ||||||||
Pacific Capital Tax-Free Short Intermediate Securities Fund | — | — | ||||||||||
Pacific Capital U.S. Government Money Market Fund | 15,459 | (15,459 | ) | |||||||||
The tax character of distributions paid during the year ended April 30, 2020, were as follows:
| Net Investment Income | Total Taxable Distributions | Tax Exempt Distributions | Total Distributions Paid* | |||||||||||||
Pacific Capital Tax-Free Securities Fund | $ | 53,481 | $ | 53,481 | $ | 7,025,619 | $ | 7,079,100 | ||||||||
Pacific Capital Tax-Free Short Intermediate Securities Fund | 39,003 | 39,003 | 903,310 | 942,313 | ||||||||||||
Pacific Capital U.S. Government Money Market Fund | 4,596,818 | 4,596,818 | — | 4,596,818 | ||||||||||||
| * | Distributions will not tie to Statement of Changes because distributions are recognized when actually paid for tax purposes. |
47
PACIFIC CAPITAL FUNDS
Notes to Financial Statements (Continued)
April 30, 2020
The tax character of distributions paid during the year ended April 30, 2019, were as follows:
| Net Investment Income | Total Taxable Distributions | Tax Exempt Distributions | Total Distributions Paid* | |||||||||||||
Pacific Capital Tax-Free Securities Fund | $ | 53,432 | $ | 53,432 | $ | 6,525,946 | $ | 6,579,378 | ||||||||
Pacific Capital Tax-Free Short Intermediate Securities Fund | 34,167 | 34,167 | 696,962 | 731,129 | ||||||||||||
Pacific Capital U.S. Government Money Market Fund | 5,428,253 | 5,428,253 | — | 5,428,253 | ||||||||||||
| * | Distributions will not tie to Statement of Changes because distributions are recognized when actually paid for tax purposes. |
Distributions from net investment income and short-term capital gains are treated as ordinary income for federal income tax purposes.
As of April 30, 2020, the components of accumulated earnings/(deficit) on a tax basis were as follows:
| Undistributed Tax-Exempt Income | Undistributed Ordinary Income | Qualified Late-Year Losses | Distributions Payable | Capital Loss Carryforwards | Unrealized Appreciation/ (Depreciation) | |||||||||||||||||||
Pacific Capital Tax-Free Securities Fund | $566,683 | $ — | $— | $(566,683 | ) | $(1,291,269 | ) | $9,955,772 | ||||||||||||||||
Pacific Capital Tax-Free Short Intermediate Securities Fund | 52,918 | — | — | (63,917 | ) | (90,382 | ) | 598,534 | ||||||||||||||||
Pacific Capital U.S. Government Money Market Fund | — | 7,794 | — | — | — | — | ||||||||||||||||||
The differences between the book and tax basis components of distributable earnings relate primarily to the timing and recognition of income and gains for federal income tax purposes. Short-term capital gain is reported as ordinary income for federal income tax purposes.
48
PACIFIC CAPITAL FUNDS
Notes to Financial Statements (Continued)
April 30, 2020
The cost for federal income tax purposes, gross unrealized appreciation, gross unrealized depreciation and net unrealized appreciation as of April 30, 2020 is as follows:
| Tax Cost of Securities | Unrealized Appreciation | Unrealized Depreciation | Net Unrealized Appreciation/ (Depreciation) | |||||||||||||
Pacific Capital Tax-Free Securities Fund | $253,693,322 | $10,817,107 | $(861,335 | ) | $9,955,772 | |||||||||||
Pacific Capital Tax-Free Short Intermediate Securities Fund | 52,370,724 | 663,838 | (65,304 | ) | 598,534 | |||||||||||
Pacific Capital U.S. Government Money Market Fund | 356,340,537 | — | — | — | ||||||||||||
Pursuant to federal income tax rules applicable to regulated investment companies, the Funds may elect to treat certain capital losses between November 1 and April 30 and late year ordinary losses ((i) ordinary losses between January 1 and April 30, and (ii) specified ordinary and currency losses between November 1 and April 30) as occurring on the first day of the following tax year. For the year ended April 30, 2020, any amount of losses elected within the tax return will not be recognized federal income tax purposes until May 1, 2020. For the year ended April 30, 2020, the Funds had no late year ordinary loss deferrals or capital loss deferrals.
Accumulated capital losses represent net capital loss carryforwards as of April 30, 2020 that may be available to offset future realized capital gains and thereby reduce future capital gains distributions. As of April 30, 2020, the Funds’ capital loss carryforward, which were comprised of both short-term losses and long-term losses, and had an unlimited period of capital loss carryover were as follows:
| Capital Loss Carryforward | ||||||||
| Short-Term | Long-Term | |||||||
Pacific Capital Tax-Free Securities Fund | $ | 1,147,436 | $ | 143,833 | ||||
Pacific Capital Tax-Free Short Intermediate Securities Fund | 45,615 | 44,767 | ||||||
Pacific Capital U.S. Government Money Market Fund | — | — | ||||||
During the year ended April 30, 2020, the Pacific Capital Tax-Free Securities Fund and the Pacific Capital Tax-Free Short Intermediate Securities Fund utilized $414,256 and $76,666 of prior year capital loss carryforwards, respectively.
6. Concentration of Credit Risk
The Pacific Capital Tax-Free Securities Fund and the Pacific Capital Tax-Free Short Intermediate Securities Fund primarily invest in debt obligations issued by the state of Hawaii and its political subdivisions, agencies, and public authorities to obtain funds for various public purposes. The Funds are more susceptible
49
PACIFIC CAPITAL FUNDS
Notes to Financial Statements (Concluded)
April 30, 2020
to factors adversely affecting issues of Hawaii municipal securities than is a municipal bond fund that is not concentrated in these issuers to the same extent.
7. Debt Investment Risk
Debt investments are affected primarily by the financial condition of the companies or other entities that have issued them and by changes in interest rates. There is a risk that an issuer of a Fund’s debt investments may not be able to meet its financial obligations (e.g., may not be able to make principal and/or interest payments when they are due or otherwise default on other financial terms) and/or go bankrupt. Securities such as high-yield/high-risk bonds, e.g., bonds with low credit ratings by Moody’s (Ba or lower) or Standard & Poor’s (BB and lower) or if unrated are of comparable quality as determined by the manager, are especially subject to credit risk during periods of economic uncertainty or during economic downturns and are more likely to default on their interest and/or principal payments than higher rated securities. Debt investments may be affected by changes in interest rates. Debt investments with longer durations tend to be more sensitive to changes in interest rates, making them more volatile than debt investments with shorter durations or floating or adjustable interest rates. The value of debt investments may fall when interest rates rise.
8. U.S. Government Obligations Risk
Obligations of U.S. Government agencies, authorities, instrumentalities and sponsored enterprises have historically involved little risk of loss of principal if held to maturity. However, not all U.S. Government securities are backed by the full faith and credit of the United States. Obligations of certain agencies, authorities, instrumentalities and sponsored enterprises of the U.S. Government are backed by the full faith and credit of the United States (e.g., the Government National Mortgage Association); other obligations are backed by the right of the issuer to borrow from the U.S. Treasury (e.g., the Federal Home Loan Banks) and others are supported by the discretionary authority of the U.S. Government to purchase an agency’s obligations. Still others are backed only by the credit of the agency, authority, instrumentality or sponsored enterprise issuing the obligation. No assurance can be given that the U.S. Government would provide financial support to any of these entities if it is not obligated to do so by law.
9. Subsequent Events
Management has evaluated the impact of all subsequent events on each Fund through the date the financial statements were issued, and has determined that there are no subsequent events requiring recognition or disclosure in the financial statements.
50
PACIFIC CAPITAL FUNDS
Report of Independent Registered Public Accounting Firm
To the Board of Trustees of FundVantage Trust and Shareholders of each of the three funds listed in the table below
Opinions on the Financial Statements
We have audited the accompanying statements of assets and liabilities, including the portfolios of investments, of each of the funds listed in the table below (three of the funds constituting FundVantage Trust, hereafter collectively referred to as the “Funds”) as of April 30, 2020, the related statements of operations and of changes in net assets for each of the periods indicated in the table below, including the related notes, and the financial highlights for each of the periods indicated therein (collectively referred to as the “financial statements”). In our opinion, the financial statements present fairly, in all material respects, the financial position of each of the Funds as of April 30, 2020, the results of each of their operations and the changes in each of their net assets for the periods indicated in the table below, and each of the financial highlights for each of the periods indicated therein, in conformity with accounting principles generally accepted in the United States of America.
Pacific Capital Tax-Free Securities Fund and Pacific Capital Tax-Free Short Intermediate Securities Fund
| Statement of operations for the year ended April 30, 2020 and the statements of changes in net assets for each of the two years in the period ended April 30, 2020
| |
Pacific Capital U.S. Government Money Market Fund
| Statement of operations for the year ended April 30, 2020 and the statements of changes in net assets for the year ended April 30, 2020 and the period from June 14, 2018 (commencement of operations) through April 30, 2019
| |
Basis for Opinions
These financial statements are the responsibility of the Funds’ management. Our responsibility is to express an opinion on the Funds’ financial statements based on our audits. We are a public accounting firm registered with the Public Company Accounting Oversight Board (United States) (PCAOB) and are required to be independent with respect to the Funds in accordance with the U.S. federal securities laws and the applicable rules and regulations of the Securities and Exchange Commission and the PCAOB.
We conducted our audits of these financial statements in accordance with the standards of the PCAOB. Those standards require that we plan and perform the audit to obtain reasonable assurance about whether the financial statements are free of material misstatement, whether due to error or fraud.
Our audits included performing procedures to assess the risks of material misstatement of the financial statements, whether due to error or fraud, and performing procedures that respond to those risks. Such procedures included examining, on a test basis, evidence regarding the amounts and disclosures in the financial statements. Our audits also included evaluating the accounting principles used and significant estimates made by management, as well as evaluating the overall presentation of the financial statements. Our procedures included confirmation of securities owned as of April 30, 2020 by correspondence with the custodian and transfer agent. We believe that our audits provide a reasonable basis for our opinions.
/s/ PricewaterhouseCoopers LLP
Philadelphia, Pennsylvania
June 24, 2020
We have served as the auditor of one or more Asset Management Group of the Bank of Hawaii investment companies since 2010.
51
PACIFIC CAPITAL FUNDS
Shareholder Tax Information
(Unaudited)
The Funds are required by Subchapter M of the Internal Revenue Code, to advise their shareholders of the U.S. federal tax status of distributions received by the Funds’ shareholders in respect of such fiscal year.
The tax character of distributions paid during the year ended April 30, 2020 were as follows:
| Net Investment Income | Total Taxable Distributions | Tax Exempt Distributions | Total Distributions Paid* | |||||||||||||
Pacific Capital Tax-Free Securities Fund | $ | 53,481 | $ | 53,481 | $ | 7,025,619 | $ | 7,079,100 | ||||||||
Pacific Capital Tax-Free Short Intermediate Securities Fund | 39,003 | 39,003 | 903,310 | 942,313 | ||||||||||||
Pacific Capital U.S. Government Money Market Fund | 4,596,818 | 4,596,818 | — | 4,596,818 | ||||||||||||
| * | Distributions will not tie to Statement of Changes because distributions are recognized when actually paid for tax purposes. |
Dividends from net investment income and short-term capital gains are treated as ordinary income dividends for federal income tax purposes.
The percentage of qualified interest income related dividends not subject to withholding tax for non-resident aliens and foreign corporations for the Pacific Capital Tax-Free Securities Fund, the Pacific Capital Tax-Free Short Intermediate Securities Fund and the Pacific Capital U.S. Government Money Market Fund is 100%, 100% and 100%, respectively.
All designations are based on financial information available as of the date of this annual report and, accordingly, are subject to change. For each item, it is the intention of each Fund to designate the maximum amount permitted under the Internal Revenue Code of 1986, as amended, and the regulations thereunder.
The percentage of the ordinary income distribution paid by the Pacific Capital U.S. Government Money Market Fund during 2020 which was derived from direct obligations of the United States was 93.40%. Such income is exempt from state and local tax in all states. However, many states, including New York and California, allow a tax exemption for a portion of the income earned only if a mutual fund has invested at least 50% of its assets at the end of each quarter of the Fund’s fiscal year in U.S. Government securities. The Fund did not meet this strict requirement in 2020. Due to the diversity in state and local tax law, it is recommended that you consult your personal tax adviser as to the applicability of the information provided to your specific situation.
52
PACIFIC CAPITAL FUNDS
Shareholder Tax Information
(Unaudited)
Because the Funds’ fiscal year is not the calendar year, another notification will be sent with respect to calendar year 2020. The second notification, which will reflect the amount, if any, to be used by calendar year taxpayers on their U.S. federal income tax returns, will be made in conjunction with Form 1099-DIV and will be mailed in January 2021.
Foreign shareholders will generally be subject to U.S. withholding tax on the amount of their ordinary income dividends. They will generally not be entitled to a foreign tax credit or deduction for the withholding taxes paid by the Funds, if any.
In general, dividends received by tax-exempt recipients (e.g., IRAs and Keoghs) need not be reported as taxable income for U.S. federal income tax purposes. However, some retirement trusts (e.g., corporate, Keogh and 403(b)(7) plans) may need this information for their annual information reporting.
Shareholders are advised to consult their own tax advisers with respect to the tax consequences of their investment in the Funds.
53
PACIFIC CAPITAL FUNDS
Other Information
(Unaudited)
Proxy Voting
Policies and procedures that the Funds use to determine how to vote proxies relating to portfolio securities as well as information regarding how the Funds voted proxies relating to portfolio securities for the most recent 12-month period ended June 30 are available without charge, upon request, by calling (888) 678-6034 and on the Securities and Exchange Commission’s (“SEC”) website at http://www.sec.gov.
Quarterly Portfolio Schedules
The Trust files its complete schedule of portfolio holdings with the SEC for the first and third fiscal quarters of each fiscal year (quarters ended July 31 and January 31) as an exhibit to their reports on Form N-PORT. The Trust’s portfolio holdings on Form N-PORT are available on the SEC’s website at http://www.sec.gov.
Board Consideration for Continuation of Investment Advisory Agreement
At an in-person meeting held on March 10-11, 2020 (the “Meeting”), the Board of Trustees (the “Board” or the “Trustees”) of FundVantage Trust (the “Trust”), including a majority of the Trustees who are not “interested persons” within the meaning of Section 2(a)(19) of the Investment Company Act of 1940, as amended (the “1940 Act”) (the “Independent Trustees”), unanimously approved the continuation of the Investment Advisory Agreement between the Asset Management Group of Bank of Hawaii (“AMG of BOH” or the “Adviser”) and the Trust (the “AMG of BOH Agreement”) on behalf of the Pacific Capital Tax-Free Securities Fund (“Pacific Capital TF Fund”), Pacific Capital Tax-Free Short Intermediate Securities Fund (“Pacific Capital TFSI Fund”) and Pacific Capital U.S. Government Money Market Fund (“Pacific Capital MMF”, and together with the Pacific Capital TF Fund and Pacific Capital TFSI Fund, the “Pacific Capital Funds,” and each, a “Fund”). At the Meeting, the Board considered the continuation of the AMG of BOH Agreement with respect to each Fund for an additional one year period.
In determining whether to continue the AMG of BOH Agreement for an additional one year period, the Trustees, including the Independent Trustees, considered information provided by AMG of BOH in response to a request for information in accordance with Section 15(c) of the 1940 Act (the “AMG of BOH 15(c)Response”) regarding (i) services performed by AMG of BOH for the Pacific Capital Funds, (ii) the size and qualifications of AMG of BOH’s portfolio management staff, (iii) any potential or actual material conflicts of interest which may arise in connection with a portfolio manager’s management of the Pacific Capital Funds, (iv) the Pacific Capital Funds’ investment performance, (v) the financial condition of Bank of Hawaii, of which AMG of BOH is a division thereof, (vi) brokerage selection procedures (including soft dollar arrangements, if any), (vii) the procedures for allocating investment opportunities between the Pacific Capital Funds and other clients, (viii) results of any regulatory examination, including any
54
PACIFIC CAPITAL FUNDS
Other Information
(Unaudited)
recommendations or deficiencies noted, (ix) any litigation, investigation or administrative proceeding which may have a material impact on AMG of BOH’s ability to service the Pacific Capital Funds, and (x) compliance with the Pacific Capital Funds’ investment objectives, policies and practices (including codes of ethics and proxy voting policies), federal securities laws and other regulatory requirements. The Trustees had previously reviewed the reports provided at Board meetings throughout the year covering matters such as the relative performance of the Pacific Capital Funds, compliance with the Pacific Capital Funds’ investment objectives, policies, strategies and limitations, compliance of portfolio management personnel with the applicable code of ethics, and adherence to pricing procedures as established by the Board (each, as applicable).
The Board noted that representatives of AMG of BOH joined the Meeting via teleconference and discussed AMG of BOH’s history, performance, investment strategy, and compliance program. Representatives of AMG of BOH responded to questions from the Board. In addition to the AMG of BOH 15(c) Response, the Trustees also considered other factors they believed to be relevant to considering the continuation of the AMG of BOH Agreement, including the matters discussed below. In their deliberations, the Trustees did not identify any particular information as controlling, and different Trustees may have attributed different weights to the various factors. After deliberating, the Trustees determined that the overall arrangement between the Pacific Capital Funds and AMG of BOH, as provided by the terms of the AMG of BOH Agreement, including the advisory fees under the AMG of BOH Agreement, are fair and reasonable in light of the services provided, expenses incurred and such other matters as the Trustees considered relevant.
The Trustees considered the services provided by AMG of BOH to the Pacific Capital Funds. The Trustees considered AMG of BOH’s personnel who provide investment management services to the Pacific Capital Funds and the depth of their experience. Based on the AMG of BOH 15(c) Response, the Trustees concluded that (i) the nature, extent and quality of the services provided by AMG of BOH are appropriate and consistent with the terms of the AMG of BOH Agreement, (ii) the quality of those services has been, and continues to be, consistent with industry norms, (iii) the Pacific Capital Funds are likely to benefit from the continued provision of those services, (iv) AMG of BOH has sufficient personnel, with the appropriate skills and experience, to serve the Funds effectively and has demonstrated its continuing ability to attract and retain qualified personnel, and (v) the satisfactory nature, extent, and quality of services currently provided to the Pacific Capital Funds is likely to continue under the AMG of BOH Agreement.
The Board discussed AMG of BOH’s business continuity plan, and its ability to continue to manage the Pacific Capital Funds effectively in light of the recent volatility in financial markets as a result of the COVID-19 virus outbreak.
The Trustees considered the investment performance for the Pacific Capital Funds and AMG of BOH. The Trustees reviewed the historical performance charts for the year-to-date, one year, two year, three
55
PACIFIC CAPITAL FUNDS
Other Information
(Unaudited)
year, five year, ten year and since inception periods ended December 31, 2019 (as applicable) for the Pacific Capital Funds.
Pacific Capital Tax-Free Securities Fund. The Trustees noted that the Pacific Capital TF Fund outperformed the Lipper Other States Intermediate Municipal Funds Index for the year-to-date, one year, two year, three year, five year and ten year periods ended December 31, 2019.
Pacific Capital Tax-Free Short Intermediate Securities Fund. The Trustees also noted that the Pacific Capital TFSI Fund underperformed the median of its Lipper peer group for the year-to-date, one year, two year, three year, five year and ten year periods ended December 31, 2019.
Pacific Capital U.S. Government Money Market Fund. The Trustees further noted that the Pacific Capital MMF Fund outperformed the Lipper US Government Money Market Index for the year-to-date, one year and since inception periods ended December 31, 2019.
The Trustees concluded that AMG of BOH had adequately explained the factors contributing to the Pacific Capital Funds’ performance over such periods.
The Trustees noted that they also received information regarding AMG of BOH’s advisory fees and an analysis of these fees in relation to the delivery of services to the Pacific Capital Funds and any other ancillary benefit resulting from AMG of BOH’s relationship with the Pacific Capital Funds. The Trustees considered the fees that AMG of BOH charges to other clients similar to the Pacific Capital TF Fund and Pacific Capital TFSI Fund, and evaluated the explanations provided by AMG of BOH as to differences in such fees. The Trustees also reviewed a peer comparison of advisory fees and total expenses for the Pacific Capital Funds versus other similarly managed funds. The Trustees concluded that the advisory fees and services provided by AMG of BOH are consistent with those of other advisers which manage mutual funds with investment objectives, strategies and policies similar to those of the Pacific Capital Funds based on the information provided at the Meeting.
The Board considered, among other data, the specific factors and related conclusions set forth below with respect to the Pacific Capital Funds:
Pacific Capital Tax-Free Securities Fund. With respect to advisory fees and expenses, the contractual advisory fee and net total expense ratio for the Fund were lower than the median of the contractual advisory fee and net total expense ratio of funds with a similar share class in the Lipper peer group with $500 million or less in assets. The Trustees also considered that the Adviser was currently voluntarily waiving its entire advisory fee with respect to the Fund.
Pacific Capital Tax-Free Short Intermediate Securities Fund. With respect to advisory fees and expenses, the contractual advisory fee and net total expense ratio for the Fund were lower than the median of the contractual advisory fee and net total expense ratio of funds with a similar share class in the Lipper peer
56
PACIFIC CAPITAL FUNDS
Other Information
(Unaudited)
group with $250 million or less in assets. The Trustees also considered that the Adviser was currently voluntarily waiving its entire advisory fee with respect to the Fund.
Pacific Capital U.S. Government Money Market Fund. With respect to advisory fees and expenses, the contractual advisory fee for the Fund was higher than the median of the contractual advisory fee of funds with a similar share class in the Lipper peer group with $500 million or less in assets, and the net total expense ratio was lower than the median of the net total expense ratio of funds with a similar share class in the Lipper peer group with $500 million or less in assets. The Trustees also considered that the Adviser was currently voluntarily waiving fees and reimbursing expenses of the Fund to the extent necessary to maintain a minimum daily net yield for the Fund.
The Trustees considered the costs of the services provided by AMG of BOH, the compensation and benefits received by AMG of BOH in providing services to the Pacific Capital Funds, its profitability and certain additional information related to the financial condition of Bank of Hawaii, of which AMG of BOH is a division thereof. In addition, the Trustees considered any direct or indirect revenues received by affiliates of AMG of BOH.
The Trustees considered the extent to which economies of scale would be realized relative to fee levels as the Pacific Capital Funds grow, and whether the advisory fee levels reflect these economies of scale for the benefit of shareholders. Because the Board concluded that economies of scale had not yet been achieved because AMG of BOH was currently waiving its entire advisory fee with respect to each of the Pacific Capital Funds, there was no need to consider whether the advisory fee adequately provided for the sharing of such economies with the Funds.
At the Meeting, after consideration of all the factors and taking into consideration the information presented, the Board, including the Independent Trustees, unanimously approved the continuation of the AMG of BOH Agreement for an additional one-year period. In arriving at their decision, the Trustees did not identify any single matter as controlling, but made their determination in light of all the circumstances.
57
PACIFIC CAPITAL FUNDS
Privacy Notice
(Unaudited)
The privacy of your personal financial information is extremely important to us. When you open an account with us, we collect a significant amount of information from you in order to properly invest and administer your account. We take very seriously the obligation to keep that information private and confidential, and we want you to know how we protect that important information.
We collect nonpublic personal information about you from applications or other forms you complete and from your transactions with us or our affiliates. We do not disclose information about you, or our former clients, to our affiliates or to service providers or other third parties, except as permitted by law. We share only the information required to properly administer your accounts, which enables us to send transaction confirmations, monthly or quarterly statements, financials and tax forms. Even within FundVantage Trust and its affiliated entities, a limited number of people who actually service accounts will have access to your personal financial information. Further, we do not share information about our current or former clients with any outside marketing groups or sales entities.
To ensure the highest degree of security and confidentiality, FundVantage Trust and its affiliates maintain various physical, electronic and procedural safeguards to protect your personal information. We also apply special measures for authentication of information you request or submit to us on our web site.
If you have questions or comments about our privacy practices, please call us at (888) 678-6034.
58
PACIFIC CAPITAL FUNDS
Fund Management
(Unaudited)
FundVantage Trust (the “Trust”) is governed by a Board of Trustees (the “Trustees”). The primary responsibility of the Trustees is to represent the interest of the Trust’s shareholders and to provide oversight management of the Trust.
The following tables present certain information regarding the Trustees and officers of the Trust. None of the Trustees are an “interested person” of the Trust, the Adviser, another investment adviser of a series of the Trust, or Foreside Funds Distributors LLC, the principal underwriter of the Trust (“Underwriter”), within the meaning of the 1940 Act and each Trustee is referred to as an “Independent Trustee” and is listed under such heading below. Employees of certain service providers to the Trust serve as officers of the Trust; such persons are not compensated by the Funds. The address of each Trustee and officer as it relates to the Trust’s business is 301 Bellevue Parkway, 2nd Floor, Wilmington, DE 19809.
The Statement of Additional Information for the Fund contains additional information about the Trustees and is available, without charge, upon request by calling (888) 678-6034.
Name and Date of Birth | Position(s) Held with Trust | Term of Office and Length of Time Served | Principal Occupation(s) During Past Five Years |
Number of Funds in Trust Complex Overseen by Trustee
| Other Directorships Held by Trustee | |||||
INDEPENDENT TRUSTEES
| ||||||||||
ROBERT J. CHRISTIAN Date of Birth: 2/49 | Trustee | Shall serve until death, resignation or removal. Trustee since 2007. Chairman from 2007 until September 30, 2019. | Retired since February 2006; Executive Vice President of Wilmington Trust Company from February 1996 to February 2006; President of Rodney Square Management Corporation (“RSMC”) (investment advisory firm) from 1996 to 2005; Vice President of RSMC from 2005 to 2006. | 39 | Optimum Fund Trust (registered investment company with 6 portfolios); Third Avenue Trust (registered investment company with 3 portfolios); Third Avenue Variable Series Trust (registered investment company with 1 portfolio).
| |||||
59
PACIFIC CAPITAL FUNDS
Fund Management (Continued)
(Unaudited)
Name and Date of Birth | Position(s) Held with Trust | Term of Office and Length of Time Served | Principal Occupation(s) During Past Five Years | Number of Funds in Trust Complex Overseen by Trustee
| Other Directorships Held by Trustee | |||||
IQBAL MANSUR Date of Birth: 6/55 |
Trustee |
Shall serve until death, resignation or removal. Trustee since 2007. |
University Professor, Widener University. |
39 |
Third Avenue Trust (registered investment company with 3 portfolios); Third Avenue Variable Series Trust (registered investment company with 1 portfolio).
| |||||
NICHOLAS M. MARSINI, JR. Date of Birth: 8/55 |
Trustee and Chairman of the Board
|
Shall serve until death, resignation or removal. Trustee since 2016. Chairman since October 1, 2019. |
Retired since March 2016. President of PNC Bank Delaware from June 2011 to March 2016; Executive Vice President of Finance of BNY Mellon from July 2010 to January 2011; Executive Vice President and Chief Financial Officer of PNC Global Investment Servicing from September 1997 to July 2010. |
39 |
Brinker Capital Destinations Trust (registered investment company with 10 portfolios); Third Avenue Trust (registered investment company with 3 portfolios); Third Avenue Variable Series Trust (registered investment company with 1 portfolio).
| |||||
60
PACIFIC CAPITAL FUNDS
Fund Management (Continued)
(Unaudited)
Name and Date of Birth | Position(s) Held with Trust | Term of Office and Length of Time Served | Principal Occupation(s) During Past Five Years | Number of Funds in Trust Complex Overseen by Trustee
| Other Directorships Held by Trustee | |||||
NANCY B. WOLCOTT Date of Birth: 11/54 |
Trustee |
Shall serve until death, resignation or removal. Trustee since 2011. |
Retired since May 2014; EVP, Head of GFI Client Service Delivery, BNY Mellon from January 2012 to May 2014; EVP, Head of US Funds Services, BNY Mellon from July 2010 to January 2012; President of PNC Global Investment Servicing from 2008 to July 2010; Chief Operating Officer of PNC Global Investment Servicing from 2007 to 2008; Executive Vice President of PFPC Worldwide Inc. from 2006 to 2007. |
39
|
Lincoln Variable Insurance Products Trust (registered investment company with 97 portfolios); Third Avenue Trust (registered investment company with 3 portfolios); Third Avenue Variable Series Trust (registered investment company with 1 portfolio).
| |||||
STEPHEN M. WYNNE Date of Birth: 1/55 | Trustee | Shall serve until death, resignation or removal. Trustee since 2009. | Retired since December 2010; Chief Executive Officer of US Funds Services, BNY Mellon Asset Servicing from July 2010 to December 2010; Chief Executive Officer of PNC Global Investment Servicing from March 2008 to July 2010; President, PNC Global Investment Servicing from 2003 to 2008. | 39 | Copeland Trust (registered investment company with 3 portfolios); Third Avenue Trust (registered investment company with 3 portfolios); Third Avenue Variable Series Trust (registered investment company with 1 portfolio).
| |||||
61
PACIFIC CAPITAL FUNDS
Fund Management (Concluded)
(Unaudited)
Name and Date of Birth | Position(s) Held with Trust | Term of Office and Length of Time Served
| Principal Occupation(s) During Past Five Years | |||
EXECUTIVE OFFICERS
| ||||||
JOEL L. WEISS Date of Birth: 1/63 |
President and Chief Executive Officer
|
Shall serve until death, resignation or removal. Officer since 2007. |
President of JW Fund Management LLC since June 2016; Vice President and Managing Director of BNY Mellon Investment Servicing (US) Inc. and predecessor firms from 1993 to June 2016.
| |||
T. RICHARD KEYES Date of Birth: 1/57 | Treasurer and Chief Financial Officer | Shall serve until death, resignation or removal. Officer since 2016. | President of TRK Fund Consulting LLC since July 2016; Head of Tax — U.S. Fund Services of BNY Mellon Investment Servicing (US) Inc. and predecessor firms from February 2006 to July 2016.
| |||
GABRIELLA MERCINCAVAGE Date of Birth: 6/68 | Assistant Treasurer | Shall serve until death, resignation or removal. Officer since 2019. | Fund Administration Consultant since January 2019; Fund Accounting and Tax Compliance Accountant to financial services companies from November 2003 to July 2018.
| |||
VINCENZO A. SCARDUZIO Date of Birth: 4/72 | Secretary | Shall serve until death, resignation or removal. Officer since 2012. | Director and Vice President Regulatory Administration of The Bank of New York Mellon and predecessor firms since 2001.
| |||
DAVID C. LEBISKY Date of Birth: 5/72 | Chief Compliance Officer and Anti-Money Laundering Officer | Shall serve until death, resignation or removal. Officer since 2015. | President of Lebisky Compliance Consulting LLC since October 2015; Consultant, Duff & Phelps, LLC since 2016; Senior Consultant, Freeh Group International Solutions, LLC (a global risk management firm) from 2015 to 2018; Scotia Institutional Investments US, LP, Director of Regulatory Administration from 2010 to 2014.
| |||
62
[THIS PAGE INTENTIONALLY LEFT BLANK.]
Investment Adviser
Asset Management Group of Bank of Hawaii
111 South King Street, 4th Floor,
Honolulu, HI 96813
Administrator
The Bank of New York Mellon
301 Bellevue Parkway
Wilmington, DE 19809
Transfer Agent
BNY Mellon Investment Servicing (US) Inc.
4400 Computer Drive
Westborough, MA 01581
Principal Underwriter
Foreside Funds Distributors LLC
400 Berwyn Park
899 Cassatt Road
Berwyn, PA 19312
Custodian
The Bank of New York Mellon
240 Greenwich Street
New York, NY 10286
Independent Registered Public Accounting Firm
PricewaterhouseCoopers LLP
Two Commerce Square, Suite 1800
2001 Market Street
Philadelphia, PA 19103-7042
Legal Counsel
Pepper Hamilton LLP
3000 Two Logan Square
18th and Arch Streets
Philadelphia, PA 19103
PAC-0420

of
FundVantage Trust
Pacific Capital Tax-Free
Securities Fund
Pacific Capital Tax-Free
Short Intermediate Securities Fund
Pacific Capital U.S. Government
Money Market Fund
ANNUAL REPORT
April 30, 2020
IMPORTANT NOTE: Beginning on January 1, 2021, paper copies of the Funds’ shareholder reports will no longer be sent by mail, unless you specifically request paper copies of the shareholder reports from the Funds or from your financial intermediary. Instead, shareholder reports will be available on the Pacific Capital Funds’ websites (www.boh.com/wealth-management/solutions/mutual-funds-investment-products.asp and www.boh.com/personal/non-banking-products/mutual-funds-investment-products.asp), and you will be notified by mail each time a report is posted and provided with a website link to access the report.
You may elect to receive all future shareholder reports in paper, free of charge. To elect to receive paper copies of shareholder reports through the mail or otherwise change your delivery method, contact your financial intermediary or, if you hold your shares directly through the Funds, call toll-free at (888) 678-6034 or write to:
Pacific Capital Funds
FundVantage Trust
c/o BNY Mellon Investment Servicing
P.O. Box 9829
Providence, RI 02940-8029
Your election to receive shareholder reports in paper will apply to all Pacific Capital Funds that you hold through the financial intermediary, or directly with the Pacific Capital Funds.
This report is submitted for the general information of shareholders and is not authorized for distribution to prospective investors unless preceded or accompanied by a current prospectus.
POLEN CAPITAL MANAGEMENT
Annual Investment Adviser’s Report
April 30, 2020
(Unaudited)
Dear Shareholders,
At Polen Capital, our “why” was shaped by our investing philosophy — find what we believe to be financially attractive, competitively advantaged companies that we can own for many years aiming to preserve and grow assets over time. We know that you have placed your financial investments in our hands. We take this responsibility extremely seriously and it is the basis of our mission, our “why,” to strive to deliver attractive results. We feel, very deeply, that fulfilling this responsibility requires an investment approach that focuses on the preservation of capital first and the growth of that capital second. The conviction we have in our approach extends to the capabilities we’ve developed in small company investing and across U.S. and international geographies. We look forward to serving your needs across the high-quality growth equity investing landscape.
Looking Back
Markets ended 2019 on a high note, exhibiting broad-based strength. At the end of 2018, investors were calling for ongoing market weakness, citing such “certainties” as continued U.S. interest rate increases, a worsening of U.S.-China trade relations, and global gross domestic product (GDP)1 deceleration. However, the narrative did not completely match reality. The U.S. Federal Reserve ultimately cut interest rates three times during the year. And, the global economy continued to muddle along amidst ongoing U.S.-China trade negotiations.
At the start of 2020, markets seemed on track to continue what had been the longest bull market in history. However, by the second half of the first calendar quarter 2020, global markets dropped in unison as COVID-19, or coronavirus, spread from China to Europe, then to the United States and nearly all corners of the world. The U.S. market experienced the fastest 30% decline in its history, and the economy saw a rapid spike in unemployment claims as consumers stayed home and businesses had to close their doors. The Federal Reserve responded swiftly with aggressive monetary policy actions — drawing from its Global Financial Crisis playbook — and Congress and President Trump passed the $2.2 trillion CARES Act, the largest fiscal stimulus bill in history. Similar impacts and actions took place in most countries across the globe as the coronavirus spread has been indiscriminate.
From our point of view, the magnitude of these actions reflects the magnitude of the situation. Given that containment and quarantine seem to be the only way to mitigate the rampant spread of the coronavirus, we have essentially experienced a government-mandated recession, the likes of which we have not seen in recent times. In a typical recession or even crisis environment, economies slow down — sometimes meaningfully. But this time, certain segments of economies have nearly stopped, at least temporarily.
| 1 | The monetary measure of the market value of all final goods and services produced by a country in a specific time period. |
1
POLEN CAPITAL MANAGEMENT
Annual Investment Adviser’s Report
April 30, 2020
(Unaudited)
The amount of time that it takes to get “back to normal” is likely the key variable in how the global economy recovers from this shock. The longer it takes, the greater the risk to the global economy.
Few could have foreseen the current situation and fewer still will emerge unscathed, but we believe our discipline of concentrating in only the highest-quality businesses is an attractive characteristic of our approach. We are always prepared for more challenging periods, and we feel this time is no different. We believe our insistence on owning durable, high-quality growth businesses positions us well in helping to endure these types of environments.
Going Forward
Balance sheet strength is one of the five Polen Capital guardrails. The guardrails help us try to avoid businesses that could prove to be risky in an unexpected, adverse economic scenario. The companies we own must meet all five of these criteria.
| · | Strong balance sheet |
| · | High return on equity |
| · | Stable-to-improving margins |
| · | Abundant free cash flow (FCF) |
| · | Organic revenue growth |
We believe that holding our companies to a stringent standard ensures that we only invest in financially sound enterprises. This approach has historically allowed us to help our clients by aiming to provide capital preservation when markets are roiled with volatility.
Beyond the enormous human toll, the COVID-19 pandemic is having unprecedented impacts on businesses globally, and its influence on human behavior and secular trends may not yet be fully understood. However, we know that, as a society, we have been thrust into a new environment. Often, circumstances beyond our control serve to catalyze new behavior patterns and accelerate trends that are already in place.
While these changes will not necessarily be linear, our experience has taught us that once human behaviors begin to adjust, these adjustments often persist well into the future. The companies we continuously seek to own have been financially strong, sustainable growth businesses that we feel are positioned to benefit from these secular shifts in behavior. We believe that seeking to own only the best businesses should continue to potentially help drive long-term capital preservation and growth for our clients.
2
POLEN CAPITAL MANAGEMENT
Annual Investment Adviser’s Report
April 30, 2020
(Unaudited)
Thank you for investing with Polen Capital and placing your trust in us.
Sincerely,
The Large Company Growth Team | The Small Company Growth Team | |
Polen Growth Fund: | Polen U.S. Small Company Growth Fund: |
|
|
|
| |||
Dan Davidowitz | Brandon Ladoff | Tucker Walsh | Rayna Lesser Hannaway | |||
| Polen Global Growth Fund: | Polen International Small Company Growth Fund: | |||||
Damon Ficklin |
Jeff Mueller |
Rob Forker | ||||
| Polen International Growth Fund: | ||||||
Todd Morris |
Daniel Fields | |||||


3
POLEN GROWTH FUND
Annual Investment Adviser’s Report
April 30, 2020
(Unaudited)
Performance Summary:
| • | U.S. markets continued to climb in 2019 despite ongoing concerns surrounding the U.S.-China trade war and generally slower global growth. By the first calendar quarter 2020, however, the COVID-19 pandemic ended the longest bull market in history, abruptly and deeply affecting the global economy. |
| • | For the fiscal year ended April 30, 2020, the Polen Growth Fund’s (the “Fund”) Institutional share class returned 10.80% net of fees versus the Russell 1000® Growth Index and S&P 500® Index which returned 10.84% and 0.86%, respectively. |
| • | Since inception September 15, 2010 to April 30, 2020, the Fund’s Institutional share class has had an annual average total return of 15.83% net of fees versus 15.54% and 12.73% for the Russell 1000® Growth Index and the S&P 500® Index respectively. |
The performance data quoted represents past performance and is not a guarantee of future results. Investment return and principal value of an investment will fluctuate so that an investor’s shares, when redeemed, may be worth more or less than their original cost. Current performance may be lower or higher than the performance information quoted. To obtain performance information current to the most recent month-end, please call 1-888-678-6024.
Performance Review:
For the fiscal year ended April 30, 2020, shares of the Fund’s Institutional class returned 10.80% net of fees versus the Russell 1000® Growth Index and S&P 500® Index which returned 10.84% and 0.86% respectively. During the period, the top absolute contributors to the Fund’s performance were Microsoft, Adobe, and Dollar General.
Microsoft continued to benefit from its transition to the cloud and its shift to a subscription-based revenue model, which has become even more critical since the onset of the pandemic environment. Both models have shown better economics, steady and more recurring revenue streams and greater customer captivity. The Office franchise, the server businesses and the Windows operating system are all competitively positioned in our view and, in aggregate, have delivered well above our long-term expectations of mid-single-digit revenue growth and low-double-digit earnings per share growth. We expect demand for Microsoft’s productivity tools, particularly the company’s collaboration software Microsoft Teams, will increase as more people need and want to work remotely. Furthermore, we believe the demand for cloud computing services will likely rise as businesses increasingly value the flexibility that the public cloud provides them. We would expect Microsoft’s Azure platform to be a direct beneficiary of this increased demand. Microsoft’s businesses and strategic shift have continued to propel its revenue growth, and we believe the runway ahead is long.
4
POLEN GROWTH FUND
Annual Investment Adviser’s Report
April 30, 2020
(Unaudited)
In the age of digital transformation, Adobe continues to strengthen its business and its value proposition as a mission-critical partner to governments and enterprises. Digital Media, over two-thirds of total revenue, and Digital Experience, roughly 30% of total revenue, were already important before the COVID-19 crisis. But, as the need for a digital-first customer experience accelerates, we expect the demand for Adobe’s services to increase. Its two strategic acquisitions, Magento and Marketo, combine with its existing solutions to create a full suite offering in digital experience management. Adobe’s point solutions within its full suite are typically best of breed, reinforcing the potency of its value proposition. We believe the world continues to move in Adobe’s direction and remain confident in the company’s ability to execute as a premier digital and creative software solutions provider.
We believe customers view their subscriptions to Adobe and Microsoft, among other software companies in the Fund, as essential parts of their employees doing business and remaining productive. Under these subscription models, customers can no longer wait to upgrade to the latest software and defer purchases like they could in the past. The software is now updated regularly and included in the cost of the ongoing subscription price. If customers do not pay the subscription price, they cannot use the software. As we expected, these businesses have been more durable and stable than we believe they would have been under prior license-based software models, acting more as ballasts within the Fund’s portfolio thus far.
Dollar General performed well during the period, delivering strong same store sales growth, and many of the company’s strategic initiatives aimed at continually improving store assortment and the store experience are beginning to click. The company’s largest ongoing growth initiatives are DG Fresh to control distribution of fresh items, the Non-Consumables Initiative to improve the non-consumables assortment in categories such as home and seasonal, and Fast Track which can make it easier and faster to checkout. Traffic growth has improved on the back of these initiatives. Furthermore, their ability to execute multiple growth initiatives while opening new stores and remodeling mature stores at a high rate has been impressive to us and demonstrates their operational prowess.
Conversely, Align Technology, Gartner, and Booking Holdings weighed on performance during the period.
After a difficult first half of 2019, Align Technology was one of our top contributors in the fourth calendar quarter 2019 before the market’s broad-based decline in the first calendar quarter 2020. Prior to the pandemic environment, new competition from direct-to-consumer companies like Smile Direct Club and incumbent orthodontic companies like Danaher and 3M caused concerns around taking market share in the clear aligner industry. However, Align’s growth rate among both teens and other adult age groups remained consistently strong in its North American businesses. The growth rate in the 20-29-year-old cohort also began to rebound in the third calendar quarter 2019 — we believe more adults have realized that direct-to-consumer options have significant limitations. Growth in China also reaccelerated to over 30%.
5
POLEN GROWTH FUND
Annual Investment Adviser’s Report
April 30, 2020
(Unaudited)
We long anticipated there would be more competition, especially from Smile Direct Club. The overall opportunity to replace braces with clear aligners, particularly in the teen market where orthodontists are almost always involved, combined with Align’s competitive strengths, should overwhelm any competitive entrants, in our opinion. Industry feedback from dentists and orthodontists remains positive on Align’s offerings and not nearly so on those from competitors. Align has remained the only real supplier to help professionals straighten teeth with high-quality clear aligners able to address greater than 80% of cases at scale. The company’s business will remain heavily impacted for so long as COVID-19 is a concern, but we continue to believe the company’s longer-term growth opportunity is significant.
Gartner also came under significant pressure in the third calendar quarter 2019 after it modestly lowered earnings growth guidance for the rest of this year and was further impacted by the broad-based market decline in the first calendar quarter 2020. Most of the modest earnings shortfall came from accelerated investments in the CEB business it acquired over two years ago. CEB, now called Gartner Business Sales (GBS), gives research and insights around corporate best practices to people in HR, Finance, Marketing, Supply Chain, Compliance and other departments within companies. The acquisition, from our perspective, added to Gartner’s expertise in all areas of technology research. New GBS subscriptions are seeing the same high level of engagement from subscribers as Gartner’s technology subscriptions, which we believe is a sign of future growth as the new offerings further penetrate Gartner’s existing client base. COVID-19 is likely to heavily impact the company’s smaller conferences business and impact the much larger research business as well, but overall, we feel Gartner’s core technology research business, which is approximately 85% of total profits, has performed well and the smaller GBS business is poised for potential longer-term growth and profitability.
Booking Holdings declined during the period, particularly in the first calendar quarter 2020. Concerns around the coronavirus, the subsequent restrictions on travel, and social distancing measures to slow the spread of the virus have challenged the stock. We had been trimming our position in Booking prior to COVID-19 and eliminated our remaining position during the period and deployed the proceeds into Facebook, which we discuss below.
Portfolio Activity:
During the period, we initiated positions in Autodesk, Salesforce, ServiceNow, and Abbott Laboratories. We sold O’Reilly Automotive, Booking Holdings, and Oracle.
We initiated a position in Autodesk, the dominant software provider for digital modeling, simulation and planning for architectural, engineering and construction and manufacturing markets. We believe the business continues to widen its competitive moat as the shift to a subscription-based business model (revenues are now 95% recurring) unlocks earnings power and customers become increasingly dependent on Autodesk’s technology to help them be more efficient. Even in the wake of COVID-19 and a potential
6
POLEN GROWTH FUND
Annual Investment Adviser’s Report
April 30, 2020
(Unaudited)
slowdown in the construction and manufacturing sectors, we believe Autodesk’s tools are mission-critical to its customers.
We initiated a new position in enterprise software company Salesforce.com. We believe Salesforce adds to the Fund’s portfolio of businesses that have been competitively-positioned and operating within alarge, growing market that has benefitted from secular tailwinds. We believe Salesforce has been well-positioned with robust revenue growth for some time. Recent company disclosures clarified the drivers of ongoing margin expansion efforts, and we realized Salesforce not only met our financial guardrails but that we believed its operating margins would likely improve meaningfully. We believe co-Founder and current CEO Marc Benioff has created a hard-charging, performance-driven environment that centers on achieving ambitious growth targets. At the same time, he continues to focus on the company’s customer-first culture that prioritizes both innovation and delivering the highest quality products and customer experiences.
We initiated a position in ServiceNow in the fourth calendar quarter 2019. ServiceNow is a trusted brand that has a unique focus and software solutions with greater than 95% retention rates. Its solutions make it easier for employees within large enterprises to complete their everyday tasks. Roughly 6,000 of these large enterprises, including about half of the largest global 2,000 companies, are already ServiceNow customers. ServiceNow continues to grow its customer base by double digits year over year — 20,000+ enterprises globally with greater than 1,000 employees could benefit from these automation products. Consider that all large enterprises, government agencies and potentially smaller businesses have employees who are both requesting and receiving services from other employees within the organization. Historically, employees have been requesting and receiving services, such as IT, HR and customer service support, via the phone, email, spreadsheets and software developed in-house.
ServiceNow’s flagship and anchor product is IT Service Management (ITSM), which allows employees to use software rather than phone or email to request technology help. It also allows technology professionals within the enterprise to more easily route, track, document, analyze, and benchmark IT service requests. Its similar “service management” software products include Field Service Management (helps employees in the field better service requests) and Facilities Service Management (helps facilities employees better service requests). The IT service management product addressable market is over $20 billion in size and growing 5-10% annually.
With ServiceNow likely generating more than $2.5 billion in annual sales from this group of service management products, they appear to have a clear #1 market share in service management software products.2 Yet, it has a runway of 85-90% available market share opportunity by our estimates. Beyond
| 2 | ServiceNow had 51.1% of the global Experience Management: IT Service Management (ITSM) market share in 2018 according to Gartner. The company was also named an August 2018 Gartner Peer Insights Customers’ Choice for IT Service Management Tools, which recognizes vendors in the market by verified end-user professionals, taking into account both the number of reviews and the overall user ratings. https://www.businesswire.com/news/ home/20190905005347/en/ |
7
POLEN GROWTH FUND
Annual Investment Adviser’s Report
April 30, 2020
(Unaudited)
IT products, customers have urged ServiceNow to use its platform to create similar workflow automation applications including Customer Service Management (CSM), which helps employees better handle customer service requests, and Human Resources Management (HR), which helps HR employees better handle tasks such as employee onboarding and employee recruitment. These “outside IT” products already represent about 40% of the company’s incremental annual contract value, and it is growing. We believe the total addressable market for its existing products and its related opportunities should allow the company to address a greater than $100 billion market today that is also growing 5-10% annually.
We welcomed Abbott Laboratories back into the Fund’s portfolio in the fourth calendar quarter of 2019. Abbott, which was a holding from inception until being sold in 2016, is a globally dominant, diversified healthcare company. In our estimation, its competitive advantages have included global scale across different healthcare markets, sticky products and strong customer relationships built on trusted products and brands. These products and brands have allowed for a diversified portfolio of stable, high-quality growth businesses with market leadership across medical devices, diagnostics, nutrition, and established pharmaceuticals products.
We believe Abbott can sustain double-digit earnings-per-share (EPS)3 growth consistently for many years, including during more challenging economic environments. We believe its higher-growth businesses should allow the total company to achieve high-single-digit organic revenue growth despite lower rates of growth in other areas of its business, such as cardiovascular stents and pacemakers. We would also expect ongoing margin expansion and buybacks.
We sold Booking Holdings in the first calendar quarter 2020. Booking was our smallest portfolio weighting because we had been monitoring the company’s slowing growth profile amid a maturing European hotel bookings market. The massive impact from COVID-19 and a lingering effect on global travel for at least some extended period of time added to our concerns. We eliminated our position, determining that our remaining investment in Booking would be better deployed into Facebook where we increased our position.
While we view Booking Holdings as a strong, competitively advantaged business, the maturity of the online travel market combined with the uncertainty in the recovery of the overall travel industry is likely to present growth challenges in our view. At the same time, we believe Facebook’s competitive advantages are even stronger. Furthermore, we think secular trends in its industry, namely the shift in advertising from traditional media to digital platforms, are likely to speed up rather than slow down on the back of COVID-19. We felt the market sell-off in the first calendar quarter 2020 presented an attractive opportunity to add to Facebook at a valuation similar to Booking.com at the time of sale despite our view
| 3 | Earnings per share (EPS) is calculated as a company’s profit divided by the outstanding shares of its common stock. The resulting number serves as an indicator of a company’s profitability. |
8
POLEN GROWTH FUND
Annual Investment Adviser’s Report
April 30, 2020
(Unaudited)
that Facebook’s competitive strengths, growth prospects and cyclicality are more favorable than Booking’s.
We sold O’Reilly Automotive partially due to the gradual maturation of the auto parts market and partially in recognition of the unique circumstances surrounding COVID-19 and the potential impact on O’Reilly’s business and financial position. The current situation has manifested new risks, and share repurchases will likely need to be curtailed in an effort to preserve liquidity. We believe these factors reduce the probability of achieving a double-digit annualized return for our clients over the next 5 years.
We sold Oracle during the fourth calendar quarter 2019 after holding it since the Fund’s inception. We believe Oracle remains a highly competitively advantaged business, but for years now, the revenue and operating profit growth from Oracle has been slow due to the company’s transition from on-premise software to the cloud and stronger competition on the application side of the business. While we think the economics of the cloud transition should be positive for business, Oracle’s customers are often slower to move their Oracle workloads to the cloud. We believe the slower nature of this transition has been a key factor in keeping revenue growth subdued for some time.
Our sale of Oracle funded the purchase of Abbott Laboratories in the period, which we discussed above.
We have all been impacted by COVID-19 in one way or another. We hope this period brings to light how interdependent we are on one another and that vibrant economies cannot exist without healthy people that work together. We hope this period also serves as a reminder that there will always be a number of ways the economy could deteriorate for periods of time, and while we hope future crises will not occur, this is likely not the last crisis we will experience. We believe periods like this demonstrate the importance of considering to invest in the highest quality companies. The high-quality companies we seek to invest in offer products and services that we feel matter to their customers, have shown almost impervious competitive advantages in our view, and are financially sound such that even large shocks to system should not derail them from investing for the future in most cases.
This letter is intended to assist shareholders in understanding how the Fund performed during the fiscal year ended April 30, 2020 and reflects the views of the investment adviser at the time of this writing. Of course, these views may change and do not guarantee the future performance of the Fund or the markets.
Portfolio composition is subject to change. The current and future portfolio holdings of the Fund are subject to investment risk. The investment return and principal value of an investment in the Fund will fluctuate so that an investor’s shares, when redeemed, may be worth more or less than their original cost.
9
POLEN GROWTH FUND
Annual Report
Performance Data
April 30, 2020
(Unaudited)
Comparison of Change in Value of $100,000 (investment minimum) Investment in Polen Growth Fund
Institutional Class Shares
vs Russell 1000® Growth Index and S&P 500® Index
| Average Annual Total Returns for the Periods Ended April 30, 2020 |
| ||||||||||||||||||||||||
| 1 Year | 3 Years | 5 Years | Since Inception* | ||||||||||||||||||||||
Institutional Class | 10.80 | % | 18.21 | % | 15.53 | % | 15.83 | % | |||||||||||||||||
| S&P 500® Index | 0.86 | % | 9.02 | % | 9.11 | % | 12.73 | %** | |||||||||||||||||
| Russell 1000® Growth Index | 10.84 | % | 15.64 | % | 13.32 | % | 15.54 | %** | |||||||||||||||||
| * | The Polen Growth Fund (the “Fund”) Institutional Class Shares commenced operations on September 15, 2010. |
| ** | Benchmark performance is from the commencement date of the Fund Class only and is not the commencement date of the benchmark itself. |
The performance data quoted represents past performance and does not guarantee future results. Current performance may be lower or higher. Performance data current to the most recent month-end may be obtained by calling (888) 678-6024. The investment return and principal value of an investment will fluctuate so that shares, when redeemed, may be worth more or less than their original cost. The graph and table do not reflect the deduction of taxes that a shareholder would pay on Fund distributions or the redemption of Fund shares.
10
POLEN GROWTH FUND
Annual Report
Performance Data
April 30, 2020
(Unaudited)
Comparison of Change in Value of $10,000 Investment in Polen Growth Fund Investor Class Shares
vs Russell 1000® Growth Index and S&P 500® Index
| Average Annual Total Returns for the Periods Ended April 30, 2020 |
| ||||||||||||||||||||||||
| 1 Year | 3 Years | 5 Years | Since Inception* | ||||||||||||||||||||||
Investor Class | 10.53 | % | 17.91 | % | 15.23 | % | 14.41 | % | |||||||||||||||||
S&P 500® Index | 0.86 | % | 9.02 | % | 9.11 | % | 11.68 | %** | |||||||||||||||||
| Russell 1000® Growth Index | 10.84 | % | 15.64 | % | 13.32 | % | 14.26 | %** | |||||||||||||||||
| * | The Investor Class Shares commenced operations on December 30, 2010. |
| ** | Benchmark performance is from the commencement date of the Fund Class only and is not the commencement date of the benchmark itself. |
The performance data quoted represents past performance and does not guarantee future results. Current performance may be lower or higher. Performance data current to the most recent month-end may be obtained by calling (888) 678-6024. The investment return and principal value of an investment will fluctuate so that shares, when redeemed, may be worth more or less than their original cost. The graph and table do not reflect the deduction of taxes that a shareholder would pay on Fund distributions or the redemption of Fund shares.
11
POLEN GROWTH FUND
Annual Report
Performance Data (Concluded)
April 30, 2020
(Unaudited)
The Fund’s “Total Annual Fund Operating Expenses” as stated in the current prospectus dated September 1, 2019 (as amended February 1, 2020), are 1.00% for the Institutional Class shares and 1.25% for the Investor Class shares, respectively, of the Fund’s average daily net assets, which may differ from the actual expenses incurred by the Fund for the period covered by this report. Polen Capital Management, LLC (“PCM” or the “Adviser”) has contractually agreed to reduce its investment advisory fee and/or reimburse certain expenses of the Fund to the extent necessary to ensure that the Fund’s total operating expenses (excluding taxes, fees and expenses attributable to a distribution or service plan adopted by the Trust, interest, extraordinary items, “Acquired Fund Fees and Expenses” and brokerage commissions) do not exceed 1.00% (on an annual basis) with respect to the Fund’s average daily net assets (the “Expense Limitation”). The Expense Limitation will remain in place until August 31, 2020 unless the Board of Trustees (“Board of Trustees”) of FundVantage Trust (the “Trust”) approves its earlier termination. The Adviser is entitled to recover, subject to approval by the Board of Trustees, any fees waived and/or expenses reimbursed by the Adviser on or after January 1, 2017 with respect to the Fund for a three (3) year period following the date of such fee waiver and/or expense reimbursement. The Adviser is permitted to seek reimbursement from the Fund, subject to certain limitations, for fees it waived and Fund expenses it paid to the extent the total annual fund operating expenses do not exceed the limits described above or any lesser limits in effect at the time of reimbursement. No recoupment will occur unless the Fund’s expenses are below the Expense Limitation amount. Total returns would be lower had such fees and expenses not been waived and/or reimbursed.
A 2.00% redemption fee applies to shares redeemed within 60 days of purchase. This redemption fee is not reflected in the returns shown above.
The Fund intends to evaluate performance as compared to that of the Standard & Poor’s 500 (“S&P 500®”) Index and the Russell 1000® Growth Index. The S&P 500® Index is a widely recognized, unmanaged index of 500 common stocks which are generally representative of the U.S. stock market as a whole. The Russell 1000® Growth Index is an unmanaged index that measures the performance of the large-cap growth segment of the U.S. equity universe. It includes those Russell 1000® Growth Index companies with higher price-to-book ratios and higher forecasted growth values. It is impossible to invest directly in an index.
All mutual fund investing involves risk, including possible loss of principal. The Fund is non-diversified, which means that a large portion of the Fund’s assets may be invested in one or few companies or sectors. The Fund could fluctuate in value more than a diversified fund.
12
POLEN GLOBAL GROWTH FUND
Annual Investment Adviser’s Report
April 30, 2020
(Unaudited)
Performance Summary:
| • | Global markets finished 2019 with robust results across the board. However, by the end of the first calendar quarter 2020 markets, in unison, dropped dramatically as COVID-19 spread to nearly all corners of the world. |
| • | For the fiscal year ended April 30, 2020, the Polen Global Growth Fund’s (the “Fund”) Institutional share class returned 6.50% net of fees versus the MSCI ACWI Index which returned -4.96%. |
| • | Since inception December 30, 2014 to April 30, 2020, the Fund’s Institutional share class has had an annual average total return of 12.63% net of fees versus 4.85% for the MSCI ACWI Index. |
The performance data quoted represents past performance and is not a guarantee of future results. Investment return and principal value of an investment will fluctuate so that an investor’s shares, when redeemed, may be worth more or less than their original cost. Current performance may be lower or higher than the performance information quoted. To obtain performance information current to the most recent month-end, please call 1-888-678-6024.
Performance Review:
For the fiscal year ended April 30, 2020, the Polen Global Growth Fund’s (the “Fund”) Institutional share class returned 6.50% net of fees versus the MSCI ACWI Index which returned -4.96%. Top contributors to absolute performance were Microsoft, CSL Limited, and Adobe.
Microsoft continued to grow revenue at scale and enjoys significant operating leverage. Its competitive position in enterprise cloud solutions, through its Azure offering and its enterprise software and tools, allowed management to grow revenues at a mid-teens rate and operating income more than 30% during the Fund’s fiscal period. Before the pandemic environment, Microsoft had an edge because nearly every enterprise already uses its sticky products, and the capital expenditure required for cloud computing is high. In a COVID-19 and post-COVID-19 world, we expect demand for Microsoft’s productivity tools, particularly the company’s collaboration software Microsoft Teams, to only increase as more people need and want to work remotely. Furthermore, we believe the demand for cloud computing services will likely rise as businesses increasingly value the flexibility that the public cloud provides them. We would expect Microsoft’s Azure platform to be a direct beneficiary of this increased demand.
Biotechnology company CSL Limited continued to experience strong and steady revenue growth during the period, and also saw an uptick in the demand for both its immunoglobins (IG) therapies and flu vaccines in the first calendar quarter 2020. In its IG business, greater awareness of the benefits of IG in immunodeficient patients have increased demand. The company also continues to take market share through the opening of more plasma collection centers. CSL centers reportedly tend to be more efficient versus competitors, which allows them to collect more plasma per center and create better donor experiences. We expect that demand for CSL’s therapies could become even stronger over time and its product pipeline remains attractive.
13
POLEN GLOBAL GROWTH FUND
Annual Investment Adviser’s Report
April 30, 2020
(Unaudited)
In the age of digital transformation, Adobe continues to strengthen its business and its value proposition as a mission-critical partner to governments and enterprises. Now more than ever, we believe the world continues to move in Adobe’s direction as more and more organizations will need to create digital-first experiences to connect with and engage their audiences. Digital Media, over two-thirds of total revenue, and Digital Experience, roughly 30% of total revenue, continue to deliver attractive growth. The acquisitions of Magento and Marketo combined with its existing solutions create a full suite offering in digital experience management. Our long history of investing in software businesses tells us that the company with a full suite offering typically wins out over companies that sell best-of-breed point solutions. That said, Adobe’s point solutions within its full suite are typically best of breed, reinforcing the potency of its value proposition.
On the other hand, Align Technology, O’Reilly Automotive, and Industria de Diseno Textil (“Inditex”) were a drag on returns during the period.
Align Technology declined during the period amid concerns about slower growth in some of its key markets, specifically North America and China. While its Chinese business still experienced healthy growth, weaker consumer sentiment in the region weighed on big-ticket purchases, including Invisalign. In addition to slower growth in China, management noted pressure in the 20-29-year-old cohort of its North American business. SmileDirectClub (“SDC”), a U.S.-focused, direct-to-consumer clear aligner competitor that just became public, has been competitive in this demographic. SDC focuses on easy fixes, or “minimal tooth movements” in industry vernacular. Overall, minimal tooth movement cases are a modest share of total cases though and Align’s real strength is in treating more complex cases that competitors like SDC cannot effectively address at this time. SDC has also had little success penetrating the important teen segment to date, an area where Align continues to grow case volume more than 30% per year. We believe that Align’s patents, capabilities and dominance in higher-end treatments will allow the company to continue to expand the addressable market and win more than their fair share of the roughly 90% of cases currently being treated with traditional bracket-and-wire braces.
Investors punished O’Reilly Automotive stock in the first calendar quarter 2020 given concerns about the consequences of reduced travel and social distancing measures on the need for automotive parts. We felt the current environment posed new risks and weakened the investment case, which led us to liquidate our position. We expand on this rationale below.
Global fast-fashion retailer Industria de Diseno Textil (“Inditex”) declined during the period in what has been a difficult environment for fashion retailers. The spread of the COVID-19 virus around the world hurt some of its strongest markets, including Italy, Spain, and France. That said, we believe Inditex is an example of how good businesses can find ways to continue to potentially grow profitably. While other retailers are struggling just to survive, Inditex has gained market share. Inditex increased free cash flow by 37% in 2019 and boosted its cash position by 20%. We expect the business will face significant headwinds with COVID-19, but believe its omnichannel business model and its strong financial position continue to make Inditex an attractive investment over the long term.
14
POLEN GLOBAL GROWTH FUND
Annual Investment Adviser’s Report
April 30, 2020
(Unaudited)
Portfolio Activity:
During the period, we initiated positions in LVMH Moet Hennessey, Abbott Laboratories, and Autodesk. We sold O’Reilly Automotive, Regeneron Pharmaceuticals and SGS.
LVMH Moet Hennessey is a collection of some of the best global luxury brands. Its brand portfolio includes the world’s largest luxury brand, Louis Vuitton, and other global megabrands like Celine, Christian Dior, Dom Perignon, Bulgari, Sephora, and, the company’s most recent acquisition, Tiffany. Our research indicates the company enjoys multiple competitive advantages that reinforce each other. LVMH has achieved significant scale across the globe, which is increasing each year. Annual revenue of >€55bn and growing allows the business to support brands and deploy capital to strengthen its competitive advantages at a scale no competitor appears able to match. Experience is a second competitive advantage. Some brands within LVMH are hundreds of years old. These brands offer significant experience of executing on a well-honed playbook for nurturing and growing brands based on marketing support, heritage, quality, and uniqueness that resonates with consumers. The company has done this successfully many times, and we expect more of the same from this well-capitalized group of talented managers. Heritage is an additional competitive advantage that we feel cannot be replicated since it is supported and created by time. These brands have appeal based on decades — if not centuries — of heritage and brand story that support the ideals of high-quality luxury.
We purchased Autodesk in the period. Autodesk’s software products have leading share in each of its three business segments — Architecture, Engineering and Construction (AEC), Manufacturing (MFG) and Media & Entertainment (M&E). Technology today is allowing some businesses to make a step-function change from good to great. We believe the business continues to widen its competitive moat as the shift to a subscription-based business model (revenues are now 95% recurring) unlocks earnings power and customers become increasingly dependent on Autodesk’s technology to help them be more efficient.
We purchased Abbott Laboratories and sold SGS during the period. While purchase and sell decisions are not always directly related, we did actively compare the two in this instance as both companies play a ballast-like role within the Fund’s portfolio. The desire for ballast-like companies stems from the concept of investing across the growth spectrum, which we use for all our Large Company Growth strategies and have employed for decades. We feel this balanced approach is one of the reasons we have captured less of the downside over the years.
Abbott Laboratories is a globally dominant, diversified healthcare company. It continues to possess the attributes we have historically found attractive, namely a diversified portfolio of stable, high-quality growth businesses with market leadership.
SGS remains an impressively decentralized company operating a large number of businesses around the globe in the critical and necessary areas of Testing, Inspection and Certification (TIC). The company can be considered a toll road for global commerce, performing critical and disparate functions, but this appears to us to have created challenges for management in recent years. Management has had difficulty in growing the business in a world experiencing broad-based GDP deceleration.
15
POLEN GLOBAL GROWTH FUND
Annual Investment Adviser’s Report
April 30, 2020
(Unaudited)
We have owned SGS since the inception of the Fund and during that period the stock has appreciated roughly 20% (in line with the Index), but on the back of roughly 15% multiple appreciation. While we continue to think SGS is a stable and competitively advantaged business, we feel that Abbott Laboratories is a better holding for the Fund. We believe Abbott is more durable, enjoys greater business momentum, is less tied to commodity prices and is run by a management team that has demonstrated better execution. At the time of trade, Abbott and SGS were trading at similar valuations. In our view, the Abbott-over-SGS trade illustrates the potential advantage of hunting the entire globe for what we feel are strong businesses.
We sold O’Reilly Automotive in response to the unique circumstances surrounding the coronavirus spread mitigation in the United States. In nearly any financial stress environment, we think O’Reilly would be positioned to play the role of a strong ballast in the Fund’s portfolio. It is a counter-cyclical business because car maintenance can only be put off for so long, regardless of the strain on households. The industry can be thought of as “healthcare” for vehicles. One key variable for this dynamic, however, is that people need to be driving their cars for parts to break down. While social distancing practices are likely to impact all our companies in some form or fashion, we felt it potentially could have a more meaningful impact on O’Reilly. The company may see not only severely reduced store traffic in the near term, but also a delay in maintenance requirements resulting from a potentially significant reduction in miles driven, particularly if the spread mitigation is prolonged. Its higher-than-average debt burden also creates some risk in our view, and we suspect that earnings growth will likely moderate as share buybacks are curtailed. No single issue is unmanageable in our opinion, but considered in aggregate, we felt the investment case had weakened.
We exited our position in Regeneron Pharmaceuticals in the period given growing concerns and lack of clarity about its growth in the coming years. The company’s best-in-class eyecare drug Eylea continues to grow at a high single-digit rate eight years after launch. Its allergy drug Dupixent is on a positive growth trajectory in atopic dermatitis and was recently approved for asthma. However, we expect stronger competition is on the horizon for both drugs and Elyea will face biosimilar competition in 2023. Healthcare reform is also a perennial overhang with ongoing proposals to modify Part B, the program through which Eylea is reimbursed. While we continue to believe that Regeneron has unique discovery and development capabilities and some interesting opportunities in its pipeline, we do not expect to have enough certainty on the pipeline in the next couple of years to offset the increasing uncertainties around the long-term growth of currently marketed products. While we think Regeneron is still an interesting and innovative business, we believe other Fund holdings offer a more compelling risk-reward proposition.
We are in uncertain times now, but we are confident that the Fund and its investment approach are built to manage through challenging market environments. By concentrating in only the highest-quality growth businesses, the Fund’s portfolio continued to deliver robust underlying earnings growth during the period, which helped us preserve capital once again in a challenging market. We remain confident that attractive underlying earnings growth may drive attractive investment returns over the long term.
16
POLEN GLOBAL GROWTH FUND
Annual Investment Adviser’s Report
April 30, 2020
(Unaudited)
This letter is intended to assist shareholders in understanding how the Fund performed during the fiscal year ended April 30, 2020 and reflects the views of the investment adviser at the time of this writing. Of course, these views may change and do not guarantee the future performance of the Fund or the markets.
Portfolio composition is subject to change. The current and future portfolio holdings of the Fund are subject to investment risk. The investment return and principal value of an investment in the Fund will fluctuate so that an investor’s shares, when redeemed, may be worth more or less than their original cost.
17
POLEN GLOBAL GROWTH FUND
Annual Report
Performance Data
April 30, 2020
(Unaudited)
Comparison of Change in Value of $100,000 (investment minimum) Investment in Polen Global Growth Fund
Institutional Class Shares
vs MSCI All Country World® Index (“ACWI”)
| Average Annual Total Returns for the Period Ended April 30, 2020 | ||||||||||||||||||
| 1 Year | 3 Years | 5 Years | Since Inception* | |||||||||||||||
Institutional Class | 6.50% | 15.27% | 12.87% | 12.63% | ||||||||||||||
| MSCI All Country World ® Index (“ACWI”)(Net Dividend) | -4.96% | 4.46% | 4.37% | 4.85%** | ||||||||||||||
| * | The Polen Global Growth Fund (the “Fund”) Institutional Class Shares commenced operations on December 30, 2014. |
| ** | Benchmark performance is from commencement date of the Fund Class (December 30, 2014) only and is not the commencement date of the benchmark itself. |
The performance data quoted represents past performance and does not guarantee future results. Current performance may be lower or higher. Performance data current to the most recent month-end may be obtained by calling (888) 678-6024. The investment return and principal value of an investment will fluctuate so that shares, when redeemed, may be worth more or less than their original cost. The graph and table do not reflect the deduction of taxes that a shareholder would pay on Fund distributions or the redemption of Fund shares.
18
POLEN GLOBAL GROWTH FUND
Annual Report
Performance Data
April 30, 2020
(Unaudited)
Comparison of Change in Value of $10,000 Investment in Polen Global Growth Fund Investor Class Shares
vs MSCI All Country World® Index (“ACWI”)
| Average Annual Total Returns for the Periods Ended April 30, 2020 |
| |||||||||||||||||||
| 1 Year | 3 Years | Since Inception* | ||||||||||||||||||
Investor Class | 6.28 | % | 14.98 | % | 13.01 | % | ||||||||||||||
| MSCI All Country World ® Index (“ACWI”)(Net Dividend) | -4.96 | % | 4.46 | % | 4.98 | %** | ||||||||||||||
| * | The Polen Global Growth Fund (the “Fund”) Investor Class Shares commenced operations on July 6, 2015. |
| ** | Benchmark performance is from commencement date of the Fund Class (July 6, 2015) only and is not the commencement date of the benchmark itself. |
The performance data quoted represents past performance and does not guarantee future results. Current performance may be lower or higher. Performance data current to the most recent month-end may be obtained by calling (888) 678-6024. The investment return and principal value of an investment will fluctuate so that shares, when redeemed, may be worth more or less than their original cost. The graph and table do not reflect the deduction of taxes that a shareholder would pay on Fund distributions or the redemption of Fund shares.
The Fund’s “Total Annual Fund Operating Expenses” and “Total Annual Fund Operating Expenses After Fee Waiver and/or Expense Reimbursement”, as stated in the current prospectus dated September 1, 2019 (as amended February 1, 2020), are 1.31% and 1.10%, respectively, for the Institutional Class shares and 1.56% and 1.35%, respectively, for the Investor Class shares of the Fund’s average daily net assets, which may differ from the actual expenses incurred by the Fund for the period covered by this report. Polen Capital Management, LLC (“PCM” or the “Adviser”) has contractually agreed to reduce its investment advisory fee and/or reimburse certain expenses of the Fund to the extent necessary to ensure that the Fund’s total operating expenses (excluding taxes, fees and expenses attributable to a distribution or service plan adopted by the Trust, interest, extraordinary items, “Acquired Fund Fees and Expenses”
19
POLEN GLOBAL GROWTH FUND
Annual Report
Performance Data
April 30, 2020
(Unaudited)
and brokerage commissions) do not exceed 1.10% (on an annual basis) with respect to the Fund’s average daily net assets (the “Expense Limitation”). The Expense Limitation will remain in place until August 31, 2020 unless the Board of Trustees (“Board of Trustees”) of FundVantage Trust (the “Trust”) approves its earlier termination. The Adviser is entitled to recover, subject to approval by the Board of Trustees, such amounts reduced or reimbursed for a period of up to three (3) years from the date on which the Adviser reduced its compensation and/or assumed expenses for the Fund. The Adviser is permitted to seek reimbursement from the Fund, subject to certain limitations, for fees it waived and Fund expenses it paid to the extent the total annual fund operating expenses do not exceed the limits described above or any lesser limits in effect at the time of reimbursement. No recoupment will occur unless the Fund’s expenses are below the Expense Limitation amount. Total returns would be lower had such fees and expenses not been waived and/or reimbursed.
A 2.00% redemption fee applies to shares redeemed within 60 days of purchase. This redemption fee is not reflected in the returns shown above.
The Fund intends to evaluate performance as compared to that of the MSCI ACWI Index (Net Dividend), which captures large and mid-cap representation across 23 Developed Markets (DM) and 26 Emerging Markets (EM) countries. With 3,044 constituents, the index covers approximately 85% of the global investable equity opportunity set. Indexes are unmanaged and it is not possible to invest directly in an index.
All mutual fund investing involves risk, including possible loss of principal. The Fund is non-diversified, which means that a large portion of the Fund’s assets may be invested in one or few companies or sectors. The Fund could fluctuate in value more than a diversified fund. Investing in foreign securities entails special risks, such as fluctuations in currency exchange rates and possible lax regulation of securities markets and accounting practices.
The Fund may invest a substantial amount of its assets in issuers located in a limited number of countries. If the Fund concentrates its investments in this manner, it assumes the risk that economic, political and social conditions in those countries will have a significant impact on its investment performance. The Fund’s investment performance may also be more volatile if it concentrates its investments in certain countries, especially emerging market countries.
20
POLEN INTERNATIONAL GROWTH FUND
Annual Investment Adviser’s Report
April 30, 2020
(Unaudited)
Performance Summary:
| • | International markets returned strong double-digit results at the end of 2019, but by the close of the first calendar quarter 2020, abruptly erased those gains in the wake of the COVID-19 pandemic. |
| • | For the fiscal year ended April 30, 2020, the Polen International Growth Fund’s (the “Fund”) Institutional share class returned -2.92% net of fees versus the MSCI ACWI ex-USA Index which returned – 11.51%. |
| • | Since inception December 30, 2016 to April 30, 2020, the Fund’s Institutional share class has had an annual average total return of 10.72% net of fees versus 2.85% for the MSCI ACWI ex-USA Index. |
The performance data quoted represents past performance and is not a guarantee of future results. Investment return and principal value of an investment will fluctuate so that an investor’s shares, when redeemed, may be worth more or less than their original cost. Current performance may be lower or higher than the performance information quoted. To obtain performance information current to the most recent month-end, please call 1-888-678-6024.
Performance Review:
For the fiscal year ended April 30, 2020, the Polen International Growth Fund’s Institutional share class (the “Fund”) returned -2.92% net of fees versus the MSCI ACWI ex-USA Index which returned –11.51%. Leading contributors to performance were CSL Limited, Coloplast, and ICON PLC.
Biotechnology company CSL Limited continued to experience strong and steady revenue growth during the period, and also saw an uptick in the demand for both its immunoglobins (IG) therapies and flu vaccines in the first calendar quarter 2020. In its IG business, greater awareness of the benefits of IG in immunodeficient patients have increased demand. The company also continues to take market share through the opening of more plasma collection centers. CSL centers tend to be more efficient versus competitors, allowing them to collect more plasma per center and create better donor experiences. We believe demand for CSL’s therapies could become even stronger over time and its product pipeline remains attractive.
Danish medical device company Coloplast is the leading player in ostomy and continence care products globally.4 We consider the businesses to be defensive growth stalwarts, and the pandemic environment does not change patients’ need for Coloplast’s products, many of which are for chronic use and, importantly, are sold directly to the patient or through non-hospital channels. The company’s supply chain continues
| 4 | Coloplast is the global market leader in the continence care market, with a market share of about 40%. The market is growing by 5-6% per year and is worth about DKK 13-14bn. Coloplast is the global market leader, holding a market share of 35–40%. The ostomy supporting products market is estimated at about DKK 2-3bn of the overall market for ostomy care products with an annual market growth of 6- 8%. Coloplast holds a share of the supporting products market of 30-35%. Coloplast 2018/19 Announcement of full-year financial results. |
21
POLEN INTERNATIONAL GROWTH FUND
Annual Investment Adviser’s Report
April 30, 2020
(Unaudited)
to operate efficiently. Market leadership in a category known for steady demand may enable consistent cash generation.
We believe Coloplast’s competitive advantage has stemmed from persistent investments in incremental product innovation and further strengthening its strong distribution position. In recent years, Coloplast’s sound management embarked on an investment program to invigorate growth by boosting the company’s ostomy market position in the U.S. Coloplast made positive strides in this effort in the first calendar quarter 2020, and we anticipate continued growth in the coming years. As usage of Coloplast’s ostomy products increases in the U.S., we feel profit margin improvement should follow. We favor competitively advantaged businesses like Coloplast, which aim to broaden their product sets, expand market reach, and ultimately improve profitability.
ICON PLC, the Irish contract research organization (CRO), has continued to produce positive results. CROs provide outsourced services involving the planning, enrollment and efficient execution of drug trials for biotech, pharmaceutical and medical device companies. ICON is a best-in-class operator with a track record of above-market growth and profit margins.5 We believe the secular shift by biotech and pharma companies away from in-house trial administration to lower cost and more efficient specialists like ICON has legs. In fact, there appears to be a boom, of sorts, in innovation among the small biotech players who often lack in-house trial administration capabilities. Consequently, as more start-up and early stage drugs come out of the research lab, ongoing demand for ICON’s services should continue to be created. ICON management continues to drive the business with one eye toward efficiency and the other toward adding new technological or geographic coverage to improve the breadth of its service offerings.
Leading detractors from absolute performance during the fiscal year period were Amadeus IT Group, Bunzl, and Baidu.
Amadeus IT Group, a Spanish travel technology company, operates two related businesses which, together, form a critical backbone for the travel industry. The first, a global distribution system (GDS), connects airlines with travelers. The second is a niche software business serving parts of the travel industry, namely airlines and hotels, with critical business management software. Travel volumes cratered in the first calendar quarter of 2020 and will likely remain subdued until the COVID-19 situation subsides. However, we remain confident that the medical world can find an answer to COVID-19. Second, we believe habits die hard, and travel will eventually resume. As a case in point, we highlight the deadly influenza pandemic
| 5 | ICON received 2020 CRO Leadership Awards in five of the overall six categories. 2020 is the fourth year ICON has won awards in the CRO Leadership Awards, having been successful in 2019, 2018 and 2015. https:// www.iconplc.com/news-events/press-releases/icon-wins-multiple-categories-in-2020-cro-leadership-awards/ |
22
POLEN INTERNATIONAL GROWTH FUND
Annual Investment Adviser’s Report
April 30, 2020
(Unaudited)
of 1957, which interestingly started in China in February of that year before spreading globally. Sadly, it killed more than one million people globally. Nonetheless, people moved forward, and the pandemic was followed by a six-decade boom in travel. Amadeus notes that in the four decades since its inception as a company, global travel spending has averaged between 1.0x and 2.0x the rate of growth in global GDP. With travel representing 12% of global GDP, travel is likely to play an important part in restoring the global economy once the virus is contained. We took the opportunity to add to our position in Amadeus because we are confident in the business and its management.
Shares of UK-headquartered Bunzl, one of the world’s leading distribution and outsourced services providers, also lagged during the period as two of its key business drivers sputtered. As a distribution and outsourced services provider in 31 countries, Bunzl benefits from the flow of goods. As economic growth slowed in 2019, Bunzl’s business felt the sting of weakening flows. Company-specific issues added to this softening. Additionally, management’s ongoing commitment to thoughtful capital allocation slowed as a few significant acquisitions fell through in 2019, resulting in lower-than-usual acquisition activity.
We continue to have a positive view of Bunzl. Although this well-positioned acquirer delivered subdued acquisition activity this past year, we still feel the opportunity for continued sound capital allocation is quite real. Bunzl buys niche operators in and around its industry, typically spending £250-300 million per year on acquisitions. Target companies are often “mom-and-pop” businesses serving clients in a city, state, or region who seek to monetize their life’s work. Bunzl sees a long runway for acquisitions in its future and follows more than 1,000 such businesses. We believe Bunzl will likely continue to compound its total returns to shareholders potentially at a double-digit rate for the foreseeable future and, therefore, think the valuation offered in the equity market is not reflective of this potential.
Baidu is the leading internet search provider in China. Our investment thesis in Baidu deteriorated when the company pivoted away from its dominant position in Chinese internet search. Baidu’s core search business had been delivering ~10% annual growth, but the results indicated the company was turning its back on search. As for management, we had seen three strategy shifts in recent years, but this is the first shift in which the company has turned away from its cash-cow core search business. In our view, strategic pivots or platform expansions are best executed when a legacy cash cow is maintained as a source to fund scaling in new areas. Baidu is now repurposing its app to be a content source meant to capture user time and attention with various video content, news, search and other offerings. We believe heightened spending to repurpose Baidu’s offerings toward content aggregation and delivery – away from search – will negate earnings growth. Deemphasizing the competitively positioned core business is a change we cannot support. We sold Baidu out of the Fund’s portfolio during the period, as noted below.
23
POLEN INTERNATIONAL GROWTH FUND
Annual Investment Adviser’s Report
April 30, 2020
(Unaudited)
Portfolio Activity:
During the fiscal year, we initiated positions in New Oriental Education, LVMH Moet Hennessey, and increased our position in Industria de Diseno Textil (“Inditex”). We sold our position in Compass Group, Reckitt Benckiser, and Baidu.
New Oriental Education & Technology Group is China’s largest non-compulsory, after school tutoring company. The company operates over 1,250 tutoring centers across 81 cities in China, teaching more than 8 million classes annually. Over 70% of its revenue comes from the K-12 segment, with almost 50% from high-school-aged students. New Oriental provides a service that sees steady demand as Chinese culture has always placed high importance on education.
As the largest after school tutoring company, we believe New Oriental has a strong competitive advantage in the scale of its operations. Greater scale allows it to outspend its competitors on advertising, which has helped to build a strong brand name nationwide. Its nationally recognized brand name also gives it an advantage when entering new cities because it allows the company to recruit teachers and students faster than competitors. New Oriental leverages its financial scale to pay its teachers 20-30% more than the competition, helping to ensure its service is among the best. A strong brand name and the best teachers can attract more students, which drives even more scale and feeds back into further strengthening those advantages. We think New Oriental can grow its earnings at a 25% annual rate over the coming three years.
Paris-headquartered LVMH Moet Hennessey is the world’s largest luxury goods company, and companies selling branded goods have long been within Polen Capital’s circle of competence. LVMH’s visionary leader, Bernard Arnault, manages the business with an eye toward the long term and a decentralized structure. Luxury brands cannot be built overnight, which creates lasting barriers to entry and pricing power, a unique dynamic today. Many LVMH brands built their significant brand equity over decades, and in some cases centuries. In total, LVMH owns more than 70 brands, including the world’s largest luxury brand, Louis Vuitton, and other megabrands like Hennessey, Christian Dior, Dom Perignon, Bulgari, and Sephora. Brands are run separately and autonomously, allowing each to pursue its own strategy while developing unique creative styles. We are excited about the growth opportunities in front of LVMH.
We added to our position in global fast-fashion retailer Industria de Diseno Textil (“Inditex”) during the period. Despite the current and challenging environment for fashion retailers, we believe Inditex is an example of how good businesses can find ways in aiming to continue to grow profitably. While other retailers are struggling just to survive, Inditex is gaining share. Inditex increased free cash flow by 37% in 2019 and boosted its cash position by 20%. We expect the business will face significant headwinds with COVID-19, but believe its omnichannel business model, with lean operations and universal inventory, and its strong financial position continue to make Inditex an attractive investment over the long term. We continue to view the business as a core holding in the Fund’s portfolio.
We exited global catering leader Compass Group as its business was squarely in the crosshairs of rolling global COVID-19 lockdowns. Compass Group operates dining facilities for corporate, university,
24
POLEN INTERNATIONAL GROWTH FUND
Annual Investment Adviser’s Report
April 30, 2020
(Unaudited)
and healthcare and senior living facility providers globally. It also operates stadium concessions around the world. Virtually all the firm’s end markets are either lacking dining demand or are out of operation entirely. We continue to believe in Compass Group’s competitive advantages and see the company as financially sound, but we are concerned with its overall growth potential once the crisis subsides. In an environment of weakened dining facility usage, we are less confident in the company’s ability to manage costs to protect profitability, as it did in the last recessionary environment. This concern atop the current backdrop prompted us to sell the shares.
We sold our position in British consumer goods company Reckitt Benckiser because we no longer see a path to persistent double-digit total returns. Many consumer products brands are losing resonance with consumers as advertising and distribution channel changes diminish the clout large players used to enjoy. Reckitt answered these challenges with a plan to separate its two business units to enable better management focus in each and to facilitate a sale or spin of the household products business. Changes made over the last two years prepared Reckitt for this outcome, but a recent CEO change upended the planned business split. Discussions with management revealed a view toward 3-5% revenue growth and minimal potential profit margin expansion. The entrance of a new CEO adds uncertainty to an already slow growing business. We recently learned the new CEO has opted against a business split and will instead re-base margins to lower levels to invest for long-term growth. Such a move may be necessary to position Reckitt’s brands for long-term success but we believe would also drive the company’s earnings power lower for the next few years.
We sold Baidu in the period, due to a deterioration of our investment thesis. The company’s pivot away from its dominant position in Chinese internet search reflects a change in business strategy which prevents the company from meeting our expectations for consistent double-digit growth.
While we remain in an unprecedented situation, we are confident that our time-tested investment approach has positioned us well to navigate these challenging times. We believe our insistence on owning nothing less than what we believe to be the most competitively advantaged growth businesses with sound financials, and investing with a long-term view, should serve us well in any market environment.
This letter is intended to assist shareholders in understanding how the Fund performed during the fiscal year ended April 30, 2020 and reflects the views of the investment adviser at the time of this writing. Of course, these views may change and do not guarantee the future performance of the Fund or the markets.
Portfolio composition is subject to change. The current and future portfolio holdings of the Fund are subject to investment risk. The investment return and principal value of an investment in the Fund will fluctuate so that an investor’s shares, when redeemed, may be worth more or less than their original cost.
25
POLEN INTERNATIONAL GROWTH FUND
Annual Report
Performance Data
April 30, 2020
(Unaudited)
Comparison of Change in Value of $100,000 (investment minimum) Investment in Polen International Growth Fund
Institutional Class Shares
vs MSCI All Country World® Index (“ACWI”) (ex-USA)
| Average Annual Total Returns for the Periods Ended April 30, 2020 | ||||||||||||||
| 1 Year | 3 Years | Since Inception* | ||||||||||||
Institutional Class | -2.92% | 6.66% | 10.72% | |||||||||||
| MSCI All Country World ® Index (“ACWI”) (ex-USA) (Net Dividend) | -11.51% | -0.25% | 2.85%** | |||||||||||
| * | The Polen International Growth Fund (the “Fund”) Institutional Class shares commenced operations on December 30, 2016. |
| ** | Benchmark performance is from commencement date of the Fund Class (December 30, 2016) only and is not the commencement date of the benchmark itself. |
The performance data quoted represents past performance and does not guarantee future results. Current performance may be lower or higher. Performance data current to the most recent month-end may be obtained by calling (888) 678-6024. The investment return and principal value of an investment will fluctuate so that shares, when redeemed, may be worth more or less than their original cost. The graph and table do not reflect the deduction of taxes that a shareholder would pay on Fund distributions or the redemption of Fund shares.
26
POLEN INTERNATIONAL GROWTH FUND
Annual Report
Performance Data
April 30, 2020
(Unaudited)
Comparison of Change in Value of $10,000 Investment in Polen International Growth Fund Investor Class Shares
vs MSCI All Country World® Index (“ACWI”) (ex-USA)
| Average Annual Total Returns for the Periods Ended April 30, 2020 | ||||||||||||||
| 1 Year | 3 Years | Since Inception* | ||||||||||||
Investor Class | -3.15% | 6.41% | 8.12% | |||||||||||
| MSCI All Country World ® Index (“ACWI”) (ex-USA) (Net Dividend) | -11.51% | -0.25% | 1.06%** | |||||||||||
| * | The Polen International Growth Fund (the “Fund”) Investor Class Shares commenced operations on March 15, 2017. |
| ** | Benchmark performance is from commencement date of the Fund Class (March 15, 2017) only and is not the commencement date of the benchmark itself. |
The performance data quoted represents past performance and does not guarantee future results. Current performance may be lower or higher. Performance data current to the most recent month-end may be obtained by calling (888) 678-6024. The investment return and principal value of an investment will fluctuate so that shares, when redeemed, may be worth more or less than their original cost. The graph and table do not reflect the deduction of taxes that a shareholder would pay on Fund distributions or the redemption of Fund shares.
The Fund’s “Total Annual Fund Operating Expenses” and “Total Annual Fund Operating Expenses After Fee Waiver and/or Expense Reimbursement,” as stated in the current prospectus dated September 1, 2019 (as amended February 1, 2020), are 1.40% and 1.10%, respectively, for the Institutional Class shares and 1.65% and 1.35%, respectively, for the Investor Class shares of the Fund’s average daily net assets, which may differ from the actual expenses incurred by the Fund for the period covered by this report. Polen Capital Management, LLC (“PCM” or the “Adviser”) has contractually agreed to reduce its investment advisory fee and/or reimburse certain expenses of the Fund to the extent necessary to ensure that the Fund’s total operating expenses (excluding taxes, fees and expenses attributable
27
POLEN INTERNATIONAL GROWTH FUND
Annual Report
Performance Data
April 30, 2020
(Unaudited)
to a distribution or service plan adopted by the Trust, interest, extraordinary items, “Acquired Fund Fees and Expenses” and brokerage commissions) do not exceed 1.10% (on an annual basis) with respect to the Fund’s average daily net assets (the “Expense Limitation”). The Expense Limitation will remain in place until August 31, 2020 unless the Board of Trustees (“Board of Trustees”) of FundVantage Trust (the “Trust”) approves its earlier termination. The Adviser is entitled to recover, subject to approval by the Board of Trustees, any fees waived and/or expenses reimbursed for a three (3) year period following the date of such fee waiver and/or expense reimbursement. The Adviser is permitted to seek reimbursement from the Fund, subject to certain limitations, for fees it waived and Fund expenses it paid to the extent the total annual fund operating expenses do not exceed the limits described above or any lesser limits in effect at the time of reimbursement. No recoupment will occur unless the Fund’s expenses are below the Expense Limitation amount. Total returns would be lower had such fees and expenses not been waived and/or reimbursed.
A 2.00% redemption fee applies to shares redeemed within 60 days of purchase. This redemption fee is not reflected in the returns shown above.
The Fund intends to evaluate performance as compared to that of the MSCI ACWI Index (ex-USA) (Net Dividend), which captures large and mid-cap representation across 22 of 23 Developed Markets (DM) countries (excluding the US) and 26 Emerging Markets (EM) countries. With 2,408 constituents, the index covers approximately 85% of the global equity opportunity set outside the US. Indexes are unmanaged and it is not possible to invest directly in an index.
All mutual fund investing involves risk, including possible loss of principal. The Fund is non-diversified, which means that a large portion of the Fund’s assets may be invested in one or few companies or sectors. The Fund could fluctuate in value more than a diversified fund. Investing in foreign securities entails special risks, such as fluctuations in currency exchange rates and possible lax regulation of securities markets and accounting practices.
The Fund may invest a substantial amount of its assets in issuers located in a limited number of countries. If the Fund concentrates its investments in this manner, it assumes the risk that economic, political and social conditions in those countries will have a significant impact on its investment performance. The Fund’s investment performance may also be more volatile if it concentrates its investments in certain countries, especially emerging market countries.
28
POLEN U.S. SMALL COMPANY GROWTH FUND
Annual Investment Adviser’s Report
April 30, 2020
(Unaudited)
Performance Summary:
| • | U.S. small cap stocks produced double-digit returns at the end of the 2019 but gave back those returns by end of the first calendar quarter 2020 amid the coronavirus pandemic and its impact on the global economy. |
| • | For the fiscal year ended April 30, 2020, the Polen U.S. Small Company Growth Fund’s (the “Fund”) Institutional share class returned -9.70% net of fees versus the Russell 2000 Growth Index which returned -9.22%. |
| • | Since inception November 1, 2017 to April 30, 2020, the Fund’s Institutional share class has had an annual average total return of 4.80% net of fees versus 0.94% for the Russell 2000 Growth Index. |
The performance data quoted represents past performance and is not a guarantee of future results. Investment return and principal value of an investment will fluctuate so that an investor’s shares, when redeemed, may be worth more or less than their original cost. Current performance may be lower or higher than the performance information quoted. To obtain performance information current to the most recent month-end, please call 1-888-678-6024.
Performance Review:
For the fiscal year ended April 30, 2020, the Fund’s Institutional share class returned -9.70% net of fees versus the Russell 2000 Growth Index which returned -9.22%. Masimo, Wingstop, and Globant were the top contributors to the Fund’s returns.
Masimo is a medical technology company that develops and manufactures patient monitoring devices, including pulse oximeters, which monitor oxygen levels in blood, and sensors used in other medical devices. In terms of the global pandemic and increased hospitalizations, it is likely Masimo’s products will be in greater demand, and we believe this is reflected in the relative performance during the period. Irrespective of the current global pandemic, our original investment thesis in Masimo was that we believed the company possessed a unique competitive position, long-term growth prospects, ability to grow free cash flow (FCF)6 at a mid-teens rate, attractive balance sheet, and thoughtful leadership. While clearly overshadowed by the global pandemic, the company reported favorable fourth-quarter results in February with 11% revenue growth and significant margin expansion of 70 basis points year over year.
Wingstop is a franchisor and operator of quick-service restaurants focused on chicken wings. We initiated a new position in the period because we believe Wingstop has a long runway for growth and the potential to increase its restaurant base by multiples both domestically and internationally. Its emphasis on take-out orders is unique and allows for a small store footprint that minimizes upfront investments and fixed costs such as rent. The company also recently launched national delivery, which allows
| 6 | Free cash flow (FCF) represents the cash available for the company to repay creditors or pay dividends and interest to investors. |
29
POLEN U.S. SMALL COMPANY GROWTH FUND
Annual Investment Adviser’s Report
April 30, 2020
(Unaudited)
customers who would not usually venture to the store to become customers. Despite a challenging pandemic environment, this model has proven to be beneficial for Wingstop. Furthermore, this model can lead to high returns for the restaurant owner and more easily attract franchisees — the company is about 98% franchised today. The business model has benefitted from stable cash flows and almost no investment required to grow. We believe Wingstop is in an enviable and rare position to pay shareholders nearly all cash it generates via dividends or buybacks without interrupting growth over the period. Additionally, we believe management has shown an attractive track record of strategic execution.
Globant is a leader in their area of IT Services, providing outsourced digital programming and design to companies that need innovative digital solutions for their customers. The company continued to report positive results during the period, exceeding management’s long-term revenue growth targets of 20%. We expect some challenges in the near term as Globant’s customers face the impact of the coronavirus. Still, we continue to believe Globant is well positioned in the fast-growing digital strategy consulting services industry as companies across all industries have an ongoing need to strengthen their online presence, better leverage technology in their own products and services, and drive customer experience.
Conversely, Fox Factory Holding, Revolve Group, and U.S. Physical Therapy were the leading detractors from the Fund’s portfolio.
Fox Factory Holding, which designs, manufactures, and sells high-performance products for bicycles, on-road vehicles, and off-road vehicles, detracted during the period. The company announced record results for fourth calendar quarter 2019 with sales up 18.5% and adjusted EPS up 22.5%. Management’s guidance for the upcoming year exhibited confidence with expected revenue growth of ~19% and adjusted EPS in the mid-to-low teens. The share price declines in the first calendar quarter 2020 seem to reflect concerns over the pandemic rather than recent results. The short-term impacts of social distancing on Fox Factory’s business remain unclear. However, we believe the company possesses a pristine balance sheet, durable competitive advantages, strong brand, and a thoughtful management team capable of leading the company through difficult times, We will continue to monitor the situation throughout, and remain confident in our long-term outlook for the company.
We also started a new position in Revolve Group, a next-generation online retailer focused on Millennial and Generation Z female customers. The company reported weaker than expected fourth calendar quarter 2019 results due to issues related to excess inventory. This appears to have been largely caused by the torrid pace of growth in owned brands over the past two years and the launch of its new lower priced site, superdown.com. We believe these issues have been addressed and feel confident that management is focused on driving long term shareholder value. While near term deceleration in consumer discretionary spending due to the coronavirus will likely negatively impact short-term results, we believe that Revolve is well positioned as a leading, digitally native online retailer for young fashion-forward women longer term. Revolve has targeted long-term sales growth of roughly 20%, is incredibly capital light, and has a net cash position on its balance sheet. We continue to remain excited about what we feel are the company’s long-term opportunities and the durability of what have been its competitive advantages.
30
POLEN U.S. SMALL COMPANY GROWTH FUND
Annual Investment Adviser’s Report
April 30, 2020
(Unaudited)
U.S. Physical Therapy is a leading operator of outpatient physical therapy clinics and injury prevention services throughout the U.S. The company reported fourth quarter 2019 results that were somewhat mixed. Strong comparable sales growth at its clinics was offset by several non-recurring operating expenses and management issued guidance that was below expectations. The spread of the coronavirus to the U.S. has negatively impacted its business and led to further declines in the stock price. Near term impacts include clinics being closed, elective surgeries being cancelled or delayed, and work from home policies and layoffs affecting demand for its injury prevention services. While this environment is unlike others the company has lived through, U.S. Physical Therapy has long been a durable and well-run business that has consistently grown earnings at a low teens rate through various market environments. We eventually exited our position based on our assessment of COVID-19 and its effect on the U.S. Physical Therapy’s business, which we detail below.
Portfolio Activity:
We initiated new positions in Revolve, Exponent, and AppFolio during the period. We eliminated our positions in U.S. Physical Therapy, EXL Services, and Cantel Medical Corp.
We started a new position in Revolve Group, a next-generation online retailer focused on Millennial and Generation Z female customers. The company participates in the attractive fast-fashion industry, which is experiencing secular shifts due to the growth in e-commerce and social media. Revolve is at the intersection of these secular shifts and has been a pioneer in both e-commerce and the use of social media that leverages influencer marketing.7 We believe Revolve’s competitive advantage stemmed from its innovative use of proprietary technology and data analytics to manage nearly all aspects of its business. This has allowed Revolve to remain on-trend and has established it as a trusted destination for discovery and inspiration for its core, fashion-forward customers. The company is founder-led, and it boasts a track record of customer growth while driving high customer retention and increased spending from existing customers. Revolve has also been highly cash generative and returns on invested capital are over 30% over the period. We believe Revolve is a truly unique and differentiated business that has a long runway of attractive growth opportunities.
We also initiated a new position in AppFolio, Inc.. Appfolio is a software-as-a-service provider to small and medium-sized (“SMB”) property managers. AppFolio targets a large, highly fragmented market that has historically been underserved by legacy, on-premise solutions. AppFolio’s all-in-one SaaS solutions provides sticky systems of record, engagement, and data insights designed to allow customers to become more efficient, save money, and spend more time growing their businesses. AppFolio’s business model is highly repeatable (>95% of revenue is recurring subscription), capital lite, and has generated increasingly higher levels of cash flow while requiring no net debt. We believe AppFolio has a truly unique and
| 7 | How Revolve used a massive network of influencers and celebrities to become a fashion giant. https:// www.businessinsider.com/revolve-dominating-online-apparel-sales-for-millennials-history-2019-6 |
31
POLEN U.S. SMALL COMPANY GROWTH FUND
Annual Investment Adviser’s Report
April 30, 2020
(Unaudited)
differentiated product and service offering, strong culture with a founder-led management team, loyal customer base, and a long runway of attractive opportunities to help further penetrate the property management market.
We purchased Exponent, a specialty consulting firm with a consistent business model, during the period. The company performs high profile, scientifically technical investigations. These investigations usually involve litigation surrounding complex events such as plane crashes, car recalls, terrorist attacks, and natural disasters. Companies often hire Exponent when they are in a defensive position and the stakes are extremely high. We believe Exponent is a great example of a flywheel business that works at driving predictable growth. Exponent has built its track record over decades. It has successfully leveraged its position in defense work to expand into proactive work, using its diverse teams of scientists to tackle product and regulatory issues. In terms of a repeatable sales process, 85% of revenue comes from existing customers and Exponent’s top consultants (for which there is <5% turnover) have generated a steady flow of new business. Importantly, the company has pricing power facilitated by its competitive position. Exponent has historically compounded free cash flow at a 20% compounded annual growth rate (CAGR)8 and has shown consistency in all economic scenarios.
We decided to sell U.S. Physical Therapy (USPH) toward the end of the period. Since the start of the shutdowns for COVID19, USPH’s business has declined dramatically. The company needs a physical presence for its practices to do well and that has been interrupted. As a reminder, the compounding formula for the company is to grow by starting new practices and acquiring practices where the owner keeps a stake. The company uses its scale and best practices in regard to efficiency to increase margins, mostly by improving utilization metrics, and then uses the cash generated to acquire or pay down debt (used to acquire practices). It is particularly good at improving the returns at the practice level by improving billing, which is not a strong suit for small operators of these practices. So, the company has had a long history of slow but repeatable growth and high returns on capital.
The company has released two updates since the start of the crisis, mentioning that practices are closed in some areas and those that are open are operating well below capacity. The company will operate at a loss for some time while social distancing restrictions are in place. The company last week announced the closure of some practices permanently, which is concerning to us. We do not have clear vision into when the crisis will end, nor does the company. The formula that was important to compound value has been interrupted and with permanent closures, it seems to us that the return to prior results may take a lot longer. We believe that the social distancing restrictions, even if we get some return to normal, will mean lower utilization for a while until confidence returns. In addition, their customers tend to be older and we think that group could be even slower to return to normal.
| 8 | Compound annual growth rate, or CAGR, is the mean annual growth rate of an investment over a specified period of time longer than one year. |
32
POLEN U.S. SMALL COMPANY GROWTH FUND
Annual Investment Adviser’s Report
April 30, 2020
(Unaudited)
We also exited our position in professional IT services company EXL Services, a holding since inception. Over our holding period, EXL Services has generated a steady low double-digit growth rate and solid returns on capital, and it still meets our flywheel conditions. However, mixed results in the past year, what we felt was poor decision-making related to a large acquisition, and recent CFO change have made the business less attractive to us relative to other opportunities, especially considering the favorable relative short-term performance of the company’s shares at the time of sale.
Cantel Medical has been a Fund holding since inception. The company provides infection prevention products and services for the healthcare industry. We felt the company had a strong position, consistent revenue growth, and margin expansion. However, in the last year, the repeatability of the company’s growth, a key component of how we define a great business, has come into question in our view. Across almost all segments, Cantel is facing different challenges including greater-than-expected cyclicality in its dental segment and a lack of strategic direction in its Life Sciences division. Also, we believe Cantel’s endoscopy business faces longer-term risks of increased competition as disposable products enter the endoscopy sterilization business. Compounding challenges also point to another violation of our flywheel — what appears to us to be poor decision making by the management team. While we think the company could overcome some of these challenges, the changes in the competitive landscape are the most concerning to us. Unfortunately, we sold Cantel Medical at a loss, but believe this decision avoids the risk of even larger losses and allows us to redeploy capital towards investments that we believe meet our high standards.
No matter what path the COVID-19 fallout and market take from here, we remain steadfast in our focus on owning only high-quality companies that we believe are well-positioned with the potential to deliver sustainable growth with attractive returns on capital. In our experience, companies with these attributes are generally well-positioned to weather whatever comes their way, and we believe a high-quality, focused strategy that seeks to own only companies like this may be generally well-positioned to weather tough times as well.*
This letter is intended to assist shareholders in understanding how the Fund performed during the fiscal year ended April 30, 2020 and reflects the views of the investment adviser at the time of this writing. Of course, these views may change and do not guarantee the future performance of the Fund or the markets.
Portfolio composition is subject to change. The current and future portfolio holdings of the Fund are subject to investment risk. The investment return and principal value of an investment in the Fund will fluctuate so that an investor’s shares, when redeemed, may be worth more or less than their original cost.
*Past performance does not guarantee future results. There can be no guarantee that any strategy (risk management or otherwise) will be successful. All investing involves risk, including potential loss of principal.
33
POLEN U.S. SMALL COMPANY GROWTH FUND
Annual Report
Performance Data
April 30, 2020
(Unaudited)
Comparison of Change in Value of $100,000 (investment minimum) Investment in
Polen U.S. Small Company Growth Fund Institutional Class Shares
vs Russell 2000® Growth Index
| Average Annual Total Returns for the Periods Ended April 30, 2020 | ||||||||
| 1 Year | Since Inception* | |||||||
Institutional Class | -9.70 | % | 4.80% | |||||
Russell 2000 ® Growth Index | -9.22 | % | 0.94%** | |||||
| * | The Polen U.S. Small Company Growth Fund (the “Fund”) Institutional Class Shares commenced operations on November 1, 2017. |
| ** | Benchmark performance is from commencement date of the Fund Class (November 1, 2017) only and is not the commencement date of the benchmark itself. |
The performance data quoted represents past performance and does not guarantee future results. Current performance may be lower or higher. Performance data current to the most recent month-end may be obtained by calling (888) 678-6024. The investment return and principal value of an investment will fluctuate so that shares, when redeemed, may be worth more or less than their original cost. The graph and table do not reflect the deduction of taxes that a shareholder would pay on Fund distributions or the redemption of Fund shares.
34
POLEN U.S. SMALL COMPANY GROWTH FUND
Annual Report
Performance Data
April 30, 2020
(Unaudited)
Comparison of Change in Value of $10,000 (investment minimum) Investment in
Polen U.S. Small Company Growth Fund Investor Class Shares
vs Russell 2000® Growth Index
| Average Annual Total Returns for the Periods Ended April 30, 2020 | ||||||
| 1 Year | Since Inception* | |||||
Investor Class | -9.87 | % | -2.45% | |||
Russell 2000 ® Growth Index | -9.22 | % | -2.62%** | |||
| * | The Polen U.S. Small Company Growth Fund (the “Fund”) Investor Class Shares commenced operations on February 8, 2019. |
| ** | Benchmark performance is from commencement date of the Fund Class (February 8, 2019) only and is not the commencement date of the benchmark itself. |
The performance data quoted represents past performance and does not guarantee future results. Current performance may be lower or higher. Performance data current to the most recent month-end may be obtained by calling (888) 678-6024. The investment return and principal value of an investment will fluctuate so that shares, when redeemed, may be worth more or less than their original cost. The graph and table do not reflect the deduction of taxes that a shareholder would pay on Fund distributions or the redemption of Fund shares.
The Fund’s “Total Annual Fund Operating Expenses” and “Total Annual Fund Operating Expenses After Fee Waiver and/or Expense Reimbursement,” as stated in the current prospectus dated September 1, 2019 (as amended February 1, 2020), are 3.38% and 1.25%, respectively, for the Institutional Class shares and 3.63% and 1.50%, respectively, for the Investor Class shares of the Fund’s average daily net assets, which may differ from the actual expenses incurred by the Fund for the period covered by this report. Polen Capital Management, LLC (“PCM” or the “Adviser”) has contractually agreed to reduce its investment advisory fee and/or reimburse certain expenses of the Fund to the extent necessary to ensure that the Fund’s total operating expenses (excluding taxes, fees and expenses attributable to a distribution or service plan adopted by the Trust, interest, extraordinary items, “Acquired Fund Fees and Expenses”
35
POLEN U.S. SMALL COMPANY GROWTH FUND
Annual Report
Performance Data
April 30, 2020
(Unaudited)
and brokerage commissions) do not exceed 1.25% (on an annual basis) with respect to the Fund’s average daily net assets (the “Expense Limitation”). The Expense Limitation will remain in place until August 31, 2020 unless the Board of Trustees (“Board of Trustees”) of FundVantage Trust (the “Trust”) approves its earlier termination. The Adviser is entitled to recover, subject to approval by the Board of Trustees, such amounts reduced or reimbursed for a period of up to three (3) years from the date on which the Adviser reduced its compensation and/or assumed expenses for the Fund. The Adviser is permitted to seek reimbursement from the Fund, for fees it waived and Fund expenses it paid to the extent the total annual fund expenses do not exceed the limits described above or any lesser limits in effect at the time of reimbursement. No reimbursement will occur unless the Fund’s expenses are below the Expense Limitation amount. Total returns would be lower had such fees and expenses not been waived and/or reimbursed.
A 2.00% redemption fee applies to shares redeemed within 60 days of purchase. This redemption fee is not reflected in the returns shown above.
The Fund intends to evaluate performance as compared to that of the Russell 2000® Growth Index, which is an unmanaged index measuring the performance of the 2,000 smallest companies in the Russell 3000® Index, which is made up of 3,000 of the biggest U.S. stocks. It is impossible to invest directly in an index.
All mutual fund investing involves risk, including possible loss of principal. The Fund is non-diversified, which means that a large portion of the Fund’s assets may be invested in one or few companies or sectors. The Fund could fluctuate in value more than a diversified fund. The Fund invests in securities of small-capitalization companies, which may be subject to more abrupt or erratic market movements than securities of larger, more established companies. Small-capitalization companies may have limited product lines or financial resources, or may be dependent upon a small or inexperienced management group. Securities of small-capitalization companies may trade less frequently and in lower volumes than the securities of larger companies, which could lead to higher transaction costs. The Fund is a recently formed mutual fund and has a limited history of operations.
36
POLEN INTERNATIONAL SMALL COMPANY GROWTH FUND
Annual Investment Adviser’s Report
April 30, 2020
(Unaudited)
Performance Summary:
| • | International markets exhibited broad-based strength in 2019, but the impact of the COVID-19 pandemic and subsequent toll on the global economy led to a significant decline by the end of the first calendar quarter 2020. |
| • | For the fiscal year ended April 30, 2020, the Polen International Small Company Growth Fund’s (the “Fund”) Institutional share class returned 1.48% net of fees versus the MSCI ACWI ex-USA Small Cap Index which returned -13.51%. |
| • | Since inception December 31, 2018 to April 30, 2020 the Fund’s Institutional share class has had an annual average total return of 15.47% net of fees versus -1.73% for the MSCI ACWI ex-USA Small Cap Index. |
The performance data quoted represents past performance and is not a guarantee of future results. Investment return and principal value of an investment will fluctuate so that an investor’s shares, when redeemed, may be worth more or less than their original cost. Current performance may be lower or higher than the performance information quoted. To obtain performance information current to the most recent month-end, please call 1-888-678-6024.
Performance Review:
For the fiscal year ended April 30, 2020, the Fund’s Institutional share class returned 1.48% net of fees versus the MSCI ACWI ex-USA Small Cap Index which returned -13.51%. Kinaxis, Globant, and Tecan Group were the top contributors to absolute returns.
Globant provides information technology services to companies undergoing a digital transformation. The company has achieved success gaining incremental customers and revenue per customer over time, leading to material growth in earnings. As more people may rely on digital content and connectivity, businesses will need to design effective digital experiences to continue to attract, engage, and retain customers. Globant enables blue-chip clients like Google, Disney, LinkedIn, Gap, and American Express to modernize their operations and transform their organizations so they can, in turn, address their end customers’ needs.
Kinaxis provides software to help large organizations manage their supply chain and logistics needs. The Ontario-based company continues to see strong demand for its subscription-based services, consistently gaining new customers while retaining existing customers. The business also continues to expand its capabilities through strategic investments in core markets. We expect growth will likely continue as enterprises undergo a transformation in their supply chain management needs and continually seek to minimize disruptions and create efficiencies.
Tecan Group is a Swiss-based healthcare technology company and a leader in precision instruments and products used in scientific research and clinical diagnostics. Tecan’s products are vital to the rapidly
37
POLEN INTERNATIONAL SMALL COMPANY GROWTH FUND
Annual Investment Adviser’s Report
April 30, 2020
(Unaudited)
growing and cutting-edge areas of genetic research and drug applications used to detect and treat cancer and other diseases. We continue to believe that the company’s competitive strengths are growing as it remains competitively positioned in an attractive industry. We expect Tecan should generate strong revenue growth driven by increased breadth and depth of demand for its products and continued margin improvements. Furthermore, we believe, given the current environment, we could see increased demand for Tecan’s research and diagnostic capabilities.
Conversely, Computershare, CAE Inc., and Despegar.com Corp detracted from performance during the period.
Computershare is a global financial technology solutions and services provider based in Australia. It has a diverse portfolio of offerings ranging from IPO and registry services, voting administration services, loan applications, claims processing, and employee equity plan administration. Over the last few years, Computershare has earned more margin income from higher interest rates. This highly profitable margin income was negatively impacted by the rapid cut in interest rates globally with the onset of the global pandemic.
The loss in earnings is, unfortunately, one of many consequences of the global pandemic. Beyond the loss in earnings, we have done a thorough analysis of Computershare’s financial position and believe that it may weather the storm without significant impairment to its core businesses, which in our view could emerge stronger. While the margin income impact is material, over 80% of Computershare’s revenue is recurring and we think is likely to hold up well.
CAE Inc. is a Canadian company that designs, manufactures, and services simulation-based training systems for aviation, military, and healthcare applications. CAE is the leader in civil aviation training, and, until recently, was poised to benefit from growth in training stemming from the Boeing 737 MAX failures. With the shock to global air travel and airlines now seeking government bailouts, near-term demand is at risk. Civil aviation, which represents a material portion of company profits, will experience difficulties. We think the defense and healthcare businesses remain strong.
In response to the crisis environment, CAE is, in our view, prudently cutting costs. These measures are aimed to shore up the company to weather this period of uncertainty and lower demand for its core offering. We believe CAE is uniquely positioned because there is a real need for CAE’s simulation technology long-term, and that the company is taking appropriate actions to ensure the company’s future.
Despegar.com is the leading online travel agency in South America. The company’s stock was punished amid concerns about the impact of travel restrictions resulting from the COVID-19 pandemic. We sold our position based on risk management because we were uncomfortable with the uncertainty surrounding the business in the current environment and foreseeable future.
38
POLEN INTERNATIONAL SMALL COMPANY GROWTH FUND
Annual Investment Adviser’s Report
April 30, 2020
(Unaudited)
Portfolio Activity:
During the period, we initiated positions in Netcompany, Technology One, and Bolsa Mexicana de Valores. We sold Nakanishi Inc, Nice Ltd, and Halma PLC.
Technology One Ltd. is a leading supplier of enterprise software solutions headquartered in Australia. Technology One’s solutions help customers reduce costs and be efficient in their core business functions such as supply chain management, financial services, HR and payroll. Technology One has achieved impressive levels of customer satisfaction and customer loyalty throughout its history, with ~99% customer retention rates over the last 30 years. Despite being the largest supplier of enterprise software solutions in Australia, our research indicates to us that the company has a long runway of growth ahead of it driven by customer acquisition, the transition to a software-as-a-service platform, price, and cross-sell opportunities.
We purchased Netcompany in the period. Netcompany serves corporations, governments, and municipalities in Northern Europe, and helps its clients become more digitally efficient, productive, and cost-effective. Netcompany has leveraged its unique go-to-market, attractive delivery track record, and strong talent pool to continue to win projects. We expect Netcompany to benefit from numerous secular tailwinds including governments and companies shifting their IT spend towards services that help with digitalization and business process re-engineering. As a business that enables governments to continuously serve and reach their citizens, we expect demand for Netcompany’s capabilities will become even more mission-critical today and years into the future.
Bolsa Mexicana de Valores is best known for operating the Mexican Stock Exchange, but it derives much of its value from data and post-trading services. It operates as a monopoly for clearing, custodial services, and depository services for the entire Mexican market across multiple asset classes. We believe BMV has significant potential to compound economic profits through revenue growth as the Mexican capital markets mature and through margin expansion at increasing returns on capital. Its cash and capital requirements for growth are very low, which has allowed it to return significant cash through dividends.
Nakanishi is a Japanese headquartered company that specializes in dental products such as drills and high precision tools. We sold the company because we became concerned that the company’s distribution efforts in America could be problematic. Nakanishi makes great products and has enviable market share in their home market, but much of their future growth depended on penetrating the market in the U.S. successfully. Our research led us to conclude that growth would be difficult for a variety of reasons and that the growth would come at much lower margin.
Nice Ltd., which we purchased at inception, was sold because we believe the expected return is now less compelling. Nice Ltd. is a company that provides enterprise software in two growing fields: 1) financial fraud detection and 2) customer engagement tools. The company appreciated roughly 45% in 2019 to become a nearly $10 billion market capitalization company. Per our investment philosophy, we consider this sale as driven by identification of what we believe is a preferable alternative.
39
POLEN INTERNATIONAL SMALL COMPANY GROWTH FUND
Annual Investment Adviser’s Report
April 30, 2020
(Unaudited)
Halma PLC makes products to protect people such as devices that can detect hazardous gas, corrosion monitoring products, infrastructure safety which includes elevator safety and security solutions, medical products that assist with eye surgery and sensor technologies, and sensors within environmental use cases. We sold our position in the company in the period due to two primary factors — the market capitalization of the company was nearly $10 billion after its performance and we believed, based on its valuation, that it would be advantageous to deploy that capital to what we felt were more promising investments. This aligns to one of our sell disciplines: identification of a more attractive alternative.
Our focus every day is to endeavor to find high-quality companies. For us, nothing less will do. We believe the Fund’s companies can deliver mid-teens compounding in nearly any environment and, more important than ever, survive difficult periods. In good times, our commitment to investing in companies with strong balance sheets and abundant cash flow can seem conservative to some; but during times like these, we hope investors appreciate that this approach seeks to deliver on our mission statement. Our mission is to preserve and grow client assets in aiming to reach their financial goals. We believe we can only deliver on that mission if we can preserve capital in times like these.
This letter is intended to assist shareholders in understanding how the Fund performed during the fiscal year ended April 30, 2020 and reflects the views of the investment adviser at the time of this writing. Of course, these views may change and do not guarantee the future performance of the Fund or the markets.
Portfolio composition is subject to change. The current and future portfolio holdings of the Fund are subject to investment risk. The investment return and principal value of an investment in the Fund will fluctuate so that an investor’s shares, when redeemed, may be worth more or less than their original cost.
40
POLEN INTERNATIONAL SMALL COMPANY GROWTH FUND
Annual Report
Performance Data
April 30, 2020
(Unaudited)
Comparison of Change in Value of $100,000 (investment minimum) Investment in
Polen International Small Company Growth Fund Institutional Class Shares
vs MSCI All Country World® Index (“ACWI”) (ex-USA Small Cap)
| Average Annual Total Returns for the Periods Ended April 30, 2020 | ||||||||||
1 Year | Since Inception* | |||||||||
Institutional Class | 1.48 | % | 15.47% | |||||||
MSCI All Country World ® Index (“ACWI”) (ex-USA Small Cap) (Net Dividend) | -13.51 | % | -1.91%** | |||||||
| * | The Polen International Small Company Growth Fund (the “Fund”) Institutional Class Shares commenced operations on December 31, 2018. |
| ** | Benchmark performance is from commencement date of the Fund Class (December 31, 2018) only and is not the commencement date of the benchmark itself. |
The performance data quoted represents past performance and does not guarantee future results. Current performance may be lower or higher. Performance data current to the most recent month-end may be obtained by calling (888) 678-6024. The investment return and principal value of an investment will fluctuate so that shares, when redeemed, may be worth more or less than their original cost. The graph and table do not reflect the deduction of taxes that a shareholder would pay on Fund distributions or the redemption of Fund shares.
41
POLEN INTERNATIONAL SMALL COMPANY GROWTH FUND
Annual Report
Performance Data
April 30, 2020
(Unaudited)
Comparison of Change in Value of $10,000 Investment in
Polen International Small Company Growth Fund Investor Class Shares
vs MSCI All Country World® Index (“ACWI”) (ex-USA Small Cap)
| Average Annual Total Returns for the Periods Ended April 30, 2020 | ||||||||||
1 Year | Since Inception* | |||||||||
Investor Class | 1.23 | % | 9.39% | |||||||
MSCI All Country World ® Index (“ACWI”) (ex-USA Small Cap) (Net Dividend) | -13.51 | % | -8.16%** | |||||||
| * | The Polen International Small Company Growth Fund (the “Fund”) Investor Class Shares commenced operations on February 8, 2019. |
| ** | Benchmark performance is from commencement date of the Fund Class (February 8, 2019) only and is not the commencement date of the benchmark itself. |
The performance data quoted represents past performance and does not guarantee future results. Current performance may be lower or higher. Performance data current to the most recent month-end may be obtained by calling (888) 678-6024. The investment return and principal value of an investment will fluctuate so that shares, when redeemed, may be worth more or less than their original cost. The graph and table do not reflect the deduction of taxes that a shareholder would pay on Fund distributions or the redemption of Fund shares.
The Fund’s “Total Annual Fund Operating Expenses” and “Total Annual Fund Operating Expenses After Fee Waiver and/or Expense Reimbursement,” as stated in the current prospectus dated September 1, 2019 (as amended February 1, 2020), are 7.51% and 1.25%, respectively, for the Institutional Class shares and 7.76% and 1.50%, respectively, for the Investor Class shares of the Fund’s average daily net assets, which may differ from the actual expenses incurred by the Fund for the period covered by this report. Polen Capital Management, LLC (“PCM” or the “Adviser”) has contractually agreed to reduce its investment advisory fee and/or reimburse certain expenses of the Fund to
42
POLEN INTERNATIONAL SMALL COMPANY GROWTH FUND
Annual Report
Performance Data
April 30, 2020
(Unaudited)
the extent necessary to ensure that the Fund’s total operating expenses (excluding taxes, fees and expenses attributable to a distribution or service plan adopted by the Trust, interest, extraordinary items, “Acquired Fund Fees and Expenses” and brokerage commissions) do not exceed 1.25% (on an annual basis) with respect to the Fund’s average daily net assets (the “Expense Limitation”). The Expense Limitation will remain in place until August 31, 2020 unless the Board of Trustees (“Board of Trustees”) of FundVantage Trust (the “Trust”) approves its earlier termination. The Adviser is entitled to recover, subject to approval by the Board of Trustees, such amounts reduced or reimbursed for a period of up to three (3) years from the date on which the Adviser reduced its compensation and/or assumed expenses for the Fund. The Adviser is permitted to seek reimbursement from the Fund, for fees it waived and Fund expenses it paid to the extent the total annual fund expenses do not exceed the limits described above or any lesser limits in effect at the time of reimbursement. No recoupment will occur unless the Fund’s expenses are below the Expense Limitation amount. Total returns would be lower had such fees and expenses not been waived and/or reimbursed.
A 2.00% redemption fee applies to shares redeemed within 60 days of purchase. This redemption fee is not reflected in the returns shown above.
The Fund intends to evaluate performance as compared to that of the MSCI ACWI Index (ex-USA Small Cap) (Net Dividend), which captures small cap representation across 22 of 23 Developed Markets (DM) countries (excluding the US) and 26 Emerging Markets (EM) countries. With 4,170 constituents, the index covers approximately 14% of the global equity opportunity set outside the US. Indexes are unmanaged and it is not possible to invest directly in an index.
All mutual fund investing involves risk, including possible loss of principal. The Fund is non-diversified, which means that a large portion of the Fund’s assets may be invested in one or few companies or sectors. The Fund could fluctuate in value more than a diversified fund. Investing in foreign securities entails special risks, such as fluctuations in currency exchange rates and possible lax regulation of securities markets and accounting practices.
The Fund may invest a substantial amount of its assets in issuers located in a limited number of countries. If the Fund concentrates its investments in this manner, it assumes the risk that economic, political and social conditions in those countries will have a significant impact on its investment performance. The Fund’s investment performance may also be more volatile if it concentrates its investments in certain countries, especially emerging market countries.
43
POLEN GROWTH FUNDS
Funds Expense Disclosure
April 30, 2020
(Unaudited)
As a shareholder of the Fund(s), you incur two types of costs: (1) transaction costs, including redemption fees; and (2) ongoing costs, including management fees, distribution and/or service (Rule 12b-1) fees (if any) and other Fund expenses. These examples are intended to help you understand your ongoing costs (in dollars) of investing in the Fund(s) and to compare these costs with the ongoing costs of investing in other mutual funds.
These examples are based on an investment of $1,000 invested at the beginning of the six-month period from November 1, 2019 through April 30, 2020 and held for the entire period.
Actual Expenses
The first line of each accompanying table provides information about actual account values and actual expenses. You may use the information in this line, together with the amount you invested, to estimate the expenses that you paid over the period. Simply divide your account value by $1,000 (for example, an $8,600 account value divided by $1,000 = 8.6), then multiply the result by the number in the first line under the heading entitled “Expenses Paid During Period” to estimate the expenses you paid on your account during this period.
Hypothetical Examples for Comparison Purposes
The second line of each accompanying table provides information about hypothetical account values and hypothetical expenses based on a Fund’s actual expense ratio and an assumed rate of return of 5% per year before expenses, which is not your Fund’s actual return. The hypothetical account values and expenses may not be used to estimate the actual ending account balance or expenses you paid for the period. You may use this information to compare the ongoing costs of investing in the Fund(s) and other funds. To do so, compare these 5% hypothetical examples with the 5% hypothetical examples that appear in the shareholder reports of other funds.
Please note that the expenses shown in the accompanying table are meant to highlight your ongoing costs only and do not reflect any transactional costs, such as redemption fees. Therefore, each hypothetical line of the accompanying table is useful in comparing ongoing costs only and will not help you determine the relative total costs of owning different funds. In addition, if these transactional costs were included, your costs would have been higher.
44
POLEN GROWTH FUNDS
Funds Expense Disclosure
April 30, 2020
(Unaudited)
| Polen Growth Fund | |||||||||||||||
| Beginning Account Value November 1, 2019 | Ending Account Value April 30, 2020 | Expenses Paid During Period | |||||||||||||
Institutional Class* | |||||||||||||||
Actual | $ | 1,000.00 | $ | 1,059.50 | $ | 5.12 | |||||||||
Hypothetical (5% return before expenses) | 1,000.00 | 1,019.89 | 5.02 | ||||||||||||
Investor Class* | |||||||||||||||
Actual | $ | 1,000.00 | $ | 1,058.30 | $ | 6.40 | |||||||||
Hypothetical (5% return before expenses) | 1,000.00 | 1,018.65 | 6.27 | ||||||||||||
| Polen Global Growth Fund | |||||||||||||||
| Beginning Account Value November 1, 2019 | Ending Account Value April 30, 2020 | Expenses Paid During Period | |||||||||||||
Institutional Class** | |||||||||||||||
Actual | $ | 1,000.00 | $ | 1,024.30 | $ | 5.54 | |||||||||
Hypothetical (5% return before expenses) | 1,000.00 | 1,019.39 | 5.52 | ||||||||||||
Investor Class** | |||||||||||||||
Actual | $ | 1,000.00 | $ | 1,023.50 | $ | 6.79 | |||||||||
Hypothetical (5% return before expenses) | 1,000.00 | 1,018.15 | 6.77 | ||||||||||||
| Polen International Growth Fund | |||||||||||||||
| Beginning Account Value November 1, 2019 | Ending Account Value April 30, 2020 | Expenses Paid During Period | |||||||||||||
Institutional Class*** | |||||||||||||||
Actual | $ | 1,000.00 | $ | 950.30 | $ | 5.33 | |||||||||
Hypothetical (5% return before expenses) | 1,000.00 | 1,019.39 | 5.52 | ||||||||||||
Investor Class*** | |||||||||||||||
Actual | $ | 1,000.00 | $ | 949.90 | $ | 6.54 | |||||||||
Hypothetical (5% return before expenses) | 1,000.00 | 1,018.15 | 6.77 | ||||||||||||
45
POLEN GROWTH FUNDS
Funds Expense Disclosure
April 30, 2020
(Unaudited)
| Polen U.S. Small Company Growth Fund | |||||||||||||||
| Beginning Account Value November 1, 2019 | Ending Account Value April 30, 2020 | Expenses Paid During Period | |||||||||||||
Institutional Class**** | |||||||||||||||
Actual | $ | 1,000.00 | $ | 940.90 | $ | 6.03 | |||||||||
Hypothetical (5% return before expenses) | 1,000.00 | 1,018.65 | 6.27 | ||||||||||||
Investor Class**** | |||||||||||||||
Actual | $ | 1,000.00 | $ | 939.90 | $ | 7.23 | |||||||||
Hypothetical (5% return before expenses) | 1,000.00 | 1,017.40 | 7.52 | ||||||||||||
| Polen International Small Company Growth Fund | |||||||||||||||
| Beginning Account Value November 1, 2019 | Ending Account Value April 30, 2020 | Expenses Paid During Period | |||||||||||||
Institutional Class***** | |||||||||||||||
Actual | $ | 1,000.00 | $ | 958.50 | $ | 6.09 | |||||||||
Hypothetical (5% return before expenses) | 1,000.00 | 1,018.65 | 6.27 | ||||||||||||
Investor Class***** | |||||||||||||||
Actual | $ | 1,000.00 | $ | 957.60 | $ | 7.30 | |||||||||
Hypothetical (5% return before expenses) | 1,000.00 | 1,017.40 | 7.52 | ||||||||||||
| * | Expenses are equal to an annualized expense ratio for the six-month period ended April 30, 2020 of 1.00% for Institutional Class and 1.25% for Investor Class, multiplied by the average account value over the period, multiplied by the number of days in the most recent period (182), then divided by 366 to reflect the period. The Fund’s ending account values on the first line of each table are based on the actual six-month total returns for the Fund of 5.95% and 5.83% for Institutional Class and Investor Class, respectively. |
| ** | Expenses are equal to an annualized expense ratio for the six-month period ended April 30, 2020 of 1.10% for Institutional Class and 1.35% for Investor Class, multiplied by the average account value over the period, multiplied by the number of days in the most recent period (182), then divided by 366 to reflect the period. The Fund’s ending account values on the first line of each table are based on the actual six-month total returns for the Fund of 2.43% and 2.35% for Institutional Class and Investor Class, respectively. |
| *** | Expenses are equal to an annualized expense ratio for the six-month period ended April 30, 2020 of 1.10% for Institutional Class and 1.35% for Investor Class, multiplied by the average account value over the period, multiplied by the number of days in the most recent period (182), then divided by 366 to reflect the period. The Fund’s ending account values on the first line of each table are based on the actual six-month total returns for the Fund of (4.97)% and (5.01)% for Institutional Class and Investor Class, respectively. |
| **** | Expenses are equal to an annualized expense ratio for the six-month period ended April 30, 2020 of 1.25% for Institutional Class and 1.50% for Investor Class, multiplied by the average account value over the period, multiplied by the number of days in the most recent period (182), then divided by 366 to reflect the period. The |
46
POLEN GROWTH FUNDS
Funds Expense Disclosure (Concluded)
April 30, 2020
(Unaudited)
Fund’s ending account values on the first line of each table are based on the actual six-month total returns for the Fund of (5.91)% and (6.01)% for Institutional Class and Investor Class, respectively.. |
| ***** | Expenses are equal to an annualized expense ratio for the six-month period ended April 30, 2020 of 1.25% for Institutional Class and 1.50% for the Investor Class, multiplied by the average account value over the period, multiplied by the number of days in the most recent period (182), then divided by 366 to reflect the period. The Fund’s ending account values on the first line of each table are based on the actual six-month total returns for the Fund of (4.15)% and (4.24)% for Institutional Class and Investor Class, respectively. |
47
POLEN GROWTH FUND
Portfolio Holdings Summary Table
April 30, 2020
(Unaudited)
The following table presents a summary by industry of the portfolio holdings of the Fund:
| % of Net Assets | Value | |||||||
COMMON STOCKS: | ||||||||
Internet Content & Information | 17.4 | % | $ | 1,073,725,976 | ||||
Software Infrastructure | 17.3 | 1,068,499,480 | ||||||
Credit Services | 13.6 | 841,251,317 | ||||||
Software Application | 10.6 | 650,498,727 | ||||||
Medical Devices | 8.2 | 505,386,764 | ||||||
Information Technology Services | 6.7 | 414,057,236 | ||||||
Drug Manufacturers - Specialty & Generic | 4.7 | 288,785,437 | ||||||
Biotechnology | 3.4 | 212,244,642 | ||||||
Discount Stores | 3.3 | 206,121,421 | ||||||
Staffing & Employment Services | 2.8 | 171,146,010 | ||||||
Footwear & Accessories | 2.7 | 167,583,150 | ||||||
Financial Data & Stock Exchanges | 2.7 | 166,186,305 | ||||||
Restaurants | 2.2 | 132,364,007 | ||||||
Other Assets In Excess of Liabilities | 4.4 | 269,110,575 | ||||||
|
|
|
| |||||
NET ASSETS | 100.0 | % | $ | 6,166,961,047 | ||||
|
|
|
| |||||
Portfolio holdings are subject to change at any time.
The accompanying notes are an integral part of the financial statements.
48
POLEN GROWTH FUND
Portfolio of Investments
April 30, 2020
| Number of Shares | Value | |||||||
COMMON STOCKS — 95.6% |
| |||||||
Biotechnology — 3.4% | ||||||||
Regeneron Pharmaceuticals, Inc.* | 403,599 | $ | 212,244,642 | |||||
|
| |||||||
Credit Services — 13.6% | ||||||||
Mastercard, Inc., Class A | 1,046,839 | 287,849,320 | ||||||
PayPal Holdings, Inc.* | 1,820,683 | 223,944,009 | ||||||
Visa, Inc., Class A | 1,843,431 | 329,457,988 | ||||||
|
| |||||||
| 841,251,317 | ||||||||
|
| |||||||
Discount Stores — 3.3% | ||||||||
Dollar General Corp. | 1,175,821 | 206,121,421 | ||||||
|
| |||||||
Drug Manufacturers - Specialty & Generic — 4.7% |
| |||||||
Zoetis, Inc. | 2,233,280 | 288,785,437 | ||||||
|
| |||||||
Financial Data & Stock Exchanges — 2.7% |
| |||||||
MSCI, Inc. | 508,215 | 166,186,305 | ||||||
|
| |||||||
Footwear & Accessories — 2.7% |
| |||||||
NIKE, Inc., Class B | 1,922,266 | 167,583,150 | ||||||
|
| |||||||
Information Technology Services — 6.7% |
| |||||||
Accenture PLC, Class A | 1,433,767 | 265,519,311 | ||||||
Gartner, Inc.* | 1,250,214 | 148,537,925 | ||||||
|
| |||||||
| 414,057,236 | ||||||||
|
| |||||||
Internet Content & Information — 17.4% |
| |||||||
Alphabet, Inc., Class A* | 101,687 | 136,941,883 | ||||||
Alphabet, Inc., Class C* | 323,141 | 435,807,341 | ||||||
Facebook, Inc., Class A* | 2,447,251 | 500,976,752 | ||||||
|
| |||||||
| 1,073,725,976 | ||||||||
|
| |||||||
Medical Devices — 8.2% | ||||||||
Abbott Laboratories | 3,997,860 | 368,162,928 | ||||||
Align Technology, Inc.* | 638,696 | 137,223,836 | ||||||
|
| |||||||
| 505,386,764 | ||||||||
|
| |||||||
| Number of Shares | Value | |||||||
COMMON STOCKS — (Continued) |
| |||||||
Restaurants — 2.2% | ||||||||
Starbucks Corp. | 1,725,062 | $ | 132,364,007 | |||||
|
| |||||||
Software Application — 10.6% |
| |||||||
Autodesk, Inc.* | 842,062 | 157,575,062 | ||||||
salesforce.com, Inc.* | 1,439,833 | 233,180,954 | ||||||
ServiceNow, Inc.* | 738,871 | 259,742,711 | ||||||
|
| |||||||
| 650,498,727 | ||||||||
|
| |||||||
Software Infrastructure — 17.3% |
| |||||||
Adobe, Inc.* | 1,151,556 | 407,236,264 | ||||||
Microsoft Corp. | 3,689,879 | 661,263,216 | ||||||
|
| |||||||
| 1,068,499,480 | ||||||||
|
| |||||||
Staffing & Employment Services — 2.8% |
| |||||||
Automatic Data Processing, Inc. | 1,166,719 | 171,146,010 | ||||||
|
| |||||||
TOTAL COMMON STOCKS |
| 5,897,850,472 | ||||||
|
| |||||||
TOTAL INVESTMENTS - 95.6% |
| 5,897,850,472 | ||||||
OTHER ASSETS IN EXCESS OF LIABILITIES - 4.4% | 269,110,575 | |||||||
|
| |||||||
NET ASSETS - 100.0% | $ | 6,166,961,047 | ||||||
|
| |||||||
| * | Non-income producing. |
PLC | Public Limited Corporation |
The accompanying notes are an integral part of the financial statements.
49
POLEN GLOBAL GROWTH FUND
Portfolio Holdings Summary Table
April 30, 2020
(Unaudited)
The following table presents a summary by industry of the portfolio holdings of the Fund:
| % of Net Assets | Value | |||||||
COMMON STOCKS: | ||||||||
Software | 20.7 | % | $ | 56,540,561 | ||||
Information Technology Services | 16.2 | 44,150,899 | ||||||
Interactive Media & Services | 15.0 | 40,874,317 | ||||||
Health Care Equipment & Supplies | 10.1 | 27,502,616 | ||||||
Textiles, Apparel & Luxury Goods | 8.4 | 23,016,855 | ||||||
Internet & Direct Marketing Retail | 5.2 | 14,256,213 | ||||||
Food Products | 3.8 | 10,417,417 | ||||||
Biotechnology | 2.8 | 7,715,345 | ||||||
Pharmaceuticals | 2.8 | 7,713,471 | ||||||
Hotels, Restaurants & Leisure | 2.1 | 5,717,229 | ||||||
Specialty Retail | 1.9 | 5,047,765 | ||||||
Other Assets In Excess of Liabilities | 11.0 | 29,972,784 | ||||||
|
|
|
| |||||
NET ASSETS | 100.0 | % | $ | 272,925,472 | ||||
|
|
|
| |||||
Portfolio holdings are subject to change at any time.
The accompanying notes are an integral part of the financial statements.
50
POLEN GLOBAL GROWTH FUND
Portfolio of Investments
April 30, 2020
| Number of Shares | Value | |||||||
COMMON STOCKS — 89.0% |
| |||||||
Australia — 2.8% | ||||||||
CSL, Ltd. | 38,707 | $ | 7,715,345 | |||||
|
| |||||||
China — 9.9% | ||||||||
Alibaba Group Holding, Ltd., SP ADR* | 70,342 | 14,256,213 | ||||||
Tencent Holdings, Ltd. | 242,320 | 12,738,626 | ||||||
|
| |||||||
| 26,994,839 | ||||||||
|
| |||||||
Denmark — 2.4% | ||||||||
Coloplast A/S, Class B | 41,975 | 6,620,462 | ||||||
|
| |||||||
France — 2.7% | ||||||||
EssilorLuxottica SA | 20,037 | 2,489,096 | ||||||
LVMH Moet Hennessy Louis Vuitton SE | 12,604 | 4,872,637 | ||||||
|
| |||||||
| 7,361,733 | ||||||||
|
| |||||||
Germany — 9.0% | ||||||||
adidas AG | 35,896 | 8,217,796 | ||||||
SAP SE | 84,306 | 10,041,500 | ||||||
Siemens Healthineers AG | 142,150 | 6,258,019 | ||||||
|
| |||||||
| 24,517,315 | ||||||||
|
| |||||||
Ireland — 3.4% | ||||||||
Accenture PLC, Class A | 50,316 | 9,318,020 | ||||||
|
| |||||||
Spain — 1.9% | ||||||||
Industria De Diseno Textil SA | 197,082 | 5,047,765 | ||||||
|
| |||||||
Switzerland — 3.8% | ||||||||
Nestle SA, Registered Shares | 98,361 | 10,417,417 | ||||||
|
| |||||||
United States — 53.1% | ||||||||
Abbott Laboratories | 107,604 | 9,909,252 | ||||||
Adobe, Inc.* | 40,976 | 14,490,753 | ||||||
| Number of Shares | Value | |||||||
COMMON STOCKS — (Continued) |
| |||||||
United States — (Continued) |
| |||||||
Align Technology, Inc.* | 21,945 | $ | 4,714,883 | |||||
Alphabet, Inc., Class C* | 11,602 | 15,647,153 | ||||||
Autodesk, Inc.* | 30,731 | 5,750,692 | ||||||
Automatic Data Processing, Inc. | 51,217 | 7,513,022 | ||||||
Facebook, Inc., Class A* | 61,006 | 12,488,538 | ||||||
Mastercard, Inc., Class A | 51,217 | 14,083,139 | ||||||
Microsoft Corp. | 122,565 | 21,964,874 | ||||||
NIKE, Inc., Class B | 85,310 | 7,437,326 | ||||||
Oracle Corp. | 81,041 | 4,292,742 | ||||||
Starbucks Corp. | 74,511 | 5,717,229 | ||||||
Visa, Inc., Class A | 74,064 | 13,236,718 | ||||||
Zoetis, Inc. | 59,651 | 7,713,471 | ||||||
|
| |||||||
| 144,959,792 | ||||||||
|
| |||||||
TOTAL COMMON STOCKS |
| 242,952,688 | ||||||
|
| |||||||
TOTAL INVESTMENTS - 89.0% |
| 242,952,688 | ||||||
OTHER ASSETS IN EXCESS OF LIABILITIES - 11.0% | 29,972,784 | |||||||
|
| |||||||
NET ASSETS - 100.0% | $ | 272,925,472 | ||||||
|
| |||||||
| * | Non-income producing. |
| PLC | Public Limited Corporation | |||
| SP ADR | Sponsored American Depository Receipt | |||
The accompanying notes are an integral part of the financial statements.
51
POLEN INTERNATIONAL GROWTH FUND
Portfolio Holdings Summary Table
April 30, 2020
(Unaudited)
The following table presents a summary by industry of the portfolio holdings of the Fund:
| % of Net Assets | Value | |||||||
COMMON STOCKS: | ||||||||
Software | 14.5 | % | $ | 28,783,977 | ||||
Health Care Equipment & Supplies | 12.4 | 24,556,310 | ||||||
Professional Services | 8.4 | 16,680,690 | ||||||
Information Technology Services | 7.9 | 15,701,555 | ||||||
Internet & Direct Marketing Retail | 7.6 | 15,026,967 | ||||||
Life Sciences Tools & Services | 7.0 | 13,852,091 | ||||||
Interactive Media & Services | 6.7 | 13,386,807 | ||||||
Textiles, Apparel & Luxury Goods | 6.4 | 12,791,889 | ||||||
Biotechnology | 5.5 | 10,977,330 | ||||||
Diversified Consumer Services | 4.8 | 9,465,351 | ||||||
Personal Products | 3.4 | 6,707,954 | ||||||
Trading Companies & Distributors | 3.1 | 6,057,507 | ||||||
Food Products | 2.9 | 5,776,757 | ||||||
Specialty Retail | 2.8 | 5,574,998 | ||||||
Food & Staples Retailing | 1.8 | 3,571,229 | ||||||
Other Assets In Excess of Liabilities | 4.8 | 9,599,896 | ||||||
|
|
|
| |||||
NET ASSETS | 100.0 | % | $ | 198,511,308 | ||||
|
|
|
| |||||
Portfolio holdings are subject to change at any time.
The accompanying notes are an integral part of the financial statements.
52
POLEN INTERNATIONAL GROWTH FUND
Portfolio of Investments
April 30, 2020
| Number of Shares | Value | |||||||
COMMON STOCKS — 95.2% |
| |||||||
Australia — 5.5% | ||||||||
CSL, Ltd. | 55,072 | $ | 10,977,330 | |||||
|
| |||||||
China — 19.1% | ||||||||
Alibaba Group Holding, Ltd., SP ADR* | 74,145 | 15,026,967 | ||||||
New Oriental Education & Technology Group, Inc., SP ADR* | 74,145 | 9,465,351 | ||||||
Tencent Holdings, Ltd. | 254,650 | 13,386,807 | ||||||
|
| |||||||
| 37,879,125 | ||||||||
|
| |||||||
Denmark — 2.6% | ||||||||
Coloplast A/S, Class B | 32,832 | 5,178,392 | ||||||
|
| |||||||
France — 5.5% | ||||||||
Dassault Systemes SE | 40,243 | 5,894,435 | ||||||
LVMH Moet Hennessy Louis Vuitton SE | 12,707 | 4,912,456 | ||||||
|
| |||||||
| 10,806,891 | ||||||||
|
| |||||||
Germany — 13.9% | ||||||||
adidas AG | 34,418 | 7,879,433 | ||||||
SAP SE | 94,267 | 11,227,932 | ||||||
Siemens Healthineers AG | 191,182 | 8,416,607 | ||||||
|
| |||||||
| 27,523,972 | ||||||||
|
| |||||||
Ireland — 22.6% | ||||||||
Accenture PLC, Class A | 56,668 | 10,494,347 | ||||||
Experian PLC | 316,689 | 9,510,238 | ||||||
ICON PLC* | 86,322 | 13,852,091 | ||||||
Medtronic PLC | 112,274 | 10,961,311 | ||||||
|
| |||||||
| 44,817,987 | ||||||||
|
| |||||||
Israel — 2.5% | ||||||||
Check Point Software Technologies, Ltd.* | 47,128 | 4,983,315 | ||||||
|
| |||||||
| Number of Shares | Value | |||||||
COMMON STOCKS — (Continued) |
| |||||||
Mexico — 1.8% | ||||||||
Wal-Mart de Mexico SAB de CV | 1,479,632 | $ | 3,571,229 | |||||
|
| |||||||
Spain — 5.4% | ||||||||
Amadeus IT Group SA | 109,091 | 5,207,208 | ||||||
Industria De Diseno Textil SA | 217,667 | 5,574,998 | ||||||
|
| |||||||
| 10,782,206 | ||||||||
|
| |||||||
Switzerland — 2.9% | ||||||||
Nestle SA, Registered Shares | 54,544 | 5,776,757 | ||||||
|
| |||||||
United Kingdom — 13.4% | ||||||||
Bunzl PLC | 279,088 | 6,057,507 | ||||||
RELX PLC | 315,098 | 7,170,452 | ||||||
Sage Group PLC (The) | 830,380 | 6,678,295 | ||||||
Unilever PLC | 130,272 | 6,707,954 | ||||||
|
| |||||||
| 26,614,208 | ||||||||
|
| |||||||
TOTAL COMMON STOCKS |
| 188,911,412 | ||||||
|
| |||||||
TOTAL INVESTMENTS - 95.2% |
| 188,911,412 | ||||||
OTHER ASSETS IN EXCESS OF | ||||||||
LIABILITIES - 4.8% | 9,599,896 | |||||||
|
| |||||||
NET ASSETS - 100.0% | $ | 198,511,308 | ||||||
|
| |||||||
| * | Non-income producing. |
PLC | Public Limited Corporation | |
SP ADR | Sponsored American Depository Receipt |
The accompanying notes are an integral part of the financial statements.
53
POLEN U.S. SMALL COMPANY GROWTH FUND
Portfolio Holdings Summary Table
April 30, 2020
(Unaudited)
The following table presents a summary by industry of the portfolio holdings of the Fund:
| % of Net Assets | Value | |||||||
COMMON STOCKS: | ||||||||
Software Application | 20.3 | % | $ | 6,755,488 | ||||
Medical Instruments & Supplies | 7.6 | 2,551,186 | ||||||
Restaurants | 7.2 | 2,398,389 | ||||||
Internet Retail | 6.7 | 2,244,229 | ||||||
Leisure | 6.7 | 2,229,103 | ||||||
Software Infrastructure | 6.0 | 2,007,941 | ||||||
Consulting Services | 5.3 | 1,763,665 | ||||||
Building Products & Equipment | 4.2 | 1,418,302 | ||||||
Recreational Vehicles | 3.9 | 1,307,284 | ||||||
Information Technology Services | 3.7 | 1,219,313 | ||||||
Household & Personal Products | 3.6 | 1,198,751 | ||||||
Home Improvement Retail | 3.5 | 1,161,548 | ||||||
Discount Stores | 2.9 | 955,494 | ||||||
Mortgage Finance | 2.4 | 793,495 | ||||||
Medical Care Facilities | 2.3 | 757,552 | ||||||
Specialty Retail | 1.6 | 539,157 | ||||||
Capital Markets | 1.6 | 526,582 | ||||||
Other Assets In Excess of Liabilities | 10.5 | 3,494,928 | ||||||
|
|
|
| |||||
NET ASSETS | 100.0 | % | $ | 33,322,407 | ||||
|
|
|
| |||||
Portfolio holdings are subject to change at any time.
The accompanying notes are an integral part of the financial statements.
54
POLEN U.S. SMALL COMPANY GROWTH FUND
Portfolio of Investments
April 30, 2020
| Number of Shares | Value | |||||||
COMMON STOCKS — 89.5% |
| |||||||
Building Products & Equipment — 4.2% |
| |||||||
Trex Co., Inc.* | 14,895 | $ | 1,418,302 | |||||
|
| |||||||
Capital Markets — 1.6% |
| |||||||
Houlihan Lokey, Inc. | 8,868 | 526,582 | ||||||
|
| |||||||
Consulting Services ��� 5.3% |
| |||||||
Exponent, Inc. | 25,077 | 1,763,665 | ||||||
|
| |||||||
Discount Stores — 2.9% | ||||||||
Ollie’s Bargain Outlet Holdings, Inc.* | 14,070 | 955,494 | ||||||
|
| |||||||
Home Improvement Retail — 3.5% |
| |||||||
Floor & Decor Holdings, Inc., Class A* | 27,395 | 1,161,548 | ||||||
|
| |||||||
Household & Personal Products — 3.6% |
| |||||||
Helen of Troy Ltd.* | 7,297 | 1,198,751 | ||||||
|
| |||||||
Information Technology Services — 3.7% |
| |||||||
EPAM Systems, Inc.* | 5,520 | 1,219,313 | ||||||
|
| |||||||
Internet Retail — 6.7% |
| |||||||
Etsy, Inc.* | 16,922 | 1,097,730 | ||||||
Revolve Group, Inc.* | 104,322 | 1,146,499 | ||||||
|
| |||||||
| 2,244,229 | ||||||||
|
| |||||||
Leisure — 6.7% |
| |||||||
Pool Corp. | 6,593 | 1,395,474 | ||||||
YETI Holdings, Inc.* | 30,193 | 833,629 | ||||||
|
| |||||||
| 2,229,103 | ||||||||
|
| |||||||
Medical Care Facilities — 2.3% |
| |||||||
AMN Healthcare Services, Inc.* | 16,125 | 757,552 | ||||||
|
| |||||||
| Number of Shares | Value | |||||||
COMMON STOCKS — (Continued) |
| |||||||
Medical Instruments & Supplies — 7.6% |
| |||||||
LeMaitre Vascular, Inc. | 41,126 | $ | 1,171,680 | |||||
Masimo Corp.* | 6,449 | 1,379,506 | ||||||
|
| |||||||
| 2,551,186 | ||||||||
|
| |||||||
Mortgage Finance — 2.4% |
| |||||||
LendingTree, Inc.* | 3,182 | 793,495 | ||||||
|
| |||||||
Recreational Vehicles — 3.9% |
| |||||||
Fox Factory Holding Corp.* | 25,628 | 1,307,284 | ||||||
|
| |||||||
Restaurants — 7.2% |
| |||||||
Texas Roadhouse, Inc. | 14,725 | 693,400 | ||||||
Wingstop, Inc. | 14,539 | 1,704,989 | ||||||
|
| |||||||
| 2,398,389 | ||||||||
|
| |||||||
Software Application — 20.3% |
| |||||||
Alarm.com Holdings, Inc.* | 21,120 | 944,698 | ||||||
Appfolio, Inc., Class A* | 14,354 | 1,576,930 | ||||||
Blackbaud, Inc. | 19,393 | 1,071,657 | ||||||
Envestnet, Inc.* | 13,697 | 856,336 | ||||||
Globant SA* | 11,885 | 1,374,738 | ||||||
Paylocity Holding Corp.* | 8,130 | 931,129 | ||||||
|
| |||||||
| 6,755,488 | ||||||||
|
| |||||||
Software Infrastructure — 6.0% |
| |||||||
Altair Engineering, Inc., Class A* | 23,657 | 780,445 | ||||||
Blackline, Inc.* | 8,418 | 511,309 | ||||||
Euronet Worldwide, Inc.* | 7,805 | 716,187 | ||||||
|
| |||||||
| 2,007,941 | ||||||||
|
| |||||||
Specialty Retail — 1.6% |
| |||||||
Five Below, Inc.* | 5,980 | 539,157 | ||||||
|
| |||||||
TOTAL COMMON STOCKS |
| 29,827,479 | ||||||
|
| |||||||
The accompanying notes are an integral part of the financial statements.
55
POLEN U.S. SMALL COMPANY GROWTH FUND
Portfolio of Investments (Continued)
April 30, 2020
| Value | ||||||
TOTAL INVESTMENTS - 89.5% | $ | 29,827,479 | ||||
OTHER ASSETS IN EXCESS OF | ||||||
LIABILITIES - 10.5% | 3,494,928 | |||||
|
| |||||
NET ASSETS - 100.0% | $ | 33,322,407 | ||||
|
| |||||
| * | Non-income producing. |
The accompanying notes are an integral part of the financial statements.
56
POLEN INTERNATIONAL SMALL COMPANY GROWTH FUND
Portfolio Holdings Summary Table
April 30, 2020
(Unaudited)
The following table presents a summary by industry of the portfolio holdings of the Fund:
| % of Net Assets | Value | |||||||
COMMON STOCKS: | ||||||||
Software | 25.1 | % | $ | 2,030,271 | ||||
Interactive Media & Services | 11.8 | 956,386 | ||||||
Capital Markets | 10.6 | 857,146 | ||||||
Health Care Technology | 6.5 | 526,291 | ||||||
Commercial Services & Supplies | 5.1 | 412,019 | ||||||
Life Sciences Tools & Services | 4.6 | 373,775 | ||||||
Professional Services | 4.4 | 353,676 | ||||||
Entertainment | 4.4 | 352,530 | ||||||
Aerospace & Defense | 3.5 | 284,156 | ||||||
Information Technology Services | 3.3 | 263,739 | ||||||
Leisure Products | 3.3 | 262,268 | ||||||
Health Care Equipment & Supplies | 3.1 | 246,117 | ||||||
Health Care Providers & Services | 2.5 | 203,436 | ||||||
Semiconductors & Semiconductor Equipment | 2.0 | 164,361 | ||||||
Real Estate Management & Development | 1.7 | 137,931 | ||||||
Household Products | 1.7 | 135,318 | ||||||
Biotechnology | 1.5 | 124,116 | ||||||
Food Products | 1.1 | 90,907 | ||||||
Other Assets In Excess of Liabilities | 3.8 | 305,412 | ||||||
|
|
|
| |||||
NET ASSETS | 100.0 | % | $ | 8,079,855 | ||||
|
|
|
| |||||
Portfolio holdings are subject to change at any time.
The accompanying notes are an integral part of the financial statements.
57
POLEN INTERNATIONAL SMALL COMPANY GROWTH FUND
Portfolio of Investments
April 30, 2020
| Number of Shares | Value | |||||||
COMMON STOCKS — 96.2% |
| |||||||
Argentina — 5.7% |
| |||||||
Globant SA* | 3,960 | $ | 458,053 | |||||
|
| |||||||
Australia — 10.7% |
| |||||||
Cochlear, Ltd. | 2,070 | 246,117 | ||||||
Computershare, Ltd. | 33,522 | 263,739 | ||||||
Technology One, Ltd. | 58,132 | 356,613 | ||||||
|
| |||||||
| 866,469 | ||||||||
|
| |||||||
Brazil — 1.1% |
| |||||||
M. Dias Branco SA | 15,300 | 90,907 | ||||||
|
| |||||||
Canada — 16.0% |
| |||||||
Altus Group, Ltd. | 4,568 | 137,931 | ||||||
CAE, Inc. | 17,197 | 284,156 | ||||||
Kinaxis, Inc.* | 2,750 | 276,432 | ||||||
Morneau Shepell, Inc. | 14,630 | 353,676 | ||||||
TMX Group, Ltd. | 2,739 | 237,290 | ||||||
|
| |||||||
| 1,289,485 | ||||||||
|
| |||||||
Denmark — 6.4% |
| |||||||
Netcompany Group A/S* | 7,110 | 367,321 | ||||||
SimCorp A/S | 1,619 | 149,545 | ||||||
| 516,866 | ||||||||
Germany — 13.8% |
| |||||||
CompuGroup Medical SE | 6,925 | 526,291 | ||||||
CTS Eventim AG & Co. KGaA | 8,480 | 352,530 | ||||||
Scout24 AG | 3,578 | 233,950 | ||||||
|
| |||||||
| 1,112,771 | ||||||||
|
| |||||||
Italy — 2.5% |
| |||||||
Amplifon SpA | 8,887 | 203,436 | ||||||
|
| |||||||
Japan — 6.3% |
| |||||||
Kakaku.com, Inc. | 18,500 | 377,499 | ||||||
Pigeon Corp. | 3,800 | 135,318 | ||||||
|
| |||||||
| 512,817 | ||||||||
|
| |||||||
Jersey — 3.8% |
| |||||||
Sanne Group PLC | 37,585 | 306,311 | ||||||
|
| |||||||
| Number of Shares | Value | |||||||
COMMON STOCKS — (Continued) |
| |||||||
Mexico — 3.9% |
| |||||||
Bolsa Mexicana de Valores SAB de CV | 173,758 | $ | 313,545 | |||||
|
| |||||||
South Korea — 3.9% |
| |||||||
Douzone Bizon Co. Ltd. | 2,055 | 148,930 | ||||||
Koh Young Technology, Inc. | 2,465 | 164,361 | ||||||
|
| |||||||
| 313,291 | ||||||||
|
| |||||||
Sweden — 4.8% |
| |||||||
Thule Group AB (The) | 14,065 | 262,268 | ||||||
Vitrolife AB | 6,840 | 124,116 | ||||||
|
| |||||||
| 386,384 | ||||||||
|
| |||||||
Switzerland — 4.6% |
| |||||||
Tecan Group AG | 1,161 | 373,775 | ||||||
|
| |||||||
United Kingdom — 12.7% |
| |||||||
Auto Trader Group PLC | 34,310 | 197,505 | ||||||
GB Group PLC | 32,258 | 273,377 | ||||||
HomeServe PLC | 29,414 | 412,019 | ||||||
Rightmove PLC | 23,580 | 147,432 | ||||||
|
| |||||||
| 1,030,333 | ||||||||
|
| |||||||
TOTAL COMMON STOCKS |
| 7,774,443 | ||||||
|
| |||||||
TOTAL INVESTMENTS - 96.2% |
| 7,774,443 | ||||||
OTHER ASSETS IN EXCESS OF |
| 305,412 | ||||||
|
| |||||||
NET ASSETS - 100.0% | $ | 8,079,855 | ||||||
|
| |||||||
| * | Non-income producing. |
PLC Public Limited Corporation
The accompanying notes are an integral part of the financial statements.
58
POLEN GROWTH FUNDS
Statements of Assets and Liabilities
April 30, 2020
| Polen Growth Fund | Polen Global Growth Fund | Polen International Growth Fund | |||||||||||||
Assets | |||||||||||||||
Investments, at value* | $ | 5,897,850,472 | $ | 242,952,688 | $ | 188,911,412 | |||||||||
Cash | 276,430,963 | 21,752,737 | 24,604,579 | ||||||||||||
Foreign currency (Cost $0, $171,577 and $89,158, respectively) | — | 173,320 | 90,070 | ||||||||||||
Receivable for investments sold | 15,815,714 | — | — | ||||||||||||
Receivable for capital shares sold | 48,935,889 | 11,803,085 | 1,525,511 | ||||||||||||
Dividends and interest receivable | 4,612,427 | 224,045 | 214,377 | ||||||||||||
Prepaid expenses and other assets | 148,836 | 30,800 | 22,230 | ||||||||||||
|
|
|
|
|
| ||||||||||
Total assets | 6,243,794,301 | 276,936,675 | 215,368,179 | ||||||||||||
|
|
|
|
|
| ||||||||||
Liabilities | |||||||||||||||
Payable for investments purchased | 46,570,092 | 2,293,309 | 16,540,757 | ||||||||||||
Payable for capital shares redeemed | 25,278,613 | 1,485,596 | 126,414 | ||||||||||||
Payable to Investment Adviser | 3,823,350 | 145,201 | 84,787 | ||||||||||||
Payable for transfer agent fees | 779,512 | 29,755 | 37,890 | ||||||||||||
Payable for administration and accounting fees | 126,234 | 15,217 | 32,531 | ||||||||||||
Payable for custodian fees | 80,238 | 8,244 | 8,342 | ||||||||||||
Payable for distribution fees | 74,241 | 3,273 | 347 | ||||||||||||
Payable for audit fees | 53,695 | 21,342 | 20,929 | ||||||||||||
Payable for printing fees | 37,412 | 8,044 | 3,682 | ||||||||||||
Payable for legal fees | 8,991 | 345 | 316 | ||||||||||||
Accrued expenses | 876 | 877 | 876 | ||||||||||||
|
|
|
|
|
| ||||||||||
Total liabilities | 76,833,254 | 4,011,203 | 16,856,871 | ||||||||||||
|
|
|
|
|
| ||||||||||
Net Assets | $ | 6,166,961,047 | $ | 272,925,472 | $ | 198,511,308 | |||||||||
|
|
|
|
|
| ||||||||||
Net Assets consisted of: | |||||||||||||||
Capital stock, $0.01 par value | $ | 1,786,301 | $ | 147,873 | $ | 142,505 | |||||||||
Paid-in capital | 4,471,312,155 | 248,305,469 | 196,687,042 | ||||||||||||
Total distributable earnings | 1,693,862,591 | 24,472,130 | 1,681,761 | ||||||||||||
|
|
|
|
|
| ||||||||||
Net Assets | $ | 6,166,961,047 | $ | 272,925,472 | $ | 198,511,308 | |||||||||
|
|
|
|
|
| ||||||||||
Institutional Class: | |||||||||||||||
Net assets | $ | 5,771,940,477 | $ | 255,373,691 | $ | 196,959,941 | |||||||||
|
|
|
|
|
| ||||||||||
Shares outstanding | 166,947,669 | 13,824,860 | 14,138,393 | ||||||||||||
|
|
|
|
|
| ||||||||||
Net asset value, offering and redemption price per share | $ | 34.57 | $ | 18.47 | $ | 13.93 | |||||||||
|
|
|
|
|
| ||||||||||
Investor Class: | |||||||||||||||
Net assets | $ | 395,020,570 | $ | 17,551,781 | $ | 1,551,367 | |||||||||
|
|
|
|
|
| ||||||||||
Shares outstanding | 11,682,402 | 962,403 | 112,133 | ||||||||||||
|
|
|
|
|
| ||||||||||
Net asset value, offering and redemption price per share | $ | 33.81 | $ | 18.24 | $ | 13.84 | |||||||||
|
|
|
|
|
| ||||||||||
* Investments, at cost | $ | 4,245,268,272 | $ | 216,225,507 | $ | 184,292,832 | |||||||||
The accompanying notes are an integral part of the financial statements.
59
POLEN GROWTH FUNDS
Statements of Assets and Liabilities
April 30, 2020
| Polen U.S. Small Company Growth Fund | Polen International Small Company Growth Fund | |||||||||
Assets | ||||||||||
Investments, at value* | $ | 29,827,479 | $ | 7,774,443 | ||||||
Cash | 3,358,251 | 309,622 | ||||||||
Receivable for capital shares sold | 640,932 | 5,300 | ||||||||
Receivable from investment adviser | 8,048 | 13,956 | ||||||||
Dividends and interest receivable | — | 9,839 | ||||||||
Receivable for investments sold | 850,154 | — | ||||||||
Prepaid expenses and other assets | 24,264 | 14,670 | ||||||||
|
|
|
| |||||||
Total assets | 34,709,128 | 8,127,830 | ||||||||
|
|
|
| |||||||
Liabilities | ||||||||||
Payable for investments purchased | 1,235,807 | — | ||||||||
Payable for capital shares redeemed | 97,000 | — | ||||||||
Payable for audit fees | 20,245 | 20,141 | ||||||||
Payable for transfer agent fees | 15,634 | 14,858 | ||||||||
Payable for custodian fees | 7,888 | 5,298 | ||||||||
Payable for printing fees | 6,004 | 5,744 | ||||||||
Payable for administration and accounting fees | 3,028 | 997 | ||||||||
Payable for distribution fees | 191 | 30 | ||||||||
Payable for legal fees | 48 | 31 | ||||||||
Accrued expenses | 876 | 876 | ||||||||
|
|
|
| |||||||
Total liabilities | 1,386,721 | 47,975 | ||||||||
|
|
|
| |||||||
Net Assets | $ | 33,322,407 | $ | 8,079,855 | ||||||
|
|
|
| |||||||
Net Assets consisted of: | ||||||||||
Capital stock, $0.01 par value | $ | 29,837 | $ | 6,725 | ||||||
Paid-in capital | 33,908,479 | 7,890,859 | ||||||||
Total distributable earnings | (615,909 | ) | 182,271 | |||||||
|
|
|
| |||||||
Net Assets | $ | 33,322,407 | $ | 8,079,855 | ||||||
|
|
|
| |||||||
Institutional Class: | ||||||||||
Net assets | $ | 32,050,808 | $ | 7,907,589 | ||||||
|
|
|
| |||||||
Shares outstanding | 2,869,482 | 658,089 | ||||||||
|
|
|
| |||||||
Net asset value, offering and redemption price per share | $ | 11.17 | $ | 12.02 | ||||||
|
|
|
| |||||||
Investor Class: | ||||||||||
Net assets | $ | 1,271,599 | $ | 172,266 | ||||||
|
|
|
| |||||||
Shares outstanding | 114,182 | 14,383 | ||||||||
|
|
|
| |||||||
Net asset value, offering and redemption price per share | $ | 11.14 | $ | 11.98 | ||||||
|
|
|
| |||||||
* Investments, at cost | $ | 28,729,691 | $ | 7,580,845 | ||||||
The accompanying notes are an integral part of the financial statements.
60
POLEN GROWTH FUNDS
Statements of Operations
For the Year Ended April 30, 2020
| Polen Growth Fund | Polen Global Growth Fund | Polen International Growth Fund | |||||||||||||
Investment income | |||||||||||||||
Dividends | $ | 26,762,721 | $ | 1,213,370 | $ | 1,490,182 | |||||||||
Less: foreign taxes withheld | — | (81,457 | ) | (81,539 | ) | ||||||||||
|
|
|
|
|
| ||||||||||
Total investment income | 26,762,721 | 1,131,913 | 1,408,643 | ||||||||||||
|
|
|
|
|
| ||||||||||
Expenses | |||||||||||||||
Advisory fees (Note 2) | 38,737,721 | 1,066,769 | 935,714 | ||||||||||||
Transfer agent fees (Note 2) | 3,750,170 | 127,120 | 148,394 | ||||||||||||
Distribution fees (Investor Shares) (Note 2) | 854,055 | 35,868 | 4,455 | ||||||||||||
Administration and accounting fees (Note 2) | 827,459 | 61,467 | 54,843 | ||||||||||||
Trustees’ and officers’ fees | 458,019 | 11,752 | 10,202 | ||||||||||||
Custodian fees (Note 2) | 283,012 | 27,601 | 31,167 | ||||||||||||
Registration and filing fees | 196,270 | 53,487 | 50,127 | ||||||||||||
Printing and shareholder reporting fees | 181,878 | 25,831 | 24,907 | ||||||||||||
Legal fees | 138,880 | 2,307 | 4,201 | ||||||||||||
Audit fees | 53,013 | 21,539 | 20,872 | ||||||||||||
Other expenses | 124,455 | 8,390 | 11,785 | ||||||||||||
|
|
|
|
|
| ||||||||||
Total expenses before waivers and reimbursements and/or recoupment | 45,604,932 | 1,442,131 | 1,296,667 | ||||||||||||
|
|
|
|
|
| ||||||||||
Less: (waivers) and (reimbursements) and/or recoupment (Note 2) | 52,409 | (25,739 | ) | (81,289 | ) | ||||||||||
|
|
|
|
|
| ||||||||||
Net expenses after waivers and reimbursements and/or recoupment | 45,657,341 | 1,416,392 | 1,215,378 | ||||||||||||
|
|
|
|
|
| ||||||||||
Net investment income/(loss) | (18,894,620 | ) | (284,479 | ) | 193,265 | ||||||||||
|
|
|
|
|
| ||||||||||
Net realized and unrealized gain/(loss) from investments | |||||||||||||||
Net realized gain/(loss) from investments | 85,352,178 | (1,552,837 | ) | (2,487,903 | ) | ||||||||||
Net realized loss from foreign currency transactions | — | (139,955 | ) | (259,094 | ) | ||||||||||
Net change in unrealized appreciation/(depreciation) from investments | 471,454,894 | 9,721,707 | (609,265 | ) | |||||||||||
Net change in unrealized appreciation/(depreciation) from foreign currency translations | — | (14,394 | ) | (101,982 | ) | ||||||||||
|
|
|
|
|
| ||||||||||
Net realized and unrealized gain/(loss) from investments | 556,807,072 | 8,014,521 | (3,458,244 | ) | |||||||||||
|
|
|
|
|
| ||||||||||
Net increase/(decrease) in net assets resulting from operations | $ | 537,912,452 | $ | 7,730,042 | $ | (3,264,979 | ) | ||||||||
|
|
|
|
|
| ||||||||||
The accompanying notes are an integral part of the financial statements.
61
POLEN GROWTH FUNDS
Statements of Operations
For the Year Ended April 30, 2020
| Polen U.S. Small Company Growth Fund | Polen International Small Company Growth Fund | |||||||||
Investment income | ||||||||||
Dividends | $ | 49,392 | $ | 70,856 | ||||||
Less: foreign taxes withheld | — | (7,034 | ) | |||||||
|
|
|
| |||||||
Total investment income | 49,392 | 63,822 | ||||||||
|
|
|
| |||||||
Expenses | ||||||||||
Advisory fees (Note 2) | 149,240 | 61,203 | ||||||||
Transfer agent fees (Note 2) | 53,422 | 47,117 | ||||||||
Registration and filing fees | 38,845 | 52,794 | ||||||||
Printing and shareholder reporting fees | 23,063 | 20,639 | ||||||||
Audit fees | 20,245 | 19,949 | ||||||||
Custodian fees (Note 2) | 17,221 | 20,260 | ||||||||
Administration and accounting fees (Note 2) | 11,433 | 9,470 | ||||||||
Trustees’ and officers’ fees | 1,369 | 586 | ||||||||
Distribution fees (Investor Shares) (Note 2) | 921 | 301 | ||||||||
Legal fees | 426 | 107 | ||||||||
Other expenses | 6,448 | 9,796 | ||||||||
|
|
|
| |||||||
Total expenses before waivers and reimbursements and/or recoupment | 322,633 | 242,222 | ||||||||
|
|
|
| |||||||
Less: (waivers) and (reimbursements) and/or recoupment (Note 2) | (135,219 | ) | (165,417 | ) | ||||||
|
|
|
| |||||||
Net expenses after waivers and reimbursements and/or recoupment | 187,414 | 76,805 | ||||||||
|
|
|
| |||||||
Net investment loss | (138,022 | ) | (12,983 | ) | ||||||
|
|
|
| |||||||
Net realized and unrealized gain/(loss) from investments | ||||||||||
Net realized gain/(loss) from investments | (1,544,443 | ) | 82,882 | |||||||
Net realized loss from foreign currency transactions | — | (14,799 | ) | |||||||
Net change in unrealized appreciation/(depreciation) from investments | 61,456 | (221,665 | ) | |||||||
Net change in unrealized appreciation/(depreciation) from foreign currency translations | — | (54 | ) | |||||||
|
|
|
| |||||||
Net realized and unrealized loss from investments | (1,482,987 | ) | (153,636 | ) | ||||||
|
|
|
| |||||||
Net decrease in net assets resulting from operations | $ | (1,621,009 | ) | $ | (166,619 | ) | ||||
|
|
|
| |||||||
The accompanying notes are an integral part of the financial statements.
62
POLEN GROWTH FUND
Statements of Changes in Net Assets
| For the Year Ended April 30, 2020 | For the Year Ended April 30, 2019 | |||||||||
Increase/(decrease) in net assets from operations: | ||||||||||
Net investment loss | $ | (18,894,620 | ) | $ | (5,079,486 | ) | ||||
Net realized gain from investments | 85,352,178 | 20,384,872 | ||||||||
Net change in unrealized appreciation/(depreciation) from investments | 471,454,894 | 623,497,248 | ||||||||
|
|
|
| |||||||
Net increase in net assets resulting from operations | 537,912,452 | 638,802,634 | ||||||||
|
|
|
| |||||||
Less dividends and distributions to shareholders from: | ||||||||||
Total distributable earnings: | ||||||||||
Institutional Class | (160,854 | ) | (61,771,852 | ) | ||||||
Investor Class | (13,512 | ) | (4,657,005 | ) | ||||||
|
|
|
| |||||||
Net decrease in net assets from dividends and distributions to shareholders | (174,366 | ) | (66,428,857 | ) | ||||||
|
|
|
| |||||||
Increase in net assets derived from capital share transactions (Note 4) | 1,961,771,710 | 1,188,667,121 | ||||||||
|
|
|
| |||||||
Total increase in net assets | 2,499,509,796 | 1,761,040,898 | ||||||||
|
|
|
| |||||||
Net assets | ||||||||||
Beginning of year | 3,667,451,251 | 1,906,410,353 | ||||||||
|
|
|
| |||||||
End of year | $ | 6,166,961,047 | $ | 3,667,451,251 | ||||||
|
|
|
| |||||||
The accompanying notes are an integral part of the financial statements.
63
POLEN GLOBAL GROWTH FUND
Statements of Changes in Net Assets
| For the Year Ended April 30, 2020 | For the Year Ended April 30, 2019 | |||||||||
Increase/(decrease) in net assets from operations: | ||||||||||
Net investment loss | $ | (284,479 | ) | $ | (87,533 | ) | ||||
Net realized gain/(loss) from investments and foreign currency transactions | (1,692,792 | ) | 155,063 | |||||||
Net change in unrealized appreciation/(depreciation) from investments and foreign currency translations | 9,707,313 | 10,787,025 | ||||||||
|
|
|
| |||||||
Net increase in net assets resulting from operations | 7,730,042 | 10,854,555 | ||||||||
|
|
|
| |||||||
Less dividends and distributions to shareholders from: | ||||||||||
Total distributable earnings: | ||||||||||
Institutional Class | (47,549 | ) | (772,271 | ) | ||||||
Investor Class | (6,822 | ) | (142,087 | ) | ||||||
|
|
|
| |||||||
Net decrease in net assets from dividends and distributions to shareholders | (54,371 | ) | (914,358 | ) | ||||||
|
|
|
| |||||||
Increase in net assets derived from capital share transactions (Note 4) | 185,504,257 | 34,009,830 | ||||||||
|
|
|
| |||||||
Total increase in net assets | 193,179,928 | 43,950,027 | ||||||||
|
|
|
| |||||||
Net assets | ||||||||||
Beginning of year | 79,745,544 | 35,795,517 | ||||||||
|
|
|
| |||||||
End of year | $ | 272,925,472 | $ | 79,745,544 | ||||||
|
|
|
| |||||||
The accompanying notes are an integral part of the financial statements.
64
POLEN INTERNATIONAL GROWTH FUND
Statements of Changes in Net Assets
| For the Year Ended April 30, 2020 | For the Year Ended April 30, 2019 | |||||||||
Increase/(decrease) in net assets from operations: | ||||||||||
Net investment income | $ | 193,265 | $ | 85,611 | ||||||
Net realized loss from investments and foreign currency transactions | (2,746,997 | ) | (383,994 | ) | ||||||
Net change in unrealized appreciation/(depreciation) from investments and foreign currency translations | (711,247 | ) | 4,578,389 | |||||||
|
|
|
| |||||||
Net increase/(decrease) in net assets resulting from operations | (3,264,979 | ) | 4,280,006 | |||||||
|
|
|
| |||||||
Less dividends and distributions to shareholders from: | ||||||||||
Total distributable earnings: | ||||||||||
Institutional Class | (14,475 | ) | (42,741 | ) | ||||||
Investor Class | — | (649 | ) | |||||||
|
|
|
| |||||||
Net decrease in net assets from dividends and distributions to shareholders | (14,475 | ) | (43,390 | ) | ||||||
|
|
|
| |||||||
Increase in net assets derived from capital share transactions (Note 4) | 131,612,815 | 54,712,301 | ||||||||
|
|
|
| |||||||
Total increase in net assets | 128,333,361 | 58,948,917 | ||||||||
|
|
|
| |||||||
Net assets | ||||||||||
Beginning of year | 70,177,947 | 11,229,030 | ||||||||
|
|
|
| |||||||
End of year | $ | 198,511,308 | $ | 70,177,947 | ||||||
|
|
|
| |||||||
The accompanying notes are an integral part of the financial statements.
65
POLEN U.S. SMALL COMPANY GROWTH FUND
Statements of Changes in Net Assets
| For the Year Ended April 30, 2020 | For the Year Ended April 30, 2019 | |||||||||
Increase/(decrease) in net assets from operations: | ||||||||||
Net investment loss | $ | (138,022 | ) | $ | (46,365 | ) | ||||
Net realized gain/(loss) from investments | (1,544,443 | ) | 11,252 | |||||||
Net change in unrealized appreciation/(depreciation) from investments | 61,456 | 1,010,346 | ||||||||
|
|
|
| |||||||
Net increase/(decrease) in net assets resulting from operations | (1,621,009 | ) | 975,233 | |||||||
|
|
|
| |||||||
Less dividends and distributions to shareholders from: | ||||||||||
Total distributable earnings: | ||||||||||
Institutional Class | (62,143 | ) | (9,611 | ) | ||||||
Investor Class | (1,894 | ) | — | |||||||
|
|
|
| |||||||
Net decrease in net assets from dividends and distributions to shareholders | (64,037 | ) | (9,611 | ) | ||||||
|
|
|
| |||||||
Increase in net assets derived from capital share transactions (Note 4) | 27,053,776 | 3,654,361 | ||||||||
|
|
|
| |||||||
Total increase in net assets | 25,368,730 | 4,619,983 | ||||||||
|
|
|
| |||||||
Net assets | ||||||||||
Beginning of year | 7,953,677 | 3,333,694 | ||||||||
|
|
|
| |||||||
End of year | $ | 33,322,407 | $ | 7,953,677 | ||||||
|
|
|
| |||||||
The accompanying notes are an integral part of the financial statements.
66
POLEN INTERNATIONAL SMALL COMPANY GROWTH FUND
Statements of Changes in Net Assets
| For the Year Ended April 30, 2020 | For the Period Ended April 30, 2019* | |||||||||
Increase/(decrease) in net assets from operations: | ||||||||||
Net investment income/(loss) | $ | (12,983 | ) | $ | 88 | |||||
Net realized gain/(loss) from investments and foreign currency transactions | 68,083 | (17,263 | ) | |||||||
Net change in unrealized appreciation/(depreciation) from investments and foreign currency translations | (221,719 | ) | 415,262 | |||||||
|
|
|
| |||||||
Net increase/(decrease) in net assets resulting from operations | (166,619 | ) | 398,087 | |||||||
|
|
|
| |||||||
Less Dividends and Distributions to Shareholders from: | ||||||||||
Total distributable earnings: | ||||||||||
Institutional Class | (48,457 | ) | — | |||||||
Investor Class | (740 | ) | — | |||||||
|
|
|
| |||||||
Net decrease in net assets from dividends and distributions to shareholders | (49,197 | ) | — | |||||||
|
|
|
| |||||||
Increase in net assets derived from capital share transactions (Note 4) | 4,901,158 | 2,996,426 | ||||||||
|
|
|
| |||||||
Total increase in net assets | 4,685,342 | 3,394,513 | ||||||||
|
|
|
| |||||||
Net assets | ||||||||||
Beginning of period | 3,394,513 | — | ||||||||
|
|
|
| |||||||
End of period | $ | 8,079,855 | $ | 3,394,513 | ||||||
|
|
|
| |||||||
| * | The Polen International Small Company Growth Fund commenced operations on December 31, 2018. |
The accompanying notes are an integral part of the financial statements.
67
POLEN GROWTH FUND
Financial Highlights
Contained below is per share operating performance data for Institutional Class shares outstanding, total investment return, ratios to average net assets and other supplemental data for the respective period. The total returns in the table represent the rate that an investor would have earned or lost on an investment in the Fund (assuming reinvestment of all dividends and distributions). This information has been derived from information provided in the financial statements and should be read in conjunction with the financial statements and the notes thereto.
| Institutional Class | |||||||||||||||||||||||||
| For the Year Ended April 30, 2020 | For the Year Ended April 30, 2019 | For the Year Ended April 30, 2018 | For the Year Ended April 30, 2017 | For the Year Ended April 30, 2016 | |||||||||||||||||||||
Per Share Operating Performance | |||||||||||||||||||||||||
Net asset value, beginning of year | $ | 31.20 | $ | 25.34 | $ | 21.85 | $ | 18.92 | $ | 18.29 | |||||||||||||||
|
|
|
|
|
|
|
|
|
| ||||||||||||||||
Net investment income/(loss)(1) | (0.13 | ) | (0.05 | ) | (0.06 | ) | (0.04 | ) | 0.01 | ||||||||||||||||
Net realized and unrealized gain on investments | 3.50 | 6.62 | 3.95 | 2.97 | 1.45 | ||||||||||||||||||||
|
|
|
|
|
|
|
|
|
| ||||||||||||||||
Net increase in net assets resulting from operations | 3.37 | 6.57 | 3.89 | 2.93 | 1.46 | ||||||||||||||||||||
|
|
|
|
|
|
|
|
|
| ||||||||||||||||
Dividends and distributions to shareholders from: | |||||||||||||||||||||||||
Net investment income | — | — | — | (0.00 | )(2) | — | |||||||||||||||||||
Net realized capital gains | (0.00 | )(2) | (0.71 | ) | (0.40 | ) | — | (0.83 | ) | ||||||||||||||||
|
|
|
|
|
|
|
|
|
| ||||||||||||||||
Total dividends and distributions to shareholders | (0.00 | )(2) | (0.71 | ) | (0.40 | ) | (0.00 | )(2) | (0.83 | ) | |||||||||||||||
|
|
|
|
|
|
|
|
|
| ||||||||||||||||
Redemption fees | 0.00 | (2) | 0.00 | (2) | 0.00 | (2) | 0.00 | (2) | 0.00 | (2) | |||||||||||||||
|
|
|
|
|
|
|
|
|
| ||||||||||||||||
Net asset value, end of year | $ | 34.57 | $ | 31.20 | $ | 25.34 | $ | 21.85 | $ | 18.92 | |||||||||||||||
|
|
|
|
|
|
|
|
|
| ||||||||||||||||
Total investment return(3) | 10.80 | % | 26.44 | % | 17.90 | % | 15.50 | % | 7.86 | % | |||||||||||||||
Ratios/Supplemental Data | |||||||||||||||||||||||||
Net assets, end of year (in thousands) | $ | 5,771,940 | $ | 3,381,068 | $ | 1,839,280 | $ | 1,363,731 | $ | 959,962 | |||||||||||||||
Ratio of expenses to average net assets | 0.98 | % | 1.00 | % | 1.00 | % | 1.00 | % | 1.00 | % | |||||||||||||||
Ratio of expenses to average net assets without waivers, expense reimbursements and/or recoupment, if any(4) | 0.98 | % | 1.00 | % | 0.98 | % | 1.12 | % | 1.17 | % | |||||||||||||||
Ratio of net investment income/(loss) to average net assets | (0.40 | )% | (0.18 | )% | (0.24 | )% | (0.18 | )% | 0.04 | % | |||||||||||||||
Portfolio turnover rate | 23 | % | 19 | % | 20 | % | 14 | % | 9 | % | |||||||||||||||
| (1) | The selected per share data was calculated using the average shares outstanding method for the year. |
| (2) | Amount is less than $0.005 per share. |
| (3) | Total investment return is calculated assuming a purchase of shares on the first day and a sale of shares on the last day of each period reported and includes reinvestment of dividends and distributions, if any. |
| (4) | During the period, certain fees were waived and/or reimbursed; or recouped, if any. If such fee waivers and/or reimbursements or recoupments had not occurred, the ratios would have been as indicated (See Note 2). |
The accompanying notes are an integral part of the financial statements.
68
POLEN GROWTH FUND
Financial Highlights
Contained below is per share operating performance data for Investor Class shares outstanding, total investment return, ratios to average net assets and other supplemental data for the respective period. The total returns in the table represent the rate that an investor would have earned or lost on an investment in the Fund (assuming reinvestment of all dividends and distributions). This information has been derived from information provided in the financial statements and should be read in conjunction with the financial statements and the notes thereto.
| Investor Class | |||||||||||||||||||||||||
| For the Year Ended April 30, 2020 | For the Year Ended April 30, 2019 | For the Year Ended April 30, 2018 | For the Year Ended April 30, 2017 | For the Year Ended April 30, 2016 | |||||||||||||||||||||
Per Share Operating Performance | |||||||||||||||||||||||||
Net asset value, beginning of year | $ | 30.59 | $ | 24.92 | $ | 21.55 | $ | 18.70 | $ | 18.14 | |||||||||||||||
|
|
|
|
|
|
|
|
|
| ||||||||||||||||
Net investment loss(1) | (0.21 | ) | (0.12 | ) | (0.11 | ) | (0.08 | ) | (0.04 | ) | |||||||||||||||
Net realized and unrealized gain on investments | 3.43 | 6.50 | 3.88 | 2.93 | 1.43 | ||||||||||||||||||||
|
|
|
|
|
|
|
|
|
| ||||||||||||||||
Net increase in net assets resulting from operations | 3.22 | 6.38 | 3.77 | 2.85 | 1.39 | ||||||||||||||||||||
|
|
|
|
|
|
|
|
|
| ||||||||||||||||
Dividends and distributions to shareholders from: | |||||||||||||||||||||||||
Net investment income | — | — | — | — | — | ||||||||||||||||||||
Net realized capital gains | (0.00 | )(2) | (0.71 | ) | (0.40 | ) | — | (0.83 | ) | ||||||||||||||||
|
|
|
|
|
|
|
|
|
| ||||||||||||||||
Total dividends and distributions to shareholders | (0.00 | )(2) | (0.71 | ) | (0.40 | ) | — | (0.83 | ) | ||||||||||||||||
|
|
|
|
|
|
|
|
|
| ||||||||||||||||
Redemption fees | 0.00 | (2) | 0.00 | (2) | 0.00 | (2) | 0.00 | (2) | 0.00 | (2) | |||||||||||||||
|
|
|
|
|
|
|
|
|
| ||||||||||||||||
Net asset value, end of year | $ | 33.81 | $ | 30.59 | $ | 24.92 | $ | 21.55 | $ | 18.70 | |||||||||||||||
|
|
|
|
|
|
|
|
|
| ||||||||||||||||
Total investment return(3) | 10.53 | % | 26.12 | % | 17.59 | % | 15.24 | % | 7.54 | % | |||||||||||||||
Ratios/Supplemental Data | |||||||||||||||||||||||||
Net assets, end of year (in thousands) | $ | 395,021 | $ | 286,383 | $ | 67,130 | $ | 107,358 | $ | 150,617 | |||||||||||||||
Ratio of expenses to average net assets | 1.23 | % | 1.25 | % | 1.25 | % | 1.25 | % | 1.25 | % | |||||||||||||||
Ratio of expenses to average net assets without waivers, expense reimbursements and/or recoupment, if any(4) | 1.23 | % | 1.26 | % | 1.23 | % | 1.38 | % | 1.42 | % | |||||||||||||||
Ratio of net investment loss to average net assets | (0.64 | )% | (0.43 | )% | (0.49 | )% | (0.43 | )% | (0.21 | )% | |||||||||||||||
Portfolio turnover rate | 23 | % | 19 | % | 20 | % | 14 | % | 9 | % | |||||||||||||||
| (1) | The selected per share data was calculated using the average shares outstanding method for the year. |
| (2) | Amount is less than $0.005 per share. |
| (3) | Total investment return is calculated assuming a purchase of shares on the first day and a sale of shares on the last day of each period reported and includes reinvestment of dividends and distributions, if any. |
| (4) | During the period, certain fees were waived and/or reimbursed; or recouped, if any. If such fee waivers and/or reimbursements or recoupments had not occurred, the ratios would have been as indicated (See Note 2). |
The accompanying notes are an integral part of the financial statements.
69
POLEN GLOBAL GROWTH FUND
Financial Highlights
Contained below is per share operating performance data for Institutional Class shares outstanding, total investment return, ratios to average net assets and other supplemental data for the respective period. The total returns in the table represent the rate that an investor would have earned or lost on an investment in the Fund (assuming reinvestment of all dividends and distributions). This information has been derived from information provided in the financial statements and should be read in conjunction with the financial statements and the notes thereto.
| Institutional Class | |||||||||||||||||||||||||
| For the Year Ended April 30, 2020 | For the Year Ended April 30, 2019 | For the Year Ended April 30, 2018 | For the Year Ended April 30, 2017 | For the Year Ended April 30, 2016 | |||||||||||||||||||||
Per Share Operating Performance | |||||||||||||||||||||||||
Net asset value, beginning of year | $ | 17.35 | $ | 14.74 | $ | 12.29 | $ | 10.67 | $ | 10.29 | |||||||||||||||
|
|
|
|
|
|
|
|
|
| ||||||||||||||||
Net investment loss(1) | (0.04 | ) | (0.02 | ) | (0.03 | ) | (0.02 | ) | (0.00 | )(2) | |||||||||||||||
Net realized and unrealized gain on investments | 1.16 | 2.90 | 2.48 | 1.65 | 0.39 | ||||||||||||||||||||
|
|
|
|
|
|
|
|
|
| ||||||||||||||||
Net increase in net assets resulting from operations | 1.12 | 2.88 | 2.45 | 1.63 | 0.39 | ||||||||||||||||||||
|
|
|
|
|
|
|
|
|
| ||||||||||||||||
Dividends and distributions to shareholders from: | |||||||||||||||||||||||||
Net investment income | — | — | — | — | (0.01 | ) | |||||||||||||||||||
Net realized capital gains | (0.01 | ) | (0.28 | ) | — | (0.01 | ) | — | |||||||||||||||||
|
|
|
|
|
|
|
|
|
| ||||||||||||||||
Total dividends and distributions to shareholders | (0.01 | ) | (0.28 | ) | — | (0.01 | ) | (0.01 | ) | ||||||||||||||||
|
|
|
|
|
|
|
|
|
| ||||||||||||||||
Redemption fees | 0.01 | 0.01 | 0.00 | (2) | 0.00 | (2) | 0.00 | (2) | |||||||||||||||||
|
|
|
|
|
|
|
|
|
| ||||||||||||||||
Net asset value, end of year | $ | 18.47 | $ | 17.35 | $ | 14.74 | $ | 12.29 | $ | 10.67 | |||||||||||||||
|
|
|
|
|
|
|
|
|
| ||||||||||||||||
Total investment return(3) | 6.50 | % | 19.91 | % | 19.94 | % | 15.24 | % | 3.78 | % | |||||||||||||||
Ratios/Supplemental Data | |||||||||||||||||||||||||
Net assets, end of year (in thousands) | $ | 255,374 | $ | 68,617 | $ | 30,702 | $ | 18,618 | $ | 13,483 | |||||||||||||||
Ratio of expenses to average net assets | 1.10 | % | 1.10 | % | 1.10 | % | 1.10 | % | 1.10 | % | |||||||||||||||
Ratio of expenses to average net assets without waivers, expense reimbursements and/or recoupment, if any(4) | 1.12 | % | 1.31 | % | 1.50 | % | 2.40 | % | 3.63 | % | |||||||||||||||
Ratio of net investment loss to average net assets | (0.20 | )% | (0.13 | )% | (0.18 | )% | (0.18 | )% | (0.01 | )% | |||||||||||||||
Portfolio turnover rate | 18 | % | 20 | % | 14 | % | 12 | % | 7 | % | |||||||||||||||
| (1) | The selected per share data was calculated using the average shares outstanding method for the year. |
| (2) | Amount is less than $0.005 per share. |
| (3) | Total investment return is calculated assuming a purchase of shares on the first day and a sale of shares on the last day of each period reported and includes reinvestment of dividends and distributions, if any. |
| (4) | During the period, certain fees were waived and/or reimbursed; or recouped, if any. If such fee waivers and/or reimbursements or recoupments had not occurred, the ratios would have been as indicated (See Note 2). |
The accompanying notes are an integral part of the financial statements.
70
POLEN GLOBAL GROWTH FUND
Financial Highlights
Contained below is per share operating performance data for Investor Class shares outstanding, total investment return, ratios to average net assets and other supplemental data for the respective period. The total returns in the table represent the rate that an investor would have earned or lost on an investment in the Fund (assuming reinvestment of all dividends and distributions). This information has been derived from information provided in the financial statements and should be read in conjunction with the financial statements and the notes thereto.
| Investor Class | |||||||||||||||||||||||||
| For the Year Ended April 30, 2020 | For the Year Ended April 30, 2019 | For the Year Ended April 30, 2018 | For the Year Ended April 30, 2017 | For the Period July 6, 2015* to April 30, 2016 | |||||||||||||||||||||
Per Share Operating Performance | |||||||||||||||||||||||||
Net asset value, beginning of period | $ | 17.17 | $ | 14.62 | $ | 12.23 | $ | 10.64 | $ | 10.32 | |||||||||||||||
|
|
|
|
|
|
|
|
|
| ||||||||||||||||
Net investment loss(1) | (0.08 | ) | (0.06 | ) | (0.06 | ) | (0.05 | ) | (0.00 | )(2) | |||||||||||||||
Net realized and unrealized gain on investments | 1.15 | 2.88 | 2.45 | 1.65 | 0.32 | ||||||||||||||||||||
|
|
|
|
|
|
|
|
|
| ||||||||||||||||
Net increase in net assets resulting from operations | 1.07 | 2.82 | 2.39 | 1.60 | 0.32 | ||||||||||||||||||||
|
|
|
|
|
|
|
|
|
| ||||||||||||||||
Dividends and distributions to shareholders from: | |||||||||||||||||||||||||
Net investment income | — | — | — | — | (0.00 | )(2) | |||||||||||||||||||
Net realized capital gains | (0.01 | ) | (0.28 | ) | — | (0.01 | ) | — | |||||||||||||||||
|
|
|
|
|
|
|
|
|
| ||||||||||||||||
Total dividends and distributions to shareholders | (0.01 | ) | (0.28 | ) | — | (0.01 | ) | (0.00 | )(2) | ||||||||||||||||
|
|
|
|
|
|
|
|
|
| ||||||||||||||||
Redemption fees | 0.01 | 0.01 | 0.00 | (2) | 0.00 | (2) | 0.00 | (2) | |||||||||||||||||
|
|
|
|
|
|
|
|
|
| ||||||||||||||||
Net asset value, end of period | $ | 18.24 | $ | 17.17 | $ | 14.62 | $ | 12.23 | $ | 10.64 | |||||||||||||||
|
|
|
|
|
|
|
|
|
| ||||||||||||||||
Total investment return(3) | 6.28 | % | 19.66 | % | 19.54 | % | 15.00 | % | 3.13 | % | |||||||||||||||
Ratios/Supplemental Data | |||||||||||||||||||||||||
Net assets, end of period (in thousands) | $ | 17,552 | $ | 11,129 | $ | 5,094 | $ | 996 | $ | 523 | |||||||||||||||
Ratio of expenses to average net assets | 1.35 | % | 1.35 | % | 1.35 | % | 1.35 | % | 1.35 | %(4) | |||||||||||||||
Ratio of expenses to average net assets without waivers, expense reimbursements and/or recoupment, if any(5) | 1.37 | % | 1.56 | % | 1.71 | % | 2.61 | % | 3.51 | %(4) | |||||||||||||||
Ratio of net investment loss to average net assets | (0.45 | )% | (0.38 | )% | (0.43 | )% | (0.43 | )% | (0.06 | )%(4) | |||||||||||||||
Portfolio turnover rate | 18 | % | 20 | % | 14 | % | 12 | % | 7 | %(6) | |||||||||||||||
| * | Commencement of operations. |
| (1) | The selected per share data was calculated using the average shares outstanding method for the year. |
| (2) | Amount is less than $0.005 per share. |
| (3) | Total investment return is calculated assuming a purchase of shares on the first day and a sale of shares on the last day of each period reported and includes reinvestment of dividends and distributions, if any. Total returns for periods less than one year are not annualized. |
| (4) | Annualized. |
| (5) | During the period, certain fees were waived and/or reimbursed; or recouped, if any. If such fee waivers and/or reimbursements or recoupments had not occurred, the ratios would have been as indicated (See Note 2). |
| (6) | Reflects portfolio turnover of the Fund for the year ended April 30, 2016. |
The accompanying notes are an integral part of the financial statements.
71
POLEN INTERNATIONAL GROWTH FUND
Financial Highlights
Contained below is per share operating performance data for Institutional Class shares outstanding, total investment return, ratios to average net assets and other supplemental data for the respective period. The total returns in the table represent the rate that an investor would have earned or lost on an investment in the Fund (assuming reinvestment of all dividends and distributions). This information has been derived from information provided in the financial statements and should be read in conjunction with the financial statements and the notes thereto.
| Institutional Class | ||||||||||||||||||||
| For the Year Ended April 30, 2020 | For the Year Ended April 30, 2019 | For the Year Ended April 30, 2018 | For the Period December 30, 2016* to April 30, 2017 | |||||||||||||||||
Per Share Operating Performance | ||||||||||||||||||||
Net asset value, beginning of period | $ | 14.35 | $ | 13.24 | $ | 11.57 | $ | 10.00 | ||||||||||||
|
|
|
|
|
|
|
| |||||||||||||
Net investment income(1) | 0.03 | 0.03 | 0.06 | 0.05 | ||||||||||||||||
Net realized and unrealized gain/(loss) on investments | (0.45 | ) | 1.10 | 1.70 | 1.52 | |||||||||||||||
|
|
|
|
|
|
|
| |||||||||||||
Net increase/(decrease) in net assets resulting from operations | (0.42 | ) | 1.13 | 1.76 | 1.57 | |||||||||||||||
|
|
|
|
|
|
|
| |||||||||||||
Dividends and distributions to shareholders from: | ||||||||||||||||||||
Net investment income | (0.00 | )(2) | (0.01 | ) | (0.07 | ) | — | |||||||||||||
Net realized capital gains | — | (0.01 | ) | (0.02 | ) | — | ||||||||||||||
|
|
|
|
|
|
|
| |||||||||||||
Total dividends and distributions to shareholders | (0.00 | )(2) | (0.02 | ) | (0.09 | ) | — | |||||||||||||
|
|
|
|
|
|
|
| |||||||||||||
Redemption fees | 0.00 | (2) | 0.00 | (2) | — | — | ||||||||||||||
|
|
|
|
|
|
|
| |||||||||||||
Net asset value, end of period | $ | 13.93 | $ | 14.35 | $ | 13.24 | $ | 11.57 | ||||||||||||
|
|
|
|
|
|
|
| |||||||||||||
Total investment return(3) | (2.92 | )% | 8.50 | % | 15.18 | % | 15.70 | % | ||||||||||||
Ratios/Supplemental Data | ||||||||||||||||||||
Net assets, end of period (in thousands) | $ | 196,960 | $ | 68,857 | $ | 10,982 | $ | 2,648 | ||||||||||||
Ratio of expenses to average net assets | 1.10 | % | 1.10 | % | 1.10 | % | 1.10 | %(4) | ||||||||||||
Ratio of expenses to average net assets without waivers and expense reimbursements(5) | 1.17 | % | 1.40 | % | 3.45 | % | 9.84 | %(4) | ||||||||||||
Ratio of net investment income to average net assets | 0.18 | % | 0.22 | % | 0.48 | % | 1.32 | %(4) | ||||||||||||
Portfolio turnover rate | 11 | % | 12 | % | 6 | % | — | |||||||||||||
| * | Commencement of operations. |
| (1) | The selected per share data was calculated using the average shares outstanding method for the period. |
| (2) | Amount is less than $0.005 per share. |
| (3) | Total investment return is calculated assuming a purchase of shares on the first day and a sale of shares on the last day of each period reported and includes reinvestment of dividends and distributions, if any. Total returns for periods less than one year are not annualized. |
| (4) | Annualized. |
| (5) | During the period, certain fees were waived and/or reimbursed. If such fee waivers and/or reimbursements had not occurred, the ratios would have been as indicated (See Note 2). |
The accompanying notes are an integral part of the financial statements.
72
POLEN INTERNATIONAL GROWTH FUND
Financial Highlights
Contained below is per share operating performance data for Investor Class shares outstanding, total investment return, ratios to average net assets and other supplemental data for the respective period. The total returns in the table represent the rate that an investor would have earned or lost on an investment in the Fund (assuming reinvestment of all dividends and distributions). This information has been derived from information provided in the financial statements and should be read in conjunction with the financial statements and the notes thereto.
| Investor Class | ||||||||||||||||||||
| For the Year Ended April 30, 2020 | For the Year Ended April 30, 2019 | For the Year Ended April 30, 2018 | For the Period March 15, 2017* to April 30, 2017 | |||||||||||||||||
Per Share Operating Performance | ||||||||||||||||||||
Net asset value, beginning of period | $ | 14.29 | $ | 13.21 | $ | 11.56 | $ | 10.91 | ||||||||||||
|
|
|
|
|
|
|
| |||||||||||||
Net investment income/(loss)(1) | (0.01 | ) | (0.00 | )(2) | 0.03 | 0.04 | ||||||||||||||
Net realized and unrealized gain/(loss) on investments | (0.44 | ) | 1.09 | 1.69 | 0.61 | |||||||||||||||
|
|
|
|
|
|
|
| |||||||||||||
Net increase/(decrease) in net assets resulting from operations | (0.45 | ) | 1.09 | 1.72 | 0.65 | |||||||||||||||
|
|
|
|
|
|
|
| |||||||||||||
Dividends and distributions to shareholders from: | ||||||||||||||||||||
Net investment income | — | — | (0.05 | ) | — | |||||||||||||||
Net realized capital gains | — | (0.01 | ) | (0.02 | ) | — | ||||||||||||||
|
|
|
|
|
|
|
| |||||||||||||
Total dividends and distributions to shareholders | — | (0.01 | ) | (0.07 | ) | — | ||||||||||||||
|
|
|
|
|
|
|
| |||||||||||||
Redemption fees | 0.00 | (2) | 0.00 | (2) | — | — | ||||||||||||||
|
|
|
|
|
|
|
| |||||||||||||
Net asset value, end of period | $ | 13.84 | $ | 14.29 | $ | 13.21 | $ | 11.56 | ||||||||||||
|
|
|
|
|
|
|
| |||||||||||||
Total investment return(3) | (3.15 | )% | 8.25 | % | 14.91 | % | 5.96 | % | ||||||||||||
Ratios/Supplemental Data | ||||||||||||||||||||
Net assets, end of period (in thousands) | $ | 1,551 | $ | 1,321 | $ | 247 | $ | 14 | ||||||||||||
Ratio of expenses to average net assets | 1.35 | % | 1.35 | % | 1.35 | % | 1.35 | %(4) | ||||||||||||
Ratio of expenses to average net assets without waivers and expense reimbursements(5) | 1.41 | % | 1.64 | % | 3.50 | % | 9.47 | %(4) | ||||||||||||
Ratio of net investment income/(loss) to average net assets | (0.07 | )% | (0.03 | )% | 0.23 | % | 2.63 | %(4) | ||||||||||||
Portfolio turnover rate | 11 | % | 12 | % | 6 | % | — | |||||||||||||
| * | Commencement of operations. |
| (1) | The selected per share data was calculated using the average shares outstanding method for the period. |
| (2) | Amount is less than $0.005 per share. |
| (3) | Total investment return is calculated assuming a purchase of shares on the first day and a sale of shares on the last day of each period reported and includes reinvestment of dividends and distributions, if any. Total returns for periods less than one year are not annualized. |
| (4) | Annualized. |
| (5) | During the period, certain fees were waived and/or reimbursed. If such fee waivers and/or reimbursements had not occurred, the ratios would have been as indicated (See Note 2). |
The accompanying notes are an integral part of the financial statements.
73
POLEN U.S. SMALL COMPANY GROWTH FUND
Financial Highlights
Contained below is per share operating performance data for Institutional Class shares outstanding, total investment return, ratios to average net assets and other supplemental data for the respective period. The total returns in the table represent the rate that an investor would have earned or lost on an investment in the Fund (assuming reinvestment of all dividends and distributions). This information has been derived from information provided in the financial statements and should be read in conjunction with the financial statements and the notes thereto.
| Institutional Class | |||||||||||||||
| For the Year Ended April 30, 2020 | For the Year Ended April 30, 2019 | For the Period November 01, 2017* to April 30, 2018 | |||||||||||||
Per Share Operating Performance | |||||||||||||||
Net asset value, beginning of period | $ | 12.43 | $ | 10.21 | $ | 10.00 | |||||||||
|
|
|
|
|
| ||||||||||
Net investment loss(1) | (0.11 | ) | (0.10 | ) | (0.05 | ) | |||||||||
Net realized and unrealized gain/(loss) on investments | (1.09 | ) | 2.34 | 0.26 | |||||||||||
|
|
|
|
|
| ||||||||||
Net increase/(decrease) in net assets resulting from operations | (1.20 | ) | 2.24 | 0.21 | |||||||||||
|
|
|
|
|
| ||||||||||
Dividends and distributions to shareholders from: | |||||||||||||||
Net realized capital gains | (0.06 | ) | (0.02 | ) | — | ||||||||||
|
|
|
|
|
| ||||||||||
Redemption fees | 0.00 | (2) | 0.00 | (2) | — | ||||||||||
|
|
|
|
|
| ||||||||||
Net asset value, end of period | $ | 11.17 | $ | 12.43 | $ | 10.21 | |||||||||
|
|
|
|
|
| ||||||||||
Total investment return(3) | (9.70 | )% | 21.94 | % | 2.10 | % | |||||||||
Ratios/Supplemental Data | |||||||||||||||
Net assets, end of period (in thousands) | $ | 32,051 | $ | 7,940 | $ | 3,334 | |||||||||
Ratio of expenses to average net assets | 1.25 | % | 1.25 | % | 1.25 | %(4) | |||||||||
Ratio of expenses to average net assets without waivers and expense reimbursements(5) | 2.16 | % | 3.38 | % | 7.51 | %(4) | |||||||||
Ratio of net investment loss to average net assets | (0.92 | )% | (0.87 | )% | (0.95 | )%(4) | |||||||||
Portfolio turnover rate | 68 | % | 35 | % | 8 | %(6) | |||||||||
| * | Commencement of operations. |
| (1) | The selected per share data was calculated using the average shares outstanding method for the period. |
| (2) | Amount is less than $0.005 per share. |
| (3) | Total investment return is calculated assuming a purchase of shares on the first day and a sale of shares on the last day of each period reported and includes reinvestment of dividends and distributions, if any. Total returns for periods less than one year are not annualized. |
| (4) | Annualized. |
| (5) | During the period, certain fees were waived and/or reimbursed. If such fee waivers and/or reimbursements had not occurred, the ratios would have been as indicated (See Note 2). |
| (6) | Not annualized. |
The accompanying notes are an integral part of the financial statements.
74
POLEN U.S. SMALL COMPANY GROWTH FUND
Financial Highlights
Contained below is per share operating performance data for Investor Class shares outstanding, total investment return, ratios to average net assets and other supplemental data for the respective period. The total returns in the table represent the rate that an investor would have earned or lost on an investment in the Fund (assuming reinvestment of all dividends and distributions). This information has been derived from information provided in the financial statements and should be read in conjunction with the financial statements and the notes thereto.
| Investor Class | ||||||||||
| For the Year Ended April 30, 2020 | For the Period February 8, 2019* to April 30, 2019 | |||||||||
Per Share Operating Performance | ||||||||||
Net asset value, beginning of period | $ | 12.42 | $ | 11.54 | ||||||
|
|
|
| |||||||
Net investment loss(1) | (0.13 | ) | (0.03 | ) | ||||||
Net realized and unrealized gain/(loss) on investments | (1.09 | ) | 0.91 | |||||||
|
|
|
| |||||||
Net increase/(decrease) in net assets resulting from operations | (1.22 | ) | 0.88 | |||||||
|
|
|
| |||||||
Dividends and distributions to shareholders from: | ||||||||||
Net realized capital gains | (0.06 | ) | — | |||||||
|
|
|
| |||||||
Redemption fees | 0.00 | (2) | — | |||||||
|
|
|
| |||||||
Net asset value, end of period | $ | 11.14 | $ | 12.42 | ||||||
|
|
|
| |||||||
Total investment return(3) | (9.87 | )% | 7.63 | % | ||||||
Ratios/Supplemental Data | ||||||||||
Net assets, end of period (in thousands) | $ | 1,272 | $ | 13 | ||||||
Ratio of expenses to average net assets | 1.50 | % | 1.50 | %(4) | ||||||
Ratio of expenses to average net assets without waivers and expense reimbursements(5) | 2.34 | % | 2.98 | %(4) | ||||||
Ratio of net investment loss to average net assets | (1.18 | )% | (1.12 | )%(4) | ||||||
Portfolio turnover rate | 68 | % | 35 | %(6) | ||||||
| * | Commencement of operations. |
| (1) | The selected per share data was calculated using the average shares outstanding method for the period. |
| (2) | Amount is less than $0.005 per share. |
| (3) | Total investment return is calculated assuming a purchase of shares on the first day and a sale of shares on the last day of each period reported and includes reinvestment of dividends and distributions, if any. Total returns for periods less than one year are not annualized. |
| (4) | Annualized. |
| (5) | During the period, certain fees were waived and/or reimbursed. If such fee waivers and/or reimbursements had not occurred, the ratios would have been as indicated (See Note 2). |
| (6) | Reflects portfolio turnover of the Fund for the year ended April 30, 2019. |
The accompanying notes are an integral part of the financial statements.
75
POLEN INTERNATIONAL SMALL COMPANY GROWTH FUND
Financial Highlights
Contained below is per share operating performance data for Institutional Class shares outstanding, total investment return, ratios to average net assets and other supplemental data for the respective period. The total returns in the table represent the rate that an investor would have earned or lost on an investment in the Fund (assuming reinvestment of all dividends and distributions). This information has been derived from information provided in the financial statements and should be read in conjunction with the financial statements and the notes thereto.
| Institutional Class | ||||||||||
| For the Year Ended April 30, 2020 | For the Period December 31, 2018* to April 30, 2019 | |||||||||
Per Share Operating Performance | ||||||||||
Net asset value, beginning of period | $ | 11.93 | $ | 10.00 | ||||||
|
|
|
| |||||||
Net investment income/(loss)(1) | (0.03 | ) | 0.00 | (2) | ||||||
Net realized and unrealized gain on investments | 0.22 | 1.93 | ||||||||
|
|
|
| |||||||
Net increase in net assets resulting from operations | 0.19 | 1.93 | ||||||||
|
|
|
| |||||||
Dividends and distributions to shareholders from: | ||||||||||
Net realized capital gains | (0.10 | ) | — | |||||||
|
|
|
| |||||||
Redemption fees | 0.00 | (2) | — | |||||||
|
|
|
| |||||||
Net asset value, end of period | $ | 12.02 | $ | 11.93 | ||||||
|
|
|
| |||||||
Total investment return(3) | 1.48 | % | 19.30 | % | ||||||
Ratios/Supplemental Data | ||||||||||
Net assets, end of period (in thousands) | $ | 7,908 | $ | 3,357 | ||||||
Ratio of expenses to average net assets | 1.25 | % | 1.25 | %(4) | ||||||
Ratio of expenses to average net assets without waivers and expense reimbursements(5) | 3.95 | % | 7.51 | %(4) | ||||||
Ratio of net investment income/(loss) to average net assets | (0.21 | )% | 0.01 | %(4) | ||||||
Portfolio turnover rate | 25 | % | 9 | %(6) | ||||||
| * | Commencement of operations. |
| (1) | The selected per share data was calculated using the average shares outstanding method for the period. |
| (2) | Amount is less than $0.005 per share. |
| (3) | Total investment return is calculated assuming a purchase of shares on the first day and a sale of shares on the last day of each period reported and includes reinvestments of dividends and distributions, if any. Total returns for periods less than one year are not annualized. |
| (4) | Annualized. |
| (5) | During the period, certain fees were waived and/or reimbursed. If such fee waivers and/or reimbursements had not occurred, the ratios would have been as indicated (See Note 2). |
| (6) | Not annualized. |
The accompanying notes are an integral part of the financial statements.
76
POLEN INTERNATIONAL SMALL COMPANY GROWTH FUND
Financial Highlights
Contained below is per share operating performance data for Investor Class shares outstanding, total investment return, ratios to average net assets and other supplemental data for the respective period. The total returns in the table represent the rate that an investor would have earned or lost on an investment in the Fund (assuming reinvestment of all dividends and distributions). This information has been derived from information provided in the financial statements and should be read in conjunction with the financial statements and the notes thereto.
| Investor Class | ||||||||||
| For the Year Ended April 30, 2020 | For the Period February 8, 2019* to April 30, 2019 | |||||||||
Per Share Operating Performance | ||||||||||
Net asset value, beginning of period | $ | 11.92 | $ | 10.81 | ||||||
|
|
|
| |||||||
Net investment income/(loss)(1) | (0.06 | ) | 0.01 | |||||||
Net realized and unrealized gain on investments | 0.22 | 1.10 | ||||||||
|
|
|
| |||||||
Net increase in net assets resulting from operations | 0.16 | 1.11 | ||||||||
|
|
|
| |||||||
Dividends and distributions to shareholders from: | ||||||||||
Net realized capital gains | (0.10 | ) | — | |||||||
|
|
|
| |||||||
Redemption fees | 0.00 | (2) | — | |||||||
|
|
|
| |||||||
Net asset value, end of period | $ | 11.98 | $ | 11.92 | ||||||
|
|
|
| |||||||
Total investment return(3) | 1.23 | % | 10.27 | % | ||||||
Ratios/Supplemental Data | ||||||||||
Net assets, end of period (in thousands) | $ | 172 | $ | 37 | ||||||
Ratio of expenses to average net assets | 1.50 | % | 1.50 | %(4) | ||||||
Ratio of expenses to average net assets without waivers and expense reimbursements(5) | 4.26 | % | 7.17 | %(4) | ||||||
Ratio of net investment income/(loss) to average net assets | (0.46 | )% | 0.36 | %(4) | ||||||
Portfolio turnover rate | 25 | % | 9 | %(6)(7) | ||||||
| * | Commencement of operations. |
| (1) | The selected per share data was calculated using the average shares outstanding method for the period. |
| (2) | Amount is less than $0.005 per share. |
| (3) | Total investment return is calculated assuming a purchase of shares on the first day and a sale of shares on the last day of each period reported and includes reinvestments of dividends and distributions, if any. Total returns for periods less than one year are not annualized. |
| (4) | Annualized. |
| (5) | During the period, certain fees were waived and/or reimbursed. If such fee waivers and/or reimbursements had not occurred, the ratios would have been as indicated (See Note 2). |
| (6) | Not annualized. |
| (7) | Reflects portfolio turnover of the Fund for the period December 31, 2018 to April 30, 2019. |
The accompanying notes are an integral part of the financial statements.
77
POLEN GROWTH FUNDS
Notes to Financial Statements
April 30, 2020
1. Organization and Significant Accounting Policies
The Polen Growth Fund, Polen Global Growth Fund, Polen International Growth Fund, Polen U.S. Small Company Growth Fund and Polen International Small Company Growth Fund (each a “Fund” and together the “Funds”) are non-diversified, open-end management investment companies registered under the Investment Company Act of 1940, as amended, (the “1940 Act”), which commenced investment operations on September 15, 2010, December 30, 2014, December 30, 2016, November 1, 2017 and December 31, 2018, respectively. The Funds are separate series of FundVantage Trust (the “Trust”) which was organized as a Delaware statutory trust on August 28, 2006. The Trust is a “series trust” authorized to issue an unlimited number of separate series or classes of shares of beneficial interest. Each series is treated as a separate entity for certain matters under the 1940 Act, and for other purposes, and a shareholder of one series is not deemed to be a shareholder of any other series. The Funds offer two separate classes of shares, Investor Class and Institutional Class.
The Funds are investment companies and follow accounting and reporting guidance in the Financial Accounting Standards Board Accounting Standards Codification Topic 946.
Portfolio Valuation — The Funds’ net asset value (“NAV”) is calculated once daily at the close of regular trading hours on the New York Stock Exchange (“NYSE”) (typically 4:00 p.m. Eastern time) on each day the NYSE is open. Securities held by the Funds are valued using the closing price or the last sale price on a national securities exchange or the National Association of Securities Dealers Automatic Quotation System (“NASDAQ”) market system where they are primarily traded. Equity securities traded in the over-the-counter market are valued at their closing prices. If there were no transactions on that day, securities traded principally on an exchange or on NASDAQ will be valued at the mean of the last bid and ask prices prior to the market close. Fixed income securities having a remaining maturity of greater than 60 days are valued using an independent pricing service. Fixed income securities having a remaining maturity of 60 days or less are generally valued at amortized cost, provided such amount approximates fair value. Investments in other open-end investment companies are valued based on the NAV of the investment companies (which may use fair value pricing as discussed in their prospectuses). If market quotations are unavailable or deemed unreliable, securities will be valued in accordance with procedures adopted by the Trust’s Board of Trustees (“Board of Trustees”). Relying on prices supplied by pricing services or dealers or using fair valuation may result in values that are higher or lower than the values used by other investment companies and investors to price the same investments. In the event that market quotes are not readily available, and the security or asset cannot be valued pursuant to one of the valuation methods, the value of the security or asset will be determined in good faith by the Adviser. The Trust has established a Valuation Committee which performs certain functions including the oversight of the Adviser’s fair valuation determinations.
78
POLEN GROWTH FUNDS
Notes to Financial Statements (Continued)
April 30, 2020
Fair Value Measurements — The inputs and valuation techniques used to measure fair value of the Funds’ investments are summarized into three levels as described in the hierarchy below:
| ● | Level 1 — quoted prices in active markets for identical securities; |
| ● | Level 2 — other significant observable inputs (including quoted prices for similar securities, interest rates, prepayment speeds, credit risk, etc.); and |
| ● | Level 3 — significant unobservable inputs (including the Funds’ own assumptions in determining the fair value of investments). |
The inputs or methodology used for valuing securities are not necessarily an indication of the risk associated with investing in those securities.
Significant events (such as movement in the U.S. securities market, or other regional and local developments) may occur between the time that foreign markets close (where the security is principally traded) and the time that each Fund calculates its NAV (generally, the close of the NYSE) that may impact the value of securities traded in these foreign markets. As a result, each Fund fair values foreign securities using an independent pricing service which considers the correlation of the trading patterns of the foreign security to the intraday trading in the U.S. markets for investments such as American Depositary Receipts, financial futures, exchange traded funds and certain indexes as well as prices for similar securities. Such fair valuations are categorized as Level 2 in the hierarchy.
Securities listed on a non-U.S. exchange are generally fair valued daily by an independent fair value pricing service approved by the Board of Trustees and categorized as Level 2 investments within the hierarchy. The fair valuations for these securities may not be the same as quoted or published prices of the securities on their primary markets. Securities for which daily fair value prices from the independent fair value pricing service are not available are generally valued at the last quoted sale price at the close of an exchange on which the security is traded and categorized as Level 1 investments within the hierarchy. Values of foreign securities, currencies, and other assets and liabilities denominated in foreign currencies are translated into U.S. dollars at the exchange rate of said currencies against the U.S. dollar, as of valuation time, as provided by an independent pricing service approved by the Board of Trustees.
79
POLEN GROWTH FUNDS
Notes to Financial Statements (Continued)
April 30, 2020
The following is a summary of the inputs used, as of April 30, 2020, in valuing the Funds’ investments carried at fair value:
Funds | Total Value at 04/30/20 | Level 1 Quoted Price | Level 2 Other Significant Observable Inputs | Level 3 Significant Unobservable Inputs | ||||||||||||
Polen Growth Fund | ||||||||||||||||
Investments in Securities* | $ | 5,897,850,472 | $ | 5,897,850,472 | $ | — | $ | — | ||||||||
|
|
|
|
|
|
|
| |||||||||
Polen Global Growth Fund | ||||||||||||||||
Australia | $ | 7,715,345 | $ | — | $ | 7,715,345 | $ | — | ||||||||
China | 26,994,839 | 14,256,213 | 12,738,626 | — | ||||||||||||
Denmark | 6,620,462 | — | 6,620,462 | — | ||||||||||||
France | 7,361,733 | — | 7,361,733 | — | ||||||||||||
Germany | 24,517,315 | — | 24,517,315 | — | ||||||||||||
Ireland | 9,318,020 | 9,318,020 | — | — | ||||||||||||
Spain | 5,047,765 | — | 5,047,765 | — | ||||||||||||
Switzerland | 10,417,417 | — | 10,417,417 | — | ||||||||||||
United States | 144,959,792 | 144,959,792 | �� | — | — | |||||||||||
|
|
|
|
|
|
|
| |||||||||
Total | $ | 242,952,688 | $ | 168,534,025 | $ | 74,418,663 | $ | — | ||||||||
|
|
|
|
|
|
|
| |||||||||
Polen International Growth Fund |
| |||||||||||||||
Australia | $ | 10,977,330 | $ | — | $ | 10,977,330 | $ | — | ||||||||
China | 37,879,125 | 24,492,318 | 13,386,807 | — | ||||||||||||
Denmark | 5,178,392 | — | 5,178,392 | — | ||||||||||||
France | 10,806,891 | — | 10,806,891 | — | ||||||||||||
Germany | 27,523,972 | — | 27,523,972 | — | ||||||||||||
Ireland | 44,817,987 | 35,307,749 | 9,510,238 | — | ||||||||||||
Israel | 4,983,315 | 4,983,315 | — | — | ||||||||||||
Mexico | 3,571,229 | 3,571,229 | — | — | ||||||||||||
Spain | 10,782,206 | — | 10,782,206 | — | ||||||||||||
Switzerland | 5,776,757 | — | 5,776,757 | — | ||||||||||||
United Kingdom | 26,614,208 | — | 26,614,208 | — | ||||||||||||
|
|
|
|
|
|
|
| |||||||||
Total | $ | 188,911,412 | $ | 68,354,611 | $ | 120,556,801 | $ | — | ||||||||
|
|
|
|
|
|
|
| |||||||||
80
POLEN GROWTH FUNDS
Notes to Financial Statements (Continued)
April 30, 2020
Funds | Total Value at 04/30/20 | Level 1 Quoted Price | Level 2 Other Significant Observable Inputs | Level 3 Significant Unobservable Inputs | ||||||||||||
Polen U.S. Small Company Growth Fund | ||||||||||||||||
Investments in Securities* | $ | 29,827,479 | $ | 29,827,479 | $ | — | $ | — | ||||||||
|
|
|
|
|
|
|
| |||||||||
Polen International Small Company Growth Fund | ||||||||||||||||
Argentina | $ | 458,053 | $ | 458,053 | $ | — | $ | — | ||||||||
Australia | 866,469 | — | 866,469 | — | ||||||||||||
Brazil | 90,907 | 90,907 | — | — | ||||||||||||
Canada | 1,289,485 | 1,289,485 | — | — | ||||||||||||
Denmark | 516,866 | — | 516,866 | — | ||||||||||||
Germany | 1,112,771 | — | 1,112,771 | — | ||||||||||||
Italy | 203,436 | — | 203,436 | — | ||||||||||||
Japan | 512,817 | — | 512,817 | — | ||||||||||||
Jersey | 306,311 | — | 306,311 | — | ||||||||||||
Mexico | 313,545 | 313,545 | — | — | ||||||||||||
South Korea | 313,291 | — | 313,291 | — | ||||||||||||
Sweden | 386,384 | — | 386,384 | — | ||||||||||||
Switzerland | 373,775 | — | 373,775 | — | ||||||||||||
United Kingdom | 1,030,333 | — | 1,030,333 | — | ||||||||||||
|
|
|
|
|
|
|
| |||||||||
Total | $ | 7,774,443 | $ | 2,151,990 | $ | 5,622,453 | $ | — | ||||||||
|
|
|
|
|
|
|
| |||||||||
* Please refer to Portfolio of Investments for details on portfolio holdings.
At the end of each quarter, management evaluates the classification of Levels 1, 2 and 3 assets and liabilities. Various factors are considered, such as changes in liquidity from the prior reporting period; whether or not a broker is willing to execute at the quoted price; the depth and consistency of prices from third party pricing services; and the existence of contemporaneous, observable trades in the market. Additionally, management evaluates the classification of Level 1 and Level 2 assets and liabilities on a quarterly basis for changes in listings or delistings on national exchanges.
Due to the inherent uncertainty of determining the fair value of investments that do not have a readily available market value, the fair value of the Funds’ investments may fluctuate from period to period. Additionally, the fair value of investments may differ significantly from the values that would have been
81
POLEN GROWTH FUNDS
Notes to Financial Statements (Continued)
April 30, 2020
used had a ready market existed for such investments and may differ materially from the values the Funds may ultimately realize. Further, such investments may be subject to legal and other restrictions on resale or otherwise less liquid than publicly traded securities.
For fair valuations using significant unobservable inputs, U.S. generally accepted accounting principles (“U.S. GAAP”) require the Funds to present a reconciliation of the beginning to ending balances for reported market values that present changes attributable to total realized and unrealized gains or losses, purchase and sales, and transfers in and out of Level 3 during the period. A reconciliation of Level 3 investments is presented only when the Funds had an amount of Level 3 investments at the end of the reporting period that was meaningful in relation to their net assets. The amounts and reasons for all transfers in and out of Level 3 are disclosed when the Funds had an amount of transfers during the reporting period that was meaningful in relation to their net assets as of the end of the reporting period.
For the year ended April 30, 2020, there were no transfers in or out of Level 3.
Use of Estimates — The preparation of financial statements in conformity with U.S. GAAP requires management to make estimates and assumptions that affect the amounts reported in the financial statements and accompanying notes at the date of the financial statements and the reported amounts of revenues and expenses during the period. Actual results could differ from those estimates and those differences could be material.
Investment Transactions, Investment Income and Expenses — Investment transactions are recorded on trade date for financial statement preparation purposes. Realized gains and losses on investments sold are recorded on the identified cost basis. Interest income is recorded on the accrual basis. Dividends are recorded on the ex-dividend date. Distribution (12b-1) fees relating to a specific class are charged directly to that class. Fund level expenses common to all classes, investment income and realized and unrealized gains and losses on investments are generally allocated to each class of each Fund based upon the relative daily net assets of each class of each Fund. General expenses of the Trust are generally allocated to each Fund in proportion to its relative daily net assets. Expenses directly attributable to a particular Fund in the Trust are charged directly to that Fund. The Funds’ investment income, expenses (other than class-specific expenses) and unrealized and realized gains and losses are allocated daily to each class of shares based upon the relative proportion of net assets of each class at the beginning of the day.
Foreign Currency Translation — Assets and liabilities initially expressed in non-U.S. currencies are translated into U.S. dollars based on the applicable exchange rates at the date of the last business day of the financial statement period. Purchases and sales of securities, interest income, dividends, variation margin received and expenses denominated in foreign currencies are translated into U.S. dollars at the exchange rates in effect on the transaction date. The Funds do not separately report the effect of changes in foreign exchange rates from changes in market prices of securities held. Such changes are
82
POLEN GROWTH FUNDS
Notes to Financial Statements (Continued)
April 30, 2020
included with the net realized gain or loss and change in unrealized appreciation or depreciation on investment securities in the Statement of Operations. Other foreign currency transactions resulting in realized and unrealized gain or loss are reported separately as net realized gain or loss and change in unrealized appreciation or depreciation on foreign currencies in the Statement of Operations.
Dividends and Distributions to Shareholders — Dividends from net investment income and distributions from net realized capital gains, if any, are declared and paid at least annually to shareholders and are recorded on ex-date. Income dividends and capital gain distributions are determined in accordance with U.S. federal income tax regulations, which may differ from U.S. GAAP.
U.S. Tax Status — No provision is made for U.S. income taxes as it is the Funds’ intention to continue to qualify for and elect the tax treatment applicable to regulated investment companies under Subchapter M of the Internal Revenue Code of 1986, as amended (“Internal Revenue Code”), and make the requisite distributions to its shareholders which will be sufficient to relieve it from U.S. income and excise taxes.
Other — In the normal course of business, the Funds may enter into contracts that provide general indemnifications. The Funds’ maximum exposure under these arrangements is dependent on claims that may be made against the Funds in the future, and therefore, cannot be estimated; however, based on experience, the risk of material loss for such claims is considered remote.
Market disruptions associated with the COVID-19 pandemic have had a global impact, and uncertainty exists as to its long-term implications. The COVID-19 pandemic could adversely affect the value and liquidity of the Funds’ investments, impair the Funds’ ability to satisfy redemption requests, and negatively impact the Funds’ performance. In addition, the outbreak of COVID-19, and measures taken to mitigate its effects, could result in disruptions to the services provided to the Funds by its service providers. Fund management is continuing to monitor this development and evaluate its impact on the Funds.
Currency Risk — The Funds invest in securities of foreign issuers, including American Depositary Receipts. These markets are subject to special risks associated with foreign investments not typically associated with investing in U.S. markets. Because the foreign securities in which the Funds may invest generally trade in currencies other than the U.S. dollar, changes in currency exchange rates will affect the Funds’ NAV, the value of dividends and interest earned and gains and losses realized on the sale of securities. Because the NAV for the Funds is determined on the basis of U.S. dollars, the Funds may lose money by investing in a foreign security if the local currency of a foreign market depreciates against the U.S. dollar, even if the local currency value of the Funds’ holdings goes up. Generally, a strong U.S. dollar relative to these other currencies will adversely affect the value of the Funds’ holdings in foreign securities.
Foreign Securities Market Risk — Securities of many non-U.S. companies may be less liquid and their prices more volatile than securities of comparable U.S. companies. Securities of companies
83
POLEN GROWTH FUNDS
Notes to Financial Statements (Continued)
April 30, 2020
traded in many countries outside the U.S., particularly emerging markets countries, may be subject to further risks due to the inexperience of local investment professionals and financial institutions, the possibility of permanent or temporary termination of trading and greater spreads between bid and asked prices of securities. In addition, non-U.S. stock exchanges and investment professionals are subject to less governmental regulation, and commissions may be higher than in the United States. Also, there may be delays in the settlement of non-U.S. stock exchange transactions.
2. Transactions with Related Parties and Other Service Providers
Polen Capital Management, LLC (“PCM” or the “Adviser”) serves as investment adviser to the Funds pursuant to an investment advisory agreement with the Trust. For its services, the Adviser is paid a monthly fee at the annual rate of 0.85% of the average daily net assets of the Polen Growth Fund, Polen Global Growth Fund and Polen International Growth Fund, and 1.00% of average daily net assets of the Polen U.S. Small Company Growth Fund and Polen International Small Company Growth Fund. The Adviser has contractually agreed to reduce its investment advisory fee and/or reimburse certain expenses of the Funds to the extent necessary to ensure that the Funds’ total operating expenses (excluding taxes, fees and expenses attributable to a distribution or service plan adopted by the Trust, interest, extraordinary items, “Acquired Fund Fees and Expenses” and brokerage commissions) do not exceed (on an annual basis) 1.00% of the Polen Growth Fund’s, 1.10% of the Polen Global Growth Fund’s and Polen International Growth Fund’s and 1.25% of the Polen U.S. Small Company Growth Fund’s and Polen International Small Company Growth Fund’s average daily net assets (the “Expense Limitations”). The Expense Limitations will remain in place until August 31, 2020 with respect to each Fund, unless the Board of Trustees approves its earlier termination. The Adviser is entitled to recover, subject to approval by the Board of Trustees, such amounts reduced or reimbursed for a period of up to three (3) years from the date on which the Adviser reduced its compensation and/or assumed expenses for such Fund. The Adviser is permitted to seek reimbursement from a Fund, subject to certain limitations, for fees it waived and Fund expenses it paid to the extent the total annual fund expenses do not exceed the limits described above or any lesser limits in effect at the time of reimbursement. For the Polen Growth Fund, the Adviser is entitled to recoup only the advisory fees waived or expenses reimbursed on or after January 1, 2017. No recoupment will occur unless the Fund’s expenses are below the Expense Limitation amount.
For the year ended April 30, 2020, the Adviser earned advisory fees of $38,737,721, $1,066,769, $935,714, $149,240 and $61,203 for the Polen Growth Fund, Polen Global Growth Fund, Polen International Growth Fund, Polen U.S. Small Company Growth Fund and Polen International Small Company Growth Fund, respectively. For the year ended April 30, 2020, the Adviser recouped fees of $52,409 waived in prior periods for the Polen Growth Fund, and waived fees and reimbursed expenses of $25,739, $81,289, $135,219 and $165,417 for the Polen Global Growth Fund, Polen International Growth Fund, Polen U.S. Small Company Growth Fund and Polen International Small Company Growth Fund, respectively. As of April 30, 2020, the Polen Growth Fund has no additional funds available to be recouped.
84
POLEN GROWTH FUNDS
Notes to Financial Statements (Continued)
April 30, 2020
As of April 30, 2020, the amount of potential recovery was as follows:
Expiration
| ||||||||||||||||||||
| 04/30/2021 | 04/30/2022 | 04/30/2023 | Total | |||||||||||||||||
Polen Global Growth Fund | $ | 97,239 | $ | 114,262 | $ | 25,739 | $ | 237,240 | ||||||||||||
Polen International Growth Fund | $ | 130,305 | $ | 116,513 | $ | 81,289 | $ | 328,107 | ||||||||||||
Polen U.S. Small Company Growth Fund | $ | 65,823 | $ | 112,930 | $ | 135,219 | $ | 313,972 | ||||||||||||
Polen International Small Company Growth Fund | $ | — | $ | 52,240 | $ | 165,417 | $ | 217,657 | ||||||||||||
Other Service Providers
The Bank of New York Mellon (“BNY Mellon”) serves as administrator and custodian for the Funds. For providing administrative and accounting services, BNY Mellon is entitled to receive a monthly fee equal to an annual percentage rate of the Funds’ average daily net assets and is subject to certain minimum monthly fees. For providing certain custodial services, BNY Mellon is entitled to receive a monthly fee, subject to certain minimum, and out of pocket expenses.
BNY Mellon Investment Servicing (US) Inc. (the “Transfer Agent”) provides transfer agent services to the Funds. The Transfer Agent is entitled to receive a monthly fee, subject to certain minimum, and out of pocket expenses.
The Trust, on behalf of the Funds, has entered into agreements with financial intermediaries to provide recordkeeping, processing, shareholder communications and other services to customers of the intermediaries investing in the Funds and has agreed to compensate the intermediaries for providing those services. The fees incurred by the Funds for these services are included in Transfer agent fees in the Statements of Operations.
Foreside Funds Distributors LLC (the “Underwriter”) provides principal underwriting services to the Funds.
The Trust and the Underwriter are parties to an underwriting agreement. The Trust has adopted a distribution plan for the Investor Shares of the Funds in accordance with Rule 12b-1 under the 1940 Act. Pursuant to the Investor Shares plan, the Funds compensate the Underwriter for direct and indirect costs and expenses incurred in connection with advertising, marketing and other distribution services in an amount not to exceed 0.25% on an annualized basis of the average daily net assets of the Funds’ Investor Shares.
85
POLEN GROWTH FUNDS
Notes to Financial Statements (Continued)
April 30, 2020
Trustees and Officers
The Trust is governed by its Board of Trustees. The Trustees receive compensation in the form of an annual retainer and per meeting fees for their services to the Trust. An employee of BNY Mellon serves as the Secretary of the Trust and is not compensated by the Funds or the Trust.
JW Fund Management LLC (“JWFM”) provides a Principal Executive Officer and Principal Financial Officer, respectively, to the Trust. Duff & Phelps, LLC (“D&P”) provides the Trust with a Chief Compliance Officer and an Anti-Money Laundering Officer. JWFM and D&P are compensated for their services provided to the Trust.
3. Investment in Securities
For the year ended April 30, 2020, aggregate purchases and sales of investment securities (excluding short-term investments) of the Funds were as follows:
| Purchases | Sales | |||||||
Polen Growth Fund | $ | 2,844,295,224 | $ | 1,014,134,558 | ||||
Polen Global Growth Fund | $ | 180,213,035 | $ | 21,609,281 | ||||
Polen International Growth Fund | $ | 137,433,790 | $ | 11,653,319 | ||||
Polen U.S. Small Company Growth Fund | $ | 33,708,912 | $ | 9,896,425 | ||||
Polen International Small Company Growth Fund | $ | 6,122,360 | $ | 1,466,721 | ||||
4. Capital Share Transactions
For the year ended April 30, 2020 and the year or period ended April 30, 2019, transactions in capital shares (authorized shares unlimited) were as follows:
| Polen Growth Fund | ||||||||||||||||
| For the Year Ended April 30, 2020 | For the Year Ended April 30, 2019 | |||||||||||||||
| Shares | Amount | Shares | Amount | |||||||||||||
Institutional Class | ||||||||||||||||
Sales | 86,945,359 | $ | 2,794,439,473 | 51,581,595 | $ | 1,440,277,408 | ||||||||||
Reinvestments | 4,110 | 138,787 | 2,018,326 | 52,859,833 | ||||||||||||
Redemption Fees* | — | 283,349 | — | 143,243 | ||||||||||||
Redemptions | (28,378,493 | ) | (912,676,501 | ) | (17,794,917 | ) | (492,616,940 | ) | ||||||||
|
|
|
|
|
|
|
| |||||||||
Net increase | 58,570,976 | $ | 1,882,185,108 | 35,805,004 | $ | 1,000,663,544 | ||||||||||
|
|
|
|
|
|
|
| |||||||||
86
POLEN GROWTH FUNDS
Notes to Financial Statements (Continued)
April 30, 2020
| Polen Growth Fund | ||||||||||||||||
| For the Year Ended April 30, 2020 | For the Year Ended April 30, 2019 | |||||||||||||||
| Shares | Amount | Shares | Amount | |||||||||||||
Investor Class | ||||||||||||||||
Sales | 6,758,621 | $ | 218,141,742 | 8,089,750 | $ | 226,705,821 | ||||||||||
Reinvestments | 395 | 13,063 | 175,372 | 4,507,051 | ||||||||||||
Redemption Fees* | — | 22,482 | — | 10,082 | ||||||||||||
Redemptions | (4,439,271 | ) | (138,590,685 | ) | (1,596,154 | ) | (43,219,377 | ) | ||||||||
|
|
|
|
|
|
|
| |||||||||
Net increase | 2,319,745 | $ | 79,586,602 | 6,668,968 | $ | 188,003,577 | ||||||||||
|
|
|
|
|
|
|
| |||||||||
Total net increase | 60,890,721 | $ | 1,961,771,710 | 42,473,972 | $ | 1,188,667,121 | ||||||||||
|
|
|
|
|
|
|
| |||||||||
| Polen Global Growth Fund | ||||||||||||||||
| For the Year Ended April 30, 2020 | For the Year Ended April 30, 2019 | |||||||||||||||
| Shares | Amount | Shares | Amount | |||||||||||||
Institutional Class | ||||||||||||||||
Sales | 11,829,561 | $ | 213,987,459 | 2,544,773 | $ | 39,693,428 | ||||||||||
Reinvestments | 2,443 | 45,609 | 50,021 | 738,309 | ||||||||||||
Redemption Fees* | — | 43,187 | — | 14,659 | ||||||||||||
Redemptions | (1,962,459 | ) | (34,760,539 | ) | (723,038 | ) | (11,082,475 | ) | ||||||||
|
|
|
|
|
|
|
| |||||||||
Net increase | 9,869,545 | $ | 179,315,716 | 1,871,756 | $ | 29,363,921 | ||||||||||
|
|
|
|
|
|
|
| |||||||||
Investor Class | ||||||||||||||||
Sales | 887,976 | $ | 16,261,822 | 587,723 | $ | 9,053,374 | ||||||||||
Reinvestments | 366 | 6,764 | 9,586 | 140,154 | ||||||||||||
Redemption Fees* | — | 5,242 | — | 2,520 | ||||||||||||
Redemptions | (574,008 | ) | (10,085,287 | ) | (297,551 | ) | (4,550,139 | ) | ||||||||
|
|
|
|
|
|
|
| |||||||||
Net increase | 314,334 | $ | 6,188,541 | 299,758 | $ | 4,645,909 | ||||||||||
|
|
|
|
|
|
|
| |||||||||
Total net increase | 10,183,879 | $ | 185,504,257 | 2,171,514 | $ | 34,009,830 | ||||||||||
|
|
|
|
|
|
|
| |||||||||
87
POLEN GROWTH FUNDS
Notes to Financial Statements (Continued)
April 30, 2020
| Polen International Growth Fund | ||||||||||||||||
| For the Year Ended April 30, 2020 | For the Year Ended April 30, 2019 | |||||||||||||||
| Shares | Amount | Shares | Amount | |||||||||||||
Institutional Class | ||||||||||||||||
Sales | 10,583,618 | $ | 148,901,278 | 4,457,711 | $ | 60,314,850 | ||||||||||
Reinvestments | 943 | 14,265 | 3,280 | 42,343 | ||||||||||||
Redemption Fees* | — | 22,528 | — | 6,973 | ||||||||||||
Redemptions | (1,243,281 | ) | (17,707,491 | ) | (493,161 | ) | (6,663,372 | ) | ||||||||
|
|
|
|
|
|
|
| |||||||||
Net increase | 9,341,280 | $ | 131,230,580 | 3,967,830 | $ | 53,700,794 | ||||||||||
|
|
|
|
|
|
|
| |||||||||
Investor Class | ||||||||||||||||
Sales | 112,821 | $ | 1,693,572 | 103,864 | $ | 1,417,453 | ||||||||||
Reinvestments | — | — | 50 | 649 | ||||||||||||
Redemption Fees* | — | 356 | — | 136 | ||||||||||||
Redemptions | (93,105 | ) | (1,311,693 | ) | (30,174 | ) | (406,731 | ) | ||||||||
|
|
|
|
|
|
|
| |||||||||
Net increase | 19,716 | $ | 382,235 | 73,740 | $ | 1,011,507 | ||||||||||
|
|
|
|
|
|
|
| |||||||||
Total net increase | 9,360,996 | $ | 131,612,815 | 4,041,570 | $ | 54,712,301 | ||||||||||
|
|
|
|
|
|
|
| |||||||||
| Polen U.S. Small Company Growth Fund | ||||||||||||||||
| For the Year Ended April 30, 2020 | For the Year Ended April 30, 2019 | |||||||||||||||
| Shares | Amount | Shares | Amount | |||||||||||||
Institutional Class | ||||||||||||||||
Sales | 2,547,202 | $ | 29,235,972 | 370,471 | $ | 4,242,234 | ||||||||||
Reinvestments | 4,980 | 60,158 | 909 | 9,611 | ||||||||||||
Redemption Fees* | — | 6,149 | — | 431 | ||||||||||||
Redemptions | (321,682 | ) | (3,516,145 | ) | (59,010 | ) | (611,287 | ) | ||||||||
|
|
|
|
|
|
|
| |||||||||
Net increase | 2,230,500 | $ | 25,786,134 | 312,370 | $ | 3,640,989 | ||||||||||
|
|
|
|
|
|
|
| |||||||||
Investor Class | ||||||||||||||||
Sales | 124,163 | $ | 1,389,764 | 1,330 | $ | 16,165 | ||||||||||
Reinvestments | 157 | 1,894 | — | — | ||||||||||||
Redemption Fees* | — | 158 | — | — | ||||||||||||
Redemptions | (11,222 | ) | (124,174 | ) | (246 | ) | (2,793 | ) | ||||||||
|
|
|
|
|
|
|
| |||||||||
Net increase | 113,098 | $ | 1,267,642 | 1,084 | $ | 13,372 | ||||||||||
|
|
|
|
|
|
|
| |||||||||
Total net increase | 2,343,598 | $ | 27,053,776 | 313,454 | $ | 3,654,361 | ||||||||||
|
|
|
|
|
|
|
| |||||||||
88
POLEN GROWTH FUNDS
Notes to Financial Statements (Continued)
April 30, 2020
| Polen International Small Company Growth Fund** | ||||||||||||||||
| For the Year Ended April 30, 2020 | For the Period Ended April 30, 2019 | |||||||||||||||
| Shares | Amount | Shares | Amount | |||||||||||||
Institutional Class | ||||||||||||||||
Sales | 404,507 | $ | 5,101,327 | 281,454 | $ | 2,960,716 | ||||||||||
Reinvestments | 3,564 | 47,687 | — | — | ||||||||||||
Redemption Fees* | — | 526 | — | — | ||||||||||||
Redemptions | (31,436 | ) | (391,784 | ) | — | — | ||||||||||
|
|
|
|
|
|
|
| |||||||||
Net increase | 376,635 | $ | 4,757,756 | 281,454 | $ | 2,960,716 | ||||||||||
|
|
|
|
|
|
|
| |||||||||
Investor Class | ||||||||||||||||
Sales | 25,974 | $ | 332,703 | 3,142 | $ | 35,710 | ||||||||||
Reinvestments | 55 | 740 | — | — | ||||||||||||
Redemption Fees* | — | 8 | — | — | ||||||||||||
Redemptions | (14,788 | ) | (190,049 | ) | — | — | ||||||||||
|
|
|
|
|
|
|
| |||||||||
Net increase | 11,241 | $ | 143,402 | 3,142 | $ | 35,710 | ||||||||||
|
|
|
|
|
|
|
| |||||||||
Total net increase | 387,876 | $ | 4,901,158 | 284,596 | $ | 2,996,426 | ||||||||||
|
|
|
|
|
|
|
| |||||||||
| * | There is a 2.00% redemption fee that may be charged on shares redeemed within the first 60 days of their acquisition. The redemption fees are retained by the Funds for the benefit of the remaining shareholders and recorded as paid-in capital. |
| ** | The Polen International Small Company Growth Fund’s Institutional Class and Investor Class commenced operations on December 31, 2018 and February 8, 2019, respectively. |
5. Federal Tax Information
The Funds have followed the authoritative guidance on accounting for and disclosure of uncertainty in tax positions, which requires the Funds to determine whether a tax position is more likely than not to be sustained upon examination, including resolution of any related appeals or litigation processes, based on the technical merits of the position. Tax positions not deemed to meet the more-likely-than-not threshold would be recorded as tax benefit or expense in the current year. The Funds have determined that there was no effect on the financial statements from following this authoritative guidance. In the normal course of business, the Funds are subject to examination by federal, state and local jurisdictions, where applicable, for tax years for which applicable statutes of limitations have not expired.
89
POLEN GROWTH FUNDS
Notes to Financial Statements (Continued)
April 30, 2020
Distributions are determined in accordance with federal income tax regulations, which may differ in amount or character from net investment income and realized gains for financial reporting purposes. Accordingly, the character of distributions and composition of net assets for tax purposes may differ from those reflected in the accompanying financial statements. To the extent these differences are permanent, such amounts are reclassified within the components of net assets based on the tax treatment; temporary differences do not require reclassifications. Net assets were not affected by these adjustments.
The following permanent differences as of April 30, 2020, primarily attributed to short-term gains netted against net operating loss, reclasses from capital gain to ordinary income and redesignation of distributions, were reclassified among the following accounts:
| Total Distributable Earnings | Paid-in-Capital | |||||||
Polen Growth Fund | $ | 11,803,670 | $ | (11,803,670 | ) | |||
Polen Global Growth Fund | 249,744 | (249,744 | ) | |||||
Polen International Growth Fund | 46,144 | (46,144 | ) | |||||
Polen U.S. Small Company Growth Fund | 57,000 | (57,000 | ) | |||||
Polen International Small Company Growth Fund | — | — | ||||||
For the year ended April 30, 2020, the tax character of distributions paid by the Polen Growth Fund, Polen Global Growth Fund, Polen International Growth Fund, Polen U.S. Small Company Growth Fund and Polen International Small Company Growth Fund were $0, $22,272, $14,475, $64,037 and $36,793 of ordinary income dividends and $174,366, $32,099, $0, $0 and $12,404 of long-term capital gains, respectively. For the year ended April 30, 2019, the tax character of distributions paid by the Polen Growth Fund, Polen Global Growth Fund, Polen International Growth Fund and Polen U.S. Small Company Growth Fund were $6,667,348, $26,262, $18,339 and $9,611 of ordinary income dividends and $59,761,509, $888,096, $25,051 and $0 of long-term capital gains, respectively. There were no distributions for the Polen International Small Company Growth Fund. Distributions from net investment income and short-term capital gains are treated as ordinary income for federal income tax purposes.
90
POLEN GROWTH FUNDS
Notes to Financial Statements (Continued)
April 30, 2020
As of April 30, 2020 the components of distributable earnings on a tax basis were as follows:
| Undistributed Long-Term Gain | Capital Loss Carrryforwards | Unrealized Appreciation | Qualified Late Year Loss Deferral | Total Distributable Earnings | ||||||||||||||||
Polen Growth Fund | $ | 69,119,056 | $ | — | $ | 1,631,834,485 | $ | (7,090,950 | ) | $ | 1,693,862,591 | |||||||||
Polen Global Growth Fund | $ | — | $ | (221,167 | ) | $ | 25,706,545 | $ | (1,013,248 | ) | $ | 24,472,130 | ||||||||
Polen International Growth Fund | $ | — | $ | (1,093,943 | ) | $ | 3,954,075 | $ | (1,178,371 | ) | $ | 1,681,761 | ||||||||
Polen U.S. Small Company Growth Fund | $ | — | $ | (399,531 | ) | $ | 800,667 | $ | (1,017,045 | ) | $ | (615,909 | ) | |||||||
Polen International Small Company Growth Fund | $ | 2,472 | $ | — | $ | 179,799 | $ | — | $ | 182,271 | ||||||||||
The differences between the book and tax basis components of distributable earnings relate primarily to the timing and recognition of income and gains for federal income tax purposes. Foreign currency and short-term capital gains are reported as ordinary income for federal income tax purposes.
As of April 30, 2020, the federal tax cost, aggregate gross unrealized appreciation and depreciation of securities held by each Fund were as follows:
| Federal Tax Cost | Gross Unrealized Appreciation | Gross Unrealized Depreciation | Net Unrealized Appreciation | |||||||||||||
Polen Growth Fund | $ | 4,266,015,987 | $ | 1,659,060,732 | $ | (27,226,247 | ) | $ | 1,631,834,485 | |||||||
Polen Global Growth Fund | 217,229,790 | 29,854,019 | (4,131,121 | ) | 25,722,898 | |||||||||||
Polen International Growth Fund | 184,850,894 | 10,956,783 | (6,896,265 | ) | 4,060,518 | |||||||||||
Polen U.S. Small Company Growth Fund | 29,026,812 | 3,146,639 | (2,345,972 | ) | 800,667 | |||||||||||
Polen International Small Company Growth Fund | 7,594,589 | 891,200 | (711,346 | ) | 179,854 | |||||||||||
91
POLEN GROWTH FUNDS
Notes to Financial Statements (Concluded)
April 30, 2020
Pursuant to federal income tax rules applicable to regulated investment companies, the Funds may elect to treat certain capital losses between November 1 and April 30 and late year ordinary losses ((i) ordinary losses between January 1 and April 30, and (ii) specified ordinary and currency losses between November 1 and April 30) as occurring on the first day of the following tax year. For the year ended April 30, 2020, any amount of losses elected within the tax return will not be recognized for federal income tax purposes until May 1, 2020. For the year ended April 30, 2020, the Funds deferred to May 1, 2020 the following losses:
| Late-Year Ordinary Losses Deferral | Short-Term Capital Loss Deferral | Long-Term Capital Loss Deferral | ||||||||||
Polen Growth Fund | $7,090,950 | $ — | $ — | |||||||||
Polen Global Growth Fund | 175,340 | 931,929 | (94,021) | |||||||||
Polen International Growth Fund | 19,689 | 453,265 | 705,417 | |||||||||
Polen U.S. Small Company Growth Fund | 81,070 | 968,490 | (32,515) | |||||||||
Polen International Small Company Growth Fund | — | — | — | |||||||||
Accumulated capital losses represent net capital loss carryforwards as of April 30, 2020 that may be available to offset future realized capital gains and thereby reduce future capital gains distributions. As of April 30, 2020, the Funds’ capital loss carryforward, which were comprised of both short-term losses and long-term losses, and had an unlimited period of capital loss carryover were as follows:
| Capital Loss Carryforward | ||||||||
| Short-Term | Long-Term | |||||||
Polen Growth Fund | $ | — | $ | — | ||||
Polen Global Growth Fund | 73,338 | 147,829 | ||||||
Polen International Growth Fund | 877,892 | 216,051 | ||||||
Polen U.S. Small Company Growth Fund | 328,785 | 70,746 | ||||||
Polen International Small Company Fund | — | — | ||||||
6. Subsequent Events
Management has evaluated the impact of all subsequent events on the Fund through the date the financial statements were issued, and has determined that there are no subsequent events requiring recognition or disclosure in the financial statements.
92
POLEN GROWTH FUNDS
Report of Independent Registered Public Accounting Firm
To the Board of Trustees of FundVantage Trust and Shareholders of each of the five funds listed in the table below
Opinions on the Financial Statements
We have audited the accompanying statements of assets and liabilities, including the portfolios of investments, of each of the funds listed in the table below (five of the funds constituting FundVantage Trust, hereafter collectively referred to as the “Funds”) as of April 30 2020, the related statements of operations and of changes in net assets for each of the periods indicated in the table below, including the related notes, and the financial highlights for each of the periods indicated therein (collectively referred to as the “financial statements”). In our opinion, the financial statements present fairly, in all material respects, the financial position of each of the Funds as of April 30, 2020, the results of each of their operations and the changes in each of their net assets for the periods indicated in the table below, and each of the financial highlights for each of the periods indicated therein, in conformity with accounting principles generally accepted in the United States of America.
| Polen Growth Fund, Polen Global Growth Fund, Polen International Growth Fund, and Polen U.S. Small Company Growth Fund | Statement of operations for the year ended April 30, 2020 and the statements of changes in net assets for each of the two years in the period ended April 30, 2020
| |
| Polen International Small Company Growth Fund | Statement of operations for the year ended April 30, 2020 and the statements of changes in net assets for the year ended April 30, 2020 and the period from December 31, 2018 (commencement of operations) through April 30, 2019
| |
Basis for Opinions
These financial statements are the responsibility of the Funds’ management. Our responsibility is to express an opinion on the Funds’ financial statements based on our audits. We are a public accounting firm registered with the Public Company Accounting Oversight Board (United States) (PCAOB) and are required to be independent with respect to the Funds in accordance with the U.S. federal securities laws and the applicable rules and regulations of the Securities and Exchange Commission and the PCAOB.
We conducted our audits of these financial statements in accordance with the standards of the PCAOB. Those standards require that we plan and perform the audit to obtain reasonable assurance about whether the financial statements are free of material misstatement, whether due to error or fraud.
Our audits included performing procedures to assess the risks of material misstatement of the financial statements, whether due to error or fraud, and performing procedures that respond to those risks. Such procedures included examining, on a test basis, evidence regarding the amounts and disclosures in the financial statements. Our audits also included evaluating the accounting principles used and significant estimates made by management, as well as evaluating the overall presentation of the financial statements. Our procedures included confirmation of securities owned as of April 30, 2020 by correspondence with the custodian and brokers; when replies were not received from brokers, we performed other auditing procedures. We believe that our audits provide a reasonable basis for our opinions.
/s/ PricewaterhouseCoopers LLP
Philadelphia, Pennsylvania
June 24, 2020
We have served as the auditor of one or more Polen Capital Management, LLC investment companies since 2011.
93
POLEN GROWTH FUNDS
Shareholder Tax Information
(Unaudited)
The Funds are required by Subchapter M of the Internal Revenue Code of 1986, as amended, to advise their shareholders of the U.S. federal tax status of distributions received by the Funds’ shareholders in respect of such fiscal year. During the year ended April 30, 2020, the Polen Growth Fund, Polen Global Growth Fund, Polen International Growth Fund, Polen U.S. Small Company Growth Fund and Polen International Small Company Growth Fund paid $0, $22,272, $14,475, $64,037 and $36,793 of ordinary income dividends and $174,366, $32,099, $0, $0 and $12,404 of long term capital gain dividends, respectively, to its shareholders. Preceding information for the Polen Growth Fund, Polen Global Growth Fund, Polen International Growth Fund, Polen U.S. Small Company Growth Fund and Polen International Small Company Growth Fund dividends from net investment income and short-term capital gains are treated as ordinary income dividends for federal income tax purposes.
The Polen Growth Fund, Polen Global Growth Fund, Polen International Growth Fund, Polen U.S. Small Company Growth Fund and Polen International Small Company Growth Fund, designates 0.00%, 97.34%, 99.97%, 28.65% and 100.00%, respectively, of ordinary income distributions as qualified dividend income pursuant to the Jobs and Growth Tax Relief Reconciliation Act of 2003.
The percentage of ordinary income dividends qualifying for corporate dividends received deduction for the Polen Growth Fund, Polen Global Growth Fund, Polen International Growth Fund, Polen U.S. Small Company Growth Fund and Polen International Small Company Growth Fund is 0.00%, 97.34%, 0.00%, 29.00% and 0.00%, respectively.
The Polen Growth Fund, Polen Global Growth Fund, Polen International Growth Fund, Polen U.S. Small Company Growth Fund and Polen International Small Company Growth Fund, designates 0.00%, 2.66%, 0.00%, 100.00% and 100.00%, respectively, of ordinary income distributions as qualified short-term gain pursuant to the American Jobs Creation Act of 2004.
The paid foreign taxes and recognized foreign source income for the funds were as follows:
| Foreign Taxes Paid | Foreign Source Income | |||||
Polen International Small Company Growth Fund | $7,001 | $70,274 |
All designations are based on financial information available as of the date of this annual report and, accordingly, are subject to change. For each item, it is the intention of the Funds to designate the maximum amount permitted under the Internal Revenue Code of 1986, as amended, and the regulations thereunder.
Because the Funds’ fiscal year is not the calendar year, another notification will be sent with respect to calendar year 2020. The second notification, which will reflect the amount, if any, to be used by calendar
94
POLEN GROWTH FUNDS
Shareholder Tax Information (Concluded)
(Unaudited)
year taxpayers on their U.S. federal income tax returns, will be made in conjunction with Form 1099-DIV and will be mailed in January 2021.
Foreign shareholders will generally be subject to U.S. withholding tax on the amount of their ordinary income dividends. They will generally not be entitled to a foreign tax credit or deduction for the withholding taxes paid by the Funds, if any.
In general, dividends received by tax-exempt recipients (e.g., IRAs and Keoghs) need not be reported as taxable income for U.S. federal income tax purposes. However, some retirement trusts (e.g., corporate, Keogh and 403(b)(7) plans) may need this information for their annual information reporting.
Shareholders are advised to consult their own tax advisers with respect to the tax consequences of their investment in the Funds.
95
POLEN GROWTH FUNDS
Statement Regarding Liquidity Risk Management Program
(Unaudited)
On October 16, 2016, the Securities and Exchange Commission adopted Rule 22e-4 under the Investment Company Act of 1940, as amended (the “Liquidity Rule”) to promote effective liquidity risk management throughout the open-end investment company industry, thereby reducing the risk that funds will be unable to meet their redemption obligations and mitigating dilution of the interests of fund shareholders.
The Board of Trustees (the “Board”) of FundVantage Trust, on behalf of the Polen Funds (each a “Fund” and, collectively, the “Funds”), met on December 9-10, 2019 (the “Meeting”) to review the liquidity risk management program (the “Program”) applicable to the Funds, pursuant to the Liquidity Rule. The Board has appointed a committee of individuals to serve as the program administrator for the Funds’ Program (the “Program Committee”). At the Meeting, the Program Committee provided the Board with a report that addressed the operation of the Program and assessed its adequacy and effectiveness of implementation and any material changes to the Program as of September 30, 2019 (the “Report”).
The Report described the Program’s liquidity classification methodology. It also described the Program Committee’s methodology in determining whether a Highly Liquid Investment Minimum (a “HLIM”) is necessary and noted that, given the composition of each Fund’s portfolio holdings, a HLIM was not currently required for any of the Funds.
The Report noted that the Program complied with the key factors for consideration under the Liquidity Rule for assessing, managing and periodically reviewing liquidity risk, as follows:
A. Each Fund’s investment strategy and liquidity of Fund investments during both normal and reasonably foreseeable stressed conditions: As part of the Report, the Program Committee reviewed each Fund’s strategy and its determination that the strategy remains appropriate for an open-end fund structure. This determination was based on each Fund’s holdings of Highly Liquid Investments, the diversification of holdings and the related average position size of the holdings.
B.Short-termandlong-term cash flow projections during both normal and reasonably foreseeable stressed conditions: As part of the Report, the Program Committee reviewed historical net redemption activity and noted that it used this information as a component to establish each Fund’s reasonably anticipated trading size. Each Fund has adopted an in-kind redemption policy which may be utilized to meet larger redemption requests. The Program Committee also took into consideration each Fund’s shareholder ownership concentration and the fact that shares of the Funds are offered through intermediaries. The intermediary agreements increase the likelihood of large unanticipated redemptions, meaning a Fund may not have the ability to conduct an orderly sale of portfolio securities. The amount of assets a Fund has on these platforms is a significant factor in the ability of the Fund to meet redemption expectations. In light of each Fund’s holdings, it was noted that each Fund maintains a high level of liquidity to meet shareholder redemptions under both normal and stressed market conditions.
96
POLEN GROWTH FUNDS
Statement Regarding Liquidity Risk Management Program (Concluded)
(Unaudited)
C. Holdings of cash and cash equivalents, as well as borrowing arrangements: As part of the Report, the Program Committee reviewed any changes in each Fund’s cash and cash equivalents positions in response to current/anticipated redemption activity or market conditions. It was noted that the Funds do not currently have a borrowing or other credit funding arrangement.
97
POLEN GROWTH FUNDS
Other Information
(Unaudited)
Proxy Voting
Policies and procedures that the Funds use to determine how to vote proxies relating to portfolio securities as well as information regarding how the Funds voted proxies relating to portfolio securities for the most recent 12-month period ended June 30 are available without charge, upon request, by calling (888) 678-6024 and on the Securities and Exchange Commission’s (“SEC”) website at http:// www.sec.gov.
Quarterly Portfolio Schedules
The Trust files its complete schedule of portfolio holdings with the SEC for the first and third fiscal quarters of each fiscal year (quarters ended July 31 and January 31) as an exhibit to their reports on Form N-PORT. The Trust’s portfolio holdings on Form N-PORT are available on the SEC’s website at http://www.sec.gov.
98
POLEN GROWTH FUNDS
Privacy Notice
(Unaudited)
The privacy of your personal financial information is extremely important to us. When you open an account with us, we collect a significant amount of information from you in order to properly invest and administer your account. We take very seriously the obligation to keep that information private and confidential, and we want you to know how we protect that important information.
We collect nonpublic personal information about you from applications or other forms you complete and from your transactions with us or our affiliates. We do not disclose information about you, or our former clients, to our affiliates or to service providers or other third parties, except as permitted by law. We share only the information required to properly administer your accounts, which enables us to send transaction confirmations, monthly or quarterly statements, financials and tax forms. Even within FundVantage Trust and its affiliated entities, a limited number of people who actually service accounts will have access to your personal financial information. Further, we do not share information about our current or former clients with any outside marketing groups or sales entities.
To ensure the highest degree of security and confidentiality, FundVantage Trust and its affiliates maintain various physical, electronic and procedural safeguards to protect your personal information. We also apply special measures for authentication of information you request or submit to us on our web site.
If you have questions or comments about our privacy practices, please call us at (888) 678-6024.
99
POLEN GROWTH FUNDS
Fund Management
(Unaudited)
FundVantage Trust (the “Trust”) is governed by a Board of Trustees (the “Trustees”). The primary responsibility of the Trustees is to represent the interest of the Trust’s shareholders and to provide oversight management of the Trust.
The following tables present certain information regarding the Board of Trustees and officers of the Trust. None of the Trustees are an “interested person” of the Trust, the Adviser, another investment adviser of a series of the Trust, or Foreside Funds Distributors LLC, the principal underwriter of the Trust (“Underwriter”), within the meaning of the 1940 Act and each Trustee is referred to as an “Independent Trustee” and is listed under such heading below. Employees of certain service providers to the Trust serve as officers of the Trust; such persons are not compensated by the Funds. The address of each Trustee and officer as it relates to the Trust’s business is 301 Bellevue Parkway, 2nd Floor, Wilmington, DE 19809.
The Statement of Additional Information for the Funds contains additional information about the Trustees and is available, without charge, upon request, by calling (888) 678-6024.
Name and Date of Birth | Position(s) Held with Trust | Term of Office and Length of Time Served | Principal Occupation(s) During Past Five Years | Number of Funds in Trust Complex Overseen by Trustee | Other Directorships Held by Trustee | |||||
| INDEPENDENT TRUSTEES | ||||||||||
ROBERT J. CHRISTIAN Date of Birth: 2/49 | Trustee | Shall serve until death, resignation or removal. Trustee since 2007. Chairman from 2007 until September 30, 2019. | Retired since February 2006; Executive Vice President of Wilmington Trust Company from February 1996 to February 2006; President of Rodney Square Management Corporation (“RSMC”) (investment advisory firm) from 1996 to 2005; Vice President of RSMC from 2005 to 2006. | 39 | Optimum Fund Trust (registered investment company with 6 portfolios); Third Avenue Trust (registered investment company with 3 portfolios); Third Avenue Variable Series Trust (registered investment company with 1 portfolio).
| |||||
100
POLEN GROWTH FUNDS
Fund Management (Continued)
(Unaudited)
Name and Date of Birth | Position(s) Held with Trust | Term of Office and Length of Time Served | Principal Occupation(s) During Past Five Years | Number of Funds in Trust Complex Overseen by Trustee | Other Directorships Held by Trustee | |||||
IQBAL MANSUR Date of Birth: 6/55 | Trustee | Shall serve until death, resignation or removal. Trustee since 2007. | University Professor, Widener University. | 39 | Third Avenue Trust (registered investment company with 3 portfolios); Third Avenue Variable Series Trust (registered investment company with 1 portfolio).
| |||||
NICHOLAS M. MARSINI, JR. Date of Birth: 8/55 | Trustee and Chairman of the Board. | Shall serve until death, resignation or removal. Trustee since 2016. Chairman since October 1, 2019. | Retired since March 2016. President of PNC Bank Delaware from June 2011 to March 2016; Executive Vice President Finance of BNY Mellon from July 2010 to January 2011; Executive Vice President and Chief Financial Officer of PNC Global Investment Servicing from September 1997 to July 2010. | 39 | Brinker Capital Destinations Trust (registered investment company with 10 portfolios); Third Avenue Trust (registered investment company with 3 portfolios); Third Avenue Variable Series Trust (registered investment company with 1 portfolio).
| |||||
101
POLEN GROWTH FUNDS
Fund Management (Continued)
(Unaudited)
Name and Date of Birth | Position(s) Held with Trust | Term of Office and Length of Time Served | Principal Occupation(s) During Past Five Years | Number of Funds in Trust Complex Trustee | Other Directorships Held by Trustee | |||||
NANCY B. WOLCOTT Date of Birth: 11/54 | Trustee | Shall serve until death, resignation or removal. Trustee since 2011. | Retired since May 2014; EVP, Head of GFI Client Service Delivery, BNY Mellon from January 2012 to May 2014; EVP, Head of US Funds Services, BNY Mellon from July 2010 to January 2012; President of PNC Global Investment Servicing from 2008 to July 2010; Chief Operating Officer of PNC Global Investment Servicing from 2007 to 2008; Executive Vice President of PFPC Worldwide Inc. from 2006 to 2007. | 39 | Lincoln Variable Insurance Products Trust (registered investment company with 97 portfolios); Third Avenue Trust (registered investment company with 3 portfolios); Third Avenue Variable Series Trust (registered investment company with 1 portfolio).
| |||||
STEPHEN M. WYNNE Date of Birth: 1/55 | Trustee | Shall serve until death, resignation or removal. Trustee since 2009. | Retired since December 2010; Chief Executive Officer of US Funds Services, BNY Mellon Asset Servicing from July 2010 to December 2010; Chief Executive Officer of PNC Global Investment Servicing from March 2008 to July 2010; President, PNC Global Investment Servicing from 2003 to 2008. | 39 | Copeland Trust (registered investment company with 3 portfolios); Third Avenue Trust (registered investment company with 3 portfolios); Third Avenue Variable Series Trust (registered investment company with 1 portfolio).
| |||||
102
POLEN GROWTH FUNDS
Fund Management (Concluded)
(Unaudited)
Name and Date of Birth | Position(s) Held with Trust | Term of Office and Length of Time Served | Principal Occupation(s) During Past Five Years | |||
| EXECUTIVE OFFICERS | ||||||
JOEL L. WEISS Date of Birth: 1/63 | President and Chief Executive Officer | Shall serve until death, resignation or removal. Officer since 2007. | President of JW Fund Management LLC since June 2016; Vice President and Managing Director of BNY Mellon Investment Servicing (US) Inc. and predecessor firms from 1993 to June 2016. | |||
T. RICHARD KEYES Date of Birth: 1/57 | Treasurer and Chief Financial Officer | Shall serve until death, resignation or removal. Officer since 2016. | President of TRK Fund Consulting LLC since July 2016; Head of Tax — U.S. Fund Services of BNY Mellon Investment Servicing (US) Inc. and predecessor firms from February 2006 to July 2016. | |||
GABRIELLA MERCINCAVAGE Date of Birth: 6/68 | Assistant Treasurer | Shall serve until death, resignation or removal. Officer since 2019. | Fund Administration Consultant since January 2019; Fund Accounting and Tax Compliance Accountant to financial services companies from November 2003 to July 2018. | |||
VINCENZO A. SCARDUZIO Date of Birth: 4/72 | Secretary | Shall serve until death, resignation or removal. Officer since 2012. | Director and Vice President Regulatory Administration of The Bank of New York Mellon and predecessor firms since 2001. | |||
DAVID C. LEBISKY Date of Birth: 5/72 | Chief Compliance Officer and Anti-Money Laundering Officer | Shall serve until death, resignation or removal. Officer since 2015. | President of Lebisky Compliance Consulting LLC since October 2015; Consultant, Duff & Phelps, LLC since 2016; Senior Consultant, Freeh Group International Solutions, LLC (a global risk management firm) from 2015 to 2018; Scotia Institutional Investments US, LP, Director of Regulatory Administration from 2010 to 2014. | |||
103
Investment Adviser
Polen Capital Management, LLC
1825 NW Corporate Blvd.
Suite 300
Boca Raton, FL 33431
Administrator
The Bank of New York Mellon
301 Bellevue Parkway
Wilmington, DE 19809
Transfer Agent
BNY Mellon Investment Servicing (US) Inc.
4400 Computer Drive
Westborough, MA 01581
Principal Underwriter
Foreside Funds Distributors LLC
400 Berwyn Park
899 Cassatt Road
Berwyn, PA 19312
Custodian
The Bank of New York Mellon
240 Greenwich Street
New York, NY 10286
Independent Registered Public Accounting Firm
PricewaterhouseCoopers LLP
Two Commerce Square, Suite 1800
2001 Market Street
Philadelphia, PA 19103-7042
Legal Counsel
Pepper Hamilton LLP
3000 Two Logan Square
18th and Arch Streets
Philadelphia, PA 19103
POL-0420

Polen Growth Fund
Polen Global Growth Fund
Polen International Growth Fund
Polen U.S. Small Company Growth Fund
Polen International Small Company Growth Fund
of
FundVantage Trust
Institutional Class
Investor Class
ANNUAL REPORT
April 30, 2020
IMPORTANT NOTE: Beginning on January 1, 2021, paper copies of the Funds’ shareholder reports will no longer be sent by mail, unless you specifically request paper copies of the shareholder reports from the Funds or from your financial intermediary. Instead, shareholder reports will be available on the Polen Funds’ website (www.polencapital.com), and you will be notified by mail each time a report is posted and provided with a website link to access the report.
You may elect to receive all future shareholder reports in paper, free of charge. To elect to receive paper copies of shareholder reports through the mail or otherwise change your delivery method, contact your financial intermediary or, if you hold your shares directly through the Funds, call toll-free at (888) 678-6024 or write to:
Polen Funds
FundVantage Trust
c/o BNY Mellon Investment Servicing
P.O. Box 9829
Providence, RI 02940-8029
Your election to receive shareholder reports in paper will apply to all Polen Funds that you hold through the financial intermediary, or directly with the Polen Funds.
This report is submitted for the general information of shareholders and is not authorized for distribution to prospective investors unless preceded or accompanied by a current prospectus.
PRIVATE CAPITAL MANAGEMENT VALUE FUND
Annual Investment Adviser’s Report
April 30, 2020
(Unaudited)
Dear Fellow Shareholder:
First and foremost, we hope you and yours are healthy and safe. The Covid-19 pandemic has obviously disrupted life as we know it along with the economy and financial markets. It has been an extraordinarily stressful period for everyone as this year’s sell-off through March marked the fastest 30% market decline in U.S. equity market history. The sell-off was, in our view, marked by forced equity market liquidations and panic selling from investors who did not have the risk tolerance for what transpired. As we now know, the pullback was not only severe but furious in its pace. With respect to the Private Capital Management Value Fund (the “Fund”), the pace of the market sell-off simply overwhelmed the pool of available buyers for stocks held in the Fund’s portfolio. “Typical” Fund investments are (by design) less well known, frequently smaller-capitalization companies. These businesses are often misunderstood by investors and “off-the-radar” to most Wall Street investment firms. While we seek out long-term opportunities in these types of companies, during a market panic they can be particularly hard hit as investors tend to look for name/brand familiarity, larger balance sheets and dividend yields. Said another way, the Fund’s portfolio valuation coming out of the market sell-off had very little relevance to the underlying long-term value we see in the businesses the Fund owns.
In the short run, stock prices obviously can be driven more by investor sentiment, fears and economic worries than by facts and intrinsic worth. We actually take comfort in this - if markets were perpetually rational, value investing would have no place. Our experience over the past 33 years has also repeatedly shown that the small-cap ecosystem is particularly susceptible to the impact of non-fundamental drivers on near-term stock pricing. In light of these circumstances, we want to focus on how we have engaged the recent maelstrom from a research and portfolio construction standpoint and discuss how we are approaching portfolio construction (and risk management), while also taking advantage of long-term opportunities. Said another way, despite the necessity of focusing our discussion on what is happening right now, this letter would be incomplete without also highlighting what we see as an abundance of opportunity available to patient investors.
The enormity of the economic disruption has, for the time being, diminished the utility of the carefully constructed earnings models we build as we analyze the Fund’s portfolio companies. Such unusual circumstances mandated that we instead analytically pivot to an evaluation of potential near-term vulnerability in capital structure and a triage focused on each company’s ability to withstand (and in some cases capitalize upon) the economic shutdown without impairing long-term shareholder value. While our normal-course analytical modeling contemplates multiple “bear case scenarios”, this challenge has taken us to places that we would have previously considered ridiculous.
Given the speed at which the business environment and credit markets deteriorated, it quickly became clear that investors feared a serious risk of permanent capital destruction. The ensuing sell-off necessitated that we act decisively with the best information we had. To this end, we re-analyzed each and every
1
PRIVATE CAPITAL MANAGEMENT VALUE FUND
Annual Investment Adviser’s Report (Continued)
April 30, 2020
(Unaudited)
business in the Fund’s portfolio, decided whether the management team was up to this unprecedented challenge, identified the extent to which the business would be impaired (or could potentially benefit) and whether the company’s capital structure and lending arrangements afforded sufficient flexibility. On a parallel track, we also analyzed whether the broader market turmoil had surfaced more attractive, lower risk alternative investments at valuation levels the Fund could capitalize on. In short, it was a comprehensive, eyes wide open review of the entire portfolio and alternative opportunities available to the Fund.
As a result of this review, we opportunistically sold or trimmed a number of portfolio names, including some which had performed well and as a result traded far closer to fair value than a number of alternative investments that became available amidst the turmoil. As these sales unfolded we also steadily deployed cash into a mix of current and new investment ideas, some of which we are still building to size. That said, we are not chasing market rallies and remain strictly focused on price discounts in what we expect will remain a choppy and unsure market and economic environment. While we share your desire to rapidly recover lost ground, experience reminds us that this is a marathon rather than a sprint.
Sadly, discussion about coronavirus has become enmeshed in our poisonous political climate - this leaves us reluctant to raise the topic. However, as investors we must be aware of the risk and reward scenarios associated with the path of recovery from this global pandemic, as well as what it means for investors if a “second wave” develops in the latter part of the year. Our view is informed by extensive healthcare industry contacts and an understanding that the more we can ascertain, the better we will be able to chart an investment path forward. As a distillation of our investment view, we note the following:
| ● | While the picture becomes clearer each week, the unpredictability of why certain people get very sick while others are largely unaffected or remain completely asymptomatic is particularly frustrating to the scientific research community and clinicians. The randomness of the disease is compounded by the fact that treatment protocols that work well in some cases are ineffective in others. As investors, our worry here is that this uncertainty will hinder a return to normalcy until there are reliable and curative treatment options or a sight line to a vaccine. |
| ● | An extended shutdown presented the likelihood of permanent economic destruction and a possibly catastrophic leveraging of our national balance sheet. The reopening of the economy is necessary in our view, even if premature when viewed purely from a public health perspective. The ramifications of the current pandemic, however, give rise to complexities that limit the utility of any single-perspective based analysis. Due to the lag between new infection and disease presentation, the full public health and economic impacts of any reopening strategy likely will be apparent by the end of September. |
There can be no guarantee that any strategy (risk management or otherwise) will be successful. All investing involves risk, including potential loss of principal.
2
PRIVATE CAPITAL MANAGEMENT VALUE FUND
Annual Investment Adviser’s Report (Continued)
April 30, 2020
(Unaudited)
| ● | The most impactful development for a complete economic recovery is a vaccine. While it would be unprecedented for a de-novo vaccine program to go from start-to-finish within twelve months, many of the current developmental stage vaccines and testing methodologies are based on research that was begun during the SARS outbreak back in 2003. It is important to remember that SARS was also a coronavirus so the foundational research is broadly applicable to the task at hand. Everything considered, it seems reasonable to believe that we may have line-of-sight to a vaccine before year end. Knowing that a vaccine is possible (even before it is widely available) would go a long way towards restoring confidence and normalcy to the world economy, including the public equity markets. This would be an enormously important development for investors in restaurants, leisure and hotels, gaming, airlines and cruise ships, etc., all of which currently trade at unusually large discounts to historical norms. |
Based on the above, we can certainly craft an argument that the worst of the storm has passed and that the economy will likely recover steadily from here and that equity markets may have seen their lows. On the other hand, it is also possible to envision an outcome where neither curative treatments nor a vaccine become available in the near term and our only viable public health alternative is to shelter the most vulnerable and allow the virus to run its course. As a result, in our evaluation of new portfolio ideas, we are focusing on companies where the capital structure is impregnable (those that have “fortress balance sheets”). We want to collect businesses that are strong and strategically important within their sphere of operations. We believe opportunity exists, particularly in small capitalization stocks which generally have shown greater dislocation as compared to the larger capitalization market indices. We have initiated a number of new investments for the Fund thus far this year, including multiple technology and financial focused companies. We have also capitalized on the sell-off by committing capital to a swath of existing portfolio names where additional buys were simply too compelling to ignore.
While we believe the long-term opportunity is attractive, we also recognize that this is a time of heightened concern for Fund investors. Accordingly, you can know that as we move forward, we remain committed to a disciplined balance focused on fundamental valuation in the context of multiple economic and market scenarios.
We appreciate your continued support.
Private Capital Management
3
PRIVATE CAPITAL MANAGEMENT VALUE FUND
Annual Investment Adviser’s Report (Concluded)
April 30, 2020
(Unaudited)
Mutual Fund investing involves risk and it is possible to lose money by investing in a fund. The Fund is a diversified fund, but nevertheless has invested a significant portion of its assets in the securities of a small number of issuers, which may cause the Fund’s value to fluctuate more widely than some other diversified funds. As a result of the Fund’s investment approach and the relative price movements of certain Fund holdings, as of April 30, 2020 the Fund’s holdings profile reflected a portfolio concentration level normally associated with a non-diversified fund. This may result in the Fund exhibiting greater volatility and less liquidity than other diversified funds. The above commentary is for informational purposes only and investors should consider the investment objectives, risks, charges, and expenses of the Fund carefully before investing. This report is not authorized for distribution unless preceded or accompanied by a current prospectus for the Private Capital Management Value Fund. The prospectus contains this and other important information about the Fund. Read it carefully before investing.
Shares of the Private Capital Management Value Fund are distributed by Foreside Funds Distributors LLC, not an adviser affiliate.
This letter is intended to assist shareholders in understanding how the Fund performed during the year ended April 30, 2020 and reflects the views of the investment adviser at the time of this writing. Of course, these views may change and do not guarantee the future performance of the Fund or the markets.
Portfolio composition is subject to change. The current and future portfolio holdings of the Fund are subject to investment risks.
4
PRIVATE CAPITAL MANAGEMENT VALUE FUND
Annual Report
Performance Data
April 30, 2020
(Unaudited)
Comparison of Change in Value of $10,000 Investment in Class A* of the Private Capital Management Value Fund vs. Russell
2000® and S&P 500® Indexes
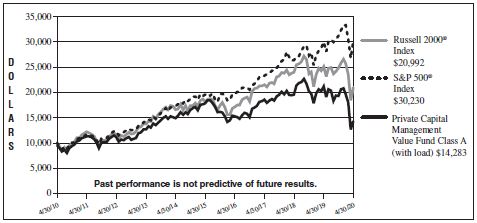
The Fund’s growth of an assumed $10,000 investment is adjusted for the maximum sales charge of 5.00%. This results in a net initial investment of $9,500.
Average Annual Total Returns for the Periods Ended April 30, 2020 |
| |||||||||||||||||||
| 1 Year | 3 Years | 5 Years | 10 Years | |||||||||||||||||
Class A (with sales charge)* | -35.66 | % | -9.82% | -5.23% | 3.63% | |||||||||||||||
Class A (without sales charge)* | -32.29 | % | -8.26% | -4.25% | 4.16% | |||||||||||||||
Russell 2000 Index | -16.40 | % | -0.80% | 2.90% | 7.70% | |||||||||||||||
S&P 500 Index | 0.86 | % | 9.04% | 9.12% | 11.69% | |||||||||||||||
The performance data quoted represents past performance and does not guarantee future results. Current performance may be lower or higher. Performance data current to the most recent month-end may be obtained by calling (888) 568-1267. The investment return and principal value of an investment will fluctuate so that shares, when redeemed, may be worth more or less than their original cost. The graphs and tables do not reflect the deduction of taxes that a shareholder would pay on Fund distributions or the redemption of Fund shares.
*Performance shown for the period from May 1, 2009 to May 28, 2010 is the performance of a corporate defined contribution plan account (the “Predecessor Account”), which transferred its assets to the Fund in connection with the Fund’s commencement of operations on May 28, 2010 and does not reflect any taxes that you may pay as a result of any distributions or sale of shares of the Fund. Average annual total returns for Class A shares of the Fund reflect the imposition of the maximum front-end sales charge of 5.00%. Performance shown for the periods prior to October 6, 2010, is the performance of the Class I shares, which includes the performance of the Predecessor Account for the period from May 1, 2009 to May 28, 2010, adjusted to reflect the monthly deduction of the Fund’s Total Annual Fund Operating Expenses After Fee Waiver and/or Expense Reimbursement applicable to Class A
5
PRIVATE CAPITAL MANAGEMENT VALUE FUND
Annual Report
Performance Data (Continued)
April 30, 2020
(Unaudited)
shares effective at the commencement of operations of Class A shares on October 6, 2010. The Predecessor Account was not registered as a mutual fund under the Investment Company Act of 1940, as amended (“1940 Act”), and therefore was not subject to certain investment restrictions, limitations and diversification requirements imposed by the 1940 Act and Internal Revenue Code. If the Predecessor Account had been registered under the 1940 Act its performance may have been different.
Class A shares have a 5.00% maximum sales charge.
6
PRIVATE CAPITAL MANAGEMENT VALUE FUND
Annual Report
Performance Data (Continued)
April 30, 2020
(Unaudited)
Comparison of Change in Value of $750,000 (investment minimum) Investment in Class I* of the Private Capital
Management Value Fund vs. Russell 2000® and S&P 500®Indexes
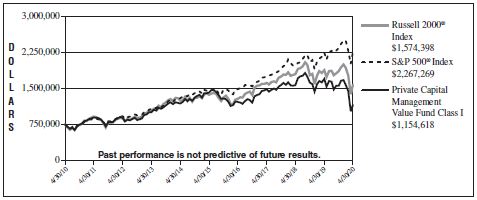
Average Annual Total Returns for the Periods Ended April 30, 2020 |
| |||||||||||||||||||
| 1 Year | 3 Years | 5 Years | 10 Years | |||||||||||||||||
| Class I * | -32.15 | % | -8.04% | -4.01% | 4.41% | |||||||||||||||
| Russell 2000 Index | -16.40 | % | -0.80% | 2.90% | 7.70% | |||||||||||||||
| S&P 500 Index | 0.86 | % | 9.04% | 9.12% | 11.69% | |||||||||||||||
The performance data quoted represents past performance and does not guarantee future results. Current performance may be lower or higher. Performance data current to the most recent month-end may be obtained by calling (888) 568-1267. The investment return and principal value of an investment will fluctuate so that shares, when redeemed, may be worth more or less than their original cost. The graphs and tables do not reflect the deduction of taxes that a shareholder would pay on Fund distributions or the redemption of Fund shares.
| * | Performance shown for the period from May 1, 2009 to May 28, 2010 is the performance of a corporate defined contribution plan account (the “Predecessor Account”), which transferred its assets to the Fund in connection with the Fund’s commencement of operations on May 28, 2010 and does not reflect any taxes that you may pay as a result of any distributions or sale of shares of the Fund. The Predecessor Account’s performance has been adjusted to reflect the monthly deduction of the Fund’s Total Annual Fund Operating Expenses After Fee Waiver and/or Expense Reimbursement applicable to Class I shares of the Fund effective at the Fund’s commencement of operations on May 28, 2010. Performance from May 28, 2010 to April 30, 2020 is from the performance of the Class I Shares. The Predecessor Account was not registered as a mutual fund under the Investment Company Act of 1940, as amended (the “1940 Act”), and therefore was not subject to certain investment restrictions, limitations and diversification requirements imposed by the 1940 Act and the Internal Revenue Code of 1986, as amended. If the Predecessor Account had been registered under the 1940 Act, its performance may have been different. |
7
PRIVATE CAPITAL MANAGEMENT VALUE FUND
Annual Report
Performance Data (Concluded)
April 30, 2020
(Unaudited)
As stated in the current prospectus dated September 1, 2019, the Fund’s “Total Annual Fund Operating Expenses” are 1.73% and 1.48%, and the Fund’s “Total Annual Fund Operating Expenses After Fee Waiver and/or Expense Reimbursement” are 1.45% and 1.20% for Class A and Class I Shares, respectively, of the Fund’s average daily net assets. These ratios may differ from the actual expenses incurred by the Fund for the period covered by this report. Effective September 1, 2019, Private Capital Management, LLC (the “Adviser”), has contractually agreed to reduce its investment advisory fee and/or reimburse certain expenses of the Fund to the extent necessary to ensure that the Fund’s total operating expenses, excluding taxes, fees and expenses attributable to a distribution or service plan adopted by FundVantage Trust (the “Trust”), “Acquired Fund Fees and Expenses,” interest, extraordinary items and brokerage commissions do not exceed 1.20% (on an annual basis) of the Fund’s average daily net assets (the “Expense Limitation”). The Expense Limitation will remain in place until August 31, 2020, unless the Board of Trustees (“Board of Trustees”) of the Trust approves its early termination. Prior to September 1, 2019, the Fund’s Expense Limitation was 1.10%. The Adviser is entitled to recover, subject to approval by the Board of Trustees, such amounts reduced or reimbursed for a period of up to three (3) years from the date on which the Adviser reduced its compensation and/or assumed expenses for the Fund. The Adviser is permitted to seek reimbursement from the Fund, subject to certain limitations, for fees it waived and Fund expenses it paid to the extent the total annual fund expenses do not exceed the limits described above or any lesser limits in effect at the time of reimbursement. No recoupment will occur unless the Fund’s expenses are below the Expense Limitation amount. Total returns would be lower had such fees and expenses not been waived and/or reimbursed.
A 2.00% redemption fee applies to shares redeemed within 30 days of purchase. This redemption fee is not reflected in the returns shown above.
The Fund intends to evaluate performance as compared to that of Standard & Poor’s 500® Index (“S&P 500® Index”) and the Russell 2000® Index. The S&P 500® Index is a widely recognized, unmanaged index of 500 common stocks which are generally representative of the U.S. stock market as a whole. The Russell 2000® Index is an unmanaged index measuring the performance of the 2,000 smallest companies in the Russell 3000® Index, which is made up of 3,000 of the biggest U.S. stocks. It is impossible to invest directly in an index.
8
PRIVATE CAPITAL MANAGEMENT VALUE FUND
Fund Expense Disclosure
April 30, 2020
(Unaudited)
As a shareholder of the Fund you incur two types of costs: (1) transaction costs, including sales charges (loads) on purchase payments, if any, and redemption fees; and (2) ongoing costs, including management fees, distribution and/or service (Rule 12b-1) fees, if any, and other Fund expenses. These examples are intended to help you understand your ongoing costs (in dollars) of investing in the Fund and to compare these costs with the ongoing costs of investing in other mutual funds.
These examples are based on an investment of $1,000 invested at the beginning of the six-month period from November 1, 2019 through April 30, 2020 and held for the entire period.
Actual Expenses
The first line of the accompanying table provides information about actual account values and actual expenses. You may use the information in this line, together with the amount you invested, to estimate the expenses that you paid over the period. Simply divide your account value by $1,000 (for example, an $8,600 account value divided by $1,000 = 8.6), then multiply the result by the number in the first line under the heading entitled “Expenses Paid During Period” to estimate the expenses you paid on your account during this period.
Hypothetical Examples for Comparison Purposes
The second line of the accompanying table provides information about hypothetical account values and hypothetical expenses based on the Fund’s actual expense ratio and an assumed rate of return of 5% per year before expenses, which is not your Fund’s actual return. The hypothetical account values and expenses may not be used to estimate the actual ending account balance or expenses you paid for the period. You may use this information to compare the ongoing costs of investing in the Fund and other funds. To do so, compare these 5% hypothetical examples with the 5% hypothetical examples that appear in the shareholder reports of other funds.
Please note that the expenses shown in the accompanying table are meant to highlight your ongoing costs only and do not reflect any transactional costs, such as sales charges (loads), if any, and redemption fees. Therefore, each hypothetical line of the accompanying table is useful in comparing ongoing costs only and will not help you determine the relative total costs of owning different funds. In addition, if these transactional costs were included, your costs would have been higher.
9
PRIVATE CAPITAL MANAGEMENT VALUE FUND
Fund Expense Disclosure (Concluded)
April 30, 2020
(Unaudited)
| Private Capital Management Value Fund | ||||||||||||
| Beginning Account Value November 1, 2019 | Ending Account Value April 30, 2020 | Expenses Paid During Period* | ||||||||||
Class A | ||||||||||||
Actual | $1,000.00 | $ 742.00 | $6.28 | |||||||||
Hypothetical (5% return before expenses) | 1,000.00 | 1,017.65 | 7.27 | |||||||||
Class I | ||||||||||||
Actual | $1,000.00 | $ 742.70 | $5.20 | |||||||||
Hypothetical (5% return before expenses) | 1,000.00 | 1,018.90 | 6.02 | |||||||||
| * | Expenses are equal to an annualized expenses ratio for the six-month period ended April 30, 2020 of 1.45% and 1.20% for Class A and Class I shares, respectively, for the Fund, multiplied by the average account value over the period, multiplied by the number of days in the most recent period (182), then divided by 366 to reflect the period. The Fund’s ending account values on the first line in each table are based on the actual six-month total return for the Fund of (25.80)% and (25.73)% for Class A and Class I shares, respectively. |
10
PRIVATE CAPITAL MANAGEMENT VALUE FUND
Portfolio Holdings Summary Table
April 30, 2020
(Unaudited)
The following table presents a summary by sector of the portfolio holdings of the Fund:
| % of Net | ||||||||
| Assets | Value | |||||||
COMMON STOCKS: | ||||||||
Financials | 37.7 | % | $ | 8,567,145 | ||||
Consumer Discretionary | 19.6 | 4,462,157 | ||||||
Communication Services | 11.3 | 2,576,092 | ||||||
Information Technology | 6.8 | 1,539,787 | ||||||
Industrials | 6.8 | 1,534,327 | ||||||
Materials | 6.3 | 1,429,268 | ||||||
Health Care | 1.7 | 389,623 | ||||||
Other Assets in Excess of Liabilities | 9.8 | 2,223,394 | ||||||
|
|
|
| |||||
NET ASSETS | 100.0 | % | $ | 22,721,793 | ||||
|
|
|
| |||||
Portfolio holdings are subject to change at any time.
The accompanying notes are an integral part of the financial statements.
11
PRIVATE CAPITAL MANAGEMENT VALUE FUND
Portfolio of Investments
April 30, 2020
| Number of Shares | Value | |||||||
COMMON STOCKS — 90.2% |
| |||||||
Communication Services — 11.3% |
| |||||||
IMAX Corp. (Canada)* | 40,300 | $ | 463,450 | |||||
Perion Network Ltd. (Israel)* | 109,592 | 546,864 | ||||||
QuinStreet, Inc.* | 154,112 | 1,565,778 | ||||||
|
| |||||||
| 2,576,092 | ||||||||
|
| |||||||
Consumer Discretionary — 19.6% |
| |||||||
Carrols Restaurant Group, Inc.* | 74,300 | 271,195 | ||||||
Everi Holdings, Inc.* | 121,206 | 599,970 | ||||||
Fiesta Restaurant Group, Inc.* | 99,455 | 723,535 | ||||||
Gildan Activewear, Inc. (Canada) | 19,915 | 277,615 | ||||||
Motorcar Parts of America, Inc.* | 81,613 | 1,161,353 | ||||||
Stoneridge, Inc.* | 26,245 | 525,687 | ||||||
Target Hospitality Corp.* | 105,132 | 212,367 | ||||||
Visteon Corp.* | 11,450 | 690,435 | ||||||
|
| |||||||
| 4,462,157 | ||||||||
|
| |||||||
Financials — 37.7% | ||||||||
Capstar Financial Holdings, Inc. | 38,185 | 435,691 | ||||||
Community Financial Corp. (The) | 16,885 | 391,732 | ||||||
ECN Capital Corp. (Canada) | 533,700 | 1,504,767 | ||||||
First Northwest Bancorp | 44,975 | 523,959 | ||||||
HomeTrust Bancshares, Inc. | 11,700 | 179,829 | ||||||
INTL. FCStone, Inc.* | 47,486 | 1,897,541 | ||||||
Jefferies Financial Group, Inc. | 49,805 | 683,325 | ||||||
KKR & Co., Inc., Class A | 48,725 | 1,228,357 | ||||||
| Number of Shares | Value | |||||||
COMMON STOCKS — (Continued) |
| |||||||
Financials — (Continued) | ||||||||
Northrim BanCorp, Inc. | 8,725 | $ | 204,601 | |||||
Raymond James Financial, Inc. | 8,400 | 553,728 | ||||||
SmartFinancial, Inc. | 34,509 | 499,000 | ||||||
Synovus Financial Corp. | 22,114 | 464,615 | ||||||
|
| |||||||
| 8,567,145 | ||||||||
|
| |||||||
Health Care — 1.7% | ||||||||
Zimmer Biomet Holdings, Inc. | 3,255 | 389,623 | ||||||
|
| |||||||
Industrials — 6.8% | ||||||||
Air Transport Services Group, Inc.* | 63,480 | 1,284,835 | ||||||
Barrett Business Services, Inc. | 5,100 | 249,492 | ||||||
|
| |||||||
| 1,534,327 | ||||||||
|
| |||||||
Information Technology — 6.8% |
| |||||||
Asure Software, Inc.* | 111,075 | 684,222 | ||||||
Information Services Group, Inc.* | 342,226 | 855,565 | ||||||
|
| |||||||
| 1,539,787 | ||||||||
|
| |||||||
Materials — 6.3% | ||||||||
Celanese Corp. | 5,545 | 460,623 | ||||||
Tronox Holdings PLC | 142,030 | 968,645 | ||||||
|
| |||||||
| 1,429,268 | ||||||||
|
| |||||||
TOTAL COMMON STOCKS |
| 20,498,399 | ||||||
|
| |||||||
The accompanying notes are an integral part of the financial statements.
12
PRIVATE CAPITAL MANAGEMENT VALUE FUND
Portfolio of Investments (Concluded)
April 30, 2020
| Value | ||||
TOTAL INVESTMENTS - 90.2% | $ | 20,498,399 | ||
OTHER ASSETS IN EXCESS OF LIABILITIES - 9.8% | 2,223,394 | |||
|
| |||
NET ASSETS - 100.0% | $ | 22,721,793 | ||
|
| |||
| * | Non-income producing. |
PLC Public Limited Company
The accompanying notes are an integral part of the financial statements.
13
PRIVATE CAPITAL MANAGEMENT VALUE FUND
Statement of Assets and Liabilities
April 30, 2020
Assets | ||||
Investments, at value (Cost $17,727,358) | $ | 20,498,399 | ||
Cash | 2,356,404 | |||
Receivable for investments sold | 641,592 | |||
Receivable for capital shares sold | 7,093 | |||
Dividends and interest receivable | 3,668 | |||
Receivable from Investment Adviser | 5,383 | |||
Prepaid expenses and other assets | 27,644 | |||
|
| |||
Total assets | 23,540,183 | |||
|
| |||
Liabilities | ||||
Payable for investments purchased | 662,724 | |||
Payable for capital shares redeemed | 72,613 | |||
Payable for transfer agent fees | 27,794 | |||
Payable for audit fees | 27,498 | |||
Payable for administration and accounting fees | 11,402 | |||
Payable for custodian fees | 5,796 | |||
Payable for printing fees | 5,162 | |||
Payable for legal fees | 3,960 | |||
Payable for distribution fees | 398 | |||
Accrued expenses | 1,043 | |||
|
| |||
Total liabilities | 818,390 | |||
|
| |||
Net Assets | $ | 22,721,793 | ||
|
| |||
Net Assets consisted of: | ||||
Capital Stock, $0.01 par value | $ | 25,896 | ||
Paid-in capital | 20,106,385 | |||
Total distributable earnings | 2,589,512 | |||
|
| |||
Net Assets | $ | 22,721,793 | ||
|
|
Class A: | ||||
Net asset value and redemption price per share ($2,157,232 / 251,860 shares) | $ | 8.57 | ||
|
| |||
Maximum offering price per share (100/95 of $8.57) | $ | 9.02 | ||
|
| |||
Class I: | ||||
Net asset value, offering and redemption price per share ($20,564,561 / 2,337,723 shares) | $ | 8.80 | ||
|
| |||
The accompanying notes are an integral part of the financial statements.
14
PRIVATE CAPITAL MANAGEMENT VALUE FUND
Statement of Operations
For the Year Ended April 30, 2020
Investment income | ||||
Dividends | $ | 410,442 | ||
Less: foreign taxes withheld | (7,375 | ) | ||
|
| |||
Total investment income | 403,067 | |||
|
| |||
Expenses | ||||
Advisory fees (Note 2) | 318,747 | |||
Transfer agent fees (Note 2) | 76,361 | |||
Administration and accounting fees (Note 2) | 62,417 | |||
Registration and filing fees | 61,075 | |||
Trustees’ and officers’ fees | 39,192 | |||
Audit fees | 27,962 | |||
Legal fees | 26,765 | |||
Custodian fees (Note 2) | 20,404 | |||
Printing and shareholder reporting fees | 11,061 | |||
Distribution fees (Class A) (Note 2) | 8,933 | |||
Other expenses | 3,993 | |||
|
| |||
Total expenses before waivers | 656,910 | |||
|
| |||
Less: waivers (Note 2) | (237,383 | ) | ||
|
| |||
Net expenses after waivers | 419,527 | |||
|
| |||
Net investment loss | (16,460 | ) | ||
|
| |||
Net realized and unrealized gain/(loss) from investments: | ||||
Net realized gain from investments | 2,185,760 | |||
Net realized loss from foreign currency transactions | (362 | ) | ||
Net change in unrealized appreciation/(depreciation) from investments | (13,701,011 | ) | ||
Net change in unrealized appreciation/(depreciation) from foreign currency transactions | (19 | ) | ||
|
| |||
Net realized and unrealized loss from investments | (11,515,632 | ) | ||
|
| |||
Net decrease in net assets resulting from operations | $ | (11,532,092 | ) | |
|
|
The accompanying notes are an integral part of the financial statements.
15
PRIVATE CAPITAL MANAGEMENT VALUE FUND
Statements of Changes in Net Assets
| For the Year Ended April 30, 2020 | For the Year Ended April 30, 2019 | |||||||
Increase/(decrease) in net assets from operations: | ||||||||
Net investment loss | $ | (16,460 | ) | $ | (103,327 | ) | ||
Net realized gain from investments | 2,185,398 | 9,715,427 | ||||||
Net change in unrealized appreciation/(depreciation) from investments | (13,701,030 | ) | (6,592,129 | ) | ||||
|
|
|
| |||||
Net increase/(decrease) in net assets resulting from operations | (11,532,092 | ) | 3,019,971 | |||||
|
|
|
| |||||
Less dividends and distributions to shareholders from: | ||||||||
Total distributable earnings | ||||||||
Class A | (631,381 | ) | (857,373 | ) | ||||
Class I | (5,517,618 | ) | (7,873,214 | ) | ||||
|
|
|
| |||||
Net decrease in net assets from dividends and distributions to shareholders | (6,148,999 | ) | (8,730,587 | ) | ||||
|
|
|
| |||||
Decrease in net assets derived from capital share transactions (Note 4) | (7,204,179 | ) | (9,097,320 | ) | ||||
|
|
|
| |||||
Total decrease in net assets | (24,885,270 | ) | (14,807,936 | ) | ||||
|
|
|
| |||||
Net assets | ||||||||
Beginning of year | 47,607,063 | 62,414,999 | ||||||
|
|
|
| |||||
End of year | $ | 22,721,793 | $ | 47,607,063 | ||||
|
|
|
| |||||
The accompanying notes are an integral part of the financial statements.
16
PRIVATE CAPITAL MANAGEMENT VALUE FUND
Financial Highlights
Contained below is per share operating performance data for Class A shares outstanding, total investment return, ratios to average net assets and other supplemental data for the respective period. The total returns in the table represent the rate that an investor would have earned or lost on an investment in the Fund (assuming reinvestment of all dividends and distributions). This information has been derived from information provided in the financial statements and should be read in conjunction with the financial statements and the notes thereto.
| Class A | ||||||||||||||||||||
| For the Year Ended April 30, 2020 | For the Year Ended April 30, 2019 | For the Year Ended April 30, 2018 | For the Year Ended April 30, 2017 | For the Year Ended April 30, 2016 | ||||||||||||||||
Per Share Operating Performance | ||||||||||||||||||||
Net asset value, beginning of year | $ | 15.44 | $ | 17.13 | $ | 16.44 | $ | 13.72 | $ | 17.07 | ||||||||||
|
|
|
|
|
|
|
|
|
| |||||||||||
Net investment income/(loss)(1) | (0.03 | ) | (0.07 | ) | (0.08 | ) | (0.26 | ) | 0.16 | |||||||||||
Net realized and unrealized gain/(loss) on investments | (4.19 | ) | 1.07 | 1.00 | 3.15 | (2.55 | ) | |||||||||||||
|
|
|
|
|
|
|
|
|
| |||||||||||
Net increase/(decrease) in net assets resulting from operations | (4.22 | ) | 1.00 | 0.92 | 2.89 | (2.39 | ) | |||||||||||||
|
|
|
|
|
|
|
|
|
| |||||||||||
Dividends and distributions to shareholders from: | ||||||||||||||||||||
Net investment income | — | — | — | (0.17 | ) | — | ||||||||||||||
Net realized capital gains | (2.65 | ) | (2.69 | ) | (0.23 | ) | — | (0.96 | ) | |||||||||||
|
|
|
|
|
|
|
|
|
| |||||||||||
Total dividends and distributions to shareholders | (2.65 | ) | (2.69 | ) | (0.23 | ) | (0.17 | ) | (0.96 | ) | ||||||||||
|
|
|
|
|
|
|
|
|
| |||||||||||
Redemption fees | — | 0.00 | (2) | — | 0.00 | (2) | 0.00 | (2) | ||||||||||||
|
|
|
|
|
|
|
|
|
| |||||||||||
Net asset value, end of year | $ | 8.57 | $ | 15.44 | $ | 17.13 | $ | 16.44 | $ | 13.72 | ||||||||||
|
|
|
|
|
|
|
|
|
| |||||||||||
Total investment return(3) | (32.29 | )% | 8.02 | % | 5.56 | % | 21.18 | % | (14.00 | )% | ||||||||||
Ratios/Supplemental Data | ||||||||||||||||||||
Net assets, end of year (in thousands) | $ | 2,157 | $ | 4,625 | $ | 5,965 | $ | 6,063 | $ | 7,408 | ||||||||||
Ratio of expenses to average net assets | 1.41 | % | 1.35 | % | 1.32 | % | 1.25 | % | 1.25 | % | ||||||||||
Ratio of expenses to average net assets without waivers and expense reimbursements(4) | 2.08 | % | 1.74 | % | 1.63 | % | 1.59 | % | 1.54 | % | ||||||||||
Ratio of net investment income/(loss) to average net assets | (0.27 | )% | (0.41 | )% | (0.47 | )% | (1.78 | )% | 1.06 | % | ||||||||||
Portfolio turnover rate | 20 | % | 20 | % | 17 | % | 11 | % | 14 | % | ||||||||||
| (1) | The selected per share data was calculated using the average shares outstanding method for the year. |
| (2) | Amount is less than $0.005 per share. |
| (3) | Total investment return is calculated assuming a purchase of shares on the first day and a sale of shares on the last day of each period reported and includes reinvestments of dividends and distributions, if any. Total investment return does not reflect the impact of the maximum front-end sales load of 5.00%. If reflected, the return would be lower. |
| (4) | During the period, certain fees were waived. If such fee waivers had not occurred, the ratios would have been as indicated (See Note 2). |
The accompanying notes are an integral part of the financial statements.
17
PRIVATE CAPITAL MANAGEMENT VALUE FUND
Financial Highlights
Contained below is per share operating performance data for Class I shares outstanding, total investment return, ratios to average net assets and other supplemental data for the respective period. The total returns in the table represent the rate that an investor would have earned or lost on an investment in the Fund (assuming reinvestment of all dividends and distributions). This information has been derived from information provided in the financial statements and should be read in conjunction with the financial statements and the notes thereto.
| Class I | ||||||||||||||||||||
| For the Year Ended April 30, 2020 | For the Year Ended April 30, 2019 | For the Year Ended April 30, 2018 | For the Year Ended April 30, 2017 | For the Year Ended April 30, 2016 | ||||||||||||||||
Per Share Operating Performance | ||||||||||||||||||||
Net asset value, beginning of year | $ | 15.75 | $ | 17.37 | $ | 16.63 | $ | 13.88 | $ | 17.21 | ||||||||||
|
|
|
|
|
|
|
|
|
| |||||||||||
Net investment income/(loss)(1) | (0.00 | )(2) | (0.03 | ) | (0.04 | ) | (0.22 | ) | 0.20 | |||||||||||
Net realized and unrealized gain/(loss) on investments | (4.30 | ) | 1.10 | 1.01 | 3.19 | (2.57 | ) | |||||||||||||
|
|
|
|
|
|
|
|
|
| |||||||||||
Net increase/(decrease) in net assets resulting from operations | (4.30 | ) | 1.07 | 0.97 | 2.97 | (2.37 | ) | |||||||||||||
|
|
|
|
|
|
|
|
|
| |||||||||||
Dividends and distributions to shareholders from: | ||||||||||||||||||||
Net investment income | — | — | — | (0.22 | ) | — | ||||||||||||||
Net realized capital gains | (2.65 | ) | (2.69 | ) | (0.23 | ) | — | (0.96 | ) | |||||||||||
|
|
|
|
|
|
|
|
|
| |||||||||||
Total dividends and distributions to shareholders | (2.65 | ) | (2.69 | ) | (0.23 | ) | (0.22 | ) | (0.96 | ) | ||||||||||
|
|
|
|
|
|
|
|
|
| |||||||||||
Redemption fees | — | 0.00 | (2) | — | 0.00 | (2) | 0.00 | (2) | ||||||||||||
|
|
|
|
|
|
|
|
|
| |||||||||||
Net asset value, end of year | $ | 8.80 | $ | 15.75 | $ | 17.37 | $ | 16.63 | $ | 13.88 | ||||||||||
|
|
|
|
|
|
|
|
|
| |||||||||||
Total investment return(3) | (32.15 | )% | 8.33 | % | 5.80 | % | 21.50 | % | (13.76 | )% | ||||||||||
Ratios/Supplemental Data | ||||||||||||||||||||
Net assets, end of year (in thousands) | $ | 20,565 | $ | 42,982 | $ | 56,450 | $ | 71,173 | $ | 79,078 | ||||||||||
Ratio of expenses to average net assets | 1.16 | % | 1.10 | % | 1.07 | % | 1.00 | % | 1.00 | % | ||||||||||
Ratio of expenses to average net assets without waivers and expense reimbursements(4) | 1.83 | % | 1.48 | % | 1.38 | % | 1.34 | % | 1.29 | % | ||||||||||
Ratio of net investment income/(loss) to average net assets | (0.02 | )% | (0.16 | )% | (0.22 | )% | (1.53 | )% | 1.30 | % | ||||||||||
Portfolio turnover rate | 20 | % | 20 | % | 17 | % | 11 | % | 14 | % | ||||||||||
| (1) | The selected per share data was calculated using the average shares outstanding method for the year. |
| (2) | Amount is less than $0.005 per share. |
| (3) | Total investment return is calculated assuming a purchase of shares on the first day and a sale of shares on the last day of each period reported and includes reinvestment of dividends and distributions, if any. |
| (4) | During the period, certain fees were waived. If such fee waivers had not occurred, the ratios would have been as indicated (See Note 2). |
The accompanying notes are an integral part of the financial statements.
18
PRIVATE CAPITAL MANAGEMENT VALUE FUND
Notes to Financial Statements
April 30, 2020
1. Organization and Significant Accounting Policies
The Private Capital Management Value Fund (the “Fund”) is operating as a diversified, open-end management investment company registered under the Investment Company Act of 1940, as amended, (the “1940 Act”), which commenced investment operations on May 28, 2010. The Fund is a separate series of FundVantage Trust (the “Trust”) which was organized as a Delaware statutory trust on August 28, 2006. The Trust is a “series trust” authorized to issue an unlimited number of separate series or classes of shares of beneficial interest. Each series is treated as a separate entity for certain matters under the 1940 Act, and for other purposes, and a shareholder of one series is not deemed to be a shareholder of any other series. The Fund offers separate classes of shares, Class A, Class C, Class I and Class R Shares. Class A Shares are sold subject to a front-end sales charge. Front-end sales charges may be reduced or waived under certain circumstances. A 1.00% contingent deferred sales charge (“CDSC”) will be assessed when Class C shares are redeemed within 12 months after initial purchase; however, the CDSC shall not apply to the purchases of Class C shares where the selling broker dealer was not paid a commission at the time of initial purchase. As of April 30, 2020, the Class C shares and the Class R shares have not yet commenced operations.
The Fund is an investment company and follows accounting and reporting guidance in the Financial Accounting Standards Board Accounting Standards Codification Topic 946.
Portfolio Valuation — The Fund’s net asset value (“NAV”) is calculated once daily as of the close of regular trading hours on the New York Stock Exchange (“NYSE”) (typically 4:00 p.m. Eastern time) on each day the NYSE is open. Securities held by the Fund are valued using the closing price or the last sale price on a national securities exchange or the National Association of Securities Dealers Automatic Quotation System (“NASDAQ”) market system where they are primarily traded. Equity securities traded in the over-the-counter market are valued at their closing prices. If there were no transactions on that day, securities traded principally on an exchange or on NASDAQ will be valued at the mean of the last bid and ask prices prior to the market close. Fixed income securities having a remaining maturity of greater than 60 days are valued using an independent pricing service. Fixed income securities having a remaining maturity of 60 days or less are generally valued at amortized cost, provided such amount approximates fair value. Foreign securities are valued based on prices from the primary market in which they are traded and are translated from the local currency into U.S. dollars using current exchange rates. Investments in other open-end investment companies are valued based on the NAV of the investment companies (which may use fair value pricing as discussed in their prospectuses). If market quotations are unavailable or deemed unreliable, securities will be valued in accordance with procedures adopted by the Trust’s Board of Trustees (“Board of Trustees”). Relying on prices supplied by pricing services or dealers or using fair valuation may result in values that are higher or lower than the values used by other investment companies and investors to price the same investments. In the event that market quotes are not readily available, and the security or asset cannot be valued pursuant to one of the valuation methods, the value
19
PRIVATE CAPITAL MANAGEMENT VALUE FUND
Notes to Financial Statements (Continued)
April 30, 2020
of the security or asset will be determined in good faith by the Adviser. The Trust has established a Valuation Committee which performs certain functions including the oversight of the Adviser’s fair valuation determinations.
Fair Value Measurements — The inputs and valuation techniques used to measure fair value of the Fund’s investments are summarized into three levels as described in the hierarchy below:
| ● | Level 1 — quoted prices in active markets for identical securities; |
| ● | Level 2 — other significant observable inputs (including quoted prices for similar securities, interest rates, prepayment speeds, credit risk, etc.); and |
| ● | Level 3 — significant unobservable inputs (including the Fund’s own assumptions in determining the fair value of investments). |
The inputs or methodology used for valuing securities are not necessarily an indication of the risk associated with investing in those securities.
The following is a summary of the inputs used, as of April 30, 2020, in valuing the Fund’s investments carried at fair value:
| Total Value at 04/30/20 | Level 1 Quoted Price | Level 2 Other Significant Observable Inputs | Level 3 Significant Unobservable Inputs | |||||||||||||
Assets: | ||||||||||||||||
Investments in Securities* | $ | 20,498,399 | $ | 20,498,399 | $ | — | $ | — | ||||||||
|
|
|
|
|
|
|
| |||||||||
* Please refer to Portfolio of Investments for further details on portfolio holdings.
At the end of each quarter, management evaluates the classification of Levels 1, 2 and 3 assets and liabilities. Various factors are considered, such as changes in liquidity from the prior reporting period; whether or not a broker is willing to execute at the quoted price; the depth and consistency of prices from third party pricing services; and the existence of contemporaneous, observable trades in the market. Additionally, management evaluates the classification of Level 1 and Level 2 assets and liabilities on a quarterly basis for changes in listings or delistings on national exchanges.
Due to the inherent uncertainty of determining the fair value of investments that do not have a readily available market value, the fair value of the Fund’s investments may fluctuate from period to period. Additionally, the fair value of investments may differ significantly from the values that would have been used had a ready market existed for such investments and may differ materially from the values the Fund
20
PRIVATE CAPITAL MANAGEMENT VALUE FUND
Notes to Financial Statements (Continued)
April 30, 2020
may ultimately realize. Further, such investments may be subject to legal and other restrictions on resale or otherwise less liquid than publicly traded securities.
For fair valuations using significant unobservable inputs, U.S. generally accepted accounting principles (“U.S. GAAP”) require the Fund to present a reconciliation of the beginning to ending balances for reported market values that present changes attributable to total realized and unrealized gains or losses, purchase and sales, and transfers in and out of Level 3 during the period. A reconciliation of Level 3 investments is presented only when the Fund had an amount of Level 3 investments at the end of the reporting period that was meaningful in relation to its net assets. The amounts and reasons for all transfers in and out of each Level within the three-tier hierarchy are disclosed when the Fund had an amount of total transfers during the reporting period that was meaningful in relation to its net assets as of the end of the reporting period.
For the year ended April 30, 2020, there were no transfers in or out of Level 3.
Use of Estimates — The preparation of financial statements in conformity with U.S. GAAP requires management to make estimates and assumptions that affect the amounts reported in the financial statements and accompanying notes at the date of the financial statements and the reported amounts of revenues and expenses during the period. Actual results could differ from those estimates and those differences could be material.
Investment Transactions, Investment Income and Expenses — Investment transactions are recorded on trade date for financial statement preparation purposes. Realized gains and losses on investments sold are recorded on the identified cost basis. Interest income is recorded on the accrual basis. Dividends are recorded on the ex-dividend date. Distribution (12b-1) fees relating to a specific class are charged directly to that class. Fund level expenses common to all classes, investment income and realized and unrealized gains and losses on investments are generally allocated to each class based upon the relative daily net assets of each class. General expenses of the Trust are generally allocated to each fund in proportion to its relative daily net assets. Expenses directly attributable to a particular fund in the Trust are charged directly to that fund.
Dividends and Distributions to Shareholders — Dividends from net investment income and distributions from net realized capital gains, if any, are declared, recorded on ex-date and paid at least annually to shareholders. Income dividends and capital gain distributions are determined in accordance with U.S. federal income tax regulations, which may differ from U.S. GAAP.
U.S. Tax Status — No provision is made for U.S. income taxes as it is the Fund’s intention to continue to qualify for and elect the tax treatment applicable to regulated investment companies under Subchapter M of the Internal Revenue Code of 1986, as amended (“Internal Revenue Code”), and make the requisite distributions to its shareholders which will be sufficient to relieve it from U.S. income and excise taxes.
21
PRIVATE CAPITAL MANAGEMENT VALUE FUND
Notes to Financial Statements (Continued)
April 30, 2020
Other — In the normal course of business, the Fund may enter into contracts that provide general indemnifications. The Fund’s maximum exposure under these arrangements is dependent on claims that may be made against the Fund in the future, and therefore, cannot be estimated; however, based on experience, the risk of material loss for such claims is considered remote.
Market disruptions associated with the COVID-19 pandemic have had a global impact, and uncertainty exists as to its long-term implications. The COVID-19 pandemic could adversely affect the value and liquidity of the Fund’s investments, impair the Fund’s ability to satisfy redemption requests, and negatively impact the Fund’s performance. In addition, the outbreak of COVID-19, and measures taken to mitigate its effects, could result in disruptions to the services provided to the Fund by its service providers. Fund management is continuing to monitor this development and evaluate its impact on the Fund.
Currency Risk — The Fund invests in securities of foreign issuers, including American Depositary Receipts. These markets are subject to special risks associated with foreign investments not typically associated with investing in U.S. markets. Because the foreign securities in which the Fund may invest generally trade in currencies other than the U.S. dollar, changes in currency exchange rates will affect the Fund’s NAV, the value of dividends and interest earned and gains and losses realized on the sale of securities. Because the NAV for the Fund is determined on the basis of U.S. dollars, the Fund may lose money by investing in a foreign security if the local currency of a foreign market depreciates against the U.S. dollar, even if the local currency value of the Fund’s holdings goes up. Generally, a strong U.S. dollar relative to these other currencies will adversely affect the value of the Fund’s holdings in foreign securities.
2. Transactions with Related Parties and Other Service Providers
Private Capital Management, LLC (the “Adviser”) serves as the investment adviser to the Fund pursuant to an investment advisory agreement with the Trust (the “Advisory Agreement”). For its services, the Adviser is paid a monthly fee at the annual rate of 0.90% of the Fund’s average daily net assets. Effective September 1, 2019, the Adviser has contractually agreed to reduce its investment advisory fee and/or reimburse certain expenses of the Fund to the extent necessary to ensure that the Fund’s total operating expenses, excluding taxes, fees and expenses attributable to a distribution or service plan adopted by the Trust, “Acquired Fund Fees and Expenses,” interest, extraordinary items and brokerage commissions do not exceed 1.20% (on an annual basis) of the Fund’s average daily net assets (the “Expense Limitation”). The Expense Limitation will remain in place until August 31, 2020, unless the Board of Trustees approves its earlier termination. Prior to September 1, 2019, the Expense Limitation was 1.10%. The Adviser is entitled to recover, subject to approval by the Board of Trustees, such amounts reduced or reimbursed for a period of up to three (3) years from the date on which the Adviser reduced its compensation and/or assumed expenses for the Fund. The Adviser is permitted to seek reimbursement from the Fund, subject to certain limitations, for fees it waived and Fund expenses it paid to the extent the total annual fund
22
PRIVATE CAPITAL MANAGEMENT VALUE FUND
Notes to Financial Statements (Continued)
April 30, 2020
expenses do not exceed the limits described above or any lesser limits in effect at the time of reimbursement. No recoupment will occur unless the Fund’s expenses are below the Expense Limitation amount.
As of April 30, 2020, the amount of potential recovery was as follows:
Expiration | ||||||
4/30/2021 | 4/30/2022 | 4/30/2023 | Total | |||
$231,595 | $219,502 | $237,383 | $688,480 | |||
For the year ended April 30, 2020, the Adviser earned fees of $318,747 and waived fees of $237,383.
Other Service Providers
The Bank of New York Mellon (“BNY Mellon”) serves as administrator and custodian for the Fund. For providing administrative and accounting services, BNY Mellon is entitled to receive a monthly fee equal to an annual percentage rate of the Fund’s average daily net assets and is subject to certain minimum monthly fees. For providing certain custodial services, BNY Mellon is entitled to receive a monthly fee, subject to certain minimum, and out of pocket expenses.
BNY Mellon Investment Servicing (US) Inc. (the “Transfer Agent”) provides transfer agent services to the Fund. The Transfer Agent is entitled to receive a monthly fee, subject to certain minimum, and out of pocket expenses.
The Trust, on behalf of the Fund, has entered into agreements with financial intermediaries to provide recordkeeping, processing, shareholder communications and other services to customers of the intermediaries investing in the Fund and have agreed to compensate the intermediaries for providing those services. The fees incurred by the Fund for these services are included in Transfer agent fees in the Statement of Operations.
Foreside Funds Distributors LLC (the “Underwriter”) provides principal underwriting services to the Fund pursuant to an underwriting agreement between the Trust and the Underwriter.
The Trust and the Underwriter are parties to an underwriting agreement. The Trust has adopted a distribution plan for the Fund’s Class A Shares in accordance with Rule 12b-1 under the 1940 Act. Pursuant to the Class A Shares plan, the Fund compensates the Underwriter for direct and indirect costs and expenses incurred in connection with advertising, marketing and other distribution services in an amount not to exceed 0.25% on an annualized basis of the average daily net assets of the Fund’s Class A Shares.
23
PRIVATE CAPITAL MANAGEMENT VALUE FUND
Notes to Financial Statements (Continued)
April 30, 2020
Trustees and Officers
The Trust is governed by its Board of Trustees. The Trustees receive compensation in the form of an annual retainer and per meeting fees for their services to the Trust. An employee of BNY Mellon serves as the Secretary of the Trust and is not compensated by the Fund or the Trust.
JW Fund Management LLC (“JWFM”) provides a Principal Executive Officer and Principal Financial Officer, respectively, to the Trust. Duff & Phelps, LLC (“D&P”) provides the Trust with a Chief Compliance Officer and an Anti-Money Laundering Officer. JWFM and D&P are compensated for their services provided to the Trust.
3. Investment in Securities
For the year ended April 30, 2020, aggregate purchases and sales of investment securities (excluding short-term investments) of the Fund were as follows:
| Purchases | Sales | |||||||
Investment Securities | $ | 6,718,419 | $ | 21,021,481 | ||||
24
PRIVATE CAPITAL MANAGEMENT VALUE FUND
Notes to Financial Statements (Continued)
April 30, 2020
4. Capital Share Transactions
For the years ended April 30, 2020 and 2019, transactions in capital shares (authorized shares unlimited) were as follows:
| For the Year Ended April 30, 2020 | For the Year Ended April 30, 2019 | |||||||||||||||
Shares | Amount | Shares | Amount | |||||||||||||
Class A | ||||||||||||||||
Sales | 5,813 | $ | 43,003 | 34,520 | $ | 668,891 | ||||||||||
Reinvestments | 52,367 | 631,022 | 61,649 | 836,578 | ||||||||||||
Redemption Fees* | — | — | — | 165 | ||||||||||||
Redemptions | (105,747 | ) | (1,339,222 | ) | (144,994 | ) | (2,310,788 | ) | ||||||||
|
|
|
|
|
|
|
| |||||||||
Net decrease | (47,567 | ) | $ | (665,197 | ) | (48,825 | ) | $ | (805,154 | ) | ||||||
|
|
|
|
|
|
|
| |||||||||
Class I | ||||||||||||||||
Sales | 350,407 | $ | 4,145,468 | 282,371 | $ | 5,041,866 | ||||||||||
Reinvestments | 445,566 | 5,507,201 | 453,396 | 6,270,466 | ||||||||||||
Redemption Fees* | — | — | — | 1,353 | ||||||||||||
Redemptions | (1,187,180 | ) | (16,191,651 | ) | (1,256,335 | ) | (19,605,851 | ) | ||||||||
|
|
|
|
|
|
|
| |||||||||
Net decrease | (391,207 | ) | $ | (6,538,982 | ) | (520,568 | ) | $ | (8,292,166 | ) | ||||||
|
|
|
|
|
|
|
| |||||||||
Total net decrease | (438,774 | ) | $ | (7,204,179 | ) | (569,393 | ) | $ | (9,097,320 | ) | ||||||
|
|
|
|
|
|
|
| |||||||||
| * | There is a 2.00% redemption fee that may be charged on shares redeemed within the first 30 days of their acquisition. The redemption fees are retained by the Fund for the benefit of the remaining shareholders and recorded as paid-in capital. |
5. Federal Tax Information
The Fund has followed the authoritative guidance on accounting for and disclosure of uncertainty in tax positions, which requires the Fund to determine whether a tax position is more likely than not to be sustained upon examination, including resolution of any related appeals or litigation processes, based on the technical merits of the position. The Fund has determined that there was no effect on the financial statements from following this authoritative guidance. In the normal course of business, the Fund is subject to examination by federal, state and local jurisdictions, where applicable, for tax years for which applicable statutes of limitations have not expired.
Distributions are determined in accordance with federal income tax regulations, which may differ in amount or character from net investment income and realized gains for financial reporting purposes.
25
PRIVATE CAPITAL MANAGEMENT VALUE FUND
Notes to Financial Statements (Continued)
April 30, 2020
Accordingly, the character of distributions and composition of net assets for tax purposes may differ from those reflected in the accompanying financial statements. To the extent these differences are permanent, such amounts are reclassified within the components of net assets based on the tax treatment; temporary differences do not require reclassifications. For the year ended April 30, 2020, these adjustments were to increase total distributable earnings by $224,400 and decrease paid-in capital by $224,400. These permanent differences were primarily attributable to reclassification from capital gain to ordinary income and write-off of current year net operating loss. Net investment income, net realized losses and net assets were not affected by these adjustments.
For the year ended April 30, 2020, the tax character of distributions paid by the Fund was $6,148,999 of long-term capital gains dividends. For the year ended April 30, 2019, the tax character of distributions paid by the Fund was $8,730,587 of long-term capital gains dividends. Distributions from net investment income and short-term capital gains are treated as ordinary income for federal income tax purposes.
As of April 30, 2020, the components of distributable earnings on a tax basis were as follows:
Undistributed Long-Term Gain | Net Unrealized Appreciation | Other Book/Tax Differences | Total Distributable Earnings | |||
$— | $2,655,962 | $(66,450) | $2,589,512 |
The differences between the book and tax basis components of distributable earnings relate primarily to the timing and recognition of income and gains for federal income tax purposes.
At April 30, 2020, the federal tax cost, aggregate gross unrealized appreciation and depreciation of securities held by the Fund were as follows:
Federal tax cost | $ | 17,842,426 | ||||
|
| |||||
Gross unrealized appreciation | $ | 5,546,958 | ||||
Gross unrealized depreciation | (2,890,985 | ) | ||||
|
| |||||
Net unrealized appreciation | $ | 2,655,973 | ||||
|
|
Pursuant to federal income tax rules applicable to regulated investment companies, the Fund may elect to treat certain capital losses between November 1 and April 30 and late year ordinary losses ((i) ordinary losses between January 1 and April 30, and (ii) specified ordinary and currency losses between November 1 and April 30) as occurring on the first day of the following tax year. For the year ended April 30, 2020, any amount of losses elected within the tax return will not be recognized for federal income tax purposes until May 1, 2020. For the year ended April 30, 2020, the Fund had long-term capital gain deferrals of $485,350, short-term capital loss deferrals of $511,934 and ordinary late year loss deferrals of $39,866.
26
PRIVATE CAPITAL MANAGEMENT VALUE FUND
Notes to Financial Statements (Concluded)
April 30, 2020
Accumulated capital losses represent net capital loss carryforwards as of April 30, 2020, that may be available to offset future realized capital gains and thereby reduce future capital gains distributions. As of April 30, 2020, the Fund had no capital loss carryforwards.
6. Subsequent Events
Management has evaluated the impact of all subsequent events on the Fund through the date the financial statements were issued and has determined that there was the following subsequent event:
At a meeting held on June 23, 2020, the Board of Trustees of FundVantage Trust unanimously approved Private Capital Management, LLC’s proposal to convert Class A shares into Class I shares, effective July 31, 2020.
27
PRIVATE CAPITAL MANAGEMENT VALUE FUND
Report of Independent Registered Public Accounting Firm
To the Board of Trustees of FundVantage Trust and Shareholders of Private Capital Management Value Fund
Opinion on the Financial Statements
We have audited the accompanying statement of assets and liabilities, including the portfolio of investments, of Private Capital Management Value Fund (one of the funds constituting FundVantage Trust, hereafter referred to as the “Fund”) as of April 30, 2020, the related statement of operations for the year ended April 30, 2020, the statements of changes in net assets for each of the two years in the period ended April 30, 2020, including the related notes, and the financial highlights for each of the five years in the period ended April 30, 2020 (collectively referred to as the “financial statements”). In our opinion, the financial statements present fairly, in all material respects, the financial position of the Fund as of April 30, 2020, the results of its operations for the year then ended, the changes in its net assets for each of the two years in the period ended April 30, 2020 and the financial highlights for each of the five years in the period ended April 30, 2020 in conformity with accounting principles generally accepted in the United States of America.
Basis for Opinion
These financial statements are the responsibility of the Fund’s management. Our responsibility is to express an opinion on the Fund’s financial statements based on our audits. We are a public accounting firm registered with the Public Company Accounting Oversight Board (United States) (PCAOB) and are required to be independent with respect to the Fund in accordance with the U.S. federal securities laws and the applicable rules and regulations of the Securities and Exchange Commission and the PCAOB.
We conducted our audits of these financial statements in accordance with the standards of the PCAOB. Those standards require that we plan and perform the audit to obtain reasonable assurance about whether the financial statements are free of material misstatement, whether due to error or fraud.
Our audits included performing procedures to assess the risks of material misstatement of the financial statements, whether due to error or fraud, and performing procedures that respond to those risks. Such procedures included examining, on a test basis, evidence regarding the amounts and disclosures in the financial statements. Our audits also included evaluating the accounting principles used and significant estimates made by management, as well as evaluating the overall presentation of the financial statements. Our procedures included confirmation of securities owned as of April 30, 2020 by correspondence with the custodian and broker. We believe that our audits provide a reasonable basis for our opinion.
/s/ PricewaterhouseCoopers LLP
Philadelphia, Pennsylvania
June 24, 2020
We have served as the auditor of one or more Private Capital Management, LLC investment companies since 2011.
28
PRIVATE CAPITAL MANAGEMENT VALUE FUND
Shareholder Tax Information
(Unaudited)
The Fund is required by Subchapter M of the Internal Revenue Code, to advise its shareholders of the U.S. federal tax status of distributions received by the Fund’s shareholders in respect of such fiscal year. During the year ended April 30, 2020, the Fund paid $6,148,999 of long-term capital gain dividends to its shareholders. Dividends from net investment income and short-term capital gains are treated as ordinary income dividends for federal income tax purposes.
All designations are based on financial information available as of the date of this annual report and, accordingly, are subject to change. For each item, it is the intention of the Fund to designate the maximum amount permitted under the Internal Revenue Code of 1986, as amended, and the regulations thereunder.
Because the Fund’s fiscal year is not the calendar year, another notification will be sent with respect to calendar year 2020. The second notification, which will reflect the amount, if any, to be used by calendar year taxpayers on their U.S. federal income tax returns, will be made in conjunction with Form 1099-DIV and will be mailed in January 2021.
Foreign shareholders will generally be subject to U.S. withholding tax on the amount of their ordinary income dividends. They will generally not be entitled to a foreign tax credit or deduction for the withholding taxes paid by the Fund, if any.
In general, dividends received by tax-exempt recipients (e.g., IRAs and Keoghs) need not be reported as taxable income for U.S. federal income tax purposes. However, some retirement trusts (e.g., corporate, Keogh and 403(b)(7) plans) may need this information for their annual information reporting.
Shareholders are advised to consult their own tax advisers with respect to the tax consequences of their investment in the Fund.
29
PRIVATE CAPITAL MANAGEMENT VALUE FUND
Other Information
(Unaudited)
Proxy Voting
Policies and procedures that the Fund uses to determine how to vote proxies relating to portfolio securities as well as information regarding how the Fund voted proxies relating to portfolio securities for the most recent 12-month period ended June 30 are available without charge, upon request, by calling (888) 568-1267 and on the Securities and Exchange Commission’s (“SEC”) website at http://www.sec.gov.
Quarterly Portfolio Schedules
The Trust files its complete schedule of portfolio holdings with the SEC for the first and third fiscal quarters of each fiscal year (quarters ended July 31 and January 31) as an exhibit to their reports on Form N-PORT. The Trust’s portfolio holdings on Form N-PORT are available on the SEC’s website at http://www.sec.gov.
30
PRIVATE CAPITAL MANAGEMENT VALUE FUND
Privacy Notice
(Unaudited)
The privacy of your personal financial information is extremely important to us. When you open an account with us, we collect a significant amount of information from you in order to properly invest and administer your account. We take very seriously the obligation to keep that information private and confidential, and we want you to know how we protect that important information.
We collect nonpublic personal information about you from applications or other forms you complete and from your transactions with us or our affiliates. We do not disclose information about you, or our former clients, to our affiliates or to service providers or other third parties, except as permitted by law. We share only the information required to properly administer your accounts, which enables us to send transaction confirmations, monthly or quarterly statements, financials and tax forms. Even within FundVantage Trust and its affiliated entities, a limited number of people who actually service accounts will have access to your personal financial information. Further, we do not share information about our current or former clients with any outside marketing groups or sales entities.
To ensure the highest degree of security and confidentiality, FundVantage Trust and its affiliates maintain various physical, electronic and procedural safeguards to protect your personal information. We also apply special measures for authentication of information you request or submit to us on our website.
If you have questions or comments about our privacy practices, please call us at (888) 568-1267.
31
PRIVATE CAPITAL MANAGEMENT VALUE FUND
Fund Management
(Unaudited)
FundVantage Trust (the “Trust”) is governed by a Board of Trustees (the “Trustees”). The primary responsibility of the Trustees is to represent the interest of the Trust’s shareholders and to provide oversight management of the Trust.
The following tables present certain information regarding the Trustees and officers of the Trust. None of the Trustees are an “interested person” of the Trust, the Adviser, another investment adviser of a series of the Trust, or Foreside Funds Distributors LLC, the principal underwriter of the Trust (“Underwriter”), within the meaning of the 1940 Act and each Trustee is referred to as an “Independent Trustee” and is listed under such heading below. Employees of certain service providers to the Trust serve as officers of the Trust; such persons are not compensated by the Fund. The address of each Trustee and officer as it relates to the Trust’s business is 301 Bellevue Parkway, 2nd Floor, Wilmington, DE 19809.
The Statement of Additional information for the Fund contains additional information about the Trustees and is available, without charge, upon request, by calling (888) 568-1267.
Name and Date of Birth | Position(s) Held with Trust | Term of Office and Length of Time Served | Principal Occupation(s) During Past Five Years |
Number of Funds in Trust Complex Overseen by Trustee
| Other Directorships Held by Trustee | |||||
INDEPENDENT TRUSTEES
| ||||||||||
ROBERT J. CHRISTIAN Date of Birth: 2/49 | Trustee | Shall serve until death, resignation or removal. Trustee since 2007. Chairman from 2007 until September 30, 2019. | Retired since February 2006; Executive Vice President of Wilmington Trust Company from February 1996 to February 2006; President of Rodney Square Management Corporation (“RSMC”) (investment advisory firm) from 1996 to 2005; Vice President of RSMC from 2005 to 2006. | 39 | Optimum Fund Trust (registered investment company with 6 portfolios); Third Avenue Trust (registered investment company with 3 portfolios); Third Avenue Variable Series Trust (registered investment company with 1 portfolio). | |||||
32
PRIVATE CAPITAL MANAGEMENT VALUE FUND
Fund Management (Continued)
(Unaudited)
Name and Date of Birth | Position(s) Held with Trust | Term of Office and Length of Time Served | Principal Occupation(s) During Past Five Years |
Number of Funds in Trust Complex Overseen by
| Other Directorships Held by Trustee | |||||
IQBAL MANSUR Date of Birth: 6/55 | Trustee | Shall serve until death, resignation or removal. Trustee since 2007. | University Professor, Widener University. | 39 | Third Avenue Trust (registered investment company with 3 portfolios); Third Avenue Variable Series Trust (registered investment company with 1 portfolio). | |||||
NICHOLAS M. MARSINI, JR. Date of Birth: 8/55 | Trustee and Chairman of the Board | Shall serve until death, resignation or removal. Trustee since 2016. Chairman since October 1, 2019. | Retired since March 2016. President of PNC Bank Delaware from June 2011 to March 2016; Executive Vice President of Finance of BNY Mellon from July 2010 to January 2011; Executive Vice President and Chief Financial Officer of PNC Global Investment Servicing from September 1997 to July 2010. | 39 | Brinker Capital Destinations Trust (registered investment company with 10 portfolios); Third Avenue Trust (registered investment company with 3 portfolios); Third Avenue Variable Series Trust (registered investment company with 1 portfolio). | |||||
33
PRIVATE CAPITAL MANAGEMENT VALUE FUND
Fund Management (Continued)
(Unaudited)
Name and Date of Birth | Position(s) Held with Trust | Term of Office and Length of Time Served | Principal Occupation(s) During Past Five Years |
Number of Funds in Trust Complex | Other Directorships Held by Trustee | |||||
NANCY B. WOLCOTT Date of Birth: 11/54 | Trustee | Shall serve until death, resignation or removal. Trustee since 2011. | Retired since May 2014; EVP, Head of GFI Client Service Delivery, BNY Mellon from January 2012 to May 2014; EVP, Head of US Funds Services, BNY Mellon from July 2010 to January 2012; President of PNC Global Investment Servicing from 2008 to July 2010; Chief Operating Officer of PNC Global Investment Servicing from 2007 to 2008; Executive Vice President of PFPC Worldwide Inc. from 2006 to 2007. | 39 | Lincoln Variable Insurance Products Trust (registered investment company with 97 portfolios); Third Avenue Trust (registered investment company with 3 portfolios); Third Avenue Variable Series Trust (registered investment company with 1 portfolio). | |||||
STEPHEN M. WYNNE Date of Birth: 1/55 | Trustee | Shall serve until death, resignation or removal. Trustee since 2009. | Retired since December 2010; Chief Executive Officer of US Funds Services, BNY Mellon Asset Servicing from July 2010 to December 2010; Chief Executive Officer of PNC Global Investment Servicing from March 2008 to July 2010; President, PNC Global Investment Servicing from 2003 to 2008. | 39 | Copeland Trust (registered investment company with 3 portfolios); Third Avenue Trust (registered investment company with 3 portfolios); Third Avenue Variable Series Trust (registered investment company with 1 portfolio). | |||||
34
PRIVATE CAPITAL MANAGEMENT VALUE FUND
Fund Management (Concluded)
(Unaudited)
Name and Date of Birth | Position(s) Held with Trust | Term of Office and Length of Time Served | Principal Occupation(s) During Past Five Years | |||
EXECUTIVE OFFICERS | ||||||
JOEL L. WEISS Date of Birth: 1/63 | President and Chief Executive Officer | Shall serve until death, resignation or removal. Officer since 2007. | President of JW Fund Management LLC since June 2016; Vice President and Managing Director of BNY Mellon Investment Servicing (US) Inc. and predecessor firms from 1993 to June 2016. | |||
T. RICHARD KEYES Date of Birth: 1/57 | Treasurer and Chief Financial Officer | Shall serve until death, resignation or removal. Officer since 2016. | President of TRK Fund Consulting LLC since July 2016; Head of Tax — U.S. Fund Services of BNY Mellon Investment Servicing (US) Inc. and predecessor firms from February 2006 to July 2016. | |||
GABRIELLA MERCINCAVAGE Date of Birth: 6/68 | Assistant Treasurer | Shall serve until death, resignation or removal. Officer since 2019. | Fund Administration Consultant since January 2019; Fund Accounting and Tax Compliance Accountant to financial services companies from November 2003 to July 2018. | |||
VINCENZO A. SCARDUZIO Date of Birth: 4/72 | Secretary | Shall serve until death, resignation or removal. Officer since 2012. | Director and Vice President Regulatory Administration of The Bank of New York Mellon and predecessor firms since 2001. | |||
DAVID C. LEBISKY Date of Birth: 5/72 | Chief Compliance Officer and Anti-Money Laundering Officer | Shall serve until death, resignation or removal. Officer since 2015. | President of Lebisky Compliance Consulting LLC since October 2015; Consultant, Duff & Phelps, LLC since 2016; Senior Consultant, Freeh Group International Solutions, LLC (a global risk management firm) from 2015 to 2018; Scotia Institutional Investments US, LP, Director of Regulatory Administration from 2010 to 2014. | |||
35
Investment Adviser
Private Capital Management, LLC
8889 Pelican Bay Boulevard
Suite 500
Naples, FL 34108
Administrator
The Bank of New York Mellon
301 Bellevue Parkway
Wilmington, DE 19809
Transfer Agent
BNY Mellon Investment Servicing (US) Inc.
4400 Computer Drive
Westborough, MA 01581
Principal Underwriter
Foreside Funds Distributors LLC
400 Berwyn Park
899 Cassatt Road
Berwyn, PA 19312
Custodian
The Bank of New York Mellon
240 Greenwich Street
New York, NY 10286
Independent Registered Public Accounting Firm
PricewaterhouseCoopers LLP
Two Commerce Square, Suite 1800
2001 Market Street
Philadelphia, PA 19103-7042
Legal Counsel
Pepper Hamilton LLP
3000 Two Logan Square
18th and Arch Streets
Philadelphia, PA 19103
PRI-0420
PRIVATECAPITAL
MANAGEMENT VALUE
FUND
of
FundVantage Trust
Class A
Class I
ANNUAL
REPORT
April 30, 2020
IMPORTANT NOTE: Beginning on January 1, 2021, paper copies of the Fund’s shareholder reports will no longer be sent by mail, unless you specifically request paper copies of the shareholder reports from the Fund or from your financial intermediary. Instead, shareholder reports will be available on the Private Capital Management Value Fund’s website (www.private-cap.com), and you will be notified by mail each time a report is posted and provided with a website link to access the report.
You may elect to receive all future shareholder reports in paper, free of charge. To elect to receive paper copies of shareholder reports through the mail or otherwise change your delivery method, contact your financial intermediary or, if you hold your shares directly through the Fund, call toll-free at (888) 568-1267 or write to:
Private Capital Management Value Fund
FundVantage Trust
c/o BNY Mellon Investment Servicing
P.O. Box 9829
Providence, RI 02940-8029
This report is submitted for the general information of shareholders and is not authorized for distribution to prospective investors unless preceded or accompanied by a current prospectus.
QUALITY DIVIDEND FUND
Annual Investment Adviser’s Report
April 30, 2020
(Unaudited)
Dear Shareholders,
During the fiscal year ended April 30, 2020, the Quality Dividend Fund (the “Fund”) Class A shares (without the sales charge) declined 12.46%, compared to a drop of 11.01% for the Russell 1000® Value Index (“Russell 1000”). Since inception on September 30, 2013, the Fund’s Class A shares (without the sales charge) have risen at an annualized rate of 5.31% versus 6.51% for the Russell 1000. The fiscal year began with sentiment improving and strong gains for stocks in the second half of 2019 amid the backdrop of accommodative Federal Reserve (Fed) policy, improving trade relations with China, record low unemployment, and healthy trends in consumer spending. The fiscal year was redefined by the first quarter of 2020, with the novel coronavirus COVID-19 pandemic leading to the closure of economies across the globe. The situation was exacerbated by an oil price war breaking out between Saudi Arabia and Russia. Energy and Financials were the hardest hit sectors, declining 35.95% and 25.58%, respectively, for the year through April. However, selling was broad, with only Information Technology in positive territory through April, posting a 0.11% gain on a total return basis. The desire for liquidity and concerns about the impact of the economic shutdown seemed to weigh disproportionately on stocks paying higher dividends. While the S&P 500 was down 9.29% YTD through April, the Fund and the Russell 1000 were down 18.48% and 18.49%, respectively, and the S&P 500 Low Volatility High Dividend Index was down 23.63%. Market action during this historic event has clearly been unfavorable for stocks paying a higher level of dividends. Although this can be frustrating, we continue to focus on the ability of stocks in the Fund to maintain and grow their dividends over time. We believe companies that have the will and ability to maintain and grow dividends will be positioned to weather this storm and reward shareholders as conditions improve. Through April 30, no current holdings had announced dividend cuts, and 10 of the 25 holdings have announced dividend increases in 2020.
The performance data quoted represents past performance and does not guarantee future results. The investment return and principal value of an investment in the Fund will fluctuate so that an investor’s shares, when redeemed, may be worth more or less than their original cost. Current performance may be lower or higher. Performance data current to the most recent month end may be obtained by calling (888) 201-5799.
Changes
Changes made during 2019 and into early 2020 reflected the normal course of management for us. Stocks were removed for reasons including strong performance reducing current yield, concerns about the potential for future dividend reductions, and concerns regarding management commitment to future dividend growth. During this period, we removed Merck & Co, Inc. (MRK), Ventas Inc. (VTR), Cisco Systems, Inc. (CSCO), Coca-Cola Co. (KO), ONEOK Inc. (OKE), and Kimberly-Clark Corp (KMB). Stocks were added that, we believe, presented an attractive combination of yield and growth potential, or were poised to benefit from the improving backdrop for consumer spending, including Carnival Corp. (CCL), Simon Property Group, Inc. (SPG), NetApp, Inc. (NTAP), Prudential Financial, Inc. (PRU), Gilead Science, Inc. (GILD), and Exxon Mobil, Inc. (XOM). When the economy shut down due to the pandemic, we removed companies we believed were most directly susceptible to declines in consumer spending and historically low oil prices. Companies with strong credit ratings and long dividend histories were added that we believe may be better positioned to navigate the current environment. Carnival Corp. (CCL), Williams Cos. Inc. (WMB), and Simon Property Group Inc. (SPG) were removed and United Parcel Service, Inc. (UPS), 3M Company (MMM), JPMorgan Chase & Company (JPM), and Emerson Electric Co. (EMR) were added.
1
QUALITY DIVIDEND FUND
Annual Investment Adviser’s Report (Continued)
April 30, 2020
(Unaudited)
Distributions
The Fund has had four income distributions and capital gain distributions during the fiscal year. Class A shares distributed income of $0.084 per share on July 1, 2019; $0.102 per share on September 30, 2019; $0.102 per share on January 2, 2020; and $0.065 per share on April 1, 2020. Class C shares distributed income of $0.059 per share on July 1, 2019; $0.077 per share on October 1, 2019; $0.078 per share on January 2, 2020; and $0.042 per share on April 1, 2020. Class I shares distributed income of $0.092 per share on July 1, 2019; $0.110 per share on October 1, 2019; $0.110 per share on January 2, 2020; and $0.072 per share on April 1, 2020. All share classes distributed long term capital gains of $0.743 per share on December 20, 2019.
Outlook
We believe the self-induced coma in which the U.S. economy has been placed will eventually reverse and begin the journey to recovery. It is extremely difficult to determine how long this will take, but we trust there are brighter days ahead. We also believe that companies with strong business models, solid balance sheets, and good cash flow will be the first to emerge from this storm. In our opinion, the Fund is well-positioned to take advantage of the coming recovery.
Past performances is no guarantee of future returns.
Sincerely,
Thomas P.Mulroy
Senior Portfolio Manager
Michael S. Scherer
Senior Portfolio Manager
Larry Baker, CFA
Senior Portfolio Adviser
Investments cannot be made directly in an Index. Unmanaged index returns assume reinvestment of any and all distributions and do not reflect fees, expenses, or sales charges.
This letter is intended to assist shareholders in understanding how the Fund performed during the fiscal year ended April 30, 2020 and reflects the views of the investment adviser at the time of this writing. Of course, these views may change and do not guarantee the future performance of the Fund or the markets.
Mutual fund investing involves risk, including possible loss of principal. Although the Fund will invest primarily in income producing equities, the Fund cannot guarantee any particular level of distributions. Companies that have paid regular dividends to shareholders may decrease or eliminate dividend payments in the future. A fund pursuing a dividend oriented investment strategy may at times underperform other funds that invest more broadly or that have different investment styles.
2
QUALITY DIVIDEND FUND
Annual Investment Adviser’s Report (Concluded)
April 30, 2020
(Unaudited)
The S&P 500 Index is an unmanaged index of equity prices and is representative of a broader market and range of securities than is found in the Fund’s portfolio. The Morningstar Large Value Category consists of Funds that invest primarily in big U.S. companies that are less expensive or growing more slowly than other large-cap stocks. Stocks in the top 70% of the capitalization of the U.S. equity market are defined as large-cap. Value is defined based on low valuations (low price ratios and high dividend yields) and slow growth (low growth rates for earnings, sales, book value, and cash flow). The Russell 1000 Value Index consists of approximately 1,000 of the largest companies in the U.S. equity markets and measures how U.S. stocks in the equity value segment perform.
Foreign securities potentially entail special risks such as less liquid markets; political and economic instability; lax regulation; and adverse fluctuations in currency exchange rates.
Real estate investing is subject to special risks, including tenant default, declining occupancy rates, adverse changes in environmental and zoning regulations, and falling property values and rents due to deteriorating local or national economic conditions. REIT securities listed on a securities exchange may be subject to abrupt or erratic price movements because of interest rate changes and other factors. Non-listed REIT securities may lack sufficient liquidity to enable the Fund to sell them at an advantageous time or to minimize a loss.
Distributions from REITs may include a return of capital. A REIT that does not qualify as a REIT under the Internal Revenue Code (“IRC”) will pay taxes on its earnings, which will reduce the dividends paid by the REIT to the Fund Some REITs are highly leveraged, which may increase the risk of loss. MLPs are partnerships which are publicly traded and listed on a national securities exchange.
MLPs are interest rate sensitive investments that may trade in lower volumes and be subject to abrupt or erratic price movements and may involve less control by outside investors and potential conflicts of interest among an MLP and its general partner. The IRC treats distributions from an MLP as non-taxable return of capital until the value of the distributions exceeds a partner’s basis in partnership interests, at which point the distributions are taxable. MLPs do not pay U.S. federal income tax at the partnership level, but an adverse change in tax laws could result in MLPs being treated as corporations for federal income tax purposes, which would reduce or eliminate an MLP’s tax deductions. MLPs primarily are engaged in energy and natural resource sectors, which makes them sensitive to negative developments in those sectors.
The above commentary is for informational purposes only and does not represent an offer, recommendation or solicitation to buy, hold or sell any security. The specific securities identified and described do not represent all of the securities purchased or sold and you should not assume that investments in the securities identified and discussed will be profitable.
Portfolio composition is subject to change. The current and future portfolio holdings of the Fund are subject to investment risk.
3
QUALITY DIVIDEND FUND
Annual Report
Performance Data
April 30, 2020
(Unaudited)
Comparison of Change in Value of $10,000 Investment in Quality Dividend Fund
Class A shares vs. Russell 1000® Value Index
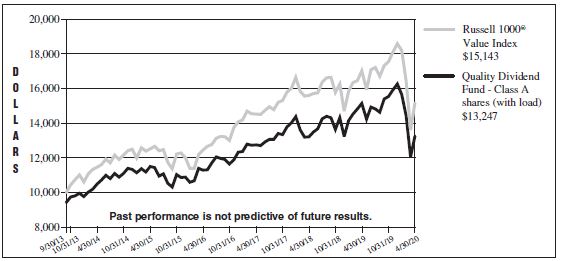
Class A shares of an assumed $10,000 investment is adjusted for the maximum sales charge of 5.75%. This results in a net investment of $9,425. Performance of Class C shares will vary from Class A shares due to difference in class specific fees.
Comparison of Change in Value of $1,000,000 (investment minimum) Investment in Quality Dividend Fund
Institutional Class shares vs. Russell 1000® Value Index
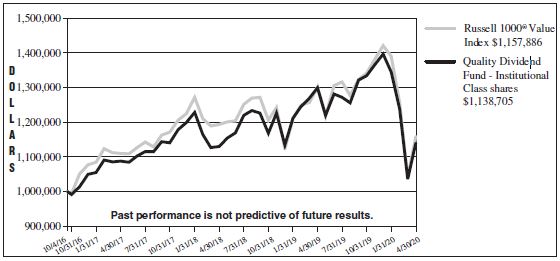
4
QUALITY DIVIDEND FUND
Annual Report
Performance Data (Continued)
April 30, 2020
(Unaudited)
| Average Annual Total Returns for the Periods Ended April 30, 2020† | ||||||||||||||||||||||||||
| 1 Year | 3 Years | 5 Years | Since Inception | |||||||||||||||||||||||
Class A (with sales charge) | -17.47 | % | -0.65 | % | 1.66 | % | 4.37 | % | ||||||||||||||||||
Class A (without sales charge) | -12.46 | % | 1.32 | % | 2.87 | % | 5.31 | % | ||||||||||||||||||
Russell 1000® Value Index | -11.01 | % | 1.42 | % | 3.90 | % | 6.51 | %* | ||||||||||||||||||
Class C (with CDSC charge) | -13.90 | % | 0.54 | % | 2.09 | % | 4.53 | % | ||||||||||||||||||
Class C (without CDSC charge) | -13.10 | % | 0.54 | % | 2.09 | % | 4.53 | % | ||||||||||||||||||
Russell 1000® Value Index | -11.01 | % | 1.42 | % | 3.90 | % | 6.38 | %** | ||||||||||||||||||
Institutional Class | -12.29 | % | 1.55 | % | N/A | 3.71 | % | |||||||||||||||||||
Russell 1000® Value Index | -11.01 | % | 1.42 | % | N/A | 4.19 | %*** | |||||||||||||||||||
| † | The Quality Dividend Fund (“the Fund”) Class A shares commenced operations on September 30, 2013; Class C shares commenced operations on October 1, 2013; Institutional Class shares commenced operations on October 4, 2016. |
| * | Benchmark performance is from the inception date of Class A shares of the Fund (September 30, 2013) only and is not the inception date of the benchmark itself. |
| ** | Benchmark performance is from the inception date of Class C shares of the Fund (October 1, 2013) only and is not the inception date of the benchmark itself. |
| *** | Benchmark performance is from the inception date of Institutional Class shares of the Fund (October 4, 2016) only and is not the inception date of the benchmark itself. |
The performance data quoted represents past performance and does not guarantee future results. The investment return and principal value of an investment in the Fund will fluctuate so that an investor’s shares, when redeemed, may be worth more or less than their original cost. The graphs and table do not reflect the deduction of taxes that a shareholder would pay on Fund distributions or redemption of Fund shares. Current performance may be lower or higher. Performance data current to the most recent month end may be obtained by calling (888) 201-5799.
The returns of Class A shares reflect a deduction for the maximum front end sales charge of 5.75%. The returns shown for Class C shares reflect a maximum deferred sales charge of 1.00% that may apply to Class C shares when shares are redeemed within 12 months after initial purchase.
The Fund’s “Total Annual Fund Operating Expenses” and “Total Annual Fund Operating Expenses After Fee Waiver and/or Expense Reimbursement”, as stated in the current prospectus dated September 1, 2019, are 1.42% and 1.24%, respectively, for Class A shares, 2.17% and 1.99%, respectively, for Class C shares and 1.17% and 0.99%, for Institutional Class shares of the Fund’s average daily net assets. These rates may fluctuate and may differ from the actual expenses incurred by the Fund for the period covered by this report. Equity Compass Investment Management, LLC (“EquityCompass” or the “Adviser”) has contractually agreed to reduce its investment advisory fee and/or reimburse certain expenses of the Fund to the extent necessary to ensure that the Fund’s total operating expenses (excluding taxes, fees and expenses attributable to a distribution or service plan adopted by FundVantage Trust (the “Trust”), “Acquired Fund Fees and Expenses,” dividend and interest expense on securities sold short, interest, extraordinary items and brokerage commissions) do not exceed 0.99% of average daily net assets of the Fund (the “Expense Limitation”). The Expense Limitation will remain in effect until August 31, 2020, unless the Board of Trustees (“Board of Trustees”) of the Trust approves its earlier termination. The Adviser is entitled to recover, subject to approval by the Board of Trustees, such amounts reduced or reimbursed for a period of up to three (3) years from the date on which the Adviser reduced its compensation and/or assumed expenses for the Fund. The Adviser is permitted to
5
QUALITY DIVIDEND FUND
Annual Report
Performance Data (Concluded)
April 30, 2020
(Unaudited)
seek reimbursement from the Fund, subject to certain limitations, for fees it waived and Fund expenses it paid to the extent the total annual fund operating expenses do not exceed the limits described above or any lesser limits in effect at the time of reimbursement. No recoupment will occur unless the Fund’s expenses are below the Expense Limitation amount. Total fees would be higher had such fees and expenses not been waived and/or reimbursed.
A 1.00% redemption fee applies to shares redeemed within 60 days of purchase. The redemption fee is not reflected in the returns shown above.
The Fund intends to evaluate performance as compared to those of the Russell 1000® Value Index. The Russell 1000® Value Index is an unmanaged index that measures the performance of the highest-ranking 1,000 stocks in the Russell 3000® Index, which represents about 90% of the total market capitalization of all listed U.S. stocks.
Mutual fund investing involves risk, including possible loss of principal. The Fund’s dividend income and distributions will fluctuate, and at times the Fund may underperform other funds that invest more broadly or that have different investment styles. Some of the assets in which the Fund may invest entail special risks. Foreign stocks may be affected by currency fluctuations, social and political instability, and lax regulatory and financial reporting standards. Master Limited Partnerships (“MLPs”) may fluctuate abruptly in value and be difficult to liquidate. Real Estate Investment Trusts (“REITs”) entail risks related to real estate, such as tenant defaults, declining occupancy rates, and falling property values due to deteriorating economic conditions. Listed REIT stocks may fluctuate erratically in market price while non-listed REITs may be illiquid.
6
QUALITY DIVIDEND FUND
Fund Expense Disclosure
April 30, 2020
(Unaudited)
As a shareholder of the Fund, you incur two types of costs: (1) transaction costs, including sales charges (loads) on purchase payments, if any, and redemption fees; and (2) ongoing costs, including management fees, distribution and/or service (Rule 12b-1) fees, if any, and other Fund expenses. These examples are intended to help you understand your ongoing costs (in dollars) of investing in the Fund and to compare these costs with the ongoing costs of investing in other mutual funds.
These examples are based on an investment of $1,000 invested at the beginning of the six-month period from November 1, 2019 through April 30, 2020 and held for the entire period.
Actual Expenses
The first line of each accompanying table provides information about actual account values and actual expenses. You may use the information in this line, together with the amount you invested, to estimate the expenses that you paid over the period. Simply divide your account value by $1,000 (for example, an $8,600 account value divided by $1,000 = 8.6), then multiply the result by the number in the first line under the heading entitled “Expenses Paid During Period” to estimate the expenses you paid on your account during this period.
Hypothetical Examples for Comparison Purposes
The second line of each accompanying table provides information about hypothetical account values and hypothetical expenses based on the Fund’s actual expense ratio and an assumed rate of return of 5% per year before expenses, which is not your Fund’s actual return. The hypothetical account values and expenses may not be used to estimate the actual ending account balance or expenses you paid for the period. You may use this information to compare the ongoing costs of investing in the Fund and other funds. To do so, compare these 5% hypothetical examples with the 5% hypothetical examples that appear in the shareholder reports of other funds.
Please note that the expenses shown in the accompanying table are meant to highlight your ongoing costs only and do not reflect any transactional costs, such as sales charges (loads), if any, or redemption fees. Therefore, the second line of the accompanying table is useful in comparing ongoing costs only, and will not help you determine the relative total costs of owning different funds. In addition, if these transactional costs were included, your costs would have been higher.
7
QUALITY DIVIDEND FUND
Fund Expense Disclosure (Concluded)
April 30, 2020
(Unaudited)
| Quality Dividend Fund | |||||||||||||||
| Beginning Account Value November 1, 2019 | Ending Account Value April 30, 2020 | Expenses Paid During Period* | |||||||||||||
Class A | |||||||||||||||
Actual | $ | 1,000.00 | $ | 853.20 | $ | 5.71 | |||||||||
Hypothetical (5% return before expenses) | 1,000.00 | 1,018.70 | 6.22 | ||||||||||||
Class C | |||||||||||||||
Actual | $ | 1,000.00 | $ | 849.60 | $ | 9.15 | |||||||||
Hypothetical (5% return before expenses) | 1,000.00 | 1,014.97 | 9.97 | ||||||||||||
Institutional Class | |||||||||||||||
Actual | $ | 1,000.00 | $ | 853.70 | $ | 4.56 | |||||||||
Hypothetical (5% return before expenses) | 1,000.00 | 1,019.94 | 4.97 | ||||||||||||
| * | Expenses are equal to an annualized expense ratio for the six-month period ended April 30, 2020 of 1.24%, 1.99% and 0.99% for Class A, Class C and Institutional Class shares, respectively, for the Fund, multiplied by the average account value over the period, multiplied by the number of days in the most recent period (182), then divided by 366 to reflect the period. The Fund’s ending account values on the first line in the table are based on the actual six-month total returns for the Fund of (14.68)%, (15.04)% and (14.63)% for Class A, Class C and Institutional Class shares, respectively. |
8
QUALITY DIVIDEND FUND
Portfolio Holdings Summary Table
April 30, 2020
(Unaudited)
The following table presents a summary by sector of the portfolio holdings of the Fund:
| % of Net Assets | Value | |||||||
COMMON STOCKS: | ||||||||
Oil, Gas & Consumable Fuels | 14.1 | % | $ | 8,256,676 | ||||
Biotechnology | 10.8 | 6,347,927 | ||||||
Electric Utilities | 9.0 | 5,262,088 | ||||||
Commercial Banks | 8.8 | 5,156,468 | ||||||
Diversified Telecommunication Services | 8.4 | 4,892,470 | ||||||
REITs | 7.5 | 4,422,536 | ||||||
Pharmaceuticals | 5.0 | 2,952,339 | ||||||
IT Services | 4.4 | 2,594,949 | ||||||
Tobacco | 4.3 | 2,526,702 | ||||||
Health Care Providers & Services | 4.3 | 2,508,389 | ||||||
Air Freight & Logistics | 4.2 | 2,483,121 | ||||||
Semiconductors & Semiconductor Equipment | 4.1 | 2,413,674 | ||||||
Industrial Conglomerates | 3.9 | 2,308,728 | ||||||
Containers & Packaging | 3.6 | 2,092,949 | ||||||
Technology Hardware, Storage & Peripherals | 3.4 | 2,011,582 | ||||||
Insurance | 3.3 | 1,903,719 | ||||||
Exchange Traded Fund | 0.3 | 154,317 | ||||||
Other Assets in Excess of Liabilities | 0.6 | 352,130 | ||||||
|
|
|
| |||||
NET ASSETS |
|
100.0 |
% |
$ |
58,640,764 |
| ||
|
|
|
| |||||
Portfolio holdings are subject to change at any time.
The accompanying notes are an integral part of the financial statements.
9
QUALITY DIVIDEND FUND
Portfolio of Investments
April 30, 2020
| Number of Shares | Value | |||||||
COMMON STOCKS — 99.1% |
| |||||||
Air Freight & Logistics — 4.2% |
| |||||||
United Parcel Service, Inc., Class B | 26,232 | $ | 2,483,121 | |||||
|
| |||||||
Biotechnology — 10.8% | ||||||||
AbbVie, Inc. | 32,407 | 2,663,855 | ||||||
Gilead Sciences, Inc. | 43,858 | 3,684,072 | ||||||
|
| |||||||
| 6,347,927 | ||||||||
|
| |||||||
Commercial Banks — 8.8% | ||||||||
JPMorgan Chase & Co. | 17,824 | 1,706,826 | ||||||
Truist Financial Corp. | 51,842 | 1,934,743 | ||||||
Wells Fargo & Co. | 52,148 | 1,514,899 | ||||||
|
| |||||||
| 5,156,468 | ||||||||
|
| |||||||
Containers & Packaging — 3.6% |
| |||||||
International Paper Co. | 61,108 | 2,092,949 | ||||||
|
| |||||||
Diversified Telecommunication Services — 8.4% |
| |||||||
AT&T, Inc. | 71,952 | 2,192,377 | ||||||
Verizon Communications, Inc. | 46,999 | 2,700,093 | ||||||
|
| |||||||
| 4,892,470 | ||||||||
|
| |||||||
Electric Utilities — 9.0% | ||||||||
Duke Energy Corp. | 32,122 | 2,719,449 | ||||||
Southern Co. (The) | 44,820 | 2,542,639 | ||||||
|
| |||||||
| 5,262,088 | ||||||||
|
| |||||||
Health Care Providers & Services — 4.3% |
| |||||||
Cardinal Health, Inc. | 50,695 | 2,508,389 | ||||||
|
| |||||||
Industrial Conglomerates — 3.9% |
| |||||||
3M Co. | 15,197 | 2,308,728 | ||||||
|
| |||||||
Insurance — 3.3% | ||||||||
Prudential Financial, Inc. | 30,523 | 1,903,719 | ||||||
|
| |||||||
IT Services — 4.4% | ||||||||
International Business Machines Corp. | 20,667 | 2,594,949 | ||||||
|
| |||||||
| Number of Shares | Value | |||||||
COMMON STOCKS — (Continued) |
| |||||||
Oil, Gas & Consumable Fuels — 14.1% |
| |||||||
Chevron Corp. | 23,373 | $ | 2,150,316 | |||||
Enbridge, Inc. (Canada) | 74,773 | 2,294,036 | ||||||
Exxon Mobil Corp. | 44,147 | 2,051,511 | ||||||
Valero Energy Corp. | 27,795 | 1,760,813 | ||||||
|
| |||||||
| 8,256,676 | ||||||||
|
| |||||||
Pharmaceuticals — 5.0% | ||||||||
Pfizer, Inc. | 76,964 | 2,952,339 | ||||||
|
| |||||||
REITs — 7.5% | ||||||||
Digital Realty Trust, Inc. | 15,657 | 2,340,565 | ||||||
Iron Mountain, Inc. | 86,103 | 2,081,971 | ||||||
|
| |||||||
| 4,422,536 | ||||||||
|
| |||||||
Semiconductors & Semiconductor Equipment — 4.1% |
| |||||||
QUALCOMM, Inc. | 30,681 | 2,413,674 | ||||||
|
| |||||||
Technology Hardware, Storage & Peripherals — 3.4% |
| |||||||
NetApp, Inc. | 45,958 | 2,011,582 | ||||||
|
| |||||||
Tobacco — 4.3% | ||||||||
Philip Morris International, Inc. | 33,870 | 2,526,702 | ||||||
|
| |||||||
TOTAL COMMON STOCKS |
| 58,134,317 | ||||||
|
| |||||||
The accompanying notes are an integral part of the financial statements.
10
QUALITY DIVIDEND FUND
Portfolio of Investments (Concluded)
April 30, 2020
| Number of Shares | Value | |||||||
EXCHANGE TRADED FUND — 0.3% |
| |||||||
SPDR S&P Dividend ETF | 1,755 | $ | 154,317 | |||||
|
| |||||||
TOTAL EXCHANGE TRADED FUND | 154,317 | |||||||
|
| |||||||
TOTAL INVESTMENTS - 99.4% |
| 58,288,634 | ||||||
OTHER ASSETS IN EXCESS OF LIABILITIES - 0.6% | 352,130 | |||||||
|
| |||||||
NET ASSETS - 100.0% | $ | 58,640,764 | ||||||
|
| |||||||
| REIT | Real Estate Investment Trust |
| SPDR | Standard & Poor’s Depository Receipt |
The accompanying notes are an integral part of the financial statements.
11
QUALITY DIVIDEND FUND
Statement of Assets and Liabilities
April 30, 2020
Assets | ||||
Investments, at value (Cost $58,430,217) | $ | 58,288,634 | ||
Cash | 283,925 | |||
Receivable for capital shares sold | 80,160 | |||
Dividends receivable | 104,560 | |||
Prepaid expenses and other assets | 22,067 | |||
|
| |||
Total assets | 58,779,346 | |||
|
| |||
Liabilities | ||||
Payable for audit fees | 30,118 | |||
Payable for transfer agent fees | 29,714 | |||
Payable for distribution fees | 17,033 | |||
Payable to Investment Adviser | 14,232 | |||
Payable for administration and accounting fees | 12,397 | |||
Payable for capital shares redeemed | 12,177 | |||
Payable for printing fees | 11,257 | |||
Payable for custodian fees | 5,008 | |||
Payable for shareholder servicing fees | 3,793 | |||
Payable for legal fees | 2,647 | |||
Accrued expenses | 206 | |||
|
| |||
Total liabilities | 138,582 | |||
|
| |||
Net Assets | $ | 58,640,764 | ||
|
| |||
Net Assets consisted of: | ||||
Capital stock, $0.01 par value | $ | 55,934 | ||
Paid-in capital | 61,207,913 | |||
Total distributable earnings. | (2,623,083 | ) | ||
|
| |||
Net Assets | $ | 58,640,764 | ||
|
|
Class A: | ||||
Net asset value, redemption price per share ($28,816,343 / 2,753,074 shares) | $ | 10.47 | ||
|
| |||
Maximum offering price per share (100/94.25 of $10.47) | $ | 11.11 | ||
|
| |||
Class C: | ||||
Net asset value, offering and redemption price per share ($19,254,695 / 1,830,856 shares) | $ | 10.52 | ||
|
| |||
Institutional Class: | ||||
Net asset value, offering and redemption price per share ($10,569,726 / 1,009,505 shares) | $ | 10.47 | ||
|
| |||
The accompanying notes are an integral part of the financial statements.
12
QUALITY DIVIDEND FUND
Statement of Operations
For the Year Ended April 30, 2020
Investment income | ||||
Dividends | $ | 2,806,841 | ||
Less: foreign taxes withheld | (25,666 | ) | ||
|
| |||
Total investment income | 2,781,175 | |||
|
| |||
Expenses | ||||
Advisory fees (Note 2) | 418,840 | |||
Distribution fees (Class C) (Note 2) | 171,312 | |||
Transfer agent fees (Note 2) | 91,047 | |||
Distribution fees (Class A) (Note 2) | 88,518 | |||
Administration and accounting fees (Note 2) | 64,472 | |||
Shareholder servicing fees (Class C) | 57,104 | |||
Registration and filing fees | 47,732 | |||
Trustees’ and officers’ fees | 40,919 | |||
Audit fees | 30,806 | |||
Legal fees | 26,946 | |||
Printing and shareholder reporting fees | 23,102 | |||
Custodian fees (Note 2) | 21,278 | |||
Other expenses | 10,717 | |||
|
| |||
Total expenses before waivers and reimbursements | 1,092,793 | |||
|
| |||
Less: waivers and reimbursements (Note 2) | (84,774 | ) | ||
|
| |||
Net expenses after waivers and reimbursements | 1,008,019 | |||
|
| |||
Net investment income. | 1,773,156 | |||
|
| |||
Net realized and unrealized gain/(loss) from investments: | ||||
Net realized gain from investments | 532,497 | |||
Net change in unrealized appreciation/(depreciation) from investments | (11,198,931 | ) | ||
|
| |||
Net realized and unrealized loss from investments | (10,666,434 | ) | ||
|
| |||
Net decrease in net assets resulting from operations | $ | (8,893,278 | ) | |
|
|
The accompanying notes are an integral part of the financial statements.
13
QUALITY DIVIDEND FUND
Statements of Changes in Net Assets
| For the Year Ended April 30, 2020 | For the Year Ended April 30, 2019 | |||||||
Increase/(decrease) in net assets from operations: | ||||||||
Net investment income | $ | 1,773,156 | $ | 1,732,533 | ||||
Net realized gain from investments | 532,497 | 1,588,090 | ||||||
Net change in unrealized appreciation/(depreciation) from investments | (11,198,931 | ) | 6,323,031 | |||||
|
|
|
| |||||
Net increase/(decrease) in net assets resulting from operations | (8,893,278 | ) | 9,643,654 | |||||
|
|
|
| |||||
Less dividends and distributions to shareholders from: | ||||||||
Total distributable earnings | ||||||||
Class A | (2,993,150 | ) | (2,894,783 | ) | ||||
Class C | (1,784,502 | ) | (1,585,083 | ) | ||||
Institutional Class | (1,073,008 | ) | (734,246 | ) | ||||
Total return of capital | ||||||||
Class A | (26,147 | ) | — | |||||
Class C | (16,868 | ) | — | |||||
Institutional Class | (8,535 | ) | — | |||||
|
|
|
| |||||
Net decrease in net assets from dividends and distributions to shareholders | (5,902,210 | ) | (5,214,112 | ) | ||||
|
|
|
| |||||
Increase/(decrease) in net assets derived from capital share transactions (Note 4) | (1,734,747 | ) | 206,093 | |||||
|
|
|
| |||||
Total increase/(decrease) in net assets | (16,530,235 | ) | 4,635,635 | |||||
|
|
|
| |||||
Net assets | ||||||||
Beginning of year | 75,170,999 | 70,535,364 | ||||||
|
|
|
| |||||
End of year | $ | 58,640,764 | $ | 75,170,999 | ||||
|
|
|
| |||||
The accompanying notes are an integral part of the financial statements.
14
QUALITY DIVIDEND FUND
Financial Highlights
Contained below is per share operating performance data for each Class A share outstanding, total investment return, ratios to average net assets and other supplemental data for the respective period. The total returns in the table represent the rate that an investor would have earned or lost on an investment in the Fund (assuming reinvestment of all dividends and distributions). This information has been derived from information provided in the financial statements and should be read in conjunction with the financial statements and the notes thereto.
| Class A | |||||||||||||||||||||||||
| For the Year Ended April 30, 2020 | For the Year Ended April 30, 2019 | For the Year Ended April 30, 2018 | For the Year Ended April 30, 2017 | For the Year Ended April 30, 2016 | |||||||||||||||||||||
Per Share Operating Performance | |||||||||||||||||||||||||
Net asset value, beginning of year | $ | 13.02 | $ | 12.29 | $ | 12.19 | $ | 11.03 | $ | 11.66 | |||||||||||||||
|
|
|
|
|
|
|
|
|
| ||||||||||||||||
Net investment income(1) | 0.34 | 0.33 | 0.29 | 0.27 | 0.26 | ||||||||||||||||||||
Net realized and unrealized gain/(loss) on investments | (1.80 | ) | 1.36 | 0.16 | 1.13 | (0.49 | ) | ||||||||||||||||||
|
|
|
|
|
|
|
|
|
| ||||||||||||||||
Net increase/(decrease) in net assets resulting from operations | (1.46 | ) | 1.69 | 0.45 | 1.40 | (0.23 | ) | ||||||||||||||||||
|
|
|
|
|
|
|
|
|
| ||||||||||||||||
Dividends and distributions to shareholders from: | |||||||||||||||||||||||||
Net investment income | (0.34 | ) | (0.38 | ) | (0.35 | ) | (0.24 | ) | (0.26 | ) | |||||||||||||||
Net realized capital gains | (0.74 | ) | (0.58 | ) | — | — | (0.14 | ) | |||||||||||||||||
Return of capital | (0.01 | ) | — | — | — | — | |||||||||||||||||||
|
|
|
|
|
|
|
|
|
| ||||||||||||||||
Total dividends and distributions to shareholders | (1.09 | ) | (0.96 | ) | (0.35 | ) | (0.24 | ) | (0.40 | ) | |||||||||||||||
|
|
|
|
|
|
|
|
|
| ||||||||||||||||
Redemption fees | 0.00 | (2) | 0.00 | (2) | 0.00 | (2) | 0.00 | (2) | 0.00 | (2) | |||||||||||||||
|
|
|
|
|
|
|
|
|
| ||||||||||||||||
Net asset value, end of year | $ | 10.47 | $ | 13.02 | $ | 12.29 | $ | 12.19 | $ | 11.03 | |||||||||||||||
|
|
|
|
|
|
|
|
|
| ||||||||||||||||
Total investment return(3) | (12.46 | )% | 14.66 | % | 3.64 | % | 12.82 | % | (1.84 | )% | |||||||||||||||
Ratios/Supplemental Data | |||||||||||||||||||||||||
Net assets, end of year (in thousands) | $ | 28,816 | $ | 40,283 | $ | 37,800 | $ | 36,731 | $ | 35,607 | |||||||||||||||
Ratio of expenses to average net assets | 1.24 | % | 1.24 | % | 1.24 | % | 1.24 | % | 1.24 | % | |||||||||||||||
Ratio of expenses to average net assets without waivers and expense reimbursements(4) | 1.36 | % | 1.41 | % | 1.32 | % | 1.35 | % | 1.37 | % | |||||||||||||||
Ratio of net investment income to average net assets | 2.74 | % | 2.62 | % | 2.32 | % | 2.35 | % | 2.40 | % | |||||||||||||||
Portfolio turnover rate | 38 | % | 37 | % | 51 | % | 44 | % | 63 | % | |||||||||||||||
| (1) | The selected per share data was calculated using the average shares outstanding method for the year. |
| (2) | Amount is less than $0.005 per share. |
| (3) | Total investment return is calculated assuming a purchase of shares on the first day and a sale of shares on the last day of each period reported and includes reinvestment of dividends and distributions, if any. Total investment return does not reflect the impact of the maximum front-end sales load of 5.75%. If reflected, the return would be lower. |
| (4) | During the period, certain fees were waived and/or reimbursed. If such fee waivers and/or reimbursements had not occurred, the ratios would have been as indicated (See Note 2). |
The accompanying notes are an integral part of the financial statements.
15
QUALITY DIVIDEND FUND
Financial Highlights (Continued)
Contained below is per share operating performance data for each Class C share outstanding, total investment return, ratios to average net assets and other supplemental data for the respective period. The total returns in the table represent the rate that an investor would have earned or lost on an investment in the Fund (assuming reinvestment of all dividends and distributions). This information has been derived from information provided in the financial statements and should be read in conjunction with the financial statements and the notes thereto.
| Class C | |||||||||||||||||||||||||
| For the Year Ended April 30, 2020 | For the Year Ended April 30, 2019 | For the Year Ended April 30, 2018 | For the Year Ended April 30, 2017 | For the Year Ended April 30, 2016 | |||||||||||||||||||||
Per Share Operating Performance | |||||||||||||||||||||||||
Net asset value, beginning of year | $ | 13.07 | $ | 12.34 | $ | 12.24 | $ | 11.06 | $ | 11.73 | |||||||||||||||
|
|
|
|
|
|
|
|
|
| ||||||||||||||||
Net investment income(1) | 0.25 | 0.24 | 0.20 | 0.18 | 0.18 | ||||||||||||||||||||
Net realized and unrealized gain/(loss) on investments | (1.80 | ) | 1.36 | 0.15 | 1.15 | (0.51 | ) | ||||||||||||||||||
|
|
|
|
|
|
|
|
|
| ||||||||||||||||
Net increase/(decrease) in net assets resulting from operations | (1.55 | ) | 1.60 | 0.35 | 1.33 | (0.33 | ) | ||||||||||||||||||
|
|
|
|
|
|
|
|
|
| ||||||||||||||||
Dividends and distributions to shareholders from: | |||||||||||||||||||||||||
Net investment income | (0.25 | ) | (0.29 | ) | (0.25 | ) | (0.15 | ) | (0.20 | ) | |||||||||||||||
Net realized capital gains | (0.74 | ) | (0.58 | ) | — | — | (0.14 | ) | |||||||||||||||||
Return of capital | (0.01 | ) | — | — | — | — | |||||||||||||||||||
|
|
|
|
|
|
|
|
|
| ||||||||||||||||
Total dividends and distributions to shareholders | (1.00 | ) | (0.87 | ) | (0.25 | ) | (0.15 | ) | (0.34 | ) | |||||||||||||||
|
|
|
|
|
|
|
|
|
| ||||||||||||||||
Redemption fees | 0.00 | (2) | 0.00 | (2) | 0.00 | (2) | 0.00 | (2) | 0.00 | (2) | |||||||||||||||
|
|
|
|
|
|
|
|
|
| ||||||||||||||||
Net asset value, end of year | $ | 10.52 | $ | 13.07 | $ | 12.34 | $ | 12.24 | $ | 11.06 | |||||||||||||||
|
|
|
|
|
|
|
|
|
| ||||||||||||||||
Total investment return(3) | (13.10 | )% | 13.73 | % | 2.84 | % | 12.07 | % | (2.65 | )% | |||||||||||||||
Ratios/Supplemental Data | |||||||||||||||||||||||||
Net assets, end of year (in thousands) | $ | 19,255 | $ | 24,326 | $ | 23,728 | $ | 26,247 | $ | 23,217 | |||||||||||||||
Ratio of expenses to average net assets | 1.99 | % | 1.99 | % | 1.99 | % | 1.99 | % | 1.99 | % | |||||||||||||||
Ratio of expenses to average net assets without waivers and expense reimbursements(4) | 2.11 | % | 2.16 | % | 2.06 | % | 2.10 | % | 2.12 | % | |||||||||||||||
Ratio of net investment income to average net assets | 1.99 | % | 1.87 | % | 1.57 | % | 1.58 | % | 1.65 | % | |||||||||||||||
Portfolio turnover rate | 38 | % | 37 | % | 51 | % | 44 | % | 63 | % | |||||||||||||||
| (1) | The selected per share data was calculated using the average shares outstanding method for the year. |
| (2) | Amount is less than $0.005 per share. |
| (3) | Total investment return is calculated assuming a purchase of shares on the first day and a sale of shares on the last day of each period reported and includes reinvestments of dividends and distributions, if any. Total investment return does not reflect any applicable sales charge. |
| (4) | During the period, certain fees were waived and/or reimbursed. If such fee waivers and/or reimbursements had not occurred, the ratios would have been as indicated (See Note 2). |
The accompanying notes are an integral part of the financial statements.
16
QUALITY DIVIDEND FUND
Financial Highlights (Concluded)
Contained below is per share operating performance data for each Institutional Class share outstanding, total investment return, ratios to average net assets and other supplemental data for the respective period. The total returns in the table represent the rate that an investor would have earned or lost on an investment in the Fund (assuming reinvestment of all dividends and distributions). This information has been derived from information provided in the financial statements and should be read in conjunction with the financial statements and the notes thereto.
| Institutional Class | ||||||||||||||||||||
| For the Year Ended April 30, 2020 | For the Year Ended April 30, 2019 | For the Year Ended April 30, 2018 | For the Period October 4, 2016* to April 30, 2017 | |||||||||||||||||
Per Share Operating Performance | ||||||||||||||||||||
Net asset value, beginning of period | $ | 13.03 | $ | 12.30 | $ | 12.20 | $ | 11.33 | ||||||||||||
|
|
|
|
|
|
|
| |||||||||||||
Net investment income(1) | 0.37 | 0.36 | 0.32 | 0.16 | ||||||||||||||||
Net realized and unrealized gain/(loss) on investments | (1.80 | ) | 1.36 | 0.16 | 0.83 | |||||||||||||||
|
|
|
|
|
|
|
| |||||||||||||
Net increase/(decrease) in net assets resulting from operations | (1.43 | ) | 1.72 | 0.48 | 0.99 | |||||||||||||||
|
|
|
|
|
|
|
| |||||||||||||
Dividends and distributions to shareholders from: | ||||||||||||||||||||
Net investment income | (0.38 | ) | (0.41 | ) | (0.38 | ) | (0.12 | ) | ||||||||||||
Net realized capital gains | (0.74 | ) | (0.58 | ) | — | — | ||||||||||||||
Return of capital | (0.01 | ) | — | — | — | |||||||||||||||
|
|
|
|
|
|
|
| |||||||||||||
Total dividends and distributions to shareholders | (1.13 | ) | (0.99 | ) | (0.38 | ) | (0.12 | ) | ||||||||||||
|
|
|
|
|
|
|
| |||||||||||||
Redemption fees | 0.00 | (2) | 0.00 | (2) | 0.00 | (2) | 0.00 | (2) | ||||||||||||
|
|
|
|
|
|
|
| |||||||||||||
Net asset value, end of period | $ | 10.47 | $ | 13.03 | $ | 12.30 | $ | 12.20 | ||||||||||||
|
|
|
|
|
|
|
| |||||||||||||
Total investment return(3) | (12.29 | )% | 14.94 | % | 3.89 | % | 8.72 | % | ||||||||||||
Ratios/Supplemental Data | ||||||||||||||||||||
Net assets, end of period (in thousands) | $ | 10,570 | $ | 10,562 | $ | 9,007 | $ | 8,731 | ||||||||||||
Ratio of expenses to average net assets | 0.99 | % | 0.99 | % | 0.99 | % | 0.99 | %(4) | ||||||||||||
Ratio of expenses to average net assets without waivers and expense | 1.11 | % | 1.17 | % | 1.07 | % | 1.12 | %(4) | ||||||||||||
Ratio of net investment income to average net assets | 2.99 | % | 2.87 | % | 2.57 | % | 2.29 | %(4) | ||||||||||||
Portfolio turnover rate | 38 | % | 37 | % | 51 | % | 44 | %(6) | ||||||||||||
| * | Commencement of operations. |
| (1) | The selected per share data was calculated using the average shares outstanding method for the year. |
| (2) | Amount is less than $0.005 per share. |
| (3) | Total investment return is calculated assuming a purchase of shares on the first day and a sale of shares on the last day of each period reported and includes reinvestment of dividends and distributions, if any. Total returns for periods less than one year are not annualized. |
| (4) | Annualized. |
| (5) | During the period, certain fees were waived and/or reimbursed. If such fee waivers and/or reimbursements had not occurred, the ratios would have been as indicated (See Note 2). |
| (6) | Reflects portfolio turnover of the Fund for the year ended April 30, 2017. |
The accompanying notes are an integral part of the financial statements.
17
QUALITY DIVIDEND FUND
Notes to Financial Statements
April 30, 2020
1. Organization and Significant Accounting Policies
The Quality Dividend Fund (the “Fund”) is a diversified, open-end management investment company registered under the Investment Company Act of 1940, as amended, (the “1940 Act”), which commenced investment operations on September 30, 2013. The Fund is a separate series of FundVantage Trust (the “Trust”) which was organized as a Delaware statutory trust on August 28, 2006. The Trust is a “series trust” authorized to issue an unlimited number of separate series or classes of shares of beneficial interest. Each series is treated as a separate entity for certain matters under the 1940 Act, and for other purposes, and a shareholder of one series is not deemed to be a shareholder of any other series. The Fund offers separate classes of shares: Class A, Class C and Institutional Class shares. Class A shares are subject to a front end sales charge of 5.75%. Front-end sales charges may be reduced or waived under certain circumstances. A contingent deferred sales charge (“CDSC”), as a percentage of the lower of the original purchase price or net asset value at redemption, of 1.00% may be imposed on full or partial redemptions of Class A shares made within twelve months of purchase where: (i) $1 million or more of Class A shares was purchased without an initial sales charge, and (ii) the selling broker-dealer received a commission for such sale. A CDSC of 1.00% may apply to Class C shares when shares are redeemed within 12 months after initial purchase where the selling broker-dealer received a commission for such sale.
The Fund is an investment company and follows accounting and reporting guidance in the Financial Accounting Standards Board Accounting Standards Codification Topic 946.
Portfolio Valuation — The Fund’s net asset value (“NAV”) is calculated once daily at the close of regular trading hours on the New York Stock Exchange (“NYSE”) (typically 4:00 p.m. Eastern time) on each day the NYSE is open. Securities held by the Fund are valued using the closing price or the last sale price on a national securities exchange or the National Association of Securities Dealers Automatic Quotation System (“NASDAQ”) market system where they are primarily traded. Equity securities traded in the over-the-counter (“OTC”) market are valued at their closing prices. If there were no transactions on that day, securities traded principally on an exchange or on NASDAQ will be valued at the mean of the last bid and ask prices prior to the market close. Investments in other open-end investment companies are valued based on the NAV of the investment companies (which may use fair value pricing as discussed in their prospectuses). If market quotations are unavailable or deemed unreliable, securities will be valued in accordance with procedures adopted by the Trust’s Board of Trustees (“Board of Trustees”). Relying on prices supplied by pricing services or dealers or using fair valuation may result in values that are higher or lower than the values used by other investment companies and investors to price the same investments. In the event that market quotes are not readily available, and the security or asset cannot be valued pursuant to one of the valuation methods, the value of the security or asset will be determined in good faith by the Adviser. The Trust has established a Valuation Committee which performs certain functions including the oversight of the Adviser’s fair valuation determinations.
18
QUALITY DIVIDEND FUND
Notes to Financial Statements (Continued)
April 30, 2020
Fair Value Measurements — The inputs and valuation techniques used to measure fair value of the Fund’s investments are summarized into three levels as described in the hierarchy below:
● Level 1 — | quoted prices in active markets for identical securities; | |
● Level 2 — | other significant observable inputs (including quoted prices for similar securities, interest rates, prepayment speeds, credit risk, etc.); and | |
● Level 3 — | significant unobservable inputs (including the Fund’s own assumptions in determining the fair value of investments). | |
The inputs or methodology used for valuing securities are not necessarily an indication of the risk associated with investing in those securities.
The following is a summary of the inputs used, as of April 30, 2020, in valuing the Fund’s investments carried at fair value:
| Total Value at 04/30/20 | Level 1 Quoted Price | Level 2 Other Significant Observable Inputs | Level 3 Significant Unobservable Inputs | |||||||||||||
Common Stocks* | $ | 58,134,317 | $ | 58,134,317 | $ | — | $ | — | ||||||||
Exchange Traded Fund | 154,317 | 154,317 | — | — | ||||||||||||
|
|
|
|
|
|
|
| |||||||||
Total Investments | $ | 58,288,634 | $ | 58,288,634 | $ | — | $ | — | ||||||||
|
|
|
|
|
|
|
| |||||||||
| * | Please refer to Portfolio of Investments for further details on portfolio holdings. |
At the end of each quarter, management evaluates the classification of Levels 1, 2 and 3 assets and liabilities. Various factors are considered, such as changes in liquidity from the prior reporting period; whether or not a broker is willing to execute at the quoted price; the depth and consistency of prices from third party pricing services; and the existence of contemporaneous, observable trades in the market. Additionally, management evaluates the classification of Level 1 and Level 2 assets and liabilities on a quarterly basis for changes in listings or delistings on national exchanges.
Due to the inherent uncertainty of determining the fair value of investments that do not have a readily available market value, the fair value of the Fund’s investments may fluctuate from period to period. Additionally, the fair value of investments may differ significantly from the values that would have been used had a ready market existed for such investments and may differ materially from the values the Fund may ultimately realize. Further, such investments may be subject to legal and other restrictions on resale or otherwise less liquid than publicly traded securities.
19
QUALITY DIVIDEND FUND
Notes to Financial Statements (Continued)
April 30, 2020
For fair valuations using significant unobservable inputs, U.S. generally accepted accounting principles (“U.S. GAAP”) require the Fund to present a reconciliation of the beginning to ending balances for reported market values that present changes attributable to total realized and unrealized gains or losses, purchase and sales, and transfers in and out of Level 3 during the period. A reconciliation of Level 3 investments is presented only when the Fund had an amount of Level 3 investments at the end of the reporting period that was meaningful in relation to its net assets. The amounts and reasons for all transfers in and out of each Level within the three-tier hierarchy are disclosed when the Fund had an amount of total transfers during the reporting period that was meaningful in relation to its net assets as of the end of the reporting period.
For the year ended April 30, 2020, there were no transfers in or out of Level 3.
Use of Estimates — The preparation of financial statements in conformity with U.S. GAAP requires management to make estimates and assumptions that affect the amounts reported in the financial statements and accompanying notes at the date of the financial statements and the reported amounts of revenues and expenses during the period. Actual results could differ from those estimates and those differences could be material.
Investment Transactions, Investment Income and Expenses — Investment transactions are recorded on trade date for financial statement preparation purposes. Realized gains and losses on investments sold are recorded on the identified cost basis. Interest income is recorded on the accrual basis. Dividends are recorded on the ex-dividend date. Estimated components of distributions received from real estate investment trusts may be considered income, return of capital distributions or capital gain distributions. Return of capital distributions are recorded as a reduction of cost of the related investments. Distribution (12b-1) fees and shareholder services fees relating to a specific class are charged directly to that class. Fund level expenses common to all classes, investment income and realized and unrealized gains and losses on investments are allocated to each class based upon relative daily net assets of each class. General expenses of the Trust are generally allocated to each fund in proportion to its relative daily net assets. Expenses directly attributable to a particular fund in the Trust are charged directly to that fund.
MLP Common Units — Master Limited Partnership (“MLP”) common units represent limited partnership interests in the MLP. Common units are generally listed and traded on the U.S. securities exchanges or OTC with their value fluctuating predominantly based on the success of the MLP. Unlike owners of common stock of a corporation, owners of MLP common units have limited voting rights and have no ability to annually elect directors. MLPs generally distribute all available cash flow (cash flow from operations less maintenance capital expenditures) in the form of quarterly distributions. Common unit holders have first priority to receive quarterly cash distributions up to the minimum quarterly distribution and have arrearage rights. In the event of liquidation, common unit holders have preference over subordinated units, but not debt holders or preferred unit holders, to remaining assets of the MLP.
20
QUALITY DIVIDEND FUND
Notes to Financial Statements (Continued)
April 30, 2020
Dividends and Distributions to Shareholders — Dividends from net investment income and distributions from net realized capital gains, if any, are declared, recorded on ex-date and paid at least annually to shareholders. Income dividends and capital gain distributions are determined in accordance with U.S. federal income tax regulations, which may differ from U.S. GAAP.
U.S. Tax Status — No provision is made for U.S. income taxes as it is the Fund’s intention to continue to qualify for and elect the tax treatment applicable to regulated investment companies under Subchapter M of the Internal Revenue Code of 1986, as amended (the “Internal Revenue Code”), and make the requisite distributions to its shareholders which will be sufficient to relieve it from U.S. income and excise taxes.
Other — In the normal course of business, the Fund may enter into contracts that provide general indemnifications. The Fund’s maximum exposure under these arrangements is dependent on claims that may be made against the Fund in the future, and therefore, cannot be estimated; however, based on experience, the risk of material loss for such claims is considered remote.
Market disruptions associated with the COVID-19 pandemic have had a global impact, and uncertainty exists as to its long-term implications. The COVID-19 pandemic could adversely affect the value and liquidity of the Fund’s investments, impair the Fund’s ability to satisfy redemption requests, and negatively impact the Fund’s performance. In addition, the outbreak of COVID-19, and measures taken to mitigate its effects, could result in disruptions to the services provided to the Fund by its service providers. Fund management is continuing to monitor this development and evaluate its impact on the Fund.
2. Transactions with Related Parties and Other Service Providers
EquityCompass Investment Management, LLC (“EquityCompass” or the “Adviser”), serves as investment adviser to the Fund pursuant to an investment advisory agreement with the Trust. For its services, the Adviser is paid a monthly fee at the annual rate of 0.60% of the Fund’s average daily net assets. The Adviser has contractually agreed to reduce its investment advisory fee and/or reimburse certain expenses of the Fund to the extent necessary to ensure that the Fund’s total operating expenses (excluding taxes, fees and expenses attributable to a distribution or service plan adopted by the Trust, “Acquired Fund Fees and Expenses,” dividend and interest expense on securities sold short, interest, extraordinary items and brokerage commissions) do not exceed 0.99% of average daily net assets of the Fund (the “Expense Limitation”). The Expense Limitation will remain in effect until August 31, 2020 unless the Board of Trustees of the Trust approves its earlier termination. The Adviser is entitled to recover, subject to approval by the Board of Trustees, such amounts reduced or reimbursed for a period of up to three (3) years from the date on which the Adviser reduced its compensation and/or assumed expenses for the Fund. The Adviser is permitted to seek reimbursement from the Fund, subject to certain limitations, for fees it waived and Fund expenses it paid to the extent the total annual fund expenses do not exceed the limits described above or any lesser limits in effect at the time of reimbursement. No recoupment will occur unless the
21
QUALITY DIVIDEND FUND
Notes to Financial Statements (Continued)
April 30, 2020
Fund’s expenses are below the Expense Limitation amount. As of April 30, 2020, the amount of potential recovery was as follows:
Expiration | ||||||||||||
April 30, 2021 | April 30, 2022 | April 30, 2023 | Total | |||||||||
$55,487 | $125,818 | $84,774 | $266,079 | |||||||||
For the year ended April 30, 2020, the Adviser earned advisory fees of $418,840 and waived fees of $84,774.
Other Service Providers
The Bank of New York Mellon (“BNY Mellon”) serves as administrator and custodian for the Fund. For providing administrative and accounting services, BNY Mellon is entitled to receive a monthly fee equal to an annual percentage rate of the Fund’s average daily net assets and is subject to certain minimum monthly fees. For providing certain custodial services, BNY Mellon is entitled to receive a monthly fee, subject to certain minimum, and out of pocket expenses.
BNY Mellon Investment Servicing (US) Inc. (the “Transfer Agent”) provides transfer agent services to the Fund. The Transfer Agent is entitled to receive a monthly fee, subject to certain minimum, and out of pocket expenses.
The Trust, on behalf of the Fund, has entered into agreements with financial intermediaries to provide recordkeeping, processing, shareholder communications and other services to customers of the intermediaries investing in the Fund and has agreed to compensate the intermediaries for providing those services. The fees incurred by the Fund for these services are included in Transfer agent fees in the Statement of Operations.
Foreside Funds Distributors LLC (the “Underwriter”) provides principal underwriting services to the Fund pursuant to an underwriting agreement between the Trust and the Underwriter.
The Trust and the Underwriter are parties to an underwriting agreement. The Trust has adopted a distribution plan for Class A and Class C shares in accordance with Rule 12b-1 under the 1940 Act. Pursuant to the Class A and Class C shares plan, the Fund compensates the Underwriter for direct and indirect costs and expenses incurred in connection with advertising, marketing and other distribution services in an amount not to exceed 0.25% and 1.00% (0.75% Rule 12b-1 distribution fee and 0.25% shareholder service fee), respectively, on an annualized basis of the average daily net assets of the Fund’s Class A and Class C shares.
22
QUALITY DIVIDEND FUND
Notes to Financial Statements (Continued)
April 30, 2020
Trustees and Officers
The Trust is governed by its Board of Trustees. The Trustees receive compensation in the form of an annual retainer and per meeting fees for their services to the Trust. An employee of BNY Mellon serves as the Secretary of the Trust and is not compensated by the Fund or the Trust.
JW Fund Management LLC (“JWFM”) provides a Principal Executive Officer and Principal Financial Officer, respectively, to the Trust. Duff & Phelps, LLC (“D&P”) provides the Trust with a Chief Compliance Officer and an Anti-Money Laundering Officer. JWFM and D&P are compensated for their services provided to the Trust.
3. Investment in Securities
For the year ended April 30, 2020, aggregate purchases and sales of investment securities (excluding short-term investments) of the Fund were as follows:
| Purchases | Sales | |||||||
Investment Securities | $ | 26,371,019 | $ | 31,751,340 | ||||
4. Capital Share Transactions
For the years ended April 30, 2020 and 2019, transactions in capital shares (authorized shares unlimited) were as follows:
| For the Year Ended April 30, 2020 | For the Year Ended April 30, 2019 | |||||||||||||||
| Shares | Amount | Shares | Amount | |||||||||||||
Class A | ||||||||||||||||
Sales | 209,196 | $ | 2,674,007 | 317,608 | $ | 4,002,713 | ||||||||||
Reinvestments | 195,387 | 2,478,629 | 182,887 | 2,186,047 | ||||||||||||
Redemption Fees* | — | 238 | — | 502 | ||||||||||||
Redemptions | (745,759 | ) | (9,242,054 | ) | (480,869 | ) | (6,041,107 | ) | ||||||||
|
|
|
|
|
|
|
| |||||||||
Net increase/(decrease) | (341,176 | ) | $ | (4,089,180 | ) | 19,626 | $ | 148,155 | ||||||||
|
|
|
|
|
|
|
| |||||||||
23
QUALITY DIVIDEND FUND
Notes to Financial Statements (Continued)
April 30, 2020
| For the Year Ended April 30, 2020 | For the Year Ended April 30, 2019 | |||||||||||||||
| Shares | Amount | Shares | Amount | |||||||||||||
Class C | ||||||||||||||||
Sales | 164,281 | $ | 1,998,118 | 153,614 | $ | 1,944,213 | ||||||||||
Reinvestments | 122,600 | 1,566,862 | 113,038 | 1,350,775 | ||||||||||||
Redemption Fees* | — | 159 | — | 303 | ||||||||||||
Redemptions | (316,888 | ) | (3,863,084 | ) | (328,701 | ) | (4,185,180 | ) | ||||||||
|
|
|
|
|
|
|
| |||||||||
Net decrease | (30,007 | ) | $ | (297,945 | ) | (62,049 | ) | $ | (889,889 | ) | ||||||
|
|
|
|
|
|
|
| |||||||||
Institutional Class | ||||||||||||||||
Sales | 303,731 | $ | 3,806,726 | 147,127 | $ | 1,845,337 | ||||||||||
Reinvestments | 70,238 | 887,687 | 49,118 | 588,938 | ||||||||||||
Redemption Fees* | — | 85 | — | 123 | ||||||||||||
Redemptions | (175,367 | ) | (2,042,120 | ) | (117,623 | ) | (1,486,571 | ) | ||||||||
|
|
|
|
|
|
|
| |||||||||
Net increase | 198,602 | $ | 2,652,378 | 78,622 | $ | 947,827 | ||||||||||
|
|
|
|
|
|
|
| |||||||||
Total Net Increase/(Decrease) | (172,581 | ) | $ | (1,734,747 | ) | 36,199 | $ | 206,093 | ||||||||
|
|
|
|
|
|
|
| |||||||||
| * | There is a 1.00% redemption fee that may be charged on shares redeemed which have been held for 60 days or less. The redemption fees are retained by the Fund for the benefit of the remaining shareholders and recorded as paid-in capital. |
5. Federal Tax Information
The Fund has followed the authoritative guidance on accounting for and disclosure of uncertainty in tax positions, which requires the Fund to determine whether a tax position is more likely than not to be sustained upon examination, including resolution of any related appeals or litigation processes, based on the technical merits of the position. Tax positions not deemed to meet the more-likely-than-not threshold would be recorded as tax benefit or expense in the current year. The Fund has determined that there was no effect on the financial statements from following this authoritative guidance. In the normal course of business, the Fund is subject to examination by federal, state and local jurisdictions, where applicable, for tax years for which applicable statutes of limitations have not expired.
24
QUALITY DIVIDEND FUND
Notes to Financial Statements (Continued)
April 30, 2020
Distributions are determined in accordance with federal income tax regulations, which may differ in amount or character from net investment income and realized gains for financial reporting purposes. Accordingly, the character of distributions and composition of net assets for tax purposes may differ from those reflected in the accompanying financial statements. To the extent these differences are permanent, such amounts are reclassified within the components of net assets based on the tax treatment; temporary differences do not require reclassifications. Net investment income, net realized gains and net assets are not affected by these adjustments. For the year ended April 30, 2020, there were no reclassifications.
For the year ended April 30, 2020, the tax character of distributions paid by the Fund was $1,968,917 of ordinary income dividends, $3,881,743 of long-term capital gains dividends and $51,550 of return of capital. For the year ended April 30, 2019, the tax character of distributions paid by the Fund was $1,895,819 of ordinary income dividends and $3,318,293 of long-term capital gains dividends. Short-term capital gains are reported as ordinary income for federal income tax purposes.
As of April 30, 2020, the components of distributable earnings on a tax basis were as follows:
| Undistributed Long-Term Gain | Net Unrealized Depreciation | Other Book/Tax Differences | Total Distributable Earnings/(Deficit) | |||||
| $— | $(219,499) | $ | (2,403,584 | ) | $(2,623,083) | |||
The differences between the book and tax basis components of distributable earnings relate primarily to the timing and recognition of income and gains for federal income tax purposes.
As of April 30, 2020, the federal tax cost, aggregate gross unrealized appreciation and depreciation of securities held by the Fund were as follows:
Federal tax cost | $ | 58,508,133 | ||||
|
| |||||
Gross unrealized appreciation | $ | 6,461,538 | ||||
Gross unrealized depreciation | (6,681,037 | ) | ||||
|
| |||||
Net unrealized depreciation | $ | (219,499 | ) | |||
|
|
Pursuant to federal income tax rules applicable to regulated investment companies, the Fund may elect to treat certain capital losses between November 1 and April 30 and late year ordinary losses ((i) ordinary losses between January 1 and April 30, and (ii) specified ordinary and currency losses between November 1 and April 30) as occurring on the first day of the following tax year. For the year ended April 30, 2020, the Fund had long-term capital gain deferrals of $1,955,408 and short-term capital loss deferrals of $4,353,073.
25
QUALITY DIVIDEND FUND
Notes to Financial Statements (Concluded)
April 30, 2020
Accumulated capital losses represent net capital loss carryforwards as of April 30, 2020, that may be available to offset future realized capital gains and thereby reduce future capital gains distributions. As of April 30, 2020, the Fund did not have any capital loss carryforwards.
6. Subsequent Events
Management has evaluated the impact of all subsequent events on the Fund through the date the financial statements were issued, and has determined that there are no subsequent events requiring recognition or disclosure in the financial statements.
26
QUALITY DIVIDEND FUND
Report of Independent Registered Public Accounting Firm
To the Board of Trustees of FundVantage Trust and
Shareholders of the Quality Dividend Fund
Opinion on the Financial Statements
We have audited the accompanying statement of assets and liabilities of Quality Dividend Fund (the “Fund”) (one of the series constituting FundVantage Trust (the “Trust”)), including the portfolio of investments, as of April 30, 2020, and the related statement of operations for the year then ended, the statements of changes in net assets for each of the two years in the period then ended, the financial highlights for each of the five years in the period then ended and the related notes (collectively referred to as the “financial statements”). In our opinion, the financial statements present fairly, in all material respects, the financial position of the Fund (one of the series constituting FundVantage Trust) at April 30, 2020, the results of its operations for the year then ended, the changes in its net assets for each of the two years in the period then ended and its financial highlights for each of the five years in the period then ended, in conformity with U.S. generally accepted accounting principles.
Basis for Opinion
These financial statements are the responsibility of the Trust’s management. Our responsibility is to express an opinion on the Fund’s financial statements based on our audits. We are a public accounting firm registered with the Public Company Accounting Oversight Board (United States) (“PCAOB”) and are required to be independent with respect to the Trust in accordance with the U.S. federal securities laws and the applicable rules and regulations of the Securities and Exchange Commission and the PCAOB.
We conducted our audits in accordance with the standards of the PCAOB. Those standards require that we plan and perform the audit to obtain reasonable assurance about whether the financial statements are free of material misstatement, whether due to error or fraud. The Trust is not required to have, nor were we engaged to perform, an audit of the Trust’s internal control over financial reporting. As part of our audits we are required to obtain an understanding of internal control over financial reporting but not for the purpose of expressing an opinion on the effectiveness of the Trust’s internal control over financial reporting. Accordingly, we express no such opinion.
Our audits included performing procedures to assess the risks of material misstatement of the financial statements, whether due to error or fraud, and performing procedures that respond to those risks. Such procedures included examining, on a test basis, evidence regarding the amounts and disclosures in the financial statements. Our procedures included confirmation of securities owned as of April 30, 2020, by correspondence with the custodian. Our audits also included evaluating the accounting principles used and significant estimates made by management, as well as evaluating the overall presentation of the financial statements. We believe that our audits provide a reasonable basis for our opinion.

We have served as the auditor of one or more EquityCompass Investment Management, LLC investment companies since 2014.
Philadelphia, Pennsylvania
June 25, 2020
27
QUALITY DIVIDEND FUND
Shareholder Tax Information
(Unaudited)
The Fund is required by Subchapter M of the Internal Revenue Code to advise its shareholders of the U.S. federal tax status of distributions received by the Fund’s shareholders in respect of such fiscal year. During the fiscal year ended April 30, 2020, the Fund paid $1,968,917 of ordinary income dividends, $3,881,743 of long-term capital gain dividends and $51,550 of return of capital to its shareholders. Dividends from short-term capital gains are treated as ordinary income dividends for federal income tax purposes.
The Fund designates 100.00% of the ordinary income distribution as qualified dividend income pursuant to the Jobs and Growth Tax Relief Reconciliation Act of 2003.
The percentage of ordinary income dividends qualifying for the corporate dividends received deduction is 100.00%.
The percentage of qualified interest income related dividends not subject to withholding tax for non-resident aliens and foreign corporations is 0.07%.
The Fund designates 100.00% of ordinary income distributions as qualified short-term gain pursuant to the American Jobs Creation Act of 2004.
All designations are based on financial information available as of the date of this annual report and, accordingly, are subject to change. For each item, it is the intention of the Fund to designate the maximum amount permitted under the Internal Revenue Code of 1986, as amended, and the regulations thereunder.
Because the Fund’s fiscal year is not the calendar year, another notification will be sent with respect to calendar year 2020. The second notification, which will reflect the amount, if any, to be used by calendar year taxpayers on their U.S. federal income tax returns, will be made in conjunction with Form 1099-DIV and will be mailed in January 2021.
Foreign shareholders will generally be subject to U.S. withholding tax on the amount of their ordinary income dividends. They will generally not be entitled to a foreign tax credit or deduction for the withholding taxes paid by the Fund, if any.
In general, dividends received by tax-exempt recipients (e.g., IRAs and Keoghs) need not be reported as taxable income for U.S. federal income tax purposes. However, some retirement trusts (e.g., corporate, Keogh and 403(b)(7) plans) may need this information for their annual information reporting.
Shareholders are advised to consult their own tax advisers with respect to the tax consequences of their investment in the Fund.
28
QUALITY DIVIDEND FUND
Other Information
(Unaudited)
Proxy Voting
Policies and procedures that the Fund uses to determine how to vote proxies relating to portfolio securities as well as information regarding how the Fund voted proxies relating to portfolio securities for the most recent 12-month period ended June 30 are available without charge, upon request, by calling (888) 201-5799 and on the Securities and Exchange Commission’s (“SEC”) website at http://www.sec.gov.
Quarterly Portfolio Schedules
The Trust files its complete schedule of portfolio holdings with the SEC for the first and third fiscal quarters of each fiscal year (quarters ended July 31 and January 31) as an exhibit to their reports on Form N-PORT. The Trust’s portfolio holdings on Form N-PORT are available on the SEC’s website at http://www.sec.gov.
29
QUALITY DIVIDEND FUND
Privacy Notice
(Unaudited)
The privacy of your personal financial information is extremely important to us. When you open an account with us, we collect a significant amount of information from you in order to properly invest and administer your account. We take very seriously the obligation to keep that information private and confidential, and we want you to know how we protect that important information.
We collect nonpublic personal information about you from applications or other forms you complete and from your transactions with us or our affiliates. We do not disclose information about you, or our former clients, to our affiliates or to service providers or other third parties, except as permitted by law. We share only the information required to properly administer your accounts, which enables us to send transaction confirmations, monthly or quarterly statements, financials and tax forms. Even within FundVantage Trust and its affiliated entities, a limited number of people who actually service accounts will have access to your personal financial information. Further, we do not share information about our current or former clients with any outside marketing groups or sales entities.
To ensure the highest degree of security and confidentiality, FundVantage Trust and its affiliates maintain various physical, electronic and procedural safeguards to protect your personal information. We also apply special measures for authentication of information you request or submit to us on our website.
If you have questions or comments about our privacy practices, please call us at (888) 201-5799.
30
QUALITY DIVIDEND FUND
Fund Management
(Unaudited)
FundVantage Trust (the “Trust”) is governed by a Board of Trustees (the “Trustees”). The primary responsibility of the Trustees is to represent the interest of the Trust’s shareholders and to provide oversight management of the Trust.
The following tables present certain information regarding the Trustees and officers of the Trust. None of the Trustees are an “interested person” of the Trust, the Adviser, another investment adviser of a series of the Trust, or Foreside Funds Distributors LLC, the principal underwriter of the Trust (“Underwriter”), within the meaning of the 1940 Act and each Trustee is referred to as an “Independent Trustee” and is listed under such heading below. Employees of certain service providers to the Trust serve as officers of the Trust; such persons are not compensated by the Fund. The address of each Trustee and officer as it relates to the Trust’s business is 301 Bellevue Parkway, 2nd Floor, Wilmington, DE 19809.
The Statement of Additional Information for the Fund contains additional information about the Trustees and is available, without charge, upon request by calling (888) 201-5799.
Name and Date of Birth | Position(s) Held with Trust | Term of Office and Length of Time Served | Principal Occupation(s) During Past Five Years | Number of Funds in Overseen by Trustee
| Other Directorships Held by Trustee | |||||
INDEPENDENT TRUSTEES
| ||||||||||
ROBERT J. CHRISTIAN Date of Birth: 2/49 | Trustee | Shall serve until death, resignation or removal. Trustee since 2007. Chairman from 2007 until September 30, 2019. | Retired since February 2006; Executive Vice President of Wilmington Trust Company from February 1996 to February 2006; President of Rodney Square Management Corporation (“RSMC”) (investment advisory firm) from 1996 to 2005; Vice President of RSMC from 2005 to 2006. | 39 | Optimum Fund Trust (registered investment company with 6 portfolios); Third Avenue Trust (registered investment company with 3 portfolios); Third Avenue Variable Series Trust (registered investment company with 1 portfolio). | |||||
31
QUALITY DIVIDEND FUND
Fund Management (Continued)
(Unaudited)
Name and Date of Birth
| Position(s) Held with Trust
| Term of Office and Length of Time Served
| Principal Occupation(s) During Past Five Years
| Number of Funds in Trust Complex Overseen by Trustee
| Other Directorships Held by Trustee
| |||||
IQBAL MANSUR Date of Birth: 6/55 | Trustee | Shall serve until death, resignation or removal. Trustee since 2007. | University Professor, Widener University. | 39 | Third Avenue Trust (registered investment company with 3 portfolios); Third Avenue Variable Series Trust (registered investment company with 1 portfolio). | |||||
NICHOLAS M. MARSINI, JR. Date of Birth: 8/55 | Trustee and Chairman of the Board | Shall serve until death, resignation or removal. Trustee since 2016. Chairman since October 1, 2019. | Retired since March 2016. President of PNC Bank Delaware from June 2011 to March 2016; Executive Vice President of Finance of BNY Mellon from July 2010 to January 2011; Executive Vice President and Chief Financial Officer of PNC Global Investment Servicing from September 1997 to July 2010. | 39 | Brinker Capital Destinations Trust (registered investment company with 10 portfolios); Third Avenue Trust (registered investment company with 3 portfolios); Third Avenue Variable Series Trust (registered investment company with 1 portfolio). | |||||
32
QUALITY DIVIDEND FUND
Fund Management (Continued)
(Unaudited)
Name and Date of Birth
| Position(s) Held with Trust
| Term of Office and Length of Time Served
| Principal Occupation(s) During Past Five Years
| Number of Funds in Trust Complex Overseen by Trustee
| Other Directorships Held by Trustee
| |||||
NANCY B. WOLCOTT Date of Birth: 11/54 | Trustee | Shall serve until death, resignation or removal. Trustee since 2011. | Retired since May 2014; EVP, Head of GFI Client Service Delivery, BNY Mellon from January 2012 to May 2014; EVP, Head of US Funds Services, BNY Mellon from July 2010 to January 2012; President of PNC Global Investment Servicing from 2008 to July 2010; Chief Operating Officer of PNC Global Investment Servicing from 2007 to 2008; Executive Vice President of PFPC Worldwide Inc. from 2006 to 2007. | 39 | Lincoln Variable Insurance Products Trust (registered investment company with 97 portfolios); Third Avenue Trust (registered investment company with 3 portfolios); Third Avenue Variable Series Trust (registered investment company with 1 portfolio). | |||||
STEPHEN M. WYNNE Date of Birth: 1/55 | Trustee | Shall serve until death, resignation or removal. Trustee since 2009. | Retired since December 2010; Chief Executive Officer of US Funds Services, BNY Mellon Asset Servicing from July 2010 to December 2010; Chief Executive Officer of PNC Global Investment Servicing from March 2008 to July 2010; President, PNC Global Investment Servicing from 2003 to 2008. | 39 | Copeland Trust (registered investment company with 3 portfolios); Third Avenue Trust (registered investment company with 3 portfolios); Third Avenue Variable Series Trust (registered investment company with 1 portfolio). | |||||
33
QUALITY DIVIDEND FUND
Fund Management (Concluded)
(Unaudited)
Name and Date of Birth | Position(s) Held with Trust | Term of Office and Length of Time Served
| Principal Occupation(s) During Past Five Years | |||
EXECUTIVE OFFICERS
| ||||||
JOEL L. WEISS Date of Birth: 1/63 |
President and Chief Executive Officer |
Shall serve until death, resignation or removal. Officer since 2007. |
President of JW Fund Management LLC since June 2016; Vice President and Managing Director of BNY Mellon Investment Servicing (US) Inc. and predecessor firms from 1993 to June 2016. | |||
T. RICHARD KEYES Date of Birth: 1/57 | Treasurer and Chief Financial Officer | Shall serve until death, resignation or removal. Officer since 2016. | President of TRK Fund Consulting LLC since July 2016; Head of Tax — U.S. Fund Services of BNY Mellon Investment Servicing (US) Inc. and predecessor firms from February 2006 to July 2016. | |||
GABRIELLA MERCINCAVAGE Date of Birth: 6/68 | Assistant Treasurer | Shall serve until death, resignation or removal. Officer since 2019. | Fund Administration Consultant since January 2019; Fund Accounting and Tax Compliance Accountant to financial services companies from November 2003 to July 2018. | |||
VINCENZO A. SCARDUZIO Date of Birth: 4/72 | Secretary | Shall serve until death, resignation or removal. Officer since 2012. | Director and Vice President Regulatory Administration of The Bank of New York Mellon and predecessor firms since 2001. | |||
DAVID C. LEBISKY Date of Birth: 5/72 | Chief Compliance Officer and Anti-Money Laundering Officer | Shall serve until death, resignation or removal. Officer since 2015. | President of Lebisky Compliance Consulting LLC since October 2015; Consultant, Duff & Phelps, LLC since 2016; Senior Consultant, Freeh Group International Solutions, LLC (a global risk management firm) from 2015 to 2018; Scotia Institutional Investments US, LP, Director of Regulatory Administration from 2010 to 2014. | |||
34
[THIS PAGE INTENTIONALLY LEFT BLANK.]
Investment Adviser
EquityCompass Investment Management, LLC
One South Street
Baltimore, MD 21202
Administrator
The Bank of New York Mellon
301 Bellevue Parkway
Wilmington, DE 19809
Transfer Agent
BNY Mellon Investment Servicing (US) Inc.
4400 Computer Drive
Westborough, MA 01581
Principal Underwriter
Foreside Funds Distributors LLC
400 Berwyn Park
899 Cassatt Road
Berwyn, PA 19312
Custodian
The Bank of New York Mellon
240 Greenwich Street
New York, NY 10286
Independent Registered Public Accounting Firm
Ernst & Young LLP
One Commerce Square
2005 Market Street, Suite 700
Philadelphia, PA 19103-7096
Legal Counsel
Pepper Hamilton LLP
3000 Two Logan Square
18th and Arch Streets
Philadelphia, PA 19103
QUA-0420

QUALITY DIVIDEND
FUND
of
FundVantage Trust
Class A (QDVAX)
Class C (QDVCX)
Institutional Class (QDVIX)
ANNUAL
REPORT
April 30, 2020
IMPORTANT NOTE: Beginning on January 1, 2021, paper copies of the Fund’s shareholder reports will no longer be sent by mail, unless you specifically request paper copies of the shareholder reports from the Fund or from your financial intermediary. Instead, shareholder reports will be available on the Quality Dividend Fund’s website (www.equitycompass.com), and you will be notified by mail each time a report is posted and provided with a website link to access the report.
You may elect to receive all future shareholder reports in paper, free of charge. To elect to receive paper copies of shareholder reports through the mail or otherwise change your delivery method, contact your financial intermediary or, if you hold your shares directly through the Fund, call toll-free at (888) 201-5799 or write to:
Quality Dividend Fund
FundVantage Trust
c/o BNY Mellon Investment Servicing
P.O. Box 9829
Providence, RI 02940-8029
This report is submitted for the general information of shareholders and is not authorized for distribution to prospective investors unless preceded or accompanied by a current prospectus.
Item 2. Code of Ethics.
| (a) | The registrant, as of the end of the period covered by this report, has adopted a code of ethics that applies to the Registrant’s principal executive officer, principal financial officer, principal accounting officer or controller, or persons performing similar functions, regardless of whether these individuals are employed by the Registrant or a third party. |
| (c) | There have been no amendments, during the period covered by this report, to a provision of the code of ethics that applies to the Registrant’s principal executive officer, principal financial officer, principal accounting officer or controller, or persons performing similar functions, regardless of whether these individuals are employed by the Registrant or a third party, and that relates to any element of the code of ethics description. |
| (d) | The registrant has not granted any waivers, including an implicit waiver, from a provision of the code of ethics that applies to the Registrant’s principal executive officer, principal financial officer, principal accounting officer or controller, or persons performing similar functions, regardless of whether these individuals are employed by the Registrant or a third party, that relates to one or more of the items set forth in paragraph (b) of this item’s instructions. |
Item 3. Audit Committee Financial Expert.
The Audit Committee of the Board of Trustees currently is comprised of Robert J. Christian, Iqbal Mansur and Stephen M. Wynne, each of whom is considered “independent” within the meaning set forth under Item 3 of Form N-CSR. The Board of Trustees has determined that Mr. Wynne is an “audit committee financial expert” as such term is defined by Item 3 of Form N-CSR.
The Registrant’s Board of Trustees has determined that Mr. Wynne acquired the attributes necessary to be considered an audit committee financial expert through his experience as a chief executive officer (and other senior-level accounting and/or financial positions) of several large financial institutions and because he has co-authored a text book on mutual fund accounting.
Item 4. Principal Accountant Fees and Services.
Audit Fees
| (a) | The aggregate fees billed for each of the last two fiscal years for professional services rendered by the principal accountant for the audit of the registrant’s annual financial statements or services that are normally provided by the accountant in connection with statutory and regulatory filings or engagements for those fiscal years were $388,217 for the fiscal year ending April 30, 2020 and $430,022 for the fiscal year ending April 30, 2019, as follows: |
Fiscal Year Ending April 30, 2020 | Fiscal Year Ending April 30, 2019 | |||
PricewaterhouseCoopers LLP
| $328,467
| $342,572
| ||
Ernst & Young LLP | $59,750
| $87,450
| ||
Aggregate Fees | $388,217
| $430,022
|
Audit-Related Fees
| (b) | The aggregate fees billed in each of the last two fiscal years for assurance and related services by the principal accountant that are reasonably related to the performance of the audit of the registrant’s financial statements and are not reported under paragraph (a) of this Item are $0 for the fiscal year ending April 30, 2020 and $0 for the fiscal year ending April 30, 2019. |
Tax Fees
| (c) | The aggregate fees billed in each of the last two fiscal years for professional services rendered by the principal accountant for tax compliance, tax advice, and tax planning were $13,402 for the fiscal year ending April 30, 2020 and $6,702 for the fiscal year ending April 30, 2019, as follows: |
Fiscal Year Ending April 30, 2020 | Fiscal Year Ending April 30, 2019 | |||
PricewaterhouseCoopers LLP | $0
| $0
| ||
Ernst & Young LLP | $13,402
| $6,702
| ||
Aggregate Fees | $13,402
| $6,702
|
These fees were for (a) Passive Foreign Investment Company (PFIC) database tax services, (b) India tax compliance services, and (c) Pakistan tax compliance services. |
All Other Fees
| (d) | The aggregate fees billed in each of the last two fiscal years for products and services provided by the principal accountant, other than the services reported in paragraphs (a) through (c) of this Item are $0 for the fiscal year ending April 30, 2020 and $0 for the fiscal year ending April 30, 2019. | |
| (e)(1) | Disclose the audit committee’s pre-approval policies and procedures described in paragraph (c)(7) of Rule 2-01 of Regulation S-X. | |
The Registrant’s Audit Committee Charter requires the Audit Committee to (i) (a) approve prior to appointment the engagement of independent registered public accounting firm to annually audit and provide their opinion on the Registrant’s financial statements, (b) recommend to the Independent Trustees the selection, retention or termination of the Registrant’s independent registered public accounting firm and, (c) in connection therewith, to review and evaluate matters potentially affecting the independence and capabilities of the independent registered public accounting firm; and (ii) to approve prior to appointment the engagement of the independent registered public accounting firm to provide other audit services to the Registrant, or to provide non-audit services to the Registrant, its series, an investment adviser to its series or any entity controlling, controlled by, or under common control with an investment adviser to its series (“adviser-affiliate”) that provides ongoing services to the Registrant if the engagement relates directly to the operations and financial reporting of the Registrant. The Audit Committee will not approve non-audit services that the Audit Committee believes may impair the independence of the Registrant’s independent registered public accountant. The Audit Committee may delegate, to the extent permitted by law, pre-approved responsibilities to one or more members of the Audit Committee who shall report to the full Audit Committee. | ||
| (e)(2) | Not applicable. | |
| (f) | Not applicable. | |
| (g) | The aggregate non-audit fees billed by the registrant’s accountant for services rendered to the registrant, and rendered to the registrant’s investment adviser (not including any sub-adviser whose role is primarily portfolio management and is subcontracted with or overseen by another investment adviser), and any entity controlling, controlled by, or under common control with the adviser that provides ongoing services to the registrant for each of the last two fiscal years of the registrant were and $75,902 for the fiscal year ending April 30, 2020 and $6,702 for the fiscal year ending April 30, 2019, as follows: | |
Fiscal Year Ending April 30, 2020 | Fiscal Year Ending April 30, 2019 | |||
PricewaterhouseCoopers LLP | $62,500
| $0
| ||
Ernst & Young LLP | $13,402
| $6,702
| ||
Aggregate Fees | $75,902
| $6,702
|
| (h) | Not applicable. |
Item 5. Audit Committee of Listed Registrants.
Not applicable.
Item 6. Investments.
| (a) | Schedule of Investments in securities of unaffiliated issuers as of the close of the reporting period is included as part of the report to shareholders filed under Item 1 of this form. |
| (b) | Not applicable. |
| Item 7. | Disclosure of Proxy Voting Policies and Procedures for Closed-End Management Investment Companies. |
Not applicable.
| Item 8. | Portfolio Managers of Closed-End Management Investment Companies. |
Not applicable.
| Item 9. | Purchases of Equity Securities by Closed-End Management Investment Company and Affiliated Purchasers. |
Not applicable.
| Item 10. | Submission of Matters to a Vote of Security Holders. |
There have been no material changes to the procedures by which the shareholders may recommend nominees to the registrant’s board of trustees, where those changes were implemented after the registrant last provided disclosure in response to the requirements of Item 407(c)(2)(iv) of Regulation S-K (17 CFR 229.407) (as required by Item 22(b)(15) of Schedule 14A (17 CFR 240.14a-101)), or this Item.
| Item 11. | Controls and Procedures. |
| (a) | The registrant’s principal executive and principal financial officers, or persons performing similar functions, have concluded that the registrant’s disclosure controls and procedures (as defined in Rule 30a-3(c) under the Investment Company Act of 1940, as amended (the “1940 Act”) (17 CFR 270.30a-3(c))) are effective, as of a date within 90 days of the filing date of the report that includes the disclosure required by this paragraph, based on their evaluation of these controls and procedures required by Rule 30a-3(b) under the 1940 Act (17 CFR 270.30a-3(b)) and Rules 13a-15(b) or 15d-15(b) under the Securities Exchange Act of 1934, as amended (17 CFR 240.13a-15(b) or 240.15d-15(b)). |
| (b) | There were no changes in the registrant’s internal control over financial reporting (as defined in Rule 30a-3(d) under the 1940 Act (17 CFR 270.30a-3(d))) that occurred during the registrant’s last fiscal quarter that has materially affected, or is reasonably likely to materially affect, the registrant’s internal control over financial reporting. |
| Item 12. | Disclosure of Securities Lending Activities for Closed-End Management Investment Companies. |
Not applicable.
Item 13. Exhibits.
| (a)(1) |
| (a)(2) |
| (a)(3) | Not applicable. |
| (a)(4) | Not applicable. |
| (b) |
SIGNATURES
Pursuant to the requirements of the Securities Exchange Act of 1934 and the Investment Company Act of 1940, the registrant has duly caused this report to be signed on its behalf by the undersigned, thereunto duly authorized.
(Registrant) FundVantage Trust | ||
By (Signature and Title)* | /s/ Joel L. Weiss Joel L. Weiss, President and Chief Executive Officer (principal executive officer) | |
Date July 8, 2020 | ||
Pursuant to the requirements of the Securities Exchange Act of 1934 and the Investment Company Act of 1940, this report has been signed below by the following persons on behalf of the registrant and in the capacities and on the dates indicated.
By (Signature and Title)* | /s/ Joel L. Weiss Joel L. Weiss, President and Chief Executive Officer (principal executive officer) | |
Date July 8, 2020 | ||
By (Signature and Title)* | /s/ T. Richard Keyes T. Richard Keyes, Treasurer and Chief Financial Officer (principal financial officer) | |
Date July 8, 2020 | ||
* Print the name and title of each signing officer under his or her signature.