UNITED STATES
SECURITIES AND EXCHANGE COMMISSION
Washington, D.C. 20549
FORM N-CSR
CERTIFIED SHAREHOLDER REPORT OF REGISTERED MANAGEMENT INVESTMENT COMPANIES
Investment Company Act file number 811-22027
FundVantage Trust
(Exact name of registrant as specified in charter)
103 Bellevue Parkway
Wilmington, DE 19809
(Address of principal executive offices) (Zip code)
Joel L. Weiss
JW Fund Management LLC
1636 N. Cedar Crest Blvd.
Suite #161
Allentown, PA 18104
(Name and address of agent for service)
Registrant’s telephone number, including area code: 856-528-3500
Date of fiscal year end: April 30
Date of reporting period: April 30, 2024
Form N-CSR is to be used by management investment companies to file reports with the Commission not later than 10 days after the transmission to stockholders of any report that is required to be transmitted to stockholders under Rule 30e-1 under the Investment Company Act of 1940 (17 CFR 270.30e-1). The Commission may use the information provided on Form N-CSR in its regulatory, disclosure review, inspection, and policymaking roles.
A registrant is required to disclose the information specified by Form N-CSR, and the Commission will make this information public. A registrant is not required to respond to the collection of information contained in Form N-CSR unless the Form displays a currently valid Office of Management and Budget (“OMB”) control number. Please direct comments concerning the accuracy of the information collection burden estimate and any suggestions for reducing the burden to Secretary, Securities and Exchange Commission, 100 F Street, NE, Washington, DC 20549-1090. The OMB has reviewed this collection of information under the clearance requirements of 44 U.S.C. § 3507.
Item 1. Reports to Stockholders.
| | (a) | The Report to Shareholders is attached herewith. |
of
FundVantage Trust
| Class A |
| Class C |
| Institutional Class |
ANNUAL REPORT
April 30, 2024
IMPORTANT NOTICE – UPCOMING CHANGES TO EIC VALUE FUND ANNUAL & SEMI-ANNUAL REPORTS
The Securities and Exchange Commission (the “SEC”) has adopted rule and form amendments that will result in changes to the design and delivery of annual and semi-annual shareholder reports (“Reports”). Beginning in July 2024, Reports will be streamlined to highlight key information (“Redesigned Reports”). Certain information currently included in the Reports, including financial statements, will no longer appear in the Redesigned Reports but will be available online, delivered free of charge to shareholders upon request, and filed with the SEC.
If you previously elected to receive the Fund's Reports electronically, you will continue to receive the Redesigned Reports electronically. Otherwise, you will receive paper copies of the Fund's Redesigned Reports via USPS mail for all Reports transmitted after July 2024. If you would like to receive the Fund's Redesigned Reports (and/or other communications) electronically instead of by mail, please contact your financial advisor or, if you are a direct investor, please call (855) 430-6487.
This report is submitted for the general information of shareholders and is not authorized for distribution to prospective investors unless preceded or accompanied by a current prospectus.
EIC VALUE FUND
Annual Investment Adviser's Report
April 30, 2024
(Unaudited)
Dear Fellow Shareholder,
Thank you for reviewing our annual report. In it, we discuss our perspective on the market, the EIC Value Fund’s (the “Fund”) Institutional Class performance, and some of the Fund’s recent purchase and sale activity. A listing of the Fund’s investments and other financial information follow our comments.
Perspective on the Market
Approximately one year ago, when the S&P 500® Index was some 30% lower, the Wall Street Journal ran a story titled, “Stocks Haven’t Looked This Unattractive Since 2007”. The article started with the observation that the “equity risk premium”, the excess earnings yield of stocks over bonds, at roughly 1.6%, had not been that low since 2007. Moreover, expected earnings growth for 2023 was scant, and the fear of recession and inflation continued to loom large.1 This viewpoint was common at the time. In fact, in our 2022 year-end commentary, we wrote: “In our estimation, more work remains to fully wring out the excesses of the last few years.” Though we were finding a variety of attractive investment opportunities at the time, we thought the overall market, and growth stocks in particular, were too expensive to generate good prospective returns.2
Such is the futility of trying to predict market movements, particularly in the short run. There was indeed no growth in earnings for the market in 2023. In fact, earnings conditions deteriorated throughout the year, but no recession materialized, and inflation fears temporarily abated, with talks of rate cuts on the horizon. Growth stocks, imbued with new momentum via AI-themed stocks, led the market in 2023 and again so far in 2024. This has given way to a creeping sense of valuation nihilism in the minds of many investors. Questions about the effectiveness of value investing have resurfaced, much as they did during the tech bubble of the late 1990s.
Because of the stock market’s strong performance over the last year, coupled with macro and geo-political developments, conditions today are worse for stocks than a year ago. The good news is that, for now, 2024 earnings are expected to show low double-digit growth. However, analysts are usually optimistic at the start of the year, and estimates have already drifted lower as companies gave their initial guidance.3 Moreover, inflation remains elevated, and while futures markets still predict interest rate cuts in 2024, multiple Fed officials, in a possibly coordinated effort, are cautioning increased patience with respect to cuts .4 Expectations of higher rates for longer could weigh on stock valuations in general and on growth stocks in particular.
Today, the forward earnings yield of the S&P 500 is only 21 basis points higher than current 10-year Treasury rates.5 Between materially higher interest rates and stocks near all-time highs, it’s become cheaper for some companies to raise capital by selling
| 1 | Wallerstein, Eric. “Stocks Haven’t Looked This Unattractive Since 2007.” The Wall Street Journal. April 6, 2023. https://www.wsj.com/ articles/stocks-havent-looked-this-unattractive-since-2007-78fc374c. 9 April 2024. |
| 2 | Equity Investment Corporation. All-Cap Value & Large-Cap Value 2022 Year-End Commentary, January 2023. https://www.eicatlanta. com/wp-content/uploads/2023/01/Q422-EIC-ACV-LCV-Client-Commentary-Final-23011004-0126.pdf |
| 3 | Data Source: S&P Capital IQPRO. S&P 500 Capital IQ Estimates Aggregates Bottom Up/Trends. S&P 500 EPS CY 2024. April 30, 2024. |
| 4 | Smialek, Jeanna. “Higher for Longer After All? Investors See Fed Rates Falling More Slowly.” The New York Times. April 9, 2024. https:// www.nytimes.com/2024/04/09/business/economy/interest-rates-inflation-federal-reserve.html#: 9 April 2024. |
| 5 | Data Source: S&P Capital IQPRO. S&P 500 Capital IQ Estimates Aggregates Bottom Up/Consensus Next Twelve Months Forward Earnings Yield and Market Yield on 10-Year U.S. Treasury Securities. 30 April 2024. |
EIC VALUE FUND
Annual Investment Adviser’s Report (Continued)
April 30, 2024
(Unaudited)
shares rather than borrowing in the debt markets. This could possibly jeopardize the future of share buybacks and leveraged buyouts, which have been reliable tailwinds for the equity markets.6
As shown below, growth stock valuations have round-tripped from year-end 2021. Moreover, profit margins remain significantly elevated relative to history. If long-term averages are used instead of recent margins, our analysis suggests that growth stocks are even more expensive today than at the peak of the tech bubble in 2000.7
Chart 1 Data Source: S&P Capital IQPRO.8 Indexes are unmanaged and cannot be invested in directly. Past performance does not guarantee future results.
| 6 | Rao, Sujata, and Lipschultz, Bailey. “Stock Market: Selling Shares Becomes Cheaper Than Issuing Debt.” Bloomberg. February 26, 2024. https://www.bloomberg.com/news/articles/2024-02-27/reddit-campari-aston-martin-turn-to-equity-markets-for-much- needed-cash. 27 February 2024. |
| 7 | Data Source: S&P Capital IQPRO. Russell 3000 Growth Margin-Normalized CAPE at each month-end from December 31, 1979 to April 30, 2024. Margin-Normalized CAPE (Cyclically Adjusted Price-to-Earnings) is the ratio of index prices to trailing 10-year index-level earnings before taxes (EBT) adjusted to reflect average trailing EBT margin over the period from December 31, 1979 to March 31, 2024, calculated on a time-weighted basis. Monthly index level margin-normalized EBT is imputed by dividing the month-end index price by an aggregated price to EBT multiple of index constituents with the resulting quotient divided by the month-end trailing EBT margin and multiplied by the long-term average trailing EBT margin. |
| 8 | Russell 3000® Growth Index modified CAPE (red line), Russell 3000® Value Index modified CAPE (green line), Russell 3000® Growth Index modified CAPE arithmetic premium over Russell 3000® Value Index modified CAPE (gray area) at each month-end January 31, 1990 to April 30, 2024. Modified CAPE is the ratio of index prices to trailing 10-year index-level EBT calculated on a time-weighted basis. Monthly index level EBT is imputed by dividing the month-end index price by an aggregated price to EBT multiple of index constituents. |
EIC VALUE FUND
Annual Investment Adviser’s Report (Continued)
April 30, 2024
(Unaudited)
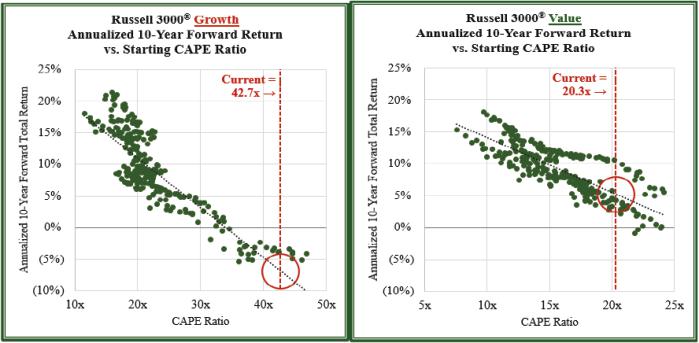
From current CAPE levels, as shown in Charts 2 and 3, history suggests that growth stocks are collectively priced for poor future returns, while value stocks offer more reasonable return prospects. In fact, at current starting valuations, growth stocks have typically lost money annually over the subsequent decade, while value stocks have historically earned positive returns.
Chart 2 and 3 Data Source: S&P Capital IQPRO.9 Indexes are unmanaged and cannot be invested in directly. Past performance does not guarantee future results.
Benjamin Graham, the “father of value investing” and mentor to Warren Buffett, defined investment versus speculation in the 1934 first edition of his pioneering work, Security Analysis:
“An investment operation is one which, upon thorough analysis, promises safety of principal and a satisfactory return. Operations not meeting these requirements are speculative.”10
We would substitute seeks safety for promises safety, but otherwise, we think the definition is emblematic of today's growth universe. History suggests caution when growth valuations are elevated, markets are concentrated, and thematic investing is in favor.11 For now, though, hope is triumphing over experience — hope expressed in valuations and hope that current favorable
| 9 | (Left Chart) Russell 3000® Growth Index modified CAPE at each month-end from January 31, 1990 to March 31, 2014, plotted against the subsequent annualized 10-year total return of the Russell 3000 Growth for each month-end January 31, 2000 through April 30, 2024. (Right Chart) Russell 3000® Value Index modified CAPE at each month-end January 31, 1990 to March 31, 2014, plotted against the subsequent annualized 10-year total return of the Russell 3000 Value for each month-end January 31, 2000 through April 30, 2024. |
| 10 | Graham, Benjamin and Dodd, David. Security Analysis, (New York: The McGraw Hill Companies),1934, 54. |
| 11 | “Bitcoin ETFs are off to a bad start. Will things improve?” The Economist. February 1, 2024. https://www.economist.com/finance-and-economics/2024/02/01/bitcoin-etfs-are-off-to-a-bad-start-will-things-improve. April 10, 2024. |
EIC VALUE FUND
Annual Investment Adviser’s Report (Continued)
April 30, 2024
(Unaudited)
conditions will persist over the experience of normal business-cycle variability and competition. Meanwhile, we believe value stocks offer investors reasonable odds of earning decent returns; the Fund continues to be positioned accordingly.
Fund Performance
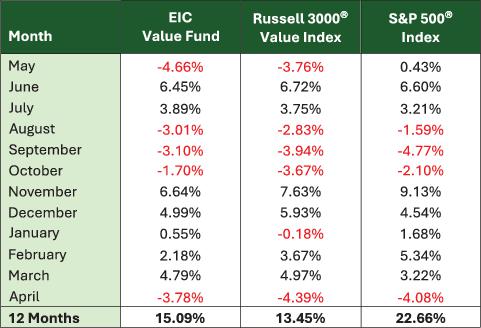
Performance for the Fund’s Institutional Class shares over the twelve months ended April 30, 2024, is presented in the following table:
Table 1 Data Source: Morningstar DirectSM.12 Indexes are unmanaged and cannot be invested in directly. Past performance does not guarantee future results.
The results shown in the table are over a relatively brief period; thus, we caution against drawing sweeping conclusions. Nevertheless, the Fund performed well relative to its primary benchmark, the Russell 3000® Value Index; however, it lagged the more growth-oriented S&P 500® Index.
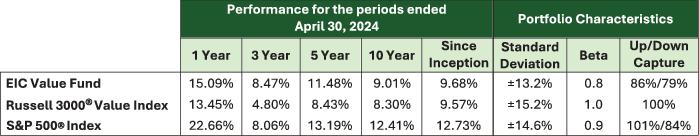
Notably, the Fund outperformed the Russell 3000® Value Index in four of the six down months but trailed it when it rose sharply. In that sense, the Fund’s monthly returns over the last fiscal year fit its long-term pattern of returns. Historically, it has declined less in down markets and recovered losses relatively quickly but lagged late cycle, especially when low-quality or momentum stocks led the way. By doing so, the Fund’s Institutional Class shares have paired above-benchmark performance with lower volatility, as shown in the next table:
| 12 | The performance data quoted represents past performance and may not be indicative of future results. The investment return and principal value of an investment in the Fund will fluctuate so that an investor’s shares, when redeemed, may be worth more or less than original cost. Current performance may be lower or higher. Performance data current to the most recent month-end may be obtained by calling (855) 430-6487. Securities in the Fund do not match those in the index and performance of the Fund will differ. Indexes are unmanaged, do not incur management fees, costs, and expenses, and cannot be invested in directly. |
EIC VALUE FUND
Annual Investment Adviser’s Report (Continued)
April 30, 2024
(Unaudited)
Table 2 Data Source: Morningstar DirectSM.13 Indexes are unmanaged and cannot be invested in directly. Past performance does not guarantee future results.
Performance attribution for the twelve months follows. Fund results are compared to those of the Russell 3000® Value Index. The Fund’s outperformance was primarily attributable to our stock selection in the consumer discretionary and health care sectors.14
We do not target sector weightings, either in an absolute sense or relative to market indexes; instead, they are principally a by-product of stock selection. Nonetheless, it is at times instructive to see how sector allocations affected Fund returns. Over the trailing twelve months, they were positive, adding 0.5% to the Fund’s relative performance.
Ten of the stock market’s eleven sectors posted positive returns for the twelve months ended April 30, 2024. The top-performing sector was industrials, gaining 27.9%, followed closely by financials, up 26.2%. Information technology, up 20.4%, energy, up 14.3%, and communication services, up 12.7%, also performed well. Relative to the index, the Fund was overweight in financials, energy, and communication services but underweight in industrials and information technology.
In contrast, the only sector with a negative return over the trailing twelve months was health care, which fell 1.5%. Utilities, up 0.3%, real estate, up 0.8%, and consumer staples, up 1.1%, also performed poorly. Compared to its benchmark, the Fund was overweight in consumer staples but underweight in health care, utilities, and real estate.
Stock selection in the health care sector positively impacted Fund performance. The Fund’s holdings in this sector posted a collective return of 10.0%, while the index’s health care stocks lost 1.5%. Cencora Inc. was the Fund’s top performer in this sector, rising 31.7% before we sold it in January of this year.
| 13 | Performance for periods longer than one year is annualized. Annualized since inception performance beginning April 29, 2011. The performance data quoted represents past performance and may not be indicative of future results. Current performance of the Fund may be lower or higher than the performance quoted. Portfolio characteristics are since inception beginning April 29, 2011 through April 30, 2024. Standard Deviation is a statistical measure describing the degree of variability (+/-) around the return over the time period calculated. The wider the performance range, the higher the standard deviation. Beta is a measure of the volatility, or systematic risk, of the Fund in comparison to the benchmark, the Russell 3000® Value Index. Upside and Downside Capture are the measures of performance in up and down markets relative to the benchmark index. The higher the upside capture, the better the performance in a rising market. Conversely, the lower the downside capture, the better the performance in a declining market. |
| 14 | Data Source: Morningstar DirectSM. Performance attribution for the EIC Value Fund versus Russell 3000® Value Index for the year ended April 30, 2024. Fund holdings and sector allocations are subject to change. Please see the schedule of investments section for a complete list of Fund holdings.Sectors are determined using the Global Industry Classification Standard (“GICS”). GICS® was developed by, and is the exclusive property of, Standard & Poor’s Financial Services LLC (“S&P”) and MSCI Inc. (“MSCI”). GICS is the trademark of S&P and MSCI. “Global Industry Classification Standard (GICS)” and “GICS Direct” are service marks of S&P and MSCI. |
EIC VALUE FUND
Annual Investment Adviser’s Report (Continued)
April 30, 2024
(Unaudited)
Stock selection in the consumer discretionary sector also helped Fund performance. The Fund’s holdings in this sector increased a combined 41.7% versus a 7.9% gain for the index’s consumer discretionary stocks. Expedia Group Inc. performed well for the Fund, surging 43.3% over the period.
Other notable Fund holdings included Meta Platforms Inc., up 97.2% before we sold it in February, Wells Fargo & Co., up 54.0%, Oshkosh Corp., up 49.4%, American Express Co., up 47.1%, and Charles Schwab Corp., up 44.1%.
On the other hand, the Fund’s underweight position in industrials, the market’s best-performing sector, was the biggest drag on performance. Additionally, stock selection within the sector detracted from performance, as the Fund’s holdings rose a combined 23.5% versus a 27.9% advance for the index’s industrial stocks. United Parcel Services Inc. was the Fund’s worst performer in this sector, falling 14.5%.
Stock selection in the financial sector also adversely affected Fund performance. Though Fund holdings gained 23.1%, they trailed the index’s financial holdings which climbed 26.2%. The Fund’s worst-performing holding in this sector was Globe Life Inc., which dropped 29.2%.
Other notable stocks detracting from Fund performance included Dollar Tree Inc., down 23.1%, Kenvue Inc., down 16.7%, Barrick Gold Corp., down 10.1%, Johnson & Johnson, down 9.0%, and Medtronic plc, down 8.8%.
Portfolio Activity
As is typical for the Fund during periods of heightened market volatility, turnover was higher than average over the past year.15 In addition to numerous opportunistic trims and adds, we sold seven positions from the Fund: Constellation Energy Corp, FedEx Corp., Cencora, Meta Platforms, Empire State Realty Trust, Haleon plc, and Global Payments Inc.. We sold the first four stocks based on valuation; we replaced Global Payments and Haleon with what we consider to be more attractive opportunities in similar industries. We sold Empire State Realty due to concerns about the health of the office property market and the headwinds this presented to the business.
We bought four new positions for the Fund: PayPal Holdings Inc., Dollar General Corp., NNN REIT Inc., and W. P. Carey Inc.. The Fund also received a small position in Kenvue from participation in the stock tender offer by Johnson & Johnson.
We purchased a 2% position in PayPal Holdings Inc. (PYPL), a technology platform that enables digital payments on behalf of merchants and consumers worldwide, including key brands like PayPal, Venmo, Braintree, Xoom, and Zettle. The company processes over $1 trillion in transaction volumes annually and generates most of its revenue from the fees (~2% on average) it takes on those volumes. Competition from other digital wallets (e.g., Apple Pay) has created concerns about the company's future growth prospects, and PYPL's share price has been under pressure. When we bought it for the Fund, the stock had fallen approximately 80% from its high watermark in mid-2021 and 40% from pre-pandemic levels. We believe the company is attractively priced given its growth profile, trading at 19x our estimate of normalized earnings at the time of purchase.16 PayPal Holdings maintains an investment grade rating
| 15 | The Fund’s annualized turnover has averaged 27% since inception. For the year ended April 30, 2024, the Fund’s annualized turnover was 37%. |
| 16 | Normalized earnings are EIC’s estimate of a company’s annual earnings per share when adjusting for temporary, unusual, or non-recurring items (e.g., margin pressure from supply chain bottlenecks, pandemic-related revenues, unusually high or low commodity prices, etc.). |
EIC VALUE FUND
Annual Investment Adviser’s Report (Continued)
April 30, 2024
(Unaudited)
of A- from S&P and has net cash on its balance sheet.17 We paired this buy for the Fund with a sale of Global Payments, a similar business with a weaker capital structure.
We bought a 2% position in Dollar General (DG), the largest retailer in the United States by store count, operating approximately 19,500 stores in primarily rural locations across 47 states. Historically, about 75% of revenues have been generated from selling staples such as food, paper, and cleaning products, with the remainder from higher-margin seasonal merchandise, home décor, and basic apparel. After an uptick during the pandemic, sales growth has decelerated in recent quarters. Inflation pressures have had an outsized impact on lower-income consumers, who comprise most of the company’s customer base. With its customers under stress, the sales mix has shifted further toward low-margin consumable items while supply chain and labor costs have increased. As a result of these pressures, management lowered full-year earnings guidance, and shares fell nearly 50% from the prior year, trading at a very reasonable valuation on both an absolute and relative basis. The stock continued to fall after the Fund’s initial purchase in August, but we view the fundamental challenges as temporary while the long-term case for DG remains intact. It is a high-quality business with growth prospects, strong returns on equity and cash flows, and a reasonable capital structure.
We also purchased a 1.5% position in NNN REIT (NNN), a mid-cap real estate investment trust that owns approximately 3,500 single-tenant retail properties in the United States. Most properties (~70%) are acquired through sale-leaseback transactions, and the remainder (~30%) are purchased at auctions. Leases are normally triple-net — tenants are responsible for all property expenses, including utilities, taxes, insurance, and maintenance, which allows NNN to generate more predictable cash flows. Occupancy is typically quite high (99% currently; minimum 96% in 2009) due to long leases (15-20 years at inception; 10-year remaining average term) and a propensity to sell vacant properties. As a result of this model, cash earnings have been reasonably stable even in more strained economic environments. NNN has a strong balance sheet, with a 12-year weighted average debt maturity and a BBB+ credit rating from S&P.
We bought a 1.5% position in W. P. Carey (WPC), a real estate investment trust (REIT) that owns more than 1,400 single-tenant properties in the United States (63%) and Europe (37%). The company’s roster of nearly 350 tenants is diversified, with the top 10 accounting for only 21% of rental revenue. Leases are normally triple-net; however, unlike other triple-net REITs that are primarily exposed to standalone retail properties, nearly 60% of WPC's rents are generated from the industrial/warehouse sector. WPC has a strong balance sheet, with mid-5x leverage, a four-year weighted average debt maturity, and a BBB+ credit rating from S&P. Shares declined 35% from their 2023 high as the company sold and spun-off office properties (currently 5% of rent versus more than 23% in 2020), cut its dividend 20%, and faced higher interest rates. At the time of purchase, the stock traded at a 15% discount to its 10-year average valuation with a well-covered 6.1% dividend yield.
Finally, we acquired a 1.5% position in Kenvue (KVUE), the consumer products business that was spun out by Johnson & Johnson (JNJ). KVUE has approximately $15 billion in annual sales split between Self Care (40% of sales with brands such as Tylenol, Nicorette, and Zyrtec), Skin Health & Beauty (30% of sales with brands including Neutrogena and Aveeno), and Essential Health (30% of sales counting Listerine, Johnson’s, and Band-Aid brands). KVUE is the market leader in many of its product categories, and its offerings tend to have higher margins with relatively stable demand and reasonable growth prospects. JNJ spun off shares in a novel transaction that allowed existing shareholders to tender their JNJ shares for KVUE shares, with a mechanism that distributed KVUE shares tax-free at a modest discount to the existing trading price. We took this opportunity to swap some of the Fund’s more fully valued JNJ shares with a low-cost basis for KVUE shares. Shares trade at 16.4x current-year earnings, with a 4.3% dividend yield, and carry an A credit rating from S&P.18
| 17 | Data Source: S&P Capital IQPRO. All credit-quality ratings discussed in this section represent Standard & Poor’s (S&P) opinion as to the quality of the securities they rate as of April 30, 2022 unless otherwise indicated. The ratings range from AAA (extremely strong capacity to meet its financial commitments) to D (in default). Ratings are relative and subjective and are not absolute standards of quality. |
| 18 | Data Source: S&P Capital IQPRO. Current earnings (EPS) are sell-side analyst estimates for a company’s adjusted annual earning per share over the next 12 months as of April 30, 2024. After the tender, the Fund still held a small position in JNJ. |
EIC VALUE FUND
Annual Investment Adviser’s Report (Concluded)
April 30, 2024
(Unaudited)
We are still finding opportunities in, and the Fund has higher than normal exposure to, European-based global businesses that trade at more attractive prices than their U.S. counterparts despite having similar characteristics. With respect to sectors, the Fund remains overweight in financials, energy, communications services, and consumer staples relative to its benchmark index. All in all, we believe the stocks in the Fund have high-quality characteristics and trade at reasonable valuations, offering good odds of earning reasonable returns.
In January 2021, near the peak of growth stock valuations and just a few quarters before the start of value-led outperformance that would carry through year-end 2022, we wrote the following:
“The near-term direction from here is uncertain, and it’s not clear what will break the growth fever, nor when it will happen. . . . growth has had a fantastic run, but it is currently too expensive to deliver good prospective returns, while its high valuation dramatically increases its risk.”19
We find ourselves saying the same thing today. Accordingly, our mission is not to predict the direction of the capital markets nor when leadership will turn, positioning the Fund to benefit from that one outcome. Rather, our mission is to protect by positioning the Fund for a range of outcomes through the consistent application of our investment process: buying stocks with quality characteristics at valuations based on reasonable assumptions, thus increasing the Fund’s odds of earning respectable returns.20
Portfolio composition is subject to change. The current and future portfolio holdings of the Fund are subject to investment risk. Investments cannot be made directly in an Index. Unmanaged index returns assume reinvestment of any and all distributions and do not reflect fees, expenses, or sales charges.
This letter is intended to assist shareholders in understanding how the Fund performed during the fiscal year ended April 30, 2024 and reflects the views of the investment adviser at the time of this writing. Of course, these views may change and do not guarantee the future performance of the Fund or the markets.
The above commentary is for informational purposes only and does not represent an offer, recommendation, or solicitation to buy, hold, or sell any security. The specific securities identified and described do not represent all of the securities purchased or sold and you should not assume that investments in the securities identified and discussed will be profitable.
London Stock Exchange Group plc (“LSE Group”) is the source and owner of FTSE Russell® index data. FTSE Russell® is a trading name of certain of the LSE Group companies. “Russell®” is a trade mark of the relevant LSE Group companies and is used by any other LSE Group company under license. All rights in the FTSE Russell indexes or data vest in the relevant LSE Group company which owns the index or the data. Neither LSE Group nor its licensors accept any liability for any errors or omissions in the indexes or data and no party may rely on any indexes or data contained in this communication. No further distribution of data from the LSE Group is permitted without the relevant LSE Group company’s express written consent. The LSE Group does not promote, sponsor or endorse the content of this communication. FTSE Russell Index information is sourced from S&P Capital IQ PRO.
| 19 | Equity Investment Corporation, All-Cap Value & Large-Cap Value, 2020 Fourth Quarter Commentary, January 2021. |
| 20 | Mutual fund investing involves risk, including possible loss of principal. A value-oriented investment approach is subject to the risk that a security believed to be undervalued does not appreciate in value as anticipated. There can be no guarantee that the EIC Value Fund’s investment strategy will be successful. |
EIC VALUE FUND
Annual Report
Performance Data
April 30, 2024
(Unaudited)
Comparison of Change in Value of $10,000 Investment in EIC Value Fund ’s Class A vs. Russell 3000® Value Index
and S&P 500® Index
Class A of an assumed $10,000 investment is adjusted for the maximum sales charge of 5.50%. This results in a net investment of $9,450. Performance of Class C will vary from Class A due to differences in class-specific fees.
| Average Annual Total Returns for the Years Ended April 30, 2024 |
| | 1 Year | | 3 Years | | 5 Years | | 10 Years |
| Class A (with sales charge) | 8.45% | | 6.17% | | 9.96% | | 8.13% |
| Class A (without sales charge) | 14.78% | | 8.20% | | 11.20% | | 8.74% |
| Russell 3000® Value Index | 13.45% | | 4.80% | | 8.43% | | 8.30% |
| S&P 500® Index | 22.66% | | 8.06% | | 13.19% | | 12.41% |
| Average Annual Total Returns for the Years Ended April 30, 2024 |
| | 1 Year | | 3 Years | | 5 Years | | 10 Years |
| Class C (with CDSC charge) | 12.91% | | 7.38% | | 10.37% | | 7.93% |
| Class C (without CDSC charge) | 13.91% | | 7.38% | | 10.37% | | 7.93% |
| Russell 3000® Value Index | 13.45% | | 4.80% | | 8.43% | | 8.30% |
| S&P 500® Index | 22.66% | | 8.06% | | 13.19% | | 12.41% |
The performance data quoted represents past performance and does not guarantee future results. The investment return and principal value of an investment in the EIC Value Fund (the “Fund”) will fluctuate so that an investor’s shares, when redeemed, may be worth more or less than their original cost. The graph and table do not reflect the deduction of taxes that a shareholder would pay on Fund distributions or redemption of Fund shares. Current performance may be lower or higher. Performance data current to the most recent month-end may be obtained by calling (855) 430-6487.
EIC VALUE FUND
Annual Report
Performance Data (Continued)
April 30, 2024
(Unaudited)
Comparison of Change in Value of $100,000 Investment in EIC Value Fund’s Institutional Class vs. Russell 3000® Value Index
and S&P 500® Index
| Average Annual Total Returns for the Years Ended April 30, 2024 |
| | 1 Year | | 3 Years | | 5 Years | | 10 Years |
| Institutional Class | 15.09% | | 8.47% | | 11.48% | | 9.01% |
| Russell 3000® Value Index | 13.45% | | 4.80% | | 8.43% | | 8.30% |
| S&P 500® Index | 22.66% | | 8.06% | | 13.19% | | 12.41% |
The performance data quoted represents past performance and does not guarantee future results. The investment return and principal value of an investment in the EIC Value Fund (the “Fund”) will fluctuate so that an investor’s shares, when redeemed, may be worth more or less than their original cost. The graph and table do not reflect the deduction of taxes that a shareholder would pay on Fund distributions or redemption of Fund shares. Current performance may be lower or higher. Performance data current to the most recent month-end may be obtained by calling (855) 430-6487.
The returns shown for Class A shares reflect a deduction for the maximum front-end sales charge of 5.50%. The returns shown for Class C shares reflect a maximum deferred sales charge of 1.00% if shares are redeemed within 18 months after initial purchase. All of the Fund’s share classes apply a 2.00% fee to the value of shares redeemed within 30 days of purchase. This redemption fee is not reflected in the returns shown above. As stated in the current prospectus dated September 1, 2023, the Fund’s “Total Annual Fund Operating Expenses” are 1.27%, 2.02% and 1.02%, and the Fund’s “Total Annual Fund Operating Expenses After Fee Waiver and/or Expense Reimbursement” are 1.21%, 1.96% and 0.96% for Class A shares, Class C shares and Institutional Class shares, respectively, of the Fund Class’ average daily net assets. The ratios may differ from the actual expenses incurred by the Fund for the period covered by this report. Equity Investment Corporation (the “Adviser”) has contractually agreed to waive or otherwise reduce its annual compensation received from and/or reimburse certain expenses of the Fund to the extent necessary to ensure that the Fund’s total operating expenses, excluding taxes, fees and expenses attributable to a distribution or service plan adopted by FundVantage Trust (the “Trust”), “Acquired Fund Fees and Expenses,” interest, extraordinary items and brokerage commissions, do not exceed 0.95% of average daily net assets of the Fund (the “Expense Limitation”). The Expense Limitation will remain in place until August 31, 2024, unless the Board of Trustees (“Board of Trustees”) of the Trust approves its earlier termination. Subject to approval by the Board of Trustees, the Adviser may recoup any expenses or fees it has reimbursed within a three-year period from the date on which the Adviser reduced its compensation and/or assumed expenses of the Fund. The Adviser is permitted to seek reimbursement from the Fund, subject to certain limitations, for fees it waived and Fund expenses it paid to the extent the total annual fund operating expenses do not exceed the limits described above or any lesser limits in effect at the time of reimbursement. No recoupment will occur unless the Fund’s expenses are below the Expense Limitation amount. Total returns would be lower had such fees and expenses not been waived and/or reimbursed.
Mutual fund investing involves risk, including possible loss of principal. Value investing involves the risk that the Fund’s investing in companies believed to be undervalued will not appreciate as anticipated. The Fund faces the risk of loss or lower investment performance as a result of incorrect estimation or other errors by the Adviser in its fundamental analysis regarding the companies in which the Fund invests.
EIC VALUE FUND
Annual Report
Performance Data (Concluded)
April 30, 2024
(Unaudited)
The Fund evaluates its performance as compared to that of the Standard & Poor’s 500 (“S&P 500®”) Index and the Russell 3000® Value Index. The S&P 500® Index is a widely recognized, unmanaged index of 500 common stocks, which are generally representative of the U.S. stock market as a whole. The Russell 3000® Value Index is an unmanaged index that measures the performance of the broad value segment of the U.S. equity value universe. It includes those Russell 3000® Index companies with lower price-to-value ratios and lower forecasted growth rates. It is impossible to invest directly in an index.
EIC VALUE FUND
Fund Expense Disclosure
April 30, 2024
(Unaudited)
As a shareholder of the Fund, you incur two types of costs: (1) transaction costs, including sales charges (loads) on purchase payments (if any) or redemption fees; and (2) ongoing costs, including management fees, distribution and/or service (Rule 12b-1) fees (if any) and other Fund expenses. These examples are intended to help you understand your ongoing costs (in dollars) of investing in the Fund and to compare these costs with the ongoing costs of investing in other mutual funds.
These examples are based on an investment of $1,000 invested at the beginning of the six-month period from November 1, 2023 through April 30, 2024 and held for the entire period.
Actual Expenses
The first line of the accompanying table provides information about actual account values and actual expenses. You may use the information in this line, together with the amount you invested, to estimate the expenses that you paid over the period. Simply divide your account value by $1,000 (for example, an $8,600 account value divided by $1,000 = 8.6), then multiply the result by the number in the first line under the heading entitled "Expenses Paid During Period" to estimate the expenses you paid on your account during this period.
Hypothetical Examples for Comparison Purposes
The second line of the accompanying table provides information about hypothetical account values and hypothetical expenses based on the Fund's actual expense ratio and an assumed rate of return of 5% per year before expenses, which is not your Fund's actual return. The hypothetical account values and expenses may not be used to estimate the actual ending account balance or expenses you paid for the period. You may use this information to compare the ongoing costs of investing in the Fund and other funds. To do so, compare these 5% hypothetical examples with the 5% hypothetical examples that appear in the shareholder reports of other funds.
Please note that the expenses shown in the accompanying table are meant to highlight your ongoing costs only and do not reflect any transactional costs, such as sales charges (loads) on purchase payments (if any) or redemption fees. Therefore, the second line of the accompanying table is useful in comparing ongoing costs only and will not help you determine the relative total costs of owning different funds. In addition, if these transactional costs were included, your costs would have been higher.
| | Beginning Account Value
November 1, 2023 | | Ending Account Value
April 30, 2024 | | Annualized
Expense Ratio | | Expenses Paid
During Period* |
| EIC Value Fund |
| Class A | | | | | | | |
| Actual | $1,000.00 | | $1,179.90 | | 1.20% | | $ 6.50 |
| Hypothetical (5% return before expenses) | 1,000.00 | | 1,018.90 | | 1.20% | | 6.02 |
| Class C | | | | | | | |
| Actual | $1,000.00 | | $1,175.20 | | 1.95% | | $10.55 |
| Hypothetical (5% return before expenses) | 1,000.00 | | 1,015.17 | | 1.95% | | 9.77 |
| Institutional Class | | | | | | | |
| Actual | $1,000.00 | | $1,181.50 | | 0.95% | | $ 5.15 |
| Hypothetical (5% return before expenses) | 1,000.00 | | 1,020.14 | | 0.95% | | 4.77 |
| * | Expenses are equal to the Fund’s annualized expense ratio for the six-month period ended April 30, 2024 of 1.20%, 1.95%, and 0.95% for Class A, Class C, and Institutional Class shares, respectively, multiplied by the average account value over the period, multiplied by the number of days in the most recent period (182), then divided by 366 to reflect the period. The Fund’s ending account values on the first line in each table are based on the actual six-month total returns for the Fund of 17.99%, 17.52%, and 18.15% for Class A, Class C, and Institutional Class shares, respectively. |
EIC Value Fund
Portfolio Holdings Summary Table
April 30, 2024
(Unaudited)
The following table presents a summary by sector of the portfolio holdings of the Fund:
| | % of Net
Assets | | Value |
| COMMON STOCKS: | | | |
| Financial | 28.1% | | $ 76,977,566 |
| Consumer, Non-cyclical | 21.2 | | 57,997,293 |
| Energy | 10.2 | | 27,814,025 |
| Communications | 10.2 | | 27,761,902 |
| Consumer, Cyclical | 6.0 | | 16,368,238 |
| Industrial | 5.6 | | 15,406,665 |
| Basic Materials | 4.2 | | 11,382,978 |
| Utilities | 3.3 | | 9,118,913 |
| Technology | 1.8 | | 4,902,126 |
| Short-Term Investment | 8.9 | | 24,386,209 |
| Other Assets in Excess of Liabilities | 0.5 | | 1,353,857 |
| NET ASSETS | 100.0% | | $273,469,772 |
Portfolio holdings are subject to change at any time.
The accompanying notes are an integral part of the financial statements.
EIC VALUE FUND
Portfolio of Investments
April 30, 2024
| | Number
of Shares | | Value |
| COMMON STOCKS — 90.6% |
| Basic Materials — 4.2% |
| Barrick Gold Corp. | 359,325 | | $ 5,979,168 |
| PPG Industries, Inc. | 41,890 | | 5,403,810 |
| | | | 11,382,978 |
| Communications — 10.2% |
| AT&T, Inc. | 581,300 | | 9,818,157 |
| Cisco Systems, Inc. | 77,025 | | 3,618,634 |
| Expedia Group, Inc.* | 33,400 | | 4,496,642 |
| Verizon Communications, Inc. | 248,885 | | 9,828,469 |
| | | | 27,761,902 |
| Consumer, Cyclical — 6.0% |
| Dollar General Corp. | 41,780 | | 5,815,358 |
| Dollar Tree, Inc.* | 53,950 | | 6,379,588 |
| Honda Motor Co. Ltd., SP ADR | 122,780 | | 4,173,292 |
| | | | 16,368,238 |
| Consumer, Non-cyclical — 21.2% |
| GSK PLC, SP ADR | 240,326 | | 9,959,109 |
| Ingredion, Inc. | 59,960 | | 6,870,816 |
| Johnson & Johnson | 5,352 | | 773,846 |
| Kenvue, Inc. | 368,214 | | 6,929,788 |
| Medtronic PLC | 95,850 | | 7,691,004 |
| PayPal Holdings, Inc.* | 104,375 | | 7,089,150 |
| Sanofi, ADR | 171,005 | | 8,418,576 |
| Unilever PLC, SP ADR | 197,975 | | 10,265,004 |
| | | | 57,997,293 |
| Energy — 10.2% |
| Coterra Energy, Inc. | 275,913 | | 7,548,980 |
| Shell PLC, ADR | 64,125 | | 4,595,197 |
| TotalEnergies SE, SP ADR | 122,125 | | 8,850,399 |
| Williams Cos., Inc. (The) | 177,775 | | 6,819,449 |
| | | | 27,814,025 |
| Financial — 28.1% |
| AGNC Investment Corp., REIT | 447,690 | | 4,096,364 |
| American Express Co. | 17,475 | | 4,089,674 |
| Charles Schwab Corp. (The) | 96,890 | | 7,165,016 |
| Globe Life, Inc. | 76,113 | | 5,797,527 |
| Hartford Financial Services Group, Inc. (The) | 67,400 | | 6,530,386 |
| Jones Lang LaSalle, Inc.* | 26,260 | | 4,745,182 |
| NNN REIT, Inc. | 93,925 | | 3,806,780 |
| PNC Financial Services Group, Inc. (The) | 45,813 | | 7,021,300 |
| Travelers Cos., Inc. (The) | 25,475 | | 5,404,776 |
| Truist Financial Corp. | 148,392 | | 5,572,120 |
| | Number
of Shares | | Value |
| COMMON STOCKS — (Continued) |
| Financial — (Continued) |
| US Bancorp | 180,040 | | $ 7,315,025 |
| Wells Fargo & Co. | 166,800 | | 9,894,576 |
| WP Carey, Inc., REIT | 101,000 | | 5,538,840 |
| | | | 76,977,566 |
| Industrial — 5.6% |
| General Dynamics Corp. | 19,250 | | 5,526,483 |
| Oshkosh Corp. | 42,500 | | 4,771,475 |
| United Parcel Service, Inc., Class B | 34,640 | | 5,108,707 |
| | | | 15,406,665 |
| Technology — 1.8% |
| Fidelity National Information Services, Inc. | 72,175 | | 4,902,126 |
| Utilities — 3.3% |
| National Fuel Gas Co. | 111,200 | | 5,904,720 |
| PPL Corp. | 117,050 | | 3,214,193 |
| | | | 9,118,913 |
TOTAL COMMON STOCKS
(Cost $189,041,207) | | | 247,729,706 |
| |
| SHORT-TERM INVESTMENT — 8.9% |
| Money Market Fund — 8.9% |
| Dreyfus Institutional Preferred Treasury Securities Money Market Fund, Hamilton Shares 5.21%(a) | 24,386,209 | | 24,386,209 |
TOTAL SHORT-TERM INVESTMENT
(Cost $24,386,209) | | | 24,386,209 |
|
| |
TOTAL INVESTMENTS - 99.5%
(Cost $213,427,416) | | | 272,115,915 |
| OTHER ASSETS IN EXCESS OF LIABILITIES - 0.5% | | | 1,353,857 |
| NET ASSETS - 100.0% | | | $273,469,772 |
| * | Non-income producing. |
| (a) | Rate disclosed is the 7-day yield at April 30, 2024. |
| ADR | American Depositary Receipt |
| PLC | Public Limited Company |
| REIT | Real Estate Investment Trust |
| SP ADR | Sponsored American Depository Receipt |
The accompanying notes are an integral part of the financial statements.
EIC VALUE FUND
Statement of Assets and Liabilities
April 30, 2024
| Assets | |
| Investments, at value (Cost $213,427,416) | $272,115,915 |
| Receivables: | |
| Investments sold | 1,498,866 |
| Capital shares sold | 309,728 |
| Dividends and interest | 813,668 |
| Prepaid expenses and other assets | 21,995 |
| Total Assets | 274,760,172 |
| Liabilities | |
| Payables: | |
| Investments purchased | 827,880 |
| Investment adviser | 184,187 |
| Capital shares redeemed | 91,671 |
| Due to custodian | 58,519 |
| Administration and accounting fees | 27,710 |
| Distribution fees (Class A and C Shares) | 8,849 |
| Shareholder servicing fees | 1,343 |
| Accrued expenses | 90,241 |
| Total Liabilities | 1,290,400 |
| Contingencies and Commitments (Note 2) | — |
| Net Assets | $273,469,772 |
| Net Assets Consisted of: | |
| Capital stock, $0.01 par value | $ 160,488 |
| Paid-in capital | 199,104,707 |
| Total distributable earnings | 74,204,577 |
| Net Assets | $273,469,772 |
| Class A Shares: | |
| Net assets | $ 23,205,065 |
| Shares outstanding | 1,362,349 |
| Net asset value, redemption price per share | $ 17.03 |
| Maximum offering price per share (100/94.50 of $17.03) | $ 18.02 |
| Class C Shares: | |
| Net assets | $ 6,450,758 |
| Shares outstanding | 390,620 |
| Net asset value, offering and redemption price per share | $ 16.51 |
| Institutional Class Shares: | |
| Net assets | $243,813,949 |
| Shares outstanding | 14,295,828 |
| Net asset value, offering and redemption price per share | $ 17.05 |
The accompanying notes are an integral part of the financial statements.
EIC VALUE FUND
Statement of Operations
For the Year Ended April 30, 2024
| Investment income | |
| Dividends | $ 8,848,261 |
| Less: foreign taxes withheld | (136,311) |
| Total investment income | 8,711,950 |
| Expenses | |
| Advisory fees(Note 2) | 1,826,154 |
| Transfer agent fees(Note 2) | 150,787 |
| Administration and accounting fees(Note 2) | 144,852 |
| Trustees’ and officers’ fees(Note 2) | 55,589 |
| Distribution fees (Class A)(Note 2) | 55,423 |
| Registration and filing fees | 48,299 |
| Distribution fees (Class C)(Note 2) | 45,035 |
| Custodian fees(Note 2) | 39,148 |
| Shareholder reporting fees | 36,677 |
| Legal fees | 36,147 |
| Audit fees | 35,667 |
| Shareholder servicing fees (Class C) | 15,012 |
| Other expenses | 22,349 |
| Total expenses before waivers and reimbursements | 2,511,139 |
| Less: waivers and reimbursements(Note 2) | (82,541) |
| Net expenses after waivers and reimbursements | 2,428,598 |
| Net investment income | 6,283,352 |
| Net realized and unrealized gain/(loss) from investments: | |
| Net realized gain from investments | 18,589,552 |
| Net change in unrealized appreciation on investments | 8,699,682 |
| Net realized and unrealized gain on investments | 27,289,234 |
| Net increase in net assets resulting from operations | $33,572,586 |
The accompanying notes are an integral part of the financial statements.
EIC VALUE FUND
Statements of Changes in Net Assets
| | For the Year
Ended
April 30, 2024 | | For the Year
Ended
April 30, 2023 |
| Net increase/(decrease) in net assets from operations: | | | |
| Net investment income | $ 6,283,352 | | $ 5,460,473 |
| Net realized gains/(losses) from investments | 18,589,552 | | (4,190,123) |
| Net change in unrealized appreciation on investments | 8,699,682 | | 3,506,318 |
| Net increase in net assets resulting from operations | 33,572,586 | | 4,776,668 |
| Less dividends and distributions to shareholders from: | | | |
| Total distributable earnings: | | | |
| Class A | (850,230) | | (1,180,466) |
| Class C | (175,406) | | (425,777) |
| Institutional Class | (8,860,634) | | (12,910,018) |
| Net decrease in net assets from dividends and distributions to shareholders | (9,886,270) | | (14,516,261) |
| Increase/(decrease) in net assets derived from capital share transactions (Note 4) | (6,208,057) | | 29,838,380 |
| Total increase in net assets | 17,478,259 | | 20,098,787 |
| Net assets | | | |
| Beginning of year | 255,991,513 | | 235,892,726 |
| End of year | $273,469,772 | | $255,991,513 |
The accompanying notes are an integral part of the financial statements.
EIC VALUE FUND
Financial Highlights
Contained below is per share operating performance data for Class A shares outstanding, total investment return, ratios to average net assets and other supplemental data for the respective period. The total returns in the table represent the rate that an investor would have earned or lost on an investment in the Fund (assuming reinvestment of all dividends and distributions). This information has been derived from information provided in the financial statements and should be read in conjunction with the financial statements and the notes thereto.
| | Class A |
| | For the
Year Ended
April 30,
2024 | | For the
Year Ended
April 30,
2023 | | For the
Year Ended
April 30,
2022 | | For the
Year Ended
April 30,
2021 | | For the
Year Ended
April 30,
2020 |
| Per Share Operating Performance | | | | | | | | | |
| Net asset value, beginning of year | $ 15.43 | | $ 16.08 | | $ 16.48 | | $ 11.75 | | $13.98 |
| Net investment income(1) | 0.38 | | 0.31 | | 0.24 | | 0.20 | | 0.23 |
| Net realized and unrealized gain/(loss) on investments | 1.85 | | (0.04) | | 1.10 | | 5.33 | | (1.42) |
| Total from investment operations | 2.23 | | 0.27 | | 1.34 | | 5.53 | | (1.19) |
| Dividends and distributions to shareholders from: | | | | | | | | | |
| Net investment income | (0.59) | | — | | (0.23) | | (0.23) | | (0.21) |
| Net realized capital gains | (0.04) | | (0.92) | | (1.51) | | (0.57) | | (0.83) |
| Total dividends and distributions to shareholders | (0.63) | | (0.92) | | (1.74) | | (0.80) | | (1.04) |
| Redemption fees | 0.00 (2) | | 0.00 (2) | | 0.00 (2) | | 0.00 (2) | | 0.00 (2) |
| Net asset value, end of year | $ 17.03 | | $ 15.43 | | $ 16.08 | | $ 16.48 | | $11.75 |
| Total investment return(3) | 14.78% | | 1.80% | | 8.39% | | 48.52% | | (9.54)% |
| Ratios/Supplemental Data | | | | | | | | | |
| Net assets, end of year (in 000s) | $23,205 | | $21,776 | | $19,522 | | $11,784 | | $8,347 |
| Ratio of expenses to average net assets | 1.20% | | 1.20% | | 1.20% | | 1.18% | | 1.15% |
| Ratio of expenses to average net assets without waivers and/or reimbursements | 1.24% (4) | | 1.26% (4) | | 1.25% (4) | | 1.32% (4) | | 1.24% (4) |
| Ratio of net investment income to average net assets | 2.38% | | 1.99% | | 1.44% | | 1.45% | | 1.67% |
| Portfolio turnover rate | 38% | | 39% | | 33% | | 41% | | 36% |
| (1) | The selected per share data was calculated using the average shares outstanding method for the year. |
| (2) | Amount is less than $0.005 per share. |
| (3) | Total investment return is calculated assuming a purchase of shares on the first day and a sale of shares on the last day of each period reported and includes reinvestment of dividends and distributions, if any. Total investment return does not reflect the impact of the maximum front-end sales load of 5.50% or any applicable sales charge. If reflected, the return would be lower. |
| (4) | During the period, certain fees were waived and/or reimbursed. If such fee waivers and/or reimbursements had not occurred, the ratios would have been as indicated (See Note 2). |
The accompanying notes are an integral part of the financial statements.
EIC VALUE FUND
Financial Highlights (Continued)
Contained below is per share operating performance data for Class C shares outstanding, total investment return, ratios to average net assets and other supplemental data for the respective period. The total returns in the table represent the rate that an investor would have earned or lost on an investment in the Fund (assuming reinvestment of all dividends and distributions). This information has been derived from information provided in the financial statements and should be read in conjunction with the financial statements and the notes thereto.
| | Class C |
| | For the
Year Ended
April 30,
2024 | | For the
Year Ended
April 30,
2023 | | For the
Year Ended
April 30,
2022 | | For the
Year Ended
April 30,
2021 | | For the
Year Ended
April 30,
2020 |
| Per Share Operating Performance | | | | | | | | | |
| Net asset value, beginning of year | $14.95 | | $15.72 | | $16.10 | | $ 11.52 | | $ 13.73 |
| Net investment income(1) | 0.25 | | 0.19 | | 0.11 | | 0.09 | | 0.12 |
| Net realized and unrealized gain/(loss) on investments | 1.79 | | (0.04) | | 1.07 | | 5.22 | | (1.41) |
| Total from investment operations | 2.04 | | 0.15 | | 1.18 | | 5.31 | | (1.29) |
| Dividends and distributions to shareholders from: | | | | | | | | | |
| Net investment income | (0.44) | | — | | (0.05) | | (0.16) | | (0.09) |
| Net realized capital gains | (0.04) | | (0.92) | | (1.51) | | (0.57) | | (0.83) |
| Total dividends and distributions to shareholders | (0.48) | | (0.92) | | (1.56) | | (0.73) | | (0.92) |
| Redemption fees | 0.00 (2) | | 0.00 (2) | | 0.00 (2) | | 0.00 (2) | | 0.00 (2) |
| Net asset value, end of year | $16.51 | | $14.95 | | $15.72 | | $ 16.10 | | $ 11.52 |
| Total investment return(3) | 13.91% | | 1.07% | | 7.56% | | 47.46% | | (10.30)% |
| Ratios/Supplemental Data | | | | | | | | | |
| Net assets, end of year (in 000s) | $6,451 | | $6,371 | | $8,933 | | $16,926 | | $17,926 |
| Ratio of expenses to average net assets | 1.95% | | 1.95% | | 1.95% | | 1.93% | | 1.90% |
| Ratio of expenses to average net assets without waivers and/or reimbursements | 1.99% (4) | | 2.01% (4) | | 2.00% (4) | | 2.07% (4) | | 1.99% (4) |
| Ratio of net investment income to average net assets | 1.63% | | 1.24% | | 0.69% | | 0.70% | | 0.92% |
| Portfolio turnover rate | 38% | | 39% | | 33% | | 41% | | 36% |
| (1) | The selected per share data was calculated using the average shares outstanding method for the year. |
| (2) | Amount is less than $0.005 per share. |
| (3) | Total investment return is calculated assuming a purchase of shares on the first day and a sale of shares on the last day of each period reported and includes reinvestment of dividends and distributions, if any. Total investment return does not reflect any applicable sales charge. |
| (4) | During the period, certain fees were waived and/or reimbursed. If such fee waivers and/or reimbursements had not occurred, the ratios would have been as indicated (See Note 2). |
The accompanying notes are an integral part of the financial statements.
EIC VALUE FUND
Financial Highlights (Concluded)
Contained below is per share operating performance data for Institutional Class shares outstanding, total investment return, ratios to average net assets and other supplemental data for the respective period. The total returns in the table represent the rate that an investor would have earned or lost on an investment in the Fund (assuming reinvestment of all dividends and distributions). This information has been derived from information provided in the financial statements and should be read in conjunction with the financial statements and the notes thereto.
| | Institutional Class |
| | For the
Year Ended
April 30,
2024 | | For the
Year Ended
April 30,
2023 | | For the
Year Ended
April 30,
2022 | | For the
Year Ended
April 30,
2021 | | For the
Year Ended
April 30,
2020 |
| Per Share Operating Performance | | | | | | | | | |
| Net asset value, beginning of year | $ 15.45 | | $ 16.06 | | $ 16.46 | | $ 11.73 | | $ 13.97 |
| Net investment income(1) | 0.42 | | 0.35 | | 0.28 | | 0.23 | | 0.26 |
| Net realized and unrealized gain/(loss) on investments | 1.85 | | (0.04) | | 1.10 | | 5.32 | | (1.42) |
| Total from investment operations | 2.27 | | 0.31 | | 1.38 | | 5.55 | | (1.16) |
| Dividends and distributions to shareholders from: | | | | | | | | | |
| Net investment income | (0.63) | | — | | (0.27) | | (0.25) | | (0.25) |
| Net realized capital gains | (0.04) | | (0.92) | | (1.51) | | (0.57) | | (0.83) |
| Total dividends and distributions to shareholders | (0.67) | | (0.92) | | (1.78) | | (0.82) | | (1.08) |
| Redemption fees | 0.00 (2) | | 0.00 (2) | | 0.00 (2) | | 0.00 (2) | | 0.00 (2) |
| Net asset value, end of year | $ 17.05 | | $ 15.45 | | $ 16.06 | | $ 16.46 | | $ 11.73 |
| Total investment return(3) | 15.09% | | 2.06% | | 8.64% | | 48.85% | | (9.36)% |
| Ratios/Supplemental Data | | | | | | | | | |
| Net assets, end of year (in 000s) | $243,814 | | $227,844 | | $207,437 | | $148,961 | | $113,292 |
| Ratio of expenses to average net assets | 0.95% | | 0.95% | | 0.95% | | 0.93% | | 0.90% |
| Ratio of expenses to average net assets without waivers and/or reimbursements | 0.98% (4) | | 1.01% (4) | | 1.00% (4) | | 1.07% (4) | | 0.99% (4) |
| Ratio of net investment income to average net assets | 2.63% | | 2.24% | | 1.69% | | 1.70% | | 1.91% |
| Portfolio turnover rate | 38% | | 39% | | 33% | | 41% | | 36% |
| (1) | The selected per share data was calculated using the average shares outstanding method for the year. |
| (2) | Amount is less than $0.005 per share. |
| (3) | Total investment return is calculated assuming a purchase of shares on the first day and a sale of shares on the last day of each period reported and includes reinvestment of dividends and distributions, if any. |
| (4) | During the period, certain fees were waived and/or reimbursed. If such fee waivers and/or reimbursements had not occurred, the ratios would have been as indicated (See Note 2). |
The accompanying notes are an integral part of the financial statements.
EIC VALUE FUND
Notes to Financial Statements
April 30, 2024
1. Organization and Significant Accounting Policies
The EIC Value Fund (the “Fund”) is a diversified, open-end management investment company registered under the Investment Company Act of 1940, as amended (the “1940 Act”), which commenced operations on May 1, 2011. The Fund is a separate series of FundVantage Trust (the “Trust”) which was organized as a Delaware statutory trust on August 28, 2006. The Trust is a “series trust” authorized to issue an unlimited number of separate series or classes of shares of beneficial interest. Each series is treated as a separate entity for certain matters under the 1940 Act, and for other purposes, and a shareholder of one series is not deemed to be a shareholder of any other series. The Fund offers separate classes of shares: Class A, Class C, Institutional Class and Retail Class shares. Class A shares are sold subject to a front-end sales charge of 5.50%. Front-end sales charges may be reduced or waived under certain circumstances. A contingent deferred sales charge (“CDSC”) may be applicable to the redemption of Class A and Class C shares. A CDSC, as a percentage of the lower of the original purchase price or net asset value at redemption, of up to 1.00% may be imposed on full or partial redemptions of Class A shares made within eighteen months of purchase where: (i) $1 million or more of Class A shares were purchased without an initial sales charge, and (ii) the Fund’s principal underwriter, Foreside Funds Distributors LLC (the “Underwriter”), paid a commission to the selling broker-dealer for such sale. A CDSC of up to 1.00% is assessed on redemptions of Class C Shares made within eighteen months after the initial purchase where the broker-dealer was paid a commission for such sale. Class C shares of the Fund will automatically convert into Class A shares of the Fund after they have been held for eight years. As of April 30, 2024, the Retail Class Shares have not been issued.
The Fund is an investment company and follows accounting and reporting guidance in the Financial Accounting Standards Board Accounting Standards Codification Topic 946.
Portfolio Valuation – The EIC Value Fund’s (the “Fund”) net asset value (“NAV”) is calculated once daily at the close of regular trading hours on the New York Stock Exchange (“NYSE”) (typically 4:00 p.m. Eastern time) on each day the NYSE is open. Securities held by the Fund are valued using the closing price or the last sale price on a national securities exchange or the National Association of Securities Dealers Automatic Quotation System (“NASDAQ”) market system where they are primarily traded. Equity securities traded in the over-the-counter (“OTC”) market are valued at their closing sale or official closing price. If there were no transactions on that day, securities traded principally on an exchange or on NASDAQ will be valued at the mean of the last bid and ask prices prior to the market close. Fixed income securities having a remaining maturity of greater than 60 days are valued using an independent pricing service. Investments in other open-end investment companies are valued based on the NAV of the investment companies (which may use fair value pricing as discussed in their prospectuses). Securities that do not have a readily available current market value are valued in good faith by the Adviser as "valuation designee" under the oversight of the Trust’s Board of Trustees. Relying on prices supplied by pricing services or dealers or using fair valuation may result in values that are higher or lower than the values used by other investment companies and investors to price the same investments. The Adviser has adopted written policies and procedures for valuing securities and other assets in circumstances where market quotes are not readily available. In the event that market quotes are not readily available, and the security or asset cannot be valued pursuant to one of the valuation methods, the value of the security or asset will be determined in good faith by the Adviser pursuant to its policies and procedures. On a quarterly basis, the Adviser’s fair valuation determinations will be reviewed by the Trust’s Board of Trustees.
Fair Value Measurements — The inputs and valuation techniques used to measure fair value of the Fund’s investments are summarized into three levels as described in the hierarchy below:
• Level 1 — quoted prices in active markets for identical securities;
• Level 2 — other significant observable inputs (including quoted prices for similar securities, interest rates, prepayment speeds, credit risk, etc.); and
• Level 3 — significant unobservable inputs (including the Fund’s own assumptions in determining the fair value of investments).
The inputs or methodology used for valuing securities are not necessarily an indication of the risk associated with investing in those securities. Transfers in and out are recognized at the value at the end of the period.
EIC VALUE FUND
Notes to Financial Statements (Continued)
April 30, 2024
The following is a summary of the inputs used, as of April 30, 2024, in valuing the Fund's investments carried at fair value:
| | Total
Value at
04/30/24 | | Level 1
Quoted
Prices | | Level 2
Other
Significant
Observable
Inputs | | Level 3
Significant
Unobservable
Inputs |
| Assets | | | | | | | |
| Common Stocks* | $ 247,729,706 | | $ 247,729,706 | | $ — | | $ — |
| Short-Term Investments* | 24,386,209 | | 24,386,209 | | — | | — |
| Total Assets | $ 272,115,915 | | $ 272,115,915 | | $ — | | $ — |
| * | Please refer to Portfolio of Investments for further details on portfolio holdings. |
At the end of each quarter, management evaluates the classification of Levels 1, 2 and 3 assets and liabilities. Various factors are considered, such as changes in liquidity from the prior reporting period; whether or not a broker is willing to execute at the quoted price; the depth and consistency of prices from third-party pricing services; and the existence of contemporaneous, observable trades in the market. Additionally, management evaluates the classification of Level 1 and Level 2 assets and liabilities on a quarterly basis for changes in listings or delistings on national exchanges.
Due to the inherent uncertainty of determining the fair value of investments that do not have a readily available market value, the fair value of the Fund’s investments may fluctuate from period to period. Additionally, the fair value of investments may differ significantly from the values that would have been used had a ready market existed for such investments and may differ materially from the values the Fund may ultimately realize. Further, such investments may be subject to legal and other restrictions on resale or are otherwise less liquid than publicly traded securities.
For fair valuations using significant unobservable inputs, U.S. generally accepted accounting principles (“U.S. GAAP”) require the Fund to present a reconciliation of the beginning to ending balances for reported market values that present changes attributable to total realized and unrealized gains or losses, purchase and sales, and transfers in and out of Level 3 during the period. A reconciliation of Level 3 investments is presented only when the Fund had an amount of Level 3 investments at the end of the reporting period that was meaningful in relation to its net assets. The amounts and reasons for all transfers in and out of Level 3 are disclosed when the Fund had an amount of transfers during the reporting period that was meaningful in relation to its net assets as of the end of the reporting period.
For the year ended April 30, 2024, there were no transfers in or out of Level 3.
Use of Estimates — The preparation of financial statements in conformity with U.S. GAAP requires management to make estimates and assumptions that affect the amounts reported in the financial statements and accompanying notes at the date of the financial statements and the reported amounts of revenues and expenses during the period. Actual results could differ from those estimates and those differences could be material.
Investment Transactions, Investment Income and Expenses — Investment transactions are recorded on trade date for financial statement preparation purposes. Realized gains and losses on investments sold are recorded on the identified cost basis. Interest income is recorded on the accrual basis. Dividends are recorded on the ex-dividend date. The Fund may be subject to foreign taxes on income, a portion of which may be recoverable. The Fund applies for refunds where available. Estimated components of distributions received from real estate investment trusts may be considered income, return of capital distributions or capital gain distributions. Return of capital distributions are recorded as a reduction of cost of the related investments. Distribution (12b-1) fees and shareholder services fees relating to a specific class are charged directly to that class. Fund level expenses common to all classes, investment income and realized and unrealized gains and losses on investments are allocated to each class based upon relative daily net assets of each class. General expenses of the Trust are generally allocated to each fund under methodologies approved by the Board Trustees. Expenses directly attributable to a particular fund in the Trust are charged directly to that fund.
EIC VALUE FUND
Notes to Financial Statements (Continued)
April 30, 2024
Dividends and Distributions to Shareholders — Dividends from net investment income and distributions from net realized capital gains, if any, are declared, recorded on ex-date and paid at least annually to shareholders. Income dividends and capital gain distributions are determined in accordance with U.S. federal income tax regulations, which may differ from U.S. GAAP.
U.S. Tax Status — No provision is made for U.S. income taxes as it is the Fund’s intention to continue to qualify for and elect the tax treatment applicable to regulated investment companies under Subchapter M of the Internal Revenue Code of 1986, as amended (“Internal Revenue Code”), and make the requisite distributions to its shareholders which will be sufficient to relieve it from U.S. income and excise taxes.
Other — In the normal course of business, the Fund may enter into contracts that provide general indemnifications. The Fund’s maximum exposure under these arrangements is dependent on claims that may be made against the Fund in the future, and therefore, cannot be estimated; however, based on experience, the risk of material loss for such claims is considered remote.
2. Transactions with Related Parties and Other Service Providers
Equity Investment Corporation (“EIC” or the “Adviser”) serves as investment adviser to the Fund pursuant to an investment advisory agreement with the Trust (the “Advisory Agreement”). For its services, the Adviser is paid a monthly fee at the annual rate of 0.75% of the Fund’s average daily net assets under $500 million; 0.65% of the Fund’s average daily net assets of $500 million or more, but less than $1 billion; and 0.50% of the Fund’s average daily net assets of $1 billion and over. The Adviser has contractually agreed to waive or otherwise reduce its annual compensation received from and/or reimburse certain expenses of the Fund to the extent necessary to ensure that the Fund’s total operating expenses, excluding taxes, fees and expenses attributable to a distribution or service plan adopted by the Trust, “Acquired Fund Fees and Expenses,” interest, extraordinary items and brokerage commissions, do not exceed 0.95% of average daily net assets of the Fund (the “Expense Limitation”). The Expense Limitation will remain in place until August 31, 2024, unless the Board of Trustees of the Trust approves its earlier termination. Subject to approval by the Board of Trustees, the Adviser may recoup any expenses or fees it has reimbursed within a three-year period from the date on which the Adviser reduced its compensation and/or assumed expenses of the Fund. The Adviser is permitted to seek reimbursement from the Fund, subject to certain limitations, for fees it waived and Fund expenses it paid to the extent the total annual fund operating expenses do not exceed the limits described above or any lesser limits in effect at the time of reimbursement. No recoupment will occur unless the Fund’s expenses are below the Expense Limitation amount.
As of April 30, 2024, the amount of potential recovery was as follows:
| | Expiration |
| | 04/30/2025 | | 04/30/2026 | | 04/30/2027 | | Total |
| | $104,148 | | $151,677 | | $82,541 | | $338,366 |
For the year ended April 30, 2024, the Adviser earned advisory fees of $1,826,154 and waived fees of $82,541.
The Fund has not recorded a commitment or contingent liability at April 30, 2024.
Other Service Providers
The Bank of New York Mellon (“BNY Mellon”) serves as administrator and custodian for the Fund. For providing administrative and accounting services, BNY Mellon is entitled to receive a monthly fee equal to an annual percentage rate of the Fund’s average daily net assets and is subject to certain minimum monthly fees. For providing certain custodial services, BNY Mellon is entitled to receive a monthly fee, subject to certain minimum, and out of pocket expenses.
BNY Mellon Investment Servicing (US) Inc. (the “Transfer Agent”) provides transfer agent services to the Fund. The Transfer Agent is entitled to receive a monthly fee, subject to certain minimum, and out of pocket expenses.
EIC VALUE FUND
Notes to Financial Statements (Continued)
April 30, 2024
The Trust, on behalf of the Fund, has entered into agreements with financial intermediaries to provide recordkeeping, processing, shareholder communications and other services to customers of the intermediaries investing in the Fund and have agreed to compensate the intermediaries for providing those services. The fees incurred by the Fund for these services are included in Transfer agent fees in the Statement of Operations.
Foreside Funds Distributors LLC (the “Underwriter”) provides principal underwriting services to the Fund pursuant to an underwriting agreement between the Trust and the Underwriter.
The Trust and the Underwriter are parties to an underwriting agreement. The Trust has adopted a distribution plan for Class A and Class C shares in accordance with Rule 12b-1 under the 1940 Act. Pursuant to the Class A and Class C shares plan, the Fund compensates the Underwriter for direct and indirect costs and expenses incurred in connection with advertising, marketing and other distribution services in an amount not to exceed 0.25% and 1.00% (0.75% Rule 12b-1 distribution fee and 0.25% shareholder service fee) on an annualized basis of the average daily net assets of the Fund’s Class A and Class C shares, respectively.
Trustees and Officers
The Trust is governed by its Board of Trustees. The Trustees receive compensation in the form of an annual retainer and per meeting fees for their services to the Trust. An employee of BNY Mellon serves as the Secretary of the Trust and is not compensated by the Fund or the Trust.
JW Fund Management LLC (“JWFM”) provides a Principal Executive Officer and Principal Financial Officer to the Trust. Chenery Compliance Group, LLC (“Chenery”) provides the Trust with a Chief Compliance Officer and an Anti-Money Laundering Officer. JWFM and Chenery are compensated for their services provided to the Trust.
3. Investment in Securities
For the year ended April 30, 2024, aggregated purchases and sales of investment securities (excluding short-term investments) of the Fund were as follows:
| | Purchases | | Sales |
| Investment Securities | $86,942,667 | | $111,448,012 |
4. Capital Share Transactions
For the years ended April 30, 2024 and 2023, transactions in capital shares (authorized shares unlimited) were as follows:
| | For the Year Ended
April 30, 2024 | | For the Year Ended
April 30, 2023 |
| | Shares | | Amount | | Shares | | Amount |
| Class A | | | | | | | |
| Sales | 162,723 | | $ 2,581,322 | | 326,841 | | $ 5,075,997 |
| Reinvestments | 49,825 | | 782,747 | | 71,941 | | 1,089,899 |
| Redemption Fees* | — | | 851 | | — | | 411 |
| Redemptions | (261,512) | | (4,163,503) | | (201,732) | | (3,117,450) |
| Net increase/(decrease) | (48,964) | | $ (798,583) | | 197,050 | | $ 3,048,857 |
EIC VALUE FUND
Notes to Financial Statements (Continued)
April 30, 2024
| | For the Year Ended
April 30, 2024 | | For the Year Ended
April 30, 2023 |
| | Shares | | Amount | | Shares | | Amount |
| |
| Class C | | | | | | | |
| Sales | 80,231 | | $ 1,270,512 | | 108,951 | | $ 1,656,613 |
| Reinvestments | 10,630 | | 162,431 | | 27,557 | | 405,649 |
| Redemption Fees* | — | | 232 | | — | | 144 |
| Redemptions | (126,460) | | (1,931,583) | | (278,587) | | (4,186,873) |
| Net decrease | (35,599) | | $ (498,408) | | (142,079) | | $ (2,124,467) |
| |
| Institutional Class | | | | | | | |
| Sales | 3,148,804 | | $ 51,013,670 | | 4,735,378 | | $ 73,679,118 |
| Reinvestments | 519,398 | | 8,159,749 | | 788,658 | | 11,956,048 |
| Redemption Fees* | — | | 8,390 | | — | | 4,516 |
| Redemptions | (4,115,694) | | (64,092,875) | | (3,695,740) | | (56,725,692) |
| Net increase/(decrease) | (447,492) | | $ (4,911,066) | | 1,828,296 | | $ 28,913,990 |
| |
| Total net increase/(decrease) | (532,055) | | $ (6,208,057) | | 1,883,267 | | $ 29,838,380 |
| | | | | | | | |
| * | There is a 2.00% redemption fee that may be charged on shares redeemed which have been held 30 days or less. The redemption fees are retained by the Fund for the benefit of the remaining shareholders and recorded as paid-in capital. |
5. Federal Tax Information
The Fund has followed the authoritative guidance on accounting for and disclosure of uncertainty in tax positions, which requires the Fund to determine whether a tax position is more likely than not to be sustained upon examination, including resolution of any related appeals or litigation processes, based on the technical merits of the position. Tax positions not deemed to meet the more-likely-than-not threshold would be recorded as tax benefit or expense in the current year. The Fund has determined that there was no effect on the financial statements from following this authoritative guidance. In the normal course of business, the Fund is subject to examination by federal, state and local jurisdictions, where applicable, for tax years for which applicable statutes of limitations have not expired.
Distributions are determined in accordance with federal income tax regulations, which may differ in amount or character from net investment income and realized gains for financial reporting purposes. Accordingly, the character of distributions and composition of net assets for tax purposes may differ from those reflected in the accompanying financial statements. To the extent these differences are permanent, such amounts are reclassified within the components of net assets based on the tax treatment; temporary differences do not require reclassifications. For the year ended April 30, 2024, these adjustments were to increase paid-in capital by $537,498 and decrease total distributable earnings by $537,498. These permanent differences were primarily attributable to the utilization of earnings and profits on shareholder redemptions (a tax accounting practice known as equalization). Net investment income, net realized gains and net assets were not affected by these adjustments.
For the year ended April 30, 2024, the tax character of distributions paid by the Fund was $9,886,270 of ordinary income dividends. For the year ended April 30, 2023 the tax character of distributions paid by the Fund was $464 of ordinary income dividends and $14,515,797 of long-term capital gains dividends. Distributions from net investment income and short-term gains are treated as ordinary income for federal income tax purposes.
EIC VALUE FUND
Notes to Financial Statements (Concluded)
April 30, 2024
As of April 30, 2024, the components of distributable earnings on a tax basis were as follows:
| | Undistributed
Ordinary
Income | | Undistributed
Long-Term
Gain | | Unrealized
Appreciation/
(Depreciation) |
| | $1,644,931 | | $13,985,898 | | $58,573,748 |
| | | | | | |
The differences between the book and tax basis components of distributable earnings relate primarily to the timing and recognition of income and gains for federal income tax purposes.
As of April 30, 2024, the federal tax cost, aggregate gross unrealized appreciation and depreciation of securities held by the Fund were as follows:
| Federal Tax Cost | $213,542,167 |
| Unrealized Appreciation | 59,454,332 |
| Unrealized Depreciation | (880,584) |
| Net Unrealized Appreciation | $ 58,573,748 |
Pursuant to federal income tax rules applicable to regulated investment companies, the Fund may elect to treat certain capital losses between November 1 and April 30 and late year ordinary losses ((i) ordinary losses between January 1 and April 30, and (ii) specified ordinary and currency losses between November 1 and April 30) as occurring on the first day of the following tax year. For the year ended April 30, 2024, the Fund had no post October capital loss deferrals or late year ordinary loss deferrals.
As of April 30, 2024, the Fund had no capital loss carryforward available to offset future realized capital gains and thereby reduce future capital gains distributions. During the year ended April 30, 2024, the Fund utilized $4,201,943 of capital loss carryforwards.
6. Subsequent Events
Management has evaluated the impact of all subsequent events on the Fund through the date the financial statements were issued, and has determined that there are no subsequent events requiring recognition or disclosure in the financial statements.
EIC VALUE FUND
Report of Independent Registered Public Accounting Firm
To the Board of Trustees of FundVantage Trust and
Shareholders of EIC Value Fund
Opinion on the Financial Statements
We have audited the accompanying statement of assets and liabilities of EIC Value Fund (the “Fund”) (one of the series constituting FundVantage Trust (the “Trust”)), including the portfolio of investments, as of April 30, 2024, and the related statement of operations for the year then ended, the statements of changes in net assets for each of the two years in the period then ended, the financial highlights for each of the five years in the period then ended and the related notes (collectively referred to as the “financial statements”). In our opinion, the financial statements present fairly, in all material respects, the financial position of the Fund (one of the series constituting FundVantage Trust) at April 30, 2024, the results of its operations for the year then ended, the changes in its net assets for each of the two years in the period then ended and its financial highlights for each of the five years in the period then ended, in conformity with U.S. generally accepted accounting principles.
Basis for Opinion
These financial statements are the responsibility of the Trust’s management. Our responsibility is to express an opinion on the Fund’s financial statements based on our audits. We are a public accounting firm registered with the Public Company Accounting Oversight Board (United States) (“PCAOB”) and are required to be independent with respect to the Trust in accordance with the U.S. federal securities laws and the applicable rules and regulations of the Securities and Exchange Commission and the PCAOB.
We conducted our audits in accordance with the standards of the PCAOB. Those standards require that we plan and perform the audit to obtain reasonable assurance about whether the financial statements are free of material misstatement, whether due to error or fraud. The Trust is not required to have, nor were we engaged to perform, an audit of the Trust’s internal control over financial reporting. As part of our audits we are required to obtain an understanding of internal control over financial reporting but not for the purpose of expressing an opinion on the effectiveness of the Trust’s internal control over financial reporting. Accordingly, we express no such opinion.
Our audits included performing procedures to assess the risks of material misstatement of the financial statements, whether due to error or fraud, and performing procedures that respond to those risks. Such procedures included examining, on a test basis, evidence regarding the amounts and disclosures in the financial statements. Our procedures included confirmation of securities owned as of April 30, 2024, by correspondence with the custodian; when replies were not received from brokers, we performed other auditing procedures. Our audits also included evaluating the accounting principles used and significant estimates made by management, as well as evaluating the overall presentation of the financial statements. We believe that our audits provide a reasonable basis for our opinion.
We have served as the auditor of one or more Equity Investment Corporation investment companies since 2012.
Philadelphia, Pennsylvania
June 26, 2024
EIC VALUE FUND
Shareholder Tax Information
(Unaudited)
The Fund is required by Subchapter M of the Internal Revenue Code to advise its shareholders of the U.S. federal tax status of distributions received by the Fund’s shareholders in respect of such fiscal year. During the fiscal year ended April 30, 2024, the Fund paid $9,886,270 of ordinary income dividends to its shareholders. Dividends from net investment income and short-term capital gains are treated as ordinary income dividends for federal income tax purposes.
The Fund designates 100.00% of the ordinary income distribution as qualified dividend income pursuant to the Jobs and Growth Tax Relief Reconciliation Act of 2003.
The percentage of ordinary income dividends qualifying for the corporate dividends received deduction is 90.88%
The percentage of qualified interest income related dividends not subject to withholding tax for non-resident aliens and foreign corporations received is 2.92%.
The Fund designated $14,387,614, as long-term capital gains distributions during the year ended April 30, 2024. Distributable long-term gains are based on net realized long-term gains determined on a tax basis and may differ from such amounts for financial reporting purposes.
All designations are based on financial information available as of the date of this annual report and, accordingly, are subject to change. For each item, it is the intention of the Fund to designate the maximum amount permitted under the Internal Revenue Code of 1986, as amended, and the regulations thereunder.
Because the Fund’s fiscal year is not the calendar year, another notification will be sent with respect to calendar year 2024. The second notification, which will reflect the amount, if any, to be used by calendar year taxpayers on their U.S. federal income tax returns, will be made in conjunction with Form 1099-DIV and will be mailed in January 2025.
Foreign shareholders will generally be subject to U.S. withholding tax on the amount of their ordinary income dividends. They will generally not be entitled to a foreign tax credit or deduction for the withholding taxes paid by the Fund, if any.
In general, dividends received by tax-exempt recipients (e.g., IRAs and Keoghs) need not be reported as taxable income for U.S. federal income tax purposes. However, some retirement trusts (e.g., corporate, Keogh and 403(b)(7) plans) may need this information for their annual information reporting.
Shareholders are advised to consult their own tax advisers with respect to the tax consequences of their investment in the Fund.
EIC VALUE FUND
Other Information
(Unaudited)
Proxy Voting
Policies and procedures that the Fund uses to determine how to vote proxies relating to portfolio securities as well as information regarding how the Fund voted proxies relating to portfolio securities for the most recent 12-month period ended June 30 are available without charge, upon request, by calling (855) 430-6487 and on the Securities and Exchange Commission's (“SEC”) website at http://www.sec.gov.
Quarterly Portfolio Schedules
The Fund files its complete schedule of portfolio holdings with the SEC for the first and third fiscal quarters of each fiscal year (quarters ended July 31 and January 31) as an exhibit to its reports on Form N-PORT. The Fund's portfolio holdings on Form N-PORT are available on the SEC's website at http://www.sec.gov.
Board Considerations with Respect to the Approval of the Continuation of the Investment Advisory Agreement with Equity Investment Corporation
At an in-person meeting held on November 29-30, 2023 (the “Meeting”), the Board of Trustees (the “Board” or the “Trustees”) of FundVantage Trust (the “Trust”), including a majority of the Trustees who are not “interested persons” within the meaning of Section 2(a)(19) of the Investment Company Act of 1940, as amended (the “1940 Act”) (the “Independent Trustees”), unanimously approved the continuation of the Investment Advisory Agreement between Equity Investment Corporation (“EIC” or the “Adviser”) and the Trust (the “EIC Agreement”) on behalf of the EIC Value Fund (the “EIC Fund”). At the Meeting, the Board considered the continuation of the EIC Agreement with respect to the EIC Fund for an additional one-year period.
In determining whether to continue the EIC Agreement for an additional one-year period, the Trustees, including the Independent Trustees, considered information provided by EIC in response to a request for information in accordance with Section 15(c) of the 1940 Act (the “EIC 15(c) Response”) regarding (i) the services performed by EIC for the EIC Fund, (ii) the composition and qualifications of EIC’s portfolio management staff, (iii) any potential or actual material conflicts of interest which may arise in connection with the management of the EIC Fund, (iv) investment performance of the EIC Fund, (v) the financial condition of EIC, (vi) brokerage selection procedures (including soft dollar arrangements, if any), (vii) the procedures for allocating investment opportunities between the EIC Fund and other clients, (viii) results of any independent audit or regulatory examination, including any recommendations or deficiencies noted, (ix) any litigation, investigation or administrative proceeding which may have a material impact on EIC’s ability to service the EIC Fund, and (x) compliance with the EIC Fund’s investment objective, policies and practices (including codes of ethics and proxy voting policies), federal securities laws and other regulatory requirements. In addition to the information in the EIC 15(c) Response, the Trustees received additional information at Board meetings throughout the year covering matters such as the relative performance of the EIC Fund; compliance with the EIC Fund’s investment objective, policies, strategy and limitations; the compliance of portfolio management personnel with applicable codes of ethics; and the adherence to pricing procedures as established by the Board.
The Board considered additional information provided by representatives from EIC invited to participate in the Meeting regarding EIC’s history, performance, investment strategy, and compliance program. Representatives of EIC responded to questions from the Board. In addition to the foregoing information, the Trustees also considered all other factors they believed to be relevant to considering the continuation of the EIC Agreement, including the specific matters discussed below. In their deliberations, the Trustees did not identify any particular information that was controlling, and different Trustees may have attributed different weights to the various factors. After deliberating, the Trustees determined that the overall arrangement between the EIC Fund and EIC, as provided by the terms of the EIC Agreement, including the advisory fee under the EIC Agreement, was fair and reasonable in light of the services provided, expenses incurred and such other matters as the Trustees considered relevant.
Based on the EIC 15(c) Response, the Trustees concluded that (i) the nature, extent and quality of the services provided by EIC are appropriate and consistent with the terms of the EIC Agreement, (ii) that the quality of those services has been, and continues to be, consistent with industry norms, (iii) the EIC Fund is likely to benefit from the continued provision of those services, (iv) EIC has sufficient personnel, with the appropriate skills and experience, to serve the EIC Fund effectively and has demonstrated its continuing
EIC VALUE FUND
Other Information (Concluded)
(Unaudited)
ability to attract and retain qualified personnel, and (v) the satisfactory nature, extent, and quality of services currently provided to the EIC Fund is likely to continue under the EIC Agreement.
The Trustees considered the investment performance for the EIC Fund and EIC. The Trustees reviewed the historical performance charts for the year-to-date, one-year, three-year, five-year and ten-year periods ended September 30, 2023, as applicable, for the EIC Fund, the Russell 3000 Value Total Return Index, the S&P 500 Total Return Index and the Lipper Multi-Cap Value Funds Classification. The Trustees noted that the EIC Fund’s Institutional Class shares outperformed the Russell 3000 Value Total Return Index for the one-year, three-year, five-year and ten-year periods ended September 30, 2023, and underperformed for the year-to-date period ended September 30, 2023. The Trustees further noted that the EIC Fund’s Institutional Class shares outperformed the S&P 500 Total Return Index for the three-year period ended September 30, 2023, and underperformed for the year-to-date, one-year, five-year and ten-year periods ended September 30, 2023. They further noted that the EIC Fund’s Institutional Class shares outperformed the Lipper Multi-Cap Value Funds Classification for the three-year, five-year and ten-year periods ended September 30, 2023, and underperformed for the year-to-date and one-year periods ended September 30, 2023.
The Trustees also considered information regarding EIC’s advisory fee and an analysis of these fees in relation to the delivery of services to the EIC Fund and any other ancillary benefit resulting from EIC’s relationship with the EIC Fund. The Trustees considered the fees that EIC charges to its separately managed accounts, and evaluated the explanations provided by EIC as to differences in fees charged to the EIC Fund and separately managed accounts. The Trustees also reviewed a peer comparison of advisory fees and total expenses for the EIC Fund versus other funds in the EIC Fund’s Lipper category (the “Peer Group”). The Trustees noted that, for the EIC Fund’s Institutional Class shares, the contractual advisory fee and net total expense ratio for the EIC Fund were higher than the median of the contractual advisory fee and net total expense ratio of the Peer Group. The Trustees concluded that the advisory fees and services provided by EIC are consistent with those of other advisers which manage mutual funds with investment objectives, strategies and policies similar to those of the EIC Fund based on the information provided at the Meeting.
The Trustees considered the costs of the services provided by EIC, the compensation and benefits received by EIC in providing services to the EIC Fund, the profitability and certain additional information related to the financial condition of EIC. In addition, the Trustees considered any direct or indirect revenues received by affiliates of EIC. The Trustees considered the extent to which economies of scale would be realized relative to fee levels as the EIC Fund grows, and whether the Advisory fee levels reflect these economies of scale for the benefit of shareholders.
The Trustees considered and determined that economies of scale for the benefit of Fund shareholders should be achieved as assets of the EIC Fund increase as a result of breakpoint reductions in the advisory fee rate at specific asset levels which are reflected in the fee schedule of the EIC Agreement. In addition, the Trustees also considered the Adviser's efforts to grow the EIC Fund's assets as economies of scale may be achieved due to the ability of the EIC Fund to spread its fixed costs across a larger asset base.
At the Meeting, after consideration of all the factors and taking into consideration the information presented, the Board, including the Independent Trustees, unanimously approved the continuation of the EIC Agreement for an additional one-year period. In arriving at their decision, the Trustees did not identify any single matter as controlling, but made their determination in light of all the circumstances.
EIC VALUE FUND
Privacy Notice
(Unaudited)
The privacy of your personal financial information is extremely important to us. When you open an account with us, we collect a significant amount of information from you in order to properly invest and administer your account. We take very seriously the obligation to keep that information private and confidential, and we want you to know how we protect that important information.
We collect nonpublic personal information about you from applications or other forms you complete and from your transactions with us or our affiliates. We do not disclose information about you, or our former clients, to our affiliates or to service providers or other third parties, except as permitted by law. We share only the information required to properly administer your accounts, which enables us to send transaction confirmations, monthly or quarterly statements, financials and tax forms. Even within the Fund and its affiliated entities, a limited number of people who actually service accounts will have access to your personal financial information. Further, we do not share information about our current or former clients with any outside marketing groups or sales entities.
To ensure the highest degree of security and confidentiality, the Fund and its affiliates maintain various physical, electronic and procedural safeguards to protect your personal information. We also apply special measures for authentication of information you request or submit to us on our web site.
If you have questions or comments about our privacy practices, please call us at (855) 430-6487.
EIC VALUE FUND
Fund Management
(Unaudited)
FundVantage Trust (the “Trust”) is governed by a Board of Trustees (the “Trustees”). The primary responsibility of the Trustees is to represent the interest of the Trust's shareholders and to provide oversight management of the Trust.
The following tables present certain information regarding the Board of Trustees and officers of the Trust. None of the Trustees are an “interested person” of the Trust, the Adviser, another investment adviser of a series of the Trust, or Foreside Funds Distributors LLC, the principal underwriter of the Trust (the “Underwriter”), within the meaning of the 1940 Act and each Trustee is referred to as an “Independent Trustee” and is listed under such heading below. Employees of certain service providers to the Trust serve as officers of the Trust; such persons are not compensated by the Fund. The address of each Trustee and officer as it relates to the Trust's business is 103 Bellevue Parkway, 2nd Floor, Wilmington, DE 19809.
The Statement of Additional Information for the Fund contains additional information about the Trustees and is available, without charge, upon request by calling .
Name
and Date of Birth | Position(s)
Held
with Trust | Term of Office
and Length of
Time Served | Principal Occupation(s)
During Past Five Years | Number of
Funds in
Trust
Complex
Overseen
by
Trustee | Other
Directorships
Held by
Trustee |
| INDEPENDENT TRUSTEES |
ROBERT J. CHRISTIAN
Date of Birth: 2/49 | Trustee | Shall serve until
death, resignation
or removal.
Trustee since
2007. Chairman
from 2007 until
September 30,
2019. | Retired since February 2006; Executive Vice
President of Wilmington Trust Company from
February 1996 to February 2006; President of
Rodney Square Management Corporation
(“RSMC”) (investment advisory firm) from 1996
to 2005; Vice President of RSMC from 2005 to 2006. | 29 | Optimum Fund
Trust
(registered
investment
company with
6 portfolios);
Third Avenue
Trust
(registered
investment
company with
4 portfolios);
Third Avenue
Variable Series
Trust
(registered
investment
company with
1 portfolio);
Polen Credit
Opportunities
Fund (registered
investment
company). |
EIC VALUE FUND
Fund Management (Continued)
(Unaudited)
Name
and Date of Birth | Position(s)
Held
with Trust | Term of Office
and Length of
Time Served | Principal Occupation(s)
During Past Five Years | Number of
Funds in
Trust
Complex
Overseen
by
Trustee | Other
Directorships
Held by
Trustee |
IQBAL MANSUR
Date of Birth: 6/55 | Trustee | Shall serve until
death, resignation
or removal.
Trustee since
2007. | Retired since September 2020; Professor of
Finance, Widener University from 1998 to August 2020; Member of the Investment Committee of ChristianaCare Health System from January 2022 to present. | 29 | Third Avenue
Trust
(registered
investment
company with
4 portfolios);
Third Avenue
Variable Series
Trust
(registered
investment
company with
1 portfolio);
Polen Credit
Opportunities
Fund (registered
investment
company). |
NICHOLAS M.
MARSINI, JR.
Date of Birth: 8/55 | Trustee and
Chairman of
the Board | Shall serve until
death, resignation
or removal.
Trustee since
2016. Chairman
since October 1,
2019. | Retired since March 2016. President of PNC Bank Delaware from June 2011 to March 2016;
Executive Vice President of Finance of BNY Mellon from July 2010 to January 2011; Executive Vice President and Chief Financial Officer of PNC Global Investment Servicing from September 1997 to July 2010. | 29 | Brinker Capital
Destinations
Trust
(registered
investment
company with
10 portfolios);
Third Avenue
Trust
(registered
investment
company with
4 portfolios);
Third Avenue
Variable Series
Trust
(registered
investment
company with
1 portfolio);
Polen Credit
Opportunities
Fund (registered
investment
company). |
EIC VALUE FUND
Fund Management (Continued)
(Unaudited)
Name
and Date of Birth | Position(s)
Held
with Trust | Term of Office
and Length of
Time Served | Principal Occupation(s)
During Past Five Years | Number of
Funds in
Trust
Complex
Overseen
by
Trustee | Other
Directorships
Held by
Trustee |
NANCY B. WOLCOTT
Date of Birth: 11/54 | Trustee | Shall serve until
death, resignation
or removal.
Trustee since
2011. | Retired since May 2014; EVP, Head of GFI Client Service Delivery, BNY Mellon from January 2012 to May 2014; EVP, Head of US Funds Services, BNY Mellon from July 2010 to January 2012; President of PNC Global Investment Servicing from 2008 to July 2010; Chief Operating Officer of PNC Global Investment Servicing from 2007 to 2008; Executive Vice President of PFPC Worldwide Inc. from 2006 to 2007. | 29 | Lincoln
Variable
Trust
Products Trust
(registered
investment
company with
97 portfolios);
Third Avenue
Trust
(registered
investment
company with
4 portfolios);
Third Avenue
Variable Series
Trust
(registered
investment
company with
1 portfolio);
Polen Credit
Opportunities
Fund (registered
investment
company). |
STEPHEN M. WYNNE
Date of Birth: 1/55 | Trustee | Shall serve until
death, resignation
or removal.
Trustee since
2009. | Retired since December 2010; Chief Executive
Officer of US Funds Services, BNY Mellon Asset Servicing from July 2010 to December 2010; Chief Executive Officer of PNC Global Investment Servicing from March 2008 to July 2010; President, PNC Global Investment Servicing from 2003 to 2008. | 29 | Copeland Trust
(registered
investment
company with
3 portfolios);
Third Avenue
Trust
(registered
investment
company with
4 portfolios);
Third Avenue
Variable Series
Trust
(registered
investment
company with
1 portfolio);
Polen Credit
Opportunities
Fund (registered
investment
company). |
EIC VALUE FUND
Fund Management (Concluded)
(Unaudited)
Name
and Date of Birth | Position(s) Held
with Trust | Term of Office
and Length of
Time Served | Principal Occupation(s)
During Past Five Years |
| EXECUTIVE OFFICERS |
JOEL L. WEISS
Date of Birth: 1/63 | President and Chief
Executive Officer | Shall serve until death,
resignation or removal. Officer
since 2007. | President of JW Fund Management LLC since June 2016; Vice President and Managing Director of BNY Mellon Investment Servicing (US) Inc. and predecessor firms from 1993 to June 2016. |
CHRISTINE S. CATANZARO
Date of Birth: 8/84 | Treasurer and Chief Financial Officer | Shall serve until death,
resignation or removal. Officer
since 2022. | Financial Reporting Consultant from October 2020 to September 2022; Senior Manager, Ernst & Young LLP from March 2013 to October 2020. |
T. RICHARD KEYES
Date of Birth: 1/57 | Vice President
| Shall serve until death,
resignation or removal. Officer
since 2016. | President of TRK Fund Consulting LLC since July 2016; Head of Tax — U.S. Fund Services of BNY Mellon Investment Servicing (US) Inc. and predecessor firms from February 2006 to July 2016. |
GABRIELLA
MERCINCAVAGE
Date of Birth: 6/68 | Assistant Treasurer | Shall serve until death,
resignation or removal. Officer
since 2019. | Fund Administration Consultant since January 2019; Fund
Accounting and Tax Compliance Accountant to financial
services companies from November 2003 to July 2018. |
VINCENZO A. SCARDUZIO
Date of Birth: 4/72 | Secretary | Shall serve until death,
resignation or removal. Officer
since 2012. | Director and Senior Vice President Regulatory Administration of The Bank of New York Mellon and predecessor firms since 2001. |
JOHN CANNING
Date of Birth: 11/70 | Chief Compliance
Officer and Anti-Money
Laundering Officer | Shall serve until death,
resignation or removal. Officer
since 2022. | Director of Chenery Compliance Group, LLC from March 2021 to present; Senior Consultant of Foreside Financial Group from August 2020 to March 2021; Chief Compliance Officer & Chief Operating Officer of Schneider Capital Management LP from May 2019 to July 2020; Chief Operating Officer and Chief Compliance Officer of Context Capital Partners, LP from March 2016 to March 2018 and February 2019, respectively. |
Investment Adviser
Equity Investment Corporation
1776 Peachtree Street, NW
Suite 600S
Atlanta, GA 30309
Administrator
The Bank of New York Mellon
103 Bellevue Parkway
Wilmington, DE 19809
Transfer Agent
BNY Mellon Investment Servicing (US) Inc.
500 Ross Street, 154-0520
Pittsburgh, PA 15262
Principal Underwriter
Foreside Funds Distributors LLC
Three Canal Plaza, Suite 100
Portland, ME 04101
Custodian
The Bank of New York Mellon
240 Greenwich Street
New York, NY 10286
Independent Registered Public Accounting Firm
Ernst & Young LLP
One Commerce Square
2005 Market Street, Suite 700
Philadelphia, PA 19103-7096
Legal Counsel
Troutman Pepper Hamilton Sanders LLP
3000 Two Logan Square
18th and Arch Streets
Philadelphia, PA 19103
| Pacific Capital Tax-Free Securities Fund |
| Pacific Capital Tax-Free Short Intermediate Securities Fund |
of
FundVantage Trust
ANNUAL REPORT
April 30, 2024
IMPORTANT NOTICE – UPCOMING CHANGES TO PACIFIC CAPITAL FUNDS ANNUAL & SEMI-ANNUAL REPORTS
The Securities and Exchange Commission (the “SEC”) has adopted rule and form amendments that will result in changes to the design and delivery of annual and semi-annual shareholder reports (“Reports”). Beginning in July 2024, Reports will be streamlined to highlight key information (“Redesigned Reports”). Certain information currently included in the Reports, including financial statements, will no longer appear in the Redesigned Reports but will be available online, delivered free of charge to shareholders upon request, and filed with the SEC.
If you previously elected to receive the Fund's Reports electronically, you will continue to receive the Redesigned Reports electronically. Otherwise, you will receive paper copies of the Fund's Redesigned Reports via USPS mail for all Reports transmitted after July 2024. If you would like to receive the Fund's Redesigned Reports (and/or other communications) electronically instead of by mail, please contact your financial advisor or, if you are a direct investor, please call (888) 678-6034.
This report is submitted for the general information of shareholders and is not authorized for distribution to prospective investors unless preceded or accompanied by a current prospectus.
PACIFIC CAPITAL FUNDS
Pacific Capital Tax-Free Securities Fund
Pacific Capital Tax-Free Short Intermediate Securities Fund
Annual Investment Adviser's Report
April 30, 2024 (Unaudited)
Dear Shareholder:
U.S. Economy
The mantra of “higher for longer” rang true over the three months ended April 30, 2024. Macro-economic factors seem to play out to question the market’s assumption of lower yields and Federal Reserve ("Fed") guidance. With confidence, the markets celebrated the end of calendar 2023 with an aggressive fixed income rally in the face of declining inflation and statements by the Fed affirming a forecast of three cuts in short term interest rates in 2024. The market quickly amplified the forecast to drive the market higher to effectively imbed six implied cuts in short term interest rates by the end of 2024. Most of the exuberance faded by the end of the first quarter of 2024 as employment showed a strong economy through solid job creation and an upward tick in inflation. By the end of the Funds’ fiscal quarter ended March 31, 2024, the Fed stood firm at the current level of Federal Funds, reportedly for "as long as it takes" to bring to bear the recent unfavorable trends in inflation. The market backed off by pushing yields higher, realizing that rates down the road will be higher for longer than expected given the current environment.
Municipal Market
In the most recent fiscal quarter ended March 31, 2024, the municipal market returns declined in sympathy with their taxable counterparts as yields increased. The Bloomberg Municipal Index and the Bloomberg Hawaii Index fell -1.11% and -0.78%, respectively. Municipals outperformed the higher increases in US Treasury yields during the quarter. The ratio of Bloomberg BVAL “AAA” tax-exempt yields to US Treasuries fell from 62.5% to 59.4% by the end of the quarter even with higher Municipal market issuance. The inverse of this ratio is an indicator of the tax savings breakeven against taxable bond equivalents.
For the fiscal quarter ended March 31, 2024, higher interest rates combined with a late quarter increase in supply of newly issued bonds, cheapened bond prices and decreased relative returns. According to Bloomberg, the national municipal 10yr maturity “AAA” yield increased from 2.4% to 2.8% during the quarter. During this same period, the Hawaiian 10yr maturity rose from 2.6% to 3.1%. Issuance remained muted, historically even with an increase of 21% in new national tax-exempt bonds from the prior year 2023. We feel that a yield higher than national municipals is a relative value opportunity for Hawaii bonds. This represents a chance for Hawaii residents to obtain the benefits of a higher Hawaii tax advantage compared to mainland yields.
An interesting observation is the unusual shape of the tax-exempt yield curve at the end of the March 31, 2024 quarter. Unlike US Treasury yields in similar maturities, municipals exhibited a greater value in longer maturities. From the previously mentioned ratio in 10yrs of 59.4% at the end of the quarter, the ratio increases to 88.5% in 30yrs. In fact, the yield of a Hawaii bond in 30yrs yields are almost 74 basis points ("bps") higher between the 1 and 30 year maturity. This gap is a negative 45bps in the US Treasury market. It underscores the relative value between the two markets in the longer end of the tax-exempt maturity curve. It is exactly the spot we have focused on with the new purchases of the Pacific Capital Tax-Free Securities Fund over the last several months. We continue to seek tax-exempt income and sustainability of dividends over many years for the long-term success of the Fund.
Hawaii Economy
Although the economic numbers are mixed for calendar year 2023, the Hawaiian economy appears to have solidly pushed forward based on State of Hawaii (DBEDT) 2023 statistics. During the year, tourism arrivals fell -1.7% and for the fourth quarter 2023 the daily visitor census dropped 4.7% (State of Hawaii’s most recent release of information.) However in contrast, in 2023 total salary jobs increased 2.2% with the State unemployment rate dropping from 3.5 to 3.0%.
In addition, for the fourth calendar quarter of 2023, the State’s general fund tax revenue increased $191 million or a positive 9.5% compared to fourth calendar quarter of 2022. During the same time period, State General Excise tax collections increased 2.3% while at the same time individual income taxes increased 23.3%. This placed the State of Hawaii position in a net favorable situation.
PACIFIC CAPITAL FUNDS
Pacific Capital Tax-Free Securities Fund
Pacific Capital Tax-Free Short Intermediate Securities Fund
Annual Investment Adviser’s Report (Concluded)
April 30, 2024 (Unaudited)
Although statistical State estimates are fluid, the reportedly proposed investment in infrastructure across all the Hawaiian islands for the next five years appears significant. From the redevelopment of essential water, wastewater and port facilities on all the islands to the rebuilding of Maui, this will be a welcome relief for many local residents and can potentially provide jobs.
Fund Performance
The Pacific Capital Tax-Free Short Intermediate Securities Fund (PTFSX) had a total return of 0.65% for the year ended April 30, 2024, and outperformed the Bloomberg Hawaii 3-Year Municipal Bond Index return of 0.15% for the same period. The Fund’s outperformance when compared to the prospectus benchmark is due a greater exposure to longer maturity bonds when the benchmark’s shorter intermediate bonds underperformed. The Pacific Capital Tax-Free Securities Fund (PTXFX) had a total return of 1.05% for the year ended April 30, 2023 and outperformed the Bloomberg Hawaii Municipal Bond Index return of 0.70% for the same period. The Fund’s outperformance when compared to the prospectus benchmark is due a greater exposure to longer maturity bonds when the benchmark’s shorter intermediate bonds underperformed.
Outlook and Strategy
Looking forward into 2024, we believe the Fed will hold interest rates at the current level for now. We expect the economy will slow in coming quarters and inflationary pressures will continue to ease despite the current stickiness. To be sure, it is unknown whether the Fed’s goal of lower inflation can be achieved without precipitating a recession. For now, we feel the outlook points towards a generally constructive environment for the performance of longer investment grade municipal bonds. We have opportunistically extended the Funds’ average maturity to lock in elevated interest rates. We believe this bodes well for the forward return potential of the Funds and continued generation of tax exempt income distributions.
These comments reflect the investment adviser’s views in general regarding the market and the economy and are compiled from Asset Management Group of Bank of Hawaii (“AMG”) research. These comments reflect opinions as of the date written and are subject to change.
This letter is intended to assist shareholders in understanding how the Funds performed for the period ending April 30, 2024 and reflects the views of the investment adviser as of the date written. Of course, these views may change and do not guarantee the future performance of the Funds or the markets.
Portfolio composition is subject to change. The current and future portfolio holdings of the Funds are subject to investment risk.
All mutual fund investing involves risk, including possible loss of principal. The Funds are non-diversified, which means that a portion of the Funds’ assets may be invested in one or fewer companies or sectors. The Funds could fluctuate in value more than a diversified fund. It is impossible to invest directly into an index.
PACIFIC CAPITAL FUNDS
Pacific Capital Tax-Free Securities Fund
Annual Report
Performance Data
April 30, 2024
(Unaudited)
Investment Style
High-quality, intermediate-term, tax-exempt
Investment Objective
The Pacific Capital Tax-Free Securities Fund (the “Fund”) seeks high current income that is exempt from federal and Hawaii income tax by normally investing at least 80% of its net assets in investment grade municipal obligations. The Fund normally invests greater than 50% of its assets in Hawaii municipal obligations — debt securities issued by or on behalf of the State of Hawaii and its political subdivisions, agencies and instrumentalities that pay interest which is exempt from Hawaii income tax as well as federal income tax.
Investment Considerations
Income received from the Fund may be subject to certain state and local taxes and, depending on one’s tax status, to the federal alternative minimum tax. Bonds offer a relatively stable level of income, although bond prices will fluctuate, providing the potential for principal gain or loss. Generally, bond prices and values fall when interest rates rise, and vice versa. The longer the average maturity of the Fund’s portfolio, the greater the fluctuation in value. Since the Fund invests significantly in securities of issuers in Hawaii, it will also be affected by a variety of Hawaii’s economic and political factors. The values of any of the Fund’s investments may also decline in response to events affecting the issuer or its credit rating.
Investment Process
• Top-down macroeconomic analysis of interest rate trends
• Bottom-up credit research to identify high quality bonds
Investment Management
Advised by Asset Management Group of Bank of Hawaii (“AMG”)
• As of April 30, 2024, AMG managed $742.8 million in mutual fund assets. In addition, AMG personnel also managed approximately $465.3 million in assets on behalf of Bank of Hawaii clients.
PACIFIC CAPITAL FUNDS
Pacific Capital Tax-Free Securities Fund
Annual Report
Performance Data (Concluded)
April 30, 2024
(Unaudited)
Comparison of Change in Value of $10,000 Investment in Pacific Capital Tax-Free Securities Fund's Class Y Shares vs. Bloomberg Hawaii Municipal Bond Index
| Average Annual Total Returns for the Years Ended April 30, 2024 |
| |
| | 1 Year | | 3 Years | | 5 Years | | 10 Years |
| Class Y | 1.05% | | -1.09% | | 1.05% | | 1.94% |
| Bloomberg Hawaii Municipal Bond Index | 0.70% | | -1.21% | | 1.06% | | 2.15% |
Past performance does not guarantee future results. The performance data quoted represents past performance and current returns may be lower or higher. The investment return and principal value will fluctuate so that an investor’s shares, when redeemed, may be worth more or less than the original cost; and current performance may be lower or higher than the performance data quoted. The graph and table do not reflect the deduction of taxes that a shareholder would pay on Fund distributions or the redemption of Fund shares. To obtain performance information current to the most recent month end, please call (888) 678-6034.
As stated in the current prospectus dated September 1, 2023, as supplemented, the Fund’s “Total Annual Fund Operating Expenses” are 0.34%, and the Fund’s “Total Annual Fund Operating Expenses After Fee Waiver” are 0.14%, of the Fund’s average daily net assets. These rates may fluctuate and may differ from the actual expenses incurred by the Fund for the period covered in this report. The Adviser has contractually agreed to waive its advisory fee (the “Waiver”) until August 31, 2025. The Waiver may not be terminated at any time prior to that date without the consent of the Board of Trustees of FundVantage Trust (the “Trust”).
Total returns reflect the waiver of advisory fees. Had these waivers not been in effect, performance quoted would have been lower.
The performance of the Fund is measured against the Bloomberg Hawaii Municipal Bond Index, a rules-based, market-value weighted index engineered for the long-term tax-exempt Hawaii bond market. The index has four main sectors: general obligation bonds, revenue bonds, insured bonds and prerefunded bonds. The index is unmanaged and does not reflect the deduction of fees associated with a mutual fund, such as investment management and fund accounting fees. The Fund’s performance reflects the deduction of fees for these services. Investors cannot invest directly in an index.
The Fund is distributed by Foreside Funds Distributors LLC.
All mutual fund investing involves risk, including possible loss of principal. The Fund is non-diversified, which means that a portion of the Fund’s assets may be invested in one or few companies or sectors. The Fund could fluctuate in value more than a diversified fund.
PACIFIC CAPITAL FUNDS
Pacific Capital Tax-Free Short Intermediate Securities Fund
Annual Report
Performance Data
April 30, 2024
(Unaudited)
Investment Style
High-quality, short-intermediate term, tax-exempt
Investment Objective
The Pacific Capital Tax-Free Short Intermediate Securities Fund (the “Fund”) seeks high current income that is exempt from federal and Hawaii income tax by normally investing at least 80% of its net assets in investment grade municipal obligations. The Fund normally invests greater than 50% of its assets in Hawaii municipal obligations — debt securities issued by or on behalf of the State of Hawaii and its political subdivisions, agencies and instrumentalities that pay interest which is exempt from Hawaii income tax as well as federal income tax. The Fund seeks to provide greater price stability than a long-term bond fund.
Investment Considerations
Income received from the Fund may be subject to certain state and local taxes and, depending on one’s tax status, to the federal alternative minimum tax. Bonds offer a relatively stable level of income, although bond prices will fluctuate, providing the potential for principal gain or loss. Generally, bond prices and values fall when interest rates rise, and vice versa. Intermediate term, higher-quality bonds generally offer less risk than longer-term bonds and a lower rate of return. Since the Fund invests significantly in securities of issuers in Hawaii, it will also be affected by a variety of Hawaii’s economic and political factors. The values of any of the Fund’s investments may also decline in response to events affecting the issuer or its credit rating.
Investment Process
• Top-down macroeconomic analysis of interest rate trends
• Bottom-up credit research to identify high quality bonds
Investment Management
Advised by Asset Management Group of Bank of Hawaii (“AMG”)
• As of April 30, 2024, AMG managed $742.8 million in mutual fund assets. In addition, AMG personnel also managed approximately $465.3 million in assets on behalf of Bank of Hawaii clients.
PACIFIC CAPITAL FUNDS
Pacific Capital Tax-Free Short Intermediate Securities Fund
Annual Report
Performance Data (Concluded)
April 30, 2024
(Unaudited)
Comparison of Change in Value of $10,000 Investment in Pacific Capital Tax-Free Short Intermediate Securities Fund's Class Y Shares vs. Bloomberg Hawaii 3-Year Municipal Bond Index
| Average Annual Total Returns for the Years Ended April 30, 2024 |
| |
| | 1 Year | | 3 Years | | 5 Years | | 10 Years |
| Class Y | 0.65% | | -0.30% | | 0.82% | | 1.00% |
| Bloomberg Hawaii 3-Year Municipal Bond Index | 0.15% | | -0.91% | | 0.49% | | 0.85% |
Past performance does not guarantee future results. The performance data quoted represents past performance and current returns may be lower or higher. The investment return and principal value will fluctuate so that an investor’s shares, when redeemed, may be worth more or less than the original cost; and current performance may be lower or higher than the performance data quoted. The graph and table do not reflect the deduction of taxes that a shareholder would pay on Fund distributions or the redemption of Fund shares. To obtain performance information current to the most recent month end, please call (888) 678-6034.
As stated in the current prospectus dated September 1, 2023, as supplemented, the Fund’s “Total Annual Fund Operating Expenses” are 0.57%, and the Fund’s “Total Annual Fund Operating Expenses After Fee Waiver” are 0.37%, of the Fund’s average daily net assets. These rates may fluctuate and may differ from the actual expenses incurred by the Fund for the period covered in this report. The Adviser has contractually agreed to waive its advisory fee (the “Waiver”) until August 31, 2025. The Waiver may not be terminated at any time prior to that date without the consent of the Board of Trustees of FundVantage Trust (the “Trust”).
Total returns reflect the waiver of advisory fees. Had these waivers not been in effect, performance quoted would have been lower.
The performance of the Fund is measured against the Bloomberg Hawaii 3-Year Municipal Bond Index, which is the 2-4 year component of the Bloomberg Hawaii Municipal Bond Index and is a rules-based, market-value weighted index engineered for the Hawaii tax-exempt bond market. The index has four main sectors: general obligation bonds, revenue bonds, insured bonds and prerefunded bonds. The index is unmanaged and does not reflect the deduction of fees associated with a mutual fund, such as investment management and fund accounting fees. The Fund’s performance reflects the deduction of fees for these services. Investors cannot invest directly in an index.
The Fund is distributed by Foreside Funds Distributors LLC.
All mutual fund investing involves risk, including possible loss of principal. The Fund is non-diversified, which means that a portion of the Fund’s assets may be invested in one or few companies or sectors. The Fund could fluctuate in value more than a diversified fund.
PACIFIC CAPITAL FUNDS
Fund Expense Disclosure
April 30, 2024
(Unaudited)
As a shareholder of the Funds, you incur two types of costs: (1) transaction costs, and (2) ongoing costs, including management fees, distribution and/or service (Rule 12b-1) fees (if any) and other Fund expenses. These examples are intended to help you understand your ongoing costs (in dollars) of investing in the Fund(s) and to compare these costs with the ongoing costs of investing in other mutual funds.
These examples are based on an investment of $1,000 invested at the beginning of the six-month period from November 1, 2023 through April 30, 2024 and held for the entire period.
Actual Expenses
The first line of each accompanying table provides information about actual account values and actual expenses. You may use the information in this line, together with the amount you invested, to estimate the expenses that you paid over the period. Simply divide your account value by $1,000 (for example, an $8,600 account value divided by $1,000 = 8.6), then multiply the result by the number in the first line of the table under the heading entitled "Expenses Paid During Period" to estimate the expenses you paid on your account during this period.
Hypothetical Examples for Comparison Purposes
The second line of each accompanying table provides information about hypothetical account values and hypothetical expenses based on the Fund's actual expense ratio and an assumed rate of return of 5% per year before expenses, which is not your Fund's actual return. The hypothetical account values and expenses may not be used to estimate the actual ending account balance or expenses you paid for the period. You may use this information to compare the ongoing costs of investing in the Fund(s) and other funds. To do so, compare these 5% hypothetical examples with the 5% hypothetical examples that appear in the shareholder reports of other funds.
Please note that the expenses shown in the accompanying table are meant to highlight your ongoing costs only and do not reflect any transactional costs, such as sales charges (loads) on purchase payments (if any) or redemption fees. Therefore, the second line of each accompanying table is useful in comparing ongoing costs only and will not help you determine the relative total costs of owning different funds. In addition, if these transactional costs were included, your costs would have been higher.
| | Beginning Account Value
November 1, 2023 | | Ending Account Value
April 30, 2024 | | Annualized
Expense Ratio | | Expenses Paid
During Period* |
| Pacific Capital Tax-Free Securities Fund |
| Class Y | | | | | | | |
| Actual | $1,000.00 | | $1,057.60 | | 0.13% | | $0.67 |
| Hypothetical (5% return before expenses) | 1,000.00 | | 1,024.22 | | 0.13% | | 0.65 |
| Pacific Capital Tax-Free Short Intermediate Securities Fund |
| Class Y | | | | | | | |
| Actual | $1,000.00 | | $1,042.40 | | 0.43% | | $2.18 |
| Hypothetical (5% return before expenses) | 1,000.00 | | 1,022.73 | | 0.43% | | 2.16 |
| * | Expenses are equal to an annualized expense ratio for the six-month period ended April 30, 2024 of 0.13% for the Pacific Capital Tax-Free Securities Fund and 0.43% for the Pacific Capital Tax-Free Short Intermediate Securities Fund, multiplied by average account value over the period, multiplied by the number of days in the most recent period (182), then divided by 366 to reflect the period. The Funds’ ending account values on the first line in each table are based on the actual six-month total returns of 5.76% for the Pacific Capital Tax-Free Securities Fund and 4.24% for the Pacific Capital Tax-Free Short Intermediate Securities Fund. |
PACIFIC CAPITAL FUNDS
Pacific Capital Tax-Free Securities Fund
Portfolio Holdings Summary Table
April 30, 2024
(Unaudited)
The following table presents a summary by credit quality of the portfolio holdings of the Fund:
| Credit Quality: | % of Total Investments |
| Pre-refunded/Escrowed to Maturity | 1.68% |
| Aaa | 7.47 |
| Aa | 78.68 |
| A | 6.16 |
| Baa | 0.32 |
| Ba | 1.89 |
| Cash | 3.80 |
| Total | 100.00% |
Portfolio holdings are subject to change at any time.
Credit quality ratings are primarily sourced from Moody’s but in the event that Moody’s has not assigned a rating, the Fund will use S&P or Fitch. If these ratings are in conflict, S&P will be used before Fitch. If none of the major rating agencies have assigned a rating, the Fund will assign a rating of NR (non-rated security). The ratings represent their (Moody’s, S&P, and Fitch) opinions as to the quality of the underlying securities in the Fund, and not the Fund itself. The ratings range from AAA (extremely strong capacity to meet financial commitment) to D (in default). Ratings are relative and subjective and are not absolute standards of quality. A pre-refunded bond is secured by an escrow fund of U.S. government obligations (i.e. Treasury securities) and assumes the superior credit rating of the government obligation. The ratings do not predict performance and are subject to change.
The accompanying notes are an integral part of the financial statements.
PACIFIC CAPITAL FUNDS
Pacific Capital Tax-Free Securities Fund
Portfolio of Investments
April 30, 2024
| | Principal
Amount | | Value |
| MUNICIPAL BONDS — 95.3% |
| Arizona — 2.4% |
State of Arizona Distribution Revenue, Civic Plaza, Convertible CAB, OID, Series B,
5.50%, 07/01/31, (NATL) | $ 5,000,000 | | $ 5,773,820 |
| California — 1.9% |
Norwalk-La Mirada Unified School District GO, CAB, OID, Series B
0.00%, 08/01/27, (AGM-CR FGIC)(a) | 5,000,000 | | 4,485,489 |
| Hawaii — 88.6% |
Hawaii County GO, Callable 09/01/33 at 100,
5.00%, 09/01/41 | 2,350,000 | | 2,589,408 |
Hawaii County GO, Series A, Refunding, Callable 03/01/27 at 100,
5.00%, 09/01/31 | 2,545,000 | | 2,661,198 |
Hawaii County GO, Series A, Refunding, Callable 03/01/27 at 100,
5.00%, 09/01/34 | 4,775,000 | | 4,974,625 |
Hawaii County GO, Series A, Refunding, Callable 09/01/30 at 100,
4.00%, 09/01/40 | 1,000,000 | | 1,001,116 |
Hawaii Housing Finance & Development Corp. Revenue, Multi-Family Housing, Iwilei Apartments, Series A, Callable 05/21/24 at 100,
3.75%, 01/01/31 | 3,120,000 | | 3,120,739 |
Hawaii State Airports System Revenue, AMT, OID, COP, Callable 05/21/24 at 100,
5.00%, 08/01/28 | 400,000 | | 400,112 |
Hawaii State Airports System Revenue, Series A, AMT, Callable 07/01/25 at 100,
5.00%, 07/01/41 | 4,000,000 | | 4,019,559 |
Hawaii State Airports System Revenue, Series A, AMT, Callable 07/01/28 at 100,
5.00%, 07/01/33 | 500,000 | | 523,664 |
| | Principal
Amount | | Value |
| MUNICIPAL BONDS — (Continued) |
| Hawaii — (Continued) |
Hawaii State Airports System Revenue, Series A, AMT, Callable 07/01/28 at 100,
5.00%, 07/01/48 | $1,500,000 | | $ 1,518,414 |
Hawaii State Airports System Revenue, Series A, AMT, Callable 07/01/30 at 100,
4.00%, 07/01/35 | 2,000,000 | | 2,007,743 |
Hawaii State Airports System Revenue, Series A, AMT, Callable 07/01/32 at 100,
5.00%, 07/01/51 | 2,000,000 | | 2,058,964 |
Hawaii State Airports System Revenue, Series B, OID, Callable 07/01/25 at 100,
4.00%, 07/01/45 | 50,000 | | 48,282 |
Hawaii State Airports System Revenue, Series C, Callable 07/01/30 at 100,
5.00%, 07/01/50 | 130,000 | | 136,878 |
Hawaii State Department of Budget & Finance Revenue, Hawaii Health Obligation Group, Series A, Refunding, Callable 07/01/33 at 100,
5.00%, 07/01/34 | 2,310,000 | | 2,609,656 |
Hawaii State Department of Budget & Finance Revenue, Hawaii Health Obligation Group, Series A, Refunding, Callable 07/01/33 at 100,
5.00%, 07/01/35 | 2,430,000 | | 2,735,600 |
Hawaii State Department of Budget & Finance Revenue, Hawaii Health Obligation Group, Series A, Refunding, Callable 07/01/33 at 100,
5.00%, 07/01/36 | 2,550,000 | | 2,849,027 |
Hawaii State Department of Budget & Finance Revenue, Hawaii Health Obligation Group, Series B, Refunding,
5.00%, 07/01/31 | 2,715,000 | | 3,000,705 |
The accompanying notes are an integral part of the financial statements.
PACIFIC CAPITAL FUNDS
Pacific Capital Tax-Free Securities Fund
Portfolio of Investments (Continued)
April 30, 2024
| | Principal
Amount | | Value |
| MUNICIPAL BONDS — (Continued) |
| Hawaii — (Continued) |
Hawaii State Department of Budget & Finance Revenue, Hawaiian Electric Company, AMT, MWC, Callable 10/01/24 at 100,
3.50%, 10/01/49 | $2,750,000 | | $ 1,712,959 |
Hawaii State Department of Budget & Finance Revenue, Hawaiian Electric Company, MWC, Refunding, Callable 07/01/29 at 100,
3.20%, 07/01/39 | 4,200,000 | | 2,702,872 |
Hawaii State Department of Budget & Finance Revenue, Mid-Pacific Project, Refunding,
4.00%, 01/01/30 | 225,000 | | 220,488 |
Hawaii State Department of Budget & Finance Revenue, Mid-Pacific Project, Refunding, Callable 01/01/30 at 100,
4.00%, 01/01/31 | 525,000 | | 512,482 |
Hawaii State Department of Budget & Finance Revenue, Queens Health System, Series A, Refunding, Callable 07/01/25 at 100,
5.00%, 07/01/35 | 10,000,000 | | 10,138,514 |
Hawaii State Department of Hawaiian Home Lands, Kapolei Office Facility, Series A, Refunding, COP, Callable 11/01/27 at 100,
5.00%, 11/01/28 | 1,170,000 | | 1,237,327 |
Hawaii State Department of Hawaiian Home Lands, Kapolei Office Facility, Series A, Refunding, COP, Callable 11/01/27 at 100,
5.00%, 11/01/30 | 800,000 | | 843,597 |
Hawaii State Department of Hawaiian Home Lands, Kapolei Office Facility, Series A, Refunding, COP, Callable 11/01/27 at 100,
5.00%, 11/01/31 | 815,000 | | 858,313 |
| | Principal
Amount | | Value |
| MUNICIPAL BONDS — (Continued) |
| Hawaii — (Continued) |
Hawaii State Department of Hawaiian Home Lands Revenue, Refunding, Callable 04/01/27 at 100,
5.00%, 04/01/28 | $1,040,000 | | $ 1,085,891 |
Hawaii State Department of Hawaiian Home Lands Revenue, Refunding, Callable 04/01/27 at 100,
5.00%, 04/01/32 | 335,000 | | 346,768 |
Hawaii State GO, Series EO, Callable 08/01/24 at 100,
5.00%, 08/01/32 | 1,285,000 | | 1,288,844 |
Hawaii State GO, Series EO, Prerefunded, Callable 08/01/24 at 100,
5.00%, 08/01/26 | 140,000 | | 140,362 |
Hawaii State GO, Series EO, Unrefunded portion, Callable 08/01/24 at 100,
5.00%, 08/01/26 | 2,660,000 | | 2,668,884 |
Hawaii State GO, Series EP, Refunding,
5.00%, 08/01/24 | 1,000,000 | | 1,003,156 |
Hawaii State GO, Series EY, Refunding, Callable 10/01/25 at 100,
5.00%, 10/01/27 | 1,040,000 | | 1,059,866 |
Hawaii State GO, Series FB,
5.00%, 04/01/25 | 5,000,000 | | 5,069,420 |
Hawaii State GO, Series FB, Callable 04/01/26 at 100,
4.00%, 04/01/29 | 2,000,000 | | 2,018,971 |
Hawaii State GO, Series FG, Callable 10/01/26 at 100,
5.00%, 10/01/30 | 7,000,000 | | 7,233,339 |
Hawaii State GO, Series FG, Callable 10/01/26 at 100,
4.00%, 10/01/35 | 1,000,000 | | 1,007,999 |
Hawaii State GO, Series FK, Callable 05/01/27 at 100,
5.00%, 05/01/33 | 2,500,000 | | 2,612,777 |
Hawaii State GO, Series FK, Callable 05/01/27 at 100,
4.00%, 05/01/37 | 2,000,000 | | 2,013,628 |
The accompanying notes are an integral part of the financial statements.
PACIFIC CAPITAL FUNDS
Pacific Capital Tax-Free Securities Fund
Portfolio of Investments (Continued)
April 30, 2024
| | Principal
Amount | | Value |
| MUNICIPAL BONDS — (Continued) |
| Hawaii — (Continued) |
Hawaii State GO, Series FT, Callable 01/01/28 at 100,
5.00%, 01/01/36 | $4,000,000 | | $ 4,249,541 |
Hawaii State GO, Series FT, Callable 01/01/28 at 100,
5.00%, 01/01/38 | 2,845,000 | | 2,996,462 |
Hawaii State GO, Series FW, Callable 01/01/29 at 100,
4.00%, 01/01/34 | 2,000,000 | | 2,064,703 |
Hawaii State Harbor System Revenue, Series A, AMT, Refunding, Callable 07/01/30 at 100,
4.00%, 07/01/33 | 1,500,000 | | 1,524,252 |
Hawaii State Harbor System Revenue, Series A, AMT, Refunding, Callable 07/01/30 at 100,
4.00%, 07/01/37 | 5,000,000 | | 4,979,676 |
Hawaii State Harbor System Revenue, Series C, Refunding, Callable 07/01/30 at 100,
4.00%, 07/01/39 | 3,065,000 | | 3,082,288 |
Hawaii State Highway Fund Revenue, Callable 01/01/31 at 100,
5.00%, 01/01/37 | 4,500,000 | | 4,968,151 |
Hawaii State Highway Fund Revenue, Callable 01/01/31 at 100,
5.00%, 01/01/40 | 1,295,000 | | 1,404,233 |
Hawaii State Highway Fund Revenue, Series A, Callable 01/01/29 at 100,
5.00%, 01/01/37 | 3,500,000 | | 3,761,836 |
Hawaii State Highway Fund Revenue, Series A, Callable 07/01/24 at 100,
5.00%, 01/01/31 | 800,000 | | 801,300 |
Honolulu City & County Board of Water Supply, Series A, Refunding, Callable 07/01/34 at 100,
5.25%, 07/01/49 | 3,760,000 | | 4,148,502 |
| | Principal
Amount | | Value |
| MUNICIPAL BONDS — (Continued) |
| Hawaii — (Continued) |
Honolulu City & County Board of Water Supply System Revenue, Callable 07/01/33 at 100,
5.00%, 07/01/48 | $4,645,000 | | $ 4,990,644 |
Honolulu City & County Board of Water Supply System Revenue, Series A, Callable 07/01/31 at 100,
5.00%, 07/01/50 | 3,515,000 | | 3,715,074 |
Honolulu City & County Board of Water Supply System Revenue, Series A, Callable 07/01/32 at 100,
5.00%, 07/01/48 | 4,290,000 | | 4,581,191 |
Honolulu City & County Board of Water Supply System Revenue, Series A, Prerefunded, Callable 07/01/24 at 100,
5.00%, 07/01/26 | 65,000 | | 65,111 |
Honolulu City & County Board of Water Supply System Revenue, Series A, Prerefunded, Callable 07/01/24 at 100,
5.00%, 07/01/27 | 850,000 | | 851,452 |
Honolulu City & County GO, Series A, Callable 05/31/24 at 100,
4.00%, 11/01/37 | 1,000,000 | | 1,000,016 |
Honolulu City & County GO, Series A, Callable 09/01/27 at 100,
5.00%, 09/01/41 | 1,390,000 | | 1,431,319 |
Honolulu City & County GO, Series A, Callable 09/01/28 at 100,
5.00%, 09/01/34 | 200,000 | | 215,221 |
Honolulu City & County GO, Series A, Callable 10/01/25 at 100,
5.00%, 10/01/31 | 2,175,000 | | 2,214,741 |
Honolulu City & County GO, Series A, Callable 10/01/25 at 100,
5.00%, 10/01/35 | 3,075,000 | | 3,124,811 |
The accompanying notes are an integral part of the financial statements.
PACIFIC CAPITAL FUNDS
Pacific Capital Tax-Free Securities Fund
Portfolio of Investments (Continued)
April 30, 2024
| | Principal
Amount | | Value |
| MUNICIPAL BONDS — (Continued) |
| Hawaii — (Continued) |
Honolulu City & County GO, Series A, Callable 10/01/25 at 100,
5.00%, 10/01/37 | $1,000,000 | | $ 1,012,894 |
Honolulu City & County GO, Series A, Callable 10/01/25 at 100,
5.00%, 10/01/38 | 1,040,000 | | 1,051,983 |
Honolulu City & County GO, Series A, Callable 10/01/25 at 100,
5.00%, 10/01/39 | 1,000,000 | | 1,010,974 |
Honolulu City & County GO, Series B, Callable 07/01/32 at 100,
5.00%, 07/01/43 | 3,960,000 | | 4,284,714 |
Honolulu City & County GO, Series C, Callable 07/01/30 at 100,
5.00%, 07/01/42 | 345,000 | | 368,641 |
Honolulu City & County GO, Series C, Callable 07/01/30 at 100,
5.00%, 07/01/45 | 1,000,000 | | 1,059,932 |
Honolulu City & County GO, Series C, Callable 08/01/29 at 100,
4.00%, 08/01/36 | 1,400,000 | | 1,432,121 |
Honolulu City & County GO, Series C, Callable 08/01/29 at 100,
4.00%, 08/01/43 | 2,000,000 | | 1,993,974 |
Honolulu City & County GO, Series C, Callable 08/01/29 at 100,
5.00%, 08/01/44 | 1,830,000 | | 1,928,458 |
Honolulu City & County GO, Series C, Refunding, Callable 10/01/25 at 100,
5.00%, 10/01/29 | 4,115,000 | | 4,191,327 |
Honolulu City & County GO, Series E, OID, Refunding, Callable 09/01/27 at 100,
3.00%, 09/01/31 | 250,000 | | 236,415 |
| | Principal
Amount | | Value |
| MUNICIPAL BONDS — (Continued) |
| Hawaii — (Continued) |
Honolulu City & County GO, Series E, Refunding, Callable 09/01/27 at 100,
5.00%, 09/01/30 | $1,500,000 | | $ 1,581,901 |
Honolulu City & County Wastewater System Revenue, 1st Bond Resolution, Series A, Callable 07/01/29 at 100,
4.00%, 07/01/34 | 2,130,000 | | 2,196,691 |
Honolulu City & County Wastewater System Revenue, Junior Series A, Refunding, Callable 07/01/25 at 100,
5.00%, 07/01/30 | 4,000,000 | | 4,060,028 |
Honolulu City & County Wastewater System Revenue, Senior 1st Bond Resolution, Series A, Callable 01/01/28 at 100,
5.00%, 07/01/36 | 2,000,000 | | 2,117,671 |
Honolulu City & County Wastewater System Revenue, Senior 1st Bond Resolution, Series A, Prerefunded, Callable 07/01/25 at 100,
5.00%, 07/01/29 | 395,000 | | 401,950 |
Honolulu City & County Wastewater System Revenue, Senior 1st Bond Resolution, Series B, Refunding, Callable 07/01/25 at 100,
5.00%, 07/01/26 | 1,000,000 | | 1,015,350 |
Honolulu City & County Wastewater System Revenue, Senior 1st Bond Resolution, Series B, Refunding, Callable 07/01/25 at 100,
5.00%, 07/01/27 | 325,000 | | 329,803 |
Honolulu City & County Wastewater System Revenue, Senior Lien Green Bond, Callable 07/01/33 at 100,
5.25%, 07/01/53 | 10,000,000 | | 10,836,845 |
Honolulu City & County Wastewater System Revenue, Senior Series B, Refunding, Callable 07/01/26 at 100,
5.00%, 07/01/35 | 125,000 | | 128,631 |
The accompanying notes are an integral part of the financial statements.
PACIFIC CAPITAL FUNDS
Pacific Capital Tax-Free Securities Fund
Portfolio of Investments (Continued)
April 30, 2024
| | Principal
Amount | | Value |
| MUNICIPAL BONDS — (Continued) |
| Hawaii — (Continued) |
Honolulu City & County Wastewater System Revenue, Series A, Senior Green Bond, Callable 07/01/32 at 100,
5.25%, 07/01/51 | $5,000,000 | | $ 5,411,156 |
Kauai County GO,
5.00%, 08/01/27 | 250,000 | | 264,296 |
Kauai County GO, Callable 08/01/27 at 100,
5.00%, 08/01/31 | 250,000 | | 263,091 |
Kauai County GO, Callable 08/01/27 at 100,
4.00%, 08/01/33 | 295,000 | | 301,338 |
Kauai County GO, Callable 08/01/27 at 100,
5.00%, 08/01/37 | 40,000 | | 41,556 |
Kauai County GO, Callable 08/01/27 at 100,
5.00%, 08/01/42 | 775,000 | | 796,549 |
Kauai County GO, Series A, Refunding,
5.00%, 08/01/24 | 930,000 | | 932,588 |
Maui County GO, Callable 03/01/31 at 100,
4.00%, 03/01/38 | 1,020,000 | | 1,035,387 |
Maui County GO, Refunding,
5.00%, 09/01/25 | 500,000 | | 509,910 |
Maui County GO, Refunding,
5.00%, 03/01/28 | 1,175,000 | | 1,256,796 |
Maui County GO, Refunding,
5.00%, 09/01/28 | 1,070,000 | | 1,155,537 |
Maui County GO, Refunding, Callable 03/01/30 at 100,
5.00%, 03/01/32 | 415,000 | | 459,402 |
Maui County GO, Refunding, Callable 09/01/25 at 100,
3.00%, 09/01/32 | 195,000 | | 186,433 |
Maui County GO, Refunding, Callable 09/01/28 at 100,
4.00%, 09/01/31 | 5,305,000 | | 5,485,298 |
University of Hawaii Revenue, Series B, Refunding,
4.00%, 10/01/24 | 165,000 | | 165,089 |
| | Principal
Amount | | Value |
| MUNICIPAL BONDS — (Continued) |
| Hawaii — (Continued) |
University of Hawaii Revenue, Series B, Refunding, Callable 10/01/25 at 100,
5.00%, 10/01/34 | $ 600,000 | | $ 610,963 |
University of Hawaii Revenue, Series B, Refunding, Callable 10/01/25 at 100,
5.00%, 10/01/35 | 1,000,000 | | 1,017,442 |
University of Hawaii Revenue, Series E, Refunding,
5.00%, 10/01/24 | 3,000,000 | | 3,013,792 |
University of Hawaii Revenue, Series E, Refunding, Callable 10/01/26 at 100,
5.00%, 10/01/31 | 1,000,000 | | 1,031,229 |
University of Hawaii Revenue, Series F, Refunding, Callable 10/01/27 at 100,
5.00%, 10/01/36 | 3,000,000 | | 3,166,364 |
University of Hawaii Revenue, Series F, Refunding, Callable 10/01/27 at 100,
5.00%, 10/01/37 | 2,000,000 | | 2,101,025 |
| | | | 208,648,215 |
| Pennsylvania — 0.6% |
Pennsylvania Turnpike Commission Oil Franchise Tax Revenue, Series B, Callable 12/01/28 at 100,
5.00%, 12/01/43 | 1,290,000 | | 1,340,638 |
| Texas — 1.8% |
Dallas Independent School District GO, Series A, Prerefunded, Callable 08/15/24 at 100,
5.00%, 08/15/29, (PSF-GTD) | 2,465,000 | | 2,472,414 |
Houston City Combined Utility System Revenue, Unrefunded Balance CAB, OID, Junior Series A, Refunding
0.00%, 12/01/27, (AGM)(a) | 2,000,000 | | 1,753,311 |
| | | | 4,225,725 |
TOTAL MUNICIPAL BONDS
(Cost $232,760,229) | | | 224,473,887 |
The accompanying notes are an integral part of the financial statements.
PACIFIC CAPITAL FUNDS
Pacific Capital Tax-Free Securities Fund
Portfolio of Investments (Concluded)
April 30, 2024
| | Shares | | Value |
| REGISTERED INVESTMENT COMPANY — 3.8% |
| Dreyfus Government Cash Management Fund, Institutional Shares, 5.19%(b) | 8,964,881 | | $ 8,964,881 |
TOTAL REGISTERED INVESTMENT COMPANY
(Cost $8,964,881) | | | 8,964,881 |
|
| |
TOTAL INVESTMENTS - 99.1%
(Cost $241,725,110) | | | 233,438,768 |
| OTHER ASSETS IN EXCESS OF LIABILITIES - 0.9% | | | 2,178,058 |
| NET ASSETS - 100.0% | | | $235,616,826 |
| (a) | Zero coupon bond. |
| (b) | Rate disclosed is the 7-day yield at April 30, 2024. |
| AGM | Assured Guaranty Municipal Corp. |
| AGM-CR | Assured Guaranty Municipal Corp. - Custodial Receipts |
| AMT | Alternative Minimum Tax |
| CAB | Capital Appreciation Bond |
| COP | Certificate of Participation |
| FGIC | Financial Guaranty Insurance Co. |
| GO | General Obligation |
| MWC | Make Whole Callable |
| NATL | National Public Finance Guarantee Corp. |
| OID | Original Issue Discount |
| PSF-GTD | Permanent School Fund Guaranteed |
The accompanying notes are an integral part of the financial statements.
PACIFIC CAPITAL FUNDS
Pacific Capital Tax-Free Short Intermediate Securities Fund
Portfolio Holdings Summary Table
April 30, 2024
(Unaudited)
The following table presents a summary by credit quality of the portfolio holdings of the Fund:
| Credit Quality: | % of Total Investments |
| Pre-refunded/Escrowed to Maturity | 11.35% |
| Aaa | 6.31 |
| Aa | 59.97 |
| A | 16.79 |
| Baa | 0.66 |
| Ba | 1.01 |
| Cash | 3.91 |
| Total | 100.00% |
Portfolio holdings are subject to change at any time.
Credit quality ratings are primarily sourced from Moody’s but in the event that Moody’s has not assigned a rating, the Fund will use S&P or Fitch. If these ratings are in conflict, S&P will be used before Fitch. If none of the major rating agencies have assigned a rating, the Fund will assign a rating of NR (non-rated security). The ratings represent their (Moody’s, S&P, and Fitch) opinions as to the quality of the underlying securities in the Fund, and not the Fund itself. The ratings range from AAA (extremely strong capacity to meet financial commitment) to D (in default). Ratings are relative and subjective and are not absolute standards of quality. A pre-refunded bond is secured by an escrow fund of U.S. government obligations (i.e. Treasury securities) and assumes the superior credit rating of the government obligation. The ratings do not predict performance and are subject to change.
The accompanying notes are an integral part of the financial statements.
PACIFIC CAPITAL FUNDS
Pacific Capital Tax-Free Short Intermediate Securities Fund
Portfolio of Investments
April 30, 2024
| | Principal
Amount | | Value |
| MUNICIPAL BONDS — 94.9% |
| Florida — 2.4% |
Florida Housing Finance Corp. Revenue, Series 1, Callable 07/01/29 at 100,
2.00%, 07/01/32, (GNMA/FNMA/FHLMC) | $ 170,000 | | $ 141,287 |
Miami-Dade Water & Sewer System Revenue County, Refunding, Callable 10/01/25 at 100,
5.00%, 10/01/26 | 900,000 | | 916,071 |
| | | | 1,057,358 |
| Hawaii — 76.8% |
Hawaii County GO, Refunding, Callable 09/01/33 at 100,
5.00%, 09/01/40 | 3,000,000 | | 3,320,380 |
Hawaii County GO, Series A, Callable 03/01/27 at 100,
5.00%, 09/01/28 | 445,000 | | 467,039 |
Hawaii County GO, Series A, Refunding,
5.00%, 09/01/24 | 320,000 | | 321,245 |
Hawaii County GO, Series A, Refunding, Callable 03/01/26 at 100,
5.00%, 09/01/26 | 200,000 | | 205,880 |
Hawaii County GO, Series A, Refunding, Callable 03/01/26 at 100,
5.00%, 09/01/27 | 525,000 | | 540,059 |
Hawaii County GO, Series A, Refunding, Callable 03/01/26 at 100,
5.00%, 09/01/29 | 450,000 | | 462,585 |
Hawaii State Airports System Revenue, AMT, COP, Callable 05/21/24 at 100,
5.00%, 08/01/27 | 300,000 | | 300,066 |
Hawaii State Airports System Revenue, Series B,
5.00%, 07/01/27 | 910,000 | | 959,073 |
Hawaii State Department of Budget & Finance Revenue, Hawaii Health Obligation Group, Series A, Refunding,
5.00%, 07/01/28 | 1,640,000 | | 1,739,232 |
| | Principal
Amount | | Value |
| MUNICIPAL BONDS — (Continued) |
| Hawaii — (Continued) |
Hawaii State Department of Budget & Finance Revenue, Hawaii Health Obligation Group, Series B, Refunding,
5.00%, 07/01/24 | $2,455,000 | | $ 2,458,177 |
Hawaii State Department of Budget & Finance Revenue, Hawaii Health Obligation Group, Series B, Refunding,
5.00%, 07/01/28 | 500,000 | | 530,254 |
Hawaii State Department of Budget & Finance Revenue, Hawaiian Electric Company, AMT, MWC, Refunding,
3.25%, 01/01/25 | 500,000 | | 439,125 |
Hawaii State Department of Budget & Finance Revenue, Mid-Pacific Project, Refunding,
4.00%, 01/01/25 | 20,000 | | 19,886 |
Hawaii State Department of Budget & Finance Revenue, Mid-Pacific Project, Refunding,
4.00%, 01/01/26 | 25,000 | | 24,719 |
Hawaii State Department of Budget & Finance Revenue, Mid-Pacific Project, Refunding,
4.00%, 01/01/30 | 250,000 | | 244,986 |
Hawaii State Department of Budget & Finance Revenue, Queens Health System, Series A, Refunding,
5.00%, 07/01/24 | 100,000 | | 100,138 |
Hawaii State Department of Budget & Finance Revenue, Queens Health System, Series A, Refunding,
5.00%, 07/01/25 | 400,000 | | 405,664 |
Hawaii State Department of Budget & Finance Revenue, Queens Health System, Series A, Refunding, Callable 07/01/25 at 100,
5.00%, 07/01/27 | 550,000 | | 557,262 |
The accompanying notes are an integral part of the financial statements.
PACIFIC CAPITAL FUNDS
Pacific Capital Tax-Free Short Intermediate Securities Fund
Portfolio of Investments (Continued)
April 30, 2024
| | Principal
Amount | | Value |
| MUNICIPAL BONDS — (Continued) |
| Hawaii — (Continued) |
Hawaii State Department of Budget & Finance Revenue, Queens Health System, Series A, Refunding, Callable 07/01/25 at 100,
5.00%, 07/01/35 | $1,000,000 | | $ 1,013,851 |
Hawaii State Department of Hawaiian Home Lands Revenue, Refunding,
5.00%, 04/01/27 | 100,000 | | 104,746 |
Hawaii State Department of Hawaiian Home Lands Revenue, Refunding, Callable 04/01/27 at 100,
5.00%, 04/01/29 | 55,000 | | 57,256 |
Hawaii State GO, Series EO, Prerefunded, Callable 08/01/24 at 100,
5.00%, 08/01/27 | 10,000 | | 10,026 |
Hawaii State GO, Series EO, Prerefunded, Callable 08/01/24 at 100,
5.00%, 08/01/28 | 400,000 | | 401,034 |
Hawaii State GO, Series EO, Prerefunded, Callable 08/01/24 at 100,
5.00%, 08/01/29 | 30,000 | | 30,077 |
Hawaii State GO, Series ET, OID, Prerefunded, Callable 10/01/25 at 100,
3.25%, 10/01/32 | 25,000 | | 24,923 |
Hawaii State GO, Series FT, Callable 01/01/28 at 100,
5.00%, 01/01/30 | 30,000 | | 31,959 |
Hawaii State Harbor System Revenue, Series A, AMT, Refunding,
5.00%, 07/01/26 | 500,000 | | 512,269 |
Hawaii State Harbor System Revenue, Series A, AMT, Refunding,
5.00%, 07/01/28 | 120,000 | | 125,835 |
| | Principal
Amount | | Value |
| MUNICIPAL BONDS — (Continued) |
| Hawaii — (Continued) |
Hawaii State Harbor System Revenue, Series A, AMT, Refunding, Callable 07/01/30 at 100,
4.00%, 07/01/31 | $1,000,000 | | $ 1,019,174 |
Hawaii State Harbor System Revenue, Series C, Refunding,
5.00%, 07/01/29 | 400,000 | | 435,708 |
Hawaii State Highway Fund Revenue, Series A, Callable 07/01/24 at 100,
5.00%, 01/01/25 | 555,000 | | 556,214 |
Honolulu City & County Board of Water Supply System Revenue, Series A,
5.00%, 07/01/27 | 1,000,000 | | 1,056,706 |
Honolulu City & County Board of Water Supply System Revenue, Series A, Prerefunded, Callable 07/01/24 at 100,
5.00%, 07/01/26 | 150,000 | | 150,256 |
Honolulu City & County Board of Water Supply System Revenue, Series A, Prerefunded, Callable 07/01/24 at 100,
5.00%, 07/01/27 | 305,000 | | 305,521 |
Honolulu City & County Board of Water Supply System Revenue, Series A, Refunding, Callable 07/01/34 at 100,
5.00%, 07/01/39 | 475,000 | | 537,721 |
Honolulu City & County GO, Series A, Callable 07/01/33 at 100,
5.00%, 07/01/40 | 1,000,000 | | 1,105,184 |
Honolulu City & County GO, Series A, Callable 07/01/33 at 100,
5.00%, 07/01/41 | 2,290,000 | | 2,519,789 |
Honolulu City & County GO, Series E, Refunding,
5.00%, 03/01/29 | 200,000 | | 218,020 |
Honolulu City & County GO, Series F, Refunding,
5.00%, 07/01/30 | 325,000 | | 362,322 |
The accompanying notes are an integral part of the financial statements.
PACIFIC CAPITAL FUNDS
Pacific Capital Tax-Free Short Intermediate Securities Fund
Portfolio of Investments (Continued)
April 30, 2024
| | Principal
Amount | | Value |
| MUNICIPAL BONDS — (Continued) |
| Hawaii — (Continued) |
Honolulu City & County Multifamily Housing Revenue, Maunakea Tower Apartments, Putable,
5.00%, 06/01/27, (HUD SECT 8)(a) | $1,000,000 | | $ 1,019,748 |
Honolulu City & County Wastewater System Revenue, Junior Series A, Refunding,
5.00%, 07/01/24 | 695,000 | | 696,303 |
Honolulu City & County Wastewater System Revenue, Senior Lien, Green bond,
5.00%, 07/01/32 | 2,000,000 | | 2,282,705 |
Honolulu City & County Wastewater System Revenue, Series A, Senior Green Bond,
5.00%, 07/01/31 | 2,000,000 | | 2,252,526 |
Honolulu City & County Wastewater System Revenue, Series B, Senior First Bond Resolution, Refunding, Callable 07/01/25 at 100,
5.00%, 07/01/31 | 1,000,000 | | 1,017,594 |
Kauai County GO, Series A, Refunding,
5.00%, 08/01/24 | 535,000 | | 536,489 |
Kauai County GO, Series A, Refunding,
5.00%, 08/01/25 | 270,000 | | 275,068 |
Maui County GO,
5.00%, 03/01/29 | 275,000 | | 299,777 |
Maui County GO, Refunding,
5.00%, 03/01/25 | 100,000 | | 101,189 |
Maui County GO, Refunding,
5.00%, 03/01/26 | 270,000 | | 278,003 |
Maui County GO, Refunding,
5.00%, 03/01/28 | 80,000 | | 85,569 |
University of Hawaii Revenue, Medical School Project, Series E, Refunding, Callable 10/01/26 at 100,
5.00%, 10/01/30 | 620,000 | | 639,942 |
| | Principal
Amount | | Value |
| MUNICIPAL BONDS — (Continued) |
| Hawaii — (Continued) |
University of Hawaii Revenue, Series B, Refunding,
4.00%, 10/01/24 | $ 300,000 | | $ 300,161 |
University of Hawaii Revenue, Series D, Refunding, Callable 10/01/30 at 100,
4.00%, 10/01/32 | 450,000 | | 467,472 |
| | | | 33,926,907 |
| Maryland — 2.2% |
Washington Suburban Sanitary Commission Revenue, Prerefunded, Callable 06/01/24 at 100,
4.00%, 06/01/25, (CNTY GTD) | 1,000,000 | | 999,939 |
| Massachusetts — 3.0% |
Commonwealth of Massachusetts Federal Highway Grant Anticipation Note Revenue, Series A, Callable 06/15/24 at 100,
5.00%, 06/15/27 | 1,325,000 | | 1,327,213 |
| Michigan — 2.1% |
Grosse Pointe Public School System GO, Refunding, Callable 05/01/29 at 100,
5.00%, 05/01/38 | 875,000 | | 923,985 |
| New Mexico — 2.4% |
Albuquerque Gross Receipts Tax Revenue, Series A, Callable 07/01/25 at 100,
5.00%, 07/01/33 | 1,035,000 | | 1,049,903 |
| Oregon — 4.5% |
State of Oregon Department of Transportation Revenue, Series A, Senior Series, Prerefunded, Callable 11/15/24 at 100,
5.00%, 11/15/27 | 2,000,000 | | 2,013,439 |
| Pennsylvania — 0.6% |
Commonwealth Financing Authority Revenue, Series A, Refunding,
5.00%, 06/01/25 | 250,000 | | 253,413 |
The accompanying notes are an integral part of the financial statements.
PACIFIC CAPITAL FUNDS
Pacific Capital Tax-Free Short Intermediate Securities Fund
Portfolio of Investments (Concluded)
April 30, 2024
| | Principal
Amount | | Value |
| MUNICIPAL BONDS — (Continued) |
| Washington — 0.9% |
Energy Northwest Revenue, Series A, Refunding, Callable 07/01/25 at 100,
5.00%, 07/01/33 | $ 380,000 | | $ 385,399 |
TOTAL MUNICIPAL BONDS
(Cost $42,481,284) | | | 41,937,556 |
| | Shares | |
| REGISTERED INVESTMENT COMPANY — 3.9% |
| Dreyfus Government Cash Management Fund, Institutional Shares, 5.19%(b) | 1,705,895 | 1,705,895 |
TOTAL REGISTERED INVESTMENT COMPANY
(Cost $1,705,895) | | 1,705,895 |
|
| |
TOTAL INVESTMENTS - 98.8%
(Cost $44,187,179) | | 43,643,451 |
| OTHER ASSETS IN EXCESS OF LIABILITIES - 1.2% | | 526,678 |
| NET ASSETS - 100.0% | | $44,170,129 |
| (a) | Variable rate investments. The rate shown is based on the latest available information as of April 30, 2024. Certain variable rate securities are not based on a published reference rate and spread but are determined by the issuer or agent and are based on current market conditions. These securities do not indicate a reference rate or spread in their description. |
| (b) | Rate disclosed is the 7-day yield at April 30, 2024. |
| AMT | Alternative Minimum Tax |
| CNTY GTD | County Guaranteed |
| COP | Certificate of Participation |
| FHLMC | Federal Home Loan Mortgage Corp. |
| FNMA | Federal National Mortgage Association |
| GNMA | Government National Mortgage Association |
| GO | General Obligation |
| HUD SECT 8 | Housing and Urban Development Section 8 |
| MWC | Make Whole Callable |
| OID | Original Issue Discount |
The accompanying notes are an integral part of the financial statements.
PACIFIC CAPITAL FUNDS
Statements of Assets and Liabilities
April 30, 2024
| | Pacific Capital
Tax-Free
Securities
Fund | | Pacific Capital
Tax-Free
Short
Intermediate
Securities Fund |
| Assets | | | |
| Investments, at value* | $233,438,768 | | $43,643,451 |
| Receivables: | | | |
| Capital shares sold | 44,011 | | 3,000 |
| Interest | 2,785,978 | | 684,955 |
| Prepaid expenses and other assets | 33 | | 34 |
| Total Assets | 236,268,790 | | 44,331,440 |
| Liabilities | | | |
| Payables: | | | |
| Distributions to shareholders | 557,383 | | 92,353 |
| Audit fees | 34,873 | | 34,873 |
| Capital shares redeemed | 18,072 | | — |
| Administration and accounting fees | 16,153 | | 10,522 |
| Shareholder reporting fees | 9,583 | | 12,410 |
| Transfer agent fees | 5,880 | | 5,560 |
| Accrued expenses | 10,020 | | 5,593 |
| Total Liabilities | 651,964 | | 161,311 |
| Net Assets | $235,616,826 | | $44,170,129 |
| Net Assets Consisted of: | | | |
| Capital stock, $0.01 par value | $ 247,761 | | $ 45,795 |
| Paid-in capital | 248,447,528 | | 45,714,362 |
| Total distributable loss | (13,078,463) | | (1,590,028) |
| Net Assets | $235,616,826 | | $44,170,129 |
| Class Y Shares: | | | |
| Net assets | $235,616,826 | | $44,170,129 |
| Shares outstanding | 24,776,142 | | 4,579,534 |
| Net asset value, offering and redemption price per share | $ 9.51 | | $ 9.65 |
| * Investments, at cost | $241,725,110 | | $44,187,179 |
The accompanying notes are an integral part of the financial statements.
PACIFIC CAPITAL FUNDS
Statements of Operations
For the Year Ended April 30, 2024
| | Pacific Capital
Tax-Free
Securities
Fund | | Pacific Capital
Tax-Free
Short
Intermediate
Securities Fund |
| Investment income | | | |
| Interest | $ 6,591,256 | | $1,213,505 |
| Dividends | 305,061 | | 102,053 |
| Total investment income | 6,896,317 | | 1,315,558 |
| Expenses | | | |
| Advisory fees(Note 2) | 468,150 | | 90,453 |
| Trustees’ and officers’ fees(Note 2) | 72,538 | | 14,847 |
| Administration and accounting fees(Note 2) | 65,462 | | 47,659 |
| Legal fees | 52,105 | | 13,795 |
| Audit fees | 34,873 | | 34,873 |
| Transfer agent fees(Note 2) | 24,442 | | 24,152 |
| Custodian fees(Note 2) | 24,360 | | 14,821 |
| Shareholder reporting fees | 15,836 | | 22,645 |
| Registration and filing fees | 4,178 | | 4,178 |
| Other expenses | 20,556 | | 8,963 |
| Total expenses before waivers | 782,500 | | 276,386 |
| Less: waivers(Note 2) | (468,150) | | (90,453) |
| Net expenses after waivers | 314,350 | | 185,933 |
| Net investment income | 6,581,967 | | 1,129,625 |
| Net realized and unrealized loss from investments: | | | |
| Net realized loss from investments | (2,401,092) | | (792,849) |
| Net change in unrealized depreciation on investments | (1,929,875) | | (297) |
| Net realized and unrealized loss on investments | (4,330,967) | | (793,146) |
| Net increase in net assets resulting from operations | $ 2,251,000 | | $ 336,479 |
The accompanying notes are an integral part of the financial statements.
PACIFIC CAPITAL FUNDS
Statements of Changes in Net Assets
| | Pacific Capital Tax-Free Securities Fund |
| | For the Year
Ended
April 30, 2024 | | For the Year
Ended
April 30, 2023 |
| Net increase/(decrease) in net assets from operations: | | | |
| Net investment income | $ 6,581,967 | | $ 6,290,370 |
| Net realized losses from investments | (2,401,092) | | (339,602) |
| Net change in unrealized depreciation on investments | (1,929,875) | | (311,185) |
| Net increase in net assets resulting from operations | 2,251,000 | | 5,639,583 |
| Less dividends and distributions to shareholders from: | | | |
| Total distributable earnings: | | | |
| Class Y | (6,581,946) | | (6,290,370) |
| Net decrease in net assets from dividends and distributions to shareholders | (6,581,946) | | (6,290,370) |
| Decrease in net assets derived from capital share transactions (Note 4) | (858,950) | | (17,896,541) |
| Total decrease in net assets | (5,189,896) | | (18,547,328) |
| Net assets | | | |
| Beginning of year | 240,806,722 | | 259,354,050 |
| End of year | $235,616,826 | | $ 240,806,722 |
The accompanying notes are an integral part of the financial statements.
PACIFIC CAPITAL FUNDS
Statements of Changes in Net Assets (Concluded)
| | Pacific Capital Tax-Free Short Intermediate
Securities Fund |
| | For the Year
Ended
April 30, 2024 | | For the Year
Ended
April 30, 2023 |
| Net increase/(decrease) in net assets from operations: | | | |
| Net investment income | $ 1,129,625 | | $ 765,410 |
| Net realized losses from investments | (792,849) | | (121,751) |
| Net change in unrealized appreciation/(depreciation) on investments | (297) | | 364,544 |
| Net increase in net assets resulting from operations | 336,479 | | 1,008,203 |
| Less dividends and distributions to shareholders from: | | | |
| Total distributable earnings: | | | |
| Class Y | (1,129,624) | | (765,405) |
| Net decrease in net assets from dividends and distributions to shareholders | (1,129,624) | | (765,405) |
| Increase/(decrease) in net assets derived from capital share transactions (Note 4) | 524,127 | | (3,132,412) |
| Total decrease in net assets | (269,018) | | (2,889,614) |
| Net assets | | | |
| Beginning of year | 44,439,147 | | 47,328,761 |
| End of year | $44,170,129 | | $ 44,439,147 |
The accompanying notes are an integral part of the financial statements.
PACIFIC CAPITAL FUNDS
Pacific Capital Tax-Free Securities Fund Financial Highlights
Contained below is per share operating performance data for Class Y shares outstanding, total investment return, ratios to average net assets and other supplemental data for the respective period. The total returns in the table represent the rate that an investor would have earned or lost on an investment in the Fund (assuming reinvestment of all dividends and distributions). This information has been derived from information provided in the financial statements and should be read in conjunction with the financial statements and the notes thereto.
| | Class Y shares |
| | For the
Year Ended
April 30,
2024 | | For the
Year Ended
April 30,
2023 | | For the
Year Ended
April 30,
2022 | | For the
Year Ended
April 30,
2021 | | For the
Year Ended
April 30,
2020 |
| Per Share Operating Performance | | | | | | | | | |
| Net asset value, beginning of year | $ 9.68 | | $ 9.69 | | $ 10.61 | | $ 10.30 | | $ 10.24 |
| Net investment income(1) | 0.27 | | 0.25 | | 0.24 | | 0.26 | | 0.26 |
| Net realized and unrealized gain/(loss) on investments | (0.17) | | (0.01) | | (0.92) | | 0.31 | | 0.06 |
| Total from investment operations | 0.10 | | 0.24 | | (0.68) | | 0.57 | | 0.32 |
| Dividends and distributions to shareholders from: | | | | | | | | | |
| Net investment income | (0.27) | | (0.25) | | (0.24) | | (0.26) | | (0.26) |
| Net asset value, end of year | $ 9.51 | | $ 9.68 | | $ 9.69 | | $ 10.61 | | $ 10.30 |
| Total investment return(2) | 1.05% | | 2.49% | | (6.56)% | | 5.54% | | 3.14% |
| Ratios/Supplemental Data | | | | | | | | | |
| Net assets, end of year (in 000s) | $235,617 | | $240,807 | | $259,354 | | $275,648 | | $265,993 |
| Ratio of expenses to average net assets | 0.13% | | 0.14% | | 0.12% | | 0.11% | | 0.09% |
| Ratio of expenses to average net assets without waivers(3) | 0.33% | | 0.34% | | 0.32% | | 0.31% | | 0.29% |
| Ratio of net investment income to average net assets | 2.80% | | 2.54% | | 2.27% | | 2.43% | | 2.51% |
| Portfolio turnover rate | 16% | | 9% | | 14% | | 9% | | 10% |
| (1) | The selected per share data was calculated using the average shares outstanding method for the year. |
| (2) | Total investment return is calculated assuming a purchase of shares on the first day and a sale of shares on the last day of each period reported and includes reinvestment of dividends and distributions, if any. |
| (3) | During the period, certain fees were waived. If such fee waivers had not occurred, the ratios would have been as indicated (See Note 2). |
The accompanying notes are an integral part of the financial statements.
PACIFIC CAPITAL FUNDS
Pacific Capital Tax-Free Short Intermediate Securities Fund Financial Highlights (Concluded)
Contained below is per share operating performance data for Class Y shares outstanding, total investment return, ratios to average net assets and other supplemental data for the respective period. The total returns in the table represent the rate that an investor would have earned or lost on an investment in the Fund (assuming reinvestment of all dividends and distributions). This information has been derived from information provided in the financial statements and should be read in conjunction with the financial statements and the notes thereto.
| | Class Y shares |
| | For the
Year Ended
April 30,
2024 | | For the
Year Ended
April 30,
2023 | | For the
Year Ended
April 30,
2022 | | For the
Year Ended
April 30,
2021 | | For the
Year Ended
April 30,
2020 |
| Per Share Operating Performance | | | | | | | | | |
| Net asset value, beginning of year | $ 9.83 | | $ 9.78 | | $ 10.28 | | $ 10.12 | | $ 10.09 |
| Net investment income(1) | 0.24 | | 0.16 | | 0.12 | | 0.15 | | 0.17 |
| Net realized and unrealized gain/(loss) on investments | (0.18) | | 0.05 | | (0.49) | | 0.16 | | 0.03 |
| Total from investment operations | 0.06 | | 0.21 | | (0.37) | | 0.31 | | 0.20 |
| Dividends and distributions to shareholders from: | | | | | | | | | |
| Net investment income | (0.24) | | (0.16) | | (0.12) | | (0.15) | | (0.17) |
| Net realized capital gains | — | | — | | (0.01) | | — | | — |
| Total dividends and distributions to shareholders | (0.24) | | (0.16) | | (0.13) | | (0.15) | | (0.17) |
| Net asset value, end of year | $ 9.65 | | $ 9.83 | | $ 9.78 | | $ 10.28 | | $ 10.12 |
| Total investment return(2) | 0.65% | | 2.16% | | (3.61)% | | 3.04% | | 1.98% |
| Ratios/Supplemental Data | | | | | | | | | |
| Net assets, end of year (in 000s) | $44,170 | | $44,439 | | $47,329 | | $50,023 | | $53,599 |
| Ratio of expenses to average net assets | 0.41% | | 0.37% | | 0.38% | | 0.28% | | 0.24% |
| Ratio of expenses to average net assets without waivers(3) | 0.61% | | 0.57% | | 0.58% | | 0.48% | | 0.44% |
| Ratio of net investment income to average net assets | 2.49% | | 1.61% | | 1.18% | | 1.43% | | 1.66% |
| Portfolio turnover rate | 55% | | 31% | | 27% | | 22% | | 30% |
| (1) | The selected per share data was calculated using the average shares outstanding method for the year. |
| (2) | Total investment return is calculated assuming a purchase of shares on the first day and a sale of shares on the last day of each period reported and includes reinvestment of dividends and distributions, if any. |
| (3) | During the period, certain fees were waived. If such fee waivers had not occurred, the ratios would have been as indicated (See Note 2). |
The accompanying notes are an integral part of the financial statements.
PACIFIC CAPITAL FUNDS
Notes to Financial Statements
April 30, 2024
1. Organization and Significant Accounting Policies
The Pacific Capital Tax-Free Securities Fund and the Pacific Capital Tax-Free Short Intermediate Securities Fund (each a “Fund” and together the “Funds”) are non-diversified, open-end management investment companies registered under the Investment Company Act of 1940, as amended (the “1940 Act”). The Funds are each a separate series of FundVantage Trust (the “Trust”) which was organized as a Delaware statutory trust on August 28, 2006. The Trust is a “series trust” authorized to issue an unlimited number of separate series or classes of shares of beneficial interest. Each series is treated as a separate entity for certain matters under the 1940 Act, and for other purposes, and a shareholder of one series is not deemed to be a shareholder of any other series. The Funds are each authorized to issue and offer Class Y shares.
The Funds are investment companies and follow accounting and reporting guidance in the Financial Accounting Standards Board Accounting Standards Codification Topic 946.
Portfolio Valuation — Each Fund’s net asset value (“NAV”) is calculated once daily at the close of regular trading hours on the New York Stock Exchange (“NYSE”) (typically 4:00 p.m. Eastern time) on each day the NYSE is open. Fixed income securities having a remaining maturity of greater than 60 days are valued using an independent pricing service. Fixed income securities having a remaining maturity of 60 days or less are generally valued at amortized cost, provided such amount approximates fair value. Debt securities are valued on the basis of broker quotations or valuations provided by a pricing service, which utilizes information with respect to recent sales, market transactions in comparable securities, quotations from dealers, and various relationships between securities in determining value. Valuations developed through pricing techniques may materially vary from the actual amounts realized upon sale of the securities. Investments in other open-end investment companies are valued based on the NAV of such investment companies (which may use fair value pricing as discussed in their prospectuses). Securities that do not have a readily available current market value are valued in good faith by the Adviser as "valuation designee" under the oversight of the Board of Trustees of the Trust ("Board of Trustees"). Relying on prices supplied by pricing services or dealers or using fair valuation may result in values that are higher or lower than the values used by other investment companies and investors to price the same investments. The Adviser has adopted written policies and procedures for valuing securities and other assets in circumstances where market quotes are not readily available. In the event that market quotes are not readily available, and the security or asset cannot be valued pursuant to one of the valuation methods, the value of the security or asset will be determined in good faith by the Adviser pursuant to its policies and procedures. On a quarterly basis, the Adviser’s fair valuation determinations will be reviewed by the Board of Trustees.
Fair Value Measurements — The inputs and valuation techniques used to measure fair value of the Funds’ investments are summarized into three levels as described in the hierarchy below:
• Level 1 — quoted prices in active markets for identical securities;
• Level 2 — other significant observable inputs (including quoted prices for similar securities, interest rates, prepayment speeds, credit risk, etc.); and
• Level 3 — significant unobservable inputs (including the Funds’ own assumptions in determining the fair value of investments).
The fair value of a Fund's bonds is generally based on quotes received from brokers or independent pricing services. Bonds with quotes that are based on actual trades with a sufficient level of activity on or near the measurement date are classified as Level 2 assets.
The inputs or methodology used for valuing securities are not necessarily an indication of the risk associated with investing in those securities. Transfers in and out are recognized at the value at the end of the period.
PACIFIC CAPITAL FUNDS
Notes to Financial Statements (Continued)
April 30, 2024
The following is a summary of the inputs used, as of April 30, 2024, in valuing each Fund's investments carried at fair value:
| Funds | | Total Value at
04/30/24 | | Level 1
Quoted
Price | | Level 2
Other
Significant
Observable
Inputs | | Level 3
Significant
Unobservable
Inputs |
| Pacific Capital Tax-Free Securities Fund | | |
| Assets | | | | | | | | |
| Municipal Bonds | | $ 224,473,887 | | $ — | | $ 224,473,887 | | $ — |
| Registered Investment Company | | 8,964,881 | | 8,964,881 | | — | | — |
| Total Assets | | $ 233,438,768 | | $ 8,964,881 | | $ 224,473,887 | | $ — |
| Pacific Capital Tax-Free Short Intermediate Securities Fund | | |
| Assets | | | | | | | | |
| Municipal Bonds | | $ 41,937,556 | | $ — | | $ 41,937,556 | | $ — |
| Registered Investment Company | | 1,705,895 | | 1,705,895 | | — | | — |
| Total Assets | | $ 43,643,451 | | $ 1,705,895 | | $ 41,937,556 | | $ — |
At the end of each quarter, management evaluates the classification of Levels 1, 2 and 3 assets and liabilities. Various factors are considered, such as changes in liquidity from the prior reporting period; whether or not a broker is willing to execute at the quoted price; the depth and consistency of prices from third-party pricing services; and the existence of contemporaneous, observable trades in the market. Additionally, management evaluates the classification of Level 1 and Level 2 assets and liabilities on a quarterly basis for changes in listings or delistings on national exchanges.
Due to the inherent uncertainty of determining the fair value of investments that do not have a readily available market value, the fair value of the Funds’ investments may fluctuate from period to period. Additionally, the fair value of investments may differ significantly from the values that would have been used had a ready market existed for such investments and may differ materially from the values the Funds may ultimately realize. Further, such investments may be subject to legal and other restrictions on resale or otherwise less liquid than publicly traded securities.
For fair valuations using significant unobservable inputs, U.S. generally accepted accounting principles (“U.S. GAAP”) require the Funds to present a reconciliation of the beginning to ending balances for reported market values that present changes attributable to total realized and unrealized gains or losses, purchase and sales, and transfers in and out of Level 3 during the period. A reconciliation of Level 3 investments is presented only when the Funds had an amount of Level 3 investments at the end of the reporting period that was meaningful in relation to their net assets. The amounts and reasons for all transfers in and out of Level 3 are disclosed when the Funds had an amount of transfers during the reporting period that was meaningful in relation to their net assets as of the end of the reporting period.
For the year ended April 30, 2024, there were no transfers in or out of Level 3.
Use of Estimates — The preparation of financial statements in conformity with U.S. GAAP requires management to make estimates and assumptions that affect the amounts reported in the financial statements and accompanying notes at the date of the financial statements and the reported amounts of revenues and expenses during the period. Actual results could differ from those estimates and those differences could be material.
Investment Transactions, Investment Income and Expenses — Investment transactions are recorded on trade date for financial statement preparation purposes. Realized gains and losses on investments sold are recorded on the identified cost basis. Interest income is recorded on the accrual basis. Accretion of discounts and amortization of premiums are recorded on a daily basis using the effective yield method except for short term securities, which records discounts and premiums on a straight-line basis.
PACIFIC CAPITAL FUNDS
Notes to Financial Statements (Continued)
April 30, 2024
Dividends are recorded on the ex-dividend date. General expenses of the Trust are generally allocated to each Fund under methodologies approved by the Board of Trustees. Expenses directly attributable to a particular fund in the Trust are charged directly to that fund.
Dividends and Distributions to Shareholders — Dividends from net investment income for each Fund are declared daily and paid monthly to shareholders. Distributions, if any, of net short-term capital gain and net capital gain (the excess of net long-term capital gain over the short-term capital loss) realized by a Fund, after deducting any available capital loss carryovers are declared and paid to its shareholders annually. Income dividends and capital gain distributions are determined in accordance with U.S. federal income tax regulations, which may differ from U.S. GAAP.
U.S. Tax Status — No provision is made for U.S. income taxes as it is each Fund's intention to continue to qualify for and elect the tax treatment applicable to regulated investment companies under Subchapter M of the Internal Revenue Code of 1986, as amended (“Internal Revenue Code”), and make the requisite distributions to its shareholders which will be sufficient to relieve it from U.S. income and excise taxes.
Other — In the normal course of business, the Funds may enter into contracts that provide general indemnifications. The Funds’ maximum exposure under these arrangements is dependent on claims that may be made against the Funds in the future, and therefore, cannot be estimated; however, based on experience, the risk of material loss for such claims is considered remote.
2. Transactions with Related Parties and Other Service Providers
Investment advisory services are provided to the Funds by the Asset Management Group of Bank of Hawaii (the “Adviser”). Under terms of an advisory agreement, the Pacific Capital Tax-Free Securities Fund and the Pacific Capital Tax-Free Short Intermediate Securities Fund are charged an annual fee of 0.20% which is computed daily and paid monthly based upon average daily net assets. The Adviser has contractually agreed to waive its advisory fee (the “Waiver”). The Waiver will remain in effect until August 31, 2025. The Waiver may not be terminated at any time prior to that date without the consent of the Board of Trustees of FundVantage Trust (the “Trust”). While the Adviser is currently waiving its entire investment advisory fee, investors who invest in a Fund through a bank trust account may be subject to account level fees applicable to such amount charged by affiliates of the Adviser, including Bank of Hawaii’s Trust Services Group.
Fee rates for the year ended April 30, 2024, were as follows:
| | Maximum Annual
Advisory Fee | | Net Annual
Fees Paid After
Contractual
Waivers |
| Pacific Capital Tax-Free Securities Fund | 0.20% | | 0.00% |
| Pacific Capital Tax-Free Short Intermediate Securities Fund | 0.20% | | 0.00% |
Other Service Providers
The Bank of New York Mellon (“BNY Mellon”) serves as administrator and custodian for the Funds. For providing administrative and accounting services, BNY Mellon is entitled to receive a monthly fee equal to an annual percentage rate of the Funds’ average daily net assets and is subject to certain minimum monthly fees. For providing certain custodial services, BNY Mellon is entitled to receive a monthly fee, subject to certain minimum, and out of pocket expenses.
BNY Mellon Investment Servicing (US) Inc. (the “Transfer Agent”) provides transfer agent services to the Funds. The Transfer Agent is entitled to receive a monthly fee, subject to certain minimum, and out of pocket expenses.
The Trust, on behalf of the Funds, has entered into agreements with financial intermediaries to provide recordkeeping, processing, shareholder communications and other services to customers of the intermediaries investing in the Funds and has
PACIFIC CAPITAL FUNDS
Notes to Financial Statements (Continued)
April 30, 2024
agreed to compensate the intermediaries for providing those services. The fees incurred by the Funds for these services are included in Transfer agent fees in the Statements of Operations.
Foreside Funds Distributors LLC (the “Underwriter”) provides principal underwriting services to the Funds pursuant to an underwriting agreement between the Trust and the Underwriter.
Trustees and Officers
The Trust is governed by its Board of Trustees. The Trustees receive compensation in the form of an annual retainer and per meeting fees for their services to the Trust. An employee of BNY Mellon serves as the Secretary of the Trust and is not compensated by the Funds or the Trust.
JW Fund Management LLC (“JWFM”) provides a Principal Executive Officer and Principal Financial Officer to the Trust. Chenery Compliance Group, LLC (“Chenery”) provides the Trust with a Chief Compliance Officer and an Anti-Money Laundering Officer. JWFM and Chenery are compensated for their services provided to the Trust.
3. Investment in Securities
For the year ended April 30, 2024, aggregated purchases and sales of investment securities (excluding short-term investments) of the Funds were as follows:
| | Purchases | | Sales |
| Pacific Capital Tax-Free Securities Fund | $36,575,359 | | $41,931,136 |
| Pacific Capital Tax-Free Short Intermediate Securities Fund | 23,817,868 | | 22,457,496 |
The Funds are permitted to purchase or sell securities, which have a readily available market quotation, from or to certain other affiliated funds under specified conditions outlined in the procedures adopted by the Board of Trustees. The procedures have been designed to provide assurances that any purchase or sale of securities by the Funds from or to another fund that is or could be considered an affiliate by virtue of having a common investment adviser (or affiliated investment adviser), common Trustees and/or common officers complies with Rule 17a-7 under the 1940 Act. Further, as defined under the procedures, each transaction is effective at the current market price.
For the year ended April 30, 2024, the Funds did not engage in purchase or sale of securities with affiliated funds under
Rule 17a-7.
4. Capital Share Transactions
For the years ended April 30, 2024 and 2023, transactions in capital shares (authorized shares unlimited) were as follows:
| | For the Year Ended
April 30, 2024 | | For the Year Ended
April 30, 2023 |
| | Shares | | Amount | | Shares | | Amount |
| Pacific Capital Tax-Free Securities Fund: | | | | | | | |
| Class Y | | | | | | | |
| Sales | 3,494,741 | | $ 33,340,892 | | 2,316,387 | | $ 22,357,524 |
| Reinvestments | 3,800 | | 36,178 | | 3,654 | | 35,117 |
| Redemptions | (3,601,752) | | (34,236,020) | | (4,195,090) | | (40,289,182) |
| Net decrease | (103,211) | | $ (858,950) | | (1,875,049) | | $(17,896,541) |
| |
PACIFIC CAPITAL FUNDS
Notes to Financial Statements (Continued)
April 30, 2024
| | For the Year Ended
April 30, 2024 | | For the Year Ended
April 30, 2023 |
| | Shares | | Amount | | Shares | | Amount |
| | | | | | | | |
| Pacific Capital Tax-Free Short Intermediate Securities Fund: | | | | | | | |
| Class Y | | | | | | | |
| Sales | 1,368,399 | | $ 13,183,186 | | 522,746 | | $ 5,126,766 |
| Reinvestments | 494 | | 4,786 | | 502 | | 4,919 |
| Redemptions | (1,310,721) | | (12,663,845) | | (840,637) | | (8,264,097) |
| Net increase/(decrease) | 58,172 | | $ 524,127 | | (317,389) | | $ (3,132,412) |
| |
| | | | | | | | |
5. Federal Tax Information
The Funds have followed the authoritative guidance on accounting for and disclosure of uncertainty in tax positions, which requires the Funds to determine whether a tax position is more likely than not to be sustained upon examination, including resolution of any related appeals or litigation processes, based on the technical merits of the position. Each Fund has determined that there was no effect on the financial statements from following this authoritative guidance. In the normal course of business, the Funds are subject to examination by federal, state and local jurisdictions, where applicable, for tax years for which applicable statutes of limitations have not expired.
Distributions are determined in accordance with federal income tax regulations, which may differ in amount or character from net investment income and realized gains for financial reporting purposes. Accordingly, the character of distributions and composition of net assets for tax purposes may differ from those reflected in the accompanying financial statements. To the extent these differences are permanent, such amounts are reclassified within the components of net assets based on the tax treatment; temporary differences do not require reclassifications. Net assets were not affected by these adjustments. For the year ended April 30, 2024, there were no reclassifications for the Funds.
The tax character of distributions paid during the year ended April 30, 2024, were as follows:
| | Ordinary
Income
Distributions | | Total
Taxable
Distributions | | Tax
Exempt
Distributions | | Total
Distributions
Paid* |
| Pacific Capital Tax-Free Securities Fund | $297,860 | | $297,860 | | $6,240,503 | | $6,538,363 |
| Pacific Capital Tax-Free Short Intermediate Securities Fund | 94,280 | | 94,280 | | 1,011,423 | | 1,105,703 |
| * | Distributions will not tie to Statements of Changes in Net Assets because distributions are recognized when actually paid for tax purposes. |
The tax character of distributions paid during the year ended April 30, 2023, were as follows:
| | Ordinary
Income
Distributions | | Total
Taxable
Distributions | | Tax
Exempt
Distributions | | Total
Distributions
Paid* |
| Pacific Capital Tax-Free Securities Fund | $145,429 | | $145,429 | | $6,141,549 | | $6,286,978 |
| Pacific Capital Tax-Free Short Intermediate Securities Fund | 31,879 | | 31,879 | | 703,940 | | 735,819 |
| * | Distributions will not tie to Statements of Changes in Net Assets because distributions are recognized when actually paid for tax purposes. |
PACIFIC CAPITAL FUNDS
Notes to Financial Statements (Continued)
April 30, 2024
Distributions from net investment income and short-term capital gains are treated as ordinary income for federal income tax purposes.
As of April 30, 2024, the components of distributable earnings/(loss) on a tax basis were as follows:
| | Capital Loss
Carryforward | | Undistributed
Tax Exempt
Income | | Distributions
Payable | | Unrealized
Appreciation/
(Depreciation) |
| Pacific Capital Tax-Free Securities Fund | $(4,792,136) | | $557,398 | | $(557,383) | | $(8,286,342) |
| Pacific Capital Tax-Free Short Intermediate Securities Fund | (1,007,460) | | 53,513 | | (92,353) | | (543,728) |
The differences between the book and tax basis components of distributable earnings relate primarily to the timing and recognition of income and gains for federal income tax purposes.
The cost for federal income tax purposes, gross unrealized appreciation, gross unrealized depreciation and net unrealized depreciation as of April 30, 2024 were as follows:
| | | Federal
Tax Cost | | Unrealized
Appreciation | | Unrealized
(Depreciation) | | Net Unrealized
(Depreciation) |
| Pacific Capital Tax-Free Securities Fund | | $241,725,110 | | $1,018,628 | | $(9,304,970) | | $(8,286,342) |
| Pacific Capital Tax-Free Short Intermediate Securities Fund | | 44,187,179 | | 75,715 | | (619,443) | | (543,728) |
Pursuant to federal income tax rules applicable to regulated investment companies, the Funds may elect to treat certain capital losses between November 1 and April 30 and late year ordinary losses ((i) ordinary losses between January 1 and April 30, and (ii) specified ordinary and currency losses between November 1 and April 30) as occurring on the first day of the following tax year. For the year ended April 30, 2024, any amount of losses elected within the tax return will not be recognized for federal income tax purposes until May 1, 2024. For the year ended April 30, 2024, the Funds did not have late year ordinary loss deferrals and capital loss deferrals.
Accumulated capital losses represent net capital loss carryforwards as of April 30, 2024 that may be available to offset future realized capital gains and thereby reduce future capital gains distributions. As of April 30, 2024, the Funds' capital loss carryforwards, which were comprised of both short-term losses and long-term losses, and had an unlimited period of capital loss carryforward were as follows:
| | Capital Loss Carryforward |
| | Short-Term | | Long-Term |
| Pacific Capital Tax-Free Securities Fund | $2,114,394 | | $2,677,742 |
| Pacific Capital Tax-Free Short Intermediate Securities Fund | 85,652 | | 921,808 |
6. Concentration of Credit Risk
The Pacific Capital Tax-Free Securities Fund and the Pacific Capital Tax-Free Short Intermediate Securities Fund primarily invest in debt obligations issued by the state of Hawaii and its political subdivisions, agencies, and public authorities to obtain funds for various public purposes. The Funds are more susceptible to factors adversely affecting issues of Hawaii municipal securities than is a municipal bond fund that is not concentrated in these issuers to the same extent.
7. Debt Investment Risk
Debt investments are affected primarily by the financial condition of the companies or other entities that have issued them and by changes in interest rates. There is a risk that an issuer of a Fund’s debt investments may not be able to meet its financial obligations (e.g., may not be able to make principal and/or interest payments when they are due or otherwise default on other financial terms) and/or go bankrupt. Securities such as high-yield/high-risk bonds, e.g., bonds with low credit ratings by Moody’s (Ba or lower) or
PACIFIC CAPITAL FUNDS
Notes to Financial Statements (Concluded)
April 30, 2024
Standard & Poor’s (BB and lower) or if unrated are of comparable quality as determined by the manager, are especially subject to credit risk during periods of economic uncertainty or during economic downturns and are more likely to default on their interest and/or principal payments than higher rated securities. Debt investments may be affected by changes in interest rates. Debt investments with longer durations tend to be more sensitive to changes in interest rates, making them more volatile than debt investments with shorter durations or floating or adjustable interest rates. The value of debt investments may fall when interest rates rise.
8. Subsequent Events
Management has evaluated the impact of all subsequent events on each Fund through the date the financial statements were issued, and has determined that there are no subsequent events requiring recognition or disclosure in the financial statements.
PACIFIC CAPITAL FUNDS
Report of Independent Registered Public Accounting Firm
To the Board of Trustees of FundVantage Trust and Shareholders of each of Pacific Capital Tax-Free Securities Fund and Pacific Capital Tax-Free Short Intermediate Securities Fund
Opinions on the Financial Statements
We have audited the accompanying statements of assets and liabilities, including the portfolios of investments, of Pacific Capital Tax-Free Securities Fund and Pacific Capital Tax-Free Short Intermediate Securities Fund (two of the funds constituting FundVantage Trust, hereafter collectively referred to as the “Funds”) as of April 30, 2024, the related statements of operations for the year ended April 30, 2024, the statements of changes in net assets for each of the two years in the period ended April 30, 2024, including the related notes, and the financial highlights for each of the five years in the period ended April 30, 2024 (collectively referred to as the “financial statements”). In our opinion, the financial statements present fairly, in all material respects, the financial position of each of the Funds as of April 30, 2024, the results of each of their operations for the year then ended, and the changes in each of their net assets for each of the two years in the period ended April 30, 2024, and each of the financial highlights for each of the five years in the period ended April 30, 2024, in conformity with accounting principles generally accepted in the United States of America.
Basis for Opinions
These financial statements are the responsibility of the Funds’ management. Our responsibility is to express an opinion on the Funds’ financial statements based on our audits. We are a public accounting firm registered with the Public Company Accounting Oversight Board (United States) (PCAOB) and are required to be independent with respect to the Funds in accordance with the U.S. federal securities laws and the applicable rules and regulations of the Securities and Exchange Commission and the PCAOB.
We conducted our audits of these financial statements in accordance with the standards of the PCAOB. Those standards require that we plan and perform the audit to obtain reasonable assurance about whether the financial statements are free of material misstatement, whether due to error or fraud.
Our audits included performing procedures to assess the risks of material misstatement of the financial statements, whether due to error or fraud, and performing procedures that respond to those risks. Such procedures included examining, on a test basis, evidence regarding the amounts and disclosures in the financial statements. Our audits also included evaluating the accounting principles used and significant estimates made by management, as well as evaluating the overall presentation of the financial statements. Our procedures included confirmation of securities owned as of April 30, 2024 by correspondence with the custodian and transfer agent. We believe that our audits provide a reasonable basis for our opinions.
/s/PricewaterhouseCoopers LLP
Philadelphia, Pennsylvania
June 28, 2024
We have served as the auditor of one or more Asset Management Group of the Bank of Hawaii investment companies since 2010.
PACIFIC CAPITAL FUNDS
Shareholder Tax Information
(Unaudited)
The Funds are required by Subchapter M of the Internal Revenue Code, to advise their shareholders of the U.S. federal tax status of distributions received by the Funds’ shareholders in respect of such fiscal year.
The tax character of distributions paid during the year ended April 30, 2024 were as follows:
| | Ordinary
Income
Distributions | | Total
Taxable
Distributions | | Tax
Exempt
Distributions | | Total
Distributions
Paid* |
| Pacific Capital Tax-Free Securities Fund | $297,860 | | $297,860 | | $6,240,503 | | $6,538,363 |
| Pacific Capital Tax-Free Short Intermediate Securities Fund | 94,280 | | 94,280 | | 1,011,423 | | 1,105,703 |
| * | Distributions will not tie to Statements of Changes in Net Assets because distributions are recognized when actually paid for tax purposes. |
Dividends from net investment income and short-term capital gains are treated as ordinary income dividends for federal income tax purposes.
The percentage of qualified interest income related dividends not subject to withholding tax for non-resident aliens and foreign corporations for the Pacific Capital Tax-Free Securities Fund and the Pacific Capital Tax-Free Short Intermediate Securities Fund is 4.45% and 7.88%, respectively.
All designations are based on financial information available as of the date of this annual report and, accordingly, are subject to change. For each item, it is the intention of each Fund to designate the maximum amount permitted under the Internal Revenue Code of 1986, as amended, and the regulations thereunder.
Because the Funds’ fiscal year is not the calendar year, another notification will be sent with respect to calendar year 2024. The second notification, which will reflect the amount, if any, to be used by calendar year taxpayers on their U.S. federal income tax returns, will be made in conjunction with Form 1099-DIV and will be mailed in January 2025.
Foreign shareholders will generally be subject to U.S. withholding tax on the amount of their ordinary income dividends. They will generally not be entitled to a foreign tax credit or deduction for the withholding taxes paid by the Funds, if any.
In general, dividends received by tax-exempt recipients (e.g., IRAs and Keoghs) need not be reported as taxable income for U.S. federal income tax purposes. However, some retirement trusts (e.g., corporate, Keogh and 403(b)(7) plans) may need this information for their annual information reporting.
Shareholders are advised to consult their own tax advisers with respect to the tax consequences of their investment in the Funds.
PACIFIC CAPITAL FUNDS
Other Information
(Unaudited)
Proxy Voting
Policies and procedures that the Funds use to determine how to vote proxies relating to portfolio securities as well as information regarding how the Funds voted proxies relating to portfolio securities for the most recent 12-month period ended June 30 are available without charge, upon request, by calling (888) 678-6034 and on the Securities and Exchange Commission's (“SEC”) website at http://www.sec.gov.
Quarterly Portfolio Schedules
Each Fund files its complete schedule of portfolio holdings with the SEC for the first and third fiscal quarters of each fiscal year (quarters ended July 31 and January 31) as an exhibit to its reports on Form N-PORT. The Funds' portfolio holdings on Form N-PORT are available on the SEC's website at http://www.sec.gov.
Board Considerations with Respect to the Approval of the Continuation of the Investment Advisory Agreement with Asset Management Group of Bank of Hawaii
At an in-person meeting held on March 11-12, 2024 (the “Meeting”), the Board of Trustees (the “Board” or the “Trustees”) of FundVantage Trust (the “Trust”), including a majority of the Trustees who are not “interested persons” within the meaning of Section 2(a)(19) of the Investment Company Act of 1940, as amended (the “1940 Act”) (the “Independent Trustees”), unanimously approved the continuation of the Investment Advisory Agreement between the Asset Management Group of Bank of Hawaii (“AMG of BOH” or the “Adviser”) and the Trust (the “Agreement”) on behalf of the Pacific Capital Tax-Free Securities Fund (“Pacific Capital TF Fund”), Pacific Capital Tax-Free Short Intermediate Securities Fund (“Pacific Capital TFSI Fund”) and Pacific Capital U.S. Government Money Market Fund (“Pacific Capital MMF”) (together the “Pacific Capital Funds”). At the Meeting, the Board considered the continuation of the Agreement with respect to each Fund for an additional one-year period.
In determining whether to approve the Agreement, the Trustees, including the Independent Trustees, considered information provided by AMG of BOH in response to a request for information in accordance with Section 15(c) of the 1940 Act (the “AMG of BOH 15(c) Response”) regarding (i) the services performed or to be performed by AMG of BOH for the Pacific Capital Funds, (ii) the composition and qualifications of AMG of BOH’s portfolio management staff, (iii) any potential or actual material conflicts of interest which may arise in connection with the management of the Pacific Capital Funds, (iv) investment performance, (v) the financial condition of Bank of Hawaii, of which AMG of BOH is a separate division thereof, (vi) brokerage selection procedures (including soft dollar arrangements, if any), (vii) the procedures for allocating investment opportunities between the Pacific Capital Funds and other clients, (viii) results of any independent audit or regulatory examination, including any recommendations or deficiencies noted, (ix) any litigation, investigation or administrative proceeding which may have a material impact on AMG of BOH’s ability to service the Pacific Capital Funds, and (x) compliance with the Pacific Capital Funds’ investment objectives, policies and practices (including codes of ethics and proxy voting policies), federal securities laws and other regulatory requirements. In addition to the information in the AMG of BOH 15(c) Response, the Trustees received additional information at Board meetings throughout the year covering matters such as the performance of each Pacific Capital Fund compared against its Lipper Index and its benchmark; compliance with the Pacific Capital Funds’ investment objectives, policies, strategy and limitations; the compliance of portfolio management personnel with applicable codes of ethics; and AMG of BOH’s adherence to pricing procedures as the Pacific Capital Funds’ Valuation Designee appointed by the Board.
The Board considered additional information provided by representatives from AMG of BOH invited to participate in the Meeting regarding AMG of BOH’s history, performance, investment strategy, and compliance program. Representatives of AMG of BOH responded to questions from the Board. In addition to the foregoing information, the Trustees also considered other factors they believed to be relevant to considering the approval of the Agreement, including the specific matters discussed below. In their deliberations, the Trustees did not identify any particular information that was controlling, and different Trustees may have attributed different weights to the various factors. After deliberating, the Trustees determined that the overall arrangement between the Pacific Capital Funds and AMG of BOH, as provided by the terms of the Agreement, including the advisory fees under the Agreement, were fair and reasonable in light of the services provided, expenses incurred and such other matters as the Trustees considered relevant.
PACIFIC CAPITAL FUNDS
Other Information (Continued)
(Unaudited)
Based on the AMG of BOH 15(c) Response, the Trustees concluded that (i) the nature, extent and quality of the services provided (or to be provided) by AMG of BOH are appropriate and consistent with the terms of the Agreement, (ii) that the quality of those services has been, and continues to be, consistent with industry norms, (iii) the Pacific Capital Funds are likely to benefit from the provision of those services, (iv) AMG of BOH has sufficient personnel, with the appropriate skills and experience, to serve the Pacific Capital Funds effectively and has demonstrated its continuing ability to attract and retain qualified personnel, and (v) the satisfactory nature, extent, and quality of services currently provided to the Pacific Capital Funds is likely to continue under the Agreement.
The Trustees considered the investment performance for the Pacific Capital Funds (as applicable) and AMG of BOH. The Trustees reviewed historical performance charts which showed the performance of the Pacific Capital Funds as compared to their respective benchmark indices and Lipper categories for the one-year, three-year, five-year and ten-year periods ended December 31, 2023, as applicable. The Trustees considered the short-term and long-term performance of the Pacific Capital Funds, as applicable. The Trustees noted that they also considered performance reports provided at Board meetings throughout the year.
Pacific Capital Tax-Free Securities Fund. The Trustees noted that the Pacific Capital TF Fund’s Class Y shares underperformed the Bloomberg Hawaii Index for the one-year, three-year, five-year and ten-year periods ended December 31, 2023. They further noted that the Pacific Capital TF Fund’s Class Y shares outperformed the Lipper Other States Intermediate Municipal Debt Funds Median for the three-year, five-year and ten-year periods ended December 31, 2023, and underperformed for the one-year period ended December 31, 2023.
Pacific Capital Tax-Free Short Intermediate Securities Fund. The Trustees noted that the Pacific Capital TFSI Fund’s Class Y shares outperformed the Bloomberg 3 Year Hawaii Municipal Index for the one-year, three-year, five-year and ten-year periods ended December 31, 2023. They further noted that the Pacific Capital TFSI Fund’s Class Y shares outperformed the Lipper Other States Short Intermediate Municipal Debt Funds Median for the three-year period ended December 31, 2023, underperformed for the one-year and ten-year periods ended December 31, 2023, and performed in line for the five-year period ended December 31, 2023.
Pacific Capital U.S. Government Money Market Fund. The Trustees noted that the Pacific Capital MMF Fund had ceased operations during the period ended December 31, 2022 and therefore did not have relevant performance information to compare.
The Trustees concluded that the performance of each of the Pacific Capital Funds, as applicable, was within an acceptable range of performance relative to other mutual funds with similar investment objectives, strategies and policies based on the information provided at the Meeting.
The Trustees noted that the representatives of AMG of BOH had provided information regarding its advisory fees and an analysis of these fees in relation to the services provided to the Pacific Capital Funds and any other ancillary benefit resulting from AMG of BOH’s relationship with the Pacific Capital Funds.
The Trustees also reviewed information regarding the fees AMG of BOH charges to certain other clients and evaluated explanations provided by AMG of BOH as to differences in fees charged to the Pacific Capital Funds and other similarly managed accounts, where applicable. The Trustees also reviewed a peer comparison of advisory fees and total expenses for the Pacific Capital Funds versus those funds in the Pacific Capital Fund’s applicable Lipper category (the “Peer Group”). The Trustees concluded that the advisory fees and services provided by AMG of BOH are consistent with those of other advisers that manage mutual funds with investment objectives, strategies and policies similar to those of the Pacific Capital Funds as measured by the information provided by AMG of BOH.
The Board considered, among other data, the specific factors and related conclusion set forth below with respect to the Pacific Capital Funds:
Pacific Capital Tax-Free Securities Fund. The Trustees noted that the contractual advisory fee and net total expense ratio for the Pacific Capital TF Fund’s Class Y shares were lower than the median of the contractual advisory fee and net total expense ratio for those funds in its Peer Group.
PACIFIC CAPITAL FUNDS
Other Information (Continued)
(Unaudited)
Pacific Capital Tax-Free Short Intermediate Securities Fund. The Trustees noted that the contractual advisory fee and net total expense ratio for the Pacific Capital TFSI Fund’s Class Y shares were lower than the median of the contractual advisory fee and net total expense ratio for those funds in its Peer Group.
Pacific Capital U.S. Government Money Market Fund. The Trustees noted that the Pacific Capital MMF Fund had ceased operations during the period ended December 31, 2022 and therefore did not have relevant fee and expense information to compare.
The Trustees considered the costs of the services provided by AMG of BOH, the compensation and benefits received by AMG of BOH in providing services to the Pacific Capital Funds, the profitability and certain additional information related to the financial condition of Bank of Hawaii, of which AMG of BOH is a separate division thereof. In addition, the Trustees considered any direct or indirect revenues received by affiliates of AMG of BOH.
The Trustees considered the extent to which economies of scale would be realized relative to fee levels as the Pacific Capital Funds grow, and whether the advisory fee levels reflect those economies of scale for the benefit of shareholders. The Trustees considered and determined that economies of scale for the benefit of shareholders should be achieved if assets of the Pacific Capital Funds increase because fixed expenses will be spread across a larger asset base. The Trustees also noted that the Pacific Capital Funds’ advisory fees do not include “breakpoint” reductions in the advisory fee rates at specific asset levels but that AMG of BOH has contractually agreed to waive fees and/or reimburse certain expenses of the Pacific Capital Funds for the benefit of shareholders.
At the Meeting, after consideration of all the factors and taking into consideration the information presented, the Board, including the Independent Trustees, unanimously approved the continuation of the AMG of BOH Agreement for an additional one-year period. In arriving at their decision, the Trustees did not identify any single factor as controlling, but made their determination in light of the information presented to them.
PACIFIC CAPITAL FUNDS
Privacy Notice
(Unaudited)
The privacy of your personal financial information is extremely important to us. When you open an account with us, we collect a significant amount of information from you in order to properly invest and administer your account. We take very seriously the obligation to keep that information private and confidential, and we want you to know how we protect that important information.
We collect nonpublic personal information about you from applications or other forms you complete and from your transactions with us or our affiliates. We do not disclose information about you, or our former clients, to our affiliates or to service providers or other third parties, except as permitted by law. We share only the information required to properly administer your accounts, which enables us to send transaction confirmations, monthly or quarterly statements, financials and tax forms. Even within FundVantage Trust and its affiliated entities, a limited number of people who actually service accounts will have access to your personal financial information. Further, we do not share information about our current or former clients with any outside marketing groups or sales entities.
To ensure the highest degree of security and confidentiality, FundVantage Trust and its affiliates maintain various physical, electronic and procedural safeguards to protect your personal information. We also apply special measures for authentication of information you request or submit to us on our web site.
If you have questions or comments about our privacy practices, please call us at (888) 678-6034.
PACIFIC CAPITAL FUNDS
Fund Management
(Unaudited)
FundVantage Trust (the “Trust”) is governed by a Board of Trustees (the “Trustees”). The primary responsibility of the Trustees is to represent the interest of the Trust's shareholders and to provide oversight management of the Trust.
The following tables present certain information regarding the Board of Trustees and officers of the Trust. None of the Trustees are an “interested person” of the Trust, the Adviser, another investment adviser of a series of the Trust, or Foreside Funds Distributors LLC, the principal underwriter of the Trust (“Underwriter”), within the meaning of the 1940 Act and each Trustee is referred to as an “Independent Trustee” and is listed under such heading below. Employees of certain service providers to the Trust serve as officers of the Trust; such persons are not compensated by the Funds. The address of each Trustee and officer as it relates to the Trust's business is 103 Bellevue Parkway, 2nd Floor, Wilmington, DE 19809.
The Statement of Additional Information for the Funds contain additional information about the Trustees and is available, without charge, upon request by calling (888) 678-6034.
Name
and Date of Birth | Position(s)
Held
with Trust | Term of Office
and Length of
Time Served | Principal Occupation(s)
During Past Five Years | Number of
Funds in
Trust
Complex
Overseen
by
Trustee | Other
Directorships
Held by
Trustee |
| INDEPENDENT TRUSTEES |
ROBERT J. CHRISTIAN
Date of Birth: 2/49 | Trustee | Shall serve until
death, resignation
or removal.
Trustee since
2007. Chairman
from 2007 until
September 30,
2019. | Retired since February 2006; Executive Vice
President of Wilmington Trust Company from
February 1996 to February 2006; President of
Rodney Square Management Corporation
(“RSMC”) (investment advisory firm) from 1996
to 2005; Vice President of RSMC from 2005 to 2006. | 29 | Optimum Fund
Trust
(registered
investment
company with
6 portfolios);
Third Avenue
Trust
(registered
investment
company with
4 portfolios);
Third Avenue
Variable Series
Trust
(registered
investment
company with
1 portfolio);
Polen Credit
Opportunities
Fund (registered
investment
company). |
PACIFIC CAPITAL FUNDS
Fund Management (Continued)
(Unaudited)
Name
and Date of Birth | Position(s)
Held
with Trust | Term of Office
and Length of
Time Served | Principal Occupation(s)
During Past Five Years | Number of
Funds in
Trust
Complex
Overseen
by
Trustee | Other
Directorships
Held by
Trustee |
IQBAL MANSUR
Date of Birth: 6/55 | Trustee | Shall serve until
death, resignation
or removal.
Trustee since
2007. | Retired since September 2020; Professor of
Finance, Widener University from 1998 to August 2020; Member of the Investment Committee of ChristianaCare Health System from January 2022 to present. | 29 | Third Avenue
Trust
(registered
investment
company with
4 portfolios);
Third Avenue
Variable Series
Trust
(registered
investment
company with
1 portfolio);
Polen Credit
Opportunities
Fund (registered
investment
company). |
NICHOLAS M.
MARSINI, JR.
Date of Birth: 8/55 | Trustee and
Chairman of
the Board | Shall serve until
death, resignation
or removal.
Trustee since
2016. Chairman
since October 1,
2019. | Retired since March 2016. President of PNC Bank Delaware from June 2011 to March 2016;
Executive Vice President of Finance of BNY Mellon from July 2010 to January 2011; Executive Vice President and Chief Financial Officer of PNC Global Investment Servicing from September 1997 to July 2010. | 29 | Brinker Capital
Destinations
Trust
(registered
investment
company with
10 portfolios);
Third Avenue
Trust
(registered
investment
company with
4 portfolios);
Third Avenue
Variable Series
Trust
(registered
investment
company with
1 portfolio);
Polen Credit
Opportunities
Fund (registered
investment
company). |
PACIFIC CAPITAL FUNDS
Fund Management (Continued)
(Unaudited)
Name
and Date of Birth | Position(s)
Held
with Trust | Term of Office
and Length of
Time Served | Principal Occupation(s)
During Past Five Years | Number of
Funds in
Trust
Complex
Overseen
by
Trustee | Other
Directorships
Held by
Trustee |
NANCY B. WOLCOTT
Date of Birth: 11/54 | Trustee | Shall serve until
death, resignation
or removal.
Trustee since
2011. | Retired since May 2014; EVP, Head of GFI Client Service Delivery, BNY Mellon from January 2012 to May 2014; EVP, Head of US Funds Services, BNY Mellon from July 2010 to January 2012; President of PNC Global Investment Servicing from 2008 to July 2010; Chief Operating Officer of PNC Global Investment Servicing from 2007 to 2008; Executive Vice President of PFPC Worldwide Inc. from 2006 to 2007. | 29 | Lincoln
Variable
Trust
Products Trust
(registered
investment
company with
97 portfolios);
Third Avenue
Trust
(registered
investment
company with
4 portfolios);
Third Avenue
Variable Series
Trust
(registered
investment
company with
1 portfolio);
Polen Credit
Opportunities
Fund (registered
investment
company). |
STEPHEN M. WYNNE
Date of Birth: 1/55 | Trustee | Shall serve until
death, resignation
or removal.
Trustee since
2009. | Retired since December 2010; Chief Executive
Officer of US Funds Services, BNY Mellon Asset Servicing from July 2010 to December 2010; Chief Executive Officer of PNC Global Investment Servicing from March 2008 to July 2010; President, PNC Global Investment Servicing from 2003 to 2008. | 29 | Copeland Trust
(registered
investment
company with
3 portfolios);
Third Avenue
Trust
(registered
investment
company with
4 portfolios);
Third Avenue
Variable Series
Trust
(registered
investment
company with
1 portfolio);
Polen Credit
Opportunities
Fund (registered
investment
company). |
PACIFIC CAPITAL FUNDS
Fund Management (Concluded)
(Unaudited)
Name
and Date of Birth | Position(s) Held
with Trust | Term of Office
and Length of
Time Served | Principal Occupation(s)
During Past Five Years |
| EXECUTIVE OFFICERS |
JOEL L. WEISS
Date of Birth: 1/63 | President and Chief
Executive Officer | Shall serve until death,
resignation or removal. Officer
since 2007. | President of JW Fund Management LLC since June 2016; Vice President and Managing Director of BNY Mellon Investment Servicing (US) Inc. and predecessor firms from 1993 to June 2016. |
CHRISTINE S. CATANZARO
Date of Birth: 8/84 | Treasurer and Chief Financial Officer | Shall serve until death,
resignation or removal. Officer
since 2022. | Financial Reporting Consultant from October 2020 to September 2022; Senior Manager, Ernst & Young LLP from March 2013 to October 2020. |
T. RICHARD KEYES
Date of Birth: 1/57 | Vice President
| Shall serve until death,
resignation or removal. Officer
since 2016. | President of TRK Fund Consulting LLC since July 2016; Head of Tax — U.S. Fund Services of BNY Mellon Investment Servicing (US) Inc. and predecessor firms from February 2006 to July 2016. |
GABRIELLA
MERCINCAVAGE
Date of Birth: 6/68 | Assistant Treasurer | Shall serve until death,
resignation or removal. Officer
since 2019. | Fund Administration Consultant since January 2019; Fund
Accounting and Tax Compliance Accountant to financial
services companies from November 2003 to July 2018. |
VINCENZO A. SCARDUZIO
Date of Birth: 4/72 | Secretary | Shall serve until death,
resignation or removal. Officer
since 2012. | Director and Senior Vice President Regulatory Administration of The Bank of New York Mellon and predecessor firms since 2001. |
JOHN CANNING
Date of Birth: 11/70 | Chief Compliance
Officer and Anti-Money
Laundering Officer | Shall serve until death,
resignation or removal. Officer
since 2022. | Director of Chenery Compliance Group, LLC from March 2021 to present; Senior Consultant of Foreside Financial Group from August 2020 to March 2021; Chief Compliance Officer & Chief Operating Officer of Schneider Capital Management LP from May 2019 to July 2020; Chief Operating Officer and Chief Compliance Officer of Context Capital Partners, LP from March 2016 to March 2018 and February 2019, respectively. |
Investment Adviser
Asset Management Group of Bank of Hawaii
111 South King Street, 4th Floor,
Honolulu, HI 96813
Administrator
The Bank of New York Mellon
103 Bellevue Parkway
Wilmington, DE 19809
Transfer Agent
BNY Mellon Investment Servicing (US) Inc.
500 Ross Street, 154-0520
Pittsburgh, PA 15262
Principal Underwriter
Foreside Funds Distributors LLC
Three Canal Plaza, Suite 100
Portland, ME 04101
Custodian
The Bank of New York Mellon
240 Greenwich Street
New York, NY 10286
Independent Registered Public Accounting Firm
PricewaterhouseCoopers LLP
Two Commerce Square, Suite 1800
2001 Market Street
Philadelphia, PA 19103-7042
Legal Counsel
Troutman Pepper Hamilton Sanders LLP
3000 Two Logan Square
18th and Arch Streets
Philadelphia, PA 19103
| Polen Growth Fund |
| Polen Global Growth Fund |
| Polen International Growth Fund |
| Polen U.S. Small Company Growth Fund |
| Polen Emerging Markets Growth Fund |
| Polen U.S. SMID Company Growth Fund |
| Polen Global SMID Company Growth Fund |
| Polen Bank Loan Fund |
Polen U.S. High Yield Fund
(formerly, Polen Upper Tier High Yield Fund) |
| Polen Opportunistic High Yield Fund |
of
FundVantage Trust
| Institutional Class |
| Investor Class |
| Class Y |
ANNUAL REPORT
April 30, 2024
IMPORTANT NOTICE – UPCOMING CHANGES TO ANNUAL & SEMI-ANNUAL REPORTS
The Securities and Exchange Commission (the “SEC”) has adopted rule and form amendments that will result in changes to the design and delivery of annual and semi-annual shareholder reports (“Reports”). Beginning in July 2024, Reports will be streamlined to highlight key information (“Redesigned Reports”). Certain information currently included in the Reports, including financial statements, will no longer appear in the Redesigned Reports but will be available online, delivered free of charge to shareholders upon request, and filed with the SEC.
If you previously elected to receive the Fund's Reports electronically, you will continue to receive the Redesigned Reports electronically. Otherwise, you will receive paper copies of the Fund's Redesigned Reports via USPS mail for all Reports transmitted after July 2024. If you would like to receive the Fund's Redesigned Reports (and/or other communications) electronically instead of by mail, please contact your financial advisor or, if you are a direct investor, please call 1-888-678-6024.
This report is submitted for the general information of shareholders and is not authorized for distribution to prospective investors unless preceded or accompanied by a current prospectus.
POLEN CAPITAL MANAGEMENT
Annual Investment Adviser's Report
April 30, 2024
(Unaudited)
Dear Shareholders,
For a good portion of the reporting period, against all odds and despite a confluence of economic, financial, and geopolitical headwinds, the global economy not only averted a highly anticipated recession but showcased remarkable resiliency. Against this backdrop, market sentiment across equity and leveraged credit market investors could be considered cautiously optimistic. Equities witnessed a bullish trend, driven by relatively strong corporate earnings and positive economic indicators. Although faced with continued economic uncertainty and price volatility, leveraged credit markets saw increased demand as investors sought to lock in compelling all-in yields.
While some economies averted a gradual economic slowdown, China was much discussed as it endured a challenging backdrop, with economic readings indicating a more conservative growth outlook. U.S. markets performed better than expected, with robust labor market conditions, solid consumer spending, and healthy corporate revenues and profit margins despite an anticipated economic downturn. Geopolitical conflicts ongoing in Ukraine and the war between Israel and Hamas brought disruptions in various regions and headwinds for the financial and energy sectors, prompting investor flights to safety.
As fundamental, bottom-up-driven investors, current environment conditions reinforce our discipline and commitment to our investment process across asset classes and our long-term mindset.
Look Back on Equity Markets
During 2023, we witnessed a return to rewarding robust fundamentals in developed equity markets like the U.S., with relatively strong corporate earnings and a favorable slate of economic indicators. On a global level, the period was heavily influenced by macroeconomic headlines, the uncertain trajectory for economic growth, shifting global inflation dynamics, interest rates, and the subsequent impact on financial markets. Outside of China, we saw some emerging countries display impressive growth, reinforcing our view that emerging markets will be more prominent in driving economic growth in the years ahead.
A duration-driven sell-off ensued in September 2023, attributed to growing investor concern about the sustainability of the economic recovery. As the post-COVID recovery matured, investors began questioning the duration of growth rates. Building inflationary pressures due to supply chain disruptions, labor shortages, and rising commodity prices led investors to question the potential impact of higher inflation on corporate profits and the overall economy. As 2023 came to a close, a few critical macroeconomic events helped trigger a broad-based U.S. equity rally, including cooling inflation, a more dovish stance from the U.S. Federal Reserve (“Fed”) on the path of interest rates, and better-than-expected corporate earnings and U.S. GDP results. Low-quality businesses led this rally.
In many ways, the start of 2024 marked a continuation of the market dynamics already in place at the end of 2023. The rally continued unabated into the first quarter, with much of the same high-momentum, highly cyclical leadership witnessed in 2023. This optimism emanated globally, particularly thoughts that cooling inflation would cause interest rates to retreat to more normal levels. Despite softening inflation data, the Fed, the European Central Bank, and the Bank of England left rates unchanged. Given our high-quality orientation, this low “risk-on” environment persisted into 2024, presenting headwinds for quality strategies such as ours.
The market enthusiasm at the start of 2024, spurred by possible rate cuts, a more likely soft landing, and all things generative artificial intelligence-related, gave way to weakness in April as hopes dimmed on the likelihood of near-term rate cuts, potentially not until November 2024. As the reporting period came to a close, interest rate expectations yet again drove equity market returns. Consumer Price Index data over the Fed target shaped market expectations for interest rate cuts, with the first cuts now expected in November 2024. These interest rate expectations impacted equities negatively, with lower-quality businesses suffering the most.
Look Back on Leveraged (High Yield) Credit Markets
In 2023, leveraged (high yield) credit markets demonstrated resiliency despite unrelenting geopolitical and macroeconomic uncertainty. At the onset of last year, prospects of a highly anticipated recession weighed on sentiment. Markets remained optimistically cautious and were encouraged as the prospects of an economic “soft landing” materialized. Fed policy decisions intended to curb inflation and stimulate economic growth were crucial in shaping high yield bond market performance during the past year. Most notably, benign inflation and dovish Fed rhetoric helped drive interest rates meaningfully lower, which benefited high yield bonds, especially in the fourth calendar quarter "Q4" 2023. Further, credit spreads tightened for high yield bonds and leveraged loans in connection with better-than-expected earnings and resilient economic growth. Credit volatility subsided throughout 2023 despite a brief uptick in October. Despite this volatility in credit spreads, 2023 reached a conciliatory close, with both high yield bonds and leveraged loans producing significant gains.
In 2023, high yield bonds outperformed their floating-rate peers. However, much of this outperformance came in the last two months of 2023, as falling U.S. Treasury yields and economic growth fueled a rally in high yield bond prices. The rate declines toward the end of 2023 prompted many leveraged credit issuers to capitalize on lower interest costs by refinancing existing debt in early 2024. This dynamic was prevalent across ratings tiers and brought issuers of lower-rated credits back to the primary market. Open capital
POLEN CAPITAL MANAGEMENT
Annual Investment Adviser’s Report (Concluded)
April 30, 2024
(Unaudited)
markets allowed issuers to extend maturities given healthy investor demand for new issuance, which provided much-needed breathing room. While default activity increased in 2023, default rates in the high yield bond and leveraged loan markets during that year remained below their historical averages of approximately 3%.
Going Forward
As 2024 continues, we remain optimistic about the future and anticipate a vast opportunity set for investors across the equity and credit spectrum. Yet, we expect the backdrop to remain highly uncertain amid ongoing geopolitical challenges, raising the possibility of elevated bouts of volatility.
On the equity side, while market sentiment has markedly improved in recent months, the consensus now expects a soft landing and stabilization of the interest rate environment.
Only a few months ago, the consensus called for rates to remain “higher for longer,” and expectations for imminent recession were not uncommon. Regardless of the near-term direction of the global economy, we aim to continue to invest in what we view as more predictable, highly competitively advantaged growth businesses that can drive earnings growth to deliver long-term returns in line with our investment goals.
We believe discerning investors should favor an active approach, as we forecast a wide dispersion of performance outcomes between what we believe to be high-quality and low-quality companies. Our research and experience tell us that high-quality, innovative businesses that re-invest in their futures, develop disruptive technologies, and open new markets are compelling factors that could determine a business's long-term success.
On the leveraged credit market side, markets ended 2023 on a high note, which so far has extended into 2024, albeit at a more subdued pace. Both the high yield bond and leveraged loan markets have ground tighter in the face of increasing U.S. Treasury yields and continued domestic and geopolitical challenges. We expect that the upcoming U.S. presidential election will likely influence markets as the year progresses. So far this year, aggregate leveraged credit market fundamentals remain healthy. Although we anticipate volatility for the remainder of the year, our analysis leads us to believe that current yields are compelling.
We remain committed to our long-term approach despite the temptation to ride short trends or invest in low-quality equity or credit without attention to the underlying fundamentals. We continue to seek compelling investment opportunities through our active investment approach. Thank you for your continued support and for placing your trust in us.
This content is being provided for informational purposes only. Although the information and any opinions or views given have been obtained from or based on sources believed to be reliable, no warranty or representation is made as to their correctness, completeness or accuracy. Opinions, estimates, forecasts, and statements of financial market trends that are based on current market conditions constitute the judgment of the investment adviser and are subject to change without notice, including any forward-looking estimates or statements. The views and strategies described may not be suitable for all clients. References to specific securities, asset classes and financial markets are for illustrative purposes only and are not intended to be, and should not be interpreted as, recommendations. This disclosure does not identify all the risks (direct or indirect) or other considerations which might be material when entering any financial transaction. The views and strategies described may not be suitable for all clients.
Duration-driven sell-off: A duration-driven sell-off is a market occurrence characterized by a prolonged period of declining asset prices, typically driven by changes in market sentiment and investor behavior.
POLEN GROWTH FUND
Annual Investment Adviser's Report
April 30, 2024
(Unaudited)
Performance Summary:
• For much of the reporting period and despite a confluence of economic, financial, and geopolitical headwinds, the global economy not only averted a highly anticipated recession but showcased resilience. Against this backdrop, market sentiment could be considered cautiously optimistic as equities were supported by relatively robust corporate earnings and a positive slate of economic indicators.
• While valuations appear to be creeping higher, we have found opportunities to add a new holding and reallocate weightings, aiming to position the Polen Growth Fund (the “Fund”) for continued long-term, mid-teens-or-better earnings growth. Historically, earnings growth has driven our long-term investment returns, and we believe it will continue to drive future returns. We are proud of the stability of that earnings growth over many different market cycles and environments.
• For the fiscal year ended April 30, 2024, the Fund’s institutional share class returned 24.80% net of fees versus the Russell 1000® Growth Index, which returned 31.80%, and the S&P 500® Index, which returned 22.66%.
The performance data quoted represents past performance and is not a guarantee of future results. Investment return and principal value of an investment will fluctuate so that an investor's shares, when redeemed, may be worth more or less than their original cost. Current performance may be lower or higher than the performance information quoted. To obtain performance information current to the most recent month-end, please call 1-888-678-6024.
Top Contributors:
During the period, the top absolute contributors to the Fund’s performance were Amazon, Netflix, and Alphabet.
• Amazon was our top absolute contributor as the company reported attractive earnings, heavily driven by profit margin expansion, as we expected. Amazon is the Fund’s largest position. Much of our investment thesis is based on solid and durable earnings growth from its three biggest businesses (e-commerce, Amazon Web Services, and advertising) and disciplined expense management that has supported robust margin expansion and earnings growth. It was only about a year ago that Amazon’s margins bottomed at 1.9%. As of the end of the period, they are back to roughly 8%, and we think they can expand significantly from here.
• Netflix has made meaningful progress on monetizing shared passwords and laying the foundation for consumer choice, although the ramp in advertising tier subscribers remains in the beginning stages. The low-hanging fruit may already have been picked on password sharing efforts, but our research shows there should be long tails of revenue and free cash flow growth. In our opinion, Netflix remains the most advantaged and profitable streaming service with opportunities to continue adding subscribers and raising prices as it demonstrates more value to consumers over time.
• Alphabet has seen reaccelerating growth in its core search business as well as in its YouTube and Cloud segments. Importantly, after some initial misgivings from investors in early 2023, we believe Alphabet is making significant progress integrating Artificial Intelligence into its offerings that we expect will drive better user engagement and return on advertising. More recently, Alphabet announced it is initiating a dividend and would be buying back an additional $70 billion worth of stock—both of which were very well received by the market.
Top Detractors:
Illumina, PayPal, and Nike were the top absolute detractors for the period.
• Illumina’s core business is growing slower than we expected, most likely due to macroeconomic reasons, but we also are seeing increased competition, especially in China. The launch of the company’s new sequencing technology has not been enough to overcome the macro weakness, and this may continue to be the case for some time if the macro environment weakens further. Illumina’s new CEO recently stated that he expects 2024 to be another year of flattish growth. Competition has also increased in Western markets, particularly for mid-throughput sequencers that need to be monitored. As such, the Fund exited the from the position in 4Q23.
• PayPal is one of the largest digital wallet companies in the world, with 400 million users and 35 million merchants. However, our research shows it has been losing market share over the last 18 months as management has been very slow to innovate and bring a true one-touch checkout experience to its customers. Friction in the checkout experience can be annoying to buyers and
POLEN GROWTH FUND
Annual Investment Adviser’s Report (Concluded)
April 30, 2024
(Unaudited)
financially problematic for merchants, leaving lost sales on the table. Apple Pay (and others) has been winning market share from PayPal as it is a true one-touch checkout experience and is highly integrated into iPhones. We believed that PayPal had finally upgraded its technology last summer and should have been able to deploy it to their merchant customers quickly. This has proven too optimistic, and based on management’s commentary, we now expect it may take up to another two years for full deployment. As we see it, this is far too long given the competitive landscape, and as such, further market share losses feel inevitable. The Fund exited the position in 1Q24.
• Nike has been challenged over the past few years because of an over-inventory position in North American apparel that required heavy discounting, and separately, the rolling COVID-19 lockdowns and weak demand in China. Both of these issues are in the rearview mirror, but the overall weak consumer environment and heavy discounting from competitors (who themselves have too much inventory) is making the near-term revenue growth picture still a bit opaque. With that said, the Fund increased its position in 1Q24 as we expect to see an acceleration in earnings growth as transient cost headwinds subside and a wave of new product innovations in footwear hit the market.
The Russell 1000® Growth Index is a market capitalization weighted index that measures the performance of the large-cap growth segment of the U.S. equity universe. It includes Russell 1000® Index companies with higher price-to-book ratios and higher forecasted growth values. The index is maintained by the FTSE Russell, a subsidiary of the London Stock Exchange Group. The S&P 500® Index is a market capitalization weighted index that measures 500 common equities that are generally representative of the U.S. stock market. The index is maintained by S&P Dow Jones Indices. It is impossible to invest directly in an index. The performance of an index does not reflect any transaction costs, management fees, or taxes.
The volatility, performance, and other characteristics of the indices referenced may be materially different from the Fund. In addition, the Fund’s holdings may be materially different from those within the index. Indices are unmanaged and one cannot invest directly in an index. This letter is intended to assist shareholders in understanding how the Fund performed during the fiscal year ended April 30, 2024 and reflects the views of the investment adviser at the time of this writing. Of course, these views may change and do not guarantee the future performance of the Fund or the markets.
This content is being provided for informational purposes only. Although the information and any opinions or views given have been obtained from or based on sources believed to be reliable, no warranty or representation is made as to their correctness, completeness or accuracy. Opinions, estimates, forecasts, and statements of financial market trends that are based on current market conditions constitute the judgment of the investment adviser and are subject to change without notice, including any forward-looking estimates or statements.
Portfolio composition is subject to change. The current and future portfolio holdings of the Fund are subject to investment risk. The investment return and principal value of an investment in the Fund will fluctuate so that an investor’s shares, when redeemed, may be worth more or less than their original cost.
The information provided in this document should not be construed as a recommendation to purchase or sell any particular security. The securities discussed do not necessarily represent the entire portfolio. It should not be assumed that any of the securities transactions or holdings discussed were or will prove to be profitable or that any future investment recommendations will equal the investment performance of the securities discussed herein. For a complete list of the investment adviser’s past specific recommendations and holdings and a list of current holdings as of the current quarter end, please contact info@polencapital.com.
The views and strategies described may not be suitable for all clients. This disclosure does not identify all the risks (direct or indirect) or other considerations which might be material when entering any financial transaction.
Free cash flow: represents the cash that a company generates after accounting for cash outflows to support operations and maintain its capital assets.
POLEN GROWTH FUND
Annual Report
Performance Data
April 30, 2024
(Unaudited)
Comparison of Change in Value of $100,000 (investment minimum) Investment in Polen Growth Fund Institutional Class Shares vs Russell 1000® Growth Index and S&P 500® Index
| Average Annual Total Returns for the Years Ended April 30, 2024 |
| | 1 Year | | 3 Years | | 5 Years | | 10 Years |
| Institutional Class | 24.80% | | -0.25% | | 10.07% | | 13.59% |
| S&P 500® Index | 22.66% | | 8.06% | | 13.18% | | 12.40% |
| Russell 1000® Growth Index | 31.80% | | 8.47% | | 16.44% | | 15.47% |
The performance data quoted represents past performance and does not guarantee future results. Current performance may be lower or higher. Performance data current to the most recent month-end may be obtained by calling 1-888-678-6024. The investment return and principal value of an investment will fluctuate so that shares, when redeemed, may be worth more or less than their original cost. The graph and table do not reflect the deduction of taxes that a shareholder would pay on Fund distributions or the redemption of Fund shares.
POLEN GROWTH FUND
Performance Data (Concluded)
April 30, 2024
(Unaudited)
Comparison of Change in Value of $10,000 Investment in Polen Growth Fund Investor Class Shares vs Russell 1000® Growth Index and S&P 500® Index
| Average Annual Total Returns for the Years Ended April 30, 2024 |
| | 1 Year | | 3 Years | | 5 Years | | 10 Years |
| Investor Class | 24.51% | | -0.50% | | 9.80% | | 13.30% |
| S&P 500® Index | 22.66% | | 8.06% | | 13.18% | | 12.40% |
| Russell 1000® Growth Index | 31.80% | | 8.47% | | 16.44% | | 15.47% |
The performance data quoted represents past performance and does not guarantee future results. Current performance may be lower or higher. Performance data current to the most recent month-end may be obtained by calling 1-888-678-6024. The investment return and principal value of an investment will fluctuate so that shares, when redeemed, may be worth more or less than their original cost. The graph and table do not reflect the deduction of taxes that a shareholder would pay on Fund distributions or the redemption of Fund shares.
The Fund’s “Total Annual Fund Operating Expenses” as stated in the current prospectus dated September 1, 2023, as supplemented, are 0.98% for the Institutional Class shares and 1.23% for the Investor Class shares, respectively, of the Fund’s average daily net assets, which may differ from the actual expenses incurred by the Fund for the period covered by this report. Polen Capital Management, LLC (“PCM” or the “Adviser”) has contractually agreed to reduce its investment advisory fee and/or reimburse certain expenses of the Fund to the extent necessary to ensure that the Fund’s total operating expenses (excluding taxes, fees and expenses attributable to a distribution or service plan adopted by the Trust, interest, extraordinary items, “Acquired Fund Fees and Expenses” and brokerage commissions) do not exceed 1.00% (on an annual basis) with respect to the Fund’s average daily net assets (the “Expense Limitation”). The Expense Limitation will remain in place until August 31, 2024 unless the Board of Trustees (“Board of Trustees”) of FundVantage Trust (the “Trust”) approves its earlier termination. The Adviser is entitled to recover, subject to approval by the Board of Trustees, any fees waived and/or expenses reimbursed by the Adviser on or after January 1, 2017 with respect to the Fund for a three (3) year period following the date of such fee waiver and/or expense reimbursement. The Adviser is permitted to seek reimbursement from the Fund, subject to certain limitations, for fees it waived and Fund expenses it paid to the extent the total annual fund operating expenses do not exceed the limits described above or any lesser limits in effect at the time of reimbursement. No recoupment will occur unless the Fund’s expenses are below the Expense Limitation amount. Total returns would be lower had such fees and expenses not been waived and/or reimbursed.
The Fund evaluates its performance as compared to that of the Standard & Poor’s 500® (“S&P 500®”) Index and the Russell 1000® Growth Index. The S&P 500® Index is a widely recognized, unmanaged index of 500 common stocks which are generally representative of the U.S. stock market as a whole. The Russell 1000® Growth Index is an unmanaged index that measures the performance of the large-cap growth segment of the U.S. equity universe. It includes those Russell 1000® Growth Index companies with higher price-to-book ratios and higher forecasted growth values. It is impossible to invest directly in an index.
All mutual fund investing involves risk, including possible loss of principal. The Fund is non-diversified, which means that a large portion of the Fund’s assets may be invested in one or few companies or sectors. The Fund could fluctuate in value more than a diversified fund.
POLEN GLOBAL GROWTH FUND
Annual Investment Adviser's Report
April 30, 2024
(Unaudited)
Performance Summary:
• For a good portion of the reporting period and despite a confluence of economic, financial, and geopolitical headwinds, the global economy not only averted a highly anticipated recession but showcased remarkable resiliency. Against this backdrop, market sentiment could be considered cautiously optimistic as equities were supported by relatively strong corporate earnings and a positive slate of economic indicators.
• Regardless of the near-term direction of the global economy, our Polen Global Growth Fund’s (the “Fund’s”) companies are performing well, and we expect them to continue to perform well through the cycle. We believe the Fund’s valuation is currently fair for what we consider to be a collection of some of the best companies in the world. We believe these companies are well- positioned to deliver mid-teens underlying earnings per share growth, in the aggregate, for many years.
• For the fiscal year ended April 30, 2024, the Fund’s institutional share class returned 17.00% net of fees versus the MSCI All Country World® Index, which returned 17.99%.
The performance data quoted represents past performance and is not a guarantee of future results. Investment return and principal value of an investment will fluctuate so that an investor's shares, when redeemed, may be worth more or less than their original cost. Current performance may be lower or higher than the performance information quoted. To obtain performance information current to the most recent month-end, please call 1-888-678-6024.
Top Contributors:
During the period, the top absolute contributors to the Fund’s performance were Amazon, Alphabet, and ICON.
• Amazon was our top absolute contributor as the company reported attractive earnings, heavily driven by profit margin expansion, as we expected. Amazon is our largest position. Much of our investment thesis is based on solid and durable earnings growth from its three biggest businesses (e-commerce, Amazon Web Services, and advertising) and disciplined expense management that has supported robust margin expansion and earnings growth. It was only about a year ago that Amazon’s margins bottomed at 1.9%. As of the end of the period, they are back to roughly 8%, and we think they can expand significantly from here.
• Alphabet has seen reaccelerating growth in its core search business as well as in its YouTube and Cloud segments. Importantly, after some initial misgivings from investors in early 2023, We believe Alphabet is making significant progress integrating AI into its offerings that we expect will drive better user engagement and return on advertising. More recently, Alphabet announced it is initiating a dividend and would be buying back an additional $70 billion worth of stock—both of which were very well received by the market.
• ICON PLC is a leading contract research organization (CRO) that provides research and testing facilities to global pharmaceutical companies of all sizes. The company’s Q423 earnings were largely in line and management’s guidance for FY24 was generally betterthan expected with the company forecasting revenue growth in the mid-single digit range and earnings growth in the mid-teens range. The company, which benefits from significant scale advantages, continues to win new business, and growth in its backlog has accelerated.
Top Detractors:
Align Technology, Nestle, and Aon were the top absolute detractors for the period.
• Align Technology ("Align") is the leader in clear orthodontic aligners, which have been taking market share from the existing standard wire-and-bracket braces. The business has been challenged over the past year as Invisalign clear aligners may be viewed as a big-ticket consumer discretionary item largely focused on adults. So, a pressured consumer can defer this purchase for some time. In the face of a potentially worsening macro environment and low visibility into Align’s future earnings growth, we decided to eliminate the position in Q4 2023. With that said, Align remains a dynamic growth business and one we’ll continue to follow because the issues facing the company today seem to have nothing to do with competition.
• Nestlé has done a great job in recent years divesting low margin and low growth businesses to lift its overall group margins. However, the company seems to be hitting a point of diminishing returns on strategies to support margin expansion. This dynamic coincides with increasing secular headwinds as advertising and distribution, previously an insurmountable moat of Nestlé’s, are
POLEN GLOBAL GROWTH FUND
Annual Investment Adviser’s Report (Concluded)
April 30, 2024
(Unaudited)
being democratized. While Nestlé has served as a great steady growth exposure in the Fund for many years, it no longer meets our return hurdle and as such we eliminated the position in 1Q24.
• Aon ended their fiscal year 2023 with high-single digit organic revenue growth and low double digit profit growth, in line with our long-term expectations. Management is guiding for mid-single digit or better organic revenue growth for fiscal year 2024 with operating margins that are expected to expand as well. Additionally, Aon’s acquisition of NFP brings the company into the middle- market insurance brokerage space for the first time where their brand and scale should be advantageous.
The MSCI ACWI Index is a market capitalization weighted equity index that measures the performance of large and mid-cap segments across developed and emerging market countries. The index is maintained by Morgan Stanley Capital International. It is impossible to invest directly in an index. The performance of an index does not reflect any transaction costs, management fees, or taxes.
The volatility, performance, and other characteristics of the index referenced may be materially different from the Fund. In addition, the Fund’s holdings may be materially different from those within the index. Indices are unmanaged and one cannot invest directly in an index. This letter is intended to assist shareholders in understanding how the Fund performed during the fiscal year ended April 30, 2024 and reflects the views of the investment adviser at the time of this writing. Of course, these views may change and do not guarantee the future performance of the Fund or the markets.
This content is being provided for informational purposes only. Although the information and any opinions or views given have been obtained from or based on sources believed to be reliable, no warranty or representation is made as to their correctness, completeness or accuracy. Opinions, estimates, forecasts, and statements of financial market trends that are based on current market conditions constitute the judgment of the investment adviser and are subject to change without notice, including any forward-looking estimates or statements.
Portfolio composition is subject to change. The current and future portfolio holdings of the Fund are subject to investment risk. The investment return and principal value of an investment in the Fund will fluctuate so that an investor’s shares, when redeemed, may be worth more or less than their original cost.
The information provided in this document should not be construed as a recommendation to purchase or sell any particular security. The securities discussed do not necessarily represent the entire portfolio. It should not be assumed that any of the securities transactions or holdings discussed were or will prove to be profitable or that any future investment recommendations will equal the investment performance of the securities discussed herein. For a complete list of the investment adviser's past specific recommendations and holdings and a list of current holdings as of the current quarter end, please contact info@polencapital.com.
The views and strategies described may not be suitable for all clients. This disclosure does not identify all the risks (direct or indirect) or other considerations which might be material when entering any financial transaction.
POLEN GLOBAL GROWTH FUND
Annual Report
Performance Data
April 30, 2024
(Unaudited)
Comparison of Change in Value of $100,000 (investment minimum) Investment in Polen Global Growth Fund Institutional Class Shares vs MSCI All Country World® Index (“ACWI”) (Net Dividend)
| Average Annual Total Returns for the Periods Ended April 30, 2024 |
| | 1 Year | | 3 Years | | 5 Years | | Since
Inception* |
| Institutional Class | 17.00% | | -0.41% | | 8.23% | | 10.91% |
MSCI All Country World® Index
(“ACWI”) (Net Dividend) | 17.99% | | 4.73% | | 9.94% | | 9.02% ** |
| * | The Polen Global Growth Fund (the “Fund”) Institutional Class commenced operations on December 30, 2014. |
| ** | Benchmark performance is from the commencement date of the Fund Class only and is not the commencement date of the benchmark itself. |
The performance data quoted represents past performance and does not guarantee future results. Current performance may be lower or higher. Performance data current to the most recent month-end may be obtained by calling 1-888-678-6024. The investment return and principal value of an investment will fluctuate so that shares, when redeemed, may be worth more or less than their original cost. The graph and table do not reflect the deduction of taxes that a shareholder would pay on Fund distributions or the redemption of Fund shares.
POLEN GLOBAL GROWTH FUND
Performance Data (Continued)
April 30, 2024
(Unaudited)
Comparison of Change in Value of $10,000 Investment in Polen Global Growth Fund Investor Class Shares vs MSCI All Country World® Index (“ACWI”) (Net Dividend)
| Average Annual Total Returns for the Periods Ended April 30, 2024 |
| | 1 Year | | 3 Years | | 5 Years | | Since
Inception* |
| Investor Class | 16.68% | | -0.66% | | 7.96% | | 10.89% |
MSCI All Country World® Index
(“ACWI”) (Net Dividend) | 17.99% | | 4.73% | | 9.94% | | 9.36% ** |
| * | The Polen Global Growth Fund (the “Fund”) Investor Class commenced operations on July 6, 2015. |
| ** | Benchmark performance is from the commencement date of the Fund Class only and is not the commencement date of the benchmark itself. |
The performance data quoted represents past performance and does not guarantee future results. Current performance may be lower or higher. Performance data current to the most recent month-end may be obtained by calling 1-888-678-6024. The investment return and principal value of an investment will fluctuate so that shares, when redeemed, may be worth more or less than their original cost. The graph and table do not reflect the deduction of taxes that a shareholder would pay on Fund distributions or the redemption of Fund shares.
The Fund’s “Total Annual Fund Operating Expenses” as stated in the current prospectus dated September 1, 2023, as supplemented, are 1.01% for the Institutional Class shares and 1.26% for the Investor Class shares, respectively, of the Fund’s average daily net assets, which may differ from the actual expenses incurred by the Fund for the period covered by this report. Polen Capital Management, LLC (“PCM” or the “Adviser”) has contractually agreed to reduce its investment advisory fee and/or reimburse certain expenses of the Fund to the extent necessary to ensure that the Fund’s total operating expenses (excluding taxes, fees and expenses attributable to a distribution or service plan adopted by the Trust, interest, extraordinary items, “Acquired Fund Fees and Expenses” and brokerage commissions) do not exceed 1.10% (on an annual basis) with respect to the Fund’s average daily net assets (the “Expense Limitation”). The Expense Limitation will remain in place until August 31, 2024 unless the Board of Trustees (“Board of Trustees”) of FundVantage Trust (the “Trust”) approves its earlier termination. The Adviser is entitled to recover, subject to approval by the Board of Trustees, such amounts reduced or reimbursed for a period of up to three (3) years from the date on which the Adviser reduced its compensation and/or assumed expenses for the Fund. The Adviser is permitted to seek reimbursement from the Fund, subject to certain limitations, for fees it waived and Fund expenses it paid to the extent the total annual fund operating expenses do not exceed the limits described above or any lesser limits in effect at the time of reimbursement. No recoupment will occur unless the Fund’s expenses are below the Expense Limitation amount. Total returns would be lower had such fees and expenses not been waived and/or reimbursed.
The Fund evaluates its performance as compared to that of the MSCI ACWI (Net Dividend), which captures large and mid-cap representation across 23 Developed Markets (DM) and 24 Emerging Markets (EM) countries. With 2,840 constituents, the index covers approximately 85% of the global investable equity opportunity set. Indexes are unmanaged and it is not possible to invest directly in an index.
POLEN GLOBAL GROWTH FUND
Performance Data (Concluded)
April 30, 2024
(Unaudited)
All mutual fund investing involves risk, including possible loss of principal. The Fund is non-diversified, which means that a large portion of the Fund’s assets may be invested in one or few companies or sectors. The Fund could fluctuate in value more than a diversified fund. Investing in foreign securities entails special risks, such as fluctuations in currency exchange rates and possible lax regulation of securities markets and accounting practices.
The Fund may invest a substantial amount of its assets in issuers located in a limited number of countries. If the Fund concentrates its investments in this manner, it assumes the risk that economic, political and social conditions in those countries will have a significant impact on its investment performance. The Fund’s investment performance may also be more volatile if it concentrates its investments in certain countries, especially emerging market countries.
POLEN INTERNATIONAL GROWTH FUND
Annual Investment Adviser's Report
April 30, 2024
(Unaudited)
Performance Summary:
• For much of the reporting period and despite a confluence of economic, financial, and geopolitical headwinds, the global economy not only averted a highly anticipated recession but showcased resilience. Against this backdrop, market sentiment could be considered cautiously optimistic as equities were supported by relatively robust corporate earnings and a positive slate of economic indicators.
• The Polen International Growth Fund (the “Fund”) holds what we see as competitively advantaged businesses whose weighted average earnings are expected to grow at a mid-teens rate over time. A portfolio of well positioned businesses supports our confidence that short term disruptions are speedbumps on the road to long-term success.
• For the fiscal year ended April 30, 2024, the Fund’s institutional share class returned 7.04% net of fees versus the MSCI All Country World® Index (ex-USA), which returned 9.32%.
The performance data quoted represents past performance and is not a guarantee of future results. Investment return and principal value of an investment will fluctuate so that an investor's shares, when redeemed, may be worth more or less than their original cost. Current performance may be lower or higher than the performance information quoted. To obtain performance information current to the most recent month-end, please call 1-888-678-6024.
Top Contributors:
During the period, the top absolute contributors to the Fund’s performance were ICON, Sage Group, and SAP.
• ICON is a leading contract research organization (CRO) that provides research and testing facilities to global pharmaceutical companies of all sizes. The company’s Q423 earnings were largely in line and management’s guidance for FY24 was generally better than expected with the company forecasting revenue growth in the mid-single digit range and earnings growth in the mid-teens range. The company, which benefits from significant scale advantages, continues to win new business, and growth in its backlog has accelerated.
• Sage Group is a UK-based small-medium business (“SMB”) accounting and financials software provider that we’ve covered for many years and is a large and long-time holding. During the period, the company delivered attractive recurring revenue growth and affirmed guidance for expanding margins looking out several years. Notably, the company has gone through a cloud transition, and with it, we believe management has smartly pruned the portfolio of non-core offerings to reinvest in the core business, which is growing faster with higher customer retention rates. According to our research, Sage is a very durable business supported by secular growth tailwinds.
• SAP is a German-headquartered global enterprise resource planning (“ERP”) software company. SAP’s transition to the cloud (a core part of our thesis on the business) continues at pace and the company is seeing compelling cloud revenue growth and expanding cloud gross margins. Management is guiding cloud sales growth through 2025in the mid-20% range, which we view as both reasonable and attractive. We also view SAP as one of the more resilient software business models as it is an essential part of its customers’ day-to-day operations and cannot easily be turned off or scaled back.
Top Detractors:
Teleperformance, Evolution AB, and Aon were the top absolute detractors for the period.
• Teleperformance, one of the world’s leading outsourced customer service providers, is a Fund holding we added in the early part of 2023. Shares suffered in 2023 as sentiment surrounding AI adoption reached a crescendo and related market narratives assumed customer experience services, like those Teleperformance provides, will be fully automated. We believe Teleperformance’s customers, and many other businesses will continue to require effective human customer experience management. In our view, Teleperformance continues to leverage technologies, including Artificial Intelligence, to deliver
POLEN INTERNATIONAL GROWTH FUND
Annual Investment Adviser’s Report (Concluded)
April 30, 2024
(Unaudited)
successful business outcomes to customers. Based on our analysis, management effectively navigated the impacts of transformational technologies at times over its 40 years in business and is proactively thinking through opportunities in the present environment.
• Evolution AB, the online gaming provider, has seen the stock come under pressure as growth has decelerated over the reporting period. Notably, this comes on the heels of a period of supercharged growth whereby sales increased 10x over the prior six years. Longer term, our analysis indicates a positive outlook for Evolution’s pursuit of the market opportunity and the value proposition it brings to casino operators.
• Aon ended its fiscal year 2023 with high-single digit organic revenue growth and low-double digit profit growth, in line with our long-term expectations. Management is guiding for mid-single digit or better organic revenue growth for their fiscal year 2024 with operating margins that are expected to expand as well. Additionally, Aon’s acquisition of NFP brings the company into the middle- market insurance brokerage space for the first time, where we believe its brand and scale should be advantageous.
The MSCI ACWI ex USA Index is a market capitalization weighted equity index that measures the performance of large and mid-cap segments across developed and emerging market countries (excluding the U.S). The index is maintained by Morgan Stanley Capital International. It is impossible to invest directly in an index. The performance of an index does not reflect any transaction costs, management fees, or taxes.
The volatility, performance, and other characteristics of the index referenced may be materially different from the Fund. In addition, the Fund’s holdings may be materially different from those within the index. Indices are unmanaged and one cannot invest directly in an index. This letter is intended to assist shareholders in understanding how the Fund performed during the fiscal year ended April 30, 2024 and reflects the views of the investment adviser at the time of this writing. Of course, these views may change and do not guarantee the future performance of the Fund or the markets.
This content is being provided for informational purposes only. Although the information and any opinions or views given have been obtained from or based on sources believed to be reliable, no warranty or representation is made as to their correctness, completeness or accuracy. Opinions, estimates, forecasts, and statements of financial market trends that are based on current market conditions constitute the judgment of the investment adviser and are subject to change without notice, including any forward-looking estimates or statements.
Portfolio composition is subject to change. The current and future portfolio holdings of the Fund are subject to investment risk. The investment return and principal value of an investment in the Fund will fluctuate so that an investor’s shares, when redeemed, may be worth more or less than their original cost.
The information provided in this document should not be construed as a recommendation to purchase or sell any particular security. The securities discussed do not necessarily represent the entire portfolio. It should not be assumed that any of the securities transactions or holdings discussed were or will prove to be profitable or that any future investment recommendations will equal the investment performance of the securities discussed herein. For a complete list of the investment adviser's past specific recommendations and holdings and a list of current holdings as of the current quarter end, please contact info@polencapital.com.
The views and strategies described may not be suitable for all clients. This disclosure does not identify all the risks (direct or indirect) or other considerations which might be material when entering any financial transaction.
POLEN INTERNATIONAL GROWTH FUND
Annual Report
Performance Data
April 30, 2024
(Unaudited)
Comparison of Change in Value of $100,000 (investment minimum) Investment in Polen International Growth Fund Institutional Class Shares vs MSCI All Country World® Index (“ACWI”) (ex-USA) (Net Dividend)
| Average Annual Total Returns for the Periods Ended April 30, 2024 |
| | 1 Year | | 3 Years | | 5 Years | | Since
Inception* |
| Institutional Class | 7.04% | | -4.50% | | 2.01% | | 6.60% |
MSCI All Country World® Index
(“ACWI”) (ex-USA) (Net Dividend) | 9.32% | | 0.35% | | 5.03% | | 6.43% ** |
| * | The Polen International Growth Fund (the "Fund") Institutional Class commenced operations on December 30, 2016. |
| ** | Benchmark performance is from the commencement date of the Fund Class only and is not the commencement date of the benchmark itself. |
The performance data quoted represents past performance and does not guarantee future results. Current performance may be lower or higher. Performance data current to the most recent month-end may be obtained by calling 1-888-678-6024. The investment return and principal value of an investment will fluctuate so that shares, when redeemed, may be worth more or less than their original cost. The graph and table do not reflect the deduction of taxes that a shareholder would pay on Fund distributions or the redemption of Fund shares.
POLEN INTERNATIONAL GROWTH FUND
Performance Data (Continued)
April 30, 2024
(Unaudited)
Comparison of Change in Value of $10,000 Investment in Polen International Growth Fund Investor Class Shares vs MSCI All Country World® Index (“ACWI”) (ex-USA) (Net Dividend)
| Average Annual Total Returns for the Periods Ended April 30, 2024 |
| | 1 Year | | 3 Years | | 5 Years | | Since
Inception* |
| Investor Class | 6.76% | | -4.76% | | 1.75% | | 5.23% |
MSCI All Country World® Index
(“ACWI”) (ex-USA) (Net Dividend) | 9.32% | | 0.35% | | 5.03% | | 5.74% ** |
| * | The Polen International Growth Fund (the “Fund”) Investor Class commenced operations on March 15, 2017. |
| ** | Benchmark performance is from the commencement date of the Fund Class only and is not the commencement date of the benchmark itself. |
The performance data quoted represents past performance and does not guarantee future results. Current performance may be lower or higher. Performance data current to the most recent month-end may be obtained by calling 1-888-678-6024. The investment return and principal value of an investment will fluctuate so that shares, when redeemed, may be worth more or less than their original cost. The graph and table do not reflect the deduction of taxes that a shareholder would pay on Fund distributions or the redemption of Fund shares.
The Fund’s “Total Annual Fund Operating Expenses” as stated in the current prospectus dated September 1, 2023, are 1.08% for Institutional Class shares and 1.33% for Investor Class shares of the Fund’s average daily net assets, which may differ from the actual expenses incurred by the Fund for the period covered by this report. Polen Capital Management, LLC (“PCM” or the “Adviser”) has contractually agreed to reduce its investment advisory fee and/or reimburse certain expenses of the Fund to the extent necessary to ensure that the Fund’s total operating expenses (excluding taxes, fees and expenses attributable to a distribution or service plan adopted by the Trust, interest, extraordinary items, “Acquired Fund Fees and Expenses” and brokerage commissions) do not exceed 1.10% (on an annual basis) with respect to the Fund’s average daily net assets (the “Expense Limitation”). The Expense Limitation will remain in place until August 31, 2024 unless the Board of Trustees (“Board of Trustees”) of FundVantage Trust (the “Trust”) approves its earlier termination. The Adviser is entitled to recover, subject to approval by the Board of Trustees, any fees waived and/or expenses reimbursed for a three (3) year period following the date of such fee waiver and/or expense reimbursement. The Adviser is permitted to seek reimbursement from the Fund, subject to certain limitations, for fees it waived and Fund expenses it paid to the extent the total annual fund operating expenses do not exceed the limits described above or any lesser limits in effect at the time of reimbursement. No recoupment will occur unless the Fund’s expenses are below the Expense Limitation amount. Total returns would be lower had such fees and expenses not been waived and/or reimbursed.
The Fund evaluates its performance as compared to that of the MSCI ACWI (ex-USA) (Net Dividend), which captures large and mid-cap representation across 22 of 23 Developed Markets (DM) countries (excluding the US) and 24 Emerging Markets (EM) countries. With 2,228 constituents, the index covers approximately 85% of the global equity opportunity set outside the US. Indexes are unmanaged and it is not possible to invest directly in an index.
POLEN INTERNATIONAL GROWTH FUND
Performance Data (Concluded)
April 30, 2024
(Unaudited)
All mutual fund investing involves risk, including possible loss of principal. The Fund is non-diversified, which means that a large portion of the Fund’s assets may be invested in one or few companies or sectors. The Fund could fluctuate in value more than a diversified fund. Investing in foreign securities entails special risks, such as fluctuations in currency exchange rates and possible lax regulation of securities markets and accounting practices.
The Fund may invest a substantial amount of its assets in issuers located in a limited number of countries. If the Fund concentrates its investments in this manner, it assumes the risk that economic, political and social conditions in those countries will have a significant impact on its investment performance. The Fund’s investment performance may also be more volatile if it concentrates its investments in certain countries, especially emerging market countries.
POLEN U.S. SMALL COMPANY GROWTH FUND
Annual Investment Adviser's Report
April 30, 2024
(Unaudited)
Performance Summary:
• For a good portion of the reporting period, against all odds and despite a confluence of economic, financial, and geopolitical headwinds, the global economy averted a highly anticipated recession and showcased remarkable resiliency. Against this backdrop, market sentiment could be considered cautiously optimistic as equities were supported by relatively strong corporate earnings and a favorable slate of economic indicators.
• As has been the case over the past several months, it is common to see low-quality leadership in the initial stages of a recovery. Although this has presented a headwind in the short term, we believe many of the companies we own have significant latent potential over the near and long term. Further, we believe that consistently owning businesses with robust balance sheets and the ability to reinvest in any environment trumps short-term temptations to own lower-quality companies.
• For the fiscal year ended April 30, 2024, the Polen U.S. Small Company Growth Fund’s (the “Fund's”) Institutional share class returned 4.14% net of fees versus the Russell 2000® Growth Index, which returned 12.39%.
The performance data quoted represents past performance and is not a guarantee of future results. Investment return and principal value of an investment will fluctuate so that an investor's shares, when redeemed, may be worth more or less than their original cost. Current performance may be lower or higher than the performance information quoted. To obtain performance information current to the most recent month-end, please call 1-888-678-6024.
Top Contributors:
During the period, the top absolute contributors to the Fund’s performance were Wingstop, Houlihan Lokey, and Hamilton Lane.
• Wingstop is the world's largest chicken wing-centric restaurant chain, with roughly 2,000 locations. The company has lofty aspirations to be a top-10 restaurant chain globally. In our view, its capital-efficient franchise model with strong unit economics in the industry positions it well to do so. Over 2023, the company exceeded high expectations, delivering double-digit same-store sales growth while expanding into new regions internationally.
• Houlihan Lokey is a global investment bank with expertise in mergers and acquisitions (“M&A”), capital markets, financial restructuring, and valuation. The company holds the #1 position in most of the markets it serves, and its diverse mix of revenues has driven robust financial performance across market cycles. M&A advisory revenue has been at cyclical lows. Still, the business has improved throughout the reporting period with the expectation of stabilizing interest rates and could potentially accelerate with the prospect of lower interest rates. In our view, Houlihan Lokey may be uniquely positioned for above-average earnings growth over the next few years and remains attractively priced.
• Hamilton Lane is a leading private markets investment management firm that provides innovative solutions to institutional and private wealth investors worldwide. In 2023, the company showcased resiliency amid a highly uncertain macro and fundraising environment. Specialized funds are a continuing area of strength, particularly as Hamilton Lane has successfully scaled its efforts with high-net-worth clients in the wirehouse channels. While Generally Accepted Accounting Principles earnings fluctuate due to performance fees, we value the company based on its core fee earnings, which we view as remarkably consistent and durable through cycles.
Top Detractors:
Fox Factory Holdings, Bumble, and Doximity were the top absolute detractors for the period.
• Fox Factory Holdings is a leading manufacturer of high-end performance shocks and suspensions for powered vehicles (trucks, ATVs, etc.) and bicycles. Over the past year, the stock experienced several headwinds, ranging from prolonged supply chain issues in the bicycle segment to production shutdowns due to the UAW strike and the significant acquisition of a sports company that prompted investors to question the company’s capital allocation discipline. Our conviction is unchanged as it relates to the company's long-term strategic vision, ability to navigate and overcome short-term challenges, and the expected positive trajectory once these temporary headwinds subside.
• Bumble is a global operator of leading mobile dating apps, including its namesake Bumble App. Given the strong and consistent 20%+ growth in the core Bumble platform, we held on to the stock through a period that proved challenging. Over the
POLEN U.S. SMALL COMPANY GROWTH FUND
Annual Investment Adviser’s Report (Concluded)
April 30, 2024
(Unaudited)
past year, the company underwent a Founder/CEO transition, significant leadership changes, and widescale layoffs amid the core business’ unexpected deceleration. While we remain positive on many aspects of the business, this confluence of sudden changes elevated the risk profile beyond what we consider prudent. As such, we exited the position during the period.
• Doximity is a productivity and professional network app for doctors that generates revenue primarily from biopharmaceutical advertising. The stock was negatively impacted by a weaker growth outlook and acknowledgment that the company needs to invest in shifting towards a self-service model to better meet customer needs. We continue to view Doximity’s advertising return on investment as best-in-class and their physician engagement as convincing, but we are closely monitoring the position.
The Russell 2000® Growth Index is a market capitalization weighted index that measures the performance of the small-cap growth segment of the U.S. equity universe. It includes Russell 2000® Index companies with higher price/book ratios and higher forecasted growth values. The index is maintained by the FTSE Russell, a subsidiary of the London Stock Exchange Group. The volatility and other material characteristics of the indices referenced may be materially different from the performance achieved by an individual investor. In addition, an investor’s holdings may be materially different from those within the index. Indices are unmanaged and one cannot invest directly in an index.
The volatility, performance, and other characteristics of the index referenced may be materially different from the Fund. In addition, the Fund’s holdings may be materially different from those within the index. Indices are unmanaged and one cannot invest directly in an index. This letter is intended to assist shareholders in understanding how the Fund performed during the fiscal year ended April 30, 2024 and reflects the views of the investment adviser at the time of this writing. Of course, these views may change and do not guarantee the future performance of the Fund or the markets.
This content is being provided for informational purposes only. Although the information and any opinions or views given have been obtained from or based on sources believed to be reliable, no warranty or representation is made as to their correctness, completeness or accuracy. Opinions, estimates, forecasts, and statements of financial market trends that are based on current market conditions constitute the judgment of the investment adviser and are subject to change without notice, including any forward-looking estimates or statements.
Portfolio composition is subject to change. The current and future portfolio holdings of the Fund are subject to investment risk. The investment return and principal value of an investment in the Fund will fluctuate so that an investor’s shares, when redeemed, may be worth more or less than their original cost.
The information provided in this document should not be construed as a recommendation to purchase or sell any particular security. The securities discussed do not necessarily represent the entire portfolio. It should not be assumed that any of the securities transactions or holdings discussed were or will prove to be profitable or that any future investment recommendations will equal the investment performance of the securities discussed herein. For a complete list of the investment adviser's past specific recommendations and holdings and a list of current holdings as of the current quarter end, please contact info@polencapital.com.
The views and strategies described may not be suitable for all clients. This disclosure does not identify all the risks (direct or indirect) or other considerations which might be material when entering any financial transaction.
POLEN U.S. SMALL COMPANY GROWTH FUND
Annual Report
Performance Data
April 30, 2024
(Unaudited)
Comparison of Change in Value of $100,000 (investment minimum) Investment in Polen U.S. Small Company Growth Fund Institutional Class Shares vs Russell 2000® Growth Index
| Average Annual Total Returns for the Periods Ended April 30, 2024 |
| | 1 Year | | 3 Years | | 5 Years | | Since
Inception* |
| Institutional Class | 4.14% | | -11.17% | | 2.24% | | 5.21% |
| Russell 2000® Growth Index | 12.39% | | -5.92% | | 5.03% | | 5.93% ** |
| * | The Polen U.S. Small Company Growth Fund (the “Fund”) Institutional Class commenced operations on November 1, 2017. |
| ** | Benchmark performance is from the commencement date of the Fund Class only and is not the commencement date of the benchmark itself. |
The performance data quoted represents past performance and does not guarantee future results. Current performance may be lower or higher. Performance data current to the most recent month-end may be obtained by calling 1-888-678-6024. The investment return and principal value of an investment will fluctuate so that shares, when redeemed, may be worth more or less than their original cost. The graph and table do not reflect the deduction of taxes that a shareholder would pay on Fund distributions or the redemption of Fund shares.
POLEN U.S. SMALL COMPANY GROWTH FUND
Performance Data (Continued)
April 30, 2024
(Unaudited)
Comparison of Change in Value of $10,000 Investment in Polen U.S. Small Company Growth Fund Investor Class Shares vs Russell 2000® Growth Index
| Average Annual Total Returns for the Periods Ended April 30, 2024 |
| | 1 Year | | 3 Years | | 5 Years | | Since
Inception* |
| Investor Class | 3.95% | | -11.39% | | 2.00% | | 3.36% |
| Russell 2000® Growth Index | 12.39% | | -5.92% | | 5.03% | | 6.29% ** |
| * | The Polen U.S. Small Company Growth Fund (the "Fund") Investor Class commenced operations on February 8, 2019. |
| ** | Benchmark performance is from the commencement date of the Fund Class only and is not the commencement date of the benchmark itself. |
The performance data quoted represents past performance and does not guarantee future results. Current performance may be lower or higher. Performance data current to the most recent month-end may be obtained by calling 1-888-678-6024. The investment return and principal value of an investment will fluctuate so that shares, when redeemed, may be worth more or less than their original cost. The graph and table do not reflect the deduction of taxes that a shareholder would pay on Fund distributions or the redemption of Fund shares.
POLEN U.S. SMALL COMPANY GROWTH FUND
Performance Data (Continued)
April 30, 2024
(Unaudited)
Comparison of Change in Value of $1,000,000 (investment minimum) Investment in Polen U.S. Small Company Growth Fund Class Y Shares vs Russell 2000® Growth Index
| Average Annual Total Returns for the Periods Ended April 30, 2024 |
| | 1 Year | | Since
Inception* |
| Class Y | 4.29% | | -10.65% |
| Russell 2000® Growth Index | 12.39% | | -5.24% ** |
| * | The Polen U.S. Small Company Growth Fund (the “Fund”) Class Y commenced operations on June 1, 2021. |
| ** | Benchmark performance is from the commencement date of the Fund Class only and is not the commencement date of the benchmark itself. |
The performance data quoted represents past performance and does not guarantee future results. Current performance may be lower or higher. Performance data current to the most recent month-end may be obtained by calling 1-888-678-6024. The investment return and principal value of an investment will fluctuate so that shares, when redeemed, may be worth more or less than their original cost. The graph and table do not reflect the deduction of taxes that a shareholder would pay on Fund distributions or the redemption of Fund shares.
The Fund’s “Total Annual Fund Operating Expenses” and “Total Annual Fund Operating Expenses After Fee Waiver and/or Expense Reimbursement,” as stated in the current prospectus dated September 1, 2023, as supplemented, are 1.40% and 1.10%, respectively, for the Institutional Class shares, 1.65% and 1.35%, respectively, for the Investor Class shares and 1.30% and 1.00%, respectively, for the Class Y shares of the Fund’s average daily net assets, which may differ from the actual expenses incurred by the Fund for the period covered by this report. Polen Capital Management, LLC (“PCM” or the “Adviser”) has contractually agreed to reduce its investment advisory fee and/or reimburse certain expenses of the Fund to the extent necessary to ensure that the Fund’s total operating expenses (excluding taxes, fees and expenses attributable to a distribution or service plan adopted by the Trust, interest, extraordinary items, “Acquired Fund Fees and Expenses” and brokerage commissions) do not exceed 1.10% with respect to Institutional Class and Investor Class shares and 1.00% with respect to Class Y shares (on an annual basis) with respect to the Fund’s average daily net assets (the “Expense Limitation”). The Expense Limitation will remain in place until August 31, 2024 unless the Board of Trustees (“Board of Trustees”) of FundVantage Trust (the “Trust”) approves its earlier termination. The Adviser is entitled to recover, subject to approval by the Board of Trustees, such amounts reduced or reimbursed for a period of up to three (3) years from the date on which the Adviser reduced its compensation and/or assumed expenses for the Fund. The Adviser is permitted to seek reimbursement from the Fund, for fees it waived and Fund expenses it paid to the extent the total annual fund operating expenses do not exceed the limits described above or any lesser limits in effect at the time of reimbursement. No reimbursement will occur unless the Fund’s expenses are below the Expense Limitation amount. Total returns would be lower had such fees and expenses not been waived and/or reimbursed.
The Fund evaluates its performance as compared to that of the Russell 2000® Growth Index, which is an unmanaged index measuring the performance of the 2,000 smallest companies in the Russell 3000® Index, which is made up of 3,000 of the biggest U.S. stocks. It is impossible to invest directly in an index.
POLEN U.S. SMALL COMPANY GROWTH FUND
Performance Data (Concluded)
April 30, 2024
(Unaudited)
All mutual fund investing involves risk, including possible loss of principal. The Fund is non-diversified, which means that a large portion of the Fund’s assets may be invested in one or few companies or sectors. The Fund could fluctuate in value more than a diversified fund. The Fund invests in securities of small-capitalization companies, which may be subject to more abrupt or erratic market movements than securities of larger, more established companies. Small-capitalization companies may have limited product lines or financial resources, or may be dependent upon a small or inexperienced management group. Securities of small-capitalization companies may trade less frequently and in lower volumes than the securities of larger companies, which could lead to higher transaction costs.
POLEN EMERGING MARKETS GROWTH FUND
Annual Investment Adviser's Report
April 30, 2024
(Unaudited)
Performance Summary:
• The reporting period witnessed the Polen Emerging Markets Growth Fund (the “Fund”) continue to be exposed to top-down pressures. These included a changing interest rate environment, further supply chain disruptions, geopolitical tensions, and a significant worsening of sentiment towards China, with slowing growth alongside liquidity concerns in the real estate market. As with many other regions, Artificial Intelligence was a notable theme that heavily influenced investor behavior.
• Within emerging markets, there were some notable winners and losers. India, Taiwan, and South Korea are driving the MSCI Emerging Markets Index higher. Taiwan and South Korea were primarily driven by tech hardware-related businesses. At the same time, India has seen broad strength, boosted by robust economic performance and net investment from domestic and international investors. Conversely, China and Hong Kong were the notable laggards.
• In 2024, there appears to be a renewed focus on company fundamentals, with market participants distinguishing between good, average, and poor businesses. We believe the Fund is well-positioned to return to the longer-term earnings growth that will ultimately drive share price appreciation.
• For the fiscal year ended April 30, 2024, the Fund’s Institutional share class returned 1.56% net of fees versus the MSCI Emerging Markets® Index, which returned 9.88%.
The performance data quoted represents past performance and is not a guarantee of future results. Investment return and principal value of an investment will fluctuate so that an investor's shares, when redeemed, may be worth more or less than their original cost. Current performance may be lower or higher than the performance information quoted. To obtain performance information current to the most recent month-end, please call 1-888-678-6024.
Top Contributors:
During the period, the top absolute contributors to the Fund’s performance were Tencent Music Entertainment, TSMC, and FPT Corp.
• Tencent Music Entertainment, China’s equivalent to Spotify, posted better-than-expected results over several consecutive quarters. Its music business continues to perform exceptionally well in a robust pricing environment, leading to solid revenue and earnings growth. As of April 30, 2024, the company had over 106 million paying music subscribers, a 20% year-over-year increase and revenue mix shift, and higher average revenue per paying user, which has led to the company’s highest gross margin in five years.
• TSMC, Taiwan’s biggest company, and the world’s largest semiconductor chipmaker, was flat through most of the period due to concerns about a semiconductor slowdown caused by a weakening global economy. However, the rise of AI has removed these concerns, and instead, the company has seen robust sales growth primarily due to sustained AI demand. While TSMC has not necessarily been grabbing the AI headlines, it is Nvidia’s sole manufacturer of its most advanced chips. We believe it has distinct competitive advantages that will ensure it cannot be dislodged, irrespective of whether Nvidia remains the leading producer of GPUs (“Graphics processing units"). In our view, TSMC remains one of the world's most competitively advantageous businesses, with good returns on capital, and its infrastructure and capital are a substantial competitive moat.
• FPT is Vietnam’s largest IT services company, as well as one of the leading telecoms (data centers and broadband TV) and private education providers in Southeast Asia. FPT’s software business continues to grow significantly due to its labor cost advantage in a world where outsourced IT services and adoptions of digital processes continue to grow strongly. It also benefits from the world’s supply bases adopting a ‘China plus one policy.’1 The company reported revenues and profits for the full year up 17% and 20%, in contrast to other global IT services businesses that have experienced slowing growth. FPT also recently announced a strategic partnership with Nvidia to create a one-stop shop for AI and the Cloudin Vietnam. In our opinion, FPT has robust fundamentals with high rates of return on incremental invested capital and has achieved growth, all while maintaining a net cash balance sheet and paying out approximately 50% of profits to shareholders.
| 1 | The business strategy to avoid investing only in China and diversify business into other countries, or to channel investments into manufacturing in other promising developing economies. |
POLEN EMERGING MARKETS GROWTH FUND
Annual Investment Adviser’s Report (Continued)
April 30, 2024
(Unaudited)
Top Detractors:
During the period, the top absolute detractors from the Fund’s performance were Momo.com, Las Vegas Sands, and Wizz Air.
• Momo is Taiwan’s dominant domestic e-commerce business, with a roughly 30% market share. The stock was down over the period due to disappointing sales growth and broader concerns over lackluster digital sales growth since lockdowns were lifted. We are monitoring this trend closely. Concerns over competitive threats from the likes of Coupang have also impacted the share price. We believe Momo’s leading infrastructure provides a solid competitive moat against Taiwan’s other e-commerce players. This has enabled it to consistently win market share and compound revenues at more than 20% over the last five years. It is investing to further strengthen this moat by expanding its last-mile logistics network. Future growth will likely be driven by increased e-commerce penetration in Taiwan, further market consolidation, and expansion into new product categories.
• Las Vegas Sands (“LVS”) is Asia’s premier casino business with two of the region’s top properties and a leading management team. The company has struggled recently, particularly its Macau business, which has yet to see Chinese tourism fully recover from the hangover of the pandemic. Still, its Singapore operation has recovered and is performing well. In a post-COVID normalized world, we believe that Macau should also be highly lucrative. We believe LVS’ shares are trading at an attractive valuation, and once the business recovers to 2019 levels, we think it can continue to grow steadily in the 15% range for several years. We can expect LVS to generate a Return on Invested Capital2 of more than 20% on a normalized business, which we view as a highly attractive dynamic given the significant structural growth potential.
• Wizz Air, an ultra-low-cost Eastern European airliner, has endured a volatile performance period. The company has primarily delivered positive results, showcasing robust growth in both sales and profits. However, its share price has been weak as lingering concerns persist over the company’s use of debt to finance growth. The volatile nature of jet fuel has also introduced uncertainty, although the company has moved to hedge most of its exposure. The share price also came under pressure during the reporting period as the company announced that it estimated a potential 10% capacity reduction due to the inspection of Pratt & Whitley’s engines. Despite some of these issues, we believe Wizz Air is an excellent operator, is gaining market share, and is trading on what we think are incredibly depressed valuations.
The MSCI Emerging Markets® Index is a market capitalization weighted equity index that measures the performance of the large and mid-cap segments across emerging market countries. The index is maintained by Morgan Stanley Capital International. The volatility and other material characteristics of the indices referenced may be materially different from the performance achieved by an individual investor. In addition, an investor’s holdings may be materially different from those within the index. Indices are unmanaged and one cannot invest directly in an index.
The volatility, performance, and other characteristics of the index referenced may be materially different from the Fund. In addition, the Fund’s holdings may be materially different from those within the index. Indices are unmanaged and one cannot invest directly in an index. This letter is intended to assist shareholders in understanding how the Fund performed during the fiscal year ended April 30, 2024 and reflects the views of the investment adviser at the time of this writing. Of course, these views may change and do not guarantee the future performance of the Fund or the markets.
This content is being provided for informational purposes only. Although the information and any opinions or views given have been obtained from or based on sources believed to be reliable, no warranty or representation is made as to their correctness, completeness or accuracy. Opinions, estimates, forecasts, and statements of financial market trends that are based on current market conditions constitute the judgment of the investment adviser and are subject to change without notice, including any forward-looking estimates or statements.
Portfolio composition is subject to change. The current and future portfolio holdings of the Fund are subject to investment risk. The investment return and principal value of an investment in the Fund will fluctuate so that an investor’s shares, when redeemed, may be worth more or less than their original cost.
The information provided in this document should not be construed as a recommendation to purchase or sell any particular security. The securities discussed do not necessarily represent the entire portfolio. It should not be assumed that any of the securities transactions or holdings discussed were or will prove to be profitable or that any future investment recommendations will equal the
| 2 | A calculation to determine how well a company allocates its capital to profitable projects or investments: calculated by dividing net operating profit after tax by invested capital. |
POLEN EMERGING MARKETS GROWTH FUND
Annual Investment Adviser’s Report (Concluded)
April 30, 2024
(Unaudited)
investment performance of the securities discussed herein. For a complete list of the investment adviser's past specific recommendations and holdings and a list of current holdings as of the current quarter end, please contact info@polencapital.com.
The views and strategies described may not be suitable for all clients. This disclosure does not identify all the risks (direct or indirect) or other considerations which might be material when entering any financial transaction.
POLEN EMERGING MARKETS GROWTH FUND
Annual Report
Performance Data
April 30, 2024
(Unaudited)
Comparison of Change in Value of $100,000 (investment minimum) Investment in Polen Emerging Markets Growth Fund Institutional Class Shares vs MSCI Emerging Markets® Index (Net Dividend)
| Average Annual Total Returns for the Periods Ended April 30, 2024 |
| | 1 Year | | 3 Years | | Since
Inception* |
| Institutional Class | 1.56% | | -9.50% | | -6.15% |
| MSCI Emerging Markets® Index (Net Dividend) | 9.88% | | -5.68% | | 0.36% ** |
| * | The Polen Emerging Markets Growth Fund (the “Fund”) Institutional Class commenced operations on October 16, 2020. |
| ** | Benchmark performance is from the commencement date of the Fund Class only and is not the commencement date of the benchmark itself. |
The performance data quoted represents past performance and does not guarantee future results. Current performance may be lower or higher. Performance data current to the most recent month-end may be obtained by calling 1-888-678-6024. The investment return and principal value of an investment will fluctuate so that shares, when redeemed, may be worth more or less than their original cost. The graph and table do not reflect the deduction of taxes that a shareholder would pay on Fund distributions or the redemption of Fund shares.
The Fund’s “Total Annual Fund Operating Expenses” and “Total Annual Fund Operating Expenses After Fee Waiver and/or Expense Reimbursement”, as stated in the current prospectus dated September 1, 2023, are 1.96% and 1.25%, respectively, for the Institutional Class shares of the Fund’s average daily net assets, which may differ from the actual expenses incurred by the Fund for the period covered by this report. Polen Capital Management, LLC (“PCM” or the “Adviser”) has contractually agreed to reduce its investment advisory fee and/or reimburse certain expenses of the Fund to the extent necessary to ensure that the Fund’s total operating expenses (excluding taxes, fees and expenses attributable to a distribution or service plan adopted by the Trust, interest, extraordinary items, “Acquired Fund Fees and Expenses” and brokerage commissions) do not exceed 1.25% (on an annual basis) with respect to the Fund’s average daily net assets (the “Expense Limitation”). The Expense Limitation will remain in place until August 31, 2024 unless the Board of Trustees (“Board of Trustees”) of FundVantage Trust (the "Trust") approves its earlier termination. The Adviser is entitled to recover, subject to approval by the Board of Trustees, any fees waived and/or expenses reimbursed for a three (3) year period following the date of such fee waiver and/or expense reimbursement. The Adviser is permitted to seek reimbursement from the Fund, subject to certain limitations, for fees it waived and Fund expenses it paid to the extent the total annual fund operating expenses do not exceed the limits described above or any lesser limits in effect at the time of reimbursement. No recoupment will occur unless the Fund’s expenses are below the Expense Limitation amount. Total returns would be lower had such fees and expenses not been waived and/or reimbursed.
The Fund evaluates its performance as compared to that of the MSCI Emerging Markets Index (Net Dividend), which captures large and mid cap representation across 24 Emerging Markets (EM) countries. With 1,375 constituents, the index covers approximately 85% of the free float-adjusted market capitalization in each country. Indexes are unmanaged and it is not possible to invest directly in an index.
POLEN EMERGING MARKETS GROWTH FUND
Performance Data (Concluded)
April 30, 2024
(Unaudited)
All mutual fund investing involves risk, including possible loss of principal. The Fund is non-diversified, which means that a large portion of the Fund’s assets may be invested in one or few companies or sectors. The Fund could fluctuate in value more than a diversified fund. Investing in foreign securities entails special risks, such as fluctuations in currency exchange rates and possible lax regulation of securities markets and accounting practices.
The Fund may invest a substantial amount of its assets in issuers located in a limited number of countries. If the Fund concentrates its investments in this manner, it assumes the risk that economic, political and social conditions in those countries will have a significant impact on its investment performance. The Fund’s investment performance may also be more volatile if it concentrates its investments in certain countries, especially emerging market countries.
POLEN U.S. SMID COMPANY GROWTH FUND
Annual Investment Adviser's Report
April 30, 2024
(Unaudited)
Performance Summary:
• For a good portion of the reporting period, against all odds and despite a confluence of economic, financial, and geopolitical headwinds, the global economy averted a highly anticipated recession and showcased remarkable resiliency. Against this backdrop, market sentiment could be considered cautiously optimistic as equities were supported by relatively strong corporate earnings and a favorable slate of economic indicators.
• As has been the case over the past several months, it is common to see low-quality leadership in the initial stages of a recovery. Although this has presented a headwind in the short term, we believe many of the companies we own have significant latent potential over the near and long term. Further, we believe that consistently owning businesses with robust balance sheets and the ability to reinvest in any environment trumps short-term temptations to own lower-quality companies.
• For the fiscal year ended April 30, 2024, the Polen U.S. SMID Company Growth Fund’s (the “Fund's”) Institutional share class returned 5.65% net of fees versus the Russell 2500® Growth Index, which returned 13.53%.
The performance data quoted represents past performance and is not a guarantee of future results. Investment return and principal value of an investment will fluctuate so that an investor's shares, when redeemed, may be worth more or less than their original cost. Current performance may be lower or higher than the performance information quoted. To obtain performance information current to the most recent month-end, please call 1-888-678-6024.
Top Contributors:
During the period, the top absolute contributors to the Fund’s performance were Wingstop, Trex, and Houlihan Lokey.
• Wingstop is the world's largest chicken wing-centric restaurant chain, with roughly 2,000 locations. The company has lofty aspirations to be a top-10 restaurant chain globally. In our view, its capital-efficient franchise model with strong unit economics in the industry positions it well to do so. Throughout 2023, the company exceeded high expectations, delivering double-digit same-store sales growth while expanding into new regions internationally.
• Trex is the world’s most extensive, high-performance, low-maintenance wood-alternative decking and railing manufacturer. Along with several other consumer discretionary businesses, the stock benefitted from a growing sense of optimism that the economy would achieve a soft landing and that interest rates would stabilize, if not decline, in the near future. While we welcome the positive sentiment and what it might mean for the broader industry, our thesis over the long term is unchanged. In our view, Trex remains a very high-quality business with profound competitive advantages around its manufacturing process and brand strength, and the opportunity to continue taking share from wood decking remains vast.
• Houlihan Lokey is a global investment bank with expertise in mergers and acquisitions (“M&A”), capital markets, financial restructuring, and valuation. The company holds the #1 position in most of the markets it serves, and its diverse mix of revenues has driven strong financial performance across market cycles. M&A advisory revenue has been at cyclical lows. Still, the business has improved throughout the reporting period with the expectation of stabilizing interest rates and could potentially accelerate with the prospect of lower interest rates. In our view, Houlihan Lokey may be uniquely positioned for above-average earnings growth over the next few years and remains attractively priced.
Top Detractors:
Fox Factory Holdings, Paycom, and Five Below were the top absolute detractors for the period.
• Fox Factory Holdings is a leading manufacturer of high-end performance shocks and suspensions for powered vehicles (trucks, ATVs, etc.) and bicycles. Over the past year, the stock experienced several headwinds, ranging from prolonged supply chain issues in the bicycle segment to production shutdowns due to the UAW strike and the significant acquisition of a sports company that prompted investors to question the company’s capital allocation discipline. Our conviction is unchanged as it relates to the company's long-term strategic vision, ability to navigate and overcome short-term challenges, and the expected positive trajectory once these temporary headwinds subside.
POLEN U.S. SMID COMPANY GROWTH FUND
Annual Investment Adviser’s Report (Concluded)
April 30, 2024
(Unaudited)
• Paycom is a leading cloud-based human capital management software provider for small and mid-sized businesses. The stock came under pressure in the second half of 2023 as the market reacted negatively to the short-term negative impact on margins from continued investments in its platform and its “BETI” product. Paycom has demonstrated that using BETI can significantly improve return on investment and has made its adoption a priority for its salesforce. While there is no immediate revenue uptick from BETI adoption, the long-term view is that it improves the return on investment of Paycom's offering and increases client retention. We maintain our view of Paycom as a high-quality, high-growth leader in human capital management and payroll software that should continue to take market share from long-standing incumbents.
• Five Below, a value retailer catering to teen and tween audiences, delivered results below expectations due to elevated and persistent shrink (i.e., retail theft/shoplifting), which required them to invest more in technology and labor. This higher-than-normal shrink is weighing on the 2024 full-year outlook. Stepping back, Five Below’s on-trend, value-focused merchandise continues to appeal to bargain seekers and remains a preferred destination for young shoppers. Investments in online and supply-chain capabilities have fostered loyalty and helped spur growth in new units.
The Russell 2500® Index is a market capitalization weighted index that measures the performance of the small to mid-cap growth segment of the U.S. equity universe. It is comprised of 2,500 of the smallest securities in the Russell 3000® Index. The index is maintained by the FTSE Russell, a subsidiary of the London Stock Exchange Group. The volatility and other material characteristics of the indices referenced may be materially different from the performance achieved by an individual investor. In addition, an investor’s holdings may be materially different from those within the index. Indices are unmanaged and one cannot invest directly in an index.
The volatility, performance, and other characteristics of the index referenced may be materially different from the Fund. In addition, the Fund’s holdings may be materially different from those within the index. Indices are unmanaged and one cannot invest directly in an index. This letter is intended to assist shareholders in understanding how the Fund performed during the fiscal year ended April 30, 2024 and reflects the views of the investment adviser at the time of this writing. Of course, these views may change and do not guarantee the future performance of the Fund or the markets.
This content is being provided for informational purposes only. Although the information and any opinions or views given have been obtained from or based on sources believed to be reliable, no warranty or representation is made as to their correctness, completeness or accuracy. Opinions, estimates, forecasts, and statements of financial market trends that are based on current market conditions constitute the judgment of the investment adviser and are subject to change without notice, including any forward-looking estimates or statements.
Portfolio composition is subject to change. The current and future portfolio holdings of the Fund are subject to investment risk. The investment return and principal value of an investment in the Fund will fluctuate so that an investor’s shares, when redeemed, may be worth more or less than their original cost.
The information provided in this document should not be construed as a recommendation to purchase or sell any particular security. The securities discussed do not necessarily represent the entire portfolio. It should not be assumed that any of the securities transactions or holdings discussed were or will prove to be profitable or that any future investment recommendations will equal the investment performance of the securities discussed herein. For a complete list of the investment adviser's past specific recommendations and holdings and a list of current holdings as of the current quarter end, please contact info@polencapital.com
The views and strategies described may not be suitable for all clients. This disclosure does not identify all the risks (direct or indirect) or other considerations which might be material when entering any financial transaction.
POLEN U.S. SMID COMPANY GROWTH FUND
Annual Report
Performance Data
April 30, 2024
(Unaudited)
Comparison of Change in Value of $100,000 (investment minimum) Investment in Polen U.S. SMID Company Growth Fund Institutional Class Shares vs Russell 2500® Growth Index
| Average Annual Total Returns for the Periods Ended April 30, 2024 |
| | 1 Year | | 3 Years | | Since
Inception* |
| Institutional Class | 5.65% | | -11.49% | | -9.48% |
| Russell 2500® Growth Index | 13.53% | | -4.44% | | -3.84% ** |
| * | The Polen U.S. SMID Company Growth Fund (the "Fund") Institutional Class commenced operations on April 1, 2021. |
| ** | Benchmark performance is from the commencement date of the Fund Class only and is not the commencement date of the benchmark itself. |
The performance data quoted represents past performance and does not guarantee future results. Current performance may be lower or higher. Performance data current to the most recent month-end may be obtained by calling 1-888-678-6024. The investment return and principal value of an investment will fluctuate so that shares, when redeemed, may be worth more or less than their original cost. The graph and table do not reflect the deduction of taxes that a shareholder would pay on Fund distributions or the redemption of Fund shares.
The Fund’s “Total Annual Fund Operating Expenses” and “Total Annual Fund Operating Expenses After Fee Waiver and/or Expense Reimbursement”, as stated in the current prospectus dated September 1, 2023, as supplemented, are 1.71% and 1.05%, respectively, for the Institutional Class shares of the Fund’s average daily net assets, which may differ from the actual expenses incurred by the Fund for the period covered by this report. Polen Capital Management, LLC (“PCM” or the “Adviser”) has contractually agreed to reduce its investment advisory fee and/or reimburse certain expenses of the Fund to the extent necessary to ensure that the Fund’s total operating expenses (excluding taxes, fees and expenses attributable to a distribution or service plan adopted by the Trust, interest, extraordinary items, “Acquired Fund Fees and Expenses” and brokerage commissions) do not exceed 1.05% (on an annual basis) with respect to the Fund’s average daily net assets (the “Expense Limitation”). The Expense Limitation will remain in place until August 31, 2024 unless the Board of Trustees (“Board of Trustees”) of FundVantage Trust (the “Trust”) approves its earlier termination. The Adviser is entitled to recover, subject to approval by the Board of Trustees, such amounts reduced or reimbursed for a period of up to three (3) years from the date on which the Adviser reduced its compensation and/or assumed expenses for the Fund. The Adviser is permitted to seek reimbursement from the Fund, subject to certain limitations, for fees it waived and Fund expenses it paid to the extent the total annual fund operating expenses do not exceed the limits described above or any lesser limits in effect at the time of reimbursement. No recoupment will occur unless the Fund’s expenses are below the Expense Limitation amount. Total returns would be lower had such fees and expenses not been waived and/or reimbursed.
The Fund evaluates its performance as compared to that of the Russell 2500® Growth Index, which is an unmanaged index measuring the performance of the 2,500 smallest companies in the Russell 3000® Index, which is made up of 3,000 of the biggest U.S. stocks. It is impossible to invest directly in an Index.
POLEN U.S. SMID COMPANY GROWTH FUND
Performance Data (Concluded)
April 30, 2024
(Unaudited)
All mutual fund investing involves risk, including possible loss of principal. The Fund is non-diversified, which means that a large portion of the Fund’s assets may be invested in one or few companies or sectors. The Fund could fluctuate in value more than a diversified fund. The Fund invests in securities of small or mid-capitalization companies. Small-capitalization companies may be subject to more abrupt or erratic market movements than securities of larger, more established companies. Small-capitalization companies may have limited product lines or financial resources, or may be dependent upon a small or inexperienced management group. Securities of small-capitalization companies may trade less frequently and in lower volumes than the securities of larger companies, which could lead to higher transaction costs. Mid-capitalization companies are usually less stable in price and less liquid than larger, more established companies.
POLEN GLOBAL SMID COMPANY GROWTH FUND
Annual Investment Adviser's Report
April 30, 2024
(Unaudited)
Performance Summary:
• The reporting period was heavily influenced by macroeconomic headlines, specifically uncertainty surrounding the trajectory for economic growth, the shifting global inflation dynamic, interest rates, and the subsequent impact on financial markets. Artificial Intelligence was also a notable theme that heavily influenced investor behavior over the period.
• Interest rates dominated the narrative through the period, with 10-Year U.S. Treasury Yields rising to the highest levels since 2007, approaching 5% in mid-October. Between mid-October and year-end, yields dropped back to 3.8%, with expectations of several rate cuts through 2024. Stubborn inflation and a strong U.S. economy saw yields rise back to 4.7%, as the Federal Reserve (“Fed”) signaled a “higher for longer” stance.
• Global economic data generally displayed resilience, especially in the U.S. However, sentiment has significantly worsened in China, with slow growth alongside liquidity concerns in the real estate market. The People’s Bank of China cut interest rates over the period, bucking the trend of many other major economies.
• That said, the backdrop appears to be gradually improving for our investing style. Specifically, share prices seem to be more correlated to company fundamentals again. Over shorter periods, many factors can impact stock-price movements. However, we believe that a company's underlying fundamentals and ability to grow its earnings and cash flow should drive positive stock performance over the long term.
• For the fiscal year ended April 30, 2024, the Polen Global SMID Company Growth Fund’s (the “Fund's”) Institutional share class returned -6.08% net of fees versus the MSCI All Country World® SMID Cap Index, which returned 11.82%.
The performance data quoted represents past performance and is not a guarantee of future results. Investment return and principal value of an investment will fluctuate so that an investor's shares, when redeemed, may be worth more or less than their original cost. Current performance may be lower or higher than the performance information quoted. To obtain performance information current to the most recent month-end, please call 1-888-678-6024.
Top Contributors:
During the period, the top absolute contributors to the Fund’s performance were Tencent Music Entertainment, Core & Main, and CTS Eventim.
• Tencent Music Entertainment, China’s equivalent to Spotify, posted better-than-expected results over several consecutive quarters. Its music business continues to perform exceptionally well in a robust pricing environment, leading to solid revenue and earnings growth. As of April 30, 2024, the company had over 106 million paying music subscribers, a 20% year-over-year increase and revenue mix shift, and higher average revenue per paying user, which has led to the company’s highest gross margin in five years.
• Core & Main is an industrial distributor specializing in waterworks and fire protection, distributing an extensive range of over 200,000 products in the water infrastructure market. The company's fundamental business performance has been better than expected, and it continues executing its disciplined M&A strategy very well. Zooming out, we view Core & Main as a high-quality business with numerous competitive advantages and reinvestment opportunities, supported by structural tailwinds from the need to repair and replace aging municipal water infrastructure.
• CTS Eventim, the European leader in ticketing and live entertainment event management, achieved substantial results with profits ahead of expectations over the period. Revenues have risen to 65% above pre-COVID levels, and net income has more than doubled. Ticketing sales were driven by blockbuster tours such as Taylor Swift and Coldplay. Despite the robust results, management maintained conservative forward guidance, with U.S. expansion plans remaining challenging, given high competitive barriers and possible regulation. We believe CTS Eventim can compound earnings close to 15% per annum, given their dominant market position, the secular trends of ticketing moving online, and increased consumer spending on experiences.
POLEN GLOBAL SMID COMPANY GROWTH FUND
Annual Investment Adviser’s Report (Concluded)
April 30, 2024
(Unaudited)
Top Detractors:
During the period, the top absolute detractors from the Fund’s performance were Keyword Studios, Endava, and Paycom Software.
• Keyword Studios is a UK-based outsourced video game production services company. The company has experienced significant selling pressure due to concerns that AI could disrupt its business model. Many of its outsourced service offerings, such as language translation and video game artwork, could perceivably be accomplished in-house using generative AI. Management has addressed these concerns, and despite ongoing uncertainty, they are embracing AI and believe it could become more of an opportunity than a threat. Ultimately, the Fund sold out of the position in the third quarter of 2023 due to risk management. The team modeled various scenarios, with the range of outcomes unacceptably wide.
• Endava, a UK-based technology consulting company, has continued to grow over the reporting period. Growth has slowed, however, and management has guided more conservatively for the medium term. Slowing growth is expected due to companies pausing discretionary technology spending and margins being impacted by higher costs, all signaling a more cautious operating environment. We remain positive in the longer term and trust Endava’s ability to play a critical role in facilitating digital transformation for its clients across various industries and end markets.
• Paycom Software is a leading cloud-based human capital management software provider for small and mid-sized businesses. The stock came under pressure in the second half of 2023 as the market reacted negatively to the short-term negative impact on margins from continued investments in its platform and its “BETI” product. The company has demonstrated that the use of BETI can significantly improve return on investment and has made its adoption a priority for its salesforce. While there is no immediate revenue uptick from BETI adoption, the long-term view is that it improves the return on investment of Paycom's offering and increases client retention. We maintain that Paycom is a high-quality, high-growth leader in human capital management and payroll software and should continue to take market share from long-standing incumbents.
MSCI All Country World® Index SMID Cap Index is a market capitalization weighted equity index that measures the performance of the mid and small-cap segments across developed and emerging market countries. The index is maintained by Morgan Stanley Capital International. The volatility and other material characteristics of the indices referenced may be materially different from the performance achieved by an individual investor. In addition, an investor’s holdings may be materially different from those within the index. Indices are unmanaged and one cannot invest directly in an index.
The volatility, performance, and other characteristics of the index referenced may be materially different from the Fund. In addition, the Fund’s holdings may be materially different from those within the index. Indices are unmanaged and one cannot invest directly in an index. This letter is intended to assist shareholders in understanding how the Fund performed during the fiscal year ended April 30, 2024 and reflects the views of the investment adviser at the time of this writing. Of course, these views may change and do not guarantee the future performance of the Fund or the markets.
This content is being provided for informational purposes only. Although the information and any opinions or views given have been obtained from or based on sources believed to be reliable, no warranty or representation is made as to their correctness, completeness or accuracy. Opinions, estimates, forecasts, and statements of financial market trends that are based on current market conditions constitute the judgment of the investment adviser and are subject to change without notice, including any forward-looking estimates or statements.
Portfolio composition is subject to change. The current and future portfolio holdings of the Fund are subject to investment risk. The investment return and principal value of an investment in the Fund will fluctuate so that an investor’s shares, when redeemed, may be worth more or less than their original cost.
The information provided in this document should not be construed as a recommendation to purchase or sell any particular security. The securities discussed do not necessarily represent the entire portfolio. It should not be assumed that any of the securities transactions or holdings discussed were or will prove to be profitable or that any future investment recommendations will equal the investment performance of the securities discussed herein. For a complete list of the investment adviser's past specific recommendations and holdings and a list of current holdings as of the current quarter end, please contact info@polencapital.com.
The views and strategies described may not be suitable for all clients. This disclosure does not identify all the risks (direct or indirect) or other considerations which might be material when entering any financial transaction.
POLEN GLOBAL SMID COMPANY GROWTH FUND
Annual Report
Performance Data
April 30, 2024
(Unaudited)
Comparison of Change in Value of $100,000 (investment minimum) Investment in Polen Global SMID Company Growth Fund Institutional Class Shares vs MSCI All Country World® Index (“ACWI”) SMID Cap Index (Net Dividend)
| Average Annual Total Returns for the Periods Ended April 30, 2024 |
| | 1 Year | | Since
Inception* |
| Institutional Class | -6.08% | | -19.58% |
| MSCI All Country World® Index (“ACWI”) SMID Cap Index (Net Dividend) | 11.82% | | -4.94% ** |
| * | The Polen Global SMID Company Growth Fund (the “Fund”) Institutional Class commenced operations on January 3, 2022. |
| ** | Benchmark performance is from the commencement date of the Fund Class only and is not the commencement date of the benchmark itself. |
The performance data quoted represents past performance and does not guarantee future results. Current performance may be lower or higher. Performance data current to the most recent month-end may be obtained by calling 1-888-678-6024. The investment return and principal value of an investment will fluctuate so that shares, when redeemed, may be worth more or less than their original cost. The graph and table do not reflect the deduction of taxes that a shareholder would pay on Fund distributions or the redemption of Fund shares.
POLEN GLOBAL SMID COMPANY GROWTH FUND
Performance Data (Continued)
April 30, 2024
(Unaudited)
Comparison of Change in Value of $10,000 Investment in Polen Global SMID Company Growth Fund Investor Class Shares vs MSCI All Country World® Index (“ACWI”) SMID Cap Index (Net Dividend)
| Total Returns for the Periods Ended April 30, 2024 |
| | Since
Inception*† |
| Investor Class | -3.68% |
| MSCI All Country World® Index (“ACWI”) SMID Cap Index (Net Dividend) | 6.95% ** |
| † | Not Annualized. |
| * | The Polen Global SMID Company Growth Fund (the “Fund”) Investor Class commenced operations on August 11, 2023. |
| ** | Benchmark performance is from the commencement date of the Fund Class only and is not the commencement date of the benchmark itself. |
The performance data quoted represents past performance and does not guarantee future results. Current performance may be lower or higher. Performance data current to the most recent month-end may be obtained by calling 1-888-678-6024. The investment return and principal value of an investment will fluctuate so that shares, when redeemed, may be worth more or less than their original cost. The graph and table do not reflect the deduction of taxes that a shareholder would pay on Fund distributions or the redemption of Fund shares.
The Fund’s “Total Annual Fund Operating Expenses” and “Total Annual Fund Operating Expenses After Fee Waiver and/or Expense Reimbursement”, as stated in the current prospectus dated September 1, 2023, as supplemented, are 2.69% and 1.25%, respectively, for the Institutional Class shares, and 2.94% and 1.50%, respectively, for the Investor Class shares of the Fund’s average daily net assets, which may differ from the actual expenses incurred by the Fund for the period covered by this report. Polen Capital Management, LLC (“PCM” or the “Adviser”) has contractually agreed to reduce its investment advisory fee and/or reimburse certain expenses of the Fund to the extent necessary to ensure that the Fund’s total operating expenses (excluding taxes, fees and expenses attributable to a distribution or service plan adopted by the Trust, interest, extraordinary items, “Acquired Fund Fees and Expenses” and brokerage commissions) do not exceed 1.25% (on an annual basis) with respect to the Fund’s average daily net assets (the “Expense Limitation”). The Expense Limitation will remain in place until August 31, 2024 unless the Board of Trustees (“Board of Trustees”) of FundVantage Trust (the "Trust") approves its earlier termination. The Adviser is entitled to recover, subject to approval by the Board of Trustees, any fees waived and/or expenses reimbursed for a period of up to three (3) years from the date on which the Adviser reduced its compensation and/or assumed expenses for the Fund. The Adviser is permitted to seek reimbursement from the Fund, for fees it waived and Fund expenses it paid to the extent the total annual fund operating expenses do not exceed the limits described above or any lesser limits in effect at the time of reimbursement. No recoupment will occur unless the Fund’s expenses are below the Expense Limitation amount. Total returns would be lower had such fees and expenses not been waived and/or reimbursed.
The Fund evaluates its performance as compared to that of the MSCI ACWI SMID Cap Index (Net Dividend), which captures mid and small cap representation across 23 Developed Markets (DM) and 24 Emerging Markets (EM) countries. With 7,901 constituents, the index covers approximately 28% of the free float-adjusted market capitalization in each country. Indexes are unmanaged and it is not possible to invest directly in an index.
POLEN GLOBAL SMID COMPANY GROWTH FUND
Performance Data (Concluded)
April 30, 2024
(Unaudited)
All mutual fund investing involves risk, including possible loss of principal. The Fund is non-diversified, which means that a large portion of the Fund’s assets may be invested in one or few companies or sectors. The Fund could fluctuate in value more than a diversified fund. Investing in foreign securities entails special risks, such as fluctuations in currency exchange rates and possible lax regulation of securities markets and accounting practices. The Fund is a recently formed mutual fund and has a limited history of operations.
The Fund may invest a substantial amount of its assets in issuers located in a limited number of countries. If the Fund concentrates its investments in this manner, it assumes the risk that economic, political and social conditions in those countries will have a significant impact on its investment performance. The Fund’s investment performance may also be more volatile if it concentrates its investments in certain countries, especially emerging market countries.
POLEN BANK LOAN FUND
Annual Investment Adviser's Report
April 30, 2024
(Unaudited)
Performance Summary:
• The trailing twelve-month period ending April 30, 2024, was marked by elevated but moderating inflation, a slowdown in the pace of monetary policy tightening, and a renewed focus on the timing and magnitude of future rate cuts. Better-than-expected economic data helped moderate concerns of an impending economic slowdown.
• Corporate earnings were more resilient than anticipated. Credit spreads tightened for high yield bonds and leveraged loans as earnings exceeded expectations and access to capital markets improved. Both asset classes registered gains; however, leveraged loans outperformed their high yield counterparts.
• High yield bond and leveraged loan markets continued to grind tighter in the face of increasing U.S. Treasury yields and continued domestic and geopolitical challenges.
• For the fiscal year ended April 30, 2024, the Polen Bank Loan Fund’s (the “Fund's”) institutional share class returned 13.09% net of fees versus the Morningstar LSTA US Leveraged Loan® Index, which returned 11.94%.
The performance data quoted represents past performance and is not a guarantee of future results. Investment return and principal value of an investment will fluctuate so that an investor's shares, when redeemed, may be worth more or less than their original cost. Current performance may be lower or higher than the performance information quoted. To obtain performance information current to the most recent month-end, please call 1-888-678-6024.
Top Contributors:
During the period, the top absolute contributors to the Fund’s performance were Aveanna Healthcare, Internet Brands, and Auction.com.
• Aveanna Healthcare, a national leader in home healthcare, focuses on delivering high quality one-on-one care to a broad spectrum of patients. The Fund’s investment in the company’s SOFR +7% Second Lien Term Loan due 2029 and SOFR +3.75% First Lien Term Loan due 2028 traded up during the period. Aveanna reported better-than-expected Q4 2023 results and provided guidance that we believe implies significant profitability growth in 2024. After a challenging 2023, the company benefited from reimbursement rate improvements during the period. Because of Aveanna’s significant earnings momentum and the attractive yield offered by both Term Loans, the Fund continues to hold both Term Loans.
• Internet Brands, a leading online media company, targets the health, legal and automotive markets. The company’s health division represents nearly three-quarters of its total revenue. The health division also includes one of the top-rated digital health resource platform for physicians and healthcare professionals globally, based on our research, and WebMD, the consumer-focused health information and services platform. The Fund’s investment in the company’s SOFR +4.25% First Lien Term Loan due 2028 and SOFR +6.25% Second Lien Term Loan due 2029 traded up during the period. The company’s health division experienced softening demand following the COVID-driven surge, and other segments were impacted by general caution around spending on marketing under an uncertain economic backdrop. During the period, the business returned to growth, driving up the trading levels of both Term Loans. In March, we exited the Fund’s First Lien Term Loan position. The Fund continues to hold the Second Lien Term Loan.
• Auction.com is the leading online marketplace for the sale of distressed homes. The Fund’s investment in the company’s S+600 First Lien Term Loan due 2028 was a top contributor to total returns during the period, reflecting the company’s recovery from the COVID foreclosure moratorium lows. We continue to view the First Lien Term Loans favorably, given the relatively low loan-to-value, underpinned by the market’s belief that any cyclical return of housing market distress will meaningfully improve operating results at Auction.com. The Fund maintains its position in the First Lien Term Loan.
Top Detractors:
Eyecare Partners, Cano Health, and Wheel Pros were the Fund’s top absolute detractors for the period.
• EyeCare Partners is the largest integrated eyecare services provider in the USA. The company offers a range of eye care services, from routine eye exams to more complex medical procedures like retina injections. EyeCare Partners has more than
POLEN BANK LOAN FUND
Annual Investment Adviser’s Report (Concluded)
April 30, 2024
(Unaudited)
750 locations and employs approximately 1,000 clinicians. In December 2019, private equity firm Partners Group acquired EyeCare Partners for $2.2 billion. The Fund’s investment in the company’s SOFR +4.50% First Lien Term Loan due 2028 and SOFR +6.75% Second Lien Term Loan due 2029 traded down during the period due to the company’s financial underperformance. Specifically, cost inflation and integration issues lowered profitability and stressed the company’s liquidity. In April 2024, the company completed an exchange transaction that involved both term loans held in the Fund. This exchange bolstered the company’s liquidity. The Fund maintains its exposure to this issuer as we believe that the risk versus reward of the position is favorable at current prices.
• Cano Health operates primary care centers and supports affiliated medical practices. The company specializes in primary care for seniors. Its business model is designed to improve the health of its patients while lowering overall healthcare costs through preventative care. The Fund’s investment in the company’s SOFR +4.0% First Lien Term Loan due 2027 depreciated in value during the period. Cano underperformed our expectations due to adverse regulatory developments, misguided expansion strategies, and higher-than-expected costs. During September 2023, we exited our entire position in Cano Health’s First Lien Term Loan at a substantial loss. Our research indicated that the company’s remaining liquidity was dwindling and that there was a high likelihood of a bankruptcy filing that would result in virtually no recovery. In February 2024, Cano filed for bankruptcy protection, and the restructuring plan contemplates a de minimis recovery for the Senior Notes.
• Wheel Pros designs and markets tires. The company offers wheels, tires, and related accessories for cars, sport utility vehicles, and trucks. Wheel Pros serves customers worldwide. The Fund’s investment in the company’s 6.5% Senior Notes due 2029 sold off earlier in the period. The company’s reported results were challenged by softening consumer demand for wheels given ongoing macroeconomic pressure as well as inflationary costs in freight, labor, and aluminum. Further, liquidity was tighter than expected due to working capital build ups and a sluggish release of inventory due to slower sales. We exited this position in the Fund in May 2023. The Fund no longer has any exposure to this issuer.
The Morningstar LSTA US Leveraged Loan® Index is a rules-based index composed of loans that meet the following inclusion rules: senior secured, minimum initial term of one year, initial minimum spread of Base Rate +125 basis points at inception, minimum size of $50 million, and U.S. dollar-denominated. The volatility and other material characteristics of the indices referenced may be materially different from the performance achieved. Holdings of portfolios pursuing the strategy may be materially different from those within the index. Indices are unmanaged.
The volatility, performance, and other characteristics of the index referenced may be materially different from the Fund. In addition, the Fund’s holdings may be materially different from those within the index. Indices are unmanaged and one cannot invest directly in an index. This letter is intended to assist shareholders in understanding how the Fund performed during the fiscal year ended April 30, 2024 and reflects the views of the investment adviser at the time of this writing. Of course, these views may change and do not guarantee the future performance of the Fund or the markets.
This content is being provided for informational purposes only. Although the information and any opinions or views given have been obtained from or based on sources believed to be reliable, no warranty or representation is made as to their correctness, completeness or accuracy. Opinions, estimates, forecasts, and statements of financial market trends that are based on current market conditions constitute the judgment of the investment adviser and are subject to change without notice, including any forward-looking estimates or statements.
Portfolio composition is subject to change. The current and future portfolio holdings of the Fund are subject to investment risk. The investment return and principal value of an investment in the Fund will fluctuate so that an investor’s shares, when redeemed, may be worth more or less than their original cost.
The information provided in this document should not be construed as a recommendation to purchase or sell any particular security. The securities discussed do not necessarily represent the entire portfolio. It should not be assumed that any of the securities transactions or holdings discussed were or will prove to be profitable or that any future investment recommendations will equal the investment performance of the securities discussed herein. For a complete list of the investment adviser’s past specific recommendations and holdings and a list of current holdings as of the current quarter end, please contact info@polencapital.com.
The views and strategies described may not be suitable for all clients. This disclosure does not identify all the risks (direct or indirect) or other considerations which might be material when entering any financial transaction.
POLEN BANK LOAN FUND
Annual Report
Performance Data
April 30, 2024
(Unaudited)
Comparison of Change in Value of $100,000 (investment minimum) Investment in Polen Bank Loan Fund Institutional Class Shares vs Morningstar LSTA US Leveraged Loan® Index
| Average Annual Total Returns for the Periods Ended April 30, 2024 |
| | 1 Year | | Since
Inception* |
| Institutional Class | 13.09% | | 11.09% |
| Morningstar LSTA US Leveraged Loan® Index | 11.94% | | 11.16% ** |
| * | The Polen Bank Loan Fund (the "Fund") Institutional Class commenced operations on June 30, 2022. |
| ** | Benchmark performance is from inception date of the Fund Class only and is not the inception date of the benchmark itself. |
The performance data quoted represents past performance and does not guarantee future results. Current performance may be lower or higher. Performance data current to the most recent month-end may be obtained by calling 1-888-678-6024. The investment return and principal value of an investment will fluctuate so that shares, when redeemed, may be worth more or less than their original cost. The graph and table do not reflect the deduction of taxes that a shareholder would pay on Fund distributions or the redemption of Fund shares.
The Fund’s “Total Annual Fund Operating Expenses” and “Total Annual Fund Operating Expenses After Fee Waiver and/or Expense Reimbursement”, as stated in the current prospectus dated November 20, 2023, as supplemented are 3.19% and 0.75%, respectively, for the Institutional Class shares of the Fund’s average daily net assets, which may differ from the actual expenses incurred by the Fund for the period covered by this report. Polen Capital Credit, LLC (“Polen Credit” or the “Adviser”) has contractually agreed to reduce its investment advisory fee and/or reimburse certain expenses of the Fund to the extent necessary to ensure that the Fund’s total operating expenses (excluding taxes, fees and expenses attributable to a distribution or service plan adopted by the Trust, interest, extraordinary items, “Acquired Fund Fees and Expenses” and brokerage commissions) do not exceed 0.75% (on an annual basis) with respect to the Fund’s average daily net assets (the “Expense Limitation”). The Expense Limitation will remain in place until August 31, 2024 unless the Board of Trustees (“Board of Trustees”) of FundVantage Trust (the “Trust”) approves its earlier termination. The Adviser is entitled to recover, subject to approval by the Board of Trustees, such amounts reduced or reimbursed for a period of up to three (3) years from the date on which the Adviser reduced its compensation and/or assumed expenses for the Fund. The Adviser is permitted to seek reimbursement from the Fund, for fees it waived and Fund expenses it paid to the extent the total annual fund operating expenses do not exceed the limits described above or any lesser limits in effect at the time of the reimbursement. No reimbursement will occur unless the Fund’s expenses are below the Expense Limitation amount. Total returns would be lower had such fees and expenses not been waived and/or reimbursed.
The Fund evaluates its performance as compared to that of the Morningstar LSTA US Leveraged Loan® Index. The Morningstar LSTA US Leveraged Loan® Index is a market-value weighted index designed to measure the performance of the US leveraged loan market. Indexes are unmanaged and it is not possible to invest directly in an index.
All mutual fund investing involves risk, including possible loss of principal. Fixed income investments are subject to interest rate risk; as interest rates rise, their value will decline. Lower-rated securities are subject to additional credit and default risks. Investments
POLEN BANK LOAN FUND
Performance Data (Concluded)
April 30, 2024
(Unaudited)
in bank loans, which are made by banks or other financial intermediaries to borrowers, will depend primarily upon the creditworthiness of the borrower for payment of principal and interest. Trading in Rule 144A securities may be less active than trading in publicly traded securities. Investments with low trading volumes may be difficult to sell at quoted market prices.
The Fund may invest a substantial amount of its assets in credit instruments that are rated below investment grade by some or all relevant independent rating agencies, including Moody’s Investors Service, Standard and Poor’s Rating Services and Fitch Ratings (including a significant portion of such assets in credit instruments in the lower tier of the high yield and leveraged loan market that are rated B and below). Additionally, certain other high yield securities may be unrated by rating agencies, but determined by the Adviser to be of similar quality as other below investment grade bonds and credit instruments and accordingly purchased for investment by the Fund. The Fund does not have a percentage limitation on investing in securities that are rated below investment grade.
POLEN U.S. HIGH YIELD FUND
(formerly, Polen Upper Tier High Yield Fund)
Annual Investment Adviser's Report
April 30, 2024
(Unaudited)
Performance Summary:
• The trailing twelve-month period ending April 30, 2024 was marked by elevated but moderating inflation, a slowdown in the pace of monetary policy tightening, and a renewed focus on the timing and magnitude of future rate cuts. Better-than-expected economic data helped moderate concerns of an impending economic slowdown.
• Corporate earnings were more resilient than anticipated. Credit spreads tightened for high yield bonds and leveraged loans as earnings exceeded expectations and access to capital markets improved. Both asset classes registered gains; however, leveraged loans outperformed their high yield counterparts.
• High yield bond and leveraged loan markets continued to grind tighter in the face of increasing U.S. Treasury yields and continued domestic and geopolitical challenges.
• For the fiscal year ended April 30, 2024, the Polen U.S. High Yield Fund’s (the “Fund's”) institutional share class returned 8.79% net of fees versus the ICE BofA BB/B U.S. Non-Financial High Yield Constrained® Index, which returned 7.91%.
The performance data quoted represents past performance and is not a guarantee of future results. Investment return and principal value of an investment will fluctuate so that an investor's shares, when redeemed, may be worth more or less than their original cost. Current performance may be lower or higher than the performance information quoted. To obtain performance information current to the most recent month-end, please call 1-888-678-6024.
Top Contributors:
During the period, the top absolute contributors to the Fund’s performance were Advantage Solutions, Five Point Operating, and Teine Energy.
• Advantage Solutions provides outsourced sales and experiential marketing to an extensive list of consumer packaged goods (“CPGs”) manufacturers and retailers. After several years of soft financial performance due to reduced labor availability, higher wages, and a slower-than-expected post-COVID recovery, earnings stabilized during 2023. Stable earnings, a new management team, expectations of lower interest rates, and more than $225 million in debt reduction caused the Fund’s investment in the company’s 6.50% First Lien Notes due 2028 to increase in price during the period. While financials remain weaker than when the First Lien Notes were originally issued, stable performance boosted market confidence that financial results will continue to improve over the next several years. This confidence supported the strong performance of the First Lien Notes during the period. The Fund continues to hold the First Lien Notes.
• Five Point Operating owns and develops mixed-use and planned communities in Orange County, Los Angeles County, and San Francisco County. The company develops raw landand sells residential and commercial land sites to homebuilders, commercial developers, and commercial buyers. The Fund’s investment in the company’s 7.875% Senior Notes due 2025 traded up during the period on the expectation that improving credit markets would lead to refinancing the Senior Notes before the November 2025 maturity date. In January 2024, the company announced a refinancing transaction. The Fund exited the position as the Senior Notes traded up in connection with the refinancing announcement. The Fund no longer has any exposure to this issuer.
• Teine Energy Ltd. is a Canadian-based oil and gas exploration and production company. The Fund’s investment in the company’s 6.875% Senior Notes due 2029 traded up during the period due to the strong oil price environment and the company’s impressive operating performance. The Fund maintains its position in the Senior Notes. We view the company’s low leverage and loan-to-value metrics favorably among its industry peers.
Top Detractors:
Lumen Technologies, ModivCare, and Commscope were the Fund’s top absolute detractors for the period.
• Lumen Technologies, an international, facilities-based telecommunications company, is focused on providing business and residential customers with integrated communications products and services. The Fund’s investment in the company’s Senior Notes and legacy Level 3 Communications Senior Notes declined in value during the period as the company’s financial results
POLEN U.S. HIGH YIELD FUND
(formerly, Polen Upper Tier High Yield Fund)
Annual Investment Adviser’s Report (Concluded)
April 30, 2024
(Unaudited)
remained soft and the company lacked easy access to capital markets to raise additional capital to fund growth initiatives. In early November, the company offered an up-tier debt exchange to select holders of the Senior Notes. Holders not invited to the exchange were left with a subordinate position, lowering debt trading levels. The uneven treatment of debtholders was a serious governance concern in our view and cemented our decision to eliminate the Fund’s exposure to the company (including legacy holdings in Level 3 Communications).
• ModivCare Inc. is a U.S.-based healthcare services company operating three segments: non-emergency transportation, home health, and remote patient monitoring. The Fund’s investment in the company’s 5.0% Senior Notes due 2029 traded down during the period, particularly in early 2024 after the company issued 2024 guidance that was below expectations. Specifically, the company’s non-emergency transportation segment experienced competitive pressure and cost inflation. Despite the headwinds, we believe the Senior Notes provide an attractive risk-versus-reward profile given the value of the company’s home health and remote patient monitoring businesses. The Fund maintains its position in the Senior Notes.
• Commscope Inc. is a leading technology provider supplying cable and telecommunications companies with core network technology. The Fund’s investment in the company’s 4.750% First Lien Notes due 2029 underperformed during the period due to weaker-than-expected financial results. Given the company's high leverage and expectation of continued operational declines, the Fund exited its position in Commscope. The Fund no longer has any exposure to this issuer.
The ICE BofA BB/B U.S. Non-Financial High Yield Constrained® Index tracks the performance of U.S. dollar denominated below investment grade corporate debt publicly issued in the U.S. domestic market and excludes investments in the financial sector. The index data referenced herein is the property of ICE Data Indices, LLC, its affiliates (“ICE Data”) and/or its Third-Party Suppliers and has been licensed for use by Polen Capital Credit, LLC. ICE Data and its Third-Party Suppliers accept no liability in connection with its use. Please contact Polen Capital Credit for a full copy of the applicable disclaimer.
The volatility, performance, and other characteristics of the index referenced may be materially different from the Fund. In addition, the Fund’s holdings may be materially different from those within the index. Indices are unmanaged and one cannot invest directly in an index. This letter is intended to assist shareholders in understanding how the Fund performed during the fiscal year ended April 30, 2024 and reflects the views of the investment adviser at the time of this writing. Of course, these views may change and do not guarantee the future performance of the Fund or the markets.
This content is being provided for informational purposes only. Although the information and any opinions or views given have been obtained from or based on sources believed to be reliable, no warranty or representation is made as to their correctness, completeness or accuracy. Opinions, estimates, forecasts, and statements of financial market trends that are based on current market conditions constitute the judgment of the investment adviser and are subject to change without notice, including any forward-looking estimates or statements.
Portfolio composition is subject to change. The current and future portfolio holdings of the Fund are subject to investment risk. The investment return and principal value of an investment in the Fund will fluctuate so that an investor’s shares, when redeemed, may be worth more or less than their original cost.
The information provided in this document should not be construed as a recommendation to purchase or sell any particular security. The securities discussed do not necessarily represent the entire portfolio. It should not be assumed that any of the securities transactions or holdings discussed were or will prove to be profitable or that any future investment recommendations will equal the investment performance of the securities discussed herein. For a complete list of the investment adviser’s past specific recommendations and holdings and a list of current holdings as of the current quarter end, please contact info@polencapital.com.
The views and strategies described may not be suitable for all clients. This disclosure does not identify all the risks (direct or indirect) or other considerations which might be material when entering any financial transaction.
POLEN U.S. HIGH YIELD FUND
(formerly, Polen Upper Tier High Yield Fund)
Annual Report
Performance Data
April 30, 2024
(Unaudited)
Comparison of Change in Value of $100,000 (investment minimum) Investment in Polen U.S. High Yield Fund Institutional Class Shares vs ICE BofA BB/B U.S. Non-Financial High Yield Constrained® Index
| Average Annual Total Returns for the Periods Ended April 30, 2024 |
| | 1 Year | | Since
Inception* |
| Institutional Class | 8.79% | | 8.76% |
| ICE BofA BB/B U.S. Non-Financial High Yield Constrained® Index | 7.91% | | 8.78% ** |
| * | The Polen U.S. High Yield Fund (the "Fund") Institutional Class commenced operations on June 30, 2022. |
| ** | Benchmark performance is from the commencement date of the Fund Class only and is not the commencement date of the benchmark itself. |
The performance data quoted represents past performance and does not guarantee future results. Current performance may be lower or higher. Performance data current to the most recent month-end may be obtained by calling 1-888-678-6024. The investment return and principal value of an investment will fluctuate so that shares, when redeemed, may be worth more or less than their original cost. The graph and table do not reflect the deduction of taxes that a shareholder would pay on Fund distributions or the redemption of Fund shares.
The Fund’s “Total Annual Fund Operating Expenses” and “Total Annual Fund Operating Expenses After Fee Waiver and/or Expense Reimbursement”, as stated in the current prospectus dated November 20, 2023, as supplemented, are 7.22% and 0.65%, respectively, for the Institutional Class shares of the Fund’s average daily net assets, which may differ from the actual expenses incurred by the Fund for the period covered by this report. Polen Capital Credit, LLC (“Polen Credit” or the “Adviser”) has contractually agreed to reduce its investment advisory fee and/or reimburse certain expenses of the Fund to the extent necessary to ensure that the Fund’s total operating expenses (excluding taxes, fees and expenses attributable to a distribution or service plan adopted by the Trust, interest, extraordinary items, “Acquired Fund Fees and Expenses” and brokerage commissions) do not exceed 0.65% (on an annual basis) with respect to the Fund’s average daily net assets (the “Expense Limitation”). The Expense Limitation will remain in place until August 31, 2024 unless the Board of Trustees ("Board of Trustees") of FundVantage Trust (the "Trust") approves its earlier termination. The Adviser is entitled to recover, subject to approval by the Board of Trustees, such amounts reduced or reimbursed for a period of up to three (3) years from the date on which the Adviser reduced its compensation and/or assumed expenses for the Fund. The Adviser is permitted to seek reimbursement from the Fund, for fees it waived and Fund expenses it paid to the extent the total annual fund operating expenses do not exceed the limits described above or any lesser limits in effect at the time of the reimbursement. No reimbursement will occur unless the Fund’s expenses are below the Expense Limitation amount. Total returns would be lower had such fees and expenses not been waived and/or reimbursed.
The Fund evaluates its performance as compared to that of the ICE BofA BB/B U.S. Non-Financial High Yield Constrained® Index, which contains all securities in the ICE BofA U.S. High Yield Index rated BB1 through B3, based on an average of Moody's, S&P and Fitch, but caps issuer exposure at 2% and excludes financials. Index constituents are capitalization-weighted, based on their current amount outstanding, provided that the total allocation to an individual issuer does not exceed 2%. The ICE BofA U.S. High Yield Index consists primarily of bonds and notes rated BB or lower. However, the benchmark is an unmanaged index and
POLEN U.S. HIGH YIELD FUND
(formerly, Polen Upper Tier High Yield Fund)
Performance Data (Concluded)
April 30, 2024
(Unaudited)
does not include any private (non-144A) obligations, convertible bonds, preferred and common equity, and certain other securities and obligations. Indexes are unmanaged and it is not possible to invest directly in an index.
All mutual fund investing involves risk, including possible loss of principal. The Fund targets investments in high yield, or below investment grade, bank loans and bonds. In particular, debt investments in high yield issuers, which are described as speculative by major credit rating agencies, are generally more susceptible to credit risk than other fixed income investments. In addition, the Fund’s high yield debt investments, including bank loans and Rule 144A securities, are subject to liquidity risk, as the Fund may not be able to sell investments at the best prices or at the value that the Fund places on them. The Adviser integrates material environmental, social, and governance (ESG) factors into research analysis as part of a comprehensive evaluation of a company’s long-term financial sustainability. The risk that the investment techniques and risk analyses applied by the investment adviser, including but not limited to the Adviser’s integration of ESG factors into its research analysis, will not produce the desired results and that legislative, regulatory, or tax developments may affect the investment techniques available to the investment adviser and the individual portfolio manager in connection with managing the Fund.
The Fund may invest a substantial amount of its assets in below investment grade fixed income securities that are rated B or above by some or all relevant independent rating agencies, including Moody’s Investors Service, Standard and Poor’s Rating Services and Fitch Ratings. Additionally, on a limited basis, certain other high yield securities may be unrated by rating agencies, but determined by the Adviser to be of similar quality as other below investment grade bonds and credit instruments may be purchased for investment by the Fund. The Fund has an investment policy whereby a minimum of 30% of the value of the Fund’s assets will be invested in securities rated BB by S&P or Ba by Moody’s, respectively, in normal market conditions.
POLEN OPPORTUNISTIC HIGH YIELD FUND
Annual Investment Adviser's Report
April 30, 2024
(Unaudited)
Performance Summary:
• The trailing twelve-month period ending April 30, 2024 was marked by elevated but moderating inflation, a slowdown in the pace of monetary policy tightening, and a renewed focus on the timing and magnitude of future rate cuts. Better-than-expected economic data helped moderate concerns of an impending economic slowdown.
• Corporate earnings were more resilient than anticipated. Credit spreads tightened for high yield bonds and leveraged loans as earnings exceeded expectations and access to capital markets improved. Both asset classes registered gains; however, leveraged loans outperformed their high yield counterparts.
• High yield bond and leveraged loan markets continued to grind tighter in the face of increasing U.S. Treasury yields and continued domestic and geopolitical challenges.
• For the fiscal year ended April 30, 2024, the Polen U.S. Opportunistic High Yield Fund's (the "Fund's") institutional share class returned 9.67% net of fees versus the ICE BofA U.S. High Yield® Index, which returned 8.85%.
The performance data quoted represents past performance and is not a guarantee of future results. Investment return and principal value of an investment will fluctuate so that an investor's shares, when redeemed, may be worth more or less than their original cost. Current performance may be lower or higher than the performance information quoted. To obtain performance information current to the most recent month-end, please call 1-888-678-6024.
Top Contributors:
During the period, the top absolute contributors to the Fund's performance were NFP Corp., Husky Injection Molding, and Century Aluminum.
• NFP Corp., a leading insurance broker and consultant, helps provide clients with various brokerage and advisory services, including corporate benefits, property & casualty, retirement, individual insurance, and wealth management solutions. NFP's end market is attractive as commercial insurance demand is recurring given that commercial customers need to purchase insurance annually. In December 2023, Aon plc announced it was acquiring NFP for $13.4 billion. Following the announcement, the Fund's investment in NFP's 8.5% First Lien Notes due 2031 and 6.875% Senior Notes due 2028 appreciated on the expectation that NFP's debt would be repaid in connection with the transaction. The debt was repaid in April 2024 with Aon's acquisition of NFP. The Fund no longer has any exposure to this issuer.
• Husky Injection Molding Systems designs and manufactures injection molding equipment. The Fund's investment in the company's 7.75% Senior Notes due 2026 appreciated in value during the period, particularly during 3Q 2023, after the company reported better-than expected second-quarter earnings and an improved outlook for the second half of 2023. In addition, the company's sponsor pledged to support the company in the face of approaching maturities coming due over the next two years. The Fund's investment in the company's Senior Notes were refinanced at par in April 2024. As a result, the Fund no longer has an exposure to this issuer.
• Century Aluminum, a global producer of primary aluminum with operations in the United States and Iceland, has an annual production capacity of approximately 1 million tons. The company's Icelandic asset is a first-quartile cost curve asset as it benefits from strong market positioning and low-cost, renewable hydropower. The Fund's investment in the company's 7.5% Second Lien Notes due 2028 appreciated during the period because of robust operating results, a supportive aluminum market that has secular tailwinds from the ongoing decarbonization of the metal supply chain, and recent U.S. Government policy programs which provide tax credits for the domestic production of critical materials. We remain optimistic about the 2024 outlook for Century Aluminum and maintain the Fund's position in the Second Lien Notes.
Top Detractors:
CWT Travel Group, Cano Health, and Eyecare Partners were the Fund’s top absolute detractors for the period.
• CWT Travel Group ("CWT") is a travel management company that handles business travel, meetings, incentives, conferencing, exhibitions, and event management. The Fund's investment in the company's 8.5% First Lien Notes due 2026, preferred equity,
POLEN OPPORTUNISTIC HIGH YIELD FUND
Annual Investment Adviser’s Report (Concluded)
April 30, 2024
(Unaudited)
and restructured equity underperformed during the period as the company faced continued operational challenges against a weak macroeconomic backdrop. In response to these shortfalls, the Fund exited its entire position in CWT at a significant loss during the period.
• Cano Health operates primary care centers and supports affiliated medical practices. The company specializes in primary care for seniors. Its business model is designed to improve the health of its patients while lowering overall healthcare costs through preventative care. The Fund's investment in the company's 6.25% Senior Notes due 2028 depreciated in value during the period. Cano underperformed our expectations due to adverse regulatory developments, misguided expansion strategies, and higher-than-expected costs. In November 2023, we exited our entire Cano Health's Senior Notes position at a substantial loss. Our research indicated that the company's remaining liquidity was dwindling and that there was a high likelihood of a bankruptcy filing that would result in virtually no recovery. In February 2024, Cano filed for bankruptcy protection, and the restructuring plan contemplates a de minimis recovery for the Senior Notes.
• EyeCare Partners is the largest integrated eyecare services provider in the USA. The company offers a range of eye care services, from routine eye exams to more complex medical procedures like retina injections. EyeCare Partners has more than 750 locations and employs approximately 1,000 clinicians. In December 2019, private equity firm Partners Group acquired EyeCare Partners for $2.2 billion. The Fund's investment in the company's SOFR +4.50% First Lien Term Loan due 2028 and SOFR +6.75% Second Lien Term Loan due 2029 traded down during the period due to the company's financial underperformance. Specifically, cost inflation and integration issues lowered profitability and stressed the company's liquidity. In April 2024, the company completed an exchange transaction that involved the term loans held in the Fund. This exchange bolstered the company’s liquidity. The Fund maintains its exposure to this issuer as we believe that the risk versus reward of the position is favorable at current prices.
The ICE BofA U.S. High Yield® Index tracks the performance of U.S. dollar denominated below investment grade corporate debt publicly issued in the U.S. domestic market. The index data referenced herein is the property of ICE Data Indices, LLC, its affiliates ("ICE Data") and/or its Third-Party Suppliers and has been licensed for use by Polen Capital Credit, LLC. ICE Data and its Third-Party Suppliers accept no liability in connection with its use. Please contact Polen Capital Credit for a full copy of the applicable disclaimer.
The volatility, performance, and other characteristics of the index referenced may be materially different from the Fund. In addition, the Fund’s holdings may be materially different from those within the index. Indices are unmanaged and one cannot invest directly in an index. This letter is intended to assist shareholders in understanding how the Fund performed during the fiscal year ended April 30, 2024 and reflects the views of the investment adviser at the time of this writing. Of course, these views may change and do not guarantee the future performance of the Fund or the markets.
This content is being provided for informational purposes only. Although the information and any opinions or views given have been obtained from or based on sources believed to be reliable, no warranty or representation is made as to their correctness, completeness or accuracy. Opinions, estimates, forecasts, and statements of financial market trends that are based on current market conditions constitute the judgment of the investment adviser and are subject to change without notice, including any forward-looking estimates or statements.
Portfolio composition is subject to change. The current and future portfolio holdings of the Fund are subject to investment risk. The investment return and principal value of an investment in the Fund will fluctuate so that an investor's shares, when redeemed, may be worth more or less than their original cost.
The information provided in this document should not be construed as a recommendation to purchase or sell any particular security. The securities discussed do not necessarily represent the entire portfolio. It should not be assumed that any of the securities transactions or holdings discussed were or will prove to be profitable or that any future investment recommendations will equal the investment performance of the securities discussed herein. For a complete list of the investment adviser’s past specific recommendations and holdings and a list of current holdings as of the current quarter end, please contact info@polencapital.com.
The views and strategies described may not be suitable for all clients. This disclosure does not identify all the risks (direct or indirect) or other considerations which might be material when entering any financial transaction.
POLEN OPPORTUNISTIC HIGH YIELD FUND
Annual Report
Performance Data
April 30, 2024
(Unaudited)
Comparison of Change in Value of $100,000 (investment minimum) Investment in Polen Opportunistic High Yield Fund Institutional Class Shares vs ICE BofA U.S. High Yield® Index
| Average Annual Total Returns for the Periods Ended April 30, 2024 |
| | Seven Months† | | 1 Year | | 3 Years | | 5 Years | | Since
Inception |
| Institutional Class | 6.02% | | 9.67% | | 1.62% | | 2.29% | | 4.27% * |
| ICE BofA U.S. High Yield® Index | 7.59% | | 8.85% | | 1.49% | | 3.53% | | 4.60% ** |
| † | Not Annualized. |
| * | The Polen Opportunistic High Yield Fund (the “Fund”) Institutional Class commenced operations on July 16, 2015. |
| ** | Benchmark performance is from the commencement date of the Fund Class only and is not the commencement date of the benchmark itself. |
The performance data quoted represents past performance and does not guarantee future results. Current performance may be lower or higher. Performance data current to the most recent month-end may be obtained by calling 1-888-678-6024. The investment return and principal value of an investment will fluctuate so that shares, when redeemed, may be worth more or less than their original cost. The graph and table do not reflect the deduction of taxes that a shareholder would pay on Fund distributions or the redemption of Fund shares.
The Fund acquired the assets and liabilities of the Polen DDJ Opportunistic High Yield Fund (the “Predecessor Fund”), a series of ALPS Series Trust, on July 24, 2023. As a result of the reorganization, the Fund is the accounting successor of the Predecessor Fund. Performance results shown in the performance table above for the periods prior to July 24, 2023, reflect the performance of the Predecessor Fund.
POLEN OPPORTUNISTIC HIGH YIELD FUND
Performance Data (Continued)
April 30, 2024
(Unaudited)
Comparison of Change in Value of $10,000 Investment in Polen Opportunistic High Yield Fund Investor Class Shares vs
ICE BofA U.S. High Yield® Index
| Average Annual Total Returns for the Periods Ended April 30, 2024 |
| | Seven Months† | | 1 Year | | 3 Years | | 5 Years | | Since
Inception |
| Investor Class | 5.92% | | 9.43% | | 1.29% | | 1.96% | | 3.93% * |
| ICE BofA U.S. High Yield® Index | 7.59% | | 8.85% | | 1.49% | | 3.53% | | 4.60% ** |
| † | Not Annualized. |
| * | The Polen Opportunistic High Yield Fund (the “Fund”) Investor Class commenced operations on July 16, 2015. |
| ** | Benchmark performance is from the commencement date of the Fund Class only and is not the commencement date of the benchmark itself. |
The performance data quoted represents past performance and does not guarantee future results. Current performance may be lower or higher. Performance data current to the most recent month-end may be obtained by calling 1-888-678-6024. The investment return and principal value of an investment will fluctuate so that shares, when redeemed, may be worth more or less than their original cost. The graph and table do not reflect the deduction of taxes that a shareholder would pay on Fund distributions or the redemption of Fund shares.
The Fund acquired the assets and liabilities of the Polen DDJ Opportunistic High Yield Fund (the “Predecessor Fund”), a series of ALPS Series Trust, on July 24, 2023. As a result of the reorganization, the Fund is the accounting successor of the Predecessor Fund. Performance results shown in the performance table above for the periods prior to July 24, 2023, reflect the performance of the Predecessor Fund.
POLEN OPPORTUNISTIC HIGH YIELD FUND
Performance Data (Continued)
April 30, 2024
(Unaudited)
Comparison of Change in Value of $1,000,000 Investment in Polen Opportunistic High Yield Fund Class Y Shares vs
ICE BofA U.S. High Yield® Index
| Average Annual Total Returns for the Periods Ended April 30, 2024 |
| | Seven Months† | | 1 Year | | 3 Years | | 5 Years | | Since
Inception |
| Class Y | 6.12% | | 9.96% | | 1.68% | | 2.34% | | 4.28% * |
| ICE BofA U.S. High Yield® Index | 7.59% | | 8.85% | | 1.49% | | 3.53% | | 4.60% ** |
| † | Not Annualized. |
| * | The Polen Opportunistic High Yield Fund (the "Fund") Class Y commenced operations on July 16, 2015. |
| ** | Benchmark performance is from the commencement date of the Fund Class only and is not the commencement date of the benchmark itself. |
The performance data quoted represents past performance and does not guarantee future results. Current performance may be lower or higher. Performance data current to the most recent month-end may be obtained by calling 1-888-678-6024. The investment return and principal value of an investment will fluctuate so that shares, when redeemed, may be worth more or less than their original cost. The graph and table do not reflect the deduction of taxes that a shareholder would pay on Fund distributions or the redemption of Fund shares.
The Fund acquired the assets and liabilities of the Polen DDJ Opportunistic High Yield Fund (the “Predecessor Fund”), a series of ALPS Series Trust, on July 24, 2023. As a result of the reorganization, the Fund is the accounting successor of the Predecessor Fund. Performance results shown in the performance table above for the periods prior to July 24, 2023, reflect the performance of the Predecessor Fund.
The Fund’s “Total Annual Fund Operating Expenses” and “Total Annual Fund Operating Expenses After Fee Waiver and/or Expense Reimbursement”, as stated in the current prospectus dated February 1, 2024, are 0.92% and 0.89%, respectively, for the Institutional Class shares, 1.26% and 1.14%, respectively, for the Investor Class shares and 0.91% and 0.79%, respectively, for the Class Y shares of the Fund’s average daily net assets, which may differ from the actual expenses incurred by the Fund for the period covered by this report. Polen Capital Credit, LLC (“Polen Credit” or the “Adviser”) has contractually agreed to reduce its investment advisory fee and/or reimburse certain expenses of the Fund to the extent necessary to ensure that the Fund’s total operating expenses (excluding taxes, fees and expenses attributable to a distribution or service plan adopted by FundVantage Trust (the “Trust”), interest, extraordinary items, “Acquired Fund Fees and Expenses” and brokerage commissions) do not exceed 0.89% (on an annual basis) with respect to Institutional Class shares and Investor Class shares and 0.79% with respect to Class Y shares’ average daily net assets (the “Expense Limitation”). The Expense Limitation will remain in place until August 31, 2025 unless the Board of Trustees (“Board of Trustees”) of the Trust approves its earlier termination. The Adviser is entitled to recover, subject to approval by the Board of Trustees, such amounts reduced or reimbursed for a period of up to three (3) years from the date on which the Adviser reduced its compensation and/or assumed expenses for the Fund. The Adviser is permitted to seek reimbursement from the Fund, for fees it waived and Fund expenses it paid to the extent the total annual fund operating expenses do not exceed the limits described above or
POLEN OPPORTUNISTIC HIGH YIELD FUND
Performance Data (Concluded)
April 30, 2024
(Unaudited)
any lesser limits in effect at the time of the reimbursement. No reimbursement will occur unless the Fund’s expenses are below the Expense Limitation amount. Total returns would be lower had such fees and expenses not been waived and/or reimbursed.
The Fund evaluates its performance as compared to that of the ICE BofA U.S. High Yield® Index, maintained by ICE BofA and comprised of U.S. dollar denominated below investment grade corporate debt publicly issued in the U.S. domestic market. Indexes are unmanaged and it is not possible to invest directly in an index.
The Fund intends to invest its assets primarily in credit instruments that are rated below investment grade by some or all relevant independent rating agencies, including Moody’s Investors Service, Standard and Poor’s Rating Services and Fitch Ratings (including a significant portion of such assets in credit instruments in the lower tier of the high yield market that are rated B and below). Additionally, certain other high yield securities may be unrated by rating agencies, but determined by the Adviser to be of similar quality as other below investment grade bonds and credit instruments and accordingly purchased for investment by the Fund. The Fund does not have a percentage limitation on investing in securities that are rated below investment grade.
Credit ratings are measured on a scale that generally ranges from AAA (highest) to D (lowest). All Fund securities except for those labeled “Not Rated” and “Other” have been rated by Moody’s, S&P or Fitch, which are each a Nationally Recognized Statistical Rating Organization (“NRSRO”). All Index securities except for those labeled “Not Rated” have been rated by Moody’s or S&P. Credit ratings are subject to change.
Mutual fund investing involves risk, including possible loss of principal. It is possible to lose money on an investment in the Fund. Fixed-income investments are subject to interest rate risk; as interest rates rise, their value will decline. Lower-rated securities are subject to additional credit and default risks. Investments in bank loans, which are made by banks or other financial intermediaries to borrowers, will depend primarily upon the creditworthiness of the borrower for payment of principal and interest. Trading in Rule 144A securities may be less active than trading in publicly traded securities. Investments with low trading volumes may be difficult to sell at quoted market prices.
POLEN FUNDS
Fund Expense Disclosure
April 30, 2024
(Unaudited)
As a shareholder of the Funds, you incur two types of costs: (1) transaction costs, and (2) ongoing costs, including management fees, distribution and/or service (Rule 12b-1) fees (if any) and other Fund expenses. These examples are intended to help you understand your ongoing costs (in dollars) of investing in the Fund(s) and to compare these costs with the ongoing costs of investing in other mutual funds.
These examples are based on an investment of $1,000 invested at the beginning of the six-month period from November 1, 2023 through April 30, 2024 and held for the entire period.
Actual Expenses
The first line of each accompanying table provides information about actual account values and actual expenses. You may use the information in this line, together with the amount you invested, to estimate the expenses that you paid over the period. Simply divide your account value by $1,000 (for example, an $8,600 account value divided by $1,000 = 8.6), then multiply the result by the number in the first line under the heading entitled "Expenses Paid During Period" to estimate the expenses you paid on your account during this period.
Hypothetical Examples for Comparison Purposes
The second line of each accompanying table provides information about hypothetical account values and hypothetical expenses based on the Fund's actual expense ratio and an assumed rate of return of 5% per year before expenses, which is not your Fund's actual return. The hypothetical account values and expenses may not be used to estimate the actual ending account balance or expenses you paid for the period. You may use this information to compare the ongoing costs of investing in the Fund(s) and other funds. To do so, compare these 5% hypothetical examples with the 5% hypothetical examples that appear in the shareholder reports of other funds.
Please note that the expenses shown in the accompanying table are meant to highlight your ongoing costs only and do not reflect any transactional costs, such as sales charges (loads) on purchase payments (if any) or redemption fees. Therefore, the second line of each accompanying table is useful in comparing ongoing costs only and will not help you determine the relative total costs of owning different funds. In addition, if these transactional costs were included, your costs would have been higher.
| | Beginning Account Value
November 1, 2023 | | Ending Account Value
April 30, 2024 | | Annualized
Expense Ratio | | Expenses Paid
During Period |
| Polen Growth Fund |
| Institutional Class1 | | | | | | | |
| Actual | $1,000.00 | | $1,180.40 | | 0.95% | | $5.15 |
| Hypothetical (5% return before expenses) | 1,000.00 | | 1,020.14 | | 0.95% | | 4.77 |
| Investor Class1 | | | | | | | |
| Actual | $1,000.00 | | $1,179.10 | | 1.20% | | $6.50 |
| Hypothetical (5% return before expenses) | 1,000.00 | | 1,018.90 | | 1.20% | | 6.02 |
| Polen Global Growth Fund |
| Institutional Class2 | | | | | | | |
| Actual | $1,000.00 | | $1,154.80 | | 0.97% | | $5.20 |
| Hypothetical (5% return before expenses) | 1,000.00 | | 1,020.04 | | 0.97% | | 4.87 |
| Investor Class2 | | | | | | | |
| Actual | $1,000.00 | | $1,153.50 | | 1.22% | | $6.53 |
| Hypothetical (5% return before expenses) | 1,000.00 | | 1,018.80 | | 1.22% | | 6.12 |
POLEN FUNDS
Fund Expense Disclosure (Continued)
April 30, 2024
(Unaudited)
| | Beginning Account Value
November 1, 2023 | | Ending Account Value
April 30, 2024 | | Annualized
Expense Ratio | | Expenses Paid
During Period |
| Polen International Growth Fund |
| Institutional Class3 | | | | | | | |
| Actual | $1,000.00 | | $1,157.10 | | 1.02% | | $5.47 |
| Hypothetical (5% return before expenses) | 1,000.00 | | 1,019.79 | | 1.02% | | 5.12 |
| Investor Class3 | | | | | | | |
| Actual | $1,000.00 | | $1,154.50 | | 1.27% | | $6.80 |
| Hypothetical (5% return before expenses) | 1,000.00 | | 1,018.55 | | 1.27% | | 6.37 |
| Polen U.S. Small Company Growth Fund |
| Institutional Class4 | | | | | | | |
| Actual | $1,000.00 | | $1,116.30 | | 1.10% | | $5.79 |
| Hypothetical (5% return before expenses) | 1,000.00 | | 1,019.39 | | 1.10% | | 5.52 |
| Investor Class4 | | | | | | | |
| Actual | $1,000.00 | | $1,115.20 | | 1.35% | | $7.10 |
| Hypothetical (5% return before expenses) | 1,000.00 | | 1,018.15 | | 1.35% | | 6.77 |
| Class Y4 | | | | | | | |
| Actual | $1,000.00 | | $1,116.90 | | 1.00% | | $5.26 |
| Hypothetical (5% return before expenses) | 1,000.00 | | 1,019.89 | | 1.00% | | 5.02 |
| Polen Emerging Markets Growth Fund |
| Institutional Class5 | | | | | | | |
| Actual | $1,000.00 | | $1,098.10 | | 1.25% | | $6.52 |
| Hypothetical (5% return before expenses) | 1,000.00 | | 1,018.65 | | 1.25% | | 6.27 |
| Polen U.S. SMID Company Growth Fund |
| Institutional Class6 | | | | | | | |
| Actual | $1,000.00 | | $1,123.30 | | 1.05% | | $5.54 |
| Hypothetical (5% return before expenses) | 1,000.00 | | 1,019.64 | | 1.05% | | 5.27 |
| Polen Global SMID Company Growth Fund |
| Institutional Class7 | | | | | | | |
| Actual | $1,000.00 | | $1,114.80 | | 1.25% | | $6.57 |
| Hypothetical (5% return before expenses) | 1,000.00 | | 1,018.65 | | 1.25% | | 6.27 |
| Investor Class7 | | | | | | | |
| Actual | $1,000.00 | | $1,114.80 | | 1.50% | | $7.89 |
| Hypothetical (5% return before expenses) | 1,000.00 | | 1,017.40 | | 1.50% | | 7.52 |
| Polen Bank Loan Fund |
| Institutional Class8 | | | | | | | |
| Actual | $1,000.00 | | $1,071.60 | | 0.75% | | $3.86 |
| Hypothetical (5% return before expenses) | 1,000.00 | | 1,021.13 | | 0.75% | | 3.77 |
| Polen U.S. High Yield Fund |
| Institutional Class9 | | | | | | | |
| Actual | $1,000.00 | | $1,079.90 | | 0.65% | | $3.36 |
| Hypothetical (5% return before expenses) | 1,000.00 | | 1,021.63 | | 0.65% | | 3.27 |
POLEN FUNDS
Fund Expense Disclosure (Continued)
April 30, 2024
(Unaudited)
| | Beginning Account Value
November 1, 2023 | | Ending Account Value
April 30, 2024 | | Annualized
Expense Ratio | | Expenses Paid
During Period |
| Polen Opportunistic High Yield Fund |
| Institutional Class10 | | | | | | | |
| Actual | $1,000.00 | | $1,070.90 | | 0.89% | | $4.58 |
| Hypothetical (5% return before expenses) | 1,000.00 | | 1,020.44 | | 0.89% | | 4.47 |
| Investor Class10 | | | | | | | |
| Actual | $1,000.00 | | $1,070.20 | | 1.14% | | $5.87 |
| Hypothetical (5% return before expenses) | 1,000.00 | | 1,019.19 | | 1.14% | | 5.72 |
| Class Y10 | | | | | | | |
| Actual | $1,000.00 | | $1,071.80 | | 0.79% | | $4.07 |
| Hypothetical (5% return before expenses) | 1,000.00 | | 1,020.93 | | 0.79% | | 3.97 |
| 1 | Expenses are equal to an annualized expense ratio for the six-month period ended April 30, 2024 of 0.95% for Institutional Class and 1.20% for Investor Class, multiplied by the average account value over the period, multiplied by the number of days in the most recent period (182), then divided by 366 to reflect the period. The Fund’s ending account values on the first line of each table are based on the actual six-month total returns for the Fund of 18.04% and 17.91% for Institutional Class and Investor Class, respectively. |
| 2 | Expenses are equal to an annualized expense ratio for the six-month period ended April 30, 2024 of 0.97% for Institutional Class and 1.22% for Investor Class, multiplied by the average account value over the period, multiplied by the number of days in the most recent period (182), then divided by 366 to reflect the period. The Fund’s ending account values on the first line of each table are based on the actual six-month total returns for the Fund of 15.48% and 15.35% for Institutional Class and Investor Class, respectively. |
| 3 | Expenses are equal to an annualized expense ratio for the six-month period ended April 30, 2024 of 1.02% for Institutional Class and 1.27% for Investor Class, multiplied by the average account value over the period, multiplied by the number of days in the most recent period (182), then divided by 366 to reflect the period. The Fund’s ending account values on the first line of each table are based on the actual six-month total returns for the Fund of 15.71% and 15.45% for Institutional Class and Investor Class, respectively. |
| 4 | Expenses are equal to an annualized expense ratio for the six-month period ended April 30, 2024 of 1.10% for Institutional Class, 1.35% for Investor Class and 1.00% for Class Y, multiplied by the average account value over the period, multiplied by the number of days in the most recent period (182), then divided by 366 to reflect the period. The Fund’s ending account values on the first line of each table are based on the actual six-month total returns for the Fund of 11.63%, 11.52% and 11.69% for Institutional Class, Investor Class and Class Y, respectively. |
| 5 | Expenses are equal to an annualized expense ratio for the six-month period ended April 30, 2024 of 1.25% for Institutional Class, multiplied by the average account value over the period, multiplied by the number of days in the most recent period (182), then divided by 366 to reflect the period. The Institutional Class ending account values on the first line of the table is based on the actual six-month total return for the Fund of 9.81%. |
| 6 | Expenses are equal to an annualized expense ratio for the six-month period ended April 30, 2024 of 1.05% for Institutional Class, multiplied by the average account value over the period, multiplied by the number of days in the most recent period (182), then divided by 366 to reflect the period. The Institutional Class ending account values on the first line of the table is based on the actual six-month total return for the Fund of 12.33%. |
| 7 | Expenses are equal to an annualized expense ratio for the six-month period ended April 30, 2024 of 1.25% for Institutional Class and 1.50% for Investor Class, multiplied by the average account value over the period, multiplied by the number of days in the most recent period (182), then divided by 366 to reflect the period. The Fund’s ending account values on the first line of each table are based on the actual six-month total returns for the Fund of 11.48% and 11.48% for Institutional Class and Investor Class, respectively. |
| 8 | Expenses are equal to an annualized expense ratio for the six-month period ended April 30, 2024 of 0.75% for Institutional Class, multiplied by the average account value over the period, multiplied by the number of days in the most recent period (182), then divided by 366 to reflect the period. The Institutional Class ending account values on the first line of the table is based on the actual six-month total return for the Fund of 7.16%. |
| 9 | Expenses are equal to an annualized expense ratio for the six-month period ended April 30, 2024 of 0.65% for Institutional Class, multiplied by the average account value over the period, multiplied by the number of days in the most recent period (182), then divided by 366 to reflect the period. The Institutional Class ending account values on the first line of the table is based on the actual six-month total return for the Fund of 7.99%. |
POLEN FUNDS
Fund Expense Disclosure (Concluded)
April 30, 2024
(Unaudited)
| 10 | Expenses are equal to an annualized expense ratio for the six-month period ended April 30, 2024 of 0.89% for Institutional Class, 1.14% for Investor Class and 0.79% for Class Y, multiplied by the average account value over the period, multiplied by the number of days in the most recent period (182), then divided by 366 to reflect the period. The Fund’s ending account values on the first line of each table are based on the actual six-month total returns for the Fund of 7.09%, 7.02% and 7.18% for Institutional Class, Investor Class and Class Y, respectively. |
Polen Growth Fund
Portfolio Holdings Summary Table
April 30, 2024
(Unaudited)
The following table presents a summary by industry of the portfolio holdings of the Fund:
| | % of Net
Assets | | Value |
| COMMON STOCKS: | | | |
| Software Application | 15.3% | | $1,155,666,752 |
| Internet Retail | 14.9 | | 1,126,932,800 |
| Software Infrastructure | 12.3 | | 931,676,664 |
| Credit Services | 10.4 | | 784,868,178 |
| Internet Content & Information | 7.8 | | 593,791,283 |
| Entertainment | 5.6 | | 420,326,639 |
| Information Technology Services | 5.2 | | 396,794,774 |
| Medical Devices | 5.0 | | 374,816,716 |
| Diagnostics & Research | 4.7 | | 355,907,251 |
| Travel Services | 4.2 | | 319,500,949 |
| Healthcare Plans | 2.9 | | 220,276,496 |
| Drug Manufacturers - Specialty & Generic | 2.9 | | 217,316,739 |
| Biotechnology | 2.4 | | 185,453,500 |
| Footwear & Accessories | 2.3 | | 171,105,119 |
| Drug Manufacturers - General | 1.2 | | 91,930,783 |
| Total Common Stocks | 97.1 | | 7,346,364,643 |
| Short-Term Investment | 2.0 | | 151,446,681 |
| Other Assets in Excess of Liabilities | 0.9 | | 65,439,549 |
| NET ASSETS | 100.0% | | $7,563,250,873 |
Portfolio holdings are subject to change at any time.
See Note 1. The industry designations set forth in the table above are those of the Morningstar Global Equity Classification System (“MGECS”).
The accompanying notes are an integral part of the financial statements.
POLEN GROWTH FUND
Portfolio of Investments
April 30, 2024
| | Number
of Shares | | Value |
| COMMON STOCKS† — 97.1% |
| Biotechnology — 2.4% |
| Novo Nordisk A/S, SP ADR | 1,445,355 | | $ 185,453,500 |
| Credit Services — 10.4% |
| Mastercard, Inc., Class A | 815,648 | | 368,020,377 |
| Visa, Inc., Class A | 1,551,870 | | 416,847,801 |
| | | | 784,868,178 |
| Diagnostics & Research — 4.7% |
| Thermo Fisher Scientific, Inc. | 625,804 | | 355,907,251 |
| Drug Manufacturers - General — 1.2% |
| Eli Lilly & Co. | 117,694 | | 91,930,783 |
| Drug Manufacturers - Specialty & Generic — 2.9% |
| Zoetis, Inc. | 1,364,712 | | 217,316,739 |
| Entertainment — 5.6% |
| Netflix, Inc.* | 763,342 | | 420,326,639 |
| Footwear & Accessories — 2.3% |
| NIKE, Inc., Class B | 1,854,597 | | 171,105,119 |
| Healthcare Plans — 2.9% |
| UnitedHealth Group, Inc. | 455,399 | | 220,276,496 |
| Information Technology Services — 5.2% |
| Accenture PLC, Class A | 810,473 | | 243,879,430 |
| Gartner, Inc.* | 370,623 | | 152,915,344 |
| | | | 396,794,774 |
| Internet Content & Information — 7.8% |
| Alphabet, Inc., Class C* | 3,606,604 | | 593,791,283 |
| Internet Retail — 14.9% |
| Amazon.com, Inc.* | 6,439,616 | | 1,126,932,800 |
| Medical Devices — 5.0% |
| Abbott Laboratories | 2,906,376 | | 307,988,665 |
| Align Technology, Inc.* | 236,660 | | 66,828,051 |
| | | | 374,816,716 |
| Software Application — 15.3% |
| Autodesk, Inc.* | 921,029 | | 196,041,023 |
| Paycom Software, Inc. | 433,417 | | 81,473,728 |
| Salesforce, Inc. | 1,412,626 | | 379,911,636 |
| | Number
of Shares | | Value |
| COMMON STOCKS — (Continued) |
| Software Application — (Continued) |
| ServiceNow, Inc.* | 506,202 | | $ 350,965,033 |
| Workday, Inc., Class A* | 601,787 | | 147,275,332 |
| | | | 1,155,666,752 |
| Software Infrastructure — 12.3% |
| Adobe, Inc.* | 488,578 | | 226,128,556 |
| Microsoft Corp. | 1,812,211 | | 705,548,108 |
| | | | 931,676,664 |
| Travel Services — 4.2% |
| Airbnb, Inc., Class A* | 2,014,889 | | 319,500,949 |
TOTAL COMMON STOCKS
(Cost $4,103,545,615) | | | 7,346,364,643 |
| SHORT-TERM INVESTMENT — 2.0% |
| Dreyfus Government Cash Management Fund, Institutional Shares, 5.19%(a) | 151,446,681 | | 151,446,681 |
|
| |
TOTAL SHORT-TERM INVESTMENT
(Cost $151,446,681) | | | 151,446,681 |
|
| |
TOTAL INVESTMENTS - 99.1%
(Cost $4,254,992,296) | | | 7,497,811,324 |
| OTHER ASSETS IN EXCESS OF LIABILITIES - 0.9% | | | 65,439,549 |
| NET ASSETS - 100.0% | | | $ 7,563,250,873 |
| (a) | Rate disclosed is the 7-day yield at April 30, 2024. |
| † | See Note 1. The industry designations set forth in the schedule above are those of the Morningstar Global Equity Classification System (“MGECS”). |
| * | Non-income producing. |
| PLC | Public Limited Company |
| SP ADR | Sponsored American Depository Receipt |
The accompanying notes are an integral part of the financial statements.
Polen Global Growth Fund
Portfolio Holdings Summary Table
April 30, 2024
(Unaudited)
The following table presents a summary by industry of the portfolio holdings of the Fund:
| | % of Net
Assets | | Value |
| COMMON STOCKS: | | | |
| Software | 26.8% | | $123,852,382 |
| Broadline Retail | 10.6 | | 49,184,800 |
| Financial Services | 9.0 | | 41,686,739 |
| Interactive Media & Services | 8.2 | | 37,942,934 |
| Health Care Equipment & Supplies | 7.4 | | 34,311,379 |
| Life Sciences Tools & Services | 6.6 | | 30,546,054 |
| Professional Services | 5.4 | | 24,610,122 |
| Information Technology Services | 4.0 | | 18,498,236 |
| Insurance | 3.6 | | 16,478,126 |
| Capital Markets | 3.5 | | 16,409,316 |
| Personal Products | 3.1 | | 14,287,831 |
| Pharmaceuticals | 3.0 | | 14,015,089 |
| Textiles, Apparel & Luxury Goods | 2.8 | | 12,932,693 |
| Hotels, Restaurants & Leisure | 2.2 | | 10,199,698 |
| Biotechnology | 1.9 | | 8,737,579 |
| Total Common Stocks | 98.1 | | 453,692,978 |
| Short-Term Investment | 2.5 | | 11,298,090 |
| Liabilities in Excess of Other Assets | (0.6) | | (2,569,070) |
| NET ASSETS | 100.0% | | $462,421,998 |
Portfolio holdings are subject to change at any time.
See Note 1. The industry designations set forth in the table above are those of the Global Industry Classification Standard (“GICS”).
The accompanying notes are an integral part of the financial statements.
POLEN GLOBAL GROWTH FUND
Portfolio of Investments
April 30, 2024
| | Number
of Shares | | Value |
| COMMON STOCKS† — 98.1% |
| Australia — 1.9% |
| CSL Ltd. | 49,177 | | $ 8,737,579 |
| Denmark — 3.0% |
| Novo Nordisk AS, Class B | 109,286 | | 14,015,089 |
| France — 5.9% |
| L'Oreal SA | 30,474 | | 14,287,831 |
| LVMH Moet Hennessy Louis Vuitton SE | 15,744 | | 12,932,693 |
| | | | 27,220,524 |
| Germany — 9.0% |
| SAP SE | 158,343 | | 28,591,528 |
| Siemens Healthineers AG(a) | 234,763 | | 13,019,357 |
| | | | 41,610,885 |
| Ireland — 6.3% |
| Accenture PLC, Class A | 38,732 | | 11,654,846 |
| ICON PLC* | 58,436 | | 17,406,916 |
| | | | 29,061,762 |
| United Kingdom — 2.0% |
| Sage Group PLC (The) | 645,450 | | 9,359,608 |
| United States — 68.5% |
| Abbott Laboratories | 200,925 | | 21,292,022 |
| Adobe, Inc.* | 41,085 | | 19,015,371 |
| Airbnb, Inc., Class A* | 64,323 | | 10,199,698 |
| Alphabet, Inc., Class C* | 230,460 | | 37,942,934 |
| Amazon.com, Inc.* | 281,056 | | 49,184,800 |
| Aon PLC, Class A | 58,431 | | 16,478,126 |
| Autodesk, Inc.* | 39,256 | | 8,355,640 |
| Automatic Data Processing, Inc. | 60,236 | | 14,570,486 |
| Mastercard, Inc., Class A | 46,870 | | 21,147,744 |
| Microsoft Corp. | 74,632 | | 29,056,477 |
| MSCI, Inc. | 35,229 | | 16,409,316 |
| Paycom Software, Inc. | 53,408 | | 10,039,636 |
| ServiceNow, Inc.* | 12,717 | | 8,817,078 |
| Thermo Fisher Scientific, Inc. | 23,103 | | 13,139,138 |
| Visa, Inc., Class A | 76,464 | | 20,538,995 |
| Workday, Inc., Class A* | 84,406 | | 20,656,680 |
| | | | 316,844,141 |
| | Number
of Shares | | Value |
| COMMON STOCKS — (Continued) |
| Uruguay — 1.5% |
| Globant SA* | 38,319 | | $ 6,843,390 |
TOTAL COMMON STOCKS
(Cost $314,459,873) | | | 453,692,978 |
| | | |
| SHORT-TERM INVESTMENT — 2.5% |
| Dreyfus Government Cash Management Fund, Institutional Shares, 5.19%(b) | 11,298,090 | 11,298,090 |
TOTAL SHORT-TERM INVESTMENT
(Cost $11,298,090) | | 11,298,090 |
|
| |
TOTAL INVESTMENTS - 100.6%
(Cost $325,757,963) | | 464,991,068 |
| LIABILITIES IN EXCESS OF OTHER ASSETS - (0.6)% | | (2,569,070) |
| NET ASSETS - 100.0% | | $462,421,998 |
| (a) | Security exempt from registration under Rule 144A of the Securities Act of 1933, as amended. This security was purchased in accordance with the guidelines approved by the Fund’s Board of Trustees and may be resold, in transactions exempt from registration, to qualified institutional buyers. At April 30, 2024, this security amounted to $13,019,357 or 2.82% of net assets. This security has been determined by the Adviser to be a liquid security. |
| (b) | Rate disclosed is the 7-day yield at April 30, 2024. |
| † | See Note 1. The industry designations set forth in the schedule above are those of the Global Industry Classification Standard (“GICS”). |
| * | Non-income producing. |
| PLC | Public Limited Company |
The accompanying notes are an integral part of the financial statements.
Polen International Growth Fund
Portfolio Holdings Summary Table
April 30, 2024
(Unaudited)
The following table presents a summary by industry of the portfolio holdings of the Fund:
| | % of Net
Assets | | Value |
| COMMON STOCKS: | | | |
| Software | 20.0% | | $ 47,487,562 |
| Life Sciences Tools & Services | 11.3 | | 26,876,223 |
| Health Care Equipment & Supplies | 11.0 | | 25,987,074 |
| Hotels, Restaurants & Leisure | 7.7 | | 18,090,115 |
| Information Technology Services | 7.1 | | 16,784,140 |
| Textiles, Apparel & Luxury Goods | 5.8 | | 13,811,118 |
| Insurance | 5.8 | | 13,622,211 |
| Professional Services | 5.1 | | 12,038,308 |
| Semiconductors & Semiconductor Equipment | 4.8 | | 11,285,320 |
| Banks | 3.9 | | 9,282,933 |
| Trading Companies & Distributors | 3.6 | | 8,548,262 |
| Broadline Retail | 2.3 | | 5,443,868 |
| Personal Products | 2.1 | | 4,892,751 |
| Pharmaceuticals | 1.9 | | 4,542,086 |
| Biotechnology | 1.4 | | 3,346,352 |
| Total Common Stocks | 93.8 | | 222,038,323 |
| Short-Term Investment | 5.8 | | 13,723,289 |
| Other Assets in Excess of Liabilities | 0.4 | | 1,039,744 |
| NET ASSETS | 100.0% | | $236,801,356 |
Portfolio holdings are subject to change at any time.
See Note 1. The industry designations set forth in the table above are those of the Global Industry Classification Standard (“GICS”).
The accompanying notes are an integral part of the financial statements.
POLEN INTERNATIONAL GROWTH FUND
Portfolio of Investments
April 30, 2024
| | Number
of Shares | | Value |
| COMMON STOCKS† — 93.8% |
| Australia — 1.4% |
| CSL Ltd. | 18,834 | | $ 3,346,352 |
| Canada — 3.6% |
| Shopify, Inc., Class A* | 121,378 | | 8,520,736 |
| Denmark — 1.9% |
| Novo Nordisk AS, Class B | 35,418 | | 4,542,086 |
| France — 4.6% |
| Dassault Systemes SE | 47,290 | | 1,856,223 |
| Kering SA | 4,817 | | 1,688,210 |
| LVMH Moet Hennessy Louis Vuitton SE | 3,252 | | 2,671,311 |
| Teleperformance SE | 51,556 | | 4,670,184 |
| | | | 10,885,928 |
| Germany — 17.9% |
| adidas AG | 39,221 | | 9,451,597 |
| SAP SE | 102,098 | | 18,435,534 |
| Siemens Healthineers AG(a) | 261,275 | | 14,489,645 |
| | | | 42,376,776 |
| India — 3.9% |
| HDFC Bank Ltd. | 511,158 | | 9,282,933 |
| Ireland — 21.2% |
| Accenture PLC, Class A | 15,024 | | 4,520,872 |
| Experian PLC | 182,678 | | 7,368,124 |
| ICON PLC* | 90,225 | | 26,876,223 |
| Medtronic PLC | 143,288 | | 11,497,429 |
| | | | 50,262,648 |
| Japan — 1.0% |
| Lasertec Corp. | 11,143 | | 2,403,606 |
| Netherlands — 3.8% |
| ASML Holding NV | 10,197 | | 8,881,714 |
| Spain — 2.6% |
| Amadeus IT Group SA | 96,157 | | 6,103,465 |
| Sweden — 5.1% |
| Evolution AB(a) | 108,491 | | 11,986,650 |
| Switzerland — 2.1% |
| Temenos AG, Registered Shares | 81,694 | | 5,081,972 |
| United Kingdom — 15.0% |
| Bunzl PLC | 222,914 | | 8,548,262 |
| Sage Group PLC (The) | 1,524,997 | | 22,113,833 |
| Unilever PLC | 94,581 | | 4,892,751 |
| | | | 35,554,846 |
| | Number
of Shares | | Value |
| COMMON STOCKS — (Continued) |
| United States — 5.8% |
| Aon PLC, Class A | 48,304 | | $ 13,622,211 |
| Uruguay — 3.9% |
| Globant SA* | 20,956 | | 3,742,532 |
| MercadoLibre, Inc.* | 3,732 | | 5,443,868 |
| | | | 9,186,400 |
TOTAL COMMON STOCKS
(Cost $177,103,697) | | | 222,038,323 |
| | | |
| SHORT-TERM INVESTMENT — 5.8% |
| Dreyfus Government Cash Management Fund, Institutional Shares, 5.19%(b) | 13,723,289 | 13,723,289 |
TOTAL SHORT-TERM INVESTMENT
(Cost $13,723,289) | | 13,723,289 |
|
| |
TOTAL INVESTMENTS - 99.6%
(Cost $190,826,986) | | 235,761,612 |
| OTHER ASSETS IN EXCESS OF LIABILITIES - 0.4% | | 1,039,744 |
| NET ASSETS - 100.0% | | $236,801,356 |
| (a) | Securities exempt from registration under Rule 144A of the Securities Act of 1933, as amended. These securities were purchased in accordance with the guidelines approved by the Fund’s Board of Trustees and may be resold, in transactions exempt from registration, to qualified institutional buyers. At April 30, 2024, these securities amounted to $26,476,295 or 11.18% of net assets. These securities have been determined by the Adviser to be liquid securities. |
| (b) | Rate disclosed is the 7-day yield at April 30, 2024. |
| † | See Note 1. The industry designations set forth in the schedule above are those of the Global Industry Classification Standard (“GICS”). |
| * | Non-income producing. |
| PLC | Public Limited Company |
The accompanying notes are an integral part of the financial statements.
Polen U.S. Small Company Growth Fund
Portfolio Holdings Summary Table
April 30, 2024
(Unaudited)
The following table presents a summary by industry of the portfolio holdings of the Fund:
| | % of Net
Assets | | Value |
| COMMON STOCKS: | | | |
| Software Application | 19.6% | | $12,597,590 |
| Software Infrastructure | 12.4 | | 7,919,393 |
| Information Technology Services | 9.4 | | 6,000,122 |
| Health Information Services | 6.5 | | 4,139,250 |
| Industrial Distribution | 5.8 | | 3,719,907 |
| Asset Management | 5.1 | | 3,303,113 |
| Capital Markets | 4.4 | | 2,802,868 |
| Medical Care Facilities | 4.2 | | 2,663,102 |
| Specialty Industrial Machinery | 3.9 | | 2,473,792 |
| Internet Retail | 3.8 | | 2,466,351 |
| Leisure | 3.5 | | 2,235,261 |
| Real Estate Services | 3.1 | | 2,004,345 |
| Auto Parts | 3.1 | | 1,987,179 |
| Insurance - Diversified | 3.0 | | 1,943,306 |
| Semiconductors | 2.4 | | 1,560,669 |
| Medical Instruments & Supplies | 2.4 | | 1,560,199 |
| Diagnostics & Research | 2.3 | | 1,472,235 |
| Specialty Retail | 1.8 | | 1,159,159 |
| Residential Construction | 1.3 | | 845,432 |
| Engineering & Construction | 1.1 | | 684,727 |
| Total Common Stocks | 99.1 | | 63,538,000 |
| Other Assets in Excess of Liabilities | 0.9 | | 568,120 |
| NET ASSETS | 100.0% | | $64,106,120 |
Portfolio holdings are subject to change at any time.
See Note 1. The industry designations set forth in the table above are those of the Morningstar Global Equity Classification System (“MGECS”).
The accompanying notes are an integral part of the financial statements.
POLEN U.S. SMALL COMPANY GROWTH FUND
Portfolio of Investments
April 30, 2024
| | Number
of Shares | | Value |
| COMMON STOCKS† — 99.1% |
| Asset Management — 5.1% |
| Hamilton Lane, Inc., Class A | 29,566 | | $ 3,303,113 |
| Auto Parts — 3.1% |
| Fox Factory Holding Corp.* | 24,752 | | 963,348 |
| XPEL, Inc.* | 19,483 | | 1,023,831 |
| | | | 1,987,179 |
| Capital Markets — 4.4% |
| Houlihan Lokey, Inc. | 21,985 | | 2,802,868 |
| Diagnostics & Research — 2.3% |
| Medpace Holdings, Inc.* | 3,791 | | 1,472,235 |
| Engineering & Construction — 1.1% |
| Bowman Consulting Group Ltd.* | 21,075 | | 684,727 |
| Health Information Services — 6.5% |
| Doximity, Inc., Class A* | 50,836 | | 1,234,806 |
| Progyny, Inc.* | 90,594 | | 2,904,444 |
| | | | 4,139,250 |
| Industrial Distribution — 5.8% |
| Core & Main, Inc., Class A* | 43,970 | | 2,482,986 |
| SiteOne Landscape Supply, Inc.* | 7,884 | | 1,236,921 |
| | | | 3,719,907 |
| Information Technology Services — 9.4% |
| ExlService Holdings, Inc.* | 106,059 | | 3,075,711 |
| Globant SA* | 16,375 | | 2,924,411 |
| | | | 6,000,122 |
| Insurance - Diversified — 3.0% |
| Goosehead Insurance, Inc., Class A* | 34,147 | | 1,943,306 |
| Internet Retail — 3.8% |
| Revolve Group, Inc.* | 123,875 | | 2,466,351 |
| Leisure — 3.5% |
| Topgolf Callaway Brands Corp.* | 48,595 | | 778,492 |
| YETI Holdings, Inc.* | 40,783 | | 1,456,769 |
| | | | 2,235,261 |
| Medical Care Facilities — 4.2% |
| AMN Healthcare Services, Inc.* | 22,979 | | 1,378,280 |
| Option Care Health, Inc.* | 42,985 | | 1,284,822 |
| | | | 2,663,102 |
| Medical Instruments & Supplies — 2.4% |
| Warby Parker, Inc., Class A* | 132,896 | | 1,560,199 |
| Real Estate Services — 3.1% |
| FirstService Corp. | 13,635 | | 2,004,345 |
| | Number
of Shares | | Value |
| COMMON STOCKS — (Continued) |
| Residential Construction — 1.3% |
| LGI Homes, Inc.* | 9,401 | | $ 845,432 |
| Semiconductors — 2.4% |
| SiTime Corp.* | 17,512 | | 1,560,669 |
| Software Application — 19.6% |
| Alarm.com Holdings, Inc.* | 39,270 | | 2,611,455 |
| Alight, Inc., Class A* | 364,085 | | 3,284,047 |
| Appfolio, Inc., Class A* | 9,955 | | 2,257,595 |
| BlackLine, Inc.* | 41,241 | | 2,394,040 |
| Clearwater Analytics Holdings, Inc., Class A* | 129,940 | | 2,050,453 |
| | | | 12,597,590 |
| Software Infrastructure — 12.4% |
| CCC Intelligent Solutions Holdings, Inc.* | 266,485 | | 2,989,962 |
| Endava PLC, SP ADR* | 15,086 | | 437,494 |
| Euronet Worldwide, Inc.* | 25,169 | | 2,584,353 |
| Qualys, Inc.* | 11,638 | | 1,907,584 |
| | | | 7,919,393 |
| Specialty Industrial Machinery — 3.9% |
| Generac Holdings, Inc.* | 18,195 | | 2,473,792 |
| Specialty Retail — 1.8% |
| RH * | 4,692 | | 1,159,159 |
TOTAL COMMON STOCKS
(Cost $57,463,241) | | | 63,538,000 |
|
| |
TOTAL INVESTMENTS - 99.1%
(Cost $57,463,241) | | | 63,538,000 |
| OTHER ASSETS IN EXCESS OF LIABILITIES - 0.9% | | | 568,120 |
| NET ASSETS - 100.0% | | | $ 64,106,120 |
| † | See Note 1. The industry designations set forth in the schedule above are those of the Morningstar Global Equity Classification System (“MGECS”). |
| * | Non-income producing. |
| PLC | Public Limited Company |
| SP ADR | Sponsored American Depository Receipt |
The accompanying notes are an integral part of the financial statements.
Polen Emerging Markets Growth Fund
Portfolio Holdings Summary Table
April 30, 2024
(Unaudited)
The following table presents a summary by industry of the portfolio holdings of the Fund:
| | % of Net
Assets | | Value |
| COMMON STOCKS: | | | |
| Entertainment | 12.5% | | $ 2,443,351 |
| Banks | 11.7 | | 2,290,068 |
| Information Technology Services | 9.5 | | 1,870,510 |
| Consumer Staples Distribution & Retail | 9.5 | | 1,859,073 |
| Hotels, Restaurants & Leisure | 7.1 | | 1,384,215 |
| Semiconductors & Semiconductor Equipment | 6.9 | | 1,340,851 |
| Broadline Retail | 6.5 | | 1,274,246 |
| Passenger Airlines | 4.7 | | 919,954 |
| Food Products | 4.5 | | 887,009 |
| Financial Services | 4.2 | | 828,628 |
| Textiles, Apparel & Luxury Goods | 3.9 | | 772,092 |
| Beverages | 3.7 | | 725,379 |
| Oil, Gas & Consumable Fuels | 3.7 | | 717,461 |
| Electronic Equipment, Instruments & Components | 2.2 | | 437,936 |
| Capital Markets | 2.1 | | 403,535 |
| Specialty Retail | 2.0 | | 400,555 |
| Insurance | 1.7 | | 331,061 |
| Interactive Media & Services | 0.0 | | 611 |
| Total Common Stocks | 96.4 | | 18,886,535 |
| Short-Term Investment | 4.0 | | 778,648 |
| Liabilities in Excess of Other Assets | (0.4) | | (86,726) |
| NET ASSETS | 100.0% | | $19,578,457 |
Portfolio holdings are subject to change at any time.
See Note 1. The industry designations set forth in the table above are those of the Global Industry Classification Standard (“GICS”).
The accompanying notes are an integral part of the financial statements.
POLEN EMERGING MARKETS GROWTH FUND
Portfolio of Investments
April 30, 2024
| | Number
of Shares | | Value |
| COMMON STOCKS† — 96.4% |
| Brazil — 2.2% |
| Raia Drogasil SA | 87,760 | | $ 433,341 |
| China — 23.5% |
| ANTA Sports Products Ltd. | 68,200 | | 772,092 |
| Inner Mongolia Yili Industrial Group Co. Ltd., Class A | 128,274 | | 505,487 |
| Meituan, Class B(a)* | 17,100 | | 233,492 |
| NetEase, Inc. | 47,661 | | 893,388 |
| Tencent Music Entertainment Group, ADR* | 123,503 | | 1,549,963 |
| Yum China Holdings, Inc. | 12,796 | | 467,182 |
| Yum China Holdings, Inc. | 4,600 | | 172,203 |
| | | | 4,593,807 |
| Hong Kong — 3.7% |
| AIA Group Ltd. | 45,200 | | 331,061 |
| Hong Kong Exchanges & Clearing Ltd. | 12,700 | | 403,535 |
| | | | 734,596 |
| Hungary — 4.7% |
| Wizz Air Holdings PLC(a)* | 33,253 | | 919,954 |
| India — 15.1% |
| HDFC Bank Ltd. | 46,262 | | 840,145 |
| Infosys Ltd. | 39,205 | | 661,958 |
| Kotak Mahindra Bank Ltd. | 18,231 | | 354,327 |
| Nestle India Ltd. | 12,710 | | 381,522 |
| Reliance Industries Ltd. | 20,438 | | 717,461 |
| | | | 2,955,413 |
| Indonesia — 5.6% |
| Bank Central Asia Tbk PT | 1,198,500 | | 720,639 |
| Bank Mandiri Persero Tbk PT | 887,100 | | 374,957 |
| | | | 1,095,596 |
| Mexico — 7.6% |
| Fomento Economico Mexicano SAB de CV | 61,675 | | 725,379 |
| Wal-Mart de Mexico SAB de CV | 205,165 | | 764,694 |
| | | | 1,490,073 |
| Netherlands — 4.4% |
| Prosus NV | 26,094 | | 873,104 |
| Poland — 3.4% |
| Dino Polska SA(a)* | 6,900 | | 661,038 |
| Russia — 0.0% |
| VK Co. Ltd., GDR(b)(c)(d)* | 34,180 | | 342 |
| Yandex NV, Class A(b)(c)(d)* | 26,923 | | 269 |
| | | | 611 |
| | Number
of Shares | | Value |
| COMMON STOCKS — (Continued) |
| Taiwan — 9.1% |
| E Ink Holdings, Inc. | 68,500 | | $ 437,936 |
| Taiwan Semiconductor Manufacturing Co. Ltd. | 56,000 | | 1,340,851 |
| | | | 1,778,787 |
| United States — 4.7% |
| EPAM Systems, Inc.* | 1,786 | | 420,174 |
| Las Vegas Sands Corp. | 11,527 | | 511,338 |
| | | | 931,512 |
| Uruguay — 6.3% |
| Dlocal Ltd.* | 58,313 | | 828,628 |
| MercadoLibre, Inc.* | 275 | | 401,142 |
| | | | 1,229,770 |
| Vietnam — 6.1% |
| FPT Corp. | 162,265 | | 788,378 |
| Mobile World Investment Corp. | 185,700 | | 400,555 |
| | | | 1,188,933 |
TOTAL COMMON STOCKS
(Cost $20,586,126) | | | 18,886,535 |
| | | |
| SHORT-TERM INVESTMENT — 4.0% |
| Dreyfus Government Cash Management Fund, Institutional Shares, 5.19%(e) | 778,648 | 778,648 |
TOTAL SHORT-TERM INVESTMENT
(Cost $778,648) | | 778,648 |
|
| |
TOTAL INVESTMENTS - 100.4%
(Cost $21,364,774) | | 19,665,183 |
| LIABILITIES IN EXCESS OF OTHER ASSETS - (0.4)% | | (86,726) |
| NET ASSETS - 100.0% | | $19,578,457 |
| (a) | Securities exempt from registration under Rule 144A of the Securities Act of 1933, as amended. These securities were purchased in accordance with the guidelines approved by the Fund’s Board of Trustees and may be resold, in transactions exempt from registration, to qualified institutional buyers. At April 30, 2024, these securities amounted to $1,814,484 or 9.27% of net assets. These securities have been determined by the Adviser to be liquid securities. |
| (b) | Security is deemed illiquid at April 30, 2024. |
The accompanying notes are an integral part of the financial statements.
POLEN EMERGING MARKETS GROWTH FUND
Portfolio of Investments (Concluded)
April 30, 2024
| (c) | Security is fair valued by the Adviser in accordance with the policies established by the Board of Trustees. |
| (d) | The Fund is unable to receive and repatriate proceeds due to U.S. sanctions. |
| (e) | Rate disclosed is the 7-day yield at April 30, 2024. |
| † | See Note 1. The industry designations set forth in the schedule above are those of the Global Industry Classification Standard (“GICS”). |
| * | Non-income producing. |
| ADR | American Depositary Receipt |
| GDR | Global Depository Receipt |
| PLC | Public Limited Company |
The accompanying notes are an integral part of the financial statements.
Polen U.S. SMID Company Growth Fund
Portfolio Holdings Summary Table
April 30, 2024
(Unaudited)
The following table presents a summary by industry of the portfolio holdings of the Fund:
| | % of Net
Assets | | Value |
| COMMON STOCKS: | | | |
| Software Application | 22.6% | | $ 3,954,954 |
| Information Technology Services | 6.9 | | 1,213,137 |
| Internet Retail | 6.3 | | 1,104,846 |
| Diagnostics & Research | 5.6 | | 982,764 |
| Specialty Retail | 5.5 | | 965,353 |
| Health Information Services | 4.9 | | 848,915 |
| Semiconductors | 4.5 | | 796,138 |
| Capital Markets | 4.5 | | 787,444 |
| Home Improvement Retail | 3.6 | | 634,729 |
| Industrial Distribution | 3.4 | | 603,833 |
| Asset Management | 3.4 | | 600,495 |
| Insurance - Diversified | 3.3 | | 585,547 |
| Biotechnology | 3.3 | | 570,723 |
| Financial Data & Stock Exchanges | 3.3 | | 569,822 |
| Specialty Industrial Machinery | 3.0 | | 519,503 |
| Software Infrastructure | 2.9 | | 506,509 |
| Leisure | 2.4 | | 416,995 |
| Medical Instruments & Supplies | 2.0 | | 345,602 |
| Medical Devices | 2.0 | | 343,939 |
| Building Products & Equipment | 2.0 | | 342,069 |
| Auto Parts | 1.5 | | 263,138 |
| Total Common Stocks | 96.9 | | 16,956,455 |
| Short-Term Investment | 4.2 | | 724,735 |
| Liabilities in Excess of Other Assets | (1.1) | | (187,032) |
| NET ASSETS | 100.0% | | $17,494,158 |
Portfolio holdings are subject to change at any time.
See Note 1. The industry designations set forth in the table above are those of the Morningstar Global Equity Classification System (“MGECS”).
The accompanying notes are an integral part of the financial statements.
POLEN U.S. SMID COMPANY GROWTH FUND
Portfolio of Investments
April 30, 2024
| | Number
of Shares | | Value |
| COMMON STOCKS† — 96.9% |
| Asset Management — 3.4% |
| Hamilton Lane, Inc., Class A | 5,375 | | $ 600,495 |
| Auto Parts — 1.5% |
| Fox Factory Holding Corp.* | 6,761 | | 263,138 |
| Biotechnology — 3.3% |
| Bio-Techne Corp. | 9,029 | | 570,723 |
| Building Products & Equipment — 2.0% |
| Trex Co., Inc.* | 3,863 | | 342,069 |
| Capital Markets — 4.5% |
| Houlihan Lokey, Inc. | 4,199 | | 535,331 |
| MarketAxess Holdings, Inc. | 1,260 | | 252,113 |
| | | | 787,444 |
| Diagnostics & Research — 5.6% |
| Charles River Laboratories International, Inc.* | 2,226 | | 509,754 |
| Medpace Holdings, Inc.* | 1,218 | | 473,010 |
| | | | 982,764 |
| Financial Data & Stock Exchanges — 3.3% |
| Morningstar, Inc. | 2,016 | | 569,822 |
| Health Information Services — 4.9% |
| Doximity, Inc., Class A* | 12,556 | | 304,985 |
| Progyny, Inc.* | 16,966 | | 543,930 |
| | | | 848,915 |
| Home Improvement Retail — 3.6% |
| Floor & Decor Holdings, Inc., Class A* | 5,753 | | 634,729 |
| Industrial Distribution — 3.4% |
| Core & Main, Inc., Class A* | 7,727 | | 436,344 |
| Pool Corp. | 462 | | 167,489 |
| | | | 603,833 |
| Information Technology Services — 6.9% |
| ExlService Holdings, Inc.* | 12,094 | | 350,726 |
| Globant SA* | 4,829 | | 862,411 |
| | | | 1,213,137 |
| Insurance - Diversified — 3.3% |
| Goosehead Insurance, Inc., Class A* | 10,289 | | 585,547 |
| Internet Retail — 6.3% |
| Etsy, Inc.* | 7,895 | | 542,150 |
| Revolve Group, Inc.* | 28,262 | | 562,696 |
| | | | 1,104,846 |
| Leisure — 2.4% |
| YETI Holdings, Inc.* | 11,674 | | 416,995 |
| | Number
of Shares | | Value |
| COMMON STOCKS — (Continued) |
| Medical Devices — 2.0% |
| Align Technology, Inc.* | 1,218 | | $ 343,939 |
| Medical Instruments & Supplies — 2.0% |
| Warby Parker, Inc., Class A* | 29,438 | | 345,602 |
| Semiconductors — 4.5% |
| Monolithic Power Systems, Inc. | 798 | | 534,125 |
| SiTime Corp.* | 2,940 | | 262,013 |
| | | | 796,138 |
| Software Application — 22.6% |
| Alarm.com Holdings, Inc.* | 8,147 | | 541,775 |
| Alight, Inc., Class A* | 45,480 | | 410,230 |
| Aspen Technology, Inc.* | 2,394 | | 471,307 |
| Clearwater Analytics Holdings, Inc., Class A* | 32,672 | | 515,564 |
| Dynatrace, Inc.* | 17,974 | | 814,402 |
| Paycom Software, Inc. | 3,402 | | 639,508 |
| Tyler Technologies, Inc.* | 1,218 | | 562,168 |
| | | | 3,954,954 |
| Software Infrastructure — 2.9% |
| Endava PLC, SP ADR* | 5,123 | | 148,567 |
| Euronet Worldwide, Inc.* | 3,486 | | 357,942 |
| | | | 506,509 |
| Specialty Industrial Machinery — 3.0% |
| Generac Holdings, Inc.* | 3,821 | | 519,503 |
| Specialty Retail — 5.5% |
| Five Below, Inc.* | 4,115 | | 602,189 |
| RH * | 1,470 | | 363,164 |
| | | | 965,353 |
TOTAL COMMON STOCKS
(Cost $16,216,814) | | | 16,956,455 |
| SHORT-TERM INVESTMENT — 4.2% |
| Dreyfus Government Cash Management Fund, Institutional Shares, 5.19%(a) | 724,735 | | 724,735 |
|
| |
TOTAL SHORT-TERM INVESTMENT
(Cost $724,735) | | | 724,735 |
|
| |
TOTAL INVESTMENTS - 101.1%
(Cost $16,941,549) | | | 17,681,190 |
| LIABILITIES IN EXCESS OF OTHER ASSETS - (1.1)% | | | (187,032) |
| NET ASSETS - 100.0% | | | $ 17,494,158 |
The accompanying notes are an integral part of the financial statements.
POLEN U.S. SMID COMPANY GROWTH FUND
Portfolio of Investments (Concluded)
April 30, 2024
| (a) | Rate disclosed is the 7-day yield at April 30, 2024. |
| † | See Note 1. The industry designations set forth in the schedule above are those of the Morningstar Global Equity Classification System (“MGECS”). |
| * | Non-income producing. |
| PLC | Public Limited Company |
| SP ADR | Sponsored American Depository Receipt |
The accompanying notes are an integral part of the financial statements.
Polen Global SMID Company Growth Fund
Portfolio Holdings Summary Table
April 30, 2024
(Unaudited)
The following table presents a summary by industry of the portfolio holdings of the Fund:
| | % of Net
Assets | | Value |
| COMMON STOCKS: | | | |
| Software | 11.7% | | $ 1,230,844 |
| Capital Markets | 10.5 | | 1,096,335 |
| Entertainment | 10.2 | | 1,068,824 |
| Life Sciences Tools & Services | 8.6 | | 895,887 |
| Professional Services | 6.2 | | 653,716 |
| Specialty Retail | 6.1 | | 627,916 |
| Information Technology Services | 5.5 | | 573,384 |
| Beverages | 4.6 | | 476,028 |
| Health Care Providers & Services | 3.8 | | 403,315 |
| Electronic Equipment, Instruments & Components | 3.1 | | 319,661 |
| Trading Companies & Distributors | 2.9 | | 302,510 |
| Machinery | 2.8 | | 297,813 |
| Insurance | 2.8 | | 296,330 |
| Financial Services | 2.6 | | 269,265 |
| Semiconductors & Semiconductor Equipment | 2.5 | | 263,716 |
| Broadline Retail | 2.5 | | 261,083 |
| Health Care Equipment & Supplies | 2.4 | | 253,860 |
| Electrical Equipment | 2.2 | | 227,325 |
| Hotels, Restaurants & Leisure | 1.8 | | 193,722 |
| Health Care Technology | 1.8 | | 184,971 |
| Distributors | 1.6 | | 167,851 |
| Passenger Airlines | 1.2 | | 129,142 |
| Automobile Components | 1.0 | | 106,368 |
| Total Common Stocks | 98.4 | | 10,299,866 |
| Short-Term Investment | 1.9 | | 197,322 |
| Liabilities in Excess of Other Assets | (0.3) | | (28,915) |
| NET ASSETS | 100.0% | | $10,468,273 |
Portfolio holdings are subject to change at any time.
See Note 1. The industry designations set forth in the table above are those of the Global Industry Classification Standard (“GICS”).
The accompanying notes are an integral part of the financial statements.
POLEN GLOBAL SMID COMPANY GROWTH FUND
Portfolio of Investments
April 30, 2024
| | Number
of Shares | | Value |
| COMMON STOCKS† — 98.4% |
| Australia — 1.8% |
| Pro Medicus Ltd. | 2,589 | | $ 184,971 |
| China — 7.1% |
| Tencent Music Entertainment Group, ADR* | 44,030 | | 552,577 |
| Yum China Holdings, Inc. | 5,306 | | 193,722 |
| | | | 746,299 |
| Germany — 4.9% |
| CTS Eventim AG & Co. KGaA | 5,838 | | 516,247 |
| Hungary — 1.2% |
| Wizz Air Holdings PLC(a)* | 4,668 | | 129,142 |
| Japan — 1.2% |
| SHIFT, Inc.* | 1,350 | | 124,183 |
| Luxembourg — 3.4% |
| Eurofins Scientific SE | 5,753 | | 352,594 |
| Netherlands — 7.0% |
| Euronext NV(a) | 2,291 | | 206,307 |
| Topicus.com, Inc., sub-voting shares | 6,490 | | 528,902 |
| | | | 735,209 |
| Taiwan — 3.1% |
| E Ink Holdings, Inc. | 50,000 | | 319,661 |
| United Kingdom — 8.6% |
| Endava PLC, SP ADR* | 4,374 | | 126,846 |
| Fevertree Drinks PLC | 33,624 | | 476,028 |
| Judges Scientific PLC | 2,128 | | 297,813 |
| | | | 900,687 |
| United States — 54.4% |
| Alight, Inc., Class A* | 46,632 | | 420,621 |
| Align Technology, Inc.* | 899 | | 253,860 |
| Aspen Technology, Inc.* | 1,109 | | 218,329 |
| Bio-Techne Corp. | 3,680 | | 232,613 |
| Clearwater Analytics Holdings, Inc., Class A* | 14,470 | | 228,337 |
| Core & Main, Inc., Class A* | 5,357 | | 302,510 |
| Dynatrace, Inc.* | 5,634 | | 255,276 |
| Etsy, Inc.* | 3,802 | | 261,083 |
| Five Below, Inc.* | 1,327 | | 194,193 |
| Fox Factory Holding Corp.* | 2,733 | | 106,368 |
| Generac Holdings, Inc.* | 1,672 | | 227,325 |
| Goosehead Insurance, Inc., Class A* | 5,207 | | 296,330 |
| Houlihan Lokey, Inc. | 4,091 | | 521,562 |
| MarketAxess Holdings, Inc. | 621 | | 124,256 |
| Medpace Holdings, Inc.* | 800 | | 310,680 |
| Monolithic Power Systems, Inc. | 394 | | 263,716 |
| | Number
of Shares | | Value |
| COMMON STOCKS — (Continued) |
| United States — (Continued) |
| Morningstar, Inc. | 864 | | $ 244,210 |
| Paycom Software, Inc. | 1,240 | | 233,095 |
| Pool Corp. | 463 | | 167,851 |
| Progyny, Inc.* | 12,580 | | 403,315 |
| Revolve Group, Inc.* | 14,124 | | 281,209 |
| Warby Parker, Inc., Class A* | 12,991 | | 152,514 |
| | | | 5,699,253 |
| Uruguay — 5.7% |
| Dlocal Ltd.* | 18,949 | | 269,265 |
| Globant SA* | 1,805 | | 322,355 |
| | | | 591,620 |
TOTAL COMMON STOCKS
(Cost $10,018,841) | | | 10,299,866 |
| | | |
| SHORT-TERM INVESTMENT — 1.9% |
| Dreyfus Government Cash Management Fund, Institutional Shares, 5.19%(b) | 197,322 | 197,322 |
TOTAL SHORT-TERM INVESTMENT
(Cost $197,322) | | 197,322 |
|
| |
TOTAL INVESTMENTS - 100.3%
(Cost $10,216,163) | | 10,497,188 |
| LIABILITIES IN EXCESS OF OTHER ASSETS - (0.3)% | | (28,915) |
| NET ASSETS - 100.0% | | $10,468,273 |
| (a) | Securities exempt from registration under Rule 144A of the Securities Act of 1933, as amended. These securities were purchased in accordance with the guidelines approved by the Fund’s Board of Trustees and may be resold, in transactions exempt from registration, to qualified institutional buyers. At April 30, 2024, these securities amounted to $335,449 or 3.20% of net assets. These securities have been determined by the Adviser to be liquid securities. |
| (b) | Rate disclosed is the 7-day yield at April 30, 2024. |
| † | See Note 1. The industry designations set forth in the schedule above are those of the Global Industry Classification Standard (“GICS”). |
| * | Non-income producing. |
The accompanying notes are an integral part of the financial statements.
POLEN GLOBAL SMID COMPANY GROWTH FUND
Portfolio of Investments (Concluded)
April 30, 2024
| ADR | American Depositary Receipt |
| PLC | Public Limited Company |
| SP ADR | Sponsored American Depository Receipt |
The accompanying notes are an integral part of the financial statements.
Polen Bank Loan Fund
Portfolio Holdings Summary Table
April 30, 2024
(Unaudited)
The following table presents a summary by industry of the portfolio holdings of the Fund:
| | % of Net
Assets | | Value |
| SENIOR LOANS: | | | |
| Materials | 13.3% | | $1,221,844 |
| Health Care | 11.9 | | 1,088,684 |
| Media | 10.6 | | 972,975 |
| Industrial Services | 9.4 | | 862,031 |
| Retail & Wholesale - Discretionary | 6.9 | | 631,098 |
| Consumer Discretionary Products | 6.5 | | 598,543 |
| Software & Technology Services | 6.4 | | 584,906 |
| Industrial Products | 5.7 | | 524,795 |
| Financial Services | 4.4 | | 405,164 |
| Consumer Discretionary Services | 4.1 | | 379,595 |
| Consumer Staple Products | 2.8 | | 259,387 |
| Technology Hardware & Semiconductors | 2.6 | | 238,170 |
| Telecommunications | 1.8 | | 164,244 |
| Utilities | 0.9 | | 80,267 |
| Insurance | 0.7 | | 63,306 |
| Retail & Wholesale - Staples | 0.5 | | 49,721 |
| CORPORATE BONDS: | | | |
| Materials | 5.1 | | 464,263 |
| Consumer Discretionary Products | 1.7 | | 155,941 |
| Insurance | 1.5 | | 140,184 |
| Other Assets in Excess of Liabilities | 3.2 | | 293,193 |
| NET ASSETS | 100.0% | | $9,178,311 |
Portfolio holdings are subject to change at any time.
See Note 1. The industry designations set forth in the schedule above are those of the Bloomberg Industry Classification System (“BICS”).
The accompanying notes are an integral part of the financial statements.
POLEN BANK LOAN FUND
Portfolio of Investments
April 30, 2024
| | Par
Value | | Value |
| SENIOR LOANS†(a) — 88.5% |
| Consumer Discretionary Products — 6.5% |
| DexKo Global, Inc., First Lien Closing Date Dollar Term Loan, 9.321% (SOFR +401 bps), 10/4/28 | $ 167,957 | | $ 166,983 |
| DexKo Global, Inc., 2023 Incremental Term Loans, 9.559% (SOFR +425 bps), 10/4/28 | 44,813 | | 44,789 |
| MajorDrive Holdings IV, LLC, 2022 Incremental Term Loan, 6/1/29(b) | 219,529 | | 221,358 |
| RealTruck Group, Inc., Second Amendment Incremental Term Loan, 10.43% (SOFR +511 bps), 1/31/28 | 165,000 | | 165,413 |
| | | | 598,543 |
| Consumer Discretionary Services — 4.1% |
| Kuehg Corp., Term Loan B, 9.823% (SOFR +450 bps), 6/12/30(b) | 258,950 | | 260,124 |
| Learning Care Group U.S. No.2, Inc., Initial Term Loans, 10.059% - 10.093% (SOFR +475 bps), 8/11/28 | 118,975 | | 119,471 |
| | | | 379,595 |
| Consumer Staple Products — 2.8% |
| Fiesta Purchaser, Inc., Initial Term Loan, 9.318% (SOFR +400 bps), 2/12/31 | 140,000 | | 140,727 |
| Kronos Acquisition Holdings, Inc., Tranche B-1 Term Loan, 9.314% (SOFR +401 bps), 12/22/26(b) | 118,307 | | 118,660 |
| | | | 259,387 |
| Financial Services — 4.4% |
| Kestra Advisor Services Holdings A, Inc., Initial Term Loan, 9.316% (SOFR +400 bps), 3/19/31(b) | 155,000 | | 155,969 |
| Nexus Buyer, LLC, Amendment No. 5 Term Loans, 9.816% (SOFR +450 bps), 12/11/28 | 225,000 | | 224,250 |
| Nexus Buyer, LLC, Second Lien Term Loan, 11.666% (SOFR +635 bps), 11/5/29 | 25,000 | | 24,945 |
| | | | 405,164 |
| | Par
Value | | Value |
| SENIOR LOANS — (Continued) |
| Health Care — 11.9% |
| Aveanna Healthcare, LLC, First Lien 2021 Extended Term Loan, 7/17/28 | $ 190,084 | | $ 183,402 |
| Aveanna Healthcare, LLC, Initial Term Loan, 12.493% (SOFR +715 bps), 12/10/29 | 85,000 | | 74,056 |
| CVET Midco 2 LP, Initial Term Loan, 10.309% (SOFR +500 bps), 10/13/29 | 118,900 | | 119,244 |
| EyeCare Partners, LLC, Second Lien Initial Term Loan, 11/15/29(b) | 20,000 | | 5,667 |
| EyeCare Partners, LLC, Term Loan B, 10.04% (SOFR +471 bps), 11/30/28 | 139,767 | | 82,463 |
| EyeCare Partners, LLC, Term Loan C, 12.18% (SOFR +675 bps), 11/30/28 | 6,750 | | 1,282 |
| Packaging Coordinators Midco, Inc., First Lien Term B Loan, 9.071% (SOFR +376 bps), 11/30/27 | 106,948 | | 107,440 |
| Sharp Services LLC, Tranche C Term Loan, 9.052% (SOFR +375 bps), 12/31/28 | 107,667 | | 108,205 |
| SM Wellness Holdings, Inc., First Lien Initial Term Loan, 10.091% (SOFR +476 bps), 4/17/28 | 204,133 | | 196,733 |
| Summit Behavioral Healthcare, LLC, TRANCHE B-1 TERM LOANS, 9.568% (SOFR +425 bps), 11/24/28 | 92,463 | | 92,717 |
| Surgery Center Holdings, Inc., New First Lien Term Loan, 8.815% (SOFR +350 bps), 12/19/30 | 116,643 | | 117,475 |
| | | | 1,088,684 |
| Industrial Products — 5.7% |
| CPM Holdings, Inc., Initial Term Loan, 9.813% (SOFR +450 bps), 9/28/28 | 64,838 | | 65,097 |
| Engineered Machinery Holdings, Inc., Incremental USD First Lien Term Loan, 9.321% (SOFR +401 bps), 5/19/28 | 154,302 | | 154,515 |
The accompanying notes are an integral part of the financial statements.
POLEN BANK LOAN FUND
Portfolio of Investments (Continued)
April 30, 2024
| | Par
Value | | Value |
| SENIOR LOANS — (Continued) |
| Industrial Products — (Continued) |
| Engineered Machinery Holdings, Inc., Second Lien Amendment No. 3 Incremental Term Loan, 11.571% (SOFR +626 bps), 5/21/29 | $ 40,000 | | $ 39,963 |
| Engineered Machinery Holdings, Inc., Second Lien Incremental Amendment No. 2 Term Loan, 12.071% (SOFR +676 bps), 5/21/29 | 185,000 | | 184,770 |
| Touchdown Acquirer, Inc., Initial Term Loan, 9.314% (SOFR +400 bps), 2/21/31 | 65,629 | | 65,998 |
| Touchdown Acquirer, Inc., Delayed Draw Term Loan, 9.317%, 2/21/31(c) | 14,371 | | 14,452 |
| | | | 524,795 |
| Industrial Services — 9.4% |
| Brown Group Holding, LLC, Incremental Term B-2 Facility, 8.33% (SOFR +300 bps), 7/2/29 | 75,000 | | 75,207 |
| CHG Healthcare Services, Inc., 2023 Incremental Term Loans, 9.066% - 9.093% (SOFR +375 bps), 9/29/28 | 94,850 | | 95,443 |
| Infinite Bidco, LLC, First Lien Term Loan, 9.341% (SOFR +401 bps), 3/2/28 | 103,913 | | 102,398 |
| Infinite Bidco, LLC, Second Lien Initial Term Loan, 12.591% (SOFR +726 bps), 3/2/29 | 85,000 | | 72,675 |
| LaserShip, Inc., First Lien Initial Term Loan, 10.071% (SOFR +476 bps), 5/7/28 | 167,642 | | 157,583 |
| Radar Bidco Sarl, Facility B USD Loan, 9.558% (SOFR +425 bps), 3/31/31 | 55,000 | | 55,275 |
| RLG Holdings, LLC, First Lien Closing Date Initial Term Loan, 9.68% (SOFR +436 bps), 7/7/28 | 189,033 | | 187,851 |
| Viad Corp., Tl, 1/1/40(b) | 115,000 | | 115,599 |
| | | | 862,031 |
| | Par
Value | | Value |
| SENIOR LOANS — (Continued) |
| Insurance — 0.7% |
| Asurion, LLC, New B-4 Term Loan, 10.68% (SOFR +536 bps), 1/20/29 | $ 70,000 | | $ 63,306 |
| Materials — 13.3% |
| Arsenal Aic Parent, LLC, 2024 Refinancing Term B Loan, 9.066% (SOFR +375 bps), 8/19/30 | 44,688 | | 45,079 |
| Aruba Investments Holdings, LLC, First Lien Initial Dollar Term Loan, 9.416% (SOFR +410 bps), 11/24/27 | 277,966 | | 271,364 |
| Clydesdale Acquisition Holdings, Inc., Term B Loan, 9.091% (SOFR +378 bps), 4/13/29 | 43,673 | | 43,911 |
| CP Iris Holdco I, Inc., Initial Term Loan, 10/1/29(b) | 160,000 | | 152,800 |
| CP Iris Holdco I, Inc., First Lien Initial Term Loan, 8.916% (SOFR +360 bps), 10/2/28 | 75,875 | | 75,899 |
| LABL, Inc., Initial Dollar Term Loan, 10.416% (SOFR +510 bps), 10/29/28(b) | 225,000 | | 220,683 |
| Oscar AcquisitionCo., LLC, Term B Loan, 9.902% (SOFR +460 bps), 4/29/29 | 128,511 | | 129,264 |
| SCIH Salt Holdings, Inc., First Lien Incremental Term B-1 Loan, 8.83% (SOFR +350 bps), 3/16/27 | 78,872 | | 79,168 |
| Trident TPI Holdings, Inc., Tranche B-6 Term Loan, 9.302% (SOFR +400 bps), 9/15/28 | 74,462 | | 74,685 |
| Trident TPI Holdings, Inc., Tranche B-4 Initial Term Loans, 10.559% (SOFR +525 bps), 9/15/28 | 128,375 | | 128,991 |
| | | | 1,221,844 |
| Media — 10.6% |
| Arches Buyer, Inc., Refinancing Term Loan, 8.666% (SOFR +335 bps), 12/6/27 | 98,724 | | 95,551 |
| Auction.com, LLC, Term Loan, 11.316% (SOFR +600 bps), 5/26/28 | 352,332 | | 340,529 |
| Cengage Learning, Inc., Term Loan B, 9.565% (SOFR +425 bps), 3/24/31 | 105,000 | | 105,338 |
The accompanying notes are an integral part of the financial statements.
POLEN BANK LOAN FUND
Portfolio of Investments (Continued)
April 30, 2024
| | Par
Value | | Value |
| SENIOR LOANS — (Continued) |
| Media — (Continued) |
| Clear Channel Outdoor Holdings, Inc., 2024 Refinancing Term Loan, 9.43% (SOFR +411 bps), 8/21/28 | $ 118,790 | | $ 119,038 |
| MH Sub I, LLC, Second Lien Term Loan, 11.566% (SOFR +625 bps), 2/23/29(b) | 315,000 | | 312,519 |
| | | | 972,975 |
| Retail & Wholesale - Discretionary — 6.9% |
| Foundation Building Materials, Inc., 2024 Incremental Term Loan, 9.316% (SOFR +400 bps), 1/29/31(b) | 95,000 | | 95,794 |
| Mavis Tire Express Services Topco Corp., Term Loan, 9.066% (SOFR +375 bps), 5/4/28 | 14,230 | | 14,293 |
| Medical Solutions Holdings, Inc., Initial Term Loan, 8.666% (SOFR +335 bps), 11/1/28(b) | 202,982 | | 180,183 |
| Sweetwater Borrower, LLC, Initial Term Loan, 9.68% (SOFR +436 bps), 8/7/28 | 149,568 | | 150,129 |
| TA TT Buyer, LLC, Initial Term Loan, 10.302% (SOFR +500 bps), 4/2/29 | 84,456 | | 84,891 |
| Wand NewCo 3, Inc., Term Loan, 9.066% (SOFR +375 bps), 1/30/31 | 105,000 | | 105,808 |
| | | | 631,098 |
| Retail & Wholesale - Staples — 0.5% |
| Quirch Foods Holdings, LLC, Term Loan, 10.324% (SOFR +501 bps), 10/27/27 | 49,488 | | 49,721 |
| Software & Technology Services — 6.4% |
| Ahead DB Holdings, LLC, 2024 Incremental Term Loan, 9.559% (SOFR +425 bps), 2/1/31 | 65,000 | | 65,463 |
| Azalea TopCo, Inc., Initial Term Loan, 4/24/31(b) | 125,000 | | 124,765 |
| Cast & Crew Payroll, LLC, First Lien Incremental Facility No 2 Incremental Term Loan, 12/29/28(b) | 75,000 | | 75,207 |
| Cloudera, Inc., Second Lien Term Loan, 11.416% (SOFR +610 bps), 10/8/29 | 85,000 | | 81,919 |
| | Par
Value | | Value |
| SENIOR LOANS — (Continued) |
| Software & Technology Services — (Continued) |
| Mitchell International, Inc., Second Lien Initial Term Loan, 11.93% (SOFR +661 bps), 10/15/29 | $ 55,000 | | $ 55,212 |
| Skopima Consilio, First Lien Initial Term Loan, 9.43% (SOFR +411 bps), 5/12/28 | 183,125 | | 182,340 |
| | | | 584,906 |
| Technology Hardware & Semiconductors — 2.6% |
| Altar Bidco, Inc., Second Lien Initial Term Loan, 10.912% (SOFR +560 bps), 2/1/30(b) | 240,000 | | 238,170 |
| Telecommunications — 1.8% |
| CCI Buyer, Inc., First Lien Initial Term Loan, 9.302% (SOFR +400 bps), 12/17/27(b) | 164,141 | | 164,244 |
| Utilities — 0.9% |
| Discovery Energy Corp., USD Term Loan, 1/30/31(b) | 80,000 | | 80,267 |
TOTAL SENIOR LOANS
(Cost $7,966,395) | | 8,124,730 |
| CORPORATE BONDS† — 8.3% |
| Consumer Discretionary Products — 1.7% |
| Dornoch Debt Merger Sub, Inc., 6.625%, 10/15/29(d) | 90,000 | | 74,440 |
| Real Hero Merger Sub 2, Inc., 6.25%, 2/1/29(d) | 95,000 | | 81,501 |
| | | | 155,941 |
| Insurance — 1.5% |
| GTCR AP Finance, Inc., 8.00%, 5/15/27(d) | 140,000 | | 140,184 |
The accompanying notes are an integral part of the financial statements.
POLEN BANK LOAN FUND
Portfolio of Investments (Concluded)
April 30, 2024
| | Par
Value | | Value |
| CORPORATE BONDS — (Continued) |
| Materials — 5.1% |
| Baffinland Iron Mines Corp., 8.75%, 7/15/26(d) | $ 295,000 | | $ 271,552 |
| Oscar AcquisitionCo., LLC, 9.50%, 4/15/30(d) | 200,000 | | 192,711 |
| | | | 464,263 |
TOTAL CORPORATE BONDS
(Cost $755,865) | | | 760,388 |
|
| |
TOTAL INVESTMENTS - 96.8%
(Cost $8,722,260) | | | 8,885,118 |
| OTHER ASSETS IN EXCESS OF LIABILITIES - 3.2% | | | 293,193 |
| NET ASSETS - 100.0% | | | $ 9,178,311 |
| (a) | Floating rate note. Coupon rate, reference index and spread shown at April 30, 2024. |
| (b) | All or a portion of this Senior Loan will settle after April 30, 2024, at which time the interest rate will be determined. Rates shown, if any, are for the settled portion. |
| (c) | All or a portion of this senior loan position is unfunded as of April 30, 2024. The Fund had approximately $14,452 in unfunded commitments pursuant to Delayed Draw Term Loan facilities. The Portfolio of Investments records each of these investments as fully funded and accordingly, a corresponding payable for investments purchased has also been recorded, which represents the actual unfunded amount on the balance sheet date. |
| (d) | Securities exempt from registration under Rule 144A of the Securities Act of 1933, as amended. These securities were purchased in accordance with the guidelines approved by the Fund’s Board of Trustees and may be resold, in transactions exempt from registration, to qualified institutional buyers. At April 30, 2024, these securities amounted to $760,388 or 8.28% of net assets. These securities have been determined by the Adviser to be liquid securities. |
| † | See Note 1. The industry designations set forth in the schedule above are those of the Bloomberg Industry Classification System (“BICS”). |
| LLC | Limited Liability Company |
| LP | Limited Partnership |
| SOFR | Secured Overnight Funding Rate |
| USD | United States Dollar |
The accompanying notes are an integral part of the financial statements.
Polen U.S. High Yield Fund
(formerly, Polen Upper Tier High Yield Fund)
Portfolio Holdings Summary Table
April 30, 2024
(Unaudited)
The following table presents a summary by industry of the portfolio holdings of the Fund:
| | % of Net
Assets | | Value |
| CORPORATE BONDS: | | | |
| Oil & Gas | 10.0% | | $ 299,510 |
| Media | 9.1 | | 272,896 |
| Industrial Services | 8.2 | | 245,916 |
| Consumer Discretionary Services | 8.1 | | 241,538 |
| Materials | 7.1 | | 212,331 |
| Consumer Discretionary Products | 6.8 | | 201,784 |
| Health Care | 5.7 | | 169,149 |
| Industrial Products | 5.6 | | 166,658 |
| Retail & Wholesale - Discretionary | 4.9 | | 146,964 |
| Real Estate | 3.9 | | 117,308 |
| Consumer Staple Products | 3.7 | | 111,641 |
| Software & Technology Services | 3.4 | | 101,652 |
| Technology Hardware & Semiconductors | 3.3 | | 99,246 |
| Utilities | 0.8 | | 24,954 |
| Telecommunications | 0.4 | | 10,220 |
| SENIOR LOANS: | | | |
| Media | 3.4 | | 101,882 |
| Industrial Products | 2.0 | | 58,850 |
| Software & Technology Services | 1.8 | | 53,951 |
| Consumer Discretionary Services | 1.7 | | 49,976 |
| Insurance | 1.7 | | 49,741 |
| Industrial Services | 1.3 | | 39,597 |
| Materials | 0.9 | | 27,563 |
| Telecommunications | 0.7 | | 22,206 |
| Health Care | 0.7 | | 19,857 |
| Consumer Discretionary Products | 0.6 | | 19,535 |
| Other Assets in Excess of Liabilities | 4.2 | | 126,393 |
| NET ASSETS | 100.0% | | $2,991,318 |
Portfolio holdings are subject to change at any time.
See Note 1. The industry designations set forth in the schedule above are those of the Bloomberg Industry Classification System ("BICS").
The accompanying notes are an integral part of the financial statements.
POLEN U.S. HIGH YIELD FUND (formerly, Polen Upper Tier High Yield Fund)
Portfolio of Investments
April 30, 2024
| | Par
Value | | Value |
| CORPORATE BONDS† — 81.0% |
| Consumer Discretionary Products — 6.8% |
| Adient Global Holdings Ltd., 8.25%, 4/15/31(a) | $ 20,000 | | $ 20,789 |
| Clarios Global LP, 6.25%, 5/15/26(a) | 25,000 | | 24,993 |
| Dornoch Debt Merger Sub, Inc., 6.625%, 10/15/29(a) | 74,000 | | 61,206 |
| Real Hero Merger Sub 2, Inc., 6.25%, 2/1/29(a) | 70,000 | | 60,054 |
| Thor Industries, Inc., 4.00%, 10/15/29(a) | 40,000 | | 34,742 |
| | | | 201,784 |
| Consumer Discretionary Services — 8.1% |
| 1011778 BC ULC, 4.00%, 10/15/30(a) | 25,000 | | 21,606 |
| Boyd Gaming Corp., 4.75%, 12/1/27 | 20,000 | | 18,988 |
| Boyd Gaming Corp., 4.75%, 6/15/31(a) | 10,000 | | 8,863 |
| Cedar Fair LP, 5.25%, 7/15/29 | 15,000 | | 14,009 |
| Hilton Domestic Operating Co., Inc., 4.00%, 5/1/31(a) | 20,000 | | 17,544 |
| Penn Entertainment, Inc., 4.125%, 7/1/29(a) | 40,000 | | 33,691 |
| Scientific Games Holdings LP, 6.625%, 3/1/30(a) | 94,000 | | 89,013 |
| Six Flags Entertainment Corp., 7.25%, 5/15/31(a) | 15,000 | | 14,981 |
| Station Casinos, LLC, 4.625%, 12/1/31(a) | 26,000 | | 22,843 |
| | | | 241,538 |
| Consumer Staple Products — 3.7% |
| Energizer Holdings, Inc., 4.75%, 6/15/28(a) | 15,000 | | 13,646 |
| Kronos Acquisition Holdings, Inc., 7.00%, 12/31/27(a) | 38,000 | | 36,797 |
| Pilgrim's Pride Corp., 4.25%, 4/15/31 | 10,000 | | 8,856 |
| Post Holdings, Inc., 5.50%, 12/15/29(a) | 25,000 | | 23,746 |
| Simmons Foods, Inc., 4.625%, 3/1/29(a) | 33,000 | | 28,596 |
| | | | 111,641 |
| Health Care — 5.7% |
| Fortrea Holdings, Inc., 7.50%, 7/1/30(a) | 22,000 | | 22,249 |
| ModivCare Escrow Issuer, Inc., 5.00%, 10/1/29(a) | 73,000 | | 50,835 |
| | Par
Value | | Value |
| CORPORATE BONDS — (Continued) |
| Health Care — (Continued) |
| Molina Healthcare, Inc., 4.375%, 6/15/28(a) | $ 15,000 | | $ 13,893 |
| Option Care Health, Inc., 4.375%, 10/31/29(a) | 10,000 | | 8,965 |
| Pediatrix Medical Group, Inc., 5.375%, 2/15/30(a) | 50,000 | | 43,800 |
| Select Medical Corp., 6.25%, 8/15/26(a) | 10,000 | | 10,011 |
| Tenet Healthcare Corp., 5.125%, 11/1/27 | 20,000 | | 19,396 |
| | | | 169,149 |
| Industrial Products — 5.6% |
| ATS Corp., 4.125%, 12/15/28(a) | 25,000 | | 22,480 |
| Chart Industries, Inc., 7.50%, 1/1/30(a) | 16,000 | | 16,400 |
| Madison IAQ, LLC, 5.875%, 6/30/29(a) | 34,000 | | 31,540 |
| SPX Flow, Inc., 8.75%, 4/1/30(a) | 49,000 | | 50,399 |
| TransDigm, Inc., 4.625%, 1/15/29 | 50,000 | | 45,839 |
| | | | 166,658 |
| Industrial Services — 8.2% |
| AMN Healthcare, Inc., 4.625%, 10/1/27(a) | 23,000 | | 21,630 |
| Brundage-Bone Concrete Pumping Holdings, Inc., 6.00%, 2/1/26(a) | 75,000 | | 74,163 |
| Dycom Industries, Inc., 4.50%, 4/15/29(a) | 15,000 | | 13,855 |
| H&E Equipment Services, Inc., 3.875%, 12/15/28(a) | 30,000 | | 26,552 |
| IEA Energy Services, LLC, 6.625%, 8/15/29(a) | 77,000 | | 73,473 |
| Korn Ferry, 4.625%, 12/15/27(a) | 10,000 | | 9,490 |
| TopBuild Corp., 3.625%, 3/15/29(a) | 20,000 | | 17,976 |
| TriNet Group, Inc., 3.50%, 3/1/29(a) | 10,000 | | 8,777 |
| | | | 245,916 |
| Materials — 7.1% |
| ATI, Inc., 5.125%, 10/1/31 | 20,000 | | 18,247 |
| Baffinland Iron Mines Corp., 8.75%, 7/15/26(a) | 10,000 | | 9,205 |
| Century Aluminum Co., 7.50%, 4/1/28(a) | 45,000 | | 44,711 |
| Cleveland-Cliffs, Inc., 5.875%, 6/1/27 | 15,000 | | 14,847 |
| Ingevity Corp., 3.875%, 11/1/28(a) | 45,000 | | 40,090 |
The accompanying notes are an integral part of the financial statements.
POLEN U.S. HIGH YIELD FUND (formerly, Polen Upper Tier High Yield Fund)
Portfolio of Investments (Continued)
April 30, 2024
| | Par
Value | | Value |
| CORPORATE BONDS — (Continued) |
| Materials — (Continued) |
| Kaiser Aluminum Corp., 4.50%, 6/1/31(a) | $ 20,000 | | $ 17,535 |
| Oscar AcquisitionCo., LLC, 9.50%, 4/15/30(a) | 32,000 | | 30,834 |
| SCIH Salt Holdings, Inc., 6.625%, 5/1/29(a) | 40,000 | | 36,862 |
| | | | 212,331 |
| Media — 9.1% |
| Advantage Sales & Marketing, Inc., 6.50%, 11/15/28(a) | 55,000 | | 51,237 |
| CCO Holdings, LLC, 4.75%, 3/1/30(a) | 16,000 | | 13,332 |
| CCO Holdings, LLC, 7.375%, 3/1/31(a) | 22,000 | | 20,915 |
| GrubHub Holdings, Inc., 5.50%, 7/1/27(a) | 61,000 | | 54,551 |
| McGraw-Hill Education, Inc., 5.75%, 8/1/28(a) | 32,000 | | 29,725 |
| Outfront Media Capital, LLC, 4.625%, 3/15/30(a) | 30,000 | | 26,512 |
| Scripps Escrow, Inc., 5.875%, 7/15/27(a) | 59,000 | | 46,453 |
| TripAdvisor, Inc., 7.00%, 7/15/25(a) | 30,000 | | 30,171 |
| | | | 272,896 |
| Oil & Gas — 10.0% |
| Antero Midstream Partners LP, 5.75%, 1/15/28(a) | 35,000 | | 34,286 |
| Archrock Partners LP, 6.25%, 4/1/28(a) | 20,000 | | 19,612 |
| DT Midstream, Inc., 4.375%, 6/15/31(a) | 30,000 | | 26,672 |
| Harvest Midstream I LP, 7.50%, 9/1/28(a) | 50,000 | | 50,183 |
| Hilcorp Energy I LP, 6.25%, 11/1/28(a) | 15,000 | | 14,778 |
| Parkland Corp., 4.625%, 5/1/30(a) | 25,000 | | 22,617 |
| Teine Energy Ltd., 6.875%, 4/15/29(a) | 91,000 | | 88,492 |
| Transocean, Inc., 11.50%, 1/30/27(a) | 41,000 | | 42,870 |
| | | | 299,510 |
| Real Estate — 3.9% |
| Howard Hughes Corp. (The), 4.375%, 2/1/31(a) | 30,000 | | 25,476 |
| Kennedy-Wilson, Inc., 5.00%, 3/1/31 | 118,000 | | 91,832 |
| | | | 117,308 |
| | Par
Value | | Value |
| CORPORATE BONDS — (Continued) |
| Retail & Wholesale - Discretionary — 4.9% |
| Builders FirstSource, Inc., 4.25%, 2/1/32(a) | $ 15,000 | | $ 13,078 |
| Dealer Tire, LLC, 8.00%, 2/1/28(a) | 14,000 | | 13,807 |
| GYP Holdings III Corp., 4.625%, 5/1/29(a) | 30,000 | | 27,864 |
| Mavis Tire Express Services Topco Corp., 6.50%, 5/15/29(a) | 16,000 | | 14,868 |
| Patrick Industries, Inc., 4.75%, 5/1/29(a) | 40,000 | | 36,326 |
| Specialty Building Products Holdings, LLC, 6.375%, 9/30/26(a) | 25,000 | | 24,757 |
| SRS Distribution, Inc., 6.125%, 7/1/29(a) | 16,000 | | 16,264 |
| | | | 146,964 |
| Software & Technology Services — 3.4% |
| Dun & Bradstreet Corp. (The), 5.00%, 12/15/29(a) | 35,000 | | 31,914 |
| Open Text Holdings, Inc., 4.125%, 12/1/31(a) | 16,000 | | 13,727 |
| Presidio Holdings, Inc., 8.25%, 2/1/28(a) | 29,000 | | 29,352 |
| Twilio, Inc., 3.625%, 3/15/29 | 30,000 | | 26,659 |
| | | | 101,652 |
| Technology Hardware & Semiconductors — 3.3% |
| Ciena Corp., 4.00%, 1/31/30(a) | 5,000 | | 4,390 |
| Imola Merger Corp., 4.75%, 5/15/29(a) | 30,000 | | 27,634 |
| TTM Technologies, Inc., 4.00%, 3/1/29(a) | 25,000 | | 22,382 |
| Viasat, Inc., 5.625%, 9/15/25(a) | 10,000 | | 9,615 |
| Viasat, Inc., 6.50%, 7/15/28(a) | 46,000 | | 35,225 |
| | | | 99,246 |
| Telecommunications — 0.4% |
| Telesat Canada, 5.625%, 12/6/26(a) | 15,000 | | 7,271 |
| Telesat Canada, 6.50%, 10/15/27(a) | 10,000 | | 2,949 |
| | | | 10,220 |
| Utilities — 0.8% |
| NextEra Energy Operating Partners LP, 4.25%, 7/15/24(a) | 25,000 | | 24,954 |
TOTAL CORPORATE BONDS
(Cost $2,373,062) | | | 2,421,767 |
The accompanying notes are an integral part of the financial statements.
POLEN U.S. HIGH YIELD FUND (formerly, Polen Upper Tier High Yield Fund)
Portfolio of Investments (Continued)
April 30, 2024
| | Par
Value | | Value |
| SENIOR LOANS†(b) — 14.8% |
| Consumer Discretionary Products — 0.6% |
| DexKo Global, Inc., First Lien Closing Date Dollar Term Loan, 9.321% (SOFR +401 bps), 10/4/28 | $ 9,825 | | $ 9,768 |
| RealTruck Goup, Inc., Initial Term Loan, 8.93% (SOFR +361 bps), 1/31/28 | 9,823 | | 9,767 |
| | | | 19,535 |
| Consumer Discretionary Services — 1.7% |
| Kuehg Corp., Term Loan B, 9.823% (SOFR +450 bps), 6/12/30 | 49,750 | | 49,976 |
| Health Care — 0.7% |
| CVET Midco 2 LP, Initial Term Loan, 10.309% (SOFR +500 bps), 10/13/29 | 19,800 | | 19,857 |
| Industrial Products — 2.0% |
| CPM Holdings, Inc., Initial Term Loan, 9.813% (SOFR +450 bps), 9/28/28 | 49,875 | | 50,075 |
| SPX Flow, Inc., Term Loan, 9.916% (SOFR +460 bps), 4/5/29 | 8,714 | | 8,775 |
| | | | 58,850 |
| Industrial Services — 1.3% |
| Cimpress PLC, Tranche B-1 Term Loan, 8.93% (SOFR +361 bps), 5/17/28 | 39,418 | | 39,597 |
| Insurance — 1.7% |
| Asurion, LLC, New B-4 Term Loan, 10.68% (SOFR +536 bps), 1/20/29 | 55,000 | | 49,741 |
| Materials — 0.9% |
| LABL, Inc., Initial Dollar Term Loan, 10.416% (SOFR +510 bps), 10/29/28(c) | 18,000 | | 17,655 |
| Oscar AcquisitionCo., LLC, Term B Loan, 9.902% (SOFR +460 bps), 4/29/29 | 9,850 | | 9,908 |
| | | | 27,563 |
| Media — 3.4% |
| Arches Buyer, Inc., Refinancing Term Loan, 8.666% (SOFR +335 bps), 12/6/27 | 9,872 | | 9,555 |
| | Par
Value | | Value |
| SENIOR LOANS — (Continued) |
| Media — (Continued) |
| Clear Channel Outdoor Holdings, Inc., 2024 Refinancing Term Loan, 9.43% (SOFR +411 bps), 8/21/28 | $ 24,846 | | $ 24,897 |
| MH Sub I, LLC, 2023 May New Term Loans, 9.566% (SOFR +425 bps), 5/3/28 | 9,849 | | 9,829 |
| MH Sub I, LLC, Second Lien Term Loan, 11.566% (SOFR +625 bps), 2/23/29 | 48,000 | | 47,622 |
| UPC Financing Partnership, Facility AX, 8.435% (SOFR +311 bps), 1/31/29 | 10,000 | | 9,979 |
| | | | 101,882 |
| Software & Technology Services — 1.8% |
| Mitchell International, Inc., Second Lien Initial Term Loan, 11.93% (SOFR +661 bps), 10/15/29 | 44,000 | | 44,170 |
| Skopima Consilio, First Lien Initial Term Loan, 9.43% (SOFR +411 bps), 5/12/28 | 9,824 | | 9,781 |
| | | | 53,951 |
| Telecommunications — 0.7% |
| Crown Subsea Communications Holding, Inc., Initial Term Loans, 10.08% (SOFR +475 bps), 1/26/31 | 22,000 | | 22,206 |
TOTAL SENIOR LOANS
(Cost $427,518) | | 443,158 |
|
| |
TOTAL INVESTMENTS - 95.8%
(Cost $2,800,580) | | | 2,864,925 |
| OTHER ASSETS IN EXCESS OF LIABILITIES - 4.2% | | | 126,393 |
| NET ASSETS - 100.0% | | | $ 2,991,318 |
The accompanying notes are an integral part of the financial statements.
POLEN U.S. HIGH YIELD FUND (formerly, Polen Upper Tier High Yield Fund)
Portfolio of Investments (Concluded)
April 30, 2024
| (a) | Securities exempt from registration under Rule 144A of the Securities Act of 1933, as amended. These securities were purchased in accordance with the guidelines approved by the Fund’s Board of Trustees and may be resold, in transactions exempt from registration, to qualified institutional buyers. At April 30, 2024, these securities amounted to $2,163,094 or 72.31% of net assets. These securities have been determined by the Adviser to be liquid securities. |
| (b) | Floating rate note. Coupon rate, reference index and spread shown at April 30, 2024. |
| (c) | All or a portion of this Senior Loan will settle after April 30, 2024, at which time the interest rate will be determined. Rates shown, if any, are for the settled portion. |
| † | See Note 1. The industry designations set forth in the schedule above are those of the Bloomberg Industry Classification System (“BICS”). |
| LLC | Limited Liability Company |
| LP | Limited Partnership |
| PLC | Public Limited Company |
| SOFR | Secured Overnight Funding Rate |
The accompanying notes are an integral part of the financial statements.
Polen Opportunistic High Yield Fund
Portfolio Holdings Summary Table
April 30, 2024
(Unaudited)
The following table presents a summary by industry of the portfolio holdings of the Fund:
| | % of Net
Assets | | Value |
| CORPORATE BONDS: | | | |
| Materials | 12.9% | | $ 40,293,599 |
| Industrial Products | 11.7 | | 36,723,704 |
| Insurance | 6.3 | | 19,822,056 |
| Health Care | 6.1 | | 19,174,742 |
| Software & Technology Services | 6.1 | | 18,970,408 |
| Consumer Discretionary Products | 4.4 | | 13,613,264 |
| Media | 4.2 | | 12,946,443 |
| Consumer Discretionary Services | 3.9 | | 12,233,871 |
| Retail & Wholesale - Discretionary | 3.2 | | 10,086,251 |
| Consumer Staple Products | 2.4 | | 7,587,446 |
| Retail & Wholesale - Staples | 1.2 | | 3,656,735 |
| Oil & Gas | 0.9 | | 2,801,191 |
| Industrial Services | 0.6 | | 1,908,397 |
| SENIOR LOANS: | | | |
| Media | 5.9 | | 18,525,107 |
| Health Care | 3.9 | | 12,308,661 |
| Materials | 3.3 | | 10,384,715 |
| Industrial Services | 2.8 | | 8,665,970 |
| Consumer Discretionary Services | 2.7 | | 8,448,176 |
| Industrial Products | 2.3 | | 7,209,965 |
| Software & Technology Services | 1.7 | | 5,444,436 |
| Consumer Staple Products | 1.5 | | 4,528,477 |
| Technology Hardware & Semiconductors | 1.2 | | 3,766,003 |
| Consumer Discretionary Products | 1.0 | | 3,017,569 |
| Financial Services | 0.8 | | 2,404,017 |
| Retail & Wholesale - Discretionary | 0.6 | | 1,990,121 |
| Insurance | 0.6 | | 1,844,925 |
| Retail & Wholesale - Staples | 0.3 | | 924,803 |
| Telecommunications | 0.0 | | 76,230 |
| COMMON STOCKS: | | | |
| Materials | 0.2 | | 651,484 |
| Industrial Products | 0.2 | | 503,277 |
| Retail & Wholesale - Discretionary | 0.0 | | 111,309 |
| Software & Technology Services | 0.0 | | 11,777 |
| WARRANTS: | | | |
| Industrial Products | 0.0 | | — |
| Other Assets in Excess of Liabilities | 7.1 | | 22,244,456 |
| NET ASSETS | 100.0% | | $312,879,585 |
Portfolio holdings are subject to change at any time.
See Note 1. The industry designations set forth in the schedule above are those of the Bloomberg Industry Classification System ("BICS").
The accompanying notes are an integral part of the financial statements.
POLEN OPPORTUNISTIC HIGH YIELD FUND
Portfolio of Investments
April 30, 2024
| | Par
Value | | Value |
| CORPORATE BONDS† — 63.9% |
| Consumer Discretionary Products — 4.4% |
| CD&R Smokey Buyer, Inc., 6.75%, 7/15/25(a) | $ 2,040,000 | | $ 2,031,984 |
| Clarios Global LP, 8.50%, 5/15/27(a) | 1,080,000 | | 1,080,536 |
| Dornoch Debt Merger Sub, Inc., 6.625%, 10/15/29(a) | 8,080,000 | | 6,683,064 |
| Real Hero Merger Sub 2, Inc., 6.25%, 2/1/29(a) | 4,450,000 | | 3,817,680 |
| | | | 13,613,264 |
| Consumer Discretionary Services — 3.9% |
| Boyd Gaming Corp., 4.75%, 6/15/31(a) | 2,470,000 | | 2,189,077 |
| Raising Cane's Restaurants, LLC, 9.375%, 5/1/29(a) | 7,140,000 | | 7,667,946 |
| Scientific Games Holdings LP, 6.625%, 3/1/30(a) | 2,510,000 | | 2,376,848 |
| | | | 12,233,871 |
| Consumer Staple Products — 2.4% |
| B&G Foods, Inc., 5.25%, 4/1/25 | 840,000 | | 831,081 |
| Fiesta Purchaser, Inc., 7.875%, 3/1/31(a) | 1,790,000 | | 1,825,667 |
| Simmons Foods, Inc., 4.625%, 3/1/29(a) | 5,690,000 | | 4,930,698 |
| | | | 7,587,446 |
| Health Care — 6.1% |
| Fortrea Holdings, Inc., 7.50%, 7/1/30(a) | 2,700,000 | | 2,730,567 |
| Option Care Health, Inc., 4.375%, 10/31/29(a) | 5,150,000 | | 4,616,926 |
| Surgery Center Holdings, Inc., 7.25%, 4/15/32(a) | 4,420,000 | | 4,414,204 |
| Tenet Healthcare Corp., 6.125%, 10/1/28 | 7,490,000 | | 7,413,045 |
| | | | 19,174,742 |
| Industrial Products — 11.7% |
| Chart Industries, Inc., 7.50%, 1/1/30(a) | 4,230,000 | | 4,335,814 |
| Chart Industries, Inc., 9.50%, 1/1/31(a) | 4,150,000 | | 4,462,196 |
| F-Brasile SpA, Series XR, 7.375%, 8/15/26(a) | 4,690,000 | | 4,671,357 |
| Madison IAQ, LLC, 5.875%, 6/30/29(a) | 7,250,000 | | 6,725,450 |
| Material Sciences Corp., 13.115%, 7/9/26(b)(c)(d) | 105,420 | | 105,420 |
| | Par
Value | | Value |
| CORPORATE BONDS — (Continued) |
| Industrial Products — (Continued) |
| SPX Flow, Inc., 8.75%, 4/1/30(a) | $5,805,000 | | $ 5,970,785 |
| TransDigm, Inc., 6.75%, 8/15/28(a) | 1,460,000 | | 1,472,964 |
| TransDigm, Inc., 4.875%, 5/1/29 | 1,660,000 | | 1,528,112 |
| TransDigm, Inc., 6.875%, 12/15/30(a) | 3,510,000 | | 3,540,088 |
| TransDigm, Inc., 6.625%, 3/1/32(a) | 3,915,000 | | 3,911,518 |
| | | | 36,723,704 |
| Industrial Services — 0.6% |
| IEA Energy Services, LLC, 6.625%, 8/15/29(a) | 2,000,000 | | 1,908,397 |
| Insurance — 6.3% |
| AssuredPartners, Inc., 7.50%, 2/15/32(a) | 4,850,000 | | 4,712,725 |
| GTCR AP Finance, Inc., 8.00%, 5/15/27(a) | 2,080,000 | | 2,082,733 |
| HUB International Ltd., 7.375%, 1/31/32(a) | 10,970,000 | | 10,875,806 |
| Jones Deslauriers Insurance Management, Inc., 8.50%, 3/15/30(a) | 2,090,000 | | 2,150,792 |
| | | | 19,822,056 |
| Materials — 12.9% |
| AmeriTex HoldCo Intermediate, LLC, 10.25%, 10/15/28(a) | 1,350,000 | | 1,424,678 |
| Baffinland Iron Mines Corp., 8.75%, 7/15/26(a) | 12,480,000 | | 11,488,013 |
| Century Aluminum Co., 7.50%, 4/1/28(a) | 12,415,000 | | 12,335,395 |
| Intelligent Packaging Ltd. Finco, Inc., 6.00%, 9/15/28(a) | 1,430,000 | | 1,366,592 |
| LABL, Inc., 6.75%, 7/15/26(a) | 1,820,000 | | 1,797,993 |
| LABL, Inc., 9.50%, 11/1/28(a) | 600,000 | | 600,453 |
| Northwest Acquisitions ULC, 7.125%, 11/1/22(a)(c)(e) | 1,650,000 | | 1,997 |
| Oscar AcquisitionCo., LLC, 9.50%, 4/15/30(a) | 6,670,000 | | 6,426,923 |
| SCIH Salt Holdings, Inc., 6.625%, 5/1/29(a) | 5,053,000 | | 4,656,555 |
| Specialty Steel Holdings, Inc., 15.39%, 11/15/26(b)(c) | 195,000 | | 195,000 |
| | | | 40,293,599 |
| Media — 4.2% |
| Arches Buyer, Inc., 6.125%, 12/1/28(a) | 1,520,000 | | 1,237,915 |
| CCO Holdings, LLC, 4.50%, 5/1/32 | 1,840,000 | | 1,420,741 |
The accompanying notes are an integral part of the financial statements.
POLEN OPPORTUNISTIC HIGH YIELD FUND
Portfolio of Investments (Continued)
April 30, 2024
| | Par
Value | | Value |
| CORPORATE BONDS — (Continued) |
| Media — (Continued) |
| CCO Holdings, LLC , 4.50%, 6/1/33(a) | $1,890,000 | | $ 1,422,886 |
| CCO Holdings, LLC , 4.25%, 1/15/34(a) | 2,930,000 | | 2,127,244 |
| Clear Channel Outdoor Holdings, Inc., 9.00%, 9/15/28(a) | 1,840,000 | | 1,894,352 |
| Clear Channel Outdoor Holdings, Inc., 7.875%, 4/1/30(a) | 3,940,000 | | 3,866,699 |
| Scripps Escrow II, Inc., 5.375%, 1/15/31(a) | 1,490,000 | | 880,481 |
| Sterling Entertainment Enterprises, LLC, 10.25%, 1/15/25(b)(c)(d) | 100,000 | | 96,125 |
| | | | 12,946,443 |
| Oil & Gas — 0.9% |
| Forum Energy Technologies, Inc., 9.00%, 8/4/25 | 1,682,042 | | 1,682,883 |
| Teine Energy Ltd., 6.875%, 4/15/29(a) | 1,150,000 | | 1,118,308 |
| | | | 2,801,191 |
| Retail & Wholesale - Discretionary — 3.2% |
| Hertz Corp. (The), 4.625%, 12/1/26(a) | 1,710,000 | | 1,323,182 |
| High Ridge Brands Escrow, 8.875%, 3/15/25(b)(c) | 125,000 | | — |
| SRS Distribution, Inc., 6.00%, 12/1/29(a) | 4,840,000 | | 4,909,125 |
| Wand NewCo 3, Inc., 7.625%, 1/30/32(a) | 3,780,000 | | 3,853,944 |
| | | | 10,086,251 |
| Retail & Wholesale - Staples — 1.2% |
| US Foods, Inc., 4.625%, 6/1/30(a) | 580,000 | | 527,876 |
| US Foods, Inc., 7.25%, 1/15/32(a) | 3,060,000 | | 3,128,859 |
| | | | 3,656,735 |
| Software & Technology Services — 6.1% |
| Boost Newco Borrower, LLC, 7.50%, 1/15/31(a) | 660,000 | | 681,698 |
| Central Parent, Inc., 7.25%, 6/15/29(a) | 2,510,000 | | 2,539,997 |
| Central Parent, LLC, 8.00%, 6/15/29(a) | 1,510,000 | | 1,554,815 |
| Dun & Bradstreet Corp. (The), 5.00%, 12/15/29(a) | 720,000 | | 656,516 |
| Presidio Holdings, Inc., 8.25%, 2/1/28(a) | 5,730,000 | | 5,799,625 |
| | Par
Value | | Value |
| CORPORATE BONDS — (Continued) |
| Software & Technology Services — (Continued) |
| Twilio, Inc., 3.875%, 3/15/31 | $1,580,000 | | $ 1,369,554 |
| UKG, Inc., 6.875%, 2/1/31(a)(c) | 6,340,000 | | 6,368,203 |
| | | | 18,970,408 |
TOTAL CORPORATE BONDS
(Cost $202,404,426) | | | 199,818,107 |
| SENIOR LOANS†(f) — 28.6% |
| Consumer Discretionary Products — 1.0% |
| DexKo Global, Inc., 2023 Incremental Term Loans, 9.559% (SOFR +425 bps), 10/4/28 | 778,050 | | 777,645 |
| RealTruck Goup, Inc., Initial Term Loan, 8.93% (SOFR +361 bps), 1/31/28 | 2,252,583 | | 2,239,924 |
| | | | 3,017,569 |
| Consumer Discretionary Services — 2.7% |
| Kuehg Corp., Term Loan B, 9.823% (SOFR +450 bps), 6/12/30 | 4,202,715 | | 4,221,775 |
| Learning Care Group U.S. No.2, Inc., Initial Term Loans, 10.059% - 10.093% (SOFR +475 bps), 8/11/28 | 4,208,850 | | 4,226,401 |
| | | | 8,448,176 |
| Consumer Staple Products — 1.5% |
| Kronos Acquisition Holdings, Inc., Tranche B-1 Term Loan, 9.314% (SOFR +401 bps), 12/22/26 | 4,515,000 | | 4,528,477 |
| Financial Services — 0.8% |
| Nexus Buyer, LLC, Amendment No. 5 Term Loans, 9.816% (SOFR +450 bps), 12/11/28 | 1,491,000 | | 1,486,027 |
| Nexus Buyer, LLC, Second Lien Term Loan, 11.666% (SOFR +635 bps), 11/5/29 | 920,000 | | 917,990 |
| | | | 2,404,017 |
| Health Care — 3.9% |
| Aveanna Healthcare, LLC, First Lien 2021 Extended Term Loan, 7/17/28(g) | 323,000 | | 311,645 |
| Aveanna Healthcare, LLC, Initial Term Loan, 12.493% (SOFR +715 bps), 12/10/29 | 4,000,000 | | 3,485,000 |
The accompanying notes are an integral part of the financial statements.
POLEN OPPORTUNISTIC HIGH YIELD FUND
Portfolio of Investments (Continued)
April 30, 2024
| | Par
Value | | Value |
| SENIOR LOANS — (Continued) |
| Health Care — (Continued) |
| EyeCare Partners, LLC, Term Loan B, 10.04% (SOFR +471 bps), 11/30/28 | $2,940,868 | | $ 1,735,112 |
| EyeCare Partners, LLC, Term Loan C, 12.18% (SOFR +675 bps), 11/30/28 | 257,250 | | 48,878 |
| Medical Solutions Holdings, Inc., Second Lien Term Loan, 12.416% (SOFR +710 bps), 11/1/29(c) | 1,770,000 | | 1,432,593 |
| Packaging Coordinators Midco, Inc., First Lien Term B Loan, 9.071% (SOFR +376 bps), 11/30/27 | 4,363,766 | | 4,383,883 |
| SM Wellness Holdings, Inc., Second Lien Initial Term Loan, 13.574% (SOFR +800 bps), 4/16/29(c) | 1,030,000 | | 911,550 |
| | | | 12,308,661 |
| Industrial Products — 2.3% |
| Engineered Machinery Holdings, Inc., Incremental USD First Lien Term Loan, 9.321% (SOFR +401 bps), 5/19/28 | 1,112,890 | | 1,114,431 |
| Engineered Machinery Holdings, Inc., Second Lien Amendment No. 3 Incremental Term Loan, 11.571% (SOFR +626 bps), 5/21/29 | 2,645,812 | | 2,643,338 |
| Engineered Machinery Holdings, Inc., Second Lien Incremental Amendment No. 2 Term Loan, 12.071% (SOFR +676 bps), 5/21/29 | 3,456,499 | | 3,452,196 |
| | | | 7,209,965 |
| Industrial Services — 2.8% |
| Ankura Consulting Group, LLC, Second Lien Closing Date Term Loan, 13.586% (SOFR +826 bps), 3/19/29 | 650,000 | | 612,625 |
| CHG Healthcare Services, Inc., 2023 Incremental Term Loans, 9.066% - 9.093% (SOFR +375 bps), 9/29/28 | 1,665,825 | | 1,676,237 |
| | Par
Value | | Value |
| SENIOR LOANS — (Continued) |
| Industrial Services — (Continued) |
| Infinite Bidco, LLC, Second Lien Initial Term Loan, 12.591% (SOFR +726 bps), 3/2/29 | $4,245,740 | | $ 3,630,108 |
| LaserShip, Inc., Second Lien Initial Loan, 13.071% (SOFR +776 bps), 5/7/29 | 3,280,000 | | 2,747,000 |
| | | | 8,665,970 |
| Insurance — 0.6% |
| Asurion, LLC, New B-4 Term Loan, 10.68% (SOFR +536 bps), 1/20/29 | 2,040,000 | | 1,844,925 |
| Materials — 3.3% |
| Arctic Canadian Diamond Company Ltd., Second Lien Term Loan, 10.00%, 12/31/27(b)(c)(d) | 370,501 | | 370,500 |
| Aruba Investments Holdings, LLC, First Lien Initial Dollar Term Loan, 9.416% (SOFR +410 bps), 11/24/27 | 1,678,897 | | 1,639,023 |
| Aruba Investments Holdings, LLC, Second Lien Initial Term Loan, 13.166% (SOFR +785 bps), 11/24/28 | 3,450,000 | | 3,315,450 |
| CP Iris Holdco I, Inc., Initial Term Loan, 12.416% (SOFR +709 bps), 10/1/29 | 1,720,000 | | 1,642,600 |
| LABL, Inc., Initial Dollar Term Loan, 10.416% (SOFR +510 bps), 10/29/28(g) | 2,670,000 | | 2,618,776 |
| Trident TPI Holdings, Inc., Tranche B-6 Term Loan, 9.302% (SOFR +400 bps), 9/15/28 | 795,990 | | 798,366 |
| | | | 10,384,715 |
| Media — 5.9% |
| Arches Buyer, Inc., Refinancing Term Loan, 8.666% (SOFR +335 bps), 12/6/27(g) | 2,912,474 | | 2,818,838 |
| Auction.com, LLC, Term Loan, 11.316% (SOFR +600 bps), 5/26/28 | 6,556,116 | | 6,336,486 |
The accompanying notes are an integral part of the financial statements.
POLEN OPPORTUNISTIC HIGH YIELD FUND
Portfolio of Investments (Continued)
April 30, 2024
| | Par
Value | | Value |
| SENIOR LOANS — (Continued) |
| Media — (Continued) |
| Clear Channel Outdoor Holdings, Inc., 2024 Refinancing Term Loan, 9.43% (SOFR +411 bps), 8/21/28 | $1,410,000 | | $ 1,412,940 |
| MH Sub I, LLC, Second Lien Term Loan, 11.566% (SOFR +625 bps), 2/23/29 | 8,020,000 | | 7,956,843 |
| | | | 18,525,107 |
| Retail & Wholesale - Discretionary — 0.6% |
| TA TT Buyer, LLC, Initial Term Loan, 10.302% (SOFR +500 bps), 4/2/29 | 666,604 | | 670,040 |
| Wand NewCo 3, Inc., Term Loan, 9.066% (SOFR +375 bps), 1/30/31 | 1,310,000 | | 1,320,081 |
| | | | 1,990,121 |
| Retail & Wholesale - Staples — 0.3% |
| Quirch Foods Holdings, LLC, Term Loan, 10.324% (SOFR +501 bps), 10/27/27 | 920,486 | | 924,803 |
| Software & Technology Services — 1.7% |
| AthenaHealth Group, Inc., Initial Term Loan, 8.566% (SOFR +325 bps), 2/15/29 | 960,798 | | 960,500 |
| Cloudera, Inc., Second Lien Term Loan, 11.416% (SOFR +610 bps), 10/8/29 | 860,000 | | 828,825 |
| Mitchell International, Inc., Second Lien Initial Term Loan, 11.93% (SOFR +661 bps), 10/15/29 | 1,650,000 | | 1,656,361 |
| Skopima Consilio, Second Lien Initial Term Loan, 12.93% (SOFR +761 bps), 4/30/29 | 2,050,000 | | 1,998,750 |
| | | | 5,444,436 |
| Technology Hardware & Semiconductors — 1.2% |
| Altar Bidco, Inc., Second Lien Initial Term Loan, 10.912% (SOFR +560 bps), 2/1/30 | 3,794,939 | | 3,766,003 |
| Telecommunications — 0.0% |
| Xplornet Communications, Inc., Second Lien Initial Term Loan, 12.564% (SOFR +726 bps), 10/1/29(c) | 770,000 | | 76,230 |
TOTAL SENIOR LOANS
(Cost $91,733,128) | | 89,539,175 |
| | Number
of Shares | | Value |
| COMMON STOCKS† — 0.4% |
| Industrial Products — 0.2% |
| Utex Industries, Inc.(b)(c)(d)* | 7,506 | | $ 503,277 |
| Materials — 0.2% |
| Arctic Canadian Diamond Co. Ltd.(b)(c)(d)* | 541 | | 135,791 |
| Burgundy Diamond Mines Ltd.(c)(d)* | 983,076 | | 120,999 |
| Real Alloy Holding, Inc.(b)(c)(d) | 3 | | 225,003 |
| Specialty Steel Holdings, Inc.(b)(c)* | 1 | | 169,691 |
| | | | 651,484 |
| Retail & Wholesale - Discretionary — 0.0% |
| ATD New Holdings, Inc.(b)(c)* | 2,940 | | 111,309 |
| Software & Technology Services — 0.0% |
| Skillsoft Corp.* | 1,638 | | 11,777 |
TOTAL COMMON STOCKS
(Cost $1,139,177) | | | 1,277,847 |
| | Par
Value | |
| WARRANTS † — 0.0% |
| Industrial Products — 0.0% |
| Utex Industries Holdings, LLC,Strike Price: $114.76, 12/3/25(b)(c)(d)* | 1,150 | — |
TOTAL WARRANTS
(Cost $—) | | — |
|
| |
TOTAL INVESTMENTS - 92.9%
(Cost $295,276,731) | | 290,635,129 |
| OTHER ASSETS IN EXCESS OF LIABILITIES - 7.1% | | 22,244,456 |
| NET ASSETS - 100.0% | | $ 312,879,585 |
| (a) | Securities exempt from registration under Rule 144A of the Securities Act of 1933, as amended. These securities were purchased in accordance with the guidelines approved by the Fund’s Board of Trustees and may be resold, in transactions exempt from registration, to qualified institutional buyers. At April 30, 2024, these securities amounted to $185,176,146 or 59.18% of net assets. These securities have been determined by the Adviser to be liquid securities. |
| (b) | Security is fair valued by the valuation committee in accordance with the policies established by the Board of Trustees. |
| (c) | Security is deemed illiquid at April 30, 2024. |
The accompanying notes are an integral part of the financial statements.
POLEN OPPORTUNISTIC HIGH YIELD FUND
Portfolio of Investments (Concluded)
April 30, 2024
| (d) | Security deemed to be restricted as of April 30, 2024. As of April 30, 2024, the fair value of restricted securities in the aggregate was $1,557,115, representing 0.50% of the Fund’s net assets. Additional information on restricted securities can be found in Note 1. |
| (e) | Security is currently in default. |
| (f) | Floating rate note. Coupon rate, reference index and spread shown at April 30, 2024. |
| (g) | All or a portion of this Senior Loan will settle after April 30, 2024, at which time the interest rate will be determined. Rates shown, if any, are for the settled portion. |
| † | See Note 1. The industry designations set forth in the schedule above are those of the Bloomberg Industry Classification System (“BICS”). |
| * | Non-income producing. |
| LLC | Limited Liability Company |
| LP | Limited Partnership |
| SOFR | Secured Overnight Funding Rate |
| USD | United States Dollar |
The accompanying notes are an integral part of the financial statements.
POLEN FUNDS
Statements of Assets and Liabilities
April 30, 2024
| | Polen Growth
Fund | | Polen Global
Growth Fund | | Polen
International
Growth Fund |
| Assets | | | | | |
| Investments, at value* | $7,497,811,324 | | $464,991,068 | | $235,761,612 |
| Cash and cash equivalents | 6 | | 1 | | — |
| Foreign currency, at value (Cost $—, $183,173 and $340, respectively) | — | | 182,472 | | 340 |
| Receivables: | | | | | |
| Investments sold | 75,694,886 | | — | | 486,386 |
| Capital shares sold | 7,772,184 | | 656,421 | | 470,057 |
| Dividends and interest | 4,677,978 | | 986,798 | | 850,264 |
| Prepaid expenses and other assets | 14,080 | | 6,690 | | 10,331 |
| Total Assets | 7,585,970,458 | | 466,823,450 | | 237,578,990 |
| Liabilities | | | | | |
| Payables: | | | | | |
| Capital shares redeemed | 10,131,800 | | 240,320 | | 492,168 |
| Investment adviser | 5,499,881 | | 332,685 | | 169,098 |
| Investments purchased | 5,437,294 | | 3,669,684 | | — |
| Transfer agent fees | 1,120,158 | | 82,234 | | 48,001 |
| Audit fees | 170,646 | | 29,155 | | 27,432 |
| Administration and accounting fees | 138,049 | | 12,615 | | 7,513 |
| Shareholder reporting fees | 79,253 | | 16,501 | | 12,336 |
| Custodian fees | 75,059 | | 11,035 | | 12,269 |
| Distribution fees (Investor Class Shares) | 57,405 | | 4,630 | | 583 |
| Accrued expenses | 10,040 | | 2,593 | | 8,234 |
| Total Liabilities | 22,719,585 | | 4,401,452 | | 777,634 |
| Contingencies and Commitments (Notes 2 and 7) | N/A | | N/A | | N/A |
| Net Assets | $7,563,250,873 | | $462,421,998 | | $236,801,356 |
| Net Assets Consisted of: | | | | | |
| Capital stock, $0.01 par value | $ 1,745,860 | | $ 186,367 | | $ 149,942 |
| Paid-in capital | 4,788,332,513 | | 349,965,247 | | 227,155,380 |
| Total distributable earnings | 2,773,172,500 | | 112,270,384 | | 9,496,034 |
| Net Assets | $7,563,250,873 | | $462,421,998 | | $236,801,356 |
| Institutional Class Shares: | | | | | |
| Net assets | $7,293,884,077 | | $440,863,146 | | $234,105,623 |
| Shares outstanding | 168,142,839 | | 17,748,301 | | 14,821,171 |
| Net asset value, offering and redemption price per share | $ 43.38 | | $ 24.84 | | $ 15.80 |
| Investor Class Shares: | | | | | |
| Net assets | $ 269,366,796 | | $ 21,558,852 | | $ 2,695,733 |
| Shares outstanding | 6,443,209 | | 888,418 | | 173,024 |
| Net asset value, offering and redemption price per share | $ 41.81 | | $ 24.27 | | $ 15.58 |
| * Investments, at cost | $4,254,992,296 | | $325,757,963 | | $190,826,986 |
The accompanying notes are an integral part of the financial statements.
POLEN FUNDS
Statements of Assets and Liabilities (Continued)
April 30, 2024
| | Polen U.S. Small
Company Growth Fund | | Polen Emerging
Markets Growth Fund | | Polen
U.S. SMID
Company Growth
Fund |
| Assets | | | | | |
| Investments, at value* | $ 63,538,000 | | $19,665,183 | | $17,681,190 |
| Foreign currency, at value (Cost $—, $12 and $—, respectively) | — | | 12 | | — |
| Receivables: | | | | | |
| Investments sold | 2,164,354 | | — | | — |
| Capital shares sold | 93,103 | | 7,946 | | 5,128 |
| Dividends and interest | — | | 8,049 | | 1,004 |
| Investment adviser | — | | — | | 15,965 |
| Prepaid expenses and other assets | 2,854 | | 155 | | 4,986 |
| Total Assets | 65,798,311 | | 19,681,345 | | 17,708,273 |
| Liabilities | | | | | |
| Payables: | | | | | |
| Due to custodian | 1,235,623 | | — | | — |
| Capital shares redeemed | 343,311 | | — | | — |
| Investment adviser | 49,071 | | 15,352 | | 17,170 |
| Transfer agent fees | 25,731 | | 4,965 | | 4,340 |
| Audit fees | 21,334 | | 20,379 | | 20,339 |
| Shareholder reporting fees | 7,950 | | 6,036 | | 6,140 |
| Administration and accounting fees | 3,372 | | 1,893 | | 2,138 |
| Custodian fees | 1,545 | | 5,705 | | 1,260 |
| Distribution fees (Investor Class Shares) | 894 | | — | | — |
| Investments purchased | — | | — | | 160,259 |
| Deferred foreign capital gains tax | — | | 38,098 | | — |
| Accrued expenses | 3,360 | | 10,460 | | 2,469 |
| Total Liabilities | 1,692,191 | | 102,888 | | 214,115 |
| Contingencies and Commitments (Notes 2 and 7) | — | | — | | — |
| Net Assets | $ 64,106,120 | | $19,578,457 | | $17,494,158 |
| Net Assets Consisted of: | | | | | |
| Capital stock, $0.01 par value | $ 48,084 | | $ 24,528 | | $ 24,007 |
| Paid-in capital | 110,234,883 | | 26,553,279 | | 25,373,449 |
| Total distributable loss | (46,176,847) | | (6,999,350) | | (7,903,298) |
| Net Assets | $ 64,106,120 | | $19,578,457 | | $17,494,158 |
| Institutional Class Shares: | | | | | |
| Net assets | $ 55,154,309 | | $19,578,457 | | $17,494,158 |
| Shares outstanding | 4,134,028 | | 2,452,847 | | 2,400,666 |
| Net asset value, offering and redemption price per share | $ 13.34 | | $ 7.98 | | $ 7.29 |
| Investor Class Shares: | | | | | |
| Net assets | $ 4,417,277 | | N/A | | N/A |
| Shares outstanding | 335,466 | | N/A | | N/A |
| Net asset value, offering and redemption price per share | $ 13.17 | | N/A | | N/A |
| Class Y Shares: | | | | | |
| Net assets | $ 4,534,534 | | N/A | | N/A |
| Shares outstanding | 338,896 | | N/A | | N/A |
| Net asset value, offering and redemption price per share | $ 13.38 | | N/A | | N/A |
| * Investments, at cost | $ 57,463,241 | | $21,364,774 | | $16,941,549 |
The accompanying notes are an integral part of the financial statements.
POLEN FUNDS
Statements of Assets and Liabilities (Concluded)
April 30, 2024
| | Polen Global
SMID Company
Growth Fund | | Polen Bank
Loan Fund | | Polen U.S. High
Yield Fund | | Polen
Opportunistic
High Yield
Fund |
| Assets | | | | | | | |
| Investments, at value* | $ 10,497,188 | | $ 8,885,118 | | $2,864,925 | | $290,635,129 |
| Cash and cash equivalents | — | | 649,073 | | 115,419 | | 26,769,197 |
| Receivables: | | | | | | | |
| Investments sold | — | | 1,176,144 | | 7,868 | | 365,396 |
| Capital shares sold | 1,946 | | — | | — | | — |
| Dividends and interest | 16,855 | | 45,502 | | 38,585 | | 3,888,356 |
| Investment adviser | 2,248 | | 2,850 | | 10,146 | | — |
| Prepaid expenses and other assets | 1,422 | | 1,048 | | 793 | | 3,929 |
| Total Assets | 10,519,659 | | 10,759,735 | | 3,037,736 | | 321,662,007 |
| Liabilities | | | | | | | |
| Payables: | | | | | | | |
| Audit fees | 20,217 | | 20,162 | | 19,690 | | 25,762 |
| Transfer agent fees | 7,702 | | 3,508 | | 3,468 | | 13,290 |
| Shareholder reporting fees | 6,060 | | 8,341 | | 8,341 | | 7,860 |
| Administration and accounting fees | 571 | | 358 | | 255 | | 11,747 |
| Due to custodian | 547 | | — | | — | | — |
| Capital shares redeemed | 269 | | — | | — | | 248,800 |
| Distribution fees (Investor Class Shares) | 55 | | — | | — | | 356 |
| Investments purchased | — | | 1,527,506 | | 11,750 | | 7,959,485 |
| Investment adviser | — | | — | | — | | 196,712 |
| Distributions to shareholders | — | | 17,015 | | — | | 295,397 |
| Shareholder servicing fees | — | | — | | — | | 859 |
| Accrued expenses | 15,965 | | 4,534 | | 2,914 | | 22,154 |
| Total Liabilities | 51,386 | | 1,581,424 | | 46,418 | | 8,782,422 |
| Contingencies and Commitments (Notes 2 and 7) | — | | — | | — | | — |
| Net Assets | $ 10,468,273 | | $ 9,178,311 | | $2,991,318 | | $312,879,585 |
| Net Assets Consisted of: | | | | | | | |
| Capital stock, $0.01 par value | $ 17,380 | | $ 8,954 | | $ 2,960 | | $ 434,288 |
| Paid-in capital | 22,714,789 | | 8,961,103 | | 2,963,713 | | 354,604,771 |
| Total distributable earnings/(loss) | (12,263,896) | | 208,254 | | 24,645 | | (42,159,474) |
| Net Assets | $ 10,468,273 | | $ 9,178,311 | | $2,991,318 | | $312,879,585 |
| Institutional Class Shares: | | | | | | | |
| Net assets | $ 10,209,889 | | $ 9,178,311 | | $2,991,318 | | $ 3,608,684 |
| Shares outstanding | 1,695,085 | | 895,407 | | 295,968 | | 498,390 |
| Net asset value, offering and redemption price per share | $ 6.02 | | $ 10.25 | | $ 10.11 | | $ 7.24 |
| Investor Class Shares: | | | | | | | |
| Net assets | $ 258,384 | | N/A | | N/A | | $ 1,725,013 |
| Shares outstanding | 42,952 | | N/A | | N/A | | 239,303 |
| Net asset value, offering and redemption price per share | $ 6.02 | | N/A | | N/A | | $ 7.21 |
| Class Y Shares: | | | | | | | |
| Net assets | N/A | | N/A | | N/A | | $307,545,888 |
| Shares outstanding | N/A | | N/A | | N/A | | 42,691,089 |
| Net asset value, offering and redemption price per share | N/A | | N/A | | N/A | | $ 7.20 |
| * Investments, at cost | $ 10,216,163 | | $ 8,722,260 | | $2,800,580 | | $295,276,731 |
The accompanying notes are an integral part of the financial statements.
POLEN FUNDS
Statements of Operations
For the Year Ended April 30, 2024
| | Polen Growth
Fund | | Polen Global
Growth Fund | | Polen
International
Growth Fund |
| Investment income | | | | | |
| Dividends | $ 34,783,877 | | $ 3,974,239 | | $ 3,615,961 |
| Less: foreign taxes withheld | (205,247) | | (176,736) | | (193,994) |
| Total investment income | 34,578,630 | | 3,797,503 | | 3,421,967 |
| Expenses | | | | | |
| Advisory fees(Note 2) | 64,665,355 | | 3,950,491 | | 2,016,652 |
| Transfer agent fees(Note 2) | 5,313,660 | | 347,410 | | 232,157 |
| Administration and accounting fees(Note 2) | 758,509 | | 51,749 | | 29,243 |
| Trustees’ and officers’ fees(Note 2) | 685,867 | | 43,259 | | 22,510 |
| Distribution fees (Investor Class)(Note 2) | 653,775 | | 55,273 | | 6,787 |
| Legal fees | 266,878 | | 20,467 | | 11,573 |
| Shareholder reporting fees | 226,669 | | — | | 4,597 |
| Custodian fees(Note 2) | 220,661 | | 33,697 | | 39,714 |
| Audit fees | 181,041 | | 31,653 | | 30,226 |
| Registration and filing fees | 80,747 | | 46,518 | | 40,936 |
| Other expenses | 386,770 | | 32,828 | | 28,952 |
| Total expenses | 73,439,932 | | 4,613,345 | | 2,463,347 |
| Net investment income/(loss) | (38,861,302) | | (815,842) | | 958,620 |
| Net realized and unrealized gain/(loss) from investments: | | | | | |
| Net realized gain from investments(a) | 140,465,868 | | 22,589,693 | | 882,159 |
| Net realized gain/(loss) from foreign currency transactions | — | | (5,228) | | 13,314 |
| Net change in unrealized appreciation on investments(b) | 1,553,843,103 | | 49,608,759 | | 13,929,348 |
| Net change in unrealized depreciation on foreign currency translations | — | | (24,611) | | (10,693) |
| Net realized and unrealized gain on investments | 1,694,308,971 | | 72,168,613 | | 14,814,128 |
| Net increase in net assets resulting from operations | $1,655,447,669 | | $71,352,771 | | $15,772,748 |
| (a) | Net realized gain/(loss) on investments for the Polen International Growth Fund was net of foreign capital gains tax withheld of $3,992. |
| (b) | Net change in unrealized appreciation/(depreciation) on investments for the Polen International Growth Fund was net of a decrease in deferred foreign capital gains tax of $114,742. |
The accompanying notes are an integral part of the financial statements.
POLEN FUNDS
Statements of Operations (Continued)
For the Year Ended April 30, 2024
| | Polen U.S. Small
Company Growth Fund | | Polen Emerging
Markets Growth Fund | | Polen
U.S. SMID
Company Growth
Fund |
| Investment income | | | | | |
| Dividends | $ 227,978 | | $ 397,334 | | $ 50,973 |
| Less: foreign taxes withheld | (3,620) | | (35,186) | | — |
| Total investment income | 224,358 | | 362,148 | | 50,973 |
| Expenses | | | | | |
| Advisory fees(Note 2) | 754,067 | | 191,542 | | 173,750 |
| Transfer agent fees(Note 2) | 110,430 | | 38,401 | | 33,127 |
| Registration and filing fees | 62,276 | | 25,048 | | 23,106 |
| Audit fees | 21,534 | | 24,423 | | 20,619 |
| Shareholder reporting fees | 15,088 | | 20,012 | | 21,680 |
| Distribution fees (Investor Class)(Note 2) | 12,106 | | — | | — |
| Administration and accounting fees(Note 2) | 11,074 | | 7,683 | | 4,481 |
| Trustees’ and officers’ fees(Note 2) | 8,110 | | 2,679 | | 2,610 |
| Custodian fees(Note 2) | 3,522 | | 12,319 | | 3,825 |
| Legal fees | 1,495 | | 4,783 | | 4,525 |
| Other expenses | 11,960 | | 14,429 | | 8,181 |
| Total expenses before waivers and/or reimbursements | 1,011,662 | | 341,319 | | 295,904 |
| Less: waivers and/or reimbursements(Note 2) | (174,781) | | (101,892) | | (113,466) |
| Net expenses after waivers and/or reimbursements | 836,881 | | 239,427 | | 182,438 |
| Net investment income/(loss) | (612,523) | | 122,721 | | (131,465) |
| Net realized and unrealized gain/(loss) from investments: | | | | | |
| Net realized loss from investments(a) | (1,581,543) | | (1,658,002) | | (1,483,068) |
| Net realized loss from foreign currency transactions | — | | (3,142) | | — |
| Net change in unrealized appreciation on investments(b) | 5,916,363 | | 1,845,851 | | 2,694,722 |
| Net change in unrealized depreciation on foreign currency translations | — | | (219) | | — |
| Net realized and unrealized gain on investments | 4,334,820 | | 184,488 | | 1,211,654 |
| Net increase in net assets resulting from operations | $ 3,722,297 | | $ 307,209 | | $ 1,080,189 |
| (a) | Net realized gain/(loss) on investments for the Polen Emerging Markets Growth Fund was net of foreign capital gains tax withheld of $14,403. |
| (b) | Net change in unrealized appreciation/(depreciation) on investments for the Polen Emerging Markets Growth Fund was net of an increase in deferred foreign capital gains tax of $6,311. |
The accompanying notes are an integral part of the financial statements.
POLEN FUNDS
Statements of Operations (Continued)
For the Year Ended April 30, 2024
| | Polen Global
SMID Company
Growth Fund | | Polen Bank
Loan Fund | | Polen U.S. High
Yield Fund |
| Investment income | | | | | |
| Dividends | $ 79,241 | | $ — | | $ — |
| Interest | — | | 890,881 | | 222,002 |
| Less: foreign taxes withheld | (9,698) | | — | | — |
| Total investment income | 69,543 | | 890,881 | | 222,002 |
| Expenses | | | | | |
| Advisory fees(Note 2) | 110,702 | | 53,868 | | 14,179 |
| Transfer agent fees(Note 2) | 48,121 | | 21,203 | | 21,365 |
| Registration and filing fees | 41,210 | | 23,332 | | 23,332 |
| Shareholder reporting fees | 22,529 | | 24,894 | | 24,648 |
| Audit fees | 22,202 | | 20,174 | | 19,694 |
| Legal fees | 4,475 | | 3,479 | | 7,920 |
| Administration and accounting fees(Note 2) | 3,274 | | 7,622 | | 9,134 |
| Custodian fees(Note 2) | 2,954 | | 6,055 | | 1,540 |
| Trustees’ and officers’ fees(Note 2) | 2,060 | | 6,860 | | 2,370 |
| Distribution fees (Investor Class)(Note 2) | 486 | | — | | — |
| Other expenses | 7,375 | | 7,489 | | 5,131 |
| Total expenses before waivers and/or reimbursements | 265,388 | | 174,976 | | 129,313 |
| Less: waivers and/or reimbursements(Note 2) | (126,524) | | (112,820) | | (112,555) |
| Net expenses after waivers and/or reimbursements | 138,864 | | 62,156 | | 16,758 |
| Net investment income/(loss) | (69,321) | | 828,725 | | 205,244 |
| Net realized and unrealized gain/(loss) from investments: | | | | | |
| Net realized gain/(loss) from investments | (1,375,750) | | 40,885 | | (35,924) |
| Net realized loss from foreign currency transactions | (12,936) | | — | | — |
| Net change in unrealized appreciation on investments(a) | 751,059 | | 144,792 | | 49,117 |
| Net change in unrealized appreciation on foreign currency translations | 1,059 | | — | | — |
| Net realized and unrealized gain/(loss) on investments | (636,568) | | 185,677 | | 13,193 |
| Net increase/(decrease) in net assets resulting from operations | $ (705,889) | | $1,014,402 | | $ 218,437 |
| (a) | Net change in unrealized appreciation/(depreciation) does not include net unrealized appreciation of $106,420 for the Polen Global SMID Company Growth Fund in connection with the Fund's merger with Polen International Small Company Growth Fund. See Note 6 in the Notes to Financial Statements. |
The accompanying notes are an integral part of the financial statements.
POLEN FUNDS
Statements of Operations (Concluded)
For the Year Ended April 30, 2024
| | Polen Opportunistic
High Yield Fund |
| | For the Period Ended
April 30, 2024* | | For the Year Ended
September 30, 2023 |
| Investment income | | | |
| Interest | $ 15,567,600 | | $ 26,667,604 |
| Dividends | 28,801 | | 94,913 |
| Total investment income | 15,596,401 | | 26,762,517 |
| Expenses | | | |
| Advisory fees(Note 2) | 1,241,461 | | 1,948,772 |
| Registration and filing fees | 62,148 | | 89,033 |
| Transfer agent fees(Note 2) | 37,694 | | 67,663 |
| Audit fees | 36,555 | | 40,598 |
| Trustees’ and officers’ fees(Note 2) | 36,009 | | 59,527 |
| Legal fees | 18,290 | | 28,597 |
| Administration and accounting fees(Note 2) | 18,103 | | 222,221 |
| Shareholder reporting fees | 9,910 | | 23,295 |
| Distribution fees (Investor Class)(Note 2) | 2,426 | | 3,524 |
| Custodian fees(Note 2) | 386 | | 35,474 |
| Shareholder servicing fees (Investor Class) | — | | 1,410 |
| Other expenses | 11,490 | | 19,543 |
| Total expenses before waivers and reimbursements | 1,474,472 | | 2,539,657 |
| Less: waivers and reimbursements(Note 2) | (68,624) | | (334,289) |
| Net expenses after waivers and reimbursements | 1,405,848 | | 2,205,368 |
| Net investment income | 14,190,553 | | 24,557,149 |
| Net realized and unrealized gain/(loss) from investments: | | | |
| Net realized loss from investments | (10,537,692) | | (17,865,163) |
| Net change in unrealized appreciation on investments | 14,625,894 | | 19,392,245 |
| Net realized and unrealized gain on investments | 4,088,202 | | 1,527,082 |
| Net increase in net assets resulting from operations | $ 18,278,755 | | $ 26,084,231 |
| * | The Fund changed its fiscal year end from September 30 to April 30. See Note 1 in the Notes to Financial Statements. |
The accompanying notes are an integral part of the financial statements.
POLEN FUNDS
Statements of Changes in Net Assets
| | Polen Growth Fund |
| | For the Year
Ended
April 30, 2024 | | For the Year
Ended
April 30, 2023 |
| Net increase/(decrease) in net assets from operations: | | | |
| Net investment loss | $ (38,861,302) | | $ (46,456,801) |
| Net realized gains/(losses) from investments | 140,465,868 | | (535,127,076) |
| Net change in unrealized appreciation/(depreciation) on investments | 1,553,843,103 | | (159,568,465) |
| Net increase/(decrease) in net assets resulting from operations | 1,655,447,669 | | (741,152,342) |
| Less dividends and distributions to shareholders from: | | | |
| Total distributable earnings: | | | |
| Institutional Class | — | | (623,075,966) |
| Investor Class | — | | (23,137,465) |
| Net decrease in net assets from dividends and distributions to shareholders | — | | (646,213,431) |
| Decrease in net assets derived from capital share transactions (Note 4) | (1,123,990,236) | | (1,379,028,368) |
| Total increase/(decrease) in net assets | 531,457,433 | | (2,766,394,141) |
| Net assets | | | |
| Beginning of year | 7,031,793,440 | | 9,798,187,581 |
| End of year | $ 7,563,250,873 | | $ 7,031,793,440 |
The accompanying notes are an integral part of the financial statements.
POLEN FUNDS
Statements of Changes in Net Assets (Continued)
| | Polen Global Growth Fund |
| | For the Year
Ended
April 30, 2024 | | For the Year
Ended
April 30, 2023 |
| Net increase/(decrease) in net assets from operations: | | | |
| Net investment loss | $ (815,842) | | $ (552,408) |
| Net realized gains/(losses) from investments and foreign currency transactions | 22,584,465 | | (44,342,057) |
| Net change in unrealized appreciation on investments and foreign currency translations | 49,584,148 | | 44,820,997 |
| Net increase/(decrease) in net assets resulting from operations | 71,352,771 | | (73,468) |
| Less dividends and distributions to shareholders from: | | | |
| Total distributable earnings: | | | |
| Institutional Class | — | | (4,702,557) |
| Investor Class | — | | (236,471) |
| Net decrease in net assets from dividends and distributions to shareholders | — | | (4,939,028) |
| Decrease in net assets derived from capital share transactions (Note 4) | (52,651,729) | | (110,304,295) |
| Total increase/(decrease) in net assets | 18,701,042 | | (115,316,791) |
| Net assets | | | |
| Beginning of year | 443,720,956 | | 559,037,747 |
| End of year | $ 462,421,998 | | $ 443,720,956 |
The accompanying notes are an integral part of the financial statements.
POLEN FUNDS
Statements of Changes in Net Assets (Continued)
| | Polen International Growth Fund |
| | For the Year
Ended
April 30, 2024 | | For the Year
Ended
April 30, 2023 |
| Net increase/(decrease) in net assets from operations: | | | |
| Net investment income | $ 958,620 | | $ 610,709 |
| Net realized gains/(losses) from investments and foreign currency transactions | 895,473 | | (11,359,632) |
| Net change in unrealized appreciation on investments and foreign currency translations | 13,918,655 | | 14,181,479 |
| Net increase in net assets resulting from operations | 15,772,748 | | 3,432,556 |
| Less dividends and distributions to shareholders from: | | | |
| Total distributable earnings: | | | |
| Institutional Class | (779,523) | | — |
| Investor Class | (1,046) | | — |
| Net decrease in net assets from dividends and distributions to shareholders | (780,569) | | — |
| Decrease in net assets derived from capital share transactions (Note 4) | (8,172,137) | | (56,227,871) |
| Total increase/(decrease) in net assets | 6,820,042 | | (52,795,315) |
| Net assets | | | |
| Beginning of year | 229,981,314 | | 282,776,629 |
| End of year | $236,801,356 | | $ 229,981,314 |
The accompanying notes are an integral part of the financial statements.
POLEN FUNDS
Statements of Changes in Net Assets (Continued)
| | Polen U.S. Small Company Growth Fund |
| | For the Year
Ended
April 30, 2024 | | For the Year
Ended
April 30, 2023 |
| Net increase/(decrease) in net assets from operations: | | | |
| Net investment loss | $ (612,523) | | $ (840,605) |
| Net realized losses from investments | (1,581,543) | | (31,220,285) |
| Net change in unrealized appreciation on investments | 5,916,363 | | 22,933,636 |
| Net increase/(decrease) in net assets resulting from operations | 3,722,297 | | (9,127,254) |
| Decrease in net assets derived from capital share transactions (Note 4) | (20,920,541) | | (45,114,778) |
| Total decrease in net assets | (17,198,244) | | (54,242,032) |
| Net assets | | | |
| Beginning of year | 81,304,364 | | 135,546,396 |
| End of year | $ 64,106,120 | | $ 81,304,364 |
The accompanying notes are an integral part of the financial statements.
POLEN FUNDS
Statements of Changes in Net Assets (Continued)
| | Polen Emerging Markets Growth Fund |
| | For the Year
Ended
April 30, 2024 | | For the Year
Ended
April 30, 2023 |
| Net increase/(decrease) in net assets from operations: | | | |
| Net investment income | $ 122,721 | | $ 50,435 |
| Net realized losses from investments and foreign currency transactions | (1,661,144) | | (1,727,370) |
| Net change in unrealized appreciation on investments and foreign currency translations | 1,845,632 | | 2,129,632 |
| Net increase in net assets resulting from operations | 307,209 | | 452,697 |
| Less dividends and distributions to shareholders from: | | | |
| Total distributable earnings: | | | |
| Institutional Class | (6,719) | | (15,994) |
| Net decrease in net assets from dividends and distributions to shareholders | (6,719) | | (15,994) |
| Increase/(decrease) in net assets derived from capital share transactions (Note 4) | (25,014) | | 200,700 |
| Total increase in net assets | 275,476 | | 637,403 |
| Net assets | | | |
| Beginning of year | 19,302,981 | | 18,665,578 |
| End of year | $19,578,457 | | $19,302,981 |
The accompanying notes are an integral part of the financial statements.
POLEN FUNDS
Statements of Changes in Net Assets (Continued)
| | Polen U.S. SMID Company Growth Fund |
| | For the Year
Ended
April 30, 2024 | | For the Year
Ended
April 30, 2023 |
| Net increase/(decrease) in net assets from operations: | | | |
| Net investment loss | $ (131,465) | | $ (170,191) |
| Net realized losses from investments | (1,483,068) | | (6,978,814) |
| Net change in unrealized appreciation on investments | 2,694,722 | | 6,427,108 |
| Net increase/(decrease) in net assets resulting from operations | 1,080,189 | | (721,897) |
| Increase/(decrease) in net assets derived from capital share transactions (Note 4) | (3,609,338) | | 455,537 |
| Total decrease in net assets | (2,529,149) | | (266,360) |
| Net assets | | | |
| Beginning of year | 20,023,307 | | 20,289,667 |
| End of year | $ 17,494,158 | | $20,023,307 |
The accompanying notes are an integral part of the financial statements.
POLEN FUNDS
Statements of Changes in Net Assets (Continued)
| | Polen Global SMID Company Growth Fund |
| | For the Year
Ended
April 30, 2024 | | For the Year
Ended
April 30, 2023 |
| Net increase/(decrease) in net assets from operations: | | | |
| Net investment loss | $ (69,321) | | $ (65,464) |
| Net realized losses from investments and foreign currency transactions | (1,388,686) | | (1,314,570) |
| Net change in unrealized appreciation on investments and foreign currency translations | 752,118 | | 1,014,941 |
| Net decrease in net assets resulting from operations | (705,889) | | (365,093) |
| Increase in net assets derived from capital share transactions and merger activity (Note 4 and Note 6) | 1,763,385 | | 1,907,770 |
| Total increase in net assets | 1,057,496 | | 1,542,677 |
| Net assets | | | |
| Beginning of year | 9,410,777 | | 7,868,100 |
| End of year | $10,468,273 | | $ 9,410,777 |
The accompanying notes are an integral part of the financial statements.
POLEN FUNDS
Statements of Changes in Net Assets (Continued)
| | Polen Bank Loan Fund |
| | For the Year
Ended
April 30, 2024 | | For the Period
June 30, 2022*
to April 30, 2023 |
| Net increase in net assets from operations: | | | |
| Net investment income | $ 828,725 | | $ 402,301 |
| Net realized gains from investments | 40,885 | | 24,361 |
| Net change in unrealized appreciation on investments | 144,792 | | 18,066 |
| Net increase in net assets resulting from operations | 1,014,402 | | 444,728 |
| Less dividends and distributions to shareholders from: | | | |
| Total distributable earnings: | | | |
| Institutional Class | (839,238) | | (411,638) |
| Net decrease in net assets from dividends and distributions to shareholders | (839,238) | | (411,638) |
| Increase in net assets derived from capital share transactions (Note 4) | 1,278,126 | | 7,691,931 |
| Total increase in net assets | 1,453,290 | | 7,725,021 |
| Net assets | | | |
| Beginning of year/period | 7,725,021 | | — |
| End of year/period | $9,178,311 | | $7,725,021 |
| * | The Polen Bank Loan Fund commenced operations on June 30, 2022. |
The accompanying notes are an integral part of the financial statements.
POLEN FUNDS
Statements of Changes in Net Assets (Continued)
| | Polen U.S. High Yield Fund |
| | For the Year
Ended
April 30, 2024 | | For the Period
June 30, 2022*
to April 30, 2023 |
| Net increase/(decrease) in net assets from operations: | | | |
| Net investment income | $ 205,244 | | $ 132,345 |
| Net realized losses from investments | (35,924) | | (4,118) |
| Net change in unrealized appreciation on investments | 49,117 | | 15,228 |
| Net increase in net assets resulting from operations | 218,437 | | 143,455 |
| Less dividends and distributions to shareholders from: | | | |
| Total distributable earnings: | | | |
| Institutional Class | (204,902) | | (132,345) |
| Net decrease in net assets from dividends and distributions to shareholders | (204,902) | | (132,345) |
| Increase in net assets derived from capital share transactions (Note 4) | 835,280 | | 2,131,393 |
| Total increase in net assets | 848,815 | | 2,142,503 |
| Net assets | | | |
| Beginning of year/period | 2,142,503 | | — |
| End of year/period | $2,991,318 | | $2,142,503 |
| * | The Polen U.S. High Yield Fund commenced operations on June 30, 2022. |
The accompanying notes are an integral part of the financial statements.
POLEN FUNDS
Statements of Changes in Net Assets (Concluded)
| | Polen Opportunistic High Yield Fund |
| | For the Period
Ended
April 30, 2024* | | For the Year
Ended
September 30, 2023 | | For the Year
Ended
September 30, 2022 |
| Net increase/(decrease) in net assets from operations: | | | | | |
| Net investment income | $ 14,190,553 | | $ 24,557,149 | | $ 16,250,210 |
| Net realized losses from investments | (10,537,692) | | (17,865,163) | | (8,007,165) |
| Net change in unrealized appreciation/(depreciation) on investments | 14,625,894 | | 19,392,245 | | (43,439,178) |
| Net increase/(decrease) in net assets resulting from operations | 18,278,755 | | 26,084,231 | | (35,196,133) |
| Less dividends and distributions to shareholders from: | | | | | |
| Total distributable earnings: | | | | | |
| Institutional Class | (116,000) | | (26,399) | | (8,679) |
| Investor Class | (77,354) | | (119,305) | | (114,444) |
| Class Y | (14,038,768) | | (24,452,801) | | (16,935,341) |
| Net decrease in net assets from dividends and distributions to shareholders | (14,232,122) | | (24,598,505) | | (17,058,464) |
| Increase in net assets derived from capital share transactions (Note 4) | 19,373,822 | | 29,534,571 | | 63,772,883 |
| Total increase in net assets | 23,420,455 | | 31,020,297 | | 11,518,286 |
| Net assets | | | | | |
| Beginning of period/year | 289,459,130 | | 258,438,833 | | 246,920,547 |
| End of period/year | $312,879,585 | | $289,459,130 | | $258,438,833 |
| * | The Fund changed its fiscal year end from September 30 to April 30. See Note 1 in the Notes to Financial Statements. |
The accompanying notes are an integral part of the financial statements.
POLEN FUNDS
POLEN GROWTH FUND Financial Highlights
Contained below is per share operating performance data for Institutional Class shares outstanding, total investment return, ratios to average net assets and other supplemental data for the respective period. The total returns in the table represent the rate that an investor would have earned or lost on an investment in the Fund (assuming reinvestment of all dividends and distributions). This information has been derived from information provided in the financial statements and should be read in conjunction with the financial statements and the notes thereto.
| | Institutional Class |
| | For the
Year Ended
April 30,
2024 | | For the
Year Ended
April 30,
2023 | | For the
Year Ended
April 30,
2022 | | For the
Year Ended
April 30,
2021 | | For the
Year Ended
April 30,
2020 |
| Per Share Operating Performance | | | | | | | | | |
| Net asset value, beginning of year | $ 34.76 | | $ 40.67 | | $ 50.14 | | $ 34.57 | | $ 31.20 |
| Net investment loss(1) | (0.20) | | (0.21) | | (0.31) | | (0.22) | | (0.13) |
| Net realized and unrealized gain/(loss) on investments | 8.82 | | (2.49) | | (6.99) | | 16.37 | | 3.50 |
| Total from investment operations | 8.62 | | (2.70) | | (7.30) | | 16.15 | | 3.37 |
| Dividends and distributions to shareholders from: | | | | | | | | | |
| Net realized capital gains | — | | (3.21) | | (2.17) | | (0.58) | | (0.00) (2) |
| Redemption fees | 0.00 (2) | | — | | — | | 0.00 (2) | | 0.00 (2) |
| Net asset value, end of year | $ 43.38 | | $ 34.76 | | $ 40.67 | | $ 50.14 | | $ 34.57 |
| Total investment return(3) | 24.80% | | (5.67)% | | (15.68)% | | 46.91% | | 10.80% |
| Ratios/Supplemental Data | | | | | | | | | |
| Net assets, end of year (in 000s) | $7,293,884 | | $6,798,041 | | $9,466,044 | | $10,700,658 | | $5,771,940 |
| Ratio of expenses to average net assets | 0.96% | | 0.98% | | 0.96% | | 0.97% | | 0.98% |
| Ratio of expenses to average net assets without recoupments, waivers and/or reimbursements, if any | 0.96% | | 0.98% | | 0.96% | | 0.97% | | 0.98% (4) |
| Ratio of net investment loss to average net assets | (0.50)% | | (0.58)% | | (0.60)% | | (0.50)% | | (0.40)% |
| Portfolio turnover rate | 18% | | 19% | | 24% | | 19% | | 23% |
| (1) | The selected per share data was calculated using the average shares outstanding method for the year. |
| (2) | Amount is less than $0.005 per share. |
| (3) | Total investment return is calculated assuming a purchase of shares on the first day and a sale of shares on the last day of each period reported and includes reinvestment of dividends and distributions, if any. |
| (4) | During the period, certain fees were waived and/or reimbursed; or recouped, if any. If such fee waivers and/or reimbursements or recoupments had not occurred, the ratios would have been as indicated (See Note 2). |
The accompanying notes are an integral part of the financial statements.
POLEN FUNDS
POLEN GROWTH FUND Financial Highlights (Continued)
Contained below is per share operating performance data for Investor Class shares outstanding, total investment return, ratios to average net assets and other supplemental data for the respective period. The total returns in the table represent the rate that an investor would have earned or lost on an investment in the Fund (assuming reinvestment of all dividends and distributions). This information has been derived from information provided in the financial statements and should be read in conjunction with the financial statements and the notes thereto.
| | Investor Class |
| | For the
Year Ended
April 30,
2024 | | For the
Year Ended
April 30,
2023 | | For the
Year Ended
April 30,
2022 | | For the
Year Ended
April 30,
2021 | | For the
Year Ended
April 30,
2020 |
| Per Share Operating Performance | | | | | | | | | |
| Net asset value, beginning of year | $ 33.58 | | $ 39.52 | | $ 48.90 | | $ 33.81 | | $ 30.59 |
| Net investment loss(1) | (0.29) | | (0.29) | | (0.43) | | (0.31) | | (0.21) |
| Net realized and unrealized gain/(loss) on investments | 8.52 | | (2.44) | | (6.78) | | 15.98 | | 3.43 |
| Total from investment operations | 8.23 | | (2.73) | | (7.21) | | 15.67 | | 3.22 |
| Dividends and distributions to shareholders from: | | | | | | | | | |
| Net realized capital gains | — | | (3.21) | | (2.17) | | (0.58) | | (0.00) (2) |
| Redemption fees | 0.00 (2) | | — | | — | | 0.00 (2) | | 0.00 (2) |
| Net asset value, end of year | $ 41.81 | | $ 33.58 | | $ 39.52 | | $ 48.90 | | $ 33.81 |
| Total investment return(3) | 24.51% | | (5.92)% | | (15.90)% | | 46.54% | | 10.53% |
| Ratios/Supplemental Data | | | | | | | | | |
| Net assets, end of year (in 000s) | $269,367 | | $233,752 | | $332,144 | | $417,735 | | $395,021 |
| Ratio of expenses to average net assets | 1.21% | | 1.23% | | 1.21% | | 1.21% | | 1.23% |
| Ratio of expenses to average net assets without recoupments, waivers and/or reimbursements, if any | 1.21% | | 1.23% | | 1.21% | | 1.21% | | 1.23% (4) |
| Ratio of net investment loss to average net assets | (0.75)% | | (0.83)% | | (0.85)% | | (0.74)% | | (0.64)% |
| Portfolio turnover rate | 18% | | 19% | | 24% | | 19% | | 23% |
| (1) | The selected per share data was calculated using the average shares outstanding method for the year. |
| (2) | Amount is less than $0.005 per share. |
| (3) | Total investment return is calculated assuming a purchase of shares on the first day and a sale of shares on the last day of each period reported and includes reinvestment of dividends and distributions, if any. |
| (4) | During the period, certain fees were waived and/or reimbursed; or recouped, if any. If such fee waivers and/or reimbursements or recoupments had not occurred, the ratios would have been as indicated (See Note 2). |
The accompanying notes are an integral part of the financial statements.
POLEN FUNDS
POLEN GLOBAL GROWTH FUND Financial Highlights (Continued)
Contained below is per share operating performance data for Institutional Class shares outstanding, total investment return, ratios to average net assets and other supplemental data for the respective period. The total returns in the table represent the rate that an investor would have earned or lost on an investment in the Fund (assuming reinvestment of all dividends and distributions). This information has been derived from information provided in the financial statements and should be read in conjunction with the financial statements and the notes thereto.
| | Institutional Class |
| | For the
Year Ended
April 30,
2024 | | For the
Year Ended
April 30,
2023 | | For the
Year Ended
April 30,
2022 | | For the
Year Ended
April 30,
2021 | | For the
Year Ended
April 30,
2020 |
| Per Share Operating Performance | | | | | | | | | |
| Net asset value, beginning of year | $ 21.23 | | $ 21.09 | | $ 26.07 | | $ 18.47 | | $ 17.35 |
| Net investment loss(1) | (0.04) | | (0.02) | | (0.09) | | (0.08) | | (0.04) |
| Net realized and unrealized gain/(loss) on investments | 3.65 | | 0.37 | | (4.21) | | 7.68 | | 1.16 |
| Total from investment operations | 3.61 | | 0.35 | | (4.30) | | 7.60 | | 1.12 |
| Dividends and distributions to shareholders from: | | | | | | | | | |
| Net realized capital gains | — | | (0.21) | | (0.68) | | — | | (0.01) |
| Redemption fees | — | | — | | — | | 0.00 (2) | | 0.01 |
| Net asset value, end of year | $ 24.84 | | $ 21.23 | | $ 21.09 | | $ 26.07 | | $ 18.47 |
| Total investment return(3) | 17.00% | | 1.80% | | (17.08)% | | 41.15% | | 6.50% |
| Ratios/Supplemental Data | | | | | | | | | |
| Net assets, end of year (in 000s) | $440,863 | | $422,798 | | $531,927 | | $587,255 | | $255,374 |
| Ratio of expenses to average net assets | 0.98% | | 1.01% | | 0.99% | | 1.06% | | 1.10% |
| Ratio of expenses to average net assets without recoupments, waivers and/or reimbursements, if any(4) | 0.98% | | 1.01% | | 0.99% | | 1.01% | | 1.12% |
| Ratio of net investment loss to average net assets | (0.16)% | | (0.10)% | | (0.36)% | | (0.35)% | | (0.20)% |
| Portfolio turnover rate | 21% | | 21% | | 36% | | 12% | | 18% |
| (1) | The selected per share data was calculated using the average shares outstanding method for the year. |
| (2) | Amount is less than $0.005 per share. |
| (3) | Total investment return is calculated assuming a purchase of shares on the first day and a sale of shares on the last day of each period reported and includes reinvestment of dividends and distributions, if any. |
| (4) | During the period, certain fees were waived and/or reimbursed. If such fee waivers and/or reimbursements had not occurred, the ratios would have been as indicated (See Note 2). |
The accompanying notes are an integral part of the financial statements.
POLEN FUNDS
POLEN GLOBAL GROWTH FUND Financial Highlights (Continued)
Contained below is per share operating performance data for Investor Class shares outstanding, total investment return, ratios to average net assets and other supplemental data for the respective period. The total returns in the table represent the rate that an investor would have earned or lost on an investment in the Fund (assuming reinvestment of all dividends and distributions). This information has been derived from information provided in the financial statements and should be read in conjunction with the financial statements and the notes thereto.
| | Investor Class |
| | For the
Year Ended
April 30,
2024 | | For the
Year Ended
April 30,
2023 | | For the
Year Ended
April 30,
2022 | | For the
Year Ended
April 30,
2021 | | For the
Year Ended
April 30,
2020 |
| Per Share Operating Performance | | | | | | | | | |
| Net asset value, beginning of year | $ 20.80 | | $ 20.71 | | $ 25.68 | | $ 18.24 | | $ 17.17 |
| Net investment loss(1) | (0.10) | | (0.07) | | (0.16) | | (0.13) | | (0.08) |
| Net realized and unrealized gain/(loss) on investments | 3.57 | | 0.37 | | (4.13) | | 7.57 | | 1.15 |
| Total from investment operations | 3.47 | | 0.30 | | (4.29) | | 7.44 | | 1.07 |
| Dividends and distributions to shareholders from: | | | | | | | | | |
| Net realized capital gains | — | | (0.21) | | (0.68) | | — | | (0.01) |
| Redemption fees | — | | — | | — | | 0.00 (2) | | 0.01 |
| Net asset value, end of year | $ 24.27 | | $ 20.80 | | $ 20.71 | | $ 25.68 | | $ 18.24 |
| Total investment return(3) | 16.68% | | 1.59% | | (17.30)% | | 40.79% | | 6.28% |
| Ratios/Supplemental Data | | | | | | | | | |
| Net assets, end of year (in 000s) | $21,559 | | $20,923 | | $27,111 | | $45,081 | | $17,552 |
| Ratio of expenses to average net assets | 1.23% | | 1.26% | | 1.24% | | 1.31% | | 1.35% |
| Ratio of expenses to average net assets without recoupments, waivers and/or reimbursements, if any(4) | 1.23% | | 1.26% | | 1.24% | | 1.26% | | 1.37% |
| Ratio of net investment loss to average net assets | (0.41)% | | (0.35)% | | (0.61)% | | (0.60)% | | (0.45)% |
| Portfolio turnover rate | 21% | | 21% | | 36% | | 12% | | 18% |
| (1) | The selected per share data was calculated using the average shares outstanding method for the year. |
| (2) | Amount is less than $0.005 per share. |
| (3) | Total investment return is calculated assuming a purchase of shares on the first day and a sale of shares on the last day of each period reported and includes reinvestment of dividends and distributions, if any. |
| (4) | During the period, certain fees were waived and/or reimbursed. If such fee waivers and/or reimbursements had not occurred, the ratios would have been as indicated (See Note 2). |
The accompanying notes are an integral part of the financial statements.
POLEN FUNDS
POLEN INTERNATIONAL GROWTH FUND Financial Highlights (Continued)
Contained below is per share operating performance data for Institutional Class shares outstanding, total investment return, ratios to average net assets and other supplemental data for the respective period. The total returns in the table represent the rate that an investor would have earned or lost on an investment in the Fund (assuming reinvestment of all dividends and distributions). This information has been derived from information provided in the financial statements and should be read in conjunction with the financial statements and the notes thereto.
| | Institutional Class |
| | For the
Year Ended
April 30,
2024 | | For the
Year Ended
April 30,
2023 | | For the
Year Ended
April 30,
2022 | | For the
Year Ended
April 30,
2021 | | For the
Year Ended
April 30,
2020 |
| Per Share Operating Performance | | | | | | | | | |
| Net asset value, beginning of year | $ 14.81 | | $ 14.27 | | $ 18.20 | | $ 13.93 | | $ 14.35 |
| Net investment income/(loss)(1) | 0.06 | | 0.04 | | 0.00 (2) | | (0.02) | | 0.03 |
| Net realized and unrealized gain/(loss) on investments | 0.98 | | 0.50 | | (3.93) | | 4.29 | | (0.45) |
| Total from investment operations | 1.04 | | 0.54 | | (3.93) | | 4.27 | | (0.42) |
| Dividends and distributions to shareholders from: | | | | | | | | | |
| Net investment income | (0.05) | | — | | — | | — | | (0.00) (2) |
| Redemption fees | — | | — | | — | | 0.00 (2) | | 0.00 (2) |
| Net asset value, end of year | $ 15.80 | | $ 14.81 | | $ 14.27 | | $ 18.20 | | $ 13.93 |
| Total investment return(3) | 7.04% | | 3.78% | | (21.59)% | | 30.65% | | (2.92)% |
| Ratios/Supplemental Data | | | | | | | | | |
| Net assets, end of year (in 000s) | $234,106 | | $227,176 | | $278,801 | | $461,059 | | $196,960 |
| Ratio of expenses to average net assets | 1.04% | | 1.08% | | 1.04% | | 1.10% | | 1.10% |
| Ratio of expenses to average net assets without recoupments, waivers and/or reimbursements, if any(4) | 1.04% | | 1.08% | | 1.03% | | 1.03% | | 1.17% |
| Ratio of net investment income/(loss) to average net assets | 0.41% | | 0.26% | | 0.02% | | (0.09)% | | 0.18% |
| Portfolio turnover rate | 15% | | 20% | | 35% | | 33% | | 11% |
| (1) | The selected per share data was calculated using the average shares outstanding method for the year. |
| (2) | Amount is less than $0.005 per share. |
| (3) | Total investment return is calculated assuming a purchase of shares on the first day and a sale of shares on the last day of each period reported and includes reinvestment of dividends and distributions, if any. |
| (4) | During the period, certain fees were waived and/or reimbursed. If such fee waivers and/or reimbursements had not occurred, the ratios would have been as indicated (See Note 2). |
The accompanying notes are an integral part of the financial statements.
POLEN FUNDS
POLEN INTERNATIONAL GROWTH FUND Financial Highlights (Continued)
Contained below is per share operating performance data for Investor Class shares outstanding, total investment return, ratios to average net assets and other supplemental data for the respective period. The total returns in the table represent the rate that an investor would have earned or lost on an investment in the Fund (assuming reinvestment of all dividends and distributions). This information has been derived from information provided in the financial statements and should be read in conjunction with the financial statements and the notes thereto.
| | Investor Class |
| | For the
Year Ended
April 30,
2024 | | For the
Year Ended
April 30,
2023 | | For the
Year Ended
April 30,
2022 | | For the
Year Ended
April 30,
2021 | | For the
Year Ended
April 30,
2020 |
| Per Share Operating Performance | | | | | | | | | |
| Net asset value, beginning of year | $ 14.60 | | $14.10 | | $ 18.04 | | $ 13.84 | | $ 14.29 |
| Net investment income/(loss)(1) | 0.02 | | 0.01 | | (0.04) | | (0.06) | | (0.01) |
| Net realized and unrealized gain/(loss) on investments | 0.97 | | 0.49 | | (3.90) | | 4.26 | | (0.44) |
| Total from investment operations | 0.99 | | 0.50 | | (3.94) | | 4.20 | | (0.45) |
| Dividends and distributions to shareholders from: | | | | | | | | | |
| Net investment income | (0.01) | | — | | — | | — | | — |
| Redemption fees | — | | — | | — | | 0.00 (2) | | 0.00 (2) |
| Net asset value, end of year | $ 15.58 | | $14.60 | | $ 14.10 | | $ 18.04 | | $ 13.84 |
| Total investment return(3) | 6.76% | | 3.55% | | (21.84)% | | 30.35% | | (3.15)% |
| Ratios/Supplemental Data | | | | | | | | | |
| Net assets, end of year (in 000s) | $ 2,696 | | $2,805 | | $ 3,976 | | $ 5,394 | | $ 1,551 |
| Ratio of expenses to average net assets | 1.29% | | 1.33% | | 1.29% | | 1.35% | | 1.35% |
| Ratio of expenses to average net assets without recoupments, waivers and/or reimbursements, if any(4) | 1.29% | | 1.33% | | 1.28% | | 1.29% | | 1.41% |
| Ratio of net investment income/(loss) to average net assets | 0.16% | | 0.08% | | (0.23)% | | (0.34)% | | (0.07)% |
| Portfolio turnover rate | 15% | | 20% | | 35% | | 33% | | 11% |
| (1) | The selected per share data was calculated using the average shares outstanding method for the year. |
| (2) | Amount is less than $0.005 per share. |
| (3) | Total investment return is calculated assuming a purchase of shares on the first day and a sale of shares on the last day of each period reported and includes reinvestment of dividends and distributions, if any. |
| (4) | During the period, certain fees were waived and/or reimbursed. If such fee waivers and/or reimbursements had not occurred, the ratios would have been as indicated (See Note 2). |
The accompanying notes are an integral part of the financial statements.
POLEN FUNDS
POLEN U.S. SMALL COMPANY GROWTH FUND Financial Highlights (Continued)
Contained below is per share operating performance data for Institutional Class shares outstanding, total investment return, ratios to average net assets and other supplemental data for the respective period. The total returns in the table represent the rate that an investor would have earned or lost on an investment in the Fund (assuming reinvestment of all dividends and distributions). This information has been derived from information provided in the financial statements and should be read in conjunction with the financial statements and the notes thereto.
| | Institutional Class |
| | For the
Year Ended
April 30,
2024 | | For the
Year Ended
April 30,
2023 | | For the
Year Ended
April 30,
2022 | | For the
Year Ended
April 30,
2021 | | For the
Year Ended
April 30,
2020 |
| Per Share Operating Performance | | | | | | | | | |
| Net asset value, beginning of year | $ 12.81 | | $ 13.49 | | $ 19.69 | | $ 11.17 | | $ 12.43 |
| Net investment loss(1) | (0.11) | | (0.11) | | (0.16) | | (0.18) | | (0.11) |
| Net realized and unrealized gain/(loss) on investments | 0.64 | | (0.57) | | (5.29) | | 8.72 | | (1.09) |
| Total from investment operations | 0.53 | | (0.68) | | (5.45) | | 8.54 | | (1.20) |
| Dividends and distributions to shareholders from: | | | | | | | | | |
| Net realized capital gains | — | | — | | (0.75) | | (0.02) | | (0.06) |
| Redemption fees | — | | — | | — | | 0.00 (2) | | 0.00 (2) |
| Net asset value, end of year | $ 13.34 | | $ 12.81 | | $ 13.49 | | $ 19.69 | | $ 11.17 |
| Total investment return(3) | 4.14% | | (5.04)% | | (29.11)% | | 76.49% | | (9.70)% |
| Ratios/Supplemental Data | | | | | | | | | |
| Net assets, end of year (in 000s) | $55,154 | | $71,304 | | $122,352 | | $118,390 | | $32,051 |
| Ratio of expenses to average net assets | 1.10% | | 1.10% | | 1.10% | | 1.25% | | 1.25% |
| Ratio of expenses to average net assets without waivers and/or reimbursements, if any(4) | 1.33% | | 1.40% | | 1.26% | | 1.34% | | 2.16% |
| Ratio of net investment loss to average net assets | (0.80)% | | (0.83)% | | (0.81)% | | (1.06)% | | (0.92)% |
| Portfolio turnover rate | 37% | | 45% | | 58% | | 40% | | 68% |
| (1) | The selected per share data was calculated using the average shares outstanding method for the year. |
| (2) | Amount is less than $0.005 per share. |
| (3) | Total investment return is calculated assuming a purchase of shares on the first day and a sale of shares on the last day of each period reported and includes reinvestments of dividends and distributions, if any. |
| (4) | During the period, certain fees were waived and/or reimbursed. If such fee waivers and/or reimbursements had not occurred, the ratios would have been as indicated (See Note 2). |
The accompanying notes are an integral part of the financial statements.
POLEN FUNDS
POLEN U.S. SMALL COMPANY GROWTH FUND Financial Highlights (Continued)
Contained below is per share operating performance data for Investor Class shares outstanding, total investment return, ratios to average net assets and other supplemental data for the respective period. The total returns in the table represent the rate that an investor would have earned or lost on an investment in the Fund (assuming reinvestment of all dividends and distributions). This information has been derived from information provided in the financial statements and should be read in conjunction with the financial statements and the notes thereto.
| | Investor Class |
| | For the
Year Ended
April 30,
2024 | | For the
Year Ended
April 30,
2023 | | For the
Year Ended
April 30,
2022 | | For the
Year Ended
April 30,
2021 | | For the
Year Ended
April 30,
2020 |
| Per Share Operating Performance | | | | | | | | | |
| Net asset value, beginning of year | $ 12.67 | | $ 13.38 | | $ 19.59 | | $ 11.14 | | $ 12.42 |
| Net investment loss(1) | (0.14) | | (0.14) | | (0.20) | | (0.22) | | (0.13) |
| Net realized and unrealized gain/(loss) on investments | 0.64 | | (0.57) | | (5.26) | | 8.69 | | (1.09) |
| Total from investment operations | 0.50 | | (0.71) | | (5.46) | | 8.47 | | (1.22) |
| Dividends and distributions to shareholders from: | | | | | | | | | |
| Net realized capital gains | — | | — | | (0.75) | | (0.02) | | (0.06) |
| Redemption fees | — | | — | | — | | 0.00 (2) | | 0.00 (2) |
| Net asset value, end of year | $ 13.17 | | $ 12.67 | | $ 13.38 | | $ 19.59 | | $ 11.14 |
| Total investment return(3) | 3.95% | | (5.31)% | | (29.31)% | | 76.07% | | (9.87)% |
| Ratios/Supplemental Data | | | | | | | | | |
| Net assets, end of year (in 000s) | $ 4,417 | | $ 5,389 | | $ 8,270 | | $11,364 | | $ 1,272 |
| Ratio of expenses to average net assets | 1.35% | | 1.35% | | 1.35% | | 1.50% | | 1.50% |
| Ratio of expenses to average net assets without waivers and/or reimbursements, if any(4) | 1.59% | | 1.65% | | 1.52% | | 1.58% | | 2.34% |
| Ratio of net investment loss to average net assets | (1.05)% | | (1.08)% | | (1.06)% | | (1.31)% | | (1.18)% |
| Portfolio turnover rate | 37% | | 45% | | 58% | | 40% | | 68% |
| (1) | The selected per share data was calculated using the average shares outstanding method for the year. |
| (2) | Amount is less than $0.005 per share. |
| (3) | Total investment return is calculated assuming a purchase of shares on the first day and a sale of shares on the last day of each period reported and includes reinvestments of dividends and distributions, if any. |
| (4) | During the period, certain fees were waived and/or reimbursed. If such fee waivers and/or reimbursements had not occurred, the ratios would have been as indicated (See Note 2). |
The accompanying notes are an integral part of the financial statements.
POLEN FUNDS
POLEN U.S. SMALL COMPANY GROWTH FUND Financial Highlights (Continued)
Contained below is per share operating performance data for Class Y shares outstanding, total investment return, ratios to average net assets and other supplemental data for the respective period. The total returns in the table represent the rate that an investor would have earned or lost on an investment in the Fund (assuming reinvestment of all dividends and distributions). This information has been derived from information provided in the financial statements and should be read in conjunction with the financial statements and the notes thereto.
| | Class Y shares |
| | For the
Year Ended
April 30,
2024 | | For the
Year Ended
April 30,
2023 | | For the
Period Ended
April 30,
2022* |
| Per Share Operating Performance | | | | | |
| Net asset value, beginning of year/period | $ 12.83 | | $ 13.50 | | $ 19.24 |
| Net investment loss(1) | (0.09) | | (0.09) | | (0.12) |
| Net realized and unrealized gain/(loss) on investments | 0.64 | | (0.58) | | (4.87) |
| Total from investment operations | 0.55 | | (0.67) | | (4.99) |
| Net realized capital gains | — | | — | | (0.75) |
| Redemption fees | — | | — | | — |
| Net asset value, end of year/period | $ 13.38 | | $ 12.83 | | $ 13.50 |
| Total investment return(2) | 4.29% | | (4.96)% | | (27.40)% |
| Ratios/Supplemental Data | | | | | |
| Net assets, end of year/period (in 000s) | $ 4,535 | | $ 4,612 | | $ 4,924 |
| Ratio of expenses to average net assets | 1.00% | | 1.00% | | 1.00% (3) |
| Ratio of expenses to average net assets without waivers and/or reimbursements, if any(4) | 1.25% | | 1.30% | | 1.15% (3) |
| Ratio of net investment loss to average net assets | (0.70)% | | (0.73)% | | (0.68)% (3) |
| Portfolio turnover rate | 37% | | 45% | | 58% (5) |
| * | Commencement of operations on June 1, 2021. |
| (1) | The selected per share data was calculated using the average shares outstanding method for the period. |
| (2) | Total investment return is calculated assuming a purchase of shares on the first day and a sale of shares on the last day of each period reported and includes reinvestments of dividends and distributions, if any. Total returns for periods less than one year are not annualized. |
| (3) | Annualized. |
| (4) | During the period, certain fees were waived and/or reimbursed. If such fee waivers and/or reimbursements had not occurred, the ratios would have been as indicated (See Note 2). |
| (5) | Not annualized. |
The accompanying notes are an integral part of the financial statements.
POLEN FUNDS
POLEN EMERGING MARKETS GROWTH FUND Financial Highlights (Continued)
Contained below is per share operating performance data for Institutional Class shares outstanding, total investment return, ratios to average net assets and other supplemental data for the respective period. The total returns in the table represent the rate that an investor would have earned or lost on an investment in the Fund (assuming reinvestment of all dividends and distributions). This information has been derived from information provided in the financial statements and should be read in conjunction with the financial statements and the notes thereto.
| | Institutional Class |
| | For the
Year Ended
April 30,
2024 | | For the
Year Ended
April 30,
2023 | | For the
Year Ended
April 30,
2022 | | For the
Period Ended
April 30,
2021* |
| Per Share Operating Performance | | | | | | | |
| Net asset value, beginning of year/period | $ 7.86 | | $ 7.67 | | $ 10.78 | | $ 10.00 |
| Net investment income/(loss)(1) | 0.05 | | 0.02 | | (0.00) (2) | | (0.04) |
| Net realized and unrealized gain/(loss) on investments | 0.07 | | 0.18 | | (3.11) | | 0.82 |
| Total from investment operations | 0.12 | | 0.20 | | (3.11) | | 0.78 |
| Dividends and distributions to shareholders from: | | | | | | | |
| Net investment income | (0.00) (2) | | (0.01) | | — | | — |
| Net asset value, end of year/period | $ 7.98 | | $ 7.86 | | $ 7.67 | | $ 10.78 |
| Total investment return(3) | 1.56% | | 2.57% | | (28.85)% | | 7.80% |
| Ratios/Supplemental Data | | | | | | | |
| Net assets, end of year/period (in 000s) | $19,578 | | $19,303 | | $18,666 | | $25,981 |
| Ratio of expenses to average net assets | 1.25% | | 1.25% | | 1.25% | | 1.25% (4) |
| Ratio of expenses to average net assets without waivers and/or reimbursements, if any(5) | 1.78% | | 1.96% | | 1.74% | | 2.51% (4) |
| Ratio of net investment income/(loss) to average net assets | 0.64% | | 0.28% | | (0.02)% | | (0.65)% (4) |
| Portfolio turnover rate | 23% | | 49% | | 28% | | 16% (6) |
| * | Commencement of operations on October 16, 2020. |
| (1) | The selected per share data was calculated using the average shares outstanding method for the period. |
| (2) | Amount is less than $(0.005) per share. |
| (3) | Total investment return is calculated assuming a purchase of shares on the first day and a sale of shares on the last day of each period reported and includes reinvestments of dividends and distributions, if any. Total returns for periods less than one year are not annualized. |
| (4) | Annualized. |
| (5) | During the period, certain fees were waived and/or reimbursed. If such fee waivers and/or reimbursements had not occurred, the ratios would have been as indicated (See Note 2). |
| (6) | Not annualized. |
The accompanying notes are an integral part of the financial statements.
POLEN FUNDS
POLEN U.S. SMID COMPANY GROWTH FUND Financial Highlights (Continued)
Contained below is per share operating performance data for Institutional Class shares outstanding, total investment return, ratios to average net assets and other supplemental data for the respective period. The total returns in the table represent the rate that an investor would have earned or lost on an investment in the Fund (assuming reinvestment of all dividends and distributions). This information has been derived from information provided in the financial statements and should be read in conjunction with the financial statements and the notes thereto.
| | Institutional Class |
| | For the
Year Ended
April 30,
2024 | | For the
Year Ended
April 30,
2023 | | For the
Year Ended
April 30,
2022 | | For the
Period Ended
April 30,
2021* |
| Per Share Operating Performance | | | | | | | |
| Net asset value, beginning of year/period | $ 6.90 | | $ 7.36 | | $ 10.61 | | $ 10.00 |
| Net investment loss(1) | (0.06) | | (0.06) | | (0.09) | | (0.01) |
| Net realized and unrealized gain/(loss) on investments | 0.45 | | (0.40) | | (3.05) | | 0.62 |
| Total from investment operations | 0.39 | | (0.46) | | (3.14) | | 0.61 |
| Dividends and distributions to shareholders from: | | | | | | | |
| Net realized capital gains | — | | — | | (0.11) | | 0.00 |
| Net asset value, end of year/period | $ 7.29 | | $ 6.90 | | $ 7.36 | | $ 10.61 |
| Total investment return(2) | 5.65% | | (6.25)% | | (30.00)% | | 6.10% |
| Ratios/Supplemental Data | | | | | | | |
| Net assets, end of year/period (in 000s) | $17,494 | | $20,023 | | $20,290 | | $11,583 |
| Ratio of expenses to average net assets | 1.05% | | 1.05% | | 1.05% | | 1.05% (3) |
| Ratio of expenses to average net assets without waivers and/or reimbursements, if any(4) | 1.70% | | 1.71% | | 1.71% | | 4.58% (3) |
| Ratio of net investment loss to average net assets | (0.76)% | | (0.86)% | | (0.82)% | | (1.05)% (3) |
| Portfolio turnover rate | 61% | | 61% | | 43% | | 0% |
| * | Commencement of operations on April 1, 2021. |
| (1) | The selected per share data was calculated using the average shares outstanding method for the period. |
| (2) | Total investment return is calculated assuming a purchase of shares on the first day and a sale of shares on the last day of each period reported and includes reinvestments of dividends and distributions, if any. Total returns for periods less than one year are not annualized. |
| (3) | Annualized. |
| (4) | During the period, certain fees were waived and/or reimbursed. If such fee waivers and/or reimbursements had not occurred, the ratios would have been as indicated (See Note 2). |
The accompanying notes are an integral part of the financial statements.
POLEN FUNDS
POLEN GLOBAL SMID COMPANY GROWTH FUND Financial Highlights (Continued)
Contained below is per share operating performance data for Institutional Class shares outstanding, total investment return, ratios to average net assets and other supplemental data for the respective period. The total returns in the table represent the rate that an investor would have earned or lost on an investment in the Fund (assuming reinvestment of all dividends and distributions). This information has been derived from information provided in the financial statements and should be read in conjunction with the financial statements and the notes thereto.
| | Institutional Class |
| | For the
Year Ended
April 30,
2024 | | For the
Year Ended
April 30,
2023 | | For the
Period Ended
April 30,
2022* |
| Per Share Operating Performance | | | | | |
| Net asset value, beginning of year/period | $ 6.41 | | $ 6.80 | | $ 10.00 |
| Net investment loss(1) | (0.04) | | (0.05) | | (0.00) (2) |
| Net realized and unrealized loss on investments | (0.35) | | (0.34) | | (3.20) |
| Total from investment operations | (0.39) | | (0.39) | | (3.20) |
| Net asset value, end of year/period | $ 6.02 | | $ 6.41 | | $ 6.80 |
| Total investment return(3) | (6.08)% | | (5.74)% | | (32.00)% |
| Ratios/Supplemental Data | | | | | |
| Net assets, end of year/period (in 000s) | $10,210 | | $ 9,411 | | $ 7,868 |
| Ratio of expenses to average net assets | 1.25% | | 1.25% | | 1.25% (4) |
| Ratio of expenses to average net assets without waivers(5) | 2.39% | | 2.69% | | 4.91% (4) |
| Ratio of net investment loss to average net assets | (0.62)% | | (0.79)% | | (0.12)% (4) |
| Portfolio turnover rate | 111% | | 41% | | 8% (6) |
| * | Commencement of operations on January 3, 2022. |
| (1) | The selected per share data was calculated using the average shares outstanding method for the period. |
| (2) | Amount is less than $(0.005) per share. |
| (3) | Total investment return is calculated assuming a purchase of shares on the first day and a sale of shares on the last day of each period reported and includes reinvestments of dividends and distributions, if any. Total returns for periods less than one year are not annualized. |
| (4) | Annualized. |
| (5) | During the period, certain fees were waived and/or reimbursed. If such fee waivers and/or reimbursements had not occurred, the ratios would have been as indicated (See Note 2). |
| (6) | Not annualized. |
The accompanying notes are an integral part of the financial statements.
POLEN FUNDS
POLEN GLOBAL SMID COMPANY GROWTH FUND Financial Highlights (Continued)
Contained below is per share operating performance data for Investor Class shares outstanding, total investment return, ratios to average net assets and other supplemental data for the respective period. The total returns in the table represent the rate that an investor would have earned or lost on an investment in the Fund (assuming reinvestment of all dividends and distributions). This information has been derived from information provided in the financial statements and should be read in conjunction with the financial statements and the notes thereto.
| | Investor Class |
| | For the
Period Ended
April 30,
2024* |
| Per Share Operating Performance | |
| Net asset value, beginning of period | $ 6.25 |
| Net investment loss(1) | (0.04) |
| Net realized and unrealized gain/(loss) on investments | (0.19) |
| Total from investment operations | (0.23) |
| Net asset value, end of period | $ 6.02 |
| Total investment return(2) | (3.68)% |
| Ratios/Supplemental Data | |
| Net assets, end of period (in 000s) | $ 258 |
| Ratio of expenses to average net assets | 1.50% (3) |
| Ratio of expenses to average net assets without waivers(4) | 2.76% (3) |
| Ratio of net investment loss to average net assets | (1.03)% (3) |
| Portfolio turnover rate | 111% (5) |
| * | Commencement of operations on August 11, 2023. |
| (1) | The selected per share data was calculated using the average shares outstanding method for the period. |
| (2) | Total investment return is calculated assuming a purchase of shares on the first day and a sale of shares on the last day of each period reported and includes reinvestments of dividends and distributions, if any. Total returns for periods less than one year are not annualized. |
| (3) | Annualized. |
| (4) | During the period, certain fees were waived and/or reimbursed. If such fee waivers and/or reimbursements had not occurred, the ratios would have been as indicated (See Note 2). |
| (5) | Not annualized. |
The accompanying notes are an integral part of the financial statements.
POLEN FUNDS
POLEN BANK LOAN FUND Financial Highlights (Continued)
Contained below is per share operating performance data for Institutional Class shares outstanding, total investment return, ratios to average net assets and other supplemental data for the respective period. The total returns in the table represent the rate that an investor would have earned or lost on an investment in the Fund (assuming reinvestment of all dividends and distributions). This information has been derived from information provided in the financial statements and should be read in conjunction with the financial statements and the notes thereto.
| | Institutional Class |
| | For the
Year Ended
April 30,
2024 | | For the Period Ended
April 30,
2023* |
| Per Share Operating Performance | | | |
| Net asset value, beginning of year/period | $ 10.03 | | $ 10.00 |
| Net investment income(1) | 1.01 | | 0.67 |
| Net realized and unrealized gain on investments | 0.24 | | 0.01 |
| Total from investment operations | 1.25 | | 0.68 |
| Dividends and distributions to shareholders from: | | | |
| Net investment income | (1.01) | | (0.64) |
| Net realized capital gains | (0.02) | | (0.01) |
| Total dividends and distributions to shareholders | (1.03) | | (0.65) |
| Net asset value, end of year/period | $ 10.25 | | $ 10.03 |
| Total investment return(2) | 13.09% | | 7.12% |
| Ratios/Supplemental Data | | | |
| Net assets, end of year/period (in 000s) | $ 9,178 | | $ 7,725 |
| Ratio of expenses to average net assets | 0.75% | | 0.75% (3) |
| Ratio of expenses to average net assets without waivers(4) | 2.11% | | 3.19% (3) |
| Ratio of net investment income to average net assets | 10.00% | | 8.11% (3) |
| Portfolio turnover rate | 120% | | 22% (5) |
| * | Commencement of operations on June 30, 2022. |
| (1) | The selected per share data was calculated using the average shares outstanding method for the period. |
| (2) | Total investment return is calculated assuming a purchase of shares on the first day and a sale of shares on the last day of each period reported and includes reinvestments of dividends and distributions, if any. Total returns for periods less than one year are not annualized. |
| (3) | Annualized. |
| (4) | During the period, certain fees were waived. If such fee waivers had not occurred, the ratios would have been as indicated (See Note 2). |
| (5) | Not annualized. |
The accompanying notes are an integral part of the financial statements.
POLEN FUNDS
POLEN U.S. HIGH YIELD FUND
(formerly, Polen Upper Tier High Yield Fund)
Financial Highlights (Continued)
Contained below is per share operating performance data for Institutional Class shares outstanding, total investment return, ratios to average net assets and other supplemental data for the respective period. The total returns in the table represent the rate that an investor would have earned or lost on an investment in the Fund (assuming reinvestment of all dividends and distributions). This information has been derived from information provided in the financial statements and should be read in conjunction with the financial statements and the notes thereto.
| | Institutional Class |
| | For the
Year Ended
April 30,
2024 | | For the Period Ended
April 30,
2023* |
| Per Share Operating Performance | | | |
| Net asset value, beginning of year/period | $ 10.06 | | $ 10.00 |
| Net investment income(1) | 0.80 | | 0.65 |
| Net realized and unrealized gain on investments | 0.05 | | 0.05 |
| Total from investment operations | 0.85 | | 0.70 |
| Dividends and distributions to shareholders from: | | | |
| Net investment income | (0.80) | | (0.64) |
| Net asset value, end of year/period | $ 10.11 | | $ 10.06 |
| Total investment return(2) | 8.79% | | 7.22% |
| Ratios/Supplemental Data | | | |
| Net assets, end of year/period (in 000s) | $ 2,991 | | $ 2,143 |
| Ratio of expenses to average net assets | 0.65% | | 0.65% (3) |
| Ratio of expenses to average net assets without waivers(4) | 5.02% | | 7.22% (3) |
| Ratio of net investment income to average net assets | 7.96% | | 7.69% (3) |
| Portfolio turnover rate | 30% | | 12% (5) |
| * | Commencement of operations on June 30, 2022. |
| (1) | The selected per share data was calculated using the average shares outstanding method for the period. |
| (2) | Total investment return is calculated assuming a purchase of shares on the first day and a sale of shares on the last day of each period reported and includes reinvestments of dividends and distributions, if any. Total returns for periods less than one year are not annualized. |
| (3) | Annualized. |
| (4) | During the period, certain fees were waived. If such fee waivers had not occurred, the ratios would have been as indicated (See Note 2). |
| (5) | Not annualized. |
The accompanying notes are an integral part of the financial statements.
POLEN FUNDS
POLEN OPPORTUNISTIC HIGH YIELD FUND Financial Highlights (Continued)
Contained below is per share operating performance data for Institutional Class shares outstanding, total investment return, ratios to average net assets and other supplemental data for the respective period. The total returns in the table represent the rate that an investor would have earned or lost on an investment in the Fund (assuming reinvestment of all dividends and distributions). This information has been derived from information provided in the financial statements and should be read in conjunction with the financial statements and the notes thereto.
| | Institutional Class |
| | For the
Period Ended
April 30,
2024* | | For the
Year Ended
September 30,
2023 | | For the
Year Ended
September 30,
2022 | | For the
Year Ended
September 30,
2021 | | For the
Year Ended
September 30,
2020 | | For the
Year Ended
September 30,
2019 |
| Per Share Operating Performance | | | | | | | | | | | |
| Net asset value, beginning of year/period | $ 7.16 | | $ 7.11 | | $ 8.58 | | $ 8.09 | | $ 8.72 | | $ 9.54 |
| Net investment income(1) | 0.33 | | 0.63 | | 0.43 | | 0.52 | | 0.61 (2) | | 0.84 |
| Net realized and unrealized gain/(loss) on investments | 0.09 | | 0.05 | | (1.45) | | 0.48 | | (0.64) | | (0.83) |
| Total from investment operations | 0.42 | | 0.68 | | (1.02) | | 1.00 | | (0.03) | | 0.01 |
| Dividends and distributions to shareholders from: | | | | | | | | | | | |
| Net investment income | (0.34) | | (0.63) | | (0.45) | | (0.51) | | (0.60) | | (0.83) |
| Net realized capital gains | — | | — | | (0.00) (3) | | — | | — | | — |
| Total dividends and distributions to shareholders | (0.34) | | (0.63) | | (0.45) | | (0.51) | | (0.60) | | (0.83) |
| Redemption fees | — | | 0.00 (3) | | — | | — | | — | | — |
| Net asset value, end of year/period | $ 7.24 | | $ 7.16 | | $ 7.11 | | $ 8.58 | | $ 8.09 | | $ 8.72 |
| Total investment return(4) | 6.02% | | 9.97% | | (12.25)% | | 12.63% | | (0.11)% | | 0.16% |
| Ratios/Supplemental Data | | | | | | | | | | | |
| Net assets, end of year/period (in 000s) | $ 3,609 | | $ 554 | | $ 12 | | $ 708 | | $ 668 | | $ 719 |
| Ratio of expenses to average net assets | 0.89% (5) | | 0.89% | | 0.79% (6) | | 0.79% (6) | | 0.79% (6) | | 0.79% (6) |
| Ratio of expenses to average net assets without waivers and/or reimbursements, if any(7) | 1.08% (5) | | 0.92% | | 0.90% | | 0.98% | | 1.32% | | 2.98% |
| Ratio of net investment income to average net assets | 7.90% (5) | | 8.96% | | 5.14% | | 6.11% | | 7.44% | | 9.20% |
| Portfolio turnover rate | 44% (8) | | 43% | | 36% | | 74% | | 66% | | 43% |
| * | The Fund changed its fiscal year end from September 30 to April 30. See Note 1 in the Notes to Financial Statements. |
| (1) | The selected per share data was calculated using the average shares outstanding method for the period. |
| (2) | The amount shown for a share outstanding throughout the period may not correlate with the Statement of Operations for the period due to the timing of sales and redemptions of Fund shares in relation to income earned and/or fluctuating market value of the investments of the Fund. |
| (3) | Amount is less than $0.005 per share. |
| (4) | Total investment return is calculated assuming a purchase of shares on the first day and a sale of shares on the last day of each period reported and includes reinvestments of dividends and distributions, if any. Total returns for periods less than one year are not annualized. |
| (5) | Annualized. |
| (6) | According to the Predecessor Fund’s shareholder services plan with respect to the Fund’s Institutional Class shares, any amount of such payment not paid during the Fund’s fiscal year for such services activities shall be reimbursed to the Fund as soon as practical after the end of the fiscal year. Fees were reimbursed to the Fund during the year ended September 30, 2019 in the amounts of 0.10% of average net assets of Institutional Class shares. For the years ended September 30, 2022, September 30, 2021 and September 30, 2020, no fees were accrued and thus no fees were reimbursed. |
| (7) | During the period, certain fees were waived and/or reimbursed. If such fee waivers and/or reimbursements had not occurred, the ratios would have been as indicated (See Note 2). |
| (8) | Not annualized. |
The accompanying notes are an integral part of the financial statements.
POLEN FUNDS
POLEN OPPORTUNISTIC HIGH YIELD FUND Financial Highlights (Continued)
Contained below is per share operating performance data for Investor Class shares outstanding, total investment return, ratios to average net assets and other supplemental data for the respective period. The total returns in the table represent the rate that an investor would have earned or lost on an investment in the Fund (assuming reinvestment of all dividends and distributions). This information has been derived from information provided in the financial statements and should be read in conjunction with the financial statements and the notes thereto.
| | Investor Class |
| | For the
Period Ended
April 30,
2024* | | For the
Year Ended
September 30,
2023 | | For the
Year Ended
September 30,
2022 | | For the
Year Ended
September 30,
2021 | | For the
Year Ended
September 30,
2020 | | For the
Year Ended
September 30,
2019 |
| Per Share Operating Performance | | | | | | | | | | | |
| Net asset value, beginning of year/period | $ 7.13 | | $ 7.09 | | $ 8.61 | | $ 8.12 | | $ 8.75 | | $ 9.55 |
| Net investment income(1) | 0.32 | | 0.61 | | 0.45 | | 0.49 | | 0.59 (2) | | 0.80 |
| Net realized and unrealized gain/(loss) on investments | 0.09 | | 0.04 | | (1.49) | | 0.48 | | (0.65) | | (0.82) |
| Total from investment operations | 0.41 | | 0.65 | | (1.04) | | 0.97 | | (0.06) | | (0.02) |
| Dividends and distributions to shareholders from: | | | | | | | | | | | |
| Net investment income | (0.33) | | (0.61) | | (0.48) | | (0.48) | | (0.57) | | (0.79) |
| Net realized capital gains | — | | — | | (0.00) (3) | | — | | — | | — |
| Total dividends and distributions to shareholders | (0.33) | | (0.61) | | (0.48) | | (0.48) | | (0.57) | | (0.79) |
| Redemption fees | — | | 0.00 (3) | | — | | 0.00 (3) | | 0.00 (3) | | 0.01 |
| Net asset value, end of year/period | $ 7.21 | | $ 7.13 | | $ 7.09 | | $ 8.61 | | $ 8.12 | | $ 8.75 |
| Total investment return(4) | 5.92% | | 9.47% | | (12.51)% | | 12.20% | | (0.46)% | | (0.12)% |
| Ratios/Supplemental Data | | | | | | | | | | | |
| Net assets, end of year/period (in 000s) | $ 1,725 | | $ 1,413 | | $ 1,384 | | $ 2,480 | | $ 2,579 | | $ 6,467 |
| Ratio of expenses to average net assets | 1.14% (5) | | 1.14% | | 1.14% | | 1.14% | | 1.14% | | 1.14% |
| Ratio of expenses to average net assets without waivers and/or reimbursements, if any(6) | 1.38% (5) | | 1.26% | | 1.24% | | 1.33% | | 1.71% | | 3.20% |
| Ratio of net investment income to average net assets | 7.65% (5) | | 8.47% | | 5.63% | | 5.75% | | 6.98% | | 8.74% |
| Portfolio turnover rate | 44% (7) | | 43% | | 36% | | 74% | | 66% | | 43% |
| * | The Fund changed its fiscal year end from September 30 to April 30. See Note 1 in the Notes to Financial Statements. |
| (1) | The selected per share data was calculated using the average shares outstanding method for the period. |
| (2) | The amount shown for a share outstanding throughout the period may not correlate with the Statement of Operations for the period due to the timing of sales and redemptions of Fund shares in relation to income earned and/or fluctuating market value of the investments of the Fund. |
| (3) | Amount is less than $0.005 per share. |
| (4) | Total investment return is calculated assuming a purchase of shares on the first day and a sale of shares on the last day of each period reported and includes reinvestments of dividends and distributions, if any. Total returns for periods less than one year are not annualized. |
| (5) | Annualized. |
| (6) | During the period, certain fees were waived and/or reimbursed. If such fee waivers and/or reimbursements had not occurred, the ratios would have been as indicated (See Note 2). |
| (7) | Not annualized. |
The accompanying notes are an integral part of the financial statements.
POLEN FUNDS
POLEN OPPORTUNISTIC HIGH YIELD FUND Financial Highlights (Concluded)
Contained below is per share operating performance data for Class Y shares outstanding, total investment return, ratios to average net assets and other supplemental data for the respective period. The total returns in the table represent the rate that an investor would have earned or lost on an investment in the Fund (assuming reinvestment of all dividends and distributions). This information has been derived from information provided in the financial statements and should be read in conjunction with the financial statements and the notes thereto.
| | Class Y shares |
| | For the
Period Ended
April 30,
2024* | | For the
Year Ended
September 30,
2023 | | For the
Year Ended
September 30,
2022 | | For the
Year Ended
September 30,
2021 | | For the
Year Ended
September 30,
2020 | | For the
Year Ended
September 30,
2019 |
| Per Share Operating Performance | | | | | | | | | | | |
| Net asset value, beginning of year/period | $ 7.11 | | $ 7.07 | | $ 8.59 | | $ 8.10 | | $ 8.72 | | $ 9.53 |
| Net investment income(1) | 0.33 | | 0.63 | | 0.49 | | 0.52 | | 0.60 (2) | | 0.83 |
| Net realized and unrealized gain/(loss) on investments | 0.10 | | 0.04 | | (1.50) | | 0.48 | | (0.63) | | (0.82) |
| Total from investment operations | 0.43 | | 0.67 | | (1.01) | | 1.00 | | (0.03) | | 0.01 |
| Dividends and distributions to shareholders from: | | | | | | | | | | | |
| Net investment income | (0.34) | | (0.63) | | (0.51) | | (0.51) | | (0.59) | | (0.82) |
| Net realized capital gains | — | | — | | (0.00) (3) | | — | | — | | — |
| Total dividends and distributions to shareholders | (0.34) | | (0.63) | | (0.51) | | (0.51) | | (0.59) | | (0.82) |
| Redemption fees | 0.00 (3) | | 0.00 (3) | | 0.00 (3) | | — | | — | | — |
| Net asset value, end of year/period | $ 7.20 | | $ 7.11 | | $ 7.07 | | $ 8.59 | | $ 8.10 | | $ 8.72 |
| Total investment return(4) | 6.12% | | 9.90% | | (12.23)% | | 12.61% | | (0.03)% | | 0.12% |
| Ratios/Supplemental Data | | | | | | | | | | | |
| Net assets, end of year/period (in 000s) | $307,546 | | $287,492 | | $257,043 | | $243,732 | | $135,801 | | $20,367 |
| Ratio of expenses to average net assets | 0.79% (5) | | 0.79% | | 0.79% | | 0.79% | | 0.79% | | 0.79% |
| Ratio of expenses to average net assets without waivers and/or reimbursements, if any(6) | 0.83% (5) | | 0.91% | | 0.89% | | 0.99% | | 1.24% | | 3.01% |
| Ratio of net investment income to average net assets | 8.00% (5) | | 8.82% | | 6.12% | | 6.07% | | 7.36% | | 9.14% |
| Portfolio turnover rate | 44% (7) | | 43% | | 36% | | 74% | | 66% | | 43% |
| * | The Fund changed its fiscal year end from September 30 to April 30. See Note 1 in the Notes to Financial Statements. |
| (1) | The selected per share data was calculated using the average shares outstanding method for the period. |
| (2) | The amount shown for a share outstanding throughout the period may not correlate with the Statement of Operations for the period due to the timing of sales and redemptions of Fund shares in relation to income earned and/or fluctuating market value of the investments of the Fund. |
| (3) | Amount is less than $0.005 per share. |
| (4) | Total investment return is calculated assuming a purchase of shares on the first day and a sale of shares on the last day of each period reported and includes reinvestments of dividends and distributions, if any. Total returns for periods less than one year are not annualized. |
| (5) | Annualized. |
| (6) | During the period, certain fees were waived and/or reimbursed. If such fee waivers and/or reimbursements had not occurred, the ratios would have been as indicated (See Note 2). |
| (7) | Not annualized. |
The accompanying notes are an integral part of the financial statements.
POLEN FUNDS
Notes to Financial Statements
April 30, 2024
1. Organization and Significant Accounting Policies
The Polen Growth Fund, Polen Global Growth Fund, Polen International Growth Fund, Polen U.S. Small Company Growth Fund, Polen Emerging Markets Growth Fund, Polen U.S. SMID Company Growth Fund, Polen Global SMID Company Growth Fund, Polen Bank Loan Fund, Polen U.S. High Yield Fund (formerly, Polen Upper Tier High Yield Fund) and Polen Opportunistic High Yield Fund (each a “Fund” and together the “Funds”) are non-diversified, open-end management investment companies registered under the Investment Company Act of 1940, as amended, (the “1940 Act”), which commenced investment operations on September 15, 2010, December 30, 2014, December 30, 2016, November 1, 2017, October 16, 2020, April 1, 2021, January 3, 2022, June 30, 2022, June 30, 2022 and July 24, 2023, respectively. The Funds are separate series of FundVantage Trust (the “Trust”) which was organized as a Delaware statutory trust on August 28, 2006. The Trust is a “series trust” authorized to issue an unlimited number of separate series or classes of shares of beneficial interest. Each series is treated as a separate entity for certain matters under the 1940 Act, and for other purposes, and a shareholder of one series is not deemed to be a shareholder of any other series. Two separate classes of shares, Investor Class and Institutional Class, are offered for the Polen Growth Fund, Polen Global Growth Fund, Polen International Growth Fund, Polen Emerging Markets Growth Fund, Polen U.S. SMID Company Growth Fund, Polen Global SMID Company Growth Fund, Polen Bank Loan Fund and Polen U.S. High Yield Fund. The Polen U.S. Small Company Growth Fund and Polen Opportunistic High Yield Fund offer three separate classes of shares, Investor Class, Institutional Class and Class Y. As of April 30, 2024, Investor Class shares had not been issued on the Polen Emerging Markets Growth Fund, Polen U.S. SMID Company Growth Fund, Polen Bank Loan Fund and Polen U.S. High Yield Fund. Polen Capital Management, LLC (“PCM” or the “Adviser”) serves as investment adviser to the Polen Growth Fund, Polen Global Growth Fund, Polen International Growth Fund, Polen U.S. Small Company Growth Fund, Polen Emerging Markets Growth Fund, Polen U.S. SMID Company Growth Fund and Polen Global SMID Company Growth Fund pursuant to an investment advisory agreement with the Trust. Polen Capital Credit, LLC (“Polen Credit” or the “Adviser”) serves as investment adviser to the Polen Bank Loan Fund, Polen U.S. High Yield Fund and Polen Opportunistic High Yield Fund pursuant to an investment advisory agreement with the Trust.
The Funds are investment companies and follow accounting and reporting guidance in the Financial Accounting Standards Board Accounting Standards Codification Topic 946.
The Polen Opportunistic High Yield Fund commenced investment operations on July 24, 2023. Prior to that date, this Fund acquired the assets and assumed the liabilities of the Polen DDJ Opportunistic High Yield Fund (the “Predecessor Fund”), a series of ALPS Series Trust (“ALPS”), in a tax-free reorganization as set out in an Agreement and Plan of Reorganization, dated as of April 17, 2023 (the “Plan”). The Predecessor Fund commenced investment operations on July 16, 2015. The Plan was approved by the Trust’s Board of Trustees on February 27, 2023, by the Board of Trustees of ALPS on February 16, 2023, and by the beneficial owners of the Predecessor Fund on July 5, 2023. The tax-free reorganization was accomplished on July 24, 2023. Financial information included for the dates prior to the reorganization is that of the Predecessor Fund. As a result of the reorganization, this Fund assumed the performance and accounting history of the Predecessor Fund listed in the table below:
Predecessor Fund
(series of ALPS Series Trust) | | Polen Opportunistic High Yield Fund
(series of FundVantage Trust) | | Net Assets | | Shares
Outstanding |
| Class I | | Institutional Class | | $ 554,159 | | 77,440 |
| Class II | | Investor Class | | 1,412,805 | | 198,233 |
| Institutional Class | | Class Y | | 287,492,166 | | 40,429,876 |
The Polen Opportunistic High Yield Fund changed its fiscal year end from September 30 to April 30. The information contained in this report for this Fund is for the seven-month period from October 1, 2023 to April 30, 2024.
The Funds are investment companies and follow accounting and reporting guidance in the Financial Accounting Standards Board Accounting Standards Codification Topic 946.
Portfolio Valuation — The Funds net asset value (“NAV”) is calculated once daily at the close of regular trading hours on the New York Stock Exchange (“NYSE”) (typically 4:00 p.m. Eastern time) on each day the NYSE is open. Securities held by the Funds are valued using the closing price or the last sale price on a national securities exchange or the National Association of Securities Dealers Automatic Quotation System (“NASDAQ”) market system where they are primarily traded. Equity securities traded in the over-the-counter (“OTC”) market are valued at their closing prices. If there were no transactions on that day, securities traded principally on an
POLEN FUNDS
Notes to Financial Statements (Continued)
April 30, 2024
exchange or on NASDAQ will be valued at the mean of the last bid and ask prices prior to the market close. Fixed income securities having a remaining maturity of greater than 60 days are valued using an independent pricing service. Fixed income securities having a remaining maturity of 60 days or less are generally valued at amortized cost, provided such amount approximates fair value. Fixed income securities are valued on the basis of broker quotations or valuations provided by a pricing service, which utilizes information with respect to recent sales, market transactions in comparable securities, quotations from dealers, and various relationships between securities in determining value. Valuations developed through pricing techniques may materially vary from the actual amounts realized upon sale of the securities. Investments in other open-end investment companies are valued based on the NAV of the investment companies (which may use fair value pricing as discussed in their prospectuses). Securities that do not have a readily available current market value are valued in good faith by each Adviser as “valuation designee” under the oversight of the Trust's Board of Trustees. Relying on prices supplied by pricing services or dealers or using fair valuation may result in values that are higher or lower than the values used by other investment companies and investors to price the same investments. Each Adviser has adopted written policies and procedures for valuing securities and other assets in circumstances where market quotes are not readily available. In the event that market quotes are not readily available, and the security or asset cannot be valued pursuant to one of the valuation methods, the value of the security or asset will be determined in good faith by each Adviser pursuant to its policies and procedures. On a quarterly basis, each Adviser’s fair valuation determinations will be reviewed by the Trust’s Board of Trustees.
The Funds have a fundamental policy with respect to industry concentration that it will not invest 25% or more of the value of the Funds’ assets in securities of issuers in any one industry. Since inception the Funds have utilized BICS at the sub-industry level for defining industries for purposes of monitoring compliance with its industry concentration policy. However, at times, the Funds may utilize other industry classification systems such as MGECS or GICS, as applicable, for purposes other than compliance monitoring.
Fair Value Measurements — The inputs and valuation techniques used to measure fair value of the Funds’ investments are summarized into three levels as described in the hierarchy below:
• Level 1 — quoted prices in active markets for identical securities;
• Level 2 — other significant observable inputs (including quoted prices for similar securities, interest rates, prepayment speeds, credit risk, etc.); and
• Level 3 — significant unobservable inputs (including the Funds’ own assumptions in determining the fair value of investments).
The inputs or methodology used for valuing securities are not necessarily an indication of the risk associated with investing in those securities. Transfers in and out are recognized at the value at the end of the period.
Significant events (such as movement in the U.S. securities market, or other regional and local developments) may occur between the time that foreign markets close (where the security is principally traded) and the time that each Fund calculates its NAV (generally, the close of the NYSE) that may impact the value of securities traded in these foreign markets. As a result, each Fund fair values foreign securities using an independent pricing service which considers the correlation of the trading patterns of the foreign security to the intraday trading in the U.S. markets for investments such as American Depositary Receipts, financial futures, exchange traded funds and certain indexes as well as prices for similar securities. Such fair valuations are categorized as Level 2 in the hierarchy.
Securities listed on a non-U.S. exchange are generally fair valued daily by an independent fair value pricing service approved by the Board of Trustees and categorized as Level 2 investments within the hierarchy. The fair valuations for these securities may not be the same as quoted or published prices of the securities on their primary markets. Securities for which daily fair value prices from the independent fair value pricing service are not available are generally valued at the last quoted sale price at the close of an exchange on which the security is traded and categorized as Level 1 investments within the hierarchy. Values of foreign securities, currencies, and other assets and liabilities denominated in foreign currencies are translated into U.S. dollars at the exchange rate of said currencies against the U.S. dollar, as of valuation time, as provided by an independent pricing service approved by the Board of Trustees.
POLEN FUNDS
Notes to Financial Statements (Continued)
April 30, 2024
The valuations for fixed income securities, including corporate bonds and floating rate senior loans ("Senior Loans"), are typically the prices supplied by independent third-party pricing services, which may use market prices or broker/dealer quotations or a variety of valuation techniques and methodologies. The independent third-party pricing services use inputs that are observable such as issuer details, interest rates, yield curves, prepayment speeds, credit risks/spreads, default rates and quoted prices for similar securities. To the extent that these inputs are observable, the fair value of fixed income securities would be categorized as Level 2; otherwise the fair values would be categorized as Level 3.
Senior Loans are fair valued based on a quoted price received from a single broker-dealer or an average of quoted prices received from multiple broker-dealers or valued relative to other benchmark securities when broker-dealer quotes are unavailable. To the extent that these inputs are observable, the fair values of Senior Loans would be categorized as Level 2; otherwise the fair values would be categorized as Level 3.
The following is a summary of the inputs used, as of April 30, 2024, in valuing each Fund's investments carried at fair value:
| Funds | | Total
Value at
04/30/24 | | Level 1
Quoted
Price | | Level 2
Other
Significant
Observable
Inputs | | Level 3
Significant
Unobservable
Inputs |
| Polen Growth Fund | | | | | | |
| Assets | | | | | | | | |
| Common Stocks* | | $ 7,346,364,643 | | $ 7,346,364,643 | | $ — | | $ — |
| Short-Term Investment | | 151,446,681 | | 151,446,681 | | — | | — |
| Total Assets | | $ 7,497,811,324 | | $ 7,497,811,324 | | $ — | | $ — |
| Polen Global Growth Fund | | | | | | |
| Assets | | | | | | | | |
| Common Stocks | | | | | | | | |
| Australia | | $ 8,737,579 | | $ 8,737,579 | | $ — | | $ — |
| Denmark | | 14,015,089 | | — | | 14,015,089 | | — |
| France | | 27,220,524 | | — | | 27,220,524 | | — |
| Germany | | 41,610,885 | | 41,610,885 | | — | | — |
| Ireland | | 29,061,762 | | 29,061,762 | | — | | — |
| United Kingdom | | 9,359,608 | | — | | 9,359,608 | | — |
| United States | | 316,844,141 | | 316,844,141 | | — | | — |
| Uruguay | | 6,843,390 | | 6,843,390 | | — | | — |
| Short-Term Investment | | 11,298,090 | | 11,298,090 | | — | | — |
| Total Assets | | $ 464,991,068 | | $ 414,395,847 | | $ 50,595,221 | | $ — |
POLEN FUNDS
Notes to Financial Statements (Continued)
April 30, 2024
| Funds | | Total
Value at
04/30/24 | | Level 1
Quoted
Price | | Level 2
Other
Significant
Observable
Inputs | | Level 3
Significant
Unobservable
Inputs |
| Polen International Growth Fund | | | | | | |
| Assets | | | | | | | | |
| Common Stocks | | | | | | | | |
| Australia | | $ 3,346,352 | | $ 3,346,352 | | $ — | | $ — |
| Canada | | 8,520,736 | | 8,520,736 | | — | | — |
| Denmark | | 4,542,086 | | — | | 4,542,086 | | — |
| France | | 10,885,928 | | — | | 10,885,928 | | — |
| Germany | | 42,376,776 | | 32,925,179 | | 9,451,597 | | — |
| India | | 9,282,933 | | — | | 9,282,933 | | — |
| Ireland | | 50,262,648 | | 42,894,524 | | 7,368,124 | | — |
| Japan | | 2,403,606 | | — | | 2,403,606 | | — |
| Netherlands | | 8,881,714 | | — | | 8,881,714 | | — |
| Spain | | 6,103,465 | | — | | 6,103,465 | | — |
| Sweden | | 11,986,650 | | — | | 11,986,650 | | — |
| Switzerland | | 5,081,972 | | — | | 5,081,972 | | — |
| United Kingdom | | 35,554,846 | | — | | 35,554,846 | | — |
| United States | | 13,622,211 | | 13,622,211 | | — | | — |
| Uruguay | | 9,186,400 | | 9,186,400 | | — | | — |
| Short-Term Investment | | 13,723,289 | | 13,723,289 | | — | | — |
| Total Assets | | $ 235,761,612 | | $ 124,218,691 | | $ 111,542,921 | | $ — |
| Polen U.S. Small Company Growth Fund | | | | | | |
| Assets | | | | | | | | |
| Investments in Securities* | | $ 63,538,000 | | $ 63,538,000 | | $ — | | $ — |
POLEN FUNDS
Notes to Financial Statements (Continued)
April 30, 2024
| Funds | | Total
Value at
04/30/24 | | Level 1
Quoted
Price | | Level 2
Other
Significant
Observable
Inputs | | Level 3
Significant
Unobservable
Inputs |
| Polen Emerging Markets Growth Fund | | | | | | |
| Assets | | | | | | | | |
| Common Stocks | | | | | | | | |
| Brazil | | $ 433,341 | | $ 433,341 | | $ — | | $ — |
| China | | 4,593,807 | | 2,017,145 | | 2,576,662 | | — |
| Hong Kong | | 734,596 | | — | | 734,596 | | — |
| Hungary | | 919,954 | | — | | 919,954 | | — |
| India | | 2,955,413 | | — | | 2,955,413 | | — |
| Indonesia | | 1,095,596 | | — | | 1,095,596 | | — |
| Mexico | | 1,490,073 | | 1,490,073 | | — | | — |
| Netherlands | | 873,104 | | — | | 873,104 | | — |
| Poland | | 661,038 | | — | | 661,038 | | — |
| Russia | | 611 | | — | | — | | 611 |
| Taiwan | | 1,778,787 | | — | | 1,778,787 | | — |
| United States | | 931,512 | | 931,512 | | — | | — |
| Uruguay | | 1,229,770 | | 1,229,770 | | — | | — |
| Vietnam | | 1,188,933 | | — | | 1,188,933 | | — |
| Short-Term Investment | | 778,648 | | 778,648 | | — | | — |
| Total Assets | | $ 19,665,183 | | $ 6,880,489 | | $ 12,784,083 | | $ 611 |
| Polen U.S. SMID Company Growth Fund | | | | | | |
| Assets | | | | | | | | |
| Common Stocks* | | $ 16,956,455 | | $ 16,956,455 | | $ — | | $ — |
| Short-Term Investment | | 724,735 | | 724,735 | | — | | — |
| Total Assets | | $ 17,681,190 | | $ 17,681,190 | | $ — | | $ — |
| Polen Global SMID Company Growth Fund | | | | | | |
| Assets | | | | | | | | |
| Common Stocks | | | | | | | | |
| Australia | | $ 184,971 | | $ — | | $ 184,971 | | $ — |
| China | | 746,299 | | 746,299 | | — | | — |
| Germany | | 516,247 | | — | | 516,247 | | — |
| Hungary | | 129,142 | | — | | 129,142 | | — |
| Japan | | 124,183 | | — | | 124,183 | | — |
| Luxembourg | | 352,594 | | — | | 352,594 | | — |
| Netherlands | | 735,209 | | 528,902 | | 206,307 | | — |
| Taiwan | | 319,661 | | — | | 319,661 | | — |
| United Kingdom | | 900,687 | | 900,687 | | — | | — |
| United States | | 5,699,253 | | 5,699,253 | | — | | — |
| Uruguay | | 591,620 | | 591,620 | | — | | — |
| Short-Term Investment | | 197,322 | | 197,322 | | — | | — |
| Total Assets | | $ 10,497,188 | | $ 8,664,083 | | $ 1,833,105 | | $ — |
POLEN FUNDS
Notes to Financial Statements (Continued)
April 30, 2024
| Funds | | Total
Value at
04/30/24 | | Level 1
Quoted
Price | | Level 2
Other
Significant
Observable
Inputs | | Level 3
Significant
Unobservable
Inputs |
| Polen Bank Loan Fund | | | | | | |
| Assets | | | | | | | | |
| Senior Loans* | | $ 8,124,730 | | $ — | | $ 8,124,730 | | $ — |
| Corporate Bonds* | | 760,388 | | — | | 760,388 | | — |
| Total Assets | | $ 8,885,118 | | $ — | | $ 8,885,118 | | $ — |
| Polen U.S. High Yield Fund | | | | | | |
| Assets | | | | | | | | |
| Corporate Bonds* | | $ 2,421,767 | | $ — | | $ 2,421,767 | | $ — |
| Senior Loans* | | 443,158 | | — | | 443,158 | | — |
| Total Assets | | $ 2,864,925 | | $ — | | $ 2,864,925 | | $ — |
| Polen Opportunistic High Yield Fund | | | | | | |
| Assets | | | | | | | | |
| Corporate Bonds | | | | | | | | |
| Consumer Discretionary Products | | $ 13,613,264 | | $ — | | $ 13,613,264 | | $ — |
| Consumer Discretionary Services | | 12,233,871 | | — | | 12,233,871 | | — |
| Consumer Staple Products | | 7,587,446 | | — | | 7,587,446 | | — |
| Health Care | | 19,174,742 | | — | | 19,174,742 | | — |
| Industrial Products | | 36,723,704 | | — | | 36,618,284 | | 105,420 |
| Industrial Services | | 1,908,397 | | — | | 1,908,397 | | — |
| Insurance | | 19,822,056 | | — | | 19,822,056 | | — |
| Materials | | 40,293,599 | | — | | 40,098,599 | | 195,000 |
| Media | | 12,946,443 | | — | | 12,850,318 | | 96,125 |
| Oil & Gas | | 2,801,191 | | — | | 2,801,191 | | — |
| Retail & Wholesale - Discretionary | | 10,086,251 | | — | | 10,086,251 | | — |
| Retail & Wholesale - Staples | | 3,656,735 | | — | | 3,656,735 | | — |
| Software & Technology Services | | 18,970,408 | | — | | 18,970,408 | | — |
| Senior Loans | | | | | | | | |
| Consumer Discretionary Products | | 3,017,569 | | — | | 3,017,569 | | — |
| Consumer Discretionary Services | | 8,448,176 | | — | | 8,448,176 | | — |
| Consumer Staple Products | | 4,528,477 | | — | | 4,528,477 | | — |
| Financial Services | | 2,404,017 | | — | | 2,404,017 | | — |
| Health Care | | 12,308,661 | | — | | 12,308,661 | | — |
| Industrial Products | | 7,209,965 | | — | | 7,209,965 | | — |
| Industrial Services | | 8,665,970 | | — | | 8,665,970 | | — |
| Insurance | | 1,844,925 | | — | | 1,844,925 | | — |
| Materials | | 10,384,715 | | — | | 10,014,215 | | 370,500 |
| Media | | 18,525,107 | | — | | 18,525,107 | | — |
| Retail & Wholesale - Discretionary | | 1,990,121 | | — | | 1,990,121 | | — |
| Retail & Wholesale - Staples | | 924,803 | | — | | 924,803 | | — |
| Software & Technology Services | | 5,444,436 | | — | | 5,444,436 | | — |
| Technology Hardware & Semiconductors | | 3,766,003 | | — | | 3,766,003 | | — |
POLEN FUNDS
Notes to Financial Statements (Continued)
April 30, 2024
| Funds | | Total
Value at
04/30/24 | | Level 1
Quoted
Price | | Level 2
Other
Significant
Observable
Inputs | | Level 3
Significant
Unobservable
Inputs |
| Telecommunications | | $ 76,230 | | $ — | | $ 76,230 | | $ — |
| Common Stocks | | | | | | | | |
| Industrial Products | | 503,277 | | — | | — | | 503,277 |
| Materials | | 651,484 | | 120,999 | | — | | 530,485 |
| Retail & Wholesale - Discretionary | | 111,309 | | — | | — | | 111,309 |
| Software & Technology Services | | 11,777 | | 11,777 | | — | | — |
| Warrants | | | | | | | | |
| Industrial Products | | — | | — | | — | | — ** |
| Total Assets | | $ 290,635,129 | | $ 132,776 | | $ 288,590,237 | | $ 1,912,116 |
| * | Please refer to Portfolio of Investments for further details on portfolio holdings. |
| ** | Current value is $0. |
At the end of each quarter, management evaluates the classification of Levels 1, 2 and 3 assets and liabilities. Various factors are considered, such as changes in liquidity from the prior reporting period; whether or not a broker is willing to execute at the quoted price; the depth and consistency of prices from third-party pricing services; and the existence of contemporaneous, observable trades in the market. Additionally, management evaluates the classification of Level 1 and Level 2 assets and liabilities on a quarterly basis for changes in listings or delistings on national exchanges.
Due to the inherent uncertainty of determining the fair value of investments that do not have a readily available market value, the fair value of the Funds’ investments may fluctuate from period to period. Additionally, the fair value of investments may differ significantly from the values that would have been used had a ready market existed for such investments and may differ materially from the values the Funds may ultimately realize. Further, such investments may be subject to legal and other restrictions on resale or otherwise less liquid than publicly traded securities.
For fair valuations using significant unobservable inputs, U.S. generally accepted accounting principles (“U.S. GAAP”) require the Funds to present a reconciliation of the beginning to ending balances for reported market values that present changes attributable to total realized and unrealized gains or losses, purchase and sales, and transfers in and out of Level 3 during the period. A reconciliation of Level 3 investments is presented only when the Funds have an amount of Level 3 investments at the end of the reporting period that was meaningful in relation to their net assets. The amounts and reasons for all transfers in and out of Level 3 are disclosed when the Funds had an amount of transfers during the reporting period that was meaningful in relation to their net assets as of the end of the reporting period.
There are significant unobservable inputs used in the fair value measurement of the Funds’ Level 3 investments. Generally, a change in the assumptions used in any input in isolation may be accompanied by a change in another input. Significant changes in any of the unobservable inputs may significantly impact the fair value measurement. The impact is based on the relationship between each unobservable input and the fair value measurement.
For the year or period ended April 30, 2024, there were no transfers in or out of Level 3.
Use of Estimates — The preparation of financial statements in conformity with U.S. GAAP requires management to make estimates and assumptions that affect the amounts reported in the financial statements and accompanying notes at the date of the financial statements and the reported amounts of revenues and expenses during the period. Actual results could differ from those estimates and those differences could be material.
Investment Transactions, Investment Income and Expenses — Investment transactions are recorded on trade date for financial statement preparation purposes. Realized gains and losses on investments sold are recorded on the identified cost basis.
POLEN FUNDS
Notes to Financial Statements (Continued)
April 30, 2024
Interest income is recorded on the accrual basis. Dividends are recorded on the ex-dividend date. The Funds may be subject to foreign taxes on income, a portion of which may be recoverable. The Funds apply for refunds where available. Distribution (12b-1) fees relating to a specific class are charged directly to that class. Fund level expenses common to all classes, investment income and realized and unrealized gains and losses on investments are generally allocated to each class of each Fund based upon the relative daily net assets of each class of each Fund. The Funds may be subject to foreign taxes on unrealized and realized gains on certain foreign investments. The Funds may also be subject to foreign taxes on income, a portion of which may be recoverable. The Funds apply for refunds where available. The Funds will accrue such taxes and reclaims, as applicable, based upon the current interpretation of tax rules and regulations that exist in the market in which the Fund invests. General expenses of the Trust are generally allocated to each Fund under methodologies approved by the Board of Trustees. Expenses directly attributable to a particular Fund in the Trust are charged directly to that Fund. The Funds’ investment income, expenses (other than class-specific expenses) and unrealized and realized gains and losses are allocated daily to each class of shares based upon the relative proportion of net assets of each class at the beginning of the day.
Foreign Currency Translation — Assets and liabilities initially expressed in non-U.S. currencies are translated into U.S. dollars based on the applicable exchange rates at the date of the last business day of the financial statement period. Purchases and sales of securities, interest income, dividends, variation margin received and expenses denominated in foreign currencies are translated into U.S. dollars at the exchange rates in effect on the transaction date. The Funds do not separately report the effect of changes in foreign exchange rates from changes in market prices of securities held. Such changes are included with the net realized gain or loss and change in unrealized appreciation or depreciation on investments in the Statements of Operations. Other foreign currency transactions resulting in realized and unrealized gain or loss are reported separately as net realized gain or loss and change in unrealized appreciation or depreciation on foreign currency transactions in the Statements of Operations.
Cash and Cash Equivalents — Cash and cash equivalents include cash and overnight investments in interest-bearing demand deposits with a financial institution with original maturities of three months or less. Each Fund maintain deposits with a high quality financial institution in an amount that is in excess of federally insured limits.
Dividends and Distributions to Shareholders — Dividends from net investment income and distributions from net realized capital gains, if any, are declared and paid to shareholders and are recorded on ex-date. Income dividends and capital gain distributions are determined in accordance with U.S. federal income tax regulations, which may differ from U.S. GAAP.
U.S. Tax Status — No provision is made for U.S. income taxes as it is each Funds' intention to continue to qualify for and elect the tax treatment applicable to regulated investment companies under Subchapter M of the Internal Revenue Code of 1986, as amended (“Internal Revenue Code”), and make the requisite distributions to its shareholders which will be sufficient to relieve it from U.S. income and excise taxes.
Other — In the normal course of business, the Funds may enter into contracts that provide general indemnifications. The Funds’ maximum exposure under these arrangements is dependent on claims that may be made against the Funds in the future, and therefore, cannot be estimated; however, based on experience, the risk of material loss for such claims is considered remote.
Currency Risk — Each Fund invests in securities of foreign issuers, including American Depositary Receipts. These markets are subject to special risks associated with foreign investments not typically associated with investing in U.S. markets. Because the foreign securities in which each Fund may invest generally trade in currencies other than the U.S. dollar, changes in currency exchange rates will affect each Fund's NAV, the value of dividends and interest earned and gains and losses realized on the sale of securities. Because the NAV for each Fund is determined on the basis of U.S. dollars, each Fund may lose money by investing in a foreign security if the local currency of a foreign market depreciates against the U.S. dollar, even if the local currency value of each Fund's holdings goes up. Generally, a strong U.S. dollar relative to these other currencies will adversely affect the value of each Fund's holdings in foreign securities.
Foreign Securities Market Risk — Securities of many non-U.S. companies may be less liquid and their prices more volatile than securities of comparable U.S. companies. Securities of companies traded in many countries outside the U.S., particularly emerging markets countries, may be subject to further risks due to the inexperience of local investment professionals and financial institutions, the possibility of permanent or temporary termination of trading and greater spreads between bid and asked prices of securities. In
POLEN FUNDS
Notes to Financial Statements (Continued)
April 30, 2024
addition, non-U.S. stock exchanges and investment professionals are subject to less governmental regulation, and commissions may be higher than in the United States. Also, there may be delays in the settlement of non-U.S. stock exchange transactions.
Emerging Markets Risk — The securities of issuers located or doing substantial business in emerging market countries tend to be more volatile and less liquid than the securities of issuers located in countries with more mature economies. Emerging markets generally have less diverse and less mature economic structures and less stable political systems than those of developed countries. Investments in these countries may be subject to political, economic, legal, market and currency risks. The risks may include less protection of property rights and uncertain political and economic policies, the imposition of capital controls and/or foreign investment limitations by a country, nationalization of businesses and the imposition of sanctions by other countries, such as the United States. Recent statements by U.S. securities and accounting regulatory agencies have expressed concern regarding information access and audit quality regarding issuers in China and other emerging market countries, which could present heightened risks associated with investments in these markets.
Debt Investment Risk — Debt investments are affected primarily by the financial condition of the companies or other entities that have issued them and by changes in interest rates. There is a risk that an issuer of a Fund's debt investments may not be able to meet its financial obligations (e. g., may not be able to make principal and/or interest payments when they are due or otherwise default on other financial terms) and/or seek bankruptcy protection. Securities such as high-yield bonds, e.g., bonds with low credit ratings by Moody's (Ba or lower) or Standard & Poor's (BB and lower) or if unrated are of comparable quality as determined by the Adviser, are especially subject to credit risk during periods of economic uncertainty or during economic downturns and are more likely to default on their interest and/or principal payments than higher rated securities. Debt investments may be affected by changes in interest rates. Debt investments with longer durations tend to be more sensitive to changes in interest rates, making them more volatile than debt investments with shorter durations or floating or adjustable interest rates. The value of debt investments may fall when interest rates rise.
Senior Loans — Certain Funds invests primarily in senior loans and other floating rate investments. Senior loans typically are rated below investment grade. Below investment grade securities, including senior loans, involve greater risk of loss, are subject to greater price volatility, and may be less liquid and more difficult to value, especially during periods of economic uncertainty or change, than higher rated debt securities. Market quotations for these securities may be volatile and/or subject to large spreads between bid and ask prices. These securities once sold, may not settle for an extended period (for example, several weeks or even longer). A Fund will not receive its sale proceeds until that time, which may constrain a Fund’s ability to meet its obligations. A Fund may invest in securities of issuers that are in default or that are in bankruptcy. The value of collateral, if any, securing a senior loan can decline or may be insufficient to meet the issuer’s obligations or may be difficult to liquidate. No active trading market may exist for many senior loans, and many loans are subject to restrictions on resale. Any secondary market may be subject to irregular trading activity and extended settlement periods. There is less readily available, reliable information about most senior loans than is the case for many other types of securities. Loans may not be considered “securities,” and purchasers, such as a Fund, therefore may not be entitled to rely on the anti-fraud protections afforded by federal securities laws.
Equity Securities Risk — Stock markets are volatile. The price of equity securities fluctuates based on changes in a company’s financial condition, historical and prospective earnings of the company, interest rates, investor perceptions and overall market and economic conditions. The prices of securities change in response to many factors including the value of its assets.
Growth Style Risk — Growth stocks may be more volatile than other stocks because they are generally more sensitive to investor perceptions and market movements. In addition, growth stocks as a group may be out of favor at times and underperform the overall equity market for long periods while the market concentrates on other types of stocks, such as “value” stocks.
Unfunded Loan Commitments — Certain Funds may enter into unfunded loan commitments. Unfunded loan commitments may be partially or wholly unfunded. During the contractual period, the Fund is obliged to provide funding to the borrower upon demand. A fee is earned by a Fund on the unfunded loan commitment and is recorded as interest income on the Statement of Operations. Unfunded loan commitments on senior loan participations and assignments, if any, are marked to market daily and valued according to the Trust’s valuation policies and procedures. Any applicable net unrealized appreciation or depreciation at the end of the
POLEN FUNDS
Notes to Financial Statements (Continued)
April 30, 2024
reporting period is recorded as an asset and any change in net unrealized appreciation or depreciation for the reporting period is recorded within the change in net unrealized appreciation or depreciation on investments. Unfunded loan commitments are included in the Portfolio of Investments.
Restricted Securities — Restricted securities are securities that may only be resold upon registration under federal securities laws or in transactions exempt from such registration. In some cases, the issuer of restricted securities has agreed to register such securities for resale, at the issuer's expense, either upon demand by a fund or in connection with another registered offering of the securities. Many restricted securities may be resold in the secondary market in transactions exempt from registration. Such restricted securities may be determined to be liquid. The Fund will not incur any registration costs upon such resale. The Fund's restricted securities are valued at the price provided by pricing services or dealers in the secondary market or, if no market prices are available, at the fair value price as determined by the Fund's adviser pursuant to the Fund's fair value policy, subject to oversight by the Board. The Fund has acquired certain securities, the sale of which is restricted under applicable provisions of the Securities Act of 1933. It is possible that the fair value price may differ significantly from the amount that may ultimately be realized in the near term, and the difference could be material.
The below securities are restricted from resale as of April 30, 2024:
| Polen Opportunistic High Yield Fund | | Security Type | | Acquisition
Date | | Cost | | Value |
| Arctic Canadian Diamond Co. Ltd. | | Common Stocks | | 02/04/2021 | | $ — | | $ 135,791 |
| Arctic Canadian Diamond Company Ltd. | | Senior Loans | | 02/03/2021 | | 370,501 | | 370,500 |
| Burgundy Diamond Mines Ltd. | | Common Stocks | | 07/03/2023 | | 164,739 | | 120,999 |
| Material Sciences Corp. | | Corporate Bonds | | 07/09/2018 | | 105,420 | | 105,420 |
| Real Alloy Holding, Inc. | | Common Stocks | | 05/31/2018 | | 103,329 | | 225,003 |
| Sterling Entertainment Enterprises, LLC | | Corporate Bonds | | 12/27/2017 | | 99,797 | | 96,125 |
| Utex Industries Holdings, LLC | | Warrants | | 12/03/2020 | | — | | — |
| Utex Industries, Inc. | | Common Stocks | | 12/03/2020 | | 368,394 | | 503,277 |
| | | | | | | | | $1,557,115 |
Restricted securities under Rule 144A, including the aggregate value and percentage of net assets of the Fund, have been identified in the Portfolio of Investments.
2. Transactions with Related Parties and Other Service Providers
For its services, PCM is paid a monthly fee at the annual rate based on average daily net assets of each Fund as shown in the table below:
| Polen Growth Fund | 0.85% |
| Polen Global Growth Fund | 0.85% |
| Polen International Growth Fund | 0.85% |
| Polen U.S. Small Company Growth Fund | 1.00% |
| Polen Emerging Markets Growth Fund | 1.00% |
| Polen U.S. SMID Company Growth Fund | 1.00% |
| Polen Global SMID Company Growth Fund | 1.00% |
For its services, Polen Credit is paid a monthly fee at the annual rate based on average daily net assets of each Fund as shown in the table below:
| Polen Bank Loan Fund | 0.65% |
| Polen U.S. High Yield Fund | 0.55% |
| Polen Opportunistic High Yield Fund | 0.70% |
POLEN FUNDS
Notes to Financial Statements (Continued)
April 30, 2024
Each Adviser has contractually agreed to reduce its investment advisory fee and/or reimburse certain expenses of the Funds to the extent necessary to ensure that the Funds’ total operating expenses (excluding taxes, fees and expenses attributable to a distribution or service plan adopted by the Trust, interest, extraordinary items, “Acquired Fund Fees and Expenses” and brokerage commissions) do not exceed (on an annual basis) the percentages set forth in the table below of each Fund's average daily net assets (the “Expense Limitations”). The Expense Limitations will remain in place until the termination date set forth below, unless the Board of Trustees approves their earlier termination. The table below reflects the Expense Limitation amounts, as a percentage of average daily net assets, in effect during the year ended April 30, 2024.
| | Institutional
Class | | Investor
Class | | Class Y | | Termination Date |
| Polen Growth Fund | 1.00% | | 1.00% | | N/A | | August 31, 2024 |
| Polen Global Growth Fund | 1.10% | | 1.10% | | N/A | | August 31, 2024 |
| Polen International Growth Fund | 1.10% | | 1.10% | | N/A | | August 31, 2024 |
| Polen U.S. Small Company Growth Fund | 1.10% | | 1.10% | | 1.00% | | August 31, 2024 |
| Polen Emerging Markets Growth Fund | 1.25% | | N/A | | N/A | | August 31, 2024 |
| Polen U.S. SMID Company Growth Fund | 1.05% | | N/A | | N/A | | August 31, 2024 |
| Polen Global SMID Company Growth Fund | 1.25% | | 1.25% | | N/A | | August 31, 2024 |
| Polen Bank Loan Fund | 0.75% | | N/A | | N/A | | August 31, 2024 |
| Polen U.S. High Yield Fund | 0.65% | | N/A | | N/A | | August 31, 2024 |
| Polen Opportunistic High Yield Fund | 0.89% | | 0.89% | | 0.79% | | August 31, 2025 |
Each Adviser is entitled to recover, subject to approval by the Board of Trustees, such amounts reduced or reimbursed for a period of up to three (3) years from the date on which each Adviser reduced its compensation and/or assumed expenses for such Fund. Each Adviser is permitted to seek reimbursement from a Fund, subject to certain limitations, for fees it waived and Fund expenses it paid to the extent the total annual fund operating expenses do not exceed the limits described above or any lesser limits in effect at the time of reimbursement. No recoupment will occur unless the Fund's expenses are below the Expense Limitation amount. As of April 30, 2024, Investor Class shares had not been issued on the Polen Emerging Markets Growth Fund, Polen U.S. SMID Company Growth Fund, Polen Bank Loan Fund and Polen U.S High Yield Fund.
For the year ended April 30, 2024, the amount of advisory fees earned and waived and/or reimbursed was as follows:
| | Gross
Advisory Fee | | Recoupments,
Waivers and/or
Reimbursements | | Net Advisory Fee/
(Reimbursement) |
| Polen Growth Fund | $64,665,355 | | $ — | | $64,665,355 |
| Polen Global Growth Fund | 3,950,491 | | — | | 3,950,491 |
| Polen International Growth Fund | 2,016,652 | | — | | 2,016,652 |
| Polen U.S. Small Company Growth Fund | 754,067 | | (174,781) | | 579,286 |
| Polen Emerging Markets Growth Fund | 191,542 | | (101,892) | | 89,650 |
| Polen U.S. SMID Company Growth Fund | 173,750 | | (113,466) | | 60,284 |
| Polen Global SMID Company Growth Fund | 110,702 | | (126,524) | | (15,822) |
| Polen Bank Loan Fund | 53,868 | | (112,820) | | (58,952) |
| Polen U.S. High Yield Fund | 14,179 | | (112,555) | | (98,376) |
| Polen Opportunistic High Yield Fund | 1,241,461 | | (68,624) | | 1,172,837 |
No Funds recouped any fees for the year or period ended April 30, 2024.
As of April 30, 2024, the Polen Growth Fund, Polen Global Growth Fund and Polen International Growth Fund have no additional funds available to be recouped.
POLEN FUNDS
Notes to Financial Statements (Continued)
April 30, 2024
As of April 30, 2024, the amount of potential recovery was as follows:
| | Expiration |
| | 04/30/2025 | | 04/30/2026 | | 04/30/2027 | | Total |
| Polen U.S. Small Company Growth Fund | $284,378 | | $297,730 | | $174,781 | | $756,889 |
| Polen Emerging Markets Growth Fund | 111,518 | | 125,725 | | 101,892 | | 339,135 |
| Polen U.S. SMID Company Growth Fund | 140,531 | | 130,457 | | 113,466 | | 384,454 |
| Polen Global SMID Company Growth Fund | 62,315 | | 120,053 | | 126,523 | | 308,891 |
| Polen Bank Loan Fund | — | | 120,962 | | 112,820 | | 233,782 |
| Polen U.S. High Yield Fund | — | | 113,023 | | 112,555 | | 225,578 |
| | Expiration |
| | 09/30/2024 | | 09/30/2025 | | 09/30/2026 | | 04/30/2027 | | Total |
| Polen Opportunistic High Yield Fund | $234,322 | | $273,460 | | $334,289 | | $68,624 | | $910,695 |
Other Service Providers
The Bank of New York Mellon (“BNY Mellon”) serves as administrator and custodian for the Funds. For providing administrative and accounting services, BNY Mellon is entitled to receive a monthly fee equal to an annual percentage rate of the Funds’ average daily net assets and is subject to certain minimum monthly fees. For providing certain custodial services, BNY Mellon is entitled to receive a monthly fee, subject to certain minimum, and out of pocket expenses.
BNY Mellon Investment Servicing (US) Inc. (the “Transfer Agent”) provides transfer agent services to the Funds. The Transfer Agent is entitled to receive a monthly fee, subject to certain minimum, and out of pocket expenses.
The Trust, on behalf of the Funds, has entered into agreements with financial intermediaries to provide recordkeeping, processing, shareholder communications and other services to customers of the intermediaries investing in the Funds and has agreed to compensate the intermediaries for providing those services. The fees incurred by the Funds for these services are included in Transfer agent fees in the Statements of Operations.
Foreside Funds Distributors LLC (the “Underwriter”) provides principal underwriting services to the Funds pursuant to an underwriting agreement between the Trust and the Underwriter.
The Trust and the Underwriter are parties to an underwriting agreement. The Trust has adopted a distribution plan for the Investor Class shares of the Funds in accordance with Rule 12b-1 under the 1940 Act. Pursuant to the Investor Class shares plan, the Funds compensate the Underwriter for direct and indirect costs and expenses incurred in connection with advertising, marketing and other distribution services in an amount not to exceed 0.25% on an annualized basis of the average daily net assets of the Funds' Investor Class shares.
Trustees and Officers
The Trust is governed by its Board of Trustees. The Trustees receive compensation in the form of an annual retainer and per meeting fees for their services to the Trust. An employee of BNY Mellon serves as the Secretary of the Trust and is not compensated by the Funds or the Trust.
JW Fund Management LLC (“JWFM”) provides a Principal Executive Officer and Principal Financial Officer to the Trust. Chenery Compliance Group, LLC (“Chenery”) provides the Trust with a Chief Compliance Officer and an Anti-Money Laundering Officer. JWFM and Chenery are compensated for their services provided to the Trust.
POLEN FUNDS
Notes to Financial Statements (Continued)
April 30, 2024
3. Investment in Securities
For the year/period ended April 30, 2024, aggregated purchases and sales of investment securities (excluding short-term investments) of the Funds were as follows:
| | Purchases | | Sales |
| Polen Growth Fund | $1,349,930,056 | | $2,659,714,124 |
| Polen Global Growth Fund | 94,935,900 | | 135,831,764 |
| Polen International Growth Fund | 32,441,068 | | 40,145,151 |
| Polen U.S. Small Company Growth Fund | 26,893,945 | | 44,699,796 |
| Polen Emerging Markets Growth Fund | 4,365,090 | | 4,387,419 |
| Polen U.S. SMID Company Growth Fund | 10,442,664 | | 13,435,315 |
| Polen Global SMID Company Growth Fund* | 11,970,548 | | 15,976,795 |
| Polen Bank Loan Fund | 10,572,441 | | 9,770,436 |
| Polen U.S. High Yield Fund | 1,445,542 | | 738,241 |
| Polen Opportunistic High Yield Fund | 132,145,249 | | 129,605,492 |
| * | The cost of purchases and proceeds from sales on the Polen Global SMID Company Growth Fund excludes the purchases and sales of the Polen International Small Company Growth Fund (See Note 6). If these transactions were included, purchases and sales would have been higher. |
4. Capital Share Transactions
For the year/period ended April 30, 2024 and the year/period ended April 30, 2023, transactions in capital shares (authorized shares unlimited) were as follows:
| | For the Year/Period Ended
April 30, 2024 | | For the Year/Period Ended
April 30, 2023 |
| | Shares | | Amount | | Shares | | Amount |
| Polen Growth Fund: | | | | | | | |
| Institutional Class | | | | | | | |
| Sales | 27,679,788 | | $ 1,110,002,990 | | 61,955,181 | | $ 2,217,172,817 |
| Reinvestments | — | | — | | 17,876,152 | | 553,445,679 |
| Redemption Fees | — | | 1,011 | | — | | — |
| Redemptions | (55,100,848) | | (2,213,308,918) | | (117,022,105) | | (4,099,303,155) |
| Net decrease | (27,421,060) | | $(1,103,304,917) | | (37,190,772) | | $(1,328,684,659) |
| |
| Investor Class | | | | | | | |
| Sales | 1,893,764 | | $ 74,381,194 | | 1,950,796 | | $ 66,857,609 |
| Reinvestments | — | | — | | 723,073 | | 21,648,786 |
| Redemption Fees | — | | 37 | | — | | — |
| Redemptions | (2,410,628) | | (95,066,550) | | (4,118,645) | | (138,850,104) |
| Net decrease | (516,864) | | $ (20,685,319) | | (1,444,776) | | $ (50,343,709) |
| |
| Total net decrease | (27,937,924) | | $(1,123,990,236) | | (38,635,548) | | $(1,379,028,368) |
POLEN FUNDS
Notes to Financial Statements (Continued)
April 30, 2024
| | For the Year/Period Ended
April 30, 2024 | | For the Year/Period Ended
April 30, 2023 |
| | Shares | | Amount | | Shares | | Amount |
| | | | | | | | |
| Polen Global Growth Fund: | | | | | | | |
| Institutional Class | | | | | | | |
| Sales | 2,886,946 | | $ 68,127,136 | | 7,038,064 | | $ 138,913,828 |
| Reinvestments | — | | — | | 237,447 | | 4,516,250 |
| Redemptions | (5,050,706) | | (118,020,862) | | (12,581,663) | | (247,810,857) |
| Net decrease | (2,163,760) | | $ (49,893,726) | | (5,306,152) | | $ (104,380,779) |
| |
| Investor Class | | | | | | | |
| Sales | 167,208 | | $ 3,813,564 | | 153,766 | | $ 3,010,488 |
| Reinvestments | — | | — | | 12,203 | | 227,583 |
| Redemptions | (284,905) | | (6,571,567) | | (468,616) | | (9,161,587) |
| Net decrease | (117,697) | | $ (2,758,003) | | (302,647) | | $ (5,923,516) |
| |
| Total net decrease | (2,281,457) | | $ (52,651,729) | | (5,608,799) | | $ (110,304,295) |
| | | | | | | | |
| Polen International Growth Fund: | | | | | | | |
| Institutional Class | | | | | | | |
| Sales | 5,317,620 | | $ 82,616,045 | | 5,912,757 | | $ 78,910,959 |
| Reinvestments | 47,013 | | 739,038 | | — | | — |
| Redemptions | (5,880,839) | | (91,269,291) | | (10,112,407) | | (134,001,317) |
| Net decrease | (516,206) | | $ (7,914,208) | | (4,199,650) | | $ (55,090,358) |
| |
| Investor Class | | | | | | | |
| Sales | 109,240 | | $ 1,616,198 | | 76,873 | | $ 1,034,740 |
| Reinvestments | 62 | | 965 | | — | | — |
| Redemptions | (128,342) | | (1,875,092) | | (166,715) | | (2,172,253) |
| Net decrease | (19,040) | | $ (257,929) | | (89,842) | | $ (1,137,513) |
| |
| Total net decrease | (535,246) | | $ (8,172,137) | | (4,289,492) | | $ (56,227,871) |
| | | | | | | | |
| Polen U.S. Small Company Growth Fund: | | | | | | | |
| Institutional Class | | | | | | | |
| Sales | 944,305 | | $ 12,861,188 | | 3,320,204 | | $ 42,141,603 |
| Reinvestments | — | | — | | — | | — |
| Redemptions | (2,376,948) | | (32,300,917) | | (6,822,576) | | (84,833,559) |
| Net decrease | (1,432,643) | | $ (19,439,729) | | (3,502,372) | | $ (42,691,956) |
| |
| Investor Class | | | | | | | |
| Sales | 64,823 | | $ 859,142 | | 37,186 | | $ 471,931 |
| Reinvestments | — | | — | | — | | — |
| Redemptions | (154,530) | | (2,061,547) | | (229,992) | | (2,869,070) |
| Net decrease | (89,707) | | $ (1,202,405) | | (192,806) | | $ (2,397,139) |
POLEN FUNDS
Notes to Financial Statements (Continued)
April 30, 2024
| | For the Year/Period Ended
April 30, 2024 | | For the Year/Period Ended
April 30, 2023 |
| | Shares | | Amount | | Shares | | Amount |
| |
| Class Y | | | | | | | |
| Sales | 36,536 | | $ 506,036 | | 52,222 | | $ 669,125 |
| Reinvestments | — | | — | | — | | — |
| Redemptions | (56,983) | | (784,443) | | (57,555) | | (694,808) |
| Net decrease | (20,447) | | $ (278,407) | | (5,333) | | $ (25,683) |
| |
| Total net decrease | (1,542,797) | | $ (20,920,541) | | (3,700,511) | | $ (45,114,778) |
| | | | | | | | |
| Polen Emerging Markets Growth Fund: | | | | | | | |
| Institutional Class | | | | | | | |
| Sales | 49,546 | | $ 390,847 | | 58,507 | | $ 462,427 |
| Reinvestments | 875 | | 6,719 | | 2,203 | | 15,994 |
| Redemptions | (53,766) | | (422,580) | | (37,391) | | (277,721) |
| Net increase/(decrease) | (3,345) | | $ (25,014) | | 23,319 | | $ 200,700 |
| |
| | | | | | | | |
| Polen U.S. SMID Company Growth Fund: | | | | | | | |
| Institutional Class | | | | | | | |
| Sales | 804,403 | | $ 5,691,485 | | 1,575,108 | | $ 10,143,670 |
| Reinvestments | — | | — | | — | | — |
| Redemptions | (1,306,727) | | (9,300,823) | | (1,428,514) | | (9,688,133) |
| Net increase/(decrease) | (502,324) | | $ (3,609,338) | | 146,594 | | $ 455,537 |
| |
| | | | | | | | |
| Polen Global SMID Company Growth Fund: | | | | | | | |
| Institutional Class | | | | | | | |
| Sales | 296,373 | | $ 1,794,764 | | 309,429 | | $ 1,907,770 |
| Proceeds from Shares issued in connection with merger(a) | 711,920 | | 4,449,566 | | — | | — |
| Reinvestments | — | | — | | — | | — |
| Redemptions | (780,222) | | (4,745,469) | | — | | — |
| Net increase | 228,071 | | $ 1,498,861 | | 309,429 | | $ 1,907,770 |
| |
| Investor Class* | | | | | | | |
| Sales | 125,330 | | $ 776,556 | | — | | $ — |
| Proceeds from Shares issued in connection with merger(a) | 36,029 | | 225,182 | | — | | — |
| Reinvestments | — | | — | | — | | — |
| Redemptions | (118,407) | | (737,214) | | — | | — |
| Net increase | 42,952 | | $ 264,524 | | — | | $ — |
| |
| Total net increase | 271,023 | | $ 1,763,385 | | 309,429 | | $ 1,907,770 |
POLEN FUNDS
Notes to Financial Statements (Continued)
April 30, 2024
| | For the Year/Period Ended
April 30, 2024 | | For the Year/Period Ended
April 30, 2023 |
| | Shares | | Amount | | Shares | | Amount |
| | | | | | | | |
| Polen Bank Loan Fund**: | | | | | | | |
| Institutional Class | | | | | | | |
| Sales | 196,393 | | $ 2,013,945 | | 736,529 | | $ 7,357,034 |
| Reinvestments | 58,929 | | 597,775 | | 33,671 | | 334,897 |
| Redemptions | (130,115) | | (1,333,594) | | — | | — |
| Net increase | 125,207 | | $ 1,278,126 | | 770,200 | | $ 7,691,931 |
| |
| | | | | | | | |
| Polen U.S. High Yield Fund***: | | | | | | | |
| Institutional Class | | | | | | | |
| Sales | 63,040 | | $ 635,927 | | 200,000 | | $ 2,000,000 |
| Reinvestments | 20,408 | | 204,902 | | 13,062 | | 131,393 |
| Redemptions | (542) | | (5,549) | | — | | — |
| Net increase | 82,906 | | $ 835,280 | | 213,062 | | $ 2,131,393 |
| |
| | | | | | | | |
| | For the Year/Period Ended
April 30, 2024 | | For the Year Ended
September 30, 2023 | | For the Year Ended
September 30, 2022 |
| | Shares | | Amount | | Shares | | Amount | | Shares | | Amount |
| Polen Opportunistic High Yield Fund****: | | | | | | | | | | | |
| Institutional Class | | | | | | | | | | | |
| Sales | 413,088 | | $ 2,967,067 | | 218,382 | | $ 1,588,492 | | — | | $ — |
| Reinvestments | 15,993 | | 115,438 | | 3,536 | | 25,357 | | — | | — |
| Redemption Fees***** | — | | — | | — | | 67 | | — | | — |
| Redemptions | (8,131) | | (58,830) | | (146,128) | | (1,057,645) | | (80,831) | | (683,837) |
| Net increase/(decrease) | 420,950 | | $ 3,023,675 | | 75,790 | | $ 556,271 | | (80,831) | | $ (683,837) |
| |
| Investor Class | | | | | | | | | | | |
| Sales | 71,117 | | $ 507,198 | | 20,757 | | $ 149,027 | | 9,398 | | $ 77,132 |
| Reinvestments | 7,679 | | 54,951 | | 11,134 | | 79,285 | | 10,236 | | 82,044 |
| Redemption Fees***** | — | | — | | — | | 53 | | — | | — |
| Redemptions | (37,726) | | (270,594) | | (28,927) | | (206,180) | | (112,277) | | (904,806) |
| Net increase/(decrease) | 41,070 | | $ 291,555 | | 2,964 | | $ 22,185 | | (92,643) | | $ (745,630) |
| |
| Class Y | | | | | | | | | | | |
| Sales | 2,605,837 | | $ 18,523,313 | | 3,053,375 | | $ 21,770,583 | | 6,587,793 | | $54,166,496 |
| Reinvestments | 1,634,719 | | 11,679,905 | | 2,912,183 | | 20,669,776 | | 2,035,407 | | 16,070,291 |
| Redemption Fees***** | — | | 60 | | — | | 10,221 | | — | | 457 |
| Redemptions | (1,979,343) | | (14,144,686) | | (1,911,688) | | (13,494,465) | | (614,491) | | (5,034,894) |
| Net increase | 2,261,213 | | $ 16,058,592 | | 4,053,870 | | $ 28,956,115 | | 8,008,709 | | $65,202,350 |
| |
| Total net increase | 2,723,233 | | $ 19,373,822 | | 4,132,624 | | $ 29,534,571 | | 7,835,235 | | $63,772,883 |
| | | | | | | | | | | | |
| * | The Polen Global SMID Company Growth Fund’s Investor Class commenced operations on August 11, 2023. |
POLEN FUNDS
Notes to Financial Statements (Continued)
April 30, 2024
| ** | The Polen Bank Loan Fund’s Institutional Class commenced operations on June 30, 2022. |
| *** | The Polen U.S. High Yield Fund’s Institutional Class commenced operations on June 30, 2022. |
| **** | The Fund changed its fiscal year end from September 30 to April 30. See Note 1 in the Notes to Financial Statements. |
| ***** | There is a 1.00% redemption fee that may be charged on shares redeemed which have been held 60 days or less. The redemption fees are retained by the Fund for the benefit of the remaining shareholders and recorded as paid-in capital. |
| (a) | See Note 6. |
Significant Shareholders
As of April 30, 2024, the Funds below had shareholders that held 10% or more of the total outstanding shares of each respective Fund. Transactions by these shareholders may have a material impact on each respective Fund.
| Polen Bank Loan Fund | |
| Affiliated Shareholders | 55% |
| Polen U.S. High Yield Fund | |
| Affiliated Shareholders | 55% |
| Polen Opportunistic High Yield Fund | |
| Non-affiliated Shareholder | 13% |
5. Federal Tax Information
The Funds have followed the authoritative guidance on accounting for and disclosure of uncertainty in tax positions, which requires the Funds to determine whether a tax position is more likely than not to be sustained upon examination, including resolution of any related appeals or litigation processes, based on the technical merits of the position. Tax positions not deemed to meet the more-likely-than-not threshold would be recorded as tax benefit or expense in the current year. Each Fund have determined that there was no effect on the financial statements from following this authoritative guidance. In the normal course of business, the Funds are subject to examination by federal, state and local jurisdictions, where applicable, for tax years for which applicable statutes of limitations have not expired.
Distributions are determined in accordance with federal income tax regulations, which may differ in amount or character from net investment income and realized gains for financial reporting purposes. Accordingly, the character of distributions and composition of net assets for tax purposes may differ from those reflected in the accompanying financial statements. To the extent these differences are permanent, such amounts are reclassified within the components of net assets based on the tax treatment; temporary differences do not require reclassifications. These temporary differences are primarily due to differing treatments for late year ordinary and post-October capital losses, capital loss carryforwards, and losses deferred due to wash sales. Net assets were not affected by these adjustments.
The following permanent differences as of April 30, 2024, primarily attributed to reclassification of foreign currency and foreign capital gains taxes from capital to ordinary, write-off or reclassification of net operating losses, fund level overdistributions and non-deductible taxes paid, were reclassified among the following accounts:
| | Total
Distributable
Earnings | | Paid-in-Capital |
| Polen Growth Fund | $39,329,207 | | $(39,329,207) |
| Polen Global Growth Fund | 830,664 | | (830,664) |
| Polen U.S. Small Company Growth Fund | 632,315 | | (632,315) |
| Polen Emerging Markets Growth Fund | 584 | | (584) |
| Polen U.S. SMID Company Growth Fund | 139,969 | | (139,969) |
| Polen Global SMID Company Growth Fund | (9,685,364) | | 9,685,364 |
POLEN FUNDS
Notes to Financial Statements (Continued)
April 30, 2024
For the year ended April 30, 2024, there were no reclassifications for the Polen International Growth Fund, Polen Bank Loan Fund, Polen U.S. High Yield Fund and Polen Opportunistic High Yield Fund Fund.
The tax character of distributions paid by the Funds during the year ended April 30, 2024, were as follows:
| | Ordinary
Income
Dividend | | Long-Term
Capital Gain
Dividend | | Total
Distributions
Paid* |
| Polen International Growth Fund | $ 780,569 | | $— | | $ 780,569 |
| Polen Emerging Markets Growth Fund | 6,719 | | — | | 6,719 |
| Polen Bank Loan Fund | 844,305 | | — | | 844,305 |
| Polen U.S. High Yield Fund | 205,853 | | — | | 205,853 |
| Polen Opportunistic High Yield Fund | 13,936,725 | | — | | 13,936,725 |
| * | Distributions will not tie to Statements of Changes in Net Assets because distributions are recognized when actually paid for tax purposes. |
The tax character of distributions paid by the Funds during the year ended April 30, 2023, were as follows:
| | Ordinary
Income
Dividend | | Long-Term
Capital Gain
Dividend | | Total
Distributions
Paid* |
| Polen Growth Fund | $ — | | $646,213,431 | | $646,213,431 |
| Polen Global Growth Fund | — | | 4,939,028 | | 4,939,028 |
| Polen Emerging Markets Growth Fund | 15,994 | | — | | 15,994 |
| Polen Bank Loan Fund | 389,555 | | — | | 389,555 |
| Polen U.S. High Yield Fund | 131,394 | | — | | 131,394 |
| * | Distributions will not tie to Statements of Changes in Net Assets because distributions are recognized when actually paid for tax purposes. |
As of April 30, 2024, the components of distributable earnings on a tax basis were as follows:
| | Capital Loss
Carryforward | | Undistributed
Ordinary
Income | | Unrealized
Appreciation/
(Depreciation) | | Qualified
Late-Year
Losses | | Temporary
Differences |
| Polen Growth Fund | $(408,212,350) | | $ — | | $3,192,266,139 | | $(10,881,289) | | $ — |
| Polen Global Growth Fund | (24,134,559) | | — | | 136,411,300 | | (6,357) | | — |
| Polen International Growth Fund | (28,153,138) | | 601,582 | | 37,047,590 | | — | | — |
| Polen U.S. Small Company Growth Fund | (46,269,747) | | — | | 317,071 | | (224,171) | | — |
| Polen Emerging Markets Growth Fund | (5,266,756) | | 5,488 | | (1,738,082) | | — | | — |
| Polen U.S. SMID Company Growth Fund | (6,755,907) | | — | | (1,096,147) | | (51,244) | | — |
| Polen Global SMID Company Growth Fund | (12,245,799) | | — | | 23,967 | | (42,064) | | — |
| Polen Bank Loan Fund | — | | 62,500 | | 162,770 | | — | | (17,016) |
| Polen U.S. High Yield Fund | (40,042) | | 342 | | 64,345 | | — | | — |
| Polen Opportunistic High Yield Fund | (37,131,695) | | 392,514 | | (5,124,896) | | — | | (295,397) |
The differences between the book and tax basis components of distributable earnings relate primarily to the timing and recognition of income and gains for federal income tax purposes. Foreign currency and short-term capital gains are reported as ordinary income for federal income tax purposes.
POLEN FUNDS
Notes to Financial Statements (Continued)
April 30, 2024
As of April 30, 2024, the federal tax cost, aggregate gross unrealized appreciation and depreciation of securities held by each Fund were as follows:
| | | Federal
Tax Cost | | Unrealized
Appreciation | | Unrealized
(Depreciation) | | Net Unrealized
Appreciation/
(Depreciation) |
| Polen Growth Fund | | $4,305,545,185 | | $3,245,133,143 | | $(52,867,004) | | $3,192,266,139 |
| Polen Global Growth Fund | | 328,562,180 | | 143,560,089 | | (7,131,201) | | 136,428,888 |
| Polen International Growth Fund | | 198,692,457 | | 63,573,247 | | (26,504,092) | | 37,069,155 |
| Polen U.S. Small Company Growth Fund | | 63,220,929 | | 11,571,419 | | (11,254,348) | | 317,071 |
| Polen Emerging Markets Growth Fund | | 21,364,774 | | 3,028,697 | | (4,728,288) | | (1,699,591) |
| Polen U.S. SMID Company Growth Fund | | 18,777,337 | | 2,301,889 | | (3,398,036) | | (1,096,147) |
| Polen Global SMID Company Growth Fund | | 10,472,390 | | 1,331,111 | | (1,306,313) | | 24,798 |
| Polen Bank Loan Fund | | 8,722,349 | | 201,792 | | (39,022) | | 162,770 |
| Polen U.S. High Yield Fund | | 2,800,580 | | 97,751 | | (33,406) | | 64,345 |
| Polen Opportunistic High Yield Fund | | 295,760,025 | | 7,485,439 | | (12,610,335) | | (5,124,896) |
Pursuant to federal income tax rules applicable to regulated investment companies, the Funds may elect to treat certain capital losses between November 1 and April 30 and late year ordinary losses ((i) ordinary losses between January 1 and April 30, and (ii) specified ordinary and currency losses between November 1 and April 30) as occurring on the first day of the following tax year. For the year ended April 30, 2024, any amount of losses elected within the tax return will not be recognized for federal income tax purposes until May 1, 2024. For the year ended April 30, 2024, the Funds deferred to May 1, 2024 the following losses:
| | Late-Year Ordinary
Losses Deferral | | Short-Term Capital
Loss Deferral | | Long-Term Capital
Loss Deferral |
| Polen Growth Fund | $10,881,289 | | $— | | $— |
| Polen Global Growth Fund | 6,357 | | — | | — |
| Polen U.S. Small Company Growth Fund | 224,171 | | — | | — |
| Polen U.S. SMID Company Growth Fund | 51,244 | | — | | — |
| Polen Global SMID Company Growth Fund | 42,064 | | — | | — |
Accumulated capital losses represent net capital loss carryforwards as of April 30, 2024 that may be available to offset future realized capital gains and thereby reduce future capital gains distributions. As of April 30, 2024, the Funds’ capital loss carryforward, which were comprised of both short-term losses and long-term losses, and had an unlimited period of capital loss carryover were as follows:
| | Capital Loss Carryforward |
| | Short-Term | | Long-Term |
| Polen Growth Fund | $408,212,350 | | $ — |
| Polen Global Growth Fund | 10,483,595 | | 13,650,964 |
| Polen International Growth Fund | 27,081,081 | | 1,072,057 |
| Polen U.S. Small Company Growth Fund | 28,792,785 | | 17,476,962 |
| Polen Emerging Markets Growth Fund | 1,611,348 | | 3,655,408 |
| Polen U.S. SMID Company Growth Fund | 1,989,978 | | 4,765,929 |
| Polen Global SMID Company Growth Fund | 3,382,503 | | 8,863,296 |
| Polen U.S. High Yield Fund | 10,980 | | 29,062 |
| Polen Opportunistic High Yield Fund | 6,077,221 | | 31,054,474 |
For the year ended April 30, 2024, the following Funds utilized capital losses as follows:
POLEN FUNDS
Notes to Financial Statements (Continued)
April 30, 2024
| | Capital Losses
Utilized |
| Polen Growth Fund | $125,296,232 |
| Polen Global Growth Fund | 15,558,094 |
| Polen International Growth Fund | 1,677,120 |
6. Fund Mergers
On June 9, 2023, the Board of Trustees of the Trust approved the reorganization of the Polen International Small Company Growth Fund with and into Polen Global SMID Company Growth Fund (the “Reorganization”). The reorganization took place after the close of business on August 11, 2023.
Immediately prior to the reorganization, the Polen International Small Company Growth Fund had Institutional Class Shares and Investor Class Shares outstanding, which were exchanged for Institutional Class Shares and Investor Class Shares of the Polen Global SMID Company Growth Fund. Investor Class Shares of the Polen Global SMID Company Growth commenced operations after the close of business on August 11, 2023. The following is a summary of shares outstanding, net assets and net asset value per share for these Funds before and after the mergers took place after the close of business on August 11, 2023:
| | Before
Reorganization | | After
Reorganization |
| | Polen International
Small Company
Growth Fund | | Polen Global SMID
Company Growth Fund | | Polen Global SMID
Company Growth Fund |
| Institutional Class | | | | | |
| Shares | 459,659 | | 1,462,729 | | 2,174,649 |
| Net Assets | $4,449,566 | | $9,148,777 | | $13,598,343 |
| Net Asset Value | $ 9.68 | | $ 6.25 | | $ 6.25 |
| |
| Investor Class | | | | | |
| Shares | 23,524 | | NA | | 36,029 |
| Net Assets | $ 225,182 | | NA | | $ 225,182 |
| Net Asset Value | $ 9.57 | | NA | | $ 6.25 |
| |
| Fund Total | | | | | |
| Shares Outstanding | 483,183 | | 1,462,729 | | 2,210,678 |
| Net Assets | $4,674,748 | | $9,148,777 | | $13,823,525 |
| Unrealized Appreciation (Depreciation) | $ 106,420 | | $ (694,577) | | $ (588,157) |
Assuming this reorganization had been completed on May 1, 2023, the Polen Global SMID Company Growth Fund’s results of operations for the year ended April 30, 2024, would have been as follows:
| Net Investment Loss | $ (61,548) |
Net realized and change in unrealized gains (losses)
on investments and foreign currency translations | $(1,640,423) |
| Net increase in asset from operations | $(1,701,971) |
Because the combined portfolios of investments have been managed as a single portfolio since the mergers were completed, it is not practical to separate the amounts of revenue and earnings to the Polen Global SMID Company Growth Fund that have been included in its statements of operations since the mergers.
POLEN FUNDS
Notes to Financial Statements (Concluded)
April 30, 2024
7. Commitments and Contingencies
Some Funds may make commitments pursuant to bridge loan facilities. Such commitments typically remain off balance sheet as it is more likely than not, based on the good faith judgement of the Adviser, that such bridge facilities will not ever fund. As of April 30, 2024, there were no outstanding bridge facility commitments.
8. Subsequent Events
Management has evaluated the impact of all subsequent events on each Fund through the date the financial statements were issued, and has determined that there was the following subsequent event:
On April 22, 2024, the Board approved a plan to liquidate and terminate Polen Global SMID Company Growth Fund, which occurred on May 23, 2024.
Management has evaluated and has determined there are no additional subsequent events.
POLEN FUNDS
Report of Independent Registered Public Accounting Firm
To the Board of Trustees of FundVantage Trust and Shareholders of Polen Growth Fund, Polen Global Growth Fund, Polen International Growth Fund, Polen U.S. Small Company Growth Fund, Polen Emerging Markets Growth Fund, Polen U.S. SMID Company Growth Fund, Polen Global SMID Company Growth Fund, Polen Bank Loan Fund, Polen U.S. High Yield Fund and Polen Opportunistic High Yield Fund
Opinions on the Financial Statements
We have audited the accompanying statements of assets and liabilities, including the portfolios of investments, Polen Growth Fund, Polen Global Growth Fund, Polen International Growth Fund, Polen U.S. Small Company Growth Fund, Polen Emerging Markets Growth Fund, Polen U.S. SMID Company Growth Fund, Polen Global SMID Company Growth Fund, Polen Bank Loan Fund, Polen U.S. High Yield Fund and Polen Opportunistic High Yield Fund (ten of the funds constituting FundVantage Trust, hereafter collectively referred to as the "Funds") as of April 30, 2024, the related statements of operations and of changes in net assets for each of the periods indicated in the table below, including the related notes, and the financial highlights for each of the periods indicated therein (collectively referred to as the “financial statements”). In our opinion, the financial statements present fairly, in all material respects, the financial position of each of the Funds as of April 30, 2024, the results of each of their operations and the changes in each of their net assets for the periods indicated in the table below, and each of the financial highlights for each of the periods indicated therein, in conformity with accounting principles generally accepted in the United States of America.
| Polen Growth Fund, Polen Global Growth Fund, Polen International Growth Fund, Polen U.S. Small Company Growth Fund, Polen Emerging Markets Growth Fund, Polen U.S. SMID Company Growth Fund and Polen Global SMID Company Growth Fund | Statements of operations for the year ended April 30, 2024 and the statements of changes in net assets for each of the two years in the period ended April 30, 2024 |
| Polen Bank Loan Fund and Polen U.S. High Yield Fund | Statement of operations for the year ended April 30, 2024 and the statements of changes in net assets for the year ended April 30, 2024 and the period from June 30, 2022 (commencement of operations) through April 30, 2023 |
| Polen Opportunistic High Yield Fund | Statements of operations and changes in net assets for the period beginning October 1, 2023 through April 30, 2024 and the year ended September 30, 2023 |
The financial statements of the Polen Opportunistic High Yield Fund, as of and for the year ended September 30, 2022 and the financial highlights for each of the periods ended on or prior to September 30, 2022 (not presented herein, other than the statement of changes in net assets and the financial highlights) were audited by other auditors whose report dated November 29, 2022 expressed an unqualified opinion on those financial statements and financial highlights.
Basis for Opinions
These financial statements are the responsibility of the Funds’ management. Our responsibility is to express an opinion on the Funds’ financial statements based on our audits. We are a public accounting firm registered with the Public Company Accounting Oversight Board (United States) (PCAOB) and are required to be independent with respect to the Funds in accordance with the U.S. federal securities laws and the applicable rules and regulations of the Securities and Exchange Commission and the PCAOB.
We conducted our audits of these financial statements in accordance with the standards of the PCAOB. Those standards require that we plan and perform the audit to obtain reasonable assurance about whether the financial statements are free of material misstatement, whether due to error or fraud.
POLEN FUNDS
Report of Independent Registered Public Accounting Firm (Concluded)
Our audits included performing procedures to assess the risks of material misstatement of the financial statements, whether due to error or fraud, and performing procedures that respond to those risks. Such procedures included examining, on a test basis, evidence regarding the amounts and disclosures in the financial statements. Our audits also included evaluating the accounting principles used and significant estimates made by management, as well as evaluating the overall presentation of the financial statements. Our procedures included confirmation of securities owned as of April 30, 2024 by correspondence with the custodian, issuers, agent banks and brokers; when replies were not received from agent banks and brokers, we performed other auditing procedures. We believe that our audits provide a reasonable basis for our opinions.
/s/PricewaterhouseCoopers LLP
Philadelphia, Pennsylvania
July 8, 2024
We have served as the auditor of one or more investment companies managed by Polen Capital Management, LLC since 2011.
POLEN FUNDS
Shareholder Tax Information
(Unaudited)
The Funds are required by Subchapter M of the Internal Revenue Code of 1986, as amended, to advise their shareholders of the U.S. federal tax status of distributions received by the Funds’ shareholders in respect of such fiscal year. During the year ended April 30, 2024, the following dividends and distributions were paid by the Funds:
| | Ordinary
Income | | Long-Term
Capital Gain |
| Polen International Growth Fund | $ 780,569 | | $— |
| Polen Emerging Markets Growth Fund | 6,719 | | — |
| Polen Bank Loan Fund | 844,305 | | — |
| Polen U.S. High Yield Fund | 205,853 | | — |
| Polen Opportunistic High Yield Fund | 13,936,725 | | — |
Distributable long-term gains are based on net realized long-term gains determined on a tax basis and may differ from such amounts for financial reporting purposes. The Funds designated the following as long-term capital gains distributions during the year ended April 30, 2024:
| Polen Growth Fund | $0 |
| Polen Global Growth Fund | $0 |
| Polen International Growth Fund | $0 |
| Polen U.S. Small Company Growth Fund | $0 |
| Polen Emerging Markets Growth Fund | $0 |
| Polen U.S. SMID Company Growth Fund | $0 |
| Polen Global SMID Company Growth Fund | $0 |
| Polen Bank Loan Fund | $0 |
| Polen U.S. High Yield Fund | $0 |
| Polen Opportunistic High Yield Fund | $0 |
Under the Jobs and Growth Tax Relief Reconciliation Act of 2003, the following percentages of ordinary income distributions paid during the year ended April 30, 2024 were designated as qualified dividend income:
| Polen Growth Fund | 0.00% |
| Polen Global Growth Fund | 0.00% |
| Polen International Growth Fund | 100.00% |
| Polen U.S. Small Company Growth Fund | 0.00% |
| Polen Emerging Markets Growth Fund | 100.00% |
| Polen U.S. SMID Company Growth Fund | 0.00% |
| Polen Global SMID Company Growth Fund | 0.00% |
| Polen Bank Loan Fund | 0.00% |
| Polen U.S. High Yield Fund | 0.00% |
| Polen Opportunistic High Yield Fund | 0.20% |
The percentage of ordinary income dividends qualifying for corporate dividends received deduction for the Funds is as follows:
| Polen Growth Fund | 0.00% |
| Polen Global Growth Fund | 0.00% |
| Polen International Growth Fund | 57.67% |
| Polen U.S. Small Company Growth Fund | 0.00% |
| Polen Emerging Markets Growth Fund | 19.26% |
| Polen U.S. SMID Company Growth Fund | 0.00% |
| Polen Global SMID Company Growth Fund | 0.00% |
| Polen Bank Loan Fund | 0.00% |
| Polen U.S. High Yield Fund | 0.00% |
| Polen Opportunistic High Yield Fund | 0.00% |
POLEN FUNDS
Shareholder Tax Information (Concluded)
(Unaudited)
The percentage of ordinary income dividends qualifying for qualified interest income for the Funds is as follows:
| Polen Growth Fund | 0.00% |
| Polen Global Growth Fund | 0.00% |
| Polen International Growth Fund | 9.71% |
| Polen U.S. Small Company Growth Fund | 0.00% |
| Polen Emerging Markets Growth Fund | 8.04% |
| Polen U.S. SMID Company Growth Fund | 0.00% |
| Polen Global SMID Company Growth Fund | 0.00% |
| Polen Bank Loan Fund | 16.12% |
| Polen U.S. High Yield Fund | 76.64% |
| Polen Opportunistic High Yield Fund | 49.35% |
The percentage of ordinary income distributions designated as qualified short-term gain pursuant to the American Jobs Creation Act of 2004 is as follows:
| Polen Growth Fund | 0.00% |
| Polen Global Growth Fund | 0.00% |
| Polen International Growth Fund | 0.00% |
| Polen U.S. Small Company Growth Fund | 0.00% |
| Polen Emerging Markets Growth Fund | 0.00% |
| Polen U.S. SMID Company Growth Fund | 0.00% |
| Polen Global SMID Company Growth Fund | 0.00% |
| Polen Bank Loan Fund | 100.00% |
| Polen U.S. High Yield Fund | 0.00% |
| Polen Opportunistic High Yield Fund | 0.00% |
The Funds paid foreign taxes and recognized foreign source income as follows:
| | Foreign Taxes Paid | | Foreign Source Income |
| Polen International Growth Fund | $197,986 | | $3,004,384 |
| Polen Emerging Markets Growth Fund | 48,850 | | 361,738 |
All designations are based on financial information available as of the date of this annual report and, accordingly, are subject to change. For each item, it is the intention of the Funds to designate the maximum amount permitted under the Internal Revenue Code of 1986, as amended, and the regulations thereunder.
Because the Funds’ fiscal year is not the calendar year, another notification will be sent with respect to calendar year 2022. The second notification, which will reflect the amount, if any, to be used by calendar year taxpayers on their U.S. federal income tax returns, will be made in conjunction with Form 1099-DIV and will be mailed in January 2025.
Foreign shareholders will generally be subject to U.S. withholding tax on the amount of their ordinary income dividends. They will generally not be entitled to a foreign tax credit or deduction for the withholding taxes paid by the Funds, if any.
In general, dividends received by tax-exempt recipients (e.g., IRAs and Keoghs) need not be reported as taxable income for U.S. federal income tax purposes. However, some retirement trusts (e.g., corporate, Keogh and 403(b)(7) plans) may need this information for their annual information reporting.
Shareholders are advised to consult their own tax advisers with respect to the tax consequences of their investment in the Funds.
POLEN FUNDS
Statement Regarding Liquidity Risk Management Program
(Unaudited)
The Securities and Exchange Commission adopted Rule 22e-4 under the Investment Company Act of 1940, as amended (the “Liquidity Rule”) to promote effective liquidity risk management throughout the open-end investment company industry, thereby reducing the risk that funds will be unable to meet their redemption obligations and mitigating dilution of the interests of fund shareholders.
The Board of Trustees (the “Board”) of FundVantage Trust, on behalf of the Polen Emerging Markets Growth Fund (the “Fund”), met on September 18-19, 2023 (the “Meeting”) to review the liquidity risk management program (the “Program”) applicable to the Fund, pursuant to the Liquidity Rule. The Board has appointed a committee of individuals to serve as the program administrator for the Fund’s Program (the “Program Committee”). At the Meeting, the Program Committee provided the Board with a report that addressed the operation of the Program and assessed its adequacy and effectiveness of implementation and any material changes to the Program as of June 30, 2023 (the “Report”).
The Report described the Program’s liquidity classification methodology. It also described the Program Committee’s methodology in determining whether a Highly Liquid Investment Minimum (a “HLIM”) is necessary and noted that, given the composition of the Fund’s portfolio holdings, a HLIM was not currently required for the Fund.
The Report noted that the Program complied with the key factors for consideration under the Liquidity Rule for assessing, managing and periodically reviewing liquidity risk, as follow:
A. Each Fund’s investment strategy and liquidity of Fund investments during both normal and reasonably foreseeable stressed conditions: As part of the Report, the Program Committee reviewed the Fund’s strategy and its determination that the strategy remains appropriate for an open-end fund structure. This determination was based on the Fund’s holdings of Highly Liquid Investments, the diversification of holdings and the related average position size of the holdings.
B. Short-term and long-term cash flow projections during both normal and reasonably foreseeable stressed conditions: As part of the Report, the Program Committee reviewed historical net redemption activity and noted that it used this information as a component to establish the Fund’s reasonably anticipated trading size. The Fund has adopted an in-kind redemption policy which may be utilized to meet larger redemption requests. The Program Committee also took into consideration the Fund’s shareholder ownership concentration and the fact that the shares of the Fund are offered through intermediaries. The intermediary agreements increase the likelihood of large unanticipated redemptions, meaning a Fund may not have the ability to conduct an orderly sale of portfolio securities. The amount of assets a Fund has on these platforms is a significant factor in the ability of the Fund to meet redemption expectations. In light of the Fund’s holdings, it was noted that the Fund maintains a high level of liquidity to meet shareholder redemptions under both normal and stressed market conditions.
C. Holdings of cash and cash equivalents, as well as borrowing arrangements: As part of the Report, the Program Committee reviewed any changes in the Fund’s cash and cash equivalents positions in response to current/anticipated redemption activity or market conditions. It was noted that the Fund does not currently have a borrowing or other credit funding arrangement.
POLEN FUNDS
Other Information
(Unaudited)
Proxy Voting
Policies and procedures that the Funds uses to determine how to vote proxies relating to portfolio securities as well as information regarding how the Funds voted proxies relating to portfolio securities for the most recent 12-month period ended June 30 are available without charge, upon request, by calling and on the Securities and Exchange Commission's ("SEC") website at http://www.sec.gov.
Quarterly Portfolio Schedules
Each Fund files its complete schedule of portfolio holdings with the SEC for the first and third fiscal quarters of each fiscal year (quarters ended July 31 and January 31) as an exhibit to its reports on Form N-PORT. The Funds' portfolio holdings on Form N-PORT are available on the SEC's website at http://www.sec.gov.
POLEN FUNDS
Privacy Notice
(Unaudited)
The privacy of your personal financial information is extremely important to us. When you open an account with us, we collect a significant amount of information from you in order to properly invest and administer your account. We take very seriously the obligation to keep that information private and confidential, and we want you to know how we protect that important information.
We collect nonpublic personal information about you from applications or other forms you complete and from your transactions with us or our affiliates. We do not disclose information about you, or our former clients, to our affiliates or to service providers or other third parties, except as permitted by law. We share only the information required to properly administer your accounts, which enables us to send transaction confirmations, monthly or quarterly statements, financials and tax forms. Even within FundVantage Trust and its affiliated entities, a limited number of people who actually service accounts will have access to your personal financial information. Further, we do not share information about our current or former clients with any outside marketing groups or sales entities.
To ensure the highest degree of security and confidentiality, FundVantage Trust and its affiliates maintain various physical, electronic and procedural safeguards to protect your personal information. We also apply special measures for authentication of information you request or submit to us on our web site.
If you have questions or comments about our privacy practices, please call us at 1-888-678-6024.
POLEN FUNDS
Fund Management
(Unaudited)
FundVantage Trust (the “Trust”) is governed by a Board of Trustees (the “Trustees”). The primary responsibility of the Trustees is to represent the interest of the Trust's shareholders and to provide oversight management of the Trust.
The following tables present certain information regarding the Board of Trustees and officers of the Trust. None of the Trustees are an “interested person” of the Trust, each Adviser, another investment adviser of a series of the Trust, or Foreside Funds Distributors LLC, the principal underwriter of the Trust (“Underwriter”), within the meaning of the 1940 Act and each Trustee is referred to as an “Independent Trustee” and is listed under such heading below. Employees of certain service providers to the Trust serve as officers of the Trust; such persons are not compensated by the Funds. The address of each Trustee and officer as it relates to the Trust's business is 103 Bellevue Parkway, 2nd Floor, Wilmington, DE 19809.
The Statement of Additional Information for the Funds contain additional information about the Trustees and is available, without charge, upon request by calling 1-888-678-6024.
Name
and Date of Birth | Position(s)
Held
with Trust | Term of Office
and Length of
Time Served | Principal Occupation(s)
During Past Five Years | Number of
Funds in
Trust
Complex
Overseen
by
Trustee | Other
Directorships
Held by
Trustee |
| INDEPENDENT TRUSTEES |
ROBERT J. CHRISTIAN
Date of Birth: 2/49 | Trustee | Shall serve until
death, resignation
or removal.
Trustee since
2007. Chairman
from 2007 until
September 30,
2019. | Retired since February 2006; Executive Vice
President of Wilmington Trust Company from
February 1996 to February 2006; President of
Rodney Square Management Corporation
(“RSMC”) (investment advisory firm) from 1996
to 2005; Vice President of RSMC from 2005 to 2006. | 29 | Optimum Fund
Trust
(registered
investment
company with
6 portfolios);
Third Avenue
Trust
(registered
investment
company with
4 portfolios);
Third Avenue
Variable Series
Trust
(registered
investment
company with
1 portfolio);
Polen Credit
Opportunities
Fund (registered
investment
company). |
POLEN FUNDS
Fund Management (Continued)
(Unaudited)
Name
and Date of Birth | Position(s)
Held
with Trust | Term of Office
and Length of
Time Served | Principal Occupation(s)
During Past Five Years | Number of
Funds in
Trust
Complex
Overseen
by
Trustee | Other
Directorships
Held by
Trustee |
IQBAL MANSUR
Date of Birth: 6/55 | Trustee | Shall serve until
death, resignation
or removal.
Trustee since
2007. | Retired since September 2020; Professor of
Finance, Widener University from 1998 to August 2020; Member of the Investment Committee of ChristianaCare Health System from January 2022 to present. | 29 | Third Avenue
Trust
(registered
investment
company with
4 portfolios);
Third Avenue
Variable Series
Trust
(registered
investment
company with
1 portfolio);
Polen Credit
Opportunities
Fund (registered
investment
company). |
NICHOLAS M.
MARSINI, JR.
Date of Birth: 8/55 | Trustee and
Chairman of
the Board | Shall serve until
death, resignation
or removal.
Trustee since
2016. Chairman
since October 1,
2019. | Retired since March 2016. President of PNC Bank Delaware from June 2011 to March 2016;
Executive Vice President of Finance of BNY Mellon from July 2010 to January 2011; Executive Vice President and Chief Financial Officer of PNC Global Investment Servicing from September 1997 to July 2010. | 29 | Brinker Capital
Destinations
Trust
(registered
investment
company with
10 portfolios);
Third Avenue
Trust
(registered
investment
company with
4 portfolios);
Third Avenue
Variable Series
Trust
(registered
investment
company with
1 portfolio);
Polen Credit
Opportunities
Fund (registered
investment
company). |
POLEN FUNDS
Fund Management (Continued)
(Unaudited)
Name
and Date of Birth | Position(s)
Held
with Trust | Term of Office
and Length of
Time Served | Principal Occupation(s)
During Past Five Years | Number of
Funds in
Trust
Complex
Overseen
by
Trustee | Other
Directorships
Held by
Trustee |
NANCY B. WOLCOTT
Date of Birth: 11/54 | Trustee | Shall serve until
death, resignation
or removal.
Trustee since
2011. | Retired since May 2014; EVP, Head of GFI Client Service Delivery, BNY Mellon from January 2012 to May 2014; EVP, Head of US Funds Services, BNY Mellon from July 2010 to January 2012; President of PNC Global Investment Servicing from 2008 to July 2010; Chief Operating Officer of PNC Global Investment Servicing from 2007 to 2008; Executive Vice President of PFPC Worldwide Inc. from 2006 to 2007. | 29 | Lincoln
Variable
Trust
Products Trust
(registered
investment
company with
97 portfolios);
Third Avenue
Trust
(registered
investment
company with
4 portfolios);
Third Avenue
Variable Series
Trust
(registered
investment
company with
1 portfolio);
Polen Credit
Opportunities
Fund (registered
investment
company). |
STEPHEN M. WYNNE
Date of Birth: 1/55 | Trustee | Shall serve until
death, resignation
or removal.
Trustee since
2009. | Retired since December 2010; Chief Executive
Officer of US Funds Services, BNY Mellon Asset Servicing from July 2010 to December 2010; Chief Executive Officer of PNC Global Investment Servicing from March 2008 to July 2010; President, PNC Global Investment Servicing from 2003 to 2008. | 29 | Copeland Trust
(registered
investment
company with
3 portfolios);
Third Avenue
Trust
(registered
investment
company with
4 portfolios);
Third Avenue
Variable Series
Trust
(registered
investment
company with
1 portfolio);
Polen Credit
Opportunities
Fund (registered
investment
company). |
POLEN FUNDS
Fund Management (Concluded)
(Unaudited)
Name
and Date of Birth | Position(s) Held
with Trust | Term of Office
and Length of
Time Served | Principal Occupation(s)
During Past Five Years |
| EXECUTIVE OFFICERS |
JOEL L. WEISS
Date of Birth: 1/63 | President and Chief
Executive Officer | Shall serve until death,
resignation or removal. Officer
since 2007. | President of JW Fund Management LLC since June 2016; Vice President and Managing Director of BNY Mellon Investment Servicing (US) Inc. and predecessor firms from 1993 to June 2016. |
CHRISTINE S. CATANZARO
Date of Birth: 8/84 | Treasurer and Chief Financial Officer | Shall serve until death,
resignation or removal. Officer
since 2022. | Financial Reporting Consultant from October 2020 to September 2022; Senior Manager, Ernst & Young LLP from March 2013 to October 2020. |
T. RICHARD KEYES
Date of Birth: 1/57 | Vice President
| Shall serve until death,
resignation or removal. Officer
since 2016. | President of TRK Fund Consulting LLC since July 2016; Head of Tax — U.S. Fund Services of BNY Mellon Investment Servicing (US) Inc. and predecessor firms from February 2006 to July 2016. |
GABRIELLA
MERCINCAVAGE
Date of Birth: 6/68 | Assistant Treasurer | Shall serve until death,
resignation or removal. Officer
since 2019. | Fund Administration Consultant since January 2019; Fund
Accounting and Tax Compliance Accountant to financial
services companies from November 2003 to July 2018. |
VINCENZO A. SCARDUZIO
Date of Birth: 4/72 | Secretary | Shall serve until death,
resignation or removal. Officer
since 2012. | Director and Senior Vice President Regulatory Administration of The Bank of New York Mellon and predecessor firms since 2001. |
JOHN CANNING
Date of Birth: 11/70 | Chief Compliance
Officer and Anti-Money
Laundering Officer | Shall serve until death,
resignation or removal. Officer
since 2022. | Director of Chenery Compliance Group, LLC from March 2021 to present; Senior Consultant of Foreside Financial Group from August 2020 to March 2021; Chief Compliance Officer & Chief Operating Officer of Schneider Capital Management LP from May 2019 to July 2020; Chief Operating Officer and Chief Compliance Officer of Context Capital Partners, LP from March 2016 to March 2018 and February 2019, respectively. |
Investment Advisers
Polen Capital Management, LLC
1825 NW Corporate Blvd.
Suite 300
Boca Raton, FL 33431
Polen Capital Credit, LLC
1075 Main Street
Suite 320
Waltham, MA 02451
Administrator
The Bank of New York Mellon
103 Bellevue Parkway
Wilmington, DE 19809
Transfer Agent
BNY Mellon Investment Servicing (US) Inc.
500 Ross Street, 154-0520
Pittsburgh, PA 15262
Principal Underwriter
Foreside Funds Distributors LLC
Three Canal Plaza, Suite 100
Portland, ME 04101
Custodian
The Bank of New York Mellon
240 Greenwich Street
New York, NY 10286
Independent Registered Public Accounting Firm
PricewaterhouseCoopers LLP
Two Commerce Square, Suite 1800
2001 Market Street
Philadelphia, PA 19103-7042
Legal Counsel
Troutman Pepper Hamilton Sanders LLP
3000 Two Logan Square
18th and Arch Streets
Philadelphia, PA 19103
| Polen Growth & Income Fund |
of
FundVantage Trust
ANNUAL REPORT
April 30, 2024
IMPORTANT NOTICE – UPCOMING CHANGES TO POLEN GROWTH & INCOME FUND ANNUAL & SEMI-ANNUAL REPORTS
The Securities and Exchange Commission (the “SEC”) has adopted rule and form amendments that will result in changes to the design and delivery of annual and semi-annual shareholder reports (“Reports”). Beginning in July 2024, Reports will be streamlined to highlight key information (“Redesigned Reports”). Certain information currently included in the Reports, including financial statements, will no longer appear in the Redesigned Reports but will be available online, delivered free of charge to shareholders upon request, and filed with the SEC.
If you previously elected to receive the Fund's Reports electronically, you will continue to receive the Redesigned Reports electronically. Otherwise, you will receive paper copies of the Fund's Redesigned Reports via USPS mail for all Reports transmitted after July 2024. If you would like to receive the Fund's Redesigned Reports (and/or other communications) electronically instead of by mail, please call (888) 678-6024.
This report is submitted for the general information of shareholders and is not authorized for distribution to prospective investors unless preceded or accompanied by a current prospectus.
POLEN GROWTH & INCOME FUND
Annual Investment Adviser's Report
April 30, 2024
(Unaudited)
Dear Shareholders,
For a good portion of the reporting period, against all odds and despite a confluence of economic, financial, and geopolitical headwinds, the global economy not only averted a highly anticipated recession but showcased remarkable resiliency. Against this backdrop, market sentiment across equity and leveraged credit market investors could be considered cautiously optimistic. Equities witnessed a bullish trend, driven by relatively strong corporate earnings and positive economic indicators. Although faced with continued economic uncertainty and price volatility, leveraged credit markets saw increased demand as investors sought to lock in compelling all-in yields.
While some economies averted a gradual economic slowdown, China was much discussed as it endured a challenging backdrop, with economic readings indicating a more conservative growth outlook. U.S. markets performed better than expected, with robust labor market conditions, solid consumer spending, and healthy corporate revenues and profit margins despite an anticipated economic downturn. Geopolitical conflicts ongoing in Ukraine and the war between Israel and Hamas brought disruptions in various regions and headwinds for the financial and energy sectors, prompting investor flights to safety.
As fundamental, bottom-up-driven investors, current environment conditions reinforce our discipline and commitment to our investment process across asset classes and our long-term mindset.
Look Back on Equity Markets
During 2023, we witnessed a return to rewarding robust fundamentals in developed equity markets like the U.S., with relatively strong corporate earnings and a favorable slate of economic indicators. On a global level, the period was heavily influenced by macroeconomic headlines, the uncertain trajectory for economic growth, shifting global inflation dynamics, interest rates, and the subsequent impact on financial markets. Outside of China, we saw some emerging countries display impressive growth, reinforcing our view that emerging markets will be more prominent in driving economic growth in the years ahead.
A duration-driven sell-off ensued in September 2023, attributed to growing investor concern about the sustainability of the economic recovery. As the post-COVID recovery matured, investors began questioning the duration of growth rates. Building inflationary pressures due to supply chain disruptions, labor shortages, and rising commodity prices led investors to question the potential impact of higher inflation on corporate profits and the overall economy. As 2023 came to a close, a few critical macroeconomic events helped trigger a broad-based U.S. equity rally, including cooling inflation, a more dovish stance from the U.S. Federal Reserve (“Fed”) on the path of interest rates, and better-than-expected corporate earnings and U.S. GDP results. Low-quality businesses led this rally.
In many ways, the start of 2024 marked a continuation of the market dynamics already in place at the end of 2023. The rally continued unabated into the first quarter, with much of the same high-momentum, highly cyclical leadership witnessed in 2023. This optimism emanated globally, particularly thoughts that cooling inflation would cause interest rates to retreat to more normal levels. Despite softening inflation data, the Fed, the European Central Bank, and the Bank of England left rates unchanged. Given our high-quality orientation, this low “risk-on” environment persisted into 2024, presenting headwinds for quality strategies such as ours.
The market enthusiasm at the start of 2024, spurred by possible rate cuts, a more likely soft landing, and all things generative artificial intelligence-related, gave way to weakness in April as hopes dimmed on the likelihood of near-term rate cuts, potentially not until November 2024. As the reporting period came to a close, interest rate expectations yet again drove equity market returns. Consumer Price Index data over the Fed target shaped market expectations for interest rate cuts, with the first cuts now expected in November 2024. These interest rate expectations impacted equities negatively, with lower-quality businesses suffering the most.
Look Back on Leveraged (High Yield) Credit Markets
In 2023, leveraged (high yield) credit markets demonstrated resiliency despite unrelenting geopolitical and macroeconomic uncertainty. At the onset of last year, prospects of a highly anticipated recession weighed on sentiment. Markets remained optimistically cautious and were encouraged as the prospects of an economic “soft landing” materialized. Fed policy decisions intended to curb inflation and stimulate economic growth were crucial in shaping high yield bond market performance during the past year. Most notably, benign inflation and dovish Fed rhetoric helped drive interest rates meaningfully lower, which benefited high yield bonds, especially in the fourth calendar quarter “Q4” 2023. Further, credit spreads tightened for high yield bonds and leveraged loans in connection with better-than-expected earnings and resilient economic growth. Credit volatility subsided throughout 2023 despite a brief uptick in October. Despite this volatility in credit spreads, 2023 reached a conciliatory close, with both high yield bonds and leveraged loans producing significant gains.
In 2023, high yield bonds outperformed their floating-rate peers. However, much of this outperformance came in the last two months of 2023, as falling U.S. Treasury yields and economic growth fueled a rally in high yield bond prices. The rate declines toward
POLEN GROWTH & INCOME FUND
Annual Investment Adviser’s Report (Continued)
April 30, 2024
(Unaudited)
the end of 2023 prompted many leveraged credit issuers to capitalize on lower interest costs by refinancing existing debt in early 2024. This dynamic was prevalent across ratings tiers and brought issuers of lower-rated credits back to the primary market. Open capital markets allowed issuers to extend maturities given healthy investor demand for new issuance, which provided much-needed breathing room. While default activity increased in 2023, default rates in the high yield bond and leveraged loan markets during that year remained below their historical averages of approximately 3%.
Going Forward
As 2024 continues, we remain optimistic about the future and anticipate a vast opportunity set for investors across the equity and credit spectrum. Yet, we expect the backdrop to remain highly uncertain amid ongoing geopolitical challenges, raising the possibility of elevated bouts of volatility.
On the equity side, while market sentiment has markedly improved in recent months, the consensus now expects a soft landing and stabilization of the interest rate environment. Only a few months ago, the consensus called for rates to remain “higher for longer,” and expectations for imminent recession were not uncommon. Regardless of the near-term direction of the global economy, we aim to continue to invest in what we view as more predictable, highly competitively advantaged growth businesses that can drive earnings growth to deliver long-term returns in line with our investment goals.
We believe discerning investors should favor an active approach, as we forecast a wide dispersion of performance outcomes between what we believe to be high-quality and low-quality companies. Our research and experience tell us that high-quality, innovative businesses that re-invest in their futures, develop disruptive technologies, and open new markets are compelling factors that could determine a business's long-term success.
On the leveraged credit market side, markets ended 2023 on a high note, which so far has extended into 2024, albeit at a more subdued pace. Both the high yield bond and leveraged loan markets have ground tighter in the face of increasing U.S. Treasury yields and continued domestic and geopolitical challenges. We expect that the upcoming U.S. presidential election will likely influence markets as the year progresses. So far this year, aggregate leveraged credit market fundamentals remain healthy. Although we anticipate volatility for the remainder of the year, our analysis leads us to believe that current yields are compelling.
We remain committed to our long-term approach despite the temptation to ride short trends or invest in low-quality equity or credit without attention to the underlying fundamentals. We continue to seek compelling investment opportunities through our active investment approach. Thank you for your continued support and for placing your trust in us.
This content is being provided for informational purposes only. Although the information and any opinions or views given have been obtained from or based on sources believed to be reliable, no warranty or representation is made as to their correctness, completeness or accuracy. Opinions, estimates, forecasts, and statements of financial market trends that are based on current market conditions constitute the judgment of the investment adviser and are subject to change without notice, including any forward-looking estimates or statements. The views and strategies described may not be suitable for all clients. References to specific securities, asset classes and financial markets are for illustrative purposes only and are not intended to be, and should not be interpreted as, recommendations. This disclosure does not identify all the risks (direct or indirect) or other considerations which might be material when entering any financial transaction. The views and strategies described may not be suitable for all clients.
POLEN GROWTH & INCOME FUND
Annual Investment Adviser’s Report (Continued)
April 30, 2024
(Unaudited)
The Polen Growth & Income Fund (“the Fund”) was incepted during the fiscal year ended April 30, 2024. Since the Fund’s inception on September 29, 2023 through April 30, 2024, the Fund returned 10.33% net of fees. As of April 30, 2024, 59% of the Fund was invested in the Global Growth Equity Portfolio and 41% of the Fund was invested in the High Yield Fixed Income Portfolio.
The performance data quoted represents past performance and is not a guarantee of future results. Investment return and principal value of an investment will fluctuate so that an investor's shares, when redeemed, may be worth more or less than their original cost. Current performance may be lower or higher than the performance information quoted. To obtain performance information current to the most recent month-end, please call 1-888 678-6024.
High Yield Fixed Income Portfolio Sleeve (Polen Capital Credit, LLC)
High Yield Fixed Income Portfolio Top Contributors:
During the period, the top absolute contributors to the Fund’s High Yield Fixed Income Portfolio’s performance were National Financial Partners, Internet Brands, and Tenet Healthcare Corporation.
• National Financial Partners (“NFP”) is a leading insurance broker and consultant that helps provide clients with a range of brokerage and advisory services, including corporate benefits, property & casualty, retirement, individual insurance, and wealth management solutions. NFP participates in an attractive end market as commercial insurance demand is highly recurring given that commercial customers need to purchase insurance to protect the assets and employees of a business each year. In December 2023, Aon Plc announced it was acquiring NFP for $13.4 billion. Following the acquisition announcement, the price of NFP’s 6.875% Senior Notes due 2028 held by the Fund increased on the expectation that all of NFP’s debt would be repaid in connection with the transaction. The debt was ultimately repaid in April 2024 in connection with Aon’s acquisition of NFP. The Fund no longer has any exposure to this issuer.
• Internet Brands is a leading online media company targeting the large addressable markets of health, legal and automotive. The company’s health division represents nearly three-quarters of its total revenue. The health division also includes one of the top-rated digital health resource platforms for physicians and healthcare professionals globally, based on our research, and WebMD, the consumer-focused health information and services platform. Additionally, the company has a joint venture that provides dental practice management software. In the legal market, the company has leading websites including NOLO.com and Avvo.com that connect consumers with legal professionals. Lastly, the company also owns branded websites including CarsDirect, ApartmentRatings and Fodor’sTravel. The Fund’s investment in the Company’s SOFR +4.25% First Lien Term Loan due 2028 and SOFR +6.25% Second Lien Term Loan due 2029 traded up during the period. The company experienced moderate softness in advertising demand in early 2023, with its health division seeing some pull-back from a COVID driven surge, and other segments impacted by general caution around spending on marketing into an uncertain economic backdrop. Internet Brands was able to cut costs and since that time, the underlying advertising demand for the company’s end markets has improved and the business has returned to growth, driving up the trading levels of both Term Loans. We chose to exit the Fund’s position in the First Lien Term Loan in March 2024 while the Fund continues to hold the Second Lien Term Loan.
• Tenet Healthcare, through its subsidiaries, owns or operates general hospitals and related health care facilities serving communities in the United States. The company operates rehabilitation hospitals, specialty hospitals, long-term care facilities, psychiatric facilities, and medical office buildings near its general hospitals, as well as ancillary health care businesses. The Fund’s investment in the company’s 5.125% First Lien Notes due 2027 and 6.125% Senior Notes due 2028 performed well during the period, and in particular, during Q4 2023. The company reported Q4 2023 results that were slightly ahead of consensus, driven by better-than-expected price and prudent cost management, particularly in the hospital business. In addition, in 2024 the company has reported solid first calendar quarter "Q1" 2024 results, raised guidance for the year as well as announced a number of asset sales at accretive valuations, with at least a portion of the proceeds expected to be used for debt reduction. We expect continued growth in 2024 and believe both the First Lien Loans and Senior Notes offer an attractive risk-versus-reward profile. As such, the Fund continues to hold these positions.
POLEN GROWTH & INCOME FUND
Annual Investment Adviser’s Report (Continued)
April 30, 2024
(Unaudited)
High Yield Fixed Income Portfolio Top Detractors:
CCO Holdings, Baffinland Iron Mines, and Hertz Corporation were the top absolute detractors to the Fund’s High Yield Fixed Income Portfolio’s performance during the period.
• CCO Holdings operates as a cable telecommunications company. The company offers cable broadcasting, internet, voice, and mass media services. The company serves customers in the United States. The Fund’s investment in the company’s 4.25% Senior Notes due 2034, 4.5% Senior Notes due 2032, and 4.5% Senior Notes due 2033, which were initiated in January 2024, detracted from total returns during the period. The Senior Notes underperformed over concerns of a sustained elevated competitive landscape for broadband customers. We believe that the company is well positioned within the industry given the company’s ability to offer a converged wireless and fixed bundle and is in a strong position to grow through subsidized rural broadband buildouts. As such, the Fund maintains its position in the Senior Notes.
• Baffinland Iron Mines is an iron ore mining company based in Baffin Island in Nunavut, Canada. The company owns one of the largest and deepest reserves of high-quality iron ore in the world. Our research shows that the company’s naturally occurring lump product, along with high iron ore grades, makes it the producer of the world’s highest grade direct shipping ore. The Fund’s investment in the company’s 8.75% First Lien Notes due 2026 detracted from total returns during the period. The First Lien Notes were downgraded by both Moody’s (October 2023) and S&P (January 2024) with the agencies citing the company’s upcoming revolving credit facility maturity in May 2024. Subsequently, in March 2024, the company extended the maturity of this facility until May 2025 and as part of such extension, the Company’s sponsors announced that they are putting in $100 million of equity in the form of a royalty. We believe that Baffinland offers a compelling, cash generative growth opportunity as the company looks to expand its operations and increase its potential production from 6.0 million tons per annum (“Mtpa”) to 12.0 – 18.0 Mtpa. The First Lien Notes held by the Fund offer an above market yield and we believe that the First Lien Notes are well covered by the Company’s assets.
• Hertz Corporation operates as a car rental company and serves customers worldwide. The company provides equipment and automobile rental services, as well as offers ancillary products to business and leisure travelers. The Fund’s investment in the company’s 4.625% Senior Notes due 2026, which was initiated in February 2024, detracted from total returns during the period. In April 2024, the company reported 1Q 2024 results that were below conservative estimates, driven by sizable write-downs on the sale of electric vehicles as well as higher than expected fleet depreciation expense. We believe these elevated costs more than offset the underlying demand trends which remain encouraging as consumers continue to spend dollars on travel and related expenditures. The Fund continues to hold the Senior Notes as we believe that the company has avenues through which it could raise liquidity if needed and that the company’s internal improvement plan will begin to show tangible benefits. The Senior Notes are the first maturity of the company and thus are expected to be the first issue addressed by the company in the future.
Global Growth Sleeve (Polen Capital Management, LLC)
Global Growth Equity Portfolio Top Contributors:
During the period, the top absolute contributors to the Fund’s Global Growth Equity Portfolio’s performance were Amazon, SAP, and Microsoft.
• Amazon was our top absolute contributor as the company reported robust earnings, heavily driven by profit margin expansion, as we expected. Amazon is our largest position as of April 30, 2024. Much of our investment thesis is based on the company’s historically solid and durable earnings growth from its three biggest businesses (e-commerce, Amazon Web Services, and advertising) and disciplined expense management that has supported robust margin expansion and earnings growth. It was only about a year ago that Amazon’s margins bottomed at 1.9%. They are now back to roughly 8%, and we think their margins can expand significantly from here.
• SAP is a German-headquartered global enterprise resource planning (“ERP”) software company. SAP’s transition to the cloud (a core part of our thesis on the business) continues at pace, and the company is seeing both strong cloud revenue growth and expanding cloud gross margins. Management has guided that cloud sales growth through 2025 is expected to be in the mid-20% range, which we view as both reasonable and attractive. We also view SAP as one of the more resilient software business models as it is an essential part of their customers’ day-to-day operations and cannot easily be turned off or scaled back.
• Microsoft delivered stronger than expected results and the stock responded positively to accelerating growth in its cloud offering. The company continues to invest heavily behind the opportunity to integrate artificial intelligence into its different product offerings.
POLEN GROWTH & INCOME FUND
Annual Investment Adviser’s Report (Continued)
April 30, 2024
(Unaudited)
Now among the largest companies in the world, Microsoft continues to surprise investors by its historical ability to expand its total addressable market and drive profitable growth.
Global Growth Equity Portfolio Top Detractors:
Align Technology, Aon, and Adobe were the top absolute detractors to the Fund’s Global Growth Equity Portfolio’s performance for the period.
• Align Technology ("Align") is the leader in clear orthodontic aligners taking share from the existing standard, wires and brackets. The business has been challenged over the past year as Align is a big-ticket consumer discretionary item largely focused on adults, meaning a pressured consumer can defer this purchase for some time. In the face of a potentially worsening macro environment and very low visibility for Align, we decided to eliminate the position in Q4 2023. With that said, we believe Align remains a dynamic growth business and one which we’ll continue to follow, especially given the issues facing it today seem unrelated to competition.
• Aon ended their fiscal year 2023 with high-single digit organic revenue growth and low double digit profit growth, in line with our long-term expectations. The company’s management is guiding for mid-single digit or better organic revenue growth for their fiscal year 2024 with operating margins that are expected to expand as well. Additionally, Aon’s acquisition of NFP brings the company into the middle-market insurance brokerage space for the first time where we expect their brand and scale should be advantageous.
• Adobe reported a weaker than expected second quarter 2024forecast which caused some investors to question whether artificial intelligence is emerging as more of a threat to Adobe’s dominance in the creative sphere. Notably, the stock’s sell off comes on the back of a very strong run through much of 2023 where excitement had built up around the company’s Firefly offering.
This letter is intended to assist shareholders in understanding how the Fund performed since its inception on September 29, 2023 through April 30, 2024 and reflects the views of the investment adviser and sub adviser at the time of this writing. Of course, these views may change and do not guarantee the future performance of the Fund or the markets.
This content is being provided for informational purposes only. Although the information and any opinions or views given have been obtained from or based on sources believed to be reliable, no warranty or representation is made as to their correctness, completeness or accuracy. Opinions, estimates, forecasts, and statements of financial market trends that are based on current market conditions constitute the judgment of the investment adviser and are subject to change without notice, including any forward-looking estimates or statements.
The Fund is a newly formed mutual fund and has no history of operations. Debt securities in which the Fund invests are subject to several types of investment risk, including market or interest rate risk (i.e., the risk that their value will be inversely affected by fluctuations in the prevailing interest rates), credit risk (i.e., the risk that the issuer may be unable to make timely interest payments and repay the principal upon maturity), call or income risk, (i.e., the risk that certain debt securities with high interest rates will be prepaid or “called” by the issuer before they mature), and event risk (i.e., the risk that certain debt securities may suffer a substantial decline in credit quality and market value if the issuer restructures). Fixed income markets have recently experienced a period of relatively high volatility which could negatively impact the Fund’s performance. The Fund’s investment in secured and unsecured assignments of (or participation in) bank loans may create substantial risk.
High yield securities (also known as junk bonds) are generally considered riskier than investment grade, fixed income securities. High yield securities are regarded as predominantly speculative with respect to the issuer’s continuing ability to meet principal and interest payments.
The Fund’s investment in foreign stocks may underperform and be more volatile than U.S. stocks. Risks relating to investments in foreign securities (including, but not limited to): currency exchange rate fluctuation; taxes; less available public information about the issuers of securities; less stringent regulatory standards; lack of uniform accounting, auditing and financial reporting standards; and country risks including less liquidity, high inflation rates, unfavorable economic practices and political instability. The Fund may invest in medium-capitalization companies that tend to trade less frequently and in smaller volumes, and as a result, may be less liquid than securities of larger companies. In addition, mid-cap companies may be more vulnerable to economic, market and industry changes, limited product lines with fewer financial resources which could cause price changes to be more sudden or erratic.
POLEN GROWTH & INCOME FUND
Annual Investment Adviser’s Report (Concluded)
April 30, 2024
(Unaudited)
Emerging markets are riskier than more developed markets because they tend to develop unevenly and may never fully develop. Investments in emerging markets may be considered speculative. Emerging markets are more likely to experience hyperinflation and currency devaluations, which adversely affect returns to U.S. investors. In addition, many emerging securities markets have far lower trading volumes and less liquidity than developed markets.
Portfolio composition is subject to change. The current and future portfolio holdings of the Fund are subject to investment risk. The investment return and principal value of an investment in the Fund will fluctuate so that an investor’s shares, when redeemed, may be worth more or less than their original cost.
The information provided in this document should not be construed as a recommendation to purchase or sell any particular security. The securities discussed do not necessarily represent the entire portfolio. It should not be assumed that any of the securities transactions or holdings discussed were or will prove to be profitable or that any future investment recommendations will equal the investment performance of the securities discussed herein. For a complete list of the investment adviser’s past specific recommendations and holdings and a list of current holdings as of the current quarter end, please contact info@polencapital.com.
The views and strategies described may not be suitable for all clients. This disclosure does not identify all the risks (direct or indirect) or other considerations which might be material when entering any financial transaction.
Duration-driven sell-off: A duration-driven sell-off is a market occurrence characterized by a prolonged period of declining asset prices, typically driven by changes in market sentiment and investor behavior.
POLEN GROWTH & INCOME FUND
Annual Report
Performance Data
April 30, 2024
(Unaudited)
Comparison of Change in Value of $10,000 Investment in Polen Growth & Income Fund Institutional Class Shares vs. MSCI All Country World® Index (“ACWI”) (Net Dividend) and 60% MSCI All Country World® Index and 40% ICE BofA U.S. High Yield Index (“Blended Index”)
| Total Returns for the Periods Ended April 30, 2024 |
| | Since
Inception*† |
| Institutional Class | 10.33% |
| MSCI All Country World® Index (“ACWI”) (Net Dividend) | 17.00% ** |
| 60% MSCI All Country World® Index and 40% ICE BofA U.S. High Yield Index (“Blended Index”) | 13.48% ** |
| † | Not Annualized. |
| * | The Polen Growth & Income Fund (the “Fund”) Institutional Class commenced operations on October 2, 2023. |
| ** | Benchmark performance is from the commencement date of the Fund Class only and is not the commencement date of the benchmark itself. |
The performance data quoted represents past performance and does not guarantee future results. Current performance may be lower or higher. Performance data current to the most recent month-end may be obtained by calling (888) 678-6024. The investment return and principal value of an investment will fluctuate so that shares, when redeemed, may be worth more or less than their original cost. The graph and table do not reflect the deduction of taxes that a shareholder would pay on Fund distributions or the redemption of Fund shares.
The Fund’s “Total Annual Fund Operating Expenses” and “Total Annual Fund Operating Expenses After Fee Waiver and/or Expense Reimbursement”, as stated in the current prospectus dated December 28, 2023, are 1.77% and 0.75%, respectively, for the Institutional Class shares of the Fund’s average daily net assets, which may differ from the actual expenses incurred by the Fund for the period covered by this report. Polen Capital Management, LLC (“Polen Capital” or the “Adviser”) has contractually agreed to reduce its investment advisory fee and/or reimburse certain expenses of the Fund to the extent necessary to ensure that the Fund’s total operating expenses (excluding taxes, fees and expenses attributable to a distribution or service plan adopted by FundVantage Trust (the "Trust"), interest, extraordinary items, “Acquired Fund Fees and Expenses” and brokerage commissions) do not exceed 0.75% (on an annual basis) with respect to the Fund’s average daily net assets (the “Expense Limitation”). The Expense Limitation will remain in place until August 31, 2025 unless the Board of Trustees (“Board of Trustees”) of the Trust approves its earlier termination. The Adviser is entitled to recover, subject to approval by the Board of Trustees, such amounts reduced or reimbursed for a period of up to three (3) years from the date on which the Adviser reduced its compensation and/or assumed expenses for the Fund. The Adviser is permitted to seek reimbursement from the Fund, for fees it waived and Fund expenses it paid to the extent the total annual fund operating expenses do not exceed the limits described above or any lesser limits in effect at the time of the reimbursement. No reimbursement will occur unless the Fund’s expenses are below the Expense Limitation amount. Total returns would be lower had such fees and expenses not been waived and/or reimbursed.
POLEN GROWTH & INCOME FUND
Annual Report
Performance Data (Concluded)
April 30, 2024
(Unaudited)
The Fund evaluates its performance as compared to that of the MSCI ACWI (Net Dividend) and an unmanaged, blended index (the "Blended Index") composed of 60% MSCI ACWI (Net Dividend) and 40% ICE BofA U.S. High Yield Index. The MSCI ACWI (Net Dividend) captures large and mid-cap representation across 23 Developed Markets (DM) and 24 Emerging Markets (EM) countries. With 2,948 constituents, the index covers approximately 85% of the global investable equity opportunity set. The ICE BofA U.S. High Yield Index is a broad unmanaged high yield index. The volatility and other material characteristics of the indices referenced may be materially different from the performance achieved. Holdings of portfolios pursuing the strategy may be materially different from those within the index. Indices are unmanaged. The two indices comprising the Blended Index measure, respectively, the performance of global equity securities and the performance of U.S. dollar denominated, below investment grade rated corporate debt. Indexes are unmanaged and it is not possible to invest directly in an index.
POLEN GROWTH & INCOME FUND
Fund Expense Disclosure
April 30, 2024
(Unaudited)
As a shareholder of the Fund, you incur two types of costs: (1) transaction costs, and (2) ongoing costs, including management fees, distribution and/or service (Rule 12b-1) fees (if any) and other Fund expenses. These examples are intended to help you understand your ongoing costs (in dollars) of investing in the Fund(s) and to compare these costs with the ongoing costs of investing in other mutual funds.
These examples are based on an investment of $1,000 invested at the beginning of the six-month period from November 1, 2023 through April 30, 2024 and held for the entire period.
Actual Expenses
The first line of each accompanying table provides information about actual account values and actual expenses. You may use the information in this line, together with the amount you invested, to estimate the expenses that you paid over the period. Simply divide your account value by $1,000 (for example, an $8,600 account value divided by $1,000 = 8.6), then multiply the result by the number in the first line under the heading entitled “Expenses Paid During Period” to estimate the expenses you paid on your account during this period.
Hypothetical Examples for Comparison Purposes
The second line of each accompanying table provides information about hypothetical account values and hypothetical expenses based on the Fund's actual expense ratio and an assumed rate of return of 5% per year before expenses, which is not your Fund's actual return. The hypothetical account values and expenses may not be used to estimate the actual ending account balance or expenses you paid for the period. You may use this information to compare the ongoing costs of investing in the Fund and other funds. To do so, compare these 5% hypothetical examples with the 5% hypothetical examples that appear in the shareholder reports of other funds.
Please note that the expenses shown in the accompanying table are meant to highlight your ongoing costs only and do not reflect any transactional costs, such as sales charges (loads) on purchase payments (if any) or redemption fees. Therefore, the second line of each accompanying table is useful in comparing ongoing costs only and will not help you determine the relative total costs of owning different funds. In addition, if these transactional costs were included, your costs would have been higher.
| | Beginning Account Value
November 1, 2023 | | Ending Account Value
April 30, 2024 | | Annualized
Expense Ratio | | Expenses Paid
During Period* |
| Polen Growth & Income Fund |
| Institutional Class | | | | | | | |
| Actual | $1,000.00 | | $1,123.50 | | 0.75% | | $3.96 |
| Hypothetical (5% return before expenses) | 1,000.00 | | 1,021.13 | | 0.75% | | 3.77 |
| * | Expenses are equal to an annualized expenses ratio for the six-month period ended April 30, 2024 of 0.75% for the Fund, multiplied by the average account value over the period, multiplied by the number of days in the most recent period (182), then divided by 366 to reflect the period. The Fund’s ending account value on the first line in the table is based on the actual six-month total return for the Fund of 12.35%. |
Polen Growth & Income Fund
Portfolio Holdings Summary Table
April 30, 2024
(Unaudited)
The following table presents a summary by industry of the portfolio holdings of the Fund:
| | % of Net
Assets | | Value |
| COMMON STOCKS: | | | |
| Software Application | 10.7% | | $ 700,123 |
| Internet Retail | 6.3 | | 411,775 |
| Software Infrastructure | 6.2 | | 401,524 |
| Credit Services | 5.3 | | 343,925 |
| Internet Content & Information | 4.9 | | 317,261 |
| Medical Devices | 4.4 | | 285,122 |
| Diagnostics & Research | 3.9 | | 252,529 |
| Biotechnology | 2.8 | | 185,028 |
| Information Technology Services | 2.4 | | 157,587 |
| Insurance Brokers | 2.1 | | 136,211 |
| Financial Data & Stock Exchanges | 2.1 | | 135,079 |
| Staffing & Employment Services | 1.9 | | 121,671 |
| Household & Personal Products | 1.8 | | 117,213 |
| Luxury Goods | 1.6 | | 104,322 |
| Travel Services | 1.3 | | 83,883 |
| CORPORATE BONDS: | | | |
| Materials | 4.6 | | 297,628 |
| Industrial Products | 4.4 | | 285,340 |
| Health Care | 2.9 | | 186,399 |
| Insurance | 2.6 | | 168,064 |
| Software & Technology Services | 2.2 | | 144,259 |
| Consumer Discretionary Products | 1.9 | | 125,421 |
| Retail & Wholesale - Discretionary | 1.5 | | 97,221 |
| Media | 1.1 | | 75,061 |
| Retail & Wholesale - Staples | 1.0 | | 66,440 |
| Oil & Gas | 0.8 | | 54,514 |
| Consumer Discretionary Services | 0.7 | | 47,057 |
| Consumer Staple Products | 0.7 | | 43,328 |
| SENIOR LOANS: | | | |
| Health Care | 2.6 | | 166,737 |
| Media | 2.4 | | 153,659 |
| Consumer Discretionary Services | 1.9 | | 124,422 |
| Materials | 1.5 | | 99,139 |
| Software & Technology Services | 1.3 | | 82,757 |
| Industrial Services | 0.8 | | 53,962 |
| Industrial Products | 0.8 | | 49,950 |
| Consumer Staple Products | 0.6 | | 39,913 |
| Retail & Wholesale - Discretionary | 0.5 | | 35,359 |
| Technology Hardware & Semiconductors | 0.4 | | 27,786 |
| Telecommunications | 0.4 | | 24,887 |
| Consumer Discretionary Products | 0.3 | | 20,050 |
| Financial Services | 0.3 | | 15,955 |
| Insurance | 0.2 | | 13,565 |
| Other Assets in Excess of Liabilities | 3.9 | | 255,533 |
| NET ASSETS | 100.0% | | $6,507,659 |
Portfolio holdings are subject to change at any time.
See Note 1. The industry designations set forth in the schedule above are those of the Bloomberg Industry Classification System (“BICS”).
The accompanying notes are an integral part of the financial statements.
POLEN GROWTH & INCOME FUND
Portfolio of Investments
April 30, 2024
| | Number
of Shares | | Value |
| COMMON STOCKS† — 57.7% |
| Biotechnology — 2.8% |
| CSL Ltd. | 399 | | $ 70,893 |
| Novo Nordisk AS, Class B | 890 | | 114,135 |
| | | | 185,028 |
| Credit Services — 5.3% |
| Mastercard, Inc., Class A | 386 | | 174,163 |
| Visa, Inc., Class A | 632 | | 169,762 |
| | | | 343,925 |
| Diagnostics & Research — 3.9% |
| ICON PLC* | 485 | | 144,472 |
| Thermo Fisher Scientific, Inc. | 190 | | 108,057 |
| | | | 252,529 |
| Financial Data & Stock Exchanges — 2.1% |
| MSCI, Inc. | 290 | | 135,079 |
| Household & Personal Products — 1.8% |
| L'Oreal SA | 250 | | 117,213 |
| Information Technology Services — 2.4% |
| Accenture PLC, Class A | 332 | | 99,902 |
| Globant SA* | 323 | | 57,685 |
| | | | 157,587 |
| Insurance Brokers — 2.1% |
| Aon PLC, Class A | 483 | | 136,211 |
| Internet Content & Information — 4.9% |
| Alphabet, Inc., Class C* | 1,927 | | 317,261 |
| Internet Retail — 6.3% |
| Amazon.com, Inc.* | 2,353 | | 411,775 |
| Luxury Goods — 1.6% |
| LVMH Moet Hennessy Louis Vuitton SE | 127 | | 104,322 |
| Medical Devices — 4.4% |
| Abbott Laboratories | 1,668 | | 176,758 |
| Siemens Healthineers AG(a) | 1,954 | | 108,364 |
| | | | 285,122 |
| Software Application — 10.7% |
| Autodesk, Inc.* | 330 | | 70,241 |
| Paycom Software, Inc. | 428 | | 80,455 |
| Sage Group PLC (The) | 4,825 | | 69,967 |
| SAP SE | 1,286 | | 232,209 |
| ServiceNow, Inc.* | 106 | | 73,493 |
| Workday, Inc., Class A* | 710 | | 173,758 |
| | | | 700,123 |
| | Number
of Shares | | Value |
| COMMON STOCKS — (Continued) |
| Software Infrastructure — 6.2% |
| Adobe, Inc.* | 346 | | $ 160,139 |
| Microsoft Corp. | 620 | | 241,385 |
| | | | 401,524 |
| Staffing & Employment Services — 1.9% |
| Automatic Data Processing, Inc. | 503 | | 121,671 |
| Travel Services — 1.3% |
| Airbnb, Inc., Class A* | 529 | | 83,883 |
TOTAL COMMON STOCKS
(Cost $3,389,895) | | | 3,753,253 |
| | Par
Value | |
| CORPORATE BONDS† — 24.4% |
| Consumer Discretionary Products — 1.9% |
| CD&R Smokey Buyer, Inc., 6.75%, 7/15/25(a) | $ 20,000 | 19,922 |
| Clarios Global LP, 8.50%, 5/15/27(a) | 4,000 | 4,002 |
| Dornoch Debt Merger Sub, Inc., 6.625%, 10/15/29(a) | 75,000 | 62,033 |
| Real Hero Merger Sub 2, Inc., 6.25%, 2/1/29(a) | 46,000 | 39,464 |
| | | 125,421 |
| Consumer Discretionary Services — 0.7% |
| Boyd Gaming Corp., 4.75%, 6/15/31(a) | 36,000 | 31,906 |
| Scientific Games Holdings LP, 6.625%, 3/1/30(a) | 16,000 | 15,151 |
| | | 47,057 |
| Consumer Staple Products — 0.7% |
| Simmons Foods, Inc., 4.625%, 3/1/29(a) | 50,000 | 43,328 |
| Health Care — 2.9% |
| Fortrea Holdings, Inc., 7.50%, 7/1/30(a) | 26,000 | 26,294 |
| Option Care Health, Inc., 4.375%, 10/31/29(a) | 74,000 | 66,340 |
| Tenet Healthcare Corp., 5.125%, 11/1/27 | 13,000 | 12,607 |
| Tenet Healthcare Corp., 6.125%, 10/1/28 | 82,000 | 81,158 |
| | | 186,399 |
| Industrial Products — 4.4% |
| Chart Industries, Inc., 7.50%, 1/1/30(a) | 35,000 | 35,876 |
The accompanying notes are an integral part of the financial statements.
POLEN GROWTH & INCOME FUND
Portfolio of Investments (Continued)
April 30, 2024
| | Par
Value | | Value |
| CORPORATE BONDS — (Continued) |
| Industrial Products — (Continued) |
| Chart Industries, Inc., 9.50%, 1/1/31(a) | $ 41,000 | | $ 44,084 |
| Madison IAQ, LLC, 5.875%, 6/30/29(a) | 67,000 | | 62,152 |
| SPX Flow, Inc., 8.75%, 4/1/30(a) | 51,000 | | 52,457 |
| TransDigm, Inc., 6.875%, 12/15/30(a) | 90,000 | | 90,771 |
| | | | 285,340 |
| Insurance — 2.6% |
| GTCR AP Finance, Inc., 8.00%, 5/15/27(a) | 74,000 | | 74,097 |
| HUB International Ltd., 5.625%, 12/1/29(a) | 102,000 | | 93,967 |
| | | | 168,064 |
| Materials — 4.6% |
| ATI, Inc., 5.875%, 12/1/27 | 32,000 | | 31,384 |
| Baffinland Iron Mines Corp., 8.75%, 7/15/26(a) | 109,000 | | 100,336 |
| Century Aluminum Co., 7.50%, 4/1/28(a) | 10,000 | | 9,936 |
| Intelligent Packaging Ltd. Finco, Inc., 6.00%, 9/15/28(a) | 30,000 | | 28,670 |
| LABL, Inc., 6.75%, 7/15/26(a) | 41,000 | | 40,504 |
| Oscar AcquisitionCo., LLC, 9.50%, 4/15/30(a) | 48,000 | | 46,250 |
| SCIH Salt Holdings, Inc., 6.625%, 5/1/29(a) | 44,000 | | 40,548 |
| | | | 297,628 |
| Media — 1.1% |
| Arches Buyer, Inc., 6.125%, 12/1/28(a) | 10,000 | | 8,144 |
| CCO Holdings, LLC, 4.50%, 5/1/32 | 18,000 | | 13,898 |
| CCO Holdings, LLC , 4.50%, 6/1/33(a) | 18,000 | | 13,551 |
| CCO Holdings, LLC , 4.25%, 1/15/34(a) | 26,000 | | 18,877 |
| Clear Channel Outdoor Holdings, Inc., 9.00%, 9/15/28(a) | 20,000 | | 20,591 |
| | | | 75,061 |
| Oil & Gas — 0.8% |
| Harvest Midstream I LP, 7.50%, 9/1/28(a) | 33,000 | | 33,120 |
| Teine Energy Ltd., 6.875%, 4/15/29(a) | 22,000 | | 21,394 |
| | | | 54,514 |
| | Par
Value | | Value |
| CORPORATE BONDS — (Continued) |
| Retail & Wholesale - Discretionary — 1.5% |
| Hertz Corp. (The), 4.625%, 12/1/26(a) | $ 14,000 | | $ 10,833 |
| Specialty Building Products Holdings, LLC, 6.375%, 9/30/26(a) | 35,000 | | 34,660 |
| SRS Distribution, Inc., 6.00%, 12/1/29(a) | 51,000 | | 51,728 |
| | | | 97,221 |
| Retail & Wholesale - Staples — 1.0% |
| US Foods, Inc., 4.625%, 6/1/30(a) | 73,000 | | 66,440 |
| Software & Technology Services — 2.2% |
| Central Parent, Inc., 7.25%, 6/15/29(a) | 42,000 | | 42,502 |
| Dun & Bradstreet Corp. (The), 5.00%, 12/15/29(a) | 29,000 | | 26,443 |
| Presidio Holdings, Inc., 8.25%, 2/1/28(a) | 53,000 | | 53,644 |
| Twilio, Inc., 3.875%, 3/15/31 | 25,000 | | 21,670 |
| | | | 144,259 |
TOTAL CORPORATE BONDS
(Cost $1,563,001) | | | 1,590,732 |
| SENIOR LOANS†(b) — 14.0% |
| Consumer Discretionary Products — 0.3% |
| RealTruck Group, Inc., Second Amendment Incremental Term Loan, 10.43% (SOFR +511 bps), 1/31/28 | 20,000 | | 20,050 |
| Consumer Discretionary Services — 1.9% |
| Kuehg Corp., Term Loan B, 6/12/30(c) | 69,930 | | 70,247 |
| Learning Care Group U.S. No. 2, Inc., Initial Term Loans, 10.059% - 10.093% (SOFR +475 bps), 8/11/28 | 53,950 | | 54,175 |
| | | | 124,422 |
| Consumer Staple Products — 0.6% |
| Kronos Acquisition Holdings, Inc., Tranche B-1 Term Loan, 9.314% (SOFR +401 bps), 12/22/26 | 39,794 | | 39,913 |
The accompanying notes are an integral part of the financial statements.
POLEN GROWTH & INCOME FUND
Portfolio of Investments (Continued)
April 30, 2024
| | Par
Value | | Value |
| SENIOR LOANS — (Continued) |
| Financial Services — 0.3% |
| Nexus Buyer, LLC, Amendment No. 5 Term Loans, 9.816% (SOFR +450 bps), 12/11/28 | $ 9,000 | | $ 8,970 |
| Nexus Buyer, LLC, Second Lien Term Loan, 11.666% (SOFR +635 bps), 11/5/29 | 7,000 | | 6,985 |
| | | | 15,955 |
| Health Care — 2.6% |
| Aveanna Healthcare, LLC, First Lien 2021 Extended Term Loan, 7/17/28(c) | 37,852 | | 36,521 |
| CVET Midco 2 LP, Initial Term Loan, 10.309% (SOFR +500 bps), 10/13/29 | 24,874 | | 24,946 |
| Packaging Coordinators Midco, Inc., First Lien Term B Loan, 9.071% (SOFR +376 bps), 11/30/27 | 44,769 | | 44,976 |
| Sharp Services LLC, Tranche C Term Loan, 9.052% (SOFR +375 bps), 12/31/28 | 19,898 | | 19,998 |
| SM Wellness Holdings, Inc., First Lien Initial Term Loan, 10.091% (SOFR +476 bps), 4/17/28 | 41,811 | | 40,296 |
| | | | 166,737 |
| Industrial Products — 0.8% |
| Engineered Machinery Holdings, Inc., Second Lien Amendment No. 3 Incremental Term Loan, 11.571% (SOFR +626 bps), 5/21/29 | 40,000 | | 39,963 |
| Engineered Machinery Holdings, Inc., Second Lien Incremental Amendment No. 2 Term Loan, 12.071% (SOFR +676 bps), 5/21/29 | 10,000 | | 9,987 |
| | | | 49,950 |
| Industrial Services — 0.8% |
| CHG Healthcare Services, Inc., 2023 Incremental Term Loans, 9.066% - 9.093% (SOFR +375 bps), 9/29/28 | 9,975 | | 10,038 |
| | Par
Value | | Value |
| SENIOR LOANS — (Continued) |
| Industrial Services — (Continued) |
| Infinite Bidco, LLC, First Lien Term Loan, 9.341% (SOFR +401 bps), 3/2/28 | $ 19,899 | | $ 19,609 |
| LaserShip, Inc., First Lien Initial Term Loan, 10.071% (SOFR +476 bps), 5/7/28 | 25,867 | | 24,315 |
| | | | 53,962 |
| Insurance — 0.2% |
| Asurion, LLC, New B-4 Term Loan, 10.68% (SOFR +536 bps), 1/20/29 | 15,000 | | 13,565 |
| Materials — 1.5% |
| Aruba Investments Holdings, LLC, First Lien Initial Dollar Term Loan, 9.416% (SOFR +410 bps), 11/24/27 | 19,898 | | 19,426 |
| CP Iris Holdco I, Inc., First Lien Initial Term Loan, 8.916% (SOFR +360 bps), 10/2/28 | 20,893 | | 20,900 |
| LABL, Inc., Initial Dollar Term Loan, 10/29/28(c) | 6,000 | | 5,885 |
| Oscar AcquisitionCo., LLC, Term B Loan, 9.902% (SOFR +460 bps), 4/29/29 | 12,934 | | 13,010 |
| Trident TPI Holdings, Inc., Tranche B-6 Term Loan, 9.302% (SOFR +400 bps), 9/15/28 | 39,800 | | 39,918 |
| | | | 99,139 |
| Media — 2.4% |
| Arches Buyer, Inc., Refinancing Term Loan, 8.666% (SOFR +335 bps), 12/6/27 | 35,907 | | 34,753 |
| Auction.com, LLC, Term Loan, 11.316% (SOFR +600 bps), 5/26/28 | 40,783 | | 39,416 |
| Clear Channel Outdoor Holdings, Inc., 2024 Refinancing Term Loan, 9.43% (SOFR +411 bps), 8/21/28 | 12,000 | | 12,025 |
| MH Sub I, LLC, Second Lien Term Loan, 11.566% (SOFR +625 bps), 2/23/29 | 68,000 | | 67,465 |
| | | | 153,659 |
The accompanying notes are an integral part of the financial statements.
POLEN GROWTH & INCOME FUND
Portfolio of Investments (Concluded)
April 30, 2024
| | Par
Value | | Value |
| SENIOR LOANS — (Continued) |
| Retail & Wholesale - Discretionary — 0.5% |
| Medical Solutions Holdings, Inc., Initial Term Loan, 8.666% (SOFR +335 bps), 11/1/28 | $ 39,833 | | $ 35,359 |
| Software & Technology Services — 1.3% |
| AthenaHealth Group, Inc., Initial Term Loan, 8.566% (SOFR +325 bps), 2/15/29 | 13,365 | | 13,361 |
| Cloudera, Inc., Term Loan, 9.166% (SOFR +385 bps), 10/8/28 | 33,812 | | 33,692 |
| Skopima Consilio, First Lien Initial Term Loan, 9.43% (SOFR +411 bps), 5/12/28 | 35,857 | | 35,704 |
| | | | 82,757 |
| Technology Hardware & Semiconductors — 0.4% |
| Altar Bidco, Inc., Second Lien Initial Term Loan, 10.912% (SOFR +560 bps), 2/1/30 | 28,000 | | 27,786 |
| Telecommunications — 0.4% |
| CCI Buyer, Inc., First Lien Initial Term Loan, 9.302% (SOFR +400 bps), 12/17/27 | 24,872 | | 24,887 |
TOTAL SENIOR LOANS
(Cost $897,727) | | 908,141 |
|
| |
TOTAL INVESTMENTS - 96.1%
(Cost $5,850,623) | | | 6,252,126 |
| OTHER ASSETS IN EXCESS OF LIABILITIES - 3.9% | | | 255,533 |
| NET ASSETS - 100.0% | | | $ 6,507,659 |
| (a) | Securities exempt from registration under Rule 144A of the Securities Act of 1933, as amended. These securities were purchased in accordance with the guidelines approved by the Fund’s Board of Trustees and may be resold, in transactions exempt from registration, to qualified institutional buyers. At April 30, 2024, these securities amounted to $1,538,379 or 23.64% of net assets. These securities have been determined by the Adviser to be liquid securities. |
| (b) | Floating rate note. Coupon rate, reference index and spread shown at April 30, 2024. |
| (c) | This term Loan will settle after April 30, 2024, at which time the interest rate will be determined. |
| † | See Note 1. The industry designations set forth in the schedule above are those of BICS. |
| * | Non-income producing. |
| LLC | Limited Liability Company |
| LP | Limited Partnership |
| PLC | Public Limited Company |
| SOFR | Secured Overnight Funding Rate |
The accompanying notes are an integral part of the financial statements.
POLEN GROWTH & INCOME FUND
Statement of Assets and Liabilities
April 30, 2024
| Assets | |
| Investments, at value (Cost $5,850,623) | $6,252,126 |
| Cash and cash equivalents | 310,941 |
| Foreign currency, at value (Cost $1,518) | 1,512 |
| Receivables: | |
| Investments sold | 1,699 |
| Dividends and interest | 35,640 |
| Deferred offering costs | 14,823 |
| Total Assets | 6,616,741 |
| Liabilities | |
| Payables: | |
| Investments purchased | 62,604 |
| Audit fees | 20,123 |
| Investment adviser | 11,783 |
| Shareholder reporting fees | 7,245 |
| Transfer agent fees | 3,002 |
| Administration and accounting fees | 288 |
| Accrued expenses | 4,037 |
| Total Liabilities | 109,082 |
| Contingencies and Commitments (Notes 2 and 6) | — |
| Net Assets | $6,507,659 |
| Net Assets Consisted of: | |
| Capital stock, $0.01 par value | $ 5,970 |
| Paid-in capital | 6,066,123 |
| Total distributable earnings | 435,566 |
| Net Assets | $6,507,659 |
| Institutional Class Shares: | |
| Net assets | $6,507,659 |
| Shares outstanding | 597,031 |
| Net asset value, offering and redemption price per share | $ 10.90 |
The accompanying notes are an integral part of the financial statements.
POLEN GROWTH & INCOME FUND
Statement of Operations
For the Period Ended April 30, 2024*
| Investment income | |
| Dividends | $ 15,554 |
| Interest | 103,417 |
| Less: foreign taxes withheld | (1,221) |
| Total investment income | 117,750 |
| Expenses | |
| Offering costs | 20,178 |
| Audit fees | 20,123 |
| Advisory fees(Note 2) | 19,803 |
| Shareholder reporting fees | 13,742 |
| Transfer agent fees(Note 2) | 12,274 |
| Legal fees | 7,124 |
| Custodian fees(Note 2) | 3,980 |
| Trustees’ and officers’ fees(Note 2) | 1,436 |
| Administration and accounting fees(Note 2) | 761 |
| Other expenses | 4,740 |
| Total expenses before waivers and reimbursements | 104,161 |
| Less: waivers and reimbursements(Note 2) | (79,433) |
| Net expenses after waivers and reimbursements | 24,728 |
| Net investment income | 93,022 |
| Net realized and unrealized gain/(loss) from investments: | |
| Net realized gain from investments | 13,210 |
| Net realized loss from foreign currency transactions | (66) |
| Net change in unrealized appreciation on investments | 401,503 |
| Net change in unrealized depreciation on foreign currency translations | (10) |
| Net realized and unrealized gain on investments | 414,637 |
| Net increase in net assets resulting from operations | $507,659 |
| * | The Polen Growth & Income Fund commenced operations on October 2, 2023. |
The accompanying notes are an integral part of the financial statements.
POLEN GROWTH & INCOME FUND
Statement of Changes in Net Assets
| | For the Period from
October 2, 2023*
to April 30, 2024 |
| Net increase in net assets from operations: | |
| Net investment income | $ 93,022 |
| Net realized gains from investments and foreign currency transactions | 13,144 |
| Net change in unrealized appreciation on investments and foreign currency translations | 401,493 |
| Net increase in net assets resulting from operations | 507,659 |
| Less dividends and distributions to shareholders from: | |
| Total distributable earnings: | |
| Institutional Class | (72,093) |
| Net decrease in net assets from dividends and distributions to shareholders | (72,093) |
| Increase in net assets derived from capital share transactions (Note 4) | 6,072,093 |
| Total increase in net assets | 6,507,659 |
| Net assets | |
| Beginning of period | — |
| End of period | $6,507,659 |
| * | The Polen Growth & Income Fund commenced operations on October 2, 2023. |
The accompanying notes are an integral part of the financial statements.
POLEN GROWTH & INCOME FUND
Financial Highlights
Contained below is per share operating performance data for Institutional Class shares outstanding, total investment return, ratios to average net assets and other supplemental data for the respective period. The total returns in the table represent the rate that an investor would have earned or lost on an investment in the Fund (assuming reinvestment of all dividends and distributions). This information has been derived from information provided in the financial statements and should be read in conjunction with the financial statements and the notes thereto.
| | Institutional Class |
| | For the Period from
October 2, 2023*
to April 30,
2024 |
| Per Share Operating Performance | |
| Net asset value, beginning of period | $ 10.00 |
| Net investment income(1) | 0.18 |
| Net realized and unrealized gain on investments | 0.85 |
| Total from investment operations | 1.03 |
| Dividends and distributions to shareholders from: | |
| Net investment income | (0.13) |
| Net asset value, end of period | $ 10.90 |
| Total investment return(2) | 10.33% |
| Ratios/Supplemental Data | |
| Net assets, end of period (in 000s) | $ 6,508 |
| Ratio of expenses to average net assets(3)(4) | 0.75% |
| Ratio of expenses to average net assets without waivers and/or reimbursements(3)(4)(5) | 2.90% |
| Ratio of net investment income to average net assets(3) | 2.82% |
| Portfolio turnover rate(6) | 22% |
| * | The Polen Growth & Income Fund commenced operations on October 2, 2023. |
| (1) | The selected per share data was calculated using the average shares outstanding method for the period. |
| (2) | Total investment return is calculated assuming a purchase of shares on the first day and a sale of shares on the last day of each period reported and includes reinvestments of dividends and distributions, if any. Total returns for periods less than one year are not annualized. |
| (3) | Annualized. |
| (4) | Offering costs were not annualized in the calculation of the ratios. |
| (5) | During the period, certain fees were waived and/or reimbursed. If such fee waivers and/or reimbursements had not occurred, the ratios would have been as indicated (See Note 2). |
| (6) | Not annualized. |
The accompanying notes are an integral part of the financial statements.
POLEN GROWTH & INCOME FUND
Notes to Financial Statements
April 30, 2024
1. Organization and Significant Accounting Policies
The Polen Growth & Income Fund (the "Fund") is a diversified, open-end management investment company registered under the Investment Company Act of 1940, as amended, (the “1940 Act”), which commenced investment operations on October 2, 2023. The Fund is a separate series of FundVantage Trust (the “Trust”) which was organized as a Delaware statutory trust on August 28, 2006. However, beneficial interests of the Fund are not registered under the Securities Act of 1933, as amended (the “1933 Act”) because such interests will be issued solely through private placement transactions that do not involve any “public offering” within the meaning of Section 4(a)(2) of the 1933 Act. The Trust is a “series trust” authorized to issue an unlimited number of separate series or classes of shares of beneficial interest. Each series is treated as a separate entity for certain matters under the 1940 Act, and for other purposes, and a shareholder of one series is not deemed to be a shareholder of any other series. The Fund offers Institutional Class shares. Polen Capital Management, LLC ("Polen Capital" or the "Adviser") serves as investment adviser to the Fund pursuant to an investment advisory agreement with the Trust. Polen Capital Credit, LLC ("Polen Credit" or the "Sub-Adviser") serves as the investment sub-adviser to the Fund. In exchange for its services to the Fund, the Sub-Adviser is paid a fee by the Adviser.
The Fund is an investment company and follows accounting and reporting guidance in the Financial Accounting Standards Board Accounting Standards Codification Topic 946.
Portfolio Valuation — The Fund's net asset value (“NAV”) is calculated once daily at the close of regular trading hours on the New York Stock Exchange (“NYSE”) (typically 4:00 p.m. Eastern time) on each day the NYSE is open. Securities held by the Fund are valued using the closing price or the last sale price on a national securities exchange or the National Association of Securities Dealers Automatic Quotation System (“NASDAQ”) market system where they are primarily traded. Equity securities traded in the over-the-counter (“OTC”) market are valued at their closing prices. If there were no transactions on that day, securities traded principally on an exchange or on NASDAQ will be valued at the mean of the last bid and ask prices prior to the market close. Fixed income securities having a remaining maturity of greater than 60 days are valued using an independent pricing service. Fixed income securities having a remaining maturity of 60 days or less are generally valued at amortized cost, provided such amount approximates fair value. Fixed income securities are valued on the basis of broker quotations or valuations provided by a pricing service, which utilizes information with respect to recent sales, market transactions in comparable securities, quotations from dealers, and various relationships between securities in determining value. Valuations developed through pricing techniques may materially vary from the actual amounts realized upon sale of the securities. Investments in other open-end investment companies are valued based on the NAV of the investment companies (which may use fair value pricing as discussed in their prospectuses). Securities that do not have a readily available current market value are valued in good faith by the Adviser as “valuation designee” under the oversight of the Trust's Board of Trustees. Relying on prices supplied by pricing services or dealers or using fair valuation may result in values that are higher or lower than the values used by other investment companies and investors to price the same investments. The Adviser has adopted written policies and procedures for valuing securities and other assets in circumstances where market quotes are not readily available. In the event that market quotes are not readily available, and the security or asset cannot be valued pursuant to one of the valuation methods, the value of the security or asset will be determined in good faith by the Adviser pursuant to its policies and procedures. On a quarterly basis, the Adviser’s fair valuation determinations will be reviewed by the Trust’s Board of Trustees.
The Fund has a fundamental policy with respect to industry concentration that it will not invest 25% or more of the value of the Fund’s assets in securities of issuers in any one industry. Since inception the Fund has utilized Bloomberg Industry Classification System (“BICS”) at the sub-industry level for defining industries for purposes of monitoring compliance with its industry concentration policy. However, at times, the Fund may utilize other industry classification systems such as Morningstar Global Equity Classification System (“MGECS”) or Global Industry Classification Standard (“GICS”), as applicable, for purposes other than compliance monitoring.
Fair Value Measurements — The inputs and valuation techniques used to measure fair value of the Fund’s investments are summarized into three levels as described in the hierarchy below:
• Level 1 — quoted prices in active markets for identical securities;
• Level 2 — other significant observable inputs (including quoted prices for similar securities, interest rates, prepayment speeds, credit risk, etc.); and
POLEN GROWTH & INCOME FUND
Notes to Financial Statements (Continued)
April 30, 2024
• Level 3 — significant unobservable inputs (including the Fund’s own assumptions in determining the fair value of investments).
The inputs or methodology used for valuing securities are not necessarily an indication of the risk associated with investing in those securities. Transfers in and out are recognized at the value at the end of the period.
Significant events (such as movement in the U.S. securities market, or other regional and local developments) may occur between the time that foreign markets close (where the security is principally traded) and the time that the Fund calculates its NAV (generally, the close of the NYSE) that may impact the value of securities traded in these foreign markets. As a result, the Fund fair values foreign securities using an independent pricing service which considers the correlation of the trading patterns of the foreign security to the intraday trading in the U.S. markets for investments such as American Depositary Receipts, financial futures, exchange traded funds and certain indexes as well as prices for similar securities. Such fair valuations are categorized as Level 2 in the hierarchy.
Securities listed on a non-U.S. exchange are generally fair valued daily by an independent fair value pricing service approved by the Board of Trustees and categorized as Level 2 investments within the hierarchy. The fair valuations for these securities may not be the same as quoted or published prices of the securities on their primary markets. Securities for which daily fair value prices from the independent fair value pricing service are not available are generally valued at the last quoted sale price at the close of an exchange on which the security is traded and categorized as Level 1 investments within the hierarchy. Values of foreign securities, currencies, and other assets and liabilities denominated in foreign currencies are translated into U.S. dollars at the exchange rate of said currencies against the U.S. dollar, as of valuation time, as provided by an independent pricing service approved by the Board of Trustees.
The valuations for fixed income securities, including corporate bonds and floating rate senior loans (“Senior Loans”), are typically the prices supplied by independent third-party pricing services, which may use market prices or broker/dealer quotations or a variety of valuation techniques and methodologies. The independent third-party pricing services use inputs that are observable such as issuer details, interest rates, yield curves, prepayment speeds, credit risks/spreads, default rates and quoted prices for similar securities. To the extent that these inputs are observable, the fair value of fixed income securities would be categorized as Level 2; otherwise the fair values would be categorized as Level 3.
Senior Loans are fair valued based on a quoted price received from a single broker-dealer or an average of quoted prices received from multiple broker-dealers or valued relative to other benchmark securities when broker-dealer quotes are unavailable. To the extent that these inputs are observable, the fair values of Senior Loans would be categorized as Level 2; otherwise the fair values would be categorized as Level 3.
The following is a summary of the inputs used, as of April 30, 2024, in valuing the Fund's investments carried at fair value:
| | | Total
Value at
04/30/24 | | Level 1
Quoted
Price | | Level 2
Other
Significant
Observable
Inputs | | Level 3
Significant
Unobservable
Inputs |
| Assets | | | | | | | | |
| Common Stocks | | | | | | | | |
| Biotechnology | | $ 185,028 | | $ 70,893 | | $ 114,135 | | $ — |
| Credit Services | | 343,925 | | 343,925 | | — | | — |
| Diagnostics & Research | | 252,529 | | 252,529 | | — | | — |
| Financial Data & Stock Exchanges | | 135,079 | | 135,079 | | — | | — |
| Household & Personal Products | | 117,213 | | — | | 117,213 | | — |
| Information Technology Services | | 157,587 | | 157,587 | | — | | — |
| Insurance Brokers | | 136,211 | | 136,211 | | — | | — |
| Internet Content & Information | | 317,261 | | 317,261 | | — | | — |
| Internet Retail | | 411,775 | | 411,775 | | — | | — |
| Luxury Goods | | 104,322 | | — | | 104,322 | | — |
POLEN GROWTH & INCOME FUND
Notes to Financial Statements (Continued)
April 30, 2024
| | | Total
Value at
04/30/24 | | Level 1
Quoted
Price | | Level 2
Other
Significant
Observable
Inputs | | Level 3
Significant
Unobservable
Inputs |
| Medical Devices | | $ 285,122 | | $ 285,122 | | $ — | | $ — |
| Software Application | | 700,123 | | 630,156 | | 69,967 | | — |
| Software Infrastructure | | 401,524 | | 401,524 | | — | | — |
| Staffing & Employment Services | | 121,671 | | 121,671 | | — | | — |
| Travel Services | | 83,883 | | 83,883 | | — | | — |
| Corporate Bonds* | | 1,590,732 | | — | | 1,590,732 | | — |
| Senior Loans* | | 908,141 | | — | | 908,141 | | — |
| Total Assets | | $ 6,252,126 | | $ 3,347,616 | | $ 2,904,510 | | $ — |
| * | Please refer to Portfolio of Investments for further details on portfolio holdings. |
At the end of each quarter, management evaluates the classification of Levels 1, 2 and 3 assets and liabilities. Various factors are considered, such as changes in liquidity from the prior reporting period; whether or not a broker is willing to execute at the quoted price; the depth and consistency of prices from third-party pricing services; and the existence of contemporaneous, observable trades in the market. Additionally, management evaluates the classification of Level 1 and Level 2 assets and liabilities on a quarterly basis for changes in listings or delistings on national exchanges.
Due to the inherent uncertainty of determining the fair value of investments that do not have a readily available market value, the fair value of the Fund’s investments may fluctuate from period to period. Additionally, the fair value of investments may differ significantly from the values that would have been used had a ready market existed for such investments and may differ materially from the values the Fund may ultimately realize. Further, such investments may be subject to legal and other restrictions on resale or otherwise less liquid than publicly traded securities.
For fair valuations using significant unobservable inputs, U.S. generally accepted accounting principles (“U.S. GAAP”) require the Fund to present a reconciliation of the beginning to ending balances for reported market values that present changes attributable to total realized and unrealized gains or losses, purchase and sales, and transfers in and out of Level 3 during the period. A reconciliation of Level 3 investments is presented only when the Fund has an amount of Level 3 investments at the end of the reporting period that was meaningful in relation to net assets. The amounts and reasons for all transfers in and out of Level 3 are disclosed when the Fund had an amount of transfers during the reporting period that was meaningful in relation to net assets as of the end of the reporting period.
From October 2, 2023, commencement of operations, to April 30, 2024, there were no transfers in or out of Level 3.
Use of Estimates — The preparation of financial statements in conformity with U.S. GAAP requires management to make estimates and assumptions that affect the amounts reported in the financial statements and accompanying notes at the date of the financial statements and the reported amounts of revenues and expenses during the period. Actual results could differ from those estimates and those differences could be material.
Investment Transactions, Investment Income and Expenses — Investment transactions are recorded on trade date for financial statement preparation purposes. Realized gains and losses on investments sold are recorded on the identified cost basis. Interest income, which includes accretion of discounts and amortization of premiums, is recorded on the accrual basis, using the effective yield method. Dividends are recorded on the ex-dividend date. The Fund may be subject to foreign taxes on income, a portion of which may be recoverable. The Fund applies for refunds where available. The Fund may be subject to foreign taxes on unrealized and realized gains on certain foreign investments. The Fund may also be subject to foreign taxes on income, a portion of which may be recoverable. The Fund applies for refunds where available. The Fund will accrue such taxes and reclaims, as applicable, based upon the current interpretation of tax rules and regulations that exist in the market in which the Fund invests. The Fund may also enter into unfunded loan commitments, which are contractual obligations for future funding. Unfunded loan commitments may include revolving credit facilities, which may obligate the Fund to supply additional cash to the borrower on demand. Unfunded loan
POLEN GROWTH & INCOME FUND
Notes to Financial Statements (Continued)
April 30, 2024
commitments represent a future obligation in full. The Fund may receive a commitment fee based on the undrawn portion of the underlying line of credit portion of a senior floating rate interest. In certain circumstances, the Fund may receive various fees upon the restructure of a senior floating rate interest by a borrower. Fees earned/paid may be recorded as a component of income or realized gain/loss in the Statement of Operations. General expenses of the Trust are generally allocated to each fund under methodologies approved by the Board of Trustees. Expenses directly attributable to a particular fund in the Trust are charged directly to that fund.
Deferred Offering Costs — Offering costs, including costs of printing initial prospectus and legal fees, are amortized over twelve-months from inception of the Fund. As of April 30, 2024, the remaining amount still to be amortized for the Fund was $14,823.
Cash and Cash Equivalents — Cash and cash equivalents include cash and overnight investments in interest-bearing demand deposits with a financial institution with original maturities of three months or less. The Fund maintains deposits with a high quality financial institution in an amount that is in excess of federally insured limits.
Dividends and Distributions to Shareholders — Dividends from net investment income and distributions from net realized capital gains, if any, are declared and paid to shareholders and are recorded on ex-date. Income dividends and capital gain distributions are determined in accordance with U.S. federal income tax regulations, which may differ from U.S. GAAP.
U.S. Tax Status — No provision is made for U.S. income taxes as it is the Fund’s intention to continue to qualify for and elect the tax treatment applicable to regulated investment companies under Subchapter M of the Internal Revenue Code of 1986, as amended (“Internal Revenue Code”), and make the requisite distributions to its shareholders which will be sufficient to relieve it from U.S. income and excise taxes.
Other — In the normal course of business, the Fund may enter into contracts that provide general indemnifications. The Fund’s maximum exposure under these arrangements is dependent on claims that may be made against the Fund in the future, and therefore, cannot be estimated; however, based on experience, the risk of material loss for such claims is considered remote.
Debt Investment Risk — Debt investments are affected primarily by the financial condition of the companies or other entities that have issued them and by changes in interest rates. There is a risk that an issuer of a Fund's debt investments may not be able to meet its financial obligations (e. g., may not be able to make principal and/or interest payments when they are due or otherwise default on other financial terms) and/or seek bankruptcy protection. Securities such as high-yield bonds, e.g., bonds with low credit ratings by Moody's (Ba or lower) or Standard & Poor's (BB and lower) or if unrated are of comparable quality as determined by the Adviser, are especially subject to credit risk during periods of economic uncertainty or during economic downturns and are more likely to default on their interest and/or principal payments than higher rated securities. Debt investments may be affected by changes in interest rates. Debt investments with longer durations tend to be more sensitive to changes in interest rates, making them more volatile than debt investments with shorter durations or floating or adjustable interest rates. The value of debt investments may fall when interest rates rise.
Senior Loans — The Fund invests in senior loans and other floating rate investments. Senior loans typically are rated below investment grade. Below investment grade securities, including senior loans, involve greater risk of loss, are subject to greater price volatility, and may be less liquid and more difficult to value, especially during periods of economic uncertainty or change, than higher rated debt securities. Market quotations for these securities may be volatile and/or subject to large spreads between bid and ask prices. These securities once sold, may not settle for an extended period (for example, several weeks or even longer). The Fund will not receive its sale proceeds until that time, which may constrain the Fund’s ability to meet its obligations. The Fund may invest in securities of issuers that are in default or that are in bankruptcy. The value of collateral, if any, securing a senior loan can decline or may be insufficient to meet the issuer’s obligations or may be difficult to liquidate. No active trading market may exist for many senior loans, and many loans are subject to restrictions on resale. Any secondary market may be subject to irregular trading activity and extended settlement periods. There is less readily available, reliable information about most senior loans than is the case for many other types of securities. Loans may not be considered “securities,” and purchasers, such as the Fund, therefore may not be entitled to rely on the anti-fraud protections afforded by federal securities laws.
POLEN GROWTH & INCOME FUND
Notes to Financial Statements (Continued)
April 30, 2024
Equity Securities Risk — Stock markets are volatile. The price of equity securities fluctuates based on changes in a company's financial condition, historical and prospective earnings of the company, interest rates, investor perceptions and overall market and economic conditions. The prices of securities change in response to many factors including the value of its assets.
2. Transactions with Related Parties and Other Service Providers
Polen Capital Management, LLC (“Polen Capital” or the “Adviser”) serves as investment adviser to the Fund pursuant to an investment advisory agreement with the Trust (the "Advisory Agreement"). For its services, the Adviser is paid a monthly fee at the annual rate of 0.60% of the Fund's average daily net assets. The Adviser has contractually agreed to reduce its investment advisory fee and/or reimburse certain expenses of the Fund to the extent necessary to ensure that the Fund's total annual fund operating expenses (excluding taxes, fees and expenses attributable to a distribution or service plan adopted by the Trust, interest, extraordinary items, “Acquired Fund Fees and Expenses” and brokerage commissions) do not exceed 0.75% (on an annual basis) with respect to the Fund’s average daily net assets (the “Expense Limitation”). The Expense Limitation will remain in place until August 31, 2025, unless the Board of Trustees of the Trust approves its earlier termination. The Adviser is entitled to recover, subject to approval by the Board of Trustees, such amounts reduced or reimbursed for a period of up to three (3) years from the date on which the Adviser reduced its compensation and/or assumed expenses for the Fund. The Adviser is permitted to seek reimbursement from the Fund, subject to certain limitations, for fees it waived and Fund expenses it paid to the extent the total annual fund operating expenses do not exceed the limits described above or any lesser limits in effect at the time of reimbursement. No recoupment will occur unless the Fund’s expenses are below the Expense Limitation amount.
As of April 30, 2024, the amount of potential recovery was as follows:
| | Expiration |
| | 04/30/2027 | | Total |
| | $79,433 | | $79,433 |
For the period ended April 30, 2024, the Adviser earned advisory fees of $19,803 and waived and/or reimbursed fees of $79,433.
The Fund has not recorded a commitment or contingent liability at April 30, 2024.
Other Service Providers
The Bank of New York Mellon (“BNY Mellon”) serves as administrator and custodian for the Fund. For providing administrative and accounting services, BNY Mellon is entitled to receive a monthly fee equal to an annual percentage rate of the Fund’s average daily net assets and is subject to certain minimum monthly fees. For providing certain custodial services, BNY Mellon is entitled to receive a monthly fee, subject to certain minimum, and out of pocket expenses.
BNY Mellon Investment Servicing (US) Inc. (the “Transfer Agent”) provides transfer agent services to the Fund. The Transfer Agent is entitled to receive a monthly fee, subject to certain minimum, and out of pocket expenses.
The Trust, on behalf of the Fund, has entered into agreements with financial intermediaries to provide recordkeeping, processing, shareholder communications and other services to customers of the intermediaries investing in the Fund and has agreed to compensate the intermediaries for providing those services. The fees incurred by the Fund for these services are included in Transfer agent fees in the Statement of Operations.
Trustees and Officers
The Trust is governed by its Board of Trustees. The Trustees receive compensation in the form of an annual retainer and per meeting fees for their services to the Trust. An employee of BNY Mellon serves as the Secretary of the Trust and is not compensated by the Fund or the Trust.
POLEN GROWTH & INCOME FUND
Notes to Financial Statements (Continued)
April 30, 2024
JW Fund Management LLC ("JWFM") provides a Principal Executive Officer and Principal Financial Officer to the Trust. Chenery Compliance Group, LLC ("Chenery") provides the Trust with a Chief Compliance Officer and an Anti-Money Laundering Officer. JWFM and Chenery are compensated for their services provided to the Trust.
3. Investment in Securities
From October 2, 2023, commencement of operations, to April 30, 2024, aggregated purchases and sales of investment securities (excluding short-term investments) of the Fund were as follows:
| | Purchases | | Sales |
| Investment Securities | $6,937,450 | | $1,111,523 |
4. Capital Share Transactions
From October 2, 2023, commencement of operations, to April 30, 2024, transactions in capital shares (authorized shares unlimited) were as follows:
| | For the Period Ended
April 30, 2024 |
| | Shares | | Amount |
| Institutional Class | | | |
| Sales | 590,461 | | $6,000,000 |
| Reinvestments | 6,570 | | 72,093 |
| Redemptions | — | | — |
| Net increase | 597,031 | | $6,072,093 |
| | | | |
Significant Shareholders
As of April 30, 2024, the Fund had shareholders that held 10% or more of the total outstanding shares of the Fund. Transactions by these shareholders may have a material impact on the Fund.
| Affiliated Shareholders | 98% |
5. Federal Tax Information
The Fund has followed the authoritative guidance on accounting for and disclosure of uncertainty in tax positions, which requires the Fund to determine whether a tax position is more likely than not to be sustained upon examination, including resolution of any related appeals or litigation processes, based on the technical merits of the position. Tax positions not deemed to meet the more-likely-than-not threshold would be recorded as tax benefit or expense in the current year. The Fund has determined that there was no effect on the financial statements from following this authoritative guidance. In the normal course of business, the Fund is subject to examination by federal, state and local jurisdictions, where applicable, for tax years for which applicable statutes of limitations have not expired.
Distributions are determined in accordance with federal income tax regulations, which may differ in amount or character from net investment income and realized gains for financial reporting purposes. Accordingly, the character of distributions and composition of net assets for tax purposes may differ from those reflected in the accompanying financial statements. To the extent these differences are permanent, such amounts are reclassified within the components of net assets based on the tax treatment; temporary differences do not require reclassifications. For the period ended April 30, 2024, there were reclassifications between components of total
POLEN GROWTH & INCOME FUND
Notes to Financial Statements (Concluded)
April 30, 2024
distributable earnings. These permanent differences are primarily attributable to reclassification of foreign currency from capital gains to ordinary income. Net assets were not affected by these adjustments.
For the period ended April 30, 2024, the tax character of distributions paid by the Fund was $72,093 of ordinary income dividends. Distributions from net investment income and short-term gains are treated as ordinary income for federal income tax purposes.
As of April 30, 2024, the components of distributable earnings on a tax basis were as follows:
| | Undistributed
Ordinary
Income | | Unrealized
Appreciation/
(Depreciation) |
| Polen Growth & Income Fund | $34,073 | | $401,493 |
| | | | |
The differences between the book and tax basis components of distributable earnings relate primarily to the timing and recognition of income and gains for federal income tax purposes.
As of April 30, 2024, the federal tax cost, aggregate gross unrealized appreciation and depreciation of securities held by the Fund was as follows:
| | Federal
Tax Cost | | Unrealized
Appreciation | | Unrealized
(Depreciation) | | Net Unrealized
Appreciation |
| | $5,850,623 | | $486,466 | | $(84,973) | | $401,493 |
Pursuant to federal income tax rules applicable to regulated investment companies, the Fund may elect to treat certain capital losses between November 1 and April 30 and late year ordinary losses ((i) ordinary losses between January 1 and April 30, and (ii) specified ordinary and currency losses between November 1 and April 30) as occurring on the first day of the following tax year. For the period ended April 30, 2024, any amount of losses elected within the tax return will not be recognized for federal income tax purposes until May 1, 2024. For the period ended April 30, 2024, the Fund had no post October capital loss deferrals or late year ordinary loss deferrals.
Accumulated capital losses represent net capital loss carryforwards as of April 30, 2024 that may be available to offset future realized capital gains and thereby reduce future capital gains distributions. As of April 30, 2024, the Fund did not have any capital loss carryforwards.
6. Commitments and Contingencies
The Fund may make commitments pursuant to bridge loan facilities. Such commitments typically remain off balance sheet as it is more likely than not, based on the good faith judgement of the Adviser, that such bridge facilities will not ever fund. As of April 30, 2024, there were no outstanding bridge facility commitments.
7. Subsequent Events
Management has evaluated the impact of all subsequent events on the Fund through the date the financial statements were issued, and has determined that there are no subsequent events requiring recognition or disclosure in the financial statements.
POLEN GROWTH & INCOME FUND
Report of Independent Registered Public Accounting Firm
To the Board of Trustees of FundVantage Trust and Shareholders of Polen Growth & Income Fund
Opinion on the Financial Statements
We have audited the accompanying statement of assets and liabilities, including the portfolio of investments, of Polen Growth & Income Fund (one of the funds constituting FundVantage Trust, hereafter referred to as the “Fund”) as of April 30, 2024, and the related statements of operations and of changes in net assets, including the related notes, and the financial highlights for the period October 2, 2023 (commencement of operations) through April 30, 2024 (collectively referred to as the “financial statements”). In our opinion, the financial statements present fairly, in all material respects, the financial position of the Fund as of April 30, 2024, the results of its operations, the changes in its net assets, and the financial highlights for the period October 2, 2023 (commencement of operations) through April 30, 2024 in conformity with accounting principles generally accepted in the United States of America.
Basis for Opinion
These financial statements are the responsibility of the Fund’s management. Our responsibility is to express an opinion on the Fund’s financial statements based on our audit. We are a public accounting firm registered with the Public Company Accounting Oversight Board (United States) (PCAOB) and are required to be independent with respect to the Fund in accordance with the U.S. federal securities laws and the applicable rules and regulations of the Securities and Exchange Commission and the PCAOB.
We conducted our audit of these financial statements in accordance with the standards of the PCAOB. Those standards require that we plan and perform the audit to obtain reasonable assurance about whether the financial statements are free of material misstatement, whether due to error or fraud.
Our audit included performing procedures to assess the risks of material misstatement of the financial statements, whether due to error or fraud, and performing procedures that respond to those risks. Such procedures included examining, on a test basis, evidence regarding the amounts and disclosures in the financial statements. Our audit also included evaluating the accounting principles used and significant estimates made by management, as well as evaluating the overall presentation of the financial statements. Our procedures included confirmation of securities owned as of April 30, 2024 by correspondence with the custodian, agent banks and brokers; when replies were not received from agent banks or brokers, we performed other auditing procedures. We believe that our audit provides a reasonable basis for our opinion.
/s/PricewaterhouseCoopers LLP
Philadelphia, Pennsylvania
June 28, 2024
We have served as the auditor of one or more Polen Capital Management, LLC investment companies since 2011.
POLEN GROWTH & INCOME FUND
Shareholder Tax Information
(Unaudited)
The Fund is required by Subchapter M of the Internal Revenue Code of 1986, as amended, to advise their shareholders of the U.S. federal tax status of distributions received by the Fund's shareholders in respect of such fiscal year. During the period ended April 30, 2024, the Fund paid $72,093 of ordinary income dividends to its shareholders.
The Fund designates 14.32% of the ordinary income distribution as qualified dividend income pursuant to the Jobs and Growth Tax Relief Reconciliation Act of 2003.
The percentage of ordinary income dividends qualifying for the corporate dividends received deduction is 5.93%
The percentage of qualified interest income related dividends not subject to withholding tax for non-resident aliens and foreign corporations received is 49.65%
All designations are based on financial information available as of the date of this annual report and, accordingly, are subject to change. For each item, it is the intention of the Fund to designate the maximum amount permitted under the Internal Revenue Code of 1986, as amended, and the regulations thereunder.
Because the Fund’s fiscal year is not the calendar year, another notification will be sent with respect to calendar year 2024. The second notification, which will reflect the amount, if any, to be used by calendar year taxpayers on their U.S. federal income tax returns, will be made in conjunction with Form 1099-DIV and will be mailed in January 2025.
Foreign shareholders will generally be subject to U.S. withholding tax on the amount of their ordinary income dividends. They will generally not be entitled to a foreign tax credit or deduction for the withholding taxes paid by the Fund, if any.
In general, dividends received by tax-exempt recipients (e.g., IRAs and Keoghs) need not be reported as taxable income for U.S. federal income tax purposes. However, some retirement trusts (e.g., corporate, Keogh and 403(b)(7) plans) may need this information for their annual information reporting.
Shareholders are advised to consult their own tax advisers with respect to the tax consequences of their investment in the Fund.
POLEN GROWTH & INCOME FUND
Other Information
(Unaudited)
Proxy Voting
Policies and procedures that the Fund uses to determine how to vote proxies relating to portfolio securities as well as information regarding how the Fund voted proxies relating to portfolio securities for the most recent 12-month period ended June 30 are available without charge, upon request, by calling (888) 678-6024 and on the Securities and Exchange Commission's (“SEC”) website at http://www.sec.gov.
Quarterly Portfolio Schedules
The Fund files its complete schedule of portfolio holdings with the SEC for the first and third fiscal quarters of each fiscal year (quarters ended July 31 and January 31) as an exhibit to its reports on Form N-PORT. The Fund's portfolio holdings on Form N-PORT are available on the SEC's website at http://www.sec.gov.
POLEN GROWTH & INCOME FUND
Privacy Notice
(Unaudited)
The privacy of your personal financial information is extremely important to us. When you open an account with us, we collect a significant amount of information from you in order to properly invest and administer your account. We take very seriously the obligation to keep that information private and confidential, and we want you to know how we protect that important information.
We collect nonpublic personal information about you from applications or other forms you complete and from your transactions with us or our affiliates. We do not disclose information about you, or our former clients, to our affiliates or to service providers or other third parties, except as permitted by law. We share only the information required to properly administer your accounts, which enables us to send transaction confirmations, monthly or quarterly statements, financials and tax forms. Even within the Fund and its affiliated entities, a limited number of people who actually service accounts will have access to your personal financial information. Further, we do not share information about our current or former clients with any outside marketing groups or sales entities.
To ensure the highest degree of security and confidentiality, the Fund and its affiliates maintain various physical, electronic and procedural safeguards to protect your personal information. We also apply special measures for authentication of information you request or submit to us on our web site.
If you have questions or comments about our privacy practices, please call us at (888) 678-6024.
POLEN GROWTH & INCOME FUND
Fund Management
(Unaudited)
FundVantage Trust (the “Trust”) is governed by a Board of Trustees (the “Trustees”). The primary responsibility of the Trustees is to represent the interest of the Trust's shareholders and to provide oversight management of the Trust.
The following tables present certain information regarding the Board of Trustees and officers of the Trust. None of the Trustees are an “interested person” of the Trust, the Adviser, another investment adviser of a series of the Trust, or Foreside Funds Distributors LLC, the principal underwriter of the Trust (“Underwriter”), within the meaning of the 1940 Act and each Trustee is referred to as an “Independent Trustee” and is listed under such heading below. Employees of certain service providers to the Trust serve as officers of the Trust; such persons are not compensated by the Fund. The address of each Trustee and officer as it relates to the Trust's business is 103 Bellevue Parkway, 2nd Floor, Wilmington, DE 19809.
The Statement of Additional Information for the Fund contains additional information about the Trustees and is available, without charge, upon request by calling .
Name
and Date of Birth | Position(s)
Held
with Trust | Term of Office
and Length of
Time Served | Principal Occupation(s)
During Past Five Years | Number of
Funds in
Trust
Complex
Overseen
by
Trustee | Other
Directorships
Held by
Trustee |
| INDEPENDENT TRUSTEES |
ROBERT J. CHRISTIAN
Date of Birth: 2/49 | Trustee | Shall serve until
death, resignation
or removal.
Trustee since
2007. Chairman
from 2007 until
September 30,
2019. | Retired since February 2006; Executive Vice
President of Wilmington Trust Company from
February 1996 to February 2006; President of
Rodney Square Management Corporation
(“RSMC”) (investment advisory firm) from 1996
to 2005; Vice President of RSMC from 2005 to 2006. | 29 | Optimum Fund
Trust
(registered
investment
company with
6 portfolios);
Third Avenue
Trust
(registered
investment
company with
4 portfolios);
Third Avenue
Variable Series
Trust
(registered
investment
company with
1 portfolio);
Polen Credit
Opportunities
Fund (registered
investment
company). |
POLEN GROWTH & INCOME FUND
Fund Management (Continued)
(Unaudited)
Name
and Date of Birth | Position(s)
Held
with Trust | Term of Office
and Length of
Time Served | Principal Occupation(s)
During Past Five Years | Number of
Funds in
Trust
Complex
Overseen
by
Trustee | Other
Directorships
Held by
Trustee |
IQBAL MANSUR
Date of Birth: 6/55 | Trustee | Shall serve until
death, resignation
or removal.
Trustee since
2007. | Retired since September 2020; Professor of
Finance, Widener University from 1998 to August 2020; Member of the Investment Committee of ChristianaCare Health System from January 2022 to present. | 29 | Third Avenue
Trust
(registered
investment
company with
4 portfolios);
Third Avenue
Variable Series
Trust
(registered
investment
company with
1 portfolio);
Polen Credit
Opportunities
Fund (registered
investment
company). |
NICHOLAS M.
MARSINI, JR.
Date of Birth: 8/55 | Trustee and
Chairman of
the Board | Shall serve until
death, resignation
or removal.
Trustee since
2016. Chairman
since October 1,
2019. | Retired since March 2016. President of PNC Bank Delaware from June 2011 to March 2016;
Executive Vice President of Finance of BNY Mellon from July 2010 to January 2011; Executive Vice President and Chief Financial Officer of PNC Global Investment Servicing from September 1997 to July 2010. | 29 | Brinker Capital
Destinations
Trust
(registered
investment
company with
10 portfolios);
Third Avenue
Trust
(registered
investment
company with
4 portfolios);
Third Avenue
Variable Series
Trust
(registered
investment
company with
1 portfolio);
Polen Credit
Opportunities
Fund (registered
investment
company). |
POLEN GROWTH & INCOME FUND
Fund Management (Continued)
(Unaudited)
Name
and Date of Birth | Position(s)
Held
with Trust | Term of Office
and Length of
Time Served | Principal Occupation(s)
During Past Five Years | Number of
Funds in
Trust
Complex
Overseen
by
Trustee | Other
Directorships
Held by
Trustee |
NANCY B. WOLCOTT
Date of Birth: 11/54 | Trustee | Shall serve until
death, resignation
or removal.
Trustee since
2011. | Retired since May 2014; EVP, Head of GFI Client Service Delivery, BNY Mellon from January 2012 to May 2014; EVP, Head of US Funds Services, BNY Mellon from July 2010 to January 2012; President of PNC Global Investment Servicing from 2008 to July 2010; Chief Operating Officer of PNC Global Investment Servicing from 2007 to 2008; Executive Vice President of PFPC Worldwide Inc. from 2006 to 2007. | 29 | Lincoln
Variable
Trust
Products Trust
(registered
investment
company with
97 portfolios);
Third Avenue
Trust
(registered
investment
company with
4 portfolios);
Third Avenue
Variable Series
Trust
(registered
investment
company with
1 portfolio);
Polen Credit
Opportunities
Fund (registered
investment
company). |
STEPHEN M. WYNNE
Date of Birth: 1/55 | Trustee | Shall serve until
death, resignation
or removal.
Trustee since
2009. | Retired since December 2010; Chief Executive
Officer of US Funds Services, BNY Mellon Asset Servicing from July 2010 to December 2010; Chief Executive Officer of PNC Global Investment Servicing from March 2008 to July 2010; President, PNC Global Investment Servicing from 2003 to 2008. | 29 | Copeland Trust
(registered
investment
company with
3 portfolios);
Third Avenue
Trust
(registered
investment
company with
4 portfolios);
Third Avenue
Variable Series
Trust
(registered
investment
company with
1 portfolio);
Polen Credit
Opportunities
Fund (registered
investment
company). |
POLEN GROWTH & INCOME FUND
Fund Management (Concluded)
(Unaudited)
Name
and Date of Birth | Position(s) Held
with Trust | Term of Office
and Length of
Time Served | Principal Occupation(s)
During Past Five Years |
| EXECUTIVE OFFICERS |
JOEL L. WEISS
Date of Birth: 1/63 | President and Chief
Executive Officer | Shall serve until death,
resignation or removal. Officer
since 2007. | President of JW Fund Management LLC since June 2016; Vice President and Managing Director of BNY Mellon Investment Servicing (US) Inc. and predecessor firms from 1993 to June 2016. |
CHRISTINE S. CATANZARO
Date of Birth: 8/84 | Treasurer and Chief Financial Officer | Shall serve until death,
resignation or removal. Officer
since 2022. | Financial Reporting Consultant from October 2020 to September 2022; Senior Manager, Ernst & Young LLP from March 2013 to October 2020. |
T. RICHARD KEYES
Date of Birth: 1/57 | Vice President
| Shall serve until death,
resignation or removal. Officer
since 2016. | President of TRK Fund Consulting LLC since July 2016; Head of Tax — U.S. Fund Services of BNY Mellon Investment Servicing (US) Inc. and predecessor firms from February 2006 to July 2016. |
GABRIELLA
MERCINCAVAGE
Date of Birth: 6/68 | Assistant Treasurer | Shall serve until death,
resignation or removal. Officer
since 2019. | Fund Administration Consultant since January 2019; Fund
Accounting and Tax Compliance Accountant to financial
services companies from November 2003 to July 2018. |
VINCENZO A. SCARDUZIO
Date of Birth: 4/72 | Secretary | Shall serve until death,
resignation or removal. Officer
since 2012. | Director and Senior Vice President Regulatory Administration of The Bank of New York Mellon and predecessor firms since 2001. |
JOHN CANNING
Date of Birth: 11/70 | Chief Compliance
Officer and Anti-Money
Laundering Officer | Shall serve until death,
resignation or removal. Officer
since 2022. | Director of Chenery Compliance Group, LLC from March 2021 to present; Senior Consultant of Foreside Financial Group from August 2020 to March 2021; Chief Compliance Officer & Chief Operating Officer of Schneider Capital Management LP from May 2019 to July 2020; Chief Operating Officer and Chief Compliance Officer of Context Capital Partners, LP from March 2016 to March 2018 and February 2019, respectively. |
Investment Adviser
Polen Capital Management, LLC
1825 NW Corporate Blvd.
Suite 300
Boca Raton, FL 33431
Investment Sub-Adviser
Polen Capital Credit, LLC
1075 Main Street
Suite 320
Waltham, MA 02451
Administrator
The Bank of New York Mellon
103 Bellevue Parkway
Wilmington, DE 19809
Transfer Agent
BNY Mellon Investment Servicing (US) Inc.
500 Ross Street, 154-0520
Pittsburgh, PA 15262
Custodian
The Bank of New York Mellon
240 Greenwich Street
New York, NY 10286
Independent Registered Public Accounting Firm
PricewaterhouseCoopers LLP
Two Commerce Square, Suite 1800
2001 Market Street
Philadelphia, PA 19103-7042
Legal Counsel
Troutman Pepper Hamilton Sanders LLP
3000 Two Logan Square
18th and Arch Streets
Philadelphia, PA 19103
| Private Capital Management Value Fund |
of
FundVantage Trust
ANNUAL REPORT
April 30, 2024
IMPORTANT NOTICE – UPCOMING CHANGES TO PRIVATE CAPITAL MANAGEMENT VALUE FUND ANNUAL & SEMI-ANNUAL REPORTS
The Securities and Exchange Commission (the “SEC”) has adopted rule and form amendments that will result in changes to the design and delivery of annual and semi-annual shareholder reports (“Reports”). Beginning in July 2024, Reports will be streamlined to highlight key information (“Redesigned Reports”). Certain information currently included in the Reports, including financial statements, will no longer appear in the Redesigned Reports but will be available online, delivered free of charge to shareholders upon request, and filed with the SEC.
If you previously elected to receive the Fund's Reports electronically, you will continue to receive the Redesigned Reports electronically. Otherwise, you will receive paper copies of the Fund's Redesigned Reports via USPS mail for all Reports transmitted after July 2024. If you would like to receive the Fund's Redesigned Reports (and/or other communications) electronically instead of by mail, please contact your financial advisor or, if you are a direct investor, please call (888) 568-1267.
This report is submitted for the general information of shareholders and is not authorized for distribution to prospective investors unless preceded or accompanied by a current prospectus.
PRIVATE CAPITAL MANAGEMENT VALUE FUND
Annual Investment Adviser's Report
April 30, 2024
(Unaudited)
Dear Fellow Shareholder:
The 12 months ended April 30, 2024 were dominated by elevated and persistently “sticky” inflation numbers running well above the Federal Reserve’s (“Fed”) 2% annual target. Coupled with the U.S. economy’s persistent strength buoyed by domestic spending, market expectations have shifted out regarding the timeframe in which the Fed can begin cutting interest rates. Complicating the data mix, some economists are questioning whether further rate increases may be warranted. Other structural macroeconomic components, including geopolitical uncertainty, unprecedented levels for the U.S. national debt and high energy costs remain prominent features of the broader investing landscape.
Against this backdrop the Private Capital Management Value Fund’s Class I shares (“PCM Value Fund”), reported a loss of -1.16% for the 12 months ending April 30, which significantly lagged the 13.32% return for the small-cap Russell 2000® Index. While so substantially delinking from the broader small-cap indices is never welcome, it has proven a periodic feature of the PCM Value Fund’s long-term record of success. Looking at the longer and more consequential periods for long-term investors, the PCM Value Fund has posted uniformly strong results. The Fund outperforms the Russell 2000® on an annualized basis by 7.17% over the trailing three years and 3.18% over the trailing five years.
The performance data quoted represents past performance. Past performance is no guarantee of future results. Investment return and principal value will fluctuate, and shares, when redeemed may be worth more or less than their original cost. The performance shown reflects fee waivers/reimbursements in effect. Without these waivers, performance would have been lower. Current performance may be lower or higher than the performance data quoted. The returns do not reflect a 2% fee that applies to shares redeemed within 30 days of purchase. For performance data current to the most recent month-end, please call (888) 568-1267.
Ironically, though we begin this letter with a description about how the Fund’s performance compares to its small-cap equity benchmark, we are decidedly not benchmark focused as small-cap investors. Instead, for us the periodic disjunctions between relative nearer-term and multi-year results invite a discussion about the investing mindset we adopt in managing the Fund and the underlying discipline that frames the decisions we make. While as stock pickers we judge ourselves on long-term performance independent of market returns, periods of relative underperformance go to the heart of the Fund’s company-specific research focus, high-conviction approach to constructing the Fund’s portfolio and the multi-year investment horizon that we apply. We would highlight these three aspects of our investment approach since together, they encapsulate the investment discipline and commitment that defines our management of the Fund.
A focus on smaller, underfollowed companies. While the Fund’s portfolio grades out as “small-cap”, that is not really a sufficient description of the portfolio. Most of the companies in which the Fund invests reside at the smaller half of the small-cap spectrum – companies with market capitalizations of less than $2 billion. These companies are often poorly covered and frequently misunderstood. Our focus on this segment of the small-cap market allows for our intensive, company-specific research to seek to identify value opportunities that markets may overlook. The resulting disconnect between our bottom-up analytical analysis and the prevailing market view allows us to establish (or add to) Fund positions at attractive valuation points. Since sustainable cash flow is a central feature of our valuation approach, we look to weed out companies that do not have staying power or the resources to grow their businesses over time. Put simply, these types of companies can succeed for shareholders by growing their businesses over time or by being acquired by competitors or in private equity transactions.
A concentrated stock pickers portfolio. The PCM Value Fund frequently holds less than 30 individual stocks in its portfolio. This means that the Fund’s top ten holdings often comprise more than one-half of the Fund’s invested capital. In addition, the Fund generally maintains multiple individual positions at weightings that exceed 5%. We manage the portfolio in this fashion because we want our investment ideas to have the capacity to be individually impactful on Fund performance. We are confident in making impactful investments because we trust the depth and rigor of our research. We believe we know the companies in which we invest as well or better than any other public market investors. This level of confidence allows us to be patient when markets may become skittish. While companies in the Fund periodically show more downside volatility than we think is warranted, as we are able to do our job competently, maintaining our discipline – we expect to see long-term value opportunities for Fund investors.
A business cycle investment horizon. When we invest Fund assets we expect to hold the position for 3 - 5 years (in some cases longer). This gives the Fund an extended time dimension that enables us to “look through” intermittent periods of volatility so long as
PRIVATE CAPITAL MANAGEMENT VALUE FUND
Annual Investment Adviser’s Report (Concluded)
April 30, 2024
(Unaudited)
the ultimate value proposition that drove our interest remains intact. Because many companies in the Fund are under-followed or misunderstood, when market sentiment turns against them (or the industry in which they operate) it will frequently take an earnings cycle and management discussion to address and calm market concerns. We understand this dynamic and often benefit from it as these periods can provide a window for the Fund to opportunistically add to core positions at attractive valuations.
The process outlined above is one we fervently believe in and have implemented consistently since PCM Value Fund’s inception. In light of our confidence, we also believe in investing our own assets in the same opportunities in which we invest for the Fund and for our high-net-worth separate account clients. As a result, it should not be a surprise that PCM Partners and employees collectively are among the Fund’s largest shareholders, with investments in the PCM Value Fund accounting for more than 25% of the Fund’s assets under management.
In closing, we would take a moment to observe that while we believe the Fund has done comparatively well, smaller capitalization stocks generally have faced headwinds over the last three years as interest rates have risen. Valuation is a powerful tool for long-term investors, even if it does not lend itself to short-term market timing. Patience and discipline are key to successfully implementing a valuation-based investment strategy. And because we cannot prognosticate as to when the Fed will turn to rate cuts, we cannot speak to timing regarding a change in small-cap market sentiment. Nevertheless, this rate cycle will end and when it does we expect the foot will come off the throat of smaller company valuations. In the meantime, we will continue to pursue our goal to find and acquire businesses with exceptional economics at substantial discounts to their intrinsic value.
We value your continued confidence,
Private Capital Management Value Fund
Mutual Fund investing involves risk and it is possible to lose money by investing in a fund. The Fund is a diversified fund, but nevertheless has invested a significant portion of its assets in the securities of a relatively smaller number of issuers, which may cause the Fund’s value to fluctuate more widely than some other diversified funds. As a result of the Fund’s investment approach and the relative price movements of certain Fund holdings, as of April 30, 2024 the Fund’s holdings profile reflected a portfolio concentration level normally associated with a non-diversified fund. This may result in the Fund exhibiting greater volatility and less liquidity than other diversified funds. The above commentary is for informational purposes only and investors should consider the investment objectives, risks, charges, and expenses of the Fund carefully before investing. This report is not authorized for distribution unless preceded or accompanied by a current prospectus for the Private Capital Management Value Fund. The prospectus contains this and other important information about the Fund. Read it carefully before investing.
Shares of the Private Capital Management Value Fund are distributed by Foreside Funds Distributors LLC, not an adviser affiliate.
This letter is intended to assist shareholders in understanding how the Fund performed during the year ended April 30, 2024 and reflects the views of the investment adviser at the time of this writing. Of course, these views may change and do not guarantee the future performance of the Fund or the markets.
Portfolio composition is subject to change. The current and future portfolio holdings of the Fund are subject to investment risks.
PRIVATE CAPITAL MANAGEMENT VALUE FUND
Annual Report
Performance Data
April 30, 2024
(Unaudited)
Comparison of Change in Value of $10,000 Investment in Class I shares of the Private Capital Management Value Fund
vs. Russell 2000® Index
| Average Annual Total Returns for the Years Ended April 30, 2024 |
| | 1 Year | | 3 Years | | 5 Years | | 10 Years |
| Class I | -1.16% | | 3.99% | | 9.01% | | 8.24% |
| Russell 2000® Index | 13.32% | | -3.18% | | 5.83% | | 7.22% |
The performance data quoted represents past performance and does not guarantee future results. Current performance may be lower or higher. Performance data current to the most recent month-end may be obtained by calling (888) 568-1267. The investment return and principal value of an investment will fluctuate so that shares, when redeemed, may be worth more or less than their original cost. The graph and table do not reflect the deduction of taxes that a shareholder would pay on Fund distributions or the redemption of Fund shares.
As stated in the current prospectus dated September 1, 2023, the Fund’s “Total Annual Fund Operating Expenses” and “Total Annual Fund Operating Expenses After Fee Waiver and/or Expense Reimbursement” are 1.67% and 1.20%, respectively, of the Fund’s average daily net assets for Class I shares. These ratios may differ from the actual expenses incurred by the Fund for the period covered by this report. Private Capital Management, LLC (the “Adviser”), has contractually agreed to reduce its investment advisory fee and/or reimburse certain expenses of the Fund to the extent necessary to ensure that the Fund’s total operating expenses, excluding taxes, fees and expenses attributable to a distribution or service plan adopted by FundVantage Trust (the “Trust”), “Acquired Fund Fees and Expenses,” interest, extraordinary items and brokerage commissions do not exceed 1.20% (on an annual basis) of the Fund’s average daily net assets (the “Expense Limitation”). The Expense Limitation will remain in place until August 31, 2024, unless the Board of Trustees ("Board of Trustees") of the Trust approves its early termination. The Adviser is entitled to recover, subject to approval by the Board of Trustees, such amounts reduced or reimbursed for a period of up to three (3) years from the date on which the Adviser reduced its compensation and/or assumed expenses for the Fund. The Adviser is permitted to seek reimbursement from the Fund, subject to certain limitations, for fees it waived and Fund expenses it paid to the extent the total annual fund operating expenses do not exceed the limits described above or any lesser limits in effect at the time of reimbursement. No recoupment will occur unless the Fund’s expenses are below the Expense Limitation amount. Total returns would be lower had such fees and expenses not been waived and/or reimbursed.
A 2.00% redemption fee applies to shares redeemed within 30 days of purchase. This redemption fee is not reflected in the returns shown above.
The Fund evaluates performance as compared to that of the Russell 2000® Index. The Russell 2000® Index is an unmanaged index measuring the performance of the 2,000 smallest companies in the Russell 3000® Index, which is made up of 3,000 of the biggest U.S. stocks. It is impossible to invest directly in an index.
PRIVATE CAPITAL MANAGEMENT VALUE FUND
Fund Expense Disclosure
April 30, 2024
(Unaudited)
As a shareholder of the Fund, you incur two types of costs: (1) transaction costs, including sales charges (loads) on purchase payments, if any, and redemption fees; and (2) ongoing costs, including management fees, distribution and/or service (Rule 12b-1) fees (if any) and other Fund expenses. These examples are intended to help you understand your ongoing costs (in dollars) of investing in the Fund and to compare these costs with the ongoing costs of investing in other mutual funds.
These examples are based on an investment of $1,000 invested at the beginning of the six-month period from November 1, 2023 through April 30, 2024 and held for the entire period.
Actual Expenses
The first line of the accompanying table provides information about actual account values and actual expenses. You may use the information in this line, together with the amount you invested, to estimate the expenses that you paid over the period. Simply divide your account value by $1,000 (for example, an $8,600 account value divided by $1,000 = 8.6), then multiply the result by the number in the first line under the heading entitled "Expenses Paid During Period" to estimate the expenses you paid on your account during this period.
Hypothetical Examples for Comparison Purposes
The second line of the accompanying table provides information about hypothetical account values and hypothetical expenses based on the Fund's actual expense ratio and an assumed rate of return of 5% per year before expenses, which is not your Fund's actual return. The hypothetical account values and expenses may not be used to estimate the actual ending account balance or expenses you paid for the period. You may use this information to compare the ongoing costs of investing in the Fund and other funds. To do so, compare these 5% hypothetical examples with the 5% hypothetical examples that appear in the shareholder reports of other funds.
Please note that the expenses shown in the accompanying table are meant to highlight your ongoing costs only and do not reflect any transactional costs, such as sales charges (loads) on purchase payments (if any) or redemption fees. Therefore, the second line of the accompanying table is useful in comparing ongoing costs only and will not help you determine the relative total costs of owning different funds. In addition, if these transactional costs were included, your costs would have been higher.
| | Beginning Account Value
November 1, 2023 | | Ending Account Value
April 30, 2024 | | Annualized
Expense Ratio | | Expenses Paid
During Period* |
| Private Capital Management Value Fund |
| Class I | | | | | | | |
| Actual | $1,000.00 | | $1,090.30 | | 1.20% | | $6.24 |
| Hypothetical (5% return before expenses) | 1,000.00 | | 1,018.90 | | 1.20% | | 6.02 |
| * | Expenses are equal to an annualized expenses ratio for the six-month period ended April 30, 2024 of 1.20% for the Fund, multiplied by the average account value over the period, multiplied by the number of days in the most recent period (182), then divided by 366 to reflect the period. The Fund’s ending account value on the first line in the table is based on the actual six-months total return for the Fund of 9.03%. |
Private Capital Management Value Fund
Portfolio Holdings Summary Table
April 30, 2024
(Unaudited)
The following table presents a summary by sector of the portfolio holdings of the Fund:
| | % of Net
Assets | | Value |
| COMMON STOCKS: | | | |
| Financials | 30.3% | | $16,302,973 |
| Consumer Discretionary | 17.5 | | 9,404,066 |
| Communication Services | 16.9 | | 9,067,046 |
| Industrials | 11.9 | | 6,410,552 |
| Health Care | 9.5 | | 5,075,333 |
| Information Technology | 8.6 | | 4,633,052 |
| Materials | 2.9 | | 1,550,847 |
| Total Common Stocks | 97.6 | | 52,443,869 |
| Short-Term Investment | 4.4 | | 2,390,095 |
| Total Investments | 102.0 | | 54,833,964 |
| Liabilities in Excess of Other Assets | (2.0) | | (1,082,064) |
| NET ASSETS | 100.0% | | $53,751,900 |
Portfolio holdings are subject to change at any time.
The accompanying notes are an integral part of the financial statements.
PRIVATE CAPITAL MANAGEMENT VALUE FUND
Portfolio of Investments
April 30, 2024
| | Number
of Shares | | Value |
| COMMON STOCKS — 97.6% |
| Communication Services — 16.9% |
| IMAX Corp. (Canada)* | 111,460 | | $ 1,784,475 |
| Perion Network Ltd. (Israel)* | 105,085 | | 1,323,020 |
| QuinStreet, Inc.* | 329,439 | | 5,959,551 |
| | | | 9,067,046 |
| Consumer Discretionary — 17.5% |
| Everi Holdings, Inc.* | 222,595 | | 1,818,601 |
| Lakeland Industries, Inc. | 99,983 | | 1,654,719 |
| Motorcar Parts of America, Inc.* | 152,660 | | 867,109 |
| Target Hospitality Corp.* | 367,450 | | 4,087,881 |
| Visteon Corp.* | 8,820 | | 975,756 |
| | | | 9,404,066 |
| Financials — 30.3% |
| BGC Group, Inc., Class A | 280,195 | | 2,193,927 |
| ECN Capital Corp. (Canada) | 1,434,005 | | 1,833,326 |
| First Busey Corp. | 45,729 | | 1,021,586 |
| First Northwest Bancorp | 60,798 | | 623,179 |
| Jefferies Financial Group, Inc. | 50,025 | | 2,154,076 |
| KKR & Co., Inc. | 37,500 | | 3,490,125 |
| Shore Bancshares, Inc. | 56,090 | | 580,532 |
| SmartFinancial, Inc. | 36,714 | | 754,473 |
| StoneX Group, Inc.* | 34,690 | | 2,518,494 |
| Synovus Financial Corp. | 31,664 | | 1,133,255 |
| | | | 16,302,973 |
| Health Care — 9.5% |
| Harrow, Inc.* | 226,033 | | 2,303,276 |
| Lantheus Holdings, Inc.* | 41,660 | | 2,772,057 |
| | | | 5,075,333 |
| Industrials — 11.9% |
| AerSale Corp.* | 205,495 | | 1,465,179 |
| Asure Software, Inc.* | 323,112 | | 2,387,798 |
| Barrett Business Services, Inc. | 21,050 | | 2,557,575 |
| | | | 6,410,552 |
| Information Technology — 8.6% |
| Information Services Group, Inc. | 369,774 | | 1,246,139 |
| Powerfleet, Inc.* | 707,080 | | 3,386,913 |
| | | | 4,633,052 |
| Materials — 2.9% |
| Tronox Holdings PLC (United Kingdom) | 91,280 | | 1,550,847 |
TOTAL COMMON STOCKS
(Cost $39,028,269) | | | 52,443,869 |
| | Number
of Shares | | Value |
| SHORT-TERM INVESTMENT — 4.4% | | |
| Money Market Fund — 4.4% | | | |
| Dreyfus Treasury Securities Cash Management, Institutional Shares 5.18%(a) | 2,390,095 | | $ 2,390,095 |
TOTAL SHORT-TERM INVESTMENT
(Cost $2,390,095) | | | 2,390,095 |
|
| |
TOTAL INVESTMENTS - 102.0%
(Cost $41,418,364) | | | 54,833,964 |
| LIABILITIES IN EXCESS OF OTHER ASSETS - (2.0)% | | | (1,082,064) |
| NET ASSETS - 100.0% | | | $ 53,751,900 |
| (a) | Rate periodically changes. Rate disclosed is the 7-day yield at April 30, 2024. |
| * | Non-income producing. |
| PLC | Public Limited Company |
The accompanying notes are an integral part of the financial statements.
PRIVATE CAPITAL MANAGEMENT VALUE FUND
Statement of Assets and Liabilities
April 30, 2024
| Assets | |
| Investments, at value (Cost $41,418,364) | $54,833,964 |
| Receivables: | |
| Capital shares sold | 24,230 |
| Dividends and interest | 8,964 |
| Prepaid expenses and other assets | 13,842 |
| Total Assets | 54,881,000 |
| Liabilities | |
| Payables: | |
| Investments purchased | 958,368 |
| Capital shares redeemed | 65,169 |
| Investment adviser | 36,317 |
| Administration and accounting fees | 13,912 |
| Accrued expenses | 55,334 |
| Total Liabilities | 1,129,100 |
| Contingencies and Commitments (Note 2) | — |
| Net Assets | $53,751,900 |
| Net Assets Consisted of: | |
| Capital stock, $0.01 par value | $ 36,022 |
| Paid-in capital | 39,416,151 |
| Total distributable earnings | 14,299,727 |
| Net Assets | $53,751,900 |
| Class I Shares: | |
| Net assets | $53,751,900 |
| Shares outstanding | 3,602,228 |
| Net asset value, offering and redemption price per share | $ 14.92 |
The accompanying notes are an integral part of the financial statements.
PRIVATE CAPITAL MANAGEMENT VALUE FUND
Statement of Operations
For the Year Ended April 30, 2024
| Investment income | |
| Dividends | $ 467,392 |
| Interest | 86,598 |
| Less: foreign taxes withheld | (9,862) |
| Total investment income | 544,128 |
| Expenses | |
| Advisory fees(Note 2) | 506,930 |
| Administration and accounting fees(Note 2) | 57,058 |
| Trustees’ and officers’ fees(Note 2) | 45,008 |
| Transfer agent fees(Note 2) | 41,838 |
| Legal fees | 38,662 |
| Audit fees | 32,365 |
| Registration and filing fees | 28,890 |
| Custodian fees(Note 2) | 20,484 |
| Shareholder reporting fees | 18,619 |
| Other expenses | 12,002 |
| Total expenses before waivers and reimbursements | 801,856 |
| Less: waivers and reimbursements(Note 2) | (125,949) |
| Net expenses after waivers and reimbursements | 675,907 |
| Net investment loss | (131,779) |
| Net realized and unrealized gain/(loss) from investments: | |
| Net realized gain from investments | 1,398,163 |
| Net realized gain from foreign currency transactions | 68 |
| Net change in unrealized depreciation on investments | (2,057,176) |
| Net change in unrealized depreciation on foreign currency translations | (3) |
| Net realized and unrealized loss on investments | (658,948) |
| Net decrease in net assets resulting from operations | $ (790,727) |
The accompanying notes are an integral part of the financial statements.
PRIVATE CAPITAL MANAGEMENT VALUE FUND
Statements of Changes in Net Assets
| | For the Year
Ended
April 30, 2024 | | For the Year
Ended
April 30, 2023 |
| Net increase/(decrease) in net assets from operations: | | | |
| Net investment loss | $ (131,779) | | $ (182,334) |
| Net realized gains from investments and foreign currency transactions | 1,398,231 | | 410,833 |
| Net change in unrealized appreciation/(depreciation) on investments and foreign currency translations | (2,057,179) | | 4,310,305 |
| Net increase/(decrease) in net assets resulting from operations | (790,727) | | 4,538,804 |
| Less dividends and distributions to shareholders from: | | | |
| Total distributable earnings: | | | |
| Class I | (392,465) | | (1,364,831) |
| Net decrease in net assets from dividends and distributions to shareholders | (392,465) | | (1,364,831) |
| Increase in net assets derived from capital share transactions (Note 4) | 1,046,999 | | 15,279,794 |
| Total increase/(decrease) in net assets | (136,193) | | 18,453,767 |
| Net assets | | | |
| Beginning of year | 53,888,093 | | 35,434,326 |
| End of year | $53,751,900 | | $53,888,093 |
The accompanying notes are an integral part of the financial statements.
PRIVATE CAPITAL MANAGEMENT VALUE FUND
Financial Highlights
Contained below is per share operating performance data for Class I shares outstanding, total investment return, ratios to average net assets and other supplemental data for the respective period. The total returns in the table represent the rate that an investor would have earned or lost on an investment in the Fund (assuming reinvestment of all dividends and distributions). This information has been derived from information provided in the financial statements and should be read in conjunction with the financial statements and the notes thereto.
| | Class I |
| | For the
Year Ended
April 30,
2024 | | For the
Year Ended
April 30,
2023 | | For the
Year Ended
April 30,
2022 | | For the
Year Ended
April 30,
2021 | | For the
Year Ended
April 30,
2020 |
| Per Share Operating Performance | | | | | | | | | |
| Net asset value, beginning of year | $ 15.20 | | $ 13.79 | | $ 15.65 | | $ 8.80 | | $ 15.75 |
| Net investment income/(loss)(1) | (0.03) | | (0.06) | | 0.79 (2) | | (0.05) | | (0.00) (3) |
| Net realized and unrealized gain/(loss) on investments | (0.15) | | 1.97 | | (0.61) | | 8.52 | | (4.30) |
| Total from investment operations | (0.18) | | 1.91 | | 0.18 | | 8.47 | | (4.30) |
| Dividends and distributions to shareholders from: | | | | | | | | | |
| Net investment income | — | | (0.17) | | (0.72) | | — | | — |
| Net realized capital gains | (0.10) | | (0.33) | | (1.34) | | (1.62) | | (2.65) |
| Total dividends and distributions to shareholders | (0.10) | | (0.50) | | (2.06) | | (1.62) | | (2.65) |
| Redemption fees | 0.00 (3) | | 0.00 (3) | | 0.02 | | 0.00 (3) | | — |
| Net asset value, end of year | $ 14.92 | | $ 15.20 | | $ 13.79 | | $ 15.65 | | $ 8.80 |
| Total investment return(4) | (1.16)% | | 13.96% | | (0.16)% | | 101.74% | | (32.15)% |
| Ratios/Supplemental Data | | | | | | | | | |
| Net assets, end of year (in 000s) | $53,752 | | $53,888 | | $35,434 | | $33,657 | | $20,565 |
| Ratio of expenses to average net assets | 1.20% | | 1.20% | | 1.20% | | 1.20% | | 1.16% |
| Ratio of expenses to average net assets without waivers and reimbursements(5) | 1.42% | | 1.67% | | 1.73% | | 2.06% | | 1.83% |
| Ratio of net investment income/(loss) to average net assets | (0.23)% | | (0.43)% | | 5.01% (2) | | (0.38)% | | (0.02)% |
| Portfolio turnover rate | 22% | | 6% | | 26% | | 20% | | 20% |
| (1) | The selected per share data was calculated using the average shares outstanding method for the year. |
| (2) | Investment income/(loss) per share reflects special dividends received during the year which amounted to $0.42 per share. Excluding the special dividend, the ratio of net investment income to average net assets would have been 2.34%. |
| (3) | Amount is less than $0.005 per share. |
| (4) | Total investment return is calculated assuming a purchase of shares on the first day and a sale of shares on the last day of each period reported and includes reinvestment of dividends and distributions, if any. |
| (5) | During the period, certain fees were waived and/or reimbursed. If such fee waivers and/or reimbursements had not occurred, the ratios would have been as indicated (See Note 2). |
The accompanying notes are an integral part of the financial statements.
PRIVATE CAPITAL MANAGEMENT VALUE FUND
Notes to Financial Statements
April 30, 2024
1. Organization and Significant Accounting Policies
The Private Capital Management Value Fund (the “Fund”) is operating as a diversified, open-end management investment company registered under the Investment Company Act of 1940, as amended, (the “1940 Act”), which commenced investment operations on May 28, 2010. The Fund is a separate series of FundVantage Trust (the “Trust”) which was organized as a Delaware statutory trust on August 28, 2006. The Trust is a “series trust” authorized to issue an unlimited number of separate series or classes of shares of beneficial interest. Each series is treated as a separate entity for certain matters under the 1940 Act, and for other purposes, and a shareholder of one series is not deemed to be a shareholder of any other series. The Fund offers separate classes of shares: Class C, Class I and Class R Shares. A 1.00% contingent deferred sales charge (“CDSC”) will be assessed when Class C shares are redeemed within 12 months after initial purchase; however, the CDSC shall not apply to the purchases of Class C shares where the selling broker dealer was not paid a commission at the time of initial purchase. As of April 30, 2024, the Class C shares and the Class R shares have not yet commenced operations.
The Fund is an investment company and follows accounting and reporting guidance in the Financial Accounting Standards Board Accounting Standards Codification Topic 946.
Portfolio Valuation – The Fund's net asset value (“NAV”) is calculated once daily at the close of regular trading hours on the New York Stock Exchange (“NYSE”) (typically 4:00 p.m. Eastern time) on each day the NYSE is open. Securities held by the Fund are valued using the last sale price on a national securities exchange or the National Association of Securities Dealers Automatic Quotation System (“NASDAQ”) market system where they are primarily traded. Equity securities traded in the over-the-counter (“OTC”) market are valued at their closing sale or official closing price. If there were no transactions on that day, securities traded principally on an exchange or on NASDAQ will be valued at the mean of the last bid and ask prices prior to the market close. Fixed income securities having a remaining maturity of greater than 60 days are valued using an independent pricing service. Fixed income securities having a remaining maturity of 60 days or less are generally valued at amortized cost, provided such amount approximates fair value. Foreign securities are valued based on prices from the primary market in which they are traded and are translated from the local currency into U.S. dollars using current exchange rates. Investments in other open-end investment companies are valued based on the NAV of the investment companies (which may use fair value pricing as discussed in their prospectuses). Securities that do not have a readily available current market value are valued in good faith by the Adviser as "valuation designee" under the oversight of the Trust’s Board of Trustees. Relying on prices supplied by pricing services or dealers or using fair valuation may result in values that are higher or lower than the values used by other investment companies and investors to price the same investments. The Adviser has adopted written policies and procedures for valuing securities and other assets in circumstances where market quotes are not readily available. In the event that market quotes are not readily available, and the security or asset cannot be valued pursuant to one of the valuation methods, the value of the security or asset will be determined in good faith by the Adviser pursuant to its policies and procedures. On a quarterly basis, the Adviser’s fair valuation determinations will be reviewed by the Trust’s Board of Trustees.
Fair Value Measurements — The inputs and valuation techniques used to measure fair value of the Fund’s investments are summarized into three levels as described in the hierarchy below:
• Level 1 — quoted prices in active markets for identical securities;
• Level 2 — other significant observable inputs (including quoted prices for similar securities, interest rates, prepayment speeds, credit risk, etc.); and
• Level 3 — significant unobservable inputs (including the Fund’s own assumptions in determining the fair value of investments).
The inputs or methodology used for valuing securities are not necessarily an indication of the risk associated with investing in those securities. Transfers in and out are recognized at the value at the end of the period.
PRIVATE CAPITAL MANAGEMENT VALUE FUND
Notes to Financial Statements (Continued)
April 30, 2024
The following is a summary of the inputs used, as of April 30, 2024, in valuing the Fund's investments carried at fair value:
| | Total Value at
04/30/24 | | Level 1
Quoted
Price | | Level 2
Other
Significant
Observable
Inputs | | Level 3
Significant
Unobservable
Inputs |
| Assets | | | | | | | |
| Common Stocks* | $ 52,443,869 | | $ 52,443,869 | | $ — | | $ — |
| Short-Term Investment* | 2,390,095 | | 2,390,095 | | — | | — |
| Total Assets | $ 54,833,964 | | $ 54,833,964 | | $ — | | $ — |
| * | Please refer to Portfolio of Investments for further details on portfolio holdings. |
At the end of each quarter, management evaluates the classification of Levels 1, 2 and 3 assets and liabilities. Various factors are considered, such as changes in liquidity from the prior reporting period; whether or not a broker is willing to execute at the quoted price; the depth and consistency of prices from third-party pricing services; and the existence of contemporaneous, observable trades in the market. Additionally, management evaluates the classification of Level 1 and Level 2 assets and liabilities on a quarterly basis for changes in listings or delistings on national exchanges.
Due to the inherent uncertainty of determining the fair value of investments that do not have a readily available market value, the fair value of the Fund’s investments may fluctuate from period to period. Additionally, the fair value of investments may differ significantly from the values that would have been used had a ready market existed for such investments and may differ materially from the values the Fund may ultimately realize. Further, such investments may be subject to legal and other restrictions on resale or otherwise less liquid than publicly traded securities.
For fair valuations using significant unobservable inputs, U.S. generally accepted accounting principles (“U.S. GAAP”) require the Fund to present a reconciliation of the beginning to ending balances for reported market values that present changes attributable to total realized and unrealized gains or losses, purchase and sales, and transfers in and out of Level 3 during the period. A reconciliation of Level 3 investments is presented only when the Fund had an amount of Level 3 investments at the end of the reporting period that was meaningful in relation to its net assets. The amounts and reasons for all transfers in and out of Level 3 are disclosed when the Fund had an amount of transfers during the reporting period that was meaningful in relation to its net assets as of the end of the reporting period.
For the year ended April 30, 2024, there were no transfers in or out of Level 3.
Use of Estimates — The preparation of financial statements in conformity with U.S. GAAP requires management to make estimates and assumptions that affect the amounts reported in the financial statements and accompanying notes at the date of the financial statements and the reported amounts of revenues and expenses during the period. Actual results could differ from those estimates and those differences could be material.
Investment Transactions, Investment Income and Expenses — Investment transactions are recorded on trade date for financial statement preparation purposes. Realized gains and losses on investments sold are recorded on the identified cost basis. Interest income is recorded on the accrual basis. Dividends are recorded on the ex-dividend date. The Fund may be subject to foreign taxes on certain foreign investments. The Fund will accrue such taxes and reclaims, as applicable, based upon the current interpretation of tax rules and regulations that exist in the market in which the Fund invests. General expenses of the Trust are generally allocated to each fund under methodologies approved by the Board of Trustees. Expenses directly attributable to a particular fund in the Trust are charged directly to that fund.
Cash and Cash Equivalents — Cash and cash equivalents include cash and overnight investments in interest-bearing demand deposits with a financial institution with original maturities of three months or less. The Fund maintains deposits with a high quality financial institution in an amount that is in excess of federally insured limits.
PRIVATE CAPITAL MANAGEMENT VALUE FUND
Notes to Financial Statements (Continued)
April 30, 2024
Foreign Currency Translation — Assets and liabilities initially expressed in non-U.S. currencies are translated into U.S. dollars based on the applicable exchange rates at the date of the last business day of the financial statement period. Purchases and sales of securities, interest income, dividends, variation margin received and expenses denominated in foreign currencies are translated into U.S. dollars at the exchange rates in effect on the transaction date.
The Fund does not separately report the effect of changes in foreign exchange rates from changes in market prices of securities held. Such changes are included with the net realized gain or loss and change in unrealized appreciation or depreciation on investments in the Statement of Operations. Other foreign currency transactions resulting in realized and unrealized gain or loss are reported separately as net realized gain or loss and change in unrealized appreciation or depreciation on foreign currency transactions in the Statement of Operations.
Dividends and Distributions to Shareholders — Dividends from net investment income and distributions from net realized capital gains, if any, are declared, recorded on ex-date and paid at least annually to shareholders. Income dividends and capital gain distributions are determined in accordance with U.S. federal income tax regulations, which may differ from U.S. GAAP.
U.S. Tax Status — No provision is made for U.S. income taxes as it is the Fund’s intention to continue to qualify for and elect the tax treatment applicable to regulated investment companies under Subchapter M of the Internal Revenue Code of 1986, as amended (“Internal Revenue Code”), and make the requisite distributions to its shareholders which will be sufficient to relieve it from U.S. income and excise taxes.
Other — In the normal course of business, the Fund may enter into contracts that provide general indemnifications. The Fund’s maximum exposure under these arrangements is dependent on claims that may be made against the Fund in the future, and therefore, cannot be estimated; however, based on experience, the risk of material loss for such claims is considered remote.
Currency Risk — The Fund invests in securities of foreign issuers, including American Depositary Receipts. These markets are subject to special risks associated with foreign investments not typically associated with investing in U.S. markets. Because the foreign securities in which the Fund may invest generally trade in currencies other than the U.S. dollar, changes in currency exchange rates will affect the Fund's NAV, the value of dividends and interest earned and gains and losses realized on the sale of securities. Because the NAV for the Fund is determined on the basis of U.S. dollars, the Fund may lose money by investing in a foreign security if the local currency of a foreign market depreciates against the U.S. dollar, even if the local currency value of the Fund's holdings goes up. Generally, a strong U.S. dollar relative to these other currencies will adversely affect the value of the Fund's holdings in foreign securities.
Common Stock Risk — The Fund invests a substantial portion of its assets in common stocks. The value of the Fund’s portfolio will be affected by changes in stock markets. Commons stock represents an equity (ownership) interest in a company or other entity. At times, the stock markets can be volatile, and stock prices can change drastically. This market risk will affect the Fund’s net asset value, which will fluctuate as the values of the Fund’s portfolio securities and other assets change. In addition, other factors can adversely affect a particular stock’s price. Not all of these factors nor their affects can be predicted.
2. Transactions with Related Parties and Other Service Providers
Private Capital Management, LLC (the “Adviser”) serves as the investment adviser to the Fund pursuant to an investment advisory agreement with the Trust (the “Advisory Agreement”). For its services, the Adviser is paid a monthly fee at the annual rate of 0.90% of the Fund’s average daily net assets. The Adviser has contractually agreed to reduce its investment advisory fee and/or reimburse certain expenses of the Fund to the extent necessary to ensure that the Fund’s total operating expenses, excluding taxes, fees and expenses attributable to a distribution or service plan adopted by the Trust, “Acquired Fund Fees and Expenses,” interest, extraordinary items and brokerage commissions do not exceed 1.20% (on an annual basis) of the Fund’s average daily net assets (the “Expense Limitation”). The Expense Limitation will remain in place until August 31, 2024, unless the Board of Trustees approves its earlier termination. The Adviser is entitled to recover, subject to approval by the Board of Trustees, such amounts reduced or reimbursed for a period of up to three (3) years from the date on which the Adviser reduced its compensation and/or assumed expenses for the Fund. The Adviser is permitted to seek reimbursement from the Fund, subject to certain limitations, for fees it waived
PRIVATE CAPITAL MANAGEMENT VALUE FUND
Notes to Financial Statements (Continued)
April 30, 2024
and Fund expenses it paid to the extent the total annual fund operating expenses do not exceed the limits described above or any lesser limits in effect at the time of reimbursement. No recoupment will occur unless the Fund’s expenses are below the Expense Limitation amount.
As of April 30, 2024, the amount of potential recovery was as follows:
| | Expiration |
| | 04/30/2025 | | 04/30/2026 | | 04/30/2027 | | Total |
| | $201,181 | | $198,031 | | $125,949 | | $525,161 |
For the year ended April 30, 2024, the Adviser earned advisory fees of $506,930 and waived fees of $125,949.
The Fund has not recorded a commitment or contingent liability at April 30, 2024.
Other Service Providers
The Bank of New York Mellon (“BNY Mellon”) serves as administrator and custodian for the Fund. For providing administrative and accounting services, BNY Mellon is entitled to receive a monthly fee equal to an annual percentage rate of the Fund’s average daily net assets and is subject to certain minimum monthly fees. For providing certain custodial services, BNY Mellon is entitled to receive a monthly fee, subject to certain minimum, and out of pocket expenses.
The Trust, on behalf of the Fund, has entered into agreements with financial intermediaries to provide recordkeeping, processing, shareholder communications and other services to customers of the intermediaries investing in the Fund and has agreed to compensate the intermediaries for providing those services. The fees incurred by the Fund for these services are included in Transfer agent fees in the Statement of Operations.
Foreside Funds Distributors LLC (the “Underwriter”) provides principal underwriting services to the Fund pursuant to an underwriting agreement between the Trust and the Underwriter.
Trustees and Officers
The Trust is governed by its Board of Trustees. The Trustees receive compensation in the form of an annual retainer and per meeting fees for their services to the Trust. An employee of BNY Mellon serves as the Secretary of the Trust and is not compensated by the Fund or the Trust.
JW Fund Management LLC (“JWFM”) provides a Principal Executive Officer and Principal Financial Officer to the Trust. Chenery Compliance Group, LLC (“Chenery”) provides the Trust with a Chief Compliance Officer and an Anti-Money Laundering Officer. JWFM and Chenery are compensated for their services provided to the Trust.
3. Investment in Securities
For the year ended April 30, 2024, aggregated purchases and sales of investment securities (excluding short-term investments) of the Fund were as follows:
| | Purchases | | Sales |
| Investment Securities | $17,734,750 | | $11,792,889 |
PRIVATE CAPITAL MANAGEMENT VALUE FUND
Notes to Financial Statements (Continued)
April 30, 2024
4. Capital Share Transactions
For the years ended April 30, 2024 and 2023, transactions in capital shares (authorized shares unlimited) were as follows:
| | For the Year Ended
April 30, 2024 | | For the Year Ended
April 30, 2023 |
| | Shares | | Amount | | Shares | | Amount |
| Class I* | | | | | | | |
| Sales | 1,586,290 | | $ 23,813,367 | | 1,348,146 | | $20,865,813 |
| Reinvestments | 27,098 | | 392,384 | | 92,532 | | 1,363,918 |
| Redemption Fees | — | | 2,938 | | — | | 7,385 |
| Redemptions | (1,555,600) | | (23,161,690) | | (466,490) | | (6,957,322) |
| Net increase | 57,788 | | $ 1,046,999 | | 974,188 | | $15,279,794 |
| |
| | | | | | | | |
| * | There is a 2.00% redemption fee that may be charged on shares redeemed which have been held 30 days or less. The redemption fees are retained by the Fund for the benefit of the remaining shareholders and recorded as paid-in capital. |
5. Federal Tax Information
The Fund has followed the authoritative guidance on accounting for and disclosure of uncertainty in tax positions, which requires the Fund to determine whether a tax position is more likely than not to be sustained upon examination, including resolution of any related appeals or litigation processes, based on the technical merits of the position. Tax positions not deemed to meet the more-likely-than-not threshold would be recorded as tax benefit or expense in the current year. The Fund has determined that there was no effect on the financial statements from following this authoritative guidance. In the normal course of business, the Fund is subject to examination by federal, state and local jurisdictions, where applicable, for tax years for which applicable statutes of limitations have not expired.
Distributions are determined in accordance with federal income tax regulations, which may differ in amount or character from net investment income and realized gains for financial reporting purposes. Accordingly, the character of distributions and composition of net assets for tax purposes may differ from those reflected in the accompanying financial statements. To the extent these differences are permanent, such amounts are reclassified within the components of net assets based on the tax treatment; temporary differences do not require reclassifications. For the year ended April 30, 2024, there were reclassifications between components of total distributable earnings. These permanent differences were primarily attributable to reclasses from capital gain to ordinary income and short-term gain netted against current year net operating loss. Net assets were not affected by these adjustments.
For the year ended April 30, 2024, the tax character of distributions paid by the Fund was $110 of ordinary income dividends and $392,355 of long-term capital gains dividends. For the year ended April 30, 2023, the tax character of distributions paid by the Fund was $464,697 of ordinary income dividends and $900,134 of long-term capital gains dividends. Distributions from net investment income and short-term gains are treated as ordinary income for federal income tax purposes.
As of April 30, 2024, the components of distributable earnings on a tax basis were as follows:
Undistributed
Ordinary
Income | | Unrealized
Appreciation/
(Depreciation) |
| $1,099,867 | | $13,199,860 |
| | | |
The differences between the book and tax basis components of distributable earnings relate primarily to wash sale loss deferrals and partnerships.
PRIVATE CAPITAL MANAGEMENT VALUE FUND
Notes to Financial Statements (Concluded)
April 30, 2024
At April 30, 2024, the federal tax cost, aggregate gross unrealized appreciation and depreciation of securities held by the Fund were as follows:
| Federal Tax Cost | $41,634,096 |
| Unrealized Appreciation | 18,158,748 |
| Unrealized Depreciation | (4,958,880) |
| Net Unrealized Appreciation | $13,199,868 |
Accumulated capital losses represent net capital loss carryforwards as of April 30, 2024 that may be available to offset future realized capital gains and thereby reduce future capital gains distributions. As of April 30, 2024, the Fund did not have any capital loss carryforwards.
6. Subsequent Events
Management has evaluated the impact of all subsequent events on the Fund through the date the financial statements were issued, and has determined that there are no subsequent events requiring recognition or disclosure in the financial statements.
PRIVATE CAPITAL MANAGEMENT VALUE FUND
Report of Independent Registered Public Accounting Firm
To the Board of Trustees of FundVantage Trust and Shareholders of Private Capital Management Value Fund
Opinion on the Financial Statements
We have audited the accompanying statement of assets and liabilities, including the portfolio of investments, of Private Capital Management Value Fund (one of the funds constituting FundVantage Trust, hereafter referred to as the “Fund”) as of April 30, 2024, the related statement of operations for the year ended April 30, 2024, the statements of changes in net assets for each of the two years in the period ended April 30, 2024, including the related notes, and the financial highlights for each of the five years in the period ended April 30, 2024 (collectively referred to as the “financial statements”). In our opinion, the financial statements present fairly, in all material respects, the financial position of the Fund as of April 30, 2024, the results of its operations for the year then ended, the changes in its net assets for each of the two years in the period ended April 30, 2024 and the financial highlights for each of the five years in the period ended April 30, 2024 in conformity with accounting principles generally accepted in the United States of America.
Basis for Opinion
These financial statements are the responsibility of the Fund’s management. Our responsibility is to express an opinion on the Fund’s financial statements based on our audits. We are a public accounting firm registered with the Public Company Accounting Oversight Board (United States) (PCAOB) and are required to be independent with respect to the Fund in accordance with the U.S. federal securities laws and the applicable rules and regulations of the Securities and Exchange Commission and the PCAOB.
We conducted our audits of these financial statements in accordance with the standards of the PCAOB. Those standards require that we plan and perform the audit to obtain reasonable assurance about whether the financial statements are free of material misstatement, whether due to error or fraud.
Our audits included performing procedures to assess the risks of material misstatement of the financial statements, whether due to error or fraud, and performing procedures that respond to those risks. Such procedures included examining, on a test basis, evidence regarding the amounts and disclosures in the financial statements. Our audits also included evaluating the accounting principles used and significant estimates made by management, as well as evaluating the overall presentation of the financial statements. Our procedures included confirmation of securities owned as of April 30, 2024 by correspondence with the custodian and transfer agent. We believe that our audits provide a reasonable basis for our opinion.
/s/PricewaterhouseCoopers LLP
June 28, 2024
We have served as the auditor of one or more Private Capital Management, LLC investment companies since 2011.
PRIVATE CAPITAL MANAGEMENT VALUE FUND
Shareholder Tax Information
(Unaudited)
The Fund is required by Subchapter M of the Internal Revenue Code, to advise its shareholders of the U.S. federal tax status of distributions received by the Fund’s shareholders in respect of such fiscal year. During the fiscal year ended April 30, 2024, the Fund paid $110 of ordinary income dividends, and $392,355 of long-term capital gain dividends to its shareholders. Dividends from net investment income and short-term capital gains are treated as ordinary income dividends for federal income tax purposes.
The Fund designates 42.62% of the ordinary income distribution as qualified dividend income pursuant to the Jobs and Growth Tax Relief Reconciliation Act of 2003.
The percentage of ordinary income dividends qualifying for the corporate dividends received deduction is 35.24%.
The Fund designates 100.00% of the ordinary income distributions as qualified short-term gain pursuant to the American Jobs Creation Act 2004.
The Fund designated $392,355 as long-term capital gains distributions during the year ended April 30, 2024. Distributable long-term gains are based on net realized long-term gains determined on a tax basis and may differ from such amounts for financial reporting purposes.
All designations are based on financial information available as of the date of this annual report and, accordingly, are subject to change. For each item, it is the intention of the Fund to designate the maximum amount permitted under the Internal Revenue Code of 1986, as amended, and the regulations thereunder.
Because the Fund's fiscal year is not the calendar year, another notification will be sent with respect to calendar year 2023. The second notification, which will reflect the amount, if any, to be used by calendar year taxpayers on their U.S. federal income tax returns will be made in conjunction with Form 1099-DIV and will be mailed in January 2024.
Foreign shareholders will generally be subject to U.S. withholding tax on the amount of their ordinary income dividends. They will generally not be entitled to a foreign tax credit or deduction for the withholding taxes paid by a Fund, if any.
In general, dividends received by tax-exempt recipients (e.g., IRAs and Keoghs) need not be reported as taxable income for U.S. federal income tax purposes. However, some retirement trusts (e.g., corporate, Keogh and 403(b)(7) plans) may need this information for their annual information reporting.
Shareholders are advised to consult their own tax advisers with respect to the tax consequences of their investment in a Fund.
PRIVATE CAPITAL MANAGEMENT VALUE FUND
Other Information
(Unaudited)
Proxy Voting
Policies and procedures that the Fund uses to determine how to vote proxies relating to portfolio securities as well as information regarding how the Fund voted proxies relating to portfolio securities for the most recent 12-month period ended June 30 are available without charge, upon request, by calling (888) 568-1267 and on the Securities and Exchange Commission's (“SEC”) website at http://www.sec.gov.
Quarterly Portfolio Schedules
The Fund files its complete schedule of portfolio holdings with the SEC for the first and third fiscal quarters of each fiscal year (quarters ended July 31 and January 31) as an exhibit to its reports on Form N-PORT. The Fund's portfolio holdings on Form N-PORT are available on the SEC's website at http://www.sec.gov.
PRIVATE CAPITAL MANAGEMENT VALUE FUND
Privacy Notice
(Unaudited)
The privacy of your personal financial information is extremely important to us. When you open an account with us, we collect a significant amount of information from you in order to properly invest and administer your account. We take very seriously the obligation to keep that information private and confidential, and we want you to know how we protect that important information.
We collect nonpublic personal information about you from applications or other forms you complete and from your transactions with us or our affiliates. We do not disclose information about you, or our former clients, to our affiliates or to service providers or other third parties, except as permitted by law. We share only the information required to properly administer your accounts, which enables us to send transaction confirmations, monthly or quarterly statements, financials and tax forms. Even within FundVantage Trust and its affiliated entities, a limited number of people who actually service accounts will have access to your personal financial information. Further, we do not share information about our current or former clients with any outside marketing groups or sales entities.
To ensure the highest degree of security and confidentiality, FundVantage Trust and its affiliates maintain various physical, electronic and procedural safeguards to protect your personal information. We also apply special measures for authentication of information you request or submit to us on our web site.
If you have questions or comments about our privacy practices, please call us at (888) 568-1267.
PRIVATE CAPITAL MANAGEMENT VALUE FUND
Fund Management
(Unaudited)
FundVantage Trust (the “Trust”) is governed by a Board of Trustees (the “Trustees”). The primary responsibility of the Trustees is to represent the interest of the Trust's shareholders and to provide oversight management of the Trust.
The following tables present certain information regarding the Board of Trustees and officers of the Trust. None of the Trustees are an “interested person” of the Trust, the Adviser, another investment adviser of a series of the Trust, or Foreside Funds Distributors LLC, the principal underwriter of the Trust (“Underwriter”), within the meaning of the 1940 Act and each Trustee is referred to as an “Independent Trustee” and is listed under such heading below. Employees of certain service providers to the Trust serve as officers of the Trust; such persons are not compensated by the Fund. The address of each Trustee and officer as it relates to the Trust's business is 103 Bellevue Parkway, 2nd Floor, Wilmington, DE 19809.
The Statement of Additional Information for the Fund contains additional information about the Trustees and is available, without charge, upon request by calling (888) 568-1267.
Name
and Date of Birth | Position(s)
Held
with Trust | Term of Office
and Length of
Time Served | Principal Occupation(s)
During Past Five Years | Number of
Funds in
Trust
Complex
Overseen
by
Trustee | Other
Directorships
Held by
Trustee |
| INDEPENDENT TRUSTEES |
ROBERT J. CHRISTIAN
Date of Birth: 2/49 | Trustee | Shall serve until
death, resignation
or removal.
Trustee since
2007. Chairman
from 2007 until
September 30,
2019. | Retired since February 2006; Executive Vice
President of Wilmington Trust Company from
February 1996 to February 2006; President of
Rodney Square Management Corporation
(“RSMC”) (investment advisory firm) from 1996
to 2005; Vice President of RSMC from 2005 to 2006. | 29 | Optimum Fund
Trust
(registered
investment
company with
6 portfolios);
Third Avenue
Trust
(registered
investment
company with
4 portfolios);
Third Avenue
Variable Series
Trust
(registered
investment
company with
1 portfolio);
Polen Credit
Opportunities
Fund (registered
investment
company). |
PRIVATE CAPITAL MANAGEMENT VALUE FUND
Fund Management (Continued)
(Unaudited)
Name
and Date of Birth | Position(s)
Held
with Trust | Term of Office
and Length of
Time Served | Principal Occupation(s)
During Past Five Years | Number of
Funds in
Trust
Complex
Overseen
by
Trustee | Other
Directorships
Held by
Trustee |
IQBAL MANSUR
Date of Birth: 6/55 | Trustee | Shall serve until
death, resignation
or removal.
Trustee since
2007. | Retired since September 2020; Professor of
Finance, Widener University from 1998 to August 2020; Member of the Investment Committee of ChristianaCare Health System from January 2022 to present. | 29 | Third Avenue
Trust
(registered
investment
company with
4 portfolios);
Third Avenue
Variable Series
Trust
(registered
investment
company with
1 portfolio);
Polen Credit
Opportunities
Fund (registered
investment
company). |
NICHOLAS M.
MARSINI, JR.
Date of Birth: 8/55 | Trustee and
Chairman of
the Board | Shall serve until
death, resignation
or removal.
Trustee since
2016. Chairman
since October 1,
2019. | Retired since March 2016. President of PNC Bank Delaware from June 2011 to March 2016;
Executive Vice President of Finance of BNY Mellon from July 2010 to January 2011; Executive Vice President and Chief Financial Officer of PNC Global Investment Servicing from September 1997 to July 2010. | 29 | Brinker Capital
Destinations
Trust
(registered
investment
company with
10 portfolios);
Third Avenue
Trust
(registered
investment
company with
4 portfolios);
Third Avenue
Variable Series
Trust
(registered
investment
company with
1 portfolio);
Polen Credit
Opportunities
Fund (registered
investment
company). |
PRIVATE CAPITAL MANAGEMENT VALUE FUND
Fund Management (Continued)
(Unaudited)
Name
and Date of Birth | Position(s)
Held
with Trust | Term of Office
and Length of
Time Served | Principal Occupation(s)
During Past Five Years | Number of
Funds in
Trust
Complex
Overseen
by
Trustee | Other
Directorships
Held by
Trustee |
NANCY B. WOLCOTT
Date of Birth: 11/54 | Trustee | Shall serve until
death, resignation
or removal.
Trustee since
2011. | Retired since May 2014; EVP, Head of GFI Client Service Delivery, BNY Mellon from January 2012 to May 2014; EVP, Head of US Funds Services, BNY Mellon from July 2010 to January 2012; President of PNC Global Investment Servicing from 2008 to July 2010; Chief Operating Officer of PNC Global Investment Servicing from 2007 to 2008; Executive Vice President of PFPC Worldwide Inc. from 2006 to 2007. | 29 | Lincoln
Variable
Trust
Products Trust
(registered
investment
company with
97 portfolios);
Third Avenue
Trust
(registered
investment
company with
4 portfolios);
Third Avenue
Variable Series
Trust
(registered
investment
company with
1 portfolio);
Polen Credit
Opportunities
Fund (registered
investment
company). |
STEPHEN M. WYNNE
Date of Birth: 1/55 | Trustee | Shall serve until
death, resignation
or removal.
Trustee since
2009. | Retired since December 2010; Chief Executive
Officer of US Funds Services, BNY Mellon Asset Servicing from July 2010 to December 2010; Chief Executive Officer of PNC Global Investment Servicing from March 2008 to July 2010; President, PNC Global Investment Servicing from 2003 to 2008. | 29 | Copeland Trust
(registered
investment
company with
3 portfolios);
Third Avenue
Trust
(registered
investment
company with
4 portfolios);
Third Avenue
Variable Series
Trust
(registered
investment
company with
1 portfolio);
Polen Credit
Opportunities
Fund (registered
investment
company). |
PRIVATE CAPITAL MANAGEMENT VALUE FUND
Fund Management (Concluded)
(Unaudited)
Name
and Date of Birth | Position(s) Held
with Trust | Term of Office
and Length of
Time Served | Principal Occupation(s)
During Past Five Years |
| EXECUTIVE OFFICERS |
JOEL L. WEISS
Date of Birth: 1/63 | President and Chief
Executive Officer | Shall serve until death,
resignation or removal. Officer
since 2007. | President of JW Fund Management LLC since June 2016; Vice President and Managing Director of BNY Mellon Investment Servicing (US) Inc. and predecessor firms from 1993 to June 2016. |
CHRISTINE S. CATANZARO
Date of Birth: 8/84 | Treasurer and Chief Financial Officer | Shall serve until death,
resignation or removal. Officer
since 2022. | Financial Reporting Consultant from October 2020 to September 2022; Senior Manager, Ernst & Young LLP from March 2013 to October 2020. |
T. RICHARD KEYES
Date of Birth: 1/57 | Vice President
| Shall serve until death,
resignation or removal. Officer
since 2016. | President of TRK Fund Consulting LLC since July 2016; Head of Tax — U.S. Fund Services of BNY Mellon Investment Servicing (US) Inc. and predecessor firms from February 2006 to July 2016. |
GABRIELLA
MERCINCAVAGE
Date of Birth: 6/68 | Assistant Treasurer | Shall serve until death,
resignation or removal. Officer
since 2019. | Fund Administration Consultant since January 2019; Fund
Accounting and Tax Compliance Accountant to financial
services companies from November 2003 to July 2018. |
VINCENZO A. SCARDUZIO
Date of Birth: 4/72 | Secretary | Shall serve until death,
resignation or removal. Officer
since 2012. | Director and Senior Vice President Regulatory Administration of The Bank of New York Mellon and predecessor firms since 2001. |
JOHN CANNING
Date of Birth: 11/70 | Chief Compliance
Officer and Anti-Money
Laundering Officer | Shall serve until death,
resignation or removal. Officer
since 2022. | Director of Chenery Compliance Group, LLC from March 2021 to present; Senior Consultant of Foreside Financial Group from August 2020 to March 2021; Chief Compliance Officer & Chief Operating Officer of Schneider Capital Management LP from May 2019 to July 2020; Chief Operating Officer and Chief Compliance Officer of Context Capital Partners, LP from March 2016 to March 2018 and February 2019, respectively. |
Investment Adviser
Private Capital Management, LLC
8889 Pelican Bay Boulevard
Suite 500
Naples, FL 34108
Administrator
The Bank of New York Mellon
103 Bellevue Parkway
Wilmington, DE 19809
Transfer Agent
BNY Mellon Investment Servicing (US) Inc.
500 Ross Street, 154-0520
Pittsburgh, PA 15262
Principal Underwriter
Foreside Funds Distributors LLC
Three Canal Plaza, Suite 100
Portland, ME 04101
Custodian
The Bank of New York Mellon
240 Greenwich Street
New York, NY 10286
Independent Registered Public Accounting Firm
PricewaterhouseCoopers LLP
Two Commerce Square, Suite 1800
2001 Market Street
Philadelphia, PA 19103-7042
Legal Counsel
Troutman Pepper Hamilton Sanders LLP
3000 Two Logan Square
18th and Arch Streets
Philadelphia, PA 19103
of
FundVantage Trust
| Class A |
| Class C |
| Institutional Class |
ANNUAL REPORT
April 30, 2024
IMPORTANT NOTICE – UPCOMING CHANGES TO QUALITY DIVIDEND FUND ANNUAL & SEMI-ANNUAL REPORTS
The Securities and Exchange Commission (the “SEC”) has adopted rule and form amendments that will result in changes to the design and delivery of annual and semi-annual shareholder reports (“Reports”). Beginning in July 2024, Reports will be streamlined to highlight key information (“Redesigned Reports”). Certain information currently included in the Reports, including financial statements, will no longer appear in the Redesigned Reports but will be available online, delivered free of charge to shareholders upon request, and filed with the SEC.
If you previously elected to receive the Fund's Reports electronically, you will continue to receive the Redesigned Reports electronically. Otherwise, you will receive paper copies of the Fund's Redesigned Reports via USPS mail for all Reports transmitted after July 2024. If you would like to receive the Fund's Redesigned Reports (and/or other communications) electronically instead of by mail, please contact your financial advisor or, if you are a direct investor, please call (888) 201-5799.
This report is submitted for the general information of shareholders and is not authorized for distribution to prospective investors unless preceded or accompanied by a current prospectus.
QUALITY DIVIDEND FUND
Annual Investment Adviser's Report
April 30, 2024
(Unaudited)
Dear Shareholder,
During the fiscal year ended April 30, 2024, the Quality Dividend Fund (the “Fund”) Class A shares (without the sales charge) rose 3.02%, compared to an increase of 7.86% for the S&P® 500 Low Volatility High Dividend Index. Since inception on September 30, 2013, the Fund’s Class A shares (without the sales charge) have risen at an annualized rate of 6.96% versus 9.11% for the S&P® 500 Low Volatility High Dividend Index.
What a difference one year makes. At this time in 2023, we were pleased to have dodged many of the issues encountered by the broader market, which experienced significant 2022 declines versus the Fund’s Class A shares (without the sales charge) more modest decline. However, what performed relatively well in 2022, did not carry over into 2023. In fact, many of the best performing individual stocks and sectors in 2022 were the worst performers in 2023, and vice versa1.
In 2023, the cap-weighted S&P® 500 Index outperformed the S&P® 500 Equal Weight Index2 by a significant 12%, representing the second largest divergence historically between the two with data going back to 1971—only 1998 generated a wider gap at 16%. Conversely, in 2022, S&P 500 Equal Weight outperformed its cap-weighted counterpart by nearly 7%—the most since 2010. Such large performance disparities typically occur within volatile markets.
Technology companies, particularly those propelled by positive leverage to the demand for Artificial Intelligence (AI), were the disproportionate winners in 2023. This outsized influence bolstered a significant divergence in equity market performance between the large cap tech stocks and most other equity asset classes. According to Bank of America, “last year was the narrowest breadth year in history, going back to 1987, meaning that if you look at the percentage of stocks in the S&P® 500 that actually beat the S&P 500 index, only 27% of stocks outperformed.”3 We believe it is unlikely that such narrow breadth is sustainable.
Most market prognosticators got 2023 wrong. The predictions of doom and gloom to start the year, and the consequences these insurmountable risks would have on the markets, never materialized. At the beginning of 2023, the probability of a pending recession seemed elevated in an environment facing stubbornly high inflation, slowing consumer spending, increasing unemployment, ongoing Federal Reserve (Fed) interest rate hikes (the fastest in 40 years), and geopolitical tensions. We find it wise to maintain a healthy bit of skepticism when it comes to Wall Street strategists’ macro predictions. Instead, we focus on building a portfolio that seeks to provide consistent income generation and the potential for capital appreciation to help investors mitigate significant market corrections.
In 2023, 21 of QDIV’s 28 holdings raised their dividend an average of 3.3%. Through the first quarter of 2024, 10 of the Fund’s 27 holdings raised their dividend an average of 3.5%. In our opinion, it is reasonable to anticipate further dividend increases will occur in the coming quarters and expect overall portfolio dividend growth in the range of 3.5% to 4.5% for 2024. We believe our portfolio companies are committed to maintaining a consistent and growing dividend.
Changes
We continue to seek opportunities to take advantage of some of the significant events occurring in the market to make changes to the Fund’s portfolio. Like our view in last year’s letter, we believe market action has priced in a recession in several names, creating
| 1 | The performance data quoted represents past performance and does not guarantee future results. The investment return and principal value of an investment in the Fund will fluctuate so that an investor’s shares, when redeemed, may be worth more or less than their original cost. The graph and table do not reflect the deduction of taxes that a shareholder would pay on Fund distributions or redemption of Fund shares. Current performance may be lower or higher. Performance data current to the most recent month-end may be obtained by calling (888) 201 – 5799. |
| 2 | The S&P 500® Equal Weight Index (EWI) is the equal-weight version of the widely-used S&P 500. The index includes the same constituents as the capitalization weighted S&P 500, but each company in the S&P® 500 EWI is allocated a fixed weight - or 0.2% of the index total at each quarterly rebalance. |
| 3 | Kwon, Ohsung. “Active Managers Had Another Rough Year. Why 2024 Could Be Better.” By Lauren Foster. Barron’s, January 6, 2024. |
QUALITY DIVIDEND FUND
Annual Investment Adviser’s Report (Continued)
April 30, 2024
(Unaudited)
opportunities for attractive levels of current income and the potential for growth in an economic recovery. With the Fed tightening cycle likely nearing an end, the prospects for interest-rate sensitive stocks to benefit as rates come down led us to add a real estate investment trust (REIT) to the Fund. Additionally, energy needs of data centers associated with AI could provide a benefit to utilities, prompting us to increase exposure to that sector.
During the last fiscal year, we removed Clorox (CLX), Verizon Communications (VZ), AT&T Corp (T), Organon & Co (OGN), and 3M Co. (MMM). Stocks that were added include United Parcel Service Inc. (UPS), Target Corp. (TGT), Whirlpool Corp (WHR), WEC Energy Group Inc (WEC), Xcel Energy (XEL) and Prologis Inc (PLD). International Flavors & Fragrances Inc (IFF) was purchased and subsequently sold during the fiscal year.
Distributions
The Fund has had four income distributions during the fiscal year. Class A shares distributed income of $0.147122 per share on June 30, 2023; $0.0871 per share on September 29, 2023; $0.092 per share on December 29, 2023; and $0.0731 per share on April 1, 2024. Class C shares distributed income of $0.125261 per share on June 30, 2023; $0.0631 per share on September 29, 2023; $0.0703 per share on December 29, 2023; and $0.0414 per share on April 1, 2024. Class I shares distributed income of $0.154208 per share on June 30, 2023; $0.0942 per share on September 29, 2023; $0.0988 per share on December 29, 2023; and $0.0828 per share on April 1, 2024. There was a capital gain distribution of $0.1596 per share on December 13, 2023.
Outlook
Since the Fed began raising interest rates in March 2022, dividend stocks have had to compete with these much higher rates. This has been a stiff headwind for the past two years as investors preferred the safety and higher yields of U.S. government bonds and money market funds versus dividend-paying stocks. However, as rates appear to be peaking, the anticipation of the Fed beginning to lower interest rates could be a catalyst for dividend stocks to come back into favor. We have seen early indications that investors are beginning to adjust their portfolios in anticipation of lower interest rates as evidenced by the recent performance of dividend-focused stocks. In our opinion, we are in the early innings of a change in investor sentiment toward more traditional value stocks which have significantly underperformed growth stocks. If this is the case, we believe the Fund should be well positioned to take advantage of this change in sentiment.
Sincerely,
Thomas P. Mulroy
Senior Portfolio Manager
Michael S. Scherer
Senior Portfolio Manager
Investments cannot be made directly in an Index. Unmanaged index returns assume reinvestment of any and all distributions and do not reflect fees, expenses, or sales charges.
This letter is intended to assist shareholders in understanding how the Fund performed during the fiscal year ended April 30, 2022 and reflects the views of the investment adviser at the time of this writing. Of course, these views may change and do not guarantee the future performance of the Fund or the markets.
Mutual fund investing involves risk, including possible loss of principal. Although the Fund will invest primarily in income producing equities, the Fund cannot guarantee any particular level of distributions. Companies that have paid regular dividends to shareholders
QUALITY DIVIDEND FUND
Annual Investment Adviser’s Report (Concluded)
April 30, 2024
(Unaudited)
may decrease or eliminate dividend payments in the future. A fund pursuing a dividend oriented investment strategy may at times underperform other funds that invest more broadly or that have different investment styles.
The S&P 500® Index is an unmanaged index of equity prices and is representative of a broader market and range of securities than is found in the Fund’s portfolio. The Morningstar Large Value Category consists of Funds that invest primarily in big U.S. companies that are less expensive or growing more slowly than other large-cap stocks. Stocks in the top 70% of the capitalization of the U.S. equity market are defined as large-cap. Value is defined based on low valuations (low price ratios and high dividend yields) and slow growth (low growth rates for earnings, sales, book value, and cash flow). The Russell 1000® Value Index consists of approximately 1,000 of the largest companies in the U.S. equity markets and measures how U.S. stocks in the equity value segment perform.
Foreign securities potentially entail special risks such as less liquid markets; political and economic instability; lax regulation; and adverse fluctuations in currency exchange rates.
Real estate investing is subject to special risks, including tenant default, declining occupancy rates, adverse changes in environmental and zoning regulations, and falling property values and rents due to deteriorating local or national economic conditions. Real Estate Investment Trust (“REIT”) securities listed on a securities exchange may be subject to abrupt or erratic price movements because of interest rate changes and other factors. Non-listed REIT securities may lack sufficient liquidity to enable the Fund to sell them at an advantageous time or to minimize a loss.
Distributions from REITs may include a return of capital. A REIT that does not qualify as a REIT under the Internal Revenue Code (“IRC”) will pay taxes on its earnings, which will reduce the dividends paid by the REIT to the Fund Some REITs are highly leveraged, which may increase the risk of loss. MLPs are partnerships which are publicly traded and listed on a national securities exchange.
Master Limited Partnerships (“MLPs”) are interest rate sensitive investments that may trade in lower volumes and be subject to abrupt or erratic price movements and may involve less control by outside investors and potential conflicts of interest among an MLP and its general partner. The IRC treats distributions from an MLP as non-taxable return of capital until the value of the distributions exceeds a partner’s basis in partnership interests, at which point the distributions are taxable. MLPs do not pay U.S. federal income tax at the partnership level, but an adverse change in tax laws could result in MLPs being treated as corporations for federal income tax purposes, which would reduce or eliminate an MLP’s tax deductions. MLPs primarily are engaged in energy and natural resource sectors, which makes them sensitive to negative developments in those sectors.
The above commentary is for informational purposes only and does not represent an offer, recommendation or solicitation to buy, hold or sell any security. The specific securities identified and described do not represent all of the securities purchased or sold and you should not assume that investments in the securities identified and discussed will be profitable.
Portfolio composition is subject to change. The current and future portfolio holdings of the Fund are subject to investment risk.
QUALITY DIVIDEND FUND
Annual Report
Performance Data
April 30, 2024
(Unaudited)
Comparison of Change in Value of $10,000 Investment in Quality Dividend Fund Class A shares vs. S&P 500® Low Volatility High Dividend Index
Class A of an assumed $10,000 investment is adjusted for the maximum sales charge of 5.75%. This results in a net investment of $9,450. Performance of Class C will vary from Class A due to differences in class-specific fees.
| Average Annual Total Returns for the Years Ended April 30, 2024 |
| | 1 Year | | 3 Years | | 5 Years | | 10 Years |
| Class A (with sales charge) | -2.90% | | -0.29% | | 3.66% | | 5.61% |
| Class A (without sales charge) | 3.02% | | 1.69% | | 4.89% | | 6.24% |
| S&P 500® Low Volatility High Dividend Index | 7.86% | | 3.76% | | 5.10% | | 8.17% |
| Average Annual Total Returns for the Years Ended April 30, 2024 |
| | 1 Year | | 3 Years | | 5 Years | | 10 Years |
| Class C (with CDSC charge) | 1.19% | | 0.90% | | 4.10% | | 5.44% |
| Class C (without CDSC charge) | 2.17% | | 0.90% | | 4.10% | | 5.44% |
| S&P 500® Low Volatility High Dividend Index | 7.86% | | 3.76% | | 5.10% | | 8.17% |
The performance data quoted represents past performance and does not guarantee future results. The investment return and principal value of an investment in the Fund will fluctuate so that an investor’s shares, when redeemed, may be worth more or less than their original cost. The graph and table do not reflect the deduction of taxes that a shareholder would pay on Fund distributions or redemption of Fund shares. Current performance may be lower or higher. Performance data current to the most recent month-end may be obtained by calling (888) 201-5799.
QUALITY DIVIDEND FUND
Annual Report
Performance Data (Continued)
April 30, 2024
(Unaudited)
Comparison of Change in Value of $1,000,000 Investment in Quality Dividend Fund Institutional Class vs. S&P 500® Low Volatility High Dividend Index
| Average Annual Total Returns for the Periods Ended April 30, 2024† |
| | 1 Year | | 3 Years | | 5 Years | | Since
Inception |
| Institutional Class | 3.21% | | 1.92% | | 5.13% | | 6.99% |
| S&P 500® Low Volatility High Dividend Index | 7.86% | | 3.76% | | 5.10% | | 6.37% * |
| † | The Quality Dividend Fund (the “Fund”) Institutional Class commenced operations on October 4, 2016. |
| * | Benchmark performance is from each Class respective inception date only and is not the inception date of the benchmark itself. |
The performance data quoted represents past performance and does not guarantee future results. The investment return and principal value of an investment in the Fund will fluctuate so that an investor’s shares, when redeemed, may be worth more or less than their original cost. The graph and table do not reflect the deduction of taxes that a shareholder would pay on Fund distributions or redemption of Fund shares. Current performance may be lower or higher. Performance data current to the most recent month-end may be obtained by calling (888) 201-5799.
The returns of Class A shares reflect a deduction for the maximum front end sales charge of 5.75%. The returns shown for Class C shares reflect a maximum deferred sales charge of 1.00% that may apply to Class C shares when shares are redeemed within 12 months after initial purchase.
The Fund’s “Total Annual Fund Operating Expenses” and “Total Annual Fund Operating Expenses After Fee Waiver and/or Expense Reimbursement”, as stated in the current prospectus dated September 1, 2023, are 1.55% and 1.24%, respectively, for Class A shares, 2.30% and 1.99%, respectively, for Class C shares and 1.30% and 0.99%, respectively, for Institutional Class shares of the Fund’s average daily net assets. These rates may fluctuate and may differ from the actual expenses incurred by the Fund for the period covered by this report. EquityCompass Investment Management, LLC (“EquityCompass” or the “Adviser”) has contractually agreed to reduce its investment advisory fee and/or reimburse certain expenses of the Fund to the extent necessary to ensure that the Fund’s total operating expenses (excluding taxes, fees and expenses attributable to a distribution or service plan adopted by FundVantage Trust (the “Trust”), “Acquired Fund Fees and Expenses,” dividend and interest expense on securities sold short, interest, extraordinary items and brokerage commissions) do not exceed 0.99% of average daily net assets of the Fund (the “Expense Limitation”). The Expense Limitation will remain in effect until August 31, 2024, unless the Board of Trustees (“Board of Trustees”) of the Trust approves its earlier termination. The Adviser is entitled to recover, subject to approval by the Board of Trustees, such amounts reduced or reimbursed for a period of up to three (3) years from the date on which the Adviser reduced its compensation and/or assumed expenses for the Fund. The Adviser is permitted to seek reimbursement from the Fund, subject to certain limitations, for fees it waived and Fund expenses it paid to the extent the total annual fund operating expenses do not exceed the limits described above or any lesser limits in effect at the time of reimbursement. No recoupment will occur unless the Fund’s expenses are below the Expense Limitation amount. Total fees would be higher had such fees and expenses not been waived and/or reimbursed.
QUALITY DIVIDEND FUND
Annual Report
Performance Data (Concluded)
April 30, 2024
(Unaudited)
A 1.00% redemption fee applies to shares redeemed within 60 days of purchase. The redemption fee is not reflected in the returns shown above.
The Fund evaluates its performance as compared to that of the S&P 500® Low Volatility High Dividend Index.The S&P 500® Low Volatility High Dividend Index measures the performance of the 50-least volatile high dividend-yielding stocks in the S&P 500®. The index is designed to serve as a benchmark for income-seeking investors in the U.S. equity markets. It is impossible to invest directly in an index.
Mutual fund investing involves risk, including possible loss of principal. The Fund’s dividend income and distributions will fluctuate, and at times the Fund may underperform other funds that invest more broadly or that have different investment styles. Some of the assets in which the Fund may invest entail special risks. Foreign stocks may be affected by currency fluctuations, social and political instability, and lax regulatory and financial reporting standards. Master Limited Partnerships ("MLPs") may fluctuate abruptly in value and be difficult to liquidate. Real Estate Investment Trusts ("REITs") entail risks related to real estate, such as tenant defaults, declining occupancy rates, and falling property values due to deteriorating economic conditions. Listed REIT stocks may fluctuate erratically in market price while non-listed REITs may be illiquid.
QUALITY DIVIDEND FUND
Fund Expense Disclosure
April 30, 2024
(Unaudited)
As a shareholder of the Fund, you incur two types of costs: (1) transaction costs, including sales charges (loads) on purchase payments, if any, and redemption fees; and (2) ongoing costs, including management fees, distribution and/or service (Rule 12b-1) fees (if any) and other Fund expenses. These examples are intended to help you understand your ongoing costs (in dollars) of investing in the Fund and to compare these costs with the ongoing costs of investing in other mutual funds.
These examples are based on an investment of $1,000 invested at the beginning of the six-month period from November 1, 2023 through April 30, 2024 and held for the entire period.
Actual Expenses
The first line of each accompanying table provides information about actual account values and actual expenses. You may use the information in this line, together with the amount you invested, to estimate the expenses that you paid over the period. Simply divide your account value by $1,000 (for example, an $8,600 account value divided by $1,000 = 8.6), then multiply the result by the number in the first line under the heading entitled "Expenses Paid During Period" to estimate the expenses you paid on your account during this period.
Hypothetical Examples for Comparison Purposes
The second line of each accompanying table provides information about hypothetical account values and hypothetical expenses based on the Fund's actual expense ratio and an assumed rate of return of 5% per year before expenses, which is not your Fund's actual return. The hypothetical account values and expenses may not be used to estimate the actual ending account balance or expenses you paid for the period. You may use this information to compare the ongoing costs of investing in the Fund and other funds. To do so, compare these 5% hypothetical examples with the 5% hypothetical examples that appear in the shareholder reports of other funds.
Please note that the expenses shown in the accompanying table are meant to highlight your ongoing costs only and do not reflect any transactional costs, such as sales charges (loads) on purchase payments (if any) or redemption fees. Therefore, the second line of the accompanying table is useful in comparing ongoing costs only and will not help you determine the relative total costs of owning different funds. In addition, if these transactional costs were included, your costs would have been higher.
| | Beginning Account Value
November 1, 2023 | | Ending Account Value
April 30, 2024 | | Annualized
Expense Ratio* | | Expenses Paid
During Period |
| Quality Dividend Fund |
| Class A | | | | | | | |
| Actual | $1,000.00 | | $1,140.60 | | 1.24% | | $ 6.60 |
| Hypothetical (5% return before expenses) | 1,000.00 | | 1,018.70 | | 1.24% | | 6.22 |
| Class C | | | | | | | |
| Actual | $1,000.00 | | $1,135.10 | | 1.99% | | $10.56 |
| Hypothetical (5% return before expenses) | 1,000.00 | | 1,014.97 | | 1.99% | | 9.97 |
| Institutional Class | | | | | | | |
| Actual | $1,000.00 | | $1,140.30 | | 0.99% | | $ 5.27 |
| Hypothetical (5% return before expenses) | 1,000.00 | | 1,019.94 | | 0.99% | | 4.97 |
| * | Expenses are equal to an annualized expense ratio for the six-month period ended April 30, 2024 of 1.24%, 1.99% and 0.99% for Class A, Class C and Institutional Class shares, respectively, for the Fund, multiplied by the average account value over the period, multiplied by the number of days in the most recent period (182), then divided by 366 to reflect the period. The Fund’s ending account values on the first line in the table are based on the actual six-month total returns for the Fund of 14.06%,13.51% and 14.03% for Class A, Class C and Institutional Class shares, respectively. |
Quality Dividend Fund
Portfolio Holdings Summary Table
April 30, 2024
(Unaudited)
The following table presents a summary by sector of the portfolio holdings of the Fund:
| | % of Net
Assets | | Value |
| COMMON STOCKS: | | | |
| Oil, Gas & Consumable Fuels | 11.8% | | $ 5,281,746 |
| Banks | 11.7 | | 5,242,496 |
| Biotechnology | 10.7 | | 4,774,249 |
| Pharmaceuticals | 7.6 | | 3,406,563 |
| Household Products | 4.1 | | 1,848,070 |
| Personal Care Products | 4.0 | | 1,770,366 |
| Multi-Utilities | 3.9 | | 1,767,174 |
| Tobacco | 3.9 | | 1,741,959 |
| Machinery | 3.8 | | 1,713,567 |
| Semiconductors & Semiconductor Equipment | 3.8 | | 1,710,577 |
| Specialty Retail | 3.8 | | 1,687,019 |
| Insurance | 3.8 | | 1,682,721 |
| Consumer Staples Distribution & Retail | 3.7 | | 1,663,567 |
| Capital Markets | 3.7 | | 1,648,371 |
| Air Freight & Logistics | 3.7 | | 1,645,877 |
| Containers & Packaging | 3.6 | | 1,626,387 |
| Communications Equipment | 3.6 | | 1,615,924 |
| Information Technology Services | 3.4 | | 1,502,947 |
| Real Estate Investment Trusts | 3.3 | | 1,492,509 |
| Household Durables | 2.2 | | 988,062 |
| Total Common Stocks | 100.1 | | 44,810,151 |
| Liabilities in Excess of Other Assets | (0.1) | | (53,914) |
| NET ASSETS | 100.0% | | $44,756,237 |
Portfolio holdings are subject to change at any time.
The accompanying notes are an integral part of the financial statements.
QUALITY DIVIDEND FUND
Portfolio of Investments
April 30, 2024
| | Number
of Shares | | Value |
| COMMON STOCKS — 100.1% |
| Air Freight & Logistics — 3.7% |
| United Parcel Service, Inc., Class B | 11,160 | | $ 1,645,877 |
| Banks — 11.7% |
| JPMorgan Chase & Co. | 9,348 | | 1,792,385 |
| Truist Financial Corp. | 46,865 | | 1,759,781 |
| US Bancorp | 41,603 | | 1,690,330 |
| | | | 5,242,496 |
| Biotechnology — 10.7% |
| AbbVie, Inc. | 9,603 | | 1,561,832 |
| Amgen, Inc. | 6,258 | | 1,714,317 |
| Gilead Sciences, Inc. | 22,977 | | 1,498,100 |
| | | | 4,774,249 |
| Capital Markets — 3.7% |
| T Rowe Price Group, Inc. | 15,044 | | 1,648,371 |
| Communications Equipment — 3.6% |
| Cisco Systems, Inc. | 34,396 | | 1,615,924 |
| Consumer Staples Distribution & Retail — 3.7% |
| Target Corp. | 10,334 | | 1,663,567 |
| Containers & Packaging — 3.6% |
| International Paper Co. | 46,548 | | 1,626,387 |
| Household Durables — 2.2% |
| Whirlpool Corp. | 10,416 | | 988,062 |
| Household Products — 4.1% |
| Kimberly-Clark Corp. | 13,536 | | 1,848,070 |
| Information Technology Services — 3.4% |
| International Business Machines Corp. | 9,043 | | 1,502,947 |
| Insurance — 3.8% |
| Prudential Financial, Inc. | 15,231 | | 1,682,721 |
| Machinery — 3.8% |
| Stanley Black & Decker, Inc. | 18,748 | | 1,713,567 |
| Multi-Utilities — 3.9% |
| WEC Energy Group, Inc. | 21,384 | | 1,767,174 |
| | Number
of Shares | | Value |
| COMMON STOCKS — (Continued) |
| Oil, Gas & Consumable Fuels — 11.8% |
| Chevron Corp. | 11,157 | | $ 1,799,289 |
| Enbridge, Inc. (Canada) | 47,654 | | 1,693,623 |
| Exxon Mobil Corp. | 15,125 | | 1,788,834 |
| | | | 5,281,746 |
| Personal Care Products — 4.0% |
| Unilever PLC, SP ADR (United Kingdom) | 34,144 | | 1,770,366 |
| Pharmaceuticals — 7.6% |
| Merck & Co., Inc. | 14,228 | | 1,838,542 |
| Pfizer, Inc. | 61,203 | | 1,568,021 |
| | | | 3,406,563 |
| Real Estate Investment Trusts — 3.3% |
| Crown Castle, Inc. | 15,915 | | 1,492,509 |
| Semiconductors & Semiconductor Equipment — 3.8% |
| QUALCOMM, Inc. | 10,314 | | 1,710,577 |
| Specialty Retail — 3.8% |
| Best Buy Co., Inc. | 22,909 | | 1,687,019 |
| Tobacco — 3.9% |
| Philip Morris International, Inc. | 18,348 | | 1,741,959 |
TOTAL COMMON STOCKS
(Cost $40,288,081) | | | 44,810,151 |
|
| |
TOTAL INVESTMENTS - 100.1%
(Cost $40,288,081) | | | 44,810,151 |
| LIABILITIES IN EXCESS OF OTHER ASSETS - (0.1)% | | | (53,914) |
| NET ASSETS - 100.0% | | | $44,756,237 |
| PLC | Public Limited Company |
| SP ADR | Sponsored American Depository Receipt |
The accompanying notes are an integral part of the financial statements.
QUALITY DIVIDEND FUND
Statement of Assets and Liabilities
April 30, 2024
| Assets | |
| Investments, at value (Cost $40,288,081) | $44,810,151 |
| Cash and cash equivalents | 113,899 |
| Receivables: | |
| Capital shares sold | 1,509 |
| Dividends | 14,885 |
| Prepaid expenses and other assets | 1,820 |
| Total Assets | 44,942,264 |
| Liabilities | |
| Payables: | |
| Capital shares redeemed | 66,658 |
| Audit fees | 35,435 |
| Investment adviser | 28,812 |
| Transfer agent fees | 15,020 |
| Shareholder reporting fees | 11,844 |
| Administration and accounting fees | 10,826 |
| Distribution fees (Class A and Class C) | 9,959 |
| Shareholder servicing fees | 1,159 |
| Accrued expenses | 6,314 |
| Total Liabilities | 186,027 |
| Contingencies and Commitments (Note 2) | — |
| Net Assets | $44,756,237 |
| Net Assets Consisted of: | |
| Capital stock, $0.01 par value | $ 39,723 |
| Paid-in capital | 43,526,650 |
| Total distributable earnings | 1,189,864 |
| Net Assets | $44,756,237 |
| Class A Shares: | |
| Net assets | $31,177,962 |
| Shares outstanding | 2,771,800 |
| Net asset value, redemption price per share | $ 11.25 |
| Maximum offering price per share (100/94.25 of $11.25) | $ 11.94 |
| Class C Shares: | |
| Net assets | $ 5,375,568 |
| Shares outstanding | 469,703 |
| Net asset value, offering and redemption price per share | $ 11.44 |
| Institutional Class Shares: | |
| Net assets | $ 8,202,707 |
| Shares outstanding | 730,818 |
| Net asset value, offering and redemption price per share | $ 11.22 |
The accompanying notes are an integral part of the financial statements.
QUALITY DIVIDEND FUND
Statement of Operations
For the Year Ended April 30, 2024
| Investment income | |
| Dividends | $ 2,225,890 |
| Less: foreign taxes withheld | (24,756) |
| Total investment income | 2,201,134 |
| Expenses | |
| Advisory fees(Note 2) | 305,331 |
| Transfer agent fees(Note 2) | 92,481 |
| Distribution fees (Class A)(Note 2) | 81,460 |
| Administration and accounting fees(Note 2) | 60,269 |
| Distribution fees (Class C)(Note 2) | 52,043 |
| Registration and filing fees | 49,455 |
| Trustees’ and officers’ fees(Note 2) | 43,737 |
| Audit fees | 35,481 |
| Legal fees | 32,374 |
| Shareholder reporting fees | 20,419 |
| Custodian fees(Note 2) | 19,221 |
| Shareholder servicing fees (Class C) | 17,347 |
| Other expenses | 12,625 |
| Total expenses before waivers and reimbursements | 822,243 |
| Less: waivers and reimbursements(Note 2) | (167,590) |
| Net expenses after waivers and reimbursements | 654,653 |
| Net investment income | 1,546,481 |
| Net realized and unrealized gain/(loss) from investments: | |
| Net realized loss from investments | (3,172,243) |
| Net realized gain from foreign currency transactions | 219 |
| Net change in unrealized appreciation on investments | 2,722,783 |
| Net realized and unrealized loss on investments | (449,241) |
| Net increase in net assets resulting from operations | $ 1,097,240 |
The accompanying notes are an integral part of the financial statements.
QUALITY DIVIDEND FUND
Statements of Changes in Net Assets
| | For the Year
Ended
April 30, 2024 | | For the Year
Ended
April 30, 2023 |
| Net increase/(decrease) in net assets from operations: | | | |
| Net investment income | $ 1,546,481 | | $ 1,774,627 |
| Net realized gains/(losses) from investments and foreign currency transactions | (3,172,024) | | 2,720,403 |
| Net change in unrealized appreciation/(depreciation) on investments | 2,722,783 | | (6,570,580) |
| Net increase/(decrease) in net assets resulting from operations | 1,097,240 | | (2,075,550) |
| Less dividends and distributions to shareholders from: | | | |
| Total distributable earnings: | | | |
| Class A | (1,635,373) | | (6,438,105) |
| Class C | (282,215) | | (1,658,587) |
| Institutional Class | (607,010) | | (2,493,981) |
| Net decrease in net assets from dividends and distributions to shareholders | (2,524,598) | | (10,590,673) |
| Increase/(decrease) in net assets derived from capital share transactions (Note 4) | (12,049,919) | | 5,202,545 |
| Total decrease in net assets | (13,477,277) | | (7,463,678) |
| Net assets | | | |
| Beginning of year | 58,233,514 | | 65,697,192 |
| End of year | $ 44,756,237 | | $ 58,233,514 |
The accompanying notes are an integral part of the financial statements.
QUALITY DIVIDEND FUND
Financial Highlights
Contained below is per share operating performance data for Class A shares outstanding, total investment return, ratios to average net assets and other supplemental data for the respective period. The total returns in the table represent the rate that an investor would have earned or lost on an investment in the Fund (assuming reinvestment of all dividends and distributions). This information has been derived from information provided in the financial statements and should be read in conjunction with the financial statements and the notes thereto.
| | Class A |
| | For the
Year Ended
April 30,
2024 | | For the
Year Ended
April 30,
2023 | | For the
Year Ended
April 30,
2022 | | For the
Year Ended
April 30,
2021 | | For the
Year Ended
April 30,
2020 |
| Per Share Operating Performance | | | | | | | | | |
| Net asset value, beginning of year | $ 11.48 | | $ 14.10 | | $ 13.99 | | $ 10.47 | | $ 13.02 |
| Net investment income(1) | 0.34 | | 0.37 | | 0.34 | | 0.37 | | 0.34 |
| Net realized and unrealized gain/(loss) on investments | (0.01) | | (0.71) | | 0.39 | | 3.51 | | (1.80) |
| Total from investment operations | 0.33 | | (0.34) | | 0.73 | | 3.88 | | (1.46) |
| Dividends and distributions to shareholders from: | | | | | | | | | |
| Net investment income | (0.40) | | (0.36) | | (0.38) | | (0.36) | | (0.34) |
| Net realized capital gains | (0.16) | | (1.92) | | (0.24) | | — | | (0.74) |
| Return of capital | — | | — | | — | | — | | (0.01) |
| Total dividends and distributions to shareholders | (0.56) | | (2.28) | | (0.62) | | (0.36) | | (1.09) |
| Redemption fees | 0.00 (2) | | 0.00 (2) | | 0.00 (2) | | 0.00 (2) | | 0.00 (2) |
| Net asset value, end of year | $ 11.25 | | $ 11.48 | | $ 14.10 | | $ 13.99 | | $ 10.47 |
| Total investment return(3) | 3.02% | | (3.00)% | | 5.25% | | 37.87% | | (12.46)% |
| Ratios/Supplemental Data | | | | | | | | | |
| Net assets, end of year (in 000s) | $31,178 | | $35,727 | | $40,081 | | $37,392 | | $28,816 |
| Ratio of expenses to average net assets | 1.24% | | 1.24% | | 1.24% | | 1.24% | | 1.24% |
| Ratio of expenses to average net assets without waivers and/or reimbursements(4) | 1.57% | | 1.55% | | 1.42% | | 1.50% | | 1.36% |
| Ratio of net investment income to average net assets | 3.09% | | 2.89% | | 2.38% | | 3.20% | | 2.74% |
| Portfolio turnover rate | 21% | | 22% | | 32% | | 28% | | 38% |
| (1) | The selected per share data was calculated using the average shares outstanding method for the year. |
| (2) | Amount is less than $0.005 per share. |
| (3) | Total investment return is calculated assuming a purchase of shares on the first day and a sale of shares on the last day of each period reported and includes reinvestment of dividends and distributions, if any. Total investment return does not reflect the impact of the maximum front-end sales load of 5.75% or any applicable sales charge. If reflected, the return would be lower. |
| (4) | During the period, certain fees were waived and/or reimbursed. If such fee waivers and/or reimbursements had not occurred, the ratios would have been as indicated (See Note 2). |
The accompanying notes are an integral part of the financial statements.
QUALITY DIVIDEND FUND
Financial Highlights (Continued)
Contained below is per share operating performance data for Class C shares outstanding, total investment return, ratios to average net assets and other supplemental data for the respective period. The total returns in the table represent the rate that an investor would have earned or lost on an investment in the Fund (assuming reinvestment of all dividends and distributions). This information has been derived from information provided in the financial statements and should be read in conjunction with the financial statements and the notes thereto.
| | Class C |
| | For the
Year Ended
April 30,
2024 | | For the
Year Ended
April 30,
2023 | | For the
Year Ended
April 30,
2022 | | For the
Year Ended
April 30,
2021 | | For the
Year Ended
April 30,
2020 |
| Per Share Operating Performance | | | | | | | | | |
| Net asset value, beginning of year | $11.66 | | $14.26 | | $ 14.07 | | $ 10.52 | | $ 13.07 |
| Net investment income(1) | 0.26 | | 0.28 | | 0.24 | | 0.28 | | 0.25 |
| Net realized and unrealized gain/(loss) on investments | (0.02) | | (0.71) | | 0.37 | | 3.54 | | (1.80) |
| Total from investment operations | 0.24 | | (0.43) | | 0.61 | | 3.82 | | (1.55) |
| Dividends and distributions to shareholders from: | | | | | | | | | |
| Net investment income | (0.30) | | (0.25) | | (0.18) | | (0.27) | | (0.25) |
| Net realized capital gains | (0.16) | | (1.92) | | (0.24) | | — | | (0.74) |
| Return of capital | — | | — | | — | | — | | (0.01) |
| Total dividends and distributions to shareholders | (0.46) | | (2.17) | | (0.42) | | (0.27) | | (1.00) |
| Redemption fees | 0.00 (2) | | 0.00 (2) | | 0.00 (2) | | 0.00 (2) | | 0.00 (2) |
| Net asset value, end of year | $11.44 | | $11.66 | | $ 14.26 | | $ 14.07 | | $ 10.52 |
| Total investment return(3) | 2.17% | | (3.68)% | | 4.39% | | 36.91% | | (13.10)% |
| Ratios/Supplemental Data | | | | | | | | | |
| Net assets, end of year (in 000s) | $5,376 | | $8,839 | | $12,527 | | $16,740 | | $19,255 |
| Ratio of expenses to average net assets | 1.99% | | 1.99% | | 1.99% | | 1.99% | | 1.99% |
| Ratio of expenses to average net assets without waivers and/or reimbursements(4) | 2.32% | | 2.30% | | 2.17% | | 2.25% | | 2.11% |
| Ratio of net investment income to average net assets | 2.34% | | 2.14% | | 1.63% | | 2.45% | | 1.99% |
| Portfolio turnover rate | 21% | | 22% | | 32% | | 28% | | 38% |
| (1) | The selected per share data was calculated using the average shares outstanding method for the year. |
| (2) | Amount is less than $0.005 per share. |
| (3) | Total investment return is calculated assuming a purchase of shares on the first day and a sale of shares on the last day of each period reported and includes reinvestments of dividends and distributions, if any. Total investment return does not reflect any applicable sales charge. |
| (4) | During the period, certain fees were waived and/or reimbursed. If such fee waivers and/or reimbursements had not occurred, the ratios would have been as indicated (See Note 2). |
The accompanying notes are an integral part of the financial statements.
QUALITY DIVIDEND FUND
Financial Highlights (Concluded)
Contained below is per share operating performance data for Institutional Class shares outstanding, total investment return, ratios to average net assets and other supplemental data for the respective period. The total returns in the table represent the rate that an investor would have earned or lost on an investment in the Fund (assuming reinvestment of all dividends and distributions). This information has been derived from information provided in the financial statements and should be read in conjunction with the financial statements and the notes thereto.
| | Institutional Class |
| | For the
Year Ended
April 30,
2024 | | For the
Year Ended
April 30,
2023 | | For the
Year Ended
April 30,
2022 | | For the
Year Ended
April 30,
2021 | | For the
Year Ended
April 30,
2020 |
| Per Share Operating Performance | | | | | | | | | |
| Net asset value, beginning of year | $ 11.46 | | $ 14.08 | | $ 14.00 | | $ 10.47 | | $ 13.03 |
| Net investment income(1) | 0.37 | | 0.40 | | 0.38 | | 0.40 | | 0.37 |
| Net realized and unrealized gain/(loss) on investments | (0.02) | | (0.71) | | 0.38 | | 3.52 | | (1.80) |
| Total from investment operations | 0.35 | | (0.31) | | 0.76 | | 3.92 | | (1.43) |
| Dividends and distributions to shareholders from: | | | | | | | | | |
| Net investment income | (0.43) | | (0.39) | | (0.44) | | (0.39) | | (0.38) |
| Net realized capital gains | (0.16) | | (1.92) | | (0.24) | | — | | (0.74) |
| Return of capital | — | | — | | — | | — | | (0.01) |
| Total dividends and distributions to shareholders | (0.59) | | (2.31) | | (0.68) | | (0.39) | | (1.13) |
| Redemption fees | 0.00 (2) | | 0.00 (2) | | 0.00 (2) | | 0.00 (2) | | 0.00 (2) |
| Net asset value, end of year | $ 11.22 | | $ 11.46 | | $ 14.08 | | $ 14.00 | | $ 10.47 |
| Total investment return(3) | 3.21% | | (2.75)% | | 5.48% | | 38.31% | | (12.29)% |
| Ratios/Supplemental Data | | | | | | | | | |
| Net assets, end of year (in 000s) | $ 8,203 | | $13,667 | | $13,089 | | $12,076 | | $10,570 |
| Ratio of expenses to average net assets | 0.99% | | 0.99% | | 0.99% | | 0.99% | | 0.99% |
| Ratio of expenses to average net assets without waivers and/or reimbursements(4) | 1.33% | | 1.30% | | 1.17% | | 1.25% | | 1.11% |
| Ratio of net investment income to average net assets | 3.34% | | 3.14% | | 2.63% | | 3.45% | | 2.99% |
| Portfolio turnover rate | 21% | | 22% | | 32% | | 28% | | 38% |
| (1) | The selected per share data was calculated using the average shares outstanding method for the year. |
| (2) | Amount is less than $0.005 per share. |
| (3) | Total investment return is calculated assuming a purchase of shares on the first day and a sale of shares on the last day of each period reported and includes reinvestments of dividends and distributions, if any. |
| (4) | During the period, certain fees were waived and/or reimbursed. If such fee waivers and/or reimbursements had not occurred, the ratios would have been as indicated (See Note 2). |
The accompanying notes are an integral part of the financial statements.
QUALITY DIVIDEND FUND
Notes to Financial Statements
April 30, 2024
1. Organization and Significant Accounting Policies
The Quality Dividend Fund (the “Fund”) is a diversified, open-end management investment company registered under the Investment Company Act of 1940, as amended, (the “1940 Act”), which commenced investment operations on September 30, 2013. The Fund is a separate series of FundVantage Trust (the “Trust”) which was organized as a Delaware statutory trust on August 28, 2006. The Trust is a “series trust” authorized to issue an unlimited number of separate series or classes of shares of beneficial interest. Each series is treated as a separate entity for certain matters under the 1940 Act, and for other purposes, and a shareholder of one series is not deemed to be a shareholder of any other series. The Fund offers separate classes of shares: Class A, Class C and Institutional Class shares. Class A shares are subject to a front end sales charge of 5.75%. Front-end sales charges may be reduced or waived under certain circumstances. A contingent deferred sales charge (“CDSC”), as a percentage of the lower of the original purchase price or net asset value at redemption, of 1.00% may be imposed on full or partial redemptions of Class A shares made within twelve months of purchase where: (i) $1 million or more of Class A shares was purchased without an initial sales charge, and (ii) the selling broker-dealer received a commission for such sale. A CDSC of 1.00% may apply to Class C shares when shares are redeemed within 12 months after initial purchase where the selling broker-dealer received a commission for such sale.
The Fund is an investment company and follows accounting and reporting guidance in the Financial Accounting Standards Board Accounting Standards Codification Topic 946.
Portfolio Valuation — The Quality Dividend Fund’s net asset value (“NAV”) is calculated once daily at the close of regular trading hours on the New York Stock Exchange (“NYSE”) (typically 4:00 p.m. Eastern time) on each day the NYSE is open. Securities held by the Fund are valued using the last sale price on a national securities exchange or the National Association of Securities Dealers Automatic Quotation System (“NASDAQ”) market system where they are primarily traded. Equity securities traded in the over-the-counter (“OTC”) market are valued at their closing sale or official closing price. If there were no transactions on that day, securities traded principally on an exchange or on NASDAQ will be valued at the mean of the last bid and ask prices prior to the market close. Investments in other open-end investment companies are valued based on the NAV of the investment companies (which may use fair value pricing as discussed in their prospectuses). Securities that do not have a readily available current market value are valued in good faith by the Adviser as "valuation designee" under the oversight of the Trust’s Board of Trustees. Relying on prices supplied by pricing services or dealers or using fair valuation may result in values that are higher or lower than the values used by other investment companies and investors to price the same investments. The Adviser has adopted written policies and procedures for valuing securities and other assets in circumstances where market quotes are not readily available. In the event that market quotes are not readily available, and the security or asset cannot be valued pursuant to one of the valuation methods, the value of the security or asset will be determined in good faith by the Adviser pursuant to its policies and procedures. On a quarterly basis, the Adviser’s fair valuation determinations will be reviewed by the Trust’s Board of Trustees.
Fair Value Measurements — The inputs and valuation techniques used to measure fair value of the Fund’s investments are summarized into three levels as described in the hierarchy below:
• Level 1 — quoted prices in active markets for identical securities;
• Level 2 — other significant observable inputs (including quoted prices for similar securities, interest rates, prepayment speeds, credit risk, etc.); and
• Level 3 — significant unobservable inputs (including the Fund’s own assumptions in determining the fair value of investments).
The inputs or methodology used for valuing securities are not necessarily an indication of the risk associated with investing in those securities. Transfers in and out are recognized at the value at the end of the period.
QUALITY DIVIDEND FUND
Notes to Financial Statements (Continued)
April 30, 2024
The following is a summary of the inputs used, as of April 30, 2024, in valuing the Fund's investments carried at fair value:
| | Total
Value at
04/30/24 | | Level 1
Quoted
Prices | | Level 2
Other
Significant
Observable
Inputs | | Level 3
Significant
Unobservable
Inputs |
| Assets | | | | | | | |
| Investments in Securities* | $ 44,810,151 | | $ 44,810,151 | | $ — | | $ — |
| * | Please refer to Portfolio of Investments for further details on portfolio holdings. |
At the end of each quarter, management evaluates the classification of Levels 1, 2 and 3 assets and liabilities. Various factors are considered, such as changes in liquidity from the prior reporting period; whether or not a broker is willing to execute at the quoted price; the depth and consistency of prices from third-party pricing services; and the existence of contemporaneous, observable trades in the market. Additionally, management evaluates the classification of Level 1 and Level 2 assets and liabilities on a quarterly basis for changes in listings or delistings on national exchanges.
Due to the inherent uncertainty of determining the fair value of investments that do not have a readily available market value, the fair value of the Fund’s investments may fluctuate from period to period. Additionally, the fair value of investments may differ significantly from the values that would have been used had a ready market existed for such investments and may differ materially from the values the Fund may ultimately realize. Further, such investments may be subject to legal and other restrictions on resale or otherwise less liquid than publicly traded securities.
For fair valuations using significant unobservable inputs, U.S. generally accepted accounting principles (“U.S. GAAP”) require the Fund to present a reconciliation of the beginning to ending balances for reported market values that present changes attributable to total realized and unrealized gains or losses, purchase and sales, and transfers in and out of Level 3 during the period. A reconciliation of Level 3 investments is presented only when the Fund had an amount of Level 3 investments at the end of the reporting period that was meaningful in relation to its net assets. The amounts and reasons for all transfers in and out of Level 3 are disclosed when the Fund had an amount of transfers during the reporting period that was meaningful in relation to its net assets as of the end of the reporting period.
For the year ended April 30, 2024, there were no transfers in or out of Level 3.
Use of Estimates — The preparation of financial statements in conformity with U.S. GAAP requires management to make estimates and assumptions that affect the amounts reported in the financial statements and accompanying notes at the date of the financial statements and the reported amounts of revenues and expenses during the period. Actual results could differ from those estimates and those differences could be material.
Investment Transactions, Investment Income and Expenses — Investment transactions are recorded on trade date for financial statement preparation purposes. Realized gains and losses on investments sold are recorded on the identified cost basis. Interest income is recorded on the accrual basis. Dividends are recorded on the ex-dividend date. The Fund may be subject to foreign taxes on income, a portion of which may be recoverable. The Fund applies for refunds where available. Estimated components of distributions received from real estate investment trusts may be considered income, return of capital distributions or capital gain distributions. Return of capital distributions are recorded as a reduction of cost of the related investments. Distribution (12b-1) fees and shareholder services fees relating to a specific class are charged directly to that class. Fund level expenses common to all classes, investment income and realized and unrealized gains and losses on investments are allocated to each class based upon relative daily net assets of each class. General expenses of the Trust are generally allocated to each fund under methodologies approved by the Board of Trustees. Expenses directly attributable to a particular fund in the Trust are charged directly to that fund.
MLP Common Units — Master Limited Partnership (“MLP”) common units represent limited partnership interests in the MLP. Common units are generally listed and traded on the U.S. securities exchanges or OTC with their value fluctuating predominantly based on the success of the MLP. Unlike owners of common stock of a corporation, owners of MLP common units have limited voting
QUALITY DIVIDEND FUND
Notes to Financial Statements (Continued)
April 30, 2024
rights and have no ability to annually elect directors. MLPs generally distribute all available cash flow (cash flow from operations less maintenance capital expenditures) in the form of quarterly distributions. Common unit holders have first priority to receive quarterly cash distributions up to the minimum quarterly distribution and have arrearage rights. In the event of liquidation, common unit holders have preference over subordinated units, but not debt holders or preferred unit holders, to remaining assets of the MLP.
Cash and Cash Equivalents — Cash and cash equivalents include cash and overnight investments in interest-bearing demand deposits with a financial institution with original maturities of three months or less. The Fund maintains deposits with a high quality financial institution in an amount that is in excess of federally insured limits.
Dividends and Distributions to Shareholders — Dividends from net investment income and distributions from net realized capital gains, if any, are declared, recorded on ex-date and paid at least annually to shareholders. Income dividends and capital gain distributions are determined in accordance with U.S. federal income tax regulations, which may differ from U.S. GAAP.
U.S. Tax Status — No provision is made for U.S. income taxes as it is the Fund’s intention to continue to qualify for and elect the tax treatment applicable to regulated investment companies under Subchapter M of the Internal Revenue Code of 1986, as amended (“Internal Revenue Code”), and make the requisite distributions to its shareholders which will be sufficient to relieve it from U.S. income and excise taxes.
Other — In the normal course of business, the Fund may enter into contracts that provide general indemnifications. The Fund’s maximum exposure under these arrangements is dependent on claims that may be made against the Fund in the future, and therefore, cannot be estimated; however, based on experience, the risk of material loss for such claims is considered remote.
2. Transactions with Related Parties and Other Service Providers
EquityCompass Investment Management, LLC (“EquityCompass” or the “Adviser”), serves as investment adviser to the Fund pursuant to an investment advisory agreement with the Trust. For its services, the Adviser is paid a monthly fee at the annual rate of 0.60% of the Fund’s average daily net assets. The Adviser has contractually agreed to reduce its investment advisory fee and/or reimburse certain expenses of the Fund to the extent necessary to ensure that the Fund’s total operating expenses (excluding taxes, fees and expenses attributable to a distribution or service plan adopted by the Trust, “Acquired Fund Fees and Expenses,” dividend and interest expense on securities sold short, interest, extraordinary items and brokerage commissions) do not exceed 0.99% of average daily net assets of the Fund (the “Expense Limitation”). The Expense Limitation will remain in effect until August 31, 2024, unless the Board of Trustees of the Trust approves its earlier termination. The Adviser is entitled to recover, subject to approval by the Board of Trustees, such amounts reduced or reimbursed for a period of up to three (3) years from the date on which the Adviser reduced its compensation and/or assumed expenses for the Fund. The Adviser is permitted to seek reimbursement from the Fund, subject to certain limitations, for fees it waived and Fund expenses it paid to the extent the total annual fund operating expenses do not exceed the limits described above or any lesser limits in effect at the time of reimbursement. No recoupment will occur unless the Fund’s expenses are below the Expense Limitation amount. As of April 30, 2024, the amount of potential recovery was as follows:
| | Expiration |
| | 04/30/2025 | | 04/30/2026 | | 04/30/2027 | | Total |
| | $117,125 | | $193,865 | | $167,590 | | $478,580 |
For the year ended April 30, 2024, the Adviser earned advisory fees of $305,331 and waived fees of $167,590.
The Fund has not recorded a commitment or contingent liability at April 30, 2024.
Other Service Providers
The Bank of New York Mellon (“BNY Mellon”) serves as administrator and custodian for the Fund. For providing administrative and accounting services, BNY Mellon is entitled to receive a monthly fee equal to an annual percentage rate of the Fund’s average
QUALITY DIVIDEND FUND
Notes to Financial Statements (Continued)
April 30, 2024
daily net assets and is subject to certain minimum monthly fees. For providing certain custodial services, BNY Mellon is entitled to receive a monthly fee, subject to certain minimum, and out of pocket expenses.
BNY Mellon Investment Servicing (US) Inc. (the “Transfer Agent”) provides transfer agent services to the Fund. The Transfer Agent is entitled to receive a monthly fee, subject to certain minimum, and out of pocket expenses.
The Trust, on behalf of the Fund, has entered into agreements with financial intermediaries to provide recordkeeping, processing, shareholder communications and other services to customers of the intermediaries investing in the Fund and has agreed to compensate the intermediaries for providing those services. The fees incurred by the Fund for these services are included in Transfer agent fees in the Statement of Operations.
Foreside Funds Distributors LLC (the “Underwriter”) provides principal underwriting services to the Fund pursuant to an underwriting agreement between the Trust and the Underwriter.
The Trust and the Underwriter are parties to an underwriting agreement. The Trust has adopted a distribution plan for Class A and Class C shares in accordance with Rule 12b-1 under the 1940 Act. Pursuant to the Class A and Class C shares plan, the Fund compensates the Underwriter for direct and indirect costs and expenses incurred in connection with advertising, marketing and other distribution services in an amount not to exceed 0.25% and 1.00% (0.75% Rule 12b-1 distribution fee and 0.25% shareholder service fee) on an annualized basis of the average daily net assets of the Fund’s Class A and Class C shares, respectively.
Trustees and Officers
The Trust is governed by its Board of Trustees. The Trustees receive compensation in the form of an annual retainer and per meeting fees for their services to the Trust. An employee of BNY Mellon serves as the Secretary of the Trust and is not compensated by the Fund or the Trust.
JW Fund Management LLC (“JWFM”) provides a Principal Executive Officer and Principal Financial Officer to the Trust. Chenery Compliance Group, LLC (“Chenery”) provides the Trust with a Chief Compliance Officer and an Anti-Money Laundering Officer. JWFM and Chenery are compensated for their services provided to the Trust.
3. Investment in Securities
For the year ended April 30, 2024, aggregated purchases and sales of investment securities (excluding short-term investments) of the Fund were as follows:
| | Purchases | | Sales |
| Investment Securities | $9,588,549 | | $22,323,342 |
QUALITY DIVIDEND FUND
Notes to Financial Statements (Continued)
April 30, 2024
4. Capital Share Transactions
For the years ended April 30, 2024 and 2023, transactions in capital shares (authorized shares unlimited) were as follows:
| | For the Year Ended
April 30, 2024 | | For the Year Ended
April 30, 2023 |
| | Shares | | Amount | | Shares | | Amount |
| Class A | | | | | | | |
| Sales | 312,444 | | $ 3,485,492 | | 333,696 | | $ 4,301,074 |
| Reinvestments | 123,717 | | 1,375,500 | | 429,606 | | 5,244,892 |
| Redemption Fees* | — | | 277 | | — | | 3,575 |
| Redemptions | (775,860) | | (8,583,300) | | (494,842) | | (6,226,587) |
| Net increase/(decrease) | (339,699) | | $ (3,722,031) | | 268,460 | | $ 3,322,954 |
| |
| Class C | | | | | | | |
| Sales | 32,983 | | $ 367,810 | | 79,237 | | $ 1,062,343 |
| Reinvestments | 22,460 | | 253,200 | | 116,813 | | 1,446,920 |
| Redemption Fees* | — | | 60 | | — | | 999 |
| Redemptions | (343,840) | | (3,871,381) | | (316,345) | | (4,139,090) |
| Net decrease | (288,397) | | $ (3,250,311) | | (120,295) | | $(1,628,828) |
| |
| Institutional Class | | | | | | | |
| Sales | 57,846 | | $ 643,309 | | 317,012 | | $ 4,259,775 |
| Reinvestments | 44,349 | | 490,878 | | 152,919 | | 1,863,327 |
| Redemption Fees* | — | | 106 | | — | | 1,320 |
| Redemptions | (563,832) | | (6,211,870) | | (207,265) | | (2,616,003) |
| Net increase/(decrease) | (461,637) | | $ (5,077,577) | | 262,666 | | $ 3,508,419 |
| |
| Total net increase/(decrease) | (1,089,733) | | $(12,049,919) | | 410,831 | | $ 5,202,545 |
| | | | | | | | |
| * | There is a 1.00% redemption fee that may be charged on shares redeemed which have been held 60 days or less. The redemption fees are retained by the Fund for the benefit of the remaining shareholders and recorded as paid-in capital. |
5. Federal Tax Information
The Fund has followed the authoritative guidance on accounting for and disclosure of uncertainty in tax positions, which requires the Fund to determine whether a tax position is more likely than not to be sustained upon examination, including resolution of any related appeals or litigation processes, based on the technical merits of the position. Tax positions not deemed to meet the more-likely-than-not threshold would be recorded as tax benefit or expense in the current year. Tax positions not deemed to meet the more-likely-than-not threshold would be recorded as tax benefit or expense in the current year. The Fund has determined that there was no effect on the financial statements from following this authoritative guidance. In the normal course of business, the Fund is subject to examination by federal, state and local jurisdictions, where applicable, for tax years for which applicable statutes of limitations have not expired.
Distributions are determined in accordance with federal income tax regulations, which may differ in amount or character from net investment income and realized gains for financial reporting purposes. Accordingly, the character of distributions and composition of net assets for tax purposes may differ from those reflected in the accompanying financial statements. To the extent these differences are permanent, such amounts are reclassified within the components of net assets based on the tax treatment; temporary differences do not require reclassifications. For the year ended April 30, 2024, there were reclassifications between components of total distributable earnings. These permanent differences were primarily attributable to reclasses from capital gain to ordinary income and
QUALITY DIVIDEND FUND
Notes to Financial Statements (Concluded)
April 30, 2024
redesignation of dividends paid. Net assets were not affected by these adjustments. For the year ended April 30, 2024, there were no permanent differences reclassified between distributable earnings and paid in capital.
For the year ended April 30, 2024, the tax character of distributions paid by the Fund was $1,815,480 of ordinary income dividends and $709,118 of long-term capital gains dividends. For the year ended April 30, 2023, the tax character of distributions paid by the Fund was $1,920,266 of ordinary income dividends and $8,670,407 of long-term capital gains dividends.
As of April 30, 2024, the components of distributable earnings on a tax basis were as follows:
Capital Loss
Carryforward | | Undistributed
Ordinary
Income | | Unrealized
Appreciation/
(Depreciation) | | Temporary
Differences |
| $(3,186,216) | | $1,836 | | $4,377,331 | | $(3,087) |
| | | | | | | |
The differences between the book and tax basis components of distributable earnings relate primarily to the non-deductible expenses and wash sale loss deferrals.
At April 30, 2024, the federal tax cost, aggregate gross unrealized appreciation and depreciation of securities held by the Fund were as follows:
| Federal Tax Cost | $40,432,820 |
| Unrealized Appreciation | 7,942,121 |
| Unrealized Depreciation | (3,564,790) |
| Net Unrealized Appreciation | $ 4,377,331 |
Pursuant to federal income tax rules applicable to regulated investment companies, the Fund may elect to treat certain capital losses between November 1 and April 30 and late year ordinary losses ((i) ordinary losses between January 1 and April 30, and (ii) specified ordinary and currency losses between November 1 and April 30) as occurring on the first day of the following tax year. For the year ended April 30, 2024, the Fund had no short-term capital loss deferrals, no long-term capital loss deferrals or ordinary loss deferrals.
Accumulated capital losses represent net capital loss carryforwards as of April 30, 2024 that may be available to offset future realized capital gains and thereby reduce future capital gains distributions. As of April 30, 2024, the Fund had capital loss carryforward of $3,186,216, of which $74,577 are short-term losses and $3,111,639 are long-term losses and have an unlimited period of capital loss caryforward.
6. Subsequent Events
Management has evaluated the impact of all subsequent events on the Fund through the date the financial statements were issued, and has determined that there are no subsequent events requiring recognition or disclosure in the financial statements.
QUALITY DIVIDEND FUND
Report of Independent Registered Public Accounting Firm
To the Board of Trustees of FundVantage Trust and
Shareholders of Quality Dividend Fund
Opinion on the Financial Statements
We have audited the accompanying statement of assets and liabilities of Quality Dividend Fund (the “Fund”) (one of the series constituting FundVantage Trust (the “Trust”)), including the portfolio of investments, as of April 30, 2024, and the related statement of operations for the year then ended, the statements of changes in net assets for each of the two years in the period then ended, the financial highlights for each of the five years in the period then ended and the related notes (collectively referred to as the “financial statements”). In our opinion, the financial statements present fairly, in all material respects, the financial position of the Fund (one of the series constituting FundVantage Trust) at April 30, 2024, the results of its operations for the year then ended, the changes in its net assets for each of the two years in the period then ended and its financial highlights for each of the five years in the period then ended, in conformity with U.S. generally accepted accounting principles.
Basis for Opinion
These financial statements are the responsibility of the Trust’s management. Our responsibility is to express an opinion on the Fund’s financial statements based on our audits. We are a public accounting firm registered with the Public Company Accounting Oversight Board (United States) (“PCAOB”) and are required to be independent with respect to the Trust in accordance with the U.S. federal securities laws and the applicable rules and regulations of the Securities and Exchange Commission and the PCAOB.
We conducted our audits in accordance with the standards of the PCAOB. Those standards require that we plan and perform the audit to obtain reasonable assurance about whether the financial statements are free of material misstatement, whether due to error or fraud. The Trust is not required to have, nor were we engaged to perform, an audit of the Trust’s internal control over financial reporting. As part of our audits we are required to obtain an understanding of internal control over financial reporting but not for the purpose of expressing an opinion on the effectiveness of the Trust’s internal control over financial reporting. Accordingly, we express no such opinion.
Our audits included performing procedures to assess the risks of material misstatement of the financial statements, whether due to error or fraud, and performing procedures that respond to those risks. Such procedures included examining, on a test basis, evidence regarding the amounts and disclosures in the financial statements. Our procedures included confirmation of securities owned as of April 30, 2024, by correspondence with the custodian. Our audits also included evaluating the accounting principles used and significant estimates made by management, as well as evaluating the overall presentation of the financial statements. We believe that our audits provide a reasonable basis for our opinion.
We have served as the auditor of one or more EquityCompass Investment Management, LLC investment companies since 2014.
Philadelphia, Pennsylvania
June 26, 2024
QUALITY DIVIDEND FUND
Shareholder Tax Information
(Unaudited)
The Fund is required by Subchapter M of the Internal Revenue Code to advise its shareholders of the U.S. federal tax status of distributions received by the Fund’s shareholders in respect of such fiscal year. During the fiscal year ended April 30, 2024, the Fund paid $1,815,480 of ordinary income dividends and $709,118 of long-term capital gain dividends to its shareholders. Dividends from net investment income and short-term capital gains are treated as ordinary income dividends for federal income tax purposes.
The Fund designates 100.00% of the ordinary income distribution as qualified dividend income pursuant to the Jobs and Growth Tax Relief Reconciliation Act of 2003.
The percentage of ordinary income dividends qualifying for the corporate dividends received deduction is 100.00%.
The percentage of qualified interest income related dividends not subject to withholding tax for non-resident aliens and foreign corporations received is 0.29%.
The Fund designated $709,118 as long-term capital gains distributions during the year ended April 30, 2024. Distributable long-term gains are based on net realized long-term gains determined on a tax basis and may differ from such amounts for financial reporting purposes.
All designations are based on financial information available as of the date of this annual report and, accordingly, are subject to change. For each item, it is the intention of the Fund to designate the maximum amount permitted under the Internal Revenue Code of 1986, as amended, and the regulations thereunder.
Because the Fund’s fiscal year is not the calendar year, another notification will be sent with respect to calendar year 2024. The second notification, which will reflect the amount, if any, to be used by calendar year taxpayers on their U.S. federal income tax returns, will be made in conjunction with Form 1099-DIV and will be mailed in January 2025.
Foreign shareholders will generally be subject to U.S. withholding tax on the amount of their ordinary income dividends. They will generally not be entitled to a foreign tax credit or deduction for the withholding taxes paid by the Fund, if any.
In general, dividends received by tax-exempt recipients (e.g., IRAs and Keoghs) need not be reported as taxable income for U.S. federal income tax purposes. However, some retirement trusts (e.g., corporate, Keogh and 403(b)(7) plans) may need this information for their annual information reporting.
Shareholders are advised to consult their own tax advisers with respect to the tax consequences of their investment in the Fund.
QUALITY DIVIDEND FUND
Other Information
(Unaudited)
Proxy Voting
Policies and procedures that the Fund uses to determine how to vote proxies relating to portfolio securities as well as information regarding how the Fund voted proxies relating to portfolio securities for the most recent 12-month period ended June 30 are available without charge, upon request, by calling (888) 201-5799 and on the Securities and Exchange Commission's (“SEC”) website at http://www.sec.gov.
Quarterly Portfolio Schedules
The Fund files its complete schedule of portfolio holdings with the SEC for the first and third fiscal quarters of each fiscal year (quarters ended July 31 and January 31) as an exhibit to its reports on Form N-PORT. The Fund's portfolio holdings on Form N-PORT are available on the SEC's website at http://www.sec.gov.
QUALITY DIVIDEND FUND
Privacy Notice
(Unaudited)
The privacy of your personal financial information is extremely important to us. When you open an account with us, we collect a significant amount of information from you in order to properly invest and administer your account. We take very seriously the obligation to keep that information private and confidential, and we want you to know how we protect that important information.
We collect nonpublic personal information about you from applications or other forms you complete and from your transactions with us or our affiliates. We do not disclose information about you, or our former clients, to our affiliates or to service providers or other third parties, except as permitted by law. We share only the information required to properly administer your accounts, which enables us to send transaction confirmations, monthly or quarterly statements, financials and tax forms. Even within FundVantage Trust and its affiliated entities, a limited number of people who actually service accounts will have access to your personal financial information. Further, we do not share information about our current or former clients with any outside marketing groups or sales entities.
To ensure the highest degree of security and confidentiality, FundVantage Trust and its affiliates maintain various physical, electronic and procedural safeguards to protect your personal information. We also apply special measures for authentication of information you request or submit to us on our web site.
If you have questions or comments about our privacy practices, please call us at (888) 201-5799.
QUALITY DIVIDEND FUND
Fund Management
(Unaudited)
FundVantage Trust (the “Trust”) is governed by a Board of Trustees (the “Trustees”). The primary responsibility of the Trustees is to represent the interest of the Trust's shareholders and to provide oversight management of the Trust.
The following tables present certain information regarding the Board of Trustees and officers of the Trust. None of the Trustees are an “interested person” of the Trust, the Adviser, another investment adviser of a series of the Trust, or Foreside Funds Distributors LLC, the principal underwriter of the Trust (“Underwriter”), within the meaning of the 1940 Act and each Trustee is referred to as an “Independent Trustee” and is listed under such heading below. Employees of certain service providers to the Trust serve as officers of the Trust; such persons are not compensated by the Fund. The address of each Trustee and officer as it relates to the Trust's business is 103 Bellevue Parkway, 2nd Floor, Wilmington, DE 19809.
The Statement of Additional Information for the Fund contains additional information about the Trustees and is available, without charge, upon request by calling (888) 201-5799.
Name
and Date of Birth | Position(s)
Held
with Trust | Term of Office
and Length of
Time Served | Principal Occupation(s)
During Past Five Years | Number of
Funds in
Trust
Complex
Overseen
by
Trustee | Other
Directorships
Held by
Trustee |
| INDEPENDENT TRUSTEES |
ROBERT J. CHRISTIAN
Date of Birth: 2/49 | Trustee | Shall serve until
death, resignation
or removal.
Trustee since
2007. Chairman
from 2007 until
September 30,
2019. | Retired since February 2006; Executive Vice
President of Wilmington Trust Company from
February 1996 to February 2006; President of
Rodney Square Management Corporation
(“RSMC”) (investment advisory firm) from 1996
to 2005; Vice President of RSMC from 2005 to 2006. | 29 | Optimum Fund
Trust
(registered
investment
company with
6 portfolios);
Third Avenue
Trust
(registered
investment
company with
4 portfolios);
Third Avenue
Variable Series
Trust
(registered
investment
company with
1 portfolio);
Polen Credit
Opportunities
Fund (registered
investment
company). |
QUALITY DIVIDEND FUND
Fund Management (Continued)
(Unaudited)
Name
and Date of Birth | Position(s)
Held
with Trust | Term of Office
and Length of
Time Served | Principal Occupation(s)
During Past Five Years | Number of
Funds in
Trust
Complex
Overseen
by
Trustee | Other
Directorships
Held by
Trustee |
IQBAL MANSUR
Date of Birth: 6/55 | Trustee | Shall serve until
death, resignation
or removal.
Trustee since
2007. | Retired since September 2020; Professor of
Finance, Widener University from 1998 to August 2020; Member of the Investment Committee of ChristianaCare Health System from January 2022 to present. | 29 | Third Avenue
Trust
(registered
investment
company with
4 portfolios);
Third Avenue
Variable Series
Trust
(registered
investment
company with
1 portfolio);
Polen Credit
Opportunities
Fund (registered
investment
company). |
NICHOLAS M.
MARSINI, JR.
Date of Birth: 8/55 | Trustee and
Chairman of
the Board | Shall serve until
death, resignation
or removal.
Trustee since
2016. Chairman
since October 1,
2019. | Retired since March 2016. President of PNC Bank Delaware from June 2011 to March 2016;
Executive Vice President of Finance of BNY Mellon from July 2010 to January 2011; Executive Vice President and Chief Financial Officer of PNC Global Investment Servicing from September 1997 to July 2010. | 29 | Brinker Capital
Destinations
Trust
(registered
investment
company with
10 portfolios);
Third Avenue
Trust
(registered
investment
company with
4 portfolios);
Third Avenue
Variable Series
Trust
(registered
investment
company with
1 portfolio);
Polen Credit
Opportunities
Fund (registered
investment
company). |
QUALITY DIVIDEND FUND
Fund Management (Continued)
(Unaudited)
Name
and Date of Birth | Position(s)
Held
with Trust | Term of Office
and Length of
Time Served | Principal Occupation(s)
During Past Five Years | Number of
Funds in
Trust
Complex
Overseen
by
Trustee | Other
Directorships
Held by
Trustee |
NANCY B. WOLCOTT
Date of Birth: 11/54 | Trustee | Shall serve until
death, resignation
or removal.
Trustee since
2011. | Retired since May 2014; EVP, Head of GFI Client Service Delivery, BNY Mellon from January 2012 to May 2014; EVP, Head of US Funds Services, BNY Mellon from July 2010 to January 2012; President of PNC Global Investment Servicing from 2008 to July 2010; Chief Operating Officer of PNC Global Investment Servicing from 2007 to 2008; Executive Vice President of PFPC Worldwide Inc. from 2006 to 2007. | 29 | Lincoln
Variable
Trust
Products Trust
(registered
investment
company with
97 portfolios);
Third Avenue
Trust
(registered
investment
company with
4 portfolios);
Third Avenue
Variable Series
Trust
(registered
investment
company with
1 portfolio);
Polen Credit
Opportunities
Fund (registered
investment
company). |
STEPHEN M. WYNNE
Date of Birth: 1/55 | Trustee | Shall serve until
death, resignation
or removal.
Trustee since
2009. | Retired since December 2010; Chief Executive
Officer of US Funds Services, BNY Mellon Asset Servicing from July 2010 to December 2010; Chief Executive Officer of PNC Global Investment Servicing from March 2008 to July 2010; President, PNC Global Investment Servicing from 2003 to 2008. | 29 | Copeland Trust
(registered
investment
company with
3 portfolios);
Third Avenue
Trust
(registered
investment
company with
4 portfolios);
Third Avenue
Variable Series
Trust
(registered
investment
company with
1 portfolio);
Polen Credit
Opportunities
Fund (registered
investment
company). |
QUALITY DIVIDEND FUND
Fund Management (Concluded)
(Unaudited)
Name
and Date of Birth | Position(s) Held
with Trust | Term of Office
and Length of
Time Served | Principal Occupation(s)
During Past Five Years |
| EXECUTIVE OFFICERS |
JOEL L. WEISS
Date of Birth: 1/63 | President and Chief
Executive Officer | Shall serve until death,
resignation or removal. Officer
since 2007. | President of JW Fund Management LLC since June 2016; Vice President and Managing Director of BNY Mellon Investment Servicing (US) Inc. and predecessor firms from 1993 to June 2016. |
CHRISTINE S. CATANZARO
Date of Birth: 8/84 | Treasurer and Chief Financial Officer | Shall serve until death,
resignation or removal. Officer
since 2022. | Financial Reporting Consultant from October 2020 to September 2022; Senior Manager, Ernst & Young LLP from March 2013 to October 2020. |
T. RICHARD KEYES
Date of Birth: 1/57 | Vice President
| Shall serve until death,
resignation or removal. Officer
since 2016. | President of TRK Fund Consulting LLC since July 2016; Head of Tax — U.S. Fund Services of BNY Mellon Investment Servicing (US) Inc. and predecessor firms from February 2006 to July 2016. |
GABRIELLA
MERCINCAVAGE
Date of Birth: 6/68 | Assistant Treasurer | Shall serve until death,
resignation or removal. Officer
since 2019. | Fund Administration Consultant since January 2019; Fund
Accounting and Tax Compliance Accountant to financial
services companies from November 2003 to July 2018. |
VINCENZO A. SCARDUZIO
Date of Birth: 4/72 | Secretary | Shall serve until death,
resignation or removal. Officer
since 2012. | Director and Senior Vice President Regulatory Administration of The Bank of New York Mellon and predecessor firms since 2001. |
JOHN CANNING
Date of Birth: 11/70 | Chief Compliance
Officer and Anti-Money
Laundering Officer | Shall serve until death,
resignation or removal. Officer
since 2022. | Director of Chenery Compliance Group, LLC from March 2021 to present; Senior Consultant of Foreside Financial Group from August 2020 to March 2021; Chief Compliance Officer & Chief Operating Officer of Schneider Capital Management LP from May 2019 to July 2020; Chief Operating Officer and Chief Compliance Officer of Context Capital Partners, LP from March 2016 to March 2018 and February 2019, respectively. |
Investment Adviser
EquityCompass Investment Management, LLC
One South Street
Baltimore, MD 21202
Administrator
The Bank of New York Mellon
103 Bellevue Parkway
Wilmington, DE 19809
Transfer Agent
BNY Mellon Investment Servicing (US) Inc.
500 Ross Street, 154-0520
Pittsburgh, PA 15262
Principal Underwriter
Foreside Funds Distributors LLC
Three Canal Plaza, Suite 100
Portland, ME 04101
Custodian
The Bank of New York Mellon
240 Greenwich Street
New York, NY 10286
Independent Registered Public Accounting Firm
Ernst & Young LLP
One Commerce Square
2005 Market Street, Suite 700
Philadelphia, PA 19103-7096
Legal Counsel
Troutman Pepper Hamilton Sanders LLP
3000 Two Logan Square
18th and Arch Streets
Philadelphia, PA 19103
Item 2. Code of Ethics.
| | (a) | The registrant, as of the end of the period covered by this report, has adopted a code of ethics that applies to the Registrant’s principal executive officer, principal financial officer, principal accounting officer or controller, or persons performing similar functions, regardless of whether these individuals are employed by the Registrant or a third party. |
| | (c) | There have been no amendments, during the period covered by this report, to a provision of the code of ethics that applies to the Registrant’s principal executive officer, principal financial officer, principal accounting officer or controller, or persons performing similar functions, regardless of whether these individuals are employed by the Registrant or a third party, and that relates to any element of the code of ethics description. |
| | (d) | The registrant has not granted any waivers, including an implicit waiver, from a provision of the code of ethics that applies to the Registrant’s principal executive officer, principal financial officer, principal accounting officer or controller, or persons performing similar functions, regardless of whether these individuals are employed by the Registrant or a third party, that relates to one or more of the items set forth in paragraph (b) of this item’s instructions. |
Item 3. Audit Committee Financial Expert.
The Audit Committee of the Board of Trustees currently is comprised of Robert J. Christian, Iqbal Mansur, Nicholas M. Marsini, Jr., Nancy B. Wolcott and Stephen M. Wynne, each of whom is considered “independent” within the meaning set forth under Item 3 of Form N-CSR. The Board of Trustees has determined that Mr. Wynne is an “audit committee financial expert” as such term is defined by Item 3 of Form N-CSR.
The Registrant’s Board of Trustees has determined that Mr. Wynne acquired the attributes necessary to be considered an audit committee financial expert through his experience as a chief executive officer (and other senior-level accounting and/or financial positions) of several large financial institutions and because he has co-authored a text book on mutual fund accounting.
Item 4. Principal Accountant Fees and Services.
Audit Fees
| | (a) | The aggregate fees billed for each of the last two fiscal years for professional services rendered by the principal accountant for the audit of the registrant’s annual financial statements or services that are normally provided by the accountant in connection with statutory and regulatory filings or engagements for those fiscal years were $566,270 for the fiscal year ending April 30, 2024 and $523,801 for the fiscal year ending April 30, 2023, as follows: |
| | | | |
| | | Fiscal Year Ending April 30, 2024 | | Fiscal Year Ending April 30, 2023 |
PricewaterhouseCoopers LLP | | $495,400 | | $456,291 |
Ernst & Young LLP | | $70,870 | | $67,510 |
Aggregate Fees | | $566,270 | | $523,801 |
Audit-Related Fees
| | (b) | The aggregate fees billed in each of the last two fiscal years for assurance and related services by the principal accountant that are reasonably related to the performance of the audit of the registrant’s financial statements and are not reported under paragraph (a) of this Item are $0 for the fiscal year ending April 30, 2024 and $0 for the fiscal year ending April 30, 2023. |
Tax Fees
| | (c) | The aggregate fees billed in each of the last two fiscal years for professional services rendered by the principal accountant for tax compliance, tax advice, and tax planning were $7,364 for the fiscal year ending April 30, 2024 and $7,419 for the fiscal year ending April 30, 2023, as follows: |
| | | | |
| | | Fiscal Year Ending April 30, 2024 | | Fiscal Year Ending April 30, 2023 |
PricewaterhouseCoopers LLP | | $7,170 | | $7,140 |
Ernst & Young LLP | | $194 | | $279 |
Aggregate Fees | | $7,364 | | $7,419 |
These fees were for (a) Passive Foreign Investment Company (PFIC) database tax services and (b) India tax compliance services.
All Other Fees
| | (d) | The aggregate fees billed in each of the last two fiscal years for products and services provided by the principal accountant, other than the services reported in paragraphs (a) through (c) of this Item are $0 for the fiscal year ending April 30, 2024 and $0 for the fiscal year ending April 30, 2023. |
| | (e)(1) | Disclose the audit committee’s pre-approval policies and procedures described in paragraph (c)(7) of Rule 2-01 of Regulation S-X. |
The Registrant’s Audit Committee Charter requires the Audit Committee to (i) (a) approve prior to appointment the engagement of independent registered public accounting firm to annually audit and provide their opinion on the Registrant’s financial statements, (b) recommend to the Independent Trustees the selection, retention or termination of the Registrant’s independent registered public accounting firm and, (c) in connection therewith, to review and evaluate matters potentially affecting the independence and capabilities of the independent registered public accounting firm; and (ii) to approve prior to appointment the engagement of the independent registered public accounting firm to provide other audit services to the Registrant, or to provide non-audit services to the Registrant, its series, an investment adviser to its series or any entity controlling, controlled by, or under common control with an investment adviser to its series (“adviser-affiliate”) that provides ongoing services to the Registrant if the engagement relates directly to the operations and financial reporting of the Registrant. The Audit Committee will not approve non-audit services that the Audit Committee believes may impair the independence of the Registrant’s independent registered public accountant. The Audit Committee may delegate, to the extent permitted by law, pre-approved responsibilities to one or more members of the Audit Committee who shall report to the full Audit Committee.
| | (g) | The aggregate non-audit fees billed by the registrant’s accountant for services rendered to the registrant, and rendered to the registrant’s investment adviser (not including any sub-adviser whose role is primarily portfolio management and is subcontracted with or overseen by another investment adviser), and any entity controlling, controlled by, or under common control with the adviser that provides ongoing services to the registrant for each of the last two fiscal years of the registrant were $6,173 for the fiscal year ending April 30, 2024 and $4,452 for the fiscal year ending April 30, 2023, as follows: |
| | | | |
| | | Fiscal Year Ending April 30, 2024 | | Fiscal Year Ending April 30, 2023 |
PricewaterhouseCoopers LLP | | $5,979 | | $4,743 |
Ernst & Young LLP | | $194 | | $279 |
Aggregate Fees | | $6,173 | | $4,452 |
Item 5. Audit Committee of Listed Registrants.
Not applicable.
Item 6. Investments.
| (a) | Schedule of Investments in securities of unaffiliated issuers as of the close of the reporting period is included as part of the report to shareholders filed under Item 1(a) of this form. |
| Item 7. | Disclosure of Proxy Voting Policies and Procedures for Closed-End Management Investment Companies. |
Not applicable.
Item 8. Portfolio Managers of Closed-End Management Investment Companies.
Not applicable.
| Item 9. | Purchases of Equity Securities by Closed-End Management Investment Company and Affiliated Purchasers. |
Not applicable.
Item 10. Submission of Matters to a Vote of Security Holders.
There have been no material changes to the procedures by which the shareholders may recommend nominees to the registrant’s board of trustees, where those changes were implemented after the registrant last provided disclosure in response to the requirements of Item 407(c)(2)(iv) of Regulation S-K (17 CFR 229.407) (as required by Item 22(b)(15) of Schedule 14A (17 CFR 240.14a-101)), or this Item.
Item 11. Controls and Procedures.
| | (a) | The registrant’s principal executive and principal financial officers, or persons performing similar functions, have concluded that the registrant’s disclosure controls and procedures (as defined in Rule 30a-3(c) under the Investment Company Act of 1940, as amended (the “1940 Act”) (17 CFR 270.30a-3(c))) are effective, as of a date within 90 days of the filing date of the report that includes the disclosure required by this paragraph, based on their evaluation of these controls and procedures required by Rule 30a-3(b) under the 1940 Act (17 CFR 270.30a-3(b)) and Rules 13a-15(b) or 15d-15(b) under the Securities Exchange Act of 1934, as amended (17 CFR 240.13a-15(b) or 240.15d-15(b)). |
| | (b) | There were no changes in the registrant’s internal control over financial reporting (as defined in Rule 30a-3(d) under the 1940 Act (17 CFR 270.30a-3(d))) that occurred during the period covered by this report that has materially affected, or is reasonably likely to materially affect, the registrant’s internal control over financial reporting. |
| Item 12. | Disclosure of Securities Lending Activities for Closed-End Management Investment Companies. |
Not applicable.
SIGNATURES
Pursuant to the requirements of the Securities Exchange Act of 1934 and the Investment Company Act of 1940, the registrant has duly caused this report to be signed on its behalf by the undersigned, thereunto duly authorized.
(Registrant) FundVantage Trust
| | | | |
| By (Signature and Title)* | | /s/ Joel L. Weiss | | |
| | Joel L. Weiss, President and | | |
| | Chief Executive Officer | | |
| | (principal executive officer) | | |
| | |
| Date July 8, 2024 | | | | |
Pursuant to the requirements of the Securities Exchange Act of 1934 and the Investment Company Act of 1940, this report has been signed below by the following persons on behalf of the registrant and in the capacities and on the dates indicated.
| | | | |
| | |
| By (Signature and Title)* | | /s/ Joel L. Weiss | | |
| | Joel L. Weiss, President and | | |
| | Chief Executive Officer | | |
| | (principal executive officer) | | |
| | |
| Date July 8, 2024 | | | | |
| | | | |
| | |
| By (Signature and Title)* | | /s/ Christine S. Catanzaro | | |
| | Christine S. Catanzaro, Treasurer and | | |
| | Chief Financial Officer | | |
| | (principal financial officer) | | |
| | |
| Date July 8, 2024 | | | | |
* Print the name and title of each signing officer under his or her signature.