UNITED STATES
SECURITIES AND EXCHANGE COMMISSION
Washington, D.C. 20549
FORM N-CSR
CERTIFIED SHAREHOLDER REPORT OF REGISTERED MANAGEMENT
INVESTMENT COMPANIES
Investment Company Act file number 811-22023
Nuveen Managed Accounts Portfolios Trust
(Exact name of registrant as specified in charter)
Nuveen Investments
333 West Wacker Drive, Chicago, IL 60606
(Address of principal executive offices) (Zip code)
Kevin J. McCarthy
Nuveen Investments
333 West Wacker Drive
Chicago, IL 60606
(Name and address of agent for service)
Registrant’s telephone number, including area code: (312) 917-7700
Date of fiscal year end: July 31
Date of reporting period: July 31, 2009
Form N-CSR is to be used by management investment companies to file reports with the Commission not later than 10 days after the transmission to stockholders of any report that is required to be transmitted to stockholders under Rule 30e-1 under the Investment Company Act of 1940 (17 CFR 270.30e-1). The Commission may use the information provided on Form N-CSR in its regulatory, disclosure review, inspection, and policy making roles.
A registrant is required to disclose the information specified by Form N-CSR, and the Commission will make this information public. A registrant is not required to respond to the collection of information contained in Form N-CSR unless the Form displays a currently valid Office of Management and Budget (“OMB”) control number. Please direct comments concerning the accuracy of the information collection burden estimate and any suggestions for reducing the burden to Secretary, Securities and Exchange Commission, 450 Fifth Street, NW, Washington, DC 20549-0609. The OMB has reviewed this collection of information under the clearance requirements of 44 U.S.C. ss.3507.
ITEM 1. REPORTS TO STOCKHOLDERS.

Mutual Funds
Nuveen Managed Accounts Portfolios Trust
Dependable, tax-free income because it’s not what you earn, it’s what you keep.®
Annual Report
July 31, 2009
|
Municipal Total
Return Managed
Accounts Portfolio |
LIFE IS COMPLEX.
Nuveen makes things e-simple.
It only takes a minute to sign up for e-Reports. Once enrolled, you’ll receive an e-mail as soon as your Nuveen Investments Fund information is ready. No more waiting for delivery by regular mail. Just click on the link within the e-mail to see the report and save it on your computer if you wish.
Free e-Reports right to your e-mail!
www.investordelivery.com
If you receive your Nuveen Fund dividends and statements from your financial advisor or brokerage account.
OR
www.nuveen.com/accountaccess
If you receive your Nuveen Fund dividends and statements directly from Nuveen.
| | | | | | |
| Must be preceded by or accompanied by a prospectus. | | NOT FDIC INSURED | | MAY LOSE VALUE | | NO BANK GUARANTEE |
Chairman’s
Letter to Shareholders

Dear Shareholder,
The financial markets in which your Fund operates continue to reflect the larger economic crosscurrents. The illiquidity that infected global credit markets over the last year appears to be slowly but steadily receding. The major institutions that are the linchpin of the international financial system are strengthening their capital structures, but many still struggle with losses in their various portfolios. There are encouraging signs of recovery in European and Asian economies, while the U.S. economy continues to feel the impact of job losses and an over-borrowed consumer. Global trends include modestly increasing trade and increased concern about the ability of the U.S. government to address its substantial budgetary deficits. Identifying those developments that will define the future is never easy, but rarely is it more difficult than at present.
After considerable volatility in the first few months of 2009, both the fixed-income and equity markets have seen a partial recovery. A fundamental component of a successful long-term investment program is a commitment to remain invested during market downturns in order to share in the rewards of the inevitable recovery. Another component is to re-evaluate investment disciplines and tactics and to confirm their validity following periods of extreme volatility and market dislocation, such as we have recently experienced. Your Board carried out an intensive review of investment performance with these objectives in mind during April and May of this year as part of the annual management contract renewal process. I encourage you to read the description of this process in the Annual Investment Management Agreement Approval Process section of this report.
Remaining invested through market downturns and reconfirming the appropriateness of a long term investment strategy is as important for our shareholders as it is for professional investment managers. For that reason, I again encourage you to remain in communication with your financial consultant on these subjects. For recent developments on all your Nuveen Funds, please visit the Nuveen web site: www.nuveen.com.
On behalf of the other members of your Fund’s Board, we look forward to continuing to earn your trust in the months and years ahead.
Sincerely,

Robert P. Bremner
Chairman of the Nuveen Fund Board
September 21, 2009
Portfolio Manager’s Comments
Certain statements in this report are forward-looking statements. Discussions of specific investments are for illustration only and are not Intended as recommendations of individual investments. The forward looking statements and other views expressed herein are those of the portfolio manager as of the date of this report. Actual future results or occurrences may differ significantly from those anticipated in any forward-looking statements and the views expressed herein are subject to change at any time, due to numerous market and other factors. The Fund disclaims any obligation to update publicly or revise any forward-looking statements or views expressed herein.
The Nuveen Municipal Total Return Managed Account Portfolio is managed by Nuveen Asset Management, an affiliate of Nuveen Investments, Inc. The Portfolio is overseen by Marty Doyle, who has 20 years of investment experience and has managed the Portfolio since its inception in 2007. Here Marty discusses the general market environment, his investment strategy and the performance of the Portfolio for the twelve-month period ended July 31, 2009.
What were the general market conditions during the reporting period?
During this reporting period, downward pressure on the economy continued. In an effort to improve overall economic conditions, the Federal Reserve (Fed) continued to cut interest rates, lowering the fed funds rate from 2.00% on August 1, 2008, to a target range of zero to 0.25% in December 2008, its lowest level on record. In March 2009, the Fed announced that, in addition to maintaining the current target rate, it would buy $300 billion in long-term Treasury securities in an effort to support private credit markets and up to an additional $750 billion (for a total of $1.25 trillion) in agency mortgage-backed securities to bolster the housing market. (At its August 2009 meeting, following the end of this reporting period, the Fed continued to keep the fed funds rate unchanged.)
Additionally, the federal government passed a $700 billion financial industry rescue package in October 2008, which was followed by a $787 billion stimulus package in February 2009. The Fed’s efforts and the stimulus package were in part a response to the decline in U.S. economic growth, as measured by the U.S. gross domestic product (GDP). Over the four quarters ended June 30, 2009, the GDP experienced its longest decline since quarterly records began in 1947 and the worst recession in 50 years. While housing prices provided something of a bright spot in May and June 2009 by posting their first positive monthly returns after three years of decline, the depth of the housing slump continued to be a source of concern. In the labor markets, July 2009 marked the 19th consecutive month of job losses, with a total of 6.7 million jobs lost since the recession began in December 2007. The national unemployment rate for July 2009 was 9.4%, up from 5.8% in July 2008. At the same time, inflation remained subdued, as the Consumer Price Index (CPI), reflecting a 28% drop in energy prices, fell 2.1% year-over-year as of July 2009, the largest twelve-month decline since 1950. The core CPI (which excludes food and energy) rose 1.5% over this same period, within the Fed’s unofficial objective of 2.0% or lower for this measure.
During this period, the nation’s financial institutions and markets experienced significant turmoil and reductions in demand for many types of securities, which decreased valuations. In the municipal market, this negative impact was felt across all credit ratings, reducing the net asset values of municipal bond funds. In addition, some of the dealer
firms that make markets in bonds were unwilling to commit capital to purchase bonds or continue serving as dealers. The reduction in dealer involvement was accompanied by significant selling pressure by investors, especially institutional investors, predominantly related to lower-rated securities.
Municipal bond prices were further negatively impacted by concerns that a supply overhang (such as a large backlog of new issues that had been postponed) would cause selling pressure to persist. Additionally, greater price volatility, including wider credit spreads (i.e., lower quality bonds fell in price more than higher quality bonds); greatly reduced liquidity (i.e., the ability to sell bonds at prices close to their carrying values), particularly for lower quality bonds; and a lack of price transparency (i.e., the ability to accurately determine the price at which a bond would likely trade) weighed down the market for much of the period.
Market conditions began to show general signs of improvement in mid-December 2008, and municipal bonds were on an improving trend during the first seven months of 2009. Another positive impact was the reduced supply of tax-exempt municipal debt available in the marketplace, part because of the introduction of “Build America” bonds in April 2009. This new class of taxable municipal debt – created as part of the February 2009 economic stimulus package – provides municipal issuers with a federal subsidy equal to 35% of the security’s interest payments. For many borrowers, these bonds offered an attractive alternative to issuing traditional tax-exempt debt. The Build America bond program got off to a quick start, effectively diverting high-grade tax-exempt new-issue supply into the taxable market. Therefore, a combination of lower issuance along with higher demand provided additional support for municipal bond prices.
Over the twelve months ended July 31, 2009, municipal bond issuance nationwide totaled $389.2 billion, a drop of approximately 16% compared with the twelve-month period ended July 31, 2008. While market conditions during this period impacted the demand for municipal bonds, investors, especially from the retail sector, continued to be attracted by the high tax-equivalent yields of the municipal bond market relative to taxable bonds.
How did the Portfolio perform during the twelve-month period ended July 31, 2009? What strategies were used to manage the Portfolio during the reporting period? How did these strategies influence performance?
The Municipal Total Return Managed Accounts Portfolio underperformed the Barclays Capital 7-Year Municipal Bond Index and slightly outperformed the Barclays Capital Municipal Bond Index during the twelve-month reporting period. The table on page four provides performance information for the one-year and since inception periods ended July 31, 2009.
| 1 | The Barclays Capital 7-Year Municipal Bond Index is an unmanaged index composed of a broad range of investment-grade municipal bonds with maturity dates of approximately seven years and does not reflect any initial or ongoing expenses. This index more closely compares to the duration of the bonds in the Fund’s portfolio. You cannot invest directly in an index. |
| 2 | The Barclays Capital Municipal Bond Index is an unmanaged index composed of a broad range of investment-grade municipal bonds. The index does not reflect any initial or ongoing expenses. You cannot invest directly in an index. |
The Portfolio uses a value-oriented strategy and looks for higher-yielding and undervalued municipal bonds that offer the potential for above-average total return. The Portfolio invests in various types of municipal securities, including investment grade (rated BBB/Baa or better), below investment grade (rated BB/Ba or lower), high yield, and unrated municipal securities. The Portfolio focuses on securities with intermediate to longer-term maturities. This investment strategy did not change during the reporting period.
One factor that contributed to the Portfolio’s relative underperformance was its comparatively lower average credit quality. In a generally unfavorable market environment, lower rated securities generally underperformed their higher rated counterparts. The Portfolio continued to add mid-grade and high yield holdings during the period. Additionally, the Portfolio also had a comparatively lower weighting in shorter maturities (6 years or less), which tended to outperform longer maturities over the full period. We found the most value in the A and BBB rated tax-backed and essential service revenue bonds.
We continued to focus on diversification, and looked to add exposure across the entire yield curve, credit ranges and industry sectors. We also looked for opportunities to purchase undervalued credits in sectors and maturities that experienced elevated volatility during the period.
We remained relatively conservative with our long-term targets with respect to higher yield and longer duration weightings. We gradually increased exposure to longer maturities and slightly lower grade holdings (some to replace prior holdings that became pre-refunded) to increase the portfolio’s income component and long-term return prospects.
Class A Shares – Average Annual Total Returns
As of 7/31/09
| | | | |
| | | 1-Year | | Since
Inception (5/31/07) |
Municipal Total Return Managed Accounts Portfolio | | 5.35% | | 3.50% |
Barclays Capital 7-Year Municipal Bond Index1 | | 8.01% | | 6.64% |
Barclays Capital Municipal Bond Index2 | | 5.11% | | 3.77% |
Returns quoted represent past performance which is no guarantee of future results. Investment returns and principal value will fluctuate so that when shares are redeemed, they may be worth more or less than their original cost. Current performance may be higher or lower than the performance shown. Returns do not reflect the deduction of taxes that a shareholder would pay on Fund distributions or the redemption of shares. Capital gains, if any, are subject to tax. For the most recent month-end performance visit www.nuveen.com or call (800) 257-8787.
Please see the Fund’s Spotlight Page later in this report for more complete performance data and expense ratios.
Municipal Total Return Managed Accounts Portfolio
Growth of an Assumed $10,000 Investment
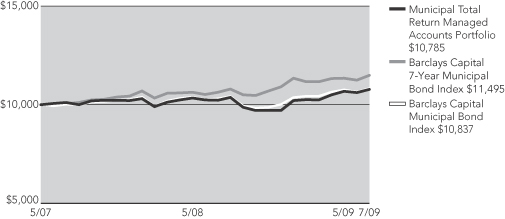
The graph does not reflect the deduction of taxes that a shareholder may pay on Fund distributions or the redemption of shares.
The index comparisons show the change in value of a $10,000 investment in the Municipal Total Return Managed Accounts Portfolio compared with the corresponding index. The Barclays Capital 7-Year Municipal Bond Index is an unmanaged index comprised of a broad range of investment-grade municipal bonds with maturity dates of approximately seven years. The Barclays Capital Municipal Bond Index is an unmanaged index comprised of a broad range of investment-grade municipal bonds. The index returns assume reinvestment of dividends and do not reflect any initial or ongoing expenses. You cannot invest directly in an index. The Municipal Total Return Managed Accounts Portfolio’s returns include reinvestment of all dividends and distributions. The performance data quoted represents past performance, which is not indicative of future results. Current performance may be lower or higher than the performance shown.
Fund Spotlight as of 7/31/09 Municipal Total Return Managed Accounts Portfolio
| | | | | | | | |
| Quick Facts | | | | | | | | |
| | | | | | | | | |
NAV | | | | | | | | $9.80 |
Latest Monthly Dividend1 | | | | | | | | $.0389 |
Inception Date | | | | | | | | 5/31/07 |
Returns quoted represent past performance which is no guarantee of future results. Investment returns and principal value will fluctuate so that when shares are redeemed, they may be worth more or less than their original cost. Current performance may be higher or lower than the performance shown. Returns do not reflect the deduction of taxes that a shareholder would pay on Fund distributions or the redemption of shares. For the most recent month-end performance visit www.nuveen.com or call (800) 257-8787.
Fund returns assume reinvestment of dividends and capital gains. Shares have no sales charge and may be purchased under limited circumstances or by specified classes of investors.
| | |
| Average Annual Total Returns as of 7/31/09 |
| |
| | | NAV |
1-Year | | 5.35% |
Since Inception | | 3.50% |
|
| Average Annual Total Returns as of 6/30/09 |
| |
| | | NAV |
1-Year | | 3.65% |
Since Inception | | 2.90% |
| |
| Tax-Free Yields | | |
| |
| | | NAV |
Dividend Yield2 | | 4.76% |
SEC 30-Day Yield2 | | 4.91% |
Taxable-Equivalent Yield3 | | 6.82% |
| | | | | | |
| Expense Ratios | | | | | | |
| | | Gross
Expense
Ratio | | Net
Expense
Ratio | | As of
Date |
| | | 0.44% | | 0.00% | | 7/31/08 |
The expense ratios shown factor in Total Annual Fund Operating Expenses. The Adviser has agreed irrevocably during the existence of the Fund to waive all fees and pay or reimburse all expenses of the Fund, except for interest expense, taxes, fees incurred in acquiring and disposing of portfolio securities and extraordinary expenses.
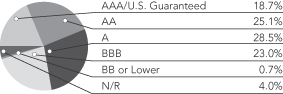
Bond Credit Quality4
| | |
| Portfolio Statistics |
| Net Assets ($000) | | $92,354 |
| Average Effective Maturity on Securities (Years) | | 13.54 |
| Average Duration | | 5.95 |
| 1 | Paid August 3, 2009. This is the latest monthly tax-exempt dividend declared during the period ended July 31, 2009. |
| 2 | Dividend Yield is the most recent dividend per share (annualized) divided by the appropriate price per share. The SEC 30-Day Yield is computed under an SEC standardized formula and is based on the maximum offer price per share. The Dividend Yield may differ from the SEC 30-Day Yield because the Fund may be paying out more or less than it is earning and it may not include the effect of amortization of bond premium. |
| 3 | The Taxable-Equivalent Yield represents the yield that must be earned on a fully taxable investment in order to equal the yield of the Fund on an after-tax basis at a specified tax rate. With respect to investments that generate qualified dividend income that is taxable at a maximum rate of 15%, the Taxable-Equivalent Yield is lower. The Taxable-Equivalent Yield is based on the Fund’s SEC 30-Day Yield on the indicated date and a federal income tax rate of 28%. |
| 4 | As a percentage of total long-term investments as of July 31, 2009. Holdings are subject to change. |
Fund Spotlight as of 7/31/09 Municipal Total Return Managed Accounts Portfolio
| | |
| Industries1 | | |
Tax Obligation/General | | 16.9% |
Tax Obligation/Limited | | 16.4% |
Education and Civic Organizations | | 14.6% |
Health Care | | 14.2% |
Transportation | | 10.1% |
Utilities | | 7.3% |
Water and Sewer | | 7.0% |
Other | | 13.5% |
| | |
| States1 | | |
California | | 11.8% |
Illinois | | 10.7% |
Pennsylvania | | 6.5% |
Indiana | | 5.4% |
New York | | 4.7% |
Texas | | 4.7% |
Michigan | | 4.2% |
Florida | | 3.9% |
North Carolina | | 3.8% |
Georgia | | 3.8% |
Wisconsin | | 3.6% |
Missouri | | 3.6% |
New Jersey | | 3.4% |
Massachusetts | | 3.1% |
Alabama | | 2.8% |
Puerto Rico | | 2.1% |
South Carolina | | 2.1% |
Virgin Islands | | 2.0% |
Nevada | | 1.8% |
Idaho | | 1.6% |
Other | | 14.4% |
| 1 | As a percentage of total long-term investments as of July 31, 2009. Holdings are subject to change. |
Expense Example
As a shareholder of the Fund, you incur two types of costs: (1) transaction costs, including front and back end sales charges (loads) or redemption fees, where applicable; and (2) ongoing costs, including management fees; distribution and service (12b-1) fees, where applicable; and other Fund expenses. This Example is intended to help you understand your ongoing costs (in dollars) of investing in the Fund and to compare these costs with the ongoing costs of investing in other mutual funds.
The Example below is based on an investment of $1,000 invested at the beginning of the period and held for the period.
The information under “Actual Performance,” together with the amount you invested, allows you to estimate actual expenses incurred over the reporting period. Simply divide your account value by $1,000 (for example, an $8,600 account value divided by $1,000 = 8.60) and multiply the result by the cost shown for your share class, in the row entitled “Expenses Incurred During Period” to estimate the expenses incurred on your account during this period.
The information under “Hypothetical Performance,” provides information about hypothetical account values and hypothetical expenses based on the Fund’s actual expense ratio and an assumed rate of return of 5% per year before expenses, which is not the Fund’s actual return. The hypothetical account values and expenses may not be used to estimate the actual ending account balance or expense you incurred for the period. You may use this information to compare the ongoing costs of investing in the Fund and other Funds. To do so, compare this 5% hypothetical example with the 5% hypothetical examples that appear in the shareholder reports of the other funds.
Please note that the expenses shown in the table are meant to highlight your ongoing costs only and do not reflect any transactional costs, such as front and back end sales charges (loads) or redemption fees, where applicable. Therefore, the hypothetical information is useful in comparing ongoing costs only, and will not help you determine the relative total costs of owning different funds or share classes. In addition, if these transactional costs were included, your costs would have been higher.
| | | | | | | | | | | | | | | | | | |
| | | | | | | | | Hypothetical Performance |
| | | Actual Performance | | (5% annualized return before expenses) |
| Beginning Account Value (2/01/09) | | | | $ | 1,000.00 | | | | | | | | $ | 1,000.00 | | | | |
| Ending Account Value (7/31/09) | | | | $ | 1,054.90 | | | | | | | | $ | 1,024.79 | | | | |
| Expenses Incurred During Period | | | | $ | — | | | | | | | | $ | — | | | | |
Expenses are equal to the Fund’s annualized net expense ratio of 0.00% multiplied by the average account value over the period, multiplied by 181/365 (to reflect the one-half year period).
Report of
Independent Registered Public Accounting Firm
To the Board of Trustees and Shareholders of
Nuveen Managed Accounts Portfolios Trust
In our opinion, the accompanying statement of assets and liabilities, including the portfolio of investments, and the related statements of operations, of changes in net assets and the financial highlights present fairly, in all material respects, the financial position of Municipal Total Return Managed Accounts Portfolio (a series of the Nuveen Managed Accounts Portfolios Trust, hereafter referred to as the “Fund”) at July 31, 2009, the results of its operations for the year then ended, the changes in its net assets for each of the two years then ended and the financial highlights for the periods indicated in conformity with accounting principles generally accepted in the United States of America. These financial statements and financial highlights (hereafter referred to as “financial statements”) are the responsibility of the Fund’s management; our responsibility is to express an opinion on these financial statements based on our audit. We conducted our audit of these financial statements in accordance with the standards of the Public Company Accounting Oversight Board (United States). Those standards require that we plan and perform the audit to obtain reasonable assurance about whether the financial statements are free of material misstatement. An audit includes examining, on a test basis, evidence supporting the amounts and disclosures in the financial statements, assessing the accounting principles used and significant estimates made by management, and evaluating the overall financial statement presentation. We believe that our audit, which included confirmation of securities at July 31, 2009 by correspondence with the custodian and brokers, provides a reasonable basis for our opinion.
PRICEWATERHOUSECOOPERS LLP
Chicago, IL
September 25, 2009
Portfolio of Investments
Municipal Total Return Managed Accounts Portfolio
July 31, 2009
| | | | | | | | | | | | | |
Principal
Amount (000) | | Description (1) | | | | Optional Call Provisions (2) | | Ratings (3) | | | Value |
| | | | | | | | | | | | | |
| | | Alabama – 2.8% | | | | | | | | | | |
| | | | | |
| $ | 1,020 | | Alabama 21st Century Authority, Tobacco Settlement Revenue Bonds, Series 2001, 5.500%, 12/01/10 | | | | No Opt. Call | | A– | | | $ | 1,031,618 |
| | | | | |
| | 850 | | Alabama State Board of Education, Revenue Bonds, Faulkner State Community College, Series 2009, 6.125%, 10/01/28 | | | | 10/18 at 100.00 | | A2 | | | | 912,127 |
| | | | | |
| | 100 | | City of Birmingham, Alabama, Water and Sewer Revenue Warrants, Series 1998-A, 4.750%, 1/01/29 – MBIA Insured | | | | 1/10 at 100.00 | | A | | | | 95,005 |
| | | | | |
| | 445 | | The Special Care Facilities Financing Authority of the City of Birmingham, Alabama, Medical Center East Health Care Facility Revenue Bonds, Series 1986 Refunding, 7.250%, 7/01/15 – MBIA Insured (ETM) | | | | 1/10 at 100.00 | | A | (4) | | | 523,120 |
| | 2,415 | | Total Alabama | | | | | | | | | | 2,561,870 |
| | | Alaska – 0.7% | | | | | | | | | | |
| | | | | |
| | 145 | | Alaska Municipal Bond Bank Authority, General Obligation Bonds, Series 2006-2, 5.500%, 12/01/21 – MBIA Insured (Alternative Minimum Tax) | | | | 12/16 at 100.00 | | A+ | | | | 145,178 |
| | | | | |
| | 500 | | Alaska Student Loan Corporation, Senior Lien Student Loan Revenue Bonds, Series 2006A-2, 5.000%, 6/01/14 (Alternative Minimum Tax) | | | | No Opt. Call | | AAA | | | | 514,000 |
| | 645 | | Total Alaska | | | | | | | | | | 659,178 |
| | | Arizona – 0.1% | | | | | | | | | | |
| | | | | |
| | 100 | | Yuma County Industrial Development Authority, Arizona, Exempt Revenue Bonds, Far West Water & Sewer Inc. Refunding, Series 2007A, 6.500%, 12/01/17 (Alternative Minimum Tax) | | | | No Opt. Call | | N/R | | | | 89,449 |
| | | Arkansas – 1.1% | | | | | | | | | | |
| | | | | |
| | 950 | | Arkansas Development Finance Authority, Single Family Mortgage Revenue Bonds, GNMA/FNMA Mortgage-Backed Securities Program, Series 2000F, 6.250%, 7/01/31 (Alternative Minimum Tax) | | | | 7/10 at 100.00 | | AAA | | | | 969,865 |
| | | California – 11.6% | | | | | | | | | | |
| | | | | |
| | 850 | | Bay Area Toll Authority, California, Revenue Bonds, San Francisco Bay Area Toll Bridge, Series 2008-F1, 5.500%, 4/01/43 | | | | 4/18 at 100.00 | | AA | | | | 865,640 |
| | | | | |
| | 385 | | California County Tobacco Securitization Agency, Tobacco Settlement Asset-Backed Bonds, Golden Gate Tobacco Funding Corporation, Turbo, Series 2002A, 5.750%, 6/01/30 (Pre-refunded 6/01/12) | | | | 6/12 at 100.00 | | BBB | (4) | | | 420,320 |
| | | | | |
| | 250 | | California Health Facilities Financing Authority, Revenue Bonds, Cedars-Sinai Medical Center, Series 2005, 5.000%, 11/15/10 | | | | No Opt. Call | | A2 | | | | 257,615 |
| | | | | |
| | 100 | | California Health Facilities Financing Authority, Revenue Bonds, Kaiser Permanente System, Series 1993A, 5.400%, 5/01/28 (ETM) | | | | 5/10 at 100.00 | | AAA | | | | 100,819 |
| | | | | |
| | 250 | | California Municipal Finance Authority, Revenue Refunding Bonds, Biola University, Series 2008A, 5.000%, 10/01/18 | | | | No Opt. Call | | Baa1 | | | | 239,860 |
| | | | | |
| | 720 | | California, Various Purpose General Obligation Bonds, Series 1997, 5.625%, 10/01/21 – BHAC Insured | | | | 10/09 at 100.00 | | AAA | | | | 724,183 |
| | | | | |
| | 225 | | Daly City Housing Development Finance Agency, California, Mobile Home Park Revenue Bonds, Franciscan Mobile Home Park Refunding, Series 2007A, 5.250%, 12/15/23 | | | | 12/17 at 100.00 | | A– | | | | 200,144 |
| | | | | |
| | 1,000 | | Gilroy Unified School District, Santa Clara County, California, General Obligation Bonds, Series 2009A, 6.000%, 8/01/25 – AGC Insured | | | | No Opt. Call | | AAA | | | | 1,125,728 |
| | | | | |
| | | Golden State Tobacco Securitization Corporation, California, Tobacco Settlement Asset-Backed Revenue Bonds, Series 2005A: | | | | | | | | | | |
| | 325 | | 4.000%, 6/01/12 – AMBAC Insured | | | | No Opt. Call | | A– | | | | 326,898 |
| | 500 | | 5.000%, 6/01/17 | | | | 6/17 at 100.00 | | A– | | | | 477,790 |
| | | | | |
| | 1,000 | | Peralta Community College District, Alameda County, California, General Obligation Bonds, Series 2004C, 5.500%, 8/01/24 – MBIA Insured | | | | 8/12 at 102.00 | | AA– | | | | 1,067,408 |
| | | | | |
| | 850 | | Public Utilities Commission of the City and County of San Francisco, California, Water Revenue Bonds, Series 2006A, 5.000%, 11/01/25 – FSA Insured | | | | 5/16 at 100.00 | | AAA | | | | 871,463 |
Portfolio of Investments
Municipal Total Return Managed Accounts Portfolio (continued)
July 31, 2009
| | | | | | | | | | | | |
Principal
Amount (000) | | Description (1) | | | | Optional Call Provisions (2) | | Ratings (3) | | Value |
| | | | | | | | | | | | |
| | | California (continued) | | | | | | | | | |
| | | | | |
| $ | 600 | | San Francisco Airports Commission, California, Revenue Bonds, San Francisco International Airport, Second Series 2000, Issue 26A, 5.000%, 5/01/15 – FGIC Insured | | | | 5/10 at 101.00 | | A1 | | $ | 603,534 |
| | | | | |
| | 750 | | San Francisco Unified School District, California, General Obligation Bonds, Series 2007A, 3.000%, 6/15/26 – FSA Insured | | | | 6/17 at 100.00 | | AAA | | | 571,620 |
| | | | | |
| | 1,000 | | San Gorgonio Memorial Healthcare District, Riverside County, California, General Obligation Bonds, Series 2009C, 7.000%, 8/01/27 (WI/DD, Settling 8/11/09) | | | | 8/17 at 100.00 | | Baa1 | | | 1,028,300 |
| | | | | |
| | 1,000 | | State of California $4,000,000,000 Various Purpose General Obligation Bonds, 6.500%, 4/01/33 – MBIA Insured | | | | 4/19 at 100.00 | | A | | | 1,084,258 |
| | | | | |
| | 750 | | Western Municipal Water District Facilities Authority, California, Water Revenue Bonds, Series 2009B, 5.000%, 10/01/34 | | | | 10/19 at 100.00 | | AA+ | | | 728,003 |
| | 10,555 | | Total California | | | | | | | | | 10,693,583 |
| | | Colorado – 1.2% | | | | | | | | | |
| | | | | |
| | 500 | | Colorado Health Facilities Authority, Colorado, Revenue Bonds, Valley View Hospital Association, Series 2008, 5.750%, 5/15/36 | | | | 5/18 at 100.00 | | BBB | | | 436,715 |
| | | | | |
| | 75 | | Colorado Health Facilities Authority, Colorado, Revenue Bonds, Yampa Valley Medical Center, Series 2007, 5.000%, 9/15/15 | | | | No Opt. Call | | BBB | | | 73,354 |
| | | | | |
| | 200 | | Colorado Health Facilities Authority, Revenue Bonds, Evangelical Lutheran Good Samaritan Society, Series 2006, 5.250%, 6/01/17 | | | | 6/16 at 100.00 | | A– | | | 205,412 |
| | | | | |
| | 150 | | Denver City and County, Colorado, Airport System Revenue Refunding Bonds, Series 2001A, 5.500%, 11/15/14 – FGIC Insured | | | | 11/11 at 100.00 | | A+ | | | 155,912 |
| | | | | |
| | 300 | | E-470 Public Highway Authority, Colorado, Senior Revenue Bonds, Series 2007B-1, 5.500%, 9/01/24 – MBIA Insured | | | | 9/15 at 100.00 | | A | | | 276,558 |
| | 1,225 | | Total Colorado | | | | | | | | | 1,147,951 |
| | | District of Columbia – 0.3% | | | | | | | | | |
| | | | | |
| | 300 | | District of Columbia Tobacco Settlement Corporation, Tobacco Settlement Asset-Backed Bonds, Series 2001, 6.750%, 5/15/40 | | | | 5/11 at 101.00 | | BBB | | | 252,414 |
| | | Florida – 3.8% | | | | | | | | | |
| | | | | |
| | 25 | | Beacon Lakes Community Development District, Florida, Special Assessment Bonds, Series 2007A, 6.000%, 5/01/38 | | | | 5/17 at 100.00 | | N/R | | | 15,880 |
| | | | | |
| | 25 | | Boynton Village Community Development District, Florida, Special Assessment Bonds, Series 2007-A1, 5.750%, 5/01/37 | | | | 5/17 at 100.00 | | N/R | | | 15,862 |
| | | | | |
| | 360 | | Brevard County, Florida, General Obligation Bonds, South Brevard Recreation, Series 2007, 5.000%, 7/01/22 – AMBAC Insured | | | | No Opt. Call | | N/R | | | 348,016 |
| | | | | |
| | 750 | | Florida Board of Education, Lottery Revenue Bonds, Series 2006A, 5.000%, 7/01/21 – AMBAC Insured | | | | 7/15 at 101.00 | | AAA | | | 774,075 |
| | | | | |
| | 490 | | Florida Housing Finance Corporation, Homeowner Mortgage Revenue Bonds, Series 2008-1, 6.450%, 1/01/39 (Alternative Minimum Tax) | | | | 7/17 at 100.00 | | AA+ | | | 512,109 |
| | | | | |
| | 280 | | Highlands County Health Facilities Authority, Florida, Hospital Revenue Bonds, Adventist Health System, Series 2005D, 5.000%, 11/15/35 | | | | No Opt. Call | | A+ | | | 248,570 |
| | | | | |
| | 750 | | Jacksonville, Florida, Excise Taxes Revenue Refunding Bonds, Series 2003C, 5.250%, 10/01/19 – MBIA Insured (Alternative Minimum Tax) | | | | 10/13 at 100.00 | | Aa3 | | | 739,785 |
| | | | | |
| | 680 | | Miami-Dade County, Florida, Aviation Revenue Bonds, Miami International Airport, Refunding Series 2003E, 5.250%, 10/01/13 – MBIA Insured (Alternative Minimum Tax) | | | | No Opt. Call | | AA | | | 705,282 |
| | | | | |
| | 75 | | Seminole Tribe of Florida, Special Obligation Bonds, Series 2007A, 5.750%, 10/01/22 | | | | 10/17 at 100.00 | | BBB | | | 70,489 |
| | | | | |
| | 75 | | Tolomato Community Development District, Florida, Special Assessment Bonds, Series 2007, 6.375%, 5/01/17 | | | | No Opt. Call | | N/R | | | 62,278 |
| | 3,510 | | Total Florida | | | | | | | | | 3,492,346 |
| | | | | | | | | | | | |
Principal
Amount (000) | | Description (1) | | | | Optional Call Provisions (2) | | Ratings (3) | | Value |
| | | | | | | | | | | | |
| | | Georgia – 3.7% | | | | | | | | | |
| | | | | |
| $ | 650 | | Atlanta Development Authority, Georgia, Educational Facilities Revenue Bonds, Science Park LLC Project, Series 2007, 5.250%, 7/01/27 | | | | 7/17 at 100.00 | | A1 | | $ | 667,973 |
| | | | | |
| | 500 | | Atlanta, Georgia, Water and Wastewater Revenue Bonds, Series 2009A, 6.000%, 11/01/22 | | | | 11/19 at 100.00 | | A | | | 508,675 |
| | | | | |
| | 500 | | Gwinnett County Development Authority, Georgia, Certificates of Participation, County Public Schools Project, Series 2006, 5.250%, 1/01/19 – MBIA Insured | | | | No Opt. Call | | AA+ | | | 555,255 |
| | | | | |
| | 60 | | Houston County Hospital Authority, Georgia, Revenue Bonds, Houston Healthcare Project, Series 2007, 5.250%, 10/01/18 | | | | 10/17 at 100.00 | | A2 | | | 60,911 |
| | | | | |
| | 500 | | La Grange-Troup County Hospital Authority, Georgia, Revenue Anticipation Certificates, Series 2008A, 5.500%, 7/01/38 | | | | 7/18 at 100.00 | | A+ | | | 495,685 |
| | | | | |
| | 350 | | Municipal Electric Authority of Georgia, Project One Subordinate Lien Revenue Bonds, Series 2008A, 5.250%, 1/01/21 | | | | No Opt. Call | | A | | | 379,736 |
| | | | | |
| | 750 | | Private Colleges and Universities Authority, Georgia, Revenue Bonds, Emory University, Series 2008C, 5.000%, 9/01/38 | | | | 9/18 at 100.00 | | AA | | | 757,605 |
| | 3,310 | | Total Georgia | | | | | | | | | 3,425,840 |
| | | Guam – 0.5% | | | | | | | | | |
| | | | | |
| | 500 | | Guam Government, General Obligation Bonds, 2009 Series A, 5.750%, 11/15/14 | | | | No Opt. Call | | B+ | | | 498,175 |
| | | Idaho – 1.6% | | | | | | | | | |
| | | | | |
| | 750 | | Boise-Kuna Irrigation District, Ada and Canyon Counties, Idaho Arrowrock Hydroelectric Project Revenue Bonds, Series 2008, 7.375%, 6/01/34 | | | | 6/18 at 100.00 | | A3 | | | 820,365 |
| | | | | |
| | | Idaho Housing and Finance Association, Single Family Mortgage Revenue Bonds, Series 2008A-1: | | | | | | | | | |
| | 130 | | 5.625%, 7/01/28 (Alternative Minimum Tax) | | | | 1/17 at 100.00 | | Aaa | | | 134,246 |
| | 500 | | 6.250%, 7/01/38 (Alternative Minimum Tax) | | | | 1/17 at 100.00 | | Aaa | | | 517,270 |
| | 1,380 | | Total Idaho | | | | | | | | | 1,471,881 |
| | | Illinois – 10.4% | | | | | | | | | |
| | | | | |
| | 685 | | Chicago, Illinois, General Obligation Refunding Bonds, Series 1992, 6.250%, 1/01/11 – AMBAC Insured | | | | No Opt. Call | | AA– | | | 711,736 |
| | | | | |
| | 500 | | Chicago, Illinois, Second Lien General Airport Revenue Refunding Bonds, O’Hare International Airport, Series 1999, 5.500%, 1/01/16 – AMBAC Insured (Alternative Minimum Tax) | | | | 1/10 at 101.00 | | AA– | | | 505,715 |
| | | | | |
| | 255 | | Green Oaks Village, Illinois, General Obligation Bonds, Series 2009, 5.500%, 12/01/28 | | | | No Opt. Call | | AAA | | | 274,574 |
| | | | | |
| | 200 | | Illinois Development Finance Authority, Revenue Bonds, Adventist Health System – Sunbelt Obligated Group, Series 1997A, 5.500%, 11/15/14 – MBIA Insured | | | | No Opt. Call | | AA | | | 210,410 |
| | | | | |
| | 750 | | Illinois Finance Authority, Revenue Bonds, Children’s Memorial Hospital, Series 2008B, 5.500%, 8/15/21 | | | | 8/18 at 100.00 | | A– | | | 768,765 |
| | | | | |
| | 650 | | Illinois Finance Authority, Revenue Bonds, Elmhurst Memorial Healthcare, Series 2008A, 5.625%, 1/01/37 | | | | 1/18 at 100.00 | | Baa1 | | | 531,525 |
| | | | | |
| | 750 | | Illinois Finance Authority, Revenue Bonds, Illinois Institute of Technology, Refunding Series 2006A, 5.000%, 4/01/17 | | | | 4/16 at 100.00 | | Baa2 | | | 711,008 |
| | | | | |
| | 1,000 | | Illinois Finance Authority, Revenue Bonds, Illinois Institute of Technology, Series 2009, 6.250%, 2/01/19 | | | | No Opt. Call | | N/R | | | 1,011,410 |
| | | | | |
| | 150 | | Illinois Finance Authority, Revenue Bonds, Roosevelt University, Series 2007, 5.400%, 4/01/27 | | | | 4/17 at 100.00 | | Baa1 | | | 141,825 |
| | | | | |
| | 100 | | Illinois Finance Authority, Revenue Bonds, Sherman Health Systems, Series 2007A, 5.500%, 8/01/37 | | | | 8/17 at 100.00 | | Baa1 | | | 75,837 |
| | | | | |
| | 700 | | Illinois Finance Authority, Revenue Refunding Bonds, Silver Cross Hospital and Medical Centers, Series 2008A, 6.000%, 8/15/23 | | | | 8/18 at 100.00 | | BBB | | | 668,682 |
Portfolio of Investments
Municipal Total Return Managed Accounts Portfolio (continued)
July 31, 2009
| | | | | | | | | | | | |
Principal
Amount (000) | | Description (1) | | | | Optional Call Provisions (2) | | Ratings (3) | | Value |
| | | | | | | | | | | | |
| | | Illinois (continued) | | | | | | | | | |
| | | | | |
| $ | 75 | | Illinois Finance Authority, Student Housing Revenue Bonds, Educational Advancement Fund Inc., University Center Project, Series 2006B, 5.000%, 5/01/13 | | | | No Opt. Call | | Baa3 | | $ | 73,454 |
| | | | | |
| | | Illinois Health Facilities Authority, Revenue Refunding Bonds, Elmhurst Memorial Healthcare, Series 2002: | | | | | | | | | |
| | 665 | | 6.250%, 1/01/17 | | | | 1/13 at 100.00 | | Baa1 | | | 676,790 |
| | 60 | | 5.500%, 1/01/22 | | | | 1/13 at 100.00 | | Baa1 | | | 56,248 |
| | | | | |
| | 205 | | Kane County, Illinois, Community Unit School District 304 Geneva, General Obligation Bonds, Series 2008, 5.250%, 1/01/23 - FSA Insured | | | | 1/18 at 100.00 | | AAA | | | 219,221 |
| | | | | |
| | 250 | | Lombard Public Facilities Corporation, Illinois, Second Tier Conference Center and Hotel Revenue Bonds, Series 2005B, 5.250%, 1/01/30 | | | | 1/16 at 100.00 | | AA | | | 251,070 |
| | | | | |
| | | Markham, Illinois, General Obligation Bonds, Series 2008A: | | | | | | | | | |
| | 225 | | 4.750%, 2/01/17 | | | | No Opt. Call | | BBB | | | 217,019 |
| | 500 | | 4.750%, 2/01/18 | | | | No Opt. Call | | BBB | | | 476,440 |
| | | | | |
| | 500 | | Metropolitan Pier and Exposition Authority, Illinois, Revenue Bonds, McCormick Place Hospitality Facility, Series 1996A, 7.000%, 7/01/26 (ETM) | | | | No Opt. Call | | AAA | | | 652,735 |
| | | | | |
| | 250 | | Regional Transportation Authority, Cook, DuPage, Kane, Lake, McHenry and Will Counties, Illinois, General Obligation Bonds, Series 1991, 6.700%, 11/01/21 – FGIC Insured | | | | No Opt. Call | | AA+ | | | 306,573 |
| | | | | |
| | 250 | | Saint Clair County High School District 203, O’Fallon, Illinois, General Obligation Bonds, Series 2007, 5.750%, 12/01/26 – AMBAC Insured | | | | 12/17 at 100.00 | | A+ | | | 268,623 |
| | | | | |
| | 750 | | Southwestern Illinois Development Authority, Local Government Program Bonds, St. Clair County Community Unit School District 19 Mascoutah, Series 2009, 5.750%, 2/01/29 – AGC Insured | | | | No Opt. Call | | AAA | | | 818,190 |
| | 9,470 | | Total Illinois | | | | | | | | | 9,627,850 |
| | | Indiana – 5.3% | | | | | | | | | |
| | | | | |
| | 250 | | Central Nine Career Charter School Building Corporation, Indiana, General Obligation Bonds, Series 2007, 5.500%, 1/15/17 | | | | No Opt. Call | | A | | | 273,795 |
| | | | | |
| | 670 | | East Chicago Multi-School Building Corporation, Lake County, Indiana, First Mortgage Bonds, Series 2008, 6.000%, 7/15/16 | | | | No Opt. Call | | AA+ | | | 786,419 |
| | | | | |
| | 750 | | Franklin Community Multi-School Building Corporation, Marion County, Indiana, First Mortgage Revenue Bonds, Series 2007A, 5.000%, 7/15/20 – FGIC Insured | | | | No Opt. Call | | A | | | 803,400 |
| | | | | |
| | 350 | | Indiana Bond Bank, Special Program Gas Revenue Bonds, JP Morgan Ventures Energy Corporation Guaranteed, Series 2007A, 5.000%, 10/15/17 | | | | No Opt. Call | | Aa3 | | | 342,923 |
| | | | | |
| | | Indiana Finance Authority, Revenue Bonds, Children’s Museum Project, Series 2008: | | | | | | | | | |
| | 500 | | 5.000%, 10/01/26 | | | | 7/18 at 100.00 | | Aa3 | | | 501,050 |
| | 280 | | 5.000%, 10/01/28 | | | | 7/18 at 100.00 | | Aa3 | | | 272,244 |
| | | | | |
| | 500 | | Jasper County, Indiana, Pollution Control Revenue Refunding Bonds, Northern Indiana Public Service Company Project, Series 1994A Remarketed, 4.150%, 8/01/10 – MBIA Insured | | | | No Opt. Call | | AA | | | 502,825 |
| | | | | |
| | 250 | | Merrillville Multi-School Building Corporation, Lake County, Indiana, First Mortgage Revenue Bonds, Series 2008, 5.250%, 7/15/22 | | | | 1/18 at 100.00 | | A | | | 260,970 |
| | | | | |
| | 300 | | Portage Redevelopment District, Indiana, Tax Increment Revenue Bonds, Series 2008, 5.250%, 1/15/19 – CIFG Insured | | | | 1/18 at 100.00 | | BBB+ | | | 306,066 |
| | | | | |
| | 75 | | Portage, Indiana, Revenue Bonds, Series 2006, 5.000%, 7/15/23 | | | | 7/16 at 100.00 | | BBB+ | | | 68,174 |
| | | | | |
| | 650 | | Tri-Creek Middle School Building Corporation, Indiana, First Mortgage Bonds, Series 2008, 6.000%, 1/15/16 – FSA Insured | | | | No Opt. Call | | AAA | | | 768,469 |
| | 4,575 | | Total Indiana | | | | | | | | | 4,886,335 |
| | | | | | | | | | | | |
Principal
Amount (000) | | Description (1) | | | | Optional Call Provisions (2) | | Ratings (3) | | Value |
| | | | | | | | | | | | |
| | | Kansas – 0.9% | | | | | | | | | |
| | | | | |
| $ | 835 | | Wyandotte County-Kansas City Unified Government, Kansas, Sales Tax Special Obligation Bonds, Redevelopment Project Area B, Series 2005, 4.750%, 12/01/16 | | | | 12/15 at 100.00 | | N/R | | $ | 818,250 |
| | | Kentucky – 0.8% | | | | | | | | | |
| | | | | |
| | 500 | | Kentucky Economic Development Finance Authority, Louisville Arena Project Revenue Bonds, Louisville Arena Authority, Inc., Series 2008A-1, 5.750%, 12/01/28 – AGC Insured | | | | 6/18 at 100.00 | | AAA | | | 521,760 |
| | | | | |
| | 250 | | Louisville and Jefferson County Metropolitan Government, Kentucky, General Revenue Bonds, Bellarmine University, Series 2008A, 6.000%, 5/01/28 | | | | 5/18 at 100.00 | | Baa2 | | | 253,195 |
| | 750 | | Total Kentucky | | | | | | | | | 774,955 |
| | | Maine – 0.4% | | | | | | | | | |
| | | | | |
| | 410 | | South Berwick, Maine, Education Revenue Bonds, Berwick Academy Issue, Series 1998, 5.250%, 8/01/13 | | | | 8/10 at 100.00 | | BBB | | | 410,357 |
| | | Massachusetts – 3.1% | | | | | | | | | |
| | | | | |
| | 750 | | Massachusetts Bay Transportation Authority, Senior Lien Sales Tax Revenue Bonds, Series 2004B, 5.250%, 7/01/18 | | | | No Opt. Call | | AAA | | | 881,145 |
| | | | | |
| | 250 | | Massachusetts Development Finance Agency, Revenue Bonds, Boston Architectural College, Series 2006, 5.000%, 1/01/37 – ACA Insured | | | | 1/17 at 100.00 | | N/R | | | 156,908 |
| | | | | |
| | 750 | | Massachusetts Development Finance Agency, Revenue Bonds, The Sabis International Charter School Issue, Series 2009, 8.000%, 4/15/31 | | | | 10/19 at 100.00 | | BBB | | | 796,620 |
| | | | | |
| | 750 | | Massachusetts Educational Financing Authority, Education Loan Revenue Bonds, Series 2008H, 6.125%, 1/01/22 – AGC Insured (Alternative Minimum Tax) | | | | 1/18 at 100.00 | | AAA | | | 769,470 |
| | | | | |
| | 300 | | Massachusetts Health and Educational Facilities Authority Revenue Bonds, Quincy Medical Center Issue, Series A (2008), 6.250%, 1/15/28 | | | | 1/18 at 100.00 | | N/R | | | 221,760 |
| | 2,800 | | Total Massachusetts | | | | | | | | | 2,825,903 |
| | | Michigan – 4.1% | | | | | | | | | |
| | | | | |
| | 250 | | Garden City Hospital Finance Authority, Michigan, Revenue Bonds, Garden City Hospital Obligated Group, Series 2007A, 4.875%, 8/15/27 | | | | 8/17 at 100.00 | | N/R | | | 139,098 |
| | | | | |
| | 500 | | Kent Hospital Finance Authority, Michigan, Revenue Bonds, Spectrum Health System, Series 2008A, 5.500%, 1/15/47 (Mandatory put 1/15/15) | | | | 1/15 at 100.00 | | AA | | | 517,580 |
| | | | | |
| | 750 | | Michigan Higher Education Facilities Authority, Limited Obligation Revenue Bonds, Alma College Project, Series 2008, 5.500%, 6/01/28 | | | | 6/18 at 100.00 | | A3 | | | 749,940 |
| | | | | |
| | 150 | | Michigan Higher Education Facilities Authority, Revenue Bonds, Kalamazoo College Project, Series 2007, 5.000%, 12/01/33 | | | | 12/17 at 100.00 | | A1 | | | 142,110 |
| | | | | |
| | 200 | | Michigan Higher Education Student Loan Authority, Revenue Bonds, Series 2003, XVII-I, 4.750%, 3/01/18 – AMBAC Insured (Alternative Minimum Tax) | | | | 3/14 at 100.00 | | AA | | | 185,692 |
| | | | | |
| | 80 | | Michigan State Building Authority, Revenue Bonds, Facilities Program, Series 2001I, 4.750%, 10/15/25 | | | | 10/09 at 100.00 | | A+ | | | 78,839 |
| | | | | |
| | 30 | | Michigan State Hospital Finance Authority, Hospital Revenue Bonds, Detroit Medical Center Obligated Group, Series 1998A, 5.250%, 8/15/23 | | | | 8/09 at 100.00 | | Ba3 | | | 20,437 |
| | | | | |
| | 130 | | Michigan State Hospital Finance Authority, Hospital Revenue Refunding Bonds, Detroit Medical Center Obligated Group, Series 1997A, 5.250%, 8/15/27 – AMBAC Insured | | | | 8/09 at 100.00 | | BB– | | | 83,587 |
| | | | | |
| | 875 | | Michigan State Hospital Finance Authority, Hospital Revenue Refunding Bonds, Trinity Health Credit Group, Series 2000A, 6.000%, 12/01/27 – AMBAC Insured | | | | 12/10 at 101.00 | | AA | | | 893,786 |
| | | | | |
| | 15 | | Michigan State Hospital Finance Authority, Revenue Refunding Bonds, Detroit Medical Center Obligated Group, Series 1993A, 6.250%, 8/15/13 | | | | 8/09 at 100.00 | | BB– | | | 14,767 |
| | | | | |
| | 300 | | Michigan Tobacco Settlement Finance Authority, Tobacco Settlement Asset-Backed Revenue Bonds, Series 2008A, 6.875%, 6/01/42 | | | | 6/18 at 100.00 | | Baa3 | | | 225,438 |
Portfolio of Investments
Municipal Total Return Managed Accounts Portfolio (continued)
July 31, 2009
| | | | | | | | | | | | |
Principal
Amount (000) | | Description (1) | | | | Optional Call Provisions (2) | | Ratings (3) | | Value |
| | | | | | | | | | | | |
| | | Michigan (continued) | | | | | | | | | |
| | | | | |
| $ | 700 | | Royal Oak Hospital Finance Authority, Michigan, Hospital Revenue Bonds, William Beaumont Hospital, Refunding Series 2009V, 6.250%, 9/01/14 | | | | No Opt. Call | | A1 | | $ | 760,802 |
| | 3,980 | | Total Michigan | | | | | | | | | 3,812,076 |
| | | Missouri – 3.5% | | | | | | | | | |
| | | | | |
| | 1,000 | | Carroll County Public Water Supply District 1, Missouri, Water System Revenue Bonds, Refunding Series 2009, 5.625%, 3/01/34 | | | | 3/18 at 100.00 | | A | | | 1,009,020 |
| | | | | |
| | 1,000 | | Missouri Development Finance Board, Independence, Infrastructure Facilities Revenue Bonds, Water System Improvement Projects, Series 2009C, 5.750%, 11/01/29 | | | | No Opt. Call | | A+ | | | 1,011,620 |
| | | | | |
| | 600 | | Missouri Development Finance Board, Infrastructure Facilities Leasehold Revenue Bonds, Independence Electric System Projects, Series 2009D, 5.750%, 6/01/34 | | | | No Opt. Call | | A+ | | | 606,744 |
| | | | | |
| | 287 | | Saint Louis, Missouri, Tax Increment Financing Revenue Notes, Marquette Building Redevelopment Project, Series 2008-A, 6.500%, 1/23/28 | | | | No Opt. Call | | N/R | | | 183,496 |
| | | | | |
| | 360 | | Sikeston, Missouri, Electric System Revenue Bonds, Series 1992, 6.200%, 6/01/10 – MBIA Insured | | | | No Opt. Call | | A | | | 365,753 |
| | | | | |
| | 75 | | St. Louis County Industrial Development Authority, Missouri, Revenue Bonds, Friendship Village of West County, Series 2007A, 5.250%, 9/01/15 | | | | No Opt. Call | | N/R | | | 73,180 |
| | 3,322 | | Total Missouri | | | | | | | | | 3,249,813 |
| | | Nebraska – 0.6% | | | | | | | | | |
| | | | | |
| | 500 | | Douglas County Hospital Authority 2, Nebraska, Health Facilities Revenue Refunding Bonds, Children’s Hospital Obligated Group, Series 2008, 6.125%, 8/15/31 | | | | 8/17 at 100.00 | | A2 | | | 512,890 |
| | | Nevada – 1.8% | | | | | | | | | |
| | | | | |
| | 800 | | Clark County, Nevada, Passenger Facility Charge Revenue Bonds, Las Vegas-McCarran International Airport, Series 2007A-2, 5.000%, 7/01/26 – AMBAC Insured | | | | 7/17 at 100.00 | | Aa3 | | | 781,224 |
| | | | | |
| | 815 | | Clark County, Nevada, Subordinate Lien Airport Revenue Bonds, Series 2007A1, 5.000%, 7/01/19 – AMBAC Insured (Alternative Minimum Tax) | | | | 7/17 at 100.00 | | Aa3 | | | 785,937 |
| | | | | |
| | 100 | | Sparks Local Improvement District 3, Legends at Sparks Marina, Nevada, Limited Obligation Improvement Bonds, Series 2008, 6.750%, 9/01/27 | | | | 9/18 at 100.00 | | N/R | | | 78,194 |
| | 1,715 | | Total Nevada | | | | | | | | | 1,645,355 |
| | | New Jersey – 3.3% | | | | | | | | | |
| | | | | |
| | 600 | | New Jersey Economic Development Authority, Cigarette Tax Revenue Bonds, Series 2004, 5.625%, 6/15/19 | | | | 6/10 at 100.00 | | BBB | | | 558,822 |
| | | | | |
| | 500 | | New Jersey Economic Development Authority, School Facilities Construction Bonds, Series 2007-T3, 5.000%, 9/01/20 (Mandatory put 9/01/14) – FSA Insured | | | | 9/14 at 100.00 | | AAA | | | 543,615 |
| | | | | |
| | 350 | | New Jersey Health Care Facilities Finance Authority, Revenue Bonds, AHS Hospital Corporation, Series 2008A, 5.125%, 7/01/22 | | | | 7/18 at 100.00 | | A1 | | | 351,600 |
| | | | | |
| | | New Jersey Housing and Mortgage Finance Agency, Single Family Housing Revenue Bonds, Series 2008X: | | | | | | | | | |
| | 735 | | 4.850%, 4/01/16 (Alternative Minimum Tax) | | | | No Opt. Call | | AA | | | 758,130 |
| | 805 | | 5.000%, 4/01/17 (Alternative Minimum Tax) | | | | No Opt. Call | | AA | | | 824,932 |
| | 2,990 | | Total New Jersey | | | | | | | | | 3,037,099 |
| | | New Mexico – 0.8% | | | | | | | | | |
| | | | | |
| | 500 | | Albuquerque, New Mexico, Airport Revenue Bonds, Subordinate Lien Refunding Series 2008E, 5.500%, 7/01/13 | | | | No Opt. Call | | A1 | | | 544,405 |
| | | | | |
| | 250 | | Farmington, New Mexico, Pollution Control Revenue Bonds, Public Service Company of New Mexico San Juan Project, Series 2007A, 5.150%, 6/01/37 – FGIC Insured (Alternative Minimum Tax) | | | | 6/12 at 100.00 | | Baa3 | | | 176,813 |
| | 750 | | Total New Mexico | | | | | | | | | 721,218 |
| | | | | | | | | | | | | |
Principal
Amount (000) | | Description (1) | | | | Optional Call Provisions (2) | | Ratings (3) | | | Value |
| | | | | | | | | | | | | |
| | | New York – 4.6% | | | | | | | | | | |
| | | | | |
| $ | 620 | | Dormitory Authority of the State of New York, Consolidated Revenue Bonds, City University System, Series 1993B, 6.000%, 7/01/14 | | | | No Opt. Call | | AA– | | | $ | 675,316 |
| | | | | |
| | 750 | | Dormitory Authority of the State of New York, Revenue Bond, Court Facilities Lease, New York City Issue, Series 2005A, 5.500%, 5/15/25 – AMBAC Insured | | | | No Opt. Call | | AA– | | | | 805,868 |
| | | | | |
| | 100 | | New York City Industrial Development Agency, New York, Civic Facility Revenue Bonds, Special Needs Facilities Pooled Program, Series 2008A-1, 5.700%, 7/01/13 | | | | No Opt. Call | | N/R | | | | 91,975 |
| | | | | |
| | 500 | | New York State Environmental Facilities Corporation, State Clean Water and Drinking Water Revolving Funds Revenue Bonds, Pooled Loan Issue, Series 2005B, 5.500%, 10/15/27 | | | | No Opt. Call | | AAA | | | | 595,575 |
| | | | | |
| | 435 | | New York State Mortgage Agency, Homeowner Mortgage Revenue Refunding Bonds, Series 87, 5.150%, 4/01/17 | | | | 9/09 at 100.00 | | Aa1 | | | | 440,685 |
| | | | | |
| | 500 | | New York State Tobacco Settlement Financing Corporation, Tobacco Settlement Asset-Backed and State Contingency Contract-Backed Bonds, Series 2003A-1, 5.250%, 6/01/20 – AMBAC Insured | | | | 6/13 at 100.00 | | AA– | | | | 517,610 |
| | | | | |
| | 450 | | Saratoga County Water and Sewer Authority, New York, Revenue Bonds, Series 2008, 5.000%, 9/01/38 | | | | 9/18 at 100.00 | | AA | | | | 449,982 |
| | | | | |
| | 640 | | Triborough Bridge and Tunnel Authority, New York, General Purpose Revenue Bonds, Series 2008C, 5.000%, 11/15/27 | | | | 11/18 at 100.00 | | Aa2 | | | | 667,987 |
| | 3,995 | | Total New York | | | | | | | | | | 4,244,998 |
| | | North Carolina – 3.7% | | | | | | | | | | |
| | | | | |
| | 100 | | Albemarle Hospital Authority, North Carolina, Health Care Facilities Revenue Bonds, Series 2007, 5.250%, 10/01/21 | | | | 10/17 at 100.00 | | N/R | | | | 91,359 |
| | | | | |
| | 1,000 | | Charlotte, North Carolina, Airport Revenue Bonds, Series 1999B, 6.000%, 7/01/16 – MBIA Insured (Alternative Minimum Tax) | | | | 7/11 at 100.00 | | A+ | | | | 1,011,250 |
| | | | | |
| | 250 | | Metropolitan Sewerage District of Buncombe County, North Carolina, Sewerage System Revenue Refunding Bonds, Series 1993A, 5.375%, 7/01/13 – FGIC Insured (ETM) | | | | 10/09 at 100.00 | | Aa3 | (4) | | | 273,990 |
| | | | | |
| | 350 | | North Carolina Eastern Municipal Power Agency, Power System Revenue Refunding Bonds, Series 1993B, 6.000%, 1/01/22 – FGIC Insured | | | | No Opt. Call | | Baa1 | | | | 386,166 |
| | | | | |
| | 500 | | North Carolina Eastern Municipal Power Agency, Power System Revenue Refunding Bonds, Series 2008A, 5.250%, 1/01/20 | | | | 1/18 at 100.00 | | BBB+ | | | | 513,665 |
| | | | | |
| | 740 | | North Carolina Medical Care Commission, Revenue Bonds, Maria Parham Medical Center, Series 2003, 5.500%, 10/01/17 – RAAI Insured | | | | No Opt. Call | | BBB– | | | | 660,095 |
| | | | | |
| | 500 | | North Carolina Municipal Power Agency 1, Catawba Electric Revenue Bonds, Series 2008C, 5.250%, 1/01/19 | | | | 1/18 at 100.00 | | A2 | | | | 534,685 |
| | 3,440 | | Total North Carolina | | | | | | | | | | 3,471,210 |
| | | Ohio – 1.4% | | | | | | | | | | |
| | | | | |
| | 95 | | Buckeye Tobacco Settlement Financing Authority, Ohio, Tobacco Settlement Asset-Backed Revenue Bonds, Senior Lien, Series 2007A-2, 5.125%, 6/01/24 | | | | 6/17 at 100.00 | | BBB | | | | 78,256 |
| | | | | |
| | 240 | | Cuyahoga County, Ohio, Revenue Refunding Bonds, Cleveland Clinic Health System, Series 2003A, 6.000%, 1/01/32 | | | | 7/13 at 100.00 | | Aa2 | | | | 249,900 |
| | | | | |
| | 200 | | Huron County, Ohio, Hospital Facilities Revenue Bonds, Fisher-Titus Medical Center, Series 2007, 5.250%, 12/01/17 | | | | 6/17 at 100.00 | | A | | | | 206,464 |
| | | | | |
| | 750 | | Lorain, Ohio, General Obligation Bonds, Pellet Terminal Improvement Series 2008, 6.750%, 12/01/23 | | | | 12/18 at 100.00 | | Baa2 | | | | 762,458 |
| | 1,285 | | Total Ohio | | | | | | | | | | 1,297,078 |
| | | Oregon – 0.1% | | | | | | | | | | |
| | | | | |
| | 150 | | Oregon Facilities Authority, Revenue Bonds, University of Portland Projects, Series 2007A, 5.500%, 4/01/27 | | | | 4/18 at 100.00 | | BBB+ | | | | 142,401 |
Portfolio of Investments
Municipal Total Return Managed Accounts Portfolio (continued)
July 31, 2009
| | | | | | | | | | | | |
Principal
Amount (000) | | Description (1) | | | | Optional Call Provisions (2) | | Ratings (3) | | Value |
| | | | | | | | | | | | |
| | | Pennsylvania – 6.4% | | | | | | | | | |
| | | | | |
| $ | 430 | | City of Erie Higher Education Building Authority (Commonwealth of Pennsylvania) College Revenue Bonds, Series 2008 (Mercyhurst College Project), 5.350%, 3/15/28 | | | | 9/18 at 100.00 | | BBB | | $ | 387,292 |
| | | | | |
| | 250 | | Delaware County Authority, Pennsylvania, Revenue Bonds, Neumann College, Series 2008, 6.000%, 10/01/25 | | | | 10/18 at 100.00 | | BBB | | | 254,025 |
| | | | | |
| | 1,250 | | Lackawanna County, Pennsylvania, General Obligation Notes, Series 2009B, 6.000%, 9/15/32 – AGC Insured | | | | 9/19 at 100.00 | | AAA | | | 1,252,711 |
| | | | | |
| | 100 | | Lancaster County Hospital Authority, Pennsylvania, Revenue Bonds, Brethren Village Project, Series 2008A, 5.200%, 7/01/12 | | | | 7/10 at 101.00 | | N/R | | | 97,092 |
| | | | | |
| | 755 | | Lehigh County General Purpose Authority, Pennsylvania, Hospital Revenue Bonds, St. Luke’s Hospital of Bethlehem, Series 1992, 6.125%, 7/01/12 – AMBAC Insured | | | | 10/09 at 100.00 | | Baa1 | | | 756,072 |
| | | | | |
| | 500 | | Pennsylvania Economic Development Financing Authority, Exempt Facilities Revenue Refunding Bonds, Exelon Generation Company, LLC Project, Series 2009A, 5.000%, 12/01/42 (Mandatory put 6/01/12) | | | | 6/12 at 100.00 | | A3 | | | 504,695 |
| | | | | |
| | 375 | | Pennsylvania State University, General Revenue Bonds, Series 2005, 5.000%, 9/01/35 | | | | 9/15 at 100.00 | | AA | | | 379,294 |
| | | | | |
| | 870 | | Philadelphia Municipal Authority, Philadelphia, Pennsylvania, Lease Revenue Bonds, Series 2009, 6.000%, 4/01/23 | | | | No Opt. Call | | Baa1 | | | 887,165 |
| | | | | |
| | 850 | | Pittsburgh, Pennsylvania, General Obligation Bonds, Refunding Series 2008A, 5.000%, 9/01/13 | | | | No Opt. Call | | Baa1 | | | 874,922 |
| | | | | |
| | 500 | | Warwick School District, Bucks County, Pennsylvania, General Obligation Bonds, Series 2009, 4.375%, 2/01/25 – AGC Insured | | | | 2/18 at 100.00 | | AAA | | | 503,070 |
| | 5,880 | | Total Pennsylvania | | | | | | | | | 5,896,338 |
| | | Puerto Rico – 2.1% | | | | | | | | | |
| | | | | |
| | 275 | | Puerto Rico Highway and Transportation Authority, Highway Revenue Bonds, Series 2003G, 5.250%, 7/01/18 – FGIC Insured | | | | 7/13 at 100.00 | | BBB | | | 266,615 |
| | | | | |
| | 135 | | Puerto Rico Highway and Transportation Authority, Highway Revenue Bonds, Series 2007N, 5.500%, 7/01/21 | | | | No Opt. Call | | BBB | | | 129,415 |
| | | | | |
| | 1,000 | | Puerto Rico, General Obligation Refunding Bonds, Series 2002, 5.500%, 7/01/14 – FGIC Insured | | | | No Opt. Call | | BBB– | | | 1,029,190 |
| | | | | |
| | 500 | | Puerto Rico, The Children’s Trust Fund, Tobacco Settlement Asset-Backed Refunding Bonds, Series 2002, 5.000%, 5/15/11 – BHAC Insured | | | | No Opt. Call | | BBB | | | 499,060 |
| | 1,910 | | Total Puerto Rico | | | | | | | | | 1,924,280 |
| | | Rhode Island – 1.2% | | | | | | | | | |
| | | | | |
| | 200 | | Rhode Island Housing & Mortgage Finance Corporation, Homeownership Opportunity Bond Program, 2007 Series 57-B, 5.150%, 4/01/22 (Alternative Minimum Tax) | | | | 4/17 at 100.00 | | AA+ | | | 202,512 |
| | | | | |
| | 250 | | Rhode Island Student Loan Authority, Student Loan Program Revenue Bonds, Series 2008A, 6.750%, 12/01/28 (Alternative Minimum Tax) | | | | 12/17 at 100.00 | | A | | | 251,153 |
| | | | | |
| | 670 | | Rhode Island Tobacco Settlement Financing Corporation, Tobacco Settlement Asset-Backed Bonds, Series 2002A, 6.000%, 6/01/23 | | | | 6/12 at 100.00 | | BBB | | | 624,628 |
| | 1,120 | | Total Rhode Island | | | | | | | | | 1,078,293 |
| | | South Carolina – 2.0% | | | | | | | | | |
| | | | | |
| | 500 | | Berkeley County School District, South Carolina, Installment Purchase Revenue Bonds, Series 2006, 5.125%, 12/01/30 | | | | 12/16 at 100.00 | | A– | | | 500,115 |
| | | | | |
| | 400 | | Piedmont Municipal Power Agency, South Carolina, Electric Revenue Bonds, Series 2008A-3, 5.250%, 1/01/19 | | | | 1/18 at 100.00 | | A– | | | 413,164 |
| | | | | |
| | 740 | | South Carolina JOBS Economic Development Authority, Hospital Refunding and Improvement Revenue Bonds, Palmetto Health Alliance, Series 2003C, 6.000%, 8/01/13 | | | | No Opt. Call | | BBB+ | | | 769,052 |
| | | | | | | | | | | | | |
Principal
Amount (000) | | Description (1) | | | | Optional Call Provisions (2) | | Ratings (3) | | | Value |
| | | | | | | | | | | | | |
| | | South Carolina (continued) | | | | | | | | | | |
| | | | | |
| | | Tobacco Settlement Revenue Management Authority, South Carolina, Tobacco Settlement Asset-Backed Bonds, Series 2001B: | | | | | | | | | | |
| $ | 195 | | 6.000%, 5/15/22 (Pre-refunded 5/15/12) | | | | 5/12 at 100.00 | | BBB | (4) | | $ | 205,175 |
| | 10 | | 6.375%, 5/15/28 (Pre-refunded 5/15/16) | | | | 5/16 at 100.00 | | BBB | (4) | | | 11,032 |
| | 1,845 | | Total South Carolina | | | | | | | | | | 1,898,538 |
| | | Tennessee – 0.9% | | | | | | | | | | |
| | | | | |
| | 145 | | Shelby County Health, Educational and Housing Facilities Board, Tennessee, Hospital Revenue Refunding Bonds, Methodist Healthcare, Series 1995, 5.250%, 8/01/15 – MBIA Insured | | | | No Opt. Call | | A | (4) | | | 161,882 |
| | | | | |
| | 1,000 | | Sullivan County Health Educational and Housing Facilities Board, Tennessee, Revenue Bonds, Wellmont Health System, Series 2006C, 5.250%, 9/01/36 | | | | 9/16 at 100.00 | | BBB+ | | | | 686,200 |
| | 1,145 | | Total Tennessee | | | | | | | | | | 848,082 |
| | | Texas – 4.5% | | | | | | | | | | |
| | | | | |
| | 500 | | City of Dallas, Texas, Counties of Dallas, Denton, Collin, and Rockwall, Waterworks and Sewer System Revenue Bonds, Series 1998 Refunding, 5.000%, 10/01/29 – FSA Insured | | | | 10/09 at 100.00 | | Aa2 | | | | 500,460 |
| | | | | |
| | 500 | | Dallas-Fort Worth International Airport, Texas, Auction Rate Revenue Bonds, Series 2004-A1, 5.750%, 11/01/18 – MBIA Insured (Alternative Minimum Tax) | | | | 11/09 at 100.00 | | A+ | | | | 501,015 |
| | | | | |
| | 350 | | Forney Independent School District, Kaufman County, Texas, General Obligation Bonds, Series 2008, 0.000%, 8/15/25 | | | | 8/17 at 65.60 | | AAA | | | | 154,609 |
| | | | | |
| | 500 | | Grapevine-Colleyville Independent School District, Tarrant and Dallas Counties, Texas, General Obligation Bonds, Series 2005A, 5.250%, 8/15/22 – FGIC Insured | | | | 8/15 at 100.00 | | AA | | | | 536,080 |
| | | | | |
| | 650 | | Houston, Texas, Subordinate Lien Airport System Revenue Refunding Bonds, Series 1998A, 6.000%, 7/01/13 – FGIC Insured (Alternative Minimum Tax) | | | | 7/10 at 100.00 | | A | | | | 654,355 |
| | | | | |
| | 380 | | North Texas Municipal Water District, Water System Revenue Bonds, Series 2006, 5.000%, 9/01/20 – FGIC Insured | | | | 9/16 at 100.00 | | AAA | | | | 413,163 |
| | | | | |
| | | North Texas Thruway Authority, First Tier System Revenue Refunding Bonds, Series 2008A: | | | | | | | | | | |
| | 200 | | 6.000%, 1/01/19 | | | | 1/18 at 100.00 | | A2 | | | | 218,184 |
| | 325 | | 6.000%, 1/01/23 – MBIA Insured | | | | 1/18 at 100.00 | | A | | | | 350,561 |
| | | | | |
| | 375 | | North Texas Thruway Authority, Second Tier System Revenue Refunding Bonds, Series 2008, 5.750%, 1/01/38 | | | | 1/18 at 100.00 | | A3 | | | | 359,310 |
| | | | | |
| | 540 | | Port of Port Arthur Navigation District, Texas, General Obligation Bonds, Port Improvement Series 2008B, 4.375%, 3/01/15 (Alternative Minimum Tax) | | | | No Opt. Call | | A | | | | 530,593 |
| | 4,320 | | Total Texas | | | | | | | | | | 4,218,330 |
| | | Utah – 1.1% | | | | | | | | | | |
| | | | | |
| | 750 | | Intermountain Power Agency, Utah, Power Supply Revenue Refunding Bonds, Series 2008A, 5.250%, 7/01/20 | | | | 7/13 at 100.00 | | A+ | | | | 775,403 |
| | | | | |
| | 100 | | Utah State Charter School Finance Authority, Revenue Bonds, Channing Hall Project, Series 2007A, 5.750%, 7/15/22 | | | | 7/15 at 102.00 | | N/R | | | | 81,736 |
| | | | | |
| | 140 | | Utah State Charter School Finance Authority, Revenue Bonds, Summit Academy Project, Series 2007A, 5.125%, 6/15/17 | | | | No Opt. Call | | BBB– | | | | 125,481 |
| | 990 | | Total Utah | | | | | | | | | | 982,620 |
| | | Virgin Islands – 2.0% | | | | | | | | | | |
| | | | | |
| | 300 | | Virgin Islands Public Finance Authority, Gross Receipts Taxes Loan Note, Series 2006, 5.000%, 10/01/16 – FGIC Insured | | | | No Opt. Call | | A | | | | 294,180 |
| | | | | |
| | 1,000 | | Virgin Islands Public Finance Authority, Matching Fund Revenue Loan
Note – Diageo Project, Series 2009A, 6.750%, 10/01/19 | | | | No Opt. Call | | Baa3 | | | | 1,046,360 |
| | | | | |
| | 500 | | Virgin Islands Public Finance Authority, Senior Lien Revenue Refunding Bonds, Matching Fund Loan Note, Series 1998A, 5.500%, 10/01/22 | | | | 10/09 at 100.50 | | BBB | | | | 472,980 |
| | 1,800 | | Total Virgin Islands | | | | | | | | | | 1,813,520 |
Portfolio of Investments
Municipal Total Return Managed Accounts Portfolio (continued)
July 31, 2009
| | | | | | | | | | | | | | |
Principal
Amount (000) | | | | Description (1) | | | | Optional Call Provisions (2) | | Ratings (3) | | Value |
| | | | | | | | | | | | | | |
| | | | | Virginia – 1.3% | | | | | | | | | |
| | | | | | |
| $ | 140 | | | | Fairfax County Water Authority, Virginia, Water Revenue Refunding Bonds, Series 1977, 5.800%, 1/01/16 (ETM) | | | | No Opt. Call | | AAA | | $ | 154,707 |
| | | | | | |
| | 100 | | | | Metropolitan Washington D.C. Airports Authority, Airport System Revenue Bonds, Series 2002A, 5.250%, 10/01/32 – FGIC Insured (Alternative Minimum Tax) | | | | 10/12 at 100.00 | | AA– | | | 94,244 |
| | | | | | |
| | 815 | | | | Virginia College Building Authority, Educational Facilities Revenue Bonds, Washington and Lee University, Series 2001, 5.750%, 1/01/34 | | | | No Opt. Call | | AA | | | 934,585 |
| | 1,055 | | | | Total Virginia | | | | | | | | | 1,183,536 |
| | | | | Washington – 0.2% | | | | | | | | | |
| | | | | | |
| | 100 | | | | Kalispel Indian Tribe, Washington, Priority Distribution Bonds, Series 2008, 6.625%, 1/01/28 | | | | No Opt. Call | | N/R | | | 75,357 |
| | | | | | |
| | 75 | | | | Skagit County Public Hospital District 1 , Washington, Skagit Valley Hospital, Series 2007, 5.750%, 12/01/28 | | | | 12/17 at 100.00 | | Baa2 | | | 65,069 |
| | 175 | | | | Total Washington | | | | | | | | | 140,426 |
| | | | | Wisconsin – 3.5% | | | | | | | | | |
| | | | | | |
| | | | | Badger Tobacco Asset Securitization Corporation, Wisconsin, Tobacco Settlement Asset-Backed Bonds, Series 2002: | | | | | | | | | |
| | 70 | | | | 6.125%, 6/01/27 (Pre-refunded 6/01/12) | | | | 6/12 at 100.00 | | AAA | | | 76,138 |
| | 320 | | | | 6.375%, 6/01/32 (Pre-refunded 6/01/12) | | | | 6/12 at 100.00 | | AAA | | | 361,440 |
| | | | | | |
| | 860 | | | | Wisconsin Health and Educational Facilities Authority, Revenue Bonds, Sisters of the Sorrowful Mother - Ministry Corporation, Series 1993D, 5.500%, 8/15/19 – MBIA Insured | | | | 8/09 at 100.00 | | A+ | | | 860,129 |
| | | | | | |
| | 860 | | | | Wisconsin Health and Educational Facilities Authority, Revenue Bonds, Wheaton Franciscan Services Inc., Series 2006B, 5.000%, 8/15/12 | | | | No Opt. Call | | BBB+ | | | 850,695 |
| | | | | | |
| | 1,000 | | | | Wisconsin State, General Fund Annual Appropriation Revenue Bonds, Series 2009A, 6.000%, 5/01/27 | | | | 5/19 at 100.00 | | AA– | | | 1,114,748 |
| | 3,110 | | | | Total Wisconsin | | | | | | | | | 3,263,150 |
| | | | | Wyoming – 0.3% | | | | | | | | | |
| | | | | | |
| | 250 | | | | Wyoming Municipal Power Agency Power Supply System Revenue Bonds, 2008 Series A, 5.500%, 1/01/28 | | | | 1/18 at 100.00 | | A2 | | | 258,318 |
| $ | 89,457 | | | | Total Long-Term Investments (cost $89,067,695) – 97.7% | | | | | | | | | 90,245,771 |
| | | | | | | | | | | | | | |
| | | | | Short-Term Investments – 2.5% | | | | | | | | | |
| | | | | | |
| $ | 2,267 | | | | State Street Global Advisors Money Market Fund, Tax Free Obligation | | | | N/A | | N/A | | | 2,267,059 |
| | | | | Total Short-Term Investments (cost $2,267,059) | | | | | | | | | 2,267,059 |
| | | | | Total Investments (cost $91,334,754) – 100.2% | | | | | | | | | 92,512,830 |
| | | | | Other Assets Less Liabilities – (0.2)% | | | | | | | | | (159,274) |
| | | | | Net Assets – 100% | | | | | | | | $ | 92,353,556 |
| | (1) | | All percentages shown in the Portfolio of Investments are based on net assets. |
| | (2) | | Optional Call Provisions (not covered by the report of independent registered public accounting firm): Dates (month and year) and prices of the earliest optional call or redemption. There may be other call provisions at varying prices at later dates. Certain mortgage-backed securities may be subject to periodic principal paydowns. |
| | (3) | | Ratings (not covered by the report of independent registered public accounting firm): Using the higher of Standard & Poor’s Group (“Standard & Poor’s”) or Moody’s Investor Service, Inc. (“Moody’s”) rating. Ratings below BBB by Standard & Poor’s or Baa by Moody’s are considered to be below investment grade. |
| | (4) | | Backed by an escrow or trust containing sufficient U.S. Government or U.S. Government agency securities which ensure the timely payment of principal and interest. Such investments are normally considered to be equivalent to AAA rated securities. |
| | WI/DD | | Purchased on a when-issued or delayed delivery basis. |
| | (ETM) | | Escrowed to maturity. |
See accompanying notes to financial statements.
Statement of Assets and Liabilities
July 31, 2009
| | | | |
Assets | | | | |
Investments, at value (cost $91,334,754) | | $ | 92,512,830 | |
Cash | | | 1,169 | |
Receivables: | | | | |
From Adviser | | | 82,632 | |
Interest | | | 1,076,788 | |
Investments sold | | | 90,000 | |
Shares sold | | | 34,056 | |
Other assets | | | 14 | |
Total assets | | | 93,797,489 | |
Liabilities | | | | |
Payables: | | | | |
Dividends | | | 304,432 | |
Investments purchased | | | 1,020,400 | |
Shares redeemed | | | 59,886 | |
Accrued other expenses | | | 59,215 | |
Total liabilities | | | 1,443,933 | |
Net assets | | $ | 92,353,556 | |
Shares outstanding | | | 9,419,505 | |
Net asset value per share | | $ | 9.80 | |
Net Assets Consist of: | | | | |
Capital paid-in | | $ | 92,113,199 | |
Undistributed (Over-distribution of) net investment income | | | 3,860 | |
Accumulated net realized gain (loss) from investments | | | (941,579 | ) |
Net unrealized appreciation (depreciation) of investments | | | 1,178,076 | |
Net assets | | $ | 92,353,556 | |
See accompanying notes to financial statements.
Statement of Operations
Year Ended July 31, 2009
| | | | |
Investment Income | | $ | 3,650,578 | |
Expenses | | | | |
Shareholders’ servicing agent fees and expenses | | | 4,948 | |
Custodian’s fees and expenses | | | 27,529 | |
Trustees’ fees and expenses | | | 2,277 | |
Professional fees | | | 59,677 | |
Shareholders’ reports – printing and mailing expenses | | | 42,318 | |
Federal and state registration fees | | | 39,720 | |
Other expenses | | | 2,109 | |
Total expenses before expense reimbursement | | | 178,578 | |
Expense reimbursement | | | (178,578 | ) |
Net expenses | | | — | |
Net investment income | | | 3,650,578 | |
Realized and Unrealized Gain (Loss) | | | | |
Net realized gain (loss) from investments | | | (856,243 | ) |
Change in net unrealized appreciation (depreciation) of investments | | | 1,870,917 | |
Net realized and unrealized gain (loss) | | | 1,014,674 | |
Net increase (decrease) in net assets from operations | | $ | 4,665,252 | |
See accompanying notes to financial statements.
Statement of Changes in Net Assets
| | | | | | | | |
| | | Year Ended
7/31/09 | | | Year Ended
7/31/08 | |
Operations | | | | | | | | |
Net investment income | | $ | 3,650,578 | | | $ | 809,706 | |
Net realized gain (loss) from investments | | | (856,243 | ) | | | (83,223 | ) |
Change in net unrealized appreciation (depreciation) of investments | | | 1,870,917 | | | | (727,908 | ) |
Net increase (decrease) in net assets from operations | | | 4,665,252 | | | | (1,425 | ) |
Distributions to Shareholders | | | | | | | | |
From net investment income | | | (3,639,392 | ) | | | (852,133 | ) |
Decrease in net assets from distributions to shareholders | | | (3,639,392 | ) | | | (852,133 | ) |
Fund Share Transactions | | | | | | | | |
Proceeds from sale of shares | | | 68,531,320 | | | | 47,631,290 | |
Proceeds from shares issued to shareholders due to reinvestment of
distributions | | | 238,828 | | | | — | |
| | | | 68,770,148 | | | | 47,631,290 | |
Cost of shares redeemed | | | (26,471,891 | ) | | | (3,326,839 | ) |
Net increase (decrease) in net assets from Fund share transactions | | | 42,298,257 | | | | 44,304,451 | |
Capital contribution from Adviser | | | 5,184 | | | | 4,480 | |
Net increase (decrease) in net assets | | | 43,329,301 | | | | 43,455,373 | |
Net assets at the beginning of year | | | 49,024,255 | | | | 5,568,882 | |
Net assets at the end of year | | | 92,353,556 | | | | 49,024,255 | |
Undistributed (Over-distribution of) net investment income at the
end of year | | $ | 3,860 | | | $ | (6,272 | ) |
See accompanying notes to financial statements.
Notes to Financial Statements
1. General Information and Significant Accounting Policies
The Nuveen Managed Accounts Portfolios Trust (the “Trust”) is an open-end management investment company registered under the Investment Company Act of 1940, as amended. The Trust is comprised of the Municipal Total Return Managed Accounts Portfolio (the “Fund”), among others. The Trust was organized as a Massachusetts business trust on November 14, 2006.
The Fund is developed exclusively for use within Nuveen-sponsored separately managed accounts. The Fund is a specialized municipal bond fund to be used in combination with selected individual securities to effectively model institutional-level investment strategies. Certain securities in which the Fund invests are highly speculative. The Fund enables certain Nuveen municipal separately managed account investors to achieve greater diversification and return potential by using lower quality, higher yielding securities than smaller managed accounts might otherwise achieve by using lower quality, higher yielding securities and to gain access to special investment opportunities normally available only to institutional investors.
The Fund’s primary investment objective is to seek attractive total return. The Fund also seeks to provide high current income exempt from regular federal income taxes. Under normal circumstances the Fund invests in various types of municipal securities, including investment grade (rated BBB/Baa or better), below investment grade (rated BB/Ba or lower) (high yield), and unrated municipal securities. The Fund will focus on securities with intermediate to longer term maturities. The Fund may invest up to 50% of its net assets in high yield municipal bonds, but will normally invest 10-30% of its net assets in such bonds. The Fund may also invest up to 5% of its net assets in defaulted bonds and up to 50% of its net assets in leveraged municipal securities, most notably inverse floating rate securities.
The following is a summary of significant accounting policies followed by the Fund in the preparation of its financial statements in accordance with accounting principles generally accepted in the United States.
Investment Valuation
The prices of municipal bonds in the Fund’s investment portfolio are provided by a pricing service approved by the Fund’s Board of Trustees. When market price quotes are not readily available (which is usually the case for municipal securities), the pricing service or, in the absence of a pricing service for a particular investment, the Board of Trustees of the Fund, or its designee, may establish fair value using a wide variety of market data including yields or prices of investments of comparable quality, type of issue, coupon, maturity and rating, market quotes or indications of value from security dealers, evaluations of anticipated cash flows or collateral, general market conditions and other information and analysis, including the obligor’s credit characteristics considered relevant. Short-term investments are valued at amortized cost, which approximates value.
Investment Transactions
Investment transactions are recorded on a trade date basis. Realized gains and losses from transactions are determined on the specific identification method. Investments purchased on a when-issued/delayed delivery basis may have extended settlement periods. Any investments so purchased are subject to market fluctuation during this period. The Funds have instructed the custodian to segregate assets with a current value at least equal to the amount of the when-issued/delayed delivery purchase commitments. At July 31, 2009, the Fund had outstanding when-issued/delayed delivery purchase commitment of $1,020,400.
Investment Income
Interest income, which includes the amortization of premiums and accretion of discounts for financial reporting purposes, is recorded on an accrual basis. Investment income also includes paydown gains and losses, if any.
Income Taxes
The Fund intends to distribute substantially all of its net investment income and net capital gains to shareholders and to otherwise comply with the requirements of Subchapter M of the Internal Revenue Code applicable to regulated investment companies. Therefore, no federal income tax provision is required. Furthermore, the Fund intends to satisfy conditions which will enable interest from municipal securities, which is exempt from regular federal income tax, to retain such tax-exempt status when distributed to shareholders of the Fund. Net realized capital gains and ordinary income distributions paid by the Fund are subject to federal taxation.
For all open tax years and all major taxing jurisdictions, management of the Fund has concluded that there are no significant uncertain tax positions that would require recognition in the financial statements. Open tax years are those that are open for examination by taxing authorities (i.e., generally the last four tax year ends and the interim tax period since then). Furthermore, management of the Fund is also not aware of any tax positions for which it is reasonably possible that the total amounts of unrecognized tax benefits will significantly change in the next twelve months.
Dividends and Distributions to Shareholders
Dividends from tax-exempt net investment income are declared monthly. Net realized capital gains and/or market discount from investment transactions, if any, are declared and distributed to shareholders at least annually. Furthermore, capital gains are distributed only to the extent they exceed available capital loss carryforwards.
Distributions to shareholders of tax-exempt net investment income, net realized capital gains and/or market discount, if any, are recorded on the ex-dividend date. The amount and timing of distributions are determined in accordance with federal income tax regulations, which may differ from accounting principles generally accepted in the United States.
Notes to Financial Statements (continued)
Derivative Instruments
The Fund is authorized to invest in certain derivative instruments, including futures, forwards, options and swap transactions. Although the Fund is authorized to invest in such derivative instruments, and may do so in the future, it did not make any such investments during the fiscal year ended July 31, 2009.
Inverse Floating Rate Securities
The Fund is authorized to invest in inverse floating rate securities. An inverse floating rate security is created by depositing a municipal bond, typically with a fixed interest rate, into a special purpose trust created by a broker-dealer. In turn, this trust (a) issues floating rate certificates, in face amounts equal to some fraction of the deposited bond’s par amount or market value, that typically pay short-term tax-exempt interest rates to third parties, and (b) issues to a long-term investor (such as the Fund) an inverse floating rate certificate (sometimes referred to as an “inverse floater”) that represents all remaining or residual interest in the trust. The income received by the inverse floater holder varies inversely with the short-term rate paid to the floating rate certificates’ holders, and in most circumstances the inverse floater holder bears substantially all of the underlying bond’s downside investment risk and also benefits disproportionately from any potential appreciation of the underlying bond’s value. The price of an inverse floating rate security will be more volatile than that of the underlying bond because the interest rate is dependent on not only the fixed coupon rate of the underlying bond but also on the short-term interest paid on the floating rate certificates, and because the inverse floating rate security essentially bears the risk of loss of the greater face value of the underlying bond.
The Fund may purchase an inverse floating rate security in a secondary market transaction without first owning the underlying bond (referred to as an “externally-deposited inverse floater”), or instead by first selling a fixed-rate bond to a broker-dealer for deposit into the special purpose trust and receiving in turn the residual interest in the trust (referred to as a “self-deposited inverse floater”). The inverse floater held by the Fund gives the Fund the right (a) to cause the holders of the floating rate certificates to tender their notes at par, and (b) to have the broker transfer the fixed-rate bond held by the trust to the Fund, thereby collapsing the trust. An investment in an externally-deposited inverse floater is identified in the Portfolio of Investments as “(IF) – Inverse floating rate investment.” An investment in a self-deposited inverse floater is accounted for as a financing transaction in accordance with Statement of Financial Accounting Standards No. 140 (SFAS No. 140) “Accounting for Transfers and Servicing of Financial Assets and Extinguishment of Liabilities.” In such instances, a fixed-rate bond deposited into a special purpose trust is identified in the Portfolio of Investments as “(UB) – Underlying bond of an inverse floating rate trust,” with the Fund accounting for the short-term floating rate certificates issued by the trust as “Floating rate obligations” on the Statement of Assets and Liabilities. In addition, the Fund reflects in “Investment Income” the entire earnings of the underlying bond and the related interest paid to the holders of the short-term floating rate certificates is recognized as “Interest expense on floating rate obligations” on the Statement of Operations. Although the Fund is authorized to invest in such securities, and may do so in the future, it did not make any such investments during the fiscal year ended July 31, 2009.
Municipal Money Market Funds
The Fund is authorized to invest in municipal money market funds that pay interest income exempt from regular federal, and in some cases state and local, income taxes. The Fund indirectly bears its proportionate share of the money market fund’s fees and expenses. Nuveen Asset Management (the “Adviser”), a wholly owned subsidiary of Nuveen Investments, Inc. (“Nuveen”) does, however, reimburse the Fund for the 12b-1 fees it indirectly incurs from its investments in money market funds. During the fiscal year ended July 31, 2009, the Adviser reimbursed the Fund $5,184 for such indirectly incurred 12b-1 fees.
Zero Coupon Securities
The Fund is authorized to invest in zero coupon securities. A zero coupon security does not pay a regular interest coupon to its holders during the life of the security. Tax-exempt income to the holder of the security comes from accretion of the difference between the original purchase price of the security at issuance and the par value of the security at maturity and is effectively paid at maturity. Such securities are included in the Portfolio of Investments with a 0.000% coupon rate in their description. The market prices of zero coupon securities generally are more volatile than the market prices of securities that pay interest periodically.
Indemnifications
Under the Trust’s organizational documents, its Officers and Trustees are indemnified against certain liabilities arising out of the performance of their duties to the Trust. In addition, in the normal course of business, the Trust enters into contracts that provide general indemnifications to other parties. The Trust’s maximum exposure under these arrangements is unknown as this would involve future claims that may be made against the Trust that have not yet occurred. However, the Trust has not had prior claims or losses pursuant to these contracts and expects the risk of loss to be remote.
Use of Estimates
The preparation of financial statements in conformity with accounting principles generally accepted in the United States requires management to make estimates and assumptions that affect the reported amounts of assets and liabilities at the date of the financial statements and the reported amounts of increases and decreases in net assets from operations during the reporting period. Actual results may differ from those estimates.
2. Fair Value Measurements
During the current fiscal period, the Fund adopted the provisions of Statement of Financial Accounting Standards No. 157 (SFAS No. 157) “Fair Value Measurements.” SFAS No. 157 defines fair value, establishes a framework for measuring fair value in generally
accepted accounting principles and expands disclosure about fair value measurements. In determining the value of the Fund’s investments various inputs are used. These inputs are summarized in the three broad levels listed below:
| | |
| Level 1 – | | Quoted prices in active markets for identical securities. |
| Level 2 – | | Other significant observable inputs (including quoted prices for similar securities, interest rates, prepayment speeds, credit risk, etc.). |
| Level 3 – | | Significant unobservable inputs (including management’s assumptions in determining the fair value of investments). |
The inputs or methodology used for valuing securities are not an indication of the risk associated with investing in those securities.
The following is a summary of the Fund’s fair value measurements as of July 31, 2009:
| | | | | | | | | | | | |
| | | Level 1 | | Level 2 | | Level 3 | | Total |
Investments: | | | | | | | | | | | | |
Municipal Bonds | | $ | — | | $ | 90,245,771 | | $ | — | | $ | 90,245,771 |
Short-Term Investments | | | 2,267,059 | | | — | | | — | | | 2,267,059 |
Total | | $ | 2,267,059 | | $ | 90,245,771 | | $ | — | | $ | 92,512,830 |
3. Derivative Instruments and Hedging Activities
During the current fiscal period, the Fund adopted the provisions of Statement of Financial Accounting Standards No. 161 (SFAS No. 161) “Disclosures about Derivative Instruments and Hedging Activities.” This standard is intended to enhance financial statement disclosures for derivative instruments and hedging activities and enable investors to better understand: a) how and why a fund uses derivative instruments; b) how derivative instruments are accounted for; and c) how derivative instruments affect the fund’s financial position, results of operations and cash flows, if any. The Fund records derivative instruments at fair value with changes in fair value recognized on the Statement of Operations, when applicable. Even though the Fund’s investments in derivatives may represent economic hedges, they are considered to be non-hedge transactions for SFAS No. 161 disclosure purposes. The Fund did not invest in derivative instruments during the fiscal year ended July 31, 2009.
4. Fund Shares
Transactions in Fund shares were as follows:
| | | | | | | | | | | | | | |
| | | Year Ended
7/31/09 | | | Year Ended
7/31/08 | |
| | | Shares | | | Amount | | | Shares | | | Amount | |
Shares sold | | 7,144,742 | | | $ | 68,531,320 | | | 4,795,526 | | | $ | 47,631,290 | |
Shares issued to shareholders due to reinvestment of distributions | | 24,664 | | | | 238,828 | | | — | | | | — | |
Shares redeemed | | (2,761,241 | ) | | | (26,471,891 | ) | | (334,226 | ) | | | (3,326,839 | ) |
Net increase (decrease) | | 4,408,165 | | | $ | 42,298,257 | | | 4,461,300 | | | $ | 44,304,451 | |
5. Investment Transactions
Purchases and sales (including maturities but excluding short-term investments) during the fiscal year ended July 31, 2009, aggregated $65,177,699 and $15,462,868, respectively.
6. Income Tax Information
The following information is presented on an income tax basis. Differences between amounts for financial statement and federal income tax purposes are primarily due to timing differences in recognizing taxable market discount and timing differences in recognizing certain gains and losses on investment transactions. To the extent that differences arise that are permanent in nature, such amounts are reclassified within the capital accounts on the Statement of Assets and Liabilities presented in the annual report, based on their federal tax basis treatment; temporary differences do not require reclassification. Temporary and permanent differences do not impact the net asset value of the Fund.
At July 31, 2009, the cost of investments was $91,263,444.
Gross unrealized appreciation and gross unrealized depreciation of investments at July 31, 2009, were as follows:
| | | | |
Gross unrealized: | | | | |
Appreciation | | $ | 2,489,883 | |
Depreciation | | | (1,240,497 | ) |
Net unrealized appreciation (depreciation) of investments | | $ | 1,249,386 | |
Notes to Financial Statements (continued)
The tax components of undistributed net tax-exempt income, net ordinary income and net long-term capital gains at July 31, 2009, the Fund’s tax year end, were as follows:
| | | |
Undistributed net tax-exempt income* | | $ | 294,520 |
Undistributed net ordinary income | | | 4,238 |
Undistributed net long-term capital gains | | | — |
| * | Undistributed net tax-exempt income (on a tax basis) has not been reduced for the dividend declared on July 10, 2009, paid on August 3, 2009. |
The tax character of distributions paid during the Fund’s tax years ended July 31, 2009 and July 31, 2008, was designated for purposes of the dividends paid deduction as follows:
| | | |
| 2009 | | |
Distributions from net tax-exempt income** | | $ | 3,461,121 |
Distributions from net ordinary income | | | — |
Distributions from net long-term capital gains | | | — |
| | | |
| 2008 | | |
Distributions from net tax-exempt income | | $ | 663,993 |
Distributions from net ordinary income | | | — |
Distributions from net long-term capital gains | | | — |
| ** | The Fund hereby designates these amounts paid during the fiscal year ended July 31, 2009, as Exempt Interest Dividends. |
At July 31, 2009, the Fund’s tax year end, the Fund had unused capital loss carryforwards available for federal income tax purposes to be applied against future capital gains, if any. If not applied, the carryforwards will expire as follows:
| | | |
Expiration: | | | |
July 31, 2016 | | $ | 10,794 |
July 31, 2017 | | | 219,876 |
Total | | $ | 230,670 |
The Fund has elected to defer net realized losses from investments incurred from November 1, 2008 through July 31, 2009, the Fund’s tax year end, (“post-October losses”) in accordance with federal income tax regulations. Post-October capital losses of $710,707 are treated as having arisen on the first day of the following fiscal year.
7. Management Fee and Other Transactions with Affiliates
The Adviser does not charge any investment advisory or administrative fees directly to the Fund. The Adviser has agreed irrevocably during the existence of the Fund to waive all fees and pay or reimburse all expenses of the Fund (excluding interest expense, taxes, fees incurred in acquiring and disposing of portfolio securities, and extraordinary expenses). The Adviser is compensated for its services to the Fund from the fee charged at the separately managed account level.
At July 31, 2009, Nuveen owned 10,000 shares of the Fund.
8. New Accounting Pronouncements
Financial Accounting Standards Board Statement of Financial Accounting Standards No. 166 (SFAS No. 166)
During June 2009, the Financial Accounting Standards Board issued SFAS No. 166, “Accounting for Transfers of Financial Assets – an amendment of SFAS No. 140.” The objective of SFAS No. 166 is to improve the relevance, representational faithfulness, and comparability of the information that a reporting entity provides in its financial statements about a transfer of financial assets; the effects of a transfer on its financial position, financial performance, and cash flows; and a transferor’s continuing involvement, if any, in transferred financial assets.
SFAS No. 166 is effective as of the beginning of each reporting entity’s first annual reporting period that begins after November 15, 2009, for interim periods within that first annual reporting period and for interim and annual reporting periods thereafter. Earlier application is prohibited. The recognition and measurement provisions of SFAS No. 166 must be applied to transfers occurring on or after the effective date. Additionally, the disclosure provisions of SFAS No. 166 should be applied to transfers that occurred both before and after the effective date of SFAS No. 166. At this time, management is evaluating the implications of SFAS No. 166 and the impact it will have on the financial statement amounts and disclosures, if any.
9. Subsequent Events
Distributions to Shareholders
The Fund declared dividend distributions from its tax-exempt net investment income of $.0349 which were paid on September 1, 2009, to shareholders of record on August 28, 2009.
Financial Accounting Standards Board Statement of Financial Accounting Standards No. 165 (SFAS No. 165)
In May 2009, the Financial Accounting Standards Board issued SFAS No. 165 “Subsequent Events.” SFAS No. 165 requires an entity to recognize in the financial statements the effects of all subsequent events that provide additional evidence about conditions that existed at the date of the balance sheet. SFAS No. 165 is intended to establish general standards of accounting and for disclosure of events that occur after the balance sheet date but before financial statements are issued or are available to be issued. SFAS No. 165 requires the disclosure of the date through which an entity has evaluated subsequent events and the basis for that date – that is, whether that date represents the date the financial statements were issued or were available to be issued. SFAS No. 165 is effective for interim and annual periods ending after June 15, 2009. The Fund has performed an evaluation of subsequent events through September 25, 2009, which is the date the financial statements were issued.
Financial Highlights
Financial Highlights
| | | | | | | | | | | | | | | | | | | | | | | | | | | | | | |
| Selected data for a share outstanding throughout each period: | |
| | | | |
| | | | | Investment Operations | | Less Distributions | | | | |
| | | | | | | | | | | | | | | | | | | |
Year Ended
July 31, | | Beginning
Net
Asset
Value | | Net
Invest-
ment
Income(a) | | Net
Realized/
Unrealized
Gain
(Loss) | | | Total | | Net
Invest-
ment
Income | | | Capital
Gains | | Total | | | Ending
Net
Asset
Value | | Total
Return(b) | |
2009 | | $ | 9.78 | | $ | .49 | | $ | .01 | | | $ | .50 | | $ | (.48 | ) | | $ | — | | $ | (.48 | ) | | $ | 9.80 | | 5.35 | % |
2008 | | | 10.12 | | | .49 | | | (.37 | ) | | | .12 | | | (.46 | ) | | | — | | | (.46 | ) | | | 9.78 | | 1.17 | |
2007(d) | | | 10.00 | | | .07 | | | .05 | | | | .12 | | | — | | | | — | | | — | | | | 10.12 | | 1.20 | |
| | | | | | | | | | | | | | | | |
| | | | | | | | | | | | | | | | |
|
| Ratios/Supplemental Data | |
| | | Ratios to Average
Net Assets Before
Reimbursement | | | Ratios to Average
Net Assets After
Reimbursement(c) | | | | |
Ending
Net
Assets
(000) | | Expenses | | | Net
Invest-
ment
Income | | | Expenses | | | Net
Invest-
ment
Income | | | Portfolio
Turnover
Rate | |
| $ | 92,354 | | .25 | % | | 4.87 | % | | — | % | | 5.12 | % | | 23 | % |
| | 49,024 | | .44 | | | 3.97 | | | — | | | 4.41 | | | 55 | |
| | 5,569 | | 1.26 | * | | 2.67 | * | | — | * | | 3.92 | * | | 7 | |
| (a) | Per share Net Investment Income is calculated using the average daily shares method. |
| (b) | Total return is the combination of changes in net asset value, reinvested dividend income at net asset value and reinvested capital gains distributions at net asset value, if any. Total returns are not annualized. |
| (c) | After expense reimbursement from the Adviser. |
| (d) | For the period May 31, 2007 (commencement of operations) through July 31, 2007. |
See accompanying notes to financial statements.
Annual Investment Management Agreement Approval Process
The Investment Company Act of 1940, as amended (the “1940 Act”), provides, in substance, that each investment advisory agreement between a fund and its investment adviser will continue in effect from year to year only if its continuance is approved at least annually by the fund’s board members, including by a vote of a majority of the board members who are not parties to the advisory agreement or “interested persons” of any parties (the “Independent Board Members”), cast in person at a meeting called for the purpose of considering such approval. In connection with such approvals, the fund’s board members must request and evaluate, and the investment adviser is required to furnish, such information as may be reasonably necessary to evaluate the terms of the advisory agreement. Accordingly, at a meeting held on May 27-29, 2009 (the “May Meeting”), the Board of Trustees (the “Board,” and each Trustee, a “Board Member”) of the Fund, including a majority of the Independent Board Members, considered and approved the continuation of the advisory agreement (the “Advisory Agreement”) between the Fund and Nuveen Asset Management (“NAM”) for an additional one-year period. In preparation for their considerations at the May Meeting, the Board also held a separate meeting on April 21-22, 2009 (the “April Meeting”). Accordingly, the factors considered and determinations made regarding the renewals by the Independent Board Members include those made at the April Meeting.
In addition, in evaluating the Advisory Agreement, the Independent Board Members reviewed a broad range of information relating to the Fund and NAM, including absolute Fund performance and performance information of recognized benchmarks, fee and expense information for the Fund, the profitability of Nuveen for its advisory activities (which includes its wholly owned subsidiaries other than Winslow Capital Management, Inc. (“Winslow Capital”), which was recently acquired in December 2008), and other information regarding the organization, personnel, and services provided by NAM. The Independent Board Members also met quarterly as well as at other times as the need arose during the year and took into account the information provided at such meetings and the knowledge gained therefrom. Prior to approving the renewal of the Advisory Agreement, the Independent Board Members reviewed the foregoing information with their independent legal counsel and with management, reviewed materials from independent legal counsel describing applicable law and their duties in reviewing advisory contracts, and met with independent legal counsel in private sessions without management present. The Independent Board Members considered the legal advice provided by independent legal counsel and relied upon their knowledge of NAM, its services and the Fund resulting from their meetings and other interactions throughout the year and their own business judgment in determining the factors to be considered in evaluating the Advisory Agreement. Each Board Member may have accorded different weight to the various factors in reaching his or her conclusions with respect to the Fund’s Advisory Agreement. The Independent Board Members did not identify any single factor as all-important or controlling. The Independent Board Members’ considerations were instead based on a comprehensive consideration of all the information presented. The principal factors considered by the Board and its conclusions are described below.
A. Nature, Extent and Quality of Services
In considering renewal of the Advisory Agreement, the Independent Board Members considered the nature, extent and quality of NAM’s services, including advisory services and administrative services. The Independent Board Members reviewed materials outlining, among other things, NAM’s organization and business; the types of services that NAM or its affiliates provide and are expected to provide to the Fund; the performance record of the Fund (as described in further detail below); and any initiatives Nuveen had taken for the applicable fund product line.
In reviewing the services provided and the initiatives undertaken during the past year, the Independent Board Members recognized the severe market turmoil experienced in the capital markets during recent periods, including sustained periods of high volatility, credit disruption and government intervention. The Independent Board Members considered NAM’s efforts, expertise and other actions taken to address matters as they arose that impacted the Fund. The Independent Board Members recognized the role of the Investment Services group which, among other things, monitors the various positions throughout the Nuveen fund complex to identify and address any systematic risks. In addition, the Capital Markets Committee of NAM provides a multi-departmental venue for developing new policies to mitigate any risks. The Independent Board Members further recognized NAM’s continuous review of the Nuveen funds’ investment strategies and mandates in seeking to continue to refine and improve the investment process for the funds, particularly in light of market conditions. In this regard, the Independent Board Members noted the changes recommended by NAM to various investment mandates for the Nuveen funds in seeking to take advantage of market opportunities and to improve the tools available for managing liquidity and market exposure; the establishment of a team responsible for coordinating the handling of large trades in or out of the Nuveen funds; and the ongoing monitoring of investment management processes.
As part of their review, the Independent Board Members also evaluated the background, experience and track record of NAM’s investment personnel. In this regard, the Independent Board Members considered any changes in the personnel, and the impact on the level of services provided to the Fund, if any. The Independent Board Members also reviewed information regarding portfolio manager compensation arrangements to evaluate NAM’s ability to attract and retain high quality investment personnel, preserve stability, and reward performance but not provide an incentive for taking undue risks.
In addition to advisory services, the Independent Board Members considered the quality of administrative services provided by NAM and its affiliates including product management, fund administration, oversight of service providers, shareholder services, administration of Board relations, regulatory and portfolio compliance and legal support. The Board Members noted, however, that the Fund is offered via separately managed accounts and may require less shareholder services than a typical open-end fund. Given the importance of compliance, the Independent Board Members considered NAM’s compliance program, including the report of the chief compliance officer regarding the Fund’s compliance policies and procedures.
Based on their review, the Independent Board Members found that, overall, the nature, extent and quality of services provided (and expected to be provided) to the Fund under the Advisory Agreement were satisfactory.
B. The Investment Performance of the Fund and NAM
The Board considered the investment performance of the Fund, including the Fund’s historic performance as well as the performance of recognized benchmarks. Given its unique structure, the Fund does not have a comparable peer group. The Independent Board Members reviewed performance information including the Fund’s total return information and performance information for recognized benchmarks for the one-year period ending December 31, 2008. This information supplemented the Fund performance information provided to the Board at each of its quarterly meetings. The Independent Board Members further considered the performance of the Fund in the context of the volatile market conditions during the past year, and their impact on various asset classes and the portfolio management of the Fund.
Based on their review and factoring in the severity of market turmoil in 2008, the Independent Board Members determined that the Fund’s investment performance over time had been satisfactory.
C. Fees, Expenses and Profitability
1. Fees and Expenses
The Independent Board Members recognized the unique fee structure of the Fund. The Fund does not pay NAM a management fee and all expenses are reimbursed by NAM. The Fund is sold via separately managed accounts. NAM therefore receives its advisory fees via the managed account management fee. Such fee is essentially a blended rate comprised of Fund fees pro-rated to the portion of the total product represented by the Fund and the managed account fees associated with the proportion of individual securities in the overall product. Given the different fee structure, and distribution and account support requirements, the Independent Board Members recognized that the expenses incurred by the Fund are not comparable to any comparable group of unaffiliated funds (a “Peer Group”) or other Nuveen funds. Based on their review, the Independent Board Members determined that the Fund’s fee and expense arrangement was reasonable.
2. Comparisons with the Fees of Other Clients
The Independent Board Members further reviewed information regarding the nature of services and fee rates offered by NAM to other clients, such as municipal separately managed accounts. In this regard, they recognized that the Fund is offered via separately managed accounts and therefore may not require or incur the costs of shareholder servicing to the same extent as typical open-end funds. Further, as noted, the Fund’s unique fee and expense structure generally limits the usefulness of comparisons with other funds.
3. Profitability of Nuveen
In conjunction with its review of fees, the Independent Board Members also considered the profitability of Nuveen for its advisory activities (which incorporated Nuveen’s wholly-owned affiliated sub-advisers other than Winslow Capital) and its financial condition. The Independent Board Members reviewed the revenues and expenses of Nuveen’s advisory activities for the last two years, the allocation methodology used in preparing the profitability data and an analysis of the key drivers behind the changes in revenues and expenses that impacted profitability in 2008. In addition, the Independent Board Members reviewed information regarding the financial results of Nuveen for 2008 based on its Form 8-K filed on March 31, 2009. The Independent Board Members noted this information supplemented the profitability information requested and received during the year to help keep them apprised of developments affecting profitability (such as changes in fee waivers and expense reimbursement commitments). In this regard, the Independent Board Members noted that they had also appointed an Independent Board Member as a point person to review and keep them apprised of changes to the profitability analysis and/or methodologies during the year. The Independent Board Members also considered Nuveen’s revenues for advisory activities, expenses, and profit margin compared to that of various unaffiliated management firms with similar amounts of assets under management and relatively comparable asset composition prepared by Nuveen.
In reviewing profitability, the Independent Board Members recognized the subjective nature of determining profitability which may be affected by numerous factors including the allocation of expenses. Further, the Independent Board Members recognized the difficulties in making comparisons as the profitability of other advisers generally is not publicly available and the profitability information that is available for certain advisers or management firms may not be representative of the industry and may be affected by, among other things, the adviser’s particular business mix, capital costs, types of funds managed and expense allocations. Notwithstanding the foregoing, the Independent Board Members reviewed Nuveen’s methodology and assumptions for allocating expenses across product lines to determine profitability. In reviewing profitability, the Independent Board Members recognized Nuveen’s investment in its fund business.
Based on their review, the Independent Board Members concluded that Nuveen’s level of profitability for its advisory activities was reasonable in light of the services provided.
In evaluating the reasonableness of the compensation, the Independent Board Members also considered other amounts paid to NAM by the Fund as well as any indirect benefits (such as soft dollar arrangements, if any) NAM and its affiliates receive, or are expected to receive, that are directly attributable to the management of the Fund, if any. See Section E below for additional
Annual Investment Management Agreement Approval Process (continued)
information on indirect benefits NAM may receive as a result of its relationship with the Fund. Based on their review of the overall fee arrangements of the Fund, the Independent Board Members determined that the advisory fees and expenses of the Fund were reasonable.
D. Economies of Scale and Whether Fee Levels Reflect These Economies of Scale
With respect to economies of scale, the Independent Board Members have recognized the potential benefits resulting from the costs of a fund being spread over a larger asset base, although economies of scale are difficult to measure and predict with precision, particularly on a fund-by-fund basis. One method to help ensure the shareholders share in these benefits is to include breakpoints in the advisory fee schedule. Generally, management fees for funds in the Nuveen complex are comprised of a fund-level component and a complex-level component. The Independent Board Members recognized, however, that the Fund does not have fund-level breakpoints given its unique structure. In addition, pursuant to the complex-wide fee arrangement, the fees of the funds in the Nuveen complex generally are reduced as the assets in the fund complex reach certain levels. However, because the Fund does not pay a management fee, there is no applicable fund-level or complex-wide level breakpoint schedule, although its assets will be counted toward the complex-wide total.
E. Indirect Benefits
In evaluating fees, the Independent Board Members received and considered information regarding potential “fall out” or ancillary benefits NAM or its affiliates may receive as a result of its relationship with the Fund. In this regard, the Independent Board Members noted that NAM does not currently have any soft dollar arrangements; however, to the extent certain bona fide agency transactions that occur on markets that traditionally trade on a principal basis and riskless principal transactions are considered as generating “commissions,” NAM intends to comply with the applicable safe harbor provisions.
Based on their review, the Independent Board Members concluded that any indirect benefits received by NAM as a result of its relationship with the Fund were reasonable and within acceptable parameters.
F. Other Considerations
The Independent Board Members did not identify any single factor discussed previously as all-important or controlling. The Board Members, including the Independent Board Members, unanimously concluded that the terms of the Advisory Agreement are fair and reasonable, that NAM’s fees are reasonable in light of the services provided to the Fund and that the Advisory Agreement be renewed.
Notes
Notes
Notes
Trustees and Officers
The management of the Fund, including general supervision of the duties performed for the Fund by the Adviser, is the responsibility of the Board of Trustees of the Fund. The number of trustees of the Fund is currently set at nine. None of the trustees who are not “interested” persons of the Fund (referred to herein as “independent trustees”) has ever been a director or employee of, or consultant to, Nuveen or its affiliates. The names and business addresses of the trustees and officers of the Fund, their principal occupations and other affiliations during the past five years, the number of portfolios each oversees and other directorships they hold are set forth below.
The Fund’s Statement of Additional Information (“SAI”) includes more information about the trustees. To request a free copy, call Nuveen Investments at (800) 257-8787 or visit the Funds’ website at www.nuveen.com.
| | | | | | | | |
Name, Birthdate and Address | | Position(s) Held with the Fund | | Year First Elected or Appointed (1) | | Principal Occupation(s) Including other Directorships During Past 5 Years | | Number of Portfolios in Fund Complex Overseen by Trustee |
| | |
| Independent Trustees: | | | | |
Robert P. Bremner 8/22/40 333 W. Wacker Drive Chicago, IL 60606 | | Chairman of the Board and Trustee | | 1997 | | Private Investor and Management Consultant; Treasurer and Director, Humanities Council of Washington D.C. | | 200 |
Jack B. Evans 10/22/48 333 W. Wacker Drive Chicago, IL 60606 | | Trustee | | 1999 | | President, The Hall-Perrine Foundation, a private philanthropic corporation (since 1996); Director and Vice Chairman, United Fire Group, a publicly held company; Member of the Board of Regents for the State of Iowa University System; Director, Gazette Companies; Life Trustee of Coe College; Director, Iowa College Foundation; Member of the Advisory Council of the Department of Finance in the Tippie College of Business, University of lowa; formerly, Director, Alliant Energy; formerly, Director, Federal Reserve Bank of Chicago; formerly, President and Chief Operating Officer, SCI Financial Group, Inc., a regional financial services firm. | | 200 |
William C. Hunter 3/6/48 333 W. Wacker Drive Chicago, IL 60606 | | Trustee | | 2004 | | Dean, Tippie College of Business, University of Iowa (since 2006); Director (since 2004) of Xerox Corporation; Director (since 2005), Beta Gamma Sigma International Honor Society; formerly, Dean and Distinguished Professor of Finance, School of Business at the University of Connecticut (2003-2006); previously, Senior Vice President and Director of Research at the Federal Reserve Bank of Chicago (1995-2003); Director, SS&C Technologies, Inc. (May 2005-October 2005); formerly, Director (1997-2007), Credit Research Center at George Washington University. | | 200 |
David J. Kundert 10/28/42 333 W. Wacker Drive Chicago, IL 60606 | | Trustee | | 2005 | | Director, Northwestern Mutual Wealth Management Company; retired (since 2004) as Chairman, JPMorgan Fleming Asset Management, President and CEO, Banc One Investment Advisors Corporation, and President, One Group Mutual Funds; prior thereto, Executive Vice President, Banc One Corporation and Chairman and CEO, Banc One Investment Management Group; Member, Board of Regents, Luther College; member of the Wisconsin Bar Association; member of Board of Directors, Friends of Boerner Botanical Gardens; member of Investment Committee, Greater Milwaukee Foundation. | | 200 |
William J. Schneider 9/24/44 333 W. Wacker Drive Chicago, IL 60606 | | Trustee | | 1997 | | Chairman of Miller-Valentine Partners Ltd., a real estate investment company; formerly, Senior Partner and Chief Operating Officer (retired, 2004) of Miller-Valentine Group; Member, Dayton Philharmonic Orchestra Association; formerly, Member, Business Advisory Council, Cleveland Federal Reserve Bank; formerly, Director, Dayton Development Coalition. | | 200 |
Judith M. Stockdale 12/29/47 333 W. Wacker Drive Chicago, IL 60606 | | Trustee | | 1997 | | Executive Director, Gaylord and Dorothy Donnelley Foundation (since 1994); prior thereto, Executive Director, Great Lakes Protection Fund (from 1990 to 1994). | | 200 |
Carole E. Stone 6/28/47 333 W. Wacker Drive Chicago, IL 60606 | | Trustee | | 2007 | | Director, Chicago Board Options Exchange (since 2006); Director, C2 Options Exchange, Incorporated (since 2009); Commissioner, New York State Commission on Public Authority Reform (since 2005); formerly, Chair, New York Racing Association Oversight Board (2005-2007). | | 200 |
| | | | | | | | |
Name, Birthdate and Address | | Position(s) Held with the Fund | | Year First Elected or Appointed (1) | | Principal Occupation(s) Including other Directorships During Past 5 Years | | Number of Portfolios in Fund Complex Overseen by Trustee |
Terence J. Toth 9/29/59 333 W. Wacker Drive Chicago, IL 60606 | | Trustee | | 2008 | | Director, Legal & General Investment Management America, Inc. (since 2008); Managing Partner, Musso Capital Management (since 2008); CEO and President, Northern Trust Investments (2004-2007); Executive Vice President, Quantitative Management & Securities Lending (2000-2004); prior thereto, various positions with Northern Trust Company (since 1994); Member: Goodman Theatre Board (since 2004); Chicago Fellowship Board (since 2005), University of Illinois Leadership Council Board (since 2007) and Catalyst Schools of Chicago Board (since 2008); formerly, Member: Northern Trust Mutual Funds Board (2005-2007), Northern Trust Investments Board (2004-2007), Northern Trust Japan Board (2004-2007), Northern Trust Securities Inc. Board (2003-2007) and Northern Trust Hong Kong Board (1997-2004). | | 200 |
| | |
| Interested Trustee: | | | | |
John P. Amboian (2) 6/14/61 333 W. Wacker Drive Chicago, IL 60606 | | Trustee | | 2008 | | Chief Executive Officer (since July 2007) and Director (since 1999) of Nuveen Investments, Inc.; Chief Executive Officer (since 2007) of Nuveen Asset Management, Nuveen Investments Advisors, Inc. formerly, President (1999-2004) of Nuveen Advisory Corp. and Nuveen Institutional Advisory Corp. (3) | | 200 |
Name, Birthdate and Address | | Position(s) Held with the Fund | | Year First Elected or Appointed (4) | | Principal Occupation(s) During Past 5 Years | | Number of Portfolios in Fund Complex Overseen by Officer |
| | |
| Officers of the Fund: | | | | |
Gifford R. Zimmerman 9/9/56 333 W. Wacker Drive Chicago, IL 60606 | | Chief Administrative Officer | | 1988 | | Managing Director (since 2002), Assistant Secretary and Associate General Counsel of Nuveen Investments, LLC; Managing Director (since 2002), Associate General Counsel and Assistant Secretary, of Nuveen Asset Management (since 2002) and of Symphony Asset Management LLC (since 2003); Vice President and Assistant Secretary of NWQ Investment Management Company, LLC. (since 2002), Nuveen Investments Advisers Inc. (since 2002), Tradewinds Global Investors, LLC, and Santa Barbara Asset Management, LLC (since 2006), Nuveen HydePark Group LLC and Nuveen Investment Solutions, Inc. (since 2007); Managing Director (since 2004) and Assistant Secretary (since 1994) of Nuveen Investments, Inc.; formerly, Managing Director (2002-2004), General Counsel (1998-2004) and Assistant Secretary of Nuveen Advisory Corp. and Nuveen Institutional Advisory Corp. (3); Chartered Financial Analyst. | | 200 |
Mark J.P. Anson 6/10/59 333 W. Wacker Drive Chicago, IL 60606 | | Vice President | | 2009 | | President and Executive Director of Nuveen Investments, Inc. (since 2007); President of Nuveen Investments Institutional Services Group LLC (since 2007); previously, Chief Executive Officer of the British Telecom Pension Scheme (2006-2007) and Chief Investment Officer of Calpers (1999-2006); PhD, Chartered Financial Analyst, Chartered Alternative Investment Analyst, Certified Public Accountant, Certified Management Accountant and Certified Internal Auditor. | | 200 |
Nizida Arriaga 6/1/1968 333 W. Wacker Drive Chicago, IL 60606 | | Vice President | | 2009 | | Vice President (since 2007) of Nuveen Investments, LLC; previously, Portfolio Manager, Allstate Investments, LLC (1996-2006); Chartered Financial Analyst. | | 200 |
Trustees and Officers (continued)
| | | | | | | | |
Name, Birthdate and Address | | Position(s) Held with the Fund | | Year First Elected or Appointed (4) | | Principal Occupation(s) During Past 5 Years | | Number of Portfolios in Fund Complex Overseen by Officer |
Michael T. Atkinson 2/3/66 333 W. Wacker Drive Chicago, IL 60606 | | Vice President and Assistant Secretary | | 2000 | | Vice President (since 2002) of Nuveen Investments, LLC; Vice President of Nuveen Asset Management (since 2005). | | 200 |
Margo L. Cook 4/11/64 333 W. Wacker Drive Chicago, IL 60606 | | Vice President | | 2009 | | Executive Vice President (since Oct 2008) of Nuveen Investments, Inc.; previously, Head of Institutional Asset Management (2007-2008) of Bear Stearns Asset Management; Head of Institutional Asset Mgt (1986-2007) of Bank of NY Mellon; Chartered Financial Analyst. | | 200 |
Alan A. Brown 8/1/62 333 W. Wacker Drive Chicago, IL 60606 | | Vice President | | 2007 | | Executive Vice President, Mutual Funds, Nuveen Investments, LLC, (since 2005), previously, Managing Director and Chief Marketing Officer (2001-2005). | | 75 |
Name, Birthdate and Address | | Position(s) Held with the Fund | | Year First Elected or Appointed (4) | | Principal Occupation(s) Including other Directorships During Past 5 Years | | Number of Portfolios in Fund Complex Overseen by Officer |
Lorna C. Ferguson 10/24/45 333 W. Wacker Drive Chicago, IL 60606 | | Vice President | | 1998 | | Managing Director (since 2004) of Nuveen Investments, LLC; Managing Director (since 2005) of Nuveen Asset Management; Managing Director (2004-2005) of Nuveen Advisory Corp. and Nuveen Institutional Advisory Corp. (3). | | 200 |
Stephen D. Foy 5/31/54 333 W. Wacker Drive Chicago, IL 60606 | | Vice President and Controller | | 1998 | | Vice President (since 1993) and Funds Controller (since 1998) of Nuveen Investments, LLC; Vice President (since 2005) of Nuveen Asset Management; Certified Public Accountant. | | 200 |
William T. Huffman 5/7/1969 333 W. Wacker Drive Chicago, IL 60606 | | Vice President | | 2009 | | Chief Operating Officer, Municipal Fixed Income (since 2008) of Nuveen Asset Management; previously, Chairman, President and Chief Executive Officer (2002 – 2007) of Northern Trust Global Advisors, Inc. and Chief Executive Officer (2007) of Northern Trust Global Investments Limited; CPA. | | 136 |
Walter M. Kelly 2/24/70 333 W. Wacker Drive Chicago, IL 60606 | | Chief Compliance Officer and Vice President | | 2003 | | Senior Vice President (since 2008), Vice President (2006- 2008) formerly, Assistant Vice President and Assistant General Counsel (2003-2006) of Nuveen Investments, LLC; Vice President (since 2006) and Assistant Secretary (since 2003) of Nuveen Asset Management. | | 200 |
David J. Lamb 3/22/63 333 W. Wacker Drive Chicago, IL 60606 | | Vice President | | 2000 | | Senior Vice President (since 2009), formerly, Vice President (2000-2009) of Nuveen Investments, LLC; Vice President (since 2005) of Nuveen Asset Management, Certified Public Accountant. | | 200 |
Tina M. Lazar 8/27/61 333 W. Wacker Drive Chicago, IL 60606 | | Vice President | | 2002 | | Senior Vice President (since 2009), formerly, Vice President of Nuveen Investments, LLC (1999-2009); Vice President of Nuveen Asset Management (since 2005). | | 200 |
Larry W. Martin 7/27/51 333 W. Wacker Drive Chicago, IL 60606 | | Vice President and Assistant Secretary | | 1988 | | Vice President, Assistant Secretary and Assistant General Counsel of Nuveen Investments, LLC; Vice President (since 2005) and Assistant Secretary of Nuveen Investments, Inc.; Vice President and Assistant Secretary of Nuveen Investments Advisers Inc. (since 2002), NWQ Investment Management Company, LLC (since 2002), Symphony Asset Management LLC (since 2003), Tradewinds Global Investors, LLC, Santa Barbara Asset Management, LLC (since 2006) and of Nuveen HydePark Group, LLC and Nuveen Investment Solutions, Inc. (since 2007); formerly, Vice President and Assistant Secretary of Nuveen Advisory Corp. and Nuveen Institutional Advisory Corp. (3) | | 200 |
| | | | | | | | |
Name, Birthdate and Address | | Position(s) Held with the Fund | | Year First Elected or Appointed (4) | | Principal Occupation(s) Including other Directorships During Past 5 Years | | Number of Portfolios in Fund Complex Overseen by Officer |
Kevin J. McCarthy 3/26/66 333 W. Wacker Drive Chicago, IL 60606 | | Vice President and Secretary | | 2007 | | Managing Director (since 2008), formerly, Vice President (2007-2008), Nuveen Investments, LLC; Managing Director (since 2008), formerly, Vice President and Assistant Secretary, Nuveen Asset Management and Nuveen Investments Holdings, Inc.; Vice President (since 2007) and Assistant Secretary, Nuveen Investment Advisers Inc., Nuveen Investment Institutional Services Group LLC, NWQ Investment Management Company, LLC, Tradewinds Global Investors LLC, NWQ Holdings, LLC, Symphony Asset Management LLC, Santa Barbara Asset Management LLC, Nuveen HydePark Group, LLC and Nuveen Investment Solutions, Inc. (since 2007); prior thereto, Partner, Bell, Boyd & Lloyd LLP (1997-2007). | | 200 |
John V. Miller 4/10/67 333 W. Wacker Drive Chicago, IL 60606 | | Vice President | | 2007 | | Chief Investment Officer and Managing Director (since 2007), formerly, Vice President (2002-2007) of Nuveen Asset Management and Managing Director (since 2007), formerly, Vice President (2002-2007) Nuveen Investments, LLC; Chartered Financial Analyst. | | 136 |
Gregory Mino 1/4/1971 333 W. Wacker Drive Chicago, IL 60606 | | Vice President | | 2009 | | Vice President of Nuveen Investments, LLC (since 2008); previously, Director (2004-2007) and Executive Director (2007-2008) of UBS Global Asset Management; previously, Vice President (2000-2003) and Director (2003-2004) of Merrill Lynch Investment Managers; Chartered Financial Analyst. | | 200 |
Christopher M. Rohrbacher 8/1/71 333 W. Wacker Drive Chicago, IL 60606 | | Vice President and Assistant Secretary | | 2008 | | Vice President, Nuveen Investments, LLC (since 2008); Vice President and Assistant Secretary, Nuveen Asset Management (since 2008); prior thereto, Associate, Skadden, Arps, Slate Meagher & Flom LLP (2002-2008) | | 200 |
James F. Ruane 7/3/62 333 W. Wacker Drive Chicago, IL 60606 | | Vice President and Assistant Secretary | | 2007 | | Vice President, Nuveen Investments (since 2007); prior thereto, Partner, Deloitte & Touche USA LLP (2005-2007), formerly, senior tax manager (2002-2005); Certified Public Accountant. | | 200 |
John S. White 5/12/67 333 W. Wacker Drive Chicago, IL 60606 | | Vice President | | 2007 | | Senior Vice President (since 2009), formerly, Vice President (2006-2009) of Nuveen Investments, LLC, formerly, Assistant Vice President (since 2002); Lieutenant Colonel (since 2007), United States Marine Corps Reserve, formerly, Major (since 2001). | | 75 |
Mark L. Winget 12/21/68 333 W. Wacker Drive Chicago, IL 60606 | | Vice President and Assistant Secretary | | 2008 | | Vice President, Nuveen Investments, LLC (since 2008); Vice President and Assistant Secretary, Nuveen Asset Management (since 2008); prior thereto, Counsel, VedderPrice P.C. (1997-2007). | | 200 |
| (1) | Trustees serve an indefinite term until his/her successor is elected or appointed. The year first elected or appointed represents the year in which the trustee was first elected or appointed to any fund in the Nuveen Fund Complex. |
| (2) | Mr. Amboian is an interested trustee because of his position with Nuveen Investments, Inc. and certain of its subsidiaries, which are affiliates of the Nuveen Funds. |
| (3) | Nuveen Advisory Corp. and Nuveen Institutional Advisory Corp. were reorganized into Nuveen Asset Management, effective January 1, 2005. |
| (4) | Officers serve one year terms through July of each year. The year first elected or appointed represents the year in which the officer was first elected or appointed to any fund in the Nuveen Fund Complex. |
Glossary of Terms Used in this Report
Average Annual Total Return: This is a commonly used method to express an investment’s performance over a particular, usually multi-year time period. It expresses the return that would have been necessary each year to equal the investment’s actual cumulative performance (including change in NAV or offer price and reinvested dividends and capital gains distributions, if any) over the time period being considered.
Average Effective Maturity: The average of the number of years to maturity of the bonds in a Fund’s portfolio, computed by weighting each bond’s time to maturity (the date the security comes due) by the market value of the security. This figure does not account for the likelihood of prepayments or the exercise of call provisions unless an escrow account has been established to redeem the bond before maturity.
Average Duration: Duration is a measure of the expected period over which a bond’s principal and interest will be paid, and consequently is a measure of the sensitivity of a bond’s (or bond fund’s) value to changes when market interest rates change. Generally, the longer a bond or Fund’s duration, the more the price of the bond or Fund will change as interest rates change.
Dividend Yield (also known as Market Yield or Current Yield): An investment’s current annualized dividend divided by its current offering price.
Net Asset Value (NAV): A Fund’s NAV is the dollar value of one share in the Fund. It is calculated by subtracting the liabilities of the Fund from its total assets and then dividing the remainder by the number of shares outstanding. Fund NAVs are calculated at the end of each business day.
Pre-Refunding: Pre-refunding, also known as advance refunding or refinancing, occurs when an issuer sells new bonds and uses the proceeds to fund principal and interest payments of older, existing bonds. This process often results in lower borrowing costs for bond issuers.
SEC 30-Day Yield: A standardized measure of a Fund’s yield that accounts for the future amortization of premiums or discounts of bonds held in the Fund’s portfolio.
Taxable-Equivalent Yield: The yield necessary from a fully taxable investment to equal, on an after-tax basis at a specified assumed tax rate, the yield of a municipal bond investment.
Zero Coupon Bond: A zero coupon bond does not pay a regular interest coupon to its holders during the life of the bond. Tax-exempt income to the holder of the bond comes from accretion of the difference between the original purchase price of the bond at issuance and the par value of the bond at maturity and is effectively paid at maturity. The market prices of zero coupon bonds generally are more volatile than the market prices of bonds that pay interest periodically.
Fund Information
Fund Manager
Nuveen Asset Management
333 West Wacker Drive
Chicago, IL 60606
Legal Counsel
Chapman and Cutler LLP
Chicago, IL
Independent Registered Public Accounting Firm
PricewaterhouseCoopers LLP
Chicago, IL
Custodian
State Street Bank & Trust Company
Boston, MA
Transfer Agent and Shareholder Services
Boston Financial
Data Services, Inc.
Nuveen Investor Services
P.O. Box 8530
Boston, MA 02266-8530
(800) 257-8787
Quarterly Portfolio of Investments and Proxy Voting Information: You may obtain (i) the Fund’s quarterly portfolio of investments, (ii) information regarding how the Fund voted proxies relating to portfolio securities held during the most recent twelve-month period ended June 30, 2009, and (iii) a description of the policies and procedures that the Fund used to determine how to vote proxies relating to portfolio securities without charge, upon request, by calling Nuveen Investments at (800) 257-8787 or on Nuveen’s website at www.nuveen.com.
You may also obtain this and other Fund information directly from the Securities and Exchange Commission (“SEC”). The SEC may charge a copying fee for this information. Visit the SEC on-line at http://www.sec.gov or in person at the SEC’s Public Reference Room in Washington, D.C. Call the SEC at (202) 942-8090 for room hours and operation. You may also request Fund information by sending an e-mail request to publicinfo@sec.gov or by writing to the SEC’s Public Reference Section at 100 F Street NE, Washington, D.C. 20549.
The Financial Industry Regulatory Authority (FINRA) provides a Public Disclosure Program which supplies certain information regarding the disciplinary history of FINRA members and their associated persons in response to either telephone inquiries at (800) 289-9999 or written inquiries at www.finra.org. Financial Industry Regulatory Authority also provides an investor brochure that includes information describing the Public Disclosure Program.
Nuveen Investments:
Serving Investors For Generations
Since 1898, financial advisors and their clients have relied on Nuveen Investments to provide dependable investment solutions. Over this time, Nuveen Investments has adhered to the belief that the best approach to investing is to apply conservative risk-management principles to help minimize volatility.
Building on this tradition, we today offer a range of high quality equity and fixed-income solutions that can be integral parts of a well-diversified core portfolio. Our clients have come to appreciate this diversity, as well as our continued adherence to proven, long-term investing principles.
We offer many different investing solutions
for our clients’ different needs.
Nuveen Investments is a global investment management firm that seeks to help secure the long-term goals of institutions and high net worth investors as well as the consultants and financial advisors who serve them. Nuveen Investments markets its growing range of specialized investment solutions under the high-quality brands of HydePark, NWQ, Nuveen, Santa Barbara, Symphony, Tradewinds and Winslow Capital. In total, the Company managed $128 billion of assets on June 30, 2009.
Find out how we can help you reach your financial goals.
An investor should carefully consider the Fund’s objectives, risks, charges and expenses before investing. For a prospectus containing this and other information about the Fund, please contact your financial advisor or Nuveen Investments at (800) 257-8787. Read the prospectus carefully before you invest or send money.
Learn more about Nuveen Funds at www.nuveen.com/mf
| | |
Distributed by Nuveen Investments, LLC 333 West Wacker Drive Chicago, IL 60606 www.nuveen.com | | |
MAN-MAPS-0709P

Mutual Funds
Nuveen Managed Accounts Portfolios Trust
For investors seeking attractive monthly income potential.
Annual Report
July 31, 2009
| | | | | | | | | | | | | | | | |
International Income
Managed Accounts
Portfolio | | | | Enhanced Multi-Strategy Income Managed Accounts
Portfolio | | | | | | | | | | | | |
LIFE IS COMPLEX.
Nuveen makes things e-simple.
It only takes a minute to sign up for e-Reports. Once enrolled, you’ll receive an e-mail as soon as your Nuveen Investments Fund information is ready. No more waiting for delivery by regular mail. Just click on the link within the e-mail to see the report and save it on your computer if you wish.
Free e-Reports right to your e-mail!
www.investordelivery.com
If you receive your Nuveen Fund dividends and statements from your financial advisor or brokerage account.
OR
www.nuveen.com/accountaccess
If you receive your Nuveen Fund dividends and statements directly from Nuveen.
| | | | | | |
| Must be preceded by or accompanied by a prospectus. | | NOT FDIC INSURED | | MAY LOSE VALUE | | NO BANK GUARANTEE |
Chairman’s
Letter to Shareholders

Dear Shareholder,
The financial markets in which your Funds operate continue to reflect the larger economic crosscurrents. The illiquidity that infected global credit markets over the last year appears to be slowly but steadily receding. The major institutions that are the linchpin of the international financial system are strengthening their capital structures, but many still struggle with losses in their various portfolios. There are encouraging signs of recovery in European and Asian economies, while the U.S. economy continues to feel the impact of job losses and an over-borrowed consumer. Global trends include modestly increasing trade and increased concern about the ability of the U.S. government to address its substantial budgetary deficits. Identifying those developments that will define the future is never easy, but rarely is it more difficult than at present.
After considerable volatility in the first few months of 2009, both the fixed-income and equity markets have seen a partial recovery. A fundamental component of a successful long-term investment program is a commitment to remain invested during market downturns in order to share in the rewards of the inevitable recovery. Another component is to re-evaluate investment disciplines and tactics and to confirm their validity following periods of extreme volatility and market dislocation, such as we have recently experienced. Your Board carried out an intensive review of investment performance with these objectives in mind during April and May of this year as part of the annual management contract renewal process. I encourage you to read the description of this process in the Annual Investment Management Agreement Approval Process section of this report.
Remaining invested through market downturns and reconfirming the appropriateness of a long term investment strategy is as important for our shareholders as it is for professional investment managers. For that reason, I again encourage you to remain in communication with your financial consultant on these subjects. For recent developments on all your Nuveen Funds, please visit the Nuveen web site: www.nuveen.com.
On behalf of the other members of your Fund’s Board, we look forward to continuing to earn your trust in the months and years ahead.
Sincerely,

Robert P. Bremner
Chairman of the Board
September 21, 2009
Portfolio Manager’s Comments
Certain statements in this report are forward-looking statements. Discussions of specific investments are for illustration only and are not Intended as recommendations of individual investments. The forward looking statements and other views expressed herein are those of the portfolio manager as of the date of this report. Actual future results or occurrences may differ significantly from those anticipated in any forward-looking statements and the views expressed herein are subject to change at any time, due to numerous market and other factors. The Funds disclaim any obligation to update publicly or revise any forward-looking statements or views expressed herein.
The International Income Managed Accounts Portfolio and the Enhanced Multi-Strategy Income Managed Accounts Portfolio are managed by Nuveen Asset Management, an affiliate of Nuveen Investments, Inc. Andy Stenwall, Chief Investment Officer and Co-Director of Taxable Fixed-Income of Nuveen Asset Management, serves as manager for both Portfolios. Here Andy, who has more than 20 years of industry experience, discusses the general market environment, investment strategies and the performance of the Portfolios for the twelve-month period ended July 31, 2009.
What were the general market conditions during the reporting period?
This period was among the most volatile in the history of the capital markets. Equity markets across the globe fell sharply in the fall of 2008 as the United States economy pushed further into recession. After IndyMac’s bankruptcy filing in August 2008, the U.S. government engaged in one of the most dramatic market interventions in years and placed both the Federal National Mortgage Association (FannieMae) and the Federal Home Loan Mortgage Corporation (FreddieMac) into receivership. In September 2008, Lehman Brothers, a major Wall Street broker/dealer, filed for bankruptcy protection. AIG, one of the world’s largest insurers, effectively was nationalized by the U.S. government, and Wachovia, Washington Mutual and other financial institutions were seized by U.S. regulators and/or merged into stronger banks. Merrill Lynch, concerned about its own solvency, negotiated a deal to be acquired by Bank of America. Goldman Sachs and Morgan Stanley converted to commercial banks, possibly signaling the end of the independent broker/dealer model. Compounding the situation was the subsequent collapse of values for structured financial products, which included auction rate securities, collateralized loan obligations (CLOs), collateralized debt obligations (CDOs) and other structured products. The following months included major financial write-downs in many areas of the U.S. economy, the uncovering of the largest Ponzi scheme in history, continued declines in real U.S. Gross Domestic Product, and significant spikes in market volatility.
As the U.S. economy moved further into recession, the international capital markets experienced their own severe downturn. Unemployment rose quickly. Economic policy responses by the U.S. Federal Reserve were followed, in part, by its counterparts at the Bank of England, the European Central Bank, and the Chinese government.
Although the S&P 500 and the MSCI EAFE indices were down 37% and 43%, respectively, in 2008, signs of global economic stability began to emerge toward the end of the first quarter in 2009. By the end of July, the 2009 year-to-date returns of these two equity indices were a positive 10.97% and 18.3%, respectively. In addition, emerging markets, which fell 53% in 2008, rebounded 51.3% in the first seven months of 2009.
In an effort to improve overall conditions, the Federal Reserve (Fed) lowered the fed funds rate from 2.00% on August 1, 2008, to a target range of zero to 0.25% in December 2008, its lowest level on record. In March 2009, the Fed announced that, in addition to maintaining the current target rate, it would buy $300 billion in long-term U.S. Treasury securities in an effort to support private credit markets and up to an additional $750 billion (for a total of $1.25 trillion) in U.S. agency mortgage-backed securities to bolster the housing market. Additionally, the U.S. government passed a $700 billion financial industry rescue package in October 2008, which was followed by a $787 billion stimulus package in February 2009.
By the end of the second quarter of 2009, some positive economic signals were beginning to emerge. Many major banks appeared to have raised the necessary capital for them to survive in the current downturn, with several of them even appearing to thrive. Domestic equity markets, as measured by the S&P 500 Index, had rocketed up from the lows experienced in March. Ten-year bond yields had come off their multi-decade lows as well.
How did the Portfolios perform during the twelve-month period ended July 31, 2009?
The table on page five provides performance information for both Portfolios for the twelve-month period ended July 31, 2009. The table also compares each Portfolio’s performance to appropriate benchmarks. A more detailed account of each Portfolio’s relative performance is provided later in this report.
What are the Portfolios’ investment strategies and how were they applied during the twelve-month period ended July 31, 2009? How did these strategies influence performance?
International Income Managed Accounts Portfolio
The International Income Managed Accounts Portfolio had positive returns, but underperformed the Citigroup World Government Bond ex-U.S. (Hedged) Index for the twelve-month period ended July 31, 2009. During the reporting period, we continued to look to invest in countries with high real yields and countries where we could take advantage of the changing shape of their fixed-income yield curves.
For the reporting period, the Portfolio was negatively impacted by our relatively greater exposure to more credit sensitive segments of the international fixed-income market. In particular, the Portfolio was negatively impacted by our fairly sizable exposure to Greek bonds. Although Greece is part of the European Union, it has a relatively weak credit rating. As higher rated securities began to outperform lower rated securities, the Portfolio’s performance was adversely affected.
Also negatively impacting performance was our exposure in some lower quality emerging markets. When a global financial crisis occurs, interest rates in emerging markets often have a tendency to spike more than in more developed, higher rated countries. This results in a comparatively larger price decline in emerging market securities, which negatively impacted Portfolio performance.
Despite these events, we were comfortable with the composition of the Portfolio. We believe the Portfolio is well positioned to take advantage of developing situations within countries which have high real rates and steep yield curves.
Enhanced Multi-Strategy Income Managed Accounts Portfolio
The Enhanced Multi-Strategy Income Managed Accounts Portfolio outperformed the Barclays Capital Indexes for the twelve-month period ended July, 31, 2009.
During the reporting period, we continued to emphasize risk avoidance and caution due to the effects of the credit crisis and the pressure it put on liquidity and pricing of many debt issues. Our relative overweight to mortgaged-backed securities when compared with agency debt positively impacted the Portfolio’s performance. While these securities experienced increased volatility, we believed their very attractive pricing made them worth the risk.
The Portfolio also benefited from our currency hedge position. We were able to diversify away from U.S. interest rate exposure, as rates here were cut throughout the reporting period. We were able to invest in United Kingdom, Europe, New Zealand and Australia, which were all raising rates. We also were able to take advantage of the second quarter 2009 rally, which positively contributed to the Portfolio’s performance.
Also contributing positively was our relative underweight in investment grade corporate bonds. These bonds dramatically underperformed over the period, especially the first half of the period. Our underweight in this area helped offset losses in the high yield bonds early in the period. As the prices for high yield bonds recovered, this position also positively contributed to performance.
Our positions in asset-backed securities (ABS) negatively impacted returns during the first six-months, but aided the Portfolio’s performance during the second half of the reporting period. We continued to focus on holding auto and credit card asset-backed securities. Auto loans are the second largest subsector in the ABS market, and securities backed by credit card receivables have been a benchmark for the ABS market since they were first introduced in 1987.
When investing in non-U.S. dollar instruments, we may elect to hedge our currency exposure through the use of forward contracts, futures, options, or interest rate and total return swaps. In addition, we may use a variety of investment techniques to seek to hedge or help protect against declines in portfolio value due to its exposure to market and interest rate movements. These techniques may include the use of derivative instruments, such as interest rate swap transactions, futures, options on futures and non-U.S. exchange transactions on a cash or forward basis, and credit default swaps.
| 1 | The Citigroup World Government Bond ex-U.S. (Hedged) Index is a market capitalization weighted index consisting of the government bond markets of the following countries: Australia, Austria, Belgium, Canada, Denmark, Finland, France, Germany, Ireland, Italy, Japan, the Netherlands, Portugal, Spain, Sweden, Switzerland, and the United Kingdom. Country eligibility is determined based on market capitalization and investability criteria. All issues have a remaining maturity of at least one year. The since inception data for the index was calculated as of 12/31/07, as index returns are calculated on a calendar-month basis. The index returns assume reinvestment of dividends and do not reflect any applicable sales charges. You cannot invest directly in an index. |
| 2 | The Barclays Capital Credit/Mortgage Index is a market-weighted blend of the Barclays Capital U.S. Credit Index and the Barclays Capital MBS Index. The since inception data for the index was calculated as of 12/31/07, as index returns are calculated on a calendar-month basis. The index returns assume reinvestment of dividends and do not reflect any applicable sales charges. You cannot invest directly in an index. |
| 3 | The Barclays Capital U.S. Aggregate Bond Index is a market capitalization-weighted measure of U.S.-traded investment grade bonds, including U.S. Treasury securities, government agency bonds, mortgage-backed bonds, corporate bonds and a small amount of foreign bonds traded in the U.S. Municipal bonds and Treasury Inflation-Protected Securities are excluded. The since inception data for the index was calculated as of 12/31/07, as index returns are calculated on a calendar-month basis. The index returns assume reinvestment of dividends and do not reflect any applicable sales charge. You cannot invest directly in an index. |
Average Annual Total Returns
As of 7/31/09
| | | | |
| | | 1-Year | | Since
Inception
(12/27/07) |
International Income Managed Accounts Portfolio | | 5.40% | | 3.48% |
Citigroup World Government Bond ex-U.S. (Hedged) Index1 | | 7.93% | | 5.65% |
| | |
Enhanced Multi-Strategy Income Managed Accounts Portfolio | | 20.12% | | 12.70% |
Barclays Capital Credit/Mortgage Index2 | | 5.11% | | 3.67% |
| | |
Barclays Capital U.S. Aggregate Bond Index3 | | 7.85% | | 5.58% |
Returns quoted represent past performance which is no guarantee of future results. Investment returns and principal value will fluctuate so that when shares are redeemed, they may be worth more or less than their original cost. Current performance may be higher or lower than the performance shown. Returns do not reflect the deduction of taxes that a shareholder would pay on Fund distributions or the redemption of shares. Capital gains, if any, are subject to tax. For the most recent month-end performance visit www.nuveen.com or call (800) 257-8787.
Please see each Fund’s Spotlight Page later in this report for more complete performance data and expense ratios.
International Income Managed Accounts Portfolio
Growth of an Assumed $10,000 Investment
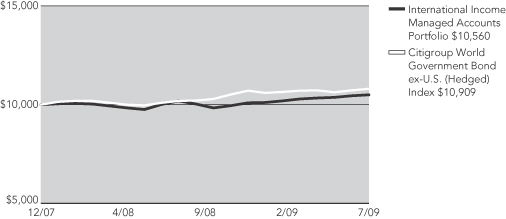
Enhanced Multi-Strategy Income Managed Accounts Portfolio
Growth of an Assumed $10,000 Investment
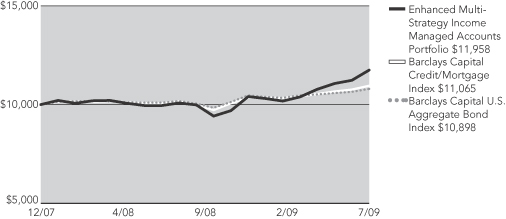
The graphs do not reflect the deduction of taxes that a shareholder may pay on Fund distributions or the redemption of shares.
The index comparisons show the change in value of a $10,000 investment in the Funds compared with the corresponding indexes. The Citigroup World Government Bond ex-U.S. (Hedged) Index is a market capitalization weighted index consisting of the government bond markets of the following countries: Australia, Austria, Belgium, Canada, Denmark, Finland, France, Germany, Ireland, Italy, Japan, the Netherlands, Portugal, Spain, Sweden, Switzerland, and the United Kingdom. Country eligibility is determined based on market capitalization and investability criteria. All issues have a remaining maturity of at least one year. The Barclays Capital Credit/Mortgage Index is a market-weighted blend of the Barclays Capital U.S. Credit Index and the Barclays Capital MBS Index. The Barclays Capital U.S. Aggregate Bond Index is a market capitalization weighted measure of U.S.-traded investment grade bonds, including U.S. Treasury securities, government agency bonds, mortgage-backed bonds, corporate bonds and a small amount of foreign bonds traded in the U.S. Municipal bonds and Treasury Inflation-Protected Securities are excluded. The index returns assume reinvestment of dividends and do not reflect any initial or ongoing expenses. You cannot invest directly in an index. The Funds’ returns include reinvestment of all dividends and distributions. The performance data quoted represents past performance, which is not indicative of future results. Current performance may be lower or higher than the performance shown.
Fund Spotlight as of 7/31/09 International Income Managed Accounts Portfolio
| | | | | | | | |
| Quick Facts | | | | | | | | |
| | | | | | | | | |
NAV | | | | | | | | $8.93 |
Latest Monthly Dividend1 | | | | | | | | $0.0325 |
Latest Ordinary Income Distribution2 | | | | | | | | $0.8823 |
Inception Date | | | | | | | | 12/27/07 |
Returns quoted represent past performance which is no guarantee of future results. Investment returns and principal value will fluctuate so that when shares are redeemed, they may be worth more or less than their original cost. Current performance may be higher or lower than the performance shown. Returns do not reflect the deduction of taxes that a shareholder would pay on Fund distributions or the redemption of shares. For the most recent month-end performance visit www.nuveen.com or call (800) 257-8787.
Fund returns assume reinvestment of dividends and capital gains. Shares have no sales charge and may be purchased under limited circumstances or by specified classes of investors. Returns reflect an expense limitation from the Fund’s investment adviser.
| | | | |
| Average Annual Total Return as of 7/31/09 |
| | |
| | | | | NAV |
1-Year | | | | 5.40% |
Since Inception | | | | 3.48% |
| |
| Average Annual Total Return as of 6/30/09 | | |
| | |
| | | | | NAV |
1-Year | | | | 8.02% |
Since Inception | | | | 3.35% |
|
| Yields |
| | |
| | | | | NAV |
Dividend Yield5 | | | | 4.37% |
SEC 30-Day Yield5 | | | | 2.12% |
| | | | | | |
| Expense Ratios | | | | | | |
| | | Gross
Expense
Ratio | | Net
Expense
Ratio | | As of
Date |
| | | 2.06% | | 0.00% | | 11/28/08 |
The expense ratios shown factor in Total Annual Fund Operating Expenses. The Adviser has agreed irrevocably during the existence of the Fund to waive all fees and pay or reimburse all expenses of the Fund, except for interest expense, taxes, fees incurred in acquiring and disposing of investment portfolio securities and extraordinary expenses. These expense ratios may vary from the expense ratios shown elsewhere in this report.
Portfolio Credit Quality3

Portfolio Allocation4

| | |
| Portfolio Statistics |
| Net Assets ($000) | | $2,968 |
| Average Effective Maturity on Securities (Years) | | 3.79 |
| Average Duration | | 4.25 |
| 1 | Paid August 3, 2009. This is the latest monthly dividend declared during the period ended July 31, 2009. |
| 2 | Ordinary income distribution consists of ordinary income paid on December 31, 2008. |
| 3 | As a percentage of total investments (excluding repurchase agreements, put options written and investments in derivatives) as of July 31, 2009. Holdings are subject to change. |
| 4 | As a percentage of total investments (excluding put options written and investments in derivatives) as of July 31, 2009. Holdings are subject to change. |
| 5 | Dividend Yield is the most recent dividend per share (annualized) divided by the appropriate price per share. The SEC 30-Day Yield is computed under an SEC standardized formula and is based on the maximum offer price per share. The Dividend Yield may differ from the SEC 30-Day Yield because the Fund may be paying out more or less than it is earning and it may not include the effect of amortization of bond premium. |
Fund Spotlight as of 7/31/09 International Income Managed Accounts Portfolio
Expense Example
As a shareholder of the Fund, you incur two types of costs: (1) transaction costs, including front and back end sales charges (loads) or redemption fees, where applicable; and (2) ongoing costs, including management fees; distribution and service (12b-1) fees, where applicable; and other Fund expenses. This Example is intended to help you understand your ongoing costs (in dollars) of investing in the Fund and to compare these costs with the ongoing costs of investing in other mutual funds.
The Example below is based on an investment of $1,000 invested at the beginning of the period and held for the period.
The information under “Actual Performance,” together with the amount you invested, allows you to estimate actual expenses incurred over the reporting period. Simply divide your account value by $1,000 (for example, an $8,600 account value divided by $1,000 = 8.60) and multiply the result by the cost shown for your share class, in the row entitled “Expenses Incurred During Period” to estimate the expenses incurred on your account during this period.
The information under “Hypothetical Performance,” provides information about hypothetical account values and hypothetical expenses based on the Fund’s actual expense ratio and an assumed rate of return of 5% per year before expenses, which is not the Fund’s actual return. The hypothetical account values and expenses may not be used to estimate the actual ending account balance or expense you incurred for the period. You may use this information to compare the ongoing costs of investing in the Fund and other Funds. To do so, compare this 5% hypothetical example with the 5% hypothetical examples that appear in the shareholder reports of the other funds.
Please note that the expenses shown in the table are meant to highlight your ongoing costs only and do not reflect any transactional costs, such as front and back end sales charges (loads) or redemption fees, where applicable. Therefore, the hypothetical information is useful in comparing ongoing costs only, and will not help you determine the relative total costs of owning different funds or share classes. In addition, if these transactional costs were included, your costs would have been higher.
| | | | | | | | | | | | | | |
| | | | | | | | | Hypothetical Performance |
| | | Actual Performance | | (5% annualized return before expenses) |
| Beginning Account Value (2/01/09) | | | | $ | 1,000.00 | | | | | | $ | 1,000.00 | | |
| Ending Account Value (7/31/09) | | | | $ | 1,042.20 | | | | | | $ | 1,024.79 | | |
| Expenses Incurred During Period | | | | $ | 0.00 | | | | | | $ | 0.00 | | |
Expenses are equal to the Fund’s annualized net expense ratio of 0.00% multiplied by the average account value over the period, multiplied by 181/365 (to reflect the one-half year period).
Fund Spotlight as of 7/31/09Enhanced Multi-Strategy Income Managed Accounts Portfolio
| | |
| Quick Facts | | |
| | | |
NAV | | $10.56 |
Latest Monthly Dividend1 | | $0.0844 |
Latest Ordinary Income Distribution2 | | $0.1998 |
Inception Date | | 12/27/07 |
Returns quoted represent past performance which is no guarantee of future results. Investment returns and principal value will fluctuate so that when shares are redeemed, they may be worth more or less than their original cost. Current performance may be higher or lower than the performance shown. Returns do not reflect the deduction of taxes that a shareholder would pay on Fund distributions or the redemption of shares. For the most recent month-end performance visit www.nuveen.com or call (800) 257-8787.
Fund returns assume reinvestment of dividends and capital gains. Shares have no sales charge and may be purchased under limited circumstances or by specified classes of investors. Returns reflect an expense limitation from the Fund’s investment adviser.
| | |
| Average Annual Total Return as of 7/31/09 |
| |
| | | NAV |
1-Year | | 20.12% |
Since Inception | | 12.70% |
|
| Average Annual Total Return as of 6/30/09 |
| |
| | | NAV |
1-Year | | 14.51% |
Since Inception | | 9.88% |
|
| Yields |
| |
| | | NAV |
Dividend Yield4 | | 9.59% |
SEC 30-Day Yield4 | | 10.01% |
| | | | | | |
| Expense Ratios | | | | | | |
| | | Gross
Expense
Ratio | | Net
Expense
Ratio | | As of
Date |
| | | 1.16% | | 0.00% | | 11/28/08 |
The expense ratios shown factor in Total Annual Fund Operating Expenses. The Adviser has agreed irrevocably during the existence of the Fund to waive all fees and pay or reimburse all expenses of the Fund, except for interest expense, taxes, fees incurred in acquiring and disposing of investment portfolio securities and extraordinary expenses. These expense ratios may vary from the expense ratios shown elsewhere in this report.
Portfolio Credit Quality3

Portfolio Allocation3
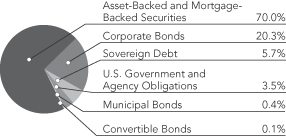
| | |
| Portfolio Statistics |
| Net Assets ($000) | | $5,711 |
| Average Effective Maturity on Securities (Years) | | 14.60 |
| Average Duration | | 6.58 |
| 1 | Paid August 3, 2009. This is the latest monthly dividend declared during the period ended July 31, 2009. |
| 2 | Ordinary income distribution consists of short-term capital gains paid on December 16, 2008. |
| 3 | As a percentage of total investments (excluding put options written and investments in derivatives) as of July 31, 2009. Holdings are subject to change. |
| 4 | Dividend Yield is the most recent dividend per share (annualized) divided by the appropriate price per share. The SEC 30-Day Yield is computed under an SEC standardized formula and is based on the maximum offer price per share. The Dividend Yield may differ from the SEC 30-Day Yield because the Fund may be paying out more or less than it is earning and it may not include the effect of amortization of bond premium. |
Fund Spotlight as of 7/31/09 Enhanced Multi-Strategy Income Managed Accounts Portfolio
| | |
| Corporate Debt: Industries1 | | |
Media | | 13.6% |
Oil, Gas & Consumable Fuels | | 11.5% |
Diversified Financial Services | | 8.1% |
Diversified Telecommunication Services | | 6.7% |
Capital Markets | | 6.4% |
Multiline Retail | | 5.8% |
Wireless Telecommunication Services | | 4.5% |
Specialty Retail | | 4.5% |
Commercial Banks | | 3.3% |
Consumer Finance | | 3.3% |
Food & Staples Retailing | | 2.7% |
IT Services | | 2.6% |
Metals & Mining | | 2.6% |
Commercial Services & Supplies | | 2.4% |
Automobiles | | 2.4% |
Hotels, Restaurants & Leisure | | 2.1% |
Food Products | | 2.1% |
Beverages | | 1.9% |
Other | | 13.5% |
| 1 | As a percentage of total corporate debt holdings as of July 31, 2009. Corporate debt holdings include corporate bonds (high-yield investment grade rated), and any other debt instruments issued by a corporation (or that references a corporation) held by the Fund at the end of the reporting period. The percentage of ”other” corporate debt represents the total of all corporate debt industries that recalculate to less than 1.9% of total corporate debt holdings. Holdings are subject to change. |
Expense Example
As a shareholder of the Fund, you incur two types of costs: (1) transaction costs, including front and back end sales charges (loads) or redemption fees, where applicable; and (2) ongoing costs, including management fees; distribution and service (12b-1) fees, where applicable; and other Fund expenses. This Example is intended to help you understand your ongoing costs (in dollars) of investing in the Fund and to compare these costs with the ongoing costs of investing in other mutual funds.
The Example below is based on an investment of $1,000 invested at the beginning of the period and held for the period.
The information under “Actual Performance,” together with the amount you invested, allows you to estimate actual expenses incurred over the reporting period. Simply divide your account value by $1,000 (for example, an $8,600 account value divided by $1,000 = 8.60) and multiply the result by the cost shown for your share class, in the row entitled “Expenses Incurred During Period” to estimate the expenses incurred on your account during this period.
The information under “Hypothetical Performance,” provides information about hypothetical account values and hypothetical expenses based on the Fund’s actual expense ratio and an assumed rate of return of 5% per year before expenses, which is not the Fund’s actual return. The hypothetical account values and expenses may not be used to estimate the actual ending account balance or expense you incurred for the period. You may use this information to compare the ongoing costs of investing in the Fund and other Funds. To do so, compare this 5% hypothetical example with the 5% hypothetical examples that appear in the shareholder reports of the other funds.
Please note that the expenses shown in the table are meant to highlight your ongoing costs only and do not reflect any transactional costs, such as front and back end sales charges (loads) or redemption fees, where applicable. Therefore, the hypothetical information is useful in comparing ongoing costs only, and will not help you determine the relative total costs of owning different funds or share classes. In addition, if these transactional costs were included, your costs would have been higher.
| | | | | | | | | | | | | | |
| | | | | | | | | Hypothetical Performance |
| | | Actual Performance | | (5% annualized return before expenses) |
| Beginning Account Value (2/01/09) | | | | $ | 1,000.00 | | | | | | $ | 1,000.00 | | |
| Ending Account Value (7/31/09) | | | | $ | 1,155.80 | | | | | | $ | 1,024.79 | | |
| Expenses Incurred During Period | | | | $ | 0.00 | | | | | | $ | 0.00 | | |
Expenses are equal to the Fund’s annualized net expense ratio of 0.00% multiplied by the average account value over the period, multiplied by 181/365 (to reflect the one-half year period).
Report of
Independent Registered Public Accounting Firm
To the Board of Trustees and Shareholders of
Nuveen Managed Accounts Portfolios Trust
In our opinion, the accompanying statements of assets and liabilities, including the portfolios of investments, and the related statements of operations, of changes in net assets and the financial highlights present fairly, in all material respects, the financial position of International Income Managed Accounts Portfolio and Enhanced Multi-Strategy Income Managed Accounts Portfolio (each a series of the Nuveen Managed Accounts Portfolios Trust, hereafter referred to as (the “Funds”) at July 31, 2009, the results of their operations for the year then ended, the changes in their net assets and financial highlights for the periods indicated, in conformity with accounting principles generally accepted in the United States of America. These financial statements and financial highlights (hereafter referred to as “financial statements”) are the responsibility of the Funds’ management; our responsibility is to express an opinion on these financial statements based on our audits. We conducted our audits of these financial statements in accordance with the standards of the Public Company Accounting Oversight Board (United States). Those standards require that we plan and perform the audit to obtain reasonable assurance about whether the financial statements are free of material misstatement. An audit includes examining, on a test basis, evidence supporting the amounts and disclosures in the financial statements, assessing the accounting principles used and significant estimates made by management, and evaluating the overall financial statement presentation. We believe that our audits, which included confirmation of securities at July 31, 2009 by correspondence with the custodian and brokers, provide a reasonable basis for our opinion.
PRICEWATERHOUSECOOPERS LLP
Chicago, IL
September 29, 2009
Portfolio of Investments
International Income Managed Accounts Portfolio
July 31, 2009
| | | | | | | | | | | | | | |
Principal
Amount (000) | | Description (1) | | Coupon | | Maturity | | Ratings (2) | | Value |
| | | | | | | | | | | | | | |
| | | U.S. Government and Agency Obligations – 12.1% | | | | | | | | | | | |
| | | | | |
| $ | 100 | | United States of America Treasury Notes | | | 3.750% | | | 11/15/18 | | AAA | | $ | 102,047 |
| | | | | |
| | 65 | | United States of America Treasury Notes | | | 3.130% | | | 5/15/19 | | AAA | | | 63,009 |
| | | | | |
| | 330 | | United States of America Treasury Securities, STRIPS (P/O) | | | 0.000% | | | 11/15/21 | | AAA | | | 193,929 |
| $ | 495 | | Total U.S. Government and Agency Obligations (cost $364,868) | | | | | | | | | | | 358,985 |
| | | | | |
Principal
Amount (000) | | Description (1) | | Coupon | | Maturity | | Ratings (2) | | Value |
| | | | | | | | | | | | | | |
| | | Sovereign Debt – 23.5% | | | | | | | | | | | |
| | | | | |
| | | Colombia – 2.0% | | | | | | | | | | | |
| | | | | |
| | 120,000 COP | | Republic of Colombia | | | 11.750% | | | 3/01/10 | | BB+ | | $ | 60,885 |
| | | France – 10.4% | | | | | | | | | | | |
| | | | | |
| | 215 EUR | | Republic of France | | | 3.000% | | | 10/25/15 | | AAA | | | 308,757 |
| | | Turkey – 10.8% | | | | | | | | | | | |
| | | | | |
| | 300 TRY | | Republic of Turkey, Government Bond | | | 16.000% | | | 3/07/12 | | BB | | | 226,486 |
| | | | | |
| | 80 USD | | Republic of Turkey, Government Bond | | | 9.500% | | | 1/15/14 | | BB– | | | 93,100 |
| | | Total Turkey | | | | | | | | | | | 319,586 |
| | | Ukraine – 0.3% | | | | | | | | | | | |
| | | | | |
| | 9 CHF | | Republic of Ukraine, Reg S | | | 3.500% | | | 9/15/18 | | CCC+ | | | 8,211 |
| | | Total Sovereign Debt (cost $676,592) | | | | | | | | | | | 697,439 |
| | | | | |
Principal
Amount (000) | | Description (1) | | Coupon | | Maturity | | Ratings (2) | | Value |
| | | | | | | | | | | | | | |
| | | Short-Term Investments – 62.9% | | | | | | | | | | | |
| | | | | |
| | | U.S. Government and Agency Obligations – 29.4% | | | | | | | | | | | |
| | | | | |
| $ | 328 | | Federal Home Loan Banks, Discount Notes | | | 0.244% | | | 10/30/09 | | AAA | | $ | 327,884 |
| | | | | |
| | 245 | | Federal Home Loan Banks, Discount Notes | | | 0.335% | | | 11/24/09 | | AAA | | | 244,866 |
| | | | | |
| | 300 | | Federal Home Loan Banks, Discount Notes | | | 0.000% | | | 2/10/10 | | AAA | | | 299,562 |
| | 873 | | Total U.S. Government and Agency Obligations | | | | | | | | | | | 872,312 |
| | | Repurchase Agreements – 33.5% | | | | | | | | | | | |
| | | | | |
| | 995 | | Repurchase Agreement with State Street Bank, dated 7/31/09, repurchase price $995,346, collateralized by $1,020,000 U.S. Treasury Bills, 0.000%, due 1/14/10, value $1,018,878 | | | 0.050% | | | 8/03/09 | | N/A | | | 995,342 |
| | | Total Short-Term Investments (cost $1,867,356) | | | | | | | | | | | 1,867,654 |
| | | Total Investments (cost $2,908,816) – 98.5% | | | | | | | | | | | 2,924,078 |
| | | | | |
Number of
Contracts | | Description (1) | | Notional
Amount (3) | | Strike
Price | | Expiration
Date | | Value |
| | | Put Options Written – (0.0)% | | | | | | | | | | | |
| | | | | |
| | (1) | | CME 3-Month December Eurodollar Futures | | $ | (1,000,000) | | $ | 98.875 | | 12/14/09 | | $ | (203) |
| | | Total Put Options Written (premiums received $675) | | | | | | | | | | | (203) |
| | | Other Assets Less Liabilities – 1.5% | | | | | | | | | | | 44,290 |
| | | Net Assets – 100% | | | | | | | | | | $ | 2,968,165 |
Investments in Derivatives
Forward Foreign Currency Exchange Contracts outstanding at July 31, 2009:
| | | | | | | | | | | | |
| Currency Contracts to Deliver | | Amount (Local Currency) | | In Exchange
For Currency | | Amount (Local Currency) | | Settlement
Date | | Unrealized
Appreciation
(Depreciation) (U.S. Dollars) | |
Australian Dollar | | 150,000 | | U.S. Dollar | | 116,237 | | 8/14/09 | | $ | (9,135 | ) |
Brazilian Real | | 191,060 | | U.S. Dollar | | 101,143 | | 8/04/09 | | | (1,260 | ) |
Colombian Peso | | 134,227,000 | | U.S. Dollar | | 62,085 | | 8/06/09 | | | (3,763 | ) |
Colombian Peso | | 134,227,000 | | U.S. Dollar | | 63,826 | | 10/06/09 | | | (1,493 | ) |
Euro | | 225,700 | | U.S. Dollar | | 317,563 | | 8/04/09 | | | (4,127 | ) |
Euro | | 100,000 | | U.S. Dollar | | 138,704 | | 8/13/09 | | | (3,829 | ) |
Euro | | 425,409 | | U.S. Dollar | | 602,784 | | 8/31/09 | | | (3,589 | ) |
Pound Sterling | | 128,550 | | U.S. Dollar | | 206,063 | | 8/28/09 | | | (8,661 | ) |
Swedish Krona | | 785,250 | | U.S. Dollar | | 98,144 | | 8/20/09 | | | (10,685 | ) |
Swiss Franc | | 121,251 | | U.S. Dollar | | 111,239 | | 8/13/09 | | | (2,232 | ) |
Swiss Franc | | 7,309 | | U.S. Dollar | | 6,400 | | 9/15/09 | | | (442 | ) |
Turkish Lira | | 353,003 | | U.S. Dollar | | 238,097 | | 8/21/09 | | | (961 | ) |
U.S. Dollar | | 121,808 | | Australian Dollar | | 150,000 | | 8/14/09 | | | 3,564 | |
U.S. Dollar | | 113,596 | | Australian Dollar | | 140,000 | | 8/24/09 | | | 3,334 | |
U.S. Dollar | | 100,000 | | Brazilian Real | | 191,060 | | 8/04/09 | | | 2,404 | |
U.S. Dollar | | 100,590 | | Brazilian Real | | 191,060 | | 9/02/09 | | | 1,225 | |
U.S. Dollar | | 64,377 | | Colombian Peso | | 134,227,000 | | 8/06/09 | | | 1,470 | |
U.S. Dollar | | 142,376 | | Euro | | 100,000 | | 8/13/09 | | | 157 | |
U.S. Dollar | | 317,577 | | Euro | | 225,700 | | 8/31/09 | | | 4,132 | |
U.S. Dollar | | 211,218 | | Pound Sterling | | 128,550 | | 8/28/09 | | | 3,506 | |
U.S. Dollar | | 1,786 | | Mexican Peso | | 23,596 | | 8/03/09 | | | 1 | |
U.S. Dollar | | 100,000 | | Mexican Peso | | 1,327,585 | | 8/24/09 | | | 243 | |
U.S. Dollar | | 100,000 | | South African Rand | | 785,440 | | 8/24/09 | | | 813 | |
U.S. Dollar | | 103,178 | | Swedish Krona | | 785,250 | | 8/20/09 | | | 5,651 | |
U.S. Dollar | | 239,000 | | Turkish Lira | | 353,003 | | 8/04/09 | | | 931 | |
U.S. Dollar | | 112,500 | | Turkish Lira | | 170,754 | | 8/21/09 | | | 3,137 | |
| | | | | | | | | | | $ | (19,609 | ) |
Interest Rate Swaps outstanding at July 31, 2009:
| | | | | | | | | | | | | | | | | | | | | | | |
| Counterparty | | Notional
Amount | | | | Fund
Pay/Receive
Floating Rate | | Floating Rate
Index | | Fixed Rate
(Annualized) | | | Fixed Rate
Payment
Frequency | | Termination
Date | | Value at
July 31,
2009
(U.S. Dollars) | | | Unrealized
Appreciation
(Depreciation) (U.S. Dollars) | |
Barclays Bank PLC | | 850,000 | | EUR | | Receive | | 6-Month EURIBOR | | 2.630 | % | | Annually | | 1/07/11 | | $ | (35,378 | ) | | $ | (35,378 | ) |
Barclays Bank PLC | | 130,000 | | EUR | | Pay | | 6-Month EURIBOR | | 3.500 | | | Annually | | 2/25/19 | | | 1,737 | | | | 822 | |
Barclays Bank PLC | | 100,000 | | EUR | | Receive | | 6-Month EURIBOR | | 3.590 | | | Annually | | 1/07/39 | | | 6,316 | | | | 6,316 | |
Barclays Bank PLC | | 410,000 | | EUR | | Pay | | 6-Month EURIBOR | | 3.735 | | | Annually | | 1/07/19 | | | 24,610 | | | | 24,610 | |
Barclays Bank PLC | | 60,000 | | GBP | | Receive | | 6-Month LIBOR-BBA | | 4.320 | | | Semi-Annually | | 7/27/19 | | | (982 | ) | | | (982 | ) |
Barclays Bank PLC | | 1,750,000 | | NOK | | Pay | | 6-Month NIBOR | | 4.400 | | | Annually | | 12/23/18 | | | 339 | | | | 340 | |
Credit Suisse | | 500,000 | | CHF | | Receive | | 3-Month LIBOR-BBA | | 0.848 | | | Annually | | 6/25/11 | | | (833 | ) | | | (833 | ) |
Citigroup Inc. | | 30,000,000 | | HUF | | Pay | | 6-Month BUBOR | | 8.430 | | | Annually | | 7/06/11 | | | 1,777 | | | | 1,777 | |
Citigroup Inc. | | 100,000,000 | | KRW | | Receive | | 3-Month KRW-KSDA | | 4.040 | | | Quarterly | | 7/31/14 | | | 250 | | | | 250 | |
Citigroup Inc. | | 3,550,000 | | SEK | | Receive | | 3-Month STIBOR | | 1.395 | | | Annually | | 7/14/11 | | | 1,308 | | | | 1,308 | |
Citigroup Inc. | | 750,000 | | SEK | | Pay | | 3-Month STIBOR | | 3.620 | | | Annually | | 7/15/19 | | | 178 | | | | 178 | |
Citigroup Inc. | | 185,394 | | USD | | Receive | | 3-Month LIBOR-BBA | | 0.000 | | | N/A | | 11/15/21 | | | 10,899 | | | | 10,900 | |
Goldman Sachs | | 600,000 | | ZAR | | Receive | | 3-Month JIBAR | | 9.950 | | | Quarterly | | 10/23/18 | | | (5,570 | ) | | | (5,570 | ) |
JPMorgan | | 12,000,000 | | HUF | | Receive | | 6-Month BUBOR | | 8.150 | | | Annually | | 6/03/19 | | | (4,929 | ) | | | (4,929 | ) |
JPMorgan | | 750,000 | | ILS | | Pay | | 3-Month TELBOR | | 5.242 | | | Annually | | 7/13/19 | | | (2,696 | ) | | | (2,696 | ) |
JPMorgan | | 2,000,000 | | MXN | | Pay | | 28-Day MXN-TIIE | | 8.260 | | | 28-Day | | 6/20/19 | | | 605 | | | | 605 | |
JPMorgan | | 455,000 | | ZAR | | Receive | | 3-Month JIBAR | | 9.940 | | | Quarterly | | 8/07/18 | | | (4,346 | ) | | | (4,346 | ) |
RBC | | 500,000 | | AUD | | Receive | | 3-Month AUD-BBR | | 4.505 | | | Quarterly | | 7/31/11 | | | (603 | ) | | | (603 | ) |
RBC | | 505,000 | | AUD | | Pay | | 6-Month AUD-BBR | | 5.970 | | | Semi-Annually | | 6/19/19 | | | 503 | | | | 1,062 | |
RBC | | 310,000 | | NZD | | Pay | | 3-Month NZD-BBR | | 6.045 | | | Semi-Annually | | 6/22/19 | | | 2,545 | | | | 2,600 | |
| | | | | | | | | | | | | | | | | | | | | | $ | (4,569 | ) |
Portfolio of Investments
International Income Managed Accounts Portfolio (continued)
July 31, 2009
| | (1) | | All percentages shown in the Portfolio of Investments are based on net assets. |
| | (2) | | Ratings (not covered by the report of independent registered public accounting firm): Using the higher of Standard & Poor’s Group (“Standard & Poor’s”) or Moody’s Investor Service, Inc. (“Moody’s”) rating. Ratings below BBB by Standard & Poor’s or Baa by Moody’s are considered to be below Investment grade. |
| | (3) | | For disclosure purposes, Notional Amount is calculated by multiplying the Number of Contracts by 1,000,000. |
| | |
| P/O | | Principal only security. |
| N/A | | Not applicable. |
| AUD | | Australian Dollar |
| CHF | | Swiss Franc |
| COP | | Colombian Peso |
| EUR | | Euro |
| GBP | | British Pound |
| HUF | | Hungarian Forint |
| ILS | | Israeli Shekel |
| KRW | | South Korean Won |
| MXN | | Mexican Peso |
| NOK | | Norweigian Krone |
| NZD | | New Zealand Dollar |
| SEK | | Swedish Krona |
| TRY | | Turkish Lira |
| USD | | United States Dollar |
| ZAR | | South African Rand |
| AUD-BBR | | Australian Dollar-Bank Short Term Bill Rate |
| BUBOR | | Budapest Inter-Bank Offered Rate |
| EURIBOR | | Euro Inter-Bank Offered Rate |
| JIBAR | | Johannesburg Inter-Bank Agreed Rate |
| KRW-KSDA | | Korean Won-Korea Securities Dealers Association |
| LIBOR-BBA | | London Inter-Bank Offered Rate-British Bankers’ Association |
| MXN-TIIE | | Mexican Peso Inter-Bank Equilibrium Interest Rate |
| NIBOR | | Norwegian Inter-Bank Offered Rate |
| NZD-BBR | | New Zealand Dollar-Bank Bill Rate |
| STIBOR | | Stockholm Inter-Bank Offered Rate |
| TELBOR | | Tel Aviv Inter-Bank Offered Rate |
See accompanying notes to financial statements.
Portfolio of Investments
Enhanced Multi-Strategy Income Managed Accounts Portfolio
July 31, 2009
| | | | | | | | | | | | |
Principal
Amount (000) | | Description (1) | | Coupon | | Maturity | | Ratings (2) | | Value |
| | | | | | | | | | | | |
| | | Corporate Bonds – 33.3% | | | | | | | | | |
| | | | | |
| | | Aerospace & Defense – 0.4% | | | | | | | | | |
| | | | | |
| $ | 5 | | BE Aerospace Inc. | | 8.500% | | 7/01/18 | | BB+ | | $ | 4,988 |
| | | | | |
| | 20 | | DI Finance/DynCorp International, Series B | | 9.500% | | 2/15/13 | | B+ | | | 20,150 |
| | 25 | | Total Aerospace & Defense | | | | | | | | | 25,138 |
| | | Auto Components – 0.4% | | | | | | | | | |
| | | | | |
| | 25 | | Allison Transmission Inc., 144A | | 11.000% | | 11/01/15 | | CCC+ | | | 22,875 |
| | | Automobiles – 0.8% | | | | | | | | | |
| | | | | |
| | 25 | | Ford Motor Credit Company | | 8.000% | | 6/01/14 | | CCC+ | | | 23,114 |
| | | | | |
| | 25 | | Kar Holdings, Inc. | | 10.000% | | 5/01/15 | | Caa1 | | | 22,125 |
| | 50 | | Total Automobiles | | | | | | | | | 45,239 |
| | | Beverages – 0.6% | | | | | | | | | |
| | | | | |
| | 20 | | Anheuser Busch InBev, 144A | | 5.375% | | 11/15/14 | | BBB+ | | | 20,931 |
| | | | | |
| | 5 | | Miller Brewing Company, 144A | | 5.500% | | 8/15/13 | | BBB+ | | | 5,194 |
| | | | | |
| | 10 | | PepsiCo Inc. | | 3.750% | | 3/01/14 | | Aa2 | | | 10,325 |
| | 35 | | Total Beverages | | | | | | | | | 36,450 |
| | | Capital Markets – 2.1% | | | | | | | | | |
| | | | | |
| | 20 | | Bank of New York Mellon | | 4.300% | | 5/15/14 | | Aa2 | | | 20,760 |
| | | | | |
| | 95 | | Goldman Sachs Group, Inc. | | 5.500% | | 11/15/14 | | A1 | | | 100,196 |
| | 115 | | Total Capital Markets | | | | | | | | | 120,956 |
| | | Chemicals – 0.2% | | | | | | | | | |
| | | | | |
| | 15 | | IMC Global Inc. | | 7.300% | | 1/15/28 | | BBB– | | | 13,879 |
| | | Commercial Banks – 1.1% | | | | | | | | | |
| | | | | |
| | 20 | | BB&T Corporation | | 5.700% | | 4/30/14 | | A1 | | | 20,621 |
| | | | | |
| | 15 | | US Bancorp | | 4.200% | | 5/15/14 | | Aa3 | | | 15,338 |
| | | | | |
| | 25 | | Wells Fargo & Company | | 5.250% | | 10/23/12 | | AA– | | | 26,385 |
| | 60 | | Total Commercial Banks | | | | | | | | | 62,344 |
| | | Commercial Services & Supplies – 0.8% | | | | | | | | | |
| | | | | |
| | 5 | | Allied Waste North America | | 7.250% | | 3/15/15 | | BBB | | | 5,181 |
| | | | | |
| | 15 | | Aramark Corporation | | 8.500% | | 2/01/15 | | B | | | 15,188 |
| | | | | |
| | 20 | | Education Management LLC | | 10.250% | | 6/01/16 | | B3 | | | 20,450 |
| | | | | |
| | 5 | | Iron Mountain Inc. | | 8.000% | | 6/15/20 | | B+ | | | 4,900 |
| | 45 | | Total Commercial Services & Supplies | | | | | | | | | 45,719 |
| | | Consumer Finance – 1.1% | | | | | | | | | |
| | | | | |
| | 35 | | American Express Credit Corporation | | 7.300% | | 8/20/13 | | A2 | | | 37,394 |
| | | | | |
| | 25 | | Ford Motor Credit Company | | 9.875% | | 8/10/11 | | CCC+ | | | 24,782 |
| | 60 | | Total Consumer Finance | | | | | | | | | 62,176 |
| | | Containers & Packaging – 0.1% | | | | | | | | | |
| | | | | |
| | 5 | | Intertape Polymer US Inc. | | 8.500% | | 8/01/14 | | Caa1 | | | 2,675 |
| | | | | |
| | 5 | | Rock-Tenn Company | | 5.625% | | 3/15/13 | | BB+ | | | 4,688 |
| | 10 | | Total Containers & Packaging | | | | | | | | | 7,363 |
| | | Diversified Financial Services – 2.7% | | | | | | | | | |
| | | | | |
| | 50 | | Citigroup Inc. | | 6.125% | | 11/21/17 | | A | | | 46,054 |
| | | | | |
| | 75 | | JP Morgan Chase & Company | | 6.000% | | 1/15/18 | | Aa3 | | | 79,556 |
| | | | | |
| | 25 | | National Rural Utilities Cooperative Finance Corporation | | 7.250% | | 3/01/12 | | A | | | 27,628 |
| | 150 | | Total Diversified Financial Services | | | | | | | | | 153,238 |
Portfolio of Investments
Enhanced Multi-Strategy Income Managed Accounts Portfolio (continued)
July 31, 2009
| | | | | | | | | | | | |
Principal
Amount (000) | | Description (1) | | Coupon | | Maturity | | Ratings (2) | | Value |
| | | | | | | | | | | | |
| | | Diversified Telecommunication Services – 2.2% | | | | | | | | | |
| | | | | |
| $ | 25 | | Cincinnati Bell Inc. | | 8.375% | | 1/15/14 | | B2 | | $ | 24,875 |
| | | | | |
| | 20 | | Citizens Communications Company | | 9.000% | | 8/15/31 | | BB | | | 18,500 |
| | | | | |
| | 15 | | France Telecom | | 5.375% | | 7/08/19 | | A– | | | 16,009 |
| | | | | |
| | 20 | | Hughes Network Systems LLC | | 9.500% | | 4/15/14 | | B1 | | | 20,100 |
| | | | | |
| | 15 | | SBA Telecommunications Corporation, Series 144A | | 8.250% | | 8/15/19 | | Ba2 | | | 15,300 |
| | | | | |
| | 25 | | Telefonica Emisiones SAU | | 4.949% | | 1/15/15 | | A– | | | 26,610 |
| | | | | |
| | 5 | | Time Warner Telecom Holdings | | 9.250% | | 2/15/14 | | B2 | | | 5,188 |
| | 125 | | Total Diversified Telecommunication Services | | | | | | | | | 126,582 |
| | | Electric Utilities – 0.4% | | | | | | | | | |
| | | | | |
| | 25 | | Texas Competitive Electric Holdings, Series A | | 10.250% | | 11/01/15 | | CCC | | | 19,750 |
| | | Electronic Equipment & Instruments – 0.4% | | | | | | | | | |
| | | | | |
| | 25 | | Sanmina-SCI Corporation | | 8.125% | | 3/01/16 | | B3 | | | 22,250 |
| | | Energy Equipment & Services – 0.2% | | | | | | | | | |
| | | | | |
| | 5 | | Helix Energy Solutions, 144A | | 9.500% | | 1/15/16 | | B+ | | | 4,625 |
| | | | | |
| | 5 | | Nabors Industries Inc., 144A | | 9.250% | | 1/15/19 | | BBB+ | | | 5,853 |
| | 10 | | Total Energy Equipment & Services | | | | | | | | | 10,478 |
| | | Food & Staples Retailing – 0.9% | | | | | | | | | |
| | | | | |
| | 50 | | Wal-Mart Stores, Inc. | | 3.200% | | 5/15/14 | | AA | | | 50,452 |
| | | Food Products – 0.7% | | | | | | | | | |
| | | | | |
| | 5 | | General Mills, Inc. | | 6.000% | | 2/15/12 | | BBB+ | | | 5,410 |
| | | | | |
| | 10 | | Great Atlantic & Pacific Tea Company Inc., 144A | | 11.375% | | 8/01/15 | | B– | | | 10,113 |
| | | | | |
| | 5 | | Kraft Foods Inc. | | 6.125% | | 2/01/18 | | BBB+ | | | 5,467 |
| | | | | |
| | 20 | | Pinnacle Foods Finance LLC | | 10.625% | | 4/01/17 | | CCC | | | 18,200 |
| | 40 | | Total Food Products | | | | | | | | | 39,190 |
| | | Hotels, Restaurants & Leisure – 0.7% | | | | | | | | | |
| | | | | |
| | 20 | | Boyd Gaming Corporation | | 7.125% | | 2/01/16 | | BB– | | | 16,100 |
| | | | | |
| | 15 | | McDonald’s Corporation | | 5.800% | | 10/15/17 | | A | | | 16,458 |
| | | | | |
| | 10 | | Wendy’s International Inc. | | 7.000% | | 12/15/25 | | B– | | | 7,500 |
| | 45 | | Total Hotels, Restaurants & Leisure | | | | | | | | | 40,058 |
| | | Household Durables – 0.4% | | | | | | | | | |
| | | | | |
| | 5 | | Ryland Group Inc. | | 5.375% | | 5/15/12 | | BB– | | | 4,850 |
| | | | | |
| | 20 | | Sealy Mattress Company | | 8.250% | | 6/15/14 | | CCC+ | | | 18,350 |
| | 25 | | Total Household Durables | | | | | | | | | 23,200 |
| | | Independent Power Producers & Energy Traders – 0.4% | | | | | | | | | |
| | | | | |
| | 25 | | Dynegy Holdings, Inc., Term Loan | | 7.750% | | 6/01/19 | | B | | | 20,031 |
| | | Industrial Conglomerates – 0.2% | | | | | | | | | |
| | | | | |
| | 10 | | Tyco International Group | | 6.000% | | 11/15/13 | | BBB+ | | | 10,728 |
| | | Insurance – 0.3% | | | | | | | | | |
| | | | | |
| | 15 | | MetLife Inc. | | 7.717% | | 2/15/19 | | A2 | | | 16,994 |
| | | IT Services – 0.9% | | | | | | | | | |
| | | | | |
| | 15 | | First Data Corporation | | 9.875% | | 9/24/15 | | B– | | | 12,731 |
| | | | | |
| | 10 | | Fiserv Inc. | | 6.125% | | 11/20/12 | | BBB | | | 10,677 |
| | | | | |
| | 25 | | Sungard Data Systems Inc., 144A | | 10.625% | | 5/15/15 | | B | | | 26,875 |
| | 50 | | Total IT Services | | | | | | | | | 50,283 |
| | | | | | | | | | | | |
Principal
Amount (000) | | Description (1) | | Coupon | | Maturity | | Ratings (2) | | Value |
| | | | | | | | | | | | |
| | | Machinery – 0.5% | | | | | | | | | |
| | | | | |
| $ | 10 | | Greenbrier Companies, Inc. | | 8.375% | | 5/15/15 | | Caa1 | | $ | 7,350 |
| | | | | |
| | 20 | | Toys R Us Property Company Inc. | | 10.750% | | 7/15/17 | | B+ | | | 20,600 |
| | 30 | | Total Machinery | | | | | | | | | 27,950 |
| | | Media – 4.5% | | | | | | | | | |
| | | | | |
| | 50 | | Comcast Corporation | | 5.850% | | 11/15/15 | | BBB+ | | | 54,266 |
| | | | | |
| | 25 | | Echostar DBS Corporation | | 7.125% | | 2/01/16 | | BB– | | | 24,375 |
| | | | | |
| | 25 | | Interpublic Group Companies Inc. | | 6.250% | | 11/15/14 | | Ba3 | | | 22,875 |
| | | | | |
| | 20 | | LIN Television Corporation | | 6.500% | | 5/15/13 | | B– | | | 15,200 |
| | | | | |
| | 35 | | Nielsen Finance LLC Co., 144A | | 11.625% | | 2/01/14 | | B– | | | 37,013 |
| | | | | |
| | 40 | | Time Warner Cable Inc. | | 6.200% | | 7/01/13 | | BBB | | | 43,476 |
| | | | | |
| | 25 | | TL Acquisitions Inc., 144A | | 13.250% | | 7/15/15 | | CCC+ | | | 19,375 |
| | | | | |
| | 25 | | Valassis Communications Inc. | | 8.250% | | 3/01/15 | | B3 | | | 21,375 |
| | | | | |
| | 20 | | WMG Acquisition Group | | 9.500% | | 6/15/16 | | BB | | | 21,300 |
| | 265 | | Total Media | | | | | | | | | 259,255 |
| | | Metals & Mining – 0.9% | | | | | | | | | |
| | | | | |
| | 5 | | Algoma Acquisition Corporation, 144A | | 9.875% | | 6/15/15 | | CCC+ | | | 3,425 |
| | | | | |
| | 20 | | BHP Billiton Finance Limited | | 5.500% | | 4/01/14 | | A+ | | | 21,747 |
| | | | | |
| | 25 | | Compass Minerals International Inc. | | 8.000% | | 6/01/19 | | B+ | | | 24,750 |
| | 50 | | Total Metals & Mining | | | | | | | | | 49,922 |
| | | Multiline Retail – 1.9% | | | | | | | | | |
| | | | | |
| | 10 | | Costco Wholesale Corporation | | 5.300% | | 3/15/12 | | A | | | 10,737 |
| | | | | |
| | 25 | | Dollar General Corporation | | 11.875% | | 7/15/17 | | B– | | | 28,125 |
| | | | | |
| | 20 | | Home Depot, Inc. | | 5.400% | | 3/01/16 | | BBB+ | | | 20,648 |
| | | | | |
| | 20 | | Neiman Marcus Group Inc. | | 10.375% | | 10/15/15 | | CCC+ | | | 14,500 |
| | | | | |
| | 35 | | Target Corporation | | 5.375% | | 5/01/17 | | A+ | | | 36,828 |
| | 110 | | Total Multiline Retail | | | | | | | | | 110,838 |
| | | Multi-Utilities – 0.1% | | | | | | | | | |
| | | | | |
| | 5 | | Aquila, Inc. | | 11.875% | | 7/01/12 | | BBB | | | 5,629 |
| | | Oil, Gas & Consumable Fuels – 3.8% | | | | | | | | | |
| | | | | |
| | 10 | | Anadarko Petroleum Corporation | | 7.625% | | 3/15/14 | | BBB– | | | 11,250 |
| | | | | |
| | 25 | | Berry Petroleum Company | | 10.250% | | 6/01/14 | �� | B | | | 26,250 |
| | | | | |
| | 25 | | BP Capital Markets PLC | | 3.625% | | 5/08/14 | | Aa1 | | | 25,643 |
| | | | | |
| | 10 | | Chevron Corporation | | 3.950% | | 3/03/14 | | Aa1 | | | 10,432 |
| | | | | |
| | 25 | | Energy XXI Gulf Coast Inc. | | 10.000% | | 6/15/13 | | CCC+ | | | 16,625 |
| | | | | |
| | 30 | | Enterprise Products Operating Group LLP | | 4.600% | | 8/01/12 | | BBB– | | | 30,911 |
| | | | | |
| | 10 | | EOG Resources Inc. | | 5.625% | | 6/01/19 | | A– | | | 10,781 |
| | | | | |
| | 25 | | McMoran Exploration Corporation | | 11.875% | | 11/15/14 | | B | | | 23,063 |
| | | | | |
| | 20 | | Occidental Petroleum Corporation | | 4.125% | | 6/01/16 | | A | | | 19,823 |
| | | | | |
| | 15 | | Stone Energy Corporation | | 6.750% | | 12/15/14 | | B | | | 9,825 |
| | | | | |
| | 25 | | SunCor Energy Inc. | | 6.100% | | 6/01/18 | | BBB+ | | | 26,078 |
| | | | | |
| | 5 | | Targa Resources Inc., 144A | | 8.500% | | 11/01/13 | | B3 | | | 4,475 |
| | | | | |
| | 5 | | W&T Offshore, Inc., 144A | | 8.250% | | 6/15/14 | | B | | | 4,175 |
| | 230 | | Total Oil, Gas & Consumable Fuels | | | | | | | | | 219,331 |
Portfolio of Investments
Enhanced Multi-Strategy Income Managed Accounts Portfolio (continued)
July 31, 2009
| | | | | | | | | | | | |
Principal
Amount (000) | | Description (1) | | Coupon | | Maturity | | Ratings (2) | | Value |
| | | | | | | | | | | | |
| | | Specialty Retail – 1.5% | | | | | | | | | |
| | | | | |
| $ | 25 | | General Nutrition Centers Inc. | | 6.404% | | 3/15/14 | | CCC+ | | $ | 22,188 |
| | | | | |
| | 15 | | Michael’s Stores | | 11.375% | | 11/01/16 | | CCC | | | 12,225 |
| | | | | |
| | 25 | | Phillips-Van Heusen Corporation | | 7.750% | | 11/15/23 | | BBB– | | | 19,393 |
| | | | | |
| | 20 | | Sally Holdings Inc. | | 10.500% | | 11/15/16 | | B– | | | 20,699 |
| | | | | |
| | 10 | | TJX Companies, Inc. | | 4.200% | | 8/15/15 | | A | | | 10,202 |
| | 95 | | Total Specialty Retail | | | | | | | | | 84,707 |
| | | Tobacco – 0.6% | | | | | | | | | |
| | | | | |
| | 30 | | Altria Group Inc. | | 8.500% | | 11/10/13 | | Baa1 | | | 34,686 |
| | | Wireless Telecommunication Services – 1.5% | | | | | | | | | |
| | | | | |
| | 5 | | American Tower Company | | 7.000% | | 10/15/17 | | BB+ | | | 4,943 |
| | | | | |
| | 20 | | Cricket Communications Inc., 144A | | 10.000% | | 7/15/15 | | B– | | | 20,749 |
| | | | | |
| | 15 | | IntelSat Jackson Holding | | 9.500% | | 6/15/16 | | BB– | | | 15,599 |
| | | | | |
| | 20 | | MetroPCS Wireless Inc. | | 9.250% | | 11/01/14 | | B | | | 20,799 |
| | | | | |
| | 5 | | Nokia Corporation | | 5.375% | | 5/15/19 | | A1 | | | 5,231 |
| | | | | |
| | 20 | | Sprint Capital Corporation | | 6.900% | | 5/01/19 | | BB | | | 17,874 |
| | 85 | | Total Wireless Telecommunication Services | | | | | | | | | 85,195 |
| $ | 1,935 | | Total Corporate Bonds (cost $1,775,739) | | | | | | | | | 1,902,886 |
| | | | | |
Principal
Amount (000) | | Description (1) | | Coupon | | Maturity | | Ratings (2) | | Value |
| | | Convertible Bonds – 0.1% | | | | | | | | | |
| | | | | |
| | | Diversified Telecommunication Services – 0.1% | | | | | | | | | |
| | | | | |
| $ | 5 | | Qwest Communications International Inc. | | 7.500% | | 2/15/14 | | Ba3 | | $ | 4,912 |
| | | Total Convertible Bonds (cost $4,653) | | | | | | | | | 4,912 |
| | | | | |
Principal
Amount (000) | | Description (1) | | Coupon | | Maturity | | Ratings (2) | | Value |
| | | Asset-Backed and Mortgage-Backed Securities – 114.7% | | | | | | | | | |
| | | | | |
| | | Autos – Asset-Backed Securities – 13.9% | | | | | | | | | |
| | | | | |
| $ | 150 | | Capital Auto Receivable Asset Trust, 2008-2, A3A | | 4.680% | | 10/15/12 | | AAA | | $ | 154,971 |
| | | | | |
| | 340 | | Daimler Chrysler Auto Trust 2008B | | 4.710% | | 9/10/12 | | AAA | | | 348,699 |
| | | | | |
| | 155 | | Nissan Auto Receivables Owner Trust 2008-B A3 | | 4.460% | | 4/16/12 | | AAA | | | 159,360 |
| | | | | |
| | 124 | | Volkswagen Auto Loan Enhanced Trust, 2008-2, Class A3A | | 5.470% | | 3/20/13 | | AAA | | | 129,205 |
| | 769 | | Total Autos – Asset-Backed Securities | | | | | | | | | 792,235 |
| | | Other – Asset-Backed Securities – 6.3% | | | | | | | | | |
| | | | | |
| | 100 | | American Express Issuance Trust 2008-2A | | 4.020% | | 1/18/11 | | AAA | | | 101,401 |
| | | | | |
| | 250 | | Chase Issuance Trust 2008 Class A9 | | 4.260% | | 5/15/13 | | AAA | | | 259,007 |
| | 350 | | Total Other – Asset-Backed Securities | | | | | | | | | 360,408 |
| | | Residential – Mortgage-Backed Securities – 94.5% | | | | | | | | | |
| | | | | |
| | 171 | | Federal National Mortgage Association Pool 946228 | | 6.130% | | 9/01/37 | | AAA | | | 180,753 |
| | | | | |
| | 878 | | Federal National Mortgage Association Pool 929182 | | 5.000% | | 3/01/38 | | AAA | | | 899,441 |
| | | | | |
| | 1,046 | | Federal National Mortgage Association Pool 984834 (4) | | 5.000% | | 7/01/38 | | AAA | | | 1,071,898 |
| | | | | |
| | 950 | | Federal National Mortgage Association (WI/DD) | | 6.000% | | TBA | | AAA | | | 995,867 |
| | | | | |
| | 2,150 | | Federal National Mortgage Association (MDR) (WI/DD) | | 5.500% | | TBA | | AAA | | | 2,252,460 |
| | 5,195 | | Total Residential – Mortgage-Backed Securities | | | | | | | | | 5,400,419 |
| $ | 6,314 | | Total Asset-Backed and Mortgage-Backed Securities (cost $6,441,725) | | | | | | | | | 6,553,062 |
| | | | | | | | | | | | |
Principal
Amount (000) | | Description (1) | | | | Optional Call
Provisions (3) | | Ratings (2) | | Value |
| | | | | | | | | | | | |
| | | Municipal Bonds – 0.7% | | | | | | | | | |
| | | | | |
| | | Connecticut – 0.7% | | | | | | | | | |
| | | | | |
| $ | 40 | | Connecticut State, General Obligation Bonds, Series 2008A, 5.850%, 3/15/32 | | | | No Opt. Call | | AA | | $ | 40,986 |
| | | Total Municipal Bonds (cost $40,000) | | | | | | | | | 40,986 |
| | | | | | | | | | | | |
| | | | | |
Principal
Amount (000) | | Description (1) | | Coupon | | Maturity | | Ratings (2) | | Value |
| | | | | | | | | | | | |
| | | U.S. Government and Agency Obligations – 5.8% | | | | | | | | | |
| | | | | |
| $ | 30 | | U.S. Treasury Bonds | | 4.750% | | 2/15/37 | | AAA | | $ | 32,142 |
| | | | | |
| | 150 | | U.S. Treasury Bonds | | 4.250% | | 5/15/39 | | AAA | | | 148,501 |
| | | | | |
| | 150 | | U.S. Treasury Notes | | 1.380% | | 5/15/12 | | AAA | | | 149,450 |
| $ | 330 | | Total U.S. Government and Agency Obligations (cost $330,268) | | | | | | | | | 330,093 |
| | | | | |
Principal
Amount (000) | | Description (1) | | Coupon | | Maturity | | Ratings (2) | | Value |
| | | Sovereign Debt – 9.4% | | | | | | | | | |
| | | | | |
| | | Colombia – 1.7% | | | | | | | | | |
| | | | | |
| | 185,000 COP | | Republic of Colombia | | 11.750% | | 3/01/10 | | BB+ | | $ | 93,864 |
| | | Turkey – 7.5% | | | | | | | | | |
| | | | | |
| | 350 TRY | | Republic of Turkey, Government Bond | | 16.000% | | 3/07/12 | | BB | | | 264,234 |
| | | | | |
| | 140 USD | | Republic of Turkey, Government Bond | | 9.500% | | 1/15/14 | | BB– | | | 162,925 |
| | | Total Turkey | | | | | | | | | 427,159 |
| | | Ukraine – 0.2% | | | | | | | | | |
| | | | | |
| | 15 CHF | | Republic of Ukraine, Reg S | | 3.500% | | 9/15/18 | | CCC+ | | | 13,229 |
| | | Total Sovereign Debt (cost $511,164) | | | | | | | | | 534,252 |
| | | Total Investments (cost $9,103,549) – 164.0% | | | | | | | | | 9,366,191 |
| | | | | | | | | | | | | | | |
| | | | | | |
Number of
Contracts | | Description (1) | | Notional
Amount (5) | | | | Strike
Price | | Expiration
Date | | Value |
| | | | | | | | | | | | | | | |
| | Put Options Written – (0.0)% | | | | | | | | | | | | | |
| | | | | | |
| (3) | | CME 3-Month December Eurodollar Futures | | $ | (3,000,000) | | | | $ | 98.875 | | 12/14/09 | | $ | (590) |
| | Total Put Options Written (premiums received $2,025) | | | | | | | | | | | | | (590) |
| | Other Assets Less Liabilities – (64.0)% | | | | | | | | | | | | | (3,654,256) |
| | Net Assets – 100% | | | | | | | | | | | | $ | 5,711,345 |
Investments in Derivatives
Forward Foreign Currency Exchange Contracts outstanding at July 31, 2009:
| | | | | | | | | | | | |
| Currency Contracts to Deliver | | Amount
(Local Currency) | | In Exchange
For Currency | | Amount
(Local Currency) | | Settlement
Date | | Unrealized
Appreciation
(Depreciation) (U.S. Dollars) | |
Australian Dollar | | 220,000 | | U.S. Dollar | | 170,480 | | 8/14/09 | | $ | (13,398 | ) |
Brazilian Real | | 382,120 | | U.S. Dollar | | 202,287 | | 8/04/09 | | | (2,521 | ) |
Colombian Peso | | 229,730,000 | | U.S. Dollar | | 106,258 | | 8/06/09 | | | (6,440 | ) |
Colombian Peso | | 229,730,000 | | U.S. Dollar | | 109,239 | | 10/06/09 | | | (2,555 | ) |
Euro | | 100,000 | | U.S. Dollar | | 138,704 | | 8/13/09 | | | (3,829 | ) |
Swedish Krona | | 1,334,925 | | U.S. Dollar | | 166,845 | | 8/20/09 | | | (18,165 | ) |
Swiss Franc | | 183,763 | | U.S. Dollar | | 168,590 | | 8/13/09 | | | (3,382 | ) |
Swiss Franc | | 11,775 | | U.S. Dollar | | 10,311 | | 9/15/09 | | | (712 | ) |
Portfolio of Investments
Enhanced Multi-Strategy Income Managed Accounts Portfolio (continued)
July 31, 2009
Forward Foreign Currency Exchange Contracts outstanding at July 31, 2009 (continued)
| | | | | | | | | | | | |
| Currency Contracts to Deliver | | Amount
(Local Currency) | | In Exchange
For Currency | | Amount
(Local Currency) | | Settlement
Date | | Unrealized
Appreciation
(Depreciation) (U.S. Dollars) | |
Turkish Lira | | 529,505 | | U.S. Dollar | | 357,146 | | 8/21/09 | | $ | (1,442 | ) |
U.S. Dollar | | 178,651 | | Australian Dollar | | 220,000 | | 8/14/09 | | | 5,227 | |
U.S. Dollar | | 170,394 | | Australian Dollar | | 210,000 | | 8/24/09 | | | 5,001 | |
U.S. Dollar | | 200,000 | | Brazilian Real | | 382,120 | | 8/04/09 | | | 4,808 | |
U.S. Dollar | | 201,179 | | Brazilian Real | | 382,120 | | 9/02/09 | | | 2,449 | |
U.S. Dollar | | 110,182 | | Colombian Peso | | 229,730,000 | | 8/06/09 | | | 2,516 | |
U.S. Dollar | | 142,376 | | Euro | | 100,000 | | 8/13/09 | | | 157 | |
U.S. Dollar | | 2,679 | | Mexican Peso | | 35,394 | | 8/03/09 | | | 1 | |
U.S. Dollar | | 200,000 | | Mexican Peso | | 2,655,170 | | 8/24/09 | | | 486 | |
U.S. Dollar | | 175,403 | | Swedish Krona | | 1,334,925 | | 8/20/09 | | | 9,606 | |
U.S. Dollar | | 358,500 | | Turkish Lira | | 529,505 | | 8/04/09 | | | 1,397 | |
U.S. Dollar | | 170,500 | | Turkish Lira | | 258,787 | | 8/21/09 | | | 4,754 | |
U.S. Dollar | | 200,000 | | South African Rand | | 1,570,880 | | 8/24/09 | | | 1,627 | |
| | | | | | | | | | | $ | (14,415 | ) |
Interest Rate Swaps outstanding at July 31, 2009:
| | | | | | | | | | | | | | | | | | | | | | | |
| Counterparty | | Notional
Amount | | | | Fund
Pay/Receive
Floating Rate | | Floating Rate Index | | Fixed Rate
(Annualized) | | | Fixed Rate
Payment
Frequency | | Termination
Date | | Value at
July 31,
2009
(U.S. Dollars) | | | Unrealized
Appreciation
(Depreciation) (U.S. Dollars) | |
Barclays Bank PLC | | 1,200,000 | | EUR | | Receive | | 6-Month EURIBOR | | 2.630 | % | | Annually | | 1/07/11 | | $ | (49,943 | ) | | $ | (49,943 | ) |
Barclays Bank PLC | | 300,000 | | EUR | | Pay | | 6-Month EURIBOR | | 3.500 | | | Annually | | 2/25/19 | | | 3,868 | | | | 3,868 | |
Barclays Bank PLC | | 130,000 | | EUR | | Receive | | 6-Month EURIBOR | | 3.590 | | | Annually | | 1/07/39 | | | 8,212 | | | | 8,212 | |
Barclays Bank PLC | | 560,000 | | EUR | | Pay | | 6-Month EURIBOR | | 3.735 | | | Annually | | 1/07/19 | | | 33,612 | | | | 33,612 | |
Barclays Bank PLC | | 300,000 | | GBP | | Receive | | 6-Month LIBOR-BBA | | 4.320 | | | Semi-Annually | | 7/27/19 | | | (4,912 | ) | | | (4,912 | ) |
Citigroup Inc. | | 60,000,000 | | HUF | | Pay | | 6-Month BUBOR | | 8.430 | | | Annually | | 7/06/11 | | | 3,554 | | | | 3,554 | |
Citigroup Inc. | | 580,000,000 | | KRW | | Receive | | 3-Month KRW-KSDA | | 4.040 | | | Quarterly | | 7/31/14 | | | 1,452 | | | | 1,452 | |
Citigroup Inc. | | 6,350,000 | | SEK | | Receive | | 3-Month STIBOR | | 1.395 | | | Annually | | 7/14/11 | | | 2,340 | | | | 2,340 | |
Citigroup Inc. | | 1,350,000 | | SEK | | Pay | | 3-Month STIBOR | | 3.620 | | | Annually | | 7/15/19 | | | 321 | | | | 321 | |
Credit Suisse | | 2,000,000 | | CHF | | Receive | | 6-Month LIBOR-BBA | | 0.848 | | | Annually | | 6/25/11 | | | (3,332 | ) | | | (3,332 | ) |
Goldman Sachs | | 1,350,000 | | ZAR | | Receive | | 3-Month JIBAR | | 9.950 | | | Quarterly | | 10/23/18 | | | (12,529 | ) | | | (12,529 | ) |
JPMorgan | | 20,000,000 | | HUF | | Receive | | 6-Month BUBOR | | 8.150 | | | Annually | | 6/03/19 | | | (8,212 | ) | | | (8,213 | ) |
JPMorgan | | 900,000 | | ILS | | Pay | | 3-Month TELBOR | | 5.242 | | | Annually | | 7/13/19 | | | (3,235 | ) | | | (3,235 | ) |
JPMorgan | | 3,000,000 | | MXN | | Pay | | 28-Day MXN-TIIE | | 8.260 | | | 28-Day | | 6/20/19 | | | 910 | | | | 910 | |
JPMorgan | | 1,850,000 | | ZAR | | Receive | | 3-Month JIBAR | | 9.940 | | | Quarterly | | 8/07/18 | | | (17,669 | ) | | | (17,669 | ) |
RBC | | 2,800,000 | | AUD | | Receive | | 3-Month AUD-BBR | | 4.505 | | | Quarterly | | 7/31/11 | | | (3,375 | ) | | | (3,375 | ) |
RBC | | 805,000 | | AUD | | Pay | | 6-Month AUD-BBR | | 5.970 | | | Semi-Annually | | 6/19/19 | | | 800 | | | | 1,720 | |
RBC | | 490,000 | | NZD | | Pay | | 3-Month NZD-BBR | | 6.045 | | | Semi-Annually | | 6/22/19 | | | 4,020 | | | | 4,107 | |
| | | | | | | | | | | | | | | | | | | | | | $ | (43,112 | ) |
Credit Default Swaps outstanding at July 31, 2009:
| | | | | | | | | | | | | | | | | | | | | | | |
| Counterparty | | Referenced Entity | | Buy/Sell
Protection | | | Current
Credit
Spread (6) | | | Notional
Amount
(U.S. Dollars) | | Fixed
Rate | | | Termination
Date | | Value at
July 31,
2009
(U.S. Dollars) | | | Unrealized
Appreciation
(Depreciation)
(U.S. Dollars) |
Barclays Bank PLC | | DJ Investment Grade CDX | | Sell | (7) | | 1.11 | % | | $ | 3,000,000 | | 1.000 | % | | 6/20/14 | | $ | (10,792 | ) | | $ | 113,977 |
JPMorgan | | DJ High Yield CDX | | Sell | (7) | | 7.54 | | | | 1,880,000 | | 5.000 | | | 6/20/14 | | | (163,558 | ) | | | 292,342 |
| | | | | | | | | | | | | | | | | | | | | | | $ | 406,319 |
Futures Contracts outstanding at July 31, 2009:
| | | | | | | | | | | | | |
| Type | | Contract
Position | | Number of
Contracts | | Contract
Expiration | | Value at
July 31, 2009
(U.S. Dollars) | | Unrealized
Appreciation
(Depreciation)
(U.S. Dollars) | |
U.S. 5-Year Treasury Note | | Long | | 4 | | 9/09 | | $ | 461,531 | | $ | (715 | ) |
U.S. 30-Year Treasury Bond | | Long | | 7 | | 9/09 | | | 833,000 | | | 29,416 | |
| | | | | | | | | | | | $ | 28,701 | |
| | (1) | | All percentages shown in the Portfolio of Investments are based on net assets. |
| | (2) | | Ratings (not covered by the report of independent registered public accounting firm): Using the higher of Standard & Poor’s Group (“Standard & Poor’s”) or Moody’s Investor Service, Inc. (“Moody’s”) rating. Ratings below BBB by Standard & Poor’s or Baa by Moody’s are considered to be below Investment grade. |
| | (3) | | Optional Call Provisions (not covered by the report of independent registered public accounting firm): Dates (month and year) and prices of the earliest optional call or redemption. There may be other call provisions at varying prices at later dates. Certain mortgage-backed securities may be subject to periodic principal paydowns. |
| | (4) | | Investment, or portion of investment, has been pledged to collateralize the net payment obligations for investments in derivatives. |
| | (5) | | For disclosure purposes, Notional Amount is calculated by multiplying the Number of Contracts by 1,000,000. |
| | (6) | | The credit spread generally serves as an indication of the current status of the payment/performance risk and therefore the likelihood of default of the credit derivative. The spread also reflects the cost of buying/selling protection and may include upfront payments required to be made to enter into a credit default swap contract. Higher credit spreads are indicative of a higher likelihood of performance by the seller of protection. |
| | (7) | | The Fund entered into the credit default swap to gain investment exposure to the referenced entity. Selling protection has a similar credit risk position to owning the referenced entity. Buying protection has a similar credit risk position to selling the referenced entity short. |
| | TBA | | To be announced. Maturity date not known prior to settlement of the transaction. |
| | WI/DD | | Purchased on a when-issued or delayed delivery basis. |
| | 144A | | Investment is exempt from registration under Rule 144A of the Securities Act of 1933, as amended. These investments may only be resold in transactions exempt from registration which are normally those transactions with qualified institutional buyers. |
| | MDR | | Denotes investment is subject to dollar roll transactions. |
| | |
| AUD | | Australian Dollar |
| CHF | | Swiss Franc |
| COP | | Colombian Peso |
| EUR | | Euro |
| GBP | | British Pound |
| HUF | | Hungarian Forint |
| ILS | | Israeli Shekel |
| KRW | | South Korean Won |
| MXN | | Mexican Peso |
| NZD | | New Zealand Dollar |
| SEK | | Swedish Krona |
| TRY | | Turkish Lira |
| USD | | United States Dollar |
| ZAR | | South African Rand |
| AUD-BBR | | Australian Dollar-Bank Short Term Bill Rate |
| BUBOR | | Budapest Inter-Bank Offered Rate |
| EURIBOR | | Euro Inter-Bank Offered Rate |
| JIBAR | | Johannesburg Inter-Bank Agreed Rate |
| KRW-KSDA | | Korean Won-Korea Securities Dealers Association |
| LIBOR-BBA | | London Inter-Bank Offered Rate-British Bankers’ Association |
| MXN-TIIE | | Mexican Peso Inter-Bank Equilibrium Interest Rate |
| NZD-BBR | | New Zealand Dollar-Bank Bill Rate |
| STIBOR | | Stockholm Inter-Bank Offered Rate |
| TELBOR | | Tel Aviv Inter-Bank Offered Rate |
See accompanying notes to financial statements.
Statement of Assets and Liabilities
July 31, 2009
| | | | | | | | |
| | | International
Income | | | Enhanced
Multi-Strategy
Income | |
Assets | | | | | | | | |
Investments, at value (cost $1,041,460 and $9,103,549, respectively) | | $ | 1,056,424 | | | $ | 9,366,191 | |
Short-term investments, at value (cost $1,867,356 and $0, respectively) | | | 1,867,654 | | | | — | |
Cash | | | — | | | | 76,072 | |
Cash in other banks | | | 43,737 | | | | 37,726 | |
Deposits with brokers for open futures contracts | |
| —
|
| |
| 32,071
|
|
Unrealized appreciation on forward foreign currency exchange contracts | | | 30,568 | | | | 38,029 | |
Unrealized appreciation on interest rate swaps | | | 17,472 | | | | 10,119 | |
Unrealized appreciation on credit default swaps | | | — | | | | 406,319 | |
Interest rate swaps premiums paid | | | 299 | | | | — | |
Receivables: | | | | | | | | |
Due from broker (net of amounts uncollectable of $0 and $11,570, respectively) | | | 296,721 | | | | 1,093 | |
From Adviser | | | 35,161 | | | | 38,592 | |
Interest | | | 24,722 | | | | 77,012 | |
Investments sold | | | 624,545 | | | | 41,014 | |
Reclaims | | | 651 | | | | 7 | |
Variation margin on futures contracts | | | — | | | | 16,391 | |
Total assets | | | 3,997,954 | | | | 10,140,636 | |
Liabilities | | | | | | | | |
Cash overdraft | | | 296,721 | | | | — | |
Cash overdraft denominated in foreign currencies (cost $5,965 and $4,654, respectively) | | | 7,069 | | | | 5,885 | |
Put options written, at value (premiums received $675 and $2,025, respectively) | | | 203 | | | | 590 | |
Unrealized depreciation on forward foreign currency exchange contracts | | | 50,177 | | | | 52,444 | |
Unrealized depreciation on interest rate swaps | | | 22,041 | | | | 53,231 | |
Interest rate swaps premiums received | | | — | | | | 1,006 | |
Credit default swaps premiums received | | | — | | | | 580,669 | |
Payables: | | | | | | | | |
Due to broker | | | 42,939 | | | | — | |
Dividends | | | 10,807 | | | | 45,635 | |
Investments purchased | | | 554,047 | | | | 3,633,902 | |
Accrued other expenses | | | 45,785 | | | | 55,929 | |
Total liabilities | | | 1,029,789 | | | | 4,429,291 | |
Net assets | | $ | 2,968,165 | | | $ | 5,711,345 | |
Shares outstanding | | | 332,522 | | | | 540,704 | |
Net asset value per share | | $ | 8.93 | | | $ | 10.56 | |
Net Assets Consist of: | | | | | | | | |
Capital paid-in | | $ | 3,320,342 | | | $ | 5,405,466 | |
Undistributed (Over-distribution of) net investment income | | | (278,490 | ) | | | 62,466 | |
Accumulated net realized gain (loss) from investments, foreign currency, options/swaptions written and derivative transactions | | | (68,136 | ) | | | (396,033 | ) |
Net unrealized appreciation (depreciation) of investments, foreign currency, options written and derivative transactions | | | (5,551 | ) | | | 639,446 | |
Net assets | | $ | 2,968,165 | | | $ | 5,711,345 | |
See accompanying notes to financial statements.
Statement of Operations
Year Ended July 31, 2009
| | | | | | | | |
| | | International
Income | | | Enhanced
Multi-Strategy
Income | |
Investment Income | | $ | 109,026 | | | $ | 583,591 | |
Expenses | | | | | | | | |
Shareholders’ servicing agent fees and expenses | | | 244 | | | | 578 | |
Custodian’s fees and expenses | | | 41,054 | | | | 47,083 | |
Trustees’ fees and expenses | | | 57 | | | | 100 | |
Professional fees | | | 39,781 | | | | 56,290 | |
Shareholders’ reports – printing and mailing expenses | | | 29,471 | | | | 29,723 | |
Federal and state registration fees | | | 22,893 | | | | 23,191 | |
Other expenses | | | 1,159 | | | | 2,292 | |
Total expenses before custodian fee credit and expense reimbursement | | | 134,659 | | | | 159,257 | |
Custodian fee credit | | | (110 | ) | | | (31 | ) |
Expense reimbursement | | | (134,659 | ) | | | (159,257 | ) |
Net expenses | | | (110 | ) | | | (31 | ) |
Net investment income | | | 109,136 | | | | 583,622 | |
Realized and Unrealized Gain (Loss) | | | | | | | | |
Net realized gain (loss) from: | | | | | | | | |
Investments and foreign currency | | | (244,421 | ) | | | (71,008 | ) |
Forward foreign currency exchange contracts | | | 268,035 | | | | 45,751 | |
Futures contracts | | | 18,198 | | | | 10,908 | |
Options written | | | 6,039 | | | | 7,680 | |
Swaps | | | 54,544 | | | | (349,080 | ) |
Swaptions written | | | (26,186 | ) | | | (39,851 | ) |
Change in net unrealized appreciation (depreciation) of: | | | | | | | | |
Investments and foreign currency | | | 17,317 | | | | 317,177 | |
Forward foreign currency exchange contracts | | | (18,047 | ) | | | (19,649 | ) |
Futures contracts | | | (15,277 | ) | | | 28,701 | |
Options written | | | 472 | | | | 1,435 | |
Swaps | | | (13,617 | ) | | | 459,979 | |
Net realized and unrealized gain (loss) | | | 47,057 | | | | 392,043 | |
Net increase (decrease) in net assets from operations | | $ | 156,193 | | | $ | 975,665 | |
See accompanying notes to financial statements.
Statement of Changes in Net Assets
| | | | | | | | | | | | | | | | |
| | | International Income | | | Enhanced Multi-Strategy Income | |
| | | Year Ended
7/31/09 | | | For the Period December 27, 2007
(commencement of operations)
through July 31, 2008 | | | Year Ended
7/31/09 | | | For the Period December 27, 2007
(commencement of operations)
through July 31, 2008 | |
Operations | | | | | | | | | | | | | | | | |
Net investment income | | $ | 109,136 | | | $ | 71,999 | | | $ | 583,622 | | | $ | 153,266 | |
Net realized gain (loss) from: | | | | | | | | | | | | | | | | |
Investments and foreign currency | | | (244,421 | ) | | | 44,254 | | | | (71,008 | ) | | | 63,464 | |
Forward foreign currency exchange contracts | | | 268,035 | | | | (112,170 | ) | | | 45,751 | | | | (7,043 | ) |
Futures contracts | | | 18,198 | | | | (23,325 | ) | | | 10,908 | | | | (10,889 | ) |
Options written | | | 6,039 | | | | — | | | | 7,680 | | | | — | |
Swaps | | | 54,544 | | | | (10 | ) | | | (349,080 | ) | | | (12,768 | ) |
Swaptions written | | | (26,186 | ) | | | — | | | | (39,851 | ) | | | — | |
Change in net unrealized appreciation (depreciation) of: | | | | | | | | | | | | | | | | |
Investments and foreign currency | | | 17,317 | | | | 838 | | | | 317,177 | | | | (56,659 | ) |
Forward foreign currency exchange contracts | | | (18,047 | ) | | | (1,562 | ) | | | (19,649 | ) | | | 5,234 | |
Futures contracts | | | (15,277 | ) | | | 15,277 | | | | 28,701 | | | | — | |
Options written | | | 472 | | | | — | | | | 1,435 | | | | — | |
Swaps | | | (13,617 | ) | | | 9,048 | | | | 459,979 | | | | (96,772 | ) |
Net increase (decrease) in net assets from operations | | | 156,193 | | | | 4,349 | | | | 975,665 | | | | 37,833 | |
Distributions to Shareholders | | | | | | | | | | | | | | | | |
From net investment income | | | (441,533 | ) | | | (71,240 | ) | | | (458,299 | ) | | | (143,688 | ) |
From accumulated net realized gains | | | — | | | | — | | | | (107,439 | ) | | | — | |
Decrease in net assets from distributions to shareholders | | | (441,533 | ) | | | (71,240 | ) | | | (565,738 | ) | | | (143,688 | ) |
Fund Share Transactions | | | | | | | | | | | | | | | | |
Proceeds from sale of shares | | | 39,249 | | | | 3,305,097 | | | | 38,960 | | | | 5,368,313 | |
Cost of shares redeemed | | | — | | | | (23,950 | ) | | | — | | | | — | |
Net increase (decrease) in net assets from Fund share transactions | | | 39,249 | | | | 3,281,147 | | | | 38,960 | | | | 5,368,313 | |
Net increase (decrease) in net assets | | | (246,091 | ) | | | 3,214,256 | | | | 448,887 | | | | 5,262,458 | |
Net assets at the beginning of period | | | 3,214,256 | | | | — | | | | 5,262,458 | | | | — | |
Net assets at the end of period | | $ | 2,968,165 | | | $ | 3,214,256 | | | $ | 5,711,345 | | | $ | 5,262,458 | |
Undistributed (Over-distribution of) net investment income at the end of period | | $ | (278,490 | ) | | $ | (45,470 | ) | | $ | 62,466 | | | $ | 16,320 | |
See accompanying notes to financial statements.
Notes to Financial Statements
1. General Information and Significant Accounting Policies
The Nuveen Managed Accounts Portfolios Trust (the “Trust”) is an open-end management investment company registered under the Investment Company Act of 1940, as amended. The Trust is comprised of the International Income Managed Accounts Portfolio (“International Income”) and Enhanced Multi-Strategy Income Managed Accounts Portfolio (“Enhanced Multi-Strategy Income”) (collectively, the “Funds”), among others. The Trust was organized as a Massachusetts business trust on November 14, 2006.
Each Fund is developed exclusively for use within Nuveen-sponsored separately managed accounts. Each Fund is a specialized fund to be used in combination with selected individual securities to effectively model institutional-level investment strategies. Certain securities in which the Funds invest may be highly speculative. The Funds enable certain Nuveen-sponsored separately managed account investors to receive greater diversification and return potential than smaller managed accounts might otherwise achieve and to gain access to special investment opportunities normally available only to institutional investors.
International Income’s primary investment objective is total return, with current income as a secondary objective. The Fund will ordinarily invest directly or indirectly (with currency forwards and similar derivative investments being measured on a notional basis) at least 80% of its net assets in securities and instruments issued or backed by non-U.S. governments and other non-U.S. issuers. The Fund will invest in various types of global government debt securities, including debt securities of non-U.S. government and supranational entities, U.S. government and government-related debt securities, interest rate and total return swaps, government bond futures and forward contracts. The Fund may invest up to 40% of its net assets in debt securities or instruments from emerging markets, and up to 35% of its net assets in debt securities or instruments rated below investment grade or securities that are unrated but deemed to be of equivalent quality by Nuveen Asset Management (the “Adviser”), a wholly-owned subsidiary of Nuveen Investments, Inc. (“Nuveen”). In addition, the Fund may invest up to 20% in debt issued by both U.S. and non-U.S. corporate issuers. These limits apply only at the time of any specific new investments.
Enhanced Multi-Strategy Income’s primary investment objective is total return, with current income as a secondary objective. The Fund will ordinarily invest at least 80% of its net assets in fixed income securities. The Fund will invest in various types of debt securities, including U.S. Treasury and U.S. agency bonds, asset backed securities, U.S. agency mortgage backed securities, commercial mortgage backed securities, U.S. investment grade corporate debt securities, U.S. high yield corporate debt securities, U.S. dollar-denominated non-U.S. government bonds, non-U.S. dollar non-U.S. government bonds, emerging market debt, futures, options, interest rate derivatives, currency forwards, total return swaps, credit default swaps, and other short-term securities. The Fund may also engage in repurchase, reverse repurchase, dollar rolls and forward purchase agreements (these investments will generally be short-term in nature and are primarily used to seek to enhance total return and manage liquidity). The Fund may invest up to 50% of its net assets in securities that are rated below investment grade or securities that are unrated but deemed to be of equivalent quality by the Adviser, which includes U.S. and non-U.S. high yield corporate bonds and securities. The Fund may invest up to 25% of its net assets in the debt of non-U.S. issuers, including up to 25% of its net assets in obligations of non-U.S. entities that are located in emerging markets. These limits apply only at the time of any specific new investments.
The Funds may elect to hedge or help protect against declines in portfolio value due to its exposure to interest rate movements, movements in securities markets and non-U.S. currency exposure through the use of derivative instruments such as currency forward contracts, futures, options, interest rate and credit default swaps.
The following is a summary of significant accounting policies followed by the Funds in the preparation of their financial statements in accordance with accounting principles generally accepted in the United States.
Investment Valuation
The prices of fixed-income securities, short-term international (non-U.S.) government securities and derivative instruments are generally provided by an independent pricing service approved by each Fund’s Board of Trustees. The pricing services typically value exchange-listed securities at the last sales price on that day; and value and other securities traded in the over-the-counter (“OTC”) market at the mean of the bid and asked prices when current quotations are readily available. Futures contracts are valued using the closing settlement price or, in the absence of such a price, at the mean of the bid and asked prices. Prices of interest rate swaps are provided by an independent pricing service approved by each Fund’s Board of Trustees. Credit default swaps are valued using market quotes provided by major broker/dealers in such investments. Exchange traded options are valued on last price or the average of the bid/ask if no trades occurred. OTC option values are modeled using market implied volatilities. When market price quotes are not readily available, the pricing service or, in the absence of a pricing service for a particular investment or derivative instrument, the Board of Trustees of the Funds, or its designee, may establish fair value using a wide variety of market data including yields or prices of investments of comparable quality, type of issue, coupon, maturity and rating, market quotes or indications of value from security dealers, evaluations of anticipated cash flows or collateral, general market conditions and other information and analysis, including the obligor’s credit characteristics considered relevant. If significant market events occur between the time of determination of the closing price of a foreign security on an exchange and the time that the Fund’s net asset value (NAV) is determined, or if under the Fund’s procedures, the closing price of a foreign security is not deemed to be reliable, and there could be a material effect on the Fund’s NAV, the security would be valued at fair value as determined in accordance with procedures established in good faith by the Fund’s Board of Trustees. Repurchase agreements are valued at amortized cost, which approximates value.
Investment Transactions
Investment transactions are recorded on a trade date basis. Realized gains and losses from transactions are determined on the specific identification method. Investments purchased on a when-issued/delayed delivery basis may have extended settlement periods. Any
Notes to Financial Statements (continued)
investments so purchased are subject to market fluctuation during this period. The Funds have instructed the custodian to segregate assets with a current value at least equal to the amount of the when-issued/delayed delivery purchase commitments. At July 31, 2009, Enhanced Multi-Strategy Income had outstanding when-issued/delayed delivery purchase commitments of $3,260,134. There were no such outstanding purchase commitments in International Income.
Investment Income
Interest income, which includes the amortization of premiums and accretion of discounts for financial reporting purposes, is recorded on an accrual basis. Investment income also includes paydown gains and losses, if any.
Income Taxes
Each Fund is a separate taxpayer for federal income tax purposes. Each Fund intends to distribute substantially all of its net investment income and net capital gains to shareholders and to otherwise comply with the requirements of Subchapter M of the Internal Revenue Code applicable to regulated investment companies. Therefore, no federal income tax provision is required.
For all open tax years and all major taxing jurisdictions, management of the Funds has concluded that there are no significant uncertain tax positions that would require recognition in the financial statements. Open tax years are those that are open for examination by taxing authorities (i.e., generally the last four tax year ends and the interim tax period since then). Furthermore, management of the Funds is also not aware of any tax positions for which it is reasonably possible that the total amounts of unrecognized tax benefits will significantly change in the next twelve months.
Dividends and Distributions to Shareholders
Dividends from net investment income are declared monthly. Net realized capital gains and/or market discount from investment transactions, if any, are declared and distributed to shareholders at least annually. Furthermore, capital gains are distributed only to the extent they exceed available capital loss carryforwards.
Distributions to shareholders are recorded on the ex-dividend date. The amount and timing of distributions are determined in accordance with federal income tax regulations, which may differ from accounting principles generally accepted in the United States.
Dollar Roll Transactions
Each Fund is authorized to enter into dollar roll transactions (“dollar rolls”) in which a Fund purchases or sells mortgage-backed securities for delivery in the future and simultaneously contracts to sell or repurchase substantially similar (same type, coupon, and maturity) securities on a different specified future date. Dollar rolls are identified in the Portfolio of Investments as “MDR” for each of the Funds, when applicable. During the roll period, the Fund foregoes principal and interest paid on the mortgage-backed securities. The Fund is compensated by fee income or the difference between the current sales price and the lower forward price for the future purchase. Such compensation is amortized over the life of the dollar rolls and is included in “Investment Income” on the Statement of Operations. Dollar rolls are valued daily. Enhanced Multi-Strategy Income invested in dollar rolls during the fiscal year ended July 31, 2009.
Dollar rolls involve the risk that the market value of the securities the Fund is obligated to repurchase under an agreement may decline below the repurchase price. These transactions also involve some risk to the Fund if the other party should default on its obligation and the Fund is delayed or prevented from completing the transaction. In the event that the buyer of securities under a dollar roll files for bankruptcy or becomes insolvent, the Fund’s use of proceeds of the dollar roll may be restricted pending a determination by the other party, or its trustee or receiver, whether to enforce the Fund’s obligation to repurchase the securities.
Foreign Currency Transactions
Each Fund is authorized to engage in foreign currency exchange transactions, including foreign currency forward, futures, options and swap contracts. To the extent that the Funds invest in securities and/or contracts that are denominated in a currency other than U.S. dollars, the Funds will be subject to currency risk, which is the risk that an increase in the U.S. dollar relative to the foreign currency will reduce returns or portfolio value. Generally, when the U.S. dollar rises in value against a foreign currency, the Funds’ investments denominated in that currency will lose value because its currency is worth fewer U.S. dollars; the opposite effect occurs if the U.S. dollar falls in relative value. Investments and other assets and liabilities denominated in foreign currencies are converted into U.S. dollars on a spot (i.e. cash) basis at the spot rate prevailing in the foreign currency exchange market at the time of valuation. Purchases and sales of investments and income denominated in foreign currencies are translated into U.S. dollars on the respective dates of such transactions.
The books and records of the Funds are maintained in U.S. dollars. Foreign currencies, investments and other assets and liabilities are translated into U.S. dollars at 4:00 p.m. Eastern time. Investments, income and expenses are translated on the respective dates of such transactions. Net realized foreign currency gains and losses resulting from changes in exchange rates include foreign currency gains and losses between trade date and settlement date of the transactions, foreign currency transactions, and the difference between the amounts of interest and dividends recorded on the books of a Fund and the amounts actually received.
The realized and unrealized gains or losses resulting from changes in foreign exchange rates are included in ‘‘Net realized gain (loss) from investments and foreign currency’’ and ‘‘Change in net unrealized appreciation (depreciation) of investments and foreign currency’’ on the Statement of Operations.
Forward Foreign Currency Exchange Contracts
Each Fund is subject to foreign currency exchange rate risk in the normal course of pursuing its investment objectives and is authorized to enter into forward foreign currency exchange contracts in an attempt to manage such risk under two circumstances: (i) when a Fund enters into a contract for the purchase or sale of a security denominated in a foreign currency to “lock in” the U.S. exchange rate of the transaction, with such period being a shortdated contract covering the period between transaction date and settlement date; or (ii) when the Adviser, believes that the currency of a particular foreign country may experience a substantial movement against the U.S. dollar or against another foreign currency. Forward foreign currency exchange contracts are valued daily at the forward rate and are recognized as “Unrealized appreciation or depreciation on forward foreign currency exchange contracts” on the Statement of Assets and Liabilities. The change in value of the contracts during the reporting period is recognized as “Change in net unrealized appreciation (depreciation) of forward foreign currency exchange contracts” on the Statement of Operations. When the contract is closed or offset with the same counterparty, a Fund recognizes the difference between the value of the contract at the time it was opened and the value at the time it was closed or offset as “Net realized gain (loss) from forward foreign currency exchange contracts” on the Statement of Operations.
Forward foreign currency exchange contracts will generally not be entered into for terms greater than three months, but may have maturities of up to six months or more. The use of forward foreign currency exchange contracts does not eliminate fluctuations in the underlying prices of a Fund’s investment securities; however, it does establish a rate of exchange that can be achieved in the future. The use of forward foreign currency exchange contracts involves the risk that anticipated currency movements will not be accurately predicted. A forward foreign currency exchange contract would limit the risk of loss due to a decline in the value of a particular currency; however, it also would limit any potential gain that might result should the value of the currency increase instead of decrease. These contracts may involve market risk in excess of the amount of unrealized gain or loss reflected on the Statement of Assets and Liabilities.
The average number of forward foreign currency exchange contracts outstanding during the fiscal year ended July 31, 2009, was as follows:
| | | | |
| | | International
Income | | Enhanced
Multi-Strategy
Income |
Average number of forward foreign currency exchange contracts | | 37 | | 29 |
Refer to Footnote 3 – Derivative Instruments and Hedging Activities for further details on forward foreign currency exchange contract activity.
Futures Contracts
Each Fund is subject to interest rate risk in the normal course of pursuing its investment objectives and is authorized to invest in futures contracts in an attempt to manage such risk. Upon entering into a futures contract, a Fund is required to deposit with the broker an amount of cash or liquid securities equal to a specified percentage of the contract amount. This is known as the “initial margin.” Cash held by the broker to cover initial margin requirements on open futures contracts, if any, is recognized as “Deposits with brokers for open futures contracts” on the Statement of Assets and Liabilities. Subsequent payments (“variation margin”) are made or received by a Fund each day, depending on the daily fluctuation of the value of the contract. Variation margin is recognized as a receivable or payable for “Variation margin on futures contracts” on the Statement of Assets and Liabilities, when applicable.
During the period the futures contract is open, changes in the value of the contract are recorded as an unrealized gain or loss by “marking-to-market” on a daily basis to reflect the changes in market value of the contract and is recognized as “Change in net unrealized appreciation (depreciation) of futures contracts” on the Statement of Operations. When the contract is closed or expired, a Fund records a realized gain or loss equal to the difference between the value of the contract on the closing date and value of the contract when originally entered into and is recognized as “Net realized gain (loss) from futures contracts” on the Statement of Operations.
Risks of investments in futures contracts include the possible adverse movement of the securities or indices underlying the contracts, the possibility that there may not be a liquid secondary market for the contracts and/or that a change in the value of the contract may not correlate with a change in the value of the underlying securities or indices.
The average number of futures contracts outstanding during the fiscal year ended July 31, 2009, was as follows:
| | | | | |
| | | International
Income | | | Enhanced
Multi-Strategy
Income |
Average number of futures contracts outstanding | | 5 | * | | 9 |
| * | The average number of contracts is calculated based on the outstanding contracts at the beginning of the fiscal year and at the end of each fiscal quarter within the current fiscal year. International Income was not invested in futures contracts at the end of the current fiscal year. |
Refer to Footnote 3 – Derivative Instruments and Hedging Activities for further details on futures contract activity.
Options Transactions
Each Fund is subject to foreign currency exchange rate risk and interest rate risk in the normal course of pursuing its investment objectives and is authorized to purchase and write (sell) call and put options on securities, futures, swaps (“swaptions”) or currencies in an attempt to manage such risks. The purchase of options involves the risk of loss of all or a part of the cash paid for the options. Options purchased are accounted for in the same manner as portfolio securities. The risk associated with purchasing options is limited
Notes to Financial Statements (continued)
to the premium paid. When a Fund writes an option, an amount equal to the net premium received (the premium less commission) is recognized as “Call and/or Put options and/or swaptions written, at value” on the Statement of Assets and Liabilities and is subsequently adjusted to reflect the current value of the written option until the option expires or a Fund enters into a closing purchase transaction. The changes in value of the options written during the reporting period are recognized as “Change in net unrealized appreciation (depreciation) of options and/or swaptions written” on the Statement of Operations. When a call or put option expires or a Fund enters into a closing purchase transaction, the difference between the net premium received and any amount paid at expiration or on executing a closing purchase transaction, including commission, is recognized as “Net realized gain (loss) from options and/or swaptions written.” The Fund, as a writer of an option, has no control over whether the underlying instrument may be sold (called) or purchased (put) and as a result bears the risk of an unfavorable change in the market value of the instrument underlying the written option. There is also the risk a Fund may not be able to enter into a closing transaction because of an illiquid market.
The average number of option and swaption contracts outstanding during the fiscal year ended July 31, 2009, was as follows:
| | | | | | |
| | | International
Income | | | Enhanced
Multi-Strategy
Income | |
Purchased options average number of contracts outstanding* | | 1 | ** | | 1 | ** |
| | |
| | | International
Income | | | Enhanced
Multi-Strategy
Income | |
Options written average number of contracts outstanding* | | 1 | | | 1 | |
| | |
| | | International
Income | | | Enhanced
Multi-Strategy
Income | |
Swaptions written average number of contracts outstanding* | | 1 | ** | | 1 | ** |
| * | Includes both calls and puts. |
| ** | The average number of contracts is calculated based on the outstanding contracts at the beginning of the fiscal year and at the end of each fiscal quarter within the current fiscal year. The Funds were not invested in purchased options or swaptions written at the beginning or end of the current fiscal year. |
Refer to Footnote 3 – Derivative Instruments and Hedging Activities for further details on written and purchased option activity.
Swap Contracts
Each Fund is authorized to enter into swap contracts consistent with their investment objectives and policies to reduce, increase or otherwise alter its risk profile or to alter its portfolio characteristics (i.e. duration, yield curve positioning and credit quality).
Each Fund is subject to interest rate risk in the normal course of pursuing its investment objectives and policies in an attempt to obtain a desired return at a lower cost than if the Funds had invested directly in the asset that yielded the desired return. In connection with these contracts, securities in the Funds’ portfolios of investments may be identified as collateral in accordance with the terms of the respective swap contract. Interest rate swap contracts involve the exchange by a Fund with another party of their respective commitments to pay or receive interest (i.e., an exchange of floating rate payments for fixed rate payments with respect to a specified notional amount of principal). Interest rate swap contracts are valued daily. The Funds accrue daily the periodic payments expected to be paid and received on each interest rate swap contract and recognize the daily change in the market value of the Funds contractual rights and obligations under the contracts. The net amount recorded on these transactions for each counterparty is recognized on the Statement of Assets and Liabilities as “Unrealized appreciation or depreciation on interest rate swaps” with the change during the fiscal period recognized on the Statement of Operations as “Change in net unrealized appreciation (depreciation) of swaps.” Income received or paid by the Funds is recognized as “Net realized gain (loss) from swaps” on the Statement of Operations, in addition to the net realized gains or losses recognized upon the termination of a interest rate swap contract and are equal to the difference between the Funds’ basis in the interest rate swap and the proceeds from (or cost of) the closing transaction. The amount of the payment obligation is based on the notional amount of the interest rate swap contract. For tax purposes, periodic payments are treated as ordinary income or expense.
The average notional amount of interest rate swap contracts outstanding during the fiscal year ended July 31, 2009, was as follows:
| | | | |
| | | International
Income | | Enhanced
Multi-Strategy
Income |
Average number of interest rate swap contracts | | 13 | | 12 |
Each Fund is subject to credit risk in the normal course of pursuing its investment objectives. A Fund may enter into a credit default swap contract to seek to maintain a total return on a particular investment or portion of its portfolio, or to take an active long or short position with respect to the likelihood of a particular issuer’s default. Credit default swap contracts involve one party making a stream of payments to another party in exchange for the right to receive a specified return if/when there is a credit event by a third party. Generally, a credit event means bankruptcy, failure to pay, or restructuring. The specific credit events applicable for each credit default swap are stated in the terms of the particular swap agreement. As a purchaser of a credit default swap contract, the Fund pays to the counterparty a periodic interest fee based on the notional amount of the credit default swap. This interest fee is accrued daily
as a component of unrealized appreciation or depreciation and is recorded as a realized loss upon payment. Upon occurrence of a specific credit event with respect to the underlying referenced entity, the Fund is obligated to deliver that security, or an equivalent amount of cash, to the counterparty in exchange for receipt of the notional amount from the counterparty. The difference between the value of the security delivered and the notional amount received is recorded as a realized gain. Payments received or made at the beginning of the measurement period are recognized as “Credit default swap premiums paid or received” on the Statement of Assets and Liabilities. As a seller of a credit default swap contract, the Fund generally receives from the counterparty a periodic interest fee based on the notional amount of the credit default swap. This interest fee is accrued daily as a component of unrealized appreciation or depreciation and is recorded as a realized gain upon payment. Upon occurrence of a specific credit event with respect to the underlying referenced entity, the Fund will either receive that security, or an equivalent amount of cash, from the counterparty in exchange for payment of the notional amount to the counterparty, or pay a net settlement amount of the credit default swap contract less the recovery value of the referenced obligation or underlying securities comprising the referenced index. The difference between the value of the security received and the notional amount paid is recorded as a realized loss. The maximum potential amount of future payments the Fund could incur as a seller of protection in a credit default swap contract is limited to the notional amount of the contract. The maximum potential amount would be offset by the recovery value, if any, of the respective referenced entity. International Income did not invest in credit default swap contracts during the fiscal year ended July 31, 2009.
The average notional amount of credit default swap contracts outstanding for Enhanced Multi-Strategy Income during the fiscal year ended July 31, 2009, was as follows:
| | | |
| | | Enhanced
Multi-Strategy
Income |
Credit default swap contracts average notional amount outstanding | | $ | 4,404,040 |
Refer to Footnote 3 – Derivative Instruments and Hedging Activities for further details on swap contract activity.
Market and Counterparty Credit Risk
In the normal course of business each Fund may invest in financial instruments and enter into financial transactions where risk of potential loss exists due to changes in the market (market risk) or failure of the other party to the transaction to perform (counterparty credit risk). The potential loss could exceed the value of the financial assets recorded on the financial statements. Financial assets, which potentially expose a Fund to counterparty credit risk, consist principally of cash due from counterparties on forward, option and swap transactions. The extent of the Funds’ exposure to counterparty credit risk in respect to these financial assets approximates their carrying value as recorded on the Statement of Assets and Liabilities. Futures contracts expose a Fund to minimal counterparty credit risk as they are exchange traded and the exchange’s clearing house, which is counterparty to all exchange traded futures, guarantees the futures contracts against default.
Each Fund helps manage counterparty credit risk by entering into agreements only with counterparties the Adviser believes have the financial resources to honor their obligations and by having the Adviser continually monitor the financial stability of the counterparties. Additionally, all counterparties are required to pledge collateral daily (based on the daily valuation of the financial asset) on behalf of a Fund with a value approximately equal to the amount of any unrealized gain above a pre-determined threshold. Reciprocally, when a Fund has an unrealized loss, the Fund has instructed the custodian to pledge assets of the Fund as collateral with a value approximately equal to the amount of the unrealized loss above a pre-determined threshold. Collateral pledges are monitored and subsequently adjusted if and when the valuations fluctuate, either up or down, by at least the predetermined threshold amount.
Zero Coupon Securities
Each Fund is authorized to invest in zero coupon securities. A zero coupon security does not pay a regular interest coupon to its holders during the life of the security. Tax-exempt income to the holder of the security comes from accretion of the difference between the original purchase price of the security at issuance and the par value of the security at maturity and is effectively paid at maturity. Such securities are included in the Portfolios of Investments with a 0.000% coupon rate in their description. The market prices of zero coupon securities generally are more volatile than the market prices of securities that pay interest periodically.
Repurchase Agreements
In connection with transactions in repurchase agreements, it is each Fund’s policy that its custodian take possession of the underlying collateral securities, the fair value of which exceeds the principal amount of the repurchase transaction, including accrued interest, at all times. If the seller defaults, and the fair value of the collateral declines, realization of the collateral may be delayed or limited.
Custodian Fee Credit
Each Fund has an arrangement with the custodian bank whereby certain custodian fees and expenses are reduced by net credits earned on each Fund’s cash on deposit with the bank. Such deposit arrangements are an alternative to overnight investments. Credits for cash balances may be offset by charges for any days on which a Fund overdraws its account at the custodian bank.
Indemnifications
Under the Trust’s organizational documents, its Officers and Trustees are indemnified against certain liabilities arising out of the performance of their duties to the Trust. In addition, in the normal course of business, the Trust enters into contracts that provide general indemnifications to other parties. The Trust’s maximum exposure under these arrangements is unknown as this would involve future claims that may be made against the Trust that have not yet occurred. However, the Trust has not had prior claims or losses pursuant to these contracts and expects the risk of loss to be remote.
Notes to Financial Statements (continued)
Use of Estimates
The preparation of financial statements in conformity with accounting principles generally accepted in the United States requires management to make estimates and assumptions that affect the reported amounts of assets and liabilities at the date of the financial statements and the reported amounts of increases and decreases in net assets from operations during the reporting period. Actual results may differ from those estimates.
2. Fair Value Measurements
During the current fiscal period, the Funds adopted the provisions of Statement of Financial Accounting Standards No. 157 (SFAS No. 157) “Fair Value Measurements.” SFAS No. 157 defines fair value, establishes a framework for measuring fair value in generally accepted accounting principles and expands disclosure about fair value measurements. In determining the value of each Fund’s investments various inputs are used. These inputs are summarized in the three broad levels listed below:
| | |
| Level 1 – | | Quoted prices in active markets for identical securities. |
| Level 2 – | | Other significant observable inputs (including quoted prices for similar securities, interest rates, prepayment speeds, credit risk, etc.). |
| Level 3 – | | Significant unobservable inputs (including management’s assumptions in determining the fair value of investments). |
The inputs or methodology used for valuing securities are not an indication of the risk associated with investing in those securities.
The following is a summary of each Fund’s fair value measurements as of July 31, 2009:
| | | | | | | | | | | | | | | |
| International Income | | Level 1 | | | Level 2 | | | Level 3 | | Total | |
Investments: | | | | | | | | | | | | | | | |
U.S. Government and Agency Obligations | | $ | 165,056 | | | $ | 193,929 | | | $ | — | | $ | 358,985 | |
Sovereign Debt | | | — | | | | 697,439 | | | | — | | | 697,439 | |
Short-Term Investments | | | 995,342 | | | | 872,312 | | | | — | | | 1,867,654 | |
Put Options Written | | | (203 | ) | | | — | | | | — | | | (203 | ) |
Derivatives: | | | | | | | | | | | | | | | |
Forward Foreign Currency Exchange Contracts* | | | — | | | | (19,609 | ) | | | — | | | (19,609 | ) |
Interest Rate Swaps* | | | — | | | | (4,569 | ) | | | — | | | (4,569 | ) |
Total | | $ | 1,160,195 | | | $ | 1,739,502 | | | $ | — | | $ | 2,899,697 | |
| | | | |
| Enhanced Multi-Strategy Income | | Level 1 | | | Level 2 | | | Level 3 | | Total | |
Investments: | | | | | | | | | | | | | | | |
Corporate Bonds | | $ | — | | | $ | 1,902,886 | | | $ | — | | $ | 1,902,886 | |
Convertible Bonds | | | — | | | | 4,912 | | | | — | | | 4,912 | |
Asset-Backed and Mortgaged-Backed Securities | | | — | | | | 6,553,062 | | | | — | | | 6,553,062 | |
Municipal Bonds | | | — | | | | 40,986 | | | | — | | | 40,986 | |
U.S. Government and Agency Obligations | | | 330,093 | | | | — | | | | — | | | 330,093 | |
Sovereign Debt | | | — | | | | 534,252 | | | | — | | | 534,252 | |
Put Options Written | | | (590 | ) | | | — | | | | — | | | (590 | ) |
Derivatives: | | | | | | | | | | | | | | | |
Forward Foreign Currency Exchange Contracts* | | | — | | | | (14,415 | ) | | | — | | | (14,415 | ) |
Interest Rate Swaps* | | | — | | | | (43,112 | ) | | | — | | | (43,112 | ) |
Credit Default Swaps* | | | — | | | | 406,319 | | | | — | | | 406,319 | |
Futures Contracts* | | | 28,701 | | | | — | | | | — | | | 28,701 | |
Total | | $ | 358,204 | | | $ | 9,384,890 | | | $ | — | | $ | 9,743,094 | |
| * | Represents net unrealized appreciation (depreciation). |
3. Derivative Instruments and Hedging Activities
During the current fiscal period, the Funds adopted the provisions of Statement of Financial Accounting Standards No. 161 (SFAS No. 161) “Disclosures about Derivative Instruments and Hedging Activities.” This standard is intended to enhance financial statement disclosures for derivative instruments and hedging activities and enable investors to better understand: a) how and why a fund uses derivative instruments; b) how derivative instruments are accounted for; and c) how derivative instruments affect a fund’s financial position, results of operations and cash flows, if any. The Funds record derivative instruments at fair value with changes in fair value recognized on the Statement of Operations, when applicable. Even though the Funds’ investments in derivatives may represent economic hedges, they are considered to be non-hedge transactions for SFAS No. 161 disclosure purposes. For additional information on the derivative instruments in which the Funds were invested during and at the end of the reporting period, refer to the Portfolios of Investments, Financial Statements and Footnote 1 – General Information and Significant Accounting Policies.
The following tables present the fair value of all derivative instruments held by the Funds as of July 31, 2009, the location of these instruments on the Statement of Assets and Liabilities, and the primary underlying risk exposure.
| | | | | | | | | | | | |
| International Income | | | | |
| | | | | Location on the Statement of Assets and Liabilities |
Underlying
Risk Exposure | | Derivative
Instrument | | Asset Derivatives | | Liability Derivatives |
| | | Location | | Value | | Location | | Value |
Foreign Currency Exchange Rate | | Forward Foreign Currency Exchange Contracts | | Unrealized appreciation on forward foreign currency exchange contracts | | $ | 30,568 | | Unrealized depreciation on forward foreign currency exchange contracts | | $ | 50,177 |
Interest Rate | | Options | | — | | | — | | Put options written, at value | | | 203 |
Interest Rate | | Swaps | | Unrealized appreciation on interest rate swaps* | | | 50,768 | | Unrealized depreciation on interest rate swaps* | | | 55,337 |
Total | | | | | | $ | 81,336 | | | | $ | 105,717 |
| * | Represents cumulative appreciation (depreciation) of swap contracts as reported in the Portfolio of Investments. Some swap contracts require a counterparty to pay or receive a premium, which is disclosed in the Statement of Assets and Liabilities but is not reflected in the cumulative appreciation (depreciation) presented above. |
| | | | | | | | | | | | |
| Enhanced Multi-Strategy Income | | |
| | | | | Location on the Statement of Assets and Liabilities |
Underlying
Risk Exposure | | Derivative Instrument | | Asset Derivatives | | Liability Derivatives |
| | | Location | | Value | | Location | | Value |
Foreign Currency Exchange Rate | | Forward Foreign Currency Exchange Contracts | | Unrealized appreciation on forward foreign currency exchange contracts | | $ | 38,029 | | Unrealized depreciation on forward foreign currency exchange contracts | | $ | 52,444 |
Interest Rate | | Futures contracts | | Deposits with brokers for open futures contracts and Receivable for variation margin on futures contracts* | | | 29,416 | | Deposits with brokers for open futures contracts and
Payable for variation margin on futures contracts* | | | 715 |
Interest Rate | | Options | | — | | | — | | Put options written, at value | | | 590 |
Interest Rate | | Swaps | | Unrealized appreciation on interest rate swaps** | | | 60,096 | | Unrealized depreciation on interest rate swaps** | | | 103,208 |
Credit | | Swaps | | Unrealized appreciation on credit default swaps** | | | 406,319 | | Unrealized depreciation on credit default swaps | | | — |
Total | | | | | | $ | 533,860 | | | | $ | 156,957 |
| * | Value represents cumulative unrealized appreciation (depreciation) of futures contracts as reported in the Portfolio of Investments and not the deposits with brokers, if any, or the receivable or payable for variation margin on futures contracts presented in the Statement of Assets and Liabilities. |
| ** | Represents cumulative appreciation (depreciation) of swap contracts as reported in the Portfolio of Investments. Some swap contracts require a counterparty to pay or receive a premium, which is disclosed in the Statement of Assets and Liabilities but is not reflected in the cumulative appreciation (depreciation) presented above. |
The following tables present the amount of net realized gain (loss) and change in net unrealized appreciation (depreciation) recognized for the fiscal year ended July 31, 2009, on derivative instruments, as well as the primary risk exposure associated with each.
| | | | | | | | |
| Net Realized Gain (Loss) from Investments and Foreign Currency* | | International
Income | | | Enhanced
Multi-Strategy
Income | |
| Risk Exposure | | | | | | |
Foreign Currency Exchange Rate | | $ | (6,695 | ) | | $ | (8,514 | ) |
| * | Represents the net realized gain (loss) on options contracts purchased included in “Net realized gain (loss) from investments and foreign currency” presented on the Statement of Operations. |
| | | | | | |
| Net Realized Gain (Loss) from Forward Foreign Currency Exchange Contracts | | International
Income | | Enhanced
Multi-Strategy
Income |
| Risk Exposure | | | | |
Foreign Currency Exchange Rate | | $ | 268,035 | | $ | 45,751 |
Notes to Financial Statements (continued)
| | | | | | | | |
| Net Realized Gain (Loss) from Futures Contracts | | International
Income | | | Enhanced
Multi-Strategy
Income | |
| Risk Exposure | | | | | | |
Interest Rate | | | $18,198 | | | | $10,908 | |
| | |
| Net Realized Gain (Loss) from Swaps | | International
Income | | | Enhanced
Multi-Strategy
Income | |
| Risk Exposure | | | | | | |
Interest Rate | | | $54,544 | | | $ | (445,431 | ) |
Credit | | | — | | | | 96,351 | |
Total | | | $54,544 | | | | $(349,080 | ) |
| | |
| Net Realized Gain (Loss) from Options Written | | International
Income | | | Enhanced
Multi-Strategy
Income | |
| Risk Exposure | | | | | | |
Foreign Currency Exchange Rate | | | $6,039 | | | | $7,680 | |
| | |
| Net Realized Gain (Loss) from Swaptions Written | | International
Income | | | Enhanced
Multi-Strategy
Income | |
| Risk Exposure | | | | | | |
Foreign Currency Exchange Rate | | $ | (26,186 | ) | | $ | (39,851 | ) |
| Change in Net Unrealized Appreciation (Depreciation) of Forward Foreign Currency Exchange Contracts | | International
Income | | | Enhanced
Multi-Strategy
Income | |
| Risk Exposure | | | | | | |
Foreign Currency Exchange Rate | | $ | (18,047 | ) | | $ | (19,649 | ) |
| | |
| Change in Net Unrealized Appreciation (Depreciation) of Futures Contracts | | International
Income | | | Enhanced
Multi-Strategy
Income | |
| Risk Exposure | | | | | | |
Interest Rate | | $ | (15,277 | ) | | | $28,701 | |
| | |
| Change in Net Unrealized Appreciation (Depreciation) of Options Written | | International
Income | | | Enhanced
Multi-Strategy
Income | |
| Risk Exposure | | | | | | |
Interest Rate | | $ | 472 | | | $ | 1,435 | |
| | |
| Change in Net Unrealized Appreciation (Depreciation) of Swaps | | International
Income | | | Enhanced
Multi-Strategy
Income | |
| Risk Exposure | | | | | | |
Interest Rate | | $ | (13,617 | ) | | $ | (43,112 | ) |
Credit | | | — | | | | 503,091 | |
Total | | $ | (13,617 | ) | | $ | 459,979 | |
4. Fund Shares
Transactions in Fund shares were as follows:
| | | | | | | | | | | | |
| | | International Income | |
| | | Year Ended
7/31/09 | | For the Period December 27, 2007
(commencement of operations)
through July 31, 2008 | |
| | | Shares | | Amount | | Shares | | | Amount | |
Shares sold | | 4,376 | | $ | 39,249 | | 330,522 | | | $ | 3,305,097 | |
Shares redeemed | | — | | | — | | (2,376 | ) | | | (23,950 | ) |
Net Increase (Decrease) | | 4,376 | | $ | 39,249 | | 328,146 | | | $ | 3,281,147 | |
| |
| | | Enhanced Multi-Strategy Income | |
| | | Year Ended
7/31/09 | | For the Period December 27, 2007
(commencement of operations)
through July 31, 2008 | |
| | | Shares | | Amount | | Shares | | | Amount | |
Shares sold | | 4,023 | | $ | 38,960 | | 536,681 | | | $ | 5,368,313 | |
Shares redeemed | | — | | | — | | — | | | | — | |
Net Increase (Decrease) | | 4,023 | | $ | 38,960 | | 536,681 | | | $ | 5,368,313 | |
5. Investment Transactions
Purchases and sales (including maturities but excluding put and call option and swaption transactions, short-term investments, derivative and dollar roll transactions) for the fiscal year ended July 31, 2009, were as follows:
| | | | | | |
| | | International
Income | | Enhanced
Multi-Strategy
Income |
Purchases: | | | | | | |
Investment securities | | $ | 1,761,281 | | $ | 3,610,009 |
U.S. Government and agency obligations | | | 976,516 | | | 34,192,889 |
Sales and maturities: | | | | | | |
Investment securities | | | 2,854,370 | | | 2,892,449 |
U.S. Government and agency obligations | | | 609,426 | | | 34,457,184 |
Transactions in call and put options written during the fiscal year ended July 31, 2009, were as follows:
| | | | | | | | | | | | | | |
| | | International Income | | | Enhanced Multi-Strategy Income | |
| | | Number of
Contracts | | | Premiums
Received | | | Number of
Contracts | | | Premiums
Received | |
Outstanding, beginning of period | | — | | | $ | — | | | — | | | $ | — | |
Options written | | 3 | | | | 7,062 | | | 5 | | | | 10,169 | |
Options terminated in closing purchase transactions | | — | | | | — | | | — | | | | — | |
Options expired | | (2 | ) | | | (6,387 | ) | | (2 | ) | | | (8,144 | ) |
Outstanding, end of period | | 1 | | | $ | 675 | | | 3 | | | $ | 2,025 | |
Transactions in call and put swaptions written during the fiscal year ended July 31, 2009, were as follows:
| | | | | | | | | | | | | | |
| | | International Income | | | Enhanced Multi-Strategy Income | |
| | | Number of
Contracts | | | Premiums
Received | | | Number of
Contracts | | | Premiums
Received | |
Outstanding, beginning of period | | — | | | $ | — | | | — | | | $ | — | |
Swaptions written | | 11 | | | | 53,443 | | | 12 | | | | 76,609 | |
Swaptions terminated in closing purchase transactions | | (7 | ) | | | (33,308 | ) | | (8 | ) | | | (50,116 | ) |
Swaptions expired | | (4 | ) | | | (20,135 | ) | | (4 | ) | | | (26,493 | ) |
Outstanding, end of period | | — | | | $ | — | | | — | | | $ | — | |
6. Income Tax Information
The following information is presented on an income tax basis. Differences between amounts for financial statement and federal income tax purposes are primarily due to the amortization of premium, recognition of unrealized gain or loss for tax (mark-to-market) for certain foreign currency contracts, and timing and character differences in recognizing certain gains and losses on investment transactions. To the extent that differences arise that are permanent in nature, such amounts are reclassified within the capital
Notes to Financial Statements (continued)
accounts on the Statement of Assets and Liabilities presented in the annual report, based on their federal tax basis treatment; temporary differences do not require reclassification. Temporary and permanent differences do not impact the net asset values of the Funds.
At July 31, 2009, the cost of investments (excluding options written) was as follows:
| | | | | | |
| | | International
Income | | Enhanced
Multi-Strategy
Income |
Cost of investments | | $ | 2,911,291 | | $ | 9,100,476 |
Gross unrealized appreciation and gross unrealized depreciation of investments (excluding options written) at July 31, 2009, were as follows:
| | | | | | | | |
| | | International
Income | | | Enhanced
Multi-Strategy
Income | |
Gross unrealized: | | | | | | | | |
Appreciation | | $ | 18,906 | | | $ | 268,423 | |
Depreciation | | | (6,119 | ) | | | (2,708 | ) |
Net unrealized appreciation (depreciation) of investments | | $ | 12,787 | | | $ | 265,715 | |
The tax components of undistributed net ordinary income and net long-term capital gains at July 31, 2009, the Funds’ tax year end, were as follows:
| | | | | | |
| | | International
Income | | Enhanced
Multi-Strategy
Income |
Undistributed net ordinary income* | | $ | 3,709 | | $ | 116,488 |
Undistributed net long-term capital gains | | | — | | | — |
| * | Undistributed net ordinary income (on a tax basis) has not been reduced for the dividend declared on July 10, 2009, paid on August 3, 2009. Net ordinary income consists of net taxable income derived from dividends, interest, and net short-term capital gains, if any. |
The tax character of distributions paid during the Funds’ tax years ended July 31, 2009 and July 31, 2008, was designated for purposes of the dividends paid deduction as follows:
| | | | | | |
| 2009 | | International
Income | | Enhanced
Multi-Strategy
Income |
Distributions from net ordinary income* | | $ | 441,817 | | $ | 545,250 |
Distributions from net long-term capital gains** | | | — | | | — |
| * | Net ordinary income consists of net taxable income derived from dividends, interest, and net short-term capital gains, if any. |
| ** | The Funds designated as a long-term capital gain dividend, pursuant to the Internal Revenue Code Section 852(b)(3), the amount necessary to reduce earnings and profits of the Funds related to net capital gain to zero for the tax year ended July 31, 2009. |
| | | | | | |
| For the period December 27, 2007 (commencement of operations) through July 31, 2008 | | International
Income | | Enhanced
Multi-Strategy
Income |
Distributions from net ordinary income* | | $ | 60,149 | | $ | 118,541 |
Distributions from net long-term capital gains | | | — | | | — |
| * | Net ordinary income consists of net taxable income derived from dividends, interest, and net short-term capital gains, if any. |
At July 31, 2009, the Funds’ tax year end, International Income had unused capital loss carryforwards available for federal income tax purposes to be applied against future capital gains, if any. If not applied, the carryforwards will expire as follows:
| | | |
| | | International
Income |
Expiration: July 31, 2017 | | $ | 18,827 |
The Funds have elected to defer net realized losses from investments incurred from November 1, 2008 through July 31, 2009, the Funds’ tax year end, (“post-October losses”) in accordance with federal income tax regulations. Post-October losses are treated as having arisen on the first day of the following fiscal year:
| | | | | | |
| | | International
Income | | Enhanced
Multi-Strategy
Income |
Post-October capital losses | | $ | 48,837 | | $ | 362,560 |
Post-October currency losses | | | 273,501 | | | — |
7. Management Fee and Other Transactions with Affiliates
The Adviser does not charge any investment advisory or administrative fees directly to the Funds. The Adviser has also agreed irrevocably during the existence of the Funds to waive all fees and pay or reimburse all expenses of the Funds (other than interest expense, taxes, fees incurred in acquiring and disposing of portfolio securities and extraordinary expenses). The Adviser is compensated for its services to the Funds from the fee charged at the separately managed account level.
At July 31, 2009, Nuveen owned 300,000 shares and 500,000 shares of International Income and Enhanced Multi-Strategy Income, respectively.
8. Subsequent Events
Distributions to Shareholders
The Funds declared dividend distributions from their net investment income which were paid on September 1, 2009, to shareholders of record on August 28, 2009, as follows:
| | | | | | |
| | | International
Income | | Enhanced
Multi-Strategy
Income |
Dividend per share | | $ | .0246 | | $ | .0711 |
Financial Accounting Standards Board Statement of Financial Accounting Standards No. 165 (SFAS No. 165)
In May 2009, the Financial Accounting Standards Board issued SFAS No. 165 “Subsequent Events.” SFAS No. 165 requires an entity to recognize in the financial statements the effects of all subsequent events that provide additional evidence about conditions that existed at the date of the balance sheet. SFAS No. 165 is intended to establish general standards of accounting and for disclosure of events that occur after the balance sheet date but before financial statements are issued or are available to be issued. SFAS No. 165 requires the disclosure of the date through which an entity has evaluated subsequent events and the basis for that date – that is, whether that date represents the date the financial statements were issued or were available to be issued. SFAS No. 165 is effective for interim and annual periods ending after June 15, 2009. The Funds have performed an evaluation of subsequent events through September 29, 2009, which is the date the Trust’s form N-SAR was filed with the Securities and Exchange Commission (SEC).
Financial Highlights
| | | | | | | | | | | | | | | | | | | | | | | | | | | | | | |
| Selected data for a share outstanding throughout each period: | |
| | | | | |
| | | | | Investment Operations | | Less Distributions | | | | | | |
| | | | | | | |
| INTERNATIONAL INCOME | | | | | | | | | | | | | | | | | | |
Year Ended
July 31, | | Beginning
Net
Asset
Value | | Net
Invest-
ment
Income(a) | | Net
Realized/
Unrealized
Gain
(Loss) | | | Total | | Net
Invest-
ment
Income | | | Capital
Gains | | Total | | | Ending
Net
Asset
Value | | Total
Return(b) | |
2009 | | $ | 9.80 | | $ | .33 | | $ | .14 | | | $ | .47 | | $ | (1.34 | ) | | $ | — | | $ | (1.34 | ) | | $ | 8.93 | | 5.40 | % |
2008(e) | | | 10.00 | | | .22 | | | (.20 | ) | | | .02 | | | (.22 | ) | | | — | | | (.22 | ) | | | 9.80 | | .19 | |
| | | | | | | | | | | | | | | | | | | | | | |
| | |
|
| Ratios/Supplemental Data | |
| | | Ratios to Average
Net Assets
Before Credit/
Reimbursement | | | Ratios to Average
Net Assets After
Reimbursement(c) | | | Ratios to Average
Net Assets
After Credit/
Reimbursement(d) | | | | |
Ending
Net
Assets
(000) | | Expenses | | | Net
Invest-
ment
Income | | | Expenses | | | Net
Invest-
ment
Income | | | Expenses** | | | Net
Invest-
ment
Income | | | Portfolio
Turnover
Rate | |
| $ | 2,968 | | 4.42 | % | | (.84 | )% | | .00 | % | | 3.58 | % | | (.00 | )% | | 3.58 | % | | 144 | % |
| | 3,214 | | 2.06 | * | | 1.68 | * | | .06 | * | | 3.68 | * | | (.00 | )* | | 3.74 | * | | 49 | |
| ** | Expense ratios round to less than (.00)%. |
| (a) | Per share Net Investment Income is calculated using the average daily shares method. |
| (b) | Total return is the combination of changes in net asset value, reinvested dividend income at net asset value and reinvested capital gains distributions at net asset value, if any. Total returns are not annualized. |
| (c) | After expense reimbursement from the Adviser. |
| (d) | After custodian fee credit and expense reimbursement. |
| (e) | For the period December 27, 2007 (commencement of operations) through July 31, 2008. |
See accompanying notes to financial statements.
Financial Highlights (continued)
| | | | | | | | | | | | | | | | | | | | | | | | | | | | | | | |
| Selected data for a share outstanding throughout each period: | |
| | | | | |
| | | | | Investment Operations | | Less Distributions | | | | | | |
| | | | | | | |
| ENHANCED MULTI-STRATEGY INCOME | | | | | | | | | | | | | | | | | | | |
Year Ended
July 31, | | Beginning
Net
Asset
Value | | Net
Invest-
ment
Income(a) | | Net
Realized/
Unrealized
Gain
(Loss) | | | Total | | Net
Invest-
ment
Income | | | Capital
Gains | | | Total | | | Ending
Net
Asset
Value | | Total
Return(b) | |
2009 | | $ | 9.81 | | $ | 1.08 | | $ | .72 | | | $ | 1.80 | | $ | (.85 | ) | | $ | (.20 | ) | | $ | (1.05 | ) | | $ | 10.56 | | 20.12 | % |
2008(f) | | | 10.00 | | | .29 | | | (.21 | ) | | | .08 | | | (.27 | ) | | | — | | | | (.27 | ) | | | 9.81 | | .74 | |
| | | | | | | | | | | | | | | | | | | | | | |
| | |
|
| Ratios/Supplemental Data | |
| | | Ratios to Average
Net Assets
Before Credit/
Reimbursement | | | Ratios to Average
Net Assets After
Reimbursement(c) | | | Ratios to Average
Net Assets
After Credit/
Reimbursement(d) | | | | |
Ending
Net
Assets
(000) | | Expenses | | |
Net
Invest-
ment
Income | | | Expenses | | | Net
Invest-
ment
Income | | | Expenses*** | | | Net
Invest-
ment
Income | | | Portfolio
Turnover
Rate(e) | |
| $ | 5,711 | | 3.04 | % | | 8.11 | % | | .00 | % | | 11.15 | % | | (.00 | )% | | 11.15 | % | | 439 | % |
| | 5,262 | | 1.16 | * | | 3.60 | * | | .00 | ** | | 4.75 | * | | (.00 | )** | | 4.76 | * | | 120 | |
| ** | Annualized expense ratio rounds to less than .00%. |
| *** | Expense ratios round to less than (.00)%. |
| (a) | Per share Net Investment Income is calculated using the average daily shares method. |
| (b) | Total return is the combination of changes in net asset value, reinvested dividend income at net asset value and reinvested capital gains distributions at net asset value, if any. Total returns are not annualized. |
| (c) | After expense reimbursement from the Adviser. |
| (d) | After custodian fee credit and expense reimbursement. |
| (e) | Excluding dollar roll transactions. |
| (f) | For the period December 27, 2007 (commencement of operations) through July 31, 2008. |
See accompanying notes to financial statements.
Annual Investment Management Agreement Approval Process
The Investment Company Act of 1940, as amended (the “1940 Act”), provides, in substance, that each investment advisory agreement between a fund and its investment adviser will continue in effect from year to year only if its continuance is approved at least annually by the fund’s board members, including by a vote of a majority of the board members who are not parties to the advisory agreement or “interested persons” of any parties (the “Independent Board Members”), cast in person at a meeting called for the purpose of considering such approval. In connection with such approvals, the fund’s board members must request and evaluate, and the investment adviser is required to furnish, such information as may be reasonably necessary to evaluate the terms of the advisory agreement. Accordingly, at a meeting held on May 27-29, 2009 (the “May Meeting”), the Boards of Trustees (each, a “Board” and each Trustee, a “Board Member”) of the Funds, including a majority of the Independent Board Members, considered and approved the continuation of the advisory agreements (each, an “Advisory Agreement”) between each Fund and Nuveen Asset Management (“NAM”) for an additional one-year period. In preparation for their considerations at the May Meeting, the Board also held a separate meeting on April 21-22, 2009 (the “April Meeting”). Accordingly, the factors considered and determinations made regarding the renewals by the Independent Board Members include those made at the April Meeting.
In addition, in evaluating the Advisory Agreements, the Independent Board Members reviewed a broad range of information relating to the Funds and NAM, including absolute Fund performance and performance information of recognized benchmarks, fee and expense information for the Funds, the profitability of Nuveen for its advisory activities (which includes its wholly owned subsidiaries other than Winslow Capital Management, Inc. (“Winslow Capital”), which was recently acquired in December 2008), and other information regarding the organization, personnel, and services provided by NAM. The Independent Board Members also met quarterly as well as at other times as the need arose during the year and took into account the information provided at such meetings and the knowledge gained therefrom. Prior to approving the renewal of the Advisory Agreements, the Independent Board Members reviewed the foregoing information with their independent legal counsel and with management, reviewed materials from independent legal counsel describing applicable law and their duties in reviewing advisory contracts, and met with independent legal counsel in private sessions without management present. The Independent Board Members considered the legal advice provided by independent legal counsel and relied upon their knowledge of NAM, its services and the Funds resulting from their meetings and other interactions throughout the year and their own business judgment in determining the factors to be considered in evaluating the Advisory Agreements. Each Board Member may have accorded different weight to the various factors in reaching his or her conclusions with respect to a Fund’s Advisory Agreement. The Independent Board Members did not identify any single factor as all-important or controlling. The Independent Board Members’ considerations were instead based on a comprehensive consideration of all the information presented. The principal factors considered by the Board and its conclusions are described below.
A. Nature, Extent and Quality of Services
In considering renewal of the Advisory Agreements, the Independent Board Members considered the nature, extent and quality of NAM’s services, including advisory services and administrative services. The Independent Board Members reviewed materials outlining, among other things, NAM’s organization and business; the types of services that NAM or its affiliates provide and are expected to provide to the Funds; the performance record of the applicable Fund (as described in further detail below); and any initiatives Nuveen had taken for the applicable fund product line.
In reviewing the services provided and the initiatives undertaken during the past year, the Independent Board Members recognized the severe market turmoil experienced in the capital markets during recent periods, including sustained periods of high volatility, credit disruption and government intervention. The Independent Board Members considered NAM’s efforts, expertise and other actions taken to address matters as they arose that impacted the Funds. The Independent Board Members recognized the role of the Investment Services group which, among other things, monitors the various positions throughout the Nuveen fund complex to identify and address any systematic risks. In addition, the Capital Markets Committee of NAM provides a multi-departmental venue for developing new policies to mitigate any risks. The Independent Board Members further recognized NAM’s continuous review of the Nuveen funds’ investment strategies and mandates in seeking to continue to refine and improve the investment process for the funds, particularly in light of market conditions. In this regard, the Independent Board Members noted the changes recommended by NAM to various investment mandates for the Nuveen funds in seeking to take advantage of market opportunities and to improve the tools available for managing liquidity and market exposure; the establishment of a team responsible for coordinating the handling of large trades in or out of the Nuveen funds; and the ongoing monitoring of investment management processes.
As part of their review, the Independent Board Members also evaluated the background, experience and track record of NAM’s investment personnel. In this regard, the Independent Board Members considered any changes in the personnel, and the impact on the level of services provided to the Funds, if any. The Independent Board Members also reviewed information regarding portfolio manager compensation arrangements to evaluate NAM’s ability to attract and retain high quality investment personnel, preserve stability, and reward performance but not provide an incentive for taking undue risks.
In addition to advisory services, the Independent Board Members considered the quality of administrative services provided by NAM and its affiliates including product management, fund administration, oversight of service providers, shareholder services, administration of Board relations, regulatory and portfolio compliance and legal support. The Board Members noted, however, that the Funds are offered via separately managed accounts and may require less shareholder services than a typical open-end fund. Given the importance of compliance, the Independent Board Members considered NAM’s compliance program, including the report of the chief compliance officer regarding the Funds’ compliance policies and procedures.
Based on their review, the Independent Board Members found that, overall, the nature, extent and quality of services provided (and expected to be provided) to the Funds under the respective Advisory Agreement were satisfactory.
B. The Investment Performance of the Funds and NAM
The Board considered the investment performance of each Fund, including the Fund’s historic performance as well as the performance of recognized benchmarks. Given their unique structure, the Funds do not have comparable peer groups. The Independent Board Members reviewed performance information including the Funds’ total return information and performance information for recognized benchmarks for the one-year period ending December 31, 2008. This information supplemented the Fund performance information provided to the Board at each of its quarterly meetings. The Independent Board Members further considered the performance of the Funds in the context of the volatile market conditions during the past year, and their impact on various asset classes and the portfolio management of the Funds.
Based on their review and factoring in the severity of market turmoil in 2008, the Independent Board Members determined that each Fund’s investment performance over time had been satisfactory.
C. Fees, Expenses and Profitability
1. Fees and Expenses
The Independent Board Members recognized the unique fee structure of the Funds. The Funds do not pay NAM a management fee and all expenses are reimbursed by NAM. The Funds are sold via separately managed accounts. NAM therefore receives its advisory fees via the managed account management fee. Such fee is essentially a blended rate comprised of Fund fees pro-rated to the portion of the total product represented by the respective Fund and the managed account fees associated with the proportion of individual securities in the overall product. Given the different fee structure, and distribution and account support requirements, the Independent Board Members recognized that the expenses incurred by the Funds are not comparable to any comparable group of unaffiliated funds (a “Peer Group”) or other Nuveen funds. Based on their review, the Independent Board Members determined that each Fund’s fee and expense arrangement was reasonable.
2. Comparisons with the Fees of Other Clients
The Independent Board Members further reviewed information regarding the nature of services and fee rates offered by NAM to other clients, such as separately managed accounts. In this regard, they recognized that the Funds are offered via separately managed accounts and therefore may not require or incur the costs of shareholder servicing to the same extent as typical open-end funds. Further, as noted, the Funds’ unique fee and expense structure generally limits the usefulness of comparisons with other funds.
3. Profitability of Nuveen
In conjunction with its review of fees, the Independent Board Members also considered the profitability of Nuveen for its advisory activities (which incorporated Nuveen’s wholly-owned affiliated sub-advisers other than Winslow Capital) and its financial condition. The Independent Board Members reviewed the revenues and expenses of Nuveen’s advisory activities for the last two years, the allocation methodology used in preparing the profitability data and an analysis of the key drivers behind the changes in revenues and expenses that impacted profitability in 2008. In addition, the Independent Board Members reviewed information regarding the financial results of Nuveen for 2008 based on its Form 8-K filed on March 31, 2009. The Independent Board Members noted this information supplemented the profitability information requested and received during the year to help keep them apprised of developments affecting profitability (such as changes in fee waivers and expense reimbursement commitments). In this regard, the Independent Board Members noted that they had also appointed an Independent Board Member as a point person to review and keep them apprised of changes to the profitability analysis and/or methodologies during the year. The Independent Board Members also considered Nuveen’s revenues for advisory activities, expenses, and profit margin compared to that of various unaffiliated management firms with similar amounts of assets under management and relatively comparable asset composition prepared by Nuveen.
In reviewing profitability, the Independent Board Members recognized the subjective nature of determining profitability which may be affected by numerous factors including the allocation of expenses. Further, the Independent Board Members recognized the difficulties in making comparisons as the profitability of other advisers generally is not publicly available and the profitability information that is available for certain advisers or management firms may not be representative of the industry and may be affected by, among other things, the adviser’s particular business mix, capital costs, types of funds managed and expense allocations. Notwithstanding the foregoing, the Independent Board Members reviewed Nuveen’s methodology and assumptions for allocating expenses across product lines to determine profitability. In reviewing profitability, the Independent Board Members recognized Nuveen’s investment in its fund business.
Based on their review, the Independent Board Members concluded that Nuveen’s level of profitability for its advisory activities was reasonable in light of the services provided.
In evaluating the reasonableness of the compensation, the Independent Board Members also considered other amounts paid to NAM by the Funds as well as any indirect benefits (such as soft dollar arrangements, if any) NAM and its affiliates receive, or are expected to receive, that are directly attributable to the management of the Funds, if any. See Section E below for additional
Annual Investment Management Agreement Approval Process (continued)
information on indirect benefits NAM may receive as a result of its relationship with the Funds. Based on their review of the overall fee arrangements of each Fund, the Independent Board Members determined that the advisory fees and expenses of the respective Fund were reasonable.
D. Economies of Scale and Whether Fee Levels Reflect These Economies of Scale
With respect to economies of scale, the Independent Board Members have recognized the potential benefits resulting from the costs of a fund being spread over a larger asset base, although economies of scale are difficult to measure and predict with precision, particularly on a fund-by-fund basis. One method to help ensure the shareholders share in these benefits is to include breakpoints in the advisory fee schedule. Generally, management fees for funds in the Nuveen complex are comprised of a fund-level component and a complex-level component. The Independent Board Members recognized, however, that the Funds do not have fund-level breakpoints given their unique structure. In addition, pursuant to the complex-wide fee arrangement, the fees of the funds in the Nuveen complex generally are reduced as the assets in the fund complex reach certain levels. However, because the Funds do not pay a management fee, there is no applicable fund-level or complex-wide level breakpoint schedule, although their respective assets will be counted toward the complex-wide total.
E. Indirect Benefits
In evaluating fees, the Independent Board Members received and considered information regarding potential “fall out” or ancillary benefits NAM or its affiliates may receive as a result of its relationship with each Fund. In this regard, the Independent Board Members noted that NAM does not currently have any soft dollar arrangements; however, to the extent certain bona fide agency transactions that occur on markets that traditionally trade on a principal basis and riskless principal transactions are considered as generating “commissions,” NAM intends to comply with the applicable safe harbor provisions.
Based on their review, the Independent Board Members concluded that any indirect benefits received by NAM as a result of its relationship with the Funds were reasonable and within acceptable parameters.
F. Other Considerations
The Independent Board Members did not identify any single factor discussed previously as all-important or controlling. The Board Members, including the Independent Board Members, unanimously concluded that the terms of the Advisory Agreements are fair and reasonable, that NAM’s fees are reasonable in light of the services provided to each Fund and that the Advisory Agreements be renewed.
Notes
Trustees and Officers
The management of the Fund, including general supervision of the duties performed for the Fund by the Adviser, is the responsibility of the Board of Trustees of the Fund. The number of trustees of the Fund is currently set at nine. None of the trustees who are not “interested” persons of the Fund (referred to herein as “independent trustees”) has ever been a director or employee of, or consultant to, Nuveen or its affiliates. The names and business addresses of the trustees and officers of the Fund, their principal occupations and other affiliations during the past five years, the number of portfolios each oversees and other directorships they hold are set forth below.
The Fund’s Statement of Additional Information (“SAI”) includes more information about the trustees. To request a free copy, call Nuveen Investments at (800) 257-8787 or visit the Funds’ website at www.nuveen.com.
| | | | | | | | |
Name, Birthdate and Address | | Position(s) Held with the Fund | | Year First Elected or Appointed (1) | | Principal Occupation(s) Including other Directorships During Past 5 Years | | Number of Portfolios in Fund Complex Overseen by Trustee |
| | |
| Independent Trustees: | | | | |
Robert P. Bremner 8/22/40 333 W. Wacker Drive Chicago, IL 60606 | | Chairman of the Board and Trustee | | 1997 | | Private Investor and Management Consultant; Treasurer and Director, Humanities Council of Washington D.C. | | 200 |
Jack B. Evans 10/22/48 333 W. Wacker Drive Chicago, IL 60606 | | Trustee | | 1999 | | President, The Hall-Perrine Foundation, a private philanthropic corporation (since 1996); Director and Vice Chairman, United Fire Group, a publicly held company; Member of the Board of Regents for the State of Iowa University System; Director, Gazette Companies; Life Trustee of Coe College; Director, Iowa College Foundation; Member of the Advisory Council of the Department of Finance in the Tippie College of Business, University of lowa; formerly, Director, Alliant Energy; formerly, Director, Federal Reserve Bank of Chicago; formerly, President and Chief Operating Officer, SCI Financial Group, Inc., a regional financial services firm. | | 200 |
William C. Hunter 3/6/48 333 W. Wacker Drive Chicago, IL 60606 | | Trustee | | 2004 | | Dean, Tippie College of Business, University of Iowa (since 2006); Director (since 2004) of Xerox Corporation; Director (since 2005), Beta Gamma Sigma International Honor Society; formerly, Dean and Distinguished Professor of Finance, School of Business at the University of Connecticut (2003-2006); previously, Senior Vice President and Director of Research at the Federal Reserve Bank of Chicago (1995-2003); Director, SS&C Technologies, Inc. (May 2005-October 2005); formerly, Director (1997-2007), Credit Research Center at George Washington University. | | 200 |
David J. Kundert 10/28/42 333 W. Wacker Drive Chicago, IL 60606 | | Trustee | | 2005 | | Director, Northwestern Mutual Wealth Management Company; retired (since 2004) as Chairman, JPMorgan Fleming Asset Management, President and CEO, Banc One Investment Advisors Corporation, and President, One Group Mutual Funds; prior thereto, Executive Vice President, Banc One Corporation and Chairman and CEO, Banc One Investment Management Group; Member, Board of Regents, Luther College; member of the Wisconsin Bar Association; member of Board of Directors, Friends of Boerner Botanical Gardens; member of Investment Committee, Greater Milwaukee Foundation. | | 200 |
William J. Schneider 9/24/44 333 W. Wacker Drive Chicago, IL 60606 | | Trustee | | 1997 | | Chairman of Miller-Valentine Partners Ltd., a real estate investment company; formerly, Senior Partner and Chief Operating Officer (retired, 2004) of Miller-Valentine Group; Member, Dayton Philharmonic Orchestra Association; formerly, Member, Business Advisory Council, Cleveland Federal Reserve Bank; formerly, Director, Dayton Development Coalition. | | 200 |
Judith M. Stockdale 12/29/47 333 W. Wacker Drive Chicago, IL 60606 | | Trustee | | 1997 | | Executive Director, Gaylord and Dorothy Donnelley Foundation (since 1994); prior thereto, Executive Director, Great Lakes Protection Fund (from 1990 to 1994). | | 200 |
Carole E. Stone 6/28/47 333 W. Wacker Drive Chicago, IL 60606 | | Trustee | | 2007 | | Director, Chicago Board Options Exchange (since 2006); Director, C2 Options Exchange, Incorporated (since 2009); Commissioner, New York State Commission on Public Authority Reform (since 2005); formerly, Chair, New York Racing Association Oversight Board (2005-2007). | | 200 |
| | | | | | | | |
Name, Birthdate and Address | | Position(s) Held with the Fund | | Year First Elected or Appointed (1) | | Principal Occupation(s) Including other Directorships During Past 5 Years | | Number of Portfolios in Fund Complex Overseen by Trustee |
Terence J. Toth 9/29/59 333 W. Wacker Drive Chicago, IL 60606 | | Trustee | | 2008 | | Director, Legal & General Investment Management America, Inc. (since 2008); Managing Partner, Musso Capital Management (since 2008); CEO and President, Northern Trust Investments (2004-2007); Executive Vice President, Quantitative Management & Securities Lending (2000-2004); prior thereto, various positions with Northern Trust Company (since 1994); Member: Goodman Theatre Board (since 2004); Chicago Fellowship Board (since 2005), University of Illinois Leadership Council Board (since 2007) and Catalyst Schools of Chicago Board (since 2008); formerly, Member: Northern Trust Mutual Funds Board (2005-2007), Northern Trust Investments Board (2004-2007), Northern Trust Japan Board (2004-2007), Northern Trust Securities Inc. Board (2003-2007) and Northern Trust Hong Kong Board (1997-2004). | | 200 |
| | |
| Interested Trustee: | | | | |
John P. Amboian (2) 6/14/61 333 W. Wacker Drive Chicago, IL 60606 | | Trustee | | 2008 | | Chief Executive Officer (since July 2007) and Director (since 1999) of Nuveen Investments, Inc.; Chief Executive Officer (since 2007) of Nuveen Asset Management, Nuveen Investments Advisors, Inc. formerly, President (1999-2004) of Nuveen Advisory Corp. and Nuveen Institutional Advisory Corp. (3) | | 200 |
Name, Birthdate and Address | | Position(s) Held with the Fund | | Year First Elected or Appointed (4) | | Principal Occupation(s) During Past 5 Years | | Number of Portfolios in Fund Complex Overseen by Officer |
| | |
| Officers of the Fund: | | | | |
Gifford R. Zimmerman 9/9/56 333 W. Wacker Drive Chicago, IL 60606 | | Chief Administrative Officer | | 1988 | | Managing Director (since 2002), Assistant Secretary and Associate General Counsel of Nuveen Investments, LLC; Managing Director (since 2002), Associate General Counsel and Assistant Secretary, of Nuveen Asset Management (since 2002) and of Symphony Asset Management LLC (since 2003); Vice President and Assistant Secretary of NWQ Investment Management Company, LLC. (since 2002), Nuveen Investments Advisers Inc. (since 2002), Tradewinds Global Investors, LLC, and Santa Barbara Asset Management, LLC (since 2006), Nuveen HydePark Group LLC and Nuveen Investment Solutions, Inc. (since 2007); Managing Director (since 2004) and Assistant Secretary (since 1994) of Nuveen Investments, Inc.; formerly, Managing Director (2002-2004), General Counsel (1998-2004) and Assistant Secretary of Nuveen Advisory Corp. and Nuveen Institutional Advisory Corp. (3); Chartered Financial Analyst. | | 200 |
Mark J.P. Anson 6/10/59 333 W. Wacker Drive Chicago, IL 60606 | | Vice President | | 2009 | | President and Executive Director of Nuveen Investments, Inc. (since 2007); President of Nuveen Investments Institutional Services Group LLC (since 2007); previously, Chief Executive Officer of the British Telecom Pension Scheme (2006-2007) and Chief Investment Officer of Calpers (1999-2006); PhD, Chartered Financial Analyst, Chartered Alternative Investment Analyst, Certified Public Accountant, Certified Management Accountant and Certified Internal Auditor. | | 200 |
Nizida Arriaga 6/1/1968 333 W. Wacker Drive Chicago, IL 60606 | | Vice President | | 2009 | | Vice President (since 2007) of Nuveen Investments, LLC; previously, Portfolio Manager, Allstate Investments, LLC (1996-2006); Chartered Financial Analyst. | | 200 |
Trustees and Officers (continued)
| | | | | | | | |
Name, Birthdate and Address | | Position(s) Held with the Fund | | Year First Elected or Appointed (4) | | Principal Occupation(s) During Past 5 Years | | Number of Portfolios in Fund Complex Overseen by Officer |
Michael T. Atkinson 2/3/66 333 W. Wacker Drive Chicago, IL 60606 | | Vice President and Assistant Secretary | | 2000 | | Vice President (since 2002) of Nuveen Investments, LLC; Vice President of Nuveen Asset Management (since 2005). | | 200 |
Margo L. Cook 4/11/64 333 W. Wacker Drive Chicago, IL 60606 | | Vice President | | 2009 | | Executive Vice President (since Oct 2008) of Nuveen Investments, Inc.; previously, Head of Institutional Asset Management (2007-2008) of Bear Stearns Asset Management; Head of Institutional Asset Mgt (1986-2007) of Bank of NY Mellon; Chartered Financial Analyst. | | 200 |
Alan A. Brown 8/1/62 333 W. Wacker Drive Chicago, IL 60606 | | Vice President | | 2007 | | Executive Vice President, Mutual Funds, Nuveen Investments, LLC, (since 2005), previously, Managing Director and Chief Marketing Officer (2001-2005). | | 75 |
Name, Birthdate and Address | | Position(s) Held with the Fund | | Year First Elected or Appointed (4) | | Principal Occupation(s) Including other Directorships During Past 5 Years | | Number of Portfolios in Fund Complex Overseen by Officer |
Lorna C. Ferguson 10/24/45 333 W. Wacker Drive Chicago, IL 60606 | | Vice President | | 1998 | | Managing Director (since 2004) of Nuveen Investments, LLC; Managing Director (since 2005) of Nuveen Asset Management; Managing Director (2004-2005) of Nuveen Advisory Corp. and Nuveen Institutional Advisory Corp. (3). | | 200 |
Stephen D. Foy 5/31/54 333 W. Wacker Drive Chicago, IL 60606 | | Vice President and Controller | | 1998 | | Vice President (since 1993) and Funds Controller (since 1998) of Nuveen Investments, LLC; Vice President (since 2005) of Nuveen Asset Management; Certified Public Accountant. | | 200 |
William T. Huffman 5/7/1969 333 W. Wacker Drive Chicago, IL 60606 | | Vice President | | 2009 | | Chief Operating Officer, Municipal Fixed Income (since 2008) of Nuveen Asset Management; previously, Chairman, President and Chief Executive Officer (2002 – 2007) of Northern Trust Global Advisors, Inc. and Chief Executive Officer (2007) of Northern Trust Global Investments Limited; CPA. | | 136 |
Walter M. Kelly 2/24/70 333 W. Wacker Drive Chicago, IL 60606 | | Chief Compliance Officer and Vice President | | 2003 | | Senior Vice President (since 2008), Vice President (2006- 2008) formerly, Assistant Vice President and Assistant General Counsel (2003-2006) of Nuveen Investments, LLC; Vice President (since 2006) and Assistant Secretary (since 2003) of Nuveen Asset Management. | | 200 |
David J. Lamb 3/22/63 333 W. Wacker Drive Chicago, IL 60606 | | Vice President | | 2000 | | Senior Vice President (since 2009), formerly, Vice President (2000-2009) of Nuveen Investments, LLC; Vice President (since 2005) of Nuveen Asset Management, Certified Public Accountant. | | 200 |
Tina M. Lazar 8/27/61 333 W. Wacker Drive Chicago, IL 60606 | | Vice President | | 2002 | | Senior Vice President (since 2009), formerly, Vice President of Nuveen Investments, LLC (1999-2009); Vice President of Nuveen Asset Management (since 2005). | | 200 |
Larry W. Martin 7/27/51 333 W. Wacker Drive Chicago, IL 60606 | | Vice President and Assistant Secretary | | 1988 | | Vice President, Assistant Secretary and Assistant General Counsel of Nuveen Investments, LLC; Vice President (since 2005) and Assistant Secretary of Nuveen Investments, Inc.; Vice President and Assistant Secretary of Nuveen Investments Advisers Inc. (since 2002), NWQ Investment Management Company, LLC (since 2002), Symphony Asset Management LLC (since 2003), Tradewinds Global Investors, LLC, Santa Barbara Asset Management, LLC (since 2006) and of Nuveen HydePark Group, LLC and Nuveen Investment Solutions, Inc. (since 2007); formerly, Vice President and Assistant Secretary of Nuveen Advisory Corp. and Nuveen Institutional Advisory Corp. (3) | | 200 |
| | | | | | | | |
Name, Birthdate and Address | | Position(s) Held with the Fund | | Year First Elected or Appointed (4) | | Principal Occupation(s) Including other Directorships During Past 5 Years | | Number of Portfolios in Fund Complex Overseen by Officer |
Kevin J. McCarthy 3/26/66 333 W. Wacker Drive Chicago, IL 60606 | | Vice President and Secretary | | 2007 | | Managing Director (since 2008), formerly, Vice President (2007-2008), Nuveen Investments, LLC; Managing Director (since 2008), formerly, Vice President and Assistant Secretary, Nuveen Asset Management and Nuveen Investments Holdings, Inc.; Vice President (since 2007) and Assistant Secretary, Nuveen Investment Advisers Inc., Nuveen Investment Institutional Services Group LLC, NWQ Investment Management Company, LLC, Tradewinds Global Investors LLC, NWQ Holdings, LLC, Symphony Asset Management LLC, Santa Barbara Asset Management LLC, Nuveen HydePark Group, LLC and Nuveen Investment Solutions, Inc. (since 2007); prior thereto, Partner, Bell, Boyd & Lloyd LLP (1997-2007). | | 200 |
John V. Miller 4/10/67 333 W. Wacker Drive Chicago, IL 60606 | | Vice President | | 2007 | | Chief Investment Officer and Managing Director (since 2007), formerly, Vice President (2002-2007) of Nuveen Asset Management and Managing Director (since 2007), formerly, Vice President (2002-2007) Nuveen Investments, LLC; Chartered Financial Analyst. | | 136 |
Gregory Mino 1/4/1971 333 W. Wacker Drive Chicago, IL 60606 | | Vice President | | 2009 | | Vice President of Nuveen Investments, LLC (since 2008); previously, Director (2004-2007) and Executive Director (2007-2008) of UBS Global Asset Management; previously, Vice President (2000-2003) and Director (2003-2004) of Merrill Lynch Investment Managers; Chartered Financial Analyst. | | 200 |
Christopher M. Rohrbacher 8/1/71 333 W. Wacker Drive Chicago, IL 60606 | | Vice President and Assistant Secretary | | 2008 | | Vice President, Nuveen Investments, LLC (since 2008); Vice President and Assistant Secretary, Nuveen Asset Management (since 2008); prior thereto, Associate, Skadden, Arps, Slate Meagher & Flom LLP (2002-2008) | | 200 |
James F. Ruane 7/3/62 333 W. Wacker Drive Chicago, IL 60606 | | Vice President and Assistant Secretary | | 2007 | | Vice President, Nuveen Investments (since 2007); prior thereto, Partner, Deloitte & Touche USA LLP (2005-2007), formerly, senior tax manager (2002-2005); Certified Public Accountant. | | 200 |
John S. White 5/12/67 333 W. Wacker Drive Chicago, IL 60606 | | Vice President | | 2007 | | Senior Vice President (since 2009), formerly, Vice President (2006-2009) of Nuveen Investments, LLC, formerly, Assistant Vice President (since 2002); Lieutenant Colonel (since 2007), United States Marine Corps Reserve, formerly, Major (since 2001). | | 75 |
Mark L. Winget 12/21/68 333 W. Wacker Drive Chicago, IL 60606 | | Vice President and Assistant Secretary | | 2008 | | Vice President, Nuveen Investments, LLC (since 2008); Vice President and Assistant Secretary, Nuveen Asset Management (since 2008); prior thereto, Counsel, VedderPrice P.C. (1997-2007). | | 200 |
| (1) | Trustees serve an indefinite term until his/her successor is elected or appointed. The year first elected or appointed represents the year in which the trustee was first elected or appointed to any fund in the Nuveen Fund Complex. |
| (2) | Mr. Amboian is an interested trustee because of his position with Nuveen Investments, Inc. and certain of its subsidiaries, which are affiliates of the Nuveen Funds. |
| (3) | Nuveen Advisory Corp. and Nuveen Institutional Advisory Corp. were reorganized into Nuveen Asset Management, effective January 1, 2005. |
| (4) | Officers serve one year terms through July of each year. The year first elected or appointed represents the year in which the officer was first elected or appointed to any fund in the Nuveen Fund Complex. |
Glossary of Terms Used in this Report
Auction Rate Bond: An auction rate bond is a security whose interest payments are adjusted periodically through an auction process, which process typically also serves as a means for buying and selling the bond. Auctions that fail to attract enough buyers for all the shares offered for sale are deemed to have “failed,” with current holders receiving a formula-based interest rate until the next scheduled auction.
Average Effective Maturity: The average of the number of years to maturity of the bonds in a Fund’s portfolio, computed by weighting each bond’s time to maturity (the date the security comes due) by the market value of the security. This figure does not account for the likelihood of prepayments or the exercise of call provisions unless an escrow account has been established to redeem the bond before maturity.
Average Duration: Duration is a measure of the expected period over which a bond’s principal and interest will be paid, and
consequently is a measure of the sensitivity of a bond’s (or bond fund’s) value to changes when market interest rates change. Generally, the longer a bond or Fund’s duration, the more the price of the bond or Fund will change as interest rates change.
Collateralized Debt Obligations (CDOs): Collateralized debt obligations are a type of asset-backed security constructed from a portfolio of fixed-income assets. CDOs usually are divided into different tranches having different ratings and paying different interest rates. Losses, if any, are applied in reverse order of seniority and so junior tranches generally offer higher coupons to compensate for added default risk.
Dividend Yield (also known as Market Yield or Current Yield): An investment’s current annualized dividend divided by its current offering price.
Net Asset Value (NAV): A Fund’s NAV is the dollar value of one share in the Fund. It is calculated by subtracting the liabilities of the Fund from its total assets and then dividing the remainder by the number of shares outstanding. Fund NAVs are calculated at the end of each business day.
SEC 30-Day Yield: A standardized measure of a Fund’s yield that accounts for the future amortization of premiums or accretion of discounts of bonds held in the Fund’s portfolio.
Fund Information
Fund Manager
Nuveen Asset Management
333 West Wacker Drive
Chicago, IL 60606
Legal Counsel
Chapman and Cutler LLP
Chicago, IL
Independent Registered Public Accounting Firm
PricewaterhouseCoopers LLP
Chicago, IL
Custodian
State Street Bank & Trust Company
Boston, MA
Transfer Agent and Shareholder Services
Boston Financial
Data Services, Inc.
Nuveen Investor Services
P.O. Box 8530
Boston, MA 02266-8530
(800) 257-8787
Quarterly Portfolio of Investments and Proxy Voting Information: You may obtain (i) each Fund’s quarterly portfolio of investments, (ii) information regarding how the Funds voted proxies relating to portfolio securities held during the most recent twelve-month period ended June 30, 2009, and (iii) a description of the policies and procedures that the Funds used to determine how to vote proxies relating to portfolio securities without charge, upon request, by calling Nuveen Investments at (800) 257-8787 or on Nuveen’s website at www.nuveen.com.
You may also obtain this and other Fund information directly from the Securities and Exchange Commission (“SEC”). The SEC may charge a copying fee for this information. Visit the SEC on-line at http://www.sec.gov or in person at the SEC’s Public Reference Room in Washington, D.C. Call the SEC at (202) 942-8090 for room hours and operation. You may also request Fund information by sending an e-mail request to publicinfo@sec.gov or by writing to the SEC’s Public Reference Section at 100 F Street NE, Washington, D.C. 20549.
The Financial Industry Regulatory Authority (FINRA) provides a Public Disclosure Program which supplies certain information regarding the disciplinary history of FINRA members and their associated persons in response to either telephone inquiries at (800) 289-9999 or written inquiries at www.finra.org. Financial Industry Regulatory Authority also provides an investor brochure that includes information describing the Public Disclosure Program.
Nuveen Investments:
Serving Investors For Generations
Since 1898, financial advisors and their clients have relied on Nuveen Investments to provide dependable investment solutions. Over this time, Nuveen Investments has adhered to the belief that the best approach to investing is to apply conservative risk-management principles to help minimize volatility.
Building on this tradition, we today offer a range of high quality equity and fixed-income solutions that can be integral parts of a well-diversified core portfolio. Our clients have come to appreciate this diversity, as well as our continued adherence to proven, long-term investing principles.
We offer many different investing solutions
for our clients’ different needs.
Nuveen Investments is a global investment management firm that seeks to help secure the long-term goals of institutions and high net worth investors as well as the consultants and financial advisors who serve them. Nuveen Investments markets its growing range of specialized investment solutions under the high-quality brands of HydePark, NWQ, Nuveen, Santa Barbara, Symphony, Tradewinds and Winslow Capital. In total, the Company managed $128 billion of assets on June 30, 2009.
Find out how we can help you reach your financial goals.
An investor should carefully consider the Fund’s objectives, risks, charges and expenses before investing. For a prospectus containing this and other information about the Fund, please contact your financial advisor or Nuveen Investments at (800) 257-8787. Read the prospectus carefully before you invest or send money.
Learn more about Nuveen Funds at www.nuveen.com/mf
| | |
Distributed by Nuveen Investments, LLC 333 West Wacker Drive Chicago, IL 60606 www.nuveen.com | | |
MAN-EIMAP-0709P
ITEM 2. CODE OF ETHICS.
As of the end of the period covered by this report, the registrant has adopted a code of ethics that applies to the registrant’s principal executive officer, principal financial officer, principal accounting officer or controller, or persons performing similar functions. There were no amendments to or waivers from the code during the period covered by this report. The registrant has posted the code of ethics on its website at www.nuveen.com/mf. (To view the code, click on the Shareholder Resources drop down menu box, click on Fund Governance and then click on Code of Conduct.)
ITEM 3. AUDIT COMMITTEE FINANCIAL EXPERT.
The registrant’s Board of Trustees determined that the registrant has at least one “audit committee financial expert” (as defined in Item 3 of Form N-CSR) serving on its Audit Committee. The registrant’s audit committee financial expert is Jack B. Evans, who is “independent” for purposes of Item 3 of Form N-CSR.
Mr. Evans was formerly President and Chief Operating Office of SCI Financial Group, Inc., a full service registered broker-dealer and registered investment adviser (“SCI”). As part of his role as President and Chief Operating Officer, Mr. Evans actively supervised the Chief Financial Officer (the “CFO”) and actively supervised the CFO’s preparation of financial statements and other filings with various regulatory authorities. In such capacity, Mr. Evans was actively involved in the preparation of SCI’s financial statements and the resolution of issues raised in connection therewith. Mr. Evans has also served on the audit committee of various reporting companies. At such companies, Mr. Evans was involved in the oversight of audits, audit plans, and the preparation of financial statements. Mr. Evans also formerly chaired the audit committee of the Federal Reserve Bank of Chicago.
ITEM 4. PRINCIPAL ACCOUNTANT FEES AND SERVICES.
The following tables show the amount of fees that PricewaterhouseCoopers LLP, the Trust’s auditor, billed to the Trust during the Trust’s last two full fiscal years. The Audit Committee approved in advance all audit services and non-audit services that PricewaterhouseCoopers LLP provided to the Trust, except for those non-audit services that were subject to the pre-approval exception under Rule 2-01 of Regulation S-X (the “pre-approval exception”). The pre-approval exception for services provided directly to the Trust waives the pre-approval requirement for services other than audit, review or attest services if: (A) the aggregate amount of all such services provided constitutes no more than 5% of the total amount of revenues paid by the Trust during the fiscal year in which the services are provided; (B) the Trust did not recognize the services as non-audit services at the time of the engagement; and (C) the services are promptly brought to the Audit Committee’s attention, and the Committee (or its delegate) approves the services before the audit is completed.
The Audit Committee has delegated certain pre-approval responsibilities to its Chairman (or, in his absence, any other member of the Audit Committee).
SERVICES THAT THE TRUST’S AUDITOR BILLED TO THE TRUST
| | | | | | | | | | | | |
Fiscal Year Ended July 31, 2009 | | Audit Fees Billed
to Funds 1 | | Audit-Related Fees
Billed to Funds 2 | | Tax Fees
Billed to Funds 3 | | All Other Fees
Billed to Funds 4 |
Name of Series | | | | | | | | | | | | |
International Income Managed Accounts Portfolio Fund | | | 14,745 | | | 0 | | | 2,505 | | | 0 |
Enhanced Multi-Strategy Income Managed Accounts Portfolio Fund | | | 15,640 | | | 0 | | | 2,505 | | | 0 |
Municipal Total Return Managed Accounts Portfolio Fund | | | 9,169 | | | 0 | | | 12,240 | | | 0 |
| | | | | | | | | | | | |
Total | | $ | 39,554 | | $ | 0 | | $ | 17,250 | | $ | 0 |
| 1 | | “Audit Fees” are the aggregate fees billed for professional services for the audit of the Fund’s annual financial statements and services provided in connection with statutory and regulatory filings or engagements. |
| 2 | | “Audit Related Fees” are the aggregate fees billed for assurance and related services reasonably related to the performance of the audit or review of financial statements and are not reported under “Audit Fees.” |
| 3 | | “Tax Fees” are the aggregate fees billed for professional services for tax advice, tax compliance, and tax planning. |
| 4 | | “All Other Fees” are the aggregate fees billed for products and services other than “Audit Fees,” “Audit Related Fees,” and “Tax Fees.” |
| | | | | | | | | | | | |
| | | Percentage Approved Pursuant to Pre-approval Exception | |
| | | Audit Fees Billed
to Funds | | | Audit-Related Fees
Billed to Funds | | | Tax Fees
Billed to Funds | | | All Other Fees
Billed to Funds | |
Name of Series | | | | | | | | | | | | |
International Income Managed Accounts Portfolio Fund | | 0 | % | | 0 | % | | 0 | % | | 0 | % |
Enhanced Multi-Strategy Income Managed Accounts Portfolio Fund | | 0 | % | | 0 | % | | 0 | % | | 0 | % |
Municipal Total Return Managed Accounts Portfolio Fund | | 0 | % | | 0 | % | | 0 | % | | 0 | % |
| | | | | | | | | | | | |
Fiscal Year Ended July 31, 2008 | | Audit Fees Billed
to Funds 1 | | Audit-Related Fees
Billed to Funds 2 | | Tax Fees
Billed to Funds 3 | | All Other Fees
Billed to Funds 4 |
Name of Series | | | | | | | | | | | | |
International Income Managed Accounts Portfolio Fund | | | 16,180 | | | 0 | | | 0 | | | 0 |
Enhanced Multi-Strategy Income Managed Accounts Portfolio Fund | | | 17,812 | | | 0 | | | 0 | | | 0 |
Municipal Total Return Managed Accounts Portfolio Fund | | | 7,500 | | | 0 | | | 0 | | | 0 |
| | | | | | | | | | | | |
Total | | $ | 41,492 | | $ | 0 | | $ | 0 | | $ | 0 |
| 1 | | "Audit Fees” are the aggregate fees billed for professional services for the audit of the Fund’s annual financial statements and services provided in connection with statutory and regulatory filings or engagements. |
| 2 | | “Audit Related Fees” are the aggregate fees billed for assurance and related services reasonably related to the performance of the audit or review of financial statements and are not reported under “Audit Fees.” |
| 3 | | “Tax Fees” are the aggregate fees billed for professional services for tax advice, tax compliance, and tax planning. |
| 4 | | “All Other Fees” are the aggregate fees billed for products and services other than “Audit Fees,” “Audit Related Fees,” and “Tax Fees.” |
| | | | | | | | | | | | |
| | | Percentage Approved Pursuant to Pre-approval Exception | |
| | | Audit Fees Billed
to Funds | | | Audit-Related Fees
Billed to Funds | | | Tax Fees
Billed to Funds | | | All Other Fees
Billed to Funds | |
Name of Series | | | | | | | | | | | | |
International Income Managed Accounts Portfolio Fund | | 0 | % | | 0 | % | | 0 | % | | 0 | % |
Enhanced Multi-Strategy Income Managed Accounts Portfolio Fund | | 0 | % | | 0 | % | | 0 | % | | 0 | % |
Municipal Total Return Managed Accounts Portfolio Fund | | 0 | % | | 0 | % | | 0 | % | | 0 | % |
SERVICES THAT THE TRUST’S AUDITOR BILLED TO THE
ADVISER AND AFFILIATED FUND SERVICE PROVIDERS
The following tables show the amount of fees billed by PricewaterhouseCoopers LLP to Nuveen Asset Management (“NAM” or the “Adviser”), and any entity controlling, controlled by or under common control with NAM that provides ongoing services to the Trust (“Affiliated Fund Service Provider”), for engagements directly related to the Trust’s operations and financial reporting, during the Trust’s last two full fiscal years.
| | | | | | | | | | | | |
Fiscal Year Ended July 31, 2009 | | Audit-Related Fees
Billed to Adviser and
Affiliated Fund
Service Providers | | | Tax Fees Billed to
Adviser and
Affiliated Fund
Service Providers | | | All Other Fees
Billed to Adviser
and Affiliated Fund
Service Providers | |
Nuveen Managed Accounts Portfolio Trust | | $ | 0 | | | $ | 0 | | | $ | 0 | |
| |
| | | Percentage Approved Pursuant to Pre-approval Exception | |
| | | Audit-Related Fees
Billed to Adviser and
Affiliated Fund
Service Providers | | | Tax Fees Billed to
Adviser and
Affiliated Fund
Service Providers | | | All Other Fees
Billed to Adviser
and Affiliated Fund
Service Providers | |
| | | 0 | % | | | 0 | % | | | 0 | % |
| | | |
Fiscal Year Ended July 31, 2008 | | Audit-Related Fees
Billed to Adviser and
Affiliated Fund
Service Providers | | | Tax Fees Billed to
Adviser and
Affiliated Fund
Service Providers | | | All Other Fees
Billed to Adviser
and Affiliated Fund
Service Providers | |
Nuveen Managed Accounts Portfolio Trust | | $ | 0 | | | $ | 0 | | | $ | 0 | |
| |
| | | Percentage Approved Pursuant to Pre-approval Exception | |
| | | Audit-Related Fees
Billed to Adviser and
Affiliated Fund
Service Providers | | | Tax Fees Billed to
Adviser and
Affiliated Fund
Service Providers | | | All Other Fees
Billed to Adviser
and Affiliated Fund
Service Providers | |
| | | 0% | | | | 0 | % | | | 0 | % |
The tables also show the percentage of fees subject to the pre-approval exception. The pre-approval exception for services provided to the Adviser and any Affiliated Fund Service Provider (other than audit, review or attest services) waives the pre-approval requirement if: (A) the aggregate amount of all such services provided constitutes no more than 5% of the total amount of revenues paid to PricewaterhouseCoopers LLP by the Trust, the Adviser and Affiliated Fund Service Providers during the fiscal year in which the services are provided that would have to be pre-approved by the Audit Committee; (B) the Trust did not recognize the services as non-audit services at the time of the engagement; and (C) the services are promptly brought to the Audit Committee’s attention, and the Committee (or its delegate) approves the services before the Trust’s audit is completed.
NON-AUDIT SERVICES
| | | | | | | | | | | | |
Fiscal Year Ended July 31, 2009 | | Total Non-Audit Fees
Billed to Trust | | Total Non-Audit Fees
billed to Adviser and
Affiliated Fund Service
Providers (engagements
related directly to the
operations and financial
reporting of the Trust) | | Total Non-Audit Fees
billed to Adviser and
Affiliated Fund Service
Providers (all other
engagements) | | Total |
Name of Series | | | | | | | | | | | | |
International Income Managed Accounts Portfolio Fund | | | 2,505 | | | 0 | | | 0 | | | 2,505 |
Enhanced Multi-Strategy Income Managed Accounts Portfolio Fund | | | 2,505 | | | 0 | | | 0 | | | 2,505 |
Municipal Total Return Managed Accounts Portfolio Fund | | | 12,240 | | | 0 | | | 0 | | | 12,240 |
| | | | | | | | | | | | |
Total | | $ | 17,250 | | $ | 0 | | $ | 0 | | $ | 17,250 |
“Non-Audit Fees Billed to Trust” represent “Tax Fees” and “All Other Fees” billed to each Fund in their respective amounts from the previous table.
| | | | | | | | | | | | |
Fiscal Year Ended July 31, 2008 | | Total Non-Audit Fees
Billed to Trust | | Total Non-Audit Fees
billed to Adviser and
Affiliated Fund Service
Providers (engagements
related directly to the
operations and financial
reporting of the Trust) | | Total Non-Audit Fees
billed to Adviser and
Affiliated Fund Service
Providers (all other
engagements) | | Total |
Name of Series | | | | | | | | | | | | |
International Income Managed Accounts Portfolio Fund | | | 0 | | | 0 | | | 0 | | | 0 |
Enhanced Multi-Strategy Income Managed Accounts Portfolio Fund | | | 0 | | | 0 | | | 0 | | | 0 |
Municipal Total Return Managed Accounts Portfolio Fund | | | 0 | | | 0 | | | 0 | | | 0 |
| | | | | | | | | | | | |
Total | | $ | 0 | | $ | 0 | | $ | 0 | | $ | 0 |
“Non-Audit Fees Billed to Trust” represent “Tax Fees” and “All Other Fees” billed to each Fund in their respective amounts from the previous table.
Audit Committee Pre-Approval Policies and Procedures. Generally, the Audit Committee must approve (i) all non-audit services to be performed for the Trust by the Trust’s independent accountants and (ii) all audit and non-audit services to be performed by the Trust’s independent accountants for the Affiliated Fund Service Providers with respect to the operations and financial reporting of the Trust. Regarding tax and research projects conducted by the independent accountants for the Trust and Affiliated Fund Service Providers (with respect to operations and financial reports of the Trust), such engagements will be (i) pre-approved by the Audit Committee if they are expected to be for amounts greater than $10,000; (ii) reported to the Audit Committee Chairman for his verbal approval prior to engagement if they are expected to be for amounts under $10,000 but greater than $5,000; and (iii) reported to the Audit Committee at the next Audit Committee meeting if they are expected to be for an amount under $5,000.
ITEM 5. AUDIT COMMITTEE OF LISTED REGISTRANTS
Not applicable to this registrant.
ITEM 6. SCHEDULE OF INVESTMENTS
See Portfolio of Investments in Item 1
ITEM 7. DISCLOSURE OF PROXY VOTING POLICIES AND PROCEDURES FOR CLOSED-END
MANAGEMENT INVESTMENT COMPANIES
Not applicable to this registrant.
ITEM 8. PORTFOLIO MANAGERS OF CLOSED-END MANAGEMENT INVESTMENT COMPANIES
Not applicable to this registrant.
ITEM 9. PURCHASES OF EQUITY SECURITIES BY CLOSED-END MANAGEMENT INVESTMENT COMPANY AND AFFILIATED PURCHASERS
Not applicable to this registrant.
ITEM 10. SUBMISSION OF MATTERS TO A VOTE OF SECURITY HOLDERS
There have been no material changes to the procedures by which shareholders may recommend nominees to the registrant’s Board of Trustees implemented after the registrant last provided disclosure in response to this Item.
ITEM 11. CONTROLS AND PROCEDURES.
| | (a) | | The registrant’s principal executive and principal financial officers, or persons performing similar functions, have concluded that the registrant’s disclosure controls and procedures (as defined in Rule 30a-3(c) under the Investment Company Act of 1940, as amended (the “1940 Act”) (17 CFR 270.30a-3(c))) are effective, as of a date within 90 days of the filing date of this report that includes the disclosure required by this paragraph, based on their evaluation of the controls and procedures required by Rule 30a-3(b) under the 1940 Act (17 CFR 270.30a-3(b)) and Rules 13a-15(b) or 15d-15(b) under the Securities Exchange Act of 1934, as amended (the “Exchange Act”) (17 CFR 240.13a-15(b) or 240.15d-15(b)). |
| | (b) | | There were no changes in the registrant’s internal control over financial reporting (as defined in Rule 30a-3(d) under the 1940 Act (17 CFR 270.30a-3(d)) that occurred during the second fiscal quarter of the period covered by this report that has materially affected, or is reasonably likely to materially affect, the registrant’s internal control over financial reporting. |
ITEM 12. EXHIBITS
File the exhibits listed below as part of this Form.
| | |
| (a)(1) | | Any code of ethics, or amendment thereto, that is the subject of the disclosure required by Item 2, to the extent that the registrant intends to satisfy the Item 2 requirements through filing of an exhibit: Not applicable because the code is posted on registrant’s website at www.nuveen.com/mf and there were no amendments during the period covered by this report. (To view the code, click on the Shareholder Resources drop down menu box, click on Fund Governance and then Code of Conduct.) |
| |
| (a)(2) | | A separate certification for each principal executive officer and principal financial officer of the registrant as required by Rule 30a-2(a) under the 1940 Act (17 CFR 270.30a-2(a)) in the exact form set forth below: See EX-99.CERT attached hereto. |
| |
| (a)(3) | | Any written solicitation to purchase securities under Rule 23c-1 under the 1940 Act (17 CFR 270.23c-1) sent or given during the period covered by the report by or on behalf of the registrant to 10 or more persons: Not applicable to this registrant. |
| |
| (b) | | If the report is filed under Section 13(a) or 15(d) of the Exchange Act, provide the certifications required by Rule 30a-2(b) under the 1940 Act (17 CFR 270.30a-2(b)), Rule 13a-14(b) or Rule 15d-14(b) under the Exchange Act (17 CFR 240.13a-14(b) or 240.15d-14(b)), and Section 1350 of Chapter 63 of Title 18 of the United States Code (18 U.S.C. 1350) as an Exhibit. A certification furnished pursuant to this paragraph will not be deemed “filed” for purposes of Section 18 of the Exchange Act (15 U.S.C. 78r), or otherwise subject to the liability of that section. Such certification will not be deemed to be incorporated by reference into any filing under the Securities Act of 1933 or the Exchange Act, except to the extent that the registration specifically incorporates it by reference: See EX-99.906 CERT attached hereto. |
SIGNATURES
Pursuant to the requirements of the Securities Exchange Act of 1934 and the Investment Company Act of 1940, the registrant has duly caused this report to be signed on its behalf by the undersigned, thereunto duly authorized.
(Registrant) Nuveen Managed Accounts Portfolios Trust
| | |
| |
By (Signature and Title) | | /s/ Kevin J. McCarthy |
| | Kevin J. McCarthy |
| | Vice President and Secretary |
Date October 8, 2009
Pursuant to the requirements of the Securities Exchange Act of 1934 and the Investment Company Act of 1940, this report has been signed below by the following persons on behalf of the registrant and in the capacities and on the dates indicated.
| | |
| |
By (Signature and Title) | | /s/ Gifford R. Zimmerman |
| | Gifford R. Zimmerman |
| | Chief Administrative Officer |
| | (principal executive officer) |
Date October 8, 2009
| | |
| |
| By (Signature and Title) | | /s/ Stephen D. Foy |
| | Stephen D. Foy |
| | Vice President and Controller |
| | (principal financial officer) |
Date October 8, 2009