UNITED STATES
SECURITIES AND EXCHANGE COMMISSION
Washington, D.C. 20549
FORM N-CSR
CERTIFIED SHAREHOLDER REPORT OF REGISTERED MANAGEMENT
INVESTMENT COMPANIES
Investment Company Act file number 811-22023
Nuveen Managed Accounts Portfolios Trust
(Exact name of registrant as specified in charter)
Nuveen Investments
333 West Wacker Drive, Chicago, IL 60606
(Address of principal executive offices) (Zip code)
Kevin J. McCarthy
Nuveen Investments
333 West Wacker Drive
Chicago, IL 60606
(Name and address of agent for service)
Registrant’s telephone number, including area code: (312) 917-7700
Date of fiscal year end: July 31
Date of reporting period: July 31, 2012
Form N-CSR is to be used by management investment companies to file reports with the Commission not later than 10 days after the transmission to stockholders of any report that is required to be transmitted to stockholders under Rule 30e-1 under the Investment Company Act of 1940 (17 CFR 270.30e-1). The Commission may use the information provided on Form N-CSR in its regulatory, disclosure review, inspection, and policy making roles.
A registrant is required to disclose the information specified by Form N-CSR, and the Commission will make this information public. A registrant is not required to respond to the collection of information contained in Form N-CSR unless the Form displays a currently valid Office of Management and Budget (“OMB”) control number. Please direct comments concerning the accuracy of the information collection burden estimate and any suggestions for reducing the burden to Secretary, Securities and Exchange Commission, 450 Fifth Street, NW, Washington, DC 20549-0609. The OMB has reviewed this collection of information under the clearance requirements of 44 U.S.C. ss.3507.
ITEM 1. REPORTS TO STOCKHOLDERS.

Mutual Fund
Nuveen Managed Accounts Portfolios Trust
Designed to provide dependable, tax-free income because it’s not what you earn, it’s what you keep.®
Annual Report
July 31, 2012
| | | | |
| |
| Fund Name | | Ticker Symbol | |
Municipal Total Return Managed Accounts Portfolio | | | NMTRX | |
LIFE IS COMPLEX.
Nuveen makes things e-simple.
It only takes a minute to sign up for e-Reports. Once enrolled, you’ll receive an e-mail as soon as your Nuveen Fund information is ready. No more waiting for delivery by regular mail. Just click on the link within the e-mail to see the report and save it on your computer if you wish.
Free e-Reports right to your e-mail!
www.investordelivery.com
If you receive your Nuveen Fund distributions and statements from your financial advisor or brokerage account.
OR
www.nuveen.com/accountaccess
If you receive your Nuveen Fund distributions and statements directly from Nuveen.
| | | | | | |
| Must be preceded by or accompanied by a prospectus. | | NOT FDIC INSURED | | MAY LOSE VALUE | | NO BANK GUARANTEE |
Table of Contents
Chairman’s
Letter to Shareholders

Dear Shareholders,
Investors have many reasons to remain cautious. The challenges in the Euro area are casting a shadow over global economies and financial markets. The political support for addressing fiscal issues is eroding as the economic and social impacts become more visible. At the same time, member nations appear unwilling to provide adequate financial support or to surrender sufficient sovereignty to strengthen the banks or unify the Euro area financial system. The gains made in reducing deficits, and the hard-won progress on winning popular acceptance of the need for economic austerity, are at risk. To their credit, European political leaders press on to find compromise solutions, but there is increasing concern that time will begin to run out.
In the U.S., strong corporate earnings have enabled the equity markets to withstand much of the downward pressures coming from weakening job creation, slower economic growth and political uncertainty. The Fed remains committed to low interest rates and announced on September 13, 2012 (after the close of this reporting period) another program of quantitative easing (QE3) to continue until mid-2015. Pre-election maneuvering has added to the already highly partisan atmosphere in Congress. The end of the Bush-era tax cuts and implementation of the spending restrictions of the Budget Control Act of 2011, both scheduled to take place at year-end, loom closer.
During the last year, U.S. based investors have experienced a sharp decline and a strong recovery in the equity markets. The experienced investment teams at Nuveen keep their eye on a longer time horizon and use their practiced investment disciplines to negotiate through market peaks and valleys to achieve long-term goals for investors. Experienced professionals pursue investments that will weather short-term volatility and at the same time, seek opportunities that are created by markets that overreact to negative developments. Monitoring this process is an important consideration for the Fund Board as it oversees your Nuveen Fund on your behalf.
As always, I encourage you to contact your financial consultant if you have any questions about your investment in a Nuveen Fund. On behalf of the other members of your Fund Board, we look forward to continuing to earn your trust in the months and years ahead.
Sincerely,

Robert P. Bremner
Chairman of the Board
September 21, 2012
Portfolio Manager’s Comments
Certain statements in this report are forward-looking statements. Discussions of specific investments are for illustration only and are not intended as recommendations of individual investments. The forward-looking statements and other views expressed herein are those of the portfolio manager as of the date of this report. Actual future results or occurrences may differ significantly from those anticipated in any forward-looking statements and the views expressed herein are subject to change at any time, due to numerous market and other factors. The Portfolio disclaims any obligation to update publicly or revise any forward-looking statements or views expressed herein.
Ratings shown are the highest rating given by one of the following national rating agencies: Standard & Poor’s Group, Moody’s Investors Service, Inc. or Fitch, Inc. Credit ratings are subject to change. AAA, AA, A and BBB are investment grade ratings; BB, B, CCC, CC, C and D are below investment grade ratings. Certain bonds backed by U.S. Government or agency securities are regarded as having an implied rating equal to the rating of such securities. Holdings designated N/R are not rated by a national rating agency.
This Portfolio was developed exclusively for use within Nuveen-sponsored separately managed accounts. It enables certain Nuveen municipal separately managed account investors to achieve greater diversification and return potential than otherwise might be achievable.
The Portfolio is managed by Martin J. Doyle, CFA, who has managed the Portfolio since its inception in 2007. Here Martin examines U.S. economic and municipal market conditions, the Portfolio’s investment strategy and its performance over the twelve-month period ended July 31, 2012.
What factors affected the U.S. economic and municipal market conditions during the twelve-month reporting period ending July 31, 2012?
During the reporting period, the U.S. economy’s progress toward recovery from recession remained sluggish. The Federal Reserve (Fed) maintained its efforts to improve the overall economic environment by continuing to hold the benchmark Fed Funds rate at the record low level of zero to 0.25% that it had established in December 2008. At its September 2012 meeting, the central bank affirmed its opinion that economic conditions would likely warrant keeping the rate at “exceptionally low levels” through mid-2015. The Fed also announced that it would extend its so-called Operation Twist program, whereby it is lengthening the average maturity of its holdings of U.S. Treasury securities, through the end of December 2012. The goals of this program are to lower longer-term interest rates, make broader financial conditions more accommodating, support a stronger economic recovery and help ensure that inflation remains at levels consistent with the Fed’s mandates of maximum employment and price stability.
In the second quarter of 2012, the U.S. economy slowed to an annualized growth rate of 1.5%, according to initial estimates for U.S. gross domestic product (GDP). While this marked the twelfth consecutive quarter of positive growth, it was also a significant slowdown from the previous few quarters. The Consumer Price Index (CPI) rose 1.4% year-over-year as of July 2012, lower than the June figure of 1.7%, which was the lowest twelve-month rate of change since November 2010. Core CPI (which excludes food and energy) increased 2.1% during the period, remaining above the Fed’s unofficial objective of 2.0% or lower for this inflation measure. However, the number was slightly below the 2.2% figure reported in June. Labor market conditions continued to be slow to improve, with the national unemployment rate registering 8.3% in July 2012. While this figure was down from 9.1% one year ago, the rate was a slight uptick from June 2012. The housing market remained the major weak spot in the economy, beleaguered by a high level of distressed properties and difficult credit conditions. For the twelve months ended June 2012 (the most recent data available at the time this report was prepared), the average
home price in the Standard & Poor’s (S&P)/Case-Shiller Index of 20 major metropolitan areas rose 0.5%, marking the second consecutive month prices rose. In addition, the U.S. economic picture continued to be clouded by concerns about the European debt crisis and global financial markets in general and efforts to reduce the U.S. federal deficit.
Throughout the fiscal year period, fixed-income markets were buffeted by concerns about the tepid U.S. economic recovery combined with the ballooning U.S. federal deficit, the seemingly unending European debt crisis and a broader slowdown in global growth, especially emerging markets. These macro events caused the financial markets to fluctuate between embracing risk and shunning risk several times during the period. In late summer of 2011, the markets experienced a massive flight to quality, leading U.S. Treasuries to outperform all risk assets, particularly equities, high yield and investment- grade corporate bonds. However, late fall brought about a renewed appetite for risk as the European crisis appeared to be on the mend and U.S. economic indicators strengthened. Risk premiums on non-government bonds contracted and asset classes such as high-yield corporates, emerging market debt and commercial mortgage-backed securities (CMBS) substantially outperformed Treasuries. In the final months of the reporting period, however, the situation reversed once again as a broad slowdown in global growth together with renewed political discord and sovereign funding pressures in Europe cast a malaise over the markets. Not surprisingly, risk premiums on non-government bonds widened once again as U.S. Treasuries renewed their perceived safe haven status, outperforming other riskier asset classes.
How did the Portfolio perform during the twelve-month period ended July 31, 2012?
The table in the Performance and Expense Ratios section of this report provide Class I Share total returns for the Portfolio for the one-year, five-year and since inception periods ended July 31, 2012. The Portfolio’s Class I Share total returns at net asset value (NAV) outperformed the Barclays 7-Year Municipal Bond Index during the twelve month reporting period.
What strategies were used to manage the Portfolio during the reporting period? How did these strategies influence performance?
The Portfolio uses a value oriented strategy and looks for higher yielding and undervalued municipal bonds that offer the potential for above-average total return. The Portfolio invests in various types of municipal securities, including investment grade (rated BBB/Baa or better), below investment grade (rated BB/Ba or lower), high yield and unrated municipal securities. The Portfolio focuses on securities with intermediate to longer-term maturities. This investment strategy did not change during the reporting period.
The Portfolio’s diversified yield curve positioning was one factor that contributed to the relative outperformance experienced over the period. We also increased the Portfolio’s exposure to mid-investment grade (A and BBB rated) bonds that offered solid total return and income potential, especially in a lower yield environment. Additionally, we continued to selectively add to the Portfolio’s high yield exposure, which added to the Portfolio’s relative performance. Throughout the period, we gradually increased our exposure to
longer duration securities and sought improved call protection to increase the Portfolio’s income sustainability, while trying to minimize potential duration volatility and enhance long-term return prospects. Replacing older, lower yielding investments that were called or matured, and selling other holdings at opportune times, allowed us to utilize the comparatively steep yield curve and take advantage of attractive situations in the market to boost relative performance.
Risk Considerations
Mutual fund investing involves risk; principal loss is possible. Debt or fixed income securities such as those held by the Portfolio, are subject to market risk, credit risk, interest rate risk, call risk, tax risk, political and economic risk, and income risk. As interest rates rise, bond prices fall. Credit risk refers to an issuers ability to make interest and principal payments when due. Below investment grade or high yield debt securities are subject to liquidity risk and heightened credit risk. The Portfolio’s potential use of inverse floaters creates effective leverage. Leverage involves the risk that the Portfolio could lose more than its original investment and also increases the Portfolio’s exposure to volatility and interest rate risk.
Performance and Expense Ratios
This is a specialized municipal bond Portfolio developed exclusively for use within Nuveen-sponsored separately managed accounts.
Returns quoted represent past performance, which is no guarantee of future results. Current performance may be higher or lower than the performance shown. Investment returns and principal value will fluctuate so that when shares are redeemed, they may be worth more or less than their original cost. Returns do not reflect the deduction of taxes that a shareholder would pay on Portfolio distributions or the redemption of Portfolio shares.
Returns may reflect a contractual agreement between the Portfolio and the investment adviser to waive certain fees and expenses; see Notes to Financial Statements, Footnote 7 — Management Fees and Other Transactions with Affiliates for more information. In addition, returns may reflect a voluntary expense limitation by the Portfolio’s investment adviser that may be modified or discontinued at any time without notice. For the most recent month-end performance call (800) 257-8787.
Portfolio shares have no sales charge. Portfolio returns assume reinvestment of dividends and capital gains.
The expense ratios shown reflect the Portfolio’s total operating expenses (before fee waivers or expense reimbursements, if any) as shown in the Portfolio’s most recent prospectus.
Performance
Average Annual Total Returns as of July 31, 2012
| | | | | | | | | | | | |
| |
| | | Average Annual | |
| | | |
| | | 1-Year | | | 5-Year | | | Since
Inception* | |
Class I Shares | | | 14.66% | | | | 7.33% | | | | 7.29% | |
Barclays 7-Year Municipal Bond Index** | | | 7.97% | | | | 6.76% | | | | 6.63% | |
Average Annual Total Returns as of June 30, 2012 (Most Recent Calendar Quarter)
| | | | | | | | | | | | |
| |
| | | Average Annual | |
| | | |
| | | 1-Year | | | 5-Year | | | Since
Inception* | |
Class I Shares | | | 13.81% | | | | 6.99% | | | | 6.98% | |
Expense Ratios as of Most Recent Prospectus
| | | | | | | | |
| | |
| | | Gross
Expense
Ratio | | | Net
Expense
Ratio | |
Class I Shares | | | 0.09% | | | | 0.01% | |
The Adviser has agreed irrevocably during the existence of the Portfolio to waive all fees and pay or reimburse all expenses of the Portfolio, except for interest expense, taxes, fees incurred in acquiring and disposing of portfolio securities and extraordinary expenses.
| * | Since inception returns are from 5/31/07. |
| ** | Refer to the Glossary of Terms Used in this Report for definitions. This index is not available for direct investment. |
Growth of an Assumed $10,000 Investment as of July 31, 2012 – Class I Shares
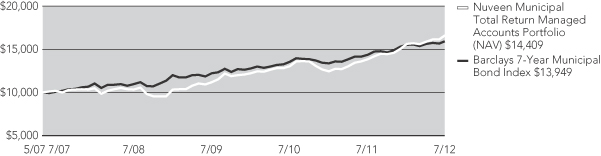
The graphs do not reflect the deduction of taxes that a shareholder may pay on Portfolio distributions or the redemption of Portfolio shares.
Yields as of July 31, 2012
Dividend Yield is the most recent dividend per share (annualized) divided by the offering price per share.
The SEC 30-Day Yield is a standardized measure of the Portfolio’s yield that accounts for the future amortization of premiums or discounts of bonds held in the portfolio of investments. The SEC 30-Day Yield is computed under an SEC standardized formula and is based on the maximum offer price per share. Dividend Yield may differ from the SEC 30-Day Yield because the Portfolio may be paying out more or less than it is earning and it may not include the effect of amortization of bond premium.
The Taxable-Equivalent Yield represents the yield that must be earned on a fully taxable investment in order to equal the yield of the Portfolio on an after-tax basis at a specified tax rate. With respect to investments that generate qualified dividend income that is taxable at a maximum rate of 15%, the Taxable-Equivalent Yield is lower.
| | | | | | | | | | | | |
| | | Dividend
Yield | | | SEC 30-Day
Yield | | | Taxable-
Equivalent
Yield1 | |
Class I Shares | | | 4.22% | | | | 3.43% | | | | 4.76% | |
| 1 | The Taxable-Equivalent Yield is based on the Portfolio’s SEC 30-Day Yield on the indicated date and a federal income tax rate of 28%. |
Holding Summaries as of July 31, 2012
This data relates to the securities held in the portfolio of investments. It should not be construed as a measure of performance for the Portfolio itself.
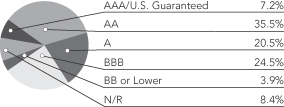
Ratings shown are the highest rating given by one of the following national rating agencies: Standard & Poor’s Group, Moody’s Investors Service, Inc. or Fitch, Inc. Credit ratings are subject to change. AAA, AA, A and BBB are investment grade ratings; BB, B, CCC, CC, C and D are below investment grade ratings. Certain bonds backed by U.S. Government or agency securities are regarded as having an implied rating equal to the rating of such securities. Holdings designated N/R are not rated by a national rating agency.
Bond Credit Quality1
| | | | |
| Portfolio Composition1 | | | |
| Health Care | | | 22.6% | |
| Education and Civic Organizations | | | 18.7% | |
| Tax Obligation/General | | | 15.6% | |
| Tax Obligation/Limited | | | 15.4% | |
| Transportation | | | 8.8% | |
| Water and Sewer | | | 6.8% | |
| Utilities | | | 6.1% | |
| Other | | | 6.0% | |
| | | | |
| States1 | | | |
Texas | | | 12.3% | |
| California | | | 9.7% | |
Illinois | | | 8.9% | |
| Florida | | | 6.4% | |
North Carolina | | | 4.8% | |
New York | | | 4.5% | |
Indiana | | | 3.6% | |
Pennsylvania | | | 3.3% | |
Colorado | | | 2.6% | |
Virginia | | | 2.6% | |
Maryland | | | 2.6% | |
New Jersey | | | 2.6% | |
Wisconsin | | | 2.3% | |
Washington | | | 2.3% | |
Massachusetts | | | 2.2% | |
Utah | | | 2.0% | |
Oregon | | | 1.8% | |
Wyoming | | | 1.7% | |
South Carolina | | | 1.6% | |
Missouri | | | 1.5% | |
Virgin Islands | | | 1.4% | |
Idaho | | | 1.4% | |
Guam | | | 1.3% | |
Michigan | | | 1.3% | |
Georgia | | | 1.3% | |
| Other | | | 14.0% | |
| 1 | As a percentage of total investments as of July 31, 2012. Holdings are subject to change. |
Expense Examples
As a shareholder of the Portfolio, you incur two types of costs: (1) transaction costs, including up-front and back-end sales charges (loads) or redemption fees, where applicable; and (2) ongoing costs, including management fees; distribution and service (12b-1) fees, where applicable; and other Portfolio expenses. The Example below is intended to help you understand your ongoing costs (in dollars) of investing in the Portfolio and to compare these costs with the ongoing costs of investing in other mutual funds.
The Example below is based on an investment of $1,000 invested at the beginning of the period and held for the period.
The information under “Actual Performance,” together with the amount you invested, allows you to estimate actual expenses incurred over the reporting period. Simply divide your account value by $1,000 (for example, an $8,600 account value divided by $1,000 = 8.60) and multiply the result by the cost shown for your share class, in the row entitled “Expenses Incurred During Period” to estimate the expenses incurred on your account during this period.
The information under “Hypothetical Performance,” provides information about hypothetical account values and hypothetical expenses based on the Portfolio’s actual expense ratio and an assumed rate of return of 5% per year before expenses, which is not the Portfolio’s actual return. The hypothetical account values and expenses may not be used to estimate the actual ending account balance or expense you incurred for the period. You may use this information to compare the ongoing costs of investing in the Portfolio and other funds. To do so, compare this 5% hypothetical example with the 5% hypothetical examples that appear in the shareholder reports of the other funds.
Please note that the expenses shown in the table are meant to highlight your ongoing costs only and do not reflect any transaction costs. Therefore, the hypothetical information is useful in comparing ongoing costs only, and will not help you determine the relative total costs of owning different funds or share classes. In addition, if these transaction costs were included, your costs would have been higher.
| | | | | | | | | | | | | | | | |
| | | | | | | | | | | Actual Performance | | | Hypothetical Performance
(5% annualized return
before expenses) | |
| Beginning Account Value (2/01/12) | | | | | | | | | | $ | 1,000.00 | | | $ | 1,000.00 | |
| Ending Account Value (7/31/12) | | | | | | | | | | $ | 1,047.30 | | | $ | 1,024.86 | |
| Expenses Incurred During Period | | | | | | | | | | $ | — | | | $ | — | |
Expenses are equal to the Portfolio’s annualized net expense ratio of 0.00% for the six-month period.
Report of
Independent Registered
Public Accounting Firm
To the Board of Trustees and Shareholders of
Nuveen Managed Accounts Portfolios Trust:
In our opinion, the accompanying statement of assets and liabilities, including the portfolio of investments, and the related statements of operations, of changes in net assets, and the financial highlights present fairly, in all material respects, the financial position of Municipal Total Return Managed Accounts Portfolio (a series of the Nuveen Managed Accounts Portfolios Trust, hereinafter referred to as the “Fund”) at July 31, 2012, the results of its operations for the year then ended, and the change in its net assets for each of the two years in the period then ended and the financial highlights for each of the five years in the period then ended, in conformity with accounting principles generally accepted in the United States of America. These financial statements and financial highlights (hereafter referred to as “financial statements”) are the responsibility of the Fund’s management; our responsibility is to express an opinion on these financial statements based on our audits. We conducted our audits of these financial statements in accordance with the standards of the Public Company Accounting Oversight Board (United States). Those standards require that we plan and perform the audit to obtain reasonable assurance about whether the financial statements are free of material misstatement. An audit includes examining, on a test basis, evidence supporting the amounts and disclosures in the financial statements, assessing the accounting principles used and significant estimates made by management, and evaluating the overall financial statement presentation. We believe that our audits, which included confirmation of securities at July 31, 2012 by correspondence with the custodian and brokers, provide a reasonable basis for our opinion.
PRICEWATERHOUSECOOPERS LLP
Chicago, IL
September 27, 2012
Portfolio of Investments
Municipal Total Return Managed Accounts Portfolio
July 31, 2012
| | | | | | | | | | | | | | | | |
Principal
Amount (000) | | | Description (1) | | Optional Call
Provisions (2) | | | Ratings (3) | | | Value | |
| | | | | | | | | | | | | | | | |
| | | | MUNICIPAL BONDS – 99.2% | | | | | | | | | | | | |
| | | | |
| | | | Alabama – 0.6% | | | | | | | | | | | | |
| | | | |
| $ | 850 | | | Alabama State Board of Education, Revenue Bonds, Faulkner State Community College, Series 2009, 6.125%, 10/01/28 | | | 10/18 at 100.00 | | | | A1 | | | $ | 994,577 | |
| | | | |
| | 500 | | | Auburn University, Alabama, General Fee Revenue Bonds, Series 2011A,
5.000%, 6/01/41 | | | 6/21 at 100.00 | | | | Aa2 | | | | 568,135 | |
| | 1,350 | | | Total Alabama | | | | | | | | | | | 1,562,712 | |
| | | | Alaska – 0.3% | | | | | | | | | | | | |
| | | | |
| | 145 | | | Alaska Municipal Bond Bank Authority, General Obligation Bonds, Series 2006-2, 5.500%, 12/01/21 – NPFG Insured (Alternative Minimum Tax) | | | 12/16 at 100.00 | | | | AA | | | | 165,333 | |
| | | | |
| | 665 | | | Northern Tobacco Securitization Corporation, Alaska, Tobacco Settlement Asset-Backed Bonds, Series 2006A, 4.625%, 6/01/23 | | | 6/14 at 100.00 | | | | Ba1 | | | | 665,020 | |
| | 810 | | | Total Alaska | | | | | | | | | | | 830,353 | |
| | | | Arizona – 1.2% | | | | | | | | | | | | |
| | | | |
| | 410 | | | Arizona School Facilities Board, School Improvement Revenue Bonds, Series 2004A, 5.500%, 7/01/14 – AMBAC Insured | | | No Opt. Call | | | | AA | | | | 442,365 | |
| | | | |
| | 1,195 | | | Maricopa County, Arizona, Hospital Revenue Bonds, Sun Health Corporation, Series 2005, 5.000%, 4/01/25 (Pre-refunded 4/01/24) | | | 4/24 at 100.00 | | | | N/R (4) | | | | 1,477,092 | |
| | | | |
| | 500 | | | Salt River Project Agricultural Improvement and Power District, Arizona, Electric System Revenue Bonds, Tender Option Bond Trust 10-9W, 18.000%, 1/01/38 (IF) (5) | | | 1/18 at 100.00 | | | | Aa1 | | | | 725,520 | |
| | | | |
| | 345 | | | Yavapai County Industrial Development Authority, Arizona, Charter School Revenue Bonds, Arizona Agribusiness and Equine Center Charter School, Series 2011, 7.625%, 3/01/31 | | | 3/21 at 100.00 | | | | BB+ | | | | 385,023 | |
| | | | |
| | 75 | | | Yuma County Industrial Development Authority, Arizona, Exempt Revenue Bonds, Far West Water & Sewer Inc. Refunding, Series 2007A, 6.500%, 12/01/17 (Alternative Minimum Tax) | | | No Opt. Call | | | | N/R | | | | 76,532 | |
| | 2,525 | | | Total Arizona | | | | | | | | | | | 3,106,532 | |
| | | | Arkansas – 0.4% | | | | | | | | | | | | |
| | | | |
| | 1,100 | | | Conway Health Facilities Board, Arkansas, Hospital Revenue Bond, Conway Regional Medical Center, Improvement Series 2012, 4.450%, 8/01/32 | | | 8/22 at 100.00 | | | | BBB+ | | | | 1,139,644 | |
| | | | California – 9.6% | | | | | | | | | | | | |
| | | | |
| | 500 | | | ABAG Finance Authority for Non-Profit Corporations, California, Revenue Bonds, Casa de Lad Campanas, Series 2010, 6.000%, 9/01/37 | | | 9/20 at 100.00 | | | | A– | | | | 569,395 | |
| | | | |
| | 700 | | | Anaheim Public Finance Authority, California, Electric Distribution Revenue Bonds, Series 1999, 5.000%, 10/01/25 – AMBAC Insured | | | 10/15 at 100.00 | | | | NA | | | | 741,202 | |
| | | | |
| | 265 | | | California Department of Veteran Affairs, Home Purchase Revenue Bonds, Series 2007B, 5.150%, 12/01/27 (Alternative Minimum Tax) | | | 12/16 at 100.00 | | | | AA | | | | 278,939 | |
| | | | |
| | 500 | | | California Educational Facilities Authority, Revenue Bonds, University of Southern California, Tender Option Bond Trust 3144, 19.270%, 10/01/16 (IF) | | | No Opt. Call | | | | Aa1 | | | | 891,820 | |
| | | | |
| | 1,000 | | | California Health Facilities Financing Authority, Revenue Bonds, Catholic Healthcare West, Series 2009F, 5.625%, 7/01/25 | | | 7/19 at 100.00 | | | | A+ | | | | 1,156,750 | |
| | | | |
| | 100 | | | California Health Facilities Financing Authority, Revenue Bonds, Kaiser Permanente System, Series 1993A, 5.400%, 5/01/28 (ETM) | | | 10/12 at 100.00 | | | | AA+ (4) | | | | 100,426 | |
| | | | |
| | 1,300 | | | California Municipal Finance Authority, Revenue Bonds, Eisenhower Medical Center, Series 2010A, 5.500%, 7/01/30 | | | 7/20 at 100.00 | | | | Baa2 | | | | 1,387,958 | |
| | | | |
| | 575 | | | California State Public Works Board, Lease Revenue Bonds, Department of Corrections & Rehabilitation, Series 2009H, 5.500%, 11/01/27 | | | 11/19 at 100.00 | | | | A2 | | | | 666,063 | |
| | | | |
| | 1,000 | | | California State, General Obligation Bonds, Various Purpose Series 2009, 6.500%, 4/01/33 | | | 4/19 at 100.00 | | | | A1 | | | | 1,250,810 | |
| | | | |
| | 90 | | | California State, General Obligation Veterans Bonds, Refunding Series 2005CB, 5.050%, 12/01/36 (Alternative Minimum Tax) | | | 6/15 at 100.00 | | | | AA | | | | 92,151 | |
| | | | | | | | | | | | | | | | |
Principal
Amount (000) | | | Description (1) | | Optional Call
Provisions (2) | | | Ratings (3) | | | Value | |
| | | | | | | | | | | | | | | | |
| | | | California (continued) | | | | | | | | | | | | |
| | | | |
| $ | 450 | | | California State, General Obligation Bonds, Refunding Various Purpose Series 2012B, 6.500%, 4/01/33 | | | 4/19 at 100.00 | | | | A1 | | | $ | 450,990 | |
| | | | |
| | 2,000 | | | California Statewide Communities Development Authority, Revenue Bonds, Kaiser Permanente, Series 2012A, 1.100%, 4/01/52 | | | 2/17 at 100.00 | | | | A+ | | | | 2,001,980 | |
| | | | |
| | 720 | | | California, Various Purpose General Obligation Bonds, Series 1997, 5.625%, 10/01/21 – FGIC Insured | | | 4/13 at 100.00 | | | | AA+ | | | | 725,962 | |
| | | | |
| | 405 | | | Compton Unified School District, Los Angeles County, California, General Obligation Bonds, 2002 Election, Refunding Series 2006D, 0.000%, 6/01/22 – AMBAC Insured | | | No Opt. Call | | | | Aa3 | | | | 261,662 | |
| | | | |
| | 1,000 | | | Culver City Redevelopment Agency, California, Tax Allocation Revenue Bonds, Redevelopment Project, Capital Appreciation Series 2011A, 0.000%, 11/01/21 | | | No Opt. Call | | | | A | | | | 605,660 | |
| | | | |
| | 1,000 | | | Gilroy Unified School District, Santa Clara County, California, General Obligation Bonds, Series 2009A, 6.000%, 8/01/25 – AGC Insured | | | 8/19 at 100.00 | | | | AA– | | | | 1,238,550 | |
| | | | |
| | | | Golden State Tobacco Securitization Corporation, California, Enhanced Tobacco Settlement Asset-Backed Revenue Bonds, Series 2005A: | | | | | | | | | | | | |
| | 1,100 | | | 5.000%, 6/01/17 | | | 10/12 at 100.00 | | | | A2 | | | | 1,100,770 | |
| | 200 | | | 5.000%, 6/01/45 | | | 6/15 at 100.00 | | | | A2 | | | | 204,624 | |
| | 135 | | | 4.625%, 6/01/45 – RAAI Insured | | | 6/15 at 100.00 | | | | A2 | | | | 136,349 | |
| | | | |
| | 1,000 | | | Long Beach, California, Harbor Revenue Bonds, Series 2005A, 5.000%, 5/15/23 – NPFG Insured (Alternative Minimum Tax) | | | 5/15 at 100.00 | | | | AA | | | | 1,107,680 | |
| | | | |
| | 1,000 | | | Los Angeles Department of Airports, California, Revenue Bonds, Los Angeles International Airport, Series 2009A, 5.250%, 5/15/29 | | | 5/19 at 100.00 | | | | AA | | | | 1,158,180 | |
| | | | |
| | 500 | | | Los Angeles Department of Water and Power, California, Power System Revenue Bonds, Series 2008A-2, 5.250%, 7/01/32 | | | 7/18 at 100.00 | | | | AA– | | | | 587,040 | |
| | | | |
| | 1,000 | | | Metropolitan Water District of Southern California, Water Revenue Refunding Bonds, Series 2012B-1, 0.500%, 7/01/27 | | | 11/14 at 100.00 | | | | Aa1 | | | | 1,000,000 | |
| | | | |
| | 485 | | | Murrieta, California, Special Tax Bonds, Community Facilities District 2003-3, Creekside Village Improvement Area 1, Series 2005, 5.200%, 9/01/35 | | | 9/12 at 100.00 | | | | N/R | | | | 485,126 | |
| | | | |
| | 85 | | | Novato Redevelopment Agency, California, Tax Allocation Bonds, Hamilton Field Redevelopment Project, Series 2011, 6.750%, 9/01/40 | | | 9/21 at 100.00 | | | | A– | | | | 98,099 | |
| | | | |
| | 1,000 | | | Palm Drive Health Care District, Sonoma County, California, Certificates of Participation, Parcel Tax Secured Financing Program, Series 2010,
7.500%, 4/01/35 | | | 4/13 at 102.00 | | | | BB | | | | 1,026,050 | |
| | | | |
| | 850 | | | Public Utilities Commission of the City and County of San Francisco, California, Water Revenue Bonds, Series 2006A, 5.000%, 11/01/25 – AGM Insured | | | 5/16 at 100.00 | | | | AA– | | | | 960,262 | |
| | | | |
| | 2,000 | | | Santa Monica Community College District, Los Angeles County, California, Certificates of Participation, Refunding Series 2004A, 5.000%, 2/01/27 – AMBAC Insured | | | 2/14 at 100.00 | | | | N/R | | | | 2,059,820 | |
| | | | |
| | 225 | | | Stockton Unified School District, San Joaquin County, California, Certificates of Participation, Series 2007, 4.375%, 2/01/31 – AMBAC Insured | | | 2/17 at 100.00 | | | | A– | | | | 218,194 | |
| | | | |
| | | | Stockton Unified School District, San Joaquin County, California, General Obligation Bonds, Election 2008 Series 2008A: | | | | | | | | | | | | |
| | 25 | | | 4.000%, 8/01/15 – AGM Insured | | | No Opt. Call | | | | AA– | | | | 26,219 | |
| | 100 | | | 5.000%, 8/01/24 – AGC Insured | | | 8/16 at 102.00 | | | | AA– | | | | 106,050 | |
| | | | |
| | | | Stockton Unified School District, San Joaquin County, California, General Obligation Bonds, Series 2006: | | | | | | | | | | | | |
| | 110 | | | 5.000%, 9/01/19 – FGIC Insured | | | 9/15 at 100.00 | | | | A | | | | 116,025 | |
| | 200 | | | 4.250%, 9/01/24 – FGIC Insured | | | 9/15 at 100.00 | | | | A | | | | 201,998 | |
| | | | |
| | 500 | | | Twentynine Palms Redevelopment Agency, California, Tax Allocation Bonds, Four Corners Project Area, Series 2011A:
7.125%, 9/01/26 | | | 9/21 at 100.00 | | | | BBB+ | | | | 590,000 | |
| | 500 | | | 7.400%, 9/01/32 | | | 9/21 at 100.00 | | | | BBB+ | | | | 586,320 | |
| | | | |
| | 750 | | | University of California, Hospital Revenue Bonds, UCLA Medical Center, Series 2004A, 5.250%, 5/15/30 – AMBAC Insured | | | 10/12 at 100.00 | | | | N/R | | | | 777,360 | |
| | | | |
| | 750 | | | Western Municipal Water District Facilities Authority, California, Water Revenue Bonds, Series 2009B, 5.000%, 10/01/34 | | | 10/19 at 100.00 | | | | AA+ | | | | 847,860 | |
| | 24,120 | | | Total California | | | | | | | | | | | 25,814,344 | |
Portfolio of Investments
Municipal Total Return Managed Accounts Portfolio (continued)
July 31, 2012
| | | | | | | | | | | | | | | | |
Principal
Amount (000) | | | Description (1) | | Optional Call
Provisions (2) | | | Ratings (3) | | | Value | |
| | | | | | | | | | | | | | | | |
| | | | Colorado – 2.6% | | | | | | | | | | | | |
| | | | |
| $ | 500 | | | Colorado Health Facilities Authority, Colorado, Revenue Bonds, Valley View Hospital Association, Series 2008, 5.750%, 5/15/36 | | | 5/18 at 100.00 | | | | BBB+ | | | $ | 539,290 | |
| | | | |
| | 75 | | | Colorado Health Facilities Authority, Colorado, Revenue Bonds, Yampa Valley Medical Center, Series 2007, 5.000%, 9/15/15 | | | No Opt. Call | | | | BBB | | | | 80,171 | |
| | | | |
| | 1,845 | | | Colorado Health Facilities Authority, Revenue Bonds, National Jewish Medical and Research Center, Series 2012, 5.000%, 1/01/20 | | | No Opt. Call | | | | BBB | | | | 2,060,736 | |
| | | | |
| | 640 | | | Colorado Housing and Finance Authority, Multifamily Project, Class I Series 2012A, 2.750%, 10/01/22 | | | No Opt. Call | | | | AAA | | | | 652,710 | |
| | | | |
| | 530 | | | Denver City and County, Colorado, Airport System Revenue Bonds, Series 1991D, 7.750%, 11/15/13 – AMBAC Insured | | | No Opt. Call | | | | A+ | | | | 553,569 | |
| | | | |
| | 300 | | | E-470 Public Highway Authority, Colorado, Senior Revenue Bonds, Series
2007B-1, 5.500%, 9/01/24 – NPFG Insured | | | 9/15 at 100.00 | | | | BBB | | | | 325,473 | |
| | | | |
| | 535 | | | Fitzsimons Village Metropolitan District 1, Aurora, Arapahoe County, Colorado, Tax Increment Public Improvement Fee Supported Revenue Bonds, Series 2010A, 7.500%, 3/01/40 | | | 3/20 at 100.00 | | | | N/R | | | | 577,201 | |
| | | | |
| | 500 | | | Fossil Ridge Metropolitan District 1, Lakewood, Colorado, Tax-Supported Revenue Bonds, Refunding Series 2010, 7.250%, 12/01/40 | | | 12/20 at 100.00 | | | | N/R | | | | 530,705 | |
| | | | |
| | 1,000 | | | Regional Transportation District, Colorado, Denver Transit Partners Eagle P3 Project Private Activity Bonds, Series 2010, 6.500%, 1/15/30 | | | 7/20 at 100.00 | | | | Baa3 | | | | 1,203,270 | |
| | | | |
| | 500 | | | Three Springs Metropolitan District 3, Durango, La Plata County, Colorado, Property Tax Supported Revenue Bonds, Series 2010, 7.750%, 12/01/39 | | | 12/20 at 100.00 | | | | N/R | | | | 527,270 | |
| | 6,425 | | | Total Colorado | | | | | | | | | | | 7,050,395 | |
| | | | Connecticut – 0.4% | | | | | | | | | | | | |
| | | | |
| | 670 | | | Connecticut Health and Educational Facilities Authority, Revenue Bonds, Yale University, Series 2009, Trust 3363, 13.488%, 7/01/15 (IF) | | | No Opt. Call | | | | AAA | | | | 973,999 | |
| | | | Delaware – 0.5% | | | | | | | | | | | | |
| | | | |
| | 1,440 | | | Delaware Economic Development Authority, Revenue Bonds, Newark Charter School, Series 2012, 3.875%, 9/01/22 | | | 3/22 at 100.00 | | | | BBB | | | | 1,470,298 | |
| | | | District of Columbia – 0.2% | | | | | | | | | | | | |
| | | | |
| | 450 | | | District of Columbia Tobacco Settlement Corporation, Tobacco Settlement Asset-Backed Bonds, Series 2001, 6.750%, 5/15/40 | | | 11/12 at 100.00 | | | | Baa1 | | | | 458,996 | |
| | | | Florida – 6.4% | | | | | | | | | | | | |
| | | | |
| | 1,440 | | | Bay County, Florida, Educational Facilities Revenue Refunding Bonds, Bay Haven Charter Academy, Inc. Project, Series 2010A, 5.250%, 9/01/30 | | | 9/20 at 100.00 | | | | BBB | | | | 1,475,179 | |
| | | | |
| | 300 | | | Brevard County, Florida, South Brevard Recreation Special District, Limited Ad Valorem Tax Bonds, Parks and Recreation Program, Series 2007, 5.000%, 7/01/13 – AMBAC Insured (ETM) | | | No Opt. Call | | | | A3 (4) | | | | 312,969 | |
| | | | |
| | 1,000 | | | Broward County, Florida, Port Facilities Revenue Bonds, Refunding Series 2011B:
5.000%, 9/01/23 – AGM Insured (Alternative Minimum Tax) | | | 9/21 at 100.00 | | | | AA– | | | | 1,122,610 | |
| | 1,250 | | | 4.625%, 9/01/27 – AGM Insured (Alternative Minimum Tax) | | | 9/21 at 100.00 | | | | AA– | | | | 1,343,663 | |
| | | | |
| | 500 | | | Crystal River, Florida, Water and Sewer Revenue Bonds, Refunding & Improvement Series 2002, 5.000%, 10/01/25 (Pre-refunded 10/01/12) – AMBAC Insured | | | 10/12 at 100.00 | | | | N/R (4) | | | | 501,090 | |
| | | | |
| | 750 | | | Florida Board of Education, Lottery Revenue Bonds, Series 2006A, 5.000%, 7/01/21 – AMBAC Insured | | | 7/15 at 101.00 | | | | AAA | | | | 847,605 | |
| | | | |
| | 300 | | | Florida Housing Finance Corporation, Homeowner Mortgage Revenue Bonds, Series 2008-1, 6.450%, 1/01/39 (Alternative Minimum Tax) | | | 7/17 at 100.00 | | | | AA+ | | | | 324,309 | |
| | | | |
| | 2,000 | | | Florida Ports Financing Commission, Revenue Bonds, State Transportation Trust Fund, Refunding Series 2011B, 5.125%, 6/01/27 (Alternative Minimum Tax) | | | 6/21 at 100.00 | | | | AA+ | | | | 2,304,918 | |
| | | | |
| | 885 | | | Gulf Breeze, Florida, Revenue Improvement Non-Ad Valorem Bonds, Series 2007, 5.000%, 12/01/32 – AMBAC Insured | | | 12/17 at 100.00 | | | | N/R | | | | 916,966 | |
| | | | | | | | | | | | | | | | |
Principal
Amount (000) | | | Description (1) | | Optional Call
Provisions (2) | | | Ratings (3) | | | Value | |
| | | | | | | | | | | | | | | | |
| | | | Florida (continued) | | | | | | | | | | | | |
| | | | |
| $ | 2,000 | | | Hillsborough County, Florida, Solid Waste and Resource Recovery Revenue Bonds, Series 2006A, 5.000%, 9/01/25 – AMBAC Insured (Alternative Minimum Tax) | | | 9/16 at 100.00 | | | | AA | | | $ | 2,134,200 | |
| | | | |
| | 2,485 | | | Lakeland, Florida, Hospital System Revenue Bonds, Lakeland Regional Medical Center, Series 2006, 5.000%, 11/15/14 | | | No Opt. Call | | | | A2 | | | | 2,702,709 | |
| | | | |
| | 1,000 | | | Miami-Dade County Health Facility Authority, Florida, Hospital Revenue Bonds, Miami Children's Hospital, Series 2010A, 5.250%, 8/01/21 | | | 8/20 at 100.00 | | | | A | | | | 1,165,630 | |
| | | | |
| | 250 | | | Miami-Dade County, Florida, Aviation Revenue Bonds, Miami International Airport, Series 2005B, 5.000%, 10/01/12 – SYNCORA GTY Insured (Alternative Minimum Tax) | | | No Opt. Call | | | | A2 | | | | 251,890 | |
| | | | |
| | 60 | | | Okaloosa County Gas District, Florida, Gas System Revenue Bonds, Series 2005A, 4.400%, 10/01/29 – AMBAC Insured | | | 10/14 at 100.00 | | | | A+ | | | | 61,561 | |
| | | | |
| | 1,030 | | | Orange County Health Facilities Authority, Florida, Hospital Revenue Bonds, Orlando Health, Inc., Series 2012B, 5.000%, 10/01/42 | | | 4/22 at 100.00 | | | | A | | | | 1,035,294 | |
| | | | |
| | 400 | | | Sanibel, Florida, General Obligation Bonds, Series 2006, 4.350%, 2/01/36 – AMBAC Insured | | | 8/16 at 100.00 | | | | N/R | | | | 410,408 | |
| | | | |
| | 75 | | | Seminole Tribe of Florida, Special Obligation Bonds, Series 2007A, 144A, 5.750%, 10/01/22 | | | 10/17 at 100.00 | | | | BBB– | | | | 80,694 | |
| | | | |
| | 170 | | | The City of Miami, Florida, Special Revenue Refunding Bonds, Series 1988, 0.000%, 1/01/15 – NPFG Insured | | | No Opt. Call | | | | BBB | | | | 152,561 | |
| | | | |
| | 75 | | | Tolomato Community Development District, Florida, Special Assessment Bonds, Series 2007, 6.375%, 5/01/17 (6), (7) | | | No Opt. Call | | | | N/R | | | | 36,855 | |
| | 15,970 | | | Total Florida | | | | | | | | | | | 17,181,111 | |
| | | | Georgia – 1.3% | | | | | | | | | | | | |
| | | | |
| | 1,155 | | | Athens-Clarke County Unified Government Development Authority, Georgia, Revenue Bonds, University of Georgia Athletic Association Project, Series 2011, 5.250%, 7/01/28 | | | 7/21 at 100.00 | | | | Aa3 | | | | 1,368,386 | |
| | | | |
| | 650 | | | Atlanta Development Authority, Georgia, Educational Facilities Revenue Bonds, Science Park LLC Project, Series 2007, 5.250%, 7/01/27 | | | 7/17 at 100.00 | | | | Aa3 | | | | 710,314 | |
| | | | |
| | 60 | | | Atlanta, Georgia, Airport General Revenue Refunding Bonds, Series 2011A, 5.000%, 1/01/19 | | | No Opt. Call | | | | A+ | | | | 72,251 | |
| | | | |
| | 500 | | | La Grange-Troup County Hospital Authority, Georgia, Revenue Anticipation Certificates, Series 2008A, 5.500%, 7/01/38 | | | 7/18 at 100.00 | | | | Aa2 | | | | 550,345 | |
| | | | |
| | 750 | | | Private Colleges and Universities Authority, Georgia, Revenue Bonds, Emory University, Series 2008C, 5.000%, 9/01/38 | | | 9/18 at 100.00 | | | | AA+ | | | | 833,040 | |
| | 3,115 | | | Total Georgia | | | | | | | | | | | 3,534,336 | |
| | | | Guam – 1.3% | | | | | | | | | | | | |
| | | | |
| | 1,000 | | | Guam Government Waterworks Authority, Water and Wastewater System Revenue Bonds, Series 2010, 4.500%, 7/01/18 | | | No Opt. Call | | | | Ba2 | | | | 1,041,050 | |
| | | | |
| | | | Guam Government, General Obligation Bonds, 2009 Series A: | | | | | | | | | | | | |
| | 315 | | | 5.750%, 11/15/14 | | | No Opt. Call | | | | B+ | | | | 334,152 | |
| | 1,515 | | | 6.000%, 11/15/19 | | | No Opt. Call | | | | B+ | | | | 1,671,590 | |
| | | | |
| | 500 | | | Guam International Airport Authority, Revenue Bonds, Series 2003C, 5.375%, 10/01/19 – NPFG Insured (Alternative Minimum Tax) | | | 10/13 at 100.00 | | | | BBB | | | | 512,295 | |
| | 3,330 | | | Total Guam | | | | | | | | | | | 3,559,087 | |
| | | | Hawaii – 0.6% | | | | | | | | | | | | |
| | | | |
| | 1,500 | | | Hawaii Department of Budget and Finance, Special Purpose Revenue Bonds, Hawaiian Electric Company Inc., Refunding Series 2007B, 4.600%, 5/01/26 – FGIC Insured (Alternative Minimum Tax) | | | 3/17 at 100.00 | | | | Baa1 | | | | 1,559,280 | |
Portfolio of Investments
Municipal Total Return Managed Accounts Portfolio (continued)
July 31, 2012
| | | | | | | | | | | | | | | | |
Principal
Amount (000) | | | Description (1) | | Optional Call
Provisions (2) | | | Ratings (3) | | | Value | |
| | | | | | | | | | | | | | | | |
| | | | Idaho – 1.4% | | | | | | | | | | | | |
| | | | |
| $ | 750 | | | Boise-Kuna Irrigation District, Ada and Canyon Counties, Idaho, Arrowrock Hydroelectric Project Revenue Bonds, Series 2008, 7.375%, 6/01/34 | | | 6/18 at 100.00 | | | | A3 | | | $ | 892,725 | |
| | | | |
| | 1,000 | | | Idaho Housing and Finance Association, Economic Development Facilities Recovery Zone Revenue Bonds, TDF Facilities Project, Series 2010A,
6.500%, 2/01/26 | | | 2/21 at 100.00 | | | | A | | | | 1,122,710 | |
| | | | |
| | 35 | | | Idaho Housing and Finance Association, Single Family Mortgage Revenue Bonds, Series 2008A-1, 6.250%, 7/01/38 (Alternative Minimum Tax) | | | 1/17 at 100.00 | | | | AAA | | | | 35,467 | |
| | | | |
| | | | Idaho Water Resource Board, Water Resource Loan Program Revenue, Ground Water Rights Mittigation Series 2012A: | | | | | | | | | | | | |
| | 430 | | | 4.750%, 9/01/25 | | | 9/22 at 100.00 | | | | Baa1 | | | | 466,868 | |
| | 1,070 | | | 4.600%, 9/01/27 | | | 9/22 at 100.00 | | | | Baa1 | | | | 1,127,898 | |
| | 3,285 | | | Total Idaho | | | | | | | | | | | 3,645,668 | |
| | | | Illinois – 8.8% | | | | | | | | | | | | |
| | | | |
| | 1,000 | | | Berwyn, Illinois, General Obligation Bonds, Refunding Series 2004, 5.000%, 12/01/13 – AMBAC Insured | | | No Opt. Call | | | | N/R | | | | 1,045,900 | |
| | | | |
| | 1,000 | | | Bourbonnais, Illinois, Industrial Project Revenue Bonds, Olivet Nazarene University Project, Series 2010, 6.000%, 11/01/35 | | | 11/20 at 100.00 | | | | BBB | | | | 1,125,080 | |
| | | | |
| | 1,085 | | | Chicago State University, Illinois, Auxiliary Facilities System Revenue Bonds, Series 1998, 5.500%, 12/01/23 – NPFG Insured | | | No Opt. Call | | | | BBB | | | | 1,314,727 | |
| | | | |
| | 750 | | | Chicago, Illinois, General Airport Revenue Bonds, O'Hare International Airport, Third Lien Refunding Series 2010D, 5.250%, 1/01/18 (Alternative Minimum Tax) | | | No Opt. Call | | | | A2 | | | | 867,233 | |
| | | | |
| | 500 | | | Chicago, Illinois, Second Lien General Airport Revenue Refunding Bonds, O'Hare International Airport, Series 1999, 5.500%, 1/01/16 (Pre-refunded 9/12/12) – AMBAC Insured (Alternative Minimum Tax) | | | 9/12 at 100.00 | | | | AA(4) | | | | 501,635 | |
| | | | |
| | 500 | | | Cook County, Illinois, Recovery Zone Facility Revenue Bonds, Navistar International Corporation Project, Series 2010, 6.500%, 10/15/40 | | | 10/20 at 100.00 | | | | B2 | | | | 518,250 | |
| | | | |
| | 270 | | | DuPage County Community Unit School District 200, Wheaton, Illinois, General Obligation Bonds, Series 2008A, 5.000%, 10/01/17 – AGM Insured | | | No Opt. Call | | | | Aa3 | | | | 319,715 | |
| | | | |
| | 1,000 | | | Illinois Finance Authority, Charter School Revenue Bonds, Uno Charter School Network, Refunding and Improvement Series 2011A, 6.875%, 10/01/31 | | | 10/21 at 100.00 | | | | BBB– | | | | 1,115,940 | |
| | | | |
| | 750 | | | Illinois Finance Authority, Revenue Bonds, Children's Memorial Hospital, Series 2008B, 5.500%, 8/15/21 | | | 8/18 at 100.00 | | | | AA– | | | | 859,268 | |
| | | | |
| | 650 | | | Illinois Finance Authority, Revenue Bonds, Elmhurst Memorial Healthcare, Series 2008A, 5.625%, 1/01/37 | | | 1/18 at 100.00 | | | | BBB+ | | | | 695,572 | |
| | | | |
| | 1,000 | | | Illinois Finance Authority, Revenue Bonds, Illinois Institute of Technology, Series 2009, 6.250%, 2/01/19 | | | No Opt. Call | | | | Baa3 | | | | 1,086,250 | |
| | | | |
| | 975 | | | Illinois Finance Authority, Revenue Bonds, OSF Healthcare System, Refunding Series 2010A, 6.000%, 5/15/39 | | | 5/20 at 100.00 | | | | A | | | | 1,123,707 | |
| | | | |
| | 150 | | | Illinois Finance Authority, Revenue Bonds, Palos Community Hospital, Series 2007A, 5.000%, 5/15/35 – NPFG Insured | | | 5/17 at 100.00 | | | | AA– | | | | 156,836 | |
| | | | |
| | 700 | | | Illinois Finance Authority, Revenue Refunding Bonds, Silver Cross Hospital and Medical Centers, Series 2008A, 6.000%, 8/15/23 | | | 8/18 at 100.00 | | | | BBB+ | | | | 778,008 | |
| | | | |
| | 665 | | | Illinois Health Facilities Authority, Revenue Refunding Bonds, Elmhurst Memorial Healthcare, Series 2002, 6.250%, 1/01/17 | | | 1/13 at 100.00 | | | | BBB+ | | | | 696,887 | |
| | | | |
| | 1,000 | | | Illinois State, Sales Tax Revenue Bonds, Series 2004, 5.000%, 6/15/27 | | | 6/14 at 100.00 | | | | AAA | | | | 1,065,800 | |
| | | | |
| | 630 | | | Markham, Cook County, Illinois, General Obligation Bonds, Library Purpose Series 2005B, 5.250%, 1/01/18 – RAAI Insured | | | No Opt. Call | | | | N/R | | | | 666,105 | |
| | | | |
| | | | Markham, Illinois, General Obligation Bonds, Series 2008A: | | | | | | | | | | | | |
| | 455 | | | 4.750%, 2/01/17 | | | No Opt. Call | | | | BBB | | | | 483,556 | |
| | 355 | | | 4.750%, 2/01/18 | | | No Opt. Call | | | | BBB | | | | 376,662 | |
| | 400 | | | 6.000%, 2/01/25 | | | 2/18 at 100.00 | | | | BBB | | | | 429,956 | |
| | | | | | | | | | | | | | | | |
Principal
Amount (000) | | | Description (1) | | Optional Call
Provisions (2) | | | Ratings (3) | | | Value | |
| | | | | | | | | | | | | | | | |
| | | | Illinois (continued) | | | | | | | | | | | | |
| | | | |
| | | | Quad Cities Regional Economic Development Authority, Illinois, Revenue Bonds, Augustana College, Series 2012: | | | | | | | | | | | | |
| $ | 400 | | | 4.000%, 10/01/19 | | | No Opt. Call | | | | Baa1 | | | $ | 425,424 | |
| | 170 | | | 4.000%, 10/01/22 | | | No Opt. Call | | | | Baa1 | | | | 174,209 | |
| | | | |
| | 1,275 | | | Railsplitter Tobacco Settlement Authority, Illinois, Tobacco Settlement Revenue Bonds, Series 2010, 5.000%, 6/01/18 | | | No Opt. Call | | | | A | | | | 1,460,831 | |
| | | | |
| | 250 | | | Regional Transportation Authority, Cook, DuPage, Kane, Lake, McHenry and Will Counties, Illinois, General Obligation Bonds, Series 1991, 6.700%, 11/01/21 – FGIC Insured | | | No Opt. Call | | | | AA | | | | 301,935 | |
| | | | |
| | 3,100 | | | Regional Transportation Authority, Cook, DuPage, Kane, Lake, McHenry and Will Counties, Illinois, General Obligation Bonds, Series 2002A, 6.000%, 7/01/29 – NPFG Insured | | | No Opt. Call | | | | AA | | | | 4,151,793 | |
| | | | |
| | 750 | | | Southwestern Illinois Development Authority, Local Government Program Bonds, St. Clair County Community Unit School District 19 Mascoutah, Series 2009, 5.750%, 2/01/29 – AGC Insured | | | 2/19 at 100.00 | | | | AA– | | | | 848,093 | |
| | | | |
| | 1,000 | | | University of Illinois, Auxiliary Facilities Systems Revenue Bonds, Series 2012C, 5.000%, 4/01/26 | | | 10/21 at 100.00 | | | | Aa2 | | | | 1,168,640 | |
| | 20,780 | | | Total Illinois | | | | | | | | | | | 23,758,012 | |
| | | | Indiana – 3.5% | | | | | | | | | | | | |
| | | | |
| | 250 | | | Central Nine Career Charter School Building Corporation, Indiana, General Obligation Bonds, Series 2007, 5.500%, 1/15/17 | | | No Opt. Call | | | | AA+ | | | | 289,003 | |
| | | | |
| | 750 | | | Columbus, Indiana, General Obligation Bonds, Series 2009, 4.500%, 7/15/23 | | | 7/19 at 100.00 | | | | N/R | | | | 845,115 | |
| | | | |
| | 1,000 | | | Fishers Redevelopment District, Indiana, General Obligation Bonds, Saxony Project Series 2009, 5.250%, 7/15/34 | | | 1/20 at 100.00 | | | | AA | | | | 1,132,520 | |
| | | | |
| | 885 | | | Hendricks County, Indiana, Redevelopment District Tax Increment Revenue Bonds, Refunding Series 2010B, 6.450%, 1/01/23 | | | 1/16 at 100.00 | | | | Baa2 | | | | 939,366 | |
| | | | |
| | 2,000 | | | Indiana Bond Bank, Special Program Gas Revenue Bonds, JP Morgan Ventures Energy Corporation Guaranteed, Series 2007-B2, 0.790%, 10/15/22 | | | No Opt. Call | | | | A2 | | | | 1,697,180 | |
| | | | |
| | 1,500 | | | Indiana Finance Authority, Educational Facilities Refunding Revenue Bonds,
Butler University Project, Series 2012A, 5.000%, 2/01/25 | | | 2/22 at 100.00 | | | | BBB+ | | | | 1,679,880 | |
| | | | |
| | 525 | | | Indiana Finance Authority, Educational Facilities Revenue Bonds, Drexel Foundation For Educational Excellence, Inc., Series 2009A, 7.000%, 10/01/39 | | | 10/19 at 100.00 | | | | BB+ | | | | 573,993 | |
| | | | |
| | 1,000 | | | Indiana Health Facility Financing Authority, Hospital Revenue Bonds, Union Hospital, Series 1993, 5.125%, 9/01/18 | | | 10/12 at 100.00 | | | | Baa2 | | | | 1,001,710 | |
| | | | |
| | 250 | | | Merrillville Multi-School Building Corporation, Lake County, Indiana, First Mortgage Revenue Bonds, Series 2008, 5.250%, 7/15/22 | | | 1/18 at 100.00 | | | | A+ | | | | 285,158 | |
| | | | |
| | 855 | | | Portage Redevelopment District, Indiana, Tax Increment Revenue Bonds, Series 2008, 5.250%, 1/15/19 – CIFG Insured | | | 1/18 at 100.00 | | | | AA– | | | | 954,419 | |
| | | | |
| | 100 | | | Tri-Creek Middle School Building Corporation, Indiana, First Mortgage Bonds, Series 2008, 6.000%, 1/15/16 – AGM Insured | | | No Opt. Call | | | | AA+ | | | | 117,729 | |
| | 9,115 | | | Total Indiana | | | | | | | | | | | 9,516,073 | |
| | | | Iowa – 1.1% | | | | | | | | | | | | |
| | | | |
| | | | Des Moines Airport Authority, Iowa, Revenue Bonds, Refunding Capital Loan Notes Series 2012: | | | | | | | | | | | | |
| | 1,000 | | | 5.000%, 6/01/27 (Alternative Minimum Tax) | | | 6/22 at 100.00 | | | | A2 | | | | 1,114,760 | |
| | 1,000 | | | 5.000%, 6/01/28 (Alternative Minimum Tax) | | | 6/22 at 100.00 | | | | A2 | | | | 1,104,990 | |
| | | | |
| | 745 | | | Des Moines, Iowa, Aviation System Revenue Bonds, Refunding Capital Loan Notes Series 2010B, 5.750%, 6/01/33 – AGM Insured (Alternative Minimum Tax) | | | 6/20 at 100.00 | | | | AA– | | | | 863,641 | |
| | 2,745 | | | Total Iowa | | | | | | | | | | | 3,083,391 | |
Portfolio of Investments
Municipal Total Return Managed Accounts Portfolio (continued)
July 31, 2012
| | | | | | | | | | | | | | | | |
Principal
Amount (000) | | | Description (1) | | Optional Call
Provisions (2) | | | Ratings (3) | | | Value | |
| | | | | | | | | | | | | | | | |
| | | | Kansas – 0.9% | | | | | | | | | | | | |
| | | | |
| $ | 1,240 | | | Kansas Development Finance Authority, Health Facilities Revenue Bonds, KU Health System, Series 2011H, 5.375%, 3/01/30 | | | 3/20 at 100.00 | | | | A+ | | | $ | 1,389,693 | |
| | | | |
| | 1,000 | | | Kansas State Independent College Finance Authority, Revenue Anticipation Notes, Ottawa University, Private Education Short-Term Loan Program, Series 2012C, 5.500%, 5/01/13 | | | No Opt. Call | | | | N/R | | | | 1,003,440 | |
| | 2,240 | | | Total Kansas | | | | | | | | | | | 2,393,133 | |
| | | | Kentucky – 0.9% | | | | | | | | | | | | |
| | | | |
| | 500 | | | Kentucky Economic Development Finance Authority, Louisville Arena Project Revenue Bonds, Louisville Arena Authority, Inc., Series 2008-A1, 5.750%, 12/01/28 – AGC Insured | | | 6/18 at 100.00 | | | | AA– | | | | 559,850 | |
| | | | |
| | 1,570 | | | Pikeville, Kentucky, Hospital Revenue Bonds, Pikeville Medical Center, Inc. Project, Improvement and Refunding Series 2011, 5.250%, 3/01/19 | | | No Opt. Call | | | | A3 | | | | 1,791,150 | |
| | 2,070 | | | Total Kentucky | | | | | | | | | | | 2,351,000 | |
| | | | Louisiana – 0.7% | | | | | | | | | | | | |
| | | | |
| | 50 | | | Louisiana Public Facilities Authority, Revenue Bonds, Ochsner Clinic Foundation Project, Series 2011, 6.375%, 5/15/31 | | | 5/21 at 100.00 | | | | Baa1 | | | | 59,396 | |
| | | | |
| | 1,315 | | | New Orleans, Louisiana, Water Revenue Bonds, Series 2002,
5.000%, 12/01/16 – FGIC Insured | | | 12/12 at 100.00 | | | | BBB– | | | | 1,327,545 | |
| | | | |
| | 430 | | | Tobacco Settlement Financing Corporation, Louisiana, Tobacco Settlement Asset-Backed Bonds, Series 2001B, 5.875%, 5/15/39 | | | 11/12 at 100.00 | | | | A– | | | | 438,596 | |
| | 1,795 | | | Total Louisiana | | | | | | | | | | | 1,825,537 | |
| | | | Maine – 0.4% | | | | | | | | | | | | |
| | | | |
| | 965 | | | Maine State Housing Authority, Single Family Mortgage Purchase Bonds, Series 2012A-1, 4.000%, 11/15/24 – AGM Insured (Alternative Minimum Tax) | | | 11/21 at 100.00 | | | | AA+ | | | | 1,026,171 | |
| | | | Maryland – 2.6% | | | | | | | | | | | | |
| | | | |
| | 845 | | | Anne Arundel County, Maryland, Economic Development Revenue Bonds, Community College Project, Refunding Series 2012, 4.000%, 9/01/21 | | | No Opt. Call | | | | A2 | | | | 956,363 | |
| | | | |
| | 110 | | | Baltimore, Maryland, Senior Lien Convention Center Hotel Revenue Bonds, Series 2006A, 5.250%, 9/01/39 – SYNCORA GTY Insured | | | 9/16 at 100.00 | | | | BB+ | | | | 111,445 | |
| | | | |
| | 300 | | | Maryland Community Development Administration, Residential Revenue Bonds, Series 1999D, 5.250%, 9/01/19 (Alternative Minimum Tax) | | | 10/12 at 100.00 | | | | Aa2 | | | | 300,534 | |
| | | | |
| | 240 | | | Maryland Community Development Administration, Residential Revenue Bonds, Series 2001B, 5.375%, 9/01/22 (Alternative Minimum Tax) | | | 10/12 at 100.00 | | | | Aa2 | | | | 240,406 | |
| | | | |
| | 1,000 | | | Maryland Economic Development Corporation, Lease Revenue Bonds, Maryland Public Health Laboratory Project, Series 2011, 4.000%, 6/01/29 | | | 6/21 at 100.00 | | | | AA+ | | | | 1,079,080 | |
| | | | |
| | 500 | | | Maryland Health and Higher Educational Facilities Authority, Revenue Bonds, Adventist Healthcare, Series 2011A, 6.125%, 1/01/36 | | | 1/22 at 100.00 | | | | Baa2 | | | | 571,275 | |
| | | | |
| | 1,405 | | | Maryland Health and Higher Educational Facilities Authority, Revenue Bonds, Civista Medical Center, Series 2005, 5.000%, 7/01/37 – RAAI Insured | | | 7/14 at 100.00 | | | | N/R | | | | 1,377,476 | |
| | | | |
| | | | Maryland Health and Higher Educational Facilities Authority, Revenue Bonds, Mercy Medical Center, Series 2012: | | | | | | | | | | | | |
| | 1,000 | | | 5.000%, 7/01/25 | | | 7/22 at 100.00 | | | | BBB | | | | 1,134,610 | |
| | 1,000 | | | 5.000%, 7/01/26 | | | 7/22 at 100.00 | | | | BBB | | | | 1,136,860 | |
| | 6,400 | | | Total Maryland | | | | | | | | | | | 6,908,049 | |
| | | | Massachusetts – 2.1% | | | | | | | | | | | | |
| | | | |
| | 1,000 | | | Massachusetts Development Finance Agency, Revenue Bonds, The Broad Institute, Series 2011A, 5.000%, 4/01/31 | | | 4/21 at 100.00 | | | | AA– | | | | 1,128,390 | |
| | | | |
| | 750 | | | Massachusetts Development Finance Agency, Revenue Bonds, The Sabis International Charter School, Series 2009A, 8.000%, 4/15/31 | | | 10/19 at 100.00 | | | | BBB | | | | 932,940 | |
| | | | |
| | 1,085 | | | Massachusetts Educational Financing Authority, Educational Loan Revenue, Series 2012J, 5.000%, 7/01/18 (Alternative Minimum Tax) | | | No Opt. Call | | | | AA | | | | 1,206,791 | |
| | | | | | | | | | | | | | | | |
Principal
Amount (000) | | | Description (1) | | Optional Call
Provisions (2) | | | Ratings (3) | | | Value | |
| | | | | | | | | | | | | | | | |
| | | | Massachusetts (continued) | | | | | | | | | | | | |
| | | | |
| $ | 300 | | | Massachusetts Health and Educational Facilities Authority Revenue Bonds, Quincy Medical Center Issue, Series 2008A, 6.250%, 1/15/28 (6) | | | 1/18 at 100.00 | | | | N/R | | | $ | 1,506 | |
| | | | |
| | 535 | | | Massachusetts Health and Educational Facilities Authority, Revenue Bonds, Harvard University, Tender Option Bond Trust 2010-20W, 13.855%,
12/15/34 (IF) (5) | | | 12/19 at 100.00 | | | | AAA | | | | 815,800 | |
| | | | |
| | 1,675 | | | Massachusetts State, General Obligation Bonds, Refunding Series 2012A, 0.630%, 2/01/16 | | | 8/15 at 100.00 | | | | AA+ | | | | 1,675,000 | |
| | 5,345 | | | Total Massachusetts | | | | | | | | | | | 5,760,427 | |
| | | | Michigan – 1.3% | | | | | | | | | | | | |
| | | | |
| | 30 | | | Detroit City School District, Wayne County, Michigan, Unlimited Tax School Building and Site Improvement Bonds, Series 1998C, 5.250%, 5/01/16 – FGIC Insured | | | No Opt. Call | | | | Aa2 | | | | 34,321 | |
| | | | |
| | 250 | | | Detroit, Michigan, General Obligation Bonds, Series 2003A, 5.250%, 4/01/14 – SYNCORA GTY Insured | | | 4/13 at 100.00 | | | | B | | | | 246,368 | |
| | | | |
| | | | Detroit, Michigan, General Obligation Bonds, Series 2004B-1: | | | | | | | | | | | | |
| | 595 | | | 5.000%, 4/01/14 – AMBAC Insured | | | No Opt. Call | | | | B | | | | 583,993 | |
| | 100 | | | 4.000%, 4/01/14 – AMBAC Insured | | | No Opt. Call | | | | B | | | | 96,590 | |
| | | | |
| | 1,000 | | | Garden City Hospital Finance Authority, Michigan, Revenue Bonds, Garden City Hospital Obligated Group, Series 2007A, 4.875%, 8/15/27 | | | 8/17 at 100.00 | | | | N/R | | | | 929,810 | |
| | | | |
| | 500 | | | Michigan Finance Authority, Public School Academy Limited Obligation Revenue Bonds, Voyageur Academy Project, Series 2011, 7.750%, 7/15/26 | | | 7/21 at 100.00 | | | | BB | | | | 524,210 | |
| | | | |
| | 750 | | | Michigan Higher Education Facilities Authority, Limited Obligation Revenue Bonds, Alma College Project, Series 2008, 5.500%, 6/01/28 | | | 6/18 at 100.00 | | | | A3 | | | | 836,235 | |
| | | | |
| | 300 | | | Michigan Tobacco Settlement Finance Authority, Tobacco Settlement Asset-Backed Revenue Bonds, Series 2008A, 6.875%, 6/01/42 | | | 6/18 at 100.00 | | | | BB– | | | | 300,603 | |
| | 3,525 | | | Total Michigan | | | | | | | | | | | 3,552,130 | |
| | | | Minnesota – 0.2% | | | | | | | | | | | | |
| | | | |
| | 500 | | | Rochester, Minnesota, Health Care Facilities Revenue Bonds, Olmsted Medical Center Project, Series 2010, 3.750%, 7/01/15 | | | No Opt. Call | | | | BBB+ | | | | 511,725 | |
| | | | Mississippi – 0.3% | | | | | | | | | | | | |
| | | | |
| | 750 | | | Medical Center Educational Building Corporation, Revenue Bonds, University of Mississippi Medical Center Facilities Expansion and Renovation Project, Series 2012A, 5.000%, 6/01/41 | | | 6/22 at 100.00 | | | | Aa2 | | | | 847,215 | |
| | | | Missouri – 1.5% | | | | | | | | | | | | |
| | | | |
| | 1,000 | | | Carroll County Public Water Supply District 1, Missouri, Water System Revenue Bonds, Refunding Series 2009, 5.625%, 3/01/34 | | | 3/18 at 100.00 | | | | A | | | | 1,118,450 | |
| | | | |
| | 900 | | | Hannibal Industrial Development Authority, Missouri, Health Facilities Refunding Revenue Bonds, Hannibal Regional Hospital, Refunding Series 2010, 5.500%, 9/01/20 | | | 9/13 at 100.00 | | | | BBB+ | | | | 938,943 | |
| | | | |
| | 1,000 | | | Missouri Development Finance Board, Independence, Infrastructure Facilities Revenue Bonds, Water System Improvement Projects, Series 2009C, 5.750%, 11/01/29 | | | 11/14 at 100.00 | | | | A– | | | | 1,052,100 | |
| | | | |
| | 600 | | | Missouri Development Finance Board, Infrastructure Facilities Leasehold Revenue Bonds, Independence Electric System Projects, Series 2009D, 5.750%, 6/01/34 | | | 6/14 at 100.00 | | | | A– | | | | 624,552 | |
| | | | |
| | 287 | | | Saint Louis, Missouri, Tax Increment Financing Revenue Notes, Marquette Building Redevelopment Project, Series 2008-A, 6.500%, 1/23/28 | | | No Opt. Call | | | | N/R | | | | 209,599 | |
| | 3,787 | | | Total Missouri | | | | | | | | | | | 3,943,644 | |
| | | | Nebraska – 0.2% | | | | | | | | | | | | |
| | | | |
| | 500 | | | Douglas County Hospital Authority 2, Nebraska, Health Facilities Revenue Refunding Bonds, Children's Hospital Obligated Group, Series 2008B, 6.125%, 8/15/31 | | | 8/17 at 100.00 | | | | A2 | | | | 564,205 | |
Portfolio of Investments
Municipal Total Return Managed Accounts Portfolio (continued)
July 31, 2012
| | | | | | | | | | | | | | | | |
Principal
Amount (000) | | | Description (1) | | Optional Call
Provisions (2) | | | Ratings (3) | | | Value | |
| | | | | | | | | | | | | | | | |
| | | | Nevada – 1.0% | | | | | | | | | | | | |
| | | | |
| $ | 1,000 | | | North Las Vegas, Nevada, General Obligation Bonds, Series 2006, 5.000%, 5/01/28 (Pre-refunded 5/01/16) – NPFG Insured | | | 5/16 at 100.00 | | | | A (4) | | | $ | 1,047,750 | |
| | | | |
| | 100 | | | Sparks Local Improvement District 3, Legends at Sparks Marina, Nevada, Limited Obligation Improvement Bonds, Series 2008, 6.750%, 9/01/27 | | | 9/18 at 100.00 | | | | N/R | | | | 103,666 | |
| | | | |
| | 1,250 | | | Washoe County School District, Nevada, General Obligation Bonds, Refunding Series 2010F, 5.000%, 6/01/23 – NPFG Insured | | | No Opt. Call | | | | AA | | | | 1,547,063 | |
| | 2,350 | | | Total Nevada | | | | | | | | | | | 2,698,479 | |
| | | | New Jersey – 2.6% | | | | | | | | | | | | |
| | | | |
| | | | Florence Township School District, Burlington County, New Jersey, General Obligation Bonds, Series 2012: | | | | | | | | | | | | |
| | 1,600 | | | 4.000%, 3/01/26 | | | 3/22 at 100.00 | | | | AA– | | | | 1,737,936 | |
| | 1,660 | | | 4.000%, 3/01/29 | | | 3/22 at 100.00 | | | | AA– | | | | 1,773,776 | |
| | | | |
| | 1,280 | | | New Jersey Economic Development Authority, Cigarette Tax Revenue Refunding Bonds, Series 2012, 5.000%, 6/15/16 | | | No Opt. Call | | | | BBB+ | | | | 1,444,237 | |
| | | | |
| | 1,000 | | | New Jersey Health Care Facilities Financing Authority, Trinitas Hospital Obligated Group, Refunding Series 2007B, 4.800%, 7/01/13 | | | No Opt. Call | | | | BBB– | | | | 1,031,500 | |
| | | | |
| | 50 | | | New Jersey Housing and Mortgage Finance Agency, Single Family Housing Revenue Bonds, Series 2007U, 5.000%, 10/01/37 (Alternative Minimum Tax) | | | 4/17 at 100.00 | | | | AA | | | | 51,945 | |
| | | | |
| | 745 | | | New Jersey Housing and Mortgage Finance Agency, Single Family Housing Revenue Bonds, Series 2008X, 5.000%, 4/01/17 (Alternative Minimum Tax) | | | No Opt. Call | | | | AA | | | | 813,406 | |
| | 6,335 | | | Total New Jersey | | | | | | | | | | | 6,852,800 | |
| | | | New Mexico – 0.3% | | | | | | | | | | | | |
| | | | |
| | 655 | | | New Mexico Mortgage Finance Authority, Single Family Mortgage Program Bonds CL 1, Series 2008A-2, 5.600%, 1/01/39 (Alternative Minimum Tax) | | | 1/18 at 102.00 | | | | AA+ | | | | 705,704 | |
| | | | New York – 4.5% | | | | | | | | | | | | |
| | | | |
| | 750 | | | Dormitory Authority of the State of New York, Revenue Bonds, Rockefeller University, Series 2012B, 5.000%, 7/01/38 | | | 7/22 at 100.00 | | | | AA+ | | | | 878,880 | |
| | | | |
| | 675 | | | Madison County Industrial Development Agency, New York, Civic Facility Revenue Bonds, Oneida Health System, Series 2007A, 5.250%, 2/01/27 | | | 2/17 at 100.00 | | | | BBB– | | | | 688,095 | |
| | | | |
| | 250 | | | Monroe County Industrial Development Corporation, New York, FHA Insured Mortgage Revenue Bonds, Unity Hospital of Rochestor Project, Series 2010, 5.750%, 8/15/30 | | | 2/21 at 100.00 | | | | Aa2 | | | | 310,060 | |
| | | | |
| | 500 | | | Nassau Health Care Corporation, New York, Revenue Anticipation Notes, Series 2012, 3.125%, 12/15/12 – AGC Insured | | | No Opt. Call | | | | AA– | | | | 504,600 | |
| | | | |
| | 100 | | | New York City Industrial Development Agency, New York, Civic Facility Revenue Bonds, Special Needs Facilities Pooled Program, Series 2008A-1, 5.700%, 7/01/13 | | | No Opt. Call | | | | N/R | | | | 101,176 | |
| | | | |
| | 1,000 | | | New York City Industrial Development Authority, New York, PILOT Revenue Bonds, Yankee Stadium Project, Series 2006, 5.000%, 3/01/46 – FGIC Insured | | | 9/16 at 100.00 | | | | BBB | | | | 1,032,160 | |
| | | | |
| | 500 | | | New York City Municipal Water Finance Authority, New York, Water and Sewerage System Revenue Bonds, Tender Option Bond Trust 3484, 18.104%, 10/01/16 (IF) | | | No Opt. Call | | | | AA+ | | | | 754,480 | |
| | | | |
| | 500 | | | New York State Environmental Facilities Corporation, State Clean Water and Drinking Water Revolving Funds Revenue Bonds, Pooled Loan Issue, Series 2005B, 5.500%, 10/15/27 | | | No Opt. Call | | | | AAA | | | | 694,380 | |
| | | | |
| | 120 | | | New York State Mortgage Agency, Homeowner Mortgage Revenue Refunding Bonds, Series 87, 5.150%, 4/01/17 | | | 10/12 at 100.00 | | | | Aa1 | | | | 122,298 | |
| | | | |
| | 500 | | | New York State Tobacco Settlement Financing Corporation, Tobacco Settlement Asset-Backed and State Contingency Contract-Backed Bonds, Series 2003A-1, 5.250%, 6/01/20 – AMBAC Insured | | | 6/13 at 100.00 | | | | AA– | | | | 520,175 | |
| | | | |
| | 930 | | | New York State Tobacco Settlement Financing Corporation, Tobacco Settlement Asset-Backed and State Contingency Contract-Backed Bonds, Series 2003B-1C, 5.500%, 6/01/19 | | | 6/13 at 100.00 | | | | AA– | | | | 969,460 | |
| | | | | | | | | | | | | | | | |
Principal
Amount (000) | | | Description (1) | | Optional Call
Provisions (2) | | | Ratings (3) | | | Value | |
| | | | | | | | | | | | | | | | |
| | | | New York (continued) | | | | | | | | | | | | |
| | | | |
| | | | Newburgh, Orange County, New York, General Obligation Bonds, Deficit Liquidation, Series 2012B: | | | | | | | | | | | | |
| $ | 605 | | | 5.000%, 6/15/24 | | | 6/22 at 100.00 | | | | Ba1 | | | $ | 617,257 | |
| | 635 | | | 5.000%, 6/15/25 | | | 6/22 at 100.00 | | | | Ba1 | | | | 644,360 | |
| | | | |
| | 915 | | | Newburgh, Orange County, New York, General Obligation Bonds, Series 2012A, 5.000%, 6/15/25 – AGC Insured | | | 6/22 at 100.00 | | | | Ba1 | | | | 928,487 | |
| | | | |
| | 300 | | | Niagara Area Development Corporation, New York, Niagara University Project, Series 2012A, 4.000%, 5/01/16 | | | No Opt. Call | | | | BBB+ | | | | 323,619 | |
| | | | |
| | 1,250 | | | Port Authority of New York and New Jersey, Consolidated Revenue Bonds, One Hundred Sixty-Ninth Series 2011, 5.000%, 10/15/24 (Alternative Minimum Tax) | | | 10/21 at 100.00 | | | | Aa2 | | | | 1,474,638 | |
| | | | |
| | 450 | | | Saratoga County Water and Sewer Authority, New York, Revenue Bonds, Series 2008, 5.000%, 9/01/38 | | | 9/18 at 100.00 | | | | AA | | | | 496,404 | |
| | | | |
| | 1,000 | | | Syracuse, New York, General Obligation Bonds, Airport Terminal Security Access Improvement Series 2011A, 5.000%, 11/01/36 (Alternative Minimum Tax) | | | 11/21 at 100.00 | | | | A1 | | | | 1,077,020 | |
| | 10,980 | | | Total New York | | | | | | | | | | | 12,137,549 | |
| | | | North Carolina – 4.7% | | | | | | | | | | | | |
| | | | |
| | 665 | | | Charlotte, North Carolina, Water and Sewer System Refunding Bonds, Tender Option Bond Trust 43W, 13.839%, 7/01/38 (IF) (5) | | | 7/20 at 100.00 | | | | AAA | | | | 973,134 | |
| | | | |
| | 2,000 | | | Charlotte-Mecklenberg Hospital Authority, North Carolina, Health Care Refunding Revenue Bonds, Carolinas HealthCare System, Series 2009A, 5.250%, 1/15/34 (UB) (5) | | | 1/19 at 100.00 | | | | AA– | | | | 2,254,160 | |
| | | | |
| | 2,000 | | | Charlotte-Mecklenberg Hospital Authority, North Carolina, Health Care Revenue Bonds, DBA Carolinas HealthCare System, Series 2011A, 5.000%, 1/15/31 | | | 1/21 at 100.00 | | | | AA– | | | | 2,265,620 | |
| | | | |
| | 1,500 | | | North Carolina Eastern Municipal Power Agency, Power System Revenue Bonds, Series 2012A, 5.000%, 1/01/26 | | | 7/22 at 100.00 | | | | A– | | | | 1,773,300 | |
| | | | |
| | 350 | | | North Carolina Eastern Municipal Power Agency, Power System Revenue Refunding Bonds, Series 1993B, 6.000%, 1/01/22 – FGIC Insured | | | No Opt. Call | | | | Baa1 | | | | 455,798 | |
| | | | |
| | 500 | | | North Carolina Eastern Municipal Power Agency, Power System Revenue Refunding Bonds, Series 2008A, 5.250%, 1/01/20 | | | 1/18 at 100.00 | | | | A– | | | | 586,805 | |
| | | | |
| | 340 | | | North Carolina Medical Care Commission, Healthcare Facilities Revenue Bonds, Duke University Health System, Tender Option Bond Trust 11808, 22.094%, 6/01/18 (IF) | | | No Opt. Call | | | | AA | | | | 544,190 | |
| | | | |
| | 2,000 | | | North Carolina Medical Care Commission, Healthcare Revenue Refunding Bonds, Novant Health Inc., Series 2006, 5.000%, 11/01/34 | | | 11/16 at 100.00 | | | | AA– | | | | 2,117,000 | |
| | | | |
| | 500 | | | North Carolina Municipal Power Agency 1, Catawba Electric Revenue Bonds, Series 2008C, 5.250%, 1/01/19 | | | 1/18 at 100.00 | | | | A | | | | 596,470 | |
| | | | |
| | 1,000 | | | University of North Carolina at Chapel Hill, General Revenue Bonds, Index Tender Series 2012B, 0.904%, 12/01/41 | | | 6/01 at 100.00 | | | | Aaa | | | | 1,001,300 | |
| | | | |
| | 100 | | | University of North Carolina System, Pooled Revenue Bonds, Series 2004B, 4.000%, 4/01/15 – AMBAC Insured | | | 4/14 at 100.00 | | | | N/R | | | | 103,708 | |
| | 10,955 | | | Total North Carolina | | | | | | | | | | | 12,671,485 | |
| | | | North Dakota – 0.2% | | | | | | | | | | | | |
| | | | |
| | | | Ward County Health Care, North Dakota, Revenue Bonds, Trinity Obligated Group, Series 2006: | | | | | | | | | | | | |
| | 150 | | | 5.250%, 7/01/16 | | | No Opt. Call | | | | BBB– | | | | 164,796 | |
| | 340 | | | 5.125%, 7/01/29 | | | 7/16 at 100.00 | | | | BBB– | | | | 347,480 | |
| | 490 | | | Total North Dakota | | | | | | | | | | | 512,276 | |
| | | | Ohio – 1.0% | | | | | | | | | | | | |
| | | | |
| | | | Cuyahoga County, Ohio, Revenue Refunding Bonds, Cleveland Clinic Health System, Series 2003A: | | | | | | | | | | | | |
| | 70 | | | 6.000%, 1/01/32 (Pre-refunded 7/01/13) | | | 7/13 at 100.00 | | | | Aa2 (4) | | | | 73,700 | |
| | 70 | | | 6.000%, 1/01/32 (Pre-refunded 7/01/13) | | | 7/13 at 100.00 | | | | Aa2 (4) | | | | 73,700 | |
Portfolio of Investments
Municipal Total Return Managed Accounts Portfolio (continued)
July 31, 2012
| | | | | | | | | | | | | | | | |
Principal
Amount (000) | | | Description (1) | | Optional Call
Provisions (2) | | | Ratings (3) | | | Value | |
| | | | | | | | | | | | | | | | |
| | | | Ohio (continued) | | | | | | | | | | | | |
| | | | |
| $ | 2,000 | | | Southeastern Ohio Port Authority, Hospital Facilities Revenue Bonds, Memorial Health System Obligated Group Project, Refunding and Improvement Series 2012, 4.000%, 12/01/12 | | | No Opt. Call | | | | N/R | | | $ | 2,013,820 | |
| | | | |
| | 500 | | | Summit County Port Authority, Ohio, Development Revenue Bonds, County NonTax Revenues, Series 2012, 5.000%, 12/01/31 | | | 12/22 at 100.00 | | | | Aa2 | | | | 570,365 | |
| | 2,640 | | | Total Ohio | | | | | | | | | | | 2,731,585 | |
| | | | Oklahoma – 0.4% | | | | | | | | | | | | |
| | | | |
| | 1,000 | | | Oklahoma State Turnpike Authority, Turnpike System Revenue Bonds, Second Senior Series 2011B, 5.000%, 1/01/26 | | | 1/21 at 100.00 | | | | AA– | | | | 1,205,090 | |
| | | | Oregon – 1.8% | | | | | | | | | | | | |
| | | | |
| | 1,000 | | | Clackamas County School District 12, North Clackamas, Oregon, General Obligation Bonds, Series 2007B, 5.000%, 6/15/27 – AGM Insured | | | 6/17 at 100.00 | | | | AA+ | | | | 1,161,130 | |
| | | | |
| | | | Lafayette, Yamhill County, Oregon, General Obligation Bonds, Full Faith Credit Refunding Series 2012: | | | | | | | | | | | | |
| | 345 | | | 3.000%, 12/01/16 – AGM Insured | | | No Opt. Call | | | | Baa1 | | | | 359,963 | |
| | 365 | | | 3.000%, 12/01/18 – AGM Insured | | | No Opt. Call | | | | Baa1 | | | | 380,936 | |
| | 390 | | | 3.250%, 12/01/20 – AGM Insured | | | No Opt. Call | | | | Baa1 | | | | 408,069 | |
| | | | |
| | 1,905 | | | Multnomah-Clackamas Counties Centennial School District 28JT, Oregon, General Obligation Bonds, Refunding Series 2012A, 0.000%, 6/01/23 | | | 6/17 at 80.87 | | | | A1 | | | | 1,356,970 | |
| | | | |
| | 1,150 | | | Sutherlin, Douglas County, Oregon, Water Revenue Bonds, Anticipation Notes Series 2012, 1.400%, 11/15/13 | | | No Opt. Call | | | | N/R | | | | 1,151,691 | |
| | 5,155 | | | Total Oregon | | | | | | | | | | | 4,818,759 | |
| | | | Pennsylvania – 3.2% | | | | | | | | | | | | |
| | | | |
| | 1,200 | | | Berks County Municipal Authority, Pennsylvania, Revenue Bonds, Reading Hospital and Medical Center Project, Variable Rate Demand Obligation Series 2012B, 1.650%, 11/01/39 | | | 7/17 at 102.00 | | | | Aa3 | | | | 1,198,164 | |
| | | | |
| | 500 | | | Delaware County Authority, Pennsylvania, Revenue Bonds, Elwyn, Inc. Project, Series 2010, 5.000%, 6/01/25 | | | 6/17 at 100.00 | | | | BBB | | | | 511,810 | |
| | | | |
| | 30 | | | Harrisburg, Dauphin County, Pennsylvania, General Obligation Refunding Bonds, Series1997D, 0.000%, 3/15/15 – AMBAC Insured | | | No Opt. Call | | | | N/R | | | | 25,048 | |
| | | | |
| | | | Harrisburg, Dauphin County, Pennsylvania, General Obligation Refunding Notes, Series1997F: | | | | | | | | | | | | |
| | 30 | | | 0.000%, 3/15/13 – AMBAC Insured | | | No Opt. Call | | | | N/R | | | | 28,778 | |
| | 1,200 | | | 0.000%, 3/15/17 – AMBAC Insured | | | No Opt. Call | | | | N/R | | | | 869,220 | |
| | | | |
| | 1,250 | | | Lycoming County Authority, Pennsylvania, Revenue Bonds, Pennsylvania College of Technology, Refunding Series 2011, 5.500%, 7/01/26 | | | 7/21 at 100.00 | | | | A | | | | 1,490,175 | |
| | | | |
| | 500 | | | Pennsylvania Economic Development Financing Authority, Sewage Sludge Disposal Revenue Bonds, Philadelphia Biosolids Facility Project, Series 2009, 5.000%, 1/01/14 | | | No Opt. Call | | | | BBB+ | | | | 518,205 | |
| | | | |
| | 1,000 | | | Pennsylvania Economic Development Financing Authority, Water Facilities Revenue Refunding Bonds, Aqua Pennsylvania, Inc. Project, Series 2010A, 5.000%, 12/01/34 (Alternative Minimum Tax) | | | 12/20 at 100.00 | | | | AA– | | | | 1,107,950 | |
| | | | |
| | 280 | | | Philadelphia Authority for Industrial Development, Pennsylvania, Revenue Bonds, MaST Charter School Project, Series 2010, 5.000%, 8/01/20 | | | No Opt. Call | | | | BBB+ | | | | 293,672 | |
| | | | |
| | 1,000 | | | Philadelphia Gas Works, Pennsylvania, Revenue Bonds, Nineth Series, 2010, 5.000%, 8/01/30 | | | 8/20 at 100.00 | | | | BBB+ | | | | 1,083,190 | |
| | | | |
| | 500 | | | Philadelphia Hospitals and Higher Education Facilities Authority, Pennsylvania, Hospital Revenue Bonds, Temple University Health System Obligated Group, Series 2012B, 5.000%, 7/01/17 | | | No Opt. Call | | | | BBB– | | | | 531,500 | |
| | | | |
| | 870 | | | Philadelphia Municipal Authority, Philadelphia, Pennsylvania, Lease Revenue Bonds, Series 2009, 6.000%, 4/01/23 | | | 4/19 at 100.00 | | | | A2 | | | | 1,030,237 | |
| | 8,360 | | | Total Pennsylvania | | | | | | | | | | | 8,687,949 | |
| | | | | | | | | | | | | | | | |
Principal
Amount (000) | | | Description (1) | | Optional Call
Provisions (2) | | | Ratings (3) | | | Value | |
| | | | | | | | | | | | | | | | |
| | | | Puerto Rico – 0.3% | | | | | | | | | | | | |
| | | | |
| $ | 300 | | | Puerto Rico Highway and Transportation Authority, Grant Anticipation Revenue Bonds, Series 2004, 5.000%, 9/15/16 – NPFG Insured | | | 3/14 at 100.00 | | | | A+ | | | $ | 316,353 | |
| | | | |
| | 500 | | | Puerto Rico, Highway Revenue Bonds, Highway and Transportation Authority, Series 2005BB, 5.250%, 7/01/18 – AMBAC Insured | | | No Opt. Call | | | | A3 | | | | 564,320 | |
| | 800 | | | Total Puerto Rico | | | | | | | | | | | 880,673 | |
| | | | Rhode Island – 0.4% | | | | | | | | | | | | |
| | | | |
| | 250 | | | Rhode Island Student Loan Authority, Student Loan Program Revenue Bonds, Series 2008A, 6.750%, 12/01/28 (Alternative Minimum Tax) | | | 12/17 at 100.00 | | | | A | | | | 278,518 | |
| | | | |
| | | | Rhode Island Tobacco Settlement Financing Corporation, Tobacco Settlement Asset-Backed Bonds, Series 2002A: | | | | | | | | | | | | |
| | 695 | | | 6.000%, 6/01/23 | | | 10/12 at 100.00 | | | | Baa1 | | | | 708,900 | |
| | 150 | | | 6.125%, 6/01/32 | | | 10/12 at 100.00 | | | | BBB+ | | | | 151,499 | |
| | 1,095 | | | Total Rhode Island | | | | | | | | | | | 1,138,917 | |
| | | | South Carolina – 1.6% | | | | | | | | | | | | |
| | | | |
| | 500 | | | Berkeley County School District, South Carolina, Installment Purchase Revenue Bonds, Series 2006, 5.125%, 12/01/30 | | | 12/16 at 100.00 | | | | A1 | | | | 537,690 | |
| | | | |
| | 500 | | | Lexington County Health Services District, Inc., South Carolina, Hospital Revenue Bonds, Refunding Series 2011, 5.000%, 11/01/26 | | | 11/21 at 100.00 | | | | AA– | | | | 579,225 | |
| | | | |
| | 400 | | | Piedmont Municipal Power Agency, South Carolina, Electric Revenue Bonds, Series 2008A-3, 5.250%, 1/01/19 | | | 1/18 at 100.00 | | | | A– | | | | 468,768 | |
| | | | |
| | 740 | | | South Carolina JOBS Economic Development Authority, Hospital Refunding and Improvement Revenue Bonds, Palmetto Health Alliance, Series 2003C, 6.000%, 8/01/13 | | | No Opt. Call | | | | BBB+ | | | | 779,242 | |
| | | | |
| | 1,200 | | | South Carolina Jobs-Economic Development Authority, Hospital Refunding Revenue Bonds, Georgetown Hospital System, Series 2012B, 4.000%, 2/01/30 – AGM Insured | | | 2/17 at 100.00 | | | | A3 | | | | 1,207,620 | |
| | | | |
| | 300 | | | South Carolina Transportation Infrastructure Bank, Revenue Bonds, Series 2007A, 5.000%, 10/01/15 – SYNCORA GTY Insured | | | No Opt. Call | | | | A1 | | | | 338,865 | |
| | | | |
| | 250 | | | South Carolina Transportation Infrastructure Bank, Revenue Bonds, Series 2010A, 5.250%, 10/01/40 | | | 10/19 at 100.00 | | | | A1 | | | | 279,438 | |
| | 3,890 | | | Total South Carolina | | | | | | | | | | | 4,190,848 | |
| | | | South Dakota – 0.1% | | | | | | | | | | | | |
| | | | |
| | 210 | | | South Dakota Educational Enhancement Funding Corporation, Tobacco Settlement Asset-Backed Bonds, Series 2002B, 6.500%, 6/01/32 | | | 10/12 at 100.00 | | | | A3 | | | | 217,348 | |
| | | | Tennessee – 0.9% | | | | | | | | | | | | |
| | | | |
| | 1,000 | | | Claiborne County Industrial Development Board, Tennessee, Revenue Refunding Bonds, Lincoln Memorial University Project, Series 2010, 6.000%, 10/01/30 | | | 10/20 at 100.00 | | | | N/R | | | | 1,119,260 | |
| | | | |
| | 1,250 | | | Metropolitan Government of Nashville-Davidson County Health and Educational Facilities Board, Tennessee, Revenue Refunding Bonds, Vanderbilt University, Variable Rate Demand Obligation Series 2012B, 0.750%, 10/01/38 | | | 4/17 at 100.00 | | | | Aa2 | | | | 1,249,763 | |
| | | | |
| | 50 | | | The Tennessee Energy Acquisition Corporation, Gas Revenue Bonds, Series 2006A, 5.000%, 9/01/16 | | | No Opt. Call | | | | A | | | | 54,217 | |
| | 2,300 | | | Total Tennessee | | | | | | | | | | | 2,423,240 | |
| | | | Texas – 12.2% | | | | | | | | | | | | |
| | | | |
| | 750 | | | La Vernia Higher Education Financing Corporation, Texas, Charter School Revenue Bonds, Kipp Inc., Series 2009A, 6.000%, 8/15/29 | | | 8/19 at 100.00 | | | | BBB | | | | 862,538 | |
| | | | |
| | 2,000 | | | Austin Community College District Public Facility Corporation, Texas, Lease Revenue Bonds, Hays New Campus Project, Series 2012, 4.125%, 8/01/36 | | | 8/22 at 100.00 | | | | AA | | | | 2,086,320 | |
| | | | |
| | 1,385 | | | Capital Area Cultural Education Facilities Finance Corporation, Texas, Revenue Bonds, The Roman Catholic Diocese of Austin, Series 2005A. Remarketed, 5.750%, 4/01/26 | | | 4/20 at 100.00 | | | | N/R | | | | 1,526,298 | |
Portfolio of Investments
Municipal Total Return Managed Accounts Portfolio (continued)
July 31, 2012
| | | | | | | | | | | | | | | | |
Principal
Amount (000) | | | Description (1) | | Optional Call
Provisions (2) | | | Ratings (3) | | | Value | |
| | | | | | | | | | | | | | | | |
| | | | Texas (continued) | | | | | | | | | | | | |
| | | | |
| $ | 500 | | | Clifton Higher Education Finance Corporation, Texas, Education Revenue Bonds, Idea Public Schools, Series 2011, 4.800%, 8/15/21 | | | No Opt. Call | | | | BBB | | | $ | 543,765 | |
| | | | |
| | 675 | | | Clifton Higher Education Finance Corporation, Texas, Education Revenue Bonds, Uplift Education Charter School, Series 2010A, 4.300%, 12/01/16 | | | No Opt. Call | | | | BBB– | | | | 705,078 | |
| | | | |
| | 1,500 | | | Frisco Independent School District, Collin and Denton Counties, Texas, General Obligation Bonds, Series 2008A, 6.000%, 8/15/38 | | | 8/18 at 100.00 | | | | Aaa | | | | 1,866,240 | |
| | | | |
| | | | Harris County, Texas, Water Control and Improvement District 74, Unlimited Tax General Obligation Bonds, Series 2010: | | | | | | | | | | | | |
| | 210 | | | 4.550%, 8/01/23 | | | 2/18 at 100.00 | | | | N/R | | | | 225,817 | |
| | 195 | | | 5.000%, 8/01/36 | | | 2/18 at 100.00 | | | | N/R | | | | 211,294 | |
| | 1,515 | | | 5.200%, 8/01/39 | | | 2/18 at 100.00 | | | | N/R | | | | 1,654,319 | |
| | | | |
| | 250 | | | Houston Higher Education Finance Corporation, Texas, Education Revenue Bonds, Cosmos Foundation, Inc., Series 2011A, 5.875%, 5/15/21 | | | No Opt. Call | | | | BBB | | | | 288,235 | |
| | | | |
| | 2,000 | | | Houston, Texas, First Lien Combined Utility System Revenue Bonds, Refunding Series 2012B, 0.900%, 5/15/34 | | | 12/16 at 100.00 | | | | AA | | | | 2,008,120 | |
| | | | |
| | 1,000 | | | Houston, Texas, Hotel Occupancy Tax and Special Revenue Bonds, Convention and Entertainment Project, Refunding Series 2012, 5.000%, 9/01/29 (WI/DD, Settling 8/15/12) | | | 9/13 at 100.00 | | | | A2 | | | | 1,031,480 | |
| | | | |
| | 1,000 | | | Houston, Texas, Subordinate Lien Airport System Revenue Refunding Bonds, Series 2011A, 5.000%, 7/01/22 (Alternative Minimum Tax) | | | 7/21 at 100.00 | | | | A+ | | | | 1,166,070 | |
| | | | |
| | 1,630 | | | Houston, Texas, Subordinate Lien Airport System Revenue Refunding Bonds, Series 2012A, 5.000%, 7/01/29 (Alternative Minimum Tax) | | | 7/22 at 100.00 | | | | A+ | | | | 1,829,691 | |
| | | | |
| | 200 | | | Leander Independent School District, Williamson and Travis Counties, Texas, General Obligation Bonds, Series 2006, 0.000%, 8/15/32 | | | 8/14 at 37.33 | | | | AAA | | | | 71,698 | |
| | | | |
| | 2,850 | | | Midland College District, Texas, General Obligation Bonds, Series 2012, 3.000%, 2/15/25 | | | 2/22 at 100.00 | | | | AA | | | | 2,895,741 | |
| | | | |
| | 2,000 | | | North Central Texas Health Facilities Development Corporation, Texas, Revenue Bonds, Children's Medical Center Dallas Project, Series 2012, 4.125%, 8/15/32 | | | 8/22 at 100.00 | | | | AA | | | | 2,054,640 | |
| | | | |
| | 1,000 | | | North Texas Education Finance Corporation, Texas, Education Revenue Bonds, Uplift Education, Series 2012A, 5.125%, 12/01/42 | | | 6/22 at 100.00 | | | | BBB– | | | | 1,058,950 | |
| | | | |
| | 200 | | | North Texas Tollway Authority, First Tier System Revenue Refunding Bonds, Series 2008A, 6.000%, 1/01/19 | | | 1/18 at 100.00 | | | | A2 | | | | 242,302 | |
| | | | |
| | 375 | | | North Texas Tollway Authority, Second Tier System Revenue Refunding Bonds, Series 2008F, 5.750%, 1/01/38 | | | 1/18 at 100.00 | | | | A3 | | | | 412,313 | |
| | | | |
| | 1,000 | | | Rockport, Texas, Certificates of Obligation, Series 2007, 5.250%, 2/15/27 – NPFG Insured | | | 2/17 at 100.00 | | | | AA | | | | 1,120,210 | |
| | | | |
| | 1,950 | | | Texas State, General Obligation Bonds, College Student Loan Series 2012, 3.250%, 8/01/29 (Alternative Minimum Tax) | | | 8/22 at 100.00 | | | | Aaa | | | | 1,952,145 | |
| | | | |
| | 1,500 | | | Texas Turnpike Authority, Central Texas Turnpike System Revenue Bonds, First Tier Series 2002A, 5.500%, 8/15/39 – AMBAC Insured | | | 8/12 at 100.00 | | | | BBB+ | | | | 1,511,835 | |
| | | | |
| | 2,000 | | | Tyler Health Facilities Development Corporation, Texas, Hospital Revenue Bonds, Mother Frances Hospital Regional Healthcare Center, Series 2011, 5.250%, 7/01/23 | | | 7/21 at 100.00 | | | | Baa1 | | | | 2,282,480 | |
| | | | |
| | 1,000 | | | Uptown Development Authority, Houston, Texas, Tax Increment Revenue Bonds, Infrastructure Improvement Facilities, Series 2009, 4.700%, 9/01/20 | | | 9/19 at 100.00 | | | | BBB | | | | 1,106,790 | |
| | | | |
| | 2,000 | | | Waco Education Finance Corporation, Texas, Revenue Bonds, Baylor University Issue Series 2012, 4.125%, 3/01/43 | | | 3/22 at 100.00 | | | | AA– | | | | 2,088,540 | |
| | 30,685 | | | Total Texas | | | | | | | | | | | 32,802,909 | |
| | | | Utah – 2.0% | | | | | | | | | | | | |
| | | | |
| | 585 | | | Utah County, Utah, Transportation Sales Tax Revenue Bonds, Series 2012, 4.000%, 12/01/31 – AGM Insured | | | 12/21 at 100.00 | | | | AA– | | | | 639,522 | |
| | | | | | | | | | | | | | | | |
Principal
Amount (000) | | | Description (1) | | Optional Call
Provisions (2) | | | Ratings (3) | | | Value | |
| | | | | | | | | | | | | | | | |
| | | | Utah (continued) | | | | | | | | | | | | |
| | | | |
| | | | Utah Infrastructure Agency, Telecommunications & Franchise Tax Revenue , Series 2011A: | | | | | | | | | | | | |
| $ | 500 | | | 5.250%, 10/15/33 – AGM Insured | | | 10/21 at 100.00 | | | | AA– | | | $ | 569,805 | |
| | 520 | | | 5.400%, 10/15/36 – AGM Insured | | | 10/21 at 100.00 | | | | AA– | | | | 591,406 | |
| | | | |
| | 435 | | | Utah State Charter School Finance Authority, Charter School Revenue Bonds, North Davis Preparatory Academy, Series 2010, 5.750%, 7/15/20 | | | No Opt. Call | | | | BBB– | | | | 462,936 | |
| | | | |
| | 1,550 | | | Utah State Charter School Finance Authority, Charter School Revenue Bonds, Paradigm High School, Series 2010A, 6.250%, 7/15/30 | | | 7/20 at 100.00 | | | | BBB– | | | | 1,633,220 | |
| | | | |
| | 90 | | | Utah State Charter School Finance Authority, Revenue Bonds, Channing Hall Project, Series 2007A, 5.750%, 7/15/22 | | | 7/15 at 102.00 | | | | N/R | | | | 90,749 | |
| | | | |
| | 95 | | | Utah State Charter School Finance Authority, Revenue Bonds, Summit Academy Project, Series 2007A, 5.125%, 6/15/17 | | | No Opt. Call | | | | BBB– | | | | 99,449 | |
| | | | |
| | 750 | | | Utah Transit Authority, Sales Tax Revenue Bonds, Tender Option Bond Trust 3006, 17.371%, 6/15/26 – AGM Insured (IF) | | | 6/18 at 100.00 | | | | AAA | | | | 1,157,880 | |
| | 4,525 | | | Total Utah | | | | | | | | | | | 5,244,967 | |
| | | | Virgin Islands – 1.4% | | | | | | | | | | | | |
| | | | |
| | 500 | | | Virgin Islands Public Finance Authority, Gross Receipts Taxes Loan Note, Series 2003, 5.000%, 10/01/31 – ACA Insured | | | 10/14 at 100.00 | | | | BBB+ | | | | 516,285 | |
| | | | |
| | | | Virgin Islands Public Finance Authority, Gross Receipts Taxes Loan Note, Series 2006: | | | | | | | | | | | | |
| | 200 | | | 5.000%, 10/01/16 – FGIC Insured | | | No Opt. Call | | | | BBB+ | | | | 221,458 | |
| | 250 | | | 4.000%, 10/01/20 – FGIC Insured | | | 10/16 at 100.00 | | | | BBB+ | | | | 258,893 | |
| | | | |
| | 1,000 | | | Virgin Islands Public Finance Authority, Matching Fund Loan Notes Revenue Refunding Bonds, Series 2009C, 5.000%, 10/01/22 | | | 10/19 at 100.00 | | | | Baa2 | | | | 1,102,630 | |
| | | | |
| | 1,000 | | | Virgin Islands Public Finance Authority, Matching Fund Revenue Loan Note – Diageo Project, Series 2009A, 6.750%, 10/01/19 | | | No Opt. Call | | | | BBB | | | | 1,179,020 | |
| | | | |
| | 500 | | | Virgin Islands Public Finance Authority, Revenue Bonds, Senior Lien Matching Fund Loan Notes, Series 2009A-1, 5.000%, 10/01/24 | | | 10/19 at 100.00 | | | | BBB+ | | | | 551,820 | |
| | 3,450 | | | Total Virgin Islands | | | | | | | | | | | 3,830,106 | |
| | | | Virginia – 2.6% | | | | | | | | | | | | |
| | | | |
| | 2,000 | | | Arlington County, Virginia, General Obligation Bonds, Public Improvement Series 2012C, 4.000%, 8/15/28 | | | 2/21 at 100.00 | | | | AAA | | | | 2,228,560 | |
| | | | |
| | 1,900 | | | Metropolitan Washington D.C. Airports Authority, Virginia, Airport System Revenue Bonds, Series 2008A, 5.375%, 10/01/28 (Alternative Minimum Tax) | | | 10/18 at 100.00 | | | | AA– | | | | 2,149,394 | |
| | | | |
| | 815 | | | Virginia College Building Authority, Educational Facilities Revenue Bonds, Washington and Lee University, Series 2001, 5.750%, 1/01/34 | | | No Opt. Call | | | | AA | | | | 1,160,764 | |
| | | | |
| | 1,400 | | | Virginia Small Business Financing Authority, Senior Lien Revenue Bonds, Elizabeth River Crossing, Opco LLC Project, Series 2012, 5.000%, 1/01/27 (Alternative Minimum Tax) | | | 7/22 at 100.00 | | | | BBB– | | | | 1,501,780 | |
| | 6,115 | | | Total Virginia | | | | | | | | | | | 7,040,498 | |
| | | | Washington – 2.2% | | | | | | | | | | | | |
| | | | |
| | 1,700 | | | Chelan County Public Utility District 1, Washington, Consolidated System Revenue Bonds Series 2011A, 5.500%, 7/01/24 (Alternative Minimum Tax) | | | 7/21 at 100.00 | | | | AA+ | | | | 2,065,160 | |
| | | | |
| | 100 | | | Kalispel Indian Tribe, Washington, Priority Distribution Bonds, Series 2008, 6.625%, 1/01/28 | | | 1/18 at 100.00 | | | | N/R | | | | 89,904 | |
| | | | |
| | 600 | | | King County, Washington, Sewer Revenue Bonds, Tender Option Bond Trust 3090, 13.161%, 7/01/32 – AGM Insured (IF) | | | 7/17 at 100.00 | | | | AA+ | | | | 840,804 | |
| | | | |
| | 75 | | | Skagit County Public Hospital District 1 , Washington, Skagit Valley Hospital, Series 2007, 5.750%, 12/01/28 | | | 12/17 at 100.00 | | | | Baa2 | | | | 80,000 | |
| | | | |
| | 750 | | | University of Washington, General Revenue Bonds, Tender Option Bond Trust 3005, 17.750%, 6/01/31 – AMBAC Insured (IF) | | | 6/17 at 100.00 | | | | Aaa | | | | 1,166,310 | |
Portfolio of Investments
Municipal Total Return Managed Accounts Portfolio (continued)
July 31, 2012
| | | | | | | | | | | | | | | | |
Principal
Amount (000) | | | Description (1) | | Optional Call
Provisions (2) | | | Ratings (3) | | | Value | |
| | | | | | | | | | | | | | | | |
| | | | Washington (continued) | | | | | | | | | | | | |
| | | | |
| $ | 1,000 | | | Washington Health Care Facilities Authority, Revenue Bonds, Kadlec Regional Medical Center, Series 2010, 5.250%, 12/01/30 | | | 12/20 at 100.00 | | | | Baa3 | | | $ | 1,062,650 | |
| | | | |
| | | | Washington State Tobacco Settlement Authority, Tobacco Settlement Asset-Backed Revenue Bonds, Series 2002: | | | | | | | | | | | | |
| | 35 | | | 6.500%, 6/01/26 | | | 6/13 at 100.00 | | | | A3 | | | | 36,429 | |
| | 660 | | | 6.625%, 6/01/32 | | | 6/13 at 100.00 | | | | Baa1 | | | | 685,377 | |
| | 4,920 | | | Total Washington | | | | | | | | | | | 6,026,634 | |
| | | | West Virginia – 0.5% | | | | | | | | | | | | |
| | | | |
| | 1,150 | | | West Virginia Higher Education Policy Commission, Revenue Bonds, Higher Education Facilities, Series 2012A, 5.000%, 4/01/29 | | | 4/22 at 100.00 | | | | Aa3 | | | | 1,330,734 | |
| | | | Wisconsin – 2.3% | | | | | | | | | | | | |
| | | | |
| | 500 | | | Wisconsin Health and Educational Facilities Authority, Revenue Bonds, Ascension Health, Tender Option Bond Trust Series 2010- 3184, 17.580%, 11/15/17 (IF) | | | No Opt. Call | | | | AA+ | | | | 720,640 | |
| | | | |
| | 1,665 | | | Wisconsin Health and Educational Facilities Authority, Revenue Bonds, Aurora Health Care, Inc., Series 2012A, 5.000%, 7/15/27 – AGM Insured | | | 7/21 at 100.00 | | | | Aa3 | | | | 1,877,387 | |
| | | | |
| | 610 | | | Wisconsin Health and Educational Facilities Authority, Revenue Bonds, Beloit Health System, Inc., Series 2010B, 5.000%, 4/01/17 | | | No Opt. Call | | | | A– | | | | 663,430 | |
| | | | |
| | 440 | | | Wisconsin Health and Educational Facilities Authority, Revenue Bonds, Childrens Hospital of Wisconsin Inc., Tender Option Bond Trust 2009-15W, 18.785%, 8/15/37 (IF) (5) | | | 2/20 at 100.00 | | | | AA– | | | | 640,407 | |
| | | | |
| | 750 | | | Wisconsin Health and Educational Facilities Authority, Revenue Bonds, Marshfield Clinic, Series 2006A, 5.125%, 2/15/26 | | | 2/16 at 100.00 | | | | A– | | | | 787,545 | |
| | | | |
| | | | Wisconsin State, General Fund Annual Appropriation Revenue Bonds, Refunding Series 2009A: | | | | | | | | | | | | |
| | 1,000 | | | 6.000%, 5/01/27 | | | 5/19 at 100.00 | | | | AA– | | | | 1,260,360 | |
| | 90 | | | 6.000%, 5/01/33 | | | 5/19 at 100.00 | | | | AA– | | | | 112,139 | |
| | 5,055 | | | Total Wisconsin | | | | | | | | | | | 6,061,908 | |
| | | | Wyoming – 1.7% | | | | | | | | | | | | |
| | | | |
| | 625 | | | Larmie County, Wyoming, Hospital Revenue Bonds, Cheyenne Regional Medical Center Project, Series 2012, 5.000%, 5/01/32 | | | 5/21 at 100.00 | | | | A+ | | | | 697,350 | |
| | | | |
| | 1,000 | | | Natrona County, Wyoming, Hospital Revenue Bonds, Wyoming Medical Center Project, Series 2011, 6.000%, 9/15/26 | | | 3/21 at 100.00 | | | | A3 | | | | 1,166,410 | |
| | | | |
| | 2,000 | | | West Park Hospital District, Wyoming, Hospital Revenue Bonds, Series 2011A, 6.375%, 6/01/26 | | | 6/21 at 100.00 | | | | BBB | | | | 2,356,118 | |
| | | | |
| | 250 | | | Wyoming Municipal Power Agency Power Supply System Revenue Bonds, 2008 Series A, 5.500%, 1/01/28 | | | 1/18 at 100.00 | | | | A2 | | | | 284,710 | |
| | 3,875 | | | Total Wyoming | | | | | | | | | | | 4,504,588 | |
| $ | 243,597 | | | Total Investments (cost $247,782,786) – 99.2% | | | | | | | | | | | 266,642,513 | |
| | | | Floating Rate Obligations – (0.5)% | | | | | | | | | | | (1,335,000) | |
| | | | Other Assets Less Liabilities – 1.3% | | | | | | | | | | | 3,468,036 | |
| | | | Net Assets – 100% | | | | | | | | | | $ | 268,775,549 | |
| | | | | | | | | | | | | | | | |
| | (1) | | All percentages shown in the Portfolio of Investments are based on net assets. |
| | (2) | | Optional Call Provisions (not covered by the report of independent registered public accounting firm): Dates (month and year) and prices of the earliest optional call or redemption. There may be other call provisions at varying prices at later dates. Certain mortgage-backed securities may be subject to periodic principal paydowns. |
| | (3) | | Ratings (not covered by the report of independent registered public accounting firm): Using the highest of Standard & Poor’s Group (“Standard & Poor's”), Moody’s Investors Service, Inc. (“Moody's”) or Fitch, Inc. (“Fitch”) rating. Ratings below BBB by Standard & Poor’s, Baa by Moody’s or BBB by Fitch are considered to be below investment grade. Holdings designated N/R are not rated by any of these national rating agencies. |
| | (4) | | Backed by an escrow or trust containing sufficient U.S. Government or U.S. Government agency securities, which ensure the timely payment of principal and interest. Certain bonds backed by U.S. Government or agency securities are regarded as having an implied rating equal to the rating of such securities. |
| | (5) | | Investment, or portion of investment, has been pledged to collateralize the net payment obligations for investments in inverse floating rate transactions. |
| | (6) | | At or subsequent to the end of the reporting period, this security is non-income producing. Non-income producing security, in the case of a bond, generally denotes that the issuer has (1) defaulted on the payment of principal or interest, (2) is under the protection of the Federal Bankruptcy Court or (3) the Fund’s Adviser has concluded that the issue is not likely to meet its future interest payment obligations and has directed the Fund’s custodian to cease accruing additional income on the Fund’s records. |
| | (7) | | Investment valued at fair value using methods determined in good faith by, or at the discretion of, the Board of Trustees. For fair value measurement disclosure purposes, investment categorized as Level 3. See notes to Financial Statements, Footnote 1– General Information and Significant Accounting Policies, Investment Valuation for more information. |
| | WI/DD | | Investment, or portion of investment, purchased on a when-issued or delayed delivery basis. |
| | (ETM) | | Escrowed to maturity. |
| | (IF) | | Inverse floating rate investment. |
| | (UB) | | Underlying bond of an inverse floating rate trust reflected as a financing transaction. See Notes to Financial Statements, Footnote 1 – General Information and Significant Accounting Policies, Inverse Floating Rate Securities for more information. |
| | 144A | | Investment is exempt from registration under Rule 144A of the Securities Act of 1933, as amended. These investments may only be resold in transactions exempt from registration, which are normally those transactions with qualified institutional buyers. |
See accompanying notes to financial statements.
Statement of Assets and Liabilities
July 31, 2012
| | | | |
Assets | | | | |
Investments, at value (cost $247,782,786) | | $ | 266,642,513 | |
Cash | | | 2,241,875 | |
Receivables: | | | | |
From Adviser | | | 18,625 | |
Interest | | | 2,881,265 | |
Investments sold | | | 1,224,770 | |
Shares sold | | | 527,990 | |
Other assets | | | 85 | |
Total assets | | | 273,537,123 | |
Liabilities | | | | |
Floating rate obligations | | | 1,335,000 | |
Payables: | | | | |
Dividends | | | 452,253 | |
Investments purchased | | | 1,030,310 | |
Shares redeemed | | | 1,857,585 | |
Accrued other expenses | | | 86,426 | |
Total liabilities | | | 4,761,574 | |
Net assets | | $ | 268,775,549 | |
Shares outstanding | | | 24,152,935 | |
Net asset value per share | | $ | 11.13 | |
Net assets consist of: | | | | |
Capital paid-in | | $ | 246,469,552 | |
Undistributed (Over-distribution of) net investment income | | | 38,106 | |
Accumulated net realized gain (loss) | | | 3,408,164 | |
Net unrealized appreciation (depreciation) | | | 18,859,727 | |
Net assets | | $ | 268,775,549 | |
Authorized shares | | | Unlimited | |
Par value per share | | $ | 0.01 | |
See accompanying notes to financial statements.
Statement of Operations
Year Ended July 31, 2012
| | | | |
Investment Income | | $ | 10,237,891 | |
Expenses | | | | |
Shareholders’ servicing agent fees and expenses | | | 28,712 | |
Interest expense on floating rate obligations | | | 9,618 | |
Custodian’s fees and expenses | | | 54,141 | |
Trustees’ fees and expenses | | | 6,315 | |
Professional fees | | | 64,564 | |
Shareholders’ reports – printing and mailing expenses | | | 51,601 | |
Federal and state registration fees | | | 33,684 | |
Other expenses | | | 9,908 | |
Total expenses before custodian fee credit and expense reimbursement | | | 258,543 | |
Custodian fee credit | | | (4,391 | ) |
Expense reimbursement | | | (248,925 | ) |
Net expenses | | | 5,227 | |
Net investment income (loss) | | | 10,232,664 | |
Realized and Unrealized Gain (Loss) | | | | |
Net realized gain (loss) from investments | | | 3,745,877 | |
Change in net unrealized appreciation (depreciation) of investments | | | 15,117,463 | |
Net realized and unrealized gain (loss) | | | 18,863,340 | |
Net increase (decrease) in net assets from operations | | $ | 29,096,004 | |
See accompanying notes to financial statements.
Statement of Changes in Net Assets
| | | | | | | | |
| | | Year Ended
7/31/12 | | | Year Ended
7/31/11 | |
Operations | | | | | | | | |
Net investment income (loss) | | $ | 10,232,664 | | | $ | 8,573,452 | |
Net realized gain (loss) from investments | | | 3,745,877 | | | | 612,804 | |
Change in net unrealized appreciation (depreciation) of investments | | | 15,117,463 | | | | (1,846,343 | ) |
Net increase (decrease) in net assets from operations | | | 29,096,004 | | | | 7,339,913 | |
Distributions to Shareholders | | | | | | | | |
From net investment income | | | (10,326,285 | ) | | | (8,564,927 | ) |
From accumulated net realized gains | | | (606,456 | ) | | | (1,412,226 | ) |
Decrease in net assets from distributions to shareholders | | | (10,932,741 | ) | | | (9,977,153 | ) |
Fund Share Transactions | | | | | | | | |
Proceeds from sale of shares | | | 116,910,018 | | | | 75,557,758 | |
Proceeds from shares issued to shareholders due to reinvestment of distributions | | | 4,772,017 | | | | 3,133,335 | |
| | | 121,682,035 | | | | 78,691,093 | |
Cost of shares redeemed | | | (44,429,234 | ) | | | (43,237,254 | ) |
Net increase (decrease) in net assets from Fund share transactions | | | 77,252,801 | | | | 35,453,839 | |
Net increase (decrease) in net assets | | | 95,416,064 | | | | 32,816,599 | |
Net assets at the beginning of period | | | 173,359,485 | | | | 140,542,886 | |
Net assets at the end of period | | $ | 268,775,549 | | | $ | 173,359,485 | |
Undistributed (Over-distribution of) net investment income at the end of period | | $ | 38,106 | | | $ | 99,227 | |
See accompanying notes to financial statements.
[THIS PAGE INTENTIONALLY LEFT BLANK]
Financial Highlights
| | | | | | | | | | | | | | | | | | | | | | | | | | | | | | | | |
| Selected data for a share outstanding throughout each period: | |
| | | | |
| | | | | | Investment Operations | | | Less Distributions | | | | |
| | | | | | | | | | | | | | | | | | | | |
Year Ended
July 31, | | Beginning
Net
Asset
Value | | | Net
Invest-
ment
Income
(Loss)(a) | | | Net
Realized/
Unrealized
Gain
(Loss) | | | Total | | | Net
Invest-
ment
Income | | | Capital
Gains(b) | | | Total | | | Ending
Net
Asset
Value | |
2012 | | $ | 10.22 | | | $ | .51 | | | $ | .95 | | | $ | 1.46 | | | $ | (.52 | ) | | $ | (.03 | ) | | $ | (.55 | ) | | $ | 11.13 | |
2011 | | | 10.42 | | | | .54 | | | | (.11 | ) | | | .43 | | | | (.54 | ) | | | (.09 | ) | | | (.63 | ) | | | 10.22 | |
2010 | | | 9.80 | | | | .52 | | | | .60 | | | | 1.12 | | | | (.50 | ) | | | — | | | | (.50 | ) | | | 10.42 | |
2009 | | | 9.78 | | | | .49 | | | | .01 | | | | .50 | | | | (.48 | ) | | | — | | | | (.48 | ) | | | 9.80 | |
2008 | | | 10.12 | | | | .49 | | | | (.37 | ) | | | .12 | | | | (.46 | ) | | | — | | | | (.46 | ) | | | 9.78 | |
| | | | | | | | | | | | | | | | | | | | | | | | | | | | | | | | | | |
| | | | | | | | | | | | | | | | | | | | | | | | | | | | | | | | | | |
| |
| | | | Ratios/Supplemental Data | |
| | | | | | | Ratios to Average
Net Assets Before
Reimbursement(e) | | | Ratios to Average
Net Assets After
Reimbursement(d)(e) | | | | |
Total
Return(c) | | |
Ending
Net
Assets
(000) | | | Expenses
Including
Interest(f) | | | Expenses
Excluding
Interest | | | Net
Invest-
ment
Income
(Loss) | | | Expenses
Including
Interest(f) | | | Expenses
Excluding
Interest | | | Net
Invest-
ment
Income
(Loss) | | | Portfolio
Turnover
Rate | |
| | 14.66 | % | | $ | 268,776 | | | | .12 | % | | | .12 | % | | | 4.64 | % | | | — | % | | | — | % | | | 4.75 | % | | | 29 | % |
| | 4.38 | | | | 173,359 | | | | .09 | | | | .08 | | | | 5.25 | | | | .01 | | | | — | | | | 5.33 | | | | 17 | |
| | 11.68 | | | | 140,543 | | | | .17 | | | | .17 | | | | 4.89 | | | | — | | | | — | | | | 5.06 | | | | 40 | |
| | 5.35 | | | | 92,354 | | | | .25 | | | | .25 | | | | 4.87 | | | | — | | | | — | | | | 5.12 | | | | 23 | |
| | 1.17 | | | | 49,024 | | | | .44 | | | | .44 | | | | 3.97 | | | | — | | | | — | | | | 4.41 | | | | 55 | |
| (a) | Per share Net Investment Income (Loss) is calculated using the average daily shares method. |
| (b) | Distributions from Capital Gains include short-term capital gains, if any. |
| (c) | Total return is the combination of changes in net asset value, reinvested dividend income at net asset value and reinvested capital gains distributions at net asset value, if any. Total returns are not annualized. |
| (d) | After expense reimbursement from the Adviser, where applicable. |
| (e) | Ratios do not reflect the effect of custodian fee credits earned on the Fund’s net cash on deposit with the custodian bank, where applicable. |
| (f) | The expense ratios reflect, among other things, the interest expense deemed to have been paid by the Fund on the floating rate certificates issued by the special purpose trusts for the self-deposited inverse floaters held by the Fund, where applicable, as described in Footnote 1 – General Information and Significant Accounting Policies, Inverse Floating Rate Securities. |
See accompanying notes to financial statements.
Notes to Financial Statements
1. General Information and Significant Accounting Policies
General Information
The Nuveen Managed Accounts Portfolios Trust (the “Trust”) is an open-end management investment company registered under the Investment Company Act of 1940, as amended. The Trust is comprised of the Municipal Total Return Managed Accounts Portfolio (the “Fund”), among others. The Trust was organized as a Massachusetts business trust on November 14, 2006.
The Fund is developed exclusively for use within Nuveen-sponsored separately managed accounts. The Fund is a specialized municipal bond Fund to be used in combination with selected individual securities to effectively model institutional-level investment strategies. The Fund enables certain Nuveen municipal separately managed account investors to achieve greater diversification and return potential than smaller managed accounts might otherwise achieve by using lower quality, higher yielding securities and to gain access to special investment opportunities normally available only to institutional investors.
The Fund’s primary investment objective is to seek attractive total return. The Fund also seeks to provide high current income exempt from regular federal income taxes. Nuveen Asset Management, LLC (the “Sub-Adviser”) a wholly-owned subsidiary of Nuveen Fund Advisors, Inc. (the “Adviser”), a wholly-owned subsidiary of Nuveen Investments, Inc. (“Nuveen”), uses a value-oriented strategy and looks for higher-yielding and undervalued municipal bonds that offer the potential for above-average total return. The Fund invests in various types of municipal securities, including investment grade (rated BBB/Baa or better), below investment grade (rated BB/Ba or lower) (high yield), and unrated municipal securities. The Fund will focus on securities with intermediate to longer term maturities. The Fund may invest up to 50% of its net assets in high yield municipal bonds, but will normally invest 10-30% of its net assets in such bonds. Such securities are commonly referred to as “high yield” securities or junk bonds. The Fund may invest up to 5% of its net assets in defaulted bonds and up to 50% of its net assets in municipal securities whose interest payments vary inversely with changes in short-term tax-exempt interest rates (“inverse floating rate securities”). The credit quality of the bonds underlying all leveraged municipal securities will be rated AA/Aa or higher, or, if unrated, judged to be of comparable quality by the Sub-Adviser. The Fund may also make forward commitments in which the Fund agrees to buy a security for settlement in the future at a price agreed upon today.
The Fund’s most recent prospectus provides further description of the Fund’s investment objective, principal investment strategies and principal risks.
Significant Accounting Policies
The following is a summary of significant accounting policies followed by the Fund in the preparation of its financial statements in accordance with accounting principles generally accepted in the United States (“U.S. GAAP”).
Investment Valuation
Prices of municipal bonds are provided by a pricing service approved by the Fund’s Board of Trustees. These securities are generally classified as Level 2 for fair value measurement purposes. The pricing service establishes a security’s fair value using methods that may include consideration of the following: yields or prices of investments of comparable quality, type of issue, coupon, maturity and rating, market quotes or indications of value from security dealers, evaluations of anticipated cash flows or collateral, general market conditions and other information and analysis, including the obligor’s credit characteristics considered relevant. In pricing certain securities, particularly less liquid and lower quality securities, the pricing service may consider information about a security, its issuer, or market activity provided by the Adviser. These securities are generally classified as Level 2 or Level 3 depending on the priority of the significant inputs.
Certain securities may not be able to be priced by the pre-established pricing methods as described above. Such securities may be valued by the Fund’s Board of Trustees or its designee at fair value. These securities generally include, but are not limited to, restricted securities (securities which may not be publicly sold without registration under the Securities Act of 1933, as amended) for which a pricing service is unable to provide a market price; securities whose trading has been formally suspended; debt securities that have gone into default and for which there is no current market quotation; a security whose market price is not available from a pre-established pricing source; a security with respect to which an event has occurred that is likely to materially affect the value of the security after the market has closed but before the calculation of a Fund’s net asset value (as may be the case in non-U.S. markets on which the security is primarily traded) or make it difficult or impossible to obtain a reliable market quotation; and a security whose price, as provided by the pricing service, is not deemed to reflect the security’s fair value. As a general principle, the fair value of a security would appear to be the amount that the owner might reasonably expect to receive for it in a current sale. A variety of factors may be considered in determining the fair value of such securities, which may include consideration of the following: yields or prices of investments of comparable quality, type of issue, coupon, maturity and rating, market quotes or indications of value from security dealers, evaluations of anticipated cash flows or collateral, general market conditions and other information and analysis, including the obligor’s credit characteristics considered relevant. These securities are classified as Level 2 or Level 3 depending on the priority of the significant inputs. Regardless of the method employed to value a particular security, all valuations are subject to review by the Fund’s Board of Trustees or its designee.
Refer to Footnote 2 – Fair Value Measurements for further details on the leveling of securities held by the Fund as of the end of the reporting period.
Investment Transactions
Investment transactions are recorded on a trade date basis. Realized gains and losses from investment transactions are determined on the specific identification method, which is the same basis used for federal income tax purposes. Investments purchased on a when-issued/delayed delivery basis may have extended settlement periods. Any investments so purchased are subject to market fluctuation during this period. The Fund has instructed the custodian to earmark securities in the Fund’s portfolio with a current value at least equal to the amount of the when-issued/delayed delivery purchase commitments. At July 31, 2012, the Fund had outstanding when-issued/delayed delivery purchase commitments of $1,030,310.
Investment Income
Investment income, which reflects the amortization of premiums and includes accretion of discounts for financial reporting purposes, is recorded on an accrual basis. Investment income also includes paydown gains and losses, if any.
Professional Fees
Professional fees presented on the Statement of Operations consist of legal fees incurred in the normal course of operations, audit fees, tax consulting fees and, in some cases, workout expenditures. Workout expenditures are incurred in an attempt to protect or enhance an investment, or to pursue other claims or legal actions on behalf of Fund shareholders.
Income Taxes
The Fund intends to distribute substantially all of its net investment income and net capital gains to shareholders and to otherwise comply with the requirements of Subchapter M of the Internal Revenue Code applicable to regulated investment companies (“RICs”). Therefore, no federal income tax provision is required. Furthermore, the Fund intends to satisfy conditions which will enable interest from municipal securities, which is exempt from regular federal income tax, to retain such tax-exempt status when distributed to shareholders of the Fund. Net realized capital gains and ordinary income distributions paid by the Fund are subject to federal taxation.
For all open tax years and all major taxing jurisdictions, management of the Fund has concluded that there are no significant uncertain tax positions that would require recognition in the financial statements. Open tax years are those that are open for examination by taxing authorities (i.e., generally the last four tax year ends and the interim tax period since then). Furthermore, management of the Fund is also not aware of any tax positions for which it is reasonably possible that the total amounts of unrecognized tax benefits will significantly change in the next twelve months.
Dividends and Distributions to Shareholders
The Fund declares dividends from its net investment income daily and pays shareholders monthly. Fund shares begin to accrue dividends on the business day after the day when the monies used to purchase Fund shares are collected by the Fund’s transfer agent.
Net realized capital gains and/or market discount from investment transactions, if any, are declared and distributed to shareholders at least annually. Furthermore, capital gains are distributed only to the extent they exceed available capital loss carryforwards.
Distributions to shareholders of net investment income, net realized capital gains and/or market discount, if any, are recorded on the ex-dividend date. The amount and timing of distributions are determined in accordance with federal income tax regulations, which may differ from U.S. GAAP.
Derivative Financial Instruments
The Fund is authorized to invest in certain derivative instruments, including, futures, options and swap contracts. Although the Fund is authorized to invest in such derivative instruments, and may do so in the future, it did not make any such investments during the fiscal year ended July 31, 2012.
Inverse Floating Rate Securities
The Fund is authorized to invest in inverse floating rate securities. An inverse floating rate security is created by depositing a municipal bond, typically with a fixed interest rate, into a special purpose trust created by a broker-dealer. In turn, this trust (a) issues floating rate certificates, in face amounts equal to some fraction of the deposited bond’s par amount or market value, that typically pay short-term tax-exempt interest rates to third parties, and (b) issues to a long-term investor (such as the Fund) an inverse floating rate certificate (sometimes referred to as an “inverse floater”) that represents all remaining or residual interest in the trust. The income received by the inverse floater holder varies inversely with the short-term rate paid to the floating rate certificates’ holders, and in most circumstances the inverse floater holder bears substantially all of the underlying bond’s downside investment risk and also benefits disproportionately from any potential appreciation of the underlying bond’s value. The price of an inverse floating rate security will be more volatile than that of the underlying bond because the interest rate is dependent on not only the fixed coupon rate of the underlying bond but also on the short-term interest paid on the floating rate certificates, and because the inverse floating rate security essentially bears the risk of loss of the greater face value of the underlying bond.
The Fund may purchase an inverse floating rate security in a secondary market transaction without first owning the underlying bond (referred to as an “externally-deposited inverse floater”), or instead by first selling a fixed-rate bond to a broker-dealer for deposit into the special purpose trust and receiving in turn the residual interest in the trust (referred to as a “self-deposited inverse floater”). The inverse floater held by the Fund gives the Fund the right (a) to cause the holders of the floating rate certificates to tender their notes at par, and (b) to have the broker transfer the fixed-rate bond held by the trust to the Fund, thereby collapsing the trust. An
Notes to Financial Statements (continued)
investment in an externally-deposited inverse floater is identified in the Portfolio of Investments as “(IF) – Inverse floating rate investment.” An investment in a self-deposited inverse floater is accounted for as a financing transaction. In such instances, a fixed-rate bond deposited into a special purpose trust is identified in the Portfolio of Investments as “(UB) – Underlying bond of an inverse floating rate trust reflected as a financing transaction,” with the Fund accounting for the short-term floating rate certificates issued by the trust as “Floating rate obligations” on the Statement of Assets and Liabilities. In addition, the Fund reflects in “Investment Income” the entire earnings of the underlying bond and recognizes the related interest paid to the holders of the short-term floating rate certificates as “Interest expense on floating rate obligations” on the Statement of Operations.
During the fiscal year ended July 31, 2012, the Fund invested in externally-deposited inverse floaters and/or self-deposited inverse floaters.
The Fund may also enter into shortfall and forbearance agreements (sometimes referred to as a “recourse trust” or “credit recovery swap”) (such agreements referred to herein as “Recourse Trusts���) with a broker-dealer by which the Fund agrees to reimburse the broker-dealer, in certain circumstances, for the difference between the liquidation value of the fixed-rate bond held by the trust and the liquidation value of the floating rate certificates issued by the trust plus any shortfalls in interest cash flows. Under these agreements, the Fund’s potential exposure to losses related to or on inverse floaters may increase beyond the value of the Fund’s inverse floater investments as the Fund may potentially be liable to fulfill all amounts owed to holders of the floating rate certificates. At period end, any such shortfall is recognized as “Unrealized depreciation on Recourse Trusts” on the Statement of Assets and Liabilities. At July 31, 2012, the Fund’s maximum exposure to externally-deposited Recourse Trusts was $15,280,000.
The average floating rate obligations outstanding and average annual interest rate and fees related to self-deposited inverse floaters for the Fund during the fiscal year ended July 31, 2012, were as follows:
| | | | |
Average floating rate obligations outstanding | | $ | 1,335,000 | |
Average annual interest rate and fees | | | 0.72 | % |
Zero Coupon Securities
The Fund is authorized to invest in zero coupon securities. A zero coupon security does not pay a regular interest coupon to its holders during the life of the security. Income to the holder of the security comes from accretion of the difference between the original purchase price of the security at issuance and the par value of the security at maturity and is effectively paid at maturity. The market prices of zero coupon securities generally are more volatile than the market prices of securities that pay interest periodically.
Custodian Fee Credit
The Fund has an arrangement with the custodian bank whereby certain custodian fees and expenses are reduced by net credits earned on the Fund’s cash on deposit with the bank. Such deposit arrangements are an alternative to overnight investments. Credits for cash balances may be offset by charges for any days on which the Fund overdraws its account at the custodian bank.
Indemnifications
Under the Trust’s organizational documents, its officers and trustees are indemnified against certain liabilities arising out of the performance of their duties to the Trust. In addition, in the normal course of business, the Trust enters into contracts that provide general indemnifications to other parties. The Trust’s maximum exposure under these arrangements is unknown as this would involve future claims that may be made against the Trust that have not yet occurred. However, the Trust has not had prior claims or losses pursuant to these contracts and expects the risk of loss to be remote.
Use of Estimates
The preparation of financial statements in conformity with U.S. GAAP requires management to make estimates and assumptions that affect the reported amounts of assets and liabilities at the date of the financial statements and the reported amounts of increases and decreases in net assets from operations during the reporting period. Actual results may differ from those estimates.
2. Fair Value Measurements
Fair value is defined as the price that the Fund would receive upon selling an investment or transferring a liability in an orderly transaction to an independent buyer in the principal or most advantageous market for the investment. A three-tier hierarchy is used to maximize the use of observable market data and minimize the use of unobservable inputs and to establish classification of fair value measurements for disclosure purposes. Observable inputs reflect the assumptions market participants would use in pricing the asset or liability. Observable inputs are based on market data obtained from sources independent of the reporting entity. Unobservable inputs reflect the reporting entity’s own assumptions about the assumptions market participants would use in pricing the asset or liability. Unobservable inputs are based on the best information available in the circumstances. The following is a summary of the three-tiered hierarchy of valuation input levels.
| | |
| Level 1 – | | Inputs are unadjusted and prices are determined using quoted prices in active markets for identical securities. |
| Level 2 – | | Prices are determined using other significant observable inputs (including quoted prices for similar securities, interest rates, prepayment speeds, credit risk, etc.). |
| Level 3 – | | Prices are determined using significant unobservable inputs (including management’s assumptions in determining the fair value of investments). |
The inputs or methodologies used for valuing securities are not an indication of the risks associated with investing in those securities. The following is a summary of the Fund’s fair value measurements as of the end of the reporting period:
| | | | | | | | | | | | | | | | |
| | | Level 1 | | | Level 2 | | | Level 3 | | | Total | |
Long-Term Investments*: | | | | | | | | | | | | | | | | |
Municipal Bonds | | $ | — | | | $ | 266,605,658 | | | $ | 36,855 | | | $ | 266,642,513 | |
| * | Refer to the Fund’s Portfolio of Investments for industry classifications and breakdown of Municipal Bonds classified as Level 3. |
The Nuveen funds’ Board of Directors/Trustees is responsible for the valuation process and has delegated the oversight of the daily valuation process to the Adviser’s Valuation Committee. The Valuation Committee, pursuant to the valuation policies and procedures adopted by the Board of Directors/Trustees, is responsible for making fair value determinations, evaluating the effectiveness of the funds’ pricing policies, and reporting to the Board of Directors/Trustees. The Valuation Committee is aided in its efforts by the Adviser’s dedicated Securities Valuation Team, which is responsible for administering the daily valuation process and applying fair value methodologies as approved by the Valuation Committee. When determining the reliability of independent pricing services for investments owned by the funds, the Valuation Committee, among other things, conducts due diligence reviews of the pricing services and monitors the quality of security prices received through various testing reports conducted by the Securities Valuation Team.
The Valuation Committee will consider pricing methodologies it deems relevant and appropriate when making fair value determinations. Examples of possible methodologies include, but are not limited to, multiple of earnings; discount from market of a similar freely traded security; discounted cash-flow analysis; book value or a multiple thereof; risk premium/yield analysis; yield to maturity; and/or fundamental investment analysis. The Valuation Committee will also consider factors it deems relevant and appropriate in light of the facts and circumstances. Examples of possible factors include, but are not limited to, the type of security; the issuer’s financial statements; the purchase price of the security; the discount from market value of unrestricted securities of the same class at the time of purchase; analysts’ research and observations from financial institutions; information regarding any transactions or offers with respect to the security; the existence of merger proposals or tender offers affecting the security; the price and extent of public trading in similar securities of the issuer or comparable companies; and the existence of a shelf registration for restricted securities.
For each portfolio security that has been fair valued pursuant to the policies adopted by the Board of Directors/Trustees, the fair value price is compared against the last available and next available market quotations. The Valuation Committee reviews the results of such testing and fair valuation occurrences are reported to the Board of Directors/Trustees.
3. Derivative Instruments and Hedging Activities
The Fund records derivative instruments at fair value, with changes in fair value recognized on the Statement of Operations, when applicable. Even though the Fund’s investments in derivatives may represent economic hedges, they are not considered to be hedge transactions for financial reporting purposes. The Fund did not invest in derivative instruments during the fiscal year ended July 31, 2012.
4. Fund Shares
Transactions in Fund shares were as follows:
| | | | | | | | | | | | | | | | |
| | | Year Ended
7/31/12 | | | Year Ended
7/31/11 | |
| | | Shares | | | Amount | | | Shares | | | Amount | |
Shares sold | | | 10,875,376 | | | $ | 116,910,018 | | | | 7,482,587 | | | $ | 75,557,758 | |
Shares issued to shareholders due to reinvestment of distributions | | | 444,051 | | | | 4,772,017 | | | | 310,095 | | | | 3,133,335 | |
Shares redeemed | | | (4,135,088 | ) | | | (44,429,234 | ) | | | (4,308,352 | ) | | | (43,237,254 | ) |
Net increase (decrease) | | | 7,184,339 | | | $ | 77,252,801 | | | | 3,484,330 | | | $ | 35,453,839 | |
5. Investment Transactions
Purchases and sales (including maturities but excluding short-term investments) during the fiscal year ended July 31, 2012, aggregated $138,462,499 and $61,980,926, respectively.
6. Income Tax Information
The following information is presented on an income tax basis. Differences between amounts for financial statement and federal income tax purposes are primarily due to timing differences in recognizing taxable market discount, timing differences in recognizing certain gains and losses on investment transactions and the treatment of investments in inverse floating rate securities reflected as financing transactions, if any. To the extent that differences arise that are permanent in nature, such amounts are reclassified within the capital accounts as detailed below. Temporary differences do not require reclassification. Temporary and permanent differences do not impact the net asset value of the Fund.
Notes to Financial Statements (continued)
At July 31, 2012, the cost and unrealized appreciation (depreciation) of investments, as determined on a federal income tax basis, were as follows:
| | | | |
Cost of investments | | $ | 246,267,446 | |
Gross unrealized: | | | | |
Appreciation | | $ | 19,250,621 | |
Depreciation | | | (210,558 | ) |
Net unrealized appreciation (depreciation) of investments | | $ | 19,040,063 | |
Permanent differences, primarily due to taxable market discount, resulted in reclassifications among the Fund’s components of net assets at July 31, 2012, the Fund’s tax year-end, as follows:
| | | | |
Capital paid-in | | $ | — | |
Undistributed (Over-distribution of) net investment income | | | 32,500 | |
Accumulated net realized gain (loss) | | | (32,500 | ) |
The tax components of undistributed net tax-exempt income, net ordinary income and net long-term capital gains at July 31, 2012, the Fund’s tax year-end, were as follows:
| | | | |
Undistributed net tax-exempt income* | | $ | 702,491 | |
Undistributed net ordinary income** | | | 466,187 | |
Undistributed net long-term capital gains | | | 3,036,380 | |
| * | Undistributed net tax-exempt income (on a tax basis) has not been reduced for the dividend declared during the period July 1, 2012 through July 31, 2012, and paid on August 1, 2012. |
| ** | Net ordinary income consists of taxable market discount income and net short-term capital gains if any. |
The tax character of distributions paid during the Fund’s tax years ended July 31, 2012 and July 31, 2011, was designated for purposes of the dividends paid deduction as follows:
| | | | |
| 2012 | | | |
Distributions from net tax-exempt income*** | | $ | 10,142,510 | |
Distributions from net ordinary income** | | | 103,587 | |
Distributions from net long-term capital gains**** | | | 517,936 | |
| | | | |
| 2011 | | | |
Distributions from net tax-exempt income | | $ | 8,237,720 | |
Distributions from net ordinary income** | | | 330,031 | |
Distributions from net long-term capital gains | | | 1,125,176 | |
| ** | Net ordinary income consists of taxable market discount income and net short-term capital gains, if any. |
| *** | The Fund hereby designates this amount paid during the fiscal year ended July 31, 2012, as Exempt Interest Dividends. |
| **** | The Fund designates as long-term capital gain dividend, pursuant to the Internal Revenue Code Section 852(b)(3), the amount necessary to reduce earnings and profits of the Fund related to net capital gain to zero for the tax year ended July 31, 2012. |
On December 22, 2010, the Regulated Investment Company Modernization Act of 2010 (the “Act”) was enacted, which changed various technical rules governing the tax treatment of RICs. The changes are generally effective for taxable years beginning after the date of enactment. One of the more prominent changes addresses capital loss carryforwards. Under the Act, the Fund will be permitted to carry forward capital losses incurred in taxable years beginning after the date of enactment for an unlimited period. However, any losses incurred during those future taxable years will be required to be utilized prior to the losses incurred in pre-enactment taxable years, which carry an expiration date. As a result of this ordering rule, pre-enactment capital loss carryforwards may be more likely to expire unused. Additionally, post-enactment capital loss carryforwards will retain their character as either short-term or long-term capital losses rather than being considered all short-term as permitted under previous regulation.
The Act also contains several provisions aimed at preserving the character of distributions made by a fiscal year RIC during the portion of its taxable year ending after October 31 or December 31, reducing the circumstances under which a RIC might be required to file amended Forms 1099 to restate previously reported distributions.
During the Fund’s tax year ended July 31, 2012, there were no post-enactment capital losses generated.
7. Management Fees and Other Transactions with Affiliates
The Adviser does not charge any investment advisory or administrative fees directly to the Fund. The Adviser has agreed irrevocably during the existence of the Fund to waive all fees and pay or reimburse all expenses of the Fund (excluding interest expense, taxes, fees incurred in acquiring and disposing of portfolio securities, and extraordinary expenses). The Adviser is compensated for its services to the Fund from the fee charged at the separately managed account level.
8. New Accounting Pronouncements
Financial Accounting Standards Board (“FASB”) Balance Sheet (Topic 210): Disclosures about Offsetting Assets and Liabilities
In December 2011, the FASB issued Accounting Standards Update (“ASU”) No. 2011-11 (“ASU No. 2011-11”) to enhance disclosures about financial instruments and derivative instruments that are subject to offsetting (“netting”) on the Statement of Assets and Liabilities. This information will enable users of the entity’s financial statements to evaluate the effect or potential effect of netting arrangements on the entity’s financial position. ASU No. 2011-11 is effective prospectively during interim or annual periods beginning on or after January 1, 2013. At this time, management is evaluating the implications of this guidance and the impact it will have to the financial statements amounts and footnote disclosures, if any.
Trustees and Officers (Unaudited)
The management of the Funds, including general supervision of the duties performed for the Funds by the Adviser, is the responsibility of the Board of Trustees of the Funds. The number of trustees of the Funds is currently set at ten. None of the trustees who are not “interested” persons of the Funds (referred to herein as “independent trustees”) has ever been a director or employee of, or consultant to, Nuveen or its affiliates. The names and business addresses of the trustees and officers of the Funds, their principal occupations and other affiliations during the past five years, the number of portfolios each oversees and other directorships they hold are set forth below.
The Funds’ Statement of Additional Information (“SAI”) includes more information about the trustees. To request a free copy, call Nuveen Investments at (800) 257-8787 or visit the Funds’ website at www.nuveen.com.
| | | | | | | | |
Name, Birthdate and Address | | Position(s) Held with the Funds | | Year First Elected or Appointed (1) | | Principal Occupation(s) Including other Directorships During Past 5 Years | | Number of Portfolios in Fund Complex Overseen by Trustee |
| | |
| Independent Trustees: | | | | |
Robert P. Bremner 8/22/40 333 W. Wacker Drive Chicago, IL 60606 | | Chairman of the Board and Trustee | | 1996 | | Private Investor and Management Consultant; Treasurer and Director, Humanities Council of Washington, D.C.; Board Member, Independent Directors Council affiliated with the Investment Company Institute. | | 219 |
Jack B. Evans 10/22/48 333 W. Wacker Drive Chicago, IL 60606 | | Trustee | | 1999 | | President, The Hall-Perrine Foundation, a private philanthropic corporation (since 1996); Director and Chairman, United Fire Group, a publicly held company; member of the Board of Regents for the State of Iowa University System; Director, Source Media Group; Life Trustee of Coe College and the Iowa College Foundation; formerly, Director, Alliant Energy; formerly, Director, Federal Reserve Bank of Chicago; formerly, President and Chief Operating Officer, SCI Financial Group, Inc., a regional financial services firm. | | 219 |
William C. Hunter 3/6/48 333 W. Wacker Drive Chicago, IL 60606 | | Trustee | | 2004 | | Dean Emeritus (since June 30, 2012), formerly, Dean, Tippie College of Business, University of Iowa (2006-2012); Director (since 2004) of Xerox Corporation; Director (since 2005), and President (since July 2012) Beta Gamma Sigma, Inc., The International Honor Society; Director of Wellmark, Inc. (since 2009); formerly, Dean and Distinguished Professor of Finance, School of Business at the University of Connecticut (2003-2006); previously, Senior Vice President and Director of Research at the Federal Reserve Bank of Chicago (1995-2003); formerly, Director (1997-2007), Credit Research Center at George Washington University. | | 219 |
David J. Kundert 10/28/42 333 W. Wacker Drive Chicago, IL 60606 | | Trustee | | 2005 | | Director, Northwestern Mutual Wealth Management Company; retired (since 2004) as Chairman, JPMorgan Fleming Asset Management, President and CEO, Banc One Investment Advisors Corporation, and President, One Group Mutual Funds; prior thereto, Executive Vice President, Banc One Corporation and Chairman and CEO, Banc One Investment Management Group; Member, Board of Regents, Luther College; member of the Wisconsin Bar Association; member of Board of Directors, Friends of Boerner Botanical Gardens; member of Board of Directors and Chair of Investment Committee, Greater Milwaukee Foundation. | | 219 |
William J. Schneider 9/24/44 333 W. Wacker Drive Chicago, IL 60606 | | Trustee | | 1996 | | Chairman of Miller-Valentine Partners Ltd., a real estate investment company; formerly, Senior Partner and Chief Operating Officer (retired 2004) of Miller-Valentine Group; member, University of Dayton Business School Advisory Council; member, Mid-America Health System Board; formerly, member and chair, Dayton Philharmonic Orchestra Association; formerly, member, Business Advisory Council, Cleveland Federal Reserve Bank. | | 219 |
Judith M. Stockdale 12/29/47 333 W. Wacker Drive Chicago, IL 60606 | | Trustee | | 1997 | | Executive Director, Gaylord and Dorothy Donnelley Foundation (since 1994); prior thereto, Executive Director, Great Lakes Protection Fund (1990-1994). | | 219 |
Carole E. Stone 6/28/47 333 W. Wacker Drive Chicago, IL 60606 | | Trustee | | 2007 | | Director, Chicago Board Options Exchange (since 2006); Director, C2 Options Exchange, Incorporated (since 2009); formerly, Commissioner, New York State Commission on Public Authority Reform (2005-2010); formerly, Chair, New York Racing Association Oversight Board (2005-2007). | | 219 |
| | | | | | | | |
Name, Birthdate and Address | | Position(s) Held with the Funds | | Year First Elected or Appointed (1) | | Principal Occupation(s) During Past Five Years | | Number of Portfolios in Fund Complex Overseen by Trustee |
Virginia L. Stringer 8/16/44 333 West Wacker Drive Chicago, IL 60606 | | Trustee | | 2011 | | Board Member, Mutual Fund Directors Forum; former governance consultant and non-profit board member; former Owner and President, Strategic Management Resources, Inc. a management consulting firm; former Member, Governing Board, Investment Company Institute’s Independent Directors Council; previously, held several executive positions in general management, marketing and human resources at IBM and The Pillsbury Company; Independent Director, First American Fund Complex (1987-2010) and Chair (1997-2010). | | 219 |
Terence J. Toth 9/29/59 333 W. Wacker Drive Chicago, IL 60606 | | Trustee | | 2008 | | Director, Legal & General Investment Management America, Inc. (since 2008); Managing Partner, Promus Capital (since 2008); formerly, CEO and President, Northern Trust Global Investments (2004-2007); Executive Vice President, Quantitative Management & Securities Lending (2000-2004); prior thereto, various positions with Northern Trust Company (since 1994); member: Goodman Theatre Board (since 2004), Chicago Fellowship Board (since 2005), Catalyst Schools of Chicago Board (since 2008); Mather Foundation Board (since 2012) and a member of its investment committee; formerly, member: Northern Trust Mutual Funds Board (2005-2007), Northern Trust Global Investments Board (2004-2007), Northern Trust Japan Board (2004-2007), Northern Trust Securities Inc. Board (2003-2007) and Northern Trust Hong Kong Board (1997-2004). | | 219 |
| | |
| Interested Trustee: | | | | |
John P. Amboian (2) 6/14/61 333 W. Wacker Drive Chicago, IL 60606 | | Trustee | | 2008 | | Chief Executive Officer and Chairman (since 2007) and Director (since 1999) of Nuveen Investments, Inc., formerly, President (1999-2007); Chief Executive Officer (since 2007) of Nuveen Investments Advisers Inc.; Director (since 1998) formerly, Chief Executive Officer (2007-2010) of Nuveen Fund Advisors, Inc. | | 219 |
Name, Birthdate and Address | | Position(s) Held with the Funds | | Year First Elected or Appointed (3) | | Principal Occupation(s) During Past 5 Years | | Number of Portfolios in Fund Complex Overseen by Officer |
| | |
| Officers of the Funds: | | | | |
Gifford R. Zimmerman 9/9/56 333 W. Wacker Drive Chicago, IL 60606 | | Chief Administrative Officer | | 1988 | | Managing Director (since 2002), Assistant Secretary of Nuveen Securities, LLC; Managing Director (since 2004) and Assistant Secretary (since 1994) of Nuveen Investments, Inc.; Managing Director (since 2002), Assistant Secretary (since 1997) and Co-General Counsel (since 2011) of Nuveen Fund Advisors, Inc.; Managing Director, Assistant Secretary and Associate General Counsel of Nuveen Asset Management, LLC (since 2011); Managing Director, Associate General Counsel and Assistant Secretary of Symphony Asset Management LLC (since 2003); Vice President and Assistant Secretary of NWQ Investment Management Company, LLC (since 2002), Nuveen Investments Advisers Inc. (since 2002), Santa Barbara Asset Management, LLC (since 2006) and of Winslow Capital Management, LLC. (since 2010); Chief Administrative Officer and Chief Compliance Officer (since 2006) of Nuveen Commodities Asset Management, LLC; Chartered Financial Analyst. | | 219 |
Margo L. Cook 4/11/64 333 W. Wacker Drive Chicago, IL 60606 | | Vice President | | 2009 | | Executive Vice President (since 2008) of Nuveen Investments, Inc. and of Nuveen Fund Advisors, Inc. (since 2011); Managing Director – Investment Services of Nuveen Commodities Asset Management, LLC (since August 2011) previously, Head of Institutional Asset Management (2007-2008) of Bear Stearns Asset Management; Head of Institutional Asset Management (1986-2007) of Bank of NY Mellon; Chartered Financial Analyst. | | 219 |
Trustees and Officers (Unaudited) (continued)
| | | | | | | | |
Name, Birthdate and Address | | Position(s) Held with the Funds | | Year First Elected or Appointed (3) | | Principal Occupation(s) During Past 5 Years | | Number of Portfolios in Fund Complex Overseen by Officer |
Lorna C. Ferguson 10/24/45 333 W. Wacker Drive Chicago, IL 60606 | | Vice President | | 1998 | | Managing Director (since 2005) of Nuveen Fund Advisors, Inc. and Nuveen Securities, LLC (since 2004). | | 219 |
Stephen D. Foy 5/31/54 333 W. Wacker Drive Chicago, IL 60606 | | Vice President and Controller | | 1998 | | Senior Vice President (since 2010), formerly, Vice President (2005-2010) and Funds Controller of Nuveen Securities, LLC; Vice President of Nuveen Fund Advisors, Inc.; Chief Financial Officer of Nuveen Commodities Asset Management, LLC (since 2010); Certified Public Accountant. | | 219 |
Scott S. Grace 8/20/70 333 W. Wacker Drive Chicago, IL 60606 | | Vice President and Treasurer | | 2009 | | Managing Director, Corporate Finance & Development, Treasurer (since 2009) of Nuveen Securities, LLC; Managing Director and Treasurer (since 2009) of Nuveen Fund Advisors, Inc., Nuveen Investments Advisers, Inc., Nuveen Investments Holdings Inc. and (since 2011) Nuveen Asset Management, LLC; Vice President and Treasurer of NWQ Investment Management Company, LLC, Tradewinds Global Investors, LLC, Symphony Asset Management LLC and Winslow Capital Management, LLC.; Vice President of Santa Barbara Asset Management, LLC; formerly, Treasurer (2006-2009), Senior Vice President (2008-2009), previously, Vice President (2006-2008) of Janus Capital Group, Inc.; formerly, Senior Associate in Morgan Stanley’s Global Financial Services Group (2000-2003); Chartered Accountant Designation. | | 219 |
Walter M. Kelly 2/24/70 333 W. Wacker Drive Chicago, IL 60606 | | Chief Compliance Officer and Vice President | | 2003 | | Senior Vice President (since 2008) and Assistant Secretary (since 2003) of Nuveen Fund Advisors, Inc; Senior Vice President (since 2008) of Nuveen Investments Holdings, Inc; formerly, Senior Vice President (2008-2011) of Nuveen Securities, LLC. | | 219 |
Tina M. Lazar 8/27/61 333 W. Wacker Drive Chicago, IL 60606 | | Vice President | | 2002 | | Senior Vice President (since 2010), formerly, Vice President (2005-2010) of Nuveen Fund Advisors, Inc. | | 219 |
Name, Birthdate and Address | | Position(s) Held with the Funds | | Year First Elected or Appointed (3) | | Principal Occupation(s) Including other Directorships During Past 5 Years | | Number of Portfolios in Fund Complex Overseen by Officer |
Kevin J. McCarthy 3/26/66 333 W. Wacker Drive Chicago, IL 60606 | | Vice President and Secretary | | 2007 | | Managing Director and Assistant Secretary (since 2008), formerly, Vice President (2007-2008), Nuveen Securities, LLC; Managing Director (since 2008), Assistant Secretary (since 2007) and Co-General Counsel (since 2011) of Nuveen Fund Advisors, Inc.; Managing Director, Assistant Secretary and Associate General Counsel (since 2011) of Nuveen Asset Management, LLC; Managing Director (since 2008), and Assistant Secretary, Nuveen Investment Holdings, Inc.; Vice President (since 2007) and Assistant Secretary of Nuveen Investments Advisers Inc., NWQ Investment Management Company, LLC, Tradewinds Global Investors LLC, NWQ Holdings, LLC, Symphony Asset Management LLC, Santa Barbara Asset Management, LLC, and of Winslow Capital Management, LLC. (since 2010); Vice President and Secretary (since 2010) of Nuveen Commodities Asset Management, LLC; prior thereto, Partner, Bell, Boyd & Lloyd LLP (1997-2007). | | 219 |
Kathleen L. Prudhomme 3/30/53 901 Marquette Avenue Minneapolis, MN 55402 | | Vice President and Assistant Secretary | | 2011 | | Managing Director, Assistant Secretary and Co-General Counsel (since 2011) of Nuveen Fund Advisors, Inc.; Managing Director, Assistant Secretary and Associate General Counsel (since 2011) of Nuveen Asset Management, LLC; Managing Director and Assistant Secretary (since 2011) of Nuveen Securities, LLC; formerly, Deputy General Counsel, FAF Advisors, Inc. (2004-2010). | | 219 |
| | | | | | | | |
Name, Birthdate and Address | | Position(s) Held with the Funds | | Year First Elected or Appointed (3) | | Principal Occupation(s) Including other Directorships During Past 5 Years | | Number of Portfolios in Fund Complex Overseen by Officer |
Jeffery M. Wilson 3/13/56 333 West Wacker Drive Chicago, IL 60606 | | Vice President | | 2011 | | Senior Vice President of Nuveen Securities, LLC (since 2011); formerly, Senior Vice President of FAF Advisors, Inc. (2000-2010). | | 102 |
| (1) | Trustees serve an indefinite term until his/her successor is elected or appointed. The year first elected or appointed represents the year in which the trustee was first elected or appointed to any fund in the Nuveen Fund Complex. |
| (2) | Mr. Amboian is an interested trustee because of his position with Nuveen Investments, Inc. and certain of its subsidiaries, which are affiliates of the Nuveen Funds. |
| (3) | Officers serve one year terms through August of each year. The year first elected or appointed represents the year in which the officer was first elected or appointed to any fund in the Nuveen Fund Complex. |
Annual Investment Management Agreement Approval Process
(Unaudited)
The Board of Trustees (the “Board,” and each Trustee, a “Board Member”) of the Fund, including the Board Members who are not parties to the Fund’s advisory or sub-advisory agreements or “interested persons” of any such parties (the “Independent Board Members”), is responsible for approving the advisory agreement (the “Investment Management Agreement”) between the Fund and Nuveen Fund Advisors, Inc. (the “Advisor”) and the sub-advisory agreement (the “Sub-Advisory Agreement”) between the Advisor and Nuveen Asset Management, LLC (the “Sub-Advisor”) (the Investment Management Agreement and the Sub-Advisory Agreement are referred to collectively as the “Advisory Agreements”) and their periodic continuation. Pursuant to the Investment Company Act of 1940, as amended (the “1940 Act”), the Board is required to consider the continuation of the Advisory Agreements on an annual basis. Accordingly, at an in-person meeting held on May 21-23, 2012 (the “May Meeting”), the Board, including a majority of the Independent Board Members, considered and approved the continuation of the Advisory Agreements for the Fund for an additional one-year period.
In preparation for its considerations at the May Meeting, the Board requested and received extensive materials prepared in connection with the review of the Advisory Agreements. The materials provided a broad range of information regarding the Fund, the Advisor and the Sub-Advisor (the Advisor and the Sub-Advisor are collectively, the “Fund Advisers” and each, a “Fund Adviser”). As described in more detail below, the information provided included, among other things, a review of Fund performance, including Fund investment performance assessments against appropriate benchmarks, Fund fees and expenses, a description and assessment of shareholder service levels for the Fund, a summary of the performance of certain service providers, a review of product initiatives and shareholder communications and an analysis of the Advisor’s profitability with comparisons to comparable peers in the managed fund business. As part of its annual review, the Board also held a separate meeting on April 18-19, 2012, to review the Fund’s investment performance and consider an analysis provided by the Advisor of the Sub-Advisor which generally evaluated the Sub-Advisor’s investment team, investment mandate, organizational structure and history, investment philosophy and process, performance of the Fund, and significant changes to the foregoing. As a result of its review of the materials and discussions, the Board presented the Advisor with questions and the Advisor responded.
The materials and information prepared in connection with the annual review of the Advisory Agreements supplement the information and analysis provided to the Board during the year. In this regard, throughout the year, the Board, acting directly or through its committees, regularly reviews the performance and various services provided by the Advisor and the Sub-Advisor. The Board meets at least quarterly as well as at other times as the need arises. At its quarterly meetings, the Board reviews reports by the Advisor which include, among other things, Fund performance, a review of the investment teams and reports on compliance, regulatory matters and risk management. The Board also meets with key investment personnel managing the Fund’s portfolio during the year. In October 2011, the Board also created two new standing committees (the Open-end Fund Committee and the Closed-end Fund Committee) to assist the full Board in monitoring and gaining a deeper insight into the distinctive issues and business practices of open-end and closed-end funds.
In addition, the Board continues its program of seeking to have the Board Members or a subset thereof visit each sub-advisor to the Nuveen funds at least once over a multiple year rotation, meeting with key investment and business personnel. In this regard, the Board visited with the Sub-Advisor’s municipal team in Minneapolis in September 2011 and with the Sub-Advisor’s municipal team in Chicago in November 2011. Further, an ad hoc committee of the Board visited the then-current transfer agents of the Nuveen funds in 2011 and the audit committee of the Board visited the various pricing agents for the Nuveen funds in January 2012.
The Board considers factors and information that are relevant to its annual consideration of the renewal of the Advisory Agreements at the meetings held throughout the year. Accordingly, the Board considers the information provided and knowledge gained at these meetings when performing its annual review of the Advisory Agreements. The Independent Board Members are assisted throughout the process by independent legal counsel who provided materials describing applicable law and the duties of directors or trustees in reviewing advisory contracts and met with the Independent Board Members in executive sessions without management present. In addition, it is important to recognize that the management arrangements for the Nuveen funds are the result of many years of review and discussion between the Independent Board Members and fund management and that the Board Members’ conclusions may be based, in part, on their consideration of fee arrangements and other factors developed in previous years.
The Board considered all factors it believed relevant with respect to the Fund, including among other factors: (a) the nature, extent and quality of the services provided by the Fund Advisers, (b) the investment performance of the Fund and Fund Advisers, (c) the advisory fees and costs of the services to be provided to the Fund and the profitability of the Fund Advisers, (d) the extent of any economies of scale, (e) any benefits derived by the Fund Advisers from the relationship with the Fund and (f) other factors. Each Board Member may have accorded different weight to the various factors in reaching his or her conclusions with respect to the Fund’s Advisory Agreements. The Independent Board Members did not identify any single factor as all important or controlling. The Independent Board Members’ considerations were instead based on a comprehensive consideration of all the information presented. The principal factors considered by the Board and its conclusions are described below.
A. Nature, Extent and Quality of Services
In considering renewal of the Advisory Agreements, the Independent Board Members considered the nature, extent and quality of the Fund Adviser’s services, including advisory services and the resulting Fund performance and administrative services. The Independent Board Members further considered the overall reputation and capabilities of the Advisor and its affiliates, the commitment of the
Advisor to provide high quality service to the Fund, their overall confidence in the Advisor’s integrity and the Advisor’s responsiveness to questions and concerns raised by them. The Independent Board Members reviewed materials outlining, among other things, the Fund Adviser’s organization and business; the types of services that the Fund Adviser or its affiliates provide to the Fund; the performance record of the Fund (as described in further detail below); and any initiatives Nuveen had taken for the applicable fund product line.
In considering advisory services, the Board recognized that the Advisor provides various oversight, administrative, compliance and other services for the Fund and the Sub-Advisor generally provides the portfolio investment management services to the Fund. In reviewing the portfolio management services provided to the Fund, the Board reviewed the materials provided by the Nuveen Investment Services Oversight Team analyzing, among other things, the Sub-Advisor’s investment team and changes thereto, organization and history, assets under management, Fund objectives and mandate, the investment team’s philosophy and strategies in managing the Fund, developments affecting the Sub-Advisor or Fund and Fund performance. The Independent Board Members also reviewed portfolio manager compensation arrangements to evaluate each Fund Adviser’s ability to attract and retain high quality investment personnel, preserve stability, and reward performance but not provide an inappropriate incentive to take undue risks. In addition, the Board considered the Advisor’s execution of its oversight responsibilities over the Sub-Advisor. Given the importance of compliance, the Independent Board Members also considered Nuveen’s compliance program, including the report of the chief compliance officer regarding the Fund’s compliance policies and procedures; the resources dedicated to compliance; and the record of compliance with the policies and procedures.
In addition to advisory services, the Board considered the quality and extent of administrative and other non-investment advisory services the Advisor and its affiliates provide to the Fund, including product management, investment services (such as oversight of investment policies and procedures, risk management, and pricing), fund administration, oversight of service providers, shareholder services and communications, administration of Board relations, regulatory and portfolio compliance and legal support. The Board further recognized Nuveen’s additional investments in personnel, including in compliance and risk management. The Board Members noted, however, that the Fund is offered via separately managed accounts and may require less shareholder services than a typical open-end fund. In reviewing the services provided, the Board also reviewed materials describing various notable initiatives and projects the Advisor performed in connection with the open-end fund product line. These initiatives included efforts to eliminate product overlap through mergers or liquidations; commencement of various new funds; elimination of insurance mandates for various funds; updates in investment policies or guidelines for several funds; and reductions in management fees and expense caps for certain funds.
Based on their review, the Independent Board Members found that, overall, the nature, extent and quality of services provided to the Fund under each Advisory Agreement were satisfactory.
B. The Investment Performance of the Fund and Fund Advisers
The Board, including the Independent Board Members, reviewed and considered the performance history of the Fund over various time periods. Given its unique structure, the Fund does not have a performance peer group (i.e., comparable funds against which the Fund can compare its performance). In considering the performance of the Fund, the Board therefore considered the Fund’s historic performance, as well as the performance of recognized benchmarks. The Independent Board Members reviewed performance information including the Fund’s total return information and performance information for recognized benchmarks for the quarter, one-year and three-year periods ending December 31, 2011 and March 31, 2012. In this regard, the Board noted that the Fund outperformed its benchmark for the one- and three-year periods.
The Independent Board Members noted that the investment experience of a particular shareholder in the Nuveen funds will vary depending on when such shareholder invests in the applicable fund, the class held (if multiple classes are offered in a fund) and the performance of the fund (or respective class) during that shareholder’s investment period. In addition, although the performance above reflects the performance results for the time periods ending as of the most recent calendar year end (unless otherwise indicated), the Board also recognized that selecting a different ending time period may derive different results. Furthermore, while the Board is cognizant of the relevant performance of a fund’s peer set and/or benchmark(s), the Board evaluated fund performance in light of the respective fund’s investment objectives, investment parameters and guidelines and recognized that the objectives, investment parameters and guidelines of peers and/or benchmarks may differ to some extent, thereby resulting in differences in performance results. Nevertheless, with respect to any Nuveen funds that the Board considers to have underperformed their peers and/or benchmarks from time to time, the Board monitors such funds closely and considers any steps necessary or appropriate to address such issues.
Based on their review, the Independent Board Members determined that the Fund’s investment performance had been satisfactory.
C. Fees, Expenses and Profitability
1. Fees and Expenses
The Independent Board Members recognized the unique fee structure of the Fund. The Fund does not pay the Advisor or Sub-Advisor a management fee and nearly all expenses are reimbursed by the Advisor. The Fund is sold via separately managed accounts. The Advisor therefore receives its advisory fees via the managed account management fee. Such fee is essentially a
Annual Investment Management Agreement Approval Process
(Unaudited) (continued)
blended rate comprised of Fund fees pro-rated to the portion of the total product represented by the Fund and the managed account fees associated with the proportion of individual securities in the overall product. Given the different fee structure, and distribution and account support requirements, the Independent Board Members recognized that the expenses incurred by the Fund (nearly all of which are reimbursed by the Advisor) are not comparable to any comparable group of unaffiliated funds or other Nuveen funds. Based on their review, the Independent Board Members determined that the Fund’s fee and expense arrangement was reasonable.
2. Comparisons with the Fees of Other Clients
The Independent Board Members further reviewed information regarding the nature of services and range of fees offered by the Advisor to other clients, including other municipal separately managed accounts and passively managed exchange traded funds (ETFs) sub-advised by the Advisor. Similarly, the Independent Board Members also reviewed the pricing schedule or fees that the Sub-Advisor charges for similar investment management services for other Nuveen funds, funds of other sponsors (if any), and other clients (such as retail and/or institutional managed accounts). Generally, in evaluating the comparisons of fees, the Independent Board Members had noted that the fee rates charged to funds and other clients vary, among other things, because of the different services involved and the additional regulatory and compliance requirements associated with registered investment companies. With respect to the Fund, however, they recognized that the Fund is offered via separately managed accounts and therefore may not require or incur the costs of shareholder servicing to the same extent as typical open-end funds. Further, as noted, given the Fund’s unique fee and expense structure pursuant to which it does not pay management fees and expenses are reimbursed, comparisons with peers were not available.
3. Profitability of Fund Advisers
In conjunction with its review of fees, the Independent Board Members also considered the profitability of Nuveen for its advisory activities and its financial condition. The Independent Board Members reviewed the revenues and expenses of Nuveen’s advisory activities for the last two calendar years, the allocation methodology used in preparing the profitability data and an analysis of the key drivers behind the changes in revenues and expenses that impacted profitability in 2011. The Independent Board Members noted this information supplemented the profitability information requested and received during the year to help keep them apprised of developments affecting profitability (such as changes in fee waivers and expense reimbursement commitments). In this regard, the Independent Board Members noted that they have an Independent Board Member serve as a point person to review and keep them apprised of changes to the profitability analysis and/or methodologies during the year. The Independent Board Members also considered Nuveen’s revenues for advisory activities, expenses, and profit margin compared to that of various unaffiliated management firms with comparable assets under management (based on asset size and asset composition).
In reviewing profitability, the Independent Board Members recognized the Advisor’s continued investment in its business to enhance its services, including capital improvements to investment technology, updated compliance systems, and additional personnel in compliance, risk management, and product development as well as its ability to allocate resources to various areas of the Advisor as the need arises. In addition, in evaluating profitability, the Independent Board Members also recognized the subjective nature of determining profitability which may be affected by numerous factors including the allocation of expenses. Further, the Independent Board Members recognized the difficulties in making comparisons as the profitability of other advisers generally is not publicly available and the profitability information that is available for certain advisers or management firms may not be representative of the industry and may be affected by, among other things, the adviser’s particular business mix, capital costs, types of funds managed and expense allocations. Notwithstanding the foregoing, the Independent Board Members reviewed Nuveen’s methodology and assumptions for allocating expenses across product lines to determine profitability. In reviewing profitability, the Independent Board Members recognized Nuveen’s investment in its fund business. Based on their review, the Independent Board Members concluded that the Advisor’s level of profitability for its advisory activities was reasonable in light of the services provided.
With respect to sub-advisers affiliated with Nuveen, including the Sub-Advisor, the Independent Board Members reviewed the sub-adviser’s revenues, expenses and profitability margins (pre- and post-tax) for its advisory activities and the methodology used for allocating expenses among the internal sub-advisers. Based on their review, the Independent Board Members were satisfied that the Sub-Advisor’s level of profitability was reasonable in light of the services provided.
In evaluating the reasonableness of the compensation, the Independent Board Members also considered other amounts paid to a Fund Adviser by the Fund as well as any indirect benefits (such as soft dollar arrangements, if any) the Fund Adviser and its affiliates receive, or are expected to receive, that are directly attributable to the management of the Fund, if any. See Section E below for additional information on indirect benefits a Fund Adviser may receive as a result of its relationship with the Fund. Based on their review of the overall fee arrangements of the Fund, the Independent Board Members determined that the advisory fees and expenses of the Fund were reasonable.
D. Economies of Scale and Whether Fee Levels Reflect These Economies of Scale
With respect to economies of scale, the Independent Board Members have recognized the potential benefits resulting from the costs of a fund being spread over a larger asset base, although economies of scale are difficult to measure and predict with precision, particularly on a fund-by-fund basis. One method to help ensure the shareholders share in these benefits is to include breakpoints in
the advisory fee schedule. Generally, management fees for funds in the Nuveen complex are comprised of a fund-level component and a complex-level component, subject to certain exceptions. The Independent Board Members recognized, however, that the Fund does not have fund-level breakpoints given its unique structure.
In addition, pursuant to a complex-wide fee arrangement, the fees of the funds in the Nuveen complex are generally reduced as the assets in the fund complex reach certain levels. However, because the Fund does not pay a management fee, there is no applicable fund-level or complex-wide level breakpoint schedule, although its assets will be counted toward the complex-wide total.
Based on their review, the Independent Board Members concluded that the absence of a fund-level breakpoint schedule and a complex-wide fee arrangement was acceptable for the Fund.
E. Indirect Benefits
In evaluating fees, the Independent Board Members received and considered information regarding potential “fall out” or ancillary benefits the respective Fund Adviser or its affiliates may receive as a result of its relationship with the Fund. In this regard, the Independent Board Members considered, whether the Fund Advisers received any benefits from soft dollar arrangements whereby a portion of the commissions paid by the Fund for brokerage may be used to acquire research that may be useful to the Fund Adviser in managing the assets of the Fund and other clients. The Independent Board Members recognized that each Fund Adviser has the authority to pay a higher commission in return for brokerage and research services if it determines in good faith that the commission paid is reasonable in relation to the value of the brokerage and research services provided and may benefit from such soft dollar arrangements. Similarly, the Board recognized that the research received pursuant to soft dollar arrangements by a Fund Adviser may also benefit the Fund and shareholders to the extent the research enhances the ability of the Fund Adviser to manage the Fund. The Independent Board Members noted that the Fund Advisers’ profitability may be somewhat lower if they did not receive the research services pursuant to the soft dollar arrangements and had to acquire such services directly.
Based on their review, the Independent Board Members concluded that any indirect benefits received by a Fund Adviser as a result of its relationship with the Fund were reasonable and within acceptable parameters.
F. Other Considerations
The Independent Board Members did not identify any single factor discussed previously as all-important or controlling. The Board Members, including the Independent Board Members, unanimously concluded that the terms of each Advisory Agreement are fair and reasonable, that the respective Fund Adviser’s fees are reasonable in light of the services provided to the Fund and that the Advisory Agreements be renewed.
Glossary of Terms Used in this Report
Average Annual Total Return: This is a commonly used method to express an investment’s performance over a particular, usually multi-year time period. It expresses the return that would have been necessary each year to equal the investment’s actual cumulative performance (including change in NAV or offer price and reinvested dividends and capital gains distributions, if any) over the time period being considered.
Barclays 7-Year Municipal Bond Index: An unmanaged index composed of a broad range of investment-grade municipal bonds with maturity dates of approximately seven years. Index returns assume reinvestment of distributions, but do not reflect any applicable sales charges or management fees.
Gross Domestic Product (GDP): The total market value of all final goods and services produced in a country/region in a given year, equal to total consumer, investment and government spending, plus the value of exports, minus the value of imports.
Net Asset Value (NAV): The net market value of all securities held in a portfolio.
Net Asset Value (NAV) Per Share: The market value of one share of a mutual fund or closed-end fund. For the Fund, the NAV is calculated daily by taking the Fund’s total assets (securities, cash, and accrued earnings), subtracting the Fund’s liabilities, and dividing by the number of shares outstanding.
Additional Fund Information
Fund Manager
Nuveen Fund Advisors, Inc.
333 West Wacker Drive
Chicago, IL 60606
Sub-Adviser
Nuveen Asset Management, LLC
333 West Wacker Drive
Chicago, IL 60606
Legal Counsel
Chapman and Cutler LLP
Chicago, IL
Independent Registered Public Accounting Firm
PricewaterhouseCoopers LLP
Chicago, IL
Custodian
State Street Bank & Trust Company
Boston, MA
Transfer Agent and Shareholder Services
Boston Financial
Data Services, Inc.
Nuveen Investor Services
P.O. Box 8530
Boston, MA 02266-8530
(800) 257-8787
Quarterly Portfolio of Investments and Proxy Voting Information: You may obtain (i) the Fund’s quarterly portfolio of investments, (ii) information regarding how the Fund voted proxies relating to portfolio securities held during the most recent twelve-month period ended June 30, and (iii) a description of the policies and procedures that the Fund used to determine how to vote proxies relating to portfolio securities without charge, upon request, by calling Nuveen Investments at (800) 257-8787 or on Nuveen’s website at www.nuveen.com.
You may also obtain this and other Fund information directly from the Securities and Exchange Commission (SEC). The SEC may charge a copying fee for this information. Visit the SEC on-line at http://www.sec.gov or in person at the SEC’s Public Reference Room in Washington, D.C. Call the SEC at (202) 942-8090 for room hours and operation. You may also request Fund information by sending an e-mail request to publicinfo@sec.gov or by writing to the SEC’s Public Reference Section at 100 F Street NE, Washington, D.C. 20549.
The Financial Industry Regulatory Authority (FINRA) provides a Public Disclosure Program which supplies certain information regarding the disciplinary history of FINRA members and their associated persons in response to either telephone inquiries at (800) 289-9999 or written inquiries at www.finra.org. FINRA also provides an investor brochure that includes information describing the Public Disclosure Program.
Nuveen Investments:
Serving Investors for Generations
Since 1898, financial advisors and their clients have relied on Nuveen Investments to provide dependable investment solutions through continued adherence to proven, long-term investing principles. Today, we offer a range of high quality equity and fixed-income solutions designed to be integral components of a well-diversified core portfolio.
Focused on meeting investor needs.
Nuveen Investments provides high-quality investment services designed to help secure the long-term goals of institutional and individual investors as well as the consultants and financial advisors who serve them. Nuveen Investments markets a wide range of specialized investment solutions which provide investors access to capabilities of its high-quality boutique investment affiliates-Nuveen Asset Management, Symphony Asset Management, NWQ Investment Management Company, Santa Barbara Asset Management, Tradewinds Global Investors, Winslow Capital Management, and Gresham Investment Management. In total, Nuveen Investments managed $212 billion as of June 30, 2012.
Find out how we can help you.
To learn more about how the products and services of Nuveen Investments may be able to help you meet your financial goals, talk to your financial advisor, or call us at (800) 257-8787. Please read the information provided carefully before you invest. Investors should consider the investment objective and policies, risk considerations, charges and expenses of any investment carefully. Where applicable, be sure to obtain a prospectus, which contains this and other relevant information. To obtain a prospectus, please contact your securities representative or Nuveen Investments, 333 W. Wacker Dr., Chicago, IL 60606. Please read the prospectus carefully before you invest or send money.
Learn more about Nuveen Funds at: www.nuveen.com/mf
| | |
Distributed by Nuveen Securities, LLC 333 West Wacker Drive Chicago, IL 60606 www.nuveen.com | | |
MAN-MAPS-0712P

Mutual Fund
Nuveen Managed Accounts Portfolios Trust
For investors seeking attractive monthly income potential.
Annual Report
July 31, 2012
| | |
| |
| Fund Name | | Ticker Symbol |
Enhanced Multi-Strategy Income Managed Accounts Portfolio | | NEMPX |
LIFE IS COMPLEX.
Nuveen makes things e-simple.
It only takes a minute to sign up for e-Reports. Once enrolled, you’ll receive an e-mail as soon as your Nuveen Fund information is ready. No more waiting for delivery by regular mail. Just click on the link within the e-mail to see the report and save it on your computer if you wish.
Free e-Reports right to your e-mail!
www.investordelivery.com
If you receive your Nuveen Fund distributions and statements from your financial advisor or brokerage account.
OR
www.nuveen.com/accountaccess
If you receive your Nuveen Fund distributions and statements directly from Nuveen.
| | | | | | |
| Must be preceded by or accompanied by a prospectus. | | NOT FDIC INSURED | | MAY LOSE VALUE | | NO BANK GUARANTEE |
Table of Contents
Chairman’s
Letter to Shareholders

Dear Shareholders,
Investors have many reasons to remain cautious. The challenges in the Euro area are casting a shadow over global economies and financial markets. The political support for addressing fiscal issues is eroding as the economic and social impacts become more visible. At the same time, member nations appear unwilling to provide adequate financial support or to surrender sufficient sovereignty to strengthen the banks or unify the Euro area financial system. The gains made in reducing deficits, and the hard-won progress on winning popular acceptance of the need for economic austerity, are at risk. To their credit, European political leaders press on to find compromise solutions, but there is increasing concern that time will begin to run out.
In the U.S., strong corporate earnings have enabled the equity markets to withstand much of the downward pressures coming from weakening job creation, slower economic growth and political uncertainty. The Fed remains committed to low interest rates and announced on September 13, 2012 (after the close of this reporting period) another program of quantitative easing (QE3) to continue until mid-2015. Pre-election maneuvering has added to the already highly partisan atmosphere in Congress. The end of the Bush-era tax cuts and implementation of the spending restrictions of the Budget Control Act of 2011, both scheduled to take place at year-end, loom closer.
During the last year, U.S. based investors have experienced a sharp decline and a strong recovery in the equity markets. The experienced investment teams at Nuveen keep their eye on a longer time horizon and use their practiced investment disciplines to negotiate through market peaks and valleys to achieve long-term goals for investors. Experienced professionals pursue investments that will weather short-term volatility and at the same time, seek opportunities that are created by markets that overreact to negative developments. Monitoring this process is an important consideration for the Fund Board as it oversees your Nuveen Fund on your behalf.
As always, I encourage you to contact your financial consultant if you have any questions about your investment in a Nuveen Fund. On behalf of the other members of your Fund Board, we look forward to continuing to earn your trust in the months and years ahead.
Sincerely,

Robert P. Bremner
Chairman of the Board
September 21, 2012
Portfolio Manager’s Comments
Certain statements in this report are forward-looking statements. Discussions of specific investments are for illustration only and are not intended as recommendations of individual investments. The forward-looking statements and other views expressed herein are those of the portfolio manager as of the date of this report. Actual future results or occurrences may differ significantly from those anticipated in any forward-looking statements and the views expressed herein are subject to change at any time, due to numerous market and other factors. The Portfolio disclaims any obligation to update publicly or revise any forward-looking statements or views expressed herein.
Ratings shown are the highest rating given by one of the following national rating agencies: Standard & Poor’s Group, Moody’s Investors Service, Inc. or Fitch, Inc. Credit ratings are subject to change. AAA, AA, A and BBB are investment grade ratings; BB, B, CCC, CC, C and D are below investment grade ratings. Certain bonds backed by U.S. Government or agency securities are regarded as having an implied rating equal to the rating of such securities. Holdings designated N/R are not rated by a national rating agency.
This Portfolio was developed exclusively for use within Nuveen-sponsored separately managed accounts. This Portfolio enables certain Nuveen separately managed account investors to achieve greater diversification and return potential than otherwise might be achievable.
The Portfolio is managed by Nuveen Asset Management, LLC, an affiliate of Nuveen Investments. Timothy Palmer, CFA serves as manager for the Portfolio. Here Tim examines economic and market conditions, key investment strategies and the performance of the Portfolio for the twelve-month period ended July 31, 2012.
What factors affected the economic and market conditions during the twelve-month reporting period ending July 31, 2012?
During the reporting period, the U.S. economy’s progress toward recovery from recession remained sluggish. The Federal Reserve (Fed) maintained its efforts to improve the overall economic environment by continuing to hold the benchmark Fed Funds rate at the record low level of zero to 0.25% that it had established in December 2008. At its September 2012 meeting, the central bank affirmed its opinion that economic conditions would likely warrant keeping the rate at “exceptionally low levels” through mid-2015. The Fed also announced that it would extend its so-called Operation Twist program, whereby it is lengthening the average maturity of its holdings of U.S. Treasury securities, through the end of December 2012. The goals of this program are to lower longer-term interest rates, make broader financial conditions more accommodating, support a stronger economic recovery and help ensure that inflation remains at levels consistent with the Fed’s mandates of maximum employment and price stability.
In the second quarter of 2012, the U.S. economy slowed to an annualized growth rate of 1.5%, according to initial estimates for U.S. gross domestic product (GDP). While this marked the twelfth consecutive quarter of positive growth, it was also a significant slowdown from the previous few quarters. The Consumer Price Index (CPI) rose 1.4% year-over-year as of July 2012, lower than the June figure of 1.7%, which was the lowest twelve-month rate of change since November 2010. Core CPI (which excludes food and energy) increased 2.1% during the period, remaining above the Fed’s unofficial objective of 2.0% or lower for this inflation measure. However, the number was slightly below the 2.2% figure reported in June. Labor market conditions continued to be slow to improve, with the national unemployment rate registering 8.3% in July 2012. While this figure was down from 9.1% one year ago, it was still a slight uptick from June 2012. The housing market remained the major weak spot in the economy, beleaguered by a high level of distressed properties and difficult credit conditions. For the twelve months ended June 2012 (the most recent data available at the time this report was prepared), the average
home price in the Standard & Poor’s (S&P)/Case-Shiller Index of 20 major metropolitan areas rose 0.5%, marking the second consecutive month prices rose. In addition, the U.S. economic picture continued to be clouded by concerns about the European debt crisis and global financial markets in general and efforts to reduce the U.S. federal deficit.
Throughout the fiscal year period, fixed-income markets were buffeted by concerns about the tepid U.S. economic recovery combined with the ballooning U.S. federal deficit, the seemingly unending European debt crisis and a broader slowdown in global growth, especially emerging markets. These macro events caused the financial markets to fluctuate between embracing risk and shunning risk several times during the period. In late summer of 2011, the markets experienced a massive flight to quality, leading U.S. Treasuries to outperform all risk assets, particularly equities, high yield and investment- grade corporate bonds. However, late fall brought about a renewed appetite for risk as the European crisis appeared to be on the mend and U.S. economic indicators strengthened. Risk premiums on non-government bonds contracted and asset classes such as high-yield corporates, emerging market debt and commercial mortgage-backed securities substantially outperformed Treasuries. In the final months of the reporting period, however, the situation reversed once again as a broad slowdown in global growth together with renewed political discord and sovereign funding pressures in Europe cast a malaise over the markets. Not surprisingly, risk premiums on non-government bonds widened once again as U.S. Treasuries renewed their perceived safe haven status, outperforming other riskier asset classes.
How did the Portfolio perform during the twelve-month period ended July 31, 2012?
The tables in the Performance and Expense Ratios section of this report provide Class I Share total returns for the Portfolio for the one-year and since inception periods ended July 31, 2012. The Portfolio’s Class I Shares outperformed the Barclays Credit/Mortgage Index for the twelve-month period ended July 31, 2012.
What strategies were used to manage the Portfolio during the reporting period? How did these strategies influence performance?
Under normal circumstances, the Portfolio will invest at least 80% of its assets in fixed income securities, including U.S. Treasury and agency bonds, asset backed securities, U.S. agency mortgage backed securities, commercial mortgage backed securities, U.S. investment grade corporate debt securities, U.S. high yield corporate debt securities, U.S. dollar denominated non-U.S. government bonds, non-U.S. dollar non-U.S. government bonds, emerging market debt, futures, options, interest rate derivatives, currency forwards, total return swaps, credit default swaps and other short-term securities or instruments.
In managing the Portfolio, we seek to maximize risk-adjusted total return through active management of sector rotation, issue selection, and yield curve positioning. We employ a sector team based process to identify and implement investment opportunities based on rigorous analysis of fixed income markets. The Portfolio invests broadly across sectors, including traditional investment-grade bonds, high yield securities, foreign currencies and bonds.
The Portfolio outperformed its benchmark index during the reporting period, as our investment themes favoring non-government sectors worked well, despite market volatility. We maintained the Portfolio’s overall positioning for an improving economic environment throughout the period. We positioned the Portfolio with significant overweights to investment-grade credit sectors, along with positions in commercial mortgage-backed securities and emerging market debt. At the same time, we maintained an underweight to Treasuries and mortgage-backed securities in the portfolio. Our ongoing fundamental research conclusions continued to support our conviction that although the market experienced periodic volatility and fears of systemic shock from global events or economic concerns, these reflected a short term market panic and liquidity withdrawal, rather than a fundamental deterioration in the economic prospects of the positions in the Portfolio. As a result, turnover was relatively low and activity in the portfolio centered on maintaining key portfolio positioning and themes. We continued to evaluate the Portfolio with respect to individual credit and country/currency selection.
The Portfolio continued to be invested in various derivative instruments over the course of this reporting period. We invested in credit default swap index positions that earn spread income in exchange for taking the credit default risk of broad investment grade and high yield default swap indexes. These positions had a positive effect on performance during the period as credit strengthened and these positions were significant in size relative to the total value of the portfolio. We also invested in interest rate swap contracts in a variety of currencies, with maturities ranging from three to ten years, some positioned to benefit if rates rise, others positioned to benefit if rates fall in the underlying country, based on analysis indicating whether rates were relatively high or low compared to future expectations.
We continued to invest in forward foreign currency exchange contracts in a variety of currencies, with settlements ranging from one to three months. Some of these contracts are positioned to benefit if the foreign currencies in the contracts strengthen with respect to the U.S. dollar, while others are positioned to benefit if the foreign currencies weaken with respect to the U.S. dollar, based on analysis indicating whether currencies were relatively high or low compared to future expectations.
We also invested in U.S Treasury bond and note futures contracts to manage the interest rate risk in the portfolio. The Portfolio no longer holds these positions.
Risk Considerations
Mutual fund investing involves risk; principal loss is possible. Debt or fixed income securities such as those held by the Portfolio, are subject to market risk, credit risk, interest rate risk, call risk, and income risk. As interest rates rise, bond prices fall. Below investment grade or high yield debt securities are subject to liquidity risk and heightened credit risk. Foreign investments involve additional risks, including currency fluctuation, political and economic instability, lack of liquidity and differing legal and accounting standards. These risks are magnified in emerging markets. Asset-backed and mortgage backed securities are subject to additional risks such as prepayment risk, liquidity risk, default risk and adverse economic developments. The use of derivative instruments involves a high degree of financial risk, including the risk that the loss on a derivative may be greater than the principal amount invested.
[THIS PAGE INTENTIONALLY LEFT BLANK]
Performance and Expense Ratios
This is a specialized Portfolio developed exclusively for use within Nuveen-sponsored separately managed accounts.
Returns quoted represent past performance which is no guarantee of future results. Current performance may be higher or lower than the performance shown. Investment returns and principal value will fluctuate so that when shares are redeemed, they may be worth more or less than their original cost. Returns do not reflect the deduction of taxes that a shareholder would pay on Portfolio distributions or the redemption of Portfolio shares.
Returns may reflect a contractual agreement between the Portfolio and the investment adviser to waive certain fees and expenses; see Notes to Financial Statements, Footnote 7 — Management Fees and Other Transactions with Affiliates for more information. In addition, returns may reflect a voluntary expense limitation by the Portfolio’s investment adviser that may be modified or discontinued at any time without notice. For the most recent month-end performance call (800) 257-8787.
Portfolio shares have no sales charge. Portfolio returns assume reinvestment of dividends and capital gains.
The expense ratios shown reflect the Portfolio’s total operating expenses (before fee waivers or expense reimbursements, if any) as shown in the Portfolio’s most recent prospectus.
Performance
Average Annual Total Returns as of July 31, 2012
| | | | | | | | |
| |
| | | Average Annual | |
| | |
| | | 1-Year | | | Since
Inception* | |
Class I Shares | | | 9.99% | | | | 12.65% | |
Barclays Credit/Mortgage Index** | | | 5.02% | | | | 7.18% | |
Average Annual Total Returns as of June 30, 2012 (Most Recent Calendar Quarter)
| | | | | | | | |
| |
| | | Average Annual | |
| | |
| | | 1-Year | | | Since
Inception* | |
Class I Shares | | | 8.18% | | | | 12.16% | |
Expense Ratios as of Most Recent Prospectus
| | | | | | | | |
| | |
| | | Gross
Expense
Ratio | | | Net
Expense
Ratio | |
Class I Shares | | | 2.25% | | | | 0.00% | |
The Adviser has agreed irrevocably during the existence of the Portfolio to waive all fees and pay or reimburse all expenses of the Portfolio, except for interest expense, taxes, fees incurred in acquiring and disposing of portfolio securities and extraordinary expenses.
| * | Since inception returns are from 12/27/07. |
| ** | Refer to the Glossary of Terms Used in this Report for definitions. This index is not available for direct investment. |
Performance and Expense Ratios (continued)
Growth of an Assumed $10,000 Investment as of July 31, 2012 – Class I Shares
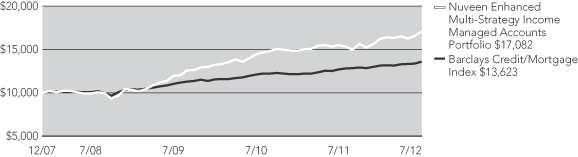
The graphs do not reflect the deduction of taxes that a shareholder may pay on Portfolio distributions or the redemption of Portfolio shares.
Yields as of July 31, 2012
Dividend Yield is the most recent dividend per share (annualized) divided by the offering price per share.
The SEC 30-Day Yield is a standardized measure of the Portfolio’s yield that accounts for the future amortization of premiums or discounts of bonds held in the portfolio of investments. The SEC 30-Day Yield is computed under an SEC standardized formula and is based on the maximum offer price per share. Dividend Yield may differ from the SEC 30-Day Yield because the Portfolio may be paying out more or less than it is earning and it may not include the effect of amortization of bond premium.
| | | | | | | | |
| | | Dividend
Yield | | | SEC 30-Day
Yield | |
Class I Shares | | | 5.62% | | | | 4.79% | |
Holding Summaries as of July 31, 2012
This data relates to the securities held in the portfolio of investments. It should not be construed as a measure of performance for the Portfolio itself.
Ratings shown are the highest rating given by one of the following national rating agencies: Standard & Poor’s Group, Moody’s Investors Service, Inc. or Fitch, Inc. Credit ratings are subject to change. AAA, AA, A and BBB are investment grade ratings; BB, B, CCC, CC, C and D are below investment grade ratings. Certain bonds backed by U.S. Government or agency securities are regarded as having an implied rating equal to the rating of such securities. Holdings designated N/R are not rated by a national rating agency.
Portfolio Credit Quality1
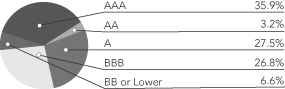
| | | | |
| Portfolio Allocation2 | | | |
| Corporate Bonds | | | 45.8% | |
| Mortgage-Backed Securities | | | 28.6% | |
| Short-Term Investments | | | 20.3% | |
| Capital Preferred Securities | | | 2.7% | |
| Taxable Municipal Bonds | | | 1.2% | |
| Sovereign Debt | | | 1.2% | |
| $25 Par (or similar) Preferred Securities | | | 0.2% | |
| | | | |
| Corporate Debt: Industries3 | |
| Diversified Financial Services | | | 18.2% | |
| Capital Markets | | | 11.3% | |
| Media | | | 8.8% | |
| Diversified Telecommunication Services | | | 8.2% | |
| Metals & Mining | | | 8.2% | |
| Oil, Gas & Consumable Fuels | | | 6.6% | |
| Insurance | | | 6.0% | |
| Commercial Banks | | | 5.7% | |
| Consumer Finance | | | 4.4% | |
| Tobacco | | | 3.0% | |
| Other | | | 19.6% | |
| 1 | As a percentage of total investments (excluding repurchase agreements and investments in derivatives) as of July 31, 2012. Holdings are subject to change. |
| 2 | As a percentage of total investments (excluding investments in derivatives) as of July 31, 2012. Holdings are subject to change. |
| 3 | As a percentage of total corporate debt holdings as of July 31, 2012. Corporate debt holdings include corporate bonds (high-yield investment grade rated), convertible bonds and any other debt instruments issued by a corporation (or that references a corporation) held by the Portfolio at the end of the reporting period. The percentage of “Other” corporate debt represents the total of all corporate debt industries that recalculate to less than 3.0% of total corporate debt holdings. Holdings are subject to change. |
Expense Examples
As a shareholder of the Portfolio, you incur two types of costs: (1) transaction costs, including up-front and back-end sales charges (loads) or redemption fees, where applicable; and (2) ongoing costs, including management fees; distribution and service (12b-1) fees, where applicable; and other Portfolio expenses. The Example below is intended to help you understand your ongoing costs (in dollars) of investing in the Portfolio and to compare these costs with the ongoing costs of investing in other mutual funds.
The Example below is based on an investment of $1,000 invested at the beginning of the period and held for the period.
The information under “Actual Performance,” together with the amount you invested, allows you to estimate actual expenses incurred over the reporting period. Simply divide your account value by $1,000 (for example, an $8,600 account value divided by $1,000 = 8.60) and multiply the result by the cost shown for your share class, in the row entitled “Expenses Incurred During Period” to estimate the expenses incurred on your account during this period.
The information under “Hypothetical Performance,” provides information about hypothetical account values and hypothetical expenses based on the Portfolio’s actual expense ratio and an assumed rate of return of 5% per year before expenses, which is not the Portfolio’s actual return. The hypothetical account values and expenses may not be used to estimate the actual ending account balance or expense you incurred for the period. You may use this information to compare the ongoing costs of investing in the Portfolio and other funds. To do so, compare this 5% hypothetical example with the 5% hypothetical examples that appear in the shareholder reports of the other funds.
Please note that the expenses shown in the table are meant to highlight your ongoing costs only and do not reflect any transaction costs. Therefore, the hypothetical information is useful in comparing ongoing costs only, and will not help you determine the relative total costs of owning different funds or share classes. In addition, if these transaction costs were included, your costs would have been higher.
| | | | | | | | | | | | | | |
| | | | | | | | | | Hypothetical Performance | | | |
| | | | | Actual Performance | | | | | (5% annualized return before expenses) | | | |
| Beginning Account Value (2/01/12) | | | | $ | 1,000.00 | | | | | $ | 1,000.00 | | | |
| Ending Account Value (7/31/12) | | | | $ | 1,052.80 | | | | | $ | 1,024.86 | | | |
| Expenses Incurred During Period | | | | $ | — | | | | | $ | — | | | |
Expenses are equal to the Portfolio’s annualized net expense ratio of 0.00% for the six month period.
Report of Independent Registered Public Accounting Firm
To the Board of Trustees and Shareholders of
Nuveen Managed Accounts Portfolios Trust:
In our opinion, the accompanying statement of assets and liabilities, including the portfolio of investments, and the related statements of operations, of changes in net assets, and the financial highlights present fairly, in all material respects, the financial position of Enhanced Multi-Strategy Income Managed Accounts Portfolio (a series of the Nuveen Managed Accounts Portfolios Trust, hereinafter referred to as the “Fund”) at July 31, 2012, the results of its operations for the year then ended, and the change in its net assets for each of the two years in the period then ended and the financial highlights for each of the periods presented, in conformity with accounting principles generally accepted in the United States of America. These financial statements and financial highlights (hereafter referred to as “financial statements”) are the responsibility of the Fund’s management; our responsibility is to express an opinion on these financial statements based on our audits. We conducted our audits of these financial statements in accordance with the standards of the Public Company Accounting Oversight Board (United States). Those standards require that we plan and perform the audit to obtain reasonable assurance about whether the financial statements are free of material misstatement. An audit includes examining, on a test basis, evidence supporting the amounts and disclosures in the financial statements, assessing the accounting principles used and significant estimates made by management, and evaluating the overall financial statement presentation. We believe that our audits, which included confirmation of securities at July 31, 2012 by correspondence with the custodian and brokers, provide a reasonable basis for our opinion.
PRICEWATERHOUSECOOPERS LLP
Chicago, IL
September 27, 2012
Portfolio of Investments
Enhanced Multi-Strategy Income Managed Accounts Portfolio
July 31, 2012
| | | | | | | | | | | | | | | | | | | | |
Principal
Amount (000) | | | Description (1) | | Coupon | | | Maturity | | | Ratings (2) | | | Value | |
| | | | | | | | | | | | | | | | | | | | |
| | | | CORPORATE BONDS – 57.8% | | | | | | | | | | | | | | | | |
| | | | | |
| | | | Aerospace & Defense – 0.2% | | | | | | | | | | | | | | | | |
| | | | | |
| $ | 10 | | | Raytheon Company | | | 4.400% | | | | 2/15/20 | | | | A– | | | $ | 11,505 | |
| | | | Airlines – 0.4% | | | | | | | | | | | | | | | | |
| | | | | |
| | 25 | | | Air Canada, 144A | | | 12.000% | | | | 2/01/16 | | | | B– | | | | 22,156 | |
| | | | Auto Components – 0.5% | | | | | | | | | | | | | | | | |
| | | | | |
| | 25 | | | Dana Holding Corporation | | | 6.500% | | | | 2/15/19 | | | | BB | | | | 26,531 | |
| | | | Beverages – 1.0% | | | | | | | | | | | | | | | | |
| | | | | |
| | 30 | | | Anheuser Busch InBev | | | 8.200% | | | | 1/15/39 | | | | A | | | | 51,386 | |
| | | | | |
| | 5 | | | Miller Brewing Company, 144A | | | 5.500% | | | | 8/15/13 | | | | BBB+ | | | | 5,222 | |
| | 35 | | | Total Beverages | | | | | | | | | | | | | | | 56,608 | |
| | | | Biotechnology – 0.3% | | | | | | | | | | | | | | | | |
| | | | | |
| | 15 | | | STHI Holding Corporation, 144A | | | 8.000% | | | | 3/15/18 | | | | B | | | | 15,900 | |
| | | | Capital Markets – 7.0% | | | | | | | | | | | | | | | | |
| | | | | |
| | 20 | | | Bank of New York Mellon | | | 4.300% | | | | 5/15/14 | | | | Aa3 | | | | 21,348 | |
| | | | | |
| | 215 | | | Goldman Sachs Group, Inc. | | | 6.000% | | | | 6/15/20 | | | | A | | | | 237,503 | |
| | | | | |
| | 50 | | | Morgan Stanley | | | 6.625% | | | | 4/01/18 | | | | A | | | | 53,509 | |
| | | | | |
| | 45 | | | Morgan Stanley | | | 5.625% | | | | 9/23/19 | | | | A | | | | 45,484 | |
| | | | | |
| | 15 | | | Morgan Stanley | | | 5.500% | | | | 7/28/21 | | | | A | | | | 15,159 | |
| | | | | |
| | 15 | | | State Street Corporation | | | 4.956% | | | | 3/15/18 | | | | A3 | | | | 16,146 | |
| | 360 | | | Total Capital Markets | | | | | | | | | | | | | | | 389,149 | |
| | | | Chemicals – 1.6% | | | | | | | | | | | | | | | | |
| | | | | |
| | 20 | | | CF Industries Inc. | | | 6.875% | | | | 5/01/18 | | | | BBB– | | | | 24,200 | |
| | | | | |
| | 20 | | | Dow Chemical Company | | | 4.250% | | | | 11/15/20 | | | | BBB | | | | 22,302 | |
| | | | | |
| | 10 | | | E.I. Du Pont de Nemours and Company | | | 3.250% | | | | 1/15/15 | | | | A | | | | 10,659 | |
| | | | | |
| | 5 | | | Praxair, Inc. | | | 4.500% | | | | 8/15/19 | | | | A | | | | 5,845 | |
| | | | | |
| | 25 | | | Rhodia SA, 144A | | | 6.875% | | | | 9/15/20 | | | | BBB+ | | | | 27,750 | |
| | 80 | | | Total Chemicals | | | | | | | | | | | | | | | 90,756 | |
| | | | Commercial Banks – 1.3% | | | | | | | | | | | | | | | | |
| | | | | |
| | 25 | | | Banco Bradesco S.A. Grand Cayman, 144A | | | 4.125% | | | | 5/16/16 | | | | Baa1 | | | | 26,063 | |
| | | | | |
| | 40 | | | HSBC Holdings PLC | | | 6.800% | | | | 6/01/38 | | | | AA– | | | | 48,385 | |
| | 65 | | | Total Commercial Banks | | | | | | | | | | | | | | | 74,448 | |
| | | | Commercial Services & Supplies – 0.1% | | | | | | | | | | | | | | | | |
| | | | | |
| | 7 | | | Ceridian Corporation, 144A | | | 8.875% | | | | 7/15/19 | | | | BB | | | | 7,368 | |
| | | | Consumer Finance – 2.0% | | | | | | | | | | | | | | | | |
| | | | | |
| | 35 | | | American Express Credit Corporation | | | 7.300% | | | | 8/20/13 | | | | A+ | | | | 37,369 | |
| | | | | |
| | 15 | | | American Express Credit Corporation | | | 1.750% | | | | 6/12/15 | | | | A+ | | | | 15,359 | |
| | | | | |
| | 20 | | | Capital One Bank | | | 8.800% | | | | 7/15/19 | | | | Baa1 | | | | 25,760 | |
| | | | | |
| | 30 | | | Discover Financial Services | | | 5.200% | | | | 4/27/22 | | | | BBB | | | | 32,004 | |
| | 100 | | | Total Consumer Finance | | | | | | | | | | | | | | | 110,492 | |
| | | | Containers & Packaging – 0.1% | | | | | | | | | | | | | | | | |
| | | | | |
| | 4 | | | Intertape Polymer US Inc. | | | 8.500% | | | | 8/01/14 | | | | CCC+ | | | | 4,000 | |
| | | | Diversified Financial Services – 11.2% | | | | | | | | | | | | | | | | |
| | | | | |
| | 10 | | | Bank of America Corporation | | | 3.750% | | | | 7/12/16 | | | | A | | | | 10,357 | |
| | | | | |
| | 155 | | | Bank of America Corporation | | | 5.875% | | | | 1/05/21 | | | | A | | | | 175,720 | |
Portfolio of Investments
Enhanced Multi-Strategy Income Managed Accounts Portfolio (continued)
July 31, 2012
| | | | | | | | | | | | | | | | | | | | |
Principal
Amount (000) | | | Description (1) | | Coupon | | | Maturity | | | Ratings (2) | | | Value | |
| | | | | | | | | | | | | | | | | | | | |
| | | | Diversified Financial Services (continued) | | | | | | | | | | | | | | | | |
| | | | | |
| $ | 50 | | | Citigroup Inc. | | | 6.125% | | | | 11/21/17 | | | | A | | | $ | 57,109 | |
| | | | | |
| | 105 | | | Citigroup Inc. | | | 5.375% | | | | 8/09/20 | | | | A | | | | 115,802 | |
| | | | | |
| | 40 | | | Citigroup Inc. | | | 6.875% | | | | 3/05/38 | | | | A | | | | 50,283 | |
| | | | | |
| | 30 | | | General Electric Capital Corporation | | | 5.300% | | | | 2/11/21 | | | | AA | | | | 34,377 | |
| | | | | |
| | 25 | | | General Electric Capital Corporation | | | 6.875% | | | | 1/10/39 | | | | AA+ | | | | 34,270 | |
| | | | | |
| | 75 | | | JP Morgan Chase & Company | | | 6.000% | | | | 1/15/18 | | | | A+ | | | | 88,770 | |
| | | | | |
| | 55 | | | JP Morgan Chase & Company | | | 4.250% | | | | 10/15/20 | | | | A+ | | | | 59,588 | |
| | 545 | | | Total Diversified Financial Services | | | | | | | | | | | | | | | 626,276 | |
| | | | Diversified Telecommunication Services – 5.0% | | | | | | | | | | | | | | | | |
| | | | | |
| | 35 | | | AT&T, Inc. | | | 6.800% | | | | 5/15/36 | | | | A2 | | | | 48,667 | |
| | | | | |
| | 50 | | | CenturyLink Inc. | | | 5.800% | | | | 3/15/22 | | | | Baa3 | | | | 53,060 | |
| | | | | |
| | 15 | | | France Telecom | | | 5.375% | | | | 7/08/19 | | | | A– | | | | 17,397 | |
| | | | | |
| | 27 | | | IntelSat Bermuda Limited | | | 11.500% | | | | 2/04/17 | | | | CCC+ | | | | 28,488 | |
| | | | | |
| | 50 | | | Telecom Italia Capital | | | 5.250% | | | | 10/01/15 | | | | BBB | | | | 49,875 | |
| | | | | |
| | 25 | | | Telefonica Emisiones SAU | | | 4.949% | | | | 1/15/15 | | | | BBB+ | | | | 24,510 | |
| | | | | |
| | 45 | | | Verizon Communications | | | 6.250% | | | | 4/01/37 | | | | A | | | | 60,605 | |
| | 247 | | | Total Diversified Telecommunication Services | | | | | | | | | | | | | | | 282,602 | |
| | | | Electric Utilities – 0.3% | | | | | | | | | | | | | | | | |
| | | | | |
| | 15 | | | FirstEnergy Solutions Corporation | | | 6.050% | | | | 8/15/21 | | | | BBB | | | | 16,722 | |
| | | | Energy Equipment & Services – 0.4% | | | | | | | | | | | | | | | | |
| | | | | |
| | 5 | | | Nabors Industries Inc. | | | 9.250% | | | | 1/15/19 | | | | BBB+ | | | | 6,499 | |
| | | | | |
| | 15 | | | Weatherford International Limited | | | 7.000% | | | | 3/15/38 | | | | BBB | | | | 17,056 | |
| | 20 | | | Total Energy Equipment & Services | | | | | | | | | | | | | | | 23,555 | |
| | | | Food & Staples Retailing – 1.0% | | | | | | | | | | | | | | | | |
| | | | | |
| | 20 | | | CVS Caremark Corporation | | | 3.250% | | | | 5/18/15 | | | | BBB+ | | | | 21,258 | |
| | | | | |
| | 10 | | | Safeway Inc. | | | 6.250% | | | | 3/15/14 | | | | BBB | | | | 10,686 | |
| | | | | |
| | 25 | | | Supervalu Inc. | | | 7.500% | | | | 11/15/14 | | | | B– | | | | 23,813 | |
| | 55 | | | Total Food & Staples Retailing | | | | | | | | | | | | | | | 55,757 | |
| | | | Food Products – 0.4% | | | | | | | | | | | | | | | | |
| | | | | |
| | 5 | | | Kraft Foods Inc. | | | 6.125% | | | | 2/01/18 | | | | Baa2 | | | | 6,124 | |
| | | | | |
| | 15 | | | Tyson Foods | | | 4.500% | | | | 6/15/22 | | | | BBB | | | | 15,150 | |
| | 20 | | | Total Food Products | | | | | | | | | | | | | | | 21,274 | |
| | | | Gas Utilities – 0.1% | | | | | | | | | | | | | | | | |
| | | | | |
| | 5 | | | Ferrellgas LP | | | 6.500% | | | | 5/01/21 | | | | B2 | | | | 4,750 | |
| | | | Health Care Providers & Services – 0.5% | | | | | | | | | | | | | | | | |
| | | | | |
| | 20 | | | UnitedHealth Group Incorporated | | | 6.875% | | | | 2/15/38 | | | | A– | | | | 28,775 | |
| | | | Household Durables – 0.3% | | | | | | | | | | | | | | | | |
| | | | | |
| | 15 | | | MDC Holdings Inc. | | | 5.625% | | | | 2/01/20 | | | | Baa3 | | | | 15,410 | |
| | | | Independent Power Producers & Energy Traders – 1.2% | | | | | | | | | | | | | | | | |
| | | | | |
| | 25 | | | Calpine Corporation, 144A | | | 7.875% | | | | 7/31/20 | | | | BB | | | | 28,188 | |
| | | | | |
| | 25 | | | NRG Energy Inc. | | | 7.375% | | | | 1/15/17 | | | | BB | | | | 25,938 | |
| | | | | |
| | 10 | | | NRG Energy Inc. | | | 7.875% | | | | 5/15/21 | | | | BB | | | | 10,625 | |
| | 60 | | | Total Indepedent Power Producers & Energy Traders | | | | | | | | | | | | | | | 64,751 | |
| | | | | | | | | | | | | | | | | | | | |
Principal
Amount (000) | | | Description (1) | | Coupon | | | Maturity | | | Ratings (2) | | | Value | |
| | | | | | | | | | | | | | | | | | | | |
| | | | Industrial Conglomerates – 0.4% | | | | | | | | | | | | | | | | |
| | | | | |
| $ | 20 | | | Offshore Group Investment Limited | | | 11.500% | | | | 8/01/15 | | | | B– | | | $ | 22,000 | |
| | | | Insurance – 2.9% | | | | | | | | | | | | | | | | |
| | | | | |
| | 25 | | | Berkshire Hathaway Finance Corporation | | | 5.400% | | | | 5/15/18 | | | | AA+ | | | | 30,186 | |
| | | | | |
| | 20 | | | Genworth Financial Inc. | | | 6.515% | | | | 5/22/18 | | | | BBB | | | | 19,740 | |
| | | | | |
| | 40 | | | Hartford Financial Services Group Inc. | | | 6.000% | | | | 1/15/19 | | | | BBB | | | | 43,700 | |
| | | | | |
| | 15 | | | MetLife Inc. | | | 7.717% | | | | 2/15/19 | | | | A– | | | | 19,407 | |
| | | | | |
| | 20 | | | Prudential Financial Inc. | | | 7.375% | | | | 6/15/19 | | | | A | | | | 24,845 | |
| | | | | |
| | 20 | | | Prudential Financial Inc. | | | 5.900% | | | | 3/17/36 | | | | A | | | | 22,093 | |
| | 140 | | | Total Insurance | | | | | | | | | | | | | | | 159,971 | |
| | | | Media – 5.4% | | | | | | | | | | | | | | | | |
| | | | | |
| | 20 | | | Comcast Corporation | | | 6.400% | | | | 5/15/38 | | | | BBB+ | | | | 26,055 | |
| | | | | |
| | 10 | | | Cox Communications Inc. | | | 5.500% | | | | 10/01/15 | | | | BBB+ | | | | 11,333 | |
| | | | | |
| | 35 | | | DIRECTV Holdings LLC | | | 5.200% | | | | 3/15/20 | | | | BBB | | | | 40,181 | |
| | | | | |
| | 50 | | | News America Holdings Inc. | | | 6.150% | | | | 2/15/41 | | | | BBB+ | | | | 63,755 | |
| | | | | |
| | 55 | | | Time Warner Cable Inc. | | | 6.550% | | | | 5/01/37 | | | | BBB | | | | 70,071 | |
| | | | | |
| | 30 | | | Time Warner Inc. | | | 4.875% | | | | 3/15/20 | | | | BBB | | | | 34,800 | |
| | | | | |
| | 40 | | | Viacom Inc. | | | 6.875% | | | | 4/30/36 | | | | BBB+ | | | | 54,709 | |
| | 240 | | | Total Media | | | | | | | | | | | | | | | 300,904 | |
| | | | Metals & Mining – 5.0% | | | | | | | | | | | | | | | | |
| | | | | |
| | 25 | | | Alcoa Inc. | | | 5.400% | | | | 4/15/21 | | | | BBB– | | | | 25,626 | |
| | | | | |
| | 25 | | | ArcelorMittal | | | 7.000% | | | | 10/15/39 | | | | Baa3 | | | | 24,058 | |
| | | | | |
| | 50 | | | Newmont Mining Corporation | | | 6.250% | | | | 10/01/39 | | | | BBB+ | | | | 60,330 | |
| | | | | |
| | 15 | | | Southern Copper Corporation | | | 7.500% | | | | 7/27/35 | | | | BBB | | | | 18,457 | |
| | | | | |
| | 25 | | | Teck Resources Limited | | | 6.125% | | | | 10/01/35 | | | | BBB | | | | 27,134 | |
| | | | | |
| | 25 | | | Teck Resources Limited | | | 6.250% | | | | 7/15/41 | | | | BBB | | | | 27,661 | |
| | | | | |
| | 25 | | | United States Steel Corporation | | | 6.050% | | | | 6/01/17 | | | | BB | | | | 24,875 | |
| | | | | |
| | 40 | | | Vale Overseas Limited | | | 6.875% | | | | 11/10/39 | | | | A– | | | | 48,563 | |
| | | | | |
| | 25 | | | Vedanta Resources PLC, 144A | | | 9.500% | | | | 7/18/18 | | | | BB | | | | 25,188 | |
| | 255 | | | Total Metals & Mining | | | | | | | | | | | | | | | 281,892 | |
| | | | Multiline Retail – 0.7% | | | | | | | | | | | | | | | | |
| | | | | |
| | 35 | | | Target Corporation | | | 5.375% | | | | 5/01/17 | | | | A+ | | | | 41,814 | |
| | | | Oil, Gas & Consumable Fuels – 4.0% | | | | | | | | | | | | | | | | |
| | | | | |
| | 10 | | | Anadarko Petroleum Corporation | | | 7.625% | | | | 3/15/14 | | | | BBB– | | | | 10,948 | |
| | | | | |
| | 55 | | | Anadarko Petroleum Corporation | | | 6.200% | | | | 3/15/40 | | | | BBB– | | | | 68,278 | |
| | | | | |
| | 10 | | | Chevron Corporation | | | 3.950% | | | | 3/03/14 | | | | Aa1 | | | | 10,548 | |
| | | | | |
| | 20 | | | Enbridge Energy Partners LP | | | 5.200% | | | | 3/15/20 | | | | BBB | | | | 22,844 | |
| | | | | |
| | 25 | | | Plains All American Pipeline L.P | | | 5.750% | | | | 1/15/20 | | | | BBB | | | | 29,780 | |
| | | | | |
| | 25 | | | SM Energy Company | | | 6.625% | | | | 2/15/19 | | | | BB | | | | 25,875 | |
| | | | | |
| | 25 | | | SunCor Energy Inc. | | | 6.100% | | | | 6/01/18 | | | | BBB+ | | | | 30,416 | |
| | | | | |
| | 25 | | | Western Refining Inc. | | | 11.250% | | | | 6/15/17 | | | | B+ | | | | 28,000 | |
| | 195 | | | Total Oil, Gas & Consumable Fuels | | | | | | | | | | | | | | | 226,689 | |
| | | | Paper & Forest Products – 0.7% | | | | | | | | | | | | | | | | |
| | | | | |
| | 25 | | | International Paper Company | | | 8.700% | | | | 6/15/38 | | | | BBB | | | | 36,610 | |
Portfolio of Investments
Enhanced Multi-Strategy Income Managed Accounts Portfolio (continued)
July 31, 2012
| | | | | | | | | | | | | | | | | | | | |
Principal
Amount (000) | | | Description (1) | | Coupon | | | Maturity | | | Ratings (2) | | | Value | |
| | | | | | | | | | | | | | | | | | | | |
| | | | Pharmaceuticals – 0.5% | | | | | | | | | | | | | | | | |
| | | | | |
| $ | 25 | | | Valeant Pharmaceuticals International, 144A | | | 6.875% | | | | 12/01/18 | | | | BB– | | | $ | 26,406 | |
| | | | Real Estate Investment Trust – 0.5% | | | | | | | | | | | | | | | | |
| | | | | |
| | 25 | | | Prologis Inc. | | | 6.875% | | | | 3/15/20 | | | | Baa2 | | | | 30,804 | |
| | | | Specialty Retail – 0.4% | | | | | | | | | | | | | | | | |
| | | | | |
| | 25 | | | Armored AutoGroup Inc., 144A | | | 9.250% | | | | 11/01/18 | | | | Caa1 | | | | 22,281 | |
| | | | Thrifts & Mortgage Finance – 0.6% | | | | | | | | | | | | | | | | |
| | | | | |
| | 30 | | | WEA Finance LLC, 144A | | | 4.625% | | | | 5/10/21 | | | | A2 | | | | 32,434 | |
| | | | Tobacco – 1.8% | | | | | | | | | | | | | | | | |
| | | | | |
| | 15 | | | Altria Group Inc. | | | 4.750% | | | | 5/05/21 | | | | Baa1 | | | | 17,587 | |
| | | | | |
| | 50 | | | Altria Group Inc. | | | 9.950% | | | | 11/10/38 | | | | Baa1 | | | | 84,125 | |
| | 65 | | | Total Tobacco | | | | | | | | | | | | | | | 101,712 | |
| $ | 2,808 | | | Total Corporate Bonds (cost $2,913,018) | | | | | | | | | | | | | | | 3,232,302 | |
| | | | | |
Principal
Amount (000)/
Shares | | | Description (1) | | Coupon | | | Maturity | | | Ratings (2) | | | Value | |
| | | | CAPITAL PREFERRED SECURITIES – 3.4% | | | | | | | | | | | | | | | | |
| | | | | |
| | | | Commercial Banks – 1.9% | | | | | | | | | | | | | | | | |
| | | | | |
| | 55 | | | Wachovia Capital Trust III | | | 5.570% | | | | 3/15/42 | | | | BBB+ | | | $ | 54,450 | |
| | | | | |
| | 50 | | | Wells Fargo Capital Trust X | | | 5.950% | | | | 12/15/86 | | | | BBB+ | | | | 51,000 | |
| | 105 | | | Total Commercial Banks | | | | | | | | | | | | | | | 105,450 | |
| | | | Consumer Finance – 0.7% | | | | | | | | | | | | | | | | |
| | | | | |
| | 40 | | | Capital One Capital III Corporation | | | 7.686% | | | | 8/01/66 | | | | Baa3 | | | | 40,400 | |
| | | | Insurance – 0.8% | | | | | | | | | | | | | | | | |
| | | | | |
| | 50 | | | Catlin Insurance Company Limited | | | 7.249% | | | | 7/19/67 | | | | BBB+ | | | | 45,000 | |
| | | | Total Capital Preferred Securities (cost $187,558) | | | �� | | | | | | | | | | | | 190,850 | |
| | | | | |
Principal
Amount (000)/
Shares | | | Description (1) | | Coupon | | | | | | Ratings (2) | | | Value | |
| | | | $25 PAR (OR SIMILAR) PREFERRED SECURITIES – 0.3% | | | | | | | | | | | | | | | | |
| | | | | |
| | | | Commercial Banks – 0.3% | | | | | | | | | | | | | | | | |
| | | | | |
| | 20 EUR | | | Barclays Bank PLC | | | 4.750% | | | | | | | | BBB | | | $ | 14,150 | |
| | | | Total $25 Par (or similar) Preferred Securities (cost $22,027) | | | | | | | | | | | | | | | 14,150 | |
| | | | | |
Principal
Amount (000) | | | Description (1) | | Coupon | | | Maturity | | | Ratings (2) | | | Value | |
| | | | MORTGAGE-BACKED SECURITIES – 36.1% | | | | | | | | | | | | | | | | |
| | | | | |
| $ | 326 | | | Fannie Mae Mortgage Pool 929182 | | | 5.000% | | | | 3/01/38 | | | | Aaa | | | $ | 355,488 | |
| | | | | |
| | 53 | | | Fannie Mae Mortgage Pool 946228 | | | 6.095% | | | | 9/01/37 | | | | Aaa | | | | 57,846 | |
| | | | | |
| | 123 | | | Fannie Mae Mortgage Pool 984834 | | | 5.000% | | | | 7/01/38 | | | | Aaa | | | | 133,584 | |
| | | | | |
| | 985 | | | Fannie Mae TBA Mortgage Pool MDR, (WI/DD) | | | 5.500% | | | | TBA | | | | Aaa | | | | 1,070,264 | |
| | | | | |
| | 200 | | | Fannie Mae TBA Mortgage Pool, (WI/DD) | | | 4.500% | | | | TBA | | | | Aaa | | | | 216,281 | |
| | | | | |
| | 170 | | | Fannie Mae TBA Mortgage Pool MDR, (WI/DD) | | | 4.000% | | | | TBA | | | | Aaa | | | | 182,192 | |
| $ | 1,857 | | | Total Mortgage-Backed Securities (cost $1,975,176) | | | | | | | | | | | | | | | 2,015,655 | |
| | | | | | | | | | | | | | | | | | | | |
Principal
Amount (000) | | | Description (1) | | | | | Optional Call
Provisions (3) | | | Ratings (2) | | | Value | |
| | | | | | | | | | | | | | | | | | | | |
| | | | TAXABLE MUNICIPAL BONDS – 1.5% | | | | | | | | | | | | | | | | |
| | | | | |
| | | | Illinois – 1.5% | | | | | | | | | | | | | | | | |
| | | | | |
| $ | 75 | | | Illinois State, General Obligation Bonds, Taxable Series 2011, 5.877%, 3/01/19 | | | | | | | No Opt. Call | | | | A+ | | | $ | 84,074 | |
| $ | 75 | | | Total Taxable Municipal Bonds (cost $75,000) | | | | | | | | | | | | | | | 84,074 | |
| | | | | |
Principal
Amount (000) (4) | | | Description (1) | | Coupon | | | Maturity | | | Ratings (2) | | | Value | |
| | | | SOVEREIGN DEBT – 1.5% | | | | | | | | | | | | | | | | |
| | | | | |
| | | | Peru – 0.4% | | | | | | | | | | | | | | | | |
| | | | | |
| | $15 | | | Republic of Peru | | | 6.550% | | | | 3/14/37 | | | | BBB | | | $ | 21,960 | |
| | | | South Africa – 1.1% | | | | | | | | | | | | | | | | |
| | | | | |
| | 400 ZAR | | | Republic of South Africa | | | 10.500% | | | | 12/31/49 | | | | A | | | | 61,671 | |
| | | | Total Sovereign Debt (cost $73,551) | | | | | | | | | | | | | | | 83,631 | |
| | | | | |
Principal
Amount (000) | | | Description (1) | | Coupon | | | Maturity | | | | | | Value | |
| | | | SHORT-TERM INVESTMENTS – 25.5% | | | | | | | | | | | | | | | | |
| | | | | |
| $ | 1,428 | | | Repurchase Agreement with State Street Bank, dated 7/31/12, repurchase price $1,428,227, collateralized by $1,455,000 U.S. Treasury Notes, 0.375%, due 4/15/15, value $1,460,915 | | | 0.010% | | | | 8/01/12 | | | | | | | $ | 1,428,226 | |
| | | | Total Short-Term Investments (cost $1,428,226) | | | | | | | | | | | | | | | 1,428,226 | |
| | | | Total Investments (cost $6,674,556) – 126.1% | | | | | | | | | | | | | | | 7,048,888 | |
| | | | Other Assets Less Liabilities – (26.1)% (5) | | | | | | | | | | | | | | | (1,457,650) | |
| | | | Net Assets – 100% | | | | | | | | | | | | | | $ | 5,591,238 | |
Investments in Derivatives at July 31, 2012
Forward Foreign Currency Exchange Contracts outstanding:
| | | | | | | | | | | | | | | | | | | | | | |
| Counterparty | | Currency
Contracts to Deliver | | Amount
(Local Currency) | | | In Exchange
For Currency | | | Amount
(Local Currency) | | | Settlement
Date | | | Unrealized
Appreciation
(Depreciation) (5) | |
Bank of America | | Japanese Yen | | | 9,000,000 | | | | U.S. Dollar | | | | 114,150 | | | | 8/21/12 | | | | (1,072 | ) |
Morgan Stanley | | U.S. Dollar | | | 37,425 | | | | Mexican Peso | | | | 500,000 | | | | 9/24/12 | | | | (16 | ) |
Citibank | | U.S. Dollar | | | 148,338 | | | | Australian Dollar | | | | 150,000 | | | | 8/20/12 | | | $ | 9,037 | |
Citibank | | U.S. Dollar | | | 213,287 | | | | Canadian Dollar | | | | 215,000 | | | | 9/24/12 | | | | 857 | |
Citibank | | Swiss Franc | | | 85,000 | | | | U.S. Dollar | | | | 90,056 | | | | 8/23/12 | | | | 2,952 | |
Morgan Stanley | | Euro | | | 60,000 | | | | U.S. Dollar | | | | 75,815 | | | | 8/21/12 | | | | 1,975 | |
| | | | | | | | | | | | | | | | | | | | | $ | 13,733 | |
Portfolio of Investments
Enhanced Multi-Strategy Income Managed Accounts Portfolio (continued)
July 31, 2012
Investments in Derivatives at July 31, 2012 (continued)
Credit Default Swaps outstanding:
| | | | | | | | | | | | | | | | | | | | | | | | | | | | | | |
| Counterparty | | Referenced Entity | | Buy/Sell
Protection (7) | | | Current
Credit
Spread (6) | | | Notional
Amount | | | Received
Fixed
Rate* | | | Termination
Date | | | Value | | | Unrealized
Appreciation
(Depreciation) (5) | |
JPMorgan | | Markit CDX NA HY 18 Index | | | Sell | | | | 5.77% | | | $ | 990,000 | | | | 5.000 | % | | | 6/20/17 | | | $ | (24,945 | ) | | $ | 7,229 | |
JPMorgan | | Markit CDX NA IG 18 Index | | | Sell | | | | 1.07% | | | | 1,500,000 | | | | 1.000 | % | | | 6/20/17 | | | | (2,981 | ) | | | (7,816 | ) |
| | | | | | | | | | | | | | | | | | | | | | | | | | | | | $ | (587 | ) |
Interest Rate Swaps outstanding:
| | | | | | | | | | | | | | | | | | | | | | | | | | | | | | | | |
| Counterparty | | Notional
Amount | | | Fund
Pay/Receive
Floating Rate | | | Floating
Rate Index | | | Fixed
Rate* | | | Fixed Rate
Payment
Frequency | | | Termination
Date | | | Value | | | Unrealized
Appreciation
Depreciation) (5) | |
RBC | | | 250,000 NZD | | | | Pay | | | | 3-Month NZD-BBR | | | | 6.045 | % | | | Semi-Annually | | | | 6/22/19 | | | $ | 33,257 | | | $ | 33,411 | |
| | (1) | | All percentages shown in the Portfolio of Investments are based on net assets. |
| | (2) | | Ratings (not covered by the report of independent registered public accounting firm): Using the highest of Standard & Poor’s Group (“Standard & Poor’s”), Moody’s Investors Service, Inc. (“Moody’s”) or Fitch, Inc. (“Fitch”) rating. Ratings below BBB by Standard & Poor’s, Baa by Moody’s or BBB by Fitch are considered to be below investment grade. Holdings designated N/R are not rated by any of these national rating agencies. |
| | (3) | | Optional Call Provisions (not covered by the report of independent registered public accounting firm): Dates (month and year) and prices of the earliest optional call or redemption. There may be other call provisions at varying prices at later dates. Certain mortgage-backed securities may be subject to periodic principal paydowns. |
| | (4) | | Principal Amount (000) denominated in U.S. Dollars, unless otherwise noted. |
| | (5) | | Other Assets Less Liabilities includes the Unrealized Appreciation (Depreciation) of derivative instruments as noted in Investments in Derivatives at July 31, 2012. |
| | (6) | | The credit spread generally serves as an indication of the current status of the payment/performance risk and therefore the likelihood of default of the credit derivative. The credit spread also reflects the cost of buying/selling protection and may include upfront payments required to be made to enter into a credit default swap contract. Higher credit spreads are indicative of a higher likelihood of performance by the seller of protection. |
| | (7) | | The Fund entered into the credit default swap to gain investment exposure to the referenced entity. Selling protection has a similar credit risk position to owning that referenced entity. Buying protection has a similar credit risk position to selling the referenced entity short. |
| | TBA | | To be announced. Maturity date not known prior to settlement of this transaction. |
| WI/DD | | Investment, or portion of investment, purchased on a when-issued or delayed delivery basis. |
| | 144A | | Investment is exempt from registration under Rule 144A of the Securities Act of 1933, as amended. These investments may only be resold in transactions exempt from registration, which are normally those transactions with qualified institutional buyers. |
| | MDR | | Denotes investment is subject to dollar roll transactions. |
| NZD-BBR | | New Zealand Dollar-Bank Bill Rate |
See accompanying notes to financial statements.
Statement of Assets and Liabilities
July 31, 2012
| | | | |
Assets | | | | |
Long-term investments, at value (cost $5,246,330) | | $ | 5,620,662 | |
Short-term investments (at cost, which approximates value) | | | 1,428,226 | |
Cash | | | 985 | |
Cash denominated in foreign currencies (cost $19,380) | | | 18,787 | |
Unrealized appreciation on: | | | | |
Forward foreign currency exchange contracts | | | 14,821 | |
Interest rate swaps | | | 33,411 | |
Receivables: | | | | |
Due from broker (net of amounts deemed uncollectable of $11,520) | | | 1,093 | |
From Adviser | | | 4,856 | |
Interest | | | 52,503 | |
Investments sold | | | 1,000 | |
Other assets | | | 3 | |
Total assets | | | 7,176,347 | |
Liabilities | | | | |
Credit default swaps premiums received | | | 27,340 | |
Interest rate swaps premiums received | | | 154 | |
Unrealized deprecation on: | | | | |
Credit default swaps | | | 587 | |
Forward foreign currency exchange contracts | | | 1,088 | |
Payables: | | | | |
Dividends | | | 26,187 | |
Investments purchased | | | 1,467,091 | |
Accrued other expenses | | | 62,662 | |
Total liabilities | | | 1,585,109 | |
Net assets | | $ | 5,591,238 | |
Shares outstanding | | | 528,067 | |
Net asset value per share | | $ | 10.59 | |
Net assets consist of: | | | | |
Capital paid-in | | $ | 5,263,416 | |
Undistributed (Over-distribution of) net investment income | | | (62,180 | ) |
Accumulated net realized gain (loss) | | | (30,289 | ) |
Net unrealized appreciation (depreciation) | | | 420,291 | |
Net assets | | $ | 5,591,238 | |
Authorized shares | | | Unlimited | |
Par value per share | | $ | 0.01 | |
See accompanying notes to financial statements.
Statement of Operations
Year Ended July 31, 2012
| | | | |
Investment Income | | $ | 249,629 | |
Expenses | | | | |
Shareholders’ servicing agent fees and expenses | | | 610 | |
Custodian’s fees and expenses | | | 30,981 | |
Trustees’ fees and expenses | | | 327 | |
Professional fees | | | 38,105 | |
Shareholders’ reports – printing and mailing expenses | | | 52,564 | |
Federal and state registration fees | | | 11,822 | |
Other expenses | | | 8,872 | |
Total expenses before expense reimbursement | | | 143,281 | |
Expense reimbursement | | | (143,281 | ) |
Net expenses | | | — | |
Net investment income (loss) | | | 249,629 | |
Realized and Unrealized Gain (Loss) | | | | |
Net realized gain (loss) from: | | | | |
Investments and foreign currency | | | 79,585 | |
Forward foreign currency exchange contracts | | | (8,138 | ) |
Futures contracts | | | (20,996 | ) |
Swaps | | | 14,501 | |
Change in net unrealized appreciation (depreciation) of: | | | | |
Investments and foreign currency | | | 123,241 | |
Forward foreign currency exchange contracts | | | 18,656 | |
Futures contracts | | | 4,467 | |
Swaps | | | 52,552 | |
Net realized and unrealized gain (loss) | | | 263,868 | |
Net increase (decrease) in net assets from operations | | $ | 513,497 | |
See accompanying notes to financial statements.
Statement of Changes in Net Assets
| | | | | | | | |
| | | Year Ended
7/31/12 | | | Year Ended
7/31/11 | |
Operations | | | | | | | | |
Net investment income (loss) | | $ | 249,629 | | | $ | 337,163 | |
Net realized gain (loss) from: | | | | | | | | |
Investments and foreign currency | | | 79,585 | | | | 191,353 | |
Forward foreign currency exchange contracts | | | (8,138 | ) | | | 32,620 | |
Futures contracts | | | (20,996 | ) | | | (18,959 | ) |
Options written | | | — | | | | (706 | ) |
Swaps | | | 14,501 | | | | 136,335 | |
Change in net unrealized appreciation (depreciation) of: | | | | | | | | |
Investments and foreign currency | | | 123,241 | | | | (122,678 | ) |
Forward foreign currency exchange contracts | | | 18,656 | | | | (20,662 | ) |
Futures contracts | | | 4,467 | | | | (34,914 | ) |
Swaps | | | 52,552 | | | | (77,330 | ) |
Net increase (decrease) in net assets from operations | | | 513,497 | | | | 422,222 | |
Distributions to Shareholders | | | | | | | | |
From net investment income | | | (344,838 | ) | | | (419,263 | ) |
From accumulated net realized gains | | | (272,920 | ) | | | (521,989 | ) |
Decrease in net assets from distributions to shareholders | | | (617,758 | ) | | | (941,252 | ) |
Fund Share Transactions | | | | | | | | |
Proceeds from sale of shares | | | 30,840 | | | | 43,964 | |
Cost of shares redeemed | | | — | | | | (196,452 | ) |
Net increase (decrease) in net assets from Fund share transactions | | | 30,840 | | | | (152,488 | ) |
Net increase (decrease) in net assets | | | (73,421 | ) | | | (671,518 | ) |
Net assets at the beginning of period | | | 5,664,659 | | | | 6,336,177 | |
Net assets at the end of period | | $ | 5,591,238 | | | $ | 5,664,659 | |
Undistributed (Over-distribution of) net investment income at the end of period | | $ | (62,180 | ) | | $ | (13 | ) |
See accompanying notes to financial statements.
Financial Highlights
| | | | | | | | | | | | | | | | | | | | | | | | | | | | | | | | |
| Selected data for a share outstanding throughout each period: | |
| | | | |
| | | | | | Investment Operations | | | Less Distributions | | | | |
| | | | | | |
| | | | | | | | | | | | | | | | | | | | |
Year Ended
July 31, | | Beginning
Net
Asset
Value | | | Net
Invest-
ment
Income
(Loss)(a) | | | Net
Realized/
Unrealized
Gain
(Loss) | | | Total | | | Net
Invest-
ment
Income | | | Capital
Gains(b) | | | Total | | | Ending
Net
Asset
Value | |
2012 | | $ | 10.79 | | | $ | .47 | | | $ | .50 | | | $ | .97 | | | $ | (.65 | ) | | $ | (.52 | ) | | $ | (1.17 | ) | | $ | 10.59 | |
2011 | | | 11.75 | | | | .64 | | | | .16 | | | | .80 | | | | (.79 | ) | | | (.97 | ) | | | (1.76 | ) | | | 10.79 | |
2010 | | | 10.56 | | | | .71 | | | | 1.42 | | | | 2.13 | | | | (.94 | ) | | | — | | | | (.94 | ) | | | 11.75 | |
2009 | | | 9.81 | | | | 1.08 | | | | .72 | | | | 1.80 | | | | (.85 | ) | | | (.20 | ) | | | (1.05 | ) | | | 10.56 | |
2008(g) | | | 10.00 | | | | .29 | | | | (.21 | ) | | | .08 | | | | (.27 | ) | | | — | | | | (.27 | ) | | | 9.81 | |
| | | | | | | | | | | | | | | | | | | | | | | | | | |
| | |
|
| Ratios/Supplemental Data | |
| | | | | | | Ratios to Average
Net Assets
Before Reimbursement(e) | | | Ratios to Average
Net Assets After
Reimbursement(d)(e) | | | | |
Total
Return(c) | | | Ending
Net
Assets
(000) | | | Expenses | | | Net
Invest-
ment
Income
(Loss) | | | Expenses | | | Net
Invest-
ment
Income
(Loss) | | | Portfolio
Turnover
Rate(f) | |
| | 9.99 | % | | $ | 5,591 | | | | 2.63 | % | | | 1.95 | % | | | — | % | | | 4.58 | % | | | 55 | % |
| | 7.44 | | | | 5,665 | | | | 2.25 | | | | 3.43 | | | | — | | | | 5.68 | | | | 137 | |
| | 20.88 | | | | 6,336 | | | | 2.60 | | | | 3.75 | | | | — | | | | 6.34 | | | | 169 | |
| | 20.12 | | | | 5,711 | | | | 3.04 | | | | 8.11 | | | | — | | | | 11.15 | | | | 439 | |
| | .74 | | | | 5,262 | | | | 1.16 | * | | | 3.60 | * | | | — | ** | | | 4.75 | * | | | 120 | |
| (a) | Per share Net Investment Income (Loss) is calculated using the average daily shares method. |
| (b) | Distributions from Capital Gains include short-term capital gains, if any. |
| (c) | Total return is the combination of changes in net asset value, reinvested dividend income at net asset value and reinvested capital gains distributions at net asset value, if any. Total returns are not annualized. |
| (d) | After expense reimbursement from the Adviser, where applicable. |
| (e) | Ratios do not reflect the effect of custodian fee credits earned on the Fund’s net cash on deposit with the custodian bank, where applicable. |
| (f) | Excluding dollar roll transactions, where applicable. |
| (g) | For the period December 27, 2007 (commencement of operations) through July 31, 2008. |
| ** | Annualized expense ratio rounds to less than .01%. |
See accompanying notes to financial statements.
Notes to Financial Statements
1. General Information and Significant Accounting Policies
General Information
The Nuveen Managed Accounts Portfolios Trust (the “Trust”) is an open-end investment company registered under the Investment Company Act of 1940, as amended. The Trust is comprised of Enhanced Multi-Strategy Income Managed Accounts Portfolio (“Enhanced Multi-Strategy Income”) (the “Fund”), among others. The Trust was organized as a Massachusetts business trust on November 14, 2006.
The Fund is developed exclusively for use within Nuveen-sponsored separately managed accounts. The Fund is a specialized Fund to be used in combination with selected individual securities to effectively model institutional-level investment strategies. The Fund enables certain Nuveen separately managed account investors to achieve greater diversification and return potential than smaller managed accounts might otherwise achieve by using lower quality, higher yielding securities and to gain access to special investment opportunities normally available only to institutional investors.
The Fund’s primary investment objective is total return, with current income as a secondary objective. Under normal conditions, the Fund will invest at least 80% of its net assets in fixed income securities. The Fund will invest in various types of debt securities, including U.S. Treasury and U.S. agency bonds, U.S. investment grade corporate debt securities, U.S. high yield corporate debt securities, U.S. dollar-denominated non-U.S. government bonds, non-U.S. dollar non-U.S. government bonds, emerging market debt, futures contracts, options, interest rate derivatives, currency forwards, total return swaps, credit default swaps, and other short-term securities. In addition, the Fund may invest a substantial portion of its assets in mortgage-backed securities, including U.S. agency mortgage backed securities and commercial mortgage backed securities. The Fund may also engage in repurchase, reverse repurchase, dollar rolls and forward purchase agreements (these investments will generally be short-term in nature and are primarily used to seek to enhance total return and manage liquidity).
In investing in non-U.S. dollar instruments, Nuveen Asset Management, LLC (the “Sub-Adviser”) a wholly-owned subsidiary of Nuveen Fund Advisors, Inc. (the “Adviser”), a wholly-owned subsidiary of Nuveen Investments, Inc. (“Nuveen”), may elect to hedge the currency exposure through the use of currency forward contracts, futures, and other hedging instruments, including, but not limited to, options, interest rate and total return swaps, and similar instruments.
The Fund may invest up to 50% of its net assets in securities that are rated below investment grade or securities that are unrated but deemed by the Sub-Adviser to be of equivalent quality. Such securities are commonly referred to as “high-yield” securities or “junk bonds”, which includes U.S. and non-U.S. high yield corporate bonds and securities. The Fund may invest up to 25% of its net assets in the debt of non-U.S. issuers, including up to 25% of its net assets in obligations of non-U.S. entities that are located in emerging markets. These limits apply only at the time of any specific new investments.
The Sub-Adviser expects the average credit quality of the Fund to be rated between A and AA. Under normal market conditions, the Sub-Adviser expects the Fund to maintain an intermediate term average duration, which will generally fall within four to seven years.
The Fund may use a variety of investment techniques to seek to hedge or help protect against declines in portfolio value due to its exposure to interest rate movements, movements in the securities markets and non-U.S. currency exposure. These techniques include the use of derivative instruments, such as interest rate swap transactions, futures contracts, options on futures and non-U.S. exchange transactions on a cash or forward basis, and credit default swaps.
The Fund’s most recent prospectus provides further description of the Fund’s investment objective, principal investment strategies and principal risks.
Significant Accounting Policies
The following is a summary of significant accounting policies followed by the Fund in the preparation of its financial statements in accordance with accounting principles generally accepted in the United States (“U.S. GAAP”).
Investment Valuation
Prices of fixed-income securities, forward foreign currency exchange contracts and swap contracts are provided by a pricing service approved by the Fund’s Board of Trustees. These securities are generally classified as Level 2. The pricing service establishes a security’s fair value using methods that may include consideration of the following: yields or prices of investments of comparable quality, type of issue, coupon, maturity and rating, market quotes or indications of value from security dealers, evaluations of anticipated cash flows or collateral, general market conditions and other information and analysis, including the obligor’s credit characteristics considered relevant. In pricing certain securities, particularly less liquid and lower quality securities, the pricing service may consider information about a security, its issuer, or market activity, provided by the Adviser. These securities are generally classified as Level 2 or Level 3 depending on the priority of the significant inputs.
Investments initially valued in currencies other than the U.S. dollar are converted to the U.S. dollar using exchange rates obtained from pricing services. As a result, the net asset value (NAV) of the Fund’s shares may be affected by changes in the value of currencies in relation to the U.S. dollar. The value of securities traded in markets outside the United States or denominated in currencies other than the U.S. dollar may be affected significantly on a day that the New York Stock Exchange is closed and an investor is not able to purchase, redeem or exchange shares. If significant market events occur between the time of determination of the closing price of a
foreign security on an exchange and the time that the Fund’s NAV is determined, or if under the Fund’s procedures, the closing price of a foreign security is not deemed to be reliable, the security would be valued at fair value as determined in accordance with procedures established in good faith by the Fund’s Board of Trustees. These securities are generally classified as Level 2 or Level 3 depending on the priority of the significant inputs.
The value of exchange-traded options are based on the mean of the closing bid and ask prices. Futures contracts are valued using the closing settlement price or, in the absence of such a price, the last traded price. Exchange-traded options and futures contracts are generally classified as Level 1. Options traded in the over-the-counter market are valued using an evaluated mean price and are generally classified as Level 2.
Repurchase agreements are valued at contract amount plus accrued interest, which approximates market value. These securities are generally classified as Level 2.
Certain securities may not be able to be priced by the pre-established pricing methods as described above. Such securities may be valued by the Fund’s Board of Trustees or its designee at fair value. These securities generally include, but are not limited to, restricted securities (securities which may not be publicly sold without registration under the Securities Act of 1933, as amended) for which a pricing service is unable to provide a market price; securities whose trading has been formally suspended; debt securities that have gone into default and for which there is no current market quotation; a security whose market price is not available from a pre-established pricing source; a security with respect to which an event has occurred that is likely to materially affect the value of the security after the market has closed but before the calculation of the Fund’s net asset value (as may be the case in non-U.S. markets on which the security is primarily traded) or make it difficult or impossible to obtain a reliable market quotation; and a security whose price, as provided by the pricing service, is not deemed to reflect the security’s fair value. As a general principle, the fair value of a security would appear to be the amount that the owner might reasonably expect to receive for it in a current sale. A variety of factors may be considered in determining the fair value of such securities, which may include consideration of the following: yields or prices of investments of comparable quality, type of issue, coupon, maturity and rating, market quotes or indications of value from security dealers, evaluations of anticipated cash flows or collateral, general market conditions and other information and analysis, including the obligor’s credit characteristics considered relevant. These securities are generally classified as Level 2 or Level 3 depending on the priority of the significant inputs. Regardless of the method employed to value a particular security, all valuations are subject to review by the Fund’s Board of Trustees or its designee.
Refer to Footnote 2 – Fair Value Measurements for further details on the leveling of securities held by the Fund as of the end of the reporting period.
Investment Transactions
Investment transactions are recorded on a trade date basis. Realized gains and losses from transactions are determined on the specific identification method, which is the same basis used for federal income tax purposes. Investments purchased on a when-issued/delayed delivery basis may have extended settlement periods. Any investments so purchased are subject to market fluctuation during this period. The Fund has instructed the custodian to earmark securities in the Fund’s portfolio with a current value at least equal to the amount of the when-issued/delayed delivery purchase commitments. At July 31, 2012, the Fund had outstanding when-issued/delayed delivery purchase commitments of $1,467,091.
Investment Income
Investment income, which reflects the amortization of premiums and includes accretion of discounts for financial reporting purposes, is recorded on an accrual basis. Investment income also includes paydown gains and losses, if any.
Income Taxes
The Fund intends to distribute substantially all of its net investment income and net capital gains to shareholders and to otherwise comply with the requirements of Subchapter M of the Internal Revenue Code applicable to regulated investment companies (“RICs”). Therefore, no federal income tax provision is required.
For all open tax years and all major taxing jurisdictions, management of the Fund has concluded that there are no significant uncertain tax positions that would require recognition in the financial statements. Open tax years are those that are open for examination by taxing authorities (i.e., generally the last four tax year ends and the interim tax period since then). Furthermore, management of the Fund is also not aware of any tax positions for which it is reasonably possible that the total amounts of unrecognized tax benefits will significantly change in the next twelve months.
Dividends and Distributions to Shareholders
The Fund declares dividends from net investment income daily and pays shareholders monthly. Fund shares begin to accrue dividends on the business day after the day when the monies used to purchase Fund shares are collected by the Fund’s transfer agent.
Net realized capital gains from investment transactions, if any, are declared and distributed to shareholders at least annually. Furthermore, capital gains are distributed only to the extent they exceed available capital loss carryforwards.
Distributions to shareholders are recorded on the ex-dividend date. The amount and timing of distributions are determined in accordance with federal income tax regulations, which may differ from U.S. GAAP.
Notes to Financial Statements (continued)
Dollar Roll Transactions
The Fund is authorized to enter into dollar roll transactions (“dollar rolls”) in which the Fund purchases or sells mortgage-backed securities (“MBS”) for delivery in the future and simultaneously contracts to sell or repurchase a substantially similar (same type, coupon, and maturity) MBS on a different specified future date. Dollar rolls are identified in the Portfolio of Investments as “MDR”, when applicable. During the roll period, the Fund foregoes principal and interest paid on the MBS. The Fund is compensated by fee income or the difference between the current sales price and the lower forward price for the future purchase. Such compensation is amortized over the life of the dollar rolls, which is recognized as a component of “Investment income” on the Statement of Operations. Dollar rolls are valued daily.
Dollar rolls involve the risk that the market value of the MBS the Fund is obligated to repurchase under an agreement may decline below the repurchase price. These transactions also involve some risk to the Fund if the other party should default on its obligation and the Fund is delayed or prevented from completing the transaction. In the event that the buyer of securities under a dollar roll files for bankruptcy or becomes insolvent, the Fund’s use of proceeds of the dollar roll may be restricted pending a determination by the other party, or its trustee or receiver, whether to enforce the Fund’s obligation to repurchase the securities.
Foreign Currency Transactions
The Fund is authorized to engage in foreign currency exchange transactions, including foreign currency exchange contracts, futures, options and swap contracts. To the extent that the Fund invests in securities and/or contracts that are denominated in a currency other than U.S. dollars, the Fund will be subject to currency risk, which is the risk that an increase in the U.S. dollar relative to the foreign currency will reduce returns or portfolio value. Generally, when the U.S. dollar rises in value against a foreign currency, the Fund’s investments denominated in that currency will lose value because its currency is worth fewer U.S. dollars; the opposite effect occurs if the U.S. dollar falls in relative value. Investments and other assets and liabilities denominated in foreign currencies are converted into U.S. dollars on a spot (i.e. cash) basis at the spot rate prevailing in the foreign currency exchange market at the time of valuation. Purchases and sales of investments and income denominated in foreign currencies are translated into U.S. dollars on the respective dates of such transactions.
The books and records of the Fund are maintained in U.S. dollars. Foreign currencies, assets and liabilities are translated into U.S. dollars at 4:00 p.m. Eastern Time. Investment transactions, income and expenses are translated on the respective dates of such transactions. Net realized foreign currency gains and losses resulting from changes in exchange rates include foreign currency gains and losses between trade date and settlement date of the transactions, foreign currency transactions, and the difference between the amounts of interest and dividends recorded on the books of the Fund and the amounts actually received.
The realized gains and losses resulting from changes in foreign currency exchange rates and changes in foreign exchange rates associated with other assets and liabilities on investments, forward foreign currency exchange contracts, options written, swaps, and swaptions written are recognized as a component of “Net realized gain (loss) from investments and foreign currency” on the Statement of Operations, when applicable.
The unrealized gains and losses resulting from changes in foreign currency exchange rates and changes in foreign exchange rates associated with other assets and liabilities on investments are recognized as a component of “Change in net unrealized appreciation (depreciation) of investments and foreign currency” on the Statement of Operations, when applicable. The unrealized gains and losses resulting from changes in foreign exchange rates associated with forward foreign currency exchange contracts, options written, swaps and swaptions written are recognized as a component of “Change in net unrealized appreciation (deprecation) of forward foreign currency exchange contracts, options written, swaps and swaptions written,” respectively, on the Statement of Operations, when applicable.
Forward Foreign Currency Exchange Contracts
The Fund is subject to foreign currency exchange rate risk in the normal course of pursuing its investment objectives and is authorized to enter into forward foreign currency exchange contracts in an attempt to manage such risk under two circumstances: (i) when the Fund enters into a contract for the purchase or sale of a security denominated in a foreign currency to “lock in” the U.S. exchange rate of the transaction, with such period being a short-dated contract covering the period between transaction date and settlement date; or (ii) when the Sub-Adviser believes that the currency of a particular foreign country may experience a substantial movement against the U.S. dollar or against another foreign currency. Forward foreign currency exchange contracts are valued daily at the forward rate and are recognized as a component of “Unrealized appreciation or depreciation on forward foreign currency exchange contracts” on the Statement of Assets and Liabilities. The change in value of the contracts during the reporting period is recognized as a component of “Change in net unrealized appreciation (depreciation) of forward foreign currency exchange contracts” on the Statement of Operations. When the contract is closed or offset with the same counterparty, the Fund recognizes the difference between the value of the contract at the time it was entered and the value at the time it was closed or offset as a component of “Net realized gain (loss) from forward foreign currency exchange contracts” on the Statement of Operations.
Forward foreign currency exchange contracts will generally not be entered into for terms greater than three months, but may have maturities of up to six months or more. The use of forward foreign currency exchange contracts does not eliminate fluctuations in the underlying prices of the Fund’s investment securities; however, it does establish a rate of exchange that can be achieved in the future. The use of forward foreign currency exchange contracts involves the risk that anticipated currency movements will not be accurately predicted. A forward foreign currency exchange contract would limit the risk of loss due to a decline in the value of a particular currency; however, it also would limit any potential gain that might result should the value of the currency increase instead of
decrease. These contracts may involve market risk in excess of the unrealized appreciation or depreciation reflected on the Statement of Assets and Liabilities. Forward foreign currency contracts are subject to counterparty risk if the counterparty fails to perform as specified in the contract due to financial impairment or other reason.
During the fiscal year ended July 31, 2012, the Fund was invested in forward foreign currency exchange contracts in a variety of currencies, with settlements ranging from one to three months. Some of these contracts are positioned to benefit if the foreign currencies in the contracts strengthen with respect to the U.S. dollar, while others are positioned to benefit if the foreign currencies weaken with respect to the U.S. dollar, based on analysis indicating whether currencies were relatively high or low compared to future expectations.
The average number of forward foreign currency exchange contracts outstanding during the fiscal year ended July 31, 2012, was as follows:
| | | | |
Average number of forward foreign currency exchange contracts outstanding* | | | 10 | |
| * | The average number of outstanding contracts is calculated based on the outstanding contracts at the beginning of the fiscal year and at the end of each fiscal quarter within the current fiscal year. |
Refer to Footnote 3 – Derivative Instruments and Hedging Activities for further details on forward foreign currency exchange contract activity.
Futures Contracts
The Fund is subject to interest rate risk in the normal course of pursuing its investment objectives and is authorized to invest in futures contracts in attempt to manage such risk. Upon entering into a futures contract, the Fund is required to deposit with the broker an amount of cash or liquid securities equal to a specified percentage of the contract amount. This is known as the “initial margin.” Cash held by the broker to cover initial margin requirements on open futures contracts, if any, is recognized as “Deposits with brokers for open futures contracts” on the Statement of Assets and Liabilities. Subsequent payments (“variation margin”) are made or received by the Fund each day, depending on the daily fluctuation of the value of the contract. Variation margin is recognized as a receivable or payable for “Variation margin on futures contracts” on the Statement of Assets and Liabilities, when applicable.
During the period the futures contract is open, changes in the value of the contract are recorded as an unrealized gain or loss by “marking-to-market” on a daily basis to reflect the changes in market value of the contract, which is recognized as a component of “Change in net unrealized appreciation (depreciation) of futures contracts” on the Statement of Operations. When the contract is closed or expired, the Fund records a realized gain or loss equal to the difference between the value of the contract on the closing date and value of the contract when originally entered into, which is recognized as a component of “Net realized gain (loss) from futures contracts” on the Statement of Operations.
Risks of investments in futures contracts include the possible adverse movement in the price of the securities or indices underlying the contracts, the possibility that there may not be a liquid secondary market for the contracts and/or that a change in the value of the contract may not correlate with a change in the value of the underlying securities or indices.
During the fiscal year ended July 31, 2012, the Fund was invested in two-month U.S. Treasury note and bond futures contracts designed to benefit if interest rates at the ten year point of the yield curve rose more than rates at the two and thirty year points.
The average number of futures contracts outstanding during the fiscal year ended July 31, 2012, was as follows:
| | | | |
Average number of futures contracts outstanding* | | | 1 | |
| * | The average number of outstanding contracts is calculated based on the outstanding contracts at the beginning of the fiscal year and at the end of each fiscal quarter within the current fiscal year. |
Refer to Footnote 3 – Derivative Instruments and Hedging Activities for further details on futures contract activity.
Options Transactions
The Fund is subject to foreign currency risk and interest rate risk in the normal course of pursuing its investment objectives and is authorized to purchase and write (sell) call and put options on securities, futures contracts, swaps (“swaptions”) or currencies in an attempt to manage such risk. The purchase of options involves the risk of loss of all or a part of the cash paid for the options (the premium). The market risk associated with purchasing options and/or swaptions is limited to the premium paid. The counterparty credit risk of purchasing options and/or swaptions, however, needs also to take into account the current value of the option, as this is the performance expected from the counterparty. When the Fund purchases an option and/or swaption, an amount equal to the premium paid (the premium plus commission) is recognized as a component of “Options and/or Swaptions purchased, at value” on the Statement of Assets and Liabilities. When the Fund writes an option and/or swaption, an amount equal to the net premium received (the premium less commission) is recognized as a component of “Options and/or Swaptions written, at value” on the Statement of Assets and Liabilities and is subsequently adjusted to reflect the current value of the written option and/or swaption until the option and/or swaption is exercised or expires or the Fund enters into a closing purchase transaction. The changes in the value of options and/or swaptions purchased during the reporting period are recognized as a component of “Change in net unrealized appreciation (depreciation) of options and/or swaptions purchased” on the Statement of Operations. The changes in the value of options and/or swaptions written during the reporting period are recognized as a component of “Change in net unrealized appreciation (depreciation) of options and/or swaptions written” on the Statement of Operations. When an option and/or swaption is
Notes to Financial Statements (continued)
exercised or expires or the Fund enters into a closing purchase transaction, the difference between the net premium received and any amount paid at expiration or on executing a closing purchase transaction, including commission, is recognized as a component of “Net realized gain (loss) from options and/or swaptions purchased and/or written” on the Statement of Operations. The Fund, as a writer of an option and/or swaption has no control over whether the underlying instrument may be sold (called) or purchased (put) and as a result bears the risk of an unfavorable change in the market value of the instrument underlying the written option and/or swaption. There is also the risk the Fund may not be able to enter into a closing transaction because of an illiquid market. During the fiscal year ended July 31, 2012, the Fund did not purchase or write any options and/or swaptions.
Swap Contracts
The Fund is authorized to enter into swap contracts consistent with its investment objectives and policies to reduce, increase or otherwise alter its risk profile or to alter its portfolio characteristics (i.e. duration, yield curve positioning and credit quality).
Interest Rate Swaps
The Fund is subject to interest rate risk in the normal course of pursuing its investment objectives and policies in an attempt to obtain a desired return at a lower cost than if the Fund had invested directly in the asset that yielded the desired return. In connection with these contracts, securities in the Fund’s portfolio of investments may be identified as collateral in accordance with the terms of the respective swap contract. Interest rate swap contracts involve the exchange by the Fund with another party of their respective commitments to pay or receive interest (i.e., an exchange of floating rate payments for fixed rate payments with respect to a specified notional amount of principal). Interest rate swap contracts are valued daily. The Fund accrues daily the periodic payments expected to be paid and/or received on each interest rate swap contract and recognize the daily change in the market value of the Fund’s contractual rights and obligations under the contracts. The net amount recorded on these transactions for each counterparty is recognized on the Statement of Assets and Liabilities as a component of “Unrealized appreciation or depreciation on interest rate swaps (,net)” with the change during the reporting period recognized on the Statement of Operations as a component of “Change in net unrealized appreciation (depreciation) of swaps” on the Statement of Operations. Income received or paid by the Fund is recognized as a component of “Net realized gain (loss) from swaps” on the Statement of Operations, in addition to the net realized gains and losses recognized upon the termination of a interest rate swap contract and are equal to the difference between the Fund’s basis in the interest rate swap and the proceeds from (or cost of) the closing transaction. The amount of the payment obligation is based on the notional amount of the interest rate swap contract. Payments received or made at the beginning of the measurement period are recognized as a component of “Interest rate swap premiums paid and/or received” on the Statement of Assets and Liabilities, when applicable. For tax purposes, periodic payments are treated as ordinary income or expense.
During the fiscal year ended July 31, 2012, the Fund was invested in interest rate swap contracts in a variety of currencies, with maturities ranging from three to ten years, some positioned to benefit if rates rise, others positioned to benefit if rates fall in the underlying country, based on analysis indicating whether rates were relatively high or low compared to future expectations.
The average number of interest rate swap contracts outstanding during the fiscal year ended July 31, 2012, was as follows:
| | | | |
Average number of interest rate swap contracts outstanding* | | | 3 | |
| * | The average number of outstanding contracts is calculated based on the outstanding contracts at the beginning of the fiscal year and at the end of each fiscal quarter within the current fiscal year. |
Credit Default Swaps
The Fund is subject to credit risk in the normal course of pursuing its investment objectives. The Fund may enter into a credit default swap contract to seek to maintain a total return on a particular investment or portion of its portfolio, or to take an active long or short position with respect to the likelihood of a particular issuer’s default. Credit default swap contracts involve one party making a stream of payments to another party in exchange for the right to receive a specified return if/when there is a credit event by a third party. Generally, a credit event means bankruptcy, failure to pay, or restructuring. The specific credit events applicable for each credit default swap are stated in the terms of the particular swap agreement. As a purchaser of a credit default swap contract, the Fund pays to the counterparty a periodic interest fee based on the notional amount of the credit default swap. This interest fee is accrued daily and recognized with the daily change in the market value of the contract as a component of “Unrealized appreciation or depreciation on credit default swaps (,net)” on the Statement of Assets and Liabilities and is recorded as a realized loss upon payment. Upon occurrence of a specific credit event with respect to the underlying referenced entity, the Fund is obligated to deliver that security, or an equivalent amount of cash, to the counterparty in exchange for receipt of the notional amount from the counterparty. The difference between the value of the security delivered and the notional amount received is recorded as a realized gain. Payments received or made at the beginning of the measurement period are recognized as a component of “Credit default swap premiums paid and/or received” on the Statement of Assets and Liabilities, when applicable. As a seller of a credit default swap contract, the Fund generally receives from the counterparty a periodic interest fee based on the notional amount of the credit default swap. This interest fee is accrued daily as a component of unrealized appreciation or depreciation and is recorded as a realized gain upon payment. Upon occurrence of a specific credit event with respect to the underlying referenced entity, the Fund will either receive that security, or an equivalent amount of cash, from the counterparty in exchange for payment of the notional amount to the counterparty, or pay a net settlement amount of the credit default swap contract less the recovery value of the referenced obligation or underlying securities comprising the referenced index. The difference between the value of the security received and the notional amount paid is recorded as a realized loss. Changes in the value of a credit default swap during the reporting period are recognized as a component of
“Change in net unrealized appreciation (depreciation) of swaps”, and realized gains and losses are recognized as a component of “Net realized gain (loss) from swaps” on the Statement of Operations. The maximum potential amount of future payments the Fund could incur as a seller of protection in a credit default swap contract is limited to the notional amount of the contract. The maximum potential amount would be offset by the recovery value, if any, of the respective referenced entity.
During the fiscal year ended July 31, 2012, the Fund was invested in credit default swap index positions that earn spread income in exchange for taking the credit default risk of broad investment grade and high yield credit default swap indices. This had a positive effect on performance in the period as credit strengthened and these positions were significant in size relative to the total value of the portfolio.
The average notional amount of credit default swap contracts outstanding during the fiscal year ended July 31, 2012, was as follows:
| | | | |
Average notional amount of credit default swap contracts outstanding* | | $ | 2,845,600 | |
| * | The average notional amount is calculated based on the outstanding notional at the beginning of the fiscal year and at the end of each fiscal quarter within the current fiscal year. |
Refer to Footnote 3 – Derivative Instruments and Hedging Activities for further details on swap contract activity.
Market and Counterparty Credit Risk
In the normal course of business the Fund may invest in financial instruments and enter into financial transactions where risk of potential loss exists due to changes in the market (market risk) or failure of the other party to the transaction to perform (counterparty credit risk). The potential loss could exceed the value of the financial assets recorded on the financial statements. Financial assets, which potentially expose the Fund to counterparty credit risk, consist principally of cash due from counterparties on forward, option and swap transactions, when applicable. The extent of the Fund’s exposure to counterparty credit risk in respect to these financial assets approximates their carrying value as recorded on the Statement of Assets and Liabilities. Futures contracts, when applicable, expose the Fund to minimal counterparty credit risk as they are exchange traded and the exchange’s clearinghouse, which is counterparty to all exchange traded futures, guarantees the futures contracts against default.
The Fund helps manage counterparty credit risk by entering into agreements only with counterparties the Adviser believes have the financial resources to honor their obligations and by having the Adviser monitor the financial stability of the counterparties. Additionally, counterparties may be required to pledge collateral daily (based on the daily valuation of the financial asset) on behalf of the Fund with a value approximately equal to the amount of any unrealized gain above a pre-determined threshold. Reciprocally, when the Fund has an unrealized loss, the Fund has instructed the custodian to pledge assets of the Fund as collateral with a value approximately equal to the amount of the unrealized loss above a pre-determined threshold. Collateral pledges are monitored and subsequently adjusted if and when the valuations fluctuate, either up or down, by at least the pre-determined threshold amount.
Zero Coupon Securities
The Fund is authorized to invest in zero coupon securities. A zero coupon security does not pay a regular interest coupon to its holders during the life of the security. Income to the holder of the security comes from accretion of the difference between the original purchase price of the security at issuance and the par value of the security at maturity and is effectively paid at maturity. The market prices of zero coupon securities generally are more volatile than the market prices of securities that pay interest periodically.
Repurchase Agreements
In connection with transactions in repurchase agreements, it is the Fund’s policy that its custodian take possession of the underlying collateral securities, the fair value of which exceeds the principal amount of the repurchase transaction, including accrued interest, at all times. If the counterparty defaults, and the fair value of the collateral declines, realization of the collateral may be delayed or limited.
Custodian Fee Credit
The Fund has an arrangement with the custodian bank whereby certain custodian fees and expenses are reduced by net credits earned on the Fund’s cash on deposit with the bank. Such deposit arrangements are an alternative to overnight investments. Credits for cash balances may be offset by charges for any days on which the Fund overdraws its account at the custodian bank.
Indemnifications
Under the Trust’s organizational documents, its officers and trustees are indemnified against certain liabilities arising out of the performance of their duties to the Trust. In addition, in the normal course of business, the Trust enters into contracts that provide general indemnifications to other parties. The Trust’s maximum exposure under these arrangements is unknown as this would involve future claims that may be made against the Trust that have not yet occurred. However, the Trust has not had prior claims or losses pursuant to these contracts and expects the risk of loss to be remote.
Use of Estimates
The preparation of financial statements in conformity with U.S. GAAP requires management to make estimates and assumptions that affect the reported amounts of assets and liabilities at the date of the financial statements and the reported amounts of increases and decreases in net assets from operations during the reporting period. Actual results may differ from those estimates.
Notes to Financial Statements (continued)
2. Fair Value Measurements
Fair value is defined as the price that the Fund would receive upon selling an investment or transferring a liability in an orderly transaction to an independent buyer in the principal or most advantageous market for the investment. A three-tier hierarchy is used to maximize the use of observable market data and minimize the use of unobservable inputs and to establish classification of fair value measurements for disclosure purposes. Observable inputs reflect the assumptions market participants would use in pricing the asset or liability. Observable inputs are based on market data obtained from sources independent of the reporting entity. Unobservable inputs reflect the reporting entity’s own assumptions about the assumptions market participants would use in pricing the asset or liability. Unobservable inputs are based on the best information available in the circumstances. The following is a summary of the three-tiered hierarchy of valuation input levels.
| | |
| Level 1 – | | Inputs are unadjusted and prices are determined using quoted prices in active markets for identical securities. |
| Level 2 – | | Prices are determined using other significant observable inputs (including quoted prices for similar securities, interest rates, prepayment speeds, credit risk, etc.). |
| Level 3 – | | Prices are determined using significant unobservable inputs (including management’s assumptions in determining the fair value of investments). |
The inputs or methodologies used for valuing securities are not an indication of the risks associated with investing in those securities.
The following is a summary of the Fund’s fair value measurements as of the end of the reporting period:
| | | | | | | | | | | | | | | | |
| | | Level 1 | | | Level 2 | | | Level 3 | | | Total | |
Long-Term Investments*: | | | | | | | | | | | | | | | | |
Corporate Bonds | | $ | — | | | $ | 3,232,302 | | | $ | — | | | $ | 3,232,302 | |
Capital Preferred Securities | | | — | | | | 190,850 | | | | — | | | | 190,850 | |
$25 Par (or similar) Preferred Securities | | | — | | | | 14,150 | | | | — | | | | 14,150 | |
Mortgage-Backed Securities | | | — | | | | 2,015,655 | | | | — | | | | 2,015,655 | |
Taxable Municipal Bonds | | | — | | | | 84,074 | | | | — | | | | 84,074 | |
Sovereign Debt | | | — | | | | 83,631 | | | | — | | | | 83,631 | |
Short-Term Investments: | | | | | | | | | | | | | | | | |
Repurchase Agreements | | | — | | | | 1,428,226 | | | | — | | | | 1,428,226 | |
Derivatives: | | | | | | | | | | | | | | | | |
Forward Foreign Currency Exchange Contracts** | | | — | | | | 13,733 | | | | — | | | | 13,733 | |
Credit Default Swaps** | | | — | | | | (587 | ) | | | — | | | | (587 | ) |
Interest Rate Swaps** | | | — | | | | 33,411 | | | | — | | | | 33,411 | |
| | | $ | — | | | $ | 7,095,445 | | | $ | — | | | $ | 7,095,445 | |
| * | Refer to the Fund’s Portfolio of Investments for industry classifications. |
| ** | Represents net unrealized appreciation (depreciation) as reported in the Fund’s Portfolio of Investments. |
The Nuveen funds’ Board of Directors/Trustees is responsible for the valuation process and has delegated the oversight of the daily valuation process to the Adviser’s Valuation Committee. The Valuation Committee, pursuant to the valuation policies and procedures adopted by the Board of Directors/Trustees, is responsible for making fair value determinations, evaluating the effectiveness of the funds’ pricing policies, and reporting to the Board of Directors/Trustees. The Valuation Committee is aided in its efforts by the Adviser’s dedicated Securities Valuation Team, which is responsible for administering the daily valuation process and applying fair value methodologies as approved by the Valuation Committee. When determining the reliability of independent pricing services for investments owned by the funds, the Valuation Committee, among other things, conducts due diligence reviews of the pricing services and monitors the quality of security prices received through various testing reports conducted by the Securities Valuation Team.
The Valuation Committee will consider pricing methodologies it deems relevant and appropriate when making fair value determinations. Examples of possible methodologies include, but are not limited to, multiple of earnings; discount from market of a similar freely traded security; discounted cash-flow analysis; book value or a multiple thereof; risk premium/yield analysis; yield to maturity; and/or fundamental investment analysis. The Valuation Committee will also consider factors it deems relevant and appropriate in light of the facts and circumstances. Examples of possible factors include, but are not limited to, the type of security; the issuer’s financial statements; the purchase price of the security; the discount from market value of unrestricted securities of the same class at the time of purchase; analysts’ research and observations from financial institutions; information regarding any transactions or offers with respect to the security; the existence of merger proposals or tender offers affecting the security; the price and extent of public trading in similar securities of the issuer or comparable companies; and the existence of a shelf registration for restricted securities.
For each portfolio security that has been fair valued pursuant to the policies adopted by the Board of Directors/Trustees, the fair value price is compared against the last available and next available market quotations. The Valuation Committee reviews the results of such testing and fair valuation occurrences are reported to the Board of Directors/Trustees.
3. Derivative Instruments and Hedging Activities
The Fund records derivative instruments at fair value, with changes in fair value recognized on the Statement of Operations, when applicable. Even though the Fund’s investments in derivatives may represent economic hedges, they are not considered to be hedge transactions for financial reporting purposes. For additional information on the derivative instruments in which the Fund was invested during and at the end of the reporting period, refer to the Portfolio of Investments, Financial Statements and Footnote 1 – General Information and Significant Accounting Policies.
The following table presents the fair value of all derivative instruments held by the Fund as of July 31, 2012, the location of these instruments on the Statement of Assets and Liabilities, and the primary underlying risk exposure.
| | | | | | | | | | | | | | |
| | | | | Location on the Statement of Assets and Liabilities | |
Underlying
Risk Exposure | | Derivative Instrument | | Asset Derivatives | | | Liability Derivatives | |
| | | Location | | Value | | | Location | | Value | |
Foreign Currency Exchange Rate | | Forward Foreign
Currency Exchange
Contracts | | Unrealized appreciation on
forward foreign currency
exchange contracts | | $ | 14,821 | | | Unrealized depreciation on
forward foreign currency
exchange contracts | | $ | (1,088 | ) |
Interest Rate | | Swaps | | Unrealized appreciation on
interest rate swaps* | | | 33,411 | | | — | | | — | |
Credit | | Swaps | | Unrealized depreciation
on credit default swaps* | | | 7,229 | | | Unrealized depreciation on
credit default swaps* | | | (7,816 | ) |
Total | | | | | | $ | 55,461 | | | | | $ | (8,904 | ) |
| * | Some swap contracts require a counterparty to pay or receive a premium, which is disclosed on the Statement of Assets and Liabilities but is not reflected in the unrealized appreciation (depreciation) presented above. |
The following tables present the amount of net realized gain (loss) and change in net unrealized appreciation (depreciation) recognized for the fiscal year ended July 31, 2012, on derivative instruments, as well as the primary risk exposure associated with each.
| | | | |
| Net Realized Gain (Loss) from Forward Foreign Currency Exchange Contracts | | | |
| Risk Exposure | | | |
Foreign Currency Exchange Rate | | | $(8,138 | ) |
| |
| Net Realized Gain (Loss) from Futures Contracts | | | |
| Risk Exposure | | | |
Interest Rate | | | $(20,996 | ) |
| |
| Net Realized Gain (Loss) from Swaps | | | |
| Risk Exposure | | | |
Interest Rate | | | $(28,133 | ) |
Credit | | | 42,634 | |
Total | | | $14,501 | |
| |
| Change in Net Unrealized Appreciation (Depreciation) of Forward Foreign Currency Exchange Contracts | | | |
| Risk Exposure | | | |
Foreign Currency Exchange Rate | | | $18,656 | |
| |
| Change in Net Unrealized Appreciation (Depreciation) of Futures Contracts | | | |
| Risk Exposure | | | |
Interest Rate | | | $4,467 | |
| |
| Change in Net Unrealized Appreciation (Depreciation) of Swaps | | | |
| Risk Exposure | | | |
Interest Rate | | | $46,630 | |
Credit | | | 5,922 | |
Total | | | $52,552 | |
Notes to Financial Statements (continued)
4. Fund Shares
Transactions in Fund shares were as follows:
| | | | | | | | | | | | | | | | |
| | | Year Ended
7/31/12 | | | Year Ended
7/31/11 | |
| | | Shares | | | Amount | | | Shares | | | Amount | |
Shares sold | | | 3,026 | | | $ | 30,840 | | | | 4,020 | | | $ | 43,964 | |
Shares redeemed | | | — | | | | — | | | | (18,162 | ) | | | (196,452 | ) |
Net increase (decrease) | | | 3,026 | | | $ | 30,840 | | | | (14,142 | ) | | $ | (152,488 | ) |
5. Investment Transactions
Purchases and sales (including maturities but excluding short-term investments, derivative and dollar roll transactions) for the fiscal year ended July 31, 2012, were as follows:
| | | | |
Purchases: | | | | |
Investment securities | | $ | 3,170,787 | |
U.S. Government and agency obligations | | | — | |
Sales and maturities: | | | | |
Investment securities | | | 3,245,753 | |
U.S. Government and agency obligations | | | 118,955 | |
6. Income Tax Information
The following information is presented on an income tax basis. Differences between amounts for financial statement and federal income tax purposes are primarily due to the treatment of foreign currency transaction gains and losses, amortization of premium and timing and character differences in recognizing certain gains and losses on investment transactions. To the extent that differences arise that are permanent in nature, such amounts are reclassified within the capital accounts as detailed below. Temporary differences do not require reclassification. Temporary and permanent differences do not impact the net asset value of the Fund.
At July 31, 2012, the cost and unrealized appreciation (depreciation) of investments (excluding investments in derivatives), as determined on a federal income tax basis, were as follows:
| | | | |
Cost of investments | | $ | 6,574,053 | |
Gross unrealized: | | | | |
Appreciation | | | 474,835 | |
Depreciation | | | — | |
Net unrealized appreciation (depreciation) of investments | | $ | 474,835 | |
Permanent differences, primarily due to federal taxes paid, treatment of notional principal contracts, complex security character adjustments and foreign currency reclassifications resulted in reclassifications among the Fund’s components of net assets at July 31, 2012, the Fund’s tax year end, as follows:
| | | | |
Capital paid-in | | $ | — | |
Undistributed (Over–distribution of) net investment income | | | 33,042 | |
Accumulated net realized gain (loss) | | | (33,042 | ) |
The tax components of undistributed net ordinary income and net long-term capital gains at July 31, 2012, the Fund’s tax year end, were as follows:
| | | | |
Undistributed net ordinary income* | | $ | 97,641 | |
Undistributed net long-term capital gains | | | 16,725 | |
| * | Undistributed net ordinary income (on a tax basis) has not been reduced for the dividend declared during the period July 1, 2012 through July 31, 2012 and paid on August 1, 2012. Net ordinary income consists of net taxable income derived from dividends, interest, and net short-term capital gains, if any. |
The tax character of distributions paid during the Fund’s tax years ended July 31, 2012 and July 31, 2011, was designated for purposes of the dividends paid deduction as follows:
| | | | |
| 2012 | | | |
Distributions from net ordinary income* | | $ | 422,695 | |
Distributions from net long-term capital gains** | | | 200,059 | |
| | | | |
| 2011 | | | |
Distributions from net ordinary income* | | $ | 615,960 | |
Distributions from net long-term capital gains | | | 322,950 | |
| * | Net ordinary income consists of net taxable income derived from dividends, interest, and net short-term capital gains, if any. |
| ** | The Fund hereby designates as long-term capital gain dividend, pursuant to the Internal Revenue Code Section 852 (b)(3), the amount necessary to reduce earnings and profits of the Fund related to net capital gain to zero for the tax year ended July 31, 2012. |
On December 22, 2010, the Regulated Investment Company Modernization Act of 2010 (the “Act”) was enacted, which changed various technical rules governing the tax treatment of RICs. The changes are generally effective for taxable years beginning after the date of enactment. One of the more prominent changes addresses capital loss carryforwards. Under the Act, the Fund will be permitted to carry forward capital losses incurred in taxable years beginning after the date of enactment for an unlimited period. However, any losses incurred during those future taxable years will be required to be utilized prior to the losses incurred in preenactment taxable years, which carry an expiration date. As a result of this ordering rule, pre-enactment capital loss carryforwards may be more likely to expire unused. Additionally, post-enactment capital loss carryforwards will retain their character as either short-term or long-term capital losses rather than being considered all short-term as permitted under previous regulation.
The Act also contains several provisions aimed at preserving the character of distributions made by a fiscal year RIC during the portion of its taxable year ending after October 31 or December 31, reducing the circumstances under which a RIC might be required to file amended Forms 1099 to restate previously reported distributions.
During the Fund’s tax year ended July 31, 2012, there were no post-enactment capital losses generated.
7. Management Fees and Other Transactions with Affiliates
The Adviser and Sub-Adviser do not charge any investment advisory or administrative fees directly to the Fund. The Adviser has also agreed irrevocably during the existence of the Fund to waive all fees and pay or reimburse all expenses of the Fund (excluding interest expense, taxes, fees incurred in acquiring and disposing of investment portfolio securities and extraordinary expenses). The Adviser and Sub-Adviser are compensated for their services to the Fund from the fee charged at the separately managed account level.
At July 31, 2012, Nuveen owned all shares of the Fund.
8. New Accounting Pronouncements
Financial Accounting Standards Board (“FASB”) Balance Sheet (Topic 210): Disclosures about Offsetting Assets and Liabilities
In December 2011, the FASB issued Accounting Standards Update (“ASU”) No. 2011-11 (“ASU No. 2011-11”) to enhance disclosures about financial instruments and derivative instruments that are subject to offsetting (“netting”) on the Statement of Assets and Liabilities. This information will enable users of the entity’s financial statements to evaluate the effect or potential effect of netting arrangements on the entity’s financial position. ASU No. 2011-11 is effective prospectively during interim or annual periods beginning on or after January 1, 2013. At this time, management is evaluating the implications of this guidance and the impact it will have to the financial statements amounts and footnote disclosures, if any.
Trustees and Officers (Unaudited)
The management of the Funds, including general supervision of the duties performed for the Funds by the Adviser, is the responsibility of the Board of Trustees of the Funds. The number of trustees of the Funds is currently set at ten. None of the trustees who are not “interested” persons of the Funds (referred to herein as “independent trustees”) has ever been a director or employee of, or consultant to, Nuveen or its affiliates. The names and business addresses of the trustees and officers of the Funds, their principal occupations and other affiliations during the past five years, the number of portfolios each oversees and other directorships they hold are set forth below.
The Funds’ Statement of Additional Information (“SAI”) includes more information about the trustees. To request a free copy, call Nuveen Investments at (800) 257-8787 or visit the Funds’ website at www.nuveen.com.
| | | | | | | | |
Name, Birthdate and Address | | Position(s) Held with the Funds | | Year First Elected or Appointed (1) | | Principal Occupation(s) Including other Directorships During Past 5 Years | | Number of Portfolios in Fund Complex Overseen by Trustee |
| | |
| Independent Trustees: | | | | |
Robert P. Bremner 8/22/40 333 W. Wacker Drive Chicago, IL 60606 | | Chairman of the Board and Trustee | | 1996 | | Private Investor and Management Consultant; Treasurer and Director, Humanities Council of Washington, D.C.; Board Member, Independent Directors Council affiliated with the Investment Company Institute. | | 219 |
Jack B. Evans 10/22/48 333 W. Wacker Drive Chicago, IL 60606 | | Trustee | | 1999 | | President, The Hall-Perrine Foundation, a private philanthropic corporation (since 1996); Director and Chairman, United Fire Group, a publicly held company; member of the Board of Regents for the State of Iowa University System; Director, Source Media Group; Life Trustee of Coe College and the Iowa College Foundation; formerly, Director, Alliant Energy; formerly, Director, Federal Reserve Bank of Chicago; formerly, President and Chief Operating Officer, SCI Financial Group, Inc., a regional financial services firm. | | 219 |
William C. Hunter 3/6/48 333 W. Wacker Drive Chicago, IL 60606 | | Trustee | | 2004 | | Dean Emeritus (since June 30, 2012), formerly, Dean, Tippie College of Business, University of Iowa (2006-2012); Director (since 2004) of Xerox Corporation; Director (since 2005), and President (since July 2012) Beta Gamma Sigma, Inc., The International Honor Society; Director of Wellmark, Inc. (since 2009); formerly, Dean and Distinguished Professor of Finance, School of Business at the University of Connecticut (2003-2006); previously, Senior Vice President and Director of Research at the Federal Reserve Bank of Chicago (1995-2003); formerly, Director (1997-2007), Credit Research Center at George Washington University. | | 219 |
David J. Kundert 10/28/42 333 W. Wacker Drive Chicago, IL 60606 | | Trustee | | 2005 | | Director, Northwestern Mutual Wealth Management Company; retired (since 2004) as Chairman, JPMorgan Fleming Asset Management, President and CEO, Banc One Investment Advisors Corporation, and President, One Group Mutual Funds; prior thereto, Executive Vice President, Banc One Corporation and Chairman and CEO, Banc One Investment Management Group; Member, Board of Regents, Luther College; member of the Wisconsin Bar Association; member of Board of Directors, Friends of Boerner Botanical Gardens; member of Board of Directors and Chair of Investment Committee, Greater Milwaukee Foundation. | | 219 |
William J. Schneider 9/24/44 333 W. Wacker Drive Chicago, IL 60606 | | Trustee | | 1996 | | Chairman of Miller-Valentine Partners Ltd., a real estate investment company; formerly, Senior Partner and Chief Operating Officer (retired 2004) of Miller-Valentine Group; member, University of Dayton Business School Advisory Council; member, Mid-America Health System Board; formerly, member and chair, Dayton Philharmonic Orchestra Association; formerly, member, Business Advisory Council, Cleveland Federal Reserve Bank. | | 219 |
Judith M. Stockdale 12/29/47 333 W. Wacker Drive Chicago, IL 60606 | | Trustee | | 1997 | | Executive Director, Gaylord and Dorothy Donnelley Foundation (since 1994); prior thereto, Executive Director, Great Lakes Protection Fund (1990-1994). | | 219 |
Carole E. Stone 6/28/47 333 W. Wacker Drive Chicago, IL 60606 | | Trustee | | 2007 | | Director, Chicago Board Options Exchange (since 2006); Director, C2 Options Exchange, Incorporated (since 2009); formerly, Commissioner, New York State Commission on Public Authority Reform (2005-2010); formerly, Chair, New York Racing Association Oversight Board (2005-2007). | | 219 |
| | | | | | | | |
Name, Birthdate and Address | | Position(s) Held with the Funds | | Year First Elected or Appointed (1) | | Principal Occupation(s) During Past Five Years | | Number of Portfolios in Fund Complex Overseen by Trustee |
Virginia L. Stringer 8/16/44 333 West Wacker Drive Chicago, IL 60606 | | Trustee | | 2011 | | Board Member, Mutual Fund Directors Forum; former governance consultant and non-profit board member; former Owner and President, Strategic Management Resources, Inc. a management consulting firm; former Member, Governing Board, Investment Company Institute’s Independent Directors Council; previously, held several executive positions in general management, marketing and human resources at IBM and The Pillsbury Company; Independent Director, First American Fund Complex (1987-2010) and Chair (1997-2010). | | 219 |
Terence J. Toth 9/29/59 333 W. Wacker Drive Chicago, IL 60606 | | Trustee | | 2008 | | Director, Legal & General Investment Management America, Inc. (since 2008); Managing Partner, Promus Capital (since 2008); formerly, CEO and President, Northern Trust Global Investments (2004-2007); Executive Vice President, Quantitative Management & Securities Lending (2000-2004); prior thereto, various positions with Northern Trust Company (since 1994); member: Goodman Theatre Board (since 2004), Chicago Fellowship Board (since 2005), Catalyst Schools of Chicago Board (since 2008); Mather Foundation Board (since 2012) and a member of its investment committee; formerly, member: Northern Trust Mutual Funds Board (2005-2007), Northern Trust Global Investments Board (2004-2007), Northern Trust Japan Board (2004-2007), Northern Trust Securities Inc. Board (2003-2007) and Northern Trust Hong Kong Board (1997-2004). | | 219 |
| | |
| Interested Trustee: | | | | |
John P. Amboian (2) 6/14/61 333 W. Wacker Drive Chicago, IL 60606 | | Trustee | | 2008 | | Chief Executive Officer and Chairman (since 2007) and Director (since 1999) of Nuveen Investments, Inc., formerly, President (1999-2007); Chief Executive Officer (since 2007) of Nuveen Investments Advisers Inc.; Director (since 1998) formerly, Chief Executive Officer (2007-2010) of Nuveen Fund Advisors, Inc. | | 219 |
Name, Birthdate and Address | | Position(s) Held with the Funds | | Year First Elected or Appointed (3) | | Principal Occupation(s) During Past 5 Years | | Number of Portfolios in Fund Complex Overseen by Officer |
| | |
| Officers of the Funds: | | | | |
Gifford R. Zimmerman 9/9/56 333 W. Wacker Drive Chicago, IL 60606 | | Chief Administrative Officer | | 1988 | | Managing Director (since 2002), Assistant Secretary of Nuveen Securities, LLC; Managing Director (since 2004) and Assistant Secretary (since 1994) of Nuveen Investments, Inc.; Managing Director (since 2002), Assistant Secretary (since 1997) and Co-General Counsel (since 2011) of Nuveen Fund Advisors, Inc.; Managing Director, Assistant Secretary and Associate General Counsel of Nuveen Asset Management, LLC (since 2011); Managing Director, Associate General Counsel and Assistant Secretary of Symphony Asset Management LLC (since 2003); Vice President and Assistant Secretary of NWQ Investment Management Company, LLC (since 2002), Nuveen Investments Advisers Inc. (since 2002), Santa Barbara Asset Management, LLC (since 2006) and of Winslow Capital Management, LLC. (since 2010); Chief Administrative Officer and Chief Compliance Officer (since 2006) of Nuveen Commodities Asset Management, LLC; Chartered Financial Analyst. | | 219 |
Margo L. Cook 4/11/64 333 W. Wacker Drive Chicago, IL 60606 | | Vice President | | 2009 | | Executive Vice President (since 2008) of Nuveen Investments, Inc. and of Nuveen Fund Advisors, Inc. (since 2011); Managing Director – Investment Services of Nuveen Commodities Asset Management, LLC (since August 2011) previously, Head of Institutional Asset Management (2007-2008) of Bear Stearns Asset Management; Head of Institutional Asset Management (1986-2007) of Bank of NY Mellon; Chartered Financial Analyst. | | 219 |
Trustees and Officers (Unaudited) (continued)
| | | | | | | | |
Name, Birthdate and Address | | Position(s) Held with the Funds | | Year First Elected or Appointed (3) | | Principal Occupation(s) During Past 5 Years | | Number of Portfolios in Fund Complex Overseen by Officer |
Lorna C. Ferguson 10/24/45 333 W. Wacker Drive Chicago, IL 60606 | | Vice President | | 1998 | | Managing Director (since 2005) of Nuveen Fund Advisors, Inc. and Nuveen Securities, LLC (since 2004). | | 219 |
Stephen D. Foy 5/31/54 333 W. Wacker Drive Chicago, IL 60606 | | Vice President and Controller | | 1998 | | Senior Vice President (since 2010), formerly, Vice President (2005-2010) and Funds Controller of Nuveen Securities, LLC; Vice President of Nuveen Fund Advisors, Inc.; Chief Financial Officer of Nuveen Commodities Asset Management, LLC (since 2010); Certified Public Accountant. | | 219 |
Scott S. Grace 8/20/70 333 W. Wacker Drive Chicago, IL 60606 | | Vice President and Treasurer | | 2009 | | Managing Director, Corporate Finance & Development, Treasurer (since 2009) of Nuveen Securities, LLC; Managing Director and Treasurer (since 2009) of Nuveen Fund Advisors, Inc., Nuveen Investments Advisers, Inc., Nuveen Investments Holdings Inc. and (since 2011) Nuveen Asset Management, LLC; Vice President and Treasurer of NWQ Investment Management Company, LLC, Tradewinds Global Investors, LLC, Symphony Asset Management LLC and Winslow Capital Management, LLC.; Vice President of Santa Barbara Asset Management, LLC; formerly, Treasurer (2006-2009), Senior Vice President (2008-2009), previously, Vice President (2006-2008) of Janus Capital Group, Inc.; formerly, Senior Associate in Morgan Stanley’s Global Financial Services Group (2000-2003); Chartered Accountant Designation. | | 219 |
Walter M. Kelly 2/24/70 333 W. Wacker Drive Chicago, IL 60606 | | Chief Compliance Officer and Vice President | | 2003 | | Senior Vice President (since 2008) and Assistant Secretary (since 2003) of Nuveen Fund Advisors, Inc; Senior Vice President (since 2008) of Nuveen Investments Holdings, Inc; formerly, Senior Vice President (2008-2011) of Nuveen Securities, LLC. | | 219 |
Tina M. Lazar 8/27/61 333 W. Wacker Drive Chicago, IL 60606 | | Vice President | | 2002 | | Senior Vice President (since 2010), formerly, Vice President (2005-2010) of Nuveen Fund Advisors, Inc. | | 219 |
Name, Birthdate and Address | | Position(s) Held with the Funds | | Year First Elected or Appointed (3) | | Principal Occupation(s) Including other Directorships During Past 5 Years | | Number of Portfolios in Fund Complex Overseen by Officer |
Kevin J. McCarthy 3/26/66 333 W. Wacker Drive Chicago, IL 60606 | | Vice President and Secretary | | 2007 | | Managing Director and Assistant Secretary (since 2008), formerly, Vice President (2007-2008), Nuveen Securities, LLC; Managing Director (since 2008), Assistant Secretary (since 2007) and Co-General Counsel (since 2011) of Nuveen Fund Advisors, Inc.; Managing Director, Assistant Secretary and Associate General Counsel (since 2011) of Nuveen Asset Management, LLC; Managing Director (since 2008), and Assistant Secretary, Nuveen Investment Holdings, Inc.; Vice President (since 2007) and Assistant Secretary of Nuveen Investments Advisers Inc., NWQ Investment Management Company, LLC, Tradewinds Global Investors LLC, NWQ Holdings, LLC, Symphony Asset Management LLC, Santa Barbara Asset Management, LLC, and of Winslow Capital Management, LLC. (since 2010); Vice President and Secretary (since 2010) of Nuveen Commodities Asset Management, LLC; prior thereto, Partner, Bell, Boyd & Lloyd LLP (1997-2007). | | 219 |
Kathleen L. Prudhomme 3/30/53 901 Marquette Avenue Minneapolis, MN 55402 | | Vice President and Assistant Secretary | | 2011 | | Managing Director, Assistant Secretary and Co-General Counsel (since 2011) of Nuveen Fund Advisors, Inc.; Managing Director, Assistant Secretary and Associate General Counsel (since 2011) of Nuveen Asset Management, LLC; Managing Director and Assistant Secretary (since 2011) of Nuveen Securities, LLC; formerly, Deputy General Counsel, FAF Advisors, Inc. (2004-2010). | | 219 |
| | | | | | | | |
Name, Birthdate and Address | | Position(s) Held with the Funds | | Year First Elected or Appointed (3) | | Principal Occupation(s) Including other Directorships During Past 5 Years | | Number of Portfolios in Fund Complex Overseen by Officer |
Jeffery M. Wilson 3/13/56 333 West Wacker Drive Chicago, IL 60606 | | Vice President | | 2011 | | Senior Vice President of Nuveen Securities, LLC (since 2011); formerly, Senior Vice President of FAF Advisors, Inc. (2000-2010). | | 102 |
| (1) | Trustees serve an indefinite term until his/her successor is elected or appointed. The year first elected or appointed represents the year in which the trustee was first elected or appointed to any fund in the Nuveen Fund Complex. |
| (2) | Mr. Amboian is an interested trustee because of his position with Nuveen Investments, Inc. and certain of its subsidiaries, which are affiliates of the Nuveen Funds. |
| (3) | Officers serve one year terms through August of each year. The year first elected or appointed represents the year in which the officer was first elected or appointed to any fund in the Nuveen Fund Complex. |
Annual Investment Management Agreement Approval Process
(Unaudited)
The Board of Trustees (the “Board,” and each Trustee, a “Board Member”) of the Fund, including the Board Members who are not parties to the Fund’s advisory or sub-advisory agreements or “interested persons” of any such parties (the “Independent Board Members”), is responsible for approving the advisory agreement (the “Investment Management Agreement”) between the Fund and Nuveen Fund Advisors, Inc. (the “Advisor”) and the sub-advisory agreement (the “Sub-Advisory Agreement”) between the Advisor and Nuveen Asset Management, LLC (the “Sub-Advisor”) (the Investment Management Agreement and the Sub-Advisory Agreement are referred to collectively as the “Advisory Agreements”) and their periodic continuation. Pursuant to the Investment Company Act of 1940, as amended (the “1940 Act”), the Board is required to consider the continuation of the Advisory Agreements on an annual basis. Accordingly, at an in-person meeting held on May 21-23, 2012 (the “May Meeting”), the Board, including a majority of the Independent Board Members, considered and approved the continuation of the Advisory Agreements for the Fund for an additional one-year period.
In preparation for its considerations at the May Meeting, the Board requested and received extensive materials prepared in connection with the review of the Advisory Agreements. The materials provided a broad range of information regarding the Fund, the Advisor and the Sub-Advisor (the Advisor and the Sub-Advisor are collectively, the “Fund Advisers” and each, a “Fund Adviser”). As described in more detail below, the information provided included, among other things, a review of Fund performance, including Fund investment performance assessments against appropriate benchmarks, Fund fees and expenses, a description and assessment of shareholder service levels for the Fund, a summary of the performance of certain service providers, a review of product initiatives and shareholder communications and an analysis of the Advisor’s profitability with comparisons to comparable peers in the managed fund business. As part of its annual review, the Board also held a separate meeting on April 18-19, 2012, to review the Fund’s investment performance and consider an analysis provided by the Advisor of the Sub-Advisor which generally evaluated the Sub-Advisor’s investment team, investment mandate, organizational structure and history, investment philosophy and process, performance of the Fund, and significant changes to the foregoing. As a result of its review of the materials and discussions, the Board presented the Advisor with questions and the Advisor responded.
The materials and information prepared in connection with the annual review of the Advisory Agreements supplement the information and analysis provided to the Board during the year. In this regard, throughout the year, the Board, acting directly or through its committees, regularly reviews the performance and various services provided by the Advisor and the Sub-Advisor. The Board meets at least quarterly as well as at other times as the need arises. At its quarterly meetings, the Board reviews reports by the Advisor which include, among other things, Fund performance, a review of the investment teams and reports on compliance, regulatory matters and risk management. The Board also meets with key investment personnel managing the Fund’s portfolio during the year. In October 2011, the Board also created two new standing committees (the Open-end Fund Committee and the Closed-end Fund Committee) to assist the full Board in monitoring and gaining a deeper insight into the distinctive issues and business practices of open-end and closed-end funds.
In addition, the Board continues its program of seeking to have the Board Members or a subset thereof visit each sub-advisor to the Nuveen funds at least once over a multiple year rotation, meeting with key investment and business personnel. Further, an ad hoc committee of the Board visited the then-current transfer agents of the Nuveen funds in 2011 and the audit committee of the Board visited the various pricing agents for the Nuveen funds in January 2012.
The Board considers factors and information that are relevant to its annual consideration of the renewal of the Advisory Agreements at the meetings held throughout the year. Accordingly, the Board considers the information provided and knowledge gained at these meetings when performing its annual review of the Advisory Agreements. The Independent Board Members are assisted throughout the process by independent legal counsel who provided materials describing applicable law and the duties of directors or trustees in reviewing advisory contracts and met with the Independent Board Members in executive sessions without management present. In addition, it is important to recognize that the management arrangements for the Nuveen funds are the result of many years of review and discussion between the Independent Board Members and fund management and that the Board Members’ conclusions may be based, in part, on their consideration of fee arrangements and other factors developed in previous years.
The Board considered all factors it believed relevant with respect to the Fund, including among other factors: (a) the nature, extent and quality of the services provided by the Fund Advisers, (b) the investment performance of the Fund and Fund Advisers, (c) the advisory fees and costs of the services to be provided to the Fund and the profitability of the Fund Advisers, (d) the extent of any economies of scale, (e) any benefits derived by the Fund Advisers from the relationship with the Fund and (f) other factors. Each Board Member may have accorded different weight to the various factors in reaching his or her conclusions with respect to the Fund’s Advisory Agreements. The Independent Board Members did not identify any single factor as all important or controlling. The Independent Board Members’ considerations were instead based on a comprehensive consideration of all the information presented. The principal factors considered by the Board and its conclusions are described below.
A. Nature, Extent and Quality of Services
In considering renewal of the Advisory Agreements, the Independent Board Members considered the nature, extent and quality of the Fund Adviser’s services, including advisory services and the resulting Fund performance and administrative services. The Independent Board Members further considered the overall reputation and capabilities of the Advisor and its affiliates, the commitment of the Advisor to provide high quality service to the Fund, their overall confidence in the Advisor’s integrity and the Advisor’s responsiveness
to questions and concerns raised by them. The Independent Board Members reviewed materials outlining, among other things, the Fund Adviser’s organization and business; the types of services that the Fund Adviser or its affiliates provide to the Fund; the performance record of the Fund (as described in further detail below); and any initiatives Nuveen had taken for the applicable fund product line.
In considering advisory services, the Board recognized that the Advisor provides various oversight, administrative, compliance and other services for the Fund and the Sub-Advisor generally provides the portfolio investment management services to the Fund. In reviewing the portfolio management services provided to the Fund, the Board reviewed the materials provided by the Nuveen Investment Services Oversight Team analyzing, among other things, the Sub-Advisor’s investment team and changes thereto, organization and history, assets under management, Fund objectives and mandate, the investment team’s philosophy and strategies in managing the Fund, developments affecting the Sub-Advisor or Fund and Fund performance. The Independent Board Members also reviewed portfolio manager compensation arrangements to evaluate each Fund Adviser’s ability to attract and retain high quality investment personnel, preserve stability, and reward performance but not provide an inappropriate incentive to take undue risks. In addition, the Board considered the Advisor’s execution of its oversight responsibilities over the Sub-Advisor. Given the importance of compliance, the Independent Board Members also considered Nuveen’s compliance program, including the report of the chief compliance officer regarding the Fund’s compliance policies and procedures; the resources dedicated to compliance; and the record of compliance with the policies and procedures.
In addition to advisory services, the Board considered the quality and extent of administrative and other non-investment advisory services the Advisor and its affiliates provide to the Fund, including product management, investment services (such as oversight of investment policies and procedures, risk management, and pricing), fund administration, oversight of service providers, shareholder services and communications, administration of Board relations, regulatory and portfolio compliance and legal support. The Board further recognized Nuveen’s additional investments in personnel, including in compliance and risk management. The Board Members noted, however, that the Fund is offered via separately managed accounts and may require less shareholder services than a typical open-end fund. In reviewing the services provided, the Board also reviewed materials describing various notable initiatives and projects the Advisor performed in connection with the open-end fund product line. These initiatives included efforts to eliminate product overlap through mergers or liquidations; commencement of various new funds; elimination of insurance mandates for various funds; updates in investment policies or guidelines for several funds; and reductions in management fees and expense caps for certain funds.
Based on their review, the Independent Board Members found that, overall, the nature, extent and quality of services provided to the Fund under each Advisory Agreement were satisfactory.
B. The Investment Performance of the Fund and Fund Advisers
The Board, including the Independent Board Members, reviewed and considered the performance history of the Fund over various time periods. Given its unique structure, the Fund does not have a performance peer group (i.e., comparable funds against which the Fund can compare its performance). In considering the performance of the Fund, the Board therefore considered the Fund’s historic performance, as well as the performance of recognized benchmarks. The Independent Board Members reviewed performance information including the Fund’s total return information and performance information for recognized benchmarks for the quarter, one-year and three-year periods ending December 31, 2011 and March 31, 2012. In this regard, the Board noted that the Fund underperformed its benchmark for the one-year period but outperformed its benchmark for the three-year period ending December 31, 2011.
The Independent Board Members noted that the investment experience of a particular shareholder in the Nuveen funds will vary depending on when such shareholder invests in the applicable fund, the class held (if multiple classes are offered in a fund) and the performance of the fund (or respective class) during that shareholder’s investment period. In addition, although the performance above reflects the performance results for the time periods ending as of the most recent calendar year end (unless otherwise indicated), the Board also recognized that selecting a different ending time period may derive different results. Furthermore, while the Board is cognizant of the relevant performance of a fund’s peer set and/or benchmark(s), the Board evaluated fund performance in light of the respective fund’s investment objectives, investment parameters and guidelines and recognized that the objectives, investment parameters and guidelines of peers and/or benchmarks may differ to some extent, thereby resulting in differences in performance results. Nevertheless, with respect to any Nuveen funds that the Board considers to have underperformed their peers and/or benchmarks from time to time, the Board monitors such funds closely and considers any steps necessary or appropriate to address such issues.
Based on their review, the Independent Board Members determined that the Fund’s investment performance had been satisfactory.
C. Fees, Expenses and Profitability
1. Fees and Expenses
The Independent Board Members recognized the unique fee structure of the Fund. The Fund does not pay the Advisor or Sub-Advisor a management fee and nearly all expenses are reimbursed by the Advisor. The Fund is sold via separately managed accounts. The Advisor therefore receives its advisory fees via the managed account management fee. Such fee is essentially a
Annual Investment Management Agreement Approval Process
(Unaudited) (continued)
blended rate comprised of Fund fees pro-rated to the portion of the total product represented by the Fund and the managed account fees associated with the proportion of individual securities in the overall product. Given the different fee structure, and distribution and account support requirements, the Independent Board Members recognized that the expenses incurred by the Fund (nearly all of which are reimbursed by the Advisor) are not comparable to any comparable group of unaffiliated funds or other Nuveen funds. Based on their review, the Independent Board Members determined that the Fund’s fee and expense arrangement was reasonable.
2. Comparisons with the Fees of Other Clients
The Independent Board Members further reviewed information regarding the nature of services and range of fees offered by the Advisor to other clients, including other separately managed accounts (both retail and institutional accounts), collective trusts, foreign investment funds offered by Nuveen and funds that are not offered by Nuveen but are sub-advised by one of Nuveen’s investment management teams. Similarly, the Independent Board Members also reviewed the pricing schedule or fees that the Sub-Advisor charges for similar investment management services for other Nuveen funds, funds of other sponsors (if any), and other clients (such as retail and/or institutional managed accounts). Generally, in evaluating the comparisons of fees, the Independent Board Members had noted that the fee rates charged to funds and other clients vary, among other things, because of the different services involved and the additional regulatory and compliance requirements associated with registered investment companies. With respect to the Fund, however, they recognized that the Fund is offered via separately managed accounts and therefore may not require or incur the costs of shareholder servicing to the same extent as typical open-end funds. Further, as noted, given the Fund’s unique fee and expense structure pursuant to which it does not pay management fees and expenses are reimbursed, comparisons with peers were not available.
3. Profitability of Fund Advisers
In conjunction with its review of fees, the Independent Board Members also considered the profitability of Nuveen for its advisory activities and its financial condition. The Independent Board Members reviewed the revenues and expenses of Nuveen’s advisory activities for the last two calendar years, the allocation methodology used in preparing the profitability data and an analysis of the key drivers behind the changes in revenues and expenses that impacted profitability in 2011. The Independent Board Members noted this information supplemented the profitability information requested and received during the year to help keep them apprised of developments affecting profitability (such as changes in fee waivers and expense reimbursement commitments). In this regard, the Independent Board Members noted that they have an Independent Board Member serve as a point person to review and keep them apprised of changes to the profitability analysis and/or methodologies during the year. The Independent Board Members also considered Nuveen’s revenues for advisory activities, expenses, and profit margin compared to that of various unaffiliated management firms with comparable assets under management (based on asset size and asset composition).
In reviewing profitability, the Independent Board Members recognized the Advisor’s continued investment in its business to enhance its services, including capital improvements to investment technology, updated compliance systems, and additional personnel in compliance, risk management, and product development as well as its ability to allocate resources to various areas of the Advisor as the need arises. In addition, in evaluating profitability, the Independent Board Members also recognized the subjective nature of determining profitability which may be affected by numerous factors including the allocation of expenses. Further, the Independent Board Members recognized the difficulties in making comparisons as the profitability of other advisers generally is not publicly available and the profitability information that is available for certain advisers or management firms may not be representative of the industry and may be affected by, among other things, the adviser’s particular business mix, capital costs, types of funds managed and expense allocations. Notwithstanding the foregoing, the Independent Board Members reviewed Nuveen’s methodology and assumptions for allocating expenses across product lines to determine profitability. In reviewing profitability, the Independent Board Members recognized Nuveen’s investment in its fund business. Based on their review, the Independent Board Members concluded that the Advisor’s level of profitability for its advisory activities was reasonable in light of the services provided.
With respect to sub-advisers affiliated with Nuveen, including the Sub-Advisor, the Independent Board Members reviewed the sub-adviser’s revenues, expenses and profitability margins (pre- and post-tax) for its advisory activities and the methodology used for allocating expenses among the internal sub-advisers. Based on their review, the Independent Board Members were satisfied that the Sub-Advisor’s level of profitability was reasonable in light of the services provided.
In evaluating the reasonableness of the compensation, the Independent Board Members also considered other amounts paid to a Fund Adviser by the Fund as well as any indirect benefits (such as soft dollar arrangements, if any) the Fund Adviser and its affiliates receive, or are expected to receive, that are directly attributable to the management of the Fund, if any. See Section E below for additional information on indirect benefits a Fund Adviser may receive as a result of its relationship with the Fund. Based on their review of the overall fee arrangements of the Fund, the Independent Board Members determined that the advisory fees and expenses of the Fund were reasonable.
D. Economies of Scale and Whether Fee Levels Reflect These Economies of Scale
With respect to economies of scale, the Independent Board Members have recognized the potential benefits resulting from the costs of a fund being spread over a larger asset base, although economies of scale are difficult to measure and predict with precision,
particularly on a fund-by-fund basis. One method to help ensure the shareholders share in these benefits is to include breakpoints in the advisory fee schedule. Generally, management fees for funds in the Nuveen complex are comprised of a fund-level component and a complex-level component, subject to certain exceptions. The Independent Board Members recognized, however, that the Fund does not have fund-level breakpoints given its unique structure.
In addition, pursuant to a complex-wide fee arrangement, the fees of the funds in the Nuveen complex are generally reduced as the assets in the fund complex reach certain levels. However, because the Fund does not pay a management fee, there is no applicable fund-level or complex-wide level breakpoint schedule, although its assets will be counted toward the complex-wide total.
Based on their review, the Independent Board Members concluded that the absence of a fund-level breakpoint schedule and a complex-wide fee arrangement was acceptable for the Fund.
E. Indirect Benefits
In evaluating fees, the Independent Board Members received and considered information regarding potential “fall out” or ancillary benefits the respective Fund Adviser or its affiliates may receive as a result of its relationship with the Fund. In this regard, the Independent Board Members considered, whether the Fund Advisers received any benefits from soft dollar arrangements whereby a portion of the commissions paid by the Fund for brokerage may be used to acquire research that may be useful to the Fund Adviser in managing the assets of the Fund and other clients. The Independent Board Members recognized that each Fund Adviser has the authority to pay a higher commission in return for brokerage and research services if it determines in good faith that the commission paid is reasonable in relation to the value of the brokerage and research services provided and may benefit from such soft dollar arrangements. Similarly, the Board recognized that the research received pursuant to soft dollar arrangements by a Fund Adviser may also benefit the Fund and shareholders to the extent the research enhances the ability of the Fund Adviser to manage the Fund. The Independent Board Members noted that the Fund Advisers’ profitability may be somewhat lower if they did not receive the research services pursuant to the soft dollar arrangements and had to acquire such services directly.
Based on their review, the Independent Board Members concluded that any indirect benefits received by a Fund Adviser as a result of its relationship with the Fund were reasonable and within acceptable parameters.
F. Other Considerations
The Independent Board Members did not identify any single factor discussed previously as all-important or controlling. The Board Members, including the Independent Board Members, unanimously concluded that the terms of each Advisory Agreement are fair and reasonable, that the respective Fund Adviser’s fees are reasonable in light of the services provided to the Fund and that the Advisory Agreements be renewed.
Notes
Notes
Glossary of Terms Used in this Report
Asset-backed securities (ABS): Securities whose value and income payments are derived from and collateralized (or “backed”) by a specified pool of underlying assets. The pools of underlying assets can include credit cards, auto loans, mortgages, aircraft leases, royalty payments, among others.
Average Annual Total Return: This is a commonly used method to express an investment’s performance over a particular, usually multi-year time period. It expresses the return that would have been necessary each year to equal the investment’s actual cumulative performance (including change in NAV or offer price and reinvested dividends and capital gains distributions, if any) over the time period being considered.
Barclays Credit/Mortgage Index: A market-weighted blend of the Barclays U.S. Credit Index and the Barclays MBS Index. The Barclays U.S. Credit Index includes both corporate and non-corporate sectors. The corporate sectors are industrial, utility, and finance, which include both U.S. and non-U.S. corporations. The non-corporate sectors are sovereign, supranational, foreign agency, and foreign local government. The Barclays Mortgage-backed Securities (MBS) Index is a market value-weighted index which covers the mortgage-backed securities component of the Barclays U.S. Aggregate Bond Index. The index is composed of agency mortgage-backed pass-through securities of the Government National Mortgage Association (Ginnie Mae), the Federal National Mortgage Association (Fannie Mae), and the Federal Home Loan Mortgage Corporation (Freddie Mac) with a minimum $150 million par amount outstanding and a weighted-average maturity of at least 1 year. Index returns assume reinvestment of dividends, but do not reflect any applicable sales charges or management fees.
Commercial Mortgage-Backed Securities (CMBS): Asset-backed securities that represents a claim on the cash flows from pools of mortgages on commercial properties.
Gross Domestic Product (GDP): The total market value of all final goods and services produced in a country/region in a given year, equal to total consumer, investment and government spending, plus the value of exports, minus the value of imports.
Net Asset Value (NAV): The net market value of all securities held in a portfolio.
Net Asset Value (NAV) Per Share: The market value of one share of a mutual fund or closed-end fund. For a Fund, the NAV is calculated daily by taking the Fund’s total assets (securities, cash, and accrued earnings), subtracting the Fund’s liabilities, and dividing by the number of shares outstanding.
Additional Fund Information
Fund Manager
Nuveen Fund Advisors, Inc.
333 West Wacker Drive
Chicago, IL 60606
Sub-Adviser
Nuveen Asset Management, LLC
333 West Wacker Drive
Chicago, IL 60606
Legal Counsel
Chapman and Cutler LLP
Chicago, IL
Independent Registered Public Accounting Firm
PricewaterhouseCoopers LLP
Chicago, IL
Custodian
State Street Bank & Trust Company
Boston, MA
Transfer Agent and Shareholder Services
Boston Financial
Data Services, Inc.
Nuveen Investor Services
P.O. Box 8530
Boston, MA 02266-8530
(800) 257-8787
Quarterly Portfolio of Investments and Proxy Voting Information: You may obtain (i) the Fund’s quarterly portfolio of investments, (ii) information regarding how the Fund voted proxies relating to portfolio securities held during the most recent twelve-month period ended June 30, and (iii) a description of the policies and procedures that the Fund used to determine how to vote proxies relating to portfolio securities without charge, upon request, by calling Nuveen Investments at (800) 257-8787 or on Nuveen’s website at www.nuveen.com.
You may also obtain this and other Fund information directly from the Securities and Exchange Commission (SEC). The SEC may charge a copying fee for this information. Visit the SEC on-line at http://www.sec.gov or in person at the SEC’s Public Reference Room in Washington, D.C. Call the SEC at (202) 942-8090 for room hours and operation. You may also request Fund information by sending an e-mail request to publicinfo@sec.gov or by writing to the SEC’s Public Reference Section at 100 F Street NE, Washington, D.C. 20549.
The Financial Industry Regulatory Authority (FINRA) provides a Public Disclosure Program which supplies certain information regarding the disciplinary history of FINRA members and their associated persons in response to either telephone inquiries at (800) 289-9999 or written inquiries at www.finra.org. FINRA also provides an investor brochure that includes information describing the Public Disclosure Program.
Nuveen Investments:
Serving Investors for Generations
Since 1898, financial advisors and their clients have relied on Nuveen Investments to provide dependable investment solutions through continued adherence to proven, long-term investing principles. Today, we offer a range of high quality equity and fixed-income solutions designed to be integral components of a well-diversified core portfolio.
Focused on meeting investor needs.
Nuveen Investments provides high-quality investment services designed to help secure the long-term goals of institutional and individual investors as well as the consultants and financial advisors who serve them. Nuveen Investments markets a wide range of specialized investment solutions which provide investors access to capabilities of its high-quality boutique investment affiliates-Nuveen Asset Management, Symphony Asset Management, NWQ Investment Management Company, Santa Barbara Asset Management, Tradewinds Global Investors, Winslow Capital Management, and Gresham Investment Management. In total, Nuveen Investments managed $212 billion as of June 30, 2012.
Find out how we can help you.
To learn more about how the products and services of Nuveen Investments may be able to help you meet your financial goals, talk to your financial advisor, or call us at (800) 257-8787. Please read the information provided carefully before you invest. Investors should consider the investment objective and policies, risk considerations, charges and expenses of any investment carefully. Where applicable, be sure to obtain a prospectus, which contains this and other relevant information. To obtain a prospectus, please contact your securities representative or Nuveen Investments, 333 W. Wacker Dr., Chicago, IL 60606. Please read the prospectus carefully before you invest or send money.
Learn more about Nuveen Funds at: www.nuveen.com/mf
| | |
Distributed by Nuveen Securities, LLC 333 West Wacker Drive Chicago, IL 60606 www.nuveen.com | | |
MAN-EIMAP-0712P
ITEM 2. CODE OF ETHICS.
As of the end of the period covered by this report, the registrant has adopted a code of ethics that applies to the registrant’s principal executive officer, principal financial officer, principal accounting officer or controller, or persons performing similar functions. There were no amendments to or waivers from the code during the period covered by this report. The registrant has posted the code of ethics on its website at www.nuveen.com/mf. (To view the code, click on the Shareholder Resources drop down menu box, click on Fund Governance and then click on Code of Conduct.)
ITEM 3. AUDIT COMMITTEE FINANCIAL EXPERT.
The registrant’s Board of Trustees determined that the registrant has at least one “audit committee financial expert” (as defined in Item 3 of Form N-CSR) serving on its Audit Committee. The registrant’s audit committee financial expert is Carole E. Stone, who is “independent” for purposes of Item 3 of Form N-CSR.
Ms. Stone served for five years as Director of the New York State Division of the Budget. As part of her role as Director, Ms. Stone was actively involved in overseeing the development of the State’s operating, local assistance and capital budgets, its financial plan and related documents; overseeing the development of the State’s bond-related disclosure documents and certifying that they fairly presented the State’s financial position; reviewing audits of various State and local agencies and programs; and coordinating the State’s system of internal audit and control. Prior to serving as Director, Ms Stone worked as a budget analyst/examiner with increasing levels of responsibility over a 30 year period, including approximately five years as Deputy Budget Director. Ms. Stone has also served as Chair of the New York State Racing Association Oversight Board, as Chair of the Public Authorities Control Board, as a Commissioner on the New York State Commission on Public Authority Reform and as a member of the Boards of Directors of several New York State public authorities. These positions have involved overseeing operations and finances of certain entities and assessing the adequacy of project/entity financing and financial reporting. Currently, Ms. Stone is on the Board of Directors of CBOE Holdings, Inc., of the Chicago Board Options Exchange, and of C2 Options Exchange. Ms. Stone’s position on the boards of these entities and as a member of both CBOE Holdings’ Audit Committee and its Finance Committee has involved, among other things, the oversight of audits, audit plans and preparation of financial statements.
ITEM 4. PRINCIPAL ACCOUNTANT FEES AND SERVICES.
The following tables show the amount of fees that PricewaterhouseCoopers LLP, the Trust’s auditor, billed to the Trust during the Trust’s last two full fiscal years. The Audit Committee approved in advance all audit services and non-audit services that PricewaterhouseCoopers LLP provided to the Trust, except for those non-audit services that were subject to the pre-approval exception under Rule 2-01 of Regulation S-X (the “pre-approval exception”). The pre-approval exception for services provided directly to the Trust waives the pre-approval requirement for services other than audit, review or attest services if: (A) the aggregate amount of all such services provided constitutes no more than 5% of the total amount of revenues paid by the Trust during the fiscal year in which the services are provided; (B) the Trust did not recognize the services as non-audit services at the time of the engagement; and (C) the services are promptly brought to the Audit Committee’s attention, and the Committee (or its delegate) approves the services before the audit is completed.
The Audit Committee has delegated certain pre-approval responsibilities to its Chairman (or, in his absence, any other member of the Audit Committee).
SERVICES THAT THE TRUST’S AUDITOR BILLED TO THE TRUST
| | | | | | | | | | | | | | | | |
Fiscal Year Ended July 31, 2012 | | Audit Fees Billed
to Funds 1 | | | Audit-Related Fees
Billed to Funds 2 | | | Tax Fees
Billed to Funds 3 | | | All Other Fees
Billed to Funds 4 | |
Name of Series | | | | | | | | | | | | | | | | |
Enhanced Multi-Strategy Income Managed Accounts Portfolio Fund | | | 36,625 | | | | 0 | | | | 0 | | | | 0 | |
Municipal Total Return Managed Accounts Portfolio Fund | | | 23,766 | | | | 0 | | | | 580 | | | | 0 | |
| | | | | | | | | | | | | | | | |
Total | | $ | 60,391 | | | $ | 0 | | | $ | 580 | | | $ | 0 | |
| 1 | | “Audit Fees” are the aggregate fees billed for professional services for the audit of the Fund’s annual financial statements and services provided in connection with statutory and regulatory filings or engagements. |
| 2 | | “Audit Related Fees” are the aggregate fees billed for assurance and related services reasonably related to the performance of the audit or review of financial statements and are not reported under “Audit Fees”. |
| 3 | | “Tax Fees” are the aggregate fees billed for professional services for tax advice, tax compliance, and tax planning. |
| 4 | | “All Other Fees” are the aggregate fees billed for products and services other than “Audit Fees”, “Audit Related Fees”, and “Tax Fees”. |
| | | | | | | | | | | | | | | | |
| | | Percentage Approved Pursuant to Pre-approval Exception | |
| | | Audit Fees Billed
to Funds | | | Audit-Related Fees
Billed to Funds | | | Tax Fees
Billed to Funds | | | All Other Fees
Billed to Funds | |
Name of Series | | | | | | | | | | | | | | | | |
Enhanced Multi-Strategy Income Managed Accounts Portfolio Fund | | | 0 | % | | | 0 | % | | | 0 | % | | | 0 | % |
Municipal Total Return Managed Accounts Portfolio Fund | | | 0 | % | | | 0 | % | | | 0 | % | | | 0 | % |
| | | | |
Fiscal Year Ended July 31, 2011 | | Audit Fees Billed
to Funds 1 | | | Audit-Related Fees
Billed to Funds 2 | | | Tax Fees
Billed to Funds 3 | | | All Other Fees
Billed to Funds 4 | |
Name of Series | | | | | | | | | | | | | | | | |
Enhanced Multi-Strategy Income Managed Accounts Portfolio Fund | | | 32,565 | | | | 0 | | | | 0 | | | | 0 | |
Municipal Total Return Managed Accounts Portfolio Fund | | | 12,164 | | | | 0 | | | | 565 | | | | 0 | |
| | | | | | | | | | | | | | | | |
Total | | $ | 44,729 | | | $ | 0 | | | $ | 565 | | | $ | 0 | |
| 1 | | “Audit Fees” are the aggregate fees billed for professional services for the audit of the Fund’s annual financial statements and services provided in connection with statutory and regulatory filings or engagements. |
| 2 | | “Audit Related Fees” are the aggregate fees billed for assurance and related services reasonably related to the performance of the audit or review of financial statements and are not reported under “Audit Fees”. |
| 3 | | “Tax Fees” are the aggregate fees billed for professional services for tax advice, tax compliance, and tax planning. |
| 4 | | “All Other Fees” are the aggregate fees billed for products and services other than “Audit Fees”, “Audit Related Fees”, and “Tax Fees”. |
| | | | | | | | | | | | | | | | |
| | | Percentage Approved Pursuant to Pre-approval Exception | |
| | | Audit Fees Billed
to Funds | | | Audit-Related Fees
Billed to Funds | | | Tax Fees
Billed to Funds | | | All Other Fees
Billed to Funds | |
Name of Series | | | | | | | | | | | | | | | | |
Enhanced Multi-Strategy Income Managed Accounts Portfolio Fund | | | 0 | % | | | 0 | % | | | 0 | % | | | 0 | % |
Municipal Total Return Managed Accounts Portfolio Fund | | | 0 | % | | | 0 | % | | | 0 | % | | | 0 | % |
| | | | | | | | | | | | |
Fiscal Year Ended July 31, 2012 | | Audit-Related Fees
Billed to Adviser and
Affiliated Fund
Service Providers | | | Tax Fees Billed to
Adviser and
Affiliated Fund
Service Providers | | | All Other Fees
Billed to Adviser
and Affiliated Fund
Service Providers | |
Nuveen Managed Accounts Portfolios Trust | | $ | 0 | | | $ | 0 | | | $ | 0 | |
| |
| | | Percentage Approved Pursuant to Pre-approval Exception | |
| | | Audit-Related Fees
Billed to Adviser and
Affiliated Fund
Service Providers | | | Tax Fees Billed to
Adviser and
Affiliated Fund
Service Providers | | | All Other Fees
Billed to Adviser
and Affiliated Fund
Service Providers | |
| | | 0 | % | | | 0 | % | | | 0 | % |
| | | |
Fiscal Year Ended July 31, 2011 | | Audit-Related Fees
Billed to Adviser and
Affiliated Fund
Service Providers | | | Tax Fees Billed to
Adviser and
Affiliated Fund
Service Providers | | | All Other Fees
Billed to Adviser
and Affiliated Fund
Service Providers | |
Nuveen Managed Accounts Portfolios Trust | | $ | 0 | | | $ | 0 | | | $ | 0 | |
| |
| | | Percentage Approved Pursuant to Pre-approval Exception | |
| | | Audit-Related Fees
Billed to Adviser and
Affiliated Fund
Service Providers | | | Tax Fees Billed to
Adviser and
Affiliated Fund
Service Providers | | | All Other Fees
Billed to Adviser
and Affiliated Fund
Service Providers | |
| | | 0 | % | | | 0 | % | | | 0 | % |
| | | | | | | | | | | | | | | | |
Fiscal Year Ended July 31, 2012 | | Total Non-Audit Fees
Billed to Trust | | | Total Non-Audit Fees
billed to Adviser and
Affiliated Fund Service
Providers (engagements
related directly to the
operations and financial
reporting of the Trust) | | | Total Non-Audit Fees
billed to Adviser and
Affiliated Fund Service
Providers (all other
engagements) | | | Total | |
Name of Series | | | | | | | | | | | | | | | | |
Enhanced Multi-Strategy Income Managed Accounts Portfolio Fund | | | 0 | | | | 0 | | | | 0 | | | | 0 | |
Municipal Total Return Managed Accounts Portfolio Fund | | | 580 | | | | 0 | | | | 0 | | | | 580 | |
| | | | | | | | | | | | | | | | |
Total | | $ | 580 | | | $ | 0 | | | $ | 0 | | | $ | 580 | |
“Non-Audit Fees Billed to Trust” represent “Tax Fees” and “All Other Fees” billed to each Fund in their respective amounts from the previous table.
| | | | | | | | | | | | | | | | |
Fiscal Year Ended July 31, 2011 | | Total Non-Audit Fees
Billed to Trust | | | Total Non-Audit Fees
billed to Adviser and
Affiliated Fund Service
Providers (engagements
related directly to the
operations and financial
reporting of the Trust) | | | Total Non-Audit Fees
billed to Adviser and
Affiliated Fund Service
Providers (all other
engagements) | | | Total | |
Name of Series | | | | | | | | | | | | | | | | |
Enhanced Multi-Strategy Income Managed Accounts Portfolio Fund | | | 0 | | | | 0 | | | | 0 | | | | 0 | |
Municipal Total Return Managed Accounts Portfolio Fund | | | 565 | | | | 0 | | | | 0 | | | | 565 | |
| | | | | | | | | | | | | | | | |
Total | | $ | 565 | | | $ | 0 | | | $ | 0 | | | $ | 565 | |
“Non-Audit Fees Billed to Trust” represent “Tax Fees” and “All Other Fees” billed to each Fund in their respective amounts from the previous table.
Audit Committee Pre-Approval Policies and Procedures. Generally, the Audit Committee must approve (i) all non-audit services to be performed for the Trust by the Trust’s independent accountants and (ii) all audit and non-audit services to be performed by the Trust’s independent accountants for the Affiliated Fund Service Providers with respect to the operations and financial reporting of the Trust. Regarding tax and research projects conducted by the independent accountants for the Trust and Affiliated Fund Service Providers (with respect to operations and financial reports of the Trust), such engagements will be (i) pre-approved by the Audit Committee if they are expected to be for amounts greater than $10,000; (ii) reported to the Audit Committee Chairman for his verbal approval prior to engagement if they are expected to be for amounts under $10,000 but greater than $5,000; and (iii) reported to the Audit Committee at the next Audit Committee meeting if they are expected to be for an amount under $5,000.
ITEM 5. AUDIT COMMITTEE OF LISTED REGISTRANTS.
Not applicable to this registrant.
ITEM 6. SCHEDULE OF INVESTMENTS.
| a) | | See Portfolio of Investments in Item 1. |
ITEM 7. DISCLOSURE OF PROXY VOTING POLICIES AND PROCEDURES FOR CLOSED-END
MANAGEMENT INVESTMENT COMPANIES.
Not applicable to this registrant.
ITEM 8. PORTFOLIO MANAGERS OF CLOSED-END MANAGEMENT INVESTMENT COMPANIES.
Not applicable to this registrant.
ITEM 9. PURCHASES OF EQUITY SECURITIES BY CLOSED-END MANAGEMENT INVESTMENT COMPANY AND AFFILIATED PURCHASERS.
Not applicable to this registrant.
ITEM 10. SUBMISSION OF MATTERS TO A VOTE OF SECURITY HOLDERS.
There have been no material changes to the procedures by which shareholders may recommend nominees to the registrant’s Board of Trustees implemented after the registrant last provided disclosure in response to this Item.
ITEM 11. CONTROLS AND PROCEDURES.
| | (a) | | The registrant’s principal executive and principal financial officers, or persons performing similar functions, have concluded that the registrant’s disclosure controls and procedures (as defined in Rule 30a-3(c) under the Investment Company Act of 1940, as amended (the “1940 Act”) (17 CFR 270.30a-3(c))) are effective, as of a date within 90 days of the filing date of this report that includes the disclosure required by this paragraph, based on their evaluation of the controls and procedures required by Rule 30a-3(b) under the 1940 Act (17 CFR 270.30a-3(b)) and Rules 13a-15(b) or 15d-15(b) under the Securities Exchange Act of 1934, as amended (the “Exchange Act”) (17 CFR 240.13a-15(b) or 240.15d-15(b)). |
| | (b) | | There were no changes in the registrant’s internal control over financial reporting (as defined in Rule 30a-3(d) under the 1940 Act (17 CFR 270.30a-3(d)) that occurred during the second fiscal quarter of the period covered by this report that has materially affected, or is reasonably likely to materially affect, the registrant’s internal control over financial reporting. |
ITEM 12. EXHIBITS.
File the exhibits listed below as part of this Form.
| | |
| (a)(1) | | Any code of ethics, or amendment thereto, that is the subject of the disclosure required by Item 2, to the extent that the registrant intends to satisfy the Item 2 requirements through filing of an exhibit: Not applicable because the code is posted on registrant’s website at www.nuveen.com/mf and there were no amendments during the period covered by this report. (To view the code, click on the Shareholder Resources drop down menu box, click on Fund Governance and then Code of Conduct.) |
| |
| (a)(2) | | A separate certification for each principal executive officer and principal financial officer of the registrant as required by Rule 30a-2(a) under the 1940 Act (17 CFR 270.30a-2(a)) in the exact form set forth below: See EX-99.CERT attached hereto. |
| |
| (a)(3) | | Any written solicitation to purchase securities under Rule 23c-1 under the 1940 Act (17 CFR 270.23c-1) sent or given during the period covered by the report by or on behalf of the registrant to 10 or more persons: Not applicable to this registrant. |
| |
| (b) | | If the report is filed under Section 13(a) or 15(d) of the Exchange Act, provide the certifications required by Rule 30a-2(b) under the 1940 Act (17 CFR 270.30a-2(b)), Rule 13a-14(b) or Rule 15d-14(b) under the Exchange Act (17 CFR 240.13a-14(b) or 240.15d-14(b)), and Section 1350 of Chapter 63 of Title 18 of the United States Code (18 U.S.C. 1350) as an Exhibit. A certification furnished pursuant to this paragraph will not be deemed “filed” for purposes of Section 18 of the Exchange Act (15 U.S.C. 78r), or otherwise subject to the liability of that section. Such certification will not be deemed to be incorporated by reference into any filing under the Securities Act of 1933 or the Exchange Act, except to the extent that the registration specifically incorporates it by reference: See EX-99.906 CERT attached hereto. |
SIGNATURES
Pursuant to the requirements of the Securities Exchange Act of 1934 and the Investment Company Act of 1940, the registrant has duly caused this report to be signed on its behalf by the undersigned, thereunto duly authorized.
(Registrant) Nuveen Managed Accounts Portfolios Trust
| | |
| |
By (Signature and Title) | | /s/ Kevin J. McCarthy |
| | Kevin J. McCarthy |
| | Vice President and Secretary |
Date: October 5, 2012
Pursuant to the requirements of the Securities Exchange Act of 1934 and the Investment Company Act of 1940, this report has been signed below by the following persons on behalf of the registrant and in the capacities and on the dates indicated.
| | |
| |
By (Signature and Title) | | /s/ Gifford R. Zimmerman |
| | Gifford R. Zimmerman |
| | Chief Administrative Officer |
| | (principal executive officer) |
Date: October 5, 2012
| | |
| |
| By (Signature and Title) | | /s/ Stephen D. Foy |
| | Stephen D. Foy |
| | Vice President and Controller |
| | (principal financial officer) |
Date: October 5, 2012