UNITED STATES
SECURITIES AND EXCHANGE COMMISSION
Washington, D.C. 20549
FORM N-CSR
CERTIFIED SHAREHOLDER REPORT OF REGISTERED MANAGEMENT
INVESTMENT COMPANIES
Investment Company Act file number 811-22023
Nuveen Managed Accounts Portfolios Trust
(Exact name of registrant as specified in charter)
Nuveen Investments
333 West Wacker Drive, Chicago, IL 60606
(Address of principal executive offices) (Zip code)
Kevin J. McCarthy
Nuveen Investments
333 West Wacker Drive
Chicago, IL 60606
(Name and address of agent for service)
Registrant’s telephone number, including area code: (312) 917-7700
Date of fiscal year end: July 31
Date of reporting period: July 31, 2015
Form N-CSR is to be used by management investment companies to file reports with the Commission not later than 10 days after the transmission to stockholders of any report that is required to be transmitted to stockholders under Rule 30e-1 under the Investment Company Act of 1940 (17 CFR 270.30e-1). The Commission may use the information provided on Form N-CSR in its regulatory, disclosure review, inspection, and policy making roles.
A registrant is required to disclose the information specified by Form N-CSR, and the Commission will make this information public. A registrant is not required to respond to the collection of information contained in Form N-CSR unless the Form displays a currently valid Office of Management and Budget (“OMB”) control number. Please direct comments concerning the accuracy of the information collection burden estimate and any suggestions for reducing the burden to Secretary, Securities and Exchange Commission, 450 Fifth Street, NW, Washington, DC 20549-0609. The OMB has reviewed this collection of information under the clearance requirements of 44 U.S.C. ss.3507.
ITEM 1. REPORTS TO STOCKHOLDERS.
| | |
| | |  |
| Mutual Fund | |
| | |
| | | |
| | | Nuveen Managed Accounts Portfolios Trust |
| | | | | | |
| | | | | | | Annual Report July 31, 2015 |
| | | | | | | | |
| | | | | | | Ticker Symbol | | |
| | | Fund Name | | | | | | |
|
| | Municipal Total Return Managed Accounts Portfolio | | | | NMTRX | | |
| | | | | | | | | | | | |
| | | | | | |
| | | | |
| | | | | | | | |
| | |
| | Life is Complex. | | |
| | |
| | Nuveen makes things e-simple. | | |
| | |
| | It only takes a minute to sign up for e-Reports. Once enrolled, you’ll receive an e-mail as soon as your Nuveen Fund information is ready. No more waiting for delivery by regular mail. Just click on the link within the e-mail to see the report and save it on your computer if you wish. | | |
| | | | |
| | | | | | Free e-Reports right to your e-mail! | | |
| | | |
| | | | | | www.investordelivery.com If you receive your Nuveen Fund distributions and statements from your
financial advisor or brokerage account. |
| | | | |
| | | | or | | www.nuveen.com/accountaccess If you receive your Nuveen Fund distributions and statements directly from Nuveen. Must be preceded by or accompanied by a prospectus. NOT FDIC INSURED MAY LOSE VALUE
NO BANK GUARANTEE | | |
| | | | | | | | | | |
| | | | | | | | | | | | | |

Table
of Contents
Chairman’s Letter
to Shareholders

Dear Shareholders,
For better or for worse, the financial markets have spent the past year waiting for the U.S. Federal Reserve (Fed) to end its ultra-loose monetary policy. The policy has propped up stock and bond markets since the Great Recession, but the question remains: how will markets behave without its influence? This uncertainty has been a considerable source of volatility for stock and bond prices lately, despite the Fed carefully conveying its intention to raise rates slowly and only when the economy shows evidence of readiness.
A large consensus expects at least one rate hike before the end of 2015. After all, the U.S. has reached “full employment” by the Fed’s standards and growth has resumed – albeit unevenly. But the picture remains somewhat uncertain. Inflation has remained stubbornly low, most recently weighed down by an unexpectedly sharp decline in commodity prices since mid-2014. With the Fed poised to tighten and foreign central banks easing, the U.S. dollar has surged against other currencies, which has weighed on corporate earnings and further contributed to commodity price weakness. U.S. consumers have benefited from an improved labor market and lower prices at the gas pump, but the overall pace of economic expansion has been lackluster.
Nevertheless, the global recovery continues to be led by the United States. Policy makers around the world are deploying their available tools to try to bolster Europe and Japan’s fragile growth, and manage China’s slowdown. Contagion fears ebb and flow with the headlines about Greece and China. Greece reluctantly agreed to a third bailout package from the European Union in July and China’s central bank and government intervened aggressively to try to stem the sell-off in stock prices. But persistent structural problems in these economies will continue to garner market attention.
Wall Street is fond of saying “markets don’t like uncertainty,” and asset prices are likely to continue to churn in the current macro environment. In times like these, you can look to a professional investment manager with the experience and discipline to maintain the proper perspective on short-term events. And if the daily headlines do concern you, I encourage you to reach out to your financial advisor. Your financial advisor can help you evaluate your investment strategies in light of current events, your time horizon and risk tolerance. On behalf of the other members of the Nuveen Fund Board, we look forward to continuing to earn your trust in the months and years ahead.
Sincerely,

William J. Schneider
Chairman of the Board
September 21, 2015
Portfolio Manager’s
Comments
Municipal Total Return Managed Accounts Portfolio
This Fund was developed exclusively for use within Nuveen-sponsored separately managed accounts and is a specialized municipal bond portfolio to be used in combination with selected individual securities to effectively model institutional-level investment strategies. The Fund enables certain Nuveen municipal separately managed account investors to achieve greater diversification and return potential than smaller managed accounts might otherwise achieve by using lower quality, higher yielding securities and to gain access to special investment opportunities normally available only to institutional investors.
The Fund is managed by Nuveen Asset Management LLC, an affiliate of Nuveen Investments, Inc. Martin J. Doyle, CFA, has served as manager for the Fund since its inception in 2007. Here he discusses U.S. municipal economy, the Fund’s investment strategy and its performance during the twelve-month reporting period ended July 31, 2015.
What factors affected the U.S. municipal market during the twelve-month reporting period ended July 31, 2015?
During this reporting period, the U.S. economy continued to expand at a moderate pace. The Federal Reserve (Fed) maintained efforts to bolster growth and promote progress toward its mandates of maximum employment and price stability by holding the benchmark fed funds rate at the record low level of zero to 0.25% that it established in December 2008. At its October 2014 meeting, the Fed announced that it would end its bond-buying stimulus program as of November 1, 2014, after tapering its monthly asset purchases of mortgage-backed and longer-term Treasury securities from the original $85 billion per month to $15 billion per month over the course of seven consecutive meetings (December 2013 through September 2014). In making the announcement, the Fed cited substantial improvement in the outlook for the labor market since the inception of the current asset purchase program as well as sufficient underlying strength in the broader economy to support ongoing progress toward maximum employment in a context of price stability. The Fed also reiterated that it would continue to look at a wide range of factors, including labor market conditions, indicators of inflationary pressures and readings on financial developments, in determining future actions. Additionally, the Fed stated that it would likely maintain the current target range for the fed funds rate for a considerable time after the end of the asset purchase program, especially if projected inflation continues to run below the Fed’s 2% longer run goal. However, if economic data shows faster progress, the Fed indicated that it could raise the fed funds rate sooner than expected.
The Fed changed its language slightly in December, indicating it would be “patient” in normalizing monetary policy. This shift helped ease investors’ worries that the Fed might raise rates too soon. However, as employment data released early in the year continued to look strong, anticipation began building that the Fed could raise its main policy rate as soon as June. As widely expected, after its March meeting, the Fed eliminated “patient” from its statement but also highlighted the policy makers’ less optimistic view of the economy’s overall health as well as downgraded their inflation projections. The Fed’s April meeting seemed to further signal that a June rate hike was off the table. While the Fed attributed the first quarter’s economic weakness to temporary factors, the meeting minutes from April revealed that many Committee members believed the economic data available in June would be insufficient to meet the Fed’s criteria for initiating a rate increase. The June meeting bore out that presumption, and the Fed decided
Certain statements in this report are forward-looking statements. Discussions of specific investments are for illustration only and are not intended as recommendations of individual investments. The forward-looking statements and other views expressed herein are those of the portfolio manager as of the date of this report. Actual future results or occurrences may differ significantly from those anticipated in any forward-looking statements and the views expressed herein are subject to change at any time, due to numerous market and other factors. The Fund disclaims any obligation to update publicly or revise any forward-looking statements or views expressed herein.
Ratings shown are the highest rating given by one of the following national rating agencies: Standard & Poor’s (S&P), Moody’s Investors Service, Inc. (Moody’s) or Fitch, Inc. (Fitch). Credit ratings are subject to change. AAA, AA, A and BBB are investment grade ratings; BB, B, CCC, CC, C and D are below investment grade ratings. Certain bonds backed by U.S. Government or agency securities are regarded as having an implied rating equal to the rating of such securities. Holdings designated N/R are not rated by these national rating agencies.
Bond insurance guarantees only the payment of principal and interest on the bond when due, and not the value of the bonds themselves, which will fluctuate with the bond market and the financial success of the issuer and the insurer. Insurance relates specifically to the bonds in the portfolio and not to the share prices of a fund. No representation is made as to the insurers’ ability to meet their commitments.
Refer to the Glossary of Terms Used in this Report for further definition of the terms used within this section.
Portfolio Manager’s Comments (continued)
to keep the target rate near zero. But the Committee also continued to telegraph the likelihood of at least one rate increase in 2015, which many analysts forecasted for September. During the September 2015 meeting (subsequent to the close of this reporting period), the Fed decided to keep the federal funds rate near zero despite broad speculation it would increase rates. The Committee said it will keep the rate near zero until the economy has seen further improvement toward reaching the Fed’s goals of maximum employment and inflation approaching two percent.
According to the government’s revised estimate, the U.S. economy increased at a 3.7% annualized rate in the second quarter of 2015, as measured by GDP, compared with a decrease of 0.6% in the first quarter of 2015 and increases of 5.0% in the third quarter 2014 and 2.2% in the fourth quarter 2014. The increase in real GDP in the second quarter reflected positive contributions from personal consumption expenditures, exports, state and local government spending, and residential fixed investment that were partly offset by negative contributions from federal government spending, private inventory investment, and nonresidential fixed investment. The Consumer Price Index (CPI) increased 0.1% year-over-year as of July 2015. The core CPI (which excludes food and energy) increased 0.1% during the same period, below the Fed’s unofficial longer term inflation objective of 2.0%. As of July 2015, the U.S. unemployment rate was 5.3%, a level not seen since mid-2008. This figure is also considered “full employment” by some Fed officials. The housing market continued to post consistent gains as of its most recent reading in June 2015. The average home price in the S&P/Case-Shiller Index of 20 major metropolitan areas rose 4.5% for the twelve months ended June 2015 (most recent data available at the time this report was prepared).
Municipal bonds enjoyed strong performance during the twelve-month reporting period, buoyed by a backdrop of low interest rates, improving investor sentiment and favorable supply-demand dynamics. Interest rates were widely expected to rise in 2015, as the economy improved and the Fed wound down its asset purchases. However, the 10-year Treasury yield ended the reporting period even lower than where it began. As a result, fixed income asset classes performed surprisingly well (as yields fall, prices rise and vice versa). At the same time, investors grew more confident that the Fed’s tapering would proceed at a measured pace and that the credit woes of Detroit and Puerto Rico would be contained. In addition, credit fundamentals for state and local governments were generally stabilizing, although pockets of trouble remained. California and New York showed marked improvements during 2014, whereas Illinois, New Jersey and Puerto Rico, still face considerable challenges.
How did the Fund perform during the twelve-month reporting period ended July 31, 2015?
The table in the Performance and Expense Ratios section of this report provides total return performance for the Fund for the one-year, five-year and since inception periods ended July 31, 2015. The Fund’s Class I Share total returns at net asset value (NAV) outperformed the Barclays 7-Year Municipal Bond Index during the twelve-month reporting period ended July 31, 2015.
What strategies were used to manage the Fund during the reporting period and how did these strategies influence performance?
The Fund uses a value-oriented strategy and looks for higher yielding and undervalued municipal bonds that offer the potential for above average total return. The Fund invests in various types of municipal securities, including investment grade (rated BBB/Baa or better), below investment grade (rated BB/Ba or lower) and unrated municipal securities. The Fund focuses on securities with intermediate to longer term maturities.
During the reporting period, longer maturities and durations outperformed shorter maturities and duration. The Fund had a much higher weighting to longer bonds than the benchmark. This higher weighting contributed to the Fund’s outperformance. We continued to increase the Fund’s exposure to longer duration securities to capitalize on a comparatively steep yield curve and sought improved call protection to maintain the Fund’s income sustainability.
Also during the reporting period, mid to lower credit quality bonds generally outperformed higher grade bonds. The Fund’s overweight to single-A rated, BBB rated and lower rated bonds contributed to the Fund’s relative performance.
During portions of the reporting period, there was a decline in municipal new issuance, which coupled with inflows into the market, provided technical support to much of the municipal market. This contributed to performance.
Revenue bonds were top contributors led by an overweight in the health care sector, while very short duration holdings (less than 3 years) and cash were negative performance factors.
Risk Considerations
and Dividend Information
Risk Considerations
Mutual fund investing involves risk; principal loss is possible. Debt or fixed income securities such as those held by the Fund, are subject to market risk, credit risk, interest rate risk, call risk, tax risk, political and economic risk, and income risk. As interest rates rise, bond prices fall. Credit risk refers to an issuers ability to make interest and principal payments when due. Below investment grade or high yield debt securities are subject to liquidity risk and heightened credit risk. The Fund’s potential use of inverse floaters creates effective leverage. Leverage involves the risk that the Fund could lose more than its original investment and also increases the Fund’s exposure to volatility and interest rate risk.
Dividend Information
The Fund seeks to pay regular monthly dividends out of its net investment income at a rate that reflects its past and projected net income performance. To permit the Fund to maintain a more stable monthly dividend, the Fund may pay dividends at a rate that may be more or less than the amount of net income actually earned by the Fund during the period. If the Fund has cumulatively earned more than it has paid in dividends, it will hold the excess in reserve as undistributed net investment income (UNII) as part of the Fund’s net asset value. Conversely, if the Fund has cumulatively paid in dividends more than it has earned, the excess will constitute a negative UNII that will likewise be reflected in the Fund’s net asset value. The Fund will, over time, pay all its net investment income as dividends to shareholders.
As of July 31, 2015, the Fund had a positive UNII balance for tax purposes and a negative UNII balance for financial reporting purposes.
All monthly dividends paid by the Fund during the current reporting period, were paid from net investment income. If a portion of the Fund’s monthly distributions was sourced from or comprised of elements other than net investment income, including capital gains and/or a return of capital, shareholders would have received a notice to that effect. For financial reporting purposes, the composition and per share amounts of the Fund’s dividends for the reporting period are presented in this report’s Statement of Changes in Net Assets and Financial Highlights, respectively. For income tax purposes, distribution information for the Fund as of its most recent tax year end is presented in Note 6 – Income Tax Information within the Notes to Financial Statements of this report.
THIS PAGE INTENTIONALLY LEFT BLANK
Fund Performance, Expense Ratios
and Effective Leverage Ratios
This is a specialized municipal bond Fund developed exclusively for use within Nuveen-sponsored separately managed accounts.
Returns quoted represent past performance, which is no guarantee of future results. Current performance may be higher or lower than the performance shown. Investment returns and principal value will fluctuate so that when shares are redeemed, they may be worth more or less than their original cost. Returns do not reflect the deduction of taxes that a shareholder would pay on Fund distributions or the redemption of Fund shares. Income is generally exempt from regular federal income taxes. Some income may be subject to state and local income taxes and to the federal alternative minimum tax. Capital gains, if any, are subject to tax.
Returns may reflect an agreement by the investment adviser to waive certain fees and/or reimburse expenses during the periods presented. If any such waivers and/or reimbursements had not been in place, returns would have been reduced. See Notes to Financial Statements, Note 7—Management Fees and Other Transactions with Affiliates for more information. For the most recent month-end performance call (800) 257-8787.
Fund shares have no sales charge. Fund returns assume reinvestment of dividends and capital gains.
The expense ratios shown reflect total operating expenses (before fee waivers and/or expense reimbursements) as shown in the most recent prospectus.
Leverage is created whenever the Fund has investment exposure (both reward and/or risk) equivalent to more than 100% of the investment capital. The effective leverage ratio shown is the amount of investment exposure created either through borrowings or indirectly through inverse floaters, divided by the assets invested, including those assets that were purchased with the proceeds of the leverage, or referenced by the levered instrument.
Fund Performance, Expense Ratios and Effective Leverage Ratios (continued)
Municipal Total Return Managed Accounts Portfolio
Refer to the first page of this Fund Performance, Expense Ratios and Effective Leverage Ratios section for further explanation of the information included within this section. Refer to the Glossary of Terms Used in this Report for definitions of terms used within this section.
Fund Performance
Average Annual Total Returns as of July 31, 2015
| | | | | | | | | | | | |
| | | Average Annual | |
| | | 1-Year | | | 5-Year | | | Since
Inception | |
Class I Shares | | | 5.96% | | | | 6.27% | | | | 6.18% | |
Barclays 7-Year Municipal Bond Index | | | 2.55% | | | | 3.88% | | | | 5.06% | |
Average Annual Total Returns as of June 30, 2015 (Most Recent Calendar Quarter)
| | | | | | | | | | | | |
| | | Average Annual | |
| | | 1-Year | | | 5-Year | | | Since
Inception | |
Class I Shares | | | 5.23% | | | | 6.35% | | | | 6.12% | |
Since inception returns are from 5/31/07. The index is not available for direct investment.
Expense Ratios as of Most Recent Prospectus
| | | | |
| | | Share Class | |
| | | Class I | |
Gross Expense Ratios | | | 0.09% | |
Net Expense Ratios | | | 0.00% | |
The Fund’s investment adviser has agreed irrevocably during the existence of the Fund to waive all fees and pay or reimburse all expenses of the Fund, except for interest expense, taxes, fees incurred in acquiring and disposing of portfolio securities and extraordinary expenses.
Effective Leverage Ratio as of July 31, 2015
| | | | |
Effective Leverage Ratio | | | 9.35% | |
Growth of an Assumed $10,000 Investment as of July 31, 2015 – Class I Shares
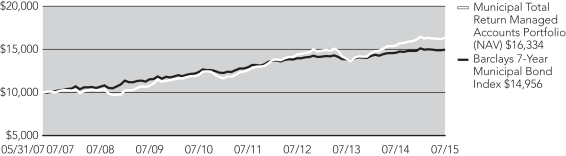
The graphs do not reflect the deduction of taxes, such as state and local income taxes or capital gains taxes, that a shareholder may pay on Portfolio distributions or the redemption of Fund shares.
Yields as of July 31, 2015
Dividend Yield is the most recent dividend per share (annualized) divided by the offering price per share.
The SEC 30-Day Yield is a standardized measure of a Fund’s yield that accounts for the future amortization of premiums or discounts of bonds held in the Fund’s portfolio. The SEC 30-Day Yield is computed under an SEC standardized formula and is based on the maximum offer price per share. Subsidized yields reflect fee waivers and/or expense reimbursements from the investment adviser during the period. If any such waivers and/or reimbursements had not been in place, yields would have been reduced. Unsubsidized yields do not reflect waivers and/or reimbursements from the investment adviser during the period. Refer to the Fund Performance and Expense Ratios page for further details on the investment adviser’s most recent agreement with the Fund to waive fees and/or reimburse expenses, where applicable. Dividend Yield may differ from the SEC 30-Day Yield because the Fund may be paying out more or less than it is earning and it may not include the effect of amortization of bond premium.
The Taxable-Equivalent Yield represents the yield that must be earned on a fully taxable investment in order to equal the yield of the Fund on an after-tax basis at a specified tax rate. With respect to investments that generate qualified dividend income that is taxable at a maximum rate of 15%, the Taxable-Equivalent Yield is lower.
| | | | |
| | | Share Class | |
| | | Class I | |
Dividend Yield | | | 3.86% | |
SEC 30-Day Yield – Subsidized | | | 3.24% | |
SEC 30-Day Yield – Unsubsidized | | | 3.18% | |
Taxable-Equivalent Yield – Subsidized (28.0%)1 | | | 4.50% | |
Taxable-Equivalent Yield – Unsubsidized (28.0%)1 | | | 4.42% | |
| 1 | The Taxable-Equivalent Yield is based on the Fund’s SEC 30-Day Yield on the indicated date and a federal income tax rate as shown in the table above. |
Holding
Summaries as of July 31, 2015
This data relates to the securities held in the portfolio of investments as of the end of this reporting period. It should not be construed as a measure of performance for the Fund itself. Holdings are subject to change.
Ratings shown are the highest rating given by one of the following national rating agencies: Standard & Poor’s, Moody’s Investors Service, Inc. or Fitch, Inc. Credit ratings are subject to change. AAA, AA, A and BBB are investment grade ratings; BB, B, CCC, CC, C and D are below investment grade ratings. Certain bonds backed by U.S. Government or agency securities are regarded as having an implied rating equal to the rating of such securities. Holdings designated N/R are not rated by these national rating agencies.
Refer to the Glossary of Terms Used in this Report for definitions of terms used within this section.
Fund Allocation
(% of net assets)
| | | | |
Long-Term Municipal Bonds | | | 98.4% | |
Short-Term Municipal Bonds | | | 0.8% | |
Other Assets Less Liabilities | | | 2.2% | |
Net Assets Plus Floating Rate Obligations | | | 101.4% | |
Floating Rate Obligations | | | (1.4)% | |
Net Assets | | | 100% | |
Bond Credit Quality
(% of total investment exposure)
| | | | |
AAA/U.S. Guaranteed | | | 12.5% | |
AA | | | 35.4% | |
A | | | 21.1% | |
BBB | | | 19.9% | |
BB or Lower | | | 7.3% | |
N/R (not rated) | | | 3.8% | |
Total | | | 100% | |
Portfolio Composition
(% of total investments)
| | | | |
Education and Civic Organizations | | | 17.3% | |
Tax Obligation/General | | | 15.7% | |
Health Care | | | 15.1% | |
Tax Obligation/Limited | | | 15.1% | |
Transportation | | | 13.6% | |
Utilities | | | 6.3% | |
Consumer Staples | | | 5.6% | |
Other | | | 11.3% | |
Total | | | 100% | |
States and Territories
(% of total investments)
| | | | |
Texas | | | 12.4% | |
California | | | 9.8% | |
New York | | | 6.7% | |
Florida | | | 5.9% | |
Washington | | | 5.6% | |
Pennsylvania | | | 5.0% | |
Illinois | | | 4.7% | |
Indiana | | | 3.8% | |
Colorado | | | 3.3% | |
Virginia | | | 2.7% | |
Wisconsin | | | 2.5% | |
Idaho | | | 2.2% | |
Arizona | | | 2.2% | |
North Carolina | | | 2.2% | |
Minnesota | | | 2.1% | |
Maryland | | | 2.1% | |
Ohio | | | 1.7% | |
Guam | | | 1.7% | |
Louisiana | | | 1.6% | |
Kansas | | | 1.6% | |
Mississippi | | | 1.4% | |
Other | | | 18.8% | |
Total | | | 100% | |
Expense
Examples
As a shareholder of the Fund, you may incur two types of costs: (1) transaction costs, including up-front and back-end sales charges (loads) or redemption fees, where applicable; and (2) ongoing costs, including management fees; distribution and service (12b-1) fees, where applicable; and other Fund expenses. The Examples below are intended to help you understand your ongoing costs (in dollars) of investing in the Fund and to compare these costs with the ongoing costs of investing in other mutual funds.
The Examples below are based on an investment of $1,000 invested at the beginning of the period and held through the period ended July 31, 2015.
The beginning of the period is February 1, 2015.
The information under “Actual Performance,” together with the amount you invested, allows you to estimate actual expenses incurred over the reporting period. Simply divide your account value by $1,000 (for example, an $8,600 account value divided by $1,000 = 8.60) and multiply the result by the cost shown for your share class, in the row entitled “Expenses Incurred During Period” to estimate the expenses incurred on your account during this period.
The information under “Hypothetical Performance,” provides information about hypothetical account values and hypothetical expenses based on the Fund’s actual expense ratio and an assumed rate of return of 5% per year before expenses, which is not the Fund’s actual return. The hypothetical account values and expenses may not be used to estimate the actual ending account balance or expense you incurred for the period. You may use this information to compare the ongoing costs of investing in the Fund and other funds. To do so, compare this 5% hypothetical example with the 5% hypothetical examples that appear in the shareholder reports of the other funds.
Please note that the expenses shown in the table are meant to highlight your ongoing costs only and do not reflect any transaction costs. Therefore, the hypothetical information is useful in comparing ongoing costs only, and will not help you determine the relative total costs of owning different funds or share classes. In addition, if these transaction costs were included, your costs would have been higher.
| | | | |
| | | Share Class | |
| | | Class I | |
Actual Performance | | | | |
Beginning Account Value | | $ | 1,000.00 | |
Ending Account Value | | $ | 993.60 | |
Expenses Incurred During Period | | $ | — | |
Hypothetical Performance (5% annualized return before expenses) | | | | |
Beginning Account Value | | $ | 1,000.00 | |
Ending Account Value | | $ | 1,024.79 | |
Expenses Incurred During Period | | $ | — | |
Expenses are equal to the Fund’s annualized net expense ratio of 0.00% for the six-month period.
Report of
Independent Registered Public Accounting Firm
To the Board of Trustees and Shareholders of
Nuveen Managed Accounts Portfolios Trust:
In our opinion, the accompanying statement of assets and liabilities, including the portfolio of investments, and the related statements of operations and of changes in net assets and the financial highlights present fairly, in all material respects, the financial position of Municipal Total Return Managed Accounts Portfolio (a series of the Nuveen Managed Accounts Portfolios Trust, hereinafter referred to as the “Fund”) at July 31, 2015, the results of its operations for the year then ended, the changes in its net assets for each of the two years in the period then ended and the financial highlights for each of the five years in the period then ended, in conformity with accounting principles generally accepted in the United States of America. These financial statements and financial highlights (hereafter referred to as “financial statements”) are the responsibility of the Fund’s management. Our responsibility is to express an opinion on these financial statements based on our audit. We conducted our audits of these financial statements in accordance with the standards of the Public Company Accounting Oversight Board (United States). Those standards require that we plan and perform the audit to obtain reasonable assurance about whether the financial statements are free of material misstatement. An audit includes examining, on a test basis, evidence supporting the amounts and disclosures in the financial statements, assessing the accounting principles used and significant estimates made by management, and evaluating the overall financial statement presentation. We believe that our audits, which included confirmation of securities at July 31, 2015 by correspondence with the custodian and brokers, provide a reasonable basis for our opinion.
PricewaterhouseCoopers LLP
Chicago, IL
September 25, 2015
Municipal Total Return Managed Accounts Portfolio
| | |
| Portfolio of Investments | | July 31, 2015 |
| | | | | | | | | | | | | | | | | | |
Principal
Amount (000) | | | Description (1) | | | | Optional Call
Provisions (2) | | | Ratings (3) | | | Value | |
| | | | | |
| | | | LONG-TERM INVESTMENTS – 98.4% | | | | | | | | | | | | | | |
| | | | | |
| | | | MUNICIPAL BONDS – 98.4% | | | | | | | | | | | | | | |
| | | | | |
| | | | National – 0.4% | | | | | | | | | | | |
| | | | | |
| | | | MuniMae Tax-Exempt Bond Subsidiary Redeemable Preferred Shares, Multifamily Housing Pool: | | | | | | | | | | | | | | |
| $ | 355 | | | 5.000%, 4/30/28 (Mandatory put 1/31/18) (Alternative Minimum Tax) | | | | | 1/18 at 100.00 | | | | Ba1 | | | $ | 385,175 | |
| | 1,000 | | | 5.750%, 6/30/50 (Mandatory put 9/30/19) (Alternative Minimum Tax) | | | | | 1/15 at 100.00 | | | | Ba2 | | | | 1,069,980 | |
| | 1,355 | | | Total National | | | | | | | | | | | | | 1,455,155 | |
| | | | | |
| | | | Alabama – 0.7% | | | | | | | | | | | |
| | | | | |
| | 850 | | | Alabama State Board of Education, Revenue Bonds, Faulkner State Community College,
Series 2009, 6.125%, 10/01/28 | | | | | 10/18 at 100.00 | | | | A1 | | | | 971,304 | |
| | | | | |
| | 500 | | | Auburn University, Alabama, General Fee Revenue Bonds, Series 2011A, 5.000%, 6/01/41 | | | | | 6/21 at 100.00 | | | | Aa2 | | | | 555,645 | |
| | | | | |
| | 1,270 | | | DCH Health Care Authority, Alabama, Healthcare Facilities Revenue Bonds,
Refunding Series 2015, 5.000%, 6/01/33 (WI/DD, Settling 8/12/15) | | | | | 6/25 at 100.00 | | | | A | | | | 1,401,140 | |
| | 2,620 | | | Total Alabama | | | | | | | | | | | | | 2,928,089 | |
| | | | | |
| | | | Alaska – 0.4% | | | | | | | | | | | |
| | | | | |
| | | | Northern Tobacco Securitization Corporation, Alaska, Tobacco Settlement Asset-Backed Bonds, Series 2006A: | | | | | | | | | | | | | | |
| | 515 | | | 4.625%, 6/01/23 | | | | | 12/15 at 100.00 | | | | Ba1 | | | | 515,000 | |
| | 1,385 | | | 5.000%, 6/01/46 | | | | | 12/15 at 100.00 | | | | B | | | | 1,063,445 | |
| | 1,900 | | | Total Alaska | | | | | | | | | | | | | 1,578,445 | |
| | | | | |
| | | | Arizona – 2.2% | | | | | | | | | | | |
| | | | | |
| | 1,000 | | | Arizona Health Facilities Authority, Hospital Revenue Bonds, Banner Health Systems,
Tender Option Bond Trust 2015-XF2046, 17.621%, 1/01/20 (IF) (4) | | | | | No Opt. Call | | | | AA– | | | | 1,330,080 | |
| | | | | |
| | 1,010 | | | Arizona Health Facilities Authority, Hospital Revenue Bonds, Phoenix Children’s Hospital, Series 2013D, 5.000%, 2/01/28 | | | | | 2/23 at 100.00 | | | | BBB+ | | | | 1,110,869 | |
| | | | | |
| | 1,000 | | | Phoenix Civic Improvement Corporation, Arizona, Senior Lien Airport Revenue Bonds, Refunding Series 2013, 5.000%, 7/01/28 (Alternative Minimum Tax) | | | | | 7/23 at 100.00 | | | | AA– | | | | 1,127,590 | |
| | | | | |
| | 735 | | | Pima County Industrial Development Authority, Arizona, Charter School Revenue Bonds, Cambridge Academy-East, Inc. Project, Series 2010, 5.875%, 4/01/22 | | | | | 4/20 at 100.00 | | | | BB– | | | | 737,587 | |
| | | | | |
| | 500 | | | Salt River Project Agricultural Improvement and Power District, Arizona, Electric System Revenue Bonds, Tender Option Bond Trust 10-9W, 17.580%, 1/01/38 (IF) (4) | | | | | 1/18 at 100.00 | | | | Aa1 | | | | 658,560 | |
| | | | | |
| | | | Yavapai County Industrial Development Authority, Arizona, Education Revenue Bonds,
Arizona Agribusiness and Equine Center Inc Project, Refunding Series 2015: | | | | | | | | | | | | | | |
| | 290 | | | 3.900%, 9/01/24 | | | | | No Opt. Call | | | | BB+ | | | | 291,972 | |
| | 1,500 | | | 5.000%, 9/01/34 | | | | | 3/25 at 100.00 | | | | BB+ | | | | 1,505,610 | |
| | | | | |
| | 350 | | | Yavapai County Industrial Development Authority, Arizona, Education Revenue Bonds,
Arizona Agribusiness and Equine Center Inc Project, Series 2012, 4.625%, 3/01/22 | | | | | No Opt. Call | | | | BB+ | | | | 370,115 | |
| | | | | |
| | 325 | | | Yavapai County Industrial Development Authority, Arizona, Education Revenue Bonds,
Arizona Agribusiness and Equine Center, Inc. Project, Series 2011, 7.625%, 3/01/31 | | | | | 3/21 at 100.00 | | | | BB+ | | | | 375,980 | |
| | | | | |
| | 40 | | | Yuma County Industrial Development Authority, Arizona, Exempt Revenue Bonds, Far West Water & Sewer Inc. Refunding, Series 2007A, 6.500%, 12/01/17 (Alternative Minimum Tax) | | | | | No Opt. Call | | | | N/R | | | | 38,145 | |
| | | | | | | | | | | | | | | | | | |
Principal
Amount (000) | | | Description (1) | | | | Optional Call
Provisions (2) | | | Ratings (3) | | | Value | |
| | | | | |
| | | | Arizona (continued) | | | | | | | | | | | |
| | | | | |
| $ | 1,000 | | | Yuma Industrial Development Authority, Arizona, Hospital Revenue Bonds, Yuma Regional Medical Center, Series 2014A, 5.000%, 8/01/24 | | | | | No Opt. Call | | | | A– | | | $ | 1,158,290 | |
| | 7,750 | | | Total Arizona | | | | | | | | | | | | | 8,704,798 | |
| | | | | |
| | | | California – 9.6% | | | | | | | | | | | |
| | | | | |
| | 500 | | | ABAG Finance Authority for Non-Profit Corporations, California, Revenue Bonds, Casa de Lad Campanas, Series 2010, 6.000%, 9/01/37 | | | | | 9/20 at 100.00 | | | | AA– | | | | 584,860 | |
| | | | | |
| | 700 | | | Anaheim Public Financing Authority, California, Revenue Bonds, Electric System Distribution Series 1999, 5.000%, 10/01/25 (Pre-refunded 10/01/15) — AMBAC Insured | | | | | 10/15 at 100.00 | | | | N/R (5) | | | | 705,635 | |
| | | | | |
| | 2,915 | | | California County Tobacco Securitization Agency, Tobacco Settlement Asset-Backed Bonds, Kern County Tobacco Funding Corporation, Refunding Series 2014, 4.000%, 6/01/29 | | | | | 12/15 at 100.00 | | | | BBB+ | | | | 2,915,466 | |
| | | | | |
| | 655 | | | California Educational Facilities Authority, Revenue Bonds, Stanford University,
Series 2013-U3, 5.000%, 6/01/43 | | | | | No Opt. Call | | | | AAA | | | | 848,205 | |
| | | | | |
| | 500 | | | California Educational Facilities Authority, Revenue Bonds, University of Southern California, Tender Option Bond Trust 3144, 19.722%, 10/01/16 (IF) | | | | | No Opt. Call | | | | Aa1 | | | | 735,840 | |
| | | | | |
| | 1,000 | | | California Health Facilities Financing Authority, Revenue Bonds, Catholic Healthcare West,
Series 2009F, 5.625%, 7/01/25 | | | | | 7/19 at 100.00 | | | | A | | | | 1,143,920 | |
| | | | | |
| | 300 | | | California Municipal Finance Authority Charter School Revenue Bonds, Albert Einstein Academies Project, Series 2013A , 6.000%, 8/01/23 | | | | | No Opt. Call | | | | BB | | | | 333,144 | |
| | | | | |
| | | | California Municipal Finance Authority, Charter School Revenue Bonds, Partnerships to Uplift Communities Project, Series 2012A: | | | | | | | | | | | | | | |
| | 295 | | | 4.750%, 8/01/22 | | | | | No Opt. Call | | | | BB+ | | | | 317,131 | |
| | 675 | | | 5.000%, 8/01/32 | | | | | No Opt. Call | | | | BB+ | | | | 701,190 | |
| | | | | |
| | 840 | | | California Municipal Finance Authority, Charter School Revenue Bonds, Rocketship Education Multiple Projects, Series 2014A , 6.000%, 6/01/23 | | | | | 6/22 at 102.00 | | | | N/R | | | | 899,447 | |
| | | | | |
| | 735 | | | California Municipal Finance Authority, Mobile Home Park Senior Revenue Bonds, Caritas Affordable Housing, Inc. Projects, Series 2014A, 5.000%, 8/15/30 | | | | | 8/24 at 100.00 | | | | BBB | | | | 809,015 | |
| | | | | |
| | 1,300 | | | California Municipal Finance Authority, Revenue Bonds, Eisenhower Medical Center,
Series 2010A, 5.500%, 7/01/30 | | | | | 7/20 at 100.00 | | | | Baa2 | | | | 1,409,434 | |
| | | | | |
| | 755 | | | California School Finance Authority, Charter School Revenue Bonds, Coastal Academy Project, Series 2013A, 5.000%, 10/01/33 | | | | | 10/22 at 100.00 | | | | BBB– | | | | 785,766 | |
| | | | | |
| | 605 | | | California School Finance Authority, Educational Facility Revenue Bonds, New Designs Charter School Project, Series 2012C, 4.250%, 6/01/17 | | | | | No Opt. Call | | | | BB+ | | | | 613,180 | |
| | | | | |
| | 450 | | | California School Finance Authority, School Facility Revenue Bonds, KIPP LA Projects,
Series 2014A, 4.125%, 7/01/24 | | | | | No Opt. Call | | | | BB+ | | | | 466,245 | |
| | | | | |
| | 695 | | | California State, General Obligation Bonds, Various Purpose Series 1997, 5.625%, 10/01/21 | | | | | 10/15 at 100.00 | | | | AA+ | | | | 701,331 | |
| | | | | |
| | | | California State, General Obligation Bonds, Various Purpose Series 2009: | | | | | | | | | | | | | | |
| | 1,000 | | | 6.500%, 4/01/33 | | | | | 4/19 at 100.00 | | | | AA– | | | | 1,187,160 | |
| | 645 | | | 6.000%, 11/01/39 | | | | | 11/19 at 100.00 | | | | AA– | | | | 767,873 | |
| | | | | |
| | 10 | | | California State, General Obligation Veterans Bonds, Refunding Series 2005CB, 5.050%,
12/01/36 (Alternative Minimum Tax) | | | | | 12/15 at 100.00 | | | | AA | | | | 10,026 | |
| | | | | |
| | | | California Statewide Community Development Authority, Revenue Bonds, Los Angeles Jewish Home for the Aging-Fountainview Gonda, Series 2014A: | | | | | | | | | | | | | | |
| | 350 | | | 5.000%, 8/01/28 | | | | | 8/22 at 102.00 | | | | AA– | | | | 400,043 | |
| | 1,130 | | | 5.000%, 8/01/29 | | | | | 8/22 at 102.00 | | | | AA– | | | | 1,285,850 | |
Municipal Total Return Managed Accounts Portfolio (continued)
| | |
| Portfolio of Investments | | July 31, 2015 |
| | | | | | | | | | | | | | | | | | |
Principal
Amount (000) | | | Description (1) | | | | Optional Call
Provisions (2) | | | Ratings (3) | | | Value | |
| | | | | |
| | | | California (continued) | | | | | | | | | | | |
| | | | | |
| | | | Carson Redevelopment Agency, California, Tax Allocation Bonds, Merged & Amended Project Area, Series 2014A: | | | | | | | | | | | | | | |
| $ | 220 | | | 5.000%, 10/01/23 | | | | | No Opt. Call | | | | AA– | | | $ | 260,216 | |
| | 440 | | | 5.000%, 10/01/24 | | | | | No Opt. Call | | | | AA– | | | | 525,026 | |
| | | | | |
| | 840 | | | Golden State Tobacco Securitization Corporation, California, Enhanced Tobacco Settlement Asset-Backed Revenue Bonds, Series 2015A, 4.000%, 6/01/31 | | | | | 6/25 at 100.00 | | | | A+ | | | | 866,183 | |
| | | | | |
| | | | Golden State Tobacco Securitization Corporation, California, Tobacco Settlement Asset-Backed Bonds, Series 2007A-1: | | | | | | | | | | | | | | |
| | 930 | | | 4.500%, 6/01/27 | | | | | 6/17 at 100.00 | | | | B | | | | 888,866 | |
| | 215 | | | 5.000%, 6/01/33 | | | | | 6/17 at 100.00 | | | | B | | | | 180,303 | |
| | | | | |
| | 750 | | | Irvine, California, Special Tax Bonds, Community Facilities District 2004-1 Central Park,
Series 2015A, 4.000%, 9/01/35 | | | | | 9/25 at 100.00 | | | | N/R | | | | 745,193 | |
| | | | | |
| | 50 | | | Long Beach Bond Finance Authority, California, Natural Gas Purchase Revenue Bonds,
Series 2007A, 5.000%, 11/15/35 | | | | | No Opt. Call | | | | A | | | | 55,934 | |
| | | | | |
| | | | Long Beach, California, Marina Revenue Bonds, Alamitos Bay Marina Project, Series 2015: | | | | | | | | | | | | | | |
| | 320 | | | 5.000%, 5/15/24 | | | | | No Opt. Call | | | | BBB | | | | 370,160 | |
| | 745 | | | 5.000%, 5/15/26 | | | | | No Opt. Call | | | | BBB | | | | 849,434 | |
| | | | | |
| | 1,000 | | | Los Angeles Department of Airports, California, Revenue Bonds, Los Angeles International Airport, Series 2009A, 5.250%, 5/15/29 | | | | | 5/19 at 100.00 | | | | AA | | | | 1,141,300 | |
| | | | | |
| | 500 | | | Los Angeles Department of Water and Power, California, Power System Revenue Bonds, Series 2008A-2, 5.250%, 7/01/32 | | | | | 7/18 at 100.00 | | | | AA– | | | | 555,360 | |
| | | | | |
| | 750 | | | Los Angeles Regional Airports Improvement Corporation, California, Lease Revenue Refunding Bonds, LAXFUEL Corporation at Los Angeles International Airport,
Series 2012, 5.000%, 1/01/22 (Alternative Minimum Tax) | | | | | No Opt. Call | | | | A | | | | 867,728 | |
| | | | | |
| | 1,000 | | | Northern Inyo County Local Hospital District, Inyo County, California, Revenue Bonds,
Series 2013, 5.000%, 12/01/29 | | | | | 12/23 at 100.00 | | | | BB | | | | 1,027,370 | |
| | | | | |
| | 85 | | | Novato Redevelopment Agency, California, Tax Allocation Bonds, Hamilton Field Redevelopment Project, Series 2011, 6.750%, 9/01/40 | | | | | 9/21 at 100.00 | | | | BBB+ | | | | 102,409 | |
| | | | | |
| | 1,000 | | | Palm Drive Health Care District, Sonoma County, California, Certificates of Participation, Parcel Tax Secured Financing Program, Series 2010, 7.500%, 4/01/35 | | | | | 10/15 at 102.00 | | | | BB | | | | 987,710 | |
| | | | | |
| | 1,215 | | | Sacramento Area Flood Control Agency, California, Special Assessment Bonds, Natomas Basin Local Assessment District, Series 2014, 5.000%, 10/01/32 – BAM Insured | | | | | No Opt. Call | | | | AA | | | | 1,380,276 | |
| | | | | |
| | | | Sacramento, California, Special Tax Bonds, North Natomas Community Facilities District 4, Refunding Series 2015F: | | | | | | | | | | | | | | |
| | 615 | | | 5.000%, 9/01/26 | | | | | 9/25 at 100.00 | | | | BBB+ | | | | 705,177 | |
| | 1,290 | | | 5.000%, 9/01/27 | | | | | 9/25 at 100.00 | | | | BBB+ | | | | 1,467,659 | |
| | | | | |
| | 1,000 | | | San Diego Unified Port District, California, Revenue Bonds, Refunding Series 2013A, 5.000%, 9/01/27 | | | | | 9/23 at 100.00 | | | | A+ | | | | 1,148,260 | |
| | | | | |
| | 1,500 | | | San Francisco City and County, California, General Obligation Bonds, Road Repaving & Street Safety, Series 2013C, 5.000%, 6/15/28 | | | | | 6/21 at 100.00 | | | | AA+ | | | | 1,722,360 | |
| | | | | |
| | 550 | | | San Jose, California, Airport Revenue Bonds, Refunding Series 2014A, 5.000%, 3/01/25 (Alternative Minimum Tax) | | | | | 3/24 at 100.00 | | | | A2 | | | | 634,277 | |
| | | | | |
| | 1,925 | | | Santa Clarita Community College District, California, General Obligation Bonds,
Series 2013, 3.000%, 8/01/27 | | | | | 8/23 at 100.00 | | | | AA | | | | 1,933,104 | |
| | | | | |
| | 550 | | | Southern California Public Power Authority, Milford Wind Corridor Phase II Project Revenue Bond, Series 2011-1, 5.250%, 7/01/28 | | | | | No Opt. Call | | | | AA– | | | | 646,756 | |
| | | | | | | | | | | | | | | | | | |
Principal
Amount (000) | | | Description (1) | | | | Optional Call
Provisions (2) | | | Ratings (3) | | | Value | |
| | | | | |
| | | | California (continued) | | | | | | | | | | | |
| | | | | |
| $ | 500 | | | Twentynine Palms Redevelopment Agency, California, Tax Allocation Bonds, Four Corners Project Area, Series 2011A, 7.400%, 9/01/32 | | | | | 9/21 at 100.00 | | | | BBB+ | | | $ | 620,330 | |
| | | | | |
| | 750 | | | Western Municipal Water District Facilities Authority, California, Water Revenue Bonds,
Series 2009B, 5.000%, 10/01/34 | | | | | 10/19 at 100.00 | | | | AA+ | | | | 841,658 | |
| | 34,795 | | | Total California | | | | | | | | | | | | | 38,143,810 | |
| | | | | |
| | | | Colorado – 3.3% | | | | | | | | | | | |
| | | | | |
| | 2,910 | | | Castle Pines North Metropolitan District, Colorado, Certificates of Participation,
Series 2015, 4.000%, 12/01/44 | | | | | No Opt. Call | | | | AA– | | | | 2,875,167 | |
| | | | | |
| | 500 | | | Colorado Educational and Cultural Facilities Authority, Charter School Revenue Bonds,
Aspen Ridge School Project, Series 2015A, 5.000%, 7/01/36 | | | | | 7/25 at 100.00 | | | | BB+ | | | | 499,335 | |
| | | | | |
| | 605 | | | Colorado Educational and Cultural Facilities Authority, Charter School Revenue Bonds, University of Northern Colorado Lab School, Refunding & Improvement Series 2015, 2.000%, 12/15/17 | | | | | No Opt. Call | | | | BB+ | | | | 605,424 | |
| | | | | |
| | 750 | | | Colorado Health Facilities Authority, Colorado, Revenue Bonds, Catholic Health Initiatives, Tender Option Bond Trust 3364, 18.713%, 10/01/31 (IF) (4) | | | | | 11/23 at 100.00 | | | | A+ | | | | 1,136,220 | |
| | | | | |
| | 1,000 | | | Colorado Health Facilities Authority, Colorado, Revenue Bonds, Sisters of Charity of Leavenworth Health Services Corporation, Tender Option Bond Trust 3367, 20.129%, 7/01/21 (IF) (4) | | | | | No Opt. Call | | | | AA– | | | | 1,657,960 | |
| | | | | |
| | 500 | | | Colorado Health Facilities Authority, Colorado, Revenue Bonds, Valley View Hospital Association, Series 2008, 5.750%, 5/15/36 | | | | | 5/18 at 100.00 | | | | A– | | | | 546,180 | |
| | | | | |
| | 1,635 | | | Colorado Health Facilities Authority, Revenue Bonds, Craig Hospital Project,
Series 2012, 5.000%, 12/01/28 (UB) (4) | | | | | 12/22 at 100.00 | | | | A | | | | 1,815,308 | |
| | | | | |
| | 1,000 | | | Denver City and County, Colorado, Airport System Revenue Bonds, Series 2012B, 5.000%, 11/15/24 | | | | | No Opt. Call | | | | A+ | | | | 1,205,250 | |
| | | | | |
| | 510 | | | Fitzsimons Village Metropolitan District 1, Aurora, Arapahoe County, Colorado, Tax Increment Public Improvement Fee Supported Revenue Bonds, Series 2010A, 7.500%, 3/01/40 | | | | | 3/20 at 100.00 | | | | N/R | | | | 560,184 | |
| | | | | |
| | 500 | | | Fossil Ridge Metropolitan District 1, Lakewood, Colorado, Tax-Supported Revenue Bonds, Refunding Series 2010, 7.250%, 12/01/40 | | | | | 12/20 at 100.00 | | | | N/R | | | | 551,410 | |
| | | | | |
| | 1,000 | | | Regional Transportation District, Colorado, Denver Transit Partners Eagle P3 Project Private Activity Bonds, Series 2010, 6.500%, 1/15/30 | | | | | 7/20 at 100.00 | | | | Baa3 | | | | 1,166,800 | |
| | | | | |
| | 500 | | | Three Springs Metropolitan District 3, Durango, La Plata County, Colorado, Property Tax Supported Revenue Bonds, Series 2010, 7.750%, 12/01/39 | | | | | 12/20 at 100.00 | | | | N/R | | | | 534,535 | |
| | 11,410 | | | Total Colorado | | | | | | | | | | | | | 13,153,773 | |
| | | | | |
| | | | Connecticut – 0.2% | | | | | | | | | | | |
| | | | | |
| | 670 | | | Connecticut Health and Educational Facilities Authority, Revenue Bonds, Yale University, Tender Option Bond Trust 2015-XF0091, 13.607%, 7/01/17 (IF) | | | | | No Opt. Call | | | | AAA | | | | 810,117 | |
| | | | | |
| | | | Delaware – 0.4% | | | | | | | | | | | |
| | | | | |
| | 1,440 | | | Delaware Economic Development Authority, Revenue Bonds, Newark Charter School,
Series 2012, 3.875%, 9/01/22 | | | | | 3/22 at 100.00 | | | | BBB | | | | 1,482,566 | |
| | | | | |
| | | | District of Columbia – 0.4% | | | | | | | | | | | |
| | | | | |
| | | | District of Columbia Tobacco Settlement Corporation, Tobacco Settlement Asset-Backed Bonds, Series 2001: | | | | | | | | | | | | | | |
| | 500 | | | 6.500%, 5/15/33 | | | | | No Opt. Call | | | | Baa1 | | | | 605,535 | |
| | 450 | | | 6.750%, 5/15/40 | | | | | 11/15 at 100.00 | | | | Baa1 | | | | 449,951 | |
Municipal Total Return Managed Accounts Portfolio (continued)
| | |
| Portfolio of Investments | | July 31, 2015 |
| | | | | | | | | | | | | | | | | | |
Principal
Amount (000) | | | Description (1) | | | | Optional Call
Provisions (2) | | | Ratings (3) | | | Value | |
| | | | | |
| | | | District of Columbia (continued) | | | | | | | | | | | |
| | | | | |
| $ | 575 | | | District of Columbia, Revenue Bonds, Association of American Medical Colleges,
Series 2011A, 5.000%, 10/01/30 | | | | | 10/23 at 100.00 | | | | A+ | | | $ | 652,821 | |
| | 1,525 | | | Total District of Columbia | | | | | | | | | | | | | 1,708,307 | |
| | | | | |
| | | | Florida – 5.8% | | | | | | | | | | | |
| | | | | |
| | 1,440 | | | Bay County, Florida, Educational Facilities Revenue Refunding Bonds, Bay Haven Charter Academy, Inc. Project, Series 2010A, 5.250%, 9/01/30 | | | | | 9/20 at 100.00 | | | | BBB– | | | | 1,488,528 | |
| | | | | |
| | 750 | | | Bay County, Florida, Educational Facilities Revenue Refunding Bonds, Bay Haven Charter Academy, Inc. Project, Series 2013A, 5.000%, 9/01/33 | | | | | 9/23 at 100.00 | | | | BBB– | | | | 777,720 | |
| | | | | |
| | 1,000 | | | Broward County, Florida, Port Facilities Revenue Bonds, Refunding Series 2011B, 5.000%, 9/01/23 – AGM Insured (Alternative Minimum Tax) | | | | | 9/21 at 100.00 | | | | AA | | | | 1,126,610 | |
| | | | | |
| | 500 | | | Capital Trust Agency, Florida, Senior Housing Revenue Bonds, Faulk Senior Residences Project, Series 2014, 6.500%, 12/01/34 | | | | | 12/22 at 102.00 | | | | N/R | | | | 454,335 | |
| | | | | |
| | 1,685 | | | Collier County Health Facilities Authority, Florida, Residential Care Facility Revenue Bonds, Moorings Inc., Series 2015A, 4.000%, 5/01/35 | | | | | 5/25 at 100.00 | | | | A+ | | | | 1,649,952 | |
| | | | | |
| | 540 | | | Florida Development Finance Corporation, Educational Facilities Revenue Bonds, Downtown Doral Charter Elementary School Project, Series 2014A, 5.750%, 7/01/24 | | | | | No Opt. Call | | | | N/R | | | | 559,780 | |
| | | | | |
| | 105 | | | Florida Housing Finance Corporation, Homeowner Mortgage Revenue Bonds,
Series 2008-1, 6.450%, 1/01/39 (Alternative Minimum Tax) | | | | | 7/17 at 100.00 | | | | AA+ | | | | 109,557 | |
| | | | | |
| | 2,000 | | | Florida Ports Financing Commission, Revenue Bonds, State Transportation Trust Fund-Intermodal Program, Refunding Series 2011B, 5.125%, 6/01/27 (Alternative Minimum Tax) | | | | | 6/21 at 100.00 | | | | AA+ | | | | 2,295,560 | |
| | | | | |
| | 885 | | | Gulf Breeze, Florida, Revenue Improvement Non-Ad Valorem Bonds, Series 2007, 5.000%, 12/01/32 – AMBAC Insured | | | | | 12/17 at 100.00 | | | | N/R | | | | 902,505 | |
| | | | | |
| | 1,000 | | | Hillsborough County Aviation Authority, Florida, Revenue Bonds, Tampa International Airport, Senior Lien Series 2015A, 5.000%, 10/01/30 (WI/DD, Settling 8/13/15)
(Alternative Minimum Tax) | | | | | 10/24 at 100.00 | | | | AA– | | | | 1,122,550 | |
| | | | | |
| | 3,000 | | | Hillsborough County Aviation Authority, Florida, Revenue Bonds, Tampa International Airport, Subordinate Refunding Series 2013A, 5.500%, 10/01/28 (Alternative Minimum Tax) | | | | | 10/23 at 100.00 | | | | A+ | | | | 3,464,880 | |
| | | | | |
| | 2,000 | | | Hillsborough County, Florida, Solid Waste and Resource Recovery Revenue Bonds, Series 2006A, 5.000%, 9/01/25 – AMBAC Insured (Alternative Minimum Tax) | | | | | 9/16 at 100.00 | | | | AA | | | | 2,084,720 | |
| | | | | |
| | 150 | | | Lake County, Florida, Industrial Development Revenue Bonds, Crane’s View Lodge Project, Series 2012A, 7.125%, 11/01/42 | | | | | No Opt. Call | | | | N/R | | | | 135,047 | |
| | | | | |
| | 2,000 | | | Lee County Industrial Development Authority, Florida, Charter School Revenue Bonds, Lee County Community Charter Schools, Series 2012A, 5.000%, 6/15/24 | | | | | 6/22 at 100.00 | | | | BB | | | | 2,114,120 | |
| | | | | |
| | | | Miami Dade County, Florida, Rickenbacker Causeway Revenue Bonds, Series 2014: | | | | | | | | | | | | | | |
| | 900 | | | 5.000%, 10/01/27 | | | | | 10/24 at 100.00 | | | | BBB+ | | | | 1,029,132 | |
| | 920 | | | 5.000%, 10/01/28 | | | | | 10/24 at 100.00 | | | | BBB+ | | | | 1,042,608 | |
| | 500 | | | 5.000%, 10/01/30 | | | | | 10/24 at 100.00 | | | | BBB+ | | | | 562,110 | |
| | | | | |
| | 500 | | | Miami-Dade County School Board, Florida, Certificates of Participation, Series 2008B, 5.250%, 5/01/31 – AGC Insured | | | | | 5/18 at 100.00 | | | | AA | | | | 546,640 | |
| | | | | |
| | 1,145 | | | Miami-Dade County, Florida, Aviation Revenue Bonds, Refunding Series 2014A, 5.000%, 10/01/28 (Alternative Minimum Tax) | | | | | 10/24 at 100.00 | | | | A | | | | 1,286,511 | |
| | | | | |
| | 400 | | | Sanibel, Florida, General Obligation Bonds, Series 2006, 4.350%, 2/01/36 – AMBAC Insured | | | | | 8/16 at 100.00 | | | | N/R | | | | 408,076 | |
| | | | | |
| | 5 | | | Tolomato Community Development District, Florida, Special Assessment Bonds, Convertible, Capital Appreciation, Series 2012A-2, 0.000%, 5/01/39 | | | | | 5/17 at 100.00 | | | | N/R | | | | 3,675 | |
| | | | | | | | | | | | | | | | | | |
Principal
Amount (000) | | | Description (1) | | | | Optional Call
Provisions (2) | | | Ratings (3) | | | Value | |
| | | | | |
| | | | Florida (continued) | | | | | | | | | | | |
| | | | | |
| $ | 15 | | | Tolomato Community Development District, Florida, Special Assessment Bonds, Convertible, Capital Appreciation, Series 2012A-3, 0.000%, 5/01/40 | | | | | 5/19 at 100.00 | | | | N/R | | | $ | 8,990 | |
| | | | | |
| | 10 | | | Tolomato Community Development District, Florida, Special Assessment Bonds, Convertible, Capital Appreciation, Series 2012A-4, 0.000%, 5/01/40 | | | | | 5/22 at 100.00 | | | | N/R | | | | 4,442 | |
| | | | | |
| | 5 | | | Tolomato Community Development District, Florida, Special Assessment Bonds, Hope Note, Series 2007-3, 6.375%, 5/01/17 (6) | | | | | No Opt. Call | | | | N/R | | | | — | |
| | | | | |
| | 5 | | | Tolomato Community Development District, Florida, Special Assessment Bonds, Non Performing ParcelSeries 2007-1. RMKT, 6.375%, 5/01/17 (6) | | | | | No Opt. Call | | | | N/R | | | | 5,038 | |
| | | | | |
| | 5 | | | Tolomato Community Development District, Florida, Special Assessment Bonds, Refunding Series 2012A-1, 6.375%, 5/01/17 | | | | | No Opt. Call | | | | N/R | | | | 4,973 | |
| | | | | |
| | 20 | | | Tolomato Community Development District, Florida, Special Assessment Bonds, Refunding Series 2015-1, 0.000%, 5/01/40 | | | | | 5/18 at 100.00 | | | | N/R | | | | 12,357 | |
| | | | | |
| | 15 | | | Tolomato Community Development District, Florida, Special Assessment Bonds, Refunding Series 2015-2, 0.000%, 5/01/40 | | | | | 5/18 at 100.00 | | | | N/R | | | | 7,842 | |
| | | | | |
| | 15 | | | Tolomato Community Development District, Florida, Special Assessment Bonds, Refunding Series 2015-3, 6.610%, 5/01/40 | | | | | 5/18 at 100.00 | | | | N/R | | | | — | |
| | 21,515 | | | Total Florida | | | | | | | | | | | | | 23,208,258 | |
| | | | | |
| | | | Georgia – 0.9% | | | | | | | | | | | |
| | | | | |
| | 1,155 | | | Athens-Clarke County Unified Government Development Authority, Georgia, Revenue Bonds, University of Georgia Athletic Association Project, Series 2011, 5.250%, 7/01/28 | | | | | 7/21 at 100.00 | | | | Aa3 | | | | 1,305,935 | |
| | | | | |
| | 220 | | | Atlanta, Georgia, Water and Wastewater Revenue Bonds, Tender Option Trust 2015-XF0234, 22.228%, 11/01/40 (IF) | | | | | 5/25 at 100.00 | | | | AA– | | | | 361,948 | |
| | | | | |
| | 500 | | | La Grange-Troup County Hospital Authority, Georgia, Revenue Anticipation Certificates, Series 2008A, 5.500%, 7/01/38 | | | | | 7/18 at 100.00 | | | | Aa2 | | | | 548,220 | |
| | | | | |
| | 750 | | | Private Colleges and Universities Authority, Georgia, Revenue Bonds, Emory University, Series 2008C, 5.000%, 9/01/38 | | | | | 9/18 at 100.00 | | | | AA+ | | | | 823,868 | |
| | | | | |
| | 530 | | | Tift County Hospital Authority, Georgia, Revenue Anticipation Certificates Series 2012, 5.000%, 12/01/38 | | | | | No Opt. Call | | | | Aa2 | | | | 580,286 | |
| | 3,155 | | | Total Georgia | | | | | | | | | | | | | 3,620,257 | |
| | | | | |
| | | | Guam – 1.7% | | | | | | | | | | | |
| | | | | |
| | 420 | | | Government of Guam, Business Privilege Tax Bonds, Series 2011A, 5.000%, 1/01/21 | | | | | No Opt. Call | | | | A | | | | 475,835 | |
| | | | | |
| | 1,000 | | | Guam Government Waterworks Authority, Water and Wastewater System Revenue Bonds, Series 2010, 4.500%, 7/01/18 | | | | | No Opt. Call | | | | A– | | | | 1,078,740 | |
| | | | | |
| | 1,515 | | | Guam Government, General Obligation Bonds, 2009 Series A, 6.000%, 11/15/19 | | | | | No Opt. Call | | | | BB– | | | | 1,658,213 | |
| | | | | |
| | | | Guam International Airport Authority, Revenue Bonds, Series 2013C: | | | | | | | | | | | | | | |
| | 1,000 | | | 5.000%, 10/01/21 (Alternative Minimum Tax) | | | | | No Opt. Call | | | | BBB | | | | 1,131,150 | |
| | 1,000 | | | 6.000%, 10/01/23 (Alternative Minimum Tax) | | | | | 8/18 at 100.00 | | | | BBB | | | | 1,115,570 | |
| | | | | |
| | | | Guam Power Authority, Revenue Bonds, Series 2012A: | | | | | | | | | | | | | | |
| | 500 | | | 5.000%, 10/01/22 – AGM Insured | | | | | No Opt. Call | | | | AA | | | | 590,615 | |
| | 235 | | | 5.000%, 10/01/34 | | | | | 10/22 at 100.00 | | | | BBB | | | | 252,077 | |
| | | | | |
| | 450 | | | Guam Waterworks Authority, Water and Wastewater System Revenue Bonds, Series 2013, 5.250%, 7/01/24 | | | | | 7/23 at 100.00 | | | | A– | | | | 521,217 | |
| | 6,120 | | | Total Guam | | | | | | | | | | | | | 6,823,417 | |
Municipal Total Return Managed Accounts Portfolio (continued)
| | |
| Portfolio of Investments | | July 31, 2015 |
| | | | | | | | | | | | | | | | | | |
Principal
Amount (000) | | | Description (1) | | | | Optional Call
Provisions (2) | | | Ratings (3) | | | Value | |
| | | | | |
| | | | Hawaii – 1.3% | | | | | | | | | | | |
| | | | | |
| $ | 600 | | | Hawaii Department of Budget and Finance, Special Purpose Revenue Bonds, Hawaii Pacific University, Series 2013A, 6.250%, 7/01/27 | | | | | 7/23 at 100.00 | | | | BB+ | | | $ | 660,864 | |
| | | | | |
| | 1,500 | | | Hawaii Department of Budget and Finance, Special Purpose Revenue Bonds, Hawaiian Electric Company Inc., Refunding Series 2007B, 4.600%, 5/01/26 – FGIC Insured (Alternative Minimum Tax) | | | | | 3/17 at 100.00 | | | | Baa1 | | | | 1,551,315 | |
| | | | | |
| | 1,000 | | | Hawaii State Department of Transportation – Airports Division, Lease Revenue Certificates of Participation, Series 2013, 5.250%, 8/01/24 (Alternative Minimum Tax) | | | | | 8/23 at 100.00 | | | | A– | | | | 1,172,750 | |
| | | | | |
| | 1,600 | | | Hawaii State, General Obligation Bonds, Series 2011DZ, 5.000%, 12/01/30 | | | | | 12/21 at 100.00 | | | | AA | | | | 1,849,840 | |
| | 4,700 | | | Total Hawaii | | | | | | | | | | | | | 5,234,769 | |
| | | | | |
| | | | Idaho – 2.2% | | | | | | | | | | | |
| | | | | |
| | | | Boise-Kuna Irrigation District, Ada and Canyon Counties, Idaho, Arrowrock Hydroelectric Project Revenue Bonds, Refunding Series 2015: | | | | | | | | | | | | | | |
| | 500 | | | 5.000%, 6/01/29 | | | | | 12/24 at 100.00 | | | | A3 | | | | 567,780 | |
| | 1,000 | | | 5.000%, 6/01/30 | | | | | 12/24 at 100.00 | | | | A3 | | | | 1,130,410 | |
| | 2,090 | | | 5.000%, 6/01/31 | | | | | 12/24 at 100.00 | | | | A3 | | | | 2,353,633 | |
| | | | | |
| | 750 | | | Boise-Kuna Irrigation District, Ada and Canyon Counties, Idaho, Arrowrock Hydroelectric Project Revenue Bonds, Series 2008, 7.375%, 6/01/34 (Pre-refunded 6/01/18) | | | | | 6/18 at 100.00 | | | | A3 (5) | | | | 884,723 | |
| | | | | |
| | 865 | | | Idaho Health Facilities Authority, Revenue Bonds, Trinity Health Group, Series 2015, 5.500%, 12/01/29 | | | | | 6/25 at 100.00 | | | | AA | | | | 1,055,352 | |
| | | | | |
| | 1,000 | | | Idaho Housing and Finance Association, Economic Development Facilities Recovery Zone Revenue Bonds, TDF Facilities Project, Series 2010A, 6.500%, 2/01/26 | | | | | 2/21 at 100.00 | | | | AA– | | | | 1,200,830 | |
| | | | | |
| | 15 | | | Idaho Housing and Finance Association, Single Family Mortgage Revenue Bonds, Series 2008A-1, 6.250%, 7/01/38 (Alternative Minimum Tax) | | | | | 1/17 at 100.00 | | | | AAA | | | | 15,156 | |
| | | | | |
| | | | Idaho Water Resource Board, Water Resource Loan Program Revenue, Ground Water Rights Mitigation Series 2012A: | | | | | | | | | | | | | | |
| | 430 | | | 4.750%, 9/01/25 | | | | | 9/22 at 100.00 | | | | Baa1 | | | | 464,288 | |
| | 1,070 | | | 4.600%, 9/01/27 | | | | | 9/22 at 100.00 | | | | Baa1 | | | | 1,127,673 | |
| | 7,720 | | | Total Idaho | | | | | | | | | | | | | 8,799,845 | |
| | | | | |
| | | | Illinois – 4.7% | | | | | | | | | | | |
| | | | | |
| | 1,000 | | | Bourbonnais, Illinois, Industrial Project Revenue Bonds, Olivet Nazarene University Project, Series 2010, 6.000%, 11/01/35 | | | | | 11/20 at 100.00 | | | | BBB | | | | 1,133,240 | |
| | | | | |
| | 750 | | | Chicago, Illinois, Certificates of Participation, Tax Increment Allocation Revenue Bonds, Pullman Park/Chicago Redevelopment Project, Series 2013A, 7.125%, 3/15/33 | | | | | 10/18 at 100.00 | | | | N/R | | | | 769,013 | |
| | | | | |
| | 500 | | | Cook County, Illinois, Recovery Zone Facility Revenue Bonds, Navistar International Corporation Project, Series 2010, 6.500%, 10/15/40 | | | | | 10/20 at 100.00 | | | | Caa1 | | | | 530,595 | |
| | | | | |
| | 965 | | | Illinois Finance Authority, Charter School Revenue Bonds, Uno Charter School Network, Refunding and Improvement Series 2011A, 6.875%, 10/01/31 | | | | | 10/21 at 100.00 | | | | BBB– | | | | 1,078,426 | |
| | | | | |
| | 360 | | | Illinois Finance Authority, Revenue Bonds, Centegra Health System, Tender Option Bond Trust 1122, 16.447%, 9/01/32 (IF) (4) | | | | | 9/22 at 100.00 | | | | BBB | | | | 429,854 | |
| | | | | |
| | 750 | | | Illinois Finance Authority, Revenue Bonds, Children’s Memorial Hospital, Series 2008B, 5.500%, 8/15/21 | | | | | 8/18 at 100.00 | | | | AA– | | | | 839,220 | |
| | | | | |
| | 650 | | | Illinois Finance Authority, Revenue Bonds, Elmhurst Memorial Healthcare, Series 2008A, 5.625%, 1/01/37 | | | | | 1/18 at 100.00 | | | | Baa2 | | | | 697,333 | |
| | | | | |
| | 960 | | | Illinois Finance Authority, Revenue Bonds, OSF Healthcare System, Refunding Series 2010A, 6.000%, 5/15/39 | | | | | 5/20 at 100.00 | | | | A | | | | 1,107,907 | |
| | | | | | | | | | | | | | | | | | |
Principal
Amount (000) | | | Description (1) | | | | Optional Call
Provisions (2) | | | Ratings (3) | | | Value | |
| | | | | |
| | | | Illinois (continued) | | | | | | | | | | | |
| | | | | |
| | | | Illinois Finance Authority, Revenue Bonds, Silver Cross Hospital and Medical Centers, Refunding Series 2015C: | | | | | | | | | | | | | | |
| $ | 25 | | | 5.000%, 8/15/21 | | | | | No Opt. Call | | | | Baa1 | | | $ | 28,231 | |
| | 220 | | | 5.000%, 8/15/23 | | | | | No Opt. Call | | | | Baa1 | | | | 249,357 | |
| | | | | |
| | 700 | | | Illinois Finance Authority, Revenue Refunding Bonds, Silver Cross Hospital and Medical Centers, Series 2008A, 6.000%, 8/15/23 | | | | | 8/18 at 100.00 | | | | BBB+ | | | | 769,300 | |
| | | | | |
| | 420 | | | Illinois Toll Highway Authority, Toll Highway Revenue Bonds, Tender Option Bond Trust 2015-XF0051, 17.772%, 1/01/21 (IF) | | | | | No Opt. Call | | | | AA– | | | | 588,034 | |
| | | | | |
| | | | Railsplitter Tobacco Settlement Authority, Illinois, Tobacco Settlement Revenue Bonds, Series 2010: | | | | | | | | | | | | | | |
| | 1,000 | | | 5.250%, 6/01/21 | | | | | No Opt. Call | | | | A | | | | 1,157,610 | |
| | 1,000 | | | 5.500%, 6/01/23 | | | | | 6/21 at 100.00 | | | | A | | | | 1,156,240 | |
| | | | | |
| | 190 | | | Regional Transportation Authority, Cook, DuPage, Kane, Lake, McHenry and Will Counties, Illinois, General Obligation Bonds, Series 1991, 6.700%, 11/01/21 – FGIC Insured | | | | | No Opt. Call | | | | AA | | | | 217,812 | |
| | | | | |
| | 500 | | | Regional Transportation Authority, Cook, DuPage, Kane, Lake, McHenry and Will Counties, Illinois, General Obligation Bonds, Series 2000A, 6.500%, 7/01/30 – NPFG Insured | | | | | No Opt. Call | | | | AA | | | | 689,425 | |
| | | | | |
| | 3,100 | | | Regional Transportation Authority, Cook, DuPage, Kane, Lake, McHenry and Will Counties, Illinois, General Obligation Bonds, Series 2002A, 6.000%, 7/01/29 – NPFG Insured | | | | | No Opt. Call | | | | AA | | | | 4,048,166 | |
| | | | | |
| | 500 | | | Romeoville, Illinois, Revenue Bonds, Lewis University Project, Series 2015, 5.000%, 10/01/19 | | | | | No Opt. Call | | | | BBB+ | | | | 558,495 | |
| | | | | |
| | | | St Clair County, Illinois, Highway Revenue Bonds, Series 2013A: | | | | | | | | | | | | | | |
| | 825 | | | 5.500%, 1/01/38 | | | | | 1/23 at 100.00 | | | | AA– | | | | 945,269 | |
| | 1,500 | | | 4.250%, 1/01/38 | | | | | 1/23 at 100.00 | | | | AA– | | | | 1,532,715 | |
| | 15,915 | | | Total Illinois | | | | | | | | | | | | | 18,526,242 | |
| | | | | |
| | | | Indiana – 3.7% | | | | | | | | | | | |
| | | | | |
| | 750 | | | Columbus, Indiana, General Obligation Bonds, Series 2009, 4.500%, 7/15/23 | | | | | 7/19 at 100.00 | | | | N/R | | | | 805,463 | |
| | | | | |
| | 1,000 | | | Fishers Redevelopment District, Indiana, General Obligation Bonds, Saxony Project Series 2009, 5.250%, 7/15/34 | | | | | 1/20 at 100.00 | | | | AA | | | | 1,124,430 | |
| | | | | |
| | 705 | | | Hendricks County, Indiana, Redevelopment District Tax Increment Revenue Bonds, Refunding Series 2010B, 6.450%, 1/01/23 | | | | | 1/16 at 100.00 | | | | Baa2 | | | | 710,774 | |
| | | | | |
| | 1,500 | | | Indiana Finance Authority, Educational Facilities Revenue Bonds, Butler University Project, Refunding Series 2012A, 5.000%, 2/01/25 | | | | | 2/22 at 100.00 | | | | BBB+ | | | | 1,717,140 | |
| | | | | |
| | | | Indiana Finance Authority, Educational Facilities Revenue Bonds, Butler University Project, Refunding Series 2014A: | | | | | | | | | | | | | | |
| | 560 | | | 5.000%, 2/01/26 | | | | | 2/24 at 100.00 | | | | BBB+ | | | | 638,702 | |
| | 425 | | | 5.000%, 2/01/27 | | | | | 2/24 at 100.00 | | | | BBB+ | | | | 481,058 | |
| | | | | |
| | 525 | | | Indiana Finance Authority, Educational Facilities Revenue Bonds, Drexel Foundation For Educational Excellence, Inc., Series 2009A, 7.000%, 10/01/39 | | | | | 10/19 at 100.00 | | | | B– | | | | 509,481 | |
| | | | | |
| | 460 | | | Indiana Finance Authority, Private Activity Bonds, Ohio River Bridges East End Crossing Project, Series 2013B, 5.000%, 1/01/19 (Alternative Minimum Tax) | | | | | 1/17 at 100.00 | | | | BBB | | | | 484,109 | |
| | | | | |
| | 400 | | | Indiana Finance Authority, Tax-Exempt Private Activity Revenue Bonds, I-69 Section 5 Project, Series 2014, 5.250%, 9/01/28 (Alternative Minimum Tax) | | | | | 9/24 at 100.00 | | | | BBB | | | | 448,760 | |
| | | | | |
| | 630 | | | Indiana Health Facility Financing Authority, Hospital Revenue Bonds, Union Hospital, Series 1993, 5.125%, 9/01/18 – NPFG Insured | | | | | 9/15 at 100.00 | | | | A3 | | | | 632,564 | |
| | | | | |
| | 1,000 | | | Indiana Municipal Power Agency, Power Supply System Revenue Bonds, Series 2013A, 5.250%, 1/01/32 | | | | | 7/23 at 100.00 | | | | A+ | | | | 1,146,860 | |
Municipal Total Return Managed Accounts Portfolio (continued)
| | |
| Portfolio of Investments | | July 31, 2015 |
| | | | | | | | | | | | | | | | | | |
Principal
Amount (000) | | | Description (1) | | | | Optional Call
Provisions (2) | | | Ratings (3) | | | Value | |
| | | | | |
| | | | Indiana (continued) | | | | | | | | | | | |
| | | | | |
| $ | 250 | | | Merrillville Multi-School Building Corporation, Lake County, Indiana, First Mortgage Revenue Bonds, Series 2008, 5.250%, 7/15/22 | | | | | 1/18 at 100.00 | | | | AA+ | | | $ | 274,500 | |
| | | | | |
| | | | Munster School Building Corporation, Lake County, Indiana, First Mortgage Bonds, Series 2009: | | | | | | | | | | | | | | |
| | 1,445 | | | 3.875%, 7/05/18 | | | | | No Opt. Call | | | | A | | | | 1,451,878 | |
| | 1,780 | | | 5.000%, 1/05/20 | | | | | No Opt. Call | | | | A | | | | 1,805,988 | |
| | 1,130 | | | 5.000%, 1/05/21 | | | | | 1/20 at 100.00 | | | | A | | | | 1,138,825 | |
| | | | | |
| | | | Richmond Hospital Authority, Indiana, Revenue Bonds, Reid Hospital Project, Refunding Series 2015A: | | | | | | | | | | | | | | |
| | 500 | | | 5.000%, 1/01/28 | | | | | 1/25 at 100.00 | | | | A | | | | 563,345 | |
| | 815 | | | 5.000%, 1/01/29 | | | | | 1/25 at 100.00 | | | | A | | | | 912,678 | |
| | 13,875 | | | Total Indiana | | | | | | | | | | | | | 14,846,555 | |
| | | | | |
| | | | Iowa – 1.4% | | | | | | | | | | | |
| | | | | |
| | | | Des Moines Airport Authority, Iowa, Revenue Bonds, Refunding Capital Loan Notes Series 2012: | | | | | | | | | | | | | | |
| | 1,000 | | | 5.000%, 6/01/27 (Alternative Minimum Tax) | | | | | 6/22 at 100.00 | | | | A2 | | | | 1,087,940 | |
| | 1,000 | | | 5.000%, 6/01/28 (Alternative Minimum Tax) | | | | | 6/22 at 100.00 | | | | A2 | | | | 1,082,260 | |
| | | | | |
| | 1,000 | | | Des Moines Independent Community School District, Polk and Warren Counties, Iowa, School Infrastructure Sales, Services and Use Tax Revenue Bonds, Series 2014, 5.000%, 6/01/22 – BAM Insured | | | | | No Opt. Call | | | | AA | | | | 1,180,160 | |
| | | | | |
| | 745 | | | Des Moines, Iowa, Aviation System Revenue Bonds, Refunding Capital Loan Notes Series 2010B, 5.750%, 6/01/33 – AGM Insured (Alternative Minimum Tax) | | | | | 6/20 at 100.00 | | | | AA | | | | 824,842 | |
| | | | | |
| | 1,240 | | | State University of Iowa, Revenue Bonds, Academic Building Series 2014A-SUI, 3.000%, 7/01/27 | | | | | 7/24 at 100.00 | | | | Aa1 | | | | 1,252,598 | |
| | 4,985 | | | Total Iowa | | | | | | | | | | | | | 5,427,800 | |
| | | | | |
| | | | Kansas – 1.6% | | | | | | | | | | | |
| | | | | |
| | 1,500 | | | Kansas Department of Transportation, Highway Revenue Bonds, Series 2014A, 5.000%, 9/01/29 | | | | | 9/24 at 100.00 | | | | AAA | | | | 1,788,225 | |
| | | | | |
| | 1,240 | | | Kansas Development Finance Authority, Health Facilities Revenue Bonds, KU Health System, Series 2011H, 5.375%, 3/01/30 | | | | | 3/20 at 100.00 | | | | A+ | | | | 1,387,176 | |
| | | | | |
| | 2,000 | | | Kansas Development Finance Authority, Revenue Bonds, Kansas State Projects, Series 2015A, 5.000%, 5/01/26 | | | | | 5/23 at 100.00 | | | | AA– | | | | 2,313,140 | |
| | | | | |
| | 205 | | | Kansas Power Pool, a Municipal Energy Agency Electric Utility Revenue Bonds, DogWood Facility, Series 2015A, 5.000%, 12/01/28 | | | | | 12/25 at 100.00 | | | | A3 | | | | 232,905 | |
| | | | | |
| | 500 | | | Kansas State Independent College Finance Authority, Revenue Anticipation Notes, Ottawa University, Private Education Short-Term Loan Program, Series 2015C, 4.850%, 5/01/16 | | | | | No Opt. Call | | | | N/R | | | | 503,320 | |
| | 5,445 | | | Total Kansas | | | | | | | | | | | | | 6,224,766 | |
| | | | | |
| | | | Kentucky – 0.2% | | | | | | | | | | | |
| | | | | |
| | 590 | | | Kentucky Public Transportation Infrastructure Authority, First Tier Toll Revenue Bonds, Downtown Crossing Project, Series 2013A, 5.000%, 7/01/17 | | | | | No Opt. Call | | | | Baa3 | | | | 635,271 | |
| | | | | |
| | | | Louisiana – 1.6% | | | | | | | | | | | |
| | | | | |
| | 835 | | | Louisiana Public Facilities Authority, Revenue Bonds, Archdiocese of New Orleans, Series 2007, 5.000%, 7/01/16 – CIFG Insured | | | | | No Opt. Call | | | | N/R | | | | 863,524 | |
| | | | | |
| | 3,000 | | | Louisiana Public Facilities Authority, Revenue Bonds, Ochsner Clinic Foundation Project,
Series 2007A, 5.250%, 5/15/38 | | | | | 5/17 at 100.00 | | | | Baa1 | | | | 3,164,970 | |
| | | | | | | | | | | | | | | | | | |
Principal
Amount (000) | | | Description (1) | | | | Optional Call
Provisions (2) | | | Ratings (3) | | | Value | |
| | | | | |
| | | | Louisiana (continued) | | | | | | | | | | | |
| | | | | |
| $ | 50 | | | Louisiana Public Facilities Authority, Revenue Bonds, Ochsner Clinic Foundation Project,
Series 2011, 6.375%, 5/15/31 | | | | | 5/21 at 100.00 | | | | Baa1 | | | $ | 58,168 | |
| | | | | |
| | 2,000 | | | Tobacco Settlement Financing Corporation, Louisiana, Tobacco Settlement Asset-Backed Refunding Bonds, Series 2013A, 5.500%, 5/15/30 | | | | | 5/20 at 100.00 | | | | A– | | | | 2,247,400 | |
| | 5,885 | | | Total Louisiana | | | | | | | | | | | | | 6,334,062 | |
| | | | | |
| | | | Maine – 0.1% | | | | | | | | | | | |
| | | | | |
| | 505 | | | Maine State Housing Authority, Single Family Mortgage Purchase Bonds, Series 2012A-1, 4.000%, 11/15/24 – AGM Insured (Alternative Minimum Tax) | | | | | 11/21 at 100.00 | | | | AA+ | | | | 532,174 | |
| | | | | |
| | | | Maryland – 2.1% | | | | | | | | | | | |
| | | | | |
| | | | Baltimore, Maryland, Senior Lien Convention Center Hotel Revenue Bonds, Series 2006A: | | | | | | | | | | | | | | |
| | 375 | | | 5.250%, 9/01/19 – SYNCORA GTY Insured | | | | | 9/16 at 100.00 | | | | Ba1 | | | | 387,784 | |
| | 140 | | | 5.250%, 9/01/39 – SYNCORA GTY Insured | | | | | 9/16 at 100.00 | | | | Ba1 | | | | 142,736 | |
| | | | | |
| | 730 | | | Maryland Economic Development Corporation, Senior Lien Student Housing Revenue Bonds, University of Maryland – Baltimore Project, Refunding Series 2015, 4.000%, 7/01/20 | | | | | No Opt. Call | | | | BBB– | | | | 781,567 | |
| | | | | |
| | | | Maryland Health and Higher Educational Facilities Authority, Maryland, Hospital Revenue Bonds, Meritus Medical Center, Series 2015: | | | | | | | | | | | | | | |
| | 205 | | | 4.000%, 7/01/20 | | | | | No Opt. Call | | | | BBB | | | | 223,005 | |
| | 290 | | | 5.000%, 7/01/21 | | | | | No Opt. Call | | | | BBB | | | | 330,844 | |
| | | | | |
| | 500 | | | Maryland Health and Higher Educational Facilities Authority, Revenue Bonds, Adventist Healthcare, Series 2011A, 6.125%, 1/01/36 | | | | | 1/22 at 100.00 | | | | Baa2 | | | | 564,565 | |
| | | | | |
| | | | Maryland Health and Higher Educational Facilities Authority, Revenue Bonds, LifeBridge Health System, Series 2015: | | | | | | | | | | | | | | |
| | 1,200 | | | 4.000%, 7/01/35 | | | | | 7/25 at 100.00 | | | | A+ | | | | 1,191,012 | |
| | 625 | | | 5.000%, 7/01/40 | | | | | 7/25 at 100.00 | | | | A+ | | | | 688,369 | |
| | | | | |
| | | | Maryland Health and Higher Educational Facilities Authority, Revenue Bonds, Mercy Medical Center, Series 2012: | | | | | | | | | | | | | | |
| | 1,000 | | | 5.000%, 7/01/25 | | | | | 7/22 at 100.00 | | | | BBB | | | | 1,096,570 | |
| | 1,000 | | | 5.000%, 7/01/26 | | | | | 7/22 at 100.00 | | | | BBB | | | | 1,087,260 | |
| | | | | |
| | 500 | | | Maryland Health and Higher Educational Facilities Authority, Revenue Bonds, Washington County Hospital, Series 2008, 5.000%, 1/01/19 (Pre-refunded 1/01/18) | | | | | 1/18 at 100.00 | | | | BBB (5) | | | | 546,060 | |
| | | | | |
| | 1,000 | | | Maryland State, General Obligation Bonds, State and Local Facilities Loan, Second Series 2014C-2, 5.000%, 8/01/23 | | | | | No Opt. Call | | | | AAA | | | | 1,222,090 | |
| | 7,565 | | | Total Maryland | | | | | | | | | | | | | 8,261,862 | |
| | | | | |
| | | | Massachusetts – 1.0% | | | | | | | | | | | |
| | | | | |
| | 1,000 | �� | | Massachusetts Development Finance Agency, Revenue Bonds, The Broad Institute,
Series 2011A, 5.000%, 4/01/31 | | | | | 4/21 at 100.00 | | | | AA– | | | | 1,131,170 | |
| | | | | |
| | 750 | | | Massachusetts Development Finance Agency, Revenue Bonds, The Sabis International Charter School, Series 2009A, 8.000%, 4/15/31 | | | | | 10/19 at 100.00 | | | | BBB | | | | 865,740 | |
| | | | | |
| | 300 | | | Massachusetts Health and Educational Facilities Authority Revenue Bonds, Quincy Medical Center Issue, Series 2008A, 6.250%, 1/15/28 (6) | | | | | 1/18 at 100.00 | | | | N/R | | | | 735 | |
| | | | | |
| | 535 | | | Massachusetts Health and Educational Facilities Authority, Revenue Bonds, Harvard University, Tender Option Bond Trust 2010-20W, 13.561%, 12/15/34 (IF) (4) | | | | | 12/19 at 100.00 | | | | AAA | | | | 764,793 | |
| | | | | |
| | 1,000 | | | Massachusetts State, General Obligation Bonds, Consolidated Loan, Series 2014F, 4.000%, 11/01/29 | | | | | 11/22 at 100.00 | | | | AA+ | | | | 1,054,010 | |
| | 3,585 | | | Total Massachusetts | | | | | | | | | | | | | 3,816,448 | |
Municipal Total Return Managed Accounts Portfolio (continued)
| | |
| Portfolio of Investments | | July 31, 2015 |
| | | | | | | | | | | | | | | | | | |
Principal
Amount (000) | | | Description (1) | | | | Optional Call
Provisions (2) | | | Ratings (3) | | | Value | |
| | | | | |
| | | | Michigan – 0.8% | | | | | | | | | | | |
| | | | | |
| $ | 450 | | | Michigan Finance Authority, Public School Academy Limited Obligation Revenue Bonds, Voyageur Academy Project, Series 2011, 7.750%, 7/15/26 | | | | | 7/21 at 100.00 | | | | B– | | | $ | 423,176 | |
| | | | | |
| | 750 | | | Michigan Higher Education Facilities Authority, Limited Obligation Revenue Bonds, Alma College Project, Series 2008, 5.500%, 6/01/28 | | | | | 6/18 at 100.00 | | | | Baa1 | | | | 802,253 | |
| | | | | |
| | 300 | | | Michigan Tobacco Settlement Finance Authority, Tobacco Settlement Asset-Backed Revenue Bonds, Series 2008A, 6.875%, 6/01/42 | | | | | 6/18 at 100.00 | | | | BB– | | | | 292,476 | |
| | | | | |
| | 1,330 | | | Royal Oak Hospital Finance Authority, Michigan, Hospital Revenue Bonds, William Beaumont Hospital Obligated Group, Refunding Series 2014D, 5.000%, 9/01/31 | | | | | 3/24 at 100.00 | | | | A1 | | | | 1,459,702 | |
| | 2,830 | | | Total Michigan | | | | | | | | | | | | | 2,977,607 | |
| | | | | |
| | | | Minnesota – 2.1% | | | | | | | | | | | |
| | | | | |
| | 2,500 | | | Elk River Independent School District 728, Minnesota, General Obligation Bonds, School Building Series 2015.A, 4.000%, 2/01/26 | | | | | 2/24 at 100.00 | | | | Aa2 | | | | 2,770,225 | |
| | | | | |
| | 835 | | | Forest Lake, Minnesota, Charter School Lease Revenue Bonds, Lakes International Language Academy, Series 2014A, 4.500%, 8/01/26 | | | | | 8/22 at 100.00 | | | | BBB– | | | | 874,203 | |
| | | | | |
| | 3,000 | | | Minnesota State, General Fund Appropriation Refunding Bonds, Series 2012B, 5.000%, 3/01/28 | | | | | No Opt. Call | | | | AA | | | | 3,468,060 | |
| | | | | |
| | 1,165 | | | Sauk Rapids, Minnesota, Health Care and Housing Facilities Revenue Bonds, Good Shepherd Lutheran Home, Refunding Series 2013, 4.000%, 1/01/24 | | | | | 1/23 at 100.00 | | | | N/R | | | | 1,172,782 | |
| | 7,500 | | | Total Minnesota | | | | | | | | | | | | | 8,285,270 | |
| | | | | |
| | | | Mississippi – 1.4% | | | | | | | | | | | |
| | | | | |
| | 750 | | | Medical Center Educational Building Corporation, Revenue Bonds, University of Mississippi Medical Center Facilities Expansion and Renovation Project, Series 2012A, 5.000%, 6/01/41 | | | | | 6/22 at 100.00 | | | | Aa2 | | | | 820,673 | |
| | | | | |
| | 1,190 | | | Mississippi Development Bank, Special Obligation Bonds, Harrison County, Mississippi Highway Refunding Project, Series 2013A, 5.000%, 1/01/26 | | | | | No Opt. Call | | | | AA– | | | | 1,417,980 | |
| | | | | |
| | 3,000 | | | Mississippi Development Bank, Special Obligation Bonds, Jackson Public School District General Obligation Project, Series 2008, 5.375%, 4/01/24 – AGM Insured | | | | | No Opt. Call | | | | A2 | | | | 3,287,490 | |
| | 4,940 | | | Total Mississippi | | | | | | | | | | | | | 5,526,143 | |
| | | | | |
| | | | Missouri – 0.6% | | | | | | | | | | | |
| | | | | |
| | 2,000 | | | Kansas City, Missouri, Airport Revenue Bonds, Refunding General Improvement Series 2013A, 5.250%, 9/01/25 (Alternative Minimum Tax) | | | | | 9/21 at 100.00 | | | | A+ | | | | 2,258,740 | |
| | | | | |
| | 287 | | | Saint Louis, Missouri, Tax Increment Financing Revenue Notes, Marquette Building Redevelopment Project, Series 2008-A, 6.500%, 1/23/28 | | | | | No Opt. Call | | | | N/R | | | | 218,264 | |
| | 2,287 | | | Total Missouri | | | | | | | | | | | | | 2,477,004 | |
| | | | | |
| | | | Montana – 0.1% | | | | | | | | | | | |
| | | | | |
| | 370 | | | Montana State, General Obligation Bonds, Water Pollution Control State Revolving Fund Program, Refunding Series 2015C, 5.000%, 7/15/30 | | | | | 7/20 at 100.00 | | | | Aa1 | | | | 425,877 | |
| | | | | |
| | | | Nebraska – 0.1% | | | | | | | | | | | |
| | | | | |
| | 285 | | | Douglas County Hospital Authority 2, Nebraska, Health Facilities Revenue Bonds, Children’s Hospital Obligated Group, Refunding Series 2008B, 6.125%, 8/15/31 | | | | | 8/17 at 100.00 | | | | A2 | | | | 308,131 | |
| | | | | |
| | | | Nevada – 0.0% | | | | | | | | | | | |
| | | | | |
| | 70 | | | Sparks Local Improvement District 3, Legends at Sparks Marina, Nevada, Limited Obligation Improvement Bonds, Series 2008, 6.750%, 9/01/27 | | | | | 9/18 at 100.00 | | | | N/R | | | | 73,321 | |
| | | | | | | | | | | | | | | | | | |
Principal
Amount (000) | | | Description (1) | | | | Optional Call
Provisions (2) | | | Ratings (3) | | | Value | |
| | | | | |
| | | | New Hampshire – 0.2% | | | | | | | | | | | |
| | | | | |
| $ | 580 | | | New Hampshire Health and Education Facilities Authority, Revenue Bonds, Catholic Medical Center, Series 2012, 5.000%, 7/01/27 | | | | | No Opt. Call | | | | A– | | | $ | 635,077 | |
| | | | | |
| | | | New Jersey – 1.2% | | | | | | | | | | | |
| | | | | |
| | 310 | | | New Jersey Turnpike Authority, Revenue Bonds, Tender Option Bond Trust 1154, 17.019%, 1/01/43 (IF) (4) | | | | | 7/22 at 100.00 | | | | A+ | | | | 436,682 | |
| | | | | |
| | 2,800 | | | Paterson, New Jersey, General Obligation Bonds, General Improvement Series 2013, 5.000%, 1/15/26 – BAM Insured | | | | | 1/23 at 100.00 | | | | AA | | | | 3,084,844 | |
| | | | | |
| | 1,780 | | | Tobacco Settlement Financing Corporation, New Jersey, Tobacco Settlement Asset-Backed Bonds, First Subordinate Capital Appreciation Series 2007-1B, 0.000%, 6/01/41 | | | | | 6/17 at 26.26 | | | | A– | | | | 446,620 | |
| | | | | |
| | 1,125 | | | Tobacco Settlement Financing Corporation, New Jersey, Tobacco Settlement Asset-Backed Bonds, Series 2007-1A, 5.000%, 6/01/41 | | | | | 6/17 at 100.00 | | | | B– | | | | 849,049 | |
| | 6,015 | | | Total New Jersey | | | | | | | | | | | | | 4,817,195 | |
| | | | | |
| | | | New Mexico – 0.1% | | | | | | | | | | | |
| | | | | |
| | 375 | | | New Mexico Mortgage Finance Authority, Single Family Mortgage Program Bonds CL 1, Series 2008A-2, 5.600%, 1/01/39 (Alternative Minimum Tax) | | | | | 1/18 at 102.00 | | | | AA+ | | | | 398,198 | |
| | | | | |
| | | | New York – 6.6% | | | | | | | | | | | |
| | | | | |
| | 1,500 | | | Build New York City Resource Corporation, New York, Revenue Bonds, Metropolitan College of New York, Series 2014, 5.250%, 11/01/34 | | | | | 11/24 at 100.00 | | | | BB | | | | 1,579,858 | |
| | | | | |
| | | | Dormitory Authority of the State of New York, Insured Revenue Bonds, Touro College and University System, Series 2014A: | | | | | | | | | | | | | | |
| | 425 | | | 4.000%, 1/01/21 | | | | | No Opt. Call | | | | BBB– | | | | 451,779 | |
| | 435 | | | 4.000%, 1/01/22 | | | | | No Opt. Call | | | | BBB– | | | | 457,094 | |
| | 445 | | | 4.000%, 1/01/23 | | | | | No Opt. Call | | | | BBB– | | | | 466,827 | |
| | 460 | | | 4.000%, 1/01/24 | | | | | No Opt. Call | | | | BBB– | | | | 481,073 | |
| | | | | |
| | 750 | | | Dormitory Authority of the State of New York, Revenue Bonds, Rockefeller University, Series 2012B, 5.000%, 7/01/38 | | | | | 7/22 at 100.00 | | | | AA+ | | | | 850,560 | |
| | | | | |
| | 1,750 | | | Dormitory Authority of the State of New York, State Personal Income Tax Revenue Bonds, General Purpose Series 2015A, 5.000%, 3/15/25 | | | | | No Opt. Call | | | | AAA | | | | 2,134,946 | |
| | | | | |
| | 675 | | | Madison County Industrial Development Agency, New York, Civic Facility Revenue Bonds, Oneida Health System, Series 2007A, 5.250%, 2/01/27 | | | | | 2/17 at 100.00 | | | | BB+ | | | | 687,164 | |
| | | | | |
| | 250 | | | Monroe County Industrial Development Corporation, New York, FHA Insured Mortgage Revenue Bonds, Unity Hospital of Rochester Project, Series 2010, 5.750%, 8/15/30 | | | | | 2/21 at 100.00 | | | | AA | | | | 295,203 | |
| | | | | |
| | 2,500 | | | Nassau County Tobacco Settlement Corporation, New York, Tobacco Settlement Asset-Backed Bonds, Refunding Series 2006A-2, 5.250%, 6/01/26 | | | | | 6/16 at 100.00 | | | | B | | | | 2,454,300 | |
| | | | | |
| | 370 | | | New Rochelle Corporation, New York, Local Development Revenue Bonds, Iona College Project, Series 2015A, 5.000%, 7/01/32 | | | | | 7/25 at 100.00 | | | | BBB | | | | 406,068 | |
| | | | | |
| | 500 | | | New York City Municipal Water Finance Authority, New York, Water and Sewerage System Revenue Bonds, Tender Option Bond Trust 2015-XF0097, 17.918%, 6/15/18 (IF) | | | | | 6/17 at 100.00 | | | | AA+ | | | | 631,380 | |
| | | | | |
| | | | New York City, New York, General Obligation Bonds, Fiscal 2012 Series F: | | | | | | | | | | | | | | |
| | 1,000 | | | 5.000%, 8/01/24 | | | | | No Opt. Call | | | | AA | | | | 1,172,080 | |
| | 2,000 | | | 5.000%, 8/01/25 | | | | | No Opt. Call | | | | AA | | | | 2,329,220 | |
| | | | | |
| | | | New York State Environmental Facilities Corporation, State Clean Water and Drinking Water Revolving Funds Revenue Bonds, Pooled Loan Issue, Series 2005B: | | | | | | | | | | | | | | |
| | 500 | | | 5.500%, 10/15/27 | | | | | No Opt. Call | | | | AAA | | | | 635,700 | |
| | 1,000 | | | 5.500%, 4/15/35 | | | | | No Opt. Call | | | | AAA | | | | 1,247,630 | |
Municipal Total Return Managed Accounts Portfolio (continued)
| | |
| Portfolio of Investments | | July 31, 2015 |
| | | | | | | | | | | | | | | | | | |
Principal
Amount (000) | | | Description (1) | | | | Optional Call
Provisions (2) | | | Ratings (3) | | | Value | |
| | | | | |
| | | | New York (continued) | | | | | | | | | | | |
| | | | | |
| | | | Newburgh, Orange County, New York, General Obligation Bonds, Deficit Liquidation, Series 2012B: | | | | | | | | | | | | | | |
| $ | 605 | | | 5.000%, 6/15/24 | | | | | 6/22 at 100.00 | | | | Baa3 | | | $ | 652,577 | |
| | 635 | | | 5.000%, 6/15/25 | | | | | 6/22 at 100.00 | | | | Baa3 | | | | 670,649 | |
| | | | | |
| | 915 | | | Newburgh, Orange County, New York, General Obligation Bonds, Series 2012A, 5.000%, 6/15/25 – AGC Insured | | | | | 6/22 at 100.00 | | | | Baa3 | | | | 966,368 | |
| | | | | |
| | | | Niagara Tobacco Asset Securitization Corporation, New York, Tobacco Settlement Asset-Backed Bonds, Series 2014: | | | | | | | | | | | | | | |
| | 150 | | | 5.000%, 5/15/20 | | | | | No Opt. Call | | | | BBB+ | | | | 170,457 | |
| | 3,400 | | | 4.000%, 5/15/29 | | | | | 11/15 at 100.00 | | | | BBB+ | | | | 3,400,714 | |
| | | | | |
| | 1,250 | | | Port Authority of New York and New Jersey, Consolidated Revenue Bonds, One Hundred Sixty-Ninth Series 2011, 5.000%, 10/15/24 (Alternative Minimum Tax) | | | | | 10/21 at 100.00 | | | | AA– | | | | 1,442,625 | |
| | | | | |
| | 1,000 | | | Rockland County, New York, General Obligation Bonds, Refunding Series 2013, 5.000%, 3/01/17 | | | | | No Opt. Call | | | | BBB | | | | 1,048,450 | |
| | | |
| | | | Saratoga County Capital Resource Corporation, New York, Revenue Bonds, Skidmore College, Refunding Series 2014B: | | | | | | |
| | 300 | | | 5.000%, 7/01/30 | | | | | 7/24 at 100.00 | | | | A1 | | | | 341,097 | |
| | 300 | | | 5.000%, 7/01/31 | | | | | 7/24 at 100.00 | | | | A1 | | | | 339,606 | |
| | | | | |
| | 1,000 | | | Syracuse, New York, General Obligation Bonds, Airport Terminal Security Access Improvement Series 2011A, 5.000%, 11/01/36 (Alternative Minimum Tax) | | | | | 11/21 at 100.00 | | | | A1 | | | | 1,067,870 | |
| | 24,115 | | | Total New York | | | | | | | | | | | | | 26,381,295 | |
| | | | | |
| | | | North Carolina – 1.9% | | | | | | | | | | | |
| | | | | |
| | 665 | | | Charlotte, North Carolina, Water and Sewer System Refunding Bonds, Tender Option Bond Trust 43W, 13.515%, 7/01/38 (IF) (4) | | | | | 7/20 at 100.00 | | | | AAA | | | | 945,118 | |
| | | | | |
| | 2,000 | | | Charlotte-Mecklenburg Hospital Authority, North Carolina, Health Care Revenue Bonds, DBA, Carolinas HealthCare System, Refunding Series 2009A, 5.250%, 1/15/34 (UB) (4) | | | | | 1/19 at 100.00 | | | | AA– | | | | 2,210,840 | |
| | | | | |
| | | | North Carolina Eastern Municipal Power Agency, Power System Revenue Bonds, Series 2012A: | | | | | | | | | | | | | | |
| | 1,000 | | | 5.000%, 1/01/25 (Pre-refunded 7/01/22) | | | | | 7/22 at 100.00 | | | | A– (5) | | | | 1,203,640 | |
| | 1,500 | | | 5.000%, 1/01/26 (Pre-refunded 7/01/22) | | | | | 7/22 at 100.00 | | | | A– (5) | | | | 1,805,460 | |
| | | | | |
| | 350 | | | North Carolina Eastern Municipal Power Agency, Power System Revenue Refunding Bonds, Series 1993B, 6.000%, 1/01/22 – NPFG Insured (ETM) | | | | | No Opt. Call | | | | A3 (5) | | | | 428,124 | |
| | | | | |
| | 500 | | | North Carolina Eastern Municipal Power Agency, Power System Revenue Refunding Bonds, Series 2008A, 5.250%, 1/01/20 (Pre-refunded 1/01/18) | | | | | 1/18 at 100.00 | | | | A– (5) | | | | 552,830 | |
| | | | | |
| | 340 | | | North Carolina Medical Care Commission, Health Care Facilities Revenue Bonds, Duke University Health System, Tender Option Bond Trust 2015-XF0147, 22.551%, 6/01/20 (IF) | | | | | No Opt. Call | | | | AA | | | | 508,402 | |
| | 6,355 | | | Total North Carolina | | | | | | | | | | | | | 7,654,414 | |
| | | | | |
| | | | North Dakota – 0.8% | | | | | | | | | | | |
| | | | | |
| | 1,365 | | | North Dakota Public Financing Authority, Capital Financing Program Revenue Bonds, Series 2015B, 5.250%, 6/01/27 | | | | | 6/25 at 100.00 | | | | AA | | | | 1,636,294 | |
| | | | | |
| | 1,500 | | | University of North Dakota, Housing and Auxiliary Facilities Revenue Bonds, Refunding Series 2012, 5.000%, 4/01/32 | | | | | 4/22 at 100.00 | | | | Aa3 | | | | 1,658,985 | |
| | 2,865 | | | Total North Dakota | | | | | | | | | | | | | 3,295,279 | |
| | | | | | | | | | | | | | | | | | |
Principal
Amount (000) | | | Description (1) | | | | Optional Call
Provisions (2) | | | Ratings (3) | | | Value | |
| | | | | |
| | | | Ohio – 1.7% | | | | | | | | | | | |
| | | | | |
| $ | 550 | | | Muskingum County, Ohio, Hospital Facilities Revenue Bonds, Genesis HealthCare System Obligated Group Project, Series 2013, 5.000%, 2/15/27 | | | | | 2/23 at 100.00 | | | | BB+ | | | $ | 589,182 | |
| | | | | |
| | 3,045 | | | Ohio State, General Obligation Bonds, Infrastructure Improvement Series 2014C, 3.000%, 3/01/28 | | | | | 3/23 at 100.00 | | | | AA+ | | | | 3,063,512 | |
| | | | | |
| | 500 | | | Riversouth Authority, Ohio, Riversouth Area Redevelopment Bonds, Refunding Series 2014A, 5.000%, 6/01/25 | | | | | 6/23 at 100.00 | | | | AA+ | | | | 583,705 | |
| | | | | |
| | | | Southeastern Ohio Port Authority, Hospital Facilities Revenue Bonds, Memorial Health System Obligated Group Project, Improvement Series 2015: | | | | | | | | | | | | | | |
| | 170 | | | 5.000%, 12/01/19 | | | | | No Opt. Call | | | | BB | | | | 182,425 | |
| | 375 | | | 5.000%, 12/01/20 | | | | | No Opt. Call | | | | BB | | | | 404,040 | |
| | | | | |
| | 1,810 | | | University of Akron, Ohio, General Receipts Bonds, Series 2010A, 5.000%, 1/01/24 – AGM Insured | | | | | No Opt. Call | | | | AA | | | | 2,035,146 | |
| | 6,450 | | | Total Ohio | | | | | | | | | | | | | 6,858,010 | |
| | | | | |
| | | | Oklahoma – 0.1% | | | | | | | | | | | |
| | | | | |
| | 500 | | | Oklahoma Municipal Power Authority, Power Supply System Revenue Bonds, Series 2008A, 5.875%, 1/01/28 (Pre-refunded 1/01/18) | | | | | 1/18 at 100.00 | | | | A (5) | | | | 560,545 | |
| | | | | |
| | | | Oregon – 0.6% | | | | | | | | | | | |
| | | | | |
| | 750 | | | Klamath Falls Intercommunity Hospital Authority, Oregon, Revenue Bonds, Sky Lakes Medical Center Project, Series 2012, 5.000%, 9/01/21 | | | | | No Opt. Call | | | | A– | | | | 842,348 | |
| | | | | |
| | 140 | | | Oregon Department of Administrative Services, State Lottery Revenue Bonds, Series 2011A, 5.250%, 4/01/24 | | | | | 4/21 at 100.00 | | | | AAA | | | | 167,553 | |
| | | | | |
| | 860 | | | Oregon Department of Administrative Services, State Lottery Revenue Bonds, Series 2011A, 5.250%, 4/01/24 (Pre-refunded 4/01/21) | | | | | 4/21 at 100.00 | | | | N/R (5) | | | | 1,027,990 | |
| | | | | |
| | 365 | | | Oregon Special Districts Association, Certificates of Participation, Flexlease Program, Series 2013A, 4.000%, 1/01/24 | | | | | 1/16 at 102.00 | | | | N/R | | | | 375,278 | |
| | 2,115 | | | Total Oregon | | | | | | | | | | | | | 2,413,169 | |
| | | | | |
| | | | Pennsylvania – 4.9% | | | | | | | | | | | |
| | | | | |
| | 1,000 | | | Central Bradford Progress Authority, Pennsylvania, Revenue Bonds, Guthrie Health, Refunding Series 2011, 5.000%, 12/01/26 | | | | | No Opt. Call | | | | AA– | | | | 1,138,030 | |
| | | | | |
| | 850 | | | Chester County Industrial Development Authority, Pennsylvania, Revenue Bonds, Renaissance Academy Charter School Project, Series 2014, 5.000%, 10/01/34 | | | | | 10/24 at 100.00 | | | | BBB– | | | | 899,088 | |
| | | | | |
| | 1,130 | | | Delaware Valley Regional Finance Authority, Pennsylvania, Local Government Revenue Bonds, Series 1998A, 5.500%, 8/01/28 – AMBAC Insured | | | | | No Opt. Call | | | | A2 | | | | 1,324,258 | |
| | | | | |
| | 1,050 | | | Hempfield Area School District, Westmoreland County, Pennsylvania, General Obligation Bonds, Series 2011, 5.250%, 3/15/25 – AGM Insured | | | | | 3/21 at 100.00 | | | | AA | | | | 1,208,382 | |
| | | | | |
| | 1,140 | | | Lancaster County Hospital Authority, Pennsylvania, Health System Revenue Bonds, Lancaster General Hospital Project, Tender Option Bond Trust 2015-XF0065, 17.782%, 7/01/36 (IF) | | | | | 1/22 at 100.00 | | | | AA– | | | | 1,507,365 | |
| | | | | |
| | 1,955 | | | Lower Merion School District, Montgomery County, Pennsylvania, General Obligation Bonds, Series 2015B, 3.000%, 9/01/27 | | | | | 9/23 at 100.00 | | | | Aaa | | | | 1,994,452 | |
| | | | | |
| | 825 | | | Lycoming County Authority, Pennsylvania, Revenue Bonds, AICUP Financing Program-Lycoming College, Series 2013M-M1, 5.250%, 11/01/43 | | | | | 11/23 at 100.00 | | | | A | | | | 915,156 | |
| | | | | |
| | 1,250 | | | Lycoming County Authority, Pennsylvania, Revenue Bonds, Pennsylvania College of Technology, Refunding Series 2011, 5.500%, 7/01/26 | | | | | 7/21 at 100.00 | | | | A | | | | 1,429,175 | |
Municipal Total Return Managed Accounts Portfolio (continued)
| | |
| Portfolio of Investments | | July 31, 2015 |
| | | | | | | | | | | | | | | | | | |
Principal
Amount (000) | | | Description (1) | | | | Optional Call
Provisions (2) | | | Ratings (3) | | | Value | |
| | | | | |
| | | | Pennsylvania (continued) | | | | | | | | | | | |
| | | | | |
| | | | Pennsylvania Economic Development Financing Authority, Private Activity Revenue Bonds, Pennsylvania Rapid Bridge Replacement Project, Series 2015: | | | | | | | | | | | | | | |
| $ | 1,000 | | | 4.000%, 6/30/18 (Alternative Minimum Tax) | | | | | No Opt. Call | | | | BBB | | | $ | 1,066,360 | |
| | 1,000 | | | 4.125%, 12/31/38 (Alternative Minimum Tax) | | | | | 6/26 at 100.00 | | | | BBB | | | | 964,140 | |
| | | | | |
| | 1,000 | | | Pennsylvania Economic Development Financing Authority, Water Facilities Revenue Refunding Bonds, Aqua Pennsylvania, Inc. Project, Series 2010A, 5.000%, 12/01/34 (Alternative Minimum Tax) | | | | | 12/20 at 100.00 | | | | AA– | | | | 1,078,920 | |
| | | | | |
| | 1,600 | | | Philadelphia Authority for Industrial Development, Pennsylvania, Revenue Bonds, Philadelphia Performing Arts Charter School, Series 2013, 6.000%, 6/15/23 | | | | | 6/20 at 100.00 | | | | BB– | | | | 1,687,024 | |
| | | | | |
| | 1,000 | | | Philadelphia Gas Works, Pennsylvania, Revenue Bonds, Ninth Series, 2010, 5.000%, 8/01/30 | | | | | 8/20 at 100.00 | | | | A– | | | | 1,095,630 | |
| | | | | |
| | 1,000 | | | Philadelphia Hospitals and Higher Education Facilities Authority, Pennsylvania, Hospital Revenue Bonds, Temple University Health System Obligated Group, Series 2007B, 5.500%, 7/01/26 | | | | | 7/17 at 100.00 | | | | BB+ | | | | 1,039,750 | |
| | | | | |
| | 870 | | | Philadelphia Municipal Authority, Pennsylvania, Lease Revenue Bonds, Series 2009, 6.000%, 4/01/23 | | | | | 4/19 at 100.00 | | | | A+ | | | | 995,210 | |
| | | | | |
| | 1,000 | | | West Chester Area School District, Chester and Delaware Counties, Pennsylvania, General Obligation Bonds, Refunding Series 2014AA, 5.000%, 5/15/27 | | | | | 11/24 at 100.00 | | | | Aaa | | | | 1,215,100 | |
| | 17,670 | | | Total Pennsylvania | | | | | | | | | | | | | 19,558,040 | |
| | | | | |
| | | | Rhode Island – 1.2% | | | | | | | | | | | |
| | | | | |
| | 4,045 | | | Narragansett Bay Commission, Rhode Island, Wastewater System Revenue Bonds, Refunding Series 2014B, 5.000%, 9/01/31 | | | | | 9/24 at 100.00 | | | | AA– | | | | 4,701,423 | |
| | | | | |
| | | | South Carolina – 0.6% | | | | | | | | | | | |
| | | | | |
| | 1,000 | | | Charleston County Airport District, South Carolina, Airport Revenue Bonds, Series 2013A, 5.250%, 7/01/21 (Alternative Minimum Tax) | | | | | No Opt. Call | | | | A1 | | | | 1,168,360 | |
| | | | | |
| | 500 | | | Lexington County Health Services District, Inc., South Carolina, Hospital Revenue Bonds, Refunding Series 2011, 5.000%, 11/01/26 | | | | | 11/21 at 100.00 | | | | AA- | | | | 567,555 | |
| | | | | |
| | | | South Carolina JOBS Economic Development Authority, Economic Development Revenue Bonds, York Preparatory Academy Project, Series 2014A: | | | | | | | | | | | | | | |
| | 320 | | | 5.750%, 11/01/23 | | | | | No Opt. Call | | | | N/R | | | | 334,275 | |
| | 180 | | | 7.000%, 11/01/33 | | | | | 11/24 at 100.00 | | | | N/R | | | | 196,081 | |
| | | | | |
| | 250 | | | South Carolina Transportation Infrastructure Bank, Revenue Bonds, Series 2010A, 5.250%, 10/01/40 | | | | | 10/19 at 100.00 | | | | A1 | | | | 280,165 | |
| | 2,250 | | | Total South Carolina | | | | | | | | | | | | | 2,546,436 | |
| | | | | |
| | | | South Dakota – 0.8% | | | | | | | | | | | |
| | | | | |
| | | | South Dakota Educational Enhancement Funding Corporation, Tobacco Settlement Revenue Bonds Series 2013B: | | | | | | | | | | | | | | |
| | 440 | | | 5.000%, 6/01/24 | | | | | 6/23 at 100.00 | | | | A | | | | 505,120 | |
| | 2,400 | | | 5.000%, 6/01/26 | | | | | 6/23 at 100.00 | | | | A– | | | | 2,709,720 | |
| | 2,840 | | | Total South Dakota | | | | | | | | | | | | | 3,214,840 | |
| | | | | |
| | | | Tennessee – 0.3% | | | | | | | | | | | |
| | | | | |
| | 1,000 | | | Claiborne County Industrial Development Board, Tennessee, Revenue Refunding Bonds, Lincoln Memorial University Project, Series 2010, 6.000%, 10/01/30 | | | | | 10/20 at 100.00 | | | | N/R | | | | 1,081,790 | |
| | | | | | | | | | | | | | | | | | |
Principal
Amount (000) | | | Description (1) | | | | Optional Call
Provisions (2) | | | Ratings (3) | | | Value | |
| | | | | |
| | | | Texas – 12.4% | | | | | | | | | | | |
| | | | | |
| $ | 485 | | | Austin Community College District Public Facility Corporation, Texas, Lease Revenue Bonds, Round Rock Campus, Refunding Series 2015, 5.000%, 8/01/27 | | | | | 8/25 at 100.00 | | | | AA | | | $ | 567,392 | |
| | | | | |
| | 3,200 | | | Austin, Texas, Electric Utility System Revenue Bonds, Refunding Series 2015A, 5.000%, 11/15/45 (UB) (4) | | | | | 11/25 at 100.00 | | | | AA– | | | | 3,553,120 | |
| | | | | |
| | 1,385 | | | Capital Area Cultural Education Facilities Finance Corporation, Texas, Revenue Bonds, The Roman Catholic Diocese of Austin, Series 2005A. Remarketed, 5.750%, 4/01/26 | | | | | 4/20 at 100.00 | | | | Baa1 | | | | 1,546,616 | |
| | | | | |
| | 965 | | | Clifton Higher Education Finance Corporation, Texas, Education Revenue Bonds, Idea Public Schools, Series 2011, 4.800%, 8/15/21 | | | | | No Opt. Call | | | | BBB | | | | 1,070,513 | |
| | | | | |
| | 675 | | | Clifton Higher Education Finance Corporation, Texas, Education Revenue Bonds, Uplift Education Charter School, Series 2010A, 4.300%, 12/01/16 | | | | | No Opt. Call | | | | BBB– | | | | 702,770 | |
| | | | | |
| | 315 | | | Clifton Higher Education Finance Corporation, Texas, Education Revenue Bonds, Uplift Education Charter School, Series 2013A, 3.100%, 12/01/22 | | | | | No Opt. Call | | | | BBB– | | | | 309,062 | |
| | | | | |
| | 1,200 | | | Dallas County Schools, Texas, Public Property Finance Contractual Obligations, Series 2014, 5.000%, 6/01/21 | | | | | No Opt. Call | | | | Baa1 | | | | 1,327,356 | |
| | | | | |
| | 2,000 | | | Dallas-Fort Worth International Airport, Texas, Joint Revenue Bonds, Improvement Series 2013A, 5.000%, 11/01/38 (Alternative Minimum Tax) | | | | | 11/20 at 100.00 | | | | A+ | | | | 2,125,860 | |
| | | | | |
| | 2,000 | | | Dallas-Fort Worth International Airport, Texas, Joint Revenue Bonds, Refunding Series 2012F, 5.000%, 11/01/29 (Alternative Minimum Tax) | | | | | 11/20 at 100.00 | | | | A+ | | | | 2,258,640 | |
| | | | | |
| | 1,000 | | | Decatur Hospital Authority, Texas, Revenue Bonds, Wise Regional Health System, Series 2013A, 6.625%, 9/01/31 | | | | | 9/23 at 100.00 | | | | N/R | | | | 1,203,490 | |
| | | | | |
| | 1,500 | | | Ennis Independent School District, Ellis County, Texas, General Obligation Bonds, Refunding Series 2015, 0.000%, 8/15/27 | | | | | 8/25 at 93.55 | | | | Aaa | | | | 1,005,975 | |
| | | | | |
| | 1,500 | | | Frisco Independent School District, Collin and Denton Counties, Texas, General Obligation Bonds, Series 2008A, 6.000%, 8/15/38 | | | | | 8/18 at 100.00 | | | | Aaa | | | | 1,710,795 | |
| | | | | |
| | | | Harris County Water Control and Improvement District 74, Texas, General Obligation Bonds, Series 2010: | | | | | | | | | | | | | | |
| | 195 | | | 5.000%, 8/01/36 | | | | | 2/18 at 100.00 | | | | N/R | | | | 205,579 | |
| | 1,515 | | | 5.200%, 8/01/39 | | | | | 2/18 at 100.00 | | | | N/R | | | | 1,604,764 | |
| | | | | |
| | | | Harris County-Houston Sports Authority, Texas, Revenue Bonds, Refunding Second Lien Series 2014C: | | | | | | | | | | | | | | |
| | 605 | | | 5.000%, 11/15/26 | | | | | 11/24 at 100.00 | | | | A3 | | | | 693,917 | |
| | 650 | | | 5.000%, 11/15/27 | | | | | 11/24 at 100.00 | | | | A3 | | | | 740,337 | |
| | | | | |
| | 1,315 | | | Houston Independent School District, Harris County, Texas, General Obligation Bonds, Refunding Series 2014B, 4.000%, 2/15/27 | | | | | 2/24 at 100.00 | | | | AAA | | | | 1,446,040 | |
| | | | | |
| | 615 | | | Houston, Texas, General Obligation Bonds, Public Improvement Refunding Series 2014A, 5.000%, 3/01/26 | | | | | 3/24 at 100.00 | | | | AA+ | | | | 729,894 | |
| | | | | |
| | 1,630 | | | Houston, Texas, Subordinate Lien Airport System Revenue Refunding Bonds, Series 2012A, 5.000%, 7/01/29 (Alternative Minimum Tax) | | | | | 7/22 at 100.00 | | | | A | | | | 1,800,074 | |
| | | | | |
| | | | Irving, Texas, Hotel Occupancy Tax Revenue Bonds, Series 2014B: | | | | | | | | | | | | | | |
| | 490 | | | 4.000%, 8/15/25 | | | | | 8/19 at 100.00 | | | | BBB+ | | | | 500,315 | |
| | 250 | | | 4.125%, 8/15/26 | | | | | 8/19 at 100.00 | | | | BBB+ | | | | 255,185 | |
| | | | | |
| | 750 | | | La Vernia Higher Education Financing Corporation, Texas, Charter School Revenue Bonds, Kipp Inc., Series 2009A, 6.000%, 8/15/29 (Pre-refunded 8/15/19) | | | | | 8/19 at 100.00 | | | | BBB (5) | | | | 888,180 | |
| | | | | |
| | 1,000 | | | Love Field Airport Modernization Corporation, Texas, General Airport Revenue Bonds Series 2015, 5.000%, 11/01/32 (WI/DD, Settling 8/18/15) (Alternative Minimum Tax) | | | | | 11/25 at 100.00 | | | | A1 | | | | 1,119,060 | |
Municipal Total Return Managed Accounts Portfolio (continued)
| | |
| Portfolio of Investments | | July 31, 2015 |
| | | | | | | | | | | | | | | | | | |
Principal
Amount (000) | | | Description (1) | | | | Optional Call
Provisions (2) | | | Ratings (3) | | | Value | |
| | | | | |
| | | | Texas (continued) | | | | | | | | | | | |
| | | | | |
| | | | Midtown Redevelopment Authority, Texas, Tax Increment Contract Revenue, Refunding Series 2015: | | | | | | | | | | | | | | |
| $ | 500 | | | 5.000%, 1/01/24 | | | | | No Opt. Call | | | | A | | | $ | 583,185 | |
| | 300 | | | 5.000%, 1/01/25 | | | | | 1/24 at 100.00 | | | | A | | | | 347,229 | |
| | | | | |
| | 1,150 | | | Montgomery Independent School District, Montgomery County, Texas, General Obligation Bonds, Refunding School Building Series 2015, 4.000%, 2/15/30 (WI/DD, Settling 8/11/15) | | | | | 2/25 at 100.00 | | | | AAA | | | | 1,218,310 | |
| | | | | |
| | 2,000 | | | New Hope Cultural Education Facilities Finance Corporation, Texas, Student Housing Revenue Bonds, CHF-Collegiate Housing NCCD College Station Properties-Texas A&M University, Series 2015A., 5.000%, 7/01/35 | | | | | 7/25 at 100.00 | | | | BBB– | | | | 2,093,918 | |
| | | | | |
| | 400 | | | Newark Cultural Education Facilities Finance Corporation, Texas, Lease Revenue Bonds, A.W. Brown-Fellowship Leadership Academy, Series 2012A, 6.000%, 8/15/32 | | | | | 8/15 at 100.00 | | | | BBB– | | | | 412,928 | |
| | | | | |
| | 1,000 | | | North Texas Education Finance Corporation, Texas, Education Revenue Bonds, Uplift Education, Series 2012A, 5.125%, 12/01/42 | | | | | 6/22 at 100.00 | | | | BBB– | | | | 1,062,300 | |
| | | | | |
| | 375 | | | North Texas Tollway Authority, System Revenue Bonds, Refunding Second Tier, Series 2008F, 5.750%, 1/01/38 (Pre-refunded 1/01/18) | | | | | 1/18 at 100.00 | | | | A3 (5) | | | | 418,620 | |
| | | | | |
| | 2,500 | | | North Texas Tollway Authority, System Revenue Bonds, Refunding Second Tier, Series 2015A, 4.000%, 1/01/38 | | | | | 1/25 at 100.00 | | | | A3 | | | | 2,481,625 | |
| | | | | |
| | 825 | | | Sam Rayburn Municipal Power Agency, Texas, Power Supply System Revenue Bonds, Refunding Series 2012, 5.000%, 10/01/21 | | | | | No Opt. Call | | | | BBB+ | | | | 953,387 | |
| | | | | |
| | 1,000 | | | San Jacinto Community College District, Texas, Combined Fee Revenue Bonds, Series 2015, 5.000%, 2/15/34 (WI/DD, Settling 8/06/15) | | | | | 2/25 at 100.00 | | | | Aa3 | | | | 1,125,060 | |
| | | | | |
| | 1,490 | | | San Jacinto River Authority, Texas, Special Project Revenue Bonds, Woodlands Water Supply System Project, Refunding Series 2014, 5.000%, 10/01/29 – BAM Insured | | | | | 10/23 at 100.00 | | | | AA | | | | 1,699,732 | |
| | | | | |
| | 245 | | | Texas Public Finance Authority Charter School Finance Corporation, Charter School Revenue Bonds, School of Excellence Education Project, Series 2004A, 7.000%, 12/01/34 | | | | | 12/15 at 100.00 | | | | BB | | | | 237,662 | |
| | | | | |
| | 1,200 | | | Texas State, General Obligation Bonds, College Student Loan Series 2014, 6.000%, 8/01/25 (Alternative Minimum Tax) | | | | | 8/24 at 100.00 | | | | AAA | | | | 1,508,808 | |
| | | | | |
| | 2,000 | | | Texas State, General Obligation Bonds, Transportation Commission Mobility Fund, Refunding Series 2014A, 5.000%, 10/01/26 | | | | | 10/24 at 100.00 | | | | AAA | | | | 2,410,460 | |
| | | | | |
| | | | Texas Transportation Commission, Central Texas Turnpike System Revenue Bonds, Second Tier Refunding Series 2015C: | | | | | | | | | | | | | | |
| | 500 | | | 5.000%, 8/15/24 | | | | | No Opt. Call | | | | BBB+ | | | | 583,025 | |
| | 1,140 | | | 5.000%, 8/15/29 | | | | | 8/24 at 100.00 | | | | BBB+ | | | | 1,272,445 | |
| | | | | |
| | 2,000 | | | Tyler Health Facilities Development Corporation, Texas, Hospital Revenue Bonds, Mother Frances Hospital Regional Healthcare Center, Series 2011, 5.250%, 7/01/23 | | | | | 7/21 at 100.00 | | | | Baa1 | | | | 2,263,120 | |
| | | | | |
| | 1,000 | | | Uptown Development Authority, Houston, Texas, Tax Increment Revenue Bonds, Infrastructure Improvement Facilities, Series 2009, 4.700%, 9/01/20 | | | | | 9/19 at 100.00 | | | | BBB | | | | 1,102,020 | |
| | 44,865 | | | Total Texas | | | | | | | | | | | | | 49,138,768 | |
| | | | | |
| | | | Utah – 1.1% | | | | | | | | | | | |
| | | | | |
| | | | Utah Infrastructure Agency, Telecommunications and Franchise Tax Revenue, Series 2011A: | | | | | | | | | | | | | | |
| | 500 | | | 5.250%, 10/15/33 – AGM Insured | | | | | 10/21 at 100.00 | | | | AA | | | | 558,745 | |
| | 520 | | | 5.400%, 10/15/36 – AGM Insured | | | | | 10/21 at 100.00 | | | | AA | | | | 583,216 | |
| | | | | |
| | 435 | | | Utah State Charter School Finance Authority, Charter School Revenue Bonds, North Davis Preparatory Academy, Series 2010, 5.750%, 7/15/20 | | | | | No Opt. Call | | | | BBB– | | | | 473,798 | |
| | | | | |
| | 1,550 | | | Utah State Charter School Finance Authority, Charter School Revenue Bonds, Paradigm High School, Series 2010A, 6.250%, 7/15/30 | | | | | 7/20 at 100.00 | | | | BB– | | | | 1,594,034 | |
| | | | | | | | | | | | | | | | | | |
Principal
Amount (000) | | | Description (1) | | | | Optional Call
Provisions (2) | | | Ratings (3) | | | Value | |
| | | | | |
| | | | Utah (continued) | | | | | | | | | | | |
| | | | | |
| $ | 70 | | | Utah State Charter School Finance Authority, Revenue Bonds, Channing Hall Project, Series 2007A, 5.750%, 7/15/22 | | | | | 7/17 at 100.00 | | | | N/R | | | $ | 71,082 | |
| | | | | |
| | 40 | | | Utah State Charter School Finance Authority, Revenue Bonds, Summit Academy Project, Series 2007A, 5.125%, 6/15/17 | | | | | No Opt. Call | | | | BBB– | | | | 41,266 | |
| | | | | |
| | 750 | | | Utah Transit Authority, Sales Tax Revenue Bonds, Tender Option Bond Trust 3006, 18.001%, 6/15/26 (Pre-refunded 6/15/18) – AGM Insured (IF) (4) | | | | | 6/18 at 100.00 | | | | AAA | | | | 1,096,650 | |
| | 3,865 | | | Total Utah | | | | | | | | | | | | | 4,418,791 | |
| | | | | |
| | | | Virgin Islands – 0.7% | | | | | | | | | | | |
| | | | | |
| | 500 | | | Virgin Islands Public Finance Authority, Matching Fund Loan Notes Revenue Bonds, Senior Lien Series 2009A-1, 5.000%, 10/01/24 | | | | | 10/19 at 100.00 | | | | BBB | | | | 547,080 | |
| | | | | |
| | 1,000 | | | Virgin Islands Public Finance Authority, Matching Fund Loan Notes Revenue Refunding Bonds, Series 2009C, 5.000%, 10/01/22 | | | | | 10/19 at 100.00 | | | | Baa2 | | | | 1,078,150 | |
| | | | | |
| | 1,000 | | | Virgin Islands Public Finance Authority, Matching Fund Revenue Loan Note – Diageo Project, Series 2009A, 6.750%, 10/01/19 | | | | | No Opt. Call | | | | Baa3 | | | | 1,116,750 | |
| | 2,500 | | | Total Virgin Islands | | | | | | | | | | | | | 2,741,980 | |
| | | | | |
| | | | Virginia – 2.6% | | | | | | | | | | | |
| | | | |
| | 1,300 | | | Alexandria, Virginia, General Obligation Bonds, Capital Improvement Series 2014B, 4.000%, 1/15/27 | | | 1/25 at 100.00 | | | | AAA | | | | 1,460,691 | |
| | | | | |
| | | | Fredericksburg Economic Development Authority, Virginia, Revenue Bonds, Mary Washington Healthcare Obligated Group, Refunding Series 2014: | | | | | | | | | | | | | | |
| | 600 | | | 5.000%, 6/15/31 | | | | | 6/24 at 100.00 | | | | Baa1 | | | | 650,712 | |
| | 1,400 | | | 5.000%, 6/15/33 | | | | | 6/24 at 100.00 | | | | Baa1 | | | | 1,506,344 | |
| | | | | |
| | 2,000 | | | Metropolitan Washington Airports Authority, Virginia, Airport System Revenue Bonds, Refunding Series 2012A, 5.000%, 10/01/31 (Alternative Minimum Tax) | | | | | 10/22 at 100.00 | | | | AA– | | | | 2,207,280 | |
| | | | | |
| | 1,900 | | | Metropolitan Washington Airports Authority, Virginia, Airport System Revenue Bonds, Series 2008A, 5.375%, 10/01/28 (Alternative Minimum Tax) | | | | | 10/18 at 100.00 | | | | AA– | | | | 2,098,018 | |
| | | | | |
| | 815 | | | Virginia College Building Authority, Educational Facilities Revenue Bonds, Washington and Lee University, Series 2001, 5.750%, 1/01/34 | | | | | No Opt. Call | | | | AA | | | | 1,038,807 | |
| | | | | |
| | | | Virginia Small Business Financing Authority, Senior Lien Revenue Bonds, Elizabeth River Crossing, Opco LLC Project, Series 2012: | | | | | | | | | | | | | | |
| | 40 | | | 4.750%, 1/01/25 (Alternative Minimum Tax) | | | | | 7/22 at 100.00 | | | | BBB– | | | | 43,111 | |
| | 1,400 | | | 5.000%, 1/01/27 (Alternative Minimum Tax) | | | | | 7/22 at 100.00 | | | | BBB– | | | | 1,516,788 | |
| | 9,455 | | | Total Virginia | | | | | | | | | | | | | 10,521,751 | |
| | | | | |
| | | | Washington – 5.5% | | | | | | | | | | | |
| | | | | |
| | 980 | | | Central Puget Sound Regional Transit Authority, Washington, Sales and Use Tax Revenue Bonds, Series 2007A, 5.000%, 11/01/34 �� AGM Insured | | | | | No Opt. Call | | | | AAA | | | | 1,056,146 | |
| | | | | |
| | 1,700 | | | Chelan County Public Utility District 1, Washington, Consolidated System Revenue Bonds Series 2011A, 5.500%, 7/01/24 (Alternative Minimum Tax) | | | | | 7/21 at 100.00 | | | | AA+ | | | | 1,983,934 | |
| | | | | |
| | 2,500 | | | Chelan County Public Utility District 1, Washington, Consolidated System Revenue Bonds Series 2011B, 5.500%, 7/01/26 (Alternative Minimum Tax) | | | | | 7/21 at 100.00 | | | | AA+ | | | | 2,889,248 | |
| | | | | |
| | 1,000 | | | Energy Northwest, Washington, Electric Revenue Bonds, Columbia Generating Station, Series 2012-D, 5.000%, 7/01/35 | | | | | 7/22 at 100.00 | | | | Aa1 | | | | 1,122,740 | |
| | | | | |
| | 100 | | | Kalispel Indian Tribe, Washington, Priority Distribution Bonds, Series 2008, 6.625%, 1/01/28 | | | | | 1/18 at 100.00 | | | | N/R | | | | 101,132 | |
| | | | | |
| | 1,900 | | | King County, Washington, Sewer Revenue Bonds, Refunding Series 2011B, 5.000%, 1/01/31 | | | | | No Opt. Call | | | | AA+ | | | | 2,166,171 | |
| | | | | |
| | 600 | | | King County, Washington, Sewer Revenue Bonds, Tender Option Bond Trust 3090, 13.341%, 7/01/32 (Pre-refunded 7/01/17) – AGM Insured (IF) (4) | | | | | 7/17 at 100.00 | | | | AA+ (5) | | | | 749,796 | |
Municipal Total Return Managed Accounts Portfolio (continued)
| | |
| Portfolio of Investments | | July 31, 2015 |
| | | | | | | | | | | | | | | | | | |
Principal
Amount (000) | | | Description (1) | | | | Optional Call
Provisions (2) | | | Ratings (3) | | | Value | |
| | | | | |
| | | | Washington (continued) | | | | | | | | | | | |
| | | | | |
| $ | 2,000 | | | Port of Seattle, Washington, Revenue Bonds, Intermediate Lien Series 2015C, 5.000%, 4/01/29 (WI/DD, Settling 8/06/15) (Alternative Minimum Tax) | | | | | 10/24 at 100.00 | | | | A+ | | | $ | 2,226,780 | |
| | | | | |
| | 750 | | | University of Washington, General Revenue Bonds, Tender Option Bond Trust 3005, 18.205%, 6/01/31 (Pre-refunded 6/01/17) – AMBAC Insured (IF) | | | | | 6/17 at 100.00 | | | | Aaa | | | | 990,180 | |
| | | | | |
| | 1,000 | | | Washington Health Care Facilities Authority, Revenue Bonds, Kadlec Regional Medical Center, Series 2010, 5.250%, 12/01/30 (Pre-refunded 12/01/20) | | | | | 12/20 at 100.00 | | | | N/R (5) | | | | 1,193,610 | |
| | | | | |
| | 1,000 | | | Washington Health Care Facilities Authority, Revenue Bonds, Seattle Children’s Hospital, Series 2015B, 5.000%, 10/01/38 (UB) | | | | | 4/25 at 100.00 | | | | Aa2 | | | | 1,116,850 | |
| | | | | |
| | 1,550 | | | Washington State Health Care Facilities Authority, Revenue Bonds, Catholic Health Initiative, Series 2008D, 6.375%, 10/01/36 | | | | | 10/18 at 100.00 | | | | A+ | | | | 1,760,599 | |
| | | | | |
| | 2,800 | | | Washington State Health Care Facilities Authority, Revenue Bonds, Seattle Cancer Care Alliance, Series 2008A, 7.375%, 3/01/38 (Pre-refunded 3/01/19) | | | | | 3/19 at 100.00 | | | | A+ (5) | | | | 3,412,584 | |
| | | | | |
| | 1,000 | | | Washington State, General Obligation Bonds, Various Purpose, Refunding Series R-2015C, 5.000%, 7/01/27 | | | | | 1/25 at 100.00 | | | | AA+ | | | | 1,192,400 | |
| | 18,880 | | | Total Washington | | | | | | | | | | | | | 21,962,170 | |
| | | | | |
| | | | West Virginia – 0.7% | | | | | | | | | | | |
| | | | | |
| | 1,150 | | | West Virginia Higher Education Policy Commission, Revenue Bonds, Higher Education Facilities, Series 2012A, 5.000%, 4/01/29 | | | | | 4/22 at 100.00 | | | | Aa3 | | | | 1,306,584 | |
| | | | | |
| | 1,250 | | | West Virginia Water Development Authority, Infrastructure Excess Lottery Revenue Bonds, Chesapeake Bay/Greenbrier River Projects, Series 2014A, 5.000%, 7/01/34 | | | | | 7/24 at 100.00 | | | | AAA | | | | 1,424,350 | |
| | 2,400 | | | Total West Virginia | | | | | | | | | | | | | 2,730,934 | |
| | | | | |
| | | | Wisconsin – 2.5% | | | | | | | | | | | |
| | | | | |
| | 350 | | | Public Finance Authority, Wisconsin, Charter School Revenue Bonds, Voyager Foundation Inc. of North Carolina, Series 2012A, 5.500%, 10/01/22 | | | | | No Opt. Call | | | | BB+ | | | | 387,002 | |
| | | | | |
| | 1,770 | | | Public Finance Authority, Wisconsin, Senior Airport Facilities Revenue and Refunding Bonds, TrIPS Obligated Group, Series 2012B, 5.000%, 7/01/22 (Alternative Minimum Tax) | | | | | No Opt. Call | | | | BBB | | | | 1,905,317 | |
| | | | | |
| | 1,880 | | | School Districts of Arcadia, Buffalo, and Trempealeau Counties, Wisconsin, Bond Anticipation Notes, Series 2014, 3.000%, 3/15/19 | | | | | 3/17 at 100.00 | | | | A | | | | 1,934,670 | |
| | | | | |
| | 485 | | | University of Wisconsin Hospitals and Clinics Authority, Revenue Bonds, Tender Option Bond Trust 2015-XF0127, 17.305%, 10/01/20 (IF) (4) | | | | | No Opt. Call | | | | Aa3 | | | | 673,136 | |
| | | | | |
| | 1,000 | | | Wisconsin Health and Educational Facilities Authority, Revenue Bonds, Mile Bluff Medical Center, Inc., Series 2014, 5.125%, 5/01/29 | | | | | 5/24 at 100.00 | | | | N/R | | | | 1,050,450 | |
| | | | | |
| | 500 | | | Wisconsin Health and Educational Facilities Authority, Revenue Bonds, Ascension Health, Tender Option Bond Trust 2015-XF2044, 18.041%, 11/15/17 (IF) (4) | | | | | No Opt. Call | | | | AA+ | | | | 704,640 | |
| | | | | |
| | 440 | | | Wisconsin Health and Educational Facilities Authority, Revenue Bonds, Childrens Hospital of Wisconsin Inc., Tender Option Bond Trust 2009-15W, 19.110%, 8/15/37 (IF) (4) | | | | | 2/20 at 100.00 | | | | AA | | | | 632,377 | |
| | | | | |
| | 1,000 | | | Wisconsin Health and Educational Facilities Authority, Revenue Bonds, SSM Healthcare System, Series 2010A, 5.250%, 6/01/34 | | | | | 6/20 at 100.00 | | | | AA– | | | | 1,107,130 | |
| | | | | |
| | 335 | | | Wisconsin Health and Educational Facilities Authority, Wisconsin, Revenue Bonds, Fort Healthcare, Series 2014, 5.000%, 5/01/25 | | | | | 5/24 at 100.00 | | | | BBB | | | | 370,765 | |
| | | | | |
| | | | Wisconsin State, General Fund Annual Appropriation Revenue Bonds, Refunding Series 2009A: | | | | | | | | | | | | | | |
| | 1,000 | | | 6.000%, 5/01/27 | | | | | 5/19 at 100.00 | | | | AA– | | | | 1,168,128 | |
| | 90 | | | 6.000%, 5/01/33 | | | | | 5/19 at 100.00 | | | | AA– | | | | 105,240 | |
| | 8,850 | | | Total Wisconsin | | | | | | | | | | | | | 10,038,855 | |
| | | | | | | | | | | | | | | | | | |
Principal
Amount (000) | | | Description (1) | | | | Optional Call
Provisions (2) | | | Ratings (3) | | | Value | |
| | | | | |
| | | | Wyoming – 0.9% | | | | | | | | | | | |
| | | | | |
| $ | 1,000 | | | Natrona County, Wyoming, Hospital Revenue Bonds, Wyoming Medical Center Project, Series 2011, 6.000%, 9/15/26 | | | | | 3/21 at 100.00 | | | | A3 | | | $ | 1,135,200 | |
| | | | | |
| | 2,000 | | | West Park Hospital District, Wyoming, Hospital Revenue Bonds, Series 2011A, 6.375%, 6/01/26 | | | | | 6/21 at 100.00 | | | | BBB | | | | 2,300,440 | |
| | | | | |
| | 250 | | | Wyoming Municipal Power Agency Power Supply System Revenue Bonds, 2008 Series A, 5.500%, 1/01/28 | | | | | 1/18 at 100.00 | | | | A2 | | | | 274,710 | |
| | 3,250 | | | Total Wyoming | | | | | | | | | | | | | 3,710,350 | |
| $ | 354,547 | | | Total Long-Term Investments (cost $375,701,775) | | | | | | | | | | | | | 391,709,449 | |
| | | | | |
Principal
Amount (000) | | | Description (1) | | | | Optional Call
Provisions (2) | | | Ratings (3) | | | Value | |
| | | | | |
| | | | SHORT-TERM INVESTMENTS – 0.8% | | | | | | | | | | | | | | |
| | | | | |
| | | | MUNICIPAL BONDS – 0.8% | | | | | | | | | | | | | | |
| | | | | |
| | | | California – 0.1% | | | | | | | | | | | | | | |
| | | | | |
| $ | 450 | | | California State, General Obligation Bonds, Variable Rate Demand Obligations, Refunding Various Purpose Series 2012B, 0.920%, 5/01/18 (7) | | | | | 11/17 at 100.00 | | | | AA– | | | $ | 453,807 | |
| | | | | |
| | | | Massachusetts – 0.4% | | | | | | | | | | | | | | |
| | | | | |
| | 1,675 | | | Massachusetts State, General Obligation Bonds, Variable Rate Demand Obligations, Refunding Series 2012A, 0.500%, 2/01/16 | | | | | 8/15 at 100.00 | | | | AA+ | | | | 1,675,737 | |
| | | | | |
| | | | North Carolina – 0.3% | | | | | | | | | | | | | | |
| | | | | |
| | 1,000 | | | University of North Carolina at Chapel Hill, General Revenue Bonds, Variable Rate Demand Obligations, Index Tender Series 2012B, 0.875%, 12/01/41 (Mandatory put 12/01/17) (7) | | | | | 6/17 at 100.00 | | | | AAA | | | | 1,004,010 | |
| $ | 3,125 | | | Total Short-Term Investments (cost $3,125,000) | | | | | | | | | | | | | 3,133,554 | |
| | | | Total Investments (cost $378,826,775) – 99.2% | | | | | | | | | | | | | 394,843,003 | |
| | | | Floating Rate Obligations – (1.4)% | | | | | | | | | | | | | (5,710,000 | ) |
| | | | Other Assets Less Liabilities – 2.2% | | | | | | | | | | | | | 8,903,168 | |
| | | | Net Assets – 100% | | | | | | | | | | | | $ | 398,036,171 | |
| (1) | All percentages shown in the Portfolio of Investments are based on net assets. |
| (2) | Optional Call Provisions (not covered by the report of independent registered public accounting firm): Dates (month and year) and prices of the earliest optional call or redemption. There may be other call provisions at varying prices at later dates. Certain mortgage- backed securities may be subject to periodic principal paydowns. |
| (3) | Ratings (not covered by the report of independent registered public accounting firm): Using the highest of Standard & Poor’s Group (“Standard & Poor’s”), Moody’s Investors Service, Inc. (“Moody’s”) or Fitch, Inc. (“Fitch”) rating. Ratings below BBB by Standard & Poor’s, Baa by Moody’s or BBB by Fitch are considered to be below investment grade. Holdings designated N/R are not rated by any of these national rating agencies. |
| (4) | Investment, or portion of investment, has been pledged to collateralize the net payment obligations for investments in inverse floating rate transactions. |
| (5) | Backed by an escrow or trust containing sufficient U.S. Government or U.S. Government agency securities, which ensure the timely payment of principal and interest. Certain bonds backed by U.S. Government or agency securities are regarded as having an implied rating equal to the rating of such securities. |
| (6) | At or subsequent to the end of the reporting period, this security is non-income producing. Non-income producing, in the case of a fixed-income security, generally denotes that the issuer has (1) defaulted on the payment of principal or interest, (2) is under the protection of the Federal Bankruptcy Court or (3) the Fund’s Adviser has concluded that the issue is not likely to meet its future interest payment obligations and has ceased accruing additional income on the Fund’s records. |
| (7) | Investment has a maturity of more than one year, but has variable rate and demand features which qualify it as a short-term investment. The rate disclosed is that in effect as of the end of the reporting period. This rate changes periodically based on market conditions or a specified market index. |
| (WI/DD) | Investment, or portion of investment, purchased on a when-issued or delayed delivery basis. |
| (ETM) | Escrowed to maturity. |
| (IF) | Inverse floating rate investment. |
| (UB) | Underlying bond of an inverse floating rate trust reflected as a financing transaction. See Notes to Financial Statements, Note 3 – Portfolio Securities and Investments in Derivatives, Inverse Floating Rate Securities for more information. |
See accompanying notes to financial statements.
Statement of
| | | | |
| | Assets and Liabilities | | July 31, 2015 |
| | | | |
Assets | | | | |
Long-term investments, at value (cost $375,701,775) | | $ | 391,709,449 | |
Short-term investments, at value (cost $3,125,000) | | | 3,133,554 | |
Cash | | | 12,300,467 | |
Receivable for: | | | | |
Interest | | | 4,460,194 | |
Reimbursement from Adviser | | | 19,944 | |
Shares sold | | | 1,831,824 | |
Other assets | | | 20,840 | |
Total assets | | | 413,476,272 | |
Liabilities | | | | |
Floating rate obligations | | | 5,710,000 | |
Payable for: | | | | |
Dividends | | | 651,039 | |
Investments purchased | | | 8,120,797 | |
Shares redeemed | | | 876,383 | |
Accrued expenses: | | | | |
Trustees fees | | | 9,592 | |
Other | | | 72,290 | |
Total liabilities | | | 15,440,101 | |
Net assets | | $ | 398,036,171 | |
Shares outstanding | | | 36,692,661 | |
Net asset value (“NAV”) per share | | $ | 10.85 | |
Net assets consist of: | | | | |
Capital paid-in | | $ | 385,075,544 | |
Undistributed (Over-distribution of) net investment income | | | (496,609 | ) |
Accumulated net realized gain (loss) | | | (2,558,992 | ) |
Net unrealized appreciation (depreciation) | | | 16,016,228 | |
Net assets | | $ | 398,036,171 | |
Authorized shares | | | Unlimited | |
Par value per share | | $ | 0.01 | |
See accompanying notes to financial statements.
Statement of
| | | | |
| | Operations | | Year Ended July 31, 2015 |
| | | | |
Investment Income | | $ | 14,703,941 | |
Expenses | | | | |
Shareholder servicing agent fees | | | 33,256 | |
Interest expense | | | 19,885 | |
Custodian fees | | | 73,614 | |
Trustees fees | | | 10,707 | |
Professional fees | | | 51,063 | |
Shareholder reporting expenses | | | 32,039 | |
Federal and state registration fees | | | 61,022 | |
Other | | | 17,444 | |
Total expenses before fee waiver/expense reimbursement | | | 299,030 | |
Fee waiver/expense reimbursement | | | (279,145 | ) |
Net expenses | | | 19,885 | |
Net investment income (loss) | | | 14,684,056 | |
Realized and Unrealized Gain (Loss) | | | | |
Net realized gain (loss) from investments | | | 3,704,659 | |
Change in net unrealized appreciation (depreciation) of investments | | | 1,443,605 | |
Net realized and unrealized gain (loss) | | | 5,148,264 | |
Net increase (decrease) in net assets from operations | | $ | 19,832,320 | |
See accompanying notes to financial statements.
Statement of
| | | | | | | | |
| | | Year Ended
7/31/15 | | | Year Ended
7/31/14 | |
Operations | | | | | | | | |
Net investment income (loss) | | $ | 14,684,056 | | | $ | 13,553,016 | |
Net realized gain (loss) from investments | | | 3,704,659 | | | | (6,029,715 | ) |
Change in net unrealized appreciation (depreciation) of investments | | | 1,443,605 | | | | 24,472,038 | |
Net increase (decrease) in net assets from operations | | | 19,832,320 | | | | 31,995,339 | |
Distributions to Shareholders | | | | | | | | |
From net investment income | | | (14,670,416 | ) | | | (13,819,172 | ) |
From accumulated net realized gains | | | — | | | | (1,867,454 | ) |
Decrease in net assets from distributions to shareholders | | | (14,670,416 | ) | | | (15,686,626 | ) |
Fund Share Transactions | | | | | | | | |
Proceeds from sale of shares | | | 129,336,540 | | | | 125,999,383 | |
Proceeds from shares issued to shareholders due to reinvestment of distributions | | | 6,956,236 | | | | 7,641,971 | |
| | | 136,292,776 | | | | 133,641,354 | |
Cost of shares redeemed | | | (73,424,638 | ) | | | (123,616,188 | ) |
Net increase (decrease) in net assets from Fund share transactions | | | 62,868,138 | | | | 10,025,166 | |
Net increase (decrease) in net assets | | | 68,030,042 | | | | 26,333,879 | |
Net assets at the beginning of period | | | 330,006,129 | | | | 303,672,250 | |
Net assets at the end of period | | $ | 398,036,171 | | | $ | 330,006,129 | |
Undistributed (Over-distribution of) net investment income at the end of period | | $ | (496,609 | ) | | $ | (504,578 | ) |
See accompanying notes to financial statements.
THIS PAGE INTENTIONALLY LEFT BLANK
Financial
Highlights
Selected data for a share outstanding throughout each period:
| | | | | | | | | | | | | | | | | | | | | | | | | | | | | | | | | | |
| | | | | |
| | | | | | Investment Operations | | | | | Less Distributions | | | | |
| | | | | | | | | |
| Year Ended July 31, | | Beginning
NAV | | | Net
Investment
Income
(Loss)(a) | | | Net
Realized/
Unrealized
Gain (Loss) | | | Total | | | | | From
Net
Investment
Income | | | From
Accumulated
Net Realized
Gains | | | Total | | | Ending
NAV | |
2015 | | $ | 10.67 | | | $ | 0.45 | | | $ | 0.18 | | | $ | 0.63 | | | | | $ | (0.45 | ) | | $ | — | | | $ | (0.45 | ) | | $ | 10.85 | |
2014 | | | 10.13 | | | | 0.45 | | | | 0.61 | | | | 1.06 | | | | | | (0.46 | ) | | | (0.06 | ) | | | (0.52 | ) | | | 10.67 | |
2013 | | | 11.13 | | | | 0.46 | | | | (0.82 | ) | | | (0.36 | ) | | | | | (0.47 | ) | | | (0.17 | ) | | | (0.64 | ) | | | 10.13 | |
2012 | | | 10.22 | | | | 0.51 | | | | 0.95 | | | | 1.46 | | | | | | (0.52 | ) | | | (0.03 | ) | | | (0.55 | ) | | | 11.13 | |
2011 | | | 10.42 | | | | 0.54 | | | | (0.11 | ) | | | 0.43 | | | | | | (0.54 | ) | | | (0.09 | ) | | | (0.63 | ) | | | 10.22 | |
| | | | | | | | | | | | | | | | | | | | | | | | | | | | | | | | | | | | | | |
| | | | Ratios/Supplemental Data | |
| | | | | | | | | Ratios to Average
Net Assets Before
Waiver/Reimbursement | | | | | Ratios to Average
Net Assets After
Waiver/Reimbursement(c) | | | | |
| | | | | | | | | | |
Total
Return(b) | | | Ending
Net
Assets
(000) | | | | | Expenses
Including
Interest(d) | | | Expenses
Excluding
Interest | | | Net
Investment
Income
(Loss) | | | | | Expenses
Including
Interest(d) | | | Expenses
Excluding
Interest | | | Net
Investment
Income
(Loss) | | | Portfolio
Turnover
Rate(e) | |
| | 5.96 | % | | $ | 398,036 | | | | | | 0.09 | % | | | 0.08 | % | | | 4.04 | % | | | | | 0.01 | % | | | — | % | | | 4.12 | % | | | 21 | % |
| | 10.85 | | | | 330,006 | | | | | | 0.09 | | | | 0.09 | | | | 4.30 | | | | | | — | * | | | — | | | | 4.39 | | | | 27 | |
| | (3.54 | ) | | | 303,672 | | | | | | 0.09 | | | | 0.09 | | | | 4.08 | | | | | | — | * | | | — | * | | | 4.17 | | | | 25 | |
| | 14.66 | | | | 268,776 | | | | | | 0.12 | | | | 0.12 | | | | 4.64 | | | | | | — | | | | — | | | | 4.75 | | | | 29 | |
| | 4.38 | | | | 173,359 | | | | | | 0.09 | | | | 0.08 | | | | 5.25 | | | | | | 0.01 | | | | — | | | | 5.33 | | | | 17 | |
| (a) | Per share Net Investment Income (Loss) is calculated using the average daily shares method. | |
| (b) | Total return is the combination of changes in NAV, reinvested dividend income at NAV and reinvested capital gains distributions at NAV, if any. Total returns are not annualized. | |
| (c) | After fee waiver and/or expense reimbursement from the Adviser. | |
| (d) | The expense ratios reflect, among other things, the interest expense deemed to have been paid by the Fund on the floating rate certificates issued by the special purpose trusts for the self-deposited inverse floaters held by the Fund, where applicable, as described in Note 3 – Portfolio Securities and Investments in Derivatives, Inverse Floating Rate Securities. | |
| (e) | Portfolio Turnover Rate is calculated based on the lesser of long-term purchases or sales (as disclosed in Note 5 – Investment Transactions) divided by the average long-term market value during the period. | |
| * | Rounds to less than 0.01%. | |
See accompanying notes to financial statements.
Notes to
Financial Statements
1. General Information and Significant Accounting Policies
General Information
Trust and Fund Information
The Nuveen Managed Accounts Portfolios Trust (the “Trust”) is an open-end management investment company registered under the Investment Company Act of 1940, as amended. The Trust is comprised of the Municipal Total Return Managed Accounts Portfolio (the “Fund”), as a diversified fund. The Trust was organized as a Massachusetts business trust on November 14, 2006.
The Fund is developed exclusively for use within separately managed accounts sponsored by Nuveen Investments, Inc. (“Nuveen”). The Fund is a specialized municipal bond fund to be used in combination with selected individual securities to effectively model institutional-level investment strategies. The Fund enables certain Nuveen municipal separately managed account investors to achieve greater diversification and return potential than smaller managed accounts might otherwise achieve by using lower quality, higher yielding securities and to gain access to special investment opportunities normally available only to institutional investors.
The end of the reporting period for the Fund is July 31, 2015, and the period covered by these Notes to Financial Statements is the fiscal year ended July 31, 2015 (“the current fiscal period”).
Investment Adviser
The Fund’s investment adviser is Nuveen Fund Advisors, LLC (the “Adviser”), a wholly-owned subsidiary of Nuveen. The Adviser is responsible for the Fund’s overall investment strategy and asset allocation decisions. The Adviser has entered into a sub-advisory agreement with Nuveen Asset Management, LLC (the “Sub-Adviser”), a subsidiary of the Adviser, under which the Sub-Adviser manages the investment portfolio of the Fund.
Investment Objectives and Principal Investment Strategies
The Fund’s primary investment objective is to seek attractive total return. The Fund also seeks to provide high current income exempt from regular federal income taxes. Under normal market conditions, the Fund invests at least 80% of the sum of its net assets and the amount of any borrowings for investment purposes in municipal bonds that pay interest that is exempt from regular federal personal income tax. These municipal bonds include obligations issued by U.S. states and their subdivisions, authorities, instrumentalities and corporations, as well as obligations issued by U.S. territories (such as Puerto Rico, the U.S. Virgin Islands and Guam) that pay interest that is exempt from regular federal personal income tax. The Fund may invest without limit in securities that generate income subject to the alternative minimum tax. The Fund will focus on securities with intermediate to longer term maturities and, as such, will generally maintain, under normal market conditions, an investment portfolio with an overall weighted average maturity of approximately 12 to 25 years.
The Fund invests in various types of municipal securities, including investment grade (rated BBB/Baa or better), below investment grade (rated BB/Ba or lower), and unrated municipal securities. The Fund may invest up to 50% of its net assets in below investment grade municipal bonds, but will normally invest 10-30% of its net assets in such bonds. Such securities are commonly referred to as “high yield” securities or “junk” bonds. The Fund may invest up to 5% of its net assets in defaulted bonds. The Fund may invest in all types of municipal bonds, including general obligation bonds, revenue bonds and participation interests in municipal leases. The Fund may invest in zero coupon bonds, which are issued at substantial discounts from their value at maturity and pay no cash income to their holders until they mature. The Fund may invest up to 50% of its net assets in municipal securities whose interest payments vary inversely with changes in short-term tax-exempt interest rates (“inverse floaters”). Inverse floaters are derivative securities that provide leveraged exposure to underlying municipal bonds. The Fund’s investments in inverse floaters are designed to increase the Fund’s income and returns through this leveraged exposure. These investments are speculative, however, and also create the possibility that income and returns will be diminished.
The Fund may also make forward commitments in which the Fund agrees to buy a security for settlement in the future at a price agreed upon today.
The Fund’s most recent prospectus provides further description of the Fund’s investment objectives, principal investment strategies and principal risks.
Significant Accounting Policies
The Fund is an investment company and follows accounting and reporting guidance under Financial Accounting Standards Board (FASB) Accounting Standards Codification (ASC) Topic 946 “Financial Services – Investment Companies.” The following is a summary of significant accounting policies followed by the Fund in the preparation of its financial statements in accordance with accounting principles generally accepted in the United States of America (“U.S. GAAP”).
Investment Transactions
Investment transactions are recorded on a trade date basis. Realized gains and losses from investment transactions are determined on the specific identification method, which is the same basis used for federal income tax purposes. Investments purchased on a when-issued/delayed delivery basis may have extended settlement periods. Any investments so purchased are subject to market fluctuation during this period. The Fund has earmarked securities in its portfolio with a current value at least equal to the amount of the when-issued/delayed delivery purchase commitments.
As of the end of the reporting period, the Fund’s outstanding when-issued/delayed delivery purchase commitments were as follows:
| | | | |
| Outstanding when-issued/delayed delivery purchase commitments | | $ | 8,120,797 | |
Investment Income
Investment income, which reflects the amortization of premiums and includes accretion of discounts for financial reporting purposes, is recorded on an accrual basis. Investment income also includes paydown gains and losses, if any.
Professional Fees
Professional fees presented on the Statement of Operations consist of legal fees incurred in the normal course of operations, audit fees, tax consulting fees and, in some cases, workout expenditures. Workout expenditures are incurred in an attempt to protect or enhance an investment or to pursue other claims or legal actions on behalf of Fund shareholders. If a refund is received for workout expenditures paid in a prior reporting period, such amounts will be recognized as “Legal fee refund” on the Statement of Operations.
Dividends and Distributions to Shareholders
Dividends from net investment income are declared daily and distributed to shareholders monthly. Fund shares begin to accrue dividends on the business day after the day when the monies used to purchase Fund shares are collected by the transfer agent.
Net realized capital gains and/or market discount from investment transactions, if any, are declared and distributed to shareholders at least annually. Furthermore, capital gains are distributed only to the extent they exceed available capital loss carryforwards.
Distributions to shareholders of net investment income, net realized capital gains and/or market discount, if any, are recorded on the ex-dividend date. The amount and timing of distributions are determined in accordance with federal income tax regulations, which may differ from U.S. GAAP.
Indemnifications
Under the Trust’s organizational documents, its officers and trustees are indemnified against certain liabilities arising out of the performance of their duties to the Trust. In addition, in the normal course of business, the Trust enters into contracts that provide general indemnifications to other parties. The Trust’s maximum exposure under these arrangements is unknown as this would involve future claims that may be made against the Trust that have not yet occurred. However, the Trust has not had prior claims or losses pursuant to these contracts and expects the risk of loss to be remote.
Netting Agreements
In the ordinary course of business, the Fund may enter into transactions subject to enforceable International Swaps and Derivative Association, Inc. (“ISDA”) master agreements or other similar arrangements (“netting agreements”). Generally, the right to offset in netting agreements allows the Fund to offset certain securities and derivatives with a specific counterparty as well as any collateral received or delivered to that counterparty based on the terms of the agreements. Generally, the Fund manages its cash collateral and securities collateral on a counterparty basis.
The Fund’s investments subject to netting agreements as of the end of the reporting period, if any, are further described in Note 3 – Portfolio Securities and Investments in Derivatives.
Use of Estimates
The preparation of financial statements in conformity with U.S. GAAP requires management to make estimates and assumptions that affect the reported amounts of assets and liabilities at the date of the financial statements and the reported amounts of increases and decreases in net assets from operations during the reporting period. Actual results may differ from those estimates.
2. Investment Valuation and Fair Value Measurements
The fair valuation input levels as described below are for fair value measurement purposes.
Fair value is defined as the price that would be received upon selling an investment or transferring a liability in an orderly transaction to an independent buyer in the principal or most advantageous market for the investment. A three-tier hierarchy is used to maximize the use of observable market data and minimize the use of unobservable inputs and to establish classification of fair value measurements for disclosure purposes. Observable inputs reflect the assumptions market participants would use in pricing the asset or liability. Observable inputs are based on market data obtained from
Notes to Financial Statements (continued)
sources independent of the reporting entity. Unobservable inputs reflect the reporting entity’s own assumptions about the assumptions market participants would use in pricing the asset or liability. Unobservable inputs are based on the best information available in the circumstances. The following is a summary of the three-tiered hierarchy of valuation input levels.
| | |
| Level 1 – | | Inputs are unadjusted and prices are determined using quoted prices in active markets for identical securities. |
| Level 2 – | | Prices are determined using other significant observable inputs (including quoted prices for similar securities, interest rates, prepayment speeds, credit risk, etc.). |
| Level 3 – | | Prices are determined using significant unobservable inputs (including management’s assumptions in determining the fair value of investments). |
Prices of fixed income securities are provided by a pricing service approved by the Fund’s Board of Trustees (the “Board”). The pricing service establishes a security’s fair value using methods that may include consideration of the following: yields or prices of investments of comparable quality, type of issue, coupon, maturity and rating, market quotes or indications of value from security dealers, evaluations of anticipated cash flows or collateral, general market conditions and other information and analysis, including the obligor’s credit characteristics considered relevant. These securities are generally classified as Level 2. In pricing certain securities, particularly less liquid and lower quality securities, the pricing service may consider information about a security, its issuer or market activity provided by the Adviser. These securities are generally classified as Level 2 or Level 3 depending on the priority of the significant inputs.
Certain securities may not be able to be priced by the pre-established pricing methods as described above. Such securities may be valued by the Board and/or its appointee at fair value. These securities generally include, but are not limited to, restricted securities (securities which may not be publicly sold without registration under the Securities Act of 1933, as amended) for which a pricing service is unable to provide a market price; securities whose trading has been formally suspended; debt securities that have gone into default and for which there is no current market quotation; a security whose market price is not available from a pre-established pricing source; a security with respect to which an event has occurred that is likely to materially affect the value of the security after the market has closed but before the calculation of the Fund’s net asset value (“NAV”) (as may be the case in non-U.S. markets on which the security is primarily traded) or make it difficult or impossible to obtain a reliable market quotation; and a security whose price, as provided by the pricing service, is not deemed to reflect the security’s fair value. As a general principle, the fair value of a security would appear to be the amount that the owner might reasonably expect to receive for it in a current sale. A variety of factors may be considered in determining the fair value of such securities, which may include consideration of the following: yields or prices of investments of comparable quality, type of issue, coupon, maturity and rating, market quotes or indications of value from security dealers, evaluations of anticipated cash flows or collateral, general market conditions and other information and analysis, including the obligor’s credit characteristics considered relevant. These securities are generally classified as Level 2 or Level 3 depending on the priority of the significant inputs. Regardless of the method employed to value a particular security, all valuations are subject to review by the Board and/or its appointee.
The inputs or methodologies used for valuing securities are not an indication of the risks associated with investing in those securities. The following is a summary of the Fund’s fair value measurements as of the end of the reporting period:
| | | | | | | | | | | | | | | | |
| | | Level 1 | | | Level 2 | | | Level 3 | | | Total | |
| Long-Term Investments*: | | | | | | | | | | | | | | | | |
Municipal Bonds | | $ | — | | | $ | 391,709,449 | | | $ | — | | | $ | 391,709,449 | |
| Short-Term Investments*: | | | | | | | | | | | | | | | | |
Municipal Bonds | | | — | | | | 3,133,554 | | | | — | | | | 3,133,554 | |
| Total | | $ | — | | | $ | 394,843,003 | | | $ | — | | | $ | 394,843,003 | |
| * | Refer to the Fund’s Portfolio of Investments for state classifications. |
The Board is responsible for the valuation process and has appointed the oversight of the daily valuation process to the Adviser’s Valuation Committee. The Valuation Committee, pursuant to the valuation policies and procedures adopted by the Board, is responsible for making fair value determinations, evaluating the effectiveness of the Fund’s pricing policies and reporting to the Board. The Valuation Committee is aided in its efforts by the Adviser’s dedicated Securities Valuation Team, which is responsible for administering the daily valuation process and applying fair value methodologies as approved by the Valuation Committee. When determining the reliability of independent pricing services for investments owned by the Fund, the Valuation Committee, among other things, conducts due diligence reviews of the pricing services and monitors the quality of security prices received through various testing reports conducted by the Securities Valuation Team.
The Valuation Committee will consider pricing methodologies it deems relevant and appropriate when making a fair value determination, based on the facts and circumstances specific to the portfolio instrument. Fair value determinations generally will be derived as follows, using public or private market information:
| | (i) | If available, fair value determinations shall be derived by extrapolating from recent transactions or quoted prices for identical or comparable securities. |
| | (ii) | If such information is not available, an analytical valuation methodology may be used based on other available information including, but not limited to: analyst appraisals, research reports, corporate action information, issuer financial statements and shelf registration statements. Such analytical valuation methodologies may include, but are not limited to: multiple of earnings, discount from market value of a similar freely-traded security, discounted cash flow analysis, book value or a multiple thereof, risk premium/yield analysis, yield to maturity and/or fundamental investment analysis. |
The purchase price of a portfolio instrument will be used to fair value the instrument only if no other valuation methodology is available or deemed appropriate, and it is determined that the purchase price fairly reflects the instrument’s current value.
For each portfolio security that has been fair valued pursuant to the policies adopted by the Board, the fair value price is compared against the last available and next available market quotations. The Valuation Committee reviews the results of such testing and fair valuation occurrences are reported to the Board.
3. Portfolio Securities and Investments in Derivatives
Portfolio Securities
Inverse Floating Rate Securities
The Fund is authorized to invest in inverse floating rate securities. An inverse floating rate security is created by depositing a municipal bond (referred to as an “Underlying Bond”), typically with a fixed interest rate, into a special purpose trust (referred to as the “Trust”) created by or at the direction of the Fund. In turn, the Trust issues (a) floating rate certificates (referred to as “Floaters”), in face amounts equal to some fraction of the Underlying Bond’s par amount or market value, and (b) an inverse floating rate certificate (referred to as an “Inverse Floater”) that represents all remaining or residual interest in the Trust. Floaters typically pay short-term tax-exempt interest rates to third parties who are also provided a right to tender their certificate and receive its par value, which may be paid from the proceeds of a remarketing of the Floaters, by a loan to the Trust from a third party liquidity provider, or by the sale of assets from the Trust. The Inverse Floater is issued to a long term investor, such as the Fund. The income received by the Inverse Floater holder varies inversely with the short-term rate paid to holders of the Floaters, and in most circumstances the Inverse Floater holder bears substantially all of the Underlying Bond’s downside investment risk and also benefits disproportionately from any potential appreciation of the Underlying Bond’s value. The value of an Inverse Floater will be more volatile than that of the Underlying Bond because the interest rate is dependent on not only the fixed coupon rate of the Underlying Bond but also on the short-term interest paid on the Floaters, and because the Inverse Floater essentially bears the risk of loss of the greater face value of the Underlying Bond.
The Inverse Floater held by the Fund gives the Fund the right to (a) cause the holders of the Floaters to tender their certificates at par, and (b) have the trustee of the Trust transfer the Underlying Bond held by the Trust to the Fund, thereby collapsing the Trust.
The Fund may acquire an Inverse Floater in a transaction where it (a) transfers an Underlying Bond that it owns to a Trust created by a third party or (b) transfers an Underlying Bond that it owns, or that it has purchased in a secondary market transaction for the purpose of creating an Inverse Floater, to a Trust created at its direction, and in return receives the Inverse Floater of the Trust (referred to as a “self-deposited Inverse Floater”). The Fund may also purchase an Inverse Floater in a secondary market transaction from a third party creator of the Trust without first owning the Underlying Bond (referred to as an “externally-deposited Inverse Floater”).
An investment in a self-deposited Inverse Floater is accounted for as a “financing” transaction (i.e., a secured borrowing). For a self-deposited Inverse Floater, the Underlying Bond deposited into the Trust is identified in the Fund’s Portfolio of Investments as “(UB) – Underlying bond of an inverse floating rate trust reflected as a financing transaction,” with the Fund recognizing the Floaters issued by the Trust as liabilities, at their liquidation value on the Statement of Assets and Liabilities as “Floating rate obligations.” In addition, the Fund recognizes in “Investment Income” the entire earnings of the Underlying Bond and recognizes the related interest paid to the holders of the Floaters as a component of “Interest expense” on the Statement of Operations.
In contrast, an investment in an externally-deposited Inverse Floater is accounted for as a purchase of the inverse floater and is identified in the Fund’s Portfolio of Investments as “(IF) – Inverse floating rate investment.” For an externally-deposited Inverse Floater, the Fund’s Statement of Assets and Liabilities recognizes the Inverse Floater and not the Underlying Bond as an asset, and the Fund does not recognize the Floaters as a liability. Additionally, the Fund reflects in “Investment Income” only the net amount of earnings on the Inverse Floater (net of the interest paid to the holders of the Floaters and the expenses of the Trust), and does not show the amount of that interest paid as an interest expense on the Statement of Operations.
The average floating rate obligations outstanding and average annual interest rate and fees related to self-deposited Inverse Floaters during the current fiscal period were as follows:
| | | | |
| Self-Deposited Inverse Floaters | | | |
| Average floating rate obligations outstanding | | $ | 3,305,068 | |
| Average annual interest rate and fees | | | 0.60 | % |
Notes to Financial Statements (continued)
As of the end of the reporting period, the total amount of floating rate obligations associated with the Fund’s self-deposited Inverse Floaters and externally-deposited Inverse Floaters was as follows:
| | | | |
| Floating Rate Obligations Outstanding | | | |
| Floating rate obligations: self-deposited Inverse Floaters | | $ | 5,710,000 | |
| Floating rate obligations: externally-deposited Inverse Floaters | | | 35,345,000 | |
| Total | | $ | 41,055,000 | |
The Fund may also enter into shortfall and forbearance agreements (sometimes referred to as a “recourse arrangement” or “credit recovery swap”) (Trusts involving such agreements are referred to herein as “Recourse Trusts”), under which the Fund agrees to reimburse the liquidity provider for the Trust’s Floaters, in certain circumstances, for the amount (if any) by which the liquidation value of the Underlying Bond held by the Trust may fall short of the liquidation value of the Floaters issued by the Trust, plus any shortfalls in interest cash flows. Under these agreements, the Fund’s potential exposure to losses related to or on an Inverse Floater may increase beyond the value of the Inverse Floater as the Fund may potentially be liable to fulfill all amounts owed to holders of the Floaters. At period end, any such shortfall amount in the aggregate is recognized as “Unrealized depreciation on Recourse Trusts” on the Statement of Assets and Liabilities.
As of the end of the reporting period, the Fund’s maximum exposure to the floating rate obligations issued by externally-deposited Recourse Trusts, was as follows:
| | | | |
| Floating Rate Obligations – Externally-Deposited Recourse Trusts | | | |
| Maximum exposure to Recourse Trusts | | $ | 25,605,000 | |
Zero Coupon Securities
A zero coupon security does not pay a regular interest coupon to its holders during the life of the security. Income to the holder of the security comes from accretion of the difference between the original purchase price of the security at issuance and the par value of the security at maturity and is effectively paid at maturity. The market prices of zero coupon securities generally are more volatile than the market prices of securities that pay interest periodically.
Investments in Derivatives
In addition to the inverse floating rate securities in which the Fund invests, which are considered portfolio securities for financial reporting purposes, the Fund is authorized to invest in certain other derivative instruments. The Fund records derivative instruments at fair value, with changes in fair value recognized on the Statement of Operations, when applicable. Even though the Fund’s investments in derivatives may represent economic hedges, they are not considered to be hedge transactions for financial reporting purposes.
Although the Fund is authorized to invest in derivative instruments, and may do so in the future, it did not make any such investments during the current fiscal period.
Market and Counterparty Credit Risk
In the normal course of business the Fund may invest in financial instruments and enter into financial transactions where risk of potential loss exists due to changes in the market (market risk) or failure of the other party to the transaction to perform (counterparty credit risk). The potential loss could exceed the value of the financial assets recorded on the financial statements. Financial assets, which potentially expose the Fund to counterparty credit risk, consist principally of cash due from counterparties on forward, option and swap transactions, when applicable. The extent of the Fund’s exposure to counterparty credit risk in respect to these financial assets approximates their carrying value as recorded on the Statement of Assets and Liabilities.
The Fund helps manage counterparty credit risk by entering into agreements only with counterparties the Adviser believes have the financial resources to honor their obligations and by having the Adviser monitor the financial stability of the counterparties. Additionally, counterparties may be required to pledge collateral daily (based on the daily valuation of the financial asset) on behalf of the Fund with a value approximately equal to the amount of any unrealized gain above a pre-determined threshold. Reciprocally, when the Fund has an unrealized loss, the Fund has instructed the custodian to pledge assets of the Fund as collateral with a value approximately equal to the amount of the unrealized loss above a pre-determined threshold. Collateral pledges are monitored and subsequently adjusted if and when the valuations fluctuate, either up or down, by at least the predetermined threshold amount.
4. Fund Shares
Transactions in Fund shares during the current and prior fiscal period were as follows:
| | | | | | | | | | | | | | | | |
| | | Year Ended
7/31/15 | | | Year Ended
7/31/14 | |
| | | Shares | | | Amount | | | Shares | | | Amount | |
| Shares sold | | | 11,886,193 | | | $ | 129,336,540 | | | | 12,240,242 | | | $ | 125,999,383 | |
| Shares issued to shareholders due to reinvestment of distributions | | | 638,284 | | | | 6,956,236 | | | | 742,455 | | | | 7,641,971 | |
| Shares redeemed | | | (6,745,841 | ) | | | (73,424,638 | ) | | | (12,058,333 | ) | | | (123,616,188 | ) |
| Net increase (decrease) | | | 5,778,636 | | | $ | 62,868,138 | | | | 924,364 | | | $ | 10,025,166 | |
5. Investment Transactions
Long-term purchases and sales (including maturities) during the current fiscal period aggregated $140,510,822 and $74,489,253, respectively.
6. Income Tax Information
The Fund intends to distribute substantially all of its net investment income and net capital gains to shareholders and to otherwise comply with the requirements of Subchapter M of the Internal Revenue Code applicable to regulated investment companies. Therefore, no federal income tax provision is required. Furthermore, the Fund intends to satisfy conditions which will enable interest from municipal securities, which is exempt from regular federal income tax, to retain such tax-exempt status when distributed to shareholders of the Fund. Net realized capital gains and ordinary income distributions paid by the Fund are subject to federal taxation.
For all open tax years and all major taxing jurisdictions, management of the Fund has concluded that there are no significant uncertain tax positions that would require recognition in the financial statements. Open tax years are those that are open for examination by taxing authorities (i.e., generally the last four tax year ends and the interim tax period since then). Furthermore, management of the Fund is also not aware of any tax positions for which it is reasonably possible that the total amounts of unrecognized tax benefits will significantly change in the next twelve months.
The following information is presented on an income tax basis. Differences between amounts for financial statement and federal income tax purposes are primarily due to the treatment of timing differences in recognizing taxable market discount, timing differences in recognizing certain gains and losses on investment transactions and the treatment of investments in inverse floating rate securities reflected as financing transactions, if any. To the extent that differences arise that are permanent in nature, such amounts are reclassified within the capital accounts as detailed below. Temporary differences do not require reclassification. Temporary and permanent differences do not impact the NAV of the Fund.
As of July 31, 2015, the cost and unrealized appreciation (depreciation) of investments, as determined on a federal income tax basis, were as follows:
| | | | |
| Cost of investments | | $ | 373,016,197 | |
| Gross unrealized: | | | | |
Appreciation | | $ | 17,785,633 | |
Depreciation | | | (1,669,013 | ) |
| Net unrealized appreciation (depreciation) of investments | | $ | 16,116,620 | |
Permanent differences, primarily due to taxable market discount, resulted in reclassifications among the Fund’s components of net assets as of July 31, 2015, the Fund’s tax year end, as follows:
| | | | |
| Capital paid-in | | $ | (3 | ) |
| Undistributed (Over-distribution of) net investment income | | | (5,671 | ) |
| Accumulated net realized gain (loss) | | | 5,674 | |
The tax components of undistributed net tax-exempt income, net ordinary income and net long-term capital gains as of July 31, 2015, the Fund’s tax year end, were as follows:
| | | | |
| Undistributed net tax-exempt income1 | | $ | 653,292 | |
| Undistributed net ordinary income2 | | | 15,592 | |
| Undistributed net long-term capital gains | | | — | |
| 1 | Undistributed net tax-exempt income (on a tax basis) has not been reduced for the dividends declared during the period July 1, 2015 through July 31, 2015, and paid on August 3, 2015. |
| 2 | Net ordinary income consists of taxable market discount income and net short-term capital gains if any. |
Notes to Financial Statements (continued)
The tax character of distributions paid during the Fund’s tax years ended July 31, 2015 and July 31, 2014, was designated for purposes of the dividends paid deduction as follows:
| | | | |
| 2015 | | | |
| Distributions from net tax-exempt income3 | | | $14,593,794 | |
| Distributions from net ordinary income2 | | | 38,308 | |
| Distributions from net long-term capital gains | | | — | |
| | | | |
| 2014 | | | |
| Distributions from net tax-exempt income | | $ | 13,683,963 | |
| Distributions from net ordinary income2 | | | 135,066 | |
| Distributions from net long-term capital gains | | | 1,878,881 | |
| 2 | Net ordinary income consists of taxable market discount income and net short-term capital gains, if any. |
| 3 | The Fund hereby designates this amount paid during the fiscal year ended July 31, 2015, as Exempt Interest Dividends. |
As of July 31, 2015, the Fund’s tax year end, the Fund had unused capital loss carryforwards available for federal income tax purposes to be applied against future capital gains, if any. The capital losses are not subject to expiration.
| | | | |
| Capital losses carryforwards – not subject to expiration | | $ | 2,562,804 | |
During the Fund’s tax year ended July 31, 2015, the Fund utilized $1,811,607 of its capital loss carryforward.
7. Management Fees and Other Transactions with Affiliates
The Adviser does not charge any management fees or other expenses directly to the Fund. The Adviser has agreed irrevocably during the existence of the Fund to waive all fees and pay or reimburse all expenses of the Fund (excluding interest expense, taxes, fees incurred in acquiring and disposing of portfolio securities and extraordinary expenses). The Adviser and the Sub-Adviser are compensated for their services to the Fund from the fee charged at the separately managed account level.
8. Borrowing Arrangements
The Fund, along with certain other funds managed by the Adviser (“Participating Funds”), established a 364-day, $2.53 billion standby credit facility with a group of leaders, under which the Participating Funds may borrow for various purposes other than leveraging for investment purposes. A large portion of this facility’s capacity (and its associated costs as described below) is currently dedicated for use by a small number of Participating Funds, which does not include the Fund covered by this shareholder report. The remaining capacity under the facility (and the corresponding portion of the facility’s annual costs) is separately dedicated to most of the other open-end funds in the Nuveen fund family, including the Fund covered by this shareholder report, along with a number of Nuveen closed-end funds. The credit facility expires in July 2016 unless extended or renewed.
The credit facility has the following terms: a fee of 0.15% per annum on unused commitment amounts, and interest at a rate equal to the higher of (a) one-month LIBOR (London Inter-Bank Offered Rate) plus 1.25% per annum or (b) the Fed Funds rate plus 1.25% per annum on amounts borrowed. Participating Funds paid administration, legal and arrangement fees, which are recognized as component of “other expenses” on the Statement of Operations, and along with commitment fees, have been allocated among such Participating Funds based upon the relative proportions of the facility’s aggregate capacity reserved for them and other factors deemed relevant by the Adviser and the Board of each Participating Fund.
9. New Accounting Pronouncement
Financial Accounting Standards Board (“FASB”) Transfers and Servicing (Topic 860): Repurchase-to-Maturity Transactions, Repurchase Financings, and Disclosures
In June 2014, the FASB issued Accounting Standards Update (“ASU”) 2014-11, Transfers and Servicing (Topic 860): Repurchase-to-Maturity Transactions, Repurchase Financings, and Disclosures” (“ASU 2014-11”), that expanded secured borrowing accounting for certain reverse repurchase agreements. ASU 2014-11 also sets forth additional disclosure requirements for certain transactions accounted for as sales in order to provide financial statement users with information to compare to similar transactions accounted for as secured borrowings. ASU 2014-11 is effective prospectively for annual periods beginning after December 15, 2014, and interim periods beginning after March 15, 2015. Management is currently evaluating the impact, if any, of ASU 2014-11 on the Fund’s financial statement disclosures.
Additional
Fund Information (Unaudited)
| | | | | | | | | | |
| | | | | |
| | Fund Manager Nuveen Fund Advisors, LLC 333 West Wacker Drive Chicago, IL 60606 Sub-Adviser Nuveen Asset Management, LLC 333 West Wacker Drive Chicago, IL 60606 | | Independent Registered
Public Accounting Firm PricewaterhouseCoopers LLP Chicago, IL 60606 Custodian State Street Bank & Trust Company Boston, MA 02111 | | Legal Counsel Chapman and Cutler LLP Chicago, IL 60603 | | Transfer Agent and
Shareholder Services Boston Financial Data Services, Inc. Nuveen Investor Services P.O. Box 8530 Boston, MA 02266-8530 (800) 257-8787 | | |
| | | | | | | | | | | | | | |
| | | | | |
| | | | | | | | | | |
| | |
| | Quarterly Form N-Q Portfolio of Investments Information: The Fund is required to file its complete schedule of portfolio holdings with the Securities and Exchange Commission (SEC) for the first and third quarters of each fiscal year on Form N-Q. You may obtain this information directly from the SEC. Visit the SEC on-line at http://www.sec.gov or in person at the SEC’s Public Reference Room in Washington, D.C. Call the SEC toll-free at (800) SEC-0330 for room hours and operation. | | |
| | | | | |
| | | | | | | | | | |
| | |
| | Nuveen Funds’ Proxy Voting Information: You may obtain (i) information regarding how each fund voted proxies relating to portfolio securities held during the most recent twelve-month period ended June 30, without charge, upon request, by calling Nuveen Investments toll-free at (800) 257-8787 or on Nuveen’s website at www.nuveen.com and (ii) a description of the policies and procedures that each fund used to determine how to vote proxies relating to portfolio securities without charge, upon request, by calling Nuveen Investments toll-free at (800) 257-8787. You may also obtain this information directly from the SEC. Visit the SEC on-line at http://www.sec.gov. | | |
| | | | | |
| | | | | | | | | | |
| | |
| | FINRA BrokerCheck: The Financial Industry Regulatory Authority (FINRA) provides information regarding the disciplinary history of FINRA member firms and associated investment professionals. This information as well as an investor brochure describing FINRA BrokerCheck is available to the public by calling the FINRA BrokerCheck Hotline number at (800) 289-9999 or by visiting www.FINRA.org. | | |
Glossary of Terms
Used in this Report (Unaudited)
Average Annual Total Return: This is a commonly used method to express an investment’s performance over a particular, usually multi-year time period. It expresses the return that would have been necessary each year to equal the investment’s actual cumulative performance (including change in NAV or offer price and reinvested dividends and capital gains distributions, if any) over the time period being considered.
Barclays 7-Year Municipal Bond Index: An unmanaged index composed of a broad range of investment-grade municipal bonds with maturity dates of approximately seven years. Index returns assume reinvestment of distributions, but do not reflect any applicable sales charges or management fees.
Duration: Duration is a measure of the expected period over which a bond’s principal and interest will be paid, and consequently is a measure of the sensitivity of a bond’s or bond fund’s value to changes when market interest rates change. Generally, the longer a bond’s or fund’s duration, the more the price of the bond or fund will change as interest rates change.
Effective Leverage (Effective Leverage Ratio): Effective leverage is investment exposure created either through borrowings or indirectly through inverse floaters, divided by the assets invested, including those assets that were purchased with the proceeds of the leverage, or referenced by the levered instrument.
Gross Domestic Product (GDP): The total market value of all final goods and services produced in a country/region in a given year, equal to total consumer, investment and government spending, plus the value of exports, minus the value of imports.
Inverse Floating Rate Securities: Inverse floating rate securities, also known as inverse floaters or tender option bonds (TOBs), are created by depositing a municipal bond, typically with a fixed interest rate, into a special purpose trust. This trust, in turn, (a) issues floating rate certificates typically paying short-term tax-exempt interest rates to third parties in amounts equal to some fraction of the deposited bond’s par amount or market value, and (b) issues an inverse floating rate certificate (sometimes referred to as an “inverse floater”) to an investor (such as a fund) interested in gaining investment exposure to a long-term municipal bond. The income received by the holder of the inverse floater varies inversely with the short-term rate paid to the floating rate certificates’ holders, and in most circumstances the holder of the inverse floater bears substantially all of the underlying bond’s downside investment risk. The holder of the inverse floater typically also benefits disproportionately from any potential appreciation of the underlying bond’s value. Hence, an inverse floater essentially represents an investment in the underlying bond on a leveraged basis.
Leverage: Leverage is created whenever a fund has investment exposure (both reward and/or risk) equivalent to more than 100% of the investment capital.
Net Asset Value (NAV) Per Share: A fund’s Net Assets is equal to its total assets (securities, cash and accrued earnings) less its total liabilities. For funds with multiple classes, Net Assets are determined separately for each share class. NAV per share is equal to the fund’s (or share class’) Net Assets divided by its number of shares outstanding.
Pre-Refundings: Pre-Refundings, also known as advance refundings or refinancings, occur when an issuer sells new bonds and uses the proceeds to fund principal and interest payments of older existing bonds. This process often results in lower borrowing costs for bond issuers.
Total Investment Exposure: Total investment exposure is the fund’s assets managed by the Adviser that are attributable to leverage. For these purposes, leverage includes the fund’s use of preferred stock and borrowings and investments in the residual interest certificates (also called inverse floating rate securities) in tender option bond (TOB) trusts, including the portion of assets held by a TOB trust that has been effectively financed by the trust’s issuance of floating rate securities.
Zero Coupon Bond: A zero coupon bond does not pay a regular interest coupon to its holders during the life of the bond. Income to the holder of the bond comes from accretion of the difference between the original purchase price of the bond at issuance and the par value of the bond at maturity and is effectively paid at maturity. The market prices of zero coupon bonds generally are more volatile than the market prices of bonds that pay interest periodically.
Annual Investment Management Agreement
Approval Process (Unaudited)
The Board of Trustees of the Fund (the “Board” and each Trustee, a “Board Member”), including the Board Members who are not parties to the Fund’s advisory or sub-advisory agreements or “interested persons” of any such parties (the “Independent Board Members”), is responsible for overseeing the performance of the investment adviser and sub-adviser to the Fund and determining whether to continue the Fund’s advisory agreement (the “Investment Management Agreement”) between the Fund and Nuveen Fund Advisors, LLC (the “Adviser”) and the sub-advisory agreement (the “Sub-Advisory Agreement” and, together with the Investment Management Agreement, the “Advisory Agreements”) between the Adviser and Nuveen Asset Management, LLC (the “Sub-Adviser”). Following an initial term with respect to the Fund upon its commencement of operations, the Board is required to consider the continuation of the Advisory Agreements on an annual basis pursuant to the requirements of the Investment Company Act of 1940, as amended (the “1940 Act”). Accordingly, at an in-person meeting held on May 11-13, 2015 (the “May Meeting”), the Board, including a majority of the Independent Board Members, considered and approved the existing Advisory Agreements for the Fund.
In preparation for its considerations at the May Meeting, the Board received in advance of the meeting extensive materials prepared in connection with the review of the Advisory Agreements. The materials provided a broad range of information regarding the Fund, including, among other things, the nature, extent and quality of services provided by the Adviser and Sub-Adviser (the Adviser and Sub-Adviser are collectively, the “Fund Advisers” and each, a “Fund Adviser”); Fund performance including performance assessments against the appropriate benchmark(s); fee and expense information of the Fund; a description and assessment of shareholder service levels for the Fund; a summary of the performance of certain service providers; a review of product initiatives and shareholder communications; and profitability information of the Fund Advisers as described in further detail below. As part of its annual review, the Board also held a separate meeting on April 14-15, 2015 to review the Fund’s investment performance and consider an analysis by the Adviser of the Sub-Adviser which generally evaluated the Sub-Adviser’s investment team, investment mandate, organizational structure and history, investment philosophy and process, and the performance of the Fund, and any significant changes to the foregoing. During the review, the Independent Board Members asked questions of and requested additional information from management.
The Board considered that the evaluation process with respect to the Fund Advisers is an ongoing process that encompassed the information and knowledge gained throughout the year. The Board, acting directly or through its committees, met regularly during the course of the year and received information and considered factors at each meeting that would be relevant to its annual consideration of the Advisory Agreements, including information relating to fund performance; fund expenses; investment team evaluations; and valuation, compliance, regulatory and risk matters. In addition to regular reports, the Adviser provided special reports to the Board to enhance the Board’s understanding on topics that impact some or all of the Nuveen funds and the Adviser (such as presentations on risk and stress testing; the new governance, risk and compliance system; cybersecurity developments; Nuveen fund accounting and reporting matters; regulatory developments impacting the investment company industry and the business plans or other matters impacting the Adviser). The Board also met with key investment personnel managing certain Nuveen fund portfolios during the year.
The Board had created several standing committees including the Open-End Funds Committee and the Closed-End Funds Committee to assist the full Board in monitoring and gaining a deeper insight into the distinctive business practices of closed-end and open-end funds. These Committees met prior to each quarterly Board meeting, and the Adviser provided presentations to these Committees permitting them to delve further into specific matters or initiatives impacting the respective product line.
The Board also continued its program of seeking to have the Board Members or a subset thereof visit each sub-adviser to the Nuveen funds at least once over a multiple year rotation, meeting with key investment and business personnel. In this regard, the Independent Board Members made site visits to multiple equity and fixed-income investment teams of the Sub-Adviser in June 2014.
The Board considered the information provided and knowledge gained at these meetings and visits during the year when performing its annual review of the Advisory Agreements. The Independent Board Members also were assisted throughout the process by independent legal counsel. During the course of the year and during their deliberations regarding the review of advisory contracts, the Independent Board Members met with independent legal counsel in executive sessions without management present. The Independent Board Members also received a memorandum from independent legal counsel outlining the legal standards for their consideration of the proposed continuation of the Advisory Agreements. In addition, it is important to recognize that the management arrangements for the Nuveen funds are the result of many years of review and discussion between the Independent Board Members and Fund management and that the Board Members’ conclusions may be based, in part, on their consideration of fee arrangements and other factors developed in previous years.
The Board took into account all factors it believed relevant with respect to the Fund, including, among other things: (a) the nature, extent and quality of the services provided by the Fund Advisers; (b) the investment performance of the Fund and Fund Advisers; (c) the advisory fees and costs of the services to be provided to the Fund and the profitability of the Fund Advisers; (d) the extent of any economies of scale; (e) any benefits derived by the
Annual Investment Management Agreement Approval Process (Unaudited) (continued)
Fund Advisers from the relationship with the Fund; and (f) other factors. Each Board Member may have accorded different weight to the various factors in reaching his or her conclusions with respect to the Advisory Agreements of the Fund. The Independent Board Members did not identify any single factor as all-important or controlling. The Independent Board Members’ considerations were instead based on a comprehensive consideration of all the information presented. The principal factors considered by the Board and its conclusions are described below.
A. Nature, Extent and Quality of Services
In evaluating the renewal of the Advisory Agreements, the Independent Board Members received and considered information regarding the nature, extent and quality of the applicable Fund Adviser’s services provided to the Fund. The Board reviewed information regarding, among other things, each Fund Adviser’s organization and business, the types of services that each Fund Adviser or its affiliates provided to the Fund, the performance record of the Fund (as described in further detail below), and any initiatives that had been undertaken on behalf of the open-end product line. The Board recognized the high quality of services the Adviser had provided to the Fund over the years and the conscientiousness with which the Adviser provided these services. The Board also considered the improved capital structure of Nuveen Investments, Inc. (“Nuveen”) (the parent of the Adviser) following the acquisition of Nuveen by TIAA-CREF in 2014 (the “TIAA-CREF Transaction”).
With respect to the services, the Board noted the Fund was a registered investment company that operated in a regulated industry and considered the myriad of investment management, administrative, compliance, oversight and other services the Adviser provided to manage and operate the Fund. Such services included, among other things: (a) product management (such as analyzing ways to better position a Nuveen fund in the marketplace, setting dividends; maintaining relationships to gain access to distribution platforms; and providing shareholder communications); (b) fund administration (such as preparing tax returns and other tax compliance services, preparing regulatory filings and shareholder reports; managing fund budgets and expenses; overseeing a fund’s various service providers and supporting and analyzing new and existing funds); (c) Board administration (such as supporting the Board and its committees, in relevant part, by organizing and administering the Board and committee meetings and preparing the necessary reports to assist the Board in its duties); (d) compliance (such as monitoring adherence to a fund’s investment policies and procedures and applicable law; reviewing the compliance program periodically and developing new policies or updating existing compliance policies and procedures as considered necessary or appropriate; responding to regulatory requests; and overseeing compliance testing of the funds’ sub-advisers); (e) legal support (such as preparing or reviewing fund registration statements, proxy statements and other necessary materials; interpreting regulatory requirements and compliance thereof; and maintaining applicable registrations); and (f) investment services (such as overseeing and reviewing the funds’ sub-advisers and their investment teams; analyzing performance of the funds; overseeing investment and risk management; evaluating brokerage transactions and securities lending, overseeing the daily valuation process for portfolio securities and developing and recommending valuation policies and methodologies and changes thereto; reporting to the Board on various matters including performance, risk and valuation; and participating in fund development, leverage management, and the developing or interpreting of investment policies and parameters). The Board Members noted, however, that the Fund is offered via separately managed accounts and may require fewer shareholder services than a typical open-end fund.
In its review, the Board considered information highlighting the various initiatives that the Adviser had implemented or continued during the last year to enhance its services to the Nuveen funds. The Board recognized that some of these initiatives are a result of a multi-year process. In reviewing the activities of 2014, the Board recognized the Adviser’s continued focus on fund rationalization for open-end funds through mergers, fund closures or repositioning the funds in seeking to enhance shareholder value, reduce costs, improve performance, eliminate fund overlap and better meet shareholder needs. The Board noted the Adviser’s investment in additional staffing to strengthen and improve its services to the Nuveen funds, including with respect to risk management and valuation. The Board recognized that expanding the depth and range of its risk oversight activities had been a major priority for the Adviser in recent years, and the Adviser continued to add to the risk management team, develop additional risk management programs and create committees or other teams designated to oversee or evaluate certain risks, such as liquidity risk, enterprise risk, investment risk and cybersecurity risk. The Adviser had also continued to add to the valuation team, launched its centralized securities valuation system which is intended to provide for uniform pricing and reporting across the complex as the system continues to develop, continued to refine its valuation analysis and updated related policies and procedures and evaluated and assessed pricing services. The Board considered the Adviser’s ongoing investment in information technology and operations and the various projects of the information technology team to support the continued growth and complexity of the Nuveen funds and increase efficiencies in their operations. The Board also recognized the Adviser’s strong commitment to compliance and reviewed information reflecting the compliance group’s ongoing activities to enhance its compliance system and refine its compliance procedures as well as the Chief Compliance Officer’s report regarding the compliance team, the initiatives the team had undertaken in 2014 and proposed for 2015, the compliance functions and reporting process, the record of compliance with the policies and procedures and its supervision activities of other service providers.
With respect to the open-end fund product line, the Adviser had also, among other things: developed new funds in seeking to enhance the product line; enhanced the reporting to the Board and its committees regarding payments to intermediaries; and continued to explore opportunities for potential funds.
As noted, the Adviser also oversees the Sub-Adviser who primarily provides the portfolio advisory services to the Fund. The Board recognized the skill and competency of the Adviser in monitoring and analyzing the performance of the Sub-Adviser and managing the sub-advisory relationship. In
considering the Sub-Advisory Agreement and supplementing its prior knowledge, the Board considered a current report provided by the Adviser analyzing, among other things, the Sub-Adviser’s investment team and changes thereto, investment approach, organization and history, and assets under management, and the investment performance of the Fund.
Based on their review, the Independent Board Members found that, overall, the nature, extent and quality of services provided to the Fund under each respective Advisory Agreement were satisfactory.
B. The Investment Performance of the Fund and Fund Advisers
The Board, including the Independent Board Members, considered the performance history of the Fund over various time periods. The Board reviewed reports, including an analysis of the Fund’s performance and the investment team. The Board reviewed, among other things, the Fund’s investment performance both on an absolute basis and in comparison to its benchmark for the quarter, one-, three- and five-year periods ending December 31, 2014 as well as performance information reflecting the first quarter of 2015. In its review, the Board noted that it also reviewed Fund performance results at each of its quarterly meetings.
In evaluating performance, the Board recognized several factors that may impact the performance data as well as the consideration given to particular performance data.
| | • | | The performance data reflected a snapshot in time, in this case as of the end of the most recent calendar year or quarter. A different performance period, however, could generate significantly different results. |
| | • | | Long-term performance can be adversely affected by even one period of significant underperformance so that a single investment decision or theme had the ability to disproportionately affect long-term performance. |
| | • | | The investment experience of a particular shareholder in a fund would vary depending on when such shareholder invested in the fund, the class held (if multiple classes are offered in the fund) and the performance of the fund (or respective class) during that shareholder’s investment period. |
| | • | | Open-end funds generally offer multiple classes and the performance data provided for open-end funds was based on Class A shares. The performance of the other classes, if any, of a fund, however, should be substantially similar on a relative basis because all of the classes would be invested in the same portfolio of securities and differences in performance among classes could be principally attributed to the variations in distribution and servicing expenses of each class. |
| | • | | The Board considered the Fund’s performance compared to its benchmark to help assess the Fund’s comparative performance. While the Board was cognizant of the relative performance of the Fund’s benchmark, the Board evaluated Fund performance in light of the Fund’s investment objectives, investment parameters and guidelines and considered that the variations between the objectives and investment parameters or guidelines of the Fund with its benchmark result in differences in performance results. |
With respect to any Nuveen funds for which the Board has identified performance concerns, the Board monitors such funds closely until performance improves, discusses with the Adviser the reasons for such results, considers those steps necessary or appropriate to address such issues, and reviews the results of any efforts undertaken. The Board is aware, however, that shareholders chose to invest or remain invested in a fund knowing that the Adviser manages the fund and knowing the fund’s fee structure.
In considering the performance data, the Independent Board Members noted that, given the unique nature of the Fund, the Fund does not have a performance peer group (i.e., comparable funds against which the Fund can compare its performance). The Fund, however, outperformed its benchmark in the one-, three- and five-year periods.
Based on their review, the Independent Board Members determined that the Fund’s investment performance had been satisfactory.
C. Fees, Expenses and Profitability
1. Fees and Expenses
The Independent Board Members recognized the unique fee structure of the Fund. The Fund does not pay the Adviser or Sub-Adviser a management fee and nearly all expenses are reimbursed by the Adviser. The Fund is sold via separately managed accounts. The Adviser therefore receives its advisory fees via the managed account management fee. Such fee is essentially a blended rate comprised of Fund fees pro-rated to the portion of the total product represented by the Fund and the managed account fees associated with the proportion of individual securities in the overall product. Given the different fee structure, and distribution and account support requirements, the Independent Board Members recognized that the expenses incurred by the Fund (nearly all of which are reimbursed by the Adviser) are not comparable to a peer group or other Nuveen funds.
Based on their review, the Independent Board Members determined that the Fund’s fee and expense structure was reasonable.
Annual Investment Management Agreement Approval Process (Unaudited) (continued)
2. Comparisons with the Fees of Other Clients
The Board considered information regarding the fees a Fund Adviser assessed to the Nuveen funds compared to that of other clients as described in further detail below. With respect to municipal funds, such other clients of a Fund Adviser may include other municipal separately managed accounts and passively managed exchange traded funds (ETFs) sub-advised by the Sub-Adviser.
The Board recognized that all Nuveen funds have a sub-adviser (either affiliated or unaffiliated) and therefore, in general, the overall fund management fee can be divided into two components, the fee retained by the Adviser and the fee paid to the sub-adviser. In reviewing the nature of the services provided by the Adviser to the Nuveen funds, including through its affiliated sub-advisers, the Board considered the range of advisory fee rates for retail and institutional managed accounts advised by Nuveen-affiliated sub-advisers. The Board also reviewed, among other things, the average fee the affiliated sub-advisers assessed such clients as well as the range of fee rates assessed to the different types of clients (such as retail, institutional and wrap accounts as well as non-Nuveen funds) applicable to such sub-advisers.
In reviewing the comparative information for the Nuveen funds, the Board also reviewed information regarding the differences between the Nuveen funds and the other clients, including differences in services provided, investment policies, investor profiles, compliance and regulatory requirements and account sizes. The Board recognized the breadth of services necessary to operate a registered investment company (as described above) and that, in general terms, the Adviser provided the administrative and other support services to the Nuveen funds and, although the sub-advisers may provide some of these services, the sub-advisers essentially provided the portfolio management services. In general, the Board noted that higher fee levels reflected higher levels of service, increased investment management complexity, greater product management requirements and higher levels of business risk or some combination of the foregoing. However, the Independent Board Members recognized that the Fund is offered via separately managed accounts and therefore may not require or incur the costs of shareholder servicing to the same extent as typical open-end funds. Further, as noted, given the Fund’s unique fee and expense structure pursuant to which the Fund does not pay management fees and the expenses are reimbursed, comparisons with peers were not available.
3. Profitability of Fund Advisers
In conjunction with their review of fees, the Independent Board Members also considered the profitability of Nuveen for its advisory activities and its financial condition. The Independent Board Members reviewed, among other things, the adjusted operating margins for Nuveen for the last two calendar years, the revenues, expenses, net income (pre-tax and after-tax) and net revenue margins (pre-tax and after-tax) of Nuveen’s managed fund advisory activities for the last two calendar years, the allocation methodology used by Nuveen in preparing the profitability data and a history of the adjustments to the methodology due to changes in the business over time. The Independent Board Members also reviewed the revenues, expenses, net income (pre-tax and after-tax) and revenue margin (pre-tax and post-tax) of the Adviser and, as described in further detail below, each affiliated sub-adviser for the 2014 calendar year. In reviewing the profitability data, the Independent Board Members noted the subjective nature of cost allocation methodologies used to determine profitability as other reasonable methods could also have been employed but yield different results. The Independent Board Members reviewed an analysis of the key drivers behind the changes in revenues and expenses that impacted profitability in 2014. The Independent Board Members recognized that Nuveen’s net revenue margin from advisory activities for 2014 was consistent with 2013. The Independent Board Members also considered the profitability of Nuveen in comparison to the adjusted operating margins of other investment advisers with publicly available data and with comparable assets under management (based on asset size and asset composition) to Nuveen. The Independent Board Members noted that Nuveen’s adjusted operating margins appeared to be reasonable in relation to such other advisers. The Independent Board Members, however, recognized the difficulty of making comparisons of profitability from fund investment advisory contracts as the information is not generally publicly available, the information for the investment advisers that was publicly available may not be representative of the industry and various other factors would impact the profitability data such as differences in services offered, business mix, expense methodology and allocations, capital structure and costs, complex size, and types of funds and other accounts managed.
The Independent Board Members noted this information supplemented the profitability information requested and received during the year and noted that two Independent Board Members served as point persons to review the profitability analysis and methodologies employed, and any changes thereto, and to keep the Board apprised of such changes during the year.
The Independent Board Members determined that Nuveen appeared to be sufficiently profitable to operate as a viable investment management firm and to honor its obligations as a sponsor of the Nuveen funds. The Independent Board Members noted the Adviser’s continued expenditures to upgrade its investment technology and increase personnel and recognized the Adviser’s continued commitment to its business to enhance the Adviser’s capacity and capabilities in providing the services necessary to meet the needs of the Nuveen funds as they grow or change over time. The Independent Board Members also noted that the sub-advisory fees for the Nuveen funds are paid by the Adviser, however, the Board recognized that many of the sub-advisers, including the Sub-Adviser, are affiliated with Nuveen. The Independent Board Members also noted the increased resources and support available to Nuveen as well as an improved capital structure as a result of the TIAA-CREF Transaction.
With respect to the Sub-Adviser, the Independent Board Members reviewed the Sub-Adviser’s revenues, expenses and revenue margins (pre- and post-tax) for its advisory activities for the calendar year ended December 31, 2014. The Independent Board Members also reviewed profitability analysis reflecting the revenues, expenses and the revenue margin (pre- and post-tax) by asset type for the Sub-Adviser for the calendar year ended December 31, 2014.
In evaluating the reasonableness of the compensation, the Independent Board Members also considered other amounts paid to a Fund Adviser by the Fund as well as indirect benefits (such as soft dollar arrangements), if any, the Fund Adviser and its affiliates received or were expected to receive that were directly attributable to the management of the Fund. See Section E below for additional information on indirect benefits a Fund Adviser may receive as a result of its relationship with the Fund.
Based on their review, the Independent Board Members determined that the Adviser’s and the Sub-Adviser’s level of profitability was reasonable in light of the respective services provided.
D. Economies of Scale and Whether Fee Levels Reflect These Economies of Scale
The Independent Board Members recognized that, as the assets of a particular fund or the Nuveen complex in the aggregate increase over time, economies of scale may be realized, and the Independent Board Members considered the extent to which the funds benefit from such economies of scale. Although the Independent Board Members recognized that economies of scale are difficult to measure, the Board recognized that one method to help ensure the shareholders share in these benefits is to include breakpoints in the management fee schedule reducing fee rates as asset levels grow. The Independent Board Members noted that, subject to certain exceptions, the management fees of the funds in the Nuveen complex are generally comprised of a fund-level component and complex-level component. The Independent Board Members noted, however, that the Fund does not have a breakpoint schedule given its unique nature.
In addition to fund-specific breakpoint schedules which reduce the fee rates of a particular fund as its assets increase, the Independent Board Members recognized that the Adviser also passed on the benefits of economies of scale through the complex-wide fee arrangement which generally reduced management fee rates as assets in the fund complex reached certain levels, subject to certain exceptions. Notwithstanding the foregoing, the Independent Board Members noted that, because the Fund does not pay a management fee, there is no applicable fund-level or complex-wide level breakpoint schedule, although its assets would be counted toward the complex-wide total.
Based on their review, the Independent Board Members concluded that the absence of a fund-level and complex-level breakpoint schedule or arrangement (as applicable) was acceptable.
E. Indirect Benefits
The Independent Board Members received and considered information regarding potential “fall out” or ancillary benefits the respective Fund Adviser or its affiliates may receive as a result of its relationship with the Fund. In this regard, the Independent Board Members considered whether the Fund Adviser received any benefits from soft dollar arrangements whereby a portion of the commissions paid by the Fund for brokerage may be used to acquire research that may be useful to the Fund Adviser in managing the assets of the Fund and other clients. The Fund’s portfolio transactions are allocated by the Sub-Adviser. Accordingly, the Independent Board Members considered that the Sub-Adviser may benefit from research provided by broker-dealers executing portfolio transactions on behalf of the Fund. With respect to any fixed income securities, however, the Board recognized that such securities generally trade on a principal basis that does not generate soft dollar credits. Similarly, the Board recognized that any research received pursuant to soft dollar arrangements by the Sub-Adviser may also benefit the Fund and shareholders to the extent the research enhanced the ability of the Sub-Adviser to manage the Fund. The Independent Board Members noted that the Sub-Adviser’s profitability may be somewhat lower if it had to acquire any such research services directly.
Based on their review, the Independent Board Members concluded that any indirect benefits received by a Fund Adviser as a result of its relationship with the Fund were reasonable and within acceptable parameters.
F. Other Considerations
The Independent Board Members did not identify any single factor discussed previously as all-important or controlling. The Board Members, including the Independent Board Members, concluded that the terms of each Advisory Agreement were fair and reasonable, that the respective Fund Adviser’s fees were reasonable in light of the services provided to the Fund and that the Advisory Agreements be renewed.
Trustees
and Officers (Unaudited)
The management of the Funds, including general supervision of the duties performed for the Funds by the Adviser, is the responsibility of the Board of trustees of the Funds. The number of directors of the Funds is currently set at eleven. None of the trustees who are not “interested” persons of the Funds (referred to herein as “independent trustees”) has ever been a director or employee of, or consultant to, Nuveen or its affiliates. The names and business addresses of the trustees and officers of the Funds, their principal occupations and other affiliations during the past five years, the number of portfolios each oversees and other directorships they hold are set forth below.
The Funds’ Statement of Additional Information (“SAI”) includes more information about the trustees. To request a free copy, call Nuveen Investments at (800) 257-8787 or visit the Funds’ website at www.nuveen.com.
| | | | | | | | |
Name, Year of Birth & Address | | Position(s) Held with the Funds | | Year First Elected or Appointed (1) | | Principal Occupation(s) Including other Directorships During Past 5 Years | | Number of Portfolios in Fund Complex Overseen by Trustee |
| | | |
| Independent Trustee: | | | | |
William J. Schneider 1944 333 W. Wacker Drive Chicago, IL 60606 | | Chairman of the Board and Trustee | | 1996 | | Chairman of Miller-Valentine Partners, a real estate investment company; formerly, Senior Partner and Chief Operating Officer (retired 2004) of Miller-Valentine Group; owner in several other Miller-Valentine entities; Board Member of Med-America Health System, and WDPR Public Radio Station; formerly, member, Business Advisory Council, Cleveland Federal Reserve Bank and University of Dayton Business School Advisory Council. | | 194 |
Jack B. Evans 1948 333 W. Wacker Drive Chicago, IL 60606 | | Trustee | | 1999 | | President, The Hall-Perrine Foundation, a private philanthropic corporation (since 1996); Director and Chairman, United Fire Group, a publicly held company; formerly, President Pro-Tem of the Board of Regents for the State of Iowa University System; Director, Source Media Group; Life Trustee of Coe College; formerly, Director, Alliant Energy; formerly, Director, Federal Reserve Bank of Chicago; formerly, President and Chief Operating Officer, SCI Financial Group, Inc., a regional financial services firm. | | 194 |
William C. Hunter 1948 333 W. Wacker Drive Chicago, IL 60606 | | Trustee | | 2004 | | Dean Emeritus, formerly, Dean, Tippie College of Business, University of Iowa (2006-2012); Director (since 2004) of Xerox Corporation; Director (since 2005), and President (since 2012) Beta Gamma Sigma, Inc., The International Business Honor Society; Director of Wellmark, Inc. (since 2009); formerly, Dean and Distinguished Professor of Finance, School of Business at the University of Connecticut (2003-2006); previously, Senior Vice President and Director of Research at the Federal Reserve Bank of Chicago (1995-2003); formerly, Director (1997-2007), Credit Research Center at Georgetown University. | | 194 |
David J. Kundert 1942 333 W. Wacker Drive Chicago, IL 60606 | | Trustee | | 2005 | | Formerly, Director, Northwestern Mutual Wealth Management Company (2006-2013); retired (since 2004) as Chairman, JPMorgan Fleming Asset Management, President and CEO, Banc One Investment Advisors Corporation, and President, One Group Mutual Funds; prior thereto, Executive Vice President, Banc One Corporation and Chairman and CEO, Banc One Investment Management Group; Regent Emeritus, Member of Investment Committee, Luther College; member of the Wisconsin Bar Association; member of Board of Directors and Chair of Investment Committee, Greater Milwaukee Foundation; member of the Board of Directors (Milwaukee), College Possible. | | 194 |
| | | | | | | | |
Name, Year of Birth & Address | | Position(s) Held with the Funds | | Year First Elected or Appointed (1) | | Principal Occupation(s) Including other Directorships During Past 5 Years | | Number of Portfolios in Fund Complex Overseen by Trustee |
John K. Nelson 1962 333 West Wacker Drive Chicago, IL 60606 | | Trustee | | 2013 | | Member of Board of Directors of Core12 LLC (since 2008), a private firm which develops branding, marketing and communications strategies for clients; Director of The Curran Center for Catholic American Studies (since 2009) and The President’s Council, Fordham University (since 2010); formerly senior external advisor to the financial services practice of Deloitte Consulting LLP (2012-2014); formerly, Chairman of the Board of Trustees of Marian University (2010 as trustee, 2011-2014 as Chairman); formerly, Chief Executive Officer of ABN AMRO N.V. North America, and Global Head of its Financial Markets Division (2007-2008); prior senior positions held at ABN AMRO include Corporate Executive Vice President and Head of Global Markets—the Americas (2006-2007), CEO of Wholesale Banking—North America and Global Head of Foreign Exchange and Futures Markets (2001-2006), and Regional Commercial Treasurer and Senior Vice President Trading—North America (1996-2001); formerly, Trustee at St. Edmund Preparatory School in New York City. | | 194 |
Judith M. Stockdale 1947 333 W. Wacker Drive Chicago, IL 60606 | | Trustee | | 1997 | | Board Member, Land Trust Alliance (since 2013) and U.S. Endowment for Forestry and Communities (since 2013); formerly, Executive Director (1994-2012), Gaylord and Dorothy Donnelley Foundation; prior thereto, Executive Director, Great Lakes Protection Fund (1990-1994). | | 194 |
Carole E. Stone 1947 333 W. Wacker Drive Chicago, IL 60606 | | Trustee | | 2007 | | Director, Chicago Board Options Exchange (since 2006), C2 Options Exchange, Incorporated (since 2009) Director, CBOE Holdings, Inc. (since 2010); formerly, Commissioner, New York State Commission on Public Authority Reform (2005-2010). | | 194 |
Virginia L. Stringer 1944 333 W. Wacker Drive Chicago, IL 60606 | | Trustee | | 2011 | | Board Member, Mutual Fund Directors Forum; non-profit board member; former governance consultant; former Owner and President, Strategic Management Resources, Inc., a management consulting firm; former Member, Governing Board, Investment Company Institute’s Independent Directors Council; previously, held several executive positions in general management, marketing and human resources at IBM and The Pillsbury Company; Independent Director, First American Fund Complex (1987-2010) and Chair (1997-2010). | | 194 |
Terence J. Toth 1959 333 W. Wacker Drive Chicago, IL 60606 | | Trustee | | 2008 | | Managing Partner, Promus Capital (since 2008); Director, Fulcrum IT Service LLC (since 2010), Quality Control Corporation (since 2012) and LogicMark LLC (since 2012); formerly, Director, Legal & General Investment Management America, Inc. (2008-2013); formerly, CEO and President, Northern Trust Global Investments (2004-2007); Executive Vice President, Quantitative Management & Securities Lending (2000-2004); prior thereto, various positions with Northern Trust Company (since 1994); member: Chicago Fellowship Board (since 2005), Catalyst Schools of Chicago Board (since 2008) and Mather Foundation Board (since 2012), and a member of its investment committee; formerly, Member, Northern Trust Mutual Funds Board (2005-2007), Northern Trust Global Investments Board (2004-2007), Northern Trust Japan Board (2004-2007), Northern Trust Securities Inc. Board (2003-2007) and Northern Trust Hong Kong Board (1997-2004). | | 194 |
Trustees and Officers (Unaudited) (continued)
| | | | | | | | |
Name, Year of Birth & Address | | Position(s) Held with the Funds | | Year First Elected or Appointed (1) | | Principal Occupation(s) Including other Directorships During Past 5 Years | | Number of Portfolios in Fund Complex Overseen by Trustee |
| | | |
| Interested Trustee: | | | | |
William Adams IV(2) 1955 333 W. Wacker Drive Chicago, IL 60606 | | Trustee | | 2013 | | Senior Executive Vice President, Global Structured Products (since 2010); Co-President of Nuveen Fund Advisors, LLC (since 2011); Executive Vice President of Nuveen Securities, LLC; President (since 2011), formerly, Managing Director (2010-2011) of Nuveen Commodities Asset Management, LLC; Board Member of the Chicago Symphony Orchestra and of Gilda’s Club Chicago; formerly, Executive Vice President, U.S. Structured Products, of Nuveen Investments, Inc. (1999-2010). | | 194 |
Thomas S. Schreier, Jr.(2) 1962 333 W. Wacker Drive Chicago, IL 60606 | | Trustee | | 2013 | | Vice Chairman, Wealth Management of Nuveen Investments, Inc. (since 2011); Co-President of Nuveen Fund Advisors, LLC; Chairman of Nuveen Asset Management, LLC (since 2011); Co-Chief Executive Officer of Nuveen Securities, LLC (since 2011); Member of Board of Governors and Chairman’s Council of the Investment Company Institute; Director of Allina Health and a Member of its Finance, Audit and Investment Committees, formerly, Chief Executive Officer (2000-2010) and Chief Investment Officer (2007-2010) of FAF Advisors, Inc.; formerly, President of First American Funds (2001-2010). | | 194 |
| | | | | | | | |
Name,
Year of Birth & Address | | Position(s) Held with the Funds | | Year First Elected or Appointed (2) | | Principal Occupation(s) During Past 5 Years | | Number of Portfolios in Fund Complex Overseen by
Officer |
| | | |
| Officers of the Funds: | | | | |
Gifford R. Zimmerman 1956 333 W. Wacker Drive Chicago, IL 60606 | | Chief Administrative Officer | | 1988 | | Managing Director (since 2002), and Assistant Secretary of Nuveen Securities, LLC; Managing Director (since 2004) and Assistant Secretary (since 1994) of Nuveen Investments, Inc.; Managing Director (since 2002), Assistant Secretary (since 1997) and Co-General Counsel (since 2011) of Nuveen Fund Advisors, LLC; Managing Director, Assistant Secretary and Associate General Counsel of Nuveen Asset Management, LLC (since 2011); Managing Director and Assistant Secretary of Symphony Asset Management LLC (since 2003); Vice President and Assistant Secretary of NWQ Investment Management Company, LLC (since 2002), Nuveen Investments Advisers Inc. (since 2002), Santa Barbara Asset Management, LLC (since 2006) and of Winslow Capital Management, LLC, (since 2010); Vice President and Assistant Secretary (since 2013), formerly, Chief Administrative Officer and Chief Compliance Officer (2006-2013) of Nuveen Commodities Asset Management, LLC; Chartered Financial Analyst. | | 195 |
Margo L. Cook 1964 333 W. Wacker Drive Chicago, IL 60606 | | Vice President | | 2009 | | Senior Executive Vice President of Nuveen Investments, Inc.; Executive Vice President, Investment Services of Nuveen Fund Advisors, LLC (since 2011); Managing Director – Investment Services of Nuveen Commodities Asset Management, LLC (since 2011); Co-Chief Executive Officer (since 2015); previously, Executive Vice President (2013-2015) of Nuveen Securities, LLC; Chartered Financial Analyst. | | 195 |
Lorna C. Ferguson 1945 333 W. Wacker Drive Chicago, IL 60606 | | Vice President | | 1998 | | Managing Director (since 2005) of Nuveen Fund Advisors, LLC and Nuveen Securities, LLC (since 2004). | | 195 |
| | | | | | | | |
Name,
Year of Birth & Address | | Position(s) Held with the Funds | | Year First Elected or Appointed (2) | | Principal Occupation(s) During Past 5 Years | | Number of Portfolios in Fund Complex Overseen by
Officer |
Stephen D. Foy 1954 333 W. Wacker Drive Chicago, IL 60606 | | Vice President and Controller | | 1998 | | Managing Director (since 2014), formerly, Senior Vice President (2013-2014) and Vice President (2005-2013) of Nuveen Fund Advisors, LLC; Chief Financial Officer of Nuveen Commodities Asset Management, LLC (since 2010); Certified Public Accountant. | | 195 |
Sherri A. Hlavacek 1962 333 W. Wacker Drive Chicago, IL 60606 | | Vice President and Treasurer | | 2015 | | Executive Vice President (since May 2015, formerly, Managing Director) and Controller of Nuveen Fund Advisors, LLC; Managing Director and Controller of Nuveen Commodities Asset Management, LLC; Executive Vice President (since May 2015, formerly, Managing Director), Treasurer and Controller of Nuveen Asset Management, LLC; Executive Vice President, Principal Financial Officer (since July 2015, formerly, Managing Director), Treasurer and Corporate Controller of Nuveen Investments, Inc.; Executive Vice President (since May 2015, formerly, Managing Director), Treasurer and Corporate Controller of Nuveen Investments Advisers Inc. and Nuveen Investments Holdings, Inc.; Managing Director, Chief Financial Officer and Corporate Controller of Nuveen Securities, LLC; Vice President, Controller and Treasurer of NWQ Investment Management Company, LLC; Vice President and Controller of Santa Barbara Asset Management, LLC, Tradewinds Global Investors, LLC, Symphony Asset Management LLC and Winslow Capital Management, LLC; Certified Public Accountant. | | 195 |
Walter M. Kelly 1970 333 W. Wacker Drive Chicago, IL 60606 | | Chief Compliance Officer and Vice President | | 2003 | | Senior Vice President (since 2008) of Nuveen Investments Holdings, Inc. | | 195 |
Tina M. Lazar 1961 333 W. Wacker Drive Chicago, IL 60606 | | Vice President | | 2002 | | Senior Vice President of Nuveen Investments Holdings, Inc. and Nuveen Securities, LLC | | 195 |
Kevin J. McCarthy 1966 333 W. Wacker Drive Chicago, IL 60606 | | Vice President and Secretary | | 2007 | | Managing Director and Assistant Secretary (since 2008), Nuveen Securities, LLC; Managing Director (since 2008), Assistant Secretary (since 2007) and Co-General Counsel (since 2011) of Nuveen Fund Advisors, LLC; Managing Director, Assistant Secretary and Associate General Counsel (since 2011) of Nuveen Asset Management, LLC; Managing Director and Assistant Secretary, Nuveen Investments, Inc.; Vice President (since 2007) and Assistant Secretary of Nuveen Investments Advisers Inc., NWQ Investment Management Company, LLC, Tradewinds Global Investors LLC, Symphony Asset Management LLC, Santa Barbara Asset Management, LLC, and of Winslow Capital Management, LLC. (since 2010); Vice President and Secretary (since 2010) of Nuveen Commodities Asset Management, LLC. | | 195 |
Kathleen L. Prudhomme 1953 901 Marquette Avenue Minneapolis, MN 55402 | | Vice President and Assistant Secretary | | 2011 | | Managing Director, Assistant Secretary and Co-General Counsel (since 2011) of Nuveen Fund Advisors, LLC; Managing Director, Assistant Secretary and Associate General Counsel (since 2011) of Nuveen Asset Management, LLC; Managing Director and Assistant Secretary (since 2011) of Nuveen Securities, LLC; formerly, Deputy General Counsel, FAF Advisors, Inc. (2004-2010). | | 195 |
Joel T. Slager 1978 333 West Wacker Drive Chicago, IL 60606 | | Vice President and Assistant Secretary | | 2013 | | Fund Tax Director for Nuveen Funds (since 2013); previously, Vice President of Morgan Stanley Investment Management, Inc., Assistant Treasurer of the Morgan Stanley Funds (from 2010 to 2013). | | 195 |
Trustees and Officers (Unaudited) (continued)
| | | | | | | | |
Name,
Year of Birth & Address | | Position(s) Held with the Funds | | Year First Elected or Appointed (2) | | Principal Occupation(s) During Past 5 Years | | Number of Portfolios in Fund Complex Overseen by
Officer |
Jeffery M. Wilson 1956 333 West Wacker Drive Chicago, IL 60606 | | Vice President | | 2011 | | Senior Vice President of Nuveen Securities, LLC (since 2011); formerly, Senior Vice President of FAF Advisors, Inc. (2000-2010). | | 107 |
| (1) | Trustees serve an indefinite term until his/her successor is elected or appointed. The year first elected or appointed represents the year in which the trustee was first elected or appointed to any fund in the Nuveen Fund Complex. |
| (2) | Officers serve one year terms through August of each year. The year first elected or appointed represents the year in which the officer was first elected or appointed to any fund in the Nuveen Fund Complex. |
Notes
Notes
Notes
| | | | | | | | | | | | | | |
| | | | | | | | |
| | | | |
| | | | | | | | |
| | | | | |
| | Nuveen Investments: | | | | | | | | |
| | | | Serving Investors for Generations | | |
| | |
| | | | |
| | |
| | | | Since 1898, financial advisors and their clients have relied on Nuveen Investments to provide dependable investment solutions through continued adherence to proven, long-term investing principles. Today, we offer a range of high quality equity and fixed-income solutions designed to be integral components of a well-diversified core portfolio. |
| | | |
| | | | | | |
| | | | |
| | | | | | Focused on meeting investor needs. Nuveen Investments provides high-quality investment services designed to help secure the longterm goals of institutional and individual investors as well as the consultants and financial advisors who serve them. Nuveen Investments markets a wide range of specialized investment solutions which provide investors access to capabilities of its high-quality boutique investment affiliates-Nuveen Asset Management, Symphony Asset Management, NWQ Investment Management Company, Santa Barbara Asset Management, Tradewinds Global Investors, Winslow Capital Management, and Gresham Investment Management. In total, Nuveen Investments managed $230 billion as of June 30, 2015. | | |
| | | | | |
| | | | | | | | | | |
| | | | | | Find out how we can help you. To learn more about how the products and services of Nuveen Investments may be able to help you meet your financial goals, talk to your financial advisor, or call us at (800) 257-8787. Please read the information provided carefully before you invest. Investors should consider the investment objective and policies, risk considerations, charges and expenses of any investment carefully. Where applicable, be sure to obtain a prospectus, which contains this and other relevant information. To obtain a prospectus, please contact your securities representative or Nuveen Investments, 333 W. Wacker Dr., Chicago, IL 60606. Please read the prospectus carefully before you invest or send money. Learn more about Nuveen Funds at: www.nuveen.com/mf | | |
| | | | | | |
| | | | | | | | | | | | |
| | Distributed by Nuveen Securities, LLC | 333 West Wacker Drive Chicago, IL 60606 | www.nuveen.com | | |
MAN-MAPS-0715P 10419-INV-Y-09/16
ITEM 2. CODE OF ETHICS.
As of the end of the period covered by this report, the registrant has adopted a code of ethics that applies to the registrant’s principal executive officer, principal financial officer, principal accounting officer or controller, or persons performing similar functions. There were no amendments to or waivers from the code during the period covered by this report. The registrant has posted the code of ethics on its website at www.nuveen.com/MutualFunds/ShareholderResources/FundGovernance.aspx. (To view the code, click on Code of Conduct.)
ITEM 3. AUDIT COMMITTEE FINANCIAL EXPERT.
The registrant’s Board of Directors or Trustees (“Board”) determined that the registrant has at least one “audit committee financial expert” (as defined in Item 3 of Form N-CSR) serving on its Audit Committee. The registrant’s audit committee financial experts are Carole E. Stone and Jack B. Evans, who are “independent” for purposes of Item 3 of Form N-CSR.
Ms. Stone served for five years as Director of the New York State Division of the Budget. As part of her role as Director, Ms. Stone was actively involved in overseeing the development of the State’s operating, local assistance and capital budgets, its financial plan and related documents; overseeing the development of the State’s bond-related disclosure documents and certifying that they fairly presented the State’s financial position; reviewing audits of various State and local agencies and programs; and coordinating the State’s system of internal audit and control. Prior to serving as Director, Ms. Stone worked as a budget analyst/examiner with increasing levels of responsibility over a 30 year period, including approximately five years as Deputy Budget Director. Ms. Stone has also served as Chair of the New York State Racing Association Oversight Board, as Chair of the Public Authorities Control Board, as a Commissioner on the New York State Commission on Public Authority Reform and as a member of the Boards of Directors of several New York State public authorities. These positions have involved overseeing operations and finances of certain entities and assessing the adequacy of project/entity financing and financial reporting. Currently, Ms. Stone is on the Board of Directors of CBOE Holdings, Inc., of the Chicago Board Options Exchange, and of C2 Options Exchange. Ms. Stone’s position on the boards of these entities and as a member of both CBOE Holdings’ Audit Committee and its Finance Committee has involved, among other things, the oversight of audits, audit plans and preparation of financial statements.
Mr. Evans was formerly President and Chief Operating Officer of SCI Financial Group, Inc., a full service registered broker-dealer and registered investment adviser (“SCI”). As part of his role as President and Chief Operating Officer, Mr. Evans actively supervised the Chief Financial Officer (the “CFO”) and actively supervised the CFO’s preparation of financial statements and other filings with various regulatory authorities. In such capacity, Mr. Evans was actively involved in the preparation of SCI’s financial statements and the resolution of issues raised in connection therewith. Mr. Evans has also served on the audit committee of various reporting companies. At such companies, Mr. Evans was involved in the oversight of audits, audit plans, and the preparation of financial statements. Mr. Evans also formerly chaired the audit committee of the Federal Reserve Bank of Chicago.
ITEM 4. PRINCIPAL ACCOUNTANT FEES AND SERVICES.
The following tables show the amount of fees that PricewaterhouseCoopers LLP, the Funds’ auditor, billed to the Funds’ during the Funds’ last two full fiscal years. The Audit Committee approved in advance all audit services and non-audit services that PricewaterhouseCoopers LLP provided to the Funds, except for those non-audit services that were subject to the pre-approval exception under Rule 2-01 of Regulation S-X (the “pre-approval exception”). The preapproval exception for services provided directly to the Funds waives the pre-approval requirement for services other than audit, review or attest services if: (A) the aggregate amount of all such services provided constitutes no more than 5% of the total amount of revenues paid by the Funds during the fiscal year in which the services are provided; (B) the Funds did not recognize the services as non-audit services at the time of the engagement; and (C) the services are promptly brought to the Audit Committee’s attention, and the Committee (or its delegate) approves the services before the audit is completed.
The Audit Committee has delegated certain pre-approval responsibilities to its Chairman (or, in his absence, any other member of the Audit Committee).
SERVICES THAT THE AUDITOR BILLED TO THE FUND
| | | | | | | | | | | | | | | | |
Fiscal Year Ended July 31, 2015 | | Audit Fees Billed
to Fund 1 | | | Audit-Related Fees
Billed to Fund 2 | | | Tax Fees
Billed to Fund 3 | | | All Other Fees
Billed to Fund 4 | |
Fund Name | | | | | | | | | | | | | | | | |
Municipal Total Return Managed Accounts Portfolio | | | 27,321 | | | | 0 | | | | 34 | | | | 0 | |
| | | | | | | | | | | | | | | | |
Total | | $ | 27,321 | | | $ | 0 | | | $ | 34 | | | $ | 0 | |
| 1 | | “Audit Fees” are the aggregate fees billed for professional services for the audit of the Fund’s annual financial statements and services provided in connection with statutory and regulatory filings or engagements. |
| 2 | | “Audit-Related Fees” are the aggregate fees billed for assurance and related services reasonably related to the performance of the audit or review of financial statements that are not reported under “Audit Fees”. These fees include offerings related to the Fund’s common shares and leverage. |
| 3 | | “Tax Fees” are the aggregate fees billed for professional services for tax advice, tax compliance, and tax planning. These fees include: all global withholding tax services; excise and state tax reviews; capital gain, tax equalization and taxable basis calculations performed by the principal accountant. |
| 4 | | “All Other Fees” are the aggregate fees billed for products and services other than “Audit Fees”, “Audit-Related Fees” and “Tax Fees”. These fees represent all “Agreed-Upon Procedures” engagements pertaining to the Fund’s use of leverage. |
| | | | | | | | | | | | | | | | |
| | | Percentage Approved Pursuant to Pre-approval Exception | |
| | | Audit Fees Billed
to Fund | | | Audit-Related Fees
Billed to Fund | | | Tax Fees
Billed to Fund | | | All Other Fees
Billed to Fund | |
Fund Name | | | | | | | | | | | | | | | | |
Municipal Total Return Managed Accounts Portfolio | | | 0 | % | | | 0 | % | | | 0 | % | | | 0 | % |
| | | | |
Fiscal Year Ended July 31, 2014 | | Audit Fees Billed
to Fund 1 | | | Audit-Related Fees
Billed to Fund 2 | | | Tax Fees
Billed to Fund 3 | | | All Other Fees
Billed to Fund 4 | |
Fund Name | | | | | | | | | | | | | | | | |
Municipal Total Return Managed Accounts Portfolio | | | 26,400 | | | | 0 | | | | 0 | | | | 0 | |
| | | | | | | | | | | | | | | | |
Total | | $ | 26,400 | | | $ | 0 | | | $ | 0 | | | $ | 0 | |
| 1 | | “Audit Fees” are the aggregate fees billed for professional services for the audit of the Fund’s annual financial statements and services provided in connection with statutory and regulatory filings or engagements. |
| 2 | | “Audit-Related Fees” are the aggregate fees billed for assurance and related services reasonably related to the performance of the audit or review of financial statements that are not reported under “Audit Fees”. These fees include offerings related to the Fund’s common shares and leverage. |
| 3 | | “Tax Fees” are the aggregate fees billed for professional services for tax advice, tax compliance, and tax planning. These fees include: all global withholding tax services; excise and state tax reviews; capital gain, tax equalization and taxable basis calculations performed by the principal accountant. |
| 4 | | “All Other Fees” are the aggregate fees billed for products and services other than “Audit Fees”, “Audit-Related Fees” and “Tax Fees”. These fees represent all “Agreed-Upon Procedures” engagements pertaining to the Fund’s use of leverage. |
| | | | | | | | | | | | | | | | |
| | | Percentage Approved Pursuant to Pre-approval Exception | |
| | | Audit Fees Billed
to Fund | | | Audit-Related Fees
Billed to Fund | | | Tax Fees
Billed to Fund | | | All Other Fees
Billed to Fund | |
Fund Name | | | | | | | | | | | | | | | | |
Municipal Total Return Managed Accounts Portfolio | | | 0 | % | | | 0 | % | | | 0 | % | | | 0 | % |
| | | | | | | | | | | | |
Fiscal Year Ended July 31, 2015 | | Audit-Related Fees
Billed to Adviser and
Affiliated Fund
Service Providers | | | Tax Fees Billed to
Adviser and
Affiliated Fund
Service Providers | | | All Other Fees
Billed to Adviser
and Affiliated Fund
Service Providers | |
Nuveen Managed Accounts Portfolios Trust | | $ | 0 | | | $ | 0 | | | $ | 0 | |
| |
| | | Percentage Approved Pursuant to Pre-approval Exception | |
| | | Audit-Related Fees
Billed to Adviser and
Affiliated Fund
Service Providers | | | Tax Fees Billed to
Adviser and
Affiliated Fund
Service Providers | | | All Other Fees
Billed to Adviser
and Affiliated Fund
Service Providers | |
| | | 0 | % | | | 0 | % | | | 0 | % |
| | | |
Fiscal Year Ended July 31, 2014 | | Audit-Related Fees
Billed to Adviser and
Affiliated Fund
Service Providers | | | Tax Fees Billed to
Adviser and
Affiliated Fund
Service Providers | | | All Other Fees
Billed to Adviser
and Affiliated Fund
Service Providers | |
Nuveen Managed Accounts Portfolios Trust | | $ | 0 | | | $ | 0 | | | $ | 0 | |
| |
| | | Percentage Approved Pursuant to Pre-approval Exception | |
| | | Audit-Related Fees
Billed to Adviser and
Affiliated Fund
Service Providers | | | Tax Fees Billed to
Adviser and
Affiliated Fund
Service Providers | | | All Other Fees
Billed to Adviser
and Affiliated Fund
Service Providers | |
| | | 0 | % | | | 0 | % | | | 0 | % |
| | | | | | | | | | | | | | | | |
Fiscal Year Ended July 31, 2015 | | Total Non-Audit Fees
Billed to Trust | | | Total Non-Audit Fees
billed to Adviser and
Affiliated Fund Service
Providers (engagements
related directly to the
operations and financial
reporting of the Trust) | | | Total Non-Audit Fees
billed to Adviser and
Affiliated Fund Service
Providers (all other
engagements) | | | Total | |
Fund Name | | | | | | | | | | | | | | | | |
Municipal Total Return Managed Accounts Portfolio | | | 34 | | | | 0 | | | | 0 | | | | 34 | |
| | | | | | | | | | | | | | | | |
Total | | $ | 34 | | | $ | 0 | | | $ | 0 | | | $ | 34 | |
“Non-Audit Fees billed to Fund” for both fiscal year ends represent “Tax Fees” and “All Other Fees” billed to Fund in their respective amounts from the previous table.
Less than 50 percent of the hours expended on the principal accountant’s engagement to audit the registrant’s financial statements for the most recent fiscal year were attributed to work performed by persons other than the principal accountant’s full-time, permanent employees.
| | | | | | | | | | | | | | | | |
Fiscal Year Ended July 31, 2014 | | Total Non-Audit Fees
Billed to Trust | | | Total Non-Audit Fees
billed to Adviser and
Affiliated Fund Service
Providers (engagements
related directly to the
operations and financial
reporting of the Trust) | | | Total Non-Audit Fees
billed to Adviser and
Affiliated Fund Service
Providers (all other
engagements) | | | Total | |
| | | | |
| | | | |
| | | | |
| | | | |
| | | | |
| | | | |
Fund Name | | | | | | | | | | | | | | | | |
Municipal Total Return Managed Accounts Portfolio | | | 0 | | | | 0 | | | | 0 | | | | 0 | |
| | | | | | | | | | | | | | | | |
Total | | $ | 0 | | | $ | 0 | | | $ | 0 | | | $ | 0 | |
“Non-Audit Fees billed to Fund” for both fiscal year ends represent “Tax Fees” and “All Other Fees” billed to Fund in their respective amounts from the previous table.
Audit Committee Pre-Approval Policies and Procedures. Generally, the Audit Committee must approve (i) all non-audit services to be performed for the Funds by the Funds’ independent accountant and (ii) all audit and non-audit services to be performed by the Funds’ independent accountant for the Affiliated Fund Service Providers with respect to the operations and financial reporting of the Funds. Regarding tax and research projects conducted by the independent accountant for the Funds and Affiliated Fund Service Providers (with respect to operations and financial reports of the Trust), such engagements will be (i) pre-approved by the Audit Committee if they are expected to be for amounts greater than $10,000; (ii) reported to the Audit Committee Chairman for his verbal approval prior to engagement if they are expected to be for amounts under $10,000 but greater than $5,000; and (iii) reported to the Audit Committee at the next Audit Committee meeting if they are expected to be for an amount under $5,000.
ITEM 5. AUDIT COMMITTEE OF LISTED REGISTRANTS.
Not applicable to this registrant.
ITEM 6. SCHEDULE OF INVESTMENTS.
| a) | | See Portfolio of Investments in Item 1. |
ITEM 7. DISCLOSURE OF PROXY VOTING POLICIES AND PROCEDURES FOR CLOSED-END
MANAGEMENT INVESTMENT COMPANIES.
Not applicable to this registrant.
ITEM 8. PORTFOLIO MANAGERS OF CLOSED-END MANAGEMENT INVESTMENT COMPANIES.
Not applicable to this registrant.
ITEM 9. PURCHASES OF EQUITY SECURITIES BY CLOSED-END MANAGEMENT INVESTMENT COMPANY AND AFFILIATED PURCHASERS.
Not applicable to this registrant.
ITEM 10. SUBMISSION OF MATTERS TO A VOTE OF SECURITY HOLDERS.
There have been no material changes to the procedures by which shareholders may recommend nominees to the registrant’s Board of Trustees implemented after the registrant last provided disclosure in response to this Item.
ITEM 11. CONTROLS AND PROCEDURES.
| | (a) | | The registrant’s principal executive and principal financial officers, or persons performing similar functions, have concluded that the registrant’s disclosure controls and procedures (as defined in Rule 30a-3(c) under the Investment Company Act of 1940, as amended (the “1940 Act”) (17 CFR 270.30a-3(c))) are effective, as of a date within 90 days of the filing date of this report that includes the disclosure required by this paragraph, based on their evaluation of the controls and procedures required by Rule 30a-3(b) under the 1940 Act (17 CFR 270.30a-3(b)) and Rules 13a-15(b) or 15d-15(b) under the Securities Exchange Act of 1934, as amended (the “Exchange Act”) (17 CFR 240.13a-15(b) or 240.15d-15(b)). |
| | (b) | | There were no changes in the registrant’s internal control over financial reporting (as defined in Rule 30a-3(d) under the 1940 Act (17 CFR 270.30a-3(d)) that occurred during the second fiscal quarter of the period covered by this report that has materially affected, or is reasonably likely to materially affect, the registrant’s internal control over financial reporting. |
ITEM 12. EXHIBITS.
File the exhibits listed below as part of this Form.
| | |
| (a)(1) | | Any code of ethics, or amendment thereto, that is the subject of the disclosure required by Item 2, to the extent that the registrant intends to satisfy the Item 2 requirements through filing of an exhibit: Not applicable because the code is posted on registrant’s website at www.nuveen.com/MutualFunds/ShareholderResources/FundGovernance.aspx and there were no amendments during the period covered by this report. (To view the code, click on Code of Conduct.) |
| |
| (a)(2) | | A separate certification for each principal executive officer and principal financial officer of the registrant as required by Rule 30a-2(a) under the 1940 Act (17 CFR 270.30a-2(a)) in the exact form set forth below: See EX-99.CERT attached hereto. |
| |
| (a)(3) | | Any written solicitation to purchase securities under Rule 23c-1 under the 1940 Act (17 CFR 270.23c-1) sent or given during the period covered by the report by or on behalf of the registrant to 10 or more persons: Not applicable to this registrant. |
| |
| (b) | | If the report is filed under Section 13(a) or 15(d) of the Exchange Act, provide the certifications required by Rule 30a-2(b) under the 1940 Act (17 CFR 270.30a-2(b)), Rule 13a-14(b) or Rule 15d-14(b) under the Exchange Act (17 CFR 240.13a-14(b) or 240.15d-14(b)), and Section 1350 of Chapter 63 of Title 18 of the United States Code (18 U.S.C. 1350) as an Exhibit. A certification furnished pursuant to this paragraph will not be deemed “filed” for purposes of Section 18 of the Exchange Act (15 U.S.C. 78r), or otherwise subject to the liability of that section. Such certification will not be deemed to be incorporated by reference into any filing under the Securities Act of 1933 or the Exchange Act, except to the extent that the registration specifically incorporates it by reference: See EX-99.906 CERT attached hereto. |
SIGNATURES
Pursuant to the requirements of the Securities Exchange Act of 1934 and the Investment Company Act of 1940, the registrant has duly caused this report to be signed on its behalf by the undersigned, thereunto duly authorized.
(Registrant) Nuveen Managed Accounts Portfolios Trust
| | |
| |
| By (Signature and Title) | | /s/ Kevin J. McCarthy |
| | Kevin J. McCarthy |
| | Vice President and Secretary |
Date: October 8, 2015
Pursuant to the requirements of the Securities Exchange Act of 1934 and the Investment Company Act of 1940, this report has been signed below by the following persons on behalf of the registrant and in the capacities and on the dates indicated.
| | |
| |
| By (Signature and Title) | | /s/ Gifford R. Zimmerman |
| | Gifford R. Zimmerman |
| | Chief Administrative Officer |
| | (principal executive officer) |
Date: October 8, 2015
| | |
| |
| By (Signature and Title) | | /s/ Stephen D. Foy |
| | Stephen D. Foy |
| | Vice President and Controller |
| | (principal financial officer) |
Date: October 8, 2015