UNITED STATES
SECURITIES AND EXCHANGE COMMISSION
Washington, D.C. 20549
FORM N-CSR
CERTIFIED SHAREHOLDER REPORT OF REGISTERED
MANAGEMENT INVESTMENT COMPANIES
Investment Company Act file number: 811-22037
Stone Harbor Investment Funds
(Exact name of registrant as specified in charter)
1290 Broadway, Suite 1100
Denver, CO 80203
(Address of principal executive offices) (Zip code)
Adam J. Shapiro, Esq.
c/o Stone Harbor Investment Partners LP
31 West 52nd Street, 16th Floor
New York, NY 10019
(Name and address of agent for service)
With copies To:
Michael G. Doherty, Esq.
Ropes & Gray LLP
1211 Avenue of the Americas
New York, NY 10036
Registrant’s telephone number, including area code: (303) 623-2577
Date of fiscal year end: May 31
Date of reporting period: May 31, 2016
| Item 1. | Report to Stockholders. |

| Table of Contents |
Shareholder Letter | 2 |
Disclosure of Fund Expenses | 10 |
Summaries of Portfolio Holdings | 11 |
| Growth of $10,000 Investment | |
| Stone Harbor Emerging Markets Debt Fund | 14 |
| Stone Harbor High Yield Bond Fund | 15 |
| Stone Harbor Local Markets Fund | 16 |
| Stone Harbor Emerging Markets Corporate Debt Fund | 17 |
| Stone Harbor Investment Grade Fund | 18 |
| Stone Harbor Strategic Income Fund | 19 |
| Stone Harbor Emerging Markets Debt Allocation Fund | 20 |
Report of Independent Registered Public Accounting Firm | 21 |
| Statements of Investments | |
| Stone Harbor Emerging Markets Debt Fund | 22 |
| Stone Harbor High Yield Bond Fund | 33 |
| Stone Harbor Local Markets Fund | 42 |
| Stone Harbor Emerging Markets Corporate Debt Fund | 47 |
| Stone Harbor Investment Grade Fund | 52 |
| Stone Harbor Strategic Income Fund | 58 |
| Stone Harbor Emerging Markets Debt Allocation Fund | 60 |
Statements of Assets & Liabilities | 62 |
Statements of Operations | 64 |
Statements of Changes in Net Assets | 66 |
| Financial Highlights | |
| Stone Harbor Emerging Markets Debt Fund | 70 |
| Stone Harbor High Yield Bond Fund | 71 |
| Stone Harbor Local Markets Fund | 72 |
| Stone Harbor Emerging Markets Corporate Debt Fund | 73 |
| Stone Harbor Investment Grade Fund | 74 |
| Stone Harbor Strategic Income Fund | 75 |
| Stone Harbor Emerging Markets Debt Allocation Fund | 76 |
Notes to Financial Statements | 77 |
Additional Information | 99 |
Board Approval of Investment Advisory Agreements | 101 |
Trustees & Officers | 103 |
| Stone Harbor Investment Funds Annual Report | May 31, 2016 | 1 |
| Stone Harbor Investment Funds | Shareholder Letter |
| May 31, 2016 (Unaudited) |
Dear Shareholder,
At the time of our last review in November 2015, we described the macroeconomic backdrop as challenging and market sentiments as unsettled. In the following months, global credit markets continued to experience market volatility ‐‐ driven by some of the same key themes from early 2015 – but also benefitted from positive macro and idiosyncratic developments that induced a broad‐based recovery in credit markets beginning in February 2016. By the end of the current reporting period, investor concerns about commodity prices, divergent global monetary and fiscal policies and global growth were offset by the search for yield. In general, the global credit markets performed well during the fiscal year. In recent days, some of this positive momentum was interrupted by the unexpected result of the UK’s referendum on EU membership. The impact of that vote will unfold over the coming months.
One of the persistent drivers of market and asset price volatility across all fixed income markets was oil prices, which remained weak throughout much of the period. Oil prices declined 56% from the beginning of the fiscal year through mid‐February, but recovered over the balance of the period to end the fiscal year down 26%. This price volatility had a negative effect on the high yield and emerging markets prior to February and a positive impact thereafter.
Another concern that influenced risk assets was the outlook for Chinese growth. China experienced slowing economic growth and took a number of stimulus measures including devaluation of the yuan, interest rate cuts, stock market intervention, and fiscal spending increases during calendar‐year 2015. Market concerns were tempered as Chinese authorities signaled that the domestic growth target of 6.8% for 2016 remained on track and markets lowered the probability of a major devaluation of the yuan in the near term.
As Chinese economic growth fears subsided, the U.S. economic outlook also improved. After the Federal Reserve (Fed) increased interest rates in December 2015, the markets grew more comfortable with policy direction. The Fed’s policy framework of slow and measured rate increases proved to be market‐friendly during much of the Fund’s fiscal year. At the same time, the European Central Bank (ECB) continued on the path of monetary stimulus. We expect the role of central banks to continue to occupy investor attention in the aftermath of the UK vote leaving the EU.
At Stone Harbor, we seek to generate positive returns from stable and improving credit situations in corporate and sovereign markets worldwide. As we continue to monitor these developments, please follow our progress throughout the year by visiting our website at www.shiplp.com. There you will find updates on our view of credit markets, as well as related news and research. We appreciate the confidence you have placed in Stone Harbor Investment Partners LP and look forward to providing you with another update in the next six months.
Market Review: Emerging Markets Debt
The fiscal year ended May 31, 2016 was a volatile period, punctuated with several positive macroeconomic developments that led to a rebound in credit markets beginning in mid‐ February 2016. In general, the fiscal year encompassed two characteristically distinct periods (June – January 2015 and February – May 2016), with each producing divergent outcomes from both a market sentiment and emerging markets (EM) total returns perspective. Until the very end of the review period, when deepening concerns around the UK referendum began to gain traction, there were no new significant episodic market triggers. What produced the differing market dynamics included several key macroeconomic themes that carried over from early 2015 and continued to play a role throughout the review period. These included deepening concerns around global growth, US Fed policy framework, low commodity prices, and the question of Chinese growth.
In the earlier part of the period (June – January 2015), emerging markets were weighed down by negative sentiment around global growth expectations, which led to weak market technicals and deteriorating returns. These growth concerns combined with the strengthening US dollar kept pressure on all sectors of emerging markets and particularly on local currency markets as the reversal of capital flows continued to drive significantly cheaper currencies. In contrast, sentiment toward risk assets improved in late February and the outlook for emerging markets debt began to brighten, helped by a strong recovery in core bond markets and an unwind of January’s general risk aversion moves in global markets. In the last four months of the fiscal year, risks that continued from the end of 2015 began to show signs of fading; concerns around Chinese growth and a major devaluation of the yuan subsided given stronger growth data from China, the US Federal Reserve postured a more dovish stance and stressed that the pace of rate increases would likely be very gradual given the current global environment of lower growth, and volatility in commodities prices declined and oil prices managed to record four consecutive months of gains by end of May. At the same time, the concerns around a potential exit of the UK from the European Union continued to rise and the possible negative outcomes, including a weakened UK economy, pressure on peripheral European bond markets, and by extension, global economic and political uncertainty, weighed on risk markets.
Against this macroeconomic backdrop, there were a few idiosyncratic and country‐specific developments that added support to asset price appreciation, particularly in Latin America during the latter part of the review period. In Brazil, after the sovereign downgrade by Fitch from BBB‐ to BB+ in mid‐December 2015 and Moody’s downgrade of Brazil’s foreign currency debt from Baa3 to Ba2 in February, prospects for a Presidential impeachment opened up the potential for improved policy‐making and drove both sovereign and corporate spread tightening, despite underlying recession. Expectations of regime change solidified and the impeachment process of Dilma Rousseff was initiated in April 2016. In Argentina, 15 years after its default in 2001, the country returned to the international capital markets with $16.5 billion in new index‐eligible US law bonds in three tranches. These transactions followed Argentina authorities’ agreements to repay holdout creditors and the lifting of a US court injunction that had prevented Argentina from paying interest on outstanding exchange bonds. In addition, as commodity price declines accelerated in 2015, spreads widened sharply in many African nation’s sovereign debt. Selling from investors in a less liquid market in fourth quarter 2015 amplified spread widening and created investment opportunities, in our view.
| 2 | www.shiplp.com |
| Stone Harbor Investment Funds | Shareholder Letter |
| May 31, 2016 (Unaudited) |
Stone Harbor Emerging Markets Debt Fund
The total return of the Stone Harbor Emerging Markets Debt Fund (the “Fund” or “portfolio”) for the 12 month period ended May 31, 2016 was 3.70% (net of expenses) and 4.38% (gross of expenses). This performance compares to a benchmark return of 4.55% for the EMBI Global Diversified. For the period, external sovereign bond credit spreads over comparable maturity US Treasury securities widened by 52 basis points, ending the period at 397 basis points. While the Fund underperformed relative to its benchmark, the positive absolute return reflected a strong rebound from the latter part of 2015 and early 2016.
The Fund underperformed its benchmark primarily as a result of country selection within the hard currency sovereign debt allocation, although this negative performance attribution was more than offset by positive performance attribution from issue selection. Local currency debt allocation detracted from returns, driven entirely by foreign exchange (FX). Hard currency corporate debt allocation and treasury attribution enhanced relative returns. An underweight in Ukraine was the largest detractor from relative performance during the period. We sold Ukraine bonds in the second quarter of 2015 after we determined Ukraine would be unable to service its debt without a substantial reduction in principal of outstanding debt. Ultimately, we were correct in this judgment as the Ukraine government restructured its debts. However, Ukraine bonds rallied sharply after the government announced restructuring terms that were less aggressive than we expected and despite assurances from the International Monetary Fund and the Ukrainians that tougher terms were likely. We subsequently covered our underweight but not until Ukraine bond prices fell again later in 2015. The decision to underweight Ukraine detracted from excess returns during the 12‐month period.
Other detractors from performance included an overweight and issue selection in Brazil. We moved Brazil exposure to overweight following rating agency downgrades of the sovereign credit and subsequent widening of the sovereign spread in September 2015. Brazil bonds underperformed through the end of 2015. We subsequently reduced this exposure as Brazil bonds rallied at the end of February 2016. Overweights and issue selection decisions in Mexico, an overweight in Iraq, and an underweight in Russia detracted from returns. Exposure to FX and interest rates markets in Colombia and Indonesia, as well as FX exposure in Mexico also detracted from relative performance.
On the other hand, issue selection decisions in sovereign hard currency debt more than offset the negative performance attribution from country selection. The largest positive contributor to relative outperformance was Venezuela. The Fund held short duration, amortizing hard currency US dollar denominated debt issued by Venezuela and by the state‐owned oil and gas company PdVSA based on our assessments of the sovereign’s ability and willingness to service its external debt. This positioning enhanced excess returns as Venezuela’s sub‐index produced strong returns throughout much of the reporting period. An important driver of this result was, in our opinion, the stabilization of oil prices during the latter half of the reporting period.
Another positive contributor to relative returns was our positioning in Kazakhstan, including a country overweight and issue selection favoring quasi‐sovereign debt. Our position in Kazakhstan was primarily in Kazmunaygas bonds, the national oil company, which benefited from the devaluation of the tenge in August 2015. Kazakhstan outperformed again in the fourth quarter of 2015 following the government’s tender for $3.4 million of Kazmunaygas debt. Stabilization of the oil prices in early part of first quarter 2016 was an important factor in the improved return profiles for the credit, similar to Venezuela. Overweights and issue selection decisions in Ecuador and Angola also enhanced returns, as did an overweight in Argentina untendered bonds. The rising price of oil supported bonds from oil exporters, including Ecuador and Angola. In Argentina, we received cash, as expected, in April for our untendered Argentina defaulted debt, which generated excess returns. Hard currency corporate debt exposure in Colombia and Russia also enhanced returns during the period.
The largest relative exposure changes during the review period included reducing the Fund’s positions in Kazakhstan, Russia, and Venezuela based on outperformance and valuations precipitated by rising oil prices in early 2016. On the other hand, we reduced the underweight in several Eastern European countries, including Hungary, Poland, and Ukraine. In Ukraine, we moved to a slight overweight by end of the period. In Poland, we reduced our underweight following spread widening in January and again in late March 2016. In addition, we increased our positions in sovereign bonds from El Salvador and Mexico, while reducing quasi sovereign exposures in Mexico and Colombia that had performed well. At the end of the period, the Fund’s sensitivity to US Treasury interest rate movements was modestly lower than that of the Fund’s benchmark. Positioning in China, Lebanon and the Philippines were the largest contributors to the duration underweight.
The Fund uses various derivative instruments to implement its strategies. These derivatives are utilized to manage the Fund’s credit risk, interest rate risk and foreign exchange risk. These derivative positions may increase or decrease the Fund’s exposure to these risks. At the end of the reporting period the Fund had net exposure to these derivatives of approximately $294 thousand. Over the course of the reporting period these derivative positions generated a net realized gain of approximately $3.0 million and $1.8 million in unrealized depreciation, for an increase in operations of $1.2 million. We plan to continue to utilize derivative instruments to implement our strategies related to credit risk, interest rate risk and foreign exchange risk.
| Stone Harbor Investment Funds Annual Report | May 31, 2016 | 3 |
| Stone Harbor Investment Funds | Shareholder Letter |
| May 31, 2016 (Unaudited) |
Stone Harbor Local Markets Fund
The total return of the Stone Harbor Local Markets Fund (the “Fund” or “portfolio”) for the 12 month period ended May 31, 2016 was ‐7.16% (net of expenses) and ‐6.28% (gross of expenses). This performance compares to a benchmark return of ‐4.86% for the GBI‐EM Global Diversified. FX exposure and issue selection accounted for all of the negative return. The largest underperformers for the period at the index level were South Africa (‐21.85%), Colombia (‐16.69%), and Mexico (‐11.97%).
The largest source of the Fund’s underperformance was our positioning in Colombia where we held overweights in the peso and in duration. Weaker‐than‐expected global growth impacted the growth trajectory of the emerging markets, with Colombia’s currency bearing the brunt of the weaker trade flows that developed. Colombia bond yields rose as inflation climbed above its target range – largely due to the oil‐related weakness in the currency – limiting the scope for rate cuts in the near term.
Other detractors included Hungary (FX and duration underweight), Mexico (FX overweight), and Nigeria (FX underweight). In Hungary, the Fund’s positioning reflected our view that most European fixed income markets were still expensive throughout 2015 due to the continuation of the aggressive monetary easing by the European Central Bank. In Mexico, we have heard many explanations for the relative weakness of the peso, including the fact that investors have 24 hours per day liquid access to markets for the currency. Because of this liquid access, investors may have turned to the Mexican peso as a means to hedge emerging markets. Nevertheless, the reasons for the peso’s underperformance remain unclear. As a result, and despite Mexico’s positive fundamentals, we have been reducing our peso overweight. In Nigeria, where capital controls and a fixed exchange rate allowed for the reported outperformance of the Nigeria sub index during the period, we held a zero weight in the country’s currency, which resulted in relative underperformance. Nigeria was removed from the GBI‐EM Global Diversified given the constraints on liquidity.
The top positive contributors to performance during the period included Brazil (FX underweight, duration overweight), Indonesia (FX overweight), Russia (FX overweight, duration overweight), and issue selection in off‐benchmark, short duration hard currency bonds in Venezuela. In Brazil, local bond markets benefited from the impeachment process involving President Dilma Rousseff and the announcement of a new standing government at the end of the reporting period. An underweight in Brazil real also enhanced performance. Indonesia was a strong performer, helped by stabilization in sentiment towards China, and a benign inflation environment enabling the central bank to ease policy rates by 75 basis points since the beginning of 2016. The Russian market also benefited from the recovery in oil prices during the first quarter from the lows posted early in 2016, and the currency was supported by an on‐going hawkish stance by the Russian central bank.
One of the largest relative changes in the Fund during the reporting period included extending duration in Poland. Our positioning in Poland is related to the Fund’s regional exposure to Central and Eastern Europe. We remain overweight Poland in part to offset our underweight in Hungary and because we believe Poland offers a better credit profile relative to Hungary. As a large country, Poland has a strong domestic economy and is less reliant on exports than a smaller, more open economy like Hungary’s. In terms of our FX exposure, we tactically reduced the overweight in the Polish zloty and added to the Hungarian forint as the zloty sharply outperformed the forint in first quarter 2016. We eventually partially reversed this tactical position to monetize gains. In Brazil, while we remained cautious given the economic and political challenges, we tactically reduced our underweight in the real during the first quarter 2016 (and gradually added until we were effectively overweight by the end of May) due to cheap valuations and expectations of improving policy responses from a new government. In Russia, we believe the ruble remains attractive and during the period we added to the Fund’s overweight position in the currency. We also believe that the Central Bank of Russia’s hawkish monetary policies have supported a significant inversion in the Russian local bond yield curve and have allowed long maturity local bond yields to fall. As a result of this move, we have recently cut our duration position to a smaller overweight. To fund these positions, we reduced FX exposure in Indonesia, Mexico, South Africa, and Turkey, among others.
The Fund uses various derivative instruments to implement its strategies. These derivatives are utilized to manage the Fund’s credit risk, interest rate risk and foreign exchange risk. These derivative positions may increase or decrease the Fund’s exposure to these risks. At the end of the reporting period the Fund had net exposure to these derivatives of approximately $1.0 million. Over the course of the reporting period these derivative positions generated a net realized gain of approximately $9.8 million and $3.5 million in unrealized depreciation, for an increase in operations of $6.3 million. We plan to continue to utilize derivative instruments to implement our strategies related to credit risk, interest rate risk and foreign exchange risk.
Stone Harbor Emerging Markets Corporate Debt Fund
The total return of the Stone Harbor Emerging Markets Corporate Debt Fund (the “Fund” or “portfolio”) for the 12 month period ended May 31, 2016 was 1.92% (net of expenses) and 2.92% (gross of expenses). This performance compares to a benchmark return of 2.52% for the CEMBI Broad Diversified. The index spread over comparable maturity US Treasury securities widened by 57 basis points, ending the period at 390 basis points. Contributions to the index total return from each of the major EM regions (i.e., Africa, Asia, Eastern Europe, Latin America, and the Middle East) were mixed with Europe generating the strongest returns and Latin America lagging the most. Specific top country performers included Dominican Republic (+14.40%), Russia (+13.75%), and Bangladesh (+12.94%); the bottom performers included Nigeria (‐11.76%), Colombia (‐11.15%), and Iraq (‐9.30%). The positive performance of the EM corporate sector was driven primarily by stabilization and the eventual rise in commodity prices, as well as strong performance from quasi sovereign bonds.
| 4 | www.shiplp.com |
| Stone Harbor Investment Funds | Shareholder Letter |
| May 31, 2016 (Unaudited) |
The Fund outperformed its benchmark due to both issue selection decisions and country and regional exposures. From a regional perspective, corporate credits from Europe, Middle East, and Africa most positively impacted relative performance. An overweight exposure to credits in Russia and an underweight exposure to credits in Nigeria were among the top contributors in the region. Russian corporate credits produced solid performance as U.S./European tensions over Ukraine subsided at the end of 2015 and subsequently as oil prices stabilized starting in early 2016. Steady improvement in international oil prices further helped Russian energy company credits and also improved sentiment for the ruble and for a broad cross‐section of Russian corporate bond toward the end of the reporting period. In Latin America, an overweight exposure in Brazil enhanced returns. Credits in Brazil rallied after the selloff in late 2015, and the prospects for an impeachment of President Rousseff opened up the potential for improved policy‐making. We continue to believe there are significant value opportunities in Brazil.
Exposure to quasi sovereign debt in Mexico (Pemex) and Colombia (Ecopetrol) also resulted in relative outperformances as quasi sovereign spreads narrowed relative to sovereign debt, particularly during the first quarter 2016. In addition to our exposure to Ecopetrol, the Fund’s positioning in Colombia’s financial sector also generated positive excess returns. From an industry perspective, issue selection in Wireless Telecommunications, Exploration & Production, and Metals/Mining/Steel industries enhanced relative returns, although overweight exposures to these industries detracted from performance during the period.
The largest detractors from performance included issue selection in Brazil and Chile. In Brazil, the most affected credits remained issuers embroiled in the Lava Jato (or “Car Wash”) scandal. An overweight exposure in Colombia also detracted from relative returns as the continued downward re‐pricing of Brent and WTI benchmarks in the global markets in the latter part of 2015 drove the weakness in Colombia and negatively impacted issuers in the Oil & Gas sector. An underweight exposure in the Banking industry also detracted from relative returns.
At the end of the reporting period, the Fund was overweight Latin America and underweight Asia, Europe, Middle East, and Africa. In our view, Latin America offers relative value vs Asia corporates as they have historically traded tight to other EM Corporate regions. The resilience of Asia can be attributed to the relatively high concentration of investment grade names, favorable macro factors, and a net short exposure to oil and commodities. Despite these positive factors, we believe that other regions, specifically Latin America, offer significant relative value to Asia. The political corruption scandal, weak commodity prices, and deteriorating economy have resulted in an underperformance by Brazilian corporate issues. However, we still believe there are significant value opportunities in Brazil, notably in the exporters (such as the protein sector), that generate hard currency and benefit from the weaker BRL. We funded some of the credit‐specific additions in Latin America (e.g., Brazil, Peru, and Colombia) through sales of existing positions in China and the Middle East, where credit spreads are either substantially tighter in comparison or have tightened during the reporting period. We also eliminated out‐of‐benchmark exposure to Venezuela and Indonesia to monetize recent gains.
In broad terms, our strategy in corporates focuses on identifying companies that are market leaders in their industries. We favor exporters that generate US dollar revenues and companies that benefit from the growth of middle classes. At the sector level, we favor Consumer Goods, Wireless Telecommunications, and Food and Beverage companies, among others. In addition, we look for companies that are growing, reducing debt and, as a result, are candidates for rating agency upgrades over the next 18 to 24 months.
The Fund uses various derivative instruments to implement its strategies. These derivatives are utilized to manage the Fund’s credit risk, interest rate risk and foreign exchange risk. These derivative positions may increase or decrease the Fund’s exposure to these risks. At the end of the reporting period the Fund had net exposure to these derivatives of approximately $3 thousand. Over the course of the reporting period these derivative positions generated a net realized gain of approximately $68 thousand and $100 in unrealized depreciation, for an increase in operations of $68 thousand. We plan to continue to utilize derivative instruments to implement our strategies related to credit risk, interest rate risk and foreign exchange risk.
Stone Harbor Emerging Markets Debt Allocation Fund
The Stone Harbor Emerging Markets Debt Allocation Fund’s (the “Fund” or “portfolio”) performance for the 12 month period ended May 31, 2016 was ‐1.96% (net of expenses) and ‐1.11% (gross of expenses). This compares to a blended benchmark (50% EMBI Global Diversified / 50% GBI‐EM Global Diversified) return of ‐0.14%. At the close of the reporting period, the Fund allocated approximately 51.2% to local currency debt, 43.8% to external sovereign debt, and 3.1% to hard currency corporate debt, with cash representing 1.9% of the Fund. The Fund’s asset allocation mix varied throughout the review period, driven by tactical asset allocation decisions based on portfolio management’s assessment of relative value opportunities and global market risks. In the first three months of the reporting period, the Fund’s allocation to local currency debt moved to underweight. Following the decision by the Chinese monetary authorities to devalue the Yuan in August, emerging market currencies sold off sharply. We began adding emerging market currency and interest rate exposure as local market valuations improved. By the end of January 2016, the portfolio’s position in local debt markets had been moved to neutral relative to the blended benchmark. The position was further increased until the beginning of May. We then reduced local exposure as global growth concerns and worries about the direction of US Federal Reserve monetary policy developed. During the period, tactical asset allocation decisions modestly detracted from the Fund’s performance relative to benchmark.
The portfolio’s local currency debt allocation detracted 110 basis points from excess returns in aggregate, driven primarily by negative attribution from issue selection decisions. In the hard currency sovereign debt allocation, issue selection enhanced returns but was partially offset by negative attribution from country selection decisions. Out‐of‐benchmark allocations to US dollar‐denominated corporate debt also enhanced relative performance. Treasury attribution, a measure that accounts for returns not already detailed was positive as well. Miscellaneous differences, which represent pricing differences among other factors, detracted from relative returns. Typically, miscellaneous differences have no impact on long term performance as they revert to zero over time.
| Stone Harbor Investment Funds Annual Report | May 31, 2016 | 5 |
| Stone Harbor Investment Funds | Shareholder Letter |
| May 31, 2016 (Unaudited) |
Within the hard currency sovereign debt allocation, an underweight in Ukraine was the largest detractor from relative performance. We sold Ukraine bonds in the second quarter of 2015 after we determined Ukraine would be unable to service its debt without a substantial reduction in principal of outstanding debt. Ultimately, we were correct in this judgment as the Ukraine government restructured its debts. However, Ukraine bonds rallied sharply after the government announced restructuring terms that were less aggressive than we expected and despite assurances from the International Monetary Fund and the Ukrainians that tougher terms were likely. We subsequently covered our underweight but not until Ukraine bond prices fell again later in 2015. The decision to underweight Ukraine detracted from excess returns during the 12‐month period.
Other detractors from performance included an overweight and issue selection in Brazil. We moved Brazil exposure to overweight following rating agency downgrades of the sovereign credit and subsequent widening of the sovereign spread in September 2015. Brazil bonds underperformed through the end of 2015. We subsequently reduced this exposure as Brazil bonds rallied at the end of February 2016. An overweight in Iraq, and an underweight in Russia also detracted from returns.
The biggest positive contributor to relative returns within the hard currency allocation was an overweight and issue selection in Venezuela. The Fund held short duration, amortizing hard currency US dollar denominated debt issued by Venezuela and by the state‐owned oil and gas company PdVSA based on our assessments of the sovereign’s ability and willingness to service its external debt. This positioning enhanced excess returns as Venezuela’s sub‐index produced strong returns throughout much of the reporting period. An important driver of this result was, in our opinion, the stabilization of oil prices during the latter half of the reporting period.
The largest detractors within the local currency debt allocation included Colombia (FX and duration overweight, issue selection), Hungary (FX and duration underweight), and Mexico (FX overweight). In Colombia, we held overweights in the peso and in local bond duration. Weaker‐than‐expected global growth impacted the growth trajectory of emerging markets, with Colombia’s currency bearing the brunt of the weaker trade flows that developed. Colombia bond yields rose as inflation climbed above its target range – largely due to the oil‐related weakness in the currency – limiting the scope for rate cuts in the near term. In Hungary, the Fund’s positioning reflected our view that most European fixed income markets were still expensive throughout 2015 due to the continuation of the aggressive monetary easing by the European Central Bank. In Mexico, we have heard many explanations for the relative weakness of the peso, including the fact that investors have 24 hours per day liquid access to markets for the currency. Because of this liquid access, investors may have turned to the Mexican peso as a means to hedge emerging markets. Nevertheless, the reasons for the peso’s underperformance remain unclear. As a result, and despite Mexico’s positive fundamentals, we have been reducing our peso overweight.
The largest positive contributors to performance during the period included Brazil (FX underweight, duration overweight) and South Africa (FX overweight). In Brazil, local bond markets benefited from the impeachment process involving President Dilma Rousseff and the announcement of a new standing government at the end of the reporting period. An underweight in the Brazil real also enhanced performance. In regard to the South African rand, we moved from a neutral position at the end of 2015 to an overweight in the first quarter 2016 in part to seek to increase beta and to take advantage of a recovery in emerging markets foreign currencies relative to the US dollar.
The Fund uses various derivative instruments to implement its strategies. These derivatives are utilized to manage the Fund’s credit risk, interest rate risk and foreign exchange risk. These derivative positions may increase or decrease the Fund’s exposure to these risks. At the end of the reporting period the Fund had net exposure to these derivatives of approximately ($21) thousand. Over the course of the reporting period these derivative positions generated a net realized gain of approximately $50 thousand and $21 thousand in unrealized depreciation, for an increase in operations of $29 thousand. We plan to continue to utilize derivative instruments to implement our strategies related to credit risk, interest rate risk and foreign exchange risk.
Stone Harbor High Yield Bond Fund
The Stone Harbor High Yield Bond Fund (the “Fund” or “portfolio”) return for the 12 months ended May 31, 2016 was ‐3.03% (net of expenses) and ‐2.39% (gross of expenses). This compares to a benchmark return of ‐1.77% for the Citigroup High Yield Market Capped Index.
Global growth concerns, expressed through a decline in commodity prices, primarily contributed to the weak high yield market during the period. In particular, oil prices declined precipitously during 2015 and early 2016 before partially recovering for the remainder of the period. Due to the energy sector’s proportionately large size within the index, the decline in oil prices weighed heavily on the market. Market volatility increased; several negative idiosyncratic events affected a number of industries causing credit spreads to widen. Despite global growth uncertainty, the Fed raised its federal funds rate for the first time since 2006. Though this was the only instance of a rate hike in the period, the Fed reiterated its intention to continue with gradual, data‐dependent increases in the future. During the last few months, as investors became more constructive on global growth and as central banks continued to signal an accommodative stance, commodity prices and the high yield market in general began recovering.
| 6 | www.shiplp.com |
| Stone Harbor Investment Funds | Shareholder Letter |
| May 31, 2016 (Unaudited) |
High yield issuance trailed the prior 12 month period due to a decline in refinancing activity. A rise in M&A transactions and new issuance during volatile periods also put downward pressure on the market. Retail flows during the period were negative but less so than the previous period. High yield spreads, as represented by the Citigroup High Yield Market Capped Index, increased 124 basis points to end the fiscal year at 597 basis points. Spreads peaked at 854 basis points during the period, as growth concerns and the subsequent drop in commodity prices triggered high market volatility. The average yield rose from 5.99% to 7.28%.
Top performing sectors for the period included Gaming, which benefitted from an improvement in consumer spending and convention bookings, and Containers, due to its defensive nature and lower raw material prices. As expected, the bottom performers included Energy, driven by lower oil prices and Metals/Mining, due to a global demand slowdown and concerns regarding future supply increases. Market volatility and lower investor risk appetite drove BB‐rated bonds to outperform both B‐rated and CCC‐rated securities, according to the Citigroup High Yield Market Capped Index. Longer duration securities, which tend to be higher in credit quality, significantly outperformed shorter duration bonds.
US credit fundamentals, in our opinion, are deteriorating and the market is witnessing a higher incidence of idiosyncratic problems. We anticipate higher default rates, heightened stress across industries, more downgrades, and an increase in fallen angels.
During the period, the portfolio underperformed its benchmark due to issue selection. Issue selection decisions within the Energy and Utilities sectors were the primary detractors from performance, partially offset by issue selection in Cable/Media. Overall weakness in oil prices put downward pressure on our holdings in Energy, particularly in Exploration & Production and Oil Field Services companies. Depressed natural gas prices pushed power prices lower, adversely affecting the portfolio’s Power Generation positions within the Utilities sector. Issue selection in the CCC‐rated sector detracted from performance, though partially offset by issue selection decisions in the BB‐ and B‐rated sectors. Industry selections contributed to performance, particularly an underweight to the Energy sector and an overweight to the Food/Beverage industry. The Food/Beverage sector benefited from its defensiveness during this period of volatility.
We continue to position the portfolio defensively as we believe the high yield market is in the later stages of the credit cycle. Weak global growth, lower corporate earnings, higher default rates and more frequent rating downgrades are concerns. We are increasing our exposure to leveraged loans and reducing our underweight in the BB sector, as well as paring down exposure to CCC‐rated issues. On the other hand, we continue to be overweight B‐rated bonds due to attractive valuations. From an industry standpoint, the portfolio is overweight several defensive sectors such as Telecommunications, Cable/Media, and Food/Beverage, as these sectors benefit from stable operations, strong cash flows and solid asset values. We maintain our large underweights to Energy and Metals/Mining, although we have selectively added to higher‐quality companies in both sectors. We believe that fallen angels entering the Energy sector of the US high yield market provide a good investment opportunity. With regard to the Metals/Mining sector, we believe the fundamentals are unattractive and expect to continue the underweight for the intermediate term.
The Fund uses various derivative instruments to implement its strategies. These derivatives are utilized to manage the Fund’s credit risk, interest rate risk and foreign exchange risk. These derivative positions may increase or decrease the Fund’s exposure to these risks. At the end of the reporting period the Fund had net exposure to these derivatives of approximately $98 thousand. Over the course of the reporting period these derivative positions generated a net realized gain of approximately $158 thousand and $3 thousand in unrealized appreciation, for an increase in operations of $161 thousand. We plan to continue to utilize derivative instruments to implement our strategies related to credit risk, interest rate risk and foreign exchange risk.
Stone Harbor Investment Grade Fund
The total return of the Stone Harbor Investment Grade Fund (the “Fund” or “portfolio”) for the 12 months ended May 31, 2016 was 2.71% (net of expenses) and 3.21% (gross of expenses). This performance compares to a benchmark return of 2.99% for the Barclays US Aggregate Index. The Fund’s modest outperformance is primarily attributable to security selection decisions in investment grade corporates, securitized assets and government bonds. Asset allocation effects were a small positive, with an overweight to securitized and an underweight to Governments more than offsetting the negative impact of a corporate bond overweight. The Fund’s average short duration position over the 12‐month period was a negative contributor to overall performance.
Over the past 12 months, there has been a startling amount of volatility in credit markets. As reported in our letter in November, during the first six months of the period, the Chinese devalued their currency and the European Central Bank (“ECB”) introduced further quantitative easing. Copper prices declined by a third, with a similar move in Chinese equities. Some stability in financial markets in October and November 2015 provided the opportunity for the US Federal Reserve (“Fed”) to raise interest rates for the first time since early 2006. However, after two quarters with US growth averaging near 3%, the fourth quarter saw a marked turndown with GDP growth registering 1.4% and momentum falling away into year end. With concerns still present in China and fears of deflation remaining in Europe, the weakness in the US raised the specter of a significant pullback in global growth. Commodity markets were riled with oil prices declining further. Globally, credit markets were negatively impacted. While we witnessed sharp widening in spreads across all asset classes, weakness was centered in the US high yield market and emerging market local currencies.
| Stone Harbor Investment Funds Annual Report | May 31, 2016 | 7 |
| Stone Harbor Investment Funds | Shareholder Letter |
| May 31, 2016 (Unaudited) |
Market sentiment was negative entering into February 2016, but longer‐term valuation measures began to show signs of improvement. For example, distress measures in the US high yield market climbed to levels seen during the credit recession of 2001‐2003, although they did not reach the elevated levels seen during the financial crisis of 2007. With growth faltering, the ECB and Bank of Japan (“BOJ”) moved to ease monetary policy further. The Peoples Bank of China (“PBOC”) encouraged credit expansion, and perhaps more significantly, moved to clarify their exchange rate policy; and the Fed stepped back from further monetary tightening. Collectively, these policy initiatives created the catalyst for investors to respond to the signs of attractive valuation. The final four months of the period saw a sharp rally in credit markets.
Looking ahead, we think the growth profile for the global economy appears subdued, but not as poor as was feared at the start of 2016. In our view, weak growth in the working age population will impact economic growth for many years, and limited investment will likely constrain productivity growth, due to high levels of leverage. Cyclically, output gaps remain large; countries such as the US and UK, which have seen significant job growth, are not seeing material wage growth, with low participation rates suggesting that large numbers of potential entrants to the work force remain. Generally, output gaps lead to downward pressure on inflation. We believe central banks will reflect these concerns in their biases.
In the near term, US growth, while perhaps slightly below trend, has shown signs of stabilization and with steady consumer activity, we expect continued improvement, notwithstanding May’s weak jobs report. We believe the possibility the Fed raising interest rates in the near term remains and the FOMC’s bias to nudge rates higher seems clear. European growth remains slightly above trend, which, despite continued softness in inflation reading, is likely to permit the ECB to hold steady for a few months to examine the efficacy of past policy initiatives. Japan remains under pressure, with the strength in the currency creating further headwinds for the BOJ in trying to reach its 2% inflation target. We expect further monetary policy easing and fiscal policy expansion. Chinese policy remains supportive of growth but the efficiency of credit expansion as a policy tool is still in doubt. In our view, it is likely that we will see Chinese growth continue to go through periods of policy‐induced stability, followed by structurally necessary slowdown.
Since the close of the reporting period, political issues have come to the forefront. The result of the Brexit vote by the British to opt to leave the EU will be a negative for the UK economy, and there will likely be a negative spillover for Euro zone growth prospects, in our view. Beyond this, the US presidential election will swing into focus over the summer. It is far too early to read too much into the opinion polls but without a strong shift in momentum towards one or other of the candidates, we believe uncertainty will persist in the near term.
From a valuation perspective, credit markets remain attractive. A sharp rise in the US default rate over the past few months is already reflected in market pricing and is providing improved clarity to investors. A relatively stable policy background would normally have signaled a broadly positive environment in which one should embrace credit risk, but near term political risks and, perhaps, the salient economic risks that they carry, should encourage a degree of near‐term caution.
The Fund uses various derivative instruments to implement its strategies. These derivatives are utilized to manage the Fund’s credit risk, interest rate risk and foreign exchange risk. These derivative positions may increase or decrease the Fund’s exposure to these risks. At the end of the reporting period the Fund had did not have exposure to these derivatives. Over the course of the reporting period these derivative positions generated a net realized gain of approximately $13 thousand. We plan to continue to utilize derivative instruments to implement our strategies related to credit risk, interest rate risk and foreign exchange risk.
Stone Harbor Strategic Income Fund
The total return of the Strategic Income Fund (the “Fund” or “portfolio”) for the 12 month period ending May 31, 2016 was 0.19% (net of expenses) and 0.89% (gross of expenses). This performance compares to a benchmark return of 2.81% for the Barclays Global Credit Index (Hedged into USD). The Fund underperformed its benchmark as a result of certain asset allocation and individual credit decisions. Approximately one third of the underperformance is attributable to broad asset allocation decisions. The largest negative contribution came from the Fund’s weighting in US high yield bonds, which significantly exceeded the weighting of high yield bonds in the benchmark. High Yield bonds underperformed the Global Credit Index by 450 basis points over the 12 month period. Within individual portfolio sectors, The Fund experienced underperformance in Global Rates & Currencies, Emerging Debt and High Yield.
Over the past 12 months, there has been a startling amount of volatility in credit markets. As reported in our letter in November, during the first six months of the period, the Chinese devalued their currency and the European Central Bank (“ECB”) introduced further quantitative easing. Copper prices declined by a third, with a similar move in Chinese equities. Some stability in financial markets in October and November 2015 provided the opportunity for the US Federal Reserve (“Fed”) to raise interest rates for the first time since early 2006. However, after two quarters with US growth averaging near 3%, the fourth quarter saw a marked turndown with GDP growth registering 1.4% and momentum falling away into year end. With concerns still present in China and fears of deflation remaining in Europe, the weakness in the US raised the specter of a significant pullback in global growth. Commodity markets were riled with oil prices declining further. Globally, credit markets were negatively impacted. While we witnessed sharp widening in spreads across all asset classes, weakness was centered in the US high yield market and emerging market local currencies.
| 8 | www.shiplp.com |
| Stone Harbor Investment Funds | Shareholder Letter |
| May 31, 2016 (Unaudited) |
Market sentiment was negative entering into February 2016, but longer‐term valuation measures began to show signs of improvement. For example, distress measures in the US high yield market climbed to levels seen during the credit recession of 2001‐2003, although they did not reach the elevated levels seen during the financial crisis of 2007. With growth faltering, the ECB and Bank of Japan (“BOJ”) moved to ease monetary policy further. The Peoples Bank of China (“PBOC”) encouraged credit expansion, and perhaps more significantly, moved to clarify their exchange rate policy; and the Fed stepped back from further monetary tightening. Collectively, these policy initiatives created the catalyst for investors to respond to the signs of attractive valuation. The final four months of the period saw a sharp rally in credit markets.
Looking ahead, we think the growth profile for the global economy appears subdued, but not as poor as was feared at the start of 2016. In our view, weak growth in the working age population will impact economic growth for many years, and limited investment will likely constrain productivity growth, due to high levels of leverage. Cyclically, output gaps remain large; countries such as the US and UK, which have seen significant job growth, are not seeing material wage growth, with low participation rates suggesting that large numbers of potential entrants to the work force remain. Generally, output gaps lead to downward pressure on inflation. We believe central banks will reflect these concerns in their biases.
In the near term, US growth, while perhaps slightly below trend, has shown signs of stabilization and with steady consumer activity, we expect continued improvement, notwithstanding May’s weak jobs report. We believe the possibility the Fed raising interest rates in the near term remains and the FOMC’s bias to nudge rates higher seems clear. European growth remains slightly above trend, which, despite continued softness in inflation reading, is likely to permit the ECB to hold steady for a few months to examine the efficacy of past policy initiatives. Japan remains under pressure, with the strength in the currency creating further headwinds for the BOJ in trying to reach its 2% inflation target. We expect further monetary policy easing and fiscal policy expansion. Chinese policy remains supportive of growth but the efficiency of credit expansion as a policy tool is still in doubt. In our view, it is likely that we will see Chinese growth continue to go through periods of policy‐induced stability, followed by structurally necessary slowdown.
Since the close of the reporting period, political issues have come to the forefront. The result of the Brexit vote by the British to opt to leave the EU will be a negative for the UK economy, and there will likely be a negative spillover for Euro zone growth prospects, in our view. Beyond this, the US presidential election will swing into focus over the summer. It is far too early to read too much into the opinion polls but without a strong shift in momentum towards one or other of the candidates, we believe uncertainty will persist in the near term.
From a valuation perspective, credit markets remain attractive. A sharp rise in the US default rate over the past few months is already reflected in market pricing and is providing improved clarity to investors. A relatively stable policy background would normally have signaled a broadly positive environment in which one should embrace credit risk, but near term political risks and, perhaps, the salient economic risks that they carry, should encourage a degree of near‐term caution.
The Fund uses various derivative instruments to implement its strategies. These derivatives are utilized to manage the Fund’s credit risk, interest rate risk and foreign exchange risk. These derivative positions may increase or decrease the Fund’s exposure to these risks. At the end of the reporting period the Fund had net exposure to these derivatives of approximately $140 thousand. Over the course of the reporting period these derivative positions generated a net realized loss of approximately $11 thousand and $8 thousand in unrealized depreciation, for a decrease in operations of $19 thousand. We plan to continue to utilize derivative instruments to implement our strategies related to credit risk, interest rate risk and foreign exchange risk.
Sincerely,

Thomas K. Flanagan
Chairman of the Board of Trustees
| Stone Harbor Investment Funds Annual Report | May 31, 2016 | 9 |
| Stone Harbor Investment Funds | Disclosure of Fund Expenses |
May 31, 2016 (Unaudited)
Example. As a shareholder of a Fund, you incur two types of costs: (1) transaction costs, including sales charges (loads) on purchase payments and/or redemption fees (if applicable) and (2) ongoing costs, including management fees and other Fund expenses. The below examples are intended to help you understand your ongoing costs (in dollars) of investing in a Fund and to compare these costs with the ongoing costs of investing in other mutual funds. The examples are based on an investment of $1,000 invested on December 1, 2015 and held until May 31, 2016.
Actual Expenses. The first table below provides information about actual account values and actual expenses. You may use the information in this table, together with the amount you invested, to estimate the expenses that you paid over the period. Simply divide your account value by $1,000 (for example, an $8,600 account value divided by $1,000 = 8.6), then multiply the result by the number in the first line under the heading “Expenses Paid During Period” to estimate the expenses you paid on your account during this period.
Hypothetical Example for Comparison Purposes. The second table below provides information about hypothetical account values and hypothetical expenses based on the Fund’s actual expense ratio and an assumed rate of return of 5% per year before expenses, which is not the Fund’s actual return. The hypothetical account values and expenses may not be used to estimate the actual ending account balance or expenses you paid for the period. You may use this information to compare the ongoing costs of investing in a Fund and other mutual funds. To do so, compare this 5% hypothetical example with the 5% hypothetical examples that appear in the shareholder reports of the other funds.
Please note that the expenses shown in the tables are meant to highlight your ongoing costs only and do not reflect transactional costs, such as redemption fees, sales charges (loads) or exchange fees. Therefore, the second table is useful in comparing ongoing costs only, and will not help you determine the relative total costs of owning different funds. In addition, if these transactional costs were included, your costs would have been higher.
BASED ON ACTUAL TOTAL RETURN
Actual Total Return | Beginning Account Value December 1, 2015 | Ending Account Value May 31, 2016 | Expense Ratio(1) | Expenses Paid During Period(2) | |
| STONE HARBOR EMERGING MARKETS DEBT FUND | 6.20% | $1,000.00 | $1,062.00 | 0.69% | $3.56 |
| STONE HARBOR HIGH YIELD BOND FUND | 3.04 | 1,000.00 | 1,030.40 | 0.64 | 3.25 |
| STONE HARBOR LOCAL MARKETS FUND | 4.15 | 1,000.00 | 1,041.50 | 0.88 | 4.49 |
| STONE HARBOR EMERGING MARKETS CORPORATE DEBT FUND | 4.92 | 1,000.00 | 1,049.20 | 1.00 | 5.12 |
| STONE HARBOR INVESTMENT GRADE FUND | 3.21 | 1,000.00 | 1,032.10 | 0.50 | 2.54 |
| STONE HARBOR STRATEGIC INCOME FUND | 3.38 | 1,000.00 | 1,033.80 | 0.13 | 0.66 |
| STONE HARBOR EMERGING MARKETS DEBT ALLOCATION FUND | 5.11 | 1,000.00 | 1,051.10 | 0.05 | 0.26 |
BASED ON HYPOTHETICAL TOTAL RETURN
Hypothetical Annualized Total Return | Beginning Account Value December 1, 2015 | Ending Account Value May 31, 2016 | Expense Ratio(1) | Expenses Paid During Period(2) | |
| STONE HARBOR EMERGING MARKETS DEBT FUND | 5.00% | $1,000.00 | $1,021.55 | 0.69% | $3.49 |
| STONE HARBOR HIGH YIELD BOND FUND | 5.00 | 1,000.00 | 1,021.80 | 0.64 | 3.23 |
| STONE HARBOR LOCAL MARKETS FUND | 5.00 | 1,000.00 | 1,020.60 | 0.88 | 4.45 |
| STONE HARBOR EMERGING MARKETS CORPORATE DEBT FUND | 5.00 | 1,000.00 | 1,020.00 | 1.00 | 5.05 |
| STONE HARBOR INVESTMENT GRADE FUND | 5.00 | 1,000.00 | 1,022.50 | 0.50 | 2.53 |
| STONE HARBOR STRATEGIC INCOME FUND | 5.00 | 1,000.00 | 1,024.35 | 0.13 | 0.66 |
| STONE HARBOR EMERGING MARKETS DEBT ALLOCATION FUND | 5.00 | 1,000.00 | 1,024.75 | 0.05 | 0.25 |
| (1) | Annualized, based on the Fund's most recent fiscal half-year expenses. |
| (2) | Expenses are equal to the Fund's annualized expense ratio multiplied by the average account value over the period, multiplied by the number of days in the most recent fiscal half year (183), divided by 366. Note this expense example is typically based on a six-month period. |
| 10 | www.shiplp.com |
| Stone Harbor Investment Funds | Summaries of Portfolio Holdings |
May 31, 2016 (Unaudited)
Under SEC Rules, all funds are required to include in their annual and semi-annual shareholder reports a presentation of portfolio holdings in a table, chart or graph by reasonably identifiable categories. The following tables, which present holdings as a percent of total net assets, are provided in compliance with such requirements.
| STONE HARBOR EMERGING MARKETS DEBT FUND | |
Country Breakdown(1) | % |
| Mexico | 8.70% |
| Brazil | 5.48% |
| Indonesia | 4.31% |
| Argentina | 4.10% |
| Colombia | 3.69% |
| Turkey | 3.46% |
| Ukraine | 3.31% |
| Dominican Republic | 2.94% |
| Hungary | 2.92% |
| Russia | 2.83% |
| El Salvador | 2.77% |
| Kazakhstan | 2.73% |
| Costa Rica | 2.63% |
| Chile | 2.54% |
| Panama | 2.54% |
| South Africa | 2.45% |
| Peru | 2.40% |
| Poland | 2.37% |
| Ivory Coast | 2.36% |
| China | 2.29% |
| Uruguay | 2.17% |
| Venezuela | 2.14% |
| Sri Lanka | 2.00% |
| Azerbaijan | 1.96% |
| Croatia | 1.92% |
| Malaysia | 1.71% |
| Serbia | 1.39% |
| Jamaica | 1.24% |
| Kenya | 1.21% |
| Gabon | 1.09% |
| Zambia | 1.09% |
| Ghana | 1.08% |
| Philippines | 1.05% |
| Romania | 1.01% |
| Angola | 0.98% |
| Ecuador | 0.87% |
| Egypt | 0.82% |
| Iraq | 0.54% |
| Namibia | 0.49% |
| Trinidad | 0.47% |
| Ethiopia | 0.42% |
| Paraguay | 0.38% |
| Nigeria | 0.36% |
| Morocco | 0.31% |
| Algeria | 0.30% |
| Bahrain | 0.30% |
| Georgia | 0.29% |
| Montenegro | 0.24% |
| Cameroon | 0.11% |
| Lithuania | 0.11% |
| India | 0.09% |
| Total | 94.96% |
| Short Term Investments | 4.04% |
| Other Assets in Excess of Liabilities | 1.00% |
| Total Net Assets | 100.00% |
| STONE HARBOR HIGH YIELD BOND FUND | |
| Industry Breakdown | % |
| Media Cable | 9.86% |
| Healthcare | 7.97% |
| Wirelines | 6.51% |
| Food & Beverage | 5.30% |
| Exploration & Production | 4.97% |
| Electric | 4.73% |
| Chemicals | 4.53% |
| Technology | 4.51% |
| Building Products | 4.29% |
| Wireless | 4.28% |
| Industrial Other | 4.25% |
| Retail Non Food/Drug | 3.96% |
| Containers/Packaging | 3.85% |
| Media Other | 3.59% |
| Gaming | 3.14% |
| Consumer Products | 3.06% |
| Retail Food/Drug | 2.58% |
| Automotive | 2.18% |
| Pharmaceuticals | 2.03% |
| Metals/Mining/Steel | 2.00% |
| Paper/Forest Products | 1.67% |
| Leisure | 1.21% |
| Textile/Apparel | 0.92% |
| Lodging | 0.82% |
| Financial Other | 0.75% |
| Home Builders | 0.73% |
| Drillers/Services | 0.66% |
| Refining | 0.59% |
| Transportation Non Air/Rail | 0.58% |
| Aerospace/Defense | 0.53% |
| Services Other | 0.47% |
| Diversified Manufacturing | 0.25% |
| Gas Pipelines | 0.23% |
| Total | 97.00% |
| Short Term Investments | 2.33% |
| Other Assets in Excess of Liabilities | 0.67% |
| Total Net Assets | 100.00% |
| (1) | Country refers to country of primary risk exposure, as determined by Stone Harbor. In certain instances, a security’s country of incorporation may be different from its country of risk. |
| Stone Harbor Investment Funds Annual Report | May 31, 2016 | 11 |
| Stone Harbor Investment Funds | Summaries of Portfolio Holdings |
May 31, 2016 (Unaudited)
| STONE HARBOR LOCAL MARKETS FUND | |
Country Breakdown(1) | % |
| Brazil | 13.99% |
| Poland | 12.64% |
| Indonesia | 10.98% |
| South Africa | 10.61% |
| Mexico | 8.50% |
| Colombia | 7.60% |
| Malaysia | 4.80% |
| Turkey | 4.78% |
| Russia | 4.69% |
| Thailand | 3.45% |
| Romania | 1.55% |
| Total | 83.59% |
| Short Term Investments | 1.31% |
| Other Assets in Excess of Liabilities | 15.10% |
| Total Net Assets | 100.00% |
| (1) | Country refers to country of primary risk exposure, as determined by Stone Harbor. In certain instances, a security’s country of incorporation may be different from its country of risk. |
| STONE EMERGING MARKETS CORPORATE DEBT FUND | |
Country Breakdown(1) | % |
| Mexico | 7.17% |
| Brazil | 6.84% |
| United Arab Emirates | 6.83% |
| India | 6.63% |
| Russia | 5.62% |
| China | 5.32% |
| Colombia | 5.21% |
| Israel | 5.08% |
| Indonesia | 4.73% |
| Hong Kong | 4.31% |
| Chile | 4.22% |
| Turkey | 3.42% |
| Peru | 3.24% |
| Thailand | 2.80% |
| South Korea | 2.79% |
| Malaysia | 2.38% |
| Jamaica | 2.14% |
| South Africa | 2.12% |
| Morocco | 2.03% |
| Singapore | 1.77% |
| Kazakhstan | 1.49% |
| Angola | 1.47% |
| Argentina | 1.39% |
| Macau | 1.33% |
| Algeria | 1.01% |
| Qatar | 0.99% |
| Guatemala | 0.68% |
| Total | 93.01% |
| Short Term Investments | 6.66% |
| Other Assets in Excess of Liabilities | 0.33% |
| Total Net Assets | 100.00% |
| 12 | www.shiplp.com |
| Stone Harbor Investment Funds | Summaries of Portfolio Holdings |
May 31, 2016 (Unaudited)
| STONE HARBOR INVESTMENT GRADE FUND | |
| Industry Breakdown | % |
| U.S. Government Agency Mortgage Backed | 22.03% |
| U.S. Treasury Bonds/Notes | 19.75% |
| Asset-Backed/Commercial Mortgage Backed | 7.79% |
| Banking | 7.69% |
| Electric | 3.90% |
| Gas Pipelines | 2.56% |
| Food and Beverage | 2.20% |
| Real Estate Investment Trust (REITs) | 1.92% |
| Media Other | 1.50% |
| Automotive | 1.46% |
| Pharmaceuticals | 1.31% |
| Exploration & Production | 1.24% |
| Media Cable | 1.20% |
| Non Captive Finance | 1.15% |
| Technology | 1.10% |
| Wirelines | 1.06% |
| Retail Food/Drug | 0.93% |
| Transportation Non Air/Rail | 0.86% |
| Healthcare | 0.83% |
| Retail Non Food/Drug | 0.77% |
| Drillers/Services | 0.74% |
| Chemicals | 0.67% |
| Life Insurance | 0.61% |
| Environmental Services | 0.50% |
| Consumer Products | 0.49% |
| Metals/Mining/Steel | 0.49% |
| Refining | 0.48% |
| Railroads | 0.34% |
| Leisure | 0.33% |
| Paper/Forest Products | 0.33% |
| Total | 86.23% |
| Short Term Investments | 13.07% |
| Other Assets in Excess of Liabilities | 0.70% |
| Total Net Assets | 100.00% |
STONE HARBOR STRATEGIC INCOME FUND
| % | |
| Stone Harbor Emerging Markets Debt Fund | 20.67% |
| Stone Harbor High Yield Bond Fund | 34.73% |
| Stone Harbor Investment Grade Fund | 43.24% |
| Foreign Currency Call Option | 0.02% |
| Foreign Currency Put Option | 0.02% |
| Total | 98.68% |
| Short Term Investments | 0.45% |
| Other Assets in Excess of Liabilities | 0.87% |
| Total Net Assets | 100.00% |
STONE HARBOR EMERGING MARKETS DEBT ALLOCATION FUND
| % | |
| Stone Harbor Emerging Markets Debt Fund | 49.37% |
| Stone Harbor Local Markets Fund | 50.57% |
| Total | 99.94% |
| Other Assets in Excess of Liabilities | 0.06% |
| Total Net Assets | 100.00% |
| Stone Harbor Investment Funds Annual Report | May 31, 2016 | 13 |
| Stone Harbor Investment Funds | Growth of $10,000 Investment |
May 31, 2016 (Unaudited)
STONE HARBOR EMERGING MARKETS DEBT FUND
Comparison of Change in Value of $10,000 Investment in Stone Harbor Emerging Markets Debt Fund and the J.P. Morgan Emerging Markets Bond Index Global Diversified (J.P. Morgan EMBI Global Diversified). Please refer to the Additional Information section for detailed benchmark descriptions.
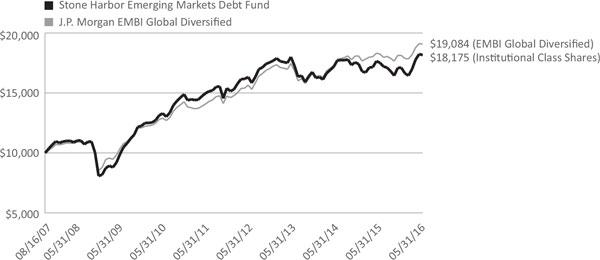
Total Returns (Inception Date, August 16, 2007)
| Average Annual Returns | |||||
| 6 Months | 1 Year | 3 Years | 5 Years | Since Inception | |
| Stone Harbor Emerging Markets Debt Fund | 6.20% | 3.70% | 1.69% | 3.71% | 7.03% |
| J.P. Morgan EMBI Global Diversified | 5.22% | 4.55% | 4.25% | 5.94% | 7.63% |
The performance data quoted represents past performance and does not guarantee future results. Current performance may be lower or higher than the performance quoted. Average annual total returns reflect the reinvestment of dividends and capital gains distributions and include all fee waivers and expense reimbursements. Without the fee waivers and expense reimbursements, total return figures would have been lower. The performance data quoted does not reflect the deduction of taxes that a shareholder would pay on Fund distributions or the redemption of Fund shares. Investment return and principal value will vary, and shares, when redeemed, may be worth more or less than their original cost. Index returns do not include the effects of sales charges, management fees or transaction costs. It is not possible to invest directly in an index.
| 14 | www.shiplp.com |
| Stone Harbor Investment Funds | Growth of $10,000 Investment |
May 31, 2016 (Unaudited)
STONE HARBOR HIGH YIELD BOND FUND
Comparison of Change in Value of $10,000 Investment in Stone Harbor High Yield Bond Fund and the Citigroup High Yield Market Capped Index. Please refer to the Additional Information section for detailed benchmark descriptions.
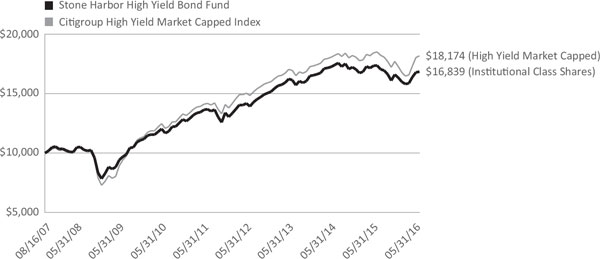
Total Returns (Inception Date, August 16, 2007)
| Average Annual Returns | |||||
| 6 Months | 1 Year | 3 Years | 5 Years | Since Inception | |
| Stone Harbor High Yield Bond Fund | 3.04% | -3.03% | 1.43% | 4.23% | 6.11% |
| Citigroup High Yield Market Capped Index | 5.20% | -1.77% | 2.35% | 5.09% | 7.03% |
The performance data quoted represents past performance and does not guarantee future results. Current performance may be lower or higher than the performance quoted. Average annual total returns reflect the reinvestment of dividends and capital gains distributions and include all fee waivers and expense reimbursements. Without the fee waivers and expense reimbursements, total return figures would have been lower. The performance data quoted does not reflect the deduction of taxes that a shareholder would pay on Fund distributions or the redemption of Fund shares. Investment return and principal value will vary, and shares, when redeemed, may be worth more or less than their original cost. Index returns do not include the effects of sales charges, management fees or transaction costs. It is not possible to invest directly in an index.
| Stone Harbor Investment Funds Annual Report | May 31, 2016 | 15 |
| Stone Harbor Investment Funds | Growth of $10,000 Investment |
May 31, 2016 (Unaudited)
STONE HARBOR LOCAL MARKETS FUND
Comparison of Change in Value of $10,000 Investment in Stone Harbor Local Markets Fund and the J.P. Morgan Global Bond Index – Emerging Markets Global Diversified (J.P. Morgan GBI-EM Global Diversified). Please refer to the Additional Information section for detailed benchmark descriptions.
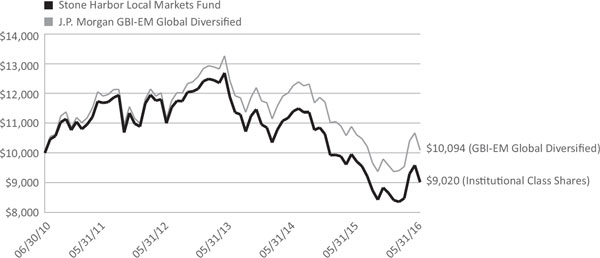
Total Returns (Inception Date, June 30, 2010)
| Average Annual Returns | |||||
| 6 Months | 1 Year | 3 Years | 5 Years | Since Inception | |
| Stone Harbor Local Markets Fund | 4.15% | -7.16% | -8.77% | -5.04% | -1.73% |
| J.P. Morgan GBI-EM Global Diversified | 5.28% | -4.86% | -6.71% | -3.26% | 0.16% |
The performance data quoted represents past performance and does not guarantee future results. Current performance may be lower or higher than the performance quoted. Average annual total returns reflect the reinvestment of dividends and capital gains distributions and include all fee waivers and expense reimbursements. Without the fee waivers and expense reimbursements, total return figures would have been lower. The performance data quoted does not reflect the deduction of taxes that a shareholder would pay on Fund distributions or the redemption of Fund shares. Investment return and principal value will vary, and shares, when redeemed, may be worth more or less than their original cost. Index returns do not include the effects of sales charges, management fees or transaction costs. It is not possible to invest directly in an index.
| 16 | www.shiplp.com |
| Stone Harbor Investment Funds | Growth of $10,000 Investment |
May 31, 2016 (Unaudited)
STONE HARBOR EMERGING MARKETS CORPORATE DEBT FUND
Comparison of Change in Value of $10,000 Investment in Stone Harbor Emerging Market Corporate Debt Fund and the J.P. Morgan Corporate Emerging Market Bond Index – Broad Diversified (J.P. Morgan CEMBI Broad Diversified). Please refer to the Additional Information section for detailed benchmark descriptions.
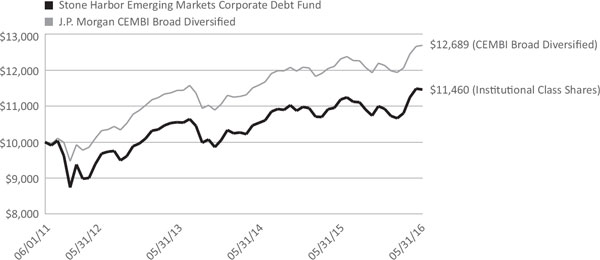
Total Returns (Inception Date, June 1, 2011)
| Average Annual Returns | |||||
| 6 Months | 1 Year | 3 Year | 5 Year | Since Inception | |
| Stone Harbor Emerging Markets Corporate Debt Fund | 4.92% | 1.92% | 3.12% | 2.76% | 2.76% |
| J.P. Morgan CEMBI Broad Diversified | 4.60% | 2.52% | 3.74% | 4.88% | 4.88% |
The performance data quoted represents past performance and does not guarantee future results. Current performance may be lower or higher than the performance quoted. Average annual total returns reflect the reinvestment of dividends and capital gains distributions and include all fee waivers and expense reimbursements. Without the fee waivers and expense reimbursements, total return figures would have been lower. The performance data quoted does not reflect the deduction of taxes that a shareholder would pay on Fund distributions or the redemption of Fund shares. Investment return and principal value will vary, and shares, when redeemed, may be worth more or less than their original cost. Index returns do not include the effects of sales charges, management fees or transaction costs. It is not possible to invest directly in an index.
| Stone Harbor Investment Funds Annual Report | May 31, 2016 | 17 |
| Stone Harbor Investment Funds | Growth of $10,000 Investment |
May 31, 2016 (Unaudited)
STONE HARBOR INVESTMENT GRADE FUND
Comparison of Change in Value of $10,000 Investment in Stone Harbor Investment Grade Fund and the Barclays Capital U.S. Aggregate Index. Please refer to the Additional Information section for detailed benchmark descriptions.
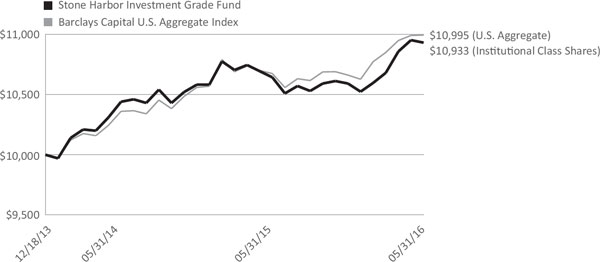
Total Returns (Inception Date, December 18, 2013)
| Average Annual Returns | |||
| 6 Months | 1 Year | Since Inception | |
| Stone Harbor Investment Grade Fund | 3.21% | 2.71% | 3.71% |
| Barclays Capital U.S. Aggregate Index | 3.12% | 2.99% | 3.95% |
The performance data quoted represents past performance and does not guarantee future results. Current performance may be lower or higher than the performance quoted. Average annual total returns reflect the reinvestment of dividends and capital gains distributions and include all fee waivers and expense reimbursements. Without the fee waivers and expense reimbursements, total return figures would have been lower. The performance data quoted does not reflect the deduction of taxes that a shareholder would pay on Fund distributions or the redemption of Fund shares. Investment return and principal value will vary, and shares, when redeemed, may be worth more or less than their original cost. Index returns do not include the effects of sales charges, management fees or transaction costs. It is not possible to invest directly in an index.
| 18 | www.shiplp.com |
| Stone Harbor Investment Funds | Growth of $10,000 Investment |
May 31, 2016 (Unaudited)
STONE HARBOR STRATEGIC INCOME FUND
Comparison of Change in Value of $10,000 Investment in Stone Harbor Strategic Income Fund and the Barclays Global Credit Index (Hedged USD). Please refer to the Additional Information section for detailed benchmark descriptions.

Total Returns (Inception Date, December 18, 2013)
| Average Annual Returns | |||
| 6 Months | 1 Year | Since Inception | |
| Stone Harbor Strategic Income Fund | 3.38% | 0.19% | 2.86% |
| Barclays Global Credit Index (Hedged USD) | 3.90% | 2.81% | 4.56% |
The performance data quoted represents past performance and does not guarantee future results. Current performance may be lower or higher than the performance quoted. Average annual total returns reflect the reinvestment of dividends and capital gains distributions and include all fee waivers and expense reimbursements. Without the fee waivers and expense reimbursements, total return figures would have been lower. The performance data quoted does not reflect the deduction of taxes that a shareholder would pay on Fund distributions or the redemption of Fund shares. Investment return and principal value will vary, and shares, when redeemed, may be worth more or less than their original cost. Index returns do not include the effects of sales charges, management fees or transaction costs. It is not possible to invest directly in an index.
| Stone Harbor Investment Funds Annual Report | May 31, 2016 | 19 |
| Stone Harbor Investment Funds | Growth of $10,000 Investment |
May 31, 2016 (Unaudited)
STONE HARBOR EMERGING MARKETS DEBT ALLOCATION FUND
Comparison of Change in Value of $10,000 Investment in Stone Harbor Emerging Markets Debt Allocation Fund, the J.P. Morgan EMBI Global Diversified Index TR, J.P. Morgan GBI-EM Global Diversified Index and the Blend Index (50% J.P. Morgan EMBI Global Diversified Index and 50% J.P. Morgan GBI-EM Global Diversified Index). Please refer to the Additional Information section for detailed benchmark descriptions.
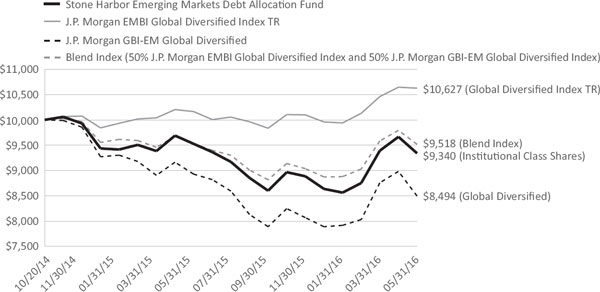
Total Returns (Inception Date, October 20, 2014)
| Average Annual Returns | |||
| 6 Months | 1 Year | Since Inception | |
| Stone Harbor Emerging Markets Debt Allocation Fund | 5.11% | -1.96% | -4.15% |
| J.P. Morgan EMBI Global Diversified | 5.22% | 4.55% | 3.84% |
| J.P. Morgan GBI-EM Global Diversified | 5.28% | -4.86% | -9.63% |
| Blend Index (50% J.P. Morgan EMBI Global Diversified Index and 50% J.P. Morgan GBI-EM Global Diversified Index) | 5.33% | -0.14% | -3.02% |
The performance data quoted represents past performance and does not guarantee future results. Current performance may be lower or higher than the performance quoted. Average annual total returns reflect the reinvestment of dividends and capital gains distributions and include all fee waivers and expense reimbursements. Without the fee waivers and expense reimbursements, total return figures would have been lower. The performance data quoted does not reflect the deduction of taxes that a shareholder would pay on Fund distributions or the redemption of Fund shares. Investment return and principal value will vary, and shares, when redeemed, may be worth more or less than their original cost. Index returns do not include the effects of sales charges, management fees or transaction costs. It is not possible to invest directly in an index.
20 | www.shiplp.com |
| Stone Harbor Investment Funds | Report of Independent Registered Public Accounting Firm |
To the Shareholders and Board of Trustees of Stone Harbor Investment Funds:
We have audited the accompanying statements of assets and liabilities, including the statements of investments, of Stone Harbor Investment Funds (the “Funds”), comprising the Stone Harbor Emerging Markets Debt Fund, Stone Harbor High Yield Bond Fund, Stone Harbor Local Markets Fund, Stone Harbor Emerging Markets Corporate Debt Fund, Stone Harbor Investment Grade Fund, Stone Harbor Strategic Income Fund, and Stone Harbor Emerging Markets Debt Allocation Fund, as of May 31, 2016, and the related statements of operations for the year then ended, the statements of changes in net assets for each of the two years in the period then ended (as to the Stone Harbor Emerging Markets Debt Allocation Fund, for the year then ended and for the period from October 21, 2014 (commencement of operations) to May 31, 2015), and the financial highlights for each of the periods presented. These financial statements and financial highlights are the responsibility of the Funds’ management. Our responsibility is to express an opinion on these financial statements and financial highlights based on our audits.
We conducted our audits in accordance with the standards of the Public Company Accounting Oversight Board (United States). Those standards require that we plan and perform the audit to obtain reasonable assurance about whether the financial statements and financial highlights are free of material misstatement. The Funds are not required to have, nor were we engaged to perform, an audit of their internal control over financial reporting. Our audits included consideration of internal control over financial reporting as a basis for designing audit procedures that are appropriate in the circumstances, but not for the purpose of expressing an opinion on the effectiveness of the Funds’ internal control over financial reporting. Accordingly, we express no such opinion. An audit also includes examining, on a test basis, evidence supporting the amounts and disclosures in the financial statements, assessing the accounting principles used and significant estimates made by management, as well as evaluating the overall financial statement presentation. Our procedures included confirmation of securities owned as of May 31, 2016, by correspondence with the custodian, brokers, and agent banks; where replies were not received from brokers and agent banks, we performed other auditing procedures. We believe that our audits provide a reasonable basis for our opinion.
In our opinion, the financial statements and financial highlights referred to above present fairly, in all material respects, the financial position of each of the funds constituting the Stone Harbor Investment Funds as of May 31, 2016, the results of their operations for the year then ended, and the changes in their net assets and the financial highlights for each of the periods presented, in conformity with accounting principles generally accepted in the United States of America.
Denver, Colorado
July 28, 2016
| Stone Harbor Investment Funds Annual Report | May 31, 2016 | 21 |
| Stone Harbor Emerging Markets Debt Fund | Statements of Investments |
May 31, 2016
| Reference Rate | Currency | Rate | Maturity Date | Principal Amount/ Shares* | Value Expressed (in USD) | |||||||||||||||||||
SOVEREIGN DEBT OBLIGATIONS - 69.64% | ||||||||||||||||||||||||
| Angola - 0.98% | ||||||||||||||||||||||||
| Republic of Angola: | ||||||||||||||||||||||||
| USD | 7.00 | % | 08/16/19 | 4,758,813 | $ | 4,842,091 | (1) | |||||||||||||||||
| USD | 9.50 | % | 11/12/25 | 3,678,000 | 3,581,453 | (1) | ||||||||||||||||||
| USD | 9.50 | % | 11/12/25 | 7,263,000 | 7,072,346 | (2) | ||||||||||||||||||
| 15,495,890 | ||||||||||||||||||||||||
| Argentina - 3.82% | ||||||||||||||||||||||||
| Republic of Argentina: | ||||||||||||||||||||||||
| EUR | 7.82 | % | 12/31/33 | 7,398,781 | 8,314,579 | |||||||||||||||||||
| EUR | 7.82 | % | 12/31/33 | 12,348,454 | 13,979,952 | |||||||||||||||||||
| USD | 8.28 | % | 12/31/33 | 4,360,338 | 4,763,670 | |||||||||||||||||||
| USD | 8.28 | % | 12/31/33 | 6,121,298 | 6,603,350 | |||||||||||||||||||
| EUR | 0.00 | % | 12/15/35 | 136,217,583 | 15,497,269 | (3) | ||||||||||||||||||
| USD | 0.00 | % | 12/15/35 | 2,922,000 | 310,462 | (3) | ||||||||||||||||||
| USD | 2.50 | % | 12/31/38 | 16,550,000 | 10,567,175 | (4) | ||||||||||||||||||
| 60,036,457 | ||||||||||||||||||||||||
| Azerbaijan - 0.93% | ||||||||||||||||||||||||
| Republic of Azerbaijan | USD | 4.75 | % | 03/18/24 | 15,152,000 | 14,640,620 | (2) | |||||||||||||||||
| Bahrain - 0.30% | ||||||||||||||||||||||||
| Bahrain Government International Bond | USD | 7.00 | % | 01/26/26 | 4,664,000 | 4,664,000 | (2) | |||||||||||||||||
| Brazil - 3.32% | ||||||||||||||||||||||||
| Brazil Loan Trust 1 | USD | 5.48 | % | 07/24/23 | 11,799,293 | 10,943,844 | (2) | |||||||||||||||||
| Brazil Minas SPE via State of Minas Gerais | USD | 5.33 | % | 02/15/28 | 496,000 | 428,048 | (2) | |||||||||||||||||
| Republic of Brazil: | ||||||||||||||||||||||||
| USD | 8.75 | % | 02/04/25 | 834,000 | 1,013,310 | |||||||||||||||||||
| USD | 6.00 | % | 04/07/26 | 16,352,000 | 16,597,280 | |||||||||||||||||||
| USD | 8.25 | % | 01/20/34 | 13,468,000 | 15,084,160 | |||||||||||||||||||
| USD | 7.13 | % | 01/20/37 | 4,788,000 | 4,859,820 | |||||||||||||||||||
| USD | 5.00 | % | 01/27/45 | 4,142,000 | 3,277,358 | |||||||||||||||||||
| 52,203,820 | ||||||||||||||||||||||||
| Cameroon - 0.11% | ||||||||||||||||||||||||
| Republic of Cameroon | USD | 9.50 | % | 11/19/25 | 1,834,000 | 1,804,656 | (2) | |||||||||||||||||
| Chile - 0.42% | ||||||||||||||||||||||||
| Chile Government International Bond: | ||||||||||||||||||||||||
| USD | 3.13 | % | 03/27/25 | 1,000,000 | 1,033,750 | |||||||||||||||||||
| USD | 3.13 | % | 01/21/26 | 5,541,000 | 5,624,115 | |||||||||||||||||||
| 6,657,865 | ||||||||||||||||||||||||
| Colombia - 2.47% | ||||||||||||||||||||||||
| Bogota Distrio Capital | COP | 9.75 | % | 07/26/28 | 7,870,000,000 | 2,600,588 | (1) | |||||||||||||||||
| Republic of Colombia: | ||||||||||||||||||||||||
| USD | 4.38 | % | 07/12/21 | 13,692,000 | 14,239,680 | |||||||||||||||||||
| USD | 2.63 | % | 03/15/23 | 814,000 | 750,915 | |||||||||||||||||||
| USD | 4.00 | % | 02/26/24 | 3,423,000 | 3,400,751 | |||||||||||||||||||
| USD | 8.13 | % | 05/21/24 | 25,000 | 31,344 | |||||||||||||||||||
| USD | 10.38 | % | 01/28/33 | 2,006,000 | 2,868,580 | |||||||||||||||||||
| USD | 7.38 | % | 09/18/37 | 5,102,000 | 6,103,267 | |||||||||||||||||||
| 22 | www.shiplp.com |
| Stone Harbor Emerging Markets Debt Fund | Statements of Investments |
May 31, 2016
| Reference Rate | Currency | Rate | Maturity Date | Principal Amount/ Shares* | Value Expressed (in USD) | |||||||||||||||||||
| Colombia (continued) | ||||||||||||||||||||||||
| Republic of Colombia: (continued) | ||||||||||||||||||||||||
| USD | 6.13 | % | 01/18/41 | 1,130,000 | $ | 1,192,150 | ||||||||||||||||||
| USD | 5.63 | % | 02/26/44 | 6,529,000 | 6,496,355 | |||||||||||||||||||
| USD | 5.00 | % | 06/15/45 | 1,244,000 | 1,158,475 | |||||||||||||||||||
| 38,842,105 | ||||||||||||||||||||||||
| Costa Rica - 2.40% | ||||||||||||||||||||||||
| Republic of Costa Rica: | ||||||||||||||||||||||||
| USD | 4.25 | % | 01/26/23 | 11,966,000 | 11,008,720 | (1) | ||||||||||||||||||
| USD | 4.38 | % | 04/30/25 | 3,973,000 | 3,550,868 | (2) | ||||||||||||||||||
| USD | 4.38 | % | 04/30/25 | 4,745,000 | 4,240,844 | (1) | ||||||||||||||||||
| USD | 7.00 | % | 04/04/44 | 20,745,000 | 19,033,538 | (2) | ||||||||||||||||||
| 37,833,970 | ||||||||||||||||||||||||
| Croatia - 1.92% | ||||||||||||||||||||||||
| Croatian Government: | ||||||||||||||||||||||||
| USD | 6.63 | % | 07/14/20 | 6,726,000 | 7,352,359 | (1) | ||||||||||||||||||
| USD | 6.38 | % | 03/24/21 | 4,148,000 | 4,510,950 | (2) | ||||||||||||||||||
| USD | 5.50 | % | 04/04/23 | 10,734,000 | 11,297,578 | (1) | ||||||||||||||||||
| USD | 6.00 | % | 01/26/24 | 6,438,000 | 6,977,182 | (2) | ||||||||||||||||||
| 30,138,069 | ||||||||||||||||||||||||
| Dominican Republic - 2.94% | ||||||||||||||||||||||||
| Dominican Republic: | ||||||||||||||||||||||||
| USD | 9.04 | % | 01/23/18 | 4,172,198 | 4,386,023 | (1) | ||||||||||||||||||
| USD | 7.50 | % | 05/06/21 | 22,542,000 | 24,824,377 | (1) | ||||||||||||||||||
| USD | 6.60 | % | 01/28/24 | 8,873,000 | 9,405,663 | (1) | ||||||||||||||||||
| USD | 5.88 | % | 04/18/24 | 2,265,000 | 2,332,950 | (2) | ||||||||||||||||||
| USD | 5.50 | % | 01/27/25 | 754,000 | 749,288 | (1) | ||||||||||||||||||
| USD | 6.88 | % | 01/29/26 | 4,281,000 | 4,621,340 | (1) | ||||||||||||||||||
| 46,319,641 | ||||||||||||||||||||||||
| Egypt - 0.82% | ||||||||||||||||||||||||
| Republic of Egypt: | ||||||||||||||||||||||||
| USD | 5.88 | % | 06/11/25 | 12,758,000 | 10,971,880 | (2) | ||||||||||||||||||
| USD | 6.88 | % | 04/30/40 | 2,350,000 | 1,946,975 | (2) | ||||||||||||||||||
| 12,918,855 | ||||||||||||||||||||||||
| El Salvador - 2.77% | ||||||||||||||||||||||||
| Republic of El Salvador: | ||||||||||||||||||||||||
| USD | 7.38 | % | 12/01/19 | 220,000 | 219,725 | (2) | ||||||||||||||||||
| USD | 7.38 | % | 12/01/19 | 2,068,000 | 2,065,415 | (1) | ||||||||||||||||||
| USD | 7.75 | % | 01/24/23 | 7,608,000 | 7,493,880 | (1) | ||||||||||||||||||
| USD | 5.88 | % | 01/30/25 | 900,000 | 768,600 | (1) | ||||||||||||||||||
| USD | 6.38 | % | 01/18/27 | 4,661,000 | 3,974,668 | (2) | ||||||||||||||||||
| USD | 8.25 | % | 04/10/32 | 2,381,000 | 2,238,735 | (1) | ||||||||||||||||||
| USD | 7.65 | % | 06/15/35 | 28,286,000 | 24,502,747 | (1) | ||||||||||||||||||
| USD | 7.63 | % | 02/01/41 | 2,734,000 | 2,337,570 | (1) | ||||||||||||||||||
| 43,601,340 | ||||||||||||||||||||||||
| Ethiopia - 0.42% | ||||||||||||||||||||||||
| Federal Democratic Republic of Ethiopia | USD | 6.63 | % | 12/11/24 | 7,169,000 | 6,550,674 | (2) | |||||||||||||||||
| Gabon - 1.09% | ||||||||||||||||||||||||
| Gabon Government International Bond | USD | 6.38 | % | 12/12/24 | 2,560,000 | 2,144,000 | (1) | |||||||||||||||||
| Stone Harbor Investment Funds Annual Report | May 31, 2016 | 23 |
| Stone Harbor Emerging Markets Debt Fund | Statements of Investments |
May 31, 2016
| Reference Rate | Currency | Rate | Maturity Date | Principal Amount/ Shares* | Value Expressed (in USD) | |||||||||||||||||||
| Gabon (continued) | ||||||||||||||||||||||||
| Republic of Gabon: | ||||||||||||||||||||||||
| USD | 8.20 | % | 12/12/17 | 50,000 | $ | 51,625 | (2) | |||||||||||||||||
| USD | 6.38 | % | 12/12/24 | 15,048,995 | 12,603,533 | (2) | ||||||||||||||||||
| USD | 6.95 | % | 06/16/25 | 2,861,000 | 2,417,545 | (2) | ||||||||||||||||||
| 17,216,703 | ||||||||||||||||||||||||
| Georgia - 0.29% | ||||||||||||||||||||||||
| Georgia Government International Bond | USD | 6.88 | % | 04/12/21 | 4,081,000 | 4,509,505 | (2) | |||||||||||||||||
| Ghana - 1.08% | ||||||||||||||||||||||||
| Republic of Ghana: | ||||||||||||||||||||||||
| USD | 8.50 | % | 10/04/17 | 2,641,000 | 2,660,147 | (1) | ||||||||||||||||||
| USD | 7.88 | % | 08/07/23 | 430,000 | 354,858 | (1) | ||||||||||||||||||
| USD | 7.88 | % | 08/07/23 | 2,786,193 | 2,299,306 | (2) | ||||||||||||||||||
| USD | 10.75 | % | 10/14/30 | 11,696,000 | 11,739,860 | (2) | ||||||||||||||||||
| 17,054,171 | ||||||||||||||||||||||||
| Hungary - 2.92% | ||||||||||||||||||||||||
| Republic of Hungary: | ||||||||||||||||||||||||
| USD | 6.38 | % | 03/29/21 | 12,417,000 | 14,093,295 | |||||||||||||||||||
| USD | 5.38 | % | 02/21/23 | 19,981,000 | 21,979,899 | |||||||||||||||||||
| USD | 5.75 | % | 11/22/23 | 6,028,000 | 6,833,462 | |||||||||||||||||||
| USD | 5.38 | % | 03/25/24 | 2,685,000 | 2,986,418 | |||||||||||||||||||
| 45,893,074 | ||||||||||||||||||||||||
| Indonesia - 3.25% | ||||||||||||||||||||||||
| Indonesia Government International Bond: | ||||||||||||||||||||||||
| USD | 5.25 | % | 01/17/42 | 1,600,000 | 1,632,192 | (1) | ||||||||||||||||||
| USD | 5.13 | % | 01/15/45 | 10,485,000 | 10,644,896 | (2) | ||||||||||||||||||
| Republic of Indonesia: | ||||||||||||||||||||||||
| USD | 3.38 | % | 04/15/23 | 4,068,000 | 4,011,556 | (2) | ||||||||||||||||||
| USD | 5.38 | % | 10/17/23 | 7,084,000 | 7,815,246 | (1) | ||||||||||||||||||
| USD | 5.88 | % | 01/15/24 | 4,540,000 | 5,130,200 | (2) | ||||||||||||||||||
| USD | 4.75 | % | 01/08/26 | 1,475,000 | 1,564,238 | (2) | ||||||||||||||||||
| USD | 8.50 | % | 10/12/35 | 6,681,000 | 9,283,250 | (1) | ||||||||||||||||||
| USD | 6.63 | % | 02/17/37 | 4,759,000 | 5,634,656 | (1) | ||||||||||||||||||
| USD | 7.75 | % | 01/17/38 | 4,214,000 | 5,491,537 | (1) | ||||||||||||||||||
| 51,207,771 | ||||||||||||||||||||||||
| Iraq - 0.13% | ||||||||||||||||||||||||
| Republic of Iraq | USD | 5.80 | % | 01/15/28 | 2,726,000 | 1,997,817 | (1) | |||||||||||||||||
| Ivory Coast - 2.36% | ||||||||||||||||||||||||
| Ivory Coast Government: | ||||||||||||||||||||||||
| USD | 5.38 | % | 07/23/24 | 3,119,000 | 2,853,885 | (2) | ||||||||||||||||||
| USD | 6.38 | % | 03/03/28 | 6,776,000 | 6,411,790 | (2) | ||||||||||||||||||
| USD | 5.75 | % | 12/31/32 | 30,724,000 | 27,882,030 | (1)(4) | ||||||||||||||||||
| 37,147,705 | ||||||||||||||||||||||||
| Jamaica - 0.89% | ||||||||||||||||||||||||
| Jamaican Government: | ||||||||||||||||||||||||
| USD | 10.63 | % | 06/20/17 | 2,278,000 | 2,457,392 | |||||||||||||||||||
| USD | 7.63 | % | 07/09/25 | 6,273,000 | 6,986,554 | |||||||||||||||||||
| USD | 6.75 | % | 04/28/28 | 3,340,000 | 3,477,775 | |||||||||||||||||||
| USD | 7.88 | % | 07/28/45 | 1,091,000 | 1,153,733 | |||||||||||||||||||
| 14,075,454 | ||||||||||||||||||||||||
| 24 | www.shiplp.com |
| Stone Harbor Emerging Markets Debt Fund | Statements of Investments |
May 31, 2016
| Reference Rate | Currency | Rate | Maturity Date | Principal Amount/ Shares* | Value Expressed (in USD) | |||||||||||||||||||
| Kenya - 1.21% | ||||||||||||||||||||||||
| Republic of Kenya: | ||||||||||||||||||||||||
| USD | 5.88 | % | 06/24/19 | 832,000 | $ | 814,112 | (2) | |||||||||||||||||
| USD | 6.88 | % | 06/24/24 | 1,618,000 | 1,490,583 | (1) | ||||||||||||||||||
| USD | 6.88 | % | 06/24/24 | 18,169,000 | 16,738,191 | (2) | ||||||||||||||||||
| 19,042,886 | ||||||||||||||||||||||||
| Lithuania - 0.11% | ||||||||||||||||||||||||
| Republic of Lithuania | USD | 7.38 | % | 02/11/20 | 1,413,000 | 1,671,346 | (2) | |||||||||||||||||
| Malaysia - 0.68% | ||||||||||||||||||||||||
| 1MDB Global Investments Ltd. | USD | 4.40 | % | 03/09/23 | 12,500,000 | 10,656,250 | (1) | |||||||||||||||||
| Mexico - 4.90% | ||||||||||||||||||||||||
| United Mexican States: | ||||||||||||||||||||||||
| USD | 4.00 | % | 10/02/23 | 32,740,000 | 34,213,300 | |||||||||||||||||||
| USD | 3.60 | % | 01/30/25 | 18,026,000 | 18,251,325 | |||||||||||||||||||
| USD | 4.13 | % | 01/21/26 | 15,433,000 | 16,119,768 | |||||||||||||||||||
| USD | 6.05 | % | 01/11/40 | 4,929,000 | 5,810,059 | |||||||||||||||||||
| USD | 5.55 | % | 01/21/45 | 2,403,000 | 2,682,349 | |||||||||||||||||||
| 77,076,801 | ||||||||||||||||||||||||
| Montenegro - 0.24% | ||||||||||||||||||||||||
| Republic of Montenegro | EUR | 5.75 | % | 03/10/21 | 3,394,000 | 3,820,235 | (2) | |||||||||||||||||
| Morocco - 0.17% | ||||||||||||||||||||||||
| Moroccan Government | USD | 4.25 | % | 12/11/22 | 2,545,000 | 2,627,076 | (2) | |||||||||||||||||
| Namibia - 0.49% | ||||||||||||||||||||||||
| Republic of Namibia | USD | 5.25 | % | 10/29/25 | 7,896,000 | 7,738,080 | (2) | |||||||||||||||||
| Nigeria - 0.36% | ||||||||||||||||||||||||
| Republic of Nigeria | USD | 5.13 | % | 07/12/18 | 5,664,000 | 5,621,520 | (1) | |||||||||||||||||
| Panama - 2.54% | ||||||||||||||||||||||||
| Panama Government International Bond: | ||||||||||||||||||||||||
| USD | 3.75 | % | 03/16/25 | 6,117,000 | 6,245,457 | |||||||||||||||||||
| USD | 3.88 | % | 03/17/28 | 1,530,000 | 1,551,037 | |||||||||||||||||||
| Republic of Panama: | ||||||||||||||||||||||||
| USD | 8.88 | % | 09/30/27 | 1,393,000 | 1,978,060 | |||||||||||||||||||
| USD | 9.38 | % | 04/01/29 | 18,584,000 | 27,411,400 | |||||||||||||||||||
| USD | 8.13 | % | 04/28/34 | 2,063,000 | 2,771,125 | |||||||||||||||||||
| 39,957,079 | ||||||||||||||||||||||||
| Paraguay - 0.38% | ||||||||||||||||||||||||
| Republic of Paraguay | USD | 6.10 | % | 08/11/44 | 5,798,000 | 5,942,950 | (2) | |||||||||||||||||
| Peru - 2.17% | ||||||||||||||||||||||||
| Republic of Peru: | ||||||||||||||||||||||||
| USD | 4.13 | % | 08/25/27 | 7,639,000 | 8,087,791 | |||||||||||||||||||
| USD | 8.75 | % | 11/21/33 | 8,539,000 | 12,757,266 | |||||||||||||||||||
| USD | 6.55 | % | 03/14/37 | 5,762,000 | 7,268,763 | |||||||||||||||||||
| USD | 5.63 | % | 11/18/50 | 5,317,000 | 6,074,673 | |||||||||||||||||||
| 34,188,493 | ||||||||||||||||||||||||
| Philippines - 1.05% | ||||||||||||||||||||||||
| Republic of Philippines | USD | 9.50 | % | 02/02/30 | 9,716,000 | 16,514,771 | ||||||||||||||||||
| Stone Harbor Investment Funds Annual Report | May 31, 2016 | 25 |
| Stone Harbor Emerging Markets Debt Fund | Statements of Investments |
May 31, 2016
| Reference Rate | Currency | Rate | Maturity Date | Principal Amount/ Shares* | Value Expressed (in USD) | |||||||||||||||||||
| Poland - 2.37% | ||||||||||||||||||||||||
| Republic of Poland: | ||||||||||||||||||||||||
| USD | 5.00 | % | 03/23/22 | 2,667,000 | $ | 2,991,120 | ||||||||||||||||||
| USD | 3.00 | % | 03/17/23 | 4,441,000 | 4,490,784 | |||||||||||||||||||
| USD | 4.00 | % | 01/22/24 | 4,753,000 | 5,097,854 | |||||||||||||||||||
| USD | 3.25 | % | 04/06/26 | 24,655,000 | 24,773,837 | |||||||||||||||||||
| 37,353,595 | ||||||||||||||||||||||||
| Romania - 1.01% | ||||||||||||||||||||||||
| Romanian Government International Bond: | ||||||||||||||||||||||||
| USD | 6.75 | % | 02/07/22 | 3,571,000 | 4,216,012 | (2) | ||||||||||||||||||
| USD | 6.75 | % | 02/07/22 | 3,587,000 | 4,234,901 | (1) | ||||||||||||||||||
| USD | 4.38 | % | 08/22/23 | 1,069,000 | 1,131,670 | (1) | ||||||||||||||||||
| USD | 4.38 | % | 08/22/23 | 3,860,000 | 4,086,293 | (2) | ||||||||||||||||||
| USD | 4.88 | % | 01/22/24 | 734,000 | 800,610 | (1) | ||||||||||||||||||
| USD | 4.88 | % | 01/22/24 | 1,249,000 | 1,362,347 | (2) | ||||||||||||||||||
| 15,831,833 | ||||||||||||||||||||||||
| Russia - 1.95% | ||||||||||||||||||||||||
| Russian Federation: | ||||||||||||||||||||||||
| USD | 5.00 | % | 04/29/20 | 4,165,000 | 4,399,282 | (2) | ||||||||||||||||||
| USD | 4.88 | % | 09/16/23 | 8,600,000 | 9,152,550 | (1) | ||||||||||||||||||
| USD | 12.75 | % | 06/24/28 | 430,000 | 742,825 | (1) | ||||||||||||||||||
| USD | 5.63 | % | 04/04/42 | 15,600,000 | 16,399,500 | (1) | ||||||||||||||||||
| 30,694,157 | ||||||||||||||||||||||||
| Serbia - 1.39% | ||||||||||||||||||||||||
| Republic of Serbia: | ||||||||||||||||||||||||
| USD | 5.88 | % | 12/03/18 | 1,505,000 | 1,597,181 | (1) | ||||||||||||||||||
| USD | 4.88 | % | 02/25/20 | 5,989,000 | 6,161,184 | (2) | ||||||||||||||||||
| USD | 4.88 | % | 02/25/20 | 9,790,000 | 10,071,462 | (1) | ||||||||||||||||||
| USD | 7.25 | % | 09/28/21 | 3,553,000 | 4,057,082 | (1) | ||||||||||||||||||
| 21,886,909 | ||||||||||||||||||||||||
| Sri Lanka - 2.00% | ||||||||||||||||||||||||
| Republic of Sri Lanka: | ||||||||||||||||||||||||
| USD | 5.13 | % | 04/11/19 | 484,000 | 482,538 | (2) | ||||||||||||||||||
| USD | 6.25 | % | 07/27/21 | 9,264,000 | 9,174,325 | (1) | ||||||||||||||||||
| USD | 5.88 | % | 07/25/22 | 10,255,000 | 9,721,817 | (2) | ||||||||||||||||||
| USD | 6.13 | % | 06/03/25 | 6,566,000 | 6,030,871 | (2) | ||||||||||||||||||
| USD | 6.85 | % | 11/03/25 | 6,258,000 | 6,024,890 | (2) | ||||||||||||||||||
| 31,434,441 | ||||||||||||||||||||||||
| Trinidad - 0.47% | ||||||||||||||||||||||||
| Republic of Trinidad & Tobago | USD | 4.38 | % | 01/16/24 | 7,174,000 | 7,371,285 | (2) | |||||||||||||||||
| Turkey - 3.46% | ||||||||||||||||||||||||
| Republic of Turkey: | ||||||||||||||||||||||||
| USD | 7.00 | % | 06/05/20 | 4,293,000 | 4,821,039 | |||||||||||||||||||
| USD | 5.13 | % | 03/25/22 | 6,809,000 | 7,105,191 | |||||||||||||||||||
| USD | 6.25 | % | 09/26/22 | 11,921,000 | 13,157,804 | |||||||||||||||||||
| USD | 5.75 | % | 03/22/24 | 9,038,000 | 9,721,499 | |||||||||||||||||||
| USD | 7.38 | % | 02/05/25 | 824,000 | 979,015 | |||||||||||||||||||
| USD | 6.88 | % | 03/17/36 | 958,000 | 1,108,119 | |||||||||||||||||||
| USD | 6.75 | % | 05/30/40 | 4,378,000 | 5,029,227 | |||||||||||||||||||
| USD | 4.88 | % | 04/16/43 | 10,459,000 | 9,481,083 | |||||||||||||||||||
| 26 | www.shiplp.com |
| Stone Harbor Emerging Markets Debt Fund | Statements of Investments |
| May 31, 2016 |
| Reference Rate | Currency | Rate | Maturity Date | PrincipalAmount/ Shares* | Value Expressed (in USD) | |||||||||||||||||||
| Turkey (continued) | ||||||||||||||||||||||||
| Republic of Turkey: (continued) | ||||||||||||||||||||||||
| USD | 6.63 | % | 02/17/45 | 2,710,000 | $ | 3,094,075 | ||||||||||||||||||
| 54,497,052 | ||||||||||||||||||||||||
| Ukraine ‐ 3.31% | ||||||||||||||||||||||||
| Ukraine Government: | ||||||||||||||||||||||||
| USD | 7.75 | % | 09/01/19 | 4,984,000 | 4,825,758 | (2) | ||||||||||||||||||
| USD | 7.75 | % | 09/01/20 | 6,746,000 | 6,454,236 | (2) | ||||||||||||||||||
| USD | 7.75 | % | 09/01/21 | 4,817,000 | 4,570,129 | (2) | ||||||||||||||||||
| USD | 7.75 | % | 09/01/22 | 7,331,000 | 6,891,139 | (2) | ||||||||||||||||||
| USD | 7.75 | % | 09/01/23 | 2,553,000 | 2,381,949 | (2) | ||||||||||||||||||
| USD | 7.75 | % | 09/01/24 | 3,519,000 | 3,268,271 | (2) | ||||||||||||||||||
| USD | 7.75 | % | 09/01/25 | 13,680,000 | 12,636,900 | (2) | ||||||||||||||||||
| USD | 7.75 | % | 09/01/26 | 9,649,000 | 8,852,958 | (2) | ||||||||||||||||||
| USD | 7.75 | % | 09/01/27 | 2,400,000 | 2,202,000 | (2) | ||||||||||||||||||
| 52,083,340 | ||||||||||||||||||||||||
| Uruguay ‐ 2.17% | ||||||||||||||||||||||||
| Republic of Uruguay: | ||||||||||||||||||||||||
| USD | 4.50 | % | 08/14/24 | 3,971,262 | 4,210,531 | |||||||||||||||||||
| USD | 4.38 | % | 10/27/27 | 11,306,000 | 11,715,842 | |||||||||||||||||||
| USD | 5.10 | % | 06/18/50 | 19,440,079 | 18,200,774 | |||||||||||||||||||
| 34,127,147 | ||||||||||||||||||||||||
| Venezuela ‐ 0.49% | ||||||||||||||||||||||||
| Republic of Venezuela: | ||||||||||||||||||||||||
| USD | 13.63 | % | 08/15/18 | 6,704,000 | 4,280,345 | (1) | ||||||||||||||||||
| USD | 8.25 | % | 10/13/24 | 5,354,800 | 2,001,357 | (1) | ||||||||||||||||||
| USD | 7.65 | % | 04/21/25 | 1,228,000 | 448,220 | (1) | ||||||||||||||||||
| USD | 9.38 | % | 01/13/34 | 2,448,000 | 936,360 | |||||||||||||||||||
| 7,666,282 | ||||||||||||||||||||||||
| Zambia ‐ 1.09% | ||||||||||||||||||||||||
| Republic of Zambia: | ||||||||||||||||||||||||
| USD | 5.38 | % | 09/20/22 | 1,398,000 | 1,050,597 | (1) | ||||||||||||||||||
| USD | 8.50 | % | 04/14/24 | 4,286,000 | 3,546,665 | (2) | ||||||||||||||||||
| USD | 8.97 | % | 07/30/27 | 6,719,000 | 5,517,979 | (2) | ||||||||||||||||||
| USD | 8.97 | % | 07/30/27 | 7,521,000 | 6,176,621 | (1) | ||||||||||||||||||
Zambia Government International Bond | USD | 8.50 | % | 04/14/24 | 1,000,000 | 827,500 | (1) | |||||||||||||||||
| 17,119,362 | ||||||||||||||||||||||||
| TOTAL SOVEREIGN DEBT OBLIGATIONS | 1,095,733,052 | |||||||||||||||||||||||
| (Cost $1,097,563,421) | ||||||||||||||||||||||||
| BANK LOANS ‐ 1.23% | ||||||||||||||||||||||||
| Brazil ‐ 1.22% | ||||||||||||||||||||||||
| Banco de Investimentos Credit Suisse Brasil SA ‐ Brazil Loan Tranche A | USD | 6.25 | % | 01/10/18 | 12,400,000 | 12,605,840 | ||||||||||||||||||
| Banco de Investimentos Credit Suisse Brasil SA ‐ Brazil Loan Tranche B | USD | 6.25 | % | 01/10/18 | 6,600,000 | 6,709,560 | ||||||||||||||||||
| 19,315,400 | ||||||||||||||||||||||||
| Stone Harbor Investment Funds Annual Report | May 31, 2016 | 27 |
| Stone Harbor Emerging Markets Debt Fund | Statements of Investments |
| May 31, 2016 |
Reference Rate | Currency | Rate | Maturity Date | PrincipalAmount/ Shares* | Value Expressed (in USD) | |||||||||||||||||||
| Indonesia ‐ 0.01% | ||||||||||||||||||||||||
| PT Bakrie & Brothers TBK | USD | N/A | 11/25/14 | 624,912 | $ | 124,982 | (5) | |||||||||||||||||
| TOTAL BANK LOANS | 19,440,382 | |||||||||||||||||||||||
| (Cost $19,249,965) | ||||||||||||||||||||||||
| CORPORATE BONDS ‐ 22.44% | ||||||||||||||||||||||||
| Algeria ‐ 0.30% | ||||||||||||||||||||||||
| GTH Finance BV: | ||||||||||||||||||||||||
| USD | 6.25 | % | 04/26/20 | 1,985,000 | 2,008,572 | (2) | ||||||||||||||||||
| USD | 7.25 | % | 04/26/23 | 2,628,000 | 2,666,106 | (2) | ||||||||||||||||||
| 4,674,678 | ||||||||||||||||||||||||
| Argentina ‐ 0.28% | ||||||||||||||||||||||||
| YPF SA | USD | 8.75 | % | 04/04/24 | 4,161,000 | 4,355,735 | (2) | |||||||||||||||||
| Azerbaijan ‐ 1.03% | ||||||||||||||||||||||||
| Southern Gas Corridor CJSC | USD | 6.88 | % | 03/24/26 | 1,400,000 | 1,445,500 | (2) | |||||||||||||||||
| State Oil Company: | ||||||||||||||||||||||||
| USD | 4.75 | % | 03/13/23 | 13,025,000 | 11,836,469 | |||||||||||||||||||
| USD | 6.95 | % | 03/18/30 | 2,955,000 | 2,873,737 | |||||||||||||||||||
| 16,155,706 | ||||||||||||||||||||||||
| Brazil ‐ 0.94% | ||||||||||||||||||||||||
| Cosan Luxembourg SA | USD | 5.00 | % | 03/14/23 | 4,769,000 | 4,351,713 | (2) | |||||||||||||||||
| ESAL GmbH | USD | 6.25 | % | 02/05/23 | 2,977,000 | 2,902,575 | (2) | |||||||||||||||||
| GTL Trade Finance, Inc. | USD | 5.89 | % | 04/29/24 | 2,503,000 | 2,067,478 | (2) | |||||||||||||||||
| Marfrig Holdings Europe BV | USD | 8.00 | % | 06/08/23 | 2,373,000 | 2,384,865 | (2) | |||||||||||||||||
| Petrobras Global Finance BV | USD | 8.38 | % | 05/23/21 | 3,060,000 | 3,036,132 | ||||||||||||||||||
| 14,742,763 | ||||||||||||||||||||||||
| Chile ‐ 2.12% | ||||||||||||||||||||||||
| Banco del Estado de Chile | USD | 3.88 | % | 02/08/22 | 3,277,000 | 3,481,813 | (2) | |||||||||||||||||
| Codelco, Inc.: | ||||||||||||||||||||||||
| USD | 3.00 | % | 07/17/22 | 17,668,000 | 17,139,727 | (2) | ||||||||||||||||||
| USD | 4.50 | % | 09/16/25 | 468,000 | 475,198 | (2) | ||||||||||||||||||
| USD | 6.15 | % | 10/24/36 | 8,279,000 | 9,272,231 | (1) | ||||||||||||||||||
| VTR Finance BV | USD | 6.88 | % | 01/15/24 | 3,047,000 | 3,024,635 | (2) | |||||||||||||||||
| 33,393,604 | ||||||||||||||||||||||||
| China ‐ 2.29% | ||||||||||||||||||||||||
| CNOOC Finance 2015 USA LLC | USD | 3.50 | % | 05/05/25 | 1,731,000 | 1,710,038 | ||||||||||||||||||
| Sinochem Offshore Capital Co. Ltd. | USD | 3.25 | % | 04/29/19 | 1,835,000 | 1,868,635 | (2) | |||||||||||||||||
| Sinochem Overseas Capital Co. Ltd.: | ||||||||||||||||||||||||
| USD | 4.50 | % | 11/12/20 | 2,614,000 | 2,766,239 | (1) | ||||||||||||||||||
| USD | 4.50 | % | 11/12/20 | 13,311,000 | 14,086,233 | (2) | ||||||||||||||||||
| USD | 6.30 | % | 11/12/40 | 4,353,000 | 5,523,190 | (1) | ||||||||||||||||||
Sinopec Group Overseas Development 2016 Ltd.: | ||||||||||||||||||||||||
| USD | 2.75 | % | 05/03/21 | 3,552,000 | 3,564,716 | (2) | ||||||||||||||||||
| USD | 3.50 | % | 05/03/26 | 3,552,000 | 3,522,107 | (2) | ||||||||||||||||||
| Three Gorges Finance I Cayman Islands Ltd. | USD | 3.15 | % | 06/02/26 | 2,946,000 | 2,944,388 | (2) | |||||||||||||||||
| 35,985,546 | ||||||||||||||||||||||||
| Colombia ‐ 1.22% | ||||||||||||||||||||||||
| Ecopetrol SA: | ||||||||||||||||||||||||
| USD | 5.88 | % | 09/18/23 | 1,924,000 | 1,919,767 | |||||||||||||||||||
| 28 | www.shiplp.com |
| Stone Harbor Emerging Markets Debt Fund | Statements of Investments |
| May 31, 2016 |
| Reference Rate | Currency | Rate | Maturity Date | PrincipalAmount/ Shares* | Value Expressed (in USD) | |||||||||||||||||||
| Colombia (continued) | ||||||||||||||||||||||||
| Ecopetrol SA: (continued) | ||||||||||||||||||||||||
| USD | 4.13 | % | 01/16/25 | 9,960,000 | $ | 8,727,450 | ||||||||||||||||||
| USD | 7.38 | % | 09/18/43 | 5,431,000 | 5,088,847 | |||||||||||||||||||
| USD | 5.88 | % | 05/28/45 | 4,249,000 | 3,426,819 | |||||||||||||||||||
| 19,162,883 | ||||||||||||||||||||||||
| Costa Rica ‐ 0.23% | ||||||||||||||||||||||||
| Banco Nacional de Costa Rica | USD | 5.88 | % | 04/25/21 | 3,673,000 | 3,689,528 | (2) | |||||||||||||||||
| Ecuador ‐ 0.87% | ||||||||||||||||||||||||
| EP PetroEcuador via Noble Sovereign Funding I Ltd. | Libor+5.63% | USD | 6.26 | % | 09/24/19 | 14,506,211 | 13,780,900 | (1)(3) | ||||||||||||||||
| India ‐ 0.09% | ||||||||||||||||||||||||
| ABJA Investment Co. Pte Ltd. | USD | 5.95 | % | 07/31/24 | 1,451,000 | 1,372,080 | ||||||||||||||||||
| Indonesia ‐ 1.05% | ||||||||||||||||||||||||
| Pertamina Persero PT: | ||||||||||||||||||||||||
| USD | 5.25 | % | 05/23/21 | 2,900,000 | 3,056,861 | (1) | ||||||||||||||||||
| USD | 4.88 | % | 05/03/22 | 6,500,000 | 6,714,500 | (2) | ||||||||||||||||||
| USD | 6.00 | % | 05/03/42 | 2,529,000 | 2,426,095 | (1) | ||||||||||||||||||
| USD | 6.45 | % | 05/30/44 | 4,385,000 | 4,417,997 | (1) | ||||||||||||||||||
| 16,615,453 | ||||||||||||||||||||||||
| Jamaica ‐ 0.35% | ||||||||||||||||||||||||
| Digicel Group Ltd. | USD | 7.13 | % | 04/01/22 | 7,017,000 | 5,455,718 | (2) | |||||||||||||||||
| Kazakhstan ‐ 2.73% | ||||||||||||||||||||||||
| Kazakhstan Temir Zholy Finance BV | USD | 6.95 | % | 07/10/42 | 2,406,000 | 2,284,497 | (2) | |||||||||||||||||
| KazMunayGas National Co. JSC: | ||||||||||||||||||||||||
| USD | 9.13 | % | 07/02/18 | 1,906,000 | 2,094,217 | (1) | ||||||||||||||||||
| USD | 7.00 | % | 05/05/20 | 1,627,000 | 1,755,126 | (1) | ||||||||||||||||||
| USD | 7.00 | % | 05/05/20 | 7,014,000 | 7,566,353 | (2) | ||||||||||||||||||
| USD | 6.38 | % | 04/09/21 | 6,877,000 | 7,295,534 | (1) | ||||||||||||||||||
| USD | 6.38 | % | 04/09/21 | 15,651,000 | 16,603,520 | (2) | ||||||||||||||||||
| Zhaikmunai LLP: | ||||||||||||||||||||||||
| USD | 6.38 | % | 02/14/19 | 3,424,000 | 2,833,360 | (2) | ||||||||||||||||||
| USD | 7.13 | % | 11/13/19 | 3,005,000 | 2,490,394 | (2) | ||||||||||||||||||
| 42,923,001 | ||||||||||||||||||||||||
| Malaysia ‐ 1.03% | ||||||||||||||||||||||||
| Petronas Capital Ltd.: | ||||||||||||||||||||||||
| USD | 3.50 | % | 03/18/25 | 9,604,000 | 9,829,329 | (2) | ||||||||||||||||||
| USD | 4.50 | % | 03/18/45 | 6,025,000 | 6,380,340 | (2) | ||||||||||||||||||
| 16,209,669 | ||||||||||||||||||||||||
| Mexico ‐ 3.80% | ||||||||||||||||||||||||
| Cemex SAB de CV | USD | 7.75 | % | 04/16/26 | 3,944,000 | 4,131,340 | (2) | |||||||||||||||||
| Comision Federal de Electricidad | USD | 4.88 | % | 01/15/24 | 1,784,000 | 1,844,210 | (2) | |||||||||||||||||
| Petroleos Mexicanos: | ||||||||||||||||||||||||
| USD | 6.00 | % | 03/05/20 | 1,533,000 | 1,632,078 | |||||||||||||||||||
| USD | 5.50 | % | 01/21/21 | 651,000 | 678,016 | |||||||||||||||||||
| USD | 6.38 | % | 02/04/21 | 2,259,000 | 2,418,937 | (2) | ||||||||||||||||||
| USD | 4.88 | % | 01/24/22 | 1,835,000 | 1,838,441 | |||||||||||||||||||
| USD | 3.50 | % | 01/30/23 | 3,045,000 | 2,778,562 | |||||||||||||||||||
| USD | 4.88 | % | 01/18/24 | 14,844,000 | 14,584,230 | |||||||||||||||||||
| USD | 4.25 | % | 01/15/25 | 1,371,000 | 1,285,450 | |||||||||||||||||||
| Stone Harbor Investment Funds Annual Report | May 31, 2016 | 29 |
| Stone Harbor Emerging Markets Debt Fund | Statements of Investments |
| May 31, 2016 |
| Reference Rate | Currency | Rate | Maturity Date | Principal Amount/ Shares* | Value Expressed (in USD) | |||||||||||||||||||
| Mexico (continued) | ||||||||||||||||||||||||
| Petroleos Mexicanos: (continued) | ||||||||||||||||||||||||
| EUR | 5.50 | % | 02/24/25 | 2,275,000 | $ | 2,749,602 | (1) | |||||||||||||||||
| USD | 4.50 | % | 01/23/26 | 2,730,000 | 2,568,657 | |||||||||||||||||||
| USD | 6.88 | % | 08/04/26 | 1,123,000 | 1,215,872 | (1) | ||||||||||||||||||
| USD | 6.88 | % | 08/04/26 | 3,601,000 | 3,898,803 | (2) | ||||||||||||||||||
| USD | 9.50 | % | 09/15/27 | 1,231,000 | 1,471,045 | |||||||||||||||||||
| USD | 6.50 | % | 06/02/41 | 8,189,000 | 7,779,550 | |||||||||||||||||||
| USD | 5.50 | % | 06/27/44 | 3,243,000 | 2,724,769 | |||||||||||||||||||
| USD | 6.38 | % | 01/23/45 | 6,273,000 | 5,844,554 | |||||||||||||||||||
| USD | 5.63 | % | 01/23/46 | 11,000 | 9,336 | |||||||||||||||||||
| Sixsigma Networks Mexico SA de CV | USD | 8.25 | % | 11/07/21 | 413,000 | 402,159 | (2) | |||||||||||||||||
| 59,855,611 | ||||||||||||||||||||||||
| Morocco ‐ 0.14% | ||||||||||||||||||||||||
| OCP SA | USD | 5.63 | % | 04/25/24 | 2,190,000 | 2,299,500 | (2) | |||||||||||||||||
| Peru ‐ 0.23% | ||||||||||||||||||||||||
| Peru Payroll Deduction Finance Ltd. | USD | N/A | 11/01/29 | 4,742,088 | 3,568,421 | (1)(6) | ||||||||||||||||||
| Russia ‐ 0.88% | ||||||||||||||||||||||||
| Gazprom OAO Via Gaz Capital SA | USD | 8.15 | % | 04/11/18 | 2,500,000 | 2,731,875 | (2) | |||||||||||||||||
Rosneft Oil Co. via Rosneft International Finance Ltd. | USD | 4.20 | % | 03/06/22 | 11,440,000 | 11,068,200 | (2) | |||||||||||||||||
| 13,800,075 | ||||||||||||||||||||||||
| South Africa ‐ 2.45% | ||||||||||||||||||||||||
| Eskom Holdings SOC Ltd.: | ||||||||||||||||||||||||
| USD | 5.75 | % | 01/26/21 | 3,382,000 | 3,119,050 | (1) | ||||||||||||||||||
| USD | 6.75 | % | 08/06/23 | 7,174,000 | 6,573,177 | (2) | ||||||||||||||||||
| USD | 7.13 | % | 02/11/25 | 654,000 | 598,410 | (1) | ||||||||||||||||||
| USD | 7.13 | % | 02/11/25 | 30,964,000 | 28,332,060 | (2) | ||||||||||||||||||
| 38,622,697 | ||||||||||||||||||||||||
| Venezuela ‐ 0.41% | ||||||||||||||||||||||||
| Petroleos de Venezuela SA: | ||||||||||||||||||||||||
| USD | 5.25 | % | 04/12/17 | 4,732,100 | 2,898,766 | |||||||||||||||||||
| USD | 6.00 | % | 05/16/24 | 10,810,000 | 3,546,761 | (1) | ||||||||||||||||||
| 6,445,527 | ||||||||||||||||||||||||
| TOTAL CORPORATE BONDS | 353,109,095 | |||||||||||||||||||||||
| (Cost $348,041,694) | ||||||||||||||||||||||||
| CREDIT LINKED NOTES ‐ 1.65% | ||||||||||||||||||||||||
| Iraq ‐ 0.41% | ||||||||||||||||||||||||
Republic of Iraq (Counterparty: Bank of America ‐ Merrill Lynch): | ||||||||||||||||||||||||
| JPY | 2.58 | % | 01/01/28 | 777,269,656 | 4,379,972 | (3) | ||||||||||||||||||
| JPY | 2.82 | % | 01/01/28 | 355,203,698 | 2,003,845 | (3) | ||||||||||||||||||
| 6,383,817 | ||||||||||||||||||||||||
| Venezuela ‐ 1.24% | ||||||||||||||||||||||||
| Petroleos De Venezuela (Counterparty: | ||||||||||||||||||||||||
| Credit Suisse First Boston) | Libor+5.00% | USD | 5.62 | % | 12/20/16 | 29,200,000 | 19,586,927 | (3) | ||||||||||||||||
| TOTAL CREDIT LINKED NOTES | 25,970,744 | |||||||||||||||||||||||
| (Cost $36,933,371) | ||||||||||||||||||||||||
| 30 | www.shiplp.com |
| Stone Harbor Emerging Markets Debt Fund | Statements of Investments |
| May 31, 2016 |
| Reference Rate | Currency | Rate | Maturity Date | Principal Amount/ Shares* | Value Expressed (in USD) | |||||||||||||||||||
| SHORT TERM INVESTMENTS - 4.04% | ||||||||||||||||||||||||
| Money Market Mutual Funds - 4.04% | ||||||||||||||||||||||||
| Dreyfus Institutional Cash Advantage Fund - Institutional Advantage Class (7-Day Yield) | USD | 0.38 | % | N/A | 63,498,821 | $ | 63,498,821 | |||||||||||||||||
| TOTAL SHORT TERM INVESTMENTS | ||||||||||||||||||||||||
| (Cost $63,498,821) | 63,498,821 | |||||||||||||||||||||||
| Total Investments - 99.00% | 1,557,752,094 | |||||||||||||||||||||||
| (Cost $1,565,287,272) | ||||||||||||||||||||||||
| Other Assets In Excess of Liabilities - 1.00% | 15,737,649 | (7) | ||||||||||||||||||||||
| Net Assets - 100.00% | $ | 1,573,489,743 | ||||||||||||||||||||||
| * | The principal amount/shares of each security is stated in the currency in which the security is denominated. |
Currency Abbreviations:
| BRL | - | Brazilian Real |
| COP | - | Colombian Peso |
| EUR | - | Euro Currency |
| JPY | - | Japanese Yen |
| USD | - | United States Dollar |
(1) | Securities were originally issued pursuant to Regulation S under the Securities Act of 1933, which exempts securities offered and sold outside of the United States from registration. Such securities cannot be sold in the United States without either an effective registration statement filed pursuant to the Securities Act of 1933, or pursuant to an exemption from registration. As of May 31, 2016, the aggregate market value of those securities was $350,314,609, which represents approximately 22.26% of net assets. |
(2) | Security exempt from registration under Rule 144A of the Securities Act of 1933. Such securities may normally be sold to qualified institutional buyers in transactions exempt from registration. Total market value of Rule 144A securities amounts to $514,055,151, which represents approximately 32.67% of net assets as of May 31, 2016. |
| (3) | Floating or variable rate security. Interest rate disclosed is that which is in effect as of May 31, 2016. |
(4) | Step bond. Coupon changes periodically based upon a predetermined schedule. Interest rate disclosed is that which is in effect as of May 31, 2016. |
(5) | Security is in default and therefore is non-income producing. |
| (6) | Issued with a zero coupon. Income is recognized through the accretion of discount. |
| (7) | Includes cash which is being held as collateral for derivatives. |
Stone Harbor Investment Funds Annual Report | May 31, 2016 | 31 |
| Stone Harbor Emerging Markets Debt Fund | Statements of Investments |
| May 31, 2016 |
OUTSTANDING FORWARD FOREIGN CURRENCY CONTRACTS
| Counterparty | Foreign Currency | Contracted Amount** | Purchase/Sale Contract | Settlement Date | Current Value | Unrealized Appreciation/ (Depreciation) | |||||||||
| Citigroup Global Markets | COP | 6,513,323,500 | Sale | 06/24/16 | $ | 2,096,608 | $ | 83,949 | |||||||
| Citigroup Global Markets | EUR | 51,124,109 | Sale | 06/10/16 | 56,905,203 | 1,393,150 | |||||||||
| J.P. Morgan Chase & Co. | JPY | 708,487,800 | Sale | 06/10/16 | 6,400,560 | 207,106 | |||||||||
| $ | 1,684,205 | ||||||||||||||
| Citigroup Global Markets | EUR | 13,878,586 | Purchase | 06/10/16 | $ | 15,447,970 | $ | (501,446 | ) | ||||||
| J.P. Morgan Chase & Co. | BRL | 30,900,805 | Sale | 06/02/16 | 8,545,982 | (985,597 | ) | ||||||||
| J.P. Morgan Chase & Co. | BRL | 30,900,805 | Purchase | 06/02/16 | 8,545,982 | (121,116 | ) | ||||||||
| $ | (1,608,159 | ) | |||||||||||||
| ** | The contracted amount is stated in the currency in which the contract is denominated. |
CREDIT DEFAULT SWAP CONTRACTS ON SOVEREIGN DEBT OBLIGATIONS ISSUE - SELL PROTECTION(1)
| Reference Obligations | Counterparty | Fixed Deal Receive Rate | Maturity Date | Implied Credit Spread at May 31, 2016(2) | Notional Amount(3) | Value | Upfront Premiums Received | Unrealized Depreciation | ||||||||||||||||
| United Mexican States | J.P. Morgan Chase & Co. | 1.000 | % | 06/20/2026 | 2.350 | % | $ | 5,000,000 | $ | (563,883 | ) | $ | 512,437 | $ | (51,446 | ) | ||||||||
| United Mexican States | Goldman Sachs & Co. | 1.000 | % | 06/20/2026 | 2.350 | % | 3,050,000 | (343,968 | ) | 307,433 | (36,535 | ) | ||||||||||||
| United Mexican States | Goldman Sachs & Co. | 1.000 | % | 06/20/2026 | 2.350 | % | 4,677,589 | (527,522 | ) | 486,562 | (40,960 | ) | ||||||||||||
| United Mexican States | J.P. Morgan Chase & Co. | 1.000 | % | 06/20/2026 | 2.350 | % | 2,820,000 | (318,030 | ) | 295,247 | (22,783 | ) | ||||||||||||
| $ | (1,753,403 | ) | $ | 1,601,679 | $ | (151,724 | ) | |||||||||||||||||
(1) | If the Fund is a seller of protection and a credit event occurs, as defined under the terms of that particular swap agreement, the Fund will either (i) pay to the buyer of protection an amount equal to the notional amount of the swap and take delivery of the referenced obligation or underlying securities comprising the referenced index or (ii) pay a net settlement amount in the form of cash or securities equal to the notional amount of the swap less the recovery value of the referenced obligation or underlying securities comprising the referenced index. |
(2) | Implied credit spreads, represented in absolute terms, utilized in determining the market value of credit default swap agreements on sovereign issues of an emerging country as of period end serve as an indicator of the current status of the payment/performance risk and represent the likelihood or risk of default for the credit derivative. The implied credit spread of a particular referenced entity reflects the cost of buying/selling protection and may include upfront payments required to be made to enter into the agreement. Wider credit spreads represent a deterioration of the referenced entity’s credit soundness and a greater likelihood or risk of default or other credit event occurring as defined under the terms of the agreement. |
(3) | The maximum potential amount the Fund could be required to pay as a seller of credit protection or receive as a buyer of credit protection if a credit event occurs as defined under the terms of that particular swap agreement. |
See Notes to Financial Statements.
| 32 | www.shiplp.com |
| Stone Harbor High Yield Bond Fund | Statements of Investments |
May 31, 2016
| Reference Rate | Currency | Rate | Maturity Date | Principal Amount/ Shares* | Value (Expressed in USD) | |||||||||||||||||||
| CORPORATE BONDS - 87.19% | ||||||||||||||||||||||||
| Aerospace/Defense - 0.22% | ||||||||||||||||||||||||
Erickson, Inc., Series WI | USD | 8.25 | % | 05/01/20 | 1,010,000 | $ | 540,350 | |||||||||||||||||
| Automotive - 2.18% | ||||||||||||||||||||||||
| Dana Financing Luxembourg Sarl | USD | 6.50 | % | 06/01/26 | 765,000 | 764,044 | (1) | |||||||||||||||||
| Fiat Chrysler Automobiles NV | USD | 5.25 | % | 04/15/23 | 1,495,000 | 1,493,131 | ||||||||||||||||||
| Goodyear Tire & Rubber Co. | USD | 5.13 | % | 11/15/23 | 670,000 | 688,425 | ||||||||||||||||||
| MPG Holdco I, Inc. | USD | 7.38 | % | 10/15/22 | 1,200,000 | 1,194,000 | ||||||||||||||||||
| ZF North America Capital, Inc. | USD | 4.75 | % | 04/29/25 | 1,325,000 | 1,329,969 | (1) | |||||||||||||||||
| 5,469,569 | ||||||||||||||||||||||||
| Building Products - 3.64% | ||||||||||||||||||||||||
| Building Materials Corp. of America | USD | 5.38 | % | 11/15/24 | 1,145,000 | 1,176,487 | (1) | |||||||||||||||||
| Griffon Corp.: | ||||||||||||||||||||||||
| USD | 5.25 | % | 03/01/22 | 2,140,000 | 2,121,275 | |||||||||||||||||||
| USD | 5.25 | % | 03/01/22 | 390,000 | 386,587 | (1) | ||||||||||||||||||
| Masonite International Corp. | USD | 5.63 | % | 03/15/23 | 825,000 | 866,250 | (1) | |||||||||||||||||
| NCI Building Systems, Inc. | USD | 8.25 | % | 01/15/23 | 920,000 | 989,000 | (1) | |||||||||||||||||
| Norbord, Inc. | USD | 5.38 | % | 12/01/20 | 1,570,000 | 1,630,838 | (1) | |||||||||||||||||
| RSI Home Products, Inc. | USD | 6.50 | % | 03/15/23 | 1,275,000 | 1,319,625 | (1) | |||||||||||||||||
| US Concrete, Inc. | USD | 6.38 | % | 06/01/24 | 640,000 | 641,600 | (1) | |||||||||||||||||
| 9,131,662 | ||||||||||||||||||||||||
| Chemicals - 3.22% | ||||||||||||||||||||||||
| CeramTec Group GmbH | EUR | 8.25 | % | 08/15/21 | 1,000,000 | 1,193,262 | (2) | |||||||||||||||||
| Chemtura Corp. | USD | 5.75 | % | 07/15/21 | 3,087,000 | 3,141,022 | ||||||||||||||||||
| INEOS Group Holdings SA | USD | 5.88 | % | 02/15/19 | 935,000 | 950,194 | (1) | |||||||||||||||||
| Lyond Basel Escrow | USD | 0.00 | % | 08/15/15 | 25,000 | 0 | (3) | |||||||||||||||||
| Lyondell Chemical Co. | USD | 0.00 | % | 08/15/15 | 945,000 | 0 | (3) | |||||||||||||||||
| Platform Specialty Products Corp. | USD | 6.50 | % | 02/01/22 | 1,045,000 | 932,663 | (1) | |||||||||||||||||
| Trinseo Materials Operating SCA / Trinseo Materials Finance, Inc. | USD | 6.75 | % | 05/01/22 | 1,795,000 | 1,857,825 | (1) | |||||||||||||||||
| 8,074,966 | ||||||||||||||||||||||||
| Consumer Products - 3.06% | ||||||||||||||||||||||||
| ACCO Brands Corp. | USD | 6.75 | % | 04/30/20 | 1,288,000 | 1,366,890 | ||||||||||||||||||
| Energizer SpinCo, Inc. | USD | 5.50 | % | 06/15/25 | 1,345,000 | 1,328,201 | (1) | |||||||||||||||||
| Prestige Brands, Inc. | USD | 6.38 | % | 03/01/24 | 695,000 | 734,962 | (1) | |||||||||||||||||
Revlon Consumer Products Corp., Series WI | USD | 5.75 | % | 02/15/21 | 895,000 | 899,475 | ||||||||||||||||||
| Spectrum Brands, Inc.: | ||||||||||||||||||||||||
| USD | 6.13 | % | 12/15/24 | 980,000 | 1,029,000 | |||||||||||||||||||
| USD | 5.75 | % | 07/15/25 | 1,080,000 | 1,134,000 | |||||||||||||||||||
| Sun Products Corp. | USD | 7.75 | % | 03/15/21 | 1,201,000 | 1,167,973 | (1) | |||||||||||||||||
| 7,660,501 | ||||||||||||||||||||||||
| Stone Harbor Investment Funds Annual Report | May 31, 2016 | 33 |
| Stone Harbor High Yield Bond Fund | Statements of Investments |
May 31, 2016
| Reference Rate | Currency | Rate | Maturity Date | Principal Amount/ Shares* | Value (Expressed in USD) | |||||||||||||||||||
| Containers/Packaging - 2.71% | ||||||||||||||||||||||||
| Albea Beauty Holdings SA | USD | 8.38 | % | 11/01/19 | 1,116,000 | $ | 1,180,170 | (1) | ||||||||||||||||
| Ardagh Packaging Finance PLC / Ardagh Holdings USA, Inc. | USD | 7.25 | % | 05/15/24 | 1,645,000 | 1,677,900 | (1) | |||||||||||||||||
| Ball Corp. | USD | 5.25 | % | 07/01/25 | 440,000 | 459,800 | ||||||||||||||||||
| Berry Plastics Corp. | USD | 6.00 | % | 10/15/22 | 525,000 | 542,062 | (1) | |||||||||||||||||
| Owens-Brockway Glass Container, Inc. | USD | 5.88 | % | 08/15/23 | 1,465,000 | 1,555,647 | (1) | |||||||||||||||||
| Signode Industrial Group Lux SA/Signode Industrial Group US, Inc. | USD | 6.38 | % | 05/01/22 | 1,445,000 | 1,385,394 | (1) | |||||||||||||||||
| 6,800,973 | ||||||||||||||||||||||||
| Drillers/Services - 0.66% | ||||||||||||||||||||||||
| FTS International, Inc. | USD | 6.25 | % | 05/01/22 | 1,625,000 | 495,625 | ||||||||||||||||||
| Hornbeck Offshore Services, Inc.: | ||||||||||||||||||||||||
| USD | 5.88 | % | 04/01/20 | 827,000 | 506,538 | |||||||||||||||||||
| USD | 5.00 | % | 03/01/21 | 1,107,000 | 647,595 | |||||||||||||||||||
| 1,649,758 | ||||||||||||||||||||||||
| Electric - 4.08% | ||||||||||||||||||||||||
| Calpine Corp. | USD | 5.75 | % | 01/15/25 | 1,980,000 | 1,923,075 | ||||||||||||||||||
| Dynegy, Inc. | USD | 6.75 | % | 11/01/19 | 1,275,000 | 1,284,563 | ||||||||||||||||||
| GenOn Energy, Inc. | USD | 9.50 | % | 10/15/18 | 3,572,000 | 2,830,810 | ||||||||||||||||||
| NRG Energy, Inc. | USD | 6.25 | % | 07/15/22 | 2,235,000 | 2,206,365 | ||||||||||||||||||
| Talen Energy Supply LLC | USD | 4.63 | % | 07/15/19 | 2,145,000 | 1,984,125 | (1) | |||||||||||||||||
| 10,228,938 | ||||||||||||||||||||||||
| Exploration & Production - 4.89% | ||||||||||||||||||||||||
| Cheniere Corpus Christi Holdings LLC | USD | 7.00 | % | 06/30/24 | 665,000 | 682,456 | (1) | |||||||||||||||||
| Continental Resource | USD | 4.90 | % | 06/01/44 | 790,000 | 653,725 | ||||||||||||||||||
| Continental Resources, Inc./OK | USD | 5.00 | % | 09/15/22 | 1,350,000 | 1,282,500 | ||||||||||||||||||
| Denbury Resources, Inc. | USD | 9.00 | % | 05/15/21 | 928,000 | 917,560 | (1) | |||||||||||||||||
| EP Energy LLC / Everest Acquisition Finance, Inc. | USD | 6.38 | % | 06/15/23 | 945,000 | 486,675 | ||||||||||||||||||
EP Energy LLC/EP Energy Finance, Inc., Series WI | USD | 9.38 | % | 05/01/20 | 1,173,000 | 765,382 | ||||||||||||||||||
| Halcon Resources Corp. | USD | 9.75 | % | 07/15/20 | 1,658,000 | 335,745 | 1 | |||||||||||||||||
| Laredo Petroleum, Inc. | USD | 7.38 | % | 05/01/22 | 993,000 | 1,004,171 | ||||||||||||||||||
| Linn Energy LLC / Linn Energy Finance Corp.: | ||||||||||||||||||||||||
| USD | 7.75 | % | 02/01/21 | 2,119,000 | 344,338 | (3) | ||||||||||||||||||
| USD | 6.50 | % | 09/15/21 | 705,000 | 112,800 | (3) | ||||||||||||||||||
| Marathon Oil Corp. | USD | 6.60 | % | 10/01/37 | 1,130,000 | 1,083,635 | ||||||||||||||||||
| Midstates Petroleum Co., Inc. | USD | 10.75 | % | 10/01/20 | 981,000 | 10,423 | (3) | |||||||||||||||||
| Murphy Oil Corp. | USD | 4.70 | % | 12/01/22 | 650,000 | 589,770 | ||||||||||||||||||
| Oasis Petroleum, Inc. | USD | 7.25 | % | 02/01/19 | 2,171,000 | 2,095,015 | ||||||||||||||||||
| QEP Resources, Inc. | USD | 5.38 | % | 10/01/22 | 2,027,000 | 1,895,245 | ||||||||||||||||||
| 12,259,440 | ||||||||||||||||||||||||
| Financial Other - 0.75% | ||||||||||||||||||||||||
| Aircastle Ltd. | USD | 5.50 | % | 02/15/22 | 640,000 | 678,400 | ||||||||||||||||||
| Quicken Loans, Inc. | USD | 5.75 | % | 05/01/25 | 1,250,000 | 1,190,625 | (1) | |||||||||||||||||
| 1,869,025 | ||||||||||||||||||||||||
| 1 | Forward - Security in default |
| 34 | www.shiplp.com |
| Stone Harbor High Yield Bond Fund | Statements of Investments |
May 31, 2016
| Reference Rate | Currency | Rate | Maturity Date | Principal Amount/ Shares* | Value (Expressed in USD) | |||||||||||||||||||
| Food & Beverage - 4.71% | ||||||||||||||||||||||||
| Bakkavor Finance 2 PLC | GBP | 8.25 | % | 02/15/18 | 255,386 | $ | 380,060 | (2) | ||||||||||||||||
| Boparan Finance PLC | GBP | 5.50 | % | 07/15/21 | 1,725,000 | 2,348,499 | (2) | |||||||||||||||||
| Dean Foods Co. | USD | 6.50 | % | 03/15/23 | 1,705,000 | 1,781,725 | (1) | |||||||||||||||||
| Pilgrim's Pride Corp. | USD | 5.75 | % | 03/15/25 | 1,510,000 | 1,529,826 | (1) | |||||||||||||||||
| Pinnacle Foods Inc. | USD | 5.88 | % | 01/15/24 | 885,000 | 933,675 | (1) | |||||||||||||||||
| Post Holdings, Inc. | USD | 7.38 | % | 02/15/22 | 1,195,000 | 1,266,700 | ||||||||||||||||||
| Premier Foods Finance PLC | GBP | 6.50 | % | 03/15/21 | 850,000 | 1,241,069 | (2) | |||||||||||||||||
| R&R PLC | EUR | 9.25 | % | 05/15/18 | 1,100,000 | 1,237,097 | (2)(4) | |||||||||||||||||
| Smithfield Foods, Inc. | USD | 6.63 | % | 08/15/22 | 1,021,000 | 1,077,155 | ||||||||||||||||||
| 11,795,806 | ||||||||||||||||||||||||
| Gaming - 3.14% | ||||||||||||||||||||||||
| Boyd Gaming Corp. | USD | 6.38 | % | 04/01/26 | 580,000 | 600,300 | (1) | |||||||||||||||||
| GLP Capital LP / GLP Financing II, Inc.: | ||||||||||||||||||||||||
| USD | 5.38 | % | 11/01/23 | 830,000 | 871,500 | |||||||||||||||||||
| USD | 5.38 | % | 04/15/26 | 265,000 | 276,925 | |||||||||||||||||||
| Golden Nugget Escrow, Inc. | USD | 8.50 | % | 12/01/21 | 805,000 | 839,212 | (1) | |||||||||||||||||
| Isle of Capri Casinos, Inc. | USD | 5.88 | % | 03/15/21 | 1,870,000 | 1,961,163 | ||||||||||||||||||
| MGM Growth Properties Operating Partnership LP / MGP Escrow Co.-Issuer, Inc. | USD | 5.63 | % | 05/01/24 | 510,000 | 538,050 | (1) | |||||||||||||||||
| MGM Resorts International | USD | 6.63 | % | 12/15/21 | 1,588,000 | 1,720,995 | ||||||||||||||||||
| PNK Entertainment, Inc. | USD | 5.63 | % | 05/01/24 | 1,075,000 | 1,053,500 | (1) | |||||||||||||||||
| 7,861,645 | ||||||||||||||||||||||||
| Gas Pipelines - 0.23% | ||||||||||||||||||||||||
| Crestwood Midstream Partners LP / Crestwood Midstream Finance Corp. | USD | 6.25 | % | 04/01/23 | 615,000 | 578,100 | (1) | |||||||||||||||||
| Healthcare - 7.97% | ||||||||||||||||||||||||
| Amsurg Corp. | USD | 5.63 | % | 07/15/22 | 1,230,000 | 1,253,062 | ||||||||||||||||||
| Centene Corp. | USD | 5.63 | % | 02/15/21 | 700,000 | 729,750 | (1) | |||||||||||||||||
| Community Health Systems, Inc. | USD | 6.88 | % | 02/01/22 | 2,060,000 | 1,780,643 | ||||||||||||||||||
| DaVita HealthCare Partners, Inc. | USD | 5.13 | % | 07/15/24 | 1,015,000 | 1,030,606 | ||||||||||||||||||
| HCA, Inc.: | ||||||||||||||||||||||||
| USD | 5.38 | % | 02/01/25 | 2,550,000 | 2,591,437 | |||||||||||||||||||
| USD | 5.25 | % | 06/15/26 | 1,525,000 | 1,570,750 | |||||||||||||||||||
| HealthSouth Corp. | USD | 5.75 | % | 11/01/24 | 1,995,000 | 2,032,406 | ||||||||||||||||||
| IASIS Healthcare LLC | USD | 8.38 | % | 05/15/19 | 1,467,000 | 1,415,655 | ||||||||||||||||||
| Kinetic Concepts, Inc./KCI USA, Inc.: | ||||||||||||||||||||||||
| USD | 10.50 | % | 11/01/18 | 1,359,000 | 1,362,398 | |||||||||||||||||||
| USD | 12.50 | % | 11/01/19 | 845,000 | 777,400 | |||||||||||||||||||
| LifePoint Health, Inc. | USD | 5.50 | % | 12/01/21 | 1,705,000 | 1,777,463 | ||||||||||||||||||
| MEDNAX, Inc. | USD | 5.25 | % | 12/01/23 | 1,050,000 | 1,076,912 | (1) | |||||||||||||||||
| RegionalCare Hospital Partners Holdings, Inc. | USD | 8.25 | % | 05/01/23 | 990,000 | 1,021,561 | (1) | |||||||||||||||||
| Team Health, Inc. | USD | 7.25 | % | 12/15/23 | 1,450,000 | 1,558,750 | (1) | |||||||||||||||||
| 19,978,793 | ||||||||||||||||||||||||
| Home Builders - 0.73% | ||||||||||||||||||||||||
| CalAtlantic Group Inc. | USD | 5.88 | % | 11/15/24 | 847,000 | 897,820 | ||||||||||||||||||
| Lennar Corp. | USD | 4.75 | % | 11/15/22 | 939,000 | 936,653 | ||||||||||||||||||
| 1,834,473 | ||||||||||||||||||||||||
| Stone Harbor Investment Funds Annual Report | May 31, 2016 | 35 |
| Stone Harbor High Yield Bond Fund | Statements of Investments |
May 31, 2016
| Reference Rate | Currency | Rate | Maturity Date | Principal Amount/ Shares* | Value (Expressed in USD) | |||||||||||||||||||
| Industrial Other - 3.22% | ||||||||||||||||||||||||
| AECOM | USD | 5.75 | % | 10/15/22 | 1,315,000 | $ | 1,364,312 | |||||||||||||||||
| Cleaver-Brooks, Inc. | USD | 8.75 | % | 12/15/19 | 1,411,000 | 1,400,418 | (1) | |||||||||||||||||
| EnerSys | USD | 5.00 | % | 04/30/23 | 1,190,000 | 1,188,513 | (1) | |||||||||||||||||
| Manitowoc Foodservice, Inc. | USD | 9.50 | % | 02/15/24 | 715,000 | 790,075 | (1) | |||||||||||||||||
| MasTec, Inc. | USD | 4.88 | % | 03/15/23 | 2,483,000 | 2,332,505 | ||||||||||||||||||
| WESCO Distribution, Inc. | USD | 5.38 | % | 12/15/21 | 970,000 | 999,100 | ||||||||||||||||||
| 8,074,923 | ||||||||||||||||||||||||
| Leisure - 1.21% | ||||||||||||||||||||||||
| AMC Entertainment, Inc. | USD | 5.75 | % | 06/15/25 | 1,890,000 | 1,885,275 | ||||||||||||||||||
| Cinemark USA, Inc.: | ||||||||||||||||||||||||
| USD | 5.13 | % | 12/15/22 | 740,000 | 762,200 | |||||||||||||||||||
| USD | 4.88 | % | 06/01/23 | 375,000 | 373,125 | |||||||||||||||||||
| 3,020,600 | ||||||||||||||||||||||||
| Lodging - 0.63% | ||||||||||||||||||||||||
| RHP Hotel Properties LP/RHP Finance Corp. | USD | 5.00 | % | 04/15/21 | 1,528,000 | 1,566,200 | ||||||||||||||||||
| Media Cable - 9.86% | ||||||||||||||||||||||||
| Altice US Finance I Corp.: | ||||||||||||||||||||||||
| USD | 5.38 | % | 07/15/23 | 285,000 | 291,165 | (1) | ||||||||||||||||||
| USD | 5.50 | % | 05/15/26 | 660,000 | 674,850 | (1) | ||||||||||||||||||
| Cable One, Inc. | USD | 5.75 | % | 06/15/22 | 1,405,000 | 1,443,637 | (1) | |||||||||||||||||
| Cablevision Systems Corp. | USD | 5.88 | % | 09/15/22 | 3,500,000 | 3,132,500 | ||||||||||||||||||
| CCO Holdings LLC / CCO Holdings Capital Corp. | USD | 5.50 | % | 05/01/26 | 3,000,000 | 3,037,500 | (1) | |||||||||||||||||
| Cequel Communications Holdings I LLC/Cequel Capital Corp. | USD | 5.13 | % | 12/15/21 | 846,000 | 812,160 | (1) | |||||||||||||||||
DISH DBS Corp., Series WI | USD | 5.00 | % | 03/15/23 | 3,753,000 | 3,424,612 | ||||||||||||||||||
| Mediacom LLC | USD | 7.25 | % | 02/15/22 | 2,182,000 | 2,315,648 | ||||||||||||||||||
| Numericable-SFR SA | USD | 7.38 | % | 05/01/26 | 1,680,000 | 1,693,650 | (1) | |||||||||||||||||
| Numericable-SFR SAS | USD | 6.25 | % | 05/15/24 | 660,000 | 644,325 | (1) | |||||||||||||||||
| Quebecor Media, Inc. | USD | 5.75 | % | 01/15/23 | 1,566,000 | 1,612,980 | ||||||||||||||||||
| Unitymedia GmbH | USD | 6.13 | % | 01/15/25 | 715,000 | 737,344 | (1) | |||||||||||||||||
| Unitymedia Hessen GmbH & Co. KG | USD | 5.00 | % | 01/15/25 | 1,040,000 | 1,050,400 | (1) | |||||||||||||||||
| UPCB Finance IV Ltd. | USD | 5.38 | % | 01/15/25 | 1,030,000 | 1,054,998 | (1) | |||||||||||||||||
| Virgin Media Finance PLC | USD | 6.00 | % | 10/15/24 | 1,475,000 | 1,502,656 | (1) | |||||||||||||||||
| Virgin Media Secured Finance PLC | USD | 5.25 | % | 01/15/26 | 1,275,000 | 1,281,375 | (1) | |||||||||||||||||
| 24,709,800 | ||||||||||||||||||||||||
| Media Other - 3.53% | ||||||||||||||||||||||||
| Gray Television, Inc. | USD | 7.50 | % | 10/01/20 | 1,740,000 | 1,827,000 | ||||||||||||||||||
| LIN Television Corp. | USD | 5.88 | % | 11/15/22 | 1,875,000 | 1,905,469 | ||||||||||||||||||
Sinclair Television Group, Inc., Series WI | USD | 6.13 | % | 10/01/22 | 940,000 | 991,700 | ||||||||||||||||||
| TEGNA, Inc. | USD | 6.38 | % | 10/15/23 | 1,299,000 | 1,392,398 | ||||||||||||||||||
| Tribune Media Co. | USD | 5.88 | % | 07/15/22 | 2,685,000 | 2,725,275 | ||||||||||||||||||
| 8,841,842 | ||||||||||||||||||||||||
| 36 | www.shiplp.com |
| Stone Harbor High Yield Bond Fund | Statements of Investments |
May 31, 2016
| Reference Rate | Currency | Rate | Maturity Date | Principal Amount/ Shares* | Value (Expressed in USD) | |||||||||||||||||||
| Metals/Mining/Steel - 1.65% | ||||||||||||||||||||||||
| Anglo American Capital PLC | USD | 4.13 | % | 09/27/22 | 1,280,000 | $ | 1,171,200 | (1) | ||||||||||||||||
| ArcelorMittal | USD | 8.00 | % | 10/15/39 | 1,425,000 | 1,353,750 | ||||||||||||||||||
| Freeport-McMoRan, Inc. | USD | 3.55 | % | 03/01/22 | 1,075,000 | 908,375 | ||||||||||||||||||
| Kaiser Aluminum Corp. | USD | 5.88 | % | 05/15/24 | 690,000 | 709,941 | (1) | |||||||||||||||||
| 4,143,266 | ||||||||||||||||||||||||
| Paper/Forest Products - 1.67% | ||||||||||||||||||||||||
| Cascades, Inc. | USD | 5.50 | % | 07/15/22 | 1,035,000 | 1,014,300 | (1) | |||||||||||||||||
| Louisiana-Pacific Corp. | USD | 7.50 | % | 06/01/20 | 1,293,000 | 1,340,679 | ||||||||||||||||||
| Mercer International, Inc. | USD | 7.75 | % | 12/01/22 | 1,810,000 | 1,832,625 | ||||||||||||||||||
| 4,187,604 | ||||||||||||||||||||||||
| Pharmaceuticals - 2.03% | ||||||||||||||||||||||||
| Endo Finance LLC / Endo Ltd. / Endo Finco, Inc. | USD | 6.00 | % | 02/01/25 | 1,900,000 | 1,657,750 | (1) | |||||||||||||||||
| Mallinckrodt International Finance SA / Mallinckrodt CB LLC | USD | �� | 5.63 | % | 10/15/23 | 1,410,000 | 1,332,450 | (1) | ||||||||||||||||
| Valeant Pharmaceuticals International, Inc. | USD | 5.88 | % | 05/15/23 | 2,490,000 | 2,105,606 | (1) | |||||||||||||||||
| 5,095,806 | ||||||||||||||||||||||||
| Refining - 0.59% | ||||||||||||||||||||||||
| Tesoro Logistics LP/Tesoro Logistics Finance Corp. | USD | 6.13 | % | 10/15/21 | 1,433,000 | 1,484,043 | ||||||||||||||||||
| Retail Food/Drug - 1.52% | ||||||||||||||||||||||||
| Albertsons Cos LLC / Safeway, Inc. / New Albertson's Inc / Albertson's LLC | USD | 6.63 | % | 06/15/24 | 670,000 | 690,100 | (1) | |||||||||||||||||
| The Fresh Market, Inc. | USD | 9.75 | % | 05/01/23 | 765,000 | 699,975 | (1) | |||||||||||||||||
| Safeway, Inc. | USD | 7.25 | % | 02/01/31 | 1,463,000 | 1,400,822 | ||||||||||||||||||
| Tops Holding II | USD | 8.00 | % | 06/15/22 | 1,140,000 | 1,011,750 | (1) | |||||||||||||||||
| 3,802,647 | ||||||||||||||||||||||||
| Retail Non Food/Drug - 2.69% | ||||||||||||||||||||||||
| Argos Merger Sub, Inc. | USD | 7.13 | % | 03/15/23 | 1,520,000 | 1,542,800 | (1) | |||||||||||||||||
| Hot Topic, Inc. | USD | 9.25 | % | 06/15/21 | 1,655,000 | 1,675,687 | (1) | |||||||||||||||||
| JC Penney Corp., Inc. | USD | 7.40 | % | 04/01/37 | 1,325,000 | 1,026,875 | ||||||||||||||||||
| L Brands, Inc. | USD | 6.88 | % | 11/01/35 | 1,335,000 | 1,415,100 | ||||||||||||||||||
| Sally Holdings LLC / Sally Capital, Inc. | USD | 5.63 | % | 12/01/25 | 1,015,000 | 1,067,019 | ||||||||||||||||||
| 6,727,481 | ||||||||||||||||||||||||
| Services Other - 0.47% | ||||||||||||||||||||||||
| Outerwall, Inc. | USD | 6.00 | % | 03/15/19 | 1,260,000 | 1,171,800 | ||||||||||||||||||
| Stone Harbor Investment Funds Annual Report | May 31, 2016 | 37 |
| Stone Harbor High Yield Bond Fund | Statements of Investments |
May 31, 2016
| Reference Rate | Currency | Rate | Maturity Date | Principal Amount/ Shares* | Value (Expressed in USD) | |||||||||||||||||||
| Technology - 3.67% | ||||||||||||||||||||||||
| Artesyn Embedded Technologies, Inc. | USD | 9.75 | % | 10/15/20 | 1,275,000 | $ | 1,125,188 | (1) | ||||||||||||||||
| Diamond 1 Finance Corp. / Diamond 2 Finance Corp | USD | 6.02 | % | 06/15/26 | 680,000 | 687,407 | (1) | |||||||||||||||||
| Diebold, Inc. | USD | 8.50 | % | 04/15/24 | 850,000 | 843,625 | (1) | |||||||||||||||||
| First Data Corp. | USD | 7.00 | % | 12/01/23 | 1,440,000 | 1,465,200 | (1) | |||||||||||||||||
| NCR Corp. | USD | 5.00 | % | 07/15/22 | 944,000 | 932,200 | ||||||||||||||||||
| Nuance Communications, Inc. | USD | 5.38 | % | 08/15/20 | 1,657,000 | 1,692,211 | (1) | |||||||||||||||||
| PTC, Inc. | USD | 6.00 | % | 05/15/24 | 775,000 | 808,906 | ||||||||||||||||||
| Western Digital Corp. | USD | 10.50 | % | 04/01/24 | 1,570,000 | 1,628,875 | (1) | |||||||||||||||||
| 9,183,612 | ||||||||||||||||||||||||
| Textile/Apparel - 0.92% | ||||||||||||||||||||||||
| Levi Strauss & Co. | USD | 5.00 | % | 05/01/25 | 963,000 | 969,019 | ||||||||||||||||||
| Quiksilver, Inc.: | ||||||||||||||||||||||||
| USD | 10.00 | % | 08/01/20 | 521,000 | 36,470 | (3) | ||||||||||||||||||
| USD | 7.88 | % | 08/01/18 | 1,117,000 | 234,570 | (1)(3) | ||||||||||||||||||
| William Carter Co. | USD | 5.25 | % | 08/15/21 | 1,025,000 | 1,066,000 | ||||||||||||||||||
| 2,306,059 | ||||||||||||||||||||||||
Transportation Non Air/Rail - 0.58% | ||||||||||||||||||||||||
| XPO Logistics, Inc. | USD | 6.50 | % | 06/15/22 | 1,500,000 | 1,447,500 | (1) | |||||||||||||||||
| Wireless - 4.25% | ||||||||||||||||||||||||
| Altice SA | USD | 7.75 | % | 05/15/22 | 1,860,000 | 1,912,313 | (1) | |||||||||||||||||
| Sprint Capital Corp. | USD | 8.75 | % | 03/15/32 | 3,740,000 | 3,038,750 | ||||||||||||||||||
| T-Mobile USA, Inc.: | �� | |||||||||||||||||||||||
| USD | 6.73 | % | 04/28/22 | 2,511,000 | 2,642,827 | |||||||||||||||||||
| USD | 6.50 | % | 01/15/26 | 1,425,000 | 1,511,391 | |||||||||||||||||||
| Wind Acquisition Finance SA: | ||||||||||||||||||||||||
| USD | 4.75 | % | 07/15/20 | 730,000 | 715,400 | (1) | ||||||||||||||||||
| USD | 7.38 | % | 04/23/21 | 865,000 | 822,831 | (1) | ||||||||||||||||||
| 10,643,512 | ||||||||||||||||||||||||
| Wirelines - 6.51% | ||||||||||||||||||||||||
| CenturyLink, Inc.: | ||||||||||||||||||||||||
| USD | 5.80 | % | 03/15/22 | 641,000 | 619,366 | |||||||||||||||||||
| USD | 7.65 | % | 03/15/42 | 1,350,000 | 1,110,375 | |||||||||||||||||||
| Cincinnati Bell, Inc. | USD | 8.38 | % | 10/15/20 | 1,828,000 | 1,914,830 | ||||||||||||||||||
| Citizens Communications Co. | USD | 9.00 | % | 08/15/31 | 2,145,000 | 1,844,700 | ||||||||||||||||||
| Cogent Communications Group, Inc. | USD | 5.38 | % | 03/01/22 | 775,000 | 782,750 | (1) | |||||||||||||||||
| CyrusOne LP / CyrusOne Finance Corp. | USD | 6.38 | % | 11/15/22 | 1,840,000 | 1,959,600 | ||||||||||||||||||
| Frontier Communications Corp. | USD | 6.25 | % | 09/15/21 | 1,160,000 | 1,084,600 | ||||||||||||||||||
| GCI, Inc. | USD | 6.88 | % | 04/15/25 | 1,556,000 | 1,575,450 | ||||||||||||||||||
| Level 3 Communications, Inc. | USD | 5.75 | % | 12/01/22 | 1,215,000 | 1,245,375 | ||||||||||||||||||
| Level 3 Financing, Inc., Series WI | USD | 5.38 | % | 08/15/22 | 1,515,000 | 1,543,406 | ||||||||||||||||||
| Telecom Italia SpA | USD | 5.30 | % | 05/30/24 | 798,000 | 806,483 | (1) | |||||||||||||||||
| Windstream Services LLC | USD | 7.50 | % | 04/01/23 | 2,226,000 | 1,819,755 | ||||||||||||||||||
| 16,306,690 | ||||||||||||||||||||||||
| TOTAL CORPORATE BONDS | 218,447,384 | |||||||||||||||||||||||
| (Cost $228,469,523) | ||||||||||||||||||||||||
| 38 | www.shiplp.com |
| Stone Harbor High Yield Bond Fund | Statements of Investments |
May 31, 2016
| Reference Rate | Currency | Rate | Maturity Date | Principal Amount/ Shares* | Value (Expressed in USD) | |||||||||||||||||||
BANK LOANS - 9.66%(5) | ||||||||||||||||||||||||
| Aerospace/Defense - 0.31% | ||||||||||||||||||||||||
| Accudyne Industries Borrower SCA (aka Hamilton Sundstrand) - Refinancing Term Loan | Libor+3.00% | USD | 4.00 | % | 12/13/19 | 864,798 | $ | 789,128 | ||||||||||||||||
| Building Products - 0.64% | ||||||||||||||||||||||||
| Beacon Roofing Supply, Inc. - Initial Term Loan | Libor+3.00% | USD | 4.00 | % | 10/01/22 | 776,100 | 779,859 | |||||||||||||||||
| Summit Materials LLC - Restatement Effective Date Term Loan | Libor+3.00% | USD | 4.00 | % | 07/17/22 | 813,850 | 816,541 | |||||||||||||||||
| 1,596,400 | ||||||||||||||||||||||||
| Chemicals - 1.31% | ||||||||||||||||||||||||
| Axalta Coating Systems Dutch Holding B BV - Refinanced Term B Loan | Libor+2.75% | USD | 3.75 | % | 02/01/20 | 622,068 | 624,012 | |||||||||||||||||
| MacDermid, Inc. - Term B-3 Loan | Libor+4.50% | USD | 5.50 | % | 06/07/20 | 925,350 | 925,581 | |||||||||||||||||
| Styrolution Group Gmbh - Tranche B1 Term Loan | Libor+5.50% | USD | 6.50 | % | 09/30/19 | 1,738,000 | 1,744,518 | |||||||||||||||||
| 3,294,111 | ||||||||||||||||||||||||
| Containers/Packaging - 0.88% | ||||||||||||||||||||||||
| Berry Plastics Group, Inc. - Term F Loan | Libor+3.00% | USD | 4.00 | % | 10/01/22 | 821,058 | 825,574 | |||||||||||||||||
| Reynolds Group Holdings, Inc. - Incremental U.S. Term Loan | Libor+3.50% | USD | 4.50 | % | 12/01/18 | 1,375,000 | 1,381,797 | |||||||||||||||||
| 2,207,371 | ||||||||||||||||||||||||
| Diversified Manufacturing - 0.25% | ||||||||||||||||||||||||
| Blount International, Inc. - Initial Term Loan | Libor+6.25% | USD | 7.25 | % | 04/05/23 | 610,000 | 618,388 | |||||||||||||||||
| Electric - 0.58% | ||||||||||||||||||||||||
| Texas Competitive Electric Holdings Co. LLC - 2017 Term Loan | Libor+4.50% | USD | 4.93 | % | 10/10/17 | 4,540,167 | 1,441,503 | |||||||||||||||||
| Food & Beverage - 0.59% | ||||||||||||||||||||||||
| Hostess Brands LLC - Term B Loan (First Lien) | Libor+3.50% | USD | 4.50 | % | 08/03/22 | 1,482,550 | 1,489,036 | |||||||||||||||||
| Industrial Other - 0.74% | ||||||||||||||||||||||||
| Gates Global LLC - Initial Term Loan | Libor+3.25% | USD | 4.25 | % | 07/06/21 | 1,401,343 | 1,355,799 | |||||||||||||||||
| Manitowoc Foodservice, Inc. - Term B Loan (First Lien) | Libor+4.75% | USD | 5.75 | % | 03/04/23 | 502,154 | 507,071 | |||||||||||||||||
| 1,862,870 | ||||||||||||||||||||||||
| Lodging - 0.19% | ||||||||||||||||||||||||
| La Quinta Intermediate Holdings LLC - Initial Term Loan | Libor+2.75% | USD | 3.75 | % | 04/14/21 | 480,882 | 476,220 | |||||||||||||||||
| Media Other - 0.76% | ||||||||||||||||||||||||
| Univision Communications, Inc. - Replacement First-Lien Term Loan | Libor+3.00% | USD | 4.00 | % | 03/01/20 | 1,892,738 | 1,895,272 | |||||||||||||||||
| Metals/Mining/Steel - 0.35% | ||||||||||||||||||||||||
| Fortescue Metal Group Resources Pty Ltd. - Term Loan | Libor+3.25% | USD | L+3.25% | 06/30/19 | 927,744 | 870,920 | (6) | |||||||||||||||||
| Stone Harbor Investment Funds Annual Report | May 31, 2016 | 39 |
| Stone Harbor High Yield Bond Fund | Statements of Investments |
May 31, 2016
| Reference Rate | Currency | Rate | Maturity Date | Principal Amount/ Shares* | Value (Expressed in USD) | |||||||||||||||||||
| Retail Food/Drug - 1.06% | ||||||||||||||||||||||||
| Albertson's Holdings LLC - Term B-4 Loan | Libor+4.50% | USD | 5.50 | % | 08/25/21 | 2,645,783 | $ | 2,654,969 | ||||||||||||||||
| Retail Non Food/Drug - 1.16% | ||||||||||||||||||||||||
| JC Penney Corp., Inc. - Term Loan | Libor+5.00% | USD | 6.00 | % | 05/22/18 | 1,094,869 | 1,097,036 | |||||||||||||||||
| PET Acquisition Merger Sub LLC - Term Loan (First Lien) | Libor+4.75% | USD | 5.75 | % | 01/26/23 | 1,795,500 | 1,810,729 | |||||||||||||||||
| 2,907,765 | ||||||||||||||||||||||||
| Technology - 0.84% | ||||||||||||||||||||||||
| Avago Technologies Cayman Finance Ltd. - Term B Loan | Libor+3.50% | USD | 4.25 | % | 02/01/23 | 1,440,000 | 1,445,200 | |||||||||||||||||
| MA Financeco. - LLC - Initial Tranche B Term Loan | Libor+4.25% | USD | 5.25 | % | 11/20/21 | 662,988 | 665,806 | |||||||||||||||||
| 2,111,006 | ||||||||||||||||||||||||
| TOTAL BANK LOANS | 24,214,959 | |||||||||||||||||||||||
| (Cost $26,539,093) | ||||||||||||||||||||||||
| COMMON/PREFERRED STOCKS - 0.15% | ||||||||||||||||||||||||
| Denbury Resources, Inc. | USD | 47,950 | 192,279 | |||||||||||||||||||||
| EME Reorganization Trust | USD | 3,059,892 | 12,240 | |||||||||||||||||||||
| NRG Energy, Inc. | USD | 10,061 | 164,799 | |||||||||||||||||||||
| 369,318 | ||||||||||||||||||||||||
| TOTAL COMMON/PREFERRED STOCKS | 369,318 | |||||||||||||||||||||||
| (Cost $951,846) | ||||||||||||||||||||||||
| SHORT TERM INVESTMENTS - 2.33% | ||||||||||||||||||||||||
| Money Market Mutual Funds - 2.33% | ||||||||||||||||||||||||
| Dreyfus Institutional Cash Advantage Fund - | ||||||||||||||||||||||||
| Institutional Advantage Class (7-Day Yield) | USD | 0.38 | % | N/A | 5,832,580 | 5,832,580 | ||||||||||||||||||
| TOTAL SHORT TERM INVESTMENTS | 5,832,580 | |||||||||||||||||||||||
| (Cost $5,832,580) | ||||||||||||||||||||||||
| Total Investments - 99.33% | 248,864,241 | |||||||||||||||||||||||
| (Cost $261,793,042) | ||||||||||||||||||||||||
| Other Assets in Excess of Liabilities - 0.67% | 1,671,318 | |||||||||||||||||||||||
| Net Assets - 100.00% | $ | 250,535,559 | ||||||||||||||||||||||
| * | The principal amount/shares of each security is stated in the currency in which the security is denominated. |
Currency Abbreviations:
EUR - Euro Currency
GBP - Great British Pound
USD - United States Dollar
| (1) | Security exempt from registration under Rule 144A of the Securities Act of 1933. Such securities may normally be sold to qualified institutional buyers in transactions exempt from registration. Total market value of Rule 144A securities amounts to $84,812,495, which represents approximately 33.85% of net assets as of May 31, 2016. |
| 40 | www.shiplp.com |
| Stone Harbor High Yield Bond Fund | Statements of Investments |
May 31, 2016
| (2) | Securities were originally issued pursuant to Regulation S under the Securities Act of 1933, which exempts securities offered and sold outside of the United States from registration. Such securities cannot be sold in the United States without either an effective registration statement filed pursuant to the Securities Act of 1933, or pursuant to an exemption from registration. As of May 31, 2016, the aggregate market value of those securities was $6,399,987, which represents approximately 2.55% of net assets. |
| (3) | Security is in default and therefore is non-income producing. |
| (4) | Payment-in-kind securities. |
| (5) | Bank loans generally pay interest at rates which are periodically determined by reference to a base lending rate plus a premium. All loans carry a variable rate of interest. These base lending rates are generally (i) the Prime Rate offered by one or more major United States banks, (ii) the lending rate offered by one or more European banks such as the London Interbank Offered Rate ("LIBOR") or (iii) the Certificate of Deposit rate. Bank Loans, while exempt from registration, under the Securities Act of 1933, contain certain restrictions on resale and cannot be sold publicly. Floating rate bank loans often require prepayments from excess cash flow or permit the borrower to repay at its election. The degree to which borrowers repay, whether as a contractual requirement or at their election, cannot be predicted with accuracy. |
| (6) | All or a portion of this position has not settled. Contract rates do not take effect until settlement date. |
OUTSTANDING FORWARD FOREIGN CURRENCY CONTRACTS
| Counterparty | Foreign Currency | Contracted Amount** | Purchase/Sale Contract | Settlement Date | Current Value | Unrealized Appreciation/ (Depreciation) | |||||||||
| Citigroup Global Markets | EUR | 2,286,206 | Sale | 06/10/16 | $ | 2,544,729 | $ | 61,943 | |||||||
| Citigroup Global Markets | GBP | 2,810,178 | Sale | 06/10/16 | 4,070,456 | 36,314 | |||||||||
| Citigroup Global Markets | GBP | 24,944 | Purchase | 06/10/16 | 36,131 | 122 | |||||||||
| $ | 98,379 | ||||||||||||||
| ** | The contracted amount is stated in the currency in which the contract is denominated. |
See Notes to Financial Statements
| Stone Harbor Investment Funds Annual Report | May 31, 2016 | 41 |
| Stone Harbor Local Markets Fund | Statements of Investments |
May 31, 2016
| Reference Rate | Currency | Rate | Maturity Date | Principal Amount/ Shares* | Value Expressed (in USD) | |||||||||||||||||||
| SOVEREIGN DEBT OBLIGATIONS - 78.92% | ||||||||||||||||||||||||
| Brazil - 13.99% | ||||||||||||||||||||||||
| Brazil Letras do Tesouro Nacional: | ||||||||||||||||||||||||
| BRL | 0.00 | % | 10/01/16 | 71,892,000 | $ | 19,005,542 | (1) | |||||||||||||||||
| BRL | 0.00 | % | 01/01/18 | 144,933,000 | 33,112,875 | (1) | ||||||||||||||||||
| BRL | 0.00 | % | 07/01/18 | 122,015,000 | 26,283,063 | (1) | ||||||||||||||||||
| BRL | 0.00 | % | 01/01/19 | 34,139,000 | 6,925,864 | (1) | ||||||||||||||||||
| BRL | 0.00 | % | 07/01/19 | 34,450,000 | 6,579,020 | (1) | ||||||||||||||||||
| Nota Do Tesouro Nacional: | ||||||||||||||||||||||||
| BRL | 10.00 | % | 01/01/21 | 56,728,000 | 14,293,742 | |||||||||||||||||||
| BRL | 10.00 | % | 01/01/25 | 99,089,000 | 23,429,108 | |||||||||||||||||||
| 129,629,214 | ||||||||||||||||||||||||
| Colombia - 6.71% | ||||||||||||||||||||||||
| Bogota Distrio Capital | COP | 9.75 | % | 07/26/28 | 65,141,000,000 | 21,525,402 | (2) | |||||||||||||||||
| International Bank for Reconstruction & Development | COP | 8.00 | % | 03/02/20 | 1,020,000,000 | 339,138 | ||||||||||||||||||
| Republic of Colombia: | ||||||||||||||||||||||||
| COP | 7.75 | % | 04/14/21 | 29,451,000,000 | 9,506,119 | |||||||||||||||||||
| COP | 4.38 | % | 03/21/23 | 742,000,000 | 197,295 | |||||||||||||||||||
| COP | 10.00 | % | 07/24/24 | 15,521,100,000 | 5,664,022 | |||||||||||||||||||
| COP | 7.50 | % | 08/26/26 | 5,800,000,000 | 1,806,472 | |||||||||||||||||||
| COP | 9.85 | % | 06/28/27 | 37,767,000,000 | 13,717,156 | |||||||||||||||||||
| COP | 7.75 | % | 09/18/30 | 250,000,000 | 77,632 | |||||||||||||||||||
| Titulos De Tesoreira: | ||||||||||||||||||||||||
| COP | 5.00 | % | 11/21/18 | 21,457,300,000 | 6,601,781 | |||||||||||||||||||
| COP | 11.00 | % | 07/24/20 | 7,530,000,000 | 2,731,312 | |||||||||||||||||||
| 62,166,329 | ||||||||||||||||||||||||
| Indonesia - 10.98% | ||||||||||||||||||||||||
| European Bank for Reconstruction & Development | IDR | 7.20 | % | 06/08/16 | 37,740,000,000 | 2,766,541 | ||||||||||||||||||
| Indonesia Government: | ||||||||||||||||||||||||
| IDR | 8.25 | % | 07/15/21 | 16,619,000,000 | 1,253,901 | |||||||||||||||||||
| IDR | 11.00 | % | 09/15/25 | 109,942,000,000 | 9,688,417 | |||||||||||||||||||
| IDR | 6.13 | % | 05/15/28 | 149,010,000,000 | 9,364,886 | |||||||||||||||||||
| IDR | 8.25 | % | 06/15/32 | 232,400,000,000 | 17,354,802 | |||||||||||||||||||
| IDR | 6.63 | % | 05/15/33 | 129,002,000,000 | 8,212,073 | |||||||||||||||||||
| IDR | 8.38 | % | 03/15/34 | 141,460,000,000 | 10,689,757 | |||||||||||||||||||
| Republic of Indonesia: | ||||||||||||||||||||||||
| IDR | 12.80 | % | 06/15/21 | 2,980,000,000 | 265,665 | |||||||||||||||||||
| IDR | 7.00 | % | 05/15/22 | 340,530,000,000 | 24,237,210 | |||||||||||||||||||
| IDR | 5.63 | % | 05/15/23 | 34,887,000,000 | 2,269,826 | |||||||||||||||||||
| IDR | 9.00 | % | 03/15/29 | 198,452,000,000 | 15,647,272 | |||||||||||||||||||
| 101,750,350 | ||||||||||||||||||||||||
| Malaysia - 4.80% | ||||||||||||||||||||||||
| Malaysian Government: | ||||||||||||||||||||||||
| MYR | 3.48 | % | 03/15/23 | 72,280,000 | 17,076,566 | |||||||||||||||||||
| MYR | 4.18 | % | 07/15/24 | 64,660,000 | 15,926,186 | |||||||||||||||||||
| MYR | 3.96 | % | 09/15/25 | 11,666,000 | 2,839,508 | |||||||||||||||||||
| MYR | 4.39 | % | 04/15/26 | 16,370,000 | 4,095,473 | |||||||||||||||||||
| MYR | 4.50 | % | 04/15/30 | 11,870,000 | 2,950,970 | |||||||||||||||||||
| 42 | www.shiplp.com |
| Stone Harbor Local Markets Fund | Statements of Investments |
May 31, 2016
| Reference Rate | Currency | Rate | Maturity Date | Principal Amount/ Shares* | Value Expressed (in USD) | |||||||||||||||||||
| Malaysia (continued) | ||||||||||||||||||||||||
| Malaysian Government: (continued) | ||||||||||||||||||||||||
| MYR | 3.84 | % | 04/15/33 | 6,980,000 | $ | 1,588,208 | ||||||||||||||||||
| 44,476,911 | ||||||||||||||||||||||||
| Mexico - 4.72% | ||||||||||||||||||||||||
| Mexican Bonos: | ||||||||||||||||||||||||
| MXN | 8.50 | % | 12/13/18 | 21,410,000 | 1,256,826 | |||||||||||||||||||
| MXN | 5.00 | % | 12/11/19 | 208,700,000 | 11,208,973 | |||||||||||||||||||
| MXN | 8.00 | % | 12/07/23 | 49,940,000 | 3,039,846 | |||||||||||||||||||
| MXN | 10.00 | % | 12/05/24 | 179,758,900 | 12,319,763 | |||||||||||||||||||
| MXN | 8.50 | % | 05/31/29 | 42,515,000 | 2,705,328 | |||||||||||||||||||
| MXN | 7.75 | % | 05/29/31 | 89,606,000 | 5,357,772 | |||||||||||||||||||
| MXN | 8.50 | % | 11/18/38 | 122,092,000 | 7,838,811 | |||||||||||||||||||
| 43,727,319 | ||||||||||||||||||||||||
| Poland - 12.64% | ||||||||||||||||||||||||
| Republic of Poland: | ||||||||||||||||||||||||
| PLN | 0.00 | % | 07/25/16 | 75,610,000 | 19,132,574 | (1) | ||||||||||||||||||
| PLN | 0.00 | % | 07/25/17 | 80,880,000 | 20,172,829 | (1) | ||||||||||||||||||
| PLN | 0.00 | % | 10/25/18 | 6,990,000 | 1,703,586 | (1) | ||||||||||||||||||
| PLN | 5.75 | % | 09/23/22 | 32,000,000 | 9,598,945 | |||||||||||||||||||
| PLN | 2.75 | % | 08/25/23 | 16,231,554 | 4,568,675 | |||||||||||||||||||
| PLN | 4.00 | % | 10/25/23 | 23,250,000 | 6,365,510 | |||||||||||||||||||
| PLN | 3.25 | % | 07/25/25 | 197,477,000 | 51,114,375 | |||||||||||||||||||
| PLN | 2.50 | % | 07/25/26 | 18,470,000 | 4,440,462 | |||||||||||||||||||
| 117,096,956 | ||||||||||||||||||||||||
| Romania - 1.55% | ||||||||||||||||||||||||
| Romania Government: | ||||||||||||||||||||||||
| RON | 5.85 | % | 04/26/23 | 23,320,000 | 6,675,694 | |||||||||||||||||||
| RON | 4.75 | % | 02/24/25 | 22,100,000 | 5,912,329 | |||||||||||||||||||
| RON | 5.80 | % | 07/26/27 | 6,070,000 | 1,738,890 | |||||||||||||||||||
| 14,326,913 | ||||||||||||||||||||||||
| Russia - 4.69% | ||||||||||||||||||||||||
| Russian Federation: | ||||||||||||||||||||||||
| RUB | 6.80 | % | 12/11/19 | 85,090,000 | 1,188,593 | |||||||||||||||||||
| RUB | 7.60 | % | 04/14/21 | 715,870,000 | 10,182,240 | |||||||||||||||||||
| RUB | 6.50 | % | 11/24/21 | 288,490,000 | 3,945,960 | (3) | ||||||||||||||||||
| RUB | 7.60 | % | 07/20/22 | 793,582,000 | 11,172,149 | |||||||||||||||||||
| RUB | 7.00 | % | 01/25/23 | 539,230,000 | 7,359,073 | |||||||||||||||||||
| RUB | 7.00 | % | 08/16/23 | 435,870,000 | 5,915,341 | |||||||||||||||||||
| RUB | 8.15 | % | 02/03/27 | 257,430,000 | 3,722,650 | |||||||||||||||||||
| 43,486,006 | ||||||||||||||||||||||||
| South Africa - 10.61% | ||||||||||||||||||||||||
| Republic of South Africa: | ||||||||||||||||||||||||
| ZAR | 7.25 | % | 01/15/20 | 36,358,000 | 2,208,686 | |||||||||||||||||||
| ZAR | 6.75 | % | 03/31/21 | 31,910,000 | 1,862,829 | |||||||||||||||||||
| ZAR | 7.75 | % | 02/28/23 | 450,000,000 | 26,648,256 | |||||||||||||||||||
| ZAR | 10.50 | % | 12/21/26 | 274,877,000 | 18,786,240 | |||||||||||||||||||
| ZAR | 7.00 | % | 02/28/31 | 331,075,000 | 16,554,320 | |||||||||||||||||||
| ZAR | 6.25 | % | 03/31/36 | 422,640,000 | 18,580,405 | |||||||||||||||||||
| ZAR | 6.50 | % | 02/28/41 | 174,390,000 | 7,610,852 | |||||||||||||||||||
| Stone Harbor Investment Funds Annual Report | May 31, 2016 | 43 |
| Stone Harbor Local Markets Fund | Statements of Investments |
May 31, 2016
| Reference Rate | Currency | Rate | Maturity Date | Principal Amount/ Shares* | Value Expressed (in USD) | |||||||||||||||||||
| South Africa (continued) | ||||||||||||||||||||||||
| Republic of South Africa: (continued) | ||||||||||||||||||||||||
| ZAR | 8.75 | % | 02/28/48 | 107,519,000 | $ | 6,029,554 | ||||||||||||||||||
| 98,281,142 | ||||||||||||||||||||||||
| Thailand - 3.45% | ||||||||||||||||||||||||
| Thailand Government: | ||||||||||||||||||||||||
| THB | 1.20 | % | 07/14/21 | 400,275,296 | 11,050,640 | |||||||||||||||||||
| THB | 3.85 | % | 12/12/25 | 79,024,000 | 2,499,491 | |||||||||||||||||||
| THB | 3.58 | % | 12/17/27 | 261,770,000 | 8,207,119 | |||||||||||||||||||
| THB | 4.88 | % | 06/22/29 | 197,846,000 | 6,949,193 | |||||||||||||||||||
| THB | 4.68 | % | 06/29/44 | 83,167,000 | 3,228,398 | |||||||||||||||||||
| 31,934,841 | ||||||||||||||||||||||||
| Turkey - 4.78% | ||||||||||||||||||||||||
| Republic of Turkey: | ||||||||||||||||||||||||
| TRY | 10.50 | % | 01/15/20 | 5,270,000 | 1,847,651 | |||||||||||||||||||
| TRY | 7.40 | % | 02/05/20 | 3,820,000 | 1,212,408 | |||||||||||||||||||
| TRY | 9.50 | % | 01/12/22 | 13,930,000 | 4,706,878 | |||||||||||||||||||
| TRY | 8.50 | % | 09/14/22 | 51,360,000 | 16,501,799 | |||||||||||||||||||
| TRY | 7.10 | % | 03/08/23 | 32,760,000 | 9,710,037 | |||||||||||||||||||
| TRY | 10.40 | % | 03/20/24 | 17,800,000 | 6,267,775 | |||||||||||||||||||
| TRY | 9.00 | % | 07/24/24 | 12,550,000 | 4,093,916 | |||||||||||||||||||
| 44,340,464 | ||||||||||||||||||||||||
| TOTAL SOVEREIGN DEBT OBLIGATIONS | 731,216,445 | |||||||||||||||||||||||
| (Cost $877,979,342) | ||||||||||||||||||||||||
| CORPORATE BONDS - 4.67% | ||||||||||||||||||||||||
| Colombia - 0.89% | ||||||||||||||||||||||||
| Emgesa SA ESP: | ||||||||||||||||||||||||
| COP | 8.75 | % | 01/25/21 | 616,000,000 | 190,121 | (4) | ||||||||||||||||||
| COP | 8.75 | % | 01/25/21 | 16,739,000,000 | 5,166,291 | (2) | ||||||||||||||||||
| Empresas Publicas de Medellin ESP: | ||||||||||||||||||||||||
| COP | 8.38 | % | 02/01/21 | 776,000,000 | 238,309 | (4) | ||||||||||||||||||
| COP | 8.38 | % | 02/01/21 | 3,338,000,000 | 1,025,099 | (2) | ||||||||||||||||||
| Financiera de Desarrollo Territorial SA Findeter | COP | 7.88 | % | 08/12/24 | 5,687,000,000 | 1,623,675 | (4) | |||||||||||||||||
| 8,243,495 | ||||||||||||||||||||||||
| Mexico - 3.78% | ||||||||||||||||||||||||
| America Movil SAB de CV | MXN | 6.00 | % | 06/09/19 | 242,900,000 | 13,015,732 | ||||||||||||||||||
| Petroleos Mexicanos: | ||||||||||||||||||||||||
| MXN | 7.65 | % | 11/24/21 | 91,160,000 | 4,731,672 | (4) | ||||||||||||||||||
| MXN | 7.19 | % | 09/12/24 | 163,460,000 | 7,775,902 | (2) | ||||||||||||||||||
| MXN | 7.47 | % | 11/12/26 | 203,100,000 | 9,507,546 | |||||||||||||||||||
| 35,030,852 | ||||||||||||||||||||||||
| TOTAL CORPORATE BONDS | 43,274,347 | |||||||||||||||||||||||
| (Cost $57,963,283) | ||||||||||||||||||||||||
| 44 | www.shiplp.com |
| Stone Harbor Local Markets Fund | Statements of Investments |
May 31, 2016
| Reference Rate | Currency | Rate | Maturity Date | Principal Amount/ Shares* | Value Expressed (in USD) | |||||||||||||||||||
| SHORT TERM INVESTMENTS - 1.31% | ||||||||||||||||||||||||
| Money Market Mutual Funds - 1.31% | ||||||||||||||||||||||||
| Dreyfus Institutional Cash Advantage Fund - Institutional Advantage Class (7-Day Yield) | USD | 0.38 | % | N/A | 12,094,674 | $ | 12,094,674 | |||||||||||||||||
| TOTAL SHORT TERM INVESTMENTS | 12,094,674 | |||||||||||||||||||||||
| (Cost $12,094,674) | ||||||||||||||||||||||||
| Total Investments - 84.90% | 786,585,466 | |||||||||||||||||||||||
| (Cost $948,037,299) | ||||||||||||||||||||||||
| Other Assets In Excess of Liabilities - 15.10% | 139,917,026 | (5) | ||||||||||||||||||||||
| Net Assets - 100.00% | $ | 926,502,492 | ||||||||||||||||||||||
| * | The principal amount/shares of each security is stated in the currency in which the security is denominated. |
| Currency Abbreviations: | ||
| BRL | - | Brazilian Real |
| CLP | - | Chilean Peso |
| COP | - | Colombian Peso |
| HUF | - | Hungarian Forint |
| IDR | - | Indonesian Rupiah |
| MXN | - | Mexican Peso |
| MYR | - | Malaysian Ringgit |
| PEN | - | Peruvian Nuevo Sol |
| PLN | - | Polish Zloty |
| RON | - | Romanian Leu |
| RUB | - | Russian Ruble |
| THB | - | Thai Baht |
| TRY | - | Turkish Lira |
| USD | - | United States Dollar |
| ZAR | - | South African Rand |
| (1) | Issued with a zero coupon. Income is recognized through the accretion of discount. |
| (2) | Securities were originally issued pursuant to Regulation S under the Securities Act of 1933, which exempts securities offered and sold outside of the United States from registration. Such securities cannot be sold in the United States without either an effective registration statement filed pursuant to the Securities Act of 1933, or pursuant to an exemption from registration. As of May 31, 2016, the aggregate market value of those securities was $35,492,694, which represents approximately 3.83% of net assets. |
| (3) | Step bond. Coupon changes periodically based upon a predetermined schedule. Interest rate disclosed is that which is in effect as of May 31, 2016. |
| (4) | Security exempt from registration under Rule 144A of the Securities Act of 1933. Such securities may normally be sold to qualified institutional buyers in transactions exempt from registration. Total market value of Rule 144A securities amounts to $6,783,776, which represents approximately 0.73% of net assets as of May 31, 2016. |
| (5) | Includes cash which is being held as collateral for forward foreign currency contracts. |
| Stone Harbor Investment Funds Annual Report | May 31, 2016 | 45 |
| Stone Harbor Local Markets Fund | Statements of Investments |
May 31, 2016
OUTSTANDING FORWARD FOREIGN CURRENCY CONTRACTS
| Counterparty | Foreign Currency | Contracted Amount** | Purchase/Sale Contract | Settlement Date | Current Value | Unrealized Appreciation/ (Depreciation) | |||||||||
| Citigroup Global Markets | CLP | 3,057,684,000 | Sale | 06/09/16 | $ | 4,409,284 | $ | 32 | |||||||
| Citigroup Global Markets | CLP | 3,012,742,885 | Sale | 06/21/16 | 4,339,596 | 27,609 | |||||||||
| Citigroup Global Markets | IDR | 85,198,590,150 | Sale | 06/24/16 | 6,206,734 | 136,696 | |||||||||
| Citigroup Global Markets | RON | 3,754,410 | Sale | 06/09/16 | 924,817 | 5,183 | |||||||||
| Citigroup Global Markets | THB | 165,669,740 | Sale | 07/08/16 | 4,634,486 | 71,105 | |||||||||
| Citigroup Global Markets | TRY | 13,091,000 | Sale | 06/09/16 | 4,423,852 | 48,034 | |||||||||
| Goldman Sachs & Co. | BRL | 60,790,010 | Sale | 06/02/16 | 16,812,194 | 295,368 | |||||||||
| Goldman Sachs & Co. | BRL | 46,027,010 | Sale | 07/05/16 | 12,605,305 | 27,331 | |||||||||
| Goldman Sachs & Co. | HUF | 3,999,588,780 | Sale | 06/02/16 | 14,190,952 | 354,395 | |||||||||
| Goldman Sachs & Co. | PLN | 68,593,105 | Sale | 06/02/16 | 17,392,574 | 357,888 | |||||||||
| Goldman Sachs & Co. | PLN | 37,502,848 | Sale | 07/15/16 | 9,499,963 | 14,663 | |||||||||
| Goldman Sachs & Co. | RUB | 332,464,800 | Sale | 06/02/16 | 4,982,751 | 53,831 | |||||||||
| Goldman Sachs & Co. | TRY | 13,709,956 | Sale | 06/09/16 | 4,633,016 | 55,431 | |||||||||
| J.P. Morgan Chase & Co. | BRL | 36,568,696 | Sale | 06/02/16 | 10,113,504 | 187,537 | |||||||||
| J.P. Morgan Chase & Co. | BRL | 36,568,696 | Sale | 07/05/16 | 10,014,980 | 3,018 | |||||||||
| J.P. Morgan Chase & Co. | IDR | 8,787,222,280 | Sale | 06/24/16 | 640,151 | 14,586 | |||||||||
| J.P. Morgan Chase & Co. | THB | 16,144,849 | Sale | 07/08/16 | 451,640 | 6,955 | |||||||||
| $ | 1,659,662 | ||||||||||||||
| Citigroup Global Markets | CLP | 3,057,684,000 | Purchase | 06/09/16 | $ | 4,409,284 | $ | (40,716 | ) | ||||||
| Citigroup Global Markets | CLP | 6,342,616,600 | Purchase | 06/21/16 | 9,135,992 | (154,008 | ) | ||||||||
| Citigroup Global Markets | MXN | 275,362,645 | Purchase | 06/30/16 | 14,865,945 | (50,775 | ) | ||||||||
| Citigroup Global Markets | MYR | 23,764,266 | Purchase | 06/27/16 | 5,743,810 | (67,945 | ) | ||||||||
| Citigroup Global Markets | PEN | 58,611,489 | Purchase | 06/17/16 | 17,320,862 | (368,285 | ) | ||||||||
| Citigroup Global Markets | RON | 36,927,742 | Purchase | 06/09/16 | 9,096,345 | (282,844 | ) | ||||||||
| Citigroup Global Markets | RUB | 495,690,278 | Purchase | 06/08/16 | 7,416,731 | (81,231 | ) | ||||||||
| Deutsche Bank | TRY | 58,893,484 | Purchase | 06/08/16 | 19,907,217 | (24,920 | ) | ||||||||
| Goldman Sachs & Co. | BRL | 60,790,010 | Purchase | 06/02/16 | 16,812,194 | (142,970 | ) | ||||||||
| Goldman Sachs & Co. | HUF | 3,999,588,780 | Purchase | 06/02/16 | 14,190,952 | (419,631 | ) | ||||||||
| Goldman Sachs & Co. | MXN | 422,176,807 | Purchase | 06/09/16 | 22,849,220 | (44,780 | ) | ||||||||
| Goldman Sachs & Co. | PLN | 75,982,848 | Purchase | 06/02/16 | 19,266,328 | (190,827 | ) | ||||||||
| Goldman Sachs & Co. | PLN | 7,389,743 | Sale | 06/02/16 | 1,873,755 | (13,755 | ) | ||||||||
| Goldman Sachs & Co. | RUB | 332,464,800 | Purchase | 06/02/16 | 4,982,751 | (24,249 | ) | ||||||||
| Goldman Sachs & Co. | RUB | 332,464,800 | Purchase | 07/15/16 | 4,923,499 | (54,264 | ) | ||||||||
| Goldman Sachs & Co. | TRY | 29,399,809 | Sale | 06/09/16 | 9,935,100 | (75,100 | ) | ||||||||
| J.P. Morgan Chase & Co. | BRL | 36,568,696 | Purchase | 06/02/16 | 10,113,504 | (2,318 | ) | ||||||||
| J.P. Morgan Chase & Co. | IDR | 25,630,800,000 | Sale | 06/24/16 | 1,867,209 | (7,209 | ) | ||||||||
| J.P. Morgan Chase & Co. | MXN | 84,291,200 | Purchase | 06/10/16 | 4,561,496 | (89,669 | ) | ||||||||
| J.P. Morgan Chase & Co. | MYR | 162,469,035 | Purchase | 06/09/16 | 39,321,707 | (21,805 | ) | ||||||||
| J.P. Morgan Chase & Co. | MYR | 14,589,411 | Purchase | 06/27/16 | 3,526,252 | (41,713 | ) | ||||||||
| J.P. Morgan Chase & Co. | RON | 42,024,424 | Purchase | 06/09/16 | 10,351,802 | (319,577 | ) | ||||||||
| J.P. Morgan Chase & Co. | TRY | 72,386,077 | Purchase | 06/08/16 | 24,467,993 | (13,229 | ) | ||||||||
| J.P. Morgan Chase & Co. | ZAR | 58,286,000 | Sale | 06/17/16 | 3,694,698 | (21,346 | ) | ||||||||
| Morgan Stanley | RUB | 669,058,333 | Purchase | 06/08/16 | 10,010,738 | (101,535 | ) | ||||||||
| $ | (2,654,701 | ) | |||||||||||||
| ** | The contracted amount is stated in the currency in which the contract is denominated. |
See Notes to Financial Statements.
| 46 | www.shiplp.com |
| Stone Harbor Emerging Markets Corporate Debt Fund | Statements of Investments |
May 31, 2016
| Reference Rate | Currency | Rate | Maturity Date | Principal Amount/ Shares* | Value Expressed (in USD) | |||||||||||||||||||
| CORPORATE BONDS - 93.01% | ||||||||||||||||||||||||
| Algeria - 1.01% | ||||||||||||||||||||||||
| GTH Finance BV: | ||||||||||||||||||||||||
| USD | 6.25 | % | 04/26/20 | 86,000 | $ | 87,021 | (1) | |||||||||||||||||
| USD | 7.25 | % | 04/26/23 | 86,000 | 87,247 | (1) | ||||||||||||||||||
| 174,268 | ||||||||||||||||||||||||
| Angola - 1.47% | ||||||||||||||||||||||||
| Puma International Financing SA | USD | 6.75 | % | 02/01/21 | 255,000 | 255,164 | (1) | |||||||||||||||||
| Argentina - 1.39% | ||||||||||||||||||||||||
| YPF SA: | ||||||||||||||||||||||||
| USD | 8.88 | % | 12/19/18 | 106,000 | 113,685 | (1) | ||||||||||||||||||
| USD | 8.75 | % | 04/04/24 | 122,000 | 127,710 | (1) | ||||||||||||||||||
| 241,395 | ||||||||||||||||||||||||
| Brazil - 6.84% | ||||||||||||||||||||||||
| Braskem Finance Ltd. | USD | 5.75 | % | 04/15/21 | 61,000 | 59,856 | (2) | |||||||||||||||||
| Cia Brasileira de Aluminio | USD | 4.75 | % | 06/17/24 | 48,000 | 43,140 | (1) | |||||||||||||||||
| CIMPOR Financial Operations BV | USD | 5.75 | % | 07/17/24 | 78,000 | 60,060 | (1) | |||||||||||||||||
| Cosan Luxembourg SA | USD | 5.00 | % | 03/14/23 | 90,000 | 82,125 | (1) | |||||||||||||||||
| ESAL GmbH | USD | 6.25 | % | 02/05/23 | 69,000 | 67,275 | (1) | |||||||||||||||||
| GTL Trade Finance, Inc. | USD | 5.89 | % | 04/29/24 | 33,000 | 27,258 | (1) | |||||||||||||||||
| Itau Unibanco Holding SA | USD | 5.65 | % | 03/19/22 | 77,000 | 77,770 | (1) | |||||||||||||||||
| Marfrig Holdings Europe BV | USD | 8.00 | % | 06/08/23 | 122,000 | 122,610 | (1) | |||||||||||||||||
| Minerva Luxembourg SA | USD | 7.75 | % | 01/31/23 | 84,000 | 85,260 | (1) | |||||||||||||||||
| Petrobras Global Finance BV: | ||||||||||||||||||||||||
| USD | 3.00 | % | 03/17/17 | 60,000 | 60,300 | (3) | ||||||||||||||||||
| USD | 5.38 | % | 01/27/21 | 159,000 | 141,351 | |||||||||||||||||||
| USD | 8.38 | % | 05/23/21 | 219,000 | 217,292 | |||||||||||||||||||
| QGOG Atlantic/Alaskan Rigs Ltd. | USD | 5.25 | % | 07/30/18 | 27,341 | 21,463 | (1) | |||||||||||||||||
| Vale Overseas Ltd.: | ||||||||||||||||||||||||
| USD | 4.63 | % | 09/15/20 | 37,000 | 34,985 | |||||||||||||||||||
| USD | 4.38 | % | 01/11/22 | 78,000 | 70,395 | |||||||||||||||||||
| USD | 6.88 | % | 11/10/39 | 19,000 | 15,586 | |||||||||||||||||||
| 1,186,726 | ||||||||||||||||||||||||
| Chile - 4.22% | ||||||||||||||||||||||||
| Cencosud SA | USD | 4.88 | % | 01/20/23 | 133,000 | 134,962 | (1) | |||||||||||||||||
| Colbun SA | USD | 4.50 | % | 07/10/24 | 106,000 | 110,372 | (1) | |||||||||||||||||
| Empresa Electrica Angamos SA | USD | 4.88 | % | 05/25/29 | 149,000 | 140,805 | (1) | |||||||||||||||||
| Empresa Nacional de Electricidad SA | USD | 4.25 | % | 04/15/24 | 33,000 | 34,650 | ||||||||||||||||||
| Empresa Nacional de Telecomunicaciones SA | USD | 4.88 | % | 10/30/24 | 45,000 | 45,338 | (1) | |||||||||||||||||
| Entel Chile SA | USD | 4.75 | % | 08/01/26 | 60,000 | 59,250 | (1) | |||||||||||||||||
| GeoPark Latin America Ltd. Agencia en Chile | USD | 7.50 | % | 02/11/20 | 106,000 | 76,850 | (1) | |||||||||||||||||
| VTR Finance BV | USD | 6.88 | % | 01/15/24 | 131,000 | 130,038 | (1) | |||||||||||||||||
| 732,265 | ||||||||||||||||||||||||
| China - 5.32% | ||||||||||||||||||||||||
| China Life Insurance Co. Ltd. | USD | 4.00 | % | 07/03/75 | 300,000 | 300,375 | (3) | |||||||||||||||||
| CITIC Ltd. | USD | 8.63 | % | Perpetual | 200,000 | 224,975 | (3)(4) | |||||||||||||||||
| JD.com Inc. | USD | 3.88 | % | 04/29/26 | 32,000 | 29,720 | ||||||||||||||||||
| Stone Harbor Investment Funds Annual Report | May 31, 2016 | 47 |
| Stone Harbor Emerging Markets Corporate Debt Fund | Statements of Investments |
May 31, 2016
| Reference Rate | Currency | Rate | Maturity Date | Principal Amount/ Shares* | Value Expressed (in USD) | |||||||||||||||||||
| China (continued) | ||||||||||||||||||||||||
| Lenovo Group Ltd. | USD | 4.70 | % | 05/08/19 | 350,000 | $ | 368,389 | (2) | ||||||||||||||||
| 923,459 | ||||||||||||||||||||||||
| Colombia - 5.21% | ||||||||||||||||||||||||
| Banco de Bogota SA | USD | 6.25 | % | 05/12/26 | 48,000 | 47,244 | (1) | |||||||||||||||||
| Bancolombia SA | USD | 5.13 | % | 09/11/22 | 100,000 | 99,155 | ||||||||||||||||||
| Ecopetrol SA: | ||||||||||||||||||||||||
| USD | 5.88 | % | 09/18/23 | 52,000 | 51,886 | |||||||||||||||||||
| USD | 5.38 | % | 06/26/26 | 278,000 | 260,486 | |||||||||||||||||||
| Grupo Aval Ltd. | USD | 4.75 | % | 09/26/22 | 87,000 | 81,127 | (1) | |||||||||||||||||
| GrupoSura Finance SA | USD | 5.50 | % | 04/29/26 | 96,000 | 97,560 | (1) | |||||||||||||||||
| Millicom International Cellular SA | USD | 6.63 | % | 10/15/21 | 118,000 | 117,262 | (1) | |||||||||||||||||
| Oleoducto Central SA | USD | 4.00 | % | 05/07/21 | 89,000 | 85,885 | (1) | |||||||||||||||||
| SUAM Finance BV | USD | 4.88 | % | 04/17/24 | 62,000 | 63,163 | (1) | |||||||||||||||||
| 903,768 | ||||||||||||||||||||||||
| Guatemala - 0.68% | ||||||||||||||||||||||||
| Comcel Trust via Comunicaciones Celulares SA | USD | 6.88 | % | 02/06/24 | 126,000 | 117,981 | (1) | |||||||||||||||||
| Hong Kong - 4.31% | ||||||||||||||||||||||||
| Hutchison Whampoa International 12 Ltd. | USD | 6.00 | % | Perpetual | 240,000 | 248,650 | (2)(3)(4) | |||||||||||||||||
| Towngas Finance Ltd. | USD | 4.75 | % | Perpetual | 475,000 | 498,453 | (3)(4) | |||||||||||||||||
| 747,103 | ||||||||||||||||||||||||
| India - 6.63% | ||||||||||||||||||||||||
| ABJA Investment Co. Pte Ltd. | USD | 5.95 | % | 07/31/24 | 200,000 | 189,122 | ||||||||||||||||||
| Bharti Airtel International Netherlands BV: | ||||||||||||||||||||||||
| USD | 5.13 | % | 03/11/23 | 48,000 | 51,626 | (1) | ||||||||||||||||||
| USD | 5.35 | % | 05/20/24 | 400,000 | 433,634 | (2) | ||||||||||||||||||
| Greenko Dutch BV | USD | 8.00 | % | 08/01/19 | 79,000 | 85,448 | (2) | |||||||||||||||||
| ICICI Bank Ltd. | USD | 6.38 | % | 04/30/22 | 100,000 | 102,432 | (2)(3) | |||||||||||||||||
| Reliance Industries Ltd. | USD | 4.13 | % | 01/28/25 | 99,000 | 100,790 | (1) | |||||||||||||||||
| Vedanta Resources PLC: | ||||||||||||||||||||||||
| USD | 6.75 | % | 06/07/16 | 113,000 | 113,000 | (2) | ||||||||||||||||||
| USD | 6.00 | % | 01/31/19 | 25,000 | 20,625 | (1) | ||||||||||||||||||
| USD | 8.25 | % | 06/07/21 | 22,000 | 17,428 | (1) | ||||||||||||||||||
| USD | 7.13 | % | 05/31/23 | 51,000 | 36,351 | (1) | ||||||||||||||||||
| 1,150,456 | ||||||||||||||||||||||||
| Indonesia - 4.73% | ||||||||||||||||||||||||
| Listrindo Capital BV | USD | 6.95 | % | 02/21/19 | 100,000 | 103,799 | (1) | |||||||||||||||||
| Perusahaan Gas Negara Persero Tbk PT | USD | 5.13 | % | 05/16/24 | 150,000 | 157,050 | (1) | |||||||||||||||||
| Pratama Agung Pte Ltd. | USD | 6.25 | % | 02/24/20 | 350,000 | 356,125 | ||||||||||||||||||
| TBG Global Pte Ltd. | USD | 4.63 | % | 04/03/18 | 200,000 | 203,632 | (1) | |||||||||||||||||
| 820,606 | ||||||||||||||||||||||||
| Israel - 5.08% | ||||||||||||||||||||||||
| B Communications Ltd. | USD | 7.38 | % | 02/15/21 | 333,000 | 357,351 | (1) | |||||||||||||||||
| Delek & Avner Tamar Bond Ltd.: | ||||||||||||||||||||||||
| USD | 3.84 | % | 12/30/18 | 47,000 | 47,764 | (1) | ||||||||||||||||||
| USD | 5.08 | % | 12/30/23 | 433,000 | 445,449 | (1) | ||||||||||||||||||
| USD | 5.41 | % | 12/30/25 | 30,000 | 30,937 | (1) | ||||||||||||||||||
| 881,501 | ||||||||||||||||||||||||
| 48 | www.shiplp.com |
| Stone Harbor Emerging Markets Corporate Debt Fund | Statements of Investments |
May 31, 2016
| Reference Rate | Currency | Rate | Maturity Date | Principal Amount/ Shares* | Value Expressed (in USD) | |||||||||||||||||||
| Jamaica - 2.14% | ||||||||||||||||||||||||
| Digicel Group Ltd.: | ||||||||||||||||||||||||
| USD | 8.25 | % | 09/30/20 | 107,000 | $ | 92,154 | (1) | |||||||||||||||||
| USD | 7.13 | % | 04/01/22 | 358,000 | 278,345 | (2) | ||||||||||||||||||
| 370,499 | ||||||||||||||||||||||||
| Kazakhstan - 1.49% | ||||||||||||||||||||||||
| Zhaikmunai LLP | USD | 7.13 | % | 11/13/19 | 311,000 | 257,741 | (1) | |||||||||||||||||
| Macau - 1.33% | ||||||||||||||||||||||||
| MCE Finance Ltd. | USD | 5.00 | % | 02/15/21 | 187,000 | 184,218 | (1) | |||||||||||||||||
| Studio City Finance Ltd. | USD | 8.50 | % | 12/01/20 | 47,000 | 47,059 | (1) | |||||||||||||||||
| 231,277 | ||||||||||||||||||||||||
| Malaysia - 2.38% | ||||||||||||||||||||||||
| Axiata SPV2 Bhd: | ||||||||||||||||||||||||
| USD | 3.47 | % | 11/19/20 | 200,000 | 205,096 | |||||||||||||||||||
| USD | 4.36 | % | 03/24/26 | 200,000 | 208,438 | |||||||||||||||||||
| 413,534 | ||||||||||||||||||||||||
| Mexico - 7.17% | ||||||||||||||||||||||||
| BBVA Bancomer SA | USD | 6.75 | % | 09/30/22 | 86,000 | 95,465 | (1) | |||||||||||||||||
| Cemex Finance LLC | USD | 9.38 | % | 10/12/22 | 200,000 | 217,000 | (1) | |||||||||||||||||
| Cemex SAB de CV: | ||||||||||||||||||||||||
| USD | 7.25 | % | 01/15/21 | 120,000 | 125,313 | (1) | ||||||||||||||||||
| USD | 5.70 | % | 01/11/25 | 121,000 | 114,345 | (1) | ||||||||||||||||||
| USD | 7.75 | % | 04/16/26 | 65,000 | 68,087 | (1) | ||||||||||||||||||
| Metalsa SA de CV | USD | 4.90 | % | 04/24/23 | 134,000 | 128,138 | (1) | |||||||||||||||||
| Mexico Generadora De Energia | USD | 5.50 | % | 12/06/32 | 172,347 | 162,178 | (1) | |||||||||||||||||
| Nemak SAB de CV | USD | 5.50 | % | 02/28/23 | 42,000 | 43,575 | (1) | |||||||||||||||||
| Sixsigma Networks Mexico SA de CV | USD | 8.25 | % | 11/07/21 | 117,000 | 113,929 | (1) | |||||||||||||||||
| Southern Copper Corp. | USD | 5.25 | % | 11/08/42 | 212,000 | 176,142 | ||||||||||||||||||
| 1,244,172 | ||||||||||||||||||||||||
| Morocco - 2.03% | ||||||||||||||||||||||||
| OCP SA: | ||||||||||||||||||||||||
| USD | 5.63 | % | 04/25/24 | 112,000 | 117,600 | (1) | ||||||||||||||||||
| USD | 4.50 | % | 10/22/25 | 168,000 | 162,960 | (1) | ||||||||||||||||||
| USD | 6.88 | % | 04/25/44 | 70,000 | 71,050 | (1) | ||||||||||||||||||
| 351,610 | ||||||||||||||||||||||||
| Peru - 3.24% | ||||||||||||||||||||||||
| Banco de Credito del Peru | USD | 4.25 | % | 04/01/23 | 46,000 | 48,070 | (2) | |||||||||||||||||
| BBVA Banco Continental SA | USD | 5.00 | % | 08/26/22 | 97,000 | 104,760 | (1) | |||||||||||||||||
| Cia Minera Ares SAC | USD | 7.75 | % | 01/23/21 | 157,000 | 162,495 | (1) | |||||||||||||||||
| Cia Minera Milpo SAA | USD | 4.63 | % | 03/28/23 | 178,000 | 164,650 | (1) | |||||||||||||||||
| Kallpa Generacion SA | USD | 4.88 | % | 05/24/26 | 82,000 | 82,779 | (1) | |||||||||||||||||
| 562,754 | ||||||||||||||||||||||||
| Qatar - 0.99% | ||||||||||||||||||||||||
| Ooredoo International Finance Ltd.: | ||||||||||||||||||||||||
| USD | 3.25 | % | 02/21/23 | 129,000 | 127,871 | (1) | ||||||||||||||||||
| USD | 3.88 | % | 01/31/28 | 44,000 | 43,010 | (1) | ||||||||||||||||||
| 170,881 | ||||||||||||||||||||||||
| Stone Harbor Investment Funds Annual Report | May 31, 2016 | 49 |
| Stone Harbor Emerging Markets Corporate Debt Fund | Statements of Investments |
May 31, 2016
| Reference Rate | Currency | Rate | Maturity Date | Principal Amount/ Shares* | Value Expressed (in USD) | |||||||||||||||||||
| Russia - 5.62% | ||||||||||||||||||||||||
| Gazprom OAO Via Gaz Capital SA: | ||||||||||||||||||||||||
| USD | 8.15 | % | 04/11/18 | 286,000 | $ | 312,527 | (1) | |||||||||||||||||
| USD | 9.25 | % | 04/23/19 | 52,000 | 59,761 | (1) | ||||||||||||||||||
| USD | 6.51 | % | 03/07/22 | 104,000 | 112,840 | (1) | ||||||||||||||||||
| Rosneft Finance SA | USD | 7.88 | % | 03/13/18 | 239,000 | 258,120 | (1) | |||||||||||||||||
| Rosneft Oil Co. via Rosneft International Finance Ltd. | USD | 4.20 | % | 03/06/22 | 240,000 | 232,200 | (1) | |||||||||||||||||
| 975,448 | ||||||||||||||||||||||||
| Singapore - 1.77% | ||||||||||||||||||||||||
| DBS Bank Ltd. | USD | 3.63 | % | 09/21/22 | 40,000 | 40,826 | (2)(3) | |||||||||||||||||
| Oversea-Chinese Banking Corp. Ltd.: | ||||||||||||||||||||||||
| USD | 3.15 | % | 03/11/23 | 200,000 | 203,087 | (1)(3) | ||||||||||||||||||
| USD | 4.00 | % | 10/15/24 | 61,000 | 63,326 | (1)(3) | ||||||||||||||||||
| 307,239 | ||||||||||||||||||||||||
| South Africa - 2.12% | ||||||||||||||||||||||||
| Myriad International Holdings BV | USD | 5.50 | % | 07/21/25 | 359,000 | 367,078 | (1) | |||||||||||||||||
| South Korea - 2.79% | ||||||||||||||||||||||||
| Kia Motors Corp. | USD | 3.25 | % | 04/21/26 | 180,000 | 181,952 | (1) | |||||||||||||||||
| Korea Gas Corp. | USD | 3.88 | % | 02/12/24 | 150,000 | 162,582 | (1) | |||||||||||||||||
| Korea National Oil Corp. | USD | 3.25 | % | 07/10/24 | 134,000 | 139,514 | (1) | |||||||||||||||||
| 484,048 | ||||||||||||||||||||||||
| Thailand - 2.80% | ||||||||||||||||||||||||
| Bangkok Bank PCL: | ||||||||||||||||||||||||
| USD | 3.30 | % | 10/03/18 | 64,000 | 65,893 | (1) | ||||||||||||||||||
| USD | 3.88 | % | 09/27/22 | 136,000 | 144,395 | (1) | ||||||||||||||||||
| PTT Exploration & Production PCL | USD | 4.88 | % | Perpetual | 277,000 | 275,615 | (1)(3)(4) | |||||||||||||||||
| 485,903 | ||||||||||||||||||||||||
| Turkey - 3.42% | ||||||||||||||||||||||||
| Turk Telekomunikasyon AS | USD | 4.88 | % | 06/19/24 | 276,000 | 270,823 | (1) | |||||||||||||||||
| Turkiye Garanti Bankasi AS: | ||||||||||||||||||||||||
| USD | 4.75 | % | 10/17/19 | 24,000 | 24,540 | (1) | ||||||||||||||||||
| USD | 5.25 | % | 09/13/22 | 101,000 | 102,767 | (1) | ||||||||||||||||||
| Turkiye Vakiflar Bankasi TAO | USD | 6.88 | % | 02/03/25 | 196,000 | 194,775 | (1)(3) | |||||||||||||||||
| 592,905 | ||||||||||||||||||||||||
| United Arab Emirates - 6.83% | ||||||||||||||||||||||||
| DP World Ltd. | USD | 6.85 | % | 07/02/37 | 216,000 | 228,960 | (1) | |||||||||||||||||
| Dubai Holding Commercial Operations MTN Ltd. | GBP | 6.00 | % | 02/01/17 | 250,000 | 367,519 | ||||||||||||||||||
| MAF Global Securities Ltd. | USD | 7.13 | % | Perpetual | 562,000 | 587,992 | (3)(4) | |||||||||||||||||
| 1,184,471 | ||||||||||||||||||||||||
| TOTAL CORPORATE BONDS | 16,134,252 | |||||||||||||||||||||||
| (Cost $16,016,497) | ||||||||||||||||||||||||
| 50 | www.shiplp.com |
| Stone Harbor Emerging Markets Corporate Debt Fund | Statements of Investments |
May 31, 2016
| Reference Rate | Currency | Rate | Maturity Date | Principal Amount/ Shares* | Value Expressed (in USD) | |||||||||||||||||||
| SHORT TERM INVESTMENTS - 6.66% | ||||||||||||||||||||||||
| Money Market Mutual Funds - 6.66% | ||||||||||||||||||||||||
| Dreyfus Institutional Cash Advantage Fund - Institutional Advantage Class (7-Day Yield) | USD | 0.38 | % | N/A | 1,154,610 | $ | 1,154,610 | |||||||||||||||||
| TOTAL SHORT TERM INVESTMENTS | 1,154,610 | |||||||||||||||||||||||
| (Cost $1,154,610) | ||||||||||||||||||||||||
Total Investments - 99.67% (Cost $17,171,107) | 17,288,862 | |||||||||||||||||||||||
| Other Assets In Excess of Liabilities - 0.33% | 57,704 | |||||||||||||||||||||||
| Net Assets - 100.00% | $ | 17,346,566 | ||||||||||||||||||||||
| * | The principal amount/shares of each security is stated in the currency in which the security is denominated. |
Currency Abbreviations:
| GBP | - | Great Britain Pound |
| USD | - | United States Dollar |
| (1) | Security exempt from registration under Rule 144A of the Securities Act of 1933. Such securities may normally be sold to qualified institutional buyers in transactions exempt from registration. Total market value of Rule 144A securities amounts to $10,225,558, which represents approximately 58.95% of net assets as of May 31, 2016. |
| (2) | Securities were originally issued pursuant to Regulation S under the Securities Act of 1933, which exempts securities offered and sold outside of the United States from registration. Such securities cannot be sold in the United States without either an effective registration statement filed pursuant to the Securities Act of 1933, or pursuant to an exemption from registration. As of May 31, 2016, the aggregate market value of those securities was $1,778,650, which represents approximately 10.25% of net assets. |
| (3) | Floating or variable rate security. Interest rate disclosed is that which is in effect as of May 31, 2016. |
| (4) | Security has no contractual maturity date, is not redeemable and contractually pays an indefinite stream of interest. |
OUTSTANDING FORWARD FOREIGN CURRENCY CONTRACTS
| Counterparty | Foreign Currency | Contracted Amount** | Sale Contract | Settlement Date | Current Value | Unrealized Appreciation/ (Depreciation) | |||||||||
| Citigroup Global Markets | GBP | 256,800 | Sale | 06/10/16 | $ | 371,967 | $ | 3,298 | |||||||
| $ | 3,298 | ||||||||||||||
| ** | The contracted amount is stated in the currency in which the contract is denominated. |
See Notes to Financial Statements
| Stone Harbor Investment Funds Annual Report | May 31, 2016 | 51 |
| Stone Harbor Investment Grade Fund | Statements of Investments |
| May 31, 2016 |
| Reference Rate | Currency | Rate | Maturity Date | Principal Amount/ Shares* | Value (Expressed in USD) | |||||||||||||||||||
| CORPORATE BONDS - 36.66% | ||||||||||||||||||||||||
| Automotive - 1.46% | ||||||||||||||||||||||||
| Ford Motor Credit Co. LLC | USD | 3.16 | % | 08/04/20 | 75,000 | $ | 76,954 | |||||||||||||||||
| General Motors Financial Co., Inc. | USD | 3.70 | % | 11/24/20 | 75,000 | 77,163 | ||||||||||||||||||
| Hyundai Capital America | USD | 2.55 | % | 02/06/19 | 75,000 | 76,001 | (1) | |||||||||||||||||
| 230,118 | ||||||||||||||||||||||||
| Banking - 7.69% | ||||||||||||||||||||||||
| American Express Co. | USD | 3.63 | % | 12/05/24 | 50,000 | 50,490 | ||||||||||||||||||
| Bank of America Corp.: | ||||||||||||||||||||||||
| USD | 3.95 | % | 04/21/25 | 25,000 | 25,009 | |||||||||||||||||||
| Series GMTN | USD | 3.30 | % | 01/11/23 | 175,000 | 178,327 | ||||||||||||||||||
| BPCE SA | USD | 5.70 | % | 10/22/23 | 50,000 | 53,507 | (1) | |||||||||||||||||
| Capital One Financial Corp. | USD | 6.75 | % | 09/15/17 | 50,000 | 53,164 | ||||||||||||||||||
| Citigroup, Inc.: | ||||||||||||||||||||||||
| USD | 4.40 | % | 06/10/25 | 100,000 | 102,923 | |||||||||||||||||||
| USD | 4.60 | % | 03/09/26 | 75,000 | 77,986 | |||||||||||||||||||
| JPMorgan Chase & Co. | USD | 2.70 | % | 05/18/23 | 150,000 | 148,654 | ||||||||||||||||||
| Lloyds Banking Group PLC | USD | 4.65 | % | 03/24/26 | 75,000 | 76,060 | ||||||||||||||||||
| Mizuho Bank Ltd. | USD | 3.60 | % | 09/25/24 | 75,000 | 78,841 | (1) | |||||||||||||||||
| Morgan Stanley | USD | 4.88 | % | 11/01/22 | 50,000 | 54,320 | ||||||||||||||||||
| The PNC Financial Services Group, Inc. | USD | 3.90 | % | 04/29/24 | 100,000 | 106,032 | ||||||||||||||||||
| Santander UK PLC | USD | 5.00 | % | 11/07/23 | 75,000 | 78,420 | (1) | |||||||||||||||||
| US Bancorp | USD | 3.60 | % | 09/11/24 | 75,000 | 78,988 | ||||||||||||||||||
Wells Fargo & Co., Series M | USD | 3.45 | % | 02/13/23 | 50,000 | 51,175 | ||||||||||||||||||
| 1,213,896 | ||||||||||||||||||||||||
| Chemicals - 0.67% | ||||||||||||||||||||||||
| Eastman Chemical Co. | USD | 4.65 | % | 10/15/44 | 25,000 | 24,731 | ||||||||||||||||||
| The Mosaic Co. | USD | 4.25 | % | 11/15/23 | 75,000 | 79,897 | ||||||||||||||||||
| 104,628 | ||||||||||||||||||||||||
| Consumer Products - 0.49% | ||||||||||||||||||||||||
| Newell Brands, Inc. | USD | 3.85 | % | 04/01/23 | 75,000 | 77,972 | ||||||||||||||||||
| Drillers/Services - 0.74% | ||||||||||||||||||||||||
| Schlumberger Holdings Corp. | USD | 4.00 | % | 12/21/25 | 75,000 | 78,255 | (1) | |||||||||||||||||
| Transocean, Inc. | USD | 7.13 | % | 12/15/21 | 50,000 | 37,125 | ||||||||||||||||||
| 115,380 | ||||||||||||||||||||||||
| Electric - 3.90% | ||||||||||||||||||||||||
| Ameren Corp. | USD | 2.70 | % | 11/15/20 | 75,000 | 76,178 | ||||||||||||||||||
DTE Energy Co., Series F | USD | 3.85 | % | 12/01/23 | 75,000 | 79,567 | ||||||||||||||||||
| Entergy Louisiana LLC | USD | 3.05 | % | 06/01/31 | 75,000 | 73,605 | ||||||||||||||||||
| Eversource Energy | USD | 2.50 | % | 03/15/21 | 50,000 | 50,758 | ||||||||||||||||||
| Exelon Generation Co. LLC | USD | 5.60 | % | 06/15/42 | 75,000 | 76,593 | ||||||||||||||||||
| Georgia Power Co. | USD | 4.30 | % | 03/15/42 | 50,000 | 53,557 | ||||||||||||||||||
| Oncor Electric Delivery Co. LLC | USD | 2.15 | % | 06/01/19 | 80,000 | 80,651 | ||||||||||||||||||
| The Southern Co. | USD | 1.55 | % | 07/01/18 | 50,000 | 50,069 | ||||||||||||||||||
| WEC Energy Group, Inc. | USD | 2.45 | % | 06/15/20 | 75,000 | 76,472 | ||||||||||||||||||
| 617,450 | ||||||||||||||||||||||||
| 52 | www.shiplp.com |
| Stone Harbor Investment Grade Fund | Statements of Investments |
| May 31, 2016 |
| Reference Rate | Currency | Rate | Maturity Date | Principal Amount/ Shares* | Value (Expressed in USD) | |||||||||||||||||||
| Environmental Services - 0.50% | ||||||||||||||||||||||||
| Republic Service, Inc. | USD | 3.55 | % | 06/01/22 | 75,000 | $ | 79,260 | |||||||||||||||||
| Exploration & Production - 1.24% | ||||||||||||||||||||||||
| Anadarko Petroleum Corp. | USD | 6.45 | % | 09/15/36 | 50,000 | 53,768 | ||||||||||||||||||
| Apache Corp. | USD | 5.10 | % | 09/01/40 | 75,000 | 74,957 | ||||||||||||||||||
| Continental Resources, Inc. | USD | 4.50 | % | 04/15/23 | 75,000 | 68,672 | ||||||||||||||||||
| 197,397 | ||||||||||||||||||||||||
| Food and Beverage - 2.20% | ||||||||||||||||||||||||
| Anheuser-Busch InBev Finance, Inc.: | ||||||||||||||||||||||||
| USD | 2.65 | % | 02/01/21 | 50,000 | 50,915 | |||||||||||||||||||
| USD | 4.90 | % | 02/01/46 | 50,000 | 55,857 | |||||||||||||||||||
| Kraft Heinz Foods Co. | USD | 4.88 | % | 02/15/25 | 75,000 | 81,909 | (1) | |||||||||||||||||
| PepsiCo, Inc. | USD | 4.25 | % | 10/22/44 | 50,000 | 53,061 | ||||||||||||||||||
| Whole Foods Market, Inc. | USD | 5.20 | % | 12/03/25 | 100,000 | 104,168 | (1) | |||||||||||||||||
| 345,910 | ||||||||||||||||||||||||
| Gas Pipelines - 2.56% | ||||||||||||||||||||||||
| Boardwalk Pipelines LP | USD | 3.38 | % | 02/01/23 | 50,000 | 44,013 | ||||||||||||||||||
| Dominion Gas Holdings LLC | USD | 4.80 | % | 11/01/43 | 25,000 | 26,407 | ||||||||||||||||||
| Dominion Resources, Inc. | USD | 7.50 | % | 06/30/66 | 25,000 | 20,937 | ||||||||||||||||||
| EQT Midstream Partners LP | USD | 4.00 | % | 08/01/24 | 75,000 | 68,049 | ||||||||||||||||||
| Kinder Morgan, Inc. | USD | 5.55 | % | 06/01/45 | 75,000 | 69,214 | ||||||||||||||||||
| Plains All American Pipeline LP / PAA Finance Corp. | USD | 3.60 | % | 11/01/24 | 50,000 | 44,404 | ||||||||||||||||||
| Spectra Energy Partners LP | USD | 3.50 | % | 03/15/25 | 50,000 | 49,451 | ||||||||||||||||||
| TransCanada PipeLines Ltd. | USD | 4.88 | % | 01/15/26 | 75,000 | 82,321 | ||||||||||||||||||
| 404,796 | ||||||||||||||||||||||||
| Healthcare - 0.83% | ||||||||||||||||||||||||
| Medtronic, Inc.: | ||||||||||||||||||||||||
| USD | 3.15 | % | 03/15/22 | 50,000 | 52,661 | |||||||||||||||||||
| USD | 4.63 | % | 03/15/45 | 25,000 | 28,035 | |||||||||||||||||||
| Thermo Fisher Scientific, Inc. | USD | 1.30 | % | 02/01/17 | 50,000 | 49,999 | ||||||||||||||||||
| 130,695 | ||||||||||||||||||||||||
| Leisure - 0.33% | ||||||||||||||||||||||||
| Time Warner, Inc. | USD | 3.60 | % | 07/15/25 | 50,000 | 51,956 | ||||||||||||||||||
| Life Insurance - 0.61% | ||||||||||||||||||||||||
| American International Group, Inc. | USD | 3.88 | % | 01/15/35 | 75,000 | 69,027 | ||||||||||||||||||
| Nippon Life Insurance Co. | USD | 5.10 | % | 10/16/44 | 25,000 | 27,250 | (1) | |||||||||||||||||
| 96,277 | ||||||||||||||||||||||||
| Media Cable - 1.20% | ||||||||||||||||||||||||
| Charter Communications Operating LLC / Charter Communications Operating Capital: | ||||||||||||||||||||||||
| USD | 3.58 | % | 07/23/20 | 50,000 | 51,605 | (1) | ||||||||||||||||||
| USD | 6.48 | % | 10/23/45 | 50,000 | 57,878 | (1) | ||||||||||||||||||
| Comcast Corp. | USD | 4.25 | % | 01/15/33 | 75,000 | 80,286 | ||||||||||||||||||
| 189,769 | ||||||||||||||||||||||||
| Stone Harbor Investment Funds Annual Report | May 31, 2016 | 53 |
| Stone Harbor Investment Grade Fund | Statements of Investments |
| May 31, 2016 |
| Reference Rate | Currency | Rate | Maturity Date | Principal Amount/ Shares* | Value (Expressed in USD) | |||||||||||||||||||
| Media Other - 1.50% | ||||||||||||||||||||||||
| 21st Century Fox America, Inc. | USD | 6.65 | % | 11/15/37 | 25,000 | $ | 31,948 | |||||||||||||||||
| CBS Corp. | USD | 4.85 | % | 07/01/42 | 50,000 | 49,647 | ||||||||||||||||||
| The Interpublic Group of Cos, Inc. | USD | 3.75 | % | 02/15/23 | 75,000 | 76,967 | ||||||||||||||||||
| Omnicom Group, Inc.: | ||||||||||||||||||||||||
| USD | 3.63 | % | 05/01/22 | 25,000 | 26,286 | |||||||||||||||||||
| USD | 3.65 | % | 11/01/24 | 50,000 | 51,951 | |||||||||||||||||||
| 236,799 | ||||||||||||||||||||||||
| Metals/Mining/Steel - 0.49% | ||||||||||||||||||||||||
| Newmont Mining Corp. | USD | 6.25 | % | 10/01/39 | 75,000 | 77,026 | ||||||||||||||||||
| Non Captive Finance - 1.15% | ||||||||||||||||||||||||
| Air Lease Corp. | USD | 3.88 | % | 04/01/21 | 75,000 | 77,772 | ||||||||||||||||||
| Discover Bank | USD | 4.25 | % | 03/13/26 | 50,000 | 51,993 | ||||||||||||||||||
| Synchrony Financial | USD | 4.25 | % | 08/15/24 | 50,000 | 51,770 | ||||||||||||||||||
| 181,535 | ||||||||||||||||||||||||
| Paper/Forest Products - 0.33% | ||||||||||||||||||||||||
| Packaging Corp. of America | USD | 3.90 | % | 06/15/22 | 50,000 | 52,114 | ||||||||||||||||||
| Pharmaceuticals - 1.31% | ||||||||||||||||||||||||
| Actavis Funding SCS | USD | 3.45 | % | 03/15/22 | 50,000 | 50,831 | ||||||||||||||||||
| Amgen, Inc. | USD | 3.63 | % | 05/22/24 | 75,000 | 78,852 | ||||||||||||||||||
| Gilead Sciences, Inc. | USD | 4.50 | % | 02/01/45 | 75,000 | 76,846 | ||||||||||||||||||
| 206,529 | ||||||||||||||||||||||||
| Railroads - 0.34% | ||||||||||||||||||||||||
| Burlington Northern Sante Fe LLC | USD | 4.40 | % | 03/15/42 | 50,000 | 53,373 | ||||||||||||||||||
Real Estate Investment Trust (REITs) - 1.92% | ||||||||||||||||||||||||
Avalonbay Communties, Inc., Series GMTN | USD | 3.45 | % | 06/01/25 | 25,000 | 26,039 | ||||||||||||||||||
| Corporate Office Properties LP | USD | 3.60 | % | 05/15/23 | 50,000 | 47,292 | ||||||||||||||||||
| DDR Corp. | USD | 3.38 | % | 05/15/23 | 75,000 | 73,531 | ||||||||||||||||||
| Digital Realty Trust LP | USD | 4.75 | % | 10/01/25 | 75,000 | 78,555 | ||||||||||||||||||
| Kimco Realty Corp. | USD | 3.20 | % | 05/01/21 | 75,000 | 77,030 | ||||||||||||||||||
| 302,447 | ||||||||||||||||||||||||
| Refining - 0.48% | ||||||||||||||||||||||||
| Phillips 66 | USD | 4.65 | % | 11/15/34 | 75,000 | 76,014 | ||||||||||||||||||
| Retail Food/Drug - 0.93% | ||||||||||||||||||||||||
| CVS Pass-Through Trust | USD | 6.04 | % | 12/10/28 | 36,061 | 40,197 | ||||||||||||||||||
| JB y Cia SA de CV | USD | 3.75 | % | 05/13/25 | 50,000 | 50,980 | (1) | |||||||||||||||||
| The Kroger Co. | USD | 5.15 | % | 08/01/43 | 50,000 | 57,116 | ||||||||||||||||||
| 148,293 | ||||||||||||||||||||||||
| Retail Non Food/Drug - 0.77% | ||||||||||||||||||||||||
| The Home Depot, Inc. | USD | 2.63 | % | 06/01/22 | 50,000 | 51,416 | ||||||||||||||||||
| Macy's Retail Holdings, Inc. | USD | 2.88 | % | 02/15/23 | 75,000 | 69,174 | ||||||||||||||||||
| 120,590 | ||||||||||||||||||||||||
| Technology - 1.10% | ||||||||||||||||||||||||
| Apple, Inc. | USD | 3.85 | % | 05/04/43 | 75,000 | 73,330 | ||||||||||||||||||
| 54 | www.shiplp.com |
| Stone Harbor Investment Grade Fund | Statements of Investments |
| May 31, 2016 |
| Reference Rate | Currency | Rate | Maturity Date | Principal Amount/ Shares* | Value (Expressed in USD) | |||||||||||||||||||
| Technology (continued) | ||||||||||||||||||||||||
| Ingram Micro, Inc. | USD | 4.95 | % | 12/15/24 | 50,000 | $ | 49,697 | |||||||||||||||||
| Tencent Holdings Ltd. | USD | 3.80 | % | 02/11/25 | 50,000 | 51,936 | (1) | |||||||||||||||||
| 174,963 | ||||||||||||||||||||||||
| Transportation Non Air/Rail - 0.86% | ||||||||||||||||||||||||
| ERAC USA Finance LLC | USD | 3.85 | % | 11/15/24 | 50,000 | 52,838 | (1) | |||||||||||||||||
| FedEx Corp. | USD | 5.10 | % | 01/15/44 | 75,000 | 83,623 | ||||||||||||||||||
| 136,461 | ||||||||||||||||||||||||
| Wirelines - 1.06% | ||||||||||||||||||||||||
| AT&T, Inc.: | ||||||||||||||||||||||||
| USD | 3.00 | % | 06/30/22 | 25,000 | 25,058 | |||||||||||||||||||
| USD | 6.00 | % | 08/15/40 | 75,000 | 85,439 | |||||||||||||||||||
| Verizon Communications, Inc. | USD | 5.15 | % | 09/15/23 | 50,000 | 57,501 | ||||||||||||||||||
| 167,998 | ||||||||||||||||||||||||
| TOTAL CORPORATE BONDS | 5,789,646 | |||||||||||||||||||||||
| (Cost $5,665,671) | ||||||||||||||||||||||||
| ASSET BACKED/COMMERCIAL MORTGAGE BACKED SECURITIES - 7.79% | ||||||||||||||||||||||||
1211 Avenue of the Americas Trust, Series 2015‐1211 | USD | 3.90 | % | 08/10/35 | 25,000 | 27,167 | (1) | |||||||||||||||||
Banc of America Funding Corp., Series 2012-R6 | USD | 0.63 | % | 07/26/36 | 26,783 | 26,011 | (1)(2) | |||||||||||||||||
BHMS Mortgage Trust, Series 2014-ATLS | USD | 1.94 | % | 07/05/33 | 25,000 | 24,656 | (1)(2) | |||||||||||||||||
Citigroup Mortgage Loan Trust, Series 2012-1 | USD | 0.81 | % | 06/25/35 | 7,631 | 7,583 | (1)(2) | |||||||||||||||||
COMM Mortgage Trust, Series 2006-C8 | USD | 5.31 | % | 12/10/46 | 74,286 | 74,992 | ||||||||||||||||||
Ellington Loan Acquisition Trust, Series 2007-1 | USD | 1.35 | % | 05/28/37 | 16,219 | 16,136 | (1)(2) | |||||||||||||||||
Financial Asset Securities Corp. AAA Trust, Series 2005-2 | USD | 0.74 | % | 11/26/35 | 34,642 | 32,127 | (1)(2) | |||||||||||||||||
Freddie Mac Whole Loan Securities Trust, Series 2015-SC02 | USD | 3.00 | % | 09/25/45 | 92,081 | 92,415 | ||||||||||||||||||
GAHR Commercial Mortgage Trust, Series 2015-NRF | USD | 1.73 | % | 12/15/16 | 99,084 | 99,161 | (1)(2) | |||||||||||||||||
Hyatt Hotel Portfolio Trust, Series 2015-HYT | USD | 1.68 | % | 11/15/29 | 100,000 | 99,618 | (1)(2) | |||||||||||||||||
Invitation Homes Trust, Series 2013-SFR1 | USD | 1.58 | % | 12/17/30 | 47,623 | 47,293 | (1)(2) | |||||||||||||||||
JP Morgan Chase Commercial Mortgage Securities Trust, Series 2007-CB18 | USD | 5.44 | % | 06/12/47 | 44,516 | 45,179 | ||||||||||||||||||
| LSTAR Securities Investment Trust: | ||||||||||||||||||||||||
| Series 2015-10 | USD | 2.44 | % | 11/01/20 | 64,901 | 63,279 | (1)(2) | |||||||||||||||||
| Series 2015-9 | USD | 2.44 | % | 10/01/20 | 93,002 | 91,674 | (1)(2) | |||||||||||||||||
| RBSSP Resecuritization Trust: | ||||||||||||||||||||||||
| Series 2012-6 | USD | 0.78 | % | 11/26/35 | 48,672 | 44,985 | (1)(2) | |||||||||||||||||
| Series 2012-6 | USD | 0.77 | % | 01/26/36 | 49,239 | 46,999 | (1)(2) | |||||||||||||||||
| Series 2012-6 | USD | 0.59 | % | 08/26/36 | 66,188 | 64,192 | (1)(2) | |||||||||||||||||
TAL Advantage V LLC, Series 2013-2A | USD | 3.55 | % | 11/20/38 | 37,500 | 36,136 | (1) | |||||||||||||||||
| Towd Point Mortgage Trust: | ||||||||||||||||||||||||
| Series 2015-3 | USD | 3.00 | % | 03/25/54 | 81,340 | 82,145 | (1)(2) | |||||||||||||||||
| Series 2015-5 | USD | 2.75 | % | 05/25/55 | 45,453 | 45,589 | (1)(2) | |||||||||||||||||
US Residential Opportunity Fund III Trust, Series 2015-1III | USD | 3.72 | % | 01/27/35 | 33,597 | 33,354 | (1) | |||||||||||||||||
VOLT XXII LLC, Series 2015-NPL4 | USD | 3.50 | % | 02/25/55 | 27,886 | 27,728 | (1)(3) | |||||||||||||||||
VOLT XXV LLC, Series 2015-NPL8 | USD | 3.50 | % | 06/26/45 | 39,939 | 39,469 | (1)(3) | |||||||||||||||||
VOLT XXXIII LLC, Series 2015-NPL5 | USD | 3.50 | % | 03/25/55 | 18,909 | 18,726 | (1)(3) | |||||||||||||||||
| Stone Harbor Investment Funds Annual Report | May 31, 2016 | 55 |
| Stone Harbor Investment Grade Fund | Statements of Investments |
May 31, 2016
| Reference Rate | Currency | Rate | Maturity Date | Principal Amount/ Shares* | Value (Expressed in USD) | |||||||||||||||||||
| ASSET BACKED/COMMERCIAL MORTGAGE BACKED SECURITIES (continued) | ||||||||||||||||||||||||
VOLT XXXIX LLC, Series 2015-NP13 | USD | 4.13 | % | 10/25/45 | 44,412 | $ | 44,237 | (1)(3) | ||||||||||||||||
| TOTAL ASSET BACKED/ COMMERCIAL MORTGAGE BACKED SECURITIES | 1,230,851 | |||||||||||||||||||||||
| (Cost $1,223,791) | ||||||||||||||||||||||||
| U.S. TREASURY BONDS/NOTES - 19.75% | ||||||||||||||||||||||||
| U.S. Treasury Notes: | ||||||||||||||||||||||||
| USD | 0.75 | % | 02/15/19 | 250,000 | 248,350 | |||||||||||||||||||
| USD | 1.38 | % | 09/30/20 | 600,000 | 601,383 | |||||||||||||||||||
| USD | 2.00 | % | 11/15/21 | 925,000 | 951,070 | |||||||||||||||||||
| USD | 2.75 | % | 02/15/24 | 250,000 | 268,931 | |||||||||||||||||||
| USD | 2.25 | % | 11/15/24 | 425,000 | 440,622 | |||||||||||||||||||
| USD | 2.00 | % | 08/15/25 | 600,000 | 608,555 | |||||||||||||||||||
| TOTAL U.S. TREASURY BONDS/NOTES | 3,118,911 | |||||||||||||||||||||||
| (Cost $3,054,503) | ||||||||||||||||||||||||
| U.S. GOVERNMENT AGENCY MORTGAGE BACKED SECURITIES - 22.03% | ||||||||||||||||||||||||
| FGLMC TBA | USD | 3.00 | % | 06/13/16 | 100,000 | 102,332 | (4) | |||||||||||||||||
| FNMA TBA: | ||||||||||||||||||||||||
| USD | 4.00 | % | 06/11/16 | 525,000 | 560,479 | (4) | ||||||||||||||||||
| USD | 3.00 | % | 06/13/16 | 500,000 | 512,031 | (4) | ||||||||||||||||||
| USD | 3.50 | % | 06/13/16 | 1,100,000 | 1,151,133 | (4) | ||||||||||||||||||
| USD | 4.50 | % | 06/13/16 | 375,000 | 408,354 | (4) | ||||||||||||||||||
| USD | 5.00 | % | 06/13/16 | 250,000 | 277,344 | (4) | ||||||||||||||||||
| USD | 2.50 | % | 06/16/16 | 100,000 | 102,523 | (4) | ||||||||||||||||||
| USD | 3.00 | % | 06/16/16 | 300,000 | 312,619 | (4) | ||||||||||||||||||
| GNMA TBA | USD | 3.50 | % | 06/21/16 | 50,000 | 52,763 | (4) | |||||||||||||||||
| TOTAL U.S. GOVERNMENT AGENCY MORTGAGE BACKED SECURITIES | 3,479,578 | |||||||||||||||||||||||
| (Cost $3,483,461) | ||||||||||||||||||||||||
| SHORT TERM INVESTMENTS - 13.07% | ||||||||||||||||||||||||
| Money Market Mutual Funds - 13.07% | ||||||||||||||||||||||||
| Dreyfus Institutional Cash Advantage Fund - Institutional Advantage Class (7-Day Yield) | USD | 0.38 | % | N/A | 2,063,406 | 2,063,406 | ||||||||||||||||||
| TOTAL SHORT TERM INVESTMENTS | 2,063,406 | |||||||||||||||||||||||
| (Cost $2,063,406) | ||||||||||||||||||||||||
| Total Investments - 99.30% | 15,682,392 | |||||||||||||||||||||||
| (Cost $15,490,832) | ||||||||||||||||||||||||
| Other Assets in Excess of Liabilities - 0.70% | 110,500 | |||||||||||||||||||||||
| Net Assets - 100.00% | $ | 15,792,892 | ||||||||||||||||||||||
| * | The principal amount/shares of each security is stated in the currency in which the security is denominated. |
Currency Abbreviations:
USD - United States Dollar
| 56 | www.shiplp.com |
| Stone Harbor Investment Grade Fund | Statements of Investments |
May 31, 2016
| (1) | Security exempt from registration under Rule 144A of the Securities Act of 1933. Such securities may normally be sold to qualified institutional buyers in transactions exempt from registration. Total market value of Rule 144A securities amounts to $1,861,853, which represents approximately 11.79% of net assets as of May 31, 2016. |
| (2) | Floating or variable rate security. Interest rate disclosed is that which is in effect as of May 31, 2016. |
| (3) | Step bond. Coupon changes periodically based upon a predetermined schedule. Interest rate disclosed is that which is in effect as of May 31, 2016. |
| (4) | Investment purchased on a delayed delivery basis. |
See Notes to Financial Statements.
| Stone Harbor Investment Funds Annual Report | May 31, 2016 | 57 |
| Stone Harbor Strategic Income Fund | Statements of Investments |
May 31, 2016
| Currency | Rate | Shares* | Value (Expressed in USD) | |||||||||||||
| OPEN-END FUNDS - 98.64% | ||||||||||||||||
| Stone Harbor Emerging Markets Debt Fund | USD | N/A | 749,205 | $ | 7,544,492 | (1) | ||||||||||
| Stone Harbor High Yield Bond Fund | USD | N/A | 1,602,382 | 12,674,839 | (1) | |||||||||||
| Stone Harbor Investment Grade Fund | USD | N/A | 1,517,054 | 15,777,364 | (1) | |||||||||||
| 35,996,695 | ||||||||||||||||
| TOTAL OPEN-END FUNDS | 35,996,695 | |||||||||||||||
| (Cost $37,956,047) | ||||||||||||||||
| Counterparty | Currency | Expiration Date | Exercise Price | Number ofContracts | Value (Expressed in USD) | |||||||||||||||||||
| PURCHASED OPTIONS - 0.04% | ||||||||||||||||||||||||
| Foreign Currency Put Option - 0.02% | ||||||||||||||||||||||||
| USD Call / EUR Put | J.P. Morgan Chase & Co. | EUR | 09/12/2016 | 1.04 | 1,633,170 | 5,270 | ||||||||||||||||||
| Foreign Currency Call Option - 0.02% | ||||||||||||||||||||||||
| USD Call / JPY Put | J.P. Morgan Chase & Co. | JPY | 08/29/2016 | 116.00 | 190,023,080 | 7,480 | ||||||||||||||||||
| TOTAL PURCHASED OPTIONS | 12,750 | |||||||||||||||||||||||
| (Cost $50,638) | ||||||||||||||||||||||||
| SHORT TERM INVESTMENTS - 0.45% | ||||||||||||||||||||||||
| Money Market Mutual Funds - 0.45% | ||||||||||||||||||||||||
| Dreyfus Institutional Cash Advantage Fund - Institutional Advantage Class (7-Day Yield) | USD | 0.38 | % | 164,450 | 164,450 | |||||||||||||||||||
| TOTAL SHORT TERM INVESTMENTS | 164,450 | |||||||||||||||||||||||
| (Cost $164,450) | ||||||||||||||||||||||||
| Total Investments - 99.13% | 36,173,895 | |||||||||||||||||||||||
| (Cost $38,171,135) | ||||||||||||||||||||||||
| Other Assets In Excess of Liabilities - 0.87% | 319,298 | (2) | ||||||||||||||||||||||
| Net Assets - 100.00% | $ | 36,493,193 | ||||||||||||||||||||||
| * | The shares of each security is stated in the currency in which the security is denominated. |
Currency Abbreviations:
| EUR - | Euro Currency |
| GBP - | Great Britain Pound |
| JPY - | Japanese Yen |
| MXN - | Mexican Peso |
| USD - | United States Dollar |
| (1) | Affiliated with the Fund, as each is a series of Stone Harbor Investment Funds and has the same investment adviser. |
| (2) | Includes cash which is being held as collateral for futures contracts. |
| 58 | www.shiplp.com |
| Stone Harbor Strategic Income Fund | Statements of Investments |
May 31, 2016
OUTSTANDING FORWARD FOREIGN CURRENCY CONTRACTS
| Counterparty | Foreign Currency | Contracted Amount** | Purchase/Sale Contract | Settlement Date | Current Value | Unrealized Appreciation/ (Depreciation) | |||||||||
| Citigroup Global Markets | EUR | 147,500 | Sale | 06/10/16 | $ | 164,179 | $ | 3,993 | |||||||
| Citigroup Global Markets | GBP | 38,400 | Sale | 06/10/16 | 55,621 | 493 | |||||||||
| J.P. Morgan Chase & Co. | EUR | 315,000 | Sale | 06/06/16 | 350,548 | 11,716 | |||||||||
| $ | 16,202 | ||||||||||||||
| Citigroup Global Markets | MXN | 14,514,500 | Purchase | 06/09/16 | $ | 785,559 | $ | (33,784 | ) | ||||||
| J.P. Morgan Chase & Co. | EUR | 315,000 | Purchase | 06/06/16 | 350,548 | (2,740 | ) | ||||||||
| $ | (36,524 | ) | |||||||||||||
| ** | The contracted amount is stated in the currency in which the contract is denominated. |
FUTURES CONTRACTS
| Description | Position | Contracts | Currency | Expiration Date | Notional Amount* | Unrealized Appreciation/(Depreciation) | |||||||||
| Euro-Bund Future | Long | 25 | EUR | 6/08/16 | 4,099,250 | $ | 36,450 | ||||||||
| Long Gilt Future | Long | 9 | GBP | 9/28/16 | 1,104,750 | 2,216 | |||||||||
| US Ultra T-Bond | Long | 2 | USD | 9/21/16 | 350,250 | 1,641 | |||||||||
| 5,554,250 | $ | 40,307 | |||||||||||||
| Long Gilt Future | Short | (4 | ) | GBP | 9/28/16 | (491,000 | ) | $ | (1,043 | ) | |||||
| US 10Yr Note Future | Short | (59 | ) | USD | 9/21/16 | (7,651,563 | ) | (18,906 | ) | ||||||
| (8,142,562 | ) | $ | (19,949 | ) | |||||||||||
| * | The notional amount of each security is stated in the currency in which the security is denominated. |
See Notes to Financial Statements.
| Stone Harbor Investment Funds Annual Report | May 31, 2016 | 59 |
| Stone Harbor Emerging Markets Debt Allocation Fund | Statements of Investments |
May 31, 2016
| Currency | Rate | Shares* | Value (Expressed in USD) | |||||||||||||
| OPEN-END FUNDS - 99.94% | ||||||||||||||||
| Stone Harbor Emerging Markets Debt Fund | USD | N/A | 3,307,937 | $ | 33,310,927 | (1) | ||||||||||
| Stone Harbor Local Markets Fund | USD | N/A | 4,386,315 | 34,125,527 | (1)(2) | |||||||||||
| 67,436,454 | ||||||||||||||||
| TOTAL OPEN-END FUNDS | 67,436,454 | |||||||||||||||
| (Cost $66,432,074) | ||||||||||||||||
| Total Investments - 99.94% | 67,436,454 | |||||||||||||||
| (Cost $66,432,074) | ||||||||||||||||
| Other Assets In Excess of Liabilities - 0.06% | 38,782 | |||||||||||||||
| Net Assets - 100.00% | $ | 67,475,236 | ||||||||||||||
| * | The shares of each security is stated in the currency in which the security is denominated. |
Currency Abbreviations:
| MXN - | Mexican Peso |
| USD - | United States Dollar |
| (1) | Affiliated with the Fund, as each is a series of Stone Harbor Investment Funds and has the same investment adviser. |
| (2) | Non-income producing security. |
OUTSTANDING FORWARD FOREIGN CURRENCY CONTRACTS
| Counterparty | Foreign Currency | Contracted Amount** | Purchase/Sale Contract | Settlement Date | CurrentValue | Unrealized Appreciation/ (Depreciation) | |||||||||
| Goldman Sachs & Co. | MXN | 12,392,660 | Sale | 06/20/16 | $ | 669,839 | $ | 10,161 | |||||||
| $ | 10,161 | ||||||||||||||
| Goldman Sachs & Co. | MXN | 23,112,960 | Purchase | 06/20/16 | $ | 1,249,285 | $ | (30,715 | ) | ||||||
| $ | (30,715 | ) | |||||||||||||
| ** | The contracted amount is stated in the currency in which the contract is denominated. |
See Notes to Financial Statements.
| 60 | www.shiplp.com |
Intentionally Left Blank
| Stone Harbor Investment Funds | Statements of Assets and Liabilities |
May 31, 2016
| Stone Harbor Emerging Markets Debt Fund | Stone Harbor High Yield Bond Fund | |||||||
| ASSETS: | ||||||||
Investments, at value(1) | $ | 1,557,752,094 | $ | 248,864,241 | ||||
Investments in affiliates, at value(2) | – | – | ||||||
| Cash | 18,998,436 | 21,159 | ||||||
| Foreign currency, at value | ||||||||
| (Cost $0, $57,548, $445,740, $0, $0, $188,352 and $0, respectively) | – | 56,607 | ||||||
| Unrealized appreciation on forward foreign currency contracts | 1,684,205 | 98,379 | ||||||
| Deposits with brokers for credit default swap contracts and forward foreign currency contracts | 2,600,000 | – | ||||||
| Cash pledged as collateral for forward commitments | – | – | ||||||
| Deposits with brokers for futures contracts | – | – | ||||||
| Receivable for investments sold | – | 759,447 | ||||||
| Receivable for fund shares sold | 17,653 | 2,917 | ||||||
| Receivable from adviser | – | – | ||||||
| Receivable on credit default swap contracts | 31,095 | – | ||||||
| Interest receivable | 23,377,800 | 3,796,331 | ||||||
| Prepaid and other assets | 25,042 | 8,523 | ||||||
| Total Assets | 1,604,486,325 | 253,607,604 | ||||||
| LIABILITIES: | ||||||||
| Payable due to brokers for forward foreign currency contracts | 660,000 | – | ||||||
| Payable for investments purchased | 25,657,132 | 2,848,664 | ||||||
| Payable for fund shares redeemed | 342,355 | 6,279 | ||||||
| Swap premium received | 1,601,679 | – | ||||||
| Unrealized depreciation on forward foreign currency contracts | 1,608,159 | – | ||||||
| Unrealized depreciation on credit default swap contracts | 151,724 | – | ||||||
| Variation margin payable on futures contracts | – | – | ||||||
| Payable to adviser | 792,625 | 105,638 | ||||||
| Payable to administrator | 83,384 | 29,532 | ||||||
| Other payables | 99,524 | 81,932 | ||||||
| Total Liabilities | 30,996,582 | 3,072,045 | ||||||
| Net Assets | $ | 1,573,489,743 | $ | 250,535,559 | ||||
| NET ASSETS CONSIST OF: | ||||||||
| Paid‐in capital | $ | 1,790,149,619 | $ | 281,880,458 | ||||
| Undistributed/(overdistributed) net investment income | 4,512,569 | 278,565 | ||||||
| Accumulated net realized gain/(loss) | (213,544,710 | ) | (18,792,434 | ) | ||||
| Net unrealized appreciation/(depreciation) | (7,627,735 | ) | (12,831,030 | ) | ||||
| Net Assets | $ | 1,573,489,743 | $ | 250,535,559 | ||||
| PRICING OF SHARES: | ||||||||
| Institutional Class | ||||||||
| Net Assets | $ | 1,573,489,743 | $ | 250,535,559 | ||||
| Shares of beneficial interest outstanding (unlimited number of shares, par value of $0.001 per share authorized) | 156,258,645 | 31,654,090 | ||||||
| Net assets value, offering and redemption price per share | $ | 10.07 | $ | 7.91 | ||||
(1)Cost of Investments | $ | 1,565,287,272 | $ | 261,793,042 | ||||
(2)Cost of Investments in affiliates | $ | – | $ | – | ||||
See Notes to Financial Statements.
| 62 | www.shiplp.com |
| Stone Harbor Investment Funds | Statements of Assets and Liabilities |
May 31, 2016
Stone Harbor Local Markets Fund | Stone Harbor Emerging Markets Corporate Debt Fund | Stone Harbor Investment Grade Fund | Stone Harbor Strategic Income Fund | Stone Harbor Emerging Markets Debt Allocation Fund | ||||||||||||||
| $ | 786,585,466 | $ | 17,288,862 | $ | 15,682,392 | $ | 177,200 | $ | – | |||||||||
| – | – | – | 35,996,695 | 67,436,454 | ||||||||||||||
| – | 39,093 | – | – | 73,918 | ||||||||||||||
| 415,570 | – | – | 185,915 | – | ||||||||||||||
| 1,659,662 | 3,298 | – | 16,202 | 10,161 | ||||||||||||||
| 2,230,000 | – | – | – | – | ||||||||||||||
| – | – | 3,557,601 | – | – | ||||||||||||||
| – | – | – | 161,982 | – | ||||||||||||||
| 126,379,813 | – | – | – | – | ||||||||||||||
| – | – | – | – | – | ||||||||||||||
| – | – | 9,039 | 7,037 | 13,364 | ||||||||||||||
| – | – | – | – | – | ||||||||||||||
| 16,624,538 | 208,867 | 74,064 | 32 | – | ||||||||||||||
| 20,838 | 7,887 | 11,906 | 30,589 | 7,609 | ||||||||||||||
| 933,915,887 | 17,548,007 | 19,335,002 | 36,575,652 | 67,541,506 | ||||||||||||||
| 200,000 | – | – | – | – | ||||||||||||||
| 3,729,293 | 138,318 | 3,487,600 | – | – | ||||||||||||||
| – | – | – | – | – | ||||||||||||||
| – | – | – | – | – | ||||||||||||||
| 2,654,701 | – | – | 36,524 | 30,715 | ||||||||||||||
| – | – | – | – | – | ||||||||||||||
| – | – | – | 2,160 | – | ||||||||||||||
| 614,710 | 861 | – | – | – | ||||||||||||||
| 50,134 | 4,564 | 13,038 | 1,756 | 2,916 | ||||||||||||||
| 164,557 | 57,698 | 41,472 | 42,019 | 32,639 | ||||||||||||||
| 7,413,395 | 201,441 | 3,542,110 | 82,459 | 66,270 | ||||||||||||||
| $ | 926,502,492 | $ | 17,346,566 | $ | 15,792,892 | $ | 36,493,193 | $ | 67,475,236 | |||||||||
| $ | 1,395,138,409 | $ | 22,302,494 | $ | 15,540,041 | $ | 38,564,544 | $ | 75,877,169 | |||||||||
| (134,019,451 | ) | 26,081 | 7,340 | 130,713 | 981,104 | |||||||||||||
| (171,835,930 | ) | (5,103,132 | ) | 53,951 | (202,828 | ) | (10,366,863 | ) | ||||||||||
| (162,780,536 | ) | 121,123 | 191,560 | (1,999,236 | ) | 983,826 | ||||||||||||
| $ | 926,502,492 | $ | 17,346,566 | $ | 15,792,892 | $ | 36,493,193 | $ | 67,475,236 | |||||||||
| $ | 926,502,492 | $ | 17,346,566 | $ | 15,792,892 | $ | 36,493,193 | $ | 67,475,236 | |||||||||
| 119,102,327 | 1,967,303 | 1,518,095 | 3,813,000 | 7,583,812 | ||||||||||||||
| $ | 7.78 | $ | 8.82 | $ | 10.40 | $ | 9.57 | $ | 8.90 | |||||||||
| $ | 948,037,299 | $ | 17,171,107 | $ | 15,490,832 | $ | 215,088 | $ | – | |||||||||
| $ | – | $ | – | $ | – | $ | 37,956,047 | $ | 66,432,074 | |||||||||
See Notes to Financial Statements.
| Stone Harbor Investment Funds Annual Report | May 31, 2016 | 63 |
| Stone Harbor Investment Funds | Statements of Operations |
For the Year Ended May 31, 2016
| Stone Harbor Emerging Markets Debt Fund | Stone Harbor High Yield Bond Fund | |||||||
| INVESTMENT INCOME: | ||||||||
Interest(1) | $ | 143,912,079 | $ | 17,750,357 | ||||
| Dividends | 94,389 | 57,955 | ||||||
| Dividends from affiliated investment companies | – | – | ||||||
| Total Investment Income | 144,006,468 | 17,808,312 | ||||||
| EXPENSES: | ||||||||
| Operational: | ||||||||
| Investment advisory fee | 10,271,224 | 1,329,804 | ||||||
| Administration fees | 915,418 | 172,338 | ||||||
| Custodian fees | 125,087 | 34,939 | ||||||
| Printing fees | 7,142 | 4,566 | ||||||
| Professional fees | 73,192 | 73,193 | ||||||
| Trustee fees | 157,983 | 23,967 | ||||||
| Transfer agent fees | 33,948 | 23,246 | ||||||
| Registration fees | 26,280 | 24,209 | ||||||
| Insurance fees | 43,260 | 5,892 | ||||||
| Other | 14,873 | 3,835 | ||||||
| Total expenses before waiver/reimbursement | 11,668,407 | 1,695,989 | ||||||
| Less fees waived by investment adviser | – | – | ||||||
| Less expenses reimbursed by investment adviser | – | – | ||||||
| Total Net Expenses | 11,668,407 | 1,695,989 | ||||||
| Net Investment Income | 132,338,061 | 16,112,323 | ||||||
| REALIZED AND UNREALIZED GAIN/(LOSS) ON INVESTMENTS: | ||||||||
| Net realized gain/(loss) on: | ||||||||
| Investments | (77,853,854 | ) | (15,582,469 | ) | ||||
| Investments ‐ affiliated investment companies | – | – | ||||||
| Distributions from other investment companies | – | – | ||||||
| Written options | – | – | ||||||
| Credit default swap contracts | 8,531,253 | – | ||||||
| Interest rate swap contracts | (3,116,547 | ) | – | |||||
| Futures contracts | – | – | ||||||
| Forward foreign currency contracts | (2,357,409 | ) | 157,625 | |||||
| Foreign currency transactions | (442,606 | ) | 9,439 | |||||
| Net realized gain/(loss) | (75,239,163 | ) | (15,415,405 | ) | ||||
| Change in unrealized appreciation/(depreciation) on: | ||||||||
| Investments | (12,777,696 | ) | (10,190,759 | ) | ||||
| Credit default swap contracts | (654,753 | ) | – | |||||
| Interest rate swap contracts | (495,133 | ) | – | |||||
| Futures contracts | – | – | ||||||
| Forward foreign currency contracts | (689,472 | ) | 3,275 | |||||
| Translation of assets and liabilities denominated in foreign currencies | 71,084 | 1,205 | ||||||
| Net change in unrealized appreciation/(depreciation) | (14,545,970 | ) | (10,186,279 | ) | ||||
| Net Realized and Unrealized Gain/(Loss) | (89,785,133 | ) | (25,601,684 | ) | ||||
| Net Increase/(Decrease) in Net Assets Resulting from Operations | $ | 42,552,928 | $ | (9,489,361 | ) | |||
(1)Including Foreign Tax Withholding | $ | 196,701 | $ | – | ||||
See Notes to Financial Statements.
| 64 | www.shiplp.com |
| Stone Harbor Investment Funds | Statements of Operations |
For the Year Ended May 31, 2016
| Stone HarborLocal MarketsFund | Stone Harbor Emerging Markets Corporate Debt Fund | Stone Harbor Investment Grade Fund | Stone Harbor Strategic Income Fund | Stone Harbor Emerging Markets Debt Allocation Fund | ||||||||||||||
| $ | 78,861,919 | $ | 1,816,530 | $ | 278,256 | $ | – | $ | – | |||||||||
| 60,705 | 2,418 | 11,101 | 266 | – | ||||||||||||||
| – | – | – | 1,594,660 | 3,431,463 | ||||||||||||||
| 78,922,624 | 1,818,948 | 289,357 | 1,594,926 | 3,431,463 | ||||||||||||||
| 8,031,733 | 260,769 | 48,923 | 191,244 | 635,185 | ||||||||||||||
| 568,892 | 23,437 | 31,672 | 18,717 | 45,423 | ||||||||||||||
| 561,308 | 13,051 | 13,334 | 18,981 | 12,280 | ||||||||||||||
| 10,570 | 4,717 | 4,586 | 4,657 | 4,985 | ||||||||||||||
| 73,192 | 67,608 | 51,608 | 51,608 | 42,172 | ||||||||||||||
| 105,990 | 2,913 | 1,141 | 3,000 | 8,244 | ||||||||||||||
| 31,649 | 21,863 | 20,551 | 21,155 | 21,774 | ||||||||||||||
| 23,871 | 21,944 | 20,675 | 21,027 | 15,922 | ||||||||||||||
| 29,991 | 832 | 288 | 724 | 1,861 | ||||||||||||||
| 14,460 | 2,500 | 2,356 | 2,935 | 4,927 | ||||||||||||||
| 9,451,656 | 419,634 | 195,134 | 334,048 | 792,773 | ||||||||||||||
| – | (112,847 | ) | (48,923 | ) | (191,244 | ) | (635,185 | ) | ||||||||||
| – | – | (76,321 | ) | (99,342 | ) | (99,026 | ) | |||||||||||
| 9,451,656 | 306,787 | 69,890 | 43,462 | 58,562 | ||||||||||||||
| 69,470,968 | 1,512,161 | 219,467 | 1,551,464 | 3,372,901 | ||||||||||||||
| (300,388,608 | ) | (1,562,353 | ) | 55,619 | – | – | ||||||||||||
| – | – | – | (480,155 | ) | (10,092,327 | ) | ||||||||||||
| – | – | – | 21,861 | – | ||||||||||||||
| – | – | – | 6,392 | – | ||||||||||||||
| – | – | – | 106,279 | – | ||||||||||||||
| – | – | – | – | – | ||||||||||||||
| – | – | 12,528 | 25,178 | – | ||||||||||||||
| 9,751,376 | 67,713 | – | (148,371 | ) | 49,827 | |||||||||||||
| (7,000,662 | ) | (6,668 | ) | – | 11,235 | (43,020 | ) | |||||||||||
| (297,637,894 | ) | (1,501,308 | ) | 68,147 | (457,581 | ) | (10,085,520 | ) | ||||||||||
| 116,246,197 | (305,630 | ) | 166,394 | (1,009,935 | ) | 5,211,805 | ||||||||||||
| – | – | – | (25,940 | ) | – | |||||||||||||
| – | – | – | – | – | ||||||||||||||
| – | – | – | 77,268 | – | ||||||||||||||
| (3,485,395 | ) | (87 | ) | – | (21,385 | ) | (20,554 | ) | ||||||||||
| 1,244,523 | 10 | – | 7,816 | – | ||||||||||||||
| 114,005,325 | (305,707 | ) | 166,394 | (972,176 | ) | 5,191,251 | ||||||||||||
| (183,632,569 | ) | (1,807,015 | ) | 234,541 | (1,429,757 | ) | (4,894,269 | ) | ||||||||||
| $ | (114,161,601 | ) | $ | (294,854 | ) | $ | 454,008 | $ | 121,707 | $ | (1,521,368 | ) | ||||||
| $ | 1,160,928 | $ | – | $ | – | $ | – | $ | – | |||||||||
See Notes to Financial Statements.
| Stone Harbor Investment Funds Annual Report | May 31, 2016 | 65 |
| Stone Harbor Investment Funds | Statements of Changes in Net Assets |
Stone Harbor Emerging Markets Debt Fund | ||||||||
For the Year Ended May 31, 2016 | For the Year Ended May 31, 2015 | |||||||
| OPERATIONS: | ||||||||
| Net investment income | $ | 132,338,061 | $ | 116,699,852 | ||||
| Net realized gain/(loss) | (75,239,163 | ) | (83,285,428 | ) | ||||
| Net change in unrealized appreciation/(depreciation) | (14,545,970 | ) | (65,214,960 | ) | ||||
| Net increase/(decrease) in net assets resulting from operations | 42,552,928 | (31,800,536 | ) | |||||
| DISTRIBUTIONS TO SHAREHOLDERS: | ||||||||
| Institutional Class | ||||||||
| From net investment income | (125,569,725 | ) | (104,263,472 | ) | ||||
| From net realized gains | – | – | ||||||
| Net decrease in net assets from distributions to shareholders | (125,569,725 | ) | (104,263,472 | ) | ||||
| CAPITAL SHARE TRANSACTIONS: | ||||||||
| Institutional Class | ||||||||
| Proceeds from sale of shares | 199,480,217 | 476,079,373 | ||||||
| Issued to shareholders in reinvestment of distributions | 118,098,700 | 98,614,208 | ||||||
| Cost of shares redeemed | (597,412,891 | ) | (680,253,445 | ) | ||||
| Net increase/(decrease) in net assets from capital share transactions | (279,833,974 | ) | (105,559,864 | ) | ||||
| Net Decrease in Net Assets | (362,850,771 | ) | (241,623,872 | ) | ||||
| NET ASSETS: | ||||||||
| Beginning of year | 1,936,340,514 | 2,177,964,386 | ||||||
| End of year | $ | 1,573,489,743 | $ | 1,936,340,514 | ||||
| Includes undistributed/(overdistributed) net investment income of: | $ | 4,512,569 | $ | 977,934 | ||||
| OTHER INFORMATION: | ||||||||
| Share Transactions: | ||||||||
| Institutional Class | ||||||||
| Beginning shares | 185,010,068 | 196,069,405 | ||||||
| Shares sold | 20,059,678 | 44,694,384 | ||||||
| Shares reinvested | 12,105,213 | 9,292,443 | ||||||
| Shares redeemed | (60,916,314 | ) | (65,046,164 | ) | ||||
| Shares outstanding ‐ end of year | 156,258,645 | 185,010,068 | ||||||
See Notes to Financial Statements.
| 66 | www.shiplp.com |
| Stone Harbor Investment Funds | Statements of Changes in Net Assets |
Stone Harbor High Yield Bond Fund | Stone Harbor Local Markets Fund | Stone Harbor Emerging Markets Corporate Debt Fund | ||||||||||||||||||||
For the Year Ended May 31, 2016 | For the Year Ended May 31, 2015 | For the Year Ended May 31, 2016 | For the Year Ended May 31, 2015 | For the Year Ended May 31, 2016 | For the Year Ended May 31, 2015 | |||||||||||||||||
| $ | 16,112,323 | $ | 17,041,253 | $ | 69,470,968 | $ | 115,420,109 | $ | 1,512,161 | $ | 1,134,569 | |||||||||||
| (15,415,405 | ) | 357,724 | (297,637,894 | ) | (262,316,954 | ) | (1,501,308 | ) | 363,555 | |||||||||||||
| (10,186,279 | ) | (17,293,072 | ) | 114,005,325 | (196,330,586 | ) | (305,707 | ) | (619,142 | ) | ||||||||||||
| (9,489,361 | ) | 105,905 | (114,161,601 | ) | (343,227,431 | ) | (294,854 | ) | 878,982 | |||||||||||||
| �� | ||||||||||||||||||||||
| (16,172,824 | ) | (18,987,355 | ) | – | (27,499,281 | ) | (1,499,763 | ) | (1,215,887 | ) | ||||||||||||
| – | (9,517,441 | ) | – | – | – | – | ||||||||||||||||
| (16,172,824 | ) | (28,504,796 | ) | – | (27,499,281 | ) | (1,499,763 | ) | (1,215,887 | ) | ||||||||||||
| 5,620,922 | 54,566,778 | 217,498,360 | 371,721,098 | 25,088,754 | 2,938,306 | |||||||||||||||||
| 14,352,976 | 25,193,090 | – | 26,635,265 | 963,639 | 1,215,887 | |||||||||||||||||
| (33,490,494 | ) | (64,502,568 | ) | (739,781,975 | ) | (955,466,079 | ) | (30,912,635 | ) | (6,102,931 | ) | |||||||||||
| (13,516,596 | ) | 15,257,300 | (522,283,615 | ) | (557,109,716 | ) | (4,860,242 | ) | (1,948,738 | ) | ||||||||||||
| (39,178,781 | ) | (13,141,591 | ) | (636,445,216 | ) | (927,836,428 | ) | (6,654,859 | ) | (2,285,643 | ) | |||||||||||
| 289,714,340 | 302,855,931 | 1,562,947,708 | 2,490,784,136 | 24,001,425 | 26,287,068 | |||||||||||||||||
| $ | 250,535,559 | $ | 289,714,340 | $ | 926,502,492 | $ | 1,562,947,708 | $ | 17,346,566 | $ | 24,001,425 | |||||||||||
| $ | 278,565 | $ | 318,332 | $ | (134,019,451 | ) | $ | (169,990,207 | ) | $ | 26,081 | $ | 63,835 | |||||||||
| 33,382,621 | 31,455,233 | 186,605,612 | 249,984,702 | 2,634,743 | 2,847,399 | |||||||||||||||||
| 705,428 | 5,947,727 | 27,917,285 | 40,488,906 | 2,877,035 | 318,097 | |||||||||||||||||
| 1,831,361 | 2,858,107 | – | 3,068,946 | 111,772 | 134,222 | |||||||||||||||||
| (4,265,320 | ) | (6,878,446 | ) | (95,420,570 | ) | (106,936,942 | ) | (3,656,247 | ) | (664,975 | ) | |||||||||||
| 31,654,090 | 33,382,621 | 119,102,327 | 186,605,612 | 1,967,303 | 2,634,743 | |||||||||||||||||
See Notes to Financial Statements.
| Stone Harbor Investment Funds Annual Report | May 31, 2016 | 67 |
| Stone Harbor Investment Funds | Statements of Changes in Net Assets |
Stone Harbor Investment Grade Fund | ||||||||
For the Year Ended May 31, 2016 | For the Year Ended May 31, 2015 | |||||||
| OPERATIONS: | ||||||||
| Net investment income | $ | 219,467 | $ | 96,786 | ||||
| Net realized gain/(loss) | 68,147 | 165,207 | ||||||
| Net realized loss on investments ‐ affiliated investment companies | – | – | ||||||
| Distributions from affiliated investment companies | – | – | ||||||
| Net change in unrealized appreciation/(depreciation) | 166,394 | (54,936 | ) | |||||
| Net increase/(decrease) in net assets resulting from operations | 454,008 | 207,057 | ||||||
| DISTRIBUTIONS TO SHAREHOLDERS: | ||||||||
| Institutional Class | ||||||||
| From net investment income | (215,807 | ) | (98,558 | ) | ||||
| From net realized gains | (135,024 | ) | (73,570 | ) | ||||
| Net decrease in net assets from distributions to shareholders | (350,831 | ) | (172,128 | ) | ||||
| CAPITAL SHARE TRANSACTIONS: | ||||||||
| Institutional Class | ||||||||
| Proceeds from sale of shares | 7,701,633 | 6,913,138 | ||||||
| Issued to shareholders in reinvestment of distributions | 350,831 | 172,128 | ||||||
| Cost of shares redeemed | (2,239,900 | ) | (365,300 | ) | ||||
| Net increase/(decrease) in net assets from capital share transactions | 5,812,564 | 6,719,966 | ||||||
| Net Increase/(Decrease) in Net Assets | 5,915,741 | 6,754,895 | ||||||
| NET ASSETS: | ||||||||
| Beginning of period | 9,877,151 | 3,122,256 | ||||||
| End of period | $ | 15,792,892 | $ | 9,877,151 | ||||
| Includes undistributed net investment income of: | $ | 7,340 | $ | 3,209 | ||||
| OTHER INFORMATION: | ||||||||
| Share Transactions: | ||||||||
| Institutional Class | ||||||||
| Beginning shares | 953,189 | 300,737 | ||||||
| Shares sold | 747,478 | 670,830 | ||||||
| Shares reinvested | 34,384 | 16,631 | ||||||
| Shares redeemed | (216,956 | ) | (35,009 | ) | ||||
| Shares outstanding ‐ end of period | 1,518,095 | 953,189 | ||||||
See Notes to Financial Statements.
| 68 | www.shiplp.com |
| Stone Harbor Investment Funds | Statements of Changes in Net Assets |
| Stone Harbor Strategic Income Fund | Stone Harbor Emerging Markets Debt Allocation Fund | |||||||||||||
For the Year Ended May 31, 2016 | For the Year Ended May 31, 2015 | For the Year Ended May 31, 2016 | For the Period October 21, 2014 (Commencement of Operations) to May 31, 2015 | |||||||||||
| $ | 1,551,464 | $ | 1,270,579 | $ | 3,372,901 | $ | 1,615,277 | |||||||
| 713 | 283,251 | 6,807 | – | |||||||||||
| (480,155 | ) | (14,796 | ) | (10,092,327 | ) | (274,536 | ) | |||||||
| 21,861 | 418,657 | – | (4,207,425 | ) | ||||||||||
| (972,176 | ) | (1,490,326 | ) | 5,191,251 | – | |||||||||
| 121,707 | 467,365 | (1,521,368 | ) | (2,866,684 | ) | |||||||||
| (1,277,346 | ) | (1,268,494 | ) | (2,967,695 | ) | (1,049,102 | ) | |||||||
| (480,732 | ) | (80,720 | ) | – | – | |||||||||
| (1,758,078 | ) | (1,349,214 | ) | (2,967,695 | ) | (1,049,102 | ) | |||||||
| 2,802,571 | 23,081,037 | 53,716,767 | 88,266,192 | |||||||||||
| 1,236,613 | 1,306,521 | 2,967,695 | 1,049,102 | |||||||||||
| – | – | (70,119,671 | ) | – | ||||||||||
| 4,039,184 | 24,387,558 | (13,435,209 | ) | 89,315,294 | ||||||||||
| 2,402,813 | 23,505,709 | (17,924,272 | ) | 85,399,508 | ||||||||||
| 34,090,380 | 10,584,671 | 85,399,508 | – | |||||||||||
| $ | 36,493,193 | $ | 34,090,380 | $ | 67,475,236 | $ | 85,399,508 | |||||||
| $ | 130,713 | $ | 38,111 | $ | 981,104 | $ | 569,091 | |||||||
| 3,390,417 | 1,013,714 | 9,124,028 | – | |||||||||||
| 289,702 | 2,247,267 | 6,166,414 | 9,010,734 | |||||||||||
| 132,881 | 129,436 | 361,033 | 113,294 | |||||||||||
| – | – | (8,067,663 | ) | – | ||||||||||
| 3,813,000 | 3,390,417 | 7,583,812 | 9,124,028 | |||||||||||
See Notes to Financial Statements.
| Stone Harbor Investment Funds Annual Report | May 31, 2016 | 69 |
| Stone Harbor Emerging Markets Debt Fund | Financial Highlights |
For a share outstanding through the periods presented.
| Institutional Class | For the Year Ended May 31, 2016 | For the Year Ended May 31, 2015 | For the Year Ended May 31, 2014 | For the Year Ended May 31, 2013 | For the Year Ended May 31, 2012 | |||||||||||||||
| Net asset value ‐ beginning of year | $ | 10.47 | $ | 11.11 | $ | 11.34 | $ | 10.93 | $ | 11.20 | ||||||||||
| Income/(loss) from investment operations: | ||||||||||||||||||||
Net investment income(1) | 0.77 | 0.59 | 0.55 | 0.55 | 0.65 | |||||||||||||||
| Net realized and unrealized gain/(loss) on investments | (0.43 | ) | (0.70 | ) | (0.31 | ) | 0.45 | (0.15 | ) | |||||||||||
| Total income/(loss) from investment operations | 0.34 | (0.11 | ) | 0.24 | 1.00 | 0.50 | ||||||||||||||
| Less distributions to common shareholders: | ||||||||||||||||||||
| From net investment income | (0.74 | ) | (0.53 | ) | (0.47 | ) | (0.54 | ) | (0.67 | ) | ||||||||||
| From net realized gains | – | – | – | (0.05 | ) | (0.10 | ) | |||||||||||||
| Total distributions | (0.74 | ) | (0.53 | ) | (0.47 | ) | (0.59 | ) | (0.77 | ) | ||||||||||
| Net Increase/(Decrease) in Net Asset Value | (0.40 | ) | (0.64 | ) | (0.23 | ) | 0.41 | (0.27 | ) | |||||||||||
| Net asset value ‐ end of year | $ | 10.07 | $ | 10.47 | $ | 11.11 | $ | 11.34 | $ | 10.93 | ||||||||||
| Total Return | 3.70 | % | (1.01 | )% | 2.45 | % | 9.05 | % | 4.61 | % | ||||||||||
| Ratios/Supplemental Data: | ||||||||||||||||||||
| Net assets, end of period (in millions) | $ | 1,573 | $ | 1,936 | $ | 2,178 | $ | 1,837 | $ | 1,184 | ||||||||||
| Ratio of expenses to average net assets without fee waivers/reimbursements/repayment of previously waived fees | 0.68 | % | 0.68 | % | 0.70 | % | 0.68 | % | 0.72 | % | ||||||||||
| Ratio of expenses to average net assets with fee waivers/reimbursements/ repayment of previously waived fees | 0.68 | % | 0.68 | % | 0.70 | % | 0.68 | % | 0.72 | % | ||||||||||
| Ratio of net investment income to average net assets with fee waivers/reimbursements/repayment of previously waived fees | 7.73 | % | 5.54 | % | 5.21 | % | 4.68 | % | 5.78 | % | ||||||||||
| Portfolio turnover rate | 90 | % | 75 | % | 68 | % | 68 | % | 60 | % | ||||||||||
(1) | Calculated using average shares throughout the period. |
| See Notes to Financial Statements. | |
| 70 | www.shiplp.com |
| Stone Harbor High Yield Bond Fund | Financial Highlights |
For a share outstanding through the periods presented.
| Institutional Class | For the Year Ended May 31, 2016 | For the Year Ended May 31, 2015 | For the Year Ended May 31, 2014 | For the Year Ended May 31, 2013 | For the Year Ended May 31, 2012 | |||||||||||||||
| Net asset value ‐ beginning of year | $ | 8.68 | $ | 9.63 | $ | 9.83 | $ | 9.13 | $ | 10.00 | ||||||||||
| Income/(loss) from investment operations: | ||||||||||||||||||||
Net investment income(1) | 0.49 | 0.54 | 0.60 | 0.70 | 0.72 | |||||||||||||||
| Net realized and unrealized gain/(loss) on investments | (0.77 | ) | (0.58 | ) | 0.13 | 0.72 | (0.59 | ) | ||||||||||||
| Total income/(loss) from investment operations | (0.28 | ) | (0.04 | ) | 0.73 | 1.42 | 0.13 | |||||||||||||
| Less distributions to common shareholders: | ||||||||||||||||||||
| From net investment income | (0.49 | ) | (0.60 | ) | (0.64 | ) | (0.68 | ) | (0.70 | ) | ||||||||||
| From net realized gains | – | (0.31 | ) | (0.29 | ) | (0.04 | ) | (0.30 | ) | |||||||||||
| Total distributions | (0.49 | ) | (0.91 | ) | (0.93 | ) | (0.72 | ) | (1.00 | ) | ||||||||||
| Net Increase/(Decrease) in Net Asset Value | (0.77 | ) | (0.95 | ) | (0.20 | ) | 0.70 | (0.87 | ) | |||||||||||
| Net asset value ‐ end of year | $ | 7.91 | $ | 8.68 | $ | 9.63 | $ | 9.83 | $ | 9.13 | ||||||||||
Total Return(2) | (3.03 | )% | (0.27 | )% | 7.90 | % | 15.87 | % | 1.77 | % | ||||||||||
| Ratios/Supplemental Data: | ||||||||||||||||||||
| Net assets, end of period (in millions) | $ | 251 | $ | 290 | $ | 303 | $ | 387 | $ | 520 | ||||||||||
| Ratio of expenses to average net assets without fee waivers/reimbursements/ repayment of previously waived fees | 0.64 | % | 0.62 | %(3) | 0.62 | % | 0.60 | % | 0.62 | % | ||||||||||
| Ratio of expenses to average net assets with fee waivers/reimbursements/ repayment of previously waived fees | 0.64 | % | 0.60 | %(3) | 0.55 | % | 0.55 | % | 0.55 | % | ||||||||||
| Ratio of net investment income to average net assets with fee waivers/reimbursements/repayment of previously waived fees | 6.06 | % | 5.98 | % | 6.23 | % | 7.27 | % | 7.67 | % | ||||||||||
| Portfolio turnover rate | 48 | % | 52 | % | 54 | % | 59 | % | 46 | % | ||||||||||
(1) | Calculated using average shares throughout the period. |
(2) | Total returns would have been lower had various fees and expenses not been waived and reimbursed during the period. The total returns in the table represent the rate that an investor would have earned (or lost) on an investment in a Fund (assuming reinvestment of all dividends and distributions). |
(3) | Effective October 1, 2014, the expense limitation rate changed from 0.55% to 0.65%. |
| See Notes to Financial Statements. | |
| Stone Harbor Investment Funds Annual Report | May 31, 2016 | 71 |
| Stone Harbor Local Markets Fund | Financial Highlights |
For a share outstanding through the periods presented.
| Institutional Class | For the Year Ended May 31, 2016 | For the Year Ended May 31, 2015 | For the Year Ended May 31, 2014 | For the Year Ended May 31, 2013 | For the Year Ended May 31, 2012 | |||||||||||||||
| Net asset value ‐ beginning of year | $ | 8.38 | $ | 9.96 | $ | 10.51 | $ | 10.10 | $ | 11.21 | ||||||||||
| Income/(loss) from investment operations: | ||||||||||||||||||||
Net investment income(1) | 0.50 | 0.52 | 0.53 | 0.49 | 0.57 | |||||||||||||||
| Net realized and unrealized gain/(loss) on investments | (1.10 | ) | (1.98 | ) | (0.96 | ) | 0.33 | (1.21 | ) | |||||||||||
| Total income/(loss) from investment operations | (0.60 | ) | (1.46 | ) | (0.43 | ) | 0.82 | (0.64 | ) | |||||||||||
| Less distributions to common shareholders: | ||||||||||||||||||||
| From net investment income | – | (0.12 | ) | (0.07 | ) | (0.39 | ) | (0.45 | ) | |||||||||||
| From net realized gains | – | – | (0.05 | ) | (0.02 | ) | – | |||||||||||||
| From tax return of capital | – | – | – | – | (0.02 | ) | ||||||||||||||
| Total distributions | – | (0.12 | ) | (0.12 | ) | (0.41 | ) | (0.47 | ) | |||||||||||
| Net Increase/(Decrease) in Net Asset Value | (0.60 | ) | (1.58 | ) | (0.55 | ) | 0.41 | (1.11 | ) | |||||||||||
| Net asset value ‐ end of year | $ | 7.78 | $ | 8.38 | $ | 9.96 | $ | 10.51 | $ | 10.10 | ||||||||||
| Total Return | (7.16 | )% | (14.70 | )% | (4.04 | )% | 7.92 | % | (5.84 | )% | ||||||||||
| Ratios/Supplemental Data: | ||||||||||||||||||||
| Net assets, end of period (in millions) | $ | 927 | $ | 1,563 | $ | 2,491 | $ | 2,464 | $ | 1,563 | ||||||||||
| Ratio of expenses to average net assets without fee waivers/reimbursements/repayment of previously waived fees | 0.88 | % | 0.87 | % | 0.88 | % | 0.86 | % | 0.89 | % | ||||||||||
| Ratio of expenses to average net assets with fee waivers/reimbursements/repayment of previously waived fees | 0.88 | % | 0.87 | % | 0.88 | % | 0.86 | % | 0.89 | % | ||||||||||
| Ratio of net investment income to average net assets with fee waivers/reimbursements/repayment of previously waived fees | 6.49 | % | 5.62 | % | 5.41 | % | 4.45 | % | 5.35 | % | ||||||||||
| Portfolio turnover rate | 166 | % | 145 | % | 181 | % | 191 | % | 161 | % | ||||||||||
(1) | Calculated using average shares throughout the period. |
| See Notes to Financial Statements. | |
| 72 | www.shiplp.com |
| Stone Harbor Emerging Markets Corporate Debt Fund | Financial Highlights |
For a share outstanding through the periods presented.
| Institutional Class | For the Year Ended May 31, 2016 | For the Year Ended May 31, 2015 | For the Year Ended May 31, 2014 | For the Year Ended May 31, 2013 | For the PeriodJune 1, 2011 (Commencement of Operations) to May 31, 2012 | |||||||||||||||
| Net asset value ‐ beginning of period | $ | 9.11 | $ | 9.23 | $ | 9.37 | $ | 8.89 | $ | 10.00 | ||||||||||
| Income/(loss) from investment operations: | ||||||||||||||||||||
Net investment income(1) | 0.43 | 0.41 | 0.41 | 0.44 | 0.59 | |||||||||||||||
| Net realized and unrealized gain/(loss) on investments | (0.27 | ) | (0.08 | ) | (0.08 | ) | 0.46 | (1.11 | ) | |||||||||||
| Total income/(loss) from investment operations | 0.16 | 0.33 | 0.33 | 0.90 | (0.52 | ) | ||||||||||||||
| Less distributions to common shareholders: | ||||||||||||||||||||
| From net investment income | (0.45 | ) | (0.45 | ) | (0.47 | ) | (0.42 | ) | (0.59 | ) | ||||||||||
| Total distributions | (0.45 | ) | (0.45 | ) | (0.47 | ) | (0.42 | ) | (0.59 | ) | ||||||||||
| Net Increase/(Decrease) in Net Asset Value | (0.29 | ) | (0.12 | ) | (0.14 | ) | 0.48 | (1.11 | ) | |||||||||||
| Net asset value ‐ end of period | $ | 8.82 | $ | 9.11 | $ | 9.23 | $ | 9.37 | $ | 8.89 | ||||||||||
Total Return(2)(3) | 1.92 | % | 3.64 | % | 3.80 | % | 10.13 | % | (5.10 | )% | ||||||||||
| Ratios/Supplemental Data: | ||||||||||||||||||||
| Net assets, end of period (in millions) | $ | 17 | $ | 24 | $ | 26 | $ | 68 | $ | 35 | ||||||||||
| Ratio of expenses to average net assets without fee waivers/reimbursements | 1.37 | % | 1.40 | % | 1.22 | % | 1.16 | % | 1.32 | % | ||||||||||
| Ratio of expenses to average net assets with fee waivers/reimbursements | 1.00 | % | 1.00 | % | 1.00 | % | 1.00 | % | 1.00 | % | ||||||||||
| Ratio of net investment income to average net assets with fee waivers/reimbursements | 4.93 | % | 4.52 | % | 4.58 | % | 4.68 | % | 6.41 | % | ||||||||||
| Portfolio turnover rate | 127 | % | 62 | % | 78 | % | 78 | % | 51 | % | ||||||||||
(1) | Calculated using average shares throughout the period. |
(2) | Total returns would have been lower had various fees and expenses not been waived and reimbursed during the period. The total returns in the table represent the rate that an investor would have earned (or lost) on an investment in a Fund (assuming reinvestment of all dividends and distributions). |
(3) | Total returns for periods of less than one year are not annualized. |
| See Notes to Financial Statements. | |
| Stone Harbor Investment Funds Annual Report | May 31, 2016 | 73 |
| Stone Harbor Investment Grade Fund | Financial Highlights |
For a share outstanding through the periods presented.
| Institutional Class | For the Year Ended May 31, 2016 | For the Year Ended May 31, 2015 | For the Period December 19, 2013 (Commencement of Operations) to May 31, 2014 | |||||||||
| Net asset value - beginning of period | $ | 10.36 | $ | 10.38 | $ | 10.00 | ||||||
| Income/(loss) from investment operations: | ||||||||||||
Net investment income(1) | 0.16 | 0.13 | 0.07 | |||||||||
| Net realized and unrealized gain on investments | 0.12 | 0.07 | 0.37 | |||||||||
| Total income from investment operations | 0.28 | 0.20 | 0.44 | |||||||||
| Less distributions to common shareholders: | ||||||||||||
| From net investment income | (0.15 | ) | (0.14 | ) | (0.06 | ) | ||||||
| From net realized gains | (0.09 | ) | (0.08 | ) | – | |||||||
| Total distributions | (0.24 | ) | (0.22 | ) | (0.06 | ) | ||||||
| Net Increase/(Decrease) in Net Asset Value | 0.04 | (0.02 | ) | 0.38 | ||||||||
| Net asset value - end of period | $ | 10.40 | $ | 10.36 | $ | 10.38 | ||||||
Total Return(2)(3) | 2.71 | % | 1.94 | % | 4.41 | % | ||||||
| Ratios/Supplemental Data: | ||||||||||||
| Net assets, end of period (in millions) | $ | 16 | $ | 10 | $ | 3 | ||||||
| Ratio of expenses to average net assets without fees waived by investment adviser and expenses reimbursed by investment adviser | 1.40 | % | 2.07 | % | 4.14 | %(4) | ||||||
| Ratio of expenses to average net assets with fees waived by investment adviser and expenses reimbursed by investment adviser | 0.50 | % | 0.50 | % | 0.50 | %(4) | ||||||
| Ratio of net investment income to average net assets with fee waivers/reimbursements | 1.57 | % | 1.26 | % | 1.62 | %(4) | ||||||
| Portfolio turnover rate | 52 | % | 51 | % | 27 | % | ||||||
| (1) | Calculated using average shares throughout the period. |
| (2) | Total returns would have been lower had various fees and expenses not been waived and reimbursed during the period. The total returns in the table represent the rate that an investor would have earned (or lost) on an investment in a Fund (assuming reinvestment of all dividends and distributions). |
| (3) | Total returns for periods of less than one year are not annualized. |
| (4) | Annualized. |
| See Notes to Financial Statements. | |
| 74 | www.shiplp.com |
| Stone Harbor Strategic Income Fund | Financial Highlights |
For a share outstanding through the periods presented.
| Institutional Class | For the Year Ended May 31, 2016 | For the Year Ended May 31, 2015 | For the Period December 19, 2013 (Commencement of Operations) to May 31, 2014 | |||||||||
| Net asset value - beginning of period | $ | 10.05 | $ | 10.44 | $ | 10.00 | ||||||
| Income/(loss) from investment operations: | ||||||||||||
Net investment income(1) | 0.43 | 0.49 | 0.15 | |||||||||
| Net realized and unrealized gain/(loss) on investments | (0.43 | ) | (0.37 | ) | 0.42 | |||||||
| Total income from investment operations | – | 0.12 | 0.57 | |||||||||
| Less distributions to common shareholders: | ||||||||||||
| From net investment income | (0.35 | ) | (0.48 | ) | (0.13 | ) | ||||||
| From net realized gains | (0.13 | ) | (0.03 | ) | – | |||||||
| Total distributions | (0.48 | ) | (0.51 | ) | (0.13 | ) | ||||||
| Net Increase/(Decrease) in Net Asset Value | (0.48 | ) | (0.39 | ) | 0.44 | |||||||
| Net asset value - end of period | $ | 9.57 | $ | 10.05 | $ | 10.44 | ||||||
Total Return(2)(3) | 0.19 | % | 1.15 | % | 5.73 | % | ||||||
| Ratios/Supplemental Data: | ||||||||||||
| Net assets, end of period (in millions) | $ | 36 | $ | 34 | $ | 11 | ||||||
| Ratio of expenses to average net assets without fees waived by investment adviser and expenses reimbursed by investment adviser | 0.96 | %(4) | 1.06 | %(4) | 1.46% | %(4)(5) | ||||||
| Ratio of expenses to average net assets with fees waived by investment adviser and expenses reimbursed by investment adviser | 0.12 | %(4) | 0.11 | %(4) | 0.12% | %(4)(5) | ||||||
| Ratio of net investment income to average net assets with fee waivers/reimbursements | 4.46 | %(4) | 4.88 | %(4) | 3.38% | %(4)(5) | ||||||
| Portfolio turnover rate | 26 | % | 8 | % | 0 | %(6) | ||||||
| (1) | Calculated using average shares throughout the period. |
| (2) | Total returns would have been lower had various fees and expenses not been waived and reimbursed during the period. The total returns in the table represent the rate that an investor would have earned (or lost) on an investment in a Fund (assuming reinvestment of all dividends and distributions). |
| (3) | Total returns for periods of less than one year are not annualized. |
| (4) | Ratio does not include expenses of the mutual funds held in the investment portfolio. |
| (5) | Annualized. |
| (6) | Less than 0.5%. |
| See Notes to Financial Statements. | |
| Stone Harbor Investment Funds Annual Report | May 31, 2016 | 75 |
| Stone Harbor Emerging Markets Debt Allocation Fund | Financial Highlights |
For a share outstanding through the periods presented.
| Institutional Class | For the Year Ended May 31, 2016 | For the Period October 21, 2014 (Commencement of Operations) to May 31, 2015 | ||||||
| Net asset value - beginning of period | $ | 9.36 | $ | 10.00 | ||||
| Income/(loss) from investment operations: | ||||||||
Net investment income(1) | 0.32 | 0.23 | ||||||
| Net realized and unrealized loss on investments | (0.52 | ) | (0.70 | ) | ||||
| Total loss from investment operations | (0.20 | ) | (0.47 | ) | ||||
| Less distributions to common shareholders: | ||||||||
| From net investment income | (0.26 | ) | (0.17 | ) | ||||
| Total distributions | (0.26 | ) | (0.17 | ) | ||||
| Net Decrease in Net Asset Value | (0.46 | ) | (0.64 | ) | ||||
| Net asset value - end of period | $ | 8.90 | $ | 9.36 | ||||
Total Return(2)(3) | (1.96 | %) | (4.73 | %) | ||||
| Ratios/Supplemental Data: | ||||||||
| Net assets, end of period (in millions) | $ | 67 | $ | 85 | ||||
| Ratio of expenses to average net assets without fees waived by investment adviser and expenses reimbursed by investment adviser | 0.87 | %(4) | 0.97% | %(4)(5) | ||||
| Ratio of expenses to average net assets with fees waived by investment adviser and expenses reimbursed by investment adviser | 0.06 | %(4) | 0.10% | %(4)(5) | ||||
| Ratio of net investment income to average net assets with fee waivers/reimbursements | 3.72 | %(4) | 3.68% | %(4)(5) | ||||
| Portfolio turnover rate | 70 | % | 11 | % | ||||
(1) | Calculated using average shares throughout the period. |
(2) | Total returns would have been lower in 2015 had various fees and expenses not been waived and reimbursed during the period. The total returns in the table represent the rate that an investor would have earned (or lost) on an investment in a Fund (assuming reinvestment of all dividends and distributions). |
(3) | Total returns for periods of less than one year are not annualized. |
(4) | Ratio does not include expenses of the mutual funds held in the investment portfolio. |
(5) | Annualized. |
| See Notes to Financial Statements. | |
| 76 | www.shiplp.com |
| Stone Harbor Investment Funds | Notes to Financial Statements |
May 31, 2016
1. ORGANIZATION AND SIGNIFICANT ACCOUNTING POLICIES
Stone Harbor Investment Funds, which consists of Stone Harbor Emerging Markets Debt Fund, Stone Harbor High Yield Bond Fund, Stone Harbor Local Markets Fund, Stone Harbor Emerging Markets Corporate Debt Fund, Stone Harbor Investment Grade Fund, Stone Harbor Strategic Income Fund, and Stone Harbor Emerging Markets Debt Allocation Fund (each, a “Fund” and together, the “Funds”) is a Massachusetts business trust (the “Trust”), organized on February 20, 2007 and registered under the Investment Company Act of 1940, as amended (the “1940 Act”), as an open-end management investment company. Shares of each Fund are currently divided into two classes, designated Institutional Class Shares and Distributor Class Shares. As of the date of this report, Distributor Class shares were not offered for sale in each Fund. The Trust’s Declaration of Trust permits the Trustees to create additional funds and share classes.
The Emerging Markets Debt Fund’s investment objective is to maximize total return. The Fund normally will invest at least 80% of its net assets (plus any borrowings made for investment purposes) in Emerging Markets Fixed Income Securities. “Emerging Markets Fixed Income Securities” include fixed income securities and derivative instruments (including, but not limited to, spot and currency contracts, futures, options and swaps) that economically are tied to countries with emerging securities markets or whose performance is linked to those countries’ markets, economies or ability to repay loans. Emerging Markets Fixed Income Securities may be denominated in non-U.S. currencies or the U.S. dollar. A security or instrument is economically tied to an emerging market country if it is principally traded on the country’s securities markets or the issuer is organized or principally operates in the country, derives a majority of its income from its operations within the country or has a majority of its assets within the country. Emerging Markets Fixed Income Securities also include derivatives and other instruments used to hedge or gain exposure to emerging securities markets (for example, futures or other derivatives whose return is based on specific emerging markets securities or indices).
The High Yield Bond Fund’s investment objective is to maximize total return. The Fund will normally invest at least 80% of its net assets (plus any borrowings made for investment purposes) in High Yield Debt Securities. “High Yield Debt Securities” include fixed income securities and derivative instruments (including, but not limited to, spot and currency contracts, futures, options and swaps) rated below investment grade (or, if unrated, of comparable quality as determined by Stone Harbor Investment Partners LP (the “Adviser” or “Stone Harbor”). These types of securities and instruments are commonly referred to as “high yield” securities or “junk bonds,” and may include, among other things, bonds, debentures, notes, equipment trust certificates, commercial paper, commercial loans, preferred stock and other obligations of U.S. and non-U.S. issuers. High Yield Debt Securities also include securities or other instruments whose return is based on the return of high yield securities, including derivative instruments and instruments created to hedge or gain exposure to the high yield markets.
The Local Markets Fund’s investment objective is to maximize total return. The Fund normally will invest at least 80% of its net assets (plus any borrowings made for investment purposes) in Emerging Markets Investments. “Emerging Markets Investments” include fixed income securities and derivative instruments (including, but not limited to, spot and currency contracts, futures, options and swaps) that economically are tied to an emerging market country, which are denominated in the predominant currency of the local market of an emerging market country (an “Emerging Markets Currency”) or whose performance is linked to those countries’ currencies, markets, economies or ability to repay loans. Although under normal circumstances a significant portion of the Fund’s investments will be denominated in Emerging Markets Currencies, Emerging Markets Investments may be denominated in non-Emerging Markets Currencies, including the U.S. dollar. A security or instrument is economically tied to an emerging market country if it is principally traded on the country’s securities markets or the issuer is organized or principally operates in the country, derives a majority of its income from its operations within the country or has a majority of its assets within the country. Emerging Markets Investments also include Emerging Markets Currencies and derivatives and other instruments used to hedge or gain exposure to emerging securities markets or Emerging Markets Currencies (for example, futures or other derivatives whose return is based on specific emerging markets securities, emerging markets indices or Emerging Markets Currencies).
The Emerging Markets Corporate Debt Fund’s investment objective is to maximize total return. The Fund normally will invest at least 80% of its net assets (plus any borrowings made for investment purposes) in Emerging Markets Corporate Debt Investments. “Emerging Markets Corporate Debt Investments” are debt instruments, including loans, issued by corporations or other business organizations that are economically tied to an emerging market country. A corporation or other business organization is economically tied to an emerging market country if it issues securities that are principally traded on the country’s securities markets or if it is organized or principally operates in the country, derives a majority of its income from its operations within the country or has a majority of its assets within the country. Emerging Markets Corporate Debt Investments also include derivative instruments used for hedging purposes or to otherwise gain or reduce long or short exposure to Emerging Markets Corporate Debt Investments.
The Investment Grade Fund’s investment objective is to maximize total return. The Fund invests in various types of fixed income securities and under normal market conditions will invest at least 80% of its net assets (plus any borrowings made for investment purposes) in Investment Grade Debt Securities. “Investment Grade Debt Securities” include fixed income securities that are rated investment grade by any of Moody’s Investors Services, Inc., Standard & Poor’s Rating Services, Fitch Ratings Limited, DBRS or other qualified rating agencies or, if unrated, are determined by the Adviser to be of comparable quality, and derivative instruments related to those securities.
Stone Harbor Investment Funds Annual Report | May 31, 2016 | 77 |
| Stone Harbor Investment Funds | Notes to Financial Statements |
May 31, 2016
The Strategic Income Fund’s investment objective is to maximize total return. The Fund is intended to provide broad exposure to global credit markets. The Fund, either directly or through investment in the underlying funds (defined below), may invest in a broad variety of fixed income and other income producing securities and instruments (including derivatives), and will not be limited in terms of type of instrument, geography, credit rating or duration. The Fund may invest all or a significant portion of its assets in Stone Harbor Investment Grade Fund, Stone Harbor High Yield Bond Fund, Stone Harbor Emerging Markets Debt Fund, Stone Harbor Local Markets Fund and Stone Harbor Emerging Markets Corporate Debt Fund and other funds sponsored or advised by the Adviser (together, the “underlying funds”). The Fund is not required to invest in the underlying funds, and from time to time may not be invested in any underlying fund. In addition to investing in the underlying funds, the Fund may invest directly in fixed income securities and in other instruments and transactions.
The Emerging Markets Debt Allocation Fund’s investment objective is to maximize total return. The Fund, either directly or through investment in the underlying funds (defined below), will invest at least 80% of its net assets (plus any borrowings made for investment purposes) in Emerging Markets Investments. Emerging Markets Investments include fixed income securities and other income producing securities and derivative instruments (including, but not limited to , spot and currency contracts, futures, options and swaps), that economically are tied to an emerging market country or whose performance is linked to those countries’ currencies, markets, economies or ability to repay loans. The Fund may invest all or a significant portion of its assets in Stone Harbor Emerging Markets Debt Fund and Stone Harbor Local Markets Fund (together, the “underlying funds”). The Fund is not required to invest in the underlying funds, and from time to time may not be invested in any underlying fund. In addition to investing in the underlying funds, the Fund may invest directly in fixed income securities and in other instruments and transactions.
The Emerging Markets Debt Fund and Local Markets Fund are each classified as “non-diversified” under the 1940 Act. As a result, these Funds can invest a greater portion of the respective Fund’s assets in obligations of a single issuer than a “diversified” fund. These Funds may therefore be more susceptible than a diversified fund to being adversely affected by any single corporate, economic, political or regulatory occurrence. The High Yield Bond Fund, Emerging Markets Corporate Debt Fund, Investment Grade Fund, Strategic Income Fund, and Emerging Markets Debt Allocation Fund are diversified funds. The Emerging Markets Corporate Debt Fund was previously classified as a non‐diversified investment company for purposes of the 1940 Act. As a result of ongoing operations, the Emerging Markets Corporate Debt Fund is now classified as a diversified company.
The following is a summary of significant accounting policies consistently followed by the Funds in the preparation of their financial statements. Each Fund is considered an investment company for financial reporting purposes under generally accepted accounting principles in the United States of America (“GAAP”). The policies are in conformity with GAAP. The preparation of the financial statements in accordance with GAAP requires management to make estimates and assumptions that affect the reported amounts of assets and liabilities at the date of the financial statements and the reported amounts of income and expenses during the reporting period. Actual results could differ from those estimates.
Investment Valuation: Sovereign debt obligations, corporate bonds, convertible corporate bonds, and U.S. Treasury bonds, are generally valued at the mean between the closing bid and asked prices provided by an independent pricing service. The pricing services generally uses market models that consider trade data, yields, spreads, quotations from dealers and active market makers, credit worthiness, market information on comparable securities, and other relevant security specific information. Asset backed/commercial mortgage backed securities are generally valued at the mean between the closing bid and asked prices provided by an independent pricing service. The pricing service generally use models that consider trade data, prepayment and default projections, benchmark yield and spread data and estimated cash flows of each tranche of the issuer. Bank loans are primarily valued by a loan pricing provider using a composite loan price at the mean of the bid and ask prices from one or more brokers of dealers. Credit Linked securities are generally valued using quotations from broker through which the Fund executed the transaction. The broker’s quotation considers cash flows, default and recovery rates, and other security specific information.. Equity securities for which market quotations are available are generally valued at the last sale price or official closing price on the primary market or exchange on which they trade. If on a given day, a closing price is not available on the exchange the equity security is valued at the mean between the closing bid and asked prices, as such prices are provided by a pricing service. Publicly traded foreign government debt securities are typically traded internationally in the over-the-counter market, and are valued at the mean between the bid and asked prices as of the close of business of that market. When prices are not readily available, or are determined not to reflect fair value, such as when the value of a security has been significantly affected by events after the close of the exchange or market on which the security is principally traded, but before the Funds calculate their net asset value, the Funds may value these investments at fair value as determined in accordance with the procedures approved by the Funds’ Board of Trustees (the “Board”). Short-term obligations with maturities of 60 days or less are valued at amortized cost, which approximates market value. Open end funds and money market mutual funds are valued at their net asset value. Futures contracts are ordinarily valued at the last sales price on the securities or commodities exchange on which they are traded. Over-the-counter (“OTC”) traded derivatives (primarily swaps and foreign currency options) are generally priced by an independent pricing service. OTC traded credit default swaps are valued by the independent pricing source using a mid price that is calculated based on data an independent pricing source receives from dealers. OTC traded foreign currency options are valued by an independent pricing source using mid foreign exchange rates against USD for all currencies at 4:00 p.m. EST. Derivatives which are cleared by an exchange are priced by using the last price on such exchange. Foreign currency positions including forward currency contracts are priced at the mean between the closing bid and asked prices at 4:00 p.m. Eastern time.
| 78 | www.shiplp.com |
| Stone Harbor Investment Funds | Notes to Financial Statements |
May 31, 2016
The three-tier hierarchy is summarized as follows:
| Level 1 — | Unadjusted quoted prices in active markets for identical assets or liabilities that each Fund has the ability to access. |
| Level 2 — | Observable inputs other than quoted prices included in level 1 that are observable for the asset or liability, either directly or indirectly. These inputs may include quoted prices for the identical instrument on an inactive market, prices for similar instruments, interest rates, prepayment speeds, credit risk, yield curve, rates, and similar data. |
| Level 3 — | Unobservable inputs for the asset or liability, to the extent relevant observable inputs are not available, representing the Fund’s own assumptions about the assumptions a market participant would use in valuing the asset or liability, and would be based on the best information available. |
The following is a summary of each Fund’s investments and financial instruments based on the three-tier hierarchy as of May 31, 2016:
| Investments in Securities at Value* | Level 1 | Level 2 | Level 3 | Total | ||||||||||||
| Stone Harbor Emerging Markets Debt Fund | ||||||||||||||||
| Sovereign Debt Obligations | $ | – | $ | 1,095,733,052 | $ | – | $ | 1,095,733,052 | ||||||||
| Bank Loans | – | – | 19,440,382 | 19,440,382 | ||||||||||||
| Corporate Bonds | – | 353,109,095 | – | 353,109,095 | ||||||||||||
| Credit Linked Notes | – | – | 25,970,744 | 25,970,744 | ||||||||||||
| ShortTermInvestments | 63,498,821 | – | – | 63,498,821 | ||||||||||||
| Total | $ | 63,498,821 | $ | 1,448,842,147 | $ | 45,411,126 | $ | 1,557,752,094 | ||||||||
Other Financial Instruments** | ||||||||||||||||
| Assets | ||||||||||||||||
| Forward Foreign Currency Contracts | $ | – | $ | 1,684,205 | $ | – | $ | 1,684,205 | ||||||||
| Liabilities | ||||||||||||||||
| Forward Foreign Currency Contracts | – | (1,608,159 | ) | – | (1,608,159 | ) | ||||||||||
| CreditDefaultSwapContracts | – | (151,724 | ) | – | (151,724 | ) | ||||||||||
| Total | $ | – | $ | (75,678 | ) | $ | – | $ | (75,678 | ) | ||||||
Investments in Securities at Value* | Level 1 | Level 2 | Level 3 | Total | ||||||||||||
| Stone Harbor High Yield Bond Fund | ||||||||||||||||
| Corporate Bonds | $ | – | $ | 218,447,384 | $ | 0 | $ | 218,447,384 | ||||||||
| Bank Loans | – | 23,596,571 | 618,388 | 24,214,959 | ||||||||||||
| Common/Preferred Stocks | 357,078 | 12,240 | – | 369,318 | ||||||||||||
| Short Term Investments | 5,832,580 | – | – | 5,832,580 | ||||||||||||
| Total | $ | 6,189,658 | $ | 242,056,195 | $ | 618,388 | $ | 248,864,241 | ||||||||
Other Financial Instruments** | ||||||||||||||||
| Assets | ||||||||||||||||
| Forward Foreign Currency Contracts | $ | – | $ | 98,379 | $ | – | $ | 98,379 | ||||||||
| Total | $ | – | $ | 98,379 | $ | – | $ | 98,379 | ||||||||
Stone Harbor Investment Funds Annual Report | May 31, 2016 | 79 |
| Stone Harbor Investment Funds | Notes to Financial Statements |
May 31, 2016
Investments in Securities at Value* | Level 1 | Level 2 | Level 3 | Total | ||||||||||||
| Stone Harbor Local Markets Fund | ||||||||||||||||
| Sovereign Debt Obligations | $ | – | $ | 731,216,445 | $ | – | $ | 731,216,445 | ||||||||
| Corporate Bonds | – | 43,274,347 | – | 43,274,347 | ||||||||||||
| Short Term Investments | 12,094,674 | – | – | 12,094,674 | ||||||||||||
| Total | $ | 12,094,674 | $ | 774,490,792 | $ | – | $ | 786,585,466 | ||||||||
Investments in Securities at Value* | Level 1 | Level 2 | Level 3 | Total | ||||||||||||
| Stone Harbor Local Markets Fund (continued) | ||||||||||||||||
Other Financial Instruments** | ||||||||||||||||
| Assets | ||||||||||||||||
| Forward Foreign Currency Contracts | $ | – | $ | 1,659,662 | $ | – | $ | 1,659,662 | ||||||||
| Liabilities | ||||||||||||||||
| Forward Foreign Currency Contracts | – | (2,654,701 | ) | – | (2,654,701 | ) | ||||||||||
| Total | $ | – | $ | (995,039 | ) | $ | – | $ | (995,039 | ) | ||||||
Investments in Securities at Value* | Level 1 | Level 2 | Level 3 | Total | ||||||||||||
| Stone Harbor Emerging Markets Corporate Debt Fund | ||||||||||||||||
| Corporate Bonds | $ | – | $ | 16,134,252 | $ | – | $ | 16,134,252 | ||||||||
| Short Term Investments | 1,154,610 | – | – | 1,154,610 | ||||||||||||
| Total | $ | 1,154,610 | $ | 16,134,252 | $ | – | $ | 17,288,862 | ||||||||
Other Financial Instruments** | ||||||||||||||||
| Assets | ||||||||||||||||
| Forward Foreign Currency Contracts | $ | – | $ | 3,298 | $ | – | $ | 3,298 | ||||||||
| Total | $ | – | $ | 3,298 | $ | – | $ | 3,298 | ||||||||
Investments in Securities at Value* | Level 1 | Level 2 | Level 3 | Total | ||||||||||||
| Stone Harbor Investment Grade Fund | ||||||||||||||||
| Corporate Bonds | $ | – | $ | 5,789,646 | $ | – | $ | 5,789,646 | ||||||||
| Asset Backed/Commercial Mortgage Backed Securities | – | 1,230,851 | – | 1,230,851 | ||||||||||||
| U.S. Treasury Bonds/Notes | – | 3,118,911 | – | 3,118,911 | ||||||||||||
| U.S. Government Agency Mortgage Backed Securities | – | 3,479,578 | – | 3,479,578 | ||||||||||||
| Short Term Investments | 2,063,406 | – | – | 2,063,406 | ||||||||||||
| Total | $ | 2,063,406 | $ | 13,618,986 | $ | – | $ | 15,682,392 | ||||||||
Investments in Securities at Value* | Level 1 | Level 2 | Level 3 | Total | ||||||||||||
| Stone Harbor Strategic Income Fund | ||||||||||||||||
| Open-End Funds | $ | 35,996,695 | $ | – | $ | – | $ | 35,996,695 | ||||||||
| Purchased Options | – | 12,750 | – | 12,750 | ||||||||||||
| Short Term Investments | 164,450 | – | – | 164,450 | ||||||||||||
| Total | $ | 36,161,145 | $ | 12,750 | $ | – | $ | 36,173,895 | ||||||||
Other Financial Instruments** | ||||||||||||||||
| Assets | ||||||||||||||||
| Forward Foreign Currency Contracts | $ | – | $ | 16,202 | $ | – | $ | 16,202 | ||||||||
| Futures Contracts | 40,307 | – | – | 40,307 | ||||||||||||
| Liabilities | ||||||||||||||||
| Forward Foreign Currency Contracts | – | (36,524 | ) | – | (36,524 | ) | ||||||||||
| Futures Contracts | (19,949 | ) | – | – | (19,949 | ) | ||||||||||
| Total | $ | 20,358 | $ | (20,322 | ) | $ | – | $ | 36 | |||||||
| 80 | www.shiplp.com |
| Stone Harbor Investment Funds | Notes to Financial Statements |
May 31, 2016
Investments in Securities at Value* | Level 1 | Level 2 | Level 3 | Total | ||||||||||||
| Stone Harbor Emerging Markets Debt Allocation Fund | ||||||||||||||||
| Open-End Funds | $ | 67,436,454 | $ | – | $ | – | $ | 67,436,454 | ||||||||
| Total | $ | 67,436,454 | $ | – | $ | – | $ | 67,436,454 | ||||||||
Investments in Securities at Value* | Level 1 | Level 2 | Level 3 | Total | ||||||||||||
| Stone Harbor Emerging Markets Debt Allocation Fund (continued) | ||||||||||||||||
Other Financial Instruments** | ||||||||||||||||
| Assets | ||||||||||||||||
| Forward Foreign Currency Contracts | $ | – | $ | 10,161 | $ | – | $ | 10,161 | ||||||||
| Liabilities | ||||||||||||||||
| Forward Foreign Currency Contracts | – | (30,715 | ) | – | (30,715 | ) | ||||||||||
| Total | $ | – | $ | (20,554 | ) | $ | – | $ | (20,554 | ) | ||||||
| * | For detailed Industry/Country descriptions, see accompanying Statements of Investments. |
| ** | Other financial instruments are derivative instruments not reflected in the Statements of Investments. The derivatives shown in this table are reported at their unrealized appreciation/(depreciation) at measurement date, which represents the change in the contract’s value. |
It is the Funds’ policy to recognize transfers into and out of all levels at the end of the reporting period. For the Fiscal Year ended May 31, 2016 the Stone Harbor High Yield Bond Fund had transfers between Level 1 and 2:
| Level 1 | Level 2 | |||||||||||||||
| Transfers In | Transfers (Out) | Transfers In | Transfers (Out) | |||||||||||||
| Common/ Preferred Stocks | $ | – | $ | (12,240 | ) | $ | 12,240 | $ | – | |||||||
| Total | $ | – | $ | (12,240 | ) | $ | 12,240 | $ | – | |||||||
Financial assets were transferred from Level 1 to Level 2 since the equity position used a stale price due to no market activity on May 31, 2016.
The following is a reconciliation of assets in which significant unobservable inputs (Level 3) were used in determining fair value:
| Investments in Securities | Balance at May 31, 2015 | Accrued discount/ premium | Realized Gain/(Loss) | Change in Unrealized Appreciation/ (Depreciation) | Purchases | Sales Proceeds | Transfer into/ (out of) Level 3 | Balance at May 31, 2016 | Net change in unrealized appreciation/(depreciation) included in the Statement of Operations attributable to Level 3 investments held at May 31, 2016 | |||||||||||||||||||||||||||
| Stone Harbor Emerging Markets Debt Fund | ||||||||||||||||||||||||||||||||||||
| Bank Loans | $ | 218,719 | $ | – | $ | – | $ | 221,663 | $ | 19,000,000 | $ | – | $ | – | $ | 19,440,382 | $ | 221,663 | ||||||||||||||||||
| Credit Linked Notes | 22,967,945 | 3,966,051 | (76,429 | ) | (99,334 | ) | – | (787,489 | ) | – | 25,970,744 | (99,334 | ) | |||||||||||||||||||||||
| Total | $ | 23,186,664 | $ | 3,966,051 | $ | (76,429 | ) | $ | 122,329 | $ | 19,000,000 | $ | (787,489 | ) | $ | – | $ | 45,411,126 | $ | 122,329 | ||||||||||||||||
| Investments in Securities | Balance at May 31, 2015 | Accrued discount/ premium | Realized Gain/(Loss) | Change in Unrealized Appreciation/ (Depreciation) | Purchases | Sales Proceeds | Transfer into/ (out of) Level 3 | Balance at May 31, 2016 | Net change in unrealized appreciation/(depreciation) included in the Statement of Operations attributable to Level 3 investments held at May 31, 2016 | |||||||||||||||||||||||||||
| Stone Harbor Emerging High Yield Bond Fund | ||||||||||||||||||||||||||||||||||||
| Bank Loans | $ | – | $ | 42 | $ | – | $ | 19,571 | $ | 598,775 | $ | – | $ | – | $ | 618,388 | $ | 19,571 | ||||||||||||||||||
| Total | $ | – | $ | 42 | $ | – | $ | 19,571 | $ | 598,775 | $ | – | $ | – | $ | 618,388 | $ | 19,571 | ||||||||||||||||||
Stone Harbor Investment Funds Annual Report | May 31, 2016 | 81 |
| Stone Harbor Investment Funds | Notes to Financial Statements |
May 31, 2016
All level 3 investments have values determined utilizing third party pricing information without adjustment.
The inputs or methodology used for valuing securities are not necessarily an indication of the risk associated with investing in those securities.
In the event a Board approved independent pricing service is unable to provide an evaluated price for a security or the Adviser believes the price provided is not reliable, securities of the Funds may be valued at fair value as described above. In these instances the Adviser may seek to find an alternative independent source, such as a broker/dealer to provide a price quote, or by using evaluated pricing models similar to the techniques and models used by the independent pricing service. These fair value measurement techniques may utilize unobservable inputs (Level 3).
On at least a quarterly basis, the Adviser presents the factors considered in determining the fair value measurements and presents that information to the Board which meets at least quarterly.
Security Transactions and Investment Income: Security transactions are accounted for on a trade date basis. Interest income, adjusted for amortization of premium and accretion of discount, is recorded on the accrual basis. Dividend income is recorded on the ex-dividend date. Foreign dividend income is recorded on the ex-dividend date or as soon as practical after the Funds determine the existence of a dividend declaration after exercising reasonable due diligence. Dividend income received from underlying affiliated funds is generally reinvested back into the underlying fund. If applicable, any foreign capital gains taxes are accrued, net of unrealized gains, and are payable upon the sale of such investments. The cost of investments sold is determined by use of the specific identification method. To the extent any issuer defaults on an expected interest payment, the Funds’ policy is to generally halt any additional interest income accruals and consider the realizability of interest accrued up to the date of default.
Foreign Currency Translation: The books and records of the Funds are maintained in U.S. dollars. Investment valuations and other assets and liabilities initially expressed in foreign currencies are converted each business day into U.S. dollars based upon current exchange rates. Prevailing foreign exchange rates may generally be obtained at the close of the NYSE (normally, 4:00 p.m. Eastern time). The portion of realized and unrealized gains or losses on investments due to fluctuations in foreign currency exchange rates is not separately disclosed and is included in realized and unrealized gains or losses on investments, when applicable.
Foreign Securities: The Funds may directly purchase securities of foreign issuers. Investing in securities of foreign issuers involves special risks not typically associated with investing in securities of U.S. issuers. The risks include possible revaluation of currencies, the ability to repatriate funds, less complete financial information about companies and possible future adverse political and economic developments. Moreover, securities of many foreign issuers and their markets may be less liquid and their prices more volatile than those of securities of comparable U.S. issuers.
Credit Linked Notes: The Funds may invest in credit linked notes to obtain economic exposure to high yield, emerging markets or other securities. Investments in a credit linked note typically provide the holder with a return based on the return of an underlying reference instrument, such as an emerging market bond. Like an investment in a bond, investments in credit‐linked securities represent the right to receive periodic income payments (in the form of distributions) and payment of principal at the end of the term of the security. In addition to the risks associated with the underlying reference instrument, an investment in a credit linked note is also subject to liquidity risk, market risk, interest rate risk and the risk that the counterparty will be unwilling or unable to meet its obligations under the note.
Segregation and Collateralization: In cases in which the 1940 Act and the interpretive positions of the U.S. Securities and Exchange Commission (“SEC”) require that a Fund either deliver collateral or segregate assets in connection with certain investments (e.g., foreign currency exchange contracts, securities with extended settlement periods, and swaps) or certain borrowings (e.g., reverse repurchase agreements), the Fund will segregate collateral or designate on its books and records cash or other liquid securities having a value at least equal to the amount that is required to be physically segregated for the benefit of the counterparty. Furthermore, based on requirements and agreements with certain exchanges and third party broker‐dealers, each party has requirements to deliver/deposit cash or securities as collateral for certain investments. Cash collateral that has been pledged to cover obligations of the Funds and cash collateral received from the counterparty, if any, is reported separately on the Statements of Assets and Liabilities as “Deposits with brokers” or “Payable due to brokers”, respectively. Securities collateral pledged for the same purpose is noted on the Statements of Investments.
Loan Participations and Assignments: The Funds may invest in loans arranged through private negotiation between one or more financial institutions. The Funds’ investment in any such loan may be in the form of a participation in or an assignment of the loan. In connection with purchasing participations, the Funds generally will have no right to enforce compliance by the borrower with the terms of the loan agreement relating to the loan, nor any rights of set-off against the borrower and the Funds may not benefit directly from any collateral supporting the loan in which they have purchased the participation.
| 82 | www.shiplp.com |
| Stone Harbor Investment Funds | Notes to Financial Statements |
May 31, 2016
While some loans are collateralized and senior to an issuer’s other debt securities, other loans may be unsecured and/or subordinated to other securities. Some senior loans, such as bank loans, may be illiquid and generally tend to be less liquid than many other debt securities.
The Funds may also invest in unfunded loan commitments, which are contractual obligations for future funding. Information regarding unfunded commitments is included at the end of the Funds’ Statements of Investments.
The Funds assume the credit risk of the borrower, the lender that is selling the participation and any other persons interpositioned between the Funds and the borrower. In the event of the insolvency of the lender selling the participation, the Funds may be treated as a general creditor of the lender and may not benefit from any set-off between the lender and the borrower. Loans may not be considered “securities”, and purchasers, such as the Funds, therefore may not be entitled to rely on the anti-fraud protections of the federal securities laws.
Inflation-Indexed Bonds: Certain Funds may invest in inflation-indexed bonds. Inflation-indexed bonds are fixed-income securities whose principal value is periodically adjusted to the rate of inflation. The interest rate on these bonds is generally fixed at issuance at a rate lower than typical bonds. Over the life of an inflation-indexed bond, however, interest will be paid based on a principal value which is adjusted for inflation. Any increase or decrease in the principal amount of an inflation-indexed bond will be included as interest income on the Statements of Operations, even though investors do not receive their principal until maturity.
Mortgage-Related and Other Asset-Backed Securities: Certain Funds may invest in mortgage-related and other asset-backed securities. These securities include mortgage pass-through securities, collateralized mortgage obligations, commercial mortgage-backed securities, stripped mortgage-backed securities, asset-backed securities, collateralized debt obligations and other securities that directly or indirectly represent a participation in, or are secured by and payable from, mortgage loans on real property. Mortgage-related and other asset-backed securities are interests in pools of loans or other receivables. Mortgage-related securities are created from pools of residential or commercial mortgage loans, including mortgage loans made by savings and loan institutions, mortgage bankers, commercial banks and others. Asset-backed securities are created from many types of assets, including auto loans, credit card receivables, home equity loans, and student loans. These securities provide a monthly payment which consists of both interest and principal payments. Interest payments may be determined by fixed or adjustable rates. The rate of prepayments on underlying mortgages will affect the price and volatility of a mortgage-related security, and may have the effect of shortening or extending the effective duration of the security relative to what was anticipated at the time of purchase. The timely payment of principal and interest of certain mortgage-related securities is guaranteed with the full faith and credit of the U.S. Government. Pools created and guaranteed by non-governmental issuers, including government sponsored corporations, may be supported by various forms of insurance or guarantees, but there can be no assurance that the private insurers or guarantors can meet their obligations under the insurance policies or guarantee arrangements.
U.S. Government Agencies or Government-Sponsored Enterprises: Certain Funds may invest in securities of U.S. Government agencies or government-sponsored enterprises. U.S. Government securities are obligations of and, in certain cases, guaranteed by, the U.S. Government, its agencies or instrumentalities. Some U.S. Government securities, such as Treasury bills, notes and bonds, and securities guaranteed by the Government National Mortgage Association (“GNMA” or “Ginnie Mae”), are supported by the full faith and credit of the U.S. Government; others, such as those of the Federal Home Loan Banks, are supported by the right of the issuer to borrow from the U.S. Department of the Treasury (the “U.S. Treasury”); others, such as those of the Federal National Mortgage Association (“FNMA” or “Fannie Mae”), are supported by the discretionary authority of the U.S. Government to purchase the agency’s obligations. U.S. Government securities may include zero coupon securities, which do not distribute interest on a current basis and tend to be subject to greater risk than interest-paying securities of similar maturities.
Government-related guarantors (i.e., not backed by the full faith and credit of the U.S. Government) include FNMA and the Federal Home Loan Mortgage Corporation (“FHLMC” or “Freddie Mac”). FNMA is a government-sponsored corporation. FNMA purchases conventional (i.e., not insured or guaranteed by any government agency) residential mortgages from a list of approved seller/servicers which include state and federally chartered savings and loan associations, mutual savings banks, commercial banks and credit unions and mortgage bankers. Pass-through securities issued by FNMA are guaranteed as to timely payment of principal and interest by FNMA, but are not backed by the full faith and credit of the U.S. Government. FHLMC issues Participation Certificates (“PCs”), which are pass-through securities, each representing an undivided interest in a pool of residential mortgages. FHLMC guarantees the timely payment of interest and ultimate collection of principal, but PCs are not backed by the full faith and credit of the U.S. Government.
Forward Commitments: Certain Funds may contract to purchase securities for a fixed price at a transaction date beyond the customary settlement period (i.e., “when-issued,” “delayed-delivery,” “forward commitment,” or “To Be Announced (“TBA”) transactions”) consistent with a Fund’s ability to manage its investment portfolio and meet redemption requests. These transactions involve a commitment by a Fund to purchase securities for a predetermined price or yield with payment and delivery taking place more than three days in the future or after a period longer than the customary settlement period for that type of security. No interest will be earned by a Fund on such purchases until the securities are delivered; however, the market value may change prior to delivery. A Fund will not engage in these transactions for investment leverage.
Stone Harbor Investment Funds Annual Report | May 31, 2016 | 83 |
| Stone Harbor Investment Funds | Notes to Financial Statements |
May 31, 2016
When-issued securities involve the risk that the yield obtained in the transaction will be less than that available in the market when delivery takes place. Securities purchased on a when‐issued basis are recorded as an asset and are subject to changes in value based upon changes in the value of the security or general level of interest rates. In when-issued and delayed-delivery transactions, a Fund relies on the seller to complete the transaction; the seller’s failure to do so may cause a Fund to miss an advantageous price or yield.
The Funds may enter into TBA commitments. TBA commitments are forward agreements for the purchase or sale of mortgage-backed securities for a fixed price, with payment and delivery on an agreed upon future settlement date. The specific securities to be delivered are not identified at the trade date. However, delivered securities must meet specified terms, including issuer, rate and mortgage terms. The Funds generally enter into TBA commitments with the intent to take possession of or deliver the underlying mortgage-backed securities but can extend the settlement or roll the transaction. Regulatory developments may limit the ability of a Fund to engage in TBA transactions to the extent desired.
Unsettled TBA sale (purchase) commitments are valued at the current market value of the underlying securities. The contract is adjusted to market value daily, and the change in market value is recorded by the Fund as an unrealized gain or loss. Outstanding TBA commitments and related deliverables are reflected on the Statement of Assets and Liabilities in Payable for investments purchased and Receivable for investments sold, respectively. If the TBA sale (purchase) commitment is closed through the acquisition of an offsetting purchase (sale) commitment, the Fund realizes a gain or loss from the sale of the securities based upon the unit price established at the date the commitment was entered into. These gain/loss amounts are reflected in the Accumulated net realized gain/loss on investments and Net unrealized appreciation on investments on the Statement of Assets and Liabilities.
Credit and Market Risk: The Funds invest in high yield and emerging market instruments that are subject to certain credit and market risks. The yields of high yield and emerging market debt obligations reflect, among other things, perceived credit and market risks. The Funds’ investment in securities rated below investment grade typically involves risks not associated with higher rated securities including, among others, greater risk related to timely and ultimate payment of interest and principal, greater market price volatility and less liquid secondary market trading. The consequences of political, social, economic or diplomatic changes may have disruptive effects on the market prices of investments held by the Funds. The Funds’ investment in non-U.S. dollar denominated securities may also result in foreign currency losses caused by devaluations and exchange rate fluctuations. Investments in derivatives are also subject to credit and market risks.
Distributions to Shareholders: Dividends and distributions to shareholders, which are determined in accordance with income tax regulations, are recorded on the ex-date. Income distributions, if any are generally declared and paid on a quarterly basis, except for any distributions paid by the Local Markets Fund and the Emerging Markets Debt Allocation Fund, which are declared and paid annually. Capital gain distributions, if any, are declared and paid at least annually. A portion of the Fund’s distributions made for a taxable year may be recharacterized as a return of capital to shareholders. This may occur, for example, if the Fund’s distributions exceed its “earnings and profits” for the taxable year or because certain foreign currency losses may reduce the Fund’s income. This recharacterization may be retroactive. A return of capital will generally not be taxable, but will reduce a shareholder’s basis in his or her Fund shares and therefore result in a higher gain or lower loss when the shareholder sells the shares.
Expenses: Direct expenses are charged to each Fund; expenses of the Trust are generally allocated to the Funds based on each Fund’s relative net assets.
Federal and Other Taxes: No provision for income taxes is included in the accompanying financial statements, as the Funds intend to distribute to shareholders all taxable investment income and realized gains and otherwise comply with Subchapter M of the Internal Revenue Code of 1986, as amended, applicable to regulated investment companies.
The Funds evaluate tax positions taken (or expected to be taken) in the course of preparing the Funds’ tax provisions to determine whether these positions meet a “more-likely-than-not” standard that, based on the technical merits, have a more than fifty percent likelihood of being sustained by a taxing authority upon examination. A tax position that meets the “more-likely-than-not” recognition threshold is measured to determine the amount of benefit to recognize in the financial statements.
As of and during the year ended May 31, 2016, the Funds did not have a liability for any unrecognized tax benefits. The Funds file U.S. federal, state, and local tax returns as required. The Funds’ tax returns are subject to examination by the relevant tax authorities until expiration of the applicable statute of limitations which is generally three years after the filing of the tax return for federal purposes and four years for most state returns. Tax returns for open years have incorporated no uncertain tax positions that require a provision for income taxes.
Statement of Changes in Net Assets for the year ended May 31, 2015: Subsequent to the issuance of the Funds’ 2015 financial statements, an error was identified in the Strategic Income Fund’s Statement of Changes in Net Assets for the year ended May 31, 2015. This error resulted in the overstatement of “Net Realized gain/(loss)” presented by $418,657 as well as the corresponding overstatement of the totals “Net increase/(decrease) in net assets resulting from operations”, “Net increase/(decrease) in net assets”, and “Net Assets” by that same amount. These balances within the Statement of Changes in Net Assets for the year ended May 31, 2015 have been revised to reflect the correct amounts. The previously issued Statement of Assets and Liabilities as of May 31, 2015, and the related Statement of Operations and Financial Highlights for the year then ended were properly stated and were not impacted by this error.
| 84 | www.shiplp.com |
| Stone Harbor Investment Funds | Notes to Financial Statements |
May 31, 2016
2. DERIVATIVE INSTRUMENTS
Risk Exposure and the Use of Derivative Instruments: The Funds’ investment objectives allow the Funds to enter in various types of derivatives contracts. In doing so, the Funds employ strategies in differing combinations to permit them to increase, decrease, or change the level or types of exposure to market factors. Central to those strategies are features inherent to derivatives that may make them more attractive for this purpose than equity or debt securities; they require little or no initial cash investment, they can focus exposure on only certain selected risk factors, and they may not require the ultimate receipt or delivery of the underlying security (or securities) to the contract. This may allow the Funds to pursue their objectives more quickly and efficiently than if they were to make direct purchases or sales of securities capable of affecting a similar response to market factors.
Market Risk Factors. In pursuit of their investment objectives, the Funds may seek to use derivatives to increase or decrease their exposure to the following market risk factors, among others:
Interest Rate Risk. Interest rate risk refers to the fluctuations in value of fixed-income securities resulting from the inverse relationship between price and yield. For example, an increase in general interest rates will tend to reduce the market value of already issued fixed-income investments, and a decline in general interest rates will tend to increase their value. In addition, debt securities with longer maturities, which tend to have higher yields, are subject to potentially greater fluctuations in value from changes in interest rates than obligations with shorter maturities.
Credit Risk. Credit risk relates to the ability of the issuer to meet interest and principal payments, or both, as they come due. In general, lower-grade, higher-yield bonds are subject to credit risk to a greater extent than lower-yield, higher-quality bonds.
Foreign Exchange Rate Risk. Foreign exchange risk relates to the change in the U.S. dollar value of a security held that is denominated in a foreign currency. The U.S. dollar value of a foreign currency denominated security will decrease as the dollar appreciates against the currency, while the U.S. dollar value will increase as the dollar depreciates against the currency.
Equity Risk. Equity risk relates to the change in value of equity securities as they relate to increases or decreases in the general market.
The Funds’ use of derivatives can result in losses due to unanticipated changes in these risk factors and the overall market. In instances where the Funds are using derivatives to decrease, or hedge, exposures to market risk factors for securities held by the Funds, there are also risks that those derivatives may not perform as expected resulting in losses for the combined or hedged positions.
Derivatives may have little or no initial cash investment relative to their market value exposure and therefore can produce significant gains or losses in excess of their cost. This use of embedded leverage allows each Fund to increase its market value exposure relative to its net assets and can substantially increase the volatility of the Funds’ performance.
Additional associated risks from investing in derivatives also exist and potentially could have significant effects on the valuation of the derivative and the Funds. Typically, the associated risks are not the risks that the Funds are attempting to increase or decrease exposure to, per their investment objectives, but are the additional risks from investing in derivatives.
Examples of these associated risks are liquidity risk, which is the risk that the Funds will not be able to sell or close out the derivative in a timely manner, and counterparty credit risk, which is the risk that the counterparty will not fulfill its obligation to the Funds. Associated risks can be different for each type of derivative and are discussed by each derivative type below in the notes that follow.
Derivatives are also subject to the risk of possible regulatory changes, which could adversely affect the availability and performance of derivative securities, make them more costly and limit or restrict their use by the Fund, which could prevent the Fund from implementing its investment strategies and adversely affect returns.
Forward Foreign Currency Contracts: Certain Funds engaged in currency transactions with counterparties during the year ended May 31, 2016 to hedge the value of portfolio securities denominated in particular currencies against fluctuations in relative value, to gain or reduce exposure to certain currencies, or to generate income or gains. A forward foreign currency contract is an agreement between two parties to buy and sell a currency at a set price on a future date. The contract is marked-to-market daily and the change in value is recorded by the Funds as an unrealized gain or loss. When a forward foreign currency contract is extinguished, through either delivery or offset by entering into another forward foreign currency contract, the Funds record a realized gain or loss equal to the difference between the value of the contract at the time it was opened and the value of the contract at the time it was extinguished.
Stone Harbor Investment Funds Annual Report | May 31, 2016 | 85 |
| Stone Harbor Investment Funds | Notes to Financial Statements |
May 31, 2016
Forward foreign currency contracts involve elements of market risk in excess of the amounts reflected in the Statements of Assets and Liabilities. The Funds bear the risk of an unfavorable change in the foreign exchange rate underlying the forward foreign currency contract. Risks may also arise upon entering into these contracts from the potential inability of the counterparties to meet the terms of their contracts.
Futures Contracts: Certain Funds invested in futures contracts during the year ended May 31, 2016 in accordance with their investment objectives. Each Fund does so for a variety of reasons including for cash management, hedging or non‐hedging purposes in an attempt to achieve investment returns consistent with the Fund’s investment objective. A futures contract provides for the future sale by one party and purchase by another party of a specified quantity of the security or other financial instrument at a specified price and time. A futures contract on an index is an agreement pursuant to which two parties agree to take or make delivery of an amount of cash equal to the difference between the value of the index at the close of the last trading day of the contract and the price at which the index contract was originally written. Futures contract transactions may result in losses in excess of the amount invested in the futures contract. There can be no guarantee that there will be a correlation between price movements in the hedging vehicle and in the portfolio securities being hedged. An incorrect correlation could result in a loss on both the hedged securities in a Fund and the hedging vehicle so that the portfolio return might have been greater had hedging not been attempted. There can be no assurance that a liquid market will exist at a time when a Fund seeks to close out a futures contract or a futures option position. Lack of a liquid market for any reason may prevent a Fund from liquidating an unfavorable position, and the Fund would remain obligated to meet margin requirements until the position is closed. In addition, a Fund could be exposed to risk if the counterparties to the contracts are unable to meet the terms of their contracts. With exchange-traded futures contracts, there is minimal counterparty credit risk to the Funds since futures contracts are exchange-traded and the exchange’s clearinghouse, as counterparty to all exchange-traded futures contracts, guarantees the futures contracts against default.
When a purchase or sale of a futures contract is made by a Fund, the Fund is required to deposit with its broker a specified amount of liquid assets (“initial margin”). The margin required for a futures contract is set by the exchange on which the contract is traded and may be modified during the term of the contract. The margin is reported on the Statement of Assets and Liabilities as “Deposit with brokers for futures contracts”. The initial margin is in the nature of a performance bond or good faith deposit on the futures contract that is returned to a Fund upon termination of the contract, assuming all contractual obligations have been satisfied. Each day a Fund may pay or receive cash, called “variation margin,” equal to the daily change in value of the futures contract. Such payments or receipts are recorded for financial statement purposes as unrealized gains or losses by a Fund. Variation margin does not represent a borrowing or loan by a Fund but is instead a settlement between a Fund and the broker of the amount one would owe the other if the futures contract expired. When the contract is closed, a Fund records a realized gain or loss equal to the difference between the value of the contract at the time it was opened and the value at the time it was closed.
Swap Agreements: Certain Funds invested in swap agreements during the year ended May 31, 2016. Swap agreements are bilaterally negotiated agreements between a Fund and a counterparty to exchange or swap investment cash flows, assets, or market-linked returns at specified, future intervals. Swap agreements are privately negotiated in the over the counter market (“OTC swaps”) or may be executed in a multilateral or other trade facility platform, such as a registered exchange (“centrally cleared swaps”). In a centrally cleared swap, immediately following execution of the swap agreement, the swap agreement is novated to a central counterparty (the “CCP”) and the Fund’s counterparty on the swap agreement becomes the CCP. The Fund may enter into credit default swaps, interest rate swaps, total return swaps on individual securities or groups or indices of securities for hedging, investment or leverage purposes. In connection with these agreements, securities or cash may be identified as collateral or margin in accordance with the terms of the respective swap agreements to provide assets of value and recourse in the event of default or bankruptcy/insolvency.
Swaps are marked-to-market daily and changes in value, including the accrual of periodic amounts of interest, are recorded daily. Daily changes in valuation of centrally cleared swaps, if any, are recorded as a receivable or payable for the change in value as appropriate (“variation margin”). Each day the Fund may pay or receive cash, equal to the variation margin of the centrally cleared swap. OTC swap payments received or paid at the beginning of the measurement period represent premiums paid or received upon entering into the swap agreement to compensate for differences between the stated terms of the swap agreement and prevailing market conditions (credit spreads, interest rates, and other relevant factors). Generally, the basis of the OTC swaps is the unamortized premium received or paid. The periodic swap payments received or made by the Fund are recorded as realized gains or losses, respectively. Any upfront fees paid are recorded as assets and any upfront fees received are recorded as liabilities. When the swap is terminated, the Fund will record a realized gain or loss equal to the difference between the proceeds from (or cost of) the closing transaction and the Fund’s basis in the contract, if any.
Credit Default Swap Contracts: Certain Funds entered into credit default swap contracts during the year ended May 31, 2016 for hedging purposes to gain market exposure or to add leverage to its portfolio. When used for hedging purposes, a Fund is the buyer of a credit default swap contract. In that case, the Fund is entitled to receive the par (or other agreed upon) value of a referenced debt obligation, index or other investment from the counterparty to the contract in the event of a default by a third party, such as a U.S. or foreign issuer, on the referenced debt obligation. In return, the Fund would pay to the counterparty a periodic stream of payments over the term of the contract provided that no event of default has occurred. If no event of default occurs, the Fund has spent the stream of payments and received no benefit from the contract. When the Fund is the seller of a credit default swap contract, the Fund receives the stream of payments but is obligated to pay upon default of the referenced debt obligation. As the seller, the Fund effectively adds leverage to its portfolio because, in addition to its total assets, the Fund is subject to investment exposure on the notional amount of the swap.
| 86 | www.shiplp.com |
| Stone Harbor Investment Funds | Notes to Financial Statements |
May 31, 2016
In addition to the risks applicable to derivatives generally, credit default swaps involve special risks because they may be difficult to value, are highly susceptible to liquidity and credit risk and generally pay a return to the counterparty only in the event of an actual default by the issuer of the underlying obligation, as opposed to a credit downgrade or other indication of financial difficulty.
Interest Rate Swap Contracts: Certain Funds entered into interest rate swap agreements during the year ended May 31, 2016. Interest rate swap contracts involve the exchange by a Fund with another party for their respective commitment to pay or receive interest on the notional amount of principal. Certain forms of interest rate swap agreements may include: (i) interest rate caps, under which, in return for a premium, one party agrees to make payments to the other to the extent that interest rates exceed a specified rate, or “cap”, (ii) interest rate floors, under which, in return for a premium, one party agrees to make payments to the other to the extent that interest rates fall below a specified rate, or “floor”, (iii) interest rate collars, under which a party sells a cap and purchases a floor or vice versa in an attempt to protect itself against interest rate movements exceeding given minimum or maximum levels, (iv) callable interest rate swaps, under which the buyer pays an upfront fee in consideration for the right to early terminate the swap transaction in whole, at zero costs and at a predetermined date and time prior to the maturity date, (v) spreadlocks, which allow the interest rate swap users to lock in the forward differential (or spread) between the interest rate swap rate and a specified benchmark, or (vi) basis swaps, under which two parties can exchange variable interest rates based on different segments of money markets.
Foreign Currency Options: During the year ended May 31, 2016, the Strategic Income Fund purchased foreign currency options. Purchasing foreign currency options gives the Fund the right, but not the obligation to buy or sell the currency with specified amounts of currency and a rate of exchange that may be exercised by a certain date. Writing foreign currency options gives the counterparty the right, but not the obligation to buy or sell the currency with specified amounts of currency and a rate of exchange that may be exercised by a certain date. These options may be used as a short or long hedge against possible variations in foreign exchange rates or to gain exposure to foreign currencies.
Currency hedging involves special risks, including possible default by the other party to the transaction, illiquidity and, to the extent the Adviser’s view as to certain market movements is incorrect, the risk that the use of hedging could result in losses greater than if they had not been used. In addition, in certain countries in which each Fund may invest, currency hedging opportunities may not be available.
The Strategic Income Fund had the following transactions in written options during the year ended May 31, 2016.
Notional Amount | Premiums Received | |||||||
| Balance as of May 31, 2015 | $ | – | $ | – | ||||
| Options written | (1,638,130 | ) | (13,171 | ) | ||||
| Options closed | 1,638,130 | 13,171 | ||||||
| Balance as of May 31, 2016 | $ | – | $ | – | ||||
Stone Harbor Investment Funds Annual Report | May 31, 2016 | 87 |
| Stone Harbor Investment Funds | Notes to Financial Statements |
May 31, 2016
The tables below are a summary of the fair valuations of derivative instruments categorized by risk exposure.
Fair values of forward foreign currency contracts, credit default swaps, interest rate swaps, foreign currency options, and future contracts on the Statements of Assets and Liabilities as of May 31, 2016 is as follows:
| Risk Exposure | Location | Fair Value | Location | Fair Value | ||||||||
| Stone Harbor Emerging Markets Debt Fund | ||||||||||||
| Credit Risk (Swap Contracts) | Unrealized appreciation on credit default swap contracts | $ | – | Unrealized depreciation on credit default swap contracts | $ | (151,724 | ) | |||||
| Foreign Exchange Rate Risk (Forward Foreign Currency Contracts) | Unrealized appreciation on forward foreign currency contracts | 1,684,205 | Unrealized depreciation on forward foreign currency contracts | (1,608,159 | ) | |||||||
| Total | $ | 1,684,205 | $ | (1,759,883 | ) | |||||||
| Stone Harbor High Yield Bond Fund | ||||||||||||
| Foreign Exchange Rate Risk (Forward Foreign Currency Contracts) | Unrealized appreciation on forward foreign currency contracts | $ | 98,379 | Unrealized depreciation on forward foreign currency contracts | $ | – | ||||||
| Total | $ | 98,379 | $ | – | ||||||||
| Stone Harbor Local Markets Fund | ||||||||||||
| Foreign Exchange Rate Risk (Forward Foreign Currency Contracts) | Unrealized appreciation on forward foreign currency contracts | $ | 1,659,662 | Unrealized depreciation on forward foreign currency contracts | $ | (2,654,701 | ) | |||||
| Total | $ | 1,659,662 | $ | (2,654,701 | ) | |||||||
| Stone Harbor Emerging Markets Corporate Debt Fund | ||||||||||||
| Foreign Exchange Rate Risk (Forward Foreign Currency Contracts) | Unrealized appreciation on forward foreign currency contracts | $ | 3,298 | Unrealized depreciation on forward foreign currency contracts | $ | – | ||||||
| Total | $ | 3,298 | $ | – | ||||||||
| Stone Harbor Strategic Income Fund | ||||||||||||
| Currency Risk (Purchased Options) | Investments, at value | $ | 12,750 | N/A | N/A | |||||||
Interest Rate Risk (Futures Contracts)* | Unrealized appreciation on futures contracts | 40,307 | Unrealized depreciation on futures contracts | $ | (19,949 | ) | ||||||
| Foreign Exchange Rate Risk (Forward Foreign Currency Contracts) | Unrealized appreciation on forward foreign currency contracts | 16,202 | Unrealized depreciation on forward foreign currency contracts | (36,524 | ) | |||||||
| Total | $ | 69,259 | $ | (56,473 | ) | |||||||
| Stone Harbor Emerging Markets Debt Allocation Fund | ||||||||||||
| Foreign Exchange Rate Risk (Forward Foreign Currency Contracts) | Unrealized appreciation on forward foreign currency contracts | $ | 10,161 | Unrealized depreciation on forward foreign currency contracts | $ | (30,715 | ) | |||||
| Total | $ | 10,161 | $ | (30,715 | ) | |||||||
| * | The value presented includes cumulative gain/(loss) on open futures contracts; however, the value reflected on the accompanying Statement of Assets and Liabilities is only the unsettled variation margin receivable/(payable) as of May 31, 2016. |
| 88 | www.shiplp.com |
| Stone Harbor Investment Funds | Notes to Financial Statements |
May 31, 2016
The forward foreign currency contracts, credit default swaps, interest rate swaps, foreign currency options, and future contracts average value during the year ended May 31, 2016 is noted below:
| Fund | Purchased Option | Forward Foreign Currency Contract | Credit DefaultSwap Contract | Interest RateSwap Contract | Futures Contracts | |||||||||||||||
| Stone Harbor Emerging Markets Debt Fund | $ | – | $ | (56,429,806 | ) | $ | 27,382,932 | $ | 52,760,300 | $ | – | |||||||||
| Stone Harbor High Yield Bond Fund | – | (11,958,533 | ) | – | – | – | ||||||||||||||
| Stone Harbor Local Markets Fund | – | 28,977,789 | – | – | – | |||||||||||||||
| Stone Harbor Emerging Markets Corporate Debt Fund | – | (806,741 | ) | – | – | – | ||||||||||||||
| Stone Harbor Strategic Income Fund | 6,720 | 749,992 | – | – | 29,504 | |||||||||||||||
| Stone Harbor Emerging Markets Debt Allocation Fund | – | 381,742 | – | – | – | |||||||||||||||
The effect of forward foreign currency contracts, credit default swaps, interest rate swaps, foreign currency options, and futures contracts on the Statements of Operations for the year ended May 31, 2016:
| Risk Exposure | Location | Realized Gain/(Loss) on Derivatives | Location | Change in Unrealized Appreciation/(Depreciation) on Derivatives Recognized in Income | ||||||
| Stone Harbor Emerging Markets Debt Fund | ||||||||||
| Credit Risk (Swap Contracts) | Net realized gain/(loss) on credit default swap contracts | $ | 8,531,253 | Change in unrealized appreciation/(depreciation) on credit default swap contracts | $ | (654,753 | ) | |||
| Interest Rate Risk (Swap Contracts) | Net realized gain/(loss) on interest rate swap contracts | (3,116,547 | ) | Change in unrealized appreciation/(depreciation) on interest rate swap contracts | (495,133 | ) | ||||
| Foreign Exchange Rate Risk (Forward Foreign Currency Contracts) | Net realized gain/(loss) on forward foreign currency contracts | (2,357,409 | ) | Change in unrealized appreciation/(depreciation) on forward foreign currency contracts | (689,472 | ) | ||||
| Total | $ | 3,057,297 | $ | (1,839,358 | ) | |||||
| Stone Harbor High Yield Bond Fund | ||||||||||
| Foreign Exchange Rate Risk (Forward Foreign Currency Contracts) | Net realized gain/(loss) on forward foreign currency contracts | $ | 157,625 | Change in unrealized appreciation/(depreciation) on forward foreign currency contracts | $ | 3,275 | ||||
| Total | $ | 157,625 | $ | 3,275 | ||||||
| Stone Harbor Local Markets Fund | ||||||||||
| Foreign Exchange Rate Risk (Forward Foreign Currency Contracts) | Net realized gain/(loss) on forward foreign currency contracts | $ | 9,751,376 | Change in unrealized appreciation/(depreciation) on forward foreign currency contracts | $ | (3,485,395 | ) | |||
| Total | $ | 9,751,376 | $ | (3,485,395 | ) | |||||
| Stone Harbor Emerging Markets Corporate Debt Fund | ||||||||||
| Foreign Exchange Rate Risk (Forward Foreign Currency Contracts) | Net realized gain/(loss) on forward foreign currency contracts | $ | 67,713 | Change in unrealized appreciation/(depreciation) on forward foreign currency contracts | $ | (87 | ) | |||
| Total | $ | 67,713 | $ | (87 | ) | |||||
| Stone Harbor Investment Funds Annual Report | May 31, 2016 | 89 |
| Stone Harbor Investment Funds | Notes to Financial Statements |
May 31, 2016
| Risk Exposure | Location | Realized Gain/(Loss) on Derivatives | Location | Change in Unrealized Appreciation/(Depreciation) on Derivatives Recognized in Income | ||||||
| Stone Harbor Investment Grade Fund | ||||||||||
| Interest Rate Risk (Futures Contracts) | Net realized gain/(loss) on futures contracts | $ | 12,528 | Change in unrealized appreciation/(depreciation) on futures contracts | $ | – | ||||
| Total | $ | 12,528 | $ | – | ||||||
| Stone Harbor Strategic Income Fund | ||||||||||
| Exchange Rate Risk (Written Options) | Net realized gain/(loss) on written options | $ | 6,392 | Change in unrealized appreciation/(depreciation) on written options | $ | – | ||||
| Currency Risk (Purchased Options) | Net realized gain/loss on investments | – | Change in unrealized appreciation/depreciation on investments | (37,888 | ) | |||||
| Credit Risk (Swap Contracts) | Net realized gain/(loss) on credit default swap contracts | 106,279 | Change in unrealized appreciation/(depreciation) on credit default swap contracts | (25,940 | ) | |||||
| Interest Rate Risk (Futures Contracts) | Net realized gain/(loss) on futures contracts | 25,178 | Change in unrealized appreciation/(depreciation) on futures contracts | 77,268 | ||||||
| Foreign Exchange Rate Risk (Forward Foreign Currency Contracts) | Net realized gain/(loss) on forward foreign currency contracts | (148,371 | ) | Change in unrealized appreciation/(depreciation) on forward foreign currency contracts | (21,385 | ) | ||||
| Total | $ | (10,522 | ) | $ | (7,945 | ) | ||||
| Stone Harbor Emerging Markets Debt Allocation Fund | ||||||||||
| Foreign Exchange Rate Risk (Forward Foreign Currency Contracts) | Net realized gain/(loss) on forward foreign currency contracts | $ | 49,827 | Change in unrealized appreciation/(depreciation) on forward foreign currency contracts | $ | (20,554 | ) | |||
| Total | $ | 49,827 | $ | (20,554 | ) | |||||
Offsetting Arrangements: Certain derivative contracts are executed under standardized netting agreements. A derivative netting arrangement creates an enforceable right of set‐off that becomes effective, and affects the realization of settlement on individual assets, liabilities and collateral amounts, only following a specified event of default or early termination. Default events may include the failure to make payments or deliver securities timely, material adverse changes in financial condition or insolvency, the breach of minimum regulatory capital requirements, or loss of license, charter or other legal authorization necessary to perform under the contract. These agreements mitigate counterparty credit risk by providing for a single net settlement with a counterparty of all financial transactions covered by the agreement in an event of default as defined under such agreement.
| 90 | www.shiplp.com |
| Stone Harbor Investment Funds | Notes to Financial Statements |
May 31, 2016
The following table presents derivative financial instruments that are subject to enforceable netting arrangements, collateral arrangements or other similar agreements as of May 31, 2016.
Offsetting of Derivatives Assets
May 31, 2016
| From | Gross Amount of Recognized Assets | Gross Amounts Offset in the Statements of Assets and Liabilities | Net Amounts Presented In The Statements of Assets and Liabilities | Financial Instruments Available for Offset(a) | Cash Collateral Received(a) | Net Amount | ||||||||||||||||||
| Stone Harbor Emerging Markets Debt Fund | ||||||||||||||||||||||||
| Forward Foreign Currency Contracts | $ | 1,684,205 | $ | – | $ | 1,684,205 | $ | (708,550 | ) | $ | (660,000 | ) | $ | 315,655 | ||||||||||
| TOTAL | $ | 1,684,205 | $ | – | $ | 1,684,205 | $ | (708,550 | ) | $ | (660,000 | ) | $ | 315,655 | ||||||||||
| Stone Harbor High Yield Bond Fund | ||||||||||||||||||||||||
| Forward Foreign Currency Contracts | $ | 98,379 | $ | – | $ | 98,379 | $ | – | $ | – | $ | 98,379 | ||||||||||||
| TOTAL | $ | 98,379 | $ | – | $ | 98,379 | $ | – | $ | – | $ | 98,379 | ||||||||||||
| Stone Harbor Local Markets Funds | ||||||||||||||||||||||||
| Forward Foreign Currency Contracts | $ | 1,659,662 | $ | – | $ | 1,659,662 | $ | (1,466,332 | ) | $ | (193,330 | ) | $ | – | ||||||||||
| TOTAL | $ | 1,659,662 | $ | – | $ | 1,659,662 | $ | (1,466,332 | ) | $ | (193,330 | ) | $ | – | ||||||||||
| Stone Harbor Emerging Markets Corporate Debt Fund | ||||||||||||||||||||||||
| Forward Foreign Currency Contracts | $ | 3,298 | $ | – | $ | 3,298 | $ | – | $ | – | $ | 3,298 | ||||||||||||
| TOTAL | $ | 3,298 | $ | – | $ | 3,298 | $ | – | $ | – | $ | 3,298 | ||||||||||||
| Stone Harbor Strategic Income Fund | ||||||||||||||||||||||||
| Forward Foreign Currency Contracts | $ | 16,202 | $ | – | $ | 16,202 | $ | (7,226 | ) | $ | – | $ | 8,976 | |||||||||||
| TOTAL | $ | 16,202 | $ | – | $ | 16,202 | $ | (7,226 | ) | $ | – | $ | 8,976 | |||||||||||
| Stone Harbor Emerging Markets Debt Allocation Fund | ||||||||||||||||||||||||
| Forward Foreign Currency Contracts | $ | 10,161 | $ | – | $ | 10,161 | $ | (10,161 | ) | $ | – | $ | – | |||||||||||
| TOTAL | $ | 10,161 | $ | – | $ | 10,161 | $ | (10,161 | ) | $ | – | $ | – | |||||||||||
| Stone Harbor Investment Funds Annual Report | May 31, 2016 | 91 |
| Stone Harbor Investment Funds | Notes to Financial Statements |
May 31, 2016
Offsetting of Derivatives Liabilities
May 31, 2016
| From | Gross Amount of Recognized Assets | Gross Amounts Offset in the Statements of Assets and Liabilities | Net Amounts Presented In The Statements of Assets and Liabilities | Financial Instruments Available for Offset(a) | Cash Collateral Received(a) | Net Amount | ||||||||||||||||||
| Stone Harbor Emerging Markets Debt Fund | ||||||||||||||||||||||||
| Forward Foreign Currency Contracts | $ | 1,608,159 | $ | – | $ | 1,608,159 | $ | (708,551 | ) | $ | (899,608 | ) | $ | – | ||||||||||
| Credit Default Swap Contracts | 151,724 | – | 151,724 | – | (151,724 | ) | – | |||||||||||||||||
| TOTAL | $ | 1,759,883 | $ | – | $ | 1,759,883 | $ | (708,551 | ) | $ | (1,051,332 | ) | $ | – | ||||||||||
| Stone Harbor Local Markets Funds | ||||||||||||||||||||||||
| Forward Foreign Currency Contracts | $ | 2,654,701 | $ | 2,654,701 | $ | (1,466,332 | ) | $ | (1,037,144 | ) | $ | 151,225 | ||||||||||||
| TOTAL | $ | 2,654,701 | $ | – | $ | 2,654,701 | $ | (1,466,332 | ) | $ | (1,037,144 | ) | $ | 151,225 | ||||||||||
| Stone Harbor Strategic Income Fund | ||||||||||||||||||||||||
| Forward Foreign Currency Contracts | $ | 36,524 | $ | – | $ | 36,524 | $ | (7,225 | ) | $ | – | $ | 29,299 | |||||||||||
| TOTAL | $ | 36,524 | $ | – | $ | 36,524 | $ | (7,225 | ) | $ | – | $ | 29,299 | |||||||||||
| Stone Harbor Emerging Markets Debt Allocation Fund | ||||||||||||||||||||||||
| Forward Foreign Currency Contracts | $ | 30,715 | $ | – | $ | 30,715 | $ | (10,161 | ) | $ | – | $ | 20,554 | |||||||||||
| TOTAL | $ | 30,715 | $ | – | $ | 30,715 | $ | (10,161 | ) | $ | – | $ | 20,554 | |||||||||||
| (a) | These amounts are limited to the derivatives asset/liability balance and, accordingly, do not include excess collateral received/pledged. |
3. TAX BASIS INFORMATION
Tax Basis of Distributions to Shareholders: Net investment income/ (loss) and net realized gain/ (loss) may differ for financial statement and tax purposes. The character of distributions made during the year from net investment income or net realized gains may differ from its ultimate characterization for federal income tax purposes. Also, due to the timing of dividend distributions, the fiscal year in which amounts are distributed may differ from the fiscal year in which the income or realized gain was recorded by a Fund.
The tax character of the distributions paid by the Funds during the periods ended May 31, 2016 and May 31, 2015 was as follows:
| Stone Harbor Emerging Markets Debt Fund | 2016 | 2015 | ||||||
| Ordinary Income | $ | 125,569,725 | $ | 104,263,472 | ||||
| Total | $ | 125,569,725 | $ | 104,263,472 | ||||
| Stone Harbor High Yield Bond Fund | 2016 | 2015 | ||||||
| Ordinary Income | $ | 16,172,824 | $ | 19,455,425 | ||||
| Long‐Term Capital Gain | – | 9,049,371 | ||||||
| Total | $ | 16,172,824 | $ | 28,504,796 | ||||
| 92 | www.shiplp.com |
| Stone Harbor Investment Funds | Notes to Financial Statements |
May 31, 2016
| Stone Harbor Local Markets Fund | 2016 | 2015 | ||||||
| Ordinary Income | $ | – | $ | 27,499,281 | ||||
| Total | $ | – | $ | 27,499,281 | ||||
| Stone Harbor Emerging Markets Corporate Debt Fund | 2016 | 2015 | ||||||
| Ordinary Income | $ | 1,499,763 | $ | 1,215,887 | ||||
| Total | $ | 1,499,763 | $ | 1,215,887 | ||||
| Stone Harbor Investment Grade Fund | 2016 | 2015 | ||||||
| Ordinary Income | $ | 329,050 | $ | 172,128 | ||||
| Long‐Term Capital Gain | 21,781 | – | ||||||
| Total | $ | 350,831 | $ | 172,128 | ||||
| Stone Harbor Strategic Income Fund | 2016 | 2015 | ||||||
| Ordinary Income | $ | 1,268,147 | $ | 1,316,926 | ||||
| Long‐Term Capital Gain | 489,931 | 32,288 | ||||||
| Total | $ | 1,758,078 | $ | 1,349,214 | ||||
| Stone Harbor Emerging Markets Debt Allocation Fund | 2016 | For the Period Ended May 31, 2015 | ||||||
| Ordinary Income | $ | 2,967,695 | $ | 1,049,102 | ||||
| Total | $ | 2,967,695 | $ | 1,049,102 | ||||
As of May 31, 2016, the components of distributable earnings on a tax basis were as follows:
| Stone Harbor Emerging Markets Debt Fund | ||||
| Undistributed Ordinary Income | $ | 4,373,855 | ||
| Accumulated Capital Loss | (209,408,527 | ) | ||
| Unrealized Depreciation | (11,763,918 | ) | ||
| Cumulative Effect of Other Timing Difference* | 138,714 | |||
| Total | $ | (216,659,876 | ) | |
| Stone Harbor High Yield Bond Fund | ||||
| Undistributed Ordinary Income | $ | 376,944 | ||
| Accumulated Capital Loss | (18,622,458 | ) | ||
| Unrealized Depreciation | (13,001,006 | ) | ||
| Cumulative Effect of Other Timing Difference* | (98,379 | ) | ||
| Total | $ | (31,344,899 | ) | |
| Stone Harbor Local Markets Fund | ||||
| Accumulated Capital Loss | $ | (167,631,984 | ) | |
| Unrealized Depreciation | (186,304,040 | ) | ||
| Cumulative Effect of Other Timing Difference* | (114,699,893 | ) | ||
| Total | $ | (468,635,917 | ) | |
| Stone Harbor Investment Funds Annual Report | May 31, 2016 | 93 |
| Stone Harbor Investment Funds | Notes to Financial Statements |
May 31, 2016
| Stone Harbor Emerging Markets Corporate Debt Fund | ||||
| Undistributed Ordinary Income | $ | 29,379 | ||
| Accumulated Capital Loss | (5,062,393 | ) | ||
| Unrealized Appreciation | 80,384 | |||
| Cumulative Effect of Other Timing Difference* | (3,298 | ) | ||
| Total | $ | (4,955,928 | ) | |
| Stone Harbor Investment Grade Fund | ||||
| Undistributed Ordinary Income | $ | 62,055 | ||
| Unrealized Appreciation | 190,796 | |||
| Total | $ | 252,851 | ||
| Stone Harbor Strategic Income Fund | ||||
| Undistributed Ordinary Income | $ | 110,391 | ||
| Accumulated Capital Loss | (119,706 | ) | ||
| Unrealized Depreciation | (2,062,000 | ) | ||
| Cumulative Effect of Other Timing Difference* | (36 | ) | ||
| Total | $ | (2,071,351 | ) | |
| Stone Harbor Emerging Markets Debt Allocation Fund | ||||
| Undistributed Ordinary Income | $ | 960,550 | ||
| Accumulated Capital Loss | (8,678,478 | ) | ||
| Unrealized Depreciation | (704,559 | ) | ||
| Cumulative Effect of Other Timing Difference* | 20,554 | |||
| Total | $ | (8,401,933 | ) | |
| * | Other temporary differences due to timing, consist primarily of mark-to-market on forward foreign currency contracts. |
The tax components of distributable earnings are determined in accordance with income tax regulations which may differ from the composition of net assets reported under GAAP. Accordingly, for the year ended May 31, 2016, certain differences were reclassified. These differences were primarily attributed to the differing tax treatment of foreign currencies and certain other investments. The amounts reclassified did not affect net assets.
The reclassifications were as follows:
| Fund | Paid-in Capital | Accumulated Net Investment Income/(Loss) | Accumulated Net Realized Gain/(Loss) on Investments | |||||||||
| Stone Harbor Emerging Markets Debt Fund | $ | – | $ | (3,233,701 | ) | $ | 3,233,701 | |||||
| Stone Harbor High Yield Bond Fund | (285 | ) | 20,734 | (20,449 | ) | |||||||
| Stone Harbor Local Markets Fund | (221,488,520 | ) | (33,500,212 | ) | 254,988,732 | |||||||
| Stone Harbor Emerging Markets Corporate Debt Fund | – | (50,152 | ) | 50,152 | ||||||||
| Stone Harbor Investment Grade Fund | – | 471 | (471 | ) | ||||||||
| Stone Harbor Strategic Income Fund | – | (181,516 | ) | 181,516 | ||||||||
| Stone Harbor Emerging Markets Debt Allocation Fund | – | 6,807 | (6,807 | ) | ||||||||
Included in the amounts reclassified above was a net operating loss offset to paid‐in capital in the amounts of:
| Fund | Amount | |||
| Stone Harbor Local Markets Fund | $ | 221,488,520 | ||
Capital Losses: As of May 31, 2016 the following Funds had capital loss carryforwards which may reduce the Funds’ taxable income arising from future net realized gains on investments, if any, to the extent permitted by the Code and thus may reduce the amount of the distributions to shareholders which would otherwise be necessary to relieve the Funds of any liability for federal tax pursuant to the Code.
| 94 | www.shiplp.com |
| Stone Harbor Investment Funds | Notes to Financial Statements |
May 31, 2016
During the year ended May 31, 2016, the Fund utilized capital loss carryforwards as follows:
| Fund | Amount | |||
| Stone Harbor Emerging Markets Corporate Debt Fund | $ | 28,170 | ||
Capital losses carried forward were as follows:
| Fund | Short-Term | Long-Term | ||||||
| Stone Harbor Emerging Markets Debt Fund | $ | 92,675,280 | $ | 48,570,817 | ||||
| Stone Harbor High Yield Bond Fund | 2,478,309 | 7,851,485 | ||||||
| Stone Harbor Local Markets Fund | 104,690,111 | 40,649,837 | ||||||
| Stone Harbor Emerging Markets Corporate Debt Fund | 1,415,884 | 2,223,504 | ||||||
| Stone Harbor Strategic Income Fund | 30,680 | 89,026 | ||||||
| Stone Harbor Emerging Markets Debt Allocation Fund | 344,515 | – | ||||||
The following Funds elect to defer to the year ending May 31, 2017 the following capital losses recognized during the period November 1, 2015 through May 31, 2016:
| Fund | Amount | |||
| Stone Harbor Emerging Markets Debt Fund | $ | 68,162,430 | ||
| Stone Harbor High Yield Bond Fund | 8,292,664 | |||
| Stone Harbor Local Markets Fund | 22,292,036 | |||
| Stone Harbor Emerging Markets Corporate Debt Fund | 1,423,005 | |||
| Stone Harbor Emerging Markets Debt Allocation Fund | 8,333,963 | |||
The following Fund elects to defer to the period ending May 31, 2017, late year ordinary losses in the amount of:
| Fund | Amount | |||
| Stone Harbor Local Markets Fund | $ | 111,664,108 | ||
Unrealized Appreciation and Depreciation on Investments: At May 31, 2016 the aggregate gross unrealized appreciation and depreciation of investments for federal income purposes were as follows:
| Stone Harbor Emerging Markets Debt Fund | ||||
| Gross appreciation on investments (excess of value over tax cost) | $ | 40,490,598 | ||
| Gross depreciation on investments (excess of tax cost over value) | (52,161,959 | ) | ||
| Net depreciation of foreign currency and derivatives | (92,557 | ) | ||
| Net unrealized depreciation | $ | (11,763,918 | ) | |
| Cost of investments for income tax purposes | $ | 1,569,423,455 | ||
| Stone Harbor High Yield Bond Fund | ||||
| Gross appreciation on investments (excess of value over tax cost) | $ | 4,888,353 | ||
| Gross depreciation on investments (excess of tax cost over value) | (17,987,130 | ) | ||
| Net appreciation of foreign currency and derivatives | 97,771 | |||
| Net unrealized depreciation | $ | (13,001,006 | ) | |
| Cost of investments for income tax purposes | $ | 261,963,018 | ||
| Stone Harbor Investment Funds Annual Report | May 31, 2016 | 95 |
| Stone Harbor Investment Funds | Notes to Financial Statements |
May 31, 2016
| Stone Harbor Local Markets Fund | ||||
| Gross appreciation on investments (excess of value over tax cost) | $ | 12,245,295 | ||
| Gross depreciation on investments (excess of tax cost over value) | (197,220,632 | ) | ||
| Net depreciation of foreign currency and derivatives | (1,328,703 | ) | ||
| Net unrealized depreciation | $ | (186,304,040 | ) | |
| Cost of investments for income tax purposes | $ | 971,560,803 | ||
| Stone Harbor Emerging Markets Corporate Debt Fund | ||||
| Gross appreciation on investments (excess of value over tax cost) | $ | 346,101 | ||
| Gross depreciation on investments (excess of tax cost over value) | (269,085 | ) | ||
| Net appreciation of foreign currency and derivatives | 3,368 | |||
| Net unrealized appreciation | $ | 80,384 | ||
| Cost of investments for income tax purposes | $ | 17,211,846 | ||
| Stone Harbor Investment Grade Fund | ||||
| Gross appreciation on investments (excess of value over tax cost) | $ | 255,565 | ||
| Gross depreciation on investments (excess of tax cost over value) | (64,769 | ) | ||
| Net unrealized appreciation | $ | 190,796 | ||
| Cost of investments for income tax purposes | $ | 15,491,596 | ||
| Stone Harbor Strategic Income Fund | ||||
| Gross appreciation on investments (excess of value over tax cost) | $ | 281,347 | ||
| Gross depreciation on investments (excess of tax cost over value) | (2,341,351 | ) | ||
| Net depreciation of foreign currency and derivatives | (1,996 | ) | ||
| Net unrealized depreciation | $ | (2,062,000 | ) | |
| Cost of investments for income tax purposes | $ | 38,233,899 | ||
| Stone Harbor Emerging Markets Debt Allocation Fund | ||||
| Gross appreciation on investments (excess of value over tax cost) | $ | 389,698 | ||
| Gross depreciation on investments (excess of tax cost over value) | (1,073,703 | ) | ||
| Net depreciation of foreign currency and derivatives | (27,372 | ) | ||
| Net unrealized depreciation | $ | (711,377 | ) | |
| Cost of investments for income tax purposes | $ | 68,120,459 | ||
4. ADVISORY FEES
Stone Harbor Investment Partners LP is the Trust’s investment adviser. Under the investment advisory agreement the Trust pays an investment advisory fee calculated daily and paid monthly of 0.60%, 0.50%, 0.75%, 0.85%, 0.35%, 0.55%, and 0.70% of the average daily net assets for Stone Harbor Emerging Markets Debt Fund, Stone Harbor High Yield Bond Fund, Stone Harbor Local Markets Fund, Stone Harbor Emerging Markets Corporate Debt Fund, Stone Harbor Investment Grade Fund, Stone Harbor Strategic Income Fund, and Stone Harbor Emerging Markets Debt Allocation Fund, respectively.
The Adviser has contractually agreed to waive investment advisory fees and reimburse other expenses with respect to each of the Funds so that the Net Annual Operating Expenses (exclusive of acquired Fund fees and expenses, brokerage expenses, interest expense, taxes and extraordinary expenses) of the Stone Harbor Emerging Markets Debt Fund Institutional Class, Stone Harbor High Yield Bond Fund Institutional Class, Stone Harbor Local Markets Fund Institutional Class, Stone Harbor Emerging Markets Corporate Debt Fund Institutional Class, and Stone Harbor Investment Grade Fund Institutional Class will not exceed 0.75%, 0.65% 1.00%, 1.00%, and 0.50%, respectively. The Adviser has contractually agreed to waive fees and reimburse expenses with respect to the Stone Harbor Strategic Income Fund Institutional Class and Stone Harbor Emerging Markets Debt Allocation Fund Institutional Class, so that the Net Annual Operating Expenses (inclusive of acquired fund fees and expenses but exclusive of brokerage expenses, interest expense, taxes and extraordinary expenses) will not exceed 0.70% and 0.85%, respectively. The fee waiver agreements are in effect through September 30, 2017 and are reevaluated on an annual basis.
| 96 | www.shiplp.com |
| Stone Harbor Investment Funds | Notes to Financial Statements |
May 31, 2016
The Adviser will be permitted to recover, on a class by class basis, expenses it has borne through the undertakings described above to the extent that a Fund’s expenses in later periods fall below the annual rates set forth in the relevant undertaking. A Fund will not be obligated to pay any such deferred fees and expenses more than three years after the end of the fiscal year in which the fee and expense was deferred. At May 31, 2016, deferred fees and expenses eligible to be recovered will expire as follows:
| 2017 | 2018 | 2019 | Total | |||||||||||||
| Stone Harbor High Yield Bond Fund | $ | 231,918 | $ | 65,578 | $ | – | $ | 297,496 | ||||||||
| Stone Harbor Emerging Markets Corporate Debt Fund | $ | 97,636 | $ | 100,868 | $ | 112,847 | $ | 311,351 | ||||||||
| Stone Harbor Investment Grade Fund | $ | 49,712 | $ | 120,267 | $ | 125,244 | $ | 295,223 | ||||||||
| Stone Harbor Strategic Income Fund | $ | 61,917 | $ | 248,095 | $ | 290,586 | $ | 600,598 | ||||||||
| Stone Harbor Debt Allocation Fund | N/A | $ | 379,648 | $ | 734,211 | $ | 1,113,859 | |||||||||
5. INVESTMENTS
For the year ended May 31, 2016, the aggregate cost of purchases and proceeds from sales of investments (excluding short‐term investments and U.S. Government Obligations) were as follows:
| Purchases | Sales | |||||||
| Stone Harbor Emerging Markets Debt Fund | $ | 1,480,508,860 | $ | 1,743,504,625 | ||||
| Stone Harbor High Yield Bond Fund | 121,672,738 | 131,426,089 | ||||||
| Stone Harbor Local Markets Fund | 1,612,098,123 | 1,881,726,392 | ||||||
| Stone Harbor Emerging Markets Corporate Debt Fund | 37,009,860 | 41,809,216 | ||||||
| Stone Harbor Investment Grade Fund | 5,702,485 | 3,545,957 | ||||||
| Stone Harbor Strategic Income Fund | 12,821,966 | 9,005,901 | ||||||
| Stone Harbor Emerging Markets Debt Allocation Fund | 64,031,618 | 77,157,258 | ||||||
For the year ended May 31, 2016, the aggregate cost of purchases and proceeds from sales of U.S. Government Obligations were as follows:
| Purchases | Sales | |||||||
| Stone Harbor Investment Grade Fund | $ | 1,943,136 | $ | 1,027,824 | ||||
6. AFFILIATED COMPANIES
Funds may invest in certain securities that are considered securities issued by affiliated companies. As defined by the 1940 Act, an affiliated person, including an affiliated company, is one in which a Fund owns 5% or more of the outstanding voting securities, or a company which is under common ownership or control with the Fund. The purchases, sales, dividend income, capital gains, return of capital distributions received, shares and value of investments in affiliated companies for the year ended May 31, 2016 were as follows:
Stone Harbor Strategic Income Fund
| Security Name | Share Balance June 1, 2015 | Purchases | Sales | Share Balance May 31, 2016 | Dividend Income | Realized Loss | Fair Value May 31, 2016 | |||||||||||||||||||||
| Stone Harbor Emerging Markets Debt Fund | 969,132 | 121,131 | 341,058 | 749,205 | $ | 525,068 | $ | (231,029 | ) | $ | 7,544,492 | |||||||||||||||||
| Stone Harbor High Yield Bond Fund | 1,569,300 | 221,624 | 188,542 | 1,602,382 | 740,862 | (196,688 | ) | 12,674,839 | ||||||||||||||||||||
| Stone Harbor Local Markets Fund | – | 223,180 | 223,180 | – | – | (49,100 | ) | – | ||||||||||||||||||||
| Stone Harbor Investment Grade Fund | 952,172 | 781,838 | 216,956 | 1,517,054 | 328,730 | (3,338 | ) | 15,777,364 | ||||||||||||||||||||
| 3,490,604 | 1,347,773 | 969,736 | 3,868,641 | $ | 1,594,660 | $ | (480,155 | ) | $ | 35,996,695 | ||||||||||||||||||
| Stone Harbor Investment Funds Annual Report | May 31, 2016 | 97 |
| Stone Harbor Investment Funds | Notes to Financial Statements | |
May 31, 2016
Stone Harbor Emerging Markets Debt Allocation Fund
| Security Name | Share Balance June 1, 2015 | Purchases | Sales | Share Balance May 31, 2016 | Dividend Income | Realized Loss | Fair Value May 31, 2016 | |||||||||||||||||||||
| Stone Harbor Emerging Markets Debt Fund | 3,994,289 | 3,264,165 | 3,950,517 | 3,307,937 | $ | 3,431,463 | $ | (3,049,059 | ) | $ | 33,310,927 | |||||||||||||||||
| Stone Harbor Local Markets Fund | 5,205,538 | 4,140,148 | 4,959,371 | 4,386,315 | – | (7,043,268 | ) | 34,125,527 | ||||||||||||||||||||
| 9,199,827 | 7,404,313 | 8,909,888 | 7,694,252 | $ | 3,431,463 | $ | (10,092,327 | ) | $ | 67,436,454 | ||||||||||||||||||
The Emerging Markets Debt Fund engaged in cross trades with an affiliate during the year ended May 31, 2016 pursuant to Rule 17a‐7 under the 1940 Act. Cross trading is the buying or selling of portfolio securities between funds to which the Adviser serves as the investment adviser. The Board of Trustees previously adopted procedures that apply to transactions between the Portfolios pursuant to Rule 17a‐7. At its regularly scheduled meetings, the Trustees review such transactions as of the most current calendar quarter for compliance with the requirements set forth by Rule 17a‐7 and the Emerging Markets Debt Fund’s procedures. The procedures require that the transactions be a purchase or sale for no consideration other than cash payment against prompt delivery of a security for which market quotations are readily available, and be consistent with the investment policies of the Funds involved. During the year ended May 31, 2016 the Emerging Markets Debt Fund purchased a security from another fund for which the Adviser is the investment adviser in the amount of $1,395,701 and the Emerging Markets Corporate Debt Fund sold securities to another fund for which the Adviser is the investment adviser in the amount of $2,002,688, resulting in a realized loss of $80,597.35.
7. SHARES OF BENEFICIAL INTEREST
At May 31, 2016, the Trust had an unlimited number of shares of beneficial interest authorized with a par value of $0.001 per share. The Funds have the ability to issue multiple classes of shares. Each share of a class represents an identical interest and has the same rights, except that each class bears certain direct expenses, including those specifically related to the distribution of its shares. Transactions in shares of the Institutional Class can be found on the Statements of Changes in Net Assets.
At May 31, 2016, the Trust had an unlimited number of shares of beneficial interest authorized with a par value of $0.001 per share. The Funds have the ability to issue multiple classes of shares. Each share of a class represents an identical interest and has the same rights, except that each class bears certain direct expenses, including those specifically related to the distribution of its shares. Transactions in shares of the Institutional Class can be found on the Statements of Changes in Net Assets.
8. BENEFICIAL OWNERSHIP
As of May 31, 2016, the Stone Harbor Strategic Income Fund owned beneficially 99.93% of the Stone Harbor Investment Grade Fund’s outstanding shares.
9. INDEMNIFICATIONS
Under the Trust’s organizational documents, its officers and Trustees are indemnified against certain liability arising out of the performance of their duties to the Trust. Additionally, in the normal course of business, the Trust enters into contracts with service providers that may contain general indemnification clauses. The Trust’s maximum exposure under these arrangements is unknown, as this would involve future claims that may be made against the Trust that have not yet occurred.
Under the Trust’s organizational documents, its officers and Trustees are indemnified against certain liability arising out of the performance of their duties to the Trust. Additionally, in the normal course of business, the Trust enters into contracts with service providers that may contain general indemnification clauses. The Trust’s maximum exposure under these arrangements is unknown, as this would involve future claims that may be made against the Trust that have not yet occurred.
10. OTHER
The Funds, along with the Stone Harbor Emerging Markets Total Income Fund and the Stone Harbor Emerging Markets Income Fund (the “Stone Harbor Fund Complex”) paid each Trustee who is not an interested person, of the Investment Adviser or any of its affiliates an aggregate fee of $84,000 per year. The Chair of the Audit Committee of the Board receives additional compensation of $5,000 per year for his service as chair. These fees were allocated over the Stone Harbor Fund Complex based on the average net assets of each fund. Interested Trustees of the Trust are not compensated by the Stone Harbor Fund Complex. All Trustees are reimbursed for reasonable travel and out‐of‐pocket expenses incurred to attend such meetings. Officers of the Funds do not receive compensation for performing the duties of their office.
The Funds, along with the Stone Harbor Emerging Markets Total Income Fund and the Stone Harbor Emerging Markets Income Fund (the “Stone Harbor Fund Complex”) paid each Trustee who is not an interested person, of the Investment Adviser or any of its affiliates an aggregate fee of $84,000 per year. The Chair of the Audit Committee of the Board receives additional compensation of $5,000 per year for his service as chair. These fees were allocated over the Stone Harbor Fund Complex based on the average net assets of each fund. Interested Trustees of the Trust are not compensated by the Stone Harbor Fund Complex. All Trustees are reimbursed for reasonable travel and out‐of‐pocket expenses incurred to attend such meetings. Officers of the Funds do not receive compensation for performing the duties of their office.
11. SUBSEQUENT EVENTS
On July 20, 2016 the Board approved the addition of the Stone Harbor Equity Portable Alpha Fund to the Trust.
| 98 | www.shiplp.com |
| Stone Harbor Investment Funds | Additional Information |
May 31, 2016 (Unaudited)
FUND PORTFOLIO HOLDINGS
The SEC has adopted the requirement that all registered investment companies file a complete schedule of portfolio holdings with the SEC for their first and third fiscal quarters on Form N‐Q. For the Funds, this would be for the fiscal quarters ending August 31 and February 28. The Form N‐Q filing must be made within 60 days of the end of the quarter. The Funds’ Forms N‐Q will be available on the SEC’s website at http://www.sec.gov., or they may be reviewed and copied at the SEC’s Public Reference Room in Washington, DC (call 1‐800‐732‐0330 for information on the operation of the Public Reference Room).
PROXY VOTING
A description of the policies and procedures that the Funds use to determine how to vote proxies relating to portfolio securities and information regarding how the Funds voted proxies relating to portfolio securities for the 12‐month period ended June 30, 2015 are available without a charge, upon request, by contacting Stone Harbor Investment Funds at 1‐866‐699‐8158 or on the SEC website at http://www.sec.gov.
SHAREHOLDER TAX INFORMATION
Certain tax information regarding the Trust is required to be provided to shareholders based upon each Funds’ income and distributions for the year ended May 31, 2016. The Funds designate the following as a percentage of taxable ordinary income distributions, up to the maximum amount allowable, for the calendar year ended December 31, 2015:
Stone Harbor Emerging Markets Debt Fund | Stone Harbor High Yield Bond Fund | Stone Harbor Local Markets Fund | Stone Harbor Emerging Markets Corporate Debt Fund | Stone Harbor Investment Grade Fund | Stone Harbor Strategic Income Fund | Stone Harbor Emerging Markets Debt Allocation Fund | |
| Dividends Received Deduction Percentage | 0.00% | 0.77% | 0.00% | 0.00% | 0.00% | 0.42% | 0.00% |
| Qualified Dividend Income Percentage | 0.00% | 0.77% | 0.00% | 0.00% | 0.00% | 0.44% | 0.00% |
In early 2016, if applicable, shareholders of record received this information for the distributions paid to them by the Funds during the calendar year 2015 via Form 1099. The Funds will notify shareholders in early 2017 of amounts paid to them by the Funds, if any, during the calendar year 2016.
Pursuant to Section 852(b)(3) of the Internal Revenue Code, the Stone Harbor Investment Grade Fund, and the Stone Harbor Strategic Income Fund designate $21,781, and $489,931 respectively, as long term capital gain dividends.
| Stone Harbor Investment Funds Annual Report | May 31, 2016 | 99 |
| Stone Harbor Investment Funds | Additional Information |
May 31, 2016 (Unaudited)
BENCHMARK DESCRIPTIONS
| Index | Description |
| J.P. Morgan EMBI Global Diversified | The J.P. Morgan EMBI Global Diversified (EMBI Global Diversified) tracks total returns for U.S. dollar-denominated debt instruments issued by emerging markets sovereign and quasi-sovereign entities: Brady bonds, loans, and Eurobonds. The index limits the weights of those index countries with larger debt stocks by only including specified portions of these countries' eligible current face amounts outstanding. The countries covered in the EMBI Global Diversified are identical to those covered by the EMBI Global. |
| Citigroup High Yield Market Capped | The Citigroup High Yield Market Capped Index represents a modified version of the High Yield Market Index by delaying the entry of “fallen angel” issues and capping the par value of individual issuers at US $15 billion par amount outstanding. The index is a total rate of return index which captures the performance of below investment grade debt issued by corporations domiciled in the United States or Canada. |
| J.P. Morgan GBI-EM Global Diversified | The J.P. Morgan GBI-EM Global Diversified consists of regularly traded, liquid fixed-rate, domestic currency government bonds to which international investors can gain exposure. The weightings among the countries are more evenly distributed within this index. |
| J.P. Morgan CEMBI Broad Diversified | The J.P. Morgan CEMBI Broad Diversified (CEMBI Broad Diversified) tracks total returns of U.S. dollar-denominated debt instruments issued by corporate entities in emerging market countries and consists of an investable universe of corporate bonds. The minimum amount outstanding required is $350 mm for the CEMBI Broad Diversified. The CEMBI Broad Diversified limits the weights of those index countries with larger corporate debt stocks by only including a specified portion of these countries’ eligible current face amounts of debt outstanding. |
| Barclays Capital U.S. Aggregate Index | The Barclays Capital U.S. Aggregate Index represents securities that are SEC-registered, taxable, and dollar denominated. The index covers the U.S. investment grade fixed rate bond market, with index components for government and corporate securities, mortgage pass-through securities, and asset-backed securities. These major sectors are subdivided into more specific indices that are calculated and reported on a regular basis. |
| Barclays Global Credit Index (Hedged USD) | Barclays Global Credit Total Return Index is a subset of the Global Aggregate Index and is subject to the same quality, liquidity, and maturity requirements and exclusion rules of the latter. Constituents must be rated investment grade by at least two of the three major ratings agencies. Constituents must have a remaining maturity of at least one year. The index does not include convertibles, floating-rate notes, fixed-rate perpetuals, warrants, linked bonds, and structured products. |
DEFINITIONS
Broad-based securities indices are unmanaged and are not subject to fees and expenses typically associated with managed accounts or investment funds. Investments cannot be made directly in a broad-based securities index.
Standard and Poor’s ratings are measured on a scale that generally ranges from AAA (highest) to D (lowest). A security that has not been given a credit rating by Standard and Poor’s is listed as “not rated”. For additional information please go to the Understanding Ratings section at www.standardpoors.com.
Alpha – A measure of performance on a risk-adjusted basis. The excess return of the fund relative to the return of the benchmark index is a fund's alpha.
Basis Point – a unit equal to one hundredth of a percentage point.
Duration – A measure of the sensitivity of the price (the value of principal) of a fixed-income investment to a change in interest rates. Duration is expressed as a number of years.
Investment Grade – Refers to bonds that are considered to have a relatively low risk of default, ranging from highest credit quality to good credit quality. Bonds rated below investment grade are considered to have significant speculative characteristics.
Quantitative Easing (QE) – is an unconventional monetary policy used by central banks to stimulate the national economy when standard monetary policy has become ineffective. A central bank implements quantitative easing by buying financial assets from commercial banks and other private institutions, thus increasing the monetary base. This is distinguished from the more usual policy of buying or selling government bonds in order to keep market interest rates at a specified target value.
Sovereign Debt – Refers to bonds issued by a national government in order to finance the issuing country’s growth. Sovereign debt described as external is denominated in U.S. dollar, while sovereign debt described as local is issued in a foreign currency.
Spread – The difference between the bid and ask price of a security or asset.
The S&P 500 – is a stock market index based on the market capitalizations of 500 leading companies publicly traded in the U.S. stock market, as determined by Standard & Poor’s. It differs from other U.S. stock market indices such as the Dow Jones Industrial Average and the Nasdaq due to its diverse constituency and weighting methodology.
| 100 | www.shiplp.com |
| Stone Harbor Investment Funds | Board Approval of Investment Advisory Agreements |
May 31, 2016 (Unaudited)
The investment advisory agreements (each an “Agreement” and, together, the “Agreements”) for each of Stone Harbor Emerging Markets Debt Fund, Stone Harbor High Yield Bond Fund, Stone Harbor Local Markets Fund, Stone Harbor Emerging Markets Corporate Debt Fund, Stone Harbor Investment Grade Fund, Stone Harbor Strategic Income Fund, Stone Harbor Emerging Markets Debt Allocation Fund and Stone Harbor Emerging Markets Debt Blend Fund (each, a “Fund” and together, the “Funds”) is subject to annual approval by (i) the vote of a majority of the entire Board of Trustees, or of a majority of the outstanding voting securities (as defined in the Investment Company Act of 1940, as amended (the “1940 Act”)), of the applicable Fund, and (ii) the vote of a majority of the Trustees who are not interested persons of the Funds (the “Independent Trustees”). Each Agreement is terminable with respect to a Fund by Stone Harbor Investment Partners LP, each Fund’s investment adviser (the “Adviser”), a majority of the Trustees, or a vote of a majority of the outstanding voting securities of the applicable Fund, without penalty, by not less than 60 days’ prior written notice. Each Agreement will terminate automatically in the event of its assignment (as defined for purposes of the 1940 Act).
The Board of Trustees, including the Independent Trustees, meets over the course of the year with representatives of the Adviser, including the Funds’ respective portfolio managers, and regularly reviews detailed information regarding the investment program and performance of each Fund. The Board of Trustees also receives periodic updates between meetings. The Trustees, including the Independent Trustees, met on April 27, 2016 to review the Agreements for each Fund and to determine whether to approve the continuation of the Agreements for an additional one-year period. The Trustees considered all information they deemed reasonably necessary to evaluate the terms thereof. In connection with this meeting, the Trustees received materials to assist them with their review. These materials included, among other things, (i) information about the Adviser and services provided by the Adviser; (ii) information on each Fund’s investment performance and the performance of a group of comparable funds (some of which was prepared by a third party); (iii) information on each Fund’s advisory fees and other expenses, including information about the fees charged to institutional accounts managed by the Adviser and other Funds where the Adviser serves as sub-adviser, comparisons of the Funds’ fees to the fees of a group of similar funds prepared by a third party and information about any applicable expense caps; and (iv) information about the profitability of each Agreement to the Adviser. In considering whether to approve the continuation of each Agreement, the Board of Trustees, including the Independent Trustees, did not identify any single factor as determinative. Individual Trustees may have evaluated the information presented differently from one another, giving different weights to various factors. Matters considered by the Trustees, including the Independent Trustees, in connection with their approval of the Agreements included, but were not limited to, the following:
The nature, extent and quality of the services provided to the Funds under the Agreements.
The Trustees considered the nature, extent and quality of the services provided by the Adviser to the Funds. In this regard, the Trustees took into account the experience of each Fund’s portfolio management team and of the Adviser’s senior management, and the time and attention they devote to the Funds. After reviewing these and related factors, the Trustees concluded, within the context of their overall conclusions regarding each Agreement, that the nature, extent and quality of the services provided by the Adviser supported the renewal of the Agreements.
Investment performance of the Funds and the Adviser.
The Trustees reviewed performance information for each Fund, including information prepared by a third party, for various time periods since each Fund’s inception. The review included a comparison of each Fund’s performance to the performance of a group of comparable funds selected by a third party and each Fund’s respective benchmark. The Trustees also considered the Adviser’s performance and reputation generally and its investment techniques, risk management controls and decision-making processes. With respect to Funds whose performance lagged the relevant benchmark or peer group average, the Trustees concluded that other factors relevant to performance supported renewal of the Agreements. These factors included one or more of the following: (1) that the underperformance was attributable, to a significant extent, to investment decisions (such as security selection or sector or country allocation) by Stone Harbor that were consistent with the Fund’s investment objective and strategies, (2) that the Fund’s more recent performance, although lagging in certain periods, had shown improvement when compared to relevant performance benchmarks and categories, (3) the relative underperformance was attributable in significant part to market or economic conditions, or (4) the Fund was relatively new and therefore had a limited operating history on which to judge its performance record. With respect to Stone Harbor Emerging Markets Debt Blend Fund, the Trustees noted that the Fund was not yet operational and therefore no performance information had been provided for the Fund.
After reviewing these and related factors, the Trustees concluded, within the context of their overall conclusions regarding each Agreement, that these factors supported the renewal of the Agreements.
The costs of the services to be provided and profits to be realized by the Adviser from its relationship with the Funds.
The Trustees considered the fees charged to each Fund for advisory services as well as the total expense level of each Fund. The Adviser furnished information to the Trustees compiled by a third party showing a comparison of each Fund’s advisory fees and total expense levels compared to a group of comparable funds selected by the third party. The Trustees noted that each of the Funds is subject to expense caps (although the total expense ratios for certain Funds are below the cap), and each of the Fund’s advisory fee and total expenses (after application of the expense caps and waivers) align competitively with comparable groups of mutual funds. The Adviser also provided information about the costs to it of providing services to the Funds, including information about how such costs are determined, and information about its profitability with respect to its management of the Funds, as well as information about the advisory fees it charges with respect to other funds, institutional separate accounts and sub-advised funds with similar strategies and information about differences in such fees and the reasons for such differences. In this regard, the Trustees noted that the effective management fee rates received by the Adviser from the Funds (after application of expense caps and waivers) are generally comparable to the fees charged to similarly managed institutional accounts. They also noted that the Funds were offered primarily to institutional investors, many of whom were focused on the Funds’ fees and expenses, and that the Funds are relatively small when compared to certain of the Adviser’s institutional accounts and therefore are able to take advantage of resources that the Adviser devotes to institutional accounts. With respect to funds for which the Adviser serves as sub-adviser, the Board took into account the different services provided as a sub-adviser and the additional risks faced as an adviser of a fund compared to serving as a sub-adviser of a fund. The Trustees also considered the demands and complexity of the investment management of the Funds as compared to the complexity of managing (or sub-advising) other funds and separate accounts. The Trustees also considered the Adviser’s description of how profitability is determined and the reasons for differences in profitability between Funds and from year to year.
| Stone Harbor Investment Funds Annual Report | May 31, 2016 | 101 |
| Stone Harbor Investment Funds | Board Approval of Investment Advisory Agreements |
May 31, 2016 (Unaudited)
After reviewing these and related factors, the Trustees concluded, within the context of their overall conclusions regarding each Agreement, that the advisory fees for each of the Funds were fair and reasonable, and that the costs of these services generally and the related profitability of the Adviser in respect of its relationship with the Funds supported the renewal of the Agreements.
Economies of Scale.
The Trustees considered to what extent economies of scale would likely be realized as the Funds grow and whether those economies would be shared with the Funds through breakpoints in their investment advisory fees or other means, such as expense caps. The Trustees noted that the Funds’ expenses are capped, and that the Adviser proposed to maintain the Funds’ fee waiver/expense reimbursement arrangements at current levels until September 30, 2017. They also noted that some of the Funds had expense ratios that were below the cap. The Trustees also considered whether breakpoints in the investment advisory fees would be appropriate and, after discussion, decided not to propose the implementation of breakpoints at this time but indicated that the implementation of breakpoints might be considered in the future.
After reviewing these and related factors, the Trustees concluded, within the context of their overall conclusions regarding each Agreement, that the extent to which economies of scale would be shared with the Funds supported the approval of the Agreements.
The Trustees also considered other factors, which included but were not limited to the following:
| • | Whether each Fund has operated in accordance with its investment objective and each Fund’s record of compliance with its investment restrictions and the compliance programs of the Funds and the Adviser. They also considered the compliance-related resources the Adviser provided to the Funds, including resources designed to ensure compliance with the investment objectives, policies and restrictions of each Fund. |
| • | So-called “fallout benefits” to the Adviser, such as the benefits from offering its institutional clients the ability to invest in a registered investment company. |
Based on their evaluation of all factors they deemed to be material, including those factors described above, the Trustees, including the Independent Trustees, concluded that the existing investment advisory agreements for Stone Harbor Emerging Markets Debt Fund, Stone Harbor High Yield Bond Fund, Stone Harbor Local Markets Fund, Stone Harbor Emerging Markets Corporate Debt Fund, Stone Harbor Investment Grade Fund, Stone Harbor Strategic Income Fund, Stone Harbor Emerging Markets Debt Allocation Fund and Stone Harbor Emerging Markets Debt Blend Fund should be continued through June 20, 2017.
| 102 | www.shiplp.com |
| Stone Harbor Investment Funds | Trustees & Officers |
May 31, 2016 (Unaudited)
The business and affairs of each Fund are managed under the direction of its Board of Trustees. The Board of Trustees approves all significant agreements between a Fund and the persons or companies that furnish services to the Fund, including agreements with its distributor, investment adviser, administrator, custodian and transfer agent. The day-to-day operations of the Fund are delegated to the Fund’s Adviser and administrator.
The name, age and principal occupations for the past five years of the Trustees and officers of the Funds are listed below, along with the number of portfolios in the Fund Complex overseen by and the other directorships held by each Trustee. Except as otherwise noted, the address of each Trustee and officer is c/o Stone Harbor Investment Partners LP, 31 W. 52nd Street, 16th Floor, New York, New York 10019. The Trust’s Statement of Additional Information includes additional information about the Trustees and is available without a charge, upon request, by calling 1-866-699-8158.
INDEPENDENT TRUSTEES
Name & Year of Birth(1) | Position with the Trust | Term of Office and Length of Time Served(2) | Principal Occupation(s) During Past Five Years | Number of Portfolios in Fund Complex Overseen by Trustee(3) | Other Directorships Held by Trustee |
Alan Brott 1942 | Chairman of Audit Committee; Trustee | Since June 21, 2007 | Columbia University Associate Professor, 2000-Present; Consultant, 1991-Present. | 10 | Stone Harbor Emerging Markets Income Fund, Stone Harbor Emerging Markets Total Income Fund, Grosvenor Registered Multi-Strategy Fund, Man FRM Alternative Multi-Strategy Fund, Excelsior Private Market Fund II and Excelsior Private Markets Fund III. |
Heath B. McLendon 1933 | Trustee | Since June 21, 2007 | Retired; formerly Citigroup— Chairman of Equity Research Oversight Committee (retired December 31, 2006). | 10 | Stone Harbor Emerging Markets Income Fund, Stone Harbor Emerging Markets Total Income Fund |
Patrick Sheehan 1947 | Trustee | Since June 21, 2007 | Retired; formerly, Citigroup Asset Management— Managing Director and Fixed Income Portfolio Manager, 1991-2002. | 10 | Stone Harbor Emerging Markets Income Fund, Stone Harbor Emerging Markets Total Income Fund |
| Stone Harbor Investment Funds Annual Report | May 31, 2016 | 103 |
| Stone Harbor Investment Funds | Trustees & Officers |
May 31, 2016 (Unaudited)
INDEPENDENT TRUSTEES (continued)
Name & Year of Birth(1) | Position with the Trust | Term of Office and Length of Time Served(2) | Principal Occupation(s) During Past Five Years | Number of Portfolios in Fund Complex Overseen by Trustee(3) | Other Directorships Held by Trustee |
Glenn Marchak 1956 | Trustee | Since April 2, 2015 | Chairman of Audit Committee, Apollo Tactical Income Fund Inc. (February 2013 to Present), Chairman of Audit Committee, Apollo Senior Floating Rate Fund Inc. (December 2010 – Present); Chairman of Audit Committee, Atlanta Equity Advisors/Resolvion (January 2010 – September 2014) | 10 | Stone Harbor Emerging Markets Income Fund, Stone Harbor Emerging Markets Total Income Fund, Apollo Tactical Income Fund Inc. and Apollo Senior Floating Rate Fund Inc. |
INTERESTED TRUSTEE
Name & Year of Birth(1) | Position(s) Held with the Trust | Term of Office and Length of Time Served(2) | Principal Occupation(s) During Past Five Years | Number of Portfolios in Fund Complex Overseen by Trustee(3) | Other Directorships Held by Trustee |
Thomas K. Flanagan* 1953 | Chairman and Trustee | Since October 17, 2012 | Since April 2006, Portfolio Manager of Stone Harbor; prior to April 2006, Managing Director and Senior Portfolio Manager for emerging markets debt portfolios at Salomon Brothers Asset Management Inc.; joined Salomon Brothers Asset Management Inc. in 1991. | 10 | Stone Harbor Emerging Markets Income Fund, Stone Harbor Emerging Markets Total Income Fund. |
| 104 | www.shiplp.com |
| Stone Harbor Investment Funds | Trustees & Officers |
May 31, 2016 (Unaudited)
OFFICERS
Name & Year of Birth(1) | Position with the Trust | Term of Office and Length of Time Served(2) | Principal Occupation(s) During Past Five Years |
Peter J. Wilby 1958 | President | Since June 21, 2007 | Co-portfolio manager of the Funds; since April 2006, Chief Investment Officer of Stone Harbor; prior to April 2006, Chief Investment Officer – North American Fixed Income at Citigroup Asset Management; joined Citigroup or its predecessor firms in 1989. |
Jeffrey S. Scott 1959 | Chief Compliance Officer | Since June 21, 2007 | Since April 2006, Chief Compliance Officer of Stone Harbor; from October 2005 to March 2006, Director of Compliance, New York Life Investment Management LLC; from July 1998 to September 2005, Chief Compliance Officer, Salomon Brothers Asset Management Inc. |
Thomas Reynolds 1960 | Principal Financial and Accounting Officer | Since April 16, 2014 | Since February 2008, Controller of Stone Harbor; from February 2006 to February 2008, Vice President of Portfolio Administration for Goldman Sachs Asset Management; from 1991 to 2006, Citigroup Asset Management. |
Amanda Suss 1969 | Treasurer | Since April 16, 2014 | Since July 2011, Senior Finance Associate of Stone Harbor; from May 2000 to July 2006, Director of Business Operations at Citigroup Asset Management; from April 1994 to April 2000, Mutual Fund Accounting Manager at Smith Barney Asset Management. |
Adam J. Shapiro 1963 | Secretary; Anti-Money Laundering Officer | Since June 21, 2007 | Since April 2006, General Counsel of Stone Harbor; from April 2004 to March 2006, General Counsel, North American Fixed Income, Salomon Brothers Asset Management Inc.; from August 1999 to March 2004, Director of Product and Business Development, Citigroup Asset Management. |
Vilma V. DeVooght 1977 | Assistant Secretary | Since January 21, 2015 | Vice President, Senior Counsel, ALPS Fund Services, Inc., since 2014; Associate Counsel, First Data Corporation 2012 to 2014; Legal Counsel, Invesco 2009 to 2011; Secretary Centaur Funds. |
Gina Meyer 1980 | Assistant Treasurer | Since July 17, 2013 | Since August 2013, Assistant Treasurer, RiverNorth Funds; since November 2012, Fund Controller for ALPS Fund Services, Inc.; from January 2011 to October 2012, Manager of Fund Accounting for Jackson National Asset Management; from August 2008 to January 2011, Supervisor of Fund Accounting for Jackson National Asset Management. |
* | Mr. Flanagan is an interested person of the Trust (as defined in the 1940 Act) (an “Interested Trustee”) because of his position with the Adviser |
(1) | The business address of each Trustee and Officer of the Fund is c/o Stone Harbor Investment Partners LP, 31 West 52nd Street, 16th Floor, New York, NY 10019. |
(2) | Each Trustee serves until retirement, resignation or removal from the Board. Officers are typically elected every year, unless an officer earlier retires, resigns or is removed from office. |
(3) | The term “Fund Complex” as used in this table includes each series of the Trust, the Stone Harbor Emerging Markets Income Fund and the Stone Harbor Emerging Markets Total Income Fund, two closed-end funds advised by the Adviser. As of May 31, 2016, the Stone Harbor Emerging Markets Debt Blend Fund had not commenced operations |
| Stone Harbor Investment Funds Annual Report | May 31, 2016 | 105 |

INVESTMENT ADVISER
Stone Harbor Investment Partners LP
31 W. 52nd Street 16th Floor
New York, New York 10019
Stone Harbor Investment Partners LP
31 W. 52nd Street 16th Floor
New York, New York 10019
ADMINISTRATOR & FUND ACCOUNTANT
ALPS Fund Services, Inc.
1290 Broadway, Suite 1100
Denver, Colorado 80203
1290 Broadway, Suite 1100
Denver, Colorado 80203
DISTRIBUTOR
ALPS Distributors, Inc.
1290 Broadway, Suite 1100
Denver, Colorado 80203
ALPS Distributors, Inc.
1290 Broadway, Suite 1100
Denver, Colorado 80203
TRANSFER AGENT
ALPS Fund Services, Inc.
1290 Broadway, Suite 1100
Denver, Colorado 80203
ALPS Fund Services, Inc.
1290 Broadway, Suite 1100
Denver, Colorado 80203
CUSTODIAN
State Street Bank and Trust Company
One Iron Street
Boston, MA 02210
State Street Bank and Trust Company
One Iron Street
Boston, MA 02210
LEGAL COUNSEL
Ropes & Gray LLP
1211 Avenue of the Americas
New York, New York 10036
Ropes & Gray LLP
1211 Avenue of the Americas
New York, New York 10036
INDEPENDENT REGISTERED PUBLIC ACCOUNTING FIRM
Deloitte & Touche LLP
555 17th Street, Suite 3600
Denver, Colorado 80202
Deloitte & Touche LLP
555 17th Street, Suite 3600
Denver, Colorado 80202
This report and its financial statements are submitted for the general information of the shareholders of the Funds. The report is not authorized for distribution to prospective investors in the Funds unless preceded or accompanied by a prospectus. Investors should carefully consider the investment objectives, risks, charges, and expenses of a Fund, which are described in its prospectus. For this and other information or to request a prospectus or summary prospectus, call 1-866-699-8125 toll free. Please read the prospectus carefully before investing. The Funds’ Statement of Additional Information contains additional information about the Funds’ Trustees and is available without charge upon request by calling 1-866-699-8125.
SHF000825 exp. 07/31/17
| Item 2. | Code of Ethics. |
| (a) | The Registrant, as of the end of the period covered by this report, has adopted a code of ethics that applies to the Registrant’s principal executive officer, principal financial officer, principal accounting officer or controller or any persons performing similar functions on behalf of the Registrant. |
| (b) | Not applicable. |
| (c) | During the period covered by this report, no amendments to the provisions of the code of ethics adopted in Item 2(a) above were made. |
| (d) | During the period covered by this report, no implicit or explicit waivers to the provisions of the code of ethics adopted in Item 2(a) above were granted. |
| (e) | Not applicable. |
| (f) | The Registrant’s Code of Ethics is attached as Exhibit 12.A.1. hereto. |
| Item 3. | Audit Committee Financial Expert. |
The Board of Trustees of the Registrant has determined that the Registrant has at least one audit committee financial expert serving on its Audit Committee. The Board of Trustees has designated Alan J. Brott as the Registrant’s “audit committee financial expert.” Mr. Brott is “independent” as defined in paragraph (a)(2) of Item 3 to Form N-CSR.
Mr. Brott has significant public accounting experience, including significant experience as a partner at a public accounting firm.
| Item 4. | Principal Accountant Fees and Services. |
| (a) | Audit Fees: For the Registrant’s fiscal years ended May 31, 2015 and May 31, 2016, the aggregate fees billed for professional services rendered by the principal accountant for the audit of the Registrant’s annual financial statements were $288,500 and $297,200, respectively. |
| (b) | Audit-Related Fees: For the Registrant’s fiscal years ended May 31, 2015 and May 31, 2016, there were no fees billed for assurance and related services by the principal accountant that were reasonably related to the performance of the audit of the Registrant’s financial statements and were not reported in paragraph (a) of this Item 4. |
2
| (c) | Tax Fees: For the Registrant’s fiscal years ended May 31, 2015 and May 31, 2016, the aggregate fees billed for professional services rendered by the principal accountant for tax compliance, tax advice and tax planning were $35,280 and $35,280, respectively. The fiscal year 2015 and 2016 tax fees were for services pertaining to federal and state income tax return review, review of year-end dividend distributions and excise tax preparation. |
| (d) | All Other Fees: For the Registrant’s fiscal years ended May 31, 2015 and May 31, 2016, aggregate fees billed to the Registrant by the principal accountant for services provided by the principal accountant other than the services reported in paragraphs (a) through (c) of this Item 4 were $0 and $1,000 respectively. These fees were related to services provided to assist Stone Harbor Investment Funds in Indian tax matters. |
| (e)(1) | Audit Committee Pre-Approval Policies and Procedures: All services to be performed by the Registrant's principal accountant must be pre-approved by the Registrant's Audit Committee. |
| (e)(2) | No services described in paragraphs (b) through (d) of this Item 4 were approved by the Registrant’s audit committee pursuant to paragraph (c)(7)(i)(C) of Rule 2-01 of Regulation S-X. |
| (f) | Not applicable. |
| (g) | The aggregate non-audit fees billed by the registrant’s accountant for services rendered to the registrant, and rendered to the registrant’s investment adviser, and any entity controlling, controlled by, or under common control with the adviser that provides ongoing services to the registrant for the fiscal year ended May 31, 2015 and May 31, 2016 were $0 and $0, respectively. |
| (h) | Not applicable. |
| Item 5. | Audit Committee of Listed Registrants. |
Not applicable to Registrant.
| Item 6. | Investments. |
| (a) | Schedule of Investments is included as part of the Report to Stockholders filed under Item 1 of this Form N-CSR. |
| (b) | Not applicable. |
3
| Item 7. | Disclosure of Proxy Voting Policies and Procedures for Closed-End Management Investment Companies. |
Not applicable to Registrant.
| Item 8. | Portfolio Managers of Closed-End Management Investment Companies. |
Not applicable to Registrant.
| Item 9. | Purchases of Equity Securities by Closed-End Management Investment Company and Affiliated Purchasers. |
Not applicable to Registrant.
| Item 10. | Submission of Matters to Vote of Security Holders. |
There have been no material changes to the procedures by which shareholders may recommend nominees to the Registrant’s Board of Trustees, where those changes were implemented after the Registrant last provided disclosure in response to the requirements of Item 407(c)(2) of Regulation S-K, or this Item.
| Item 11. | Controls and Procedures. |
| (a) | The Registrant’s principal executive officer and principal financial officer have concluded that the Registrant’s disclosure controls and procedures (as defined in Rule 30a-3(c) under the Investment Company Act of 1940, as amended) are effective based on their evaluation of these controls and procedures as of a date within 90 days of the filing date of this report. |
| (b) | There was no change in the Registrant's internal control over financial reporting (as defined in Rule 30a-3(d) under the Investment Company Act of 1940, as amended) during the second fiscal quarter of the period covered by this report that has materially affected, or is reasonably likely to materially affect, the Registrant's internal control over financial reporting. |
| Item 12. | Exhibits. |
| (a)(1) | The Code of Ethics that applies to the Registrant’s principal executive officer and principal financial officer is attached hereto as Exhibit 12.A.1. |
| (a)(2) | The certifications required by Rule 30a-2(a) of the Investment Company Act of 1940, as amended, and Section 302 of the Sarbanes-Oxley Act of 2002 are attached hereto as Exhibit 99.Cert. |
| (a)(3) | Not applicable. |
| (b) | The certifications by the Registrant’s principal executive officer and principal financial officer, as required by Rule 30a-2(b) of the Investment Company Act of 1940, as amended, and Section 906 of the Sarbanes-Oxley Act of 2002 are attached hereto as Exhibit 99.906Cert. |
4
SIGNATURES
Pursuant to the requirements of the Securities Exchange Act of 1934 and the Investment Company Act of 1940, the Registrant has duly caused this Report to be signed on its behalf by the undersigned, thereunto duly authorized.
| Stone Harbor Investment Funds | |||
| By: | /s/ Peter J. Wilby | ||
| Peter J. Wilby | |||
| President and Chief Executive Officer/ Principal Executive Officer | |||
| Date: | August 5, 2016 | ||
Pursuant to the requirements of the Securities Exchange Act of 1934 and the Investment Company Act of 1940, this Report has been signed below by the following persons on behalf of the Registrant and in the capacities and on the dates indicated.
| Stone Harbor Investment Funds | |||
| By: | /s/ Peter J. Wilby | ||
| Peter J. Wilby | |||
| President and Chief Executive Officer/ Principal Executive Officer | |||
| Date: | August 5, 2016 | ||
| By: | /s/ Thomas M. Reynolds | ||
| Thomas M. Reynolds | |||
| Principal Financial Officer/ Principal Accounting Officer | |||
| Date: | August 5, 2016 | ||
5