Table of Contents
UNITED STATES
SECURITIES AND EXCHANGE COMMISSION
Washington, D.C. 20549
FORM N-CSR
CERTIFIED SHAREHOLDER REPORT OF REGISTERED
MANAGEMENT INVESTMENT COMPANIES
Investment Company Act file number: 811-22037
Stone Harbor Investment Funds
(Exact name of registrant as specified in charter)
1290 Broadway, Suite 1100
Denver, CO 80203
(Address of principal executive offices) (Zip code)
Adam J. Shapiro, Esq.
c/o Stone Harbor Investment Partners LP
31 West 52nd Street, 16th Floor
New York, NY 10019
(Name and address of agent for service)
With copies To:
Michael G. Doherty, Esq.
Ropes & Gray LLP
1211 Avenue of the Americas
New York, NY 10036
Registrant’s telephone number, including area code: (303) 623-2577
Date of fiscal year end: May 31
Date of reporting period: May 31, 2015
Table of Contents
Item 1. Report to Stockholders.
Table of Contents

Table of Contents
| 2 | ||||
| ||||
| 10 | ||||
| ||||
| 12 | ||||
| ||||
| 15 | ||||
| 16 | ||||
| 17 | ||||
| 18 | ||||
| 19 | ||||
| 20 | ||||
| 21 | ||||
| 22 | ||||
| ||||
| 23 | ||||
| 35 | ||||
| 45 | ||||
| 50 | ||||
| 56 | ||||
| 62 | ||||
| 64 | ||||
| 65 | ||||
| ||||
| 67 | ||||
| ||||
| 69 | ||||
| ||||
| 73 | ||||
| 74 | ||||
| 75 | ||||
| 76 | ||||
| 77 | ||||
| 78 | ||||
| 79 | ||||
| 80 | ||||
| ||||
| 100 | ||||
| ||||
| 102 | ||||
| ||||
| 105 | ||||
| ||||
Stone Harbor Investment Funds Annual Report | May 31, 2015 | 1 |
Table of Contents
| Stone Harbor Investment Funds | Shareholder Letter | |
May 31, 2015 (Unaudited) |
Dear Shareholder,
During the 12 months ended 31 May 2015, credit markets were heavily influenced by several key factors that produced divergent results across asset classes and regions. What began as a relatively calm credit market environment at the start of the period was altered and reshaped – in a disruptive manner, in some cases – by shifting market fundamentals leading to a rise in asset price volatility. The macro-economic themes that had the largest impact on credit market performance were a dramatic decline in commodity prices led by oil; the Federal Reserve’s (“Fed”) wind down of its asset purchase program; weak global growth concerns, particularly as U.S. dollar strength continued to put pressure on emerging market countries and currencies; and ongoing geopolitical conflict in Eastern Europe and the Middle East. While easing global monetary policies lifted market sentiment, the continued uncertainly around economic growth constrained performance in credit markets.
The near 60% drop in oil prices during the period was a significant driver of asset price volatility, particularly in emerging markets and high yield. While the implications of the rapid price decline was the initial market focus many developed and emerging countries and industries are importers of oil and are benefitting from lower oil prices.
Another important theme that continued to occupy market attention was the importance of global monetary policies aimed at supporting growth and reducing deflationary risks. The European Central Bank (ECB) exceeded market expectations with its long awaited quantitative easing program; the People’s Bank of China (PBOC) cut its benchmark rate for the first time since 2012 and three times during the period; and the Bank of Japan (BOJ) surprised the markets with the large scale of its asset purchase program. Although U.S. economic growth slowed during the period, the U.S. Federal Reserve completed its asset purchase program while maintaining its cautious stance on future interest rate hikes.
We believe it is likely that global growth will be sustained, albeit at a modest level, as we continue through the balance of this calendar year. In our view, the next cycle of monetary policy focus is likely to be in the U.S. and we continue to expect a rise in the Fed Funds rate in the latter part of the year with only a gradual pace of appreciation thereafter. In our view, credit markets remain attractively valued for this stage of the cycle.
At Stone Harbor Investment Partners L.P., we will continue to focus on seeking to capture excess return from stable and improving credit situations in corporate and sovereign markets worldwide. As we continue to monitor these developments, please follow our progress throughout the year by visiting our website at www.shiplp.com. There you will find updates on our view of credit markets, as well as related news and research. We appreciate the confidence you have placed in Stone Harbor Investment Partners LP and look forward to providing you with another update in the next six months.
Market Review: Emerging Markets Debt
The 12 months ended 31 May 2015 was a volatile period for emerging markets (“EM”) in general and a particularly difficult period for emerging local markets. While strong technicals, improved market sentiment stemming from prospective European Central Bank (“ECB”) policy actions, and reduced levels of geopolitical risks served as backdrop to a relatively benign market environment at the start of the period, several vital macro-economic themes dominated the latter half of 2014 and into 2015. These drivers included declining core fixed income yields, U.S. dollar strength, and falling oil prices, all of which were underscored by continued EM growth concerns and slower-than-expected U.S. growth. The decline in U.S. Treasury yields was the primary driver of returns for EM hard currency sector in aggregate, while local currency debt returns were largely driven by weakness in energy-related commodity markets combined with the ongoing strength of the U.S. dollar. The Organization of the Petroleum Exporting Countries (OPEC) decision to maintain production at its November 2014 meeting exacerbated a slide in oil prices, which fell by over 40% in the fourth quarter 2014 alone, weighing heavily on oil exporting economies. Returns on EM corporate debt led USD sovereign debt, and remained positive.
In the last several months of the review period, a recovery and a stabilization in commodity prices (particularly in the energy sector) recalibrated market sentiment and demand for risk assets. In addition, reduced concerns around geopolitical risks associated with Russia and Ukraine, better-than-expected European growth data, stronger currencies, and weaker U.S. economic data that tempered expectations for further U.S. dollar strength provided support for emerging markets. These market dynamics had varying degrees of impact across EM sectors, countries, currencies, and industries. In many cases, the drivers of underperformance in 2014 became catalysts for positive performance by the end of the review period.
Stone Harbor Emerging Markets Debt Fund
The total return of the Emerging Markets Debt Fund (the “Fund” or “portfolio”) for the 12 month period ended May 31, 2015 was -1.01% (net of expenses) and -0.33% (gross of expenses). This performance compares to a benchmark return of 2.46% for the J.P. Morgan EMBI Global Diversified. For the period, external sovereign bond credit spreads over comparable maturity U.S. Treasury securities widened by 71 basis points, ending the period at 344 basis points.
2 | www.shiplp.com |
Table of Contents
| Stone Harbor Investment Funds | Shareholder Letter | |
May 31, 2015 (Unaudited) |
The Fund underperformed its benchmark primarily as a result of country selection within the hard currency sovereign debt allocation, which detracted 276 basis points from relative returns, and secondarily as a result of Foreign Currency (FX) exposure within the local currency debt allocation. As oil prices stabilized after March 2015, Venezuela bonds have been among the best performing hard currency sovereign debt. However, Venezuela bonds performed poorly in late 2014 as oil prices declined. We held the view then and now that Venezuela’s near term payment obligations are manageable, and that the deeply discounted prices of Venezuela bonds support our overweight.
Based on our independent research, including several research trips to Caracas, we concluded that the probability of default was much lower than the market’s expectation. In our view, Venezuela has large disincentives to default. The country is somewhat unusual in the sense that PDVSA, the state owned oil company, is responsible for almost all FX earnings in the country. In our view, a PDVSA default would almost certainly reduce its ability to continue to generate FX revenue due to legal risk and possible court actions. Moreover, in the event of default, we believe the long-term viability of the oil sector would be greatly at risk as PDVSA relies on foreign partners and cooperation would be made more difficult. In addition, there is a large risk of attachment of foreign assets. As a quasi sovereign entity (government owned, but not guaranteed), PDVSA does not automatically benefit from the same immunities as a sovereign issuer, thus providing more possible legal angles for creditors to go after PDVSA assets than would be available in the case of a sovereign issuer. In addition, securing any new financing would be close to impossible if Venezuela went into default.
During the period, however, our position in Venezuela suffered due to the decline in oil prices and because of a delay in an expected devaluation of the bolivar that, in turn, caused concerns that Venezuela would lose international reserves as it met obligations to pay for imports, government wages as well as debt service. Nevertheless, in the first quarter 2015, the difference in returns between the best and worst performing Venezuelan bond was large, creating a significant opportunity in security selection, in our view. Issue selection in Venezuela enhanced relative returns by 118 basis points during the review period.
In Russia, while issue selection decisions in hard currency sovereign debt enhanced relative performance, emerging market currency and local interest rate exposure detracted from performance as the ruble declined in value relative to the US dollar over the course of the year. Likewise, FX exposure in Colombia, Indonesia, Mexico and Turkey detracted from relative performance. Other detractors within the hard currency debt allocation included underweights in Hungary, Lebanon, Ukraine, and the Philippines.
Positive contributors, other than issue selection in Russia and Venezuela, included overweights in Argentina and Indonesia. Indonesia benefitted from a rebalancing of its economy following the depreciation of the rupiah relative to the US dollar in 2013, as well as reduced political uncertainty following the completion of the presidential election in July 2014. Argentina bonds outperformed the market on speculation of a potential agreement with holdout creditors, which ultimately did not materialize in 2014.
The largest relative exposure changes during the review period included adding to the Fund’s positions in Argentina, Colombia, Dominican Republic, and Kazakhstan. We maintained an overweight position in Argentina throughout the year, but reduced our exposure at the end of 2014 to take advantage of the strong performance of the credit relative to the benchmark. In May 2015, we added to our positions in Argentina, particularly in select corporate bonds and short duration, U.S. dollar denominated local sovereign bonds. In our view, Dominican Republic benefits from strong U.S. growth as tourism and remittance revenues increase, and as we see it, institutional improvements to monetary and fiscal policy should be supportive. Based on our view that some of the market’s most attractive opportunities remained in oil exporters, particularly those with low production costs, we increased our position in Kazakhstan during the year. Our overweight position detracted from performance during the period, but we continue to believe valuations and fundamental credit metrics support the investments.
These changes were funded with reduced exposures in several countries where valuations appear to us unattractive relative to underlying sovereign credit fundamentals. A common theme has been to underweight countries from Central and Eastern Europe where demand from Euro-based investors has driven spreads to very tight levels. We believed this to be the case in Croatia, Hungary, Poland, and Romania. We also reduced our exposure in Brazil, where we are still cautious on the country’s macro-economic environment; however, our primary concern is the currency, the real. We expect the real to continue to weaken and, therefore, have no position in the currency currently in the portfolio. We maintain an overweight in Brazil sovereign debt, albeit a smaller overweight than at the end of first quarter 2015, as Brazil external sovereign debt has outperformed the broader market since March. We have also increased exposure to select Brazil corporate bonds, which are all out of benchmark. We reduced our position in Indonesia on recent outperformance.
As of this writing, the reduced exposure to out-of-benchmark local currency debt reflected two factors. First, we had tactically increased currency exposure in select countries that we believed would benefit most from a pause in the strength in the US dollar. As this view played out in Colombia, India, Indonesia and Russia in April and May 2015, we eliminated our currency positions in these countries. Second, as growth data remained weak, we reduced exposure to the Mexican peso and eliminated positions in the South African rand and the Turkish lira.
Stone Harbor Investment Funds Annual Report | May 31, 2015 | 3 |
Table of Contents
| Stone Harbor Investment Funds | Shareholder Letter | |
May 31, 2015 (Unaudited) |
At the end of the period, the portfolio remained modestly underweight duration given our view that US Treasury yields will gradually increase over the course of 2015.
Stone Harbor Local Markets Fund
The total return of the Stone Harbor Local Markets Fund (the “Fund” or “portfolio”) for the 12 month period ended May 31, 2015 was -14.70% (net of expenses) and -13.83% (gross of expenses). This performance compares to a benchmark return of -13.49% for the J.P. Morgan GBI-EM Global Diversified, with FX accounting for all of the negative return. The largest underperformers for the period at the index level were Russia (-33.09%), Brazil (-22.76%) and Colombia (-21.31%).
The Fund underperformed its benchmark as a result of duration positioning and issue selection decisions. The largest source of underperformance was an overweight in Russia (FX and duration). We had established an overweight in the Russian ruble in mid-2014 after the currency and local debt markets had already adjusted lower to news of EU and US sanctions. We added materially to the position in July-September as the currency weakened further and local interest rates escalated. The securities we held in Russia had a longer average duration than the benchmark; we held this position on the view that as the Russian economy weakens in 2015, inflation levels would fall and allow longer duration securities to outperform. However, the ruble depreciated more than the market and beyond our expectations as oil prices fell and the Central Bank of Russia did not intervene. Despite the drawdown that heavily influenced returns for the entire period, the Fund’s overweight position produced positive results in the last several months of the review period, helped by stabilization of oil prices, a lowering of geopolitical risk following the ceasefire agreement between Russia and Ukraine, and a more conservative policy approach by the Central Bank of Russia that cut rates less aggressively than the market had expected.
Other significant detractors included South Africa (FX and duration) and Thailand (FX and duration). In South Africa, our underweight positions in the rand and in duration contribution reflected our view that the weak growth profile should lead to a steady deterioration of credit-worthiness. However, this position detracted from excess returns as South Africa outperformed due to an increase in economic activity after the cessation of platinum strikes in July 2014 and as the general decline in global interest rates supported this long duration fixed income market. Issue selection in Indonesia and Mexico, as well as a position in US dollar denominated debt from Venezuela also detracted from relative performance.
The top positive contributors to performance during the period included an overweight in Indonesia (FX and duration) and an underweight in Hungary FX. In Indonesia, we held an overweight position since the start of the review period based on our view that Indonesia was rebalancing its economy, growing and had a tailwind of support from a new reform-minded government. We believed that the July 2014 election of Joko Widodo as President further supported this view. President Widodo was successful in implementing key fuel subsidy cuts soon after elections, despite an opposition parliament. We believed these reforms would continue supporting market sentiment toward the rupiah.
The Fund’s positioning at the end of the period reflected recent muted growth data from many of the largest emerging markets and Stone Harbor’s country-specific analyses of the expected returns from currencies and local interest rates. In Latin America, we hold unhedged local bonds in Mexico as the portfolio’s largest active local currency risk with a view that Mexico’s growth rate will benefit from improving growth in the US and from ongoing foreign direct investment in the auto, energy, and telecommunications sectors. Ultimately, we’d expect improving growth to support returns on the peso relative to the US dollar. Local bonds in Mexico also trade at wide yield levels relative to US Treasuries, providing, in our view, an attractive bond return in the current environment if we are right about the timing and pace of potential US Federal Reserve policy rate increases. In Brazil and Colombia, we have either partially or fully hedged currency exposure and hold small currency risk in Chile and none in Peru. Given, in our view, the still attractive valuations and steep local bond yield curve, we have overweighted duration in Colombia. We continue to expect weaker performance of the Eurozone economies and the Euro over the course of the next year and our defensive positioning in Czech Republic reflects this view. In Poland, our position is neutral with the exposure in shorter-than-benchmark unhedged local currency bonds. In Asia, we maintain a positive outlook for the Indonesia economy that has continued to perform well with a growth rate of around 5%. Inflation has eased following fuel price declines and we expect inflation to fall further this year. We believe this environment supports our overweight in local Indonesia interest rate duration.
Stone Harbor Emerging Markets Corporate Debt Fund
The total return of the Stone Harbor Emerging Markets Corporate Debt Fund (the “Fund” or “portfolio”) for the 12 month period ended May 31, 2015 was 3.64% (net of expenses) and 4.64% (gross of expenses). This performance compares to a benchmark return of 3.95% for the J.P. Morgan Corporate Emerging Markets Bond Index Broad Diversified (CEMBI Broad Diversified). The index spread over comparable maturity U.S. Treasury securities widened by 41 basis points, ending the period at 395 basis points. Contributions to the index total return from each of the major EM regions (i.e., Africa, Asia, Europe, Latin America, and the Middle East) were positive for the period. The top performers included Mongolia (+39.70%) and Dominican Republic (+22.90%); the bottom performers included Ukraine (-15.72%), Ghana (-4.62%), and Nigeria (-3.68%). Despite a
4 | www.shiplp.com |
Table of Contents
| Stone Harbor Investment Funds | Shareholder Letter | |
May 31, 2015 (Unaudited) |
drawdown that began late in 2014, performance of the EM corporate sector was ultimately helped by the recovery in oil prices, an easing of concerns over a political scandal in Brazil and over geopolitical risks between Russia and Ukraine.
The Fund outperformed its benchmark gross of expenses largely as a result of issue selection decisions in several countries including Brazil and Indonesia. Corporate bonds in Indonesia were supported by election results that secured the presidency for the market favorite candidate, Joko Widodo. Likewise, one of the key drivers of Brazil corporate debt returns was the presidential election in the early part of the period, then later, a corruption scandal at the state-sponsored oil and gas producer Petroleo Brasileiro SA (“Petrobas”). We added to Brazilian corporates given the attractive valuations triggered by the Petrobras scandal and a widening of corporate bond spreads.
Positioning in Ukraine and Russia also enhanced returns. During the period the Fund held underweight exposure in Ukraine corporate bonds. The weakness in Ukraine corporate debt resulted from ongoing hostilities in Ukraine’s Donbass region as well as expectations of continuing decline in Ukraine’s economic activity, along with the associated concerns over support from the west and the International Monetary Fund (IMF). In addition, an overweight exposure to Russian corporate debt enhanced relative returns. The Fund’s positioning in Russia moved from an underweight in fourth quarter 2014 to an overweight in January 2015, and this overweight was maintained even as the Russian corporates were downgraded in February and throughout the remainder of the review period. This positioning eventually enabled us to capture the recovery in Russian corporate bonds that was induced by stabilizing oil prices.
Some of the primary detractors from performance were overweight corporate positions in Ghana, and Venezuela. Exposure in Venezuela as well as an independent oil and gas producer from Ghana suffered as oil price continued to decline during the latter half of the period. Issue selection in China, India, and Kazakhstan also detracted from performance.
Corporate debt spreads have tightened relative to sovereign bonds since the December sell-off driven by fundamental improvements in the Brazil/Petrobras-related complex of credits and following index-driven demand for corporate debt from Russia. Corporate debt remains an attractive sector in the current environment, in our view, though we recognize that risk premiums have declined so far this year. Our strategy continues to focus on identifying companies that are market leaders in their industries. We also currently favor exporters that generate US dollar revenues and companies that benefit from the growth of middle classes. At the sector level, we currently favor consumer goods, wireless telecommunications, and food and beverage companies, among others. In addition, we look for companies that are growing, reducing debt and, as a result, are candidates for rating agency upgrades over the next 18 to 24 months.
Stone Harbor Emerging Markets Debt Allocation Fund
The Emerging Markets Debt Allocation Portfolio (the “Fund”) performance since inception (October 21, 2014) through May 31, 2015 was -4.73% (net of expenses) and -4.21% (gross of expenses). This compares to a blended benchmark (50% J.P. Morgan EMBI Global Diversified / 50% J.P. Morgan GBI- EM Global Diversified) return of -4.69%. At the close of the reporting period, the Fund allocated approximately 51.2% to local currency debt, 43.8% to external sovereign debt, and 3.1% to hard currency corporate debt, with cash representing 1.9% of the Fund. The Fund’s asset allocation mix varied throughout the review period, driven by tactical asset allocation decisions based on portfolio management’s assessment of relative value opportunities and global market risks. The hard currency sovereign allocation enhanced relative returns by 65 basis points, in aggregate, driven by positive attribution from issue selection. Country selection decisions, in total, detracted from excess returns in this sector. Hard currency corporate allocations enhanced relative returns by 4 basis points. Tactical asset allocation decisions, including the decision to reduce local currency exposure in January and then to increase it later in the reporting period, contributed 29 basis points. Nevertheless, local currency allocation decisions detracted 53 basis points from excess returns. The largest contributor to this result was an overweight in the Russian ruble, which detracted from excess returns early in the period as oil prices fell but enhanced performance later in the period as energy prices stabilized and Russian monetary authorities intervened to support the ruble in 2015. Miscellaneous differences compared to benchmark weightings, a result of holding modestly lower U.S. Treasury duration than that of the blended benchmark, detracted 12 basis points from relative total returns.
Within the hard currency sovereign allocation, issue selection decisions in Argentina, Russia and Venezuela were the largest positive contributors to relative returns. While the Fund’s overweight position in Venezuela suffered due to the drop in oil prices and because of a delay in an expected devaluation of the bolivar, the difference in returns between the best and worst performing Venezuelan bonds was large, creating a significant opportunity in security selection, in our view. Issue selection in Venezuela enhanced relative returns by 74 basis points during the period. In Argentina, our decision to invest in out-of-benchmark bonds rather than the defaulted bonds that are included in the J.P. Morgan EMBI Global Diversified Index also enhanced relative performance. The decisions to overweight Argentina and Indonesia also enhanced relative returns. Argentina bonds outperformed on expectations of market friendly political change in presidential elections planned for October 2015. Indonesia benefitted from a rebalancing of its economy following the depreciation of the rupiah relative to the U.S. dollar in 2013, as well as reduced political uncertainty following the completion of the presidential election in July 2014. Other positive contributors to relative returns included an overweight and issue selection in Dominican Republic and Turkey, and underweights in Ecuador and Malaysia.
Stone Harbor Investment Funds Annual Report | May 31, 2015 | 5 |
Table of Contents
| Stone Harbor Investment Funds | Shareholder Letter | |
May 31, 2015 (Unaudited) |
On the other hand, the biggest detractor within the hard currency allocation was an overweight in Venezuela. As oil prices stabilized after March 2015, Venezuela bonds have been among the best performing hard currency sovereign debt. However, Venezuela bonds performed poorly in late 2014 as oil prices declined. We held the view then and now that Venezuela’s near term payment obligations are manageable, and that the deeply discounted prices of Venezuela bonds support our overweight. Underweights in Lebanon, Philippines, and Ukraine also detracted from relative performance, as did issue selection in Brazil.
Within the local currency allocation, an underweight in the Brazil real enhanced relative performance. During the review period, Brazil’s currency depreciated by nearly 20% relative to the U.S. dollar. The top detractors included our decisions to overweight the Russian ruble and to hold longer than benchmark average duration in Russian local bonds. Our currency position in Russia worked poorly at the start of the period, but began to outperform in 2015. The duration position in Russia reflected our view that Russia’s economy was slowing and that inflation would soon fall. Ultimately, this view has proven correct so far in 2015. We also underperformed in Turkey with an overweight in the lira and generally shorter average duration than benchmark exposure in local bonds from Turkey.
During the period, we increased the Fund’s local currency exposure and reduced hard currency exposure. Our largest additions to local currency exposure during the period were in the Polish zloty, Romanian leu, and South African rand. While our relatively large underweight position in the Polish zloty at the end of 2014 was based on our expectation of continued weakness in the euro, we began reducing the Fund’s underweight in Poland in February 2015 as economic activity improved and the country remained a likely beneficiary of better-than- expected economic activity in the Eurozone. We also reduced our underweight in South Africa in order to capture a possible recovery in the rand relative to the US dollar. To fund these additions, we reduced our longstanding overweight to external sovereign debt, which outperformed during the period. The country with the largest reduction was Russia. While we maintained our Russia overweight at the overall portfolio level, we eliminated our active risk in Russia external sovereign debt as Russian credit spreads narrowed substantially from their recent widest spread levels. We also reduced our hard currency exposure in Argentina, Indonesia, Turkey, and Venezuela.
Stone Harbor High Yield Bond Fund
The Stone Harbor High Yield Bond Fund (the “Fund” or “portfolio”) return for the 12 months ended May 31, 2015 was -0.27% (net of expenses) and 0.35% (gross of expenses). This compares to a benchmark return of 1.54% for the Citigroup High Yield Market Capped Index. The high yield market began the fiscal year with tight valuations and was negatively impacted by several macro-economic factors throughout the review period; most significant of which included a dramatic decline in commodity prices, especially oil prices, U.S. dollar strength, and weak market technicals as evidenced by record mutual fund outflow. These drivers were further exacerbated by continuing concerns around weaker-than-expected global economic growth, uncertainty surrounding the timing of the Federal Reserve’s initial rate increase, and ongoing geopolitical risk.
The U.S. Federal Reserve completed its asset purchase program during the first half of the review period despite slower-than-expected economic growth in the U.S., and it maintained the pledge to be “patient” on raising interest rates. Europe benefited from the aggressive European Central Bank (ECB) plan to revive inflation and the euro-area economy with an open-ended quantitative easing program and a stronger U.S. dollar. The decline in commodity prices, particularly oil and coal, had a significant impact on market performance. The decline in oil prices had a disproportionate impact on the high yield market due to its weighting (i.e., over 17%) within the high yield benchmark. High yield spreads, as represented by the Citigroup High Yield Market Capped Index, widened 78 basis points to end the period at 473 basis points, and the average yield rose 0.91% to end the period at 5.99%.
The top performing industries included Retail-Food & Drug and Restaurants, as consumer related sectors are expected to be large beneficiaries of lower energy prices. The bottom performers included Metals & Mining and Energy sectors, driven lower by the decline in commodity prices, due to supply/demand imbalances. Interest rate sensitive BB rated bonds outperformed both B and CCC rated securities within the Citigroup High Yield Market Capped index as they tend to have a longer duration and benefitted from the decline in interest rates. The par-weighted default rate declined to 1.58% from 2.11% at the beginning of the period, well below the long-term average of 3.69%. Although we remain constructive on company fundamentals, we believe that the low point in defaults has been reached for this cycle. Overall, however, company balance sheets are solid, in our view, with reasonable although slightly increasing leverage, high cash balances, and fewer near term maturities. Our current expectations are that the market will experience more negative event risk through increasing downgrades and fallen angels. However, positive event risk, especially due to M&A activity is expected to continue, in our view.
During the 12-month period, we increased the Fund’s industry exposure to the Utility sector, as new issuance during the review period added compelling value, in our view; and the Food/Beverage/Bottling sectors, due to what we believe are strong cash flow characteristics and brand value. We reduced the Fund’s exposure to the Energy sector as existing holdings were refinanced and new energy issuance was not attractive from a valuation perspective; and the Technology sector, due to valuation. Lastly, we increased the Fund’s bank loan exposure during the last 12 months based on our assumption that U.S. Treasury rates will slowly rise.
6 | www.shiplp.com |
Table of Contents
| Stone Harbor Investment Funds | Shareholder Letter | |
May 31, 2015 (Unaudited) |
The Fund underperformed its benchmark primarily as a result of issue selection decisions in the Energy sector. The selection of coal companies within the Metals & Mining industry also contributed to negative performance. Industry selection was neutral and cash balances detracted slightly from performance.
The Fund remains positioned for moderate U.S. economic growth. Relative to BB rated bonds, the Fund remains overweight B rated securities as we believe this sector may outperform on lower interest rate sensitivities and attractive valuations. As of the date of this report, the largest portfolio industry overweights are Cable & Media and Food/Beverage/Bottling. The largest industry underweights are Finance-Other and Energy.
Although overall valuation and market technicals are favorable, we believe that certain industry sectors of the U.S. high yield markets are currently fully valued, and the European high yield market is fairly valued. In our view, the largest market risk is that lower commodity prices may be signaling a slower global growth environment. While lower energy prices have pressured the E&P sector’s business model, especially for highly leveraged issuers, the sector is currently benefitting from stable energy prices, access to capital from the equity and leveraged finance markets as well as good liquidity, few near term maturities, and good price hedges. We also expect M&A to increase across the sector. Despite these near-term positives, we believe oil prices will remain volatile and could put pressure on the industry, particularly if current pricing strength retraces previous lows and lower prices persist for an extended period of time. Other market risks include the impact of eventually higher rates on the high yield market (although historically, high yield is the best performing fixed income sector in a rising rate environment due to the higher credit spreads ability to absorb rate increases), and increased geopolitical risk.
Stone Harbor Investment Grade Fund
The total return of the Stone Harbor Investment Grade Fund (the “Fund” or “portfolio”) for the twelve months ended May 31, 2015 was 1.94% (net of expenses) and 2.44% (gross of expenses). This performance compares to a benchmark return of 3.03% for the Barclays Capital U.S. Aggregate Index. The Fund underperformed its benchmark as a result of certain asset allocation and duration management decisions. Part of the Fund’s underperformance is attributable to maintaining a duration position shorter than that of the benchmark during a period when long-term Treasury rates declined. In terms of asset allocation, part of the Fund’s under performance relative to the benchmark can be explained by over weights to corporate bonds and securitized assets during period where credit spreads were generally wider. Security selection was a positive contributor to the Fund’s performance relative to the benchmark. Securitized assets accounted for more than half of the security selection alpha, followed by Treasury and corporate securities.
The first eight months of the period under review were dominated by two main themes: the growing risk of deflation in the Eurozone and the sharp decline in the price of oil. Overall government bond yields declined sharply during this period with U.S. Treasury 10-year yields declining to a low of 1.67% at end January 2015 from a high of 2.65% in July 2014, German 10-year yields to 0.07% from 1.36%, and UK 10-year Gilts declining to 1.33% from 2.76%. Despite the positive environment for government bonds, credit markets during these eight months performed poorly with U.S. investment grade corporate bonds registering an underperformance relative to equivalent maturity U.S. Treasuries of 1.63%. U.S. High Yield Spreads recorded an underperformance relative to equivalent maturity U.S. Treasuries of 3.52%. Emerging market USD bond underperformed relative to equivalent maturity U.S. Treasuries by 2.13%.
During the subsequent and final four months of the year, many markets reversed a significant but not complete part of these moves, helped by the introduction of quantitative easing from the European Central Bank, a stabilizing oil price, and better economic performance in Europe even as first quarter growth in the U.S. disappointed. At the end of the period under review, U.S. 10- year yields had risen to 2.1%, German ten-year yields to 0.49% and UK Gilts to 1.82%. The relative performance of U.S. investment grade corporate bonds continued to languish, registering an underperformance of 1.67% for the twelve months, reflecting the modest performance of the U.S. economy in the early part of 2015. U.S. high yield bonds and EMD outperformed equivalent maturity U.S. Treasuries by some 2.82% and 2.09%, respectively, during these final months allowing them to record modest underperformance for the past twelve months of 0.7% and 0.32%, respectively.
Looking ahead to the next twelve months, we are focusing on a number of issues. Of immediate concern is the situation in Greece. It seems likely, in our view, that the Greece debt profile will ultimately prove to be unsustainable, regardless of whether or not near term financial aid packages can be agreed. However, the Greek economy is less than 2% of that of the euro area and economic and banking sector links have been weak. This suggests that Europe will not be significantly impacted by Greek issues and that market volatility arising from these stresses will offer investment opportunities rather than reasons for deep routed concern, in our view. Beyond the immediate future, it is likely, in our view, that the Federal Reserve will start the process of tightening monetary policy over the coming months. While we currently expect an initial move in September, we think that the key issue is not when they move but ultimately where they move to. We currently estimate that the terminal rate for Fed Funds is likely to be in the order of 3.5% against a current market pricing of 2.7%. This suggests that U.S. Treasuries remain vulnerable to a sell off. Given that, however, the scale of a likely sell off is not sufficient to suggest that there will be a material shock to the system, in our view. Market volatilities are expected to remain broadly stable. Against this backdrop, we believe credit spreads look relatively attractive. Historical analysis suggests that credit spreads are around the center of their historic distributions and with only a limited rise in yields and stable volatility expected
Stone Harbor Investment Funds Annual Report | May 31, 2015 | 7 |
Table of Contents
| Stone Harbor Investment Funds | Shareholder Letter | |
May 31, 2015 (Unaudited) |
to be the order of the day, returns to credit risk are likely to be positive, in our view. In the near term, we believe an expected pick-up in the level of consumer activity is likely to feed through to continuing positive performance for corporate credits. As we move through the year, stronger U.S. growth should feed through to enhance global growth and an upward move in demand for oil and other commodities, along with increased demand for emerging market manufactured exports, in our view. With the U.S. now effectively the world’s swing producer of oil, it is worth noting that despite current high oil stocks, the active rig count in the U.S. has fallen by over 50%, suggesting to us that future production will decline. We believe this may support oil prices and in turn help the emerging markets. Many investors are currently concerned that rising U.S. interest rates may further damage local currency emerging market debt. We would point out that real effective exchanges rates are now some 11% lower than they were in 2013 at the time of the “Taper Tantrum” and that spreads are some 150 basis points wider. Current pricing is attractive relative to an overvaluation at that time, in our view. It is also worth noting that during the 2004 to 2006 Fed tightening cycle real effective exchange rates rose in emerging markets because growth of demand arising from developed markets trumped Fed interest rate rises. As we move to the second half of the coming year, we believe we may potentially see similar dynamics unfold.
Stone Harbor Strategic Income Fund
The total return of the Strategic Income Fund (the “Fund” or “portfolio”) for the 12 month period ended May 31, 2015 was 1.15% (net of expenses) and 1.85% (gross of expenses). This performance compares to a benchmark return of 3.59% for the Barclays Global Credit Index (Hedged into USD). The Fund underperformed its benchmark as a result of certain asset allocation and individual credit decisions. The Fund’s investments in the high yield and emerging debt sectors were negative contributors to performance, as both markets underperformed the investment grade sector. The market weight of the Fund’s investments in high yield and emerging debt exceeded the weight of those sectors represented in the benchmark. This asset allocation effect accounted for less than half of the Fund’s total relative underperformance. In addition to the negative impact of asset allocation, the Fund’s investments in high yield and emerging debt also underperformed benchmarks for their respective sectors. These negative security selection effects accounted for much of the Fund’s underperformance beyond the asset allocation effects discussed earlier.
The first eight months of the period under review were dominated by two main themes: the growing risk of deflation in the Eurozone and the sharp decline in the price of oil. Overall government bond yields declined sharply during this period with U.S. Treasury 10-year yields declining to a low of 1.67% at end January 2015 from a high of 2.65% in July 2014, German 10-year yields to 0.07% from 1.36%, and UK 10-year Gilts declining to 1.33% from 2.76%. Despite the positive environment for government bonds, credit markets during these eight months performed poorly with U.S. investment grade corporate bonds registering an underperformance relative to equivalent maturity U.S. Treasuries of 1.63%. U.S. High Yield Spreads recorded an underperformance relative to equivalent maturity U.S. Treasuries of 3.52%. Emerging market USD bond underperformed relative to equivalent maturity U.S. Treasuries by 2.13%.
During the subsequent and final four months of the year, many markets reversed a significant but not complete part of these moves, helped by the introduction of quantitative easing from the European Central Bank, a stabilizing oil price, and better economic performance in Europe even as first quarter growth in the U.S. disappointed. At the end of the period under review, U.S. 10- year yields had risen to 2.1%, German ten-year yields to 0.49% and UK Gilts to 1.82%. The relative performance of U.S. investment grade corporate bonds continued to languish, registering an underperformance of 1.67% for the twelve months, reflecting the modest performance of the U.S. economy in the early part of 2015. U.S. high yield bonds and Emerging Markets Debt (EMD) outperformed equivalent maturity U.S. Treasuries by some 2.82% and 2.09%, respectively, during these final months allowing them to record modest underperformance for the past twelve months of 0.7% and 0.32%, respectively.
Looking ahead to the next twelve months, we are focusing on a number of issues. Of immediate concern is the situation in Greece. It seems likely, in our view, that the Greece debt profile will ultimately prove to be unsustainable, regardless of whether or not near term financial aid packages can be agreed. However, the Greek economy is less than 2% of that of the euro area and economic and banking sector links have been weak. This suggests that Europe will not be significantly impacted by Greek issues and that market volatility arising from these stresses will offer investment opportunities rather than reasons for deep routed concern, in our view. Beyond the immediate future, it is likely, in our view, that the Federal Reserve will start the process of tightening monetary policy over the coming months. While we currently expect an initial move in September, we think that the key issue is not when they move but ultimately where they move to. We currently estimate that the terminal rate for Fed Funds is likely to be in the order of 3.5% against a current market pricing of 2.7%. This suggests that U.S. Treasuries remain vulnerable to a sell off. Given that, however, the scale of a likely sell off is not sufficient to suggest that there will be a material shock to the system, in our view. Market volatilities are expected to remain broadly stable. Against this backdrop, we believe credit spreads look relatively attractive. Historical analysis suggests that credit spreads are around the center of their historic distributions and with only a limited rise in yields and stable volatility expected to be the order of the day, returns to credit risk are likely to be positive, in our view. In the near term, we believe an expected pick-up in the level of consumer activity is likely to feed through to continuing positive performance for corporate credits. As we move through the year, stronger U.S. growth should feed through to enhance global growth and an upward move in demand for oil and other commodities, along with increased demand for emerging market manufactured exports, in our view. With the U.S. now effectively the world’s swing producer of oil, it is worth noting that despite current high oil stocks, the active rig count in the U.S. has fallen by over 50%, suggesting that future production will decline. We believe this may support oil prices and in turn help the emerging markets. Many investors
8 | www.shiplp.com |
Table of Contents
| Stone Harbor Investment Funds | Shareholder Letter | |
May 31, 2015 (Unaudited) |
are currently concerned that rising U.S. interest rates may further damage local currency emerging market debt. We would point out that real effective exchanges rates are now some 11% lower than they were in 2013 at the time of the “Taper Tantrum” and that spreads are some 150 basis points wider. Current pricing is attractive relative to an overvaluation at that time. It is also worth noting that during the 2004 to 2006 Fed tightening cycle real effective exchange rates rose in emerging markets because growth of demand arising from developed markets trumped Fed interest rate rises. As we move to the second half of the coming year, we believe we may potentially see similar dynamics unfold.
Sincerely, |
|
Thomas K. Flanagan |
Chairman of the Board of Trustees |

Stone Harbor Investment Funds Annual Report | May 31, 2015 | 9 |
Table of Contents
| Stone Harbor Investment Funds | Disclosure of Fund Expenses | |
May 31, 2015 (Unaudited) |
Example. As a shareholder of a Fund, you incur two types of costs: (1) transaction costs, including sales charges (loads) on purchase payments and/or redemption fees (if applicable) and (2) ongoing costs, including management fees and other Fund expenses. The below examples are intended to help you understand your ongoing costs (in dollars) of investing in a Fund and to compare these costs with the ongoing costs of investing in other mutual funds. The examples are based on an investment of $1,000 invested on December 1, 2014 and held until May 31, 2015.
Actual Expenses. The first line of each table below provides information about actual account values and actual expenses. You may use the information in this line, together with the amount you invested, to estimate the expenses that you paid over the period. Simply divide your account value by $1,000 (for example, an $8,600 account value divided by $1,000 = 8.6), then multiply the result by the number in the first line under the heading “Expenses Paid During Period” to estimate the expenses you paid on your account during this period.
Hypothetical Example for Comparison Purposes. The second line of each table below provides information about hypothetical account values and hypothetical expenses based on the Fund’s actual expense ratio and an assumed rate of return of 5% per year before expenses, which is not the Fund’s actual return. The hypothetical account values and expenses may not be used to estimate the actual ending account balance or expenses you paid for the period. You may use this information to compare the ongoing costs of investing in a Fund and other mutual funds. To do so, compare this 5% hypothetical example with the 5% hypothetical examples that appear in the shareholder reports of the other funds.
Please note that the expenses shown in the table are meant to highlight your ongoing costs only and do not reflect transactional costs, such as redemption fees, sales charges (loads) or exchange fees. Therefore, the second line of the table is useful in comparing ongoing costs only, and will not help you determine the relative total costs of owning different funds. In addition, if these transactional costs were included, your costs would have been higher.
10 | www.shiplp.com |
Table of Contents
| Stone Harbor Investment Funds | Disclosure of Fund Expenses | |
May 31, 2015 (Unaudited) |
| Beginning Account Value December 1, 2014 | Ending Account Value May 31, 2015 | Expense Ratio(1) | Expenses Paid During Period(2) | |||||||||||
|
| |||||||||||||
STONE HARBOR EMERGING MARKETS DEBT FUND | ||||||||||||||
Institutional Class | ||||||||||||||
Actual | $ | 1,000.00 | $ | 1,005.60 | 0.67% | $ | 3.35 | |||||||
Hypothetical (5% return before expenses) | $ | 1,000.00 | $ | 1,021.59 | 0.67% | $ | 3.38 | |||||||
STONE HARBOR HIGH YIELD BOND FUND | ||||||||||||||
Institutional Class | ||||||||||||||
Actual | $ | 1,000.00 | $ | 1,018.90 | 0.62% | $ | 3.12 | |||||||
Hypothetical (5% return before expenses) | $ | 1,000.00 | $ | 1,021.84 | 0.62% | $ | 3.13 | |||||||
STONE HARBOR LOCAL MARKETS FUND | ||||||||||||||
Institutional Class | ||||||||||||||
Actual | $ | 1,000.00 | $ | 913.60 | 0.85% | $ | 4.06 | |||||||
Hypothetical (5% return before expenses) | $ | 1,000.00 | $ | 1,020.69 | 0.85% | $ | 4.28 | |||||||
STONE HARBOR EMERGING MARKETS CORPORATE DEBT FUND | ||||||||||||||
Institutional Class | ||||||||||||||
Actual | $ | 1,000.00 | $ | 1,027.50 | 1.00% | $ | 5.05 | |||||||
Hypothetical (5% return before expenses) | $ | 1,000.00 | $ | 1,019.95 | 1.00% | $ | 5.04 | |||||||
STONE HARBOR INVESTMENT GRADE FUND | ||||||||||||||
Institutional Class | ||||||||||||||
Actual | $ | 1,000.00 | $ | 1,005.80 | 0.50% | $ | 2.50 | |||||||
Hypothetical (5% return before expenses) | $ | 1,000.00 | $ | 1,022.44 | 0.50% | $ | 2.52 | |||||||
STONE HARBOR STRATEGIC INCOME FUND | ||||||||||||||
Institutional Class | ||||||||||||||
Actual | $ | 1,000.00 | $ | 1,011.60 | 0.11% | $ | 0.55 | |||||||
Hypothetical (5% return before expenses) | $ | 1,000.00 | $ | 1,024.38 | 0.11% | $ | 0.56 | |||||||
STONE HARBOR EMERGING MARKETS DEBT ALLOCATION FUND | ||||||||||||||
Institutional Class | ||||||||||||||
Actual | $ | 1,000.00 | $ | 959.40 | 0.10% | $ | 0.49 | |||||||
Hypothetical (5% return before expenses) | $ | 1,000.00 | $ | 1,024.43 | 0.10% | $ | 0.50 | |||||||
| (1) | Annualized, based on the Fund’s most recent fiscal half-year expenses. |
| (2) | Expenses are equal to the Fund’s annualized ratio multiplied by the average account value over the period, multiplied by the number of days in the most recent fiscal half year (182), divided by 365. Note this expense example is typically based on a six-month period. |
Stone Harbor Investment Funds Annual Report | May 31, 2015 | 11 |
Table of Contents
| Stone Harbor Investment Funds | Summaries of Portfolio Holdings | |
May 31, 2015 (Unaudited) |
Under SEC Rules, all funds are required to include in their annual and semi-annual shareholder reports a presentation of portfolio holdings in a table, chart or graph by reasonably identifiable categories. The following tables, which present holdings as a percent of total net assets (“TNA”), are provided in compliance with such requirements.
| STONE HARBOR EMERGING MARKETS DEBT FUND | ||||
| Country Breakdown | % of TNA | |||
| ||||
Mexico | 6.40% | |||
Venezuela | 6.25% | |||
Brazil | 6.23% | |||
Kazakhstan | 6.21% | |||
Russia | 4.95% | |||
Indonesia | 4.94% | |||
Colombia | 4.78% | |||
Argentina | 4.40% | |||
South Africa | 4.04% | |||
Turkey | 3.89% | |||
Chile | 3.83% | |||
Dominican Republic | 3.77% | |||
China | 3.44% | |||
Ivory Coast | 2.48% | |||
Panama | 2.18% | |||
Costa Rica | 2.16% | |||
Philippines | 1.66% | |||
Jamaica | 1.57% | |||
Azerbaijan | 1.56% | |||
Peru | 1.54% | |||
Uruguay | 1.52% | |||
El Salvador | 1.42% | |||
Iraq | 1.32% | |||
Malaysia | 1.17% | |||
Paraguay | 1.14% | |||
Croatia | 1.08% | |||
Hungary | 1.07% | |||
Nigeria | 1.07% | |||
Sri Lanka | 0.99% | |||
Ecuador | 0.95% | |||
Romania | 0.79% | |||
Kenya | 0.70% | |||
Serbia | 0.61% | |||
Ghana | 0.56% | |||
Gabon | 0.49% | |||
India | 0.48% | |||
Honduras | 0.46% | |||
Trinidad | 0.40% | |||
Angola | 0.31% | |||
Mozambique | 0.31% | |||
Morocco | 0.26% | |||
Ethiopia | 0.24% | |||
Thailand | 0.17% | |||
Kuwait | 0.13% | |||
Macau | 0.10% | |||
Poland | 0.10% | |||
| ||||
Total | 94.12% | |||
| ||||
Short Term Investments | 4.72% | |||
| ||||
Other Assets in Excess of Liabilities | 1.16% | |||
| ||||
Total Net Assets | 100.00% | |||
| ||||
STONE HARBOR HIGH YIELD BOND FUND Industry Breakdown | % of TNA | |||
| ||||
Media Cable | 8.34% | |||
Healthcare | 7.49% | |||
Exploration & Production | 7.15% | |||
Wirelines | 5.66% | |||
Food/Beverage/Tobacco | 5.63% | |||
Electric | 5.58% | |||
Chemicals | 4.96% | |||
Media Other | 4.74% | |||
Technology | 4.64% | |||
Drillers/Services | 3.34% | |||
Wireless | 3.25% | |||
Consumer Products | 2.95% | |||
Industrial Other | 2.89% | |||
Metals/Mining/Steel | 2.80% | |||
Building Products | 2.74% | |||
Gaming | 2.61% | |||
Retail Non Food/Drug | 2.42% | |||
Paper/Forest Products | 2.39% | |||
Containers/Packaging | 2.14% | |||
Automotive | 1.98% | |||
Textile/Apparel | 1.51% | |||
Retail Food/Drug | 1.35% | |||
Pharmaceuticals | 1.26% | |||
Lodging | 1.17% | |||
Leisure | 1.09% | |||
Restaurants | 0.91% | |||
Home Builders | 0.88% | |||
Financial Other | 0.72% | |||
Refining | 0.65% | |||
Environmental Services | 0.58% | |||
Aerospace/Defense | 0.55% | |||
Services Other | 0.54% | |||
Advertising | 0.34% | |||
Building Materials | 0.34% | |||
Transportation | 0.24% | |||
Airlines | 0.22% | |||
Transportation Non Air/Rail | 0.00%* | |||
| ||||
Total | 96.05% | |||
| ||||
Short Term Investments | 3.93% | |||
| ||||
Other Assets in Excess of Liabilities | 0.02% | |||
| ||||
Total Net Assets | 100.00% | |||
| ||||
| * | Amount represents less than 0.005% of net assets. |
12 | www.shiplp.com |
Table of Contents
| Stone Harbor Investment Funds | Summaries of Portfolio Holdings | |
May 31, 2015 (Unaudited) |
STONE HARBOR LOCAL MARKETS FUND Country Breakdown | % of TNA | |||
| ||||
Brazil | 12.41% | |||
Indonesia | 11.18% | |||
South Africa | 11.14% | |||
Turkey | 11.00% | |||
Colombia | 7.52% | |||
Mexico | 6.07% | |||
Malaysia | 4.80% | |||
Poland | 4.67% | |||
Russia | 4.67% | |||
Venezuela | 2.23% | |||
Thailand | 2.08% | |||
| ||||
Total | 77.77% | |||
| ||||
Short Term Investments | 3.43% | |||
| ||||
Other Assets in Excess of Liabilities | 18.80% | |||
| ||||
Total Net Assets | 100.00% | |||
| ||||
| ||||
| STONE EMERGING MARKETS CORPORATE DEBT FUND | ||||
| Country Breakdown | % of TNA | |||
| ||||
China | 7.22% | |||
Mexico | 7.12% | |||
Russia | 6.14% | |||
United Arab Emirates | 5.82% | |||
India | 5.75% | |||
Colombia | 5.60% | |||
Israel | 5.12% | |||
Turkey | 4.92% | |||
Brazil | 4.74% | |||
Hong Kong | 4.50% | |||
Thailand | 4.09% | |||
Indonesia | 3.82% | |||
Chile | 3.46% | |||
South Korea | 3.27% | |||
South Africa | 2.89% | |||
Qatar | 2.45% | |||
Peru | 2.42% | |||
Argentina | 1.95% | |||
Jamaica | 1.92% | |||
Kazakhstan | 1.69% | |||
Morocco | 1.65% | |||
Philippines | 1.62% | |||
Macau | 1.40% | |||
Malaysia | 0.93% | |||
Guatemala | 0.90% | |||
Angola | 0.89% | |||
Venezuela | 0.87% | |||
Oman | 0.81% | |||
Singapore | 0.61% | |||
Saudi Arabia | 0.16% | |||
| ||||
Total | 94.73% | |||
| ||||
Short Term Investments | 4.21% | |||
| ||||
Other Assets in Excess of Liabilities | 1.06% | |||
| ||||
Total Net Assets | 100.00% | |||
| ||||
| ||||
Stone Harbor Investment Funds Annual Report | May 31, 2015 | 13 |
Table of Contents
| Stone Harbor Investment Funds | Summaries of Portfolio Holdings | |
May 31, 2015 (Unaudited) |
| STONE HARBOR INVESTMENT GRADE FUND | ||||
| Industry Breakdown | % of TNA | |||
| ||||
U.S. Government Agency Mortgage Backed | 25.76% | |||
Sovereign | 22.03% | |||
Banking | 10.45% | |||
Asset Backed/Commercial Mortgage Backed | 5.86% | |||
Healthcare | 2.32% | |||
Retail Non Food/Drug | 2.10% | |||
Exploration & Production | 2.10% | |||
Pipelines | 2.00% | |||
Real Estate Investment Trust (REITs) | 1.75% | |||
Wirelines | 1.65% | |||
Non Captive Finance | 1.63% | |||
Retail Food/Drug | 1.52% | |||
Technology | 1.51% | |||
Pharmaceuticals | 1.51% | |||
Media Non Cable | 1.33% | |||
Media Cable | 1.32% | |||
Life Insurance | 1.26% | |||
Automotive | 1.07% | |||
Gas Pipelines | 0.94% | |||
Electric | 0.76% | |||
Wireless | 0.56% | |||
Transportation | 0.54% | |||
Transportation Non Air/Rail | 0.52% | |||
Railroads | 0.51% | |||
Metals/Mining/Steel | 0.51% | |||
Property & Casualty Insurance | 0.51% | |||
Food and Beverage | 0.51% | |||
Leisure | 0.51% | |||
Chemicals | 0.50% | |||
Environmental Services | 0.50% | |||
Media Other | 0.48% | |||
Oil Field Services | 0.48% | |||
Paper/Forest Products | 0.27% | |||
Consumer Products | 0.27% | |||
Diversified Manufacturing | 0.26% | |||
Aerospace/Defense | 0.25% | |||
| ||||
Total | 96.05% | |||
| ||||
Short Term Investments | 3.65% | |||
| ||||
Other Assets in Excess of Liabilities | 0.30% | |||
| ||||
Total Net Assets | 100.00% | |||
| ||||
| ||||
| STONE HARBOR STRATEGIC INCOME FUND | ||||
| % of TNA | ||||
| ||||
Stone Harbor Emerging Markets Debt Fund | 29.76% | |||
Stone Harbor High Yield Bond Fund | 39.96% | |||
Stone Harbor Investment Grade Fund | 28.94% | |||
| ||||
Total | 98.66% | |||
| ||||
Other Assets in Excess of Liabilities | 1.34% | |||
| ||||
Total Net Assets | 100.00% | |||
| ||||
| ||||
| STONE HARBOR EMERGING MARKETS DEBT ALLOCATION FUND | ||||
| % of TNA | ||||
| ||||
Stone Harbor Emerging Markets Debt Fund | 48.97% | |||
Stone Harbor Local Markets Fund | 51.08% | |||
| ||||
Total | 100.05% | |||
| ||||
Liabilities in Excess of Other Assets | -0.05% | |||
| ||||
Total Net Assets | 100.00% | |||
| ||||
| ||||
14 | www.shiplp.com |
Table of Contents
| Stone Harbor Investment Funds | Growth of $10,000 Investment | |
May 31, 2015 (Unaudited) |
STONE HARBOR EMERGING MARKETS DEBT FUND
Comparison of Change in Value of $10,000 Investment in Stone Harbor Emerging Markets Debt Fund and the J.P. Morgan Emerging Markets Bond Index Global Diversified (J.P. Morgan EMBI Global Diversified). Please refer to page 101 for detailed benchmark descriptions.
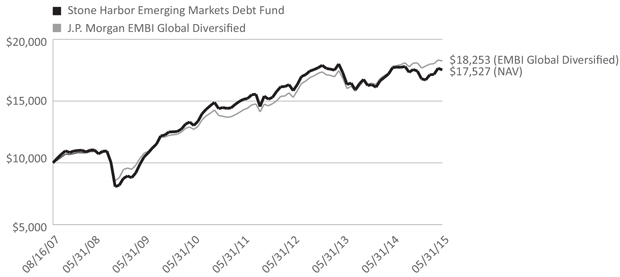
Average Annual Total Returns (Commencement of Operations, August 16, 2007)
| 6 Months | 1 Year | 3 Years | 5 Years | Since Inception | ||||||
Stone Harbor Emerging Markets Debt Fund | 0.56% | -1.01% | 3.42% | 6.12% | 7.47% | |||||
J.P. Morgan EMBI Global Diversified | 0.89% | 2.46% | 6.06% | 7.51% | 8.03% |
The performance data quoted represents past performance and does not guarantee future results. Current performance may be lower or higher than the performance quoted. Average annual total returns reflect the reinvestment of dividends and capital gains distributions and include all fee waivers and expense reimbursements. Without the fee waivers and expense reimbursements, total return figures would have been lower. The performance data quoted does not reflect the deduction of taxes that a shareholder would pay on Fund distributions or the redemption of Fund shares. Investment return and principal value will vary, and shares, when redeemed, may be worth more or less than their original cost. Index returns do not include the effects of sales charges, management fees or transaction costs. It is not possible to invest directly in an index.
Stone Harbor Investment Funds Annual Report | May 31, 2015 | 15 |
Table of Contents
| Stone Harbor Investment Funds | Growth of $10,000 Investment | |
May 31, 2015 (Unaudited) |
STONE HARBOR HIGH YIELD BOND FUND
Comparison of Change in Value of $10,000 Investment in Stone Harbor High Yield Bond Fund and the Citigroup High Yield Market Capped Index. Please refer to page 101 for detailed benchmark descriptions.
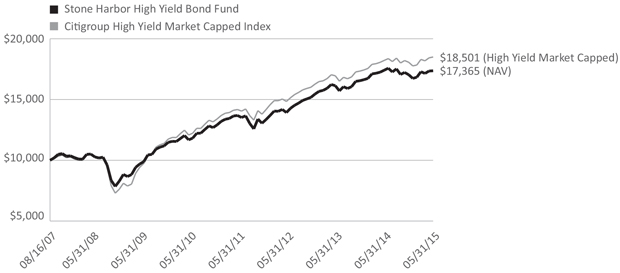
Average Annual Total Returns (Commencement of Operations, August 16, 2007)
| 6 Months | 1 Year | 3 Years | 5 Years | Since Inception | ||||||
Stone Harbor High Yield Bond Fund | 1.89% | -0.27% | 7.63% | 8.25% | 7.34% | |||||
Citigroup High Yield Market Capped Index | 2.40% | 1.54% | 7.63% | 8.89% | 8.22% |
The performance data quoted represents past performance and does not guarantee future results. Current performance may be lower or higher than the performance quoted. Average annual total returns reflect the reinvestment of dividends and capital gains distributions and include all fee waivers and expense reimbursements. Without the fee waivers and expense reimbursements, total return figures would have been lower. The performance data quoted does not reflect the deduction of taxes that a shareholder would pay on Fund distributions or the redemption of Fund shares. Investment return and principal value will vary, and shares, when redeemed, may be worth more or less than their original cost. Index returns do not include the effects of sales charges, management fees or transaction costs. It is not possible to invest directly in an index.
16 | www.shiplp.com |
Table of Contents
| Stone Harbor Investment Funds | Growth of $10,000 Investment | |
May 31, 2015 (Unaudited) |
STONE HARBOR LOCAL MARKETS FUND
Comparison of Change in Value of $10,000 Investment in Stone Harbor Local Markets Fund and the J.P. Morgan Global Bond Index – Emerging Markets Global Diversified (J.P. Morgan GBI-EM Global Diversified). Please refer to page 101 for detailed benchmark descriptions.
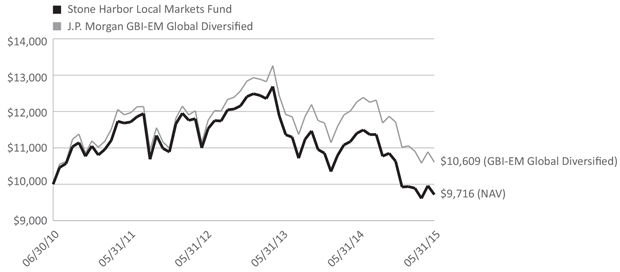
Average Annual Total Returns (Commencement of Operations, June 30, 2010)
| 6 Months | 1 Year | 3 Years | Since Inception | |||||
Stone Harbor Local Markets Fund | -8.64% | -14.70% | -4.05% | -0.58% | ||||
J.P. Morgan GBI-EM Global Diversified | -9.42% | -13.49% | -1.62% | 1.21% |
The performance data quoted represents past performance and does not guarantee future results. Current performance may be lower or higher than the performance quoted. Average annual total returns reflect the reinvestment of dividends and capital gains distributions and include all fee waivers and expense reimbursements. Without the fee waivers and expense reimbursements, total return figures would have been lower. The performance data quoted does not reflect the deduction of taxes that a shareholder would pay on Fund distributions or the redemption of Fund shares. Investment return and principal value will vary, and shares, when redeemed, may be worth more or less than their original cost. Index returns do not include the effects of sales charges, management fees or transaction costs. It is not possible to invest directly in an index.
Stone Harbor Investment Funds Annual Report | May 31, 2015 | 17 |
Table of Contents
| Stone Harbor Investment Funds | Growth of $10,000 Investment | |
May 31, 2015 (Unaudited) |
STONE HARBOR EMERGING MARKETS CORPORATE DEBT FUND
Comparison of Change in Value of $10,000 Investment in Stone Harbor Emerging Market Corporate Debt Fund and the J.P. Morgan Corporate Emerging Market Bond Index – Broad Diversified (J.P. Morgan CEMBI Broad Diversified). Please refer to page 101 for detailed benchmark descriptions.
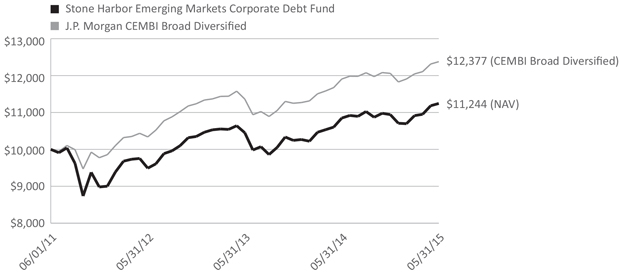
Average Annual Total Returns (Commencement of Operations, June 1, 2011)
| 6 Months | 1 Year | 3 Year | Since Inception | |||||||||||||||||
Stone Harbor Emerging Markets Corporate Debt Fund | 2.75% | 3.64% | 5.81% | 2.97% | ||||||||||||||||
J.P. Morgan CEMBI Broad Diversified | 2.63% | 3.95% | 6.18% | 5.48% | ||||||||||||||||
The performance data quoted represents past performance and does not guarantee future results. Current performance may be lower or higher than the performance quoted. Average annual total returns reflect the reinvestment of dividends and capital gains distributions and include all fee waivers and expense reimbursements. Without the fee waivers and expense reimbursements, total return figures would have been lower. The performance data quoted does not reflect the deduction of taxes that a shareholder would pay on Fund distributions or the redemption of Fund shares. Investment return and principal value will vary, and shares, when redeemed, may be worth more or less than their original cost. Index returns do not include the effects of sales charges, management fees or transaction costs. It is not possible to invest directly in an index.
18 | www.shiplp.com |
Table of Contents
| Stone Harbor Investment Funds | Growth of $10,000 Investment | |
May 31, 2015 (Unaudited) |
STONE HARBOR INVESTMENT GRADE FUND
Comparison of Change in Value of $10,000 Investment in Stone Harbor Investment Grade Fund and the Barclays Capital U.S. Aggregate Index. Please refer to page 101 for detailed benchmark descriptions.
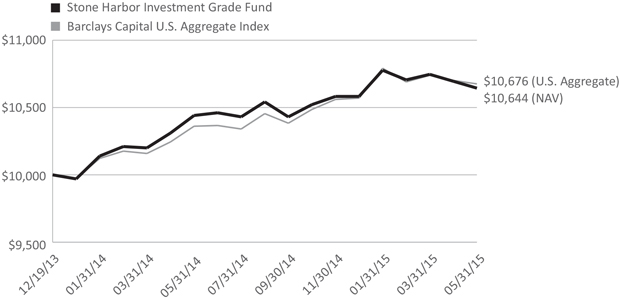
Cumulative Returns (Commencement of Operations, December 19, 2013)
| 3 Months | 6 Months | 1 Year | Since Inception | |||||
Stone Harbor Investment Grade Fund | -0.57% | 0.58% | 1.94% | 4.40% | ||||
Barclays Capital U.S. Aggregate Index | -0.14% | 1.09% | 3.03% | 4.61% |
The performance data quoted represents past performance and does not guarantee future results. Current performance may be lower or higher than the performance quoted. Average annual total returns reflect the reinvestment of dividends and capital gains distributions and include all fee waivers and expense reimbursements. Without the fee waivers and expense reimbursements, total return figures would have been lower. The performance data quoted does not reflect the deduction of taxes that a shareholder would pay on Fund distributions or the redemption of Fund shares. Investment return and principal value will vary, and shares, when redeemed, may be worth more or less than their original cost. Index returns do not include the effects of sales charges, management fees or transaction costs. It is not possible to invest directly in an index.
Stone Harbor Investment Funds Annual Report | May 31, 2015 | 19 |
Table of Contents
| Stone Harbor Investment Funds | Growth of $10,000 Investment | |
May 31, 2015 (Unaudited) |
STONE HARBOR STRATEGIC INCOME FUND
Comparison of Change in Value of $10,000 Investment in Stone Harbor Strategic Income Fund and the Barclays Global Credit Index (Hedged USD). Please refer to page 101 for detailed benchmark descriptions.
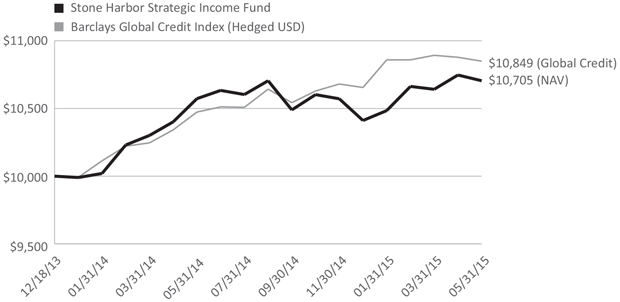
Cumulative Returns (Commencement of Operations, December 19, 2013)
| 3 Months | 6 Months | 1 Year | Since Inception | |||||||||||||||||
Stone Harbor Strategic Income Fund | 0.30% | 1.16% | 1.15% | 4.81% | ||||||||||||||||
Barclays Global Credit Index (Hedged USD) | -0.09% | 1.58% | 3.59% | 5.79% | ||||||||||||||||
The performance data quoted represents past performance and does not guarantee future results. Current performance may be lower or higher than the performance quoted. Average annual total returns reflect the reinvestment of dividends and capital gains distributions and include all fee waivers and expense reimbursements. Without the fee waivers and expense reimbursements, total return figures would have been lower. The performance data quoted does not reflect the deduction of taxes that a shareholder would pay on Fund distributions or the redemption of Fund shares. Investment return and principal value will vary, and shares, when redeemed, may be worth more or less than their original cost. Index returns do not include the effects of sales charges, management fees or transaction costs. It is not possible to invest directly in an index.
20 | www.shiplp.com |
Table of Contents
| Stone Harbor Investment Funds | Growth of $10,000 Investment | |
May 31, 2015 (Unaudited) |
STONE HARBOR EMERGING MARKETS DEBT ALLOCATION FUND
Comparison of Change in Value of $10,000 Investment in Stone Harbor Emerging Markets Debt Allocation Fund and the Blend Index (50% J.P. Morgan EMBI Global Diversified Index and 50% J.P. Morgan GBI-EM Global Diversified Index). Please refer to page 101 for detailed benchmark descriptions.
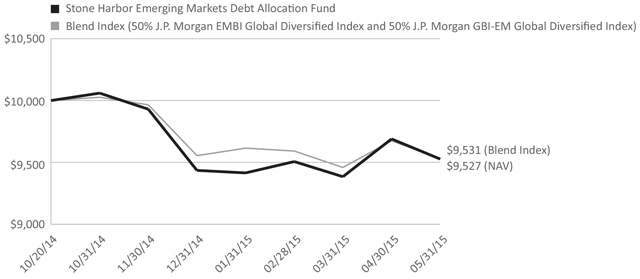
Cumulative Returns (Commencement of Operations, October 21, 2014)
| 3 Months | 6 Months | Since Inception | |||||||||||||
Stone Harbor Emerging Markets Debt Allocation Fund | 0.32% | -4.06% | -4.73% | ||||||||||||
Blend Index (50% J.P. Morgan EMBI Global Diversified Index and 50% J.P. Morgan GBI-EM Global Diversified Index) | -0.64% | -4.36% | -4.69% | ||||||||||||
The performance data quoted represents past performance and does not guarantee future results. Current performance may be lower or higher than the performance quoted. Average annual total returns reflect the reinvestment of dividends and capital gains distributions and include all fee waivers and expense reimbursements. Without the fee waivers and expense reimbursements, total return figures would have been lower. The performance data quoted does not reflect the deduction of taxes that a shareholder would pay on Fund distributions or the redemption of Fund shares. Investment return and principal value will vary, and shares, when redeemed, may be worth more or less than their original cost. Index returns do not include the effects of sales charges, management fees or transaction costs. It is not possible to invest directly in an index.
Stone Harbor Investment Funds Annual Report | May 31, 2015 | 21 |
Table of Contents
| Stone Harbor Investment Funds | Report of Independent Registered Public Accounting Firm |
To the Shareholders and Board of Trustees of Stone Harbor Investment Funds:
We have audited the accompanying statements of assets and liabilities of Stone Harbor Investment Funds (the “Funds”), comprising the Stone Harbor Emerging Markets Debt Fund, Stone Harbor High Yield Bond Fund, Stone Harbor Local Markets Fund, Stone Harbor Emerging Markets Corporate Debt Fund, Stone Harbor Investment Grade Fund, Stone Harbor Strategic Income Fund, and Stone Harbor Emerging Markets Debt Allocation Fund, including the statements of investments, as of May 31, 2015, and the related statements of operations for the year then ended, the statements of changes in net assets for each of the two years in the period then ended, and the financial highlights for each of the periods presented (as to the Stone Harbor Investment Grade Fund and the Stone Harbor Strategic Income Fund, the related statements of operations for the year then ended, and statements of changes in net assets and the financial highlights for the year then ended and for the period from December 19, 2013 (Commencement of Operations) to May 31, 2014) (as to the Stone Harbor Emerging Markets Debt Allocation Fund, the related statement of operations, statement of changes in net assets and the financial highlights for the period October 21, 2014 (Commencement of Operations) to May 31, 2015). These financial statements and financial highlights are the responsibility of the Funds’ management. Our responsibility is to express an opinion on these financial statements and financial highlights based on our audits.
We conducted our audits in accordance with the standards of the Public Company Accounting Oversight Board (United States). Those standards require that we plan and perform the audit to obtain reasonable assurance about whether the financial statements and financial highlights are free of material misstatement. The Funds are not required to have, nor were we engaged to perform, an audit of their internal control over financial reporting. Our audits included consideration of internal control over financial reporting as a basis for designing audit procedures that are appropriate in the circumstances, but not for the purpose of expressing an opinion on the effectiveness of the Funds’ internal control over financial reporting. Accordingly, we express no such opinion. An audit also includes examining, on a test basis, evidence supporting the amounts and disclosures in the financial statements, assessing the accounting principles used and significant estimates made by management, as well as evaluating the overall financial statement presentation. Our procedures included confirmation of securities owned as of May 31, 2015, by correspondence with the custodian and brokers; where replies were not received from brokers, we performed other auditing procedures. We believe that our audits provide a reasonable basis for our opinion.
In our opinion, the financial statements and financial highlights referred to above present fairly, in all material respects, the financial position of each of the funds constituting the Stone Harbor Investment Funds as of May 31, 2015, and the results of their operations, the changes in their net assets, and the financial highlights for each of the periods presented, in conformity with accounting principles generally accepted in the United States of America.
DELOITTE & TOUCHE LLP
Denver, Colorado
July 29, 2015
22 | www.shiplp.com |
Table of Contents
| Stone Harbor Emerging Markets Debt Fund | Statements of Investments | |
May 31, 2015 |
Currency | Rate | Maturity Date | Principal | Market Value | ||||||||||||
SOVEREIGN DEBT OBLIGATIONS - 64.27% | ||||||||||||||||
Angola - 0.31% | ||||||||||||||||
Republic of Angola | USD | 7.000 | % | 08/16/2019 | 5,857,000 | $ | 6,010,746(1) | |||||||||
|
| |||||||||||||||
Argentina - 3.49% | ||||||||||||||||
Republic of Argentina: | ||||||||||||||||
| USD | 7.000 | % | 10/03/2015 | 18,414,966 | 18,117,257 | |||||||||||
| USD | 7.000 | % | 04/17/2017 | 32,613,043 | 31,766,917 | |||||||||||
| EUR | 5.870 | % | 03/31/2023 | 10,755,000 | 7,247,500(2) | |||||||||||
| USD | 0.000 | % | 03/31/2023 | 184,000 | 220,800(2)(3) | |||||||||||
| USD | 6.000 | % | 03/31/2023 | 7,841,000 | 9,409,200(2) | |||||||||||
| EUR | 8.500 | % | 07/01/2049 | 700,000 | 722,681(2) | |||||||||||
|
| |||||||||||||||
| 67,484,355 | ||||||||||||||||
|
| |||||||||||||||
Azerbaijan - 0.86% | ||||||||||||||||
Republic of Azerbaijan | USD | 4.750 | % | 03/18/2024 | 16,005,000 | 16,565,175(4) | ||||||||||
|
| |||||||||||||||
Brazil - 5.10% | ||||||||||||||||
Brazil Loan Trust 1 | USD | 5.477 | % | 07/24/2023 | 18,925,614 | 18,954,002(4) | ||||||||||
Brazil Minas SPE via State of Minas Gerais: | ||||||||||||||||
| USD | 5.333 | % | 02/15/2028 | 496,000 | 483,600(4) | |||||||||||
| USD | 5.333 | % | 02/15/2028 | 1,479,000 | 1,442,025(1) | |||||||||||
Republic of Brazil: | ||||||||||||||||
| USD | 4.250 | % | 01/07/2025 | 34,611,000 | 34,143,752 | |||||||||||
| USD | 8.750 | % | 02/04/2025 | 834,000 | 1,117,560 | |||||||||||
| USD | 8.250 | % | 01/20/2034 | 12,755,000 | 16,613,387 | |||||||||||
| USD | 7.125 | % | 01/20/2037 | 21,858,000 | 26,011,020 | |||||||||||
|
| |||||||||||||||
| 98,765,346 | ||||||||||||||||
|
| |||||||||||||||
Colombia - 4.39% | ||||||||||||||||
Bogota Distrio Capital | COP | 9.750 | % | 07/26/2028 | 7,870,000,000 | 3,784,814(1) | ||||||||||
Republic of Colombia: | ||||||||||||||||
| COP | 12.000 | % | 10/22/2015 | 4,798,000,000 | 1,943,673 | |||||||||||
| USD | 7.375 | % | 01/27/2017 | 1,838,000 | 2,017,205 | |||||||||||
| USD | 11.750 | % | 02/25/2020 | 4,338,000 | 5,943,060 | |||||||||||
| COP | 7.750 | % | 04/14/2021 | 5,210,000,000 | 2,258,149 | |||||||||||
| USD | 4.375 | % | 07/12/2021 | 19,783,000 | 20,969,980 | |||||||||||
| USD | 2.625 | % | 03/15/2023 | 814,000 | 761,090 | |||||||||||
| USD | 4.000 | % | 02/26/2024 | 7,448,000 | 7,615,580 | |||||||||||
| USD | 8.125 | % | 05/21/2024 | 25,000 | 32,906 | |||||||||||
| COP | 9.850 | % | 06/28/2027 | 8,281,000,000 | 4,113,312 | |||||||||||
| COP | 7.750 | % | 09/18/2030 | 9,209,500,000 | 3,684,892 | |||||||||||
| USD | 10.375 | % | 01/28/2033 | 2,006,000 | 3,169,480 | |||||||||||
| USD | 7.375 | % | 09/18/2037 | 13,959,000 | 18,164,149 | |||||||||||
| USD | 6.125 | % | 01/18/2041 | 387,000 | 443,599 | |||||||||||
| USD | 5.625 | % | 02/26/2044 | 5,930,000 | 6,411,812 | |||||||||||
| USD | 5.000 | % | 06/15/2045 | 3,726,000 | 3,693,397 | |||||||||||
|
| |||||||||||||||
| 85,007,098 | ||||||||||||||||
|
| |||||||||||||||
Costa Rica - 2.16% | ||||||||||||||||
Republic of Costa Rica: | ||||||||||||||||
| USD | 4.250 | % | 01/26/2023 | 15,042,000 | 14,092,474(1) | |||||||||||
| USD | 4.375 | % | 04/30/2025 | 4,745,000 | 4,356,503(1) | |||||||||||
| USD | 4.375 | % | 04/30/2025 | 5,728,000 | 5,259,020(4) | |||||||||||
Stone Harbor Investment Funds Annual Report | May 31, 2015 | 23 |
Table of Contents
| Stone Harbor Emerging Markets Debt Fund | Statements of Investments | |
May 31, 2015 |
Currency | Rate | Maturity Date | Principal | Market Value | ||||||||||||
Costa Rica (continued) | ||||||||||||||||
Republic of Costa Rica: (continued) | ||||||||||||||||
| USD | 7.000 | % | 04/04/2044 | 18,275,000 | $ | 18,172,203(4) | ||||||||||
|
| |||||||||||||||
| 41,880,200 | ||||||||||||||||
|
| |||||||||||||||
Croatia - 1.08% | ||||||||||||||||
Croatian Government: | ||||||||||||||||
| USD | 5.500 | % | 04/04/2023 | 14,058,000 | 14,831,190(1) | |||||||||||
| USD | 6.000 | % | 01/26/2024 | 5,662,000 | 6,136,192(4) | |||||||||||
|
| |||||||||||||||
| 20,967,382 | ||||||||||||||||
|
| |||||||||||||||
Dominican Republic - 3.77% | ||||||||||||||||
Dominican Republic: | ||||||||||||||||
| USD | 9.040 | % | 01/23/2018 | 9,523,326 | 10,297,096(1) | |||||||||||
| USD | 7.500 | % | 05/06/2021 | 36,382,000 | 40,929,750(1) | |||||||||||
| USD | 6.600 | % | 01/28/2024 | 7,818,000 | 8,541,165(1) | |||||||||||
| USD | 5.875 | % | 04/18/2024 | 6,265,000 | 6,593,912(4) | |||||||||||
| USD | 7.450 | % | 04/30/2044 | 5,883,000 | 6,544,838(4) | |||||||||||
|
| |||||||||||||||
| 72,906,761 | ||||||||||||||||
|
| |||||||||||||||
El Salvador - 1.42% | ||||||||||||||||
Republic of El Salvador: | ||||||||||||||||
| USD | 7.375 | % | 12/01/2019 | 220,000 | 241,862(4) | |||||||||||
| USD | 7.375 | % | 12/01/2019 | 2,068,000 | 2,273,508(1) | |||||||||||
| USD | 7.750 | % | 01/24/2023 | 4,320,000 | 4,749,300(1) | |||||||||||
| USD | 6.375 | % | 01/18/2027 | 6,844,000 | 6,809,780(4) | |||||||||||
| USD | 7.650 | % | 06/15/2035 | 12,924,000 | 13,384,417(1) | |||||||||||
|
| |||||||||||||||
| 27,458,867 | ||||||||||||||||
|
| |||||||||||||||
Ethiopia - 0.24% | ||||||||||||||||
Federal Democratic Republic of Ethiopia | USD | 6.625 | % | 12/11/2024 | 4,562,000 | 4,601,918(4) | ||||||||||
|
| |||||||||||||||
Gabon - 0.49% | ||||||||||||||||
Republic of Gabon: | ||||||||||||||||
| USD | 8.200 | % | 12/12/2017 | 50,000 | 53,688(4) | |||||||||||
| USD | 6.375 | % | 12/12/2024 | 9,674,347 | 9,514,720(4) | |||||||||||
|
| |||||||||||||||
| 9,568,408 | ||||||||||||||||
|
| |||||||||||||||
Ghana - 0.56% | ||||||||||||||||
Republic of Ghana: | ||||||||||||||||
| USD | 8.500 | % | 10/04/2017 | 2,641,000 | 2,736,736(1) | |||||||||||
| USD | 7.875 | % | 08/07/2023 | 6,267,000 | 5,922,315(4) | |||||||||||
| USD | 8.125 | % | 01/18/2026 | 2,379,000 | 2,248,155(4) | |||||||||||
|
| |||||||||||||||
| 10,907,206 | ||||||||||||||||
|
| |||||||||||||||
Honduras - 0.46% | ||||||||||||||||
Republic of Honduras | USD | 8.750 | % | 12/16/2020 | 7,720,000 | 8,820,100(1) | ||||||||||
|
| |||||||||||||||
Hungary - 1.07% | ||||||||||||||||
Republic of Hungary: | ||||||||||||||||
| GBP | 5.000 | % | 03/30/2016 | 670,000 | 1,055,435 | |||||||||||
| USD | 6.375 | % | 03/29/2021 | 15,182,000 | 17,582,654 | |||||||||||
| USD | 5.750 | % | 11/22/2023 | 1,910,000 | 2,177,400 | |||||||||||
|
| |||||||||||||||
| 20,815,489 | ||||||||||||||||
|
| |||||||||||||||
Indonesia - 4.80% | ||||||||||||||||
Republic of Indonesia: | ||||||||||||||||
| USD | 11.625 | % | 03/04/2019 | 1,683,000 | 2,233,341(1) | |||||||||||
24 | www.shiplp.com |
Table of Contents
| Stone Harbor Emerging Markets Debt Fund | Statements of Investments | |
May 31, 2015 |
| Currency | Rate | Maturity Date | Principal Amount* | Market Value Expressed (in U.S. $) | ||||||||||||
Indonesia (continued) | ||||||||||||||||
Republic of Indonesia: (continued) | ||||||||||||||||
| USD | 11.625 | % | 03/04/2019 | 2,170,000 | $ | 2,879,590(4) | ||||||||||
| IDR | 7.875 | % | 04/15/2019 | 59,940,000,000 | 4,521,336 | |||||||||||
| USD | 4.875 | % | 05/05/2021 | 733,000 | 795,305(1) | |||||||||||
| IDR | 7.000 | % | 05/15/2022 | 16,100,000,000 | 1,150,991 | |||||||||||
| USD | 3.375 | % | 04/15/2023 | 13,093,000 | 12,670,751(4) | |||||||||||
| USD | 5.375 | % | 10/17/2023 | 10,407,000 | 11,445,098(1) | |||||||||||
| IDR | 8.375 | % | 03/15/2024 | 116,782,000,000 | 8,974,790 | |||||||||||
| IDR | 9.000 | % | 03/15/2029 | 46,100,000,000 | 3,693,177 | |||||||||||
| USD | 8.500 | % | 10/12/2035 | 9,681,000 | 13,475,952(1) | |||||||||||
| USD | 6.625 | % | 02/17/2037 | 8,960,000 | 10,454,080(1) | |||||||||||
| USD | 7.750 | % | 01/17/2038 | 15,704,000 | 20,674,316(1) | |||||||||||
|
| |||||||||||||||
| 92,968,727 | ||||||||||||||||
|
| |||||||||||||||
Iraq - 0.97% | ||||||||||||||||
Republic of Iraq | USD | 5.800 | % | 01/15/2028 | 22,679,000 | 18,823,570(1) | ||||||||||
|
| |||||||||||||||
Ivory Coast - 2.48% | ||||||||||||||||
Ivory Coast Government: | ||||||||||||||||
| USD | 5.375 | % | 07/23/2024 | 3,119,000 | 2,978,645(4) | |||||||||||
| USD | 6.375 | % | 03/03/2028 | 5,346,000 | 5,332,635(4) | |||||||||||
| USD | 5.750 | % | 12/31/2032 | 41,291,000 | 39,639,360(1)(5) | |||||||||||
|
| |||||||||||||||
| 47,950,640 | ||||||||||||||||
|
| |||||||||||||||
Jamaica - 1.19% | ||||||||||||||||
Jamaican Government: | ||||||||||||||||
| USD | 10.625 | % | 06/20/2017 | 2,278,000 | 2,611,158 | |||||||||||
| USD | 7.625 | % | 07/09/2025 | 18,240,000 | 20,406,000 | |||||||||||
|
| |||||||||||||||
| 23,017,158 | ||||||||||||||||
|
| |||||||||||||||
Kenya - 0.70% | ||||||||||||||||
Republic of Kenya | USD | 6.875 | % | 06/24/2024 | 12,990,000 | 13,639,500(4) | ||||||||||
|
| |||||||||||||||
Mexico - 5.53% | ||||||||||||||||
Mexican Bonos | MXN | 6.250 | % | 06/16/2016 | 261,394,000 | 17,450,506 | ||||||||||
United Mexican States: | ||||||||||||||||
| USD | 4.000 | % | 10/02/2023 | 1,880,000 | 1,958,960 | |||||||||||
| USD | 6.050 | % | 01/11/2040 | 11,892,000 | 14,225,805 | |||||||||||
| USD | 4.750 | % | 03/08/2044 | 23,794,000 | 23,942,712 | |||||||||||
| USD | 5.550 | % | 01/21/2045 | 43,975,000 | 49,581,813 | |||||||||||
|
| |||||||||||||||
| 107,159,796 | ||||||||||||||||
|
| |||||||||||||||
Morocco - 0.14% | ||||||||||||||||
Moroccan Government | USD | 4.250 | % | 12/11/2022 | 2,545,000 | 2,649,981(4) | ||||||||||
|
| |||||||||||||||
Mozambique - 0.31% | ||||||||||||||||
Republic of Mozambique | USD | 6.305 | % | 09/11/2020 | 6,214,000 | 5,980,975(1) | ||||||||||
|
| |||||||||||||||
Nigeria - 1.07% | ||||||||||||||||
Republic of Nigeria: | ||||||||||||||||
| USD | 5.125 | % | 07/12/2018 | 5,664,000 | 5,770,200(1) | |||||||||||
| USD | 6.750 | % | 01/28/2021 | 11,638,000 | 12,248,995(1) | |||||||||||
| USD | 6.375 | % | 07/12/2023 | 2,636,000 | 2,715,080(1) | |||||||||||
|
| |||||||||||||||
| 20,734,275 | ||||||||||||||||
|
| |||||||||||||||
Stone Harbor Investment Funds Annual Report | May 31, 2015 | 25 |
Table of Contents
| Stone Harbor Emerging Markets Debt Fund | Statements of Investments | |
May 31, 2015 |
| Currency | Rate | Maturity Date | Principal Amount* | Market Value Expressed (in U.S. $) | ||||||||||||
Panama - 2.18% | ||||||||||||||||
Republic of Panama: | ||||||||||||||||
| USD | 5.200 | % | 01/30/2020 | 2,622,000 | $ | 2,907,143 | ||||||||||
| USD | 9.375 | % | 01/16/2023 | 450,000 | 621,000 | |||||||||||
| USD | 8.875 | % | 09/30/2027 | 3,493,000 | 5,077,949 | |||||||||||
| USD | 9.375 | % | 04/01/2029 | 17,723,000 | 26,894,652 | |||||||||||
| USD | 8.125 | % | 04/28/2034 | 2,063,000 | 2,846,940 | |||||||||||
| USD | 6.700 | % | 01/26/2036 | 2,974,000 | 3,803,002 | |||||||||||
|
| |||||||||||||||
| 42,150,686 | ||||||||||||||||
|
| |||||||||||||||
Paraguay - 1.14% | ||||||||||||||||
Republic of Paraguay: | ||||||||||||||||
| USD | 4.625 | % | 01/25/2023 | 1,976,000 | 2,035,280(4) | |||||||||||
| USD | 4.625 | % | 01/25/2023 | 4,242,000 | 4,369,260(1) | |||||||||||
| USD | 6.100 | % | 08/11/2044 | 14,580,000 | 15,709,950(4) | |||||||||||
|
| |||||||||||||||
| 22,114,490 | ||||||||||||||||
|
| |||||||||||||||
Peru - 1.34% | ||||||||||||||||
Republic of Peru: | ||||||||||||||||
| USD | 8.750 | % | 11/21/2033 | 10,945,000 | 17,183,705 | |||||||||||
| USD | 6.550 | % | 03/14/2037 | 1,970,000 | 2,565,925 | |||||||||||
| USD | 5.625 | % | 11/18/2050 | 5,299,000 | 6,252,820 | |||||||||||
|
| |||||||||||||||
| 26,002,450 | ||||||||||||||||
|
| |||||||||||||||
Philippines - 1.66% | ||||||||||||||||
Republic of Philippines: | ||||||||||||||||
| USD | 9.500 | % | 02/02/2030 | 9,716,000 | 16,284,016 | |||||||||||
| USD | 7.750 | % | 01/14/2031 | 1,560,000 | 2,333,760 | |||||||||||
| USD | 6.375 | % | 01/15/2032 | 6,015,000 | 8,108,220 | |||||||||||
| USD | 3.950 | % | 01/20/2040 | 5,210,000 | 5,452,265 | |||||||||||
|
| |||||||||||||||
| 32,178,261 | ||||||||||||||||
|
| |||||||||||||||
Poland - 0.10% | ||||||||||||||||
Republic of Poland: | ||||||||||||||||
| USD | 5.000 | % | 03/23/2022 | 1,000 | 1,134 | |||||||||||
| USD | 4.000 | % | 01/22/2024 | 1,738,000 | 1,864,005 | |||||||||||
|
| |||||||||||||||
| 1,865,139 | ||||||||||||||||
|
| |||||||||||||||
Romania - 0.79% | ||||||||||||||||
Romanian Government International Bond | USD | 6.750 | % | 02/07/2022 | 12,761,000 | 15,337,127(1) | ||||||||||
|
| |||||||||||||||
Russia - 3.97% | ||||||||||||||||
Russian Federation: | ||||||||||||||||
| USD | 3.500 | % | 01/16/2019 | 2,200,000 | 2,189,000(1) | |||||||||||
| USD | 5.000 | % | 04/29/2020 | 10,300,000 | 10,673,375(1) | |||||||||||
| USD | 4.500 | % | 04/04/2022 | 2,200,000 | 2,172,500(1) | |||||||||||
| USD | 4.875 | % | 09/16/2023 | 14,400,000 | 14,382,000(1) | |||||||||||
| USD | 12.750 | % | 06/24/2028 | 3,430,000 | 5,462,275(1) | |||||||||||
| USD | 7.500 | % | 03/31/2030 | 19,787,689 | 23,206,012(1)(5) | |||||||||||
| USD | 5.625 | % | 04/04/2042 | 19,400,000 | 18,818,000(1) | |||||||||||
|
| |||||||||||||||
| 76,903,162 | ||||||||||||||||
|
| |||||||||||||||
Serbia - 0.61% | ||||||||||||||||
Republic of Serbia: | ||||||||||||||||
| USD | 5.875 | % | 12/03/2018 | 1,505,000 | 1,600,944(1) | |||||||||||
26 | www.shiplp.com |
Table of Contents
| Stone Harbor Emerging Markets Debt Fund | Statements of Investments | |
May 31, 2015 |
| Currency | Rate | Maturity Date | Principal Amount* | Market Value Expressed (in U.S. $) | ||||||||||||||||
Serbia (continued) | ||||||||||||||||||||
Republic of Serbia: (continued) | ||||||||||||||||||||
| USD | 7.250 | % | 09/28/2021 | 8,804,000 | $ | 10,135,605(1) | ||||||||||||||
|
| |||||||||||||||||||
| 11,736,549 | ||||||||||||||||||||
|
| |||||||||||||||||||
South Africa - 1.67% | ||||||||||||||||||||
Republic of South Africa | USD | 5.875 | % | 09/16/2025 | 28,387,000 | 32,254,729 | ||||||||||||||
|
| |||||||||||||||||||
Sri Lanka - 0.99% | ||||||||||||||||||||
Republic of Sri Lanka: | ||||||||||||||||||||
| USD | 5.125 | % | 04/11/2019 | 484,000 | 484,121(4) | |||||||||||||||
| USD | 6.250 | % | 07/27/2021 | 6,600,000 | 6,733,650(1) | |||||||||||||||
| USD | 5.875 | % | 07/25/2022 | 5,493,000 | 5,465,535(4) | |||||||||||||||
| USD | 6.125 | % | 06/03/2025 | 6,566,000 | 6,566,000(4) | |||||||||||||||
|
| |||||||||||||||||||
| 19,249,306 | ||||||||||||||||||||
|
| |||||||||||||||||||
Trinidad - 0.40% | ||||||||||||||||||||
Republic of Trinidad & Tobago | USD | 4.375 | % | 01/16/2024 | 7,174,000 | 7,738,953(4) | ||||||||||||||
|
| |||||||||||||||||||
Turkey - 3.89% | ||||||||||||||||||||
Republic of Turkey: | ||||||||||||||||||||
| USD | 7.500 | % | 07/14/2017 | 7,869,000 | 8,754,263 | |||||||||||||||
| USD | 7.500 | % | 11/07/2019 | 5,407,000 | 6,319,431 | |||||||||||||||
| USD | 7.000 | % | 06/05/2020 | 4,293,000 | 4,958,415 | |||||||||||||||
| USD | 5.125 | % | 03/25/2022 | 6,809,000 | 7,251,585 | |||||||||||||||
| USD | 6.250 | % | 09/26/2022 | 11,921,000 | 13,485,631 | |||||||||||||||
| USD | 3.250 | % | 03/23/2023 | 9,845,000 | 9,303,525 | |||||||||||||||
| USD | 7.375 | % | 02/05/2025 | 3,189,000 | 3,906,525 | |||||||||||||||
| USD | 6.875 | % | 03/17/2036 | 958,000 | 1,160,377 | |||||||||||||||
| USD | 6.750 | % | 05/30/2040 | 4,378,000 | 5,286,435 | |||||||||||||||
| USD | 6.000 | % | 01/14/2041 | 1,120,000 | 1,240,400 | |||||||||||||||
| USD | 4.875 | % | 04/16/2043 | 5,773,000 | 5,527,648 | |||||||||||||||
| USD | 6.625 | % | 02/17/2045 | 6,681,000 | 8,058,956 | |||||||||||||||
|
| |||||||||||||||||||
| 75,253,191 | ||||||||||||||||||||
|
| |||||||||||||||||||
Uruguay - 1.52% | ||||||||||||||||||||
Republic of Uruguay: | ||||||||||||||||||||
| USD | 4.500 | % | 08/14/2024 | 10,276,613 | 10,995,976 | |||||||||||||||
| USD | 5.100 | % | 06/18/2050 | 18,212,991 | 18,417,887 | |||||||||||||||
|
| |||||||||||||||||||
| 29,413,863 | ||||||||||||||||||||
|
| |||||||||||||||||||
Venezuela - 1.42% | ||||||||||||||||||||
Republic of Venezuela: | ||||||||||||||||||||
| USD | 5.750 | % | 02/26/2016 | 17,161,000 | 14,372,338(1) | |||||||||||||||
| USD | 13.625 | % | 08/15/2018 | 6,704,000 | 4,944,200(1) | |||||||||||||||
| USD | 7.750 | % | 10/13/2019 | 19,118,900 | 8,221,127(1) | |||||||||||||||
|
| |||||||||||||||||||
| 27,537,665 | ||||||||||||||||||||
|
| |||||||||||||||||||
TOTAL SOVEREIGN DEBT OBLIGATIONS | 1,244,419,244 | |||||||||||||||||||
|
| |||||||||||||||||||
(Cost $1,223,215,021) | ||||||||||||||||||||
BANK LOANS - 0.01%(6) | ||||||||||||||||||||
Indonesia - 0.01% | ||||||||||||||||||||
PT Bakrie & Brothers TBK | USD | 6.151 | % | 11/25/2014 | 624,912 | 218,719(2) | ||||||||||||||
|
| |||||||||||||||||||
TOTAL BANK LOANS | 218,719 | |||||||||||||||||||
|
| |||||||||||||||||||
(Cost $249,965) | ||||||||||||||||||||
Stone Harbor Investment Funds Annual Report | May 31, 2015 | 27 |
Table of Contents
| Stone Harbor Emerging Markets Debt Fund | Statements of Investments | |
May 31, 2015 |
| Currency | Rate | Maturity Date | Principal Amount* | Market Value Expressed (in U.S. $) | ||||||||||||||||
CORPORATE BONDS - 28.57% | ||||||||||||||||||||
Argentina - 0.91% | ||||||||||||||||||||
YPF SA: | ||||||||||||||||||||
| USD | 8.875 | % | 12/19/2018 | 1,711,000 | $ | 1,847,880(4) | ||||||||||||||
| USD | 8.750 | % | 04/04/2024 | 5,635,000 | 5,846,313(4) | |||||||||||||||
| USD | 8.500 | % | 07/28/2025 | 9,694,000 | 9,936,350(4) | |||||||||||||||
|
| |||||||||||||||||||
| 17,630,543 | ||||||||||||||||||||
|
| |||||||||||||||||||
Azerbaijan - 0.70% | ||||||||||||||||||||
State Oil Company: | ||||||||||||||||||||
| USD | 5.450 | % | 02/09/2017 | 6,323,000 | 6,568,016 | |||||||||||||||
| USD | 4.750 | % | 03/13/2023 | 7,270,000 | 7,006,463 | |||||||||||||||
|
| |||||||||||||||||||
| 13,574,479 | ||||||||||||||||||||
|
| |||||||||||||||||||
Brazil - 1.13% | ||||||||||||||||||||
CIMPOR Financial Operations BV | USD | 5.750 | % | 07/17/2024 | 4,375,000 | 3,981,250(4) | ||||||||||||||
Cosan Luxembourg SA | USD | 5.000 | % | 03/14/2023 | 5,052,000 | 4,793,312(4) | ||||||||||||||
ESAL GmbH | USD | 6.250 | % | 02/05/2023 | 5,512,000 | 5,622,240(4) | ||||||||||||||
Gerdau Trade, Inc. | USD | 5.750 | % | 01/30/2021 | 397,000 | 411,014(4) | ||||||||||||||
GTL Trade Finance, Inc. | USD | 5.893 | % | 04/29/2024 | 5,407,000 | 5,319,407(4) | ||||||||||||||
Petrobras Global Finance BV | USD | 6.875 | % | 01/20/2040 | 1,908,000 | 1,803,060 | ||||||||||||||
|
| |||||||||||||||||||
| 21,930,283 | ||||||||||||||||||||
|
| |||||||||||||||||||
Chile - 3.83% | ||||||||||||||||||||
Banco del Estado de Chile | USD | 3.875 | % | 02/08/2022 | 3,277,000 | 3,428,561(4) | ||||||||||||||
Codelco, Inc.: | ||||||||||||||||||||
| USD | 3.875 | % | 11/03/2021 | 6,970,000 | 7,310,694(1) | |||||||||||||||
| USD | 3.000 | % | 07/17/2022 | 22,668,000 | 22,331,607(4) | |||||||||||||||
| USD | 4.500 | % | 08/13/2023 | 8,054,000 | 8,712,575(4) | |||||||||||||||
| USD | 6.150 | % | 10/24/2036 | 14,132,000 | 16,845,909(1) | |||||||||||||||
| USD | 4.250 | % | 07/17/2042 | 7,321,000 | 6,813,289(4) | |||||||||||||||
| USD | 4.875 | % | 11/04/2044 | 2,928,000 | 2,973,750(4) | |||||||||||||||
VTR Finance BV | USD | 6.875 | % | 01/15/2024 | 5,431,000 | 5,671,050(4) | ||||||||||||||
|
| |||||||||||||||||||
| 74,087,435 | ||||||||||||||||||||
|
| |||||||||||||||||||
China - 3.44% | ||||||||||||||||||||
CITIC Ltd.: | ||||||||||||||||||||
| USD | 6.800 | % | 01/17/2023 | 1,300,000 | 1,532,064 | |||||||||||||||
| USD | 7.875 | % | Perpetual | 1,800,000 | 1,885,500(3) | |||||||||||||||
| USD | 8.625 | % | Perpetual | 350,000 | 405,125(3) | |||||||||||||||
CNOOC Finance 2015 USA LLC | USD | 3.500 | % | 05/05/2025 | 1,731,000 | 1,718,450 | ||||||||||||||
Country Garden Holdings Co. Ltd. | USD | 7.250 | % | 04/04/2021 | 1,359,000 | 1,379,385(1) | ||||||||||||||
Longfor Properties Co. Ltd.: | ||||||||||||||||||||
| USD | 6.875 | % | 10/18/2019 | 300,000 | 313,500 | |||||||||||||||
| USD | 6.750 | % | 01/29/2023 | 800,000 | 794,000 | |||||||||||||||
Sinochem Offshore Capital Co. Ltd. | USD | 3.250 | % | 04/29/2019 | 7,862,000 | 8,034,137(4) | ||||||||||||||
Sinochem Overseas Capital Co. Ltd.: | ||||||||||||||||||||
| USD | 4.500 | % | 11/12/2020 | 5,534,000 | 5,947,154(1) | |||||||||||||||
| USD | 4.500 | % | 11/12/2020 | 24,980,000 | 26,872,735(4) | |||||||||||||||
| USD | 6.300 | % | 11/12/2040 | 4,353,000 | 5,474,442(1) | |||||||||||||||
Sinopec Capital 2013 Ltd. | USD | 3.125 | % | 04/24/2023 | 4,284,000 | 4,195,986(4) | ||||||||||||||
Sinopec Group Overseas Development 2015 Ltd. | USD | 3.250 | % | 04/28/2025 | 8,091,000 | 7,975,218(4) | ||||||||||||||
|
| |||||||||||||||||||
| 66,527,696 | ||||||||||||||||||||
|
| |||||||||||||||||||
28 | www.shiplp.com |
Table of Contents
| Stone Harbor Emerging Markets Debt Fund | Statements of Investments | |
May 31, 2015 |
| Currency | Rate | Maturity Date | Principal Amount* | Market Value Expressed (in U.S. $) | ||||||||||||||
Colombia - 0.30% | ||||||||||||||||||
Ecopetrol SA | USD | 5.875 | % | 05/28/2045 | 4,334,000 | $ | 4,028,453 | |||||||||||
Pacific Rubiales Energy Corp. | USD | 5.125 | % | 03/28/2023 | 2,307,000 | 1,851,367(4) | ||||||||||||
|
| |||||||||||||||||
| 5,879,820 | ||||||||||||||||||
|
| |||||||||||||||||
Ecuador - 0.95% | ||||||||||||||||||
EP PetroEcuador via Noble Sovereign Funding I Ltd. | USD | 5.897 | % | 09/24/2019 | 20,268,000 | 18,443,880(1)(3) | ||||||||||||
|
| |||||||||||||||||
India - 0.48% | ||||||||||||||||||
ABJA Investment Co. Pte Ltd.: | ||||||||||||||||||
| USD | 4.850 | % | 01/31/2020 | 1,000,000 | 1,028,025 | |||||||||||||
| USD | 5.950 | % | 07/31/2024 | 3,404,000 | 3,453,699 | |||||||||||||
Vedanta Resources PLC: | ||||||||||||||||||
| USD | 6.000 | % | 01/31/2019 | 3,484,000 | 3,283,670(4) | |||||||||||||
| USD | 8.250 | % | 06/07/2021 | 1,452,000 | 1,429,893(4) | |||||||||||||
|
| |||||||||||||||||
| 9,195,287 | ||||||||||||||||||
|
| |||||||||||||||||
Indonesia - 0.13% | ||||||||||||||||||
Pertamina Persero PT | USD | 6.000 | % | 05/03/2042 | 2,529,000 | 2,456,924(1) | ||||||||||||
|
| |||||||||||||||||
Jamaica - 0.38% | ||||||||||||||||||
Digicel Group Ltd. | USD | 7.125 | % | 04/01/2022 | 7,632,000 | 7,441,200(4) | ||||||||||||
|
| |||||||||||||||||
Kazakhstan - 6.21% | ||||||||||||||||||
KazMunayGas National Co. JSC: | ||||||||||||||||||
| USD | 9.125 | % | 07/02/2018 | 2,806,000 | 3,181,302(1) | |||||||||||||
| USD | 9.125 | % | 07/02/2018 | 19,124,000 | 21,681,835(4) | |||||||||||||
| USD | 7.000 | % | 05/05/2020 | 8,739,000 | 9,339,806(4) | |||||||||||||
| USD | 7.000 | % | 05/05/2020 | 10,197,000 | 10,898,044(1) | |||||||||||||
| USD | 6.375 | % | 04/09/2021 | 6,552,000 | 6,774,178(1) | |||||||||||||
| USD | 6.375 | % | 04/09/2021 | 12,534,000 | 12,959,028(4) | |||||||||||||
| USD | 4.400 | % | 04/30/2023 | 2,738,000 | 2,522,382(1) | |||||||||||||
| USD | 4.400 | % | 04/30/2023 | 10,403,000 | 9,583,764(4) | |||||||||||||
| USD | 4.875 | % | 05/07/2025 | 8,110,000 | 7,471,338(4) | |||||||||||||
| USD | 5.750 | % | 04/30/2043 | 6,861,000 | 5,754,149(1) | |||||||||||||
| USD | 5.750 | % | 04/30/2043 | 11,987,000 | 10,053,197(4) | |||||||||||||
| USD | 6.000 | % | 11/07/2044 | 519,000 | 446,600(1) | |||||||||||||
| USD | 6.000 | % | 11/07/2044 | 17,394,000 | 14,967,537(4) | |||||||||||||
Nostrum Oil & Gas Finance BV | USD | 6.375 | % | 02/14/2019 | 2,912,000 | 2,755,480(4) | ||||||||||||
Zhaikmunai LP | USD | 7.125 | % | 11/13/2019 | 1,862,000 | 1,780,538(4) | ||||||||||||
|
| |||||||||||||||||
| 120,169,178 | ||||||||||||||||||
|
| |||||||||||||||||
Kuwait - 0.13% | ||||||||||||||||||
NBK Tier 1 Financing Ltd. | USD | 5.750 | % | 10/09/2049 | 2,366,000 | 2,434,023 | ||||||||||||
|
| |||||||||||||||||
Macau - 0.10% | ||||||||||||||||||
MCE Finance Ltd.: | ||||||||||||||||||
| USD | 5.000 | % | 02/15/2021 | 568,000 | 549,540(4) | |||||||||||||
| USD | 5.000 | % | 02/15/2021 | 1,491,000 | 1,442,543(1) | |||||||||||||
|
| |||||||||||||||||
| 1,992,083 | ||||||||||||||||||
|
| |||||||||||||||||
Malaysia - 1.17% | ||||||||||||||||||
Petronas Capital Ltd. | USD | 3.500 | % | 03/18/2025 | 22,386,000 | 22,665,349(4) | ||||||||||||
|
| |||||||||||||||||
Mexico - 0.87% | ||||||||||||||||||
Cemex Finance LLC | USD | 9.375 | % | 10/12/2022 | 1,297,000 | 1,470,474(4) | ||||||||||||
Cemex SAB de CV: | ||||||||||||||||||
| USD | 9.500 | % | 06/15/2018 | 2,448,000 | 2,717,280(4) | |||||||||||||
Stone Harbor Investment Funds Annual Report | May 31, 2015 | 29 |
Table of Contents
| Stone Harbor Emerging Markets Debt Fund | Statements of Investments | |
May 31, 2015 |
| Counterparty | Currency | Rate | Maturity Date | Principal Amount* | Market Value Expressed (in U.S. $) | |||||||||||||||
Mexico (continued) | ||||||||||||||||||||
Cemex SAB de CV: (continued) | ||||||||||||||||||||
| USD | 7.250 | % | 01/15/2021 | 849,000 | $ | 911,826(4) | ||||||||||||||
| USD | 5.700 | % | 01/11/2025 | 1,175,000 | 1,163,250(4) | |||||||||||||||
| USD | 6.125 | % | 05/05/2025 | 2,667,000 | 2,720,340(4) | |||||||||||||||
Comision Federal de Electricidad | USD | 4.875 | % | 01/15/2024 | 1,784,000 | 1,873,200(4) | ||||||||||||||
Petroleos Mexicanos: | ||||||||||||||||||||
| EUR | 5.500 | % | 02/24/2025 | 2,275,000 | 3,051,568(1) | |||||||||||||||
| USD | 5.625 | % | 01/23/2046 | 3,001,000 | 2,963,487(4) | |||||||||||||||
|
| |||||||||||||||||||
| 16,871,425 | ||||||||||||||||||||
|
| |||||||||||||||||||
Morocco - 0.12% | ||||||||||||||||||||
OCP SA | USD | 5.625 | % | 04/25/2024 | 2,190,000 | 2,342,862(4) | ||||||||||||||
|
| |||||||||||||||||||
Peru - 0.20% | ||||||||||||||||||||
Peru Payroll Deduction Finance Ltd. | USD | 0.000 | % | 11/01/2029 | 5,218,986 | 3,888,145(1)(7) | ||||||||||||||
|
| |||||||||||||||||||
Russia - 0.98% | ||||||||||||||||||||
Gazpram Via Gaz Capital SA | USD | 6.510 | % | 03/07/2022 | 1,785,000 | 1,820,700(4) | ||||||||||||||
Gazprom OAO Via Gaz Capital SA: | ||||||||||||||||||||
| USD | 4.300 | % | 11/12/2015 | 4,286,000 | 4,312,788(4) | |||||||||||||||
| USD | 9.250 | % | 04/23/2019 | 3,106,000 | 3,517,545(4) | |||||||||||||||
| USD | 4.950 | % | 07/19/2022 | 1,066,000 | 1,006,037(4) | |||||||||||||||
Lukoil International Finance BV | USD | 3.416 | % | 04/24/2018 | 1,519,000 | 1,462,037(4) | ||||||||||||||
Vimpel Communications Holdings BV: | ||||||||||||||||||||
| USD | 5.200 | % | 02/13/2019 | 164,000 | 159,080(4) | |||||||||||||||
| USD | 7.504 | % | 03/01/2022 | 300,000 | 300,750(1) | |||||||||||||||
| USD | 7.504 | % | 03/01/2022 | 2,278,000 | 2,283,695(4) | |||||||||||||||
| USD | 5.950 | % | 02/13/2023 | 671,000 | 617,991(4) | |||||||||||||||
Vimpel Communications Via VIP Finance Ireland Ltd. OJSC | USD | 7.748 | % | 02/02/2021 | 2,040,000 | 2,091,000(4) | ||||||||||||||
Wind Acquisition Finance SA: | ||||||||||||||||||||
| EUR | 4.000 | % | 07/15/2020 | 911,000 | 1,018,061(4) | |||||||||||||||
| USD | 4.750 | % | 07/15/2020 | 419,000 | 423,190(4) | |||||||||||||||
|
| |||||||||||||||||||
| 19,012,874 | ||||||||||||||||||||
|
| |||||||||||||||||||
South Africa - 2.37% | ||||||||||||||||||||
Eskom Holdings SOC Ltd.: | ||||||||||||||||||||
| USD | 6.750 | % | 08/06/2023 | 7,174,000 | 7,371,285(4) | |||||||||||||||
| USD | 7.125 | % | 02/11/2025 | 37,178,000 | 38,525,702(4) | |||||||||||||||
|
| |||||||||||||||||||
| 45,896,987 | ||||||||||||||||||||
|
| |||||||||||||||||||
Thailand - 0.17% | ||||||||||||||||||||
PTT Exploration & Production PCL | USD | 4.875 | % | Perpetual | 3,289,000 | 3,358,891(3)(4) | ||||||||||||||
|
| |||||||||||||||||||
Venezuela - 4.00% | ||||||||||||||||||||
Petroleos de Venezuela SA: | ||||||||||||||||||||
| USD | 5.250 | % | 04/12/2017 | 18,145,600 | 9,932,901 | |||||||||||||||
| USD | 8.500 | % | 11/02/2017 | 73,724,100 | 54,924,455(1) | |||||||||||||||
| USD | 9.000 | % | 11/17/2021 | 28,630,328 | 12,611,659(1) | |||||||||||||||
|
| |||||||||||||||||||
| 77,469,015 | ||||||||||||||||||||
|
| |||||||||||||||||||
TOTAL CORPORATE BONDS | 553,268,379 | |||||||||||||||||||
|
| |||||||||||||||||||
(Cost $557,808,280) | ||||||||||||||||||||
CREDIT LINKED NOTES - 1.27% | ||||||||||||||||||||
Colombia - 0.09% | ||||||||||||||||||||
Titulos de Tesoreria - Series B | Citigroup Global Markets | COP | 11.000 | % | 07/27/2020 | 3,500,000,000 | 1,690,122 | |||||||||||||
|
| |||||||||||||||||||
30 | www.shiplp.com |
Table of Contents
| Stone Harbor Emerging Markets Debt Fund | Statements of Investments | |
May 31, 2015 |
| Counterparty | Currency | Rate | Maturity Date | Principal Amount/Shares* | Market Value Expressed (in U.S. $) | |||||||||||||||
Iraq - 0.35% | ||||||||||||||||||||
Republic of Iraq: | ||||||||||||||||||||
| Bank of America - Merrill Lynch | JPY | 2.484 | % | 01/01/2028 | 843,349,489 | $ | 4,697,317(3) | |||||||||||||
| Bank of America - Merrill Lynch | JPY | 2.715 | % | 01/01/2028 | 384,939,391 | 2,144,049(3) | ||||||||||||||
|
| |||||||||||||||||||
| 6,841,366 | ||||||||||||||||||||
|
| |||||||||||||||||||
Venezuela - 0.83% | ||||||||||||||||||||
Petroleos De Venezuela | Credit Suisse First Boston | USD | 5.267 | % | 12/20/2016 | 29,200,000 | 16,126,579(3) | |||||||||||||
|
| |||||||||||||||||||
TOTAL CREDIT LINKED NOTES | 24,658,067 | |||||||||||||||||||
|
| |||||||||||||||||||
(Cost $36,048,625) | ||||||||||||||||||||
SHORT TERM INVESTMENTS - 4.72% | ||||||||||||||||||||
Money Market Mutual Funds - 4.72% | ||||||||||||||||||||
Dreyfus Institutional Cash Advantage Fund - Institutional Advantage Class (7-Day Yield) | USD | 0.07989 | % | N/A | 91,336,097 | 91,336,097 | ||||||||||||||
|
| |||||||||||||||||||
TOTAL SHORT TERM INVESTMENTS | 91,336,097 | |||||||||||||||||||
|
| |||||||||||||||||||
(Cost $91,336,097) | ||||||||||||||||||||
Total Investments - 98.84% | 1,913,900,506 | |||||||||||||||||||
(Cost $1,908,657,988) | ||||||||||||||||||||
Other Assets In Excess of Liabilities - 1.16% | 22,440,008(8) | |||||||||||||||||||
|
| |||||||||||||||||||
Net Assets - 100.00% | $ | 1,936,340,514 | ||||||||||||||||||
|
| |||||||||||||||||||
* The principal amount/shares of each security is stated in the currency in which the security is denominated.
Currency Abbreviations:
COP | - | Colombian Peso | ||
EUR | - | Euro Currency | ||
GBP | - | Great Britain Pound | ||
IDR | - | Indonesian Rupiah | ||
INR | - | Indian Rupee | ||
JPY | - | Japanese Yen | ||
MXN | - | Mexican Peso | ||
PLN | - | Polish Zloty | ||
RUB | - | Russian Ruble | ||
USD | - | United States Dollar | ||
ZAR | - | South African Rand |
| (1) | Securities were originally issued pursuant to Regulation S under the Securities Act of 1933, which exempts securities offered and sold outside of the United States from registration. Such securities cannot be sold in the United States without either an effective registration statement filed pursuant to the Securities Act of 1933, or pursuant to an exemption from registration. As of May 31, 2015, the aggregate market value of those securities was $586,777,672, which represents approximately 30.30% of net assets. |
| (2) | Security is in default and therefore is non-income producing. |
| (3) | Floating or variable rate security. Interest rate disclosed is that which is in effect as of May 31, 2015. |
| (4) | Security exempt from registration under Rule 144A of the Securities Act of 1933. Such securities may normally be sold to qualified institutional buyers in transactions exempt from registration. Total market value of Rule 144A securities amounts to $532,963,258, which represents approximately 27.52% of net assets as of May 31, 2015. |
| (5) | Step bond. Coupon changes periodically based upon a predetermined schedule. Interest rate disclosed is that which is in effect as of May 31, 2015. |
Stone Harbor Investment Funds Annual Report | May 31, 2015 | 31 |
Table of Contents
| Stone Harbor Emerging Markets Debt Fund | Statements of Investments | |
May 31, 2015 |
| (6) | Bank loans generally pay interest at rates which are periodically determined by reference to a base lending rate plus a premium. All loans carry a variable rate of interest. These base lending rates are generally (i) the Prime Rate offered by one or more major United States banks, (ii) the lending rate offered by one or more European banks such as the London Interbank Offered Rate (“LIBOR”) or (iii) the Certificate of Deposit rate. Bank loans, while exempt from registration, under the Securities Act of 1933, contain certain restrictions on resale and cannot be sold publicly. Floating rate bank loans often require prepayments from excess cash flow or permit the borrower to repay at its election. The degree to which borrowers repay, whether as a contractual requirement or at their election, cannot be predicted with accuracy. The loan matured on November 25, 2014, but due to a default, final payments were not received. The security is shown to represent future expected payments. |
| (7) | Issued with a zero coupon. Income is recognized through the accretion of discount. |
| (8) | Includes cash which is being held as collateral for credit default swap contracts. |
Common Abbreviations:
BV | - | Besloten Vennootschap is the Dutch term for private limited liability company. | ||
GmbH | - | Gesellschaft mit beschrankter Haftung is the German term for a company with limited liability. | ||
JSC | - | Joint Stock Company. | ||
LLC | - | Limited Liability Corporation. | ||
LP | - | Limited Partnership. | ||
Ltd. | - | Limited. | ||
OAO | - | Otkrytoe Aktsionernoe Obschestvo is the Russian term for Open Joint Stock Company. | ||
OJSC | - | Open Joint Stock Company. | ||
PCL | - | A rearrangement of the letters for Public Limited Company, used in Thailand. | ||
PLC | - | Public Limited Company. | ||
PT | - | Perseroan terbuka is an Indonesian term for limited liability company. | ||
Pte | - | Private. | ||
SA | - | Generally designates corporations in various countries, mostly those employing the civil law. | ||
SAB de CV | - | A variable capital company. | ||
SOC | - | State owned Company. | ||
SPE | - | Special Purpose Entity. | ||
TBK | - | Perseroan terbuka is an Indonesian term for limited liability company. |
32 | www.shiplp.com |
Table of Contents
| Stone Harbor Emerging Markets Debt Fund | Statements of Investments | |
May 31, 2015 |
OUTSTANDING FORWARD FOREIGN CURRENCY CONTRACTS
| Counterparty | Foreign Currency | Contracted Amount** | Purchase/Sale Contract | Settlement Date | Current Value | Unrealized Appreciation/ (Depreciation) | ||||||||||
| ||||||||||||||||
Citigroup Global Markets | COP | 42,913,584,000 | Sale | 06/11/2015 | $ | 16,934,169 | $ | 341,831 | ||||||||
Citigroup Global Markets | INR | 1,210,582,762 | Purchase | 06/08/2015 | 18,916,710 | 18,628 | ||||||||||
Citigroup Global Markets | PLN | 71,634,717 | Sale | 06/08/2015 | 19,134,065 | 507,760 | ||||||||||
Citigroup Global Markets | RUB | 333,229,224 | Purchase | 06/08/2015 | 6,336,963 | 57,913 | ||||||||||
Citigroup Global Markets | RUB | 685,376,710 | Sale | 06/08/2015 | 13,033,692 | 412,977 | ||||||||||
J.P. Morgan Chase & Co. | EUR | 14,313,800 | Sale | 06/10/2015 | 15,723,320 | 424,207 | ||||||||||
J.P. Morgan Chase & Co. | JPY | 845,992,000 | Sale | 06/10/2015 | 6,817,369 | 239,916 | ||||||||||
|
| |||||||||||||||
| $ | 2,003,232 | |||||||||||||||
|
| |||||||||||||||
Citigroup Global Markets | INR | 1,210,582,762 | Sale | 06/08/2015 | $ | 18,916,710 | $ | (172,688) | ||||||||
Citigroup Global Markets | PLN | 71,634,717 | Purchase | 06/08/2015 | 19,134,065 | (730,808) | ||||||||||
Citigroup Global Markets | RUB | 352,147,486 | Purchase | 06/08/2015 | 6,696,729 | (24,926) | ||||||||||
Citigroup Global Markets | ZAR | 229,290,834 | Sale | 06/08/2015 | 18,848,068 | (30,910) | ||||||||||
Citigroup Global Markets | ZAR | 229,290,834 | Purchase | 06/08/2015 | 18,848,068 | (170,116) | ||||||||||
J.P. Morgan Chase & Co. | EUR | 3,592,734 | Purchase | 06/10/2015 | 3,946,521 | (103,500) | ||||||||||
J.P. Morgan Chase & Co. | GBP | 693,300 | Sale | 06/10/2015 | 1,059,548 | (4,766) | ||||||||||
|
| |||||||||||||||
| $ | (1,237,714) | |||||||||||||||
|
| |||||||||||||||
** The contracted amount is stated in the currency in which the contract is denominated.
CREDIT DEFAULT SWAP CONTRACTS ON SOVEREIGN DEBT OBLIGATIONS ISSUE - SELL PROTECTION(9)
Reference Obligations | Counterparty | Fixed Deal Receive Rate | Maturity Date | Implied Credit May 31, 2015(10) | Notional Amount(11) | Market Value | Upfront Premiums Received | Unrealized Appreciation | ||||||||||||||||
| ||||||||||||||||||||||||
Petroleos de Venezuela | Credit Suisse First Boston | 5.000% | 06/20/2016 | 38.520% | $ | 27,500,000 | $ | 7,815,721 | $ | 8,318,750 | $ | 503,029 | ||||||||||||
|
| |||||||||||||||||||||||
| $ | 7,815,721 | $ | 8,318,750 | $ | 503,029 | |||||||||||||||||||
|
| |||||||||||||||||||||||
| (9) | If the Fund is a seller of protection and a credit event occurs, as defined under the terms of that particular swap agreement, the Fund will either (i) pay to the buyer of protection an amount equal to the notional amount of the swap and take delivery of the referenced obligation or underlying securities comprising the referenced index or (ii) pay a net settlement amount in the form of cash or securities equal to the notional amount of the swap less the recovery value of the referenced obligation or underlying securities comprising the referenced index. |
| (10) | Implied credit spreads, represented in absolute terms, utilized in determining the market value of credit default swap agreements on sovereign issues of an emerging country as of period end serve as an indicator of the current status of the payment/performance risk and represent the likelihood or risk of default for the credit derivative. The implied credit spread of a particular referenced entity reflects the cost of buying/selling protection and may include upfront payments required to be made to enter into the agreement. Wider credit spreads represent a deterioration of the referenced entity’s credit soundness and a greater likelihood or risk of default or other credit event occurring as defined under the terms of the agreement. |
| (11) | The maximum potential amount the Fund could be required to pay as a seller of credit protection or receive as a buyer of credit protection if a credit event occurs as defined under the terms of that particular swap agreement. |
Stone Harbor Investment Funds Annual Report | May 31, 2015 | 33 |
Table of Contents
| Stone Harbor Emerging Markets Debt Fund | Statements of Investments | |
May 31, 2015 |
INTEREST RATE SWAP CONTRACTS
Pay/Receive Floating Rate | Clearing House | Floating Rate | Expiration Date | Notional Amount | Fixed Rate | Market Value | Unrealized (Depreciation) | |||||||||||
| ||||||||||||||||||
Receive | Chicago Mercantile Exchange | 3 month LIBOR | 1/12/2025 | $ 31,570,000 | 2.140% | $ | 51,190 | $ | 51,190 | |||||||||
Receive | Chicago Mercantile Exchange | 3 month LIBOR | 1/13/2025 | 15,490,300 | 2.077% | 112,001 | 112,001 | |||||||||||
Receive | Chicago Mercantile Exchange | 3 month LIBOR | 2/6/2045 | 5,700,000 | 2.343% | 331,942 | 331,942 | |||||||||||
|
| |||||||||||||||||
| $ | 495,133 | $ | 495,133 | |||||||||||||||
|
| |||||||||||||||||
See Notes to Financial Statements.
34 | www.shiplp.com |
Table of Contents
| Stone Harbor High Yield Bond Fund | Statements of Investments | |
May 31, 2015 |
| Currency | Rate | Maturity Date | Principal Amount* | Market Value (Expressed in U.S. $) | ||||||||||||||||
CORPORATE BONDS - 88.86% | ||||||||||||||||||||
Advertising - 0.34% | ||||||||||||||||||||
Outfront Media Capital LLC / Outfront Media Capital Corp. | USD | 5.250 | % | 02/15/2022 | 955,000 | $ | 990,812 | |||||||||||||
|
| |||||||||||||||||||
Aerospace/Defense - 0.55% | ||||||||||||||||||||
Bombardier, Inc.: | ||||||||||||||||||||
| USD | 6.000 | % | 10/15/2022 | 1,245,000 | 1,134,506(1) | |||||||||||||||
| USD | 7.500 | % | 03/15/2025 | 480,000 | 460,800(1) | |||||||||||||||
|
| |||||||||||||||||||
| 1,595,306 | ||||||||||||||||||||
|
| |||||||||||||||||||
Airlines - 0.22% | ||||||||||||||||||||
Allegiant Travel Co. | USD | 5.500 | % | 07/15/2019 | 620,000 | 639,375 | ||||||||||||||
|
| |||||||||||||||||||
Automotive - 1.98% | ||||||||||||||||||||
Chrysler Group LLC | USD | 8.250 | % | 06/15/2021 | 920,000 | 1,018,440 | ||||||||||||||
Fiat Chrysler Automobiles NV | USD | 5.250 | % | 04/15/2023 | 825,000 | 831,188(1) | ||||||||||||||
Goodyear Tire & Rubber Co. | USD | 6.500 | % | 03/01/2021 | 1,528,000 | 1,633,050 | ||||||||||||||
MPG Holdco I, Inc. | USD | 7.375 | % | 10/15/2022 | 1,200,000 | 1,290,000(1) | ||||||||||||||
Schaeffler Holding Finance BV: | ||||||||||||||||||||
| USD | 6.250 | % | 11/15/2019 | 620,000 | �� | 661,856(1)(2) | ||||||||||||||
| USD | 6.750 | % | 11/15/2022 | 265,000 | 290,175(1)(2) | |||||||||||||||
|
| |||||||||||||||||||
| 5,724,709 | ||||||||||||||||||||
|
| |||||||||||||||||||
Building Materials - 0.34% | ||||||||||||||||||||
NCI Building Systems, Inc. | USD | 8.250 | % | 01/15/2023 | 920,000 | 986,700(1) | ||||||||||||||
|
| |||||||||||||||||||
Building Products - 2.74% | ||||||||||||||||||||
Building Materials Corp. of America | USD | 5.375 | % | 11/15/2024 | 1,145,000 | 1,160,022(1) | ||||||||||||||
Griffon Corp. | USD | 5.250 | % | 03/01/2022 | 2,490,000 | 2,511,787 | ||||||||||||||
Masonite International Corp. | USD | 5.625 | % | 03/15/2023 | 725,000 | 754,000(1) | ||||||||||||||
Norbord, Inc. | USD | 5.375 | % | 12/01/2020 | 1,985,000 | 1,989,963(1) | ||||||||||||||
RSI Home Products, Inc. | USD | 6.500 | % | 03/15/2023 | 1,475,000 | 1,526,625(1) | ||||||||||||||
|
| |||||||||||||||||||
| 7,942,397 | ||||||||||||||||||||
|
| |||||||||||||||||||
Chemicals - 4.35% | ||||||||||||||||||||
CeramTec Group GmbH | EUR | 8.250 | % | 08/15/2021 | 1,000,000 | 1,210,876(3) | ||||||||||||||
Chemtura Corp. | USD | 5.750 | % | 07/15/2021 | 3,602,000 | 3,719,065 | ||||||||||||||
INEOS Group Holdings SA | USD | 5.875 | % | 02/01/2019 | 2,425,000 | 2,476,531(1) | ||||||||||||||
Lyond Basel Escrow | USD | 8.375 | % | 08/15/2015 | 25,000 | 0(4) | ||||||||||||||
Lyondell Chemical Co. | USD | 8.375 | % | 08/15/2015 | 945,000 | 0(4) | ||||||||||||||
Platform Specialty Products Corp. | USD | 6.500 | % | 02/01/2022 | 1,630,000 | 1,719,650(1) | ||||||||||||||
SPCM SA | USD | 6.000 | % | 01/15/2022 | 1,521,000 | 1,604,655(1) | ||||||||||||||
Trinseo Materials Operating SCA / Trinseo Materials Finance, Inc.: | ||||||||||||||||||||
| EUR | 6.375 | % | 05/01/2022 | 500,000 | 565,625(1) | |||||||||||||||
| USD | 6.750 | % | 05/01/2022 | 1,280,000 | 1,307,200(1) | |||||||||||||||
|
| |||||||||||||||||||
| 12,603,602 | ||||||||||||||||||||
|
| |||||||||||||||||||
Consumer Products - 2.86% | ||||||||||||||||||||
ACCO Brands Corp. | USD | 6.750 | % | 04/30/2020 | 2,348,000 | 2,512,360 | ||||||||||||||
Edgewell Personal Care Co. | USD | 5.500 | % | 06/15/2025 | 1,175,000 | 1,177,937(1) | ||||||||||||||
Stone Harbor Investment Funds Annual Report | May 31, 2015 | 35 |
Table of Contents
| Stone Harbor High Yield Bond Fund | Statements of Investments | |
May 31, 2015 |
| Currency | Rate | Maturity Date | Principal Amount* | Market Value (Expressed in U.S. $) | ||||||||||||||||
Consumer Products (continued) | ||||||||||||||||||||
Spectrum Brands, Inc.: | ||||||||||||||||||||
| USD | 6.375 | % | 11/15/2020 | 1,455,000 | $ | 1,560,487 | ||||||||||||||
| USD | 6.125 | % | 12/15/2024 | 880,000 | 939,400(1) | |||||||||||||||
| USD | 5.750 | % | 07/15/2025 | 490,000 | 505,925(1) | |||||||||||||||
Sun Products Corp. | USD | 7.750 | % | 03/15/2021 | 1,751,000 | 1,597,788(1) | ||||||||||||||
|
| |||||||||||||||||||
| 8,293,897 | ||||||||||||||||||||
|
| |||||||||||||||||||
Containers/Packaging - 2.14% | ||||||||||||||||||||
Albea Beauty Holdings SA | USD | 8.375 | % | 11/01/2019 | 1,116,000 | 1,210,860(1) | ||||||||||||||
Ardagh Finance Holdings SA | USD | 8.625 | % | 06/15/2019 | 735,909 | 788,343(1)(2) | ||||||||||||||
Ardagh Packaging Finance PLC/Ardagh Holdings USA, Inc. | USD | 6.000 | % | 06/30/2021 | 700,000 | 707,000(1) | ||||||||||||||
Reynolds Group Issuer LLC | USD | 8.250 | % | 02/15/2021 | 2,235,000 | 2,366,306 | ||||||||||||||
Signode Industrial Group Lux SA/Signode | USD | 6.375 | % | 05/01/2022 | 1,115,000 | 1,120,575(1) | ||||||||||||||
|
| |||||||||||||||||||
| 6,193,084 | ||||||||||||||||||||
|
| |||||||||||||||||||
Drillers/Services - 3.17% | ||||||||||||||||||||
FTS International, Inc. | USD | 6.250 | % | 05/01/2022 | 1,625,000 | 1,304,062 | ||||||||||||||
Hornbeck Offshore Services, Inc.: | ||||||||||||||||||||
| USD | 5.875 | % | 04/01/2020 | 827,000 | 771,178 | |||||||||||||||
| USD | 5.000 | % | 03/01/2021 | 1,107,000 | 968,625 | |||||||||||||||
Offshore Group Investment Ltd. | USD | 7.125 | % | 04/01/2023 | 2,360,000 | 1,663,800 | ||||||||||||||
Pacific Drilling SA | USD | 5.375 | % | 06/01/2020 | 872,000 | 723,760(1) | ||||||||||||||
Parker Drilling Co. | USD | 6.750 | % | 07/15/2022 | 2,070,000 | 1,806,075 | ||||||||||||||
Trinidad Drilling Ltd. | USD | 7.875 | % | 01/15/2019 | 1,975,000 | 1,955,250(1) | ||||||||||||||
|
| |||||||||||||||||||
| 9,192,750 | ||||||||||||||||||||
|
| |||||||||||||||||||
Electric - 4.50% | ||||||||||||||||||||
Calpine Corp. | USD | 5.750 | % | 01/15/2025 | 2,330,000 | 2,356,212 | ||||||||||||||
Dynegy, Inc.: | ||||||||||||||||||||
| USD | 6.750 | % | 11/01/2019 | 1,355,000 | 1,439,688(1) | |||||||||||||||
| USD | 7.625 | % | 11/01/2024 | 800,000 | 862,000(1) | |||||||||||||||
GenOn Energy, Inc. | USD | 9.500 | % | 10/15/2018 | 4,187,000 | 4,344,013 | ||||||||||||||
NRG Energy, Inc. | USD | 6.250 | % | 07/15/2022 | 2,330,000 | 2,452,325 | ||||||||||||||
RJS Power Holdings LLC | USD | 5.125 | % | 07/15/2019 | 1,575,000 | 1,573,031(1) | ||||||||||||||
|
| |||||||||||||||||||
| 13,027,269 | ||||||||||||||||||||
|
| |||||||||||||||||||
Environmental Services - 0.58% | ||||||||||||||||||||
Clean Harbors, Inc. | USD | 5.250 | % | 08/01/2020 | 1,641,000 | 1,694,332 | ||||||||||||||
|
| |||||||||||||||||||
Exploration & Production - 6.95% | ||||||||||||||||||||
Bonanza Creek Energy, Inc.: | ||||||||||||||||||||
| USD | 6.750 | % | 04/15/2021 | 2,198,000 | 2,137,555 | |||||||||||||||
| USD | 5.750 | % | 02/01/2023 | 250,000 | 232,500 | |||||||||||||||
Chesapeake Energy Corp. | USD | 5.750 | % | 03/15/2023 | 2,210,000 | 2,193,425 | ||||||||||||||
Denbury Resources, Inc. | USD | 5.500 | % | 05/01/2022 | 1,770,000 | 1,698,094 | ||||||||||||||
EP Energy LLC / Everest Acquisition Finance, Inc. | USD | 6.375 | % | 06/15/2023 | 920,000 | 922,300(1) | ||||||||||||||
EP Energy LLC/EP Energy Finance, Inc., | USD | 9.375 | % | 05/01/2020 | 1,228,000 | 1,341,590 | ||||||||||||||
Halcon Resources Corp.: | ||||||||||||||||||||
| USD | 8.625 | % | 02/01/2020 | 165,000 | 167,887(1) | |||||||||||||||
| USD | 9.750 | % | 07/15/2020 | 1,658,000 | 1,218,630 | |||||||||||||||
36 | www.shiplp.com |
Table of Contents
| Stone Harbor High Yield Bond Fund | Statements of Investments | |
May 31, 2015 |
| Currency | Rate | Maturity Date | Principal Amount* | Market Value (Expressed in U.S. $) | ||||||||||||||||
Exploration & Production (continued) | ||||||||||||||||||||
Laredo Petroleum, Inc.: | ||||||||||||||||||||
| USD | 5.625 | % | 01/15/2022 | 1,100,000 | $ | 1,108,250 | ||||||||||||||
| USD | 7.375 | % | 05/01/2022 | 1,243,000 | 1,326,902 | |||||||||||||||
Linn Energy LLC | USD | 7.750 | % | 02/01/2021 | 1,219,000 | 1,057,482 | ||||||||||||||
Linn Energy LLC / Linn Energy Finance Corp. | USD | 6.500 | % | 09/15/2021 | 705,000 | 569,288 | ||||||||||||||
MEG Energy Corp. | USD | 6.500 | % | 03/15/2021 | 1,305,000 | 1,272,375(1) | ||||||||||||||
Midstates Petroleum Co., Inc. | USD | 10.750 | % | 10/01/2020 | 981,000 | 470,880 | ||||||||||||||
Oasis Petroleum, Inc. | USD | 7.250 | % | 02/01/2019 | 1,901,000 | 1,962,783 | ||||||||||||||
QEP Resources, Inc. | USD | 5.375 | % | 10/01/2022 | 1,427,000 | 1,441,270 | ||||||||||||||
SandRidge Energy, Inc. | USD | 7.500 | % | 03/15/2021 | 997,000 | 575,768 | ||||||||||||||
Venoco, Inc. | USD | 8.875 | % | 02/15/2019 | 1,186,000 | 432,890 | ||||||||||||||
|
| |||||||||||||||||||
| 20,129,869 | ||||||||||||||||||||
|
| |||||||||||||||||||
Financial Other - 0.72% | ||||||||||||||||||||
Aircastle Ltd. | USD | 5.500 | % | 02/15/2022 | 1,140,000 | 1,208,400 | ||||||||||||||
Quicken Loans, Inc. | USD | 5.750 | % | 05/01/2025 | 880,000 | 883,300(1) | ||||||||||||||
|
| |||||||||||||||||||
| 2,091,700 | ||||||||||||||||||||
|
| |||||||||||||||||||
Food/Beverage/Tobacco - 4.70% | ||||||||||||||||||||
Bakkavor Finance 2 PLC | GBP | 8.250 | % | 02/15/2018 | 419,204 | 671,145(3) | ||||||||||||||
Boparan Finance PLC | GBP | 5.500 | % | 07/15/2021 | 1,380,000 | 1,966,294(3) | ||||||||||||||
Chiquita Brands International, Inc./Chiquita Brands LLC | USD | 7.875 | % | 02/01/2021 | 862,000 | 940,658 | ||||||||||||||
Dean Foods Co. | USD | 6.500 | % | 03/15/2023 | 1,855,000 | 1,933,838(1) | ||||||||||||||
Pilgrim’s Pride Corp. | USD | 5.750 | % | 03/15/2025 | 1,240,000 | 1,261,700(1) | ||||||||||||||
Post Holdings, Inc. | USD | 7.375 | % | 02/15/2022 | 2,165,000 | 2,223,628 | ||||||||||||||
Premier Foods Finance PLC | GBP | 6.500 | % | 03/15/2021 | 1,000,000 | 1,480,637(3) | ||||||||||||||
R&R PLC | EUR | 9.250 | % | 05/15/2018 | 1,100,000 | 1,230,782(2)(3) | ||||||||||||||
Smithfield Foods, Inc. | USD | 6.625 | % | 08/15/2022 | 1,756,000 | 1,904,382 | ||||||||||||||
|
| |||||||||||||||||||
| 13,613,064 | ||||||||||||||||||||
|
| |||||||||||||||||||
Gaming - 2.61% | ||||||||||||||||||||
Boyd Gaming Corp. | USD | 6.875 | % | 05/15/2023 | 320,000 | 327,200 | ||||||||||||||
Isle of Capri Casinos, Inc. | USD | 5.875 | % | 03/15/2021 | 2,325,000 | 2,418,000 | ||||||||||||||
MGM Resorts International | USD | 6.625 | % | 12/15/2021 | 2,333,000 | 2,519,640 | ||||||||||||||
Pinnacle Entertainment, Inc. | USD | 6.375 | % | 08/01/2021 | 2,135,000 | 2,289,787 | ||||||||||||||
|
| |||||||||||||||||||
| 7,554,627 | ||||||||||||||||||||
|
| |||||||||||||||||||
Healthcare - 7.49% | ||||||||||||||||||||
Amsurg Corp. | USD | 5.625 | % | 07/15/2022 | 1,230,000 | 1,263,825 | ||||||||||||||
Community Health Systems, Inc.: | ||||||||||||||||||||
| USD | 8.000 | % | 11/15/2019 | 1,552,000 | 1,652,880 | |||||||||||||||
| USD | 6.875 | % | 02/01/2022 | 1,100,000 | 1,178,375 | |||||||||||||||
Concordia Healthcare Corp. | USD | 7.000 | % | 04/15/2023 | 690,000 | 696,037(1) | ||||||||||||||
DaVita HealthCare Partners, Inc. | USD | 5.125 | % | 07/15/2024 | 1,530,000 | 1,549,125 | ||||||||||||||
Grifols Worldwide Operations Ltd. | USD | 5.250 | % | 04/01/2022 | 1,270,000 | 1,298,575 | ||||||||||||||
HCA, Inc.: | ||||||||||||||||||||
| USD | 4.250 | % | 10/15/2019 | 600,000 | 623,490 | |||||||||||||||
| USD | 5.375 | % | 02/01/2025 | 1,195,000 | 1,233,838 | |||||||||||||||
HealthSouth Corp.: | ||||||||||||||||||||
| USD | 5.125 | % | 03/15/2023 | 300,000 | 308,625 | |||||||||||||||
| USD | 5.750 | % | 11/01/2024 | 1,800,000 | 1,865,250 | |||||||||||||||
Stone Harbor Investment Funds Annual Report | May 31, 2015 | 37 |
Table of Contents
| Stone Harbor High Yield Bond Fund | Statements of Investments | |
May 31, 2015 |
| Currency | Rate | Maturity Date | Principal Amount* | Market Value (Expressed in U.S. $) | ||||||||||||||||
Healthcare (continued) | ||||||||||||||||||||
Hologic, Inc. | USD | 6.250 | % | 08/01/2020 | 1,759,000 | $ | 1,827,161 | |||||||||||||
IASIS Healthcare LLC | USD | 8.375 | % | 05/15/2019 | 1,487,000 | 1,558,562 | ||||||||||||||
Kinetic Concepts, Inc./KCI USA, Inc.: | ||||||||||||||||||||
| USD | 10.500 | % | 11/01/2018 | 1,064,000 | 1,146,992 | |||||||||||||||
| USD | 12.500 | % | 11/01/2019 | 845,000 | 925,275 | |||||||||||||||
LifePoint Health, Inc. | USD | 5.500 | % | 12/01/2021 | 1,760,000 | 1,854,600 | ||||||||||||||
Quintiles Transnational Corp. | USD | 4.875 | % | 05/15/2023 | 515,000 | 524,013(1) | ||||||||||||||
Tenet Healthcare Corp.: | ||||||||||||||||||||
| USD | 6.000 | % | 10/01/2020 | 718,000 | 770,055 | |||||||||||||||
| USD | 8.125 | % | 04/01/2022 | 1,308,000 | 1,428,990 | |||||||||||||||
|
| |||||||||||||||||||
| 21,705,668 | ||||||||||||||||||||
|
| |||||||||||||||||||
Home Builders - 0.88% | ||||||||||||||||||||
Lennar Corp. | USD | 4.750 | % | 11/15/2022 | 939,000 | 935,479 | ||||||||||||||
Shea Homes LP / Shea Homes Funding Corp. | USD | 5.875 | % | 04/01/2023 | 710,000 | 734,850(1) | ||||||||||||||
Standard Pacific Corp. | USD | 5.875 | % | 11/15/2024 | 847,000 | 885,115 | ||||||||||||||
|
| |||||||||||||||||||
| 2,555,444 | ||||||||||||||||||||
|
| |||||||||||||||||||
Industrial Other - 2.55% | ||||||||||||||||||||
AECOM | USD | 5.750 | % | 10/15/2022 | 1,415,000 | 1,468,062(1) | ||||||||||||||
Cleaver-Brooks, Inc. | USD | 8.750 | % | 12/15/2019 | 1,461,000 | 1,479,263(1) | ||||||||||||||
EnerSys | USD | 5.000 | % | 04/30/2023 | 900,000 | 913,500(1) | ||||||||||||||
MasTec, Inc. | USD | 4.875 | % | 03/15/2023 | 2,688,000 | 2,520,000 | ||||||||||||||
WESCO Distribution, Inc. | USD | 5.375 | % | 12/15/2021 | 970,000 | 994,250 | ||||||||||||||
|
| |||||||||||||||||||
| 7,375,075 | ||||||||||||||||||||
|
| |||||||||||||||||||
Leisure - 1.09% | ||||||||||||||||||||
AMC Entertainment, Inc. | USD | 5.875 | % | 02/15/2022 | 1,945,000 | 2,037,387 | ||||||||||||||
Cinemark USA, Inc.: | ||||||||||||||||||||
| USD | 5.125 | % | 12/15/2022 | 740,000 | 757,575 | |||||||||||||||
| USD | 4.875 | % | 06/01/2023 | 375,000 | 377,794 | |||||||||||||||
|
| |||||||||||||||||||
| 3,172,756 | ||||||||||||||||||||
|
| |||||||||||||||||||
Lodging - 0.70% | ||||||||||||||||||||
RHP Hotel Properties LP/RHP Finance Corp. | USD | 5.000 | % | 04/15/2021 | 1,978,000 | 2,017,560 | ||||||||||||||
|
| |||||||||||||||||||
Media Cable - 8.34% | ||||||||||||||||||||
Cablevision Systems Corp.: | ||||||||||||||||||||
| USD | 8.000 | % | 04/15/2020 | 864,000 | 952,560 | |||||||||||||||
| USD | 5.875 | % | 09/15/2022 | 3,080,000 | 3,080,000 | |||||||||||||||
CCO Holdings LLC: | ||||||||||||||||||||
| USD | 6.625 | % | 01/31/2022 | 1,487,000 | 1,585,514 | |||||||||||||||
| USD | 5.125 | % | 02/15/2023 | 750,000 | 751,875 | |||||||||||||||
Cequel Communications Holdings I LLC/Cequel Capital Corp. | USD | 5.125 | % | 12/15/2021 | 2,566,000 | 2,440,907(1) | ||||||||||||||
DISH DBS Corp., Series WI | USD | 5.000 | % | 03/15/2023 | 4,478,000 | 4,343,660 | ||||||||||||||
Mediacom LLC | USD | 7.250 | % | 02/15/2022 | 2,371,000 | 2,525,115 | ||||||||||||||
Numericable-SFR SAS: | ||||||||||||||||||||
| USD | 6.000 | % | 05/15/2022 | 1,270,000 | 1,285,875(1) | |||||||||||||||
| USD | 6.250 | % | 05/15/2024 | 660,000 | 671,550(1) | |||||||||||||||
Quebecor Media, Inc. | USD | 5.750 | % | 01/15/2023 | 1,566,000 | 1,630,597 | ||||||||||||||
38 | www.shiplp.com |
Table of Contents
| Stone Harbor High Yield Bond Fund | Statements of Investments | |
May 31, 2015 |
| Currency | Rate | Maturity Date | Principal Amount* | Market Value (Expressed in U.S. $) | ||||||||||||||||
Media Cable (continued) | ||||||||||||||||||||
Unitymedia Hessen GmbH & Co. KG | USD | 5.000 | % | 01/15/2025 | 755,000 | $ | 753,113(1) | |||||||||||||
UPC Holding BV | EUR | 6.375 | % | 09/15/2022 | 1,300,000 | 1,550,580(3) | ||||||||||||||
UPCB Finance IV Ltd. | USD | 5.375 | % | 01/15/2025 | 1,030,000 | 1,036,438(1) | ||||||||||||||
Virgin Media Finance PLC | USD | 6.000 | % | 10/15/2024 | 1,475,000 | 1,543,219(1) | ||||||||||||||
|
| |||||||||||||||||||
| 24,151,003 | ||||||||||||||||||||
|
| |||||||||||||||||||
Media Other - 3.96% | ||||||||||||||||||||
Gannett Co., Inc. | USD | 6.375 | % | 10/15/2023 | 1,714,000 | 1,831,837 | ||||||||||||||
Gray Television, Inc. | USD | 7.500 | % | 10/01/2020 | 2,240,000 | 2,396,800 | ||||||||||||||
Interep National Radio Sales, Inc., Series B | USD | 10.000 | % | 07/01/2008 | 27,318 | 3(4) | ||||||||||||||
LIN Television Corp. | USD | 5.875 | % | 11/15/2022 | 2,075,000 | 2,132,063(1) | ||||||||||||||
Nexstar Broadcasting, Inc., Series WI | USD | 6.875 | % | 11/15/2020 | 2,020,000 | 2,156,350 | ||||||||||||||
Sinclair Television Group, Inc., Series WI | USD | 6.125 | % | 10/01/2022 | 2,780,000 | 2,946,800 | ||||||||||||||
|
| |||||||||||||||||||
| 11,463,853 | ||||||||||||||||||||
|
| |||||||||||||||||||
Metals/Mining/Steel - 2.63% | ||||||||||||||||||||
Alcoa, Inc. | USD | 5.125 | % | 10/01/2024 | 655,000 | 702,487 | ||||||||||||||
ArcelorMittal: | �� | |||||||||||||||||||
| USD | 6.750 | % | 02/25/2022 | 1,546,000 | 1,696,735 | |||||||||||||||
| USD | 7.500 | % | 10/15/2039 | 1,255,000 | 1,296,955 | |||||||||||||||
Cloud Peak Energy Resources LLC: | ||||||||||||||||||||
| USD | 8.500 | % | 12/15/2019 | 615,000 | 588,862 | |||||||||||||||
| USD | 6.375 | % | 03/15/2024 | 1,580,000 | 1,295,600 | |||||||||||||||
Peabody Energy Corp.: | ||||||||||||||||||||
| USD | 10.000 | % | 03/15/2022 | 1,495,000 | 1,143,675(1) | |||||||||||||||
Series WI | USD | 6.250 | % | 11/15/2021 | 1,777,000 | 884,058 | ||||||||||||||
|
| |||||||||||||||||||
| 7,608,372 | ||||||||||||||||||||
|
| |||||||||||||||||||
Paper/Forest Products - 2.39% | ||||||||||||||||||||
Cascades, Inc. | USD | 5.500 | % | 07/15/2022 | 735,000 | 734,081(1) | ||||||||||||||
Louisiana-Pacific Corp. | USD | 7.500 | % | 06/01/2020 | 1,578,000 | 1,696,350 | ||||||||||||||
Mercer International, Inc. | USD | 7.750 | % | 12/01/2022 | 1,470,000 | 1,591,275 | ||||||||||||||
Rayonier AM Products, Inc. | USD | 5.500 | % | 06/01/2024 | 1,900,000 | 1,712,090(1) | ||||||||||||||
Xerium Technologies, Inc. | USD | 8.875 | % | 06/15/2018 | 1,154,000 | 1,199,439 | ||||||||||||||
|
| |||||||||||||||||||
| 6,933,235 | ||||||||||||||||||||
|
| |||||||||||||||||||
Pharmaceuticals - 1.26% | ||||||||||||||||||||
Endo Finance LLC / Endo Ltd. / Endo | USD | 6.000 | % | 02/01/2025 | 1,210,000 | 1,231,175(1) | ||||||||||||||
Mallinckrodt International Finance SA / Mallinckrodt CB LLC | USD | 5.750 | % | 08/01/2022 | 920,000 | 967,150(1) | ||||||||||||||
Valeant Pharmaceuticals International, Inc. | USD | 5.875 | % | 05/15/2023 | 1,410,000 | 1,464,638(1) | ||||||||||||||
|
| |||||||||||||||||||
| 3,662,963 | ||||||||||||||||||||
|
| |||||||||||||||||||
Publishing/Printing - 0.00% | ||||||||||||||||||||
IDEARC, Inc. | USD | 8.000 | % | 11/15/2016 | 1,345,000 | 0(4) | ||||||||||||||
|
| |||||||||||||||||||
Refining - 0.65% | ||||||||||||||||||||
Tesoro Logistics LP/Tesoro Logistics Finance Corp.: | ||||||||||||||||||||
| USD | 5.875 | % | 10/01/2020 | 776,000 | 816,352 | |||||||||||||||
Stone Harbor Investment Funds Annual Report | May 31, 2015 | 39 |
Table of Contents
| Stone Harbor High Yield Bond Fund | Statements of Investments | |
May 31, 2015 |
| Currency | Rate | Maturity Date | Principal Amount* | Market Value (Expressed in U.S. $) | ||||||||||||||||
Refining (continued) | ||||||||||||||||||||
Tesoro Logistics LP/Tesoro Logistics Finance Corp.: (continued) | ||||||||||||||||||||
| USD | 6.125 | % | 10/15/2021 | 1,003,000 | $ | 1,058,165 | ||||||||||||||
|
| |||||||||||||||||||
| 1,874,517 | ||||||||||||||||||||
|
| |||||||||||||||||||
Restaurants - 0.91% | ||||||||||||||||||||
Landry’s, Inc. | USD | 9.375 | % | 05/01/2020 | 1,742,000 | 1,883,538(1) | ||||||||||||||
Ruby Tuesday, Inc. | USD | 7.625 | % | 05/15/2020 | 740,000 | 765,900 | ||||||||||||||
|
| |||||||||||||||||||
| 2,649,438 | ||||||||||||||||||||
|
| |||||||||||||||||||
Retail Food/Drug - 0.54% | ||||||||||||||||||||
Tops Holding II | USD | 8.000 | % | 6/15/2022 | 1,580,000 | 1,580,000(1) | ||||||||||||||
|
| |||||||||||||||||||
Retail Non Food/Drug - 2.42% | ||||||||||||||||||||
Argos Merger Sub, Inc. | USD | 7.125 | % | 03/15/2023 | 1,840,000 | 1,955,000(1) | ||||||||||||||
Bon-Ton Department Stores, Inc. | USD | 8.000 | % | 06/15/2021 | 1,027,000 | 839,572 | ||||||||||||||
Family Tree Escrow LLC | USD | 5.750 | % | 03/01/2023 | 460,000 | 487,025(1) | ||||||||||||||
Hot Topic, Inc. | USD | 9.250 | % | 06/15/2021 | 1,515,000 | 1,647,562(1) | ||||||||||||||
JC Penney Corp., Inc. | USD | 5.650 | % | 06/01/2020 | 1,125,000 | 1,020,938 | ||||||||||||||
Petco Holdings, Inc. | USD | 8.500 | % | 10/15/2017 | 1,026,000 | 1,059,345(1)(2) | ||||||||||||||
|
| |||||||||||||||||||
| 7,009,442 | ||||||||||||||||||||
|
| |||||||||||||||||||
Services Other - 0.54% | ||||||||||||||||||||
Outerwall, Inc. | USD | 6.000 | % | 03/15/2019 | 1,540,000 | 1,555,400 | ||||||||||||||
|
| |||||||||||||||||||
Technology - 3.10% | ||||||||||||||||||||
Alcatel-Lucent USA, Inc. | USD | 6.750 | % | 11/15/2020 | 1,230,000 | 1,308,412(1) | ||||||||||||||
Artesyn Embedded Technologies, Inc. | USD | 9.750 | % | 10/15/2020 | 1,275,000 | 1,329,187(1) | ||||||||||||||
CommScope Technologies Finance LLC | USD | 6.000 | % | 06/15/2025 | 980,000 | 994,700(1) | ||||||||||||||
First Data Corp. | USD | 12.625 | % | 01/15/2021 | 1,637,000 | 1,921,429 | ||||||||||||||
NCR Corp. | USD | 5.000 | % | 07/15/2022 | 1,784,000 | 1,741,630 | ||||||||||||||
Nuance Communications, Inc. | USD | 5.375 | % | 08/15/2020 | 1,657,000 | 1,679,784(1) | ||||||||||||||
|
| |||||||||||||||||||
| 8,975,142 | ||||||||||||||||||||
|
| |||||||||||||||||||
Textile/Apparel - 1.51% | ||||||||||||||||||||
Levi Strauss & Co.: | ||||||||||||||||||||
| USD | 6.875 | % | 05/01/2022 | 1,525,000 | 1,669,875 | |||||||||||||||
| USD | 5.000 | % | 05/01/2025 | 245,000 | 245,307(1) | |||||||||||||||
Quiksilver, Inc.: | ||||||||||||||||||||
| USD | 10.000 | % | 08/01/2020 | 521,000 | 333,440 | |||||||||||||||
| USD | 7.875 | % | 08/01/2018 | 1,117,000 | 1,056,961(1) | |||||||||||||||
William Carter Co. | USD | 5.250 | % | 08/15/2021 | 1,025,000 | 1,066,000 | ||||||||||||||
|
| |||||||||||||||||||
| 4,371,583 | ||||||||||||||||||||
|
| |||||||||||||||||||
Transportation - 0.24% | ||||||||||||||||||||
Erickson, Inc., Series WI | USD | 8.250 | % | 05/01/2020 | 900,000 | 686,250 | ||||||||||||||
|
| |||||||||||||||||||
Wireless - 3.25% | ||||||||||||||||||||
Altice SA | USD | 7.750 | % | 05/15/2022 | 1,510,000 | 1,528,875(1) | ||||||||||||||
Altice US Finance I Corp | USD | 5.375 | % | 07/15/2023 | 320,000 | 320,000(1) | ||||||||||||||
Sprint Capital Corp. | USD | 8.750 | % | 03/15/2032 | 3,725,000 | 3,808,812 | ||||||||||||||
40 | www.shiplp.com |
Table of Contents
| Stone Harbor High Yield Bond Fund | Statements of Investments | |
May 31, 2015 |
| Currency | Rate | Maturity Date | Principal Amount* | Market Value (Expressed in U.S. $) | ||||||||||||||||||||||
Wireless (continued) | ||||||||||||||||||||||||||
T-Mobile USA, Inc.: | ||||||||||||||||||||||||||
| USD | 6.731 | % | 04/28/2022 | 3,096,000 | $ | 3,304,980 | ||||||||||||||||||||
| USD | 6.500 | % | 01/15/2024 | 435,000 | 460,013 | |||||||||||||||||||||
|
| |||||||||||||||||||||||||
| 9,422,680 | ||||||||||||||||||||||||||
|
| |||||||||||||||||||||||||
Wirelines - 5.66% | ||||||||||||||||||||||||||
CenturyLink, Inc.: | ||||||||||||||||||||||||||
| USD | 5.800 | % | 03/15/2022 | 641,000 | 659,428 | |||||||||||||||||||||
| USD | 7.650 | % | 03/15/2042 | 1,350,000 | 1,316,250 | |||||||||||||||||||||
Cincinnati Bell, Inc. | USD | 8.375 | % | 10/15/2020 | 1,128,000 | 1,197,090 | ||||||||||||||||||||
Citizens Communications Co. | USD | 9.000 | % | 08/15/2031 | 1,485,000 | 1,470,150 | ||||||||||||||||||||
Cogent Communications Group, Inc. | USD | 5.375 | % | 03/01/2022 | 580,000 | 582,900(1) | ||||||||||||||||||||
CyrusOne LP/CyrusOne Finance Corp. | USD | 6.375 | % | 11/15/2022 | 1,940,000 | 2,046,700 | ||||||||||||||||||||
Frontier Communications Corp. | USD | 6.250 | % | 09/15/2021 | 1,170,000 | 1,132,706 | ||||||||||||||||||||
GCI, Inc. | USD | 6.875 | % | 04/15/2025 | 830,000 | 856,975 | ||||||||||||||||||||
Level 3 Communications, Inc. | USD | 5.750 | % | 12/01/2022 | 485,000 | 496,519 | ||||||||||||||||||||
Level 3 Financing, Inc., Series WI: | ||||||||||||||||||||||||||
| USD | 7.000 | % | 06/01/2020 | 1,334,000 | 1,432,383 | |||||||||||||||||||||
| USD | 5.375 | % | 08/15/2022 | 1,865,000 | 1,913,956 | |||||||||||||||||||||
Telecom Italia SpA | USD | 5.303 | % | 05/30/2024 | 1,233,000 | 1,286,944(1) | ||||||||||||||||||||
Windstream Services LLC | USD | 7.500 | % | 04/01/2023 | 2,226,000 | 2,008,965 | ||||||||||||||||||||
|
| |||||||||||||||||||||||||
| 16,400,966 | ||||||||||||||||||||||||||
|
| |||||||||||||||||||||||||
TOTAL CORPORATE BONDS | 257,444,840 | |||||||||||||||||||||||||
|
| |||||||||||||||||||||||||
(Cost $258,384,383) | ||||||||||||||||||||||||||
CONVERTIBLE CORPORATE BONDS - 0.64% | ||||||||||||||||||||||||||
Consumer Products - 0.09% | ||||||||||||||||||||||||||
Jarden Corp. | USD | 1.125 | % | 03/15/2034 | 226,000 | 268,799 | ||||||||||||||||||||
|
| |||||||||||||||||||||||||
Drillers/Services - 0.12% | ||||||||||||||||||||||||||
Hornbeck Offshore Services, Inc. | USD | 1.500 | % | 09/01/2019 | 397,000 | 336,209 | ||||||||||||||||||||
|
| |||||||||||||||||||||||||
Exploration & Production - 0.17% | ||||||||||||||||||||||||||
Energy XXI Ltd. | USD | 3.000 | % | 12/15/2018 | 540,000 | 183,600 | ||||||||||||||||||||
Stone Energy Corp. | USD | 1.750 | % | 03/01/2017 | 347,000 | 320,325 | ||||||||||||||||||||
|
| |||||||||||||||||||||||||
| 503,925 | ||||||||||||||||||||||||||
|
| |||||||||||||||||||||||||
Metals/Mining/Steel - 0.17% | ||||||||||||||||||||||||||
RTI International Metals, Inc.: | ||||||||||||||||||||||||||
| USD | 3.000 | % | 12/01/2015 | 353,000 | 379,916 | |||||||||||||||||||||
| USD | 1.625 | % | 10/15/2019 | 99,400 | 114,372 | |||||||||||||||||||||
|
| |||||||||||||||||||||||||
| 494,288 | ||||||||||||||||||||||||||
|
| |||||||||||||||||||||||||
Technology - 0.09% | ||||||||||||||||||||||||||
SanDisk Corp. | USD | 0.500 | % | 10/15/2020 | 245,000 | 254,647 | ||||||||||||||||||||
|
| |||||||||||||||||||||||||
TOTAL CONVERTIBLE CORPORATE BONDS | 1,857,868 | |||||||||||||||||||||||||
|
| |||||||||||||||||||||||||
(Cost $2,189,377) | ||||||||||||||||||||||||||
Stone Harbor Investment Funds Annual Report | May 31, 2015 | 41 |
Table of Contents
| Stone Harbor High Yield Bond Fund | Statements of Investments | |
May 31, 2015 |
| Currency | Rate | Maturity Date | Principal Amount/Shares* | Market Value (Expressed in U.S. $) | ||||||||||||||||||||||
BANK LOANS - 6.23%(5) | ||||||||||||||||||||||||||
Chemicals - 0.61% | ||||||||||||||||||||||||||
Styrolution Group Gmbh - Tranche B1 Term Loan | USD | 6.500 | % | 09/30/2019 | 1,755,600 | $ | 1,781,934 | |||||||||||||||||||
|
| |||||||||||||||||||||||||
Electric - 0.98% | ||||||||||||||||||||||||||
Texas Competitive Electric Holdings Co. LLC - 2017 Term Loan | USD | 4.670 | % | 10/10/2017 | 4,540,167 | 2,825,686 | ||||||||||||||||||||
|
| |||||||||||||||||||||||||
Food/Beverage/Tobacco - 0.93% | ||||||||||||||||||||||||||
Del Monte Foods Inc. - Initial Term Loan | USD | 8.250 | % | 05/26/2021 | 1,305,000 | 1,199,513 | ||||||||||||||||||||
New HB Acquisition LLC - Term B Loan | USD | 6.750 | % | 03/12/2020 | 1,460,324 | 1,493,182 | ||||||||||||||||||||
|
| |||||||||||||||||||||||||
| 2,692,695 | ||||||||||||||||||||||||||
|
| |||||||||||||||||||||||||
Industrial Other - 0.34% | ||||||||||||||||||||||||||
Gates Global LLC - Initial Term Loan | USD | 4.250 | % | 06/12/2021 | 975,100 | 972,205 | ||||||||||||||||||||
|
| |||||||||||||||||||||||||
Lodging - 0.47% | ||||||||||||||||||||||||||
La Quinta Intermediate Holdings LLC - Initial Term Loan | USD | 4.000 | % | 02/10/2021 | 1,345,376 | 1,350,421 | ||||||||||||||||||||
|
| |||||||||||||||||||||||||
Media Other - 0.78% | ||||||||||||||||||||||||||
Tribune Company - Initial Term Loan | USD | 4.000 | % | 11/20/2020 | 2,254,568 | 2,260,486 | ||||||||||||||||||||
|
| |||||||||||||||||||||||||
Retail Food/Drug - 0.81% | ||||||||||||||||||||||||||
Albertson’s Holdings LLC - Term B-4 Loan | USD | 5.500 | % | 08/08/2021 | 2,330,000 | 2,348,137 | ||||||||||||||||||||
|
| |||||||||||||||||||||||||
Technology - 1.31% | ||||||||||||||||||||||||||
Dell International LLC - Term B Loan | USD | 4.500 | % | 04/29/2020 | 3,120,500 | 3,129,765 | ||||||||||||||||||||
MA Financeco., LLC - Initial Tranche B Term Loan | USD | 5.250 | % | 10/07/2021 | 670,588 | 673,342 | ||||||||||||||||||||
|
| |||||||||||||||||||||||||
| 3,803,107 | ||||||||||||||||||||||||||
|
| |||||||||||||||||||||||||
TOTAL BANK LOANS | 18,034,671 | |||||||||||||||||||||||||
|
| |||||||||||||||||||||||||
(Cost $18,675,494) | ||||||||||||||||||||||||||
COMMON/PREFERRED STOCKS - 0.32% | ||||||||||||||||||||||||||
Ciena Corp. | USD | 16,237 | 391,636 | |||||||||||||||||||||||
EME Reorganization Trust | USD | 3,059,892 | 39,779 | |||||||||||||||||||||||
General Maritime Corp. | USD | 1,929 | 19 | |||||||||||||||||||||||
NRG Energy, Inc. | USD | 10,061 | 253,537 | |||||||||||||||||||||||
SandRidge Energy, Inc. | USD | 3,451 | 93,005 | |||||||||||||||||||||||
Subsea 7 SA | NOK | 14,306 | 150,034 | |||||||||||||||||||||||
|
| |||||||||||||||||||||||||
| 928,010 | ||||||||||||||||||||||||||
|
| |||||||||||||||||||||||||
TOTAL COMMON/PREFERRED STOCKS | 928,010 | |||||||||||||||||||||||||
|
| |||||||||||||||||||||||||
(Cost $1,754,177) | ||||||||||||||||||||||||||
42 | www.shiplp.com |
Table of Contents
| Stone Harbor High Yield Bond Fund | Statements of Investments | |
May 31, 2015 |
| Currency | Rate | Maturity Date | Principal Amount/Shares* | Market Value (Expressed in U.S. $) | ||||||||||||||||
SHORT TERM INVESTMENTS - 3.93% | ||||||||||||||||||||
Money Market Mutual Funds - 3.93% | ||||||||||||||||||||
Dreyfus Institutional Cash Advantage Fund - Institutional Advantage Class (7-Day Yield) | USD | 0.07989% | N/A | 11,377,477 | $ | 11,377,477 | ||||||||||||||
|
| |||||||||||||||||||
TOTAL SHORT TERM INVESTMENTS | 11,377,477 | |||||||||||||||||||
|
| |||||||||||||||||||
(Cost $11,377,477) | ||||||||||||||||||||
Total Investments - 99.98% | 289,642,866 | |||||||||||||||||||
(Cost $292,380,908) | ||||||||||||||||||||
Other Assets in Excess of Liabilities - 0.02% | 71,474 | |||||||||||||||||||
|
| |||||||||||||||||||
Net Assets - 100.00% | $ | 289,714,340 | ||||||||||||||||||
|
| |||||||||||||||||||
* The principal amount/shares of each security is stated in the currency in which the security is denominated.
Currency Abbreviations:
EUR | - | Euro Currency | ||
GBP | - | Great British Pound | ||
NOK | - | Norwegian Krone | ||
USD | - | United States Dollar |
| (1) | Security exempt from registration under Rule 144A of the Securities Act of 1933. Such securities may normally be sold to qualified institutional buyers in transactions exempt from registration. Total market value of Rule 144A securities amounts to $81,679,692, which represents approximately 28.19% of net assets as of May 31, 2015. |
| (2) | Payment-in-kind securities. |
| (3) | Securities were originally issued pursuant to Regulation S under the Securities Act of 1933, which exempts securities offered and sold outside of the United States from registration. Such securities cannot be sold in the United States without either an effective registration statement filed pursuant to the Securities Act of 1933, or pursuant to an exemption from registration. As of May 31, 2015, the aggregate market value of those securities was $8,110,314, which represents approximately 2.80% of net assets. |
| (4) | Security is in default and therefore is non-income producing. |
| (5) | Bank loans generally pay interest at rates which are periodically determined by reference to a base lending rate plus a premium. All loans carry a variable rate of interest. These base lending rates are generally (i) the Prime Rate offered by one or more major United States banks, (ii) the lending rate offered by one or more European banks such as the London Interbank Offered Rate (“LIBOR”) or (iii) the Certificate of Deposit rate. Bank Loans, while exempt from registration, under the Securities Act of 1933, contain certain restrictions on resale and cannot be sold publicly. Floating rate bank loans often require prepayments from excess cash flow or permit the borrower to repay at its election. The degree to which borrowers repay, whether as a contractual requirement or at their election, cannot be predicted with accuracy. |
Common Abbreviations:
BV | - | Besloten Vennootschap is the Dutch term for private limited liability company. | ||
GmbH | - | Gesellschaft mit beschrankter Haftung is the German term for a company wtih limited liability. | ||
KG | - | A Kommanditgesellschaft is the German name for a limited partnership business entity. | ||
LLC | - | Limited Liability Corporation. | ||
LP | - | Limited Partnership. | ||
Ltd. | - | Limited. | ||
NV | - | Naamloze Vennootshap is the Dutch term for a Public Limited Liability Corporation. | ||
PLC | - | Public Limited Company. | ||
SA | - | Generally designates corporations in various countries, mostly those employing the civil law. | ||
SAS | - | Société par actions simplifiée (French: Joint Stock Company). | ||
SCA | - | Société en commandite par actions is a term from Luxembourg meaning partnership by limited shares. | ||
SpA | - | Società per Azioni is the Italian term for Limited share company. |
Stone Harbor Investment Funds Annual Report | May 31, 2015 | 43 |
Table of Contents
| Stone Harbor High Yield Bond Fund | Statements of Investments | |
May 31, 2015 |
OUTSTANDING FORWARD FOREIGN CURRENCY CONTRACTS
| Counterparty | Foreign Currency | Contracted Amount** | Purchase/Sale Contract | Settlement Date | Current Value | Unrealized Appreciation/ (Depreciation) | ||||||||||||||||||||||||||
| ||||||||||||||||||||||||||||||||
J.P. Morgan Chase & Co. | EUR | 4,209,400 | Sale | 06/10/2015 | $ | 4,623,911 | $ | 124,750 | ||||||||||||||||||||||||
J.P. Morgan Chase & Co. | GBP | 121,936 | Sale | 06/10/2015 | 186,351 | 4,050 | ||||||||||||||||||||||||||
|
| |||||||||||||||||||||||||||||||
| $ | 128,800 | |||||||||||||||||||||||||||||||
|
| |||||||||||||||||||||||||||||||
J.P. Morgan Chase & Co. | GBP | 359,822 | Purchase | 06/10/2015 | $ | 549,904 | $ | (13,349) | ||||||||||||||||||||||||
J.P. Morgan Chase & Co. | GBP | 2,959,400 | Sale | 06/10/2015 | 4,522,757 | (20,347) | ||||||||||||||||||||||||||
|
| |||||||||||||||||||||||||||||||
| $ | (33,696) | |||||||||||||||||||||||||||||||
|
| |||||||||||||||||||||||||||||||
** The contracted amount is stated in the currency in which the contract is denominated.
See Notes to Financial Statements.
44 | www.shiplp.com |
Table of Contents
| Stone Harbor Local Markets Fund | Statements of Investments | |
May 31, 2015 |
| Currency | Rate | Maturity Date | Principal Amount* | Market Value Expressed (in U.S. $) | ||||||||||||||||||||||
SOVEREIGN DEBT OBLIGATIONS - 67.64% | ||||||||||||||||||||||||||
Brazil - 12.41% | ||||||||||||||||||||||||||
Brazil Letras do Tesouro Nacional: | ||||||||||||||||||||||||||
| BRL | 0.000 | % | 01/01/2018 | 147,118,000 | $ | 33,811,792(1) | ||||||||||||||||||||
| BRL | 0.000 | % | 07/01/2018 | 173,069,000 | 37,581,659(1) | |||||||||||||||||||||
Nota Do Tesouro Nacional: | ||||||||||||||||||||||||||
| BRL | 10.000 | % | 01/01/2017 | 205,979,000 | 61,748,622 | |||||||||||||||||||||
| BRL | 10.000 | % | 01/01/2021 | 48,528,000 | 13,870,035 | |||||||||||||||||||||
| BRL | 10.000 | % | 01/01/2023 | 102,674,000 | 28,839,870 | |||||||||||||||||||||
| BRL | 9.762 | % | 01/01/2025 | 65,358,000 | 18,091,604 | |||||||||||||||||||||
|
| |||||||||||||||||||||||||
| 193,943,582 | ||||||||||||||||||||||||||
|
| |||||||||||||||||||||||||
Colombia - 5.49% | ||||||||||||||||||||||||||
Bogota Distrio Capital | COP | 9.750 | % | 07/26/2028 | 62,441,000,000 | 30,028,915(2) | ||||||||||||||||||||
International Bank for Reconstruction & Development | COP | 8.000 | % | 03/02/2020 | 1,020,000,000 | 449,602 | ||||||||||||||||||||
Republic of Colombia: | ||||||||||||||||||||||||||
| COP | 7.750 | % | 04/14/2021 | 20,892,000,000 | 9,055,133 | |||||||||||||||||||||
| COP | 4.375 | % | 03/21/2023 | 18,986,000,000 | 6,767,748 | |||||||||||||||||||||
| COP | 9.850 | % | 06/28/2027 | 37,027,000,000 | 18,391,932 | |||||||||||||||||||||
| COP | 7.750 | % | 09/18/2030 | 47,259,000,000 | 18,909,202 | |||||||||||||||||||||
Republic of Columbia | COP | 10.000 | % | 07/24/2024 | 4,776,100,000 | 2,276,545 | ||||||||||||||||||||
|
| |||||||||||||||||||||||||
| 85,879,077 | ||||||||||||||||||||||||||
|
| |||||||||||||||||||||||||
Indonesia - 6.00% | ||||||||||||||||||||||||||
European Bank for Reconstruction & Development | IDR | 7.200 | % | 06/08/2016 | 37,740,000,000 | 2,803,245 | ||||||||||||||||||||
Indonesia Government: | ||||||||||||||||||||||||||
| IDR | 5.625 | % | 05/15/2023 | 21,052,000,000 | 1,365,634 | |||||||||||||||||||||
| IDR | 6.125 | % | 05/15/2028 | 132,110,000,000 | 8,311,871 | |||||||||||||||||||||
| IDR | 8.250 | % | 06/15/2032 | 56,400,000,000 | 4,220,873 | |||||||||||||||||||||
| IDR | 6.625 | % | 05/15/2033 | 184,000,000,000 | 11,673,926 | |||||||||||||||||||||
| IDR | 8.375 | % | 03/15/2034 | 141,460,000,000 | 10,747,655 | |||||||||||||||||||||
Inter-American Development Bank | IDR | 0.000 | % | 08/20/2015 | 224,330,000,000 | 16,661,897(1) | ||||||||||||||||||||
Republic of Indonesia: | ||||||||||||||||||||||||||
| IDR | 12.800 | % | 06/15/2021 | 2,980,000,000 | 276,357 | |||||||||||||||||||||
| IDR | 7.000 | % | 05/15/2022 | 132,570,000,000 | 9,477,442 | |||||||||||||||||||||
| IDR | 8.375 | % | 03/15/2024 | 100,140,000,000 | 7,695,839 | |||||||||||||||||||||
| IDR | 9.000 | % | 03/15/2029 | 256,280,000,000 | 20,531,179 | |||||||||||||||||||||
|
| |||||||||||||||||||||||||
| 93,765,918 | ||||||||||||||||||||||||||
|
| |||||||||||||||||||||||||
Malaysia - 4.80% | ||||||||||||||||||||||||||
Malaysian Government: | ||||||||||||||||||||||||||
| MYR | 3.889 | % | 07/31/2020 | 15,290,000 | 4,208,295 | |||||||||||||||||||||
| MYR | 4.048 | % | 09/30/2021 | 45,270,000 | 12,459,746 | |||||||||||||||||||||
| MYR | 3.418 | % | 08/15/2022 | 43,150,000 | 11,399,557 | |||||||||||||||||||||
| MYR | 3.480 | % | 03/15/2023 | 72,280,000 | 19,114,965 | |||||||||||||||||||||
| MYR | 4.181 | % | 07/15/2024 | 54,930,000 | 15,193,404 | |||||||||||||||||||||
| MYR | 4.392 | % | 04/15/2026 | 16,370,000 | 4,590,387 | |||||||||||||||||||||
| MYR | 4.498 | % | 04/15/2030 | 11,870,000 | 3,367,376 | |||||||||||||||||||||
| MYR | 3.844 | % | 04/15/2033 | 18,480,000 | 4,746,023 | |||||||||||||||||||||
|
| |||||||||||||||||||||||||
| 75,079,753 | ||||||||||||||||||||||||||
|
| |||||||||||||||||||||||||
Mexico - 4.67% | ||||||||||||||||||||||||||
Mexican Bonos: | ||||||||||||||||||||||||||
| MXN | 6.500 | % | 06/09/2022 | 38,252,000 | 2,594,547 | |||||||||||||||||||||
| MXN | 10.000 | % | 12/05/2024 | 113,747,500 | 9,545,910 | |||||||||||||||||||||
| MXN | 8.500 | % | 05/31/2029 | 58,535,000 | 4,562,235 | |||||||||||||||||||||
Stone Harbor Investment Funds Annual Report | May 31, 2015 | 45 |
Table of Contents
| Stone Harbor Local Markets Fund | Statements of Investments | |
May 31, 2015 |
| Currency | Rate | Maturity Date | Principal Amount* | Market Value Expressed (in U.S. $) | ||||||||||||||||||||||
Mexico (continued) | ||||||||||||||||||||||||||
Mexican Bonos: (continued) | ||||||||||||||||||||||||||
| MXN | 7.750 | % | 05/29/2031 | 209,386,000 | $ | 15,343,892 | ||||||||||||||||||||
| MXN | 8.500 | % | 11/18/2038 | 200,592,000 | 15,831,948 | |||||||||||||||||||||
| MXN | 7.750 | % | 11/13/2042 | 31,053,000 | 2,278,172 | |||||||||||||||||||||
Mexican Udibonos: | ||||||||||||||||||||||||||
| MXN | 2.000 | % | 06/09/2022 | 87,245,440 | 5,534,463 | |||||||||||||||||||||
| MXN | 4.500 | % | 11/22/2035 | 226,633,559 | 17,241,277 | |||||||||||||||||||||
|
| |||||||||||||||||||||||||
| 72,932,444 | ||||||||||||||||||||||||||
|
| |||||||||||||||||||||||||
Poland - 4.68% | ||||||||||||||||||||||||||
Republic of Poland: | ||||||||||||||||||||||||||
| PLN | 0.000 | % | 07/25/2016 | 57,160,000 | 14,990,421(1) | |||||||||||||||||||||
| PLN | 3.000 | % | 08/24/2016 | 122,182,263 | 33,689,692 | |||||||||||||||||||||
| PLN | 0.000 | % | 07/25/2017 | 2,500,000 | 642,943(1) | |||||||||||||||||||||
| PLN | 5.250 | % | 10/25/2017 | 28,190,000 | 8,132,187 | |||||||||||||||||||||
| PLN | 2.750 | % | 08/25/2023 | 40,475,395 | 12,247,247 | |||||||||||||||||||||
| PLN | 3.250 | % | 07/25/2025 | 12,236,000 | 3,362,428 | |||||||||||||||||||||
|
| |||||||||||||||||||||||||
| 73,064,918 | ||||||||||||||||||||||||||
|
| |||||||||||||||||||||||||
Russia - 4.67% | ||||||||||||||||||||||||||
Russian Federation: | ||||||||||||||||||||||||||
| RUB | 7.600 | % | 04/14/2021 | 363,220,000 | 6,066,991 | |||||||||||||||||||||
| RUB | 6.500 | % | 11/24/2021 | 288,490,000 | 4,504,266(3) | |||||||||||||||||||||
| RUB | 7.600 | % | 07/20/2022 | 1,243,582,000 | 20,352,394 | |||||||||||||||||||||
| RUB | 7.000 | % | 01/25/2023 | 1,104,600,000 | 17,396,211 | |||||||||||||||||||||
| RUB | 7.000 | % | 08/16/2023 | 554,690,000 | 8,629,858 | |||||||||||||||||||||
| RUB | 8.150 | % | 02/03/2027 | 376,180,000 | 6,175,786 | |||||||||||||||||||||
| RUB | 7.050 | % | 01/19/2028 | 666,980,000 | 9,899,468 | |||||||||||||||||||||
|
| |||||||||||||||||||||||||
| 73,024,974 | ||||||||||||||||||||||||||
|
| |||||||||||||||||||||||||
South Africa - 11.14% | ||||||||||||||||||||||||||
Asian Development Bank | ZAR | 6.500 | % | 09/15/2015 | 4,500,000 | 369,726 | ||||||||||||||||||||
Republic of South Africa: | ||||||||||||||||||||||||||
| ZAR | 8.000 | % | 12/21/2018 | 407,430,000 | 34,130,884 | |||||||||||||||||||||
| ZAR | 7.250 | % | 01/15/2020 | 180,316,000 | 14,615,838 | |||||||||||||||||||||
| ZAR | 6.750 | % | 03/31/2021 | 144,120,000 | 11,300,853 | |||||||||||||||||||||
| ZAR | 10.500 | % | 12/21/2026 | 401,570,000 | 38,811,020 | |||||||||||||||||||||
| ZAR | 7.000 | % | 02/28/2031 | 142,480,000 | 10,111,591 | |||||||||||||||||||||
| ZAR | 6.250 | % | 03/31/2036 | 304,170,000 | 19,145,970 | |||||||||||||||||||||
| ZAR | 6.500 | % | 02/28/2041 | 234,390,000 | 14,838,576 | |||||||||||||||||||||
| ZAR | 8.750 | % | 01/31/2044 | 229,260,000 | 18,672,842 | |||||||||||||||||||||
| ZAR | 8.750 | % | 02/28/2048 | 149,110,000 | 12,129,043 | |||||||||||||||||||||
|
| |||||||||||||||||||||||||
| 174,126,343 | ||||||||||||||||||||||||||
|
| |||||||||||||||||||||||||
Thailand - 2.08% | ||||||||||||||||||||||||||
Thailand Government: | ||||||||||||||||||||||||||
| THB | 1.200 | % | 07/14/2021 | 521,854,618 | 14,972,931 | |||||||||||||||||||||
| THB | 3.650 | % | 12/17/2021 | 111,490,000 | 3,542,936 | |||||||||||||||||||||
| THB | 3.625 | % | 06/16/2023 | 206,735,000 | 6,572,302 | |||||||||||||||||||||
| THB | 3.580 | % | 12/17/2027 | 236,470,000 | 7,397,740 | |||||||||||||||||||||
|
| |||||||||||||||||||||||||
| 32,485,909 | ||||||||||||||||||||||||||
|
| |||||||||||||||||||||||||
Turkey - 11.00% | ||||||||||||||||||||||||||
Republic of Turkey: | ||||||||||||||||||||||||||
| TRY | 10.700 | % | 02/24/2016 | 40,030,000 | 15,094,412 | |||||||||||||||||||||
| TRY | 8.200 | % | 07/13/2016 | 63,930,000 | 23,603,518 | |||||||||||||||||||||
46 | www.shiplp.com |
Table of Contents
| Stone Harbor Local Markets Fund | Statements of Investments | |
May 31, 2015 |
| Counterparty | Currency | Rate | Maturity Date | Principal Amount* | Market Value Expressed (in U.S. $) | |||||||||||||||||||||||||
Turkey (continued) | ||||||||||||||||||||||||||||||
Republic of Turkey: (continued) | ||||||||||||||||||||||||||||||
| TRY | 9.000 | % | 03/08/2017 | 26,580,000 | $ | 9,918,395 | ||||||||||||||||||||||||
| TRY | 10.400 | % | 03/27/2019 | 8,400,000 | 3,281,062 | |||||||||||||||||||||||||
| TRY | 8.500 | % | 07/10/2019 | 11,650,000 | 4,283,780 | |||||||||||||||||||||||||
| TRY | 10.500 | % | 01/15/2020 | 62,380,000 | 24,797,023 | |||||||||||||||||||||||||
| TRY | 7.400 | % | 02/05/2020 | 26,180,000 | 9,179,151 | |||||||||||||||||||||||||
| TRY | 9.500 | % | 01/12/2022 | 63,490,000 | 24,371,078 | |||||||||||||||||||||||||
| TRY | 8.500 | % | 09/14/2022 | 51,360,000 | 18,856,466 | |||||||||||||||||||||||||
| TRY | 7.100 | % | 03/08/2023 | 59,460,000 | 19,954,368 | |||||||||||||||||||||||||
| TRY | 10.400 | % | 03/20/2024 | 25,200,000 | 10,241,094 | |||||||||||||||||||||||||
| TRY | 9.000 | % | 07/24/2024 | 22,150,000 | 8,343,947 | |||||||||||||||||||||||||
|
| |||||||||||||||||||||||||||||
| 171,924,294 | ||||||||||||||||||||||||||||||
|
| |||||||||||||||||||||||||||||
Venezuela - 0.70% | ||||||||||||||||||||||||||||||
Republic of Venezuela | USD | 5.750 | % | 02/26/2016 | 13,069,500 | 10,945,706(2) | ||||||||||||||||||||||||
|
| |||||||||||||||||||||||||||||
TOTAL SOVEREIGN DEBT OBLIGATIONS | 1,057,172,918 | |||||||||||||||||||||||||||||
|
| |||||||||||||||||||||||||||||
(Cost $1,271,658,361) | ||||||||||||||||||||||||||||||
CORPORATE BONDS - 3.89% | ||||||||||||||||||||||||||||||
Colombia - 0.96% | ||||||||||||||||||||||||||||||
Emgesa SA ESP: | ||||||||||||||||||||||||||||||
| COP | 8.750 | % | 01/25/2021 | 616,000,000 | 258,348(4) | |||||||||||||||||||||||||
| COP | 8.750 | % | 01/25/2021 | 16,739,000,000 | 7,020,261(2) | |||||||||||||||||||||||||
Empresas Publicas de Medellin ESP: | ||||||||||||||||||||||||||||||
| COP | 8.375 | % | 02/01/2021 | 776,000,000 | 326,175(4) | |||||||||||||||||||||||||
| COP | 8.375 | % | 02/01/2021 | 3,338,000,000 | 1,403,055(2) | |||||||||||||||||||||||||
| COP | 7.625 | % | 09/10/2024 | 9,444,000,000 | 3,675,361(4) | |||||||||||||||||||||||||
Findeter | COP | 7.875 | % | 08/12/2024 | 5,687,000,000 | 2,252,555(4) | ||||||||||||||||||||||||
|
| |||||||||||||||||||||||||||||
| 14,935,755 | ||||||||||||||||||||||||||||||
|
| |||||||||||||||||||||||||||||
Mexico - 1.40% | ||||||||||||||||||||||||||||||
America Movil SAB de CV | MXN | 6.000 | % | 06/09/2019 | 242,900,000 | 15,854,222 | ||||||||||||||||||||||||
Petroleos Mexicanos | MXN | 7.650 | % | 11/24/2021 | 91,160,000 | 6,106,203(4) | ||||||||||||||||||||||||
|
| |||||||||||||||||||||||||||||
| 21,960,425 | ||||||||||||||||||||||||||||||
|
| |||||||||||||||||||||||||||||
Venezuela - 1.53% | ||||||||||||||||||||||||||||||
Petroleos de Venezuela SA | USD | 8.500 | % | 11/02/2017 | 32,034,200 | 23,865,479(2) | ||||||||||||||||||||||||
|
| |||||||||||||||||||||||||||||
TOTAL CORPORATE BONDS | 60,761,659 | |||||||||||||||||||||||||||||
|
| |||||||||||||||||||||||||||||
(Cost $72,606,583) | ||||||||||||||||||||||||||||||
CREDIT LINKED NOTES - 6.24% | ||||||||||||||||||||||||||||||
Colombia - 1.06% | ||||||||||||||||||||||||||||||
Titulos de Tesoreria - Series B: | ||||||||||||||||||||||||||||||
| Citigroup Global Markets | COP | 11.000 | % | 07/27/2020 | 4,500,000,000 | 2,173,015 | ||||||||||||||||||||||||
| Citigroup Global Markets | COP | 11.000 | % | 07/27/2020 | 4,570,000,000 | 2,206,817 | ||||||||||||||||||||||||
| Citigroup Global Markets | COP | 11.000 | % | 07/27/2020 | 6,546,000,000 | 3,161,012 | ||||||||||||||||||||||||
| Citigroup Global Markets | COP | 7.000 | % | 05/05/2022 | 5,200,000,000 | 2,106,709 | ||||||||||||||||||||||||
| Citigroup Global Markets | COP | 7.000 | % | 05/05/2022 | 10,113,510,000 | 4,097,350 | ||||||||||||||||||||||||
| Citigroup Global Markets | COP | 10.000 | % | 07/25/2024 | 6,000,000,000 | 2,858,475 | ||||||||||||||||||||||||
|
| |||||||||||||||||||||||||||||
| 16,603,378 | ||||||||||||||||||||||||||||||
|
| |||||||||||||||||||||||||||||
Stone Harbor Investment Funds Annual Report | May 31, 2015 | 47 |
Table of Contents
| Stone Harbor Local Markets Fund | Statements of Investments | |
May 31, 2015 |
| Counterparty | Currency | Rate | Maturity Date | Principal Amount/Shares* | Market Value Expressed (in U.S. $) | |||||||||||||
Indonesia - 5.18% | ||||||||||||||||||
Republic of Indonesia: | ||||||||||||||||||
Deutsche Bank AG London | IDR | 8.250% | 07/19/2021 | 111,500,000,000 | $ | 8,484,421 | ||||||||||||
J.P. Morgan Chase & Co. | IDR | 7.000% | 05/15/2022 | 105,974,000,000 | 7,525,725 | |||||||||||||
Deutsche Bank AG London | IDR | 7.000% | 05/17/2022 | 60,000,000,000 | 4,269,918 | |||||||||||||
Deutsche Bank AG London | IDR | 7.000% | 05/17/2022 | 240,900,000,000 | 17,143,722 | |||||||||||||
Deutsche Bank AG London | IDR | 5.625% | 05/17/2023 | 15,000,000,000 | 970,542 | |||||||||||||
J.P. Morgan Chase & Co. | IDR | 5.625% | 05/17/2023 | 180,398,000,000 | 11,633,652 | |||||||||||||
Deutsche Bank AG London | IDR | 11.000% | 09/15/2025 | 32,500,000,000 | 2,920,232 | |||||||||||||
HSBC Bank | IDR | 11.000% | 09/15/2025 | 49,455,000,000 | 4,450,352 | |||||||||||||
HSBC Bank | IDR | 11.000% | 09/15/2025 | 60,487,000,000 | 5,443,098 | |||||||||||||
Deutsche Bank AG London | IDR | 7.000% | 05/18/2027 | 25,400,000,000 | 1,738,164 | |||||||||||||
J.P. Morgan Chase & Co. | IDR | 6.125% | 05/17/2028 | 16,900,000,000 | 1,063,279 | |||||||||||||
Deutsche Bank AG London | IDR | 8.250% | 06/17/2032 | 176,000,000,000 | 13,080,883 | |||||||||||||
J.P. Morgan Chase & Co. | IDR | 6.625% | 05/15/2033 | 36,002,000,000 | 2,270,544 | |||||||||||||
|
| |||||||||||||||||
| 80,994,532 | ||||||||||||||||||
|
| |||||||||||||||||
TOTAL CREDIT LINKED NOTES | 97,597,910 | |||||||||||||||||
|
| |||||||||||||||||
(Cost $148,965,573) | ||||||||||||||||||
SHORT TERM INVESTMENTS - 3.43% | ||||||||||||||||||
Money Market Mutual Funds - 3.43% | ||||||||||||||||||
Dreyfus Institutional Cash Advantage Fund - Institutional Advantage Class (7-Day Yield) | USD | 0.07989% | N/A | 53,533,849 | 53,533,849 | |||||||||||||
|
| |||||||||||||||||
TOTAL SHORT TERM INVESTMENTS | 53,533,849 | |||||||||||||||||
|
| |||||||||||||||||
(Cost $53,533,849) | ||||||||||||||||||
Total Investments - 81.20% | 1,269,066,336 | |||||||||||||||||
(Cost $1,546,764,366) | ||||||||||||||||||
Other Assets In Excess of Liabilities - 18.80% | 293,881,372 | |||||||||||||||||
|
| |||||||||||||||||
Net Assets - 100.00% | $ | 1,562,947,708 | ||||||||||||||||
|
| |||||||||||||||||
* The principal amount/shares of each security is stated in the currency in which the security is denominated.
Currency Abbreviations:
BRL | - | Brazilian Real | ||
CLP | - | Chilean Peso | ||
COP | - | Colombian Peso | ||
IDR | - | Indonesian Rupiah | ||
INR | - | Indian Rupee | ||
MXN | - | Mexican Peso | ||
MYR | - | Malaysian Ringgit | ||
PHP | - | Philippine Peso | ||
PLN | - | Polish Zloty | ||
RON | - | Romanian Leu | ||
RUB | - | Russian Ruble |
48 | www.shiplp.com |
Table of Contents
| Stone Harbor Local Markets Fund | Statements of Investments | |
May 31, 2015 |
THB | - | Thai Baht | ||
TRY | - | Turkish Lira | ||
USD | - | United States Dollar | ||
ZAR | - | South African Rand |
| (1) | Issued with a zero coupon. Income is recognized through the accretion of discount. |
| (2) | Securities were originally issued pursuant to Regulation S under the Securities Act of 1933, which exempts securities offered and sold outside of the United States from registration. Such securities cannot be sold in the United States without either an effective registration statement filed pursuant to the Securities Act of 1933, or pursuant to an exemption from registration. As of May 31, 2015, the aggregate market value of those securities was $73,263,416, which represents approximately 4.69% of net assets. |
| (3) | Step bond. Coupon changes periodically based upon a predetermined schedule. Interest rate disclosed is that which is in effect as of May 31, 2015. |
| (4) | Security exempt from registration under Rule 144A of the Securities Act of 1933. Such securities may normally be sold to qualified institutional buyers in transactions exempt from registration. Total market value of Rule 144A securities amounts to $12,618,642, which represents approximately 0.81% of net assets as of May 31, 2015. |
Common Abbreviations:
ESP | - | Empresa de Servicios Publicos is the Colombian term for Public Service Company. | ||
SA | - | Generally designates corporations in various countries mostly employing civil law. | ||
SAB de CV | - | A Variable Capital Company. |
OUTSTANDING FORWARD FOREIGN CURRENCY CONTRACTS
| Counterparty | Foreign Currency | Contracted Amount** | Purchase/Sale Contract | Settlement Date | Current Value | Unrealized Appreciation/ (Depreciation) | ||||||||||
| ||||||||||||||||
Citigroup Global Markets | COP | 15,972,120,000 | Sale | 06/11/2015 | $ | 6,302,773 | $ | 127,227 | ||||||||
Citigroup Global Markets | INR | 971,536,500 | Purchase | 06/08/2015 | 15,181,345 | 14,950 | ||||||||||
Citigroup Global Markets | MYR | 86,500,470 | Sale | 06/08/2015 | 23,575,071 | 412,192 | ||||||||||
Citigroup Global Markets | RON | 66,020,234 | Purchase | 06/25/2015 | 16,316,237 | 98,237 | ||||||||||
Citigroup Global Markets | RUB | 2,208,669,564 | Sale | 06/22/2015 | 41,779,430 | 2,450,576 | ||||||||||
Citigroup Global Markets | TRY | 44,586,385 | Sale | 06/15/2015 | 16,664,532 | 415,757 | ||||||||||
CS First Boston | RUB | 2,698,740,166 | Purchase | 06/08/2015 | 51,321,483 | 133,847 | ||||||||||
J.P Morgan Chase & Co. | BRL | 245,287,036 | Sale | 07/02/2015 | 76,045,891 | 4,219,109 | ||||||||||
J.P Morgan Chase & Co. | RON | 159,300,016 | Purchase | 06/25/2015 | 39,369,397 | 560,223 | ||||||||||
|
| |||||||||||||||
| $ | 8,432,118 | |||||||||||||||
|
| |||||||||||||||
Citigroup Global Markets | CLP | 5,774,072,292 | Purchase | 06/12/2015 | $ | 9,329,115 | $ | (205,193) | ||||||||
Citigroup Global Markets | CLP | 9,822,706,840 | Purchase | 06/26/2015 | 15,847,276 | (348,463) | ||||||||||
Citigroup Global Markets | COP | 36,781,726,240 | Purchase | 06/11/2015 | 14,514,471 | (1,061,106) | ||||||||||
Citigroup Global Markets | IDR | 69,285,370,000 | Purchase | 08/19/2015 | 5,151,520 | (7,480) | ||||||||||
Citigroup Global Markets | INR | 971,536,500 | Sale | 06/08/2015 | 15,181,345 | (138,587) | ||||||||||
Citigroup Global Markets | INR | 974,122,072 | Sale | 07/08/2015 | 15,127,000 | (135,894) | ||||||||||
Citigroup Global Markets | INR | 974,122,072 | Purchase | 07/08/2015 | 15,127,000 | (290,535) | ||||||||||
Citigroup Global Markets | MXN | 2,033,610,000 | Purchase | 06/19/2015 | 131,953,789 | (546,211) | ||||||||||
Citigroup Global Markets | MYR | 86,500,470 | Purchase | 06/08/2015 | 23,575,071 | (398,232) | ||||||||||
Citigroup Global Markets | PHP | 381,766,860 | Purchase | 08/26/2015 | 8,517,336 | (26,750) | ||||||||||
Citigroup Global Markets | PLN | 132,572,032 | Purchase | 06/05/2015 | 35,414,635 | (1,118,574) | ||||||||||
Citigroup Global Markets | PLN | 221,397,340 | Purchase | 07/27/2015 | 59,049,322 | (1,297,226) | ||||||||||
Citigroup Global Markets | TRY | 27,429,567 | Sale | 06/15/2015 | 10,252,028 | (127,615) | ||||||||||
Citigroup Global Markets | ZAR | 93,171,716 | Purchase | 06/08/2015 | 7,658,862 | (69,126) | ||||||||||
J.P. Morgan Chase & Co. | MYR | 295,499,190 | Purchase | 06/19/2015 | 80,529,230 | (170,770) | ||||||||||
|
| |||||||||||||||
| $ | (5,941,762) | |||||||||||||||
|
| |||||||||||||||
** The contracted amount is stated in the currency in which the contract is denominated.
See Notes to Financial Statements.
Stone Harbor Investment Funds Annual Report | May 31, 2015 | 49 |
Table of Contents
| Stone Harbor Emerging Markets Corporate Debt Fund | Statements of Investments | |
May 31, 2015
|
| Currency | Rate | Maturity Date | Principal Amount* | Market Value Expressed (in U.S. $) | ||||||||||||
CORPORATE BONDS - 94.73% | ||||||||||||||||
Angola - 0.89% | ||||||||||||||||
Puma International Financing SA | USD | 6.750 | % | 02/01/2021 | 205,000 | $ | 213,456(1) | |||||||||
|
| |||||||||||||||
Argentina - 1.95% | ||||||||||||||||
YPF SA: | ||||||||||||||||
| USD | 8.875 | % | 12/19/2018 | 106,000 | 114,480(1) | |||||||||||
| USD | 8.750 | % | 04/04/2024 | 341,000 | 353,788(1) | |||||||||||
|
| |||||||||||||||
| 468,268 | ||||||||||||||||
|
| |||||||||||||||
Brazil - 4.74% | ||||||||||||||||
Cia Brasileira de Aluminio | USD | 4.750 | % | 06/17/2024 | 112,000 | 109,760(1) | ||||||||||
CIMPOR Financial Operations BV | USD | 5.750 | % | 07/17/2024 | 93,000 | 84,630(1) | ||||||||||
Cosan Luxembourg SA | USD | 5.000 | % | 03/14/2023 | 200,000 | 189,759(1) | ||||||||||
ESAL GmbH | USD | 6.250 | % | 02/05/2023 | 108,000 | 110,160(1) | ||||||||||
Itau Unibanco Holding SA | USD | 5.650 | % | 03/19/2022 | 98,000 | 101,597(1) | ||||||||||
Odebrecht Finance Ltd. | USD | 5.250 | % | 06/27/2029 | 66,000 | 58,456(1) | ||||||||||
Odebrecht Offshore Drilling Finance Ltd. | USD | 6.750 | % | 10/01/2022 | 85,569 | 77,226(1) | ||||||||||
Petrobras International Finance Co. | USD | 5.375 | % | 01/27/2021 | 193,000 | 188,562 | ||||||||||
QGOG Atlantic/Alaskan Rigs Ltd. | USD | 5.250 | % | 07/30/2018 | 65,301 | 61,383(1) | ||||||||||
Samarco Mineracao SA | USD | 4.125 | % | 11/01/2022 | 39,000 | 36,660(1) | ||||||||||
Vale Overseas Ltd. | USD | 4.625 | % | 09/15/2020 | 116,000 | 120,327 | ||||||||||
|
| |||||||||||||||
| 1,138,520 | ||||||||||||||||
|
| |||||||||||||||
Chile - 3.46% | ||||||||||||||||
Cencosud SA: | ||||||||||||||||
| USD | 4.875 | % | 01/20/2023 | 180,000 | 182,574(1) | |||||||||||
| USD | 6.625 | % | 02/12/2045 | 57,000 | 55,575(1) | |||||||||||
Empresa Nacional de Electricidad SA | USD | 4.250 | % | 04/15/2024 | 89,000 | 92,916 | ||||||||||
ENTEL Chile SA | USD | 4.875 | % | 10/30/2024 | 67,000 | 69,010(1) | ||||||||||
GeoPark Latin America Ltd. Agencia en Chile | USD | 7.500 | % | 02/11/2020 | 206,000 | 182,997(1) | ||||||||||
VTR Finance BV | USD | 6.875 | % | 01/15/2024 | 236,000 | 246,431(1) | ||||||||||
|
| |||||||||||||||
| 829,503 | ||||||||||||||||
|
| |||||||||||||||
China - 7.22% | ||||||||||||||||
Bestgain Real Estate Ltd. | USD | 2.625 | % | 03/13/2018 | 200,000 | 198,950(2) | ||||||||||
CAR, Inc. | USD | 6.125 | % | 02/04/2020 | 88,000 | 90,640(1) | ||||||||||
CITIC Ltd.: | ||||||||||||||||
| USD | 7.875 | % | Perpetual | 200,000 | 209,500(3) | |||||||||||
| USD | 8.625 | % | Perpetual | 200,000 | 231,500(3) | |||||||||||
Country Garden Holdings Co. Ltd. | USD | 7.875 | % | 05/27/2019 | 400,000 | 423,000(2) | ||||||||||
Industrial & Commercial Bank of China Ltd. | USD | 6.000 | % | Perpetual | 200,000 | 210,000(2)(3) | ||||||||||
Lenovo Group Ltd. | USD | 4.700 | % | 05/08/2019 | 350,000 | 369,840(2) | ||||||||||
|
| |||||||||||||||
| 1,733,430 | ||||||||||||||||
|
| |||||||||||||||
Colombia - 5.60% | ||||||||||||||||
Bancolombia SA | USD | 5.125 | % | 09/11/2022 | 200,000 | 206,480 | ||||||||||
Empresa de Energia de Bogota SA ESP | USD | 6.125 | % | 11/10/2021 | 175,000 | 188,125(1) | ||||||||||
Grupo Aval Ltd. | USD | 5.250 | % | 02/01/2017 | 130,000 | 135,607(1) | ||||||||||
GrupoSura Finance SA | USD | 5.700 | % | 05/18/2021 | 157,000 | 171,130(1) | ||||||||||
Millicom International Cellular SA | USD | 6.625 | % | 10/15/2021 | 124,000 | 132,990(1) | ||||||||||
Oleoducto Central SA | USD | 4.000 | % | 05/07/2021 | 120,000 | 118,800(1) | ||||||||||
Pacific Rubiales Energy Corp. | USD | 5.125 | % | 03/28/2023 | 295,000 | 236,738(1) | ||||||||||
SUAM Finance BV | USD | 4.875 | % | 04/17/2024 | 148,000 | 154,275(1) | ||||||||||
|
| |||||||||||||||
| 1,344,145 | ||||||||||||||||
|
| |||||||||||||||
50 | www.shiplp.com |
Table of Contents
| Stone Harbor Emerging Markets Corporate Debt Fund | Statements of Investments | |
May 31, 2015 |
| Currency | Rate | Maturity Date | Principal Amount* | Market Value Expressed (in U.S. $) | ||||||||||||
Guatemala - 0.90% | ||||||||||||||||
Comcel Trust via Comunicaciones Celulares SA | USD | 6.875 | % | 02/06/2024 | 200,000 | $ | 216,500(1) | |||||||||
|
| |||||||||||||||
Hong Kong - 4.50% | ||||||||||||||||
Goodman HK Finance | USD | 4.375 | % | 06/19/2024 | 300,000 | 310,086 | ||||||||||
Hutchison Whampoa International 10 Ltd. | USD | 6.000 | % | Perpetual | 152,000 | 154,850(2)(3) | ||||||||||
Hutchison Whampoa International 11 Ltd. | USD | 4.625 | % | 01/13/2022 | 37,000 | 40,719(1) | ||||||||||
Hutchison Whampoa International 12 Ltd. | USD | 6.000 | % | Perpetual | 140,000 | 149,161(2)(3) | ||||||||||
Li & Fung Ltd. | USD | 6.000 | % | Perpetual | 200,000 | 214,250(2)(3) | ||||||||||
Towngas Finance Ltd | USD | 4.750 | % | Perpetual | 200,000 | 211,750(2)(3) | ||||||||||
|
| |||||||||||||||
| 1,080,816 | ||||||||||||||||
|
| |||||||||||||||
India - 5.75% | ||||||||||||||||
ABJA Investment Co. Pte Ltd. | USD | 5.950 | % | 07/31/2024 | 200,000 | 202,920 | ||||||||||
Bharti Airtel International Netherlands BV: | ||||||||||||||||
| USD | 5.125 | % | 03/11/2023 | 256,000 | 276,410(1) | |||||||||||
| USD | 5.350 | % | 05/20/2024 | 300,000 | 328,502(2) | |||||||||||
Reliance Holding USA, Inc. | USD | 5.400 | % | 02/14/2022 | 200,000 | 221,068(1) | ||||||||||
Reliance Industries Ltd. | USD | 4.125 | % | 01/28/2025 | 99,000 | 100,344(1) | ||||||||||
Vedanta Resources PLC: | ||||||||||||||||
| USD | 6.000 | % | 01/31/2019 | 92,000 | 86,710(1) | |||||||||||
| USD | 8.250 | % | 06/07/2021 | 54,000 | 53,178(1) | |||||||||||
| USD | 7.125 | % | 05/31/2023 | 120,000 | 110,550(1) | |||||||||||
|
| |||||||||||||||
| 1,379,682 | ||||||||||||||||
|
| |||||||||||||||
Indonesia - 3.82% | ||||||||||||||||
Indosat Palapa Co. BV | USD | 7.375 | % | 07/29/2020 | 215,000 | 223,869(2) | ||||||||||
Listrindo Capital BV | USD | 6.950 | % | 02/21/2019 | 305,000 | 321,227(1) | ||||||||||
Pelabuhan Indonesia III PT | USD | 4.875 | % | 10/01/2024 | 162,000 | 166,131(1) | ||||||||||
Perusahaan Gas Negara Persero Tbk PT | USD | 5.125 | % | 05/16/2024 | 200,000 | 206,400(1) | ||||||||||
|
| |||||||||||||||
| 917,627 | ||||||||||||||||
|
| |||||||||||||||
Israel - 5.12% | ||||||||||||||||
B Communications Ltd. | USD | 7.375 | % | 02/15/2021 | 348,000 | 373,230(1) | ||||||||||
Delek & Avner Tamar Bond Ltd.: | ||||||||||||||||
| USD | 3.839 | % | 12/30/2018 | 77,000 | 78,251(1) | |||||||||||
| USD | 5.082 | % | 12/30/2023 | 558,000 | 569,160(1) | |||||||||||
Israel Electric Corp. Ltd. | USD | 5.000 | % | 11/12/2024 | 200,000 | 209,000(1) | ||||||||||
|
| |||||||||||||||
| 1,229,641 | ||||||||||||||||
|
| |||||||||||||||
Jamaica - 1.92% | ||||||||||||||||
Digicel Group Ltd.: | ||||||||||||||||
| USD | 8.250 | % | 09/30/2020 | 115,000 | 119,830(1) | |||||||||||
| USD | 7.125 | % | 04/01/2022 | 350,000 | 341,250(2) | |||||||||||
|
| |||||||||||||||
| 461,080 | ||||||||||||||||
|
| |||||||||||||||
Kazakhstan - 1.69% | ||||||||||||||||
Zhaikmunai LP | USD | 7.125 | % | 11/13/2019 | 425,000 | 406,406(1) | ||||||||||
|
| |||||||||||||||
Macau - 1.40% | ||||||||||||||||
MCE Finance Ltd. | USD | 5.000 | % | 02/15/2021 | 180,000 | 174,150(1) | ||||||||||
Studio City Finance Ltd. | USD | 8.500 | % | 12/01/2020 | 160,000 | 162,400(2) | ||||||||||
|
| |||||||||||||||
| 336,550 | ||||||||||||||||
|
| |||||||||||||||
Malaysia - 0.93% | ||||||||||||||||
Malayan Banking Bhd | USD | 3.250 | % | 09/20/2022 | 220,000 | 222,446(3) | ||||||||||
|
| |||||||||||||||
Stone Harbor Investment Funds Annual Report | May 31, 2015 | 51 |
Table of Contents
| Stone Harbor Emerging Markets Corporate Debt Fund | Statements of Investments | |
May 31, 2015 |
| Currency | Rate | Maturity Date | Principal Amount* | Market Value Expressed (in U.S. $) | ||||||||||||
Mexico - 7.12% | ||||||||||||||||
Cemex Finance LLC | USD | 9.375 | % | 10/12/2022 | 118,000 | $ | 133,782(1) | |||||||||
Cemex SAB de CV: | ||||||||||||||||
| USD | 9.500 | % | 06/15/2018 | 165,000 | 183,150(1) | |||||||||||
| USD | 7.250 | % | 01/15/2021 | 120,000 | 128,880(1) | |||||||||||
Fresnillo PLC | USD | 5.500 | % | 11/13/2023 | 125,000 | 135,312(1) | ||||||||||
Gruma SAB de CV | USD | 4.875 | % | 12/01/2024 | 200,000 | 212,000(1) | ||||||||||
Metalsa SAB de CV | USD | 4.900 | % | 04/24/2023 | 331,000 | 326,035(1) | ||||||||||
Mexico Generadora De Energia | USD | 5.500 | % | 12/06/2032 | 160,000 | 161,200(1) | ||||||||||
Sixsigma Networks Mexico SA de CV | USD | 8.250 | % | 11/07/2021 | 203,000 | 217,718(1) | ||||||||||
Tenedora Nemak SAB de CV | USD | 5.500 | % | 02/28/2023 | 200,000 | 210,500(1) | ||||||||||
|
| |||||||||||||||
| 1,708,577 | ||||||||||||||||
|
| |||||||||||||||
Morocco - 1.65% | ||||||||||||||||
OCP SA: | ||||||||||||||||
| USD | 5.625 | % | 04/25/2024 | 112,000 | 119,818(1) | |||||||||||
| USD | 4.500 | % | 10/22/2025 | 205,000 | 200,644(1) | |||||||||||
| USD | 6.875 | % | 04/25/2044 | 70,000 | 76,212(1) | |||||||||||
|
| |||||||||||||||
| 396,674 | ||||||||||||||||
|
| |||||||||||||||
Oman - 0.81% | ||||||||||||||||
Lamar Funding Ltd. | USD | 3.958 | % | 05/07/2025 | 192,000 | 192,960(1) | ||||||||||
|
| |||||||||||||||
Peru - 2.42% | ||||||||||||||||
Cementos Pacasmayo SAA | USD | 4.500 | % | 02/08/2023 | 60,000 | 58,212(1) | ||||||||||
Cia Minera Ares SAC | USD | 7.750 | % | 01/23/2021 | 157,000 | 160,925(1) | ||||||||||
Cia Minera Milpo SAA | USD | 4.625 | % | 03/28/2023 | 192,000 | 196,800(1) | ||||||||||
Consorcio Transmantaro SA | USD | 4.375 | % | 05/07/2023 | 32,000 | 32,557(1) | ||||||||||
Inkia Energy Ltd. | USD | 8.375 | % | 04/04/2021 | 125,000 | 133,125(1) | ||||||||||
|
| |||||||||||||||
| 581,619 | ||||||||||||||||
|
| |||||||||||||||
Philippines - 1.62% | ||||||||||||||||
FPT Finance Ltd. | USD | 6.375 | % | 09/28/2020 | 350,000 | 388,556 | ||||||||||
|
| |||||||||||||||
Qatar - 2.45% | ||||||||||||||||
Ooredoo International Finance Ltd. | USD | 4.750 | % | 02/16/2021 | 434,000 | 477,400(2) | ||||||||||
Ras Laffan Liquefied Natural Gas Co. Ltd. III | USD | 6.750 | % | 09/30/2019 | 93,000 | 110,786(2) | ||||||||||
|
| |||||||||||||||
| 588,186 | ||||||||||||||||
|
| |||||||||||||||
Russia - 6.14% | ||||||||||||||||
Evraz Group SA: | ||||||||||||||||
| USD | 6.750 | % | 04/27/2018 | 89,000 | 85,885(1) | |||||||||||
| USD | 6.500 | % | 04/22/2020 | 200,000 | 184,000(2) | |||||||||||
Gazpram Via Gaz Capital SA | USD | 6.510 | % | 03/07/2022 | 104,000 | 106,080(1) | ||||||||||
Gazprom OAO Via Gaz Capital SA: | ||||||||||||||||
| USD | 8.146 | % | 04/11/2018 | 62,000 | 66,960(1) | |||||||||||
| USD | 9.250 | % | 04/23/2019 | 52,000 | 58,890(1) | |||||||||||
Rosneft Oil Co. via Rosneft International | USD | 3.149 | % | 03/06/2017 | 134,000 | 129,645(1) | ||||||||||
Vimpel Communications Holdings BV: | ||||||||||||||||
| USD | 6.255 | % | 03/01/2017 | 200,000 | 204,000(2) | |||||||||||
| USD | 7.504 | % | 03/01/2022 | 200,000 | 200,500(2) | |||||||||||
| USD | 5.950 | % | 02/13/2023 | 60,000 | 55,260(1) | |||||||||||
Vimpel Communications Via VIP Finance Ireland Ltd. OJSC | USD | 7.748 | % | 02/02/2021 | 148,000 | 151,700(1) | ||||||||||
Wind Acquisition Finance SA | EUR | 4.000 | % | 07/15/2020 | 206,000 | 230,209(1) | ||||||||||
|
| |||||||||||||||
| 1,473,129 | ||||||||||||||||
|
| |||||||||||||||
52 | www.shiplp.com |
Table of Contents
| Stone Harbor Emerging Markets Corporate Debt Fund | Statements of Investments | |
May 31, 2015 |
| Currency | Rate | Maturity Date | Principal Amount* | Market Value Expressed (in U.S. $) | ||||||||||||
Saudi Arabia - 0.16% | ||||||||||||||||
Saudi Electricity Global Sukuk Co. 3 | USD | 5.500 | % | 04/08/2044 | 36,000 | $ | 39,006(1) | |||||||||
|
| |||||||||||||||
Singapore - 0.61% | ||||||||||||||||
DBS Bank Ltd. | USD | 3.625 | % | 09/21/2022 | 80,000 | 82,894(2)(3) | ||||||||||
Oversea-Chinese Banking Corp. Ltd. | USD | 4.000 | % | 10/15/2024 | 61,000 | 63,033(1)(3) | ||||||||||
|
| |||||||||||||||
| 145,927 | ||||||||||||||||
|
| |||||||||||||||
South Africa - 2.89% | ||||||||||||||||
Eskom Holdings SOC Ltd.: | ||||||||||||||||
| USD | 5.750 | % | 01/26/2021 | 98,000 | 97,388(1) | |||||||||||
| USD | 6.750 | % | 08/06/2023 | 274,000 | 281,535(1) | |||||||||||
| USD | 7.125 | % | 02/11/2025 | 107,000 | 110,879(1) | |||||||||||
Myriad International Holdings BV | USD | 6.000 | % | 07/18/2020 | 183,000 | 202,901(1) | ||||||||||
|
| |||||||||||||||
| 692,703 | ||||||||||||||||
|
| |||||||||||||||
South Korea - 3.27% | ||||||||||||||||
Korea Gas Corp. | USD | 3.875 | % | 02/12/2024 | 150,000 | 160,576(1) | ||||||||||
Korea Hydro & Nuclear Power Co. Ltd. | USD | 4.750 | % | 07/13/2021 | 160,000 | 179,888(2) | ||||||||||
Korea Midland Power Co. Ltd. | USD | 2.750 | % | 02/11/2019 | 300,000 | 306,021(2) | ||||||||||
Korea National Oil Corp. | USD | 3.250 | % | 07/10/2024 | 134,000 | 137,304(1) | ||||||||||
|
| |||||||||||||||
| 783,789 | ||||||||||||||||
|
| |||||||||||||||
Thailand - 4.09% | ||||||||||||||||
Bangkok Bank PCL: | ||||||||||||||||
| USD | 3.300 | % | 10/03/2018 | 64,000 | 66,196(1) | |||||||||||
| USD | 3.875 | % | 09/27/2022 | 136,000 | 141,501(1) | |||||||||||
PTT Exploration & Production PCL | USD | 4.875 | % | Perpetual | 573,000 | 585,176(1)(3) | ||||||||||
PTT Global Chemical PCL | USD | 4.250 | % | 09/19/2022 | 80,000 | 83,547(1) | ||||||||||
PTTEP Canada International Finance Ltd. | USD | 5.692 | % | 04/05/2021 | 94,000 | 106,031(2) | ||||||||||
|
| |||||||||||||||
| 982,451 | ||||||||||||||||
|
| |||||||||||||||
Turkey - 3.96% | ||||||||||||||||
Akbank TAS | USD | 4.000 | % | 01/24/2020 | 77,000 | 75,748(1) | ||||||||||
Turk Telekomunikasyon AS | USD | 4.875 | % | 06/19/2024 | 301,000 | 302,129(1) | ||||||||||
Turkiye Garanti Bankasi AS: | ||||||||||||||||
| USD | 4.750 | % | 10/17/2019 | 140,000 | 142,800(1) | |||||||||||
| USD | 5.250 | % | 09/13/2022 | 101,000 | 103,525(1) | |||||||||||
Turkiye Is Bankasi: | ||||||||||||||||
| USD | 5.500 | % | 04/21/2019 | 80,000 | 83,300(1) | |||||||||||
| USD | 6.000 | % | 10/24/2022 | 241,000 | 242,205(1) | |||||||||||
Turkiye Vakiflar Ban | USD | 6.875 | % | 02/03/2025 | 230,000 | 229,712(1)(3) | ||||||||||
|
| |||||||||||||||
| 1,179,419 | ||||||||||||||||
|
| |||||||||||||||
United Arab Emirates - 5.82% | ||||||||||||||||
DP World Ltd. | USD | 3.250 | % | 05/18/2020 | 100,000 | 100,475(1) | ||||||||||
Dubai Holding Commercial Operations MTN Ltd. | GBP | 6.000 | % | 02/01/2017 | 400,000 | 631,993 | ||||||||||
MAF Global Securities Ltd. | USD | 7.125 | % | Perpetual | 612,000 | 664,020(3) | ||||||||||
|
| |||||||||||||||
| 1,396,488 | ||||||||||||||||
|
| |||||||||||||||
Venezuela - 0.87% | ||||||||||||||||
Petroleos de Venezuela SA | USD | 8.500 | % | 11/02/2017 | 280,700 | 209,122(2) | ||||||||||
|
| |||||||||||||||
TOTAL CORPORATE BONDS | 22,736,676 | |||||||||||||||
|
| |||||||||||||||
(Cost $22,313,291) | ||||||||||||||||
Stone Harbor Investment Funds Annual Report | May 31, 2015 | 53 |
Table of Contents
| Stone Harbor Emerging Markets Corporate Debt Fund | Statements of Investments | |
May 31, 2015 |
| Currency | Rate | Maturity Date | Principal Amount/Shares* | Market Value Expressed (in U.S. $) | ||||||||||||||||||||||
SHORT TERM INVESTMENTS - 4.21% | ||||||||||||||||||||||||||
Money Market Mutual Funds - 4.21% | ||||||||||||||||||||||||||
Dreyfus Institutional Cash Advantage Fund - Institutional Advantage Class (7-Day Yield) | USD | 0.07989 | % | N/A | 1,010,937 | 1,010,937 | ||||||||||||||||||||
|
| |||||||||||||||||||||||||
TOTAL SHORT TERM INVESTMENTS | 1,010,937 | |||||||||||||||||||||||||
|
| |||||||||||||||||||||||||
(Cost $1,010,937) | ||||||||||||||||||||||||||
Total Investments - 98.94% | 23,747,613 | |||||||||||||||||||||||||
(Cost $23,324,228) | ||||||||||||||||||||||||||
Other Assets In Excess of Liabilities - 1.06% | 253,812 | |||||||||||||||||||||||||
|
| |||||||||||||||||||||||||
Net Assets - 100.00% | $ | 24,001,425 | ||||||||||||||||||||||||
|
| |||||||||||||||||||||||||
* The principal amount/shares of each security is stated in the currency in which the security is denominated.
Currency Abbreviations:
EUR | - | Euro Currency | ||
GBP | - | Great Britain Pound | ||
USD | - | United States Dollar |
| (1) | Security exempt from registration under Rule 144A of the Securities Act of 1933. Such securities may normally be sold to qualified institutional buyers in transactions exempt from registration. Total market value of Rule 144A securities amounts to $14,218,906, which represents approximately 59.24% of net assets as of May 31, 2015. |
| (2) | Securities were originally issued pursuant to Regulation S under the Securities Act of 1933, which exempts securities offered and sold outside of the United States from registration. Such securities cannot be sold in the United States without either an effective registration statement filed pursuant to the Securities Act of 1933, or pursuant to an exemption from registration. As of May 31, 2015, the aggregate market value of those securities was $5,048,464, which represents approximately 21.03% of net assets. |
| (3) | Floating or variable rate security. Interest rate disclosed is that which is in effect as of May 31, 2015. |
Common Abbreviations:
AS | - | Anonim Sirket is the Turkish term for Incorporation. | ||
Bhd | - | Berhad is the Malaysian term for public limited company. | ||
BV | - | Besloten Vennootschap is the Dutch term for private limited liability company. | ||
ESP | - | Empresa de Servicios Publicos is the Colombian term for Public Service Company. | ||
GmbH | - | Gesellschaft mit beschrankter Haftung is the German term for a company wtih limited liability. | ||
LLC | - | Limited Liability Corporation. | ||
LP | - | Limited Partnership. | ||
Ltd. | - | Limited. | ||
MTN | - | Medium Term Note. | ||
OAO | - | Otkrytoe Aktsionernoe Obschestvo is the Russian term for Open Joint Stock Company. | ||
OJSC | - | Open Joint Stock Company. | ||
PCL | - | A rearrangement of the letters for Public Limited Company, used in Thailand. | ||
PLC | - | Public Limited Company. | ||
PT | - | Perseroan terbuka is an Indonesian term for limited liability company. | ||
Pte | - | Private. | ||
SA | - | Generally designates corporations in various countries, mostly those employing the civil law. | ||
SA de CV | - | A Variable Capital Company. | ||
SAA | - | Sociedad Anonima Abierta is the Peruvian term used for companies with 20 or more shareholders. | ||
SAB de CV | - | A Variable Capital Company. | ||
SAC | - | Sociedad Anonima Abierta is the Peruvian term used for a publicly traded corporation. | ||
TAS | - | TüRk Anonim Sirketi is the Turkish term for Joint Stock Company. | ||
Tbk PT | - | Terbuka is the Indonesian term for Limited Liability Company. |
54 | www.shiplp.com |
Table of Contents
| Stone Harbor Emerging Markets Corporate Debt Fund | Statements of Investments | |
May 31, 2015 |
OUTSTANDING FORWARD FOREIGN CURRENCY CONTRACTS
| Counterparty | Foreign Currency | Contracted Amount** | Sale Contract | Settlement Date | Current Value | Unrealized Appreciation/ (Depreciation) | ||||||||||||||||||||||||||||
| ||||||||||||||||||||||||||||||||||
J.P. Morgan Chase & Co. | EUR | 211,200 | Sale | 06/10/2015 | $ | 231,997 | $ | 6,259 | ||||||||||||||||||||||||||
|
| |||||||||||||||||||||||||||||||||
| $ | 6,259 | |||||||||||||||||||||||||||||||||
|
| |||||||||||||||||||||||||||||||||
J.P. Morgan Chase & Co. | GBP | 418,000 | Sale | 06/10/2015 | $ | 638,816 | $ | (2,874) | ||||||||||||||||||||||||||
|
| |||||||||||||||||||||||||||||||||
| $ | (2,874) | |||||||||||||||||||||||||||||||||
|
| |||||||||||||||||||||||||||||||||
** The contracted amount is stated in the currency in which the contract is denominated.
See Notes to Financial Statements.
Stone Harbor Investment Funds Annual Report | May 31, 2015 | 55 |
Table of Contents
| Stone Harbor Investment Grade Fund | Statements of Investments | |
May 31, 2015 |
| Currency | Rate | Maturity Date | Principal Amount* | Market Value (Expressed in U.S. $) | ||||||||||||||||||||
CORPORATE BONDS - 42.40% | ||||||||||||||||||||||||
Aerospace/Defense - 0.25% | ||||||||||||||||||||||||
Northrop Grumman Corp. | USD | 1.750% | 06/01/2018 | 25,000 | $ | 25,033 | ||||||||||||||||||
|
| |||||||||||||||||||||||
Automotive - 1.07% | ||||||||||||||||||||||||
Ford Motor Credit Co. LLC | USD | 4.250% | 09/20/2022 | 50,000 | 53,213 | |||||||||||||||||||
Hyundai Capital America | USD | 4.000% | 06/08/2017 | 50,000 | 52,433(1) | |||||||||||||||||||
|
| |||||||||||||||||||||||
| 105,646 | ||||||||||||||||||||||||
|
| |||||||||||||||||||||||
Banking - 10.45% | ||||||||||||||||||||||||
American Express Co. | USD | 3.625% | 12/05/2024 | 50,000 | 50,088 | |||||||||||||||||||
ANZ New Zealand Int’l Ltd. | USD | 1.750% | 03/29/2018 | 25,000 | 25,099(1) | |||||||||||||||||||
Bank of America Corp.: | ||||||||||||||||||||||||
| USD | 6.050% | 05/16/2016 | 25,000 | 26,090 | ||||||||||||||||||||
| USD | 3.300% | 01/11/2023 | 125,000 | 125,223 | ||||||||||||||||||||
| USD | 3.950% | 04/21/2025 | 25,000 | 24,771 | ||||||||||||||||||||
BPCE SA | USD | 5.700% | 10/22/2023 | 50,000 | 54,414(1) | |||||||||||||||||||
Capital One Bank USA NA | USD | 3.375% | 02/15/2023 | 25,000 | 24,885 | |||||||||||||||||||
Capital One Financial Corp. | USD | 6.750% | 09/15/2017 | 50,000 | 55,880 | |||||||||||||||||||
Citigroup, Inc. | USD | 3.875% | 03/26/2025 | 125,000 | 123,807 | |||||||||||||||||||
Goldman Sachs Capital I | USD | 6.345% | 02/15/2034 | 50,000 | 60,339 | |||||||||||||||||||
Intesa Sanpaolo SpA | USD | 3.125% | 01/15/2016 | 50,000 | 50,606 | |||||||||||||||||||
Mizuho Bank Ltd. | USD | 3.600% | 09/25/2024 | 75,000 | 77,257(1) | |||||||||||||||||||
Morgan Stanley | USD | 4.875% | 11/01/2022 | 50,000 | 53,951 | |||||||||||||||||||
MUFG Americas Holdings Corp. | USD | 3.000% | 02/10/2025 | 50,000 | 48,529 | |||||||||||||||||||
PNC Financial Services Group, Inc. | USD | 3.900% | 04/29/2024 | 100,000 | 103,683 | |||||||||||||||||||
Santander UK PLC | USD | 5.000% | 11/07/2023 | 50,000 | 52,657(1) | |||||||||||||||||||
Wells Fargo & Co., Series M | USD | 3.450% | 02/13/2023 | 75,000 | 76,047 | |||||||||||||||||||
|
| |||||||||||||||||||||||
| 1,033,326 | ||||||||||||||||||||||||
|
| |||||||||||||||||||||||
Chemicals - 0.50% | ||||||||||||||||||||||||
Eastman Chemical Co. | USD | 4.650% | 10/15/2044 | 50,000 | 49,337 | |||||||||||||||||||
|
| |||||||||||||||||||||||
Consumer Products - 0.27% | ||||||||||||||||||||||||
Newell Rubbermaid, Inc. | USD | 4.000% | 06/15/2022 | 25,000 | 26,254 | |||||||||||||||||||
|
| |||||||||||||||||||||||
Diversified Manufacturing - 0.26% | ||||||||||||||||||||||||
Siemens Financieringsmaatschappij NV | USD | 3.250% | 05/27/2025 | 25,000 | 25,185(1) | |||||||||||||||||||
|
| |||||||||||||||||||||||
Electric - 0.76% | ||||||||||||||||||||||||
Georgia Power Co. | USD | 4.300% | 03/15/2042 | 25,000 | 24,866 | |||||||||||||||||||
Oncor Electric Delivery Co. LLC | USD | 2.150% | 06/01/2019 | 50,000 | 50,233 | |||||||||||||||||||
|
| |||||||||||||||||||||||
| 75,099 | ||||||||||||||||||||||||
|
| |||||||||||||||||||||||
Environmental Services - 0.50% | ||||||||||||||||||||||||
Republic Services, Inc. | USD | 3.200% | 03/15/2025 | 50,000 | 49,201 | |||||||||||||||||||
|
| |||||||||||||||||||||||
Exploration & Production - 2.10% | ||||||||||||||||||||||||
Anadarko Petroleum Corp. | USD | 6.450% | 09/15/2036 | 50,000 | 59,916 | |||||||||||||||||||
Apache Corp. | USD | 5.100% | 09/01/2040 | 50,000 | 50,467 | |||||||||||||||||||
Continental Resources, Inc. | USD | 3.800% | 06/01/2024 | 50,000 | 46,407 | |||||||||||||||||||
56 | www.shiplp.com |
Table of Contents
| Stone Harbor Investment Grade Fund | Statements of Investments | |
May 31, 2015 |
| Currency | Rate | Maturity Date | Principal Amount* | Market Value (Expressed in U.S. $) | ||||||||||||||||||||
Exploration & Production (continued) | ||||||||||||||||||||||||
Phillips 66 | USD | 4.650% | 11/15/2034 | 50,000 | $ | 50,797 | ||||||||||||||||||
|
| |||||||||||||||||||||||
| 207,587 | ||||||||||||||||||||||||
|
| |||||||||||||||||||||||
Food and Beverage - 0.51% | ||||||||||||||||||||||||
PepsiCo, Inc. | USD | 4.250% | 10/22/2044 | 50,000 | 50,133 | |||||||||||||||||||
|
| |||||||||||||||||||||||
Gas Pipelines - 0.94% | ||||||||||||||||||||||||
Kinder Morgan Energy Partners LP | USD | 4.700% | 11/01/2042 | 50,000 | 43,833 | |||||||||||||||||||
Spectra Energy Partners LP | USD | 3.500% | 03/15/2025 | 50,000 | 49,293 | |||||||||||||||||||
|
| |||||||||||||||||||||||
| 93,126 | ||||||||||||||||||||||||
|
| |||||||||||||||||||||||
Healthcare - 2.32% | ||||||||||||||||||||||||
McKesson Corp. | USD | 3.796% | 03/15/2024 | 50,000 | 51,632 | |||||||||||||||||||
Medtronic, Inc.: | ||||||||||||||||||||||||
| USD | 3.150% | 03/15/2022 | 50,000 | 51,128(1) | ||||||||||||||||||||
| USD | 4.625% | 03/15/2045 | 25,000 | 25,997(1) | ||||||||||||||||||||
Thermo Fisher Scientific, Inc. | USD | 1.300% | 02/01/2017 | 50,000 | 50,010 | |||||||||||||||||||
Zimmer Holdings, Inc. | USD | 2.700% | 04/01/2020 | 50,000 | 50,386 | |||||||||||||||||||
|
| |||||||||||||||||||||||
| 229,153 | ||||||||||||||||||||||||
|
| |||||||||||||||||||||||
Leisure - 0.51% | ||||||||||||||||||||||||
Time Warner, Inc. | USD | 3.600% | 07/15/2025 | 50,000 | 49,900 | |||||||||||||||||||
|
| |||||||||||||||||||||||
Life Insurance - 1.26% | ||||||||||||||||||||||||
American International Group, Inc. | USD | 4.375% | 01/15/2055 | 50,000 | 47,186 | |||||||||||||||||||
ING Bank NV | USD | 2.500% | 10/01/2019 | 50,000 | 50,731(1) | |||||||||||||||||||
Nippon Life Insurance Co. | USD | 5.100% | 10/16/2044 | 25,000 | 26,812(1)(2) | |||||||||||||||||||
|
| |||||||||||||||||||||||
| 124,729 | ||||||||||||||||||||||||
|
| |||||||||||||||||||||||
Media Cable - 1.32% | ||||||||||||||||||||||||
Comcast Corp. | USD | 4.250% | 01/15/2033 | 75,000 | 75,659 | |||||||||||||||||||
DIRECTV Holdings LLC / DIRECTV Financing Co. Inc | USD | 6.000% | 08/15/2040 | 50,000 | 54,055 | |||||||||||||||||||
|
| |||||||||||||||||||||||
| 129,714 | ||||||||||||||||||||||||
|
| |||||||||||||||||||||||
Media Non Cable - 1.01% | ||||||||||||||||||||||||
Discovery Communications LLC | USD | 3.300% | 05/15/2022 | 50,000 | 49,771 | |||||||||||||||||||
Omnicom Group, Inc. | USD | 3.650% | 11/01/2024 | 50,000 | 50,106 | |||||||||||||||||||
|
| |||||||||||||||||||||||
| 99,877 | ||||||||||||||||||||||||
|
| |||||||||||||||||||||||
Media Other - 0.80% | ||||||||||||||||||||||||
21st Century Fox America, Inc. | USD | 6.650% | 11/15/2037 | 25,000 | 31,701 | |||||||||||||||||||
CBS Corp. | USD | 4.850% | 07/01/2042 | 50,000 | 47,795 | |||||||||||||||||||
|
| |||||||||||||||||||||||
| 79,496 | ||||||||||||||||||||||||
|
| |||||||||||||||||||||||
Metals/Mining/Steel - 0.51% | ||||||||||||||||||||||||
Newmont Mining Corp. | USD | 6.250% | 10/01/2039 | 50,000 | 50,598 | |||||||||||||||||||
|
| |||||||||||||||||||||||
Non Captive Finance - 1.63% | ||||||||||||||||||||||||
Aviation Capital Group Corp. | USD | 6.750% | 04/06/2021 | 50,000 | 57,970(1) | |||||||||||||||||||
Discover Bank | USD | 4.250% | 03/13/2026 | 50,000 | 51,136 | |||||||||||||||||||
Stone Harbor Investment Funds Annual Report | May 31, 2015 | 57 |
Table of Contents
| Stone Harbor Investment Grade Fund | Statements of Investments | |
May 31, 2015 |
| Currency | Rate | Maturity Date | Principal Amount* | Market Value (Expressed in U.S. $) | ||||||||||||||||||||
Non Captive Finance (continued) | ||||||||||||||||||||||||
Synchrony Financial | USD | 4.250% | 08/15/2024 | 50,000 | $ | 51,262 | ||||||||||||||||||
|
| |||||||||||||||||||||||
| 160,368 | ||||||||||||||||||||||||
|
| |||||||||||||||||||||||
Oil Field Services - 0.48% | ||||||||||||||||||||||||
Transocean, Inc. | USD | 6.375% | 12/15/2021 | 50,000 | 47,187 | |||||||||||||||||||
|
| |||||||||||||||||||||||
Paper/Forest Products - 0.27% | ||||||||||||||||||||||||
Packaging Corp. of America | USD | 4.500% | 11/01/2023 | 25,000 | 26,411 | |||||||||||||||||||
|
| |||||||||||||||||||||||
Pharmaceuticals - 1.51% | ||||||||||||||||||||||||
Actavis Funding SCS | USD | 4.550% | 03/15/2035 | 25,000 | 24,761 | |||||||||||||||||||
Amgen, Inc. | USD | 3.125% | 05/01/2025 | 75,000 | 73,134 | |||||||||||||||||||
Gilead Sciences, Inc. | USD | 4.500% | 02/01/2045 | 50,000 | 50,946 | |||||||||||||||||||
|
| |||||||||||||||||||||||
| 148,841 | ||||||||||||||||||||||||
|
| |||||||||||||||||||||||
Pipelines - 2.00% | ||||||||||||||||||||||||
Boardwalk Pipelines LP | USD | 3.375% | 02/01/2023 | 50,000 | 46,011 | |||||||||||||||||||
Dominion Gas Holdings LLC | USD | 4.800% | 11/01/2043 | 50,000 | 53,268 | |||||||||||||||||||
EQT Midstream Partners LP | USD | 4.000% | 08/01/2024 | 50,000 | 48,529 | |||||||||||||||||||
Plains All American Pipeline LP / PAA Finance Corp. | USD | 3.600% | 11/01/2024 | 50,000 | 49,202 | |||||||||||||||||||
|
| |||||||||||||||||||||||
| 197,010 | ||||||||||||||||||||||||
|
| |||||||||||||||||||||||
Property & Casualty Insurance - 0.51% | ||||||||||||||||||||||||
Berkshire Hathaway Energy Co. | USD | 2.000% | 11/15/2018 | 50,000 | 50,579 | |||||||||||||||||||
|
| |||||||||||||||||||||||
Railroads - 0.51% | ||||||||||||||||||||||||
Burlington Northern Sante Fe LLC | USD | 4.400% | 03/15/2042 | 50,000 | 50,672 | |||||||||||||||||||
|
| |||||||||||||||||||||||
Real Estate Investment Trust (REITs) - 1.75% | ||||||||||||||||||||||||
Avalonbay Communties Inc. | USD | 3.450% | 06/01/2025 | 25,000 | 25,304 | |||||||||||||||||||
Corporate Office Properties LP | USD | 3.600% | 05/15/2023 | 50,000 | 47,898 | |||||||||||||||||||
DDR Corp. | USD | 3.500% | 01/15/2021 | 45,000 | 46,413 | |||||||||||||||||||
Kimco Realty Corp. | USD | 4.300% | 02/01/2018 | 50,000 | 53,469 | |||||||||||||||||||
|
| |||||||||||||||||||||||
| 173,084 | ||||||||||||||||||||||||
|
| |||||||||||||||||||||||
Retail Food/Drug - 1.52% | ||||||||||||||||||||||||
CVS Pass-Through Trust | USD | 6.036% | 12/10/2028 | 37,947 | 44,429 | |||||||||||||||||||
JB y Co. SA de CV | USD | 3.750% | 05/13/2025 | 50,000 | 50,125(1) | |||||||||||||||||||
Kroger Co. | USD | 5.150% | 08/01/2043 | 50,000 | 55,248 | |||||||||||||||||||
|
| |||||||||||||||||||||||
| 149,802 | ||||||||||||||||||||||||
|
| |||||||||||||||||||||||
Retail Non Food/Drug - 2.10% | ||||||||||||||||||||||||
Advance Auto Parts, Inc. | USD | 4.500% | 12/01/2023 | 50,000 | 52,829 | |||||||||||||||||||
The Home Depot, Inc. | USD | 2.625% | 06/01/2022 | 25,000 | 25,003 | |||||||||||||||||||
Macy’s Retail Holdings, Inc. | USD | 3.875% | 01/15/2022 | 75,000 | 79,367 | |||||||||||||||||||
The TJX Cos., Inc. | USD | 2.750% | 06/15/2021 | 50,000 | 51,144 | |||||||||||||||||||
|
| |||||||||||||||||||||||
| 208,343 | ||||||||||||||||||||||||
|
| |||||||||||||||||||||||
Technology - 1.51% | ||||||||||||||||||||||||
Apple, Inc. | USD | 3.850% | 05/04/2043 | 50,000 | 46,835 | |||||||||||||||||||
Ingram Micro, Inc. | USD | 4.950% | 12/15/2024 | 50,000 | 51,991 | |||||||||||||||||||
58 | www.shiplp.com |
Table of Contents
| Stone Harbor Investment Grade Fund | Statements of Investments | |
May 31, 2015 |
| Currency | Rate | Maturity Date | Principal Amount* | Market Value (Expressed in U.S. $) | ||||||||||||||||||||
Technology (continued) | ||||||||||||||||||||||||
Tencent Holdings Ltd. | USD | 3.800% | 02/11/2025 | 50,000 | $ | 50,228(1) | ||||||||||||||||||
|
| |||||||||||||||||||||||
| 149,054 | ||||||||||||||||||||||||
|
| |||||||||||||||||||||||
Transportaion Non Air/Rail - 0.52% | ||||||||||||||||||||||||
ERAC USA Finance LLC | USD | 3.850% | 11/15/2024 | 50,000 | 51,395(1) | |||||||||||||||||||
|
| |||||||||||||||||||||||
Transportation - 0.54% | ||||||||||||||||||||||||
FedEx Corp. | USD | 5.100% | 01/15/2044 | 50,000 | 53,507 | |||||||||||||||||||
|
| |||||||||||||||||||||||
Wireless - 0.56% | ||||||||||||||||||||||||
Rogers Communications, Inc. | USD | 5.450% | 10/01/2043 | 50,000 | 55,505 | |||||||||||||||||||
|
| |||||||||||||||||||||||
Wirelines - 1.65% | ||||||||||||||||||||||||
AT&T, Inc.: | ||||||||||||||||||||||||
| USD | 2.450% | 06/30/2020 | 25,000 | 24,773 | ||||||||||||||||||||
| USD | 4.500% | 05/15/2035 | 25,000 | 23,678 | ||||||||||||||||||||
Telefonica Emisiones SAU | USD | 5.134% | 04/27/2020 | 25,000 | 27,816 | |||||||||||||||||||
Verizon Communications, Inc.: | ||||||||||||||||||||||||
| USD | 5.150% | 09/15/2023 | 25,000 | 27,975 | ||||||||||||||||||||
| USD | 6.400% | 09/15/2033 | 50,000 | 58,760 | ||||||||||||||||||||
|
| |||||||||||||||||||||||
| 163,002 | ||||||||||||||||||||||||
|
| |||||||||||||||||||||||
TOTAL CORPORATE BONDS | 4,188,154 | |||||||||||||||||||||||
|
| |||||||||||||||||||||||
(Cost $4,206,009) | ||||||||||||||||||||||||
ASSET BACKED/COMMERCIAL MORTGAGE BACKED SECURITIES - 5.86% |
| |||||||||||||||||||||||
BHMS 2014-ATLS Mortgage Trust, Series 2014- ATLS | USD | 1.680% | 07/05/2017 | 25,000 | 25,111(1)(2) | |||||||||||||||||||
CDGJ Commercial Mortgage Trust 2014-BXCH A, Series 2014-BXCH | USD | 1.579% | 11/15/2016 | 50,000 | 50,222(1)(2) | |||||||||||||||||||
Ellington Loan Acquisition Trust 2007-1 A2B | USD | 1.085% | 05/28/2037 | 37,734 | 37,278(1)(2) | |||||||||||||||||||
Financial Asset Securities Corp. AAA Trust, Series 2005-2 | USD | 0.482% | 11/26/2035 | 38,762 | 35,879(1)(2) | |||||||||||||||||||
GAHR Commericial Mortgage Trust 2015-NRF, Series 2015-NRF | USD | 1.486% | 12/15/2016 | 100,000 | 100,181(1)(2) | |||||||||||||||||||
Hyatt Hotel Portfolio Trust 2015-HYT, Series 2015-HYT | USD | 1.436% | 11/15/2019 | 100,000 | 100,359(1)(2) | |||||||||||||||||||
Invitation Homes Trust 2013-SFR1 A | USD | 1.400% | 12/17/2015 | 48,782 | 48,953(1)(2) | |||||||||||||||||||
ML-CFC Commercial Mortgage Trust 2007-8 AMA | USD | 5.880% | 07/12/2017 | 25,000 | 26,005(2) | |||||||||||||||||||
Oak Hill Advisors Residential Loan Trust 2015- NPL1, Series 2015-NPL1 | USD | 3.475% | 01/25/2055 | 19,288 | 19,349(1)(3) | |||||||||||||||||||
TAL Advantage V LLC, Series 2013-2A | USD | 3.550% | 11/20/2023 | 21,250 | 21,535(1) | |||||||||||||||||||
US Residential Opportunity Fund III Trust 2015-1, Series 2015-1III | USD | 3.721% | 01/27/2018 | 49,237 | 49,750(1) | |||||||||||||||||||
VOLT XXII LLC, Series 2015-NPL4 | USD | 3.500% | 02/25/2055 | 38,874 | 39,069(1)(3) | |||||||||||||||||||
VOLT XXXIII LLC, Series 2015-NPL5 | USD | 3.500% | 03/25/2055 | 24,688 | 24,724(1)(3) | |||||||||||||||||||
|
| |||||||||||||||||||||||
TOTAL ASSET BACKED/COMMERCIAL MORTGAGE BACKED SECURITIES | 578,415 | |||||||||||||||||||||||
|
| |||||||||||||||||||||||
(Cost $575,695) | ||||||||||||||||||||||||
Stone Harbor Investment Funds Annual Report | May 31, 2015 | 59 |
Table of Contents
| Stone Harbor Investment Grade Fund | Statements of Investments | |
May 31, 2015 |
| Currency | Rate | Maturity Date | Principal Amount/Shares* | Market Value (Expressed in U.S. $) | ||||||||||||||
U.S. TREASURY BONDS/NOTES - 22.03% |
| |||||||||||||||||
U.S. Treasury Bonds: | ||||||||||||||||||
| USD | 2.000% | 11/15/2021 | 925,000 | $ | 936,129 | |||||||||||||
| USD | 2.250% | 11/15/2024 | 100,000 | 101,172 | ||||||||||||||
U.S. Treasury Notes: | ||||||||||||||||||
| USD | 0.250% | 12/15/2015 | 425,000 | 425,332 | ||||||||||||||
| USD | 2.000% | 01/31/2016 | 450,000 | 455,484 | ||||||||||||||
| USD | 1.625% | 04/30/2019 | 150,000 | 152,180 | ||||||||||||||
| USD | 2.750% | 02/15/2024 | 100,000 | 105,656 | ||||||||||||||
|
| |||||||||||||||||
TOTAL U.S. TREASURY BONDS/NOTES | 2,175,953 | |||||||||||||||||
|
| |||||||||||||||||
(Cost $2,137,786) | ||||||||||||||||||
U.S. GOVERNMENT AGENCY MORTGAGE BACKED SECURITIES - 25.76% |
| |||||||||||||||||
FNMA TBA: | ||||||||||||||||||
| USD | 3.000% | 06/11/2015 | 250,000 | 253,188(4) | ||||||||||||||
| USD | 3.500% | 06/11/2015 | 450,000 | 469,934(4) | ||||||||||||||
| USD | 4.000% | 06/11/2015 | 625,000 | 667,334(4) | ||||||||||||||
| USD | 4.500% | 06/11/2015 | 375,000 | 407,707(4) | ||||||||||||||
| USD | 5.000% | 06/11/2015 | 250,000 | 278,079(4) | ||||||||||||||
| USD | 2.500% | 06/16/2015 | 100,000 | 102,151(4) | ||||||||||||||
| USD | 3.000% | 06/16/2015 | 300,000 | 313,289(4) | ||||||||||||||
GNMA TBA | USD | 3.500% | 06/18/2015 | 50,000 | 52,379(4) | |||||||||||||
|
| |||||||||||||||||
TOTAL U.S. GOVERNMENT AGENCY MORTGAGE BACKED SECURITIES | 2,544,061 | |||||||||||||||||
|
| |||||||||||||||||
(Cost $2,541,927) | ||||||||||||||||||
SHORT TERM INVESTMENTS - 3.65% | ||||||||||||||||||
Money Market Mutual Funds - 3.65% | ||||||||||||||||||
Dreyfus Institutional Cash Advantage Fund - Institutional Advantage Class (7-Day Yield) | USD | 0.07989% | N/A | 360,967 | 360,967 | |||||||||||||
|
| |||||||||||||||||
TOTAL SHORT TERM INVESTMENTS | 360,967 | |||||||||||||||||
|
| |||||||||||||||||
(Cost $360,967) | ||||||||||||||||||
Total Investments - 99.70% | 9,847,550 | |||||||||||||||||
(Cost $9,822,384) | ||||||||||||||||||
Other Assets in Excess of Liabilities - 0.30% | 29,601 | |||||||||||||||||
|
| |||||||||||||||||
Net Assets - 100.00% | $ | 9,877,151 | ||||||||||||||||
|
| |||||||||||||||||
* The principal amount/shares of each security is stated in the currency in which the security is denominated.
Currency Abbreviations: |
USD - United States Dollar |
| (1) | Security exempt from registration under Rule 144A of the Securities Act of 1933. Such securities may normally be sold to qualified institutional buyers in transactions exempt from registration. Total market value of Rule 144A securities amounts to $1,203,841, which represents approximately 12.19% of net assets as of May 31, 2015. |
| (2) | Floating or variable rate security. Interest rate disclosed is that which is in effect as of May 31, 2015. |
| (3) | Step bond. Coupon changes periodically based upon a predetermined schedule. Interest rate disclosed is that which is in effect as of May 31, 2015. |
| (4) | Investment purchased on a delayed delivery basis. |
60 | www.shiplp.com |
Table of Contents
| Stone Harbor Investment Grade Fund | Statements of Investments | |
May 31, 2015 |
Common Abbreviations:
FNMA | - | Fannie Mae. | ||
GNMA | - | Government National Mortgage Association. | ||
LLC | - | Limited Liability Corporation. | ||
LP | - | Limited Partnership. | ||
Ltd | - | Limited. | ||
NA | - | National Association. | ||
NV | - | Naamloze Vennootshap is the Dutch term for a Public Limited Liability Corporation. | ||
PLC | - | Public Limited Company. | ||
SA | - | Generally designated corporations in various countries, mostly those employing civil law. | ||
SA de CV | - | A Variable Capital Company. | ||
SAU | - | Sociedad Anonima Unipersonal is the Spanish term for Single Shareholder Corporation. | ||
SpA | - | Società per Azioni is the Italian term for Limited share company. | ||
TBA | - | To Be Announced. | ||
UK | - | United Kingdom. |
See Notes to Financial Statements.
Stone Harbor Investment Funds Annual Report | May 31, 2015 | 61 |
Table of Contents
| Stone Harbor Strategic Income Fund | Statements of Investments | |
May 31, 2015 |
| Currency | Rate | Shares* | Market Value (Expressed in U.S. $) | |||||||||||
OPEN-END FUNDS - 98.66% | ||||||||||||||
Stone Harbor Emerging Markets Debt Fund | USD | N/A | 969,132 | $ 10,146,808(1) | ||||||||||
Stone Harbor High Yield Bond Fund | USD | N/A | 1,569,300 | 13,621,522(1) | ||||||||||
Stone Harbor Investment Grade Fund | USD | N/A | 952,172 | 9,864,501(1) | ||||||||||
|
| |||||||||||||
| 33,632,831 | ||||||||||||||
|
| |||||||||||||
TOTAL OPEN-END FUNDS | 33,632,831 | |||||||||||||
|
| |||||||||||||
(Cost $34,620,136) | ||||||||||||||
Total Investments - 98.66% | 33,632,831 | |||||||||||||
(Cost $34,620,136) | ||||||||||||||
Other Assets In Excess of Liabilities - 1.34% | 457,549(2) | |||||||||||||
|
| |||||||||||||
Net Assets - 100.00% | $ 34,090,380 | |||||||||||||
|
| |||||||||||||
* The shares of each security is stated in the currency in which the security is denominated.
Currency Abbreviations:
EUR | - | Euro Currency | ||
GBP | - | Great Britain Pound | ||
USD | - | United States Dollar |
| (1) | Affiliated with the Fund, as each is a series of Stone Harbor Investment Funds and has the same investment adviser. |
| (2) | Includes cash which is being held as collateral for credit default swap contracts. |
OUTSTANDING FORWARD FOREIGN CURRENCY CONTRACTS
| Counterparty | Foreign Currency | Contracted Amount** | Purchase/Sale Contract | Settlement Date | Current Value | Unrealized Appreciation/ (Depreciation) | ||||||||||
| ||||||||||||||||
Citigroup Global Markets | EUR | 49,000 | Sale | 06/10/2015 | $ 53,825 | $ 1,274 | ||||||||||
|
| |||||||||||||||
| $ 1,274 | ||||||||||||||||
|
| |||||||||||||||
Citigroup Global Markets | GBP | 29,100 | Sale | 06/10/2015 | $ 44,473 | $ (211) | ||||||||||
|
| |||||||||||||||
| $ (211) | ||||||||||||||||
|
| |||||||||||||||
** The contracted amount is stated in the currency in which the contract is denominated.
FUTURES CONTRACTS
| Description | Position | Contracts | Currency | Expiration Date | Notional Amount* | Unrealized Appreciation | ||||||||||
| ||||||||||||||||
Long Gilt Future | Long | 10 | GBP | 9/29/15 | $ | 1,178,000 | $ | 12,839 | ||||||||
US Ultra T-Bond | Long | 2 | USD | 9/22/15 | 320,563 | 4,187 | ||||||||||
|
| |||||||||||||||
| $ | 1,498,563 | $ | 17,026 | |||||||||||||
|
| |||||||||||||||
| Description | Position | Contracts | Currency | Expiration Date | Notional Amount* | Unrealized Depreciation | ||||||||||
| ||||||||||||||||
Euro-Bund Future | Long | 26 | EUR | 6/09/15 | $ | 4,041,180 | $ | (53,311) | ||||||||
US 10yr T-Note | Short | (55) | USD | 9/22/15 | (7,022,813) | (20,625) | ||||||||||
|
| |||||||||||||||
| $ | (2,981,633) | $ | (73,936) | |||||||||||||
|
| |||||||||||||||
* The notional amount of each security is stated in the currency in which the security is denominated.
62 | www.shiplp.com |
Table of Contents
| Stone Harbor Strategic Income Fund | Statements of Investments | |
May 31, 2015 |
CREDIT DEFAULT SWAP CONTRACTS ON CREDIT INDICES ISSUE - SELL PROTECTION(3)
Reference Obligations | Clearing House | Fixed Deal Receive Rate | Maturity Date | Implied Credit Spread at May 31, 2015(5) | Notional Amount(6) | Market Value | Upfront Premiums Paid | Unrealized Appreciation | ||||||||||||||||
| ||||||||||||||||||||||||
CDX HY CDSI | Intercontinental Exchange | 5.000% | 12/20/2019 | 2.973% | $ 1,519,000 | $ 125,871 | $99,190 | $ 26,681 | ||||||||||||||||
|
| |||||||||||||||||||||||
| $ 125,871 | $99,190 | $ 26,681 | ||||||||||||||||||||||
|
| |||||||||||||||||||||||
| CREDIT DEFAULT SWAP CONTRACTS ON CREDIT INDICES ISSUE - BUY PROTECTION(7) | ||||||||||||||||||||||||
Reference Obligations | Clearing House | Fixed Deal Receive Rate | Maturity Date | Implied Credit Spread at May 31, 2015(5) | Notional Amount(6) | Market Value | Upfront Premiums Received | Unrealized Depreciation | ||||||||||||||||
| ||||||||||||||||||||||||
CDX IG CDSI | Intercontinental Exchange | 1.000% | 12/20/2019 | 0.633% | $ 1,625,000 | $ 26,219 | $25,478 | $ (741) | ||||||||||||||||
|
| |||||||||||||||||||||||
| $ 26,219 | $25,478 | $ (741) | ||||||||||||||||||||||
|
| |||||||||||||||||||||||
| (3) | If the Fund is a seller of protection and a credit event occurs, as defined under the terms of that particular swap agreement, the Fund will either (i) pay to the buyer of protection an amount equal to the notional amount of the swap and take delivery of the referenced obligation or underlying securities comprising the referenced index or (ii) pay a net settlement amount in the form of cash or securities equal to the notional amount of the swap less the recovery value of the referenced obligation or underlying securities comprising the referenced index. |
| (4) | Based on an index of 100 North American equities with high yield credit ratings that trade in the CDS market. |
| (5) | Implied credit spreads, represented in absolute terms, utilized in determining the market value of credit default swap agreements on sovereign issues of an emerging country as of period end serve as an indicator of the current status of the payment/performance risk and represent the likelihood or risk of default for the credit derivative. The implied credit spread of a particular referenced entity reflects the cost of buying/selling protection and may include upfront payments required to be made to enter into the agreement. Wider credit spreads represent a deterioration of the referenced entity’s credit soundness and a greater likelihood or risk of default or other credit event occurring as defined under the terms of the agreement. |
| (6) | The maximum potential amount the Fund could be required to pay as a seller of credit protection or receive as a buyer of credit protection if a credit event occurs as defined under the terms of that particular swap agreement. |
| (7) | If the Fund is a buyer of protection and a credit event occurs, as defined under the terms of that particular swap agreement, the Fund will either (i) receive from the seller of protection an amount equal to the notional amount of the swap and deliver the referenced obligation or (ii) receive a net settlement amount in the form of cash or securities equal to the notional amount of the swap less the recovery value of the referenced obligation. |
| (8) | Based on an index of 125 of the most liquid North American entities with investment grade ratings that trade in the CDS market. |
See Notes to Financial Statements.
Stone Harbor Investment Funds Annual Report | May 31, 2015 | 63 |
Table of Contents
| Stone Harbor Emerging Markets Debt Allocation Fund | Statements of Investments | |
May 31, 2015 |
| Currency | Rate | Shares* | Market Value (Expressed in U.S. $) | |||||||||
OPEN-END FUNDS - 100.05% | ||||||||||||
Stone Harbor Emerging Markets Debt Fund | USD | N/A | 3,994,289 | $ 41,820,208(1) | ||||||||
Stone Harbor Local Markets Fund | USD | N/A | 5,205,538 | 43,622,409(1) | ||||||||
|
| |||||||||||
| 85,442,617 | ||||||||||||
|
| |||||||||||
TOTAL OPEN-END FUNDS | 85,442,617 | |||||||||||
|
| |||||||||||
(Cost $89,650,042) | ||||||||||||
Total Investments - 100.05% | 85,442,617 | |||||||||||
(Cost $89,650,042) | ||||||||||||
Liabilities in Excess of Other Assets - (0.05)% | (43,109) | |||||||||||
|
| |||||||||||
Net Assets - 100.00% | $ 85,399,508 | |||||||||||
|
| |||||||||||
* The shares of each security is stated in the currency in which the security is denominated.
Currency Abbreviations:
USD - United States Dollar
| (1) | Affiliated with the Fund, as each is a series of Stone Harbor Investment Funds and has the same investment adviser. |
See Notes to Financial Statements.
64 | www.shiplp.com |
Table of Contents
| Stone Harbor Investment Funds | Statements of Assets and Liabilities | |
May 31, 2015 |
| Stone Harbor Emerging Markets Debt Fund | Stone Harbor Bond Fund | Stone Harbor Local Markets Fund | Stone Harbor Emerging Markets Corporate Debt Fund | |||||||||||||
| ||||||||||||||||
ASSETS: | ||||||||||||||||
Investments, at value(1) | $ | 1,913,900,506 | $ | 289,642,866 | $ | 1,269,066,336 | $ | 23,747,613 | ||||||||
Cash | 1,328,513 | – | 643,926 | – | ||||||||||||
Foreign currency, at value | – | 55,876 | – | – | ||||||||||||
Unrealized appreciation on credit default swap contracts | 503,029 | – | – | – | ||||||||||||
Unrealized appreciation on forward foreign currency contracts | 2,003,232 | 128,800 | 8,432,118 | 6,259 | ||||||||||||
Deposits with brokers for credit default swap contracts collateral | 7,360,000 | – | – | – | ||||||||||||
Deposits with brokers for forward foreign currency contracts collateral | – | – | 3,804,000 | – | ||||||||||||
Deposits with brokers for interest rate swap contracts | 2,203,777 | – | – | – | ||||||||||||
Receivable for investments sold | 24,181,287 | – | 268,823,182 | – | ||||||||||||
Receivable for fund shares sold | 60,223 | 48,984 | 118,283 | – | ||||||||||||
Interest receivable on credit default swap contracts | 271,181 | – | – | – | ||||||||||||
Interest receivable | 27,231,203 | 4,215,229 | 31,857,366 | 310,940 | ||||||||||||
Prepaid and other assets | 20,337 | 8,785 | 20,658 | 18,569 | ||||||||||||
| ||||||||||||||||
Total Assets | 1,979,063,288 | 294,100,540 | 1,582,765,869 | 24,083,381 | ||||||||||||
| ||||||||||||||||
LIABILITIES: | ||||||||||||||||
Payable due to brokers for forward foreign currency contracts collateral | 580,000 | – | 2,790,000 | – | ||||||||||||
Payable for investments purchased | 30,627,372 | 4,064,575 | 8,610,162 | – | ||||||||||||
Payable for fund shares redeemed | 110,000 | 33,355 | 1,052,644 | – | ||||||||||||
Swap premium received | 8,318,750 | – | – | – | ||||||||||||
Unrealized depreciation on forward foreign currency contracts | 1,237,714 | 33,696 | 5,941,762 | 2,874 | ||||||||||||
Variation margin payable on interest rate swap contracts | 152,540 | – | – | – | ||||||||||||
Interest payable for interest rate swap contracts | 407,754 | – | – | – | ||||||||||||
Payable to adviser | 992,541 | 122,851 | 1,016,478 | 17,273 | ||||||||||||
Payable to administrator | 170,677 | 32,727 | 138,759 | 3,347 �� | ||||||||||||
Other payables | 125,426 | 98,996 | 268,356 | 58,462 | ||||||||||||
| ||||||||||||||||
Total Liabilities | 42,722,774 | 4,386,200 | 19,818,161 | 81,956 | ||||||||||||
| ||||||||||||||||
Net Assets | $ | 1,936,340,514 | $ | 289,714,340 | $ | 1,562,947,708 | $ | 24,001,425 | ||||||||
| ||||||||||||||||
NET ASSETS CONSIST OF: | ||||||||||||||||
Paid-in capital | $ | 2,069,983,593 | $ | 295,397,339 | $ | 2,138,910,544 | $ | 27,162,736 | ||||||||
Undistributed/(overdistributed) net investment income | 977,934 | 318,332 | (169,990,207) | 63,835 | ||||||||||||
Accumulated net realized loss on investments, forward foreign currency contracts, credit default swap contracts, interest rate swap contracts and foreign currency transactions | (141,539,248) | (3,356,580) | (129,186,768) | (3,651,976) | ||||||||||||
Net unrealized appreciation/(depreciation) on investments, forward foreign currency contracts credit default swap contracts, interest rate swap contracts and translation of assets and liabilities denominated in foreign currencies | 6,918,235 | (2,644,751) | (276,785,861) | 426,830 | ||||||||||||
| ||||||||||||||||
Net Assets | $ | 1,936,340,514 | $ | 289,714,340 | $ | 1,562,947,708 | $ | 24,001,425 | ||||||||
| ||||||||||||||||
PRICING OF SHARES: | ||||||||||||||||
Institutional Class | ||||||||||||||||
Net Assets | $ | 1,936,340,514 | $ | 289,714,340 | $ | 1,562,947,708 | $ | 24,001,425 | ||||||||
Shares of beneficial interest outstanding (unlimited number of shares, par value of $0.001 per share authorized) | 185,010,068 | 33,382,621 | 186,605,612 | 2,634,743 | ||||||||||||
| ||||||||||||||||
Net assets value, offering and redemption price per share | $ | 10.47 | $ | 8.68 | $ | 8.38 | $ | 9.11 | ||||||||
| ||||||||||||||||
(1)Cost of Investments | $ | 1,908,657,988 | $ | 292,380,908 | $ | 1,546,764,366 | $ | 23,324,228 | ||||||||
See Notes to Financial Statements.
Stone Harbor Investment Funds Annual Report | May 31, 2015 | 65 |
Table of Contents
| Stone Harbor Investment Funds | Statements of Assets and Liabilities | |
May 31, 2015 |
| Stone Harbor Investment Grade Fund | Stone Harbor Strategic Income Fund | Stone Harbor Emerging Markets Debt Allocation Fund | ||||||||||
| ||||||||||||
ASSETS: | ||||||||||||
Investments, at value(1) | $ | 9,847,550 | $ | – | $ | – | ||||||
Investments in affiliates, at value(2) | – | 33,632,831 | 85,442,617 | |||||||||
Cash | – | 105,205 | 40,888 | |||||||||
Foreign currency, at value | – | 89,924 | – | |||||||||
Unrealized appreciation on forward foreign currency contracts | – | 1,274 | – | |||||||||
Swap premium paid | – | 99,190 | – | |||||||||
Deposits with brokers for credit default swap contracts | – | 12,091 | – | |||||||||
Cash pledged as collateral for forward commitments | 2,401,127 | – | – | |||||||||
Deposits with brokers for futures contracts collateral | – | 146,697 | – | |||||||||
Receivable for investments sold | 245,942 | – | – | |||||||||
Receivable for variation margin on future contracts | – | 24,760 | – | |||||||||
Interest receivable on credit default swap contracts | – | 12,106 | – | |||||||||
Interest receivable | 47,639 | – | – | |||||||||
Receivable from adviser | 13,308 | 25,263 | – | |||||||||
Prepaid and other assets | 14,089 | 14,544 | 2,305 | |||||||||
| ||||||||||||
Total Assets | 12,569,655 | 34,163,885 | 85,485,810 | |||||||||
| ||||||||||||
LIABILITIES: | ||||||||||||
Payable for investments purchased | 2,644,512 | – | 40,888 | |||||||||
Swap premium received | – | 25,478 | – | |||||||||
Unrealized depreciation on forward foreign currency contracts | – | 211 | – | |||||||||
Variation margin payable on credit default swap contracts | – | 312 | – | |||||||||
Payable to adviser | – | – | 10,040 | |||||||||
Payable to administrator | 4,645 | 2,976 | 6,581 | |||||||||
Other payables | 43,347 | 44,528 | 28,793 | |||||||||
| ||||||||||||
Total Liabilities | 2,692,504 | 73,505 | 86,302 | |||||||||
| ||||||||||||
Net Assets | $ | 9,877,151 | $ | 34,090,380 | $ | 85,399,508 | ||||||
| ||||||||||||
NET ASSETS CONSIST OF: | ||||||||||||
Paid-in capital | $ | 9,727,477 | $ | 34,525,360 | $ | 89,312,378 | ||||||
Undistributed net investment income | 3,209 | 38,111 | 569,091 | |||||||||
Accumulated net realized gain/(loss) on investments, forward foreign currency contracts, credit default swap contracts, interest rate swap contracts and foreign currency transactions | 121,299 | 553,969 | (274,536) | |||||||||
Net unrealized appreciation/(depreciation) on investments, forward foreign currency contracts credit default swap contracts, interest rate swap contracts and translation of assets and liabilities denominated in foreign currencies | 25,166 | (1,027,060) | (4,207,425) | |||||||||
| ||||||||||||
Net Assets | $ | 9,877,151 | $ | 34,090,380 | $ | 85,399,508 | ||||||
| ||||||||||||
PRICING OF SHARES: | ||||||||||||
Institutional Class | ||||||||||||
Net Assets | $ | 9,877,151 | $ | 34,090,380 | $ | 85,399,508 | ||||||
Shares of beneficial interest outstanding (unlimited number of shares, par value of $0.001 per share authorized) | 953,189 | 3,390,417 | 9,124,028 | |||||||||
| ||||||||||||
Net assets value, offering and redemption price per share | $ | 10.36 | $ | 10.05 | $ | 9.36 | ||||||
| ||||||||||||
(1)Cost of Investments | $ | 9,822,384 | $ | – | $ | – | ||||||
(2)Cost of Investments in affiliates | $ | – | $ | 34,620,136 | $ | 89,650,042 | ||||||
See Notes to Financial Statements.
66 | www.shiplp.com |
Table of Contents
| Stone Harbor Investment Funds | Statements of Operations | |
For the Year Ended May 31, 2015 |
| Stone Harbor Emerging Markets Debt Fund | Stone Harbor Bond Fund | Stone Harbor Local Markets Fund | Stone Harbor Emerging Markets Corporate Debt Fund | |||||||||||||
| ||||||||||||||||
INVESTMENT INCOME: | ||||||||||||||||
Interest(a) | $ | 130,937,515 | $ | 18,224,142 | $ | 133,213,246 | $ | 1,385,195 | ||||||||
Dividends | 32,458 | 520,411 | 86,372 | 362 | ||||||||||||
| ||||||||||||||||
Total Investment Income | 130,969,973 | 18,744,553 | 133,299,618 | 1,385,557 | ||||||||||||
| ||||||||||||||||
EXPENSES: | ||||||||||||||||
Investment advisory fees | 12,640,296 | 1,425,599 | 15,393,705 | 213,340 | ||||||||||||
Administration fees | 1,042,349 | 170,291 | 1,009,263 | 17,668 | ||||||||||||
Custodian fees | 290,207 | 27,811 | 1,183,101 | 5,294 | ||||||||||||
Printing fees | 7,135 | 7,283 | 15,347 | 5,415 | ||||||||||||
Professional fees | 68,204 | 68,204 | 68,204 | 60,975 | ||||||||||||
Trustee fees | 98,089 | 13,154 | 99,103 | 1,150 | ||||||||||||
Transfer agent fees | 37,190 | 23,333 | 37,719 | 21,834 | ||||||||||||
Registration fees | 40,008 | 25,836 | 26,510 | 22,901 | ||||||||||||
Insurance fees | 29,283 | 3,190 | 30,257 | 290 | ||||||||||||
Other | 17,360 | 4,177 | 16,300 | 2,989 | ||||||||||||
| ||||||||||||||||
Total expenses before waiver/reimbursement | 14,270,121 | 1,768,878 | 17,879,509 | 351,856 | ||||||||||||
Less fees waived by investment adviser | – | (65,578) | – | (100,868) | ||||||||||||
| ||||||||||||||||
Total Net Expenses | 14,270,121 | 1,703,300 | 17,879,509 | 250,988 | ||||||||||||
| ||||||||||||||||
Net Investment Income | 116,699,852 | 17,041,253 | 115,420,109 | 1,134,569 | ||||||||||||
| ||||||||||||||||
REALIZED AND UNREALIZED GAIN/(LOSS) ON INVESTMENTS: |
| |||||||||||||||
Net realized gain/(loss) on: | ||||||||||||||||
Investments | (88,082,834) | (1,442,479) | (233,117,584) | 255,580 | ||||||||||||
Credit default swap contracts | 775,347 | – | – | – | ||||||||||||
Interest rate swap contracts | 795,787 | – | – | – | ||||||||||||
Forward foreign currency contracts | 4,227,921 | 1,784,096 | (22,561,456) | 128,845 | ||||||||||||
Foreign currency transactions | (1,001,649) | 16,107 | (6,637,914) | (20,870) | ||||||||||||
| ||||||||||||||||
Net realized gain/(loss) | (83,285,428) | 357,724 | (262,316,954) | 363,555 | ||||||||||||
| ||||||||||||||||
Change in unrealized appreciation/(depreciation) on: | ||||||||||||||||
Investments | (66,906,750) | (17,326,460) | (198,504,322) | (620,722) | ||||||||||||
Credit default swap contracts | 503,029 | – | – | – | ||||||||||||
Interest rate swap contracts | 495,133 | – | – | – | ||||||||||||
Forward foreign currency contracts | 657,404 | 32,952 | 3,898,244 | 1,554 | ||||||||||||
Translation of assets and liabilities denominated in foreign currencies | 36,224 | 436 | (1,724,508) | 26 | ||||||||||||
| ||||||||||||||||
Net change in unrealized depreciation | (65,214,960) | (17,293,072) | (196,330,586) | (619,142) | ||||||||||||
| ||||||||||||||||
Net Realized and Unrealized Loss | (148,500,388) | (16,935,348) | (458,647,540) | (255,587) | ||||||||||||
| ||||||||||||||||
Net Increase/(Decrease) in Net Assets Resulting from Operations | $ | (31,800,536) | $ | 105,905 | $ | (343,227,431) | $ | 878,982 | ||||||||
| ||||||||||||||||
(a)Including Foreign Tax Withholding | $ | 131,995 | $ | – | $ | 850,206 | $ | – | ||||||||
See Notes to Financial Statements.
Stone Harbor Investment Funds Annual Report | May 31, 2015 | 67 |
Table of Contents
| Stone Harbor Investment Funds | Statements of Operations | |
For the Year Ended May 31, 2015 |
Stone Harbor Fund | Stone Harbor Strategic Income Fund | Stone Harbor Emerging Markets Debt Allocation Fund(1) | ||||||||||
| ||||||||||||
INVESTMENT INCOME: | ||||||||||||
Interest | $ | 133,528 | $ | – | $ | – | ||||||
Dividends | 1,547 | 21 | – | |||||||||
Dividends from affiliated investment companies | – | 1,299,375 | 1,659,091 | |||||||||
| ||||||||||||
Total Investment Income | 135,075 | 1,299,396 | 1,659,091 | |||||||||
| ||||||||||||
EXPENSES: | ||||||||||||
Investment advisory fees | 26,802 | 143,121 | 306,986 | |||||||||
Administration fees | 17,153 | 13,283 | 20,646 | |||||||||
Custodian fees | 6,416 | 8,103 | 1,540 | |||||||||
Printing fees | 5,476 | 5,481 | 6,522 | |||||||||
Professional fees | 56,513 | 56,513 | 46,631 | |||||||||
Trustee fees | 334 | 1,132 | 1,912 | |||||||||
Transfer agent fees | 20,559 | 21,043 | 12,504 | |||||||||
Registration fees | 20,238 | 20,281 | 25,203 | |||||||||
Insurance fees | 88 | 293 | 449 | |||||||||
Other | 4,977 | 7,662 | 1,069 | |||||||||
| ||||||||||||
Total expenses before waiver/reimbursement | 158,556 | 276,912 | 423,462 | |||||||||
Less fees waived by investment adviser | (26,802) | (143,121) | (306,986) | |||||||||
Less expenses reimbursed by investment adviser | (93,465) | (104,974) | (72,662) | |||||||||
| ||||||||||||
Total Net Expenses | 38,289 | 28,817 | 43,814 | |||||||||
| ||||||||||||
Net Investment Income | 96,786 | 1,270,579 | 1,615,277 | |||||||||
| ||||||||||||
REALIZED AND UNREALIZED GAIN/(LOSS) ON INVESTMENTS: | ||||||||||||
Net realized gain/(loss) on: | ||||||||||||
Investments | 151,923 | – | – | |||||||||
Investments - affiliated investment companies | – | (14,796) | (274,536) | |||||||||
Distributions from affiliated investment companies | – | 418,657 | – | |||||||||
Credit default swap contracts | – | (16,762) | – | |||||||||
Futures contracts | 13,284 | 275,716 | – | |||||||||
Forward foreign currency contracts | – | 35,775 | – | |||||||||
Foreign currency transactions | – | (11,478) | – | |||||||||
| ||||||||||||
Net realized gain/(loss) | 165,207 | 687,112 | (274,536) | |||||||||
| ||||||||||||
Change in unrealized appreciation/(depreciation) on: | ||||||||||||
Investments | (54,936) | (1,415,229) | (4,207,425) | |||||||||
Credit default swap contracts | – | 25,940 | – | |||||||||
Futures contracts | – | (91,906) | – | |||||||||
Forward foreign currency contracts | – | 818 | – | |||||||||
Translation of assets and liabilities denominated in foreign currencies | – | (9,949) | – | |||||||||
| ||||||||||||
Net change in unrealized depreciation | (54,936) | (1,490,326) | (4,207,425) | |||||||||
| ||||||||||||
Net Realized and Unrealized Gain/(Loss) | 110,271 | (803,214) | (4,481,961) | |||||||||
| ||||||||||||
Net Increase/(Decrease) in Net Assets Resulting from Operations | $ | 207,057 | $ | 467,365 | $ | (2,866,684) | ||||||
| ||||||||||||
| (1) | The Fund commenced operation on October 21, 2014. |
See Notes to Financial Statements.
68 | www.shiplp.com |
Table of Contents
| Stone Harbor Investment Funds | Statements of Changes in Net Assets | |
| Stone Harbor Emerging Markets Debt Fund | Stone Harbor High Yield Bond Fund | |||||||||||||||
|
| |||||||||||||||
For the Year Ended May 31, 2015 | For the Year Ended May 31, 2014 | For the Year Ended May 31, 2015 | For the Year Ended May 31, 2014 | |||||||||||||
| ||||||||||||||||
OPERATIONS: | ||||||||||||||||
Net investment income | $ | 116,699,852 | $ | 99,624,975 | $ | 17,041,253 | $ | 21,690,768 | ||||||||
Net realized gain/(loss) on investments, credit default swap contracts, futures contracts, interest rate swap contracts, forward foreign currency contracts and foreign currency transactions | (83,285,428) | (75,846,274) | 357,724 | 8,405,472 | ||||||||||||
Net realized gain on investments - affiliated investment companies | – | 343,748 | – | – | ||||||||||||
Net change in unrealized appreciation/(depreciation) on investments, credit default swap contracts, interest rate swap contracts, futures contracts, forward foreign currency contracts and foreign currency transactions | (65,214,960) | 41,237,853 | (17,293,072) | (4,854,203) | ||||||||||||
| ||||||||||||||||
Net increase/(decrease) in net assets resulting from operations | (31,800,536) | 65,360,302 | 105,905 | 25,242,037 | ||||||||||||
| ||||||||||||||||
DISTRIBUTIONS TO SHAREHOLDERS: | ||||||||||||||||
Institutional Class | ||||||||||||||||
From net investment income | (104,263,472) | (86,019,842) | (18,987,355) | (22,390,532) | ||||||||||||
From net realized gains | – | – | (9,517,441) | (10,114,843) | ||||||||||||
| ||||||||||||||||
Net decrease in net assets from distributions to shareholders | (104,263,472) | (86,019,842) | (28,504,796) | (32,505,375) | ||||||||||||
| ||||||||||||||||
CAPITAL SHARE TRANSACTIONS: | ||||||||||||||||
Institutional Class | ||||||||||||||||
Proceeds from sale of shares | 476,079,373 | 589,771,294 | 54,566,778 | 18,366,132 | ||||||||||||
Issued to shareholders in reinvestment of distributions | 98,614,208 | 82,361,287 | 25,193,090 | 30,458,281 | ||||||||||||
Cost of shares redeemed | (680,253,445) | (310,280,824) | (64,502,568) | (125,687,444) | ||||||||||||
| ||||||||||||||||
Net increase/(decrease) in net assets from capital share transactions | (105,559,864) | 361,851,757 | 15,257,300 | (76,863,031) | ||||||||||||
| ||||||||||||||||
Net Increase/(Decrease) in Net Assets | (241,623,872) | 341,192,217 | (13,141,591) | (84,126,369) | ||||||||||||
| ||||||||||||||||
NET ASSETS: | ||||||||||||||||
Beginning of period | 2,177,964,386 | 1,836,772,169 | 302,855,931 | 386,982,300 | ||||||||||||
| ||||||||||||||||
End of period | $ | 1,936,340,514 | $ | 2,177,964,386 | $ | 289,714,340 | $ | 302,855,931 | ||||||||
| ||||||||||||||||
Includes undistributed net investment income of: | $ | 977,934 | $ | 1,548,029 | $ | 318,332 | $ | 723,656 | ||||||||
OTHER INFORMATION: | ||||||||||||||||
Share Transactions: | ||||||||||||||||
Institutional Class | ||||||||||||||||
Beginning shares | 196,069,405 | 162,037,118 | 31,455,233 | 39,368,510 | ||||||||||||
Shares sold | 44,694,384 | 55,561,421 | 5,947,727 | 1,918,497 | ||||||||||||
Shares reinvested | 9,292,443 | 7,802,599 | 2,858,107 | 3,203,877 | ||||||||||||
Shares redeemed | (65,046,164) | (29,331,733) | (6,878,446) | (13,035,651) | ||||||||||||
| ||||||||||||||||
Shares outstanding - end of period | 185,010,068 | 196,069,405 | 33,382,621 | 31,455,233 | ||||||||||||
| ||||||||||||||||
See Notes to Financial Statements.
Stone Harbor Investment Funds Annual Report | May 31, 2015 | 69 |
Table of Contents
| Stone Harbor Investment Funds | Statements of Changes in Net Assets | |
| Stone Harbor Local Markets Fund | Stone Harbor Emerging Markets Corporate Debt Fund | |||||||||||||||
|
| |||||||||||||||
For the Year Ended | For the Year Ended | For the Year Ended | For the Year Ended | |||||||||||||
| ||||||||||||||||
OPERATIONS: | ||||||||||||||||
Net investment income | $ | 115,420,109 | $ | 132,011,677 | $ | 1,134,569 | $ | 2,005,319 | ||||||||
Net realized gain/(loss) on investments, credit default swap contracts, futures contracts, interest rate swap contracts, forward foreign currency contracts and foreign currency transactions | (262,316,954) | (253,220,413) | 363,555 | (2,602,601) | ||||||||||||
Net change in unrealized appreciation/(depreciation) on investments, credit default swap contracts, interest rate swap contracts, futures contracts, forward foreign currency contracts and foreign currency transactions | (196,330,586) | 16,126,803 | (619,142) | 487,117 | ||||||||||||
| ||||||||||||||||
Net increase/(decrease) in net assets resulting from operations | (343,227,431) | (105,081,933) | 878,982 | (110,165) | ||||||||||||
| ||||||||||||||||
DISTRIBUTIONS TO SHAREHOLDERS: | ||||||||||||||||
Institutional Class | ||||||||||||||||
From net investment income | (27,499,281) | (17,612,618) | (1,215,887) | (2,080,114) | ||||||||||||
From net realized gains | – | (12,318,762) | – | – | ||||||||||||
| ||||||||||||||||
Net decrease in net assets from distributions to shareholders | (27,499,281) | (29,931,380) | (1,215,887) | (2,080,114) | ||||||||||||
| ||||||||||||||||
CAPITAL SHARE TRANSACTIONS: | ||||||||||||||||
Institutional Class | ||||||||||||||||
Proceeds from sale of shares | 371,721,098 | 1,007,385,023 | 2,938,306 | 26,904,350 | ||||||||||||
Issued to shareholders in reinvestment of distributions | 26,635,265 | 29,494,620 | 1,215,887 | 2,080,114 | ||||||||||||
Cost of shares redeemed | (955,466,079) | (875,509,273) | (6,102,931) | (68,683,365) | ||||||||||||
| ||||||||||||||||
Net increase/(decrease) in net assets from capital share transactions | (557,109,716) | 161,370,370 | (1,948,738) | (39,698,901) | ||||||||||||
| ||||||||||||||||
Net Increase/(Decrease) in Net Assets | (927,836,428) | 26,357,057 | (2,285,643) | (41,889,180) | ||||||||||||
| ||||||||||||||||
NET ASSETS: | ||||||||||||||||
Beginning of period | 2,490,784,136 | 2,464,427,079 | 26,287,068 | 68,176,248 | ||||||||||||
| ||||||||||||||||
End of period | $ | 1,562,947,708 | $ | 2,490,784,136 | $ | 24,001,425 | $ | 26,287,068 | ||||||||
| ||||||||||||||||
Includes undistributed/(overdistributed) net investment income of: | $ | (169,990,207) | $ | (22,425,485) | $ | 63,835 | $ | 33,976 | ||||||||
OTHER INFORMATION: | ||||||||||||||||
Share Transactions: | ||||||||||||||||
Institutional Class | ||||||||||||||||
Beginning shares | 249,984,702 | 234,568,603 | 2,847,399 | 7,278,681 | ||||||||||||
Shares sold | 40,488,906 | 102,260,030 | 318,097 | 2,959,490 | ||||||||||||
Shares reinvested | 3,068,946 | 3,069,429 | 134,222 | 234,122 | ||||||||||||
Shares redeemed | (106,936,942) | (89,913,360) | (664,975) | (7,624,894) | ||||||||||||
| ||||||||||||||||
Shares outstanding - end of period | 186,605,612 | 249,984,702 | 2,634,743 | 2,847,399 | ||||||||||||
| ||||||||||||||||
See Notes to Financial Statements.
70 | www.shiplp.com |
Table of Contents
| Stone Harbor Investment Funds | Statements of Changes in Net Assets | |
| Stone Harbor Investment Grade Fund | Stone Harbor Strategic Income Fund | |||||||||||||||
|
| |||||||||||||||
For the Year Ended | For the Period May 31, 2014 | For the Year Ended | For the Period (Commencement of Operations) to | |||||||||||||
| ||||||||||||||||
OPERATIONS: | ||||||||||||||||
Net investment income | $ | 96,786 | $ | 22,162 | $ | 1,270,579 | $ | 155,131 | ||||||||
Net realized gain/(loss) on investments, credit default swap contracts, futures contracts, interest rate swap contracts, forward foreign currency contracts and foreign currency transactions | 165,207 | 29,993 | 701,908 | (45,067) | ||||||||||||
Net realized gain/(loss) on investments - affiliated investment companies | – | – | (14,796) | 1,340 | ||||||||||||
Distributions from affiliated investment companies | – | – | 418,657 | – | ||||||||||||
Net change in unrealized appreciation/(depreciation) on investments, credit default swap contracts, interest rate swap contracts, futures contracts, forward foreign currency contracts and foreign currency transactions | (54,936) | 80,102 | (1,490,326) | 463,266 | ||||||||||||
| ||||||||||||||||
Net increase in net assets resulting from operations | 207,057 | 132,257 | 886,022 | 574,670 | ||||||||||||
| ||||||||||||||||
DISTRIBUTIONS TO SHAREHOLDERS: | ||||||||||||||||
Institutional Class | ||||||||||||||||
From net investment income | (98,558) | (17,965) | (1,268,494) | (130,527) | ||||||||||||
From net realized gains | (73,570) | – | (80,720) | – | ||||||||||||
| ||||||||||||||||
Net decrease in net assets from distributions to shareholders | (172,128) | (17,965) | (1,349,214) | (130,527) | ||||||||||||
| ||||||||||||||||
CAPITAL SHARE TRANSACTIONS: | ||||||||||||||||
Institutional Class | ||||||||||||||||
Proceeds from sale of shares | 6,913,138 | 2,989,999 | 23,081,037 | 10,010,001 | ||||||||||||
Issued to shareholders in reinvestment of distributions | 172,128 | 17,965 | 1,306,521 | 130,527 | ||||||||||||
Cost of shares redeemed | (365,300) | – | – | – | ||||||||||||
| ||||||||||||||||
Net increase in net assets from capital share transactions | 6,719,966 | 3,007,964 | 24,387,558 | 10,140,528 | ||||||||||||
| ||||||||||||||||
Net Increase in Net Assets | 6,754,895 | 3,122,256 | 23,924,366 | 10,584,671 | ||||||||||||
| ||||||||||||||||
NET ASSETS: | ||||||||||||||||
Beginning of period | 3,122,256 | – | 10,584,671 | – | ||||||||||||
| ||||||||||||||||
End of period | $ | 9,877,151 | $ | 3,122,256 | $ | 34,509,037 | $ | 10,584,671 | ||||||||
| ||||||||||||||||
Includes undistributed net investment income of: | $ | 3,209 | $ | 4,236 | $ | 38,111 | $ | 25,766 | ||||||||
OTHER INFORMATION: | ||||||||||||||||
Share Transactions: | ||||||||||||||||
Institutional Class | ||||||||||||||||
Beginning shares | 300,737 | – | 1,013,714 | – | ||||||||||||
Shares sold | 670,830 | 298,981 | 2,247,267 | 1,000,996 | ||||||||||||
Shares reinvested | 16,631 | 1,756 | 129,436 | 12,718 | ||||||||||||
Shares redeemed | (35,009) | – | – | – | ||||||||||||
| ||||||||||||||||
Shares outstanding - end of period | 953,189 | 300,737 | 3,390,417 | 1,013,714 | ||||||||||||
| ||||||||||||||||
See Notes to Financial Statements.
Stone Harbor Investment Funds Annual Report | May 31, 2015 | 71 |
Table of Contents
| Stone Harbor Investment Funds | Statements of Changes in Net Assets | |
| Stone Harbor Emerging Markets Debt Allocation Fund | ||||
| For the Period October 21, 2014 (Commencement of Operations) to May 31, 2015 | ||||
| ||||
OPERATIONS: | ||||
Net investment income | $ | 1,615,277 | ||
Net realized loss on investments - affiliated investment companies | (274,536) | |||
Net change in unrealized depreciation on investments - affiliated investment companies | (4,207,425) | |||
| ||||
Net decrease in net assets resulting from operations | (2,866,684) | |||
| ||||
DISTRIBUTIONS TO SHAREHOLDERS: | ||||
Institutional Class | ||||
From net investment income | (1,049,102) | |||
| ||||
Net decrease in net assets from distributions to shareholders | (1,049,102) | |||
| ||||
CAPITAL SHARE TRANSACTIONS: | ||||
Institutional Class | ||||
Proceeds from sale of shares | 88,266,192 | |||
Issued to shareholders in reinvestment of distributions | 1,049,102 | |||
| ||||
Net increase in net assets from capital share transactions | 89,315,294 | |||
| ||||
Net Increase in Net Assets | 85,399,508 | |||
| ||||
NET ASSETS: | ||||
Beginning of period | – | |||
| ||||
End of period | $ | 85,399,508 | ||
| ||||
Includes undistributed net investment income of: | $ | 569,091 | ||
OTHER INFORMATION: | ||||
Share Transactions: | ||||
Institutional Class | ||||
Beginning shares | – | |||
Shares sold | 9,010,734 | |||
Shares reinvested | 113,294 | |||
| ||||
Shares outstanding - end of period | 9,124,028 | |||
| ||||
See Notes to Financial Statements.
72 | www.shiplp.com |
Table of Contents
| Stone Harbor Emerging Markets Debt Fund | Financial Highlights | |
For a share outstanding through the periods presented. |
| Institutional Class For the Year Ended May 31 | 2015 | 2014 | 2013 | 2012 | 2011 | |||||||||||||||
| ||||||||||||||||||||
Net asset value - beginning of period | $ | 11.11 | $ | 11.34 | $ | 10.93 | $ | 11.20 | $ | 10.48 | ||||||||||
Income/(loss) from investment operations: |
| |||||||||||||||||||
Net investment income(1) | 0.59 | 0.55 | 0.55 | 0.65 | 0.67 | |||||||||||||||
Net realized and unrealized gain/(loss) on investments | (0.70) | (0.31) | 0.45 | (0.15) | 1.00 | |||||||||||||||
| ||||||||||||||||||||
Total income/(loss) from investment operations | (0.11) | 0.24 | 1.00 | 0.50 | 1.67 | |||||||||||||||
| ||||||||||||||||||||
Less distributions to common shareholders: |
| |||||||||||||||||||
From net investment income | (0.53) | (0.47) | (0.54) | (0.67) | (0.63) | |||||||||||||||
From net realized gains | – | – | (0.05) | (0.10) | (0.32) | |||||||||||||||
| ||||||||||||||||||||
Total distributions | (0.53) | (0.47) | (0.59) | (0.77) | (0.95) | |||||||||||||||
| ||||||||||||||||||||
Net Increase/(Decrease) in Net Asset Value | (0.64) | (0.23) | 0.41 | (0.27) | 0.72 | |||||||||||||||
| ||||||||||||||||||||
Net asset value - end of period | $ | 10.47 | $ | 11.11 | $ | 11.34 | $ | 10.93 | $ | 11.20 | ||||||||||
| ||||||||||||||||||||
Total Return(2) | (1.01)% | 2.45% | 9.05% | 4.61% | 16.30% | |||||||||||||||
Ratios/Supplemental Data: | ||||||||||||||||||||
Net assets, end of period (in millions) | $ | 1,936 | $ | 2,178 | $ | 1,837 | $ | 1,184 | $ | 749 | ||||||||||
Ratio of expenses to average net assets without fee waivers/reimbursements/ repayment of previously waived fees | 0.68% | 0.70% | 0.68% | 0.72% | 0.77% | |||||||||||||||
Ratio of expenses to average net assets with fee waivers/reimbursements/ repayment of previously waived fees | 0.68% | 0.70% | 0.68% | 0.72% | 0.75% | |||||||||||||||
Ratio of net investment income to average net assets with fee waivers/ reimbursements/repayment of previously waived fees | 5.54% | 5.21% | 4.68% | 5.78% | 6.02% | |||||||||||||||
Portfolio turnover rate | 75% | 68% | 68% | 60% | 82% | |||||||||||||||
| (1) | Calculated using average shares throughout the period. |
| (2) | Total returns would have been lower in 2011 had various fees and expenses not been waived and reimbursed during the period. The total returns in the table represent the rate that an investor would have earned (or lost) on an investment in a Fund (assuming reinvestment of all dividends and distributions). |
See Notes to Financial Statements.
Stone Harbor Investment Funds Annual Report | May 31, 2015 | 73 |
Table of Contents
| Stone Harbor High Yield Bond Fund | Financial Highlights | |
For a share outstanding through the periods presented. |
| Institutional Class For the Year Ended May 31 | 2015 | 2014 | 2013 | 2012 | 2011 | |||||||||||||||
| ||||||||||||||||||||
Net asset value - beginning of period | $ | 9.63 | $ | 9.83 | $ | 9.13 | $ | 10.00 | $ | 9.36 | ||||||||||
Income/(loss) from investment operations: |
| |||||||||||||||||||
Net investment income(1) | 0.54 | 0.60 | 0.70 | 0.72 | 0.77 | |||||||||||||||
Net realized and unrealized gain/(loss) on investments | (0.58) | 0.13 | 0.72 | (0.59) | 0.78 | |||||||||||||||
| ||||||||||||||||||||
Total income/(loss) from investment operations | (0.04) | 0.73 | 1.42 | 0.13 | 1.55 | |||||||||||||||
| ||||||||||||||||||||
Less distributions to common shareholders: |
| |||||||||||||||||||
From net investment income | (0.60) | (0.64) | (0.68) | (0.70) | (0.76) | |||||||||||||||
From net realized gains | (0.31) | (0.29) | (0.04) | (0.30) | (0.15) | |||||||||||||||
| ||||||||||||||||||||
Total distributions | (0.91) | (0.93) | (0.72) | (1.00) | (0.91) | |||||||||||||||
| ||||||||||||||||||||
Net Increase/(Decrease) in Net Asset Value | (0.95) | (0.20) | 0.70 | (0.87) | 0.64 | |||||||||||||||
| ||||||||||||||||||||
Net asset value - end of period | $ | 8.68 | $ | 9.63 | $ | 9.83 | $ | 9.13 | $ | 10.00 | ||||||||||
| ||||||||||||||||||||
Total Return(2) | (0.27)% | 7.90% | 15.87% | 1.77% | 17.14% | |||||||||||||||
Ratios/Supplemental Data: | ||||||||||||||||||||
Net assets, end of period (in millions) | $ | 290 | $ | 303 | $ | 387 | $ | 520 | $ | 488 | ||||||||||
Ratio of expenses to average net assets without fee waivers/reimbursements/ repayment of previously waived fees | 0.62%(3 | ) | 0.62% | 0.60% | 0.62% | 0.65% | ||||||||||||||
Ratio of expenses to average net assets with fee waivers/reimbursements/ repayment of previously waived fees | 0.60%(3 | ) | 0.55% | 0.55% | 0.55% | 0.55% | ||||||||||||||
Ratio of net investment income to average net assets with fee waivers/ reimbursements/repayment of previously waived fees | 5.98% | 6.23% | 7.27% | 7.67% | 7.78% | |||||||||||||||
Portfolio turnover rate | 52% | 54% | 59% | 46% | 60% | |||||||||||||||
| (1) | Calculated using average shares throughout the period. |
| (2) | Total returns would have been lower had various fees and expenses not been waived and reimbursed during the period. The total returns in the table represent the rate that an investor would have earned (or lost) on an investment in a Fund (assuming reinvestment of all dividends and distributions). |
| (3) | Effective October 1, 2014, the expense limitation rate changed from 0.55% to 0.65%. |
See Notes to Financial Statements.
74 | www.shiplp.com |
Table of Contents
| Stone Harbor Local Markets Fund | Financial Highlights | |
For a share outstanding through the periods presented. |
| Institutional Class For the Year Ended May 31 | 2015 | 2014 | 2013 | 2012 | 2011(1) | |||||||||||||||
| ||||||||||||||||||||
Net asset value - beginning of period | $ | 9.96 | $ | 10.51 | $ | 10.10 | $ | 11.21 | $ | 10.00 | ||||||||||
Income/(loss) from investment operations: | ||||||||||||||||||||
Net investment income(2) | 0.52 | 0.53 | 0.49 | 0.57 | 0.51 | |||||||||||||||
Net realized and unrealized gain/(loss) on investments | (1.98) | (0.96) | 0.33 | (1.21) | 1.14 | |||||||||||||||
| ||||||||||||||||||||
Total income/(loss) from investment operations | (1.46) | (0.43) | 0.82 | (0.64) | 1.65 | |||||||||||||||
| ||||||||||||||||||||
Less distributions to common shareholders: | ||||||||||||||||||||
From net investment income | (0.12) | (0.07) | (0.39) | (0.45) | (0.39) | |||||||||||||||
From net realized gains | – | (0.05) | (0.02) | – | (0.05) | |||||||||||||||
From tax return of capital | – | – | – | (0.02) | – | |||||||||||||||
| ||||||||||||||||||||
Total distributions | (0.12) | (0.12) | (0.41) | (0.47) | (0.44) | |||||||||||||||
| ||||||||||||||||||||
Net Increase/(Decrease) in Net Asset Value | (1.58) | (0.55) | 0.41 | (1.11) | 1.21 | |||||||||||||||
| ||||||||||||||||||||
Net asset value - end of period | $ | 8.38 | $ | 9.96 | $ | 10.51 | $ | 10.10 | $ | 11.21 | ||||||||||
| ||||||||||||||||||||
Total Return(3)(4) | (14.70)% | (4.04)% | 7.92% | (5.84)% | 16.82% | |||||||||||||||
Ratios/Supplemental Data: | ||||||||||||||||||||
Net assets, end of period (in millions) | $ | 1,563 | $ | 2,491 | $ | 2,464 | $ | 1,563 | $ | 606 | ||||||||||
Ratio of expenses to average net assets without fee waivers/reimbursements/repayment of previously waived fees | 0.87% | 0.88% | 0.86% | 0.89% | 1.01%(5) | |||||||||||||||
Ratio of expenses to average net assets with fee waivers/reimbursements/repayment of previously waived fees | 0.87% | 0.88% | 0.86% | 0.89% | 1.00%(5) | |||||||||||||||
Ratio of net investment income to average net assets with fee waivers/reimbursements/repayment of previously waived fees | 5.62% | 5.41% | 4.45% | 5.35% | 5.13%(5) | |||||||||||||||
Portfolio turnover rate | 145% | 181% | 191% | 161% | 102% | |||||||||||||||
| (1) | The Fund commenced operation on June 30, 2010. |
| (2) | Calculated using average shares throughout the period. |
| (3) | Total returns would have been lower in 2011 had various fees and expenses not been waived and reimbursed during the period. The total returns in the table represent the rate that an investor would have earned (or lost) on an investment in a Fund (assuming reinvestment of all dividends and distributions). |
| (4) | Total returns for periods of less than one year are not annualized. |
| (5) | Annualized. |
See Notes to Financial Statements.
Stone Harbor Investment Funds Annual Report | May 31, 2015 | 75 |
Table of Contents
| Stone Harbor Emerging Markets Corporate Debt Fund | Financial Highlights | |
For a share outstanding through the periods presented. | ||
| Institutional Class For the Year Ended May 31 | 2015 | 2014 | 2013 | 2012(1) | ||||||||||||
| ||||||||||||||||
Net asset value - beginning of period | $ | 9.23 | $ | 9.37 | $ | 8.89 | $ | 10.00 | ||||||||
Income/(loss) from investment operations: | ||||||||||||||||
Net investment income(2) | 0.41 | 0.41 | 0.44 | 0.59 | ||||||||||||
Net realized and unrealized gain/(loss) on investments | (0.08) | (0.08) | 0.46 | (1.11) | ||||||||||||
| ||||||||||||||||
Total income/(loss) from investment operations | 0.33 | 0.33 | 0.90 | (0.52) | ||||||||||||
| ||||||||||||||||
Less distributions to common shareholders: | ||||||||||||||||
From net investment income | (0.45) | (0.47) | (0.42) | (0.59) | ||||||||||||
| ||||||||||||||||
Total distributions | (0.45) | (0.47) | (0.42) | (0.59) | ||||||||||||
| ||||||||||||||||
Net Increase/(Decrease) in Net Asset Value | (0.12) | (0.14) | 0.48 | (1.11) | ||||||||||||
| ||||||||||||||||
Net asset value - end of period | $ | 9.11 | $ | 9.23 | $ | 9.37 | $ | 8.89 | ||||||||
| ||||||||||||||||
Total Return(3) | 3.64% | 3.80% | 10.13% | (5.10)% | ||||||||||||
Ratios/Supplemental Data: | ||||||||||||||||
Net assets, end of period (in millions) | $ | 24 | $ | 26 | $ | 68 | $ | 35 | ||||||||
Ratio of expenses to average net assets without fee waivers/reimbursements | 1.40% | 1.22% | 1.16% | 1.32% | ||||||||||||
Ratio of expenses to average net assets with fee waivers/reimbursements | 1.00% | 1.00% | 1.00% | 1.00% | ||||||||||||
Ratio of net investment income to average net assets with fee waivers/reimbursements | 4.52% | 4.58% | 4.68% | 6.41% | ||||||||||||
Portfolio turnover rate | 62% | 78% | 78% | 51% | ||||||||||||
| (1) | The Fund commenced operation on June 1, 2011. |
| (2) | Calculated using average shares throughout the period. |
| (3) | Total returns would have been lower had various fees and expenses not been waived and reimbursed during the period. The total returns in the table represent the rate that an investor would have earned (or lost) on an investment in a Fund (assuming reinvestment of all dividends and distributions). |
See Notes to Financial Statements.
76 | www.shiplp.com |
Table of Contents
| Stone Harbor Investment Grade Fund | Financial Highlights | |
For a share outstanding through the periods presented. |
| Institutional Class For the Year Ended May 31 | 2015 | 2014(1) | ||||||
| ||||||||
Net asset value - beginning of period | $ | 10.38 | $ | 10.00 | ||||
Income/(loss) from investment operations: | ||||||||
Net investment income(2) | 0.13 | 0.07 | ||||||
Net realized and unrealized gain on investments | 0.07 | 0.37 | ||||||
| ||||||||
Total income from investment operations | 0.20 | 0.44 | ||||||
| ||||||||
Less distributions to common shareholders: | ||||||||
From net investment income | (0.14) | (0.06) | ||||||
From net realized gains | (0.08) | – | ||||||
| ||||||||
Total distributions | (0.22) | (0.06) | ||||||
| ||||||||
Net Increase/(Decrease) in Net Asset Value | (0.02) | 0.38 | ||||||
| ||||||||
Net asset value - end of period | $ | 10.36 | $ | 10.38 | ||||
| ||||||||
Total Return(3)(4) | 1.94% | 4.41% | ||||||
Ratios/Supplemental Data: | ||||||||
Net assets, end of period (in millions) | $ | 10 | $ | 3 | ||||
Ratio of expenses to average net assets without fees waived by investment adviser and expenses reimbursed by investment adviser | 2.07% | 4.14% (5) | ||||||
Ratio of expenses to average net assets with fees waived by investment adviser and expenses reimbursed by investment adviser | 0.50% | 0.50% (5) | ||||||
Ratio of net investment income to average net assets with fee waivers/reimbursements | 1.26% | 1.62% (5) | ||||||
Portfolio turnover rate | 51% | 27% | ||||||
| (1) | The Fund commenced operation on December 19, 2013. |
| (2) | Calculated using average shares throughout the period. |
| (3) | Total returns would have been lower had various fees and expenses not been waived and reimbursed during the period. The total returns in the table represent the rate that an investor would have earned (or lost) on an investment in a Fund (assuming reinvestment of all dividends and distributions). |
| (4) | Total returns for periods of less than one year are not annualized. |
| (5) | Annualized. |
See Notes to Financial Statements.
Stone Harbor Investment Funds Annual Report | May 31, 2015 | 77 |
Table of Contents
| Stone Harbor Strategic Income Fund | Financial Highlights | |
For a share outstanding through the periods presented. |
| Institutional Class For the Year Ended May 31 | 2015 | 2014(1) | ||||||
| ||||||||
Net asset value - beginning of period | $ | 10.44 | �� | $ | 10.00 | |||
Income/(loss) from investment operations: | ||||||||
Net investment income(2) | 0.49 | 0.15 | ||||||
Net realized and unrealized gain/(loss) on investments | (0.37) | 0.42 | ||||||
| ||||||||
Total income from investment operations | 0.12 | 0.57 | ||||||
| ||||||||
Less distributions to common shareholders: | ||||||||
From net investment income | (0.48) | (0.13) | ||||||
From net realized gains | (0.03) | – | ||||||
| ||||||||
Total distributions | (0.51) | (0.13) | ||||||
| ||||||||
Net Increase/(Decrease) in Net Asset Value | (0.39) | 0.44 | ||||||
| ||||||||
Net asset value - end of period | $ | 10.05 | $ | 10.44 | ||||
| ||||||||
Total Return(3)(4) | 1.15% | 5.73% | ||||||
Ratios/Supplemental Data: | ||||||||
Net assets, end of period (in millions) | $ | 34 | $ | 11 | ||||
Ratio of expenses to average net assets without fees waived by investment adviser and expenses reimbursed by investment adviser | 1.06% (5) | 1.46% (5)(6) | ||||||
Ratio of expenses to average net assets with fees waived by investment adviser and expenses reimbursed by investment adviser | 0.11% (5) | 0.12% (5)(6) | ||||||
Ratio of net investment income to average net assets with fee waivers/reimbursements | 4.88% (5) | 3.38% (5)(6) | ||||||
Portfolio turnover rate | 8% | 0% (7) | ||||||
| (1) | The Fund commenced operation on December 19, 2013. |
| (2) | Calculated using average shares throughout the period. |
| (3) | Total returns would have been lower had various fees and expenses not been waived and reimbursed during the period. The total returns in the table represent the rate that an investor would have earned (or lost) on an investment in a Fund (assuming reinvestment of all dividends and distributions). |
| (4) | Total returns for periods of less than one year are not annualized. |
| (5) | Ratio does not include expenses of the mutual funds held in the investment portfolio. |
| (6) | Annualized. |
| (7) | Less than 0.5%. |
See Notes to Financial Statements.
78 | www.shiplp.com |
Table of Contents
| Stone Harbor Emerging Markets Debt Allocation Fund | Financial Highlights | |
For a share outstanding through the periods presented. | ||
| Institutional Class For the Year Ended May 31 | For the Period October 21, 2014 (Commencement of Operations) to May 31, 2015 | |||
Net asset value - beginning of period | $ | 10.00 | ||
Income/(loss) from investment operations: | ||||
Net investment income(1) | 0.23 | |||
Net realized and unrealized loss on investments | (0.70) | |||
| ||||
Total loss from investment operations | (0.47) | |||
| ||||
Less distributions to common shareholders: | ||||
From net investment income | (0.17) | |||
| ||||
Total distributions | (0.17) | |||
| ||||
Net Decrease in Net Asset Value | (0.64) | |||
| ||||
Net asset value - end of period | $ | 9.36 | ||
| ||||
Total Return(2) | (4.73%) (3) | |||
Ratios/Supplemental Data: | ||||
Net assets, end of period (in millions) | $ | 85 | ||
Ratio of expenses to average net assets without fees waived by investment adviser and expenses reimbursed by investment adviser | 0.97% (4)(5) | |||
Ratio of expenses to average net assets with fees waived by investment adviser and expenses reimbursed by investment adviser | 0.10% (4)(5) | |||
Ratio of net investment income to average net assets with fee waivers/reimbursements | 3.68% (4)(5) | |||
Portfolio turnover rate | 11% (3) | |||
| (1) | Calculated using average shares throughout the period. |
| (2) | Total returns would have been lower in 2015 had various fees and expenses not been waived and reimbursed during the period. The total returns in the table represent the rate that an investor would have earned (or lost) on an investment in a Fund (assuming reinvestment of all dividends and distributions). |
| (3) | Not-Annualized |
| (4) | Annualized. |
| (5) | Ratio does not include expenses of the mutual funds held in the investment portfolio. |
See Notes to Financial Statements.
Stone Harbor Investment Funds Annual Report | May 31, 2015 | 79 |
Table of Contents
| Stone Harbor Investment Funds | Notes to Financial Statements | |
May 31, 2015 |
1. ORGANIZATION AND SIGNIFICANT ACCOUNTING POLICIES
Stone Harbor Investment Funds, which consists of Stone Harbor Emerging Markets Debt Fund, Stone Harbor High Yield Bond Fund, Stone Harbor Local Markets Fund, Stone Harbor Emerging Markets Corporate Debt Fund, Stone Harbor Investment Grade Fund, Stone Harbor Strategic Income Fund, and Stone Harbor Emerging Markets Debt Allocation Fund (each, a “Fund” and together, the “Funds”) is a Massachusetts business trust (the “Trust”), organized on February 20, 2007 and registered under the Investment Company Act of 1940, as amended (the “1940 Act”), as an open-end management investment company. The Stone Harbor Emerging Markets Debt Allocation Fund commenced operations on October 21, 2014. Shares of each Fund are currently divided into two classes, designated Institutional Class Shares and Distributor Class Shares. As of the date of this report, Distributor Class shares were not offered for sale in each Fund. The Trust’s Declaration of Trust permits the Trustees to create additional funds and share classes.
The Emerging Markets Debt Fund’s investment objective is to maximize total return. The Fund normally will invest at least 80% of its net assets (plus any borrowings made for investment purposes) in Emerging Markets Fixed Income Securities. “Emerging Markets Fixed Income Securities” include fixed income securities and derivative instruments (including, but not limited to, spot and currency contracts, futures, options and swaps) that economically are tied to countries with emerging securities markets or whose performance is linked to those countries’ markets, economies or ability to repay loans. Emerging Markets Fixed Income Securities may be denominated in non-U.S. currencies or the U.S. dollar. A security or instrument is economically tied to an emerging market country if it is principally traded on the country’s securities markets or the issuer is organized or principally operates in the country, derives a majority of its income from its operations within the country or has a majority of its assets within the country. Emerging Markets Fixed Income Securities also include derivatives and other instruments used to hedge or gain exposure to emerging securities markets (for example, futures or other derivatives whose return is based on specific emerging markets securities or indices).
The High Yield Bond Fund’s investment objective is to maximize total return. The Fund will normally invest at least 80% of its net assets (plus any borrowings made for investment purposes) in High Yield Debt Securities. “High Yield Debt Securities” include fixed income securities and derivative instruments (including, but not limited to, spot and currency contracts, futures, options and swaps) rated below investment grade (or, if unrated, of comparable quality as determined by Stone Harbor Investment Partners LP (the “Adviser” or “Stone Harbor”). These types of securities and instruments are commonly referred to as “high yield” securities or “junk bonds,” and may include, among other things, bonds, debentures, notes, equipment trust certificates, commercial paper, commercial loans, preferred stock and other obligations of U.S. and non-U.S. issuers. High Yield Debt Securities also include securities or other instruments whose return is based on the return of high yield securities, including derivative instruments and instruments created to hedge or gain exposure to the high yield markets.
The Local Markets Fund’s investment objective is to maximize total return. The Fund normally will invest at least 80% of its net assets (plus any borrowings made for investment purposes) in Emerging Markets Investments. “Emerging Markets Investments” include fixed income securities and derivative instruments (including, but not limited to, spot and currency contracts, futures, options and swaps) that economically are tied to an emerging market country, which are denominated in the predominant currency of the local market of an emerging market country (an “Emerging Markets Currency”) or whose performance is linked to those countries’ currencies, markets, economies or ability to repay loans. Although under normal circumstances a significant portion of the Fund’s investments will be denominated in Emerging Markets Currencies, Emerging Markets Investments may be denominated in non-Emerging Markets Currencies, including the U.S. dollar. A security or instrument is economically tied to an emerging market country if it is principally traded on the country’s securities markets or the issuer is organized or principally operates in the country, derives a majority of its income from its operations within the country or has a majority of its assets within the country. Emerging Markets Investments also include Emerging Markets Currencies and derivatives and other instruments used to hedge or gain exposure to emerging securities markets or Emerging Markets Currencies (for example, futures or other derivatives whose return is based on specific emerging markets securities, emerging markets indices or Emerging Markets Currencies).
The Emerging Markets Corporate Debt Fund’s investment objective is to maximize total return. The Fund normally will invest at least 80% of its net assets (plus any borrowings made for investment purposes) in Emerging Markets Corporate Debt Investments. “Emerging Markets Corporate Debt Investments” are debt instruments, including loans, issued by corporations or other business organizations that are economically tied to an emerging market country. A corporation or other business organization is economically tied to an emerging market country if it issues securities that are principally traded on the country’s securities markets or if it is organized or principally operates in the country, derives a majority of its income from its operations within the country or has a majority of its assets within the country. Emerging Markets Corporate Debt Investments also include derivative instruments used for hedging purposes or to otherwise gain or reduce long or short exposure to Emerging Markets Corporate Debt Investments.
The Investment Grade Fund’s investment objective is to maximize total return. The Fund invests in various types of fixed income securities and under normal market conditions will invest at least 80% of its net assets (plus any borrowings made for investment purposes) in Investment Grade Debt Securities. “Investment Grade Debt Securities” include fixed income securities that are rated investment grade by any of Moody’s Investors Services, Inc., Standard & Poor’s Rating Services, Fitch Ratings Limited, DBRS or other qualified rating agencies or, if unrated, are determined by the Adviser to be of comparable quality, and derivative instruments related to those securities.
80 | www.shiplp.com |
Table of Contents
| Stone Harbor Investment Funds | Notes to Financial Statements | |
May 31, 2015 |
The Strategic Income Fund’s investment objective is to maximize total return. The Fund is intended to provide broad exposure to global credit markets. The Fund, either directly or through investment in the underlying funds, may invest in a broad variety of fixed income and other income producing securities and instruments (including derivatives), and will not be limited in terms of type of instrument, geography, credit rating or duration. The Fund may invest all or a significant portion of its assets in Stone Harbor Investment Grade Fund, Stone Harbor High Yield Bond Fund, Stone Harbor Emerging Markets Debt Fund, Stone Harbor Local Markets Fund and Stone Harbor Emerging Markets Corporate Debt Fund and other funds sponsored or advised by the Adviser (together, the “underlying funds”). The Fund is not required to invest in the underlying funds, and from time to time may not be invested in any underlying fund. In addition to investing in the underlying funds, the Fund may invest directly in fixed income securities and in other instruments and transactions.
The Emerging Markets Debt Allocation Fund’s investment objective is to maximize total return. The Fund, either directly or through investment in the underlying funds, will invest at least 80% of its net assets (plus any borrowings made for investment purposes) in a broad variety of fixed income and other income producing securities and instruments (including derivatives), that economically are tied to an emerging market country or whose performance is linked to those countries’ currencies, markets, economies or ability to repay loans. The Fund may invest all or a significant portion of its assets in Stone Harbor Emerging Markets Debt Fund and Stone Harbor Local Markets Fund (together, the “underlying funds”). The Fund is not required to invest in the underlying funds, and from time to time may not be invested in any underlying fund. In addition to investing in the underlying funds, the Fund may invest directly in fixed income securities and in other instruments and transactions.
The Emerging Markets Debt Fund and Local Markets Fund are each classified as “non-diversified” under the 1940 Act. As a result, the Funds can invest a greater portion of the Funds’ assets in obligations of a single issuer than a “diversified” fund. The Funds may therefore be more susceptible than a diversified fund to being adversely affected by any single corporate, economic, political or regulatory occurrence. The High Yield Bond Fund, Emerging Markets Corporate Debt Fund, Investment Grade Fund, Strategic Income Fund, and Emerging Markets Debt Allocation Fund are diversified funds. The Emerging Markets Corporate Debt Fund was previously classified as a non-diversified investment company for purposes of the 1940 Act. As a result of ongoing operations, the Emerging Markets Corporate Debt Fund is now classified as a diversified company.
The following is a summary of significant accounting policies consistently followed by the Funds in the preparation of their financial statements. Each Fund is considered an investment company for financial reporting purposes under generally accepted accounting principles in the United States of America (“GAAP”). The policies are in conformity with GAAP. The preparation of the financial statements in accordance with GAAP requires management to make estimates and assumptions that affect the reported amounts of assets and liabilities at the date of the financial statements and the reported amounts of income and expenses during the reporting period. Actual results could differ from those estimates.
Investment Valuation: Debt securities, including bank loans and linked notes, are generally valued at the mean between the closing bid and asked prices provided by independent pricing services or brokers that are based on transactions in debt obligations, quotations from dealers, market transactions in comparable securities and various other relationships between securities. Equity securities for which market quotations are available are generally valued at the last sale price or official closing price on the primary market or exchange on which they trade. Publicly traded foreign government debt securities are typically traded internationally in the over-the-counter market, and are valued at the mean between the bid and asked prices as of the close of business of that market. When prices are not readily available, or are determined not to reflect fair value, such as when the value of a security has been significantly affected by events after the close of the exchange or market on which the security is principally traded, but before the Funds calculate their net asset value, the Funds may value these investments at fair value as determined in accordance with the procedures approved by the Funds’ Board of Trustees (the “Board”). Short-term obligations with maturities of 60 days or less are valued at amortized cost, which approximates market value. Open end funds and money market mutual funds are valued at their net asset value. Futures contracts are ordinarily valued at the last sales price on the securities or commodities exchange on which they are traded. Credit default swaps are priced by an independent pricing service based off of the underlying terms of the swap. Over-the-counter traded derivatives (primarily swaps) are priced by an independent pricing service. Derivatives which are cleared by an exchange are priced by such exchange. Foreign currency positions including forward currency contracts are priced at the mean between the closing bid and asked prices at 4:00 p.m. Eastern time.
A three-tier hierarchy has been established to measure fair value based on the extent of use of “observable inputs” as compared to “unobservable inputs” for disclosure purposes and requires additional disclosures about these valuations measurements. Inputs refer broadly to the assumptions that market participants would use in pricing a security. Observable inputs are inputs that reflect the assumptions market participants would use in pricing the security developed based on market data obtained from sources independent of the reporting entity. Unobservable inputs are inputs that reflect the reporting entity’s own assumptions about the assumptions market participants would use in pricing the security developed based on the best information available in the circumstances.
The three-tier hierarchy is summarized as follows:
Level 1— Unadjusted quoted prices in active markets for identical assets or liabilities that the Fund has the ability to access.
Stone Harbor Investment Funds Annual Report | May 31, 2015 | 81 |
Table of Contents
| Stone Harbor Investment Funds | Notes to Financial Statements | |
May 31, 2015 |
Level 2— | Observable inputs other than quoted prices included in level 1 that are observable for the asset or liability, either directly or indirectly. These inputs may include quoted prices for the identical instrument on an inactive market, prices for similar instruments, interest rates, prepayment speeds, credit risk, yield curve, rates, and similar data. | |
Level 3— | Unobservable inputs for the asset or liability, to the extent relevant observable inputs are not available, representing the Fund’s own assumptions about the assumptions a market participant would use in valuing the asset or liability, and would be based on the best information available. | |
The following is a summary of each Fund’s investments and financial instruments based on the three-tier hierarchy as of May 31, 2015:
| Investments in Securities at Value* | Level 1 - Quoted and Unadjusted Prices | Level 2 - Other Significant Observable Inputs | Level 3 - Significant Unobservable Inputs | Total | ||||||||||||
| ||||||||||||||||
Stone Harbor Emerging Markets Debt Fund | ||||||||||||||||
Sovereign Debt Obligations | $ | – | $ | 1,244,419,244 | $ | – | $ | 1,244,419,244 | ||||||||
Bank Loans | – | – | 218,719 | 218,719 | ||||||||||||
Corporate Bonds | – | 553,268,379 | – | 553,268,379 | ||||||||||||
Credit Linked Notes | ||||||||||||||||
Colombia | – | 1,690,122 | – | 1,690,122 | ||||||||||||
Iraq | – | – | 6,841,366 | 6,841,366 | ||||||||||||
Venezuela | – | – | 16,126,579 | 16,126,579 | ||||||||||||
Short Term Investments | 91,336,097 | – | – | 91,336,097 | ||||||||||||
| ||||||||||||||||
Total | $ | 91,336,097 | $ | 1,799,377,745 | $ | 23,186,664 | $ | 1,913,900,506 | ||||||||
| ||||||||||||||||
| ||||||||||||||||
| ||||||||||||||||
Other Financial Instruments** | ||||||||||||||||
| ||||||||||||||||
Assets | ||||||||||||||||
Forward Foreign Currency Contracts | $ | – | $ | 2,003,232 | $ | – | $ | 2,003,232 | ||||||||
Interest Rate Swap Contracts | – | 495,133 | – | 495,133 | ||||||||||||
Credit Default Swap Contracts | – | 503,029 | – | 503,029 | ||||||||||||
Liabilities | ||||||||||||||||
Forward Foreign Currency Contracts | – | (1,237,714) | – | (1,237,714) | ||||||||||||
| ||||||||||||||||
Total | $ | – | $ | 1,763,680 | $ | – | $ | 1,763,680 | ||||||||
| ||||||||||||||||
| Investments in Securities at Value* | Level 1 - Quoted and Unadjusted Prices | Level 2 - Other Significant Observable Inputs | Level 3 - Significant Unobservable Inputs | Total | ||||||||||||
| ||||||||||||||||
Stone Harbor High Yield Bond Fund | ||||||||||||||||
Corporate Bonds | $ | – | $ | 257,444,840 | $ | – | $ | 257,444,840 | ||||||||
Convertible Corporate Bonds | – | 1,857,868 | – | 1,857,868 | ||||||||||||
Bank Loans | – | 18,034,671 | – | 18,034,671 | ||||||||||||
Common/Preferred Stocks | 927,991 | 19 | – | 928,010 | ||||||||||||
Short Term Investments | 11,377,477 | – | – | 11,377,477 | ||||||||||||
| ||||||||||||||||
Total | $ | 12,305,468 | $ | 277,337,398 | $ | – | $ | 289,642,866 | ||||||||
| ||||||||||||||||
| ||||||||||||||||
Other Financial Instruments** | ||||||||||||||||
| ||||||||||||||||
Assets | ||||||||||||||||
Forward Foreign Currency Contracts | $ | – | $ | 128,800 | $ | – | $ | 128,800 | ||||||||
Liabilities | ||||||||||||||||
Forward Foreign Currency Contracts | – | (33,696) | – | (33,696) | ||||||||||||
| ||||||||||||||||
Total | $ | – | $ | 95,104 | $ | – | $ | 95,104 | ||||||||
| ||||||||||||||||
82 | www.shiplp.com |
Table of Contents
| Stone Harbor Investment Funds | Notes to Financial Statements | |
May 31, 2015 |
| Investments in Securities at Value* | Level 1 - Quoted and Unadjusted Prices | Level 2 - Other Significant Observable Inputs | Level 3 - Significant Unobservable Inputs | Total | ||||||||||||
| ||||||||||||||||
Stone Harbor Local Markets Fund | ||||||||||||||||
Sovereign Debt Obligations | $ | – | $ | 1,057,172,918 | $ | – | $ | 1,057,172,918 | ||||||||
Corporate Bonds | – | 60,761,659 | – | 60,761,659 | ||||||||||||
Credit Linked Notes | – | 97,597,910 | – | 97,597,910 | ||||||||||||
Short Term Investments | 53,533,849 | – | – | 53,533,849 | ||||||||||||
| ||||||||||||||||
Total | $ | 53,533,849 | $ | 1,215,532,487 | $ | – | $ | 1,269,066,336 | ||||||||
| ||||||||||||||||
| ||||||||||||||||
| ||||||||||||||||
Other Financial Instruments** | ||||||||||||||||
| ||||||||||||||||
Assets | ||||||||||||||||
Forward Foreign Currency Contracts | $ | – | $ | 8,432,118 | $ | – | $ | 8,432,118 | ||||||||
Liabilities | ||||||||||||||||
Forward Foreign Currency Contracts | – | (5,941,762) | – | (5,941,762) | ||||||||||||
| ||||||||||||||||
Total | $ | – | $ | 2,490,356 | $ | – | $ | 2,490,356 | ||||||||
| ||||||||||||||||
| Investments in Securities at Value* | Level 1 - Quoted and Unadjusted Prices | Level 2 - Other Significant Observable Inputs | Level 3 - Significant Unobservable Inputs | Total | ||||||||||||
| ||||||||||||||||
Stone Harbor Emerging Markets Corporate Debt Fund | ||||||||||||||||
Corporate Bonds | $ | – | $ | 22,736,676 | $ | – | $ | 22,736,676 | ||||||||
Short Term Investments | 1,010,937 | – | – | 1,010,937 | ||||||||||||
| ||||||||||||||||
Total | $ | 1,010,937 | $ | 22,736,676 | $ | –�� | $ | 23,747,613 | ||||||||
| ||||||||||||||||
| ||||||||||||||||
| ||||||||||||||||
Other Financial Instruments** | ||||||||||||||||
| ||||||||||||||||
Assets | ||||||||||||||||
Forward Foreign Currency Contracts | $ | – | $ | 6,259 | $ | – | $ | 6,259 | ||||||||
Liabilities | ||||||||||||||||
Forward Foreign Currency Contracts | – | (2,874) | – | (2,874) | ||||||||||||
| ||||||||||||||||
Total | $ | – | $ | 3,385 | $ | – | $ | 3,385 | ||||||||
| ||||||||||||||||
| Investments in Securities at Value* | Level 1 - Quoted and Unadjusted Prices | Level 2 - Other Significant Observable Inputs | Level 3 - Significant Unobservable Inputs | Total | ||||||||||||
| ||||||||||||||||
Stone Harbor Investment Grade Fund | ||||||||||||||||
Corporate Bonds | $ | – | $ | 4,188,154 | $ | – | $ | 4,188,154 | ||||||||
Asset Backed/Commercial Mortgage Backed Securities | – | 578,415 | – | 578,415 | ||||||||||||
U.S. Treasury Bonds/Notes | – | 2,175,953 | – | 2,175,953 | ||||||||||||
U.S. Government Agency Mortgage Backed Securities | – | 2,544,061 | – | 2,544,061 | ||||||||||||
Short Term Investments | 360,967 | – | – | 360,967 | ||||||||||||
| ||||||||||||||||
Total | $ | 360,967 | $ | 9,486,583 | $ | – | $ | 9,847,550 | ||||||||
| ||||||||||||||||
Stone Harbor Investment Funds Annual Report | May 31, 2015 | 83 |
Table of Contents
| Stone Harbor Investment Funds | Notes to Financial Statements | |
May 31, 2015 |
| Investments in Securities at Value* | Level 1 - Quoted and Unadjusted Prices | Level 2 - Other Significant Observable Inputs | Level 3 - Significant Unobservable Inputs | Total | ||||||||||||
| ||||||||||||||||
Stone Harbor Strategic Income Fund | ||||||||||||||||
Open-End Funds | $ | 33,632,831 | $ | – | $ | – | $ | 33,632,831 | ||||||||
| ||||||||||||||||
Total | $ | 33,632,831 | $ | – | $ | – | $ | 33,632,831 | ||||||||
| ||||||||||||||||
| ||||||||||||||||
Other Financial Instruments** | ||||||||||||||||
| ||||||||||||||||
Assets | ||||||||||||||||
Forward Foreign Currency Contracts | $ | – | $ | 1,274 | $ | – | $ | 1,274 | ||||||||
Futures Contracts | 17,026 | – | – | 17,026 | ||||||||||||
Credit Default Swap Contracts | – | 26,681 | – | 26,681 | ||||||||||||
Liabilities | ||||||||||||||||
Forward Foreign Currency Contracts | – | (211) | – | (211) | ||||||||||||
Credit Default Swap Contracts | – | (741) | – | (741) | ||||||||||||
Futures Contracts | (73,936) | – | – | (73,936) | ||||||||||||
| ||||||||||||||||
Total | $ | (56,910) | $ | 27,003 | $ | – | $ | (29,907) | ||||||||
| ||||||||||||||||
| Investments in Securities at Value* | Level 1 - Quoted and Unadjusted Prices | Level 2 - Other Significant Observable Inputs | Level 3 - Significant Unobservable Inputs | Total | ||||||||||||
| ||||||||||||||||
Stone Harbor Emerging Markets Debt Allocation Fund | ||||||||||||||||
Open-End Funds | $ | 85,442,617 | $ | – | $ | – | $ | 85,442,617 | ||||||||
| ||||||||||||||||
Total | $ | 85,442,617 | $ | – | $ | – | $ | 85,442,617 | ||||||||
| ||||||||||||||||
| * | For detailed Industry/Country descriptions, see accompanying Statements of Investments. |
| ** | Other financial instruments are derivative instruments not reflected in the Statements of Investments. The derivatives shown in this table are reported at their unrealized appreciation/(depreciation) at measurement date, which represents the change in the contract’s value. |
There were no transfers between Levels 1 and 2 during the year ended May 31, 2015. It is the Funds’ policy to recognize transfers into and out of all levels at the end of the reporting period.
The following is a reconciliation of assets in which significant unobservable inputs (Level 3) were used in determining fair value:
| Investments in Securities | Balance as of | Accrued discount/ premium | Return of Capital | Realized Gain/ (Loss) | Change in Unrealized Appreciation/ (Depreciation) | Purchases | Sales Proceeds | Transfer into Level 3 | Transfer out of Level 3 | Balance as of May 31, 2015 | Net change in investments | |||||||||||||||||||||||||||||||||
| ||||||||||||||||||||||||||||||||||||||||||||
| Stone Harbor Emerging Markets Debt Fund | ||||||||||||||||||||||||||||||||||||||||||||
Bank Loans | $ | 249,965 | $ | – | $ | – | $ | – | $ | (31,246 | ) | $ | – | $ | – | $ | – | $ | – | $ | 218,719 | $ | (31,246) | |||||||||||||||||||||
Credit Linked Notes | 9,778,779 | 2,265,498 | – | 20,746 | (8,898,761 | ) | 20,702,829 | (901,146 | ) | – | – | 22,967,945 | (8,898,761) | |||||||||||||||||||||||||||||||
| ||||||||||||||||||||||||||||||||||||||||||||
Total | $ | 10,028,744 | $ | 2,265,498 | $ | – | $ | 20,746 | $ | (8,930,007 | ) | $ | 20,702,829 | $ | (901,146 | ) | $ | – | $ | – | $ | 23,186,664 | $ | (8,930,007) | ||||||||||||||||||||
| ||||||||||||||||||||||||||||||||||||||||||||
All level 3 investments have values determined utilizing third party pricing information without adjustment.
84 | www.shiplp.com |
Table of Contents
| Stone Harbor Investment Funds | Notes to Financial Statements | |
May 31, 2015 |
The inputs or methodology used for valuing securities are not necessarily an indication of the risk associated with investing in those securities.
In the event a Board approved independent pricing service is unable to provide an evaluated price for a security or the Adviser believes the price provided is not reliable, securities of the Funds may be valued at fair value as described above. In these instances the Adviser may seek to find an alternative independent source, such as a broker/dealer to provide a price quote, or by using evaluated pricing models similar to the techniques and models used by the independent pricing service. These fair value measurement techniques may utilize unobservable inputs (Level 3).
On at least a quarterly basis, the Adviser presents the factors considered in determining the fair value measurements and presents that information to the Board which meets at least quarterly.
Security Transactions and Investment Income: Security transactions are accounted for on a trade date basis. Interest income, adjusted for amortization of premium and accretion of discount, is recorded on the accrual basis. Dividend income is recorded on the ex-dividend date. Foreign dividend income is recorded on the ex-dividend date or as soon as practical after the Funds determine the existence of a dividend declaration after exercising reasonable due diligence. If applicable, any foreign capital gains taxes are accrued, net of unrealized gains, and are payable upon the sale of such investments. The cost of investments sold is determined by use of the specific identification method. To the extent any issuer defaults on an expected interest payment, the Funds’ policy is to generally halt any additional interest income accruals and consider the realizability of interest accrued up to the date of default.
Foreign Currency Translation: The books and records of the Funds are maintained in U.S. dollars. Investment valuations and other assets and liabilities initially expressed in foreign currencies are converted each business day into U.S. dollars based upon current exchange rates. Prevailing foreign exchange rates may generally be obtained at the close of the NYSE (normally, 4:00 p.m. Eastern time). The portion of realized and unrealized gains or losses on investments due to fluctuations in foreign currency exchange rates is not separately disclosed and is included in realized and unrealized gains or losses on investments, when applicable.
Foreign Securities: The Funds may directly purchase securities of foreign issuers. Investing in securities of foreign issuers involves special risks not typically associated with investing in securities of U.S. issuers. The risks include possible revaluation of currencies, the ability to repatriate funds, less complete financial information about companies and possible future adverse political and economic developments. Moreover, securities of many foreign issuers and their markets may be less liquid and their prices more volatile than those of securities of comparable U.S. issuers.
Credit Linked Notes: The Funds may invest in credit linked notes to obtain economic exposure to high yield, emerging markets or other securities. Investments in a credit linked note typically provide the holder with a return based on the return of an underlying reference instrument, such as an emerging market bond. Like an investment in a bond, investments in credit-linked securities represent the right to receive periodic income payments (in the form of distributions) and payment of principal at the end of the term of the security. In addition to the risks associated with the underlying reference instrument, an investment in a credit linked note is also subject to the risk that the counterparty will be unwilling or unable to meet its obligations under the note.
Segregation and Collateralization: In cases in which the 1940 Act and the interpretive positions of the Securities and Exchange Commission (“SEC”) require that the Fund either delivers collateral or segregate assets in connection with certain investments (e.g., foreign currency exchange contracts, securities with extended settlement periods, and swaps) or certain borrowings (e.g., reverse repurchase agreements), the Fund will segregate collateral or designate on its books and records cash or other liquid securities having a value at least equal to the amount that is required to be physically segregated for the benefit of the counterparty. Furthermore, based on requirements and agreements with certain exchanges and third party broker-dealers, each party has requirements to deliver/deposit cash or securities as collateral for certain investments. Cash collateral that has been pledged to cover obligations of the Funds and cash collateral received from the counterparty, if any, is reported separately on the Statements of Assets and Liabilities as “Deposits with brokers” or “Payable due to brokers”, respectively. Securities collateral pledged for the same purpose is noted on the Statement of Investments.
Loan Participations and Assignments: The Funds may invest in loans arranged through private negotiation between one or more financial institutions. The Funds’ investment in any such loan may be in the form of a participation in or an assignment of the loan. In connection with purchasing participations, the Funds generally will have no right to enforce compliance by the borrower with the terms of the loan agreement relating to the loan, nor any rights of set-off against the borrower and the Funds may not benefit directly from any collateral supporting the loan in which they have purchased the participation.
The Funds may also invest in unfunded loan commitments, which are contractual obligations for future funding. Information regarding unfunded commitments is included at the end of the Funds’ Schedules of Investments.
Stone Harbor Investment Funds Annual Report | May 31, 2015 | 85 |
Table of Contents
| Stone Harbor Investment Funds | Notes to Financial Statements | |
May 31, 2015 |
The Funds assume the credit risk of the borrower, the lender that is selling the participation and any other persons interpositioned between the Funds and the borrower. In the event of the insolvency of the lender selling the participation, the Funds may be treated as a general creditor of the lender and may not benefit from any set-off between the lender and the borrower.
Inflation-Indexed Bonds: Certain Funds may invest in inflation indexed bonds. Inflation-indexed bonds are fixed-income securities whose principal value is periodically adjusted to the rate of inflation. The interest rate on these bonds is generally fixed at issuance at a rate lower than typical bonds. Over the life of an inflation-indexed bond, however, interest will be paid based on a principal value which is adjusted for inflation. Any increase or decrease in the principal amount of an inflation-indexed bond will be included as interest income on the Statements of Operations, even though investors do not receive their principal until maturity.
Mortgage-Related and Other Asset-Backed Securities: Certain Funds may invest in mortgage-related and other asset-backed securities. These securities include mortgage pass-through securities, collateralized mortgage obligations, commercial mortgage-backed securities, stripped mortgage-backed securities, asset-backed securities, collateralized debt obligations and other securities that directly or indirectly represent a participation in, or are secured by and payable from, mortgage loans on real property. Mortgage-related and other asset-backed securities are interests in pools of loans or other receivables. Mortgage-related securities are created from pools of residential or commercial mortgage loans, including mortgage loans made by savings and loan institutions, mortgage bankers, commercial banks and others. Asset-backed securities are created from many types of assets, including auto loans, credit card receivables, home equity loans, and student loans. These securities provide a monthly payment which consists of both interest and principal payments. Interest payments may be determined by fixed or adjustable rates. The rate of prepayments on underlying mortgages will affect the price and volatility of a mortgage-related security, and may have the effect of shortening or extending the effective duration of the security relative to what was anticipated at the time of purchase. The timely payment of principal and interest of certain mortgage-related securities is guaranteed with the full faith and credit of the U.S. Government. Pools created and guaranteed by non-governmental issuers, including government sponsored corporations, may be supported by various forms of insurance or guarantees, but there can be no assurance that the private insurers or guarantors can meet their obligations under the insurance policies or guarantee arrangements.
U.S. Government Agencies or Government-Sponsored Enterprises: Certain Funds may invest in securities of U.S. Government agencies or government-sponsored enterprises. U.S. Government securities are obligations of and, in certain cases, guaranteed by, the U.S. Government, its agencies or instrumentalities. Some U.S. Government securities, such as Treasury bills, notes and bonds, and securities guaranteed by the Government National Mortgage Association (“GNMA” or “Ginnie Mae”), are supported by the full faith and credit of the U.S. Government; others, such as those of the Federal Home Loan Banks, are supported by the right of the issuer to borrow from the U.S. Department of the Treasury (the “U.S. Treasury”); others, such as those of the Federal National Mortgage Association (“FNMA” or “Fannie Mae”), are supported by the discretionary authority of the U.S. Government to purchase the agency’s obligations. U.S. Government securities may include zero coupon securities, which do not distribute interest on a current basis and tend to be subject to greater risk than interest-paying securities of similar maturities.
Government-related guarantors (i.e., not backed by the full faith and credit of the U.S. Government) include FNMA and the Federal Home Loan Mortgage Corporation (“FHLMC” or “Freddie Mac”). FNMA is a government-sponsored corporation. FNMA purchases conventional (i.e., not insured or guaranteed by any government agency) residential mortgages from a list of approved seller/servicers which include state and federally chartered savings and loan associations, mutual savings banks, commercial banks and credit unions and mortgage bankers. Pass-through securities issued by FNMA are guaranteed as to timely payment of principal and interest by FNMA, but are not backed by the full faith and credit of the U.S. Government. FHLMC issues Participation Certificates (“PCs”), which are pass-through securities, each representing an undivided interest in a pool of residential mortgages. FHLMC guarantees the timely payment of interest and ultimate collection of principal, but PCs are not backed by the full faith and credit of the U.S. Government.
Forward Commitments: Certain Funds may contract to purchase securities for a fixed price at a transaction date beyond the customary settlement period (i.e., “when-issued,” “delayed-delivery,” “forward commitment,” or “To Be Announced (“TBA”) transactions”) consistent with a Fund’s ability to manage its investment portfolio and meet redemption requests. These transactions involve a commitment by a Fund to purchase securities for a predetermined price or yield with payment and delivery taking place more than three days in the future or after a period longer than the customary settlement period for that type of security. No interest will be earned by a Fund on such purchases until the securities are delivered; however, the market value may change prior to delivery. A Fund will not engage in these transactions for investment leverage.
When-issued securities involve the risk that the yield obtained in the transaction will be less than that available in the market when delivery takes place. Securities purchased on a when-issued basis are recorded as an asset and are subject to changes in value based upon changes in the value of the security or general level of interest rates. In when-issued and delayed-delivery transactions, a Fund relies on the seller to complete the transaction; the seller’s failure to do so may cause a Fund to miss an advantageous price or yield.
86 | www.shiplp.com |
Table of Contents
| Stone Harbor Investment Funds | Notes to Financial Statements | |
May 31, 2015 |
The Funds may enter into TBA commitments. TBA commitments are forward agreements for the purchase or sale of mortgage-backed securities for a fixed price, with payment and delivery on an agreed upon future settlement date. The specific securities to be delivered are not identified at the trade date. However, delivered securities must meet specified terms, including issuer, rate and mortgage terms. The Funds generally enter into TBA commitments with the intent to take possession of or deliver the underlying mortgage-backed securities but can extend the settlement or roll the transaction.
Unsettled TBA sale (purchase) commitments are valued at the current market value of the underlying securities. The contract is adjusted to market value daily, and the change in market value is recorded by the Fund as an unrealized gain or loss. Outstanding TBA commitments and related deliverables are reflected on the State of Assets and Liabilities in Payable for investments purchased and Receivable for investments sold, respectively. If the TBA sale (purchase) commitment is closed through the acquisition of an offsetting purchase (sale) commitment, the Fund realizes a gain or loss from the sale of the securities based upon the unit price established at the date the commitment was entered into. These gain/loss amounts are reflected in the Accumulated net realized gain/loss on investments and Net unrealized appreciation on investments on the Statement of Assets and Liabilities.
Credit and Market Risk: The Funds invest in high yield and emerging market instruments that are subject to certain credit and market risks. The yields of high yield and emerging market debt obligations reflect, among other things, perceived credit and market risks. The Funds’ investment in securities rated below investment grade typically involves risks not associated with higher rated securities including, among others, greater risk related to timely and ultimate payment of interest and principal, greater market price volatility and less liquid secondary market trading. The consequences of political, social, economic or diplomatic changes may have disruptive effects on the market prices of investments held by the Funds. The Funds’ investment in non-U.S. dollar denominated securities may also result in foreign currency losses caused by devaluations and exchange rate fluctuations. Investments in derivatives are also subject to credit and market risks.
Distributions to Shareholders: Dividends and distributions to shareholders, which are determined in accordance with income tax regulations, are recorded on the ex-date. Income distributions, if any are generally declared and paid on a quarterly basis. Capital gain distributions, if any, are declared and paid at least annually.
Expenses: Direct expenses are charged to each Fund; expenses of the Trust are generally allocated to the Funds based on each Fund’s relative net assets.
Federal and Other Taxes: No provision for income taxes is included in the accompanying financial statements, as the Funds intend to distribute to shareholders all taxable investment income and realized gains and otherwise comply with Subchapter M of the Internal Revenue Code of 1986, as amended, applicable to regulated investment companies.
The Funds evaluate tax positions taken (or expected to be taken) in the course of preparing the Funds’ tax provisions to determine whether these positions meet a “more-likely-than-not” standard that, based on the technical merits, have a more than fifty percent likelihood of being sustained by a taxing authority upon examination. A tax position that meets the “more-likely-than-not” recognition threshold is measured to determine the amount of benefit to recognize in the financial statements.
As of and during the year ended May 31, 2015, the Funds did not have a liability for any unrecognized tax benefits. The Funds file U.S. federal, state, and local tax returns as required. The Funds’ tax returns are subject to examination by the relevant tax authorities until expiration of the applicable statute of limitations which is generally three years after the filing of the tax return for federal purposes and four years for most state returns. Tax returns for open years have incorporated no uncertain tax positions that require a provision for income taxes.
2. DERIVATIVE INSTRUMENTS
Risk Exposure and the Use of Derivative Instruments: The Funds’ investment objectives not only permit the Funds to purchase investment securities, they also allow the Funds to enter in various types of derivatives contracts. In doing so, the Funds employ strategies in differing combinations to permit them to increase, decrease, or change the level or types of exposure to market factors. Central to those strategies are features inherent to derivatives that may make them more attractive for this purpose than equity or debt securities; they require little or no initial cash investment, they can focus exposure on only certain selected risk factors, and they may not require the ultimate receipt or delivery of the underlying security (or securities) to the contract. This may allow the Funds to pursue their objectives more quickly and efficiently than if they were to make direct purchases or sales of securities capable of affecting a similar response to market factors.
Stone Harbor Investment Funds Annual Report | May 31, 2015 | 87 |
Table of Contents
| Stone Harbor Investment Funds | Notes to Financial Statements | |
May 31, 2015 |
Market Risk Factors. In pursuit of their investment objectives, the Funds may seek to use derivatives to increase or decrease their exposure to the following market risk factors, among others:
Interest Rate Risk. Interest rate risk refers to the fluctuations in value of fixed-income securities resulting from the inverse relationship between price and yield. For example, an increase in general interest rates will tend to reduce the market value of already issued fixed-income investments, and a decline in general interest rates will tend to increase their value. In addition, debt securities with longer maturities, which tend to have higher yields, are subject to potentially greater fluctuations in value from changes in interest rates than obligations with shorter maturities.
Credit Risk. Credit risk relates to the ability of the issuer to meet interest and principal payments, or both, as they come due. In general, lower-grade, higher-yield bonds are subject to credit risk to a greater extent than lower-yield, higher-quality bonds.
Foreign Exchange Rate Risk. Foreign exchange risk relates to the change in the U.S. dollar value of a security held that is denominated in a foreign currency. The U.S. dollar value of a foreign currency denominated security will decrease as the dollar appreciates against the currency, while the U.S. dollar value will increase as the dollar depreciates against the currency.
Equity Risk. Equity risk relates to the change in value of equity securities as they relate to increases or decreases in the general market.
The Funds’ use of derivatives can result in losses due to unanticipated changes in these risk factors and the overall market. In instances where the Funds are using derivatives to decrease, or hedge, exposures to market risk factors for securities held by the Funds, there are also risks that those derivatives may not perform as expected resulting in losses for the combined or hedged positions.
Derivatives may have little or no initial cash investment relative to their market value exposure and therefore can produce significant gains or losses in excess of their cost. This use of embedded leverage allows each Fund to increase its market value exposure relative to its net assets and can substantially increase the volatility of the Funds’ performance.
Additional associated risks from investing in derivatives also exist and potentially could have significant effects on the valuation of the derivative and the Funds. Typically, the associated risks are not the risks that the Funds are attempting to increase or decrease exposure to, per their investment objectives, but are the additional risks from investing in derivatives.
Examples of these associated risks are liquidity risk, which is the risk that the Funds will not be able to sell or close out the derivative in a timely manner, and counterparty credit risk, which is the risk that the counterparty will not fulfill its obligation to the Funds. Associated risks can be different for each type of derivative and are discussed by each derivative type below in the notes that follow.
Forward Foreign Currency Contracts: The Funds may engage in currency transactions with counterparties to hedge the value of portfolio securities denominated in particular currencies against fluctuations in relative value, to gain or reduce exposure to certain currencies, or to generate income or gains. A forward foreign currency contract is an agreement between two parties to buy and sell a currency at a set price on a future date. The contract is marked-to-market daily and the change in value is recorded by the Funds as an unrealized gain or loss. When a forward foreign currency contract is extinguished, through either delivery or offset by entering into another forward foreign currency contract, the Funds record a realized gain or loss equal to the difference between the value of the contract at the time it was opened and the value of the contract at the time it was extinguished.
Forward foreign currency contracts involve elements of market risk in excess of the amounts reflected in the Statements of Assets and Liabilities. The Funds bear the risk of an unfavorable change in the foreign exchange rate underlying the forward foreign currency contract. Risks may also arise upon entering into these contracts from the potential inability of the counterparties to meet the terms of their contracts.
Futures Contracts: Certain Funds may invest in futures contracts in accordance with their investment objectives. Each Fund does so for a variety of reasons including for cash management, hedging or non-hedging purposes in an attempt to achieve investment returns consistent with the Fund’s investment objective. A futures contract provides for the future sale by one party and purchase by another party of a specified quantity of the security or other financial instrument at a specified price and time. A futures contract on an index is an agreement pursuant to which two parties agree to take or make delivery of an amount of cash equal to the difference between the value of the index at the close of the last trading day of the contract and the price at which the index contract was originally written. Futures contract transactions may result in losses in excess of the amount invested in the futures contract. There can be no guarantee that there will be a correlation between price movements in the hedging vehicle and in the portfolio securities being hedged. An incorrect correlation could result in a loss on both the hedged securities in a Fund and the hedging vehicle so that the portfolio return might have been greater had hedging not been attempted. There can be no assurance that a liquid market will exist at a time when a Fund seeks to close out a futures contract or a futures option position. Lack of a liquid market for any reason may
88 | www.shiplp.com |
Table of Contents
| Stone Harbor Investment Funds | Notes to Financial Statements | |
May 31, 2015 |
prevent a Fund from liquidating an unfavorable position, and the Fund would remain obligated to meet margin requirements until the position is closed. In addition, a Fund could be exposed to risk if the counterparties to the contracts are unable to meet the terms of their contracts. With exchange-traded futures contracts, there is minimal counterparty credit risk to the Funds since futures contracts are exchange-traded and the exchange’s clearinghouse, as counterparty to all exchange-traded futures contracts, guarantees the futures contracts against default.
When a purchase or sale of a futures contract is made by a Fund, the Fund is required to deposit with its broker a specified amount of liquid assets (“initial margin”). The margin required for a futures contract is set by the exchange on which the contract is traded and may be modified during the term of the contract. The initial margin is in the nature of a performance bond or good faith deposit on the futures contract that is returned to a Fund upon termination of the contract, assuming all contractual obligations have been satisfied. Each day a Fund may pay or receive cash, called “variation margin,” equal to the daily change in value of the futures contract. Such payments or receipts are recorded for financial statement purposes as unrealized gains or losses by a Fund. Variation margin does not represent a borrowing or loan by a Fund but is instead a settlement between a Fund and the broker of the amount one would owe the other if the futures contract expired. When the contract is closed, a Fund records a realized gain or loss equal to the difference between the value of the contract at the time it was opened and the value at the time it was closed.
Swap Agreements: The Funds may invest in swap agreements. Swap agreements are bilaterally negotiated agreements between a Fund and a counterparty to exchange or swap investment cash flows, assets, or market-linked returns at specified, future intervals. Swap agreements are privately negotiated in the over the counter market (“OTC swaps”) or may be executed in a multilateral or other trade facility platform, such as a registered exchange (“centrally cleared swaps”). In a centrally cleared swap, immediately following execution of the swap agreement, the swap agreement is novated to a central counterparty (the “CCP”) and the Fund’s counterparty on the swap agreement becomes the CCP. The Fund may enter into credit default swaps, interest rate swaps, total return swaps on individual securities or groups or indices of securities for hedging, investment or leverage purposes. In connection with these agreements, securities or cash may be identified as collateral or margin in accordance with the terms of the respective swap agreements to provide assets of value and recourse in the event of default or bankruptcy/insolvency.
Swaps are marked-to-market daily and changes in value, including the accrual of periodic amounts of interest, are recorded daily. Daily changes in valuation of centrally cleared swaps, if any, are recorded as a receivable or payable for the change in value as appropriate (“variation margin”). Each day the Fund may pay or receive cash, equal to the variation margin of the centrally cleared swap. OTC swap payments received or paid at the beginning of the measurement period represent premiums paid or received upon entering into the swap agreement to compensate for differences between the stated terms of the swap agreement and prevailing market conditions (credit spreads, interest rates, and other relevant factors). Generally, the basis of the OTC swaps is the unamortized premium received or paid. The periodic swap payments received or made by the Fund are recorded as realized gains or losses, respectively. Any upfront fees paid are recorded as assets and any upfront fees received are recorded as liabilities. When the swap is terminated, the Fund will record a realized gain or loss equal to the difference between the proceeds from (or cost of) the closing transaction and the Fund’s basis in the contract, if any.
Credit Default Swap Contracts: The Funds may enter into credit default swap contracts for hedging purposes to gain market exposure or to add leverage to its portfolio. When used for hedging purposes, a Fund would be the buyer of a credit default swap contract. In that case, the Fund would be entitled to receive the par (or other agreed upon) value of a referenced debt obligation, index or other investment from the counterparty to the contract in the event of a default by a third party, such as a U.S. or foreign issuer, on the referenced debt obligation. In return, the Fund would pay to the counterparty a periodic stream of payments over the term of the contract provided that no event of default has occurred. If no event of default occurs, the Fund would have spent the stream of payments and received no benefit from the contract. When the Fund is the seller of a credit default swap contract, it receives the stream of payments but is obligated to pay upon default of the referenced debt obligation. As the seller, the Fund would effectively add leverage to its portfolio because, in addition to its total assets, the Fund would be subject to investment exposure on the notional amount of the swap.
In addition to the risks applicable to derivatives generally, credit default swaps involve special risks because they may be difficult to value, are highly susceptible to liquidity and credit risk and generally pay a return to the counterparty only in the event of an actual default by the issuer of the underlying obligation, as opposed to a credit downgrade or other indication of financial difficulty.
Interest Rate Swap Contracts: Interest rate swap contracts involve the exchange by a Fund with another party for their respective commitment to pay or receive interest on the notional amount of principal. Certain forms of interest rate swap agreements may include: (i) interest rate caps, under which, in return for a premium, one party agrees to make payments to the other to the extent that interest rates exceed a specified rate, or “cap”, (ii) interest rate floors, under which, in return for a premium, one party agrees to make payments to the other to the extent that interest rates fall below a specified rate, or “floor”, (iii) interest rate collars, under which a party sells a cap and purchases a floor or vice versa in an attempt to protect itself against interest rate movements exceeding given minimum or maximum levels, (iv) callable interest rate swaps, under which the buyer pays an upfront fee in consideration for the right to early terminate the swap transaction in whole, at zero costs and at a predetermined date and time prior to the maturity date, (v) spreadlocks, which allow the interest rate swap users to lock in the forward differential (or spread) between
Stone Harbor Investment Funds Annual Report | May 31, 2015 | 89 |
Table of Contents
| Stone Harbor Investment Funds | Notes to Financial Statements | |
May 31, 2015 |
the interest rate swap rate and a specified benchmark, or (vi) basis swaps, under which two parties can exchange variable interest rates based on different segments of money markets.
The tables below are a summary of the fair valuations of derivative instruments categorized by risk exposure.
Fair values of forward foreign currency contracts, credit default swaps, interest rate swaps, and future contracts on the Statements of Assets and Liabilities as of May 31, 2015:
| Risk Exposure | Statement of Assets and Liabilities Location | Fair Value | Statement of Assets and Liabilities Location | Fair Value | ||||||||
| ||||||||||||
Stone Harbor Emerging Markets Debt Fund | ||||||||||||
Credit Risk (Swap Contracts) | Unrealized appreciation on credit default swap contracts | 503,029 | Unrealized depreciation on credit default swap contracts | – | ||||||||
Interest Rate Risk (Swap Contracts)* | Unrealized appreciation on interest rate swap contracts | 495,133 | Unrealized depreciation on interest rate swap contracts | – | ||||||||
Foreign Exchange Rate Risk | Unrealized appreciation on forward foreign currency contracts | 2,003,232 | Unrealized depreciation on forward foreign currency contracts | (1,237,714) | ||||||||
| ||||||||||||
Total | $ | 3,001,394 | $ | (1,237,714) | ||||||||
| ||||||||||||
Stone Harbor High Yield Bond Fund | ||||||||||||
Foreign Exchange Rate Risk | Unrealized appreciation on forward foreign currency contracts | 128,800 | Unrealized depreciation on forward foreign currency contracts | (33,696) | ||||||||
| ||||||||||||
Total | $ | 128,800 | $ | (33,696) | ||||||||
| ||||||||||||
Stone Harbor Local Markets Fund | ||||||||||||
Foreign Exchange Rate Risk | Unrealized appreciation on forward foreign currency contracts | 8,432,118 | Unrealized depreciation on forward foreign currency contracts | (5,941,762) | ||||||||
| ||||||||||||
Total | $ | 8,432,118 | $ | (5,941,762) | ||||||||
| ||||||||||||
Stone Harbor Emerging Markets Corporate Debt Fund | ||||||||||||
Foreign Exchange Rate Risk | Unrealized appreciation on forward foreign currency contracts | 6,259 | Unrealized depreciation on forward foreign currency contracts | (2,874) | ||||||||
| ||||||||||||
Total | $ | 6,259 | $ | (2,874) | ||||||||
| ||||||||||||
Stone Harbor Strategic Income Fund | ||||||||||||
Credit Risk (Swap Contracts)* | Unrealized appreciation on credit default swap contracts | 26,681 | Unrealized depreciation on credit default swap contracts | (741) | ||||||||
Interest Rate Risk (Futures Contracts)* | Unrealized appreciation on futures contracts | 17,026 | Unrealized depreciation on futures contracts | (73,936) | ||||||||
Foreign Exchange Rate Risk | Unrealized appreciation on forward foreign currency contracts | 1,274 | Unrealized depreciation on forward foreign currency contracts | (211) | ||||||||
| ||||||||||||
Total | $ | 44,981 | $ | (74,888) | ||||||||
| ||||||||||||
| * | The value presented includes cumulative gain/(loss) on open futures contracts, interest rate swap contracts and credit default swap contracts; however, the value reflected on the accompanying Statement of Assets and Liabilities is only the unsettled variation margin receivable/(payable) as of May 31, 2015. |
The number of forward foreign currency contracts, credit default swap contracts, interest rate swap contracts, and futures contracts held at May 31, 2015 is representative of activity during the year ended May 31, 2015.
90 | www.shiplp.com |
Table of Contents
| Stone Harbor Investment Funds | Notes to Financial Statements | |
May 31, 2015 |
The effect of forward foreign currency contracts, credit default swaps, interest rate swaps, and futures contracts on the Statements of Operations for the year ended May 31, 2015:
| Risk Exposure | Statement of Operations Location | Realized Gain/(Loss) on Derivatives | Location | Change in Unrealized Appreciation/(Depreciation) on Derivatives Recognized in Income | ||||||
| ||||||||||
Stone Harbor Emerging Markets Debt Fund | ||||||||||
Credit Risk (Swap Contracts) | Net realized gain/(loss) on credit default swap contracts | 775,3472 | Change in unrealized appreciation/(depreciation) on credit default swap contracts | 503,029 | ||||||
Interest Rate Risk (Swap Contracts) | Net realized gain/(loss) on interest rate swap contracts | 795,787 | Change in unrealized appreciation/(depreciation) on interest rate swap contracts | 495,133 | ||||||
Foreign Exchange Rate Risk | Net realized gain/(loss) on forward foreign currency contracts | $ | 4,227,921 | Change in unrealized appreciation/(depreciation) on forward foreign currency contracts | $ 657,404 | |||||
| ||||||||||
Total | $ | 5,799,055 | $ 1,655,566 | |||||||
| ||||||||||
Stone Harbor High Yield Bond Fund | ||||||||||
Foreign Exchange Rate Risk | Net realized gain/(loss) on forward foreign currency contracts | $ | 1,784,096 | Change in unrealized appreciation/(depreciation) on forward foreign currency contracts | $ 32,952 | |||||
| ||||||||||
Total | $ | 1,784,096 | $ 32,952 | |||||||
| ||||||||||
Stone Harbor Local Markets Fund | ||||||||||
Foreign Exchange Rate Risk | Net realized gain/(loss) on forward foreign currency contracts | $ | (22,561,456) | Change in unrealized appreciation/(depreciation) on forward foreign currency contracts | $ 3,898,244 | |||||
| ||||||||||
Total | $ | (22,561,456) | $ 3,898,244 | |||||||
| ||||||||||
Stone Harbor Emerging Markets Corporate Debt Fund | ||||||||||
Foreign Exchange Rate Risk | Net realized gain/(loss) on forward foreign currency contracts | $ | 128,845 | Change in unrealized appreciation/(depreciation) on forward foreign currency contracts | $ 1,554 | |||||
| ||||||||||
Total | $ | 128,845 | $ 1,554 | |||||||
| ||||||||||
Stone Harbor Investment Grade Fund | ||||||||||
Interest Rate Risk (Futures Contracts) | Net realized gain/(loss) on futures contracts | $ | 13,284 | Change in unrealized appreciation/(depreciation) on futures contracts | $ – | |||||
| ||||||||||
Total | $ | 13,284 | $ – | |||||||
| ||||||||||
Stone Harbor Strategic Income Fund | ||||||||||
Credit Risk (Swap Contracts) | Net realized gain/(loss) on credit default swap contracts | (16,762) | Change in unrealized appreciation/(depreciation) on credit default swap contracts | 25,940 | ||||||
Interest Rate Risk (Futures Contracts) | Net realized gain/(loss) on futures contracts | 275,716 | Change in unrealized appreciation/(depreciation) on futures contracts | (91,906) | ||||||
Foreign Exchange Rate Risk | Net realized gain/(loss) on forward foreign currency contracts | $ | 35,775 | Change in unrealized appreciation/(depreciation) on forward foreign currency contracts | $ 818 | |||||
| ||||||||||
Total | $ | 294,729 | $ (65,148) | |||||||
| ||||||||||
Stone Harbor Investment Funds Annual Report | May 31, 2015 | 91 |
Table of Contents
| Stone Harbor Investment Funds | Notes to Financial Statements | |
May 31, 2015 |
Offsetting Arrangements: Certain derivative contracts are executed under standardized netting agreements. A derivative netting arrangement creates an enforceable right of set-off that becomes effective, and affects the realization of settlement on individual assets, liabilities and collateral amounts, only following a specified event of default or early termination. Default events may include the failure to make payments or deliver securities timely, material adverse changes in financial condition or insolvency, the breach of minimum regulatory capital requirements, or loss of license, charter or other legal authorization necessary to perform under the contract. These agreements mitigate counterparty credit risk by providing for a single net settlement with a counterparty of all financial transactions covered by the agreement in an event of default as defined under such agreement.
The following table presents derivative financial instruments that are subject to enforceable netting arrangements, collateral arrangements or other similar agreements as of May 31, 2015.
Offsetting of Derivatives Assets
May 31, 2015
| Gross Amounts Not Offset in the Statements of Assets and Liabilities | ||||||||||||||||||||||||
| Description | Gross Amounts of Recognized Assets | Gross Amounts Offset in the Statements of Assets and Liabilities | Net Amounts Presented in the Statements of Assets and Liabilities Available for Offset | Financial Instruments Available for Offset(a) | Cash Collateral Received(a) | Net Amount Receivable | ||||||||||||||||||
| ||||||||||||||||||||||||
Stone Harbor Emerging Markets Debt Fund |
| |||||||||||||||||||||||
Forward Foreign | ||||||||||||||||||||||||
Currency Contracts | $ | 2,003,232 | $ | – | $ | 2,003,232 | $ | (1,237,714) | $ | (555,856) | $ | 209,662 | ||||||||||||
Credit Default Swap Contract | 503,029 | – | 503,029 | – | – | 503,029 | ||||||||||||||||||
| ||||||||||||||||||||||||
Total | $ | 2,506,261 | $ | – | $ | 2,506,261 | $ | (1,237,714) | $ | – | $ | 712,691 | ||||||||||||
| ||||||||||||||||||||||||
Stone Harbor High Yield Bond Fund |
| |||||||||||||||||||||||
Forward Foreign | ||||||||||||||||||||||||
Currency Contracts | $ | 128,800 | $ | – | $ | 128,800 | $ | (33,696) | $ | – | $ | 95,104 | ||||||||||||
| ||||||||||||||||||||||||
Total | $ | 128,800 | $ | – | $ | 128,800 | $ | (33,696) | $ | – | $ | 95,104 | ||||||||||||
| ||||||||||||||||||||||||
Stone Harbor Local Markets Fund |
| |||||||||||||||||||||||
Forward Foreign | ||||||||||||||||||||||||
Currency Contracts | $ | 8,432,118 | $ | – | $ | 8,432,118 | $ | (3,689,710) | $ | (2,790,000) | $ | 1,952,408 | ||||||||||||
| ||||||||||||||||||||||||
Total | $ | 8,432,118 | $ | – | $ | 8,432,118 | $ | (3,689,710) | $ | (2,790,000) | $ | 1,952,408 | ||||||||||||
| ||||||||||||||||||||||||
Stone Harbor Emerging Markets Corporate Debt Fund |
| |||||||||||||||||||||||
Forward Foreign | ||||||||||||||||||||||||
Currency Contracts | $ | 6,259 | $ | – | $ | 6,259 | $ | (2,874) | $ | – | $ | 3,385 | ||||||||||||
| ||||||||||||||||||||||||
Total | $ | 6,259 | $ | – | $ | 6,259 | $ | (2,874) | $ | – | $ | 3,385 | ||||||||||||
| ||||||||||||||||||||||||
Stone Harbor Strategic Income Fund |
| |||||||||||||||||||||||
Forward Foreign | ||||||||||||||||||||||||
Currency Contracts | $ | 1,274 | $ | – | $ | 1,274 | $ | (211) | $ | – | $ | 1,063 | ||||||||||||
| ||||||||||||||||||||||||
Total | $ | 1,274 | $ | – | $ | 1,274 | $ | (211) | $ | – | $ | 1,603 | ||||||||||||
| ||||||||||||||||||||||||
92 | www.shiplp.com |
Table of Contents
| Stone Harbor Investment Funds | Notes to Financial Statements | |
May 31, 2015 |
Offsetting of Derivatives Liabilities
May 31, 2015
| Gross Amounts Not Offset in the Statements of Assets and Liabilities | ||||||||||||||||||||||||
| Description | Gross Amounts of Recognized Liabilities | Gross Amounts Offset in the Statements of Assets and Liabilities | Net Amounts Presented in the Statements of Assets and Liabilities Available for Offset | Financial Instruments Available for Offset(a) | Cash Collateral Pledged(a) | Net Amount Payable | ||||||||||||||||||
| ||||||||||||||||||||||||
Stone Harbor Emerging Markets Debt Fund |
| |||||||||||||||||||||||
Forward Foreign | ||||||||||||||||||||||||
Currency Contracts | $ | 1,237,714 | $ | – | $ | 1,237,714 | $ | (1,237,714) | $ | – | $ | – | ||||||||||||
| ||||||||||||||||||||||||
Total | $ | 1,237,714 | $ | – | $ | 1,237,714 | $ | (1,237,714) | $ | – | $ | – | ||||||||||||
| ||||||||||||||||||||||||
Stone Harbor High Yield Bond Fund |
| |||||||||||||||||||||||
Forward Foreign | ||||||||||||||||||||||||
Currency Contracts | $ | 33,696 | $ | – | $ | 33,696 | $ | (33,696) | $ | – | $ | – | ||||||||||||
| ||||||||||||||||||||||||
Total | $ | 33,696 | $ | – | $ | 33,696 | $ | (33,696) | $ | – | $ | – | ||||||||||||
| ||||||||||||||||||||||||
Stone Harbor Local Markets Fund |
| |||||||||||||||||||||||
Forward Foreign | ||||||||||||||||||||||||
Currency Contracts | $ | 5,941,762 | $ | – | $ | 5,941,762 | $ | (3,689,710) | $ | (2,252,052) | $ | – | ||||||||||||
| ||||||||||||||||||||||||
Total | $ | 5,941,762 | $ | – | $ | 5,941,762 | $ | (3,689,710) | $ | (2,252,052) | $ | – | ||||||||||||
| ||||||||||||||||||||||||
Stone Harbor Emerging Markets Corporate Debt Fund |
| |||||||||||||||||||||||
Forward Foreign | ||||||||||||||||||||||||
Currency Contracts | $ | 2,874 | $ | – | $ | 2,874 | $ | (2,874) | $ | – | $ | – | ||||||||||||
| ||||||||||||||||||||||||
Total | $ | 2,874 | $ | – | $ | 2,874 | $ | (2,874) | $ | – | $ | – | ||||||||||||
| ||||||||||||||||||||||||
Stone Harbor Strategic Income Fund |
| |||||||||||||||||||||||
Forward Foreign | ||||||||||||||||||||||||
Currency Contracts | $ | 211 | $ | – | $ | 211 | $ | (211) | $ | – | $ | – | ||||||||||||
| ||||||||||||||||||||||||
Total | $ | 211 | $ | – | $ | 211 | $ | (211) | $ | – | $ | – | ||||||||||||
| ||||||||||||||||||||||||
| (a) | These amounts are limited to the derivatives asset/liability balance and, accordingly, do not include excess collateral received/pledged. |
3. TAX BASIS INFORMATION
Tax Basis of Distributions to Shareholders: Net investment income/ (loss) and net realized gain/ (loss) may differ for financial statement and tax purposes. The character of distributions made during the year from net investment income or net realized gains may differ from its ultimate characterization for federal income tax purposes. Also, due to the timing of dividend distributions, the fiscal year in which amounts are distributed may differ from the fiscal year in which the income or realized gain was recorded by a Fund.
The tax character of the distributions paid by the Funds during the periods ended May 31, 2015 and May 31, 2014 was as follows:
| Stone Harbor Emerging Markets Debt Fund | 2015 | 2014 | ||||||
|
| |||||||
Ordinary Income | $ | 104,263,472 | $ | 85,919,272 | ||||
Long-Term Capital Gain | – | 100,570 | ||||||
| ||||||||
Total | $ | 104,263,472 | $ | 86,019,842 | ||||
| ||||||||
| Stone Harbor High Yield Bond Fund | 2015 | 2014 | ||||||
|
| |||||||
Ordinary Income | $ | 19,455,425 | $ | 23,884,719 | ||||
Long-Term Capital Gain | 9,049,371 | 8,620,656 | ||||||
| ||||||||
Total | $ | 28,504,796 | $ | 32,505,375 | ||||
| ||||||||
Stone Harbor Investment Funds Annual Report | May 31, 2015 | 93 |
Table of Contents
| Stone Harbor Investment Funds | Notes to Financial Statements | |
May 31, 2015 |
| Stone Harbor Local Markets Fund | 2015 | 2014 | ||||||
|
| |||||||
Ordinary Income | $ | 27,499,281 | $ | 25,186,122 | ||||
Long-Term Capital Gain | – | 4,745,258 | ||||||
| ||||||||
Total | $ | 27,499,281 | $ | 29,931,380 | ||||
| ||||||||
| Stone Harbor Emerging Markets Corporate Debt Fund | 2015 | 2014 | ||||||
|
| |||||||
Ordinary Income | $ | 1,215,887 | $ | 2,080,114 | ||||
| ||||||||
Total | $ | 1,215,887 | $ | 2,080,114 | ||||
| ||||||||
| Stone Harbor Investment Grade Fund | 2015 | For the Period Ended May 31, 2014 | ||||||
|
| |||||||
Ordinary Income | $ | 172,128 | $ | 17,965 | ||||
| ||||||||
Total | $ | 172,128 | $ | 17,965 | ||||
| ||||||||
| Stone Harbor Strategic Income Fund | 2015 | For the Period Ended May 31, 2014 | ||||||
|
| |||||||
Ordinary Income | $ | 1,316,926 | $ | 130,527 | ||||
Long-Term Capital Gain | 32,288 | – | ||||||
| ||||||||
Total | $ | 1,349,214 | $ | 130,527 | ||||
| ||||||||
| Stone Harbor Emerging Markets Debt Allocation Fund | For the Period Ended May 31, 2015 | |||||||
Ordinary Income | $ | 1,049,102 | ||||||
| ||||||||
Total | $ | 1,049,102 | ||||||
| ||||||||
As of May 31, 2015, the components of distributable earnings on a tax basis were as follows:
Stone Harbor Emerging Markets Debt Fund | ||||
Undistributed Ordinary Income | $ | 4,476,156 | ||
Accumulated Capital Loss | $ | (132,337,679) | ||
Unrealized Depreciation | (2,479,492) | |||
Cumulative Effect of Other Timing Difference* | (3,302,064) | |||
| ||||
Total | $ | (133,643,079) | ||
| ||||
Stone Harbor High Yield Bond Fund | ||||
Undistributed Ordinary Income | $ | 413,436 | ||
Accumulated Capital Loss | (3,173,432) | |||
Unrealized Depreciation | (2,827,899) | |||
Cumulative Effect of Other Timing Difference* | (95,104) | |||
| ||||
Total | $ | (5,682,999) | ||
| ||||
Stone Harbor Local Markets Fund | ||||
Accumulated Capital Loss | (121,225,776) | |||
Unrealized Depreciation | (317,983,923) | |||
Cumulative Effect of Other Timing Difference* | (136,753,137) | |||
| ||||
Total | $ | (575,962,836) | ||
| ||||
94 | www.shiplp.com |
Table of Contents
| Stone Harbor Investment Funds | Notes to Financial Statements | |
May 31, 2015 |
Stone Harbor Emerging Markets Corporate Debt Fund | ||||
Undistributed Ordinary Income | $ | 76,312 | ||
Accumulated Capital Loss | (3,617,629) | |||
Unrealized Appreciation | 392,483 | |||
Cumulative Effect of Other Timing Difference* | (12,477) | |||
| ||||
Total | $ | (3,161,311) | ||
| ||||
Stone Harbor Investment Grade Fund | ||||
Undistributed Ordinary Income | $ | 103,491 | ||
Accumulated Capital Gain | 21,781 | |||
Unrealized Appreciation | 24,402 | |||
| ||||
Total | $ | 149,674 | ||
| ||||
Stone Harbor Strategic Income Fund | ||||
Undistributed Ordinary Income | $ | 88,467 | ||
Accumulated Capital Gain | 489,931 | |||
Unrealized Depreciation | (1,043,285) | |||
Cumulative Effect of Other Timing Difference* | 29,907 | |||
| ||||
Total | $ | (434,980) | ||
| ||||
Stone Harbor Emerging Markets Debt Allocation Fund | ||||
Undistributed Ordinary Income | $ | 569,091 | ||
Accumulated Capital Loss | (28,021) | |||
Unrealized Depreciation | (4,453,940) | |||
| ||||
Total | $ | (3,912,870) | ||
| ||||
| * | Other temporary differences due to timing, consist primarily of mark-to-market on forward foreign currency contracts. |
The tax components of distributable earnings are determined in accordance with income tax regulations which may differ from the composition of net assets reported under GAAP. Accordingly, for the year ended May 31, 2015, certain differences were reclassified. These differences were primarily attributed to the differing tax treatment of foreign currencies and certain other investments. The amounts reclassified did not affect net assets.
The reclassifications were as follows:
| Fund | Paid-in Capital | Accumulated Net Investment Income/(Loss) | Accumulated Net Realized Gain/(Loss) on Investments | |||||||||
Stone Harbor Emerging Markets Debt Fund | $ | – | $ | (13,006,475) | $ | 13,006,475 | ||||||
Stone Harbor High Yield Bond Fund | – | 1,540,778 | (1,540,778) | |||||||||
Stone Harbor Local Markets Fund | (1) | (235,485,550) | 235,485,551 | |||||||||
Stone Harbor Emerging Markets Corporate Debt Fund | – | 111,177 | (111,177) | |||||||||
Stone Harbor Investment Grade Fund | (423) | 745 | (322) | |||||||||
Stone Harbor Strategic Income Fund | (2,726) | 10,260 | (7,534) | |||||||||
Stone Harbor Emerging Markets Debt Allocation Fund | (2,916) | 2,916 | – | |||||||||
Capital Losses: As of May 31, 2015 the following Funds had capital loss carryforwards which may reduce the Funds’ taxable income arising from future net realized gains on investments, if any, to the extent permitted by the Code and thus may reduce the amount of the distributions to shareholders which would otherwise be necessary to relieve the Funds of any liability for federal tax pursuant to the Code.
Stone Harbor Investment Funds Annual Report | May 31, 2015 | 95 |
Table of Contents
| Stone Harbor Investment Funds | Notes to Financial Statements | |
May 31, 2015 |
Capital losses carried forward were as follows:
| Fund | Short-Term | Long-Term | ||||||
| ||||||||
Stone Harbor Emerging Markets Debt Fund | $ | 47,841,364 | $ | 17,042,098 | ||||
Stone Harbor Local Markets Fund | 84,978,042 | 4,728,953 | ||||||
Stone Harbor Emerging Markets Corporate Debt Fund | 1,359,129 | 2,251,674 | ||||||
The following Funds elect to defer to the year ending May 31, 2016 the following capital losses recognized during the period November 1, 2014 through May 31, 2015:
| Fund | Amount | |||
| ||||
Stone Harbor Emerging Markets Debt Fund | $ | 67,454,217 | ||
Stone Harbor High Yield Bond Fund | 3,173,432 | |||
Stone Harbor Local Markets Fund | 31,518,781 | |||
Stone Harbor Emerging Markets Corporate Debt Fund | 6,826 | |||
Stone Harbor Emerging Markets Debt Allocation Fund | 28,021 | |||
The following Fund elects to defer to the period ending May 31, 2016, late year ordinary losses in the amount of:
| Fund | Amount | |||
| ||||
Stone Harbor Local Markets Fund | $ | 133,045,763 | ||
Unrealized Appreciation and Depreciation on Investments: At May 31, 2015 the aggregate gross unrealized appreciation and depreciation of investments for federal income purposes were as follows:
Stone Harbor Emerging Markets Debt Fund | ||||
Gross appreciation on investments (excess of value over tax cost) | $ | 55,240,915 | ||
Gross depreciation on investments (excess of tax cost over value) | (59,396,124) | |||
Net appreciation (excess of value over tax cost) of foreign currency and derivatives | 1,675,717 | |||
| ||||
Net unrealized depreciation | $ | (2,479,492) | ||
| ||||
Cost of investments for income tax purposes | $ | 1,918,055,715 | ||
| ||||
Stone Harbor High Yield Bond Fund | ||||
Gross appreciation on investments (excess of value over tax cost) | $ | 7,885,695 | ||
Gross depreciation on investments (excess of tax cost over value) | (10,806,885) | |||
Net appreciation (excess of value over tax cost) of foreign currency and derivatives | 93,291 | |||
| ||||
Net unrealized depreciation | $ | (2,827,899) | ||
| ||||
Cost of investments for income tax purposes | $ | 292,564,056 | ||
| ||||
Stone Harbor Local Markets Fund | ||||
Gross appreciation on investments (excess of value over tax cost) | $ | (7,839,954) | ||
Gross depreciation on investments (excess of tax cost over value) | (311,056,138) | |||
Net appreciation (excess of value over tax cost) of foreign currency and derivatives | 912,169 | |||
| ||||
Net unrealized depreciation | $ | (317,983,923) | ||
| ||||
Cost of investments for income tax purposes | $ | 1,587,962,428 | ||
| ||||
96 | www.shiplp.com |
Table of Contents
| Stone Harbor Investment Funds | Notes to Financial Statements | |
May 31, 2015 |
Stone Harbor Emerging Markets Corporate Debt Fund | ||||
Gross appreciation on investments (excess of value over tax cost) | $ | 697,199 | ||
Gross depreciation on investments (excess of tax cost over value) | (308,161) | |||
Net appreciation (excess of value over tax cost) of foreign currency and derivatives | 3,445 | |||
| ||||
Net unrealized appreciation | $ | 392,483 | ||
| ||||
Cost of investments for income tax purposes | $ | 23,358,575 | ||
| ||||
Stone Harbor Investment Grade Fund | ||||
Gross appreciation on investments (excess of value over tax cost) | $ | 101,870 | ||
Gross depreciation on investments (excess of tax cost over value) | (77,468) | |||
| ||||
Net unrealized appreciation | $ | 24,402 | ||
| ||||
Cost of investments for income tax purposes | $ | 9,823,148 | ||
| ||||
Stone Harbor Strategic Income Fund | ||||
Gross appreciation on investments (excess of value over tax cost) | $ | 183,962 | ||
Gross depreciation on investments (excess of tax cost over value) | (1,187,492) | |||
Net depreciation (excess of value over tax cost) of foreign currency and derivatives | (39,755) | |||
| ||||
Net unrealized depreciation | $ | (1,043,285) | ||
| ||||
Cost of investments for income tax purposes | $ | 34,636,361 | ||
| ||||
Stone Harbor Emerging Markets Debt Allocation Fund | ||||
Gross appreciation on investments (excess of value over tax cost) | $ | 335,291 | ||
Gross depreciation on investments (excess of tax cost over value) | (4,789,231) | |||
| ||||
Net unrealized depreciation | $ | (4,453,940) | ||
| ||||
Cost of investments for income tax purposes | $ | 89,896,557 | ||
| ||||
4. ADVISORY FEES
Stone Harbor Investment Partners LP is the Trust’s investment adviser. Under the investment advisory agreement the Trust pays an investment advisory fee calculated daily and paid monthly of 0.60%, 0.50%, 0.75%, 0.85%, 0.35%, 0.55%, and 0.70% of the average daily net assets for Stone Harbor Emerging Markets Debt Fund, Stone Harbor High Yield Bond Fund, Stone Harbor Local Markets Fund, Stone Harbor Emerging Markets Corporate Debt Fund, Stone Harbor Investment Grade Fund, Stone Harbor Strategic Income Fund, and Stone Harbor Emerging Markets Debt Allocation Fund, respectively.
The Adviser has contractually agreed to waive fees and reimburse expenses with respect to each of the Funds so that the Net Annual Operating Expenses (exclusive of acquired Fund fees and expenses, brokerage expenses, interest expense, taxes and extraordinary expenses) of the Stone Harbor Emerging Markets Debt Fund Institutional Class, Stone Harbor Local Markets Fund Institutional Class, Stone Harbor Emerging Markets Corporate Debt Fund Institutional Class, and Stone Harbor Investment Grade Fund Institutional Class will not exceed 0.75%, 1.00%, 1.00%, and 0.50%, respectively. The Net Annual Operating Expenses (exclusive of acquired Fund fees and expenses, brokerage expenses, interest expense, taxes and extraordinary expenses) of the Stone Harbor High Yield Bond Fund Institutional Class were limited to 0.55% through September 30, 2014, at which point the agreement expired. Effective October 1, 2014, the Adviser contractually agreed to waive fees and reimburse expenses with respect to the Stone Harbor High Yield Bond Fund Institutional Class so that the Net Annual Operating Expenses (exclusive of acquired Fund fees and expenses, brokerage expenses, interest expense, taxes and extraordinary expenses) will not exceed 0.65%. The Adviser has contractually agreed to waive fees and reimburse expenses with respect to the Stone Harbor Strategic Income Fund Institutional Class and Stone Harbor Emerging Markets Debt Allocation Fund Institutional Class, so that the Net Annual Operating Expenses (inclusive of acquired fund fees and expenses but exclusive of brokerage expenses, interest expense, taxes and extraordinary expenses) will not exceed 0.70% and 0.85%, respectively. The fee waiver agreements are in effect through September 30, 2015 and are reevaluated on an annual basis.
The Adviser will be permitted to recover, on a class by class basis, expenses it has borne through the undertakings described above to the extent that a Fund’s expenses in later periods fall below the annual rates set forth in the relevant undertaking. A Fund will not be obligated to pay any
Stone Harbor Investment Funds Annual Report | May 31, 2015 | 97 |
Table of Contents
| Stone Harbor Investment Funds | Notes to Financial Statements | |
May 31, 2015 |
such deferred fees and expenses more than three years after the end of the fiscal year in which the fee and expense was deferred. At May 31, 2015, deferred fees and expenses eligible to be recovered will expire as follows:
| 2016 | 2017 | 2018 | Total | ||||||||||||||||
Stone Harbor High Yield Bond Fund | $ | 256,488 | $ | 231,918 | $ | 65,578 | $ | 533,984 | ||||||||||||
Stone Harbor Emerging Markets Corporate Debt Fund | $ | 99,115 | $ | 97,636 | $ | 100,868 | $ | 297,619 | ||||||||||||
Stone Harbor Investment Grade Fund | N/A | $ | 49,712 | $ | 120,267 | $ | 169,979 | |||||||||||||
Stone Harbor Strategic Income Fund | N/A | $ | 61,917 | $ | 248,095 | $ | 310,012 | |||||||||||||
Stone Harbor Debt Allocation Fund | N/A | N/A | $ | 379,648 | $ | 379,648 | ||||||||||||||
5. INVESTMENTS
For the period ended May 31, 2015, the aggregate cost of purchases and proceeds from sales of investments (excluding short-term investments and U.S. Government Obligations) were as follows:
| Purchases | Sales | |||||||
Stone Harbor Emerging Markets Debt Fund | $ | 1,519,569,257 | $ | 1,675,402,389 | ||||
Stone Harbor High Yield Bond Fund | 149,425,947 | 143,217,266 �� | ||||||
Stone Harbor Local Markets Fund | 2,584,622,175 | 2,895,062,474 | ||||||
Stone Harbor Emerging Markets Corporate Debt Fund | 15,115,723 | 17,951,130 | ||||||
Stone Harbor Investment Grade Fund | 5,412,056 | 2,338,231 | ||||||
Stone Harbor Strategic Income Fund | 26,616,493 | 2,059,907 | ||||||
Stone Harbor Emerging Markets Debt Allocation Fund | 97,509,968 | 7,585,390 | ||||||
For the period ended May 31, 2015 the aggregate cost of purchases and proceeds from sales of U.S. Government Obligations were as follows:
| Purchases | Sales | |||||||
Stone Harbor Investment Grade Fund | $ | 1,772,700 | $ | 211,398 | ||||
6. AFFILIATED COMPANIES
Funds may invest in certain securities that are considered securities issued by affiliated companies. As defined by the Investment Company Act of 1940, an affiliated person, including an affiliated company, is one in which a Fund owns 5% or more of the outstanding voting securities, or a company which is under common ownership or control with the Fund. The purchases, sales, dividend income, capital gains, return of capital distributions received, shares and value of investments in affiliated companies for the period ended May 31, 2015 were as follows:
Stone Harbor Strategic Income Fund
| Security Name | Share Balance June 1, 2014 | Purchases | Sales | Share Balance May 31, 2015 | Dividend Income | Realized Gain/(Loss) | Market Value May 31, 2015 | |||||||||||||||||||||
| ||||||||||||||||||||||||||||
Stone Harbor Emerging Markets Debt Fund | 335,330 | 778,515 | 144,714 | 969,132 | $ | 397,218 | $ | (9,233 | ) | $ | 10,146,808 | |||||||||||||||||
Stone Harbor High Yield Bond Fund | 381,043 | 1,203,960 | 15,703 | 1,569,300 | 1,148,907 | (10,056 | ) | 13,621,522 | ||||||||||||||||||||
Stone Harbor Investment Grade Fund | 299,741 | 687,440 | 35,009 | 952,172 | 171,907 | 4,493 | 9,864,501 | |||||||||||||||||||||
| ||||||||||||||||||||||||||||
| 1,016,114 | 2,669,915 | 195,426 | 3,490,604 | $ | 1,718,032 | $ | (14,796 | ) | $ | 33,632,831 | ||||||||||||||||||
| ||||||||||||||||||||||||||||
Stone Harbor Emerging Markets Debt Allocation Fund
|
| |||||||||||||||||||||||||||
| Security Name | Share Balance June 1, 2014 | Purchases | Sales | Share Balance May 31, 2015 | Dividend Income | Realized Gain/(Loss) | Market Value May 31, 2015 | |||||||||||||||||||||
| ||||||||||||||||||||||||||||
Stone Harbor Emerging Markets Debt Fund | – | 4,724,553 | 730,264 | 3,994,289 | $ | 1,322,975 | $ | (273,776 | ) | $ | 41,820,208 | |||||||||||||||||
Stone Harbor Local Markets Fund | – | 5,206,550 | 1,012 | 5,205,538 | 336,116 | (760 | ) | 43,622,409 | ||||||||||||||||||||
| ||||||||||||||||||||||||||||
| – | 9,931,103 | 731,276 | 9,199,827 | $ | 1,659,091 | $ | (274,536 | ) | $ | 85,442,617 | ||||||||||||||||||
| ||||||||||||||||||||||||||||
98 | www.shiplp.com |
Table of Contents
| Stone Harbor Investment Funds | Notes to Financial Statements | |
May 31, 2015 |
The Emerging Markets Debt Fund engaged in cross trades with an affiliate of the Fund during the year ended May 31, 2015 pursuant to Rule 17a-7 under the 1940 Act. Cross trading is the buying or selling of portfolio securities between funds to which the Adviser serves as the investment adviser. The Board of trustees previously adopted procedures that apply to transactions between the Portfolios pursuant to Rule 17a-7. At its regularly scheduled meetings, the Trustees review such transactions as of the most current calendar quarter for compliance with the requirements set forth by Rule 17a-7 and the Emerging Markets Debt Fund’s procedures. The procedures require that the transactions be a purchase or sale for no consideration other than cash payment against prompt delivery of a security for which market quotations are readily available, and be consistent with the investment policies of each Emerging Markets Debt Fund. During the year ended May 31, 2015 the Emerging Markets Corporate Debt Fund purchased a security from another fund for which the Adviser is the investment adviser in the amount of $164,063, and the Emerging Markets Debt Fund sold securities to another fund for which the Adviser is the investment adviser in the amount of $2,210,798 and a realized gain of $71,277.
7. SHARES OF BENEFICIAL INTEREST
At May 31, 2015, the Trust had an unlimited number of shares of beneficial interest authorized with a par value of $0.001 per share. The Funds have the ability to issue multiple classes of shares. Each share of a class represents an identical interest and has the same rights, except that each class bears certain direct expenses, including those specifically related to the distribution of its shares. Transactions in shares of the Institutional Class can be found on the Statements of Changes in Net Assets.
8. BENEFICIAL OWNERSHIP
As of May 31, 2015 IMF Retired Staff Benefits owned beneficially 42.30% of the Stone Harbor High Yield Bond Fund’s outstanding shares, an individual shareholder owned beneficially 78.48% of the Stone Harbor Emerging Markets Debt Allocation Fund’s outstanding shares, the Stone Harbor Strategic Income Fund owned beneficially 99.89% of the Stone Harbor Investment Grade Fund’s outstanding shares and an individual shareholder owned 64.99% of the Stone Harbor Strategic Income Fund’s outstanding shares.
9. INDEMNIFICATIONS
Under the Trust’s organizational documents, its officers and Trustees are indemnified against certain liability arising out of the performance of their duties to the Trust. Additionally, in the normal course of business, the Trust enters into contracts with service providers that may contain general indemnification clauses. The Trust’s maximum exposure under these arrangements is unknown, as this would involve future claims that may be made against the Trust that have not yet occurred.
10. OTHER
Through December 31, 2014, the Funds paid each Trustee who is not a director, officer, employee or affiliate of the Investment Adviser, a fee of $2,500 per quarter and $250 for each additional meeting of the Board of Trustees in which that Trustee participated. Effective January 1, 2015, the Funds, along with the Stone Harbor Emerging Markets Total Income Fund and the Stone Harbor Emerging Markets Income Fund (the “Stone Harbor Fund Complex”) paid each Trustee who is not an interested person, of the Investment Adviser or any of its affiliates a fee of $84,000 per year. These fees were allocated over the Stone Harbor Fund Complex based on the average net assets of each fund. Interested Trustees of the Trust are not compensated by the Stone Harbor Fund Complex. All Trustees are reimbursed for reasonable travel and out-of-pocket expenses incurred to attend such meetings. Officers of the Fund will not receive compensation for performing the duties of their office.
Stone Harbor Investment Funds Annual Report | May 31, 2015 | 99 |
Table of Contents
| Stone Harbor Investment Funds | Additional Information | |
May 31, 2015 (Unaudited) |
FUND PORTFOLIO HOLDINGS
The SEC has adopted the requirement that all registered investment companies file a complete schedule of portfolio holdings with the SEC for their first and third fiscal quarters on Form N-Q. For the Funds, this would be for the fiscal quarters ending August 31 and February 28. The Form N-Q filing must be made within 60 days of the end of the quarter. The Funds’ Forms N-Q will be available on the SEC’s website at http://www.sec.gov., or they may be reviewed and copied at the SEC’s Public Reference Room in Washington, DC (call 1-800-732-0330 for information on the operation of the Public Reference Room).
PROXY VOTING
A description of the policies and procedures that the Funds use to determine how to vote proxies relating to portfolio securities and information regarding how the Funds voted proxies relating to portfolio securities for the 12-month period ended June 30, 2014 are available without a charge, upon request, by contacting Stone Harbor Investment Funds at 1-866-699-8158 or on the SEC website at http://www.sec.gov.
SHAREHOLDER TAX INFORMATION
Certain tax information regarding the Trust is required to be provided to shareholders based upon each Funds’ income and distributions for the year ended May 31, 2015. The Funds designate the following as a percentage of taxable ordinary income distributions, up to the maximum amount allowable, for the calendar year ended December 31, 2014:
Stone Harbor Emerging Markets Debt Fund | Stone Harbor High Yield Bond Fund | Stone Harbor Local Markets Fund | Stone Harbor Emerging Markets Corporate Debt Fund | Stone Harbor Investment Grade Fund | Stone Harbor Strategic Income Fund | Stone Harbor Emerging Markets Debt Allocation Fund | ||||||||
| ||||||||||||||
Dividends Received | ||||||||||||||
Deduction Percentage | 0.00% | 2.98% | 0.00% | 0.00% | 0.00% | 1.62% | 0.00% | |||||||
Qualified Dividend | ||||||||||||||
Income Percentage | 0.00% | 3.02% | 0.00% | 0.00% | 0.00% | 1.60% | 0.00% | |||||||
In early 2015, if applicable, shareholders of record received this information for the distributions paid to them by the Funds during the calendar year 2014 via Form 1099. The Funds will notify shareholders in early 2016 of amounts paid to them by the Funds, if any, during the calendar year 2015.
Pursuant to Section 852(b)(3) of the Internal Revenue Code, the Stone Harbor High Yield Bond Fund, and the Stone Harbor Strategic Income Fund designate $9,049,371, and $32,288 respectively, as long term capital gain dividends.
SHAREHOLDER MEETING
On April 2, 2015, the Funds held a special meeting of Shareholders for the purpose of voting on a proposal to re-elect a Trustee and appoint a new Trustee of the Funds. The results of the proposal were as follows:
Proposal: To re-elect the following Trustee to the Stone Harbor Investment Fund’s Board
| Thomas Flanagan | ||||||
| ||||||
For | 178,748,595 | |||||
Withheld | 172,491 | |||||
Proposal: To elect the following Trustee to the Stone Harbor Emerging Markets Income Fund Board
| Glenn Marchak | ||||||
| ||||||
For | 178,748,595 | |||||
Withheld | 172,491 | |||||
100 | www.shiplp.com |
Table of Contents
| Stone Harbor Investment Funds | Additional Information | |
May 31, 2015 (Unaudited) |
Benchmark Descriptions
Index | Description | |
| ||
J.P. Morgan EMBI Global Diversified | The J.P. Morgan EMBI Global Diversified (EMBI Global Diversified) tracks total returns for U.S. dollar-denominated debt instruments issued by emerging markets sovereign and quasi-sovereign entities: Brady bonds, loans, and Eurobonds. The index limits the weights of those index countries with larger debt stocks by only including specified portions of these countries’ eligible current face amounts outstanding. The countries covered in the EMBI Global Diversified are identical to those covered by the EMBI Global. | |
| ||
Citigroup High Yield Market Capped | The Citigroup High Yield Market Capped Index represents a modified version of the High Yield Market Index by delaying the entry of “fallen angel” issues and capping the par value of individual issuers at US $10 billion par amount outstanding. The index is a total rate of return index which captures the performance of below investment grade debt issued by corporations domiciled in the United States or Canada. | |
| ||
J.P. Morgan GBI-EM Global Diversified | The J.P. Morgan GBI-EM Global Diversified consists of regularly traded, liquid fixed-rate, domestic currency government bonds to which international investors can gain exposure. The weightings among the countries are more evenly distributed within this index. | |
| ||
J.P. Morgan CEMBI Broad Diversified | The J.P. Morgan CEMBI Broad Diversified tracks total returns of U.S. dollar-denominated debt instruments issued by corporate entities in emerging market countries and consists of an investable universe of corporate bonds. The minimum amount outstanding required is $350 mm for the CEMBI Broad Diversified. The CEMBI Broad Diversified limits the weights of those index countries with larger corporate debt stocks by only including a specified portion of these countries’ eligible current face amounts of debt outstanding. | |
| ||
Barclays Capital U.S. Aggregate Index | The Barclays Capital U.S. Aggregate Index represents securities that are SEC-registered, taxable, and dollar denominated. The index covers the U.S. investment grade fixed rate bond market, with index components for government and corporate securities, mortgage pass-through securities, and asset-backed securities. These major sectors are subdivided into more specific indices that are calculated and reported on a regular basis. | |
| ||
Barclays Global Credit Index (Hedged USD) | Barclays Global Credit Total Return Index is a subset of the Global Aggregate Index and is subject to the same quality, liquidity, and maturity requirements and exclusion rules of the latter. Constituents must be rated investment grade by at least two of the three major ratings agencies. Constituents must have a remaining maturity of at least one year. The index does not include convertibles, floating-rate notes, fixed-rate perpetuals, warrants, linked bonds, and structured products. | |
| ||
Definitions
Broad-based securities indices are unmanaged and are not subject to fees and expenses typically associated with managed accounts or investment funds. Investments cannot be made directly in a broad-based securities index.
Standard and Poor’s ratings are measured on a scale that generally ranges from AAA (highest) to D (lowest). A security that has not been given a credit rating by Standard and Poor’s is listed as “not rated”. For additional information please go to the Understanding Ratings section at www.standardpoors.com.
Alpha – A measure of performance on a risk-adjusted basis. The excess return of the fund relative to the return of the benchmark index is a fund’s alpha.
Basis Point – a unit equal to one hundredth of a percentage point.
Duration – A measure of the sensitivity of the price (the value of principal) of a fixed-income investment to a change in interest rates. Duration is expressed as a number of years.
Investment Grade – Refers to bonds that are considered to have a relatively low risk of default, ranging from highest credit quality to good credit quality. Bonds rated below investment grade are considered to have significant speculative characteristics.
Quantitative Easing (QE) – is an unconventional monetary policy used by central banks to stimulate the national economy when standard monetary policy has become ineffective. A central bank implements quantitative easing by buying financial assets from commercial banks and other private institutions, thus increasing the monetary base. This is distinguished from the more usual policy of buying or selling government bonds in order to keep market interest rates at a specified target value.
Sovereign Debt – Refers to bonds issued by a national government in order to finance the issuing country’s growth. Sovereign debt described as external is denominated in U.S. dollar, while sovereign debt described as local is issued in a foreign currency.
Spread – The difference between the bid and ask price of a security or asset.
The S&P 500 – is a stock market index based on the market capitalizations of 500 leading companies publicly traded in the U.S. stock market, as determined by Standard & Poor’s. It differs from other U.S. stock market indices such as the Dow Jones Industrial Average and the Nasdaq due to its diverse constituency and weighting methodology.
Stone Harbor Investment Funds Annual Report | May 31, 2015 | 101 |
Table of Contents
| Stone Harbor Investment Funds | Board Approval of Investment Advisory Agreements |
May 31, 2015 (Unaudited)
The investment advisory agreements (each an “Agreement” and, together, the “Agreements”) for each of Stone Harbor Emerging Markets Debt Fund, Stone Harbor High Yield Bond Fund, Stone Harbor Local Markets Fund, Stone Harbor Emerging Markets Corporate Debt Fund, Stone Harbor Investment Grade Fund and Stone Harbor Strategic Income Fund (each, a “Fund” and together, the “Funds”) is subject to annual approval by (i) the vote of a majority of the entire Board of Trustees, or of a majority of the outstanding voting securities (as defined in the Investment Company Act of 1940, as amended (the “1940 Act”)), of the applicable Fund, and (ii) the vote of a majority of the Trustees who are not interested persons of the Funds (the “Independent Trustees”). Each Agreement is terminable with respect to a Fund by the Adviser, a majority of the Trustees, or a vote of a majority of the outstanding voting securities of the applicable Fund, without penalty, by not less than 60 days’ prior written notice. Each Agreement will terminate automatically in the event of its assignment (as defined for purposes of the 1940 Act).
The Board of Trustees, including the Independent Trustees, meets over the course of the year with representatives of the Adviser, including the Funds’ respective portfolio managers, and regularly reviews detailed information regarding the investment program and performance of each Fund. The Board of Trustees also receives periodic updates between meetings. The Trustees, including the Independent Trustees, met on April 22, 2015 to review the Agreements for each Fund and to determine whether to approve the continuation of the Agreements for an additional one-year period. The Trustees considered all information they deemed reasonably necessary to evaluate the terms thereof. In connection with this meeting, the Trustees received materials to assist them with their review. These materials included, among other things, (i) information on each Fund’s investment performance and the performance of a group of comparable funds (some of which was prepared by a third party); (ii) information on each Fund’s advisory fees and other expenses, including information about the fees charged to institutional accounts managed by the Adviser, comparisons of the Funds’ fees to the fees of a group of similar funds prepared by a third party and information about any applicable expense caps; and (iii) information about the profitability of each Agreement to the Adviser. In considering whether to approve the continuation of each Agreement, the Board of Trustees, including the Independent Trustees, did not identify any single factor as determinative. Individual Trustees may have evaluated the information presented differently from one another, giving different weights to various factors. Matters considered by the Trustees, including the Independent Trustees, in connection with their approval of the Agreements included, but were not limited to, the following:
The nature, extent and quality of the services provided to the Funds under the Agreements.
The Trustees considered the nature, extent and quality of the services provided by the Adviser to the Funds. In this regard, the Trustees took into account the experience of each Fund’s portfolio management team and of the Adviser’s senior management, and the time and attention they devote to the Funds. After reviewing these and related factors, the Trustees concluded, within the context of their overall conclusions regarding each Agreement, that the nature, extent and quality of the services provided by the Adviser supported the renewal of the Agreements.
Investment performance of the Funds and the Adviser.
The Trustees reviewed performance information for each Fund, including information prepared by a third party, for various time periods since each Fund’s inception. The review included a comparison of each Fund’s performance to the performance of a group of comparable funds selected by a third party and each Fund’s respective benchmark. The Trustees also considered the Adviser’s performance and reputation generally and its investment techniques, risk management controls and decision-making processes. With respect to Funds whose performance lagged the relevant benchmark or peer group median, the Trustees concluded that other factors relevant to performance supported renewal of the Agreements. These factors included one or more of the following: (1) that the underperformance was attributable, to a significant extent, to investment decisions (such as security selection or sector allocation) by the Adviser that were reasonable and consistent with the Fund’s investment objective and policies, (2) that the Fund’s more recent performance, although lagging in certain periods, had shown improvement when compared to relevant performance benchmarks and categories, (3) the relative underperformance was attributable in significant part to market or economic conditions, or (4) the Fund was relatively new and therefore had a limited operating history on which to judge its performance record.
After reviewing these and related factors, the Trustees concluded, within the context of their overall conclusions regarding each Agreement, that these factors supported the renewal of the Agreements.
The costs of the services to be provided and profits to be realized by the Adviser from its relationship with the Funds.
The Trustees considered the fees charged to each Fund for advisory services as well as the total expense level of each Fund. The Adviser furnished information to the Trustees compiled by a third party showing a comparison of each Fund’s advisory fees and total expense levels compared to a group of comparable funds selected by the third party. The Trustees noted that each of the Funds is subject to expense caps, and each of the Fund’s advisory fee and total expenses (after application of the expense caps and waivers) align competitively with comparable groups of mutual funds. The Adviser also provided information about the costs to it of providing services to the Funds, including information about how such costs are determined, and information about its profitability with respect to its management of the Funds, as well as information about the advisory fees it charges to other funds and institutional separate accounts with similar strategies and information about differences in such fees and the reasons for such differences. In this regard, the Trustees noted that the effective management fee rates received by the Adviser from the Funds (after
102 | www.shiplp.com |
Table of Contents
| Stone Harbor Investment Funds | Board Approval of Investment Advisory Agreements |
May 31, 2015 (Unaudited)
application of expense caps and waivers) are generally comparable to the fees charged to similarly managed institutional accounts. They also noted that the Funds were offered primarily to institutional investors, many of whom were focused on the Funds’ fees and expenses, and that the Funds are relatively small when compared to certain of the Adviser’s institutional accounts and therefore are able to take advantage of resources that the Adviser devotes to institutional accounts. The Trustees also considered the demands and complexity of the investment management of the Funds as compared to the complexity of managing other funds and separate accounts.
After reviewing these and related factors, the Trustees concluded, within the context of their overall conclusions regarding each Agreement, that the advisory fees for each of the Funds were fair and reasonable, and that the costs of these services generally and the related profitability of the Adviser in respect of its relationship with the Funds supported the renewal of the Agreements.
Economies of Scale.
The Trustees considered to what extent economies of scale would likely be realized as the Funds grow and whether those economies would be shared with the Funds through breakpoints in their investment advisory fees or other means, such as expense caps. The Trustees noted that the Funds’ expenses are capped, and that the Adviser proposed to maintain the Funds’ fee waiver/expense reimbursement arrangements at current levels until September 30, 2016. They also noted that some of the Funds had expense ratios that were below the cap. The Trustees also considered whether breakpoints in the investment advisory fees would be appropriate and, after discussion, decided not to propose the implementation of breakpoints at this time but indicated that the implementation of breakpoints might be considered in the future.
After reviewing these and related factors, the Trustees concluded, within the context of their overall conclusions regarding each Agreement, that the extent to which economies of scale would be shared with the Funds supported the approval of the Agreements.
The Trustees also considered other factors, which included but were not limited to the following:
| ● | Whether each Fund has operated in accordance with its investment objective and each Fund’s record of compliance with its investment restrictions and the compliance programs of the Funds and the Adviser. They also considered the compliance-related resources the Adviser provided to the Funds, including resources designed to ensure compliance with the investment objectives, policies and restrictions of each Fund. |
| ● | So-called “fallout benefits” to the Adviser, such as the benefits from offering its institutional clients the ability to invest in a registered investment company. |
Based on their evaluation of all factors they deemed to be material, including those factors described above, the Trustees, including the Independent Trustees, concluded that the existing investment advisory agreements for Stone Harbor Emerging Markets Debt Fund, Stone Harbor High Yield Bond Fund, Stone Harbor Local Markets Fund, Stone Harbor Emerging Markets Corporate Debt Fund, Stone Harbor Investment Grade Fund and Stone Harbor Strategic Income Fund should be continued through June 20, 2016.
STONE HARBOR EMERGING MARKETS DEBT ALLOCATION FUND
The Stone Harbor Emerging Markets Debt Allocation Fund (the “Fund”) commenced operations in October 2014. The Board of Trustees approved the Fund’s investment advisory agreement (the “Agreement”) at a Board meeting held on July 16, 2014. In addition to reviewing materials provided in advance of that meeting, the Trustees considered their experience as trustees of other funds managed by the Adviser (the “Stone Harbor Funds”) and information provided to the Trustees at the meeting. In considering whether to approve the Agreement, the Board of Trustees, including the trustees who are not interested persons of the Fund (the “Independent Trustees”), did not identify any single factor as determinative. Individual Trustees may have evaluated the information presented differently from one another, giving different weights to various factors. Matters considered by the Trustees, including the Independent Trustees, in connection with their approval of the Agreement included, but were not limited to, the following:
The nature, extent and quality of the services to be provided to the Fund under the Agreement.
The Trustees considered the nature, extent and quality of the services proposed to be provided by the Adviser to the Fund. In this regard, the Trustees took into account the experience of the Fund’s portfolio management team and of the Adviser’s senior management, and the time and attention they expect to devote to the Fund.
After reviewing these and related factors, the Trustees concluded, within the context of their overall conclusions regarding the Agreement, that the nature, extent and quality of the services proposed to be provided by the Adviser supported the approval of the Agreement.
Stone Harbor Investment Funds Annual Report | May 31, 2015 | 103 |
Table of Contents
| Stone Harbor Investment Funds | Board Approval of Investment Advisory Agreements |
May 31, 2015 (Unaudited)
Investment performance of the Adviser.
The Trustees noted that since the Fund had not yet begun operations, there was no Fund performance to be reviewed or analyzed at that time. However, because each Fund will invest most or all of its assets in Stone Harbor Funds, the Trustees considered the performance of the Stone Harbor Funds in which the Fund proposed to invest. The Trustees also considered the Adviser’s performance and reputation generally and its proposed investment techniques, risk management controls and decision-making processes.
After reviewing these and related factors, the Trustees concluded, within the context of their overall conclusions regarding the Agreement, that these factors supported the approval of the Agreement.
The costs of the services to be provided and profits to be realized by the Adviser from its relationship with the Fund.
The Trustees considered the fee proposed to be charged to the Fund for advisory services as well as the total expense level expected for the Fund. The Adviser furnished information to the Trustees compiled by a third party showing a comparison of the Fund’s proposed advisory fee and expected total expense levels compared to a group of comparable funds selected by the third party. The Trustees noted that an expense cap is proposed for the Fund, and the Fund’s proposed advisory fee and expected total expenses (after application of the expense caps and waivers) align competitively with comparable groups of mutual funds. The Trustees also noted that the Fund will invest in Stone Harbor Funds and took into account the fees being paid to the Adviser by those Stone Harbor Funds and the allocation services being provided by the Adviser. The Adviser also provided information about the expected costs to it of providing services to the Fund, including information about how such costs are determined, and information about its expected profitability with respect to its management of the Fund, as well as information about the advisory fees it charges to institutional separate accounts with similar strategies and information about differences in such fees and the reasons for such differences. In this regard, the Trustees noted that the effective management fee rate proposed to be received by the Adviser from the Fund (after application of expense caps and waivers) is comparable to the fees charged to similarly managed institutional accounts. They also noted that the Fund is to be offered primarily to institutional investors, which are generally focused on fee levels and expense ratios. The Trustees also considered the demands and complexity of the investment management of the Fund as compared to the complexity of managing separate accounts.
After reviewing these and related factors, the Trustees concluded, within the context of their overall conclusions regarding the Agreement, that the proposed advisory fee for the Fund was fair and reasonable, and that the costs of these services generally and the related profitability of the Adviser in respect of its expected relationship with the Fund supported the approval of the Agreement.
Economies of Scale.
The Trustees considered to what extent economies of scale would likely be realized as the Fund grows and whether those economies would be shared with the Fund through breakpoints in its investment advisory fee or other means, such as expense caps. The Trustees noted the caps proposed for the Fund’s expenses and that the Adviser proposed to maintain the Fund’s fee waiver/expense reimbursement arrangements at current levels until September 30, 2015.
After reviewing these and related factors, the Trustees concluded, within the context of their overall conclusions regarding the Agreement, that the extent to which economies of scale would be shared with the Fund supported the approval of the Agreement.
The Trustees also considered other factors, which included but were not limited to the following:
| ● | The compliance programs of the Fund and the Adviser. They also considered the compliance-related resources the Adviser proposed to provide to the Fund, including resources designed to ensure compliance with the investment objectives, policies and restrictions of the Fund. |
| ● | So-called “fallout benefits” to the Adviser, such as the benefits from offering its institutional clients the ability to invest in a registered investment company and to invest in products which provide a blended allocation to various emerging market strategies. |
Based on their evaluation of all factors they deemed to be material, including those factors described above, the Trustees, including the Independent Trustees, concluded that the proposed Agreement should be approved for an initial two-year period.
104 | www.shiplp.com |
Table of Contents
| Stone Harbor Investment Funds | Trustees & Officers | |
May 31, 2015 (Unaudited) |
The business and affairs of each Fund are managed under the direction of its Board of Trustees. The Board of Trustees approves all significant agreements between a Fund and the persons or companies that furnish services to the Fund, including agreements with its distributor, investment adviser, administrator, custodian and transfer agent. The day-to-day operations of the Fund are delegated to the Fund’s Adviser and administrator.
The name, age and principal occupations for the past five years of the Trustees and officers of the Funds are listed below, along with the number of portfolios in the Fund complex overseen by and the other directorships held by each Trustee. Except as otherwise noted, the address of each Trustee and officer is c/o Stone Harbor Investment Partners LP, 31 W. 52nd Street, 16th Floor, New York, New York 10019. The Trust’s Statement of Additional Information includes additional information about the Trustees and is available without a charge, upon request, by calling 1-866-699-8158.
INDEPENDENT TRUSTEES
| Name & Year of Birth | Position with the Trust | Term of Office and Length of Time Served(1) | Principal Occupation(s) Five Years | Number of Portfolios in Fund Complex Overseen by Trustee(2) | Other Directorships Held by Trustee | Experience, Qualifications, Attributes, Skills for Board Membership | ||||||
| ||||||||||||
Alan Brott 1942 | Chairman of Audit Committee; Trustee | Since June 21, 2007 | Columbia University Associate Professor, 2000-Present; Consultant, 1991-Present. | 10 | Stone Harbor Emerging Markets Income Fund, Stone Harbor Emerging Markets Total Income Fund, Grosvenor Registered Multi- Strategy Fund, Man FRM Alternative Multi- Strategy Fund and Excelsior Private Markets Fund II and Excelsior Private Markets Fund III. | Significant experience on Board of Trustees of the Trust and/or other business organizations; academic experience; significant public accounting experience, including significant experience as a partner at a public accounting firm. | ||||||
| ||||||||||||
Heath B. McLendon 1933 | Trustee | Since June 21, 2007 | Retired; formerly Citigroup— Chairman of Equity Research Oversight Committee (retired December 31, 2006). | 10 | Stone Harbor Emerging Markets Income Fund, Stone Harbor Emerging Markets Total Income Fund. | Significant experience on Board of Trustees of the Trust and/ or other business organizations; executive experience in the mutual fund industry. | ||||||
| ||||||||||||
Patrick Sheehan 1947 | Trustee | Since June 21, 2007 | Retired; formerly, Citigroup Asset Management— Managing Director and Fixed Income Portfolio Manager, 1991-2002. | 10 | Stone Harbor Emerging Markets Income Fund, Stone Harbor Emerging Markets Total Income Fund. | Significant experience on Board of Trustees of the Trust and/ or other business organizations; experience in the financial industry, including executive and portfolio management experience. | ||||||
Stone Harbor Investment Funds Annual Report | May 31, 2015 | 105 |
Table of Contents
| Stone Harbor Investment Funds | Trustees & Officers | |
May 31, 2015 (Unaudited) |
INDEPENDENT TRUSTEES (continued)
| Name & Year of Birth | Position(s) Held with the Trust | Term of Office and Length of Time Served(1) | Principal Occupation(s) During Past Five Years | Number of Trustee(2) | Other Directorships Held by Trustee | |||||
| ||||||||||
Glenn Marchak 1956 | Trustee | Since April 2, 2015 | Chairman of Audit Committee, Apollo Tactical Income Fund Inc. (February 2013 to Present), Chairman of Audit Committee, Apollo Senior Floating Rate Fund Inc. (December 2010 – Present); Chairman of Audit Committee, Atlanta Equity Advisors/Resolvion (January 2010 – September 2014) | 10 | Stone Harbor Emerging Markets Income Fund, Stone Harbor Emerging Markets Total Income Fund, Apollo Tactical Inc. and Apollo Senior Floating Rate Fund Inc. | |||||
INTERESTED TRUSTEE
| ||||||||||
| Name & Year of Birth | Position(s) Held with the Trust | Term of Office and Length of Time Served(1) | Principal Occupation(s) During Past Five Years | Number of Portfolios in Fund | Other Directorships Held by Trustee | |||||
| ||||||||||
Thomas K. Flanagan(3) 1953 | Chairman and Trustee | Trustee: Since October 17, 2012 | Since April 2006, Portfolio Manager of Stone Harbor; prior to April 2006, Managing Director and Senior Portfolio Manager for emerging markets debt portfolios at Salomon Brothers Asset Management Inc.; joined Salomon Brothers Asset Management Inc. in 1991. | 10 | Stone Harbor Emerging Markets Income Fund, Stone Harbor Emerging Markets Total Income Fund. | |||||
106 | www.shiplp.com |
Table of Contents
| Stone Harbor Investment Funds | Trustees & Officers | |
May 31, 2015 (Unaudited) |
OFFICERS
| Term of Office and | ||||||
| Name & Year of Birth | Position with the Trust | Length of Time Served(4) | Principal Occupation(s) During Past Five Years | |||
| ||||||
Peter J. Wilby 1958 | President | Since June 21, 2007 | Co-portfolio manager of the Funds; since April 2006, Chief Investment Officer of Stone Harbor; prior to April 2006, Chief Investment Officer – North American Fixed Income at Citigroup Asset Management; joined Citigroup or its predecessor firms in 1989. | |||
| ||||||
Dan Berkery 1967 | Executive Vice President | Since September 27, 2010 | Co-portfolio manager of High Yield Bond Fund and Strategic Income Fund; since June 2010, Portfolio Manager of Stone Harbor; prior to June 2010, Executive Director, Portfolio Manager for convertible bond securities at UBS O’Conner; joined UBS O’Conner in 2000. | |||
| ||||||
Pablo Cisilino 1967 | Executive Vice President | Since June 21, 2007 | Co-portfolio manager of Emerging Markets Debt Fund, Local Markets Fund, Emerging Markets Corporate Debt Fund and Strategic Income Fund; since July 2006, Portfolio Manager of Stone Harbor; from June 2004 to July 2006, Executive Director for Sales and Trading in Emerging Markets at Morgan Stanley Inc; prior to June 2004, Vice President for local markets and FX sales and trading, Goldman Sachs; joined Goldman Sachs in 1994. | |||
| ||||||
James E. Craige 1967 | Executive Vice President | Since June 21, 2007 | Co-portfolio manager of Emerging Markets Debt Fund, Local Markets Fund, Emerging Markets Corporate Debt Fund and Strategic Income Fund; since April 2006, Portfolio Manager of Stone Harbor; prior to April 2006, Managing Director and Senior Portfolio Manager at Salomon Brothers Asset Management Inc.; joined Salomon Brothers Asset Management Inc. in 1992. | |||
| ||||||
David Oliver 1959 | Executive Vice President | Since September 29, 2008 | Co-portfolio manager of Emerging Markets Debt Fund, Local Markets Fund, and Emerging Markets Corporate Debt Fund; since June 2008, Senior Portfolio Manager of Stone Harbor; from 1986 to June 2008, Managing Director in Emerging Market sales and trading at Citigroup. | |||
| ||||||
Angus Halkett 1977 | Executive Vice President | Since October 17, 2012 | Co-portfolio manager of Emerging Markets Debt Fund, Local Markets Fund and Emerging Markets Corporate Debt Fund; since June 2011, Portfolio Manager of Stone Harbor; prior to joining Stone Harbor, Director at Deutsche Bank responsible for Central Europe rates trading and EMEA Local Markets Strategy; Assistant Fund Manager and Quantitative Analyst in Emerging Markets Fixed Income at F&C Asset Management. | |||
| ||||||
William Perry 1962 | Executive Vice President | Since October 17, 2012 | Co-portfolio manager of Emerging Markets Debt Fund, Local Markets Fund, Emerging Markets Corporate Debt Fund and Strategic Income Fund; since September 2012, Portfolio Manager of Stone Harbor; from August 2010 to August 2012, Emerging Markets Corporate Portfolio Manager at Morgan Stanley Investment Management; prior to 2010, Managing Director/Portfolio Manager in the Global Special Opportunities Group for Latin American Special Situations at J.P.Morgan Chase. | |||
| ||||||
Marianne Rossi 1960 | Executive Vice President | Since September 27, 2010 | Co-portfolio manager of High Yield Bond Fund and Strategic Income Fund; since June 2010, Portfolio Manager of Stone Harbor; from October 2007 to June 2010, Senior Portfolio Manager for US and global high yield strategies at Fischer Francis Tree & Watts/BNP Paribas Asset Management; from December 2006 to October 2007, Chief Investment Officer, Head of Global High Yield and Senior Portfolio Manager at BNY Asset Management; prior to December 2006, Head of Global High Yield and Senior Portfolio Manager at UBS Global Asset Management; joined UBS Global Asset Management in 2000. | |||
Stone Harbor Investment Funds Annual Report | May 31, 2015 | 107 |
Table of Contents
| Stone Harbor Investment Funds | Trustees & Officers | |
May 31, 2015 (Unaudited) |
OFFICERS (continued)
| Term of Office and | ||||||
| Name & Year of Birth | Position with the Trust | Length of Time Served(4) | Principal Occupation(s) During Past Five Years | |||
| ||||||
David Torchia 1959 | Executive Vice President | Since July 17, 2013 | Co-portfolio manager of Investment Grade Fund and Strategic Income Fund; since April 2006, Portfolio Manager of Stone Harbor; prior to April 2006, Managing Director and senior portfolio manager responsible for directing investment policy and strategy for all investment grade U.S. fixed income portfolios at Citigroup Asset Management; joined Citigroup or its predecessor firms in 1984. | |||
| ||||||
Roger Lavan 1963 | Executive Vice President | Since July 17, 2013 | Co-portfolio manager of Investment Grade Fund and Strategic Income Fund; since April 2006, Portfolio Manager of Stone Harbor; prior to April 2006, Managing Director and senior portfolio manager responsible for U.S. governments, mortgages and asset-backed securities at Citigroup Asset Management; joined Citigroup or its predecessor firms in 1987. | |||
| ||||||
David Scott 1961 | Executive Vice President | Since July 17, 2013 | Co-portfolio manager of Investment Grade Fund and Strategic Income Fund; since April 2006, Portfolio Manager of Stone Harbor; prior to April 2006, Managing Director and Head of Traditional Investment Group responsible for the global bond portfolios at Salomon Brothers Asset Management Limited; joined Salomon Brothers Asset Management Limited in 1983. | |||
| ||||||
David Griffiths 1964 | Executive Vice President | Since July 17, 2013 | Co-portfolio manager of Strategic Income Fund; since April 2006, Portfolio Manager of Stone Harbor; prior to April 2006, Senior Portfolio Manager and economist responsible for market opportunity analysis, hedging and alternative asset allocation strategies; joined Salomon Brothers Asset Management Limited in 1993. | |||
| ||||||
Catherine Nolan 1960 | Executive Vice President | Since July 17, 2013 | Co-portfolio manager of High Yield Bond Fund and Strategic Income Fund; since April 2006, Portfolio Manager of Stone Harbor; prior to April 2006, Director, Senior Vice President and Senior High Yield Credit Analyst at Credit Suisse Asset Management/DLJ Asset Management, Associate Director and Senior High Yield Credit Analyst for Bear Stearns Asset Management. | |||
| ||||||
Wei Romualdo 1970 | Executive Vice President | Since July 17, 2013 | Co-portfolio manager of Strategic Income Fund; since April 2006, Portfolio Manager and Credit Analyst of Stone Harbor; prior to April 2006, Director and Senior Analyst at Citigroup Asset Management; joined Citigroup Asset Management in 1998. | |||
| ||||||
Jeffrey S. Scott 1959 | Chief Compliance Officer | Since June 21, 2007 | Since April 2006, Chief Compliance Officer of Stone Harbor; from October 2005 to March 2006, Director of Compliance, New York Life Investment Management LLC; from July 1998 to September 2005, Chief Compliance Officer, Salomon Brothers Asset Management Inc. | |||
| ||||||
Thomas Reynolds 1960 | Principal Financial and Accounting Officer | Since April 16, 2014 | Since February 2008, Controller of Stone Harbor; from February 2006 to February 2008, Vice President of Portfolio Administration for Goldman Sachs Asset Management; from 1991 to 2006, Citigroup Asset Management. | |||
108 | www.shiplp.com |
Table of Contents
| Stone Harbor Investment Funds | Trustees & Officers | |
May 31, 2015 (Unaudited) |
OFFICERS (continued)
| ||||||
| Term of Office and | ||||||
| Name & Year of Birth | Position with the Trust | Length of Time Served(4) | Principal Occupation(s) During Past Five Years | |||
| ||||||
Amanda Suss 1969 | Treasurer | Since April 16, 2014 | Since July 2011, Senior Finance Associate of Stone Harbor; from May 2000 to July 2006, Director of Business Operations at Citigroup Asset Management; from April 1994 to April 2000, Mutual Fund Accounting Manager at Smith Barney Asset Management. | |||
| ||||||
Adam J. Shapiro 1963 | Secretary; Anti-Money Laundering Officer | Since June 21, 2007 | Since April 2006, General Counsel of Stone Harbor; from April 2004 to March 2006, General Counsel, North American Fixed Income, Salomon Brothers Asset Management Inc.; from August 1999 to March 2004, Director of Product and Business Development, Citigroup Asset Management. | |||
| ||||||
Vilma Valdez 1977 | Assistant Secretary | Since January 21, 2015 | Vice President, Senior Counsel, ALPS, since 2014; Associate Counsel, First Data Corporation 2012 to 2014; Legal Counsel, Invesco 2009 to 2011; Secretary Centaur Funds. | |||
| ||||||
Gina Meyer 1980 | Assistant Treasurer | Since July 17, 2013 | Since August 2013, Assistant Treasurer, RiverNorth Funds; since November 2012, Fund Controller for ALPS Fund Services, Inc.; from January 2011 to October 2012, Manager of Fund Accounting for Jackson National Asset Management; from August 2008 to January 2011, Supervisor of Fund Accounting for Jackson National Asset Management. | |||
| (1) | Trustees serve for an indefinite term, unless a trustee earlier retires, resigns or is removed from office. |
| (2) | For purposes of this table, the Stone Harbor Fund Complex includes each series of the Stone Harbor Investment Funds (the “Funds”) and the Stone Harbor Emerging Markets Income Fund and Stone Harbor Emerging Markets Total Income Fund, each of which shares an investment adviser with the Funds. As of May 31, 2015, the Stone Harbor Emerging Markets Debt Blend Fund had not commenced operations. |
| (3) | Mr. Flanagan is an interested person of the Fund (as defined in the 1940 Act) (an “Interested Trustee”) because of his position with Stone Harbor. |
| (4) | Officers are typically elected every year, unless an officer earlier retires, resigns or is removed from office. |
Stone Harbor Investment Funds Annual Report | May 31, 2015 | 109 |
Table of Contents
| ||||
INVESTMENT ADVISER
Stone Harbor Investment Partners LP
31 W. 52nd Street 16th Floor
New York, New York 10019
ADMINISTRATOR & FUND ACCOUNTANT
ALPS Fund Services, Inc.
1290 Broadway, Suite 1100
Denver, Colorado 80203
DISTRIBUTOR
ALPS Distributors, Inc.
1290 Broadway, Suite 1100
Denver, Colorado 80203
TRANSFER AGENT
ALPS Fund Services, Inc.
1290 Broadway, Suite 1100
Denver, Colorado 80203
CUSTODIAN
State Street Bank and Trust Company
One Iron Street
Boston, MA 02210
LEGAL COUNSEL
Ropes & Gray LLP
1211 Avenue of the Americas
New York, New York 10036
INDEPENDENT REGISTERED PUBLIC ACCOUNTING FIRM
Deloitte & Touche LLP
555 17th Street, Suite 3600
Denver, Colorado 80202
This report and its financial statements are submitted for the general information of the shareholders of the Funds. The report is not authorized for distribution to prospective investors in the Funds unless preceded or accompanied by a prospectus. Investors should carefully consider the investment objectives, risks, charges, and expenses of a Fund, which are described in its prospectus. For this and other information or to request a prospectus or summary prospectus, call 1-866-699-8125 toll free. Please read the prospectus carefully before investing. The Funds’ Statement of Additional Information contains additional information about the Funds’ Trustees and is available without charge upon request by calling 1-866-699-8125. | ||||

SHF000782 exp. 07/31/16
Table of Contents
| Item 2. | Code of Ethics. |
| (a) | The Registrant, as of the end of the period covered by this report, has adopted a code of ethics that applies to the Registrant’s principal executive officer, principal financial officer, principal accounting officer or controller or any persons performing similar functions on behalf of the Registrant. |
| (b) | Not applicable. |
| (c) | During the period covered by this report, no amendments to the provisions of the code of ethics adopted in Item 2(a) above were made. |
| (d) | During the period covered by this report, no implicit or explicit waivers to the provisions of the code of ethics adopted in Item 2(a) above were granted. |
| (e) | Not applicable. |
| (f) | The Registrant’s Code of Ethics is attached as Exhibit 12.A.1. hereto. |
| Item 3. | Audit Committee Financial Expert. |
The Board of Trustees of the Registrant has determined that the Registrant has at least one audit committee financial expert serving on its Audit Committee. The Board of Trustees has designated Alan J. Brott as the Registrant’s “audit committee financial expert.” Mr. Brott is “independent” as defined in paragraph (a)(2) of Item 3 to Form N-CSR.
Mr. Brott has significant public accounting experience, including significant experience as a partner at a public accounting firm.
| Item 4. | Principal Accountant Fees and Services. |
| (a) | Audit Fees: For the Registrant’s fiscal years ended May 31, 2014 and May 31, 2015, the aggregate fees billed for professional services rendered by the principal accountant for the audit of the Registrant’s annual financial statements were $257,000 and $288,500, respectively. |
| (b) | Audit-Related Fees: For the Registrant’s fiscal years ended May 31, 2014 and May 31, 2015, there were no fees billed for assurance and related services by the principal accountant that were reasonably related to the performance of the audit |
2
Table of Contents
of the Registrant’s financial statements and were not reported in paragraph (a) of this Item 4. |
| (c) | Tax Fees: For the Registrant’s fiscal years ended May 31, 2014 and May 31, 2015, the aggregate fees billed for professional services rendered by the principal accountant for tax compliance, tax advice and tax planning were $29,340 and $35,280, respectively. The fiscal year 2014 and 2015 tax fees were for services pertaining to federal and state income tax return review, review of year-end dividend distributions and excise tax preparation. |
| (d) | All Other Fees: For the Registrant’s fiscal years ended May 31, 2014 and May 31, 2015, aggregate fees billed to the Registrant by the principal accountant for services provided by the principal accountant other than the services reported in paragraphs (a) through (c) of this Item 4 were $0 and $0, respectively. |
| (e)(1) | Audit Committee Pre-Approval Policies and Procedures: All services to be performed by the Registrant’s principal accountant must be pre-approved by the Registrant’s Audit Committee. |
| (e)(2) | No services described in paragraphs (b) through (d) of this Item 4 were approved by the Registrant’s audit committee pursuant to paragraph (c)(7)(i)(C) of Rule 2-01 of Regulation S-X. |
| (f) | Not applicable. |
| (g) | The aggregate non-audit fees billed by the registrant’s accountant for services rendered to the registrant, and rendered to the registrant’s investment adviser, and any entity controlling, controlled by, or under common control with the adviser that provides ongoing services to the registrant for the fiscal year ended May 31, 2014 and May 31, 2015 were $0 and $0, respectively. |
| (h) | Not applicable. |
| Item 5. | Audit Committee of Listed Registrants. |
Not applicable to Registrant.
| Item 6. | Investments. |
| (a) | Schedule of Investments is included as part of the Report to Stockholders filed under Item 1 of this Form N-CSR. |
| (b) | Not applicable. |
3
Table of Contents
| Item 7. | Disclosure of Proxy Voting Policies and Procedures for Closed-End Management Investment Companies. |
Not applicable to Registrant.
| Item 8. | Portfolio Managers of Closed-End Management Investment Companies. |
Not applicable to Registrant.
| Item 9. | Purchases of Equity Securities by Closed-End Management Investment Company and Affiliated Purchasers. |
Not applicable to Registrant.
| Item 10. | Submission of Matters to Vote of Security Holders. |
There have been no material changes to the procedures by which shareholders may recommend nominees to the Registrant’s Board of Trustees, where those changes were implemented after the Registrant last provided disclosure in response to the requirements of Item 407(c)(2) of Regulation S-K, or this Item.
| Item 11. | Controls and Procedures. |
| (a) | The Registrant’s principal executive officer and principal financial officer have concluded that the Registrant’s disclosure controls and procedures (as defined in Rule 30a-3(c) under the Investment Company Act of 1940, as amended) are effective based on their evaluation of these controls and procedures as of a date within 90 days of the filing date of this report. |
| (b) | There was no change in the Registrant’s internal control over financial reporting (as defined in Rule 30a-3(d) under the Investment Company Act of 1940, as amended) during the second fiscal quarter of the period covered by this report that has materially affected, or is reasonably likely to materially affect, the Registrant’s internal control over financial reporting. |
| Item 12. | Exhibits. |
| (a)(1) | The Code of Ethics that applies to the Registrant’s principal executive officer and principal financial officer is attached hereto as Exhibit 12.A.1. |
| (a)(2) | The certifications required by Rule 30a-2(a) of the Investment Company Act of 1940, as amended, and Section 302 of the Sarbanes-Oxley Act of 2002 are attached hereto as Exhibit 99.Cert. |
| (a)(3) | Not applicable. |
4
Table of Contents
| (b) | The certifications by the Registrant’s principal executive officer and principal financial officer, as required by Rule 30a-2(b) of the Investment Company Act of 1940, as amended, and Section 906 of the Sarbanes-Oxley Act of 2002 are attached hereto as Exhibit 99.906Cert. |
5
Table of Contents
SIGNATURES
Pursuant to the requirements of the Securities Exchange Act of 1934 and the Investment Company Act of 1940, the Registrant has duly caused this report to be signed on its behalf by the undersigned, thereunto duly authorized.
| Stone Harbor Investment Funds | ||
| By: | /s/ Peter J. Wilby | |
| Peter J. Wilby | ||
| President/Principal Executive Officer | ||
Date: | August 7, 2015 | |
Pursuant to the requirements of the Securities Exchange Act of 1934 and the Investment Company Act of 1940, this report has been signed below by the following persons on behalf of the Registrant and in the capacities and on the dates indicated.
| By: | /s/ Peter J. Wilby | |
| Peter J. Wilby | ||
| President/Principal Executive Officer | ||
Date: | August 7, 2015 | |
| By: | /s/ Thomas M. Reynolds | |
| Thomas M. Reynolds | ||
Principal Financial Officer/Principal Accounting Officer | ||
Date: | August 7, 2015 | |
6