Table of Contents
UNITED STATES
SECURITIES AND EXCHANGE COMMISSION
Washington, D.C. 20549
FORM N-CSR
CERTIFIED SHAREHOLDER REPORT OF REGISTERED
MANAGEMENT INVESTMENT COMPANIES
Investment Company Act file number: 811-22037
Stone Harbor Investment Funds
(Exact name of registrant as specified in charter)
1290 Broadway, Suite 1100
Denver, CO 80203
(Address of principal executive offices) (Zip code)
Adam J. Shapiro, Esq.
c/o Stone Harbor Investment Partners LP
31 West 52nd Street, 16th Floor
New York, NY 10019
(Name and address of agent for service)
With copies To:
John M. Loder, Esq.
Ropes & Gray LLP
One International Place
Boston, MA 02110-2624
Registrant’s telephone number, including area code: (303) 623-2577
Date of fiscal year end: May 31
Date of reporting period: June 1, 2011 - May 31, 2012
Table of Contents
Item 1. Report to Stockholders.
Table of Contents

Table of Contents
| �� | Table of Contents | |
| 2 | ||||
| ||||
| 8 | ||||
| ||||
| 9 | ||||
| ||||
| 11 | ||||
| 12 | ||||
| 13 | ||||
| 14 | ||||
| 15 | ||||
| ||||
| 16 | ||||
| 30 | ||||
| 43 | ||||
| 50 | ||||
| 56 | ||||
| ||||
| 57 | ||||
| ||||
| 58 | ||||
| ||||
| 60 | ||||
| 61 | ||||
| 62 | ||||
| 63 | ||||
| 64 | ||||
| ||||
| 75 | ||||
| ||||
| 76 | ||||
| ||||
| 78 | ||||
| ||||
Stone Harbor Investment Funds Annual Report | May 31, 2012 | 1 |
Table of Contents
Stone Harbor Investment Funds | Shareholder Letter | |
| May 31, 2012 |
Dear Shareholder,
The year ended May 2012 proved to be a difficult one for financial markets in general and for credit-focused, fixed income investors, specifically. Though hardly disastrous when compared to the 2008 financial crisis period, nonetheless credit markets struggled to produce positive returns. Amid concerns over insufficient policy responses by European Union (“EU”) officials to the mushrooming European sovereign debt crisis, questions about European bank capital adequacy, and the emergence of a world-wide economic slowdown, investors once again sought the perceived safety of higher-rated government bonds. As a result, credit spreads widened across all markets and returns for credit oriented investors were muted.
Continued uncertainty exists as we examine prospects for the coming year. Markets will closely scrutinize fiscal progress in the larger EU countries like Spain and Italy, not to mention the continuing problems in the peripheral nations of Greece, Portugal and Ireland. The EU must make continued progress toward a broader fiscal and banking union in order for markets to feel assured. In the meantime, China and the United States will struggle to regain their historic economic growth rates, as the governmental de-leveraging process continues throughout the developed world. The U.S. fiscal deficit will be a critical point of investor focus as we approach the November presidential election. Private sector deleveraging has progressed well in the U.S., with earnings and corporate balance sheets showing considerable improvement, but Europe has not fared as well. The European banks will require significant capital infusions and more aggressive loan loss provisioning if they are to regain the confidence of global investors.
We will continue to monitor these developments and will do our utmost to navigate through this period of uncertainty. Please follow our progress throughout the year by visiting our website at www.shiplp.com. There you will find continuing updates on our views of credit markets as well as other news and research. As we have said to you many times before, we appreciate the confidence you have placed in Stone Harbor Investment Partners.
Market Overview
Credit markets were impacted by a number of macroeconomic factors during the year including an escalating sovereign debt and financial crisis in Europe, the undetermined magnitude of the global slowdown, and a sluggish US economy. The fiscal year can be viewed as two distinct periods. The first six-month period was dominated by the growing contagion in Europe and the reality of a global economic slowdown. This period was followed by five months of strong market performance for all risk assets, primarily due to the effect of global monetary stimulus. Then market sentiments turned in the final month of the year, as the Euro crisis once again shook investor confidence and led to a flight to quality.
The inability to resolve a restructuring of Greek debt became the primary catalyst for market volatility as the EU failed to contain the crisis. EU governance issues raised doubts of the effectiveness of the existing mechanisms such as the European Financial Stability Facility (“EFSF”) to insure the fiscal stability of larger, more meaningful economies including Spain, Italy, and France. Adding further stress to a deteriorating economic outlook for the region, Greece, Portugal, Ireland, and Italy, as well as several prominent French banks were downgraded, increasing concern over the viability of the European banking system. In the U.S., the economy continued to falter as second quarter Gross Domestic Product (“GDP”) was revised downward and the inability of the US Congress to address the nation’s debt problems led to a downgrade of the US credit rating by credit rating agency, Standard and Poor’s (“S&P”). During this period, the Federal Reserve not only continued to reiterate its forecast for slower growth but stated that there are “significant downside risks to the economic outlook, including strains in global markets.” This was more negative than investor expectations and it was soon followed with QE ll, a new version of “Operation Twist,”1 intended to push down longer-term interest rates and to maintain very low rates “at least until mid-2013.” This resulted in investor uncertainty and a flight to quality, culminating in a late summer sell-off in global equities coupled with material spread widening across fixed income sectors, to levels not seen since 2009. US Treasury prices surged, rallying 100 basis points during the August-September time period.
In the fall, plans for a coordinated effort to recapitalize troubled banks materialized, and investors grew cautiously optimistic that Europe might be closer to the resolution of its debt crisis. The unveiling of a comprehensive debt deal at the conclusion of the EU summit in October fueled a brief rally. The rally was soon undercut by Greece’s failure to reach its deficit target and its flirting with calling for a referendum on the bailout package, the Federal Reserve lowering its outlook for GDP growth, and the US Government’s Super Committee being unable to reach an agreement on budget cuts. Financial pressures intensified, exacerbated by an unexpected 25 basis point rate cut by the European Central Bank and its assessment that the region is likely to be headed towards a mild recession by year-end. In addition to ongoing sovereign issues, the world economy grappled with the continued slowdown in global growth. The 34-nation Organization for Economic Co-operation and Development (“OECD”) predicted that it will expand 1.9% this year and 1.6% next year, down from estimates of 2.3% and 2.8% in May. The Bundesbank also lowered Germany’s growth forecast from 1.8% to 0.75%. In an attempt to provide stimulus and liquidity, the Federal Reserve led a globally coordinated central bank response to the sovereign debt crisis, lowering interest rates on emergency dollar funding for European banks. Also on the last day of the month, China lowered bank minimum reserve requirements for the first time since 2008 in an effort to offset the negative impact of Europe’s debt crisis on exports and growth.
2 | www.shiplp.com |
Table of Contents
Stone Harbor Investment Funds | Shareholder Letter | |
| May 31, 2012 |
The market began a strong recovery in December helped by several significant actions. On the back of European Central Bank (“ECB”) President Marco Draghi warning substantial “downside risk” for the European economy, the ECB cut its benchmark rate 25 basis points to one percent and offered European banks unlimited liquidity for three years in an effort to stimulate the economy. This relieved concern over the financial viability of the European banking system, and investors shifted focus to an improving US economy. Upside surprises in economic fundamentals were forthcoming with better than expected economic indicators in the US and China, and with Europe expected to sustain a slight recession. The Fed followed with an announcement that it would keep rates low through 2014, while extending the maturity of its Operation Twist. Global monetary policy also remained one of the key catalysts to an improving economic environment, as the ECB completed its second Long-term Refinancing Operations (“LTRO”), China cut its bank reserve requirement for a second time, and other central banks also lowered rates.
Although Greece reached a finalized agreement in March, worldwide growth began to fade. China and European manufacturing both declined and China lowered its economic growth target. The International Monetary Fund (“IMF”) also downgraded its expectations for global economic growth and warned of a significant threat to the recovery posed by the ongoing stress in the euro area. Sovereign concerns spread through Europe, particularly for Spain and Italy as both countries warned of higher deficits, pushed back their balanced budget goals, and questioned their ability to endure more austerity. Sovereign spreads for both countries widened to three month highs. The domestic economy began to show signs of moderating economic growth; however, strong corporate earnings helped markets improve in April.
Risk markets took a dramatic downward turn in May. Greece’s inability to form a government, the prospect of its withdrawal from the EU, and the risk of contagion weighed heavily on the market. The Euro region also continued to show accelerated economic weakness, while China showed no signs of recovering from its recent economic slowdown. Signs of moderate economic growth in the US fell short of sustaining the momentum from prior months. With the downgrade of 16 Spanish banks, worries about the health of the Spanish banking system triggered a flight to quality into US Treasuries with the yield on the 10-year note falling to a record low of 1.56%, 150 basis points lower than at the beginning of the fiscal year.
The year was marked by significant volatility as macroeconomic events drove credit market performance. As represented by the Citigroup High Yield Market Index2, high yield spreads began the period at 526 basis points and widened to a level of 873 basis points in early October, before recovering to end the year at 688 basis points. The yield during the year increased from 6.78% to 7.66%. In emerging markets (“EM”), credit spreads for EM external debt (hard currency) also widened during the period. However, total returns in 41 of the 47 countries in the index were positive, reflecting technical developments in emerging markets debt and sustained investor support. The yield spread on the JP Morgan Emerging Markets Bond Index (EMBI) Global Diversified3 moved from 296 basis points to 414 basis points during the period. Returns for the emerging local currency debt markets were driven largely by movements in foreign currency and interest rates. The EM Corporate asset class was impacted by the deteriorating global macro environment, combined with negative technical environment where we saw significant outflows from primarily non-dedicated EM Corporate investors, as well as a reduction in risk taking and liquidity from dealers due to the volatile risk outlook and uncertain regulatory environment. The high yield segment of the asset class suffered most significantly, while the investment grade component, by large, fared better.
At Stone Harbor, we will continue to focus on seeking to capture excess return from stable and improving credit situations in corporate and sovereign markets worldwide. We remain vigilant to the credit risks associated with the systematic banking problems in Europe, as well as the slowdown in global growth.
Performance Overview
Stone Harbor Emerging Markets Corporate Debt Fund
The total return of the Stone Harbor Emerging Markets Corporate Debt Fund (the Fund) since inception June 1, 2011 was -5.10% (net of expenses) and -4.10% (gross of expenses). This performance compares to a benchmark return of 3.39% for the JP Morgan Corporate Emerging Markets Bond Index Broad Diversified5 (CEMBI Broad Diversified). The performance for the Emerging Markets (EM) corporate sector was driven by global macro headlines including: S&P’s downgrade of the United States credit rating, concerns over European sovereign defaults, concerns of a China hard-landing and lower growth expectations.
The negative impact on the EM corporate sectors caused by the deterioration in the global macro environment was compounded by a negative technical environment in which we saw significant outflows from primarily non-dedicated EM corporate investors, as well as a reduction in risk-taking and liquidity from dealers due to the volatile risk outlook and uncertain regulatory environment. This combination of factors led to weak performance of the asset class during Q3 2011 with the CEMBI Broad Diversified returning -4.79%. The impact was felt even more severely in the high yield segment of the sector, with the CEMBI Broad Diversified High Yield Sub Index returning -12.64% during Q3 2011. By contrast, the investment grade component of the index was down only -1.04%. In the portfolio management team’s view, this sell-off was largely sentiment-driven, rather than a reflection of EM Corporate credit fundamentals. The Fund maintained a significant overweight to high yield relative to the index during this period, which contributed to the vast majority of underperformance during Q3 and Q4 2011. Liquidity in the asset class during this timeframe was weaker than normal, and valuations had moved to levels that justified holding existing credit quality positions relative to the
Stone Harbor Investment Funds Annual Report | May 31, 2012 | 3 |
Table of Contents
Stone Harbor Investment Funds | Shareholder Letter | |
| May 31, 2012 |
index, according to the Fund’s management team. This positioning allowed the Fund to outperform as risk markets rallied in the first quarter of 2012.
From a regional perspective, the Fund remained overweight Latin America and Emerging Europe while underweight Asia and the Middle East. Latin America was the largest contributor to underperformance during the year, contributing -4.12% towards underperformance relative to the index. The overweight to Emerging Europe also contributed -2.09% to the underperformance relative to the index. The region’s significant commodity exposure, both oil & gas and metals & mining, led to underperformance, as commodity prices were negatively impacted by downward revisions in global economic growth.
An underweight to Asia also detracted from relative returns, The underperformance in Asia was a combination of our exposure to high yield bonds from China and an underweight exposure to defensive countries and sectors in the Asia region. Although Middle East positions also detracted from performance, the region was one of the best performing EM corporate sectors during the reporting period. The Fund increased its position in the Middle East by 3.05%.
From a country perspective, the Fund’s largest overweight exposures were Brazil, Argentina, Indonesia, Russia and Ukraine. While we reduced our exposure to these countries during the period, we remained overweight. Our overweight to Brazil contributed -0.16% towards underperformance relative to the index, driven by investor concerns related to the potential for lower GDP growth for 2012 and the negative impact of the recent weakening of the Brazilian real on corporate margins and leverage. Argentina has been a significant underperformer during the period contributing -1.10% towards underperformance relative to the index. As a result of the expropriation of Repsol’s controlling stake in YPF by the Argentine government, the entire Argentine corporate bond universe suffered significant price action. In Mexico, we underperformed the index primarily due to our exposure to high yield corporates in Mexico. Other notable underperforming countries relative to the index were Indonesia (-0.65%) and Ukraine (-0.24%) – both countries were impacted by the deterioration in commodity prices. The -0.63% underperformance in China relative to the index was largely driven by our overweight exposure to China high yield debt during the period.
The Fund increased exposure to defensive industries such as electric utilities, media and cable companies and investment grade exploration and production (E&P) companies. The increase in weighting to E&P of 4.25% was the largest Industry increase during the period, followed closely by a 3.99% increase in the electric industry. While the exposure to the electric industry negatively impacted results during the period, the underperformance was primarily related to exposure to Edenor, an Argentine electricity distribution company. The Fund’s exposure to the South Korean power sector, which we increased, positively impacted returns.
Stone Harbor Emerging Markets Debt Fund
The total return of the Stone Harbor Emerging Markets Debt Fund for the twelve months ended May 31, 2012 was 4.61% (net of expenses) and 5.33% (gross of expenses). This performance compares to a benchmark return of 7.01% for the JP Morgan EMBI Global Diversified. External sovereign bond credit spreads over comparable maturity US Treasury securities widened during the reporting period. However, total returns in all but 6 of the 47 countries in the index were positive. Emerging markets debt returns benefitted from significant declines in US Treasury yields. Return volatility spiked in specific time periods, particularly late in the third quarter of 2011, in December 2011 and in May 2012, in response to a variety of factors largely related to advanced economies, including concerns over global growth and Europe’s debt crisis. During these periods, local currency debt from emerging markets was significantly impacted as EM foreign exchange markets remained highly liquid and served as an efficient means to reduce emerging markets risk. Foreign exchange markets began to recover in January 2012 after the European Central Bank implemented a new policy that provided cheap, long-term funding to European banks. By mid-January and continuing until early May, returns on all three sectors of emerging markets debt remained strongly positive, buoyed, in our view, by central bank liquidity as well as ongoing capital inflows.
Total returns for the reporting period reflected technical developments in emerging markets debt, as well as fundamental factors in advanced and developing economies. Strong investor demand remained supportive for emerging markets external debt. According to JP Morgan, new allocations to emerging markets from institutional fixed income investors amounted to over $28.5 billion. Of this amount, over 80% was allocated to US dollar-denominated sovereign and corporate bonds; the remainder went to local currency investments. In addition, many emerging market governments took advantage of improving markets in the first several months of 2012 to fulfill a majority of annual financing needs. As a result, the remaining calendar of debt issuance remained manageable, in our view, particularly in comparison to the large funding needs of advanced economies including Spain, Italy, Japan, the United Kingdom and the United States.
Throughout the period, the portfolio was positioned to take advantage of the portfolio management team’s country views and assessments of global risks and relative value. The Fund retained its exposure to corporate debt, but gradually shifted into more defensive investment grade positions, as markets rallied in the first few months of 2012. The Fund’s corporate market value exposure at the end of the reporting period was 15.29%. As local currency debt market returns accelerated in the first quarter, the management team reduced the portfolio’s exposure to local currencies and local interest rates from approximately 13% at the end of January 2012 to just over 5% at the end of the reporting period. Net of
4 | www.shiplp.com |
Table of Contents
Stone Harbor Investment Funds | Shareholder Letter | |
| May 31, 2012 |
hedges, exposure to emerging market local currencies was approximately 3.61% at the end of the reporting period. Local currency markets remain liquid with low bid/ask costs; the team viewed this change as an efficient way to reduce risk, as the cost of replacing the exposure is limited in the current market.
The portfolio underperformed its benchmark as a result of country selection and issue selection decisions. The country decision that detracted most from performance was an overweight to Argentina, particularly in the period following March when the government announced stricter capital controls, and in May following the government’s renationalization of YPF, Argentina’s largest producer of oil and gas. An overweight to Iraq also detracted from performance as did allocations to corporate debt in several countries including Brazil, China, Dominican Republic, Indonesia, Kazakhstan, and Mexico. An overweight in Venezuela and an underweight in Hungary enhanced excess returns. Issue selection decisions that dominated performance attribution included good relative value trading of various debt instruments from Argentina and allocations to short maturity external debt from Venezuela. Allocations to local currencies in Brazil and Mexico, in particular, detracted from performance.
Stone Harbor Local Markets Fund
Fund performance for the twelve months ended May 31, 2012 was –5.84% (net of expenses) and -4.95% (gross of expenses). This compares to a benchmark total return of -6.46% for the JP Morgan GBI-EM Global Diversified4. Local markets total returns are generally driven by movements in foreign currency, interest rates, and yields. During the period, the foreign exchange component of the index was down -16.19%, local rates were up 9.73%, and yield differentials versus the developed world remained wide. Return volatility spiked in the third quarter of 2011, December 2011, and May 2012 as a result of a variety of factors. While currency weakness accompanies most periods of volatility within emerging markets, weaker currencies resulted at these times from heightened concerns over banking and sovereign debt crises in Europe and lower global growth. Additionally, the highly liquid nature of foreign exchange facilitated its use as a risk reduction instrument during these periods of volatility, putting further pressure on currencies. Local interest rates, in contrast, delivered strong positive performance over the same period in local currency terms. Global growth expectations and inflationary pressure moved lower, which allowed EM central banks to remain on hold despite currency weakness, potentially leaving the door open for modest rate cuts. Additionally, unlike other periods of EM weakness, there have not been significant investor redemptions from the asset class, supporting local rate performance.
Throughout the reporting period, the portfolio favored faster growing economies in Latin America and Asia, with overweight allocations in Brazil, Colombia, Mexico and Malaysia. The portfolio’s underweight positions have been concentrated in Central and Eastern Europe, where a mix of more limited growth prospects, short-term policymaking, and contagion effects from an increasingly unstable Euro zone have reduced the attractiveness of local debt markets. We maintained country overweights in Brazil, but reduced the size of the overweight in March as the Brazilian Central Bank began to intervene aggressively to weaken its currency, subsequently adding back to our overweight after an aggressive sell-off in May. The interventionist stance of the Brazilian Central Bank prompted us to partially hedge our currency risk in the Colombian Peso in anticipation of government-supported intervention to weaken the Peso.
As global growth slowed and commodity prices fell, inflation and inflation expectations declined, and allowed room for central bankers to lower policy interest rates in several EM countries including Brazil, Russia and China. Brazil embarked on an aggressive easing cycle in August 2011, cutting rates by 400 basis points and leaving its policy rate at its lowest level in history. China cut its one year lending rate for the first time since 2008. The Stone Harbor Local Markets Fund was positioned in longer duration bonds relative to the benchmark in several countries, including Brazil, Mexico, Colombia and South Africa at various times to take advantage of either steep yield curves or expectations of falling interest rates, or both.
The Stone Harbor Local Markets Fund outperformed its benchmark as a result of country selection and issue selection decisions. The country decision which most enhanced performance was an underweight in Hungary, as it underperformed the market due to weak growth and heavy public debt load. Underweights in Poland, Turkey and Indonesia also enhanced performance. The country decision which most detracted from performance was an underweight position in Peru. The Central Bank of Peru continued to heavily manage its currency, and President Humala distanced himself from the populist rhetoric of his campaign platform. Decisions to allocate to long duration bonds in Brazil, Colombia and Mexico enhanced total returns. Our allocation to short duration Indonesia local debt detracted from performance.
Stone Harbor High Yield Bond Fund
The Stone Harbor High Yield Bond Fund return for the twelve months ended May 31, 2012 was 1.77% (net of expenses) and 2.32% (gross of expenses). This compares to a benchmark return of 4.69% for the Citigroup High Yield Market Capped Index. It was a difficult year for high yield, which felt the widespread impact of an escalating sovereign debt and financial debt crisis in Europe, the undetermined magnitude of the global slowdown, and a sluggish US economy. It was a period of significant volatility, with high yield spreads ranging from an initial 535 basis points widening to over 800 basis points (the highest since 2009), before closing the year at 690 basis points.
Stone Harbor Investment Funds Annual Report | May 31, 2012 | 5 |
Table of Contents
Stone Harbor Investment Funds | Shareholder Letter | |
| May 31, 2012 |
Within this context of market volatility and growing concerns over the European banking system, fiscal 2012 can be divided into two distinct periods, trailed by the final month of May. During the first period from June to November, a number of macroeconomic events caused significant volatility. From December through April, positive domestic economic growth and global monetary stimulus were the catalyst for the market’s rebound. The market came full circle in May 2012 and declined as macroeconomic events, particularly from Europe, put pressure on risk assets.
The major macroeconomic factors that caused extreme volatility in the early part of the review period were a second bailout required by Greece, which stoked fears of contagion in the European periphery; the downgrade of Greece, Portugal, and Italy; and the question of financial viability of the European banking system. In response, high yield spreads widened to levels not seen since September 2009. The domestic markets came under pressure by the debt ceiling debate and subsequent S&P downgrade of US debt. Growth also slowed in the US, driven by the shutdown of Japanese manufacturing (particularly auto production), which was caused by the earlier earthquake and increased energy prices from the growing political instability in North Africa and the Middle East. A downward revision to the first and second quarter GDP growth was also a surprise to the market.
These macroeconomic events sparked a number of actions globally, but the most significant measures were taken by the US and Europe. The goal of these actions was twofold: inject substantial monetary stimulus to promote worldwide economic growth and provide stability to the wavering European banking system. In addition to committing to keeping rates low for an extended period of time, the US instituted “operation twist” to lower long term rates. The Federal Reserve also led a globally coordinated central bank response to the sovereign debt crisis by lowering interest rates on emergency dollar funding to the European banking system. Shortly thereafter, the ECB cut its benchmark rate to one percent and offered the European banks unlimited liquidity (Long Term Refinancing Operation) for three years, which proved to be the most effective measure of all. The IMF also alluded to the possibility of additional funding.
Encouraged by an improving domestic economy, reduced fears of a European debt crisis, and worldwide accommodative monetary policy, the high yield market experienced a strong recovery through April 2012. Solid corporate earnings, improving US economic indicators, continued global monetary stimulus, and declining sovereign spreads to multi-month lows, together provided support for all risk assets and the S&P 500 reached its highest level since May, 2008. The market was also aided by the Federal Reserve’s commitment to maintain low rates through 2014, as investors looking for yield led to strong technical conditions in the market.
With bond yields at their lowest level of the year on strong corporate earnings and robust technical factors, macroeconomic concerns again put pressure on the market in May 2012. The market declined on the possibility of Greece’s withdrawal from the euro (and the possible contagion associated with such an event), the viability of the Spanish banking system, accelerated economic weakness in Europe, and the domestic economy showing mixed signals on economic growth for the first time since November 2011. In response to weakening economic conditions in Europe, the ten-year Treasury bond rallied to end the year at 1.56%.
It was a difficult year for performance as macroeconomic factors overwhelmed company fundamentals. High yield fundamentals remain strong with favorable company earnings and cash flows, while balance sheets remain conservatively leveraged. The market has not witnessed any signs of re-leveraging as the record breaking new issuance in the last two years has enabled companies to reduce refinancing risk, while maintaining adequate liquidity. The number of ratings upgrades continues to exceed downgrades, suggesting that fundamentals are strong and intact. Credit spreads remain wide in spite of historically low default rates.
Our credit rating exposure has had a negative effect on performance, as high quality securities outperformed for the year. Our underweight in BB-rated issues also was negatively impacted by the 150 basis point rally in the 10-year Treasury bond as BB-rated securities are more closely correlated to interest rates. Issue selection, particularly in the Transportation, Telecommunications, Retail, and Utility sectors, detracted from returns, while our cash position had a positive effect on performance.
Our high yield strategy is positioned for continuing moderate US economic growth. We are overweight B-rated securities relative to BB-rated bonds due to our expectations for US economic growth, low default rates and attractive valuations. We are overweight the Chemical, Food, and Cable/Media industries due to strong cash flows, good asset values, and attractive valuations. We remain underweight Financials and Services industries.
Sincerely,

Thomas W. Brock
Chairman of the Board of Trustees
6 | www.shiplp.com |
Table of Contents
Stone Harbor Investment Funds | Shareholder Letter | |
| May 31, 2012 |
(1) Operation Twist is a policy, originally from the 1960’s but revived in September 2011, implemented by the Federal Reserve, which involves the selling of short-term Treasuries by the central bank in exchange for the same amount in longer-term bonds, thereby lowering longer-term interest rates.
(2) The Citigroup High Yield Market Index (previously the Salomon Smith Barney High Yield Market Index) is a total rate-of-return index which captures the performance of below investment-grade debt issued by corporations domiciled in the United States or Canada. This index comprises Citigroup’s broadest market measure and includes cash-pay and deferred-interest securities. All the bonds in the high-yield indices are publicly placed, have a fixed coupon and are nonconvertible.
(3) The JP Morgan Emerging Markets Bond Index (EMBI) Global Diversified tracks total returns for U.S. dollar-denominated debt instruments issued by emerging markets sovereign and quasi-sovereign entities: Brady bonds, loans, and Eurobonds. Source: JP Morgan Chase.
(4) The JP Morgan Government Bond Index – Emerging Markets (GBI-EM) Global Diversified consists of regularly traded, liquid fixed-rate, domestic currency government bonds to which international investors can gain exposure. The weightings among the countries are more evenly distributed within this index. Although not expected to be a principal investment tool, the Portfolio may make use of derivative securities (including futures and options on securities, securities indices or currencies, options on futures, forward currency contracts, and interest rate, currency or credit default) for the purposes of reducing risk and/or obtaining efficient investment exposure. Source: JP Morgan Chase.
(5) Emerging markets corporate debt is represented by JP Morgan Corporate Emerging Markets Bond Index (CEMBI) Broad Diversified. The CEMBI tracks total returns of US dollar-denominated debt instruments issued by corporate entities in Emerging Markets countries. Two variations are available: CEMBI Broad and CEMBI. The CEMBI Broad is the most comprehensive corporate benchmark followed by the CEMBI, which consists of an Investable universe of corporate bonds. Both indices are also available in Diversified version. The JPMorgan CEMBI Broad Diversified limits the current face amount allocations of the bonds. Both indices are also available in outstanding countries with larger debt stocks. Qualifying corporate bonds have a face amount greater than USD 300 million, maturity greater than 5 years, verifiable prices and cash flows, and from countries within Asia ex-Japan, Latin America, Eastern Europe, Middle East, and Africa.
It is not possible to invest directly in an index.
Standard and Poor’s ratings are measured on a scale that generally ranges from AAA (highest) to D (lowest). A security that has not been given a credit rating by Standard and Poor’s is listed as “not rated”.
European Financial Stability Facility (EFSF) - The European Financial Stability Facility is a special purpose vehicle financed by members of the Euro zone to address the European sovereign-debt crisis.
Basis Point - a unit equal to one hundredth of a percentage point.
Super Committee – also known as the Joint Select Committee on Deficit Reduction. It is a joint select committee of the United States Congress, created by the Budget Control Act of 2011 on August 2, 2011.
Bundesbank – the central bank of the Federal Republic of Germany.
Bid Price/Ask Price - A bid price is the highest price that a buyer is willing to pay. Ask price is the price a seller is willing to accept. In bid and ask, the bid price stands in contrast to the ask price or “offer”, and the difference between the two is called the bid/ask spread.
Sovereign Debt - Refers to bonds issued by a national government in order to finance the issuing country’s growth. Sovereign debt described as external is denominated in US dollar, while sovereign debt described as local is issued in a foreign currency.
The Citigroup High Yield Market Capped Index - represents a modified version of the High Yield Market Index by delaying the entry of fallen angel issues and capping the par value of individual issuers at US $10 billion par amount outstanding. The Citigroup High Yield Market Index includes cash-pay, deferred-interest and Rule 144A bonds. The bonds must have a remaining maturity of at least one year, a minimum amount outstanding of $100 million (subject to an entry criteria of $200 million per issue or $400 million per issuer), and a speculative grade rating by both Moody’s Investor Service and Standard & Poor’s. When an issuer misses or expects to miss an interest payment or enters Chapter 11, the bonds exit the index at month-end. The returns are adjusted for the loss of a coupon payment or accrued interest.
QEII - The second round of quantitative easing, which is expected to focus on purchases of long-dated US treasuries.
Investment Grade - Refers to bonds that have a relatively low risk of default, ranging from highest credit quality to good credit quality. Bonds rated below investment grade are considered to have significant speculative characteristics.
Stone Harbor Investment Funds Annual Report | May 31, 2012 | 7 |
Table of Contents
Stone Harbor Investment Funds | Disclosure of Fund Expenses | |
| May 31, 2012 (Unaudited) |
Example. As a shareholder of a Fund, you incur two types of costs: (1) transaction costs, including sales charges (loads) on purchase payments and/or redemption fees (if applicable) and (2) ongoing costs, including management fees and other Fund expenses. The below examples are intended to help you understand your ongoing costs (in dollars) of investing in a Fund and to compare these costs with the ongoing costs of investing in other mutual funds. The examples are based on an investment of $1,000 invested on December 1, 2011 and held until May 31, 2012.
Actual Expenses. The first line of each table below provides information about actual account values and actual expenses. You may use the information in this line, together with the amount you invested, to estimate the expenses that you paid over the period. Simply divide your account value by $1,000 (for example, an $8,600 account value divided by $1,000 = 8.6), then multiply the result by the number in the first line under the heading “Expenses Paid During Period” to estimate the expenses you paid on your account during this period.
Hypothetical Example for Comparison Purposes. The second line of each table below provides information about hypothetical account values and hypothetical expenses based on the Fund’s actual expense ratio and an assumed rate of return of 5% per year before expenses, which is not the Fund’s actual return. The hypothetical account values and expenses may not be used to estimate the actual ending account balance or expenses you paid for the period. You may use this information to compare the ongoing costs of investing in a Fund and other mutual funds. To do so, compare this 5% hypothetical example with the 5% hypothetical examples that appear in the shareholder reports of the other funds.
Please note that the expenses shown in the table are meant to highlight your ongoing costs only and do not reflect transactional costs, such as redemption fees, sales charges (loads) or exchange fees. Therefore, the second line of the table is useful in comparing ongoing costs only, and will not help you determine the relative total costs of owning different funds. In addition, if these transactional costs were included, your costs would have been higher.
| Beginning Account Value 12/01/2011 | Ending Account Value 05/31/2012 | Expense Ratio(1) | Expenses Paid During Period(2) | |||||||||||
STONE HARBOR EMERGING MARKETS DEBT FUND | ||||||||||||||
Institutional Class | ||||||||||||||
Actual | $ | 1,000.00 | $ | 1,045.30 | 0.71% | $ | 3.63 | |||||||
Hypothetical (5% return before expenses) | $ | 1,000.00 | $ | 1,021.45 | 0.71% | $ | 3.59 | |||||||
STONE HARBOR HIGH YIELD BOND FUND | ||||||||||||||
Institutional Class | ||||||||||||||
Actual | $ | 1,000.00 | $ | 1,067.50 | 0.55% | $ | 2.84 | |||||||
Hypothetical (5% return before expenses) | $ | 1,000.00 | $ | 1,022.25 | 0.55% | $ | 2.78 | |||||||
STONE HARBOR LOCAL MARKETS FUND | ||||||||||||||
Institutional Class | ||||||||||||||
Actual | $ | 1,000.00 | $ | 1,001.30 | 0.89% | $ | 4.45 | |||||||
Hypothetical (5% return before expenses) | $ | 1,000.00 | $ | 1,020.55 | 0.89% | $ | 4.50 | |||||||
STONE HARBOR EMERGING MARKETS CORPORATE DEBT FUND | ||||||||||||||
Institutional Class | ||||||||||||||
Actual | $ | 1,000.00 | $ | 1,056.70 | 1.00% | $ | 5.14 | |||||||
Hypothetical (5% return before expenses) | $ | 1,000.00 | $ | 1,020.00 | 1.00% | $ | 5.05 | |||||||
| (1) | Annualized, based on the Fund’s most recent fiscal half-year expenses. |
| (2) | Expenses are equal to the Fund’s annualized ratio multiplied by the average account value over the period, multiplied by the number of days in the most recent fiscal half year (183), divided by 366. Note this expense example is typically based on a six-month period. |
8 | www.shiplp.com |
Table of Contents
Stone Harbor Investment Funds | Summaries of Portfolio Holdings | |
| May 31, 2012 |
Under SEC Rules, all funds are required to include in their annual and semi-annual shareholder reports a presentation of portfolio holdings in a table, chart or graph by reasonably identifiable categories. The following tables, which present holdings as a percent of total net assets (“TNA”), are provided in compliance with such requirements.
STONE HARBOR EMERGING MARKETS DEBT FUND | ||||
| Country Breakdown | % of TNA | |||
Russia | 9.44% | |||
Mexico | 8.11% | |||
Colombia | 5.87% | |||
Venezuela | 5.61% | |||
Brazil | 5.47% | |||
Argentina | 5.20% | |||
Poland | 4.56% | |||
Turkey | 4.51% | |||
Panama | 3.58% | |||
Indonesia | 3.58% | |||
South Africa | 3.39% | |||
Ukraine | 3.27% | |||
Kazakhstan | 3.02% | |||
Iraq | 2.64% | |||
Qatar | 2.48% | |||
Malaysia | 2.36% | |||
Philippines | 2.31% | |||
Peru | 2.29% | |||
Lithuania | 2.08% | |||
Uruguay | 1.66% | |||
China | 1.45% | |||
Croatia | 1.40% | |||
United Arab Emirates | 1.26% | |||
Hungary | 1.11% | |||
El Salvador | 1.05% | |||
Chile | 0.96% | |||
South Korea | 0.74% | |||
Slovakia | 0.72% | |||
Hong Kong | 0.64% | |||
Jamaica | 0.38% | |||
India | 0.34% | |||
Ghana | 0.24% | |||
Mongolia | 0.18% | |||
Singapore | 0.15% | |||
Barbados | 0.13% | |||
Romania | 0.09% | |||
Nigeria | 0.08% | |||
Greece | 0.05% | |||
Dominican Republic | 0.04% | |||
Gabon | 0.01% | |||
Total | 92.45% | |||
Money Market Mutual Funds | 2.85% | |||
Other Assets in Excess of Liabilities | 4.70% | |||
Total Net Assets | 100.00% | |||
STONE HARBOR HIGH YIELD BOND FUND | ||||||
| Industry Breakdown | % of TNA | |||||
Healthcare | 7.60% | |||||
Exploration & Production | 6.38% | |||||
Wirelines | 5.98% | |||||
Media Cable | 5.78% | |||||
Electric | 5.08% | |||||
Drillers/Services | 4.94% | |||||
Technology | 4.75% | |||||
Metals/Mining/Steel | 4.65% | |||||
Food & Beverage | 4.44% | |||||
Chemicals | 4.17% | |||||
Media Other | 4.16% | |||||
Gaming | 3.83% | |||||
Services Other | 3.12% | |||||
Paper/Forest Products | 2.98% | |||||
Retail Non Food/Drug | 2.84% | |||||
Containers/Packaging | 2.48% | |||||
Wireless | 2.23% | |||||
Leisure | 1.85% | |||||
Automotive | 1.75% | |||||
Consumer Products | 1.55% | |||||
Gas Pipelines | 1.54% | |||||
Aerospace/Defense | 1.28% | |||||
Building Products | 1.25% | |||||
Healthcare-Services | 1.20% | |||||
Financial Other | 1.13% | |||||
Industrial Other | 1.03% | |||||
Non Captive Finance | 1.02% | |||||
Publishing/Printing | 0.87% | |||||
Textile/Apparel | 0.80% | |||||
Gas Distributors | 0.73% | |||||
Retail Food/Drug | 0.72% | |||||
Construction Machinery | 0.63% | |||||
Restaurants | 0.58% | |||||
Life | 0.57% | |||||
Satellite | 0.46% | |||||
Banking | 0.40% | |||||
Property & Casualty Insurance | 0.22% | |||||
Transportation Non Air/Rail | 0.20% | |||||
Railroads | 0.05% | |||||
Pharmaceuticals | 0.04% | |||||
Airlines | 0.03% | |||||
Lodging | 0.01% | |||||
Total | 95.32% | |||||
Money Market Mutual Funds | 3.03% | |||||
Other Assets in Excess of Liabilities | 1.65% | |||||
Total Net Assets | 100.00% | |||||
Stone Harbor Investment Funds Annual Report | May 31, 2012 | 9 |
Table of Contents
Stone Harbor Investment Funds | Summaries of Portfolio Holdings | |
| May 31, 2012 |
| STONE HARBOR LOCAL MARKETS FUND | ||||
| Country Breakdown | % of TNA | |||
Mexico | 10.85 | % | ||
South Africa | 9.43 | % | ||
Brazil | 9.05 | % | ||
Russia | 6.15 | % | ||
Indonesia | 5.63 | % | ||
Colombia | 5.62 | % | ||
Turkey | 5.33 | % | ||
Malaysia | 4.82 | % | ||
Poland | 4.64 | % | ||
Thailand | 4.43 | % | ||
European Union | 2.53 | % | ||
Hungary | 2.18 | % | ||
Peru | 0.39 | % | ||
Argentina | 0.29 | % | ||
Chile | 0.12 | % | ||
Venezuela | 0.09 | % | ||
Philippines | 0.02 | % | ||
Total | 71.57 | % | ||
Money Market Mutual Funds | 8.24 | % | ||
Other Assets in Excess of Liabilities | 20.19 | % | ||
Total Net Assets | 100.00 | % | ||
| STONE HARBOR EMERGING MARKETS CORPORATE DEBT FUND | ||||
| Country Breakdown | % of TNA | |||
Brazil | 15.72 | % | ||
Russia | 9.83 | % | ||
Mexico | 9.57 | % | ||
United Arab Emirates | 9.33 | % | ||
China | 7.24 | % | ||
Indonesia | 4.51 | % | ||
South Africa | 4.22 | % | ||
Colombia | 4.17 | % | ||
Argentina | 3.85 | % | ||
Hong Kong | 3.83 | % | ||
Qatar | 3.44 | % | ||
Peru | 3.02 | % | ||
South Korea | 2.98 | % | ||
India | 2.45 | % | ||
Ukraine | 2.33 | % | ||
Kazakhstan | 2.09 | % | ||
Jamaica | 2.08 | % | ||
Singapore | 1.56 | % | ||
Turkey | 1.40 | % | ||
Barbados | 1.20 | % | ||
Mongolia | 1.16 | % | ||
Chile | 0.76 | % | ||
Dominican Republic | 0.58 | % | ||
Total | 97.32 | % | ||
Money Market Mutual Funds | 2.86 | % | ||
Liabilities in Excess of Other Assets | -0.18 | % | ||
Total Net Assets | 100.00 | % | ||
10 | www.shiplp.com |
Table of Contents
Stone Harbor Investment Funds | Growth of $10,000 Investment | |
| May 31, 2012 (Unaudited) |
STONE HARBOR EMERGING MARKETS DEBT FUND
Comparison of Change in Value of $10,000 Investment in Stone Harbor Emerging Markets Debt Fund and the JP Morgan Emerging Market Bond Index Global Diversified (JP Morgan EMBI Global Diversified).
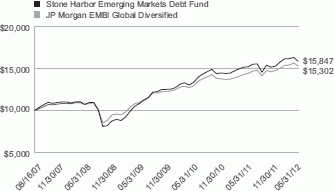
The JP Morgan EMBI Global Diversified limits the weights of those index countries with larger debt stocks by only including specified portions of these countries’ eligible current face amounts outstanding. The countries covered in the EMBI Global Diversified are identical to those covered by the EMBI Global.
Average Annual Total Returns
| 1 Year | 3 Years | Since Inception | Inception Date | |||||
Stone Harbor Emerging Markets Debt Fund | 4.61% | 14.77% | 10.08% | 08/16/07 | ||||
JP Morgan EMBI Global Diversified | 7.01% | 12.38% | 9.28% |
The performance data quoted represents past performance and does not guarantee future results. Current performance may be lower or higher than the performance quoted. Average annual total returns reflect the reinvestment of dividends and capital gains distributions and include all fee waivers and expense reimbursements. Without the fee waivers and expense reimbursements, total return figures would have been lower. The performance data quoted does not reflect the deduction of taxes that a shareholder would pay on Fund distributions or the redemption of Fund shares. Investment return and principal value will vary, and shares, when redeemed, may be worth more or less than their original cost. Index returns do not include the effects of sales charges, management fees or transaction costs. It is not possible to invest directly in an index.
Stone Harbor Investment Funds Annual Report | May 31, 2012 | 11 |
Table of Contents
Stone Harbor Investment Funds | Growth of $10,000 Investment | |
| May 31, 2012 (Unaudited) |
STONE HARBOR HIGH YIELD BOND FUND
Comparison of Change in Value of $10,000 Investment in Stone Harbor High Yield Bond Fund and the Citigroup High Yield Market Capped Index.
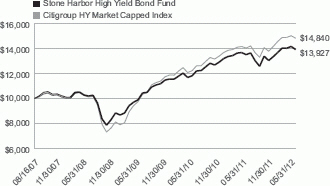
The Citigroup High Yield Market Capped Index represents a modified version of the High Yield Market Index by delaying the entry of “fallen angel” issues (corporate or municipal bonds that were investment-grade when issued but have since been downgraded) and capping the par value of individual issuers at US $5 billion par amount outstanding.
Average Annual Total Returns
| 1 Year | 3 Years | Since Inception | Inception Date | |||||
Stone Harbor High Yield Bond Fund | 1.77% | 12.84% | 7.16% | 08/16/07 | ||||
Citigroup HY Market Capped Index | 4.69% | 16.36% | 8.58% |
The performance data quoted represents past performance and does not guarantee future results. Current performance may be lower or higher than the performance quoted. Average annual total returns reflect the reinvestment of dividends and capital gains distributions and include all fee waivers and expense reimbursements. Without the fee waivers and expense reimbursements, total return figures would have been lower. The performance data quoted does not reflect the deduction of taxes that a shareholder would pay on Fund distributions or the redemption of Fund shares. Investment return and principal value will vary, and shares, when redeemed, may be worth more or less than their original cost. Index returns do not include the effects of sales charges, management fees or transaction costs. It is not possible to invest directly in an index.
12 | www.shiplp.com |
Table of Contents
Stone Harbor Investment Funds | Growth of $10,000 Investment | |
| May 31, 2012 (Unaudited) |
STONE HARBOR LOCAL MARKETS FUND
Comparison of Change in Value of $10,000 Investment in Stone Harbor Local Markets Fund and the JP Morgan Global Bond Index – Emerging Markets Global Diversified (JP Morgan GBI-EM Global Diversified).
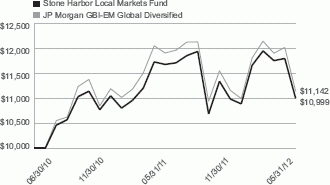
The JP Morgan GBI-EM Global Diversified consists of regularly traded, liquid fixed-rate, domestic currency government bonds to which international investors can gain exposure. The weightings among the countries are more evenly distributed within this index.
Average Annual Total Return
| 1 Year | Since Inception | Inception Date | ||||
Stone Harbor Local Markets Fund | -5.84% | 5.09% | 06/30/10 | |||
JP Morgan GBI-EM Global Diversified | -6.46% | 5.81% |
The performance data quoted represents past performance and does not guarantee future results. Current performance may be lower or higher than the performance quoted. Average annual total returns reflect the reinvestment of dividends and capital gains distributions and include all fee waivers and expense reimbursements. Without the fee waivers and expense reimbursements, total return figures would have been lower. The performance data quoted does not reflect the deduction of taxes that a shareholder would pay on Fund distributions or the redemption of Fund shares. Investment return and principal value will vary, and shares, when redeemed, may be worth more or less than their original cost. Index returns do not include the effects of sales charges, management fees or transaction costs. It is not possible to invest directly in an index.
Stone Harbor Investment Funds Annual Report | May 31, 2012 | 13 |
Table of Contents
Stone Harbor Investment Funds | Growth of $10,000 Investment | |
| May 31, 2012 (Unaudited) |
STONE HARBOR EMERGING MARKETS CORPORATE DEBT FUND
Comparison of Change in Value of $10,000 Investment in Stone Harbor Emerging Market Corporate Debt Fund and the JP Morgan Corporate Emerging Market Bond Index – Broad Diversified (JP Morgan CEMBI Broad Diversified).
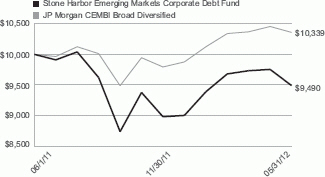
The JP Morgan CEMBI Broad is a market capitalization weighted index that tracks total returns of US dollar-denominated debt instruments issued by corporate entities in Emerging Markets countries. The CEMBI Broad Diversified limits the current face amount allocations of the bonds in the CEMBI Broad by constraining the total face amount outstanding for countries with larger debt stocks.
Cumulative Returns
| 1 Month | 3 Months | Since Inception | Inception Date | |||||
Stone Harbor Emerging Markets Corporate Debt Fund | -2.70% | -1.96% | -5.10% | 06/01/11 | ||||
JP Morgan CEMBI Broad Diversified | -0.92% | 0.18% | 3.39% |
The performance data quoted represents past performance and does not guarantee future results. Current performance may be lower or higher than the performance quoted. Average annual total returns reflect the reinvestment of dividends and capital gains distributions and include all fee waivers and expense reimbursements. Without the fee waivers and expense reimbursements, total return figures would have been lower. The performance data quoted does not reflect the deduction of taxes that a shareholder would pay on Fund distributions or the redemption of Fund shares. Investment return and principal value will vary, and shares, when redeemed, may be worth more or less than their original cost. Index returns do not include the effects of sales charges, management fees or transaction costs. It is not possible to invest directly in an index.
14 | www.shiplp.com |
Table of Contents
Stone Harbor Investment Funds | Registered Public Accounting Firm |
To the Shareholders and Board of Trustees of Stone Harbor Investment Funds:
We have audited the accompanying statements of assets and liabilities of Stone Harbor Investment Funds (the “Funds”), comprising the Stone Harbor Emerging Markets Debt Fund, Stone Harbor High Yield Bond Fund, Stone Harbor Local Markets Fund, and Stone Harbor Emerging Markets Corporate Debt Fund, including the statements of investments, as of May 31, 2012, and the related statements of operations for the year then ended, the statements of changes in net assets for each of the two years in the period then ended for Stone Harbor Emerging Markets Debt Fund and Stone Harbor High Yield Bond Fund, the year ended May 31, 2012 and the period June 30, 2010 (Inception) to May 31, 2011 for Stone Harbor Local Markets Fund, and the year ended May 31, 2012 for Stone Harbor Emerging Markets Corporate Debt Fund, and the financial highlights for each of the periods presented. These financial statements and financial highlights are the responsibility of the Funds’ management. Our responsibility is to express an opinion on these financial statements and financial highlights based on our audits.
We conducted our audits in accordance with the standards of the Public Company Accounting Oversight Board (United States). Those standards require that we plan and perform the audit to obtain reasonable assurance about whether the financial statements and financial highlights are free of material misstatement. The Funds are not required to have, nor were we engaged to perform, an audit of their internal control over financial reporting. Our audits included consideration of internal control over financial reporting as a basis for designing audit procedures that are appropriate in the circumstances, but not for the purpose of expressing an opinion on the effectiveness of the Funds’ internal control over financial reporting. Accordingly, we express no such opinion. An audit also includes examining, on a test basis, evidence supporting the amounts and disclosures in the financial statements, assessing the accounting principles used and significant estimates made by management, as well as evaluating the overall financial statement presentation. Our procedures included confirmation of securities owned as of May 31, 2012, by correspondence with the custodian and brokers; where replies were not received from brokers, we performed other auditing procedures. We believe that our audits provide a reasonable basis for our opinion.
In our opinion, the financial statements and financial highlights referred to above present fairly, in all material respects, the financial position of each of the funds constituting the Stone Harbor Investment Funds as of May 31, 2012, the results of their operations for the year then ended, the changes in their net assets for each of the two years in the period then ended for Stone Harbor Emerging Markets Debt Fund and Stone Harbor High Yield Bond Fund, the year ended May 31, 2012 and period June 30, 2010 (Inception) to May 31, 2011 for Stone Harbor Local Markets Fund, and the year ended May 31, 2012 for Stone Harbor Emerging Markets Corporate Debt Fund, and the financial highlights for each of the periods presented, in conformity with accounting principles generally accepted in the United States of America.
DELOITTE & TOUCHE LLP
Denver, Colorado
July 27, 2012
Stone Harbor Investment Funds Annual Report | May 31, 2012 | 15 |
Table of Contents
| Statements of Investments | ||
| May 31, 2012 |
Currency | Rate | Maturity Date | Principal Amount* | Market Value | ||||||||||||||
SOVEREIGN DEBT OBLIGATIONS - 61.70% |
| |||||||||||||||||
Argentina - 4.64% | ||||||||||||||||||
City of Buenos Aires Argentina | USD | 9.950 | % | 03/01/2017 | 1,655,000 | $ | 1,208,150 | (1) | ||||||||||
Republic of Argentina: | ||||||||||||||||||
| USD | 7.000 | % | 10/03/2015 | 10,288,337 | 7,695,104 | |||||||||||||
| USD | 7.000 | % | 04/17/2017 | 7,311,196 | 4,775,430 | |||||||||||||
| USD | 0.000 | % | 03/31/2023 | 184,000 | 133,400 | (2) | ||||||||||||
| USD | 6.000 | % | 03/31/2023 | 480,000 | 372,000 | (2) | ||||||||||||
| ARS | 9.540 | % | 12/31/2033 | 22,163,275 | 3,146,043 | (3) | ||||||||||||
| EUR | 6.840 | % | 12/31/2033 | 25,464,452 | 15,743,482 | (3) | ||||||||||||
| EUR | 7.820 | % | 12/31/2033 | 23,217,399 | 14,497,776 | |||||||||||||
| USD | 7.470 | % | 12/31/2033 | 7,033,004 | 4,008,812 | |||||||||||||
| EUR | 4.191 | % | 12/15/2035 | 29,165,000 | 3,137,456 | (3) | ||||||||||||
| USD | 4.383 | % | 12/15/2035 | 1,777,000 | 170,592 | (3) | ||||||||||||
|
| |||||||||||||||||
| 54,888,245 | ||||||||||||||||||
|
| |||||||||||||||||
Brazil - 2.46% | ||||||||||||||||||
Nota Do Tesouro Nacional: | ||||||||||||||||||
| BRL | 10.000 | % | 01/01/2014 | 639,000 | 323,930 | |||||||||||||
| BRL | 10.000 | % | 01/01/2021 | 12,205,000 | 5,981,887 | |||||||||||||
Republic of Brazil: | ||||||||||||||||||
| USD | 8.750 | % | 02/04/2025 | 1,680,000 | 2,536,800 | |||||||||||||
| USD | 10.125 | % | 05/15/2027 | 1,868,000 | 3,133,570 | |||||||||||||
| USD | 8.250 | % | 01/20/2034 | 4,576,000 | 6,944,080 | |||||||||||||
| USD | 7.125 | % | 01/20/2037 | 7,391,000 | 10,227,296 | |||||||||||||
|
| |||||||||||||||||
| 29,147,563 | ||||||||||||||||||
|
| |||||||||||||||||
Colombia - 4.17% | ||||||||||||||||||
Bogota Distrio Capital | COP | 9.750 | % | 07/26/2028 | 7,800,000,000 | 5,808,653 | (4) | |||||||||||
Republic of Colombia: | ||||||||||||||||||
| USD | 7.375 | % | 01/27/2017 | 1,838,000 | 2,251,550 | |||||||||||||
| USD | 11.750 | % | 02/25/2020 | 1,006,000 | 1,594,510 | |||||||||||||
| USD | 8.125 | % | 05/21/2024 | 25,000 | 35,437 | |||||||||||||
| USD | 7.375 | % | 09/18/2037 | 23,859,000 | 33,671,014 | |||||||||||||
| USD | 6.125 | % | 01/18/2041 | 4,818,000 | 5,968,298 | |||||||||||||
|
| |||||||||||||||||
| 49,329,462 | ||||||||||||||||||
|
| |||||||||||||||||
Croatia - 1.40% | ||||||||||||||||||
Croatian Government: | ||||||||||||||||||
| USD | 6.250 | % | 04/27/2017 | 1,704,000 | 1,652,880 | (1) | ||||||||||||
| USD | 6.750 | % | 11/05/2019 | 2,250,000 | 2,152,969 | (4) | ||||||||||||
| USD | 6.625 | % | 07/14/2020 | 1,299,000 | 1,227,555 | (4) | ||||||||||||
| USD | 6.375 | % | 03/24/2021 | 12,498,000 | 11,545,027 | (1) | ||||||||||||
|
| |||||||||||||||||
| 16,578,431 | ||||||||||||||||||
|
| |||||||||||||||||
El Salvador - 1.05% | ||||||||||||||||||
Republic of El Salvador: | ||||||||||||||||||
| USD | 7.375 | % | 12/01/2019 | 220,000 | 240,350 | (1) | ||||||||||||
| USD | 7.375 | % | 12/01/2019 | 2,068,000 | 2,259,290 | (4) | ||||||||||||
| USD | 7.750 | % | 01/24/2023 | 1,014,000 | 1,107,795 | (4) | ||||||||||||
| USD | 8.250 | % | 04/10/2032 | 1,000,000 | 1,105,000 | (4) | ||||||||||||
See Notes to Financial Statements.
16 | www.shiplp.com |
Table of Contents
Stone Harbor Emerging Markets Debt Fund | Statements of Investments | |
| May 31, 2012 |
Currency | Rate | Maturity Date | Principal | Market Value | ||||||||||||||
El Salvador (continued) | ||||||||||||||||||
Republic of El Salvador (continued) | ||||||||||||||||||
| USD | 7.650 | % | 06/15/2035 | 7,420,000 | $ | 7,661,150 | (4) | |||||||||||
|
| |||||||||||||||||
| 12,373,585 | ||||||||||||||||||
|
| |||||||||||||||||
Gabon - 0.01% | ||||||||||||||||||
Republic of Gabon | USD | 8.200 | % | 12/12/2017 | 50,000 | 58,562 | (1) | |||||||||||
|
| |||||||||||||||||
Ghana - 0.24% | ||||||||||||||||||
Republic of Ghana | USD | 8.500 | % | 10/04/2017 | 2,498,000 | 2,782,147 | (4) | |||||||||||
|
| |||||||||||||||||
Greece - 0.05% | ||||||||||||||||||
Hellenic Republic Government Bond: | ||||||||||||||||||
| EUR | 2.000 | % | 02/24/2023 | 203,730 | 37,658 | (5) | ||||||||||||
| EUR | 2.000 | % | 02/24/2024 | 203,730 | 34,526 | (5) | ||||||||||||
| EUR | 2.000 | % | 02/24/2025 | 203,730 | 33,160 | (5) | ||||||||||||
| EUR | 2.000 | % | 02/24/2026 | 203,730 | 32,162 | (5) | ||||||||||||
| EUR | 2.000 | % | 02/24/2027 | 203,730 | 31,758 | (5) | ||||||||||||
| EUR | 2.000 | % | 02/24/2028 | 217,312 | 33,377 | (5) | ||||||||||||
| EUR | 2.000 | % | 02/24/2029 | 217,312 | 32,989 | (5) | ||||||||||||
| EUR | 2.000 | % | 02/24/2030 | 217,312 | 32,690 | (5) | ||||||||||||
| EUR | 2.000 | % | 02/24/2031 | 217,312 | 32,500 | (5) | ||||||||||||
| EUR | 2.000 | % | 02/24/2032 | 217,312 | 32,165 | (5) | ||||||||||||
| EUR | 2.000 | % | 02/24/2033 | 217,312 | 31,654 | (5) | ||||||||||||
| EUR | 2.000 | % | 02/24/2034 | 217,312 | 31,488 | (5) | ||||||||||||
| EUR | 2.000 | % | 02/24/2035 | 217,312 | 31,343 | (5) | ||||||||||||
| EUR | 2.000 | % | 02/24/2036 | 217,312 | 31,216 | (5) | ||||||||||||
| EUR | 2.000 | % | 02/24/2037 | 217,312 | 31,126 | (5) | ||||||||||||
| EUR | 2.000 | % | 02/24/2038 | 217,312 | 31,104 | (5) | ||||||||||||
| EUR | 2.000 | % | 02/24/2039 | 217,312 | 31,093 | (5) | ||||||||||||
| EUR | 2.000 | % | 02/24/2040 | 217,312 | 31,066 | (5) | ||||||||||||
| EUR | 2.000 | % | 02/24/2041 | 217,312 | 31,066 | (5) | ||||||||||||
| EUR | 2.000 | % | 02/24/2042 | 217,312 | 31,063 | (5) | ||||||||||||
|
| |||||||||||||||||
| 645,204 | ||||||||||||||||||
|
| |||||||||||||||||
Hungary - 1.11% | ||||||||||||||||||
Republic of Hungary: | ||||||||||||||||||
| EUR | 4.500 | % | 01/29/2014 | 2,326,000 | 2,766,462 | |||||||||||||
| GBP | 5.500 | % | 05/06/2014 | 194,000 | 284,878 | |||||||||||||
| GBP | 5.000 | % | 03/30/2016 | 668,000 | 911,223 | |||||||||||||
| EUR | 3.500 | % | 07/18/2016 | 4,928,000 | 5,198,521 | |||||||||||||
| EUR | 4.375 | % | 07/04/2017 | 2,798,000 | 2,942,946 | |||||||||||||
| EUR | 5.750 | % | 06/11/2018 | 961,000 | 1,046,432 | |||||||||||||
|
| |||||||||||||||||
| 13,150,462 | ||||||||||||||||||
|
| |||||||||||||||||
Indonesia - 2.80% | ||||||||||||||||||
Republic of Indonesia: | ||||||||||||||||||
| USD | 6.875 | % | 01/17/2018 | 1,278,000 | 1,490,467 | (4) | ||||||||||||
| USD | 11.625 | % | 03/04/2019 | 2,170,000 | 3,130,225 | (1) | ||||||||||||
| USD | 11.625 | % | 03/04/2019 | 9,333,000 | 13,462,853 | (4) | ||||||||||||
| USD | 5.875 | % | 03/13/2020 | 2,977,000 | 3,326,797 | (4) | ||||||||||||
| USD | 6.625 | % | 02/17/2037 | 2,050,000 | 2,398,500 | (4) | ||||||||||||
| USD | 6.625 | % | 02/17/2037 | 2,597,000 | 3,038,490 | (1) | ||||||||||||
See Notes to Financial Statements.
Stone Harbor Investment Funds Annual Report | May 31, 2012 | 17 |
Table of Contents
Stone Harbor Emerging Markets Debt Fund | Statements of Investments | |
| May 31, 2012 |
Currency | Rate | Maturity Date | Principal Amount* | Market Value | ||||||||||||||
Indonesia (continued) | ||||||||||||||||||
Republic of Indonesia (continued) | ||||||||||||||||||
| USD | 7.750 | % | 01/17/2038 | 4,807,000 | $ | 6,333,223 | (4) | |||||||||||
|
| |||||||||||||||||
| 33,180,555 | ||||||||||||||||||
|
| |||||||||||||||||
Iraq - 2.28% | ||||||||||||||||||
Republic of Iraq | USD | 5.800 | % | 01/15/2028 | 34,553,000 | 26,951,340 | (4) | |||||||||||
|
| |||||||||||||||||
Lithuania - 2.08% | ||||||||||||||||||
Republic of Lithuania: | ||||||||||||||||||
| USD | 7.375 | % | 02/11/2020 | 503,000 | 573,106 | (4) | ||||||||||||
| USD | 6.125 | % | 03/09/2021 | 17,443,000 | 18,358,757 | (4) | ||||||||||||
| USD | 6.625 | % | 02/01/2022 | 2,622,000 | 2,844,870 | (1) | ||||||||||||
| USD | 6.625 | % | 02/01/2022 | 2,660,000 | 2,886,100 | (4) | ||||||||||||
|
| |||||||||||||||||
| 24,662,833 | ||||||||||||||||||
|
| |||||||||||||||||
Mexico - 6.16% | ||||||||||||||||||
Mexican Bonos: | ||||||||||||||||||
| MXN | 7.750 | % | 12/14/2017 | 34,840,000 | 2,723,807 | |||||||||||||
| MXN | 6.500 | % | 06/10/2021 | 98,770,000 | 7,149,141 | |||||||||||||
| MXN | 7.500 | % | 06/03/2027 | 10,000,000 | 748,422 | |||||||||||||
United Mexican States: | ||||||||||||||||||
| USD | 5.125 | % | 01/15/2020 | 8,292,000 | 9,473,610 | |||||||||||||
| USD | 8.000 | % | 09/24/2022 | 2,012,000 | 2,766,500 | |||||||||||||
| USD | 8.300 | % | 08/15/2031 | 6,157,000 | 9,204,715 | |||||||||||||
| USD | 7.500 | % | 04/08/2033 | 2,442,000 | 3,418,800 | |||||||||||||
| USD | 6.750 | % | 09/27/2034 | 5,010,000 | 6,538,050 | |||||||||||||
| USD | 6.050 | % | 01/11/2040 | 11,172,000 | 13,532,085 | |||||||||||||
| USD | 5.750 | % | 10/12/2110 | 16,276,000 | 17,333,940 | |||||||||||||
|
| |||||||||||||||||
| 72,889,070 | ||||||||||||||||||
|
| |||||||||||||||||
Panama - 3.58% | ||||||||||||||||||
Republic of Panama: | ||||||||||||||||||
| USD | 5.200 | % | 01/30/2020 | 8,552,000 | 9,813,420 | |||||||||||||
| USD | 9.375 | % | 01/16/2023 | 25,000 | 35,500 | |||||||||||||
| USD | 7.125 | % | 01/29/2026 | 967,000 | 1,295,780 | |||||||||||||
| USD | 8.875 | % | 09/30/2027 | 5,002,000 | 7,653,060 | |||||||||||||
| USD | 9.375 | % | 04/01/2029 | 11,762,000 | 18,936,820 | |||||||||||||
| USD | 8.125 | % | 04/28/2034 | 764,000 | 1,061,960 | |||||||||||||
| USD | 6.700 | % | 01/26/2036 | 2,792,000 | 3,629,600 | |||||||||||||
|
| |||||||||||||||||
| 42,426,140 | ||||||||||||||||||
|
| |||||||||||||||||
Peru - 1.95% | ||||||||||||||||||
Republic of Peru: | ||||||||||||||||||
| USD | 8.750 | % | 11/21/2033 | 5,990,000 | 9,464,200 | |||||||||||||
| USD | 5.625 | % | 11/18/2050 | 11,897,000 | 13,651,807 | |||||||||||||
|
| |||||||||||||||||
| 23,116,007 | ||||||||||||||||||
|
| |||||||||||||||||
Philippines - 2.31% | ||||||||||||||||||
Republic of Philippines: | ||||||||||||||||||
| USD | 6.500 | % | 01/20/2020 | 2,697,000 | 3,278,541 | |||||||||||||
| USD | 10.625 | % | 03/16/2025 | 1,109,000 | 1,791,035 | |||||||||||||
| USD | 5.500 | % | 03/30/2026 | 2,002,000 | 2,302,300 | |||||||||||||
See Notes to Financial Statements.
18 | www.shiplp.com |
Table of Contents
Stone Harbor Emerging Markets Debt Fund | Statements of Investments | |
| May 31, 2012 |
Currency | Rate | Maturity Date | Principal Amount* | Market Value | ||||||||||||||
Philippines (continued) | ||||||||||||||||||
Republic of Philippines (continued) | ||||||||||||||||||
| USD | 9.500 | % | 02/02/2030 | 8,226,000 | $ | 12,940,526 | ||||||||||||
| USD | 7.750 | % | 01/14/2031 | 4,590,000 | 6,308,381 | |||||||||||||
| USD | 6.375 | % | 01/15/2032 | 520,000 | 634,075 | |||||||||||||
| USD | 6.375 | % | 10/23/2034 | 116,000 | 142,970 | |||||||||||||
|
| |||||||||||||||||
| 27,397,828 | ||||||||||||||||||
|
| |||||||||||||||||
Poland - 4.56% | ||||||||||||||||||
Republic of Poland: | ||||||||||||||||||
| USD | 6.375 | % | 07/15/2019 | 20,710,000 | 23,842,388 | |||||||||||||
| EUR | 4.200 | % | 04/15/2020 | 6,630,000 | 8,550,964 | |||||||||||||
| EUR | 4.000 | % | 03/23/2021 | 665,000 | 843,471 | |||||||||||||
| USD | 5.125 | % | 04/21/2021 | 8,058,000 | 8,551,553 | |||||||||||||
| USD | 5.000 | % | 03/23/2022 | 11,685,000 | 12,210,825 | |||||||||||||
|
| |||||||||||||||||
| 53,999,201 | ||||||||||||||||||
|
| |||||||||||||||||
Qatar - 1.94% | ||||||||||||||||||
State of Qatar: | ||||||||||||||||||
| USD | 6.550 | % | 04/09/2019 | 9,087,000 | 10,995,270 | (4) | ||||||||||||
| USD | 5.250 | % | 01/20/2020 | 5,230,000 | 5,909,900 | (4) | ||||||||||||
| USD | 6.400 | % | 01/20/2040 | 3,117,000 | 3,787,155 | (4) | ||||||||||||
| USD | 5.750 | % | 01/20/2042 | 2,055,000 | 2,304,169 | (4) | ||||||||||||
|
| |||||||||||||||||
| 22,996,494 | ||||||||||||||||||
|
| |||||||||||||||||
Romania - 0.09% | ||||||||||||||||||
Romania | USD | 6.750 | % | 2/7/2022 | 1,110,000 | 1,113,469 | (1) | |||||||||||
|
| |||||||||||||||||
Russia - 7.25% | ||||||||||||||||||
Russian Federation: | ||||||||||||||||||
| USD | 11.000 | % | 07/24/2018 | 437,000 | 606,337 | (4) | ||||||||||||
| USD | 5.000 | % | 04/29/2020 | 500,000 | 532,813 | (4) | ||||||||||||
| USD | 12.750 | % | 06/24/2028 | 6,139,000 | 10,796,966 | (4) | ||||||||||||
| USD | 7.500 | % | 03/31/2030 | 62,702,402 | 73,832,079 | (4)(5) | ||||||||||||
|
| |||||||||||||||||
| 85,768,195 | ||||||||||||||||||
|
| |||||||||||||||||
Slovakia - 0.72% | ||||||||||||||||||
Republic of Slovakia | USD | 4.375 | % | 05/21/2022 | 8,831,000 | 8,499,838 | (1) | |||||||||||
|
| |||||||||||||||||
South Africa - 2.80% | ||||||||||||||||||
Republic of South Africa: | ||||||||||||||||||
| USD | 6.875 | % | 05/27/2019 | 3,141,000 | 3,780,979 | |||||||||||||
| USD | 5.500 | % | 03/09/2020 | 7,373,000 | 8,266,976 | |||||||||||||
| USD | 5.875 | % | 05/30/2022 | 8,140,000 | 9,330,475 | |||||||||||||
| USD | 4.665 | % | 01/17/2024 | 7,999,000 | 8,248,969 | |||||||||||||
| USD | 6.250 | % | 03/08/2041 | 3,031,000 | 3,565,214 | |||||||||||||
|
| |||||||||||||||||
| 33,192,613 | ||||||||||||||||||
|
| |||||||||||||||||
Turkey - 4.27% | ||||||||||||||||||
Republic of Turkey: | ||||||||||||||||||
| USD | 7.000 | % | 09/26/2016 | 159,000 | 177,683 | |||||||||||||
| TRY | 9.000 | % | 03/08/2017 | 6,990,000 | 3,737,246 | |||||||||||||
| USD | 6.750 | % | 04/03/2018 | 5,293,000 | 5,888,462 | |||||||||||||
See Notes to Financial Statements.
Stone Harbor Investment Funds Annual Report | May 31, 2012 | 19 |
Table of Contents
Stone Harbor Emerging Markets Debt Fund | Statements of Investments | |
| May 31, 2012 |
Currency | Rate | Maturity Date | Principal Amount* | Market Value | ||||||||||||||
Turkey (continued) | ||||||||||||||||||
Republic of Turkey (continued) | ||||||||||||||||||
| USD | 7.000 | % | 03/11/2019 | 135,000 | $ | 153,225 | ||||||||||||
| USD | 7.500 | % | 11/07/2019 | 16,848,000 | 19,691,100 | |||||||||||||
| USD | 7.000 | % | 06/05/2020 | 372,000 | 422,220 | |||||||||||||
| USD | 5.625 | % | 03/30/2021 | 1,053,000 | 1,096,436 | |||||||||||||
| USD | 5.125 | % | 03/25/2022 | 4,992,000 | 4,948,320 | |||||||||||||
| USD | 6.250 | % | 09/26/2022 | 7,981,000 | 8,549,646 | |||||||||||||
| USD | 7.375 | % | 02/05/2025 | 1,820,000 | 2,133,950 | |||||||||||||
| USD | 6.875 | % | 03/17/2036 | 2,000,000 | 2,205,000 | |||||||||||||
| USD | 7.250 | % | 03/05/2038 | 1,285,000 | 1,487,388 | |||||||||||||
|
| |||||||||||||||||
| 50,490,676 | ||||||||||||||||||
|
| |||||||||||||||||
Ukraine - 1.82% | ||||||||||||||||||
Ukraine Government: | ||||||||||||||||||
| USD | 6.385 | % | 06/26/2012 | 6,505,000 | 6,513,131 | (4) | ||||||||||||
| USD | 7.650 | % | 06/11/2013 | 6,064,000 | 5,919,980 | (4) | ||||||||||||
| USD | 6.875 | % | 09/23/2015 | 208,000 | 189,280 | (4) | ||||||||||||
| USD | 6.875 | % | 09/23/2015 | 1,723,000 | 1,567,930 | (1) | ||||||||||||
| USD | 6.250 | % | 06/17/2016 | 935,000 | 813,450 | (4) | ||||||||||||
| USD | 6.250 | % | 06/17/2016 | 2,600,000 | 2,262,000 | (1) | ||||||||||||
| USD | 6.750 | % | 11/14/2017 | 4,950,000 | 4,275,563 | (4) | ||||||||||||
|
| |||||||||||||||||
| 21,541,334 | ||||||||||||||||||
|
| |||||||||||||||||
Uruguay - 1.66% | ||||||||||||||||||
Republic of Uruguay: | ||||||||||||||||||
| USD | 9.250 | % | 05/17/2017 | 3,467,000 | 4,593,775 | |||||||||||||
| USD | 8.000 | % | 11/18/2022 | 3,972,497 | 5,422,459 | |||||||||||||
| USD | 6.875 | % | 09/28/2025 | 1,448,650 | 1,861,515 | |||||||||||||
| USD | 7.875 | % | 01/15/2033 | 1,390,800 | 1,919,304 | (6) | ||||||||||||
| USD | 7.625 | % | 03/21/2036 | 4,257,176 | 5,842,974 | |||||||||||||
|
| |||||||||||||||||
| 19,640,027 | ||||||||||||||||||
|
| |||||||||||||||||
Venezuela - 0.30% | ||||||||||||||||||
Republic of Venezuela: | ||||||||||||||||||
| USD | 8.500 | % | 10/08/2014 | 2,015,000 | 1,972,181 | |||||||||||||
| USD | 13.625 | % | 08/15/2018 | 1,669,000 | 1,627,275 | (4) | ||||||||||||
|
| |||||||||||||||||
| 3,599,456 | ||||||||||||||||||
|
| |||||||||||||||||
TOTAL SOVEREIGN DEBT OBLIGATIONS | 730,418,737 | |||||||||||||||||
|
| |||||||||||||||||
(Cost $725,420,390) | ||||||||||||||||||
BANK LOANS - 0.26%(7) | ||||||||||||||||||
Brazil - 0.07% | ||||||||||||||||||
Virgolino de Oliveira - GVO Loan | USD | 5.273 | % | 03/11/2015 | 823,529 | 788,529 | ||||||||||||
|
| |||||||||||||||||
See Notes to Financial Statements.
20 | www.shiplp.com |
Table of Contents
Stone Harbor Emerging Markets Debt Fund | Statements of Investments | |
| May 31, 2012 |
Currency | Rate | Maturity Date | Principal Amount* | Market Value | ||||||||||||||
Indonesia - 0.19% | ||||||||||||||||||
PT Bumi Resources | USD | 11.250 | % | 08/07/2013 | 1,337,000 | $ | 1,374,436 | |||||||||||
PT Bumi Tranche A | USD | 15.000 | % | 01/18/2013 | 577,486 | 519,737 | ||||||||||||
PT Bumi Tranche B | USD | 15.000 | % | 01/18/2013 | 460,908 | 414,817 | ||||||||||||
|
| |||||||||||||||||
| 2,308,990 | ||||||||||||||||||
|
| |||||||||||||||||
TOTAL BANK LOANS | 3,097,519 | |||||||||||||||||
|
| |||||||||||||||||
(Cost $3,195,400) | ||||||||||||||||||
CORPORATE BONDS - 27.19% | ||||||||||||||||||
Argentina - 0.20% | ||||||||||||||||||
Capex SA | USD | 10.000 | % | 03/10/2018 | 1,642,000 | 1,083,720 | (1) | |||||||||||
Empresa Distribuidora Y Comercializadora Norte: | ||||||||||||||||||
| USD | 9.750 | % | 10/25/2022 | 500,000 | 205,000 | (4) | ||||||||||||
| USD | 9.750 | % | 10/25/2022 | 1,362,000 | 558,420 | (1) | ||||||||||||
Inversiones y Representaciones SA | USD | 11.500 | % | 07/20/2020 | 636,000 | 569,633 | (1) | |||||||||||
|
| |||||||||||||||||
| 2,416,773 | ||||||||||||||||||
|
| |||||||||||||||||
Barbados - 0.13% | ||||||||||||||||||
Columbus International, Inc. | USD | 11.500 | % | 11/20/2014 | 1,500,000 | 1,560,000 | (4) | |||||||||||
|
| |||||||||||||||||
Brazil - 2.59% | ||||||||||||||||||
Banco Cruzeiro do Sul SA: | ||||||||||||||||||
| USD | 8.875 | % | 09/22/2020 | 1,184,000 | 793,280 | (1) | ||||||||||||
| USD | 8.875 | % | 09/22/2020 | 1,200,000 | 804,000 | (4) | ||||||||||||
BM&FBovespa SA: | ||||||||||||||||||
| USD | 5.500 | % | 07/16/2020 | 842,000 | 886,205 | (1) | ||||||||||||
| USD | 5.500 | % | 07/16/2020 | 1,400,000 | 1,473,500 | (4) | ||||||||||||
BR Malls International Finance Ltd.: | ||||||||||||||||||
| USD | 8.500 | % | 01/21/2049 | 260,000 | 267,800 | (4) | ||||||||||||
| USD | 8.500 | % | 01/21/2049 | 482,000 | 496,460 | (1) | ||||||||||||
BR Properties SA | USD | 9.000 | % | 10/07/2015 | 310,000 | 320,075 | (1) | |||||||||||
Braskem Finance Ltd. | USD | 7.375 | % | 10/29/2049 | 1,200,000 | 1,185,000 | (1) | |||||||||||
General Shopping Finance Ltd.: | ||||||||||||||||||
| USD | 10.000 | % | 11/09/2015 | 1,824,000 | 1,732,800 | (1) | ||||||||||||
| USD | 10.000 | % | 11/09/2049 | 246,000 | 233,700 | (4) | ||||||||||||
Globo Comunicacao e Participacoes SA | USD | 6.250 | % | 07/20/2049 | 825,000 | 882,750 | (4)(5) | |||||||||||
Hypermarcas SA | USD | 6.500 | % | 04/20/2021 | 2,049,000 | 1,905,570 | (1) | |||||||||||
Itau Unibanco Holding SA | USD | 5.650 | % | 03/19/2022 | 1,158,000 | 1,137,735 | (1) | |||||||||||
Minerva Luxembourg SA | USD | 12.250 | % | 02/10/2022 | 200,000 | 197,000 | (1) | |||||||||||
Minerva Overseas II Ltd.: | ||||||||||||||||||
| USD | 10.875 | % | 11/15/2019 | 538,000 | 521,860 | (4) | ||||||||||||
| USD | 10.875 | % | 11/15/2019 | 633,000 | 614,010 | (1) | ||||||||||||
Mirabela Nickel Ltd. | USD | 8.750 | % | 04/15/2018 | 392,000 | 284,200 | (1) | |||||||||||
NET Servicos de Comunicacao SA | USD | 7.500 | % | 01/27/2020 | 2,802,000 | 3,194,280 | ||||||||||||
Odebrecht Drilling Norbe VIII/IX Ltd.: | ||||||||||||||||||
| USD | 6.350 | % | 06/30/2021 | 382,200 | 394,621 | (4) | ||||||||||||
| USD | 6.350 | % | 06/30/2021 | 686,980 | 709,307 | (1) | ||||||||||||
Odebrecht Finance Ltd. | USD | 7.000 | % | 04/21/2020 | 350,000 | 383,250 | (4) | |||||||||||
OGX Austria GmbH: | ||||||||||||||||||
| USD | 8.500 | % | 06/01/2018 | 2,056,000 | 1,989,180 | (1) | ||||||||||||
| USD | 8.375 | % | 04/01/2022 | 1,466,000 | 1,392,700 | (1) | ||||||||||||
See Notes to Financial Statements.
Stone Harbor Investment Funds Annual Report | May 31, 2012 | 21 |
Table of Contents
Stone Harbor Emerging Markets Debt Fund | Statements of Investments | |
| May 31, 2012 |
Currency | Rate | Maturity Date | Principal Amount* | Market Value | ||||||||||||||
Brazil (continued) | ||||||||||||||||||
Petrobras International Finance Co. | ||||||||||||||||||
| USD | 2.875 | % | 02/06/2015 | 700,000 | 709,361 | |||||||||||||
| USD | 5.375 | % | 01/27/2021 | 430,000 | $ | 461,045 | ||||||||||||
QGOG Atlantic / Alaskan Rigs Ltd. | USD | 5.250 | % | 07/30/2018 | 2,231,844 | 2,209,525 | (1) | |||||||||||
Schahin II Finance Co. SPV Ltd. | USD | 5.875 | % | 09/25/2022 | 1,970,000 | 1,935,525 | (1) | |||||||||||
Telemar Norte Leste SA | USD | 5.500 | % | 10/23/2020 | 2,212,000 | 2,189,880 | (1) | |||||||||||
Virgolino de Oliveira Finance Ltd.: | ||||||||||||||||||
| USD | 10.500 | % | 01/28/2018 | 617,000 | 493,600 | (4) | ||||||||||||
| USD | 11.750 | % | 02/09/2022 | 500,000 | 400,000 | (1) | ||||||||||||
Votorantim Cimentos SA | USD | 7.250 | % | 04/05/2041 | 500,000 | 491,250 | (1) | |||||||||||
|
| |||||||||||||||||
| 30,689,469 | ||||||||||||||||||
|
| |||||||||||||||||
Chile - 0.96% | ||||||||||||||||||
Banco del Estado de Chile | USD | 3.875 | % | 02/08/2022 | 3,277,000 | 3,360,953 | (1) | |||||||||||
Cencosud SA | USD | 5.500 | % | 01/20/2021 | 2,000,000 | 2,103,492 | (1) | |||||||||||
Codelco, Inc.: | ||||||||||||||||||
| USD | 7.500 | % | 01/15/2019 | 450,000 | 576,571 | (4) | ||||||||||||
| USD | 6.150 | % | 10/24/2036 | 4,295,000 | 5,357,257 | (4) | ||||||||||||
|
| |||||||||||||||||
| 11,398,273 | ||||||||||||||||||
|
| |||||||||||||||||
China - 1.45% | ||||||||||||||||||
Central China Real Estate Ltd. | USD | 12.250 | % | 10/20/2015 | 200,000 | 204,500 | (4) | |||||||||||
China Liansu Group Holdings Ltd. | USD | 7.875 | % | 05/13/2016 | 1,268,000 | 1,141,200 | (1) | |||||||||||
China Overseas Finance Cayman IV Ltd. | USD | 4.875 | % | 02/15/2017 | 500,000 | 514,825 | ||||||||||||
ENN Energy Holdings Ltd. | USD | 6.000 | % | 05/13/2021 | 200,000 | 203,042 | (4) | |||||||||||
Evergrande Real Estate Group Ltd.: | ||||||||||||||||||
| USD | 13.000 | % | 01/27/2015 | 106,000 | 101,230 | (1) | ||||||||||||
| USD | 13.000 | % | 01/27/2015 | 666,000 | 636,030 | (4) | ||||||||||||
Kaisa Group Holdings Ltd. | USD | 13.500 | % | 04/28/2015 | 549,000 | 514,688 | (4) | |||||||||||
Mega Advance Investments Ltd. | USD | 5.000 | % | 05/12/2021 | 1,161,000 | 1,213,733 | (1) | |||||||||||
MIE Holdings Corp. | USD | 9.750 | % | 05/12/2016 | 1,586,000 | 1,534,455 | (1) | |||||||||||
Sinochem Overseas Capital Co. Ltd. | USD | 4.500 | % | 11/12/2020 | 4,384,000 | 4,352,065 | (1) | |||||||||||
Sinopec Group Overseas Development 2012 Ltd. | USD | 4.875 | % | 05/17/2042 | 2,340,000 | 2,381,418 | (1) | |||||||||||
Tencent Holdings Ltd. | USD | 4.625 | % | 12/12/2016 | 1,200,000 | 1,218,666 | (1) | |||||||||||
Texhong Textile Group Ltd.: | ||||||||||||||||||
| USD | 7.625 | % | 01/19/2016 | 343,000 | 273,543 | (1) | ||||||||||||
| USD | 7.625 | % | 01/19/2016 | 858,000 | 684,255 | (4) | ||||||||||||
West China Cement Ltd. | USD | 7.500 | % | 01/25/2016 | 824,000 | 714,820 | (4) | |||||||||||
Yancoal International Resources Development Co. Ltd. | USD | 5.730 | % | 05/16/2022 | 1,519,000 | 1,471,683 | (1) | |||||||||||
|
| |||||||||||||||||
| 17,160,153 | ||||||||||||||||||
|
| |||||||||||||||||
Colombia - 0.66% | ||||||||||||||||||
Bancolombia SA | USD | 5.950 | % | 06/03/2021 | 1,000,000 | 1,040,000 | ||||||||||||
Empresa de Energia de Bogota SA | USD | 6.125 | % | 11/10/2021 | 1,900,000 | 1,971,250 | (1) | |||||||||||
Grupo Aval Ltd. | USD | 5.250 | % | 02/01/2017 | 1,000,000 | 1,030,000 | (1) | |||||||||||
Gruposura Finance | USD | 5.700 | % | 05/18/2021 | 2,113,000 | 2,171,107 | (1) | |||||||||||
Transportadora de Gas Internacional SA ESP | USD | 5.700 | % | 03/20/2022 | 1,500,000 | 1,537,500 | (1) | |||||||||||
|
| |||||||||||||||||
| 7,749,857 | ||||||||||||||||||
|
| |||||||||||||||||
Dominican Republic - 0.04% | ||||||||||||||||||
Cap Cana SA: | ||||||||||||||||||
| USD | 10.000 | % | 04/30/2016 | 1,103,320 | 275,830 | (2)(4)(8) | ||||||||||||
See Notes to Financial Statements.
22 | www.shiplp.com |
Table of Contents
Stone Harbor Emerging Markets Debt Fund | Statements of Investments | |
| May 31, 2012 |
Currency | Rate | Maturity Date | Principal Amount* | Market Value | ||||||||||||||
Dominican Republic (continued) | ||||||||||||||||||
Cap Cana SA (continued) | ||||||||||||||||||
| USD | 10.000 | % | 04/30/2016 | 1,343,373 | $ | 201,506 | (2)(4)(8) | |||||||||||
|
| |||||||||||||||||
| 477,336 | ||||||||||||||||||
|
| |||||||||||||||||
Hong Kong - 0.64% | ||||||||||||||||||
Hutchison Whampoa International 10 Ltd. | USD | 6.000 | % | 10/28/2049 | 1,757,000 | 1,765,785 | (3)(4) | |||||||||||
Hutchison Whampoa International 11 Ltd. | USD | 4.625 | % | 01/13/2022 | 1,500,000 | 1,546,327 | (1) | |||||||||||
PCCW - HKT Capital No. 4 Ltd. | USD | 4.250 | % | 02/24/2016 | 2,299,000 | 2,364,981 | ||||||||||||
Swire Pacific MTN Financing Ltd. | USD | 4.500 | % | 02/28/2022 | 1,800,000 | 1,835,010 | ||||||||||||
|
| |||||||||||||||||
| 7,512,103 | ||||||||||||||||||
|
| |||||||||||||||||
India - 0.34% | ||||||||||||||||||
Axis Bank Ltd. | USD | 7.125 | % | 06/28/2022 | 209,000 | 188,100 | (3) | |||||||||||
Bank of India | USD | 6.994 | % | 03/03/2049 | 344,000 | 294,120 | (3) | |||||||||||
ICICI Bank Ltd.: | ||||||||||||||||||
| USD | 5.750 | % | 11/16/2020 | 200,000 | 195,390 | (4) | ||||||||||||
| USD | 5.750 | % | 11/16/2020 | 508,000 | 496,291 | (1) | ||||||||||||
Reliance Holdings USA, Inc. | USD | 5.400 | % | 02/14/2022 | 1,000,000 | 981,250 | (1) | |||||||||||
Vedanta Resources PLC: | ||||||||||||||||||
| USD | 9.500 | % | 07/18/2018 | 800,000 | 766,000 | (4) | ||||||||||||
| USD | 8.250 | % | 06/07/2021 | 1,263,000 | 1,095,652 | (1) | ||||||||||||
|
| |||||||||||||||||
| 4,016,803 | ||||||||||||||||||
|
| |||||||||||||||||
Indonesia - 0.59% | ||||||||||||||||||
Bakrie Telecom Pte. Ltd. | USD | 11.500 | % | 05/07/2015 | 1,805,000 | 1,263,500 | (4) | |||||||||||
Berau Coal Energy Tbk PT | USD | 7.250 | % | 03/13/2017 | 865,000 | 830,400 | (1) | |||||||||||
BLT Finance BV | USD | 7.500 | % | 05/15/2014 | 644,000 | 141,680 | (4) | |||||||||||
Bumi Capital Pte Ltd. | USD | 12.000 | % | 11/10/2016 | 1,200,000 | 1,251,000 | (4) | |||||||||||
Indosat Palapa Co. BV: | ||||||||||||||||||
| USD | 7.375 | % | 07/29/2020 | 241,000 | 260,280 | (1) | ||||||||||||
| USD | 7.375 | % | 07/29/2020 | 550,000 | 594,000 | (4) | ||||||||||||
Listrindo Capital BV | USD | 6.950 | % | 02/21/2019 | 861,000 | 869,610 | (1) | |||||||||||
PT Adaro Indonesia | USD | 7.625 | % | 10/22/2019 | 1,617,000 | 1,718,063 | (4) | |||||||||||
|
| |||||||||||||||||
| 6,928,533 | ||||||||||||||||||
|
| |||||||||||||||||
Jamaica - 0.38% | ||||||||||||||||||
Digicel Group Ltd.: | ||||||||||||||||||
| USD | 8.875 | % | 01/15/2015 | 1,000,000 | 990,000 | (4) | ||||||||||||
| USD | 9.125 | % | 01/15/2015 | 1,378,000 | 1,364,220 | (1) | ||||||||||||
| USD | 8.250 | % | 09/01/2017 | 660,000 | 669,900 | (4) | ||||||||||||
| USD | 10.500 | % | 04/15/2018 | 1,450,000 | 1,493,500 | (4) | ||||||||||||
|
| |||||||||||||||||
| 4,517,620 | ||||||||||||||||||
|
| |||||||||||||||||
Kazakhstan - 3.02% | ||||||||||||||||||
BTA Bank JSC: | ||||||||||||||||||
| USD | 10.750 | % | 07/01/2018 | 1,159,562 | 208,721 | (1)(2) | ||||||||||||
| USD | 10.750 | % | 07/01/2018 | 4,949,274 | 890,870 | (2)(4) | ||||||||||||
| USD | 0.000 | % | 07/01/2020 | 500,000 | 42,500 | (4)(9) | ||||||||||||
| USD | 0.000 | % | 07/01/2020 | 2,515,532 | 213,820 | (1)(9) | ||||||||||||
KazMunayGas National Co.: | ||||||||||||||||||
| USD | 8.375 | % | 07/02/2013 | 10,747,000 | 11,297,784 | (4) | ||||||||||||
| USD | 11.750 | % | 01/23/2015 | 8,305,000 | 9,799,900 | (4) | ||||||||||||
See Notes to Financial Statements.
Stone Harbor Investment Funds Annual Report | May 31, 2012 | 23 |
Table of Contents
Stone Harbor Emerging Markets Debt Fund | Statements of Investments | |
| May 31, 2012 |
Currency | Rate | Maturity Date | Principal Amount* | Market Value | ||||||||||||||
Kazakhstan (continued) | ||||||||||||||||||
KazMunayGas National Co. (continued) | ||||||||||||||||||
| USD | 9.125 | % | 07/02/2018 | 1,158,000 | $ | 1,392,495 | (1) | |||||||||||
| USD | 7.000 | % | 05/05/2020 | 739,000 | 809,205 | (1) | ||||||||||||
| USD | 7.000 | % | 05/05/2020 | 5,615,000 | 6,148,425 | (4) | ||||||||||||
| USD | 6.375 | % | 04/09/2021 | 2,538,000 | 2,693,452 | (1) | ||||||||||||
Zhaikmunai LLP: | ||||||||||||||||||
| USD | 10.500 | % | 10/19/2015 | 1,037,000 | 1,021,445 | (1) | ||||||||||||
| USD | 10.500 | % | 10/19/2015 | 1,275,000 | 1,255,875 | (4) | ||||||||||||
|
| |||||||||||||||||
| 35,774,492 | ||||||||||||||||||
|
| |||||||||||||||||
Malaysia - 2.36% | ||||||||||||||||||
Penerbangan Malaysia BHD | USD | 5.625 | % | 03/15/2016 | 1,195,000 | 1,332,963 | (4) | |||||||||||
Petroliam Nasional BHD: | ||||||||||||||||||
| USD | 7.750 | % | 08/15/2015 | 335,000 | 395,534 | (1) | ||||||||||||
| USD | 7.625 | % | 10/15/2026 | 840,000 | 1,195,698 | (4) | ||||||||||||
Petronas Capital Ltd. | USD | 7.875 | % | 05/22/2022 | 16,734,000 | 22,674,570 | (4) | |||||||||||
Petronas Global Sukuk Ltd. | USD | 4.250 | % | 08/12/2014 | 2,240,000 | 2,352,448 | (1) | |||||||||||
|
| |||||||||||||||||
| 27,951,213 | ||||||||||||||||||
|
| |||||||||||||||||
Mexico - 1.95% | ||||||||||||||||||
America Movil SAB de CV | USD | 2.375 | % | 09/08/2016 | 3,778,000 | 3,831,243 | ||||||||||||
Axtel SAB de CV: | ||||||||||||||||||
| USD | 7.625 | % | 02/01/2017 | 347,000 | 229,020 | (1) | ||||||||||||
| USD | 9.000 | % | 09/22/2019 | 1,171,000 | 772,860 | (4) | ||||||||||||
BBVA Bancomer SA | USD | 4.500 | % | 03/10/2016 | 585,000 | 579,150 | (4) | |||||||||||
Cemex Espana Luxembourg | USD | 9.250 | % | 05/12/2020 | 1,000,000 | 800,000 | (4) | |||||||||||
Cemex SAB de CV: | ||||||||||||||||||
| USD | 5.470 | % | 09/30/2015 | 921,000 | 766,733 | (1)(3) | ||||||||||||
| USD | 9.000 | % | 01/11/2018 | 530,000 | 442,550 | (4) | ||||||||||||
| USD | 9.000 | % | 01/11/2018 | 1,047,000 | 874,245 | (1) | ||||||||||||
Geo Maquinaria | USD | 9.625 | % | 05/02/2021 | 3,775,505 | 3,303,567 | (1) | |||||||||||
Grupo Bimbo SAB de CV | USD | 4.875 | % | 06/30/2020 | 183,000 | 201,307 | (1) | |||||||||||
Grupo Televisa SAB | USD | 6.000 | % | 05/12/2018 | 300,000 | 348,663 | ||||||||||||
Pemex Finance Ltd. | USD | 9.150 | % | 11/15/2018 | 1,250,000 | 1,520,086 | ||||||||||||
Pemex Project Funding Master Trust: | ||||||||||||||||||
| EUR | 5.500 | % | 02/24/2025 | 2,275,000 | 2,951,525 | (4) | ||||||||||||
| USD | 6.625 | % | 06/15/2035 | 3,034,000 | 3,443,590 | |||||||||||||
Telefonos de Mexico SAB de CV | USD | 5.500 | % | 11/15/2019 | 1,100,000 | 1,271,119 | ||||||||||||
Urbi Desarrollos Urbanos SAB de CV | USD | 10.576 | % | 01/21/2020 | 1,700,000 | 1,722,950 | (3) | |||||||||||
|
| |||||||||||||||||
| 23,058,608 | ||||||||||||||||||
|
| |||||||||||||||||
Mongolia - 0.18% | ||||||||||||||||||
Mongolian Mining Corp. | USD | 8.875 | % | 03/29/2017 | 2,195,000 | 2,145,613 | (1) | |||||||||||
|
| |||||||||||||||||
Nigeria - 0.08% | ||||||||||||||||||
Afren PLC | USD | 10.250 | % | 04/08/2019 | 964,000 | 978,460 | (1) | |||||||||||
|
| |||||||||||||||||
Peru - 0.34% | ||||||||||||||||||
Banco de Credito del Peru: | ||||||||||||||||||
| USD | 5.375 | % | 09/16/2020 | 500,000 | 507,500 | (4) | ||||||||||||
| USD | 5.375 | % | 09/16/2020 | 561,000 | 569,415 | (1) | ||||||||||||
See Notes to Financial Statements.
24 | www.shiplp.com |
Table of Contents
Stone Harbor Emerging Markets Debt Fund | Statements of Investments | |
| May 31, 2012 |
Currency | Rate | Maturity Date | Principal Amount* | Market Value | ||||||||||||||
Peru (continued) | ||||||||||||||||||
Inkia Energy Ltd. | USD | 8.375 | % | 04/04/2021 | 785,000 | $ | 824,250 | (1) | ||||||||||
Southern Copper Corp. | USD | 6.750 | % | 04/16/2040 | 1,167,000 | 1,230,244 | ||||||||||||
Volcan Cia Minera SAA | USD | 5.375 | % | 02/02/2022 | 836,000 | 850,630 | (1) | |||||||||||
|
| |||||||||||||||||
| 3,982,039 | ||||||||||||||||||
|
| |||||||||||||||||
Qatar - 0.54% | ||||||||||||||||||
Qtel International Finance Ltd.: | ||||||||||||||||||
| USD | 4.750 | % | 02/16/2021 | 567,000 | 593,933 | (1) | ||||||||||||
| USD | 4.750 | % | 02/16/2021 | 2,340,000 | 2,451,150 | (4) | ||||||||||||
| USD | 5.000 | % | 10/19/2025 | 955,000 | 983,650 | (1) | ||||||||||||
| USD | 5.000 | % | 10/19/2025 | 2,322,000 | 2,391,660 | (4) | ||||||||||||
|
| |||||||||||||||||
| 6,420,393 | ||||||||||||||||||
|
| |||||||||||||||||
Russia - 1.79% | ||||||||||||||||||
Alfa Bank OJSC Via Alfa Bond Issuance PLC: | ||||||||||||||||||
| USD | 7.875 | % | 09/25/2017 | 100,000 | 98,875 | (4) | ||||||||||||
| USD | 7.875 | % | 09/25/2017 | 658,000 | 650,598 | (1) | ||||||||||||
ALROSA Finance SA | USD | 7.750 | % | 11/03/2020 | 1,040,000 | 1,073,800 | (4) | |||||||||||
Evraz Group SA: | ||||||||||||||||||
| USD | 7.400 | % | 04/24/2017 | 700,000 | 682,500 | (1) | ||||||||||||
| USD | 6.750 | % | 04/27/2018 | 1,484,000 | 1,381,975 | (1) | ||||||||||||
Gazprom OAO Via Gaz Capital SA | USD | 9.250 | % | 04/23/2019 | 200,000 | 244,240 | (4) | |||||||||||
Metalloinvest Finance Ltd. | USD | 6.500 | % | 07/21/2016 | 1,937,000 | 1,893,418 | (1) | |||||||||||
MTS International Funding Ltd. | USD | 8.625 | % | 06/22/2020 | 800,000 | 884,000 | (4) | |||||||||||
Novatek Finance Ltd.: | ||||||||||||||||||
| USD | 5.326 | % | 02/03/2016 | 1,700,000 | 1,746,750 | (4) | ||||||||||||
| USD | 6.604 | % | 02/03/2021 | 2,392,000 | 2,556,450 | (1) | ||||||||||||
Sberbank of Russia Via SB Capital SA | USD | 6.125 | % | 02/07/2022 | 1,000,000 | 1,021,875 | (1) | |||||||||||
SCF Capital Ltd. | USD | 5.375 | % | 10/27/2017 | 2,170,000 | 2,028,950 | (1) | |||||||||||
Severstal OAO Via Steel Capital SA | USD | 6.700 | % | 10/25/2017 | 800,000 | 782,000 | (1) | |||||||||||
Vimpel Communications Holdings BV: | ||||||||||||||||||
| USD | 6.255 | % | 03/01/2017 | 830,000 | 767,750 | (4) | ||||||||||||
| USD | 7.504 | % | 03/01/2022 | 1,000,000 | 900,000 | (1) | ||||||||||||
Vimpel Communications Via VIP Finance Ireland Ltd. | ||||||||||||||||||
OJSC | USD | 7.748 | % | 02/02/2021 | 1,167,000 | 1,082,392 | (1) | |||||||||||
VTB Bank OJSC Via VTB Capital SA: | ||||||||||||||||||
| USD | 6.315 | % | 02/22/2018 | 2,317,000 | 2,325,688 | (4) | ||||||||||||
| USD | 6.250 | % | 06/30/2035 | 1,085,000 | 1,116,194 | (4) | ||||||||||||
|
| |||||||||||||||||
| 21,237,455 | ||||||||||||||||||
|
| |||||||||||||||||
Singapore - 0.15% | ||||||||||||||||||
PSA International Pte Ltd. | USD | 3.875 | % | 02/11/2021 | 100,000 | 105,640 | ||||||||||||
SingTel Group Treasury Pte Ltd. | USD | 4.500 | % | 09/08/2021 | 1,000,000 | 1,101,050 | ||||||||||||
STATS ChipPAC Ltd. | USD | 5.375 | % | 03/31/2016 | 510,000 | 522,750 | (1) | |||||||||||
|
| |||||||||||||||||
| 1,729,440 | ||||||||||||||||||
|
| |||||||||||||||||
South Africa - 0.59% | ||||||||||||||||||
Gold Fields Orogen Holding BVI Ltd. | USD | 4.875 | % | 10/07/2020 | 3,339,000 | 3,138,660 | (4) | |||||||||||
Myriad International Holding BV | USD | 6.375 | % | 07/28/2017 | 3,500,000 | 3,850,000 | (4) | |||||||||||
|
| |||||||||||||||||
| 6,988,660 | ||||||||||||||||||
|
| |||||||||||||||||
See Notes to Financial Statements.
Stone Harbor Investment Funds Annual Report | May 31, 2012 | 25 |
Table of Contents
Stone Harbor Emerging Markets Debt Fund | Statements of Investments | |
| May 31, 2012 |
Currency | Rate | Maturity Date | Principal | Market Value | ||||||||||||||
South Korea - 0.74% | ||||||||||||||||||
Export-Import Bank of Korea: | ||||||||||||||||||
| USD | 8.125 | % | 01/21/2014 | 2,447,000 | $ | 2,678,853 | ||||||||||||
| USD | 4.375 | % | 09/15/2021 | 1,913,000 | 1,990,955 | |||||||||||||
Korea Electric Power Corp. | USD | 3.000 | % | 10/05/2015 | 1,000,000 | 1,014,500 | (1) | |||||||||||
Korea Hydro & Nuclear Power Co. Ltd. | USD | 4.750 | % | 07/13/2021 | 1,200,000 | 1,293,960 | (4) | |||||||||||
Korea Western Power Co. Ltd. | USD | 3.125 | % | 05/10/2017 | 1,251,000 | 1,260,070 | (1) | |||||||||||
KT Corp. | USD | 3.875 | % | 01/20/2017 | 500,000 | 520,002 | ||||||||||||
|
| |||||||||||||||||
| 8,758,340 | ||||||||||||||||||
|
| |||||||||||||||||
Turkey - 0.24% | ||||||||||||||||||
Yuksel Insaat AS | USD | 9.500 | % | 11/10/2015 | 3,237,000 | 2,848,560 | (4) | |||||||||||
|
| |||||||||||||||||
Ukraine - 0.66% | ||||||||||||||||||
Ferrexpo Finance PLC | USD | 7.875 | % | 04/07/2016 | 1,947,000 | 1,752,300 | (1) | |||||||||||
Metinvest BV | USD | 8.750 | % | 02/14/2018 | 2,037,000 | 1,802,745 | (1) | |||||||||||
MHP SA | USD | 10.250 | % | 04/29/2015 | 1,005,000 | 949,725 | (4) | |||||||||||
Mriya Agro Holding PLC | USD | 10.950 | % | 03/30/2016 | 1,452,000 | 1,248,720 | (1) | |||||||||||
National JSC Naftogaz of Ukraine | USD | 9.500 | % | 09/30/2014 | 2,189,000 | 2,079,550 | ||||||||||||
|
| |||||||||||||||||
| 7,833,040 | ||||||||||||||||||
|
| |||||||||||||||||
United Arab Emirates - 1.26% | ||||||||||||||||||
Abu Dhabi National Energy Co. | USD | 6.250 | % | 09/16/2019 | 200,000 | 223,750 | (4) | |||||||||||
Dolphin Energy Ltd.: | ||||||||||||||||||
| USD | 5.888 | % | 06/15/2019 | 1,348,640 | 1,463,275 | (4) | ||||||||||||
| USD | 5.500 | % | 12/15/2021 | 780,000 | 844,350 | (1) | ||||||||||||
DP World Ltd. | USD | 6.850 | % | 07/02/2037 | 1,820,000 | 1,715,350 | (4) | |||||||||||
DP World Sukuk Ltd. | USD | 6.250 | % | 07/02/2017 | 2,990,000 | 3,146,975 | (4) | |||||||||||
Dubai Holding Commercial Operations MTN Ltd.: | ||||||||||||||||||
| EUR | 4.750 | % | 01/30/2014 | 350,000 | 398,155 | |||||||||||||
| GBP | 6.000 | % | 02/01/2017 | 1,950,000 | 2,464,360 | |||||||||||||
IPIC GMTN Ltd.: | ||||||||||||||||||
| USD | 3.750 | % | 03/01/2017 | 1,940,000 | 1,983,650 | (1) | ||||||||||||
| USD | 6.875 | % | 11/01/2041 | 1,400,000 | 1,512,000 | (1) | ||||||||||||
MAF SUKUK Ltd. | USD | 5.850 | % | 02/07/2017 | 1,100,000 | 1,157,750 | ||||||||||||
|
| |||||||||||||||||
| 14,909,615 | ||||||||||||||||||
|
| |||||||||||||||||
Venezuela - 5.31% | ||||||||||||||||||
Petroleos de Venezuela SA: | ||||||||||||||||||
| USD | 4.900 | % | 10/28/2014 | 62,038,680 | 53,663,458 | |||||||||||||
| USD | 5.000 | % | 10/28/2015 | 3,231,899 | 2,520,881 | (4) | ||||||||||||
| USD | 5.250 | % | 04/12/2017 | 4,331,000 | 2,972,149 | (4) | ||||||||||||
| USD | 8.500 | % | 11/02/2017 | 4,616,200 | 3,664,109 | (4) | ||||||||||||
|
| |||||||||||||||||
| 62,820,597 | ||||||||||||||||||
|
| |||||||||||||||||
TOTAL CORPORATE BONDS | 321,863,445 | |||||||||||||||||
|
| |||||||||||||||||
(Cost $326,182,401) | ||||||||||||||||||
PARTICIPATION NOTES - 0.88% | ||||||||||||||||||
Argentina - 0.09% | ||||||||||||||||||
Hidroelec el Chocon SA | USD | 8.061 | % | 03/01/2015 | 1,015,385 | 1,015,385 | ||||||||||||
|
| |||||||||||||||||
See Notes to Financial Statements.
26 | www.shiplp.com |
Table of Contents
| Stone Harbor Emerging Markets Debt Fund | Statements of Investments | |
| May 31, 2012 |
Currency | Rate | Maturity Date | Principal | Market Value | ||||||||||||||
Ukraine - 0.79% | ||||||||||||||||||
Ukreximbank Biz Finance PLC | USD | 8.375 | % | 04/27/2015 | 10,324,000 | $ | 9,343,220 | (4) | ||||||||||
|
| |||||||||||||||||
TOTAL PARTICIPATION NOTES | 10,358,605 | |||||||||||||||||
|
| |||||||||||||||||
(Cost $11,036,883) | ||||||||||||||||||
CREDIT LINKED NOTES - 2.42% | ||||||||||||||||||
Argentina - 0.27% | ||||||||||||||||||
Cablevision SA | USD | 9.375 | % | 02/12/2018 | 3,618,000 | 3,183,840 | (10) | |||||||||||
|
| |||||||||||||||||
Brazil - 0.35% | ||||||||||||||||||
Nota Do Tesouro Nacional: | ||||||||||||||||||
| BRL | 10.000 | % | 01/01/2014 | 5,500,000 | 2,788,655 | (11) | ||||||||||||
| BRL | 10.000 | % | 01/01/2015 | 2,760,000 | 1,403,371 | (12) | ||||||||||||
|
| |||||||||||||||||
| 4,192,026 | ||||||||||||||||||
|
| |||||||||||||||||
Colombia - 1.04% | ||||||||||||||||||
Titulos de Tesoreria - Series B: | ||||||||||||||||||
| COP | 11.000 | % | 07/24/2020 | 3,000,000,000 | 2,037,801 | (11) | ||||||||||||
| COP | 11.000 | % | 07/24/2020 | 3,500,000,000 | 2,377,434 | (11) | ||||||||||||
| COP | 11.000 | % | 07/24/2020 | 4,000,000,000 | 2,717,068 | (11) | ||||||||||||
| COP | 11.000 | % | 07/24/2020 | 5,700,000,000 | 3,871,822 | (11) | ||||||||||||
| COP | 10.000 | % | 07/24/2024 | 1,952,000,000 | 1,307,135 | (11) | ||||||||||||
|
| |||||||||||||||||
| 12,311,260 | ||||||||||||||||||
|
| |||||||||||||||||
Iraq - 0.36% | ||||||||||||||||||
Republic of Iraq | JPY | 2.447 | % | 01/01/2028 | 511,551,997 | 4,210,707 | (3)(13) | |||||||||||
|
| |||||||||||||||||
Russia - 0.40% | ||||||||||||||||||
Russian Government | RUB | 7.600 | % | 04/14/2021 | 167,100,000 | 4,723,861 | (14) | |||||||||||
|
| |||||||||||||||||
TOTAL CREDIT LINKED NOTES | 28,621,694 | |||||||||||||||||
|
| |||||||||||||||||
(Cost $30,313,063) | ||||||||||||||||||
SHORT TERM INVESTMENTS - 2.85% | ||||||||||||||||||
Money Market Mutual Funds - 2.85% | ||||||||||||||||||
Dreyfus Institutional Cash Advantage Fund - Institutional Advantage Shares (0.16429% 7-Day Yield) | 33,749,090 | 33,749,090 | ||||||||||||||||
|
| |||||||||||||||||
TOTAL SHORT TERM INVESTMENTS | 33,749,090 | |||||||||||||||||
|
| |||||||||||||||||
(Cost $33,749,090) | ||||||||||||||||||
Total Investments - 95.30% | 1,128,109,090 | |||||||||||||||||
(Cost $1,129,897,227) | ||||||||||||||||||
Other Assets In Excess of Liabilities - 4.70% | 55,619,247 | |||||||||||||||||
|
| |||||||||||||||||
Net Assets - 100.00% | $ | 1,183,728,337 | ||||||||||||||||
|
| |||||||||||||||||
See Notes to Financial Statements.
| Stone Harbor Investment Funds Annual Report | May 31, 2012 | 27 |
Table of Contents
Stone Harbor Emerging Markets Debt Fund | Statements of Investments | |
| May 31, 2012 |
* The contract/principal amounts of each security is stated in the currency in which the security is denominated. See below.
ARS | - | Argentine Peso | ||
BRL | - | Brazilian Real | ||
COP | - | Colombian Peso | ||
EUR | - | Euro Currency | ||
GBP | - | Great Britain Pound | ||
JPY | - | Japanese Yen | ||
MXN | - | Mexican Peso | ||
RUB | - | Russian Ruble | ||
TRY | - | Turkish Lira | ||
USD | - | United States Dollar |
| (1) | Security exempt from registration under Rule 144A of the Securities Act of 1933. Under procedures approved by the Board of Trustees, such securities have been determined to be liquid by Stone Harbor Investment Partners and may normally be sold to qualified institutional buyers in transactions exempt from registration. Total market value of Rule 144A securities amounts to $139,878,777, which represents approximately 11.82% of net assets as of May 31, 2012. |
| (2) | Security is currently in default/non-income producing. |
| (3) | Floating or variable rate security. Interest rate disclosed is that which is in effect at May 31, 2012. |
| (4) | Securities were originally issued pursuant to Regulation S under the Securities Act of 1933, which exempts securities offered and sold outside of the United States from registration. Such securities cannot be sold in the United States without either an effective registration statement filed pursuant to the Securities Act of 1933, or pursuant to an exemption from registration. As of May 31, 2012, the aggregate market value of those securities was $366,349,359, which represents approximately 30.95% of net assets. |
| (5) | Step bond. Coupon increases periodically based upon a predetermined schedule. Interest rate disclosed is that which is in effect at May 31, 2012. |
| (6) | Pay-in-kind securities. |
| (7) | Bank loans generally pay interest at rates which are periodically determined by reference to a base lending rate plus a premium. All loans carry a variable rate of interest. These base lending rates are generally (i) the Prime Rate offered by one or more major United States banks, (ii) the lending rate offered by one or more European banks such as the London Interbank Offered Rate (“LIBOR”) or (iii) the Certificate of Deposit rate. Rate shown represents the weighted average rate at May 31, 2012. Bank Loans, while exempt from registration, under the Securities Act of 1933, contain certain restrictions on resale and cannot be sold publicly. Floating rate bank loans often require prepayments from excess cash flow or permit the borrower to repay at its election. The degree to which borrowers repay, whether as a contractual requirement or at their election, cannot be predicted with accuracy. As a result, the actual remaining maturity may be substantially less than the stated maturity shown. |
| (8) | This security has been valued by management at its fair value determined in good faith pursuant to procedures approved by the Board of Trustees. Total market value of fair valued securities amounts to $477,336, which represents approximately 0.04% of net assets as of May 31, 2012. |
| (9) | Issued with zero coupon. Income is recognized through the accretion of discount. |
| (10) | The underlying security is issued by Deutsche Bank AG London. |
| (11) | The underlying security is issued by Citigroup Global Markets. |
| (12) | The underlying security is issued by JPMorgan Chase. |
| (13) | The underlying security is issued by Merrill Lynch. |
| (14) | The underlying security is issued by Credit Suisse First Boston. |
Common Abbreviations:
AS | - | Anonim Sirket is the Turkish term for Incorporation. | ||
BHD | - | Berhad is the Malaysian term for public limited company. | ||
BVI | - | British Virgin Islands. | ||
BV | - | Besloten Vennootschap a Dutch private limited liability company. | ||
ESP | �� | - | Empresa de Servicios Publicos is the Colombian term for Public Service Company. | |
GmbH | - | Gesellschaft mit beschrankter Haftung is the German term for a company wtih limited liability. | ||
GMTN | - | Global Medium Term Note. | ||
JSC | - | Joint Stock Company. | ||
LLP | - | Limited Liability Partnership. | ||
Ltd. | - | Limited. | ||
MTN | - | Medium Term Note. | ||
OAO | - | Otkrytoe Aktsionernoe Obschestvo is the Russian term for Open Joint Stock Company. | ||
OJSC | - | Open Joint Stock Company. | ||
PLC | - | Public Limited Company. | ||
Pte | - | Private. | ||
SA | - | Generally designates corporations in various countries, mostly those employing the civil law. | ||
SAA | - | Sociedad Anonima Abierta is the Peruvian term used for companies with 20 or more shareholders. | ||
SAB de CV | - | A variable capital company. | ||
SPV | - | Special Purpose Vehicle. | ||
Tbk | - | Terbuka is the Indonesian term for limited liability company. |
See Notes to Financial Statements.
28 | www.shiplp.com |
Table of Contents
| Stone Harbor Emerging Markets Debt Fund | Statements of Investments | |
| May 31, 2012 |
OUTSTANDING FORWARD FOREIGN CURRENCY CONTRACTS
Contract Description | Contracted Amount | Purchase/Sale Contract | Settlement Date | Current Value | Unrealized Appreciation/ (Depreciation) | |||||||||||
BRL(1) | 11,843,220 | Purchase | 06/04/2012 | $ | 5,867,981 | $ | 87,981 | |||||||||
BRL(1) | 11,843,220 | Purchase | 07/03/2012 | 5,833,086 | 48,427 | |||||||||||
COP(1) | 30,827,125,000 | Sale | 06/01/2012 | 16,861,153 | 496,463 | |||||||||||
COP(1) | 30,827,125,000 | Sale | 06/29/2012 | 16,797,235 | 68,926 | |||||||||||
EUR(2) | 53,519,000 | Sale | 06/29/2012 | 66,185,300 | 1,942,246 | |||||||||||
GBP(2) | 2,414,000 | Sale | 06/29/2012 | 3,719,930 | 101,988 | |||||||||||
|
| |||||||||||||||
| $ | 2,746,031 | |||||||||||||||
|
| |||||||||||||||
BRL(1) | 11,843,220 | Sale | 06/04/2012 | $ | 5,867,981 | $ | (53,931) | |||||||||
COP(1) | 30,827,125,000 | Purchase | 06/01/2012 | 16,861,153 | (76,828) | |||||||||||
EUR(2) | 2,350,177 | Purchase | 06/29/2012 | 2,906,391 | (19,692) | |||||||||||
JPY(2) | 342,297,000 | Sale | 06/29/2012 | 4,369,566 | (57,326) | |||||||||||
|
| |||||||||||||||
| $ | (207,777) | |||||||||||||||
|
| |||||||||||||||
| (1) | The Counterparty is Citigroup Global Markets. |
| (2) | The Counterparty is JPMorgan Chase & Co. |
See Notes to Financial Statements.
Stone Harbor Investment Funds Annual Report | May 31, 2012 | 29 |
Table of Contents
| Statements of Investments | ||
| May 31, 2012 |
Currency | Rate | Maturity Date | Principal Amount* | Market Value | ||||||||||||||
CORPORATE BONDS - 91.69% | ||||||||||||||||||
Aerospace/Defense - 1.28% | ||||||||||||||||||
CPI International, Inc. | USD | 8.000 | % | 02/15/2018 | 2,050,000 | $ | 1,845,000 | |||||||||||
TransDigm, Inc. | USD | 7.750 | % | 12/15/2018 | 2,900,000 | 3,095,750 | ||||||||||||
Triumph Group, Inc. | USD | 8.625 | % | 07/15/2018 | 1,575,000 | 1,740,375 | ||||||||||||
|
| |||||||||||||||||
| 6,681,125 | ||||||||||||||||||
|
| |||||||||||||||||
Automotive - 1.68% | ||||||||||||||||||
Allison Transmission, Inc. | USD | 7.125 | % | 05/15/2019 | 1,300,000 | 1,365,000 | (1) | |||||||||||
Chrysler Group LLC: | ||||||||||||||||||
| USD | 8.000 | % | 06/15/2019 | 1,925,000 | 1,939,438 | |||||||||||||
| USD | 8.250 | % | 06/15/2021 | 885,000 | 891,637 | |||||||||||||
The Goodyear Tire & Rubber Co. | USD | 7.000 | % | 05/15/2022 | 1,600,000 | 1,576,000 | ||||||||||||
Tomkins LLC | USD | 9.000 | % | 10/01/2018 | 1,745,000 | 1,926,044 | ||||||||||||
UCI International, Inc. | USD | 8.625 | % | 02/15/2019 | 1,000,000 | 1,025,000 | ||||||||||||
|
| |||||||||||||||||
| 8,723,119 | ||||||||||||||||||
|
| |||||||||||||||||
Banking - 0.40% | ||||||||||||||||||
Provident Funding Associates LP: | ||||||||||||||||||
| USD | 10.250 | % | 04/15/2017 | 1,025,000 | 1,066,000 | (1) | ||||||||||||
| USD | 10.125 | % | 02/15/2019 | 1,125,000 | 1,012,500 | (1) | ||||||||||||
|
| |||||||||||||||||
| 2,078,500 | ||||||||||||||||||
|
| |||||||||||||||||
Building Products - 1.21% | ||||||||||||||||||
American Standard Americas | USD | 10.750 | % | 01/15/2016 | 715,000 | 561,275 | (1) | |||||||||||
Griffon Corp. | USD | 7.125 | % | 04/01/2018 | 3,675,000 | 3,711,750 | ||||||||||||
Norcraft Cos. LP | USD | 10.500 | % | 12/15/2015 | 2,100,000 | 1,995,000 | ||||||||||||
|
| |||||||||||||||||
| 6,268,025 | ||||||||||||||||||
|
| |||||||||||||||||
Chemicals - 3.73% | ||||||||||||||||||
Hexion US Finance Corp. | USD | 6.625 | % | 04/15/2020 | 2,645,000 | 2,691,288 | (1) | |||||||||||
Ineos Finance PLC | USD | 8.375 | % | 02/15/2019 | 1,810,000 | 1,864,300 | (1) | |||||||||||
Ineos Group Holdings Ltd. | USD | 8.500 | % | 02/15/2016 | 2,740,000 | 2,486,550 | (1) | |||||||||||
Koppers, Inc. | USD | 7.875 | % | 12/01/2019 | 1,990,000 | 2,134,275 | ||||||||||||
Lyondell Chemical Co. | USD | 8.375 | % | 08/15/2015 | 945,000 | 0 | (2) | |||||||||||
LyondellBasell Industries NV | USD | 6.000 | % | 11/15/2021 | 2,485,000 | 2,671,375 | (1) | |||||||||||
MacDermid, Inc. | USD | 9.500 | % | 04/15/2017 | 1,875,000 | 1,954,687 | (1) | |||||||||||
Momentive Performance Materials, Inc.: | ||||||||||||||||||
| USD | 11.500 | % | 12/01/2016 | 1,375,000 | 1,038,125 | (3) | ||||||||||||
| USD | 9.000 | % | 01/15/2021 | 2,495,000 | 1,896,200 | |||||||||||||
NOVA Chemicals Corp. | USD | 8.375 | % | 11/01/2016 | 2,375,000 | 2,627,344 | ||||||||||||
|
| |||||||||||||||||
| 19,364,144 | ||||||||||||||||||
|
| |||||||||||||||||
Construction Machinery - 0.63% | ||||||||||||||||||
Case New Holland, Inc. | USD | 7.875 | % | 12/01/2017 | 950,000 | 1,087,750 | ||||||||||||
The Manitowoc Co., Inc. | USD | 9.500 | % | 02/15/2018 | 1,975,000 | 2,167,563 | ||||||||||||
|
| |||||||||||||||||
| 3,255,313 | ||||||||||||||||||
|
| |||||||||||||||||
Consumer Products - 1.55% | ||||||||||||||||||
Armored Autogroup, Inc. | USD | 9.250 | % | 11/01/2018 | 1,025,000 | 880,219 | (1) | |||||||||||
Elizabeth Arden, Inc. | USD | 7.375 | % | 03/15/2021 | 1,065,000 | 1,167,506 | ||||||||||||
Libbey Glass, Inc. | USD | 6.875 | % | 05/15/2020 | 1,000,000 | 1,007,500 | (1) | |||||||||||
Mead Products LLC | USD | 6.750 | % | 04/30/2020 | 1,700,000 | 1,755,250 | (1) | |||||||||||
See Notes to Financial Statements.
30 | www.shiplp.com |
Table of Contents
Stone Harbor High Yield Bond Fund | Statements of Investments | |
| May 31, 2012 |
Currency | Rate | Maturity Date | Principal Amount* | Market Value | ||||||||||||||
Consumer Products (continued) | ||||||||||||||||||
NBTY, Inc. | USD | 9.000 | % | 10/01/2018 | 2,070,000 | $ | 2,251,125 | |||||||||||
Visant Corp. | USD | 10.000 | % | 10/01/2017 | 1,025,000 | 973,750 | ||||||||||||
|
| |||||||||||||||||
| 8,035,350 | ||||||||||||||||||
|
| |||||||||||||||||
Containers/Packaging - 2.48% | ||||||||||||||||||
ARD Finance SA | USD | 11.125 | % | 06/01/2018 | 1,184,204 | 1,119,073 | (1)(4) | |||||||||||
Ardagh Packaging Finance PLC: | ||||||||||||||||||
| USD | 9.125 | % | 10/15/2020 | 1,450,000 | 1,515,250 | (1) | ||||||||||||
| EUR | 9.250 | % | 10/15/2020 | 500,000 | 615,935 | (5) | ||||||||||||
Radnor Holdings Corp. | USD | 11.000 | % | 03/15/2010 | 25,000 | 2 | (2) | |||||||||||
Reynolds Group Issuer, Inc.: | ||||||||||||||||||
| USD | 8.750 | % | 10/15/2016 | 1,850,000 | 1,961,000 | (1)(6) | ||||||||||||
| USD | 9.875 | % | 08/15/2019 | 1,005,000 | 1,003,744 | (1) | ||||||||||||
| USD | 9.875 | % | 08/15/2019 | 2,080,000 | 2,077,400 | (1) | ||||||||||||
| USD | 8.250 | % | 02/15/2021 | 650,000 | 606,125 | (1) | ||||||||||||
Sealed Air Corp. | USD | 8.375 | % | 09/15/2021 | 3,610,000 | 3,989,050 | (1) | |||||||||||
|
| |||||||||||||||||
| 12,887,579 | ||||||||||||||||||
|
| |||||||||||||||||
Drillers/Services - 4.82% | ||||||||||||||||||
Basic Energy Services, Inc.: | ||||||||||||||||||
| USD | 7.125 | % | 04/15/2016 | 1,150,000 | 1,132,750 | |||||||||||||
| USD | 7.750 | % | 02/15/2019 | 1,025,000 | 1,004,500 | |||||||||||||
CHC Helicopter SA | USD | 9.250 | % | 10/15/2020 | 1,945,000 | 1,896,375 | (1) | |||||||||||
Gulfmark Offshore, Inc. | USD | 6.375 | % | 03/15/2022 | 2,375,000 | 2,392,812 | (1) | |||||||||||
Hercules Offshore LLC: | ||||||||||||||||||
| USD | 7.125 | % | 04/01/2017 | 900,000 | 869,625 | (1) | ||||||||||||
| USD | 10.500 | % | 10/15/2017 | 2,550,000 | 2,562,750 | (1) | ||||||||||||
| USD | 10.250 | % | 04/01/2019 | 235,000 | 221,488 | (1) | ||||||||||||
Hornbeck Offshore Services, Inc.: | ||||||||||||||||||
| USD | 8.000 | % | 09/01/2017 | 1,875,000 | 1,973,438 | |||||||||||||
| USD | 5.875 | % | 04/01/2020 | 1,325,000 | 1,305,125 | (1) | ||||||||||||
Offshore Group Investments Ltd.: | ||||||||||||||||||
| USD | 11.500 | % | 08/01/2015 | 1,200,000 | 1,284,000 | (1) | ||||||||||||
| USD | 11.500 | % | 08/01/2015 | 2,415,000 | 2,584,050 | |||||||||||||
Parker Drilling Co.: | ||||||||||||||||||
| USD | 9.125 | % | 04/01/2018 | 1,000,000 | 1,065,000 | (1) | ||||||||||||
| USD | 9.125 | % | 04/01/2018 | 1,575,000 | 1,677,375 | |||||||||||||
SESI LLC: | ||||||||||||||||||
| USD | 6.375 | % | 05/01/2019 | 1,915,000 | 2,020,325 | |||||||||||||
| USD | 7.125 | % | 12/15/2021 | 1,000,000 | 1,095,000 | (1) | ||||||||||||
Trinidad Drilling Ltd. | USD | 7.875 | % | 01/15/2019 | 1,870,000 | 1,972,850 | (1) | |||||||||||
|
| |||||||||||||||||
| 25,057,463 | ||||||||||||||||||
|
| |||||||||||||||||
Electric - 4.48% | ||||||||||||||||||
The AES Corp.: | ||||||||||||||||||
| USD | 8.000 | % | 10/15/2017 | 2,225,000 | 2,480,875 | |||||||||||||
| USD | 8.000 | % | 06/01/2020 | 925,000 | 1,045,250 | |||||||||||||
| USD | 7.375 | % | 07/01/2021 | 2,375,000 | 2,576,875 | (1) | ||||||||||||
Calpine Corp.: | ||||||||||||||||||
| USD | 7.875 | % | 07/31/2020 | 2,250,000 | 2,396,250 | (1) | ||||||||||||
| USD | 7.500 | % | 02/15/2021 | 1,925,000 | 2,021,250 | (1) | ||||||||||||
DPL, Inc. | USD | 7.250 | % | 10/15/2021 | 2,145,000 | 2,343,412 | (1) | |||||||||||
See Notes to Financial Statements.
Stone Harbor Investment Funds Annual Report | May 31, 2012 | 31 |
Table of Contents
Stone Harbor High Yield Bond Fund | Statements of Investments | |
| May 31, 2012 |
Currency | Rate | Maturity Date | Principal Amount* | Market Value | ||||||||||||||
Electric (continued) | ||||||||||||||||||
Edison Mission Energy: | ||||||||||||||||||
| USD | 7.750 | % | 06/15/2016 | 1,825,000 | $ | 980,938 | ||||||||||||
| USD | 7.000 | % | 05/15/2017 | 150,000 | 81,000 | |||||||||||||
| USD | 7.200 | % | 05/15/2019 | 1,540,000 | 820,050 | |||||||||||||
| USD | 7.625 | % | 05/15/2027 | 1,135,000 | 593,037 | |||||||||||||
GenOn Energy, Inc. | USD | 9.500 | % | 10/15/2018 | 2,460,000 | 2,300,100 | ||||||||||||
NRG Energy, Inc.: | ||||||||||||||||||
| USD | 8.500 | % | 06/15/2019 | 2,300,000 | 2,311,500 | |||||||||||||
| USD | 8.250 | % | 09/01/2020 | 1,235,000 | 1,222,650 | |||||||||||||
| USD | 7.875 | % | 05/15/2021 | 2,200,000 | 2,128,500 | |||||||||||||
|
| |||||||||||||||||
| 23,301,687 | ||||||||||||||||||
|
| |||||||||||||||||
Exploration & Production - 6.26% | ||||||||||||||||||
Atlas Pipeline Partners LP | USD | 8.750 | % | 06/15/2018 | 1,925,000 | 2,050,125 | ||||||||||||
Concho Resources, Inc. | USD | 7.000 | % | 01/15/2021 | 1,575,000 | 1,697,062 | ||||||||||||
Eagle Rock Energy Partners LP | USD | 8.375 | % | 06/01/2019 | 2,110,000 | 2,120,550 | ||||||||||||
Everest Acquisition LLC: | ||||||||||||||||||
| USD | 6.875 | % | 05/01/2019 | 1,455,000 | 1,493,194 | (1) | ||||||||||||
| USD | 9.375 | % | 05/01/2020 | 1,230,000 | 1,262,287 | (1) | ||||||||||||
Forest Oil Corp. | USD | 7.250 | % | 06/15/2019 | 3,415,000 | 3,124,725 | ||||||||||||
Kodiak Oil & Gas Corp. | USD | 8.125 | % | 12/01/2019 | 1,575,000 | 1,624,219 | (1) | |||||||||||
Laredo Petroleum, Inc. | USD | 7.375 | % | 05/01/2022 | 1,290,000 | 1,322,250 | (1) | |||||||||||
Linn Energy LLC | USD | 7.750 | % | 02/01/2021 | 3,225,000 | 3,313,688 | ||||||||||||
MEG Energy Corp. | USD | 6.500 | % | 03/15/2021 | 1,875,000 | 1,921,875 | (1) | |||||||||||
Oasis Petroleum, Inc. | USD | 7.250 | % | 02/01/2019 | 3,320,000 | 3,436,200 | ||||||||||||
Plains Exploration & Production Co.: | ||||||||||||||||||
| USD | 7.625 | % | 06/01/2018 | 800,000 | 846,000 | |||||||||||||
| USD | 7.625 | % | 04/01/2020 | 1,050,000 | 1,107,750 | |||||||||||||
QEP Resources, Inc. | USD | 5.375 | % | 10/01/2022 | 1,300,000 | 1,274,000 | ||||||||||||
Range Resources Corp. | USD | 5.000 | % | 08/15/2022 | 1,050,000 | 1,009,312 | ||||||||||||
SandRidge Energy, Inc.: | ||||||||||||||||||
| USD | 8.000 | % | 06/01/2018 | 575,000 | 577,875 | (1) | ||||||||||||
| USD | 8.750 | % | 01/15/2020 | 1,000,000 | 1,030,000 | |||||||||||||
| USD | 7.500 | % | 03/15/2021 | 2,000,000 | 1,950,000 | |||||||||||||
Venoco, Inc. | USD | 8.875 | % | 02/15/2019 | 1,475,000 | 1,364,375 | ||||||||||||
|
| |||||||||||||||||
| 32,525,487 | ||||||||||||||||||
|
| |||||||||||||||||
Financial Other - 1.13% | ||||||||||||||||||
Aircastle Ltd. | USD | 6.750 | % | 04/15/2017 | 3,365,000 | 3,348,175 | (1) | |||||||||||
International Lease Finance Corp. | USD | 8.250 | % | 12/15/2020 | 2,258,000 | 2,523,315 | ||||||||||||
|
| |||||||||||||||||
| 5,871,490 | ||||||||||||||||||
|
| |||||||||||||||||
Food & Beverage - 4.36% | ||||||||||||||||||
Boparan Finance PLC | EUR | 9.750 | % | 04/30/2018 | 1,100,000 | 1,394,161 | (5) | |||||||||||
Campofrio Food Group SA | EUR | 8.250 | % | 10/31/2016 | 1,200,000 | 1,431,875 | (5) | |||||||||||
Cott Beverages, Inc. | USD | 8.375 | % | 11/15/2017 | 1,050,000 | 1,136,625 | ||||||||||||
Dean Foods Co.: | ||||||||||||||||||
| USD | 7.000 | % | 06/01/2016 | 2,075,000 | 2,170,969 | |||||||||||||
| USD | 9.750 | % | 12/15/2018 | 2,885,000 | 3,186,122 | |||||||||||||
Del Monte Corp. | USD | 7.625 | % | 02/15/2019 | 4,905,000 | 4,782,375 | ||||||||||||
Michael Foods Group, Inc. | USD | 9.750 | % | 07/15/2018 | 860,000 | 935,250 | ||||||||||||
Pinnacle Foods Finance LLC: | ||||||||||||||||||
| USD | 9.250 | % | 04/01/2015 | 1,825,000 | 1,870,625 | |||||||||||||
See Notes to Financial Statements.
32 | www.shiplp.com |
Table of Contents
Stone Harbor High Yield Bond Fund | Statements of Investments | |
| May 31, 2012 |
Currency | Rate | Maturity Date | Principal Amount* | Market Value | ||||||||||||||
Food & Beverage (continued) | ||||||||||||||||||
Pinnacle Foods Finance LLC (continued) | ||||||||||||||||||
| USD | 8.250 | % | 09/01/2017 | 1,550,000 | $ | 1,627,500 | ||||||||||||
Post Holdings, Inc. | USD | 7.375 | % | 02/15/2022 | 4,045,000 | 4,125,900 | (1) | |||||||||||
|
| |||||||||||||||||
| 22,661,402 | ||||||||||||||||||
|
| |||||||||||||||||
Gaming - 3.40% | ||||||||||||||||||
Boyd Gaming Corp. | USD | 9.125 | % | 12/01/2018 | 3,515,000 | 3,620,450 | ||||||||||||
Caesars Entertainment Operating Co., Inc. | USD | 12.750 | % | 04/15/2018 | 820,000 | 651,900 | ||||||||||||
Harrah’s Operating Co., Inc. | USD | 5.375 | % | 12/15/2013 | 1,100,000 | 1,028,500 | ||||||||||||
Isle of Capri Casinos, Inc.: | ||||||||||||||||||
| USD | 7.000 | % | 03/01/2014 | 2,300,000 | 2,294,250 | |||||||||||||
| USD | 7.750 | % | 03/15/2019 | 1,225,000 | 1,244,906 | |||||||||||||
MGM Resorts International: | ||||||||||||||||||
| USD | 6.875 | % | 04/01/2016 | 1,140,000 | 1,151,400 | |||||||||||||
| USD | 7.500 | % | 06/01/2016 | 3,115,000 | 3,200,662 | |||||||||||||
| USD | 8.625 | % | 02/01/2019 | 1,320,000 | 1,402,500 | (1) | ||||||||||||
Pinnacle Entertainment, Inc.: | ||||||||||||||||||
| USD | 8.625 | % | 08/01/2017 | 775,000 | 844,750 | |||||||||||||
| USD | 8.750 | % | 05/15/2020 | 2,035,000 | 2,223,238 | |||||||||||||
|
| |||||||||||||||||
| 17,662,556 | ||||||||||||||||||
|
| |||||||||||||||||
Gas Distributors - 0.73% | ||||||||||||||||||
Inergy LP: | ||||||||||||||||||
| USD | 7.000 | % | 10/01/2018 | 300,000 | 307,500 | |||||||||||||
| USD | 6.875 | % | 08/01/2021 | 1,850,000 | 1,859,250 | |||||||||||||
Niska Gas Storage US LLC | USD | 8.875 | % | 03/15/2018 | 1,690,000 | 1,618,175 | ||||||||||||
|
| |||||||||||||||||
| 3,784,925 | ||||||||||||||||||
|
| |||||||||||||||||
Gas Pipelines - 1.54% | ||||||||||||||||||
ANR Pipeline Co.: | ||||||||||||||||||
| USD | 7.375 | % | 02/15/2024 | 60,000 | 79,259 | |||||||||||||
| USD | 7.000 | % | 06/01/2025 | 10,000 | 12,916 | |||||||||||||
Copano Energy LLC: | ||||||||||||||||||
| USD | 7.750 | % | 06/01/2018 | 675,000 | 707,062 | |||||||||||||
| USD | 7.125 | % | 04/01/2021 | 1,525,000 | 1,578,375 | |||||||||||||
MarkWest Energy Partners LP: | ||||||||||||||||||
| USD | 6.750 | % | 11/01/2020 | 475,000 | 507,063 | |||||||||||||
| USD | 6.250 | % | 06/15/2022 | 1,100,000 | 1,133,000 | |||||||||||||
Sabine Pass LNG LP | USD | 7.250 | % | 11/30/2013 | 2,175,000 | 2,278,312 | ||||||||||||
Targa Resources Partners LP: | ||||||||||||||||||
| USD | 7.875 | % | 10/15/2018 | 775,000 | 837,000 | |||||||||||||
| USD | 6.875 | % | 02/01/2021 | 850,000 | 879,750 | |||||||||||||
|
| |||||||||||||||||
| 8,012,737 | ||||||||||||||||||
|
| |||||||||||||||||
Healthcare - 7.57% | ||||||||||||||||||
American Renal Holdings, Inc. | USD | 8.375 | % | 05/15/2018 | 1,875,000 | 1,978,125 | ||||||||||||
Biomet, Inc. | USD | 11.625 | % | 10/15/2017 | 1,685,000 | 1,794,525 | ||||||||||||
ConvaTec Healthcare E SA | USD | 10.500 | % | 12/15/2018 | 2,100,000 | 2,079,000 | (1) | |||||||||||
Emergency Medical Services Corp., Series WI | USD | 8.125 | % | 06/01/2019 | 2,305,000 | 2,362,625 | ||||||||||||
Fresenius Medical Care US Finance II, Inc. | USD | 5.875 | % | 01/31/2022 | 2,340,000 | 2,334,150 | (1) | |||||||||||
HCA Holdings, Inc. | USD | 7.750 | % | 05/15/2021 | 1,050,000 | 1,084,125 | ||||||||||||
HCA, Inc.: | ||||||||||||||||||
| USD | 7.500 | % | 02/15/2022 | 4,560,000 | 4,790,850 | |||||||||||||
See Notes to Financial Statements.
Stone Harbor Investment Funds Annual Report | May 31, 2012 | 33 |
Table of Contents
Stone Harbor High Yield Bond Fund | Statements of Investments | |
| May 31, 2012 |
Currency | Rate | Maturity Date | Principal Amount* | Market Value (Expressed in U.S. $) | ||||||||||||||
Healthcare (continued) | ||||||||||||||||||
HCA, Inc. (continued) | ||||||||||||||||||
| USD | 5.875 | % | 03/15/2022 | 2,130,000 | $ | 2,119,350 | ||||||||||||
Health Management Associates, Inc. | USD | 7.375 | % | 01/15/2020 | 2,190,000 | 2,255,700 | (1) | |||||||||||
HealthSouth Corp. | USD | 8.125 | % | 02/15/2020 | 3,425,000 | 3,673,313 | ||||||||||||
IASIS Healthcare LLC | USD | 8.375 | % | 05/15/2019 | 2,835,000 | 2,679,075 | ||||||||||||
Kinetic Concepts, Inc.: | ||||||||||||||||||
| USD | 10.500 | % | 11/01/2018 | 2,020,000 | 2,050,300 | (1) | ||||||||||||
| USD | 12.500 | % | 11/01/2019 | 1,040,000 | 936,000 | (1) | ||||||||||||
Prospect Medical Holdings, Inc. | USD | 8.375 | % | 05/01/2019 | 1,330,000 | 1,278,130 | (1) | |||||||||||
Radiation Therapy Services, Inc. | USD | 9.875 | % | 04/15/2017 | 2,275,000 | 1,763,125 | ||||||||||||
Surgical Care Affiliates, Inc.: | ||||||||||||||||||
| USD | 8.875 | % | 07/15/2015 | 984,000 | 998,760 | (1)(4) | ||||||||||||
| USD | 10.000 | % | 07/15/2017 | 1,275,000 | 1,278,187 | (1) | ||||||||||||
Vanguard Health Holding Co. II LLC | USD | 8.000 | % | 02/01/2018 | 3,955,000 | 3,895,675 | ||||||||||||
|
| |||||||||||||||||
| 39,351,015 | ||||||||||||||||||
|
| |||||||||||||||||
Healthcare-Services - 1.20% | ||||||||||||||||||
CHS/Community Health Systems, Inc. | USD | 8.000 | % | 11/15/2019 | 3,605,000 | 3,699,631 | ||||||||||||
United Surgical Partners International, Inc. | USD | 9.000 | % | 04/01/2020 | 2,435,000 | 2,538,488 | (1) | |||||||||||
|
| |||||||||||||||||
| 6,238,119 | ||||||||||||||||||
|
| |||||||||||||||||
Industrial Other - 0.98% | ||||||||||||||||||
Park-Ohio Industries, Inc. | USD | 8.125 | % | 04/01/2021 | 1,250,000 | 1,293,750 | ||||||||||||
RBS Global, Inc. | USD | 8.500 | % | 05/01/2018 | 3,550,000 | 3,789,625 | ||||||||||||
|
| |||||||||||||||||
| 5,083,375 | ||||||||||||||||||
|
| |||||||||||||||||
Leisure - 1.85% | ||||||||||||||||||
AMC Entertainment, Inc. | USD | 9.750 | % | 12/01/2020 | 3,725,000 | 4,023,000 | ||||||||||||
Cinemark USA, Inc.: | ||||||||||||||||||
| USD | 8.625 | % | 06/15/2019 | 1,775,000 | 1,939,188 | |||||||||||||
| USD | 7.375 | % | 06/15/2021 | 1,175,000 | 1,263,125 | |||||||||||||
Regal Cinemas Corp. | USD | 8.625 | % | 07/15/2019 | 1,700,000 | 1,857,250 | ||||||||||||
Regal Entertainment Group | USD | 9.125 | % | 08/15/2018 | 475,000 | 518,937 | ||||||||||||
|
| |||||||||||||||||
| 9,601,500 | ||||||||||||||||||
|
| |||||||||||||||||
Life - 0.54% | ||||||||||||||||||
Genworth Financial, Inc. | USD | 7.625 | % | 09/24/2021 | 2,870,000 | 2,789,766 | ||||||||||||
|
| |||||||||||||||||
Media Cable - 5.78% | ||||||||||||||||||
Cablevision Systems Corp.: | ||||||||||||||||||
| USD | 8.625 | % | 09/15/2017 | 1,725,000 | 1,893,188 | |||||||||||||
| USD | 7.750 | % | 04/15/2018 | 525,000 | 538,781 | |||||||||||||
| USD | 8.000 | % | 04/15/2020 | 1,275,000 | 1,335,562 | |||||||||||||
CCO Holdings LLC | USD | 6.625 | % | 01/31/2022 | 2,715,000 | 2,793,056 | ||||||||||||
Cequel Communications Holdings I LLC | USD | 8.625 | % | 11/15/2017 | 1,425,000 | 1,508,719 | (1) | |||||||||||
CSC Holdings LLC: | ||||||||||||||||||
| USD | 7.625 | % | 07/15/2018 | 325,000 | 352,625 | |||||||||||||
| USD | 8.625 | % | 02/15/2019 | 475,000 | 532,000 | |||||||||||||
DISH DBS Corp.: | ||||||||||||||||||
| USD | 7.875 | % | 09/01/2019 | 2,750,000 | 3,073,125 | |||||||||||||
| USD | 6.750 | % | 06/01/2021 | 1,825,000 | 1,893,437 | |||||||||||||
| USD | 5.875 | % | 07/15/2022 | 1,265,000 | 1,239,700 | (1) | ||||||||||||
Mediacom LLC | USD | 7.250 | % | 02/15/2022 | 2,520,000 | 2,538,900 | (1) | |||||||||||
See Notes to Financial Statements.
34 | www.shiplp.com |
Table of Contents
Stone Harbor High Yield Bond Fund | Statements of Investments | |
| May 31, 2012 |
Currency | Rate | Maturity Date | Principal Amount* | Market Value (Expressed in U.S. $) | ||||||||||||||
Media Cable (continued) | ||||||||||||||||||
DISH DBS Corp. (continued) | ||||||||||||||||||
Nara Cable Funding Ltd. | USD | 8.875 | % | 12/01/2018 | 4,340,000 | $ | 3,819,200 | (1) | ||||||||||
Ono Finance II PLC | USD | 10.875 | % | 07/15/2019 | 805,000 | 648,025 | (1) | |||||||||||
Unitymedia GmbH | EUR | 9.500 | % | 03/15/2021 | 1,600,000 | 2,082,277 | (1) | |||||||||||
UPC Holding BV: | ||||||||||||||||||
| USD | 9.875 | % | 04/15/2018 | 2,625,000 | 2,848,125 | (1) | ||||||||||||
| EUR | 8.375 | % | 08/15/2020 | 850,000 | 1,051,031 | (5) | ||||||||||||
Ziggo Bond Co. BV | EUR | 8.000 | % | 05/15/2018 | 1,425,000 | 1,894,174 | (5) | |||||||||||
|
| |||||||||||||||||
| 30,041,925 | ||||||||||||||||||
|
| |||||||||||||||||
Media Other - 4.15% | ||||||||||||||||||
Allbritton Communications Co. | USD | 8.000 | % | 05/15/2018 | 2,530,000 | 2,631,200 | ||||||||||||
AMC Networks, Inc. | USD | 7.750 | % | 07/15/2021 | 945,000 | 1,053,675 | (1) | |||||||||||
Bonten Media Acquisition Co. | USD | 9.000 | % | 06/01/2015 | 539,195 | 374,741 | (1)(6) | |||||||||||
Entravision Communications Corp. | USD | 8.750 | % | 08/01/2017 | 3,482,000 | 3,656,100 | ||||||||||||
Fox Acquisition Sub LLC | USD | 13.375 | % | 07/15/2016 | 1,715,000 | 1,860,775 | (1) | |||||||||||
Interep National Radio Sales, Inc., Series B | USD | 10.000 | % | 07/01/2008 | 4,000 | 0 | (2) | |||||||||||
Local TV Finance LLC | USD | 9.250 | % | 06/15/2015 | 1,595,000 | 1,632,881 | (1)(4) | |||||||||||
Radio One, Inc. | USD | 15.000 | % | 05/24/2016 | 2,826,001 | 2,218,411 | (4) | |||||||||||
Sinclair Television Group, Inc.: | ||||||||||||||||||
| USD | 9.250 | % | 11/01/2017 | 800,000 | 884,000 | (1) | ||||||||||||
| USD | 8.375 | % | 10/15/2018 | 2,460,000 | 2,650,650 | |||||||||||||
Univision Communications, Inc.: | ||||||||||||||||||
| USD | 7.875 | % | 11/01/2020 | 2,205,000 | 2,265,637 | (1) | ||||||||||||
| USD | 8.500 | % | 05/15/2021 | 2,400,000 | 2,328,000 | (1) | ||||||||||||
|
| |||||||||||||||||
| 21,556,070 | ||||||||||||||||||
|
| |||||||||||||||||
Metals/Mining/Steel - 4.45% | ||||||||||||||||||
APERAM: | ||||||||||||||||||
| USD | 7.375 | % | 04/01/2016 | 850,000 | 786,250 | (1) | ||||||||||||
| USD | 7.750 | % | 04/01/2018 | 1,425,000 | 1,296,750 | (1) | ||||||||||||
Arch Coal, Inc. | USD | 7.250 | % | 06/15/2021 | 2,295,000 | 1,967,962 | (1) | |||||||||||
Atkore International, Inc. | USD | 9.875 | % | 01/01/2018 | 2,189,000 | 2,189,000 | ||||||||||||
Cloud Peak Energy Resources LLC: | ||||||||||||||||||
| USD | 8.250 | % | 12/15/2017 | 400,000 | 411,000 | |||||||||||||
| USD | 8.500 | % | 12/15/2019 | 1,530,000 | 1,583,550 | |||||||||||||
CONSOL Energy, Inc. | USD | 8.250 | % | 04/01/2020 | 1,975,000 | 1,984,875 | ||||||||||||
FMG Resources August 2006 Pty. Ltd. | USD | 8.250 | % | 11/01/2019 | 3,710,000 | 3,849,125 | (1) | |||||||||||
JMC Steel Group | USD | 8.250 | % | 03/15/2018 | 1,615,000 | 1,639,225 | (1) | |||||||||||
Novelis, Inc. | USD | 8.375 | % | 12/15/2017 | 1,825,000 | 1,934,500 | ||||||||||||
Peabody Energy Corp. | USD | 6.250 | % | 11/15/2021 | 3,255,000 | 3,263,138 | (1) | |||||||||||
Taseko Mines Ltd. | USD | 7.750 | % | 04/15/2019 | 2,315,000 | 2,210,825 | ||||||||||||
|
| |||||||||||||||||
| 23,116,200 | ||||||||||||||||||
|
| |||||||||||||||||
Non Captive Finance - 0.57% | ||||||||||||||||||
Ally Financial, Inc.: | ||||||||||||||||||
| USD | 6.250 | % | 12/01/2017 | 790,000 | 813,534 | |||||||||||||
| USD | 8.000 | % | 11/01/2031 | 785,000 | 879,630 | |||||||||||||
CIT Group, Inc. | USD | 5.250 | % | 03/15/2018 | 1,310,000 | 1,291,988 | ||||||||||||
|
| |||||||||||||||||
| 2,985,152 | ||||||||||||||||||
|
| |||||||||||||||||
Paper/Forest Products - 2.98% | ||||||||||||||||||
Ainsworth Lumber Co. Ltd. | USD | 11.000 | % | 07/29/2015 | 2,146,153 | 1,749,115 | (1)(4) | |||||||||||
See Notes to Financial Statements.
Stone Harbor Investment Funds Annual Report | May 31, 2012 | 35 |
Table of Contents
Stone Harbor High Yield Bond Fund | Statements of Investments | |
| May 31, 2012 |
Currency | Rate | Maturity Date | Principal Amount* | Market Value (Expressed in U.S. $) | ||||||||||||||
Paper/Forest Products (continued) | ||||||||||||||||||
Boise Paper Holdings LLC | USD | 8.000 | % | 04/01/2020 | 2,000,000 | $ | 2,200,000 | |||||||||||
Cascades, Inc.: | ||||||||||||||||||
| USD | 7.750 | % | 12/15/2017 | 1,750,000 | 1,750,000 | |||||||||||||
| USD | 7.875 | % | 01/15/2020 | 650,000 | 640,250 | |||||||||||||
Catalyst Paper Corp. | USD | 11.000 | % | 12/15/2016 | 1,540,000 | 793,100 | (1)(2) | |||||||||||
Louisiana-Pacific Corp. | USD | 7.500 | % | 06/01/2020 | 2,380,000 | 2,439,500 | (1) | |||||||||||
Mercer International, Inc. | USD | 9.500 | % | 12/01/2017 | 1,990,000 | 2,074,575 | ||||||||||||
NewPage Corp. | USD | 11.375 | % | 12/31/2014 | 1,215,000 | 759,375 | (2) | |||||||||||
Verso Paper Holdings LLC: | ||||||||||||||||||
| USD | 11.750 | % | 01/15/2019 | 1,210,000 | 1,214,537 | (1) | ||||||||||||
| USD | 11.750 | % | 01/15/2019 | 395,000 | 302,175 | (1) | ||||||||||||
| USD | 8.750 | % | 02/01/2019 | 595,000 | 214,200 | |||||||||||||
Series B | USD | 11.375 | % | 08/01/2016 | 482,000 | 236,180 | ||||||||||||
Xerium Technologies, Inc. | USD | 8.875 | % | 06/15/2018 | 1,500,000 | 1,140,000 | ||||||||||||
|
| |||||||||||||||||
| 15,513,007 | ||||||||||||||||||
|
| |||||||||||||||||
Property & Casualty Insurance - 0.22% | ||||||||||||||||||
CNO Financial Group, Inc. | USD | 9.000 | % | 01/15/2018 | 1,100,000 | 1,171,500 | (1) | |||||||||||
|
| |||||||||||||||||
Publishing/Printing - 0.80% | ||||||||||||||||||
Baker & Taylor, Inc. | USD | 11.500 | % | 07/01/2013 | 1,295,000 | 770,525 | (1) | |||||||||||
IDEARC, Inc. | USD | 8.000 | % | 11/15/2016 | 1,265,000 | 0 | (2) | |||||||||||
The McClatchy Co. | USD | 11.500 | % | 02/15/2017 | 3,330,000 | 3,379,950 | ||||||||||||
|
| |||||||||||||||||
| 4,150,475 | ||||||||||||||||||
|
| |||||||||||||||||
Restaurants - 0.58% | ||||||||||||||||||
Landry’s, Inc. | USD | 9.375 | % | 05/01/2020 | 3,015,000 | 3,037,612 | (1) | |||||||||||
|
| |||||||||||||||||
Retail Food/Drug - 0.72% | ||||||||||||||||||
Albertsons, Inc.: | ||||||||||||||||||
| USD | 8.700 | % | 05/01/2030 | 725,000 | 609,906 | |||||||||||||
| USD | 8.000 | % | 05/01/2031 | 1,250,000 | 965,625 | |||||||||||||
American Stores Co.: | ||||||||||||||||||
| USD | 7.900 | % | 05/01/2017 | 550,000 | 535,563 | |||||||||||||
| USD | 8.000 | % | 06/01/2026 | 1,465,000 | 1,195,806 | |||||||||||||
Series MTNB | USD | 7.100 | % | 03/20/2028 | 600,000 | 444,750 | ||||||||||||
|
| |||||||||||||||||
| 3,751,650 | ||||||||||||||||||
|
| |||||||||||||||||
Retail Non Food/Drug - 2.47% | ||||||||||||||||||
Claire’s Stores, Inc.: | ||||||||||||||||||
| USD | 9.250 | % | 06/01/2015 | 550,000 | 457,875 | |||||||||||||
| USD | 9.625 | % | 06/01/2015 | 958,282 | 807,353 | (4) | ||||||||||||
| USD | 8.875 | % | 03/15/2019 | 1,150,000 | 977,500 | |||||||||||||
Express LLC | USD | 8.750 | % | 03/01/2018 | 1,415,000 | 1,537,044 | ||||||||||||
GRD Holdings III Corp. | USD | 10.750 | % | 06/01/2019 | 1,115,000 | 1,103,850 | (1) | |||||||||||
JC Penney Corp., Inc. | USD | 7.400 | % | 04/01/2037 | 2,215,000 | 1,860,600 | ||||||||||||
Limited Brands, Inc.: | ||||||||||||||||||
| USD | 6.950 | % | 03/01/2033 | 1,350,000 | 1,302,750 | |||||||||||||
| USD | 7.600 | % | 07/15/2037 | 400,000 | 400,000 | |||||||||||||
Michaels Stores, Inc. | USD | 7.750 | % | 11/01/2018 | 2,225,000 | 2,330,687 | ||||||||||||
RadioShack Corp. | USD | 6.750 | % | 05/15/2019 | 2,750,000 | 2,045,312 | ||||||||||||
|
| |||||||||||||||||
| 12,822,971 | ||||||||||||||||||
|
| |||||||||||||||||
See Notes to Financial Statements.
36 | www.shiplp.com |
Table of Contents
Stone Harbor High Yield Bond Fund | Statements of Investments | |
| May 31, 2012 |
Currency | Rate | Maturity Date | Principal Amount* | �� | Market Value (Expressed in U.S. $) | |||||||||||||
Satellite - 0.46% | ||||||||||||||||||
Intelsat Jackson Holdings SA | USD | 7.250 | % | 04/01/2019 | 2,385,000 | $ | 2,393,944 | |||||||||||
|
| |||||||||||||||||
Services Other - 3.12% | ||||||||||||||||||
American Residential Services LLC | USD | 12.000 | % | 04/15/2015 | 1,075,000 | 1,080,375 | (1) | |||||||||||
ARAMARK Holdings Corp. | USD | 8.625 | % | 05/01/2016 | 1,060,000 | 1,086,511 | (1)(4) | |||||||||||
Brickman Group Holdings, Inc. | USD | 9.125 | % | 11/01/2018 | 2,295,000 | 2,214,675 | (1) | |||||||||||
GXS Worldwide, Inc. | USD | 9.750 | % | 06/15/2015 | 2,040,000 | 1,989,000 | ||||||||||||
Interactive Data Corp. | USD | 10.250 | % | 08/01/2018 | 1,875,000 | 2,085,938 | ||||||||||||
Iron Mountain, Inc. | USD | 8.750 | % | 07/15/2018 | 1,200,000 | 1,245,000 | ||||||||||||
ServiceMaster Co.: | ||||||||||||||||||
| USD | 8.000 | % | 02/15/2020 | 1,373,000 | 1,446,799 | (1) | ||||||||||||
| USD | 7.450 | % | 08/15/2027 | 325,000 | 275,437 | |||||||||||||
Trans Union LLC | USD | 11.375 | % | 06/15/2018 | 1,925,000 | 2,264,281 | ||||||||||||
TransUnion Holding Co., Inc. | USD | 9.625 | % | 06/15/2018 | 755,000 | 800,300 | (1)(4) | |||||||||||
West Corp.: | ||||||||||||||||||
| USD | 8.625 | % | 10/01/2018 | 350,000 | 366,625 | |||||||||||||
| USD | 7.875 | % | 01/15/2019 | 1,350,000 | 1,360,125 | |||||||||||||
|
| |||||||||||||||||
| 16,215,066 | ||||||||||||||||||
|
| |||||||||||||||||
Technology - 4.36% | ||||||||||||||||||
CommScope, Inc. | USD | 8.250 | % | 01/15/2019 | 2,350,000 | 2,429,313 | (1) | |||||||||||
First Data Corp.: | ||||||||||||||||||
| USD | 7.375 | % | 06/15/2019 | 2,385,000 | 2,396,925 | (1) | ||||||||||||
| USD | 12.625 | % | 01/15/2021 | 2,515,000 | 2,382,963 | |||||||||||||
iGATE Corp. | USD | 9.000 | % | 05/01/2016 | 2,125,000 | 2,263,125 | ||||||||||||
Lawson Software, Inc.: | ||||||||||||||||||
| USD | 11.500 | % | 07/15/2018 | 2,690,000 | 2,965,725 | (1) | ||||||||||||
| USD | 9.375 | % | 04/01/2019 | 845,000 | 874,575 | (1) | ||||||||||||
MEMC Electronic Materials, Inc. | USD | 7.750 | % | 04/01/2019 | 1,550,000 | 988,125 | ||||||||||||
NXP BV | USD | 9.750 | % | 08/01/2018 | 2,125,000 | 2,406,562 | (1) | |||||||||||
Seagate HDD Cayman | USD | 7.750 | % | 12/15/2018 | 2,075,000 | 2,246,187 | ||||||||||||
SSI Investments II | USD | 11.125 | % | 06/01/2018 | 1,810,000 | 2,031,725 | ||||||||||||
SunGard Data Systems, Inc. | USD | 7.375 | % | 11/15/2018 | 1,625,000 | 1,661,562 | ||||||||||||
|
| |||||||||||||||||
| 22,646,787 | ||||||||||||||||||
|
| |||||||||||||||||
Textile/Apparel - 0.80% | ||||||||||||||||||
Levi Strauss & Co.: | ||||||||||||||||||
| USD | 7.625 | % | 05/15/2020 | 1,550,000 | 1,629,437 | |||||||||||||
| USD | 6.875 | % | 05/01/2022 | 850,000 | 847,875 | (1) | ||||||||||||
Quiksilver, Inc. | USD | 6.875 | % | 04/15/2015 | 1,700,000 | 1,674,500 | ||||||||||||
|
| |||||||||||||||||
| 4,151,812 | ||||||||||||||||||
|
| |||||||||||||||||
Transportation Non Air/Rail - 0.20% | ||||||||||||||||||
Teekay Corp. | USD | 8.500 | % | 01/15/2020 | 1,025,000 | 1,060,875 | ||||||||||||
|
| |||||||||||||||||
Wireless - 2.23% | ||||||||||||||||||
Matterhorn Mobile | EUR | 8.250 | % | 02/15/2020 | 1,100,000 | 1,383,960 | (5) | |||||||||||
Sprint Capital Corp. | USD | 8.750 | % | 03/15/2032 | 5,950,000 | 5,042,625 | ||||||||||||
Sprint Nextel Corp. | USD | 9.125 | % | 03/01/2017 | 2,455,000 | 2,442,725 | (1) | |||||||||||
Wind Acquisition Finance SA | USD | 12.250 | % | 07/15/2017 | 3,667,582 | 2,732,349 | (1)(4) | |||||||||||
|
| |||||||||||||||||
| 11,601,659 | ||||||||||||||||||
|
| |||||||||||||||||
See Notes to Financial Statements.
Stone Harbor Investment Funds Annual Report | May 31, 2012 | 37 |
Table of Contents
Stone Harbor High Yield Bond Fund | Statements of Investments | |
| May 31, 2012 |
Currency | Rate | Maturity Date | Principal Amount* | Market Value (Expressed in U.S. $) | ||||||||||||||
Wirelines - 5.98% | ||||||||||||||||||
CenturyLink, Inc.: | ||||||||||||||||||
| USD | 5.800 | % | 03/15/2022 | 2,460,000 | $ | 2,431,767 | ||||||||||||
| USD | 7.650 | % | 03/15/2042 | 1,385,000 | 1,323,665 | |||||||||||||
Cincinnati Bell, Inc.: | ||||||||||||||||||
| USD | 8.250 | % | 10/15/2017 | 2,730,000 | 2,798,250 | |||||||||||||
| USD | 8.750 | % | 03/15/2018 | 1,995,000 | 1,860,337 | |||||||||||||
Citizens Communications Co. | USD | 9.000 | % | 08/15/2031 | 8,413,000 | 7,739,960 | ||||||||||||
Embarq Corp. | USD | 7.995 | % | 06/01/2036 | 1,575,000 | 1,618,122 | ||||||||||||
ITC Deltacom, Inc. | USD | 10.500 | % | 04/01/2016 | 2,000,000 | 2,115,000 | ||||||||||||
Level 3 Financing, Inc. | USD | 10.000 | % | 02/01/2018 | 3,075,000 | 3,328,688 | ||||||||||||
Qwest Corp. | USD | 6.875 | % | 09/15/2033 | 1,750,000 | 1,728,125 | ||||||||||||
Syniverse Holdings, Inc. | USD | 9.125 | % | 01/15/2019 | 1,140,000 | 1,228,350 | ||||||||||||
Windstream Corp. | USD | 7.500 | % | 04/01/2023 | 5,069,000 | 4,891,585 | ||||||||||||
|
| |||||||||||||||||
| 31,063,849 | ||||||||||||||||||
|
| |||||||||||||||||
TOTAL CORPORATE BONDS | 476,515,231 | |||||||||||||||||
|
| |||||||||||||||||
(Cost $476,814,794) | ||||||||||||||||||
CONVERTIBLE CORPORATE BONDS - 0.99% | ||||||||||||||||||
Airlines - 0.03% | ||||||||||||||||||
AirTran Holdings, Inc. | USD | 5.250 | % | 11/01/2016 | 110,000 | 141,625 | ||||||||||||
|
| |||||||||||||||||
Automotive - 0.07% | ||||||||||||||||||
TRW Automotive, Inc. | USD | 3.500 | % | 12/01/2015 | 250,000 | 379,062 | ||||||||||||
|
| |||||||||||||||||
Building Products - 0.01% | ||||||||||||||||||
Cemex SAB de CV | USD | 3.750 | % | 03/15/2018 | 100,000 | 71,875 | ||||||||||||
|
| |||||||||||||||||
Drillers/Services - 0.12% | ||||||||||||||||||
Hornbeck Offshore Services, Inc. | USD | 1.625 | % | 11/15/2026 | 140,000 | 140,966 | (3) | |||||||||||
Newpark Resources, Inc. | USD | 4.000 | % | 10/01/2017 | 163,000 | 154,239 | ||||||||||||
Subsea 7 SA, Series ACY | USD | 2.250 | % | 10/11/2013 | 300,000 | 322,800 | ||||||||||||
|
| |||||||||||||||||
| 618,005 | ||||||||||||||||||
|
| |||||||||||||||||
Exploration & Production - 0.03% | ||||||||||||||||||
Stone Energy Corp. | USD | 1.750 | % | 03/01/2017 | 159,000 | 145,087 | (1) | |||||||||||
|
| |||||||||||||||||
Food & Beverage - 0.08% | ||||||||||||||||||
Smithfield Foods, Inc. | USD | 4.000 | % | 06/30/2013 | 88,000 | 94,820 | ||||||||||||
Tyson Foods, Inc. | USD | 3.250 | % | 10/15/2013 | 280,000 | 347,200 | ||||||||||||
|
| |||||||||||||||||
| 442,020 | ||||||||||||||||||
|
| |||||||||||||||||
Healthcare - 0.03% | ||||||||||||||||||
Dendreon Corp. | USD | 2.875 | % | 01/15/2016 | 231,000 | 164,299 | ||||||||||||
|
| |||||||||||||||||
Industrial Other - 0.05% | ||||||||||||||||||
Altra Holdings, Inc. | USD | 2.750 | % | 03/01/2031 | 289,000 | 273,828 | (1) | |||||||||||
|
| |||||||||||||||||
Lodging - 0.01% | ||||||||||||||||||
Home Inns & Hotels Management, Inc. | USD | 2.000 | % | 12/15/2015 | 56,000 | 38,850 | (1) | |||||||||||
|
| |||||||||||||||||
See Notes to Financial Statements.
38 | www.shiplp.com |
Table of Contents
Stone Harbor High Yield Bond Fund | Statements of Investments | |
| May 31, 2012 |
Currency | Rate | Maturity Date | Principal Amount* | Market Value | ||||||||||||||
Metals/Mining/Steel - 0.03% | ||||||||||||||||||
RTI International Metals, Inc. | USD | 3.000 | % | 12/01/2015 | 164,000 | $ | 160,105 | |||||||||||
|
| |||||||||||||||||
Pharmaceuticals - 0.04% | ||||||||||||||||||
Teva Pharmaceutical Finance Co. LLC, Series C | USD | 0.250 | % | 02/01/2026 | 175,000 | 182,875 | ||||||||||||
|
| |||||||||||||||||
Railroads - 0.05% | ||||||||||||||||||
Greenbrier Cos., Inc. | USD | 3.500 | % | 04/01/2018 | 287,000 | 240,362 | (1) | |||||||||||
|
| |||||||||||||||||
Retail Non Food/Drug - 0.05% | ||||||||||||||||||
RadioShack Corp. | USD | 2.500 | % | 08/01/2013 | 250,000 | 236,875 | (1) | |||||||||||
|
| |||||||||||||||||
Technology - 0.39% | ||||||||||||||||||
Alcatel-Lucent, Series ALU | EUR | 5.000 | % | 01/01/2015 | 2,000,000 | 67,342 | ||||||||||||
Alcatel-Lucent USA, Inc., Series A | USD | 2.875 | % | 06/15/2023 | 330,000 | 254,100 | ||||||||||||
Callidus Software, Inc. | USD | 4.750 | % | 06/01/2016 | 197,000 | 202,664 | ||||||||||||
Ciena Corp. | USD | 4.000 | % | 03/15/2015 | 73,000 | 76,103 | (1) | |||||||||||
Comtech Telecommunications Corp. | USD | 3.000 | % | 05/01/2029 | 184,000 | 198,720 | ||||||||||||
Micron Technology, Inc.: | ||||||||||||||||||
| USD | 1.875 | % | 06/01/2027 | 121,000 | 104,060 | |||||||||||||
Series A | USD | 1.500 | % | 08/01/2031 | 145,000 | 125,425 | (1) | |||||||||||
ON Semiconductor Corp. | USD | 2.625 | % | 12/15/2026 | 303,000 | 311,711 | ||||||||||||
Symantec Corp., Series B | USD | 1.000 | % | 06/15/2013 | 514,000 | 528,777 | ||||||||||||
WebMD Health Corp. | USD | 2.500 | % | 01/31/2018 | 208,000 | 177,840 | ||||||||||||
|
| |||||||||||||||||
| 2,046,742 | ||||||||||||||||||
|
| |||||||||||||||||
TOTAL CONVERTIBLE CORPORATE BONDS | 5,141,610 | |||||||||||||||||
|
| |||||||||||||||||
(Cost $5,535,100) | ||||||||||||||||||
BANK LOANS - 2.50%(7) | ||||||||||||||||||
Building Products - 0.03% | ||||||||||||||||||
Collins & Aikman Floorcoverings, Inc. - Term Loan B: | ||||||||||||||||||
| USD | 2.740 | % | 06/21/2012 | 128,571 | 125,357 | |||||||||||||
| USD | 2.740 | % | 06/25/2012 | 18,367 | 17,908 | |||||||||||||
| USD | 2.739 | % | 06/29/2012 | 7,113 | 6,936 | |||||||||||||
|
| |||||||||||||||||
| 150,201 | ||||||||||||||||||
|
| |||||||||||||||||
Chemicals - 0.44% | ||||||||||||||||||
Trinseo Materials Operating S.C.A.: | ||||||||||||||||||
| USD | 6.750 | % | 06/29/2012 | 91,248 | 82,180 | |||||||||||||
| USD | 6.000 | % | 08/31/2012 | 2,431,758 | 2,190,102 | |||||||||||||
|
| |||||||||||||||||
| 2,272,282 | ||||||||||||||||||
|
| |||||||||||||||||
Electric - 0.60% | ||||||||||||||||||
Texas Competitive Electric Holdings Co. LLC - 2017 Term Loan | USD | 4.739 | % | 06/11/2012 | 5,332,609 | 3,121,576 | ||||||||||||
|
| |||||||||||||||||
Gaming - 0.43% | ||||||||||||||||||
Caesars Entertainment Operating Co., Inc. - Term B-6 Loan | USD | 5.489 | % | 06/25/2012 | 2,500,000 | 2,215,625 | ||||||||||||
|
| |||||||||||||||||
See Notes to Financial Statements.
Stone Harbor Investment Funds Annual Report | May 31, 2012 | 39 |
Table of Contents
Stone Harbor High Yield Bond Fund | Statements of Investments | |
| May 31, 2012 |
Currency | Rate | Maturity Date | Principal | Market Value | ||||||||||||||
Metals/Mining/Steel - 0.16% | ||||||||||||||||||
Arch Coal, Inc. - Term Loan Facility | USD | 5.750 | % | 06/21/2012 | 850,000 | $ | 830,521 | |||||||||||
|
| |||||||||||||||||
Non Captive Finance - 0.45% | ||||||||||||||||||
iStar Financial, Inc. - Tranche A-2 Loan | USD | 7.000 | % | 06/01/2012 | 2,366,200 | 2,368,152 | ||||||||||||
|
| |||||||||||||||||
Publishing/Printing - 0.07% | ||||||||||||||||||
Merrill Communications LLC - Term Loan 2L -Second Lien: | ||||||||||||||||||
| USD | 13.750 | % | 06/30/2012 | 150,000 | 136,125 | |||||||||||||
| USD | 14.000 | % | 07/31/2012 | 10,251 | 9,303 | |||||||||||||
R.H. Donnelley, Inc. -Term Loan D3-Exit: | ||||||||||||||||||
| USD | 9.000 | % | 06/29/2012 | 38,965 | 17,573 | |||||||||||||
| USD | 9.000 | % | 07/31/2012 | 107,460 | 48,464 | |||||||||||||
| USD | 9.000 | % | 08/31/2012 | 89,162 | 40,212 | |||||||||||||
Tribune Co. -Tranche X Advance | USD | 5.000 | % | 06/30/2011 | 192,000 | 123,552 | (2) | |||||||||||
|
| |||||||||||||||||
| 375,229 | ||||||||||||||||||
|
| |||||||||||||||||
Retail Non Food/Drug - 0.32% | ||||||||||||||||||
Lord & Taylor Holdings LLC -Term Loan: | ||||||||||||||||||
| USD | 5.750 | % | 06/11/2012 | 1,100,000 | 1,107,791 | |||||||||||||
| USD | 5.750 | % | 07/11/2012 | 438,625 | 441,732 | |||||||||||||
| USD | 5.750 | % | 07/31/2012 | 107,250 | 108,010 | |||||||||||||
|
| |||||||||||||||||
| 1,657,533 | ||||||||||||||||||
|
| |||||||||||||||||
TOTAL BANK LOANS | 12,991,119 | |||||||||||||||||
|
| |||||||||||||||||
(Cost $14,324,654) | ||||||||||||||||||
COMMON STOCKS - 0.00%(8) | ||||||||||||||||||
Transportation Non Air/Rail -0.00%(8) | ||||||||||||||||||
General Maritime | 1,784 | 18 | ||||||||||||||||
|
| |||||||||||||||||
TOTAL COMMON STOCKS | 18 | |||||||||||||||||
|
| |||||||||||||||||
(Cost $0) | ||||||||||||||||||
PREFERRED STOCKS - 0.13% | ||||||||||||||||||
Exploration & Production - 0.09% | ||||||||||||||||||
Apache Corp. | 6.000 | % | 08/01/2013 | 5,540 | 264,701 | |||||||||||||
SandRidge Energy, Inc. | 8.500 | % | 12/31/2049 | 1,900 | 198,550 | |||||||||||||
|
| |||||||||||||||||
| 463,251 | ||||||||||||||||||
|
| |||||||||||||||||
Life - 0.03% | ||||||||||||||||||
Hartford Financial Services Group, Inc. | 7.250 | % | 04/01/2013 | 2,229 | 43,042 | |||||||||||||
MetLife, Inc. | 5.000 | % | 09/11/2013 | 1,650 | 96,789 | |||||||||||||
|
| |||||||||||||||||
| 139,831 | ||||||||||||||||||
|
| |||||||||||||||||
Metals/Mining/Steel - 0.01% | ||||||||||||||||||
Molycorp, Inc. | 5.500 | % | 03/01/2014 | 850 | 44,684 | |||||||||||||
|
| |||||||||||||||||
See Notes to Financial Statements.
40 | www.shiplp.com |
Table of Contents
Stone Harbor High Yield Bond Fund | Statements of Investments | |
| May 31, 2012 |
Rate | Maturity Date | Shares | Market Value (Expressed in U.S. $) | |||||||||||
Technology - 0.00%(8) | ||||||||||||||
Unisys Corp. | 6.250% | 03/01/2014 | 70 | $ | 3,555 | |||||||||
|
| |||||||||||||
TOTAL PREFERRED STOCKS | 651,321 | |||||||||||||
|
| |||||||||||||
(Cost $777,062) | ||||||||||||||
WARRANTS - 0.01%(9) | ||||||||||||||
Media Other - 0.01% | ||||||||||||||
Cumulus Media, Inc. expires 06/03/2030, strike price $0.010 | 12,989 | 38,967 | ||||||||||||
|
| |||||||||||||
Publishing/Printing - 0.00% | ||||||||||||||
Readers Digest expires 02/19/2014, strike price $0.010 | 1,498 | 0 | ||||||||||||
|
| |||||||||||||
Transportation Non Air/Rail - 0.00% | ||||||||||||||
General Maritime expires 05/17/2017, strike price $42.500 | 2,759 | 0 | ||||||||||||
|
| |||||||||||||
TOTAL WARRANTS | 38,967 | |||||||||||||
|
| |||||||||||||
(Cost $490,671) | ||||||||||||||
SHORT TERM INVESTMENTS - 3.03% | ||||||||||||||
Money Market Mutual Funds - 3.03% | ||||||||||||||
Dreyfus Institutional Cash Advantage Fund - Institutional Advantage Shares (0.16429% 7-Day Yield) | 15,765,865 | 15,765,865 | ||||||||||||
|
| |||||||||||||
TOTAL SHORT TERM INVESTMENTS | 15,765,865 | |||||||||||||
|
| |||||||||||||
(Cost $15,765,865) | ||||||||||||||
Total Investments - 98.35% | 511,104,131 | |||||||||||||
(Cost $513,708,146) | ||||||||||||||
Other Assets in Excess of Liabilities - 1.65% | 8,576,228 | |||||||||||||
|
| |||||||||||||
Net Assets - 100.00% | $ | 519,680,359 | ||||||||||||
|
| |||||||||||||
* The contract/principal amounts of each security is stated in the currency in which the security is denominated. See below.
EUR | - | Euro Currency | ||
JPY | - | Japanese Yen | ||
USD | - | United States Dollar |
| (1) | Security exempt from registration under Rule 144A of the Securities Act of 1933. Under procedures approved by the Board of Trustees, such securities have been determined to be liquid by Stone Harbor Investment Partners and may normally be sold to qualified institutional buyers in transactions exempt from registration. Total market value of Rule 144A securities amounts to $163,747,646, which represents approximately 31.51% of net assets as of May 31, 2012. |
| (2) | Security is currently in default/non-income producing. |
| (3) | Step bond. Coupon increases periodically based upon a predetermined schedule. Interest rate disclosed is that which is in effect at May 31, 2012. |
| (4) | Pay-in-kind securities. |
| (5) | Securities were originally issued pursuant to Regulation S under the Securities Act of 1933, which exempts securities offered and sold outside of the United States from registration. Such securities cannot be sold in the United States without either an effective registration statement filed pursuant to the Securities Act of 1933, or pursuant to an exemption from registration. As of May 31, 2012, the aggregate market value of those securities was $7,771,136, which represents approximately 1.50% of net assets. |
| (6) | Floating or variable rate security. Interest rate disclosed is that which is in effect at May 31, 2012. |
See Notes to Financial Statements.
Stone Harbor Investment Funds Annual Report | May 31, 2012 | 41 |
Table of Contents
Stone Harbor High Yield Bond Fund | Statements of Investments | |
| May 31, 2012 |
| (7) | Bank loans generally pay interest at rates which are periodically determined by reference to a base lending rate plus a premium. All loans carry a variable rate of interest. These base lending rates are generally (i) the Prime Rate offered by one or more major United States banks, (ii) the lending rate offered by one or more European banks such as the London Interbank Offered Rate (“LIBOR”) or (iii) the Certificate of Deposit rate. Rate shown represents the weighted average rate at May 31, 2012. Bank Loans, while exempt from registration, under the Securities Act of 1933 (the “1933 Act”), contain certain restrictions on resale and cannot be sold publicly. Floating rate bank loans often require prepayments from excess cash flow or permit the borrower to repay at its election. The degree to which borrowers repay, whether as a contractual requirement or at their election, cannot be predicted with accuracy. As a result, the actual remaining maturity may be substantially less than the stated maturity shown. |
| (8) | Amount represents less than 0.005% of net assets. |
| (9) | Non-income producing security. |
Common Abbreviations:
BV | - | Besloten Vennootschap a Dutch private limited liability company. | ||
GmbH | - | Gesellschaft mit beschrankter Haftung is the German term for a company wtih limited liability. | ||
LLC | - | Limited Liability Corporation. | ||
LP | - | Limited Partnership. | ||
Ltd. | - | Limited. | ||
NV | - | Naamloze Vennootschap is the Dutch term for a public limited liability corporation. | ||
PLC | - | Public Limited Company. | ||
Pty. | - | Proprietary. | ||
SA | - | Generally designates corporations in various countries, mostly those employing the civil law. | ||
SAB de CV | - | A variable capital company. |
OUTSTANDING FORWARD FOREIGN CURRENCY CONTRACTS
Contract Description | Contracted Amount | Purchase/Sale Contract | Settlement Date | Current Value | Unrealized Appreciation/ (Depreciation) | |||||||||
EUR(1) | 9,901,000 | Sale | 06/29/2012 | $ | 12,244,262 | $ | 359,315 | |||||||
JPY(1) | 25,061,000 | Purchase | 06/29/2012 | 319,914 | 4,986 | |||||||||
|
| |||||||||||||
| $ | 364,301 | |||||||||||||
|
| |||||||||||||
EUR(1) | 1,602,918 | Purchase | 06/29/2012 | $ | 1,982,280 | $ | (54,656) | |||||||
JPY(1) | 25,061,000 | Sale | 06/29/2012 | 319,914 | (4,197) | |||||||||
|
| |||||||||||||
| $ | (58,853) | |||||||||||||
|
| |||||||||||||
| (1) | The Counterparty is JPMorgan Chase & Co. |
See Notes to Financial Statements.
42 | www.shiplp.com |
Table of Contents
| Statements of Investments | ||
| May 31, 2012 |
Currency | Rate | Maturity Date | Principal Amount* | Market Value | ||||||||||||||
SOVEREIGN DEBT OBLIGATIONS - 48.09% | ||||||||||||||||||
Argentina - 0.29% | ||||||||||||||||||
Republic of Argentina: | ||||||||||||||||||
| USD | 7.000 | % | 10/03/2015 | 3,700,000 | $ | 2,767,394 | ||||||||||||
| ARS | 9.540 | % | 12/31/2033 | 7,680,627 | 1,090,254 | (1) | ||||||||||||
| EUR | 6.840 | % | 12/31/2033 | 984,573 | 608,715 | (1) | ||||||||||||
|
| |||||||||||||||||
| 4,466,363 | ||||||||||||||||||
|
| |||||||||||||||||
Brazil - 2.03% | ||||||||||||||||||
Nota Do Tesouro Nacional: | ||||||||||||||||||
| BRL | 6.000 | % | 05/15/2015 | 22,398,842 | 11,829,297 | |||||||||||||
| BRL | 10.000 | % | 01/01/2017 | 29,980,000 | 15,034,333 | |||||||||||||
| BRL | 10.000 | % | 01/01/2021 | 9,800,000 | 4,803,154 | |||||||||||||
|
| |||||||||||||||||
| 31,666,784 | ||||||||||||||||||
|
| |||||||||||||||||
Chile - 0.12% | ||||||||||||||||||
Republic of Chile | CLP | 5.500 | % | 08/05/2020 | 890,000,000 | 1,820,113 | ||||||||||||
|
| |||||||||||||||||
Colombia - 3.21% | ||||||||||||||||||
Bogota Distrio Capital | COP | 9.750 | % | 07/26/2028 | 37,957,000,000 | 28,266,545 | (2) | |||||||||||
Republic of Colombia: | ||||||||||||||||||
| COP | 12.000 | % | 10/22/2015 | 11,840,000,000 | 7,954,109 | |||||||||||||
| COP | 7.750 | % | 04/14/2021 | 17,433,000,000 | 11,603,054 | |||||||||||||
| COP | 9.850 | % | 06/28/2027 | 2,937,000,000 | 2,299,472 | |||||||||||||
|
| |||||||||||||||||
| 50,123,180 | ||||||||||||||||||
|
| |||||||||||||||||
Hungary - 2.18% | ||||||||||||||||||
Hungarian Government: | ||||||||||||||||||
| HUF | 6.750 | % | 02/12/2013 | 2,190,480,000 | 8,956,385 | |||||||||||||
| HUF | 7.500 | % | 10/24/2013 | 700,100,000 | 2,869,638 | |||||||||||||
| HUF | 5.500 | % | 02/12/2014 | 1,204,890,000 | 4,770,373 | |||||||||||||
| HUF | 6.750 | % | 08/22/2014 | 414,880,000 | 1,662,458 | |||||||||||||
| HUF | 8.000 | % | 02/12/2015 | 3,488,700,000 | 14,214,790 | |||||||||||||
| HUF | 6.750 | % | 02/24/2017 | 358,100,000 | 1,365,788 | |||||||||||||
| HUF | 7.500 | % | 11/12/2020 | 71,790,000 | 273,801 | |||||||||||||
|
| |||||||||||||||||
| 34,113,233 | ||||||||||||||||||
|
| |||||||||||||||||
Malaysia - 4.82% | ||||||||||||||||||
Malaysian Government: | ||||||||||||||||||
| MYR | 5.094 | % | 04/30/2014 | 25,000,000 | 8,179,633 | |||||||||||||
| MYR | 3.434 | % | 08/15/2014 | 18,350,000 | 5,829,130 | |||||||||||||
| MYR | 3.741 | % | 02/27/2015 | 14,000,000 | 4,480,177 | |||||||||||||
| MYR | 3.835 | % | 08/12/2015 | 34,320,000 | 11,031,525 | |||||||||||||
| MYR | 3.197 | % | 10/15/2015 | 13,200,000 | 4,166,942 | |||||||||||||
| MYR | 4.012 | % | 09/15/2017 | 85,800,000 | 27,948,063 | |||||||||||||
| MYR | 4.160 | % | 07/15/2021 | 5,050,000 | 1,662,237 | |||||||||||||
| MYR | 3.418 | % | 08/15/2022 | 27,710,000 | 8,644,769 | |||||||||||||
| MYR | 4.392 | % | 04/15/2026 | 10,350,000 | 3,452,447 | |||||||||||||
|
| |||||||||||||||||
| 75,394,923 | ||||||||||||||||||
|
| |||||||||||||||||
See Notes to Financial Statements.
Stone Harbor Investment Funds Annual Report | May 31, 2012 | 43 |
Table of Contents
Stone Harbor Local Markets Fund | Statements of Investments | |
| May 31, 2012 |
Currency | Rate | Maturity Date | Principal Amount* | Market Value | ||||||||||||||
Mexico - 10.42% | ||||||||||||||||||
Mexican Bonos: | ||||||||||||||||||
| MXN | 6.000 | % | 06/18/2015 | 135,700,000 | $ | 9,790,671 | ||||||||||||
| MXN | 8.000 | % | 12/17/2015 | 19,440,000 | 1,488,984 | |||||||||||||
| MXN | 7.750 | % | 12/14/2017 | 109,990,000 | 8,599,067 | |||||||||||||
| MXN | 8.000 | % | 06/11/2020 | 356,068,000 | 28,428,321 | |||||||||||||
| MXN | 6.500 | % | 06/10/2021 | 655,849,000 | 47,471,472 | |||||||||||||
| MXN | 6.500 | % | 06/09/2022 | 198,560,000 | 14,232,596 | |||||||||||||
| MXN | 8.500 | % | 05/31/2029 | 62,000,000 | 4,974,011 | |||||||||||||
| MXN | 7.750 | % | 05/29/2031 | 104,850,000 | 7,763,044 | |||||||||||||
| MXN | 8.500 | % | 11/18/2038 | 18,500,000 | 1,444,518 | |||||||||||||
Mexican Udibonos: | ||||||||||||||||||
| MXN | 5.000 | % | 06/16/2016 | 35,949,439 | 2,895,392 | |||||||||||||
| MXN | 3.500 | % | 12/14/2017 | 3,604,429 | 281,910 | |||||||||||||
| MXN | 4.000 | % | 06/13/2019 | 24,235,044 | 1,951,352 | |||||||||||||
| MXN | 2.500 | % | 12/10/2020 | 462,462,494 | 33,532,092 | |||||||||||||
|
| |||||||||||||||||
| 162,853,430 | ||||||||||||||||||
|
| |||||||||||||||||
Peru - 0.39% | ||||||||||||||||||
Republic of Peru: | ||||||||||||||||||
| PEN | 7.840 | % | 08/12/2020 | 8,570,000 | 3,690,328 | (2) | ||||||||||||
| PEN | 8.200 | % | 08/12/2026 | 5,330,000 | 2,455,484 | (2) | ||||||||||||
|
| |||||||||||||||||
| 6,145,812 | ||||||||||||||||||
|
| |||||||||||||||||
Philippines - 0.02% | ||||||||||||||||||
Republic of Philippines | PHP | 4.950 | % | 01/15/2021 | 14,000,000 | 336,283 | ||||||||||||
|
| |||||||||||||||||
Poland - 4.64% | ||||||||||||||||||
Republic of Poland: | ||||||||||||||||||
| PLN | 5.250 | % | 04/25/2013 | 3,700,000 | 1,047,365 | |||||||||||||
| PLN | 0.000 | % | 07/25/2013 | 4,570,000 | 1,222,241 | (3) | ||||||||||||
| PLN | 5.500 | % | 04/25/2015 | 64,170,000 | 18,426,187 | |||||||||||||
| PLN | 3.000 | % | 08/24/2016 | 52,099,124 | 15,226,002 | |||||||||||||
| PLN | 5.250 | % | 10/25/2017 | 22,062,000 | 6,271,877 | |||||||||||||
| PLN | 5.250 | % | 10/25/2020 | 24,980,000 | 6,995,753 | |||||||||||||
| PLN | 5.750 | % | 10/25/2021 | 68,910,000 | 19,858,190 | |||||||||||||
| PLN | 5.750 | % | 09/23/2022 | 12,360,000 | 3,561,504 | |||||||||||||
|
| |||||||||||||||||
| 72,609,119 | ||||||||||||||||||
|
| |||||||||||||||||
Russia - 0.78% | ||||||||||||||||||
Russian Federation | RUB | 7.850 | % | 03/10/2018 | 400,000,000 | 12,272,659 | (2) | |||||||||||
|
| |||||||||||||||||
South Africa - 9.43% | ||||||||||||||||||
Republic of South Africa: | ||||||||||||||||||
| ZAR | 13.500 | % | 09/15/2015 | 92,050,000 | 13,083,707 | |||||||||||||
| ZAR | 8.250 | % | 09/15/2017 | 25,950,000 | 3,220,312 | |||||||||||||
| ZAR | 8.000 | % | 12/21/2018 | 170,975,000 | 20,847,584 | |||||||||||||
| ZAR | 7.250 | % | 01/15/2020 | 27,990,000 | 3,222,554 | |||||||||||||
| ZAR | 6.750 | % | 03/31/2021 | 738,560,000 | 81,543,258 | |||||||||||||
| ZAR | 10.500 | % | 12/21/2026 | 60,940,000 | 8,445,163 | |||||||||||||
| ZAR | 7.000 | % | 02/28/2031 | 100,220,000 | 9,856,166 | |||||||||||||
See Notes to Financial Statements.
44 | www.shiplp.com |
Table of Contents
Stone Harbor Local Markets Fund | Statements of Investments | |
| May 31, 2012 |
Currency | Rate | Maturity Date | Principal Amount* | Market Value | ||||||||||||||
South Africa (continued) | ||||||||||||||||||
Republic of South Africa (continued) | ||||||||||||||||||
| ZAR | 6.250 | % | 03/31/2036 | 82,000,000 | $ | 7,142,095 | ||||||||||||
|
| |||||||||||||||||
| 147,360,839 | ||||||||||||||||||
|
| |||||||||||||||||
Thailand - 4.43% | ||||||||||||||||||
Thailand Government: | ||||||||||||||||||
| THB | 4.250 | % | 03/13/2013 | 29,630,000 | 938,715 | |||||||||||||
| THB | 5.250 | % | 05/12/2014 | 224,900,000 | 7,328,135 | |||||||||||||
| THB | 3.625 | % | 05/22/2015 | 717,160,000 | 22,683,098 | |||||||||||||
| THB | 3.125 | % | 12/11/2015 | 239,010,000 | 7,443,369 | |||||||||||||
| THB | 3.250 | % | 06/16/2017 | 331,750,000 | 10,305,271 | |||||||||||||
| THB | 2.800 | % | 10/10/2017 | 324,480,000 | 9,831,100 | |||||||||||||
| THB | 3.875 | % | 06/13/2019 | 4,775,000 | 151,514 | |||||||||||||
| THB | 1.200 | % | 07/14/2021 | 230,100,000 | 7,361,355 | |||||||||||||
| THB | 3.650 | % | 12/17/2021 | 105,180,000 | 3,299,192 | |||||||||||||
|
| |||||||||||||||||
| 69,341,749 | ||||||||||||||||||
|
| |||||||||||||||||
Turkey - 5.33% | ||||||||||||||||||
Republic of Turkey: | ||||||||||||||||||
| TRY | 0.000 | % | 08/08/2012 | 1,300,000 | 684,519 | (3) | ||||||||||||
| TRY | 0.000 | % | 07/17/2013 | 62,800,000 | 30,272,121 | (3) | ||||||||||||
| TRY | 8.000 | % | 01/29/2014 | 1,760,000 | 925,894 | |||||||||||||
| TRY | 9.000 | % | 03/05/2014 | 10,200,000 | 5,448,023 | |||||||||||||
| TRY | 10.000 | % | 06/17/2015 | 1,760,000 | 963,647 | |||||||||||||
| TRY | 9.000 | % | 01/27/2016 | 51,490,000 | 27,501,831 | |||||||||||||
| TRY | 9.000 | % | 03/08/2017 | 32,920,000 | 17,600,879 | |||||||||||||
|
| |||||||||||||||||
| 83,396,914 | ||||||||||||||||||
|
| |||||||||||||||||
TOTAL SOVEREIGN DEBT OBLIGATIONS | 751,901,401 | |||||||||||||||||
|
| |||||||||||||||||
(Cost $798,216,591) | ||||||||||||||||||
CORPORATE BONDS - 3.54% | ||||||||||||||||||
Colombia - 0.49% | ||||||||||||||||||
Emgesa SA ESP: | ||||||||||||||||||
| COP | 8.750 | % | 01/25/2021 | 636,000,000 | 378,886 | (4) | ||||||||||||
| COP | 8.750 | % | 01/25/2021 | 8,043,000,000 | �� | 4,791,481 | (2) | |||||||||||
Empresas Publicas de Medellin ESP: | ||||||||||||||||||
| COP | 8.375 | % | 02/01/2021 | 802,000,000 | 468,389 | (4) | ||||||||||||
| COP | 8.375 | % | 02/01/2021 | 3,450,000,000 | 2,014,891 | (2) | ||||||||||||
|
| |||||||||||||||||
| 7,653,647 | ||||||||||||||||||
|
| |||||||||||||||||
European Union - 2.53% | ||||||||||||||||||
Asian Development Bank | ZAR | 6.500 | % | 09/15/2015 | 4,650,000 | 541,754 | ||||||||||||
European Bank for Reconstruction & Development: | ||||||||||||||||||
| BRL | 9.250 | % | 09/10/2012 | 2,500,000 | 1,244,794 | |||||||||||||
| MXN | 7.300 | % | 05/23/2013 | 8,500,000 | 609,598 | |||||||||||||
| IDR | 7.200 | % | 06/08/2016 | 39,000,000,000 | 4,225,277 | |||||||||||||
European Investment Bank: | ||||||||||||||||||
| ZAR | 8.000 | % | 10/21/2013 | 3,810,000 | 460,948 | |||||||||||||
| IDR | 6.000 | % | 04/22/2014 | 11,000,000,000 | 1,140,431 | |||||||||||||
| ZAR | 9.000 | % | 12/21/2018 | 139,000,000 | 17,539,645 | |||||||||||||
| ZAR | 0.000 | % | 12/31/2018 | 5,280,000 | 388,688 | (3) | ||||||||||||
See Notes to Financial Statements.
Stone Harbor Investment Funds Annual Report | May 31, 2012 | 45 |
Table of Contents
Stone Harbor Local Markets Fund | Statements of Investments | |
| May 31, 2012 |
Currency | Rate | Maturity Date | Principal Amount* | Market Value | ||||||||||||||
European Union (continued) | ||||||||||||||||||
Inter-American Development Bank: | ||||||||||||||||||
| IDR | 6.500 | % | 03/10/2014 | 15,000,000,000 | $ | 1,574,681 | ||||||||||||
| IDR | 6.500 | % | 06/04/2014 | 16,000,000,000 | 1,674,553 | |||||||||||||
| IDR | 0.000 | % | 08/20/2015 | 105,450,000,000 | 8,918,378 | (3) | ||||||||||||
International Bank for Reconstruction & Development: | ||||||||||||||||||
| RUB | 6.000 | % | 11/29/2012 | 21,500,000 | 642,855 | |||||||||||||
| COP | 8.000 | % | 03/02/2020 | 1,050,000,000 | 672,103 | |||||||||||||
|
| |||||||||||||||||
| 39,633,705 | ||||||||||||||||||
|
| |||||||||||||||||
Mexico - 0.43% | ||||||||||||||||||
Petroleos Mexicanos | MXN | 7.650 | % | 11/24/2021 | 94,160,000 | 6,653,461 | (4) | |||||||||||
|
| |||||||||||||||||
Venezuela - 0.09% | ||||||||||||||||||
Petroleos de Venezuela SA | USD | 4.900 | % | 10/28/2014 | 1,650,000 | 1,427,250 | ||||||||||||
|
| |||||||||||||||||
TOTAL CORPORATE BONDS | 55,368,063 | |||||||||||||||||
|
| |||||||||||||||||
(Cost $60,049,724) | ||||||||||||||||||
CREDIT LINKED NOTES - 19.94% | ||||||||||||||||||
Brazil - 7.02% | ||||||||||||||||||
Nota Do Tesouro Nacional: | ||||||||||||||||||
| BRL | 10.000 | % | 01/01/2014 | 5,000,000 | 2,535,141 | (5) | ||||||||||||
| BRL | 10.000 | % | 01/01/2014 | 7,000,000 | 3,548,524 | (6) | ||||||||||||
| BRL | 10.000 | % | 01/01/2015 | 3,700,000 | 1,881,330 | (6) | ||||||||||||
| BRL | 10.000 | % | 01/01/2015 | 15,300,000 | 6,064,978 | (6) | ||||||||||||
| BRL | 6.000 | % | 05/15/2015 | 6,700,325 | 3,539,630 | (6) | ||||||||||||
| BRL | 6.000 | % | 05/15/2015 | 12,756,388 | 6,738,912 | (7) | ||||||||||||
| BRL | 10.000 | % | 01/01/2017 | 7,940,000 | 3,981,741 | (7) | ||||||||||||
| BRL | 10.000 | % | 01/01/2017 | 16,040,000 | 8,043,719 | (7) | ||||||||||||
| BRL | 10.000 | % | 01/01/2017 | 18,000,000 | 9,026,618 | (7) | ||||||||||||
| BRL | 10.000 | % | 01/01/2017 | 30,800,000 | 15,445,545 | (6) | ||||||||||||
| BRL | 10.000 | % | 01/01/2021 | 2,600,000 | 1,274,306 | (5) | ||||||||||||
| BRL | 10.000 | % | 01/01/2021 | 3,000,000 | 1,466,197 | (5) | ||||||||||||
| BRL | 10.000 | % | 01/01/2021 | 5,000,000 | 2,450,589 | (7) | ||||||||||||
| BRL | 10.000 | % | 01/01/2021 | 5,500,000 | 2,695,648 | (7) | ||||||||||||
| BRL | 10.000 | % | 01/01/2021 | 6,000,000 | 2,932,395 | (5) | ||||||||||||
| BRL | 10.000 | % | 01/01/2021 | 6,800,000 | 3,332,801 | (7) | ||||||||||||
| BRL | 10.000 | % | 01/01/2021 | 7,000,000 | 3,421,127 | (5) | ||||||||||||
| BRL | 10.000 | % | 01/01/2021 | 8,200,000 | 4,377,024 | (8) | ||||||||||||
| BRL | 10.000 | % | 01/01/2021 | 11,000,000 | 5,871,617 | (8) | ||||||||||||
| BRL | 10.000 | % | 01/01/2021 | 12,000,000 | 5,864,789 | (5) | ||||||||||||
| BRL | 10.000 | % | 01/01/2021 | 12,220,000 | 5,989,239 | (7) | ||||||||||||
| BRL | 10.000 | % | 01/01/2021 | 19,100,000 | 9,361,249 | (7) | ||||||||||||
|
| |||||||||||||||||
| 109,843,119 | ||||||||||||||||||
|
| |||||||||||||||||
Colombia - 1.92% | ||||||||||||||||||
Titulos de Tesoreria - Series B: | ||||||||||||||||||
| COP | 7.250 | % | 06/15/2016 | 2,200,000,000 | 1,238,884 | (5) | ||||||||||||
| COP | 7.250 | % | 06/15/2016 | 10,000,000,000 | 5,631,291 | (5) | ||||||||||||
| COP | 11.000 | % | 07/24/2020 | 1,000,000,000 | 679,256 | (5) | ||||||||||||
| COP | 11.000 | % | 07/24/2020 | 1,000,000,000 | 679,267 | (5) | ||||||||||||
| COP | 11.000 | % | 07/24/2020 | 1,764,000,000 | 1,198,227 | (5) | ||||||||||||
| COP | 11.000 | % | 07/24/2020 | 2,300,000,000 | 1,562,314 | (5) | ||||||||||||
See Notes to Financial Statements.
46 | www.shiplp.com |
Table of Contents
Stone Harbor Local Markets Fund | Statements of Investments | |
| May 31, 2012 |
Currency | Rate | Maturity Date | Principal Amount* | Market Value | ||||||||||||||
Colombia (continued) | ||||||||||||||||||
Titulos de Tesoreria - Series B (continued) | ||||||||||||||||||
| COP | 11.000 | % | 07/24/2020 | 2,800,000,000 | $ | 1,901,947 | (5) | |||||||||||
| COP | 11.000 | % | 07/24/2020 | 5,100,000,000 | 3,464,262 | (5) | ||||||||||||
| COP | 11.000 | % | 07/24/2020 | 8,000,000,000 | 5,434,136 | (5) | ||||||||||||
| COP | 11.000 | % | 07/24/2020 | 12,018,000,000 | 8,163,430 | (5) | ||||||||||||
|
| |||||||||||||||||
| 29,953,014 | ||||||||||||||||||
|
| |||||||||||||||||
Indonesia - 5.63% | ||||||||||||||||||
Republic of Indonesia: | ||||||||||||||||||
| IDR | 12.800 | % | 06/15/2021 | 10,800,000,000 | 1,647,000 | (7) | ||||||||||||
| IDR | 12.800 | % | 06/15/2021 | 27,700,000,000 | 4,215,528 | (9) | ||||||||||||
| IDR | 8.250 | % | 07/15/2021 | 90,200,000,000 | 10,766,425 | (6) | ||||||||||||
| IDR | 8.250 | % | 07/15/2021 | 240,100,000,000 | 28,502,169 | (9) | ||||||||||||
| IDR | 7.000 | % | 05/15/2022 | 39,200,000,000 | 4,352,660 | (6) | ||||||||||||
| IDR | 7.000 | % | 05/15/2022 | 76,600,000,000 | 8,425,592 | (9) | ||||||||||||
| IDR | 11.000 | % | 09/15/2025 | 19,072,000,000 | 2,759,353 | (6) | ||||||||||||
| IDR | 11.000 | % | 09/15/2025 | 51,100,000,000 | 7,341,548 | (10) | ||||||||||||
| IDR | 11.000 | % | 09/15/2025 | 62,500,000,000 | 8,979,388 | (10) | ||||||||||||
| IDR | 11.000 | % | 09/17/2025 | 33,600,000,000 | 4,803,656 | (9) | ||||||||||||
| IDR | 8.250 | % | 06/15/2032 | 21,400,000,000 | 2,529,867 | (6) | ||||||||||||
| IDR | 8.250 | % | 06/15/2032 | 31,000,000,000 | 3,652,328 | (9) | ||||||||||||
|
| |||||||||||||||||
| 87,975,514 | ||||||||||||||||||
|
| |||||||||||||||||
Russia - 5.37% | ||||||||||||||||||
Russian Federation: | ||||||||||||||||||
| RUB | 7.000 | % | 06/03/2015 | 390,000,000 | 11,527,641 | (8) | ||||||||||||
| RUB | 7.000 | % | 06/03/2015 | 515,900,000 | 15,248,999 | (8) | ||||||||||||
| RUB | 6.880 | % | 07/15/2015 | 205,300,000 | 6,046,738 | (6) | ||||||||||||
| RUB | 6.880 | % | 07/15/2015 | 390,000,000 | 11,480,899 | (8) | ||||||||||||
| RUB | 7.350 | % | 01/20/2016 | 100,000,000 | 2,957,303 | (6) | ||||||||||||
| RUB | 7.350 | % | 01/20/2016 | 105,000,000 | 3,105,169 | (9) | ||||||||||||
| RUB | 7.400 | % | 06/14/2017 | 304,200,000 | 8,800,153 | (8) | ||||||||||||
| RUB | 7.500 | % | 03/15/2018 | 116,600,000 | 3,397,558 | (6) | ||||||||||||
| RUB | 7.500 | % | 03/15/2018 | 338,500,000 | 9,787,341 | (8) | ||||||||||||
| RUB | 7.600 | % | 04/14/2021 | 202,000,000 | 5,746,786 | (6) | ||||||||||||
| RUB | 7.600 | % | 04/14/2021 | 205,000,000 | 5,795,281 | (9) | ||||||||||||
|
| |||||||||||||||||
| 83,893,868 | ||||||||||||||||||
|
| |||||||||||||||||
TOTAL CREDIT LINKED NOTES | 311,665,515 | |||||||||||||||||
|
| |||||||||||||||||
(Cost $334,433,158) | ||||||||||||||||||
See Notes to Financial Statements.
Stone Harbor Investment Funds Annual Report | May 31, 2012 | 47 |
Table of Contents
Stone Harbor Local Markets Fund | Statements of Investments | |
| May 31, 2012 |
Shares | Market Value | |||||||
SHORT TERM INVESTMENTS - 8.24% | ||||||||
Money Market Mutual Funds - 8.24% | ||||||||
Dreyfus Institutional Cash Advantage Fund - Institutional Advantage Shares (0.16429% 7 - Day Yield) | 128,876,237 | $ | 128,876,237 | |||||
|
| |||||||
TOTAL SHORT TERM INVESTMENTS | 128,876,237 | |||||||
|
| |||||||
(Cost $128,876,237) | ||||||||
Total Investments - 79.81% | 1,247,811,216 | |||||||
(Cost $1,321,575,710) | ||||||||
Other Assets In Excess of Liabilities - 20.19% | 315,683,873 | |||||||
|
| |||||||
Net Assets - 100.00% | $ | 1,563,495,089 | ||||||
|
| |||||||
* The contract/principal amounts of each security is stated in the currency in which the security is denominated. See below.
| ARS | - | Argentine Peso | ||
| BRL | - | Brazilian Real | ||
| CLP | - | Chilean Peso | ||
| COP | - | Colombian Peso | ||
| EUR | - | Euro Currency | ||
| HUF | - | Hungarian Forint | ||
| IDR | - | Indonesian Rupiah | ||
| MXN | - | Mexican Peso | ||
| MYR | - | Malaysian Ringgit | ||
| PEN | - | Peruvian Nuevo Sol | ||
| PHP | - | Philippine Peso | ||
| PLN | - | Polish Zloty | ||
| RUB | - | Russian Ruble | ||
| THB | - | Thai Baht | ||
| TRY | - | Turkish Lira | ||
| USD | - | United States Dollar | ||
| ZAR | - | South African Rand |
| (1) | Floating or variable rate security. Interest rate disclosed is that which is in effect at May 31, 2012. |
| (2) | Securities were originally issued pursuant to Regulation S under the Securities Act of 1933, which exempts securities offered and sold outside of the United States from registration. Such securities cannot be sold in the United States without either an effective registration statement filed pursuant to the Securities Act of 1933, or pursuant to an exemption from registration. As of May 31, 2012, the aggregate market value of those securities was $53,491,388, which represents approximately 3.42% of net assets. |
| (3) | Issued with a zero coupon. Income is recognized through the accretion of discount. |
| (4) | Security exempt from registration under Rule 144A of the Securities Act of 1933. Under procedures approved by the Board of Trustees, such securities have been determined to be liquid by Stone Harbor Investment Partners and may normally be sold to qualified institutional buyers in transactions exempt from registration. Total market value of Rule 144A securities amounts to $7,500,736, which represents approximately 0.48% of net assets as of May 31, 2012. |
| (5) | The underlying security is issued by Citigroup Global Markets. |
| (6) | The underlying security is issued by JPMorgan Chase. |
| (7) | The underlying security is issued by Barclays Bank PLC. |
| (8) | The underlying security is issued by Credit Suisse First Boston. |
| (9) | The underlying security is issued by Deutsche Bank AG London. |
| (10) | The underlying security is issued by HSBC Bank. |
See Notes to Financial Statements.
48 | www.shiplp.com |
Table of Contents
Stone Harbor Local Markets Fund | Statements of Investments | |
| May 31, 2012 |
Common Abbreviations: | ||
ESP | - Empresa de Servicios Publicos is the Colombian term for Public Service Company. | |
SA | - Generally designates corporations in various countries mostly employing civil law. | |
OUTSTANDING FORWARD FOREIGN CURRENCY CONTRACTS
Contract Description | Contracted Amount | Purchase/Sale | Settlement Date | Current Value | Unrealized Appreciation/ (Depreciation) | |||||||||
BRL(1) | 119,393,507 | Purchase | 07/03/2012 | $ | 58,804,324 | $ | 466,425 | |||||||
COP(1) | 12,952,866,300 | Sale | 06/01/2012 | 7,084,678 | 208,603 | |||||||||
COP(1) | 13,622,655,000 | Sale | 06/19/2012 | 7,432,904 | 187,096 | |||||||||
COP(1) | 12,952,866,300 | Sale | 06/29/2012 | 7,057,821 | 28,961 | |||||||||
|
| |||||||||||||
| $ | 891,085 | |||||||||||||
|
| |||||||||||||
BRL(1) | 93,232,017 | Sale | 06/04/2012 | $ | 46,193,830 | $ | (424,553) | |||||||
BRL(1) | 93,232,017 | Purchase | 06/04/2012 | 46,193,830 | (1,927,802) | |||||||||
COP(1) | 12,952,866,300 | Purchase | 06/01/2012 | 7,084,678 | (32,282) | |||||||||
MXN(1) | 73,343,100 | Purchase | 07/05/2012 | 5,091,079 | (8,921) | |||||||||
MYR(2) | 298,289,250 | Purchase | 06/29/2012 | 93,863,981 | (636,019) | |||||||||
PHP(1) | 138,621,300 | Purchase | 06/08/2012 | 3,184,330 | (42,648) | |||||||||
PLN(2) | 183,132,500 | Purchase | 06/29/2012 | 51,456,934 | (1,243,066) | |||||||||
PLN(3) | 13,845,390 | Purchase | 07/02/2012 | 3,888,946 | (11,054) | |||||||||
RUB(1) | 1,843,501,496 | Purchase | 08/16/2012 | 54,411,247 | (4,562,458) | |||||||||
RUB(4) | 51,426,000 | Purchase | 08/16/2012 | 1,517,847 | (149,366) | |||||||||
THB(2) | 490,877,400 | Purchase | 06/29/2012 | 15,403,611 | (46,389) | |||||||||
TRY(4) | 159,125,800 | Purchase | 06/29/2012 | 84,700,869 | (1,299,131) | |||||||||
|
| |||||||||||||
| $ | (10,383,689) | |||||||||||||
|
| |||||||||||||
| (1) | The Counterparty is Citigroup Global Markets. |
| (2) | The Counterparty is Deutsche Bank Alex Brown. |
| (3) | The Counterparty is Goldman Sachs. |
| (4) | The Counterparty is JPMorgan Chase & Co. |
See Notes to Financial Statements.
Stone Harbor Investment Funds Annual Report | May 31, 2012 | 49 |
Table of Contents
Stone Harbor Emerging Markets Corporate Debt Fund | Statements of Investments | |
| May 31, 2012 |
Currency | Rate | Maturity Date | Principal Amount* | Market Value | ||||||||||||||
CORPORATE BONDS - 95.54% | ||||||||||||||||||
Argentina - 2.07% | ||||||||||||||||||
Alto Palermo SA | USD | 7.875 | % | 05/11/2017 | 258,000 | $ | 229,620 | (1) | ||||||||||
Capex SA | USD | 10.000 | % | 03/10/2018 | 550,000 | 363,000 | (2) | |||||||||||
Empresa Distribuidora Y Comercializadora Norte | USD | 9.750 | % | 10/25/2022 | 300,000 | 123,000 | (1) | |||||||||||
|
| |||||||||||||||||
| 715,620 | ||||||||||||||||||
|
| |||||||||||||||||
Barbados - 1.20% | ||||||||||||||||||
Columbus International, Inc. | USD | 11.500 | % | 11/20/2014 | 400,000 | 416,000 | (1) | |||||||||||
|
| |||||||||||||||||
Brazil - 15.72% | ||||||||||||||||||
Banco Cruzeiro do Sul SA: | ||||||||||||||||||
| USD | 8.875 | % | 09/22/2020 | 200,000 | 134,000 | (2) | ||||||||||||
| USD | 8.875 | % | 09/22/2020 | 325,000 | 217,750 | (1) | ||||||||||||
BM&FBovespa SA | USD | 5.500 | % | 07/16/2020 | 450,000 | 473,625 | (1) | |||||||||||
BR Malls International Finance Ltd. | USD | 8.500 | % | 01/21/2049 | 300,000 | 309,000 | (1) | |||||||||||
Braskem Finance Ltd. | USD | 7.375 | % | 10/29/2049 | 200,000 | 197,500 | (2) | |||||||||||
General Shopping Finance Ltd. | USD | 10.000 | % | 11/09/2015 | 294,000 | 279,300 | (2) | |||||||||||
Globo Comunicacao e Participacoes SA | USD | 6.250 | % | 07/20/2049 | 100,000 | 107,000 | (1)(3) | |||||||||||
Hypermarcas SA | USD | 6.500 | % | 04/20/2021 | 400,000 | 372,000 | (2) | |||||||||||
Itau Unibanco Holding SA | USD | 5.650 | % | 03/19/2022 | 228,000 | 224,010 | (2) | |||||||||||
Minerva Overseas II Ltd. | USD | 10.875 | % | 11/15/2019 | 225,000 | 218,250 | (1) | |||||||||||
Mirabela Nickel Ltd. | USD | 8.750 | % | 04/15/2018 | 200,000 | 145,000 | (2) | |||||||||||
NET Servicos de Comunicacao SA | USD | 7.500 | % | 01/27/2020 | 311,000 | 354,540 | ||||||||||||
Odebrecht Drilling Norbe VIII/IX Ltd. | USD | 6.350 | % | 06/30/2021 | 343,000 | 354,148 | (1) | |||||||||||
Odebrecht Finance Ltd. | USD | 7.000 | % | 04/21/2020 | 102,000 | 111,690 | (1) | |||||||||||
OGX Austria GmbH: | ||||||||||||||||||
| USD | 8.500 | % | 06/01/2018 | 300,000 | 290,250 | (2) | ||||||||||||
| USD | 8.375 | % | 04/01/2022 | 283,000 | 268,850 | (2) | ||||||||||||
Petrobras International Finance Co.: | ||||||||||||||||||
| USD | 2.875 | % | 02/06/2015 | 116,000 | 117,551 | |||||||||||||
| USD | 5.375 | % | 01/27/2021 | 67,000 | 71,837 | |||||||||||||
QGOG Atlantic / Alaskan Rigs Ltd. | USD | 5.250 | % | 07/30/2018 | 260,946 | 258,336 | (2) | |||||||||||
Schahin II Finance Co. SPV Ltd. | USD | 5.875 | % | 09/25/2022 | 380,000 | 373,350 | (2) | |||||||||||
Telemar Norte Leste SA | USD | 5.500 | % | 10/23/2020 | 373,000 | 369,270 | (1) | |||||||||||
Votorantim Cimentos SA | USD | 7.250 | % | 04/05/2041 | 200,000 | 196,500 | (2) | |||||||||||
|
| |||||||||||||||||
| 5,443,757 | ||||||||||||||||||
|
| |||||||||||||||||
Chile - 0.76% | ||||||||||||||||||
Cencosud SA | USD | 5.500 | % | 01/20/2021 | 250,000 | 262,936 | (2) | |||||||||||
|
| |||||||||||||||||
See Notes to Financial Statements.
50 | www.shiplp.com |
Table of Contents
Stone Harbor Emerging Markets Corporate Debt Fund | Statements of Investments | |
| May 31, 2012 |
Currency | Rate | Maturity Date | Principal Amount* | Market Value | ||||||||||||||
China - 7.24% | ||||||||||||||||||
Central China Real Estate Ltd. | USD | 12.250 | % | 10/20/2015 | 100,000 | $ | 102,250 | (1) | ||||||||||
China Liansu Group Holdings Ltd. | USD | 7.875 | % | 05/13/2016 | 200,000 | 180,000 | (2) | |||||||||||
Evergrande Real Estate Group Ltd. | USD | 13.000 | % | 01/27/2015 | 150,000 | 143,250 | (1) | |||||||||||
Kaisa Group Holdings Ltd. | USD | 13.500 | % | 04/28/2015 | 300,000 | 281,250 | (1) | |||||||||||
Mega Advance Investments Ltd. | USD | 5.000 | % | 05/12/2021 | 205,000 | 214,311 | (2) | |||||||||||
MIE Holdings Corp. | USD | 9.750 | % | 05/12/2016 | 250,000 | 241,875 | (2) | |||||||||||
Sinopec Group Overseas Development 2012 Ltd. | USD | 4.875 | % | 05/17/2042 | 500,000 | 508,850 | (2) | |||||||||||
Tencent Holdings Ltd. | USD | 4.625 | % | 12/12/2016 | 200,000 | 203,111 | (2) | |||||||||||
Texhong Textile Group Ltd. | USD | 7.625 | % | 01/19/2016 | 250,000 | 199,375 | (1) | |||||||||||
West China Cement Ltd. | USD | 7.500 | % | 01/25/2016 | 250,000 | 216,875 | (1) | |||||||||||
Yancoal International Resources Development Co. Ltd. | USD | 5.730 | % | 05/16/2022 | 223,000 | 216,054 | (2) | |||||||||||
|
| |||||||||||||||||
| 2,507,201 | ||||||||||||||||||
|
| |||||||||||||||||
Colombia - 4.17% | ||||||||||||||||||
Bancolombia SA | USD | 5.950 | % | 06/03/2021 | 200,000 | 208,000 | ||||||||||||
Empresa de Energia de Bogota SA | USD | 6.125 | % | 11/10/2021 | 200,000 | 207,500 | (2) | |||||||||||
Grupo Aval Ltd. | USD | 5.250 | % | 02/01/2017 | 200,000 | 206,000 | (2) | |||||||||||
Gruposura Finance | USD | 5.700 | % | 05/18/2021 | 400,000 | 411,000 | (2) | |||||||||||
Transportadora de Gas Internacional SA ESP | USD | 5.700 | % | 03/20/2022 | 400,000 | 410,000 | (2) | |||||||||||
|
| |||||||||||||||||
| 1,442,500 | ||||||||||||||||||
|
| |||||||||||||||||
Dominican Republic - 0.58% | ||||||||||||||||||
Cap Cana SA: | ||||||||||||||||||
| USD | 10.000 | % | 04/30/2016 | 500,000 | 125,000 | (1)(4)(8) | ||||||||||||
| USD | 10.000 | % | 04/30/2016 | 509,432 | 76,415 | (1)(4)(8) | ||||||||||||
|
| |||||||||||||||||
| 201,415 | ||||||||||||||||||
|
| |||||||||||||||||
Hong Kong - 3.83% | ||||||||||||||||||
Hutchison Whampoa International 10 Ltd. | USD | 6.000 | % | 10/28/2049 | 300,000 | 301,500 | (1)(5) | |||||||||||
Hutchison Whampoa International 11 Ltd. | USD | 4.625 | % | 01/13/2022 | 200,000 | 206,177 | (2) | |||||||||||
PCCW-HKT Capital No. 4 Ltd. | USD | 4.250 | % | 02/24/2016 | 500,000 | 514,350 | ||||||||||||
Swire Pacific MTN Financing Ltd. | USD | 4.500 | % | 02/28/2022 | 300,000 | 305,835 | ||||||||||||
|
| |||||||||||||||||
| 1,327,862 | ||||||||||||||||||
|
| |||||||||||||||||
India - 2.45% | ||||||||||||||||||
ICICI Bank Ltd. | USD | 5.750 | % | 11/16/2020 | 400,000 | 390,780 | (1) | |||||||||||
Reliance Holdings USA, Inc. | USD | 5.400 | % | 02/14/2022 | 250,000 | 245,313 | (2) | |||||||||||
Vedanta Resources PLC | USD | 8.250 | % | 06/07/2021 | 245,000 | 212,537 | (2) | |||||||||||
|
| |||||||||||||||||
| 848,630 | ||||||||||||||||||
|
| |||||||||||||||||
Indonesia - 4.51% | ||||||||||||||||||
Bakrie Telecom Pte Ltd. | USD | 11.500 | % | 05/07/2015 | 303,000 | 212,100 | (1) | |||||||||||
Berau Coal Energy Tbk PT | USD | 7.250 | % | 03/13/2017 | 200,000 | 192,000 | (2) | |||||||||||
BLT Finance BV | USD | 7.500 | % | 05/15/2014 | 100,000 | 22,000 | (1) | |||||||||||
Bumi Capital Pte Ltd. | USD | 12.000 | % | 11/10/2016 | 200,000 | 208,500 | (1) | |||||||||||
Bumi Investment Pte Ltd. | USD | 10.750 | % | 10/06/2017 | 300,000 | 296,250 | (1) | |||||||||||
Indosat Palapa Co. BV | USD | 7.375 | % | 07/29/2020 | 200,000 | 216,000 | (1) | |||||||||||
Listrindo Capital BV | USD | 6.950 | % | 02/21/2019 | 200,000 | 202,000 | (2) | |||||||||||
PT Adaro Indonesia | USD | 7.625 | % | 10/22/2019 | 201,000 | 213,563 | (1) | |||||||||||
|
| |||||||||||||||||
| 1,562,413 | ||||||||||||||||||
|
| |||||||||||||||||
See Notes to Financial Statements.
Stone Harbor Investment Funds Annual Report | May 31, 2012 | 51 |
Table of Contents
Stone Harbor Emerging Markets Corporate Debt Fund | Statements of Investments | |
| May 31, 2012 |
Currency | Rate | Maturity Date | Principal Amount* | Market Value | ||||||||||||||
Jamaica - 2.08% | ||||||||||||||||||
Digicel Group Ltd. | USD | 10.500 | % | 04/15/2018 | 700,000 | $ | 721,000 | (1) | ||||||||||
|
| |||||||||||||||||
Kazakhstan - 2.09% | ||||||||||||||||||
BTA Bank JSC: | ||||||||||||||||||
| USD | 10.750 | % | 07/01/2018 | 1,030,326 | 185,459 | (1)(4) | ||||||||||||
| USD | 0.000 | % | 07/01/2020 | 1,000,000 | 85,000 | (1)(6) | ||||||||||||
Zhaikmunai LLP | USD | 10.500 | % | 10/19/2015 | 459,000 | 452,115 | (1) | |||||||||||
|
| |||||||||||||||||
| 722,574 | ||||||||||||||||||
|
| |||||||||||||||||
Mexico - 9.57% | ||||||||||||||||||
America Movil SAB de CV | USD | 2.375 | % | 09/08/2016 | 600,000 | 608,456 | ||||||||||||
Axtel SAB de CV: | ||||||||||||||||||
| USD | 7.625 | % | 02/01/2017 | 80,000 | 52,800 | (2) | ||||||||||||
| USD | 9.000 | % | 09/22/2019 | 300,000 | 198,000 | (1) | ||||||||||||
BBVA Bancomer SA | USD | 4.500 | % | 03/10/2016 | 150,000 | 148,500 | (1) | |||||||||||
Cemex SAB de CV: | ||||||||||||||||||
| USD | 5.470 | % | 09/30/2015 | 450,000 | 374,625 | (2)(5) | ||||||||||||
| USD | 9.000 | % | 01/11/2018 | 300,000 | 250,500 | (1) | ||||||||||||
Geo Maquinaria | USD | 9.625 | % | 05/02/2021 | 640,250 | 560,219 | (2) | |||||||||||
Grupo Bimbo SAB de CV | USD | 4.875 | % | 06/30/2020 | 202,000 | 222,208 | (2) | |||||||||||
Grupo Televisa SAB | USD | 6.000 | % | 05/12/2018 | 300,000 | 348,663 | ||||||||||||
Telefonos de Mexico SAB de CV | USD | 5.500 | % | 11/15/2019 | 300,000 | 346,669 | ||||||||||||
Urbi Desarrollos Urbanos SAB de CV | USD | 10.576 | % | 12/22/2012 | 200,000 | 202,700 | (5) | |||||||||||
|
| |||||||||||||||||
| 3,313,340 | ||||||||||||||||||
|
| |||||||||||||||||
Mongolia - 1.16% | ||||||||||||||||||
Mongolian Mining Corp. | USD | 8.875 | % | 03/29/2017 | 412,000 | 402,730 | (2) | |||||||||||
|
| |||||||||||||||||
Peru - 3.02% | ||||||||||||||||||
Banco de Credito del Peru | USD | 5.375 | % | 09/16/2020 | 200,000 | 203,000 | (1) | |||||||||||
Inkia Energy Ltd. | USD | 8.375 | % | 04/04/2021 | 350,000 | 367,500 | (2) | |||||||||||
Southern Copper Corp. | USD | 6.750 | % | 04/16/2040 | 295,000 | 310,987 | ||||||||||||
Volcan Cia Minera SAA | USD | 5.375 | % | 02/02/2022 | 163,000 | 165,853 | (2) | |||||||||||
|
| |||||||||||||||||
| 1,047,340 | ||||||||||||||||||
|
| |||||||||||||||||
Qatar - 3.44% | ||||||||||||||||||
Qtel International Finance Ltd.: | ||||||||||||||||||
| USD | 4.750 | % | 02/16/2021 | 450,000 | 471,375 | (1) | ||||||||||||
| USD | 5.000 | % | 10/19/2025 | 700,000 | 721,000 | (1) | ||||||||||||
|
| |||||||||||||||||
| 1,192,375 | ||||||||||||||||||
|
| |||||||||||||||||
Russia - 9.83% | ||||||||||||||||||
Alfa Bank OJSC Via Alfa Bond Issuance PLC | USD | 7.875 | % | 09/25/2017 | 300,000 | 296,625 | (1) | |||||||||||
ALROSA Finance SA | USD | 7.750 | % | 11/03/2020 | 200,000 | 206,500 | (1) | |||||||||||
Evraz Group SA: | ||||||||||||||||||
| USD | 7.400 | % | 04/24/2017 | 200,000 | 195,000 | (2) | ||||||||||||
| USD | 6.750 | % | 04/27/2018 | 200,000 | 186,250 | (2) | ||||||||||||
See Notes to Financial Statements.
52 | www.shiplp.com |
Table of Contents
Stone Harbor Emerging Markets Corporate Debt Fund | Statements of Investments | |
| May 31, 2012 |
Currency | Rate | Maturity Date | Principal Amount* | Market Value | ||||||||||||||
Russia (continued) | ||||||||||||||||||
Metalloinvest Finance Ltd. | USD | 6.500 | % | 07/21/2016 | 200,000 | $ | 195,500 | (2) | ||||||||||
MTS International Funding Ltd. | USD | 8.625 | % | 06/22/2020 | 300,000 | 331,500 | (1) | |||||||||||
Novatek Finance Ltd. | USD | 6.604 | % | 02/03/2021 | 450,000 | 480,937 | (2) | |||||||||||
Sberbank of Russia Via SB Capital SA | USD | 6.125 | % | 02/07/2022 | 200,000 | 204,375 | (2) | |||||||||||
SCF Capital Ltd. | USD | 5.375 | % | 10/27/2017 | 400,000 | 374,000 | (2) | |||||||||||
Severstal OAO Via Steel Capital SA | USD | 6.700 | % | 10/25/2017 | 200,000 | 195,500 | (2) | |||||||||||
Vimpel Communications Holdings BV | USD | 7.504 | % | 03/01/2022 | 200,000 | 180,000 | (2) | |||||||||||
Vimpel Communications Via VIP Finance Ireland Ltd. OJSC | USD | 7.748 | % | 02/02/2021 | 600,000 | 556,500 | (1) | |||||||||||
|
| |||||||||||||||||
| 3,402,687 | ||||||||||||||||||
|
| |||||||||||||||||
Singapore - 1.56% | ||||||||||||||||||
PSA International Pte Ltd. | USD | 3.875 | % | 02/11/2021 | 100,000 | 105,640 | ||||||||||||
SingTel Group Treasury Pte Ltd. | USD | 4.500 | % | 09/08/2021 | 300,000 | 330,315 | ||||||||||||
STATS ChipPAC Ltd. | USD | 5.375 | % | 03/31/2016 | 100,000 | 102,500 | (1) | |||||||||||
|
| |||||||||||||||||
| 538,455 | ||||||||||||||||||
|
| |||||||||||||||||
South Africa - 4.22% | ||||||||||||||||||
Gold Fields Orogen Holding BVI Ltd. | USD | 4.875 | % | 10/07/2020 | 700,000 | 658,000 | (1) | |||||||||||
Myriad International Holding BV | USD | 6.375 | % | 07/28/2017 | 730,000 | 803,000 | (1) | |||||||||||
|
| |||||||||||||||||
| 1,461,000 | ||||||||||||||||||
|
| |||||||||||||||||
South Korea - 2.98% | ||||||||||||||||||
Korea Electric Power Corp. | USD | 3.000 | % | 10/05/2015 | 200,000 | 202,900 | (2) | |||||||||||
Korea Hydro & Nuclear Power Co. Ltd. | USD | 4.750 | % | 07/13/2021 | 200,000 | 215,660 | (1) | |||||||||||
Korea Western Power Co. Ltd. | USD | 3.125 | % | 05/10/2017 | 404,000 | 406,929 | (2) | |||||||||||
KT Corp. | USD | 3.875 | % | 01/20/2017 | 200,000 | 208,001 | ||||||||||||
|
| |||||||||||||||||
| 1,033,490 | ||||||||||||||||||
|
| |||||||||||||||||
Turkey - 1.40% | ||||||||||||||||||
Yuksel Insaat AS | USD | 9.500 | % | 11/10/2015 | 550,000 | 484,000 | (1) | |||||||||||
|
| |||||||||||||||||
Ukraine - 2.33% | ||||||||||||||||||
Ferrexpo Finance PLC | USD | 7.875 | % | 04/07/2016 | 200,000 | 180,000 | (2) | |||||||||||
Metinvest BV | USD | 8.750 | % | 02/14/2018 | 300,000 | 265,500 | (2) | |||||||||||
MHP SA | USD | 10.250 | % | 04/29/2015 | 200,000 | 189,000 | (1) | |||||||||||
Mriya Agro Holding PLC | USD | 10.950 | % | 03/30/2016 | 200,000 | 172,000 | (2) | |||||||||||
|
| |||||||||||||||||
| 806,500 | ||||||||||||||||||
|
| |||||||||||||||||
United Arab Emirates - 9.33% | ||||||||||||||||||
Dolphin Energy Ltd.: | ||||||||||||||||||
| USD | 5.888 | % | 06/15/2019 | 379,305 | 411,546 | (1) | ||||||||||||
| USD | 5.500 | % | 12/15/2021 | 200,000 | 216,500 | (2) | ||||||||||||
DP World Ltd. | USD | 6.850 | % | 07/02/2037 | 300,000 | 282,750 | (1) | |||||||||||
DP World Sukuk Ltd. | USD | 6.250 | % | 07/02/2017 | 490,000 | 515,725 | (1) | |||||||||||
Dubai Holding Commercial Operations MTN Ltd.: | ||||||||||||||||||
| EUR | 4.750 | % | 01/30/2014 | 100,000 | 113,758 | |||||||||||||
| GBP | 6.000 | % | 02/01/2017 | 550,000 | 695,076 | |||||||||||||
IPIC GMTN Ltd.: | ||||||||||||||||||
| USD | 3.750 | % | 03/01/2017 | 350,000 | 357,875 | (2) | ||||||||||||
| USD | 6.875 | % | 11/01/2041 | 200,000 | 216,000 | (2) | ||||||||||||
See Notes to Financial Statements.
Stone Harbor Investment Funds Annual Report | May 31, 2012 | 53 |
Table of Contents
Stone Harbor Emerging Markets Corporate Debt Fund | Statements of Investments | |
| May 31, 2012 |
Currency | Rate | Maturity Date | Principal | Market Value | ||||||||||||||
United Arab Emirates (continued) | ||||||||||||||||||
MAF SUKUK Ltd. | USD | 5.850 | % | 02/07/2017 | 400,000 | $ | 421,000 | |||||||||||
|
| |||||||||||||||||
| 3,230,230 | ||||||||||||||||||
|
| |||||||||||||||||
TOTAL CORPORATE BONDS | 33,084,055 | |||||||||||||||||
|
| |||||||||||||||||
(Cost $35,959,391) | ||||||||||||||||||
CREDIT LINKED NOTES - 1.78% | ||||||||||||||||||
Argentina - 1.78% | ||||||||||||||||||
Cablevision SA | USD | 9.375 | % | 02/12/2018 | 700,000 | 616,000 | (7) | |||||||||||
|
| |||||||||||||||||
TOTAL CREDIT LINKED NOTES | 616,000 | |||||||||||||||||
|
| |||||||||||||||||
(Cost $702,502) | ||||||||||||||||||
SHORT TERM INVESTMENTS - 2.86% | ||||||||||||||||||
Money Market Mutual Funds - 2.86% | ||||||||||||||||||
Dreyfus Institutional Cash Advantage Fund - Institutional Advantage Shares (0.16429% 7-Day Yield) | 990,392 | 990,392 | ||||||||||||||||
|
| |||||||||||||||||
TOTAL SHORT TERM INVESTMENTS | 990,392 | |||||||||||||||||
|
| |||||||||||||||||
(Cost $990,392) | ||||||||||||||||||
Total Investments - 100.18% | 34,690,447 | |||||||||||||||||
(Cost $37,652,285) | ||||||||||||||||||
Liabilities in Excess of Other Assets - (0.18)% | (60,935 | ) | ||||||||||||||||
|
| |||||||||||||||||
Net Assets - 100.00% | $ | 34,629,512 | ||||||||||||||||
|
| |||||||||||||||||
* The contract/principal amounts of each security is stated in the currency in which the security is denominated. See below.
EUR | - | Euro | ||
GBP | - | Great Britain Pound | ||
USD | - | United States Dollar |
| (1) | Securities were originally issued pursuant to Regulation S under the Securities Act of 1933, which exempts securities offered and sold outside of the United States from registration. Such securities cannot be sold in the United States without either an effective registration statement filed pursuant to the Securities Act of 1933, or pursuant to an exemption from registration. As of May 31, 2012, the aggregate market value of those securities was $14,423,716, which represents approximately 41.65% of net assets. |
| (2) | Security exempt from registration under Rule 144A of the Securities Act of 1933. Under procedures approved by the Board of Trustees, such securities have been determined to be liquid by Stone Harbor Investment Partners and may normally be sold to qualified institutional buyers in transactions exempt from registration. Total market value of Rule 144A securities amounts to $13,396,961, which represents approximately 38.69% of net assets as of May 31, 2012. |
| (3) | Step bond. Coupon increases periodically based upon a predetermined schedule. Interest rate disclosed is that which is in effect at May 31, 2012. |
| (4) | Security is currently in default/non-income producing. |
| (5) | Floating or variable rate security. Interest rate disclosed is that which is in effect at May 31, 2012. |
| (6) | Issued with a zero coupon. Income is recognized through the accretion of discount. |
| (7) | The underlying security is issued by Deutsche Bank AG London. |
| (8) | This security has been valued by management at its fair value determined in good faith pursuant to procedures approved by the Board of Trustees. Total market value of fair valued securities amounts to $201,415, which represents approximately 0.58% of net assets as of May 31, 2012. |
See Notes to Financial Statements.
54 | www.shiplp.com |
Table of Contents
Stone Harbor Emerging Markets Corporate Debt Fund | Statements of Investments | |
| May 31, 2012 |
Common Abbreviations:
AS | - | Anonim Sirket is the Turkish term for Incorporation. | ||
BV | - | Besloten Vennootschap a Dutch private limited liability company. | ||
BVI | - | British Virgin Islands. | ||
ESP | - | Empresa de Servicios Publicos is the Colombian term for Public Service Company. | ||
GmbH | - | Gesellschaft mit beschrankter Haftung is the German term for a company wtih limited liability. | ||
GMTN | - | Global Medium Term Note. | ||
JSC | - | Joing Stock Company. | ||
LLP | - | Limited Liability Partnership. | ||
Ltd. | - | Limited. | ||
MTN | - | Medium Term Note. | ||
OAO | - | Otkrytoe Aktsionernoe Obschestvo is the Russian term for Open Joint Stock Company. | ||
OJSC | - | Open Joint Stock Company. | ||
PLC | - | Public Limited Company. | ||
Pte | - | Private. | ||
SA | - | Generally designates corporations in various countries, mostly those employing the civil law. | ||
SAA | - | Sociedad Anonima Abierta is the Peruvian term used for companies with 20 or more shareholders. | ||
SAB | - | Sociedad Anonima Bursatil is the Spanish term used for publicly held company. | ||
SAB de CV | - | A variable capital company. | ||
SPV | - | Special Purpose Vehicle. | ||
Tbk | - | Terbuka is the Indonesian term for limited liability company. |
OUTSTANDING FORWARD FOREIGN CURRENCY CONTRACTS
Contract Description | Contracted Amount | Purchase/Sale Contract | Settlement Date | Current Value | Unrealized Appreciation | |||||||||
| EUR(1) | 95,000 | Sale | 06/29/2012 | $ | 117,484 | $ | 3,447 | |||||||
| GBP(1) | 466,000 | Sale | 06/29/2012 | 718,097 | 19,688 | |||||||||
|
| |||||||||||||
| $ | 23,135 | |||||||||||||
|
| |||||||||||||
| (1) | The Counterparty is JPMorgan Chase & Co. |
See Notes to Financial Statements.
Stone Harbor Investment Funds Annual Report | May 31, 2012 | 55 |
Table of Contents
Stone Harbor Investment Funds | Statements of Assets & Liabilities | |
| May 31, 2012 |
Stone Harbor Emerging Markets Debt Fund | Stone Harbor High Yield Bond Fund | Stone Harbor Local Markets Fund | Stone Harbor Emerging Markets Corporate Debt Fund | |||||||||||||
ASSETS: | ||||||||||||||||
Investments, at value(1) | $ | 1,128,109,090 | $ | 511,104,131 | $ | 1,247,811,216 | $ | 34,690,447 | ||||||||
Cash | 7,753,487 | 8,531 | 59,736,877 | 119,298 | ||||||||||||
Foreign currency, at value | ||||||||||||||||
(Cost $3,087,396, $-0-, $388,267 and $-0-, respectively) | 3,045,951 | – | 385,637 | – | ||||||||||||
Unrealized appreciation on forward foreign currency contracts | 2,746,031 | 364,301 | 891,085 | 23,135 | ||||||||||||
Receivable due from broker | – | – | 3,640,000 | – | ||||||||||||
Receivable for investments sold | 3,127,832 | 1,525,740 | 208,738,910 | – | ||||||||||||
Receivable for fund shares sold | 38,552,002 | 76,873 | 35,055,667 | – | ||||||||||||
Interest receivable | 18,357,506 | 10,836,552 | 28,330,586 | 488,208 | ||||||||||||
Dividends receivable | – | 2,825 | – | – | ||||||||||||
Prepaid and other assets | 18,869 | 39,700 | 22,328 | 18,957 | ||||||||||||
Total Assets | 1,201,710,768 | 523,958,653 | 1,584,612,306 | 35,340,045 | ||||||||||||
LIABILITIES: | ||||||||||||||||
Payable due to broker | 3,650,000 | 340,000 | – | – | ||||||||||||
Payable for investments purchased | 13,277,306 | 1,119,380 | 9,359,625 | 627,228 | ||||||||||||
Payable for fund shares redeemed | – | 2,368,118 | 249 | – | ||||||||||||
Unrealized depreciation on forward foreign currency contracts | 207,777 | 58,853 | 10,383,689 | – | ||||||||||||
Payable for distributions | 3,986 | – | – | – | ||||||||||||
Payable to advisor | 590,690 | 228,608 | 977,758 | 25,323 | ||||||||||||
Payable to administrator | 49,235 | 31,019 | 63,987 | 1,868 | ||||||||||||
Payable for trustee fees | 19,546 | 8,550 | 18,582 | 710 | ||||||||||||
Other payables | 183,891 | 123,766 | 313,327 | 55,404 | ||||||||||||
Total Liabilities | 17,982,431 | 4,278,294 | 21,117,217 | 710,533 | ||||||||||||
Net Assets | $ | 1,183,728,337 | $ | 519,680,359 | $ | 1,563,495,089 | $ | 34,629,512 | ||||||||
NET ASSETS CONSIST OF: | ||||||||||||||||
Paid-in capital | $ | 1,182,595,071 | $ | 523,733,806 | $ | 1,666,790,713 | $ | 37,897,171 | ||||||||
Undistributed/(overdistributed) net investment income | 1,084,360 | 1,700,036 | (2,054,814) | 29,413 | ||||||||||||
Accumulated net realized loss on investments and foreign currency transactions | (420,199) | (3,447,779) | (16,393,838) | (357,725) | ||||||||||||
Net unrealized appreciation/(depreciation) on investments and translation of assets and liabilities denominated in foreign currencies | 469,105 | (2,305,704) | (84,846,972) | (2,939,347) | ||||||||||||
Net Assets | $ | 1,183,728,337 | $ | 519,680,359 | $ | 1,563,495,089 | $ | 34,629,512 | ||||||||
PRICING OF SHARES: | ||||||||||||||||
Institutional Class | ||||||||||||||||
Net Assets | $ | 1,183,728,337 | $ | 519,680,359 | $ | 1,563,495,089 | $ | 34,629,512 | ||||||||
Shares of beneficial interest outstanding (unlimited number of shares, par value of $0.001 per share authorized) | 108,310,075 | 56,889,085 | 154,809,668 | 3,896,019 | ||||||||||||
Net assets value, offering and redemption price per share | $ | 10.93 | $ | 9.13 | $ | 10.10 | $ | 8.89 | ||||||||
(1)Cost of Investments | $ | 1,129,897,227 | $ | 513,708,146 | $ | 1,321,575,710 | $ | 37,652,285 | ||||||||
See Notes to Financial Statements.
56 | www.shiplp.com |
Table of Contents
Stone Harbor Investment Funds | Statements of Operations | |
| For the Year Ended May 31, 2012 |
Stone Harbor Emerging Markets Debt Fund | Stone Harbor High Yield Bond Fund | Stone Harbor Local Markets Fund | Stone Harbor Emerging Markets Corporate Debt Fund | |||||||||||||
INVESTMENT INCOME: |
| |||||||||||||||
Interest | ||||||||||||||||
(net of foreign withholdings tax of | $ | 65,136,826 | $ | 39,430,268 | $ | 69,702,336 | $ | 2,277,066 | ||||||||
Dividends | – | 94,229 | – | – | ||||||||||||
Total Investment Income | 65,136,826 | 39,524,497 | 69,702,336 | 2,277,066 | ||||||||||||
EXPENSES: | ||||||||||||||||
Investment advisory fee | 6,009,377 | 2,402,791 | 8,384,195 | 261,328 | ||||||||||||
Administration fee | 525,135 | 305,273 | 575,973 | 18,695 | ||||||||||||
Custodian fees | 185,566 | 36,441 | 542,635 | 7,010 | ||||||||||||
Audit fees | 68,453 | 67,731 | 68,542 | 39,956 | ||||||||||||
Printing fees | 7,535 | 7,266 | 12,386 | 5,244 | ||||||||||||
Legal fees | 34,127 | 34,127 | 34,127 | 30,145 | ||||||||||||
Trustee fee | 45,589 | 22,418 | 48,748 | 2,081 | ||||||||||||
Transfer agent fees | 39,150 | 24,919 | 33,438 | 20,697 | ||||||||||||
Registration fees | 171,467 | 42,845 | 165,628 | 16,588 | ||||||||||||
Insurance fees | 18,643 | 15,851 | 15,841 | 312 | ||||||||||||
Repayment of reimbursed expenses | 83,978 | – | 10,036 | – | ||||||||||||
Other | 7,792 | 8,348 | 7,549 | 3,229 | ||||||||||||
Total expenses before waiver | 7,196,812 | 2,968,010 | 9,899,098 | 405,285 | ||||||||||||
Less fees waived by investment advisor | – | (324,939) | – | (97,840) | ||||||||||||
Total Net Expenses | 7,196,812 | 2,643,071 | 9,899,098 | 307,445 | ||||||||||||
Net Investment Income | 57,940,014 | 36,881,426 | 59,803,238 | 1,969,621 | ||||||||||||
REALIZED AND UNREALIZED GAIN/(LOSS) ON INVESTMENTS: |
| |||||||||||||||
Net realized gain/(loss) on: | ||||||||||||||||
Investments | 5,662,031 | (400,000) | (27,427,494) | (359,714) | ||||||||||||
Forward foreign currency contracts | 7,030,690 | 843,032 | (1,321,141) | 31,200 | ||||||||||||
Forward currency transactions | (263,965) | (37,587) | (2,284,883) | (4,248) | ||||||||||||
Net realized gain/(loss) | 12,428,756 | 405,445 | (31,033,518) | (332,762) | ||||||||||||
Change in unrealized appreciation/(depreciation) on: |
| |||||||||||||||
Investments | (26,752,906) | (31,125,212) | (89,468,266) | (2,961,838) | ||||||||||||
Forward foreign currency contracts | 2,524,050 | 313,084 | (11,571,511) | 23,135 | ||||||||||||
Translation of assets and liabilities dominated in foreign currencies | (259,980) | (7,070) | (1,367,599) | (644) | ||||||||||||
Net change | (24,488,836) | (30,819,198) | (102,407,376) | (2,939,347) | ||||||||||||
Net Realized and Unrealized Loss on Investments | (12,060,080) | (30,413,753) | (133,440,894) | (3,272,109) | ||||||||||||
Net lncrease/(Decrease) in Net Assets Resulting from Operations | $ | 45,879,934 | $ | 6,467,673 | $ | (73,637,656) | $ | (1,302,488) | ||||||||
See Notes to Financial Statements.
Stone Harbor Investment Funds Annual Report | May 31, 2012 | 57 |
Table of Contents
Stone Harbor Investment Funds | Statements of Changes in Net Assets |
Stone Harbor Emerging Markets Debt Fund | Stone Harbor High Yield Bond Fund | |||||||||||||||
|
| |||||||||||||||
For the Year Ended May 31, 2012 | For the Year Ended May 31, 2011 | For the Year Ended May 31, 2012 | For the Year Ended May 31, 2011 | |||||||||||||
OPERATIONS: | ||||||||||||||||
Net investment income | $ | 57,940,014 | $ | 23,722,320 | $ | 36,881,426 | $ | 34,681,823 | ||||||||
Net realized gain on investments and foreign currency transactions | 12,428,756 | 6,919,738 | 405,445 | 17,313,821 | ||||||||||||
Net change in unrealized appreciation/(depreciation) on investments and foreign currency translations | (24,488,836) | 19,256,880 | (30,819,198) | 17,440,379 | ||||||||||||
Net increase in net assets resulting from operations | 45,879,934 | 49,898,938 | 6,467,673 | 69,436,023 | ||||||||||||
DISTRIBUTIONS TO SHAREHOLDERS: |
| |||||||||||||||
Institutional Class | ||||||||||||||||
From net investment income | (62,119,059) | (24,375,551) | (35,520,684) | (34,395,574) | ||||||||||||
From net realized gains | (9,021,936) | (9,643,963) | (14,866,777) | (6,870,389) | ||||||||||||
Net decrease in net assets from distributions to shareholders | (71,140,995) | (34,019,514) | (50,387,461) | (41,265,963) | ||||||||||||
CAPITAL SHARE TRANSACTIONS: | ||||||||||||||||
Institutional Class | ||||||||||||||||
Proceeds from sale of shares | 509,808,699 | 601,352,890 | 111,505,627 | 91,159,822 | ||||||||||||
Issued to shareholders in reinvestment of distributions | 67,065,948 | 32,341,186 | 48,229,973 | 39,501,275 | ||||||||||||
Cost of shares redeemed | (117,232,918) | (78,251,861) | (84,560,710) | (78,370,360) | ||||||||||||
Net increase in net assets from capital share transactions | 459,641,729 | 555,442,215 | 75,174,890 | 52,290,737 | ||||||||||||
Net Increase in Net Assets | 434,380,668 | 571,321,639 | 31,255,102 | 80,460,797 | ||||||||||||
NET ASSETS: | ||||||||||||||||
Beginning of period | 749,347,669 | 178,026,030 | 488,425,257 | 407,964,460 | ||||||||||||
End of period | $ | 1,183,728,337 | $ | 749,347,669 | $ | 519,680,359 | $ | 488,425,257 | ||||||||
Includes undistributed net investment income of: | $ | 1,084,360 | $ | 1,037,266 | $ | 1,700,036 | $ | 129,248 | ||||||||
OTHER INFORMATION: | ||||||||||||||||
Share Transactions: | ||||||||||||||||
Institutional Class | ||||||||||||||||
Beginning shares | 66,925,355 | 16,992,367 | 48,832,904 | 43,581,412 | ||||||||||||
Shares sold | 45,737,532 | 53,869,983 | 11,902,013 | 9,968,502 | ||||||||||||
Shares reinvested | 6,095,861 | 2,923,915 | 5,307,792 | 3,225,739 | ||||||||||||
Shares redeemed | (10,448,673) | (6,860,910) | (9,153,624) | (7,942,749) | ||||||||||||
Shares outstanding - end of period | 108,310,075 | 66,925,355 | 56,889,085 | 48,832,904 | ||||||||||||
See Notes to Financial Statements.
58 | www.shiplp.com |
Table of Contents
Stone Harbor Investment Funds | Statements of Changes in Net Assets |
| Stone Harbor Local Markets Fund | Stone Harbor Emerging Markets Corporate Debt Fund | |||||||||||
|
| |||||||||||
For the Year Ended May 31, 2012 | For the Period June 30, 2010 (Inception) to | For the Year Ended May 31, 2012 | ||||||||||
OPERATIONS: | ||||||||||||
Net investment income | $ | 59,803,238 | $ | 9,392,458 | $ | 1,969,621 | ||||||
Net realized gain/(loss) on investments and foreign currency transactions | (31,033,518) | 622,122 | (332,762) | |||||||||
Net change in unrealized appreciation/(depreciation) on investments and foreign currency translations | (102,407,376) | 17,560,404 | (2,939,347) | |||||||||
Net increase/decrease) in net assets resulting from operations | (73,637,656) | 27,574,984 | (1,302,488) | |||||||||
DISTRIBUTIONS TO SHAREHOLDERS: | ||||||||||||
Institutional Class | ||||||||||||
From net investment income | (46,535,140) | (9,743,385) | (1,965,171) | |||||||||
From net realized gains | – | (954,427) | – | |||||||||
From tax return of capital | (2,731,631) | – | – | |||||||||
Net decrease in net assets from distributions to shareholders | (49,266,771) | (10,697,812) | (1,965,171) | |||||||||
CAPITAL SHARE TRANSACTIONS: | ||||||||||||
Institutional Class | ||||||||||||
Proceeds from sale of shares | 1,147,925,382 | 580,987,585 | 35,932,000 | |||||||||
Issued to shareholders in reinvestment of distributions | 48,814,517 | 10,631,445 | 1,965,171 | |||||||||
Cost of shares redeemed | (116,133,532) | (2,703,053) | – | |||||||||
Net increase in net assets from capital share transactions | 1,080,606,367 | 588,915,977 | 37,897,171 | |||||||||
Net Increase in Net Assets | 957,701,940 | 605,793,149 | 34,629,512 | |||||||||
NET ASSETS: | ||||||||||||
Beginning of period | 605,793,149 | – | – | |||||||||
End of period | $ | 1,563,495,089 | $ | 605,793,149 | $ | 34,629,512 | ||||||
Includes undistributed/(overdistributed) net investment income of: | $ | (2,054,814) | $ | (27,562) | $ | 29,413 | ||||||
OTHER INFORMATION: | ||||||||||||
Share Transactions: | ||||||||||||
Institutional Class | ||||||||||||
Beginning shares | 54,032,190 | – | – | |||||||||
Shares sold | 106,956,969 | 53,300,605 | 3,676,780 | |||||||||
Shares reinvested | 4,632,478 | 977,555 | 219,239 | |||||||||
Shares redeemed | (10,811,969) | (245,970) | – | |||||||||
Shares outstanding - end of period | 154,809,668 | 54,032,190 | 3,896,019 | |||||||||
See Notes to Financial Statements.
Stone Harbor Investment Funds Annual Report | May 31, 2012 | 59 |
Table of Contents
| Financial Highlights | ||
| For a share outstanding through the periods presented. |
| Institutional Class | For the Year Ended May 31, 2012 | For the Year Ended May 31, 2011 | For the Year Ended May 31, 2010 | For the Year Ended May 31, 2009 | For the Period August 16, 2007 (Inception) to May 31, 2008 | |||||||||||||||
Net asset value - beginning of period | $ | 11.20 | $ | 10.48 | $ | 9.22 | $ | 10.34 | $ | 10.00 | ||||||||||
lncome/(loss) from investment operations: |
| |||||||||||||||||||
Net investment income | 0.65(1) | 0.67(1) | 0.75 | 0.59 | 0.46 | |||||||||||||||
Net realized and unrealized | (0.15) | 1.00 | 1.44 | (1.18) | 0.58 | |||||||||||||||
Total income/(loss) from investment operations | 0.50 | 1.67 | 2.19 | (0.59) | 1.04 | |||||||||||||||
Less distributions to common shareholders: |
| |||||||||||||||||||
From net investment income | (0.67) | (0.63) | (0.79) | (0.53) | (0.54) | |||||||||||||||
From net realized gains | (0.10) | (0.32) | (0.14) | – | (0.16) | |||||||||||||||
From tax return of capital | – | – | – | – | (0.00)(2) | |||||||||||||||
Total distributions | (0.77) | (0.95) | (0.93) | (0.53) | (0.70) | |||||||||||||||
Net lncrease/(Decrease) in Net Asset Value | (0.27) | 0.72 | 1.26 | (1.12) | 0.34 | |||||||||||||||
Net asset value - end of period | $ | 10.93 | $ | 11.20 | $ | 10.48 | $ | 9.22 | $ | 10.34 | ||||||||||
Total Return(3)(4) | 4.61% | 16.30% | 24.25% | (5.10)% | 10.46% | |||||||||||||||
Ratios/Supplemental Data: | ||||||||||||||||||||
Net assets, end of period (in thousands) | $ | 1,183,728 | $ | 749,348 | $ | 178,026 | $ | 91,753 | $ | 19,587 | ||||||||||
Ratio of expenses to average net assets with fee waivers/reimbursements/repayment of previously waived fees | 0.72% | 0.75% | 0.75% | 0.75% | 0.75%(5) | |||||||||||||||
Ratio of expenses to average net assets without fee waivers/reimbursements/ repayment of previously waived fees | 0.72% | 0.77% | 0.91% | 1.33% | 2.27%(5) | |||||||||||||||
Ratio of net investment income to average net assets with fee waivers/reimbursements /repayment of previously waived fees | 5.78% | 6.02% | 6.80% | 9.32% | 5.91%(5) | |||||||||||||||
Portfolio turnover rate | 60% | 82% | 125% | 84% | 143% | |||||||||||||||
| (1) | Calculated using average shares throughout the period. |
| (2) | Less than $(0.005) per share. |
| (3) | Total returns would have been lower had various fees and expenses not been waived and reimbursed during the period. The total returns in the table represent the rate that an investor would have earned (or lost) on an investment in a Fund (assuming reinvestment of all dividends and distributions). |
| (4) | Total returns for periods of less than one year are not annualized. |
| (5) | Annualized. |
See Notes to Financial Statements.
60 | www.shiplp.com |
Table of Contents
| Financial Highlights | ||
| For a share outstanding through the periods presented. |
| Institutional Class | For the Year Ended May 31, 2012 | For the Year Ended May 31, 2011 | For the Year Ended May 31, 2010 | For the Year Ended May 31, 2009 | For the Period (Inception) to May 31, 2008 | |||||||||||||||
Net asset value - beginning of period | $ | 10.00 | $ | 9.36 | $ | 8.39 | $ | 9.92 | $ | 10.00 | ||||||||||
lncome/(loss) from investment operations: |
| |||||||||||||||||||
Net investment income | 0.72 | (1) | 0.77 | (1) | 0.73 | 0.70 | 0.58 | |||||||||||||
Net realized and unrealized gain/(loss) on investments | (0.59) | 0.78 | 0.96 | (1.53) | (0.08) | |||||||||||||||
Total income/(loss) from investment operations | 0.13 | 1.55 | 1.69 | (0.83) | 0.50 | |||||||||||||||
Less distributions to common shareholders: |
| |||||||||||||||||||
From net investment income | (0.70) | (0.76) | (0.72) | (0.70) | (0.57) | |||||||||||||||
From net realized gains | (0.30) | (0.15) | – | – | (0.01) | |||||||||||||||
From tax return of capital | – | – | – | – | (0.00) | (2) | ||||||||||||||
Total distributions | (1.00) | (0.91) | (0.72) | (0.70) | (0.58) | |||||||||||||||
Net lncrease/(Decrease) in Net Asset Value | (0.87) | 0.64 | 0.97 | (1.53) | (0.08) | |||||||||||||||
Net asset value - end of period | $ | 9.13 | $ | 10.00 | $ | 9.36 | $ | 8.39 | $ | 9.92 | ||||||||||
Total Return(3)(4) | 1.77 | % | 17.14 | % | 20.53 | % | (7.77) | % | 5.09 | % | ||||||||||
Ratios/Supplemental Data: | ||||||||||||||||||||
Net assets, end of period (in thousands) | $ | 519,680 | $ | 488,425 | $ | 407,964 | $ | 223,210 | $ | 106,912 | ||||||||||
Ratio of expenses to average net assets with fee waivers/reimbursements | 0.55 | % | 0.55 | % | 0.55 | % | 0.55 | % | 0.55 | %(5) | ||||||||||
Ratio of expenses to average net assets without fee waivers/reimbursements | 0.62 | % | 0.65 | % | 0.67 | % | 0.88 | % | 1.21 | %(5) | ||||||||||
Ratio of net investment income to average net assets with fee waivers/reimbursements | 7.67 | % | 7.78 | % | 8.13 | % | 9.07 | % | 7.81 | %(5) | ||||||||||
Portfolio turnover rate | 46 | % | 60 | % | 36 | % | 16 | % | 11 | % | ||||||||||
| (1) | Calculated using average shares throughout the period. |
| (2) | Less than $(0.005) per share. |
| (3) | Total returns would have been lower had various fees and expenses not been waived and reimbursed during the period. The total returns in the table represent the rate that an investor would have earned (or lost) on an investment in a Fund (assuming reinvestment of all dividends and distributions). |
| (4) | Total returns for periods of less than one year are not annualized. |
| (5) | Annualized. |
See Notes to Financial Statements.
Stone Harbor Investment Funds Annual Report | May 31, 2012 | 61 |
Table of Contents
| Financial Highlights | ||
| For a share outstanding through the periods presented. |
| Institutional Class | For the Year Ended May 31, 2012 | For the Period (Inception) to May 31, 2011 | ||||||
Net asset value - beginning of period | $ | 11.21 | $ | 10.00 | ||||
lncome/(loss) from investment operations: | ||||||||
Net investment income(1) | 0.57 | 0.51 | ||||||
Net realized and unrealized gain/(loss) on investments | (1.21) | 1.14 | ||||||
Total income/(loss) from investment operations | (0.64) | 1.65 | ||||||
Less distributions to common shareholders: | ||||||||
From net investment income | (0.45) | (0.39) | ||||||
From net realized gains | – | (0.05) | ||||||
From tax return of capital | (0.02) | – | ||||||
Total distributions | (0.47) | (0.44) | ||||||
Net lncrease/(Decrease) in Net Asset Value | (1.11) | 1.21 | ||||||
Net asset value - end of period | $ | 10.10 | $ | 11.21 | ||||
Total Return(2)(3) | (5.84) | % | 16.82 | % | ||||
Ratios/Supplemental Data: | ||||||||
Net assets, end of period (in thousands) | $ | 1,563,495 | $ | 605,793 | ||||
Ratio of expenses to average net assets with fee waivers /reimbursements/repayment of previously waived fees | 0.89 | % | 1.00 | %(4) | ||||
Ratio of expenses to average net assets without fee waivers /reimbursements/repayment of previously waived fees | 0.89 | % | 1.01 | %(4) | ||||
Ratio of net investment income to average net assets with fee waivers /reimbursements/repayment of previously waived fees | 5.35 | % | 5.13 | %(4) | ||||
Portfolio turnover rate | 161 | % | 102 | % | ||||
| (1) | Calculated using average shares throughout the period. |
| (2) | Total returns would have been lower had various fees and expenses not been waived and reimbursed during the period. The total returns in the table represent the rate that an investor would have earned (or lost) on an investment in a Fund (assuming reinvestment of all dividends and distributions). |
| (3) | Total returns for periods of less than one year are not annualized. |
| (4) | Annualized. |
See Notes to Financial Statements.
62 | www.shiplp.com |
Table of Contents
Stone Harbor Emerging Markets Corporate Debt Fund | Financial Highlights | |
| For a share outstanding through the period presented. | ||
| Institutional Class | For the Year Ended May 31, 2012 | |||
Net asset value - beginning of period | $ | 10.00 | ||
Loss from investment operations: | ||||
Net investment income(1) | 0.59 | |||
Net realized and unrealized loss on investments | (1.11) | |||
Total loss from investment operations | (0.52) | |||
Less distributions to common shareholders: | ||||
From net investment income | (0.59) | |||
Total distributions | (0.59) | |||
Net Decrease in Net Asset Value | (1.11) | |||
Net asset value - end of period | $ | 8.89 | ||
Total Return(2) | (5.10) | % | ||
Ratios/Supplemental Data: | ||||
Net assets, end of period (in thousands) | $ | 34,630 | ||
Ratio of expenses to average net assets with fee waivers/reimbursements | 1.00% | |||
Ratio of expenses to average net assets without fee waivers/reimbursements | 1.32% | |||
Ratio of net investment income to average net assets with fee waivers/reimbursements | 6.41% | |||
Portfolio turnover rate | 51% | |||
| (1) | Calculated using average shares throughout the period. |
| (2) | Total returns would have been lower had various fees and expenses not been waived and reimbursed during the period. The total returns in the table represent the rate that an investor would have earned (or lost) on an investment in a Fund (assuming reinvestment of all dividends and distributions). |
See Notes to Financial Statements.
Stone Harbor Investment Funds Annual Report | May 31, 2012 | 63 |
Table of Contents
Stone Harbor Investment Funds | Notes to Financial Statements | |
| May 31, 2012 |
1. ORGANIZATION AND SIGNIFICANT ACCOUNTING POLICIES
Stone Harbor Investment Funds, which consists of Stone Harbor Emerging Markets Debt Fund, Stone Harbor High Yield Bond Fund, Stone Harbor Local Markets Fund and Stone Harbor Emerging Markets Corporate Debt Fund (each, a “Fund” and together, the “Funds”) is a Massachusetts business trust (the “Trust”), organized on February 20, 2007 and registered under the Investment Company Act of 1940, as amended (the “1940 Act”), as an open-end management investment company. The Stone Harbor Emerging Markets Corporate Debt Fund commenced operations on June 1, 2011. Each Fund is a non-diversified portfolio with an investment objective to maximize total return. Shares of each Fund are currently divided into two classes, designated Institutional Class Shares and Distributor Class Shares. As of the date of this report, there were no outstanding shares for the Distributor Class of each Fund. The Declaration of Trust permits the Trustees to create additional funds and share classes.
The following is a summary of significant accounting policies consistently followed by the Funds in the preparation of their financial statements. The policies are in conformity with accounting principles generally accepted in the United States of America (“GAAP”). The preparation of the financial statements in accordance with GAAP requires management to make estimates and assumptions that affect the reported amounts of assets and liabilities at the date of the financial statements and the reported amounts of income and expenses during the reporting period. Actual results could differ from those estimates.
(a) Investment Valuation: Debt securities, including bank loans and linked notes, are generally valued at the mean between the bid and asked prices provided by independent pricing services or brokers that are based on transactions in debt obligations, quotations from dealers, market transactions in comparable securities and various other relationships between securities. Equity securities for which market quotations are available are generally valued at the last sale price or official closing price on the primary market or exchange on which they trade. Publicly traded foreign government debt securities are typically traded internationally in the over-the-counter market, and are valued at the mean between the bid and asked prices as of the close of business of that market. When prices are not readily available, or are determined not to reflect fair value, such as when the value of a security has been significantly affected by events after the close of the exchange or market on which the security is principally traded, but before the Funds calculate their net asset value, the Funds may value these investments at fair value as determined in accordance with the procedures approved by the Funds’ Board of Trustees. Short-term obligations with maturities of 60 days or less are valued at amortized cost, which approximates market value. Money market mutual funds are valued at their net asset value.
A three-tier hierarchy has been established to measure fair value based on the extent of use of “observable inputs” as compared to “unobservable inputs” for disclosure purposes and requires additional disclosures about these valuations measurements. Inputs refer broadly to the assumptions that market participants would use in pricing a security. Observable inputs are inputs that reflect the assumptions market participants would use in pricing the security developed based on market data obtained from sources independent of the reporting entity. Unobservable inputs are inputs that reflect the reporting entity’s own assumptions about the assumptions market participants would use in pricing the security developed based on the best information available in the circumstances.
The three-tier hierarchy is summarized as follows:
Level 1— | Unadjusted quoted prices in active markets for identical assets or liabilities that the Fund has the ability to access. | |
Level 2— | Observable inputs other than quoted prices included in level 1 that are observable for the asset or liability, either directly or indirectly. These inputs may include quoted prices for the identical instrument on an inactive market, prices for similar instruments, interest rates, prepayment speeds, credit risk, yield curve, rates, and similar data. | |
Level 3— | Unobservable inputs for the asset or liability, to the extent relevant observable inputs are not available, representing the Fund’s own assumptions about the assumptions a market participant would use in valuing the asset or liability, and would be based on the best information available. | |
64 | www.shiplp.com |
Table of Contents
Stone Harbor Investment Funds | Notes to Financial Statements | |
| May 31, 2012 |
The following is a summary of each Fund’s investments and financial instruments based on the three-tier hierarchy as of May 31, 2012:
| Investments in Securities at Value* | Level 1 - Quoted and Unadjusted Prices | Level 2 - Other Significant Observable Inputs | Level 3 - Significant Inputs | Total | ||||||||||||
Stone Harbor Emerging Markets Debt Fund | ||||||||||||||||
Sovereign Debt Obligations | $ | – | $ | 730,418,737 | $ | – | $ | 730,418,737 | ||||||||
Bank Loans | – | 2,162,965 | 934,554 | 3,097,519 | ||||||||||||
Corporate Bonds | – | 321,386,109 | 477,336 | 321,863,445 | ||||||||||||
Participation Notes | – | 10,358,605 | – | 10,358,605 | ||||||||||||
Credit Linked Notes | – | 28,621,694 | – | 28,621,694 | ||||||||||||
Short Term Investments | 33,749,090 | – | – | 33,749,090 | ||||||||||||
Total | $ | 33,749,090 | $ | 1,092,948,110 | $ | 1,411,890 | $ | 1,128,109,090 | ||||||||
| ||||||||||||||||
Other Financial Instruments** | ||||||||||||||||
Assets | ||||||||||||||||
Forward Foreign Currency Contracts | $ | – | $ | 2,746,031 | $ | – | $ | 2,746,031 | ||||||||
Liabilities | ||||||||||||||||
Forward Foreign Currency Contracts | – | (207,777) | – | (207,777) | ||||||||||||
Total | $ | – | $ | 2,538,254 | $ | – | $ | 2,538,254 | ||||||||
| Investments in Securities at Value* | Level 1 - Quoted and Unadjusted Prices | Level 2 - Other Significant Observable Inputs | Level 3 - Significant Unobservable Inputs | Total | ||||||||||||
Stone Harbor High Yield Bond Fund | ||||||||||||||||
Corporate Bonds | $ | – | $ | 476,515,231 | $ | – | $ | 476,515,231 | ||||||||
Convertible Corporate Bonds | – | 5,141,610 | – | 5,141,610 | ||||||||||||
Bank Loans | – | 12,991,119 | – | 12,991,119 | ||||||||||||
Common Stocks | – | 18 | – | 18 | ||||||||||||
Preferred Stocks | 651,321 | – | – | 651,321 | ||||||||||||
Warrants | 38,967 | – | – | 38,967 | ||||||||||||
Short Term Investments | 15,765,865 | – | – | 15,765,865 | ||||||||||||
Total | $ | 16,456,153 | $ | 494,647,978 | $ | – | $ | 511,104,131 | ||||||||
| ||||||||||||||||
Other Financial Instruments** | ||||||||||||||||
Assets | ||||||||||||||||
Forward Foreign Currency Contracts | $ | – | $ | 364,301 | $ | – | $ | 364,301 | ||||||||
Liabilities | ||||||||||||||||
Forward Foreign Currency Contracts | – | (58,853) | – | (58,853) | ||||||||||||
Total | $ | – | $ | 305,448 | $ | – | $ | 305,448 | ||||||||
| Investments in Securities at Value* | Level 1 - Quoted and Unadjusted Prices | Level 2 - Other Significant Observable Inputs | Level 3 - Significant Unobservable Inputs | Total | ||||||||||||
Stone Harbor Local Markets Fund | ||||||||||||||||
Sovereign Debt Obligations | $ | – | $ | 751,901,401 | $ | – | $ | 751,901,401 | ||||||||
Corporate Bonds | – | 55,368,063 | – | 55,368,063 | ||||||||||||
Credit Linked Notes | – | 311,665,515 | – | 311,665,515 | ||||||||||||
Short Term Investments | 128,876,237 | – | – | 128,876,237 | ||||||||||||
Total | $ | 128,876,237 | $ | 1,118,934,979 | $ | – | $ | 1,247,811,216 | ||||||||
| ||||||||||||||||
Stone Harbor Investment Funds Annual Report | May 31, 2012 | 65 |
Table of Contents
Stone Harbor Investment Funds | Notes to Financial Statements | |
| May 31, 2012 |
| Investments in Securities at Value* | Level 1 - Quoted and Unadjusted Prices | Level 2 - Other Significant Observable Inputs | Level 3 - Significant Unobservable Inputs | Total | ||||||||||||
Other Financial Instruments** | ||||||||||||||||
Assets | ||||||||||||||||
Forward Foreign Currency Contracts | $ | – | $ | 891,085 | $ | – | $ | 891,085 | ||||||||
Liabilities | ||||||||||||||||
Forward Foreign Currency Contracts | – | (10,383,689) | – | (10,383,689) | ||||||||||||
Total | $ | – | $ | (9,492,604) | $ | – | $ | (9,492,604) | ||||||||
| Investments in Securities at Value* | Level 1 - Quoted Prices | Level 2 - Other Significant Observable Inputs | Level 3 - Significant Inputs | Total | ||||||||||||
Stone Harbor Emerging Markets Corporate Debt Fund | ||||||||||||||||
Corporate Bonds | $ | – | $ | 32,882,640 | $ | 201,415 | $ | 33,084,055 | ||||||||
Credit Linked Notes | – | 616,000 | – | 616,000 | ||||||||||||
Short Term Investments | $ | 990,392 | – | – | 990,392 | |||||||||||
Total | $ | 990,392 | $ | 33,498,640 | $ | 201,415 | $ | 34,690,447 | ||||||||
| ||||||||||||||||
Other Financial Instruments** | ||||||||||||||||
Assets | ||||||||||||||||
Forward Foreign Currency Contracts | $ | – | $ | 23,135 | $ | – | $ | 23,135 | ||||||||
Total | $ | – | $ | 23,135 | $ | – | $ | 23,135 | ||||||||
| * | For detailed Industry/Country descriptions, see accompanying Statement of Investments. |
| ** | Other financial instruments are derivative instruments not reflected in the Statement of Investments. |
There were no significant transfers between Levels 1 and 2 during the period. It is the Funds’ policy to recognize transfers into and out of all levels at the end of the reporting period.
The following is a reconciliation of assets in which significant unobservable inputs (Level 3) were used in determining fair value:
| Investments in Securities | Balance as of May 31, 2011 | Accrued discount/ premium | Realized gain/(loss)* | Change in unrealized appreciation/ (depreciation)* | Purchase | Sales | Transfer Out of Level 3 | Balance as of | Net change in May 31, 2012 | |||||||||||||||||||||||||||
Stone Harbor Emerging Markets Debt Fund | ||||||||||||||||||||||||||||||||||||
Sovereign Debt Obligations | $17,818,730 | $ (9,634) | $(634,283) | $(1,856,728) | $ 7,562,128 | $(13,420,117) | $(9,460,096) | $ – | $ – | |||||||||||||||||||||||||||
Bank Loans | 3,197,000 | – | 23,236 | (103,840) | 1,038,394 | (3,220,236) | – | 934,554 | (103,840) | |||||||||||||||||||||||||||
Corporate Bonds | 4,257,737 | 134,033 | (7,466) | (1,552,293) | 1,171,408 | (222,516) | (3,303,567) | 477,336 | (1,077,792) | |||||||||||||||||||||||||||
TOTAL | $25,273,467 | $ 124,399 | $(618,513) | $(3,512,861) | $ 9,771,930 | $(16,862,869) | $(12,763,663) | $ 1,411,890 | $(1,181,632) | |||||||||||||||||||||||||||
66 | www.shiplp.com |
Table of Contents
Stone Harbor Investment Funds | Notes to Financial Statements | |
| May 31, 2012 |
Investments in Securities | Balance as of May 31, 2011 | Accrued discount/ premium | Realized gain/(loss)* | Change in unrealized appreciation/ (depreciation)* | Purchase | Sales | Transfer Out of Level 3 | Balance as of | Net change in May 31, 2012 | |||||||||||||||||||||||||||
| Stone Harbor High Yield Fund | ||||||||||||||||||||||||||||||||||||
Corporate Bonds | $ | 2 | $ | 100 | $ | – | $ | (100) | $ | – | $ | – | $ | (2) | $ | – | $ | – | ||||||||||||||||||
Convertible Corporate Bonds | 342,923 | 145,910 | 12,251 | (194,359) | – | (239,383) | (67,342) | – | – | |||||||||||||||||||||||||||
TOTAL | $ | 342,925 | $ | 146,010 | $ | 12,251 | $ | (194,459) | $ | – | $ | (239,383) | $ | (67,344) | $ | – | $ | – | ||||||||||||||||||
Investments in Securities | Balance as of May 31, 2011 | Accrued discount/ premium | Realized gain/(loss)* | Change in unrealized appreciation/ (depreciation)* | Purchase | Sales | Transfer Out of Level 3 | Balance as of May 31, 2012 | Net change in May 31, 2012 | |||||||||||||||||||||||||||
| Stone Harbor Local Markets Fund | ||||||||||||||||||||||||||||||||||||
Sovereign Debt Obligations | $ | 13,281,491 | $ | (167,958) | $ | (44,462) | $ | 307,469 | $ | 17,554,748 | $ | (1,574,489) | $ | (29,356,799) | $ | – | $ | – | ||||||||||||||||||
TOTAL | $ | 13,281,491 | $ | (167,958) | $ | (44,462) | $ | 307,469 | $ | 17,554,748 | $ | (1,574,489) | $ | (29,356,799) | $ | – | $ | – | ||||||||||||||||||
Investments in Securities | Balance as of May 31, 2011 | Accrued discount/ premium | Realized gain/(loss)* | Change in unrealized appreciation/ (depreciation)* | Purchase | Sales | Transfer Out of Level 3 | Balance as of May 31, 2012 | Net change in May 31, 2012 | |||||||||||||||||||||||||||
| Stone Harbor Emerging Markets Corporate Debt Fund | ||||||||||||||||||||||||||||||||||||
Corporate Bonds | $ | – | $ | 52,745 | $ | – | $ | (445,055) | $ | 593,725 | $ | – | $ | – | $ | 201,415 | $ | (445,055) | ||||||||||||||||||
TOTAL | $ | – | $ | 52,745 | $ | – | $ | (445,055) | $ | 593,725 | $ | – | $ | – | $ | 201,415 | $ | (445,055) | ||||||||||||||||||
| * | Realized gain/(loss) and change in unrealized appreciation/(depreciation) are included in the related amounts on the investment in the Statement of Operations. |
The inputs or methodology used for valuing securities are not necessarily an indication of the risk associated with investing in those securities.
(b) Security Transactions and Investment Income: Security transactions are accounted for on a trade date basis. Interest income, adjusted for amortization of premium and accretion of discount, is recorded on the accrual basis. Dividend income is recorded on the ex-dividend date. Foreign dividend income is recorded on the ex-dividend date or as soon as practical after the Funds determine the existence of a dividend declaration after exercising reasonable due diligence. The cost of investments sold is determined by use of the specific identification method. To the extent any issuer defaults on an expected interest payment, the Funds’ policy is to generally halt any additional interest income accruals and consider the realizability of interest accrued up to the date of default.
(c) Foreign Currency Translation: The books and records of the Funds are maintained in U.S. dollars. Investment valuations and other assets and liabilities initially expressed in foreign currencies are converted each business day into U.S. dollars based upon current exchange rates. Prevailing foreign exchange rates may generally be obtained at the close of the NYSE (normally, 4:00 p.m. Eastern time). The portion of realized and unrealized gains or losses on investments due to fluctuations in foreign currency exchange rates is not separately disclosed and is included in realized and unrealized gains or losses on investments, when applicable.
Stone Harbor Investment Funds Annual Report | May 31, 2012 | 67 |
Table of Contents
Stone Harbor Investment Funds | Notes to Financial Statements | |
| May 31, 2012 |
(d) Foreign Securities: The Funds may directly purchase securities of foreign issuers. Investing in securities of foreign issuers involves special risks not typically associated with investing in securities of U.S. issuers. The risks include possible revaluation of currencies, the ability to repatriate funds, less complete financial information about companies and possible future adverse political and economic developments. Moreover, securities of many foreign issuers and their markets may be less liquid and their prices more volatile than those of securities of comparable U.S. issuers.
(e) Risk Exposure and the Use of Derivative Instruments: The Funds’ investment objectives not only permit the Funds to purchase investment securities, they also allow the Funds to enter in various types of derivatives contracts. In doing so, the Funds employ strategies in differing combinations to permit them to increase, decrease, or change the level or types of exposure to market factors. Central to those strategies are features inherent to derivatives that may make them more attractive for this purpose than equity or debt securities; they require little or no initial cash investment, they can focus exposure on only certain selected risk factors, and they may not require the ultimate receipt or delivery of the underlying security (or securities) to the contract. This may allow the Funds to pursue their objectives more quickly and efficiently than if they were to make direct purchases or sales of securities capable of effecting a similar response to market factors.
Market Risk Factors. In pursuit of their investment objectives, the Funds may seek to use derivatives to increase or decrease their exposure to the following market risk factors, among others:
Interest Rate Risk. Interest rate risk refers to the fluctuations in value of fixed-income securities resulting from the inverse relationship between price and yield. For example, an increase in general interest rates will tend to reduce the market value of already issued fixed-income investments, and a decline in general interest rates will tend to increase their value. In addition, debt securities with longer maturities, which tend to have higher yields, are subject to potentially greater fluctuations in value from changes in interest rates than obligations with shorter maturities.
Credit Risk. Credit risk relates to the ability of the issuer to meet interest and principal payments, or both, as they come due. In general, lower-grade, higher-yield bonds are subject to credit risk to a greater extent than lower-yield, higher-quality bonds.
Foreign Exchange Rate Risk. Foreign exchange risk relates to the change in the U.S. dollar value of a security held that is denominated in a foreign currency. The U.S. dollar value of a foreign currency denominated security will decrease as the dollar appreciates against the currency, while the U.S. dollar value will increase as the dollar depreciates against the currency.
Equity Risk. Equity risk relates to the change in value of equity securities as they relate to increases or decreases in the general market.
The Funds’ use of derivatives can result in losses due to unanticipated changes in these risk factors and the overall market. In instances where the Funds are using derivatives to decrease, or hedge, exposures to market risk factors for securities held by the Funds, there are also risks that those derivatives may not perform as expected resulting in losses for the combined or hedged positions.
Derivatives may have little or no initial cash investment relative to their market value exposure and therefore can produce significant gains or losses in excess of their cost. This use of embedded leverage allows the Fund to increase its market value exposure relative to it net assets and can substantially increase the volatility of the Funds’ performance.
Additional associated risks from investing in derivatives also exist and potentially could have significant effects on the valuation of the derivative and the Funds. Typically, the associated risks are not the risks that the Funds are attempting to increase or decrease exposure to, per their investment objectives, but are the additional risks from investing in derivatives.
Examples of these associated risks are liquidity risk, which is the risk that the Funds will not be able to sell or close out the derivative in a timely manner, and counterparty credit risk, which is the risk that the counterparty will not fulfill its obligation to the Funds. Associated risks can be different for each type of derivative and are discussed by each derivative type bellow in the notes that follow.
Forward Foreign Currency Contracts. The Funds may engage in currency transactions with counterparties to hedge the value of portfolio securities denominated in particular currencies against fluctuations in relative value, to gain or reduce exposure to certain currencies, or to generate income or gains. A forward foreign currency contract is an agreement between two parties to buy and sell a currency at a set price on a future date. The contract is marked-to-market daily and the change in value is recorded by the Funds as an unrealized gain or loss. When a forward foreign currency contract is extinguished, through either delivery or offset by entering into another forward foreign currency contract, the Funds record a realized gain or loss equal to the difference between the value of the contract at the time it was opened and the value of the contract at the time it was extinguished.
Forward foreign currency contracts involve elements of market risk in excess of the amounts reflected in the Statements of Assets and Liabilities. The Funds bear the risk of an unfavorable change in the foreign exchange rate underlying the forward foreign currency contract. Risks may also arise upon entering into these contracts from the potential inability of the counterparties to meet the terms of their contracts.
68 | www.shiplp.com |
Table of Contents
Stone Harbor Investment Funds | Notes to Financial Statements | |
| May 31, 2012 |
Credit Linked Notes: The Funds may invest in credit linked notes to obtain economic exposure to high yield, emerging markets or other securities. Investments in a credit linked note typically provide the holder with a return based on the return of an underlying reference instrument, such as an emerging market bond. Like an investment in a bond, investments in credit-linked securities represent the right to receive periodic income payments (in the form of distributions) and payment of principal at the end of the term of the security. In addition to the risks associated with the underlying reference instrument, an investment in a credit linked note is also subject to the risk that the counterparty will be unwilling or unable to meet its obligations under the note. Because credit linked notes are derivatives, an investment in these instruments is generally subject to the risks associated with derivatives.
The following is a summary of the fair valuations of derivative instruments categorized by risk exposure: Fair values of derivative instruments on the Statements of Assets and Liabilities as of May 31, 2012:
| Foreign Exchange Contracts | ||||
Stone Harbor Emerging Markets Debt Fund Assets: | ||||
Unrealized appreciation on forward foreign currency contracts | $ | 2,746,031 | ||
Liabilities: | ||||
Unrealized depreciation on forward foreign currency contracts | $ | (207,777) | ||
Stone Harbor High Yield Bond Fund Assets: | ||||
Unrealized appreciation on forward foreign currency contracts | $ | 364,301 | ||
Liabilities: | ||||
Unrealized depreciation on forward foreign currency contracts | $ | (58,853) | ||
Stone Harbor Local Markets Fund Assets: | ||||
Unrealized appreciation on forward foreign currency contracts | $ | 891,085 | ||
Liabilities: | ||||
Unrealized depreciation on forward foreign currency contracts | $ | (10,383,689) | ||
Stone Harbor Emerging Markets Corporate Debt Fund Assets: | ||||
Unrealized appreciation on forward foreign currency contracts | $ | 23,135 | ||
Liabilities: | ||||
Unrealized appreciation on forward foreign currency contracts | $ | – | ||
The number of forward foreign currency contracts held at May 31, 2012 is representative of activity during the twelve months ended May 31, 2012.
The effect of derivative instruments on the Statements of Operations for the year ended May 31, 2012:
| Foreign Exchange Contracts | ||||
Stone Harbor Emerging Markets Debt Fund Net Realized Gain on: | ||||
Forward foreign currency contracts | $ | 7,030,690 | ||
Change in Unrealized Appreciation on: | ||||
Forward foreign currency contracts | $ | 2,524,050 | ||
Stone Harbor High Yield Bond Fund Net Realized Gain on: | ||||
Forward foreign currency contracts | $ | 843,032 | ||
Change in Unrealized Appreciation on: | ||||
Forward foreign currency contracts | $ | 313,084 | ||
Stone Harbor Local Markets Fund Net Realized Loss on: | ||||
Forward foreign currency contracts | $ | (1,321,141) | ||
Change in Unrealized Depreciation on: | ||||
Forward foreign currency contracts | $ | (11,571,511) | ||
Stone Harbor Investment Funds Annual Report | May 31, 2012 | 69 |
Table of Contents
Stone Harbor Investment Funds | Notes to Financial Statements | |
| May 31, 2012 |
Stone Harbor Emerging Markets Corporate Debt Fund Net Realized Gain on: | ||||||
Forward foreign currency contracts | $ | 31,200 | ||||
Change in Unrealized Appreciation on: | ||||||
Forward foreign currency contracts | $ | 23,135 | ||||
(f) Loan Participations and Assignments: The Funds may invest in loans arranged through private negotiation between one or more financial institutions. The Funds’ investment in any such loan may be in the form of a participation in or an assignment of the loan. In connection with purchasing participations, the Funds generally will have no right to enforce compliance by the borrower with the terms of the loan agreement relating to the loan, nor any rights of set-off against the borrower and the Funds may not benefit directly from any collateral supporting the loan in which they have purchased the participation.
The Funds assume the credit risk of the borrower, the lender that is selling the participation and any other persons interpositioned between the Funds and the borrower. In the event of the insolvency of the lender selling the participation, the Funds may be treated as a general creditor of the lender and may not benefit from any set-off between the lender and the borrower.
(g) Credit and Market Risk: The Funds invest in high yield and emerging market instruments that are subject to certain credit and market risks. The yields of high yield and emerging market debt obligations reflect, among other things, perceived credit and market risks. The Funds’ investment in securities rated below investment grade typically involves risks not associated with higher rated securities including, among others, greater risk related to timely and ultimate payment of interest and principal, greater market price volatility and less liquid secondary market trading. The consequences of political, social, economic or diplomatic changes may have disruptive effects on the market prices of investments held by the Funds. The Funds’ investment in non-U.S. dollar denominated securities may also result in foreign currency losses caused by devaluations and exchange rate fluctuations. Investments in derivatives are also subject to credit and market risks.
(h) Distributions to Shareholders: Dividends and distributions to shareholders, which are determined in accordance with income tax regulations, are recorded on the ex-date. Income distributions, if any are generally declared and paid on a quarterly basis. Capital gain distributions, if any, are declared and paid at least annually.
(i) Classifications of Distributions: Net investment income (loss) and net realized gain (loss) may differ for financial statement and tax purposes. The character of distributions made during the year from net investment income or net realized gains may differ from its ultimate characterization for federal income tax purposes. Also, due to the timing of dividend distributions, the fiscal year in which amounts are distributed may differ from the fiscal year in which the income or realized gain was recorded by a Fund.
The tax character of the distributions paid by the Funds during the years ended May 31, 2012, and May 31, 2011, was as follows:
Stone Harbor Emerging Markets Debt Fund
| For the Year Ended May 31, 2012 | For the Year Ended May 31, 2011 | |||||||||
Ordinary Income | $ | 69,336,608 | $ | 30,268,192 | ||||||
Long-Term Capital Gain | 1,804,387 | 3,751,322 | ||||||||
Total | $ | 71,140,995 | $ | 34,019,514 | ||||||
Stone Harbor High Yield Bond Fund | ||||||||||
| For the Year Ended May 31, 2012 | For the Year Ended May 31, 2011 | |||||||||
Ordinary Income | $ | 38,131,521 | $ | 37,432,474 | ||||||
Long-Term Capital Gain | 12,255,940 | 3,833,489 | ||||||||
Total | $ | 50,387,461 | $ | 41,265,963 | ||||||
Stone Harbor Local Markets Fund | ||||||||||
| For the Year Ended May 31, 2012 | For the Period June 30, 2010 (Inception) To May 31, 2011 | |||||||||
Ordinary Income | $ | 44,750,817 | $ | 10,697,812 | ||||||
Long-Term Capital Gain | 1,784,323 | – | ||||||||
Tax Return of Capital | 2,731,631 | – | ||||||||
Total | $ | 49,266,771 | $ | 10,697,812 | ||||||
70 | www.shiplp.com |
Table of Contents
Stone Harbor Investment Funds | Notes to Financial Statements | |
| May 31, 2012 |
Stone Harbor Emerging Markets Corporate Debt Fund
| For the Year Ended May 31, 2012 | ||||||
Ordinary Income | $ | 1,965,171 | ||||
Total | $ | 1,965,171 | ||||
As of May 31, 2012, the components of distributable earnings on a tax basis were as follows:
Stone Harbor Emerging Markets Debt Fund
Undistributed Ordinary Income | $ | 3,622,764 | ||||
Accumulated Capital Gains | 2,475,810 | |||||
Unrealized (Depreciation) | (2,426,904 | ) | ||||
Cumulative Effect of Other Timing Difference* | (2,538,404 | ) | ||||
Total | $ | 1,133,266 | ||||
Stone Harbor High Yield Bond Fund | ||||||
Undistributed Ordinary Income | $ | 2,004,559 | ||||
Accumulated Capital (Loss) | (3,386,948 | ) | ||||
Unrealized (Depreciation) | (2,366,535 | ) | ||||
Cumulative Effect of Other Timing Difference* | (304,523 | ) | ||||
Total | $ | (4,053,447 | ) | |||
Stone Harbor Local Markets Fund | ||||||
Unrealized (Depreciation) | (101,240,810 | ) | ||||
Cumulative Effect of Other Timing Difference* | (2,054,814 | ) | ||||
Total | $ | (103,295,624 | ) | |||
Stone Harbor Emerging Markets Corporate Debt Fund | ||||||
Undistributed Ordinary Income | $ | 52,548 | ||||
Accumulated Capital (Loss) | (357,156 | ) | ||||
Unrealized (Depreciation) | (2,939,916 | ) | ||||
Cumulative Effect of Other Timing Difference* | (23,135 | ) | ||||
Total | $ | (3,267,659 | ) | |||
*Other temporary differences due to timing, consist primarily of mark-to-market on forward foreign currency contracts.
The tax components of distributable earnings are determined in accordance with income tax regulations which may differ from the composition of net assets reported under GAAP. Accordingly, for the year ended May 31, 2012, certain differences were reclassified. These differences were primarily due to the differing tax treatment of certain investments and the amounts reclassified did not affect net assets.
The reclassifications were as follows:
Stone Harbor | Stone Harbor High Yield Bond Fund | |||||||||||||
Paid-in Capital | $ | – | $ | 210,829 | ||||||||||
Undistributed Net Investment Income | $ | 4,226,139 | $ | 210,046 | ||||||||||
Accumulated Net Realized Loss | $ | (4,226,139 | ) | $ | (420,875 | ) | ||||||||
Stone Harbor | Stone Harbor Emerging Markets Corporate Debt Fund | |||||||||||||
(Over)/Undistributed Net Investment Income | $ | (15,295,350 | ) | $ | 24,963 | |||||||||
Accumulated Net Realized Gains/(Loss) | $ | 15,295,350 | $ | (24,963 | ) | |||||||||
(j) Expenses: Direct expenses are charged to the Funds; general expenses of the Trust are allocated to the Funds based on each Fund’s relative net assets.
Stone Harbor Investment Funds Annual Report | May 31, 2012 | 71 |
Table of Contents
Stone Harbor Investment Funds | Notes to Financial Statements | |
| May 31, 2012 |
(k) Federal and Other Taxes: No provision for income taxes is included in the accompanying financial statements, as the Funds intend to distribute to shareholders all taxable investment income and realized gains and otherwise comply with Subchapter M of the Internal Revenue Code applicable to regulated investment companies.
The Funds evaluate tax positions taken (or expected to be taken) in the course of preparing the Funds’ tax returns to determine whether these positions meet a “more-likely-than-not” standard that, based on the technical merits, have a more than fifty percent likelihood of being sustained by a taxing authority upon examination. A tax position that meets the “more-likely-than-not” recognition threshold is measured to determine the amount of benefit to recognize in the financial statements.
Management of the Funds analyzes all open tax years, as defined by the Statute of Limitations, for all major jurisdictions, including federal tax authorities and certain state tax authorities. As of and during the fiscal year ended May 31, 2012, the Funds did not have a liability for any unrecognized tax benefits. The Funds’ federal and state income and federal excise tax returns for all tax years since inception are subject to examination by the Internal Revenue Service and state departments of revenue.
On December 22, 2010, the Regulated Investment Company Modernization Act of 2010 (the “Modernization Act”) was signed into law. The provisions of the Modernization Act are generally effective for tax years beginning after the date it was signed into law, therefore the enacted provisions will apply to the Funds for the fiscal year ending May 31, 2012. The Modernization Act is the first major piece of legislation affecting regulated investment companies (“RICs”) since 1986 and it modernizes several of the federal income and excise tax provisions related to RICs. Some highlights of the enacted provisions are as follows:
New capital losses may now be carried forward indefinitely, and retain the character of the original loss.
The Modernization Act contains simplification provisions, which are aimed at preventing disqualification of a RIC for “inadvertent” failures of the asset diversification and/or qualifying income tests. Additionally, the Modernization Act exempts RICs from the preferential dividend rule, and repealed the 60-day designation requirement for certain types of paythrough income and gains.
Finally, the Modernization Act contains several provisions aimed at preserving the character of distributions made by a RIC during the portion of its taxable year ending after October 31 or December 31, reducing the circumstances under which a RIC might be required to file amended Forms 1099 to restate previously reported distributions.
2. ADVISORY FEES
Stone Harbor Investment Partners LP is the Trust’s investment adviser. Under the investment advisory agreement the Trust pays an investment advisory fee calculated daily and paid monthly of 0.60%, 0.50%, 0.75% and 0.85% of the average daily net assets for Stone Harbor Emerging Markets Debt Fund, Stone Harbor High Yield Bond Fund, Stone Harbor Local Markets Fund, and Stone Harbor Emerging Markets Corporate Debt Fund, respectively.
The Adviser has contractually agreed to waive fees and reimburse expenses with respect to each of the Funds so that the Net Annual Operating Expenses (exclusive of acquired Fund fees and expenses, brokerage expenses, interest expense, taxes and extraordinary expenses) of the Stone Harbor Emerging Markets Debt Fund Institutional Class, Stone Harbor High Yield Bond Fund Institutional Class, Stone Harbor Local Markets Fund Institutional Class and Stone Harbor Emerging Markets Corporate Debt Fund Institutional Class will not exceed 0.75%, 0.55%, 1.00% and 1.00%, respectively. This undertaking is in effect through September 30, 2012 and is reevaluated on an annual basis.
The Adviser will be permitted to recover, on a class by class basis, expenses it has borne through the undertakings described above to the extent that a Fund’s expenses in later periods fall below the annual rates set forth in the relevant undertaking. A Fund will not be obligated to pay any such deferred fees and expenses more than three years after the end of the fiscal year in which the fee and expense was deferred. Prior to 2011, the recovery period was limited to one year for the Stone Harbor Emerging Markets Debt Fund and Stone Harbor High Yield Bond Fund and as such, amounts waived and reimbursed through 2010 are not eligible to be recovered. At May 31, 2012, deferred fees and expenses that were eligible to be recovered by the Adviser were as follows:
| Expires 2014 | Expires 2015 | Total | ||||||||||||
Stone Harbor High Yield Bond Fund | $ | 423,643 | $ | 324,939 | $ | 748,582 | ||||||||
Stone Harbor Emerging Markets Corporate Debt Fund | N/A | 97,840 | 97,840 | |||||||||||
The Stone Harbor Emerging Markets Debt Fund and Stone Harbor Local Markets Fund did not have any recoverable amounts outstanding as of May 31, 2012.
72 | www.shiplp.com |
Table of Contents
Stone Harbor Investment Funds | Notes to Financial Statements | |
| May 31, 2012 |
3. INVESTMENTS
During the year ended May 31, 2012 the aggregate cost of purchases and proceeds from sales of investments (excluding short-term investments) were as follows:
| Purchases of investments | Sales of investments | |||||||
Stone Harbor Emerging Markets Debt Fund | $ | 981,567,735 | $ | 570,690,903 | ||||
Stone Harbor High Yield Bond Fund | 270,431,550 | 213,673,392 | ||||||
Stone Harbor Local Markets Fund | 2,280,299,368 | 1,517,345,889 | ||||||
Stone Harbor Emerging Markets Corporate Debt Fund | 51,316,358 | 14,316,651 | ||||||
At May 31, 2012 the aggregate gross unrealized appreciation and depreciation of investments for federal income purposes were as follows:
Stone Harbor Emerging Markets Debt Fund | ||||
Gross appreciation on investments (excess of value over tax cost) | $ | 42,206,842 | ||
Gross depreciation on investments (excess of tax cost over value) | (46,890,988) | |||
Net appreciation of foreign currency and derivatives | 2,257,242 | |||
Net unrealized depreciation | (2,426,904) | |||
Cost of investments for income tax purposes | $ | 1,132,793,236 | ||
Stone Harbor High Yield Bond Fund | ||||
Gross appreciation on investments (excess of value over tax cost) | $ | 15,981,617 | ||
Gross depreciation on investments (excess of tax cost over value) | (18,646,463) | |||
Net appreciation of foreign currency and derivatives | 298,311 | |||
Net unrealized depreciation | (2,366,535) | |||
Cost of investments for income tax purposes | $ | 513,768,977 | ||
Stone Harbor Local Markets Fund | ||||
Gross appreciation on investments (excess of value over tax cost) | $ | 4,398,096 | ||
Gross depreciation on investments (excess of tax cost over value) | (94,556,428) | |||
Net depreciation of foreign currency and derivatives | (11,082,478) | |||
Net unrealized depreciation | (101,240,810) | |||
Cost of investments for income tax purposes | $ | 1,337,969,548 | ||
Stone Harbor Emerging Markets Corporate Debt Fund | ||||
Gross appreciation on investments (excess of value over tax cost) | $ | 373,405 | ||
Gross depreciation on investments (excess of tax cost over value) | (3,335,812) | |||
Net appreciation of foreign currency and derivatives | 22,491 | |||
Net unrealized depreciation | (2,939,916) | |||
Cost of investments for income tax purposes | $ | 37,652,854 | ||
Capital Losses: As of May 31, 2012 the following Funds had capital loss carryforwards which may reduce the Funds’ taxable income arising from future net realized gains on investments, if any, to the extent permitted by the Code and thus may reduce the amount of the distributions to shareholders which would otherwise be necessary to relieve the Funds of any liability for federal tax pursuant to the Code.
Capital losses deferred to next tax year were as follows:
| Fund | Short-Term | |||||
Stone Harbor Emerging Markets Corporate Debt Fund | $ | 173,100 | ||||
Under the recently enacted Regulated Investment Company Modernization Act of 2010, capital losses incurred by each Fund after January 1, 2011 will not be subject to expiration.
Stone Harbor Investment Funds Annual Report | May 31, 2012 | 73 |
Table of Contents
Stone Harbor Investment Funds | Notes to Financial Statements | |
| May 31, 2012 |
The following Funds elect to defer to the period ending May 31, 2013 the following losses recognized during the period November 1, 2011 through May 31, 2012:
| Capital | ||||||
Stone Harbor High Yield Bond Fund | $ | 3,386,948 | ||||
Stone Harbor Emerging Markets Corporate Debt Fund | 184,056 | |||||
The following Fund elects to defer to the period ending May 31, 2013, late year ordinary losses in the amount of:
| Fund | ||||||
Stone Harbor Local Markets Fund | $ | 10,822,361 | ||||
4. SHARES OF BENEFICIAL INTEREST
At May 31, 2012, the Trust had an unlimited number of shares of beneficial interest authorized with a par value of $0.001 per share. The Funds have the ability to issue multiple classes of shares. Each share of a class represents an identical interest and has the same rights, except that each class bears certain direct expenses, including those specifically related to the distribution of its shares. Transactions in shares of the Institutional Class can be found on the Statements of Changes in Net Assets.
5. APPLICATION OF RECENT ACCOUNTING PRONOUNCEMENTS
In May 2011, the FASB issued ASU No. 2011-04 “Amendments to Achieve Common Fair Value Measurement and Disclosure Requirements” in GAAP and the International Financial Reporting Standards (“IFRSs”). ASU No. 2011-04 amends FASB ASC Topic 820, “Fair Value Measurements and Disclosures”, to establish common requirements for measuring fair value and for disclosing information about fair value measurements in accordance with GAAP and IFRSs. ASU No. 2011-04 is effective for fiscal years beginning after December 15, 2011 and for interim periods within those fiscal years. Management is currently evaluating the impact these amendments may have on the Funds financial statements.
In December 2011, the FASB issued ASU No. 2011-11 “Disclosures about Offsetting Assets and Liabilities” to expand current disclosure requirements on the offsetting of certain assets and liabilities. The new disclosures will be required for investments and derivative financial instruments subject to master netting or similar agreements which are eligible for offset in the Statements of Assets and Liabilities and will require an entity to disclose both gross and net information about such investments and transactions in the financial statements. The guidance is effective for financial statements with fiscal years beginning on or after January 1, 2013, and interim periods within those fiscal years. Management is evaluating the impact of this guidance on the Funds’ financial statement disclosures.
6. OTHER
Board of Trustees Compensation: No officer, trustee or employee of the Adviser or any of its affiliates receives any compensation from the Funds for serving as an officer or trustee of the Funds. For the fiscal year ended May 31, 2012 the Trust paid each Trustee who is not an interested person, as defined by the 1940 Act, of the Adviser or any of its affiliates a fee of $39,000. Going forward, the Trust will pay each Trustee who is not an interested person an annual fee of $54,000. All Trustees are reimbursed for reasonable travel and out-of-pocket expenses incurred to attend such meetings.
74 | www.shiplp.com |
Table of Contents
Stone Harbor Investment Funds | Additional Information | |
| May 31, 2012 (Unaudited) |
FUND PORTFOLIO HOLDINGS
The SEC has adopted the requirement that all registered investment companies file a complete schedule of portfolio holdings with the SEC for their first and third fiscal quarters on Form N-Q. For the Funds, this would be for the fiscal quarters ending August 31 and February 28. The Form N-Q filing must be made within 60 days of the end of the quarter. The Funds’ Forms N-Q will be available on the SEC’s website at http://www.sec.gov., or they may be reviewed and copied at the SEC’s Public Reference Room in Washington, DC (call 1-800-732-0330 for information on the operation of the Public Reference Room).
PROXY VOTING
A description of the policies and procedures that the Funds use to determine how to vote proxies relating to portfolio securities and information regarding how the Funds voted proxies relating to portfolio securities for the period ending June 30, 2010 will be available without a charge, upon request, by contacting Stone Harbor Investment Funds at 1-866-699-8158 or on the SEC website at http://www.sec.gov.
SHAREHOLDER TAX INFORMATION
Certain tax information regarding the Trust is required to be provided to shareholders based upon each Fund’s income and distributions for the year ended May 31, 2012. The Funds designate the following as a percentage of taxable ordinary income distributions, up to the maximum amount allowable, for the calendar year ended December 31, 2011:
Stone Harbor Emerging Markets Debt Fund | Stone Harbor High Yield Bond Fund | Stone Harbor Local Markets Fund | Stone Harbor Emerging Markets Corporate Debt Fund | |||||
Dividends Received Deduction Percentage | 0.00% | 0.16% | 0.00% | 0.00% | ||||
Qualified Dividend Income Percentage | 0.00% | 0.21% | 0.00% | 0.00% |
In early 2012, if applicable, shareholders of record received this information for the distributions paid to them by the Funds during the calendar year 2011 via Form 1099. The Funds will notify shareholders in early 2013 of amounts paid to them by the Funds, if any, during the calendar year 2012.
Pursuant to Section 852(b)(3) of the Internal Revenue Code, the Stone Harbor Emerging Markets Debt Fund, the Stone Harbor High Yield Bond Fund, and the Stone Harbor Local Markets Fund designate $1,804,387, $12,255,940, and $1,784,323, respectively, as long term capital gain dividends.
Stone Harbor Investment Funds Annual Report | May 31, 2012 | 75 |
Table of Contents
Stone Harbor Investment Funds | Investment Advisory Agreements | |
| May 31, 2012 (Unaudited) |
The investment advisory agreements (each an “Agreement” and, together, the “Agreements”) for each of Stone Harbor Emerging Markets Debt Fund, Stone Harbor High Yield Bond Fund, Stone Harbor Local Markets Fund and Stone Harbor Emerging Markets Corporate Debt Fund (each, a “Fund” and together, the “Funds”) is subject to annual approval by (i) the vote of a majority of the entire Board of Trustees, or of a majority of the outstanding voting securities (as defined in the Investment Company Act of 1940, as amended (the “1940 Act”)), of the applicable Fund, and (ii) the vote of a majority of the Trustees who are not interested persons of the Funds (the “Independent Trustees”). Each Agreement is terminable with respect to a Fund by the Adviser, a majority of the Trustees, or a vote of a majority of the outstanding voting securities of the applicable Fund, without penalty, by not less than 60 days’ prior written notice. Each Agreement will terminate automatically in the event of its assignment (as defined for purposes of the 1940 Act).
The Board of Trustees, including the Independent Trustees, meets over the course of the year with representatives of Stone Harbor Investment Partners LP, each Fund’s investment adviser (the “Adviser”), including the Funds’ respective portfolio managers, and regularly reviews detailed information regarding the investment program and performance of each Fund. The Board of Trustees also receives periodic updates between meetings. The Trustees, including the Independent Trustees, met on April 18, 2012 to review the Agreements for each Fund and to determine whether to approve the continuation of the Agreements for an additional one-year period. The Trustees considered all information they deemed reasonably necessary to evaluate the terms thereof. In connection with this meeting, the Trustees received materials to assist them with their review. These materials included, among other things, (i) information on each Fund’s investment performance and the performance of a group of similar mutual funds (some of which was prepared by a third party); (ii) information on each Fund’s advisory fees and other expenses, including information comparing each Fund’s expenses to the fees charged to institutional accounts managed by the Adviser and to a group of similar funds prepared by a third party and information about any applicable expense caps; and (iii) information about the profitability of each Agreement to the Adviser. In considering whether to approve the continuation of each Agreement, the Board of Trustees, including the Independent Trustees, did not identify any single factor as determinative. Individual Trustees may have evaluated the information presented differently from one another, giving different weights to various factors. Matters considered by the Trustees, including the Independent Trustees, in connection with their approval of the Agreements included, but were not limited to, the following:
The nature, extent and quality of the services provided to the Funds under the Agreements.
The Trustees considered the nature, extent and quality of the services provided by the Adviser to the Funds. In this regard, the Trustees took into account the experience of each Fund’s portfolio management team and of the Adviser’s senior management, and the time and attention they devote to the Funds.
After reviewing these and related factors, the Trustees concluded, within the context of their overall conclusions regarding each Agreement, that the nature, extent and quality of the services provided by the Adviser supported the renewal of the Agreements.
Investment performance of the Funds and the Adviser.
The Trustees reviewed performance information for each Fund for various time periods. The Trustees also reviewed more recent performance information provided at the meeting. The review included a comparison of each Fund’s performance to the performance of a group of comparable funds selected by a third party (except with respect to the Emerging Markets Corporate Debt Fund, which as of the date of the meeting had not been operational for a full year) and each Fund’s respective benchmark. The Trustees also considered the Adviser’s performance and reputation generally and its investment techniques, risk management controls and decision-making processes.
After reviewing these and related factors, the Trustees concluded, within the context of their overall conclusions regarding each Agreement, that these factors supported the renewal of the Agreements.
The costs of the services to be provided and profits to be realized by the Adviser from its relationship with the Funds.
The Trustees considered the fees charged to each Fund for advisory services as well as the total expense level of each Fund. The Adviser furnished information to the Trustees compiled by a third party showing a comparison of each Fund’s advisory fees and total expense levels compared to a group of similar mutual funds selected by the third party. The Trustees considered that several of the Funds, because they were smaller than most of the funds to which they were being compared, could not take advantage of economies of scale (which can reduce fund expenses) to the same extent as those larger funds. The Trustees also noted that each Fund is subject to expense caps. The Adviser also provided information about the costs to it of providing services to the Funds and information about its profitability with respect to its management of the Funds, as well as information about the advisory fees it charges to institutional separate accounts with similar strategies and information about differences in such fees. In this regard, the Trustees noted that the effective management fee rates charged by the Adviser to the Funds (after application of expense caps and waivers) are generally comparable to the fees charged to similarly managed institutional accounts. The Trustees also considered the demands and complexity of the investment management of the Funds as compared to the complexity of managing separate accounts.
After reviewing these and related factors, the Trustees concluded, within the context of their overall conclusions regarding each Agreement, that the advisory fees for each of the Funds were fair and reasonable, and that the costs of these services generally and
76 | www.shiplp.com |
Table of Contents
Stone Harbor Investment Funds | Board Approval of Investment Advisory Agreements | |
| May 31, 2012 (Unaudited) |
the related profitability of the Adviser in respect of its relationship with the Funds supported the renewal of the Agreements.
Economies of Scale.
The Trustees considered to what extent economies of scale would likely be realized as the Funds grow and whether those economies would be shared with the Funds through breakpoints in their investment advisory fees or other means, such as expense caps. The Trustees noted that several of the Funds are relatively new and small in size, and in the near term were not expected to generate any significant economies of scale, and that all the Funds were subject to expense caps. The Trustees also noted that the Adviser proposed to maintain the Funds’ fee waiver/expense reimbursement arrangements at current levels until September 30, 2013.
After reviewing these and related factors, the Trustees concluded, within the context of their overall conclusions regarding each Agreement, that the extent to which economies of scale would be shared with the Funds supported the approval of the Agreements.
The Trustees also considered other factors, which included but were not limited to the following:
| • | Whether each Fund has operated in accordance with its investment objective and each Fund’s record of compliance with its investment restrictions, and the compliance programs of the Funds and the Adviser. They also considered the compliance-related resources the Adviser provided to the Funds, including resources designed to ensure compliance with the investment objectives, policies and restrictions of each Fund. |
| • | So-called “fallout benefits” to the Adviser, such as the benefits from offering its institutional clients the ability to invest in a registered investment company. |
Based on their evaluation of all factors they deemed to be material, including those factors described above, the Trustees, including the Independent Trustees, concluded that the existing investment advisory agreements for Stone Harbor Emerging Markets Debt Fund, Stone Harbor High Yield Bond Fund, Stone Harbor Local Markets Fund and Stone Harbor Emerging Markets Corporate Debt Fund should be continued through June 20, 2013.
Stone Harbor Investment Funds Annual Report | May 31, 2012 | 77 |
Table of Contents
Stone Harbor Investment Funds | Trustees & Officers | |
| May 31, 2012 (Unaudited) |
The business and affairs of each Fund are managed under the direction of its Board of Trustees. The Board of Trustees approves all significant agreements between a Fund and the persons or companies that furnish services to the Fund, including agreements with its distributor, investment adviser, administrator, custodian and transfer agent. The day-to-day operations of the Fund are delegated to the Fund’s Adviser and administrator.
The name, age and principal occupations for the past five years of the Trustees and officers of the Funds are listed below, along with the number of portfolios in the Fund complex overseen by and the other directorships held by each Trustee. Except as otherwise noted, the address of each Trustee and officer is c/o Stone Harbor Investment Partners LP, 31 W. 52nd Street, 16th Floor, New York, New York 10019. The Trust’s Statement of Additional Information includes additional information about the Trustees and is available without a charge, upon request, by calling 1-866-699-8158.
INDEPENDENT TRUSTEES
| Name & Age | Position with the Trust | Term of Office and Length of Time Served(1) | Principal Past Five Years | Number of Portfolios in Fund Complex Overseen by Trustee(2) | Other Directorships Held by Trustee | Experience, Qualifications, Attributes, Skills for Board Membership | ||||||
Alan Brott Age: 69 | Chairman of Audit Committee; Trustee | Since June 21, 2007 | Columbia University Graduate School of Business—Associate Professor, 2000-Present; Consultant, 1991-Present. | 5 | Stone Harbor Emerging Markets Income Fund, Grosvenor Registered Multi-Strategy Fund, Excelsior Multi-Strategy Hedge Fund of Funds and Excelsior Private Markets Fund II. | Significant experience on Board of Trustees of the Fund and/or other business organizations; academic experience; significant public accounting experience, including significant experience as a partner at a public accounting firm. | ||||||
Heath B. McLendon Age: 79 | Trustee | Since June 21, 2007 | Citigroup— Chairman of Equity Research Oversight Committee (retired December 31, 2006). | 5 | Stone Harbor Emerging Markets Income Fund. | Significant experience on Board of Trustees of the Fund and/or other business organizations; executive experience in the mutual fund industry. | ||||||
Patrick Sheehan Age: 64 | Trustee | Since June 21, 2007 | Retired; formerly, Citigroup Asset Management— Managing Director and Fixed Income Portfolio Manager, 1991-2002. | 5 | Stone Harbor Emerging Markets Income Fund. | Significant experience on Board of Trustees of the Fund and/or other business organizations; experience in the financial industry, including executive and portfolio management experience. |
78 | www.shiplp.com |
Table of Contents
Stone Harbor Investment Funds | Trustees & Officers | |
| May 31, 2012 (Unaudited) |
| INTERESTED TRUSTEE | ||||||||||||
| Name & Age | Position with the Trust | Term of Office and Length of Time Served(1) | Principal Occupation(s) During Past Five Years |
Number of Portfolios | Other Directorships Held by Trustee | Experience, Qualifications, Attributes, Skills for Board Membership | ||||||
| Thomas W. Brock* Age: 65 | Chairman; Trustee | Since June 21, 2007 | Stone Harbor Investment Partners LP— Chief Executive Officer, 2006- Present; Columbia University Graduate School of Business— Adjunct Professor, 1998-2006. | 5 | Stone Harbor Emerging Markets Income Fund; Liberty All Star Funds— two closed-end funds. | Significant experience on Board of Trustees of the Fund and/or other business organizations; continuing experience as Chief Executive Officer of Stone Harbor Investment Partners LP; other financial and academic experience. | ||||||
| (1) | Trustees serve for an indefinite term, unless a trustee early retires, resigns or is removed from office. |
| (2) | For purposes of this table, the Stone Harbor Fund Complex includes each series of the Stone Harbor Investment Funds (the “Funds”) and the Stone Harbor Emerging Markets Income Fund, which shares an investment adviser with the Funds. |
| * | Mr. Brock is an interested Trustee because of his position with Stone Harbor. |
Stone Harbor Investment Funds Annual Report | May 31, 2012 | 79 |
Table of Contents
Stone Harbor Investment Funds | Trustees & Officers | |
| May 31, 2012 (Unaudited) |
OFFICERS
| Name & Age | Position with the Trust | Term of Office and Length of Time Served(1) | Principal Occupation(s) During Past FiveYears | Other Directorships by Trustee | ||||
Peter J. Wilby Age: 53 | President | Since June 21, 2007 | Co-portfolio manager of the Funds; since April 3, 2006, Chief Investment Officer of Stone Harbor Investment Partners LP; prior to April 3, 2006, Chief Investment Officer – North American Fixed Income; joined Citigroup or its predecessor firms in 1989. | N/A | ||||
Dan Berkery Age: 44 | Executive Vice President | Since September 27, 2010 | Co-portfolio manager of High Yield Bond Fund; Since June 2010, Portfolio Manager of Stone Harbor; Prior to June 2010, Executive Director, Portfolio Manager for convertible bond securities at UBS O’Conner; Joined UBS O’Conner in 2000. | N/A | ||||
Pablo Cisilino Age: 44 | Executive Vice President | Since June 21, 2007 | Co-portfolio manager of Emerging Markets Debt Fund, Local Markets Fund, and Emerging Markets Corporate Debt Fund; since July 1, 2006, Senior Portfolio Manager of Stone Harbor Investment Partners LP; from June 1, 2004 to July 1, 2006, Executive Director for Sales and Trading in Emerging Markets at Morgan Stanley Inc; prior to June 1, 2004, Vice President for local markets and FX sales and trading, Goldman Sachs; joined Goldman Sachs in 1994. | N/A | ||||
James E. Craige Age: 44 | Executive Vice President | Since June 21, 2007 | Co-portfolio manager of Emerging Markets Debt Fund, Local Markets Fund, and Emerging Markets Corporate Debt Fund; since April 3, 2006, Senior Portfolio Manager of Stone Harbor Investment Partners LP; prior to April 3, 2006, Managing Director and Senior Portfolio Manager at Salomon Brothers Asset Management Inc.; joined Salomon Brothers Asset Management Inc. in 1992. | N/A | ||||
Thomas K. Flanagan Age: 59 | Executive Vice President | Since June 21, 2007 | Co-portfolio manager of Emerging Markets Debt Fund, Local Markets Fund, and Emerging Markets Corporate Debt Fund; since April 3, 2006, Senior Portfolio Manager of Stone Harbor Investment Partners LP; prior to April 3, 2006, Managing Director and Senior Portfolio Manager at Salomon Brothers Asset Management Inc.; joined Salomon Brothers Asset Management Inc. in 1991. | N/A | ||||
David Oliver Age: 52 | Executive Vice President | Since September 29, 2008 | Co-portfolio manager of Emerging Markets Debt Fund, Local Markets Fund, and Emerging Markets Corporate Debt Fund; since June 1, 2008, Senior Portfolio Manager of Stone Harbor, from 1986 to June 1, 2008, Managing Director in Emerging Market sales and trading Citigroup. | N/A | ||||
Marianne Rossi Age: 51 | Executive Vice President | Since September 27, 2010 | Co-portfolio manager of High Yield Bond Fund; Since June 2010, Portfolio Manager of Stone Harbor; From October 2007 to June 2010, Senior Portfolio Manager for US and global high yield strategies at Fischer Francis Tree & Watts/BNP Paribas Asset Management; From December 2006 to October 2007, Chief Investment Officer, Head of Global High Yield and Senior Portfolio Manager at BNY Asset Management; Prior to December 2006; Head Global High Yield and Senior Portfolio Manager at UBS Global Asset Management; Joined UBS Global Asset Management in 2000. | N/A |
80 | www.shiplp.com |
Table of Contents
Stone Harbor Investment Funds | Trustees & Officers | |
| May 31, 2012 (Unaudited) |
OFFICERS (continued)
| Name & Age | Position with the Trust | Term of Office and Length of Time Served(1) | Principal Occupation(s) During Past Five Years | Other Directorships by Trustee | ||||
Christopher M. Wilder Age: 40 | Executive Vice President | Since September 27, 2010 | Co-portfolio manager of Emerging Markets Debt Fund, Local Markets Fund, and Emerging Markets Corporate Debt Fund; Since June 2010, Portfolio Manager of Stone Harbor; From May 2008 to May 2010, Manager of an emerging market corporate debt and private equity fund at Autonomy Capital Group; Prior to May 2008, Head of the Emerging Markets Corporate Credit Trading and Special Situations Group at Deutsche Bank; Joined Deutsche Bank in 1997. | N/A | ||||
Jeffrey S. Scott Age: 52 | Chief Compliance Officer | Since June 21, 2007 | Since April 3, 2006, Chief Compliance Officer of Stone Harbor Investment Partners LP; from October 2006 to March 2007, Director of Compliance, New York Life Investment Management LLC; from July 1998 to September 2006, Chief Compliance Officer, Salomon Brothers Asset Management Inc. | N/A | ||||
James J. Dooley Age: 56 | Treasurer | Since June 21, 2007 | Since April 3, 2006, Head of Operations, Technology and Finance of Stone Harbor Investment Partners LP; from August 2004 to March 2006, Senior Operations Manager of Institutional Asset Management, Citigroup Asset Management; from October 2002 to August 2004, Managing Director, Global Operations & Application Development, AIG Global Investment Group; from May 2001 to September 2002, President and Chief Operating Officer, Financial Technologies International. | N/A | ||||
Adam J. Shapiro Age: 48 | Secretary; Anti-Money Laundering Officer | Since June 21, 2007 | Since April 3, 2006, General Counsel of Stone Harbor Investment Partners LP; from April 2004 to March 2006, General Counsel, North American Fixed Income, Salomon Brothers Asset Management Inc.; from August 1999 to March 2004, Director of Product and Business Development, Citigroup Asset Management. | N/A | ||||
Patrick D. Buchanan Age: 40 | Assistant Treasurer | Since April 23, 2008 | Since October 15, 2007, Senior Fund Controller for ALPS Fund Services, Inc.; from February 2005 to October 2007, Director of Accounting for Madison Capital Management LLC; from August 2003 to February, 2005, Manager of Fund Accounting for Janus Capital Group | N/A |
| (1) | Officers are typically elected every year, unless an officer early retires, resigns or is removed from office. |
Stone Harbor Investment Funds Annual Report | May 31, 2012 | 81 |
Table of Contents

INVESTMENT ADVISER
Stone Harbor Investment Partners LP
31 W. 52nd Street 16th Floor
New York, New York 10019
ADMINISTRATOR & FUND ACCOUNTANT
ALPS Fund Services, Inc.
1290 Broadway, Suite 1100
Denver, Colorado 80203
DISTRIBUTOR
ALPS Distributors, Inc.
1290 Broadway, Suite 1100
Denver, Colorado 80203
TRANSFER AGENT
ALPS Fund Services, Inc.
1290 Broadway, Suite 1100
Denver, Colorado 80203
CUSTODIAN
The Bank of New York Mellon
One Wall Street
New York, New York 10286
LEGAL COUNSEL
Ropes & Gray LLP
1211 Avenue of the Americas
New York, New York 10036
INDEPENDENT REGISTERED PUBLIC ACCOUNTING FIRM
Deloitte & Touche LLP
555 17th Street, Suite 3600
Denver, Colorado 80202
This report and its financial statements are submitted for the general information of the
shareholders of the Funds. The report is not authorized for distribution to prospective
investors in the Funds unless preceded or accompanied by a prospectus.
SHF000602 exp. 12/31/12
Table of Contents
| Item 2. | Code of Ethics. |
| (a) | The Registrant, as of the end of the period covered by this report, has adopted a code of ethics that applies to the Registrant’s principal executive officer, principal financial officer, principal accounting officer or controller or any persons performing similar functions on behalf of the Registrant. |
| (b) | Not applicable. |
| (c) | During the period covered by this report, no amendments to the provisions of the code of ethics adopted in Item 2(a) above were made. |
| (d) | During the period covered by this report, no implicit or explicit waivers to the provisions of the code of ethics adopted in Item 2(a) above were granted. |
| (e) | Not applicable. |
| (f) | The Registrant’s Code of Ethics is attached as an Exhibit hereto. |
| Item 3. | Audit Committee Financial Expert. |
The Board of Trustees of the Registrant has determined that the Registrant has at least one audit committee financial expert serving on its Audit Committee. The Board of Trustees has designated Alan J. Brott as the Registrant’s “Audit Committee Financial Expert.” Mr. Brott is “independent” as defined in paragraph (a)(2) of Item 3 to Form N-CSR.
| Item 4. | Principal Accountant Fees and Services. |
| (a) | Audit Fees: For the Registrant’s fiscal years ended May 31, 2011 and May 31, 2012, the aggregate fees billed for professional services rendered by the principal accountant for the audit of the Registrant’s annual financial statements were $ 187,500 and $222,500, respectively. |
| (b) | Audit-Related Fees: For the Registrant’s fiscal years ended May 31, 2011 and May 31, 2012, there were no fees billed for assurance and related services by the principal accountant that were reasonably related to the performance of the audit of the Registrant’s financial statements and were not reported in paragraph (a) of this Item 4. |
Table of Contents
| (c) | Tax Fees: For the Registrant’s fiscal years ended May 31, 2011 and May 31, 2012, the aggregate fees billed for professional services rendered by the principal accountant for tax compliance, tax advice and tax planning were $13,515 and $18,540, respectively. The fiscal year 2011 and 2012 tax fees were for services pertaining to federal and state income tax return review, review of year-end dividend distributions and excise tax preparation. |
| (d) | All Other Fees: For the Registrant’s fiscal years ended May 31, 2011 and May 31, 2012, aggregate fees billed to the Registrant by the principal accountant for services provided by the principal accountant other than the services reported in paragraphs (a) through (c) of this Item 4 were $0 and $0, respectively. |
| (e)(1) | Audit Committee Pre-Approval Policies and Procedures: All services to be performed by the Registrant’s principal accountant must be pre-approved by the Registrant’s Audit Committee. |
| (e)(2) | No services described in paragraphs (b) through (d) of this Item 4 were approved by the Registrant’s audit committee pursuant to paragraph (c)(7)(i)(C) of Rule 2-01 of Regulation S-X. |
| (f) | Not applicable. |
| (g) | Not applicable. |
| (h) | Not applicable. |
| Item 5. | Audit Committee of Listed Registrants. |
Not applicable.
| Item 6. | Investments. |
| (a) | Schedule of Investments is included as part of the Report to Stockholders filed under Item 1 of this Form N-CSR. |
| (b) | Not applicable. |
| Item 7. | Disclosure of Proxy Voting Policies and Procedures for Closed-End Management Investment Companies. |
Not applicable.
| Item 8. | Portfolio Managers of Closed-End Management Investment Companies. |
Not applicable.
Table of Contents
| Item 9. | Purchases of Equity Securities by Closed-End Management Investment Company and Affiliated Purchasers. |
Not applicable to Registrant.
| Item 10. | Submission of Matters to Vote of Security Holders. |
There have been no material changes to the procedures by which shareholders may recommend nominees to the Registrant’s Board of Trustees, where those changes were implemented after the Registrant last provided disclosure in response to the requirements of Item 407(c)(2) of Regulation S-K, or this Item.
| Item 11. | Controls and Procedures. |
| (a) | The Registrant’s principal executive officer and principal financial officer have concluded that the Registrant’s disclosure controls and procedures (as defined in Rule 30a-3(c) under the Investment Company Act of 1940, as amended) are effective based on their evaluation of these controls and procedures as of a date within 90 days of the filing date of this report. |
| (b) | There was no change in the Registrant’s internal control over financial reporting (as defined in Rule 30a-3(d) under the Investment Company Act of 1940, as amended) during the second fiscal quarter of the period covered by this report that has materially affected, or is reasonably likely to materially affect, the Registrant’s internal control over financial reporting. |
| Item 12. | Exhibits. |
(a)(1) | Registrant’s Code of Ethics for Senior Financial Officers, which is the subject of the disclosure required by Item 2 of Form N-CSR, was filed as Exhibit 12(a)(1) to the Registrant’s Certified Shareholder Report on Form N-CSR, File No. 811-22037, on August 7, 2009. | |||
(a)(2) | The certifications required by Rule 30a-2(a) of the Investment Company Act of 1940, as amended, and Section 302 of the Sarbanes-Oxley Act of 2002 are attached hereto as Exhibit 99.Cert. | |||
(a)(3) | Not applicable. | |||
(b) | The certifications by the Registrant’s principal executive officer and principal financial officer, as required by Rule 30a-2(b) of the Investment Company Act of 1940, as amended, and Section 906 of the Sarbanes-Oxley Act of 2002 are attached hereto as Exhibit 99.906Cert. | |||
Table of Contents
SIGNATURES
Pursuant to the requirements of the Securities Exchange Act of 1934 and the Investment Company Act of 1940, the Registrant has duly caused this report to be signed on its behalf by the undersigned, thereunto duly authorized.
Stone Harbor Investment Funds | ||
By: | /s/ Peter J. Wilby | |
Peter J. Wilby | ||
President/Principal Executive Officer | ||
Date: | August 8, 2012 | |
Pursuant to the requirements of the Securities Exchange Act of 1934 and the Investment Company Act of 1940, this report has been signed below by the following persons on behalf of the Registrant and in the capacities and on the dates indicated.
By: | /s/ Peter J. Wilby | |
Peter J. Wilby | ||
President/Principal Executive Officer | ||
Date: | August 8, 2012 | |
By: | /s/ James J. Dooley | |
James J. Dooley | ||
Treasurer, Chief Financial Officer/ Principal Financial Officer | ||
Date: | August 8, 2012 | |