Table of Contents
UNITED STATES
SECURITIES AND EXCHANGE COMMISSION
Washington, D.C. 20549
FORM N-CSR
CERTIFIED SHAREHOLDER REPORT OF REGISTERED
MANAGEMENT INVESTMENT COMPANIES
Investment Company Act file number: 811-22037
Stone Harbor Investment Funds
(Exact name of registrant as specified in charter)
1290 Broadway, Suite 1100
Denver, CO 80203
(Address of principal executive offices) (Zip code)
Adam J. Shapiro, Esq.
c/o Stone Harbor Investment Partners LP
31 West 52nd Street, 16th Floor
New York, NY 10019
(Name and address of agent for service)
With copies To:
John M. Loder, Esq.
Ropes & Gray LLP
One International Place
Boston, MA 02110-2624
Registrant’s telephone number, including area code: (303) 623-2577
Date of fiscal year end: May 31
Date of reporting period: June 1, 2010 - May 31, 2011
Table of Contents
Item 1. Report to Stockholders.
Table of Contents
Table of Contents
Table of Contents
| Stone Harbor Investment Funds | Shareholder Letter | |
| May 31, 2011 |
Dear Shareholder,
The year ended May 2011 has been another excellent period for credit-focused, fixed income investors. While returns were not as dramatic as in the previous year, where the market recovery helped the Stone Harbor Funds to achieve gains in excess of 20% (see pages 7-9 for complete performance information), all three of our institutional funds achieved impressive mid-teens returns for the period. We continue to believe that against the backdrop of a below-trend economic recovery in developed economies, and their associated accommodative monetary policies, the outlook for credit-based strategies remains very favorable for the near- to intermediate-term. Once again, we thank you for your support and commitment to Stone Harbor Investment Partners.
Market Overview
From a global economic point of view, the last twelve months have been strikingly similar to the previous twelve months, albeit one year deeper into a very sub-par developed market economic recovery, following the sharp 2008 recession. On the positive side of the global economic landscape, strong growth in China and most of the major emerging market economies has been led by inter-regional trade and the development of an emerging middle class consumer market. This shift is propelling global commodity-producing developed economies like Canada and Australia, as well as commodity exporting emerging market economies. Also of positive note has been the surprisingly strong growth of the core of Northern Continental Europe (i.e., Germany, France, and the Nordic region), driven very much by high value added exports to emerging economies. It is quite the opposite case for the European Union as a whole, which has been dragged down by struggling peripheral economies, mostly along the Mediterranean.
On the mixed to negative side, the economic performance of the US could best be described as a “fits and starts” economy. While exports and investment have been healthy, overall growth has been offset by the run-off of government stimulus programs. More importantly, the persistent oversupply in the housing market, coupled with the slow pace of job creation have severely impacted consumer spending. The US, as well as all world economies, has also been encumbered by a series of external shocks over the last year. The tragic earthquake and follow-on events in Japan have not only severely damaged that economy, but have also had knock-on effects through the global industrial supply chain, acutely hampering global auto production, as an example. The political instability in North Africa and the Middle East region has sharply increased energy prices worldwide, putting a drag on global consumer growth, and undermining confidence amidst political uncertainties. Finally, the continuing saga of the still unresolved European sovereign debt crisis heightens volatility and reinforces focus on the perilous state of developed market government finances.
Financial markets have been dominated by instability surrounding the above-mentioned external shocks, as well as by ongoing extraordinarily accommodative interest rate policies of major
developed market central banks. This dynamic has been most highlighted by the US Federal Reserve’s so-called quantitative easing policy of buying mortgage securities, the second round of which is expiring in June of 2011. These policies have been aimed at maintaining low mortgage rates in the US, and perhaps driving liquidity into other financial assets to boost confidence and spur consumer spending. This contrasts with tightening monetary conditions in many emerging markets economies, where many central banks are raising interest rates in an attempt to prevent inflation from accelerating in their rapidly growing economies.
Although certainly affected by some of the global volatility, the high yield corporate bond market, which is dominated by US corporations, continued its strong recovery from the 2008 downturn. The total return of the Fund’s benchmark, the Citigroup High Yield Market Capped Index, was 17.32% for the twelve months ended May 31, 2011. Yields on the broad market fell from 9.23% at the beginning of the period to 7.39% at the end of the reporting period, with risk premiums, or credit spreads, declining from 708 basis points above comparable US Treasury bonds to 524 basis points above at May 31, 2011. The largest gaining sectors in this market were the global cyclical industries, energy producers and the still recovering financial sectors.
Emerging markets fixed income also experienced strong performance for the twelve month period. Driven by rallies in base interest rates, as well as continued improvements in underlying emerging market sovereign credit quality, a direct contrast from most developed market governments, the JP Morgan Emerging Markets Bond Index Global Diversified, the benchmark index for the US dollar-denominated Stone Harbor Emerging Markets Debt Fund, returned 12.52% for the twelve months ended May 31, 2011, as market yields fell from 6.57% at the beginning of the period to 5.86% at May 31, 2011. Risk premiums, or spreads over comparable US Treasury bonds, fell from 338 basis points to 290 basis points. In the Stone Harbor Local Markets Fund, which invests in non-US dollar-based emerging market bond and currency markets, the benchmark for the fund returned 20.18% for the twelve month period.
Looking ahead, the world economy continues on a slow-to-moderate expansion, but facing considerable headwinds. We believe growth should remain strong in most emerging markets, driven by the aforementioned factors, while inflationary pressures in many of those regions will start to moderate, giving central banks more breathing room. The developed markets will again remain mixed in terms of economic strength, with natural demand growth facing the headwinds of fiscal reforms in the public sector in most major markets. Deficit reduction and fiscal balance are timely issues in many developed markets, crimping aggregate demand. In many cases, such as in Greece, the adjustments needed in the face of the mounting related-debt issues cause extreme hardship and also extreme market volatility. Current fixes in Greece are at best temporary, and uncertainty surrounding Greece’s solvency and that of other peripheral European nations will continue to be a concern. In the US, the benefit of the dollar’s position as the world’s reserve currency has helped temper market reaction to the federal budget
Stone Harbor Investment Funds Annual Report | May 31, 2011 | 1 |
Table of Contents
| Stone Harbor Investment Funds | Shareholder Letter | |
| May 31, 2011 |
situation, but unless the situation is dealt with, the US potentially faces similar issues.
At Stone Harbor, we will continue to focus on capturing excess return from stable to improving credit situations in corporate and sovereign markets worldwide, while being alert to crises as well as economic softness. We believe credit quality runs in cycles, and corporations globally, as well as governments in emerging markets, are on the expansionary part of these cycles. We remain vigilant to potential changes in that outlook and somewhat cautious that developed market debt stresses will continue to pose major risks for all.
Performance Review
Stone Harbor Emerging Markets Debt Fund
The Stone Harbor Emerging Markets Debt Fund return for the twelve months ended May 31, 2011 was 16.30% (net of expenses) and 17.05% (gross of expenses). This compares to a benchmark return of 12.52% for the JP Morgan Emerging Market Bond Index Global Diversified. During this period, emerging market sovereign credit spreads in most countries within the benchmark tightened. Commodity prices rose, led first by food prices, then later by energy, a move that was exacerbated by the Jasmine Revolution in Tunisia and subsequent uprisings in the Middle East. Risk assets, in general, performed well. The US dollar, however, continued on a sustained weakening trend, as a combination of low interest rates and worries about rising fiscal uncertainty drove global investors to diversify away from the greenback.
Throughout this period, the portfolio was positioned to favor select high beta credits that had strong valuation support, including Argentina and Venezuela. Argentina’s country benchmark total return for the twelve-month period was 39.69%; Venezuela’s performance was 27.10%. Both countries benefited from strong demand for high yielding assets, as well as idiosyncratic developments. As a major oil exporter, Venezuela benefits from higher crude prices; the country’s improved debt repayment capacity, in our view, was reflected in higher bond prices. Argentina’s strong growth performance amidst a period of relative political calm aided bond market stability, and led to tightening of credit spreads.
The portfolio was also positioned for an improving environment for corporate prosperity in many key emerging markets. Tactical allocations to select corporate bonds increased throughout the period in recognition of attractive corporate debt valuations, and given our opportunistic view on the potential for spread compression in many corporate credits. Corporate investments in the portfolio focused on commodity producers in sub-investment grade countries, on companies focused on domestic consumption in higher growth economies and on other companies, which are deleveraging either organically or via Merger & Acquisition activity.
Excess returns of 466 basis points for the period (gross basis) resulted from country/corporate selection decisions and issue selection decisions in roughly equal proportions. Country selection
decisions, including allocations to sovereign and corporate debt, enhanced performance by 215 basis points. Issue selection decisions boosted returns by 206 basis points.
Key contributors to outperformance in country selection included overweight positions in Venezuela and Iraq, and underweight positions in Lebanon. Allocations to debt of companies domiciled in Argentina, Brazil, China, Egypt, India, Indonesia, Mexico, Russia Singapore, South Africa, Ukraine and United Arab Emirates also drove outperformance. In issue selection, the key contributors to excess returns included allocations to foreign exchange markets in Brazil, Colombia, Indonesia, Malaysia, Mexico, Russia and South Africa. In addition, allocations to long duration debt in Argentina enhanced returns.
Stone Harbor High Yield Bond Fund
The Stone Harbor High Yield Bond Fund return for the twelve months ended May 31, 2011 was 17.14% (net of expenses) and 17.69% (gross of expenses). This compares to a benchmark return of 17.32% for the Citigroup High Yield Market Capped Index. Despite a rocky start, the high yield market resumed an upward trajectory and delivered strong gains, dipping below breakeven in only two of the trailing twelve months, as doubts lingered regarding the sustainability of a synchronized global recovery. Firmly anchored by strong corporate earnings, declining default risk and a robust new issue market, high yield bonds showed resilience in the face of large swings in equities.
Exogenous shocks remained key drivers of market volatility throughout the reporting period. The threat of a European debt crisis subsided and resurfaced intermittently, adding to the uneven progression of the global economic recovery. A catalyst to a modest market correction in November, sovereign debt concerns yielded to political instability in the Middle East and North Africa, which gained traction in the first few months of the year. More importantly, contagion to bordering countries, including Libya, nursed fears of potential production disruptions and realized speculation of surging oil prices. A headline-driven sell-off in global equity prices was compounded by news of a devastating earthquake and subsequent tsunami in Japan, as well as the ensuing threat of a nuclear crisis. Investors immediately took a more cautious view towards global growth estimates, as the outlook for long-term US debt was downgraded from “stable” to “negative” on uncertainty surrounding the ballooning deficit.
Despite an overall reduction in risk, high yield bonds held within a tight range, supported by upside fundamentals signaling trend-like economic growth and a broadening recovery, although the message was somewhat obscured by a lagging jobs market and depressed home prices. As external headwinds were eclipsed by quarterly earnings, credit spreads tightened notably in the first half of April, but drifted wider heading into May. Both the manufacturing and services sectors experienced some cooling, with global industrial production levels dipping, a decline that was not completely unexpected given the impact of Japan-related supply chain disruptions. Mounting signs of a slowdown in global growth fostered
| 2 | www.shiplp.com |
Table of Contents
| Stone Harbor Investment Funds | Shareholder Letter | |
| May 31, 2011 |
some risk aversion towards the end of May, a bias that was exacerbated by a meaningful downturn in most sectors of the economy.
While we acknowledge that the downside risks to a pickup in growth in the second half of the year have certainly increased relative to where the economy stood six months ago, we believe that the brunt of the pullback can be attributed to the transitory after-shocks of global events. Particularly in light of the extent to which credit spreads have widened, we remain constructive on high yield and believe credit risk assets have room to tighten as the recovery resumes and gains traction. As a result, we are currently favoring the single B sector as the best market subcomponent to benefit from narrowing credit spreads, as well as the least vulnerable to losses from rising underlying Treasury rates. Within industries, we are increasingly tilting our portfolios towards a sustainable recovery in the consumer sector of the economy, as well as a broadening out of the industrial recovery.
Stone Harbor Local Markets Fund
The Stone Harbor Local Markets Fund return for the period ended May 31, 2011 was 16.82% (net of expenses) and 17.74% (gross of expenses). This compares to a benchmark return of 19.12% for the JP Morgan Global Bond Index-Emerging Markets Global Diversified. During the reporting period, emerging local currency debt markets outperformed all other emerging debt markets, aided significantly by the weakness in the US dollar, continued strong growth and prudent countercyclical monetary policies in most emerging markets. In addition, market performance was also driven by strong, ongoing portfolio and foreign direct investment inflows into emerging markets.
Throughout the reporting period, the portfolio favored faster growing economies in Latin America and Asia, with overweight allocations in Brazil, Colombia, Mexico, China, Indonesia and Malaysia. The portfolio’s underweight positions have been concentrated in Central and Eastern Europe, where a mix of more limited growth prospects and short-term policymaking have reduced the attractiveness of local debt markets, in our view. Importantly, this view was not shared by all investors over the trailing twelve months. Hungary’s local debt market total return during the period, for example, was 36.26% despite the country’s tepid growth and heavy public debt load. The strong performance of the Euro versus the US dollar (+16.98%, source: Bloomberg) further reflected optimism over the Eurozone’s prospects that we did not share.
The period was also marked by the imposition of the US Federal Reserve’s second attempt at quantitative easing, which many policymakers in emerging markets decried as a source of destabilizing capital inflows. Appreciation of emerging market currencies led the Brazilian Finance Minister to coin the phrase “currency wars” in September 2010 to describe the US Fed’s efforts to effectively devalue its currency via beggar-thy-neighbor policy. In response, the Brazilians and policymakers in other emerging market countries sought measures to reduce inflows by imposing taxes on capital inflows. In the particular case of Brazil, new financial
transaction taxes were imposed, which had the immediate impact of a steepening Brazil local debt yield curve, as foreign investors reconsidered ways to effectively invest in local Brazilian debt.
As food prices increased from mid-summer 2010 through the start of 2011, many global investors questioned whether emerging market central banks were falling behind the curve in terms of their willingness to normalize monetary policy and fight inflation. This concern also led to a sharp correction in local interest rates at the close of 2010, and prompted many investors, including ourselves, to shorten duration in local debt portfolios. However, our view throughout the period was that central bankers in most emerging markets, particularly in key Latin American and Asian countries, had strong inflation-fighting credentials. We also believed that the acceleration of food prices was unlikely to continue indefinitely. As a result, we began to increase duration positions in select markets where valuations were particularly attractive. Brazil, Mexico and South Africa were three key examples.
Of the country selection decisions that detracted from performance, the most important was our underweight position in Hungary. Conversely, underweight allocations in Thailand and Turkey enhanced performance. In issue selection, the key investment decision was our allocation to long duration Brazil fixed rate debt, which detracted from overall returns.
Sincerely,

Thomas W. Brock
Chairman of the Board of Trustees
Beta: A measurement of sensitivity of performance relative to changes in benchmark performance. A beta of 1.0 implies up and down movements of roughly the same magnitude as the benchmark. A higher beta means higher risk associated with the benchmark.
The percentage of the Funds’ assets invested in securities in a particular rating category will vary. The following terms pertain to Standard & Poor’s ratings, although the Funds may also make use of Moody’s and Fitch ratings.
Sub-investment grade: Obligations rated ‘BB’, ‘B’, ‘CCC’, ‘CC’ and ‘C’ are regarded as having significant speculative characteristics. ‘BB’ indicates the least degree of speculation and ‘C’ the highest. While such obligations will likely have some quality and protective characteristics, these may be outweighed by large uncertainties or major exposures to adverse conditions.
Single B Sector: An obligation rated ‘B’ is more vulnerable to non-payment than obligations rated ‘BB’, but the obligor currently has the capacity to meet its financial commitment on the obligation. Adverse business, financial, or economic conditions will likely impair the obligor’s capacity or willingness to meet its financial commitment on the obligation.
Stone Harbor Investment Funds Annual Report | May 31, 2011 | 3 |
Table of Contents
| Stone Harbor Investment Funds | Disclosure of Fund Expenses | |
| May 31, 2011(Unaudited) |
Example. As a shareholder of a Fund, you incur two types of costs: (1) transaction costs, including sales charges (loads) on purchase payments and/or redemption fees (if applicable) and (2) ongoing costs, including management fees and other Fund expenses. The below examples are intended to help you understand your ongoing costs (in dollars) of investing in a Fund and to compare these costs with the ongoing costs of investing in other mutual funds. The examples are based on an investment of $1,000 invested on December 1, 2010 and held until May 31, 2011.
Actual Expenses. The first line of each table below provides information about actual account values and actual expenses. You may use the information in this line, together with the amount you invested, to estimate the expenses that you paid over the period. Simply divide your account value by $1,000 (for example, an $8,600 account value divided by $1,000 = 8.6), then multiply the result by the number in the first line under the heading “Expenses Paid During Period” to estimate the expenses you paid on your account during this period.
Hypothetical Example for Comparison Purposes. The second line of each table below provides information about hypothetical account values and hypothetical expenses based on the Fund’s actual expense ratio and an assumed rate of return of 5% per year before expenses, which is not the Fund’s actual return. The hypothetical account values and expenses may not be used to estimate the actual ending account balance or expenses you paid for the period. You may use this information to compare the ongoing costs of investing in a Fund and other mutual funds. To do so, compare this 5% hypothetical example with the 5% hypothetical examples that appear in the shareholder reports of the other funds.
Please note that the expenses shown in the table are meant to highlight your ongoing costs only and do not reflect transactional costs, such as redemption fees, sales charges (loads) or exchange fees. Therefore, the second line of the table is useful in comparing ongoing costs only, and will not help you determine the relative total costs of owning different funds. In addition, if these transactional costs were included, your costs would have been higher.
Beginning | Ending | Expense | Expenses | |||||
STONE HARBOR EMERGING MARKETS DEBT FUND | ||||||||
Institutional Class | ||||||||
Actual | $1,000.00 | $1,052.70 | 0.75% | $3.84 | ||||
Hypothetical (5% return before expenses) | $1,000.00 | $1,021.19 | 0.75% | $3.78 | ||||
STONE HARBOR HIGH YIELD BOND FUND | ||||||||
Institutional Class | ||||||||
Actual | $1,000.00 | $1,078.50 | 0.55% | $2.85 | ||||
Hypothetical (5% return before expenses) | $1,000.00 | $1,022.19 | 0.55% | $2.77 | ||||
STONE HARBOR LOCAL MARKETS FUND | ||||||||
Institutional Class | ||||||||
Actual | $1,000.00 | $1,084.70 | 1.00% | $5.20 | ||||
Hypothetical (5% return before expenses) | $1,000.00 | $1,019.95 | 1.00% | $5.04 | ||||
(1) Annualized, based on the Fund’s most recent fiscal half-year expenses. (2) Expenses are equal to the Fund’s annualized ratio multiplied by the average account value over the period, multiplied by the number of days in the most recent fiscal half year (182), divided by 365. Note this expense example is typically based on a six-month period. | ||||||||
| 4 | www.shiplp.com |
Table of Contents
| Stone Harbor Investment Funds | Summaries of Portfolio Holdings | |
| May 31, 2011 |
Under SEC Rules, all funds are required to include in their annual and semi-annual shareholder reports a presentation of portfolio holdings in a table, chart or graph by reasonably identifiable categories. The following tables, which present holdings as a percent of total net assets (“TNA”), are provided in compliance with such requirements.
| STONE HARBOR EMERGING MARKETS DEBT FUND | ||||
Country Breakdown | % of TNA | |||
Mexico | 8.23% | |||
Russia | 8.20% | |||
Argentina | 7.59% | |||
Venezuela | 7.19% | |||
Brazil | 7.18% | |||
Colombia | 6.33% | |||
Indonesia | 5.45% | |||
South Africa | 5.23% | |||
Malaysia | 5.15% | |||
Iraq | 3.35% | |||
Philippines | 3.26% | |||
Turkey | 3.21% | |||
Poland | 3.09% | |||
Panama | 3.04% | |||
Ukraine | 3.00% | |||
China | 2.05% | |||
Kazakhstan | 2.01% | |||
Uruguay | 1.91% | |||
Croatia | 1.45% | |||
Peru | 1.40% | |||
Qatar | 1.18% | |||
El Salvador | 0.89% | |||
United Arab Emirates | 0.74% | |||
Chile | 0.72% | |||
India | 0.43% | |||
South Korea | 0.37% | |||
Jamaica | 0.24% | |||
Hong Kong | 0.20% | |||
Dominican Republic | 0.19% | |||
Egypt | 0.17% | |||
Ghana | 0.16% | |||
Singapore | 0.16% | |||
Barbados | 0.11% | |||
Pakistan | 0.08% | |||
Gabon | 0.01% | |||
Total | 93.97% | |||
Money Market Mutual Funds | 6.80% | |||
Liabilities in Excess of Other Assets | 0.77% | |||
Total Net Assets | 100.00% | |||
| STONE HARBOR HIGH YIELD BOND FUND | ||||
Industry Breakdown | % of TNA | |||
Healthcare | 8.23% | |||
Electric | 6.23% | |||
Services Other | 5.04% | |||
Gaming | 4.78% | |||
Exploration & Production | 4.65% | |||
Metals/Mining/Steel | 4.65% | |||
Media Cable | 4.50% | |||
Retail Non Food/Drug | 4.46% | |||
Technology | 4.43% | |||
Wirelines | 4.05% | |||
Drillers/Services | 3.51% | |||
Media Other | 3.34% | |||
Wireless | 3.32% | |||
Paper/Forest Products | 3.19% | |||
Food & Beverage | 3.07% | |||
Gas Pipelines | 3.04% | |||
Chemicals | 2.88% | |||
Containers/Packaging | 2.64% | |||
Leisure | 2.04% | |||
Aerospace/Defense | 1.98% | |||
Automotive | 1.85% | |||
Publishing/Printing | 1.70% | |||
Building Products | 1.28% | |||
Industrial Other | 1.27% | |||
Construction Machinery | 1.13% | |||
Gas Distributors | 1.13% | |||
Banking | 1.01% | |||
Consumer Products | 0.75% | |||
Transportation - Non Air/Rail | 0.75% | |||
Retail Food/Drug | 0.73% | |||
Textile/Apparel | 0.69% | |||
Non Captive Finance | 0.68% | |||
Refining | 0.56% | |||
Satellite | 0.47% | |||
REITS | 0.41% | |||
Restaurants | 0.40% | |||
Environmental Services | 0.35% | |||
Property & Casualty Insurance | 0.25% | |||
Financial Other | 0.24% | |||
Pharmaceuticals | 0.23% | |||
Life | 0.05% | |||
Railroads | 0.03% | |||
Airlines | 0.02% | |||
Lodging | 0.01% | |||
| ||||
Total | 96.02% | |||
| ||||
Money Market Mutual Funds | 2.95% | |||
| ||||
Other Assets in Excess of Liabilities | 1.03% | |||
| ||||
Total Net Assets | 100.00% | |||
| ||||
Stone Harbor Investment Funds Annual Report | May 31, 2011 | 5 |
Table of Contents
| Stone Harbor Investment Funds | Summaries of Portfolio Holdings | |
| May 31, 2011 |
STONE HARBOR LOCAL MARKETS FUND |
| |||
Country Breakdown | % of TNA | |||
Brazil | 12.75% | |||
Mexico | 11.17% | |||
Indonesia | 9.61% | |||
Malaysia | 9.47% | |||
European Union | 6.17% | |||
Colombia | 6.06% | |||
Thailand | 4.55% | |||
Poland | 4.19% | |||
Turkey | 4.10% | |||
South Africa | 4.06% | |||
Venezuela | 1.96% | |||
Hungary | 1.45% | |||
Philippines | 0.56% | |||
Argentina | 0.28% | |||
Russia | 0.16% | |||
Total | 76.54% | |||
Money Market Mutual Funds | 21.19% | |||
Other Assets in Excess of Liabilities | 2.27% | |||
Total Net Assets | 100.00% | |||
| 6 | www.shiplp.com |
Table of Contents
| Stone Harbor Investment Funds | Growth of $10,000 Investment | |
| May 31, 2011 (Unaudited) |
STONE HARBOR EMERGING MARKETS DEBT FUND
Comparison of Change in Value of $10,000 Investment in Stone Harbor Emerging Markets Debt Fund and the JP Morgan Emerging Market Bond Global Diversified Index.
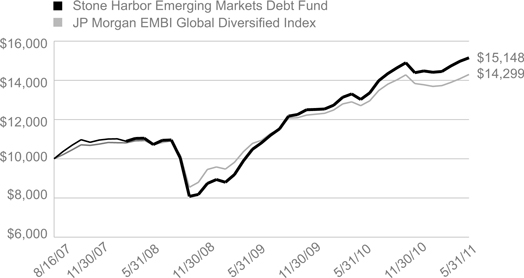
The JP Morgan EMBI Global Diversified Index limits the weights of those index countries with larger debt stocks by only including specified portions of these countries’ eligible current face amounts outstanding. The countries covered in the EMBI Global Diversified are identical to those covered by the EMBI Global.
Average Annual Total Returns
| 1 Year | 3 Years | Since Inception | Inception Date | |||||
Stone Harbor Emerging Markets Debt Fund | 16.30% | 11.10% | 11.57% | 8/16/07 | ||||
JP Morgan EMBI Global Diversified Index | 12.52% | 9.38% | 10.00% |
The performance data quoted represents past performance and does not guarantee future results. Current performance may be lower or higher than the performance quoted. Average annual total returns reflect the reinvestment of dividends and capital gains distributions and include all fee waivers and expense reimbursements. Without the fee waivers and expense reimbursements, total return figures would have been lower. The performance data quoted does not reflect the deduction of taxes that a shareholder would pay on Fund distributions or the redemption of Fund shares. Investment return and principal value will vary, and shares, when redeemed, may be worth more or less than their original cost. Index returns do not include the effects of sales charges, management fees or transaction costs. It is not possible to invest directly in an index.
Stone Harbor Investment Funds Annual Report | May 31, 2011 | 7 |
Table of Contents
| Stone Harbor Investment Funds | Growth of $10,000 Investment | |
| May 31, 2011 (Unaudited) |
STONE HARBOR HIGH YIELD BOND FUND
Comparison of Change in Value of $10,000 Investment in Stone Harbor High Yield Bond Fund and the Citigroup High Yield Market Capped Index.
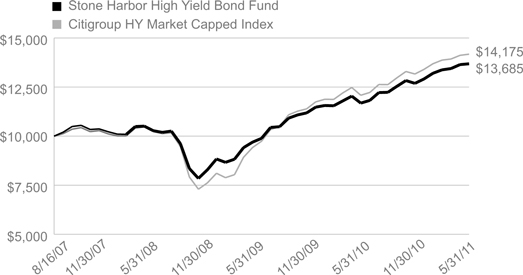
The Citigroup High Yield Market Capped Index represents a modified version of the High Yield Market Index by delaying the entry of “fallen angel” issues (corporate or municipal bonds that were investment-grade when issued but have since been downgraded) and capping the par value of individual issuers at US $5 billion par amount outstanding.
Average Annual Total Returns
| 1 Year | 3 Years | Since Inception | Inception Date | |||||
Stone Harbor High Yield Bond Fund | 17.14% | 9.20% | 8.63% | 8/16/07 | ||||
Citigroup HY Market Capped Index | 17.32% | 10.63% | 9.75% |
The performance data quoted represents past performance and does not guarantee future results. Current performance may be lower or higher than the performance quoted. Average annual total returns reflect the reinvestment of dividends and capital gains distributions and include all fee waivers and expense reimbursements. Without the fee waivers and expense reimbursements, total return figures would have been lower. The performance data quoted does not reflect the deduction of taxes that a shareholder would pay on Fund distributions or the redemption of Fund shares. Investment return and principal value will vary, and shares, when redeemed, may be worth more or less than their original cost. Index returns do not include the effects of sales charges, management fees or transaction costs. It is not possible to invest directly in an index.
| 8 | www.shiplp.com |
Table of Contents
| Stone Harbor Investment Funds | Growth of $10,000 Investment | |
| May 31, 2011 (Unaudited) |
STONE HARBOR LOCAL MARKETS FUND
Comparison of Change in Value of $10,000 Investment in Stone Harbor Local Markets Fund and the JP Morgan GBI-EM Global Diversified Index.
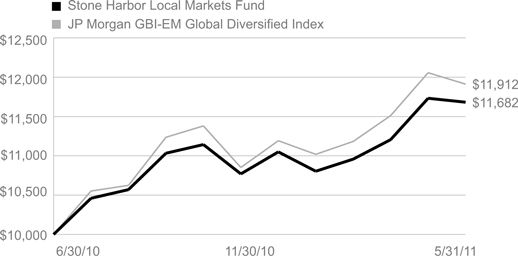
The JP Morgan GBI-EM Global Diversified Index consists of regularly traded, liquid fixed rate, domestic currency government bonds to which international investors can gain exposure. The weightings among the countries are more evenly distributed within this index.
Total Returns
| 1 Month | 3 Months | Since Inception | Inception Date | |||||
Stone Harbor Local Markets Fund | (0.43)% | 6.60% | 16.82% | 6/30/10 | ||||
JP Morgan GBI-EM Global Diversified Index | (1.20)% | 6.52% | 19.12% |
The performance data quoted represents past performance and does not guarantee future results. Current performance may be lower or higher than the performance quoted. Average annual total returns reflect the reinvestment of dividends and capital gains distributions and include all fee waivers and expense reimbursements. Without the fee waivers and expense reimbursements, total return figures would have been lower. The performance data quoted does not reflect the deduction of taxes that a shareholder would pay on Fund distributions or the redemption of Fund shares. Investment return and principal value will vary, and shares, when redeemed, may be worth more or less than their original cost. Index returns do not include the effects of sales charges, management fees or transaction costs. It is not possible to invest directly in an index.
Stone Harbor Investment Funds Annual Report | May 31, 2011 | 9 |
Table of Contents
| Stone Harbor Investment Funds | Registered Public Accounting Firm | |
To the Shareholders and Board of Trustees of Stone Harbor Investment Funds:
We have audited the accompanying statements of assets and liabilities of Stone Harbor Investment Funds (the “Funds”), comprising the Stone Harbor Emerging Markets Debt Fund, Stone Harbor High Yield Bond Fund, and Stone Harbor Local Markets Fund, including the statements of investments, as of May 31, 2011, and the related statements of operations for the year then ended for Stone Harbor Emerging Markets Debt Fund and Stone Harbor High Yield Bond Fund and the period June 30, 2010 (Inception) to May 31, 2011 for Stone Harbor Local Markets Fund, the statements of changes in net assets for each of the two years in the period then ended for Stone Harbor Emerging Markets Debt Fund and Stone Harbor High Yield Bond Fund and the period June 30, 2010 (Inception) to May 31, 2011 for Stone Harbor Local Markets Fund, and the financial highlights for each of the periods presented. These financial statements and financial highlights are the responsibility of the Funds’ management. Our responsibility is to express an opinion on these financial statements and financial highlights based on our audits.
We conducted our audits in accordance with the standards of the Public Company Accounting Oversight Board (United States). Those standards require that we plan and perform the audit to obtain reasonable assurance about whether the financial statements and financial highlights are free of material misstatement. The Funds are not required to have, nor were we engaged to perform, an audit of their internal control over financial reporting. Our audits included consideration of internal control over financial reporting as a basis for designing audit procedures that are appropriate in the circumstances, but not for the purpose of expressing an opinion on the effectiveness of the Funds’ internal control over financial reporting. Accordingly, we express no such opinion. An audit also includes examining, on a test basis, evidence supporting the amounts and disclosures in the financial statements, assessing the accounting principles used and significant estimates made by management, as well as evaluating the overall financial statement presentation. Our procedures included confirmation of securities owned as of May 31, 2011, by correspondence with the custodian and brokers; where replies were not received from brokers, we performed other auditing procedures. We believe that our audits provide a reasonable basis for our opinion.
In our opinion, the financial statements and financial highlights referred to above present fairly, in all material respects, the financial position of each of the funds constituting the Stone Harbor Investment Funds as of May 31, 2011, the results of their operations for the year then ended for Stone Harbor Emerging Markets Debt Fund and Stone Harbor High Yield Bond Fund and the period June 30, 2010 (Inception) to May 31, 2011 for Stone Harbor Local Markets Fund, the changes in their net assets for each of the two years in the period then ended for Stone Harbor Emerging Markets Debt Fund and Stone Harbor High Yield Bond Fund and the period June 30, 2010 (Inception) to May 31, 2011 for Stone Harbor Local Markets Fund, and the financial highlights for each of the periods presented, in conformity with accounting principles generally accepted in the United States of America.
DELOITTE & TOUCHE LLP
Denver, Colorado
July 27, 2011
| 10 | www.shiplp.com |
Table of Contents
| Stone Harbor Emerging Markets Debt Fund | Statements of Investments | |
| May 31, 2011 |
Currency | Rate | Maturity Date | Principal Amount * | Market Value (Expressed in U.S. $) | ||||||||||||||
SOVEREIGN DEBT OBLIGATIONS - 61.65% | ||||||||||||||||||
Argentina - 6.41% | ||||||||||||||||||
Republic of Argentina: | ||||||||||||||||||
| 7.000 | % | 04/17/2017 | $ | 16,741,851 | $ | 15,143,934 | ||||||||||||
| 0.000 | % | 03/31/2023 | 184,000 | 128,800 | (1)(2) | |||||||||||||
| 6.000 | % | 03/31/2023 | 480,000 | 360,000 | (1)(2) | |||||||||||||
| EUR | 7.820 | % | 12/31/2033 | 674,467 | 703,217 | |||||||||||||
| EUR | 7.820 | % | 12/31/2033 | 3,630,646 | 3,748,832 | (3) | ||||||||||||
| 8.280 | % | 12/31/2033 | 5,262,176 | 4,525,471 | ||||||||||||||
| ARS | 5.820 | % | 12/31/2033 | 41,817,229 | 13,679,889 | (2)(3) | ||||||||||||
| 0.000 | % | 12/15/2035 | 1,738,812 | 287,339 | (3) | |||||||||||||
| EUR | 0.000 | % | 12/15/2035 | 46,703,000 | 9,493,436 | (3) | ||||||||||||
|
| |||||||||||||||||
| 48,070,918 | ||||||||||||||||||
|
| |||||||||||||||||
Brazil - 2.24% | ||||||||||||||||||
Nota Do Tesouro Nacional | BRL | 10.000 | % | 01/01/2021 | 6,205,000 | 3,431,351 | ||||||||||||
Republic of Brazil: | ||||||||||||||||||
| 5.875 | % | 01/15/2019 | 3,933,000 | 4,515,084 | ||||||||||||||
| 8.875 | % | 10/14/2019 | 100,000 | 135,500 | ||||||||||||||
| 4.875 | % | 01/22/2021 | 3,035,000 | 3,190,544 | ||||||||||||||
| 8.750 | % | 02/04/2025 | 3,931,000 | 5,498,486 | ||||||||||||||
| 10.125 | % | 05/15/2027 | 32,000 | 49,840 | ||||||||||||||
|
| |||||||||||||||||
| 16,820,805 | ||||||||||||||||||
|
| |||||||||||||||||
Colombia - 5.25% | ||||||||||||||||||
Bogota Distrio Capital | COP | 9.750 | % | 07/26/2028 | 5,065,000,000 | 3,593,791 | (2)(4) | |||||||||||
Republic of Colombia: | ||||||||||||||||||
| 7.375 | % | 01/27/2017 | 4,595,000 | 5,588,669 | ||||||||||||||
| 7.375 | % | 03/18/2019 | 2,764,000 | 3,427,360 | ||||||||||||||
| 11.750 | % | 02/25/2020 | 1,113,000 | 1,719,585 | ||||||||||||||
| 8.125 | % | 05/21/2024 | 25,000 | 32,937 | ||||||||||||||
| 8.375 | % | 02/15/2027 | 25,000 | 31,500 | ||||||||||||||
| COP | 9.850 | % | 06/28/2027 | 5,775,000,000 | 4,348,409 | |||||||||||||
| 7.375 | % | 09/18/2037 | 15,610,000 | 19,707,625 | ||||||||||||||
| 6.125 | % | 01/18/2041 | 790,000 | 865,050 | ||||||||||||||
|
| |||||||||||||||||
| 39,314,926 | ||||||||||||||||||
|
| |||||||||||||||||
Croatia - 1.45% | ||||||||||||||||||
Croatian Government: | ||||||||||||||||||
| 6.750 | % | 11/05/2019 | 1,529,000 | 1,642,146 | (4) | |||||||||||||
| 6.625 | % | 07/14/2020 | 1,906,000 | 2,021,313 | (5) | |||||||||||||
| 6.375 | % | 03/24/2021 | 7,007,000 | 7,238,231 | (5) | |||||||||||||
|
| |||||||||||||||||
| 10,901,690 | ||||||||||||||||||
|
| |||||||||||||||||
See Notes to Financial Statements.
Stone Harbor Investment Funds Annual Report | May 31, 2011 | 11 |
Table of Contents
| Stone Harbor Emerging Markets Debt Fund | Statements of Investments | |
| May 31, 2011 |
Currency | Rate | Maturity Date | Principal Amount * | Market Value (Expressed in U.S. $) | ||||||||||||||
El Salvador - 0.89% | ||||||||||||||||||
Republic of El Salvador: | 7.375 | % | 12/01/2019 | $ | 220,000 | $ | 243,100 | (5) | ||||||||||
| 7.375 | % | 12/01/2019 | 2,068,000 | 2,285,140 | (4) | |||||||||||||
| 7.750 | % | 01/24/2023 | 15,000 | 17,138 | (4) | |||||||||||||
| 8.250 | % | 04/10/2032 | 1,000,000 | 1,122,500 | (4) | |||||||||||||
| 7.650 | % | 06/15/2035 | 2,895,000 | 3,003,562 | (4) | |||||||||||||
|
| |||||||||||||||||
| 6,671,440 | ||||||||||||||||||
|
| |||||||||||||||||
Gabon - 0.01% | ||||||||||||||||||
Republic of Gabon | 8.200 | % | 12/12/2017 | 50,000 | 58,812 | (5) | ||||||||||||
|
| |||||||||||||||||
Ghana - 0.16% | ||||||||||||||||||
Republic of Ghana | 8.500 | % | 10/04/2017 | 1,051,000 | 1,181,061 | (4) | ||||||||||||
|
| |||||||||||||||||
Indonesia - 2.53% | ||||||||||||||||||
Republic of Indonesia: | ||||||||||||||||||
| 6.875 | % | 01/17/2018 | 1,278,000 | 1,481,649 | (4) | |||||||||||||
| 11.625 | % | 03/04/2019 | 2,170,000 | 3,175,036 | (5) | |||||||||||||
| 11.625 | % | 03/04/2019 | 4,628,000 | 6,771,458 | (4) | |||||||||||||
| 5.875 | % | 03/13/2020 | 189,000 | 207,428 | (4) | |||||||||||||
| 6.625 | % | 02/17/2037 | 2,050,000 | 2,288,312 | (4) | |||||||||||||
| 7.750 | % | 01/17/2038 | 4,045,000 | 5,038,452 | (4) | |||||||||||||
|
| |||||||||||||||||
| 18,962,335 | ||||||||||||||||||
|
| |||||||||||||||||
Iraq - 2.64% | ||||||||||||||||||
Republic of Iraq | 5.800 | % | 01/15/2028 | 21,394,000 | 19,762,707 | (4) | ||||||||||||
|
| |||||||||||||||||
Malaysia - 1.88% | ||||||||||||||||||
Malaysian Government: | ||||||||||||||||||
| 7.500 | % | 07/15/2011 | 495,000 | 497,486 | ||||||||||||||
| MYR | 5.094 | % | 04/30/2014 | 12,240,000 | 4,263,200 | |||||||||||||
| MYR | 3.741 | % | 02/27/2015 | 8,065,000 | 2,701,728 | �� | ||||||||||||
| MYR | 3.835 | % | 08/12/2015 | 19,604,000 | 6,609,553 | |||||||||||||
|
| |||||||||||||||||
| 14,071,967 | ||||||||||||||||||
|
| |||||||||||||||||
Mexico - 6.09% | ||||||||||||||||||
Mexican Bonos: | ||||||||||||||||||
| MXN | 7.750 | % | 12/14/2017 | 34,840,000 | 3,226,215 | |||||||||||||
| MXN | 8.000 | % | 06/11/2020 | 100,440,000 | 9,403,993 | |||||||||||||
| MXN | 10.000 | % | 12/05/2024 | 27,890,000 | 3,026,979 | |||||||||||||
| MXN | 7.500 | % | 06/03/2027 | 10,000,000 | 873,238 | |||||||||||||
| MXN | 8.500 | % | 05/31/2029 | 37,660,000 | 3,572,359 | |||||||||||||
United Mexican States: | ||||||||||||||||||
| 5.625 | % | 01/15/2017 | 11,494,000 | 12,927,876 | ||||||||||||||
| 5.125 | % | 01/15/2020 | 1,692,000 | 1,823,976 | ||||||||||||||
| 8.000 | % | 09/24/2022 | 2,012,000 | 2,706,140 | ||||||||||||||
| 8.300 | % | 08/15/2031 | 3,645,000 | 4,988,183 | ||||||||||||||
| 7.500 | % | 04/08/2033 | 2,442,000 | 3,076,920 | ||||||||||||||
|
| |||||||||||||||||
| 45,625,879 | ||||||||||||||||||
|
| |||||||||||||||||
See Notes to Financial Statements.
| 12 | www.shiplp.com |
Table of Contents
| Stone Harbor Emerging Markets Debt Fund | Statements of Investments | |
| May 31, 2011 |
Currency | Rate | Maturity Date | Principal Amount * | Market Value (Expressed in U.S. $) | ||||||||||||||
Pakistan - 0.08% | ||||||||||||||||||
Islamic Republic of Pakistan | 7.125 | % | 03/31/2016 | $ | 692,000 | $ | 619,340 | (4) | ||||||||||
|
| |||||||||||||||||
Panama - 3.04% | ||||||||||||||||||
Republic of Panama: | ||||||||||||||||||
| 5.200 | % | 01/30/2020 | 7,602,000 | 8,229,165 | ||||||||||||||
| 9.375 | % | 01/16/2023 | 25,000 | 34,188 | ||||||||||||||
| 7.125 | % | 01/29/2026 | 600,000 | 729,000 | ||||||||||||||
| 8.875 | % | 09/30/2027 | 4,255,000 | 5,978,275 | ||||||||||||||
| 9.375 | % | 04/01/2029 | 5,196,000 | 7,690,080 | ||||||||||||||
| 6.700 | % | 01/26/2036 | 100,000 | 116,750 | ||||||||||||||
|
| |||||||||||||||||
| 22,777,458 | ||||||||||||||||||
|
| |||||||||||||||||
Peru - 1.09% | ||||||||||||||||||
Republic of Peru | 8.750 | % | 11/21/2033 | 5,990,000 | 8,171,858 | |||||||||||||
|
| |||||||||||||||||
Philippines - 3.26% | ||||||||||||||||||
Republic of Philippines: | ||||||||||||||||||
| 9.375 | % | 01/18/2017 | 70,000 | 91,000 | ||||||||||||||
| PHP | 4.950 | % | 01/15/2021 | 119,000,000 | 2,778,317 | |||||||||||||
| 7.500 | % | 09/25/2024 | 4,593,000 | 5,540,306 | ||||||||||||||
| 5.500 | % | 03/30/2026 | 2,002,000 | 2,019,518 | ||||||||||||||
| 9.500 | % | 02/02/2030 | 6,533,000 | 9,366,689 | ||||||||||||||
| 7.750 | % | 01/14/2031 | 3,215,000 | 3,962,487 | ||||||||||||||
| 6.375 | % | 01/15/2032 | 520,000 | 562,900 | ||||||||||||||
| 6.375 | % | 10/23/2034 | 116,000 | 125,785 | ||||||||||||||
|
| |||||||||||||||||
| 24,447,002 | ||||||||||||||||||
|
| |||||||||||||||||
Poland - 3.09% | ||||||||||||||||||
Republic or Poland: | ||||||||||||||||||
| 6.375 | % | 07/15/2019 | 17,624,000 | 20,135,420 | ||||||||||||||
| EUR | 4.000 | % | 03/23/2021 | 665,000 | 888,144 | |||||||||||||
| 5.125 | % | 04/21/2021 | 2,083,000 | 2,153,301 | ||||||||||||||
|
| |||||||||||||||||
| 23,176,865 | ||||||||||||||||||
|
| |||||||||||||||||
Qatar - 0.44% | ||||||||||||||||||
State of Qatar | 5.250 | % | 01/20/2020 | 3,052,000 | 3,265,640 | (4) | ||||||||||||
|
| |||||||||||||||||
Russia - 7.18% | ||||||||||||||||||
Russian Federation: | ||||||||||||||||||
| 5.000 | % | 04/29/2020 | 500,000 | 513,125 | (4) | |||||||||||||
| 5.000 | % | 04/29/2020 | 800,000 | 821,000 | (5) | |||||||||||||
| 12.750 | % | 06/24/2028 | 3,470,000 | 6,176,600 | (4) | |||||||||||||
| 7.500 | % | 03/31/2030 | 39,262,913 | 46,290,975 | (4)(6) | |||||||||||||
|
| |||||||||||||||||
| 53,801,700 | ||||||||||||||||||
|
| |||||||||||||||||
See Notes to Financial Statements.
Stone Harbor Investment Funds Annual Report | May 31, 2011 | 13 |
Table of Contents
| Stone Harbor Emerging Markets Debt Fund | Statements of Investments | |
| May 31, 2011 |
Currency | Rate | Maturity Date | Principal Amount * | Market Value (Expressed in U.S. $) | ||||||||||||||
South Africa - 5.05% | ||||||||||||||||||
Republic of South Africa: | ||||||||||||||||||
| 6.500 | % | 06/02/2014 | $ | 1,028,000 | $ | 1,158,042 | ||||||||||||
| 8.500 | % | 06/23/2017 | 45,000 | 56,250 | (2) | |||||||||||||
| ZAR | 8.000 | % | 12/21/2018 | 24,070,000 | 3,495,212 | |||||||||||||
| 6.875 | % | 05/27/2019 | 2,023,000 | 2,409,393 | ||||||||||||||
| ZAR | 7.250 | % | 01/15/2020 | 8,560,000 | 1,178,763 | |||||||||||||
| 5.500 | % | 03/09/2020 | 4,923,000 | 5,370,993 | ||||||||||||||
| ZAR | 6.750 | % | 03/31/2021 | 41,360,000 | 5,438,548 | |||||||||||||
| 5.875 | % | 05/30/2022 | 10,552,000 | 11,744,376 | ||||||||||||||
| ZAR | 10.500 | % | 12/21/2026 | 40,810,000 | 7,013,213 | |||||||||||||
|
| |||||||||||||||||
| 37,864,790 | ||||||||||||||||||
|
| |||||||||||||||||
Turkey - 2.79% | ||||||||||||||||||
Republic of Turkey: | ||||||||||||||||||
| 7.000 | % | 09/26/2016 | 159,000 | 182,691 | ||||||||||||||
| 7.000 | % | 03/11/2019 | 135,000 | 155,858 | ||||||||||||||
| 7.500 | % | 11/07/2019 | 12,634,000 | 15,072,362 | ||||||||||||||
| 7.000 | % | 06/05/2020 | 372,000 | 429,846 | ||||||||||||||
| 7.375 | % | 02/05/2025 | 1,820,000 | 2,155,790 | ||||||||||||||
| 6.875 | % | 03/17/2036 | 1,305,000 | 1,438,762 | ||||||||||||||
| 7.250 | % | 03/05/2038 | 1,285,000 | 1,480,963 | ||||||||||||||
|
| |||||||||||||||||
| 20,916,272 | ||||||||||||||||||
|
| |||||||||||||||||
Ukraine - 1.72% | ||||||||||||||||||
Ukraine Government: | ||||||||||||||||||
| 6.385 | % | 06/26/2012 | 5,205,000 | 5,374,162 | (4) | |||||||||||||
| 7.650 | % | 06/11/2013 | 2,386,000 | 2,535,125 | (4) | |||||||||||||
| 6.875 | % | 09/23/2015 | 1,723,000 | 1,787,613 | (5) | |||||||||||||
| 7.750 | % | 09/23/2020 | 3,094,000 | 3,175,991 | (4) | |||||||||||||
|
| |||||||||||||||||
| 12,872,891 | ||||||||||||||||||
|
| |||||||||||||||||
Uruguay - 1.91% | ||||||||||||||||||
Republic of Uruguay: | ||||||||||||||||||
| 9.250 | % | 05/17/2017 | 3,467,000 | 4,533,102 | ||||||||||||||
| 8.000 | % | 11/18/2022 | 1,895,497 | 2,414,389 | ||||||||||||||
| 6.875 | % | 09/28/2025 | 1,313,650 | 1,566,528 | ||||||||||||||
| 7.875 | % | 01/15/2033 | 1,390,800 | 1,734,328 | (7) | |||||||||||||
| 7.625 | % | 03/21/2036 | 3,280,000 | 4,059,000 | ||||||||||||||
|
| |||||||||||||||||
| 14,307,347 | ||||||||||||||||||
|
| |||||||||||||||||
Venezuela - 2.45% | ||||||||||||||||||
Republic of Venezuela: | ||||||||||||||||||
| 5.750 | % | 02/26/2016 | 4,168,000 | 3,110,370 | (4) | |||||||||||||
| 13.625 | % | 08/15/2018 | 10,000 | 9,650 | ||||||||||||||
| 13.625 | % | 08/15/2018 | 1,669,000 | 1,610,585 | (4) | |||||||||||||
| 7.000 | % | 12/01/2018 | 120,000 | 82,500 | (4) | |||||||||||||
| 7.750 | % | 10/13/2019 | 4,611,000 | 3,166,604 | (4) | |||||||||||||
| 12.750 | % | 08/23/2022 | 10,861,400 | 9,340,804 | (4) | |||||||||||||
| 9.000 | % | 05/07/2023 | 1,480,000 | 1,013,800 | (4) | |||||||||||||
|
| |||||||||||||||||
| 18,334,313 | ||||||||||||||||||
|
| |||||||||||||||||
See Notes to Financial Statements.
| 14 | www.shiplp.com |
Table of Contents
| Stone Harbor Emerging Markets Debt Fund | Statements of Investments | |
| May 31, 2011 |
| Rate | Maturity Date | Principal Amount * | Market Value (Expressed in U.S. $) | |||||||||||||||
TOTAL SOVEREIGN DEBT OBLIGATIONS | $ | 461,998,016 | ||||||||||||||||
|
| |||||||||||||||||
(Cost $442,406,035) | ||||||||||||||||||
BANK LOANS - 0.75%(8) | ||||||||||||||||||
Brazil - 0.13% | ||||||||||||||||||
Virgolino de Oliveira - GVO Loan | 5.273 | % | 03/11/2015 | $ | 1,000,000 | 1,000,000 | ||||||||||||
|
| |||||||||||||||||
Indonesia - 0.62% | ||||||||||||||||||
PT Bumi Resources | 11.250 | % | 08/07/2013 | 1,337,000 | 1,415,883 | |||||||||||||
PT Bumi Tranche A | 13.720 | % | 03/02/2012 | 1,777,960 | 1,777,960 | (2) | ||||||||||||
PT Bumi Tranche B | 13.720 | % | 03/02/2012 | 1,419,040 | 1,419,040 | (2) | ||||||||||||
|
| |||||||||||||||||
| 4,612,883 | ||||||||||||||||||
|
| |||||||||||||||||
TOTAL BANK LOANS | 5,612,883 | |||||||||||||||||
|
| |||||||||||||||||
(Cost $5,520,739) | ||||||||||||||||||
CONVERTIBLE CORPORATE BONDS - 0.08% | ||||||||||||||||||
Indonesia - 0.08% | ||||||||||||||||||
BLT International Corp. | 12.000 | % | 02/10/2015 | 600,000 | 611,130 | |||||||||||||
|
| |||||||||||||||||
TOTAL CONVERTIBLE CORPORATE BONDS | 611,130 | |||||||||||||||||
|
| |||||||||||||||||
(Cost $600,000) | ||||||||||||||||||
CORPORATE BONDS - 24.58% | ||||||||||||||||||
Argentina - 0.51% | ||||||||||||||||||
Capex SA | 10.000 | % | 03/10/2018 | 1,342,000 | 1,335,021 | (5) | ||||||||||||
Empresa Distribuidora Y Comercializadora Norte | 9.750 | % | 10/25/2022 | 962,000 | 986,050 | (5) | ||||||||||||
Inversiones y Representaciones SA: | ||||||||||||||||||
| 11.500 | % | 07/20/2020 | 100,000 | 112,050 | (4) | |||||||||||||
| 11.500 | % | 07/20/2020 | 636,000 | 721,663 | (5) | |||||||||||||
Tarjeta Naranja SA | 9.000 | % | 01/28/2017 | 625,000 | 648,269 | (5) | ||||||||||||
|
| |||||||||||||||||
| 3,803,053 | ||||||||||||||||||
|
| |||||||||||||||||
Barbados - 0.11% | ||||||||||||||||||
Columbus International, Inc. | 11.500 | % | 11/20/2014 | 695,000 | 803,211 | (4) | ||||||||||||
|
| |||||||||||||||||
See Notes to Financial Statements.
Stone Harbor Investment Funds Annual Report | May 31, 2011 | 15 |
Table of Contents
| Stone Harbor Emerging Markets Debt Fund | Statements of Investments | |
| May 31, 2011 |
| Rate | Maturity Date | Principal Amount * | Market Value (Expressed in U.S. $) | |||||||||||||||
Brazil - 2.26% | ||||||||||||||||||
Banco Cruzeiro do Sul SA: | ||||||||||||||||||
| 8.875 | % | 09/22/2020 | $ | 900,000 | $ | 888,840 | (4) | |||||||||||
| 8.875 | % | 09/22/2020 | 984,000 | 971,798 | (5) | |||||||||||||
BM&FBovespa SA: | ||||||||||||||||||
| 5.500 | % | 07/16/2020 | 200,000 | 206,764 | (4) | |||||||||||||
| 5.500 | % | 07/16/2020 | 842,000 | 870,352 | (5) | |||||||||||||
BR Malls International Finance Ltd.: | ||||||||||||||||||
| 8.500 | % | 01/21/2049 | 160,000 | 169,952 | (4) | |||||||||||||
| 8.500 | % | 01/21/2049 | 482,000 | 511,980 | (5) | |||||||||||||
BR Properties SA: | ||||||||||||||||||
| 9.000 | % | 10/07/2015 | 579,000 | 595,733 | (5) | |||||||||||||
| 9.000 | % | 10/07/2049 | 300,000 | 308,670 | (4) | |||||||||||||
Cia de Saneamento Basico do Estado de Sao Paulo | 6.250 | % | 12/16/2020 | 580,000 | 595,950 | (5) | ||||||||||||
General Shopping Finance Ltd.: | ||||||||||||||||||
| 10.000 | % | 11/09/2015 | 1,751,000 | 1,847,077 | (5) | |||||||||||||
| 10.000 | % | 11/09/2049 | 246,000 | 259,899 | (4) | |||||||||||||
Gerdau Trade, Inc.: | ||||||||||||||||||
| 5.750 | % | 01/30/2021 | 424,000 | 427,180 | (5) | |||||||||||||
| 5.750 | % | 01/30/2021 | 700,000 | 705,250 | (4) | |||||||||||||
Hypermarcas SA | 6.500 | % | 04/20/2021 | 1,388,000 | 1,391,470 | (5) | ||||||||||||
Marfrig Holding Europe BV | 8.375 | % | 05/09/2018 | 876,000 | 868,554 | (5) | ||||||||||||
Minerva Overseas II Ltd.: | ||||||||||||||||||
| 10.875 | % | 11/15/2019 | 538,000 | 594,759 | (4) | |||||||||||||
| 10.875 | % | 11/15/2019 | 633,000 | 699,782 | (5) | |||||||||||||
Mirabela Nickel Ltd. | 8.750 | % | 04/15/2018 | 392,000 | 396,900 | (5) | ||||||||||||
Odebrecht Drilling Norbe VIII/IX Ltd.: | ||||||||||||||||||
| 6.350 | % | 06/30/2021 | 350,000 | 370,125 | (4) | |||||||||||||
| 6.350 | % | 06/30/2021 | 1,265,000 | 1,337,738 | (5) | |||||||||||||
OGX Petroleo e Gas Participacoes SA | 8.500 | % | 06/01/2018 | 1,732,000 | 1,781,362 | (5) | ||||||||||||
Telemar Norte Leste SA: | ||||||||||||||||||
| 5.500 | % | 10/23/2020 | 100,000 | 98,620 | (4) | |||||||||||||
| 5.500 | % | 10/23/2020 | 595,000 | 586,789 | (5) | |||||||||||||
Virgolino de Oliveira Finance Ltd. | 10.500 | % | 01/28/2018 | 424,000 | 452,917 | (4) | ||||||||||||
|
| |||||||||||||||||
| 16,938,461 | ||||||||||||||||||
|
| |||||||||||||||||
Chile - 0.72% | ||||||||||||||||||
Codelco, Inc.: | ||||||||||||||||||
| 7.500 | % | 01/15/2019 | 450,000 | 555,505 | (4) | |||||||||||||
| 6.150 | % | 10/24/2036 | 4,295,000 | 4,845,933 | (4) | |||||||||||||
|
| |||||||||||||||||
| 5,401,438 | ||||||||||||||||||
|
| |||||||||||||||||
See Notes to Financial Statements.
| 16 | www.shiplp.com |
Table of Contents
| Stone Harbor Emerging Markets Debt Fund | Statements of Investments | |
| May 31, 2011 |
| Rate | Maturity Date | Principal Amount * | Market Value (Expressed in U.S. $) | |||||||||||||||
China - 2.05% | ||||||||||||||||||
China Liansu Group Holdings Ltd. | 7.875 | % | 05/13/2016 | $ | 1,685,000 | $ | 1,628,131 | (5) | ||||||||||
China Oriental Group Co. Ltd.: | ||||||||||||||||||
| 8.000 | % | 08/18/2015 | 300,000 | 311,625 | (4) | |||||||||||||
| 8.000 | % | 08/18/2015 | 543,000 | 564,041 | (5) | |||||||||||||
Evergrande Real Estate Group Ltd.: | ||||||||||||||||||
| 13.000 | % | 01/27/2015 | 106,000 | �� | 110,643 | (5) | ||||||||||||
| 13.000 | % | 01/27/2015 | 407,000 | 424,826 | (4) | |||||||||||||
Hidili Industry International Development Ltd. | 8.625 | % | 11/04/2015 | 1,267,000 | 1,255,914 | (4) | ||||||||||||
Kaisa Group Holdings Ltd. | 13.500 | % | 04/28/2015 | 1,257,000 | 1,274,284 | (4) | ||||||||||||
MIE Holdings Corp. | 9.750 | % | 05/12/2016 | 1,586,000 | 1,576,167 | (5) | ||||||||||||
Sinochem Overseas Capital Co. Ltd. | 4.500 | % | 11/12/2020 | 4,384,000 | 4,195,400 | (5) | ||||||||||||
Sino-Forest Corp.: | ||||||||||||||||||
| 6.250 | % | 10/21/2017 | 100,000 | 93,375 | (4) | |||||||||||||
| 6.250 | % | 10/21/2017 | 470,000 | 438,863 | (5) | |||||||||||||
Texhong Textile Group Ltd.: | ||||||||||||||||||
| 7.625 | % | 01/19/2016 | 343,000 | 336,569 | (5) | |||||||||||||
| 7.625 | % | 01/19/2016 | 858,000 | 841,912 | (4) | |||||||||||||
West China Cement Ltd.: | ||||||||||||||||||
| 7.500 | % | 01/25/2016 | 824,000 | 809,580 | (4) | |||||||||||||
| 7.500 | % | 01/25/2016 | 1,138,000 | 1,118,085 | (5) | |||||||||||||
Yanlord Land Group Ltd. | 9.500 | % | 05/04/2017 | 349,000 | 357,306 | (4) | ||||||||||||
|
| |||||||||||||||||
| 15,336,721 | ||||||||||||||||||
|
| |||||||||||||||||
Colombia - 0.11% | ||||||||||||||||||
Gruposura Finance | 5.700 | % | 05/18/2021 | 813,000 | 810,967 | (5) | ||||||||||||
|
| |||||||||||||||||
Dominican Republic - 0.19% | ||||||||||||||||||
Cap Cana SA: | ||||||||||||||||||
| 10.000 | % | 04/30/2016 | 1,103,320 | 772,324 | (2)(4) | |||||||||||||
| 10.000 | % | 04/30/2016 | 1,279,402 | 639,701 | (2)(4) | |||||||||||||
|
| |||||||||||||||||
| 1,412,025 | ||||||||||||||||||
|
| |||||||||||||||||
Egypt - 0.17% | ||||||||||||||||||
Orascom Telecom Finance SCA | 7.875 | % | 02/08/2014 | 1,239,000 | 1,287,011 | (4) | ||||||||||||
|
| |||||||||||||||||
Hong Kong - 0.20% | ||||||||||||||||||
Hutchison Whampoa International 10 Ltd. | 6.000 | % | 10/28/2049 | 698,000 | 722,460 | (3)(4) | ||||||||||||
PCCW-HKT Capital No 4 Ltd. | 4.250 | % | 02/24/2016 | 749,000 | 758,168 | |||||||||||||
|
| |||||||||||||||||
| 1,480,628 | ||||||||||||||||||
|
| |||||||||||||||||
India - 0.43% | ||||||||||||||||||
Axis Bank Ltd. | 7.125 | % | 06/28/2022 | 311,000 | 310,222 | (3) | ||||||||||||
Bank of India | 6.994 | % | 03/03/2049 | 344,000 | 339,253 | (3) | ||||||||||||
ICICI Bank Ltd.: | ||||||||||||||||||
| 5.750 | % | 11/16/2020 | 200,000 | 199,994 | (4) | |||||||||||||
| 5.750 | % | 11/16/2020 | 608,000 | 607,982 | (5) | |||||||||||||
Vedanta Resources PLC | 8.250 | % | 06/07/2021 | 1,715,000 | 1,732,150 | (5) | ||||||||||||
|
| |||||||||||||||||
| 3,189,601 | ||||||||||||||||||
|
| |||||||||||||||||
See Notes to Financial Statements.
Stone Harbor Investment Funds Annual Report | May 31, 2011 | 17 |
Table of Contents
| Stone Harbor Emerging Markets Debt Fund | Statements of Investments | |
| May 31, 2011 |
Currency | Rate | Maturity Date | Principal Amount * | Market Value (Expressed in U.S. $) | ||||||||||||||
Indonesia - 0.66% | ||||||||||||||||||
Bakrie Telecom Pte Ltd. | 11.500 | % | 05/07/2015 | $ | 1,270,000 | $ | 1,330,325 | (4) | ||||||||||
BLT Finance BV | 7.500 | % | 05/15/2014 | 644,000 | 555,253 | (4) | ||||||||||||
BSP Finance BV | 10.750 | % | 11/01/2011 | 300,000 | 298,110 | |||||||||||||
Bumi Investment Pte Ltd.: | ||||||||||||||||||
| 10.750 | % | 10/06/2017 | 300,000 | 343,110 | (4) | |||||||||||||
| 10.750 | % | 10/06/2017 | 325,000 | 371,703 | (5) | |||||||||||||
European Bank for Reconstruction & Development | IDR | 7.200 | % | 06/08/2016 | 15,130,000,000 | 1,785,891 | ||||||||||||
Indosat Palapa Co. BV | 7.375 | % | 07/29/2020 | 241,000 | 269,028 | (5) | ||||||||||||
|
| |||||||||||||||||
| 4,953,420 | ||||||||||||||||||
|
| |||||||||||||||||
Jamaica - 0.24% | ||||||||||||||||||
Digicel Group Ltd.: | ||||||||||||||||||
| 9.125 | % | 01/15/2015 | 408,000 | 423,300 | (5) | |||||||||||||
| 8.250 | % | 09/01/2017 | 1,160,000 | 1,223,800 | (4) | |||||||||||||
| 10.500 | % | 04/15/2018 | 150,000 | 170,250 | (4) | |||||||||||||
|
| |||||||||||||||||
| 1,817,350 | ||||||||||||||||||
|
| |||||||||||||||||
Kazakhstan - 2.01% | ||||||||||||||||||
BTA Bank JSC: | ||||||||||||||||||
| 10.750 | % | 07/01/2018 | 1,159,562 | 1,043,606 | (5)(6) | |||||||||||||
| 10.750 | % | 07/01/2018 | 4,666,676 | 4,200,008 | (4)(6) | |||||||||||||
| 26.180 | % | 07/01/2020 | 500,000 | 32,500 | (4)(17) | |||||||||||||
| 0.000 | % | 07/01/2020 | 2,515,532 | 163,510 | (3)(5) | |||||||||||||
KazMunayGas National Co.: | ||||||||||||||||||
| 7.000 | % | 05/05/2020 | 739,000 | 828,604 | (5) | |||||||||||||
| 7.000 | % | 05/05/2020 | 5,615,000 | 6,295,819 | (4) | |||||||||||||
| 6.375 | % | 04/09/2021 | 1,071,000 | 1,144,631 | (5) | |||||||||||||
Zhaikmunai LLP: | ||||||||||||||||||
| 10.500 | % | 10/19/2015 | 200,000 | 215,500 | (4) | |||||||||||||
| 10.500 | % | 10/19/2015 | 1,037,000 | 1,117,367 | (5) | |||||||||||||
|
| |||||||||||||||||
| 15,041,545 | ||||||||||||||||||
|
| |||||||||||||||||
Malaysia - 3.27% | ||||||||||||||||||
Penerbangan Malaysia BHD | 5.625 | % | 03/15/2016 | 1,195,000 | 1,340,850 | (4) | ||||||||||||
Petroliam Nasional BHD: | ||||||||||||||||||
| 7.750 | % | 08/15/2015 | 335,000 | 406,271 | (5) | |||||||||||||
| 7.625 | % | 10/15/2026 | 840,000 | 1,109,766 | (4) | |||||||||||||
Petronas Capital Ltd.: | ||||||||||||||||||
| 5.250 | % | 08/12/2019 | 630,000 | 683,206 | (5) | |||||||||||||
| 5.250 | % | 08/12/2019 | 2,749,000 | 2,981,167 | (4) | |||||||||||||
| 7.875 | % | 05/22/2022 | 12,024,000 | 15,649,477 | (4) | |||||||||||||
Petronas Global Sukuk Ltd. | 4.250 | % | 08/12/2014 | 2,240,000 | 2,372,496 | (5) | ||||||||||||
|
| |||||||||||||||||
| 24,543,233 | ||||||||||||||||||
|
| |||||||||||||||||
See Notes to Financial Statements.
| 18 | www.shiplp.com |
Table of Contents
| Stone Harbor Emerging Markets Debt Fund | Statements of Investments | |
| May 31, 2011 |
Currency | Rate | Maturity Date | Principal Amount * | Market Value (Expressed in U.S. $) | ||||||||||||||||||
Mexico - 2.14% | ||||||||||||||||||||||
Alestra SA | 11.750 | % | 08/11/2014 | $ | 587,000 | $ | 676,518 | |||||||||||||||
Axtel SAB de CV: | ||||||||||||||||||||||
| 7.625 | % | 02/01/2017 | 17,000 | 16,363 | (5) | |||||||||||||||||
| 9.000 | % | 09/22/2019 | 271,000 | 270,322 | (4) | |||||||||||||||||
Bank of New York Mellon SA Institucion de Banca Multiple | 9.625 | % | 05/02/2021 | 2,583,000 | 2,679,862 | (2)(5) | ||||||||||||||||
Cemex Espana Luxembourg | EUR | 8.875 | % | 05/12/2017 | 54,000 | 78,100 | (2)(4) | |||||||||||||||
Cemex Finance Europe BV | EUR | 4.750 | % | 03/05/2014 | 483,000 | 657,723 | ||||||||||||||||
Cemex SAB de CV: | ||||||||||||||||||||||
| 5.301 | % | 09/30/2015 | 2,251,000 | 2,225,676 | (3)(5) | |||||||||||||||||
| 9.000 | % | 01/11/2018 | 100,000 | 104,750 | (4) | |||||||||||||||||
| 9.000 | % | 01/11/2018 | 847,000 | 887,233 | (5) | |||||||||||||||||
Desarrolla Homex SAB de CV | 7.500 | % | 09/28/2015 | 215,000 | 220,375 | |||||||||||||||||
Hipotecaria Su Casita SA de CV: | ||||||||||||||||||||||
| 8.500 | % | 10/04/2016 | 67,000 | 28,810 | (4) | |||||||||||||||||
| 8.500 | % | 10/04/2016 | 195,000 | 87,750 | (2)(5) | |||||||||||||||||
Pemex Finance Ltd. | 9.150 | % | 11/15/2018 | 1,250,000 | 1,442,018 | |||||||||||||||||
Pemex Project Funding Master Trust: | ||||||||||||||||||||||
| EUR | 5.500 | % | 02/24/2025 | 2,275,000 | 3,160,995 | (4) | ||||||||||||||||
| 6.625 | % | 06/15/2035 | 3,034,000 | 3,150,051 | ||||||||||||||||||
Urbi Desarrollos Urbanos SAB de CV | 9.500 | % | 01/21/2020 | 308,000 | 343,420 | (4) | ||||||||||||||||
|
| |||||||||||||||||||||
| 16,029,966 | ||||||||||||||||||||||
|
| |||||||||||||||||||||
Peru - 0.31% | ||||||||||||||||||||||
Banco Continental SA via Continental Senior Trustees Cayman Ltd. | 5.500 | % | 11/18/2020 | 766,000 | 714,992 | (5) | ||||||||||||||||
Banco de Credito del Peru/Panama | 5.375 | % | 09/16/2020 | 561,000 | 535,755 | (5) | ||||||||||||||||
Inkia Energy Ltd. | 8.375 | % | 04/04/2021 | 785,000 | 805,803 | (5) | ||||||||||||||||
Southern Copper Corp. | 6.750 | % | 04/16/2040 | 267,000 | 272,577 | |||||||||||||||||
|
| |||||||||||||||||||||
| 2,329,127 | ||||||||||||||||||||||
|
| |||||||||||||||||||||
Qatar - 0.74% | ||||||||||||||||||||||
Qtel International Finance Ltd.: | ||||||||||||||||||||||
| 7.875 | % | 06/10/2019 | 779,000 | 935,579 | (4) | |||||||||||||||||
| 4.750 | % | 02/16/2021 | 567,000 | 552,825 | (5) | |||||||||||||||||
| 5.000 | % | 10/19/2025 | 1,738,000 | 1,607,650 | (5) | |||||||||||||||||
| 5.000 | % | 10/19/2025 | 2,622,000 | 2,425,350 | (4) | |||||||||||||||||
|
| |||||||||||||||||||||
| 5,521,404 | ||||||||||||||||||||||
|
| |||||||||||||||||||||
Russia - 1.02% | ||||||||||||||||||||||
Alfa Bank OJSC Via Alfa Bond Issuance PLC: | ||||||||||||||||||||||
| 7.875 | % | 09/25/2017 | 100,000 | 104,750 | (4) | |||||||||||||||||
| 7.875 | % | 09/25/2017 | 658,000 | 689,255 | (5) | |||||||||||||||||
Alliance Oil Co. Ltd. | 9.875 | % | 03/11/2015 | 271,000 | 300,471 | (4) | ||||||||||||||||
ALROSA Finance SA | 7.750 | % | 11/03/2020 | 378,000 | 414,383 | (5) | ||||||||||||||||
Evraz Group SA | 6.750 | % | 04/27/2018 | 1,714,000 | 1,729,854 | (5) | ||||||||||||||||
Novatek Finance Ltd. | 6.604 | % | 02/03/2021 | 1,672,000 | 1,774,410 | (5) | ||||||||||||||||
Severstal OAO Via Steel Capital SA: | ||||||||||||||||||||||
| 6.700 | % | 10/25/2017 | 613,000 | 629,091 | (5) | |||||||||||||||||
| 6.700 | % | 10/25/2017 | 750,000 | 769,688 | (4) | |||||||||||||||||
Vimpel Communications Via VIP Finance Ireland Ltd. OJSC | 7.748 | % | 02/02/2021 | 1,167,000 | 1,237,020 | (5) | ||||||||||||||||
|
| |||||||||||||||||||||
| 7,648,922 | ||||||||||||||||||||||
|
| |||||||||||||||||||||
See Notes to Financial Statements.
Stone Harbor Investment Funds Annual Report | May 31, 2011 | 19 |
Table of Contents
| Stone Harbor Emerging Markets Debt Fund | Statements of Investments | |
| May 31, 2011 |
Currency | Rate | Maturity Date | Principal Amount * | Market Value (Expressed in U.S. $) | ||||||||||||||||||
Singapore - 0.16% | ||||||||||||||||||||||
STATS ChipPAC Ltd.: | ||||||||||||||||||||||
| 7.500 | % | 08/12/2015 | $ | 234,000 | $ | 254,475 | (4) | |||||||||||||||
| 7.500 | % | 08/12/2015 | 389,000 | 423,037 | (5) | |||||||||||||||||
| 5.375 | % | 03/31/2016 | 510,000 | 513,825 | (5) | |||||||||||||||||
|
| |||||||||||||||||||||
| 1,191,337 | ||||||||||||||||||||||
|
| |||||||||||||||||||||
South Africa - 0.18% | ||||||||||||||||||||||
Gold Fields Orogen Holding BVI Ltd. | 4.875 | % | 10/07/2020 | 544,000 | 529,720 | (4) | ||||||||||||||||
Myriad International Holding BV: | ||||||||||||||||||||||
| 6.375 | % | 07/28/2017 | 100,000 | 108,625 | (4) | |||||||||||||||||
| 6.375 | % | 07/28/2017 | 650,000 | 706,063 | (5) | |||||||||||||||||
|
| |||||||||||||||||||||
| 1,344,408 | ||||||||||||||||||||||
|
| |||||||||||||||||||||
South Korea - 0.37% | ||||||||||||||||||||||
Export Import Bank of Korea | 8.125 | % | 01/21/2014 | 2,447,000 | 2,813,194 | |||||||||||||||||
|
| |||||||||||||||||||||
Turkey - 0.42% | ||||||||||||||||||||||
Yuksel Insaat AS | 9.500 | % | 11/10/2015 | 3,237,000 | 3,123,705 | (4) | ||||||||||||||||
|
| |||||||||||||||||||||
Ukraine - 0.83% | ||||||||||||||||||||||
Avangardco Investments Public Ltd. | 10.000 | % | 10/29/2015 | 646,000 | 642,770 | |||||||||||||||||
DTEK Finance BV | 9.500 | % | 04/28/2015 | 860,000 | 929,514 | (4) | ||||||||||||||||
Ferrexpo Finance PLC | 7.875 | % | 04/07/2016 | 886,000 | 914,795 | (5) | ||||||||||||||||
Metinvest BV | 8.750 | % | 02/14/2018 | 2,424,000 | 2,590,650 | (5) | ||||||||||||||||
MHP SA | 10.250 | % | 04/29/2015 | 585,000 | 623,756 | (4) | ||||||||||||||||
Mriya Agro Holding PLC | 10.950 | % | 03/30/2016 | 510,000 | 513,188 | (5) | ||||||||||||||||
|
| |||||||||||||||||||||
| 6,214,673 | ||||||||||||||||||||||
|
| |||||||||||||||||||||
United Arab Emirates - 0.74% | ||||||||||||||||||||||
DP World Ltd. | 6.850 | % | 07/02/2037 | 1,770,000 | 1,718,670 | (4) | ||||||||||||||||
Dubai Holding Commercial Operations MTN Ltd.: | ||||||||||||||||||||||
EUR | 4.750 | % | 01/30/2014 | 150,000 | 195,897 | |||||||||||||||||
GBP | 6.000 | % | 02/01/2017 | 1,300,000 | 1,807,041 | |||||||||||||||||
Dubai Sukuk Centre Ltd. | 0.685 | % | 06/13/2012 | 1,993,000 | 1,865,448 | (3) | ||||||||||||||||
|
| |||||||||||||||||||||
| 5,587,056 | ||||||||||||||||||||||
|
| |||||||||||||||||||||
Venezuela - 4.74% | ||||||||||||||||||||||
Petroleos de Venezuela SA: | ||||||||||||||||||||||
| 4.900 | % | 10/28/2014 | 37,064,039 | 27,381,059 | ||||||||||||||||||
| 5.000 | % | 10/28/2015 | 2,669,366 | 1,755,108 | ||||||||||||||||||
| 5.250 | % | 04/12/2017 | 6,000,000 | 3,655,500 | ||||||||||||||||||
| 8.500 | % | 11/02/2017 | 3,818,000 | 2,734,642 | (4) | |||||||||||||||||
|
| |||||||||||||||||||||
| 35,526,309 | ||||||||||||||||||||||
|
| |||||||||||||||||||||
TOTAL CORPORATE BONDS | 184,148,765 | |||||||||||||||||||||
|
| |||||||||||||||||||||
(Cost $180,335,164) | ||||||||||||||||||||||
See Notes to Financial Statements.
| 20 | www.shiplp.com |
Table of Contents
| Stone Harbor Emerging Markets Debt Fund | Statements of Investments | |
| May 31, 2011 |
Currency | Rate | Maturity Date | Principal Amount * | Market Value (Expressed in U.S. $) | ||||||||||||||||||
CREDIT LINKED NOTES - 6.26% | ||||||||||||||||||||||
Argentina - 0.46% | ||||||||||||||||||||||
Cablevision SA | 9.375 | % | 02/12/2018 | $ | 3,459,000 | $ | 3,467,648 | (9) | ||||||||||||||
|
| |||||||||||||||||||||
Brazil - 2.55% | ||||||||||||||||||||||
Nota Do Tesouro Nacional: | ||||||||||||||||||||||
| BRL | 10.000 | % | 01/01/2017 | 600,000 | 344,920 | (12) | ||||||||||||||||
| BRL | 10.000 | % | 01/01/2017 | 1,000,000 | 573,602 | (13) | ||||||||||||||||
| BRL | 10.000 | % | 01/01/2017 | 1,000,000 | 573,221 | (13) | ||||||||||||||||
| BRL | 10.000 | % | 01/01/2021 | 2,000,000 | 1,102,836 | (13) | ||||||||||||||||
| BRL | 10.000 | % | 01/01/2021 | 2,000,000 | 1,102,837 | (13) | ||||||||||||||||
| BRL | 10.000 | % | 01/01/2021 | 3,000,000 | 1,801,616 | (14) | ||||||||||||||||
| BRL | 10.000 | % | 01/01/2021 | 4,000,000 | 2,211,991 | (15) | ||||||||||||||||
| BRL | 10.000 | % | 01/01/2021 | 5,000,000 | 2,764,989 | (10) | ||||||||||||||||
| BRL | 10.000 | % | 01/01/2021 | 6,000,000 | 3,317,986 | (9) | ||||||||||||||||
| BRL | 10.000 | % | 01/01/2021 | 9,600,000 | 5,308,778 | (14) | ||||||||||||||||
|
| |||||||||||||||||||||
| 19,102,776 | ||||||||||||||||||||||
|
| |||||||||||||||||||||
Colombia - 0.98% | ||||||||||||||||||||||
Colombia CGM: | ||||||||||||||||||||||
| COP | 11.000 | % | 07/24/2020 | 3,500,000,000 | 2,308,176 | (14) | ||||||||||||||||
| COP | 11.000 | % | 07/24/2020 | 5,700,000,000 | 3,759,030 | (14) | ||||||||||||||||
| COP | 10.000 | % | 07/24/2024 | 1,952,000,000 | 1,242,290 | (14) | ||||||||||||||||
|
| |||||||||||||||||||||
| 7,309,496 | ||||||||||||||||||||||
|
| |||||||||||||||||||||
Indonesia - 1.56% | ||||||||||||||||||||||
Republic of Indonesia: | ||||||||||||||||||||||
| IDR | 11.500 | % | 09/18/2019 | 3,900,000,000 | 575,142 | (15) | ||||||||||||||||
| IDR | 11.000 | % | 11/16/2020 | 4,600,000,000 | 668,537 | (12) | ||||||||||||||||
| IDR | 12.800 | % | 06/15/2021 | 7,000,000,000 | 1,127,644 | (13) | ||||||||||||||||
| IDR | 12.800 | % | 06/15/2021 | 17,000,000,000 | 2,708,687 | (10) | ||||||||||||||||
| IDR | 8.250 | % | 07/15/2021 | 7,400,000,000 | 922,237 | (9) | ||||||||||||||||
| IDR | 8.250 | % | 07/15/2021 | 7,411,000,000 | | 923,607 | (13) | |||||||||||||||
| IDR | 8.250 | % | 07/15/2021 | 14,200,000,000 | 1,770,113 | (12) | ||||||||||||||||
| IDR | 11.000 | % | 09/15/2025 | 9,000,000,000 | 1,294,300 | (12) | ||||||||||||||||
| IDR | 10.000 | % | 02/15/2028 | 13,000,000,000 | 1,703,913 | (15) | ||||||||||||||||
|
| |||||||||||||||||||||
| 11,694,180 | ||||||||||||||||||||||
|
| |||||||||||||||||||||
Iraq - 0.71% | ||||||||||||||||||||||
Republic of Iraq | JPY | 2.286 | % | 01/01/2028 | 600,000,000 | 5,299,963 | (3)(16) | |||||||||||||||
|
| |||||||||||||||||||||
TOTAL CREDIT LINKED NOTES | 46,874,063 | |||||||||||||||||||||
|
| |||||||||||||||||||||
(Cost $45,470,562) | ||||||||||||||||||||||
PARTICIPATION NOTES - 0.65% | ||||||||||||||||||||||
Argentina - 0.21% | ||||||||||||||||||||||
Endesa Costanera SA | 11.304 | % | 03/30/2012 | 456,000 | 456,000 | (3)(10) | ||||||||||||||||
Hidroelec el Chocon SA | 8.061 | % | 03/01/2015 | 1,100,00 | 1,100,000 | (11) | ||||||||||||||||
|
| |||||||||||||||||||||
| 1,556,000 | ||||||||||||||||||||||
|
| |||||||||||||||||||||
Ukraine - 0.44% | ||||||||||||||||||||||
Ukreximbank Biz Finance PLC | 8.375 | % | 04/27/2015 | 3,166,000 | 3,340,130 | (4) | ||||||||||||||||
|
| |||||||||||||||||||||
TOTAL PARTICIPATION NOTES | 4,896,130 | |||||||||||||||||||||
|
| |||||||||||||||||||||
(Cost $4,843,718) | ||||||||||||||||||||||
See Notes to Financial Statements.
Stone Harbor Investment Funds Annual Report | May 31, 2011 | 21 |
Table of Contents
| Stone Harbor Emerging Markets Debt Fund | Statements of Investments | |
| May 31, 2011 |
| Shares | Market Value (Expressed in U.S. $) | |||||||
SHORT TERM INVESTMENTS - 6.80% | ||||||||
Money Market Mutual Funds - 6.80% | ||||||||
Dreyfus Cash Advantage Plus Fund | ||||||||
(0.042% 7-Day Yield) | 50,972,750 | $ | 50,972,750 | |||||
|
| |||||||
TOTAL SHORT TERM INVESTMENTS | 50,972,750 | |||||||
|
| |||||||
(Cost $50,972,750) | ||||||||
Total Investments - 100.77% | $ | 755,113,737 | ||||||
(Cost $730,148,968) | ||||||||
Liabilities in Excess of Other Assets - (0.77)% | (5,766,068 | ) | ||||||
|
| |||||||
Net Assets - 100.00% | $ | 749,347,669 | ||||||
|
| |||||||
* The principal/contract amount of each security is stated in the currency in which the bond is denominated (U.S. Dollar unless otherwise notated). See below.
ARS | Argentine Peso | IDR | Indonesian Rupiah | |||
BRL | Brazilian Real | JPY | Japanese Yen | |||
CNY | Chinese Yen | MXN | Mexican Peso | |||
COP | Colombian Peso | MYR | Malaysian Ringgit | |||
EUR | Euro Currency | RUB | Russian Ruble | |||
GBP | Great Britain Pound | ZAR | South African Rand |
| (1) | Security is currently in default/non-income producing. |
| (2) | This security has been valued by management at its fair value determined in good faith pursuant to procedures approved by the Board of Trustees. Total market value of fair valued securities amounts to $25,273,467 which represents approximately 3.37% of net assets as of May 31, 2011. |
| (3) | Floating or variable rate security. Interest rate disclosed is that which is in effect at May 31, 2011. |
| (4) | Securities were issued pursuant to Regulation S under the Securities Act of 1933, which exempts securities offered and sold outside of the United States from registration. Such securities cannot be sold in the United States without either an effective registration statement filed pursuant to the Securities Act of 1933, or pursuant to an exemption from registration. These securities have been deemed liquid under procedures approved by the Fund’s Board of Trustees. As of May 31, 2011, the aggregate market value of those securities was $211,367,070, representing 28.21% of net assets. |
| (5) | Security exempt from registration under Rule 144A of the Securities Act of 1933. Under procedures approved by the Board of Trustees, such securities have been determined to be liquid by the Investment Advisor and may normally be sold to qualified institutional buyers in transactions exempt from registration. Total market value of Rule 144A securities amounts to $76,110,973, which represents approximately 10.16% of net assets as of May 31, 2011. |
| (6) | Step bond. Coupon increases periodically based upon a predetermined schedule. Interest rate disclosed is that which is in effect at May 31, 2011. |
| (7) | Pay-in-kind securities. |
| (8) | Bank loans generally pay interest at rates which are periodically determined by reference to a base lending rate plus a premium. All loans carry a variable rate of interest. These base lending rates are generally (i) the Prime Rate offered by one or more major United States banks, (ii) the lending rate offered by one or more European banks such as the London Interbank Offered Rate (“LIBOR”) or (iii) the Certificate of Deposit rate. Rate shown represents the weighted average rate at May 31, 2011. Bank Loans, while exempt from registration, under the Securities Act of 1933 (the “1933 Act”), contain certain restrictions on resale and cannot be sold publicly. Floating rate bank loans often require prepayments from excess cash flow or permit the borrower to repay at its election. The degree to which borrowers repay, whether as a contractual requirement or at their election, cannot be predicted with accuracy. As a result, the actual remaining maturity may be substantially less than the stated maturity shown. |
| (9) | The underlying security is issued by Deutsche Bank AG London. |
| (10) | The underlying security is issued by Credit Suisse First Boston. |
| (11) | The underlying security is issued by Bley Investment. |
| (12) | The underlying security is issued by HSBC Bank. |
| (13) | The underlying security is issued by JP Morgan Chase. |
| (14) | The underlying security is issued by Citigroup Global Markets. |
| (15) | The underlying security is issued by Barclays Bank PLC. |
| (16) | The underlying security is issued by Merrill Lynch. |
| (17) | Zero coupon bond reflects effective yield on date of purchase. |
See Notes to Financial Statements.
| 22 | www.shiplp.com |
Table of Contents
| Stone Harbor Emerging Markets Debt Fund | Statements of Investments | |
| May 31, 2011 |
Common Abbreviations:
AS - Anonim Sirket is the Turkish term for Incorporation.
BHD - Berhad is the Malaysian term for public limited company.
BV - Besloten Vennootschap a Dutch private limited liability company.
CGM - Citigroup Global Markets.
JSC - Joint Stock Co.
LLP - Limited Liability Partnership.
Ltd. - Limited.
MTN - Medium Term Note.
OJSC - Open Joint Stock Co.
PLC - Public Limited Co.
Pte - Private.
SA - Generally designates corporations in various countries, mostly those employing the civil law.
SA de CV - A variable capital company.
SAB de CV - A variable capital company.
SCA - Soceite en Commandite par actions is the French equivalent of a limited partnership.
OUTSTANDING FORWARD FOREIGN CURRENCY CONTRACTS
Contract Description | Contracted Amount | Purchase/Sale Contract | Settlement Date | Current Value | Unrealized Appreciation/ (Depreciation) | |||||||||||
| BRL | 12,465,149 | Purchase | 06/02/2011 | $ | 7,897,082 | $ | 234,180 | |||||||||
| BRL | 12,465,150 | Sale | 06/02/2011 | 7,897,082 | 9,782 | |||||||||||
| CNY | 28,149,000 | Purchase | 08/09/2011 | 4,358,188 | 101,046 | |||||||||||
| CNY | 37,208,050 | Purchase | 11/14/2011 | 5,795,060 | 37,194 | |||||||||||
| CNY | 46,122,798 | Purchase | 05/16/2012 | 7,256,291 | 13,350 | |||||||||||
| RUB | 199,445,312 | Purchase | 08/19/2011 | 7,068,673 | 28,673 | |||||||||||
|
| |||||||||||||||
| $ | 424,225 | |||||||||||||||
|
| |||||||||||||||
| CNY | 28,149,000 | Sale | 08/09/2011 | $ | 4,358,188 | $ | (27,143 | ) | ||||||||
| CNY | 43,251,798 | Sale | 11/14/2011 | 6,736,358 | (10,417 | ) | ||||||||||
| CNY | 6,043,748 | Purchase | 11/14/2011 | 941,298 | (3,702 | ) | ||||||||||
| EUR | 13,240,955 | Sale | 07/14/2011 | 19,034,132 | (323,542 | ) | ||||||||||
| GBP | 1,122,000 | Sale | 07/14/2011 | 1,844,697 | (28,123 | ) | ||||||||||
| JPY | 436,083,000 | Sale | 07/14/2011 | 5,350,953 | (17,094 | ) | ||||||||||
|
| |||||||||||||||
| $ | (410,021 | ) | ||||||||||||||
|
| |||||||||||||||
See Notes to Financial Statements.
Stone Harbor Investment Funds Annual Report | May 31, 2011 | 23 |
Table of Contents
| Stone Harbor High Yield Bond Fund | Statements of Investments | |
| May 31, 2011 |
| Rate | Maturity Date | Principal Amount * | Market Value (Expressed in U.S. $) | |||||||||||||||
CORPORATE BONDS - 91.39% | ||||||||||||||||||
Aerospace/Defense - 1.91% | ||||||||||||||||||
CPI International Acquisition, Inc. | 8.000 | % | 02/15/2018 | $ | 2,225,000 | $ | 2,250,031 | (1) | ||||||||||
Huntington Ingalls Industries, Inc. | 7.125 | % | 03/15/2021 | 2,125,000 | 2,228,594 | (1) | ||||||||||||
TransDigm, Inc. | 7.750 | % | 12/15/2018 | 2,900,000 | 3,095,750 | (1) | ||||||||||||
Triumph Group, Inc. | 8.625 | % | 07/15/2018 | 1,575,000 | 1,750,219 | |||||||||||||
|
| |||||||||||||||||
| 9,324,594 | ||||||||||||||||||
|
| |||||||||||||||||
Automotive - 1.68% | ||||||||||||||||||
Allison Transmission, Inc. | 7.125 | % | 05/15/2019 | 1,100,000 | 1,097,250 | (1) | ||||||||||||
Chrysler Group LLC: | ||||||||||||||||||
| 8.000 | % | 06/15/2019 | 750,000 | 751,875 | (1) | |||||||||||||
| 8.250 | % | 06/15/2021 | 1,200,000 | 1,203,000 | (1) | |||||||||||||
Commercial Vehicle Group, Inc. | 7.875 | % | 04/15/2019 | 650,000 | 667,875 | (1) | ||||||||||||
Ford Motor Co.: | ||||||||||||||||||
| 7.450 | % | 07/16/2031 | 910,000 | 1,037,843 | ||||||||||||||
| 8.900 | % | 01/15/2032 | 25,000 | 30,091 | ||||||||||||||
Pinafore LLC | 9.000 | % | 10/01/2018 | 1,975,000 | 2,177,438 | (1) | ||||||||||||
TRW Automotive, Inc. | 8.875 | % | 12/01/2017 | 550,000 | 620,125 | (1) | ||||||||||||
Uncle Acquisition 2010 Corp. | 8.625 | % | 02/15/2019 | 575,000 | 606,625 | (1) | ||||||||||||
|
| |||||||||||||||||
| 8,192,122 | ||||||||||||||||||
|
| |||||||||||||||||
Banking - 0.89% | ||||||||||||||||||
E*Trade Financial Corp. | 12.500 | % | 11/30/2017 | 1,670,000 | 2,016,525 | (2) | ||||||||||||
Provident Funding Associates LP: | ||||||||||||||||||
| 10.250 | % | 04/15/2017 | 1,025,000 | 1,137,750 | (1) | |||||||||||||
| 10.125 | % | 02/15/2019 | 1,125,000 | 1,170,000 | (1) | |||||||||||||
|
| |||||||||||||||||
| 4,324,275 | ||||||||||||||||||
|
| |||||||||||||||||
Building Products - 1.21% | ||||||||||||||||||
American Standard Americas | 10.750 | % | 01/15/2016 | 715,000 | 752,538 | (1) | ||||||||||||
Associated Materials LLC | 9.125 | % | 11/01/2017 | 150,000 | 155,438 | (1) | ||||||||||||
Griffon Corp. | 7.125 | % | 04/01/2018 | 1,025,000 | 1,050,625 | (1) | ||||||||||||
Interface, Inc. | 7.625 | % | 12/01/2018 | 1,225,000 | 1,316,875 | |||||||||||||
Interline Brands, Inc. | 7.000 | % | 11/15/2018 | 550,000 | 565,812 | |||||||||||||
Norcraft Cos. LP: | ||||||||||||||||||
| 10.500 | % | 12/15/2015 | 850,000 | 894,625 | (1) | |||||||||||||
| 10.500 | % | 12/15/2015 | 1,125,000 | 1,184,062 | ||||||||||||||
|
| |||||||||||||||||
| 5,919,975 | ||||||||||||||||||
|
| |||||||||||||||||
Chemicals - 2.84% | ||||||||||||||||||
Ineos Group Holdings PLC | 8.500 | % | 02/15/2016 | 2,165,000 | 2,238,069 | (1) | ||||||||||||
Koppers, Inc. | 7.875 | % | 12/01/2019 | 1,875,000 | 2,043,750 | |||||||||||||
Lyondell Chemical Co. | 8.375 | % | 08/15/2015 | 945,000 | 0 | (1)(3)(4) | ||||||||||||
MacDermid, Inc. | 9.500 | % | 04/15/2017 | 1,875,000 | 2,010,938 | (1) | ||||||||||||
Momentive Performance Materials, Inc.: | ||||||||||||||||||
| 11.500 | % | 12/01/2016 | 1,100,000 | 1,190,750 | ||||||||||||||
| 9.000 | % | 01/15/2021 | 2,120,000 | 2,273,700 | (1) | |||||||||||||
NewMarket Corp. | 7.125 | % | 12/15/2016 | 1,405,000 | 1,467,354 | |||||||||||||
Nova Chemicals Corp. | 8.375 | % | 11/01/2016 | 2,375,000 | 2,665,937 | |||||||||||||
|
| |||||||||||||||||
| 13,890,498 | ||||||||||||||||||
|
| |||||||||||||||||
See Notes to Financial Statements.
| 24 | www.shiplp.com |
Table of Contents
| Stone Harbor High Yield Bond Fund | Statements of Investments | |
| May 31, 2011 |
| Rate | Maturity Date | Principal Amount * | Market Value (Expressed in U.S. $) | |||||||||||||||||||
Construction Machinery - 1.13% | ||||||||||||||||||||||
Case New Holland, Inc. | 7.875 | % | 12/01/2017 | $ | 950,000 | $ | 1,061,625 | (1) | ||||||||||||||
The Manitowoc Co., Inc.: | ||||||||||||||||||||||
| 9.500 | % | 02/15/2018 | 1,975,000 | 2,197,187 | ||||||||||||||||||
| 8.500 | % | 11/01/2020 | 100,000 | 109,250 | ||||||||||||||||||
United Rentals North America, Inc. | 8.375 | % | 09/15/2020 | 2,050,000 | 2,142,250 | |||||||||||||||||
|
| |||||||||||||||||||||
| 5,510,312 | ||||||||||||||||||||||
|
| |||||||||||||||||||||
Consumer Products - 0.75% | ||||||||||||||||||||||
Armored Autogroup, Inc. | 9.250 | % | 11/01/2018 | 1,025,000 | 1,044,219 | (1) | ||||||||||||||||
Elizabeth Arden, Inc. | 7.375 | % | 03/15/2021 | 850,000 | 896,750 | |||||||||||||||||
NBTY, Inc. | 9.000 | % | 10/01/2018 | 800,000 | 862,000 | (1) | ||||||||||||||||
Visant Corp. | 10.000 | % | 10/01/2017 | 800,000 | 850,000 | |||||||||||||||||
|
| |||||||||||||||||||||
| 3,652,969 | ||||||||||||||||||||||
|
| |||||||||||||||||||||
Containers/Packaging - 2.58% | ||||||||||||||||||||||
ARD Finance SA | 11.125 | % | 06/01/2018 | 200,000 | | 207,000 | (1)(2) | |||||||||||||||
Ardagh Packaging Finance PLC | 9.125 | % | 10/15/2020 | 2,050,000 | 2,265,250 | (1) | ||||||||||||||||
BWAY Holding Co. | 10.000 | % | 06/15/2018 | 1,275,000 | 1,428,000 | |||||||||||||||||
Graham Packaging Co. LP | 8.250 | % | 10/01/2018 | 975,000 | 1,067,625 | |||||||||||||||||
Owens Illinois, Inc. | 7.800 | % | 05/15/2018 | 325,000 | 357,500 | |||||||||||||||||
Pregis Corp. | 12.375 | % | 10/15/2013 | 750,000 | 748,125 | |||||||||||||||||
Radnor Holdings Corp. | 11.000 | % | 03/15/2010 | 25,000 | 2 | (3)(4) | ||||||||||||||||
Reynolds Group Issuer, Inc.: | ||||||||||||||||||||||
| 7.750 | % | 10/15/2016 | 1,850,000 | 1,988,750 | (1) | |||||||||||||||||
| 9.000 | % | 04/15/2019 | 2,250,000 | 2,399,063 | (1) | |||||||||||||||||
| 8.250 | % | 02/15/2021 | 650,000 | 664,625 | (1) | |||||||||||||||||
Reynolds Group, Inc. | 8.500 | % | 05/15/2018 | 975,000 | 1,018,875 | (1) | ||||||||||||||||
Solo Cup Co. | 8.500 | % | 02/15/2014 | 490,000 | 452,025 | |||||||||||||||||
|
| |||||||||||||||||||||
| 12,596,840 | ||||||||||||||||||||||
|
| |||||||||||||||||||||
Drillers/Services - 3.33% | ||||||||||||||||||||||
Basic Energy Services, Inc. | 7.125 | % | 04/15/2016 | 1,150,000 | 1,184,500 | |||||||||||||||||
Bristow Group, Inc. | 7.500 | % | 09/15/2017 | 1,205,000 | 1,271,275 | |||||||||||||||||
CHC Helicopter SA | 9.250 | % | 10/15/2020 | 2,175,000 | 2,120,625 | (1) | ||||||||||||||||
Complete Production Services, Inc. | 8.000 | % | 12/15/2016 | 1,975,000 | 2,088,563 | |||||||||||||||||
Exterran Holdings, Inc. | 7.250 | % | 12/01/2018 | 1,125,000 | 1,161,562 | (1) | ||||||||||||||||
Hercules Offshore LLC | 10.500 | % | 10/15/2017 | 2,255,000 | 2,407,213 | (1) | ||||||||||||||||
Hornbeck Offshore Services, Inc. | 8.000 | % | 09/01/2017 | 1,875,000 | 1,931,250 | |||||||||||||||||
Offshore Group Investments Ltd.: | ||||||||||||||||||||||
| 11.500 | % | 08/01/2015 | 125,000 | 138,125 | (1) | |||||||||||||||||
| 11.500 | % | 08/01/2015 | 515,000 | 570,362 | ||||||||||||||||||
Parker Drilling Co. | 9.125 | % | 04/01/2018 | 200,000 | 219,000 | |||||||||||||||||
PHI, Inc. | 8.625 | % | 10/15/2018 | 800,000 | 854,000 | |||||||||||||||||
SESI LLC | 6.375 | % | 05/01/2019 | 1,100,000 | 1,100,000 | (1) | ||||||||||||||||
Trinidad Drilling Ltd. | 7.875 | % | 01/15/2019 | 1,150,000 | 1,219,000 | (1) | ||||||||||||||||
|
| |||||||||||||||||||||
| 16,265,475 | ||||||||||||||||||||||
|
| |||||||||||||||||||||
Electric - 5.40% | ||||||||||||||||||||||
The AES Corp.: | ||||||||||||||||||||||
| 7.750 | % | 10/15/2015 | 850,000 | 930,750 | ||||||||||||||||||
| 9.750 | % | 04/15/2016 | 925,000 | 1,075,313 | ||||||||||||||||||
See Notes to Financial Statements.
Stone Harbor Investment Funds Annual Report | May 31, 2011 | 25 |
Table of Contents
| Stone Harbor High Yield Bond Fund | Statements of Investments | |
| May 31, 2011 |
| Rate | Maturity Date | Principal Amount * | Market Value (Expressed in U.S. $) | |||||||||||||||||||
| 8.000 | % | 10/15/2017 | $ | 2,225,000 | $ | 2,416,906 | ||||||||||||||||
Calpine Corp.: | ||||||||||||||||||||||
| 7.875 | % | 07/31/2020 | 2,250,000 | 2,396,250 | (1) | |||||||||||||||||
| 7.500 | % | 02/15/2021 | 1,925,000 | 2,011,625 | (1) | |||||||||||||||||
Dynegy Holdings, Inc.: | ||||||||||||||||||||||
| 8.375 | % | 05/01/2016 | 3,070,000 | 2,555,775 | ||||||||||||||||||
| 7.125 | % | 05/15/2018 | 500,000 | 352,500 | ||||||||||||||||||
| 7.750 | % | 06/01/2019 | 460,000 | 338,100 | ||||||||||||||||||
| 7.625 | % | 10/15/2026 | 25,000 | 17,375 | ||||||||||||||||||
Edison Mission Energy: | ||||||||||||||||||||||
| 7.750 | % | 06/15/2016 | 1,825,000 | 1,665,313 | ||||||||||||||||||
| 7.000 | % | 05/15/2017 | 150,000 | 124,875 | ||||||||||||||||||
| 7.200 | % | 05/15/2019 | 1,540,000 | 1,255,100 | ||||||||||||||||||
| 7.625 | % | 05/15/2027 | 1,135,000 | 862,600 | ||||||||||||||||||
GenOn Energy, Inc.: | ||||||||||||||||||||||
| 9.500 | % | 10/15/2018 | 1,650,000 | 1,744,875 | ||||||||||||||||||
| 9.875 | % | 10/15/2020 | 1,875,000 | 1,982,812 | ||||||||||||||||||
NRG Energy, Inc.: | ||||||||||||||||||||||
| 7.625 | % | 05/15/2019 | 775,000 | 775,969 | (1) | |||||||||||||||||
| 8.500 | % | 06/15/2019 | 2,300,000 | 2,392,000 | ||||||||||||||||||
| 8.250 | % | 09/01/2020 | 1,235,000 | 1,272,050 | ||||||||||||||||||
| 7.875 | % | 05/15/2021 | 2,200,000 | 2,208,250 | (1) | |||||||||||||||||
|
| |||||||||||||||||||||
| 26,378,438 | ||||||||||||||||||||||
|
| |||||||||||||||||||||
Environmental Services - 0.35% | ||||||||||||||||||||||
Clean Harbors, Inc. | 7.625 | % | 08/15/2016 | 1,591,000 | 1,706,347 | |||||||||||||||||
|
| |||||||||||||||||||||
Exploration & Production - 4.55% | ||||||||||||||||||||||
Atlas Pipeline Partners LP | 8.750 | % | 06/15/2018 | 225,000 | 244,125 | |||||||||||||||||
Concho Resources, Inc. | 7.000 | % | 01/15/2021 | 1,450,000 | 1,522,500 | |||||||||||||||||
Denbury Resources, Inc. | 8.250 | % | 02/15/2020 | 1,346,000 | 1,494,060 | |||||||||||||||||
Eagle Rock Energy Partners LP | 8.375 | % | 06/01/2019 | 1,525,000 | 1,530,719 | (1) | ||||||||||||||||
Encore Acquisition Co. | 9.500 | % | 05/01/2016 | 1,000,000 | 1,127,500 | |||||||||||||||||
Linn Energy LLC: | ||||||||||||||||||||||
| 6.500 | % | 05/15/2019 | 250,000 | 250,625 | (1) | |||||||||||||||||
| 7.750 | % | 02/01/2021 | 3,225,000 | 3,418,500 | (1) | |||||||||||||||||
MEG Energy Corp. | 6.500 | % | 03/15/2021 | 1,875,000 | 1,896,094 | (1) | ||||||||||||||||
NFR Energy LLC: | ||||||||||||||||||||||
| 9.750 | % | 02/15/2017 | 225,000 | 222,188 | (1) | |||||||||||||||||
| 9.750 | % | 02/15/2017 | 1,075,000 | 1,061,562 | (1) | |||||||||||||||||
Penn Virginia Corp. | 10.375 | % | 06/15/2016 | 1,450,000 | 1,638,500 | |||||||||||||||||
Plains Exploration & Production Co.: | ||||||||||||||||||||||
| 7.625 | % | 06/01/2018 | 800,000 | 854,000 | ||||||||||||||||||
| 7.625 | % | 04/01/2020 | 1,050,000 | 1,113,000 | ||||||||||||||||||
Quicksilver Resources, Inc.: | ||||||||||||||||||||||
| 8.250 | % | 08/01/2015 | 200,000 | 212,000 | ||||||||||||||||||
| 11.750 | % | 01/01/2016 | 700,000 | 815,500 | ||||||||||||||||||
SandRidge Energy, Inc.: | ||||||||||||||||||||||
| 8.000 | % | 06/01/2018 | 575,000 | 606,625 | (1) | |||||||||||||||||
| 8.750 | % | 01/15/2020 | 1,000,000 | 1,092,500 | ||||||||||||||||||
| 7.500 | % | 03/15/2021 | 2,000,000 | 2,072,500 | (1) | |||||||||||||||||
See Notes to Financial Statements.
| 26 | www.shiplp.com |
Table of Contents
| Stone Harbor High Yield Bond Fund | Statements of Investments | |
| May 31, 2011 |
| Rate | Maturity Date | Principal Amount * | Market Value (Expressed in U.S. $) | |||||||||||||||||||
Venoco, Inc. | 8.875 | % | 02/15/2019 | $ | 1,050,000 | $ | 1,064,437 | (1) | ||||||||||||||
|
| |||||||||||||||||||||
| 22,236,935 | ||||||||||||||||||||||
|
| |||||||||||||||||||||
Financial Other - 0.24% | ||||||||||||||||||||||
International Lease Finance Corp. | 8.250 | % | 12/15/2020 | 1,025,000 | 1,153,125 | |||||||||||||||||
|
| |||||||||||||||||||||
Food & Beverage - 2.91% | ||||||||||||||||||||||
Cott Beverages, Inc. | 8.375 | % | 11/15/2017 | 900,000 | 967,500 | |||||||||||||||||
Dean Foods Co.: | ||||||||||||||||||||||
| 7.000 | % | 06/01/2016 | 2,225,000 | 2,241,688 | ||||||||||||||||||
| 9.750 | % | 12/15/2018 | 2,425,000 | 2,625,063 | (1) | |||||||||||||||||
Del Monte Foods Co. | 7.625 | % | 02/15/2019 | 3,475,000 | 3,564,047 | (1) | ||||||||||||||||
Michael Foods, Inc. | 9.750 | % | 07/15/2018 | 725,000 | 801,125 | (1) | ||||||||||||||||
Pinnacle Foods Finance LLC: | ||||||||||||||||||||||
| 9.250 | % | 04/01/2015 | 1,825,000 | 1,920,812 | ||||||||||||||||||
| 10.625 | % | 04/01/2017 | 400,000 | 431,000 | ||||||||||||||||||
| 8.250 | % | 09/01/2017 | 1,550,000 | 1,652,687 | ||||||||||||||||||
|
| |||||||||||||||||||||
| 14,203,922 | ||||||||||||||||||||||
|
| |||||||||||||||||||||
Gaming - 4.31% | ||||||||||||||||||||||
American Casino & Entertainment Properties LLC | 11.000 | % | 06/15/2014 | 675,000 | 723,938 | |||||||||||||||||
Ameristar Casinos, Inc. | 7.500 | % | 04/15/2021 | 1,475,000 | 1,537,688 | (1) | ||||||||||||||||
Boyd Gaming Corp. | 9.125 | % | 12/01/2018 | 2,025,000 | 2,108,531 | (1) | ||||||||||||||||
Caesars Entertainment Operating Co., Inc | 12.750 | % | 04/15/2018 | 1,165,000 | 1,199,950 | |||||||||||||||||
Harrah’s Operating Co., Inc. | 5.375 | % | 12/15/2013 | 1,100,000 | 1,039,500 | |||||||||||||||||
Isle of Capri Casinos, Inc.: | ||||||||||||||||||||||
| 7.000 | % | 03/01/2014 | 2,300,000 | 2,294,250 | ||||||||||||||||||
| 7.750 | % | 03/15/2019 | 1,225,000 | 1,251,031 | (1) | |||||||||||||||||
Jacobs Entertainment, Inc. | 9.750 | % | 06/15/2014 | 205,000 | 210,125 | |||||||||||||||||
MGM Resorts International: | ||||||||||||||||||||||
| 5.875 | % | 02/27/2014 | 2,025,000 | 2,014,875 | ||||||||||||||||||
| 6.875 | % | 04/01/2016 | 1,140,000 | 1,095,825 | ||||||||||||||||||
| 10.000 | % | 11/01/2016 | 1,025,000 | 1,114,688 | (1) | |||||||||||||||||
| 11.125 | % | 11/15/2017 | 800,000 | 932,000 | ||||||||||||||||||
| 9.000 | % | 03/15/2020 | 875,000 | 977,812 | ||||||||||||||||||
Pinnacle Entertainment, Inc.: | ||||||||||||||||||||||
| 7.500 | % | 06/15/2015 | 2,605,000 | 2,676,637 | ||||||||||||||||||
| 8.625 | % | 08/01/2017 | 775,000 | 856,375 | ||||||||||||||||||
| 8.750 | % | 05/15/2020 | 950,000 | 1,028,375 | ||||||||||||||||||
|
| |||||||||||||||||||||
| 21,061,600 | ||||||||||||||||||||||
|
| |||||||||||||||||||||
Gas Distributors - 1.13% | ||||||||||||||||||||||
Inergy LP: | ||||||||||||||||||||||
| 8.750 | % | 03/01/2015 | 556,000 | 597,700 | ||||||||||||||||||
| 6.875 | % | 08/01/2021 | 2,150,000 | 2,217,188 | (1) | |||||||||||||||||
Niska Gas Storage US LLC | 8.875 | % | 03/15/2018 | 2,200,000 | 2,376,000 | |||||||||||||||||
Regency Energy Partners LP | 6.875 | % | 12/01/2018 | 300,000 | 317,250 | |||||||||||||||||
|
| |||||||||||||||||||||
| 5,508,138 | ||||||||||||||||||||||
|
| |||||||||||||||||||||
Gas Pipelines - 2.99% | ||||||||||||||||||||||
ANR Pipeline Co.: | ||||||||||||||||||||||
| 7.375 | % | 02/15/2024 | 60,000 | 75,049 | ||||||||||||||||||
See Notes to Financial Statements.
Stone Harbor Investment Funds Annual Report | May 31, 2011 | 27 |
Table of Contents
| Stone Harbor High Yield Bond Fund | Statements of Investments | |
| May 31, 2011 |
| Rate | Maturity Date | Principal Amount * | Market Value (Expressed in U.S. $) | |||||||||||||||||||
| 7.000 | % | 06/01/2025 | $ | 10,000 | $ | 11,531 | ||||||||||||||||
Copano Energy LLC: | ||||||||||||||||||||||
| 7.750 | % | 06/01/2018 | 675,000 | 710,438 | ||||||||||||||||||
| 7.125 | % | 04/01/2021 | 1,525,000 | 1,544,062 | ||||||||||||||||||
Crosstex Energy, Inc. | 8.875 | % | 02/15/2018 | 1,950,000 | 2,125,500 | |||||||||||||||||
El Paso Corp.: | ||||||||||||||||||||||
| 7.250 | % | 06/01/2018 | 1,500,000 | 1,772,358 | ||||||||||||||||||
Series GMTN | 7.800 | % | 08/01/2031 | 1,900,000 | 2,317,343 | |||||||||||||||||
MarkWest Energy Partners LP: | ||||||||||||||||||||||
Series B | 8.750 | % | 04/15/2018 | 850,000 | 944,562 | |||||||||||||||||
| 6.750 | % | 11/01/2020 | 475,000 | 491,625 | ||||||||||||||||||
| 6.500 | % | 08/15/2021 | 650,000 | 658,937 | ||||||||||||||||||
Sabine Pass LNG LP | 7.250 | % | 11/30/2013 | 2,175,000 | 2,262,000 | |||||||||||||||||
Targa Resources Partners LP: | ||||||||||||||||||||||
| 7.875 | % | 10/15/2018 | 775,000 | 827,312 | (1) | |||||||||||||||||
| 6.875 | % | 02/01/2021 | 850,000 | 848,938 | (1) | |||||||||||||||||
|
| |||||||||||||||||||||
| 14,589,655 | ||||||||||||||||||||||
|
| |||||||||||||||||||||
Healthcare - 8.07% | ||||||||||||||||||||||
Alere, Inc.: | ||||||||||||||||||||||
| 7.875 | % | 02/01/2016 | 1,350,000 | 1,415,812 | ||||||||||||||||||
| 9.000 | % | 05/15/2016 | 1,625,000 | 1,730,625 | ||||||||||||||||||
American Renal Holdings, Inc. | 8.375 | % | 05/15/2018 | 1,875,000 | 1,968,750 | |||||||||||||||||
Biomet, Inc. | 11.625 | % | 10/15/2017 | 1,400,000 | 1,578,500 | |||||||||||||||||
CDRT Merger Sub, Inc. | 8.125 | % | 06/01/2019 | 1,350,000 | 1,365,187 | (1) | ||||||||||||||||
Community Health Systems, Inc. | 8.875 | % | 07/15/2015 | 4,325,000 | 4,476,375 | |||||||||||||||||
ConvaTec Healthcare E SA | 10.500 | % | 12/15/2018 | 2,100,000 | 2,278,500 | (1) | ||||||||||||||||
DaVita, Inc. | 6.625 | % | 11/01/2020 | 850,000 | 875,500 | |||||||||||||||||
HCA Holdings, Inc. | 7.750 | % | 05/15/2021 | 275,000 | 289,094 | (1) | ||||||||||||||||
HCA, Inc.: | ||||||||||||||||||||||
| 6.375 | % | 01/15/2015 | 1,100,000 | 1,138,500 | ||||||||||||||||||
| 9.250 | % | 11/15/2016 | 2,200,000 | 2,359,500 | ||||||||||||||||||
| 9.625 | % | 11/15/2016 | 2,013,000 | 2,158,942 | (2) | |||||||||||||||||
HealthSouth Corp. | 8.125 | % | 02/15/2020 | 3,425,000 | 3,784,625 | |||||||||||||||||
IASIS Healthcare LLC | 8.375 | % | 05/15/2019 | 1,500,000 | 1,513,125 | (1) | ||||||||||||||||
Multiplan, Inc. | 9.875 | % | 09/01/2018 | 850,000 | 922,250 | (1) | ||||||||||||||||
Radiation Therapy Services, Inc. | 9.875 | % | 04/15/2017 | 2,275,000 | 2,317,656 | |||||||||||||||||
Surgical Care Affiliates, Inc.: | ||||||||||||||||||||||
| 8.875 | % | 07/15/2015 | 984,000 | 1,018,440 | (1)(2) | |||||||||||||||||
| 10.000 | % | 07/15/2017 | 1,275,000 | 1,326,000 | (1) | |||||||||||||||||
United Surgical Partners International, Inc.: | ||||||||||||||||||||||
| 8.875 | % | 05/01/2017 | 125,000 | 132,969 | ||||||||||||||||||
| 9.250 | % | 05/01/2017 | 1,220,000 | 1,300,825 | (2) | |||||||||||||||||
Vanguard Health Holding Co. II LLC | 8.000 | % | 02/01/2018 | 4,525,000 | 4,739,938 | |||||||||||||||||
Vanguard Health Systems, Inc. | 10.625 | % | 02/01/2016 | 1,150,000 | 748,938 | (1)(5) | ||||||||||||||||
|
| |||||||||||||||||||||
| 39,440,051 | ||||||||||||||||||||||
|
| |||||||||||||||||||||
Industrial Other - 1.25% | ||||||||||||||||||||||
Dematic SA | 8.750 | % | 05/01/2016 | 925,000 | 943,500 | (1) | ||||||||||||||||
Park-Ohio Industries, Inc. | 8.125 | % | 04/01/2021 | 1,250,000 | 1,284,375 | (1) | ||||||||||||||||
RBS Global, Inc. | 8.500 | % | 05/01/2018 | 3,550,000 | 3,869,500 | |||||||||||||||||
|
| |||||||||||||||||||||
| 6,097,375 | ||||||||||||||||||||||
|
| |||||||||||||||||||||
See Notes to Financial Statements.
| 28 | www.shiplp.com |
Table of Contents
| Stone Harbor High Yield Bond Fund | Statements of Investments | |
| May 31, 2011 |
| Rate | Maturity Date | Principal Amount * | Market Value (Expressed in U.S. $) | |||||||||||||||
Leisure - 2.04% | ||||||||||||||||||
AMC Entertainment, Inc.: | ||||||||||||||||||
| 8.000 | % | 03/01/2014 | $ | 550,000 | $ | 558,250 | ||||||||||||
| 9.750 | % | 12/01/2020 | 3,725,000 | 3,971,781 | (1) | |||||||||||||
Cinemark USA, Inc.: | ||||||||||||||||||
| 8.625 | % | 06/15/2019 | 1,775,000 | 1,948,063 | ||||||||||||||
| 7.375 | % | 06/15/2021 | 1,175,000 | 1,175,000 | (1) | |||||||||||||
Regal Cinemas Corp. | 8.625 | % | 07/15/2019 | 1,700,000 | 1,827,500 | |||||||||||||
Regal Entertainment Group | 9.125 | % | 08/15/2018 | 475,000 | 507,062 | |||||||||||||
|
| |||||||||||||||||
| 9,987,656 | ||||||||||||||||||
|
| |||||||||||||||||
Media Cable - 4.14% | ||||||||||||||||||
Atlantic Broadband Finance LLC | 9.375 | % | 01/15/2014 | 1,710,000 | 1,744,200 | |||||||||||||
Cablevision Systems Corp.: | ||||||||||||||||||
| 8.625 | % | 09/15/2017 | 925,000 | 1,047,563 | ||||||||||||||
| 7.750 | % | 04/15/2018 | 525,000 | 572,250 | ||||||||||||||
| 8.000 | % | 04/15/2020 | 750,000 | 826,875 | ||||||||||||||
CCO Holdings LLC | 7.000 | % | 01/15/2019 | 425,000 | 436,156 | |||||||||||||
Cequel Communications Holdings I LLC | 8.625 | % | 11/15/2017 | 1,175,000 | 1,254,312 | (1) | ||||||||||||
CSC Holdings LLC: | ||||||||||||||||||
| 8.500 | % | 06/15/2015 | 800,000 | 872,000 | ||||||||||||||
| 7.625 | % | 07/15/2018 | 325,000 | 356,281 | ||||||||||||||
| 8.625 | % | 02/15/2019 | 475,000 | 549,812 | ||||||||||||||
DISH DBS Corp.: | ||||||||||||||||||
| 7.125 | % | 02/01/2016 | 960,000 | 1,029,600 | ||||||||||||||
| 7.875 | % | 09/01/2019 | 2,750,000 | 3,007,813 | ||||||||||||||
| 6.750 | % | 06/01/2021 | 850,000 | 862,750 | (1) | |||||||||||||
Insight Communications Co., Inc. | 9.375 | % | 07/15/2018 | 575,000 | 646,875 | (1) | ||||||||||||
Kabel BW Erste Beteiligungs GmbH | 7.500 | % | 03/15/2019 | 1,075,000 | 1,124,719 | (1) | ||||||||||||
Mediacom LLC | 9.125 | % | 08/15/2019 | 500,000 | 545,000 | |||||||||||||
Ono Finance II PLC | 10.875 | % | 07/15/2019 | 675,000 | 752,625 | (1) | ||||||||||||
Unitymedia Hesson GmbH & Co. | 8.125 | % | 12/01/2017 | 125,000 | 133,438 | (1) | ||||||||||||
UPC Holding BV | 9.875 | % | 04/15/2018 | 1,900,000 | 2,137,500 | (1) | ||||||||||||
Virgin Media Finance PLC: | ||||||||||||||||||
| 9.125 | % | 08/15/2016 | 725,000 | 766,687 | ||||||||||||||
Series 1 | 9.500 | % | 08/15/2016 | 1,100,000 | 1,262,250 | (1) | ||||||||||||
| 8.375 | % | 10/15/2019 | 275,000 | 310,750 | ||||||||||||||
|
| |||||||||||||||||
| 20,239,456 | ||||||||||||||||||
|
| |||||||||||||||||
Media Other - 3.28% | ||||||||||||||||||
Bonten Media Acquisition Co. | 9.000 | % | 06/01/2015 | 514,131 | 388,169 | (1)(2) | ||||||||||||
Citadel Broadcasting Corp. | 7.750 | % | 12/15/2018 | 400,000 | 434,500 | (1) | ||||||||||||
Entravision Communications Corp. | 8.750 | % | 08/01/2017 | 2,125,000 | 2,268,437 | |||||||||||||
Fox Acquisition Sub LLC | 13.375 | % | 07/15/2016 | 1,665,000 | 1,885,613 | (1) | ||||||||||||
Interep National Radio Sales, Inc., Series B | 10.000 | % | 07/01/2008 | 4,000 | 0 | (3)(4) | ||||||||||||
Lamar Media Corp.: | ||||||||||||||||||
| 6.625 | % | 08/15/2015 | 710,000 | 729,525 | ||||||||||||||
Series B | 6.625 | % | 08/15/2015 | 1,680,000 | 1,722,000 | |||||||||||||
Series C | 6.625 | % | 08/15/2015 | 200,000 | 205,000 | |||||||||||||
Radio One, Inc. | 12.500 | % | 05/11/2016 | 2,442,833 | 2,528,332 | (1)(2) | ||||||||||||
Sinclair Television Group, Inc.: | ||||||||||||||||||
| 9.250 | % | 11/01/2017 | 800,000 | 898,000 | (1) | |||||||||||||
See Notes to Financial Statements.
Stone Harbor Investment Funds Annual Report | May 31, 2011 | 29 |
Table of Contents
| Stone Harbor High Yield Bond Fund | Statements of Investments | |
| May 31, 2011 |
| Rate | Maturity Date | Principal Amount * | Market Value (Expressed in U.S. $) | |||||||||||||||||||
| 8.375 | % | 10/15/2018 | $ | 1,325,000 | $ | 1,421,063 | ||||||||||||||||
Univision Communications, Inc.: | ||||||||||||||||||||||
| 7.875 | % | 11/01/2010 | 1,900,000 | 2,023,500 | (1) | |||||||||||||||||
| 6.875 | % | 05/15/2019 | 600,000 | 603,000 | (1) | |||||||||||||||||
| 8.500 | % | 05/15/2021 | 900,000 | 931,500 | (1) | |||||||||||||||||
|
| |||||||||||||||||||||
| 16,038,639 | ||||||||||||||||||||||
|
| |||||||||||||||||||||
Metals/Mining/Steel - 4.59% | ||||||||||||||||||||||
APERAM: | ||||||||||||||||||||||
| 7.375 | % | 04/01/2016 | 850,000 | 885,063 | (1) | |||||||||||||||||
| 7.750 | % | 04/01/2018 | 1,425,000 | 1,478,438 | (1) | |||||||||||||||||
Atkore International, Inc. | 9.875 | % | 01/01/2018 | 2,074,000 | 2,260,660 | (1) | ||||||||||||||||
Cloud Peak Energy Resources LLC: | ||||||||||||||||||||||
| 8.250 | % | 12/15/2017 | 400,000 | 438,000 | ||||||||||||||||||
| 8.500 | % | 12/15/2019 | 1,450,000 | 1,624,000 | ||||||||||||||||||
Consol Energy, Inc.: | ||||||||||||||||||||||
| 8.000 | % | 04/01/2017 | 1,175,000 | 1,292,500 | ||||||||||||||||||
| 8.250 | % | 04/01/2020 | 800,000 | 892,000 | ||||||||||||||||||
Drummond Co., Inc.: | ||||||||||||||||||||||
| 9.000 | % | 10/15/2014 | 325,000 | 342,875 | (1) | |||||||||||||||||
| 7.375 | % | 02/15/2016 | 1,475,000 | 1,515,562 | ||||||||||||||||||
FMG Resources August 2006 Property Ltd. | 7.000 | % | 11/01/2015 | 1,115,000 | 1,165,175 | (1) | ||||||||||||||||
JMC Steel Group | 8.250 | % | 03/15/2018 | 1,600,000 | 1,660,000 | (1) | ||||||||||||||||
Mirabela Nickel Ltd. | 8.750 | % | 04/15/2018 | 2,325,000 | 2,354,062 | (1) | ||||||||||||||||
Novelis, Inc. | 8.375 | % | 12/15/2017 | 1,800,000 | 1,971,000 | |||||||||||||||||
Penn Virginia Resource Partners LP | 8.250 | % | 04/15/2018 | 2,130,000 | 2,263,125 | |||||||||||||||||
Taseko Mines Ltd. | 7.750 | % | 04/15/2019 | 2,225,000 | 2,269,500 | |||||||||||||||||
|
| |||||||||||||||||||||
| 22,411,960 | ||||||||||||||||||||||
|
| |||||||||||||||||||||
Non Captive Finance - 0.27% | ||||||||||||||||||||||
Ally Financial, Inc. | 6.250 | % | 12/01/2017 | 790,000 | 816,787 | (1) | ||||||||||||||||
PHH Corp. | 9.250 | % | 03/01/2016 | 450,000 | 502,875 | |||||||||||||||||
|
| |||||||||||||||||||||
| 1,319,662 | ||||||||||||||||||||||
|
| |||||||||||||||||||||
Paper/Forest Products - 3.19% | ||||||||||||||||||||||
Ainsworth Lumber Co. Ltd. | 11.000 | % | 07/29/2015 | 1,946,250 | 1,938,952 | (1)(2) | ||||||||||||||||
Boise Paper Holdings LLC | 8.000 | % | 04/01/2020 | 2,000,000 | 2,170,000 | |||||||||||||||||
Cascades, Inc.: | ||||||||||||||||||||||
| 7.750 | % | 12/15/2017 | 1,750,000 | 1,863,750 | ||||||||||||||||||
| 7.875 | % | 01/15/2020 | 225,000 | 238,500 | ||||||||||||||||||
Catalyst Paper Corp. | 11.000 | % | 12/15/2016 | 1,475,000 | 1,349,625 | (1) | ||||||||||||||||
Graphic Packaging International, Inc. | 9.500 | % | 06/15/2017 | 2,155,000 | 2,413,600 | |||||||||||||||||
Mercer International, Inc. | 9.500 | % | 12/01/2017 | 1,650,000 | 1,817,062 | |||||||||||||||||
NewPage Corp. | 11.375 | % | 12/31/2014 | 1,215,000 | 1,178,550 | |||||||||||||||||
Verso Paper Holdings LLC, Series B | 11.375 | % | 08/01/2016 | 1,075,000 | 1,118,000 | |||||||||||||||||
Xerium Technologies, Inc. | 8.875 | % | 06/15/2018 | 1,500,000 | 1,507,500 | (1) | ||||||||||||||||
|
| |||||||||||||||||||||
| 15,595,539 | ||||||||||||||||||||||
|
| |||||||||||||||||||||
Property & Casualty Insurance - 0.24% | ||||||||||||||||||||||
CNO Financial Group, Inc. | 9.000 | % | 01/15/2018 | 1,100,000 | 1,193,500 | (1) | ||||||||||||||||
|
| |||||||||||||||||||||
See Notes to Financial Statements.
| 30 | www.shiplp.com |
Table of Contents
| Stone Harbor High Yield Bond Fund | Statements of Investments | |
| May 31, 2011 |
| Rate | Maturity Date | Principal Amount * | Market Value (Expressed in U.S. $) | |||||||||||||||||||
Publishing/Printing - 1.59% | ||||||||||||||||||||||
Baker & Taylor, Inc. | 11.500 | % | 07/01/2013 | $ | 1,295,000 | $ | 1,087,800 | (1) | ||||||||||||||
Cenveo Corp.: | ||||||||||||||||||||||
| 7.875 | % | 12/01/2013 | 3,400,000 | 3,374,500 | ||||||||||||||||||
| 8.375 | % | 06/15/2014 | 650,000 | 606,125 | ||||||||||||||||||
| 10.500 | % | 08/15/2016 | 350,000 | 354,375 | (1) | |||||||||||||||||
| 8.875 | % | 02/01/2018 | 500,000 | 510,000 | ||||||||||||||||||
Dex One Corp. | 12.000 | % | 01/29/2017 | 15,236 | 7,009 | (2) | ||||||||||||||||
IDEARC, Inc. | 8.000 | % | 11/15/2016 | 1,265,000 | 0 | (3)(4) | ||||||||||||||||
The McClatchy Co. | 11.500 | % | 02/15/2017 | 1,205,000 | 1,325,500 | |||||||||||||||||
Nielsen Finance LLC | 7.750 | % | 10/15/2018 | 450,000 | | 484,875 | (1) | |||||||||||||||
|
| |||||||||||||||||||||
| 7,750,184 | ||||||||||||||||||||||
|
| |||||||||||||||||||||
Refining - 0.56% | ||||||||||||||||||||||
Petroplus Finance Ltd.: | ||||||||||||||||||||||
| 6.750 | % | 05/01/2014 | 1,585,000 | 1,561,225 | (1) | |||||||||||||||||
| 7.000 | % | 05/01/2017 | 925,000 | 883,375 | (1) | |||||||||||||||||
| 9.375 | % | 09/15/2019 | 300,000 | 309,000 | (1) | |||||||||||||||||
|
| |||||||||||||||||||||
| 2,753,600 | ||||||||||||||||||||||
|
| |||||||||||||||||||||
REITS - 0.41% | ||||||||||||||||||||||
CB Richard Ellis Services, Inc. | 11.625 | % | 06/15/2017 | 1,675,000 | 1,984,875 | |||||||||||||||||
|
| |||||||||||||||||||||
Restaurants - 0.40% | ||||||||||||||||||||||
DineEquity, Inc. | 9.500 | % | 10/30/2018 | 975,000 | 1,072,500 | (1) | ||||||||||||||||
Dunkin’ Brands, Inc. | 9.625 | % | 12/01/2018 | 821,000 | | 832,281 | (1) | |||||||||||||||
Sbarro, Inc. | 10.375 | % | 02/01/2015 | 225,000 | 46,125 | (3) | ||||||||||||||||
|
| |||||||||||||||||||||
| 1,950,906 | ||||||||||||||||||||||
|
| |||||||||||||||||||||
Retail Food/Drug - 0.73% | ||||||||||||||||||||||
Albertsons, Inc.: | ||||||||||||||||||||||
| 8.700 | % | 05/01/2030 | 725,000 | 676,062 | ||||||||||||||||||
| 8.000 | % | 05/01/2031 | 550,000 | 484,000 | ||||||||||||||||||
American Stores Co.: | ||||||||||||||||||||||
| 7.900 | % | 05/01/2017 | 550,000 | 548,625 | ||||||||||||||||||
| 8.000 | % | 06/01/2026 | 1,465,000 | 1,355,125 | ||||||||||||||||||
Series MTNB | 7.100 | % | 03/20/2028 | 600,000 | 492,000 | |||||||||||||||||
|
| |||||||||||||||||||||
| 3,555,812 | ||||||||||||||||||||||
|
| |||||||||||||||||||||
Retail Non Food/Drug - 4.46% | ||||||||||||||||||||||
The Bon Ton Department Stores, Inc. | 10.250 | % | 03/15/2014 | 1,380,000 | 1,411,050 | |||||||||||||||||
Claire’s Stores, Inc.: | ||||||||||||||||||||||
| 9.250 | % | 06/01/2015 | 550,000 | 548,625 | ||||||||||||||||||
| 9.625 | % | 06/01/2015 | 1,243,762 | 1,246,871 | (2) | |||||||||||||||||
| 8.875 | % | 03/15/2019 | 1,150,000 | 1,109,750 | (1) | |||||||||||||||||
Express LLC | 8.750 | % | 03/01/2018 | 1,300,000 | 1,417,000 | |||||||||||||||||
JC Penney Corp., Inc. | 7.400 | % | 04/01/2037 | 1,475,000 | 1,430,750 | |||||||||||||||||
Limited Brands, Inc.: | ||||||||||||||||||||||
| 7.000 | % | 05/01/2020 | 1,075,000 | 1,161,000 | ||||||||||||||||||
| 6.625 | % | 04/01/2021 | 625,000 | 654,688 | ||||||||||||||||||
| 6.950 | % | 03/01/2033 | 1,350,000 | 1,263,938 | ||||||||||||||||||
| 7.600 | % | 07/15/2037 | 400,000 | 397,000 | ||||||||||||||||||
Macy’s Retail Holdings, Inc. | 7.875 | % | 08/15/2036 | 325,000 | 358,193 | |||||||||||||||||
See Notes to Financial Statements.
Stone Harbor Investment Funds Annual Report | May 31, 2011 | 31 |
Table of Contents
| Stone Harbor High Yield Bond Fund | Statements of Investments | |
| May 31, 2011 |
| Rate | Maturity Date | Principal Amount * | Market Value (Expressed in U.S. $) | |||||||||||||||||||
Michaels Stores, Inc. | 7.750 | % | 11/01/2018 | $ | 725,000 | $ | 744,937 | (1) | ||||||||||||||
Needle Merger Sub Corp. | 8.125 | % | 03/15/2019 | 1,050,000 | 1,068,375 | (1) | ||||||||||||||||
Neiman Marcus Group, Inc. | 10.375 | % | 10/15/2015 | 1,200,000 | 1,269,000 | |||||||||||||||||
Petco Animal Supplies, Inc. | 9.250 | % | 12/01/2018 | 1,200,000 | 1,293,000 | (1) | ||||||||||||||||
QVC, Inc. | 7.500 | % | 10/01/2019 | 1,150,000 | 1,244,875 | (1) | ||||||||||||||||
RadioShack Corp. | 6.750 | % | 05/15/2019 | 2,250,000 | 2,255,625 | (1) | ||||||||||||||||
Toys R Us Delaware, Inc. | 7.375 | % | 09/01/2016 | 375,000 | 391,875 | (1) | ||||||||||||||||
Toys R Us Property Co. I LLC | 10.750 | % | 07/15/2017 | 2,200,000 | 2,497,000 | |||||||||||||||||
|
| |||||||||||||||||||||
| 21,763,552 | ||||||||||||||||||||||
|
| |||||||||||||||||||||
Satellite - 0.47% | ||||||||||||||||||||||
Intelsat Jackson Holdings SA: | ||||||||||||||||||||||
| 9.500 | % | 06/15/2016 | 900,000 | 949,500 | ||||||||||||||||||
| 7.250 | % | 04/01/2019 | 375,000 | 379,688 | (1) | |||||||||||||||||
| 8.500 | % | 11/01/2019 | 900,000 | 967,500 | ||||||||||||||||||
|
| |||||||||||||||||||||
| 2,296,688 | ||||||||||||||||||||||
|
| |||||||||||||||||||||
Services Other - 5.04% | ||||||||||||||||||||||
American Residential Services LLC | 12.000 | % | 04/15/2015 | 1,075,000 | 1,173,094 | (1) | ||||||||||||||||
ARAMARK Corp. | 8.500 | % | 02/01/2015 | 3,070,000 | 3,208,150 | |||||||||||||||||
ARAMARK Holdings Corp. | 8.625 | % | 05/01/2016 | 1,475,000 | 1,515,563 | (1)(2) | ||||||||||||||||
Brickman Group Holdings, Inc. | 9.125 | % | 11/01/2018 | 2,250,000 | 2,345,625 | (1) | ||||||||||||||||
Education Management LLC: | ||||||||||||||||||||||
| 8.750 | % | 06/01/2014 | 1,200,000 | 1,227,000 | ||||||||||||||||||
| 10.250 | % | 06/01/2016 | 215,000 | 225,212 | ||||||||||||||||||
The Geo Group, Inc. | 7.750 | % | 10/15/2017 | 2,300,000 | 2,478,250 | |||||||||||||||||
GXS Worldwide, Inc. | 9.750 | % | 06/15/2015 | 2,175,000 | 2,223,937 | |||||||||||||||||
Interactive Data Corp. | 10.250 | % | 08/01/2018 | 1,875,000 | 2,095,313 | (1) | ||||||||||||||||
Iron Mountain, Inc.: | ||||||||||||||||||||||
| 8.750 | % | 07/15/2018 | 1,200,000 | 1,261,500 | ||||||||||||||||||
| 8.000 | % | 06/15/2020 | 375,000 | 397,500 | ||||||||||||||||||
| 8.375 | % | 08/15/2021 | 325,000 | 349,375 | ||||||||||||||||||
The ServiceMaster Co.: | ||||||||||||||||||||||
| 10.750 | % | 07/15/2015 | 1,800,000 | 1,912,500 | (1)(2) | |||||||||||||||||
| 7.450 | % | 08/15/2027 | 325,000 | 271,375 | ||||||||||||||||||
Trans Union LLC | 11.375 | % | 06/15/2018 | 1,875,000 | 2,175,000 | |||||||||||||||||
West Corp.: | ||||||||||||||||||||||
| 8.625 | % | 10/01/2018 | 350,000 | 370,562 | (1) | |||||||||||||||||
| 7.875 | % | 01/15/2019 | 1,350,000 | 1,378,688 | (1) | |||||||||||||||||
|
| |||||||||||||||||||||
| 24,608,644 | ||||||||||||||||||||||
|
| |||||||||||||||||||||
Technology - 3.74% | ||||||||||||||||||||||
Buccaneer Merger Sub, Inc. | 9.125 | % | 01/15/2019 | 1,050,000 | 1,130,063 | (1) | ||||||||||||||||
CommScope, Inc. | 8.250 | % | 01/15/2019 | 1,750,000 | 1,841,875 | (1) | ||||||||||||||||
Fidelity National Information Services, Inc. | 7.875 | % | 07/15/2020 | 575,000 | 636,813 | |||||||||||||||||
First Data Corp. | 12.625 | % | 01/15/2021 | 1,165,000 | 1,272,762 | (1) | ||||||||||||||||
iGate Corp. | 9.000 | % | 05/01/2016 | 1,750,000 | 1,806,875 | (1) | ||||||||||||||||
MEMC Electronic Materials, Inc. | 7.750 | % | 04/01/2019 | 1,725,000 | 1,776,750 | (1) | ||||||||||||||||
NXP BV | 9.750 | % | 08/01/2018 | 2,125,000 | 2,465,000 | (1) | ||||||||||||||||
Seagate HDD Cayman | 7.750 | % | 12/15/2018 | 2,075,000 | 2,194,312 | (1) | ||||||||||||||||
Sensata Technologies BV | 6.500 | % | 05/15/2019 | 1,175,000 | 1,194,094 | (1) | ||||||||||||||||
See Notes to Financial Statements.
| 32 | www.shiplp.com |
Table of Contents
| Stone Harbor High Yield Bond Fund | Statements of Investments | |
| May 31, 2011 |
| Rate | Maturity Date | Principal Amount * | Market Value (Expressed in U.S. $) | |||||||||||||||||||
SSI Investments II | 11.125 | % | 06/01/2018 | $ | 1,700,000 | $ | 1,904,000 | |||||||||||||||
SunGard Data Systems, Inc.: | ||||||||||||||||||||||
| 7.375 | % | 11/15/2018 | 1,625,000 | 1,665,625 | ||||||||||||||||||
| 7.625 | % | 11/15/2020 | 375,000 | 390,937 | ||||||||||||||||||
|
| |||||||||||||||||||||
| 18,279,106 | ||||||||||||||||||||||
|
| |||||||||||||||||||||
Textile/Apparel - 0.69% | ||||||||||||||||||||||
Levi Strauss & Co.: | ||||||||||||||||||||||
| 8.875 | % | 04/01/2016 | 725,000 | 759,438 | ||||||||||||||||||
| 7.625 | % | 05/15/2020 | 925,000 | 941,187 | ||||||||||||||||||
Quiksilver, Inc. | 6.875 | % | 04/15/2015 | 1,700,000 | 1,670,250 | |||||||||||||||||
|
| |||||||||||||||||||||
| 3,370,875 | ||||||||||||||||||||||
|
| |||||||||||||||||||||
Transportation - Non Air/Rail - 0.74% | ||||||||||||||||||||||
CMA CGM SA | 8.500 | % | 04/15/2017 | 1,000,000 | 915,000 | (1) | ||||||||||||||||
General Maritime Corp. | 12.000 | % | 11/15/2017 | 1,775,000 | 1,570,875 | |||||||||||||||||
Teekay Corp. | 8.500 | % | 01/15/2020 | 1,025,000 | 1,124,937 | |||||||||||||||||
|
| |||||||||||||||||||||
| 3,610,812 | ||||||||||||||||||||||
|
| |||||||||||||||||||||
Wireless - 3.32% | ||||||||||||||||||||||
Crown Castle International Corp. | 9.000 | % | 01/15/2015 | 3,050,000 | 3,400,750 | |||||||||||||||||
MetroPCS Wireless, Inc.: | ||||||||||||||||||||||
| 7.875 | % | 09/01/2018 | 1,300,000 | 1,405,625 | ||||||||||||||||||
| 6.625 | % | 11/15/2020 | 975,000 | 975,000 | ||||||||||||||||||
Nextel Communications, Inc., Series D | 7.375 | % | 08/01/2015 | 2,325,000 | 2,351,156 | |||||||||||||||||
NII Capital Corp. | 7.625 | % | 04/01/2021 | 600,000 | 639,750 | |||||||||||||||||
SBA Telecommunications, Inc. | 8.250 | % | 08/15/2019 | 700,000 | 774,375 | |||||||||||||||||
Sprint Capital Corp. | 8.750 | % | 03/15/2032 | 3,825,000 | 4,240,969 | |||||||||||||||||
Wind Acquisition Finance SA: | ||||||||||||||||||||||
| 11.750 | % | 07/15/2014 | 975,000 | 1,138,312 | (1) | |||||||||||||||||
| 12.250 | % | 07/15/2017 | 1,039,917 | 1,292,097 | (1)(2) | |||||||||||||||||
|
| |||||||||||||||||||||
| 16,218,034 | ||||||||||||||||||||||
|
| |||||||||||||||||||||
Wirelines - 3.97% | ||||||||||||||||||||||
Cincinnati Bell, Inc.: | ||||||||||||||||||||||
| 8.250 | % | 10/15/2017 | 975,000 | 998,156 | ||||||||||||||||||
| 8.750 | % | 03/15/2018 | 1,150,000 | 1,115,500 | ||||||||||||||||||
| 8.375 | % | 10/15/2020 | 50,000 | 50,750 | ||||||||||||||||||
Citizens Communications Co.: | ||||||||||||||||||||||
| 7.875 | % | 01/15/2027 | 125,000 | 123,750 | ||||||||||||||||||
| 9.000 | % | 08/15/2031 | 4,555,000 | 4,777,056 | ||||||||||||||||||
Embarq Corp. | 7.995 | % | 06/01/2036 | 1,575,000 | 1,722,910 | |||||||||||||||||
ITC Deltacom, Inc. | 10.500 | % | 04/01/2016 | 2,025,000 | 2,197,125 | |||||||||||||||||
Level 3 Financing, Inc.: | ||||||||||||||||||||||
| 9.250 | % | 11/01/2014 | 576,000 | 596,160 | ||||||||||||||||||
| 4.215 | % | 02/15/2015 | 225,000 | 217,125 | (6) | |||||||||||||||||
| 10.000 | % | 02/01/2018 | 2,100,000 | 2,283,750 | ||||||||||||||||||
Qwest Corp.: | ||||||||||||||||||||||
| 7.500 | % | 06/15/2023 | 425,000 | 428,719 | ||||||||||||||||||
| 6.875 | % | 09/15/2033 | 2,150,000 | 2,125,812 | ||||||||||||||||||
Windstream Corp.: | ||||||||||||||||||||||
| 7.875 | % | 11/01/2017 | 675,000 | 741,656 | ||||||||||||||||||
| 7.750 | % | 10/15/2020 | 400,000 | 432,000 | ||||||||||||||||||
See Notes to Financial Statements.
Stone Harbor Investment Funds Annual Report | May 31, 2011 | 33 |
Table of Contents
| Stone Harbor High Yield Bond Fund | Statements of Investments | |
| May 31, 2011 |
Currency | Rate | Maturity Date | Principal Amount* | Market Value (Expressed in U.S. $) | ||||||||||||||
Windstream Corp.: | ||||||||||||||||||
| 7.750 | % | 10/01/2021 | $ | 515,000 | $ | 560,063 | ||||||||||||
| 7.500 | % | 04/01/2023 | 1,000,000 | 1,035,000 | ||||||||||||||
|
| |||||||||||||||||
| 19,405,532 | ||||||||||||||||||
|
| |||||||||||||||||
TOTAL CORPORATE BONDS | 446,387,678 | |||||||||||||||||
|
| |||||||||||||||||
(Cost $416,578,734) | ||||||||||||||||||
CONVERTIBLE CORPORATE BONDS - 1.94% | ||||||||||||||||||
Aerospace/Defense - 0.07% | ||||||||||||||||||
Alliant Techsystems, Inc. | 2.750 | % | 09/15/2011 | 331,000 | 334,310 | |||||||||||||
|
| |||||||||||||||||
Airlines - 0.02% | ||||||||||||||||||
AirTran Holdings, Inc. | 5.250 | % | 11/01/2016 | 80,000 | 118,100 | |||||||||||||
|
| |||||||||||||||||
Automotive - 0.17% | ||||||||||||||||||
Cie Generale des Etablissements Michelin, Series ML | EUR | 1.197 | % | 01/01/2017 | 166,631 | 270,540 | (4)(5) | |||||||||||
Suzuki Motor Corp., Series 4 | JPY | 0.000 | % | 03/29/2013 | 25,000,000 | 309,080 | (1)(5) | |||||||||||
TRW Automotive, Inc. | 3.500 | % | 12/01/2015 | 130,000 | 266,337 | (1) | ||||||||||||
|
| |||||||||||||||||
| 845,957 | ||||||||||||||||||
|
| |||||||||||||||||
Building Products - 0.03% | ||||||||||||||||||
Cemex SAB de CV: | ||||||||||||||||||
| 3.250 | % | 03/15/2016 | 49,000 | 49,184 | (1) | |||||||||||||
| 3.750 | % | 03/15/2018 | 100,000 | 100,500 | (1) | |||||||||||||
|
| |||||||||||||||||
| 149,684 | ||||||||||||||||||
|
| |||||||||||||||||
Containers/Packaging - 0.06% | ||||||||||||||||||
Owens-Brockway Glass Container, Inc. | 3.000 | % | 06/01/2015 | 278,000 | 289,815 | (1) | ||||||||||||
|
| |||||||||||||||||
Drillers/Services - 0.18% | ||||||||||||||||||
Hercules Offshore, Inc. | 3.375 | % | 06/01/2038 | 252,000 | 238,770 | (7) | ||||||||||||
Newpark Resources, Inc. | 4.000 | % | 10/01/2017 | 199,000 | 244,770 | |||||||||||||
Subsea 7 SA, Series ACY | 2.250 | % | 10/11/2013 | 300,000 | 373,500 | |||||||||||||
|
| |||||||||||||||||
| 857,040 | ||||||||||||||||||
|
| |||||||||||||||||
Exploration & Production - 0.03% | ||||||||||||||||||
InterOil Corp. | 2.750 | % | 11/15/2015 | 9,000 | 8,235 | |||||||||||||
Quicksilver Resources, Inc. | 1.875 | % | 11/01/2024 | 138,000 | 145,762 | |||||||||||||
|
| |||||||||||||||||
| 153,997 | ||||||||||||||||||
|
| |||||||||||||||||
Financial Other - 0.00%(8) | ||||||||||||||||||
Ares Capital Corp. | 5.125 | % | 06/01/2016 | 18,000 | 18,495 | (1) | ||||||||||||
|
| |||||||||||||||||
Food & Beverage - 0.11% | ||||||||||||||||||
Smithfield Foods, Inc. | 4.000 | % | 06/30/2013 | 163,000 | 191,118 | |||||||||||||
Tyson Foods, Inc. | 3.250 | % | 10/15/2013 | 280,000 | 361,550 | |||||||||||||
|
| |||||||||||||||||
| 552,668 | ||||||||||||||||||
|
| |||||||||||||||||
Healthcare - 0.16% | ||||||||||||||||||
Amylin Pharmaceuticals, Inc. | 3.000 | % | 06/15/2014 | 192,000 | 176,160 | |||||||||||||
Hologic, Inc. | 2.000 | % | 12/15/2037 | 84,000 | 82,425 | (7) | ||||||||||||
See Notes to Financial Statements.
| 34 | www.shiplp.com |
Table of Contents
| Stone Harbor High Yield Bond Fund | Statements of Investments | |
| May 31, 2011 |
Currency | Rate | Maturity Date | Principal Amount* | Market Value (Expressed in U.S. $) | ||||||||||||||
Life Technologies Corp. | 3.250 | % | 06/15/2025 | $ | 498,000 | $ | 529,125 | |||||||||||
|
| |||||||||||||||||
| 787,710 | ||||||||||||||||||
|
| |||||||||||||||||
Industrial Other - 0.02% | ||||||||||||||||||
Altra Holdings, Inc. | 2.750 | % | 03/01/2031 | 68,000 | 78,965 | (1) | ||||||||||||
|
| |||||||||||||||||
Lodging - 0.01% | ||||||||||||||||||
Home Inns & Hotels Management, Inc. | 2.000 | % | 12/15/2015 | 56,000 | 58,870 | (1) | ||||||||||||
|
| |||||||||||||||||
Metals/Mining/Steel - 0.04% | ||||||||||||||||||
RTI International Metals, Inc. | 3.000 | % | 12/01/2015 | 134,000 | 173,697 | |||||||||||||
|
| |||||||||||||||||
Pharmaceuticals - 0.23% | ||||||||||||||||||
Gilead Sciences, Inc. | 1.000 | % | 05/01/2014 | 282,000 | 317,603 | (1) | ||||||||||||
PDL BioPharma, Inc. | 3.750 | % | 05/01/2015 | 74,000 | 76,127 | |||||||||||||
Savient Pharmaceuticals, Inc. | 4.750 | % | 02/01/2018 | 74,000 | 79,550 | |||||||||||||
Shire PLC, Series SHP | 2.750 | % | 05/09/2014 | 375,000 | 432,656 | |||||||||||||
Teva Pharmaceutical Finance Co. LLC, Series C | 0.250 | % | 02/01/2026 | 175,000 | 206,719 | |||||||||||||
|
| |||||||||||||||||
| 1,112,655 | ||||||||||||||||||
|
| |||||||||||||||||
Property & Casualty Insurance - 0.01% | ||||||||||||||||||
Radian Group, Inc. | 3.000 | % | 11/15/2017 | 71,000 | 55,114 | |||||||||||||
|
| |||||||||||||||||
Railroads - 0.03% | ||||||||||||||||||
Greenbrier Cos., Inc. | 3.500 | % | 04/01/2018 | 152,000 | 156,560 | (1) | ||||||||||||
|
| |||||||||||||||||
Technology - 0.68% | ||||||||||||||||||
Alcatel-Lucent, Series ALU | EUR | 5.000 | % | 01/01/2015 | 2,000,000 | 72,383 | (4) | |||||||||||
Alcatel Lucent USA, Inc.: | ||||||||||||||||||
Series A | 2.875 | % | 06/15/2023 | 330,000 | 296,175 | |||||||||||||
Series B | 2.750 | % | 06/15/2025 | 90,000 | 89,437 | |||||||||||||
Callidus Software, Inc. | 4.750 | % | 06/01/2016 | 94,000 | 92,881 | (1) | ||||||||||||
Comtech Telecommunications Corp. | 3.000 | % | 05/01/2029 | 284,000 | 296,780 | |||||||||||||
Digital River, Inc. | 2.000 | % | 11/01/2030 | 255,000 | 257,550 | (1) | ||||||||||||
Hon Hai Precision Industry Co. Ltd. | 0.000 | % | 10/12/2013 | 100,000 | 103,250 | (5) | ||||||||||||
Intel Corp. | 3.250 | % | 08/01/2039 | 148,000 | 184,260 | |||||||||||||
Ixia | 3.000 | % | 12/15/2015 | 271,000 | 307,585 | (1) | ||||||||||||
Lam Research Corp. | 0.500 | % | 05/15/2016 | 41,000 | 42,333 | (1) | ||||||||||||
Mentor Graphics Corp. | 4.000 | % | 04/01/2031 | 183,000 | 185,745 | (1) | ||||||||||||
Micron Technology, Inc. | 1.875 | % | 06/01/2027 | 232,000 | 265,060 | |||||||||||||
Novellus Systems, Inc. | 2.625 | % | 05/15/2041 | 44,000 | 47,630 | (1) | ||||||||||||
ON Semiconductor Corp.: | ||||||||||||||||||
Series B | 0.221 | % | 04/15/2024 | 280,000 | 341,250 | (5) | ||||||||||||
| 2.625 | % | 12/15/2026 | 223,000 | 285,161 | ||||||||||||||
SanDisk Corp. | 1.500 | % | 08/15/2017 | 127,000 | 145,733 | |||||||||||||
WebMD Health Corp.: | ||||||||||||||||||
| 2.250 | % | 03/31/2016 | 40,000 | 38,750 | (1) | |||||||||||||
| 2.500 | % | 01/31/2018 | 100,000 | 99,625 | (1) | |||||||||||||
Xilinx, Inc. | 3.125 | % | 03/15/2037 | 146,000 | 182,683 | |||||||||||||
|
| |||||||||||||||||
| 3,334,271 | ||||||||||||||||||
|
| |||||||||||||||||
See Notes to Financial Statements.
Stone Harbor Investment Funds Annual Report | May 31, 2011 | 35 |
Table of Contents
| Stone Harbor High Yield Bond Fund | Statements of Investments | |
| May 31, 2011 |
| Rate | Maturity Date | Principal Amount/Shares* | Market Value (Expressed in U.S. $) | |||||||||||||||
Transportation Non Air/Rail - 0.01% | ||||||||||||||||||
Ultrapetrol Bahamas Ltd. | 7.250 | % | 01/15/2017 | $ | 31,000 | $ | 30,651 | (1) | ||||||||||
|
| |||||||||||||||||
Wirelines - 0.08% | ||||||||||||||||||
Earthlink, Inc. | 3.250 | % | 11/15/2026 | 360,000 | 380,700 | (7) | ||||||||||||
|
| |||||||||||||||||
TOTAL CONVERTIBLE CORPORATE BONDS | 9,489,259 | |||||||||||||||||
|
| |||||||||||||||||
(Cost $8,910,065) | ||||||||||||||||||
BANK LOANS - 1.83%(9) | ||||||||||||||||||
Building Products - 0.04% | ||||||||||||||||||
Collins & Aikman Floorcoverings, Inc. Loan: | ||||||||||||||||||
| 2.810 | % | 06/14/2011 | 146,939 | 141,612 | ||||||||||||||
| 2.809 | % | 06/21/2011 | 18,367 | 17,702 | ||||||||||||||
| 2.807 | % | 06/30/2011 | 7,113 | 6,855 | ||||||||||||||
|
| |||||||||||||||||
| 166,169 | ||||||||||||||||||
|
| |||||||||||||||||
Electric - 0.81% | ||||||||||||||||||
Texas Competitive Electric Holdings Co., LLC - 2017 Term Loan: | ||||||||||||||||||
| 4.706 | % | 06/09/2011 | 2,429,552 | 1,923,750 | ||||||||||||||
| 4.768 | % | 08/09/2011 | 2,578,057 | 2,041,339 | ||||||||||||||
|
| |||||||||||||||||
| 3,965,089 | ||||||||||||||||||
|
| |||||||||||||||||
Gaming - 0.47% | ||||||||||||||||||
Caesers Entertainment Operating Co., Inc. - Term - B-2 Loan: | ||||||||||||||||||
| 3.194 | % | 06/27/2011 | 766,868 | 715,679 | ||||||||||||||
| 3.274 | % | 07/25/2011 | 1,708,132 | 1,594,110 | ||||||||||||||
|
| |||||||||||||||||
| 2,309,789 | ||||||||||||||||||
|
| |||||||||||||||||
Non Captive Finance - 0.41% | ||||||||||||||||||
iStar Financial, Inc. Tranche A 2 Loan | 7.000 | % | 06/10/2011 | 2,000,000 | 2,019,822 | |||||||||||||
|
| |||||||||||||||||
Publishing/Printing - 0.10% | ||||||||||||||||||
Merrill Communications LLC - Loan (Second Lien): | ||||||||||||||||||
| 13.750 | % | 06/30/2011 | 150,000 | 150,562 | ||||||||||||||
| 14.000 | % | 07/29/2011 | 6,152 | 6,175 | ||||||||||||||
R.H. Donnelley, Inc. - Loan: | ||||||||||||||||||
| 9.000 | % | 06/30/2011 | 30,793 | 23,018 | ||||||||||||||
| 9.000 | % | 07/29/2011 | 111,820 | 83,586 | ||||||||||||||
| 9.000 | % | 08/31/2011 | 116,534 | 87,109 | ||||||||||||||
Tribune Co. - Tranche X Advance | 5.000 | % | 12/31/2010 | 192,000 | 129,520 | (3) | ||||||||||||
|
| |||||||||||||||||
| 479,970 | ||||||||||||||||||
|
| |||||||||||||||||
TOTAL BANK LOANS | 8,940,839 | |||||||||||||||||
|
| |||||||||||||||||
(Cost $8,622,492) | ||||||||||||||||||
COMMON STOCKS - 0.47% | ||||||||||||||||||
Chemicals - 0.04% | ||||||||||||||||||
LyondellBasell Industries NV | 4,658 | 204,067 | ||||||||||||||||
|
| |||||||||||||||||
See Notes to Financial Statements.
| 36 | www.shiplp.com |
Table of Contents
| Stone Harbor High Yield Bond Fund | Statements of Investments | |
| May 31, 2011 |
| Rate | Maturity Date | Principal Amount/Shares* | Market Value (Expressed in U.S. $) | |||||||||||||||
Gas Pipelines - 0.05% | ||||||||||||||||||
El Paso Corp. | 11,346 | 238,833 | ||||||||||||||||
|
| |||||||||||||||||
Media Cable - 0.36% | ||||||||||||||||||
Charter Communications, Inc. | 31,035 | $ | 1,753,167 | (10) | ||||||||||||||
|
| |||||||||||||||||
Publishing/Printing - 0.01% | ||||||||||||||||||
Dex One Corp. | 12,498 | 29,245 | (10) | |||||||||||||||
SuperMedia, Inc. | 998 | 4,332 | (10) | |||||||||||||||
|
| |||||||||||||||||
| 33,577 | ||||||||||||||||||
|
| |||||||||||||||||
Technology - 0.01% | ||||||||||||||||||
Veeco Instruments, Inc. | 1,236 | 71,181 | (10) | |||||||||||||||
|
| |||||||||||||||||
TOTAL COMMON STOCKS | 2,300,825 | |||||||||||||||||
|
| |||||||||||||||||
(Cost $4,351,320) | ||||||||||||||||||
PREFERRED STOCKS - 0.33% | ||||||||||||||||||
Banking - 0.12% | ||||||||||||||||||
Wells Fargo & Co. | 7.500 | % | 12/31/2049 | 345 | 374,325 | |||||||||||||
Wintrust Financial Corp. | 7.500 | % | 12/15/2013 | 3,450 | 184,520 | |||||||||||||
|
| |||||||||||||||||
| 558,845 | ||||||||||||||||||
|
| |||||||||||||||||
Electric - 0.02% | ||||||||||||||||||
AES Trust III | 6.750 | % | 10/15/2029 | 600 | 29,490 | |||||||||||||
PPL Corp. | 8.750 | % | 05/11/2014 | 1,300 | 71,175 | |||||||||||||
|
| |||||||||||||||||
| 100,665 | ||||||||||||||||||
|
| |||||||||||||||||
Exploration & Production - 0.07% | ||||||||||||||||||
Apache Corp. | 6.000 | % | 08/01/2013 | 5,210 | 346,621 | |||||||||||||
Food & Beverage - 0.05% | ||||||||||||||||||
Archer-Daniels-Midland Co. | 6.250 | % | 06/01/2011 | 5,700 | 232,674 | |||||||||||||
Life - 0.05% | ||||||||||||||||||
Hartford Financial Services Group, Inc. | 7.250 | % | 04/01/2013 | 3,400 | 89,352 | |||||||||||||
MetLife, Inc. | 5.000 | % | 09/11/2013 | 1,850 | 153,014 | |||||||||||||
|
| |||||||||||||||||
| 242,366 | ||||||||||||||||||
|
| |||||||||||||||||
Metals/Mining/Steel - 0.02% | ||||||||||||||||||
AngloGold Ashanti Holdings Finance PLC | 6.000 | % | 09/15/2013 | 950 | 49,761 | |||||||||||||
Molycorp, Inc. | 5.500 | % | 03/01/2014 | 550 | 67,050 | |||||||||||||
|
| |||||||||||||||||
| 116,811 | ||||||||||||||||||
|
| |||||||||||||||||
Technology - 0.00%(8) | ||||||||||||||||||
Unisys Corp. | 6.250 | % | 03/01/2014 | 70 | 5,771 | |||||||||||||
|
| |||||||||||||||||
TOTAL PREFERRED STOCKS | 1,603,753 | |||||||||||||||||
|
| |||||||||||||||||
(Cost $1,450,754) | ||||||||||||||||||
See Notes to Financial Statements.
Stone Harbor Investment Funds Annual Report | May 31, 2011 | 37 |
Table of Contents
| Stone Harbor High Yield Bond Fund | Statements of Investments | |
| May 31, 2011 |
| Shares | Market Value (expressed in U.S. $) | |||||||
RIGHTS AND WARRANTS - 0.06% | ||||||||
Media Other - 0.06% | ||||||||
Citadel Broadcasting Corp. expires 06/03/2030 | 8,540 | $ | 288,225 | (10) | ||||
|
| |||||||
Publishing/Printing - 0.00% | ||||||||
Readers Digest expires 02/19/2014 | 1,498 | 0 | (4)(10) | |||||
|
| |||||||
TOTAL RIGHTS AND WARRANTS | 288,225 | |||||||
|
| |||||||
(Cost $576,017) | ||||||||
SHORT TERM INVESTMENTS - 2.95% | ||||||||
Money Market Mutual Funds - 2.95% | ||||||||
Dreyfus Cash Advantage Plus Fund | ||||||||
(0.042% 7-Day Yield) | 14,383,985 | 14,383,985 | ||||||
|
| |||||||
TOTAL SHORT TERM INVESTMENTS | 14,383,985 | |||||||
|
| |||||||
(Cost $14,383,985) | ||||||||
Total Investments - 98.97% | $ | 483,394,564 | ||||||
(Cost $454,873,367) | ||||||||
Other Assets in Excess of Liabilities - 1.03% | 5,030,693 | |||||||
|
| |||||||
Net Assets - 100.00% | $ | 488,425,257 | ||||||
|
| |||||||
* The principal/contract amount of each security is stated in the currency in which the bond is denominated (U.S. Dollar unless otherwise notated). See below.
EUR Euro Currency
JPY Japanese Yen
| (1) | Security exempt from registration under Rule 144A of the Securities Act of 1933. Under procedures approved by the Board of Trustees, such securities have been determined to be liquid by the Investment Advisor and may normally be sold, to qualified institutional buyers in transactions exempt from registration. Total market value of Rule 144A securities amounts to $179,747,244, which represents approximately 36.80% of net assets as of May 31, 2011. |
| (2) | Pay-in-kind securities. |
| (3) | Security is currently in default/non-income producing. |
| (4) | This security has been valued by management at its fair value determined in good faith pursuant to procedures approved by the Board of Trustees. Total market value of fair valued securities amounts to $342,925, which represents approximately 0.07% of net assets as of May 31, 2011. |
| (5) | Zero coupon bond reflects effective yield on the date of purchase. |
| (6) | Floating or variable rate security. Interest rate disclosed is that which is in effect at May 31, 2011. |
| (7) | Step bond. Coupon increases periodically based upon a predetermined schedule. Interest rate disclosed is that which is in effect at May 31, 2011. |
| (8) | Amount represents less than 0.005% of net assets. |
| (9) | Bank loans generally pay interest at rates which are periodically determined by reference to a base lending rate plus a premium. All loans carry a variable rate of interest. These base lending rates are generally (i) the Prime Rate offered by one or more major United States banks, (ii) the lending rate offered by one or more European banks such as the London Interbank Offered Rate (“LIBOR”) or (iii) the Certificate of Deposit rate. Rate shown represents the weighted average rate at May 31, 2011. Bank Loans, while exempt from registration, under the Securities Act of 1933 (the “1933 Act”), contain certain restrictions on resale and cannot be sold publicly. Floating rate bank loans often require prepayments from excess cash flow or permit the borrower to repay at its election. The degree to which borrowers repay, whether as a contractual requirement or at their election, cannot be predicted with accuracy. As a result, the actual remaining maturity may be substantially less than the stated maturity shown. |
| (10) | Non-income producing security. |
See Notes to Financial Statements.
| 38 | www.shiplp.com |
Table of Contents
| Stone Harbor High Yield Bond Fund | Statements of Investments | |
| May 31, 2011 |
Common Abbreviations:
BV - Besloten Vennootschap a Dutch private limited liability company.
GmbH - Gesellschaft mit bescharankter Haftung is the German term for limited liability company.
LLC - Limited Liability Corp.
LP - Limited Partnership.
Ltd. - Limited.
NV - Naamloze Vennootschap is the Dutch term for a public limited liability corporation.
PLC - Public Limited Co.
REIT - Real Estate Investment Trust.
SA - Generally designates corporations in various countries, mostly those employing the civil law.
Sab de CV - A variable capital company.
OUTSTANDING FORWARD FOREIGN CURRENCY CONTRACTS
Contract | Contracted Amount | Purchase/Sale Contract | Settlement Date | Current Value | Unrealized (Depreciation) | |||||||||||
EUR | 284,000 | Sale | 07/15/2011 | $408,245 | $(6,647) | |||||||||||
JPY | 25,258,000 | Sale | 07/15/2011 | 309,929 | (989) | |||||||||||
| ||||||||||||||||
| $(7,636) | ||||||||||||||||
| ||||||||||||||||
See Notes to Financial Statements.
Stone Harbor Investment Funds Annual Report | May 31, 2011 | 39 |
Table of Contents
| Stone Harbor Local Markets Fund | Statements of Investments | |
| May 31, 2011 |
Currency | Rate | Maturity Date | Principal Amount * | Market Value (Expressed in U.S. $) | ||||||||||||||
SOVEREIGN DEBT OBLIGATIONS - 46.37% | ||||||||||||||||||
Argentina - 0.28% | ||||||||||||||||||
Republic of Argentina | ARS | 5.820 | % | 12/31/2033 | 5,245,786 | $ | 1,716,081 | (1)(2) | ||||||||||
|
| |||||||||||||||||
Brazil - 2.74% | ||||||||||||||||||
Nota Do Tesouro Nacional: | ||||||||||||||||||
| BRL | 10.000 | % | 01/01/2014 | 5,160,000 | 3,100,680 | |||||||||||||
| BRL | 10.000 | % | 01/01/2021 | 24,342,000 | 13,461,070 | |||||||||||||
|
| |||||||||||||||||
| 16,561,750 | ||||||||||||||||||
|
| |||||||||||||||||
Colombia - 3.80% | ||||||||||||||||||
Bogota Distrio Capital | COP | 9.750 | % | 07/26/2028 | 16,300,000,000 | 11,565,410 | (2)(3) | |||||||||||
Republic of Colombia: | ||||||||||||||||||
| COP | 7.750 | % | 04/14/2021 | 2,559,000,000 | 1,667,776 | |||||||||||||
| COP | 9.850 | % | 06/28/2027 | 13,003,000,000 | 9,790,884 | |||||||||||||
|
| |||||||||||||||||
| 23,024,070 | ||||||||||||||||||
|
| |||||||||||||||||
Hungary - 1.45% | ||||||||||||||||||
Hungarian Government: | ||||||||||||||||||
| HUF | 7.500 | % | 10/24/2013 | 174,500,000 | 969,395 | |||||||||||||
| HUF | 8.000 | % | 02/12/2015 | 1,395,780,000 | 7,834,629 | |||||||||||||
|
| |||||||||||||||||
| 8,804,024 | ||||||||||||||||||
|
| |||||||||||||||||
Malaysia - 9.47% | ||||||||||||||||||
Malaysian Government: | ||||||||||||||||||
| MYR | 3.835 | % | 08/12/2015 | 39,625,000 | 13,359,699 | |||||||||||||
| MYR | 4.262 | % | 09/15/2016 | 102,400,000 | 35,160,565 | |||||||||||||
| MYR | 4.012 | % | 09/15/2017 | 23,460,000 | 7,895,979 | |||||||||||||
| MYR | 4.378 | % | 11/29/2019 | 580,000 | 198,728 | |||||||||||||
| MYR | 4.160 | % | 07/15/2021 | 2,300,000 | 774,116 | |||||||||||||
|
| |||||||||||||||||
| 57,389,087 | ||||||||||||||||||
|
| |||||||||||||||||
Mexico - 11.17% | ||||||||||||||||||
Mexican Bonos: | ||||||||||||||||||
| MXN | 8.000 | % | 12/17/2015 | 1,440,000 | 133,605 | |||||||||||||
| MXN | 7.750 | % | 12/14/2017 | 131,100,000 | 12,139,976 | |||||||||||||
| MXN | 8.000 | % | 06/11/2020 | 407,190,000 | 38,124,370 | |||||||||||||
| MXN | 10.000 | % | 12/05/2024 | 79,400,000 | 8,617,504 | |||||||||||||
| MXN | 8.500 | % | 05/31/2029 | 65,020,000 | 6,167,680 | |||||||||||||
Mexican Udibonos: | ||||||||||||||||||
| MXN | 5.000 | % | 06/16/2016 | 45,809 | 4,421 | |||||||||||||
| MXN | 3.500 | % | 12/14/2017 | 3,481,454 | 314,294 | |||||||||||||
| MXN | 4.000 | % | 06/13/2019 | 23,408,195 | 2,185,854 | |||||||||||||
|
| |||||||||||||||||
| 67,687,704 | ||||||||||||||||||
|
| |||||||||||||||||
Philippines - 0.56% | ||||||||||||||||||
Republic of Philippines | PHP | 4.950 | % | 01/15/2021 | 145,000,000 | 3,385,344 | ||||||||||||
|
| |||||||||||||||||
See Notes to Financial Statements.
| 40 | www.shiplp.com |
Table of Contents
| Stone Harbor Local Markets Fund | Statements of Investments | |
| May 31, 2011 |
Currency | Rate | Maturity Date | Principal Amount * | Market Value (Expressed in U.S. $) | ||||||||||||||
Poland - 4.19% | ||||||||||||||||||
Republic of Poland: | ||||||||||||||||||
| PLN | 5.500 | % | 04/25/2015 | 38,585,000 | $ | 14,107,939 | ||||||||||||
| PLN | 3.000 | % | 08/24/2016 | 11,562,368 | 4,329,145 | |||||||||||||
| PLN | 5.250 | % | 10/25/2017 | 16,062,000 | 5,706,237 | |||||||||||||
| PLN | 5.500 | % | 10/25/2019 | 2,755,000 | 974,432 | |||||||||||||
| PLN | 5.250 | % | 10/25/2020 | 740,000 | 254,682 | |||||||||||||
|
| |||||||||||||||||
| 25,372,435 | ||||||||||||||||||
|
| |||||||||||||||||
South Africa - 4.06% | ||||||||||||||||||
Republic of South Africa: | ||||||||||||||||||
| ZAR | 8.000 | % | 12/21/2018 | 10,419 | 1,513 | |||||||||||||
| ZAR | 7.250 | % | 01/15/2020 | 10,690,000 | 1,472,077 | |||||||||||||
| ZAR | 6.750 | % | 03/31/2021 | 121,700,000 | 16,002,692 | |||||||||||||
| ZAR | 10.500 | % | 12/21/2026 | 41,530,000 | 7,136,945 | |||||||||||||
|
| |||||||||||||||||
| 24,613,227 | ||||||||||||||||||
|
| |||||||||||||||||
Thailand - 4.55% | ||||||||||||||||||
Thailand Government: | ||||||||||||||||||
| THB | 3.625 | % | 05/22/2015 | 99,050,000 | 3,288,937 | |||||||||||||
| THB | 3.125 | % | 12/11/2015 | 739,800,000 | 24,091,262 | |||||||||||||
| THB | 3.875 | % | 06/13/2019 | 4,775,000 | 160,047 | |||||||||||||
|
| |||||||||||||||||
| 27,540,246 | ||||||||||||||||||
|
| |||||||||||||||||
Turkey - 4.10% | ||||||||||||||||||
Republic of Turkey: | ||||||||||||||||||
| TRY | 10.000 | % | 02/15/2012 | 14,733,470 | 9,808,773 | |||||||||||||
| TRY | 8.060 | % | 08/08/2012 | 1,300,000 | 736,783 | (4) | ||||||||||||
| TRY | 8.936 | % | 11/07/2012 | 22,900,000 | 12,680,010 | (4) | ||||||||||||
| TRY | 10.000 | % | 06/17/2015 | 2,520,000 | 1,620,051 | |||||||||||||
|
| |||||||||||||||||
| 24,845,617 | ||||||||||||||||||
|
| |||||||||||||||||
TOTAL SOVEREIGN DEBT OBLIGATIONS | 280,939,585 | |||||||||||||||||
|
| |||||||||||||||||
(Cost $271,142,668) | ||||||||||||||||||
CORPORATE BONDS - 8.27% | ||||||||||||||||||
Colombia - 0.14% | ||||||||||||||||||
Emgesa SA ESP: | ||||||||||||||||||
| COP | 8.750 | % | 01/25/2021 | 59,000,000 | 34,929 | (3) | ||||||||||||
| COP | 8.750 | % | 01/25/2021 | 636,000,000 | 376,523 | (5) | ||||||||||||
Empresas Publicas de Medellin ESP | COP | 8.375 | % | 02/01/2021 | 802,000,000 | 463,773 | (5) | |||||||||||
|
| |||||||||||||||||
| 875,225 | ||||||||||||||||||
|
| |||||||||||||||||
See Notes to Financial Statements.
Stone Harbor Investment Funds Annual Report | May 31, 2011 | 41 |
Table of Contents
| Stone Harbor Local Markets Fund | Statements of Investments | |
| May 31, 2011 |
Currency | Rate | Maturity Date | Principal Amount * | Market Value (Expressed in U.S. $) | ||||||||||||||||
European Union - 6.17% | ||||||||||||||||||||
Asian Development Bank | ZAR | 6.500 | % | 09/15/2015 | 4,650,000 | $ | 640,663 | |||||||||||||
European Bank for Reconstruction & Development: | ||||||||||||||||||||
| BRL | 9.250 | % | 09/10/2012 | 2,500,000 | 1,596,601 | |||||||||||||||
| MXN | 7.300 | % | 05/23/2013 | 8,500,000 | 763,169 | |||||||||||||||
| IDR | 7.200 | % | 06/08/2016 | 27,000,000,000 | 3,186,984 | |||||||||||||||
European Investment Bank: | ||||||||||||||||||||
| ZAR | 8.000 | % | 10/21/2013 | 3,810,000 | 570,960 | |||||||||||||||
| ZAR | 7.500 | % | 06/01/2016 | 42,000,000 | 6,053,462 | |||||||||||||||
| ZAR | 9.000 | % | 12/21/2018 | 139,000,000 | 21,003,045 | |||||||||||||||
| ZAR | 9.051 | % | 12/31/2018 | 5,280,000 | 409,394 | (4) | ||||||||||||||
International Bank for Reconstruction & Development: | ||||||||||||||||||||
| RUB | 10.000 | % | 04/05/2012 | 39,350,000 | 1,465,284 | |||||||||||||||
| ZAR | 6.626 | % | 05/14/2012 | 6,500,000 | 900,762 | (4) | ||||||||||||||
| RUB | 6.000 | % | 11/29/2012 | 21,500,000 | 775,202 | |||||||||||||||
|
| |||||||||||||||||||
| 37,365,526 | ||||||||||||||||||||
|
| |||||||||||||||||||
Venezuela - 1.96% | ||||||||||||||||||||
Petroleos de Venezuela SA | 4.900 | % | 10/28/2014 | 16,090,000 | 11,886,487 | |||||||||||||||
|
| |||||||||||||||||||
TOTAL CORPORATE BONDS | 50,127,238 | |||||||||||||||||||
|
| |||||||||||||||||||
(Cost $48,289,469) | ||||||||||||||||||||
CREDIT LINKED NOTES - 21.90% | ||||||||||||||||||||
Brazil - 10.01% | ||||||||||||||||||||
Nota Do Tesouro Nacional: | ||||||||||||||||||||
| BRL | 10.000 | % | 01/01/2014 | 2,670,000 | 1,601,069 | (6) | ||||||||||||||
| BRL | 10.000 | % | 01/01/2014 | 2,670,000 | 1,602,085 | (6) | ||||||||||||||
| BRL | 10.000 | % | 01/01/2014 | 4,300,000 | 2,575,776 | (7) | ||||||||||||||
| BRL | 10.000 | % | 01/01/2014 | 7,000,000 | 4,206,348 | (6) | ||||||||||||||
| BRL | 10.000 | % | 01/01/2021 | 1,000,000 | 600,539 | (8) | ||||||||||||||
| BRL | 10.000 | % | 01/01/2021 | 1,100,000 | 607,397 | (8) | ||||||||||||||
| BRL | 10.000 | % | 01/01/2021 | 1,200,000 | 663,597 | (7) | ||||||||||||||
| BRL | 10.000 | % | 01/01/2021 | 2,000,000 | 1,104,358 | (8) | ||||||||||||||
| BRL | 10.000 | % | 01/01/2021 | 2,000,000 | 1,105,995 | (7) | ||||||||||||||
| BRL | 10.000 | % | 01/01/2021 | 2,600,000 | 1,435,665 | (8) | ||||||||||||||
| BRL | 10.000 | % | 01/01/2021 | 3,000,000 | 1,656,536 | (8) | ||||||||||||||
| BRL | 10.000 | % | 01/01/2021 | 4,825,000 | 2,660,593 | (6) | ||||||||||||||
| BRL | 10.000 | % | 01/01/2021 | 5,000,000 | 2,748,534 | (7) | ||||||||||||||
| BRL | 10.000 | % | 01/01/2021 | 6,000,000 | 3,313,072 | (8) | ||||||||||||||
| BRL | 10.000 | % | 01/01/2021 | 6,800,000 | 3,760,384 | (9) | ||||||||||||||
| BRL | 10.000 | % | 01/01/2021 | 7,825,000 | 4,314,847 | (6) | ||||||||||||||
| BRL | 10.000 | % | 01/01/2021 | 8,000,000 | 4,423,982 | (10) | ||||||||||||||
| BRL | 10.000 | % | 01/01/2021 | 11,000,000 | 6,046,775 | (7) | ||||||||||||||
| BRL | 10.000 | % | 01/01/2021 | 11,280,000 | 6,237,814 | (9) | ||||||||||||||
| BRL | 10.000 | % | 01/01/2021 | 18,000,000 | 9,953,959 | (9) | ||||||||||||||
|
| |||||||||||||||||||
| 60,619,325 | ||||||||||||||||||||
|
| |||||||||||||||||||
See Notes to Financial Statements.
| 42 | www.shiplp.com |
Table of Contents
| Stone Harbor Local Markets Fund | Statements of Investments | |
| May 31, 2011 |
| Currency | Rate | Maturity Date | Principal Amount /Shares* | Market Value (Expressed in U.S. $) | ||||||||||||||||
Colombia - 2.12% | ||||||||||||||||||||
Colombia CGM: | ||||||||||||||||||||
| COP | 11.000 | % | 07/24/2020 | 1,200,000,000 | $ | 791,375 | (8) | |||||||||||||
| COP | 11.000 | % | 07/24/2020 | 2,000,000,000 | 1,318,958 | (8) | ||||||||||||||
| COP | 11.000 | % | 07/24/2020 | 2,300,000,000 | 1,510,452 | (8) | ||||||||||||||
| COP | 11.000 | % | 07/24/2020 | 12,018,000,000 | 7,925,618 | (8) | ||||||||||||||
| COP | 10.000 | % | 07/24/2024 | 185,000,000 | 117,738 | (8) | ||||||||||||||
| COP | 10.000 | % | 07/24/2024 | 903,000,000 | 574,686 | (8) | ||||||||||||||
| COP | 10.000 | % | 07/24/2024 | 919,000,000 | 584,869 | (8) | ||||||||||||||
|
| |||||||||||||||||||
| 12,823,696 | ||||||||||||||||||||
|
| |||||||||||||||||||
Indonesia - 9.61% | ||||||||||||||||||||
Republic of Indonesia: | ||||||||||||||||||||
| IDR | 9.500 | % | 06/15/2015 | 7,500,000,000 | 968,309 | (11) | ||||||||||||||
| IDR | 9.500 | % | 06/15/2015 | 8,500,000,000 | 1,095,425 | (6) | ||||||||||||||
| IDR | 9.500 | % | 06/15/2015 | 18,500,000,000 | 2,384,160 | (10) | ||||||||||||||
| IDR | 10.000 | % | 07/15/2017 | 12,000,000,000 | 1,606,373 | (7) | ||||||||||||||
| IDR | 11.500 | % | 09/15/2019 | 13,254,000,000 | 1,954,598 | (6) | ||||||||||||||
| IDR | 12.800 | % | 06/15/2021 | 5,800,000,000 | 934,333 | (10) | ||||||||||||||
| IDR | 12.800 | % | 06/15/2021 | 5,800,000,000 | 934,673 | (11) | ||||||||||||||
| IDR | 12.800 | % | 06/15/2021 | 8,000,000,000 | 1,289,204 | (11) | ||||||||||||||
| IDR | 12.800 | % | 06/15/2021 | 8,300,000,000 | 1,337,549 | (11) | ||||||||||||||
| IDR | 12.800 | % | 06/15/2021 | 10,000,000,000 | 1,611,505 | (11) | ||||||||||||||
| IDR | 12.800 | % | 06/15/2021 | 12,000,000,000 | 1,933,806 | (11) | ||||||||||||||
| IDR | 12.800 | % | 06/15/2021 | 16,000,000,000 | 2,549,353 | (7) | ||||||||||||||
| IDR | 12.800 | % | 06/15/2021 | 19,800,000,000 | 3,189,620 | (10) | ||||||||||||||
| IDR | 12.800 | % | 06/15/2021 | 23,452,000,000 | 3,777,927 | (6) | ||||||||||||||
| IDR | 12.800 | % | 06/15/2021 | 24,800,000,000 | 3,995,079 | (9) | ||||||||||||||
| IDR | 12.800 | % | 06/15/2021 | 50,600,000,000 | 8,151,251 | (10) | ||||||||||||||
| IDR | 8.250 | % | 07/15/2021 | 25,000,000,000 | 3,116,396 | (11) | ||||||||||||||
| IDR | 8.250 | % | 07/15/2021 | 32,300,000,000 | 4,025,438 | (10) | ||||||||||||||
| IDR | 8.250 | % | 07/15/2021 | 47,000,000,000 | 5,857,448 | (6) | ||||||||||||||
| IDR | 11.000 | % | 09/15/2025 | 4,072,000,000 | 587,388 | (6) | ||||||||||||||
| IDR | 11.000 | % | 09/15/2025 | 7,800,000,000 | 1,121,727 | (11) | ||||||||||||||
| IDR | 11.000 | % | 09/15/2025 | 16,500,000,000 | 2,372,884 | (11) | ||||||||||||||
| IDR | 11.000 | % | 09/15/2025 | 23,700,000,000 | 3,408,324 | (11) | ||||||||||||||
|
| |||||||||||||||||||
| 58,202,770 | ||||||||||||||||||||
|
| |||||||||||||||||||
Russia - 0.16% | ||||||||||||||||||||
Russian Federation | RUB | 10.550 | % | 07/06/2011 | 27,800,000 | 1,000,238 | (9) | |||||||||||||
|
| |||||||||||||||||||
TOTAL CREDIT LINKED NOTES | 132,646,029 | |||||||||||||||||||
|
| |||||||||||||||||||
(Cost $128,576,943) | ||||||||||||||||||||
SHORT TERM INVESTMENTS - 21.19% | ||||||||||||||||||||
Money Market Mutual Funds - 21.19% | ||||||||||||||||||||
Dreyfus Cash Advantage Plus Fund | ||||||||||||||||||||
(0.042% 7-Day Yield) | 128,349,251 | 128,349,251 | ||||||||||||||||||
|
| |||||||||||||||||||
See Notes to Financial Statements.
Stone Harbor Investment Funds Annual Report | May 31, 2011 | 43 |
Table of Contents
| Stone Harbor Local Markets Fund | Statements of Investments | |
| May 31, 2011 |
| Market Value (Expressed in U.S. $) | ||||
TOTAL SHORT TERM INVESTMENTS | $ | 128,349,251 | ||
|
| |||
(Cost $128,349,251) | ||||
Total Investments - 97.73% | $ | 592,062,103 | ||
(Cost $576,358,331) | ||||
Other Assets In Excess of Liabilities - 2.27% | 13,731,046 | |||
|
| |||
Net Assets - 100.00% | $ | 605,793,149 | ||
|
| |||
* The principal/contract amount of each security is stated in the currency in which the bond is denominated (U.S. Dollar unless otherwise notated). See below.
ARS | Argentinian Peso | MYR | Malaysian Ringgit | |||
BRL | Brazilian Real | PHP | Philippine Peso | |||
CNY | Chinese Yen | PLN | Polish Zloty | |||
COP | Colombian Peso | RUB | Russian Ruble | |||
HUF | Hungarian Forint | THB | Thai Baht | |||
IDR | Indonesian Rupiah | TRY | Turkish Lira | |||
MXN | Mexican Peso | ZAR | South African Rand |
| (1) | Floating or variable rate security. Interest rate disclosed is that which is in effect at May 31, 2011. |
| (2) | This security has been valued by management at its fair value determined in good faith pursuant to procedures approved by the Board of Trustees. Total market value of fair valued securities amounts to $13,281,491, which represents approximately 2.19% of net assets as of May 31, 2011. |
| (3) | Securities were issued pursuant to Regulation S under the Securities Act of 1933, which exempts securities offered and sold outside of the United States from registration. Such securities cannot be sold in the United States without either an effective registration statement filed pursuant to the Securities Act of 1933, or pursuant to an exemption from registration. These securities have been deemed liquid under procedures approved by the Fund’s Board of Trustees. As of May 31, 2011, the aggregate market value of those securities was $11,600,339, representing 1.91% of net assets. |
| (4) | Zero coupon bond reflects effective yield on the date of purchase. |
| (5) | Security exempt from registration under Rule 144A of the Securities Act of 1933. Under procedures approved by the Board of Trustees, such securities have been determined to be liquid by the Investment Advisor and may normally be sold to qualified institutional buyers in transactions exempt from registration. Total market value of Rule 144A securities amounts to $840,296, which represents approximately 0.14% of net assets as of May 31, 2011. |
| (6) | The underlying security is issued by JP Morgan Chase. |
| (7) | The underlying security is issued by Credit Suisse First Boston. |
| (8) | The underlying security is issued by Citigroup Global Markets. |
| (9) | The underlying security is issued by Barclays Bank PLC. |
| (10) | underlying The security is issued by Deutsche Bank AG London. |
| (11) | underlying The security is issued by HSBC Bank. |
Common Abbreviations:
CGM - Citigroup Global Markets.
ESP - Empresa de Servicios Publicos is the Colombian term for Public Service Company.
SA - Generally designates corporations in various countries mostly employing civil law.
See Notes to Financial Statements.
| 44 | www.shiplp.com |
Table of Contents
| Stone Harbor Local Markets Fund | Statements of Investments | |
| May 31, 2011 |
OUTSTANDING FORWARD FOREIGN CURRENCY CONTRACTS
Contract Description | Contracted | Purchase/Sale | Settlement | Current Value | Unrealized | |||||||||
BRL | 9,143,205 | Purchase | 06/02/2011 | $5,792,522 | $171,772 | |||||||||
BRL | 9,143,205 | Sale | 06/02/2011 | 5,792,521 | 7,330 | |||||||||
BRL | 10,398,000 | Purchase | 07/05/2011 | 6,542,503 | 142,503 | |||||||||
CNY | 28,595,325 | Purchase | 08/09/2011 | 4,427,291 | 52,801 | |||||||||
CNY | 20,839,061 | Purchase | 11/14/2011 | 3,245,632 | 21,785 | |||||||||
CNY | 37,678,111 | Purchase | 05/16/2012 | 5,927,725 | 13,752 | |||||||||
COP | 3,658,000,000 | Purchase | 06/28/2011 | 2,027,716 | 27,716 | |||||||||
IDR | 34,440,000,000 | Purchase | 06/27/2011 | 4,015,016 | 15,016 | |||||||||
MXN | 51,570,200 | Purchase | 06/27/2011 | 4,448,698 | 48,698 | |||||||||
MYR | 12,200,000 | Purchase | 06/27/2011 | 4,044,080 | 44,080 | |||||||||
MYR | 57,938,900 | Purchase | 07/05/2011 | 19,197,435 | 671,310 | |||||||||
PLN | 53,292,650 | Purchase | 06/27/2011 | 19,371,608 | 321,608 | |||||||||
RUB | 60,543,000 | Sale | 06/17/2011 | 2,160,481 | 9,363 | |||||||||
RUB | 60,543,000 | Purchase | 06/17/2011 | 2,160,481 | 60,481 | |||||||||
RUB | 76,747,500 | Purchase | 06/27/2011 | 2,735,933 | 35,933 | |||||||||
RUB | 80,026,000 | Purchase | 07/01/2011 | 2,851,441 | 51,441 | |||||||||
RUB | 80,026,000 | Sale | 07/01/2011 | 2,851,441 | 10,977 | |||||||||
RUB | 520,256,560 | Purchase | 07/06/2011 | 18,527,788 | 217,787 | |||||||||
RUB | 307,194,750 | Purchase | 07/27/2011 | 10,916,082 | 96,082 | |||||||||
RUB | 77,145,385 | Purchase | 08/19/2011 | 2,734,160 | 4,160 | |||||||||
THB | 159,768,000 | Purchase | 06/27/2011 | 5,262,242 | 12,242 | |||||||||
TRY | 10,113,480 | Purchase | 06/27/2011 | 6,306,876 | 6,876 | |||||||||
ZAR | 77,941,610 | Purchase | 06/27/2011 | 11,395,114 | 295,114 | |||||||||
|
| |||||||||||||
| $2,338,827 | ||||||||||||||
|
| |||||||||||||
CNY | 28,595,325 | Sale | 08/09/2011 | $4,427,290 | $(35,254) | |||||||||
CNY | 5,430,650 | Purchase | 11/14/2011 | 845,810 | (4,190) | |||||||||
CNY | 26,269,711 | Sale | 11/14/2011 | 4,091,441 | (9,124) | |||||||||
MYR | 57,938,900 | Sale | 07/05/2011 | 19,197,435 | (104,043) | |||||||||
PHP | 58,829,700 | Purchase | 07/28/2011 | 1,354,010 | (8,179) | |||||||||
RUB | 368,779,370 | Purchase | 07/27/2011 | 13,104,473 | (93,853) | |||||||||
TRY | 6,566,150 | Purchase | 06/27/2011 | 4,094,723 | (5,277) | |||||||||
|
| |||||||||||||
| $(259,920) | ||||||||||||||
|
| |||||||||||||
See Notes to Financial Statements.
Stone Harbor Investment Funds Annual Report | May 31, 2011 | 45 |
Table of Contents
| Stone Harbor Investment Funds | Statements of Assets & Liabilites | |
| May 31, 2011 |
Stone Harbor Debt Fund | Stone Harbor High Yield Bond Fund | Stone Harbor Local Markets Fund | ||||||||||
ASSETS: | ||||||||||||
Investments, at value(1) | $ | 755,113,737 | $ | 483,394,564 | $ | 592,062,103 | ||||||
Cash | 3,090,867 | 11,212 | 15,037,018 | |||||||||
Foreign currency, at value (Cost $2,174, $-0 and $11,669, respectively) | 2,365 | – | 12,096 | |||||||||
Unrealized appreciation on forward foreign currency contracts | 424,225 | – | 2,338,827 | |||||||||
Receivable for investments sold | 19,387,195 | 223,975 | 4,645,270 | |||||||||
Receivable for fund shares sold | 2,513,407 | 241,118 | 37,094,180 | |||||||||
Interest receivable | 12,746,559 | 9,900,883 | 14,745,417 | |||||||||
Dividends receivable | – | 14,362 | – | |||||||||
Prepaid and other assets | 14,846 | 22,146 | 20,109 | |||||||||
Total Assets | 793,293,201 | 493,808,260 | 665,955,020 | |||||||||
LIABILITIES: | ||||||||||||
Payable due to broker | 110,000 | – | 580,000 | |||||||||
Payable for investments purchased | 42,870,371 | 3,042,615 | 58,827,467 | |||||||||
Payable for fund shares redeemed | 13,482 | 2,014,698 | – | |||||||||
Unrealized depreciation on forward foreign currency contracts | 410,021 | 7,636 | 259,920 | |||||||||
Payable to advisor | 317,889 | 167,424 | 299,873 | |||||||||
Payable to administrator | 35,774 | 35,134 | 24,143 | |||||||||
Payable for trustee fees | 6,944 | 6,944 | 6,944 | |||||||||
Other payables | 181,051 | 108,552 | 163,524 | |||||||||
Total Liabilities | 43,945,532 | 5,383,003 | 60,161,871 | |||||||||
Net Assets | $ | 749,347,669 | $ | 488,425,257 | $ | 605,793,149 | ||||||
NET ASSETS CONSIST OF: | ||||||||||||
Paid-in capital | $ | 722,953,342 | $ | 448,348,087 | $ | 588,915,977 | ||||||
Undistributed/(overdistributed) net investment income | 1,037,266 | 129,248 | (27,562 | ) | ||||||||
Accumulated net realized gain/(loss) on investments and translation of assets and liabilities denominated in foreign currency | 399,120 | 11,434,428 | (655,670 | ) | ||||||||
Net unrealized appreciation on investments and translation of assets and liabilities denominated in foreign currency | 24,957,941 | 28,513,494 | 17,560,404 | |||||||||
Net Assets | $ | 749,347,669 | $ | 488,425,257 | $ | 605,793,149 | ||||||
PRICING OF SHARES: | ||||||||||||
Institutional Class | ||||||||||||
Net Assets | $ | 749,347,669 | $ | 488,425,257 | $ | 605,793,149 | ||||||
Shares of beneficial interest outstanding (unlimited number of shares, par value of $0.001 per share authorized) | 66,925,355 | 48,832,904 | 54,032,190 | |||||||||
Net assets value, offering and redemption price per share | $ | 11.20 | $ | 10.00 | $ | 11.21 | ||||||
(1) Cost of Investments | $ | 730,148,968 | $ | 454,873,367 | $ | 576,358,331 | ||||||
See Notes to Financial Statements.
| 46 | www.shiplp.com |
Table of Contents
| Stone Harbor Investment Funds | Statements of Operations | |
| For the Year Ended May 31, 2011 |
| Stone Harbor Emerging Markets Debt Fund | Stone Harbor High Yield Bond Fund | Stone Harbor Local Markets Fund (1) | ||||||||||
INVESTMENT INCOME: | ||||||||||||
Interest (net of foreign withholding tax of $3,999, $70 and $15,807, respectively) | $ | 26,677,398 | $ | 36,121,507 | $ | 11,223,347 | ||||||
Dividends | – | 89,778 | – | |||||||||
Other income | 1,813 | 922,922 | – | |||||||||
Total Investment Income | 26,679,211 | 37,134,207 | 11,223,347 | |||||||||
EXPENSES: | ||||||||||||
Investment advisory fee | 2,365,512 | 2,229,441 | 1,373,164 | |||||||||
Administration fee | 275,912 | 344,743 | 123,137 | |||||||||
Custodian fees | 94,433 | 32,198 | 96,387 | |||||||||
Audit fees | 73,047 | 73,047 | 72,184 | |||||||||
Printing fees | 5,882 | 5,804 | 5,661 | |||||||||
Legal fees | 61,619 | 61,618 | 46,080 | |||||||||
Trustee fees | 24,153 | 24,153 | 25,397 | |||||||||
Transfer agent fees | 36,488 | 27,156 | 24,208 | |||||||||
Registration fees | 83,760 | 33,812 | 67,889 | |||||||||
Insurance fees | 16,388 | 39,035 | 3,597 | |||||||||
Other | 3,675 | 5,020 | 3,221 | |||||||||
Total expenses before waiver | 3,040,869 | 2,876,027 | 1,840,925 | |||||||||
Less fees waived by investment advisor | (83,978) | (423,643) | (10,036) | |||||||||
Total Net Expenses | 2,956,891 | 2,452,384 | 1,830,889 | |||||||||
Net Investment Income | 23,722,320 | 34,681,823 | 9,392,458 | |||||||||
REALIZED AND UNREALIZED GAIN/(LOSS) ON INVESTMENTS: | ||||||||||||
Net realized gain/(loss) on: | ||||||||||||
Investments | 5,039,735 | 17,338,202 | (189,093) | |||||||||
Foreign currency transactions | 1,880,003 | (24,381) | 811,215 | |||||||||
Net realized gain | 6,919,738 | 17,313,821 | 622,122 | |||||||||
Change in unrealized appreciation/(depreciation) on: | ||||||||||||
Investments | 19,239,463 | 17,448,082 | 15,703,772 | |||||||||
Translation of assets and liabilities denominated in foreign currencies | 17,417 | (7,703) | 1,856,632 | |||||||||
Net change | 19,256,880 | 17,440,379 | 17,560,404 | |||||||||
Net Realized and Unrealized Gain on Investments | 26,176,618 | 34,754,200 | 18,182,526 | |||||||||
Net Increase in Net Assets Resulting from Operations | $ | 49,898,938 | $ | 69,436,023 | $ | 27,574,984 | ||||||
| (1) | For the period June 30, 2010 (Inception) to May 31, 2011. |
See Notes to Financial Statements.
Stone Harbor Investment Funds Annual Report | May 31, 2011 | 47 |
Table of Contents
| Stone Harbor Investment Funds | Statements of Changes in Net Assets | |
| May 31, 2011 |
| Stone Harbor Emerging Markets Debt Fund | Stone Harbor High Yield Bond Fund | Stone Harbor Local Markets Fund | ||||||||||||||||||
For the Year Ended | For the Year Ended May 31, 2010 | For the Year Ended | For the Year Ended | For the Period June 30, 2010 (Inception) to May 31, 2011 | ||||||||||||||||
OPERATIONS: | ||||||||||||||||||||
Net investment income | $ | 23,722,320 | $ | 7,972,731 | $ | 34,681,823 | $ | 28,652,485 | $ | 9,392,458 | ||||||||||
Net realized gain on investments | 6,919,738 | 11,619,476 | 17,313,821 | 5,807,602 | 622,122 | |||||||||||||||
Net change in unrealized appreciation on investments and foreign currency translations | 19,256,880 | 1,889,753 | 17,440,379 | 25,039,605 | 17,560,404 | |||||||||||||||
Net increase in net assets resulting from operations | 49,898,938 | 21,481,960 | 69,436,023 | 59,499,692 | 27,574,984 | |||||||||||||||
DISTRIBUTIONS TO SHAREHOLDERS: |
| |||||||||||||||||||
Institutional Class | ||||||||||||||||||||
From net investment income | (24,375,551 | ) | (8,618,487 | ) | (34,395,574 | ) | (28,484,852 | ) | (9,743,385 | ) | ||||||||||
From net realized gains | (9,643,963 | ) | (1,703,347 | ) | (6,870,389 | ) | – | (954,427 | ) | |||||||||||
Net decrease in net assets from distributions to shareholders | (34,019,514 | ) | (10,321,834 | ) | (41,265,963 | ) | (28,484,852 | ) | (10,697,812 | ) | ||||||||||
CAPITAL SHARE TRANSACTIONS: |
| |||||||||||||||||||
Institutional Class | ||||||||||||||||||||
Proceeds from sale of shares | 601,352,890 | 120,511,062 | 91,159,822 | 168,548,608 | 580,987,585 | |||||||||||||||
Issued to shareholders in reinvestment of distributions | 32,341,186 | 9,893,837 | 39,501,275 | 26,880,125 | 10,631,445 | |||||||||||||||
Cost of shares redeemed | (78,251,861 | ) | (55,291,995 | ) | (78,370,360 | ) | (41,688,947 | ) | (2,703,053 | ) | ||||||||||
Net increase in net assets from capital share transactions | 555,442,215 | 75,112,904 | 52,290,737 | 153,739,786 | 588,915,977 | |||||||||||||||
Net Increase in Net Assets | 571,321,639 | 86,273,030 | 80,460,797 | 184,754,626 | 605,793,149 | |||||||||||||||
NET ASSETS: | ||||||||||||||||||||
Beginning of period | 178,026,030 | 91,753,000 | 407,964,460 | 223,209,834 | – | |||||||||||||||
End of period | $ | 749,347,669 | $ | 178,026,030 | $ | 488,425,257 | $ | 407,964,460 | $ | 605,793,149 | ||||||||||
Includes undistributed/(overdistributed) net investment income of: | $ | 1,037,266 | $ | 278,613 | $ | 129,248 | $ | (95,135 | ) | $ | (27,562 | ) | ||||||||
OTHER INFORMATION: |
| |||||||||||||||||||
Share Transactions: | ||||||||||||||||||||
Institutional Class | ||||||||||||||||||||
Beginning shares | 16,992,367 | 9,952,470 | 43,581,412 | 26,613,415 | – | |||||||||||||||
Shares sold | 53,869,983 | 11,360,440 | 9,968,502 | 18,456,848 | 53,300,605 | |||||||||||||||
Shares reinvested | 2,923,915 | 955,219 | 3,225,739 | 2,893,977 | 977,555 | |||||||||||||||
Shares redeemed | (6,860,910 | ) | (5,275,762 | ) | (7,942,749 | ) | (4,382,828 | ) | (245,970 | ) | ||||||||||
Shares outstanding - end of period | 66,925,355 | 16,992,367 | 48,832,904 | 43,581,412 | 54,032,190 | |||||||||||||||
See Notes to Financial Statements.
| 48 | www.shiplp.com |
Table of Contents
| Stone Harbor Emerging Markets Debt Fund | Financial Highlights | |
| For a share outstanding through the periods presented. |
| Institutional Class | For the Year Ended May 31, 2011 | For the Year Ended May 31, 2010 | For the Year Ended May 31, 2009 | For the Period August 16, 2007 (Inception) to May 31, 2008 | ||||||||||||
Net asset value - beginning of period | $ | 10.48 | $ | 9.22 | $ | 10.34 | $ | 10.00 | ||||||||
Income/(loss) from investment operations: | ||||||||||||||||
Net investment income | 0.67 (1) | 0.75 | 0.59 | 0.46 | ||||||||||||
Net realized and unrealized gain/(loss) on investments | 1.00 | 1.44 | (1.18) | 0.58 | ||||||||||||
Total income/(loss) from investment operations | 1.67 | 2.19 | (0.59) | 1.04 | ||||||||||||
Less distributions to common shareholders: | ||||||||||||||||
From net investment income | (0.63) | (0.79) | (0.53) | (0.54) | ||||||||||||
From net realized gains | (0.32) | (0.14) | – | (0.16) | ||||||||||||
From tax return of capital | – | – | – | (0.00) (2) | ||||||||||||
Total distributions | (0.95) | (0.93) | (0.53) | (0.70) | ||||||||||||
Net Increase/(Decrease) in Net Asset Value | 0.72 | 1.26 | (1.12) | 0.34 | ||||||||||||
Net asset value - end of period | $ | 11.20 | $ | 10.48 | $ | 9.22 | $ | 10.34 | ||||||||
Total Return(3)(4) | 16.30% | 24.25% | (5.10)% | 10.46% | ||||||||||||
Ratios/Supplemental Data: | ||||||||||||||||
Net assets, end of period (in thousands) | $ | 749,348 | $ | 178,026 | $ | 91,753 | $ | 19,587 | ||||||||
Ratio of expenses to average net assets with fee waivers/reimbursements | 0.75% | 0.75% | 0.75% | 0.75%(5) | ||||||||||||
Ratio of expenses to average net assets without fee waivers/reimbursements | 0.77% | 0.91% | 1.33% | 2.27%(5) | ||||||||||||
Ratio of net investment income to average net assets with fee waivers/reimbursements | 6.02% | 6.80% | 9.32% | 5.91%(5) | ||||||||||||
Portfolio turnover rate | 82% | 125% | 84% | 143% | ||||||||||||
| (1) | Calculated using average shares throughout the period. |
| (2) | Less than $(0.005) per share. |
| (3) | Total returns would have been lower had various fees and expenses not been waived and reimbursed during the period. The total returns in the table represent the rate that an investor would have earned (or lost) on an investment in a Fund (assuming reinvestment of all dividends and distributions). |
| (4) | Total returns for periods of less than one year are not annualized. |
| (5) | Annualized. |
See Notes to Financial Statements.
Stone Harbor Investment Funds Annual Report | May 31, 2011 | 49 |
Table of Contents
| Stone Harbor High Yield Bond Fund | Financial Highlights | |
For a share outstanding through the periods presented. |
| Institutional Class | For the Year Ended May 31, 2011 | For the Year Ended May 31, 2010 | For the Year Ended May 31, 2009 | For the Period August 16, 2007 (Inception) to May 31, 2008 | ||||||||||||
Net asset value - beginning of period | $ | 9.36 | $ | 8.39 | $ | 9.92 | $ | 10.00 | ||||||||
Income/(loss) from investment operations: | ||||||||||||||||
Net investment income | 0.77 (1) | 0.73 | 0.70 | 0.58 | ||||||||||||
Net realized and unrealized gain/(loss) on investments | 0.78 | 0.96 | (1.53) | (0.08) | ||||||||||||
Total income/(loss) from investment operations | 1.55 | 1.69 | (0.83) | 0.50 | ||||||||||||
Less distributions to common shareholders: | ||||||||||||||||
From net investment income | (0.76) | (0.72) | (0.70) | (0.57) | ||||||||||||
From net realized gains | (0.15) | – | – | (0.01) | ||||||||||||
From tax return of capital | – | – | – | (0.00) (2) | ||||||||||||
Total distributions | (0.91) | (0.72) | (0.70) | (0.58) | ||||||||||||
Net Increase/(Decrease) in Net Asset Value | 0.64 | 0.97 | (1.53) | (0.08) | ||||||||||||
Net asset value - end of period | $ | 10.00 | $ | 9.36 | $ | 8.39 | $ | 9.92 | ||||||||
Total Return(3)(4) | 17.14% | 20.53% | (7.77)% | 5.09% | ||||||||||||
Ratios/Supplemental Data: | ||||||||||||||||
Net assets, end of period (in thousands) | $ | 488,425 | $ | 407,964 | $ | 223,210 | $ | 106,912 | ||||||||
Ratio of expenses to average net assets with fee waivers/reimbursements | 0.55% | 0.55% | 0.55% | 0.55%(5) | ||||||||||||
Ratio of expenses to average net assets without fee waivers/reimbursements | 0.65% | 0.67% | 0.88% | 1.21%(5) | ||||||||||||
Ratio of net investment income to average net assets with fee waivers/reimbursements | 7.78% | 8.13% | 9.07% | 7.81%(5) | ||||||||||||
Portfolio turnover rate | 60% | 36% | 16% | 11% | ||||||||||||
| (1) | Calculated using average shares throughout the period. |
| (2) | Less than $(0.005) per share. |
| (3) | Total returns would have been lower had various fees and expenses not been waived and reimbursed during the period. The total returns in the table represent the rate that an investor would have earned (or lost) on an investment in a Fund (assuming reinvestment of all dividends and distributions). |
| (4) | Total returns for periods of less than one year are not annualized. |
| (5) | Annualized. |
See Notes to Financial Statements.
| 50 | www.shiplp.com |
Table of Contents
| Stone Harbor Local Markets Fund | Financial Highlights | |
| For a share outstanding through the period presented. |
| Institutional Class | For the Period June 30, 2010 (Inception) to May 31, 2011 | |||
Net asset value - beginning of period | $ | 10.00 | ||
Income from investment operations: | ||||
Net investment income | 0.51 (1) | |||
Net realized and unrealized gain on investments | 1.14 | |||
Total income from investment operations | 1.65 | |||
Less distributions to common shareholders: | ||||
From net investment income | (0.39) | |||
From net realized gains | (0.05) | |||
Total distributions | (0.44) | |||
Net Increase in Net Asset Value | 1.21 | |||
Net asset value - end of period | $ | 11.21 | ||
Total Return(2)(3) | 16.82% | |||
Ratios/Supplemental Data: | ||||
Net assets, end of period (in thousands) | $ | 605,793 | ||
Ratio of expenses to average net assets with fee waivers/reimbursements | 1.00%(4) | |||
Ratio of expenses to average net assets without fee waivers/reimbursements | 1.01%(4) | |||
Ratio of net investment income to average net assets with fee waivers/reimbursements | 5.13%(4) | |||
Portfolio turnover rate | 102% | |||
| (1) | Calculated using average shares throughout the period. |
| (2) | Total returns would have been lower had various fees and expenses not been waived and reimbursed during the period. The total returns in the table represent the rate that an investor would have earned (or lost) on an investment in a Fund (assuming reinvestment of all dividends and distributions). |
| (3) | Total returns for periods of less than one year are not annualized. |
| (4) | Annualized. |
Stone Harbor Investment Funds Annual Report | May 31, 2011 | 51 |
Table of Contents
| Stone Harbor Investment Funds | Notes to Financial Statements | |
| May 31, 2011 |
1. ORGANIZATION AND SIGNIFICANT ACCOUNTING POLICIES
Stone Harbor Investment Funds, which consists of Stone Harbor Emerging Markets Debt Fund, Stone Harbor High Yield Bond Fund, Stone Harbor Local Markets Fund and Stone Harbor Emerging Markets Corporate Debt Fund (each, a “Fund” and together, the “Funds”) is a Massachusetts business trust (the “Trust”), organized on February 20, 2007 and registered under the Investment Company Act of 1940, as amended (the “1940 Act”), as an open-end management investment company. Each Fund is a non-diversified portfolio with an investment objective to maximize total return. Shares of each Fund are currently divided into two classes, designated Institutional Class Shares and Distributor Class Shares. As of the date of this report, the Stone Harbor Emerging Markets Corporate Debt Fund had not launched and there were no outstanding shares for the Distributor Class of each Fund. The Declaration of Trust permits the Trustees to create additional funds and share classes.
The following is a summary of significant accounting policies consistently followed by the Funds in the preparation of their financial statements. The policies are in conformity with accounting principles generally accepted in the United States of America (“GAAP”). The preparation of the financial statements in accordance with GAAP requires management to make estimates and assumptions that affect the reported amounts of assets and liabilities at the date of the financial statements and the reported amounts of income and expenses during the reporting period. Actual results could differ from those estimates.
(a) Investment Valuation: Debt securities, including bank loans and linked notes, are generally valued at the mean between the bid and asked prices provided by independent pricing services or brokers that are based on transactions in debt obligations, quotations from dealers, market transactions in comparable securities and various other relationships between securities. Equity securities for which market quotations are available are generally valued at the last sale price or official closing price on the primary market or exchange on which they trade. Publicly traded foreign
government debt securities are typically traded internationally in the over-the-counter market, and are valued at the mean between the bid and asked prices as of the close of business of that market. When prices are not readily available, or are determined not to reflect fair value, such as when the value of a security has been significantly affected by events after the close of the exchange or market on which the security is principally traded, but before the Funds calculate their net asset value, the Funds may value these investments at fair value as determined in accordance with the procedures approved by the Funds’ Board of Trustees. Short-term obligations with maturities of 60 days or less are valued at amortized cost, which approximates market value. Money market mutual funds are valued at their net asset value.
A three tier hierarchy has been established to measure fair value based on the extent of use of “observable inputs” as compared to “unobservable inputs” for disclosure purposes and requires additional disclosures about these valuations measurements. Inputs refer broadly to the assumptions that the market participants would use in pricing a security. Observable inputs are inputs that reflect the assumptions market participants would use in pricing the security developed based on market data obtained from sources independent of the reporting entity. Unobservable inputs are inputs that reflect the reporting entity’s own assumptions about the assumptions market participants would use in pricing the security developed based on the best information available in the circumstances.
The three-tier hierarchy is summarized as follows:
Level 1 – | Quoted and Unadjusted Prices in active markets for identical investments | |
Level 2 – | Other Significant Observable Inputs (including quoted prices for similar investments, interest rates, prepayment speeds, credit risk, etc.) | |
Level 3 – | Significant Unobservable Inputs (including the Fund’s own assumptions in determining the fair value of investments) |
The following is a summary of each Fund’s investments and financial instruments based on the three tier hierarchy as of May 31, 2011:
| Investments in Securities at Value* | Level 1 - Quoted and Unadjusted Prices | Level 2 - Other Significant Observable Inputs | Level 3 - Significant Unobservable Inputs | Total | ||||||||||||
Stone Harbor Emerging Markets Debt Fund | ||||||||||||||||
Sovereign Debt Obligations | $ | – | $ | 444,179,286 | $ | 17,818,730 | $ | 461,998,016 | ||||||||
Bank Loans | – | 2,415,883 | 3,197,000 | 5,612,883 | ||||||||||||
Convertible Corporate Bonds | – | 611,130 | – | 611,130 | ||||||||||||
Corporate Bonds | – | 179,891,028 | 4,257,737 | 184,148,765 | ||||||||||||
Credit Linked Notes | – | 46,874,063 | – | 46,874,063 | ||||||||||||
Participation Notes | – | 4,896,130 | – | 4,896,130 | ||||||||||||
Short Term Investments | 50,972,750 | – | – | 50,972,750 | ||||||||||||
Total | $ | 50,972,750 | $ | 678,867,520 | $ | 25,273,467 | $ | 755,113,737 | ||||||||
Other Financial Instruments** | ||||||||||||||||
Assets | ||||||||||||||||
Forward Foreign Currency Contracts | $ | – | $ | 424,225 | $ | – | $ | 424,225 | ||||||||
Liabilities | ||||||||||||||||
Forward Foreign Currency Contracts | – | (410,021 | ) | – | (410,021 | ) | ||||||||||
Total | $ | – | $ | 14,204 | $ | – | $ | 14,204 | ||||||||
| 52 | www.shiplp.com |
Table of Contents
Stone Harbor Investment Funds | Notes to Financial Statements | |
| May 31, 2011 |
| Investments in Securities at Value* | Level 1 - Quoted and Unadjusted Prices | Level 2 - Other Significant Observable Inputs | Level 3 - Significant Unobservable Inputs | Total | ||||||||||||
Stone Harbor High Yield Bond Fund | ||||||||||||||||
Corporate Bonds | $ | – | $ | 446,387,676 | $ | 2 | $ | 446,387,678 | ||||||||
Convertible Corporate Bonds | – | 9,146,336 | 342,923 | 9,489,259 | ||||||||||||
Bank Loans | – | 8,940,839 | – | 8,940,839 | ||||||||||||
Common Stocks | 2,300,825 | – | – | 2,300,825 | ||||||||||||
Preferred Stocks | – | 1,603,753 | – | 1,603,753 | ||||||||||||
Rights and Warrants | 288,225 | – | – | 288,225 | ||||||||||||
Short Term Investments | 14,383,985 | – | – | 14,383,985 | ||||||||||||
Total | $ | 16,973,035 | $ | 466,078,604 | $ | 342,925 | $ | 483,394,564 | ||||||||
Other Financial Instruments** | ||||||||||||||||
Liabilities | ||||||||||||||||
Forward Foreign Currency Contracts | $ | – | $ | (7,636) | $ | – | $ | (7,636) | ||||||||
Total | $ | – | $ | (7,636) | $ | – | $ | (7,636) | ||||||||
| Investments in Securities at Value* | Level 1 - Quoted and Unadjusted Prices | Level 2 - Other Significant Observable Inputs | Level 3 - Significant Inputs | Total | ||||||||||||
Stone Harbor Local Markets Fund | ||||||||||||||||
Sovereign Debt Obligations | $ | – | $ | 267,658,094 | $ | 13,281,491 | $ | 280,939,585 | ||||||||
Corporate Bonds | – | 50,127,238 | – | 50,127,238 | ||||||||||||
Credit Linked Notes | – | 132,646,029 | – | 132,646,029 | ||||||||||||
Short Term Investments | 128,349,251 | – | – | 128,349,251 | ||||||||||||
Total | $ | 128,349,251 | $ | 450,431,361 | $ | 13,281,491 | $ | 592,062,103 | ||||||||
Other Financial Instruments** | ||||||||||||||||
Assets | ||||||||||||||||
Forward Foreign Currency Contracts | $ | – | $ | 2,338,827 | $ | – | $ | 2,338,827 | ||||||||
Liabilities | ||||||||||||||||
Forward Foreign Currency Contracts | – | (259,920) | – | (259,920) | ||||||||||||
Total | $ | – | $ | 2,078,907 | $ | – | $ | 2,078,907 | ||||||||
| * | For detailed Industry/Country descriptions, see accompanying Statement of Investments. |
| ** | Other financial instruments are derivative instruments not reflected in the Statement of Investments. |
There were no significant transfers into or out of Levels 1 and 2 during the period.
The following is a reconciliation of assets in which significant unobservable inputs (Level 3) were used in determining fair value:
| Investments in Securities at Value | Balance as of May 31, | Accrued Discount/ Premium | Realized Gain/(Loss)* | Change in Unrealized Appreciation/ (Depreciation)* | Net Purchases/ Sales | Transfers in and/or out of Level 3 | Balance as of May 31, 2011 | Net Change in May 31, 2011 | ||||||||||||||||||||||||
Stone Harbor Emerging Markets Debt Fund |
| |||||||||||||||||||||||||||||||
Sovereign Debt Obligations | $ | 414,800 | $ | (8,868 | ) | $ | 96,677 | $ | 734,451 | $ | 12,965,816 | $ | 3,615,854 | $ | 17,818,730 | $ | 1,330,921 | |||||||||||||||
Bank Loans | – | 219,386 | – | – | 2,977,614 | – | 3,197,000 | – | ||||||||||||||||||||||||
Corporate Bonds | 812,778 | (13,733 | ) | 57,596 | 48,352 | 3,352,744 | – | 4,257,737 | 48,982 | |||||||||||||||||||||||
Credit Linked Notes | 10,408,722 | 27,057 | 975,181 | 317,105 | (9,011,823 | ) | (2,716,242 | ) | – | – | ||||||||||||||||||||||
Total | $ | 11,636,300 | $ | 223,842 | $ | 1,129,454 | $ | 1,099,908 | $ | 10,284,351 | $ | 899,612 | $ | 25,273,467 | $ | 1,379,903 | ||||||||||||||||
Stone Harbor Investment Funds Annual Report | May 31, 2011 | 53 |
Table of Contents
| Stone Harbor Investment Funds | Notes to Financial Statements | |
| May 31, 2011 |
| Investments in Securities at Value | Balance as of | Accrued Discount/ Premium | Realized Gain/(Loss)* | Change in Unrealized Appreciation/ (Depreciation)* | Net Purchases/ Sales | Transfers in and/or out of Level 3 | Balance as of May 31, 2011 | Net Change in May 31, 2011 | ||||||||||||||||||||||||
Stone Harbor High Yield Bond Fund |
| |||||||||||||||||||||||||||||||
Corporate Bonds | $ | 2,230,500 | $ | 487 | $ | 124,569 | $ | 97,315 | $ | (436,344 | ) | $ | (2,016,525 | ) | $ | 2 | $ | (28,140 | ) | |||||||||||||
Convertible Corporate Bonds | – | (836 | ) | – | 22,916 | 320,843 | – | 342,923 | 22,916 | |||||||||||||||||||||||
Bank Loans | 399,936 | – | 14,384 | (48,782 | ) | (42,305 | ) | (323,233 | ) | – | – | |||||||||||||||||||||
| ||||||||||||||||||||||||||||||||
Total | $ | 2,630,436 | $ | (349 | ) | $ | 138,953 | $ | 71,449 | $ | (157,806 | ) | $ | (2,339,758 | ) | $ | 342,925 | $ | (5,224 | ) | ||||||||||||
| ||||||||||||||||||||||||||||||||
Stone Harbor Local Markets Fund |
| |||||||||||||||||||||||||||||||
Sovereign Debt Obligations | $ | – | $ | (23,214 | ) | $ | – | $ | 291,975 | $ | 13,012,730 | $ | – | $ | 13,281,491 | $ | 291,975 | |||||||||||||||
| ||||||||||||||||||||||||||||||||
Total | $ | – | $ | (23,214 | ) | $ | – | $ | 291,975 | $ | 13,012,730 | $ | – | $ | 13,281,491 | $ | 291,975 | |||||||||||||||
| ||||||||||||||||||||||||||||||||
| * | Realized gain and change in unrealized appreciation/(depreciation) are included in the related amounts on the investment in the Statement of Operations. |
The inputs or methodology used for valuing securities are not necessarily an indication of the risk associated with investing in those securities.
(b) Security Transactions and Investment Income: Security transactions are accounted for on a trade date basis. Interest income, adjusted for amortization of premium and accretion of discount, is recorded on the accrual basis. Dividend income is recorded on the ex-dividend date. Foreign dividend income is recorded on the ex-dividend date or as soon as practical after the Funds determine the existence of a dividend declaration after exercising reasonable due diligence. The cost of investments sold is determined by use of the specific identification method. To the extent any issuer defaults on an expected interest payment, the Funds’ policy is to generally halt any additional interest income accruals and consider the realizability of interest accrued up to the date of default.
(c) Foreign Currency Translation: The books and records of the Funds are maintained in U.S. dollars. Investment valuations and other assets and liabilities initially expressed in foreign currencies are converted each business day into U.S. dollars based upon current exchange rates. Prevailing foreign exchange rates may generally be obtained at the close of the NYSE (normally, 4:00 p.m. Eastern time). The portion of realized and unrealized gains or losses on investments due to fluctuations in foreign currency exchange rates is not separately disclosed and is included in realized and unrealized gains or losses on investments, when applicable.
(d) Foreign Securities: The Funds may directly purchase securities of foreign issuers. Investing in securities of foreign issuers involves special risks not typically associated with investing in securities of U.S. issuers. The risks include possible revaluation of currencies, the ability to repatriate funds, less complete financial information about companies and possible future adverse political and economic
developments. Moreover, securities of many foreign issuers and their markets may be less liquid and their prices more volatile than those of securities of comparable U.S. issuers.
(e) Risk Exposure and the Use of Derivative Instruments: The Funds’ investment objectives not only permit the Funds to purchase investment securities, they also allow the Funds to enter in various types of derivatives contracts. In doing so, the Funds employ strategies in differing combinations to permit them to increase, decrease, or change the level or types of exposure to market factors. Central to those strategies are features inherent to derivatives that may make them more attractive for this purpose than equity or debt securities; they require little or no initial cash investment, they can focus exposure on only certain selected risk factors, and they may not require the ultimate receipt or delivery of the underlying security (or securities) to the contract. This may allow the Funds to pursue their objectives more quickly and efficiently than if they were to make direct purchases or sales of securities capable of effecting a similar response to market factors.
Risk Factors. In pursuit of their investment objectives, the Funds may seek to use derivatives to increase or decrease their exposure to the following risk factors, among others:
Interest Rate Risk. Interest rate risk refers to the fluctuations in value of fixed-income securities resulting from the inverse relationship between price and yield. For example, an increase in general interest rates will tend to reduce the market value of already issued fixed-income investments, and a decline in general interest rates will tend to increase their value. In addition, debt securities with longer maturities, which tend to have higher yields, are subject to potentially greater fluctuations in value from changes in interest rates than obligations with shorter maturities.
| 54 | www.shiplp.com |
Table of Contents
| Stone Harbor Investment Funds | Notes to Financial Statements | |
| May 31, 2011 |
Credit Risk. Credit risk relates to the ability of the issuer to meet interest and principal payments, or both, as they come due. In general, lower grade, higher yield bonds are subject to credit risk to a greater extent than lower yield, higher quality bonds.
Foreign Exchange Rate Risk. Foreign exchange rate risk relates to the change in the U.S. dollar value of a security held that is denominated in a foreign currency. The U.S. dollar value of a foreign currency denominated security will decrease as the dollar appreciates against the currency, while the U.S. dollar value will increase as the dollar depreciates against the currency.
Equity Risk. Equity risk relates to the change in value of equity securities as they relate to increases or decreases in the general market.
The Funds’ use of derivatives can result in losses due to unanticipated changes in these risk factors and the overall market. In instances where the Funds are using derivatives to decrease, or hedge, exposures to market risk factors for securities held by the Funds, there are also risks that those derivatives may not perform as expected resulting in losses for the combined or hedged positions.
Derivatives may have little or no initial cash investment relative to their market value exposure and therefore can produce significant gains or losses in excess of their cost. This use of embedded leverage allows the Fund to increase its market value exposure relative to it net assets and can substantially increase the volatility of the Funds’ performance.
Additional associated risks from investing in derivatives also exist and potentially could have significant effects on the valuation of the derivative and the Funds. Typically, the associated risks are not the risks that the Funds are attempting to increase or decrease exposure to, per their investment objectives, but are the additional risks from investing in derivatives.
Examples of these associated risks are liquidity risk, which is the risk that the Funds will not be able to sell the derivative in the open market in a timely manner, and counterparty credit risk, which is the risk that the counterparty will not fulfill its obligation to the Funds. Associated risks can be different for each type of derivative and are discussed by each derivative type below in the notes that follow.
Forward Foreign Currency Contracts. The Funds may engage in currency transactions with counterparties to hedge the value of portfolio securities denominated in particular currencies against fluctuations in relative value, to gain or reduce exposure to certain currencies, or to generate income or gains. A forward foreign currency contract is an agreement between two parties to buy and sell a currency at a set price on a future date. The contract is marked-to-market daily and the change in value is recorded by the Funds as an unrealized gain or loss. When a forward foreign currency contract is extinguished, through either delivery or offset by entering into another forward foreign currency contract, the Funds record a realized gain or loss equal to the difference between the value of the contract at the time it was opened and the value of the contract at the time it was extinguished.
Forward foreign currency contracts involve elements of market risk in excess of the amounts reflected in the Statements of Assets and Liabilities. The Funds bear the risk of an unfavorable change in the foreign exchange rate underlying the forward foreign currency contract. Risks may also arise upon entering into these contracts from the potential inability of the counterparties to meet the terms of their contracts.
Credit Linked Notes: The Funds may invest in Credit Linked Notes to obtain economic exposure to high yield, emerging markets or other securities. Investments in a Credit Linked Note typically provide the holder with a return based on the return of an underlying reference instrument, such as an emerging market bond. Like an investment in a bond, investments in credit linked securities represent the right to receive periodic income payments (in the form of distributions) and payment of principal at the end of the term of the security. In addition to the risks associated with the underlying reference instrument, an investment in a Credit Linked Note is also subject to the risk that the counterparty will be unwilling or unable to meet its obligations under the note. Because Credit Linked Notes are derivatives, an investment in these instruments is generally subject to the risks associated with derivatives.
Stone Harbor Investment Funds Annual Report | May 31, 2011 | 55 |
Table of Contents
| Stone Harbor Investment Funds | Notes to Financial Statements | |
| May 31, 2011 |
The following is a summary of the fair valuations of derivative instruments categorized by risk exposure:
Fair values of derivative instruments on the Statement of Assets and Liabilities as of May 31, 2011:
| Foreign Exchange Contracts | ||||
Stone Harbor Emerging Markets Debt Fund | ||||
Assets: | ||||
Unrealized appreciation on forward foreign currency contracts | $ | 424,225 | ||
Liabilities: | ||||
Unrealized depreciation on forward foreign currency contracts | $ | (410,021) | ||
Stone Harbor High Yield Bond Fund | ||||
Assets: | ||||
Unrealized appreciation on forward foreign currency contracts | $ | – | ||
Liabilities: | ||||
Unrealized depreciation on forward foreign currency contracts | $ | (7,636) | ||
Stone Harbor Local Markets Fund | ||||
Assets: | ||||
Unrealized appreciation on forward foreign currency contracts | $ | 2,338,827 | ||
Liabilities: | ||||
Unrealized depreciation on forward foreign currency contracts | $ | (259,920) | ||
The effect of derivative instruments on the Statement of Operations for the period ended May 31, 2011:
| Foreign Exchange Contracts | ||||
Stone Harbor Emerging Markets Debt Fund | ||||
Net Realized Loss on: | ||||
Foreign currency transactions | $ | (1,119,119) | ||
Change in Unrealized Appreciation on: | ||||
Translation of assets and liabilities denominated in foreign currencies | $ | 28,905 | ||
Stone Harbor High Yield Bond Fund | ||||
Net Realized Loss on: | ||||
Foreign currency transactions | $ | (25,768) | ||
Change in Unrealized Depreciation on: | ||||
Translation of assets and liabilities denominated in foreign currencies | $ | (7,636) | ||
Stone Harbor Local Markets Fund | ||||
Net Realized Gain on: | ||||
Foreign currency transactions | $ | 351,378 | ||
Change in Unrealized Appreciation on: | ||||
Translation of assets and liabilities denominated in foreign currencies | $ | 2,078,907 | ||
| 56 | www.shiplp.com |
Table of Contents
| Stone Harbor Investment Funds | Notes to Financial Statements | |
| May 31, 2011 |
(f) Loan Participations and Assignments: The Funds may invest in loans arranged through private negotiation between one or more financial institutions. The Funds’ investment in any such loan may be in the form of a participation in or an assignment of the loan. In connection with purchasing participations, the Funds generally will have no right to enforce compliance by the borrower with the terms of the loan agreement relating to the loan, nor any rights of set off against the borrower and the Funds may not benefit directly from any collateral supporting the loan in which they have purchased the participation.
The Funds assume the credit risk of the borrower, the lender that is selling the participation and any other persons interpositioned between the Funds and the borrower. In the event of the insolvency of the lender selling the participation, the Funds may be treated as a general creditor of the lender and may not benefit from any set off between the lender and the borrower.
(g) Credit and Market Risk: The Funds invest in high yield and emerging market instruments that are subject to certain credit and market risks. The yields of high yield and emerging market debt obligations reflect, among other things, perceived credit and market risks. The Funds’ investment in securities rated below investment grade typically involves risks not associated with higher rated securities including, among others, greater risk related to timely and ultimate payment of interest and principal, greater market price volatility and less liquid secondary market trading. The consequences of political, social, economic or diplomatic changes may have disruptive effects on the market prices of investments held by the Funds. The Funds’ investment in non-dollar denominated securities may also result in foreign currency losses caused by devaluations and exchange rate fluctuations. Investments in derivatives are also subject to credit and market risks.
(h) Distributions to Shareholders: Dividends and distributions to shareholders, which are determined in accordance with income tax regulations, are recorded on the ex-date. Income distributions, if any are generally declared and paid on a quarterly basis. Capital gain distributions, if any, are declared and paid at least annually.
(i) Classifications of Distributions: Net investment income (loss) and net realized gain (loss) may differ for financial statement and tax purposes. The character of distributions made during the year from net investment income or net realized gains may differ from its ultimate characterization for federal income tax purposes. Also, due to the timing of dividend distributions, the fiscal year in which amounts are distributed may differ from the fiscal year in which the income or realized gain was recorded by a Fund.
The tax character of the distributions paid by the Funds during the years ended May 31, 2011, and May 31, 2010, was as follows:
Stone Harbor Emerging Markets Debt Fund |
| |||||||
For the Year Ended | For the Year Ended | |||||||
|
| |||||||
Ordinary Income | $ | 30,268,192 | $ | 10,321,834 | ||||
Long-Term Capital Gain | 3,751,322 | – | ||||||
Tax Return of Capital | – | – | ||||||
Total | $ | 34,019,514 | $ | 10,321,834 | ||||
Stone Harbor High Yield Bond Fund |
| |||||||
For the Year Ended May 31, 2011 | For the Year Ended May 31, 2010 | |||||||
|
| |||||||
Ordinary Income | $ | 37,432,474 | $ | 28,484,852 | ||||
Long-Term Capital Gain | 3,833,489 | – | ||||||
Tax Return of Capital | – | – | ||||||
Total | $ | 41,265,963 | $ | 28,484,852 | ||||
Stone Harbor Local Markets Fund |
| |||||||
| For the Period Ended May 31, 2011 | ||||||||
Ordinary Income | $ | 10,697,812 | ||||||
Long-Term Capital Gain | – | |||||||
Tax Return of Capital | – | |||||||
Total | $ | 10,697,812 | ||||||
As of May 31, 2011, the components of distributable earnings on a tax basis were as follows:
Stone Harbor Emerging Markets Debt Fund | ||||
Undistributed Ordinary Income | $ | 1,827,502 | ||
Accumulated Capital Gains/(Loss) | 899,020 | |||
Unrealized Appreciation/(Depreciation) | 23,682,009 | |||
Cumulative Effect of Other Timing Difference* | (14,204 | ) | ||
Total | $ | 26,394,327 | ||
Stone Harbor High Yield Bond Fund | ||||
Undistributed Ordinary Income | $ | 2,353,392 | ||
Accumulated Capital Gains/(Loss) | 9,217,158 | |||
Unrealized Appreciation/(Depreciation) | 28,506,438 | |||
Cumulative Effect of Other Timing Difference* | 182 | |||
Total | $ | 40,077,170 | ||
Stone Harbor Local Markets Fund | ||||
Undistributed Ordinary Income | $ | 1,530,108 | ||
Accumulated Capital Gains/(Loss) | – | |||
Unrealized Appreciation/(Depreciation) | 16,767,828 | |||
Cumulative Effect of Other Timing Difference* | (1,420,764 | ) | ||
Total | $ | 16,877,172 | ||
*Other temporary differences due to timing, consist primarily of mark-to-market on forward foreign currency contracts.
Stone Harbor Investment Funds Annual Report | May 31, 2011 | 57 |
Table of Contents
| Stone Harbor Investment Funds | Notes to Financial Statements | |
| May 31, 2011 |
The tax components of distributable earnings are determined in accordance with income tax regulations which may differ from the composition of net assets reported under accounting principles generally accepted in the United States. Accordingly, for the period ended May 31, 2011, certain differences were reclassified. These differences were primarily due to the differing tax treatment of certain investments and the amounts reclassified did not affect net assets.
The reclassifications were as follows:
Stone Harbor Emerging Markets Debt Fund | Stone Harbor High Yield Bond Fund | Stone Harbor Local Markets Fund | ||||||||||
Paid-in Capital | $ | – | $ | 550,704 | $ | – | ||||||
(Over)/ Undistributed Income | $ | 1,411,884 | $ | (61,866 | ) | $ | 323,365 | |||||
Accumulated Net Realized Losses | $ | (1,411,884 | ) | $ | (488,838 | ) | $ | (323,365 | ) | |||
(j) Expenses: Direct expenses are charged to the Funds; general expenses of the Trust are allocated to the Funds based on each Fund’s relative net assets.
(k) Federal and Other Taxes: No provision for income taxes is included in the accompanying financial statements, as the Funds intend to distribute to shareholders all taxable investment income and realized gains and otherwise comply with Subchapter M of the Internal Revenue Code applicable to regulated investment companies.
The Funds evaluate tax positions taken (or expected to be taken) in the course of preparing the Funds’ tax returns to determine whether these positions meet a “more-likely-than-not” standard that, based on the technical merits, have a more than fifty percent likelihood of being sustained by a taxing authority upon examination. A tax position that meets the “more-likely-than-not” recognition threshold is measured to determine the amount of benefit to recognize in the financial statements.
Management of the Funds analyzes all open tax years, as defined by the Statute of Limitations, for all major jurisdictions, including federal tax authorities and certain state tax authorities. As of and during the fiscal year ended May 31, 2011, the Funds did not have a liability for any unrecognized tax benefits. The Funds’ federal and state income and federal excise tax returns for all tax years since inception are subject to examination by the Internal Revenue Service and state departments of revenue.
Under the Regulated Investment Company Modernization Act of 2010 (the “Act”), net capital losses recognized in tax years beginning after December 22, 2010 may be carried forward indefinitely, and the character of the losses is retained as short-term and/or long-term. Under the law in effect prior to the Act, net capital losses were carried forward for eight years and treated as short-term. As a
transition rule, the Act requires that post enactment net capital losses be used before pre-enactment net capital losses.
2. APPLICATION OF RECENT ACCOUNTING PRONOUNCEMENTS
In January 2010, the FASB issued ASU No. 2010-06 “Fair Value Measurements and Disclosures: Improving Disclosures about Fair Value Measurements” (ASU No. 2010-06). ASU No. 2010-06 provides for disclosure of significant transfers in and out of the fair value hierarchy Levels 1 and 2, and the reasons for these transfers. In addition, ASU No. 2010-06 provides for separate disclosure about purchases, sales, issuances and settlements in the Level 3 hierarchy roll forward activity. ASU No. 2010-06 is effective for interim and annual periods beginning after December 31, 2009 except for the provisions relating to purchases, sales, issuances and settlements of Level 3 investments, which are effective for fiscal years beginning after December 15, 2010. Stone Harbor Emerging Markets Debt Fund and Stone Harbor High Yield Bond Fund adopted the disclosure provisions of ASU 2010-06 for their fiscal year beginning June 1, 2010 and Stone Harbor Local Markets Fund adopted the disclosure provisions of ASU 2010-06 for the period beginning June 30, 2010 (Inception), and all Funds will adopt the Level 3 purchase, sales, issuances and settlement provisions for their fiscal year beginning June 1, 2011. To date, the adoption of ASU No. 2010-06 has not had an impact on the Funds’ financial position, the results of its operations, or disclosures.
3. ADVISORY FEES
Stone Harbor Investment Partners LP is the Trust’s investment adviser. Under the investment advisory agreement the Trust pays an investment advisory fee calculated daily and paid monthly of 0.60%, 0.50% and 0.75% of the average daily net assets for Stone Harbor Emerging Markets Debt Fund, Stone Harbor High Yield Bond Fund, and Stone Harbor Local Markets Fund, respectively.
The Adviser has contractually agreed to waive fees and reimburse expenses with respect to each of the Funds so that the Net Annual Operating Expenses (exclusive of acquired Fund fees and expenses, brokerage expenses, interest expense, taxes and extraordinary expenses) of the Stone Harbor Emerging Markets Debt Fund Institutional Class, Stone Harbor High Yield Bond Fund Institutional Class and Stone Harbor Local Markets Fund Institutional Class will not exceed 0.75%, 0.55% and 1.00%, respectively. This undertaking is in effect through September 30, 2011 and is reevaluated on an annual basis.
The Adviser will be permitted to recover, on a class by class basis, expenses it has borne through the undertakings described above to the extent that a Fund’s expenses in later periods fall below the annual rates set forth in the relevant undertaking. A Fund will not be obligated to pay any such deferred fees and expenses more than three years after the end of the fiscal year in which the fee and expense was deferred. As of May 31, 2011, deferred fees and expenses that were eligible to be recovered amounted to $501,296, $1,259,770 and $10,036 for the Stone Harbor Emerging Markets
| 58 | www.shiplp.com |
Table of Contents
| Stone Harbor Investment Funds | Notes to Financial Statements | |
| May 31, 2011 |
Debt Fund, Stone Harbor High Yield Bond Fund and Stone Harbor Local Markets Fund, respectively.
4. INVESTMENTS
During the year ended May 31, 2011 the aggregate cost of purchases and proceeds from sales of investments (excluding short-term investments) were as follows:
Stone Harbor Emerging Markets Debt Fund | Stone Harbor High Yield Bond Fund | Stone Harbor Local Markets Fund | ||||||||||
Purchases of investments | $ | 790,753,756 | $ | 302,869,195 | $ | 640,836,323 | ||||||
Sales of investments | $ | 303,598,619 | $ | 256,029,652 | $ | 193,483,592 | ||||||
At May 31, 2011 the aggregate gross unrealized appreciation and depreciation of investments for federal income purposes were substantially as follows:
Stone Harbor Emerging Markets Debt Fund | ||||
Gross appreciation on investments (excess of value over tax cost) | $ | 27,198,213 | ||
Gross depreciation on investments (excess of tax cost over value) | (3,509,376 | ) | ||
Net appreciation/(depreciation) on foreign currency and derivatives | (6,828 | ) | ||
Net unrealized appreciation | 23,682,009 | |||
Cost of investments for income tax purposes | $ | 731,424,900 | ||
Stone Harbor High Yield Bond Fund | ||||
Gross appreciation on investments (excess of value over tax cost) | $ | 34,214,423 | ||
Gross depreciation on investments (excess of tax cost over value) | (5,700,282 | ) | ||
Net appreciation/(depreciation) on foreign currency and derivatives | (7,703 | ) | ||
Net unrealized appreciation | 28,506,438 | |||
Cost of investments for income tax purposes | $ | 454,880,423 | ||
Stone Harbor Local Markets Fund | ||||
Gross appreciation on investments (excess of value over tax cost) | $ | 16,630,515 | ||
Gross depreciation on investments (excess of tax cost over value) | (1,719,319 | ) | ||
Net appreciation/(depreciation) on foreign currency and derivatives | 1,856,632 | |||
Net unrealized appreciation | 16,767,828 | |||
Cost of investments for income tax purposes | $ | 577,150,907 | ||
The Funds elect to defer to the period ending May 31, 2012 the following losses recognized during the period November 1, 2010 through May 31, 2011:
| Capital | Currency | |||||||
Stone Harbor Emerging Markets Debt Fund | – | – | ||||||
Stone Harbor High Yield Bond Fund | – | 9,401 | ||||||
Stone Harbor Local Markets Fund | – | – | ||||||
5. SHARES OF BENEFICIAL INTEREST
At May 31, 2011, the Trust had an unlimited number of shares of beneficial interest authorized with a par value of $0.001 per share. The Funds have the ability to issue multiple classes of shares. Each share of a class represents an identical interest and has the same rights, except that each class bears certain direct expenses, including those specifically related to the distribution of its shares. Transactions in shares of the Institutional Class can be found on the Statement of Changes in Net Assets.
6. OTHER
Board of Trustees Compensation: No officer, trustee or employee of the Adviser or any of its affiliates receives any compensation from the Funds for serving as an officer or trustee of the Funds. The Trust pays each Trustee who is not an interested person, as defined by the 1940 Act, of the Adviser or any of its affiliates a fee of $24,000 per year. Interested Trustees of the Trust are not compensated by the Trust. All Trustees are reimbursed for reasonable travel and out-of pocket expenses incurred to attend such meetings.
Stone Harbor Investment Funds Annual Report | May 31, 2011 | 59 |
Table of Contents
| Stone Harbor Investment Funds | Additional Information | |
| May 31, 2011 |
FUND PORTFOLIO HOLDINGS
The SEC has adopted the requirement that all registered investment companies file a complete schedule of portfolio holdings with the SEC for their first and third fiscal quarters on Form N-Q. For the Funds, this would be for the fiscal quarters ending August 31 and February 28. The Form N-Q filing must be made within 60 days of the end of the quarter. The Funds’ Forms N-Q will be available on the SEC’s website at http://www.sec.gov., or they may be reviewed and copied at the SEC’s Public Reference Room in Washington, DC (call 1-800-732-0330 for information on the operation of the Public Reference Room).
PROXY VOTING
A description of the policies and procedures that the Funds use to determine how to vote proxies relating to portfolio securities and information regarding how the Funds voted proxies relating to portfolio securities for the period ending June 30, 2010 will be available without a charge, upon request, by contacting Stone Harbor Investment Funds at 1-866-699 8158 or on the SEC website at http://www.sec.gov.
SHAREHOLDER TAX INFORMATION
Certain tax information regarding the Trust is required to be provided to shareholders based upon each Fund’s income and distributions for the year ended May 31, 2011.
Stone Harbor Emerging Markets Debt Fund | Stone Harbor High Yield Bond Fund | Stone Harbor Local Markets Fund | ||||||||||
Dividends Received Deduction Percentage | 0.00 | % | 0.18 | % | 0.00 | % | ||||||
Qualified Dividend Income Percentage | 0.00 | % | 0.18 | % | 0.00 | % | ||||||
Pursuant to Section 852(b)(3) of the Internal Revenue Code, the Stone Harbor Emerging Markets Debt Fund and the Stone Harbor High Yield Bond Fund designate $3,751,322 and $3,833,489, respectively, as long term capital gain dividends.
| 60 | www.shiplp.com |
Table of Contents
| Stone Harbor Investment Funds | Investment Advisory Agreements | |
| May 31, 2011 |
Each Fund’s investment advisory agreement (each an “Agreement” and, together, the “Agreements”) is subject to annual approval by (i) the vote of a majority of the entire Board of Trustees, or of a majority of the outstanding voting securities (as defined in the Investment Company Act of 1940 (the “1940 Act”)), of the applicable Fund, and (ii) the vote of a majority of the Trustees who are not interested persons of the Funds (the “Independent Trustees”). Each Agreement is terminable with respect to a Fund by the Adviser, a majority of the Trustees, or a vote of a majority of the outstanding voting securities of the applicable Fund, without penalty, by not less than 60 days’ prior written notice. Each Agreement will terminate automatically in the event of its assignment (as defined for purposes of the 1940 Act).
The Board of Trustees, including the Independent Trustees, meets over the course of the year with representatives of Stone Harbor Investment Partners LP, each Fund’s investment adviser (the “Adviser”), including the Funds’ respective portfolio managers, and regularly reviews detailed information regarding the investment program and performance of each Fund. The Board of Trustees also receives periodic updates between meetings. The Trustees, including the Independent Trustees, met on April 20, 2011 to review the Agreements for Stone Harbor Emerging Markets Fund, Stone Harbor High Yield Fund and Stone Harbor Local Markets Fund and to determine whether to approve the continuation of the Agreements for an additional one year period. The Agreement for Stone Harbor Emerging Markets Corporate Debt Fund was not required to be re approved at this time. The Trustees considered all information they deemed reasonably necessary to evaluate the terms thereof. In connection with this meeting, the Trustees received materials to assist them with their review. These materials included, among other things, (i) information on each Fund’s investment performance and the performance of a group of similar mutual funds (some of which was prepared by a third party); (ii) information on each Fund’s advisory fees and other expenses, including information comparing each Fund’s expenses to the fees charged to institutional accounts managed by the Adviser and to a group of similar funds prepared by a third party and information about any applicable expense caps; and (iii) information about the profitability of each Agreement to the Adviser. In considering whether to approve the continuation of each Agreement, the Board of Trustees, including the Independent Trustees, did not identify any single factor as determinative. Individual Trustees may have evaluated the information presented differently from one another, giving different weights to various factors. Matters considered by the Trustees, including the Independent Trustees, in connection with their approval of the Agreements included, but were not limited to, the following:
The nature, extent and quality of the services provided to the Funds under the Agreements.
The Trustees considered the nature, extent and quality of the services provided by the Adviser to the Funds. In this regard, the Trustees took into account the experience of each Fund’s portfolio management team and of the Adviser’s senior management, and the time and attention they devote to the Funds.
After reviewing these and related factors, the Trustees concluded, within the context of their overall conclusions regarding each Agreement, that the nature, extent and quality of the services provided by the Adviser supported the renewal of the Agreements.
Investment performance of the Funds and the Adviser.
The Trustees reviewed performance information for Stone Harbor Emerging Market Debt Fund and Stone Harbor High Yield Fund for the one year period ended February 28, 2011 and since each Fund’s inception and for Stone Harbor Local Markets Fund for the period ended February 28, 2011 since that Fund’s inception on July 1, 2010. The Trustees also reviewed more recent performance information provided at the meeting. The review included a comparison of each Fund’s performance to the performance of a group of comparable funds selected by a third party and each Fund’s respective benchmark. The Trustees also considered the Adviser’s performance and reputation generally and its investment techniques, risk management controls and decision making processes.
After reviewing these and related factors, the Trustees concluded, within the context of their overall conclusions regarding each Agreement, that these factors supported the renewal of the Agreements.
The costs of the services to be provided and profits to be realized by the Adviser from its relationship with the Funds.
The Trustees considered the fees charged to each Fund for advisory services as well as the total expense level of each Fund. The Adviser furnished information to the Trustees compiled by a third party showing a comparison of each Fund’s advisory fees and total expense levels compared to a group of similar mutual funds selected by the third party. The Trustees considered that the Funds, because they were smaller than most of the funds to which they were being compared, could not take advantage of economies of scale (which can reduce fund expenses) to the same extent as those larger funds. The Trustees noted that each Fund is subject to expense caps, and each Fund’s advisory fee and net expense ratio (after application of the expense caps) is below the medians for comparable groups of mutual funds. The Adviser also provided information about the costs to it of providing services to the Funds and information about its profitability with respect to its management of the Funds, as well as information about the advisory fees it charges to institutional separate accounts with similar strategies and information about differences in such fees. In this regard, the Trustees noted that the effective management fee rate received by the Adviser (after application of expense caps and waivers) is lower for the Funds than it is for similarly managed institutional accounts. The Trustees also considered the demands and complexity of the investment management of the Funds as compared to the complexity of managing separate accounts.
After reviewing these and related factors, the Trustees concluded, within the context of their overall conclusions regarding each Agreement, that the advisory fees for each of the Funds were fair
Stone Harbor Investment Funds Annual Report | May 31, 2011 | 61 |
Table of Contents
| Stone Harbor Investment Funds | Approval of Investment Advisory Agreements | |
| May 31, 2011 |
and reasonable, and that the costs of these services generally and the related profitability of the Adviser in respect of its relationship with the Funds supported the renewal of the Agreements.
Economies of Scale.
The Trustees considered to what extent economies of scale would likely be realized as the Funds grow and whether those economies would be shared with the Funds through breakpoints in their investment advisory fees or other means, such as expense caps. The Trustees noted that because the Funds are relatively new and relatively small in size, the Funds in the near term were not expected to generate any significant economies of scale. The Trustees also noted that the Adviser proposed to maintain the Funds’ fee waiver/expense reimbursement arrangement at current levels until September 30, 2012.
After reviewing these and related factors, the Trustees concluded, within the context of their overall conclusions regarding each Agreement, that the extent to which economies of scale would be shared with the Funds supported the approval of the Agreements.
The Trustees also considered other factors, which included but were not limited to the following:
| — | Whether each Fund has operated in accordance with its investment objective and each Fund’s record of compliance with its investment restrictions, and the compliance programs of the Funds and the Adviser. They also considered the compliance related resources the Adviser provided to the Funds, including resources designed to ensure compliance with the investment objectives, policies and restrictions of each Fund. |
| — | So called “fallout benefits” to the Adviser, such as the benefits from offering its institutional clients the ability to invest in a registered investment company. |
Based on their evaluation of all factors they deemed to be material, including those factors described above, the Trustees, including the Independent Trustees, concluded that the existing investment advisory agreements for Stone Harbor Emerging Markets Fund, Stone Harbor High Yield Fund, and Stone Harbor Local Markets Fund should be continued through June 20, 2012.
| 62 | www.shiplp.com |
Table of Contents
| Stone Harbor Investment Funds | Trustees & Officers | |
| May 31, 2011 (Unaudited) |
The business and affairs of each Fund are managed under the direction of its Board of Trustees. The Board of Trustees approves all significant agreements between a Fund and the persons or companies that furnish services to the Fund, including agreements with its distributor, investment adviser, administrator, custodian and transfer agent. The day to day operations of the Fund are delegated to the Fund’s Adviser and administrator.
The name, age and principal occupations for the past five years of the Trustees and officers of the Funds are listed below, along with the number of portfolios in the Fund complex overseen by and the other directorships held by each Trustee. Except as otherwise noted, the address of each Trustee and officer is c/o Stone Harbor Investment Partners LP, 31 W. 52nd Street, 16th Floor, New York, New York 10019. The Trust’s Statement of Additional Information includes additional information about the Trustees and is available without a charge, upon request, by calling 1-866-699-8158.
INDEPENDENT TRUSTEES | ||||||||||
| Name & Age | Position with the Trust | Term of Office and Length of Time Served(1) | Principal Occupation(s) During Past Five Years | Number of Portfolios in Fund Complex Overseen by Trustee(2) | Other Directorships by Trustee | |||||
Alan Brott Age: 68 | Chairman of Audit Committee; Trustee | Since June 21, 2007 | Columbia University Graduate School of Business – Associate Professor, 2000-Present; Consultant, 1991-Present; Partner, Ernst & Young LLP, 1978-1991; Various Postions, Ernst & Young LLP, 1966-1978. | 5 | Bank of America – two closed end registered hedge funds. Governor Capital Management – one closed end registered hedge fund. | |||||
| Heath B. McLendon Age: 78 | Trustee | Since June 21, 2007 | Citigroup – Chairman of Equity Research Oversight Committee (retired December 31, 2006). | 5 | None | |||||
| Patrick Sheehan Age: 63 | Trustee | Since June 21, 2007 | Retired; formerly, Citigroup Asset Management – Managing Director and Fixed Income Portfolio Manager, 1991-2002. | 5 | None | |||||
| INTERESTED TRUSTEE | ||||||||||
| Name & Age | Position with the Trust | Term of Office and Length of Time Served(1) | Principal Occupation(s) During Past Five Years | Number of Portfolios in Fund Complex Overseen by Trustee(2) | Other Directorships by Trustee | |||||
| Thomas W. Brock* Age: 64 | Chairman; Trustee | Since June 21, 2007 | Stone harbor Investment Partners LP – Chief Executive Officer, 2006-Present; Columbia University Graduate School of Business – Associate Professor, 1998-2006. | 5 | Bank of America – two closed end registered hedge funds; Liberty All Star Funds – two closed end funds. | |||||
| (1) | Trustees serve for an indefinite term, unless a trustee early retires, resigns or is removed from office. |
| (2) | For purposes of this table, the Stone Harbor Fund Complex includes each series of the Stone Harbor Investment Funds (the “Funds”) and the Stone Harbor Emerging Markets Income Fund, which shares an investment adviser with the Funds. |
| * | Mr. Brock is an interested Trustee because of his position with Stone Harbor. |
Stone Harbor Investment Funds Annual Report | May 31, 2011 | 63 |
Table of Contents
| Stone Harbor Investment Funds | Trustees & Officers | |
| May 31, 2011 (Unaudited) |
| OFFICERS | ||||||||
| Name & Age | Position with the Trust | Term of Office and Length of Time Served(1) | Principal Occupation(s) During Past Five Years | Other Directorships by Trustee | ||||
Peter J. Wilby Age: 52 | President | Since June 21, 2007 | Co portfolio manager of the Funds; since April 3, 2006, Chief Investment Officer of Stone Harbor Investment Partners LP; prior to April 3, 2006, Chief Investment Officer – North American Fixed Income; joined Citigroup or its predecessor firms in 1989. | N/A | ||||
Pablo Cisilino Age: 43 | Executive Vice President | Since June 21, 2007 | Co portfolio manager of Emerging Markets Debt Fund; since July 1, 2006, Senior Portfolio Manager of Stone Harbor Investment Partners LP; from June 1, 2004 to July 1, 2006, Executive Director for Sales and Trading in Emerging Markets at Morgan Stanley Inc; prior to June 1, 2004, Vice President for local markets and FX sales and trading, Goldman Sachs; joined Goldman Sachs in 1994. | N/A | ||||
| James E. Craige Age: 43 | Executive Vice President | Since June 21, 2007 | Co portfolio manager of Emerging Markets Debt Fund; since April 3, 2006, Senior Portfolio Manager of Stone Harbor Investment Partners LP; prior to April 3, 2006, Managing Director and Senior Portfolio Manager at Salomon Brothers Asset Management Inc.; joined Salomon Brothers Asset Management Inc. in 1992. | N/A | ||||
Thomas K. Flanagan Age: 58 | Executive Vice President | Since June 21, 2007 | Co portfolio manager of Emerging Markets Debt Fund; since April 3, 2006, Senior Portfolio Managerof Stone Harbor Investment Partners LP; prior to April 3, 2006, Managing Director and Senior Portfolio Manager at Salomon Brothers Asset Management Inc.; joined Salomon Brothers Asset Management Inc. in 1991. | N/A | ||||
David Oliver Age: 51 | Executive Vice President | Since September 29, 2008 | Co portfolio manager of Emerging Markets Debt Fund; since June 1, 2008 Senior Portfolio Manager of Stone Harbor, from 1986 to June 1, 2008 Managing Director in Emerging Market sales and trading Citigroup. | N/A | ||||
| Beth A. Semmel Age: 50 | Executive Vice President | Since June 21, 2007 | Co portfolio manager of High Yield Bond Fund; since April 3, 2006, Senior Portfolio Manager of Stone Harbor Investment Partners LP; Prior to April 3, 2006, Managing Director, Senior Portfolio Manager and Senior Trader for all high yield securities portfolios at Salomon Brothers Asset Management Inc.; joined Salomon Brothers Asset Management Inc. in 1993. | N/A | ||||
| (1) | Officers are typically elected every year, unless an officer early retires, resigns or is removed from office. |
| 64 | www.shiplp.com |
Table of Contents
| Stone Harbor Investment Funds | Trustees & Officers | |
| May 31, 2011 (Unaudited) |
OFFICERS (continued) | ||||||||
Name & Age | Position with the Trust | Term of Office and | Principal Occupation(s) During Past Five Years | Other Directorships | ||||
Jeffrey S. Scott Age: 51 | Chief Compliance Officer | Since June 21, 2007 | Since April 3, 2006, Chief Compliance Officer of Stone Harbor Investment Partners LP; from October 2006 to March 2007, Director of Compliance, New York Life Investment Management LLC; from July 1998 to September 2006, Chief Compliance Officer, Salomon Brothers Asset Management Inc. | N/A | ||||
James J. Dooley Age: 55 | Treasurer | Since June 21, 2007 | Since April 3, 2006, Head of Operations, Technology and Finance of Stone Harbor Investment Partners LP; from August 2004 to March 2006, Senior Operations Manager of Institutional Asset Management, Citigroup Asset Management; from October 2002 to August 2004, Managing Director, Global Operations & Application Development, AIG Global Investment Group; from May 2001 to September 2002, President and Chief Operating Officer, Financial Technologies International. | N/A | ||||
Adam J. Shapiro Age: 47 | Secretary; Anti Money Laundering Officer | Since June 21, 2007 | Since April 3, 2006, General Counsel of Stone Harbor Investment Partners LP; from April 2004 to March 2006, General Counsel, North American Fixed Income, Salomon Brothers Asset Management Inc.; from August 1999 to March 2004, Director of Product and Business Development, Citigroup Asset Management. | N/A | ||||
Patrick D. Buchanan Age: 39 | Assistant Treasurer | Since April 23, 2008 | Since October 15, 2007, Senior Fund Controller for ALPS Fund Services, Inc.; from February 2005 to October 2007, Director of Accounting for Madison Capital Management LLC; from August 2003 to February, 2005, Manager of Fund Accounting for Janus Capital Group | N/A | ||||
| (1) | Officers are typically elected every year, unless an officer early retires, resigns or is removed from office. |
Stone Harbor Investment Funds Annual Report | May 31, 2011 | 65 |
Table of Contents

OFFICERS AND TRUSTEES
Alan Brott, Trustee
Heath B. McLendon, Trustee
Patrick Sheehan, Trustee
Thomas W. Brock, Chairman
Peter J. Wilby, President
Pablo Cisilino, Exec. Vice President
James E. Craige, Exec. Vice President
Thomas K. Flanagan, Exec. Vice President
David Oliver, Exec. Vice President
Beth A. Semmel, Exec. Vice President
Jeffrey S. Scott, Chief Compliance Officer
Adam Shapiro, Secretary/Anti-Money Laundering Officer
James J. Dooley, Treasurer
Patrick Buchanan, Assistant Treasurer
INVESTMENT ADVISER
Stone Harbor Investment Partners LP
31 W. 52nd Street 16th Floor
New York, New York 10019
ADMINISTRATOR & FUND ACCOUNTANT
ALPS Fund Services, Inc.
1290 Broadway, Suite 1100
Denver, Colorado 80203
DISTRIBUTOR
ALPS Distributors, Inc.
1290 Broadway, Suite 1100
Denver, Colorado 80203
TRANSFER AGENT
ALPS Fund Services, Inc.
1290 Broadway, Suite 1100
Denver, Colorado 80203
CUSTODIAN
The Bank of New York Mellon
One Wall Street New York,
New York 10286
LEGAL COUNSEL
Ropes & Gray LLP
1211 Avenue of the Americas
New York, New York 10036
INDEPENDENT REGISTERED PUBLIC ACCOUNTING FIRM
Deloitte & Touche LLP
555 17th Street, Suite 3600
Denver, Colorado 80202
This report and its financial statements are submitted for the general information of the shareholders of the Funds. The report is not authorized for distribution to prospective investors in the Funds unless preceded or accompanied by a prospectus.
SHF000135 12/11
Table of Contents
| Item 2. | Code of Ethics. |
| (a) | The Registrant, as of the end of the period covered by this report, has adopted a code of ethics that applies to the Registrant’s principal executive officer, principal financial officer, principal accounting officer or controller or any persons performing similar functions on behalf of the Registrant. |
| (b) | Not applicable. |
| (c) | During the period covered by this report, no amendments to the provisions of the code of ethics adopted in Item 2(a) above were made. |
| (d) | During the period covered by this report, no implicit or explicit waivers to the provisions of the code of ethics adopted in Item 2(a) above were granted. |
| (e) | Not applicable. |
| (f) | The Registrant’s Code of Ethics is attached as an Exhibit hereto. |
| Item 3. | Audit Committee Financial Expert. |
The Board of Trustees of the Registrant has determined that the Registrant has at least one audit committee financial expert serving on its Audit Committee. The Board of Trustees has designated Alan J. Brott as the Registrant’s “Audit Committee Financial Expert.” Mr. Brott is “independent” as defined in paragraph (a)(2) of Item 3 to Form N-CSR.
| Item 4. | Principal Accountant Fees and Services. |
| (a) | Audit Fees: For the Registrant’s fiscal years ended May 31, 2010 and May 31, 2011, the aggregate fees billed for professional services rendered by the principal accountant for the audit of the Registrant’s annual financial statements were $125,000 and $187,500 respectively. |
| (b) | Audit-Related Fees: For the Registrant’s fiscal years ended May 31, 2010 and May 31, 2011, there were no fees billed for assurance and related services by the principal accountant that were reasonably related to the performance of the audit of the Registrant’s financial statements and were not reported in paragraph (a) of this Item 4. |
Table of Contents
| (c) | Tax Fees: For the Registrant’s fiscal years ended May 31, 2010 and May 31, 2011, the aggregate fees billed for professional services rendered by the principal accountant for tax compliance, tax advice and tax planning were $9,860 and $13,515, respectively. The fiscal year 2010 and 2011 tax fees were for services pertaining to federal and state income tax return review, review of year-end dividend distributions and excise tax preparation. |
| (d) | All Other Fees: For the Registrant’s fiscal years ended May 31, 2010 and May 31, 2011, aggregate fees billed to the Registrant by the principal accountant for services provided by the principal accountant other than the services reported in paragraphs (a) through (c) of this Item 4 were $0 and $0, respectively. |
| (e)(1) | Audit Committee Pre-Approval Policies and Procedures: All services to be performed by the Registrant’s principal accountant must be pre-approved by the Registrant’s Audit Committee. |
| (e)(2) | No services described in paragraphs (b) through (d) of this Item 4 were approved by the Registrant’s audit committee pursuant to paragraph (c)(7)(i)(C) of Rule 2-01 of Regulation S-X. |
| (f) | Not applicable. |
| (g) | Not applicable. |
| (h) | Not applicable. |
| Item 5. | Audit Committee of Listed Registrants. |
Not applicable.
| Item 6. | Investments. |
| (a) | Schedule of Investments is included as part of the Report to Stockholders filed under Item 1 of this Form N-CSR. |
| (b) | Not applicable. |
| Item 7. | Disclosure of Proxy Voting Policies and Procedures for Closed-End Management Investment Companies. |
Not applicable.
| Item 8. | Portfolio Managers of Closed-End Management Investment Companies. |
Not applicable.
Table of Contents
| Item 9. | Purchases of Equity Securities by Closed-End Management Investment Company and Affiliated Purchasers. |
Not applicable to Registrant.
| Item 10. | Submission of Matters to Vote of Security Holders. |
There have been no material changes to the procedures by which shareholders may recommend nominees to the Registrant’s Board of Trustees, where those changes were implemented after the Registrant last provided disclosure in response to the requirements of Item 407(c)(2) of Regulation S-K, or this Item.
| Item 11. | Controls and Procedures. |
| (a) | The Registrant’s principal executive officer and principal financial officer have concluded that the Registrant’s disclosure controls and procedures (as defined in Rule 30a-3(c) under the Investment Company Act of 1940, as amended) are effective based on their evaluation of these controls and procedures as of a date within 90 days of the filing date of this report. |
| (b) | There was no change in the Registrant’s internal control over financial reporting (as defined in Rule 30a-3(d) under the Investment Company Act of 1940, as amended) during the second fiscal quarter of the period covered by this report that has materially affected, or is reasonably likely to materially affect, the Registrant's internal control over financial reporting. |
| Item 12. | Exhibits. |
| (a)(1) | Registrant’s Code of Ethics for Senior Financial Officers, which is the subject of the disclosure required by Item 2 of Form N-CSR, was filed as Exhibit 12(a)(1) to the Registrant’s Certified Shareholder Report on Form N-CSR, File No. 811-22037, on August 7, 2009. |
| (a)(2) | The certifications required by Rule 30a-2(a) of the Investment Company Act of 1940, as amended, and Section 302 of the Sarbanes-Oxley Act of 2002 are attached hereto as Exhibit 99.Cert. |
| (a)(3) | Not applicable. |
| (b) | The certifications by the Registrant’s principal executive officer and principal financial officer, as required by Rule 30a-2(b) of the Investment Company Act of 1940, as amended, and Section 906 of the Sarbanes-Oxley Act of 2002 are attached hereto as Exhibit 99.906Cert. |
Table of Contents
SIGNATURES
Pursuant to the requirements of the Securities Exchange Act of 1934 and the Investment Company Act of 1940, the Registrant has duly caused this report to be signed on its behalf by the undersigned, thereunto duly authorized.
Stone Harbor Investment Funds | ||
By: | /s/ Peter J. Wilby | |
Peter J. Wilby | ||
President/Principal Executive | ||
Officer | ||
Date: | August 5, 2011 | |
Pursuant to the requirements of the Securities Exchange Act of 1934 and the Investment Company Act of 1940, this report has been signed below by the following persons on behalf of the Registrant and in the capacities and on the dates indicated.
By: | /s/ Peter J. Wilby | |
Peter J. Wilby | ||
President/Principal Executive | ||
Officer | ||
Date: | August 5, 2011 | |
By: | /s/ James J. Dooley | |
James J. Dooley | ||
Treasurer, Chief Financial Officer/ | ||
Principal Financial Officer | ||
Date: | August 5, 2011 | |