UNITED STATES
SECURITIES AND EXCHANGE COMMISSION
Washington, D.C. 20549
FORM N-CSR
CERTIFIED SHAREHOLDER REPORT OF REGISTERED
MANAGEMENT INVESTMENT COMPANIES
Investment Company Act file number | 811-22037 | ||||||||
| |||||||||
Stone Harbor Investment Funds | |||||||||
(Exact name of registrant as specified in charter) | |||||||||
| |||||||||
1290 Broadway, Suite 1100 Denver, CO |
| 80203 | |||||||
(Address of principal executive offices) |
| (Zip code) | |||||||
| |||||||||
Adam J. Shapiro, Esq. c/o Stone Harbor Investment Partners LP 31 West 52nd Street, 16th Floor New York, NY 10019 | |||||||||
(Name and address of agent for service) | |||||||||
| |||||||||
With copies To:
John M. Loder, Esq. Ropes & Gray LLP One International Place Boston, MA 02110-2624 | |||||||||
| |||||||||
Registrant’s telephone number, including area code: | (303) 623-2577 |
| |||||||
| |||||||||
Date of fiscal year end: | May 31 |
| |||||||
| |||||||||
Date of reporting period: | June 1, 2008 - May 31, 2009 |
| |||||||
Item 1. Report to Stockholders.
Table of Contents
Letter to Shareholders | 2 |
|
|
Disclosure of Fund Expenses | 4 |
|
|
Report of Independent Registered Public Accounting Firm | 5 |
|
|
Summary of Portfolio Holdings | 6 |
|
|
Growth of a $10,000 Investment | 7 |
|
|
Statement of Investments |
|
Emerging Markets Debt Fund | 9 |
High Yield Bond Fund | 16 |
|
|
Statement of Assets & Liabilities | 35 |
|
|
Statement of Operations | 36 |
|
|
Statements of Changes in Net Assets |
|
Emerging Markets Debt Fund | 37 |
High Yield Bond Fund | 38 |
|
|
Financial Highlights |
|
Emerging Markets Debt Fund | 39 |
High Yield Bond Fund | 40 |
|
|
Notes to Financial Statements | 41 |
|
|
Additional Information | 49 |
|
|
Trustees and Officers | 52 |
Letter to Shareholders
July 6, 2009
Dear Shareholder,
As we emerge from the worst credit crisis of the post-war era, we once again thank you for your confidence in Stone Harbor Investment Funds. Though we have witnessed extreme volatility over the past 12 months, our goal is still to produce long-term returns that exceed benchmarks, while maintaining risk levels comparable to, or less than the general level of market risk. As always, we endeavor to keep you well informed about your investment in our Funds. Please feel free to call us at 212-548-1200 if you have any questions.
MARKET OVERVIEW
Shocks from the credit crunch accelerated during the second half of 2008. As a result, financial institutions took massive write-offs in their credit portfolios, consumer and investor confidence plummeted, and the Federal Reserve was left with no choice but to intervene. In the second half of 2008, the Fed aggressively lowered its overnight funds target rate by 175 basis points (“bps”) to near zero (0.25%).
Historic events in September intensified market concerns. Following the government takeover of Fannie Mae and Freddie Mac, Lehman Brothers and Washington Mutual filed for bankruptcy, and Merrill Lynch was absorbed by Bank of America. In turn, Goldman Sachs and Morgan Stanley sought to raise needed capital by selling significant stakes in their businesses, while at the same time converting to bank holding company structures in order to qualify for federal assistance. Aggressive steps taken by the Fed and U.S. Treasury were aimed at reducing systemic risk. Nonetheless, unprecedented write-offs severely impaired banking system capital and investor confidence, precipitating a tide of deleveraging and investor redemptions. In response, the Fed injected capital into banks, guaranteed future bank bond issuance, increased deposit guarantees with banks and money market funds, and implemented over $1.5 trillion in government-sponsored financial relief programs.
Market concern over a prolonged economic downturn rocked markets in the fourth quarter of 2008. Rapidly widening credit spreads lead to underperformance across all credit sectors for the year. U.S. investment grade credit, as represented by the Barclay’s Credit Index, reached a record wide at 545 bps over U.S. Treasuries on December 4 with the Financial sector reaching 707 bps. On the same day, credit spreads in the high yield market, as measured by the Citigroup High Yield Market Capped Index, also widened to an all-time high of 1850 bps. Spreads for the emerging markets debt dollar-denominated benchmark, the JP Morgan EMBI Global Diversified Index, widened to a cyclical high of 891 bps on October 24.
Congress struggled to make progress on an auto bailout plan for GM and Chrysler in the last weeks of 2008, in an effort to avoid further economic deterioration. Simultaneously, President-elect Obama provided better clarity on his fiscal stimulus package for 2009. As the calendar year came to a close, credit markets began to show signs of stabilization despite expectations for further corporate earnings declines.
Investor sentiment improved significantly in the first half of 2009 as Washington announced an unprecedented monetary and fiscal stimulus program. The Fed committed $1.15 trillion to the purchase of government-backed fixed income securities, while the U.S. Treasury offered numerous plans to remove troubled assets from bank balance sheets. Other central banks around the world pursued similar paths and investor optimism grew amid increasing evidence that the risks of massive bank failures had been averted. The G20 decision to provide the IMF with up to $750 billion in commitments to aid developing nations provided further relief to concerned global capital markets. Credit market spreads across most major sectors tightened aggressively from their record highs, even against a backdrop of declining U.S. Treasury and equity prices. High yield and bank loans led performance with record monthly returns in April and May, while emerging markets debt, investment grade corporates and agency mortgage backed securities also significantly rallied. By May 31, 2009, investment grade credit spreads contracted 226 bps to 319 bps over U.S. Treasuries, high yield debt spreads contracted 815 bps to 1035 bps, and emerging markets debt spreads contracted 413 bps to 478 bps.
The market’s attention is now focused on the extent and timing of a global economic recovery. Investors remain concerned about the quality of assets in many of the European banks and the effect this might have on the speed of recovery. As evidence of an economic turnaround begins to appear, the market will turn its attention to the difficulty central banks will encounter in sopping up the vast excess liquidity that was provided to the global financial system. Concerns about inflation will surface and the markets will have to gauge if this concern is legitimate or whether they should really be worried about the pace of economic expansion.
PERFORMANCE REVIEW
Stone Harbor Emerging Markets Debt Fund
Fund performance during the 1-year ended May 31, 2009 was -5.10% (net of expenses), and -4.35% (gross of expenses), relative to the JP Morgan EMBI Global Diversified Index’s return of -1.32%. Risk aversion and deleveraging following the bankruptcy of Lehman Brothers in mid-September led to indiscriminate selling of emerging markets bonds, including those of fundamentally sound credit quality. Emerging markets debt spreads hit a cyclical high in October 2008; however, the asset class (both in dollar-denominated and local currency) rallied significantly in the ensuing months. By the end of the reporting period, the index recovered most of its losses from peak 2008 levels. While the Fund outperformed the benchmark during the first half of 2009, overall performance for the year in review was below the Index. From a country selection standpoint, the Fund’s overweight position in Argentina was a key driver of underperformance. Stone Harbor’s decision to maintain an overweight position in Argentina was based on a constructive view on the government’s ability to pay its debts. In our view, the government’s need to return to the capital markets for financing purposes enhances its willingness to pay. The portfolio’s allocation to Ukraine bonds as well as to local currency bonds in Brazil and Colombia were the primary contributors to weakness in security selection. As the U.S. Treasury curve steepened, yield curve movements and rolling yield effects detracted 98 bps from performance.
Stone Harbor High Yield Bond Fund
The Fund outperformed its benchmark during the 1-year ended May 31, 2009, returning -7.77% (net of expenses) and -7.22% (gross of expenses), 278 bps above the Citigroup High Yield Market Capped Index, which returned -10.04%. The first half of the period in review was marked by extreme investor risk aversion and record high volatility. Following the historic events of September, technical pressures were accelerated by hedge and mutual fund deleveraging. Fundamental stresses also deepened as recessionary data weighed further on market sentiment, driving high yield spreads to record highs in December. However, investor confidence strengthened during the last 6 months of the period as issues such as the auto bailout and the President-elect’s stimulus plan made progress. Washington announced several efforts to spur borrowing, amid growing optimism regarding bank earnings and modest evidence of a stabilizing economy. This momentum led to strong inflows into the high yield market and a reopening of the credit markets. Economic reports continued to reinforce suggestions that the economy no longer suffered from the extreme contraction experienced at the end of 2008. Healthy cash levels and more attractive yields supported robust primary market activity while the pace of defaults slowed. Stone Harbor’s high yield strategy maintained its positioning in defensive sectors and placed emphasis on security selection. Issue selection, particularly in Aerospace, Chemicals, and Paper & Forest Products, positively contributed to performance.
Sincerely,
![]()
Thomas W. Brock
Chairman of the Board of Trustees
3
Disclosure of Fund Expenses (Unaudited)
Example. As a shareholder of a Fund, you incur two types of costs: (1) transaction costs, including sales charges (loads) on purchase payments and/or redemption fees (if applicable) and (2) ongoing costs, including management fees and other Fund expenses. The below examples are intended to help you understand your ongoing costs (in dollars) of investing in a Fund and to compare these costs with the ongoing costs of investing in other mutual funds. The examples are based on an investment of $1,000 invested on December 1, 2008 and held until May 31, 2009.
Actual Expenses. The first line of the table below provides information about actual account values and actual expenses. You may use the information in this line, together with the amount you invested, to estimate the expenses that you paid over the period. Simply divide your account value by $1,000 (for example, an $8,600 account value divided by $1,000 = 8.6), then multiply the result by the number in the first line under the heading Expenses Paid During Period to estimate the expenses you paid on your account during this period.
Hypothetical Example for Comparison Purposes. The second line of the table below provides information about hypothetical account values and hypothetical expenses based on the Fund’s actual expense ratio and an assumed rate of return of 5% per year before expenses, which is not the Fund’s actual return. The hypothetical account values and expenses may not be used to estimate the actual ending account balance or expenses you paid for the period. You may use this information to compare the ongoing costs of investing in a Fund and other mutual funds. To do so, compare this 5% hypothetical example with the 5% hypothetical examples that appear in the shareholder reports of the other funds.
Please note that the expenses shown in the table are meant to highlight your ongoing costs only and do not reflect transactional costs, such as redemption fees, sales charges (loads) or exchange fees. Therefore, the second line of the table is useful in comparing ongoing costs only, and will not help you determine the relative total costs of owning different funds. In addition, if these transactional costs were included, your costs would have been higher.
|
| Beginning |
| Ending |
|
|
| Expenses |
| |||
|
| Account Value |
| Account Value |
| Expense |
| Paid During |
| |||
|
| 12/01/2008 |
| 05/31/2009 |
| Ratio(a) |
| Period(b) |
| |||
STONE HARBOR EMERGING MARKETS DEBT FUND |
|
|
|
|
|
|
|
|
| |||
Actual |
| $ | 1,000.00 |
| $ | 1,281.80 |
| 0.75 | % | $ | 4.27 |
|
Hypothetical (5% return before expenses) |
| $ | 1,000.00 |
| $ | 1,021.19 |
| 0.75 | % | $ | 3.78 |
|
|
|
|
|
|
|
|
|
|
| |||
STONE HARBOR HIGH YIELD BOND FUND |
|
|
|
|
|
|
|
|
| |||
Actual |
| $ | 1,000.00 |
| $ | 1,235.10 |
| 0.55 | % | $ | 3.06 |
|
Hypothetical (5% return before expenses) |
| $ | 1,000.00 |
| $ | 1,022.19 |
| 0.55 | % | $ | 2.77 |
|
(a) Annualized, based on the Fund’s most recent fiscal half-year expenses.
(b) Expenses are equal to the Fund’s annualized expense ratio multiplied by the average account value over the period, multiplied by the number of days in the most recent fiscal half year (182), divided by 365. Note this expense example is typically based on a six-month period.
4
Report of Independent Registered Public Accounting Firm
May 31, 2009
To the Shareholders and Board of Trustees of Stone Harbor Investment Funds:
We have audited the accompanying statements of assets and liabilities of Stone Harbor Investment Funds (the “Trust”), comprising the Stone Harbor High Yield Bond Fund and Stone Harbor Emerging Markets Debt Fund, including the statements of investments, as of May 31, 2009, and the related statements of operations for the year then ended, and the statements of changes in net assets and the financial highlights for the year then ended and for the period from August 16, 2007 (inception) to May 31, 2008. These financial statements and financial highlights are the responsibility of the Trust’s management. Our responsibility is to express an opinion on these financial statements and financial highlights based on our audits.
We conducted our audits in accordance with the standards of the Public Company Accounting Oversight Board (United States). Those standards require that we plan and perform the audit to obtain reasonable assurance about whether the financial statements and financial highlights are free of material misstatement. The Trust is not required to have, nor were we engaged to perform, an audit of its internal control over financial reporting. Our audits included consideration of internal control over financial reporting as a basis for designing audit procedures that are appropriate in the circumstances, but not for the purpose of expressing an opinion on the effectiveness of the Trust’s internal control over financial reporting. Accordingly, we express no such opinion. An audit also includes examining, on a test basis, evidence supporting the amounts and disclosures in the financial statements, assessing the accounting principles used and significant estimates made by management, as well as evaluating the overall financial statement presentation. Our procedures included confirmation of securities owned as of May 31, 2009, by correspondence with the custodian and brokers; where replies were not received from brokers, we performed other auditing procedures. We believe that our audits provide a reasonable basis for our opinion.
In our opinion, the financial statements and financial highlights referred to above present fairly, in all material respects, the financial position of each of the funds constituting the Stone Harbor Investment Funds as of May 31, 2009, the results of their operations for the year then ended, and the changes in their net assets and the financial highlights for the year then ended and the period from August 16, 2007 to May 31, 2008, in conformity with accounting principles generally accepted in the United States of America.
![]()
Denver, Colorado
July 29, 2009
5
Summary of Portfolio Holdings
May 31, 2009 (Unaudited)
Under SEC Rules, all funds are required to include in their annual and semi-annual shareholder reports a presentation of portfolio holdings in a table, chart or graph by reasonably identifiable categories. The following tables which present holdings as a percent of total net assets (“TNA”) are provided in compliance with such requirements.
EMERGING MARKETS DEBT FUND
Country Breakout |
| % of TNA |
|
Brazil |
| 10.25 | % |
Venezuela |
| 10.05 | % |
Mexico |
| 6.68 | % |
Argentina |
| 6.58 | % |
Indonesia |
| 6.33 | % |
Russia |
| 6.12 | % |
Colombia |
| 4.91 | % |
Philippines |
| 4.75 | % |
Turkey |
| 4.64 | % |
Ukraine |
| 4.49 | % |
Panama |
| 3.96 | % |
Iraq |
| 3.84 | % |
Peru |
| 3.58 | % |
Malaysia |
| 3.57 | % |
Uruguay |
| 2.52 | % |
El Salvador |
| 1.50 | % |
South Africa |
| 1.01 | % |
South Korea |
| 1.00 | % |
India |
| 0.33 | % |
Kazakhstan |
| 0.29 | % |
Gabon |
| 0.18 | % |
Pakistan |
| 0.18 | % |
Tunisia |
| 0.18 | % |
Vietnam |
| 0.17 | % |
Total |
| 87.11 | % |
Other Assets in Excess of Liabilities |
| 12.89 | % |
Total Net Assets |
| 100.00 | % |
HIGH YIELD BOND FUND
Industry Breakout |
| % of TNA |
|
Telecommunications |
| 11.13 | % |
Healthcare-Services |
| 6.36 | % |
Diversified Financial Services |
| 6.30 | % |
Media |
| 5.82 | % |
Pipelines |
| 5.17 | % |
Oil & Gas |
| 5.16 | % |
Commercial Services |
| 5.08 | % |
Electric |
| 4.68 | % |
Entertainment |
| 4.33 | % |
Food |
| 3.26 | % |
Packaging & Containers |
| 3.20 | % |
Retail |
| 3.10 | % |
Chemicals |
| 2.60 | % |
Aerospace - Defense |
| 2.21 | % |
Healthcare-Products |
| 1.99 | % |
Beverages |
| 1.89 | % |
Gaming |
| 1.84 | % |
Lodging |
| 1.69 | % |
Agriculture |
| 1.40 | % |
Coal |
| 1.37 | % |
Forest Products & Paper |
| 1.07 | % |
Oil & Gas Services |
| 1.07 | % |
Office-Business Equipment |
| 1.03 | % |
Gas |
| 1.01 | % |
Mining |
| 1.00 | % |
Apparel |
| 0.91 | % |
Miscellaneous Manufacturers |
| 0.91 | % |
Advertising |
| 0.86 | % |
Environmental Control |
| 0.74 | % |
Building Products |
| 0.68 | % |
Auto Manufacturers |
| 0.54 | % |
Transportation |
| 0.47 | % |
Communications |
| 0.43 | % |
Office Furnishings |
| 0.34 | % |
Machinery - Construction & Mining |
| 0.30 | % |
Building Materials |
| 0.28 | % |
Electrical Components & Equipment |
| 0.26 | % |
Research Services |
| 0.17 | % |
Distribution - Wholesale |
| 0.15 | % |
Semiconductors |
| 0.14 | % |
Home Furnishings |
| 0.13 | % |
Exploration & Production |
| 0.10 | % |
Internet |
| 0.09 | % |
Radio & TV/Other |
| 0.08 | % |
Holding Companies-Diversified |
| 0.07 | % |
Hotels & Motels |
| 0.03 | % |
Total |
| 91.44 | % |
Other Assets in Excess of Liabilities |
| 8.56 | % |
Total Net Assets |
| 100.00 | % |
6
Growth of a $10,000 Investment
May 31, 2009 (Unaudited)
STONE HARBOR EMERGING MARKETS DEBT FUND
Comparison of Change in Value of $10,000 Investment in Stone Harbor Emerging Markets Debt Fund and the JP Morgan Emerging Market Bond Index Global Diversified
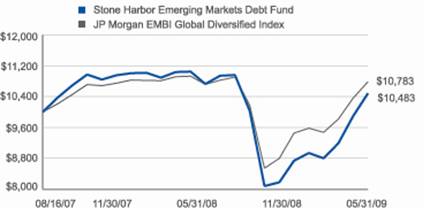
The JP Morgan Emerging Market Bond Index Global Diversified is a uniquely-weighted version of the EMBI Global Index, which tracks total returns for U.S. dollar-denominated debt instruments issued by emerging market sovereign and quasi-sovereign entities such as: Brady bonds, loans and Eurobonds. Currently, the EMBI Global Index covers 196 instruments across 28 countries. It limits the weights of those index countries with larger debt stocks by only including specified portions of these countries’ eligible debt outstanding. The countries covered in the EMBI Global Diversified are identical to those covered by the EMBI Global Index.
AVERAGE ANNUAL TOTAL RETURNS
|
|
|
|
|
|
|
|
|
| Since |
| Inception |
|
|
| 1 Year |
| 3 Years |
| 5 Years |
| 10 Years |
| Inception |
| Date |
|
Stone Harbor Emerging Markets Debt Fund |
| (5.10 | )% | N/A |
| N/A |
| N/A |
| 2.66 | % | 8/16/07 |
|
JP Morgan Emerging Market Bond Index Global Diversified |
| (1.32 | )% | N/A |
| N/A |
| N/A |
| (4.30 | )% |
|
|
The performance data quoted represents past performance and does not guarantee future results. Current performance may be lower or higher than the performance quoted. Average annual total returns reflect the reinvestment of dividends and capital gains distributions and include all fee waivers and expense reimbursements. Without the fee waivers and expense reimbursements, total return figures would have been lower. The performance data quoted does not reflect the deduction of taxes that a shareholder would pay on Fund distributions or the redemption of Fund shares. Investment return and principal value will vary, and shares, when redeemed, may be worth more or less than their original cost.
7
STONE HARBOR HIGH YIELD BOND FUND
Comparison of Change in Value of $10,000 Investment in Stone Harbor High Yield Bond Fund and the Citigroup High Yield Market Capped Index
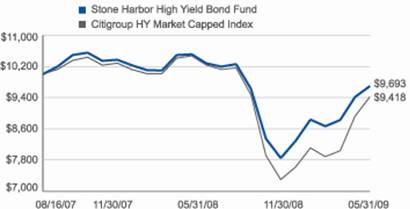
The Citigroup High Yield Market Capped Index represents a modified version of the High Yield Market Index by delaying the entry of “fallen angel” issues (corporate or municipal bonds that were investment-grade when issued but have since been downgraded) and capping the par value of individual issuers at US $5 billion par amount outstanding.
AVERAGE ANNUAL TOTAL RETURNS
|
|
|
|
|
|
|
|
|
| Since |
| Inception |
|
|
| 1 Year |
| 3 Years |
| 5 Years |
| 10 Years |
| Inception |
| Date |
|
Stone Harbor High Yield Bond Fund |
| (7.77 | )% | N/A |
| N/A |
| N/A |
| (1.73 | )% | 8/16/07 |
|
Citigroup High Yield Market Capped Index |
| (10.04 | )% | N/A |
| N/A |
| N/A |
| (4.79 | )% |
|
|
The performance data quoted represents past performance and does not guarantee future results. Current performance may be lower or higher than the performance quoted. Average annual total returns reflect the reinvestment of dividends and capital gains distributions and include all fee waivers and expense reimbursements. Without the fee waivers and expense reimbursements, total return figures would have been lower. The performance data quoted does not reflect the deduction of taxes that a shareholder would pay on Fund distributions or the redemption of Fund shares. Investment return and principal value will vary, and shares, when redeemed, may be worth more or less than their original cost.
8
Statement of Investments |
|
|
May 31, 2009 |
| Emerging Markets Debt Fund |
|
|
|
| Principal |
| Market Value |
| |
Interest Rate/Maturity Date |
| Currency |
| Amount* |
| (Expressed in U.S. $) |
| |
|
|
|
|
|
|
|
| |
SOVEREIGN DEBT OBLIGATIONS - 81.47% |
|
|
|
|
|
|
| |
Argentina - 6.58% |
|
|
|
|
|
|
| |
Republic of Argentina |
|
|
|
|
|
|
| |
10.500%, 11/14/2002(1) |
| EUR |
| 2,165,000 |
| $ | 203,433 |
|
8.750%, 02/04/2003(1) |
| EUR |
| 57,000 |
| 10,476 |
| |
7.000%, 03/18/2004(1) |
| EUR |
| 30,000 |
| 5,513 |
| |
7.000%, 03/18/2004(1) |
| EUR |
| 58,000 |
| 5,450 |
| |
0.000%, 03/29/2005(1) |
|
|
| 154,000 |
| 18,480 |
| |
9.000%, 05/24/2005(1) |
| EUR |
| 191,000 |
| 35,102 |
| |
9.000%, 04/26/2006(1) |
| EUR |
| 58,000 |
| 10,659 |
| |
10.000%, 01/03/2007(1) |
| ITL |
| 140,000,000 |
| 13,288 |
| |
10.250%, 01/26/2007(1) |
| EUR |
| 661,000 |
| 121,480 |
| |
8.000%, 02/26/2008(1) |
| EUR |
| 243,000 |
| 44,659 |
| |
15.500%, 12/19/2008(1) |
|
|
| 755,000 |
| 113,250 |
| |
11.750%, 04/07/2009(1) |
|
|
| 1,840,000 |
| 276,000 |
| |
1.683%, 08/03/2012(2) |
|
|
| 1,037,500 |
| 658,259 |
| |
7.000%, 09/12/2013 |
|
|
| 210,000 |
| 91,718 |
| |
7.000%, 10/03/2015 |
|
|
| 11,610,000 |
| 4,084,786 |
| |
6.000%, 03/31/2023(1) |
|
|
| 480,000 |
| 220,800 |
| |
7.820%, 12/31/2033 |
| EUR |
|
|
| 36,695 |
| |
8.280%, 12/31/2033 |
|
|
| 238,865 |
| 102,115 |
| |
|
|
|
|
|
| 6,033,884 |
| |
|
|
|
|
|
|
|
| |
Brazil - 10.25% |
|
|
|
|
|
|
| |
Nota Do Tesouro Nacional |
|
|
|
|
|
|
| |
Series F, 10.000%, 01/01/2017 |
| BRL |
| 9,230,000 |
| 4,254,799 |
| |
Republic of Brazil |
|
|
|
|
|
|
| |
7.875%, 03/07/2015 |
|
|
| 1,290,000 |
| 1,461,248 |
| |
6.000%, 01/17/2017 |
|
|
| 100,000 |
| 103,125 |
| |
8.000%, 01/15/2018 |
|
|
| 1,220,000 |
| 1,370,364 |
| |
5.875%, 01/15/2019 |
|
|
| 320,000 |
| 323,200 |
| |
8.750%, 02/04/2025 |
|
|
| 265,000 |
| 321,975 |
| |
10.125%, 05/15/2027 |
|
|
| 230,000 |
| 312,800 |
| |
12.250%, 03/06/2030 |
|
|
| 20,000 |
| 31,750 |
| |
8.250%, 01/20/2034 |
|
|
| 130,000 |
| 153,563 |
| |
11.000%, 08/17/2040 |
|
|
| 815,000 |
| 1,069,688 |
| |
|
|
|
|
|
| 9,402,512 |
| |
|
|
|
|
|
|
|
| |
Colombia - 4.91% |
|
|
|
|
|
|
| |
Bogota Distrio Capital |
|
|
|
|
|
|
| |
9.750%, 07/26/2028 |
| COP |
| 2,404,000,000 |
| 1,024,333 |
| |
Republic of Colombia |
|
|
|
|
|
|
| |
2.654%, 11/16/2015(2) |
|
|
| 100,000 |
| 95,500 |
| |
9
|
|
|
| Principal |
| Market Value |
| ||
Interest Rate/Maturity Date |
| Currency |
| Amount* |
| (Expressed in U.S. $) |
| ||
|
|
|
|
|
|
|
| ||
Republic of Colombia (continued) |
|
|
|
|
|
|
| ||
7.375%, 03/18/2019 |
|
|
| $ | 230,000 |
| $ | 245,525 |
|
11.750%, 02/25/2020 |
|
|
| 275,000 |
| 375,375 |
| ||
7.375%, 09/18/2037 |
|
|
| 2,725,000 |
| 2,765,875 |
| ||
|
|
|
|
|
| 4,506,608 |
| ||
El Salvador - 1.50% |
|
|
|
|
|
|
| ||
Republic of El Salvador |
|
|
|
|
|
|
| ||
7.750%, 01/24/2023 |
|
|
| 13,000 |
| 13,049 |
| ||
8.250%, 04/10/2032 |
|
|
| 40,000 |
| 36,800 |
| ||
7.650%, 06/15/2035 |
|
|
| 1,558,000 |
| 1,323,910 |
| ||
|
|
|
|
|
| 1,373,759 |
| ||
Gabon - 0.18% |
|
|
|
|
|
|
| ||
Republic of Gabonese |
|
|
|
|
|
|
| ||
8.200%, 12/12/2017(3) |
|
|
| 180,000 |
| 162,900 |
| ||
|
|
|
|
|
|
|
| ||
Indonesia - 6.33% |
|
|
|
|
|
|
| ||
Republic of Indonesia |
|
|
|
|
|
|
| ||
6.750%, 03/10/2014 |
|
|
| 525,000 |
| 524,344 |
| ||
11.625%, 03/04/2019(3) |
|
|
| 1,930,000 |
| 2,426,975 |
| ||
6.625%, 02/17/2037 |
|
|
| 55,000 |
| 46,338 |
| ||
7.750%, 01/17/2038 |
|
|
| 2,970,000 |
| 2,814,074 |
| ||
|
|
|
|
|
| 5,811,731 |
| ||
Iraq - 3.84% |
|
|
|
|
|
|
| ||
Republic of Iraq |
|
|
|
|
|
|
| ||
5.800%, 01/15/2028 |
|
|
| 5,550,000 |
| 3,524,250 |
| ||
|
|
|
|
|
|
|
| ||
Mexico - 6.68% |
|
|
|
|
|
|
| ||
Mexican Bonos |
|
|
|
|
|
|
| ||
7.750%, 12/14/2017 |
| MXN |
| 24,130,000 |
| 1,816,455 |
| ||
United Mexican States |
|
|
|
|
|
|
| ||
5.625%, 01/15/2017 |
|
|
| 106,000 |
| 109,180 |
| ||
5.950%, 03/19/2019 |
|
|
| 332,000 |
| 338,308 |
| ||
8.125%, 12/30/2019 |
|
|
| 935,000 |
| 1,105,637 |
| ||
8.000%, 09/24/2022 |
|
|
| 445,000 |
| 523,988 |
| ||
8.300%, 08/15/2031 |
|
|
| 555,000 |
| 667,388 |
| ||
7.500%, 04/08/2033 |
|
|
| 525,000 |
| 582,750 |
| ||
6.750%, 09/27/2034 |
|
|
| 960,000 |
| 985,200 |
| ||
|
|
|
|
|
| 6,128,906 |
| ||
10
|
|
|
| Principal |
| Market Value |
| ||
Interest Rate/Maturity Date |
|
|
| Amount* |
| (Expressed in U.S. $) |
| ||
|
|
|
|
|
|
|
| ||
Pakistan - 0.18% |
|
|
|
|
|
|
| ||
Islamic Republic of Pakistan |
|
|
|
|
|
|
| ||
7.125%, 03/31/2016 |
|
|
| $ | 260,000 |
| $ | 165,100 |
|
|
|
|
|
|
|
|
| ||
Panama - 3.96% |
|
|
|
|
|
|
| ||
Republic of Panama |
|
|
|
|
|
|
| ||
7.250%, 03/15/2015 |
|
|
| 1,490,000 |
| 1,612,925 |
| ||
9.375%, 01/16/2023 |
|
|
| 25,000 |
| 30,563 |
| ||
8.875%, 09/30/2027 |
|
|
| 295,000 |
| 351,050 |
| ||
9.375%, 04/01/2029 |
|
|
| 1,310,000 |
| 1,619,487 |
| ||
6.700%, 01/26/2036 |
|
|
| 20,000 |
| 19,450 |
| ||
|
|
|
|
|
| 3,633,475 |
| ||
Peru - 3.58% |
|
|
|
|
|
|
| ||
Republic of Peru |
|
|
|
|
|
|
| ||
9.875%, 02/06/2015 |
|
|
| 5,000 |
| 6,138 |
| ||
8.375%, 05/03/2016 |
|
|
| 120,000 |
| 138,450 |
| ||
7.125%, 03/30/2019 |
|
|
| 1,445,000 |
| 1,549,763 |
| ||
7.350%, 07/21/2025 |
|
|
| 425,000 |
| 455,812 |
| ||
8.750%, 11/21/2033 |
|
|
| 320,000 |
| 388,800 |
| ||
6.550%, 03/14/2037 |
|
|
| 765,000 |
| 743,962 |
| ||
|
|
|
|
|
| 3,282,925 |
| ||
Philippines - 4.75% |
|
|
|
|
|
|
| ||
Republic of Philippines |
|
|
|
|
|
|
| ||
8.000%, 01/15/2016 |
|
|
| 495,000 |
| 555,638 |
| ||
9.375%, 01/18/2017 |
|
|
| 1,755,000 |
| 2,110,387 |
| ||
8.375%, 06/17/2019 |
|
|
| 100,000 |
| 116,375 |
| ||
7.500%, 09/25/2024 |
|
|
| 965,000 |
| 1,020,487 |
| ||
10.625%, 03/16/2025 |
|
|
| 315,000 |
| 419,942 |
| ||
9.500%, 02/02/2030 |
|
|
| 30,000 |
| 37,595 |
| ||
6.375%, 01/15/2032 |
|
|
| 100,000 |
| 94,750 |
| ||
|
|
|
|
|
| 4,355,174 |
| ||
Russia - 5.85% |
|
|
|
|
|
|
| ||
Russian Federation |
|
|
|
|
|
|
| ||
7.500%, 03/31/2030 |
|
|
| 5,355,840 |
| 5,362,535 |
| ||
11
|
|
|
| Principal |
| Market Value |
| ||
Interest Rate/Maturity Date |
| Currency |
| Amount* |
| (Expressed in U.S. $) |
| ||
|
|
|
|
|
|
|
| ||
South Africa - 1.01% |
|
|
|
|
|
|
| ||
Republic of South Africa |
|
|
|
|
|
|
| ||
6.500%, 06/02/2014 |
|
|
| $ | 218,000 |
| $ | 225,630 |
|
8.500%, 06/23/2017 |
|
|
| 20,000 |
| 22,500 |
| ||
5.875%, 05/30/2022 |
|
|
| 750,000 |
| 682,500 |
| ||
|
|
|
|
|
| 930,630 |
| ||
Turkey - 4.64% |
|
|
|
|
|
|
| ||
Republic of Turkey |
|
|
|
|
|
|
| ||
7.250%, 03/15/2015 |
|
|
| 1,270,000 |
| 1,319,212 |
| ||
7.000%, 09/26/2016 |
|
|
| 100,000 |
| 102,125 |
| ||
6.750%, 04/03/2018 |
|
|
| 1,000,000 |
| 983,750 |
| ||
7.000%, 03/11/2019 |
|
|
| 275,000 |
| 273,969 |
| ||
7.375%, 02/05/2025 |
|
|
| 550,000 |
| 550,688 |
| ||
6.875%, 03/17/2036 |
|
|
| 360,000 |
| 327,600 |
| ||
7.250%, 03/05/2038 |
|
|
| 745,000 |
| 704,025 |
| ||
|
|
|
|
|
| 4,261,369 |
| ||
Ukraine - 4.49% |
|
|
|
|
|
|
| ||
Ukraine Government |
|
|
|
|
|
|
| ||
5.151%, 08/05/2009(2) |
|
|
| 275,000 |
| 262,625 |
| ||
6.875%, 03/04/2011(3) |
|
|
| 110,000 |
| 90,200 |
| ||
6.875%, 03/04/2011 |
|
|
| 775,000 |
| 635,500 |
| ||
6.385%, 06/26/2012 |
|
|
| 555,000 |
| 432,900 |
| ||
7.650%, 06/11/2013 |
|
|
| 1,115,000 |
| 869,700 |
| ||
3.500%, 09/15/2018 |
| CHF |
| 2,300,000 |
| 1,830,591 |
| ||
|
|
|
|
|
| 4,121,516 |
| ||
Uruguay - 2.52% |
|
|
|
|
|
|
| ||
Republic of Uruguay |
|
|
|
|
|
|
| ||
8.000%, 11/18/2022 |
|
|
| 935,000 |
| 981,750 |
| ||
7.875%, 01/15/2033(4) |
|
|
| 800 |
| 810 |
| ||
7.625%, 03/21/2036 |
|
|
| 1,345,000 |
| 1,331,550 |
| ||
|
|
|
|
|
| 2,314,110 |
| ||
12
|
|
|
| Principal |
| Market Value |
| ||
Interest Rate/Maturity Date |
|
|
| Amount* |
| (Expressed in U.S. $) |
| ||
|
|
|
|
|
|
|
| ||
Venezuela - 10.05% |
|
|
|
|
|
|
| ||
Republic of Venezuela |
|
|
|
|
|
|
| ||
2.101%, 04/20/2011(2) |
|
|
| $ | 5,900,000 |
| $ | 4,601,999 |
|
5.750%, 02/26/2016 |
|
|
| 440,000 |
| 242,550 |
| ||
7.000%, 12/01/2018 |
|
|
| 75,000 |
| 41,438 |
| ||
9.000%, 05/07/2023 |
|
|
| 470,000 |
| 273,188 |
| ||
7.650%, 04/21/2025 |
|
|
| 5,570,000 |
| 2,854,624 |
| ||
9.250%, 05/07/2028 |
|
|
| 2,095,000 |
| 1,209,863 |
| ||
|
|
|
|
|
| 9,223,662 |
| ||
Vietnam - 0.17% |
|
|
|
|
|
|
| ||
Republic of Vietnam |
|
|
|
|
|
|
| ||
6.875%, 01/15/2016 |
|
|
| 160,000 |
| 159,200 |
| ||
|
|
|
|
|
|
|
| ||
TOTAL SOVEREIGN DEBT OBLIGATIONS |
|
|
|
|
|
|
| ||
(Cost $70,822,343) |
|
|
|
|
| 74,754,246 |
| ||
|
|
|
|
|
|
|
| ||
CORPORATE BONDS - 5.64% |
|
|
|
|
|
|
| ||
|
|
|
|
|
|
|
| ||
India - 0.33% |
|
|
|
|
|
|
| ||
Vedanta Resources PLC |
|
|
|
|
|
|
| ||
9.500%, 07/18/2018(3) |
|
|
| 340,000 |
| 297,500 |
| ||
|
|
|
|
|
|
|
| ||
Kazakhstan - 0.29% |
|
|
|
|
|
|
| ||
HSBK Europe BV |
|
|
|
|
|
|
| ||
9.250%, 10/16/2013(3) |
|
|
| 110,000 |
| 74,250 |
| ||
KazMunaiGaz Finance Sub BV |
|
|
|
|
|
|
| ||
9.125%, 07/02/2018(3) |
|
|
| 205,000 |
| 189,625 |
| ||
|
|
|
|
|
| 263,875 |
| ||
Malaysia - 3.57% |
|
|
|
|
|
|
| ||
Penerbangan Malaysia BHD |
|
|
|
|
|
|
| ||
5.625%, 03/15/2016 |
|
|
| 1,215,000 |
| 1,255,338 |
| ||
Petroliam Nasional BHD |
|
|
|
|
|
|
| ||
7.750%, 08/15/2015(3) |
|
|
| 335,000 |
| 385,908 |
| ||
Petronas Capital Ltd. |
|
|
|
|
|
|
| ||
7.000%, 05/22/2012 |
|
|
| 785,000 |
| 869,623 |
| ||
7.875%, 05/22/2022 |
|
|
| 675,000 |
| 767,374 |
| ||
|
|
|
|
|
| 3,278,243 |
| ||
13
|
|
|
| Principal |
| Market Value |
| ||
Interest Rate/Maturity Date |
|
|
| Amount*/Shares |
| (Expressed in U.S. $) |
| ||
|
|
|
|
|
|
|
| ||
Russia - 0.27% |
|
|
|
|
|
|
| ||
TransCapitalInvest Ltd. for OJSC AK Transneft |
|
|
|
|
|
|
| ||
8.700%, 08/07/2018(3) |
|
|
| $ | 160,000 |
| $ | 155,200 |
|
VIP Finance Ireland Ltd. for OJSC |
|
|
|
|
|
|
| ||
Vimpel Communications |
|
|
|
|
|
|
| ||
8.375%, 04/30/2013(3) |
|
|
| 100,000 |
| 91,620 |
| ||
|
|
|
|
|
| 246,820 |
| ||
South Korea - 1.00% |
|
|
|
|
|
|
| ||
Export-Import Bank of Korea |
|
|
|
|
|
|
| ||
8.125%, 01/21/2014 |
|
|
| 870,000 |
| 917,850 |
| ||
|
|
|
|
|
|
|
| ||
Tunisia - 0.18% |
|
|
|
|
|
|
| ||
Banque Centrale de Tunisie |
|
|
|
|
|
|
| ||
7.375%, 04/25/2012 |
|
|
| 155,000 |
| 166,625 |
| ||
|
|
|
|
|
|
|
| ||
TOTAL CORPORATE BONDS |
|
|
|
|
| 5,170,913 |
| ||
|
|
|
|
|
|
|
| ||
MONEY MARKET MUTUAL FUNDS - 2.76% |
|
|
|
|
|
|
| ||
Dreyfus Cash Advantage Plus Fund (0.525% 7-Day Yield) |
|
|
| 2,536,914 |
| 2,536,914 |
| ||
|
|
|
|
|
|
|
| ||
TOTAL MONEY MARKET MUTUAL FUNDS |
|
|
|
|
| 2,536,914 |
| ||
|
|
|
|
|
|
|
| ||
Total Investments - 89.87% |
|
|
|
|
| $ | 82,462,073 |
| |
|
|
|
|
|
|
|
| ||
Other Assets In Excess of Liabilities - 10.13% |
|
|
|
|
| 9,290,927 |
| ||
|
|
|
|
|
|
|
| ||
Net Assets - 100.00% |
|
|
|
|
| $ | 91,753,000 |
| |
Country classifications are unaudited.
14
* | The principal/contract amount of each security is stated in the currency in which the bond is denominated (U.S. Dollar unless otherwise notated). See below. | |
|
| |
| BRL | Brazilian Real |
| CHF | Swiss Franc |
| COP | Colombian Peso |
| EUR | Euro Currency |
| ITL | Italian Lira |
| MXN | Mexican Peso |
|
| |
(1) | Security is currently in default/non-income producing. | |
(2) | Floating or variable rate security. Interest rate disclosed is that which is in effect at May 31, 2009. | |
(3) | Security exempt from registration under Rule 144A of the Securities Act of 1933. Under procedures approved by the Board of Trustees, such securities have been determined to be liquid by the Fund’s investment adviser and may be resold, normally to qualified buyers in transactions exempt from registration. Total market value of Rule 144A securities amounts to $3,874,178, which represents approximately 4.22% of net assets as of May 31, 2009. | |
(4) | Pay-in-kind securities. | |
|
| |
Common Abbreviations: | ||
| BHD - Berhad is the Malaysian term for public limited company. | |
| BV - Besloten Vennootschap a Dutch private limited liability company. | |
| OJSC - Open Joint Stock Company. | |
| PLC - Public Limited Co. | |
| SA - Generally designates corporations in various countries, mostly those employing the civil law. | |
OUTSTANDING FORWARD FOREIGN CURRENCY CONTRACTS
Contract |
| Contracted |
| Purchase/Sale |
| Expiration |
| Value on |
| Current |
| Unrealized |
| ||||
Description |
| Amount |
| Contract |
| Date |
| Settlement Date |
| Value |
| Depreciation |
| ||||
CHF |
| 2,093,886 | (CHF) |
| Sale |
| 06/22/2009 |
| $ | 1,895,405 |
| $ | 1,961,464 |
| $ | (66,059 | ) |
EUR |
| 336,750 | (EUR) |
| Sale |
| 06/22/2009 |
| 461,105 |
| 475,980 |
| (14,875 | ) | |||
|
|
|
|
|
|
|
|
|
| $ | 2,437,444 |
| $ | (80,934 | ) | ||
See Notes to Financial Statements
15
Statement of Investments |
|
|
May 31, 2009 |
| High Yield Bond Fund |
|
| Principal |
|
|
| ||
Interest Rate/Maturity Date |
| Amount |
| Market Value |
| ||
|
|
|
|
|
| ||
CORPORATE BONDS - 87.79% |
|
|
|
|
| ||
Advertising - 0.72% |
|
|
|
|
| ||
Interep National Radio Sales, Inc. |
|
|
|
|
| ||
Series B, 10.000%, 07/01/2008(1)(2) |
| $ | 4,000 |
| $ | — |
|
Lamar Media Corp. |
|
|
|
|
| ||
6.625%, 08/15/2015 |
| 710,000 |
| 607,050 |
| ||
Series B, 6.625%, 08/15/2015 |
| 780,000 |
| 643,500 |
| ||
Series C, 6.625%, 08/15/2015 |
| 200,000 |
| 163,000 |
| ||
RH Donnelley Corp. |
|
|
|
|
| ||
Series A-1, 6.875%, 01/15/2013 |
| 250,000 |
| 18,750 |
| ||
Series A-2, 6.875%, 01/15/2013 |
| 25,000 |
| 1,875 |
| ||
Series A-3, 8.875%, 01/15/2016 |
| 380,000 |
| 28,500 |
| ||
Series A-4, 8.875%, 10/15/2017 |
| 1,800,000 |
| 135,000 |
| ||
|
|
|
| 1,597,675 |
| ||
Aerospace - Defense - 2.09% |
|
|
|
|
| ||
Alliant Techsystems, Inc. |
|
|
|
|
| ||
6.750%, 04/01/2016 |
| 640,000 |
| 596,800 |
| ||
DRS Technologies, Inc. |
|
|
|
|
| ||
6.875%, 11/01/2013(3) |
| 175,000 |
| 169,019 |
| ||
Esterline Technologies Corp. |
|
|
|
|
| ||
7.750%, 06/15/2013 |
| 625,000 |
| 607,813 |
| ||
6.625%, 03/01/2017 |
| 275,000 |
| 252,313 |
| ||
L-3 Communications Corp. |
|
|
|
|
| ||
7.625%, 06/15/2012 |
| 1,531,000 |
| 1,532,913 |
| ||
6.125%, 07/15/2013 |
| 100,000 |
| 93,250 |
| ||
6.125%, 01/15/2014 |
| 475,000 |
| 439,375 |
| ||
Series B, 6.375%, 10/15/2015 |
| 400,000 |
| 366,000 |
| ||
TransDigm, Inc. |
|
|
|
|
| ||
7.750%, 07/15/2014 |
| 625,000 |
| 606,250 |
| ||
|
|
|
| 4,663,733 |
| ||
Agriculture - 1.40% |
|
|
|
|
| ||
Altria Group, Inc. |
|
|
|
|
| ||
9.250%, 08/06/2019 |
| 825,000 |
| 914,227 |
| ||
Reynolds American, Inc. |
|
|
|
|
| ||
7.250%, 06/01/2013 |
| 625,000 |
| 626,599 |
| ||
7.625%, 06/01/2016 |
| 1,605,000 |
| 1,577,543 |
| ||
|
|
|
| 3,118,369 |
| ||
Apparel - 0.91% |
|
|
|
|
| ||
Levi Strauss & Co. |
|
|
|
|
| ||
9.750%, 01/15/2015 |
| 1,370,000 |
| 1,328,900 |
| ||
8.875%, 04/01/2016 |
| 750,000 |
| 708,750 |
| ||
|
|
|
| 2,037,650 |
| ||
16
|
| Principal |
|
|
| ||
Interest Rate/Maturity Date |
| Amount |
| Market Value |
| ||
|
|
|
|
|
| ||
Auto Manufacturers - 0.36% |
|
|
|
|
| ||
Ford Motor Co. |
|
|
|
|
| ||
7.450%, 07/16/2031 |
| $ | 1,360,000 |
| $ | 795,600 |
|
8.900%, 01/15/2032 |
| 25,000 |
| 13,625 |
| ||
|
|
|
| 809,225 |
| ||
Beverages - 1.89% |
|
|
|
|
| ||
Anheuser-Busch InBev Worldwide, Inc. |
|
|
|
|
| ||
7.750%, 01/15/2019(4) |
| 1,200,000 |
| 1,292,984 |
| ||
Constellation Brands, Inc. |
|
|
|
|
| ||
8.375%, 12/15/2014 |
| 1,500,000 |
| 1,507,500 |
| ||
7.250%, 09/01/2016 |
| 1,470,000 |
| 1,378,125 |
| ||
7.250%, 05/15/2017 |
| 50,000 |
| 46,875 |
| ||
|
|
|
| 4,225,484 |
| ||
Building Materials - 0.28% |
|
|
|
|
| ||
Interline Brands, Inc. |
|
|
|
|
| ||
8.125%, 06/15/2014 |
| 600,000 |
| 576,000 |
| ||
Nortek, Inc. |
|
|
|
|
| ||
8.500%, 09/01/2014 |
| 150,000 |
| 40,500 |
| ||
NTK Holdings, Inc. |
|
|
|
|
| ||
10.750%, 03/01/2014(5) |
| 75,000 |
| 7,781 |
| ||
|
|
|
| 624,281 |
| ||
Chemicals - 2.46% |
|
|
|
|
| ||
Airgas, Inc. |
|
|
|
|
| ||
6.250%, 07/15/2014 |
| 425,000 |
| 398,438 |
| ||
7.125%, 10/01/2018(4) |
| 375,000 |
| 350,625 |
| ||
Ashland, Inc. |
|
|
|
|
| ||
9.125%, 06/01/2017(4) |
| 1,000,000 |
| 1,017,500 |
| ||
Lyondell Chemical Co. |
|
|
|
|
| ||
8.375%, 08/15/2015(1)(4) |
| 945,000 |
| 21,263 |
| ||
MacDermid, Inc. |
|
|
|
|
| ||
9.500%, 04/15/2017(4) |
| 650,000 |
| 399,750 |
| ||
Nalco Co. |
|
|
|
|
| ||
7.750%, 11/15/2011 |
| 375,000 |
| 380,625 |
| ||
8.875%, 11/15/2013 |
| 530,000 |
| 535,300 |
| ||
8.250%, 05/15/2017(4) |
| 1,050,000 |
| 1,060,500 |
| ||
NewMarket Corp. |
|
|
|
|
| ||
7.125%, 12/15/2016 |
| 405,000 |
| 358,425 |
| ||
Nova Chemicals Corp. |
|
|
|
|
| ||
6.500%, 01/15/2012 |
| 1,045,000 |
| 956,175 |
| ||
|
|
|
| 5,478,601 |
| ||
17
|
| Principal |
|
|
| ||
Interest Rate/Maturity Date |
| Amount |
| Market Value |
| ||
|
|
|
|
|
| ||
Coal - 1.37% |
|
|
|
|
| ||
Arch Western Finance LLC |
|
|
|
|
| ||
6.750%, 07/01/2013(6) |
| $ | 1,225,000 |
| $ | 1,120,875 |
|
Peabody Energy Corp. |
|
|
|
|
| ||
Series B, 6.875%, 03/15/2013 |
| 1,475,000 |
| 1,430,750 |
| ||
5.875%, 04/15/2016 |
| 150,000 |
| 132,375 |
| ||
7.875%, 11/01/2026 |
| 425,000 |
| 380,375 |
| ||
|
|
|
| 3,064,375 |
| ||
Commercial Services - 5.08% |
|
|
|
|
| ||
ARAMARK Corp. |
|
|
|
|
| ||
4.528%, 02/01/2015(6) |
| 65,000 |
| 52,650 |
| ||
8.500%, 02/01/2015 |
| 2,130,000 |
| 2,042,137 |
| ||
Cenveo Corp. |
|
|
|
|
| ||
7.875%, 12/01/2013 |
| 725,000 |
| 500,250 |
| ||
8.375%, 06/15/2014 |
| 550,000 |
| 379,500 |
| ||
10.500%, 08/15/2016(4) |
| 350,000 |
| 252,875 |
| ||
Corrections Corp. of America |
|
|
|
|
| ||
7.500%, 05/01/2011 |
| 10,000 |
| 9,950 |
| ||
6.250%, 03/15/2013 |
| 999,000 |
| 951,548 |
| ||
6.750%, 01/31/2014 |
| 1,450,000 |
| 1,399,250 |
| ||
7.750%, 06/01/2017 |
| 675,000 |
| 664,875 |
| ||
Deluxe Corp. |
|
|
|
|
| ||
7.375%, 06/01/2015 |
| 395,000 |
| 314,025 |
| ||
Education Management LLC |
|
|
|
|
| ||
8.750%, 06/01/2014 |
| 950,000 |
| 931,000 |
| ||
10.250%, 06/01/2016 |
| 1,045,000 |
| 1,024,100 |
| ||
The Geo Group, Inc. |
|
|
|
|
| ||
8.250%, 07/15/2013 |
| 575,000 |
| 563,500 |
| ||
Iron Mountain, Inc. |
|
|
|
|
| ||
8.625%, 04/01/2013 |
| 25,000 |
| 25,125 |
| ||
7.750%, 01/15/2015 |
| 575,000 |
| 557,750 |
| ||
8.750%, 07/15/2018 |
| 1,360,000 |
| 1,329,400 |
| ||
8.000%, 06/15/2020 |
| 375,000 |
| 348,750 |
| ||
|
|
|
| 11,346,685 |
| ||
Communications - 0.43% |
|
|
|
|
| ||
Intelsat Jackson Holdings Ltd. |
|
|
|
|
| ||
9.500%, 06/15/2016(4) |
| 350,000 |
| 350,000 |
| ||
11.250%, 06/15/2016 |
| 600,000 |
| 618,000 |
| ||
|
|
|
| 968,000 |
| ||
Distribution - Wholesale - 0.15% |
|
|
|
|
| ||
Baker & Taylor, Inc. |
|
|
|
|
| ||
11.500%, 07/01/2013(4) |
| 1,295,000 |
| 331,844 |
| ||
18
|
| Principal |
|
|
| ||
Interest Rate/Maturity Date |
| Amount |
| Market Value |
| ||
|
|
|
|
|
| ||
Diversified Financial Services - 6.17% |
|
|
|
|
| ||
Ford Motor Credit Co. LLC |
|
|
|
|
| ||
7.375%, 10/28/2009 |
| $ | 700,000 |
| $ | 682,801 |
|
5.700%, 01/15/2010 |
| 25,000 |
| 23,911 |
| ||
9.875%, 08/10/2011 |
| 1,775,000 |
| 1,621,183 |
| ||
7.250%, 10/25/2011 |
| 2,575,000 |
| 2,223,301 |
| ||
8.000%, 12/15/2016 |
| 1,385,000 |
| 1,113,674 |
| ||
Fox Acquisition Sub LLC |
|
|
|
|
| ||
13.375%, 07/15/2016(4) |
| 540,000 |
| 203,850 |
| ||
Global Cash Access LLC |
|
|
|
|
| ||
8.750%, 03/15/2012 |
| 925,000 |
| 911,125 |
| ||
GMAC LLC |
|
|
|
|
| ||
7.250%, 03/02/2011(4) |
| 79,000 |
| 71,128 |
| ||
6.875%, 09/15/2011(4) |
| 237,000 |
| 212,222 |
| ||
6.000%, 12/15/2011(4) |
| 94,000 |
| 81,826 |
| ||
7.000%, 02/01/2012(4) |
| 379,000 |
| 331,817 |
| ||
6.625%, 05/15/2012(4) |
| 66,000 |
| 57,126 |
| ||
Hughes Network Systems LLC |
|
|
|
|
| ||
9.500%, 04/15/2014 |
| 1,010,000 |
| 979,700 |
| ||
Petroplus Finance Ltd. |
|
|
|
|
| ||
6.750%, 05/01/2014(4) |
| 485,000 |
| 407,400 |
| ||
7.000%, 05/01/2017(4) |
| 550,000 |
| 451,000 |
| ||
Pinnacle Foods Finance LLC |
|
|
|
|
| ||
9.250%, 04/01/2015 |
| 1,025,000 |
| 919,938 |
| ||
Rainbow National Services LLC |
|
|
|
|
| ||
8.750%, 09/01/2012(4) |
| 200,000 |
| 203,250 |
| ||
Sensus Metering Systems, Inc. |
|
|
|
|
| ||
8.625%, 12/15/2013 |
| 600,000 |
| 546,000 |
| ||
Southern Star Central Corp. |
|
|
|
|
| ||
6.750%, 03/01/2016 |
| 75,000 |
| 67,875 |
| ||
6.750%, 03/01/2016(4) |
| 575,000 |
| 520,375 |
| ||
Vanguard Health Holding Co. I LLC |
|
|
|
|
| ||
11.250%, 10/01/2015(5) |
| 1,550,000 |
| 1,453,125 |
| ||
Vanguard Health Holding Co. II LLC |
|
|
|
|
| ||
9.000%, 10/01/2014 |
| 690,000 |
| 679,650 |
| ||
|
|
|
| 13,762,277 |
| ||
Electric - 4.68% |
|
|
|
|
| ||
The AES Corp. |
|
|
|
|
| ||
8.750%, 05/15/2013(4) |
| 275,000 |
| 281,187 |
| ||
7.750%, 03/01/2014 |
| 650,000 |
| 622,375 |
| ||
7.750%, 10/15/2015 |
| 850,000 |
| 794,750 |
| ||
8.000%, 10/15/2017 |
| 1,125,000 |
| 1,051,875 |
| ||
19
|
| Principal |
|
|
| ||
Interest Rate/Maturity Date |
| Amount |
| Market Value |
| ||
|
|
|
|
|
| ||
Edison Mission Energy |
|
|
|
|
| ||
7.500%, 06/15/2013 |
| $ | 55,000 |
| $ | 46,613 |
|
7.750%, 06/15/2016 |
| 700,000 |
| 546,000 |
| ||
7.200%, 05/15/2019 |
| 1,540,000 |
| 1,049,125 |
| ||
7.625%, 05/15/2027 |
| 1,135,000 |
| 699,444 |
| ||
Mirant Americas Generation LLC |
|
|
|
|
| ||
8.300%, 05/01/2011 |
| 275,000 |
| 275,000 |
| ||
8.500%, 10/01/2021 |
| 175,000 |
| 146,125 |
| ||
Mirant North America LLC |
|
|
|
|
| ||
7.375%, 12/31/2013 |
| 1,290,000 |
| 1,241,625 |
| ||
NRG Energy, Inc. |
|
|
|
|
| ||
7.250%, 02/01/2014 |
| 800,000 |
| 768,000 |
| ||
7.375%, 02/01/2016 |
| 1,515,000 |
| 1,429,781 |
| ||
Texas Competitive Electric Holdings Co. LLC |
|
|
|
|
| ||
Series A, 10.250%, 11/01/2015(7) |
| 2,500,000 |
| 1,493,750 |
| ||
|
|
|
| 10,445,650 |
| ||
Electrical Components & Equipment - 0.26% |
|
|
|
|
| ||
Belden, Inc. |
|
|
|
|
| ||
7.000%, 03/15/2017 |
| 655,000 |
| 583,769 |
| ||
|
|
|
|
|
| ||
Entertainment - 4.26% |
|
|
|
|
| ||
AMC Entertainment, Inc. |
|
|
|
|
| ||
8.000%, 03/01/2014 |
| 50,000 |
| 45,250 |
| ||
11.000%, 02/01/2016 |
| 565,000 |
| 570,650 |
| ||
Cinemark, Inc. |
|
|
|
|
| ||
9.750%, 03/15/2014(7) |
| 2,110,000 |
| 2,152,200 |
| ||
Great Canadian Gaming Corp. |
|
|
|
|
| ||
7.250%, 02/15/2015(4) |
| 1,030,000 |
| 937,300 |
| ||
Marquee Holdings, Inc. |
|
|
|
|
| ||
12.000%, 08/15/2014(7) |
| 1,665,000 |
| 1,356,975 |
| ||
Penn National Gaming, Inc. |
|
|
|
|
| ||
6.875%, 12/01/2011 |
| 650,000 |
| 633,750 |
| ||
Pinnacle Entertainment, Inc. |
|
|
|
|
| ||
8.250%, 03/15/2012 |
| 425,000 |
| 416,500 |
| ||
8.750%, 10/01/2013 |
| 175,000 |
| 173,250 |
| ||
7.500%, 06/15/2015 |
| 1,305,000 |
| 1,096,200 |
| ||
Seneca Gaming Corp. |
|
|
|
|
| ||
7.250%, 05/01/2012 |
| 720,000 |
| 586,800 |
| ||
Series B, 7.250%, 05/01/2012 |
| 630,000 |
| 513,450 |
| ||
Speedway Motorsports, Inc. |
|
|
|
|
| ||
8.750%, 06/01/2016(4) |
| 1,025,000 |
| 1,027,563 |
| ||
|
|
|
| 9,509,888 |
| ||
20
|
| Principal |
|
|
| ||
Interest Rate/Maturity Date |
| Amount |
| Market Value |
| ||
|
|
|
|
|
| ||
Environmental Control - 0.74% |
|
|
|
|
| ||
Allied Waste North America, Inc. |
|
|
|
|
| ||
7.875%, 04/15/2013 |
| $ | 500,000 |
| $ | 509,173 |
|
7.250%, 03/15/2015 |
| 900,000 |
| 901,049 |
| ||
Series B, 7.125%, 05/15/2016 |
| 200,000 |
| 195,763 |
| ||
Browning-Ferris Industries, Inc. |
|
|
|
|
| ||
9.250%, 05/01/2021 |
| 35,000 |
| 36,651 |
| ||
Safety-Kleen Services, Inc. |
|
|
|
|
| ||
9.250%, 06/01/2008(1)(2) |
| 50,000 |
| 10 |
| ||
|
|
|
| 1,642,646 |
| ||
Food - 3.15% |
|
|
|
|
| ||
Ahold Lease USA, Inc. |
|
|
|
|
| ||
Series A-1, 7.820%, 01/02/2020(7) |
| 451,891 |
| 385,802 |
| ||
Series A-2, 8.620%, 01/02/2025(7) |
| 482,879 |
| 427,348 |
| ||
American Stores Co. |
|
|
|
|
| ||
7.900%, 05/01/2017 |
| 550,000 |
| 534,188 |
| ||
8.000%, 06/01/2026 |
| 1,465,000 |
| 1,320,331 |
| ||
Del Monte Corp. |
|
|
|
|
| ||
8.625%, 12/15/2012 |
| 1,525,000 |
| 1,540,249 |
| ||
6.750%, 02/15/2015 |
| 100,000 |
| 95,250 |
| ||
Dole Food Co., Inc. |
|
|
|
|
| ||
7.250%, 06/15/2010 |
| 850,000 |
| 835,125 |
| ||
13.875%, 03/15/2014(4) |
| 1,050,000 |
| 1,128,750 |
| ||
Pilgrim’s Pride Corp. |
|
|
|
|
| ||
9.250%, 11/15/2013(1)(3) |
| 100,000 |
| 56,125 |
| ||
Smithfield Foods, Inc. |
|
|
|
|
| ||
Series B, 8.000%, 10/15/2009 |
| 600,000 |
| 597,000 |
| ||
SUPERVALU, Inc. |
|
|
|
|
| ||
8.000%, 05/01/2016 |
| 100,000 |
| 98,500 |
| ||
|
|
|
| 7,018,668 |
| ||
Forest Products & Paper - 1.07% |
|
|
|
|
| ||
Buckeye Technologies, Inc. |
|
|
|
|
| ||
8.000%, 10/15/2010 |
| 341,000 |
| 335,885 |
| ||
8.500%, 10/01/2013 |
| 525,000 |
| 488,250 |
| ||
Georgia-Pacific LLC |
|
|
|
|
| ||
9.500%, 12/01/2011 |
| 775,000 |
| 800,188 |
| ||
8.250%, 05/01/2016(4) |
| 50,000 |
| 49,500 |
| ||
International Paper Co. |
|
|
|
|
| ||
7.400%, 06/15/2014 |
| 150,000 |
| 147,899 |
| ||
7.950%, 06/15/2018 |
| 600,000 |
| 565,973 |
| ||
|
|
|
| 2,387,695 |
| ||
21
|
| Principal |
|
|
| ||
Interest Rate/Maturity Date |
| Amount |
| Market Value |
| ||
|
|
|
|
|
| ||
Gaming - 1.84% |
|
|
|
|
| ||
Ameristar Casinos, Inc. |
|
|
|
|
| ||
9.250%, 06/01/2014(4) |
| $ | 1,000,000 |
| $ | 1,015,000 |
|
Harrah’s Operating Escrow LLC |
|
|
|
|
| ||
11.250%, 06/01/2017(4) |
| 1,175,000 |
| 1,145,625 |
| ||
MGM Mirage |
|
|
|
|
| ||
8.500%, 09/15/2010 |
| 1,175,000 |
| 1,110,375 |
| ||
11.125%, 11/15/2017(4) |
| 800,000 |
| 842,000 |
| ||
|
|
|
| 4,113,000 |
| ||
Gas - 1.01% |
|
|
|
|
| ||
Southern Star Central Gas Pipeline, Inc. |
|
|
|
|
| ||
6.000%, 06/01/2016(4) |
| 500,000 |
| 455,000 |
| ||
Southern Union Co. |
|
|
|
|
| ||
7.600%, 02/01/2024 |
| 425,000 |
| 367,510 |
| ||
8.250%, 11/15/2029 |
| 1,625,000 |
| 1,435,564 |
| ||
|
|
|
| 2,258,074 |
| ||
Healthcare-Products - 1.99% |
|
|
|
|
| ||
Accellent, Inc. |
|
|
|
|
| ||
10.500%, 12/01/2013 |
| 1,205,000 |
| 957,975 |
| ||
Boston Scientific Corp. |
|
|
|
|
| ||
6.000%, 06/15/2011 |
| 900,000 |
| 891,000 |
| ||
5.450%, 06/15/2014 |
| 450,000 |
| 405,000 |
| ||
6.400%, 06/15/2016 |
| 575,000 |
| 526,125 |
| ||
7.000%, 11/15/2035 |
| 375,000 |
| 311,250 |
| ||
Inverness Medical Innovations, Inc. |
|
|
|
|
| ||
9.000%, 05/15/2016 |
| 1,400,000 |
| 1,347,500 |
| ||
|
|
|
| 4,438,850 |
| ||
Healthcare-Services - 5.55% |
|
|
|
|
| ||
Community Health Systems, Inc. |
|
|
|
|
| ||
8.875%, 07/15/2015 |
| 900,000 |
| 894,375 |
| ||
DaVita, Inc. |
|
|
|
|
| ||
7.250%, 03/15/2015 |
| 3,545,000 |
| 3,350,024 |
| ||
HCA, Inc. |
|
|
|
|
| ||
6.300%, 10/01/2012 |
| 1,250,000 |
| 1,118,750 |
| ||
6.750%, 07/15/2013 |
| 875,000 |
| 741,563 |
| ||
9.250%, 11/15/2016 |
| 1,300,000 |
| 1,280,500 |
| ||
9.625%, 11/15/2016(8) |
| 788,000 |
| 756,480 |
| ||
Healthsouth Corp. |
|
|
|
|
| ||
8.323%, 06/15/2014(6) |
| 675,000 |
| 624,375 |
| ||
10.750%, 06/15/2016 |
| 600,000 |
| 615,000 |
| ||
22
|
| Principal |
|
|
| ||
Interest Rate/Maturity Date |
| Amount |
| Market Value |
| ||
|
|
|
|
|
| ||
IASIS Healthcare LLC |
|
|
|
|
| ||
8.750%, 06/15/2014 |
| $ | 600,000 |
| $ | 589,500 |
|
Psychiatric Solutions, Inc. |
|
|
|
|
| ||
7.750%, 07/15/2015 |
| 755,000 |
| 683,275 |
| ||
7.750%, 07/15/2015(4) |
| 750,000 |
| 671,250 |
| ||
United Surgical Partners International, Inc. |
|
|
|
|
| ||
8.875%, 05/01/2017 |
| 125,000 |
| 107,188 |
| ||
9.250%, 05/01/2017(8) |
| 1,220,000 |
| 951,600 |
| ||
|
|
|
| 12,383,880 |
| ||
Holding Companies-Diversified - 0.07% |
|
|
|
|
| ||
AMH Holdings, Inc. |
|
|
|
|
| ||
11.250%, 03/01/2014(7) |
| 130,000 |
| 42,250 |
| ||
Atlantic Broadband Finance LLC |
|
|
|
|
| ||
9.375%, 01/15/2014 |
| 135,000 |
| 114,413 |
| ||
|
|
|
| 156,663 |
| ||
Home Furnishings - 0.13% |
|
|
|
|
| ||
Norcraft Cos LP |
|
|
|
|
| ||
9.000%, 11/01/2011 |
| 35,000 |
| 33,425 |
| ||
Norcraft Holdings LP |
|
|
|
|
| ||
9.750%, 09/01/2012(7) |
| 300,000 |
| 265,500 |
| ||
|
|
|
| 298,925 |
| ||
Lodging - 1.69% |
|
|
|
|
| ||
Host Hotels & Resorts LP - REIT |
|
|
|
|
| ||
Series M, 7.000%, 08/15/2012 |
| 275,000 |
| 265,375 |
| ||
7.125%, 11/01/2013 |
| 875,000 |
| 818,125 |
| ||
Series O, 6.375%, 03/15/2015 |
| 75,000 |
| 64,500 |
| ||
Series Q, 6.750%, 06/01/2016 |
| 400,000 |
| 346,000 |
| ||
9.000%, 05/15/2017(4) |
| 1,000,000 |
| 945,000 |
| ||
Starwood Hotels & Resorts Worldwide, Inc. |
|
|
|
|
| ||
6.250%, 02/15/2013 |
| 1,450,000 |
| 1,327,816 |
| ||
|
|
|
| 3,766,816 |
| ||
Machinery - Construction & Mining - 0.30% |
|
|
|
|
| ||
Terex Corp. |
|
|
|
|
| ||
8.000%, 11/15/2017 |
| 825,000 |
| 672,375 |
| ||
|
|
|
|
|
| ||
Media - 5.70% |
|
|
|
|
| ||
Bonten Media Acquisition Co. |
|
|
|
|
| ||
9.000%, 06/01/2015(4)(8) |
| 425,000 |
| 74,375 |
| ||
CanWest MediaWorks, Inc. |
|
|
|
|
| ||
8.000%, 09/15/2012 |
| 700,000 |
| 199,500 |
| ||
23
Interest Rate/Maturity Date |
| Principal |
| Market Value |
| ||
|
|
|
|
|
| ||
CCH I Holdings LLC |
|
|
|
|
| ||
9.920%, 04/01/2014(1) |
| $ | 275,000 |
| $ | 3,781 |
|
10.000%, 05/15/2014(1)(7) |
| 25,000 |
| 344 |
| ||
11.750%, 05/15/2014(1)(7) |
| 230,000 |
| 3,162 |
| ||
12.125%, 01/15/2015(1)(7) |
| 25,000 |
| 344 |
| ||
11.000%, 10/01/2015(1) |
| 1,365,000 |
| 163,800 |
| ||
CCO Holdings LLC |
|
|
|
|
| ||
8.750%, 11/15/2013(1) |
| 200,000 |
| 184,000 |
| ||
Charter Communications Operating LLC |
|
|
|
|
| ||
8.000%, 04/30/2012(1)(4) |
| 475,000 |
| 458,375 |
| ||
CSC Holdings, Inc. |
|
|
|
|
| ||
Series B, 7.625%, 04/01/2011 |
| 1,475,000 |
| 1,478,688 |
| ||
6.750%, 04/15/2012 |
| 350,000 |
| 339,500 |
| ||
8.500%, 04/15/2014(4) |
| 200,000 |
| 200,000 |
| ||
8.500%, 06/15/2015(4) |
| 725,000 |
| 717,750 |
| ||
7.625%, 07/15/2018 |
| 325,000 |
| 303,875 |
| ||
8.625%, 02/15/2019(4) |
| 475,000 |
| 468,469 |
| ||
Dex Media, Inc. |
|
|
|
|
| ||
8.000%, 11/15/2013 |
| 20,000 |
| 3,300 |
| ||
9.000%, 11/15/2013(1)(7) |
| 150,000 |
| 24,750 |
| ||
9.000%, 11/15/2013(1)(7) |
| 225,000 |
| 37,125 |
| ||
Dex Media West LLC |
|
|
|
|
| ||
Series B, 8.500%, 08/15/2010 |
| 20,000 |
| 15,000 |
| ||
Series B, 9.875%, 08/15/2013 |
| 44,000 |
| 9,570 |
| ||
DirecTV Holdings LLC |
|
|
|
|
| ||
7.625%, 05/15/2016 |
| 1,975,000 |
| 1,920,687 |
| ||
DISH DBS Corp. |
|
|
|
|
| ||
7.000%, 10/01/2013 |
| 25,000 |
| 23,750 |
| ||
6.625%, 10/01/2014 |
| 650,000 |
| 591,500 |
| ||
7.750%, 05/31/2015 |
| 450,000 |
| 427,500 |
| ||
7.125%, 02/01/2016 |
| 660,000 |
| 610,500 |
| ||
Idearc, Inc. |
|
|
|
|
| ||
8.000%, 11/15/2016(1) |
| 1,265,000 |
| 34,788 |
| ||
Radio One, Inc. |
|
|
|
|
| ||
Series B, 8.875%, 07/01/2011 |
| 865,000 |
| 330,863 |
| ||
The Reader’s Digest Association, Inc. |
|
|
|
|
| ||
9.000%, 02/15/2017 |
| 470,000 |
| 21,150 |
| ||
Salem Communications Holding Corp. |
|
|
|
|
| ||
7.750%, 12/15/2010 |
| 445,000 |
| 135,725 |
| ||
Shaw Communications, Inc. |
|
|
|
|
| ||
7.250%, 04/06/2011 |
| 325,000 |
| 332,719 |
| ||
7.200%, 12/15/2011 |
| 250,000 |
| 256,250 |
| ||
Sinclair Television Group, Inc. |
|
|
|
|
| ||
8.000%, 03/15/2012 |
| 550,000 |
| 360,250 |
| ||
UPC Holding BV |
|
|
|
|
| ||
9.875%, 04/15/2018(4) |
| 1,050,000 |
| 1,018,499 |
| ||
24
|
| Principal |
|
|
| ||
Interest Rate/Maturity Date |
| Amount |
| Market Value |
| ||
|
|
|
|
|
| ||
Videotron Ltee |
|
|
|
|
| ||
6.875%, 01/15/2014 |
| $ | 920,000 |
| $ | 874,000 |
|
6.375%, 12/15/2015 |
| 185,000 |
| 168,350 |
| ||
9.125%, 04/15/2018(4) |
| 400,000 |
| 416,000 |
| ||
9.125%, 04/15/2018 |
| 500,000 |
| 519,999 |
| ||
|
|
|
| 12,728,238 |
| ||
Mining - 1.00% |
|
|
|
|
| ||
Alcoa, Inc. |
|
|
|
|
| ||
6.750%, 07/15/2018 |
| 1,325,000 |
| 1,146,105 |
| ||
5.720%, 02/23/2019 |
| 25,000 |
| 19,832 |
| ||
Teck Resources Ltd. |
|
|
|
|
| ||
9.750%, 05/15/2014(4) |
| 250,000 |
| 248,990 |
| ||
10.750%, 05/15/2019(4) |
| 800,000 |
| 824,253 |
| ||
|
|
|
| 2,239,180 |
| ||
Miscellaneous Manufacturers - 0.91% |
|
|
|
|
| ||
Koppers Holdings, Inc. |
|
|
|
|
| ||
9.875%, 11/15/2014(5) |
| 425,000 |
| 376,125 |
| ||
Koppers, Inc. |
|
|
|
|
| ||
9.875%, 10/15/2013 |
| 575,000 |
| 561,344 |
| ||
RBS Global, Inc. |
|
|
|
|
| ||
9.500%, 08/01/2014 |
| 635,000 |
| 533,400 |
| ||
SPX Corp. |
|
|
|
|
| ||
7.625%, 12/15/2014 |
| 575,000 |
| 560,625 |
| ||
|
|
|
| 2,031,494 |
| ||
Office-Business Equipment - 1.03% |
|
|
|
|
| ||
Xerox Capital Trust I |
|
|
|
|
| ||
8.000%, 02/01/2027 |
| 2,970,000 |
| 2,306,505 |
| ||
|
|
|
|
|
| ||
Office Furnishings - 0.29% |
|
|
|
|
| ||
Interface, Inc. |
|
|
|
|
| ||
10.375%, 02/01/2010 |
| 425,000 |
| 446,292 |
| ||
9.500%, 02/01/2014 |
| 265,000 |
| 203,388 |
| ||
|
|
|
| 649,680 |
| ||
Oil & Gas - 4.93% |
|
|
|
|
| ||
Chaparral Energy, Inc. |
|
|
|
|
| ||
8.500%, 12/01/2015 |
| 625,000 |
| 362,500 |
| ||
9.375%, 02/01/2017(7) |
| 145,000 |
| 84,281 |
| ||
25
|
| Principal |
|
|
| ||
Interest Rate/Maturity Date |
| Amount |
| Market Value |
| ||
|
|
|
|
|
| ||
Chesapeake Energy Corp. |
|
|
|
|
| ||
7.625%, 07/15/2013 |
| $ | 575,000 |
| $ | 540,500 |
|
7.000%, 08/15/2014 |
| 50,000 |
| 45,625 |
| ||
9.500%, 02/15/2015 |
| 275,000 |
| 272,938 |
| ||
6.375%, 06/15/2015 |
| 275,000 |
| 237,188 |
| ||
6.250%, 01/15/2018 |
| 585,000 |
| 477,506 |
| ||
7.250%, 12/15/2018 |
| 550,000 |
| 462,000 |
| ||
Encore Acquisition Co. |
|
|
|
|
| ||
9.500%, 05/01/2016 |
| 1,000,000 |
| 975,000 |
| ||
EXCO Resources, Inc. |
|
|
|
|
| ||
7.250%, 01/15/2011 |
| 1,300,000 |
| 1,170,000 |
| ||
Hilcorp Energy I LP |
|
|
|
|
| ||
7.750%, 11/01/2015(4) |
| 95,000 |
| 82,175 |
| ||
9.000%, 06/01/2016(4) |
| 334,000 |
| 295,590 |
| ||
Newfield Exploration Co. |
|
|
|
|
| ||
7.125%, 05/15/2018 |
| 875,000 |
| 791,875 |
| ||
Pioneer Natural Resources Co. |
|
|
|
|
| ||
6.650%, 03/15/2017 |
| 2,150,000 |
| 1,896,432 |
| ||
Quicksilver Resources, Inc. |
|
|
|
|
| ||
8.250%, 08/01/2015 |
| 625,000 |
| 525,000 |
| ||
Sabine Pass LNG LP |
|
|
|
|
| ||
7.250%, 11/30/2013 |
| 1,125,000 |
| 961,875 |
| ||
SandRidge Energy, Inc. |
|
|
|
|
| ||
8.625%, 04/01/2015(8) |
| 575,000 |
| 493,063 |
| ||
8.000%, 06/01/2018(4) |
| 575,000 |
| 488,750 |
| ||
Stone Energy Corp. |
|
|
|
|
| ||
8.250%, 12/15/2011 |
| 425,000 |
| 280,500 |
| ||
Swift Energy Co. |
|
|
|
|
| ||
7.125%, 06/01/2017 |
| 900,000 |
| 567,000 |
| ||
|
|
|
| 11,009,798 |
| ||
Oil & Gas Services - 1.07% |
|
|
|
|
| ||
Complete Production Services, Inc. |
|
|
|
|
| ||
8.000%, 12/15/2016 |
| 850,000 |
| 692,750 |
| ||
Dresser-Rand Group, Inc. |
|
|
|
|
| ||
7.375%, 11/01/2014 |
| 1,780,000 |
| 1,682,100 |
| ||
|
|
|
| 2,374,850 |
| ||
Packaging & Containers - 3.20% |
|
|
|
|
| ||
Crown Americas LLC |
|
|
|
|
| ||
7.625%, 11/15/2013 |
| 175,000 |
| 171,500 |
| ||
7.750%, 11/15/2015 |
| 605,000 |
| 592,900 |
| ||
7.625%, 05/15/2017(4) |
| 700,000 |
| 689,500 |
| ||
Graphic Packaging International, Inc. |
|
|
|
|
| ||
8.500%, 08/15/2011 |
| 1,460,000 |
| 1,452,699 |
| ||
9.500%, 08/15/2013 |
| 460,000 |
| 432,400 |
| ||
26
|
| Principal |
|
|
| ||
Interest Rate/Maturity Date |
| Amount |
| Market Value |
| ||
|
|
|
|
|
| ||
Owens-Brockway Glass Container, Inc. |
|
|
|
|
| ||
8.250%, 05/15/2013 |
| $ | 1,132,000 |
| $ | 1,137,660 |
|
6.750%, 12/01/2014 |
| 425,000 |
| 404,813 |
| ||
7.375%, 05/15/2016(4) |
| 400,000 |
| 389,000 |
| ||
Packaging Dynamics Finance Corp. |
|
|
|
|
| ||
10.000%, 05/01/2016(4) |
| 225,000 |
| 76,500 |
| ||
Radnor Holdings Corp. |
|
|
|
|
| ||
11.000%, 03/15/2010(1)(2) |
| 25,000 |
| 3 |
| ||
Rexam PLC |
|
|
|
|
| ||
6.750%, 06/01/2013(4) |
| 900,000 |
| 857,963 |
| ||
Silgan Holdings, Inc. |
|
|
|
|
| ||
7.250%, 08/15/2016(4) |
| 975,000 |
| 945,750 |
| ||
|
|
|
| 7,150,688 |
| ||
Pipelines - 5.17% |
|
|
|
|
| ||
ANR Pipeline Co. |
|
|
|
|
| ||
7.375%, 02/15/2024 |
| 60,000 |
| 60,841 |
| ||
7.000%, 06/01/2025 |
| 10,000 |
| 9,577 |
| ||
Atlas Pipeline Partners LP |
|
|
|
|
| ||
8.125%, 12/15/2015 |
| 1,350,000 |
| 837,000 |
| ||
Copano Energy LLC |
|
|
|
|
| ||
8.125%, 03/01/2016 |
| 350,000 |
| 327,250 |
| ||
7.750%, 06/01/2018 |
| 675,000 |
| 600,750 |
| ||
Dynegy Holdings, Inc. |
|
|
|
|
| ||
8.375%, 05/01/2016 |
| 2,195,000 |
| 1,777,949 |
| ||
7.125%, 05/15/2018 |
| 500,000 |
| 322,500 |
| ||
7.750%, 06/01/2019 |
| 335,000 |
| 245,388 |
| ||
7.625%, 10/15/2026 |
| 25,000 |
| 15,000 |
| ||
El Paso Corp. |
|
|
|
|
| ||
7.750%, 06/15/2010 |
| 300,000 |
| 301,961 |
| ||
7.000%, 05/15/2011 |
| 100,000 |
| 98,926 |
| ||
8.250%, 02/15/2016 |
| 125,000 |
| 124,688 |
| ||
7.250%, 06/01/2018 |
| 175,000 |
| 162,061 |
| ||
Series GMTN, 7.800%, 08/01/2031 |
| 800,000 |
| 640,302 |
| ||
Series GMTN, 7.750%, 01/15/2032 |
| 150,000 |
| 119,780 |
| ||
Kinder Morgan Finance Co. ULC |
|
|
|
|
| ||
5.350%, 01/05/2011 |
| 1,050,000 |
| 1,026,375 |
| ||
MarkWest Energy Partners LP |
|
|
|
|
| ||
Series B, 8.500%, 07/15/2016 |
| 600,000 |
| 510,000 |
| ||
Series B, 8.750%, 04/15/2018 |
| 575,000 |
| 480,125 |
| ||
Regency Energy Partners LP |
|
|
|
|
| ||
9.375%, 06/01/2016(4) |
| 1,025,000 |
| 999,374 |
| ||
Targa Resources, Inc. |
|
|
|
|
| ||
8.500%, 11/01/2013 |
| 855,000 |
| 615,600 |
| ||
Tennessee Gas Pipeline Co. |
|
|
|
|
| ||
8.375%, 06/15/2032 |
| 150,000 |
| 152,167 |
| ||
27
|
| Principal |
|
|
| ||
Interest Rate/Maturity Date |
| Amount |
| Market Value |
| ||
|
|
|
|
|
| ||
Transcontinental Gas Pipe Line Co. LLC |
|
|
|
|
| ||
6.400%, 04/15/2016 |
| $ | 50,000 |
| $ | 49,202 |
|
The Williams Cos, Inc. |
|
|
|
|
| ||
7.875%, 09/01/2021 |
| 1,650,000 |
| 1,603,580 |
| ||
8.750%, 03/15/2032 |
| 473,000 |
| 455,169 |
| ||
|
|
|
| 11,535,565 |
| ||
Retail - 2.77% |
|
|
|
|
| ||
Claire’s Stores, Inc. |
|
|
|
|
| ||
9.625%, 06/01/2015(8) |
| 846,761 |
| 232,859 |
| ||
10.500%, 06/01/2017 |
| 425,000 |
| 146,625 |
| ||
Inergy LP |
|
|
|
|
| ||
6.875%, 12/15/2014 |
| 50,000 |
| 46,000 |
| ||
8.250%, 03/01/2016 |
| 625,000 |
| 614,063 |
| ||
JC Penney Corp. Inc |
|
|
|
|
| ||
7.400%, 04/01/2037 |
| 1,275,000 |
| 1,043,030 |
| ||
Macy’s Retail Holdings, Inc. |
|
|
|
|
| ||
5.350%, 03/15/2012 |
| 2,040,000 |
| 1,877,303 |
| ||
5.875%, 01/15/2013 |
| 425,000 |
| 383,735 |
| ||
Michaels Stores, Inc. |
|
|
|
|
| ||
10.000%, 11/01/2014 |
| 1,350,000 |
| 978,750 |
| ||
11.375%, 11/01/2016 |
| 75,000 |
| 41,250 |
| ||
Neiman-Marcus Group, Inc. |
|
|
|
|
| ||
9.000%, 10/15/2015(8) |
| 97,315 |
| 52,550 |
| ||
10.375%, 10/15/2015 |
| 200,000 |
| 107,000 |
| ||
Quiksilver, Inc. |
|
|
|
|
| ||
6.875%, 04/15/2015 |
| 800,000 |
| 536,000 |
| ||
Sbarro, Inc. |
|
|
|
|
| ||
10.375%, 02/01/2015 |
| 225,000 |
| 126,563 |
| ||
|
|
|
| 6,185,728 |
| ||
Semiconductors - 0.14% |
|
|
|
|
| ||
Freescale Semiconductor, Inc. |
|
|
|
|
| ||
8.875%, 12/15/2014 |
| 490,000 |
| 222,950 |
| ||
9.125%, 12/15/2014(8) |
| 285,000 |
| 79,800 |
| ||
|
|
|
| 302,750 |
| ||
Telecommunications - 11.06% |
|
|
|
|
| ||
American Tower Corp. |
|
|
|
|
| ||
7.500%, 05/01/2012 |
| 400,000 |
| 409,500 |
| ||
7.125%, 10/15/2012 |
| 75,000 |
| 75,938 |
| ||
7.000%, 10/15/2017 |
| 575,000 |
| 557,750 |
| ||
CC Holdings GS V LLC |
|
|
|
|
| ||
7.750%, 05/01/2017(4) |
| 1,675,000 |
| 1,658,249 |
| ||
Centennial Communications Corp. |
|
|
|
|
| ||
6.958%, 01/01/2013 |
| 575,000 |
| 576,438 |
| ||
28
|
| Principal |
|
|
| ||
Interest Rate/Maturity Date |
| Amount |
| Market Value |
| ||
|
|
|
|
|
| ||
Citizens Communications Co. |
|
|
|
|
| ||
7.875%, 01/15/2027 |
| $ | 125,000 |
| $ | 102,500 |
|
9.000%, 08/15/2031 |
| 2,230,000 |
| 1,892,712 |
| ||
Crown Castle International Corp. |
|
|
|
|
| ||
9.000%, 01/15/2015 |
| 1,325,000 |
| 1,344,875 |
| ||
DigitalGlobe, Inc. |
|
|
|
|
| ||
10.500%, 05/01/2014(4) |
| 850,000 |
| 877,625 |
| ||
Embarq Corp. |
|
|
|
|
| ||
7.082%, 06/01/2016 |
| 610,000 |
| 598,610 |
| ||
7.995%, 06/01/2036 |
| 850,000 |
| 737,091 |
| ||
Hughes Network Systems LLC |
|
|
|
|
| ||
9.500%, 04/15/2014(4) |
| 75,000 |
| 72,750 |
| ||
Intelsat Corp. |
|
|
|
|
| ||
9.250%, 06/15/2016(4) |
| 500,000 |
| 482,500 |
| ||
Intelsat Intermediate Holding Co. Ltd. |
|
|
|
|
| ||
9.500%, 02/01/2015(4)(5) |
| 275,000 |
| 249,563 |
| ||
Level 3 Financing, Inc. |
|
|
|
|
| ||
12.250%, 03/15/2013 |
| 520,000 |
| 478,400 |
| ||
9.250%, 11/01/2014 |
| 1,040,000 |
| 817,700 |
| ||
5.474%, 02/15/2015(6) |
| 350,000 |
| 218,750 |
| ||
MetroPCS Wireless, Inc. |
|
|
|
|
| ||
9.250%, 11/01/2014(4) |
| 25,000 |
| 25,125 |
| ||
9.250%, 11/01/2014 |
| 1,590,000 |
| 1,603,912 |
| ||
Nextel Communications, Inc. |
|
|
|
|
| ||
Series F, 5.950%, 03/15/2014 |
| 250,000 |
| 198,750 |
| ||
Series D, 7.375%, 08/01/2015 |
| 1,975,000 |
| 1,575,063 |
| ||
Qwest Communications International, Inc. |
|
|
|
|
| ||
Series B, 7.500%, 02/15/2014 |
| 875,000 |
| 809,375 |
| ||
Qwest Corp. |
|
|
|
|
| ||
8.875%, 03/15/2012 |
| 750,000 |
| 759,375 |
| ||
7.500%, 10/01/2014 |
| 1,050,000 |
| 1,008,000 |
| ||
7.500%, 6/15/2023 |
| 25,000 |
| 20,000 |
| ||
6.875%, 09/15/2033 |
| 2,000,000 |
| 1,410,000 |
| ||
Rogers Communications, Inc. |
|
|
|
|
| ||
7.250%, 12/15/2012 |
| 30,000 |
| 32,258 |
| ||
8.000%, 12/15/2012 |
| 1,545,000 |
| 1,595,212 |
| ||
8.750%, 05/01/2032 |
| 175,000 |
| 196,522 |
| ||
Sprint Capital Corp. |
|
|
|
|
| ||
6.875%, 11/15/2028 |
| 50,000 |
| 35,250 |
| ||
8.750%, 03/15/2032 |
| 1,825,000 |
| 1,450,875 |
| ||
Virgin Media Finance PLC |
|
|
|
|
| ||
Series $, 8.750%, 04/15/2014 |
| 450,000 |
| 436,500 |
| ||
9.125%, 08/15/2016 |
| 1,550,000 |
| 1,503,500 |
| ||
Windstream Corp. |
|
|
|
|
| ||
8.625%, 08/01/2016 |
| 890,000 |
| 878,875 |
| ||
|
|
|
| 24,689,543 |
| ||
29
|
| Principal |
|
|
| ||
Interest Rate/Maturity Date |
| Amount |
| Market Value |
| ||
|
|
|
|
|
| ||
Transportation - 0.47% |
|
|
|
|
| ||
Bristow Group, Inc. |
|
|
|
|
| ||
7.500%, 09/15/2017 |
| $ | 630,000 |
| $ | 551,250 |
|
Navios Maritime Holdings, Inc. |
|
|
|
|
| ||
9.500%, 12/15/2014 |
| 630,000 |
| 485,100 |
| ||
|
|
|
| 1,036,350 |
| ||
|
|
|
|
|
| ||
TOTAL CORPORATE BONDS |
|
|
| 195,945,467 |
| ||
|
|
|
|
|
| ||
CONVERTIBLE CORPORATE BONDS - 0.01% |
|
|
|
|
| ||
Aerospace - Defense - 0.00%(9) |
|
|
|
|
| ||
L-3 Communications Holdings, Inc. |
|
|
|
|
| ||
3.000%, 08/01/2035(4) |
| 15,000 |
| 14,813 |
| ||
|
|
|
|
|
| ||
Media - 0.01% |
|
|
|
|
| ||
Sinclair Broadcast Group, Inc. |
|
|
|
|
| ||
4.875%, 07/15/2018(7) |
| 25,000 |
| 16,250 |
| ||
|
|
|
|
|
| ||
TOTAL CONVERTIBLE CORPORATE BONDS |
|
|
| 31,063 |
| ||
|
|
|
|
|
| ||
BANK LOANS - 3.54%(10) |
|
|
|
|
| ||
Advertising - 0.14% |
|
|
|
|
| ||
RH Donnelley Corp. |
|
|
|
|
| ||
06/30/2011(11) |
| 400,000 |
| 312,000 |
| ||
|
|
|
|
|
| ||
Aerospace - Defense - 0.12% |
|
|
|
|
| ||
Sequa Corp.3 |
|
|
|
|
| ||
4.052%, 12/07/2014 |
| 316,718 |
| 241,498 |
| ||
Sequa Corp.10 |
|
|
|
|
| ||
4.052%, 12/07/2014 |
| 9,563 |
| 7,291 |
| ||
Sequa Corp.11 |
|
|
|
|
| ||
4.052%, 12/07/2014 |
| 11,316 |
| 8,628 |
| ||
|
|
|
| 257,417 |
| ||
Auto Manufacturers - 0.18% |
|
|
|
|
| ||
Ford Motor Co. |
|
|
|
|
| ||
3.613%, 11/29/2013 |
| 562,561 |
| 402,231 |
| ||
|
|
|
|
|
| ||
Building Products - 0.68% |
|
|
|
|
| ||
Texas Electric 3 |
|
|
|
|
| ||
3.881%, 10/10/2014 |
| 1,116,304 |
| 774,017 |
| ||
Texas Electric 10 |
|
|
|
|
| ||
3.881%, 10/10/2014 |
| 174,910 |
| 121,278 |
| ||
30
|
| Principal |
|
|
| ||
Interest Rate/Maturity Date |
| Amount |
| Market Value |
| ||
|
|
|
|
|
| ||
Texas Electric 11 |
|
|
|
|
| ||
3.881%, 10/10/2014 |
| $ | 5,080 |
| $ | 3,523 |
|
Texas Electric 12 |
|
|
|
|
| ||
3.881%, 10/10/2014 |
| 890,620 |
| 617,534 |
| ||
|
|
|
| 1,516,352 |
| ||
Chemicals - 0.14% |
|
|
|
|
| ||
Lyondell Chemical Co. |
|
|
|
|
| ||
5.750%, 06/12/2014 |
| 4,812 |
| 2,069 |
| ||
5.750%, 06/12/2014 |
| 11,322 |
| 4,868 |
| ||
5.750%, 06/12/2014 |
| 18,046 |
| 7,760 |
| ||
5.750%, 06/12/2014 |
| 34,383 |
| 14,785 |
| ||
5.940%, 06/12/2014 |
| 106,938 |
| 86,174 |
| ||
6.000%, 06/12/2014 |
| 13,816 |
| 5,941 |
| ||
6.000%, 06/12/2014 |
| 13,816 |
| 5,941 |
| ||
6.000%, 06/12/2014 |
| 13,816 |
| 5,941 |
| ||
7.000%, 06/12/2014 |
| 59,951 |
| 25,779 |
| ||
7.000%, 06/12/2014 |
| 59,951 |
| 25,779 |
| ||
7.000%, 06/12/2014 |
| 59,951 |
| 25,779 |
| ||
9.168%, 06/12/2014 |
| 106,991 |
| 110,053 |
| ||
|
|
|
| 320,869 |
| ||
Diversified Financial Services - 0.10% |
|
|
|
|
| ||
First Data Corp. B1 T3 |
|
|
|
|
| ||
3.059%, 10/08/2014 |
| 16,901 |
| 12,466 |
| ||
First Data Corp. B1 T4 |
|
|
|
|
| ||
3.059%, 10/08/2014 |
| 270,379 |
| 199,421 |
| ||
First Data Corp. B1 T5 |
|
|
|
|
| ||
3.059%, 10/08/2014 |
| 8,220 |
| 6,063 |
| ||
|
|
|
| 217,950 |
| ||
Entertainment - 0.07% |
|
|
|
|
| ||
Las Vegas Sands Corp.-Delayed Draw I |
|
|
|
|
| ||
2.070%, 06/30/2009 |
| 44,663 |
| 32,269 |
| ||
Las Vegas Sands Corp.-Tranche 3 |
|
|
|
|
| ||
2.070%, 06/30/2009 |
| 176,850 |
| 127,774 |
| ||
|
|
|
| 160,043 |
| ||
Exploration & Production - 0.10% |
|
|
|
|
| ||
Quicksilver, Inc. |
|
|
|
|
| ||
7.750%, 08/10/2013 |
| 219,698 |
| 216,403 |
| ||
|
|
|
|
|
| ||
Food - 0.11% |
|
|
|
|
| ||
Pinnacle Foods |
|
|
|
|
| ||
3.161%, 04/09/2014 |
| 275,000 |
| 234,781 |
| ||
31
|
| Principal |
|
|
| ||
Interest Rate/Maturity Date |
| Amount |
| Market Value |
| ||
|
|
|
|
|
| ||
Healthcare-Services - 0.81% |
|
|
|
|
| ||
CHS Community Health Systems |
|
|
|
|
| ||
2.569%, 07/30/2016 |
| $ | 16,404 |
| $ | 14,609 |
|
2.569%, 07/30/2016 |
| 42,340 |
| 37,707 |
| ||
2.898%, 07/30/2016 |
| 1,151,502 |
| 1,025,492 |
| ||
HCA, Inc. |
|
|
|
|
| ||
3.470%, 11/18/2013 |
| 821,904 |
| 734,063 |
| ||
|
|
|
| 1,811,871 |
| ||
Hotels & Motels - 0.03% |
|
|
|
|
| ||
Tribune Co. |
|
|
|
|
| ||
5.000%, 06/30/2009 |
| 192,000 |
| 58,423 |
| ||
|
|
|
|
|
| ||
Internet - 0.09% |
|
|
|
|
| ||
Level 3 Communications, Inc. |
|
|
|
|
| ||
3.164%, 03/09/2014 |
| 71,429 |
| 57,716 |
| ||
3.164%, 03/09/2014 |
| 178,571 |
| 144,289 |
| ||
|
|
|
| 202,005 |
| ||
Media - 0.11% |
|
|
|
|
| ||
Charter Communications, Inc. |
|
|
|
|
| ||
6.250%, 07/30/2099 |
| 13,822 |
| 11,769 |
| ||
6.250%, 07/30/2099 |
| 26,923 |
| 22,924 |
| ||
6.250%, 07/30/2099 |
| 82,692 |
| 70,409 |
| ||
Merrill Communications LLC |
|
|
|
|
| ||
7.174%, 11/27/2013 |
| 150,000 |
| 42,750 |
| ||
Univision Communications, Inc. |
|
|
|
|
| ||
2.569%, 06/30/2009 |
| 9,060 |
| 6,240 |
| ||
2.569%, 10/03/2014 |
| 140,940 |
| 97,072 |
| ||
|
|
|
| 251,164 |
| ||
Office Furnishings - 0.05% |
|
|
|
|
| ||
Collins & Aikman Floorcoverings, Inc. |
|
|
|
|
| ||
3.646%, 05/08/2014 |
| 15,046 |
| 7,899 |
| ||
3.646%, 05/08/2014 |
| 18,367 |
| 9,643 |
| ||
3.646%, 05/08/2014 |
| 178,034 |
| 93,468 |
| ||
|
|
|
| 111,010 |
| ||
Oil & Gas - 0.23% |
|
|
|
|
| ||
Dresser, Inc. |
|
|
|
|
| ||
05/04/2014(11) |
| 600,000 |
| 524,357 |
| ||
32
|
| Principal |
|
|
| ||
Interest Rate/Maturity Date |
| Amount/Shares |
| Market Value |
| ||
|
|
|
|
|
| ||
Radio & TV/Other - 0.08% |
|
|
|
|
| ||
Citadel Broadcasting Corp. |
|
|
|
|
| ||
2.953%, 05/31/2014 |
| $ | 168,990 |
| $ | 79,425 |
|
2.953%, 05/31/2014 |
| 231,010 |
| 108,575 |
| ||
|
|
|
| 188,000 |
| ||
Research Services - 0.17% |
|
|
|
|
| ||
Nielsen Finance 14 |
|
|
|
|
| ||
2.382%, 08/08/2099 |
| 312,531 |
| 277,371 |
| ||
Nielsen Finance 15 |
|
|
|
|
| ||
2.382%, 08/08/2099 |
| 105,550 |
| 93,676 |
| ||
|
|
|
| 371,047 |
| ||
Retail - 0.33% |
|
|
|
|
| ||
Claire’s Stores, Inc. |
|
|
|
|
| ||
05/29/2014(11) |
| 350,000 |
| 197,860 |
| ||
MIKESTORS |
|
|
|
|
| ||
10/31/2013(11) |
| 750,000 |
| 541,406 |
| ||
|
|
|
| 739,266 |
| ||
|
|
|
|
|
| ||
TOTAL BANK LOANS |
|
|
| 7,895,189 |
| ||
|
|
|
|
|
| ||
COMMON STOCKS - 0.07% |
|
|
|
|
| ||
Telecommunications - 0.07% |
|
|
|
|
| ||
American Tower Corp.(12) |
| 3,930 |
| 125,250 |
| ||
Virgin Media, Inc. |
| 3,372 |
| 29,336 |
| ||
|
|
|
| 154,586 |
| ||
|
|
|
|
|
| ||
TOTAL COMMON STOCKS |
|
|
| 154,586 |
| ||
|
|
|
|
|
| ||
PREFERRED STOCK - 0.03% |
|
|
|
|
| ||
Diversified Financial Services - 0.03% |
|
|
|
|
| ||
Preferred Blocker, Inc. |
|
|
|
|
| ||
7.000%(4) |
| 184 |
| 77,619 |
| ||
|
|
|
|
|
| ||
TOTAL PREFERRED STOCK |
|
|
| 77,619 |
| ||
33
Interest Rate |
| Shares |
| Market Value |
| |
|
|
|
|
|
| |
MONEY MARKET MUTUAL FUNDS - 5.27% |
|
|
|
|
| |
|
|
|
|
|
| |
Dreyfus Cash Advantage Plus Fund |
| 11,753,479 |
| $ | 11,753,479 |
|
|
|
|
|
|
| |
TOTAL MONEY MARKET MUTUAL FUNDS |
|
|
| 11,753,479 |
| |
|
|
|
|
|
| |
Total Investments - 96.71% |
|
|
| $ | 215,857,403 |
|
|
|
|
|
|
| |
Other Assets in Excess of Liabilities - 3.29% |
|
|
| 7,352,431 |
| |
|
|
|
|
|
| |
Net Assets - 100.00% |
|
|
| $ | 223,209,834 |
|
Sector and industry classifications are unaudited.
(1) | Security is currently in default/non-income producing. |
(2) | This security has been valued at its fair value determined in good faith by or under procedures adopted by the Board of Trustees. |
(3) | This security is considered illiquid by the Fund’s investment adviser. |
(4) | Security exempt from registration under Rule 144A of the Securities Act of 1933 (the “1933 Act”). Under procedures approved by the Board of Trustees, such securities have been determined to be liquid by the Fund’s investment adviser and may be resold, normally to qualified buyers in transactions exempt from registration. Total market value of Rule 144A securities amounts to $28,825,067, which represents approximately 12.91% of net assets as of May 31, 2009. |
(5) | Step bond. Coupon increases periodically based upon a predetermined schedule. Interest rate disclosed is the stated rate at a set date in the future. |
(6) | Floating or variable rate security. Interest rate disclosed is that which is in effect at May 31, 2009. |
(7) | Step bond. Coupon increases periodically based upon a predetermined schedule. Interest rate disclosed is that which is in effect at May 31, 2009. |
(8) | Pay-in-kind securities. |
(9) | Less than 0.005% of net assets. |
(10) | Bank loans generally pay interest at rates which are periodically determined by reference to a base lending rate plus a premium. All loans carry a variable rate of interest. These base lending rates are generally (i) the Prime Rate offered by one or more major United States banks, (ii) the lending rate offered by one or more European banks such as the London Interbank Offered Rate (“LIBOR”) or (iii) the Certificate of Deposit rate. Rate shown represents the weighted average rate at May 31, 2009. Bank loans, while exempt from registration under the 1933 Act, contain certain restrictions on resale and cannot be sold publicly. Floating rate bank loans often require prepayments from excess cash flow or permit the borrower to repay at its election. The degree to which borrowers repay, whether as a contractual requirement or at their election, cannot be predicted with accuracy. As a result, the actual remaining maturity may be substantially less than the stated maturity shown. |
(11) | All or a portion of this position has not settled. Contract rates do not take effect until settlement date. |
(12) | Non-income producing. |
See Notes to Financial Statements
34
Statement of Assets & Liabilities
May 31, 2009
|
| Stone Harbor |
| Stone Harbor |
| ||
|
|
|
|
|
| ||
ASSETS |
|
|
|
|
| ||
Investments, at value(1) |
| $ | 82,462,073 |
| $ | 215,857,403 |
|
Receivable for investments sold |
| 68,194 |
| — |
| ||
Receivable for Fund shares sold |
| 15,000,000 |
| 14,301,610 |
| ||
Interest receivable |
| 1,712,359 |
| 4,816,246 |
| ||
Prepaids and other assets |
| 1,319 |
| 5,527 |
| ||
Total Assets |
| 99,243,945 |
| 234,980,786 |
| ||
|
|
|
|
|
| ||
LIABILITIES: |
|
|
|
|
| ||
Payable for investments purchased |
| 7,204,369 |
| 11,239,174 |
| ||
Payable for Fund shares redeemed |
| 73,000 |
| 73,000 |
| ||
Unrealized depreciation on forward foreign currency contracts |
| 80,934 |
| — |
| ||
Payable for distributions |
| 17,511 |
| 307,660 |
| ||
Payable to advisor |
| 9,968 |
| 36,735 |
| ||
Payable to administrator |
| 6,858 |
| 19,073 |
| ||
Payable for trustee fees |
| 4,109 |
| 4,109 |
| ||
Other payables |
| 94,196 |
| 91,201 |
| ||
Total Liabilities |
| 7,490,945 |
| 11,770,952 |
| ||
Net Assets |
| $ | 91,753,000 |
| $ | 223,209,834 |
|
|
|
|
|
|
| ||
NET ASSETS CONSIST OF: |
|
|
|
|
| ||
Paid-in capital |
| $ | 92,398,223 |
| $ | 241,405,763 |
|
Undistributed/(overdistributed) net investment income |
| 63,457 |
| (135,044 | ) | ||
Accumulated net realized loss on investments and translation of assets and liabilities denominated in foreign currency |
| (4,519,988 | ) | (4,094,395 | ) | ||
Net unrealized appreciation/(depreciation) on investments and translation of assets and liabilities denominated in foreign currency |
| 3,811,308 |
| (13,966,490 | ) | ||
Net Assets |
| $ | 91,753,000 |
| $ | 223,209,834 |
|
|
|
|
|
|
| ||
PRICING OF SHARES: |
|
|
|
|
| ||
Institutional Class Shares |
|
|
|
|
| ||
Net Assets |
| $ | 91,753,000 |
| $ | 223,209,834 |
|
Shares of beneficial interest outstanding (unlimited number of shares, par value of $0.001 per share authorized) |
| 9,952,470 |
| 26,613,415 |
| ||
Net asset value, offering and redemption price per share |
| $ | 9.22 |
| $ | 8.39 |
|
|
|
|
|
| |||
(1) Cost of Investments |
| $ | 78,597,042 |
| $ | 229,823,893 |
|
See Notes to Financial Statements
35
Statement of Operations
For the Year Ended May 31, 2009
|
| Stone Harbor |
| Stone Harbor |
| ||
|
| Emerging Markets |
| High Yield |
| ||
|
| Debt Fund |
| Bond Fund |
| ||
|
|
|
|
|
| ||
INVESTMENT INCOME |
|
|
|
|
| ||
Interest (net of foreign withholding tax of $817 on Stone Harbor Emerging Markets Debt Fund) |
| $ | 4,041,572 |
| $ | 12,166,776 |
|
Dividends |
| — |
| 5,533 |
| ||
Other income |
| — |
| 55,655 |
| ||
Total Investment Income |
| 4,041,572 |
| 12,227,964 |
| ||
|
|
|
|
|
| ||
EXPENSES |
|
|
|
|
| ||
Investment advisory fee |
| 240,800 |
| 635,589 |
| ||
Administrative fee |
| 67,123 |
| 212,804 |
| ||
Custodian fees |
| 29,923 |
| 15,276 |
| ||
Audit fees |
| 69,466 |
| 69,466 |
| ||
Printing fees |
| 9,060 |
| 7,884 |
| ||
Offering costs |
| 11,235 |
| 11,108 |
| ||
Legal fees |
| 37,797 |
| 81,570 |
| ||
Trustee fees |
| 22,403 |
| 21,078 |
| ||
Transfer agent fees |
| 23,366 |
| 23,637 |
| ||
Registration fees |
| 11,033 |
| 12,676 |
| ||
Insurance fees |
| 6,485 |
| 25,846 |
| ||
Other |
| 3,723 |
| 4,679 |
| ||
Total expenses before waiver |
| 532,414 |
| 1,121,613 |
| ||
Less fees waived by investment advisor |
| (231,412 | ) | (422,456 | ) | ||
Total Net Expenses |
| 301,002 |
| 699,157 |
| ||
Net Investment Income |
| 3,740,570 |
| 11,528,807 |
| ||
|
|
|
|
|
| ||
REALIZED AND UNREALIZED GAIN/(LOSS) ON INVESTMENTS |
|
|
|
|
| ||
Net realized loss on: |
|
|
|
|
| ||
Investments |
| (4,516,600 | ) | (3,443,983 | ) | ||
Foreign currency transactions |
| (703,908 | ) | — |
| ||
Net realized loss |
| (5,220,508 | ) | (3,443,983 | ) | ||
Change in unrealized appreciation/(depreciation) on: |
|
|
|
|
| ||
Investments |
| 3,603,771 |
| (12,603,307 | ) | ||
Translation of assets and liabilities denominated in foreign currencies |
| 27,310 |
| — |
| ||
Net change |
| 3,631,081 |
| (12,603,307 | ) | ||
Net Realized and Unrealized Loss on Investments |
| (1,589,427 | ) | (16,047,290 | ) | ||
Net Increase/(Decrease) in Net Assets Resulting from Operations |
| $ | 2,151,143 |
| $ | (4,518,483 | ) |
See Notes to Financial Statements
36
Statements of Changes in Net Assets
STONE HARBOR EMERGING MARKETS DEBT FUND
|
|
|
| For the Period |
| ||
|
| For the |
| August 16, 2007 |
| ||
|
| Year Ended |
| (Inception) to |
| ||
|
| May 31, 2009 |
| May 31, 2008 |
| ||
|
|
|
|
|
| ||
OPERATIONS |
|
|
|
|
| ||
Net investment income |
| $ | 3,740,570 |
| $ | 783,825 |
|
Net realized gain/(loss) on investments |
| (5,220,508 | ) | 457,737 |
| ||
Net change in unrealized appreciation on investments and foreign currency translations |
| 3,631,081 |
| 180,227 |
| ||
Net increase in net assets resulting from operations |
| 2,151,143 |
| 1,421,789 |
| ||
|
|
|
|
|
| ||
DISTRIBUTIONS TO SHAREHOLDERS |
|
|
|
|
| ||
From net investment income |
| (3,008,908 | ) | (936,189 | ) | ||
From realized gains on investments |
| — |
| (277,514 | ) | ||
From tax return of capital |
| — |
| (6,303 | ) | ||
Net decrease in net assets from distributions to shareholders |
| (3,008,908 | ) | (1,220,006 | ) | ||
|
|
|
|
|
| ||
CAPITAL SHARE TRANSACTIONS |
|
|
|
|
| ||
Institutional Class Shares |
|
|
|
|
| ||
Proceeds from sale of shares |
| 72,248,655 |
| 19,485,836 |
| ||
Issued to shareholders in reinvestment of distributions |
| 2,948,631 |
| 1,152,287 |
| ||
Cost of shares redeemed |
| (2,173,927 | ) | (1,302,500 | ) | ||
Net increase in net assets from capital share transactions |
| 73,023,359 |
| 19,335,623 |
| ||
Net Increase in Net Assets |
| 72,165,594 |
| 19,537,406 |
| ||
Net Assets |
|
|
|
|
| ||
Beginning of period |
| 19,587,406 |
| 50,000 |
| ||
End of period (including undistributed net investment income of $63,457 and $48,116, respectively) |
| $ | 91,753,000 |
| $ | 19,587,406 |
|
|
|
|
|
|
| ||
OTHER INFORMATION: |
|
|
|
|
| ||
Share Transactions: |
|
|
|
|
| ||
Institutional Class Shares |
|
|
|
|
| ||
Beginning Shares |
| 1,894,363 |
| 5,000 |
| ||
Sold |
| 7,950,246 |
| 1,901,770 |
| ||
Reinvested |
| 344,206 |
| 110,056 |
| ||
Redeemed |
| (236,345 | ) | (122,463 | ) | ||
Shares outstanding |
| 9,952,470 |
| 1,894,363 |
| ||
See Notes to Financial Statements
37
Statements of Changes in Net Assets
STONE HARBOR HIGH YIELD BOND FUND
|
|
|
| For the Period |
| ||
|
| For the |
| August 16, 2007 |
| ||
|
| Year Ended |
| (Inception) to |
| ||
|
| May 31, 2009 |
| May 31, 2008 |
| ||
|
|
|
|
|
| ||
OPERATIONS |
|
|
|
|
| ||
Net investment income |
| $ | 11,528,807 |
| $ | 4,196,581 |
|
Net realized gain/(loss) on investments |
| (3,443,983 | ) | 53,916 |
| ||
Net change in unrealized depreciation on investments |
| (12,603,307 | ) | (1,363,183 | ) | ||
Net increase/(decrease) in net assets resulting from operations |
| (4,518,483 | ) | 2,887,314 |
| ||
|
|
|
|
|
| ||
DISTRIBUTIONS TO SHAREHOLDERS |
|
|
|
|
| ||
From net investment income |
| (11,426,115 | ) | (4,051,279 | ) | ||
From realized gains on investments |
| — |
| (93,241 | ) | ||
From tax return of capital |
| — |
| (21,250 | ) | ||
Net decrease in net assets from distributions to shareholders |
| (11,426,115 | ) | (4,165,770 | ) | ||
|
|
|
|
|
| ||
CAPITAL SHARE TRANSACTIONS |
|
|
|
|
| ||
Institutional Class Shares |
|
|
|
|
| ||
Proceeds from sales of shares |
| 131,188,255 |
| 109,502,778 |
| ||
Issued to shareholders in reinvestment of distributions |
| 9,950,073 |
| 2,978,804 |
| ||
Cost of shares redeemed |
| (8,895,972 | ) | (4,341,050 | ) | ||
Net increase in net assets from capital share transactions |
| 132,242,356 |
| 108,140,532 |
| ||
Net Increase in Net Assets |
| 116,297,758 |
| 106,862,076 |
| ||
Net Assets |
|
|
|
|
| ||
Beginning of period |
| 106,912,076 |
| 50,000 |
| ||
End of period (including (overdistributed) net investment income of ($135,044) and ($56,185), respectively) |
| $ | 223,209,834 |
| $ | 106,912,076 |
|
|
|
|
|
|
| ||
OTHER INFORMATION: |
|
|
|
|
| ||
Share Transactions: |
|
|
|
|
| ||
Institutional Class Shares |
|
|
|
|
| ||
Beginning Shares |
| 10,776,299 |
| 5,000 |
| ||
Sold |
| 15,634,751 |
| 10,903,020 |
| ||
Reinvested |
| 1,246,011 |
| 301,150 |
| ||
Redeemed |
| (1,043,646 | ) | (432,871 | ) | ||
Shares outstanding |
| 26,613,415 |
| 10,776,299 |
| ||
See Notes to Financial Statements
38
Financial Highlights*
For a share outstanding through the periods presented
Emerging Markets Debt Fund
|
|
|
| For the Period |
| ||
|
| For the |
| August 16, 2007 |
| ||
|
| Year Ended |
| (Inception) to |
| ||
Institutional Class Shares |
| May 31, 2009 |
| May 31, 2008 |
| ||
|
|
|
|
|
|
|
|
Net asset value - beginning of the period |
| $ | 10.34 |
| $ | 10.00 |
|
Income/(loss) from investment operations |
|
|
|
|
| ||
Net investment income |
| 0.59 |
| 0.46 |
| ||
Net realized and unrealized gain/(loss) on investments |
| (1.18 | ) | 0.58 |
| ||
Total income/(loss) from investment operations |
| (0.59 | ) | 1.04 |
| ||
|
|
|
|
|
| ||
Less distributions to common shareholders |
|
|
|
|
| ||
From net investment income |
| (0.53 | ) | (0.54 | ) | ||
From net realized gain on investments |
| — |
| (0.16 | ) | ||
From tax return of capital |
| — |
| (0.00 | )(1) | ||
Total distributions |
| (0.53 | ) | (0.70 | ) | ||
|
|
|
|
|
| ||
Net Increase/(Decrease) in Net Asset Value |
| (1.12 | ) | 0.34 |
| ||
Net asset value - end of period |
| $ | 9.22 |
| $ | 10.34 |
|
|
|
|
|
|
| ||
Total Return (2)(3) |
| (5.10 | )% | 10.46 | % | ||
|
|
|
|
|
| ||
RATIOS/SUPPLEMENTAL DATA: |
|
|
|
|
| ||
Net assets, end of period (in thousands) |
| $ | 91,753 |
| $ | 19,587 |
|
Ratio of expenses to average net assets with fee waivers/reimbursements |
| 0.75 | % | 0.75 | %** | ||
Ratio of expenses to average net assets without fee waivers/reimbursements |
| 1.33 | % | 2.27 | %** | ||
Ratio of net investment income to average net assets with fee waivers/reimbursements |
| 9.32 | % | 5.91 | %** | ||
|
|
|
|
|
| ||
Portfolio Turnover Rate |
| 84 | % | 143 | % | ||
* | The amount shown for a share outstanding throughout the period may not correlate with the Statement of Operations for the period due to the timing of sales and repurchase of the Fund Shares in relation to income earned and/or fluctuating market value of the investment of the Fund. |
** | Annualized. |
(1) | Less than $(0.005) per share. |
(2) | Total returns would have been lower had various fees and expenses not been waived and reimbursed during the period. |
(3) | Total returns for periods of less than one year are not annualized. |
See Notes to Financial Statements
39
Financial Highlights
For a share outstanding through the periods presented
High Yield Bond Fund
|
|
|
| For the Period |
| ||
|
| For the |
| August 16, 2007 |
| ||
|
| Year Ended |
| (Inception) to |
| ||
Institutional Class Shares |
| May 31, 2009 |
| May 31, 2008 |
| ||
|
|
|
|
|
|
|
|
Net asset value - beginning of the period |
| $ | 9.92 |
| $ | 10.00 |
|
Income/(loss) from investment operations |
|
|
|
|
| ||
Net investment income |
| 0.70 |
| 0.58 |
| ||
Net realized and unrealized loss on investments |
| (1.53 | ) | (0.08 | ) | ||
Total income/(loss) from investment operations |
| (0.83 | ) | 0.50 |
| ||
|
|
|
|
|
| ||
Less distributions to common shareholders |
|
|
|
|
| ||
From net investment income |
| (0.70 | ) | (0.57 | ) | ||
From net realized gain on investments |
| — |
| (0.01 | ) | ||
From tax return of capital |
| — |
| (0.00 | )(1) | ||
Total distributions |
| (0.70 | ) | (0.58 | ) | ||
|
|
|
|
|
| ||
Net Decrease in Net Asset Value |
| (1.53 | ) | (0.08 | ) | ||
Net asset value - end of period |
| $ | 8.39 |
| $ | 9.92 |
|
|
|
|
|
|
| ||
Total Return (2)(3) |
| (7.77 | )% | 5.09 | % | ||
|
|
|
|
|
| ||
RATIOS/SUPPLEMENTAL DATA: |
|
|
|
|
| ||
Net assets, end of period (in thousands) |
| $ | 223,210 |
| $ | 106,912 |
|
Ratio of expenses to average net assets with fee waivers/reimbursements |
| 0.55 | % | 0.55 | %** | ||
Ratio of expenses to average net assets without fee waivers/reimbursements |
| 0.88 | % | 1.21 | %** | ||
Ratio of net investment income to average net assets with fee waivers/reimbursements |
| 9.07 | % | 7.81 | %** | ||
|
|
|
|
|
| ||
Portfolio Turnover Rate |
| 16 | % | 11 | % | ||
** | Annualized. |
(1) | Less than $(0.005) per share. |
(2) | Total returns would have been lower had various fees and expenses not been waived and reimbursed during the period. |
(3) | Total returns for periods of less than one year are not annualized. |
See Notes to Financial Statements
40
Notes to Financial Statements
May 31, 2009
1. ORGANIZATION AND SIGNIFICANT ACCOUNTING POLICIES
Stone Harbor Investment Funds, which consist of Stone Harbor Emerging Markets Debt Fund and Stone Harbor High Yield Bond Fund (each, a “Fund” and together, the “Funds” ) is a Massachusetts business trust (the “Trust”), organized on February 20, 2007 and registered under the Investment Company Act of 1940, as amended (the “1940 Act”), as an open-end management investment company. Each Fund is a non-diversified portfolio with an investment objective to maximize total return. Shares of each Fund are currently divided into two classes, designated Institutional Class Shares and Distributor Class Shares. As of the date of this report, there were no outstanding shares for the Distributor Class of each Fund. The Declaration of Trust permits the Trustees to create additional funds and share classes.
The following is a summary of significant accounting policies consistently followed by the Funds in the preparation of their financial statements. The policies are in conformity with accounting principles generally accepted in the United States of America (GAAP). The preparation of the financial statements in accordance with GAAP requires management to make estimates and assumptions that affect the reported amounts of assets and liabilities at the date of the financial statements and the reported amounts of income and expenses during the reporting period. Actual results could differ from those estimates.
(a) Investment Valuation: Debt securities, bank loans and linked notes are valued at the mean between the bid and asked prices provided by an independent pricing service that are based on transactions in debt obligations, quotations from dealers, market transactions in comparable securities and various other relationships between securities. Equity securities for which market quotations are available are valued at the last sale price or official closing price on the primary market or exchange on which they trade. Publicly traded foreign government debt securities are typically traded internationally in the over-the-counter market, and are valued at the mean between the bid and asked prices as of the close of business of that market. When prices are not readily available, or are determined not to reflect fair value, such as when the value of a security has been significantly affected by events after the close of the exchange or market on which the security is principally traded, but before the Funds calculate their net asset value, the Funds may value these investments at fair value as determined in accordance with the procedures approved by the Funds’ Board of Trustees. Short-term obligations with maturities of 60 days or less are valued at amortized cost, which approximates market value. Available cash is generally invested into a money market fund by the custodian, and is valued at the latest net asset value per share as reported by the fund’s administrator.
The Funds adopted Financial Accounting Standards Board Statement of Financial Accounting Standards No. 157, “Fair Value Measurements” (“FAS 157”), effective June 1, 2008. In accordance with FAS 157, fair value is defined as the price that the Funds would receive to sell an investment or pay to transfer a liability in a timely transaction with an independent buyer in the principal market, or in the absence of a principal market the most advantageous market for the investment or liability. FAS 157 establishes a single definition of fair value, creates a three-tier hierarchy as a framework for measuring fair value based on inputs used to value the Funds’ investments, and requires additional disclosure about fair value. The hierarchy of inputs is summarized below.
Level 1 – quoted prices in active markets for identical investments
Level 2 – other significant observable inputs (including quoted prices for similar investments, interest rates, prepayment speeds, credit risk, etc.)
Level 3 – significant unobservable inputs (including the Funds’ own assumptions in determining the fair value of investments)
41
Notes to Financial Statements (continued)
May 31, 2009
The inputs or methodology used for valuing securities are not necessarily an indication of the risk associated with investing in those securities.
The following is a summary of the inputs used as of May 31, 2009 in valuing the Funds’ investments carried at value:
|
| Stone Harbor Emerging Markets Debt Fund |
| ||||
|
|
|
| Other Financial |
| ||
|
| Investments in |
| Instruments* - |
| ||
Valuation Inputs |
| Securities at Value |
| Unrealized Appreciation |
| ||
Level 1 - Quoted Prices in Active Market for Identical Assets |
| $ | — |
| $ | — |
|
Level 2 - Other Significant Observable Inputs |
| $ | 82,462,073 |
| $ | (80,934 | ) |
Level 3 - Significant Unobservable Inputs |
| $ | — |
| $ | — |
|
Total |
| $ | 82,462,073 |
| $ | (80,934 | ) |
|
| Stone Harbor High Yield Bond Fund |
| ||||
|
|
|
| Other Financial |
| ||
|
| Investments in |
| Instruments* - |
| ||
Valuation Inputs |
| Securities at Value |
| Unrealized Appreciation |
| ||
Level 1 - Quoted Prices in Active Market for Identical Assets |
| $ | 154,586 |
| $ | — |
|
Level 2 - Other Significant Observable Inputs |
| $ | 214,348,753 |
| $ | — |
|
Level 3 - Significant Unobservable Inputs |
| $ | 1,354,064 |
| $ | — |
|
Total |
| $ | 215,857,403 |
| $ | — |
|
* Other financial instruments include futures, forwards and swap contracts.
The following is a reconciliation of assets in which significant unobservable inputs (Level 3) were used in determining fair value:
|
| Stone Harbor |
| Stone Harbor |
| ||||||||||||||
|
| Emerging Markets Debt Fund |
| High Yield Bond Fund |
| ||||||||||||||
|
|
|
| Other |
|
|
|
|
| Other |
|
|
| ||||||
|
|
|
| Financial |
| OFI - |
|
|
| Financial |
| OFI - |
| ||||||
|
| Investments in |
| Instruments |
| Market |
| Investments |
| Instruments |
| Market |
| ||||||
|
| Securities |
| (OFI) |
| Value |
| in Securities |
| (OFI) |
| Value |
| ||||||
Balance as of 5/31/2008 |
| $ | 277,886 |
| $ | — |
| $ | — |
| $ | 3,766 |
| $ | — |
| $ | — |
|
Realized gain/(loss)** |
| (100,755 | ) | — |
| — |
| — |
| — |
| — |
| ||||||
Change in unrealized appreciation/(depreciation)** |
| 26,216 |
| — |
| — |
| (13,847 | ) | — |
| — |
| ||||||
Net purchases (sales) |
| (203,347 | ) | — |
| — |
| 544,281 |
| — |
| — |
| ||||||
Transfers in and/or (out) of Level 3 |
| — |
| — |
| — |
| 819,864 |
| — |
| — |
| ||||||
Balance as of 5/31/2009 |
| $ | — |
| $ | — |
| $ | — |
| $ | 1,354,064 |
| $ | — |
| $ | — |
|
** Net realized gain/(loss) and net unrealized appreciation/(depreciation) are included in the related amounts on investments in the statement of operations.
42
Notes to Financial Statements (continued)
May 31, 2009
(b) Security Transactions and Investment Income: Security transactions are accounted for on a trade date basis. Interest income, adjusted for amortization of premium and accretion of discount, is recorded on the accrual basis. Dividend income is recorded on the ex-dividend date. Foreign dividend income is recorded on the ex-dividend date or as soon as practical after the Funds determine the existence of a dividend declaration after exercising reasonable due diligence. The cost of investments sold is determined by use of the specific identification method. To the extent any issuer defaults on an expected interest payment, the Funds’ policy is to generally halt any additional interest income accruals and consider the realizability of interest accrued up to the date of default.
(c) Foreign Currency Translation: The books and records of the Fund are maintained in U.S. dollars as follows: (1) the foreign currency market value of investment securities, other assets and liabilities and foreign currency contracts are translated at the exchange rates prevailing at the end of the period; and (2) purchases, sales, income and expenses are translated at the exchange rates prevailing on the respective date of such transactions.
The resultant exchange gains and losses are recorded as realized and unrealized gain/loss on foreign exchange transactions. Pursuant to U.S. federal income tax regulations, certain foreign exchange gains/losses included in realized and unrealized gain/loss are included in or are a reduction of ordinary income for federal income tax purposes. The Funds do not isolate that portion of the results of operations arising as a result of changes in the foreign exchange rates from the changes in the market prices of the securities.
(d) Foreign Securities: The Funds may directly purchase securities of foreign issuers. Investing in securities of foreign issuers involves special risks not typically associated with investing in securities of U.S. issuers. The risks include, among other things, possible revaluation of currencies, the ability to repatriate funds, less complete financial information about companies and possible future adverse political and economic developments. Moreover, securities of many foreign issuers and their markets may be less liquid and their prices more volatile than those of securities of comparable U.S. issuers.
(e) Forward Foreign Currency Contracts: The Funds may engage in currency transactions with counterparties to hedge the value of portfolio securities denominated in particular currencies against fluctuations in relative value, to gain or reduce exposure to certain currencies, or to generate income or gains. A forward foreign currency contract is an agreement between two parties to buy and sell a currency at a set price on a future date. The contract is marked-to-market daily and the change in value is recorded by the Funds as an unrealized gain or loss. When a forward foreign currency contract is extinguished, through either delivery or offset by entering into another forward foreign currency contract, the Funds record a realized gain or loss equal to the difference between the value of the contract at the time it was opened and the value of the contract at the time it was extinguished.
Forward foreign currency contracts involve elements of market risk in excess of the amounts reflected in the Statements of Assets and Liabilities. The Funds bear the risk of an unfavorable change in the foreign exchange rate underlying the forward foreign currency contract. Risks may also arise upon entering into these contracts from the potential inability of the counterparties to meet the terms of their contracts.
(f) Credit Default Swaps: The Funds may enter into credit default swap contracts for hedging purposes, to gain market exposure or to add leverage to their portfolios. When used for hedging pur-
43
Notes to Financial Statements (continued)
May 31, 2009
poses, a Fund would be the buyer of a credit default swap contract. In that case, the Fund would be entitled to receive the par (or other agreed-upon) value of a referenced debt obligation, index or other investment from the counterparty to the contract in the event of a default by a third party, such as a U.S. or foreign issuer, on the referenced debt obligation. In return, the Fund would pay to the counterparty a periodic stream of payments over the term of the contract provided that no event of default has occurred. If no default occurs, the Fund would have spent the stream of payments and received no benefit from the contract. When the Fund is the seller of a credit default swap contract, it receives the stream of payments but is obligated to pay upon default of the referenced debt obligation. As the seller, the Fund would effectively add leverage to its portfolio because, in addition to its total assets, the Fund would be subject to investment exposure on the notional amount of the swap.
In addition to the risks applicable to derivatives generally, credit default swaps involve special risks because they are difficult to value, are highly susceptible to liquidity and credit risk, and generally pay a return to the party that has paid the premium only in the event of an actual default by the issuer of the underlying obligation, as opposed to a credit downgrade or other indication of financial difficulty.
No swaps were held in the Funds as of May 31, 2009.
(g) Loan Participations: The High Yield Bond Fund may invest in loans arranged through private negotiation between one or more financial institutions. The Fund’s investment in any such loan may be in the form of a participation in or an assignment of the loan. In connection with purchasing participations, the Fund generally will have no right to enforce compliance by the borrower with the terms of the loan agreement relating to the loan, nor any rights of set-off against the borrower and the Fund may not benefit directly from any collateral supporting the loan in which it has purchased the participation.
The Fund assumes the credit risk of the borrower, the lender that is selling the participation and any other persons interpositioned between the Fund and the borrower. In the event of the insolvency of the lender selling the participation, the Fund may be treated as a general creditor of the lender and may not benefit from any set-off between the lender and the borrower.
(h) Credit and Market Risk: The Funds invest in high yield and emerging market instruments that are subject to certain credit and market risks. The yields of high yield and emerging market debt obligations reflect, among other things, perceived credit and market risks. The Funds’ investment in securities rated below investment grade typically involves risks not associated with higher rated securities including, among others, greater risk related to timely and ultimate payment of interest and principal, greater market price volatility and less liquid secondary market trading. The consequences of political, social, economic or diplomatic changes may have disruptive effects on the market prices of investments held by the Funds. The Funds’ investment in non-dollar denominated securities may also result in foreign currency losses caused by devaluations and exchange rate fluctuations.
(i) Distributions to Shareholders: Dividends and distributions to shareholders, which are determined in accordance with income tax regulations, are recorded on the ex-date. Income distributions, if any, are declared and paid on a quarterly basis. Capital gain distributions, if any, are declared and paid at least annually.
(j) Classifications of Distributions: Net investment income (loss) and net realized gain (loss) may differ for financial statement and tax purposes. The character of distributions made during the year from net investment income or net realized gains may differ from its ultimate characterization for federal income tax purposes. Also, due to the timing of dividend distributions, the fiscal year in which amounts are distrib-
44
Notes to Financial Statements (continued)
May 31, 2009
uted may differ from the fiscal year in which the income or realized gain was recorded by a Fund.
The tax character of the distributions paid by the Funds during the year ended May 31, 2009, was as follows:
|
| Stone Harbor |
| Stone Harbor |
| ||
|
| Emerging Markets |
| High Yield |
| ||
|
| Debt Fund |
| Bond Fund |
| ||
Ordinary Income |
| $ | 3,008,908 |
| $ | 11,426,115 |
|
As of May 31, 2009, the components of distributable earnings on a tax basis were as follows:
|
| Stone Harbor |
| Stone Harbor |
| ||
|
| Emerging Markets |
| High Yield |
| ||
|
| Debt Fund |
| Bond Fund |
| ||
Undistributed Ordinary Income |
| $ | 259,541 |
| $ | 172,616 |
|
Accumulated Capital Losses |
| $ | (4,051,127 | ) | $ | (4,089,660 | ) |
Unrealized Appreciation/(Depreciation) |
| $ | 3,342,447 |
| $ | (15,316,280 | ) |
Cumulative Effect of Other Timing Differences* |
| $ | (196,084 | ) | $ | (307,660 | ) |
|
| $ | (645,223 | ) | $ | (19,540,984 | ) |
* Other temporary differences due to timing consist primarily of mark-to-market under section 1256 of the Internal Revenue Code, dividends payable, and post-October foreign currency losses.
At May 31, 2009, each Fund had available for federal income tax purposes unused capital loss carryforwards as follows:
|
| Stone Harbor |
| Stone Harbor |
| ||
|
| Emerging Markets |
| High Yield |
| ||
Expiring |
| Debt Fund |
| Bond Fund |
| ||
May 31, 2017 |
| $ | 899,017 |
| $ | 651,342 |
|
The tax components of distributable earnings are determined in accordance with income tax regulations which may differ from the composition of net assets reported under accounting principles generally accepted in the United States. Accordingly, for the period ended May 31, 2009, certain differences were reclassified. These differences were primarily due to the differing tax treatment of certain investments and the amounts reclassified did not affect net assets. For Stone Harbor High Yield Bond Fund, the differences were primarily due to the differing tax treatment of the securities contributed to the Fund’s portfolio at the time of inception.
The reclassifications were as follows:
|
| Stone Harbor |
| Stone Harbor |
| ||
|
| Emerging Markets |
| High Yield |
| ||
|
| Debt Fund |
| Bond Fund |
| ||
Paid-in-capital |
| $ | 6,303 |
| $ | 1,004,884 |
|
Over-distributed Income |
| $ | (716,321 | ) | $ | (181,551 | ) |
Accumulated Net Realized Gains/(Losses) |
| $ | 710,018 |
| $ | (823,333 | ) |
(k) Expenses: Direct expenses are charged to the Funds; general expenses of the Trust are allocated to the Funds based on each Fund’s relative net assets or any other reasonable basis.
45
Notes to Financial Statements (continued)
May 31, 2009
(l) Federal and Other Taxes: It is the Funds’ policy to comply with the federal income and excise tax requirements of the Internal Revenue Code of 1986, as amended, applicable to regulated investment companies. Accordingly, the Funds intend to distribute substantially all of their income and net realized gains on investments, if any, to shareholders each year. Therefore, no federal income tax provision is required in the Funds’ financial statements.
The Funds follow Financial Accounting Standards Board (“FASB”) Interpretation No. 48, “Accounting for Uncertainty in Income Taxes” (“FIN 48”). FIN 48 establishes financial accounting and disclosure requirements for recognition and measurement of tax positions taken or expected to be taken on an income tax return.
Management has analyzed the Funds’ tax positions taken on federal income tax returns for all open tax years and has concluded that as of May 31, 2009, no provision for income tax is required in the Funds’ financial statements. The Funds’ federal and state income and federal excise tax returns for tax years since inception are subject to examination by the Internal Revenue Service and state departments of revenue.
2. Advisory Fees
Stone Harbor Investment Partners LP is the Trust’s investment adviser (the “Adviser”). Under the investment advisory agreement the Trust pays an investment advisory fee calculated daily and paid monthly of 0.50% and 0.60% of the average daily net assets for Stone Harbor High Yield Bond Fund and Stone Harbor Emerging Markets Debt Fund, respectively.
The Adviser has contractually agreed to waive fees and reimburse expenses with respect to each of the Funds so that the Net Annual Operating Expenses (exclusive of acquired fund fees and expenses, brokerage expenses, interest expense, taxes and extraordinary expenses) of the Stone Harbor High Yield Bond Fund Institutional Class, Stone Harbor High Yield Bond Fund Distributor Class, Stone Harbor Emerging Markets Debt Fund Institutional Class and Stone Harbor Emerging Markets Debt Fund Distributor Class will not exceed 0.55%, 0.80%, 0.75% and 1.00%, respectively. This undertaking is in effect through September 30, 2010 and is reevaluated on an annual basis.
The Adviser will be permitted to recover, on a class by class basis, expenses it has borne through the undertakings described above to the extent that a Fund’s expenses in later periods fall below the annual rates set forth in the relevant undertaking. A Fund will not be obligated to pay any such deferred fees and expenses more than one year after the end of the fiscal year in which the fee and expense was deferred.
3. Investments
During the year ended May 31, 2009 the aggregate cost of purchases and proceeds from sales of investments (excluding short-term investments) were as follows:
|
| Stone Harbor |
| Stone Harbor |
| ||
|
| Emerging Markets |
| High Yield |
| ||
|
| Debt Fund |
| Bond Fund |
| ||
Purchases of investments |
| $ | 94,962,987 |
| $ | 145,890,446 |
|
Sales of investments |
| $ | 32,823,628 |
| $ | 19,330,202 |
|
46
Notes to Financial Statements (continued)
May 31, 2009
At May 31, 2009 the aggregate gross unrealized appreciation and depreciation of investments for federal income purposes were substantially as follows:
|
| Stone Harbor |
| Stone Harbor |
| ||
|
| Emerging Markets |
| High Yield |
| ||
|
| Debt Fund |
| Bond Fund |
| ||
Gross appreciation (excess of value over tax cost) |
| $ | 5,754,198 |
| $ | 5,979,027 |
|
Gross depreciation (excess of tax cost over value) |
| $ | (2,411,751 | ) | $ | (21,295,307 | ) |
Net unrealized appreciation/(depreciation) |
| $ | 3,342,447 |
| $ | (15,316,280 | ) |
Cost of investments for income tax purposes |
| $ | 79,065,903 |
| $ | 231,173,683 |
|
4. Shares of Beneficial Interest
At May 31, 2009, the Trust had an unlimited number of shares of beneficial interest authorized with a par value of $0.001 per share. The Funds have the ability to issue multiple classes of shares. Each share of a class represents an identical interest and has the same rights, except that each class bears certain direct expenses, including those specifically related to the distribution of its shares.
Transactions in shares of the Institutional Class were as follows:
|
| Stone Harbor |
| Stone Harbor |
| ||||
|
| Emerging Markets Debt Fund |
| High Yield Bond Fund |
| ||||
|
| Year Ended |
| Period Ended |
| Year Ended |
| Period Ended |
|
|
| 5/31/09 |
| 5/31/08 |
| 5/31/09 |
| 5/31/08 |
|
Shares sold |
| 7,950,246 |
| 1,901,770 |
| 15,634,751 |
| 10,903,020 |
|
Shares reinvested |
| 344,206 |
| 110,056 |
| 1,246,011 |
| 301,150 |
|
Shares redeemed |
| (236,345 | ) | (122,463 | ) | (1,043,646 | ) | (432,871 | ) |
Net increase in shares outstanding |
| 8,058,107 |
| 1,889,363 |
| 15,837,116 |
| 10,771,299 |
|
5. Post October Loss Deferral
Stone Harbor Emerging Markets Debt Fund and Stone Harbor High Yield Bond Fund elect to defer to the fiscal year ending May 31, 2010, approximately $ 3,152,110 and $ 3,438,318, respectively, of capital losses recognized during the period from November 1, 2008 to May 31, 2009. Additionally, Stone Harbor Emerging Markets Debt Fund elects to defer to its fiscal year ending May 31, 2010, approximately $ 259,507 of foreign currency losses recognized during the period from November 1, 2008 to May 31, 2009.
6. Recent Accounting Pronouncements
In March 2008, the Financial Accounting Standards Board (“FASB”) issued the Statement of Financial Accounting Standards No. 161, “Disclosures about Derivative Instruments and Hedging Activities” (“SFAS 161”). SFAS 161 is effective for fiscal years and interim periods beginning after November 15, 2008. SFAS 161 requires enhanced disclosures about the Funds’ derivative and hedging activities, including how such activities are accounted for and their effect on the Funds’ financial position, performance and cash flows. Management is currently evaluating the impact the adoption of SFAS 161 will have on the Funds’ financial statements and related disclosures.
In April 2009, the FASB issued FASB Staff Position No. 157-4, “Determining Fair Value When the
47
Notes to Financial Statements (continued)
May 31, 2009
Volume and Level of Activity for the Asset or Liability Have Significantly Decreased and Identifying Transactions That Are Not Orderly” (“FSP 157-4”). FSP 157-4 provides additional guidance for estimating fair value in accordance with FAS 157, when the volume and level of activity for the asset or liability have significantly decreased as well as guidance on identifying circumstances that indicate a transaction is not orderly. FSP 157-4 is effective for fiscal years and interim periods ending after June 15, 2009. Management is currently evaluating the impact the adoption of FSP 157-4 will have on the Funds’ future financial statement disclosures.
7. Other
Board of Trustees Compensation: No officer, trustee or employee of the Adviser or any of its affiliates receives any compensation from the Funds for serving as an officer or trustee of the Funds. Each individual Fund pays each Trustee who is not an interested person, as defined by the 1940 Act, of the Adviser or any of its affiliates, a fee of $1,250 per quarter plus $500 for each additional meeting in which that Trustee participates. All Trustees are reimbursed for reasonable travel and out-of-pocket expenses incurred to attend such meetings.
Shareholder Tax Information (unaudited):
Certain tax information regarding the Trust is required to be provided to shareholders based upon each Fund’s income and distributions for the year ended May 31, 2009.
During the year ended May 31, 2009, 0.05% of the dividends paid by Stone Harbor High Yield Bond Fund qualify for the corporate dividends received deduction and met the requirements for qualified dividend income.
48
Fund Portfolio Holdings
The SEC has adopted the requirement that all funds file a complete schedule of portfolio holdings with the SEC for their first and third fiscal quarters on Form N-Q. For the Funds, this would be for the fiscal quarters ending August 31 and February 28. The Form N-Q filing must be made within 60 days of the end of the quarter. The Funds’ Forms N-Q are available without change, upon request, by contacting the Funds at 1-866-699-8158, on the SEC’s website at http://www.sec.gov., or they may be reviewed and copied at the SEC’s Public Reference Room in Washington, DC (call 1-800-732-0330 for information on the operation of the Public Reference Room).
Proxy Voting
A description of the policies and procedures that the Funds use to determine how to vote proxies relating to portfolio securities and information regarding how the Funds voted proxies relating to portfolio securities for the 12 month period ended June 30, 2009 will be available without a charge, upon request, by contacting Stone Harbor Investment Funds at 1-866-699-8158 and on the SEC’s Web site at http://www.sec.gov.
Approval of Agreements
Each Fund’s investment advisory agreement (each an “Agreement” and, together, the “Agreements”) is subject to annual approval by (i) the vote of a majority of the entire Board of Trustees, or of a majority of the outstanding voting securities (as defined in the Investment Company Act of 1940, as amended (the “1940 Act”)) of the applicable Fund, and (ii) the vote of a majority of the Trustees who are not interested persons of the Funds (the “Independent Trustees”). Each Agreement is terminable with respect to a Fund by the Adviser, a majority of the Trustees, or a vote of a majority of the outstanding voting securities of the applicable Fund, without penalty, by not less than 60 days’ prior written notice. Each Agreement will terminate automatically in the event of its assignment (as defined for purposes of the 1940 Act).
The Board of Trustees, including the Independent Trustees, meets over the course of the year with representatives of Stone Harbor Investment Partners LP, each Fund’s investment adviser (the “Adviser”), including the Funds’ respective portfolio managers, and regularly reviews detailed information regarding the investment program and performance of each Fund. The Trustees, including the Independent Trustees, met on April 22, 2009 to review the Agreements and to determine whether to approve the continuation of the Agreements for an additional one-year period. The Trustees evaluated the information presented and considered various factors relevant to the decision whether or not to continue each Agreement. The Trustees considered all information they deemed reasonably necessary to evaluate the terms thereof. In connection with this meeting, the Trustees received materials to assist them with their review. These materials included, among other things, (i) information on each Fund’s investment performance and the performance of a group of similar mutual funds (some of which was prepared by a third party); (ii) information on each Fund’s advisory fees and other expenses, including information comparing each Fund’s expenses to a group of similar funds prepared by a third party and information about any applicable expense caps; and (iii) information about the profitability of each Agreement to the Adviser. In considering whether to approve the continuation of each Agreement, the Board of Trustees, including the Independent Trustees, did not identify any single factor as determinative. Individual Trustees may have evaluated the information presented differently from one another, giving different weights to various factors. Matters considered by the Trustees, including the Independent Trustees, in connection with their approval of the Agreements included the following:
49
The nature, extent and quality of the services provided to the Funds under the Agreements. The Trustees considered the nature, extent and quality of the services provided by the Adviser to the Funds. In this regard, the Trustees took into account the experience of each Fund’s portfolio management team and of the Adviser’s senior management, and the time and attention they devote to the Funds.
After reviewing these and related factors, the Trustees concluded, within the context of their overall conclusions regarding each Agreement, that the nature, extent and quality of the services provided by the Adviser supported the renewal of the Agreements.
Investment performance of the Funds and the Adviser. The Trustees reviewed performance information for the Funds for the one-year period ended March 31, 2009 and since each Fund’s inception. That review included a comparison of each Fund’s performance to the performance of a group of comparable funds selected by a third party and each Fund’s respective benchmark. The Trustees also considered the Adviser’s representations about the effect of recent market turmoil on the Funds’ performance and on the emerging markets debt and high yield markets generally. The Trustees also considered the Adviser’s performance and reputation generally and its investment techniques, risk management controls and decision-making processes.
After reviewing these and related factors, the Trustees concluded, within the context of their overall conclusions regarding each Agreement, that these factors supported the renewal of the Agreements.
The costs of the services to be provided and profits to be realized by the Adviser from its relationship with the Funds. The Trustees considered the fees charged to each Fund for advisory services as well as the total expense level of each Fund. The Adviser furnished information to the Trustees compiled by a third party showing a comparison of each Fund’s advisory fees and total expense levels compared to a group of similar mutual funds selected by the third party. The Trustees considered that the Funds, because they were smaller than most of the funds to which they were being compared, could not take advantage of economies of scale (which can reduce fund expenses) to the same extent as those larger funds. The Trustees noted that both Funds are subject to expense caps, and each Fund’s advisory fee and net expense ratio (after application of the caps) is below the medians for comparable groups of mutual funds. The Adviser also provided information about the costs to it of providing services to the Funds and information about its profitability with respect to its management of the Funds, as well as information about the advisory fees it charges to accounts with similar strategies. The Trustees also considered the demands and complexity of the investment management of the Funds as compared to the complexity of managing separate accounts.
After reviewing these and related factors, the Trustees concluded, within the context of their overall conclusions regarding each Agreement, that the advisory fees for each of the Funds were fair and reasonable, and that the costs of these services generally and the related profitability of the Adviser in respect of its relationship with the Funds supported the renewal of the Agreements.
Economies of Scale. The Trustees considered to what extent economies of scale would likely be realized as the Funds grow and whether those economies would be shared with the Funds through breakpoints in their investment advisory fees or other means, such as expense caps. The Trustees noted that because the Funds are relatively new and of relatively small size, the Funds in the near term were not expected to generate any economies of scale. The Trustees also noted that the Adviser proposed to maintain the current fee waiver/expense reimbursement arrangement with respect to each Fund until September 30, 2010.
50
After reviewing these and related factors, the Trustees concluded, within the context of their overall conclusions regarding each Agreement, that the extent to which economies of scale would be shared with the Funds supported the approval of the Agreements.
The Trustees also considered other factors, which included but were not limited to the following:
· Whether each Fund has operated in accordance with its investment objective and each Fund’s record of compliance with its investment restrictions, and the compliance programs of the Funds and the Adviser. They also considered the compliance-related resources the Adviser provided to the Funds, including resources designed to ensure compliance with the investment objectives, policies and restrictions of each Fund.
· So-called “fallout benefits” to the Adviser, such as the benefits from offering its institutional clients the ability to invest in a registered investment company.
Based on their evaluation of all factors that they deemed to be material, including those factors described above, the Trustees, including the Independent Trustees, concluded that the existing investment advisory agreements for each of the Funds should be continued through June 20, 2010.
51
Trustees and Officers
May 31, 2009 (Unaudited)
The business and affairs of each Fund are managed under the direction of its Board of Trustees. The Board of Trustees approves all significant agreements between a Fund and the persons or companies that furnish services to the Fund, including agreements with its distributor, investment adviser, administrator, custodian and transfer agent. The day-to-day operations of the Fund are delegated to the Fund’s Adviser and administrator.
The name, age and principal occupations for the past five years of the Trustees and officers of the Funds are listed below, along with the number of portfolios in the Fund complex overseen by and the other directorships held by each Trustee. Except as otherwise noted, the address of each Trustee and officer is c/o Stone Harbor Investment Partners LP, 31 W. 52nd Street, 16th Floor, New York, New York 10019. The Trust’s Statement of Additional Information includes additional information about the Trustees and is available without a charge, upon request, by calling 1-866-699-8158.
INDEPENDENT TRUSTEES
|
|
|
| Term of Office and Length |
Name and Age |
| Position with the Trust |
| of Time Served(1) |
Alan Brott |
| Chairman of Audit Committee; Trustee |
| Since June 21, 2007 |
Age: 66 |
|
|
|
|
|
|
|
|
|
Heath B. McLendon |
| Trustee |
| Since June 21, 2007 |
Age: 76 |
|
|
|
|
|
|
|
|
|
Patrick Sheehan |
| Trustee |
| Since June 21, 2007 |
Age: 61 |
|
|
|
|
INTERESTED TRUSTEE
|
|
|
| Term of Office and Length |
Name and Age |
| Position with the Trust |
| of Time Served(1) |
Thomas W. Brock* |
| Chairman; |
| Since June 21, 2007 |
Age: 62 |
| Trustee |
|
|
* Mr. Brock is an interested Trustee because of his position with Stone Harbor.
52
|
| Number of |
|
|
|
| Portfolios in |
|
|
|
| Fund Complex |
|
|
|
| Overseen by |
| Other Directorships |
Principal Occupation(s) During Past 5 Years |
| Trustee |
| by Trustee |
Columbia University Graduate School of Business - Associate Professor, 2000-Present; Consultant, 1991-Present. |
| 2 |
| Bank of America– two closed-end registered hedge funds. |
|
|
|
|
|
Citigroup - Chairman of Equity Research Oversight Committee (retired December 31, 2006). |
| 2 |
| None |
|
|
|
|
|
Retired; formerly, Citigroup Asset Management - Managing Director and Fixed Income Portfolio Manager, 1991-2002. |
| 2 |
| None |
|
| Number of |
|
|
|
| Portfolios in |
|
|
|
| Fund Complex |
|
|
|
| Overseen by |
| Other Directorships |
Principal Occupation(s) During Past 5 Years |
| Trustee |
| by Trustee |
Stone Harbor Investment Partners LP - Chief Executive Officer, 2006-Present; Columbia University Graduate School of Business - Associate Professor, 1998-2006. |
| 2 |
| Bank of America - two closed-end registered hedge funds; Liberty All Star Funds - two closed-end funds. |
53
OFFICERS
|
|
|
| Term of Office and Length |
Name and Age |
| Position with the Trust |
| of Time Served(1) |
Peter J. Wilby |
| President |
| Since June 21, 2007 |
Age: 50 |
|
|
|
|
|
|
|
|
|
Pablo Cisilino |
| Executive Vice President |
| Since June 21, 2007 |
Age: 41 |
|
|
|
|
|
|
|
|
|
James E. Craige |
| Executive Vice President |
| Since June 21, 2007 |
Age: 41 |
|
|
|
|
|
|
|
|
|
Thomas K. Flanagan |
| Executive Vice President |
| Since June 21, 2007 |
Age: 56 |
|
|
|
|
|
|
|
|
|
David Oliver |
| Executive Vice President |
| Since September 29, 2008 |
Age: 49 |
|
|
|
|
54
|
| Number of |
|
|
|
| Portfolios in |
|
|
|
| Fund Complex |
|
|
|
| Overseen by |
| Other Directorships |
Principal Occupation(s) During Past 5 Years |
| Trustee |
| by Trustee |
Co-portfolio manager of the Funds; since April 3, 2006, Chief Investment Officer of Stone Harbor Investment Partners LP; prior to April 3, 2006, Chief Investment Officer - North American Fixed Income; joined Citigroup or its predecessor firms in 1989. |
| N/A |
| N/A |
|
|
|
|
|
Co-portfolio manager of Emerging Markets Debt Fund; since July 1, 2006, Senior Portfolio Manager of Stone Harbor Investment Partners LP; from June 1, 2004 to July 1, 2006, Executive Director for Sales and Trading in Emerging Markets at Morgan Stanley Inc; prior to June 1, 2004, Vice President for local markets and FX sales and trading, Goldman Sachs; joined Goldman Sachs in 1994. |
| N/A |
| N/A |
|
|
|
|
|
Co-portfolio manager of Emerging Markets Debt Fund; since April 3, 2006, Senior Portfolio Manager of Stone Harbor Investment Partners LP; prior to April 3, 2006, Managing Director and Senior Portfolio Manager at Salomon Brothers Asset Management Inc.; joined Salomon Brothers Asset Management Inc. in 1992. |
| N/A |
| N/A |
|
|
|
|
|
Co-portfolio manager of Emerging Markets Debt Fund; since April 3, 2006, Senior Portfolio Manager of Stone Harbor Investment Partners LP; prior to April 3, 2006, Managing Director and Senior Portfolio Manager at Salomon Brothers Asset Management Inc.; joined Salomon Brothers Asset Management Inc. in 1991. |
| N/A |
| N/A |
|
|
|
|
|
Co-portfolio manager of Emerging Markets Debt Fund; since June 1, 2008 Senior Portfolio Manager of Stone Harbor, from 1986 to June 1, 2008 Managing Director in Emerging Market sales and trading Citigroup. |
| N/A |
| N/A |
55
|
| Position with |
| Term of Office and Length |
Name and Age |
| the Trust |
| of Time Served(1) |
Beth A. Semmel |
| Executive Vice President |
| Since June 21, 2007 |
Age: 48 |
|
|
|
|
|
|
|
|
|
Jeffrey S. Scott |
| Chief Compliance Officer |
| Since June 21, 2007 |
Age: 49 |
|
|
|
|
|
|
|
|
|
James J. Dooley |
| Treasurer |
| Since June 21, 2007 |
Age: 53 |
|
|
|
|
|
|
|
|
|
Adam J. Shapiro |
| Secretary; Anti-Money Laundering Officer |
| Since June 21, 2007 |
|
|
|
|
|
Patrick D. Buchanan |
| Assistant Treasurer |
| Since April 23, 2008 |
Age: 37 |
|
|
|
|
(1) Officers are typically elected every year, unless an officer early retires, resigns or is removed from office. The current retirement age is 80.
56
|
| Number of |
|
|
|
| Portfolios in |
|
|
|
| Fund Complex |
|
|
|
| Overseen by |
| Other Directorships |
Principal Occupation(s) During Past 5 Years |
| Trustee |
| by Trustee |
Co-portfolio manager of High Yield Bond Fund; since April 3, 2006, Senior Portfolio Manager of Stone Harbor Investment Partners LP; Prior to April 3, 2006, Managing Director, Senior Portfolio Manager and Senior Trader for all high yield securities portfolios at Salomon Brothers Asset Management Inc.; joined Salomon Brothers Asset Management Inc. in 1993. |
| N/A |
| N/A |
|
|
|
|
|
Since April 3, 2006, Chief Compliance Officer of Stone Harbor Investment Partners LP; from October 2006 to March 2007, Director of Compliance, New York Life Investment Management LLC; from July 1998 to September 2006, Chief Compliance Officer, Salomon Brothers Asset Management Inc. |
| N/A |
| N/A |
|
|
|
|
|
Since April 3, 2006, Head of Operations, Technology and Finance of Stone Harbor Investment Partners LP; from August 2004 to March 2006, Senior Operations Manager of Institutional Asset Management, Citigroup Asset Management; from October 2002 to August 2004, Managing Director, Global Operations & Application Development, AIG Global Investment Group; from May 2001 to September 2002, President and Chief Operating Officer, Financial Technologies International. |
| N/A |
| N/A |
|
|
|
|
|
Since April 3, 2006, General Counsel of Stone Harbor Investment Partners LP; from April 2004 to March 2006, General Counsel, North American Fixed Income, Salomon Brothers Asset Management Inc.; from August 1999 to March 2004, Director of Product and Business Development, Citigroup Asset Management. |
| N/A |
| N/A |
|
|
|
|
|
Since October 15, 2007, Senior Fund Controller for ALPS Fund Services, Inc; from February 2005 to October 2007, Director of Accounting for Madison Capital Management LLC; from August 2003 to February, 2005, Manager of Fund Accounting for Janus Capital Group. |
| N/A |
| N/A |
57
Notes
58
|
|
|
|
| |
| OFFICERS AND TRUSTEES | |
| Alan Brott, Trustee | |
| Heath B. McLendon, Trustee | |
| Patrick Sheehan, Trustee | |
| Thomas W. Brock, Chairman | |
| Peter J. Wilby, President | |
| Pablo Cisilino, Exec. Vice President | |
| James E. Craige, Exec. Vice President | |
| Thomas K. Flanagan, Exec. Vice President | |
| David Oliver, Exec. Vice President | |
| Beth A. Semmel, Exec. Vice President | |
| Jeffrey S. Scott, Chief Compliance Officer | |
| Adam Shapiro, Secretary/Anti-Money Laundering Officer | |
| James J. Dooley, Treasurer | |
| Patrick Buchanan, Assistant Treasurer | |
|
| |
| INVESTMENT ADVISER | |
| Stone Harbor Investment Partners LP | |
| 31 W. 52nd Street 16th Floor | |
| New York, New York 10019 | |
|
| |
| ADMINISTRATOR & FUND ACCOUNTANT | |
| ALPS Fund Services, Inc. | |
| 1290 Broadway, Suite 1100 | |
| Denver, Colorado 80203 | |
|
| |
| DISTRIBUTOR | |
| ALPS Distributors, Inc. | |
| 1290 Broadway, Suite 1100 | |
| Denver, Colorado 80203 | |
|
| |
| TRANSFER AGENT | |
| ALPS Fund Services, Inc. | |
| 1290 Broadway, Suite 1100 | |
| Denver, Colorado 80203 | |
|
| |
| CUSTODIAN | |
| The Bank of New York Mellon | |
| One Wall Street | |
| New York, New York 10286 | |
|
| |
| LEGAL COUNSEL | |
| Ropes & Gray LLP | |
| 1211 Avenue of the Americas | |
| New York, New York 10036 | |
|
| |
| INDEPENDENT REGISTERED | |
| PUBLIC ACCOUNTING FIRM | |
| Deloitte & Touche LLP | |
| 555 17th Street, Suite 3600 | |
| Denver, Colorado 80202 | |
|
| |
This report and its financial statements are submitted for the general information of the shareholders of the Funds. The report is not authorized for distribution to prospective investors in the Funds unless preceded or accompanied by a prospectus. | ||
| ||
SHF000116 12/09 | ||

Item 2. Code of Ethics.
(a) The Registrant, as of the end of the period covered by this report, has adopted a code of ethics that applies to the Registrant’s principal executive officer, principal financial officer, principal accounting officer or controller or any persons performing similar functions on behalf of the Registrant.
(b) Not applicable.
(c) During the period covered by this report, no amendments to the provisions of the code of ethics adopted in Item 2(a) above were made.
(d) During the period covered by this report, no implicit or explicit waivers to the provisions of the code of ethics adopted in Item 2(a) above were granted.
(e) Not applicable.
(f) The Registrant’s Code of Ethics is attached as an Exhibit hereto.
Item 3. Audit Committee Financial Expert.
The Board of Trustees of the Registrant has determined that the Registrant has at least one audit committee financial expert serving on its Audit Committee. The Board of Trustees has designated Alan J. Brott as the Registrant’s “Audit Committee Financial Expert.” Mr. Brott is “independent” as defined in paragraph (a)(2) of Item 3 to Form N-CSR.
Item 4. Principal Accountant Fees and Services.
(a) Audit Fees: For the Registrant’s fiscal years ended May 31, 2008 and May 31, 2009, the aggregate fees billed for professional services rendered by the principal accountant for the audit of the Registrant’s annual financial statements were $130,000 and $130,000, respectively.
(b) Audit-Related Fees: For the Registrant’s fiscal years ended May 31, 2008 and May 31, 2009, there were no fees billed for assurance and related services by the principal accountant that were reasonably related to the performance of the audit
2
of the Registrant’s financial statements and were not reported in paragraph (a) of this Item 4.
(c) Tax Fees: For the Registrant’s fiscal years ended May 31, 2008 and May 31, 2009, the aggregate fees billed for professional services rendered by the principal accountant for tax compliance, tax advice and tax planning were $9,000 and $9,500, respectively. The fiscal year 2008 and 2009 tax fees were for services pertaining to federal and state income tax return review, review of year-end dividend distributions and excise tax preparation.
(d) All Other Fees: For the Registrant’s fiscal years ended May 31, 2008 and May 31, 2009, aggregate fees billed to the Registrant by the principal accountant for services provided by the principal accountant other than the services reported in paragraphs (a) through (c) of this Item 4 were $13,351.34 and $0, respectively. These services were associated with the formation of the Funds.
(e)(1) Audit Committee Pre-Approval Policies and Procedures: All services to be performed by the Registrant’s principal accountant must be pre-approved by the Registrant’s Audit Committee.
(e)(2) No services described in paragraphs (b) through (d) of this Item 4 were approved by the Registrant’s audit committee pursuant to paragraph (c)(7)(i)(C) of Rule 2-01 of Regulation S-X.
(f) Not applicable.
(g) Not applicable.
(h) Not applicable.
Item 5. Audit Committee of Listed Registrants.
Not applicable.
Item 6. Investments.
(a) Schedule of Investments is included as part of the Report to Stockholders filed under Item 1 of this Form N-CSR.
(b) Not applicable.
Item 7. Disclosure of Proxy Voting Policies and Procedures for Closed-End Management Investment Companies.
Not applicable.
3
Item 8. Portfolio Managers of Closed-End Management Investment Companies.
Not applicable.
Item 9. Purchases of Equity Securities by Closed-End Management Investment Company and Affiliated Purchasers.
Not applicable.
Item 10. Submission of Matters to Vote of Security Holders.
There have been no material changes to the procedures by which shareholders may recommend nominees to the Registrant’s Board of Trustees, where those changes were implemented after the Registrant last provided disclosure in response to the requirements of Item 407(c)(2) of Regulation S-K, or this Item.
Item 11. Controls and Procedures.
(a) The Registrant’s principal executive officer and principal financial officer have concluded that the Registrant’s disclosure controls and procedures (as defined in Rule 30a-3(c) under the Investment Company Act of 1940, as amended) are effective based on their evaluation of these controls and procedures as of a date within 90 days of the filing date of this report.
(b) There was no change in the Registrant’s internal control over financial reporting (as defined in Rule 30a-3(d) under the Investment Company Act of 1940, as amended) during the second fiscal quarter of the period covered by this report that has materially affected, or is reasonably likely to materially affect, the Registrant’s internal control over financial reporting.
Item 12. Exhibits.
(a)(1) Registrant’s Code of Ethics for Senior Financial Officers, which is the subject of the disclosure required by Item 2 of Form N-CSR, is attached hereto as Exhibit 12(a)(1).
(a)(2) The certifications required by Rule 30a-2(a) of the Investment Company Act of 1940, as amended, and Section 302 of the Sarbanes-Oxley Act of 2002 are attached hereto as Exhibit 99.Cert.
(a)(3) Not applicable.
(b) The certifications by the Registrant’s principal executive officer and principal financial officer, as required by Rule 30a-2(b) of the Investment Company Act of 1940, as amended, and Section 906 of the Sarbanes-Oxley Act of 2002 are attached hereto as Exhibit 99.906Cert.
4
SIGNATURES
Pursuant to the requirements of the Securities Exchange Act of 1934 and the Investment Company Act of 1940, the Registrant has duly caused this report to be signed on its behalf by the undersigned, thereunto duly authorized.
| Stone Harbor Investment Funds | |
|
|
|
| By: | /s/ Peter J. Wilby |
|
| Peter J. Wilby |
|
| President/Principal Executive Officer |
|
|
|
| Date: | August 7, 2009 |
Pursuant to the requirements of the Securities Exchange Act of 1934 and the Investment Company Act of 1940, this report has been signed below by the following persons on behalf of the Registrant and in the capacities and on the dates indicated.
| By: | /s/ Peter J. Wilby |
|
| Peter J. Wilby |
|
| President/Principal Executive Officer |
|
|
|
| Date: | August 7, 2009 |
| By: | /s/ James J. Dooley |
|
| James J. Dooley |
|
| Treasurer, Chief Financial Officer/Principal Financial Officer |
|
|
|
| Date: | August 7, 2009 |
5