Table of Contents
UNITED STATES
SECURITIES AND EXCHANGE COMMISSION
Washington, D.C. 20549
FORM N-CSR
CERTIFIED SHAREHOLDER REPORT OF REGISTERED
MANAGEMENT INVESTMENT COMPANIES
Investment Company Act file number: 811-22037
Stone Harbor Investment Funds
(Exact name of registrant as specified in charter)
1290 Broadway, Suite 1100
Denver, CO 80203
(Address of principal executive offices) (Zip code)
Adam J. Shapiro, Esq.
c/o Stone Harbor Investment Partners LP
31 West 52nd Street, 16th Floor
New York, NY 10019
(Name and address of agent for service)
With copies To:
John M. Loder, Esq.
Ropes & Gray LLP
One International Place
Boston, MA 02110-2624
Registrant’s telephone number, including area code: (303) 623-2577
Date of fiscal year end: May 31
Date of reporting period: June 1, 2009 - May 31, 2010
Table of Contents
Item 1. Report to Stockholders.
Table of Contents
Table of Contents
| Table of Contents | ||||
| 2
| |
| 5
| |
| 6
| |
Summaries of Portfolio Holdings
| 7
| |
Growth of a $10,000 Investment
| 8
| |
| ||
| 10 | ||
| 19
| |
Statements of Assets & Liabilities
| 39
| |
| 40
| |
| ||
| 41 | ||
| 42
| |
| ||
| 43 | ||
| 44
| |
| 45
| |
| 55
| |
| 58
| |
Table of Contents
| Letter to Shareholders | ||||
| May 31, 2010 |
Dear Shareholder,
The credit markets have made significant progress during the past year. Following one of the most severe recessions of the post-war period, global economies have begun to recover and concerns about defaults and systemic risk have generally subsided. We believe Stone Harbor Funds appear to be well positioned to capture the attractive returns that we perceive will be available in the coming year. As you know, our goal is to produce long-term returns that exceed benchmarks, while maintaining risk levels over a cycle that are generally below that of the market. Once again, we thank you for your support and commitment to Stone Harbor.
MARKET OVERVIEW
Credit risk assets ended 2009 on a high note as yield spreads narrowed across the full spectrum of fixed income sectors. Catalysts for spread tightening that characterized the last half of 2009 gained traction as mounting evidence of a global economic recovery took root. Strengthening fundamentals and rebounding growth allowed the market to shift its focus from the credit crisis and worries of systemic risks to stabilization and an incipient economic recovery.
Manufacturing gains and favorable corporate quarterly profits reports helped buoy investor sentiment and sustain demand for credit risk through the transition into 2010. Spreads continued to move tighter as flush liquidity and steep yield curves drew investors to higher yielding assets. Upside surprise in labor market and consumer confidence surveys, which had lagged the overall improvement in economic fundamentals, provided nascent signs of broad-based growth.
Interest in risk assets peaked in April 2010 supported by continued bullish earnings releases, low volatility, a precipitous decline in default rates and steady flows into debt sectors from both institutional and retail investors. The 10-Year Treasury note rose to 4% for the first time in 18 months as reports continued to point to a strengthening economic rebound. Credit spreads among fixed income risk assets narrowed to lows not seen since 2007 led by high yield and emerging markets debt.
The powerful spread rally, however, came to an abrupt halt in May as news of an understated fiscal deficit emerged from Greece. Concerns developed about the ability of the Greek government to extricate itself from an accelerating debt burden. The credit market quickly sold off, as investors reacted to concerns about unsustainable fiscal deficits not only in Greece, but also in other peripheral countries in the Eurozone (the now much talked about PIIGS -Portugal, Italy, Ireland, Greece and Spain). Similar to reactions during past panics of this nature, the market sought the perceived safety of U.S. Treasuries and the U.S. dollar, causing significant rallies in both.
The European Central Bank (ECB) responded by announcing unparalleled initiatives to convince the broader markets of the credibility and stability of the European Union (EU) political establishment. A rescue package valued at nearly $1 trillion was approved. The package included funds dedicated to the creation of government-backed loans, a euro stabilization fund, a contribution from the IMF and a strong commitment from all EU member countries to undergo efforts toward strict fiscal consolidation. Despite such persuasive measures, investors clung to doubt as the euro dipped to $1.22, its lowest level in four years, from a high in the trailing 12-month period of $1.51 as recently as December 2009.
The May panic in the European sovereign market and its possible impact on the European banking system and the global economic expansion, caused significant damage to the credit markets. As represented by the Citigroup High Yield Market Index, high yield spreads went from 561 bps in late April to 703 bps by May 31, 2010, a difference of 142 bps in little over one month. Likewise, the JP Morgan Emerging Markets Bond Index Global contracted to a spread of 242 bps in mid-April, yet
| 2 | Stone Harbor Investment Funds® |
Table of Contents
| Letter to Shareholders (continued) | ||||
finished the month of May at 343 bps, an increase of 101 bps. A significant portion of the widening in credit spreads could be attributed to the flight to quality in the Treasury market. Treasury yields dropped from a high of 4% in April to 3.29% at the end of our reporting period, a decline of 71 bps.
As our reporting period ended, the markets began to fret over issues beyond concerns for European growth and bank safety. Macroeconomic themes —such as U.S. financial regulatory reform, the BP oil spill, political tensions in Korea, and more significantly a potential slowdown in China — spurred new skepticism about the strength of the economic recovery. Despite the coordinated effort by European governments, the ECB and the IMF to diminish the likelihood of mass sovereign defaults among Europe’s periphery, the verdict is still out as to whether the long-term crisis has been averted. The dual problems of ballooning deficits and the lack of a central unilateral monetary authority, still exists. The Eurozone collective effort, albeit a bit delayed, has managed to temporarily prevent the destabilization of the European banking system.
In the global economy, concerns remain that the universal focus on deficit reduction may put additional pressure on prospects for growth. Much will depend on the stability of growth in China and other developing nations. We believe that the U.S. recovery will be steady, but more subdued than the optimistic case formed earlier in the year. This will result in a likely delay in tightening of short term interest rates on the part of the U.S. Federal Reserve Bank. Based on our reading of the fundamental underpinnings of a U.S. recovery, we believe moderate economic growth will persist as long as employment levels rise in response to global demand.
PERFORMANCE REVIEW
Stone Harbor Emerging Markets Debt Fund
The Stone Harbor Emerging Markets Debt Fund return for the twelve months ended May 31, 2010 was 24.25% (net of expenses) and 25.18% (gross of expenses). This compares to a benchmark return of 17.85% for the JP Morgan Emerging Market Bond Index Global Diversified. Emerging debt markets rallied aggressively in the latter half of 2009 as evidence of a global economic rebound developed. Sharp declines in volatility and ongoing government stimulus efforts contributed to spread tightening. Emerging market indices reached their 2009 peak levels in the fourth quarter but gave back some gains as investors worried about the impact of premature fiscal tightening and unsustainable government deficits – spurred by events in Dubai and Greece – on a fragile global recovery.
Emerging market debt spreads widened in April for the first time since January as authorities groped for solutions to mounting sovereign debt problems in Europe. Nevertheless, steep yield curves, strong economic growth without significant inflation and attractive spreads relative to similarly rated developed market credits extended strong access to the capital markets for emerging market issuers. Credit risk assets gyrated in May as macro themes including political tensions in Korea, U.S. regulatory fears and a potential slowdown in China fueled a sell-off, eroding liquidity and reversing funds flows into emerging debt markets, but only among retail investors; institutional demand for the asset class persisted.
Country selection decisions accounted for approximately two-thirds of excess returns; the remainder came from issue selection. Treasury attribution was negative, primarily due to rolling yield effects and a steepening U.S. Treasury yield curve. Key country decisions during the period included an overweight in Argentina, which contributed most to performance. Argentina’s debt markets were supported by a receptive market for high beta risk, but also by positive idiosyncratic developments. During the reporting period, Argentina offered investors in debt which had not been submitted in a prior debt exchange a new exchange for current debt and GDP warrants. Investors viewed this event positively as it seemed likely to restore Argentina’s capacity to borrow in the capital markets. Other high beta credits such as Iraq and Ukraine also outperformed. The portfolio’s overweight in
| Annual Report | May 31, 2010 | 3 |
Table of Contents
| Letter to Shareholders (continued) | ||||
these credits based on attractive valuations and strong capacity and willingness to pay enhanced performance. Key issue selection decisions included an allocation to short and intermediate maturity US dollar debt from Argentina. Beginning in August as evidence of a global economic turnaround became more entrenched, the manager increased the portfolio’s exposure to local currency debt in Brazil, Colombia, Mexico, Indonesia and Malaysia, which also boosted performance. A decision to invest in short dated debt in Ukraine detracted most from gains.
Stone Harbor High Yield Bond Fund
The Stone Harbor High Yield Bond Fund return for the twelve months ended May 31, 2010 was 20.53% (net of expenses) and 21.19% (gross of expenses) This compares to a benchmark return of 28.29% for the Citigroup High Yield Market Capped Index Positive momentum within the high yield market that began in the first six months of the year picked up speed in the latter half leading to significant spread contraction as the US. and global economy showed signs of stabilization. Better than expected economic indicators as well as continued monetary and fiscal stimulus cut of Washington buoyed investor sentiment.
This renewed demand for risk assets helped to foster a robust new issue market for high yield bonds and a subsequent notable decline in levels of distressed debt. Constructive earnings and continued improvement in domestic manufacturing and global production sustained strong inflows into the asset class which reached record-high levels at the end of the first quarter.
Yet despite just over a year of strong market momentum, concerns over household income, the employment outlook and, ultimately, the stability of the U.S. economy, eclipsed signs of a stabilizing housing market and a re-engaged consumer and led to wider risk premiums. Market focus shifted overseas as developments regarding a potential bailout for Greece, EU efforts to limit contagion and a pullback on Chinese growth challenged the viability of a synchronized global recovery and kept investors on the sidelines Tracking equity volatility, a sharp decline across risk assets in May reflected investor unease and uncertainty regarding the negative impact of global events on U.S. growth. The technical landscape, which had seemingly escaped the buffeting incurred by the secondary market, weakened as new issuance dried up and mutual fund flows reversed course. Higher risk sectors were particularly vulnerable as market participants flocked to quality.
Nevertheless, against a backdrop of low short-term interest rates, little threat of inflation and continued diminishing refinance and maturity risk in the senior part of the capital structure, we remain constructive on high yield and believe credit risk assets have room to tighten. Despite potential exogenous shocks and the impact of an eventual government stimulus unwind, we believe economic growth will continue to gain traction, albeit subdued.
Our investment style has been to focus on industries and companies poised to benefit from a continued moderate economic recovery while properly financed to resist financial stress should a sustainable upturn falter As a result we have focused on mid to better quality investments within our universe, which despite very strong returns over the past twelve months, lagged the broader market indices until the May period of volatility. As investors recede from indiscriminate buying within the high yield market to focusing on companies that can thrive in a lower growth, more subdued economic recovery, we believe that more differentiation will take place in the market.
Sincerely,

Thomas W. Brock
Chairman of the Board of Trustees
| 4 | Stone Harbor Investment Funds® |
Table of Contents
| Disclosure of Fund Expenses (Unaudited) | ||||
Example. As a shareholder of a Fund, you incur two types of costs: (1) transaction costs, including sales charges (loads) on purchase payments and/or redemption fees (if applicable) and (2) ongoing costs, including management fees and other Fund expenses. The below examples are intended to help you understand your ongoing costs (in dollars) of investing in a Fund and to compare these costs with the ongoing costs of investing in other mutual funds. The examples are based on an investment of $1,000 invested on December 1, 2009 and held until May 31, 2010.
Actual Expenses. The first line of the table below provides information about actual account values and actual expenses. You may use the information in this line, together with the amount you invested, to estimate the expenses that you paid over the period. Simply divide your account value by $1,000 (for example, an $8,600 account value divided by $1,000 = 8.6), then multiply the result by the number in the first line under the heading “Expenses Paid During Period” to estimate the expenses you paid on your account during this period.
Hypothetical Example for Comparison Purposes. The second line of the table below provides information about hypothetical account values and hypothetical expenses based on the Fund’s actual expense ratio and an assumed rate of return of 5% per year before expenses, which is not the Fund’s actual return. The hypothetical account values and expenses may not be used to estimate the actual ending account balance or expenses you paid for the period. You may use this information to compare the ongoing costs of investing in a Fund and other mutual funds. To do so, compare this 5% hypothetical example with the 5% hypothetical examples that appear in the shareholder reports of the other funds.
Please note that the expenses shown in the table are meant to highlight your ongoing costs only and do not reflect transactional costs, such as redemption fees, sales charges (loads) or exchange fees. Therefore, the second line of the table is useful in comparing ongoing costs only, and will not help you determine the relative total costs of owning different funds. In addition, if these transactional costs were included, your costs would have been higher.
| Beginning Account Value 12/01/2009 | Ending Account Value 05/31/2010 | Expense Ratio (1) | Expenses Paid During Period(2) | |||||||||
STONE HARBOR EMERGING MARKETS DEBT FUND | ||||||||||||
Actual | $ | 1,000.00 | $ | 1,042.00 | 0.75 | % | $ | 3.82 | ||||
Hypothetical (5% return before expenses) | $ | 1,000.00 | $ | 1,021.19 | 0.75 | % | $ | 3.78 | ||||
STONE HARBOR HIGH YIELD BOND FUND | ||||||||||||
Actual | $ | 1,000.00 | $ | 1,044.60 | 0.55 | % | $ | 2.80 | ||||
Hypothetical (5% return before expenses) | $ | 1,000.00 | $ | 1,022.19 | 0.55 | % | $ | 2.77 | ||||
| (1) | Annualized, based on the Fund’s most recent fiscal half-year expenses. |
| (2) | Expenses are equal to the Fund’s annualized ratio multiplied by the average account value over the period, multiplied by the number of days in the most recent fiscal half year (182), divided by 365. Note this expense example is typically based on a six-month period. |
| Annual Report | May 31, 2010 | 5 |
Table of Contents
| Report of Independent Registered Public Accounting Firm | ||||
To the Shareholders and Board of Trustees of Stone Harbor Investment Funds:
We have audited the accompanying statements of assets and liabilities of Stone Harbor Investment Funds, including the Stone Harbor High Yield Bond Fund and Stone Harbor Emerging Markets Debt Fund (collectively, the “Funds”), including the statements of investments, as of May 31, 2010, and the related statements of operations for the year then ended, the statements of changes in net assets for each of the two years in the period then ended, and the financial highlights for each of the two years in the period then ended and for the period from August 16, 2007 (inception) to May 31, 2008. These financial statements and financial highlights are the responsibility of the Funds’ management. Our responsibility is to express an opinion on these financial statements and financial highlights based on our audits.
We conducted our audits in accordance with the standards of the Public Company Accounting Oversight Board (United States). Those standards require that we plan and perform the audit to obtain reasonable assurance about whether the financial statements and financial highlights are free of material misstatement. The Funds are not required to have, nor were we engaged to perform, an audit of its internal control over financial reporting. Our audits included consideration of internal control over financial reporting as a basis for designing audit procedures that are appropriate in the circumstances, but not for the purpose of expressing an opinion on the effectiveness of the Funds’ internal control over financial reporting. Accordingly, we express no such opinion. An audit also includes examining, on a test basis, evidence supporting the amounts and disclosures in the financial statements, assessing the accounting principles used and significant estimates made by management, as well as evaluating the overall financial statement presentation. Our procedures included confirmation of securities owned as of May 31, 2010, by correspondence with the custodian and brokers; where replies were not received from brokers, we performed other auditing procedures. We believe that our audits provide a reasonable basis for our opinion.
In our opinion, the financial statements and financial highlights referred to above present fairly, in all material respects, the financial position of the Funds as of May 31, 2010, the results of their operations for the year then ended, the changes in their net assets for each of the two years in the period then ended, and the financial highlights for each of the two years in the period then ended and for the period from August 16, 2007 (inception) to May 31, 2008, in conformity with accounting principles generally accepted in the United States of America.

Denver, Colorado
July 28, 2010
| 6 | Stone Harbor Investment Funds® |
Table of Contents
| Summaries of Portfolio Holdings | ||||
| May 31, 2010 |
Under SEC Rules, all funds are required to include in their annual and semi-annual shareholder reports a presentation of portfolio holdings in a table, chart or graph by reasonably identifiable categories. The following tables which present holdings as a percent of total net assets (“TNA”) are provided in compliance with such requirements.
EMERGING MARKETS DEBT FUND | HIGH YIELD BOND FUND | |||||||
Country Breakdown | % of TNA | Industry Breakdown | % of TNA | |||||
Brazil | 12.82% | Exploration & Production | 11.25% | |||||
Mexico | 11.62% | Healthcare | 9.49% | |||||
Venezuela | 9.30% | Electric | 6.10% | |||||
Russia | 7.82% | Media Cable | 5.87% | |||||
Indonesia | 6.69% | Retail Non Food/Drug | 5.16% | |||||
Philippines | 5.86% | Wirelines | 5.16% | |||||
Colombia | 5.72% | Services Other | 4.52% | |||||
Malaysia | 5.38% | Wireless | 3.75% | |||||
Panama | 3.44% | Food/Beverage/Tobacco | 3.69% | |||||
Ukraine | 3.35% | Gaming | 3.25% | |||||
Iraq | 3.16% | Chemicals | 3.16% | |||||
Peru | 3.00% | Containers/Packaging | 2.90% | |||||
Uruguay | 2.65% | Automotive | 2.86% | |||||
Turkey | 2.38% | Financial/Lease | 2.81% | |||||
Poland | 2.35% | Metals/Mining/Steel | 2.30% | |||||
Argentina | 1.65% | Drillers/Services | 2.23% | |||||
El Salvador | 1.40% | Media Other | 1.99% | |||||
Qatar | 1.34% | Publishing/Printing | 1.72% | |||||
South Africa | 1.27% | Consumer Products | 1.69% | |||||
Chile | 1.08% | Paper/Forest Products | 1.69% | |||||
Kazakhstan | 0.89% | Leisure | 1.52% | |||||
Tunisia | 0.46% | Gas Distributors | 1.37% | |||||
India | 0.42% | Satellite | 1.23% | |||||
South Korea | 0.36% | Aerospace/Defense | 1.13% | |||||
Pakistan | 0.27% | Capital Goods | 0.92% | |||||
Total | 94.68% | Textile/Apparel | 0.90% | |||||
Money Market Mutual Funds | 2.92% | Building Products | 0.88% | |||||
Other Assets in Excess | Industrial Other | 0.88% | ||||||
of Liabilities | 2.40% | Transport Other | 0.86% | |||||
Total Net Assets | 100.00% | Technology | 0.85% | |||||
Retail Food/Drug | 0.78% | |||||||
Refining | 0.61% | |||||||
Lodging | 0.50% | |||||||
Environmental Services | 0.46% | |||||||
Restaurants | 0.04% | |||||||
Total | 94.52% | |||||||
Money Market Mutual Funds | 3.36% | |||||||
Other Assets in Excess of Liabilities | 2.12% | |||||||
Total Net Assets | 100.00% | |||||||
| Annual Report | May 31, 2010 | 7 |
Table of Contents
| Growth of a $10,000 Investment | ||||
| May 31, 2010 (Unaudited) | ||||
STONE HARBOR EMERGING MARKETS DEBT FUND
Comparison of Change in Value of $10,000 Investment in Stone Harbor Emerging Markets Debt Fund and the JP Morgan Emerging Market Bond Index Global Diversified
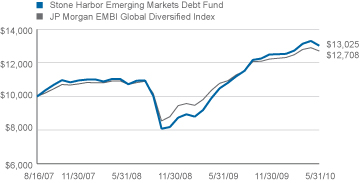
The JP Morgan Emerging Market Bond Index Global Diversified is a uniquely-weighted version of the EMBI Global Index, which tracks total returns for U.S. dollar-denominated debt instruments issued by emerging market sovereign and quasi-sovereign entities such as: Brady bonds, loans and Eurobonds. Currently, the EMBI Global Index covers 196 instruments across 28 countries. It limits the weights of those index countries with larger debt stocks by only including specified portions of these countries’ eligible debt outstanding. The countries covered in the EMBI Global Diversified are identical to those covered by the EMBI Global Index.
AVERAGE ANNUAL TOTAL RETURNS
| 1 Year | 3 Years | 5 Years | 10 Years | Since Inception | Inception Date | |||||||
Stone Harbor Emerging Markets Debt Fund | 24.25% | N/A | N/A | N/A | 9.93% | 8/16/07 | ||||||
JP Morgan Emerging Market Bond Index Global Diversified | 17.85% | N/A | N/A | N/A | 8.96% |
The performance data quoted represents past performance and does not guarantee future results. Current performance may be lower or higher than the performance quoted. Average annual total returns reflect the reinvestment of dividends and capital gains distributions and include all fee waivers and expense reimbursements. Without the fee waivers and expense reimbursements, total return figures would have been lower. The performance data quoted does not reflect the deduction of taxes that a shareholder would pay on Fund distributions or the redemption of Fund shares. Investment return and principal value will vary, and shares, when redeemed, may be worth more or less than their original cost.
| 8 | Stone Harbor Investment Funds® |
Table of Contents
| Growth of a $10,000 Investment (continued) | ||||
| May 31, 2010 (Unaudited) |
STONE HARBOR HIGH YIELD BOND FUND
Comparison of Change in Value of $10,000 Investment in Stone Harbor High Yield Bond Fund and the Citigroup High Yield Market Capped Index.
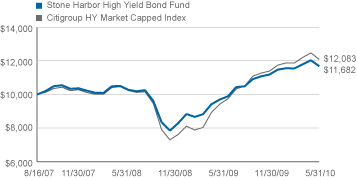
The Citigroup High Yield Market Capped Index represents a modified version of the High Yield Market Index by delaying the entry of “fallen angel” issues (corporate or municipal bonds that were investment-grade when issued but have since been downgraded) and capping the par value of individual issuers at US $5 billion par amount outstanding.
AVERAGE ANNUAL TOTAL RETURNS
| 1 Year | 3 Years | 5 Years | 10 Years | Since Inception | Inception Date | |||||||
Stone Harbor High Yield | ||||||||||||
Bond Fund | 20.53% | N/A | N/A | N/A | 5.73% | 8/16/07 | ||||||
Citigroup High Yield | ||||||||||||
Market Capped Index | 28.29% | N/A | N/A | N/A | 7.01% |
The performance may be lower or higher than the performance quoted. Average annual total returns reflect the reinvestment of dividends and capital gains distributions and include all fee waivers and expense reim- bursements. Without the fee waivers and expense reimbursements, total return figures would have been lower. The performance data quoted does not reflect the deduction of taxes that a shareholder would pay on Fund distributions or the redemption of Fund shares. Investment return and principal value will vary, and shares, when redeemed, may be worth more or less than their original cost.
| Annual Report | May 31, 2010 | 9 |
Table of Contents
| Statements of Investments | ||||||
| May 31, 2010 | Emerging Markets Debt Fund | |||||
| Interest Rate/Maturity Date | Currency | Principal Amount* | Market Value (Expressed in U.S. $) | |||||
SOVEREIGN DEBT OBLIGATIONS - 74.81% | ||||||||
Argentina - 1.65% | ||||||||
Republic of Argentina | ||||||||
7.000%, 03/18/2004(1) | EUR | $ | 30,000 | $ | 14,542 | |||
9.000%, 05/24/2005(1)(2) | EUR | 191,000 | 92,582 | |||||
11.000%, 12/04/2005(1) | 600,000 | 231,000 | ||||||
9.000%, 04/26/2006(1) | EUR | 58,000 | 28,292 | |||||
10.000%, 01/03/2007(1) | ITL | 20,000,000 | 5,229 | |||||
10.250%, 01/26/2007(1) | EUR | 661,000 | 336,624 | |||||
8.000%, 02/26/2008(1) | EUR | 243,000 | 119,278 | |||||
9.000%, 07/06/2010(1) | EUR | 420,000 | 204,872 | |||||
7.000%, 10/03/2015 | 1,750,000 | 1,278,083 | ||||||
0.000%, 03/31/2023(1)(9) | 184,000 | 105,800 | ||||||
6.000%, 03/31/2023(1)(9) | 480,000 | 276,000 | ||||||
9.750%, 09/19/2027(1) | 617,000 | 237,545 | ||||||
| 2,929,847 | ||||||||
Brazil - 9.35% | ||||||||
Nota Do Tesouro Nacional | ||||||||
10.000%, 01/01/2021 | BRL | 10,430,000 | 4,920,847 | |||||
Republic of Brazil | ||||||||
6.000%, 01/17/2017 | 885,000 | 960,225 | ||||||
5.875%, 01/15/2019 | 2,270,000 | 2,445,925 | ||||||
4.875%, 01/22/2021 | 530,000 | 518,738 | ||||||
8.875%, 04/15/2024 | 150,000 | 200,250 | ||||||
8.750%, 02/04/2025 | 1,550,000 | 2,065,375 | ||||||
10.125%, 05/15/2027 | 25,000 | 37,250 | ||||||
12.250%, 03/06/2030 | 20,000 | 35,100 | ||||||
8.250%, 01/20/2034 | 130,000 | 167,863 | ||||||
11.000%, 08/17/2040 | 3,990,000 | 5,289,742 | ||||||
| 16,641,315 | ||||||||
Colombia - 5.72% | ||||||||
Bogota Distrio Capital | ||||||||
9.750%, 07/26/2028(2) | COP | 4,378,000,000 | 2,496,832 | |||||
Republic of Colombia | ||||||||
7.375%, 03/18/2019 | 1,760,000 | 2,019,600 | ||||||
11.750%, 02/25/2020 | 1,000,000 | 1,460,000 | ||||||
9.850%, 06/28/2027 | COP | 1,483,000,000 | 943,884 | |||||
7.375%, 09/18/2037 | 2,282,000 | 2,518,757 | ||||||
6.125%, 01/18/2041 | 790,000 | 745,563 | ||||||
| 10,184,636 | ||||||||
| 10 | Stone Harbor Investment Funds® |
Table of Contents
| Statements of Investments (continued) | ||||||
| May 31, 2010 | Emerging Markets Debt Fund | |||||
| Interest Rate/Maturity Date | Currency | Principal Amount* | Market Value (Expressed in U.S. $) | |||||
El Salvador - 1.40% | ||||||||
Republic of El Salvador | ||||||||
7.375%, 12/01/2019(3) | $ | 220,000 | $ | 236,500 | ||||
7.650%, 06/15/2035(2) | 2,198,000 | 2,263,940 | ||||||
| 2,500,440 | ||||||||
Indonesia - 3.99% | ||||||||
Republic of Indonesia | ||||||||
11.625%, 03/04/2019(2) | 675,000 | 969,469 | ||||||
11.625%, 03/04/2019(3) | 2,070,000 | 2,973,038 | ||||||
7.750%, 01/17/2038(2) | 2,770,000 | 3,164,724 | ||||||
| 7,107,231 | ||||||||
Iraq - 3.16% | ||||||||
Republic of Iraq | ||||||||
5.800%, 01/15/2028(2) | 6,810,000 | 5,618,250 | ||||||
Malaysia - 1.87% | ||||||||
Malaysian Government | ||||||||
3.741%, 02/27/2015 | MYR | 6,595,000 | 2,007,913 | |||||
4.378%, 11/29/2019 | MYR | 4,260,000 | 1,326,080 | |||||
| 3,333,993 | ||||||||
Mexico - 10.91% | ||||||||
Mexican Bonos | ||||||||
8.000%, 12/17/2015 | MXN | 15,300,000 | 1,266,114 | |||||
8.000%, 06/11/2020 | MXN | 21,900,000 | 1,780,521 | |||||
7.500%, 06/03/2027 | MXN | 15,340,000 | 1,152,931 | |||||
8.500%, 05/31/2029 | MXN | 12,090,000 | 993,425 | |||||
United Mexican States | ||||||||
11.375%, 09/15/2016 | 600,000 | 829,500 | ||||||
5.950%, 03/19/2019 | 1,332,000 | 1,440,891 | ||||||
8.125%, 12/30/2019 | 935,000 | 1,152,388 | ||||||
5.125%, 01/15/2020 | 944,000 | 960,520 | ||||||
8.300%, 08/15/2031 | 4,285,000 | 5,549,074 | ||||||
6.750%, 09/27/2034 | 1,445,000 | 1,598,170 | ||||||
6.050%, 01/11/2040 | 2,666,000 | 2,695,992 | ||||||
| 19,419,526 | ||||||||
| Annual Report | May 31, 2010 | 11 |
Table of Contents
| Statements of Investments (continued) | ||||||
| May 31, 2010 | Emerging Markets Debt Fund | |||||
| Interest Rate/Maturity Date | Principal Amount* | Market Value (Expressed in U.S. $) | ||||
Pakistan - 0.27% | ||||||
Islamic Republic of Pakistan | ||||||
7.125%, 03/31/2016(2) | $ | 525,000 | $ | 488,250 | ||
Panama - 3.44% | ||||||
Republic of Panama | ||||||
7.250%, 03/15/2015 | 805,000 | 929,775 | ||||
5.200%, 01/30/2020 | 2,205,000 | 2,293,200 | ||||
9.375%, 01/16/2023(9) | 25,000 | 33,000 | ||||
7.125%, 01/29/2026 | 600,000 | 693,000 | ||||
9.375%, 04/01/2029 | 1,565,000 | 2,167,525 | ||||
| 6,116,500 | ||||||
Peru - 3.00% | ||||||
Republic of Peru | ||||||
7.125%, 03/30/2019 | 605,000 | 709,363 | ||||
7.350%, 07/21/2025 | 2,695,000 | 3,170,667 | ||||
8.750%, 11/21/2033 | 745,000 | 987,125 | ||||
6.550%, 03/14/2037 | 440,000 | 471,900 | ||||
| 5,339,055 | ||||||
Philippines - 5.86% | ||||||
Republic of Philippines | ||||||
8.000%, 01/15/2016 | 120,000 | 144,900 | ||||
7.500%, 09/25/2024 | 1,050,000 | 1,233,750 | ||||
10.625%, 03/16/2025 | 70,000 | 101,063 | ||||
9.500%, 02/02/2030 | 3,185,000 | 4,319,656 | ||||
7.750%, 01/14/2031 | 3,215,000 | 3,749,494 | ||||
6.375%, 01/15/2032 | 520,000 | 524,550 | ||||
6.375%, 10/23/2034 | 360,000 | 361,134 | ||||
| 10,434,547 | ||||||
Poland - 2.35% | ||||||
Republic of Poland | ||||||
6.375%, 07/15/2019 | 3,840,000 | 4,182,240 | ||||
Qatar - 1.34% | ||||||
State of Qatar | ||||||
5.250%, 01/20/2020(2) | 500,000 | 515,000 | ||||
5.250%, 01/20/2020(3) | 1,815,000 | 1,869,450 | ||||
| 2,384,450 | ||||||
| 12 | Stone Harbor Investment Funds® |
Table of Contents
| Statements of Investments (continued) | ||||
| May 31, 2010 | Emerging Markets Debt Fund | |||
| Interest Rate/Maturity Date | Currency | Principal Amount* | Market Value (Expressed in U.S. $) | |||||
Russia - 3.90% | ||||||||
Russian Federation | ||||||||
3.625%, 04/29/2015(3) | $ | 500,000 | $ | 479,375 | ||||
5.000%, 04/29/2020(3) | 800,000 | 764,000 | ||||||
7.500%, 03/31/2030(2) | 5,091,280 | 5,695,870 | ||||||
| 6,939,245 | ||||||||
South Africa - 1.27% | ||||||||
Republic of South Africa | ||||||||
7.500%, 01/15/2014 | ZAR | 3,400,000 | 442,506 | |||||
13.500%, 09/15/2015 | ZAR | 2,670,000 | 433,375 | |||||
8.500%, 06/23/2017 | 20,000 | 24,300 | ||||||
6.875%, 05/27/2019 | 705,000 | 787,837 | ||||||
5.875%, 05/30/2022 | 560,000 | 571,200 | ||||||
| 2,259,218 | ||||||||
Turkey - 2.38% | ||||||||
Republic of Turkey | ||||||||
7.500%, 11/07/2019 | 685,000 | 785,181 | ||||||
7.375%, 02/05/2025 | 1,625,000 | 1,822,031 | ||||||
6.875%, 03/17/2036 | 1,305,000 | 1,335,994 | ||||||
7.250%, 03/05/2038 | 270,000 | 286,538 | ||||||
| 4,229,744 | ||||||||
Ukraine - 3.35% | ||||||||
Ukraine Government | ||||||||
3.200%, 12/19/2010 | JPY | 270,000,000 | 2,918,869 | |||||
6.385%, 06/26/2012(2) | 3,060,000 | 3,052,350 | ||||||
| 5,971,219 | ||||||||
Uruguay - 2.65% | ||||||||
Republic of Uruguay | ||||||||
8.000%, 11/18/2022 | 1,000,000 | 1,177,500 | ||||||
7.875%, 01/15/2033(4) | 1,710,800 | 1,967,420 | ||||||
7.625%, 03/21/2036 | 1,400,000 | 1,575,000 | ||||||
| 4,719,920 | ||||||||
| Annual Report | May 31, 2010 | 13 |
Table of Contents
| Statements of Investments (continued) | ||||
| May 31, 2010 | Emerging Markets Debt Fund | |||
Interest Rate/Maturity Date | Principal Amount* | Market Value (Expressed in U.S. $) | ||||
Venezuela - 6.95% | ||||||
Republic of Venezuela | ||||||
1.307%, 04/20/2011(2)(5) | $ | 7,425,000 | $ | 6,608,250 | ||
8.500%, 10/08/2014 | 2,490,000 | 1,892,400 | ||||
5.750%, 02/26/2016(2) | 115,000 | 71,300 | ||||
13.625%, 08/15/2018(2) | 970,000 | 829,350 | ||||
7.000%, 12/01/2018(2) | 120,000 | 70,200 | ||||
7.750%, 10/13/2019(2) | 2,920,000 | 1,752,000 | ||||
9.000%, 05/07/2023(2) | 920,000 | 558,900 | ||||
8.250%, 10/13/2024(2) | 505,000 | 287,850 | ||||
7.650%, 04/21/2025 | 430,000 | 236,500 | ||||
9.250%, 05/07/2028(2) | 120,000 | 72,000 | ||||
| 12,378,750 | ||||||
TOTAL SOVEREIGN DEBT OBLIGATIONS | 133,178,376 | |||||
(Cost $127,053,909) | ||||||
CORPORATE BONDS - 14.02% | ||||||
Brazil - 0.38% | ||||||
Voto-Votorantim Ltd. | ||||||
6.750%, 04/05/2021(3) | 680,000 | 671,500 | ||||
Chile - 1.08% | ||||||
Codelco, Inc. | ||||||
6.150%, 10/24/2036(3) | 410,000 | 423,486 | ||||
6.150%, 10/24/2036(2) | 1,455,000 | 1,497,908 | ||||
| 1,921,394 | ||||||
India - 0.42% | ||||||
Vedanta Resources PLC | ||||||
9.500%, 07/18/2018(3) | 735,000 | 753,375 | ||||
Indonesia - 0.42% | ||||||
PT Adaro Indonesia | ||||||
7.625%, 10/22/2019(3) | 725,000 | 741,313 | ||||
Kazakhstan - 0.89% | ||||||
KazMunaiGaz Finance Sub BV | ||||||
9.125%, 07/02/2018(3) | 445,000 | 489,500 | ||||
7.000%, 05/05/2020(3) | 1,140,000 | 1,102,950 | ||||
| 1,592,450 | ||||||
| 14 | Stone Harbor Investment Funds® |
Table of Contents
| Statements of Investments (continued) | ||||||
| May 31, 2010 | Emerging Markets Debt Fund | |||||
Interest Rate/Maturity Date | Currency | Principal Amount* | Market Value (Expressed in U.S. $) | |||||
Malaysia - 3.51% | ||||||||
Penerbangan Malaysia BHD | ||||||||
5.625%, 03/15/2016(2) | $ | 1,095,000 | $ | 1,220,826 | ||||
Petroliam Nasional BHD | ||||||||
7.750%, 08/15/2015(3) | 335,000 | 404,499 | ||||||
7.625%, 10/15/2026(2) | 840,000 | 1,026,094 | ||||||
Petronas Capital Ltd. | ||||||||
5.250%, 08/12/2019(3) | 530,000 | 544,272 | ||||||
7.875%, 05/22/2022(2) | 2,490,000 | 3,057,403 | ||||||
| 6,253,094 | ||||||||
Mexico - 0.71% | ||||||||
Pemex Finance Ltd. | ||||||||
9.150%, 11/15/2018 | 1,025,000 | 1,264,868 | ||||||
Russia - 3.44% | ||||||||
Gaz Capital SA | ||||||||
6.510%, 03/07/2022(3) | 560,000 | 532,000 | ||||||
TNK-BP Finance SA | ||||||||
6.250%, 02/02/2015(3) | 160,000 | 159,200 | ||||||
7.500%, 07/18/2016(3) | 1,125,000 | 1,144,688 | ||||||
7.875%, 03/13/2018(3) | 145,000 | 148,625 | ||||||
7.250%, 02/02/2020(3) | 305,000 | 300,425 | ||||||
TransCapitalInvest Ltd. for OJSC AK Transneft | ||||||||
8.700%, 08/07/2018(3) | 1,890,000 | 2,097,899 | ||||||
VIP Finance Ireland Ltd. for OJSC Vimpel Communications | ||||||||
8.375%, 04/30/2013(3) | 1,000,000 | 1,048,800 | ||||||
9.125%, 04/30/2018(3) | 655,000 | 694,300 | ||||||
| 6,125,937 | ||||||||
South Korea - 0.36% | ||||||||
Export-Import Bank of Korea | ||||||||
8.125%, 01/21/2014 | 545,000 | 636,795 | ||||||
Tunisia - 0.46% | ||||||||
Banque Centrale de Tunisie | ||||||||
7.375%, 04/25/2012(9) | 545,000 | 599,500 | ||||||
6.250%, 02/20/2013(9) | EUR | 160,000 | 213,278 | |||||
| 812,778 | ||||||||
Annual Report | May 31, 201
| 15 |
Table of Contents
| Statements of Investments (continued) | ||||
| May 31, 2010 | Emerging Markets Debt Fund | |||
| Interest Rate/Maturity Date | Currency | Principal Amount*/Shares | Market Value (Expressed in U.S. $) | |||||
Venezuela - 2.35% | ||||||||
Petroleos de Venezuela SA | ||||||||
4.900%, 10/28/2014 | $ | 3,170,000 | $ | 1,886,150 | ||||
5.000%, 10/28/2015 | 345,000 | 189,750 | ||||||
5.250%, 04/12/2017 | 3,860,000 | 2,113,350 | ||||||
| 4,189,250 | ||||||||
TOTAL CORPORATE BONDS | 24,962,754 | |||||||
(Amortized Cost $25,422,960) | ||||||||
CREDIT LINKED NOTES - 5.85% | ||||||||
Brazil - 3.09% | ||||||||
Nota Do Tesouro Nacional | ||||||||
10.000%, 05/11/2011(6)(9) | BRL | 750,000 | 353,848 | |||||
10.000%, 01/01/2017(7)(9) | BRL | 600,000 | 295,442 | |||||
10.000%, 01/01/2017(6)(9) | BRL | 7,500,000 | 3,693,026 | |||||
10.000%, 01/01/2021(6)(9) | BRL | 2,450,000 | 1,155,904 | |||||
| 5,498,220 | ||||||||
Indonesia - 2.28% | ||||||||
Republic of Indonesia | ||||||||
11.500%, 09/18/2019(8)(9) | IDR | 3,300,000,000 | 414,259 | |||||
11.000%, 11/16/2020(7)(9) | IDR | 3,100,000,000 | 380,784 | |||||
12.800%, 06/15/2021(6)(9) | IDR | 24,000,000,000 | 3,259,004 | |||||
| 4,054,047 | ||||||||
Russia - 0.48% | ||||||||
Russian Federation | ||||||||
11.200%, 12/17/2014(8)(9) | RUB | 22,500,000 | 856,455 | |||||
TOTAL CREDIT LINKED NOTES | 10,408,722 | |||||||
(Cost $10,347,677) | ||||||||
MONEY MARKET MUTUAL FUNDS - 2.92% | ||||||||
Dreyfus Cash Advantage Plus Fund | ||||||||
(0.151% 7-Day Yield) | 5,194,140 | 5,194,140 | ||||||
TOTAL MONEY MARKET MUTUAL FUNDS | 5,194,140 | |||||||
(Cost $5,194,140) | ||||||||
Total Investments - 97.60% | 173,743,992 | |||||||
(Cost $168,018,686) | ||||||||
| 16 | Stone Harbor Investment Funds® |
Table of Contents
| Statements of Investments (continued) | ||||
| May 31, 2010 | Emerging Markets Debt Fund | |||
Market Value (Expressed in U.S. $) | |||||
Other Assets In Excess of Liabilities - 2.40% | $ | 4,282,038 | |||
Net Assets - 100.00% | $ | 178,026,030 | |||
| * | The principal/contract amount of each security is stated in the currency in which the bond is denominated (U.S. Dollar unless otherwise notated). See below. |
BRL CNY COP EUR IDR ITL JPY MXN MYR RUB ZAR | Brazilian Real Chinese Yuan Colombian Peso Euro Currency Indonesian Rupiah Italian Lira Japanese Yen Mexican Peso Malaysian Ringgit Russian Ruble South Aftrican Rand |
| (1) | Security is currently in default/non-income producing. |
| (2) | Securities were purchased pursuant to Regulation S under the Securities Act of 1933, which exempts securities offered and sold outside of the United States from registration. Such securities cannot be sold in the United States without either an effective registration statement filed pursuant to the Securities Act of 1933, or pursuant to an exemption from registration. These securities have been deemed liquid under guidelines approved by the Fund’s Board of Trustees. As of May 31, 2010, the aggregate market value of those securities was $41,409,348, representing 23.26% of net assets. |
| (3) | Security exempt from registration under Rule 144A of the Securities Act of 1933. Under procedures approved by the Board of Trustees, such securities have been determined to be liquid by the Investment Advisor and may be resold, normally to qualified buyers in transactions exempt from registration. Total market value of Rule 144A securities amounts to $17,579,195, which represents approximately 9.87% of net assets as of May 31, 2010. |
| (4) | Pay-in-kind securities. |
| (5) | Floating or variable rate security. Interest rate disclosed is that which is in effect at May 31, 2010. |
| (6) | The underlying security is issued by JP Morgan Chase. |
| (7) | The underlying security is issued by HSBC Bank. |
| (8) | The underlying security is issued by Barclays Bank PLC. |
| (9) | This security has been valued at its fair value determined in good faith by or under the direction of the Board of Trustees. Total market value of fair valued securities amounts to $11,636,300, which represents approximately 6.54% of net assets as of May 31, 2010. |
Common Abbreviations:
BHD - Berhad is the Malaysian term for public limited company.
BV - Besloten Vennootschap a Dutch private limited liability company.
Ltd. - Limited
OJSC - Open Joint Stock Company.
PLC - Public Limited Co.
PT - Perseroan Terbatas an Indonesian limited liability company.
SA - Generally designates corporations in various countries, mostly those employing the civil law.
| Annual Report | May 31, 2010 | 17 |
Table of Contents
| Statements of Investments (continued) | ||||
| May 31, 2010 | Emerging Markets Debt Fund | |||
OUTSTANDING FORWARD FOREIGN CURRENCY CONTRACTS | ||||||||||||
Contract Description | Contracted Amount | Purchase/Sale Contract | Expiration Date | Value on Settlement Date | Current Value | Unrealized Appreciation/ (Depreciation) | ||||||
EUR | 812,000 (EUR) | Sale | 06/30/2010 | $ 993,888 | $ 996,805 | $ (2,917) | ||||||
JPY | 266,008,000 (JPY) | Sale | 06/30/2010 | 2,939,445 | 2,927,612 | 11,833 | ||||||
| $3,924,417 | $ 8,916 | |||||||||||
CNY | 8,000,000 (CNY) | Purchase | 05/20/2011 | $1,191,842 | $1,185,014 | $ (6,828) | ||||||
CNY | 9,325,510 (CNY) | Purchase | 11/23/2010 | 1,390,000 | 1,373,211 | (16,789) | ||||||
| $2,558,225 | $ (23,617) | |||||||||||
See notes to Financial Statements
| 18 | Stone Harbor Investment Funds® |
Table of Contents
| Statements of Investments | ||||
| May 31, 2010 | High Yield Bond Fund | |||
| Interest Rate/Maturity Date | Principal Amount | Market Value | ||||
CORPORATE BONDS - 91.77% | ||||||
Aerospace/Defense - 1.05% | ||||||
Alliant Techsystems, Inc. | ||||||
6.750%, 04/01/2016 | $ | 915,000 | $ | 905,850 | ||
L-3 Communications Corp. | ||||||
5.875%, 01/15/2015 | 1,100,000 | 1,097,250 | ||||
Series B, 6.375%, 10/15/2015 | 400,000 | 402,000 | ||||
TransDigm, Inc. | ||||||
7.750%, 07/15/2014 | 1,875,000 | 1,879,688 | ||||
| 4,284,788 | ||||||
Automotive - 2.62% | ||||||
American Tire Distributors, Inc. | ||||||
9.750%, 06/01/2017(1) | 950,000 | 942,875 | ||||
Ford Motor Co. | ||||||
7.450%, 07/16/2031 | 1,260,000 | 1,127,700 | ||||
8.900%, 01/15/2032 | 25,000 | 24,000 | ||||
Ford Motor Credit Co. LLC | ||||||
9.875%, 08/10/2011 | 1,425,000 | 1,486,436 | ||||
3.048%, 01/13/2012(2) | 2,850,000 | 2,739,562 | ||||
7.800%, 06/01/2012 | 900,000 | 918,329 | ||||
7.500%, 08/01/2012 | 875,000 | 890,762 | ||||
8.700%, 10/01/2014 | 575,000 | 591,911 | ||||
8.000%, 12/15/2016 | 1,385,000 | 1,389,431 | ||||
TRW Automotive, Inc. | ||||||
8.875%, 12/01/2017(1) | 550,000 | 558,250 | ||||
| 10,669,256 | ||||||
Building Products - 0.84% | ||||||
Associated Materials LLC | ||||||
9.875%, 11/15/2016 | 175,000 | 189,000 | ||||
Goodman Global Group, Inc. | ||||||
12.431%, 12/15/2014(1)(3) | 1,575,000 | 944,999 | ||||
Interface, Inc. | ||||||
Series B, 11.375%, 11/01/2013 | 475,000 | 533,188 | ||||
9.500%, 02/01/2014 | 211,000 | 216,803 | ||||
Interline Brands, Inc. | ||||||
8.125%, 06/15/2014 | 600,000 | 609,000 | ||||
Norcraft Cos. LP | ||||||
10.500%, 12/15/2015(1) | 775,000 | 817,625 | ||||
Norcraft Holdings LP | ||||||
9.750%, 09/01/2012(4) | 137,000 | 125,526 | ||||
| 3,436,141 | ||||||
| Annual Report | | 19 |
Table of Contents
| Statements of Investments (continued) | ||||
| May 31, 2010 | High Yield Bond Fund | |||
Interest Rate/Maturity Date | Principal Amount | Market Value | ||||
Capital Goods - 0.92% | ||||||
The Manitowoc Co., Inc. | ||||||
9.500%, 02/15/2018 | $ | 1,875,000 | $ | 1,851,562 | ||
Maxim Crane Works LP | ||||||
12.250%, 04/15/2015(1) | 550,000 | 558,250 | ||||
SPX Corp. | ||||||
7.625%, 12/15/2014 | 825,000 | 843,563 | ||||
Terex Corp. | ||||||
8.000%, 11/15/2017 | 550,000 | 512,875 | ||||
| 3,766,250 | ||||||
Chemicals - 3.14% | ||||||
Ashland, Inc. | ||||||
9.125%, 06/01/2017 | 1,725,000 | 1,897,500 | ||||
Koppers, Inc. | ||||||
7.875%, 12/01/2019(1) | 1,875,000 | 1,893,750 | ||||
LBI Escrow Corp. | ||||||
8.000%, 11/01/2017(1) | 500,000 | 510,000 | ||||
Lyondell Chemical Co. | ||||||
8.375%, 08/15/2015(1)(6)(7) | 945,000 | 28,350 | ||||
11.000%, 05/01/2018 | 106,669 | 113,602 | ||||
MacDermid, Inc. | ||||||
9.500%, 04/15/2017(1) | 1,875,000 | 1,889,063 | ||||
Nalco Co. | ||||||
8.875%, 11/15/2013 | 530,000 | 541,925 | ||||
8.250%, 05/15/2017 | 1,050,000 | 1,092,000 | ||||
NewMarket Corp. | ||||||
7.125%, 12/15/2016 | 1,405,000 | 1,383,925 | ||||
Nova Chemicals Corp. | ||||||
6.500%, 01/15/2012 | 1,045,000 | 1,050,225 | ||||
8.375%, 11/01/2016 | 2,375,000 | 2,398,750 | ||||
| 12,799,090 | ||||||
Consumer Products - 1.69% | ||||||
Central Garden and Pet Co. | ||||||
8.250%, 03/01/2018 | 1,875,000 | 1,865,624 | ||||
Elizabeth Arden, Inc. | ||||||
7.750%, 01/15/2014 | 1,611,000 | 1,598,918 | ||||
FGI Holding Co., Inc | ||||||
11.250%, 10/01/2015(1)(5) | 550,000 | 548,625 | ||||
Freedom Group, Inc. | ||||||
10.250%, 08/01/2015(1) | 1,650,000 | 1,707,750 | ||||
| 20 | Stone Harbor Investment Funds® |
Table of Contents
| Statements of Investments (continued) | ||||
May 31, 2010 | High Yield Bond Fund | |||
| Interest Rate/Maturity Date | Principal Amount | Market Value | ||||
Consumer Products (con’t) | ||||||
Libbey Glass, Inc. | ||||||
10.000%, 02/15/2015(1) | $ | 1,125,000 | $ | 1,172,813 | ||
| 6,893,730 | ||||||
Containers/Packaging - 2.90% | ||||||
Ball Corp. | ||||||
6.750%, 09/15/2020 | 1,175,000 | 1,148,562 | ||||
Crown Americas LLC | ||||||
7.625%, 11/15/2013 | 158,000 | 161,950 | ||||
7.750%, 11/15/2015 | 605,000 | 618,613 | ||||
7.625%, 05/15/2017(1) | 700,000 | 707,000 | ||||
Greif, Inc. | ||||||
7.750%, 08/01/2019 | 1,625,000 | 1,667,656 | ||||
Owens-Brockway Glass Container, Inc. | ||||||
8.250%, 05/15/2013 | 1,132,000 | 1,151,810 | ||||
6.750%, 12/01/2014 | 425,000 | 428,188 | ||||
7.375%, 05/15/2016 | 400,000 | 409,000 | ||||
Owens-Illinois, Inc. | ||||||
7.800%, 05/15/2018 | 1,675,000 | 1,714,781 | ||||
Radnor Holdings Corp. | ||||||
11.000%, 03/15/2010(6)(7) | 25,000 | 3 | ||||
Reynolds Group, Inc. | ||||||
8.500%, 05/15/2018(1) | 575,000 | 549,125 | ||||
Reynolds Group DL Escrow, Inc. | ||||||
7.750%, 10/15/2016(1) | 1,850,000 | 1,840,749 | ||||
Silgan Holdings, Inc. | ||||||
7.250%, 08/15/2016 | 1,425,000 | 1,446,375 | ||||
| 11,843,812 | ||||||
Drillers/Services - 2.23% | ||||||
Bristow Group, Inc. | ||||||
7.500%, 09/15/2017 | 1,205,000 | 1,174,875 | ||||
Complete Production Services, Inc. | ||||||
8.000%, 12/15/2016 | 1,975,000 | 1,955,250 | ||||
Dresser-Rand Group, Inc. | ||||||
7.375%, 11/01/2014 | 2,230,000 | 2,246,725 | ||||
Hercules Offshore LLC | ||||||
10.500%, 10/15/2017(1) | 1,750,000 | 1,636,250 | ||||
Hornbeck Offshore Services, Inc. | ||||||
8.000%, 09/01/2017 | 1,875,000 | 1,846,875 | ||||
Pioneer Drilling Co. | ||||||
9.875%, 03/15/2018(1) | 250,000 | 248,750 | ||||
| 9,108,725 | ||||||
| Annual Report | May 31, 2010 | 21 |
Table of Contents
| Statements of Investments (continued) | ||||
| May 31, 2010 | High Yield Bound Fund | |||
| Interest Rate/Maturity Date | Principal Amount | Market Value | ||||
Electric - 5.29% | ||||||
The AES Corp. | ||||||
7.750%, 03/01/2014 | $ | 650,000 | $ | 653,250 | ||
7.750%, 10/15/2015 | 850,000 | 847,875 | ||||
9.750%, 04/15/2016(1) | 725,000 | 773,938 | ||||
8.000%, 10/15/2017 | 2,225,000 | 2,197,188 | ||||
8.000%, 06/01/2020 | 325,000 | 316,875 | ||||
Dynegy Holdings, Inc. | ||||||
8.375%, 05/01/2016 | 3,070,000 | 2,548,099 | ||||
7.125%, 05/15/2018 | 500,000 | 362,500 | ||||
7.750%, 06/01/2019 | 460,000 | 334,650 | ||||
7.625%, 10/15/2026 | 25,000 | 16,375 | ||||
Edison Mission Energy | ||||||
7.500%, 06/15/2013 | 55,000 | 49,088 | ||||
7.750%, 06/15/2016 | 1,825,000 | 1,332,250 | ||||
7.000%, 05/15/2017 | 150,000 | 102,188 | ||||
7.200%, 05/15/2019 | 1,540,000 | 1,008,700 | ||||
7.625%, 05/15/2027 | 1,135,000 | 720,725 | ||||
Mirant Americas Generation LLC | ||||||
8.500%, 10/01/2021 | 1,150,000 | 1,058,000 | ||||
Mirant North America LLC | ||||||
7.375%, 12/31/2013 | 1,290,000 | 1,299,675 | ||||
NRG Energy, Inc. | ||||||
7.375%, 02/01/2016 | 2,690,000 | 2,609,299 | ||||
8.500%, 06/15/2019 | 3,075,000 | 2,990,437 | ||||
Texas Competitive Electric Holdings Co. LLC | ||||||
Series A, 10.250%, 11/01/2015(4) | 3,500,000 | 2,362,500 | ||||
| 21,583,612 | ||||||
Environmental Services - 0.46% | ||||||
Browning-Ferris Industries, Inc. | ||||||
9.250%, 05/01/2021 | 35,000 | 42,288 | ||||
Clean Harbors, Inc. | ||||||
7.625%, 08/15/2016 | 1,775,000 | 1,828,250 | ||||
| 1,870,538 | ||||||
Exploration & Production - 11.25% | ||||||
ANR Pipeline Co. | ||||||
7.375%, 02/15/2024 | 60,000 | 68,066 | ||||
7.000%, 06/01/2025 | 10,000 | 10,746 | ||||
Atlas Energy Operating Co. LLC | ||||||
12.125%, 08/01/2017 | 1,600,000 | 1,784,000 | ||||
| 22 | Stone Harbor Investment Funds® |
Table of Contents
| Statements of Investments (continued) | ||||
| May 31, 2010 | High Yield Bound Fund | |||
| Interest Rate/Maturity Date | Principal Amount | Market Value | ||||
Exploration & Production (con’t) | ||||||
Atlas Pipeline Partners LP | ||||||
8.125%, 12/15/2015 | $ | 1,850,000 | $ | 1,757,500 | ||
8.750%, 06/15/2018 | 200,000 | 190,000 | ||||
Chesapeake Energy Corp. | ||||||
7.625%, 07/15/2013 | 1,250,000 | 1,303,125 | ||||
7.000%, 08/15/2014 | 50,000 | 51,187 | ||||
9.500%, 02/15/2015 | 275,000 | 299,063 | ||||
6.375%, 06/15/2015 | 275,000 | 275,688 | ||||
7.250%, 12/15/2018 | 550,000 | 558,250 | ||||
Comstock Resources, Inc. | ||||||
8.375%, 10/15/2017 | 1,500,000 | 1,515,000 | ||||
Copano Energy LLC | ||||||
8.125%, 03/01/2016 | 1,225,000 | 1,188,250 | ||||
7.750%, 06/01/2018 | 675,000 | 644,625 | ||||
Crosstex Energy, Inc. | ||||||
8.875%, 02/15/2018(1) | 1,950,000 | 1,930,500 | ||||
Denbury Resources, Inc. | ||||||
8.250%, 02/15/2020 | 1,346,000 | 1,396,475 | ||||
El Paso Corp. | ||||||
Series GMTN, 7.375%, 12/15/2012 | 125,000 | 131,544 | ||||
8.250%, 02/15/2016 | 125,000 | 130,000 | ||||
7.250%, 06/01/2018 | 1,675,000 | 1,648,813 | ||||
Series GMTN, 7.800%, 08/01/2031 | 2,025,000 | 1,913,957 | ||||
Series GMTN, 7.750%, 01/15/2032 | 150,000 | 141,675 | ||||
Encore Acquisition Co. | ||||||
9.500%, 05/01/2016 | 1,000,000 | 1,065,000 | ||||
EXCO Resources, Inc. | ||||||
7.250%, 01/15/2011 | 850,000 | 851,063 | ||||
Gibson Energy ULC | ||||||
10.000%, 01/15/2018(1) | 975,000 | 957,938 | ||||
Hilcorp Energy I LP | ||||||
7.750%, 11/01/2015(1) | 95,000 | 93,100 | ||||
9.000%, 06/01/2016(1) | 334,000 | 340,680 | ||||
Mariner Energy, Inc. | ||||||
11.750%, 06/30/2016 | 1,375,000 | 1,711,875 | ||||
MarkWest Energy Partners LP | ||||||
6.875%, 11/01/2014 | 250,000 | 240,000 | ||||
Series B, 6.875%, 11/01/2014 | 175,000 | 167,563 | ||||
Series B, 8.500%, 07/15/2016 | 600,000 | 606,000 | ||||
Series B, 8.750%, 04/15/2018 | 850,000 | 862,750 | ||||
Newfield Exploration Co. | ||||||
7.125%, 05/15/2018 | 875,000 | 868,438 | ||||
6.875%, 02/01/2020 | 1,900,000 | 1,843,000 | ||||
| Annual Report | May 31, 2010 | 23 |
Table of Contents
| Statements of Investments (continued) | ||||
| May 31, 2010 | High Yield Bound Fund | |||
Interest Rate/Maturity Date | | Principal Amount | Market Value | |||
Exploration & Production (con’t) | ||||||
NFR Energy LLC | ||||||
9.750%, 02/15/2017(1) | $ | 225,000 | $ | 211,500 | ||
9.750%, 02/15/2017(1) | 1,075,000 | 1,010,500 | ||||
Penn Virginia Corp. | ||||||
10.375%, 06/15/2016 | 1,450,000 | 1,551,500 | ||||
Pioneer Natural Resources Co. | ||||||
6.650%, 03/15/2017 | 3,650,000 | 3,571,130 | ||||
Plains Exploration & Production Co. | ||||||
7.625%, 04/01/2020 | 1,050,000 | 976,500 | ||||
Quicksilver Resources, Inc. | ||||||
8.250%, 08/01/2015 | 850,000 | 833,000 | ||||
11.750%, 01/01/2016 | 700,000 | 766,500 | ||||
Sabine Pass LNG LP | ||||||
7.250%, 11/30/2013 | 2,050,000 | 1,896,250 | ||||
SandRidge Energy, Inc. | ||||||
8.625%, 04/01/2015(5) | 2,200,000 | 2,056,999 | ||||
8.000%, 06/01/2018(1) | 575,000 | 517,500 | ||||
8.750%, 01/15/2020(1) | 700,000 | 637,000 | ||||
Southern Star Central Corp. | ||||||
6.750%, 03/01/2016 | 75,000 | 75,375 | ||||
6.750%, 03/01/2016(1) | 575,000 | 577,875 | ||||
Southern Star Central Gas Pipeline, Inc. | ||||||
6.000%, 06/01/2016(1) | 500,000 | 507,500 | ||||
Southern Union Co. | ||||||
8.250%, 11/15/2029 | 1,625,000 | 1,858,423 | ||||
Targa Resources Partners LP | ||||||
11.250%, 07/15/2017(1) | 850,000 | 918,000 | ||||
The Williams Cos., Inc. | ||||||
7.875%, 09/01/2021 | 1,184,000 | 1,371,086 | ||||
| 45,882,509 | ||||||
Financial/Lease - 2.59% | ||||||
CB Richard Ellis Services, Inc. | ||||||
11.625%, 06/15/2017 | 1,675,000 | 1,876,000 | ||||
E*Trade Financial Corp. | ||||||
12.500%, 11/30/2017(5)(7) | 1,620,000 | 1,703,991 | ||||
GMAC LLC | ||||||
7.250%, 03/02/2011 | 79,000 | 79,691 | ||||
6.875%, 09/15/2011 | 237,000 | 238,185 | ||||
6.000%, 12/15/2011 | 244,000 | 242,475 | ||||
7.000%, 02/01/2012 | 1,004,000 | 1,007,765 | ||||
6.625%, 05/15/2012 | 66,000 | 65,670 | ||||
8.000%, 11/01/2031 | 2,050,000 | 1,875,750 | ||||
| 24 | Stone Harbor Investment Funds® |
Table of Contents
| Statements of Investments (continued) | ||||
| May 31, 2010 | High Yield Bond Fund | |||
Interest Rate/Maturity Date | Principal Amount | Market Value | ||||
Financial/Lease (con’t) | ||||||
Provident Funding Associates | ||||||
10.250%, 04/15/2017(1) | $ | 1,775,000 | $ | 1,775,000 | ||
SSI Investments II | ||||||
11.125%, 06/01/2018(1) | 1,700,000 | 1,683,000 | ||||
| 10,547,527 | ||||||
Food/Beverage/Tobacco - 3.69% | ||||||
Constellation Brands, Inc. | ||||||
8.375%, 12/15/2014 | 1,500,000 | 1,567,500 | ||||
7.250%, 09/01/2016 | 1,995,000 | 1,995,000 | ||||
7.250%, 05/15/2017 | 400,000 | 398,000 | ||||
Cott Beverages, Inc. | ||||||
8.375%, 11/15/2017(1) | 900,000 | 911,250 | ||||
Dean Foods Co. | ||||||
7.000%, 06/01/2016 | 2,225,000 | 2,055,343 | ||||
Del Monte Corp. | ||||||
6.750%, 02/15/2015 | 100,000 | 100,750 | ||||
7.500%, 10/15/2019(1) | 1,225,000 | 1,252,563 | ||||
Dole Food Co., Inc. | ||||||
8.750%, 07/15/2013 | 1,125,000 | 1,153,125 | ||||
13.875%, 03/15/2014 | 691,000 | 801,560 | ||||
Pinnacle Foods Finance LLC | ||||||
9.250%, 04/01/2015(1) | 275,000 | 275,688 | ||||
9.250%, 04/01/2015 | 1,550,000 | 1,553,875 | ||||
10.625%, 04/01/2017 | 400,000 | 413,000 | ||||
Reynolds American, Inc. | ||||||
7.625%, 06/01/2016 | 1,155,000 | 1,263,640 | ||||
Smithfield Foods, Inc. | ||||||
10.000%, 07/15/2014(1) | 1,225,000 | 1,317,641 | ||||
| 15,058,935 | ||||||
Gaming - 2.74% | ||||||
Ameristar Casinos, Inc. | ||||||
9.250%, 06/01/2014 | 1,625,000 | 1,673,750 | ||||
Great Canadian Gaming Corp. | ||||||
7.250%, 02/15/2015(1) | 1,000,000 | 967,500 | ||||
MGM Mirage | ||||||
6.750%, 09/01/2012 | 1,525,000 | 1,414,438 | ||||
11.125%, 11/15/2017(1) | 800,000 | 870,000 | ||||
9.000%, 03/15/2020(1) | 875,000 | 881,563 | ||||
Pinnacle Entertainment, Inc. | ||||||
7.500%, 06/15/2015 | 2,605,000 | 2,435,674 | ||||
8.625%, 08/01/2017(1) | 775,000 | 786,625 | ||||
| Annual Report | May 31,2010 | 25 |
Table of Contents
| Statements of Investments (continued) | ||||
| May 31, 2010 | High Yield Bond Fund | |||
Interest Rate/Maturity Date | Principal Amount | Market Value | ||||
Gaming (con’t) | ||||||
Seneca Gaming Corp. | ||||||
7.250%, 05/01/2012 | $ | 720,000 | $ | 711,000 | ||
Series B, 7.250%, 05/01/2012 | 630,000 | 622,125 | ||||
Wynn Las Vegas LLC | ||||||
7.875%, 11/01/2017(1) | 825,000 | 820,875 | ||||
| 11,183,550 | ||||||
Gas Distributors - 1.37% | ||||||
Inergy LP | ||||||
6.875%, 12/15/2014 | 50,000 | 49,250 | ||||
8.750%, 03/01/2015 | 900,000 | 922,500 | ||||
8.250%, 03/01/2016 | 750,000 | 761,250 | ||||
Niska Gas Storage | ||||||
8.875%, 03/15/2018(1) | 1,900,000 | 1,919,000 | ||||
Regency Energy Partners LP | ||||||
9.375%, 06/01/2016(1) | 1,850,000 | 1,933,250 | ||||
| 5,585,250 | ||||||
Healthcare - 9.49% | ||||||
American Renal Holdings, Inc. | ||||||
8.375%, 05/15/2018(1) | 900,000 | 879,750 | ||||
Community Health Systems, Inc. | ||||||
8.875%, 07/15/2015 | 3,950,000 | 4,053,687 | ||||
DaVita, Inc. | ||||||
7.250%, 03/15/2015 | 4,620,000 | 4,619,999 | ||||
HCA, Inc. | ||||||
6.300%, 10/01/2012 | 1,250,000 | 1,234,375 | ||||
6.750%, 07/15/2013 | 875,000 | 850,938 | ||||
9.125%, 11/15/2014 | 210,000 | 221,550 | ||||
9.250%, 11/15/2016 | 2,200,000 | 2,310,000 | ||||
9.625%, 11/15/2016(5) | 2,013,000 | 2,123,715 | ||||
Healthsouth Corp. | ||||||
10.750%, 06/15/2016 | 650,000 | 705,250 | ||||
8.125%, 02/15/2020 | 3,425,000 | 3,339,375 | ||||
IASIS Healthcare LLC | ||||||
8.750%, 06/15/2014 | 1,900,000 | 1,909,500 | ||||
Inverness Medical Innovations, Inc. | ||||||
7.875%, 02/01/2016(1) | 200,000 | 193,000 | ||||
7.875%, 02/01/2016 | 1,150,000 | 1,109,750 | ||||
9.000%, 05/15/2016 | 1,625,000 | 1,604,687 | ||||
Mylan, Inc. | ||||||
7.875%, 07/15/2020(1) | 1,350,000 | 1,358,438 | ||||
| 26 | Stone Harbor Investment Funds® |
Table of Contents
| Statements of Investments (continued) | ||||
| May 31, 2010 | High Yield Bond Fund | |||
Interest Rate/Maturity Date | Principal Amount | Market Value | ||||
Healthcare (con’t) | ||||||
Psychiatric Solutions, Inc. | ||||||
7.750%, 07/15/2015 | $ | 1,375,000 | $ | 1,416,250 | ||
7.750%, 07/15/2015 | 1,105,000 | 1,138,150 | ||||
Radiation Therapy Services, Inc. | ||||||
9.875%, 04/15/2017(1) | 2,000,000 | 1,950,000 | ||||
Surgical Care Affiliates, Inc. | ||||||
8.875%, 07/15/2015(1)(5) | 984,000 | 969,240 | ||||
10.000%, 07/15/2017(1) | 1,000,000 | 987,500 | ||||
United Surgical Partners International, Inc. | ||||||
8.875%, 05/01/2017 | 125,000 | 125,625 | ||||
9.250%, 05/01/2017(5) | 1,220,000 | 1,216,950 | ||||
Vanguard Health Holding Co. II LLC | ||||||
8.000%, 02/01/2018 | 4,625,000 | 4,416,875 | ||||
| 38,734,604 | ||||||
Industrial Other - 0.88% | ||||||
RBS Global, Inc. | ||||||
8.500%, 05/01/2018(1) | 3,125,000 | 2,984,375 | ||||
Sensus Metering Systems, Inc. | ||||||
8.625%, 12/15/2013 | 600,000 | 594,000 | ||||
| 3,578,375 | ||||||
Leisure - 1.52% | ||||||
AMC Entertainment, Inc. | ||||||
8.000%, 03/01/2014 | 50,000 | 49,750 | ||||
11.000%, 02/01/2016 | 565,000 | 581,950 | ||||
Cinemark USA, Inc. | ||||||
8.625%, 06/15/2019 | 1,775,000 | 1,801,625 | ||||
Marquee Holdings, Inc. | ||||||
9.505%, 08/15/2014(4) | 2,490,000 | 2,041,800 | ||||
Regal Cinemas Corp. | ||||||
8.625%, 07/15/2019 | 1,700,000 | 1,734,000 | ||||
| 6,209,125 | ||||||
Lodging - 0.50% | ||||||
Host Hotels & Resorts LP - REIT | ||||||
Series O, 6.375%, 03/15/2015 | 75,000 | 73,688 | ||||
Series Q, 6.750%, 06/01/2016 | 625,000 | 615,625 | ||||
9.000%, 05/15/2017(1) | 1,000,000 | 1,065,000 | ||||
Starwood Hotels & Resorts Worldwide, Inc. | ||||||
7.875%, 10/15/2014 | 250,000 | 268,125 | ||||
| 2,022,438 | ||||||
| Annual Report | May 31,2010 | 27 |
Table of Contents
| Statements of Investments (continued) | ||||
| May 31, 2010 | High Yield Bond Fund | |||
| Interest Rate/Maturity Date | Principal Amount | Market Value | ||||
Media Cable - 5.59% | ||||||
Atlantic Broadband Finance LLC | ||||||
9.375%, 01/15/2014 | $ | 985,000 | $ | 999,775 | ||
Cablevision Systems Corp. | ||||||
8.625%, 09/15/2017(1) | 925,000 | 934,250 | ||||
7.750%, 04/15/2018 | 525,000 | 515,812 | ||||
8.000%, 04/15/2020 | 750,000 | 742,500 | ||||
Cequel Communications Holdings | ||||||
8.625%, 11/15/2017(1) | 1,175,000 | 1,139,750 | ||||
Charter Communications Operating LLC | ||||||
8.000%, 04/30/2012(1)(6) | 475,000 | 498,156 | ||||
CSC Holdings, Inc. | ||||||
8.500%, 04/15/2014(1) | 200,000 | 209,000 | ||||
8.500%, 06/15/2015(1) | 1,700,000 | 1,768,000 | ||||
7.625%, 07/15/2018 | 325,000 | 329,875 | ||||
8.625%, 02/15/2019(1) | 475,000 | 497,563 | ||||
DISH DBS Corp. | ||||||
7.000%, 10/01/2013 | 475,000 | 484,500 | ||||
6.625%, 10/01/2014 | 650,000 | 641,875 | ||||
7.750%, 05/31/2015 | 1,450,000 | 1,464,500 | ||||
7.125%, 02/01/2016 | 960,000 | 945,600 | ||||
7.875%, 09/01/2019 | 1,700,000 | 1,725,500 | ||||
Mediacom LLC | ||||||
9.125%, 08/15/2019(1) | 500,000 | 497,500 | ||||
Rainbow National Services LLC | ||||||
8.750%, 09/01/2012(1) | 200,000 | 203,000 | ||||
Unitymedia Hesson Gmbtt & Co. | ||||||
8.125%, 12/01/2017(1) | 125,000 | 123,125 | ||||
UPC Holding BV | ||||||
9.875%, 04/15/2018(1) | 1,750,000 | 1,776,250 | ||||
Videotron Ltee | ||||||
6.875%, 01/15/2014 | 1,770,000 | 1,770,000 | ||||
6.375%, 12/15/2015 | 685,000 | 657,600 | ||||
9.125%, 04/15/2018 | 1,225,000 | 1,316,875 | ||||
Virgin Media Finance PLC | ||||||
9.125%, 08/15/2016 | 2,125,000 | 2,159,531 | ||||
Series 1, 9.500%, 08/15/2016 | 1,100,000 | 1,133,000 | ||||
8.375%, 10/15/2019 | 275,000 | 275,688 | ||||
| 22,809,225 | ||||||
| 28 | Stone Harbor Investment Funds® |
Table of Contents
| Statements of Investments (continued) | ||||
| May 31, 2010 | High Yield Bond Fund | |||
| Interest Rate/Maturity Date | Principal Amount | Market Value | ||||
Media Other - 1.86% | ||||||
Bonten Media Acquisition Co. | ||||||
9.000%, 06/01/2015(1)(5) | $ | 467,446 | $ | 276,377 | ||
Fox Acquisition Sub LLC | ||||||
13.375%, 07/15/2016(1) | 965,000 | 938,463 | ||||
Interep National Radio Sales, Inc. | ||||||
Series B, 10.000%, 07/01/2008(6)(7) | 4,000 | – | ||||
Lamar Media Corp. | ||||||
6.625%, 08/15/2015 | 710,000 | 678,050 | ||||
Series B, 6.625%, 08/15/2015 | 1,680,000 | 1,587,600 | ||||
Series C, 6.625%, 08/15/2015 | 200,000 | 189,000 | ||||
Radio One, Inc. | ||||||
Series B, 8.875%, 07/01/2011 | 865,000 | 797,963 | ||||
6.375%, 02/15/2013 | 1,550,000 | 1,317,500 | ||||
Sinclair Television Group, Inc. | ||||||
8.000%, 03/15/2012 | 1,825,000 | 1,806,750 | ||||
| 7,591,703 | ||||||
Metals/Mining/Steel - 2.30% | ||||||
Arch Coal, Inc. | ||||||
8.750%, 08/01/2016(1) | 875,000 | 896,875 | ||||
Arch Western Finance LLC | ||||||
6.750%, 07/01/2013(2) | 1,550,000 | 1,538,374 | ||||
Cloud Peak Energy Resources LLC | ||||||
8.250%, 12/15/2017(1) | 400,000 | 397,000 | ||||
8.500%, 12/15/2019(1) | 1,450,000 | 1,450,000 | ||||
Consol Energy, Inc. | ||||||
8.000%, 04/01/2017(1) | 1,175,000 | 1,199,969 | ||||
8.250%, 04/01/2020(1) | 800,000 | 821,000 | ||||
Drummond Co., Inc. | ||||||
9.000%, 10/15/2014(1) | 325,000 | 325,000 | ||||
7.375%, 02/15/2016 | 1,475,000 | 1,412,313 | ||||
Peabody Energy Corp. | ||||||
5.875%, 04/15/2016 | 900,000 | 886,500 | ||||
7.875%, 11/01/2026 | 425,000 | 444,125 | ||||
| 9,371,156 | ||||||
Paper/Forest Products - 1.69% | ||||||
Boise Paper Holdings LLC | ||||||
8.000%, 04/01/2020(1) | 2,000,000 | 2,025,000 | ||||
Buckeye Technologies, Inc. | ||||||
8.500%, 10/01/2013 | 558,000 | 570,555 | ||||
Annual Report | May 31, 201
| 29 |
Table of Contents
| Statements of Investments (continued) | ||||
| May 31, 2010 | High Yield Bond Fund | |||
Interest Rate/Maturity Date | Principal Amount | Market Value | ||||
Paper/Forest Products (con’t) | ||||||
Georgia-Pacific LLC | ||||||
8.250%, 05/01/2016(1) | $ | 275,000 | $ | 287,375 | ||
7.125%, 01/15/2017(1) | 575,000 | 575,000 | ||||
Graphic Packaging International, Inc. | ||||||
9.500%, 08/15/2013 | 1,160,000 | 1,186,100 | ||||
9.500%, 06/15/2017 | 2,155,000 | 2,251,975 | ||||
| 6,896,005 | ||||||
Publishing/Printing - 1.52% | ||||||
Baker & Taylor, Inc. | ||||||
11.500%, 07/01/2013(1) | 1,295,000 | 966,394 | ||||
CanWest Media, Inc. | ||||||
8.000%, 09/15/2012 | 361,654 | 366,174 | ||||
Cenveo Corp. | ||||||
7.875%, 12/01/2013 | 1,025,000 | 999,375 | ||||
8.375%, 06/15/2014 | 650,000 | 596,375 | ||||
10.500%, 08/15/2016(1) | 350,000 | 352,188 | ||||
8.875%, 02/01/2018(1) | 500,000 | 488,750 | ||||
Deluxe Corp. | ||||||
7.375%, 06/01/2015 | 870,000 | 865,650 | ||||
Dex One Corp. | ||||||
12.000%, 01/29/2017(5) | 15,236 | 14,855 | ||||
IDEARC, Inc. | ||||||
8.000%, 11/15/2016(6)(7) | 1,265,000 | – | ||||
Neilsen Finance LLC | ||||||
10.000%, 08/01/2014 | 1,525,000 | 1,557,406 | ||||
| 6,207,167 | ||||||
Refining - 0.61% | ||||||
Petroplus Finance Ltd. | ||||||
6.750%, 05/01/2014(1) | 1,585,000 | 1,434,425 | ||||
7.000%, 05/01/2017(1) | 925,000 | 781,625 | ||||
9.375%, 09/15/2019(1) | 300,000 | 277,500 | ||||
| 2,493,550 | ||||||
Restaurants - 0.04% | ||||||
Sbarro, Inc. | ||||||
10.375%, 02/01/2015 | 225,000 | 174,375 | ||||
| 30 | Stone Harbor Investment Funds® |
Table of Contents
| Statements of Investments (continued) | ||||
| May 31, 2010 | High Yield Bond Fund | |||
| Interest Rate/Maturity Date | Principal Amount | Market Value | ||||
Retail Food/Drug - 0.78% | ||||||
Albertsons, Inc. | ||||||
8.000%, 05/01/2031 | $ | 50,000 | $ | 43,750 | ||
American Stores Co. | ||||||
7.900%, 05/01/2017 | 550,000 | 523,875 | ||||
8.000%, 06/01/2026 | 1,465,000 | 1,267,225 | ||||
Series MTNB, 7.100%, 03/20/2028 | 600,000 | 477,000 | ||||
SUPERVALU, Inc. | ||||||
7.500%, 11/15/2014 | 350,000 | 355,250 | ||||
8.000%, 05/01/2016 | 500,000 | 495,000 | ||||
| 3,162,100 | ||||||
Retail Non Food/Drug - 4.94% | ||||||
Claire’s Stores, Inc. | ||||||
9.625%, 06/01/2015(5) | 1,646,984 | 1,432,876 | ||||
10.500%, 06/01/2017 | 425,000 | 359,125 | ||||
Express LLC | ||||||
8.750%, 03/01/2018(1) | 1,300,000 | 1,316,250 | ||||
JC Penney Corp., Inc. | ||||||
7.400%, 04/01/2037 | 1,475,000 | 1,522,938 | ||||
Limited Brands, Inc. | ||||||
8.500%, 06/15/2019 | 1,175,000 | 1,257,250 | ||||
7.000%, 05/01/2020 | 1,075,000 | 1,075,000 | ||||
6.950%, 03/01/2033 | 1,350,000 | 1,181,250 | ||||
7.600%, 07/15/2037 | 400,000 | 372,000 | ||||
Macy’s Retail Holdings, Inc. | ||||||
6.900%, 01/15/2032 | 175,000 | 164,938 | ||||
7.875%, 08/15/2036 | 525,000 | 500,062 | ||||
Michaels Stores, Inc. | ||||||
10.000%, 11/01/2014 | 1,625,000 | 1,675,781 | ||||
11.375%, 11/01/2016 | 1,800,000 | 1,860,750 | ||||
Neiman-Marcus Group, Inc. | ||||||
9.000%, 10/15/2015(5) | 1,652,116 | 1,621,139 | ||||
10.375%, 10/15/2015 | 1,200,000 | 1,188,000 | ||||
QVC, Inc. | ||||||
7.125%, 04/15/2017(1) | 500,000 | 488,750 | ||||
7.500%, 10/01/2019(1) | 1,400,000 | 1,372,000 | ||||
Toys R Us Property Co. I LLC | ||||||
10.750%, 07/15/2017(1) | 2,500,000 | 2,781,250 | ||||
| 20,169,359 | ||||||
Annual Report | May 31, 2010
| 31 |
Table of Contents
| Statements of Investments (continued) | ||||
| May 31, 2010 | High Yield Bond Fund | |||
| Interest Rate/Maturity Date | Principal Amount | Market Value | ||||
Satellite - 1.23% | ||||||
Hughes Network Systems LLC | ||||||
9.500%, 04/15/2014 | $ | 75,000 | $ | 75,000 | ||
9.500%, 04/15/2014 | 1,560,000 | 1,560,000 | ||||
Intelsat Corp. | ||||||
9.250%, 06/15/2016 | 500,000 | 515,000 | ||||
Intelsat Intermediate Holding Co. SA | ||||||
9.500%, 02/01/2015(4) | 275,000 | 280,500 | ||||
Intelsat Jackson Holdings SA | ||||||
9.500%, 06/15/2016 | 900,000 | 931,500 | ||||
11.250%, 06/15/2016 | 600,000 | 636,000 | ||||
8.500%, 11/01/2019(1) | 1,025,000 | 1,025,000 | ||||
| 5,023,000 | ||||||
Services Other - 4.52% | ||||||
American Residential Services LLC | ||||||
12.000%, 04/15/2015(1) | 500,000 | 497,500 | ||||
ARAMARK Corp. | ||||||
8.500%, 02/01/2015 | 3,870,000 | 3,879,674 | ||||
Corrections Corp. of America | ||||||
6.750%, 01/31/2014 | 1,450,000 | 1,455,438 | ||||
7.750%, 06/01/2017 | 1,725,000 | 1,789,688 | ||||
Education Management LLC | ||||||
8.750%, 06/01/2014 | 1,200,000 | 1,219,500 | ||||
10.250%, 06/01/2016 | 215,000 | 228,975 | ||||
The Geo Group, Inc. | ||||||
7.750%, 10/15/2017(1) | 2,300,000 | 2,302,875 | ||||
GXS Worldwide, Inc. | ||||||
9.750%, 06/15/2015(1) | 1,900,000 | 1,790,750 | ||||
Iron Mountain, Inc. | ||||||
7.750%, 01/15/2015 | 1,000,000 | 1,010,000 | ||||
8.750%, 07/15/2018 | 1,710,000 | 1,761,300 | ||||
8.000%, 06/15/2020 | 375,000 | 374,063 | ||||
8.375%, 08/15/2021 | 325,000 | 331,500 | ||||
The ServiceMaster Co. | ||||||
10.750%, 07/15/2015(1)(5) | 1,675,000 | 1,683,375 | ||||
7.450%, 08/15/2027 | 175,000 | 132,125 | ||||
| 18,456,763 | ||||||
Technology - 0.85% | ||||||
Xerox Capital Trust I | ||||||
8.000%, 02/01/2027 | 3,445,000 | 3,447,236 | ||||
| 32 | Stone Harbor Investment Funds® |
Table of Contents
| Statements of Investments (continued) | ||||
| May 31, 2010 | High Yield Bond Fund | |||
Interest Rate/Maturity Date | Principal Amount | Market Value | ||||
Textile/Apparel - 0.90% | ||||||
Levi Strauss & Co. | ||||||
8.875%, 04/01/2016 | $ | 1,200,000 | $ | 1,251,000 | ||
7.625%, 05/15/2020(1) | 925,000 | 906,500 | ||||
Quiksilver, Inc. | ||||||
6.875%, 04/15/2015 | 1,700,000 | 1,496,000 | ||||
| 3,653,500 | ||||||
Transport Other - 0.86% | ||||||
General Maritime Corp. | ||||||
12.000%, 11/15/2017(1) | 1,775,000 | 1,828,250 | ||||
Navios Maritime Holdings, Inc. | ||||||
9.500%, 12/15/2014 | 630,000 | 615,825 | ||||
8.875%, 11/01/2017(1) | 1,050,000 | 1,065,750 | ||||
| 3,509,825 | ||||||
Wireless - 3.75% | ||||||
Crown Castle International Corp. | ||||||
9.000%, 01/15/2015 | 2,525,000 | 2,667,031 | ||||
7.125%, 11/01/2019 | 100,000 | 97,500 | ||||
MetroPCS Wireless, Inc. | ||||||
9.250%, 11/01/2014 | 175,000 | 179,375 | ||||
9.250%, 11/01/2014 | 2,690,000 | 2,784,150 | ||||
Nextel Communications, Inc. | ||||||
Series D, 7.375%, 08/01/2015 | 3,475,000 | 3,292,562 | ||||
SBA Telecommunications, Inc. | ||||||
8.000%, 08/15/2016(1) | 625,000 | 646,875 | ||||
8.250%, 08/15/2019(1) | 700,000 | 733,250 | ||||
Sprint Capital Corp. | ||||||
8.750%, 03/15/2032 | 2,775,000 | 2,657,063 | ||||
Wind Acquisition Finance SA | ||||||
11.750%, 07/15/2014(1) | 1,325,000 | 1,358,125 | ||||
12.250%, 07/15/2017(1)(5) | 950,000 | 897,750 | ||||
| 15,313,681 | ||||||
Wirelines - 5.16% | ||||||
Cincinnati Bell, Inc. | ||||||
8.250%, 10/15/2017 | 975,000 | 923,813 | ||||
Citizens Communications Co. | ||||||
7.875%, 01/15/2027 | 125,000 | 115,000 | ||||
9.000%, 08/15/2031 | 3,880,000 | 3,676,299 | ||||
| Annual Report | May 31,2010 | 33 |
Table of Contents
| Statements of Investments (continued) | ||||
| May 31, 2010 | High Yield Bond Fund | |||
| Interest Rate/Maturity Date | Principal Amount | Market Value | ||||
Wirelines (con’t) | ||||||
Embarq Corp. | ||||||
7.995%, 06/01/2036 | $ | 1,975,000 | $ | 1,996,219 | ||
ITC Deltacom, Inc. | ||||||
10.500%, 04/01/2016(1) | 2,025,000 | 1,954,125 | ||||
Level 3 Financing, Inc. | ||||||
9.250%, 11/01/2014 | 1,040,000 | 951,600 | ||||
4.140%, 02/15/2015(2) | 350,000 | 271,250 | ||||
10.000%, 02/01/2018(1) | 2,550,000 | 2,256,750 | ||||
Qwest Communications International, Inc. | ||||||
Series B, 7.500%, 02/15/2014 | 875,000 | 866,250 | ||||
7.125%, 04/01/2018(1) | 1,975,000 | 1,935,500 | ||||
Qwest Corp. | ||||||
7.500%, 10/01/2014 | 1,050,000 | 1,110,375 | ||||
7.500%, 06/15/2023 | 425,000 | 414,375 | ||||
6.875%, 09/15/2033 | 2,550,000 | 2,346,000 | ||||
Windstream Corp. | ||||||
8.625%, 08/01/2016 | 1,000,000 | 995,000 | ||||
7.875%, 11/01/2017 | 1,325,000 | 1,255,438 | ||||
| 21,067,994 | ||||||
TOTAL CORPORATE BONDS | 374,404,894 | |||||
(Amortized Cost $360,664,282) | ||||||
CONVERTIBLE CORPORATE BONDS - 0.00%(8) | ||||||
Aerospace/Defense - 0.00%(8) | ||||||
L-3 Communications Holdings, Inc. | ||||||
3.000%, 08/01/2035(1) | 15,000 | 15,244 | ||||
TOTAL CONVERTIBLE CORPORATE BONDS | 15,244 | |||||
(Amortized Cost $16,202) | ||||||
BANK LOANS - 2.38%(9) | ||||||
Aerospace/Defense - 0.08% | ||||||
Sequa Corp. - Term Loan | ||||||
3.510%, 06/08/2010 | 11,385 | 10,450 | ||||
3.480%, 06/15/2010 | 9,829 | 9,022 | ||||
3.550%, 07/01/2010 | 316,382 | 290,393 | ||||
| 309,865 | ||||||
| 34 | Stone Harbor Investment Funds® |
Table of Contents
| Statements of Investments (continued) | ||||
| May 31, 2010 | High Yield Bond Fund | |||
Interest Rate/Maturity Date | Principal Amount | Market Value | ||||
Automotive - 0.24% | ||||||
Ford Motor Co. - Tranche B-1 Term Loan | ||||||
3.340%, 06/15/2010 | $ | 553,535 | $ | 518,148 | ||
3.310%, 07/15/2010 | 496,629 | 464,880 | ||||
| 983,028 | ||||||
Building Products - 0.04% | ||||||
Collins & Aikman Floorcoverings, Inc. - Loan | ||||||
2.754%, 06/10/2010 | 146,939 | 131,509 | ||||
2.798%, 07/13/2010 | 31,095 | 27,830 | ||||
2.804%, 07/19/2010 | 18,367 | 16,439 | ||||
2.853%, 08/06/2010 | 3,569 | 3,195 | ||||
| 178,973 | ||||||
Electric - 0.81% | ||||||
Texas Competitive Holdings Co. LLC Initial Tranche B-2 Term Loan | ||||||
3.797%, 06/10/2010 | 357,220 | 276,016 | ||||
3.790%, 06/30/2010 | 32,723 | 25,285 | ||||
3.874%, 08/10/2010 | 1,589,406 | 1,228,101 | ||||
4.066%, 11/10/2010 | 2,274,649 | 1,757,574 | ||||
| 3,286,976 | ||||||
Financial/Lease - 0.22% | ||||||
American General Finance Co. - Loan. | ||||||
7.250%, 06/21/2010 | 925,000 | 899,331 | ||||
Gaming - 0.51% | ||||||
Harrah’s Operating Co., Inc. - Term B-2 Loan | ||||||
3.316%, 07/26/2010 | 2,475,000 | 2,077,673 | ||||
Media Other - 0.13% | ||||||
Citadel Broadcasting Corp. - Tranche B Term Loan | ||||||
2.110%, 06/30/2010 | 411,888 | 402,277 | ||||
Univision Communications, Inc. - Initial Term Loan | ||||||
2.540%, 06/30/2010 | 148,107 | 127,673 | ||||
| 529,950 | ||||||
Publishing/Printing - 0.13% | ||||||
Merrill Communications LLC - Loan (Second Lien) | ||||||
14.750%, 06/30/2010 | 150,000 | 120,000 | ||||
15.000%, 07/30/2010 | 2,529 | 2,023 | ||||
| Annual Report | May 31,2010 | 35 |
Table of Contents
| Statements of Investments (continued) | ||||
| May 31, 2010 | High Yield Bond Fund | |||
Interest Rate/Maturity Date | Principal Amount | Market Value | ||||
Publishing/Printing (con’t) | ||||||
RH Donnelley, Inc. - Loan | ||||||
9.250%, 06/30/2010 | $ | 28,580 | $ | 26,972 | ||
9.250%, 07/30/2010 | 135,389 | 127,773 | ||||
9.250%, 08/31/2010 | 137,484 | 129,751 | ||||
Tribune Co. - Tranche X Advance | ||||||
5.000%, 06/30/2010 | 192,000 | 115,440 | ||||
| 521,959 | ||||||
Retail Non Food/Drug - 0.22% | ||||||
Claire’s Stores, Inc. - Term B Loan | ||||||
3.040%, 06/30/2010 | 346,438 | 292,632 | ||||
Michaels Stores, Inc. - B-1 Term Loan | ||||||
2.563%, 06/30/2010 | 179,747 | 164,276 | ||||
2.625%, 07/30/2010 | 5,446 | 4,977 | ||||
2.688%, 08/10/2010 | 174,503 | 159,484 | ||||
2.688%, 08/16/2010 | 93,625 | 85,566 | ||||
2.813%, 08/25/2010 | 212,664 | 194,360 | ||||
| 901,295 | ||||||
TOTAL BANK LOANS | 9,689,050 | |||||
(Amortized Cost $9,285,790) | ||||||
COMMON STOCKS - 0.37% | ||||||
Chemicals - 0.02% | ||||||
LyondellBasell Industries NV(10) | 4,658 | 82,773 | ||||
Media Cable - 0.28% | ||||||
Charter Communications, Inc.(10) | 31,035 | 1,117,259 | ||||
Publishing/Printing—0.07% | ||||||
Dex One Corp.(10) | 12,498 | 255,959 | ||||
SuperMedia, Inc.(10) | 998 | 30,070 | ||||
| 286,029 | ||||||
TOTAL COMMON STOCKS | 1,486,061 | |||||
(Cost $4,147,172) | ||||||
| 36 | Stone Harbor Investment Funds® |
Table of Contents
| Statements of Investments (continued) | ||||
| May 31, 2010 | High Yield Bond Fund | |||
Interest Rate/Maturity Date | Principal Amount/Shares | Market Value | ||||
RIGHTS AND WARRANTS - 0.00% | ||||||
Publishing/Printing - 0.00% | ||||||
Readers Digest, expires 02/19/2014(7) | $ | 1,498 | $ | 0 | ||
TOTAL RIGHTS AND WARRANTS | 0 | |||||
(Cost $408,688) | ||||||
MONEY MARKET MUTUAL FUNDS - 3.36% | ||||||
Dreyfus Cash Advantage Plus Fund | ||||||
(0.151% 7-Day Yield) | 13,702,620 | 13,702,620 | ||||
TOTAL MONEY MARKET MUTUAL FUNDS | 13,702,620 | |||||
(Cost $13,702,620) | ||||||
Total Investments - 97.88% | $ | 399,297,869 | ||||
(Cost $388,224,754) | ||||||
Other Assets in Excess of Liabilities - 2.12% | 8,666,591 | |||||
Net Assets - 100.00% | $ | 407,964,460 | ||||
| (1) | Security exempt from registration under Rule 144A of the Securities Act of 1933. Under procedures approved by the Board of Trustees, such securities have been determined to be liquid by the Investment Advisor and may be resold, normally to qualified buyers in transactions exempt from registration. Total market value of Rule 144A securities amounts to $98,806,917, which represents approximately 24.22% of net assets as of May 31, 2010. |
| (2) | Floating or variable rate security. Interest rate disclosed is that which is in effect at May 31, 2010. (3) Zero coupon bond reflects effective yield on the date of purchase. |
| (4) | Step bond. Coupon increases periodically based upon a predetermined schedule. Interest rate disclosed is that which is in effect at May 31, 2010. |
| (5) | Pay-in-kind securities. |
| (6) | Security is currently in default/non-income producing. |
| (7) | This security has been valued at its fair value determined in good faith by or under the direction of the Board of Trustees. Total market value of fair valued securities amounts to $2,630,436, which represents approximately 0.64% of net assets as of May 31, 2010. |
| (8) | Amount represents less than 0.005% of net assets. |
| Annual Report | May 31,2010 | 37 |
Table of Contents
| Statements of Investments (continued) | ||||
| May 31, 2010 | High Yield Bond Fund | |||
| (9) | Bank loans generally pay interest at rates which are periodically determined by reference to a base lending rate plus a premium. All loans carry a variable rate of interest. These base lending rates are generally (i) the Prime Rate offered by one or more major United States banks, (ii) the lending rate offered by one or more European banks such as the London Interbank Offered Rate (“LIBOR”) or (iii) the Certificate of Deposit rate. Rate shown represents the weighted average rate at May 31, 2010. Bank Loans, while exempt from registration, under the Securities Act of 1933 (the “1933 Act”), contain certain restrictions on resale and cannot be sold publicly. Floating rate bank loans often require prepayments from excess cash flow or permit the borrower to repay at its election. The degree to which borrowers repay, whether as a contractual requirement or at their election, cannot be predicted with accuracy. As a result, the actual remaining maturity may be substantially less than the stated maturity shown. |
| (10) | Non-income producing security. |
Common Abbreviations:
BV - Besloten Vennootschap a Dutch private limited liability company.
LLC - Limited Liability Corp.
LP - Limited Partnership.
Ltd.-Limited.
NV - Naamloze Vennootschap is the Dutch term for a public limited liability corporation.
PLC - Public Limited Co.
REIT - Real Estate Investment Trust.
SA -Generally designates corporations in various countries, mostly those employing the civil law.
ULC - Unlimited Liability Corp.
See Notes to Financial Statements
| 38 | Stone Harbor Investment Funds® |
Table of Contents
| Statements of Assets & Liabilities | ||||
| May 31, 2010 | ||||
Stone Harbor Debt Fund | Stone Harbor High Yield Bond Fund | ||||||
ASSETS | |||||||
Investments, at value(1) | $ | 173,743,992 | $ | 399,297,869 | |||
Cash | 85,407 | 3,215 | |||||
Foreign currency, at value (Cost $33,747) | 33,990 | – | |||||
Receivable for investments sold | 7,464,597 | 1,893 | |||||
Receivable for fund shares sold | 1,440,000 | 4,116,836 | |||||
Interest receivable | 3,534,440 | 8,924,345 | |||||
Prepaid and other assets | 8,116 | 22,995 | |||||
Total Assets | 186,310,542 | 412,367,153 | |||||
LIABILITIES | |||||||
Payable for investments purchased | 7,929,659 | 3,697,866 | |||||
Unrealized depreciation on forward foreign currency contracts | 14,701 | – | |||||
Distributions payable | 137,655 | 427,069 | |||||
Payable to advisor | 81,064 | 134,520 | |||||
Payable to administrator | 13,554 | 33,227 | |||||
Payable for trustee fees | 7,244 | 7,244 | |||||
Other payables | 100,635 | 102,767 | |||||
Total Liabilities | 8,284,512 | 4,402,693 | |||||
Net Assets | $ | 178,026,030 | $ | 407,964,460 | |||
NET ASSETS CONSIST OF | |||||||
Paid-in capital | $ | 167,511,127 | $ | 395,506,646 | |||
Undistributed/(overdistributed) net investment income | 278,613 | (95,135 | ) | ||||
Accumulated net realized gain on investments and translation of assets and liabilities denominated in foreign currency | 4,535,229 | 1,479,834 | |||||
Net unrealized appreciation on investments and translation of assets and liabilities denominated in foreign currency | 5,701,061 | 11,073,115 | |||||
Net Assets | $ | 178,026,030 | $ | 407,964,460 | |||
PRICING OF SHARES | |||||||
Institutional Class Shares | |||||||
Net Assets | $ | 178,026,030 | $ | 407,964,460 | |||
Shares of beneficial interest outstanding (unlimited number of shares, par value of $0.001 per share authorized) | 16,992,367 | 43,581,412 | |||||
Net assets value, offering and redemption price per share | $ | 10.48 | $ | 9.36 | |||
(1) Cost of Investments | $ | 168,018,686 | $ | 388,224,754 | |||
See Notes to Financial Statements
| Annual Report | May 31,2010 | 39 |
Table of Contents
| Statements of Operations | ||||
| For the Year Ended May 31, 2010 | ||||
| Stone Harbor Emerging Markets Debt Fund | Stone Harbor High Yield Bond Fund | |||||||
INVESTMENT INCOME | ||||||||
Interest (net of foreign withholding tax of $961 on Stone Harbor Emerging Markets Debt Fund) | $ | 8,852,885 | $ | 30,068,244 | ||||
Other Income | – | 522,218 | ||||||
Total Investment Income | 8,852,885 | 30,590,462 | ||||||
EXPENSES | ||||||||
Investment advisory fee | 703,989 | 1,761,796 | ||||||
Administration fee | 105,330 | 319,672 | ||||||
Custodian fees | 43,963 | 27,965 | ||||||
Audit fees | 68,289 | 68,289 | ||||||
Printing fees | 6,575 | 6,506 | ||||||
Legal fees | 68,403 | 67,961 | ||||||
Trustee fees | 20,990 | 20,990 | ||||||
Transfer agent fees | 22,892 | 24,230 | ||||||
Registration fees | 13,865 | 18,939 | ||||||
Insurance fees | 9,142 | 30,637 | ||||||
Other | 2,622 | 4,663 | ||||||
Total expenses before waiver | 1,066,060 | 2,351,648 | ||||||
Less fees waived by investment advisor | (185,906 | ) | (413,671 | ) | ||||
Total Net Expenses | 880,154 | 1,937,977 | ||||||
Net Investment Income | 7,972,731 | 28,652,485 | ||||||
REALIZED AND UNREALIZED GAIN ON INVESTMENTS | ||||||||
Net realized gain on: | ||||||||
Investments | 10,931,284 | 5,807,602 | ||||||
Foreign currency transactions | 688,192 | – | ||||||
Net realized gain | 11,619,476 | 5,807,602 | ||||||
Change in unrealized appreciation on: | ||||||||
Investments | 1,860,275 | 25,039,605 | ||||||
Translation of assets and liabilities denominated in foreign currencies | 29,478 | – | ||||||
Net change | 1,889,753 | 25,039,605 | ||||||
Net Realized and Unrealized Gain on Investments | 13,509,229 | 30,847,207 | ||||||
Net Increase in Net Assets Resulting from Operations | $ | 21,481,960 | $ | 59,499,692 | ||||
See Notes to Financial Statements
| 40 | Stone Harbor Investment Funds® |
Table of Contents
| Statements of Changes in Net Assets | ||||
| STONE HARBOR EMERGING MARKETS DEBT FUND | ||||
| For the Year Ended May 31, 2010 | For the Year Ended May 31, 2009 | |||||||
OPERATIONS | ||||||||
Net investment income | $ | 7,972,731 | $ | 3,740,570 | ||||
Net realized gain/(loss) on investments | 11,619,476 | (5,220,508 | ) | |||||
Net change in unrealized appreciation on investments and foreign currency translations | 1,889,753 | 3,631,081 | ||||||
Net increase in net assets resulting from operations | 21,481,960 | 2,151,143 | ||||||
DISTRIBUTIONS TO SHAREHOLDERS | ||||||||
From net investment income | (8,618,487 | ) | (3,008,908 | ) | ||||
From net realized gains on investments | (1,703,347 | ) | – | |||||
Net decrease in net assets from distributions to shareholders | (10,321,834 | ) | (3,008,908 | ) | ||||
CAPITAL SHARE TRANSACTIONS | ||||||||
Institutional Class Shares | ||||||||
Proceeds from sale of shares | 120,511,062 | 72,248,655 | ||||||
Issued to shareholders in reinvestment of distributions | 9,893,837 | 2,948,631 | ||||||
Cost of shares redeemed | (55,291,995 | ) | (2,173,927 | ) | ||||
Net increase in net assets from capital share transactions | 75,112,904 | 73,023,359 | ||||||
Net Increase in Net Assets | 86,273,030 | 72,165,594 | ||||||
Net Assets | ||||||||
Beginning of period | 91,753,000 | 19,587,406 | ||||||
End of period (including undistributed net investment income of $278,613 and $63,457, respectively) | $ | 178,026,030 | $ | 91,753,000 | ||||
OTHER INFORMATION | ||||||||
Share Transactions: | ||||||||
Institutional Class Shares | ||||||||
Beginning shares | 9,952,470 | 1,894,363 | ||||||
Shares sold | 11,360,440 | 7,950,246 | ||||||
Shares reinvested | 955,219 | 344,206 | ||||||
Shares redeemed | (5,275,762 | ) | (236,345 | ) | ||||
Shares outstanding-end of period | 16,992,367 | 9,952,470 | ||||||
See Notes to Financial Statements
| Annual Report | May 31,2010 | 41 |
Table of Contents
| Statements of Changes in Net Assets | ||||
| STONE HARBOR HIGH YIELD BOND FUND |
| For the Year Ended May 31, 2010 | For the Year Ended May 31, 2009 | |||||||
OPERATIONS | ||||||||
Net investment income | $ | 28,652,485 | $ | 11,528,807 | ||||
Net realized gain/(loss) on investments | 5,807,602 | (3,443,983 | ) | |||||
Net change in unrealized appreciation/(depreciation) on investments and foreign currency translations | 25,039,605 | (12,603,307 | ) | |||||
Net increase/(decrease) in net assets resulting from operations | 59,499,692 | (4,518,483 | ) | |||||
DISTRIBUTIONS TO SHAREHOLDERS | ||||||||
From net investment income | (28,484,852 | ) | (11,426,115 | ) | ||||
Net decrease in net assets from distributions to shareholders | (28,484,852 | ) | (11,426,115 | ) | ||||
CAPITAL SHARE TRANSACTIONS | ||||||||
Institutional Class Shares | ||||||||
Proceeds from sale of shares | 168,548,608 | 131,188,255 | ||||||
Issued to shareholders in reinvestment of distributions | 26,880,125 | 9,950,073 | ||||||
Cost of shares redeemed | (41,688,947 | ) | (8,895,972 | ) | ||||
Net increase in net assets from capital share transactions | 153,739,786 | 132,242,356 | ||||||
Net Increase in Net Assets | 184,754,626 | 116,297,758 | ||||||
Net Assets | ||||||||
Beginning of period | 223,209,834 | 106,912,076 | ||||||
End of period (including (overdistributed) net investment income of $(95,135) and $(135,044), respectively) | $ | 407,964,460 | $ | 223,209,834 | ||||
OTHER INFORMATION | ||||||||
Share Transactions: | ||||||||
Institutional Class Shares | ||||||||
Beginning shares | 26,613,415 | 10,776,299 | ||||||
Shares sold | 18,456,848 | 15,634,751 | ||||||
Shares reinvested | 2,893,977 | 1,246,011 | ||||||
Shares redeemed | (4,382,828 | ) | (1,043,646 | ) | ||||
Shares outstanding-end of period | 43,581,412 | 26,613,415 | ||||||
See Notes to Financial Statements
| 42 | Stone Harbor Investment Funds® |
Table of Contents
| Financial Highlights* | ||||
| For a share outstanding through the periods presented | ||||
Institutional Class Shares | For the Year Ended May 31, 2010 | For the Year Ended May 31, 2009 | For the Period August 16, 2007 (Inception) to May 31, 2008 | |||||||||
Net asset value - beginning of period | $ | 9.22 | $ | 10.34 | $ | 10.00 | ||||||
Income/(loss) from investment operations | ||||||||||||
Net investment income | 0.75 | 0.59 | 0.46 | |||||||||
Net realized and unrealized gain/(loss) on investments | 1.44 | (1.18 | ) | 0.58 | ||||||||
Total income/(loss) from investment operations | 2.19 | (0.59 | ) | 1.04 | ||||||||
Less distributions to common shareholders | ||||||||||||
From net investment income | (0.79 | ) | (0.53 | ) | (0.54 | ) | ||||||
From net realized gain on investments | (0.14 | ) | – | (0.16 | ) | |||||||
From tax return of capital | – | – | (0.00 | )(1) | ||||||||
Total distributions | (0.93 | ) | (0.53 | ) | (0.70 | ) | ||||||
Net Increase/(Decrease) in Net Asset Value | 1.26 | (1.12 | ) | 0.34 | ||||||||
Net asset value - end of period | $ | 10.48 | $ | 9.22 | $ | 10.34 | ||||||
Total Return (2)(3) | 24.25 | % | (5.10 | )% | 10.46 | % | ||||||
RATIOS/SUPPLEMENTAL DATA: | ||||||||||||
Net assets, end of period (in thousands) | $ | 178,026 | $ | 91,753 | $ | 19,587 | ||||||
Ratio of expenses to average net assets with fee waivers/reimbursements | 0.75 | % | 0.75 | % | 0.75 | %** | ||||||
Ratio of expenses to average net assets without fee waivers/reimbursements | 0.91 | % | 1.33 | % | 2.27 | %** | ||||||
Ratio of net investment income to average net assets with fee waivers/reimbursements | 6.80 | % | 9.32 | % | 5.91 | %** | ||||||
Portfolio Turnover Rate | 125 | % | 84 | % | 143 | % | ||||||
| * | The amount shown for a share outstanding throughout the period may not correlate with the Statement of Operations for the period due to the timing of sales and repurchase of the Fund Shares in relation to income earned and/or fluctuating market value of the investment of the Fund. |
| ** | Annualized. |
| (1) | Less than $(0.005) per share. |
| (2) | Total returns would have been lower had various fees and expenses not been waived and reimbursed during the period. |
| (3) | Total returns for periods of less than one year are not annualized. |
See Notes to Financial Statements
| Annual Report | May 31, 2010 | 43 |
Table of Contents
| Financial Highlights* | ||||
| For a share outstanding through the periods presented | ||||
Institutional Class Shares | For the Year Ended May 31, 2010 | For the Year Ended May 31, 2009 | For the Period August 16, 2007 (Inception) to May 31, 2008 | |||||||||
Net asset value - beginning of period | $ | 8.39 | $ | 9.92 | $ | 10.00 | ||||||
Income/(loss) from investment operations | ||||||||||||
Net investment income | 0.73 | 0.70 | 0.58 | |||||||||
Net realized and unrealized gain/(loss) on investments | 0.96 | (1.53 | ) | (0.08 | ) | |||||||
Total income/(loss) from investment operations | 1.69 | (0.83 | ) | 0.50 | ||||||||
Less distributions to common shareholders | ||||||||||||
From net investment income | (0.72 | ) | (0.70 | ) | (0.57 | ) | ||||||
From net realized gain on investments | – | – | (0.01 | ) | ||||||||
From tax return of capital | – | – | (0.00 | )(1) | ||||||||
Total distributions | (0.72 | ) | (0.70 | ) | (0.58 | ) | ||||||
Net Increase/(Decrease) in Net Asset Value | 0.97 | (1.53 | ) | (0.08 | ) | |||||||
Net asset value - end of period | $ | 9.36 | $ | 8.39 | $ | 9.92 | ||||||
Total Return (2)(3) | 20.53 | % | (7.77 | )% | 5.09 | % | ||||||
RATIOS/SUPPLEMENTAL DATA: | ||||||||||||
Net assets, end of period (in thousands) | $ | 407,964 | $ | 223,210 | $ | 106,912 | ||||||
Ratio of expenses to average net assets with fee waivers/reimbursements | 0.55 | % | 0.55 | % | 0.55 | %** | ||||||
Ratio of expenses to average net assets without fee waivers/reimbursements | 0.67 | % | 0.88 | % | 1.21 | %** | ||||||
Ratio of net investment income to average net assets with fee waivers/reimbursements | 8.13 | % | 9.07 | % | 7.81 | %** | ||||||
Portfolio Turnover Rate | 36 | % | 16 | % | 11 | % | ||||||
| * | The amount shown for a share outstanding throughout the period may not correlate with the Statement of Operations for the period due to the timing of sales and repurchase of the Fund Shares in relation to income earned and/or fluctuating market value of the investment of the Fund. |
| ** | Annualized. |
| (1) | Less than $(0.005) per share. |
| (2) | Total returns would have been lower had various fees and expenses not been waived and reimbursed during the period. |
| (3) | Total returns for periods of less than one year are not annualized. |
See Notes to Financial Statements
| 44 | Stone Harbor Investment Funds® |
Table of Contents
| Notes to Financial Statements | ||||
| May 31, 2010 | ||||
| 1. ORGANIZATION AND SIGNIFICANT ACCOUNTING POLICIES |
Stone Harbor Investment Funds, which consist of Stone Harbor Emerging Markets Debt Fund and Stone Harbor High Yield Bond Fund (each, a Fund and together, the “Funds”) is a Massachusetts business trust, organized on February 20, 2007 and registered under the Investment Company Act of 1940, as amended (the “1940 Act”), as an open-end management investment company. Each Fund is a non-diversified portfolio with an investment objective to maximize total return. Shares of each Fund are currently divided into two classes, designated Institutional Class Shares and Distributor Class Shares. As of the date of this report, there were no outstanding shares for the Distributor Class of each Fund. The Declaration of Trust permits the Trustees to create additional funds and share classes.
The following is a summary of significant accounting policies consistently followed by the Funds in the preparation of their financial statements. The policies are in conformity with accounting principles generally accepted in the United States of America (“GAAP”). The preparation of the financial statements in accordance with GAAP requires management to make estimates and assumptions that affect the reported amounts of assets and liabilities at the date of the financial statements and the reported amounts of income and expenses during the reporting period. Actual results could differ from those estimates.
(a) Investment Valuation: Debt securities, bank loans and linked notes are valued at the mean between the bid and asked prices provided by an independent pricing service that are based on transactions in debt obligations, quotations from dealers, market transactions in comparable securities and various other relationships between securities. Equity securities for which market quotations are available are valued at the last sale price or official closing price on the primary market or exchange on which they trade. Publicly traded foreign government debt securities are typically traded internationally in the over-the-counter market, and are valued at the mean between the bid and asked prices as of the close of business of that market. When prices are not readily available, or are determined not to reflect fair value, such as when the value of a security has been significantly affected by events after the close of the exchange or market on which the security is principally traded, but before the Funds calculate their net asset value, the Funds may value these investments at fair value as determined in accordance with the procedures approved by the Funds’ Board of Trustees. Short-term obligations with maturities of 60 days or less are valued at amortized cost, which approximates market value. Available cash is invested into a money market fund by the custodian.
A three-tier hierarchy has been established for fair value measurements based on the extent of the use of “observable inputs” as compared to “unobservable inputs” and requires additional disclosures about these valuation measurements. Inputs refer broadly to the assumptions that the market participants would use in pricing a security. Observable inputs are inputs that reflect the assumptions market participants would use in pricing the security developed based on market data obtained from sources independent of the reporting entity. Unobservable inputs are inputs that reflect the reporting entity’s own assumptions about the assumptions market participants would use in pricing the security developed based on the best information available in the circumstances.
The three-tier hierarchy is summarized as follows:
Level 1 | – | quoted and unadjusted prices in active markets for identical investments | ||
Level 2 | – | other significant observable inputs (including quoted prices for similar investments, interest rates, prepayment speeds, credit risk, etc.) | ||
Level 3 | – | significant unobservable inputs (including the Funds’ own assumptions in determining the fair value of investments) | ||
| Annual Report | May 31,2010 | 45 |
Table of Contents
| Notes to Financial Statements (continued) | ||||
| May 31, 2010 | ||||
The following is a summary of the inputs used as of May 31, 2010 in valuing the Funds’ investments
Stone Harbor Emerging Markets Debt Fund
Assets: | ||||||||||||
Investments in Securities at Value* | Level 1 - Quoted Prices in Active Market for Identical Assets | Level 2 - Other Significant Observable Inputs | Level 3 - Significant Unobservable Inputs | Total | ||||||||
Sovereign Debt | ||||||||||||
Obligations | $ | – | $ | 132,763,576 | $ | 414,800 | $ | 133,178,376 | ||||
Corporate Bonds | – | 24,149,976 | 812,778 | 24,962,754 | ||||||||
Credit Linked | ||||||||||||
Notes | – | – | 10,408,722 | 10,408,722 | ||||||||
Money Market | ||||||||||||
Mutual Funds | – | 5,194,140 | – | 5,194,140 | ||||||||
TOTAL | $ | – | $ | 162,107,692 | $ | 11,636,300 | $ | 173,743,992 | ||||
Liabilities: | ||||||||||||
Other Financial Instruments at Value | ||||||||||||
Derivative | ||||||||||||
Instruments** | $ | – | $ | 14,701 | $ | – | $ | 14,701 | ||||
TOTAL | $ | – | $ | 14,701 | $ | – | $ | 14,701 | ||||
| * | For detailed Industry descriptions, see the accompanying Statement of Investments. |
| ** | Derivative instruments are forward foreign currency contracts held at May 31, 2010. |
Stone Harbor High Yield Bond Fund
Assets: | ||||||||||||
Investments in Securities at Value* | Level 1 - Quoted Prices in Active Market for Identical Assets | Level 2 - Other Significant Observable Inputs | Level 3 - Significant Unobservable Inputs | Total | ||||||||
Corporate Bonds | $ | – | $ | 372,174,394 | $ | 2,230,500 | $ | 374,404,894 | ||||
Convertible | ||||||||||||
Corporate Bonds | – | 15,244 | – | 15,244 | ||||||||
Bank Loans | – | 9,289,114 | 399,936 | 9,689,050 | ||||||||
Common Stocks | 1,486,061 | – | – | 1,486,061 | ||||||||
Money Market | ||||||||||||
Mutual Funds | – | 13,702,620 | – | 13,702,620 | ||||||||
TOTAL | $ | 1,486,061 | $ | 395,181,372 | $ | 2,630,436 | $ | 399,297,869 | ||||
| * | For detailed Industry descriptions, see the accompanying Statement of Investments. |
| 46 | Stone Harbor Investment Funds® |
Table of Contents
| Notes to Financial Statements (continued) | ||||
| May 31, 2010 | ||||
The following is a reconciliation of assets in which significant unobservable inputs (Level 3) were used in determining fair value:
Stone Harbor Emerging Markets Debt Fund
Investments in Securities | Balance as of May 31, 2009 | Realized Gain | Change In Unrealized Appreciation | Net Purchases/ (Sales) | Transfers in and/or (out) of Level 3 | Balance as of May 31, 2010 | |||||||||||||||
Sovereign | |||||||||||||||||||||
Debt | |||||||||||||||||||||
Obligations | $ | – | $ | – | $ | 11,840 | $ | 93,960 | $ | 309,000 | $ | 414,800 | |||||||||
Corporate | |||||||||||||||||||||
Bonds | – | – | (18,105 | ) | 231,383 | 599,500 | 812,778 | ||||||||||||||
Credit | |||||||||||||||||||||
Linked Notes | – | – | 61,045 | 10,347,677 | – | 10,408,722 | |||||||||||||||
TOTAL | $ | – | $ | – | $ | 54,780 | $ | 10,673,020 | $ | 908,500 | $ | 11,636,300 | |||||||||
Stone Harbor High Yield Bond Fund | |||||||||||||||||||||
Investments in Securities | Balance as of May 31, 2009 | Realized Gain** | Change In Unrealized Appreciation** | Net Purchases/ (Sales) | Transfers in and/or (out) of Level 3 | Balance as of May 31, 2010 | |||||||||||||||
Corporate | |||||||||||||||||||||
Bonds | $ | 1,042,064 | $ | 46,577 | $ | 2,797,032 | $ | 993,631 | $ | (2,648,804 | ) | $ | 2,230,500 | ||||||||
Bank Loans | 312,000 | 26,184 | 37,537 | (91,225 | ) | 115,440 | 399,936 | ||||||||||||||
TOTAL | $ | 1,354,064 | $ | 72,761 | $ | 2,834,569 | $ | 902,406 | $ | (2,533,364 | ) | $ | 2,630,436 | ||||||||
| ** | Realized gain and change in unrealized appreciation are included in the related amounts on investments in the statement of operations. |
The inputs or methodology used for valuing securities are not necessarily an indication of the risk associated with investing in those securities.
(b) Security Transactions and Investment Income: Security transactions are accounted for on a trade date basis. Interest income, adjusted for amortization of premium and accretion of discount, is recorded on the accrual basis. Dividend income is recorded on the ex-dividend date. Foreign dividend income is recorded on the ex-dividend date or as soon as practical after the Funds determine the existence of a dividend declaration after exercising reasonable due diligence. The cost of investments sold is determined by use of the specific identification method. To the extent any issuer defaults on an expected interest payment, the Funds’ policy is to generally halt any additional interest income accruals and consider the realizability of interest accrued up to the date of default.
(c) Foreign Currency Translation: Investment securities and other assets and liabilities denominated in foreign currencies are translated into U.S. dollar amounts based upon prevailing exchange rates on the date of valuation. Purchases and sales of investment securities and income and expense items denominated in foreign currencies are translated into U.S. dollar amounts based upon prevailing exchange rates on the respective dates of such transactions.
| Annual Report | May 31,2010 | 47 |
Table of Contents
| Notes to Financial Statements (continued) | ||||
| May 31, 2010 | ||||
The resultant exchange gains and losses are recorded as realized and unrealized gain/loss on foreign exchange transactions. Pursuant to U.S. federal income tax regulations, certain foreign exchange gains/losses included in realized and unrealized gain/loss are included in or are a reduction of ordinary income for federal income tax purposes. The Funds do not isolate that portion of the results of operations arising as a result of changes in the foreign exchange rates from the changes in the market prices of the securities.
(d) Foreign Securities: The Funds may directly purchase securities of foreign issuers. Investing in securities of foreign issuers involves special risks not typically associated with investing in securities of U.S. issuers. The risks include possible revaluation of currencies, the ability to repatriate funds, less complete financial information about companies and possible future adverse political and economic developments. Moreover, securities of many foreign issuers and their markets may be less liquid and their prices more volatile than those of securities of comparable U.S. issuers.
(e) Risk Exposure and the Use of Derivative Instruments: The Funds’ investment objectives not only permit the Funds to purchase investment securities, they also allow the Funds to enter in various types of derivatives contracts. In doing so, the Funds will employ strategies in differing combinations to permit them to increase, decrease, or change the level or types of exposure to market factors. Central to those strategies are features inherent in derivatives that make them more attractive for this purpose than equity or debt securities; they require little or no initial cash investment, they can focus exposure on only certain selected risk factors, and they may not require the ultimate receipt or delivery of the underlying security (or securities) to the contract. This may allow the Funds to pursue their objectives more quickly and efficiently than if they were to make direct purchases or sales of securities capable of effecting a similar response to market factors.
Market Risk Factors. In pursuit of its investment objectives, the Fund’s may seek to use derivatives to increase or decrease its exposure to the following market risk factors:
Interest Rate Risk. Interest rate risk refers to the fluctuations in value of fixed-income securities resulting from the inverse relationship between price and yield. For example, an increase in general interest rates will tend to reduce the make value of already issued fixed-income investments, and a decline in general interest rates will tend to increase their value. In addition, debt securities with longer maturities, which tend to have higher yields, are subject to potentially greater fluctuations in value from changes in interest rates than obligations with shorter maturities.
Credit Risk. Credit risk relates to the ability of the issuer to meet interest and principal payments, or both, as they come due. In general, lower-grade, higher-yield bonds are subject to credit risk to a greater extent than lower-yield, higher-quality bonds.
Foreign Exchange Rate Risk. Foreign exchange rate risk relates to the change in the U.S. dollar value of a security held that is denominated in a foreign currency. The U.S. dollar value of a foreign currency denominated security will decrease as the dollar appreciates against the currency, while the U.S. dollar value will decrease as the dollar depreciates against the currency.
Equity Risk. Equity risk relates to the change in value of equity securities as they relate to increases or decreases in the general market.
Risk of Investing in Derivatives. The Funds’ use of derivatives can result in losses due to unanticipated changes in the market risk factors and the overall market. In instances where the Funds are using derivatives to decrease, or hedge, exposures to market risk factors for securities held by the
| 48 | Stone Harbor Investment Funds® |
Table of Contents
| Notes to Financial Statements (continued) | ||||
| May 31, 2010 | ||||
Funds, there are also risks that those derivatives may not perform as expected resulting in losses for the combined or hedged positions.
Derivatives may have little or no initial cash investment relative to their market value exposure and therefore can produce significant gains or losses in excess of their cost. This use of embedded leverage allows the Fund to increase its market value exposure relative to it net assets and can substantially increase the volatility of the Funds’ performance.
Additional associated risks from investing in derivatives also exist and potentially could have significant effects on the valuation of the derivative and the Funds. Typically, the associated risks are not the risks that the Funds is attempting to increase or decrease exposure to, per their investment objectives, but are the additional risks from investing in derivatives.
Example of these associated risks are liquidity risk, which is the risk that the Funds will not be able to sell the derivative in the open market in a timely manner, and counterparty credit risk, which is the risk that the counterparty will not fulfill its obligation to the Funds. Associated risks can be different for each type of derivative and are discussed by each derivative type in the notes that follow.
Forward Foreign Currency Contracts: The Funds may engage in currency transactions with coun-terparties to hedge the value of portfolio securities denominated in particular currencies against fluctuations in relative value, to gain or reduce exposure to certain currencies, or to generate income or gains. A forward foreign currency contract is an agreement between two parties to buy and sell a currency at a set price on a future date. The contract is marked-to-market daily and the change in value is recorded by the Funds as an unrealized gain or loss. When a forward foreign currency contract is extinguished, through either delivery or offset by entering into another forward foreign currency contract, the Funds record a realized gain or loss equal to the difference between the value of the contract at the time it was opened and the value of the contract at the time it was extinguished.
Forward foreign currency contracts involve elements of market risk in excess of the amounts reflected in the Statements of Assets and Liabilities. The Funds bear the risk of an unfavorable change in the foreign exchange rate underlying the forward foreign currency contract. Risks may also arise upon entering into these contracts from the potential inability of the counterparties to meet the terms of their contracts.
Credit Default Swaps: The Funds may enter into credit default swap contracts for hedging purposes, to gain market exposure or to add leverage to their portfolios. When used for hedging purposes, a Fund would be the buyer of a credit default swap contract. In that case, the Fund would be entitled to receive the par (or other agreed-upon) value of a referenced debt obligation, index or other investment from the counterparty to the contract in the event of a default by a third party, such as a U.S. or foreign issuer, on the referenced debt obligation. In return, the Fund would pay to the counterparty a periodic stream of payments over the term of the contract provided that no event of default has occurred. If no default occurs, the Fund would have spent the stream of payments and received no benefit from the contract. When the Fund is the seller of a credit default swap contract, it receives the stream of payments but is obligated to pay upon default of the referenced debt obligation. As the seller, the Fund would effectively add leverage to its portfolio because, in addition to its total assets, the Fund would be subject to investment exposure on the notional amount of the swap.
In addition to the risks applicable to derivatives generally, credit default swaps involve special risks because they are difficult to value, are highly susceptible to liquidity and credit risk, and generally pay a return to the party that has paid the premium only in the event of an actual default by the issuer of the underlying obligation, as opposed to a credit downgrade or other indication of financial difficulty.
| Annual Report | May 31,2010 | 49 |
Table of Contents
| Notes to Financial Statements (continued) | ||||
| May 31, 2010 | ||||
No swaps were held in the Funds as of May 31, 2010.
The effect of derivative instruments on the Balance Sheet as of May 31, 2010 is as follows:
Stone Harbor Emerging Markets Debt Fund
| Asset Derivatives | Liability Derivatives | ||||||||
Derivatives not accounted for as hedging instruments | Location | Fair Value | Location | Fair Value | |||||
| Unrealized depreciation | |||||||||
Foreign | on forward foreign | ||||||||
Exchange Contracts | – | – | currency contracts | $ | 14,701 | ||||
Total | – | – | $ | 14,701 | |||||
The effect of derivatives instruments on the Statement of Operations for the year ended May 31, 2010 is as follows:
Derivatives not accounted for as hedging instruments | Location | Realized Gain On Derivatives Recognized in Income | Change in Unrealized Gain On Derivatives Recognized in Income | |||||
Foreign Exchange Contracts | Net realized gain on Foreign currency transactions/Change in unrealized appreciation on translation of assets and liabilities denominated in foreign currencies | $ | 250,916 | $ | 66,233 | |||
Total | $ | 250,916 | $ | 66,233 | ||||
(f) Loan Participations: The High Yield Bond Portfolio may invest in loans arranged through private negotiation between one or more financial institutions. The Fund’s investment in any such loan may be in the form of a participation in or an assignment of the loan. In connection with purchasing participations, the Fund generally will have no right to enforce compliance by the borrower with the terms of the loan agreement relating to the loan, nor any rights of set-off against the borrower and the Fund may not benefit directly from any collateral supporting the loan in which it has purchased the participation.
The Fund assumes the credit risk of the borrower, the lender that is selling the participation and any other persons interpositioned between the Fund and the borrower. In the event of the insolvency of the lender selling the participation, the Fund may be treated as a general creditor of the lender and may not benefit from any set-off between the lender and the borrower.
| 50 | Stone Harbor Investment Funds® |
Table of Contents
| Notes to Financial Statements (continued) | ||||
| May 31, 2010 | ||||
(g) Credit and Market Risk: The Funds invest in high yield and emerging market instruments that are subject to certain credit and market risks. The yields of high yield and emerging market debt obligations reflect, among other things, perceived credit and market risks. The Funds’ investment in securities rated below investment grade typically involves risks not associated with higher rated securities including, among others, greater risk related to timely and ultimate payment of interest and principal, greater market price volatility and less liquid secondary market trading. The consequences of political, social, economic or diplomatic changes may have disruptive effects on the market prices of investments held by the Funds. The Funds’ investment in non-dollar denominated securities may also result in foreign currency losses caused by devaluations and exchange rate fluctuations.
(h) Distributions to Shareholders: Dividends and distributions to shareholders, which are determined in accordance with income tax regulations, are recorded on the ex-date. Income distribu-tions, if any are declared and paid on a quarterly basis. Capital gain distributions, if any, are declared and paid at least annually.
(i) Classifications of Distributions: Net investment income (loss) and net realized gain (loss) may differ for financial statement and tax purposes. The character of distributions made during the year from net investment income or net realized gains may differ from its ultimate characterization for federal income tax purposes. Also, due to the timing of dividend distributions, the fiscal year in which amounts are distributed may differ from the fiscal year in which the income or realized gain was recorded by a Fund.
The tax character of the distributions paid by the Funds during the year ended May 31, 2010, was as follows:
Stone Harbor Emerging Markets Debt Fund | Stone Harbor High Yield Bond Fund | |||||
Ordinary Income | $ 10,321,834 | $ 28,484,852 |
As of May 31, 2010, the components of distributable earnings on a tax basis were as follows:
Stone Harbor Emerging Markets Debt Fund | Stone Harbor High Yield Bond Fund | |||||
Undistributed Ordinary Income | $ 2,739,372 | $ 1,853,773 | ||||
Accumulated Capital Gains | 2,551,314 | – | ||||
Unrealized Appreciation | 5,347,171 | 10,047,152 | ||||
Cumulative Effect of Other Timing Differences* | (122,954) | (427,069) | ||||
| $ 10,514,903 | $ 11,473,856 |
| * | Other temporary differences due to timing, consist primarily of mark-to-market under section 1256 of the Internal Revenue Code and dividends payable. |
The tax components of distributable earnings are determined in accordance with income tax regu-lations which may differ from the composition of net assets reported under accounting principles generally accepted in the United States. Accordingly, for the period ended May 31, 2010, certain differences were reclassified. These differences were primarily due to the differing tax treatment of certain investments and the amounts reclassified did not affect net assets.
| Annual Report | May 31,2010 | 51 |
Table of Contents
| Notes to Financial Statements (continued) | ||||
| May 31, 2010 | ||||
The reclassifications were as follows:
Stone Harbor Emerging Markets Debt Fund | Stone Harbor High Yield Bond Fund | |||
Paid-in Capital | $ – | $ 361,097 | ||
(Over)/Undistributed Income | $ 860,912 | $ (127,724) | ||
Accumulated Net Realized Losses | $ (860,912) | $ (233,373) | ||
(j) Expenses: Direct expenses are charged to the Funds; general expenses of the Series are al-located to the Funds based on each Fund’s relative net assets.
(k) Federal and Other Taxes: No provision for income taxes is included in the accompanying financial statements, as the Funds intend to distribute to shareholders all taxable investment income and realized gains and otherwise comply with Subchapter M of the Internal Revenue Code applicable to regulated investment companies.
The Funds evaluate tax positions taken (or expected to be taken) in the course of preparing the Funds’ tax returns to determine whether these positions meet a “more-likely-than-not” standard that, based on the technical merits, have a more than fifty percent likelihood of being sustained by a taxing authority upon examination. A tax position that meets the “more-likely-than-not” recognition threshold is measured to determine the amount of benefit to recognize in the financial statements.
Management of the Funds analyzes all open tax years, as defined by the Statute of Limitations, for all major jurisdictions, including federal tax authorities and certain state tax authorities. As of and during the fiscal year ended May 31, 2010, the Funds did not have a liability for any unrecognized tax benefits. The Funds’ federal and state income and federal excise tax returns for tax years since inception are subject to examination by the Internal Revenue Service and state departments of revenue.
2. ADVISORY FEES
Stone Harbor Investment Partners LP is the Trust’s investment adviser. Under the investment advisory agreement the Trust pays an investment advisory fee calculated daily and paid monthly of 0.50% and 0.60% of the average daily net assets for Stone Harbor High Yield Bond Fund and Stone Harbor Emerging Markets Debt Fund, respectively.
The Adviser has contractually agreed to waive fees and reimburse expenses with respect to each of the Funds so that the Net Annual Operating Expenses (exclusive of acquired Fund fees and expenses, brokerage expenses, interest expense, taxes and extraordinary expenses) of the Stone Harbor High Yield Bond Fund Institutional Class, Stone Harbor High Yield Bond Fund Distributor Class, Stone Harbor Emerging Markets Debt Fund Institutional Class and Stone Harbor Emerging Markets Debt Fund Distributor Class will not exceed 0.55%, 0.80%, 0.75% and 1.00%, respectively. This undertaking is in effect through September 30, 2011 and is reevaluated on an annual basis. For the fiscal year ending May 31, 2010, the Adviser waived $185,906 and $413,671 in fees for Stone Harbor Emerging Markets Debt Fund and Stone Harbor High Yield Bond Fund, respectively.
The Adviser will be permitted to recover, on a class by class basis, expenses it has borne through the undertakings described above to the extent that a Fund’s expenses in later periods fall below the annual
| 52 | Stone Harbor Investment Funds® |
Table of Contents
| Notes to Financial Statements (continued) | ||||
| May 31, 2010 | ||||
rates set forth in the relevant undertaking. A Fund will not be obligated to pay any such deferred fees and expenses more than one year after the end of the fiscal year in which the fee and expense was deferred.
3. INVESTMENTS
During the year ended May 31, 2010 the aggregate cost of purchases and proceeds from sales of investments (excluding short-term investments) were as follows:
Stone Harbor Emerging Markets Debt Fund | Stone Harbor High Yield Bond Fund | |||
Purchases of investments | $ 212,344,450 | $ 267,036,877 | ||
Sales of investments | $ 138,106,478 | $ 119,308,562 | ||
At May 31, 2010 the aggregate gross unrealized appreciation and depreciation of investments for federal income purposes were substantially as follows:
Stone Harbor Emerging Markets Debt Fund | Stone Harbor High Yield Bond Fund | |||
Gross appreciation | $ 7,941,305 | $ 19,935,571 | ||
Gross depreciation | (2,569,889) | (9,888,419) | ||
Gross depreciation of foreign | (24,245) | – | ||
Net unrealized appreciation | $ 5,347,171 | $ 10,047,152 | ||
Cost of investments for income tax purposes | $ 168,372,576 | $ 389,250,717 | ||
4. SHARES OF BENEFICIAL INTEREST
At May 31, 2010, the Trust had an unlimited number of shares of beneficial interest authorized with a par value of $0.001 per share. The Funds have the ability to issue multiple classes of shares. Each share of a class represents an identical interest and has the same rights, except that each class bears certain direct expenses, including those specifically related to the distribution of its shares.
Transactions in shares of the Institutional Class were as follows:
Stone Harbor Emerging Markets Debt Fund | Stone Harbor High Yield Bond Fund | |||||||
| Year Ended May 31 | 2010 | 2009 | 2010 | 2009 | ||||
Shares sold | 11,360,440 | 7,950,246 | 18,456,848 | 15,634,751 | ||||
Shares reinvested | 955,219 | 344,206 | 2,893,977 | 1,246,011 | ||||
Shares redeemed | (5,275,762) | (236,345) | (4,382,828) | (1,043,646) | ||||
Net increase in shares outstanding | 7,039,897 | 8,058,107 | 16,967,997 | 15,837,116 | ||||
| Annual Report | May 31,2010 | 53 |
Table of Contents
| Notes to Financial Statements | ||||
| May 31, 2010 | ||||
5. SUBSEQUENT EVENTS
In May 2009, in accordance with the FASB guidance, the Funds adopted the provision of “Subsequent Events,” which provides guidance to establish general standards of accounting for and disclosures of events that occur subsequent to the balance sheet date but before financial statements are issued or are available to be issued. Management has evaluated whether any events or transactions occurred subsequent to May 31, 2010 through the issuance date of the Funds’ financial statements, and determined that there were no other material events or transactions that would require recognition or disclosure in the Funds’ financial statements.
6. RECENT ACCOUNTING PRONOUNCEMENTS
In January 2010, the Financial Accounting Standards Board issued Accounting Standards Updated No. 2010-06, “Improving Disclosures About Fair Value Measurements” (“ASU”). The ASU requires enhanced disclosures about (1) transfers into and out of Levels 1 and 2 and (2) purchases, sales, issuances, and settlements on a gross basis relating to Level 3 measurements. The first disclosure is effective for the first reporting period (including interim periods) beginning after December 15, 2009, and the second disclosure will be effective for fiscal years beginning after December 15, 2010, and for interim periods within those fiscal years. Management is currently evaluating the impact the adoption of this ASU will have on the Funds’ financial statement disclosures. The implementation of the ASU did not have a material effect on the Company’s financial disclosures contained in this Report.
7. OTHER
Board of Trustees Compensation: No officer, trustee or employee of the Adviser or any of its affiliates receives any compensation from the Funds for serving as an officer or trustee of the Funds. Each individual Fund pays each Trustee who is not an interested person, as defined by the 1940 Act, of the Adviser or any of its affiliates, a fee of $2,000 per quarter plus $250 for each additional meeting in which that Trustee participates. All Trustees are reimbursed for reasonable travel and out-of-pocket expenses incurred to attend such meetings.
| 54 | Stone Harbor Investment Funds® |
Table of Contents
| Additional Information | ||||
| May 31, 2010(Unaudited) | ||||
Shareholder Tax Information
Certain tax information regarding the Trust is required to be provided to shareholders based upon each Fund’s income and distributions for the year ended May 31, 2010.
Stone Harbor Emerging Markets Debt Fund | Stone Harbor High Yield Bond Fund | |||
Dividends Received Deduction Percentage | 0.00% | 0.00% | ||
Qualified Dividend Income Percentage | 0.00% | 0.00% | ||
Fund Portfolio Holdings
with The the SEC SEC has for adopted their first the and requirement third fiscal that quarters all funds on Form file a N-Q. complete For the schedule Funds, this of portfolio would be holdings for the of fiscal the quarters end of the ending quarter. August The Funds’ 31 and Forms February N-Q 28. will The be available Form N-Q on filing the must SEC’s be website made within at http://www. 60 days DC sec. (call gov. ,1-800-732-0330 or they may be reviewed for information and copied on the at operation the SEC’s of Public the Public Reference Reference Room Room) in Washington, .
Proxy Voting
A relating description to portfolio of the securities policies and and procedures information that regarding the Funds how use the to Funds determine voted how proxies to vote relating proxies to portfolio request, by securities contacting for the Stone 12 Harbor month Investment period ending Funds June at 30, 1-866-699-8158 is available without or on the a charge, SEC website upon at http://www.sec.gov.
Approval of Agreements
Each Fund’s investment advisory agreement (each an “Agreement” and, together, the “Agreements”) is subject to annual approval by (i) the vote of a majority of the entire Board of Trustees, or of a majority of the outstanding voting securities (as defined in the Investment Company Act of 1940, as amended (the “1940 Act”)), of the applicable Fund, and (ii) the vote of a majority of the Trustees who are not interested persons of the Funds (the “Independent Trustees”). Each Agreement is terminable with respect to a Fund by the Adviser, a majority of the Trustees, or a vote of a majority of the outstanding voting securities of the applicable Fund, without penalty, by not less than 60 days’ prior written notice. Each Agreement will terminate automatically in the event of its assignment (as defined for purposes of the 1940 Act).
The Board of Trustees, including the Independent Trustees, meets over the course of the year with representatives of Stone Harbor Investment Partners LP, each Fund’s investment adviser (the “Adviser”), including the Funds’ respective portfolio managers, and regularly reviews detailed information regarding the investment program and performance of each Fund. The Board of Trustees also receives periodic updates between meetings. The Trustees, including the Independent Trustees, met on April 19, 2010 to review the Agreements and to determine whether to approve the continuation of the Agreements for an additional one-year period. The Trustees evaluated the information presented and considered various factors relevant to the decision whether or not to continue each
| Annual Report | May 31,2010 | 55 |
Table of Contents
| Additional Information (continued) | ||||
| May 31, 2010 | ||||
Agreement. The Trustees considered all information they deemed reasonably necessary to evaluate the terms thereof. In connection with this meeting, the Trustees received materials to assist them with their review. These materials included, among other things, (i) information on each Fund’s investment performance and the performance of a group of similar mutual funds (some of which was prepared by a third party); (ii) information on each Fund’s advisory fees and other expenses, including information comparing each Fund’s expenses to the fees charged to institutional accounts managed by the Adviser and to a group of similar funds prepared by a third party and information about any applicable expense caps; and (iii) information about the profitability of each Agreement to the Adviser. In considering whether to approve the continuation of each Agreement, the Board of Trustees, including the Independent Trustees, did not identify any single factor as determinative. Individual Trustees may have evaluated the information presented differently from one another, giv-ing different weights to various factors. Matters considered by the Trustees, including the Indepen-dent Trustees, in connection with their approval of the Agreements included, but were not limited to, the following:
The nature, extent and quality of the services provided to the Funds under the Agreements. The Trustees considered the nature, extent and quality of the services provided by the Adviser to the Funds. In this regard, the Trustees took into account the experience of each Fund’s portfolio man-agement team and of the Adviser’s senior management, and the time and attention they devote to the Funds.
After reviewing these and related factors, the Trustees concluded, within the context of their overall conclusions regarding each Agreement, that the nature, extent and quality of the services provided by the Adviser supported the renewal of the Agreements.
Investment performance of the Funds and the Adviser. The Trustees reviewed performance in-formation for the Funds for the one-year period ended February 28, 2010 and since each Fund’s inception. They also reviewed more recent performance information provided at the meeting. The review included a comparison of each Fund’s performance to the performance of a group of com-parable funds selected by a third party and each Fund’s respective benchmark. The Trustees also considered the Adviser’s representations about the effect of recent market turmoil on the Funds’ performance and on the emerging markets debt and high yield markets generally. The Trustees also considered the Adviser’s performance and reputation generally and its investment techniques, risk management controls and decision-making processes.
After reviewing these and related factors, the Trustees concluded, within the context of their overall conclusions regarding each Agreement, that these factors supported the renewal of the Agreements.
The costs of the services to be provided and profits to be realized by the Adviser from its relation-ship with the Funds. The Trustees considered the fees charged to each Fund for advisory services as well as the total expense level of each Fund. The Adviser furnished information to the Trustees compiled by a third party showing a comparison of each Fund’s advisory fees and total expense levels compared to a group of similar mutual funds selected by the third party. The Trustees con-sidered that the Funds, because they were smaller than most of the funds to which they were being compared, could not take advantage of economies of scale (which can reduce fund expenses) to
| 56 | Stone Harbor Investment Funds® |
Table of Contents
| Additional Information(continued) | ||||
| May 31, 2010 | ||||
the same extent as those larger funds. The Trustees noted that both Funds are subject to expense caps, and each Fund’s advisory fee and net expense ratio (after application of the caps) is below the medians for comparable groups of mutual funds. The Adviser also provided information about the costs to it of providing services to the Funds and information about its profitability with respect to its management of the Funds, as well as information about the advisory fees it charges to institutional separate accounts with similar strategies and information about differences in such fees. In this regard, the Trustees noted that the effective management fee rate received by the Adviser (after application of expense caps and waivers) is lower for the Funds than it is for similarly managed institutional accounts. The Trustees also considered the demands and complexity of the investment management of the Funds as compared to the complexity of managing separate accounts.
After reviewing these and related factors, the Trustees concluded, within the context of their overall conclusions regarding each Agreement, that the advisory fees for each of the Funds were fair and reasonable, and that the costs of these services generally and the related profitability of the Adviser in respect of its relationship with the Funds supported the renewal of the Agreements.
Economies of Scale . The Trustees considered to what extent economies of scale would likely be realized as the Funds grow and whether those economies would be shared with the Funds through breakpoints in their investment advisory fees or other means, such as expense caps. The Trustees noted that because the Funds are relatively new and of relatively small size, the Funds in the near term were not expected to generate any significant economies of scale. The Trustees also noted that the Adviser proposed to maintain the Funds’ fee waiver/expense reimbursement arrangement at current levels until September 30, 2011.
After reviewing these and related factors, the Trustees concluded, within the context of their overall conclusions regarding each Agreement, that the extent to which economies of scale would be shared with the Funds supported the approval of the Agreements.
The Trustees also considered other factors, which included but were not limited to the following:
| • | Whether each Fund has operated in accordance with its investment objective and each Fund’s record of compliance with its investment restrictions, and the compliance programs of the Funds and the Adviser. They also considered the compliance-related resources the Adviser provided to the Funds, including resources designed to ensure compliance with the investment objectives, policies and restrictions of each Fund. |
| • | So-called “fallout benefits” to the Adviser, such as the benefits from offering its institutional clients the ability to invest in a registered investment company. |
Based on their evaluation of all factors that they deemed to be material, including those factors described above, the Trustees, including the Independent Trustees, concluded that the existing investment advisory agreements for each of the Funds should be continued through June 20, 2011.
| Annual Report | May 31,2010 | 57 |
Table of Contents
| Trustees and Officers | ||||
| May 31, 2010 (Unaudited) | ||||
The business and affairs of each Fund are managed under the direction of its Board of Trustees. The Board of Trustees approves all significant agreements between a Fund and the persons or companies that furnish services to the Fund, including agreements with its distributor, investment adviser, adminis-trator, custodian and transfer agent. The day-to-day operations of the Fund are delegated to the Fund’s Adviser and administrator.
The name, age and principal occupations for the past five years of the Trustees and officers of the Funds are listed below, along with the number of portfolios in the Fund complex overseen by and the other directorships held by each Trustee. Except as otherwise noted, the address of each Trustee and officer is c/o Stone Harbor Investment Partners LP, 31 W. 52nd Street, 16th Floor, New York, New York 10019. The Trust’s Statement of Additional Information includes additional information about the Trustees and is available without a charge, upon request, by calling 1-866-699-8158.
INDEPENDENT TRUSTEES
| Name and Age | Position with the Trust | Term of Office and Length of Time Served(1) | ||
Alan Brott Age: 67
| Chairman of Audit Committee; Trustee | Since June 21, 2007 | ||
Heath B. McLendon Age: 77
| Trustee | Since June 21, 2007 | ||
Patrick Sheehan Age: 62
| Trustee | Since June 21, 2007 | ||
INTERESTED TRUSTEE
| ||||
| Name and Age | Position with the Trust | Term of Office and Length of Time Served(1) | ||
Thomas W. Brock* Age: 63 | Chairman; Trustee
| Since June 21, 2007 | ||
* Mr. Brock is an interested Trustee because of his position with Stone Harbor. | ||||
| 58 | Stone Harbor Investment Funds® |
Table of Contents
Principal Occupation(s) During Past 5 Years | Number of Portfolios in Fund Complex Overseen by Trustee | Other Directorships by Trustee | ||||
| Columbia University Graduate School of Business - Associate Professor, 2000-Present; Consultant, 1991-Present. | 2 | Bank of America– two closed-end registered hedge funds. | ||||
| Citigroup – Chairman of Equity Research Oversight Committee (retired December 31, 2006). | 2 | None | ||||
| Retired; formerly, Citigroup Asset Management- Managing Director and Fixed Income Portfolio Manager, 1991-2002. | 2 | None | ||||
Principal Occupation(s) During Past 5 Years | Number of Portfolios in Fund Complex Overseen by Trustee | Other Directorships by Trustee | ||||
| Stone Harbor Investment Partners LP – Chief Ex- ecutive Officer, 2006-Present; Columbia University Graduate School of Business - Associate Professor, 1998-2006. | 2 | Bank of America – two closed-end registered hedge funds; Liberty All Star Funds – two closed-end funds. | ||||
| Annual Report | May 31,2010 | 59 |
Table of Contents
| Trustees and Officers (continued) | ||||
| May 31, 2010 (Unaudited) | ||||
OFFICERS
| Name and Age | Position with the Trust | Term of Office and Length of Time Served(1) | ||
Peter J. Wilby | President | Since June 21, 2007 | ||
Age: 51
| ||||
Pablo Cisilino | Executive Vice President | Since June 21, 2007 | ||
Age: 42
| ||||
James E. Craige | Executive Vice President | Since June 21, 2007 | ||
Age: 42
| ||||
Thomas K. Flanagan | Executive Vice President | Since June 21, 2007 | ||
Age: 57
| ||||
David Oliver | Executive Vice President | Since September 29, 2008 | ||
Age: 50
| ||||
(1) Officers are typically elected every year, unless an officer early retires, resigns or is removed from office. | ||||
The current retirement age is 80. | ||||
| 60 | Stone Harbor Investment Funds® |
Table of Contents
Principal Occupation(s) During Past 5 Years | Number of Portfolios in Fund Complex Overseen by Trustee | Other Directorships by Trustee | ||||
| Co-portfolio manager of the Funds; since April 3, 2006, Chief Investment Officer of Stone Harbor Investment Partners LP; prior to April 3, 2006, Chief Investment Officer – North American Fixed Income; joined Citigroup or its predecessor firms in 1989. | N/A | N/A | ||||
| Co-portfolio manager of Emerging Markets Debt Fund; since July 1, 2006, Senior Portfolio Manager of Stone Harbor Investment Partners LP; from June 1, 2004 to July 1, 2006, Executive Director for Sales and Trading in Emerging Markets at Morgan Stanley Inc; prior to June 1, 2004, Vice President for local markets and FX sales and trading, Goldman Sachs; joined Goldman Sachs in 1994. | N/A | N/A | ||||
| Co-portfolio manager of Emerging Markets Debt Fund; since April 3, 2006, Senior Portfolio Manager of Stone Harbor Investment Partners LP; prior to April 3, 2006, Managing Director and Senior Portfolio Manager at Salomon Brothers Asset Management Inc.; joined Salomon Brothers Asset Management Inc. in 1992. | N/A | N/A | ||||
| Co-portfolio manager of Emerging Markets Debt Fund; since April 3, 2006, Senior Portfolio Manager of Stone Harbor Investment Partners LP; prior to April 3, 2006, Managing Director and Senior Portfolio Manager at Salomon Brothers Asset Management Inc.; joined Salomon Brothers Asset Management Inc. in 1991. | N/A | N/A | ||||
| Co-portfolio manager of Emerging Markets Debt Fund; since June 1, 2008 Senior Portfolio Manager of Stone Harbor, from 1986 to June 1, 2008 Managing Director in Emerging Market sales and trading Citigroup. | N/A | N/A |
| Annual Report | May 31,2010 | 61 |
Table of Contents
| Trustees and Officers (continued) | ||||
| May 31, 2010(Unaudited) | ||||
OFFICERS (continued)
| ||||
| Name and Age | Position with the Trust | Term of Office and Length of Time Served(1) | ||
Beth A. Semmel Age: 49 | Executive Vice President
| Since June 21, 2007 | ||
Jeffrey S. Scott Age: 50 | Chief Compliance Officer
| Since June 21, 2007 | ||
James J. Dooley Age: 54 | Treasurer
| Since June 21, 2007 | ||
Adam J. Shapiro Age: 46 | Secretary; Anti-Money Laundering Officer
| Since June 21, 2007 Since June 21, 2007 | ||
Patrick D. Buchanan Age: 38 | Assistant Treasurer
| Since April 23, 2008 | ||
(1) Officers are typically elected every year, unless an officer early retires, resigns or is removed from office.
The current retirement age is 80
| 62 | Stone Harbor Investment Funds® |
Table of Contents
| Principal Occupation(s) During Past 5 Years | Number of Portfolios in Fund Complex Overseen by Trustee | Other Directorships by Trustee | ||||
| Co-portfolio manager of High Yield Bond Fund; since April 3, 2006, Senior Portfolio Manager of Stone Har- bor Investment Partners LP; Prior to April 3, 2006, Managing Director, Senior Portfolio Manager and Senior Trader for all high yield securities portfolios at Salomon Brothers Asset Management Inc.; joined Salomon Brothers Asset Management Inc. in 1993. | N/A | N/A | ||||
| Since April 3, 2006, Chief Compliance Officer of Stone Harbor Investment Partners LP; from October 2006 to March 2007, Director of Compliance, New York Life Investment Management LLC; from July 1998 to September 2006, Chief Compliance Officer, Salomon Brothers Asset Management Inc. | N/A | N/A | ||||
| Since April 3, 2006, Head of Operations, Tech- nology and Finance of Stone Harbor Investment Partners LP; from August 2004 to March 2006, Senior Operations Manager of Institutional Asset Management, Citigroup Asset Management; from October 2002 to August 2004, Managing Director, Global Operations & Application Development, AIG Global Investment Group; from May 2001 to September 2002, President and Chief Operating Officer, Financial Technologies International. | N/A | N/A | ||||
| Since April 3, 2006, General Counsel of Stone Harbor Investment Partners LP; from April 2004 to March 2006, General Counsel, North American Fixed Income, Salomon Brothers Asset Management Inc.; from August 1999 to March 2004, Director of Product and Business Development, Citigroup Asset Management. | N/A | N/A | ||||
| Since October 15, 2007, Senior Fund Controller for ALPS Fund Services, Inc; from February 2005 to October 2007, Director of Accounting for Madison Capital Management LLC; from August 2003 to February, 2005, Manager of Fund Accounting for Janus Capital Group. | N/A | N/A |
| Annual Report | May 31,2010 | 63 |
Table of Contents
| Notes | ||||
| 64 | Stone Harbor Investment Funds® |
Table of Contents

OFFICERS AND TRUSTEES
Alan Brott, Trustee
Heath B. McLendon, Trustee
Patrick Sheehan, Trustee
Thomas W. Brock, Chairman
Peter J. Wilby, President
Pablo Cisilino, Exec. Vice President
James E. Craige, Exec. Vice President
Thomas K. Flanagan, Exec. Vice President
David Oliver, Exec. Vice President
Beth A. Semmel, Exec. Vice President
Jeffrey S. Scott, Chief Compliance Officer
Adam Shapiro, Secretary/Anti-Money Laundering Officer
James J. Dooley, Treasurer
Patrick Buchanan, Assistant Treasurer
INVESTMENT ADVISER
Stone Harbor Investment Partners LP
31 W. 52nd Street 16th Floor
New York, New York 10019
ADMINISTRATOR & FUND ACCOUNTANT
ALPS Fund Services, Inc.
1290 Broadway, Suite 1100
Denver, Colorado 80203
DISTRIBUTOR
ALPS Distributors, Inc.
1290 Broadway, Suite 1100
Denver, Colorado 80203
TRANSFER AGENT
ALPS Fund Services, Inc.
1290 Broadway, Suite 1100
Denver, Colorado 80203
CUSTODIAN
The Bank of New York Mellon
One Wall Street
New York, New York 10286
LEGAL COUNSEL
Ropes & Gray LLP
1211 Avenue of the Americas
New York, New York 10036
INDEPENDENT REGISTERED
PUBLIC ACCOUNTING FIRM
Deloitte & Touche LLP
555 17th Street, Suite 3600
Denver, Colorado 80202
This report and its financial statements are submitted for the general information of the shareholders of the Funds. The report is not authorized for distribution to prospective investors in the Funds unless preceded or accompanied by a prospectus.
SHF000119 12/10
Table of Contents
Item 2. Code of Ethics.
| (a) | The Registrant, as of the end of the period covered by this report, has adopted a code of ethics that applies to the Registrant’s principal executive officer, principal financial officer, principal accounting officer or controller or any persons performing similar functions on behalf of the Registrant. |
| (b) | Not applicable. |
| (c) | During the period covered by this report, no amendments to the provisions of the code of ethics adopted in Item 2(a) above were made. |
| (d) | During the period covered by this report, no implicit or explicit waivers to the provisions of the code of ethics adopted in Item 2(a) above were granted. |
| (e) | Not applicable. |
| (f) | The Registrant’s Code of Ethics is attached as an Exhibit hereto. |
Item 3. Audit Committee Financial Expert.
The Board of Trustees of the Registrant has determined that the Registrant has at least one audit committee financial expert serving on its Audit Committee. The Board of Trustees has designated Alan J. Brott as the Registrant’s “Audit Committee Financial Expert.” Mr. Brott is “independent” as defined in paragraph (a)(2) of Item 3 to Form N-CSR.
Item 4. Principal Accountant Fees and Services.
| (a) | Audit Fees: For the Registrant’s fiscal years ended May 31, 2009 and May 31, 2010, the aggregate fees billed for professional services rendered by the principal accountant for the audit of the Registrant’s annual financial statements were $130,000 and $125,000, respectively. |
| (b) | Audit-Related Fees: For the Registrant’s fiscal years ended May 31, 2009 and May 31, 2010, there were no fees billed for assurance and related services by the principal accountant that were reasonably related to the performance of the audit of the Registrant’s financial statements and were not reported in paragraph (a) of this Item 4. |
Table of Contents
| (c) | Tax Fees: For the Registrant’s fiscal years ended May 31, 2009 and May 31, 2010, the aggregate fees billed for professional services rendered by the principal accountant for tax compliance, tax advice and tax planning were $9,500 and $9,860, respectively. The fiscal year 2009 and 2010 tax fees were for services pertaining to federal and state income tax return review, review of year-end dividend distributions and excise tax preparation. |
| (d) | All Other Fees: For the Registrant’s fiscal years ended May 31, 2009 and May 31, 2010, aggregate fees billed to the Registrant by the principal accountant for services provided by the principal accountant other than the services reported in paragraphs (a) through (c) of this Item 4 were $0 and $0, respectively. |
| (e)(1) | Audit Committee Pre-Approval Policies and Procedures: All services to be performed by the Registrant's principal accountant must be pre-approved by the Registrant's Audit Committee. |
| (e)(2) | No services described in paragraphs (b) through (d) of this Item 4 were approved by the Registrant’s audit committee pursuant to paragraph (c)(7)(i)(C) of Rule 2-01 of Regulation S-X. |
| (f) | Not applicable. |
| (g) | Not applicable. |
| (h) | Not applicable. |
Item 5. Audit Committee of Listed Registrants.
Not applicable.
Item 6. Investments.
| (a) | Schedule of Investments is included as part of the Report to Stockholders filed under Item 1 of this Form N-CSR. |
| (b) | Not applicable. |
Item 7. Disclosure of Proxy Voting Policies and Procedures for Closed-End
Management Investment Companies.
Not applicable.
Item 8. Portfolio Managers of Closed-End Management Investment Companies.
Not applicable.
Table of Contents
| Item 9. | Purchases of Equity Securities by Closed-End Management Investment Company and Affiliated Purchasers. |
Not applicable to Registrant.
Item 10. Submission of Matters to Vote of Security Holders.
There have been no material changes to the procedures by which shareholders may recommend nominees to the Registrant’s Board of Trustees, where those changes were implemented after the Registrant last provided disclosure in response to the requirements of Item 407(c)(2) of Regulation S-K, or this Item.
Item 11. Controls and Procedures.
| (a) | The Registrant’s principal executive officer and principal financial officer have concluded that the Registrant’s disclosure controls and procedures (as defined in Rule 30a-3(c) under the Investment Company Act of 1940, as amended) are effective based on their evaluation of these controls and procedures as of a date within 90 days of the filing date of this report. |
| (b) | There was no change in the Registrant's internal control over financial reporting (as defined in Rule 30a-3(d) under the Investment Company Act of 1940, as amended) during the second fiscal quarter of the period covered by this report that has materially affected, or is reasonably likely to materially affect, the Registrant's internal control over financial reporting. |
Item 12. Exhibits.
| (a)(1) | Registrant’s Code of Ethics for Senior Financial Officers, which is the subject of the disclosure required by Item 2 of Form N-CSR, was filed as Exhibit 12(a)(1) to the Registrant’s Certified Shareholder Report on Form N-CSR, File No. 811-22037, on August 7, 2009. |
| (a)(2) | The certifications required by Rule 30a-2(a) of the Investment Company Act of 1940, as amended, and Section 302 of the Sarbanes-Oxley Act of 2002 are attached hereto as Exhibit 99.Cert. |
| (a)(3) | Not applicable. |
| (b) | The certifications by the Registrant’s principal executive officer and principal financial officer, as required by Rule 30a-2(b) of the Investment Company Act of 1940, as amended, and Section 906 of the Sarbanes-Oxley Act of 2002 are attached hereto as Exhibit 99.906Cert. |
Table of Contents
SIGNATURES
Pursuant to the requirements of the Securities Exchange Act of 1934 and the Investment Company Act of 1940, the Registrant has duly caused this report to be signed on its behalf by the undersigned, thereunto duly authorized.
Stone Harbor Investment Funds | ||
By: | /s/ Peter J. Wilby | |
| Peter J. Wilby | ||
| President/Principal Executive Officer | ||
Date: | August 6, 2010 | |
Pursuant to the requirements of the Securities Exchange Act of 1934 and the Investment Company Act of 1940, this report has been signed below by the following persons on behalf of the Registrant and in the capacities and on the dates indicated.
| By: | /s/ Peter J. Wilby | |
| Peter J. Wilby | ||
| President/Principal Executive Officer | ||
| Date: | August 6, 2010 | |
| By: | /s/ James J. Dooley | |
| James J. Dooley | ||
Treasurer, Chief Financial Officer/ Principal Financial Officer | ||
| Date: | August 6, 2010 | |