UNITED STATES
SECURITIES AND EXCHANGE COMMISSION
Washington, D.C. 20549
FORM N-CSR
CERTIFIED SHAREHOLDER REPORT OF REGISTERED
MANAGEMENT INVESTMENT COMPANIES
Investment Company Act file number | 811-22037 | ||||||
| |||||||
Stone Harbor Investment Funds | |||||||
(Exact name of registrant as specified in charter) | |||||||
| |||||||
1290 Broadway, Suite 1100 Denver, CO |
| 80203 | |||||
(Address of principal executive offices) |
| (Zip code) | |||||
| |||||||
Adam J. Shapiro, Esq. c/o Stone Harbor Investment Partners LP 31 West 52nd Street, 16th Floor New York, NY 10019 | |||||||
(Name and address of agent for service) | |||||||
| |||||||
With copies To:
John M. Loder, Esq. Ropes & Gray LLP One International Place Boston, MA 02110-2624 | |||||||
| |||||||
Registrant’s telephone number, including area code: | (303) 623-2577 |
| |||||
| |||||||
Date of fiscal year end: | May 31 |
| |||||
| |||||||
Date of reporting period: | August 16, 2007 - May 31, 2008 |
| |||||
Item 1. Reports to Stockholders.

Table of Contents
Letter to Shareholders |
| 2 |
|
|
|
Disclosure of Fund Expenses |
| 5 |
|
|
|
Summary of Portfolio Holdings |
| 6 |
|
|
|
Growth of a $10,000 Investment |
| 7 |
|
|
|
Report of Independent Registered Public Accounting Firm |
| 8 |
|
|
|
Statement of Investments |
|
|
Emerging Markets Debt Fund |
| 9 |
High Yield Bond Fund |
| 16 |
|
|
|
Statement of Assets & Liabilities |
| 33 |
|
|
|
Statement of Operations |
| 34 |
|
|
|
Statement of Changes in Net Assets |
|
|
Emerging Markets Debt Fund |
| 35 |
High Yield Bond Fund |
| 36 |
|
|
|
Financial Highlights |
|
|
Emerging Markets Debt Fund |
| 37 |
High Yield Bond Fund |
| 38 |
|
|
|
Notes to Financial Statements |
| 39 |
|
|
|
Additional Information |
| 45 |
|
|
|
Trustees and Officers |
| 48 |
Letter to Shareholders
Dear Shareholder,
We once again thank you for your investment in the Stone Harbor Investment Funds. Our goal is to produce long-term returns that exceed market benchmarks at risk levels comparable to, or less than, the general level of market risk. We will also strive to keep you well informed about information pertaining to your investment in our funds. If you have questions, please feel free to a call us at 212-548-1200.
PERFORMANCE
The two Stone Harbor institutional mutual funds underperformed their benchmarks on a net return basis for the six month period ended May 31, 2008. The High Yield Bond Fund returned 1.64% net of expenses, versus the Citigroup High Yield Market Capped Index return of 2.34%. In the same period the Stone Harbor Emerging Markets Debt Fund returned 1.90% net of expenses, as compared to the JP Morgan EMBI Global Diversified Index return of 2.29%. Both funds, however, remain ahead of benchmark on a net basis since their inception date of August 16, 2007; 5.09% net for the High Yield Bond Fund versus 4.69% for the benchmark, and 10.46% net for the Emerging Markets Debt Fund versus its benchmark of 9.27%.
THE MARKETS
The credit shocks of 2007 have carried over into 2008. Last year’s concerns over lax lending practices, particularly in the housing sector, led to tighter credit conditions and a dramatic economic slowdown. This year housing prices, as reported by the Case Schiller / S & P index, have declined over 15 % on a year-on-year basis and delinquencies on home mortgages have reached levels not seen since the 1930s.As a result, financial institutions have taken massive write-offs in their credit portfolios, and the Federal Reserve Bank has been left with no choice but to step in dramatically to calm the storm. Since the beginning of 2008, the Fed has lowered their overnight funds target by 225 basis points, forced a bailout of Bear Stearns, and given investment banks unprecedented access to the discount window.
Against this backdrop, it would be fair to say that navigating the waters of the credit markets for the past six months has been difficult. Investors have continued to favor the safety of U.S. government debt and credit risk has been approached with great caution. Spreads versus governments in all fixed income asset classes have been quite volatile as investors remained concerned about U.S. economic prospects. Credit spreads in the high yield market, as measured by our Citigroup High Yield benchmark, have widened by 75 basis points since December 1, 2007, while emerging debt spreads remained unchanged. Ironically, credit spreads in both markets were significantly wider just two months earlier in March.
In the Emerging Debt Fund country investments making positive contributions to performance were Colombia, Brazil and Ecuador. Investments in Argentina detracted from Fund performance. In the High Yield Fund, credits of homebuilders made a sudden recovery, and we have continued to under- weight this sector. Our over-weight of publishers also hurt our relative returns to benchmark.
Looking forward, the uncertainty of economic conditions forces us to remain cautious. The market has become extremely conscious of the threat of global inflation. Central banks face the difficult balancing act of trying to create enough economic stimulus to prevent recession, while at the same time maintaining the perception that they are vigilant against the threat of accelerating inflation. This will be a difficult task to accomplish. As a result, we believe that in the months ahead, spread volatility is likely to remain
2
at higher levels. We are comfortable that investors will achieve attractive long-term returns even from current spread levels, but opportunities for better returns seem likely later in the year.
BOND PERFORMANCE COMPARISONS
The charts below depict the performance of various debt market indices over our reporting period. As can be seen, The Stone Harbor Funds fared well in comparison.
|
| Dec. 1, 2007 to |
|
|
| May 31, 2008 (%) |
|
Citigroup Treasury 1-10 Year (1) |
| 2.01 |
|
Lehman U.S. Corporate Investment Grade (2) |
| -0.05 |
|
Citigroup High Yield Market Capped Index (3) |
| 2.34 |
|
JP Morgan EMBI Global Diversified Index (4) |
| 2.29 |
|
|
|
|
|
Stone Harbor High Yield Bond Fund (Gross) |
| 1.92 |
|
Stone Harbor High Yield Bond Fund (Net) |
| 1.64 |
|
Stone Harbor Emerging Markets Debt Fund (Gross) |
| 2.28 |
|
Stone Harbor Emerging Markets Debt Fund (Net) |
| 1.90 |
|

3
Sincerely,
![]()
Thomas W. Brock
Chairman of the Board of Trustees
June 30, 2008
(1) |
| The Citigroup US Treasury 1-10 Year Benchmark (On-The-Run) Index measures total returns for the current ten year on-the-run Treasuries that have been in existence for the entire month. |
(2) |
| The Lehman Brothers U.S. Corporate Investment Grade Index is comprised of publicly issued U.S. corporate and specified foreign debentures and secured notes that meet the specified maturity, liquidity, and quality requirements. To qualify, bonds must be SEC-registered. |
(3) |
| The Citigroup High Yield Market Capped Index represents a modified version of the High Yield Market Index by delaying the entry of fallen angel issues and capping the par value of individual issuers at US$5 billion par amount outstanding. |
(4) |
| The JPMorgan EMBI Global Diversified is a uniquely-weighted version of the EMBI Global (Which tracks total returns for U.S.-dollar-denominated debt instruments issued by emerging markets sovereign and qua-si-sovereign entities: Brady bonds, loans, Eurobonds. Currently, the EMBI Global covers 196 instruments across 28 countries). It limits the weights of those index countries with larger debt stocks by only including specified portions of these countries’ eligible current face amounts of debt outstanding. The countries covered in the EMBI Global Diversified are identical to those covered by the EMBI Global. |
This report must be preceded or accompanied by a prospectus. For more complete information including charges and expenses, please call 1-866-699-8158 to receive a prospectus. Read the prospectus carefully before investing or sending money.
Past performance is no guarantee of future results. The performance data quoted represents past performance and current returns may be lower or higher. Total return figures include change in share price, reinvestment of dividends and capital gains and do not reflect taxes that a shareholder would pay on fund distributions or on the redemption of fund shares. The investment return and net asset value will fluctuate so that an investor’s shares, when redeemed, may be worth more or less than the original cost. [To obtain performance information for the most recent month end, please call 1-866-699-8158.]
For more complete information on the Funds, you may request additional prospectuses by calling 1-866-699-8158. You should consider each Fund’s investment objectives, risk, charges and expenses carefully before you invest. Information about these and other important information is in the Funds’ prospectus which you should read carefully before investing.
Not FDIC insured. May lose value. No bank guarantee.
4
Disclosure of Fund Expenses
For the period August 16, 2007 (Inception) to May 31, 2008
Example. As a shareholder of a Fund, you incur two types of costs: (1) transaction costs, including sales charges (loads) on purchase payments and/or redemption fees (if applicable) and (2) ongoing costs, including management fees and other Fund expenses. The below examples are intended to help you understand your ongoing costs (in dollars) of investing in a Fund and to compare these costs with the ongoing costs of investing in other mutual funds. The examples are based on an investment of $1,000 invested on December 1, 2007 and held until May 31, 2008.
Actual Expenses. The first line of the table below provides information about actual account values and actual expenses. You may use the information in this line, together with the amount you invested, to estimate the expenses that you paid over the period. Simply divide your account value by $1,000 (for example, an $8,600 account value divided by $1,000 = 8.6), then multiply the result by the number in the first line under the heading “Expenses Paid During Period” to estimate the expenses you paid on your account during this period.
Hypothetical Example for Comparison Purposes. The second line of the table below provides information about hypothetical account values and hypothetical expenses based on the Fund’s actual expense ratio and an assumed rate of return of 5% per year before expenses, which is not the Fund’s actual return. The hypothetical account values and expenses may not be used to estimate the actual ending ac- count balance or expenses you paid for the period. You may use this information to compare the ongoing costs of investing in a Fund and other mutual funds. To do so, compare this 5% hypothetical example with the 5% hypothetical examples that appear in the shareholder reports of the other funds.
Please note that the expenses shown in the table are meant to highlight your ongoing costs only and do not reflect transaction fees, such as redemption fees, sales charges (loads) or exchange fees.Therefore, the second line of the table is useful in comparing ongoing costs only, and will not help you determine the relative total costs of owning different funds. In addition, if these transaction fees were included, your costs would have been higher.
|
| Beginning |
| Ending |
|
|
| Expenses |
| |||
|
| Account Value |
| Account Value |
| Expense |
| Paid During |
| |||
|
| 12/01/2007 |
| 05/31/2008 |
| Ratio (a) |
| Period (b) |
| |||
STONE HARBOR EMERGING MARKETS DEBT FUND |
|
|
|
|
|
|
|
|
| |||
Institutional Class |
|
|
|
|
|
|
|
|
| |||
Actual |
| $ | 1,000.00 |
| $ | 1,019.00 |
| 0.75 | % | $ | 3.78 |
|
Hypothetical |
| $ | 1,000.00 |
| $ | 1,021.26 |
| 0.75 | % | $ | 3.78 |
|
|
|
|
|
|
|
|
|
|
| |||
STONE HARBOR HIGH YIELD BOND FUND |
|
|
|
|
|
|
|
|
| |||
Institutional Class |
|
|
|
|
|
|
|
|
| |||
Actual |
| $ | 1,000.00 |
| $ | 1,016.40 |
| 0.55 | % | $ | 2.76 |
|
Hypothetical |
| $ | 1,000.00 |
| $ | 1,022.26 |
| 0.55 | % | $ | 2.77 |
|
(a) |
| Annualized, based on the Portfolio’s most recent fiscal half-year expenses. |
(b) |
| Expenses are equal to the Fund’s annualized expense ratio multiplied by the average account value over the period, multiplied by the number of days in the most recent fiscal half year (183), divided by 366. Note this expense example is typically based on a six-month period. |
5
Summary of Portfolio Holdings
May 31, 2008 (Unaudited)
Under SEC Rules, all funds are required to include in their annual and semi-annual shareholder reports a presentation of portfolio holdings in a table, chart or graph by reasonably identifiable categories. The following tables which present holdings as a percent of total net assets (“TNA”) are provided in compliance with such requirements.
EMERGING MARKETS DEBT FUND
Country Breakout |
| % of TNA |
|
Argentina |
| 6.95 | % |
Brazil |
| 13.41 | % |
Chile |
| 0.32 | % |
Colombia |
| 6.78 | % |
Ecuador |
| 2.67 | % |
El Savador |
| 3.68 | % |
Gabon |
| 1.29 | % |
Indonesia |
| 6.45 | % |
Iraq |
| 2.37 | % |
Ireland |
| 1.56 | % |
Lebanon |
| 1.11 | % |
Luxembourg |
| 2.07 | % |
Malaysia |
| 3.58 | % |
Mexico |
| 5.94 | % |
Panama |
| 4.56 | % |
Peru |
| 4.12 | % |
Philippines |
| 7.03 | % |
Russia |
| 4.42 | % |
Singapore |
| 0.05 | % |
South Africa |
| 1.85 | % |
Tunisia |
| 0.51 | % |
Turkey |
| 4.61 | % |
Ukraine |
| 2.67 | % |
Uruguay |
| 2.87 | % |
Venezuela |
| 5.44 | % |
Total |
| 96.31 | % |
Other Assets in Excess of Liabilities |
| 3.69 | % |
Total Net Assets |
| 100.00 | % |
HIGH YIELD BOND FUND
Industry Breakout |
| % of TNA |
|
Advertising |
| 2.15 | % |
Aerospace - Defense |
| 3.99 | % |
Agriculture |
| 0.72 | % |
Apparel |
| 0.77 | % |
Auto Manufacturers |
| 1.73 | % |
Beverages |
| 1.26 | % |
Building Products |
| 0.97 | % |
Chemicals |
| 3.37 | % |
Coal |
| 1.04 | % |
Commercial Services |
| 4.17 | % |
Distribution - Wholesale |
| 0.34 | % |
Diversified Financial Services |
| 6.17 | % |
Electric |
| 5.51 | % |
Electrical Components & Equipment |
| 0.27 | % |
Entertainment |
| 3.54 | % |
Environmental Control |
| 0.92 | % |
Food |
| 1.58 | % |
Forest Products & Paper |
| 1.13 | % |
Healthcare-Products |
| 1.53 | % |
Healthcare-Services |
| 3.71 | % |
Holding Companies-Diversified |
| 0.12 | % |
Home Furnishings |
| 0.14 | % |
Hotels & Motels |
| 0.47 | % |
Internet |
| 0.27 | % |
Investment Companies |
| 0.43 | % |
Iron/Steel |
| 1.03 | % |
Lodging |
| 0.96 | % |
Machinery - Construction & Mining |
| 0.53 | % |
Media |
| 7.40 | % |
Miscellaneous Manufacturers |
| 1.11 | % |
Office Furnishings |
| 0.22 | % |
Office-Business Equipment |
| 1.46 | % |
Oil & Gas |
| 5.49 | % |
Oil & Gas Services |
| 1.16 | % |
Packaging & Containers |
| 2.00 | % |
Pharmaceuticals |
| 0.57 | % |
Pipelines |
| 4.59 | % |
Real Estate Investment Trusts |
| 1.70 | % |
Research Services |
| 0.37 | % |
Retail |
| 2.93 | % |
Semiconductors |
| 0.64 | % |
Telecommunications |
| 7.48 | % |
Transportation |
| 0.61 | % |
Total |
| 86.55 | % |
Other Assets in Excess of Liabilities |
| 13.45 | % |
Total Net Assets |
| 100.00 | % |
6
Growth of a $10,000 Investment
May 31, 2008 (Unaudited)
STONE HARBOR EMERGING MARKETS DEBT FUND
Comparison of Change in Value of $10,000 Investment in Stone Harbor Emerging Markets Debt Fund and the JP Morgan Emerging Bond Index Global Diversified
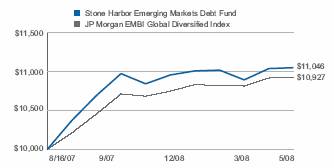
The JP Morgan Emerging Bond Index Global Diversified is a uniquely-weighted version of the EMBI Global (Which tracks total returns for U.S.-dollar denominated debt instruments issued by emerging market sovereign and quasi-sovereign entities: Brady bonds, loans, Eurobonds. Currently, the EMBI Global covers 196 instruments across 28 countries). It limits the weights of those index countries with larger debt stocks by only including specified portions of these countries eligible current face amounts of debt outstanding. The countries covered in the EMBI Global Diversified are identical to those covered by the EMBI Global.
STONE HARBOR HIGH YIELD BOND FUND
Comparison of Change in Value of $10,000 Investment in Stone Harbor High Yield Bond Fund and the Citigroup High Yield Market Capped Index

The Citigroup High Yield Market Capped Index represents a modified version of the High Yield Market Index by delaying the entry of fallen angel issues and capping the par value of individual issuers at US $5 billion par amount outstanding.
7
Report of Independent Registered Public Accounting Firm
May 31, 2008
To the Shareholders of Stone Harbor Investment Funds:
We have audited the accompanying statements of assets and liabilities of Stone Harbor Investment Funds, including the Stone Harbor High Yield Bond Fund and Stone Harbor Emerging Markets Debt Fund (collectively, the “Funds”), including the statements of investments, as of May 31, 2008, and the related statements of operations and net assets, and the financial highlights for the period from August 16, 2008 (inception) to May 31, 2008. These financial statements and financial highlights are the responsibility of the Funds’ management. Our responsibility is to express an opinion on these financial statements and financial highlights based
on our audits.
We conducted our audits in accordance with the standards of the Public Company Accounting Oversight Board (United States).Those standards require that we plan and perform the audit to obtain reasonable assurance about whether the financial statements and financial highlights are free of material misstatement. The Funds are not required to have, nor were we engaged to perform, an audit of its internal control over financial reporting. Our audits included consideration of internal control over financial reporting as a basis for designing audit procedures that are appropriate in the circumstances, but not for the purpose of expressing an opinion on the effectiveness of the Funds’ internal control over financial reporting. Accordingly, we express no such opinion. An audit also-includes examining, on a test basis, evidence supporting the amounts and disclosures in the financial statements, assessing the accounting principles used and significant estimates made by management, as well as evaluating the overall financial statement presentation. Our procedures included confirmation of securities owned as of May 31, 2008, by correspondence with the custodian and brokers. We believe that our audits provide a reasonable basis for our opinion.
In our opinion, the financial statements and financial highlights referred to above present fairly, in all material respects, the financial position of each of the funds constituting the Stone Harbor Investment Funds as of May 31, 2008, and the results of its operations, and the net assets, and its financial highlights for the period from August 16, 2008 (inception) to May 31, 2008, in conformity with accounting principles generally accepted in the United States of America.
DELOITTE & TOUCHE LLP
Denver, Colorado
July 30, 2008
8
Statement of Investments
May 31, 2008 |
| Emerging Markets Debt Fund |
|
|
|
| Principal |
| Market Value |
| |
Interest Rate/Maturity Date |
| Currency |
| Amount * |
| (Expressed in U.S. $) |
| |
|
|
|
|
|
|
|
| |
SOVEREIGN DEBT OBLIGATIONS - 86.88% |
|
|
|
|
|
|
| |
Argentina - 6.95% |
|
|
|
|
|
|
| |
Republic of Argentina |
|
|
|
|
|
|
| |
8.750%, 02/04/2003(1) |
| EUR |
| 57,000 |
| $ | 27,460 |
|
7.000%, 03/18/2004(1) |
| EUR |
| 30,000 |
| 14,103 |
| |
7.000%, 03/18/2004(1) |
| EUR |
| 58,000 |
| 13,918 |
| |
9.000%, 05/24/2005(1) |
| EUR |
| 25,000 |
| 11,733 |
| |
9.000%, 04/26/2006(1) |
| EUR |
| 58,000 |
| 27,040 |
| |
10.000%, 01/03/2007(1) |
| ITL |
| 140,000,000 |
| 35,395 |
| |
10.250%, 01/26/2007(1) |
| EUR |
| 661,000 |
| 323,576 |
| |
8.000%, 02/26/2008(1) |
| EUR |
| 93,000 |
| 44,514 |
| |
7.000%, 09/12/2013 |
|
|
| 165,000 |
| 131,019 |
| |
7.000%, 04/17/2017 |
|
|
| 145,000 |
| 102,205 |
| |
8.280%, 12/31/2033(2) |
|
|
| 727,003 |
| 594,325 |
| |
1.330%, 12/31/2038(3) |
|
|
| 100,000 |
| 36,850 |
| |
|
|
|
|
|
| 1,362,138 |
| |
Brazil - 11.18% |
|
|
|
|
|
|
| |
Nota Do Tesouro Nacional |
|
|
|
|
|
|
| |
Series F, 10.000%, 01/01/2014 |
| BRL |
| 625,000 |
| 332,687 |
| |
Series F, 10.000%, 01/01/2017 |
| BRL |
| 1,775,000 |
| 906,412 |
| |
Republic of Brazil |
|
|
|
|
|
|
| |
8.500%, 09/24/2012 |
| EUR |
| 290,000 |
| 504,327 |
| |
8.000%, 01/15/2018 |
|
|
| 390,000 |
| 445,868 |
| |
|
|
|
|
|
| 2,189,294 |
| |
Chile - 0.32% |
|
| �� |
|
|
|
| |
Republic of Chile |
|
|
|
|
|
|
| |
5.500%, 01/15/2013 |
|
|
| 60,000 |
| 62,124 |
| |
|
|
|
|
|
|
|
| |
Colombia - 6.78% |
|
|
|
|
|
|
| |
Republic of Colombia |
|
|
|
|
|
|
| |
10.750%, 01/15/2013 |
|
|
| 30,000 |
| 37,313 |
| |
4.870%, 11/16/2015(4) |
|
|
| 100,000 |
| 106,125 |
| |
7.375%, 01/27/2017 |
|
|
| 100,000 |
| 113,875 |
| |
11.750%, 02/25/2020 |
|
|
| 385,000 |
| 584,718 |
| |
9.850%, 06/28/2027 |
| COP |
| 824,000,000 |
| 431,824 |
| |
10.375%, 01/28/2033 |
|
|
| 35,000 |
| 53,200 |
| |
|
|
|
|
|
| 1,327,055 |
| |
9
|
|
|
| Principal |
| Market Value |
| |
Interest Rate/Maturity Date |
| Currency |
| Amount * |
| (Expressed in U.S. $) |
| |
|
|
|
|
|
|
|
| |
Ecuador - 2.67% |
|
|
|
|
|
|
| |
Republic of Ecuador |
|
|
|
|
|
|
| |
9.375%, 12/15/2015 |
|
|
| 85,000 |
| $ | 91,163 |
|
10.000%, 08/15/2030 |
|
|
| 425,000 |
| 431,375 |
| |
|
|
|
|
|
| 522,538 |
| |
El Salvador - 3.68% |
|
|
|
|
|
|
| |
Republic of El Salvador |
|
|
|
|
|
|
| |
7.750%, 01/24/2023 |
|
|
| 153,000 |
| 171,743 |
| |
7.650%, 06/15/2035 |
|
|
| 513,000 |
| 548,910 |
| |
|
|
|
|
|
| 720,653 |
| |
Gabon - 1.29% |
|
|
|
|
|
|
| |
Republic of Gabonese |
|
|
|
|
|
|
| |
8.200%, 12/12/2017(5) |
|
|
| 235,000 |
| 252,331 |
| |
|
|
|
|
|
|
|
| |
Indonesia - 6.45% |
|
|
|
|
|
|
| |
Indonesia Government Credit Linked Note |
|
|
|
|
|
|
| |
8.705%, 02/20/2010(6)(7) |
| IDR |
| 1,000,000,000 |
| 87,493 |
| |
8.410%, 02/20/2010(6)(7) |
| IDR |
| 1,943,000,000 |
| 169,999 |
| |
8.443%, 02/20/2010(6)(7) |
| IDR |
| 1,954,000,000 |
| 170,962 |
| |
12.500%, 03/15/2013(6) |
| IDR |
| 1,000,000,000 |
| 106,924 |
| |
Republic of Indonesia |
|
|
|
|
|
|
| |
8.500%, 10/12/2035 |
|
|
| 100,000 |
| 107,750 |
| |
7.750%, 01/17/2038 |
|
|
| 635,000 |
| 620,713 |
| |
|
|
|
|
|
| 1,263,841 |
| |
Iraq - 2.37% |
|
|
|
|
|
|
| |
Republic of Iraq |
|
|
|
|
|
|
| |
5.800%, 01/15/2028 |
|
|
| 625,000 |
| 464,063 |
| |
|
|
|
|
|
|
|
| |
Lebanon - 1.11% |
|
|
|
|
|
|
| |
Lebanese Republic |
|
|
|
|
|
|
| |
4.000%, 12/31/2017 |
|
|
| 275,000 |
| 218,213 |
| |
|
|
|
|
|
|
|
| |
Malaysia - 2.62% |
|
|
|
|
|
|
| |
Malaysia |
|
|
|
|
|
|
| |
3.833%, 09/28/2011 |
| MYR |
| 1,455,000 |
| 452,330 |
| |
3.461%, 07/31/2013 |
| MYR |
| 200,000 |
| 60,694 |
| |
|
|
|
|
|
| 513,024 |
| |
10
|
|
|
| Principal |
| Market Value |
| |
Interest Rate/Maturity Date |
| Currency |
| Amount * |
| (Expressed in U.S. $) |
| |
|
|
|
|
|
|
|
| |
Mexico - 3.89% |
|
|
|
|
|
|
| |
United Mexican States |
|
|
|
|
|
|
| |
7.250%, 12/15/2016 |
| MXN |
| 2,090,000 |
| $ | 190,982 |
|
5.625%, 01/15/2017 |
|
|
| 194,000 |
| 199,918 |
| |
8.300%, 08/15/2031 |
|
|
| 140,000 |
| 179,795 |
| |
6.750%, 09/27/2034 |
|
|
| 175,000 |
| 191,406 |
| |
|
|
|
|
|
| 762,101 |
| |
Panama - 4.56% |
|
|
|
|
|
|
| |
Republic of Panama |
|
|
|
|
|
|
| |
7.250%, 03/15/2015 |
|
|
| 457,000 |
| 504,642 |
| |
9.375%, 01/16/2023 |
|
|
| 25,000 |
| 32,750 |
| |
8.875%, 09/30/2027 |
|
|
| 46,000 |
| 59,570 |
| |
9.375%, 04/01/2029 |
|
|
| 16,000 |
| 21,668 |
| |
6.700%, 01/26/2036 |
|
|
| 260,000 |
| 273,650 |
| |
|
|
|
|
|
| 892,280 |
| |
Peru - 4.12% |
|
|
|
|
|
|
| |
Republic of Peru |
|
|
|
|
|
|
| |
9.875%, 02/06/2015 |
|
|
| 115,000 |
| 146,050 |
| |
8.375%, 05/03/2016 |
|
|
| 360,000 |
| 433,800 |
| |
8.750%, 11/21/2033 |
|
|
| 120,000 |
| 159,000 |
| |
6.550%, 03/14/2037 |
|
|
| 65,000 |
| 68,413 |
| |
|
|
|
|
|
| 807,263 |
| |
Philippines - 7.03% |
|
|
|
|
|
|
| |
Republic of Philippines |
|
|
|
|
|
|
| |
8.250%, 01/15/2014 |
|
|
| 207,000 |
| 233,909 |
| |
8.875%, 03/17/2015 |
|
|
| 58,000 |
| 68,150 |
| |
9.375%, 01/18/2017 |
|
|
| 635,000 |
| 782,637 |
| |
7.500%, 09/25/2024 |
|
|
| 145,000 |
| 157,869 |
| |
9.500%, 02/02/2030 |
|
|
| 30,000 |
| 38,962 |
| |
6.375%, 01/15/2032 |
|
|
| 100,000 |
| 96,000 |
| |
|
|
|
|
|
| 1,377,527 |
| |
Russia - 4.42% |
|
|
|
|
|
|
| |
Russian Federation |
|
|
|
|
|
|
| |
7.500%, 03/31/2030 |
|
|
| 762,390 |
| 866,377 |
| |
|
|
|
|
|
|
|
| |
South Africa - 1.85% |
|
|
|
|
|
|
| |
Republic of South Africa |
|
|
|
|
|
|
| |
6.500%, 06/02/2014 |
|
|
| 323,000 |
| 338,141 |
| |
8.500%, 06/23/2017 |
|
|
| 20,000 |
| 23,600 |
| |
|
|
|
|
|
| 361,741 |
| |
11
|
|
|
| Principal |
| Market Value |
| |
Interest Rate/Maturity Date |
| Currency |
| Amount * |
| (Expressed in U.S. $) |
| |
|
|
|
|
|
|
|
| |
Turkey - 4.61% |
|
|
|
|
|
|
| |
Republic of Turkey |
|
|
|
|
|
|
| |
6.750%, 04/03/2018 |
|
|
| 75,000 |
| $ | 74,438 |
|
7.375%, 02/05/2025 |
|
|
| 100,000 |
| 100,563 |
| |
8.000%, 02/14/2034 |
|
|
| 35,000 |
| 36,654 |
| |
6.875%, 03/17/2036 |
|
|
| 485,000 |
| 441,955 |
| |
7.250%, 03/05/2038 |
|
|
| 265,000 |
| 250,343 |
| |
|
|
|
|
|
| 903,953 |
| |
Ukraine - 2.67% |
|
|
|
|
|
|
| |
Ukraine Government |
|
|
|
|
|
|
| |
6.875%, 03/04/2011(5) |
|
|
| 110,000 |
| 112,063 |
| |
6.385%, 06/26/2012 |
|
|
| 100,000 |
| 99,750 |
| |
7.650%, 06/11/2013 |
|
|
| 300,000 |
| 311,625 |
| |
|
|
|
|
|
| 523,438 |
| |
Uruguay - 2.87% |
|
|
|
|
|
|
| |
Republic of Uruguay |
|
|
|
|
|
|
| |
8.000%, 11/18/2022 |
|
|
| 510,000 |
| 561,000 |
| |
7.875%, 01/15/2033(2) |
|
|
| 800 |
| 868 |
| |
|
|
|
|
|
| 561,868 |
| |
Venezuela - 5.44% |
|
|
|
|
|
|
| |
Republic of Venezuela |
|
|
|
|
|
|
| |
5.375%, 08/07/2010 |
|
|
| 130,000 |
| 123,175 |
| |
10.750%, 09/19/2013 |
|
|
| 245,000 |
| 256,025 |
| |
8.500%, 10/08/2014 |
|
|
| 40,000 |
| 37,800 |
| |
7.000%, 12/01/2018 |
|
|
| 75,000 |
| 60,825 |
| |
7.650%, 04/21/2025 |
|
|
| 480,000 |
| 379,200 |
| |
9.375%, 01/13/2034 |
|
|
| 235,000 |
| 207,975 |
| |
|
|
|
|
|
| 1,065,000 |
| |
TOTAL SOVEREIGN DEBT OBLIGATIONS |
|
|
|
|
| 17,016,822 |
| |
|
|
|
|
|
|
|
| |
CORPORATE BONDS - 9.43% |
|
|
|
|
|
|
| |
Brazil - 2.23% |
|
|
|
|
|
|
| |
GTL Trade Finance, Inc. |
|
|
|
|
|
|
| |
7.250%, 10/20/2017(5) |
|
|
| 100,000 |
| 102,375 |
| |
National Development Co. |
|
|
|
|
|
|
| |
6.369%, 06/16/2018(5) |
|
|
| 160,000 |
| 162,000 |
| |
12
|
|
|
| Principal |
| Market Value |
| |
Interest Rate/Maturity Date |
| Currency |
| Amount * |
| (Expressed in U.S. $) |
| |
|
|
|
|
|
|
|
| |
Petrobras International Finance Co. |
|
|
|
|
|
|
| |
5.875%, 03/01/2018 |
|
|
| 175,000 |
| $ | 171,832 |
|
|
|
|
|
|
| 436,207 |
| |
Ireland - 1.56% |
|
|
|
|
|
|
| |
VIP Finance Ireland Ltd. for OJSC Vimpel Communications |
|
|
|
|
|
|
| |
8.375%, 04/30/2013(5)(8) |
|
|
| 300,000 |
| 306,390 |
| |
|
|
|
|
|
|
|
| |
Luxembourg - 2.07% |
|
|
|
|
|
|
| |
RSHB Capital SA for OJSC Russian Agricultural Bank |
|
|
|
|
|
|
| |
7.750%, 05/29/2018(5)(8) |
|
|
| 200,000 |
| 201,800 |
| |
VTB Capital SA |
|
|
|
|
|
|
| |
6.875%, 05/29/2018(5) |
|
|
| 205,000 |
| 204,487 |
| |
|
|
|
|
|
| 406,287 |
| |
Malaysia - 0.96% |
|
|
|
|
|
|
| |
Petronas Capital Ltd. |
|
|
|
|
|
|
| |
7.875%, 05/22/2022 |
|
|
| 155,000 |
| 187,181 |
| |
|
|
|
|
|
|
|
| |
Mexico - 2.05% |
|
|
|
|
|
|
| |
Pemex Project Funding Master Trust |
|
|
|
|
|
|
| |
5.750%, 03/01/2018 |
|
|
| 400,000 |
| 401,520 |
| |
|
|
|
|
|
|
|
| |
Singapore - 0.05% |
|
|
|
|
|
|
| |
DBS Bank Ltd. |
|
|
|
|
|
|
| |
5.000%, 11/15/2019(4)(5) |
|
|
| 10,000 |
| 9,401 |
| |
|
|
|
|
|
|
|
| |
Tunisia - 0.51% |
|
|
|
|
|
|
| |
Banque Centrale de Tunisie |
|
|
|
|
|
|
| |
7.375%, 04/25/2012 |
|
|
| 60,000 |
| 64,950 |
| |
8.250%, 09/19/2027 |
|
|
| 30,000 |
| 34,849 |
| |
|
|
|
|
|
| 99,799 |
| |
TOTAL CORPORATE BONDS |
|
|
|
|
| 1,846,785 |
| |
|
|
|
|
|
|
|
| |
MONEY MARKET MUTUAL FUNDS - 7.05% |
|
|
|
|
|
|
| |
Dreyfus Cash Advantage Plus Fund(2.83% 7-day yield) |
|
|
| 1,381,709 |
| 1,381,709 |
| |
|
|
|
|
|
|
|
| |
TOTAL MONEY MARKET MUTUAL FUNDS |
|
|
|
|
| 1,381,709 |
| |
13
|
|
|
| Principal |
| Market Value |
| |
Interest Rate/Maturity Date |
| Currency |
| Amount * |
| (Expressed in U.S. $) |
| |
|
|
|
|
|
|
|
|
|
Total Investments - 103.36% |
|
|
|
|
| $ | 20,245,316 |
|
Liabilities in Excess of Other Assets - (3.36)% |
|
|
|
|
| $ | (657,910 | ) |
|
|
|
|
|
|
|
| |
Net Assets - 100% |
|
|
|
|
| $ | 19,587,406 |
|
* |
| The principal/contract amount of each security is stated in the currency in which the bond is denominated (U.S. Dollar unless otherwise notated). See below. |
BRL | Brazilian Real |
COP | Colombian Peso |
EUR | Euro Currency |
IDR | Indonesian Rupiah |
ITL | Italian Lira |
MXN | Mexican Peso |
MYR | Malaysian Ringgit |
(1) | Security is currently in default/non-income producing. |
(2) | Pay-in-kind securities. |
(3) | Step Bond. Coupon increases periodically based upon a predetermined schedule. Interest rate disclosed is the stated rate at a set date in the future. |
(4) | Floating or variable rate security. Interest rate disclosed is that which is in effect at May 31, 2008. |
(5) | Security exempt from registration under Rule 144A of the Securities Act of 1933. Under procedures approved by the Board of Trustees, such securities have been determined to be liquid by the Investment Advisor and may be resold, normally to qualified buyers in transactions exempt from registration. Total market value of Rule 144Asecurities amounts to $1,350,847, which represents approximately 6.90% of net assets as of May 31, 2008. |
(6) | The security is issued by JP Morgan Securities, Inc. |
(7) | Zero coupon bond reflects effective yield on the date of purchase. |
(8) | “OJSC” Open Joint Stock Company - A business whose capital is held in transferable shares of stock by its joint owners. |
See Notes to Financial Statements
14
OUTSTANDING FORWARD FOREIGN CURRENCY CONTRACTS
Contract |
| Contracted |
| Purchase/Sale |
| Expiration |
| Value on |
| Current |
| Unrealized |
| |||
Description |
| Amount |
| Contract |
| Date |
| Settlement Date |
| Value |
| Depreciation |
| |||
BRL |
| 1,460,817 | (BRL) | Purchase |
| 06/03/2008 |
| $ | 896,536 |
| $ | 894,928 |
| $ | (1,608 | ) |
|
|
|
|
|
|
|
|
|
|
|
|
|
| |||
BRL |
| 1,460,817 | (BRL) | Sale |
| 06/03/2008 |
| $ | 870,000 |
| $ | 894,928 |
| $ | (24,928 | ) |
COP |
| 414,460,000 | (COP) | Sale |
| 06/19/2008 |
| 230,000 |
| 236,373 |
| (6,373 | ) | |||
EUR |
| 661,850 | (EUR) | Sale |
| 07/16/2008 |
| 970,385 |
| 1,026,137 |
| (55,752 | ) | |||
|
|
|
|
|
|
|
|
|
| $ | 2,157,438 |
| $ | (87,053 | ) | |
15
Statement of Investments
May 31, 2008 |
| High Yield Bond Fund |
|
| Principal |
|
|
| |
Interest Rate/Maturity Date |
| Amount |
| Market Value |
| |
|
|
|
|
|
| |
CORPORATE BONDS - 81.39% |
|
|
|
|
| |
Advertising - 2.15% |
|
|
|
|
| |
Interep National Radio Sales, Inc. |
|
|
|
|
| |
Series B, 10.000%, 07/01/2008 |
| 4,000 |
| $ | 2,700 |
|
Lamar Media Corp. |
|
|
|
|
| |
6.625%, 08/15/2015 |
| 710,000 |
| 672,725 |
| |
Series B, 6.625%, 08/15/2015 |
| 330,000 |
| 312,675 |
| |
Series C, 6.625%, 08/15/2015 |
| 200,000 |
| 189,500 |
| |
RH Donnelley Corp. |
|
|
|
|
| |
Series A-1, 6.875%, 01/15/2013 |
| 250,000 |
| 168,750 |
| |
Series A-2, 6.875%, 01/15/2013 |
| 25,000 |
| 16,875 |
| |
Series A-3, 8.875%, 01/15/2016 |
| 380,000 |
| 262,200 |
| |
8.875%, 10/15/2017(1) |
| 1,000,000 |
| 675,000 |
| |
|
|
|
| 2,300,425 |
| |
Aerospace - Defense - 3.58% |
|
|
|
|
| |
Alliant Techsystems, Inc. |
|
|
|
|
| |
6.750%, 04/01/2016 |
| 390,000 |
| 387,075 |
| |
DRS Technologies, Inc. |
|
|
|
|
| |
6.875%, 11/01/2013 |
| 50,000 |
| 51,375 |
| |
6.625%, 02/01/2016 |
| 20,000 |
| 20,950 |
| |
7.625%, 02/01/2018 |
| 335,000 |
| 362,638 |
| |
Esterline Technologies Corp. |
|
|
|
|
| |
7.750%, 06/15/2013 |
| 325,000 |
| 332,313 |
| |
6.625%, 03/01/2017 |
| 150,000 |
| 152,250 |
| |
L-3 Communications Corp. |
|
|
|
|
| |
7.625%, 06/15/2012 |
| 1,531,000 |
| 1,563,533 |
| |
Series B, 6.375%, 10/15/2015 |
| 100,000 |
| 96,875 |
| |
Moog, Inc. |
|
|
|
|
| |
6.250%, 01/15/2015 |
| 410,000 |
| 397,700 |
| |
TransDigm, Inc. |
|
|
|
|
| |
7.750%, 07/15/2014 |
| 450,000 |
| 462,375 |
| |
|
|
|
| 3,827,084 |
| |
Agriculture - 0.72% |
|
|
|
|
| |
Reynolds American, Inc. |
|
|
|
|
| |
7.625%, 06/01/2016 |
| 730,000 |
| 765,878 |
| |
|
|
|
|
|
| |
Airlines - 0.00%(2) |
|
|
|
|
| |
Continental Airlines, Inc. |
|
|
|
|
| |
Series 981C, 6.541%, 09/15/2009 |
| 743 |
| 743 |
| |
16
|
| Principal |
|
|
| |
Interest Rate/Maturity Date |
| Amount |
| Market Value |
| |
|
|
|
|
|
| |
Apparel - 0.77% |
|
|
|
|
| |
Levi Strauss & Co. |
|
|
|
|
| |
9.750%, 01/15/2015 |
| 785,000 |
| $ | 826,213 |
|
|
|
|
|
|
| |
Auto Manufacturers - 1.29% |
|
|
|
|
| |
Ford Motor Co. |
|
|
|
|
| |
7.450%, 07/16/2031 |
| 410,000 |
| 285,975 |
| |
8.900%, 01/15/2032 |
| 25,000 |
| 18,875 |
| |
General Motors Corp. |
|
|
|
|
| |
8.375%, 07/15/2033 |
| 1,560,000 |
| 1,076,400 |
| |
|
|
|
| 1,381,250 |
| |
Beverages - 1.13% |
|
|
|
|
| |
Constellation Brands, Inc. |
|
|
|
|
| |
8.375%, 12/15/2014 |
| 675,000 |
| 708,750 |
| |
7.250%, 09/01/2016 |
| 445,000 |
| 445,000 |
| |
7.250%, 05/15/2017 |
| 50,000 |
| 49,625 |
| |
|
|
|
| 1,203,375 |
| |
Building Materials - 0.38% |
|
|
|
|
| |
Associated Materials, Inc. |
|
|
|
|
| |
11.250%, 03/01/2014(3) |
| 130,000 |
| 89,375 |
| |
Interline Brands, Inc. |
|
|
|
|
| |
8.125%, 06/15/2014 |
| 175,000 |
| 171,500 |
| |
Nortek, Inc. |
|
|
|
|
| |
8.500%, 09/01/2014 |
| 150,000 |
| 105,750 |
| |
NTK Holdings, Inc. |
|
|
|
|
| |
10.750%, 03/01/2014(3) |
| 75,000 |
| 37,594 |
| |
|
|
|
| 404,219 |
| |
Chemicals - 3.03% |
|
|
|
|
| |
Airgas, Inc. |
|
|
|
|
| |
6.250%, 07/15/2014 |
| 425,000 |
| 426,063 |
| |
Hercules, Inc. |
|
|
|
|
| |
6.750%, 10/15/2029 |
| 475,000 |
| 456,000 |
| |
Lyondell Chemical Co. |
|
|
|
|
| |
8.375%, 08/15/2015(1) |
| 525,000 |
| 378,000 |
| |
MacDermid, Inc. |
|
|
|
|
| |
9.500%, 04/15/2017(1) |
| 225,000 |
| 219,375 |
| |
Nalco Co. |
|
|
|
|
| |
7.750%, 11/15/2011 |
| 375,000 |
| 384,375 |
| |
8.875%, 11/15/2013 |
| 355,000 |
| 375,413 |
| |
17
|
| Principal |
|
|
| |
Interest Rate/Maturity Date |
| Amount |
| Market Value |
| |
|
|
|
|
|
| |
NewMarket Corp. |
|
|
|
|
| |
7.125%, 12/15/2016 |
| 405,000 |
| $ | 400,950 |
|
Nova Chemicals Corp. |
|
|
|
|
| |
6.500%, 01/15/2012 |
| 645,000 |
| 603,074 |
| |
|
|
|
| 3,243,250 |
| |
Coal - 1.04% |
|
|
|
|
| |
Arch Western Finance LLC |
|
|
|
|
| |
6.750%, 07/01/2013(4) |
| 450,000 |
| 446,625 |
| |
Peabody Energy Corp. |
|
|
|
|
| |
Series B, 6.875%, 03/15/2013 |
| 490,000 |
| 497,350 |
| |
7.375%, 11/01/2016 |
| 35,000 |
| 35,963 |
| |
7.875%, 11/01/2026 |
| 125,000 |
| 127,500 |
| |
|
|
|
| 1,107,438 |
| |
Commercial Services - 4.08% |
|
|
|
|
| |
ARAMARK Corp. |
|
|
|
|
| |
6.373%, 02/01/2015(4) |
| 65,000 |
| 62,725 |
| |
8.500%, 02/01/2015 |
| 780,000 |
| 802,425 |
| |
Cadmus Communications Corp. |
|
|
|
|
| |
8.375%, 06/15/2014 |
| 200,000 |
| 170,000 |
| |
Cenveo Corp. |
|
|
|
|
| |
7.875%, 12/01/2013 |
| 100,000 |
| 87,250 |
| |
Corrections Corp. of America |
|
|
|
|
| |
7.500%, 05/01/2011 |
| 10,000 |
| 10,125 |
| |
6.250%, 03/15/2013 |
| 999,000 |
| 989,009 |
| |
6.750%, 01/31/2014 |
| 75,000 |
| 75,188 |
| |
Deluxe Corp. |
|
|
|
|
| |
7.375%, 06/01/2015 |
| 345,000 |
| 316,106 |
| |
Education Management, LLC |
|
|
|
|
| |
8.750%, 06/01/2014 |
| 475,000 |
| 459,563 |
| |
10.250%, 06/01/2016 |
| 195,000 |
| 186,713 |
| |
The Geo Group, Inc. |
|
|
|
|
| |
8.250%, 07/15/2013 |
| 275,000 |
| 283,250 |
| |
Iron Mountain, Inc. |
|
|
|
|
| |
8.625%, 04/01/2013 |
| 25,000 |
| 25,500 |
| |
7.750%, 01/15/2015 |
| 575,000 |
| 589,375 |
| |
8.750%, 07/15/2018 |
| 285,000 |
| 304,950 |
| |
|
|
|
| 4,362,179 |
| |
Distribution - Wholesale - 0.34% |
|
|
|
|
| |
Baker & Taylor, Inc. |
|
|
|
|
| |
11.500%, 07/01/2013(1) |
| 395,000 |
| 361,425 |
| |
18
|
| Principal |
|
|
| |
Interest Rate/Maturity Date |
| Amount |
| Market Value |
| |
|
|
|
|
|
| |
Diversified Financial Services - 5.91% |
|
|
|
|
| |
AmeriCredit Corp. |
|
|
|
|
| |
8.500%, 07/01/2015 |
| 110,000 |
| $ | 89,238 |
|
Ford Motor Credit Co. LLC |
|
|
|
|
| |
7.375%, 10/28/2009 |
| 275,000 |
| 267,923 |
| |
9.875%, 08/10/2011 |
| 1,075,000 |
| 1,017,861 |
| |
8.000%, 12/15/2016 |
| 460,000 |
| 386,741 |
| |
Global Cash Access LLC |
|
|
|
|
| |
8.750%, 03/15/2012 |
| 448,000 |
| 448,000 |
| |
GMAC LLC |
|
|
|
|
| |
5.850%, 01/14/2009 |
| 450,000 |
| 442,121 |
| |
5.625%, 05/15/2009 |
| 224,000 |
| 216,278 |
| |
7.250%, 03/02/2011 |
| 125,000 |
| 107,130 |
| |
6.875%, 09/15/2011 |
| 375,000 |
| 316,379 |
| |
6.000%, 12/15/2011 |
| 150,000 |
| 120,802 |
| |
7.000%, 02/01/2012 |
| 375,000 |
| 306,370 |
| |
6.625%, 05/15/2012 |
| 105,000 |
| 84,716 |
| |
8.000%, 11/01/2031 |
| 20,000 |
| 15,356 |
| |
Hughes Network Systems LLC |
|
|
|
|
| |
9.500%, 04/15/2014 |
| 160,000 |
| 162,400 |
| |
Petroplus Finance Ltd. |
|
|
|
|
| |
6.750%, 05/01/2014(1) |
| 110,000 |
| 101,475 |
| |
7.000%, 05/01/2017(1) |
| 550,000 |
| 499,125 |
| |
Pinnacle Foods Finance LLC |
|
|
|
|
| |
9.250%, 04/01/2015 |
| 475,000 |
| 439,375 |
| |
Rainbow National Services LLC |
|
|
|
|
| |
8.750%, 09/01/2012(1) |
| 200,000 |
| 206,000 |
| |
Sensus Metering Systems, Inc. |
|
|
|
|
| |
8.625%, 12/15/2013 |
| 125,000 |
| 121,563 |
| |
Southern Star Central Corp. |
|
|
|
|
| |
6.750%, 03/01/2016 |
| 25,000 |
| 24,219 |
| |
6.750%, 03/01/2016(1) |
| 475,000 |
| 460,156 |
| |
Vanguard Health Holding Co. II LLC |
|
|
|
|
| |
9.000%, 10/01/2014 |
| 465,000 |
| 480,113 |
| |
|
|
|
| 6,313,341 |
| |
Electric - 5.51% |
|
|
|
|
| |
TheAES Corp. |
|
|
|
|
| |
9.375%, 09/15/2010 |
| 118,000 |
| 125,670 |
| |
8.875%, 02/15/2011 |
| 131,000 |
| 137,878 |
| |
7.750%, 03/01/2014 |
| 275,000 |
| 276,375 |
| |
8.000%, 10/15/2017 |
| 850,000 |
| 857,438 |
| |
19
|
| Principal |
|
|
| |
Interest Rate/Maturity Date |
| Amount |
| Market Value |
| |
|
|
|
|
|
| |
Edison Mission Energy |
|
|
|
|
| |
7.500%, 06/15/2013 |
| 55,000 |
| $ | 56,375 |
|
7.200%, 05/15/2019 |
| 290,000 |
| 284,200 |
| |
7.625%, 05/15/2027 |
| 960,000 |
| 909,599 |
| |
Mirant Americas Generation LLC |
|
|
|
|
| |
8.500%, 10/01/2021 |
| 175,000 |
| 169,750 |
| |
Mirant North America LLC |
|
|
|
|
| |
7.375%, 12/31/2013 |
| 765,000 |
| 774,563 |
| |
NRG Energy, Inc. |
|
|
|
|
| |
7.250%, 02/01/2014 |
| 425,000 |
| 417,563 |
| |
7.375%, 02/01/2016 |
| 640,000 |
| 625,600 |
| |
Texas Competitive Electric Holdings Co. LLC |
|
|
|
|
| |
10.250%, 11/01/2015(1) |
| 1,225,000 |
| 1,257,155 |
| |
|
|
|
| 5,892,166 |
| |
Electrical Components & Equipment - 0.27% |
|
|
|
|
| |
Belden, Inc. |
|
|
|
|
| |
7.000%, 03/15/2017 |
| 300,000 |
| 294,000 |
| |
|
|
|
|
|
| |
Entertainment - 3.35% |
|
|
|
|
| |
AMC Entertainment, Inc. |
|
|
|
|
| |
8.000%, 03/01/2014 |
| 50,000 |
| 45,500 |
| |
11.000%, 02/01/2016 |
| 240,000 |
| 244,800 |
| |
Cinemark, Inc. |
|
|
|
|
| |
9.750%, 03/15/2014(3) |
| 735,000 |
| 701,925 |
| |
Great Canadian Gaming Corp. |
|
|
|
|
| |
7.250%, 02/15/2015(1) |
| 430,000 |
| 419,250 |
| |
Isle of Capri Casinos, Inc. |
|
|
|
|
| |
7.000%, 03/01/2014 |
| 170,000 |
| 130,475 |
| |
Marquee Holdings, Inc. |
|
|
|
|
| |
12.000%, 08/15/2014(3) |
| 540,000 |
| 437,400 |
| |
Penn National Gaming, Inc. |
|
|
|
|
| |
6.875%, 12/01/2011 |
| 25,000 |
| 24,625 |
| |
Pinnacle Entertainment, Inc. |
|
|
|
|
| |
8.250%, 03/15/2012 |
| 425,000 |
| 430,313 |
| |
8.750%, 10/01/2013 |
| 175,000 |
| 180,250 |
| |
7.500%, 06/15/2015(1) |
| 230,000 |
| 190,900 |
| |
Seneca Gaming Corp. |
|
|
|
|
| |
7.250%, 05/01/2012 |
| 695,000 |
| 674,150 |
| |
Series B, 7.250%, 05/01/2012 |
| 105,000 |
| 101,850 |
| |
|
|
|
| 3,581,438 |
| |
20
|
| Principal |
|
|
| |
Interest Rate/Maturity Date |
| Amount |
| Market Value |
| |
|
|
|
|
|
| |
Environmental Control - 0.92% |
|
|
|
|
| |
Allied Waste North America, Inc. |
|
|
|
|
| |
7.250%, 03/15/2015 |
| 900,000 |
| $ | 897,750 |
|
Series B, 7.125%, 05/15/2016 |
| 50,000 |
| 49,375 |
| |
Browning-Ferris Industries, Inc. |
|
|
|
|
| |
9.250%, 05/01/2021 |
| 35,000 |
| 36,356 |
| |
Safety-Kleen Services, Inc. |
|
|
|
|
| |
9.250%, 06/01/2008(5) |
| 50,000 |
| 10 |
| |
|
|
|
| 983,491 |
| |
Food - 1.58% |
|
|
|
|
| |
Del Monte Corp. |
|
|
|
|
| |
8.625%, 12/15/2012 |
| 625,000 |
| 643,749 |
| |
Dole Food Co., Inc. |
|
|
|
|
| |
8.625%, 05/01/2009 |
| 300,000 |
| 295,500 |
| |
7.250%, 06/15/2010 |
| 325,000 |
| 303,063 |
| |
8.750%, 07/15/2013 |
| 65,000 |
| 58,013 |
| |
Pilgrim’s Pride Corp. |
|
|
|
|
| |
9.250%, 11/15/2013 |
| 100,000 |
| 105,750 |
| |
8.375%, 05/01/2017 |
| 325,000 |
| 285,188 |
| |
|
|
|
| 1,691,263 |
| |
Forest Products & Paper - 0.75% |
|
|
|
|
| |
Appleton Papers, Inc. |
|
|
|
|
| |
8.125%, 06/15/2011 |
| 120,000 |
| 116,400 |
| |
Series B, 9.750%, 06/15/2014 |
| 200,000 |
| 192,000 |
| |
Buckeye Technologies, Inc. |
|
|
|
|
| |
8.000%, 10/15/2010 |
| 111,000 |
| 111,555 |
| |
8.500%, 10/01/2013 |
| 350,000 |
| 353,500 |
| |
NewPage Corp. |
|
|
|
|
| |
10.000%, 05/01/2012 |
| 30,000 |
| 32,100 |
| |
|
|
|
| 805,555 |
| |
Healthcare-Products - 1.53% |
|
|
|
|
| |
Accellent, Inc. |
|
|
|
|
| |
10.500%, 12/01/2013 |
| 430,000 |
| 394,525 |
| |
Advanced Medical Optics, Inc. |
|
|
|
|
| |
7.500%, 05/01/2017 |
| 475,000 |
| 446,500 |
| |
Boston Scientific Corp. |
|
|
|
|
| |
6.000%, 06/15/2011 |
| 675,000 |
| 664,875 |
| |
6.400%, 06/15/2016 |
| 50,000 |
| 47,875 |
| |
7.000%, 11/15/2035 |
| 100,000 |
| 86,500 |
| |
|
|
|
| 1,640,275 |
| |
21
|
| Principal |
|
|
| |
Interest Rate/Maturity Date |
| Amount |
| Market Value |
| |
|
|
|
|
|
| |
Healthcare-Services - 3.48% |
|
|
|
|
| |
Community Health Systems, Inc. |
|
|
|
|
| |
8.875%, 07/15/2015 |
| 625,000 |
| $ | 647,656 |
|
DaVita, Inc. |
|
|
|
|
| |
7.250%, 03/15/2015 |
| 920,000 |
| 903,900 |
| |
HCA, Inc. |
|
|
|
|
| |
9.250%, 11/15/2016 |
| 500,000 |
| 529,375 |
| |
9.625%, 11/15/2016(6) |
| 25,000 |
| 26,438 |
| |
National Mentor Holdings, Inc. |
|
|
|
|
| |
11.250%, 07/01/2014 |
| 175,000 |
| 182,875 |
| |
Psychiatric Solutions, Inc. |
|
|
|
|
| |
7.750%, 07/15/2015 |
| 680,000 |
| 700,400 |
| |
United Surgical Partners International, Inc. |
|
|
|
|
| |
8.875%, 05/01/2017 |
| 125,000 |
| 123,125 |
| |
9.250%, 05/01/2017(6) |
| 620,000 |
| 610,700 |
| |
|
|
|
| 3,724,469 |
| |
Holding Companies-Diversified - 0.12% |
|
|
|
|
| |
Atlantic Broadband Finance LLC |
|
|
|
|
| |
9.375%, 01/15/2014 |
| 135,000 |
| 126,394 |
| |
|
|
|
|
|
| |
Home Furnishings - 0.14% |
|
|
|
|
| |
Norcraft Cos LP |
|
|
|
|
| |
9.000%, 11/01/2011 |
| 35,000 |
| 35,700 |
| |
Norcraft Holdings LP |
|
|
|
|
| |
9.750%, 09/01/2012(3) |
| 125,000 |
| 116,875 |
| |
|
|
|
| 152,575 |
| |
Internet - 0.05% |
|
|
|
|
| |
FTD, Inc. |
|
|
|
|
| |
7.750%, 02/15/2014 |
| 50,000 |
| 50,500 |
| |
|
|
|
|
|
| |
Investment Companies - 0.43% |
|
|
|
|
| |
Intelsat Jackson Holdings Ltd. |
|
|
|
|
| |
11.250%, 06/15/2016 |
| 450,000 |
| 461,250 |
| |
|
|
|
|
|
| |
Iron/Steel - 1.03% |
|
|
|
|
| |
RathGibson, Inc. |
|
|
|
|
| |
11.250%, 02/15/2014 |
| 400,000 |
| 396,000 |
| |
22
|
| Principal |
|
|
| |
Interest Rate/Maturity Date |
| Amount |
| Market Value |
| |
|
|
|
|
|
| |
Steel Dynamics, Inc. |
|
|
|
|
| |
7.375%, 11/01/2012(1) |
| 450,000 |
| $ | 455,625 |
|
6.750%, 04/01/2015 |
| 250,000 |
| 245,625 |
| |
|
|
|
| 1,097,250 |
| |
Lodging - 0.96% |
|
|
|
|
| |
Caesars Entertainment, Inc. |
|
|
|
|
| |
7.875%, 03/15/2010 |
| 200,000 |
| 190,500 |
| |
MGM Mirage |
|
|
|
|
| |
6.000%, 10/01/2009 |
| 35,000 |
| 34,956 |
| |
8.500%, 09/15/2010 |
| 225,000 |
| 230,906 |
| |
8.375%, 02/01/2011 |
| 75,000 |
| 74,719 |
| |
Station Casinos, Inc. |
|
|
|
|
| |
6.000%, 04/01/2012 |
| 60,000 |
| 50,700 |
| |
7.750%, 08/15/2016 |
| 525,000 |
| 439,688 |
| |
|
|
|
| 1,021,469 |
| |
Machinery - Construction & Mining - 0.53% |
|
|
|
|
| |
Terex Corp. |
|
|
|
|
| |
8.000%, 11/15/2017 |
| 550,000 |
| 565,125 |
| |
|
|
|
|
|
| |
Media - 6.82% |
|
|
|
|
| |
CanWest MediaWorks, Inc. |
|
|
|
|
| |
8.000%, 09/15/2012 |
| 450,000 |
| 415,125 |
| |
CCH I Holdings LLC |
|
|
|
|
| |
10.000%, 05/15/2014 |
| 25,000 |
| 15,875 |
| |
CCH I Holdings LLC |
|
|
|
|
| |
11.750%, 05/15/2014(3) |
| 230,000 |
| 152,950 |
| |
12.125%, 01/15/2015(3) |
| 25,000 |
| 16,375 |
| |
CCH I Holdings, LLC |
|
|
|
|
| |
11.000%, 10/01/2015 |
| 945,000 |
| 807,974 |
| |
CCO Holdings LLC |
|
|
|
|
| |
8.750%, 11/15/2013 |
| 75,000 |
| 71,625 |
| |
Charter Communications Operating, LLC |
|
|
|
|
| |
8.375%, 04/30/2014(1) |
| 50,000 |
| 49,375 |
| |
CSC Holdings, Inc. |
|
|
|
|
| |
Series B, 7.625%, 04/01/2011 |
| 575,000 |
| 577,875 |
| |
6.750%, 04/15/2012 |
| 175,000 |
| 170,625 |
| |
Dex Media, Inc. |
|
|
|
|
| |
8.000%, 11/15/2013 |
| 20,000 |
| 16,000 |
| |
9.000%, 11/15/2013(3) |
| 100,000 |
| 78,000 |
| |
9.000%, 11/15/2013(3) |
| 150,000 |
| 117,000 |
| |
23
|
| Principal |
|
|
| |
Interest Rate/Maturity Date |
| Amount |
| Market Value |
| |
|
|
|
|
|
| |
Dex Media West LLC |
|
|
|
|
| |
Series B, 8.500%, 08/15/2010 |
| 20,000 |
| $ | 20,150 |
|
Series B, 9.875%, 08/15/2013 |
| 44,000 |
| 42,515 |
| |
Echostar DBS Corp. |
|
|
|
|
| |
5.750%, 10/01/2008 |
| 55,000 |
| 55,138 |
| |
7.000%, 10/01/2013 |
| 25,000 |
| 24,313 |
| |
6.625%, 10/01/2014 |
| 350,000 |
| 330,750 |
| |
7.125%, 02/01/2016 |
| 610,000 |
| 585,600 |
| |
Idearc, Inc. |
|
|
|
|
| |
8.000%, 11/15/2016 |
| 940,000 |
| 676,799 |
| |
Radio One, Inc. |
|
|
|
|
| |
Series B, 8.875%, 07/01/2011 |
| 430,000 |
| 362,813 |
| |
The Reader’s Digest Association, Inc. |
|
|
|
|
| |
9.000%, 02/15/2017(1) |
| 470,000 |
| 363,075 |
| |
Rogers Cable, Inc. |
|
|
|
|
| |
8.750%, 05/01/2032 |
| 175,000 |
| 197,599 |
| |
Salem Communications Holding Corp. |
|
|
|
|
| |
7.750%, 12/15/2010 |
| 445,000 |
| 418,856 |
| |
Sinclair Television Group, Inc. |
|
|
|
|
| |
8.000%, 03/15/2012 |
| 358,000 |
| 366,055 |
| |
Univision Communications, Inc. |
|
|
|
|
| |
9.750%, 03/15/2015(1)(6) |
| 675,000 |
| 513,000 |
| |
Videotron Ltee |
|
|
|
|
| |
6.875%, 01/15/2014 |
| 670,000 |
| 664,974 |
| |
6.375%, 12/15/2015 |
| 185,000 |
| 177,600 |
| |
|
|
|
| 7,288,036 |
| |
Miscellaneous Manufacturers - 1.11% |
|
|
|
|
| |
Blount, Inc. |
|
|
|
|
| |
8.875%, 08/01/2012 |
| 50,000 |
| 51,000 |
| |
Koppers, Inc. |
|
|
|
|
| |
9.875%, 10/15/2013 |
| 50,000 |
| 53,250 |
| |
Koppers Holdings, Inc. |
|
|
|
|
| |
9.875%, 11/15/2014(3) |
| 250,000 |
| 231,250 |
| |
RBS Global, Inc. |
|
|
|
|
| |
9.500%, 08/01/2014 |
| 460,000 |
| 463,450 |
| |
SPX Corp. |
|
|
|
|
| |
7.625%, 12/15/2014(1) |
| 375,000 |
| 390,469 |
| |
|
|
|
| 1,189,419 |
| |
Office-Business Equipment - 1.46% |
|
|
|
|
| |
Xerox Capital Trust I |
|
|
|
|
| |
8.000%, 02/01/2027 |
| 1,595,000 |
| 1,556,785 |
| |
24
|
| Principal |
|
|
| |
Interest Rate/Maturity Date |
| Amount |
| Market Value |
| |
|
|
|
|
|
| |
Office Furnishings - 0.06% |
|
|
|
|
| |
Interface, Inc. |
|
|
|
|
| |
9.500%, 02/01/2014 |
| 65,000 |
| $ | 68,250 |
|
|
|
|
|
|
| |
Oil & Gas - 5.49% |
|
|
|
|
| |
Chaparral Energy, Inc. |
|
|
|
|
| |
8.500%, 12/01/2015 |
| 625,000 |
| 556,249 |
| |
9.375%, 02/01/2017(4) |
| 145,000 |
| 129,413 |
| |
Chesapeake Energy Corp. |
|
|
|
|
| |
7.625%, 07/15/2013 |
| 275,000 |
| 281,188 |
| |
7.000%, 08/15/2014 |
| 50,000 |
| 50,063 |
| |
7.750%, 01/15/2015 |
| 550,000 |
| 572,687 |
| |
6.375%, 06/15/2015 |
| 150,000 |
| 144,375 |
| |
6.250%, 01/15/2018 |
| 285,000 |
| 268,613 |
| |
7.250%, 12/15/2018 |
| 550,000 |
| 548,624 |
| |
EXCO Resources, Inc. |
|
|
|
|
| |
7.250%, 01/15/2011 |
| 900,000 |
| 887,624 |
| |
Hilcorp Energy I LP |
|
|
|
|
| |
7.750%, 11/01/2015(1) |
| 270,000 |
| 265,275 |
| |
9.000%, 06/01/2016(1) |
| 205,000 |
| 213,713 |
| |
Newfield Exploration Co. |
|
|
|
|
| |
7.125%, 05/15/2018 |
| 450,000 |
| 446,063 |
| |
Pioneer Natural Resources Co. |
|
|
|
|
| |
6.650%, 03/15/2017 |
| 425,000 |
| 410,259 |
| |
Range Resources Corp. |
|
|
|
|
| |
7.250%, 05/01/2018 |
| 225,000 |
| 229,500 |
| |
SandRidge Energy, Inc. |
|
|
|
|
| |
8.000%, 06/01/2018(1) |
| 425,000 |
| 432,438 |
| |
Stone Energy Corp. |
|
|
|
|
| |
8.250%, 12/15/2011 |
| 425,000 |
| 429,250 |
| |
|
|
|
| 5,865,334 |
| |
Oil & Gas Services - 1.16% |
|
|
|
|
| |
Complete Production Services, Inc. |
|
|
|
|
| |
8.000%, 12/15/2016 |
| 425,000 |
| 432,438 |
| |
Dresser-Rand Group, Inc. |
|
|
|
|
| |
7.375%, 11/01/2014 |
| 805,000 |
| 805,000 |
| |
|
|
|
| 1,237,438 |
| |
Packaging & Containers - 2.00% |
|
|
|
|
| |
CrownAmericas LLC |
|
|
|
|
| |
7.750%, 11/15/2015 |
| 430,000 |
| 453,650 |
| |
25
|
| Principal |
|
|
| |
Interest Rate/Maturity Date |
| Amount |
| Market Value |
| |
|
|
|
|
|
| |
Graphic Packaging International, Inc. |
|
|
|
|
| |
8.500%, 08/15/2011 |
| 410,000 |
| $ | 416,150 |
|
9.500%, 08/15/2013 |
| 260,000 |
| 263,250 |
| |
Owens Brockway Glass Container, Inc. |
|
|
|
|
| |
8.250%, 05/15/2013 |
| 500,000 |
| 519,999 |
| |
Series $, 6.750%, 12/01/2014 |
| 275,000 |
| 279,813 |
| |
Owens-Illinois, Inc. |
|
|
|
|
| |
7.500%, 05/15/2010 |
| 50,000 |
| 51,250 |
| |
Packaging Dynamics Finance Corp. |
|
|
|
|
| |
10.000%, 05/01/2016(1) |
| 225,000 |
| 149,625 |
| |
Radnor Holdings Corp. |
|
|
|
|
| |
11.000%, 03/15/2010(5) |
| 25,000 |
| 313 |
| |
|
|
|
| 2,134,050 |
| |
Pharmaceuticals - 0.57% |
|
|
|
|
| |
Valeant Pharmaceuticals International |
|
|
|
|
| |
7.000%, 12/15/2011 |
| 630,000 |
| 611,100 |
| |
|
|
|
|
|
| |
Pipelines - 4.59% |
|
|
|
|
| |
ANR Pipeline Co. |
|
|
|
|
| |
7.375%, 02/15/2024 |
| 60,000 |
| 63,755 |
| |
7.000%, 06/01/2025 |
| 10,000 |
| 10,279 |
| |
Atlas Pipeline Partners LP |
|
|
|
|
| |
8.125%, 12/15/2015 |
| 400,000 |
| 415,000 |
| |
Copano Energy LLC |
|
|
|
|
| |
7.750%, 06/01/2018(1) |
| 450,000 |
| 449,438 |
| |
Dynegy Holdings, Inc. |
|
|
|
|
| |
8.375%, 05/01/2016 |
| 920,000 |
| 929,200 |
| |
7.125%, 05/15/2018 |
| 75,000 |
| 69,563 |
| |
7.750%, 06/01/2019 |
| 160,000 |
| 152,400 |
| |
7.625%, 10/15/2026 |
| 25,000 |
| 22,375 |
| |
El Paso Corp. |
|
|
|
|
| |
7.250%, 06/01/2018 |
| 175,000 |
| 176,531 |
| |
7.800%, 08/01/2031 |
| 800,000 |
| 809,262 |
| |
Targa Resources, Inc. |
|
|
|
|
| |
8.500%, 11/01/2013 |
| 630,000 |
| 609,525 |
| |
Tennessee Gas Pipeline Co. |
|
|
|
|
| |
8.375%, 06/15/2032 |
| 150,000 |
| 167,114 |
| |
Transcontinental Gas Pipe Line Corp. |
|
|
|
|
| |
6.400%, 04/15/2016 |
| 50,000 |
| 50,625 |
| |
26
|
| Principal |
|
|
| |
Interest Rate/Maturity Date |
| Amount |
| Market Value |
| |
|
|
|
|
|
| |
Williams Cos, Inc. |
|
|
|
|
| |
7.875%, 09/01/2021 |
| 625,000 |
| $ | 684,375 |
|
8.750%, 03/15/2032 |
| 250,000 |
| 292,500 |
| |
|
|
|
| 4,901,942 |
| |
Real Estate Investment Trusts - 1.66% |
|
|
|
|
| |
Felcor Lodging LP |
|
|
|
|
| |
8.500%, 06/01/2011 |
| 525,000 |
| 536,813 |
| |
6.788%, 12/01/2011(4) |
| 90,000 |
| 82,575 |
| |
Host Hotels & Resorts LP |
|
|
|
|
| |
Series M, 7.000%, 08/15/2012 |
| 125,000 |
| 125,469 |
| |
7.125%, 11/01/2013 |
| 575,000 |
| 572,124 |
| |
Series O, 6.375%, 03/15/2015 |
| 75,000 |
| 71,625 |
| |
Series Q, 6.750%, 06/01/2016 |
| 400,000 |
| 390,000 |
| |
|
|
|
| 1,778,606 |
| |
Retail - 2.93% |
|
|
|
|
| |
Claire’s Stores, Inc. |
|
|
|
|
| |
9.625%, 06/01/2015(6) |
| 730,000 |
| 429,787 |
| |
10.500%, 06/01/2017 |
| 400,000 |
| 211,500 |
| |
Inergy LP |
|
|
|
|
| |
8.250%, 03/01/2016 |
| 125,000 |
| 127,813 |
| |
8.250%, 03/01/2016(1) |
| 325,000 |
| 332,313 |
| |
Michaels Stores, Inc. |
|
|
|
|
| |
10.000%, 11/01/2014 |
| 525,000 |
| 488,249 |
| |
11.375%, 11/01/2016 |
| 75,000 |
| 64,875 |
| |
Neiman-Marcus Group, Inc. |
|
|
|
|
| |
9.000%, 10/15/2015(6) |
| 95,000 |
| 97,613 |
| |
10.375%, 10/15/2015 |
| 375,000 |
| 389,531 |
| |
Quiksilver, Inc. |
|
|
|
|
| |
6.875%, 04/15/2015 |
| 475,000 |
| 391,875 |
| |
RiteAid Corp. |
|
|
|
|
| |
6.125%, 12/15/2008(1) |
| 400,000 |
| 407,000 |
| |
Sbarro, Inc. |
|
|
|
|
| |
10.375%, 02/01/2015 |
| 225,000 |
| 196,875 |
| |
|
|
|
| 3,137,431 |
| |
Semiconductors - 0.60% |
|
|
|
|
| |
Freescale Semiconductor, Inc. |
|
|
|
|
| |
8.875%, 12/15/2014 |
| 440,000 |
| 391,600 |
| |
9.125%, 12/15/2014(6) |
| 285,000 |
| 245,813 |
| |
|
|
|
| 637,413 |
| |
27
|
| Principal |
|
|
| |
Interest Rate/Maturity Date |
| Amount |
| Market Value |
| |
|
|
|
|
|
| |
Telecommunications - 7.26% |
|
|
|
|
| |
American Tower Corp. |
|
|
|
|
| |
7.500%, 05/01/2012 |
| 75,000 |
| $ | 76,688 |
|
7.000%, 10/15/2017(1) |
| 575,000 |
| 576,438 |
| |
Citizens Communications Co. |
|
|
|
|
| |
7.875%, 01/15/2027 |
| 125,000 |
| 113,125 |
| |
9.000%, 08/15/2031 |
| 855,000 |
| 795,149 |
| |
Embarq Corp. |
|
|
|
|
| |
7.082%, 06/01/2016 |
| 585,000 |
| 569,741 |
| |
7.995%, 06/01/2036 |
| 350,000 |
| 339,487 |
| |
Level 3 Financing, Inc. |
|
|
|
|
| |
12.250%, 03/15/2013 |
| 220,000 |
| 229,900 |
| |
9.250%, 11/01/2014 |
| 190,000 |
| 178,600 |
| |
MetroPCS Wireless, Inc. |
|
|
|
|
| |
9.250%, 11/01/2014 |
| 465,000 |
| 449,306 |
| |
Nextel Communications, Inc. |
|
|
|
|
| |
Series D, 7.375%, 08/01/2015 |
| 800,000 |
| 644,425 |
| |
Qwest Communications International, Inc. |
|
|
|
|
| |
Series B, 7.500%, 02/15/2014 |
| 175,000 |
| 172,375 |
| |
Qwest Corp. |
|
|
|
|
| |
8.875%, 03/15/2012 |
| 100,000 |
| 105,250 |
| |
7.500%, 10/01/2014 |
| 1,050,000 |
| 1,049,999 |
| |
7.500%, 6/15/2023 |
| 25,000 |
| 23,188 |
| |
6.875%, 09/15/2033 |
| 625,000 |
| 537,500 |
| |
Rogers Communications, Inc. |
|
|
|
|
| |
7.250%, 12/15/2012 |
| 30,000 |
| 32,231 |
| |
8.000%, 12/15/2012 |
| 770,000 |
| 800,799 |
| |
Rural Cellular Corp. |
|
|
|
|
| |
6.076%, 06/01/2013(4) |
| 230,000 |
| 233,450 |
| |
Virgin Media Finance PLC |
|
|
|
|
| |
9.125%, 08/15/2016 |
| 425,000 |
| 418,625 |
| |
Wind Acquisition Finance SA |
|
|
|
|
| |
10.750%, 12/01/2015(1) |
| 20,000 |
| 21,500 |
| |
Windstream Corp. |
|
|
|
|
| |
8.625%, 08/01/2016 |
| 390,000 |
| 405,113 |
| |
|
|
|
| 7,772,889 |
| |
Transportation - 0.61% |
|
|
|
|
| |
Bristow Group, Inc. |
|
|
|
|
| |
7.500%, 09/15/2017 |
| 405,000 |
| 417,150 |
| |
Navios Maritime Holdings, Inc. |
|
|
|
|
| |
9.500%, 12/15/2014 |
| 230,000 |
| 238,050 |
| |
|
|
|
| 655,200 |
| |
28
|
| Principal |
|
|
| |
Interest Rate/Maturity Date |
| Amount |
| Market Value |
| |
|
|
|
|
|
| |
TOTAL CORPORATE BONDS |
|
|
| $ | 87,017,933 |
|
|
|
|
|
|
| |
CONVERTIBLE CORPORATE BONDS - 0.09% |
|
|
|
|
| |
Aerospace - Defense - 0.03% |
|
|
|
|
| |
Alliant Techsystems, Inc. |
|
|
|
|
| |
2.750%, 02/15/2024(1) |
| 10,000 |
| 14,100 |
| |
L-3 Communications Holdings, Inc. |
|
|
|
|
| |
3.000%, 08/01/2035(1) |
| 15,000 |
| 18,488 |
| |
|
|
|
| 32,588 |
| |
Media - 0.02% |
|
|
|
|
| |
Sinclair Broadcast Group, Inc. |
|
|
|
|
| |
4.875%, 07/15/2018(4) |
| 25,000 |
| 23,094 |
| |
|
|
|
|
|
| |
Real Estate Investment Trusts - 0.04% |
|
|
|
|
| |
MeriStar Hospitality Corp. |
|
|
|
|
| |
9.500%, 04/01/2010 |
| 40,000 |
| 41,059 |
| |
|
|
|
|
|
| |
TOTAL CONVERTIBLE CORPORATE BONDS |
|
|
| 96,741 |
| |
|
|
|
|
|
| |
BANK LOANS - 4.85% |
|
|
|
|
| |
Aerospace - Defense - 0.38% |
|
|
|
|
| |
Sequa Corp.3 |
|
|
|
|
| |
5.950%, 12/07/2014 |
| 318,750 |
| 304,405 |
| |
Sequa Corp.4 |
|
|
|
|
| |
5.950%, 12/07/2014 |
| 105,188 |
| 100,454 |
| |
|
|
|
| 404,859 |
| |
Auto Manufacturers - 0.44% |
|
|
|
|
| |
Ford Motor Co. |
|
|
|
|
| |
8.000%, 11/29/2013 |
| 543,125 |
| 469,973 |
| |
|
|
|
|
|
| |
Beverages — 0.13% |
|
|
|
|
| |
Tropicana Products, Inc. |
|
|
|
|
| |
9.250%, 12/15/2011 |
| 142,147 |
| 137,994 |
| |
|
|
|
|
|
| |
Building Products - 0.59% |
|
|
|
|
| |
Texas Electric |
|
|
|
|
| |
6.121%, 06/09/2008 |
| 81,770 |
| 77,161 |
| |
6.234%, 08/11/2008 |
| 495,458 |
| 467,532 |
| |
6.478%, 10/10/2014 |
| 96,769 |
| 91,315 |
| |
|
|
|
| 636,008 |
| |
29
|
| Principal |
|
|
| |
Interest Rate/Maturity Date |
| Amount |
| Market Value |
| |
|
|
|
|
|
| |
Chemicals - 0.34% |
|
|
|
|
| |
LYON |
|
|
|
|
| |
4.890%, 06/12/2014 |
| 400,000 |
| $ | 363,600 |
|
|
|
|
|
|
| |
Commercial Services - 0.09% |
|
|
|
|
| |
ARAMARK Corp. |
|
|
|
|
| |
4.571%, 01/26/2014 |
| 91,966 |
| 86,552 |
| |
5.198%, 01/26/2014 |
| 5,843 |
| 5,499 |
| |
|
|
|
| 92,051 |
| |
Diversified Financial Services - 0.26% |
|
|
|
|
| |
First Data Corp B-1 |
|
|
|
|
| |
7.580%, 10/08/2014 |
| 19,901 |
| 18,510 |
| |
First Data Crp B1 T4 |
|
|
|
|
| |
5.143%, 10/08/2014 |
| 270,379 |
| 251,483 |
| |
First Data Crp B1 T5 |
|
|
|
|
| |
5.349%, 10/08/2014 |
| 8,220 |
| 7,646 |
| |
|
|
|
| 277,639 |
| |
Entertainment - 0.19% |
|
|
|
|
| |
LV Sands-Del Draw I |
|
|
|
|
| |
4.170%, 06/30/2008 |
| 45,000 |
| 41,516 |
| |
LV Sands-Tranche 3 |
|
|
|
|
| |
4.450%, 06/30/2008 |
| 178,650 |
| 164,817 |
| |
|
|
|
| 206,333 |
| |
Forest Products & Paper - 0.38% |
|
|
|
|
| |
Graphpack1 |
|
|
|
|
| |
5.484%, 05/16/2014 |
| 53,125 |
| 51,379 |
| |
Graphpack2 |
|
|
|
|
| |
5.670%, 05/16/2014 |
| 53,125 |
| 51,379 |
| |
Graphpack3 |
|
|
|
|
| |
5.484%, 05/16/2014 |
| 194,792 |
| 188,387 |
| |
Graphpack5 |
|
|
|
|
| |
5.670%, 05/16/2014 |
| 123,958 |
| 119,883 |
| |
|
|
|
| 411,028 |
| |
Healthcare-Services - 0.23% |
|
|
|
|
| |
HCA, Inc. |
|
|
|
|
| |
7.080%, 11/18/2013 |
| 263,832 |
| 248,801 |
| |
30
|
| Principal |
|
|
| |
Interest Rate/Maturity Date |
| Amount |
| Market Value |
| |
|
|
|
|
|
| |
Hotels & Motels - 0.47% |
|
|
|
|
| |
Tribune Company |
|
|
|
|
| |
7.396%, 05/14/2009 |
| 525,000 |
| $ | 499,875 |
|
|
|
|
|
|
| |
Internet - 0.22% |
|
|
|
|
| |
Level 3 Communications, Inc. |
|
|
|
|
| |
5.389%, 03/09/2014 |
| 71,429 |
| 66,094 |
| |
6.627%, 03/09/2014 |
| 178,571 |
| 165,234 |
| |
|
|
|
| 231,328 |
| |
Media - 0.56% |
|
|
|
|
| |
Charter Comm 3 |
|
|
|
|
| |
4.890%, 06/30/2008 |
| 313 |
| 279 |
| |
Charter Comm 4 |
|
|
|
|
| |
4.900%, 07/30/2008 |
| 124,375 |
| 110,920 |
| |
Crown Castle International Corp. |
|
|
|
|
| |
6.330%, 03/02/2014 |
| 247,500 |
| 235,744 |
| |
Merrill Communications, LLC |
|
|
|
|
| |
9.517%, 11/27/2013 |
| 150,000 |
| 121,125 |
| |
Univision 1L 22 |
|
|
|
|
| |
4.631%, 05/30/2008 |
| 9,060 |
| 7,679 |
| |
Univision Communications, Inc. |
|
|
|
|
| |
5.494%, 10/03/2014 |
| 140,940 |
| 119,455 |
| |
|
|
|
| 595,202 |
| |
Office Furnishings - 0.16% |
|
|
|
|
| |
Collins & Aikman Floorcoverings, Inc. |
|
|
|
|
| |
5.090%, 05/08/2014 |
| 21,272 |
| 16,273 |
| |
7.401%, 05/08/2014 |
| 178,034 |
| 136,196 |
| |
7.646%, 05/08/2014 |
| 18,367 |
| 14,051 |
| |
|
|
|
| 166,520 |
| |
Research Services - 0.37% |
|
|
|
|
| |
Nielsen Finance 13 |
|
|
|
|
| |
4.734%, 08/08/2008 |
| 422,366 |
| 397,854 |
| |
|
|
|
|
|
| |
Semiconductors - 0.04% |
|
|
|
|
| |
Freescale Semiconductor, Inc. |
|
|
|
|
| |
5.014%, 12/01/2013 |
| 49,748 |
| 44,892 |
| |
|
|
|
|
|
| |
TOTAL BANK LOANS (Amortized Cost $5,341,606) |
|
|
| 5,183,957 |
| |
31
|
| Principal |
|
|
| |
Interest Rate/Maturity Date |
| Amount |
| Market Value |
| |
|
|
|
|
|
| |
COMMON STOCKS - 0.22% |
|
|
|
|
| |
Telecommunications - 0.22% |
|
|
|
|
| |
American Tower Corp.(7) |
| 3,930 |
| $ | 179,679 |
|
Virgin Media, Inc. |
| 3,372 |
| 52,907 |
| |
|
|
|
| 232,586 |
| |
TOTAL COMMON STOCKS |
|
|
| 232,586 |
| |
|
|
|
|
|
| |
MONEY MARKET MUTUAL FUNDS - 8.31% |
|
|
|
|
| |
Dreyfus Cash Advantage Plus Fund (2.83% 7-day yield) |
| 8,888,955 |
| 8,888,955 |
| |
|
|
|
|
|
| |
TOTAL MONEY MARKET MUTUAL FUNDS |
|
|
| 8,888,955 |
| |
|
|
|
|
|
| |
Total Investments - 94.86% |
|
|
| $ | 101,420,172 |
|
Other Assets in Excess of Liabilities - 5.14% |
|
|
| 5,491,904 |
| |
|
|
|
|
|
| |
Net Assets - 100.00% |
|
|
| $ | 106,912,076 |
|
(1) | Security exempt from registration under Rule 144A of the Securities Act of 1933. Under procedures approved by the Board of Trustees, such securities have been determined to be liquid by the Investment Advisor and may be resold, normally to qualified buyers in transactions exempt from registration. Total market value of Rule 144Asecurities amounts to $9,419,733, which represents approximately 8.81% of net assets as of May 31, 2008. |
(2) | Amount represents less than 0.005% of net assets. |
(3) | Step Bond. Coupon increases periodically based upon a predetermined schedule. Interest rate disclosed is the stated rate at a set date in the future. |
(4) | Floating or variable rate security. Interest rate disclosed is that which is in effect at May 31, 2008. |
(5) | Security is currently in default/non-income producing. |
(6) | Pay-in-kind securities. |
(7) | Non-income producing. |
See Notes to Financial Statements
32
Statement of Assets & Liabilities
May 31, 2008
|
| Stone Harbor |
| Stone Harbor |
| ||
|
| Emerging Markets |
| High Yield |
| ||
|
| Debt Fund |
| Bond Fund |
| ||
ASSETS |
|
|
|
|
| ||
Investments, at value(1) |
| $ | 20,245,316 |
| $ | 101,420,172 |
|
Receivable for investments sold |
| 420,509 |
| — |
| ||
Receivable for shares sold |
| — |
| 5,075,846 |
| ||
Interest receivable |
| 445,593 |
| 2,042,965 |
| ||
Receivable from investment advisor |
| 24,703 |
| — |
| ||
Deferred offering costs |
| 11,235 |
| 11,108 |
| ||
Prepaids and other assets |
| 3,560 |
| 8,869 |
| ||
Total Assets |
| 21,150,916 |
| 108,558,960 |
| ||
|
|
|
|
|
| ||
LIABILITIES |
|
|
|
|
| ||
Payable for investments purchased |
| 1,362,247 |
| 1,194,041 |
| ||
Unrealized depreciation on forward foreign currency contracts |
| 88,661 |
| — |
| ||
Payable for distributions |
| 32,756 |
| 339,136 |
| ||
Payable to advisor |
| — |
| 11,961 |
| ||
Payable to administrator |
| 3,842 |
| 18,280 |
| ||
Payable for trustee fees |
| — |
| 1,313 |
| ||
Other payables |
| 76,004 |
| 82,153 |
| ||
Total Liabilities |
| 1,563,510 |
| 1,646,884 |
| ||
Net Assets |
| $ | 19,587,406 |
| $ | 106,912,076 |
|
|
|
|
|
|
| ||
NET ASSETS CONSIST OF: |
|
|
|
|
| ||
Paid-in capital |
| $ | 19,368,561 |
| $ | 108,158,523 |
|
(Over)/undistributed net investment income |
| 48,116 |
| (56,185 | ) | ||
Accumulated net realized gain/(loss) on investments, swaps and translation of assets and liabilities denominated in foreign currency |
| (9,498 | ) | 172,921 |
| ||
Net unrealized appreciation/(depreciation) on investments and translation of assets and liabilities denominated in foreign currencies |
| 180,227 |
| (1,363,183 | ) | ||
Net Assets |
| $ | 19,587,406 |
| $ | 106,912,076 |
|
|
|
|
|
|
| ||
PRICING OF SHARES: |
|
|
|
|
| ||
Institutional Class Shares |
|
|
|
|
| ||
Net Assets |
| $ | 19,587,406 |
| $ | 106,912,076 |
|
Shares of beneficial interest outstanding (unlimited number of shares, par value of $0.001 per share authorized) |
| 1,894,363 |
| 10,776,299 |
| ||
Net asset value, offering and redemption price per share |
| $ | 10.34 |
| $ | 9.92 |
|
(1) Cost of Investments |
| $ | 19,984,056 |
| $ | 102,783,355 |
|
See Notes to Financial Statements
33
Statement of Operations
For the period August 16, 2007 (Inception) to May 31, 2008
|
| Stone Harbor |
| Stone Harbor |
| ||
|
| Emerging Markets |
| High Yield |
| ||
|
| Debt Fund |
| Bond Fund |
| ||
INVESTMENT INCOME |
|
|
|
|
| ||
Interest (net of foreign withholding tax of $231 on Stone Harbor Emerging Markets Debt Fund) |
| $ | 882,967 |
| $ | 4,468,701 |
|
Other income |
| — |
| 21,839 |
| ||
Total Investment Income |
| 882,967 |
| 4,490,540 |
| ||
|
|
|
|
|
| ||
EXPENSES |
|
|
|
|
| ||
Investment advisory fee |
| 79,313 |
| 267,236 |
| ||
Administrative fee |
| 38,088 |
| 145,683 |
| ||
Custodian fees |
| 13,827 |
| 6,519 |
| ||
Audit fees |
| 73,000 |
| 73,000 |
| ||
Printing fees |
| 3,111 |
| 4,364 |
| ||
Offering costs |
| 42,244 |
| 42,385 |
| ||
Legal fees |
| 13,641 |
| 55,624 |
| ||
Trustee fees |
| 11,835 |
| 13,160 |
| ||
Transfer agent fees |
| 16,001 |
| 16,164 |
| ||
Registration fees |
| 2,338 |
| 3,230 |
| ||
Insurance fees |
| 6,409 |
| 19,224 |
| ||
Other |
| 1,755 |
| 2,580 |
| ||
Total expenses before waiver/reimbursement |
| 301,562 |
| 649,169 |
| ||
Less fees waived by investment advisor |
| (79,313 | ) | (267,236 | ) | ||
Less fees reimbursed by investment advisor |
| (123,107 | ) | (87,974 | ) | ||
Total Net Expenses |
| 99,142 |
| 293,959 |
| ||
Net Investment Income |
| 783,825 |
| 4,196,581 |
| ||
|
|
|
|
|
| ||
REALIZED AND UNREALIZED GAIN/(LOSS) ON INVESTMENTS |
|
|
|
|
| ||
Net realized gain/(loss) on: |
|
|
|
|
| ||
Investments |
| 559,609 |
| 53,916 |
| ||
Swaps |
| (30,973 | ) | — |
| ||
Foreign currency transactions |
| (70,899 | ) | — |
| ||
Net realized gain |
| 457,737 |
| 53,916 |
| ||
Change in unrealized appreciation/(depreciation) on: |
|
|
|
|
| ||
Investments |
| 261,260 |
| (1,363,183 | ) | ||
Translation of assets and liabilities denominated in foreign currencies |
| (81,033 | ) | — |
| ||
Net change |
| 180,227 |
| (1,363,183 | ) | ||
Net Realized and Unrealized Gain/(Loss) on Investments |
| 637,964 |
| (1,309,267 | ) | ||
Net Increase in Net Assets Resulting from Operations |
| $ | 1,421,789 |
| $ | 2,887,314 |
|
See Notes to Financial Statements
34
Statement of Changes in Net Assets
For the period August 16, 2007 (Inception) to May 31, 2008
|
| Stone Harbor |
| |
|
| Emerging Markets |
| |
|
| Debt Fund |
| |
OPERATIONS |
|
|
| |
Net investment income |
| $ | 783,825 |
|
Net realized gain/(loss) on investments: |
| 457,737 |
| |
Net change in unrealized appreciation on investments and foreign currency translations |
| 180,227 |
| |
Net increase in net assets resulting from operations |
| 1,421,789 |
| |
|
|
|
| |
DISTRIBUTIONS TO SHAREHOLDERS |
|
|
| |
From net investment income |
| (936,189 | ) | |
From realized gains on investments |
| (277,514 | ) | |
From tax return of capital |
| (6,303 | ) | |
Net decrease in net assets from distributions to shareholders |
| (1,220,006 | ) | |
|
|
|
| |
CAPITAL SHARE TRANSACTIONS |
|
|
| |
Institutional Class Shares |
|
|
| |
Proceeds from sale of shares |
| 19,485,836 |
| |
Issued to shareholders in reinvestment of distributions |
| 1,152,287 |
| |
Cost of shares redeemed |
| (1,302,500 | ) | |
Net increase in net assets from capital share transactions |
| 19,335,623 |
| |
Net Increase in Net Assets |
| 19,537,406 |
| |
Net Assets |
|
|
| |
Beginning of period |
| 50,000 |
| |
End of period (including underdistributed net investment income of $48,116) |
| $ | 19,587,406 |
|
|
|
|
| |
OTHER INFORMATION |
|
|
| |
Share Transactions: |
|
|
| |
Institutional Class Shares |
|
|
| |
Beginning Shares |
| 5,000 |
| |
Sold |
| 1,901,770 |
| |
Reinvested |
| 110,056 |
| |
Redeemed |
| (122,463 | ) | |
Net increase in shares outstanding |
| 1,894,363 |
| |
See Notes to Financial Statements
35
|
| Stone Harbor |
| |
|
| High Yield |
| |
|
| Bond Fund |
| |
OPERATIONS |
|
|
| |
Net investment income |
| $ | 4,196,581 |
|
Net realized gain on investments |
| 53,916 |
| |
Net change in unrealized depreciation on investments |
| (1,363,183 | ) | |
Net increase in net assets resulting from operations |
| 2,887,314 |
| |
|
|
|
| |
DISTRIBUTIONS TO SHAREHOLDERS |
|
|
| |
From net investment income |
| (4,051,279 | ) | |
From realized gains on investments |
| (93,241 | ) | |
From tax return of capital |
| (21,250 | ) | |
Net decrease in net assets from distributions to shareholders |
| (4,165,770 | ) | |
|
|
|
| |
CAPITAL SHARE TRANSACTIONS |
|
|
| |
Institutional Class Shares |
|
|
| |
Proceeds from sales of shares |
| 109,502,778 |
| |
Issued to shareholders in reinvestment of distributions |
| 2,978,804 |
| |
Cost of shares redeemed |
| (4,341,050 | ) | |
Net increase in net assets from capital share transactions |
| 108,140,532 |
| |
Net Increase in Net Assets |
| 108,862,076 |
| |
Net Assets |
|
|
| |
Beginning of period |
| 50,000 |
| |
End of period (including overdistributed net investment income of $56,185) |
| $ | 106,912,076 |
|
|
|
|
| |
OTHER INFORMATION |
|
|
| |
Share Transactions: |
|
|
| |
Institutional Class Shares |
|
|
| |
Beginning Shares |
| 5,000 |
| |
Sold |
| 10,903,020 |
| |
Reinvested |
| 301,150 |
| |
Redeemed |
| (432,871 | ) | |
Net increase in shares outstanding |
| 10,776,299 |
| |
See Notes to Financial Statements
36
Financial Highlights
For a share outstanding through the period presented |
| Emerging Markets Debt Fund |
|
| Institutional Class Shares |
|
| For the period |
| |
|
| August 16, 2007 |
| |
|
| (Inception) to |
| |
|
| May 31, 2008 |
| |
Net asset value - beginning of the period |
| $ | 10.00 |
|
Income from investment operations |
|
|
| |
Net investment income |
| 0.46 |
| |
Net realized and unrealized gain on investments |
| 0.58 |
| |
Total income from investment operations |
| 1.04 |
| |
|
|
|
| |
Less distributions to common shareholders |
|
|
| |
From net investment income |
| (0.54 | ) | |
From net realized gain on investments |
| (0.16 | ) | |
From tax return of capital |
| (0.00 | )(3) | |
Total distributions |
| (0.70 | ) | |
|
|
|
| |
Net Increase in Net Asset Value |
| 0.34 |
| |
Net asset value - end of period |
| $ | 10.34 |
|
|
|
|
| |
Total Return(1)(2) |
| 10.46 | % | |
|
|
|
| |
RATIOS/SUPPLEMENTAL DATA: |
|
|
| |
Net assets, end of period (in thousands) |
| $ | 19,587 |
|
Ratio of expenses to average net assets with fee waivers/reimbursements |
| 0.75 | %* | |
Ratio of expenses to average net assets without fee waivers/reimbursements |
| 2.27 | %* | |
Ratio of net investment income to average net assets with fee waivers/reimbursements |
| 5.91 | %* | |
|
|
|
| |
Portfolio Turnover Rate |
| 143 | % | |
* | Annualized. |
(1) | Total returns for periods of less than one year are not annualized. |
(2) | Total returns would have been lower had various fees and expenses not been waived and reimbursed during the period. |
(3) | Less than (0.005) per share. |
See Notes to Financial Statements
37
Financial Highlights
For a share outstanding through the period presented |
| Emerging Yield Bond Fund |
|
| Institutional Class Shares |
|
| For the period |
| |
|
| August 16, 2007 |
| |
|
| (Inception) to |
| |
|
| May 31, 2008 |
| |
Net asset value - beginning of the period |
| $ | 10.00 |
|
Income from investment operations |
|
|
| |
Net investment income |
| 0.58 |
| |
Net realized and unrealized loss on investments |
| (0.08 | ) | |
Total income from investment operations |
| 0.50 |
| |
|
|
|
| |
Less distributions to common shareholders |
|
|
| |
From net investment income |
| (0.57 | ) | |
From net realized gain on investments |
| (0.01 | ) | |
From tax return of capital |
| (0.00 | )(3) | |
Total distributions |
| (0.58 | ) | |
|
|
|
| |
Net Decrease in Net Asset Value |
| (0.08 | ) | |
Net asset value - end of period |
| $ | 9.92 |
|
|
|
|
| |
Total Return (1)(2) |
| 5.09 | % | |
|
|
|
| |
RATIOS/SUPPLEMENTAL DATA: |
|
|
| |
Net assets, end of period (in thousands) |
| $ | 106,912 |
|
Ratio of expenses to average net assets with fee waivers/reimbursements |
| 0.55 | %* | |
Ratio of expenses to average net assets without fee waivers/reimbursements |
| 1.21 | %* | |
Ratio of net investment income to average net assets with fee waivers/reimbursements |
| 7.81 | %* | |
|
|
|
| |
Portfolio Turnover Rate |
| 11 | % | |
* | Annualized. |
(1) | Total returns for periods of less than one year are not annualized. |
(2) | Total returns would have been lower had various fees and expenses not been waived and reimbursed during the period. |
(3) | Less than (0.005) per share |
See Notes to Financial Statements
38
Notes to Financial Statements
May 31, 2008
1. ORGANIZATION AND SIGNIFICANT ACCOUNTING POLICIES
Stone Harbor Investment Funds consist of Stone Harbor Emerging Markets Debt Fund and Stone Harbor High Yield Bond Fund (each, a “Fund and together, the Funds”) is a Massachusetts business trust, organized on February 20, 2007 and registered under the Investment Company Act of 1940, as amended (the “1940 Act”), as an open-end management investment company. Each Fund is a non- diversified portfolio with an investment objective to maximize total return. Shares of each Fund are currently divided into two classes, designated Institutional Class Shares and Distributor Class Shares. As of the date of this report, there were no outstanding shares for the Distributor Class of each Fund. The Declaration of Trust permits the Trustees to create additional funds and share classes.
The following are significant accounting policies consistently followed by the Fund and are in conformity with U.S. generally accepted accounting principles (“GAAP”). Estimates and assumptions are required to be made regarding assets, liabilities and changes in net assets resulting from operations when financial statements are prepared. Changes in the economic environment, financial markets and any other parameters used in determining these estimates could cause actual results to differ.
(a) Investment Valuation: Debt securities, bank loans and linked notes are valued at the mean between the bid and asked prices provided by an independent pricing service that are based on transactions in debt obligations, quotations from dealers, market transactions in comparable securities and various other relationships between securities. Equity securities for which market quotations are available are valued at the last sale price or official closing price on the primary market or exchange on which they trade. Publicly traded foreign government debt securities are typically traded internationally in the over-the-counter market, and are valued at the mean between the bid and asked prices as of the close of business of that market. When prices are not readily available, or are determined not to reflect fair value, such as when the value of a security has been significantly affected by events after the close of the exchange or market on which the security is principally traded, but before the Funds calculate their net asset value, the Funds may value these investments at fair value as determined in accordance with the procedures approved by the Funds’ Board of Trustees. Short-term obligations with maturities of 60 days or less are valued at amortized cost, which approximates market value. Available cash is invested into a money market fund by the custodian.
(b) Security Transactions and Investment Income: Security transactions are accounted for on a trade date basis. Interest income, adjusted for amortization of premium and accretion of discount, is recorded on the accrual basis. Dividend income is recorded on the ex-dividend date. Foreign dividend income is recorded on the ex-dividend date or as soon as practical after the Funds determine the existence of a dividend declaration after exercising reasonable due diligence. The cost of investments sold is determined by use of the specific identification method. To the extent any issuer defaults on an expected interest payment, the Funds’ policy is to generally halt any additional interest income accruals and consider the realizability of interest accrued up to the date of default.
(c) Foreign Currency Translation: The books and records of the Fund are maintained in U.S. dollars. Investment valuations and other assets and liabilities initially expressed in foreign currencies are converted each business day into U.S. dollars based upon current exchange rates. Prevailing foreign exchange rates may generally be obtained at the close of the NYSE, normally 4:00 p.m. Eastern Time. As available and as provided by an appropriate pricing service, translation of foreign security and currency market values may also occur with the use of foreign exchange rates obtained at approximately 11:00 a.m. Eastern Time, which approximates the close of the London Exchange. The portion of unrealized gains or losses on investments due to fluctuations in foreign currency rates is not separately disclosed.
39
Notes to Financial Statements (continued)
May 31, 2008
(d) Forward Foreign Currency Contracts: The Funds may engage in currency transactions with counterparties to hedge the value of portfolio securities denominated in particular currencies against fluctuations in relative value, to gain or reduce exposure to certain currencies, or to generate income or gains. A forward foreign currency contract is an agreement between two parties to buy and sell a currency at a set price on a future date. The contract is marked-to-market daily and the change in value is recorded by the Funds as an unrealized gain or loss. When a forward foreign currency contract is extinguished, through either delivery or offset by entering into another forward foreign currency contract, the Funds record a realized gain or loss equal to the difference between the value of the contract at the time it was opened and the value of the contract at the time it was extinguished.
Forward foreign currency contracts involve elements of market risk in excess of the amounts reflected in the Statements of Assets and Liabilities. The Funds bear the risk of an unfavorable change in the foreign exchange rate underlying the forward foreign currency contract. Risks may also arise upon entering into these contracts from the potential inability of the counterparties to meet the terms of their contracts.
(e) Credit Default Swaps: The Funds may enter into credit default swap contracts for hedging purposes, to gain market exposure or to add leverage to its portfolio. When used for hedging purposes, a Fund would be the buyer of a credit default swap contract. In that case, the Fund would be entitled to receive the par (or other agreed-upon) value of a referenced debt obligation, index or other investment from the counterparty to the contract in the event of a default by a third party, such as a U.S. or foreign issuer, on the referenced debt obligation. In return, the Fund would pay to the counterparty a periodic stream of payments over the term of the contract provided that no event of default has occurred. If no default occurs, the Fund would have spent the stream of payments and received no benefit from the contract. When the fund is the seller of a credit default swap contract, it receives the stream of payments but is obligated to pay upon default of the referenced debt obligation. As the seller, the Fund would effectively add leverage to its portfolio because, in addition to its total assets, the Fund would be subject to investment exposure on the notional amount of the swap.
In addition to the risks applicable to derivatives generally, credit default swaps involve special risks because they are difficult to value, are highly susceptible to liquidity and credit risk, and generally pay a return to the party that has paid the premium only in the event of an actual default by the issuer of the underlying obligation, as opposed to a credit downgrade or other indication of financial difficulty.
(f) Loan Participations: The High Yield Bond Portfolio may invest in loans arranged through private negotiation between one or more financial institutions. The Fund’s investment in any such loan may be in the form of a participation in or an assignment of the loan. In connection with purchasing participations, the Fund generally will have no right to enforce compliance by the borrower with the terms of the loan agreement relating to the loan, nor any rights of set-off against the borrower and the Fund may not benefit directly from any collateral supporting the loan in which it has purchased the participation.
The Fund assumes the credit risk of the borrower, the lender that is selling the participation and any other persons inter positioned between the Fund and the borrower. In the event of the insolvency of the lender selling the participation, the Fund may be treated as a general creditor of the lender and may not benefit from any set-off between the lender and the borrower.
(g) Credit and Market Risk: The Funds invest in high yield and emerging market instruments that are subject to certain credit and market risks. The yields of high yield and emerging market debt obligations reflect, among other things, perceived credit and market risks. The Funds’ investment in securities rated below investment grade typically involves risks not associated with higher rated
40
Notes to Financial Statements (continued)
May 31, 2008
securities including, among others, greater risk related to timely and ultimate payment of interest and principal, greater market price volatility and less liquid secondary market trading. The consequences of political, social, economic or diplomatic changes may have disruptive effects on the market prices of investments held by the Funds. The Funds’ investment in non-dollar denominated securities may also result in foreign currency losses caused by devaluations and exchange rate fluctuations.
(h) Other Risks: Consistent with their objective to seek high current income, the Funds may invest in instruments whose values and interest rates are linked to foreign currencies, interest rates, indices or some other financial indicator. The value at maturity or interest rates for these instruments will increase or decrease according to the change in the indicator to which they are indexed. These securities are generally more volatile in nature and the risk of loss of principal is greater.
(i) Distributions to Shareholders: Dividends and distributions to shareholders, which are determined in accordance with income tax regulations, are recorded on the ex-date. Income distributions, if any are declared and paid on a quarterly basis. Capital gain distributions, if any, are declared and paid at least annually.
(j) Classifications of Distributions: Net investment income (loss) and net realized gain (loss) may differ for financial statement and tax purposes. The character of distributions made during the year from net investment income or net realized gains may differ from its ultimate characterization for federal income tax purposes. Also, due to the timing of dividend distributions, the fiscal year in which amounts are distributed may differ from the fiscal year in which the income or realized gain was recorded by a Fund.
The tax character of the distributions paid by the Funds during the year ended May 31, 2008, was as follows:
|
| Stone Harbor |
| Stone Harbor |
| ||
|
| Emerging Markets |
| High Yield |
| ||
|
| Debt Fund |
| Bond Fund |
| ||
Ordinary Income |
| $ | 1,213,703 |
| $ | 4,125,892 |
|
Long-term Capital Gain |
| $ | — |
| $ | 18,628 |
|
Tax Return of Capital |
| $ | 6,303 |
| $ | 21,250 |
|
|
| $ | 1,220,006 |
| $ | 4,165,770 |
|
As of May 31, 2008, the components of distributable earnings on a tax basis were as follows:
|
| Stone Harbor |
| Stone Harbor |
| ||
|
| Emerging Markets |
| High Yield |
| ||
|
| Debt Fund |
| Bond Fund |
| ||
Undistributed Ordinary Income |
| $ | — |
| $ | — |
|
Accumulated Capital Gains/(Losses) |
| $ | — |
| $ | (374,458 | ) |
Unrealized Appreciation/(Depreciation) |
| $ | 170,729 |
| $ | (3,138,113 | ) |
Cumulative Effect of Other Timing Differences* |
| $ | 48,116 |
| $ | (56,185 | ) |
|
| $ | 218,845 |
| $ | (3,568,756 | ) |
*Other temporary differences due to timing, consist primarily of mark-to-market under section 1256 of the Internal Revenue Code and differences due to the timing of the deductibility of certain expenses.
41
Notes to Financial Statements (continued)
May 31, 2008
The tax components of distributable earnings are determined in accordance with income tax regulations which may differ from the composition of net assets reported under accounting principles generally accepted in the United States. Accordingly, for the period ended May 31, 2008, certain differences were reclassified. These differences were primarily due to the differing tax treatment of certain investments and the amounts reclassified did not affect net assets. The reclassifications were as follows:
|
| Stone Harbor |
| Stone Harbor |
| ||
|
| Emerging Markets |
| High Yield |
| ||
|
| Debt Fund |
| Bond Fund |
| ||
Paid-in-capital |
| $ | (10,759 | ) | $ | (10,759 | ) |
Undistributed Income |
| $ | 200,480 |
| $ | (201,487 | ) |
Accumulated Net Realized Gains |
| $ | (189,721 | ) | $ | 212,246 |
|
|
| — |
| — |
| ||
(k) Expenses: Direct expenses are charged to the Funds; general expenses of the Series are allocated to the Funds based on each Fund’s relative net assets.
(l) Federal and Other Taxes: It is the Funds’ policy to comply with the federal income and excise tax requirements of the Internal Revenue Code of 1986, as amended, applicable to regulated investment companies. Accordingly, the Funds intend to distribute substantially all of their income and net realized gains on investments, if any, to shareholders each year. Therefore, no federal income tax provision is required in the Funds’ financial statements.
The Funds adopted Financial Accounting Standards Board (‘‘FASB’’) Interpretation No. 48, ‘‘Accounting for Uncertainty in Income Taxes’’ (‘‘FIN 48’’). FIN 48 establishes financial accounting and disclosure requirements for recognition and measurement of tax positions taken or expected to be taken on an income tax return.
Management believes that this will not have a material impact on the Funds’ financial statements. Management has analyzed the Funds’ tax positions taken on federal income tax returns for all open tax years and has concluded that as of May 31, 2008, no provision for income tax would be required in the Funds’ financial statements. The Funds’ federal and state income and federal excise tax returns for tax years since inception are subject to examination by the Internal Revenue Service and state departments of revenue.
2. Advisory Fees
Stone Harbor Investment Partners LP is the Trust’s investment adviser. Under the investment advisory agreement the Trust pays an investment advisory fee calculated daily and paid monthly of 0.50% and 0.60% of the average daily net assets for Stone Harbor High Yield Bond Fund and Stone Harbor Emerging Markets Debt Fund, respectively.
The Adviser has contractually agreed to waive fees and reimburse expenses with respect to each of the Funds so that the Net Annual Operating Expenses (exclusive of acquired Fund fees and expenses, brokerage expenses, interest expense, taxes and extraordinary expenses) of the Stone Harbor High Yield Bond Fund Institutional Class, Stone Harbor High Yield Bond Fund Distributor Class, Stone Harbor Emerging Markets Debt Fund Institutional Class and Stone Harbor Emerging Markets Debt Fund Distributor Class will not exceed 0.55%, 0.80%, 0.75% and 1.00%, respectively. This undertaking is in effect through July 31, 2008 and is reevaluated on an annual basis. In addition, the Funds’ organizational expenses will be borne by the Adviser.
42
Notes to Financial Statements (continued)
May 31, 2008
The Adviser will be permitted to recover, on a class by class basis, expenses it has borne through the undertakings described above to the extent that a Fund’s expenses in later periods fall below the annual rates set forth in the relevant undertaking. A Fund will not be obligated to pay any such deferred fees and expenses more than one year after the end of the fiscal year in which the fee and expense was deferred.
3. Investments
During the year ended May 31, 2008 the aggregate cost of purchases and proceeds from sales of investments were as follows:
|
| Stone Harbor |
| Stone Harbor |
| ||
|
| Emerging Markets |
| High Yield |
| ||
|
| Debt Fund |
| Bond Fund |
| ||
Purchases of investments (other than U.S. Government Securities) |
| $ | 38,802,925 |
| $ | 100,729,895 |
|
Purchases U.S. Government Securities |
| $ | 2,191,476 |
| $ | — |
|
Total Purchases |
| $ | 40,994,401 |
| $ | 100,729,895 |
|
Sales of investments (other than U.S. Government Securities) |
| $ | 20,728,953 |
| $ | 6,997,409 |
|
Sales of U.S. Government Securities |
| $ | 2,195,770 |
| $ | — |
|
Total Sales |
| $ | 22,924,723 |
| $ | 6,997,409 |
|
At May 31, 2008 the aggregate gross unrealized appreciation and depreciation of investments for federal income purposes were substantially as follows:
|
| Stone Harbor |
| Stone Harbor |
| ||
|
| Emerging Markets |
| High Yield |
| ||
|
| Debt Fund |
| Bond Fund |
| ||
Gross appreciation (excess of value over tax cost) |
| $ | 526,461 |
| $ | 1,202,701 |
|
Gross depreciation (excess of tax cost over value) |
| $ | (274,699 | ) | $ | (4,340,814 | ) |
Net unrealized appreciation/(depreciation) |
| $ | 251,762 |
| $ | (3,138,113 | ) |
Cost of investments for income tax purposes |
| $ | 19,993,554 |
| $ | 104,558,285 |
|
4. Shares of Beneficial Interest
At May 31, 2008, the Trust had an unlimited number of shares of beneficial interest authorized with a par value of $0.001 per share. The Funds have the ability to issue multiple classes of shares. Each share of a class represents an identical interest and has the same rights, except that each class bears certain direct expenses, including those specifically related to the distribution of its shares.
43
Notes to Financial Statements (continued)
May 31, 2008
Transactions in shares of the Institutional Class were as follows:
|
| Stone Harbor |
| Stone Harbor |
| ||
|
| Emerging Markets |
| High Yield |
| ||
|
| Debt Fund |
| Bond Fund |
| ||
Shares sold |
| $ | 1,901,770 |
| $ | 10,903,020 |
|
Shares reinvested |
| $ | 110,056 |
| $ | 301,150 |
|
Shares redeemed |
| $ | (122,463 | ) | $ | (432,871 | ) |
Net increase in shares outstanding |
| $ | 1,889,363 |
| $ | 10,771,299 |
|
5. Post October Loss Deferral
On May 31, 2008, the High Yield Bond Fund had a post October loss deferral of $374,458 expiring in 2016. This amount is available to offset like amounts of any future taxable gains.
6. Recent Accounting Pronouncements
On September 20, 2006, FASB released Statement of Financial Accounting Standards No. 157, Fair Value Measurements (“FAS 157”). FAS 157 establishes an authoritative definition of fair value, sets out a framework for measuring fair value, and requires additional disclosures about fair value measurements. The application of FAS157 is required for fiscal years beginning after November 15, 2007 and interim periods within those fiscal years. Management has determined that there is no material impact to the Fund’s valuation policies as a result of adopting FAS 157. The Fund will implement the disclosure requirements beginning with its August 31, 2008 Form N-Q.
In February 2007, FASB issued Statement of Financial Accounting Standards No. 159, “The Fair Value Option for Financial Assets and Financial Liabilities including an amendment of FASB Statement No. 115” (“FAS 159”), which permits entities to choose to measure many financial instruments and certain other items at fair value. This Statement is expected to expand the use of fair value measurement, which is consistent with the FASB’s long-term measurement objectives for accounting for financial instruments. This Statement is effective as of the beginning of an entity’s first fiscal year that begins after November 15, 2007. Management is currently evaluating the impact the adoption of SFAS 159 will have on the Fund’s financial statements and related disclosures.
In March 2008, FASB issued the Statement of Financial Accounting Standards No. 161, “Disclosures about Derivative Instruments and Hedging Activities” (“SFAS 161”). SFAS 161 is effective for fiscal years and interim periods beginning after November 15, 2008. SFAS 161 requires enhanced disclosures about the Fund’s derivative and hedging activities, including how such activities are accounted for and their effect on the Fund’s financial position, performance and cash flows. Management is currently evaluating the impact the adoption of SFAS 161 will have on the Fund’s financial statements and related disclosures.
7. Other
Board of Trustees Compensation: No officer, trustee or employee of the Adviser or any of its affiliates receives any compensation from the Funds for serving as an officer or trustee of the Funds. Each individual Fund pays each Trustee who is not an interested person, as defined by the 1940 Act, of the Adviser or any of its affiliates, a fee of $1,250 per quarter plus $500 for each additional meeting in which that Trustee participates. All Trustees are reimbursed for reasonable travel and out-of-pocket expenses incurred to attend such meetings.
44
Additional Information
May 31, 2008
Fund Portfolio Holdings
The SEC has adopted the requirement that all funds file a complete schedule of portfolio holdings with the SEC for their first and third fiscal quarters on Form N-Q. For the Funds, this would be for the fiscal quarters ending August 31 and February 29.The Form N-Q filing must be made within 60 days of the end of the quarter. The Funds’ Forms N-Q will be available on the SEC’s website at http://www. sec.gov., or they may be reviewed and copied at the SEC’s Public Reference Room in Washington, DC (call 1-800-732-0330 for information on the operation of the Public Reference Room).
Proxy Voting
A description of the policies and procedures that the Funds use to determine how to vote proxies relating to portfolio securities and information regarding how the Funds voted proxies relating to portfolio securities for the period ending June 30, 2008 will be available without a charge, upon request, by contacting Stone Harbor Investment Funds at 1-866-699-8158 or on the SEC website at http://www.sec.gov.
Approval of Agreements
The Funds commenced operations in August 2007. The Board of Trustees approved each Fund’s Agreement at their initial Board meeting held on June 21, 2007. In considering whether to approve the Agreements, the Board of Trustees, including the Independent Trustees, did not identify any single factor as determinative. Matters considered by the Trustees, including the Independent Trustees, in connection with their approval of the Agreements included the following:
The nature, extent and quality of the services to be provided to the Funds under the Agreements. The Trustees considered the nature, extent and quality of the services proposed to be provided by Stone Harbor Investment Partners (the “Adviser”) to the Funds. The Trustees also considered the nature, extent and quality of the services provided by the Adviser to its institutional clients and sub-advised funds and the proposed dedication of resources to the Funds by the Adviser, including the Adviser’s dedication to attract and retain superior talent. The Trustees also noted that each Fund was expected to be offered to institutional clients of the Adviser and not to “retail” investors.
After reviewing these and related factors, the Trustees concluded, within the context of their overall conclusions regarding each investment advisory agreement, that the nature, extent and quality of services proposed supported the approval of the Agreements
Investment performance of the Adviser. Prior to the approval of the Agreements, the Trustees received information regarding the performance of other accounts managed or sub-advised by the Adviser or its personnel over various time periods, including information which compared the Adviser’s performance to that of appropriate performance benchmarks. They also considered the expense caps proposed for the Fund, which by lowering expenses would help performance.
The Trustees also considered the Adviser’s performance and reputation generally and its proposed investment techniques, risk management controls and decision-making processes.
After reviewing these and related factors, the Trustees concluded, within the context of their overall conclusions regarding each Agreement, that the performance of the Adviser supported the approval of the Agreements.
ThecostsoftheservicestobeprovidedandprofitstoberealizedbytheAdviserfromitsrelationshipwith
45
the Funds. The Trustees considered the proposed fees to be charged to the Funds for advisory services as well as the total expense levels proposed for the Funds. This information included comparisons (provided by an independent third party) of the Funds’ proposed advisory fees and total expense levels to those of their peer groups and information about the advisory fees charged by the Adviser to its institutional and sub-advised accounts. In considering the fees charged to the Adviser’s institutional accounts, the Trustees considered, among other things, management’s representations about the differences between managing mutual funds as compared to other types of accounts, including the additional resources required to effectively manage mutual fund assets, and the fact that institutional clients generally paid for custodial services separately. In evaluating each Fund’s proposed advisory fees, the Trustees also took into account the demands, complexity and quality of the investment management of such Fund. The Trustees also considered the expense caps proposed by the Adviser and the fact that the Adviser did not expect to earn a profit from managing the Funds during the Funds initial fiscal year.
After reviewing these and related factors, the Trustees concluded, within the context of their overall conclusions regarding each Agreement, that the advisory fees proposed for each of the Funds were fair and reasonable, and that the costs of these services generally and the related profitability of the Adviser in respect of its relationship with the Funds supported the approval of the Agreements.
Economies of Scale. The Trustees considered the existence of any economies of scale in the provision of proposed services by the Adviser and whether those economies would be shared with the Funds through breakpoints in their investment advisory fees or other means, such as expense waivers. The Trustees noted that because the Funds were newly organized, the expected sizes of the Funds in the near term were not expected to generate any economies of scale. The Trustees also noted that the Funds would be subject to expense caps.
After reviewing these and related factors, the Trustees concluded, within the context of their overall conclusions regarding each investment advisory agreement, that the extent to which economies of scale would be shared with the Funds supported the approval of the Agreements
The Trustees also considered other factors, which included but were not limited to the following:
· the compliance programs of the Funds and the Adviser. They also considered the compliance- related resources the Adviser proposed to provide to the Funds, including resources designed to ensure compliance with the investment objectives, policies and restrictions of each Fund.
· potential “fallout benefits” to the Adviser, such as the benefits from offering its clients the ability to invest in a registered investment company.
Based on their evaluation of all factors that they deemed to be material, including those factors de- scribed above, the Trustees, including the Independent Trustees, concluded that the investment advisory agreements for each of the Funds should be approved.
46
This page intentionally left blank
47
Trustees and Officers
May 31, 2008
The business and affairs of each Fund are managed under the direction of its Board of Trustees. The Board of Trustees approves all significant agreements between a Fund and the persons or companies that furnish services to the Fund, including agreements with its distributor, investment manager, administrator, custodian and transfer agent. The day-to-day operations of the Fund are delegated to the Fund’s manager and administrator.
The name, address, age, and principal occupations for the past five years of the Trustees and officers of the Funds are listed below, along with the number of portfolios in the Fund complex overseen by and the other directorships held by each Trustee. Except as otherwise noted, the address of each Trustee and officer is c/o Stone Harbor Investment Partners LP, 31 W. 52nd Street, 16th Floor, New York, New York 10019. The Trust’s Statement of Additional Information includes additional information about the Trustees and is available without a charge, upon request, by calling 1-866-699-8158.
INDEPENDENT TRUSTEES
|
|
|
|
|
|
|
| Number of |
|
|
|
|
|
|
|
|
|
| Portfolios in |
|
|
|
|
|
|
|
|
|
| Fund Complex |
|
|
|
|
|
| Term of Office and Length |
|
|
| Overseen by |
| Other Directorships |
Name, Address and Age |
| Position with the Trust |
| of Time Served(1) |
| Principal Occupation(s) During Past 5 Years |
| Trustee |
| by Trustee |
|
|
|
|
|
|
|
|
|
|
|
Alan Brott |
| Chairman of Audit Committee; Trustee |
| Since June 21, 2007 |
| Columbia University Graduate School of Business - Associate Professor, 2000-Present; Consultant, 1991-Present. |
| 2 |
| Bank of America– two closed-end registered hedge funds. |
|
|
|
|
|
|
|
|
|
|
|
Heath B. McLendon |
| Trustee |
| Since June 21, 2007 |
| Citigroup – Chairman of Equity Research Oversight Committee (retired December 31, 2006). |
| 2 |
| None |
|
|
|
|
|
|
|
|
|
|
|
Patrick Sheehan |
| Trustee |
| Since June 21, 2007 |
| Retired; formerly, Citigroup Asset Management-Managing Director and Fixed Income Portfolio Manager, 1991-2002. |
| 2 |
| None |
INTERESTED TRUSTEES
|
|
|
|
|
|
|
| Number of |
|
|
|
|
|
|
|
|
|
| Portfolios in |
|
|
|
|
|
|
|
|
|
| Fund Complex |
|
|
|
|
|
| Term of Office and Length |
|
|
| Overseen by |
| Other Directorships |
Name, Address and Age |
| Position with the Trust |
| of Time Served(1) |
| Principal Occupation(s) During Past 5 Years |
| Trustee |
| by Trustee |
|
|
|
|
|
|
|
|
|
|
|
Thomas W. Brock |
| Chairman; |
| Since June 21, 2007 |
| Stone Harbor Investment Partners LP – Chief Executive Officer, 2006-Present; Columbia University Graduate School of Business - Associate Professor, 1998-2006. |
| 2 |
| Bank of America – two closed-end registered hedge funds; Liberty All Star Funds – two closed-end funds. |
48
OFFICERS
|
|
|
|
|
|
|
| Number of |
|
|
|
|
|
|
|
|
|
| Portfolios in |
|
|
|
|
|
|
|
|
|
| Fund Complex |
|
|
|
|
|
| Term of Office and Length |
|
|
| Overseen by |
| Other Directorships |
Name, Address and Age |
| Position with the Trust |
| of Time Served(1) |
| Principal Occupation(s) During Past 5 Years |
| Trustee |
| by Trustee |
|
|
|
|
|
|
|
|
|
|
|
Peter J. Wilby |
| President |
| Since June 21, 2007 |
| Co-portfolio manager of the Funds; since April 1, 2006, Chief Investment Officer of Stone Harbor Investment Partners LP; prior to April 1, 2006, Chief Investment Officer –North American Fixed Income; joined Citigroup or its predecessor firms in 1989. |
| N/A |
| N/A |
|
|
|
|
|
|
|
|
|
|
|
Pablo Cisilino |
| Executive Vice President |
| Since June 21, 2007 |
| Co-portfolio manager of Emerging Markets Debt Fund; since July 1, 2006, Senior Portfolio Manager of Stone Harbor Investment Partners LP; from June 1, 2004 to July 1, 2006, Executive Director for Sales and Trading in Emerging Markets at Morgan Stanley Inc; prior to June 1, 2004, Vice President for local markets and FX sales and trading, Goldman Sachs; joined Goldman Sachs in 1994. |
| N/A |
| N/A |
|
|
|
|
|
|
|
|
|
|
|
James E. Craige |
| Executive Vice President |
| Since June 21, 2007 |
| Co-portfolio manager of Emerging Markets Debt Fund; since April 1, 2006, Senior Portfolio Manager of Stone Harbor Investment Partners LP; prior to April 1, 2006, Managing Director and Senior Portfolio Manager at Salomon Brothers Asset Management Inc.; joined Salomon Brothers Asset Management Inc. in 1992. |
| N/A |
| N/A |
|
|
|
|
|
|
|
|
|
|
|
Thomas K. Flanagan |
| Executive Vice President |
| Since June 21, 2007 |
| Co-portfolio manager of Emerging Markets Debt Fund; since April 1, 2006, Senior Portfolio Manager of Stone Harbor Investment Partners LP; prior to April 1, 2006, Managing Director and Senior Portfolio Manager at Salomon Brothers Asset Management Inc.; joined Salomon Brothers Asset Management Inc. in 1991. |
| N/A |
| N/A |
49
|
|
|
|
|
|
|
| Number of |
|
|
|
|
|
|
|
|
|
| Portfolios in |
|
|
|
| Position |
|
|
|
|
| Fund Complex |
|
|
|
| with the |
| Term of Office and Length |
|
|
| Overseen by |
| Other Directorships |
Name, Address and Age |
| Trust |
| of Time Served(1) |
| Principal Occupation(s) During Past 5 Years |
| Trustee |
| by Trustee |
|
|
|
|
|
|
|
|
|
|
|
Beth A. Semmel |
| Executive Vice President |
| Since June 21, 2007 |
| Co-portfolio manager of High Yield Bond Fund; since April 1, 2006, Senior Portfolio Manager of Stone Harbor Investment Partners LP; Prior to April 1, 2006, Managing Director, Senior Portfolio Manager and Senior Trader for all high yield securities portfolios at Salomon Brothers Asset Management Inc.; joined Salomon Brothers Asset Management Inc. in 1993. |
| N/A |
| N/A |
|
|
|
|
|
|
|
|
|
|
|
Jeffrey S. Scott |
| Chief Compliance Officer |
| Since June 21, 2007 |
| Since April 1, 2006, Chief Compliance Officer of Stone Harbor Investment Partners LP; from October 2006 to March 2007, Director of Compliance, New York Life Investment Management LLC; from July 1998 to September 2006, Chief Compliance Officer, Salomon Brothers Asset Management Inc. |
| N/A |
| N/A |
|
|
|
|
|
|
|
|
|
|
|
James J. Dooley |
| Treasurer |
| Since June 21, 2007 |
| Since April 1, 2006, Head of Operations, Technology and Finance of Stone Harbor Investment Partners LP; from August 2004 to March 2006, Senior Operations Manager of Institutional Asset Management, Citigroup Asset Management; from October 2002 to August 2004, Managing Director, Global Operations & Application Development, AIG Global Investment Group; from May 2001 to September 2002, President and Chief Operating Officer, Financial Technologies International. |
| N/A |
| N/A |
|
|
|
|
|
|
|
|
|
|
|
Adam J. Shapiro |
| Secretary; Anti-Money Laundering Officer |
| Since June 21, 2007 |
| Since April 1, 2006, General Counsel of Stone Harbor Investment Partners LP; from April 2004 to March 2006, General Counsel, North American Fixed Income, Salomon Brothers Asset Management Inc.; from August 1999 to March 2004, Director of Product and Business Development, Citigroup Asset Management. |
| N/A |
| N/A |
|
|
|
|
|
|
|
|
|
|
|
Patrick D. Buchanan |
| Assistant Treasurer |
| Since April 23, 2008 |
| Since October 15, 2007, Senior Fund Controller for ALPS Fund Services, Inc; from February 2005 to October 2007, Director of Accounting for Madison Capital Management LLC; from August 2003 to February, 2005, Manager of Fund Accounting for Janus Capital Group. |
| N/A |
| N/A |
(1) | Each Trustee serves until retirement, resignation or removal from the Board of Trustees. The current retirement age is 80. |
50
This page intentionally left blank
51
This page intentionally left blank
52
This page intentionally left blank
53

OFFICERS AND TRUSTEES
Alan Brott, Trustee
Heath B. McLendon, Trustee
Patrick Sheehan, Trustee
Thomas W. Brock, Chairman
Peter J. Wilby, President
Pablo Cisilino, Exec. Vice President
James E. Craige, Exec. Vice President
Thomas K. Flanagan, Exec. Vice President
Beth A. Semmel, Exec. Vice President
Jeffrey S. Scott, Chief Compliance Officer
Adam Shapiro, Secretary/Anti-Money Laundering Officer
James J. Dooley, Treasurer
Patrick Buchanan, Assistant Treasurer
INVESTMENT ADVISER
Stone Harbor Investment Partners LP
31 W. 52nd Street 16th Floor
New York, New York 10019
ADMINISTRATOR & FUND ACCOUNTANT
ALPS Fund Services, Inc.
1290 Broadway, Suite 1100
Denver, Colorado 80203
DISTRIBUTOR
ALPS Distributors, Inc.
1290 Broadway, Suite 1100
Denver, Colorado 80203
TRANSFER AGENT
ALPS Fund Services, Inc.
1290 Broadway, Suite 1100
Denver, Colorado 80203
CUSTODIAN
The Bank of New York
One Wall Street
New York, New York 10286
LEGAL COUNSEL
Ropes & Gray LLP
1211 Avenue of the Americas
New York, New York 10036
INDEPENDENT REGISTERED PUBLIC ACCOUNTING FIRM
Deloitte & Touche LLP
555 17th Street, Suite 3600
Denver, Colorado 80202
This report and its financial statements are submitted for the general information of the shareholders of the Funds. The report is not authorized for distribution to prospective investors in the Funds unless preceded or accompanied by a prospectus.
SHF000111 3/09
Item 2. Code of Ethics.
(a) The Registrant has adopted a code of ethics pursuant to Rule 17j-1 under the Investment Company Act of 1940, as amended, but had not adopted a separate code of ethics as defined for purposes of Item 2 of Form N-CSR for the period covered by this report. However, the Registrant has adopted a separate code of ethics as defined for purposes of Item 2 of Form N-CSR as of the date of this report filing. In addition, the Registrant believes that its code of ethics adopted pursuant to Rule 17j-1, which applies to its senior officers, including its principal executive officer and principal financial officer, is reasonably designed to deter wrongdoing and promote honest and ethical conduct.
(b) Not applicable.
(c) During the period covered by this report, no amendments to the provisions of the code of ethics adopted in 2(a) above were made.
(d) During the period covered by this report, no implicit or explicit waivers to the provisions of the code of ethics adopted in 2(a) above were granted.
(e) Not applicable.
(f) The Registrant’s Code of Ethics is attached as an Exhibit hereto.
Item 3. Audit Committee Financial Expert.
The Board of Trustees of the Registrant has determined that the Registrant has at least one audit committee financial expert serving on its Audit Committee. The Board of Trustees has designated Alan J. Brott as the Registrant’s “Audit Committee Financial Expert.” Mr. Brott is “independent” as defined in paragraph (a)(2) of Item 3 to Form N-CSR.
Item 4. Principal Accountant Fees and Services.
(a) Audit Fees: For the Registrant’s fiscal year ended May 31, 2008, the aggregate fees billed for professional services rendered by the principal accountant for the audit of the Registrant’s annual financial statements were $130,000.
2
(b) Audit-Related Fees: For the Registrant’s fiscal year ended May 31, 2008, their were no fees billed for assurance and related services by the principal accountant.
(c) Tax Fees: For the Registrant’s fiscal year ended May 31, 2008, the aggregate fees billed for professional services rendered by the principal accountant for tax compliance, tax advice and tax planning were $9,000. The fiscal year 2008 tax fees were for services pertaining to federal and state income tax return review, review of year end dividend distributions and excise tax preparation.
(d) All Other Fees: For the Registrant’s fiscal year ended May 31, 2008, aggregate fees billed to the Registrant by the principal accountant for services provided by the principal accountant other than the services reported in paragraphs (a) through (c) of this Item 4 were $13,351.34. These services were associated with the formation of the Funds.
(e)(1) Audit Committee Pre-Approval Policies and Procedures: All services to be performed by the Registrant’s principal accountant must be pre-approved by the Registrant’s Audit Committee.
(e)(2) No services described in paragraphs (b) through (d) of this Item were approved by the Registrant’s audit committee pursuant to paragraph (c)(7)(i)(C) of Rule 2-01 of Regulation S-X.
(f) Not applicable.
(g) Not applicable.
(h) Not applicable.
Item 5. Audit Committee of Listed Registrants.
Not applicable.
Item 6. Investments.
(a) Schedule of Investments is included as part of the Report to Stockholders filed under Item 1 of this Form N-CSR.
(b) Not applicable.
Item 7. Disclosure of Proxy Voting Policies and Procedures for Closed-End Management Investment Companies.
Not applicable.
3
Item 8. Portfolio Managers of Closed-End Management Investment Companies.
Not applicable.
Item 9. Purchases of Equity Securities by Closed-End Management Investment Company and Affiliated Purchasers.
Not applicable.
Item 10. Submission of Matters to Vote of Security Holders.
There have been no material changes to the procedures by which shareholders may recommend nominees to the Registrant’s Board of Trustees, where those changes were implemented after the Registrant last provided disclosure in response to the requirements of Item 407(c)(2) of Regulation S-K, or this Item.
Item 11. Controls and Procedures.
(a) The Registrant’s principal executive officer and principal financial officer have concluded that the Registrant’s disclosure controls and procedures (as defined in Rule 30a-3(c) under the Investment Company Act of 1940, as amended) are effective based on their evaluation of these controls and procedures as of a date within 90 days of the filing date of this report.
(b) There was no change in the Registrant’s internal control over financial reporting (as defined in Rule 30a-3(d) under the Investment Company Act of 1940, as amended) during the second fiscal quarter of the period covered by this report that has materially affected, or is reasonably likely to materially affect, the Registrant’s internal control over financial reporting.
Item 12. Exhibits.
(a)(1) |
| The code of ethics that applies to the Registrant’s principal executive officer and principal financial officer is attached hereto as Ex-12.A.1. |
|
|
|
(a)(2) |
| The certifications required by Rule 30a-2(a) of the Investment Company Act of 1940, as amended, and Section 302 of the Sarbanes-Oxley Act of 2002 are attached hereto as Ex99.Cert. |
|
|
|
(a)(3) |
| Not applicable. |
|
|
|
(b) |
| The certifications by the Registrant’s principal executive officer and principal financial officer, as required by Rule 30a-2(b) of the Investment Company Act of 1940, as amended, and Section 906 of the Sarbanes-Oxley Act of 2002 are attached hereto as Ex99.906Cert. |
4
SIGNATURES
Pursuant to the requirements of the Securities Exchange Act of 1934 and the Investment Company Act of 1940, the Registrant has duly caused this Report to be signed on its behalf by the undersigned, thereunto duly authorized.
| Stone Harbor Investment Funds | |
|
| |
| By: | /s/ Peter J. Wilby |
|
| Peter J. Wilby |
|
| President/Principal Executive |
|
| Officer |
|
|
|
| Date: | August 8, 2008 |
Pursuant to the requirements of the Securities Exchange Act of 1934 and the Investment Company Act of 1940, this Report has been signed below by the following persons on behalf of the Registrant and in the capacities and on the dates indicated.
| By: | /s/ Peter J. Wilby |
|
| Peter J. Wilby |
|
| President/Principal Executive |
|
| Officer |
|
|
|
| Date: | August 8, 2008 |
| By: | /s/ James J. Dooley |
|
| James J. Dooley |
|
| Treasurer, Chief Financial Officer/ |
|
| Principal Financial Officer |
|
|
|
| Date: | August 8, 2008 |
5