UNITED STATES
SECURITIES AND EXCHANGE COMMISSION
Washington, D.C. 20549
FORM N-CSR
CERTIFIED SHAREHOLDER REPORT OF REGISTERED
MANAGEMENT INVESTMENT COMPANIES
Investment Company Act file number: 811-22037
Stone Harbor Investment Funds
(Exact name of registrant as specified in charter)
1290 Broadway, Suite 1100
Denver, CO 80203
(Address of principal executive offices) (Zip code)
Adam J. Shapiro, Esq.
c/o Stone Harbor Investment Partners LP
31 West 52nd Street, 16th Floor
New York, NY 10019
(Name and address of agent for service)
With copies To:
Michael G. Doherty, Esq.
Ropes & Gray LLP
1211 Avenue of the Americas
New York, NY 10036
Registrant’s telephone number, including area code: (303) 623-2577
Date of fiscal year end: May 31
Date of reporting period: May 31, 2017
1
Item 1. Report to Stockholders.

Table of Contents
| Shareholder Letter | 2 |
| Disclosure of Fund Expenses | 10 |
| Summaries of Portfolio Holdings | 11 |
| Growth of $10,000 Investment | |
| Stone Harbor Emerging Markets Debt Fund | 14 |
| Stone Harbor High Yield Bond Fund | 15 |
| Stone Harbor Local Markets Fund | 16 |
| Stone Harbor Emerging Markets Corporate Debt Fund | 17 |
| Stone Harbor Investment Grade Fund | 18 |
| Stone Harbor Strategic Income Fund | 19 |
| Stone Harbor Emerging Markets Debt Allocation Fund | 20 |
| Stone Harbor 500 Plus Fund | 21 |
| Report of Independent Registered Public Accounting Firm | 22 |
| Statements of Investments | |
| Stone Harbor Emerging Markets Debt Fund | 23 |
| Stone Harbor High Yield Bond Fund | 34 |
| Stone Harbor Local Markets Fund | 42 |
| Stone Harbor Emerging Markets Corporate Debt Fund | 47 |
| Stone Harbor Investment Grade Fund | 52 |
| Stone Harbor Strategic Income Fund | 58 |
| Stone Harbor Emerging Markets Debt Allocation Fund | 60 |
| Stone Harbor 500 Plus Fund | 61 |
| Statements of Assets & Liabilities | 64 |
| Statements of Operations | 66 |
| Statements of Changes in Net Assets | 68 |
| Financial Highlights | |
| Stone Harbor Emerging Markets Debt Fund | 72 |
| Stone Harbor High Yield Bond Fund | 73 |
| Stone Harbor Local Markets Fund | 74 |
| Stone Harbor Emerging Markets Corporate Debt Fund | 75 |
| Stone Harbor Investment Grade Fund | 76 |
| Stone Harbor Strategic Income Fund | 77 |
| Stone Harbor Emerging Markets Debt Allocation Fund | 78 |
| Stone Harbor 500 Plus Fund | 79 |
| Notes to Financial Statements | 80 |
| Additional Information | 103 |
| Board Approval of Investment Advisory Agreements | 106 |
| Trustees & Officers | 109 |
| Stone Harbor Investment Funds Annual Report | May 31, 2017 | 1 |
| Stone Harbor Investment Funds | Shareholder Letter |
May 31, 2017 (Unaudited)
Dear Shareholder,
The 12 month period ended May 31, 2017 was a positive one for global credit markets. Stable to improving growth in the US and European Union economies and accelerating growth in several large emerging markets economies, coupled with continued support from an accommodative US Federal Reserve (“Fed”) and European Central Bank (“ECB”) helped produce positive returns across the asset classes. Stable commodity prices, albeit with some volatility, also played an important role in supporting asset prices. On the political front, two key events -- the surprise results of the UK referendum on EU membership (BREXIT) and the US presidential election – were also sources of short term volatility, but the markets quickly adjusted and remained focused on finding yield in the ongoing low interest rate environment.
Key factors impacting credit markets over the 12 month period included interest rate volatility in the early part of the period followed by uncertainties around Trump administration policies, particularly those regarding trade. From historically low levels of 1.36% in July 2016, the US Treasury 10 year bond yield ended the period at 2.20%. Developed market monetary policy was an investor focus as central banks continued to be extremely accommodative. Following the election of Donald Trump, attention shifted to the likely path of US fiscal policy and its implications for US growth. Investors also focused on Trump’s protectionist campaign rhetoric to conclude that emerging markets would be disadvantaged by policies that curtail international trade. These factors impacted market returns negatively during November 2016. Markets quickly rebounded and generated positive returns in the second half of the fiscal year as the distinction between campaign rhetoric and policy implementation became clearer.
As we look ahead, global growth looks stable but is unlikely to accelerate further, in our view. Inflation may push a little higher, barring any sustained commodity price declines. The Fed is likely to push rates higher but will move slowly in order to avoid any marked negative impact on growth; and the ECB is likely to lay the ground work for an eventual end to quantitative easing. Government bond yields are expected to move modestly higher over the next 12 months. As of this writing, volatility measures remain remarkably subdued with the Chicago Board Options Exchange Volatility Index (“VIX”) trending around 10%. This suggests that the markets are perhaps vulnerable to any surprise rise in risk, although the exact catalyst for this remains unclear.
Given this backdrop, credit market valuations appear slightly extended, in our view. For example, US High Yield spreads have, since 1991, been tighter than current levels 25% of the time. On a relative basis, emerging markets appear to offer better value than high yield with positive underlying fundamentals and more attractive spread levels.
At Stone Harbor, we will continue to focus on seeking to capture excess return from stable and improving credit situations in corporate and sovereign markets worldwide. As we continue to monitor these developments, please follow our progress throughout the year by visiting our website at www.shiplp.com. There you will find updates on our view of credit markets, as well as related news and research. We appreciate the confidence you have placed in Stone Harbor Investment Partners LP and look forward to providing you with another update in the next six months.
Market Review: Emerging Markets Debt
Emerging markets (“EM”) debt total returns were positive for the 12-month period ended May 31, 2017. US dollar-denominated sovereign debt, as represented by the JPMorgan EMBI Global Diversified Index, returned 9.77%; local currency debt, as represented by the JPMorgan GBI EM Global Diversified Index, posted a return of 12.17%; and US dollar-denominated corporate bonds were up 8.50%, according to the JPMorgan CEMBI Broad Diversified Index.
The trailing 12-month period ended May 31, 2017 presented a favorable investment environment for EM debt. In the first half of the review period, a pickup in economic activity in several large EM countries allowed EM growth to outpace developed country growth for the first time since 2010. Better performance of the Chinese economy, compared to 2015, and recovery from recessions in Argentina, Brazil, and Russia contributed to this cyclical growth rebound. Political changes, including significant leadership changes in Brazil and improved relationship with creditors in Argentina, allowing for deep access to capital to finance new growth-oriented policies, were supportive of emerging markets performance. Lastly, higher commodity prices sustained throughout much of the period (partly as consequence of China’s economic resilience, and also due to efforts by oil producing countries to reduce production levels) also provided broad support for many EM exporters.
While uncertainties emanating from the US - including the presidential election in November, the directional move of the US dollar, and future US trade policies - induced a brief period of market volatility at the end of 2016, EM debt held on to the rebound in subsequent months. Hard currency sovereign debt in Latin America continued to be a strong contributor to index total return throughout the remainder of the review period, with the exception of May. In local markets, large capitalization, high yielding bonds and currency, including Brazil’s and Russia’s, maintained their outperformance relative to lower yielding countries. In Europe, further strengthening of economic data, combined with rhetoric from the ECB on the continuation of accommodative monetary policy, helped to accelerate the growth momentum in the region.
| 2 | www.shiplp.com |
| Stone Harbor Investment Funds | Shareholder Letter |
May 31, 2017 (Unaudited)
Stone Harbor Emerging Markets Debt Fund
The total return of the Stone Harbor Emerging Markets Debt Fund (the “Fund” or “portfolio”) for the 12 month period ended May 31, 2017 was 11.70% (net of expenses) and 12.39% (gross of expenses). This performance compares to a benchmark return of 9.77% for the JPMorgan EMBI Global Diversified Index. For the period, external sovereign bond credit spreads over comparable maturity US Treasury securities tightened by 92 basis points, ending the period at 305 basis points.
The Fund outperformed its benchmark predominantly as a result of country selection but also due to issue selection decisions. Off benchmark hard currency corporate debt exposure also enhanced relative returns, while off benchmark local currency sovereign debt exposure detracted modestly from performance. Treasury attribution was positive, but the gains were offset by negative attribution from miscellaneous differences.
Positioning in Central Europe, the Middle East, and Africa contributed most to returns in excess of the benchmark, driven by overweights in Azerbaijan, Ghana, Ukraine, and an underweight and issue selection decisions in Lebanon. We initiated a position in Lebanon in August 2016 after a sharp sell-off in Lebanese bonds. In subsequent months, we moved from a neutral to an underweight position based on our country-specific growth outlook and developments; and this positioning enhanced performance. In Ukraine, demand for Ukraine debt was supported by reform agenda and by the International Monetary Fund’s (“IMF”) recent approval to disburse the first tranche of the current $17.5 billion support program; and the Fund’s overweight throughout the reporting period enhanced performance. Issue selection in South Africa was also a positive contributor. In Asia, performance benefitted from underweights in China, India, Malaysia, and the Philippines. The Fund’s underweight positions in these countries reflected, in general, tight valuations and what we viewed as risks to these open markets stemming from possible protectionist trade policies from the Trump administration. In Latin America, the largest positive contributors to relative performance included overweights in Argentina, El Salvador, and Venezuela. Argentina bonds continued a rally that began in May 2016 (with a short term disruption in November/December 2016 following the US election and in May 2017). Argentina has been a major turnaround story. After a series of defaults, the country has experienced improved governance under the tenure of market-orientated President Mauricio Macri. Inflation and interest rates have fallen, with the government ending currency controls as the independent Central Bank started following a strict inflation-targeting regime. Argentina’s capital markets have deepened after the issuance of $16.5 billion worth of bonds last year. In El Salvador, hard currency bonds benefitted from expectations for a new Standby Agreement with the IMF in the early part of the review period. In our view, El Salvador’s willingness to engage with the IMF was supportive of bond prices. Issue selection in Mexico also enhanced relative performance.
Other positive contributors included off benchmark exposure to local currency debt in Colombia (duration), Mexico (Foreign exchange (“FX”)), and to out-of-benchmark hard currency corporate debt exposure in Latin America, particularly Argentina, Brazil, Colombia, Jamaica, and Mexico.
Issue selection decisions in select countries, including Azerbaijan, Dominican Republic, Ukraine, and Venezuela, detracted from relative returns.
The Fund uses various derivative instruments to implement its strategies. These derivatives are utilized to manage the Fund’s credit risk, interest rate risk and foreign exchange risk. These derivative positions may increase or decrease the Fund’s exposure to these risks. At the end of the reporting period the Fund had net exposure to these derivatives of approximately -$116 thousand. Over the course of the reporting period these derivative positions generated a net realized gain of approximately $6.2 million and $2.8 million in unrealized depreciation for an increase in operations of $3.4 million. We plan to continue to utilize derivative instruments to implement our strategies related to credit risk, interest rate risk and foreign exchange risk.
Stone Harbor Local Markets Fund
The total return of the Stone Harbor Local Markets Fund (the “Fund” or “portfolio”) for the 12 month period ended May 31, 2017 was 12.60% (net of expenses) and 13.49% (gross of expenses). This performance compares to a benchmark return of 12.17% for the JPMorgan GBI-EM Global Diversified Index. (FX) exposure and duration positioning contributed positively to performance, as did miscellaneous differences, which account for FX timing and pricing differences. However, issue selection, taxes and other considerations detracted from relative returns. The top performers for the period at the index level were South Africa (+35.51%), Brazil (+33.17%), and Russia (+32.86%). The bottom performers were Turkey (-10.54%), Philippines (-2.22%), and Mexico (-1.09%).
The largest source of the Fund’s outperformance was our positioning in Brazil, where we held overweights in the Brazilian real and in duration. Brazil’s real and local bonds benefitted from improved policy-making under a new administration. In addition, our positioning in Brazil was supported by the continued outperformance of large capitalization high yielding local bond and currency markets relative to lower yielding countries.
Other contributors to relative performance included Hungary (FX underweight), Russia (FX and duration overweight), and Turkey (FX underweight). In Hungary, the forint underperformed for much of the period as currencies and local bond markets in Europe experienced downward pressure due to the decline in euro, particularly in fourth quarter 2016 and until May 2017. In Russia, the availability of high yields in the local bond and currency markets and Russia’s emergence from recession and stabilization of international oil prices helped Russia outperform for the period. In Turkey, the lira depreciated significantly relative to the US dollar. Growing concerns over politics and rising inflation contributed to Turkey’s negative local market return.
| Stone Harbor Investment Funds Annual Report | May 31, 2017 | 3 |
| Stone Harbor Investment Funds | Shareholder Letter |
May 31, 2017 (Unaudited)
The top detractors from relative performance included Mexico (FX and duration overweight), Hungary (duration underweight), and Peru (FX and duration underweight). In Mexico, while our fundamental analysis led us to believe that the Mexican peso is a highly undervalued currency, external circumstances related to economic growth in the US, as well as the uncertainty regarding US trade policies continued to exert a negative influence in the Mexican currency for much of the period. However, signs of softening in the US approach to trade with Mexico in first quarter 2017 supported the peso, which outperformed all other currencies within the benchmark for that period. (For the year-to-date period ended May 31, 2017, the Fund’s overweight positioning in Mexico was one of the largest contributors to relative outperformance.) Lastly, Peru has outperformed as commodity prices have stabilized and the Fund’s underweight positioning detracted from performance.
The Fund uses various derivative instruments to implement its strategies. These derivatives are utilized to manage the Fund’s credit risk, interest rate risk and foreign exchange risk. These derivative positions may increase or decrease the Fund’s exposure to these risks. At the end of the reporting period the Fund had net exposure to these derivatives of approximately $894 thousand. Over the course of the reporting period these derivative positions generated a net realized loss of approximately $19.1 million and $1.3 million in unrealized appreciation, for a decrease in operations of $17.8 million. We plan to continue to utilize derivative instruments to implement our strategies related to credit risk, interest rate risk and foreign exchange risk.
Stone Harbor Emerging Markets Corporate Debt Fund
The total return of the Stone Harbor Emerging Markets Corporate Debt Fund (the “Fund” or “portfolio”) for the 12 month period ended May 31, 2017 was 8.43% (net of expenses) and 9.43% (gross of expenses). This performance compares to a benchmark return of 8.50% for the CEMBI Broad Diversified. The index spread over comparable maturity US Treasury securities tightened by 92 basis points, ending the period at 298 basis points. The high yield sub-sector outperformed, returning 13.48%, while the investment grade sector returned 5.43%. Contributions to the index total return from each of the major EM regions (i.e., Africa, Asia, Eastern Europe, Latin America, and the Middle East) were positive with Africa and Latin American generating the strongest returns, followed by Europe. Specific top country performers included Zambia (+37.54%), Iraq (+32.19%), and Ghana (+26.35%); the bottom performers included Croatia (-65.68%), Azerbaijan (-8.60%), and South Korea (1.52%). The positive performance of the EM corporate sector was driven primarily by improving commodity prices and several positive company developments.
The Fund outperformed its benchmark due to both issue selection decisions and country and regional exposures. Positive issue selection in Chile, Guatemala, Jamaica, and Mexico were the top contributors to performance in Latin America. In other regions, strong issue selection in the UAE and India also enhanced relative returns. Some of this positive attribution was offset by issue selection in Brazil, China, Indonesia, and Russia. In Russia, the decision to limit exposure to Russia’s sanctioned banking sector detracted from excess returns.
In terms of country exposures, the largest positive contributors to Fund performance included underweights in several Asian countries, particularly China, Singapore, and South Korea. An overweight exposure to corporate debt in Indonesia also enhanced performance. Other positive contributors included overweights in Guatemala, Jamaica, Mexico, and Kazakhstan. An underweight in Qatar also enhanced relative returns. Some of this positive attribution was offset by an underweight exposure in Zambia.
From an industry perspective, overweight exposures to exploration & production, and metals/mining/steel, and an underweight exposure to banking were among the top contributors to excess returns. Issue selection in the wireless and wireline sectors also enhanced performance. On the other hand, issue selection in banking, exploration & production, and metals/mining/steel detracted from relative returns, as did an overweight exposure to the wirelines sector.
Attribution from credit rating was predominantly positive, with the largest contributions from underweights in A rated and BBB rated credits; overweights in BB rated and B rated credits also enhanced the Fund’s relative returns for the period.
The Fund uses various derivative instruments to implement its strategies. These derivatives are utilized to manage the Fund’s credit risk, interest rate risk and foreign exchange risk. These derivative positions may increase or decrease the Fund’s exposure to these risks. At the end of the reporting period, the Fund did not have exposure to these derivatives. Over the course of the reporting period these derivative positions generated a net realized gain of approximately $53 thousand and $3 thousand in unrealized depreciation, for an increase in operations of $50 thousand. We plan to continue to utilize derivative instruments to implement our strategies related to credit risk, interest rate risk and foreign exchange risk.
| 4 | www.shiplp.com |
| Stone Harbor Investment Funds | Shareholder Letter |
May 31, 2017 (Unaudited)
Stone Harbor Emerging Markets Debt Allocation Fund
The Stone Harbor Emerging Markets Debt Allocation Fund’s (the “Fund” or “portfolio”) performance for the 12 month period ended May 31, 2017 was 11.51% (net of direct and indirect expenses) and 12.35% (gross of direct and indirect expenses). This compares to a blended benchmark (50% JPMorgan EMBI Global Diversified Index / 50% JPMorgan GBI-EM Global Diversified Index) return of 11.00%.
During the period, allocations to hard currency sovereign debt and local currency debt enhanced returns. An out-of-benchmark allocation to US dollar-denominated corporate debt, particularly in Latin America, also enhanced relative performance. US Treasury attribution and miscellaneous differences, which represents pricing differences among other factors, also enhanced relative returns.
Within the hard currency sovereign debt allocation, positioning in Central Europe, Middle East, and Africa contributed most to excess returns, driven by overweights in Ghana and Ukraine, and underweights in Lebanon and Lithuania. We initiated a position in Lebanon in August 2016 after a sharp sell-off in Lebanese bonds. In subsequent months, we moved from a neutral to an underweight position based on our country-specific growth outlook and developments and this positioning enhanced performance. In Ukraine, demand for Ukraine debt was supported by reform agenda and by the International Monetary Fund’s (“IMF”) recent approval to disburse the first tranche of the current $17.5 billion support program; and the Fund’s overweight throughout the reporting period enhanced performance. Issue selection in South Africa was also a positive contributor. In Asia, performance benefitted from underweights in China, India, Malaysia, and Philippines, all low-beta, low-yielding credits that underperformed as emerging markets debt rallied. The Fund’s underweight positions in these countries reflected, in general, tight valuations and what we viewed as risks to these open markets stemming from possible protectionist trade policies from the Trump administration. . In Latin America, the largest positive contributors to relative performance included overweights in Argentina, Dominican Republic, El Salvador, and Venezuela. Argentina bonds continued a rally that began in May 2016 (with a short term disruption in November/December 2016 following the US election and in May 2017). Argentina has been a major turnaround story. After a series of defaults, the country has experienced improved governance under the tenure of market-orientated President Mauricio Macri. Inflation and interest rates have fallen, with the government ending currency controls as the independent Central Bank started following a strict inflation-targeting regime. Argentina’s capital markets have deepened after the issuance of $16.5 billion worth of bonds last year. In El Salvador, hard currency bonds benefitted from expectations for a new Standby Agreement with the IMF in the early part of the review period. In our view, El Salvador’s willingness to engage with the IMF was supportive of bond prices. Issue selection in Mexico also enhanced relative performance.
Detractors from performance included issue selections in Dominican Republic and in Venezuela.
Within the local currency debt allocation, the largest source of the Fund’s outperformance was our positioning in Brazil, where we held FX and duration overweights. Brazil’s real and local bonds benefitted from improved policy-making under a new administration. In addition, our positioning in Brazil was supported by the continued outperformance of large market-capitalization high-yielding local bond and currency markets relative to lower yielding countries.
Other contributors to relative performance included Russia (FX and duration overweight), and Turkey (FX underweight). In Russia, the availability of high yields in the local bond and currency markets, Russia’s emergence from recession, and stabilization of international oil prices, helped Russia outperform for the period. In Turkey, the lira depreciated significantly relative to the US dollar. Growing concerns over politics and rising inflation contributed to Turkey’s negative local market return. Issue selection in Mexico and South Africa also enhanced performance.
The top detractors from relative performance included Mexico (FX and duration overweight) and South Africa (FX underweight). In Mexico, while our fundamental analysis led us to believe that the Mexican peso is a highly undervalued currency, external circumstances related to economic growth in the US, as well as the uncertainty regarding US trade policies continued to exert a negative influence in the Mexican currency for much of the period. However, signs of softening in the US approach to trade with Mexico in first quarter 2017 supported the peso, which outperformed all other currencies within the benchmark for that period. (For the year-to-date period ended May 31, 2017, the Fund’s overweight positioning in Mexico was one of the largest contributors to relative outperformance.) Lastly, issue selection in Russia was a detractor.
Out-of-benchmark hard currency corporate debt exposure in Latin America, particularly Argentina, Brazil, Colombia, and Jamaica enhanced relative returns.
During the period, tactical asset allocation decisions detracted 4 basis points from the Fund’s performance relative to benchmark. At the close of the reporting period, the Fund allocated approximately 56.5% to local currency debt, 39.6% to external sovereign debt, and 1.9% to hard currency corporate debt, with cash representing 2.0% of the Fund. The Fund’s asset allocation mix varied throughout the review period, driven by tactical asset allocation decisions based on portfolio management’s assessment of relative value opportunities and global market risks. In August and September of 2016, we shifted the sector allocation to an overweight in local currency, adding selectively through currency exposure in several countries where we saw attractive valuations and carry within the low interest rate environment. The Fund remained overweight local currency and interest rate exposure relative to benchmark throughout much of 2016, with the exception of a brief period around the US presidential election, on the view that local currencies and domestic bonds may outperform over the course of the next twelve months, particularly if growth in select developing countries outpaces that of developed markets.
| Stone Harbor Investment Funds Annual Report | May 31, 2017 | 5 |
| Stone Harbor Investment Funds | Shareholder Letter |
May 31, 2017 (Unaudited)
Between January and February of this year, we reduced the Fund’s exposure to local currency to an underweight as we believed the asset class would underperform hard currency sovereign debt in the event of US dollar appreciation. However, as EM hard currency debt spreads narrowed in beginning in February, local currency appeared increasingly more attractive and we reduced the underweight and moved to an overweight by the end of first quarter 2017. During the period, tactical asset allocation decisions detracted modestly from the Fund’s performance relative to benchmark.
The Fund uses various derivative instruments to implement its strategies. These derivatives are utilized to manage the Fund’s credit risk, interest rate risk and foreign exchange risk. These derivative positions may increase or decrease the Fund’s exposure to these risks. At the end of the reporting period the Fund had net exposure to these derivatives of approximately -$4 thousand. Over the course of the reporting period these derivative positions generated a net realized loss of approximately $195 thousand and $16 thousand in unrealized appreciation, for decrease in operations of $179 thousand. We plan to continue to utilize derivative instruments to implement our strategies related to credit risk, interest rate risk and foreign exchange risk.
Stone Harbor High Yield Bond Fund
The Stone Harbor High Yield Bond Fund (the “Fund” or “portfolio”) return for the 12 months ended May 31, 2017 was 10.97% (net of expenses) and 11.62% (gross of expenses). This compares to a benchmark return of 13.26% for the Citigroup High Yield Market Capped Index (the “Index”).
During the fiscal year ended May 31, 2017, high yield market performance was driven by several key macroeconomic factors that supported global growth including accommodative global monetary policies and rising commodity prices. The high yield and equity markets alike benefitted from the results of the US presidential and Congressional elections that were suggestive of a reduced regulatory environment, tax and healthcare reform, and increased fiscal spending. At the same time, although oil prices were volatile as OPEC production cuts could not sustain higher prices, commodities continued to recover. Corporate fundamentals improved with strong earnings results, declining defaults, and positive overall credit rating changes. Treasury yields increased as the market participants readjusted their views on US economic growth, higher inflation and strengthened views of a steady and gradual pace of Federal Reserve hikes.
Although high yield issuance increased 32% from the same period last year, the par value of the Index remained unchanged as approximately two-thirds of the proceeds were used to repay or refinance existing debt. Retail flows were negative for the period, although substantially better than the prior year period. Improving retail flows combined with weak new issuance (excluding refinancing) resulted in strong market technicals. High yield spreads, as represented by the Index, tightened 200 basis points to end the period at 397 basis points. The average yield declined from 7.28% to 5.59%.
Top performing sectors at the index level for the period included metals/mining/steel, which benefitted from an increase in commodity prices, and energy, as oil prices stabilized and oil service (drilling) activity increased. The bottom performers included pharmaceuticals, due to investigations regarding the pricing of drugs. The retail sectors were also adversely affected by increased competition from large on-line retailers and the retail-food & drug sector was additionally negatively impacted by food price deflation. Lower rated securities significantly outperformed as accommodative central bank policy pushed investors down the quality spectrum in search of yield. Longer duration securities significantly outperformed shorter duration bonds.
The high yield portfolio underperformed the index largely as a result of negative industry selection. In a reflection of our cautious outlook, the portfolio’s defensive posture was the key detractor from relative returns. An underweight to the energy and metals/mining industries drove underperformance as commodity prices recovered from their lows earlier in the period and oil prices stabilized. The negative impact on relative returns was partially offset by an underweight in banking and an overweight to telecommunications. The portfolio’s exposure to leveraged loans was also a relative detractor due to the more defensive nature of the asset class given its higher capital structure position. Cash exposure also detracted from performance.
From a credit quality perspective, the Fund’s higher quality bias hurt performance as the portfolio was underweight the CCC-rated sector. Our positioning in the utilities sector and higher quality holdings in the chemicals sector also detracted from relative returns as lower rated issuers significantly outperformed. This performance was partially offset by positive security selection in the cable & media and telecommunications sectors.
| 6 | www.shiplp.com |
| Stone Harbor Investment Funds | Shareholder Letter |
May 31, 2017 (Unaudited)
We believe the high yield market is fully valued, and while the market appears to be incorporating fundamental improvements in corporate earnings and credit trends in both the US and Europe, it appears to us to be including only the potential benefits of changes in US policy actions. Our concerns center on risks related to policy missteps regarding trade and taxes in the US, the pace and the magnitude of the Federal Reserve’s path to monetary policy normalization, the impact of a strengthening US dollar on corporate earnings, shareholder-friendly strategies particularly in Europe, the result of the Brexit negotiation, and the lack of volatility despite accelerating geopolitical problems. Also, idiosyncratic risks are growing, in our view.
Based on our current outlook, we reduced our underweight in the BB-sector but continue to be overweight B-rated bonds due to attractive valuations. Our industry overweights include cable/media, building products and conglomerates/diversified manufacturing while our underweights are in finance, services, and healthcare sectors.
The Fund uses various derivative instruments to implement its strategies. These derivatives are utilized to manage the Fund’s credit risk, interest rate risk and foreign exchange risk. These derivative positions may increase or decrease the Fund’s exposure to these risks. At the end of the reporting period the Fund had net exposure to these derivatives of approximately ($36) thousand. Over the course of the reporting period these derivative positions generated a net realized gain of approximately $400 thousand and $134 thousand in unrealized depreciation for an increase in operations of $266 thousand. We plan to continue to utilize derivative instruments to implement our strategies related to credit risk, interest rate risk and foreign exchange risk.
Stone Harbor Investment Grade Fund
The total return of the Stone Harbor Investment Grade Fund (the “Fund” or “portfolio”) for the 12 months ended May 31, 2017 was 2.07% (net of expenses) and 2.57% (gross of expenses). This performance compares to a benchmark return of 1.58% for the Bloomberg Barclays US Aggregate Index. The Fund’s outperformance is primarily attributable to sector weighting and security selection decisions in investment grade corporate and government bonds. Asset allocation effects accounted for approximately half of the outperformance, with an overweight to corporates and an underweight to Governments serving as the primary driver. The remaining excess returns were attributable to investment grade corporate security selection, particularly within the energy sector.
After the trials and tribulations of the prior year, the year ended May, 31 2017 was very positive for the global economy and for credit markets.
US growth - following a marked loss of momentum through the previous twelve months and registering 0.8% annualized Gross Domestic Product (“GDP”) growth in the first quarter of 2016 - averaged over 2% annualized growth over the four subsequent quarters. Over the same four quarters, the Eurozone averaged 1.8% growth, China averaged over 6.5%, and the U.K. over 2%. Despite softer numbers in Japan, global growth has been strong. Despite firm growth, inflation remains subdued with headline CPI in the US registering 1.9% most recently and core inflation in Europe below 1%.
Political events have surprised across regions. The decision by the UK to leave the European Union and the election of Donald Trump as president in the US were both judged unlikely and created short-term volatility. However, neither event caused a breakdown of near-term economic policy, which allowed markets to continue to focus on underlying positive growth momentum.
Over the past twelve months, central banks have become more cautious about the need for additional monetary stimulus as economic momentum has become more entrenched. The Federal Reserve raised rates twice over the last year and looks set to move further. It has also begun to lay the ground for a reduction in the size of its balance sheet as it seeks to move away from past quantitative easing. As the year progressed, the ECB has offered slightly changed forward guidance, suggesting a still accommodative stance but with lower likelihood of further easing. A similar message has come from the Monetary Policy Committee in the U.K. The People's Bank of China has sought to tighten lending conditions and bring credit growth under control.
Against this background, government bond yields in Europe and the US have risen but have been broadly stable or fallen elsewhere. US ten-year bond yields rose by 37 basis points and German ten-year bond yields by 16 basis points. With modest increases in government bond yields, credit markets have performed very well with substantial spread tightening. Among major markets, option adjusted spreads tightened by over 200 basis points in US High Yield, 120 basis points in Pan-European High Yield, 70 basis points in EMD and 35 basis points in US corporate investment grade bonds.
The Fund uses various derivative instruments to implement its strategies. These derivatives are utilized to manage the Fund’s credit risk, interest rate risk and foreign exchange risk. These derivative positions may increase or decrease the Fund’s exposure to these risks. At the end of the reporting period the Fund did not have exposure to these derivatives.
| Stone Harbor Investment Funds Annual Report | May 31, 2017 | 7 |
| Stone Harbor Investment Funds | Shareholder Letter |
May 31, 2017 (Unaudited)
Stone Harbor Strategic Income Fund
The total return of the Strategic Income Fund (the “Fund” or “portfolio”) for the 12 month period ending May 31, 2017 was 7.34% (net of direct and indirect expenses) and 8.04% (gross of direct and indirect expenses). This performance compares to a benchmark return of 5.77% for the Bloomberg Barclays Global Credit Index (Hedged into USD). The Fund outperformed its benchmark as a result of certain asset allocation, duration and individual credit decisions. During the period the Fund was overweight both the high yield and emerging debt sectors relative to the index, which drove a significant portion of the positive contribution from asset allocation. Within individual portfolio sectors, the Fund experienced outperformance in investment grade, global rates & currencies, and emerging debt while underperforming within the high yield component.
After the trials and tribulations of the prior year, the year ended May, 31 2017 was very positive for the global economy and for credit markets.
US growth - following a marked loss of momentum through the previous twelve months and registering 0.8% annualized GDP growth in the first quarter of 2016 - averaged over 2% annualized growth over the four subsequent quarters. Over the same four quarters, the Eurozone averaged 1.8% growth, China averaged over 6.5%, and the U.K. over 2%. Despite softer numbers in Japan, global growth has been strong. Despite firm growth, inflation remains subdued with headline Consumer Pricing Index (“CPI”) in the US registering 1.9% most recently and core inflation in Europe below 1%.
Political events have surprised across regions. The decision by the UK to leave the European Union and the election of Donald Trump as president in the US were both judged unlikely and created short-term volatility. However, neither event caused a breakdown of near-term economic policy, which allowed markets to continue to focus on underlying positive growth momentum.
Over the past twelve months, central banks have become more cautious about the need for additional monetary stimulus as economic momentum has become more entrenched. The Federal Reserve raised rates twice over the last year and looks set to move further. It has also begun to lay the ground for a reduction in the size of its balance sheet as it seeks to move away from past quantitative easing. As the year progressed, the ECB has offered slightly changed forward guidance, suggesting a still accommodative stance but with lower likelihood of further easing. A similar message has come from the Monetary Policy Committee in the UK The People's Bank of China has sought to tighten lending conditions and bring credit growth under control.
Against this background, government bond yields in Europe and the US have risen but have been broadly stable or fallen elsewhere. US ten-year bond yields rose by 37 basis points and German ten-year bond yields by 16 basis points. With modest increases in government bond yields, credit markets have performed very well with substantial spread tightening. Among major markets, option adjusted spreads tightened by over 200 basis points in US High Yield, 120 basis points in Pan-European High Yield, 70 basis points in EMD and 35 basis points in US corporate investment grade bonds.
The Fund uses various derivative instruments to implement its strategies. These derivatives are utilized to manage the Fund’s credit risk, interest rate risk and foreign exchange risk. These derivative positions may increase or decrease the Fund’s exposure to these risks. At the end of the reporting period the Fund had net exposure to these derivatives of approximately $341 thousand. Over the course of the reporting period these derivative positions generated a net realized gain of approximately $146 thousand and $1 thousand in unrealized appreciation for an increase in operations of $147 thousand. We plan to continue to utilize derivative instruments to implement our strategies related to credit risk, interest rate risk and foreign exchange risk.
Stone Harbor 500 Plus Fund
The total return of the Stone Harbor 500 Plus Fund (the “Fund” or “portfolio”) for the period since inception (January 19, 2017) through May 31, 2017 was 7.71% (net of expenses) and 7.93% (gross of expenses). This performance compares favorably versus the Fund’s benchmark, the S&P 500 Index, which returned 7.38% over that time period.
The Fund’s strategy of purchasing S&P futures, in an attempt to replicate the performance of the S&P 500 Index, while investing the remainder of the Fund’s cash in a portfolio of fixed income instruments designed to outperform USD 3-month LIBOR proved advantageous during the period. At inception in January, the portfolio management team chose to purchase e-mini S&P futures contracts expiring in June as this contract appeared to be the cheapest way to replicate the performance of the S&P 500 Index. After purchasing the e-mini June contract, the portfolio management team began assembling a portfolio of securitized assets designed to outperform 3-month LIBOR. By the end of the first quarter, the Fund was allocated approximately 38% to commercial mortgage backed securities (CMBS), 37% to non-agency residential mortgage backed securities (RMBS), and 25% to asset backed securities (ABS), which produce a yield-to-maturity of 2.65% and AA rated average credit quality. By the end of May, the June futures contract outperformed the S&P’s return by 5 basis points and the securitized fixed income portfolio outperformed 3-month LIBOR by 67 basis points, enabling the combined strategy to outperform the S&P 500 index gross of fees by 55 basis points.
| 8 | www.shiplp.com |
| Stone Harbor Investment Funds | Shareholder Letter |
May 31, 2017 (Unaudited)
Looking forward, with credit spreads tightening considerably in 2017, we are allowing cash to build in the portfolio with the expectation that spreads are likely to widen modestly during the second half of 2017. We are applying a defensive strategy to the bonds we are purchasing by focusing on higher rated positions in what are currently less volatile segments of the securitized markets.
The Fund uses various derivative instruments to implement its strategies. These derivatives are utilized to manage the Fund’s credit risk, interest rate risk and foreign exchange risk. These derivative positions may increase or decrease the Fund’s exposure to these risks. At the end of the reporting period the Fund had net exposure to these derivatives of approximately $83 thousand. Over the course of the reporting period these derivative positions generated an increase in operations of $131 thousand. We plan to continue to utilize derivative instruments to implement our strategies related to credit risk, interest rate risk and foreign exchange risk.
Sincerely,

Thomas K. Flanagan
Chairman of the Board of Trustees
| Stone Harbor Investment Funds Annual Report | May 31, 2017 | 9 |
| Stone Harbor Investment Funds | Disclosure of Fund Expenses |
| May 31, 2017 (Unaudited) |
Example. As a shareholder of a Fund, you incur two types of costs: (1) transaction costs, including sales charges (loads) on purchase payments and/or redemption fees (if applicable) and (2) ongoing costs, including management fees and other Fund expenses. The below examples are intended to help you understand your ongoing costs (in dollars) of investing in a Fund and to compare these costs with the ongoing costs of investing in other mutual funds. The examples are based on an investment of $1,000 invested on December 1, 2016 and held until May 31, 2017.
Actual Expenses. The first table below provides information about actual account values and actual expenses. You may use the information in this table, together with the amount you invested, to estimate the expenses that you paid over the period. Simply divide your account value by $1,000 (for example, an $8,600 account value divided by $1,000 = 8.6), then multiply the result by the number in the first line under the heading “Expenses Paid During Period” to estimate the expenses you paid on your account during this period.
Hypothetical Example for Comparison Purposes. The second table below provides information about hypothetical account values and hypothetical expenses based on the Fund’s actual expense ratio and an assumed rate of return of 5% per year before expenses, which is not the Fund’s actual return. The hypothetical account values and expenses may not be used to estimate the actual ending account balance or expenses you paid for the period. You may use this information to compare the ongoing costs of investing in a Fund and other mutual funds. To do so, compare this 5% hypothetical example with the 5% hypothetical examples that appear in the shareholder reports of the other funds.
Please note that the expenses shown in the tables are meant to highlight your ongoing costs only and do not reflect transactional costs, such as redemption fees, sales charges (loads) or exchange fees. Therefore, the second table is useful in comparing ongoing costs only, and will not help you determine the relative total costs of owning different funds. In addition, if these transactional costs were included, your costs would have been higher.
BASED ON ACTUAL TOTAL RETURN
| Actual Total Return | Beginning Account Value December 1, 2016 | Ending Account Value May 31, 2017 | Expense Ratio(1) | Expenses Paid During Period(2) | |
| STONE HARBOR EMERGING MARKETS DEBT FUND | 8.46% | $1,000.00 | $1,084.60 | 0.69% | $3.59 |
| STONE HARBOR HIGH YIELD BOND FUND | 6.00 | 1,000.00 | 1,060.00 | 0.65 | 3.34 |
| STONE HARBOR LOCAL MARKETS FUND | 12.89 | 1,000.00 | 1,128.90 | 0.89 | 4.72 |
| STONE HARBOR EMERGING MARKETS CORPORATE DEBT FUND | 5.96 | 1,000.00 | 1,059.60 | 1.00 | 5.14 |
| STONE HARBOR INVESTMENT GRADE FUND | 2.67 | 1,000.00 | 1,026.70 | 0.50 | 2.53 |
| STONE HARBOR STRATEGIC INCOME FUND | 4.95 | 1,000.00 | 1,049.50 | 0.10 | 0.51 |
| STONE HARBOR EMERGING MARKETS DEBT ALLOCATION FUND | 10.51 | 1,000.00 | 1,105.10 | 0.02 | 0.10 |
STONE HARBOR 500 PLUS FUND(3) | 7.71 | 1,000.00 | 1,077.10 | 0.60 | 2.25 |
BASED ON HYPOTHETICAL TOTAL RETURN
| Hypothetical Annualized Total Return | Beginning Account Value December 1, 2016 | Ending Account Value May 31, 2017 | Expense Ratio(1) | Expenses Paid During Period(2) | |
| STONE HARBOR EMERGING MARKETS DEBT FUND | 5.00% | $1,000.00 | $1,021.49 | 0.69% | $3.48 |
| STONE HARBOR HIGH YIELD BOND FUND | 5.00 | 1,000.00 | 1,021.69 | 0.65 | 3.28 |
| STONE HARBOR LOCAL MARKETS FUND | 5.00 | 1,000.00 | 1,020.49 | 0.89 | 4.48 |
| STONE HARBOR EMERGING MARKETS CORPORATE DEBT FUND | 5.00 | 1,000.00 | 1,019.95 | 1.00 | 5.04 |
| STONE HARBOR INVESTMENT GRADE FUND | 5.00 | 1,000.00 | 1,022.44 | 0.50 | 2.52 |
| STONE HARBOR STRATEGIC INCOME FUND | 5.00 | 1,000.00 | 1,024.43 | 0.10 | 0.50 |
| STONE HARBOR EMERGING MARKETS DEBT ALLOCATION FUND | 5.00 | 1,000.00 | 1,024.83 | 0.02 | 0.10 |
| STONE HARBOR 500 PLUS FUND | 5.00 | 1,000.00 | 1,021.94 | 0.60 | 3.02 |
| (1) | Annualized, based on the Fund's most recent fiscal half-year expenses. |
| (2) | Expenses are equal to the Fund's annualized expense ratio multiplied by the average account value over the period, multiplied by the number of days in the most recent fiscal half year (182), divided by 365. Note this expense example is typically based on a six-month period. |
| (3) | The Stone Harbor 500 Plus Fund's Institutional Class commenced operations on January 20, 2017. Actual expenses for this Fund are equal to the Fund’s annualized expense ratio multiplied by the average account value of the period, multiplied by the number of days since the Fund launched (132), divided by 365. |
| 10 | www.shiplp.com |
| Stone Harbor Investment Funds | Summaries of Portfolio Holdings |
| May 31, 2017 (Unaudited) |
Under SEC Rules, all funds are required to include in their annual and semi-annual shareholder reports a presentation of portfolio holdings in a table, chart or graph by reasonably identifiable categories. The following tables, which present holdings as a percent of total net assets, are provided in compliance with such requirements.
| STONE HARBOR EMERGING MARKETS DEBT FUND | |
Country Breakdown(1) | % |
| Brazil | 8.80% |
| Argentina | 8.74% |
| Ukraine | 6.85% |
| Mexico | 5.94% |
| Indonesia | 4.50% |
| Dominican Republic | 3.87% |
| Venezuela | 3.73% |
| Azerbaijan | 3.57% |
| Turkey | 3.39% |
| Colombia | 3.22% |
| Russia | 2.92% |
| South Africa | 2.78% |
| Costa Rica | 2.74% |
| Ivory Coast | 2.39% |
| Malaysia | 2.30% |
| Uruguay | 1.91% |
| Sri Lanka | 1.85% |
| El Salvador | 1.83% |
| Zambia | 1.72% |
| Croatia | 1.69% |
| Gabon | 1.67% |
| Angola | 1.61% |
| Ecuador | 1.60% |
| Kazakhstan | 1.48% |
| China | 1.47% |
| Iraq | 1.30% |
| Oman | 1.08% |
| Panama | 1.07% |
| Ghana | 0.99% |
| Hungary | 0.74% |
| Egypt | 0.73% |
| Peru | 0.67% |
| Chile | 0.59% |
| Kenya | 0.59% |
| Paraguay | 0.39% |
| Luxembourg | 0.38% |
| Senegal | 0.37% |
| Morocco | 0.36% |
| Cameroon | 0.36% |
| Trinidad/Tobago | 0.33% |
| Namibia | 0.31% |
| Lebanon | 0.31% |
| Bahrain | 0.30% |
| Jamaica | 0.28% |
| Georgia | 0.28% |
| Serbia | 0.28% |
| Montenegro | 0.25% |
| India | 0.23% |
| Honduras | 0.22% |
| Suriname | 0.22% |
| Ethiopia | 0.20% |
| Bolivia | 0.14% |
| Nigeria | 0.10% |
| Jordan | 0.10% |
| Total | 95.74% |
| Short Term Investments | 2.91% |
| Other Assets in Excess of Liabilities | 1.35% |
| Total Net Assets | 100.00% |
| STONE HARBOR HIGH YIELD BOND FUND | |
| Industry Breakdown | % |
| Exploration & Production | 9.95% |
| Media Cable | 8.20% |
| Healthcare | 7.03% |
| Media Other | 5.94% |
| Industrial Other | 5.40% |
| Technology | 5.05% |
| Electric | 4.49% |
| Building Products | 4.28% |
| Food & Beverage | 4.28% |
| Chemicals | 4.07% |
| Metals/Mining/Steel | 3.91% |
| Wirelines | 3.78% |
| Wireless | 3.42% |
| Containers/Packaging | 3.22% |
| Gaming | 3.00% |
| Drillers/Services | 2.85% |
| Paper/Forest Products | 2.61% |
| Consumer Products | 2.27% |
| Capital Goods | 2.27% |
| Retail Non Food/Drug | 2.17% |
| Retail Food/Drug | 1.96% |
| Automotive | 1.95% |
| Leisure | 1.56% |
| Satellite | 1.10% |
| Restaurants | 0.72% |
| Utility Other | 0.66% |
| Textile/Apparel | 0.52% |
| Transportation Other | 0.40% |
| Services Other | 0.27% |
| Total | 97.33% |
| Short Term Investments | 2.86% |
| Liabilities in Excess of Other Assets | -0.19% |
| Total Net Assets | 100.00% |
| (1) | Country refers to country of primary risk exposure, as determined by Stone Harbor Investment Partners LP (the “Adviser” or “Stone Harbor”). In certain instances, a security’s country of incorporation may be different from its country of risk. |
| Stone Harbor Investment Funds Annual Report | May 31, 2017 | 11 |
| Stone Harbor Investment Funds | Summaries of Portfolio Holdings |
| May 31, 2017 (Unaudited) |
| STONE HARBOR LOCAL MARKETS FUND | |
Country Breakdown(1) | % |
| Mexico | 10.96% |
| Brazil | 10.81% |
| Indonesia | 10.53% |
| South Africa | 10.39% |
| Colombia | 8.42% |
| Malaysia | 5.47% |
| Russia | 4.85% |
| Poland | 4.82% |
| Thailand | 3.58% |
| Turkey | 4.87% |
| Argentina | 1.53% |
| Peru | 1.36% |
| Uruguay | 0.36% |
| Chile | 0.22% |
| Total | 78.17% |
| Short Term Investments | 4.04% |
| Other Assets in Excess of Liabilities | 17.79% |
| Total Net Assets | 100.00% |
| (1) | Country refers to country of primary risk exposure, as determined by Stone Harbor. In certain instances, a security’s country of incorporation may be different from its country of risk. |
| STONE HARBOR EMERGING MARKETS CORPORATE DEBT FUND | |
Country Breakdown(1) | % |
| Brazil | 9.47% |
| India | 6.77% |
| Turkey | 5.37% |
| China | 5.04% |
| Mexico | 4.31% |
| Indonesia | 4.18% |
| Colombia | 4.17% |
| Chile | 4.09% |
| Argentina | 3.87% |
| Luxembourg | 3.43% |
| Hong Kong | 3.20% |
| Ukraine | 3.11% |
| Macau | 2.99% |
| Peru | 2.97% |
| Ireland | 2.65% |
| United Arab Emirates | 2.61% |
| Thailand | 2.59% |
| Russia | 2.51% |
| Ghana | 2.28% |
| Israel | 2.19% |
| Algeria | 2.15% |
| Angola | 2.01% |
| Jamaica | 1.99% |
| Malaysia | 1.56% |
| Guatemala | 1.55% |
| South Korea | 1.54% |
| Kuwait | 1.53% |
| Singapore | 1.52% |
| Morocco | 1.46% |
| Saudi Arabia | 1.22% |
| South Africa | 0.94% |
| Philippines | 0.83% |
| United States | 0.74% |
| Total | 96.84% |
| Short Term Investments | 0.94% |
| Other Assets in Excess of Liabilities | 2.22% |
| Total Net Assets | 100.00% |
| 12 | www.shiplp.com |
| Stone Harbor Investment Funds | Summaries of Portfolio Holdings |
| May 31, 2017 (Unaudited) |
| STONE HARBOR INVESTMENT GRADE FUND | |
| Industry Breakdown | % |
| U.S. Treasury Bonds/Notes | 19.83% |
| U.S. Government Agency Mortgage Backed | 18.61% |
| Asset Backed/Commercial Mortgage Backed | 16.23% |
| Banking | 10.04% |
| Electric | 5.25% |
| Technology | 3.03% |
| Gas Pipelines | 2.74% |
| Real Estate Investment Trust (REITs) | 2.54% |
| Exploration & Production | 2.08% |
| Automotive | 2.01% |
| Media Other | 1.57% |
| Food and Beverage | 1.38% |
| Media Cable | 1.37% |
| Wirelines | 1.35% |
| Healthcare | 1.00% |
| Transportation Non Air/Rail | 0.91% |
| Pharmaceuticals | 0.84% |
| Life Insurance | 0.81% |
| Retail Food/Drug | 0.74% |
| Metals/Mining/Steel | 0.59% |
| Consumer Products | 0.52% |
| Refining | 0.52% |
| Retail Non Food/Drug | 0.49% |
| Drillers/Services | 0.35% |
| Aerospace/Defense | 0.34% |
| Non Captive Finance | 0.34% |
| Paper/Forest Products | 0.34% |
| Leisure | 0.33% |
| Total | 96.15% |
| Short Term Investments | 8.13% |
| Liabilities in Excess of Other Assets | -4.28% |
| Total Net Assets | 100.00% |
| STONE HARBOR STRATEGIC INCOME FUND | |
| Industry Breakdown | % |
| Stone Harbor Investment Grade Fund | 40.94% |
| Stone Harbor High Yield Bond Fund | 34.76% |
| Stone Harbor Emerging Markets Debt Fund | 15.10% |
| Stone Harbor Local Markets Fund | 5.08% |
| Stone Harbor Emerging Markets Corporate Fund | 2.50% |
| Total | 98.39% |
| Short Term Investments | 0.33% |
| Other Assets in Excess of Liabilities | 1.28% |
| Total Net Assets | 100.00% |
| STONE HARBOR EMERGING MARKETS DEBT ALLOCATION FUND | |
| Industry Breakdown | % |
| Stone Harbor Emerging Markets Debt Fund | 43.74% |
| Stone Harbor Local Markets Fund | 55.90% |
| Total | 99.64% |
| Short Term Investments | 0.46% |
| Liabilities in Excess of Other Assets | -0.10% |
| Total Net Assets | 100.00% |
| STONE HARBOR 500 PLUS FUND | |
| Industry Breakdown | % |
| Asset Backed/Commercial Mortgage Backed | 79.49% |
| Total | 79.49% |
| Short Term Investments | 18.63% |
| Other Assets in Excess of Liabilities | 1.88% |
| Total Net Assets | 100.00% |
| Stone Harbor Investment Funds Annual Report | May 31, 2017 | 13 |
| Stone Harbor Investment Funds | Growth of $10,000 Investment |
May 31, 2017 (Unaudited)
STONE HARBOR EMERGING MARKETS DEBT FUND
Comparison of Change in Value of $10,000 Investment in Stone Harbor Emerging Markets Debt Fund and the JPMorgan Emerging Markets Bond Index Global Diversified (JPMorgan EMBI Global Diversified Index). Please refer to the Additional Information section for detailed benchmark descriptions.
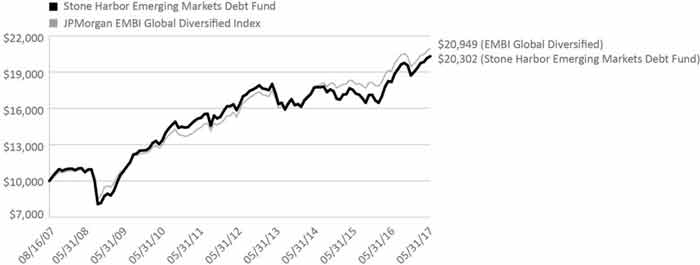
Total Returns (Inception Date, August 16, 2007)
| 6 Months | 1 Year | 3 Years | 5 Years | Since Inception | |
| Stone Harbor Emerging Markets Debt Fund | 8.46% | 11.70% | 4.67% | 5.08% | 7.50% |
| JPMorgan EMBI Global Diversified Index | 7.76% | 9.77% | 5.55% | 6.48% | 7.84% |
The performance data quoted represents past performance and does not guarantee future results. Current performance may be lower or higher than the performance quoted. Average annual total returns reflect the reinvestment of dividends and capital gains distributions and include all fee waivers and expense reimbursements. Without the fee waivers and expense reimbursements, total return figures would have been lower. The performance data quoted does not reflect the deduction of taxes that a shareholder would pay on Fund distributions or the redemption of Fund shares. Investment return and principal value will vary, and shares, when redeemed, may be worth more or less than their original cost. Index returns do not include the effects of sales charges, management fees or transaction costs. It is not possible to invest directly in an index.
| 14 | www.shiplp.com |
| Stone Harbor Investment Funds | Growth of $10,000 Investment |
May 31, 2017 (Unaudited)
STONE HARBOR HIGH YIELD BOND FUND
Comparison of Change in Value of $10,000 Investment in Stone Harbor High Yield Bond Fund and the Citigroup High Yield Market Capped Index. Please refer to the Additional Information section for detailed benchmark descriptions.
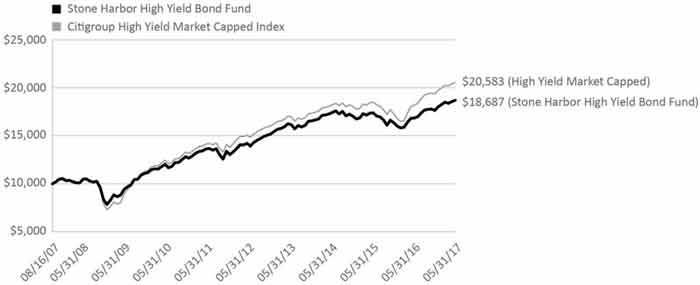
Total Returns (Inception Date, August 16, 2007)
| 6 Months | 1 Year | 3 Years | 5 Years | Since Inception | |
| Stone Harbor High Yield Bond Fund | 6.00% | 10.97% | 2.38% | 6.06% | 6.59% |
| Citigroup High Yield Market Capped Index | 6.31% | 13.26% | 4.15% | 6.76% | 7.65% |
The performance data quoted represents past performance and does not guarantee future results. Current performance may be lower or higher than the performance quoted. Average annual total returns reflect the reinvestment of dividends and capital gains distributions and include all fee waivers and expense reimbursements. Without the fee waivers and expense reimbursements, total return figures would have been lower. The performance data quoted does not reflect the deduction of taxes that a shareholder would pay on Fund distributions or the redemption of Fund shares. Investment return and principal value will vary, and shares, when redeemed, may be worth more or less than their original cost. Index returns do not include the effects of sales charges, management fees or transaction costs. It is not possible to invest directly in an index.
| Stone Harbor Investment Funds Annual Report | May 31, 2017 | 15 |
| Stone Harbor Investment Funds | Growth of $10,000 Investment |
May 31, 2017 (Unaudited)
STONE HARBOR LOCAL MARKETS FUND
Comparison of Change in Value of $10,000 Investment in Stone Harbor Local Markets Fund and the JPMorgan Global Bond Index – Emerging Markets Global Diversified (JPMorgan GBI EM Global Diversified). Please refer to the Additional Information section for detailed benchmark descriptions.
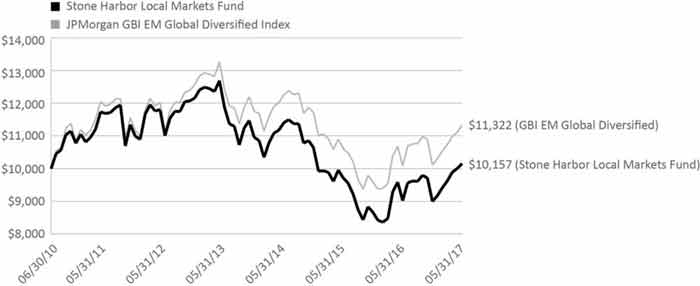
Total Returns (Inception Date, June 30, 2010)
| 6 Months | 1 Year | 3 Years | 5 Years | Since Inception | |
| Stone Harbor Local Markets Fund | 12.89% | 12.60% | ‐3.78% | ‐1.58% | 0.22% |
| JPMorgan GBI EM Global Diversified Index | 11.91% | 12.17% | ‐2.63% | 0.32% | 1.81% |
The performance data quoted represents past performance and does not guarantee future results. Current performance may be lower or higher than the performance quoted. Average annual total returns reflect the reinvestment of dividends and capital gains distributions and include all fee waivers and expense reimbursements. Without the fee waivers and expense reimbursements, total return figures would have been lower. The performance data quoted does not reflect the deduction of taxes that a shareholder would pay on Fund distributions or the redemption of Fund shares. Investment return and principal value will vary, and shares, when redeemed, may be worth more or less than their original cost. Index returns do not include the effects of sales charges, management fees or transaction costs. It is not possible to invest directly in an index.
| 16 | www.shiplp.com |
| Stone Harbor Investment Funds | Growth of $10,000 Investment |
May 31, 2017 (Unaudited)
STONE HARBOR EMERGING MARKETS CORPORATE DEBT FUND
Comparison of Change in Value of $10,000 Investment in Stone Harbor Emerging Market Corporate Debt Fund and the JPMorgan Corporate Emerging Market Bond Index – Broad Diversified (JPMorgan CEMBI Broad Diversified Index). Please refer to the Additional Information section for detailed benchmark descriptions.
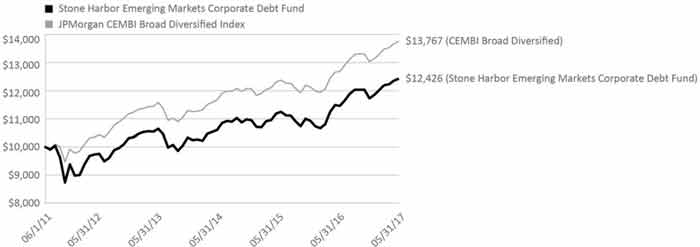
Total Returns (Inception Date, June 1, 2011)
| 6 Months | 1 Year | 3 Year | 5 Year | Since Inception | |
| Stone Harbor Emerging Markets Corporate Debt Fund | 5.96% | 8.43% | 4.63% | 5.54% | 3.69% |
| JPMorgan CEMBI Broad Diversified Index | 5.61% | 8.50% | 4.96% | 5.90% | 5.47% |
The performance data quoted represents past performance and does not guarantee future results. Current performance may be lower or higher than the performance quoted. Average annual total returns reflect the reinvestment of dividends and capital gains distributions and include all fee waivers and expense reimbursements. Without the fee waivers and expense reimbursements, total return figures would have been lower. The performance data quoted does not reflect the deduction of taxes that a shareholder would pay on Fund distributions or the redemption of Fund shares. Investment return and principal value will vary, and shares, when redeemed, may be worth more or less than their original cost. Index returns do not include the effects of sales charges, management fees or transaction costs. It is not possible to invest directly in an index.
| Stone Harbor Investment Funds Annual Report | May 31, 2017 | 17 |
| Stone Harbor Investment Funds | Growth of $10,000 Investment |
May 31, 2017 (Unaudited)
STONE HARBOR INVESTMENT GRADE FUND
Comparison of Change in Value of $10,000 Investment in Stone Harbor Investment Grade Fund and the Bloomberg Barclays U.S. Aggregate Index. Please refer to the Additional Information section for detailed benchmark descriptions.
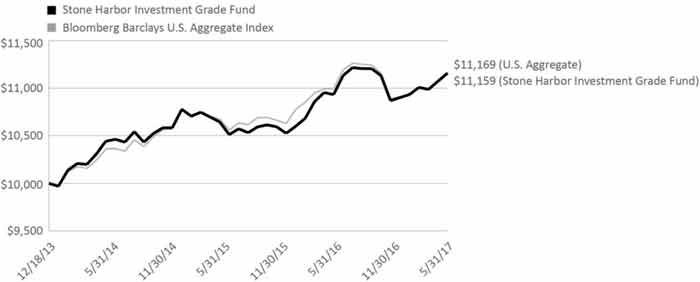
Total Returns (Inception Date, December 18, 2013)
| 6 Months | 1 Year | 3 Year | Since Inception | |
| Stone Harbor Investment Grade Fund | 2.67% | 2.07% | 2.24% | 3.23% |
| Bloomberg Barclays U.S. Aggregate Index | 2.52% | 1.58% | 2.53% | 3.26% |
The performance data quoted represents past performance and does not guarantee future results. Current performance may be lower or higher than the performance quoted. Average annual total returns reflect the reinvestment of dividends and capital gains distributions and include all fee waivers and expense reimbursements. Without the fee waivers and expense reimbursements, total return figures would have been lower. The performance data quoted does not reflect the deduction of taxes that a shareholder would pay on Fund distributions or the redemption of Fund shares. Investment return and principal value will vary, and shares, when redeemed, may be worth more or less than their original cost. Index returns do not include the effects of sales charges, management fees or transaction costs. It is not possible to invest directly in an index.
| 18 | www.shiplp.com |
| Stone Harbor Investment Funds | Growth of $10,000 Investment |
May 31, 2017 (Unaudited)
STONE HARBOR STRATEGIC INCOME FUND
Comparison of Change in Value of $10,000 Investment in Stone Harbor Strategic Income Fund and the Bloomberg Barclays Global Credit Index (Hedged USD). Please refer to the Additional Information section for detailed benchmark descriptions.
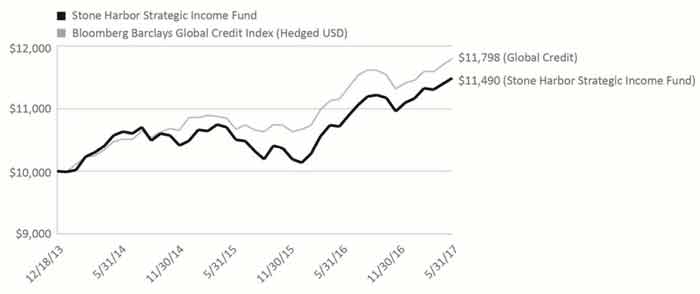
Total Returns (Inception Date, December 18, 2013)
| 6 Months | 1 Year | 3 Year | Since Inception | |
| Stone Harbor Strategic Income Fund | 4.85% | 7.34% | 2.81% | 4.11% |
| Bloomberg Barclays Global Credit Index (Hedged USD) | 4.23% | 5.77% | 4.05% | 4.91% |
The performance data quoted represents past performance and does not guarantee future results. Current performance may be lower or higher than the performance quoted. Average annual total returns reflect the reinvestment of dividends and capital gains distributions and include all fee waivers and expense reimbursements. Without the fee waivers and expense reimbursements, total return figures would have been lower. The performance data quoted does not reflect the deduction of taxes that a shareholder would pay on Fund distributions or the redemption of Fund shares. Investment return and principal value will vary, and shares, when redeemed, may be worth more or less than their original cost. Index returns do not include the effects of sales charges, management fees or transaction costs. It is not possible to invest directly in an index.
| Stone Harbor Investment Funds Annual Report | May 31, 2017 | 19 |
| Stone Harbor Investment Funds | Growth of $10,000 Investment |
May 31, 2017 (Unaudited)
STONE HARBOR EMERGING MARKETS DEBT ALLOCATION FUND
Comparison of Change in Value of $10,000 Investment in Stone Harbor Emerging Markets Debt Allocation Fund, the JPMorgan EMBI Global Diversified Index, JPMorgan GBI EM Global Diversified Index and the Blend Index (50% JPMorgan EMBI Global Diversified Index and 50% JP Morgan GBI EM Global Diversified Index). Please refer to the Additional Information section for detailed benchmark descriptions.
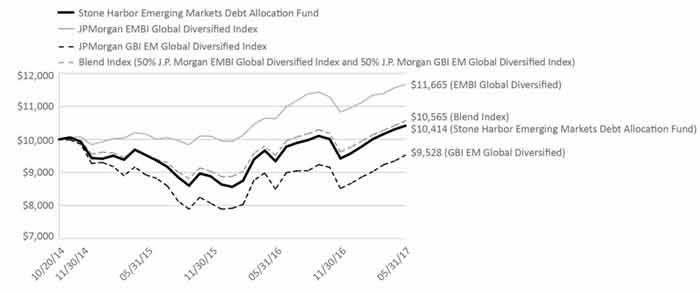
Total Returns (Inception Date, October 20, 2014)
| 6 Months | 1 Year | Since Inception | |
| Stone Harbor Emerging Markets Debt Allocation Fund | 10.51% | 11.51% | 1.57% |
| JPMorgan EMBI Global Diversified Index | 7.76% | 9.77% | 6.08% |
| JPMorgan GBI EM Global Diversified Index | 11.91% | 12.17% | ‐1.84% |
| Blend Index (50% JPMorgan EMBI Global Diversified Index and 50% JPMorgan GBI EM Global Diversified Index) | 9.82% | 11.00% | 2.13% |
The performance data quoted represents past performance and does not guarantee future results. Current performance may be lower or higher than the performance quoted. Average annual total returns reflect the reinvestment of dividends and capital gains distributions and include all fee waivers and expense reimbursements. Without the fee waivers and expense reimbursements, total return figures would have been lower. The performance data quoted does not reflect the deduction of taxes that a shareholder would pay on Fund distributions or the redemption of Fund shares. Investment return and principal value will vary, and shares, when redeemed, may be worth more or less than their original cost. Index returns do not include the effects of sales charges, management fees or transaction costs. It is not possible to invest directly in an index.
| 20 | www.shiplp.com |
| Stone Harbor Investment Funds | Growth of $10,000 Investment |
May 31, 2017 (Unaudited)
STONE HARBOR 500 PLUS FUND
Comparison of Change in Value of $10,000 Investment in Stone Harbor 500 Plus Fund and S&P 500 Index. Please refer to the Additional Information section for detailed benchmark descriptions.
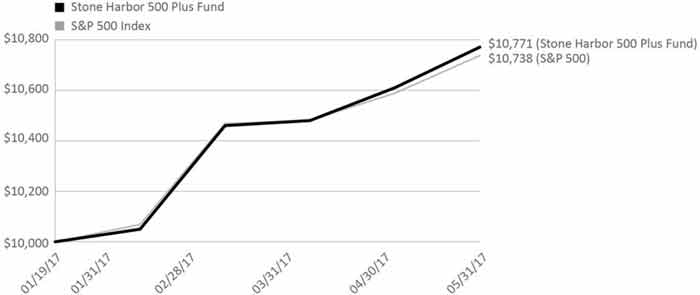
Total Returns (Inception Date, January 19, 2017)
| 1 Month | 3 Month | YTD | Since Inception | |
| Stone Harbor 500 Plus Fund | 1.52% | 2.97% | 7.71% | 7.71% |
| S&P 500 Index | 1.41% | 2.57% | 7.38% | 7.38% |
The performance data quoted represents past performance and does not guarantee future results. Current performance may be lower or higher than the performance quoted. Average annual total returns reflect the reinvestment of dividends and capital gains distributions and include all fee waivers and expense reimbursements. Without the fee waivers and expense reimbursements, total return figures would have been lower. The performance data quoted does not reflect the deduction of taxes that a shareholder would pay on Fund distributions or the redemption of Fund shares. Investment return and principal value will vary, and shares, when redeemed, may be worth more or less than their original cost. Index returns do not include the effects of sales charges, management fees or transaction costs. It is not possible to invest directly in an index.
| Stone Harbor Investment Funds Annual Report | May 31, 2017 | 21 |
| Stone Harbor Investment Funds | Report of Independent Registered Public Accounting Firm |
To the Shareholders and Board of Trustees of Stone Harbor Investment Funds:
We have audited the accompanying statements of assets and liabilities, including the statements of investments, of Stone Harbor Investment Funds (the “Funds”), comprising the Stone Harbor Emerging Markets Debt Fund, Stone Harbor High Yield Bond Fund, Stone Harbor Local Markets Fund, Stone Harbor Emerging Markets Corporate Debt Fund, Stone Harbor Investment Grade Fund, Stone Harbor Strategic Income Fund, Stone Harbor Emerging Markets Debt Allocation Fund, and Stone Harbor 500 Plus Fund, as of May 31, 2017, and the related statements of operations for the year then ended, the statements of changes in net assets for each of the two years in the period then ended, and the financial highlights for each of the periods presented (as to the Stone Harbor 500 Plus Fund, the statements of operations and changes in net assets and the financial highlights for the period January 20, 2017 (commencement of operations) to May 31, 2017). These financial statements and financial highlights are the responsibility of the Funds’ management.
Our responsibility is to express an opinion on these financial statements and financial highlights based on our audits. We conducted our audits in accordance with the standards of the Public Company Accounting Oversight Board (United States). Those standards require that we plan and perform the audit to obtain reasonable assurance about whether the financial statements and financial highlights are free of material misstatement. The Funds are not required to have, nor were we engaged to perform, an audit of their internal control over financial reporting. Our audits included consideration of internal control over financial reporting as a basis for designing audit procedures that are appropriate in the circumstances, but not for the purpose of expressing an opinion on the effectiveness of the Funds’ internal control over financial reporting. Accordingly, we express no such opinion. An audit also includes examining, on a test basis, evidence supporting the amounts and disclosures in the financial statements, assessing the accounting principles used and significant estimates made by management, as well as evaluating the overall financial statement presentation. Our procedures included confirmation of securities owned as of May 31, 2017, by correspondence with the custodian, brokers, transfer agent, and agent banks; where replies were not received from brokers and agent banks, we performed other auditing procedures. We believe that our audits provide a reasonable basis for our opinion.
In our opinion, the financial statements and financial highlights referred to above present fairly, in all material respects, the financial position of each of the funds constituting the Stone Harbor Investment Funds as of May 31, 2017, the results of their operations, the changes in their net assets and the financial highlights for each of the periods presented, in conformity with accounting principles generally accepted in the United States of America.
Denver, Colorado
July 27, 2017
| 22 | www.shiplp.com |
| Stone Harbor Emerging Markets Debt Fund | Statements of Investments |
May 31, 2017
| Reference Rate | Currency | Rate | Maturity Date | Principal Amount/Shares* | Value Expressed (in USD) | ||||||||||||
SOVEREIGN DEBT OBLIGATIONS - 74.82% | |||||||||||||||||
Angola - 1.61% | |||||||||||||||||
| Republic of Angola: | |||||||||||||||||
| USD | 7.00 | % | 08/16/19 | 1,747,000 | $ | 1,809,018 | |||||||||||
| USD | 9.50 | % | 11/12/25 | 4,930,000 | 5,293,587 | (1) | |||||||||||
| USD | 9.50 | % | 11/12/25 | 14,956,000 | 16,059,005 | (2) | |||||||||||
| 23,161,610 | |||||||||||||||||
Argentina - 8.42% | |||||||||||||||||
| Provincia del Chaco | USD | 9.38 | % | 08/18/24 | 3,971,000 | 3,980,928 | (2) | ||||||||||
| Republic of Argentina: | |||||||||||||||||
| EUR | 7.82 | % | 12/31/33 | 33,422,720 | 39,845,091 | ||||||||||||
| EUR | 7.82 | % | 12/31/33 | 52,803,444 | 63,691,396 | ||||||||||||
| EUR | 0.00 | % | 12/15/35 | 131,391,109 | 13,911,138 | (3) | |||||||||||
| 121,428,553 | |||||||||||||||||
Azerbaijan - 2.61% | |||||||||||||||||
| Republic of Azerbaijan: | |||||||||||||||||
| USD | 4.75 | % | 03/18/24 | 2,403,000 | 2,447,455 | (2) | |||||||||||
| USD | 4.75 | % | 03/18/24 | 34,492,000 | 35,130,102 | (1) | |||||||||||
| 37,577,557 | |||||||||||||||||
Bahrain - 0.30% | |||||||||||||||||
| Kingdom of Baharain | USD | 7.00 | % | 10/12/28 | 4,110,000 | 4,300,087 | (1) | ||||||||||
Bolivia - 0.14% | |||||||||||||||||
| Republic of Bolivia | USD | 4.50 | % | 03/20/28 | 2,097,000 | 2,062,924 | (2) | ||||||||||
Brazil - 5.80% | |||||||||||||||||
| Brazil Minas SPE via State of Minas Gerais: | |||||||||||||||||
| USD | 5.33 | % | 02/15/28 | 1,892,000 | 1,835,240 | (1) | |||||||||||
| USD | 5.33 | % | 02/15/28 | 17,625,000 | 17,096,250 | (2) | |||||||||||
| Nota Do Tesouro Nacional | BRL | 10.00 | % | 01/01/27 | 68,040,000 | 20,228,486 | |||||||||||
| Republic of Brazil: | |||||||||||||||||
| USD | 8.75 | % | 02/04/25 | 735,000 | 937,125 | ||||||||||||
| USD | 6.00 | % | 04/07/26 | 24,296,000 | 26,470,492 | ||||||||||||
| USD | 8.25 | % | 01/20/34 | 3,089,000 | 3,876,695 | ||||||||||||
| USD | 5.63 | % | 01/07/41 | 705,000 | 690,900 | ||||||||||||
| USD | 5.00 | % | 01/27/45 | 12,014,000 | 10,714,987 | ||||||||||||
| USD | 5.63 | % | 02/21/47 | 1,807,000 | 1,759,566 | ||||||||||||
| 83,609,741 | |||||||||||||||||
Cameroon - 0.36% | |||||||||||||||||
| Republic of Cameroon: | |||||||||||||||||
| USD | 9.50 | % | 11/19/25 | 400,000 | 476,500 | (2) | |||||||||||
| USD | 9.50 | % | 11/19/25 | 3,953,000 | 4,709,011 | (1) | |||||||||||
| 5,185,511 | |||||||||||||||||
Chile - 0.06% | |||||||||||||||||
| Republic of Chile | USD | 3.13 | % | 03/27/25 | 881,000 | 904,346 | |||||||||||
Colombia - 3.22% | |||||||||||||||||
| Bogota Distrio Capital | COP | 9.75 | % | 07/26/28 | 638,000,000 | 232,217 | (2) | ||||||||||
| Republic of Colombia: | |||||||||||||||||
| USD | 4.38 | % | 07/12/21 | 4,578,000 | 4,887,015 | ||||||||||||
| USD | 4.00 | % | 02/26/24 | 18,079,000 | 18,738,883 | ||||||||||||
| Stone Harbor Investment Funds Annual Report | May 31, 2017 | 23 |
| Stone Harbor Emerging Markets Debt Fund | Statements of Investments |
May 31, 2017
| Reference Rate | Currency | Rate | Maturity Date | Principal Amount/Shares* | Value Expressed (in USD) | ||||||||||||
| Colombia (continued) | |||||||||||||||||
| Republic of Colombia: (continued) | |||||||||||||||||
| USD | 4.50 | % | 01/28/26 | 4,670,000 | $ | 4,980,555 | |||||||||||
| COP | 7.50 | % | 08/26/26 | 39,286,600,000 | 14,649,966 | ||||||||||||
| USD | 5.63 | % | 02/26/44 | 2,674,000 | 2,930,035 | ||||||||||||
| 46,418,671 | |||||||||||||||||
Costa Rica - 2.50% | |||||||||||||||||
| Republic of Costa Rica: | |||||||||||||||||
| USD | 4.25 | % | 01/26/23 | 10,200,000 | 10,098,000 | (2) | |||||||||||
| USD | 4.38 | % | 04/30/25 | 1,920,000 | 1,862,400 | (1) | |||||||||||
| USD | 4.38 | % | 04/30/25 | 4,181,000 | 4,055,570 | (2) | |||||||||||
| USD | 5.63 | % | 04/30/43 | 822,000 | 746,992 | (1) | |||||||||||
| USD | 7.00 | % | 04/04/44 | 2,203,000 | 2,293,874 | (2) | |||||||||||
| USD | 7.00 | % | 04/04/44 | 11,287,000 | 11,752,589 | (1) | |||||||||||
| USD | 7.16 | % | 03/12/45 | 5,001,000 | 5,257,301 | (2) | |||||||||||
| 36,066,726 | |||||||||||||||||
Croatia - 1.69% | |||||||||||||||||
| Croatian Government: | |||||||||||||||||
| USD | 6.63 | % | 07/14/20 | 5,927,000 | 6,556,744 | (2) | |||||||||||
| USD | 6.38 | % | 03/24/21 | 3,655,000 | 4,064,360 | (1) | |||||||||||
| USD | 5.50 | % | 04/04/23 | 9,459,000 | 10,333,957 | (2) | |||||||||||
| USD | 6.00 | % | 01/26/24 | 3,040,000 | 3,421,520 | (1) | |||||||||||
| 24,376,581 | |||||||||||||||||
Dominican Republic - 3.87% | |||||||||||||||||
| Dominican Republic: | |||||||||||||||||
| USD | 9.04 | % | 01/23/18 | 1,838,269 | 1,890,375 | (2) | |||||||||||
| USD | 7.50 | % | 05/06/21 | 17,382,000 | 19,380,930 | (2) | |||||||||||
| USD | 6.60 | % | 01/28/24 | 7,187,000 | 7,932,651 | (2) | |||||||||||
| USD | 5.88 | % | 04/18/24 | 457,000 | 487,276 | (1) | |||||||||||
| USD | 5.50 | % | 01/27/25 | 6,825,000 | 7,106,531 | (2) | |||||||||||
| USD | 6.88 | % | 01/29/26 | 5,633,000 | 6,323,043 | (2) | |||||||||||
| USD | 5.95 | % | 01/25/27 | 3,630,000 | 3,820,575 | (1) | |||||||||||
| USD | 8.63 | % | 04/20/27 | 1,225,000 | 1,466,938 | (2) | |||||||||||
| USD | 7.45 | % | 04/30/44 | 5,986,000 | 6,794,110 | (1) | |||||||||||
| USD | 6.85 | % | 01/27/45 | 560,000 | 596,400 | (2) | |||||||||||
| 55,798,829 | |||||||||||||||||
Ecuador - 1.20% | |||||||||||||||||
| Republic of Ecuador: | |||||||||||||||||
| USD | 7.95 | % | 06/20/24 | 900,000 | 857,250 | (1) | |||||||||||
| USD | 7.95 | % | 06/20/24 | 10,246,000 | 9,759,315 | (2) | |||||||||||
| USD | 9.65 | % | 12/13/26 | 900,000 | 913,500 | (2) | |||||||||||
| USD | 9.65 | % | 12/13/26 | 5,669,000 | 5,754,035 | (1) | |||||||||||
| 17,284,100 | |||||||||||||||||
Egypt - 0.73% | |||||||||||||||||
| Republic of Egypt: | |||||||||||||||||
| USD | 6.13 | % | 01/31/22 | 2,289,000 | 2,357,384 | (1) | |||||||||||
| USD | 6.88 | % | 04/30/40 | 2,071,000 | 1,975,216 | (1) | |||||||||||
| USD | 8.50 | % | 01/31/47 | 5,800,000 | 6,220,500 | (1) | |||||||||||
| 10,553,100 | |||||||||||||||||
El Salvador - 1.83% | |||||||||||||||||
| Republic of El Salvador: | |||||||||||||||||
| USD | 7.38 | % | 12/01/19 | 194,000 | 196,425 | (1) | |||||||||||
| 24 | www.shiplp.com |
| Stone Harbor Emerging Markets Debt Fund | Statements of Investments |
May 31, 2017
| Reference Rate | Currency | Rate | Maturity Date | Principal Amount/Shares* | Value Expressed (in USD) | ||||||||||||
| El Salvador (continued) | |||||||||||||||||
| Republic of El Salvador: (continued) | |||||||||||||||||
| USD | 7.75 | % | 01/24/23 | 6,331,000 | $ | 6,433,879 | (2) | ||||||||||
| USD | 5.88 | % | 01/30/25 | 443,000 | 397,592 | (1) | |||||||||||
| USD | 5.88 | % | 01/30/25 | 1,828,000 | 1,640,630 | (2) | |||||||||||
| USD | 6.38 | % | 01/18/27 | 837,000 | 753,300 | (1) | |||||||||||
| USD | 6.38 | % | 01/18/27 | 1,734,000 | 1,560,600 | (2) | |||||||||||
| USD | 8.25 | % | 04/10/32 | 886,000 | 879,355 | (1) | |||||||||||
| USD | 7.65 | % | 06/15/35 | 10,703,000 | 9,980,548 | (2) | |||||||||||
| USD | 7.63 | % | 02/01/41 | 4,877,000 | 4,486,840 | (2) | |||||||||||
| 26,329,169 | |||||||||||||||||
Ethiopia - 0.20% | |||||||||||||||||
| Federal Democratic Republic of Ethiopia | USD | 6.63 | % | 12/11/24 | 2,841,000 | 2,865,859 | (1) | ||||||||||
Gabon - 1.67% | |||||||||||||||||
| Republic of Gabon: | |||||||||||||||||
| USD | 8.20 | % | 12/12/17 | 44,000 | 45,237 | (1) | |||||||||||
| USD | 6.38 | % | 12/12/24 | 2,507,014 | 2,497,613 | (2) | |||||||||||
| USD | 6.38 | % | 12/12/24 | 13,179,935 | 13,130,510 | (1) | |||||||||||
| USD | 6.95 | % | 06/16/25 | 8,221,000 | 8,344,315 | (1) | |||||||||||
| 24,017,675 | |||||||||||||||||
Georgia - 0.28% | |||||||||||||||||
| Republic of Georgia | USD | 6.88 | % | 04/12/21 | 3,596,000 | 4,009,540 | (1) | ||||||||||
Ghana - 0.55% | |||||||||||||||||
| Republic of Ghana | USD | 10.75 | % | 10/14/30 | 6,368,000 | 7,944,080 | (2) | ||||||||||
Honduras - 0.22% | |||||||||||||||||
| Honduras Government | USD | 6.25 | % | 01/19/27 | 3,104,000 | 3,235,920 | (1) | ||||||||||
Hungary - 0.74% | |||||||||||||||||
| Republic of Hungary | USD | 6.38 | % | 03/29/21 | 9,483,000 | 10,733,571 | |||||||||||
Indonesia - 2.57% | |||||||||||||||||
| Republic of Indonesia: | |||||||||||||||||
| USD | 5.38 | % | 10/17/23 | 6,242,000 | 6,948,126 | (2) | |||||||||||
| USD | 5.88 | % | 01/15/24 | 4,001,000 | 4,558,640 | (2) | |||||||||||
| USD | 4.13 | % | 01/15/25 | 6,424,000 | 6,640,810 | (2) | |||||||||||
| USD | 4.75 | % | 01/08/26 | 1,007,000 | 1,085,672 | (2) | |||||||||||
| USD | 8.50 | % | 10/12/35 | 5,887,000 | 8,521,433 | (2) | |||||||||||
| USD | 6.63 | % | 02/17/37 | 3,628,000 | 4,516,860 | (2) | |||||||||||
| USD | 5.25 | % | 01/17/42 | 1,410,000 | 1,541,306 | (2) | |||||||||||
| USD | 6.75 | % | 01/15/44 | 969,000 | 1,265,756 | (2) | |||||||||||
| USD | 5.13 | % | 01/15/45 | 1,809,000 | 1,965,026 | (2) | |||||||||||
| 37,043,629 | |||||||||||||||||
Iraq - 0.80% | |||||||||||||||||
| Republic of Iraq | USD | 5.80 | % | 01/15/28 | 12,536,000 | 11,501,780 | (2) | ||||||||||
Ivory Coast - 2.39% | |||||||||||||||||
| Ivory Coast Government: | |||||||||||||||||
| USD | 5.38 | % | 07/23/24 | 1,314,000 | 1,284,435 | (2) | |||||||||||
| USD | 5.38 | % | 07/23/24 | 6,086,000 | 5,949,065 | (1) | |||||||||||
| USD | 6.38 | % | 03/03/28 | 10,222,000 | 10,324,220 | (1) | |||||||||||
| USD | 5.75 | % | 12/31/32 | 2,731,260 | 2,656,151 | (1)(4) | |||||||||||
| Stone Harbor Investment Funds Annual Report | May 31, 2017 | 25 |
| Stone Harbor Emerging Markets Debt Fund | Statements of Investments |
May 31, 2017
| Reference Rate | Currency | Rate | Maturity Date | Principal Amount/Shares* | Value Expressed (in USD) | ||||||||||||
| Ivory Coast (continued) | |||||||||||||||||
| Ivory Coast Government: (continued) | |||||||||||||||||
| USD | 5.75 | % | 12/31/32 | 14,665,700 | $ | 14,262,393 | (2)(4) | ||||||||||
| 34,476,264 | |||||||||||||||||
Jamaica - 0.08% | |||||||||||||||||
| Jamaican Government | USD | 8.00 | % | 03/15/39 | 1,000,000 | 1,191,500 | |||||||||||
Jordan - 0.10% | |||||||||||||||||
| Kingdom of Jordan | USD | 5.75 | % | 01/31/27 | 1,443,000 | 1,443,902 | (1) | ||||||||||
Kazakhstan - 0.46% | |||||||||||||||||
| KazAgro National Management Holding JSC | USD | 4.63 | % | 05/24/23 | 4,921,000 | 4,951,756 | (1) | ||||||||||
| Republic of Kazakhstan | USD | 5.13 | % | 07/21/25 | 1,487,000 | 1,631,239 | (1) | ||||||||||
| 6,582,995 | |||||||||||||||||
Kenya - 0.59% | |||||||||||||||||
| Republic of Kenya: | |||||||||||||||||
| USD | 5.88 | % | 06/24/19 | 733,000 | 761,404 | (1) | |||||||||||
| USD | 6.88 | % | 06/24/24 | 418,000 | 430,540 | (2) | |||||||||||
| USD | 6.88 | % | 06/24/24 | 7,123,000 | 7,336,690 | (1) | |||||||||||
| 8,528,634 | |||||||||||||||||
Lebanon - 0.31% | |||||||||||||||||
| Lebanese Republic: | |||||||||||||||||
| USD | 5.15 | % | 11/12/18 | 2,680,000 | 2,716,850 | ||||||||||||
| USD | 6.75 | % | 11/29/27 | 1,679,000 | 1,698,309 | ||||||||||||
| 4,415,159 | |||||||||||||||||
Malaysia - 1.84% | |||||||||||||||||
| 1MDB Global Investments Ltd. | USD | 4.40 | % | 03/09/23 | 28,500,000 | 26,505,000 | (2) | ||||||||||
Mexico - 0.72% | |||||||||||||||||
| United Mexican States: | |||||||||||||||||
| USD | 4.13 | % | 01/21/26 | 4,692,000 | 4,880,853 | ||||||||||||
| USD | 4.15 | % | 03/28/27 | 1,460,000 | 1,506,720 | ||||||||||||
| USD | 4.75 | % | 03/08/44 | 1,370,000 | 1,361,437 | ||||||||||||
| USD | 4.60 | % | 01/23/46 | 1,230,000 | 1,197,713 | ||||||||||||
| USD | 4.35 | % | 01/15/47 | 1,582,000 | 1,480,159 | ||||||||||||
| 10,426,882 | |||||||||||||||||
Montenegro - 0.25% | |||||||||||||||||
| Republic of Montenegro | EUR | 5.75 | % | 03/10/21 | 2,991,000 | 3,603,706 | (1) | ||||||||||
Namibia - 0.31% | |||||||||||||||||
| Republic of Namibia | USD | 5.25 | % | 10/29/25 | 4,343,000 | 4,451,575 | (1) | ||||||||||
Nigeria - 0.10% | |||||||||||||||||
| Republic of Nigeria | USD | 7.88 | % | 02/16/32 | 1,369,000 | 1,516,167 | (1) | ||||||||||
Oman - 1.08% | |||||||||||||||||
| Oman Government: | |||||||||||||||||
| USD | 4.75 | % | 06/15/26 | 4,629,000 | 4,652,145 | (1) | |||||||||||
| USD | 6.50 | % | 03/08/47 | 10,088,000 | 10,932,870 | (1) | |||||||||||
| 15,585,015 | |||||||||||||||||
| 26 | www.shiplp.com |
| Stone Harbor Emerging Markets Debt Fund | Statements of Investments |
May 31, 2017
| Reference Rate | Currency | Rate | Maturity Date | Principal Amount/Shares* | Value Expressed (in USD) | ||||||||||||
Panama - 1.07% | |||||||||||||||||
| Republic of Panama: | |||||||||||||||||
| USD | 4.00 | % | 09/22/24 | 1,658,000 | $ | 1,745,045 | |||||||||||
| USD | 9.38 | % | 04/01/29 | 7,525,000 | 11,184,031 | ||||||||||||
| USD | 8.13 | % | 04/28/34 | 1,818,000 | 2,431,575 | ||||||||||||
| 15,360,651 | |||||||||||||||||
Paraguay - 0.39% | |||||||||||||||||
| Republic of Paraguay | USD | 6.10 | % | 08/11/44 | 5,109,000 | 5,594,355 | (1) | ||||||||||
Peru - 0.47% | |||||||||||||||||
| Republic of Peru | USD | 6.55 | % | 03/14/37 | 5,077,000 | 6,740,987 | |||||||||||
Russia - 2.92% | |||||||||||||||||
| Russian Federation: | |||||||||||||||||
| USD | 5.00 | % | 04/29/20 | 5,566,000 | 5,948,662 | (1) | |||||||||||
| RUB | 7.40 | % | 12/07/22 | 800,700,000 | 13,904,963 | ||||||||||||
| USD | 4.88 | % | 09/16/23 | 6,800,000 | 7,386,500 | (2) | |||||||||||
| USD | 4.75 | % | 05/27/26 | 13,400,000 | 14,126,950 | (2) | |||||||||||
| USD | 12.75 | % | 06/24/28 | 379,000 | 672,725 | (2) | |||||||||||
| 42,039,800 | |||||||||||||||||
Senegal - 0.37% | |||||||||||||||||
| Republic of Senegal | USD | 6.25 | % | 05/23/33 | 5,320,000 | 5,383,893 | (1) | ||||||||||
Serbia - 0.28% | |||||||||||||||||
| Republic of Serbia | USD | 4.88 | % | 02/25/20 | 3,827,000 | 3,997,302 | (2) | ||||||||||
South Africa - 2.55% | |||||||||||||||||
| Republic of South Africa: | |||||||||||||||||
| USD | 4.67 | % | 01/17/24 | 2,945,000 | 3,029,669 | ||||||||||||
| USD | 5.88 | % | 09/16/25 | 20,773,000 | 22,772,401 | ||||||||||||
| USD | 4.30 | % | 10/12/28 | 11,381,000 | 10,911,534 | ||||||||||||
| 36,713,604 | |||||||||||||||||
Sri Lanka - 1.85% | |||||||||||||||||
| Republic of Sri Lanka: | |||||||||||||||||
| USD | 6.25 | % | 10/04/20 | 3,096,000 | 3,301,110 | (2) | |||||||||||
| USD | 6.25 | % | 07/27/21 | 5,058,000 | 5,405,738 | (2) | |||||||||||
| USD | 5.88 | % | 07/25/22 | 12,967,000 | 13,518,097 | (1) | |||||||||||
| USD | 6.85 | % | 11/03/25 | 4,232,000 | 4,517,660 | (1) | |||||||||||
| 26,742,605 | |||||||||||||||||
Suriname - 0.22% | |||||||||||||||||
| Republic of Suriname | USD | 9.25 | % | 10/26/26 | 3,078,000 | 3,162,645 | (1) | ||||||||||
Trinidad & Tobago - 0.33% | |||||||||||||||||
| Republic of Trinidad & Tobago | USD | 4.50 | % | 08/04/26 | 4,809,000 | 4,720,034 | (1) | ||||||||||
Turkey - 3.39% | |||||||||||||||||
| Republic of Turkey: | |||||||||||||||||
| USD | 7.00 | % | 06/05/20 | 3,783,000 | 4,161,300 | ||||||||||||
| USD | 5.63 | % | 03/30/21 | 3,776,000 | 4,019,080 | ||||||||||||
| USD | 6.25 | % | 09/26/22 | 9,659,000 | 10,576,605 | ||||||||||||
| USD | 3.25 | % | 03/23/23 | 4,699,000 | 4,449,366 | ||||||||||||
| USD | 5.75 | % | 03/22/24 | 3,319,000 | 3,547,181 | ||||||||||||
| USD | 6.00 | % | 03/25/27 | 12,160,000 | 13,072,000 | ||||||||||||
| USD | 6.88 | % | 03/17/36 | 6,021,000 | 6,894,045 | ||||||||||||
| USD | 6.75 | % | 05/30/40 | 1,232,000 | 1,393,700 | ||||||||||||
| Stone Harbor Investment Funds Annual Report | May 31, 2017 | 27 |
| Stone Harbor Emerging Markets Debt Fund | Statements of Investments |
May 31, 2017
| Reference Rate | Currency | Rate | Maturity Date | Principal Amount/Shares* | Value Expressed (in USD) | ||||||||||||
| Turkey (continued) | |||||||||||||||||
| Republic of Turkey: (continued) | |||||||||||||||||
| USD | 6.00 | % | 01/14/41 | 686,000 | $ | 712,582 | |||||||||||
| 48,825,859 | |||||||||||||||||
Ukraine - 6.85% | |||||||||||||||||
| Ukraine Government: | |||||||||||||||||
| USD | 7.75 | % | 09/01/19 | 221,000 | 227,299 | (1) | |||||||||||
| USD | 7.75 | % | 09/01/20 | 2,540,000 | 2,588,260 | (2) | |||||||||||
| USD | 7.75 | % | 09/01/20 | 19,370,000 | 19,738,030 | (1) | |||||||||||
| USD | 7.75 | % | 09/01/21 | 879,000 | 892,625 | (2) | |||||||||||
| USD | 7.75 | % | 09/01/21 | 13,243,000 | 13,448,266 | (1) | |||||||||||
| USD | 7.75 | % | 09/01/22 | 6,700,000 | 6,740,200 | (1) | |||||||||||
| USD | 7.75 | % | 09/01/22 | 22,035,000 | 22,167,210 | (2) | |||||||||||
| USD | 7.75 | % | 09/01/23 | 10,377,000 | 10,356,246 | (1) | |||||||||||
| USD | 7.75 | % | 09/01/24 | 2,269,000 | 2,244,041 | (2) | |||||||||||
| USD | 7.75 | % | 09/01/24 | 7,412,000 | 7,330,468 | (1) | |||||||||||
| USD | 7.75 | % | 09/01/25 | 450,000 | 443,250 | (2) | |||||||||||
| USD | 7.75 | % | 09/01/25 | 8,011,000 | 7,890,835 | (1) | |||||||||||
| USD | 7.75 | % | 09/01/27 | 200,000 | 195,300 | (2) | |||||||||||
| USD | 7.75 | % | 09/01/27 | 4,613,000 | 4,504,594 | (1) | |||||||||||
| 98,766,624 | |||||||||||||||||
Uruguay - 1.91% | |||||||||||||||||
| Republic of Uruguay: | |||||||||||||||||
| USD | 4.50 | % | 08/14/24 | 5,356,164 | 5,777,962 | ||||||||||||
| USD | 4.38 | % | 10/27/27 | 16,653,799 | 17,611,393 | ||||||||||||
| USD | 5.10 | % | 06/18/50 | 4,132,830 | 4,158,660 | ||||||||||||
| 27,548,015 | |||||||||||||||||
Venezuela - 0.90% | |||||||||||||||||
| Republic of Venezuela: | |||||||||||||||||
| USD | 13.63 | % | 08/15/18 | 5,908,000 | 4,674,705 | (2) | |||||||||||
| USD | 7.75 | % | 10/13/19 | 15,051,900 | 8,372,619 | ||||||||||||
| 13,047,324 | |||||||||||||||||
Zambia - 1.72% | |||||||||||||||||
| Republic of Zambia: | |||||||||||||||||
| USD | 5.38 | % | 09/20/22 | 669,000 | 639,731 | (1) | |||||||||||
| USD | 5.38 | % | 09/20/22 | 13,094,000 | 12,521,138 | (2) | |||||||||||
| USD | 8.50 | % | 04/14/24 | 8,264,000 | 8,832,150 | (1) | |||||||||||
| USD | 8.97 | % | 07/30/27 | 2,663,000 | 2,877,704 | (1) | |||||||||||
| 24,870,723 | |||||||||||||||||
| TOTAL SOVEREIGN DEBT OBLIGATIONS | |||||||||||||||||
| (Cost $1,033,864,216) | 1,078,650,779 | ||||||||||||||||
BANK LOANS - 0.94% | |||||||||||||||||
Brazil - 0.94% | |||||||||||||||||
| Banco de Investimentos Credit Suisse | |||||||||||||||||
Brasil SA - Brazil Loan Tranche A | USD | 6.25 | % | 01/10/18 | 6,200,000 | 6,241,235 | (5) | ||||||||||
| Banco de Investimentos Credit Suisse | |||||||||||||||||
Brasil SA - Brazil Loan Tranche B | USD | 6.25 | % | 01/10/18 | 7,300,000 | 7,348,551 | (5) | ||||||||||
| 13,589,786 | |||||||||||||||||
| 28 | www.shiplp.com |
| Stone Harbor Emerging Markets Debt Fund | Statements of Investments |
May 31, 2017
| Reference Rate | Currency | Rate | Maturity Date | Principal Amount/Shares* | Value Expressed (in USD) | ||||||||||||
Indonesia - 0.00%(6) | |||||||||||||||||
| PT Bakrie & Brothers TBK | USD | N/A | 11/25/14 | 624,912 | $ | 62 | (5)(7) | ||||||||||
| TOTAL BANK LOANS | 13,589,848 | ||||||||||||||||
| (Cost $13,749,965) | |||||||||||||||||
CORPORATE BONDS - 19.48% | |||||||||||||||||
Argentina - 0.32% | |||||||||||||||||
| Cablevision SA | USD | 6.50 | % | 06/15/21 | 545,000 | 579,063 | (1) | ||||||||||
| Pampa Energia SA | USD | 7.50 | % | 01/24/27 | 1,274,000 | 1,348,529 | (1) | ||||||||||
| Petrobras Argentina SA | USD | 7.38 | % | 07/21/23 | 1,209,000 | 1,281,540 | (1) | ||||||||||
| YPF SA | USD | 8.75 | % | 04/04/24 | 1,169,000 | 1,349,318 | (1) | ||||||||||
| 4,558,450 | |||||||||||||||||
Azerbaijan - 0.96% | |||||||||||||||||
| Southern Gas Corridor CJSC: | |||||||||||||||||
| USD | 6.88 | % | 03/24/26 | 1,234,000 | 1,366,963 | (1) | |||||||||||
| USD | 6.88 | % | 03/24/26 | 2,817,000 | 3,120,532 | (2) | |||||||||||
| State Oil Co. of the Azerbaijan Republic | USD | 4.75 | % | 03/13/23 | 9,480,000 | 9,385,200 | |||||||||||
| 13,872,695 | |||||||||||||||||
Brazil - 2.06% | |||||||||||||||||
| Cosan Luxembourg SA | USD | 7.00 | % | 01/20/27 | 2,178,000 | 2,265,120 | (1) | ||||||||||
| ESAL GmbH | USD | 6.25 | % | 02/05/23 | 1,542,000 | 1,413,821 | (1) | ||||||||||
| MARB BondCo PLC | USD | 7.00 | % | 03/15/24 | 750,000 | 741,563 | (1) | ||||||||||
| Marfrig Holdings Europe BV | USD | 8.00 | % | 06/08/23 | 3,220,000 | 3,347,190 | (1) | ||||||||||
| Minerva Luxembourg SA | USD | 6.50 | % | 09/20/26 | 2,370,000 | 2,358,150 | (1) | ||||||||||
| Petrobras Global Finance BV: | |||||||||||||||||
| USD | 8.38 | % | 05/23/21 | 2,787,000 | 3,130,358 | ||||||||||||
| USD | 8.75 | % | 05/23/26 | 13,279,000 | 15,486,634 | ||||||||||||
| Rumo Luxembourg Sarl | USD | 7.38 | % | 02/09/24 | 872,000 | 901,430 | (1) | ||||||||||
| 29,644,266 | |||||||||||||||||
Chile - 0.53% | |||||||||||||||||
| Banco del Estado de Chile | USD | 3.88 | % | 02/08/22 | 2,888,000 | 3,032,400 | (1) | ||||||||||
| Codelco, Inc.: | |||||||||||||||||
| USD | 3.00 | % | 07/17/22 | 3,008,000 | 3,059,437 | (1) | |||||||||||
| USD | 6.15 | % | 10/24/36 | 1,277,000 | 1,537,910 | (2) | |||||||||||
| 7,629,747 | |||||||||||||||||
China - 1.47% | |||||||||||||||||
| Sinochem Overseas Capital Co. Ltd. | USD | 6.30 | % | 11/12/40 | 3,836,000 | 4,905,285 | (2) | ||||||||||
| Sinopec Group Overseas Development Ltd.: | |||||||||||||||||
| USD | 3.90 | % | 05/17/22 | 2,595,000 | 2,722,514 | (1) | |||||||||||
| USD | 4.38 | % | 10/17/23 | 2,765,000 | 2,959,932 | (2) | |||||||||||
| USD | 4.38 | % | 04/10/24 | 2,481,000 | 2,664,287 | (1) | |||||||||||
| USD | 3.50 | % | 05/03/26 | 3,130,000 | 3,136,880 | (1) | |||||||||||
| Three Gorges Finance I Cayman Islands Ltd. | USD | 3.15 | % | 06/02/26 | 4,960,000 | 4,857,700 | (1) | ||||||||||
| 21,246,598 | |||||||||||||||||
Costa Rica - 0.24% | |||||||||||||||||
| Banco Nacional de Costa Rica | USD | 5.88 | % | 04/25/21 | 3,237,000 | 3,403,705 | (1) | ||||||||||
Ecuador - 0.40% | |||||||||||||||||
| EP PetroEcuador via Noble Sovereign Funding I Ltd. | USD | 6.78 | % | 09/24/19 | 3,507,368 | 3,542,442 | (3) | ||||||||||
| Stone Harbor Investment Funds Annual Report | May 31, 2017 | 29 |
| Stone Harbor Emerging Markets Debt Fund | Statements of Investments |
May 31, 2017
| Reference Rate | Currency | Rate | Maturity Date | Principal Amount/Shares* | Value Expressed (in USD) | ||||||||||||
| Ecuador (continued) | |||||||||||||||||
| Petroamazonas EP | USD | 4.63 | % | 02/16/20 | 2,410,000 | $ | 2,246,638 | (1) | |||||||||
| 5,789,080 | |||||||||||||||||
Ghana - 0.44% | |||||||||||||||||
| Tullow Oil PLC: | |||||||||||||||||
| USD | 6.00 | % | 11/01/20 | 1,075,000 | 1,045,438 | (2) | |||||||||||
| USD | 6.25 | % | 04/15/22 | 5,620,000 | 5,324,950 | (2) | |||||||||||
| 6,370,388 | |||||||||||||||||
India - 0.23% | |||||||||||||||||
| Vedanta Resources PLC: | |||||||||||||||||
| USD | 8.25 | % | 06/07/21 | 186,000 | 199,020 | (1) | |||||||||||
| USD | 6.38 | % | 07/30/22 | 3,121,000 | 3,121,000 | (1) | |||||||||||
| 3,320,020 | |||||||||||||||||
Indonesia - 1.93% | |||||||||||||||||
| Indika Energy Capital II Pte Ltd. | USD | 6.88 | % | 04/10/22 | 440,000 | 430,100 | (1) | ||||||||||
| Indo Energy Finance II BV | USD | 6.38 | % | 01/24/23 | 1,627,000 | 1,509,043 | (2) | ||||||||||
| Pertamina Persero PT: | |||||||||||||||||
| USD | 5.25 | % | 05/23/21 | 2,555,000 | 2,753,012 | (2) | |||||||||||
| USD | 4.88 | % | 05/03/22 | 5,728,000 | 6,114,640 | (1) | |||||||||||
| USD | 6.00 | % | 05/03/42 | 814,000 | 896,817 | (1) | |||||||||||
| USD | 6.00 | % | 05/03/42 | 1,964,000 | 2,163,817 | (2) | |||||||||||
| USD | 5.63 | % | 05/20/43 | 4,525,000 | 4,809,238 | (2) | |||||||||||
| USD | 6.45 | % | 05/30/44 | 7,817,000 | 9,117,983 | (2) | |||||||||||
| 27,794,650 | |||||||||||||||||
Jamaica - 0.20% | |||||||||||||||||
| Digicel Group Ltd. | USD | 7.13 | % | 04/01/22 | 3,339,000 | 2,938,320 | (1) | ||||||||||
Kazakhstan - 1.02% | |||||||||||||||||
| KazMunayGas National Co. JSC: | |||||||||||||||||
| USD | 7.00 | % | 05/05/20 | 1,110,000 | 1,225,856 | (1) | |||||||||||
| USD | 7.00 | % | 05/05/20 | 1,434,000 | 1,583,674 | (2) | |||||||||||
| USD | 6.38 | % | 04/09/21 | 3,416,000 | 3,772,084 | (2) | |||||||||||
| USD | 6.38 | % | 04/09/21 | 7,298,000 | 8,058,743 | (1) | |||||||||||
| 14,640,357 | |||||||||||||||||
Luxembourg - 0.38% | |||||||||||||||||
| Sberbank of Russia PJSC | USD | 5.50 | % | 02/26/24 | 5,278,000 | 5,436,340 | (1)(3) | ||||||||||
Malaysia - 0.46% | |||||||||||||||||
| Petronas Capital Ltd. | USD | 3.50 | % | 03/18/25 | 6,475,000 | 6,686,354 | (1) | ||||||||||
Mexico - 5.22% | |||||||||||||||||
| Banco Nacional de Comercio Exterior SNC: | |||||||||||||||||
| USD | 3.80 | % | 08/11/26 | 5,537,000 | 5,523,158 | (2)(3) | |||||||||||
| USD | 3.80 | % | 08/11/26 | 5,681,000 | 5,666,797 | (1)(3) | |||||||||||
| Cemex SAB de CV: | |||||||||||||||||
| USD | 6.13 | % | 05/05/25 | 728,000 | 785,330 | (1) | |||||||||||
| USD | 7.75 | % | 04/16/26 | 508,000 | 578,104 | (1) | |||||||||||
| Comision Federal de Electricidad: | |||||||||||||||||
| USD | 4.88 | % | 01/15/24 | 1,572,000 | 1,658,460 | (1) | |||||||||||
| USD | 4.75 | % | 02/23/27 | 2,073,000 | 2,119,643 | (1) | |||||||||||
| Petroleos Mexicanos: | |||||||||||||||||
| USD | 6.00 | % | 03/05/20 | 1,351,000 | 1,461,782 | ||||||||||||
| USD | 5.50 | % | 01/21/21 | 574,000 | 611,597 | ||||||||||||
| USD | 6.38 | % | 02/04/21 | 1,991,000 | 2,183,928 | ||||||||||||
| 30 | www.shiplp.com |
| Stone Harbor Emerging Markets Debt Fund | Statements of Investments |
May 31, 2017
| Reference Rate | Currency | Rate | Maturity Date | Principal Amount/Shares* | Value Expressed (in USD) | ||||||||||||
| Mexico (continued) | |||||||||||||||||
| Petroleos Mexicanos: (continued) | |||||||||||||||||
| USD | 4.88 | % | 01/24/22 | 1,617,000 | $ | 1,685,399 | |||||||||||
| USD | 4.77 | % | 03/11/22 | 3,067,000 | 3,330,762 | (1)(3) | |||||||||||
| USD | 4.88 | % | 01/18/24 | 2,457,000 | 2,518,425 | ||||||||||||
| EUR | 5.50 | % | 02/24/25 | 2,005,000 | 2,561,865 | (2) | |||||||||||
| USD | 4.50 | % | 01/23/26 | 1,761,000 | 1,732,824 | ||||||||||||
| USD | 6.88 | % | 08/04/26 | 7,039,000 | 7,910,780 | ||||||||||||
| USD | 6.50 | % | 03/13/27 | 2,835,000 | 3,097,238 | (1) | |||||||||||
| USD | 9.50 | % | 09/15/27 | 1,085,000 | 1,329,668 | ||||||||||||
| USD | 6.50 | % | 06/02/41 | 8,520,000 | 8,624,796 | ||||||||||||
| USD | 5.50 | % | 06/27/44 | 2,986,000 | 2,690,087 | ||||||||||||
| USD | 6.38 | % | 01/23/45 | 8,534,000 | 8,509,251 | ||||||||||||
| USD | 5.63 | % | 01/23/46 | 1,088,000 | 985,456 | ||||||||||||
| USD | 6.75 | % | 09/21/47 | 9,123,000 | 9,387,111 | ||||||||||||
| Sixsigma Networks Mexico SA de CV | USD | 8.25 | % | 11/07/21 | 364,000 | 364,655 | (1) | ||||||||||
| 75,317,116 | |||||||||||||||||
Morocco - 0.36% | |||||||||||||||||
| OCP SA: | |||||||||||||||||
| USD | 5.63 | % | 04/25/24 | 3,977,000 | 4,315,045 | (1) | |||||||||||
| USD | 4.50 | % | 10/22/25 | 913,000 | 922,130 | (1) | |||||||||||
| 5,237,175 | |||||||||||||||||
Peru - 0.20% | |||||||||||||||||
| Peru Payroll Deduction Finance Ltd. | USD | N/A | 11/01/29 | 3,763,182 | 2,897,650 | (8) | |||||||||||
South Africa - 0.23% | |||||||||||||||||
| Eskom Holdings SOC Ltd.: | |||||||||||||||||
| USD | 5.75 | % | 01/26/21 | 1,375,000 | 1,401,813 | (1) | |||||||||||
| USD | 7.13 | % | 02/11/25 | 400,000 | 421,300 | (2) | |||||||||||
| USD | 7.13 | % | 02/11/25 | 1,368,000 | 1,440,846 | (1) | |||||||||||
| 3,263,959 | |||||||||||||||||
Venezuela - 2.83% | |||||||||||||||||
| Petroleos de Venezuela: | |||||||||||||||||
| USD | 6.00 | % | 05/16/24 | 89,661,931 | 35,407,496 | (2) | |||||||||||
| USD | 6.00 | % | 11/15/26 | 14,123,143 | 5,458,595 | (2) | |||||||||||
| 40,866,091 | |||||||||||||||||
| TOTAL CORPORATE BONDS | 280,912,961 | ||||||||||||||||
| (Cost $268,514,030) | |||||||||||||||||
CREDIT LINKED NOTES - 0.50% | |||||||||||||||||
Iraq - 0.50% | |||||||||||||||||
Republic of Iraq (Counterparty: Bank of America - Merrill Lynch): | |||||||||||||||||
| JPY | 2.59 | % | 01/01/28 | 712,496,731 | 4,952,415 | (3)(5) | |||||||||||
| JPY | 2.86 | % | 01/01/28 | 325,488,161 | 2,262,400 | (3)(5) | |||||||||||
| 7,214,815 | |||||||||||||||||
| TOTAL CREDIT LINKED NOTES | 7,214,815 | ||||||||||||||||
| (Cost $9,603,586) | |||||||||||||||||
| Stone Harbor Investment Funds Annual Report | May 31, 2017 | 31 |
| Stone Harbor Emerging Markets Debt Fund | Statements of Investments |
May 31, 2017
| Reference Rate | Currency | Rate | Maturity Date | Principal Amount/Shares* | Value Expressed (in USD) | ||||||||||||||
SHORT TERM INVESTMENTS - 2.91% | |||||||||||||||||||
Money Market Mutual Funds - 2.91% | |||||||||||||||||||
State Street Institutional Liquid Reserves Fund (7-Day Yield) | USD | 0.94 | % | N/A | 41,963,013 | $ | 41,967,210 | ||||||||||||
| TOTAL SHORT TERM INVESTMENTS | 41,967,210 | ||||||||||||||||||
| (Cost $41,967,204) | |||||||||||||||||||
| Total Investments - 98.65% | 1,422,335,613 | ||||||||||||||||||
| (Cost $1,367,699,001) | |||||||||||||||||||
Other Assets In Excess of Liabilities - 1.35% | 19,435,911 | (9) | |||||||||||||||||
Net Assets - 100.00% | $ | 1,441,771,524 | |||||||||||||||||
| * | The principal amount/shares of each security is stated in the currency in which the security is denominated. |
Currency Abbreviations:
| BRL | - | Brazilian Real |
| COP | - | Colombian Peso |
| EUR | - | Euro Currency |
| JPY | - | Japanese Yen |
| MXN | - | Mexican Peso |
| RUB | - | Russian Ruble |
| USD | - | United States Dollar |
(1) | Security exempt from registration under Rule 144A of the Securities Act of 1933. Such securities may normally be sold to qualified institutional buyers in transactions exempt from registration. Total market value of Rule 144A securities amounts to $423,746,307, which represents approximately 29.39% of net assets as of May 31, 2017. |
(2) | Securities were originally issued pursuant to Regulation S under the Securities Act of 1933, which exempts securities offered and sold outside of the United States from registration. Such securities cannot be sold in the United States without either an effective registration statement filed pursuant to the Securities Act of 1933, or pursuant to an exemption from registration. As of May 31, 2017, the aggregate market value of those securities was $436,484,541, which represents approximately 30.27% of net assets. |
(3) | Floating or variable rate security. Interest rate disclosed is that which is in effect as of May 31, 2017. |
(4) | Step bond. Coupon changes periodically based upon a predetermined schedule. Interest rate disclosed is that which is in effect as of May 31, 2017. |
(5) | The level 3 assets were a result of unavailable quoted prices from an active market or the unavailability of other significant observable inputs. |
(6) | Amount represents less than 0.005% of net assets. |
(7) | Security is in default and therefore is non-income producing. |
(8) | Issued with a zero coupon. Income is recognized through the accretion of discount. |
(9) | Includes cash which is being held as collateral for forward foreign currency contracts. |
OUTSTANDING FORWARD FOREIGN CURRENCY CONTRACTS
| Counterparty | Foreign Currency | Contracted Amount** | Purchase/Sale Contract | Settlement Date | Current Value | Unrealized Appreciation/ (Depreciation) | |||||||||||
| Citigroup Global Markets | COP | 41,577,514,000 | Sale | 06/02/17 | $ | 14,252,304 | $ | 113,253 | |||||||||
| Citigroup Global Markets | COP | 41,577,514,000 | Sale | 06/16/17 | 14,220,044 | 24,685 | |||||||||||
| Citigroup Global Markets | EUR | 112,125,203 | Purchase | 06/09/17 | 126,019,155 | 180,838 | |||||||||||
| Citigroup Global Markets | JPY | 776,608,000 | Purchase | 06/09/17 | 7,015,217 | 7,595 | |||||||||||
| Goldman Sachs & Co. | MXN | 283,471,440 | Sale | 06/02/17 | 15,197,678 | 135,463 | |||||||||||
| Goldman Sachs & Co. | MXN | 283,471,440 | Purchase | 06/02/17 | 15,197,678 | 317,678 | |||||||||||
| 32 | www.shiplp.com |
| Stone Harbor Emerging Markets Debt Fund | Statements of Investments |
May 31, 2017
OUTSTANDING FORWARD FOREIGN CURRENCY CONTRACTS (continued)
| Counterparty | Foreign Currency | Contracted Amount** | Purchase/Sale Contract | Settlement Date | Current Value | Unrealized Appreciation/ (Depreciation) | |||||||||||
| J.P. Morgan Chase & Co. | EUR | 16,199,659 | Purchase | 06/09/17 | $ | 18,207,032 | $ | 315,795 | |||||||||
| $ | 1,095,307 | ||||||||||||||||
| Citigroup Global Markets | COP | 41,577,514,000 | Purchase | 06/02/17 | $ | 14,252,304 | $ | (30,593 | ) | ||||||||
| Citigroup Global Markets | EUR | 111,758,000 | Sale | 07/10/17 | 125,812,799 | (170,890 | ) | ||||||||||
| Citigroup Global Markets | JPY | 797,887,700 | Sale | 07/10/17 | 7,217,501 | (7,152 | ) | ||||||||||
| Goldman Sachs & Co. | MXN | 283,471,440 | Purchase | 07/14/17 | 15,090,453 | (133,005 | ) | ||||||||||
| J.P. Morgan Chase & Co. | EUR | 128,324,861 | Sale | 06/09/17 | 144,226,188 | (3,554,466 | ) | ||||||||||
| J.P. Morgan Chase & Co. | JPY | 776,608,000 | Sale | 06/09/17 | 7,015,217 | (35,456 | ) | ||||||||||
| $ | (3,931,562 | ) | |||||||||||||||
| ** | The contracted amount is stated in the currency in which the contract is denominated. |
See Notes to Financial Statements.
| Stone Harbor Investment Funds Annual Report | May 31, 2017 | 33 |
| Stone Harbor High Yield Bond Fund | Statements of Investments |
May 31, 2017
| Reference Rate | Currency | Rate | Maturity Date | Principal Amount/Shares* | Value (Expressed in USD) | ||||||||||||
| CORPORATE BONDS ‐ 88.17% | |||||||||||||||||
| Automotive ‐ 1.95% | |||||||||||||||||
| American Axle & Manufacturing, Inc. | USD | 6.25 | % | 04/01/25 | 485,000 | $ | 481,362 | (1) | |||||||||
| Dana Financing Luxembourg Sarl | USD | 6.50 | % | 06/01/26 | 1,165,000 | 1,252,375 | (1) | ||||||||||
| ZF North America Capital, Inc. | USD | 4.75 | % | 04/29/25 | 1,325,000 | 1,397,478 | (1) | ||||||||||
| 3,131,215 | |||||||||||||||||
| Building Products ‐ 3.77% | |||||||||||||||||
| Griffon Corp. | USD | 5.25 | % | 03/01/22 | 1,280,000 | 1,316,800 | |||||||||||
| NCI Building Systems, Inc. | USD | 8.25 | % | 01/15/23 | 745,000 | 811,119 | (1) | ||||||||||
| Norbord, Inc. | USD | 6.25 | % | 04/15/23 | 1,005,000 | 1,075,350 | (1) | ||||||||||
| RSI Home Products, Inc. | USD | 6.50 | % | 03/15/23 | 775,000 | 821,500 | (1) | ||||||||||
| Standard Industries, Inc. | USD | 5.38 | % | 11/15/24 | 595,000 | 628,468 | (1) | ||||||||||
| Summit Materials LLC / Summit Materials Finance Corp. | USD | 6.13 | % | 07/15/23 | 585,000 | 614,250 | |||||||||||
| US Concrete, Inc. | USD | 6.38 | % | 06/01/24 | 745,000 | 782,250 | |||||||||||
| 6,049,737 | |||||||||||||||||
| Capital Goods ‐ 1.12% | |||||||||||||||||
| SPX FLOW, Inc. | USD | 5.63 | % | 08/15/24 | 1,250,000 | 1,287,500 | (1) | ||||||||||
| Terex Corp. | USD | 5.63 | % | 02/01/25 | 495,000 | 507,994 | (1) | ||||||||||
| 1,795,494 | |||||||||||||||||
| Chemicals ‐ 2.43% | |||||||||||||||||
| CF Industries, Inc. | USD | 5.15 | % | 03/15/34 | 1,625,000 | 1,509,219 | |||||||||||
| Lyond Basel Escrow | USD | 0.00 | % | 08/15/15 | 25,000 | 0 | (2) | ||||||||||
| Lyondell Chemical Co. | USD | 0.00 | % | 08/15/15 | 945,000 | 0 | (2) | ||||||||||
| Trinseo Materials Operating SCA / Trinseo Materials Finance, Inc. | USD | 6.75 | % | 05/01/22 | 1,235,000 | 1,315,275 | (1) | ||||||||||
| Versum Materials, Inc. | USD | 5.50 | % | 09/30/24 | 1,010,000 | 1,063,025 | (1) | ||||||||||
| 3,887,519 | |||||||||||||||||
| Consumer Products ‐ 2.27% | |||||||||||||||||
| Energizer SpinCo, Inc. | USD | 5.50 | % | 06/15/25 | 1,095,000 | 1,159,331 | (1) | ||||||||||
| Revlon Consumer Products Corp.: | |||||||||||||||||
| USD | 5.75 | % | 02/15/21 | 645,000 | 606,693 | ||||||||||||
| USD | 6.25 | % | 08/01/24 | 925,000 | 825,563 | ||||||||||||
| Spectrum Brands, Inc. | USD | 6.13 | % | 12/15/24 | 980,000 | 1,043,700 | |||||||||||
| 3,635,287 | |||||||||||||||||
| Containers/Packaging ‐ 1.69% | |||||||||||||||||
| Ardagh Packaging Finance PLC / Ardagh Holdings USA, Inc. | USD | 7.25 | % | 05/15/24 | 1,205,000 | 1,319,475 | (1) | ||||||||||
| Flex Acquisition Co. Inc. | USD | 6.88 | % | 01/15/25 | 630,000 | 661,106 | (1) | ||||||||||
| Signode Industrial Group Lux SA/Signode Industrial Group US, Inc. | USD | 6.38 | % | 05/01/22 | 695,000 | 728,013 | (1) | ||||||||||
| 2,708,594 | |||||||||||||||||
| Drillers/Services ‐ 2.85% | |||||||||||||||||
| FTS International, Inc. | USD | 6.25 | % | 05/01/22 | 1,030,000 | 911,550 | |||||||||||
| Parker Drilling Co. | USD | 7.50 | % | 08/01/20 | 1,180,000 | 1,098,875 | |||||||||||
| Rowan Cos, Inc. | USD | 7.38 | % | 06/15/25 | 1,387,000 | 1,366,195 | |||||||||||
| SESI LLC | USD | 7.13 | % | 12/15/21 | 1,190,000 | 1,192,975 | |||||||||||
| 4,569,595 | |||||||||||||||||
| 34 | www.shiplp.com |
| Stone Harbor High Yield Bond Fund | Statements of Investments |
May 31, 2017
| Reference Rate | Currency | Rate | Maturity Date | Principal Amount/Shares* | Value (Expressed in USD) | ||||||||||||
| Electric ‐ 3.63% | |||||||||||||||||
| Calpine Corp. | USD | 5.75 | % | 01/15/25 | 975,000 | $ | 929,906 | ||||||||||
| Covanta Holding Corp. | USD | 5.88 | % | 07/01/25 | 975,000 | 953,063 | |||||||||||
| Dynegy, Inc.: | |||||||||||||||||
| USD | 6.75 | % | 11/01/19 | 580,000 | 599,575 | ||||||||||||
| USD | 8.00 | % | 01/15/25 | 835,000 | 814,209 | (1) | |||||||||||
| GenOn Energy, Inc. | USD | 9.50 | % | 10/15/18 | 1,722,000 | 1,248,450 | |||||||||||
| NRG Energy, Inc. | USD | 6.25 | % | 07/15/22 | 1,235,000 | 1,268,184 | |||||||||||
| 5,813,387 | |||||||||||||||||
| Exploration & Production ‐ 9.76% | |||||||||||||||||
| Callon Petroleum Co. | USD | 6.13 | % | 10/01/24 | 935,000 | 972,400 | |||||||||||
| Continental Resources, Inc.: | |||||||||||||||||
| USD | 5.00 | % | 09/15/22 | 950,000 | 954,750 | ||||||||||||
| USD | 4.90 | % | 06/01/44 | 895,000 | 770,255 | ||||||||||||
| Denbury Resources, Inc. | USD | 9.00 | % | 05/15/21 | 653,000 | 675,855 | (1) | ||||||||||
| Diamondback Energy, Inc. | USD | 4.75 | % | 11/01/24 | 935,000 | 942,012 | (1) | ||||||||||
| EP Energy LLC / Everest Acquisition Finance, Inc.: | |||||||||||||||||
| USD | 6.38 | % | 06/15/23 | 1,035,000 | 746,494 | ||||||||||||
| USD | 8.00 | % | 02/15/25 | 905,000 | 778,300 | (1) | |||||||||||
| Series WI | USD | 9.38 | % | 05/01/20 | 293,000 | 265,897 | |||||||||||
| Laredo Petroleum, Inc. | USD | 5.63 | % | 01/15/22 | 800,000 | 789,000 | |||||||||||
| Murphy Oil Corp.: | |||||||||||||||||
| USD | 4.70 | % | 12/01/22 | 450,000 | 441,000 | ||||||||||||
| USD | 6.88 | % | 08/15/24 | 605,000 | 635,250 | ||||||||||||
| Oasis Petroleum, Inc. | USD | 6.88 | % | 03/15/22 | 1,213,000 | 1,231,195 | |||||||||||
| QEP Resources, Inc. | USD | 5.38 | % | 10/01/22 | 1,302,000 | 1,279,215 | |||||||||||
| Range Resources Corp. | USD | 5.00 | % | 03/15/23 | 1,000,000 | 978,750 | (1) | ||||||||||
| RSP Permian, Inc. | USD | 5.25 | % | 01/15/25 | 765,000 | 780,300 | (1) | ||||||||||
| SM Energy Co.: | |||||||||||||||||
| USD | 6.13 | % | 11/15/22 | 1,055,000 | 1,044,450 | ||||||||||||
| USD | 5.63 | % | 06/01/25 | 520,000 | 491,239 | ||||||||||||
| Southwestern Energy Co. | USD | 6.70 | % | 01/23/25 | 1,050,000 | 1,042,125 | |||||||||||
| Ultra Resources, Inc. | USD | 6.88 | % | 04/15/22 | 810,000 | 818,100 | (1) | ||||||||||
| 15,636,587 | |||||||||||||||||
| Food & Beverage ‐ 4.28% | |||||||||||||||||
| Chobani LLC / Chobani Finance Corp. Inc | USD | 7.50 | % | 04/15/25 | 1,005,000 | 1,060,727 | (1) | ||||||||||
| Cott Holdings, Inc. | USD | 5.50 | % | 04/01/25 | 890,000 | 913,362 | (1) | ||||||||||
| Dean Foods Co. | USD | 6.50 | % | 03/15/23 | 1,010,000 | 1,070,600 | (1) | ||||||||||
| Pilgrim’s Pride Corp. | USD | 5.75 | % | 03/15/25 | 1,100,000 | 1,133,000 | (1) | ||||||||||
Pinnacle Foods Finance LLC / Pinnacle Food Finance Corp., Series WI | USD | 5.88 | % | 01/15/24 | 1,135,000 | 1,214,450 | |||||||||||
| Post Holdings, Inc.: | |||||||||||||||||
| USD | 5.50 | % | 03/01/25 | 675,000 | 710,438 | (1) | |||||||||||
| USD | 5.00 | % | 08/15/26 | 755,000 | 762,550 | (1) | |||||||||||
| 6,865,127 | |||||||||||||||||
| Gaming ‐ 3.00% | |||||||||||||||||
Boyd Gaming Corp., Series WI | USD | 6.38 | % | 04/01/26 | 505,000 | 552,268 | |||||||||||
| Stone Harbor Investment Funds Annual Report | May 31, 2017 | 35 |
| Stone Harbor High Yield Bond Fund | Statements of Investments |
May 31, 2017
| Reference Rate | Currency | Rate | Maturity Date | Principal Amount/Shares* | Value (Expressed in USD) | ||||||||||||
| Gaming (continued) | |||||||||||||||||
| Eldorado Resorts, Inc. | USD | 6.00 | % | 04/01/25 | 650,000 | $ | 685,750 | (1) | |||||||||
| Golden Nugget, Inc. | USD | 8.50 | % | 12/01/21 | 985,000 | 1,056,412 | (1) | ||||||||||
| Jacobs Entertainment, Inc. | USD | 7.88 | % | 02/01/24 | 950,000 | 1,004,625 | (1) | ||||||||||
| MGM Resorts International | USD | 6.63 | % | 12/15/21 | 588,000 | 662,970 | |||||||||||
| Pinnacle Entertainment, Inc. | USD | 5.63 | % | 05/01/24 | 815,000 | 845,563 | (1) | ||||||||||
| 4,807,588 | |||||||||||||||||
| Healthcare ‐ 6.70% | |||||||||||||||||
| Amsurg Corp. | USD | 5.63 | % | 07/15/22 | 980,000 | 1,026,427 | |||||||||||
| CHS/Community Health Systems, Inc. | USD | 6.25 | % | 03/31/23 | 1,215,000 | 1,259,955 | |||||||||||
| Endo Dac / Endo Finance LLC / Endo Finco, Inc. | USD | 5.88 | % | 10/15/24 | 330,000 | 342,788 | (1) | ||||||||||
| Endo Finance LLC / Endo Ltd. / Endo Finco, Inc. | USD | 6.00 | % | 02/01/25 | 1,080,000 | 973,080 | (1) | ||||||||||
| Envision Healthcare Corp. | USD | 6.25 | % | 12/01/24 | 360,000 | 386,100 | (1) | ||||||||||
| HCA, Inc.: | |||||||||||||||||
| USD | 5.38 | % | 02/01/25 | 1,000,000 | 1,053,750 | ||||||||||||
| USD | 5.25 | % | 06/15/26 | 750,000 | 815,625 | ||||||||||||
| HealthSouth Corp. | USD | 5.75 | % | 11/01/24 | 680,000 | 705,500 | |||||||||||
| Mallinckrodt International Finance SA / Mallinckrodt CB LLC | USD | 5.63 | % | 10/15/23 | 1,414,000 | 1,364,510 | (1) | ||||||||||
| Tenet Healthcare Corp. | USD | 4.38 | % | 10/01/21 | 440,000 | 453,860 | |||||||||||
| Valeant Pharmaceuticals International, Inc.: | |||||||||||||||||
| USD | 7.00 | % | 10/01/20 | 435,000 | 417,600 | (1) | |||||||||||
| USD | 6.50 | % | 03/15/22 | 615,000 | 647,164 | (1) | |||||||||||
| USD | 5.88 | % | 05/15/23 | 1,570,000 | 1,286,419 | (1) | |||||||||||
| 10,732,778 | |||||||||||||||||
| Industrial Other ‐ 3.83% | |||||||||||||||||
| AECOM: | |||||||||||||||||
| USD | 5.75 | % | 10/15/22 | 565,000 | 596,075 | ||||||||||||
| USD | 5.13 | % | 03/15/27 | 630,000 | 629,212 | (1) | |||||||||||
| Cleaver‐Brooks, Inc. | USD | 8.75 | % | 12/15/19 | 901,000 | 929,156 | (1) | ||||||||||
| Gates Global LLC / Gates Global Co. | USD | 6.00 | % | 07/15/22 | 955,000 | 977,729 | (1) | ||||||||||
| MasTec, Inc. | USD | 4.88 | % | 03/15/23 | 1,233,000 | 1,248,413 | |||||||||||
| Park‐Ohio Industries, Inc. | USD | 6.63 | % | 04/15/27 | 890,000 | 930,606 | (1) | ||||||||||
| Welbilt, Inc. | USD | 9.50 | % | 02/15/24 | 715,000 | 832,975 | |||||||||||
| 6,144,166 | |||||||||||||||||
| Leisure ‐ 1.56% | |||||||||||||||||
| AMC Entertainment Holdings, Inc. | USD | 5.75 | % | 06/15/25 | 1,035,000 | 1,077,021 | |||||||||||
| Cinemark USA, Inc.: | |||||||||||||||||
| USD | 5.13 | % | 12/15/22 | 740,000 | 764,050 | ||||||||||||
| USD | 4.88 | % | 06/01/23 | 646,000 | 660,529 | ||||||||||||
| 2,501,600 | |||||||||||||||||
| Media Cable ‐ 8.20% | |||||||||||||||||
| Cable One, Inc. | USD | 5.75 | % | 06/15/22 | 655,000 | 689,387 | (1) | ||||||||||
| Cablevision Systems Corp. | USD | 5.88 | % | 09/15/22 | 2,010,000 | 2,090,400 | |||||||||||
| CCO Holdings LLC / CCO Holdings Capital Corp.: | |||||||||||||||||
| USD | 5.13 | % | 05/01/27 | 975,000 | 999,985 | (1) | |||||||||||
| USD | 5.50 | % | 05/01/26 | 1,485,000 | 1,573,387 | (1) | |||||||||||
| 36 | www.shiplp.com |
| Stone Harbor High Yield Bond Fund | Statements of Investments |
May 31, 2017
| Reference Rate | Currency | Rate | Maturity Date | Principal Amount/Shares* | Value (Expressed in USD) | ||||||||||||
| Media Cable (continued) | |||||||||||||||||
| DISH DBS Corp. | USD | 7.75 | % | 07/01/26 | 2,720,000 | $ | 3,202,800 | ||||||||||
| Quebecor Media, Inc. | USD | 5.75 | % | 01/15/23 | 701,000 | 745,689 | |||||||||||
| SFR Group SA | USD | 7.38 | % | 05/01/26 | 745,000 | 809,718 | (1) | ||||||||||
| Unitymedia GmbH | USD | 6.13 | % | 01/15/25 | 715,000 | 768,625 | (1) | ||||||||||
| UPCB Finance IV Ltd. | USD | 5.38 | % | 01/15/25 | 680,000 | 709,172 | (1) | ||||||||||
| Virgin Media Finance PLC | USD | 6.00 | % | 10/15/24 | 860,000 | 909,450 | (1) | ||||||||||
| Ziggo Secured Finance BV | USD | 5.50 | % | 01/15/27 | 635,000 | 646,830 | (1) | ||||||||||
| 13,145,443 | |||||||||||||||||
| Media Other ‐ 5.94% | |||||||||||||||||
| Block Communications, Inc. | USD | 6.88 | % | 02/15/25 | 1,210,000 | 1,305,287 | (1) | ||||||||||
| EW Scripps Co. | USD | 5.13 | % | 05/15/25 | 1,320,000 | 1,354,650 | (1) | ||||||||||
| Gray Television, Inc. | USD | 5.88 | % | 07/15/26 | 1,020,000 | 1,037,850 | (1) | ||||||||||
| LIN Television Corp. | USD | 5.88 | % | 11/15/22 | 800,000 | 841,000 | |||||||||||
| Nexstar Broadcasting, Inc. | USD | 5.63 | % | 08/01/24 | 975,000 | 984,750 | (1) | ||||||||||
| Sinclair Television Group, Inc. | USD | 5.63 | % | 08/01/24 | 1,240,000 | 1,278,750 | (1) | ||||||||||
| TEGNA, Inc. | USD | 6.38 | % | 10/15/23 | 1,109,000 | 1,178,312 | |||||||||||
| Tribune Media Co. | USD | 5.88 | % | 07/15/22 | 1,450,000 | 1,535,188 | |||||||||||
| 9,515,787 | |||||||||||||||||
| Metals/Mining/Steel ‐ 3.91% | |||||||||||||||||
| Anglo American Capital PLC: | |||||||||||||||||
| USD | 4.88 | % | 05/14/25 | 565,000 | 588,690 | (1) | |||||||||||
| USD | 4.13 | % | 09/27/22 | 795,000 | 814,875 | (1) | |||||||||||
| Coeur Mining, Inc. | USD | 5.88 | % | 06/01/24 | 530,000 | 528,013 | (1) | ||||||||||
| Freeport‐McMoRan, Inc. | USD | 3.55 | % | 03/01/22 | 870,000 | 817,800 | |||||||||||
| Hudbay Minerals, Inc. | USD | 7.25 | % | 01/15/23 | 420,000 | 441,000 | (1) | ||||||||||
| Kaiser Aluminum Corp. | USD | 5.88 | % | 05/15/24 | 765,000 | 808,988 | |||||||||||
| New Gold, Inc. | USD | 6.25 | % | 11/15/22 | 850,000 | 877,625 | (1) | ||||||||||
| Nyrstar Netherlands Holdings BV | EUR | 6.88 | % | 03/15/24 | 1,200,000 | 1,395,642 | (1) | ||||||||||
| 6,272,633 | |||||||||||||||||
| Paper/Forest Products ‐ 2.61% | |||||||||||||||||
| Boise Cascade Co. | USD | 5.63 | % | 09/01/24 | 745,000 | 776,663 | (1) | ||||||||||
| Cascades, Inc. | USD | 5.50 | % | 07/15/22 | 1,200,000 | 1,227,000 | (1) | ||||||||||
| Louisiana‐Pacific Corp. | USD | 4.88 | % | 09/15/24 | 1,290,000 | 1,309,350 | |||||||||||
| Mercer International, Inc. | USD | 7.75 | % | 12/01/22 | 810,000 | 872,775 | |||||||||||
| NewPage Corp. | USD | 11.38 | % | 12/31/14 | 1,120,616 | 112 | (2)(3) | ||||||||||
| 4,185,900 | |||||||||||||||||
| Restaurants ‐ 0.72% | |||||||||||||||||
| Landry’s, Inc. | USD | 6.75 | % | 10/15/24 | 1,110,000 | 1,148,850 | (1) | ||||||||||
| Retail Food/Drug ‐ 1.96% | |||||||||||||||||
| Albertsons Cos LLC / Safeway, Inc. / New Albertson’s, Inc. / | |||||||||||||||||
| Albertson’s LLC | USD | 6.63 | % | 06/15/24 | 795,000 | 824,813 | (1) | ||||||||||
| Fresh Market, Inc. | USD | 9.75 | % | 05/01/23 | 840,000 | 711,900 | (1) | ||||||||||
| Safeway, Inc. | USD | 7.25 | % | 02/01/31 | 918,000 | 899,679 | |||||||||||
| Tops Holding LLC / Tops Markets II Corp. | USD | 8.00 | % | 06/15/22 | 835,000 | 705,575 | (1) | ||||||||||
| 3,141,967 | |||||||||||||||||
| Stone Harbor Investment Funds Annual Report | May 31, 2017 | 37 |
| Stone Harbor High Yield Bond Fund | Statements of Investments |
May 31, 2017
| Reference Rate | Currency | Rate | Maturity Date | Principal Amount/Shares* | Value (Expressed in USD) | ||||||||||||
| Retail Non Food/Drug ‐ 2.17% | |||||||||||||||||
| Hot Topic, Inc. | USD | 9.25 | % | 06/15/21 | 720,000 | $ | 734,400 | (1) | |||||||||
| JC Penney Corp., Inc. | USD | 7.40 | % | 04/01/37 | 930,000 | 720,750 | |||||||||||
| L Brands, Inc. | USD | 6.88 | % | 11/01/35 | 980,000 | 954,883 | |||||||||||
| Murphy Oil USA, Inc. | USD | 5.63 | % | 05/01/27 | 590,000 | 618,762 | |||||||||||
| PetSmart, Inc. | USD | 7.13 | % | 03/15/23 | 475,000 | 444,125 | (1) | ||||||||||
| 3,472,920 | |||||||||||||||||
| Satellite ‐ 1.10% | |||||||||||||||||
| Hughes Satellite Systems Corp. | USD | 6.63 | % | 08/01/26 | 890,000 | 945,625 | |||||||||||
| Intelsat Jackson Holdings SA | USD | 5.50 | % | 08/01/23 | 985,000 | 817,550 | |||||||||||
| 1,763,175 | |||||||||||||||||
| Services Other ‐ 0.27% | |||||||||||||||||
| KAR Auction Services, Inc. | USD | 5.13 | % | 06/01/25 | 420,000 | 429,450 | (1) | ||||||||||
| Technology ‐ 4.40% | |||||||||||||||||
| Artesyn Embedded Technologies, Inc. | USD | 9.75 | % | 10/15/20 | 600,000 | 592,500 | (1) | ||||||||||
Diebold Nixdorf, Inc., Series WI | USD | 8.50 | % | 04/15/24 | 535,000 | 602,544 | |||||||||||
| Micron Technology, Inc. | USD | 5.50 | % | 02/01/25 | 351,000 | 367,894 | |||||||||||
| Nuance Communication | USD | 5.63 | % | 12/15/26 | 995,000 | 1,052,212 | (1) | ||||||||||
| Ptc Inc. 05/15/2024, 6.0% | USD | 6.00 | % | 05/15/24 | 775,000 | 827,793 | |||||||||||
| Seagate HDD Cayman | USD | 4.88 | % | 06/01/27 | 1,250,000 | 1,221,014 | |||||||||||
| Symantec Corp. | USD | 5.00 | % | 04/15/25 | 500,000 | 520,000 | (1) | ||||||||||
| Western Digital Corp. | USD | 10.50 | % | 04/01/24 | 960,000 | 1,128,000 | |||||||||||
| Zayo Group LLC / Zayo Capital, Inc. | USD | 5.75 | % | 01/15/27 | 705,000 | 745,460 | (1) | ||||||||||
| 7,057,417 | |||||||||||||||||
| Textile/Apparel ‐ 0.45% | |||||||||||||||||
| Levi Strauss & Co. | USD | 5.00 | % | 05/01/25 | 693,000 | 725,051 | |||||||||||
| Transportation Other ‐ 0.40% | |||||||||||||||||
| XPO Logistics, Inc. | USD | 6.50 | % | 06/15/22 | 600,000 | 639,270 | (1) | ||||||||||
| Wireless ‐ 3.42% | |||||||||||||||||
| Altice Luxembourg SA | USD | 7.75 | % | 05/15/22 | 435,000 | 462,731 | (1) | ||||||||||
| Sprint Capital Corp. | USD | 8.75 | % | 03/15/32 | 2,355,000 | 2,974,659 | |||||||||||
| T‐Mobile USA, Inc. | USD | 6.50 | % | 01/15/26 | 1,010,000 | 1,117,313 | |||||||||||
| Wind Acquisition Finance SA | USD | 7.38 | % | 04/23/21 | 895,000 | 933,149 | (1) | ||||||||||
| 5,487,852 | |||||||||||||||||
| Wirelines ‐ 3.78% | |||||||||||||||||
| CenturyLink, Inc.: | |||||||||||||||||
| USD | 7.65 | % | 03/15/42 | 730,000 | 693,044 | ||||||||||||
| Series WI | USD | 5.63 | % | 04/01/25 | 470,000 | 468,388 | |||||||||||
| Cogent Communications Group, Inc. | USD | 5.38 | % | 03/01/22 | 675,000 | 713,812 | (1) | ||||||||||
| Frontier Communications Corp. | USD | 9.00 | % | 08/15/31 | 1,600,000 | 1,320,000 | |||||||||||
| GCI, Inc. | USD | 6.88 | % | 04/15/25 | 516,000 | 562,440 | |||||||||||
| Level 3 Financing, Inc. | USD | 5.25 | % | 03/15/26 | 485,000 | 505,462 | |||||||||||
| T‐Mobile USA, Inc. | USD | 5.38 | % | 04/15/27 | 965,000 | 1,030,138 | |||||||||||
| Windstream Services LLC | USD | 7.50 | % | 04/01/23 | 841,000 | 765,310 | |||||||||||
| 6,058,594 | |||||||||||||||||
| TOTAL CORPORATE BONDS | 141,322,983 | ||||||||||||||||
| (Cost $135,618,991) | |||||||||||||||||
| 38 | www.shiplp.com |
| Stone Harbor High Yield Bond Fund | Statements of Investments |
May 31, 2017
| Reference Rate | Currency | Rate | Maturity Date | Principal Amount/Shares* | Value (Expressed in USD) | ||||||||||||
BANK LOANS ‐ 8.04%(4) | |||||||||||||||||
| Building Products ‐ 0.51% | |||||||||||||||||
| Summit Materials, LLC ‐ Restatement Effective Date Term Loan | Libor+2.75% | USD | 3.79 | % | 07/17/22 | 805,650 | $ | 814,588 | |||||||||
| Capital Goods ‐ 1.15% | |||||||||||||||||
| Blount International, Inc. ‐ Initial Term Loan | Libor+5.00% | USD | 6.01 | % | 04/12/23 | 888,061 | 903,047 | (3) | |||||||||
| Gardner Denver, Inc. ‐ Initial Term Loan | Libor+3.25% | USD | 4.56 | % | 07/30/20 | 932,630 | 937,759 | ||||||||||
| 1,840,806 | |||||||||||||||||
| Chemicals ‐ 1.64% | |||||||||||||||||
| Axalta Coating Systems Dutch Holding B B.V. (Axalta Coatng Systems U.S. Holdings, Inc.) ‐ Term B‐1 Dollar Loan | Libor+2.50% | USD | 3.65 | % | 02/01/23 | 734,432 | 740,445 | ||||||||||
| Ineos Styrolution US Holding LLC ‐ (Styrolution US Holding LLC) ‐ 2024 Dollar Term Loan | Libor+2.75% | USD | 3.90 | % | 03/07/24 | 789,963 | 792,432 | ||||||||||
| MacDermid, Incorporated (Platform Specialty Products Corporation) ‐Tranche B‐5 Term Loan | Libor+3.50% | USD | 4.54 | % | 06/07/20 | 1,084,325 | 1,095,846 | ||||||||||
| 2,628,723 | |||||||||||||||||
| Containers/Packaging ‐ 1.53% | |||||||||||||||||
| Albea Beauty Holdings S.A. ‐ Facility B | Libor+3.75% | USD | L+3.75 | % | 04/12/24 | 1,160,000 | 1,162,900 | ||||||||||
| Flex Acquisition Co., Inc. (aka Novalex) ‐ Initial Term Loan | Libor+3.25% | USD | 4.40 | % | 12/29/23 | 1,280,000 | 1,288,960 | ||||||||||
| 2,451,860 | |||||||||||||||||
| Healthcare ‐ 0.33% | |||||||||||||||||
| Air Medical Group Holdings, Inc. ‐ Initial Term Loan | Libor+3.25% | USD | 4.29 | % | 04/28/22 | 528,655 | 524,171 | ||||||||||
| Industrial Other ‐ 1.57% | |||||||||||||||||
| Filtration Group Corporation ‐ Term Loan (First Lien) | Libor+3.25% | USD | 4.29 | % | 11/23/20 | 1,057,788 | 1,067,595 | ||||||||||
| Gates Global LLC ‐ Initial B‐1 Dollar Term Loan | Libor+3.25% | USD | 4.41 | % | 03/30/24 | 1,017,369 | 1,023,012 | ||||||||||
| Welbilt, Inc. (Manitowoc Foodservice, Inc.) ‐ Term B Loan | Libor+3.00% | USD | 4.00 | % | 02/28/23 | 426,308 | 431,104 | ||||||||||
| 2,521,711 | |||||||||||||||||
| Technology ‐ 0.65% | |||||||||||||||||
| Vertiv Group Corporation (Cortes NP Acquisition Corporation) ‐ Term B Loan | Libor+4.00% | USD | 5.00 | % | 11/30/23 | 1,035,409 | 1,045,440 | ||||||||||
| Utility Other ‐ 0.66% | |||||||||||||||||
| Lightstone Holdco LLC ‐ Refinanced Term B Loan | Libor+4.50% | USD | 5.54 | % | 01/30/24 | 1,010,149 | 994,997 | ||||||||||
| Lightstone Holdco LLC ‐ Refinanced Term C Loan | Libor+4.50% | USD | 5.54 | % | 01/30/24 | 62,319 | 61,384 | ||||||||||
| 1,056,381 | |||||||||||||||||
| TOTAL BANK LOANS | 12,883,680 | ||||||||||||||||
| (Cost $12,823,474) | |||||||||||||||||
| COMMON/PREFERRED STOCKS ‐ 1.06% | |||||||||||||||||
| Denbury Resources | USD | 47,950 | 73,363 | (5) | |||||||||||||
| Halcon Resources Co | USD | 35,619 | 216,564 | (5) | |||||||||||||
| Midstates Petroleum | USD | 456 | 7,825 | (5) | |||||||||||||
| Stone Harbor Investment Funds Annual Report | May 31, 2017 | 39 |
| Stone Harbor High Yield Bond Fund | Statements of Investments |
May 31, 2017
| Reference Rate | Currency | Rate | Maturity Date | Principal Amount/Shares* | Value (Expressed in USD) | ||||||||||||
| COMMON/PREFERRED STOCKS (continued) | |||||||||||||||||
| NRG Energy, Inc. | USD | 10,061 | $ | 161,580 | |||||||||||||
| Quicksilver, Inc. | USD | 10,219 | 129,373 | (3)(5) | |||||||||||||
| Quiksilver Escrow ESCROW | USD | 521,000 | 0 | (3)(5) | |||||||||||||
| Vistra Energy Corp. | USD | 75,699 | 1,118,074 | ||||||||||||||
| TOTAL COMMON/PREFERRED STOCKS | 1,706,779 | ||||||||||||||||
| (Cost $2,229,154) | |||||||||||||||||
| RIGHTS ‐ 0.06% | |||||||||||||||||
| Electric ‐ 0.06% | |||||||||||||||||
| Vistra Energy Corp. | |||||||||||||||||
| expires 10/01/2020, strike price $1.350 | USD | 75,699 | 94,624 | (3) | |||||||||||||
| TOTAL RIGHTS | 94,624 | ||||||||||||||||
| (Cost $102,194) | |||||||||||||||||
WARRANTS ‐ 0.00%(6) | |||||||||||||||||
Exploration & Production ‐ 0.00%(6) | |||||||||||||||||
| Halcon Resources Corp. | |||||||||||||||||
| expires 09/09/2020, strike price $0.010 | USD | 9,675 | 8,224 | ||||||||||||||
| Midstates Petroleum | |||||||||||||||||
| expires 04/21/2020, strike price $0.010 | USD | 3,236 | 32 | (3) | |||||||||||||
Transportation Other ‐ 0.00%(6) | |||||||||||||||||
| General Maritime Corp. | |||||||||||||||||
| expires 05/17/2017, strike price $0.010 | USD | 2,984 | 0 | (3) | |||||||||||||
| TOTAL WARRANTS | 8,256 | ||||||||||||||||
| (Cost $129) | |||||||||||||||||
| SHORT TERM INVESTMENTS ‐ 2.86% | |||||||||||||||||
| Money Market Mutual Funds ‐ 2.86% | |||||||||||||||||
State Street Institutional Liquid Reserves Fund (7‐Day Yield) | USD | 0.94 | % | N/A | 4,579,086 | 4,579,544 | |||||||||||
| TOTAL SHORT TERM INVESTMENTS | 4,579,544 | ||||||||||||||||
| (Cost $4,578,449) | |||||||||||||||||
| Total Investments ‐ 100.19% | 160,595,866 | ||||||||||||||||
| (Cost $155,352,391) | |||||||||||||||||
| Liabilities in Excess of Other Assets ‐ (0.19)% | (311,117 | ) | |||||||||||||||
| Net Assets ‐ 100.00% | $ | 160,284,749 | |||||||||||||||
| * | The principal amount/shares of each security is stated in the currency in which the security is denominated. |
Currency Abbreviations:
EUR - Euro Currency
USD - United States Dollar
| 40 | www.shiplp.com |
| Stone Harbor High Yield Bond Fund | Statements of Investments |
May 31, 2017
Common Abbreviations:
Libor - London Interbank Offered Rate.
(1) | Security exempt from registration under Rule 144A of the Securities Act of 1933. Such securities may normally be sold to qualified institutional buyers in transactions exempt from registration. Total market value of Rule 144A securities amounts to $68,799,884, which represents approximately 42.92% of net assets as of May 31, 2017. |
(2) | Security is in default and therefore is non-income producing. |
(3) | The level 3 assets were a result of unavailable quoted prices from an active market or the unavailability of other significant observable inputs. |
(4) | Bank loans generally pay interest at rates which are periodically determined by reference to a base lending rate plus a premium. All loans carry a variable rate of interest. These base lending rates are generally (i) the Prime Rate offered by one or more major United States banks, (ii) the lending rate offered by one or more European banks such as the London Interbank Offered Rate (“LIBOR”) or (iii) the Certificate of Deposit rate. Bank Loans, while exempt from registration, under the Securities Act of 1933, contain certain restrictions on resale and cannot be sold publicly. Floating rate bank loans often require prepayments from excess cash flow or permit the borrower to repay at its election. The degree to which borrowers repay, whether as a contractual requirement or at their election, cannot be predicted with accuracy. |
(5) | Non-income producing security. |
(6) | Amount represents less than 0.005% of net assets. |
OUTSTANDING FORWARD FOREIGN CURRENCY CONTRACTS
| Counterparty | Foreign Currency | Contracted Amount** | Purchase/Sale Contract | Settlement Date | Current Value | Unrealized Appreciation/ (Depreciation) | |||||||||||
| Citigroup Global Markets | EUR | 1,219,900 | Purchase | 06/09/17 | $ | 1,371,063 | $ | 1,967 | |||||||||
| $ | 1,967 | ||||||||||||||||
| Citigroup Global Markets | EUR | 1,246,900 | Sale | 07/10/17 | $ | 1,403,711 | $ | (1,906 | ) | ||||||||
| J.P. Morgan Chase & Co. | EUR | 1,219,900 | Sale | 06/09/17 | 1,371,063 | (35,701 | ) | ||||||||||
| $ | (37,607 | ) | |||||||||||||||
| ** | The contracted amount is stated in the currency in which the contract is denominated. |
See Notes to Financial Statements
| Stone Harbor Investment Funds Annual Report | May 31, 2017 | 41 |
| Stone Harbor Local Markets Fund | Statements of Investments |
May 31, 2017
| Reference Rate | Currency | Rate | Maturity Date | Principal Amount/Shares* | Value Expressed (in USD) | |||||||||||
| SOVEREIGN DEBT OBLIGATIONS ‐ 71.96% | ||||||||||||||||
| Argentina ‐ 1.53% | ||||||||||||||||
| Republic of Argentina: | ||||||||||||||||
| ARS | 15.50 | % | 10/17/26 | 81,596,000 | $ | 5,596,329 | ||||||||||
| EUR | 7.82 | % | 12/31/33 | 2,810,004 | 3,349,963 | |||||||||||
| EUR | 7.82 | % | 12/31/33 | 5,185,159 | 6,254,327 | |||||||||||
| 15,200,619 | ||||||||||||||||
| Brazil ‐ 10.81% | ||||||||||||||||
| Nota Do Tesouro Nacional: | ||||||||||||||||
| BRL | 10.00 | % | 01/01/21 | 131,928,000 | 40,547,579 | |||||||||||
| BRL | 10.00 | % | 01/01/23 | 31,963,000 | 9,668,633 | |||||||||||
| BRL | 10.00 | % | 01/01/25 | 138,858,000 | 41,527,472 | |||||||||||
| BRL | 10.00 | % | 01/01/27 | 51,790,000 | 15,397,315 | |||||||||||
| 107,140,999 | ||||||||||||||||
| Chile ‐ 0.22% | ||||||||||||||||
| Republic of Chile | CLP | 4.50 | % | 02/28/21 | 1,440,000,000 | 2,207,694 | ||||||||||
| Colombia ‐ 8.42% | ||||||||||||||||
| Bogota Distrio Capital | COP | 9.75 | % | 07/26/28 | 62,776,000,000 | 22,848,966 | (1) | |||||||||
| Republic of Colombia: | ||||||||||||||||
| COP | 7.75 | % | 04/14/21 | 24,451,000,000 | 8,993,365 | |||||||||||
| COP | 4.38 | % | 03/21/23 | 2,013,000,000 | 646,790 | |||||||||||
| COP | 10.00 | % | 07/24/24 | 24,599,700,000 | 10,419,024 | |||||||||||
| COP | 7.50 | % | 08/26/26 | 23,854,000,000 | 8,895,152 | |||||||||||
| COP | 9.85 | % | 06/28/27 | 33,767,000,000 | 15,104,978 | |||||||||||
| Titulos De Tesoreira: | ||||||||||||||||
| COP | 5.00 | % | 11/21/18 | 35,708,600,000 | 12,199,316 | |||||||||||
| COP | 11.00 | % | 07/24/20 | 10,975,500,000 | 4,336,252 | |||||||||||
| 83,443,843 | ||||||||||||||||
| Indonesia ‐ 10.53% | ||||||||||||||||
| Republic of Indonesia: | ||||||||||||||||
| IDR | 8.25 | % | 07/15/21 | 121,545,000,000 | 9,636,000 | |||||||||||
| IDR | 7.00 | % | 05/15/22 | 257,180,000,000 | 19,570,780 | |||||||||||
| IDR | 5.63 | % | 05/15/23 | 34,887,000,000 | 2,462,768 | |||||||||||
| IDR | 11.00 | % | 09/15/25 | 86,142,000,000 | 8,033,679 | |||||||||||
| IDR | 8.38 | % | 09/15/26 | 56,377,000,000 | 4,634,596 | |||||||||||
| IDR | 6.13 | % | 05/15/28 | 149,010,000,000 | 10,250,031 | |||||||||||
| IDR | 9.00 | % | 03/15/29 | 155,632,000,000 | 13,188,936 | |||||||||||
| IDR | 8.75 | % | 05/15/31 | 13,809,000,000 | 1,160,091 | |||||||||||
| IDR | 8.25 | % | 06/15/32 | 189,700,000,000 | 15,182,124 | |||||||||||
| IDR | 6.63 | % | 05/15/33 | 129,002,000,000 | 8,865,885 | |||||||||||
| IDR | 8.38 | % | 03/15/34 | 141,460,000,000 | 11,386,149 | |||||||||||
| 104,371,039 | ||||||||||||||||
| Malaysia ‐ 5.47% | ||||||||||||||||
| Malaysian Government: | ||||||||||||||||
| MYR | 3.58 | % | 09/28/18 | 12,870,000 | 3,020,391 | |||||||||||
| MYR | 3.65 | % | 10/31/19 | 33,930,000 | 7,970,775 | |||||||||||
| MYR | 4.16 | % | 07/15/21 | 4,460,000 | 1,063,679 | |||||||||||
| MYR | 4.05 | % | 09/30/21 | 2,480,000 | 589,000 | |||||||||||
| MYR | 3.62 | % | 11/30/21 | 44,530,000 | 10,399,004 | |||||||||||
| MYR | 3.48 | % | 03/15/23 | 31,981,000 | 7,352,641 | |||||||||||
| MYR | 4.18 | % | 07/15/24 | 53,160,000 | 12,656,551 | |||||||||||
| 42 | www.shiplp.com |
| Stone Harbor Local Markets Fund | Statements of Investments |
May 31, 2017
| Reference Rate | Currency | Rate | Maturity Date | Principal Amount/Shares* | Value Expressed (in USD) | |||||||||||
| Malaysia (continued) | ||||||||||||||||
| Malaysian Government: (continued) | ||||||||||||||||
| MYR | 3.96 | % | 09/15/25 | 10,692,000 | $ | 2,493,135 | ||||||||||
| MYR | 4.39 | % | 04/15/26 | 16,370,000 | 3,928,991 | |||||||||||
| MYR | 3.90 | % | 11/30/26 | 4,280,000 | 998,000 | |||||||||||
| MYR | 4.50 | % | 04/15/30 | 11,870,000 | 2,809,418 | |||||||||||
| MYR | 3.84 | % | 04/15/33 | 4,270,000 | 944,787 | |||||||||||
| 54,226,372 | ||||||||||||||||
| Mexico ‐ 4.75% | ||||||||||||||||
| Mexican Bonos: | ||||||||||||||||
| MXN | 10.00 | % | 12/05/24 | 114,760,900 | 7,116,983 | |||||||||||
| MXN | 5.75 | % | 03/05/26 | 124,230,000 | 5,987,705 | |||||||||||
| MXN | 8.50 | % | 05/31/29 | 42,515,000 | 2,480,894 | |||||||||||
| MXN | 7.75 | % | 05/29/31 | 89,606,000 | 4,934,616 | |||||||||||
| MXN | 7.75 | % | 11/23/34 | 173,246,000 | 9,523,030 | |||||||||||
| MXN | 10.00 | % | 11/20/36 | 50,396,000 | 3,378,109 | |||||||||||
| MXN | 8.50 | % | 11/18/38 | 119,442,000 | 7,034,095 | |||||||||||
| MXN | 7.75 | % | 11/13/42 | 120,860,000 | 6,595,174 | |||||||||||
| 47,050,606 | ||||||||||||||||
| Peru ‐ 1.36% | ||||||||||||||||
| Republic of Peru: | ||||||||||||||||
| PEN | 6.35 | % | 08/12/28 | 24,715,000 | 7,978,162 | (2) | ||||||||||
| PEN | 6.95 | % | 08/12/31 | 16,290,000 | 5,492,910 | (2) | ||||||||||
| 13,471,072 | ||||||||||||||||
| Poland ‐ 4.82% | ||||||||||||||||
| Republic of Poland: | ||||||||||||||||
| PLN | 2.75 | % | 08/25/23 | 16,559,479 | 4,909,909 | |||||||||||
| PLN | 4.00 | % | 10/25/23 | 24,665,000 | 7,081,810 | |||||||||||
| PLN | 3.25 | % | 07/25/25 | 105,440,000 | 28,787,284 | |||||||||||
| PLN | 2.50 | % | 07/25/26 | 14,140,000 | 3,612,493 | |||||||||||
| PLN | 2.75 | % | 04/25/28 | 13,050,000 | 3,361,154 | |||||||||||
| 47,752,650 | ||||||||||||||||
| Russia ‐ 4.85% | ||||||||||||||||
| Russian Federation: | ||||||||||||||||
| RUB | 7.00 | % | 08/16/23 | 278,060,000 | 4,730,746 | |||||||||||
| RUB | 7.75 | % | 09/16/26 | 744,810,000 | 13,216,701 | |||||||||||
| RUB | 8.15 | % | 02/03/27 | 330,937,000 | 6,105,910 | |||||||||||
| RUB | 7.05 | % | 01/19/28 | 164,290,000 | 2,783,545 | |||||||||||
| RUB | 8.50 | % | 09/17/31 | 1,125,240,000 | 21,177,604 | |||||||||||
| 48,014,506 | ||||||||||||||||
| South Africa ‐ 10.39% | ||||||||||||||||
| Republic of South Africa: | ||||||||||||||||
| ZAR | 7.75 | % | 02/28/23 | 410,700,000 | 30,963,600 | |||||||||||
| ZAR | 10.50 | % | 12/21/26 | 238,693,000 | 20,440,463 | |||||||||||
| ZAR | 7.00 | % | 02/28/31 | 309,715,000 | 19,730,158 | |||||||||||
| ZAR | 6.25 | % | 03/31/36 | 310,320,000 | 17,118,922 | |||||||||||
| ZAR | 6.50 | % | 02/28/41 | 174,390,000 | 9,481,343 | |||||||||||
| ZAR | 8.75 | % | 02/28/48 | 75,030,000 | 5,201,386 | |||||||||||
| 102,935,872 | ||||||||||||||||
| Thailand ‐ 3.58% | ||||||||||||||||
| Thailand Government: | ||||||||||||||||
| THB | 3.88 | % | 06/13/19 | 240,000,000 | 7,376,547 | |||||||||||
| Stone Harbor Investment Funds Annual Report | May 31, 2017 | 43 |
| Stone Harbor Local Markets Fund | Statements of Investments |
May 31, 2017
| Reference Rate | Currency | Rate | Maturity Date | Principal Amount/Shares* | Value Expressed (in USD) | ||||||||||||
| Thailand (continued) | |||||||||||||||||
| Thailand Government: (continued) | |||||||||||||||||
| THB | 1.20 | % | 07/14/21 | 343,613,487 | $ | 9,944,740 | |||||||||||
| THB | 3.85 | % | 12/12/25 | 273,250,000 | 8,822,462 | ||||||||||||
| THB | 3.58 | % | 12/17/27 | 202,770,000 | 6,363,507 | ||||||||||||
| THB | 4.68 | % | 06/29/44 | 83,167,000 | 2,962,792 | ||||||||||||
| 35,470,048 | |||||||||||||||||
| Turkey ‐ 4.87% | |||||||||||||||||
| Republic of Turkey: | |||||||||||||||||
| TRY | 9.20 | % | 09/22/21 | 42,675,000 | 11,605,316 | ||||||||||||
| TRY | 9.50 | % | 01/12/22 | 13,930,000 | 3,821,382 | ||||||||||||
| TRY | 8.50 | % | 09/14/22 | 47,860,000 | 12,582,599 | ||||||||||||
| TRY | 7.10 | % | 03/08/23 | 29,000,000 | 7,094,022 | ||||||||||||
| TRY | 10.40 | % | 03/20/24 | 17,800,000 | 5,085,858 | ||||||||||||
| TRY | 9.00 | % | 07/24/24 | 12,550,000 | 3,340,358 | ||||||||||||
| TRY | 10.60 | % | 02/11/26 | 16,300,000 | 4,712,719 | ||||||||||||
| 48,242,254 | |||||||||||||||||
| Uruguay ‐ 0.36% | |||||||||||||||||
| Oriental Republic of Uruguay | UYU | 5.00 | % | 09/14/18 | 99,225,880 | 3,556,379 | |||||||||||
| TOTAL SOVEREIGN DEBT OBLIGATIONS | 713,083,953 | ||||||||||||||||
| (Cost $751,396,362) | |||||||||||||||||
| CORPORATE BONDS ‐ 6.21% | |||||||||||||||||
| Mexico ‐ 6.21% | |||||||||||||||||
| America Movil SAB de CV | MXN | 6.00 | % | 06/09/19 | 342,900,000 | 17,706,999 | |||||||||||
| Petroleos Mexicanos: | |||||||||||||||||
| MXN | 7.65 | % | 11/24/21 | 120,000,000 | 6,097,655 | (1) | |||||||||||
| MXN | 7.19 | % | 09/12/24 | 383,460,000 | 18,131,780 | (1) | |||||||||||
| MXN | 7.47 | % | 11/12/26 | 421,560,000 | 19,634,215 | ||||||||||||
| 61,570,649 | |||||||||||||||||
| TOTAL CORPORATE BONDS | 61,570,649 | ||||||||||||||||
| (Cost $67,820,318) | |||||||||||||||||
| SHORT TERM INVESTMENTS ‐ 4.04% | |||||||||||||||||
| Money Market Mutual Funds ‐ 4.04% | |||||||||||||||||
| State Street Institutional Liquid Reserves Fund (7‐Day Yield) | USD | 0.94 | % | N/A | 40,007,356 | 40,011,357 | |||||||||||
| TOTAL SHORT TERM INVESTMENTS | 40,011,357 | ||||||||||||||||
| (Cost $40,009,682) | |||||||||||||||||
| Total Investments ‐ 82.21% | 814,665,959 | ||||||||||||||||
| (Cost $859,226,362) | |||||||||||||||||
| Other Assets In Excess of Liabilities ‐ 17.79% | 176,276,068 | (3) | |||||||||||||||
| Net Assets ‐ 100.00% | $ | 990,942,027 | |||||||||||||||
| * | The principal amount/shares of each security is stated in the currency in which the security is denominated. |
| 44 | www.shiplp.com |
| Stone Harbor Local Markets Fund | Statements of Investments |
May 31, 2017
| Currency Abbreviations: | ||
| ARS | - | Argentine Peso |
| BRL | - | Brazilian Real |
| CLP | - | Chilean Peso |
| COP | - | Columbian Peso |
| CZK | - | Czech Republic Koruna |
| EUR | - | Euro |
| HUF | - | Hungarian Forint |
| IDR | - | Indonesian Rupiah |
| INR | - | Indian Rupee |
| MXN | - | Mexican Peso |
| MYR | - | Malaysian Ringgit |
| PEN | - | Peruvian Nuevo Sol |
| PLN | - | Polish Zloty |
| RON | - | Romanian Leu |
| RUB | - | Russian Ruble |
| THB | - | Thai Baht |
| TRY | - | Turkish Lira |
| USD | - | United States Dollar |
| UYU | - | Uruguayan Peso |
| ZAR | - | South African Rand |
| (1) | Securities were originally issued pursuant to Regulation S under the Securities Act of 1933, which exempts securities offered and sold outside of the United States from registration. Such securities cannot be sold in the United States without either an effective registration statement filed pursuant to the Securities Act of 1933, or pursuant to an exemption from registration. As of May 31, 2017, the aggregate market value of those securities was $47,078,401, which represents approximately 4.75% of net assets. |
| (2) | Security exempt from registration under Rule 144A of the Securities Act of 1933. Such securities may normally be sold to qualified institutional buyers in transactions exempt from registration. Total market value of Rule 144A securities amounts to $13,471,072, which represents approximately 1.36% of net assets as of May 31, 2017. |
| (3) | Includes cash which is being held as collateral for forward foreign currency contracts. |
OUTSTANDING FORWARD FOREIGN CURRENCY CONTRACTS
| Counterparty | Foreign Currency | Contracted Amount** | Purchase/Sale Contract | Settlement Date | Current Value | Unrealized Appreciation/ (Depreciation) | ||||||||||
| Citigroup Global Markets | ARS | 143,833,494 | Sale | 06/05/17 | $ | 8,909,317 | $ | 240,538 | ||||||||
| Citigroup Global Markets | BRL | 33,999,568 | Purchase | 07/05/17 | 10,422,189 | 121,162 | ||||||||||
| Citigroup Global Markets | COP | 18,657,355,000 | Sale | 06/16/17 | 6,381,055 | 50,852 | ||||||||||
| Citigroup Global Markets | EUR | 2,656,005 | Purchase | 06/05/17 | 2,984,306 | 80,195 | ||||||||||
| Citigroup Global Markets | EUR | 2,656,005 | Purchase | 07/07/17 | 2,989,546 | 9,601 | ||||||||||
| Citigroup Global Markets | HUF | 1,540,346,970 | Purchase | 06/26/17 | 5,619,318 | 16,121 | ||||||||||
| Citigroup Global Markets | INR | 86,722,650 | Purchase | 06/22/17 | 1,340,236 | 10,236 | ||||||||||
| Citigroup Global Markets | MXN | 540,000,000 | Purchase | 06/09/17 | 28,915,183 | 94,432 | ||||||||||
| Citigroup Global Markets | MXN | 253,886,307 | Sale | 07/14/17 | 13,515,504 | 116,854 | ||||||||||
| Citigroup Global Markets | PEN | 2,271,808 | Sale | 07/07/17 | 692,027 | 1,443 | ||||||||||
| Citigroup Global Markets | PLN | 44,062,230 | Purchase | 06/26/17 | 11,841,823 | 33,008 | ||||||||||
| Citigroup Global Markets | RON | 54,215,604 | Purchase | 06/26/17 | 13,349,065 | 53,106 | ||||||||||
| Citigroup Global Markets | ZAR | 79,592,086 | Sale | 06/28/17 | 6,036,991 | 51,948 | ||||||||||
| Citigroup Global Markets | RUB | 669,712,738 | Sale | 06/28/17 | 11,730,190 | 85,698 | ||||||||||
| Goldman Sachs & Co. | BRL | 21,045,465 | Purchase | 06/02/17 | 6,500,458 | 110,458 | ||||||||||
| Goldman Sachs & Co. | BRL | 13,787,682 | Purchase | 07/05/17 | 4,226,460 | 50,399 | ||||||||||
| Goldman Sachs & Co. | CZK | 115,000,000 | Purchase | 08/07/17 | 4,923,891 | 279,866 | ||||||||||
| Goldman Sachs & Co. | HUF | 539,779,870 | Purchase | 06/26/17 | 1,969,163 | 5,041 | ||||||||||
| Goldman Sachs & Co. | INR | 110,514,000 | Purchase | 06/22/17 | 1,707,914 | 12,914 | ||||||||||
| Goldman Sachs & Co. | MXN | 118,896,813 | Sale | 06/02/17 | 6,374,383 | 15,617 | ||||||||||
| Stone Harbor Investment Funds Annual Report | May 31, 2017 | 45 |
| Stone Harbor Local Markets Fund | Statements of Investments | |||||
May 31, 2017
OUTSTANDING FORWARD FOREIGN CURRENCY CONTRACTS (continued)
| Counterparty | Foreign Currency | Contracted Amount** | Purchase/Sale Contract | Settlement Date | Current Value | Unrealized Appreciation/ (Depreciation) | ||||||||||
| Goldman Sachs & Co. | MXN | 91,213,794 | Purchase | 06/02/17 | $ | 4,890,221 | $ | 102,221 | ||||||||
| Goldman Sachs & Co. | MXN | 86,482,047 | Sale | 07/14/17 | 4,603,826 | 40,578 | ||||||||||
| Goldman Sachs & Co. | RON | 31,505,712 | Purchase | 06/26/17 | 7,757,394 | 31,429 | ||||||||||
| Goldman Sachs & Co. | RUB | 2,350,000,000 | Purchase | 06/09/17 | 41,344,182 | 121,536 | ||||||||||
| Goldman Sachs & Co. | RUB | 18,697,326 | Sale | 06/28/17 | 327,488 | 2,125 | ||||||||||
| Goldman Sachs & Co. | TRY | 29,160,708 | Purchase | 06/30/17 | 8,189,772 | 81,692 | ||||||||||
| Goldman Sachs & Co. | ZAR | 87,154,161 | Sale | 06/28/17 | 6,610,567 | 38,666 | ||||||||||
| J.P. Morgan Chase & Co. | TRY | 87,600,000 | Purchase | 06/09/17 | 24,761,728 | 42,849 | ||||||||||
| J.P. Morgan Chase & Co. | ARS | 65,198,000 | Sale | 06/01/17 | 4,046,842 | 7,760 | ||||||||||
| J.P. Morgan Chase & Co. | ARS | 49,751,330 | Sale | 06/05/17 | 3,081,691 | 8,454 | ||||||||||
| J.P. Morgan Chase & Co. | BRL | 17,215,048 | Purchase | 07/05/17 | 5,277,081 | 65,138 | ||||||||||
| J.P. Morgan Chase & Co. | COP | 140,223,500 | Sale | 06/16/17 | 47,958 | 388 | ||||||||||
| J.P. Morgan Chase & Co. | EUR | 2,729,000 | Purchase | 06/05/17 | 3,066,323 | 81,402 | ||||||||||
| J.P. Morgan Chase & Co. | EUR | 2,729,000 | Purchase | 07/07/17 | 3,071,707 | 9,940 | ||||||||||
| J.P. Morgan Chase & Co. | HUF | 583,347,000 | Purchase | 06/26/17 | 2,128,100 | 5,758 | ||||||||||
| J.P. Morgan Chase & Co. | INR | 59,923,395 | Purchase | 06/22/17 | 926,073 | 7,073 | ||||||||||
| J.P. Morgan Chase & Co. | RON | 56,798,716 | Purchase | 06/26/17 | 13,985,084 | 52,219 | ||||||||||
| J.P. Morgan Chase & Co. | RUB | 146,851,600 | Sale | 06/28/17 | 2,572,143 | 17,147 | ||||||||||
| J.P. Morgan Chase & Co. | UYU | 71,606,350 | Purchase | 10/26/17 | 2,456,057 | 38,557 | ||||||||||
| J.P. Morgan Chase & Co. | ZAR | 59,593,723 | Sale | 06/28/17 | 4,520,132 | 26,456 | ||||||||||
| $ | 2,220,877 | |||||||||||||||
| Citigroup Global Markets | ARS | 143,433,185 | Purchase | 06/05/17 | $ | 8,884,521 | $ | (60,479 | ) | |||||||
| Citigroup Global Markets | BRL | 33,999,568 | Purchase | 06/02/17 | 10,501,681 | (121,192 | ) | |||||||||
| Citigroup Global Markets | BRL | 33,999,568 | Sale | 06/02/17 | 10,501,681 | (128,052 | ) | |||||||||
| Citigroup Global Markets | EUR | 2,656,005 | Sale | 06/05/17 | 2,984,306 | (9,580 | ) | |||||||||
| Citigroup Global Markets | MXN | 253,886,307 | Purchase | 06/02/17 | 13,611,539 | (119,467 | ) | |||||||||
| Citigroup Global Markets | MXN | 253,886,307 | Sale | 06/02/17 | 13,611,539 | (395,341 | ) | |||||||||
| Citigroup Global Markets | PEN | 11,902,440 | Sale | 06/09/17 | 3,635,998 | (1,998 | ) | |||||||||
| Citigroup Global Markets | PEN | 11,902,440 | Purchase | 06/09/17 | 3,635,998 | (12,418 | ) | |||||||||
| Citigroup Global Markets | PLN | 206,400,000 | Purchase | 06/09/17 | 55,478,741 | (29,825 | ) | |||||||||
| Citigroup Global Markets | THB | 168,500,000 | Purchase | 07/14/17 | 4,946,140 | (3,410 | ) | |||||||||
| Citigroup Global Markets | THB | 336,592,955 | Sale | 07/14/17 | 9,880,332 | (142,108 | ) | |||||||||
| Citigroup Global Markets | UYU | 35,842,200 | Purchase | 11/07/17 | 1,226,632 | (3,368 | ) | |||||||||
| Goldman Sachs & Co. | BRL | 21,045,466 | Sale | 06/02/17 | 6,500,458 | (91,973 | ) | |||||||||
| Goldman Sachs & Co. | CLP | 6,510,768,540 | Purchase | 06/12/17 | 9,658,862 | (78,468 | ) | |||||||||
| Goldman Sachs & Co. | IDR | 55,479,330,000 | Sale | 06/16/17 | 4,157,873 | (26,873 | ) | |||||||||
| Goldman Sachs & Co. | MXN | 86,482,047 | Purchase | 06/02/17 | 4,636,539 | (41,327 | ) | |||||||||
| Goldman Sachs & Co. | MXN | 58,799,028 | Sale | 06/02/17 | 3,152,377 | (98,866 | ) | |||||||||
| J.P. Morgan Chase & Co. | ARS | 65,198,000 | Purchase | 06/01/17 | 4,046,842 | (5,240 | ) | |||||||||
| J.P. Morgan Chase & Co. | ARS | 50,151,640 | Purchase | 06/05/17 | 3,106,487 | (136,425 | ) | |||||||||
| J.P. Morgan Chase & Co. | ARS | 114,949,330 | Purchase | 07/14/17 | 6,989,005 | (15,829 | ) | |||||||||
| J.P. Morgan Chase & Co. | ARS | 82,392,780 | Purchase | 08/28/17 | 4,902,986 | (17,014 | ) | |||||||||
| J.P. Morgan Chase & Co. | BRL | 17,215,048 | Purchase | 06/02/17 | 5,317,331 | (112,488 | ) | |||||||||
| J.P. Morgan Chase & Co. | BRL | 17,215,048 | Sale | 06/02/17 | 5,317,331 | (68,841 | ) | |||||||||
| J.P. Morgan Chase & Co. | EUR | 2,729,000 | Sale | 06/05/17 | 3,066,323 | (9,963 | ) | |||||||||
| J.P. Morgan Chase & Co. | IDR | 55,462,265,600 | Sale | 06/16/17 | 4,156,594 | (26,594 | ) | |||||||||
| J.P. Morgan Chase & Co. | THB | 296,368,330 | Sale | 07/14/17 | 8,699,581 | (130,146 | ) | |||||||||
| �� | $ | (1,887,285 | ) | |||||||||||||
| ** | The contracted amount is stated in the currency in which the contract is denominated. |
See Notes to Financial Statements.
| 46 | www.shiplp.com |
| Stone Harbor Emerging Markets Corporate Debt Fund | Statements of Investments |
May 31, 2017
| Reference Rate | Currency | Rate | Maturity Date | Principal Amount/Shares* | Value Expressed (in USD) | |||||||||||
| CORPORATE BONDS - 96.84% | ||||||||||||||||
| Algeria - 2.15% | ||||||||||||||||
| GTH Finance BV: | ||||||||||||||||
| USD | 6.25 | % | 04/26/20 | 86,000 | $ | 92,020 | (1) | |||||||||
| USD | 7.25 | % | 04/26/23 | 172,000 | 191,350 | (1) | ||||||||||
| 283,370 | ||||||||||||||||
| Angola - 2.01% | ||||||||||||||||
| Puma International Financing SA | USD | 6.75 | % | 02/01/21 | 255,000 | 263,925 | (1) | |||||||||
| Argentina - 3.87% | ||||||||||||||||
| Cablevision SA | USD | 6.50 | % | 06/15/21 | 91,000 | 96,687 | (1) | |||||||||
| Pampa Energia SA | USD | 7.50 | % | 01/24/27 | 64,000 | 67,744 | (1) | |||||||||
| Petrobras Argentina SA | USD | 7.38 | % | 07/21/23 | 116,000 | 122,960 | (1) | |||||||||
| YPF SA: | ||||||||||||||||
| USD | 8.75 | % | 04/04/24 | 52,000 | 60,021 | (1) | ||||||||||
| USD | 8.50 | % | 07/28/25 | 142,000 | 162,519 | (1) | ||||||||||
| 509,931 | ||||||||||||||||
| Brazil - 9.47% | ||||||||||||||||
| Banco do Brasil SA/Cayman | USD | 9.00 | % | Perpetual | 70,000 | 72,261 | (1)(2)(3) | |||||||||
| Braskem Finance Ltd. | USD | 5.75 | % | 04/15/21 | 26,000 | 27,304 | (4) | |||||||||
| Cosan Luxembourg SA | USD | 7.00 | % | 01/20/27 | 93,000 | 96,720 | (1) | |||||||||
| ESAL GmbH | USD | 6.25 | % | 02/05/23 | 29,000 | 26,589 | (1) | |||||||||
| GTL Trade Finance, Inc. | USD | 5.89 | % | 04/29/24 | 22,000 | 21,890 | (1) | |||||||||
| Itau Unibanco Holding SA | USD | 5.65 | % | 03/19/22 | 65,000 | 68,185 | (1) | |||||||||
| MARB BondCo PLC | USD | 7.00 | % | 03/15/24 | 77,000 | 76,134 | (1) | |||||||||
| Marfrig Holdings Europe BV: | ||||||||||||||||
| USD | 6.88 | % | 06/24/19 | 42,000 | 43,273 | (1) | ||||||||||
| USD | 8.00 | % | 06/08/23 | 77,000 | 80,041 | (1) | ||||||||||
| Minerva Luxembourg SA | USD | 6.50 | % | 09/20/26 | 60,000 | 59,700 | (1) | |||||||||
| Petrobras Global Finance BV: | ||||||||||||||||
| USD | 5.38 | % | 01/27/21 | 34,000 | 34,924 | |||||||||||
| USD | 8.38 | % | 05/23/21 | 92,000 | 103,334 | |||||||||||
| USD | 6.25 | % | 03/17/24 | 74,000 | 76,587 | |||||||||||
| USD | 7.25 | % | 03/17/44 | 82,000 | 81,231 | |||||||||||
| Raizen Fuels Finance SA | USD | 5.30 | % | 01/20/27 | 52,000 | 53,755 | (1) | |||||||||
| Rumo Luxembourg Sarl | USD | 7.38 | % | 02/09/24 | 93,000 | 96,139 | (1) | |||||||||
| Vale Overseas Ltd.: | ||||||||||||||||
| USD | 4.38 | % | 01/11/22 | 78,000 | 79,537 | |||||||||||
| USD | 6.88 | % | 11/10/39 | 80,000 | 85,880 | |||||||||||
| Votorantim Group | USD | 5.75 | % | 01/28/27 | 64,000 | 63,072 | (1) | |||||||||
| 1,246,556 | ||||||||||||||||
| Chile - 4.09% | ||||||||||||||||
| Cencosud SA | USD | 4.88 | % | 01/20/23 | 36,000 | 38,293 | (1) | |||||||||
| Colbun SA | USD | 4.50 | % | 07/10/24 | 69,000 | 72,019 | (1) | |||||||||
| Empresa Electrica Angamos SA | USD | 4.88 | % | 05/25/29 | 63,000 | 64,654 | (1) | |||||||||
| Empresa Nacional de Telecomunicaciones SA | USD | 4.88 | % | 10/30/24 | 45,000 | 47,025 | (1) | |||||||||
| Entel Chile SA | USD | 4.75 | % | 08/01/26 | 48,000 | 49,558 | (1) | |||||||||
| GeoPark Latin America Ltd. Agencia en Chile | USD | 7.50 | % | 02/11/20 | 195,000 | 196,950 | (1) | |||||||||
| VTR Finance BV | USD | 6.88 | % | 01/15/24 | 65,000 | 69,306 | (1) | |||||||||
| 537,805 | ||||||||||||||||
| Stone Harbor Investment Funds Annual Report | May 31, 2017 | 47 |
| Stone Harbor Emerging Markets Corporate Debt Fund | Statements of Investments |
May 31, 2017
| Reference Rate | Currency | Rate | Maturity Date | Principal Amount/Shares* | Value Expressed (in USD) | |||||||||||
| China - 5.04% | ||||||||||||||||
| China Life Insurance Co. Ltd. | USD | 4.00 | % | 07/03/75 | 300,000 | $ | 302,025 | (2) | ||||||||
| Lenovo Group Ltd. | USD | 4.70 | % | 05/08/19 | 350,000 | 361,017 | ||||||||||
| 663,042 | ||||||||||||||||
| Colombia - 4.17% | ||||||||||||||||
| Banco de Bogota SA | USD | 6.25 | % | 05/12/26 | 67,000 | 71,505 | (1) | |||||||||
| Bancolombia SA | USD | 5.13 | % | 09/11/22 | 100,000 | 104,095 | ||||||||||
| Ecopetrol SA: | ||||||||||||||||
| USD | 5.38 | % | 06/26/26 | 108,000 | 111,677 | |||||||||||
| USD | 7.38 | % | 09/18/43 | 76,000 | 82,035 | |||||||||||
| GrupoSura Finance SA | USD | 5.50 | % | 04/29/26 | 59,000 | 63,425 | (1) | |||||||||
| Millicom International Cellular SA | USD | 6.63 | % | 10/15/21 | 48,000 | 50,196 | (1) | |||||||||
| Oleoducto Central SA | USD | 4.00 | % | 05/07/21 | 64,000 | 66,301 | (1) | |||||||||
| 549,234 | ||||||||||||||||
| Ghana - 2.28% | ||||||||||||||||
| Tullow Oil PLC: | ||||||||||||||||
| USD | 6.00 | % | 11/01/20 | 18,000 | 17,505 | (4) | ||||||||||
| USD | 6.00 | % | 11/01/20 | 63,000 | 61,267 | (1) | ||||||||||
| USD | 6.25 | % | 04/15/22 | 64,000 | 60,640 | (4) | ||||||||||
| USD | 6.25 | % | 04/15/22 | 169,000 | 160,128 | (1) | ||||||||||
| 299,540 | ||||||||||||||||
| Guatemala - 1.55% | ||||||||||||||||
| Comcel Trust via Comunicaciones Celulares SA | USD | 6.88 | % | 02/06/24 | 149,000 | 159,415 | (1) | |||||||||
| Energuate Trust | USD | 5.88 | % | 05/03/27 | 44,000 | 44,785 | (1) | |||||||||
| 204,200 | ||||||||||||||||
| Hong Kong - 3.20% | ||||||||||||||||
| CK Hutchison Capital Securities 17 Ltd. | USD | 4.00 | % | Perpetual | 214,000 | 215,070 | (1)(2)(3) | |||||||||
| Towngas Finance Ltd. | USD | 4.75 | % | Perpetual | 200,000 | 206,766 | (2)(3) | |||||||||
| 421,836 | ||||||||||||||||
| India - 6.77% | ||||||||||||||||
| ABJA Investment Co. Pte Ltd. | USD | 5.95 | % | 07/31/24 | 200,000 | 209,250 | ||||||||||
| Adani Transmission | USD | 4.00 | % | 08/03/26 | 126,000 | 125,987 | (1) | |||||||||
| Bharti Airtel International Netherlands BV | USD | 5.13 | % | 03/11/23 | 23,000 | 24,363 | (1) | |||||||||
| Greenko Dutch BV | USD | 8.00 | % | 08/01/19 | 107,000 | 111,614 | (4) | |||||||||
| Greenko Investment Co. | USD | 4.88 | % | 08/16/23 | 100,000 | 97,906 | (1) | |||||||||
| Reliance Industries Ltd. | USD | 4.13 | % | 01/28/25 | 40,000 | 41,511 | (1) | |||||||||
| Vedanta Resources PLC: | ||||||||||||||||
| USD | 6.00 | % | 01/31/19 | 66,000 | 67,898 | (1) | ||||||||||
| USD | 8.25 | % | 06/07/21 | 55,000 | 58,850 | (1) | ||||||||||
| USD | 6.38 | % | 07/30/22 | 102,000 | 102,000 | (1) | ||||||||||
| USD | 7.13 | % | 05/31/23 | 51,000 | 52,466 | (1) | ||||||||||
| 891,845 | ||||||||||||||||
| Indonesia - 4.18% | ||||||||||||||||
| Indika Energy Capital II Pte Ltd. | USD | 6.88 | % | 04/10/22 | 125,000 | 122,188 | (1) | |||||||||
| Listrindo Capital BV | USD | 4.95 | % | 09/14/26 | 61,000 | 61,610 | (1) | |||||||||
| Pratama Agung Pte Ltd. | USD | 6.25 | % | 02/24/20 | 350,000 | 366,184 | ||||||||||
| 549,982 | ||||||||||||||||
| 48 | www.shiplp.com |
| Stone Harbor Emerging Markets Corporate Debt Fund | Statements of Investments |
May 31, 2017
| Reference Rate | Currency | Rate | Maturity Date | Principal Amount/Shares* | Value Expressed (in USD) | |||||||||||
| Ireland - 2.65% | ||||||||||||||||
| Rosneft Oil Co. via Rosneft International | ||||||||||||||||
| Finance Ltd. | USD | 4.20 | % | 03/06/22 | 345,000 | $ | 349,097 | (1) | ||||||||
| Israel - 2.19% | ||||||||||||||||
| Delek & Avner Tamar Bond Ltd.: | ||||||||||||||||
| USD | 3.84 | % | 12/30/18 | 47,000 | 47,764 | (1) | ||||||||||
| USD | 5.08 | % | 12/30/23 | 233,000 | 240,572 | (1) | ||||||||||
| 288,336 | ||||||||||||||||
| Jamaica - 1.99% | ||||||||||||||||
| Digicel Group Ltd. | USD | 7.13 | % | 04/01/22 | 298,000 | 262,240 | (4) | |||||||||
| Kuwait - 1.53% | ||||||||||||||||
| Equate Petrochemical BV: | ||||||||||||||||
| USD | 3.00 | % | 03/03/22 | 107,000 | 105,663 | (1) | ||||||||||
| USD | 4.25 | % | 11/03/26 | 94,000 | 96,021 | (1) | ||||||||||
| 201,684 | ||||||||||||||||
| Luxembourg - 3.43% | ||||||||||||||||
| Sberbank of Russia PJSC | USD | 5.50 | % | 02/26/24 | 438,000 | 451,139 | (1)(2) | |||||||||
| Macau - 2.99% | ||||||||||||||||
| MCE Finance Ltd. | USD | 5.00 | % | 02/15/21 | 80,000 | 82,100 | (1) | |||||||||
| Melco Resorts Finance Ltd. | USD | 4.88 | % | 06/06/25 | 110,000 | 110,550 | (1) | |||||||||
| Studio City Co. Ltd.: | ||||||||||||||||
| USD | 5.88 | % | 11/30/19 | 23,000 | 24,308 | (1) | ||||||||||
| USD | 7.25 | % | 11/30/21 | 163,000 | 176,142 | (1) | ||||||||||
| 393,100 | ||||||||||||||||
| Malaysia - 1.56% | ||||||||||||||||
| Axiata SPV2 Bhd | USD | 3.47 | % | 11/19/20 | 200,000 | 205,428 | ||||||||||
| Mexico - 4.31% | ||||||||||||||||
| Alfa SAB de CV | USD | 5.25 | % | 03/25/24 | 35,000 | 37,537 | (1) | |||||||||
| Cemex SAB de CV: | ||||||||||||||||
| USD | 5.70 | % | 01/11/25 | 20,000 | 21,044 | (1) | ||||||||||
| USD | 7.75 | % | 04/16/26 | 79,000 | 89,902 | (1) | ||||||||||
| Metalsa SA de CV | USD | 4.90 | % | 04/24/23 | 74,000 | 74,185 | (1) | |||||||||
| Mexico Generadora De Energia | USD | 5.50 | % | 12/06/32 | 142,982 | 146,735 | (1) | |||||||||
| Sixsigma Networks Mexico SA de CV | USD | 8.25 | % | 11/07/21 | 117,000 | 117,211 | (1) | |||||||||
| Southern Copper Corp. | USD | 6.75 | % | 04/16/40 | 71,000 | 80,851 | ||||||||||
| 567,465 | ||||||||||||||||
| Morocco - 1.46% | ||||||||||||||||
| OCP SA: | ||||||||||||||||
| USD | 5.63 | % | 04/25/24 | 21,000 | 22,785 | (1) | ||||||||||
| USD | 4.50 | % | 10/22/25 | 168,000 | 169,680 | (1) | ||||||||||
| 192,465 | ||||||||||||||||
| Peru - 2.97% | ||||||||||||||||
| BBVA Banco Continental SA | USD | 5.00 | % | 08/26/22 | 97,000 | 104,942 | (1) | |||||||||
| Cia Minera Ares SAC | USD | 7.75 | % | 01/23/21 | 55,000 | 59,125 | (1) | |||||||||
| Cia Minera Milpo SAA | USD | 4.63 | % | 03/28/23 | 158,000 | 159,975 | (1) | |||||||||
| Kallpa Generacion SA | USD | 4.88 | % | 05/24/26 | 64,000 | 67,200 | (1) | |||||||||
| 391,242 | ||||||||||||||||
| Stone Harbor Investment Funds Annual Report | May 31, 2017 | 49 |
| Stone Harbor Emerging Markets Corporate Debt Fund | Statements of Investments |
May 31, 2017
| Reference Rate | Currency | Rate | Maturity Date | Principal Amount/Shares* | Value Expressed (in USD) | |||||||||||
| Philippines - 0.83% | ||||||||||||||||
| FPT Finance Ltd. | USD | 6.38 | % | 09/28/20 | 100,000 | $ | 108,975 | |||||||||
| Russia - 2.51% | ||||||||||||||||
| Evraz Group SA | USD | 6.75 | % | 01/31/22 | 200,000 | 213,875 | ||||||||||
| Gazprom OAO Via Gaz Capital SA | USD | 6.51 | % | 03/07/22 | 104,000 | 116,415 | (1) | |||||||||
| 330,290 | ||||||||||||||||
| Saudi Arabia - 1.22% | ||||||||||||||||
| Acwa Power Management And | ||||||||||||||||
| Investments One Ltd. | USD | 5.95 | % | 12/15/39 | 157,000 | 160,827 | (1) | |||||||||
| Singapore - 1.52% | ||||||||||||||||
| United Overseas Bank Ltd. | USD | 2.88 | % | 10/17/22 | 200,000 | 200,490 | (2) | |||||||||
| South Africa - 0.94% | ||||||||||||||||
| Myriad International Holdings BV | USD | 5.50 | % | 07/21/25 | 115,000 | 123,913 | (1) | |||||||||
| South Korea - 1.54% | ||||||||||||||||
| Korea Gas Corp. | USD | 3.88 | % | 02/12/24 | 63,000 | 66,312 | (1) | |||||||||
| Korea National Oil Corp. | USD | 3.25 | % | 07/10/24 | 134,000 | 136,376 | (1) | |||||||||
| 202,688 | ||||||||||||||||
| Thailand - 2.59% | ||||||||||||||||
| PTT Exploration & Production PCL | USD | 4.88 | % | Perpetual | 333,000 | 340,909 | (1)(2)(3) | |||||||||
| Turkey - 5.37% | ||||||||||||||||
| Akbank TAS | USD | 5.13 | % | 03/31/25 | 73,000 | 71,814 | (1) | |||||||||
| Turkiye Garanti Bankasi AS: | ||||||||||||||||
| USD | 4.75 | % | 10/17/19 | 193,000 | 198,307 | (1) | ||||||||||
| USD | 5.00 | % | 04/30/20 | 129,000 | 130,935 | (1) | ||||||||||
| USD | 6.25 | % | 04/20/21 | 56,000 | 59,640 | (1) | ||||||||||
| USD | 5.25 | % | 09/13/22 | 154,000 | 157,080 | (1) | ||||||||||
| USD | 6.13 | % | 05/24/27 | 88,000 | 88,594 | (1)(2) | ||||||||||
| 706,370 | ||||||||||||||||
| Ukraine - 3.11% | ||||||||||||||||
| Oschadbank Via SSB #1 PLC | USD | 9.63 | % | 03/20/25 | 400,000 | 408,900 | (4)(5) | |||||||||
| United Arab Emirates - 2.61% | ||||||||||||||||
| DP World Ltd. | USD | 6.85 | % | 07/02/37 | 84,000 | 100,905 | (1) | |||||||||
| MAF Global Securities Ltd. | USD | 5.50 | % | Perpetual | 239,000 | 243,182 | (2)(3) | |||||||||
| 344,087 | ||||||||||||||||
| United States - 0.74% | ||||||||||||||||
| BBVA Bancomer SA | USD | 6.75 | % | 09/30/22 | 86,000 | 97,567 | (1) | |||||||||
| TOTAL CORPORATE BONDS | 12,748,478 | |||||||||||||||
| (Cost $12,230,855) | ||||||||||||||||
| 50 | www.shiplp.com |
| Stone Harbor Emerging Markets Corporate Debt Fund | Statements of Investments |
May 31, 2017
| Reference Rate | Currency | Rate | Maturity Date | Principal Amount/Shares* | Value Expressed (in USD) | |||||||||||
| SHORT TERM INVESTMENTS - 0.94% | ||||||||||||||||
| Money Market Mutual Funds - 0.94% | ||||||||||||||||
| State Street Institutional Liquid Reserves Fund (7-Day Yield) | USD | 0.94 | % | N/A | 123,543 | $ | 123,556 | |||||||||
| TOTAL SHORT TERM INVESTMENTS | 123,556 | |||||||||||||||
| (Cost $123,555) | ||||||||||||||||
| Total Investments - 97.78% | 12,872,034 | |||||||||||||||
| (Cost $12,354,410) | ||||||||||||||||
| Other Assets In Excess of Liabilities - 2.22% | 292,712 | |||||||||||||||
| Net Assets - 100.00% | $ | 13,164,746 | ||||||||||||||
| * | The principal amount/shares of each security is stated in the currency in which the security is denominated. |
Currency Abbreviations:
USD - United States Dollar
| (1) | Security exempt from registration under Rule 144A of the Securities Act of 1933. Such securities may normally be sold to qualified institutional buyers in transactions exempt from registration. Total market value of Rule 144A securities amounts to $8,602,932, which represents approximately 65.35% of net assets as of May 31, 2017. |
| (2) | Floating or variable rate security. Interest rate disclosed is that which is in effect as of May 31, 2017. |
| (3) | Security has no contractual maturity date, is not redeemable and contractually pays an indefinite stream of interest. |
| (4) | Securities were originally issued pursuant to Regulation S under the Securities Act of 1933, which exempts securities offered and sold outside of the United States from registration. Such securities cannot be sold in the United States without either an effective registration statement filed pursuant to the Securities Act of 1933, or pursuant to an exemption from registration. As of May 31, 2017, the aggregate market value of those securities was $888,203, which represents approximately 6.75% of net assets. |
| (5) | Step bond. Coupon changes periodically based upon a predetermined schedule. Interest rate disclosed is that which is in effect as of May 31, 2017. |
See Notes to Financial Statements
| Stone Harbor Investment Funds Annual Report | May 31, 2017 | 51 |
| Stone Harbor Investment Grade Fund | Statements of Investments |
May 31, 2017
| Reference Rate | Currency | Rate | Maturity Date | Principal Amount/Shares* | Value (Expressed in USD) | ||||||||||||
| CORPORATE BONDS ‐ 41.48% | |||||||||||||||||
| Aerospace/Defense ‐ 0.34% | |||||||||||||||||
| L3 Technologies, Inc. | USD | 3.85 | % | 12/15/26 | 50,000 | $ | 51,602 | ||||||||||
| Automotive ‐ 2.01% | |||||||||||||||||
| Ford Motor Credit Co. LLC | USD | 3.16 | % | 08/04/20 | 75,000 | 76,396 | |||||||||||
| General Motors Financial Co., Inc. | USD | 4.30 | % | 07/13/25 | 75,000 | 76,056 | |||||||||||
| Hyundai Capital America | USD | 2.55 | % | 02/06/19 | 75,000 | 75,328 | (1) | ||||||||||
| Johnson Controls International PLC | USD | 4.50 | % | 02/15/47 | 75,000 | 79,109 | |||||||||||
| 306,889 | |||||||||||||||||
| Banking ‐ 10.04% | |||||||||||||||||
| American Express Co. | USD | 3.63 | % | 12/05/24 | 75,000 | 77,471 | |||||||||||
| Bank of America Corp.: | |||||||||||||||||
| USD | 3.95 | % | 04/21/25 | 25,000 | 25,462 | ||||||||||||
| Series GMTN | USD | 3.30 | % | 01/11/23 | 175,000 | 178,479 | |||||||||||
| Capital One Financial Corp. | USD | 3.75 | % | 03/09/27 | 200,000 | 200,859 | |||||||||||
| Citigroup, Inc.: | |||||||||||||||||
| USD | 4.40 | % | 06/10/25 | 100,000 | 104,441 | ||||||||||||
| USD | 4.60 | % | 03/09/26 | 100,000 | 105,489 | ||||||||||||
| Deutsche Bank AG | USD | 3.70 | % | 05/30/24 | 75,000 | 74,994 | |||||||||||
| The Goldman Sachs Group, Inc. | USD | 2.35 | % | 11/15/21 | 125,000 | 124,047 | |||||||||||
| ING Groep NV | USD | 3.15 | % | 03/29/22 | 75,000 | 76,522 | |||||||||||
| JPMorgan Chase & Co. | USD | 2.70 | % | 05/18/23 | 75,000 | 74,379 | |||||||||||
| Mizuho Financial Group, Inc. | USD | 2.63 | % | 04/12/21 | 100,000 | 100,224 | (1) | ||||||||||
| Morgan Stanley | USD | 4.88 | % | 11/01/22 | 75,000 | 81,851 | |||||||||||
| PNC Financial Services Group, Inc. | USD | 3.90 | % | 04/29/24 | 75,000 | 79,053 | |||||||||||
| Santander UK PLC | USD | 5.00 | % | 11/07/23 | 75,000 | 80,395 | (1) | ||||||||||
| Wells Fargo & Co.: | |||||||||||||||||
| USD | 2.10 | % | 07/26/21 | 125,000 | 123,901 | ||||||||||||
| USD | 3.58 | % | 05/22/28 | 25,000 | 25,319 | (2) | |||||||||||
| 1,532,886 | |||||||||||||||||
| Consumer Products ‐ 0.52% | |||||||||||||||||
| Newell Brands, Inc. | USD | 3.85 | % | 04/01/23 | 75,000 | 79,102 | |||||||||||
| Drillers/Services ‐ 0.35% | |||||||||||||||||
| Halliburton Co. | USD | 5.00 | % | 11/15/45 | 50,000 | 53,967 | |||||||||||
| Electric ‐ 5.25% | |||||||||||||||||
| Dominion Energy, Inc. | USD | 2.58 | % | 07/01/20 | 100,000 | 100,836 | |||||||||||
DTE Energy Co., Series F | USD | 3.85 | % | 12/01/23 | 75,000 | 78,633 | |||||||||||
| Duke Energy Corp. | USD | 3.75 | % | 09/01/46 | 50,000 | 46,988 | |||||||||||
| Enel Finance International NV | USD | 2.88 | % | 05/25/22 | 75,000 | 75,025 | (1) | ||||||||||
| Entergy Louisiana LLC | USD | 3.05 | % | 06/01/31 | 75,000 | 72,714 | |||||||||||
| Eversource Energy | USD | 2.50 | % | 03/15/21 | 50,000 | 50,038 | |||||||||||
| Exelon Generation Co. LLC | USD | 5.60 | % | 06/15/42 | 75,000 | 74,641 | |||||||||||
| Georgia Power Co. | USD | 4.30 | % | 03/15/42 | 50,000 | 50,686 | |||||||||||
| Great Plains Energy, Inc. | USD | 3.15 | % | 04/01/22 | 75,000 | 76,335 | |||||||||||
| South Carolina Electric & Gas Co. | USD | 4.10 | % | 06/15/46 | 50,000 | 48,409 | |||||||||||
| Southern Co. | USD | 1.55 | % | 07/01/18 | 50,000 | 49,879 | |||||||||||
| WEC Energy Group, Inc. | USD | 2.45 | % | 06/15/20 | 75,000 | 75,849 | |||||||||||
| 800,033 | |||||||||||||||||
| 52 | www.shiplp.com |
| Stone Harbor Investment Grade Fund | Statements of Investments |
May 31, 2017
| Reference Rate | Currency | Rate | Maturity Date | Principal Amount/Shares* | Value (Expressed in USD) | ||||||||||||
| Exploration & Production ‐ 2.08% | |||||||||||||||||
| Anadarko Petroleum Corp. | USD | 6.45 | % | 09/15/36 | 75,000 | $ | 89,422 | ||||||||||
| Apache Corp. | USD | 5.10 | % | 09/01/40 | 75,000 | 79,244 | |||||||||||
| BP Capital Markets PLC | USD | 2.32 | % | 02/13/20 | 75,000 | 75,886 | |||||||||||
| Continental Resources, Inc. | USD | 4.50 | % | 04/15/23 | 75,000 | 73,875 | |||||||||||
| 318,427 | |||||||||||||||||
| Food and Beverage ‐ 1.38% | |||||||||||||||||
| Anheuser‐Busch InBev Finance, Inc. | USD | 3.65 | % | 02/01/26 | 75,000 | 77,272 | |||||||||||
| Kraft Heinz Foods Co. | USD | 4.88 | % | 02/15/25 | 75,000 | 80,343 | (1) | ||||||||||
| PepsiCo, Inc. | USD | 4.25 | % | 10/22/44 | 50,000 | 52,686 | |||||||||||
| 210,301 | |||||||||||||||||
| Gas Pipelines ‐ 2.74% | |||||||||||||||||
| Boardwalk Pipelines LP | USD | 3.38 | % | 02/01/23 | 75,000 | 74,788 | |||||||||||
| EQT Midstream Partners LP | USD | 4.00 | % | 08/01/24 | 75,000 | 77,139 | |||||||||||
| Kinder Morgan, Inc. | USD | 5.55 | % | 06/01/45 | 75,000 | 80,230 | |||||||||||
| Sabine Pass Liquefaction LLC | USD | 5.75 | % | 05/15/24 | 75,000 | 83,898 | |||||||||||
| Western Gas Partners LP | USD | 5.45 | % | 04/01/44 | 50,000 | 52,418 | |||||||||||
| Williams Partners LP / ACMP Finance Corp. | USD | 4.88 | % | 03/15/24 | 50,000 | 51,937 | |||||||||||
| 420,410 | |||||||||||||||||
| Healthcare ‐ 1.00% | |||||||||||||||||
| Medtronic, Inc.: | |||||||||||||||||
| USD | 3.15 | % | 03/15/22 | 50,000 | 51,990 | ||||||||||||
| USD | 4.63 | % | 03/15/45 | 25,000 | 27,834 | ||||||||||||
| Teva Pharmaceutical Finance Netherlands III BV | USD | 2.20 | % | 07/21/21 | 75,000 | 73,600 | |||||||||||
| 153,424 | |||||||||||||||||
| Leisure ‐ 0.33% | |||||||||||||||||
| Time Warner, Inc. | USD | 3.60 | % | 07/15/25 | 50,000 | 50,059 | |||||||||||
| Life Insurance ‐ 0.81% | |||||||||||||||||
| American International Group, Inc. | USD | 3.88 | % | 01/15/35 | 100,000 | 96,331 | |||||||||||
| Nippon Life Insurance Co. | USD | 5.10 | % | 10/16/44 | 25,000 | 26,969 | (1)(2) | ||||||||||
| 123,300 | |||||||||||||||||
| Media Cable ‐ 1.37% | |||||||||||||||||
| Charter Communications Operating LLC / Charter Communications Operating Capital | USD | 5.38 | % | 05/01/47 | 125,000 | 130,753 | (1) | ||||||||||
| Comcast Corp. | USD | 4.25 | % | 01/15/33 | 75,000 | 79,628 | |||||||||||
| 210,381 | |||||||||||||||||
| Media Other ‐ 1.57% | |||||||||||||||||
| 21st Century Fox America, Inc. | USD | 6.65 | % | 11/15/37 | 25,000 | 32,211 | |||||||||||
| CBS Corp. | USD | 4.85 | % | 07/01/42 | 50,000 | 52,076 | |||||||||||
| The Interpublic Group of Cos, Inc. | USD | 3.75 | % | 02/15/23 | 75,000 | 78,216 | |||||||||||
| Omnicom Group, Inc.: | |||||||||||||||||
| USD | 3.63 | % | 05/01/22 | 25,000 | 26,195 | ||||||||||||
| USD | 3.65 | % | 11/01/24 | 50,000 | 51,669 | ||||||||||||
| 240,367 | |||||||||||||||||
| Metals/Mining/Steel ‐ 0.59% | |||||||||||||||||
| Newmont Mining Corp. | USD | 6.25 | % | 10/01/39 | 75,000 | 90,213 | |||||||||||
| Stone Harbor Investment Funds Annual Report | May 31, 2017 | 53 |
| Stone Harbor Investment Grade Fund | Statements of Investments |
May 31, 2017
| Reference Rate | Currency | Rate | Maturity Date | Principal Amount/Shares* | Value (Expressed in USD) | ||||||||||||
| Non Captive Finance ‐ 0.34% | |||||||||||||||||
| Discover Bank | USD | 4.25 | % | 03/13/26 | 50,000 | $ | 51,951 | ||||||||||
| Paper/Forest Products ‐ 0.34% | |||||||||||||||||
| Packaging Corp. of America | USD | 3.90 | % | 06/15/22 | 50,000 | 52,649 | |||||||||||
| Pharmaceuticals ‐ 0.84% | |||||||||||||||||
| Allergan Funding SCS | USD | 3.45 | % | 03/15/22 | 50,000 | 51,892 | |||||||||||
| Gilead Sciences, Inc. | USD | 4.50 | % | 02/01/45 | 75,000 | 76,853 | |||||||||||
| 128,745 | |||||||||||||||||
| Real Estate Investment Trust (REITs) ‐ 2.54% | |||||||||||||||||
| Corporate Office Properties LP | USD | 3.60 | % | 05/15/23 | 75,000 | 74,483 | |||||||||||
| Crown Castle International Corp. | USD | 4.88 | % | 04/15/22 | 75,000 | 82,248 | |||||||||||
| DDR Corp. | USD | 3.38 | % | 05/15/23 | 75,000 | 73,123 | |||||||||||
| Digital Realty Trust LP | USD | 4.75 | % | 10/01/25 | 75,000 | 80,919 | |||||||||||
| Kimco Realty Corp. | USD | 3.20 | % | 05/01/21 | 75,000 | 76,614 | |||||||||||
| 387,387 | |||||||||||||||||
| Refining ‐ 0.52% | |||||||||||||||||
| Phillips 66 | USD | 4.65 | % | 11/15/34 | 75,000 | 79,373 | |||||||||||
| Retail Food/Drug ‐ 0.74% | |||||||||||||||||
| CVS Pass‐Through Trust | USD | 6.04 | % | 12/10/28 | 34,058 | 38,662 | |||||||||||
| Kroger Co. | USD | 4.45 | % | 02/01/47 | 75,000 | 75,160 | |||||||||||
| 113,822 | |||||||||||||||||
| Retail Non Food/Drug ‐ 0.49% | |||||||||||||||||
| Macy's Retail Holdings, Inc. | USD | 3.88 | % | 01/15/22 | 75,000 | 74,648 | |||||||||||
| Technology ‐ 3.03% | |||||||||||||||||
| Broadcom Corp. / Broadcom Cayman Finance Ltd. | USD | 2.38 | % | 01/15/20 | 125,000 | 125,309 | (1) | ||||||||||
Microsoft Corp., Series 30Y | USD | 4.25 | % | 02/06/47 | 125,000 | 133,198 | |||||||||||
| Oracle Corp.: | |||||||||||||||||
| USD | 2.65 | % | 07/15/26 | 25,000 | 24,277 | ||||||||||||
| USD | 4.30 | % | 07/08/34 | 50,000 | 53,570 | ||||||||||||
| Tencent Holdings Ltd. | USD | 3.80 | % | 02/11/25 | 50,000 | 52,160 | (1) | ||||||||||
| Xilinx, Inc. | USD | 2.95 | % | 06/01/24 | 75,000 | 75,463 | |||||||||||
| 463,977 | |||||||||||||||||
| Transportation Non Air/Rail ‐ 0.91% | |||||||||||||||||
| ERAC USA Finance LLC | USD | 7.00 | % | 10/15/37 | 50,000 | 63,589 | (1) | ||||||||||
| FedEx Corp. | USD | 4.40 | % | 01/15/47 | 75,000 | 75,684 | |||||||||||
| 139,273 | |||||||||||||||||
| Wirelines ‐ 1.35% | |||||||||||||||||
| AT&T, Inc.: | |||||||||||||||||
| USD | 3.60 | % | 02/17/23 | 50,000 | 51,217 | ||||||||||||
| USD | 5.45 | % | 03/01/47 | 75,000 | 79,493 | ||||||||||||
| 54 | www.shiplp.com |
| Stone Harbor Investment Grade Fund | Statements of Investments |
May 31, 2017
| Reference Rate | Currency | Rate | Maturity Date | Principal Amount/Shares* | Value (Expressed in USD) | ||||||||||||
| Wirelines (continued) | |||||||||||||||||
| Verizon Communications, Inc. | USD | 3.50 | % | 11/01/24 | 75,000 | $ | 76,136 | ||||||||||
| 206,846 | |||||||||||||||||
TOTAL CORPORATE BONDS (Cost $6,185,108) | 6,340,032 | ||||||||||||||||
| ASSET BACKED/COMMERCIAL MORTGAGE BACKED SECURITIES ‐ 16.23% | |||||||||||||||||
1211 Avenue of the Americas Trust, Series 2015‐1211 | USD | 3.90 | % | 08/10/35 | 25,000 | 26,722 | (1) | ||||||||||
Banc of America Funding Corp., Series 2012‐R6 | USD | 1.18 | % | 07/26/36 | 7,050 | 7,044 | (1)(2) | ||||||||||
| Bayview Opportunity Master Fund IVb Trust: | |||||||||||||||||
| Series 2016‐CRT1 | USD | 2.79 | % | 10/27/27 | 137,186 | 137,190 | (1)(2) | ||||||||||
| Series 2017‐NPL1 | USD | 3.60 | % | 01/28/32 | 41,414 | 41,450 | (1)(3) | ||||||||||
BHMS Mortgage Trust, Series 2014‐ATLS | USD | 2.49 | % | 07/05/33 | 25,000 | 25,065 | (1)(2) | ||||||||||
Cosmopolitan Hotel Trust, Series 2016‐CSMO | USD | 2.39 | % | 11/15/21 | 100,000 | 100,865 | (1)(2) | ||||||||||
| Fannie Mae Pool: | |||||||||||||||||
| Series 2009 | USD | 5.00 | % | 02/01/23 | 200,617 | 220,443 | |||||||||||
| Series 2016 | USD | 2.30 | % | 09/01/46 | 201,344 | 205,026 | (2) | ||||||||||
Financial Asset Securities Corp. AAA Trust, Series 2005‐2 | USD | 1.29 | % | 11/26/35 | 32,410 | 31,234 | (1)(2) | ||||||||||
| Freddie Mac Non Gold Pool: | |||||||||||||||||
| Series 2012 | USD | 2.18 | % | 12/01/42 | 159,444 | 162,799 | (2) | ||||||||||
| Series 2015 | USD | 2.49 | % | 07/01/45 | 108,299 | 110,389 | (2) | ||||||||||
| Series 2016 | USD | 2.42 | % | 09/01/43 | 82,321 | 84,115 | (2) | ||||||||||
| Freddie Mac Whole Loan Securities Trust: | |||||||||||||||||
| Series 2015‐SC02 | USD | 3.00 | % | 09/25/45 | 72,583 | 71,289 | |||||||||||
| Series 2016‐SC01 | USD | 3.50 | % | 07/25/46 | 130,645 | 133,064 | |||||||||||
GAHR Commercial Mortgage Trust, Series 2015‐NRF | USD | 2.29 | % | 12/15/34 | 18,305 | 18,342 | (1)(2) | ||||||||||
Hyatt Hotel Portfolio Trust, Series 2015‐HYT | USD | 2.25 | % | 11/15/19 | 100,000 | 100,219 | (1)(2) | ||||||||||
| JP Morgan Chase Commercial Mortgage Securities Trust: | |||||||||||||||||
| Series 2006‐LDP9 | USD | 5.34 | % | 05/15/47 | 75,000 | 74,455 | |||||||||||
| Series 2007‐LDPX | USD | 5.46 | % | 01/15/49 | 33,184 | 33,155 | (2) | ||||||||||
New Residential Advance Receivables Trust Advance Receivables Backed Notes, Series 2017‐T1 | USD | 3.21 | % | 02/16/21 | 100,000 | 101,032 | (1) | ||||||||||
Progress Residential Trust, Series 2016‐SFR1 | USD | 2.49 | % | 09/17/18 | 49,793 | 50,458 | (1)(2) | ||||||||||
| RBSSP Resecuritization Trust: | |||||||||||||||||
| Series 2012‐6 | USD | 1.33 | % | 11/26/35 | 41,263 | 39,150 | (1)(2) | ||||||||||
| Series 2012‐6 | USD | 1.31 | % | 01/26/36 | 35,729 | 34,873 | (1)(2) | ||||||||||
| Series 2012‐6 | USD | 1.14 | % | 08/26/36 | 45,459 | 44,954 | (1)(2) | ||||||||||
Santandar Drive Auto Receivables Trust, Series 2013‐1 | USD | 2.27 | % | 01/15/19 | 96,885 | 97,075 | |||||||||||
TAL Advantage V LLC, Series 2013‐2A | USD | 3.55 | % | 11/20/23 | 32,500 | 32,242 | (1) | ||||||||||
| Towd Point Mortgage Trust: | |||||||||||||||||
| Series 2015‐3 | USD | 3.00 | % | 03/25/23 | 57,378 | 58,174 | (1)(2) | ||||||||||
| Series 2015‐5 | USD | 2.75 | % | 09/25/22 | 35,073 | 35,389 | (1)(2) | ||||||||||
| Series 2016‐3 | USD | 2.25 | % | 04/25/56 | 118,843 | 118,658 | (1)(2) | ||||||||||
| Series 2016‐5 | USD | 2.50 | % | 10/25/56 | 46,280 | 46,404 | (1)(2) | ||||||||||
TRU Trust, Series 2016‐TOYS | USD | 3.24 | % | 11/15/19 | 49,385 | 49,630 | (1)(2) | ||||||||||
VOLT LIV LLC, Series 2017‐NPL1 | USD | 3.63 | % | 02/25/47 | 95,861 | 96,332 | (1)(3) | ||||||||||
VOLT XXII LLC, Series 2015‐NPL4 | USD | 3.50 | % | 02/25/18 | 11,583 | 11,653 | (1)(3) | ||||||||||
| Stone Harbor Investment Funds Annual Report | May 31, 2017 | 55 |
| Stone Harbor Investment Grade Fund | Statements of Investments |
May 31, 2017
| Reference Rate | Currency | Rate | Maturity Date | Principal Amount/Shares* | Value(Expressed in USD) | ||||||||||||
| ASSET BACKED/COMMERCIAL MORTGAGE BACKED SECURITIES (continued) | |||||||||||||||||
VOLT XXV LLC, Series 2015‐NPL8 | USD | 3.50 | % | 06/26/45 | 40,972 | $ | 41,157 | (1)(3) | |||||||||
VOLT XXXIII LLC, Series 2015‐NPL5 | USD | 3.50 | % | 03/25/55 | 11,484 | 11,556 | (1)(3) | ||||||||||
VOLT XXXIX LLC, Series 2015‐NP13 | USD | 4.13 | % | 10/25/18 | 28,266 | 28,536 | (1)(3) | ||||||||||
| TOTAL ASSET BACKED/COMMERCIAL MORTGAGE BACKED SECURITIES | 2,480,139 | ||||||||||||||||
| (Cost $2,466,747) | |||||||||||||||||
| U.S. TREASURY BONDS/NOTES ‐ 19.83% | |||||||||||||||||
| U.S. Treasury Bonds | USD | 2.50 | % | 02/15/46 | 425,000 | 393,241 | |||||||||||
| U.S. Treasury Notes: | |||||||||||||||||
| USD | 0.75 | % | 02/15/19 | 250,000 | 247,890 | ||||||||||||
| USD | 1.38 | % | 09/30/20 | 600,000 | 597,129 | ||||||||||||
| USD | 2.00 | % | 11/15/21 | 925,000 | 937,032 | ||||||||||||
| USD | 2.75 | % | 02/15/24 | 250,000 | 261,929 | ||||||||||||
| USD | 2.00 | % | 08/15/25 | 600,000 | 593,731 | ||||||||||||
| TOTAL U.S. TREASURY BONDS/NOTES | 3,030,952 | ||||||||||||||||
| (Cost $3,064,263) | |||||||||||||||||
| U.S. GOVERNMENT AGENCY MORTGAGE BACKED SECURITIES ‐ 18.61% | |||||||||||||||||
| FGLMC TBA: | |||||||||||||||||
| USD | 3.00 | % | 06/13/17 | 100,000 | 100,409 | (4) | |||||||||||
| USD | 3.50 | % | 06/13/17 | 425,000 | 438,717 | (4) | |||||||||||
| FNMA TBA: | |||||||||||||||||
| USD | 3.00 | % | 06/13/17 | 600,000 | 602,766 | (4) | |||||||||||
| USD | 3.50 | % | 06/13/17 | 300,000 | 309,667 | (4) | |||||||||||
| USD | 4.00 | % | 06/13/17 | 700,000 | 739,156 | (4) | |||||||||||
| USD | 4.50 | % | 06/13/17 | 225,000 | 242,524 | (4) | |||||||||||
| USD | 2.50 | % | 06/19/17 | 100,000 | 100,991 | (4) | |||||||||||
| USD | 3.00 | % | 06/19/17 | 300,000 | 309,363 | (4) | |||||||||||
| TOTAL U.S. GOVERNMENT AGENCY MORTGAGE BACKED SECURITIES | 2,843,593 | ||||||||||||||||
| (Cost $2,819,632) | |||||||||||||||||
| SHORT TERM INVESTMENTS ‐ 8.13% | |||||||||||||||||
| Money Market Mutual Funds ‐ 8.13% | |||||||||||||||||
| State Street Institutional Liquid Reserves Fund | |||||||||||||||||
| (7‐Day Yield) | USD | 0.94 | % | N/A | 1,242,956 | 1,243,081 | |||||||||||
| TOTAL SHORT TERM INVESTMENTS | 1,243,081 | ||||||||||||||||
| (Cost $1,242,798) | |||||||||||||||||
| Total Investments ‐ 104.28% | 15,937,797 | ||||||||||||||||
| (Cost $15,778,548) | |||||||||||||||||
| Liabilities in Excess of Other Assets ‐ (4.28)% | (654,730 | ) | |||||||||||||||
| Net Assets ‐ 100.00% | $ | 15,283,067 | |||||||||||||||
* | The principal amount/shares of each security is stated in the currency in which the security is denominated. |
| 56 | www.shiplp.com |
| Stone Harbor Investment Grade Fund | Statements of Investments |
May 31, 2017
Currency Abbreviations:
USD - United States Dollar
(1) | Security exempt from registration under Rule 144A of the Securities Act of 1933. Such securities may normally be sold to qualified institutional buyers in transactions exempt from registration. Total market value of Rule 144A securities amounts to $2,098,424, which represents approximately 13.73% of net assets as of May 31, 2017. |
(2) | Floating or variable rate security. Interest rate disclosed is that which is in effect as of May 31, 2017. |
(3) | Step bond. Coupon changes periodically based upon a predetermined schedule. Interest rate disclosed is that which is in effect as of May 31, 2017. |
(4) | Investment purchased on a delayed delivery basis. |
See Notes to Financial Statements.
| Stone Harbor Investment Funds Annual Report | May 31, 2017 | 57 |
| Stone Harbor Strategic Income Fund | Statements of Investments |
May 31, 2017
| Currency | Rate | Shares* | Value (Expressed in USD) | |||||||||||
| OPEN-END FUNDS - 98.39% | ||||||||||||||
| Stone Harbor Emerging Markets Corporate Debt Fund | USD | N/A | 102,140 | $ | 933,563 | (1) | ||||||||
| Stone Harbor Emerging Markets Debt Fund | USD | N/A | 531,630 | 5,635,273 | (1) | |||||||||
| Stone Harbor High Yield Bond Fund | USD | N/A | 1,560,636 | 12,968,881 | (1) | |||||||||
| Stone Harbor Investment Grade Fund | USD | N/A | 1,471,669 | 15,275,924 | (1) | |||||||||
| Stone Harbor Local Markets Fund | USD | N/A | 216,232 | 1,894,190 | (1)(2) | |||||||||
| 36,707,831 | ||||||||||||||
| TOTAL OPEN‐END FUNDS | 36,707,831 | |||||||||||||
| (Cost $37,230,435) | ||||||||||||||
| SHORT TERM INVESTMENTS ‐ 0.33% | ||||||||||||||
| Money Market Mutual Funds ‐ 0.33% | ||||||||||||||
| State Street Institutional Liquid Reserves Fund (7‐Day Yield) | USD | 0.94 | % | 124,514 | 124,514 | |||||||||
| TOTAL SHORT TERM INVESTMENTS | 124,514 | |||||||||||||
| (Cost $124,514) | ||||||||||||||
| Total Investments ‐ 98.72% | 36,832,345 | |||||||||||||
| (Cost $37,354,949) | ||||||||||||||
| Other Assets In Excess of Liabilities ‐ 1.28% | 476,572 | (3) | ||||||||||||
| Net Assets ‐ 100.00% | $ | 37,308,917 | ||||||||||||
| * | The shares of each security is stated in the currency in which the security is denominated. |
Currency Abbreviations:
| EUR | - | Euro Currency |
| GBP | - | Great Britain Pound |
| JPY | - | Japanese Yen |
| MXN | - | Mexican Peso |
| USD | - | United States Dollar |
| (1) | Affiliated with the Fund, as each is a series of Stone Harbor Investment Funds and has the same investment adviser. |
| (2) | Non-income producing security. |
| (3) | Includes cash which is being held as collateral for futures contracts and credit default swap contracts. |
OUTSTANDING FORWARD FOREIGN CURRENCY CONTRACTS
| Counterparty | Foreign Currency | Contracted Amount** | Purchase/Sale Contract | Settlement Date | Current Value | Unrealized Appreciation/ (Depreciation) | |||||||||||
| Citigroup Global Markets | EUR | 190,200 | Purchase | 06/09/17 | $ | 213,769 | $ | 307 | |||||||||
| Citigroup Global Markets | GBP | 92,400 | Purchase | 06/09/17 | 119,089 | 325 | |||||||||||
| Citigroup Global Markets | JPY | 88,708,000 | Purchase | 06/19/17 | 801,688 | 13,289 | |||||||||||
| Citigroup Global Markets | MXN | 7,421,000 | Purchase | 06/22/17 | 396,471 | 5,799 | |||||||||||
| J.P. Morgan Chase & Co. | EUR | 710,000 | Purchase | 06/30/17 | 798,915 | 2,101 | |||||||||||
| J.P. Morgan Chase & Co. | GBP | 92,400 | Sale | 06/09/17 | 119,089 | 596 | |||||||||||
| $ | 22,417 | ||||||||||||||||
| 58 | www.shiplp.com |
| Stone Harbor Strategic Income Fund | Statements of Investments |
May 31, 2017
OUTSTANDING FORWARD FOREIGN CURRENCY CONTRACTS (continued)
| Counterparty | Foreign Currency | Contracted Amount** | Purchase/Sale Contract | Settlement Date | Current Value | Unrealized Appreciation/ (Depreciation) | |||||||||||
| Citigroup Global Markets | EUR | 211,900 | Sale | 07/10/17 | $ | 238,549 | $ | (324 | ) | ||||||||
| Citigroup Global Markets | GBP | 101,100 | Sale | 07/10/17 | 130,428 | (346 | ) | ||||||||||
| Citigroup Global Markets | JPY | 88,708,000 | Sale | 06/19/17 | 801,688 | (2,118 | ) | ||||||||||
| Citigroup Global Markets | MXN | 7,421,000 | Sale | 06/22/17 | 396,471 | (1,667 | ) | ||||||||||
| J.P. Morgan Chase & Co. | EUR | 190,200 | Sale | 06/09/17 | 213,768 | (5,566 | ) | ||||||||||
| J.P. Morgan Chase & Co. | MXN | 7,238,000 | Purchase | 06/22/17 | 386,694 | (5,281 | ) | ||||||||||
| $ | (15,302 | ) | |||||||||||||||
| ** | The contracted amount is stated in the currency in which the contract is denominated. |
FUTURES CONTRACTS
| Description | Position | Contracts | Currency | Expiration Date | Notional Amount*** | Unrealized Appreciation/(Depreciation) | ||||||||||||
| Euro‐Bund Future | Long | 32 | EUR | 6/08/17 | 5,194,240 | $ | 40,845 | |||||||||||
| US Ultra T‐bond | Long | 2 | USD | 9/20/17 | 330,250 | 3,375 | ||||||||||||
| $ | 44,220 | |||||||||||||||||
| Long Gilt Future | Long | 10 | GBP | 9/27/17 | 1,279,400 | $ | (2,706 | ) | ||||||||||
| US 10Yr Note Future | Short | (37 | ) | USD | 9/20/17 | (4,672,985 | ) | (14,453 | ) | |||||||||
| $ | (17,159 | ) | ||||||||||||||||
| *** | The notional amount of each security is stated in the currency in which the security is denominated. |
CREDIT DEFAULT SWAP CONTRACTS ON CREDIT INDICES ISSUE - BUY PROTECTION(1)
| Reference Obligations | Clearinghouse | Fixed Deal Pay Rate | Maturity Date | Implied Credit Spread at May 31, 2017(2) | Notional Amount(3) | Value | Upfront Premiums Received | Unrealized Depreciation | |||||||||||||||||||
CDX HY CDSI S285 Y(4) | Intercontinental Exchange | 5.000 | % | 06/20/2022 | 3.280 | % | $ | 5,450,000 | $ | (409,502 | ) | $ | 338,445 | $ | (71,057 | ) | |||||||||||
| $ | (409,502 | ) | $ | 338,445 | $ | (71,057 | ) | ||||||||||||||||||||
| (1) | If the Fund is a buyer of protection and a credit event occurs, as defined under the terms of that particular swap agreement, the Fund will either (i) receive from the seller of protection an amount equal to the notional amount of the swap and deliver the referenced obligation or (ii) receive a net settlement amount in the form of cash or securities equal to the notional amount of the swap less the recovery value of the referenced obligation. |
| (2) | Implied credit spreads, represented in absolute terms, utilized in determining the market value of credit default swap agreements on sovereign issues of an emerging country as of period end serve as an indicator of the current status of the payment/performance risk and represent the likelihood or risk of default for the credit derivative. The implied credit spread of a particular referenced entity reflects the cost of buying/selling protection and may include upfront payments required to be made to enter into the agreement. Wider credit spreads represent a deterioration of the referenced entity’s credit soundness and a greater likelihood or risk of default or other credit event occurring as defined under the terms of the agreement. |
| (3) | The maximum potential amount the Fund could be required to pay as a seller of credit protection or receive as a buyer of credit protection if a credit event occurs as defined under the terms of that particular swap agreement. |
| (4) | Based on an index of 100 North American equities with high yield credit ratings that trade in the CDS market. |
See Notes to Financial Statements.
| Stone Harbor Investment Funds Annual Report | May 31, 2017 | 59 |
| Stone Harbor Emerging Markets Debt Allocation Fund | Statements of Investments |
May 31, 2017
| Currency | Rate | Shares* | Value (Expressed in USD) | |||||||||||
| OPEN‐END FUNDS ‐ 99.64% | ||||||||||||||
| Stone Harbor Emerging Markets Debt Fund | USD | N/A | 1,142,278 | $ | 12,108,147 | (1) | ||||||||
| Stone Harbor Local Markets Fund | USD | N/A | 1,766,344 | 15,473,177 | (1)(2) | |||||||||
| 27,581,324 | ||||||||||||||
| TOTAL OPEN‐END FUNDS | 27,581,324 | |||||||||||||
| (Cost $24,080,615) | ||||||||||||||
| SHORT TERM INVESTMENTS ‐ 0.46% | ||||||||||||||
| Money Market Mutual Funds ‐ 0.46% | ||||||||||||||
| State Street Institutional Liquid Reserves Fund (7‐Day Yield) | USD | 0.94 | % | 127,090 | 127,103 | |||||||||
| TOTAL SHORT TERM INVESTMENTS | 127,103 | |||||||||||||
| (Cost $127,103) | ||||||||||||||
| Total Investments ‐ 100.10% | 27,708,427 | |||||||||||||
| (Cost $24,207,718) | ||||||||||||||
| Liabilities in Excess of Other Assets ‐ (0.10)% | (27,573 | ) | ||||||||||||
| Net Assets ‐ 100.00% | $ | 27,680,854 | ||||||||||||
| * | The shares of each security is stated in the currency in which the security is denominated. |
Currency Abbreviations:
EUR - Euro Currency
USD - United States Dollar
(1) | Affiliated with the Fund, as each is a series of Stone Harbor Investment Funds and has the same investment adviser. |
(2) | Non-income producing security. |
OUTSTANDING FORWARD FOREIGN CURRENCY CONTRACTS
| Counterparty | Foreign Currency | Contracted Amount** | Purchase/Sale Contract | Settlement Date | Current Value | Unrealized Appreciation/ (Depreciation) | |||||||||||
| Citigroup Global Markets | EUR | 160,000 | Purchase | 06/05/17 | $ | 179,777 | $ | 577 | |||||||||
| $ | 577 | ||||||||||||||||
| Citigroup Global Markets | EUR | 160,000 | Sale | 06/05/17 | $ | 179,777 | $ | (4,177 | ) | ||||||||
| Citigroup Global Markets | EUR | 160,000 | Sale | 07/07/17 | 180,093 | (579 | ) | ||||||||||
| $ | (4,756 | ) | |||||||||||||||
| ** | The contracted amount is stated in the currency in which the contract is denominated. |
See Notes to Financial Statements.
| 60 | www.shiplp.com |
| Stone Harbor 500 Plus Fund | Statements of Investments |
May 31, 2017
| Reference Rate | Currency | Rate | Maturity Date | Principal Amount/Shares* | Value (Expressed in USD) | ||||||||||||
| ASSET BACKED/COMMERCIAL MORTGAGE BACKED SECURITIES -79.49% | |||||||||||||||||
| Bayview Opportunity Master Fund IVb Trust: | |||||||||||||||||
| Series 2017-CRT1 | USD | 3.19 | % | 10/25/28 | 97,492 | $ | 97,843 | (1)(2) | |||||||||
| Series 2017-NPL1 | USD | 3.60 | % | 01/28/32 | 20,707 | 20,725 | (2)(3) | ||||||||||
CD Commercial Mortgage Trust, Series 2007-CD5 | USD | 5.89 | % | 08/15/17 | 14,491 | 14,510 | (1) | ||||||||||
COMM Mortgage Trust, Series 2013-THL | USD | 2.04 | % | 06/08/30 | 75,000 | 75,273 | (1)(2) | ||||||||||
Hertz Vehicle Financing LLC, Series 2015-2A | USD | 2.02 | % | 09/25/19 | 100,000 | 99,733 | (2) | ||||||||||
Hudsons Bay Simon JV Trust, Series 2015-HBFL | USD | 3.54 | % | 08/05/34 | 100,000 | 99,729 | (1)(2) | ||||||||||
Hyatt Hotel Portfolio Trust, Series 2015-HYT | USD | 2.25 | % | 11/15/19 | 75,000 | 75,164 | (1)(2) | ||||||||||
| JP Morgan Chase Commercial Mortgage Securities Trust: | |||||||||||||||||
| Series 2006-LDP9 | USD | 5.34 | % | 05/15/47 | 80,000 | 79,419 | |||||||||||
| Series 2007-LDPX | USD | 5.46 | % | 01/15/49 | 59,732 | 59,678 | (1) | ||||||||||
LB Commercial Mortgage Trust, Series 2007-C3 | USD | 6.01 | % | 07/15/44 | 17,498 | 17,507 | (1) | ||||||||||
| Mill City Mortgage Loan Trust: | |||||||||||||||||
| Series 2016-1 | USD | 2.50 | % | 04/25/57 | 25,567 | 25,672 | (1)(2) | ||||||||||
| Series 2017-1 | USD | 2.75 | % | 11/25/58 | 96,622 | 97,465 | (1)(2) | ||||||||||
New Residential Advance Receivables Trust Advance Receivables Backed Notes, Series 2017-T1 | USD | 3.21 | % | 02/16/21 | 100,000 | 101,032 | (2) | ||||||||||
Progress Residential Trust, Series 2016-SFR1 | USD | 2.49 | % | 09/17/18 | 39,834 | 40,366 | (1)(2) | ||||||||||
SLM Student Loan Trust, Series 2005-3 | USD | 1.25 | % | 10/25/24 | 192,132 | 191,861 | (1) | ||||||||||
| Towd Point Mortgage Trust: | |||||||||||||||||
| Series 2015-3 | USD | 3.00 | % | 03/25/23 | 17,214 | 17,452 | (1)(2) | ||||||||||
| Series 2016-2 | USD | 2.75 | % | 08/25/55 | 23,994 | 24,182 | (1)(2) | ||||||||||
| Series 2016-3 | USD | 2.25 | % | 04/25/56 | 19,807 | 19,776 | (1)(2) | ||||||||||
| Series 2016-5 | USD | 2.50 | % | 10/25/56 | 92,561 | 92,808 | (1)(2) | ||||||||||
| Series 2017-1 | USD | 2.75 | % | 10/25/56 | 75,338 | 76,026 | (1)(2) | ||||||||||
TRU Trust, Series 2016-TOYS | USD | 3.24 | % | 11/15/19 | 39,508 | 39,704 | (1)(2) | ||||||||||
VOLT LIV LLC, Series 2017-NPL1 | USD | 3.63 | % | 02/25/47 | 86,275 | 86,699 | (2)(3) | ||||||||||
VOLT LVIII LLC, Series 2017-NPL5 | USD | 3.38 | % | 05/27/47 | 100,000 | 100,262 | (2)(3) | ||||||||||
VOLT XXV LLC, Series 2015-NPL8 | USD | 3.50 | % | 06/26/45 | 46,825 | 47,037 | (2)(3) | ||||||||||
VOLT XXXIII LLC, Series 2015-NPL5 | USD | 3.50 | % | 03/25/55 | 45,935 | 46,226 | (2)(3) | ||||||||||
Wells Fargo Commercial Mortgage Trust, Series 2015-BXRP | USD | 2.46 | % | 11/15/29 | 80,343 | 80,407 | (1)(2) | ||||||||||
| TOTAL ASSET BACKED/COMMERCIAL MORTGAGE BACKED SECURITIES | 1,726,556 | ||||||||||||||||
| (Cost $1,719,346) | |||||||||||||||||
| SHORT TERM INVESTMENTS - 18.63% | |||||||||||||||||
| Money Market Mutual Funds - 18.63% | |||||||||||||||||
| State Street Institutional Liquid Reserves Fund (7-Day Yield) | USD | 0.94 | % | N/A | 404,550 | 404,590 | |||||||||||
| TOTAL SHORT TERM INVESTMENTS | 404,590 | ||||||||||||||||
| (Cost $404,590) | |||||||||||||||||
| Total Investments - 98.12% | 2,131,146 | ||||||||||||||||
| (Cost $2,123,936) | |||||||||||||||||
| Other Assets in Excess of Liabilities - 1.88% | 40,897 | ||||||||||||||||
| Net Assets - 100.00% | $ | 2,172,043 | |||||||||||||||
| * | The principal amount/shares of each security is stated in the currency in which the security is denominated. |
| Stone Harbor Investment Funds Annual Report | May 31, 2017 | 61 |
| Stone Harbor 500 Plus Fund | Statements of Investments |
May 31, 2017
Currency Abbreviations:
USD - United States Dollar
(1) | Floating or variable rate security. Interest rate disclosed is that which is in effect as of May 31, 2017. |
(2) | Security exempt from registration under Rule 144A of the Securities Act of 1933. Such securities may normally be sold to qualified institutional buyers in transactions exempt from registration. Total market value of Rule 144A securities amounts to $1,363,581, which represents approximately 62.78% of net assets as of May 31, 2017. |
(3) | Step bond. Coupon changes periodically based upon a predetermined schedule. Interest rate disclosed is that which is in effect as of May 31, 2017. |
FUTURES CONTRACTS
| Description | Position | Contracts | Currency | Expiration Date | Notional Amount** | Unrealized Appreciation/(Depreciation) | |||||||||
| S&P 500 Mini Future | Long | 18 | USD | 6/16/17 | 2,169,990 | $ | 131,465 | ||||||||
| 2,169,990 | $ | 131,465 | |||||||||||||
| ** | The notional amount of each security is stated in the currency in which the security is denominated. |
See Notes to Financial Statements.
| 62 | www.shiplp.com |
Intentionally Left Blank
| Stone Harbor Investment Funds | Statements of Assets and Liabilities |
May 31, 2017
Stone Harbor Emerging Markets Debt Fund | Stone Harbor High Yield Bond Fund | Stone Harbor Local Markets Fund | ||||||||||
| ASSETS: | ||||||||||||
Investments, at value(1) | $ | 1,422,335,613 | $ | 160,595,866 | $ | 814,665,959 | ||||||
Investments in affiliates, at value(2) | – | – | – | |||||||||
| Cash | 8,973,172 | – | 140,000 | |||||||||
Foreign currency, at value (3) | – | – | 1,441,141 | |||||||||
| Variation margin receivable on credit default swap contracts | – | – | – | |||||||||
| Unrealized appreciation on forward foreign currency contracts | 1,095,307 | 1,967 | 2,220,877 | |||||||||
| Deposits with brokers for credit default swap contracts and forward foreign currency contracts | 2,830,000 | – | 750,000 | |||||||||
| Cash pledged as collateral for forward commitments | – | – | – | |||||||||
| Deposits with brokers for futures contracts | – | – | – | |||||||||
| Receivable for investments sold | 47,934,112 | – | 190,505,897 | |||||||||
| Receivable for variation margin on future contracts | – | – | – | |||||||||
| Receivable for fund shares sold | 1,675,339 | 9,702 | – | |||||||||
| Receivable from adviser | – | – | – | |||||||||
| Interest receivable | 22,047,081 | 2,473,004 | 19,575,562 | |||||||||
| Deferred offering costs | – | – | – | |||||||||
| Prepaid and other assets | 24,489 | 5,456 | 16,028 | |||||||||
| Total Assets | 1,506,915,113 | 163,085,995 | 1,029,315,464 | |||||||||
| LIABILITIES: | ||||||||||||
| Payable due to brokers for forward foreign currency contracts | 110,000 | – | 190,000 | |||||||||
| Payable for investments purchased | 19,769,163 | 1,849,244 | 35,149,549 | |||||||||
| Payable for fund shares redeemed | 40,315,000 | 735,000 | 338,596 | |||||||||
| Swap premium received | – | – | – | |||||||||
| Unrealized depreciation on forward foreign currency contracts | 3,931,562 | 37,607 | 1,887,285 | |||||||||
| Variation margin payable on futures contracts | – | – | – | |||||||||
| Payable to adviser | 750,708 | 57,624 | 622,225 | |||||||||
| Payable to administrator | 151,383 | 30,937 | 96,849 | |||||||||
| Payable for offering costs | – | – | – | |||||||||
| Other payables | 115,773 | 90,834 | 88,933 | |||||||||
| Total Liabilities | 65,143,589 | 2,801,246 | 38,373,437 | |||||||||
| Net Assets | $ | 1,441,771,524 | $ | 160,284,749 | $ | 990,942,027 | ||||||
| NET ASSETS CONSIST OF: | ||||||||||||
| Paid‐in capital | $ | 1,568,465,387 | $ | 178,970,405 | $ | 1,275,733,465 | ||||||
| Undistributed/(overdistributed) net investment income | 2,015,745 | 560,218 | (59,111,856 | ) | ||||||||
| Accumulated net realized gain/(loss) | (180,619,968 | ) | (24,454,411 | ) | (181,696,581 | ) | ||||||
| Net unrealized appreciation/(depreciation) | 51,910,360 | 5,208,537 | (43,983,001 | ) | ||||||||
| Net Assets | $ | 1,441,771,524 | $ | 160,284,749 | $ | 990,942,027 | ||||||
| PRICING OF SHARES: | ||||||||||||
| Institutional Class | ||||||||||||
| Net Assets | $ | 1,441,771,524 | $ | 160,284,749 | $ | 990,942,027 | ||||||
| Shares of beneficial interest outstanding (unlimited number of shares, par value of $0.001 per share authorized) | 135,994,567 | 19,299,361 | 113,182,642 | |||||||||
| Net assets value, offering and redemption price per share | $ | 10.60 | $ | 8.31 | $ | 8.76 | ||||||
(1)Cost of Investments | $ | 1,367,699,001 | $ | 155,352,391 | $ | 859,226,362 | ||||||
(2)Cost of Investments in affiliates | $ | – | $ | – | $ | – | ||||||
(3)Cost of Investments in foreign cash | $ | – | $ | – | $ | 1,448,845 | ||||||
See Notes to Financial Statements.
| 64 | www.shiplp.com |
| Stone Harbor Investment Funds | Statements of Assets and Liabilities |
May 31, 2017
Stone Harbor Emerging Markets Corporate Debt Fund | Stone Harbor Investment Grade Fund | Stone Harbor Strategic Income Fund | Stone Harbor Emerging Markets Debt Allocation Fund | Stone Harbor 500 Plus Fund | ||||||||||||||
| $ | 12,872,034 | $ | 15,937,797 | $ | 124,514 | $ | 127,103 | $ | 2,131,146 | |||||||||
| – | – | 36,707,831 | 27,581,324 | – | ||||||||||||||
| – | – | – | – | – | ||||||||||||||
| – | – | 190,484 | – | – | ||||||||||||||
| – | – | 622 | – | – | ||||||||||||||
| – | – | 22,417 | 577 | – | ||||||||||||||
| – | – | 189,879 | – | – | ||||||||||||||
| – | 3,000,000 | – | – | – | ||||||||||||||
| – | – | 151,284 | – | 82,800 | ||||||||||||||
| 336,350 | – | 2,079,000 | – | – | ||||||||||||||
| – | – | – | – | 360 | ||||||||||||||
| – | – | – | – | – | ||||||||||||||
| 6,928 | 12,385 | 13,199 | 11,457 | – | ||||||||||||||
| 171,778 | 85,788 | 84 | 83 | 3,261 | ||||||||||||||
| – | – | – | – | 41,274 | ||||||||||||||
| 6,526 | 1,277 | 1,486 | 4,473 | 1,062 | ||||||||||||||
| 13,393,616 | 19,037,247 | 39,480,800 | 27,725,017 | 2,259,903 | ||||||||||||||
| – | – | – | – | – | ||||||||||||||
| 110,000 | 2,823,024 | – | – | – | ||||||||||||||
| 52,500 | 871,500 | 2,100,000 | – | – | ||||||||||||||
| – | – | – | – | – | ||||||||||||||
| – | – | 15,302 | 4,756 | – | ||||||||||||||
| – | – | 8,091 | – | – | ||||||||||||||
| – | – | – | – | 36,593 | ||||||||||||||
| 3,203 | 12,578 | 3,865 | 2,217 | 8,788 | ||||||||||||||
| – | – | – | – | – | ||||||||||||||
| 63,167 | 47,078 | 44,625 | 37,190 | 42,479 | ||||||||||||||
| 228,870 | 3,754,180 | 2,171,883 | 44,163 | 87,860 | ||||||||||||||
| $ | 13,164,746 | $ | 15,283,067 | $ | 37,308,917 | $ | 27,680,854 | $ | 2,172,043 | |||||||||
| $ | 17,481,080 | $ | 15,084,937 | $ | 38,161,649 | $ | 32,098,413 | $ | 2,031,953 | |||||||||
| 17,169 | 0 | 138,924 | 301,402 | 1,777 | ||||||||||||||
| (4,851,127 | ) | 38,881 | (433,513 | ) | (8,215,491 | ) | (362 | ) | ||||||||||
| 517,624 | 159,249 | (558,143 | ) | 3,496,530 | 138,675 | |||||||||||||
| $ | 13,164,746 | $ | 15,283,067 | $ | 37,308,917 | $ | 27,680,854 | $ | 2,172,043 | |||||||||
| $ | 13,164,746 | $ | 15,283,067 | $ | 37,308,917 | $ | 27,680,854 | $ | 2,172,043 | |||||||||
| 1,439,886 | 1,472,733 | 3,770,478 | 2,897,021 | 202,741 | ||||||||||||||
| $ | 9.14 | $ | 10.38 | $ | 9.90 | $ | 9.55 | $ | 10.71 | |||||||||
| $ | 12,354,410 | $ | 15,778,548 | $ | 124,514 | $ | 127,103 | $ | 2,123,936 | |||||||||
| $ | – | $ | – | $ | 37,230,435 | $ | 24,080,615 | $ | – | |||||||||
| $ | – | $ | – | $ | 192,590 | $ | – | $ | – | |||||||||
See Notes to Financial Statements.
| Stone Harbor Investment Funds Annual Report | May 31, 2017 | 65 |
| Stone Harbor Investment Funds | Statements of Operations |
For the Year or Period Ended May 31, 2017
Stone Harbor Emerging Markets Debt Fund | Stone Harbor High Yield Bond Fund | Stone Harbor Local Markets Fund | ||||||||||
| INVESTMENT INCOME: | ||||||||||||
Interest(1) | $ | 94,101,623 | $ | 14,771,671 | $ | 73,025,646 | ||||||
| Dividends | 268,975 | 212,703 | 187,833 | |||||||||
| Dividends from affiliated investment companies | – | – | – | |||||||||
| Total Investment Income | 94,370,598 | 14,984,374 | 73,213,479 | |||||||||
| EXPENSES: | ||||||||||||
| Operational: | ||||||||||||
| Investment advisory fee | 9,352,667 | 1,193,357 | 7,180,770 | |||||||||
| Administration fees | 855,883 | 159,338 | 525,154 | |||||||||
| Custodian fees | 112,171 | 42,514 | 475,758 | |||||||||
| Printing fees | 6,317 | 6,056 | 4,288 | |||||||||
| Professional fees | 93,344 | 93,344 | 94,344 | |||||||||
| Offering costs | – | – | – | |||||||||
| Trustee fees | 186,189 | 29,696 | 113,216 | |||||||||
| Transfer agent fees | 33,900 | 23,574 | 30,812 | |||||||||
| Registration fees | 22,313 | 22,745 | 25,516 | |||||||||
| Insurance fees | 40,181 | 6,824 | 26,251 | |||||||||
| Other | 27,870 | 11,430 | 23,091 | |||||||||
| Total expenses before waiver/reimbursement | 10,730,835 | 1,588,878 | 8,499,200 | |||||||||
| Less fees waived by investment adviser | – | (36,364 | ) | – | ||||||||
| Less expenses reimbursed by investment adviser | – | – | – | |||||||||
| Total Net Expenses | 10,730,835 | 1,552,514 | 8,499,200 | |||||||||
| Net Investment Income | 83,639,763 | 13,431,860 | 64,714,279 | |||||||||
| REALIZED AND UNREALIZED GAIN/(LOSS) ON INVESTMENTS: | ||||||||||||
| Net realized gain/(loss) on: | ||||||||||||
| Investments | 29,724,800 | (6,759,356 | ) | (58,879,887 | ) | |||||||
| Investments ‐ affiliated investment companies | – | – | – | |||||||||
| Credit default swap contracts | 4,681,709 | – | – | |||||||||
| Futures contracts | – | – | – | |||||||||
| Forward foreign currency contracts | 1,478,256 | 399,980 | (19,148,143 | ) | ||||||||
| Foreign currency transactions | (173,271 | ) | (23,280 | ) | 1,697,906 | |||||||
| Net realized gain/(loss) | 35,711,494 | (6,382,656 | ) | (76,330,124 | ) | |||||||
| Change in unrealized appreciation/(depreciation) on: | ||||||||||||
| Investments | 62,171,790 | 18,172,276 | 116,891,430 | |||||||||
| Credit default swap contracts | 151,724 | – | – | |||||||||
| Futures contracts | – | – | – | |||||||||
| Forward foreign currency contracts | (2,912,301 | ) | (134,019 | ) | 1,328,631 | |||||||
| Translation of assets and liabilities denominated in foreign currencies | 126,882 | 1,310 | 577,474 | |||||||||
| Net change in unrealized appreciation/(depreciation) | 59,538,095 | 18,039,567 | 118,797,535 | |||||||||
| Net Realized and Unrealized Gain | 95,249,589 | 11,656,911 | 42,467,411 | |||||||||
| Net Increase in Net Assets Resulting from Operations | $ | 178,889,352 | $ | 25,088,771 | $ | 107,181,690 | ||||||
(1)Including Foreign Tax Withholding | $ | 11,510 | $ | – | $ | 874,091 | ||||||
(2)For the Period January 20, 2017 (Commencement of Operations) to May 31, 2017.
See Notes to Financial Statements.
| 66 | www.shiplp.com |
| Stone Harbor Investment Funds | Statements of Operations |
For the Year or Period Ended May 31, 2017
| Stone Harbor Emerging Markets Corporate Debt Fund | Stone Harbor Investment Grade Fund | Stone Harbor Strategic Income Fund | Stone Harbor Emerging Markets Debt Allocation Fund | Stone Harbor 500 Plus Fund(2) | ||||||||||||||
| $ | 826,729 | $ | 349,513 | $ | – | $ | – | $ | 15,067 | |||||||||
| 2,454 | 12,273 | 345 | 184 | 1,717 | ||||||||||||||
| – | – | 1,539,669 | 1,416,353 | – | ||||||||||||||
| 829,183 | 361,786 | 1,540,014 | 1,416,537 | 16,784 | ||||||||||||||
| 128,324 | 56,921 | 211,418 | 358,155 | 3,276 | ||||||||||||||
| 12,397 | 36,964 | 21,107 | 26,255 | 8,978 | ||||||||||||||
| 8,961 | 13,103 | 19,366 | 5,932 | 3,631 | ||||||||||||||
| 3,592 | 3,594 | 3,626 | 3,723 | 1,999 | ||||||||||||||
| 72,689 | 56,046 | 52,946 | 47,916 | 42,671 | ||||||||||||||
| – | – | – | – | 23,465 | ||||||||||||||
| 1,882 | 1,873 | 4,463 | 7,219 | 58 | ||||||||||||||
| 21,796 | 20,644 | 21,335 | 22,676 | 7,445 | ||||||||||||||
| 32,366 | 19,974 | 20,351 | 21,978 | 385 | ||||||||||||||
| 781 | 409 | 934 | 2,053 | – | ||||||||||||||
| 5,135 | 5,187 | 4,291 | 6,268 | 619 | ||||||||||||||
| 287,923 | 214,715 | 359,837 | 502,175 | 92,527 | ||||||||||||||
| (128,324 | ) | (56,921 | ) | (211,418 | ) | (358,155 | ) | (3,276 | ) | |||||||||
| (8,529 | ) | (76,346 | ) | (105,162 | ) | (117,093 | ) | (84,869 | ) | |||||||||
| 151,070 | 81,448 | 43,257 | 26,927 | 4,382 | ||||||||||||||
| 678,113 | 280,338 | 1,496,757 | 1,389,610 | 12,402 | ||||||||||||||
| 166,313 | 56,374 | (50,575 | ) | 13 | – | |||||||||||||
| – | – | (408,037 | ) | 2,151,359 | – | |||||||||||||
| – | – | (307,292 | ) | – | – | |||||||||||||
| – | – | 337,337 | – | (35 | ) | |||||||||||||
| 53,364 | – | 170,491 | (195,260 | ) | – | |||||||||||||
| (1,494 | ) | – | (43,462 | ) | (55,201 | ) | – | |||||||||||
| 218,183 | 56,374 | (301,538 | ) | 1,900,911 | (35 | ) | ||||||||||||
| 399,869 | (32,311 | ) | 1,474,636 | 2,496,329 | 7,210 | |||||||||||||
| – | – | (71,057 | ) | – | – | |||||||||||||
| – | – | 6,703 | – | 131,465 | ||||||||||||||
| (3,298 | ) | – | 27,437 | 16,375 | – | |||||||||||||
| (70 | ) | – | 3,374 | – | – | |||||||||||||
| 396,501 | (32,311 | ) | 1,441,093 | 2,512,704 | 138,675 | |||||||||||||
| 614,684 | 24,063 | 1,139,555 | 4,413,615 | 138,640 | ||||||||||||||
| $ | 1,292,797 | $ | 304,401 | $ | 2,636,312 | $ | 5,803,225 | $ | 151,042 | |||||||||
| $ | – | $ | – | $ | – | $ | – | $ | – | |||||||||
See Notes to Financial Statements.
| Stone Harbor Investment Funds Annual Report | May 31, 2017 | 67 |
| Stone Harbor Investment Funds | Statements of Changes in Net Assets |
| Stone Harbor Emerging Markets Debt Fund | ||||||||
| For the Year Ended May 31, 2017 | For the Year Ended May 31, 2016 | |||||||
| OPERATIONS: | ||||||||
| Net investment income | $ | 83,639,763 | $ | 132,338,061 | ||||
| Net realized gain/(loss) | 35,711,494 | (75,239,163 | ) | |||||
| Net change in unrealized appreciation/(depreciation) | 59,538,095 | (14,545,970 | ) | |||||
| Net increase/(decrease) in net assets resulting from operations | 178,889,352 | 42,552,928 | ||||||
| DISTRIBUTIONS TO SHAREHOLDERS: | ||||||||
| Institutional Class | ||||||||
| From net investment income | (90,794,571 | ) | (125,569,725 | ) | ||||
| Net decrease in net assets from distributions to shareholders | (90,794,571 | ) | (125,569,725 | ) | ||||
| CAPITAL SHARE TRANSACTIONS: | ||||||||
| Institutional Class | ||||||||
| Proceeds from sale of shares | 263,243,956 | 199,480,217 | ||||||
| Issued to shareholders in reinvestment of distributions | 85,031,047 | 118,098,700 | ||||||
| Cost of shares redeemed | (568,088,003 | ) | (597,412,891 | ) | ||||
| Net decrease in net assets from capital share transactions | (219,813,000 | ) | (279,833,974 | ) | ||||
| Net Increase/(Decrease) in Net Assets | (131,718,219 | ) | (362,850,771 | ) | ||||
| NET ASSETS: | ||||||||
| Beginning of year | 1,573,489,743 | 1,936,340,514 | ||||||
| End of year | $ | 1,441,771,524 | $ | 1,573,489,743 | ||||
| Includes undistributed/(overdistributed) net investment income of: | $ | 2,015,745 | $ | 4,512,569 | ||||
| OTHER INFORMATION: | ||||||||
| Share Transactions: | ||||||||
| Institutional Class | ||||||||
| Beginning shares | 156,258,645 | 185,010,068 | ||||||
| Shares sold | 25,504,654 | 20,059,678 | ||||||
| Shares reinvested | 8,200,580 | 12,105,213 | ||||||
| Shares redeemed | (53,969,312 | ) | (60,916,314 | ) | ||||
| Shares outstanding ‐ end of year | 135,994,567 | 156,258,645 | ||||||
See Notes to Financial Statements.
| 68 | www.shiplp.com |
| Stone Harbor Investment Funds | Statements of Changes in Net Assets |
| Stone Harbor High Yield Bond Fund | Stone Harbor Local Markets Fund | Stone Harbor Emerging Markets Corporate Debt Fund | ||||||||||||||||||||
| For the Year Ended May 31, 2017 | For the Year Ended May 31, 2016 | For the Year Ended May 31, 2017 | For the Year Ended May 31, 2016 | For the Year Ended May 31, 2017 | For the Year Ended May 31, 2016 | |||||||||||||||||
| $ | 13,431,860 | $ | 16,112,323 | $ | 64,714,279 | $ | 69,470,968 | $ | 678,113 | $ | 1,512,161 | |||||||||||
| (6,382,656 | ) | (15,415,405 | ) | (76,330,124 | ) | (297,637,894 | ) | 218,183 | (1,501,308 | ) | ||||||||||||
| 18,039,567 | (10,186,279 | ) | 118,797,535 | 114,005,325 | 396,501 | (305,707 | ) | |||||||||||||||
| 25,088,771 | (9,489,361 | ) | 107,181,690 | (114,161,601 | ) | 1,292,797 | (294,854 | ) | ||||||||||||||
| (12,429,528 | ) | (16,172,824 | ) | – | – | (653,203 | ) | (1,499,763 | ) | |||||||||||||
| (12,429,528 | ) | (16,172,824 | ) | – | – | (653,203 | ) | (1,499,763 | ) | |||||||||||||
| 7,142,372 | 5,620,922 | 183,701,624 | 217,498,360 | 962,544 | 25,088,754 | |||||||||||||||||
| 11,608,008 | 14,352,976 | – | – | 653,203 | 963,639 | |||||||||||||||||
| (121,660,433 | ) | (33,490,494 | ) | (226,443,779 | ) | (739,781,975 | ) | (6,437,161 | ) | (30,912,635 | ) | |||||||||||
| (102,910,053 | ) | (13,516,596 | ) | (42,742,155 | ) | (522,283,615 | ) | (4,821,414 | ) | (4,860,242 | ) | |||||||||||
| (90,250,810 | ) | (39,178,781 | ) | 64,439,535 | (636,445,216 | ) | (4,181,820 | ) | (6,654,859 | ) | ||||||||||||
| 250,535,559 | 289,714,340 | 926,502,492 | 1,562,947,708 | 17,346,566 | 24,001,425 | |||||||||||||||||
| $ | 160,284,749 | $ | 250,535,559 | $ | 990,942,027 | $ | 926,502,492 | $ | 13,164,746 | $ | 17,346,566 | |||||||||||
| $ | 560,218 | $ | 278,565 | $ | (59,111,856 | ) | $ | (134,019,451 | ) | $ | 17,169 | $ | 26,081 | |||||||||
| 31,654,090 | 33,382,621 | 119,102,327 | 186,605,612 | 1,967,303 | 2,634,743 | |||||||||||||||||
| 869,025 | 705,428 | 21,754,483 | 27,917,285 | 106,476 | 2,877,035 | |||||||||||||||||
| 1,425,710 | 1,831,361 | – | – | 72,666 | 111,772 | |||||||||||||||||
| (14,649,464 | ) | (4,265,320 | ) | (27,674,168 | ) | (95,420,570 | ) | (706,559 | ) | (3,656,247 | ) | |||||||||||
| 19,299,361 | 31,654,090 | 113,182,642 | 119,102,327 | 1,439,886 | 1,967,303 | |||||||||||||||||
See Notes to Financial Statements.
| Stone Harbor Investment Funds Annual Report | May 31, 2017 | 69 |
| Stone Harbor Investment Funds | Statements of Changes in Net Assets |
| Stone Harbor Investment Grade Fund | ||||||||
| For the Year Ended May 31, 2017 | For the Year Ended May 31, 2016 | |||||||
| OPERATIONS: | ||||||||
| Net investment income | $ | 280,338 | $ | 219,467 | ||||
| Net realized gain/(loss) | 56,374 | 68,147 | ||||||
| Net realized gain/(loss) on investments ‐ affiliated investment companies | – | – | ||||||
| Distributions from affiliated investment companies | – | – | ||||||
| Net change in unrealized appreciation/(depreciation) | (32,311 | ) | 166,394 | |||||
| Net increase/(decrease) in net assets resulting from operations | 304,401 | 454,008 | ||||||
| DISTRIBUTIONS TO SHAREHOLDERS: | ||||||||
| Institutional Class | ||||||||
| From net investment income | (297,043 | ) | (215,807 | ) | ||||
| From net realized gains | (62,079 | ) | (135,024 | ) | ||||
| Net decrease in net assets from distributions to shareholders | (359,122 | ) | (350,831 | ) | ||||
| CAPITAL SHARE TRANSACTIONS: | ||||||||
| Institutional Class | ||||||||
| Proceeds from sale of shares | 1,714,642 | 7,701,633 | ||||||
| Issued to shareholders in reinvestment of distributions | 359,122 | 350,831 | ||||||
| Cost of shares redeemed | (2,528,868 | ) | (2,239,900 | ) | ||||
| Net increase/(decrease) in net assets from capital share transactions | (455,104 | ) | 5,812,564 | |||||
| Net Increase/(Decrease) in Net Assets | (509,825 | ) | 5,915,741 | |||||
| NET ASSETS: | ||||||||
| Beginning of period | 15,792,892 | 9,877,151 | ||||||
| End of period | $ | 15,283,067 | $ | 15,792,892 | ||||
| Includes undistributed net investment income of: | $ | – | $ | 7,340 | ||||
| OTHER INFORMATION: | ||||||||
| Share Transactions: | ||||||||
| Institutional Class | ||||||||
| Beginning shares | 1,518,095 | 953,189 | ||||||
| Shares sold | 164,614 | 747,478 | ||||||
| Shares reinvested | 35,095 | 34,384 | ||||||
| Shares redeemed | (245,071 | ) | (216,956 | ) | ||||
| Shares outstanding ‐ end of period | 1,472,733 | 1,518,095 | ||||||
See Notes to Financial Statements.
| 70 | www.shiplp.com |
| Stone Harbor Investment Funds | Statements of Changes in Net Assets |
| Stone Harbor Strategic Income Fund | Stone Harbor Emerging Markets Debt Allocation Fund | Stone Harbor 500 Plus Fund | ||||||||||||||||
| For the Year Ended May 31, 2017 | For the Year Ended May 31, 2016 | For the Year Ended May 31, 2017 | For the Year Ended May 31, 2016 | For the Period January 20, 2017 (Commencement of Operations) to May 31, 2017 | ||||||||||||||
| $ | 1,496,757 | $ | 1,551,464 | $ | 1,389,610 | $ | 3,372,901 | $ | 12,402 | |||||||||
| 106,499 | 713 | (250,448 | ) | 6,807 | (35 | ) | ||||||||||||
| (408,037 | ) | (480,155 | ) | 2,151,359 | (10,092,327 | ) | – | |||||||||||
| – | 21,861 | – | – | – | ||||||||||||||
| 1,441,093 | (972,176 | ) | 2,512,704 | 5,191,251 | 138,675 | |||||||||||||
| 2,636,312 | 121,707 | 5,803,225 | (1,521,368 | ) | 151,042 | |||||||||||||
| (1,417,693 | ) | (1,277,346 | ) | (1,818,851 | ) | (2,967,695 | ) | (12,105 | ) | |||||||||
| – | (480,732 | ) | – | – | – | |||||||||||||
| (1,417,693 | ) | (1,758,078 | ) | (1,818,851 | ) | (2,967,695 | ) | (12,105 | ) | |||||||||
| 2,400,000 | 2,802,571 | 5,055,634 | 53,716,767 | 2,021,001 | ||||||||||||||
| 1,247,105 | 1,236,613 | 1,818,851 | 2,967,695 | 12,105 | ||||||||||||||
| (4,050,000 | ) | – | (50,653,241 | ) | (70,119,671 | ) | – | |||||||||||
| (402,895 | ) | 4,039,184 | (43,778,756 | ) | (13,435,209 | ) | 2,033,106 | |||||||||||
| 815,724 | 2,402,813 | (39,794,382 | ) | (17,924,272 | ) | 2,172,043 | ||||||||||||
| 36,493,193 | 34,090,380 | 67,475,236 | 85,399,508 | – | ||||||||||||||
| $ | 37,308,917 | $ | 36,493,193 | $ | 27,680,854 | $ | 67,475,236 | $ | 2,172,043 | |||||||||
| $ | 138,924 | $ | 130,713 | $ | 301,402 | $ | 981,104 | $ | 1,777 | |||||||||
| 3,813,000 | 3,390,417 | 7,583,812 | 9,124,028 | – | ||||||||||||||
| 243,244 | 289,702 | 538,403 | 6,166,414 | 201,592 | ||||||||||||||
| 128,674 | 132,881 | 209,545 | 361,033 | 1,149 | ||||||||||||||
| (414,440 | ) | – | (5,434,739 | ) | (8,067,663 | ) | – | |||||||||||
| 3,770,478 | 3,813,000 | 2,897,021 | 7,583,812 | 202,741 | ||||||||||||||
See Notes to Financial Statements.
| Stone Harbor Investment Funds Annual Report | May 31, 2017 | 71 |
| Stone Harbor Emerging Markets Debt Fund | Financial Highlights |
For a share outstanding through the periods presented.
| Institutional Class | For the Year Ended May 31, 2017 | For the Year Ended May 31, 2016 | For the Year Ended May 31, 2015 | For the Year Ended May 31, 2014 | For the Year Ended May 31, 2013 | |||||||||||||||
| Net asset value ‐ beginning of year | $ | 10.07 | $ | 10.47 | $ | 11.11 | $ | 11.34 | $ | 10.93 | ||||||||||
| Income/(loss) from investment operations: | ||||||||||||||||||||
Net investment income(1) | 0.56 | 0.77 | 0.59 | 0.55 | 0.55 | |||||||||||||||
| Net realized and unrealized gain/(loss) on investments | 0.59 | (0.43 | ) | (0.70 | ) | (0.31 | ) | 0.45 | ||||||||||||
| Total income/(loss) from investment operations | 1.15 | 0.34 | (0.11 | ) | 0.24 | 1.00 | ||||||||||||||
| Less distributions to shareholders: | ||||||||||||||||||||
| From net investment income | (0.62 | ) | (0.74 | ) | (0.53 | ) | (0.47 | ) | (0.54 | ) | ||||||||||
| From net realized gains | – | – | – | – | (0.05 | ) | ||||||||||||||
| Total distributions | (0.62 | ) | (0.74 | ) | (0.53 | ) | (0.47 | ) | (0.59 | ) | ||||||||||
| Net Increase/(Decrease) in Net Asset Value | 0.53 | (0.40 | ) | (0.64 | ) | (0.23 | ) | 0.41 | ||||||||||||
| Net asset value ‐ end of year | $ | 10.60 | $ | 10.07 | $ | 10.47 | $ | 11.11 | $ | 11.34 | ||||||||||
| Total Return | 11.70 | % | 3.70 | % | (1.01 | )% | 2.45 | % | 9.05 | % | ||||||||||
| Ratios/Supplemental Data: | ||||||||||||||||||||
| Net assets, end of period (in millions) | $ | 1,442 | $ | 1,573 | $ | 1,936 | $ | 2,178 | $ | 1,837 | ||||||||||
| Ratio of expenses to average net assets without fee waivers/reimbursements/ repayment of previously waived fees | 0.69 | % | 0.68 | % | 0.68 | % | 0.70 | % | 0.68 | % | ||||||||||
| Ratio of expenses to average net assets with fee waivers/reimbursements/ repayment of previously waived fees | 0.69 | % | 0.68 | % | 0.68 | % | 0.70 | % | 0.68 | % | ||||||||||
| Ratio of net investment income to average net assets with fee waivers/ reimbursements/repayment of previously waived fees | 5.37 | % | 7.73 | % | 5.54 | % | 5.21 | % | 4.68 | % | ||||||||||
| Portfolio turnover rate | 114 | % | 90 | % | 75 | % | 68 | % | 68 | % | ||||||||||
| (1) | Calculated using average shares throughout the period. |
See Notes to Financial Statements.
| 72 | www.shiplp.com |
| Stone Harbor High Yield Bond Fund | Financial Highlights |
For a share outstanding through the periods presented.
| Institutional Class | For the Year Ended May 31, 2017 | For the Year Ended May 31, 2016 | For the Year Ended May 31, 2015 | For the Year Ended May 31, 2014 | For the Year Ended May 31, 2013 | |||||||||||||||
| Net asset value ‐ beginning of year | $ | 7.91 | $ | 8.68 | $ | 9.63 | $ | 9.83 | $ | 9.13 | ||||||||||
| Income/(loss) from investment operations: | ||||||||||||||||||||
Net investment income(1) | 0.46 | 0.49 | 0.54 | 0.60 | 0.70 | |||||||||||||||
| Net realized and unrealized gain/(loss) on investments | 0.39 | (0.77 | ) | (0.58 | ) | 0.13 | 0.72 | |||||||||||||
| Total income/(loss) from investment operations | 0.85 | (0.28 | ) | (0.04 | ) | 0.73 | 1.42 | |||||||||||||
| Less distributions to shareholders: | ||||||||||||||||||||
| From net investment income | (0.45 | ) | (0.49 | ) | (0.60 | ) | (0.64 | ) | (0.68 | ) | ||||||||||
| From net realized gains | – | – | (0.31 | ) | (0.29 | ) | (0.04 | ) | ||||||||||||
| Total distributions | (0.45 | ) | (0.49 | ) | (0.91 | ) | (0.93 | ) | (0.72 | ) | ||||||||||
| Net Increase/(Decrease) in Net Asset Value | 0.40 | (0.77 | ) | (0.95 | ) | (0.20 | ) | 0.70 | ||||||||||||
| Net asset value ‐ end of year | $ | 8.31 | $ | 7.91 | $ | 8.68 | $ | 9.63 | $ | 9.83 | ||||||||||
Total Return(2) | 10.97 | % | (3.03 | )% | (0.27 | )% | 7.90 | % | 15.87 | % | ||||||||||
| Ratios/Supplemental Data: | ||||||||||||||||||||
| Net assets, end of period (in millions) | $ | 160 | $ | 251 | $ | 290 | $ | 303 | $ | 387 | ||||||||||
| Ratio of expenses to average net assets without fee waivers/reimbursements/ repayment of previously waived fees | 0.67 | % | 0.64 | % | 0.62 | %(3) | 0.62 | % | 0.60 | % | ||||||||||
| Ratio of expenses to average net assets with fee waivers/reimbursements/ repayment of previously waived fees | 0.65 | % | 0.64 | % | 0.60 | %(3) | 0.55 | % | 0.55 | % | ||||||||||
| Ratio of net investment income to average net assets with fee waivers/ reimbursements/repayment of previously waived fees | 5.63 | % | 6.06 | % | 5.98 | % | 6.23 | % | 7.27 | % | ||||||||||
| Portfolio turnover rate | 70 | % | 48 | % | 52 | % | 54 | % | 59 | % | ||||||||||
| (1) | Calculated using average shares throughout the period. |
| (2) | Total returns would have been lower had various fees and expenses not been waived and reimbursed during the period. The total returns in the table represent the rate that an investor would have earned (or lost) on an investment in a Fund (assuming reinvestment of all dividends and distributions). |
| (3) | Effective October 1, 2014, the expense limitation rate changed from 0.55% to 0.65%. |
See Notes to Financial Statements.
| Stone Harbor Investment Funds Annual Report | May 31, 2017 | 73 |
| Stone Harbor Local Markets Fund | Financial Highlights |
For a share outstanding through the periods presented.
| Institutional Class | For the Year Ended May 31, 2017 | For the Year Ended May 31, 2016 | For the Year Ended May 31, 2015 | For the Year Ended May 31, 2014 | For the Year Ended May 31, 2013 | |||||||||||||||
| Net asset value ‐ beginning of year | $ | 7.78 | $ | 8.38 | $ | 9.96 | $ | 10.51 | $ | 10.10 | ||||||||||
| Income/(loss) from investment operations: | ||||||||||||||||||||
Net investment income(1) | 0.56 | 0.50 | 0.52 | 0.53 | 0.49 | |||||||||||||||
| Net realized and unrealized gain/(loss) on investments | 0.42 | (1.10 | ) | (1.98 | ) | (0.96 | ) | 0.33 | ||||||||||||
| Total income/(loss) from investment operations | 0.98 | (0.60 | ) | (1.46 | ) | (0.43 | ) | 0.82 | ||||||||||||
| Less distributions to shareholders: | ||||||||||||||||||||
| From net investment income | – | – | (0.12 | ) | (0.07 | ) | (0.39 | ) | ||||||||||||
| From net realized gains | – | – | – | (0.05 | ) | (0.02 | ) | |||||||||||||
| Total distributions | – | – | (0.12 | ) | (0.12 | ) | (0.41 | ) | ||||||||||||
| Net Increase/(Decrease) in Net Asset Value | 0.98 | (0.60 | ) | (1.58 | ) | (0.55 | ) | 0.41 | ||||||||||||
| Net asset value ‐ end of year | $ | 8.76 | $ | 7.78 | $ | 8.38 | $ | 9.96 | $ | 10.51 | ||||||||||
| Total Return | 12.60 | % | (7.16 | )% | (14.70 | )% | (4.04 | )% | 7.92 | % | ||||||||||
| Ratios/Supplemental Data: | ||||||||||||||||||||
| Net assets, end of period (in millions) | $ | 991 | $ | 927 | $ | 1,563 | $ | 2,491 | $ | 2,464 | ||||||||||
| Ratio of expenses to average net assets without fee waivers/reimbursements/repayment of previously waived fees | 0.89 | % | 0.88 | % | 0.87 | % | 0.88 | % | 0.86 | % | ||||||||||
| Ratio of expenses to average net assets with fee waivers/reimbursements/repayment of previously waived fees | 0.89 | % | 0.88 | % | 0.87 | % | 0.88 | % | 0.86 | % | ||||||||||
| Ratio of net investment income to average net assets with fee waivers/reimbursements/repayment of previously waived fees | 6.76 | % | 6.49 | % | 5.62 | % | 5.41 | % | 4.45 | % | ||||||||||
| Portfolio turnover rate | 125 | % | 166 | % | 145 | % | 181 | % | 191 | % | ||||||||||
| (1) | Calculated using average shares throughout the period. |
See Notes to Financial Statements.
| 74 | www.shiplp.com |
| Stone Harbor Emerging Markets Corporate Debt Fund | Financial Highlights |
For a share outstanding through the periods presented.
| Institutional Class | For the Year Ended May 31, 2017 | For the Year Ended May 31, 2016 | For the Year Ended May 31, 2015 | For the Year Ended May 31, 2014 | For the Year Ended May 31, 2013 | |||||||||||||||
| Net asset value ‐ beginning of period | $ | 8.82 | $ | 9.11 | $ | 9.23 | $ | 9.37 | $ | 8.89 | ||||||||||
| Income from investment operations: | ||||||||||||||||||||
Net investment income(1) | 0.41 | 0.43 | 0.41 | 0.41 | 0.44 | |||||||||||||||
| Net realized and unrealized gain/(loss) on investments | 0.32 | (0.27 | ) | (0.08 | ) | (0.08 | ) | 0.46 | ||||||||||||
| Total income from investment operations | 0.73 | 0.16 | 0.33 | 0.33 | 0.90 | |||||||||||||||
| Less distributions to shareholders: | ||||||||||||||||||||
| From net investment income | (0.41 | ) | (0.45 | ) | (0.45 | ) | (0.47 | ) | (0.42 | ) | ||||||||||
| Total distributions | (0.41 | ) | (0.45 | ) | (0.45 | ) | (0.47 | ) | (0.42 | ) | ||||||||||
| Net Increase/(Decrease) in Net Asset Value | 0.32 | (0.29 | ) | (0.12 | ) | (0.14 | ) | 0.48 | ||||||||||||
| Net asset value ‐ end of period | $ | 9.14 | $ | 8.82 | $ | 9.11 | $ | 9.23 | $ | 9.37 | ||||||||||
Total Return(2) | 8.43 | % | 1.92 | % | 3.64 | % | 3.80 | % | 10.13 | % | ||||||||||
| Ratios/Supplemental Data: | ||||||||||||||||||||
| Net assets, end of period (in millions) | $ | 13 | $ | 17 | $ | 24 | $ | 26 | $ | 68 | ||||||||||
| Ratio of expenses to average net assets without fee waivers/reimbursements | 1.91 | % | 1.37 | % | 1.40 | % | 1.22 | % | 1.16 | % | ||||||||||
| Ratio of expenses to average net assets with fee waivers/reimbursements | 1.00 | % | 1.00 | % | 1.00 | % | 1.00 | % | 1.00 | % | ||||||||||
| Ratio of net investment income to average net assets with fee waivers/reimbursements | 4.49 | % | 4.93 | % | 4.52 | % | 4.58 | % | 4.68 | % | ||||||||||
| Portfolio turnover rate | 72 | % | 127 | % | 62 | % | 78 | % | 78 | % | ||||||||||
| (1) | Calculated using average shares throughout the period. |
| (2) | Total returns would have been lower had various fees and expenses not been waived and reimbursed during the period. The total returns in the table represent the rate that an investor would have earned (or lost) on an investment in a Fund (assuming reinvestment of all dividends and distributions). |
See Notes to Financial Statements.
| Stone Harbor Investment Funds Annual Report | May 31, 2017 | 75 |
| Stone Harbor Investment Grade Fund | Financial Highlights |
For a share outstanding through the periods presented.
| Institutional Class | For the Year Ended May 31, 2017 | For the Year Ended May 31, 2016 | For the Year Ended May 31, 2015 | For the Period December 19, 2013 (Commencement of Operations) to May 31, 2014 | ||||||||||||
| Net asset value ‐ beginning of period | $ | 10.40 | $ | 10.36 | $ | 10.38 | $ | 10.00 | ||||||||
| Income/(loss) from investment operations: | ||||||||||||||||
Net investment income(1) | 0.18 | 0.16 | 0.13 | 0.07 | ||||||||||||
| Net realized and unrealized gain on investments | 0.03 | 0.12 | 0.07 | 0.37 | ||||||||||||
| Total income from investment operations | 0.21 | 0.28 | 0.20 | 0.44 | ||||||||||||
| Less distributions to shareholders: | ||||||||||||||||
| From net investment income | (0.19 | ) | (0.15 | ) | (0.14 | ) | (0.06 | ) | ||||||||
| From net realized gains | (0.04 | ) | (0.09 | ) | (0.08 | ) | – | |||||||||
| Total distributions | (0.23 | ) | (0.24 | ) | (0.22 | ) | (0.06 | ) | ||||||||
| Net Increase/(Decrease) in Net Asset Value | (0.02 | ) | 0.04 | (0.02 | ) | 0.38 | ||||||||||
| Net asset value ‐ end of period | $ | 10.38 | $ | 10.40 | $ | 10.36 | $ | 10.38 | ||||||||
Total Return(2)(3) | 2.07 | % | 2.71 | % | 1.94 | % | 4.41 | % | ||||||||
| Ratios/Supplemental Data: | ||||||||||||||||
| Net assets, end of period (in millions) | $ | 15 | $ | 16 | $ | 10 | $ | 3 | ||||||||
| Ratio of expenses to average net assets without fees waived by investment adviser and expenses reimbursed by investment adviser | 1.32 | % | 1.40 | % | 2.07 | % | 4.14 | %(4) | ||||||||
| Ratio of expenses to average net assets with fees waived by investment adviser and expenses reimbursed by investment adviser | 0.50 | % | 0.50 | % | 0.50 | % | 0.50 | %(4) | ||||||||
| Ratio of net investment income to average net assets with fee waivers/reimbursements | 1.72 | % | 1.57 | % | 1.26 | % | 1.62 | %(4) | ||||||||
| Portfolio turnover rate | 49 | % | 52 | % | 51 | % | 27 | % | ||||||||
| (1) | Calculated using average shares throughout the period. |
| (2) | Total returns would have been lower had various fees and expenses not been waived and reimbursed during the period. The total returns in the table represent the rate that an investor would have earned (or lost) on an investment in a Fund (assuming reinvestment of all dividends and distributions). |
| (3) | Total returns for periods of less than one year are not annualized. |
| (4) | Annualized. |
See Notes to Financial Statements.
| 76 | www.shiplp.com |
| Stone Harbor Strategic Income Fund | Financial Highlights |
For a share outstanding through the periods presented.
| Institutional Class | For the Year Ended May 31, 2017 | For the Year Ended May 31, 2016 | For the Year Ended May 31, 2015 | For the Period December 19, 2013 (Commencement of Operations) to May 31, 2014 | ||||||||||||
| Net asset value ‐ beginning of period | $ | 9.57 | $ | 10.05 | $ | 10.44 | $ | 10.00 | ||||||||
| Income/(loss) from investment operations: | ||||||||||||||||
Net investment income(1) | 0.38 | 0.43 | 0.49 | 0.15 | ||||||||||||
| Net realized and unrealized gain/(loss) on investments | 0.31 | (0.43 | ) | (0.37 | ) | 0.42 | ||||||||||
| Total income from investment operations | 0.69 | – | 0.12 | 0.57 | ||||||||||||
| Less distributions to shareholders: | ||||||||||||||||
| From net investment income | (0.36 | ) | (0.35 | ) | (0.48 | ) | (0.13 | ) | ||||||||
| From net realized gains | – | (0.13 | ) | (0.03 | ) | – | ||||||||||
| Total distributions | (0.36 | ) | (0.48 | ) | (0.51 | ) | (0.13 | ) | ||||||||
| Net Increase/(Decrease) in Net Asset Value | 0.33 | (0.48 | ) | (0.39 | ) | 0.44 | ||||||||||
| Net asset value ‐ end of period | $ | 9.90 | $ | 9.57 | $ | 10.05 | $ | 10.44 | ||||||||
Total Return(2)(3) | 7.34 | % | 0.19 | % | 1.15 | % | 5.73 | % | ||||||||
| Ratios/Supplemental Data: | ||||||||||||||||
| Net assets, end of period (in millions) | $ | 37 | $ | 36 | $ | 34 | $ | 11 | ||||||||
| Ratio of expenses to average net assets without fees waived by investment adviser and expenses reimbursed by investment adviser | 0.94 | %(4) | 0.96 | %(4) | 1.06 | %(4) | 1.46 | %(4)(5) | ||||||||
| Ratio of expenses to average net assets with fees waived by investment adviser and expenses reimbursed by investment adviser | 0.11 | %(4) | 0.12 | %(4) | 0.11 | %(4) | 0.12 | %(4)(5) | ||||||||
| Ratio of net investment income to average net assets with fee waivers/reimbursements | 3.89 | %(4) | 4.46 | %(4) | 4.88 | %(4) | 3.38 | %(4)(5) | ||||||||
| Portfolio turnover rate | 20 | % | 26 | % | 8 | % | 0 | %(6) | ||||||||
| (1) | Calculated using average shares throughout the period. |
| (2) | Total returns would have been lower had various fees and expenses not been waived and reimbursed during the period. The total returns in the table represent the rate that an investor would have earned (or lost) on an investment in a Fund (assuming reinvestment of all dividends and distributions). |
| (3) | Total returns for periods of less than one year are not annualized. |
| (4) | Ratio does not include expenses of the mutual funds held in the investment portfolio. |
| (5) | Annualized. |
| (6) | Less than 0.5%. |
See Notes to Financial Statements.
| Stone Harbor Investment Funds Annual Report | May 31, 2017 | 77 |
| Stone Harbor Emerging Markets Debt Allocation Fund | Financial Highlights |
For a share outstanding through the periods presented.
| Institutional Class | For the Year Ended May 31, 2017 | For the Year Ended May 31, 2016 | For the Period October 21, 2014 (Commencement of Operations) to May 31, 2015 | |||||||||
| Net asset value ‐ beginning of period | $ | 8.90 | $ | 9.36 | $ | 10.00 | ||||||
| Income/(loss) from investment operations: | ||||||||||||
Net investment income(1) | 0.25 | 0.32 | 0.23 | |||||||||
| Net realized and unrealized gain/(loss) on investments | 0.74 | (0.52 | ) | (0.70 | ) | |||||||
| Total income/(loss) from investment operations | 0.99 | (0.20 | ) | (0.47 | ) | |||||||
| Less distributions to shareholders: | ||||||||||||
| From net investment income | (0.34 | ) | (0.26 | ) | (0.17 | ) | ||||||
| Total distributions | (0.34 | ) | (0.26 | ) | (0.17 | ) | ||||||
| Net Increase/(Decrease) in Net Asset Value | 0.65 | (0.46 | ) | (0.64 | ) | |||||||
| Net asset value ‐ end of period | $ | 9.55 | $ | 8.90 | $ | 9.36 | ||||||
Total Return(2)(3) | 11.51 | % | (1.96 | %) | (4.73 | %) | ||||||
| Ratios/Supplemental Data: | ||||||||||||
| Net assets, end of period (in millions) | $ | 28 | $ | 67 | $ | 85 | ||||||
| Ratio of expenses to average net assets without fees waived by investment adviser and expenses reimbursed by investment adviser | 0.98 | %(4) | 0.87 | %(4) | 0.97 | %(4)(5) | ||||||
| Ratio of expenses to average net assets with fees waived by investment adviser and expenses reimbursed by investment adviser | 0.05 | %(4) | 0.06 | %(4) | 0.10 | %(4)(5) | ||||||
| Ratio of net investment income to average net assets with fee waivers/reimbursements | 2.72 | %(4) | 3.72 | %(4) | 3.68 | %(4)(5) | ||||||
| Portfolio turnover rate | 24 | % | 70 | % | 11 | % | ||||||
| (1) | Calculated using average shares throughout the period. |
| (2) | Total returns would have been lower in 2015 had various fees and expenses not been waived and reimbursed during the period. The total returns in the table represent the rate that an investor would have earned (or lost) on an investment in a Fund (assuming reinvestment of all dividends and distributions). |
| (3) | Total returns for periods of less than one year are not annualized. |
| (4) | Ratio does not include expenses of the mutual funds held in the investment portfolio. |
| (5) | Annualized. |
See Notes to Financial Statements.
| 78 | www.shiplp.com |
| Stone Harbor 500 Plus Fund | Financial Highlights |
For a share outstanding through the periods presented.
| Institutional Class | For the Period January 20, 2017 (Commencement of Operations) to May 31, 2017 | |||
| Net asset value ‐ beginning of period | $ | 10.00 | ||
| Income/(loss) from investment operations: | ||||
Net investment income(1) | 0.06 | |||
| Net realized and unrealized gain on investments | 0.71 | |||
| Total income from investment operations | 0.77 | |||
| Less distributions to shareholders: | ||||
| From net investment income | (0.06 | ) | ||
| Total distributions | (0.06 | ) | ||
| Net Increase in Net Asset Value | 0.71 | |||
| Net asset value ‐ end of period | $ | 10.71 | ||
Total Return(2)(3) | 7.71 | % | ||
| Ratios/Supplemental Data: | ||||
| Net assets, end of period (in millions) | $ | 2 | ||
| Ratio of expenses to average net assets without fees waived by investment adviser and expenses reimbursed by investment adviser | 12.71 | %(4)(5) | ||
| Ratio of expenses to average net assets with fees waived by investment adviser and expenses reimbursed by investment adviser | 0.60 | %(4) | ||
| Ratio of net investment income to average net assets with fee waivers/reimbursements | 1.70 | %(4) | ||
| Portfolio turnover rate | 20 | % | ||
| (1) | Calculated using average shares throughout the period. |
| (2) | Total returns for periods of less than one year are not annualized. |
| (3) | Total returns would have been lower had various fees and expenses not been waived and reimbursed during the period. The total returns in the table represent the rate that an investor would have earned (or lost) on an investment in a Fund (assuming reinvestment of all dividends and distributions). |
| (4) | Annualized. |
| (5) | Ratios before fee waivers for start up periods may not be representative of long term operating results. |
See Notes to Financial Statements.
| Stone Harbor Investment Funds Annual Report | May 31, 2017 | 79 |
| Stone Harbor Investment Funds | Notes to Financial Statements |
May 31, 2017
1. ORGANIZATION
Stone Harbor Investment Funds, which consists of Stone Harbor Emerging Markets Debt Fund, Stone Harbor High Yield Bond Fund, Stone Harbor Local Markets Fund, Stone Harbor Emerging Markets Corporate Debt Fund, Stone Harbor Investment Grade Fund, Stone Harbor Strategic Income Fund, Stone Harbor Emerging Markets Debt Allocation Fund and Stone Harbor 500 Plus Fund (each, a “Fund” and together, the “Funds”) is a Massachusetts business trust (the “Trust”), organized on February 20, 2007 and registered under the Investment Company Act of 1940, as amended (the “1940 Act”), as an open‐end management investment company. The Stone Harbor 500 Plus Fund commenced operations on January 20, 2017. Shares of each Fund are currently divided into two classes, designated Institutional Class Shares and Distributor Class Shares. As of the date of this report, Distributor Class shares were not offered for sale in each Fund. The Trust’s Declaration of Trust permits the Trustees to create additional funds and share classes. The Trust also includes the Stone Harbor Emerging Markets Debt Blend Fund which had not commenced operations as of the reporting period.
The Emerging Markets Debt Fund’s investment objective is to maximize total return. The Fund normally will invest at least 80% of its net assets (plus any borrowings made for investment purposes) in Emerging Markets Fixed Income Securities. “Emerging Markets Fixed Income Securities” include fixed income securities and derivative instruments (including, but not limited to, spot and currency contracts, futures, options and swaps) that economically are tied to countries with emerging securities markets or whose performance is linked to those countries’ markets, economies or ability to repay loans. Emerging Markets Fixed Income Securities may be denominated in non‐U.S. currencies or the U.S. dollar. A security or instrument is economically tied to an emerging market country if it is principally traded on the country’s securities markets or the issuer is organized or principally operates in the country, derives a majority of its income from its operations within the country or has a majority of its assets within the country. Emerging Markets Fixed Income Securities also include derivatives and other instruments used to hedge or gain exposure to emerging securities markets (for example, futures or other derivatives whose return is based on specific emerging markets securities or indices).
The High Yield Bond Fund’s investment objective is to maximize total return. The Fund will normally invest at least 80% of its net assets (plus any borrowings made for investment purposes) in High Yield Debt Securities. “High Yield Debt Securities” include fixed income securities and derivative instruments (including, but not limited to, spot and currency contracts, futures, options and swaps) rated below investment grade (or, if unrated, of comparable quality as determined by Stone Harbor Investment Partners LP (the “Adviser” or “Stone Harbor”). These types of securities and instruments are commonly referred to as “high yield” securities or “junk bonds,” and may include, among other things, bonds, debentures, notes, equipment trust certificates, commercial paper, commercial loans, preferred stock and other obligations of U.S. and non‐U.S. issuers. High Yield Debt Securities also include securities or other instruments whose return is based on the return of high yield securities, including derivative instruments and instruments created to hedge or gain exposure to the high yield markets.
The Local Markets Fund’s investment objective is to maximize total return. The Fund normally will invest at least 80% of its net assets (plus any borrowings made for investment purposes) in Emerging Markets Investments. “Emerging Markets Investments” include fixed income securities and derivative instruments (including, but not limited to, spot and currency contracts, futures, options and swaps) that economically are tied to an emerging market country, which are denominated in the predominant currency of the local market of an emerging market country (an “Emerging Markets Currency”) or whose performance is linked to those countries’ currencies, markets, economies or ability to repay loans. Although under normal circumstances a significant portion of the Fund’s investments will be denominated in Emerging Markets Currencies, Emerging Markets Investments may be denominated in non‐Emerging Markets Currencies, including the U.S. dollar. A security or instrument is economically tied to an emerging market country if it is principally traded on the country’s securities markets or the issuer is organized or principally operates in the country, derives a majority of its income from its operations within the country or has a majority of its assets within the country. Emerging Markets Investments also include Emerging Markets Currencies and derivatives and other instruments used to hedge or gain exposure to emerging securities markets or Emerging Markets Currencies (for example, futures or other derivatives whose return is based on specific emerging markets securities, emerging markets indices or Emerging Markets Currencies).
The Emerging Markets Corporate Debt Fund’s investment objective is to maximize total return. The Fund normally will invest at least 80% of its net assets (plus any borrowings made for investment purposes) in Emerging Markets Corporate Debt Investments. “Emerging Markets Corporate Debt Investments” are debt instruments, including loans, issued by corporations or other business organizations that are economically tied to an emerging market country. A corporation or other business organization is economically tied to an emerging market country if it issues securities that are principally traded on the country’s securities markets or if it is organized or principally operates in the country, derives a majority of its income from its operations within the country or has a majority of its assets within the country. Emerging Markets Corporate Debt Investments also include derivative instruments used for hedging purposes or to otherwise gain or reduce long or short exposure to Emerging Markets Corporate Debt Investments.
The Investment Grade Fund’s investment objective is to maximize total return. The Fund invests in various types of fixed income securities and under normal market conditions will invest at least 80% of its net assets (plus any borrowings made for investment purposes) in Investment Grade Debt Securities. “Investment Grade Debt Securities” include fixed income securities that are rated investment grade by any of Moody’s Investors Services, Inc., Standard & Poor’s Rating Services, Fitch Ratings Limited, DBRS or other qualified rating agencies or, if unrated, are determined by the Adviser to be of comparable quality, and derivative instruments related to those securities.
| 80 | www.shiplp.com |
| Stone Harbor Investment Funds | Notes to Financial Statements |
May 31, 2017
The Strategic Income Fund’s investment objective is to maximize total return. The Fund is intended to provide broad exposure to global credit markets. The Fund, either directly or through investment in the underlying funds (defined below), may invest in a broad variety of fixed income and other income producing securities and instruments (including derivatives), and will not be limited in terms of type of instrument, geography, credit rating or duration. The Fund may invest all or a significant portion of its assets in Stone Harbor Investment Grade Fund, Stone Harbor High Yield Bond Fund, Stone Harbor Emerging Markets Debt Fund, Stone Harbor Local Markets Fund and Stone Harbor Emerging Markets Corporate Debt Fund and other funds sponsored or advised by the Adviser (together, the “underlying funds”). The Fund is not required to invest in the underlying funds, and from time to time may not be invested in any underlying fund. In addition to investing in the underlying funds, the Fund may invest directly in fixed income securities and in other instruments and transactions.
The Emerging Markets Debt Allocation Fund’s investment objective is to maximize total return. The Fund, either directly or through investment in the underlying funds (defined below), will invest at least 80% of its net assets (plus any borrowings made for investment purposes) in Emerging Markets Investments. Emerging Markets Investments include fixed income securities and other income producing securities and derivative instruments (including, but not limited to , spot and currency contracts, futures, options and swaps), that economically are tied to an emerging market country or whose performance is linked to those countries’ currencies, markets, economies or ability to repay loans. The Fund may invest all or a significant portion of its assets in Stone Harbor Emerging Markets Debt Fund and Stone Harbor Local Markets Fund (together, the “underlying funds”). The Fund is not required to invest in the underlying funds, and from time to time may not be invested in any underlying fund. In addition to investing in the underlying funds, the Fund may invest directly in fixed income securities and in other instruments and transactions.
The 500 Plus Fund’s investment objective is to maximize total return. The Fund will normally invest in S&P 500 Index derivatives and various types of fixed income instruments. The derivatives the Fund may invest in are: futures, options, swaps, including total return swaps, credit default swap, and credit linked notes. Fixed income instruments will typically be rated at least investment grade by any of Moody’s Investor Services, Inc., Standard & Poor’s Rating Services, Fitch Ratings Limited, DBRS or other qualified rating agencies or, if unrated, are determined by the Adviser to be of comparable quality, and derivative instruments related to those securities.
The Emerging Markets Debt Fund, Local Markets Fund and the 500 Plus Fund are each classified as “non‐diversified” under the 1940 Act. As a result, these Funds can invest a greater portion of the respective Funds’ assets in obligations of a single issuer than a “diversified” fund. These Funds may therefore be more susceptible than a diversified fund to being adversely affected by any single corporate, economic, political or regulatory occurrence. The High Yield Bond Fund, Emerging Markets Corporate Debt Fund, Investment Grade Fund, Strategic Income Fund, and Emerging Markets Debt Allocation Fund are diversified funds. The Emerging Markets Corporate Debt Fund was previously classified as a non‐diversified investment company for purposes of the 1940 Act. As a result of ongoing operations, the Emerging Markets Corporate Debt Fund is now classified as a diversified company.
2. SIGNIFICANT ACCOUNTING POLICIES AND RISK DISCLOSURES
The following is a summary of significant accounting policies consistently followed by the Funds in the preparation of their financial statements. Each Fund is considered an investment company for financial reporting purposes under generally accepted accounting principles in the United States of America (“GAAP”). The policies are in conformity with GAAP. The preparation of the financial statements in accordance with GAAP requires management to make estimates and assumptions that affect the reported amounts of assets and liabilities at the date of the financial statements and the reported amounts of income and expenses during the reporting period. Actual results could differ from those estimates.
Investment Valuation: Sovereign debt obligations, corporate bonds, convertible corporate bonds, and U.S. Treasury bonds, are generally valued at the mean between the closing bid and asked prices provided by an independent pricing service. The pricing services generally use market models that consider trade data, yields, spreads, quotations from dealers and active market makers, credit worthiness, market information on comparable securities, and other relevant security specific information. Asset backed/commercial mortgage backed securities are generally valued at the mean between the closing bid and asked prices provided by an independent pricing service. The pricing services generally use models that consider trade data, prepayment and default projections, benchmark yield and spread data and estimated cash flows of each tranche of the issuer. Bank loans are primarily valued by a loan pricing provider using a composite loan price at the mean of the bid and ask prices from one or more brokers of dealers. Credit Linked securities are generally valued using quotations from broker through which the Fund executed the transaction. The broker’s quotation considers cash flows, default and recovery rates, and other security specific information. Equity securities for which market quotations are available are generally valued at the last sale price or official closing price on the primary market or exchange on which they trade. If on a given day, a closing price is not available on the exchange, the equity security is valued at the mean between the closing bid and asked prices, as such prices are provided by a pricing service. Publicly traded foreign government debt securities are typically traded internationally in the over the counter (“OTC”) market, and are valued at the mean between the bid and asked prices as of the close of business of that market. When prices are not readily available, or are determined not to reflect fair value, such as when the value of a security has been significantly affected by events after the close of the exchange or market on which the security is principally traded, but before the Funds calculate their net asset value, the Funds may value these investments at fair value as determined in accordance with the procedures approved by the Funds’ Board of Trustees (the “Board”). Short term obligations with maturities of 60 days or less are valued at amortized cost, which approximates market value. Open end funds and money market mutual funds are valued at their net asset value. Futures contracts are ordinarily valued at the last sales price on the securities or commodities exchange on which they are traded. OTC traded derivatives (primarily swaps and foreign currency options) are generally priced by an independent pricing service. OTC traded credit default swaps are valued by the independent pricing source using a mid price that is calculated based on data an independent pricing source receives from dealers. OTC traded foreign currency options are valued by an independent pricing source using mid foreign exchange rates against USD for all currencies at 4:00 p.m. Eastern Standard Time (“EST”). Derivatives which are cleared by an exchange are priced by using the last price on such exchange. Foreign currency positions including forward currency contracts are priced at the mean between the closing bid and asked prices at 4:00 p.m. EST.
| Stone Harbor Investment Funds Annual Report | May 31, 2017 | 81 |
| Stone Harbor Investment Funds | Notes to Financial Statements |
May 31, 2017
A three‐tier hierarchy has been established to measure fair value based on the extent of use of “observable inputs” as compared to “unobservable inputs” for disclosure purposes and requires additional disclosures about these valuations measurements. Inputs refer broadly to the assumptions that market participants would use in pricing a security. Observable inputs are inputs that reflect the assumptions market participants would use in pricing the security developed based on market data obtained from sources independent of the reporting entity. Unobservable inputs are inputs that reflect the reporting entity’s own assumptions about the assumptions market participants would use in pricing the security developed based on the best information available in the circumstances.
The three‐tier hierarchy is summarized as follows:
| Level 1— | Unadjusted quoted prices in active markets for identical assets or liabilities that the Fund has the ability to access. |
| Level 2— | Observable inputs other than quoted prices included in level 1 that are observable for the asset or liability, either directly or indirectly. These inputs may include quoted prices for the identical instrument on an inactive market, prices for similar instruments, interest rates, prepayment speeds, credit risk, yield curve, rates, and similar data. |
| Level 3— | Unobservable inputs for the asset or liability, to the extent relevant observable inputs are not available, representing the Fund’s own assumptions about the assumptions a market participant would use in valuing the asset or liability, and would be based on the best information available. |
The following is a summary of each Fund’s investments and financial instruments based on the three‐tier hierarchy as of May 31, 2017:
Investments in Securities at Value* | Level 1 | Level 2 | Level 3 | Total | |||||||||
| Stone Harbor Emerging Markets Debt Fund | |||||||||||||
| Sovereign Debt Obligations | $ | – | $ | 1,078,650,779 | $ | – | $ | 1,078,650,779 | |||||
| Bank Loans | – | – | 13,589,848 | 13,589,848 | |||||||||
| Corporate Bonds | – | 280,912,961 | – | 280,912,961 | |||||||||
| Credit Linked Notes | – | – | 7,214,815 | 7,214,815 | |||||||||
| Short Term Investments | 41,967,210 | – | – | 41,967,210 | |||||||||
| Total | $ | 41,967,210 | $ | 1,359,563,740 | $ | 20,804,663 | $ | 1,422,335,613 | |||||
Other Financial Instruments** | |||||||||||||
| Assets | |||||||||||||
| Forward Foreign Currency Contracts | $ | – | $ | 1,095,307 | $ | – | $ | 1,095,307 | |||||
| Liabilities | |||||||||||||
| Forward Foreign Currency Contracts | – | (3,931,562 | ) | – | (3,931,562 | ) | |||||||
| Total | $ | – | $ | (2,836,255 | ) | $ | – | $ | (2,836,255 | ) | |||
Investments in Securities at Value* | Level 1 | Level 2 | Level 3 | Total | |||||||||
| Stone Harbor High Yield Bond Fund | |||||||||||||
| Corporate Bonds | $ | – | $ | 141,322,871 | $ | 112 | $ | 141,322,983 | |||||
| Bank Loans | – | 11,980,633 | 903,047 | 12,883,680 | |||||||||
| Common/Preferred Stocks | 1,577,406 | – | 129,373 | 1,706,779 | |||||||||
| Rights | – | – | 94,624 | 94,624 | |||||||||
| Warrants | 8,224 | – | 32 | 8,256 | |||||||||
| Short Term Investments | 4,579,544 | – | – | 4,579,544 | |||||||||
| Total | $ | 6,165,174 | $ | 153,303,504 | $ | 1,127,188 | $ | 160,595,866 | |||||
| 82 | www.shiplp.com |
| Stone Harbor Investment Funds | Notes to Financial Statements |
May 31, 2017
Other Financial Instruments** | |||||||||||||
| Assets | |||||||||||||
| Forward Foreign Currency Contracts | $ | – | $ | 1,967 | $ | – | $ | 1,967 | |||||
| Liabilities | |||||||||||||
| Forward Foreign Currency Contracts | – | (37,607 | ) | – | (37,607 | ) | |||||||
| Total | $ | – | $ | (35,640 | ) | $ | – | $ | (35,640 | ) | |||
Investments in Securities at Value* | Level 1 | Level 2 | Level 3 | Total | |||||||||
| Stone Harbor Local Markets Fund | |||||||||||||
| Sovereign Debt Obligations | $ | – | $ | 713,083,953 | $ | – | $ | 713,083,953 | |||||
| Corporate Bonds | – | 61,570,649 | – | 61,570,649 | |||||||||
| Short Term Investments | 40,011,357 | – | – | 40,011,357 | |||||||||
| Total | $ | 40,011,357 | $ | 774,654,602 | $ | – | $ | 814,665,959 | |||||
Other Financial Instruments** | |||||||||||||
| Assets | |||||||||||||
| Forward Foreign Currency Contracts | $ | – | $ | 2,220,877 | $ | – | $ | 2,220,877 | |||||
| Liabilities | |||||||||||||
| Forward Foreign Currency Contracts | – | (1,887,285 | ) | – | (1,887,285 | ) | |||||||
| Total | $ | – | $ | 333,592 | $ | – | $ | 333,592 | |||||
Investments in Securities at Value* | Level 1 | Level 2 | Level 3 | Total | |||||||||
| Stone Harbor Emerging Markets Corporate Debt Fund | |||||||||||||
| Corporate Bonds | $ | – | $ | 12,748,478 | $ | – | $ | 12,748,478 | |||||
| Short Term Investments | 123,556 | – | – | 123,556 | |||||||||
| Total | $ | 123,556 | $ | 12,748,478 | $ | – | $ | 12,872,034 | |||||
Investments in Securities at Value* | Level 1 | Level 2 | Level 3 | Total | |||||||||
| Stone Harbor Investment Grade Fund | |||||||||||||
| Corporate Bonds | $ | – | $ | 6,340,032 | $ | – | $ | 6,340,032 | |||||
| Asset Backed/Commercial Mortgage Backed Securities | – | 2,480,139 | – | 2,480,139 | |||||||||
| U.S. Treasury Bonds/Notes | – | 3,030,952 | – | 3,030,952 | |||||||||
| U.S. Government Agency Mortgage Backed Securities | – | 2,843,593 | – | 2,843,593 | |||||||||
| Short Term Investments | 1,243,081 | – | – | 1,243,081 | |||||||||
| Total | $ | 1,243,081 | $ | 14,694,716 | $ | – | $ | 15,937,797 | |||||
Investments in Securities at Value* | Level 1 | Level 2 | Level 3 | Total | |||||||||
| Stone Harbor Strategic Income Fund | |||||||||||||
| Open‐End Funds | $ | 36,707,831 | $ | – | $ | – | $ | 36,707,831 | |||||
| Short Term Investments | 124,514 | – | – | 124,514 | |||||||||
| Total | $ | 36,832,345 | $ | – | $ | – | $ | 36,832,345 | |||||
Other Financial Instruments** | |||||||||||||
| Assets | |||||||||||||
| Forward Foreign Currency Contracts | $ | – | $ | 22,417 | $ | – | $ | 22,417 | |||||
| Futures Contracts | 44,220 | – | – | 44,220 | |||||||||
| Liabilities | 4 | ||||||||||||
| Forward Foreign Currency Contracts | – | (15,302 | ) | – | (15,302 | ) | |||||||
| Credit Default Swap Contracts | – | (71,057 | ) | – | (71,057 | ) | |||||||
| Futures Contracts | (17,159 | ) | – | – | (17,159 | ) | |||||||
| Total | $ | 27,061 | $ | (63,942 | ) | $ | – | $ | (36,881 | ) | |||
| Stone Harbor Investment Funds Annual Report | May 31, 2017 | 83 |
| Stone Harbor Investment Funds | Notes to Financial Statements |
May 31, 2017
Investments in Securities at Value* | Level 1 | Level 2 | Level 3 | Total | ||||||||||||
| Stone Harbor Emerging Markets Debt Allocation Fund | ||||||||||||||||
| Open‐End Funds | $ | 27,581,324 | $ | – | $ | – | $ | 27,581,324 | ||||||||
| Short Term Investments | 127,103 | – | – | 127,103 | ||||||||||||
| Total | $ | 27,708,427 | $ | – | $ | – | $ | 27,708,427 | ||||||||
Other Financial Instruments** | ||||||||||||||||
| Assets | ||||||||||||||||
| Forward Foreign Currency Contracts | $ | – | $ | 577 | $ | – | $ | 577 | ||||||||
| Liabilities | ||||||||||||||||
| Forward Foreign Currency Contracts | – | (4,756 | ) | – | (4,756 | ) | ||||||||||
| Total | $ | – | $ | (4,179 | ) | $ | – | $ | (4,179 | ) | ||||||
Investments in Securities at Value* | Level 1 | Level 2 | Level 3 | Total | ||||||||||||
| Stone Harbor 500 Plus Fund | ||||||||||||||||
| Asset Backed/Commercial Mortgage Backed Securities | $ | – | $ | 1,726,556 | $ | – | $ | 1,726,556 | ||||||||
| Short Term Investments | 404,590 | – | – | 404,590 | ||||||||||||
| Total | $ | 404,590 | $ | 1,726,556 | $ | – | $ | 2,131,146 | ||||||||
Other Financial Instruments** | ||||||||||||||||
| Assets | ||||||||||||||||
| Futures Contracts | $ | 131,465 | $ | – | $ | – | $ | 131,465 | ||||||||
| Total | $ | 131,465 | $ | – | $ | – | $ | 131,465 | ||||||||
| * | For detailed Industry/Country descriptions see accompanying Statement of Investments. |
| ** | Other financial instruments are derivative instruments reflected in the Statement of Investments. The derivatives shown in this table are reported at their unrealized appreciation/(depreciation) at measurement date, which represents the change in the contract’s value. |
There were no transfers in or out of Levels 1 and 2 during the period ended May 31, 2017. It is the Funds’ policy to recognize transfers into and out of all levels at the end of the reporting period.
The following is a reconciliation of assets in which significant unobservable inputs (Level 3) were used in determining fair value:
| Investments in Securities | Balance as of May 31, 2016 | Accrued discount/ premium | Return of Capital | Realized Gain/(Loss) | Change in Unrealized Appreciation/ (Depreciation) | Purchases | Sales Proceeds | Transfer into Level 3 | Transfer out of Level 3 | Balance as of May 31, 2017 | Net change in unrealized appreciation/ (depreciation) included in the Statements of Operations at May 31, 2017 | |||||||||||||||||||||||||||||||||
| Stone Harbor Emerging Markets Debt Fund | ||||||||||||||||||||||||||||||||||||||||||||
| Bank Loans | $ | 19,440,382 | $ | – | $ | – | $ | – | $ | (350,534 | ) | $ | 8,000,000 | $ | (13,500,000 | ) | $ | – | $ | – | $ | 13,589,848 | $ | (350,534 | ) | |||||||||||||||||||
| Credit Linked Notes | 25,970,744 | 571,144 | – | (5,793,323 | ) | 8,573,857 | – | (22,107,607 | ) | – | – | 7,214,815 | 1,538,168 | |||||||||||||||||||||||||||||||
| Total | $ | 45,411,126 | $ | 571,144 | $ | – | $ | (5,793,323 | ) | $ | 8,223,323 | $ | 8,000,000 | $ | (35,607,607 | ) | $ | – | $ | – | $ | 20,804,663 | $ | 1,187,634 | ||||||||||||||||||||
| 84 | www.shiplp.com |
| Stone Harbor Investment Funds | Notes to Financial Statements |
May 31, 2017
| Investments in Securities | Balance as of May 31, 2016 | Accrued discount/ premium | Return of Capital | Realized Gain/(Loss) | Change in Unrealized Appreciation/ (Depreciation) | Purchases | Sales Proceeds | Transfer into Level 3 | Transfer out of Level 3 | Balance as of May 31, 2017 | Net change in unrealized appreciation/ (depreciation) included in the Statements of Operations at May 31, 2017 | |||||||||||||||||||||||||||||||||
| Stone Harbor High Yield Bond Fund | ||||||||||||||||||||||||||||||||||||||||||||
| Bank Loans | $ | 618,388 | $ | 327 | $ | – | $ | 5,193 | $ | (4,585 | ) | $ | 1,406,536 | $ | (1,122,813 | ) | $ | – | $ | – | $ | 903,047 | $ | 14,986 | ||||||||||||||||||||
| Warrants | – | – | – | – | 32 | – | – | – | 32 | – | ||||||||||||||||||||||||||||||||||
| Corporate Bond | – | – | – | – | 112 | – | – | – | – | 112 | 112 | |||||||||||||||||||||||||||||||||
| Rights | – | – | – | – | (7,570 | ) | 102,194 | – | – | – | 94,624 | (7,570 | ) | |||||||||||||||||||||||||||||||
| Common Stock | – | – | – | – | (66,419 | ) | 195,792 | – | – | – | 129,373 | (66,419 | ) | |||||||||||||||||||||||||||||||
| Total | $ | 618,388 | $ | 327 | $ | – | $ | 5,193 | $ | (78,462 | ) | $ | 1,704,554 | $ | (1,122,813 | ) | $ | – | $ | – | $ | 1,127,188 | $ | (58,891 | ) | |||||||||||||||||||
All level 3 investments have values determined utilizing third party pricing information without adjustment.
The inputs or methodology used for valuing securities are not necessarily an indication of the risk associated with investing in those securities.
In the event a Board approved independent pricing service is unable to provide an evaluated price for a security or the Adviser believes the price provided is not reliable, securities of the Funds may be valued at fair value as described above. In these instances the Adviser may seek to find an alternative independent source, such as a broker/dealer to provide a price quote, or by using evaluated pricing models similar to the techniques and models used by the independent pricing service. These fair value measurement techniques may utilize unobservable inputs (Level 3).
On at least a quarterly basis, the Adviser presents the factors considered in determining the fair value measurements and presents that information to the Board which meets at least quarterly.
Security Transactions and Investment Income: Security transactions are accounted for on a trade date basis. Interest income, adjusted for amortization of premium and accretion of discount, is recorded on the accrual basis. Dividend income is recorded on the ex‐dividend date. Foreign dividend income is recorded on the ex‐dividend date or as soon as practical after the Funds determine the existence of a dividend declaration after exercising reasonable due diligence. Dividend income received from underlying affiliated funds is generally reinvested back into the underlying fund. If applicable, any foreign capital gains taxes are accrued, net of unrealized gains, and are payable upon the sale of such investments. The cost of investments sold is determined by use of the specific identification method. To the extent any issuer defaults on an expected interest payment, the Funds’ policy is to generally halt any additional interest income accruals and consider the realizability of interest accrued up to the date of default.
Foreign Currency Translation: The books and records of the Funds are maintained in U.S. dollars. Investment valuations and other assets and liabilities initially expressed in foreign currencies are converted each business day into U.S. dollars based upon current exchange rates. Prevailing foreign exchange rates may generally be obtained at the close of the NYSE (normally, 4:00 p.m. EST). The portion of realized and unrealized gains or losses on investments due to fluctuations in foreign currency exchange rates is not separately disclosed and is included in realized and unrealized gains or losses on investments, when applicable.
Foreign Securities: The Funds may directly purchase securities of foreign issuers. Investing in securities of foreign issuers involves special risks not typically associated with investing in securities of U.S. issuers. The risks include possible revaluation of currencies, the ability to repatriate funds, less complete financial information about companies and possible future adverse political and economic developments. Moreover, securities of many foreign issuers and their markets may be less liquid and their prices more volatile than those of securities of comparable U.S. issuers.
Credit Linked Notes: The Funds may invest in credit linked notes to obtain economic exposure to high yield, emerging markets or other securities. Investments in a credit linked note typically provide the holder with a return based on the return of an underlying reference instrument, such as an emerging market bond. Like an investment in a bond, investments in credit‐linked securities represent the right to receive periodic income payments (in the form of distributions) and payment of principal at the end of the term of the security. In addition to the risks associated with the underlying reference instrument, an investment in a credit linked note is also subject to liquidity risk, market risk, interest rate risk and the risk that the counterparty will be unwilling or unable to meet its obligations under the note.
| Stone Harbor Investment Funds Annual Report | May 31, 2017 | 85 |
| Stone Harbor Investment Funds | Notes to Financial Statements |
May 31, 2017
Segregation and Collateralization: In cases in which the 1940 Act and the interpretive positions of the U.S. Securities and Exchange Commission (“SEC”) require that a Fund either deliver collateral or segregate assets in connection with certain investments (e.g., foreign currency exchange contracts, securities with extended settlement periods, and swaps) or certain borrowings (e.g., reverse repurchase agreements), the Fund will segregate collateral or designate on its books and records cash or other liquid securities having a value at least equal to the amount that is required to be physically segregated for the benefit of the counterparty. Furthermore, based on requirements and agreements with certain exchanges and third party broker‐dealers, each party has requirements to deliver/deposit cash or securities as collateral for certain investments. Cash collateral that has been pledged to cover obligations of the Funds and cash collateral received from the counterparty, if any, is reported separately on the Statements of Assets and Liabilities as “Deposits with brokers” or “Payable due to brokers”, respectively. Securities collateral pledged for the same purpose is noted on the Statements of Investments.
Line of Credit: On May 5, 2017, the Trust entered into a credit agreement (“Credit Agreement”) with State Street Bank and Trust Company (the “Bank”) in which the Funds may borrow through a revolving line of credit. Borrowings under the Credit Agreement are secured by investments held in the Funds. During the period ended May 31, 2017, the Funds did not borrow under the Credit Agreement. Interest and commitment fees on funded and unfunded loans can be found under other expense in the Statements of Operations of the applicable Fund. The Credit Agreement provides for an aggregate commitment amount of $50,000,000 with an annual commitment fee of 0.35% allocated on a pro‐rata basis between the Funds based on their net assets, with the exception of the Stone Harbor Emerging Debt Allocation Fund and the Strategic Income Fund. The Credit Agreement will expire on May 4, 2018.
Loan Participations and Assignments: The Funds may invest in loans arranged through private negotiation between one or more financial institutions. The Funds’ investment in any such loan may be in the form of a participation in or an assignment of the loan. In connection with purchasing participations, the Funds generally will have no right to enforce compliance by the borrower with the terms of the loan agreement relating to the loan, nor any rights of set‐off against the borrower and the Funds may not benefit directly from any collateral supporting the loan in which they have purchased the participation.
While some loans are collateralized and senior to an issuer’s other debt securities, other loans may be unsecured and/or subordinated to other securities. Some senior loans, such as bank loans, may be illiquid and generally tend to be less liquid than many other debt securities.
The Funds may also invest in unfunded loan commitments, which are contractual obligations for future funding. Information regarding unfunded commitments is included at the end of the Funds’ Statements of Investments.
The Funds assume the credit risk of the borrower, the lender that is selling the participation and any other persons interpositioned between the Funds and the borrower. In the event of the insolvency of the lender selling the participation, the Funds may be treated as a general creditor of the lender and may not benefit from any set‐off between the lender and the borrower. Loans may not be considered “securities”, and purchasers, such as the Funds, therefore may not be entitled to rely on the anti‐fraud protections of the federal securities laws.
Inflation‐Indexed Bonds: Certain Funds may invest in inflation‐indexed bonds. Inflation‐indexed bonds are fixed‐income securities whose principal value is periodically adjusted to the rate of inflation. The interest rate on these bonds is generally fixed at issuance at a rate lower than typical bonds. Over the life of an inflation‐indexed bond, however, interest will be paid based on a principal value which is adjusted for inflation. Any increase or decrease in the principal amount of an inflation‐indexed bond will be included as interest income on the Statements of Operations, even though investors do not receive their principal until maturity.
Mortgage‐Related and Other Asset‐Backed Securities: Certain Funds may invest in mortgage‐related and other asset‐backed securities. These securities include mortgage pass‐through securities, collateralized mortgage obligations, commercial mortgage‐backed securities, stripped mortgage‐backed securities, asset‐backed securities, collateralized debt obligations and other securities that directly or indirectly represent a participation in, or are secured by and payable from, mortgage loans on real property. Mortgage‐related and other asset‐backed securities are interests in pools of loans or other receivables. Mortgage‐related securities are created from pools of residential or commercial mortgage loans, including mortgage loans made by savings and loan institutions, mortgage bankers, commercial banks and others. Asset‐backed securities are created from many types of assets, including auto loans, credit card receivables, home equity loans, and student loans. These securities provide a monthly payment which consists of both interest and principal payments. Interest payments may be determined by fixed or adjustable rates. The rate of prepayments on underlying mortgages will affect the price and volatility of a mortgage‐related security, and may have the effect of shortening or extending the effective duration of the security relative to what was anticipated at the time of purchase. The timely payment of principal and interest of certain mortgage‐related securities is guaranteed with the full faith and credit of the U.S. Government. Pools created and guaranteed by non‐governmental issuers, including government sponsored corporations, may be supported by various forms of insurance or guarantees, but there can be no assurance that the private insurers or guarantors can meet their obligations under the insurance policies or guarantee arrangements.
| 86 | www.shiplp.com |
| Stone Harbor Investment Funds | Notes to Financial Statements |
May 31, 2017
U.S. Government Agencies or Government‐Sponsored Enterprises: Certain Funds may invest in securities of U.S. Government agencies or government‐sponsored enterprises. U.S. Government securities are obligations of and, in certain cases, guaranteed by, the U.S. Government, its agencies or instrumentalities. Some U.S. Government securities, such as Treasury bills, notes and bonds, and securities guaranteed by the Government National Mortgage Association (“GNMA” or “Ginnie Mae”), are supported by the full faith and credit of the U.S. Government; others, such as those of the Federal Home Loan Banks, are supported by the right of the issuer to borrow from the U.S. Department of the Treasury (the “U.S. Treasury”); others, such as those of the Federal National Mortgage Association (“FNMA” or “Fannie Mae”), are supported by the discretionary authority of the U.S. Government to purchase the agency’s obligations. U.S. Government securities may include zero coupon securities, which do not distribute interest on a current basis and tend to be subject to greater risk than interest‐paying securities of similar maturities.
Government‐related guarantors (i.e., not backed by the full faith and credit of the U.S. Government) include FNMA and the Federal Home Loan Mortgage Corporation (“FHLMC” or “Freddie Mac”). FNMA is a government‐sponsored corporation. FNMA purchases conventional (i.e., not insured or guaranteed by any government agency) residential mortgages from a list of approved seller/servicers which include state and federally chartered savings and loan associations, mutual savings banks, commercial banks and credit unions and mortgage bankers. Pass‐through securities issued by FNMA are guaranteed as to timely payment of principal and interest by FNMA, but are not backed by the full faith and credit of the U.S. Government. FHLMC issues Participation Certificates (“PCs”), which are pass‐through securities, each representing an undivided interest in a pool of residential mortgages. FHLMC guarantees the timely payment of interest and ultimate collection of principal, but PCs are not backed by the full faith and credit of the U.S. Government.
Forward Commitments: Certain Funds may contract to purchase securities for a fixed price at a transaction date beyond the customary settlement period (i.e., “when‐issued,” “delayed‐delivery,” “forward commitment,” or “To Be Announced (“TBA”) transactions”) consistent with a Fund’s ability to manage its investment portfolio and meet redemption requests. These transactions involve a commitment by a Fund to purchase securities for a predetermined price or yield with payment and delivery taking place more than three days in the future or after a period longer than the customary settlement period for that type of security. No interest will be earned by a Fund on such purchases until the securities are delivered; however, the market value may change prior to delivery. A Fund will not engage in these transactions for investment leverage.
When‐issued securities involve the risk that the yield obtained in the transaction will be less than that available in the market when delivery takes place. Securities purchased on a when‐issued basis are recorded as an asset and are subject to changes in value based upon changes in the value of the security or general level of interest rates. In when‐issued and delayed‐delivery transactions, a Fund relies on the seller to complete the transaction; the seller’s failure to do so may cause a Fund to miss an advantageous price or yield.
The Funds may enter into TBA commitments. TBA commitments are forward agreements for the purchase or sale of mortgage‐backed securities for a fixed price, with payment and delivery on an agreed upon future settlement date. The specific securities to be delivered are not identified at the trade date. However, delivered securities must meet specified terms, including issuer, rate and mortgage terms. The Funds generally enter into TBA commitments with the intent to take possession of or deliver the underlying mortgage‐backed securities but can extend the settlement or roll the transaction. Regulatory developments may limit the ability of a Fund to engage in TBA transactions to the extent desired.
Unsettled TBA sale (purchase) commitments are valued at the current market value of the underlying securities. The contract is adjusted to market value daily, and the change in market value is recorded by the Fund as an unrealized gain or loss. Outstanding TBA commitments and related deliverables are reflected on the Statement of Assets and Liabilities in Payable for investments purchased and Receivable for investments sold, respectively. If the TBA sale (purchase) commitment is closed through the acquisition of an offsetting purchase (sale) commitment, the Fund realizes a gain or loss from the sale of the securities based upon the unit price established at the date the commitment was entered into. These gain/loss amounts are reflected in the Accumulated net realized gain/loss on investments and Net unrealized appreciation on investments on the Statement of Assets and Liabilities.
Emerging Market Risk: Emerging market countries often experience instability in their political and economic structures. Government actions could have a great effect on the economic conditions in these countries, which can affect the value and liquidity of the assets of a Fund. Specific risks that could decrease a Fund’s return include seizure of a company’s assets, restrictions imposed on payments as a result of blockages on foreign currency exchanges, expropriation, confiscatory taxation and unanticipated social or political occurrences. In addition, the ability of an emerging market government to make timely payments on its debt obligations will depend on the extent of its reserves, interest rate fluctuations and access to international credit and investments. A country with non‐diversified exports or that relies on specific imports will be subject to a greater extent to fluctuations in the pricing of those commodities. Failure to generate adequate earnings from foreign trade would make it difficult for an emerging market country to service foreign debt. Disruptions resulting from social and political factors may cause the securities markets of emerging market countries to close. If this were to occur, the liquidity and value of a Fund’s assets invested in corporate debt obligations of emerging market companies would decline. Foreign investment in debt securities of emerging market countries may be restricted or controlled to varying degrees. These restrictions can limit or preclude foreign investment in debt securities of certain emerging market countries. In addition, certain emerging market countries may also restrict investment opportunities in issuers in industries deemed important to national interests.
| Stone Harbor Investment Funds Annual Report | May 31, 2017 | 87 |
| Stone Harbor Investment Funds | Notes to Financial Statements |
May 31, 2017
Interest Rate Risk: Changes in interest rates will affect the value of a Fund’s investments. In general, as interest rates rise, bond prices fall, and as interest rates fall, bond prices rise. Interest rate risk is generally greater for funds that invest a significant portion of their assets in high yield securities. However, funds that generally invest a significant portion of their assets in higher‐rated fixed income securities are also subject to this risk. A Fund also faces increased interest rate risk if it invests in fixed income securities paying no current interest (such as zero coupon securities and principal‐only securities), interest‐only securities and fixed income securities paying non‐cash interest in the form of other securities.
Liquidity Risk: Liquidity risk exists when particular investments are difficult to purchase or sell at the time that a Fund would like or at the price that the Fund believes such investments are currently worth. Certain of the Funds’ investments may be illiquid. Illiquid securities may become harder to value, especially in changing markets. A Fund’s investments in illiquid securities may reduce the returns of the Fund because it may be unable to sell the illiquid securities at an advantageous time or price or possibly require the Fund to dispose of other investments at unfavorable times or prices in order to satisfy its obligations, which could prevent the Fund from taking advantage of other investment opportunities. Additionally, the market for certain investments may become illiquid under adverse market or economic conditions independent of any specific adverse changes in the conditions of a particular issuer. Derivatives, securities that involve substantial interest rate or credit risk and bank loans tend to involve greater liquidity risk. In addition, liquidity risk tends to increase to the extent a Fund invests in securities whose sale may be restricted by law or by contract, such as Rule 144A and Regulation S securities.
Foreign Investment Risk: The securities markets of many foreign countries are relatively small, with a limited number of companies representing a small number of industries. Additionally, issuers of foreign (non‐U.S.) securities are usually not subject to the same degree of regulation as U.S. issuers. Reporting, accounting, auditing and custody standards of foreign countries differ, in some cases significantly, from U.S. standards. Global economies and financial markets are becoming increasingly interconnected, and conditions and events in one country, region or financial market may adversely impact issuers in a different country, region or financial market. Also, nationalization, expropriation or confiscatory taxation, currency blockage, political changes or diplomatic developments could adversely affect a Fund’s investments in a foreign country. In the event of nationalization, expropriation or other confiscation, a Fund could lose its entire investment in foreign (non‐U.S.) securities. Adverse conditions in a certain region can adversely affect securities of other countries whose economies appear to be unrelated. Foreign (non‐U.S.) securities may also be less liquid and more difficult to value than securities of U.S. issuers.
Credit and Market Risk: The Funds invest in high yield and emerging market instruments that are subject to certain credit and market risks. The yields of high yield and emerging market debt obligations reflect, among other things, perceived credit and market risks. The Funds’ investment in securities rated below investment grade typically involves risks not associated with higher rated securities including, among others, greater risk related to timely and ultimate payment of interest and principal, greater market price volatility and less liquid secondary market trading. The consequences of political, social, economic or diplomatic changes may have disruptive effects on the market prices of investments held by the Funds. The Funds’ investment in non‐U.S. dollar denominated securities may also result in foreign currency losses caused by devaluations and exchange rate fluctuations. Investments in derivatives are also subject to credit and market risks.
Distributions to Shareholders: Dividends and distributions to shareholders, which are determined in accordance with income tax regulations, are recorded on the ex‐date. Income distributions, if any are generally declared and paid on a quarterly basis, except for any distributions paid by the Local Markets Fund and the Emerging Markets Debt Allocation Fund, which are declared and paid annually. Capital gain distributions, if any, are declared and paid at least annually. A portion of the Fund’s distributions made for a taxable year may be recharacterized as a return of capital to shareholders. This may occur, for example, if the Fund’s distributions exceed its “earnings and profits” for the taxable year or because certain foreign currency losses may reduce the Fund’s income. This recharacterization may be retroactive. A return of capital will generally not be taxable, but will reduce a shareholder’s basis in his or her Fund shares and therefore result in a higher gain or lower loss when the shareholder sells the shares.
Expenses: Direct expenses are charged to each Fund; expenses of the Trust are generally allocated to the Funds based on each Fund’s relative net assets.
Offering Costs: Offering costs for the Stone Harbor 500 Plus Fund of $64,739, consisted of fees related to the mailing and printing of the initial prospectus, certain startup legal costs, and initial registration filings. Such costs are amortized over a twelve month period beginning with the commencement of operations of the Fund.
Federal and Other Taxes: No provision for income taxes is included in the accompanying financial statements, as the Funds intend to distribute to shareholders all taxable investment income and realized gains and otherwise comply with Subchapter M of the Internal Revenue Code of 1986, as amended, applicable to regulated investment companies.
The Funds evaluate tax positions taken (or expected to be taken) in the course of preparing the Funds’ tax provisions to determine whether these positions meet a “more‐likely‐than‐not” standard that, based on the technical merits, have a more than fifty percent likelihood of being sustained by a taxing authority upon examination. A tax position that meets the “more‐likely‐than‐not” recognition threshold is measured to determine the amount of benefit to recognize in the financial statements.
| 88 | www.shiplp.com |
| Stone Harbor Investment Funds | Notes to Financial Statements |
May 31, 2017
As of and during the period ended May 31, 2017, the Funds did not have a liability for any unrecognized tax benefits. The Funds file U.S. federal, state, and local tax returns as required. The Funds’ tax returns are subject to examination by the relevant tax authorities until expiration of the applicable statute of limitations which is generally three years after the filing of the tax return for federal purposes and four years for most state returns. Tax returns for open years have incorporated no uncertain tax positions that require a provision for income taxes.
| 3. | DERIVATIVE INSTRUMENTS |
Risk Exposure and the Use of Derivative Instruments: The Funds’ investment objectives allow the Funds to enter in various types of derivatives contracts. In doing so, the Funds employ strategies in differing combinations to permit them to increase, decrease, or change the level or types of exposure to market factors. Central to those strategies are features inherent to derivatives that may make them more attractive for this purpose than equity or debt securities; they require little or no initial cash investment, they can focus exposure on only certain selected risk factors, and they may not require the ultimate receipt or delivery of the underlying security (or securities) to the contract. This may allow the Funds to pursue their objectives more quickly and efficiently than if they were to make direct purchases or sales of securities capable of affecting a similar response to market factors.
The Funds’ use of derivatives can result in losses due to unanticipated changes in the risk factors described in Note 2 and the overall market. In instances where the Funds are using derivatives to decrease, or hedge, exposures to market risk factors for securities held by the Funds, there are also risks that those derivatives may not perform as expected resulting in losses for the combined or hedged positions.
Derivatives may have little or no initial cash investment relative to their market value exposure and therefore can produce significant gains or losses in excess of their cost. This use of embedded leverage allows each Fund to increase its market value exposure relative to its net assets and can substantially increase the volatility of the Funds’ performance.
Additional associated risks from investing in derivatives also exist and potentially could have significant effects on the valuation of the derivative and the Funds. Typically, the associated risks are not the risks that the Funds are attempting to increase or decrease exposure to, per their investment objectives, but are the additional risks from investing in derivatives.
Examples of these associated risks are liquidity risk, which is the risk that the Funds will not be able to sell or close out the derivative in a timely manner, and counterparty credit risk, which is the risk that the counterparty will not fulfill its obligation to the Funds. Associated risks can be different for each type of derivative and are discussed by each derivative type below in the notes that follow.
Derivatives are also subject to the risk of possible regulatory changes, which could adversely affect the availability and performance of derivative securities, make them more costly and limit or restrict their use by the Fund, which could prevent the Fund from implementing its investment strategies and adversely affect returns.
Forward Foreign Currency Contracts: Certain Funds engaged in currency transactions with counterparties during the period ended May 31, 2017 to hedge the value of portfolio securities denominated in particular currencies against fluctuations in relative value, to gain or reduce exposure to certain currencies, or to generate income or gains. A forward foreign currency contract is an agreement between two parties to buy and sell a currency at a set price on a future date. The contract is marked‐to‐market daily and the change in value is recorded by the Funds as an unrealized gain or loss. When a forward foreign currency contract is extinguished, through delivery, the Funds record a realized gain or loss equal to the difference between the value of the contract at the time it was opened and the value of the contract at the time it was extinguished.
Forward foreign currency contracts involve elements of market risk in excess of the amounts reflected in the Statements of Assets and Liabilities. The Funds bear the risk of an unfavorable change in the foreign exchange rate underlying the forward foreign currency contract. Risks may also arise upon entering into these contracts from the potential inability of the counterparties to meet the terms of their contracts.
Futures Contracts: Certain Funds invested in futures contracts during the period ended May 31, 2017 in accordance with their investment objectives. Each Fund does so for a variety of reasons including for cash management, hedging or non‐hedging purposes in an attempt to achieve investment returns consistent with the Fund’s investment objective. A futures contract provides for the future sale by one party and purchase by another party of a specified quantity of the security or other financial instrument at a specified price and time. A futures contract on an index is an agreement pursuant to which two parties agree to take or make delivery of an amount of cash equal to the difference between the value of the index at the close of the last trading day of the contract and the price at which the index contract was originally written. Futures contract transactions may result in losses in excess of the amount invested in the futures contract. There can be no guarantee that there will be a correlation between price movements in the hedging vehicle and in the portfolio securities being hedged. An incorrect correlation could result in a loss on both the hedged securities in a Fund and the hedging vehicle so that the portfolio return might have been greater had hedging not been attempted. There can be no assurance that a liquid market will exist at a time when a Fund seeks to close out a futures contract or a futures option position. Lack of a liquid market for any reason may prevent a Fund from liquidating an unfavorable position, and the Fund would remain obligated to meet margin requirements until the position is closed. In addition, a Fund could be exposed to risk if the counterparties to the contracts are unable to meet the terms of their contracts. With exchange‐traded futures contracts, there is minimal counterparty credit risk to the Funds since futures contracts are exchange‐traded and the exchange’s clearinghouse, as counterparty to all exchange‐traded futures contracts, guarantees the futures contracts against default.
| Stone Harbor Investment Funds Annual Report | May 31, 2017 | 89 |
| Stone Harbor Investment Funds | Notes to Financial Statements |
May 31, 2017
When a purchase or sale of a futures contract is made by a Fund, the Fund is required to deposit with its broker a specified amount of liquid assets (“initial margin”). The margin required for a futures contract is set by the exchange on which the contract is traded and may be modified during the term of the contract. The margin is reported on the Statement of Assets and Liabilities as “Deposit with brokers for futures contracts”. The initial margin is in the nature of a performance bond or good faith deposit on the futures contract that is returned to a Fund upon termination of the contract, assuming all contractual obligations have been satisfied. Each day a Fund may pay or receive cash, called “variation margin,” equal to the daily change in value of the futures contract. Such payments or receipts are recorded for financial statement purposes as unrealized gains or losses by a Fund. Variation margin does not represent a borrowing or loan by a Fund but is instead a settlement between a Fund and the broker of the amount one would owe the other if the futures contract expired. When the contract is closed, a Fund records a realized gain or loss equal to the difference between the value of the contract at the time it was opened and the value at the time it was closed.
Swap Agreements: Certain Funds invested in swap agreements during the period ended May 31, 2017. Swap agreements are bilaterally negotiated agreements between a Fund and a counterparty to exchange or swap investment cash flows, assets, or market‐linked returns at specified, future intervals. Swap agreements are privately negotiated in the over the counter market (“OTC swaps”) or may be executed in a multilateral or other trade facility platform, such as a registered exchange (“centrally cleared swaps”). In a centrally cleared swap, immediately following execution of the swap agreement, the swap agreement is novated to a central counterparty (the “CCP”) and the Fund’s counterparty on the swap agreement becomes the CCP. The Fund may enter into credit default swaps, interest rate swaps, total return swaps on individual securities or groups or indices of securities for hedging, investment or leverage purposes. In connection with these agreements, securities or cash may be identified as collateral or margin in accordance with the terms of the respective swap agreements to provide assets of value and recourse in the event of default or bankruptcy/insolvency.
Swaps are marked‐to‐market daily and changes in value, including the accrual of periodic amounts of interest, are recorded daily. Daily changes in valuation of centrally cleared swaps, if any, are recorded as a receivable or payable for the change in value as appropriate (“variation margin”) and also reflected in the change in unrealized appreciation/(depreciation) on credit default swap contracts in the Statement of Operations. Each day the Fund may pay or receive cash, equal to the variation margin of the centrally cleared swap. Changes in value for OTC swaps are reflected in the unrealized appreciation/(depreciation) of the position until a periodic payment is made by either party.
Swap payments received or paid at the beginning of the measurement period represent premiums paid or received upon entering into the swap agreement to compensate for differences between the stated terms of the swap agreement and prevailing market conditions (credit spreads, interest rates, and other relevant factors). Generally, the basis of the swap is the unamortized premium received or paid. Periodic payments received or made by the Fund are recorded as realized gains or losses, respectively. Any upfront fees paid are recorded as assets and any upfront fees received are recorded as liabilities. For centrally cleared swaps, these amounts are included in the deposits with brokers for swap contracts while OTC swaps are displayed as a swap premium paid/received. When the swap is terminated, the Fund will record a realized gain or loss equal to the difference between the proceeds from (or cost of) the closing transaction and the Fund’s basis in the contract, if any.
Credit Default Swap Contracts: Certain Funds entered into credit default swap contracts during the period ended May 31, 2017 for hedging purposes to gain market exposure or to add leverage to its portfolio. When used for hedging purposes, a Fund is the buyer of a credit default swap contract. In that case, the Fund is entitled to receive the par (or other agreed upon) value of a referenced debt obligation, index or other investment from the counterparty to the contract in the event of a default by a third party, such as a U.S. or foreign issuer, on the referenced debt obligation. In return, the Fund would pay to the counterparty a periodic stream of payments over the term of the contract provided that no event of default has occurred. If no event of default occurs, the Fund has spent the stream of payments and received no benefit from the contract. When the Fund is the seller of a credit default swap contract, the Fund receives the stream of payments but is obligated to pay upon default of the referenced debt obligation. As the seller, the Fund effectively adds leverage to its portfolio because, in addition to its total assets, the Fund is subject to investment exposure on the notional amount of the swap.
In addition to the risks applicable to derivatives generally, credit default swaps involve special risks because they may be difficult to value, are highly susceptible to liquidity and credit risk and generally pay a return to the counterparty only in the event of an actual default by the issuer of the underlying obligation, as opposed to a credit downgrade or other indication of financial difficulty.
| 90 | www.shiplp.com |
| Stone Harbor Investment Funds | Notes to Financial Statements |
May 31, 2017
Interest Rate Swap Contracts: Certain Funds may enter into interest rate swap agreements. Interest rate swap contracts involve the exchange by a Fund with another party for their respective commitment to pay or receive interest on the notional amount of principal. Certain forms of interest rate swap agreements may include: (i) interest rate caps, under which, in return for a premium, one party agrees to make payments to the other to the extent that interest rates exceed a specified rate, or “cap”, (ii) interest rate floors, under which, in return for a premium, one party agrees to make payments to the other to the extent that interest rates fall below a specified rate, or “floor”, (iii) interest rate collars, under which a party sells a cap and purchases a floor or vice versa in an attempt to protect itself against interest rate movements exceeding given minimum or maximum levels, (iv) callable interest rate swaps, under which the buyer pays an upfront fee in consideration for the right to early terminate the swap transaction in whole, at zero costs and at a predetermined date and time prior to the maturity date, (v) spreadlocks, which allow the interest rate swap users to lock in the forward differential (or spread) between the interest rate swap rate and a specified benchmark, or (vi) basis swaps, under which two parties can exchange variable interest rates based on different segments of money markets.
Foreign Currency Options: During the period ended May 31, 2017, the Strategic Income Fund purchased foreign currency options. Purchasing foreign currency options gives the Fund the right, but not the obligation to buy or sell the currency with specified amounts of currency and a rate of exchange that may be exercised by a certain date. Writing foreign currency options gives the counterparty the right, but not the obligation to buy or sell the currency with specified amounts of currency and a rate of exchange that may be exercised by a certain date. These options may be used as a short or long hedge against possible variations in foreign exchange rates or to gain exposure to foreign currencies.
Currency hedging involves special risks, including possible default by the other party to the transaction, illiquidity and, to the extent the Adviser’s view as to certain market movements is incorrect, the risk that the use of hedging could result in losses greater than if they had not been used. In addition, in certain countries in which each Fund may invest, currency hedging opportunities may not be available.
Premiums received or paid from writing or purchasing options, which expire unexercised, are treated by a portfolio on the expiration date as realized gains or losses. The difference between the premium and the amount paid or received on a closing purchase or sale transaction, including brokerage commissions, is also treated as a realized gain or loss. If an option is exercised, the premium paid or realized is added to the cost of the purchase or proceeds from the sale in determining whether the portfolio has realized a gain or loss on investment transactions.
The tables below are a summary of the fair valuations of derivative instruments categorized by risk exposure.
Fair values of forward foreign currency contracts, credit default swaps, and future contracts on the Statements of Assets and Liabilities as of May 31, 2017:
| Risk Exposure | Location | Fair Value | Location | Fair Value | |||||||
| Stone Harbor Emerging Markets Debt Fund | |||||||||||
| Foreign Exchange Rate Risk (Forward Foreign Currency Contracts) | Unrealized appreciation on forward foreign currency contracts | $ | 1,095,307 | Unrealized depreciation on forward foreign currency contracts | $ | (3,931,562 | ) | ||||
| Total | $ | 1,095,307 | $ | (3,931,562 | ) | ||||||
| Stone Harbor High Yield Bond Fund | |||||||||||
| Foreign Exchange Rate Risk (Forward Foreign Currency Contracts) | Unrealized appreciation on forward foreign currency contracts | $ | 1,967 | Unrealized depreciation on forward foreign currency contracts | |||||||
| Total | $ | 1,967 | $ | (37,607 | ) | ||||||
| Stone Harbor Local Markets Fund | |||||||||||
| Foreign Exchange Rate Risk (Forward Foreign Currency Contracts) | Unrealized appreciation on forward foreign currency contracts | $ | 2,220,877 | Unrealized depreciation on forward foreign currency contracts | |||||||
| Total | $ | 2,220,877 | $ | (1,887,285 | ) | ||||||
| Stone Harbor Investment Funds Annual Report | May 31, 2017 | 91 |
| Stone Harbor Investment Funds | Notes to Financial Statements |
May 31, 2017
| Risk Exposure | Location | Fair Value | Location | Fair Value | |||||||
| Stone Harbor Strategic Income Fund | |||||||||||
Credit Risk (Swap Contracts)* | Unrealized appreciation on credit default swap contracts | $ | – | Unrealized depreciation on credit default swap contracts | $ | (71,057 | ) | ||||
Interest Rate Risk (Futures Contracts)* | Unrealized appreciation on futures contracts | 44,220 | Unrealized depreciation on futures contracts | (17,159 | ) | ||||||
| Foreign Exchange Rate Risk (Forward Foreign Currency Contracts) | Unrealized appreciation on forward foreign currency contracts | 22,417 | Unrealized depreciation on forward foreign currency contracts | (15,302 | ) | ||||||
| Total | $ | 66,637 | $ | (103,518 | ) | ||||||
| Stone Harbor Emerging Markets Debt Allocation Fund | |||||||||||
| Foreign Exchange Rate Risk (Forward Foreign Currency Contracts) | Unrealized appreciation on forward foreign currency contracts | $ | 577 | Unrealized depreciation on forward foreign currency contracts | $ | (4,756 | ) | ||||
| Total | $ | 577 | $ | (4,756 | ) | ||||||
| Stone Harbor 500 Plus Fund | |||||||||||
Interest Rate Risk (Futures Contracts)* | Unrealized appreciation on futures contracts | $ | 131,465 | Unrealized depreciation on futures contracts | $ | – | |||||
| Total | $ | 131,465 | $ | – | |||||||
| * | The value presented includes cumulative gain/(loss) on open futures contracts and credit default swap contracts; however, the value reflected on the accompanying Statement of Assets and Liabilities is only the unsettled variation margin receivable/(payable) as of May 31, 2017. |
The foreign currency options, forward foreign currency contracts, credit default swaps, and future contracts average value during the period ended May 31, 2017 is noted below:
| Fund | Purchased Options | Forward Foreign Currency Contracts* | Credit Default Swap Contracts | Futures Contracts** | ||||||||||||
| Stone Harbor Emerging Markets Debt Fund | $ | – | $ | (103,616,239 | ) | $ | (1,992,885 | ) | $ | – | ||||||
| Stone Harbor High Yield Bond Fund | – | (1,103,496 | ) | – | – | |||||||||||
| Stone Harbor Local Markets Fund | – | 67,271,907 | – | – | ||||||||||||
| Stone Harbor Emerging Markets Corporate Debt Fund | – | (152,519 | ) | – | – | |||||||||||
| Stone Harbor Investment Grade Fund | – | – | – | – | ||||||||||||
| Stone Harbor Strategic Income Fund | 479 | 175,334 | (319,396 | ) | 13,293 | |||||||||||
| Stone Harbor Emerging Markets Debt Allocation Fund | – | (354,087 | ) | – | – | |||||||||||
| Stone Harbor 500 Plus Fund | – | – | – | 81,641 | ||||||||||||
| * | Represents the average foreign currency amount translated into US dollars (bought) or sold |
| ** | Represents the average unrealized appreciation/(depreciation) |
| 92 | www.shiplp.com |
| Stone Harbor Investment Funds | Notes to Financial Statements |
May 31, 2017
The effect of forward foreign currency contracts, credit default swaps, foreign currency options, and futures contracts on the Statements of Operations for the period ended May 31, 2017:
| Risk Exposure | Location | Realized Gain/(Loss) on Derivatives | Location | Change in Unrealized Appreciation/(Depreciation) on Derivatives Recognized in Income | ||||||
| Stone Harbor Emerging Markets Debt Fund | ||||||||||
| Credit Risk (Swap Contracts) | Net realized gain/(loss) on credit default swap contracts | $ | 4,681,709 | Change in unrealized appreciation/(depreciation) on credit default swap contracts | $ | 151,724 | ||||
| Foreign Exchange Rate Risk (Forward Foreign Currency Contracts) | Net realized gain/(loss) on forward foreign currency contracts | 1,478,256 | Change in unrealized appreciation/(depreciation) on forward foreign currency contracts | (2,912,301 | ) | |||||
| Total | $ | 6,159,965 | $ | (2,760,577 | ) | |||||
| Stone Harbor High Yield Bond Fund | ||||||||||
| Foreign Exchange Rate Risk (Forward Foreign Currency Contracts) | Net realized gain/(loss) on forward foreign currency contracts | $ | 399,980 | Change in unrealized appreciation/(depreciation) on forward foreign currency contracts | $ | (134,019 | ) | |||
| Total | $ | 399,980 | $ | (134,019 | ) | |||||
| Stone Harbor Local Markets Fund | ||||||||||
| Foreign Exchange Rate Risk (Forward Foreign Currency Contracts) | Net realized gain/(loss) on forward foreign currency contracts | $ | (19,148,143 | ) | Change in unrealized appreciation/(depreciation) on forward foreign currency contracts | $ | 1,328,631 | |||
| Total | $ | (19,148,143 | ) | $ | 1,328,631 | |||||
| Stone Harbor Emerging Markets Corporate Debt Fund | ||||||||||
| Foreign Exchange Rate Risk (Forward Foreign Currency Contracts) | Net realized gain/(loss) on forward foreign currency contracts | $ | 53,364 | Change in unrealized appreciation/(depreciation) on forward foreign currency contracts | $ | (3,298 | ) | |||
| Total | $ | 53,364 | $ | (3,298 | ) | |||||
| Stone Harbor Strategic Income Fund | ||||||||||
| Currency Risk (Purchased Options) | Net realized gain/loss on investments | $ | (54,168 | ) | Change in unrealized appreciation/depreciation on investments | $ | 37,888 | |||
| Credit Risk (Swap Contracts) | Net realized gain/(loss) on credit default swap contracts | (307,292 | ) | Change in unrealized appreciation/(depreciation) on credit default swap contracts | (71,057 | ) | ||||
| Interest Rate Risk (Futures Contracts) | Net realized gain/(loss) on futures contracts | 337,337 | Change in unrealized appreciation/(depreciation) on futures contracts | 6,703 | ||||||
| Foreign Exchange Rate Risk (Forward Foreign Currency Contracts) | Net realized gain/(loss) on forward foreign currency contracts | 170,491 | Change in unrealized appreciation/(depreciation) on forward foreign currency contracts | 27,437 | ||||||
| Total | $ | 146,368 | $ | 971 | ||||||
| Stone Harbor Investment Funds Annual Report | May 31, 2017 | 93 |
| Stone Harbor Investment Funds | Notes to Financial Statements |
May 31, 2017
| Risk Exposure | Location | Realized Gain/(Loss) on Derivatives | Location | Change in Unrealized Appreciation/(Depreciation) on Derivatives Recognized in Income | |||||||
| Stone Harbor Emerging Markets Debt Allocation Fund | |||||||||||
| Foreign Exchange Rate Risk (Forward Foreign Currency Contracts) | Net realized gain/(loss) on forward foreign currency contracts | $ | (195,260 | ) | Change in unrealized appreciation/(depreciation) on forward foreign currency contracts | $ | 16,375 | ||||
| Total | $ | (195,260 | ) | $ | 16,375 | ||||||
| Stone Harbor 500 Plus Fund | |||||||||||
| Interest Rate Risk (Futures Contracts) | Net realized gain/(loss) on futures contracts | $ | (35 | ) | Change in unrealized appreciation/(depreciation) on futures contracts | $ | 131,465 | ||||
| Total | $ | (35 | ) | $ | 131,465 | ||||||
Offsetting Arrangements: Certain derivative contracts are executed under standardized netting agreements. A derivative netting arrangement creates an enforceable right of set‐off that becomes effective, and affects the realization of settlement on individual assets, liabilities and collateral amounts, only following a specified event of default or early termination. Default events may include the failure to make payments or deliver securities timely, material adverse changes in financial condition or insolvency, the breach of minimum regulatory capital requirements, or loss of license, charter or other legal authorization necessary to perform under the contract. These agreements mitigate counterparty credit risk by providing for a single net settlement with a counterparty of all financial transactions covered by the agreement in an event of default as defined under such agreement.
The following table presents derivative financial instruments that are subject to enforceable netting arrangements, collateral arrangements or other similar agreements as of May 31, 2017.
Offsetting of Derivatives Assets
| From | Gross Amounts of Recognized Assets | Gross Amounts Offset In The Statements of Assets and Liabilities | Net Amounts Presented In The Statements of Assets and Liabilities | Financial Instruments Available for Offset(a) | Cash Collateral Received(a) | Net Amount | ||||||||||||||||||
| Stone Harbor Emerging Market Debt Fund | ||||||||||||||||||||||||
| Forward Foreign Currency Contracts | $ | 1,095,307 | $ | – | $ | 1,095,307 | $ | (657,436 | ) | $ | (110,000 | ) | $ | 327,871 | ||||||||||
| TOTAL | $ | 1,095,307 | $ | – | $ | 1,095,307 | $ | (657,436 | ) | $ | (110,000 | ) | $ | 327,871 | ||||||||||
| Stone Harbor High Yield | ||||||||||||||||||||||||
| Forward Foreign Currency Contracts | $ | 1,967 | $ | – | $ | 1,967 | $ | (1,906 | ) | $ | – | $ | 61 | |||||||||||
| TOTAL | $ | 1,967 | $ | – | $ | 1,967 | $ | (1,906 | ) | $ | – | $ | 61 | |||||||||||
| Stone Harbor Local Markets Funds | ||||||||||||||||||||||||
| Forward Foreign Currency Contracts | $ | 2,220,878 | $ | – | $ | 2,220,878 | $ | (1,665,841 | ) | $ | (190,000 | ) | $ | 365,037 | ||||||||||
| TOTAL | $ | 2,220,878 | $ | – | $ | 2,220,878 | $ | (1,665,841 | ) | $ | (190,000 | ) | $ | 365,037 | ||||||||||
| Stone Harbor Strategic Income Fund | ||||||||||||||||||||||||
| Forward Foreign Currency Contracts | $ | 22,417 | $ | – | $ | 22,417 | $ | (7,152 | ) | $ | – | $ | 15,265 | |||||||||||
| TOTAL | $ | 22,417 | $ | – | $ | 22,417 | $ | (7,152 | ) | $ | – | $ | 15,265 | |||||||||||
| Stone Harbor Emerging Markets Debt Allocation Fund | ||||||||||||||||||||||||
| Forward Foreign Currency Contracts | $ | 577 | $ | – | $ | 577 | $ | (577 | ) | $ | – | $ | – | |||||||||||
| TOTAL | $ | 577 | $ | – | $ | 577 | $ | (577 | ) | $ | – | $ | – | |||||||||||
| 94 | www.shiplp.com |
| Stone Harbor Investment Funds | Notes to Financial Statements |
May 31, 2017
Offsetting of Derivatives Liabilities
| Description | Gross Amounts of Recognized Liabilities | Gross Amounts Offset In The Statements of Assets and Liabilities | Net Amounts Presented In The Statements of Assets and Liabilities | Financial Instruments Available for Offset(a) | Cash Collateral Pledged(a) | Net Amount | ||||||||||||||||||
| Stone Harbor Emerging Market Debt Fund | ||||||||||||||||||||||||
| Forward Foreign Currency Contracts | $ | 3,931,562 | $ | – | $ | 3,931,562 | $ | (657,436 | ) | $ | (2,830,000 | ) | $ | 444,126 | ||||||||||
| TOTAL | $ | 3,931,562 | $ | – | $ | 3,931,562 | $ | (657,436 | ) | $ | (2,830,000 | ) | $ | 444,126 | ||||||||||
| Stone Harbor High Yield Fund | ||||||||||||||||||||||||
| Forward Foreign Currency Contracts | $ | 37,607 | $ | – | $ | 37,607 | $ | (1,906 | ) | $ | – | $ | 35,701 | |||||||||||
| TOTAL | $ | 37,607 | $ | – | $ | 37,607 | $ | (1,906 | ) | $ | – | $ | 35,701 | |||||||||||
| Stone Harbor Local Markets Funds | ||||||||||||||||||||||||
| Forward Foreign Currency Contracts | $ | 1,887,285 | $ | – | $ | 1,887,285 | $ | (1,665,841 | ) | $ | (221,444 | ) | $ | – | ||||||||||
| TOTAL | $ | 1,887,285 | $ | – | $ | 1,887,285 | $ | (1,665,841 | ) | $ | (221,444 | ) | $ | – | ||||||||||
| Stone Harbor Strategic Income Fund | ||||||||||||||||||||||||
| Forward Foreign Currency Contracts | $ | 15,302 | $ | – | $ | 15,302 | $ | (7,152 | ) | $ | – | $ | 8,150 | |||||||||||
| TOTAL | $ | 15,302 | $ | – | $ | 15,302 | $ | (7,152 | ) | $ | – | $ | 8,150 | |||||||||||
| Stone Harbor Emerging Markets Debt Allocation Fund | ||||||||||||||||||||||||
| Forward Foreign Currency Contracts | $ | 4,756 | $ | – | $ | 4,756 | $ | (577 | ) | $ | – | $ | 4,179 | |||||||||||
| TOTAL | $ | 4,756 | $ | – | $ | 4,756 | $ | (577 | ) | $ | – | $ | 4,179 | |||||||||||
(a) | These amounts are limited to the derivatives asset/liability balance and, accordingly, do not include excess collateral received/pledged. |
4. TAX BASIS INFORMATION
Tax Basis of Distributions to Shareholders: Net investment income/ (loss) and net realized gain/ (loss) may differ for financial statement and tax purposes. The character of distributions made during the year from net investment income or net realized gains may differ from its ultimate characterization for federal income tax purposes. Also, due to the timing of dividend distributions, the fiscal year in which amounts are distributed may differ from the fiscal year in which the income or realized gain was recorded by a Fund.
The tax character of the distributions paid by the Funds during the periods ended May 31, here as follow:
| Stone Harbor Emerging Markets Debt Fund | 2017 | 2016 | ||||||
| Ordinary Income | $ | 90,794,571 | $ | 125,569,725 | ||||
| Total | $ | 90,794,571 | $ | 125,569,725 | ||||
| Stone Harbor High Yield Bond Fund | 2017 | 2016 | ||||||
| Ordinary Income | $ | 12,429,528 | $ | 16,172,824 | ||||
| Total | $ | 12,429,528 | $ | 16,172,824 |
| Stone Harbor Local Markets Fund | 2017 | 2016 | ||||||
| Total | $ | – | $ | – |
| Stone Harbor Emerging Markets Corporate Debt Fund | 2017 | 2016 | ||||||
| Ordinary Income | $ | 653,203 | $ | 1,499,763 | ||||
| Total | $ | 653,203 | $ | 1,499,763 | ||||
| Stone Harbor Investment Grade Fund | 2017 | 2016 | ||||||
| Ordinary Income | $ | 351,688 | $ | 329,050 | ||||
| Long‐Term Capital Gain | 7,434 | 21,781 | ||||||
| Total | $ | 359,122 | $ | 350,831 | ||||
| Stone Harbor Investment Funds Annual Report | May 31, 2017 | 95 |
| Stone Harbor Investment Funds | Notes to Financial Statements |
May 31, 2017
| Stone Harbor Strategic Income Fund | 2017 | 2016 | ||||||
| Ordinary Income | $ | 1,417,693 | $ | 1,268,147 | ||||
| Long‐Term Capital Gain | – | 489,931 | ||||||
| Total | $ | 1,417,693 | $ | 1,758,078 | ||||
| Stone Harbor Emerging Markets Debt Allocation Fund | 2017 | 2016 | ||||||
| Ordinary Income | $ | 1,818,851 | $ | 2,967,695 | ||||
| Total | $ | 1,818,851 | $ | 2,967,695 | ||||
| Stone Harbor 500 Plus Fund | For the Period Ended May 31, 2017 | |||
| Ordinary Income | $ | 12,105 | ||
| Total | $ | 12,105 | ||
As of May 31, 2017, the components of distributable earnings on a tax basis were as follows:
| Stone Harbor Emerging Markets Debt Fund | ||||
| Undistributed Ordinary Income | $ | 4,894,492 | ||
| Accumulated Capital Loss | (179,140,573 | ) | ||
| Unrealized Appreciation | 50,248,057 | |||
| Cumulative Effect of Other Timing Difference* | (2,695,839 | ) | ||
| Total | $ | (126,693,863 | ) | |
| Stone Harbor High Yield Bond Fund | ||||
| Undistributed Ordinary Income | $ | 524,578 | ||
| Accumulated Capital Loss | (24,346,686 | ) | ||
| Unrealized Appreciation | 5,100,812 | |||
| Cumulative Effect of Other Timing Difference* | 35,640 | |||
| Total | $ | (18,685,656 | ) | |
| Stone Harbor Local Markets Fund | ||||
| Accumulated Capital Loss | $ | (179,901,476 | ) | |
| Unrealized Depreciation | (58,735,041 | ) | ||
| Cumulative Effect of Other Timing Difference* | (46,154,921 | ) | ||
| Total | $ | (284,791,438 | ) | |
| Stone Harbor Emerging Markets Corporate Debt Fund | ||||
| Undistributed Ordinary Income | $ | 17,169 | ||
| Accumulated Capital Loss | (4,820,775 | ) | ||
| Unrealized Appreciation | 487,272 | |||
| Total | $ | (4,316,334 | ) | |
| Stone Harbor Investment Grade Fund | ||||
| Accumulated Capital Gain | $ | 38,881 | ||
| Unrealized Appreciation | 159,249 | |||
| Total | $ | 198,130 |
| 96 | www.shiplp.com |
| Stone Harbor Investment Funds | Notes to Financial Statements |
May 31, 2017
| Stone Harbor Strategic Income Fund | ||||
| Undistributed Ordinary Income | $ | 71,585 | ||
| Accumulated Capital Loss | (141,064 | ) | ||
| Unrealized Depreciation | (823,531 | ) | ||
| Cumulative Effect of Other Timing Difference* | 40,278 | |||
| Total | $ | (852,732 | ) | |
| Stone Harbor Emerging Markets Debt Allocation Fund | ||||
| Undistributed Ordinary Income | $ | 297,223 | ||
| Accumulated Capital Loss | (7,916,062 | ) | ||
| Unrealized Appreciation | 3,197,101 | |||
| Cumulative Effect of Other Timing Difference* | 4,179 | |||
| Total | $ | (4,417,559 | ) | |
| Stone Harbor 500 Plus Fund | ||||
| Undistributed Ordinary Income | $ | 54,025 | ||
| Accumulated Capital Gain | 78,858 | |||
| Unrealized Appreciation | 138,672 | |||
| Cumulative Effect of Other Timing Difference* | (131,465 | ) | ||
| Total | $ | 140,090 | ||
| * | Other temporary differences due to timing, consist primarily of mark-to-market on forward foreign currency contracts. |
The tax components of distributable earnings are determined in accordance with income tax regulations which may differ from the composition of net assets reported under GAAP. Accordingly, for the year ended May 31, 2017, certain differences were reclassified. These differences were primarily attributed to the differing tax treatment of credit default swap amortization, foreign currencies and certain other investments. The amounts reclassified did not affect net assets.
The reclassifications were as follows:
| Fund | Paid-in Capital | Accumulated Net Investment Income/(Loss) | Accumulated Net Realized Gain/(Loss) on Investments | |||||||||
| Stone Harbor Emerging Markets Debt Fund | $ | (1,871,232 | ) | $ | 4,657,984 | $ | (2,786,752 | ) | ||||
| Stone Harbor High Yield Bond Fund | – | (720,679 | ) | 720,679 | ||||||||
| Stone Harbor Local Markets Fund | (76,662,789 | ) | 10,193,316 | 66,469,473 | ||||||||
| Stone Harbor Emerging Markets Corporate Debt Fund | – | (33,822 | ) | 33,822 | ||||||||
| Stone Harbor Investment Grade Fund | – | 9,365 | (9,365 | ) | ||||||||
| Stone Harbor Strategic Income Fund | – | (70,853 | ) | 70,853 | ||||||||
| Stone Harbor Emerging Markets Debt Allocation Fund | – | (250,461 | ) | 250,461 | ||||||||
| Stone Harbor 500 Plus Fund | (1,153 | ) | 1,480 | (327 | ) | |||||||
Included in the amounts reclassified above was a net operating loss offset to paid‐in capital in the amounts of:
| Fund | Amount | |||
| Stone Harbor Local Markets Fund | $ | 76,662,789 | ||
Capital Losses: As of May 31, 2017 the following Funds had capital loss carryforwards which may reduce the Funds’ taxable income arising from future net realized gains on investments, if any, to the extent permitted by the Code and thus may reduce the amount of the distributions to shareholders which would otherwise be necessary to relieve the Funds of any liability for federal tax pursuant to the Code.
| Stone Harbor Investment Funds Annual Report | May 31, 2017 | 97 |
| Stone Harbor Investment Funds | Notes to Financial Statements |
May 31, 2017
During the year ended May 31, 2017, the Funds utilized capital loss carryforwards as follows:
| Fund | Amount | |||
| Stone Harbor Emerging Markets Debt Fund | $ | 15,295,197 | ||
| Stone Harbor Strategic Income Fund | 31,016 | |||
Capital losses carried forward were as follows:
| Fund | Short-Term | Long-Term | ||||||
| Stone Harbor Emerging Markets Debt Fund | $ | 77,380,083 | $ | 101,760,490 | ||||
| Stone Harbor High Yield Bond Fund | 2,836,987 | 20,393,992 | ||||||
| Stone Harbor Local Markets Fund | 111,964,632 | 62,257,292 | ||||||
| Stone Harbor Emerging Markets Corporate Debt Fund | 2,010,614 | 2,798,816 | ||||||
| Stone Harbor Strategic Income Fund | 59,112 | 58,010 | ||||||
| Stone Harbor Emerging Markets Debt Allocation Fund | 980,119 | 6,935,943 | ||||||
The following Funds elect to defer to the year ending May 31, 2018 the following capital losses recognized during the period November 1, 2016 through May 31, 2017:
| Fund | Amount | |||
| Stone Harbor High Yield Bond Fund | $ | 1,115,707 | ||
| Stone Harbor Local Markets Fund | 5,679,552 | |||
| Stone Harbor Emerging Markets Corporate Debt Fund | 11,345 | |||
| Stone Harbor Strategic Income Fund | 23,942 | |||
The following Fund elects to defer to the period ending May 31, 2018, late year ordinary losses in the amount of:
| Fund | Amount | |||
| Stone Harbor Local Markets Fund | $ | 35,529,488 | ||
Unrealized Appreciation and Depreciation on Investments: At May 31, 2017 the aggregate gross unrealized appreciation and depreciation of investments for federal income purposes were as follows:
| Stone Harbor Emerging Markets Debt Fund | ||||
| Gross appreciation on investments (excess of value over tax cost) | $ | 62,545,266 | ||
| Gross depreciation on investments (excess of tax cost over value) | (9,570,957 | ) | ||
| Net depreciation of foreign currency and derivatives | (2,726,252 | ) | ||
| Net unrealized appreciation | $ | 50,248,057 | ||
| Cost of investments for income tax purposes | $ | 1,369,361,304 | ||
| Stone Harbor High Yield Bond Fund | ||||
| Gross appreciation on investments (excess of value over tax cost) | $ | 7,689,125 | ||
| Gross depreciation on investments (excess of tax cost over value) | (2,553,375 | ) | ||
| Net depreciation of foreign currency and derivatives | (34,938 | ) | ||
| Net unrealized appreciation | $ | 5,100,812 | ||
| Cost of investments for income tax purposes | $ | 155,460,116 | ||
| 98 | www.shiplp.com |
| Stone Harbor Investment Funds | Notes to Financial Statements |
May 31, 2017
| Stone Harbor Local Markets Fund | ||||
| Gross appreciation on investments (excess of value over tax cost) | $ | 37,256,009 | ||
| Gross depreciation on investments (excess of tax cost over value) | (96,568,452 | ) | ||
| Net appreciation of foreign currency and derivatives | 577,402 | |||
| Net unrealized depreciation | $ | (58,735,041 | ) | |
| Cost of investments for income tax purposes | $ | 873,978,402 | ||
| Stone Harbor Emerging Markets Corporate Debt Fund | ||||
| Gross appreciation on investments (excess of value over tax cost) | $ | 496,607 | ||
| Gross depreciation on investments (excess of tax cost over value) | (9,335 | ) | ||
| Net unrealized appreciation | $ | 487,272 | ||
| Cost of investments for income tax purposes | $ | 12,384,762 | ||
| Stone Harbor Investment Grade Fund | ||||
| Gross appreciation on investments (excess of value over tax cost) | $ | 254,404 | ||
| Gross depreciation on investments (excess of tax cost over value) | (95,155 | ) | ||
| Net unrealized appreciation | $ | 159,249 | ||
| Cost of investments for income tax purposes | $ | 15,778,548 | ||
| Stone Harbor Strategic Income Fund | ||||
| Gross appreciation on investments (excess of value over tax cost) | $ | 510,878 | ||
| Gross depreciation on investments (excess of tax cost over value) | (1,298,870 | ) | ||
| Net depreciation of foreign currency and derivatives | (35,539 | ) | ||
| Net unrealized depreciation | $ | (823,531 | ) | |
| Cost of investments for income tax purposes | $ | 37,620,337 | ||
| Stone Harbor Emerging Markets Debt Allocation Fund | ||||
| Gross appreciation on investments (excess of value over tax cost) | $ | 3,206,421 | ||
| Gross depreciation on investments (excess of tax cost over value) | (5,141 | ) | ||
| Net depreciation of foreign currency and derivatives | (4,179 | ) | ||
| Net unrealized appreciation | $ | 3,197,101 | ||
| Cost of investments for income tax purposes | $ | 24,507,147 | ||
| Stone Harbor 500 Plus Fund | ||||
| Gross appreciation on investments (excess of value over tax cost) | $ | 7,671 | ||
| Gross depreciation on investments (excess of tax cost over value) | (464 | ) | ||
| Net appreciation of foreign currency and derivatives | 131,465 | |||
Net unrealized appreciation | $ | 138,672 | ||
| Cost of investments for income tax purposes | $ | 2,123,939 | ||
5. ADVISORY FEES
Stone Harbor Investment Partners LP is the Trust’s investment adviser. Under the investment advisory agreement the Trust pays an investment advisory fee calculated daily and paid monthly of 0.60%, 0.50%, 0.75%, 0.85%, 0.35%, 0.55%, 0.70%, and 0.45% of the average daily net assets for Stone Harbor Emerging Markets Debt Fund, Stone Harbor High Yield Bond Fund, Stone Harbor Local Markets Fund, Stone Harbor Emerging Markets Corporate Debt Fund, Stone Harbor Investment Grade Fund, Stone Harbor Strategic Income Fund, Stone Harbor Emerging Markets Debt Allocation Fund, and Stone Harbor 500 Plus Fund, respectively.
| Stone Harbor Investment Funds Annual Report | May 31, 2017 | 99 |
| Stone Harbor Investment Funds | Notes to Financial Statements |
May 31, 2017
The Adviser has contractually agreed to waive investment advisory fees and reimburse other expenses with respect to each of the Funds so that the Net Annual Operating Expenses (exclusive of acquired Fund fees and expenses, brokerage expenses, interest expense, taxes and extraordinary expenses) of the Stone Harbor Emerging Markets Debt Fund Institutional Class, Stone Harbor High Yield Bond Fund Institutional Class, Stone Harbor Local Markets Fund Institutional Class, Stone Harbor Emerging Markets Corporate Debt Fund Institutional Class, Stone Harbor Investment Grade Fund Institutional Class, and Stone Harbor 500 Plus Fund Institutional Class will not exceed 0.75%, 0.65% 1.00%, 1.00%, 0.50%, and 0.60% respectively. The Adviser has contractually agreed to waive fees and reimburse expenses with respect to the Stone Harbor Strategic Income Fund Institutional Class and Stone Harbor Emerging Markets Debt Allocation Fund Institutional Class, so that the Net Annual Operating Expenses (inclusive of acquired fund fees and expenses but exclusive of brokerage expenses, interest expense, taxes and extraordinary expenses) will not exceed 0.70% and 0.85%, respectively. The fee waiver agreements are in effect through September 30, 2018 and are reevaluated on an annual basis.
The Adviser will be permitted to recover, on a class by class basis, expenses it has borne through the undertakings described above to the extent that a Fund’s expenses in later periods fall below the annual rates set forth in the relevant undertaking. A Fund will not be obligated to pay any such deferred fees and expenses more than three years after the end of the fiscal year in which the fee and expense was deferred. At May 31, 2017, deferred fees and expenses eligible to be recovered will expire as follows:
| 2018 | 2019 | 2020 | Total | ||||||||||||
| Stone Harbor High Yield Bond Fund | $ | 65,578 | $ | – | $ | 36,364 | $ | 101,942 | |||||||
| Stone Harbor Emerging Markets Corporate Debt Fund | $ | 100,868 | $ | 112,847 | $ | 136,853 | $ | 350,568 | |||||||
| Stone Harbor Investment Grade Fund | $ | 120,267 | $ | 125,244 | $ | 133,267 | $ | 378,778 | |||||||
| Stone Harbor Strategic Income Fund | $ | 248,095 | $ | 290,586 | $ | 316,580 | $ | 855,261 | |||||||
| Stone Harbor Debt Allocation Fund | $ | 379,648 | $ | 734,211 | $ | 475,248 | $ | 1,589,107 | |||||||
| Stone Harbor 500 Plus Fund | N/A | N/A | $ | 88,145 | $ | 88,145 | |||||||||
6. INVESTMENTS
During the period ended May 31, 2017, securities were redeemed in-kind from the Stone Harbor Emerging Markets Debt Fund. The intent of the transfers was to save on transaction costs both for the redeeming shareholder at the institution they transferred to and for the Stone Harbor Emerging Markets Debt Fund, on the sale of assets. The assets of the separate account in the Stone Harbor Emerging Markets Debt Fund, was redeemed-in-kind out of the Fund in the amount of $191,700,378, with a realized loss of $1,493,423.
During the period ended May 31, 2017, securities were redeemed in-kind from the Stone Harbor Emerging Markets Debt Fund. The intent of the transfers was to save on transaction costs both for the redeeming shareholder at the institution they transferred to and for the Stone Harbor Emerging Markets Debt Fund, on the sale of assets. The assets of the separate account in the Stone Harbor Emerging Markets Debt Fund, was redeemed-in-kind out of the Fund in the amount of $191,700,378, with a realized loss of $1,493,423.
For the period ended May 31, 2017, the aggregate cost of purchases and proceeds from sales of investments (excluding short-term investments and U.S. Government Obligations) were as follows:
| Purchases | Sales | |||||||
| Stone Harbor Emerging Markets Debt Fund | $ | 1,686,963,756 | $ | 1,897,618,876 | ||||
| Stone Harbor High Yield Bond Fund | 159,313,552 | 258,207,071 | ||||||
| Stone Harbor Local Markets Fund | 1,079,658,587 | 1,150,752,648 | ||||||
| Stone Harbor Emerging Markets Corporate Debt Fund | 10,387,624 | 14,431,894 | ||||||
| Stone Harbor Investment Grade Fund | 6,892,309 | 5,177,240 | ||||||
| Stone Harbor Strategic Income Fund | 7,476,706 | 7,794,281 | ||||||
| Stone Harbor Emerging Markets Debt Allocation Fund | 11,872,719 | 56,375,536 | ||||||
| Stone Harbor 500 Plus Fund | 1,949,020 | 229,265 | ||||||
For the period ended May 31, 2017 the aggregate cost of purchases and proceeds from sales of U.S. Government Obligations were as follows:
| Purchases | Sales | |||||||
| Stone Harbor Investment Grade Fund | $ | 447,146 | $ | 451,496 | ||||
| 100 | www.shiplp.com |
| Stone Harbor Investment Funds | Notes to Financial Statements |
May 31, 2017
7. AFFILIATED COMPANIES
Funds may invest in certain securities that are considered securities issued by affiliated companies. As defined by the Investment Company Act of 1940, an affiliated person, including an affiliated company, is one in which a Fund owns 5% or more of the outstanding voting securities, or a company which is under common ownership or control with the Fund. The purchases, sales, dividend income, capital gains, return of capital distributions received, shares and value of investments in affiliated companies for the period ended May 31, 2017 were as follows:
Stone Harbor Strategic Income Fund
| Security Name | Share Balance May 31, 2016 | Purchases | Sales | Share Balance May 31, 2017 | Dividend Income | Realized Gain /Loss | Market Value May 31, 2017 | |||||||||||||||||||||
| Stone Harbor Emerging Markets Corporate Debt Fund | - | 107,884 | 5,744 | 102,140 | $ | 12,809 | $ | 490 | $ | 933,563 | ||||||||||||||||||
| Stone Harbor Emerging Markets Debt Fund | 749,205 | 86,399 | 303,974 | 531,630 | 428,533 | (94,930 | ) | 5,635,273 | ||||||||||||||||||||
| Stone Harbor High Yield Bond Fund | 1,602,382 | 193,118 | 234,864 | 1,560,636 | 739,445 | (272,891 | ) | 12,968,881 | ||||||||||||||||||||
| Stone Harbor Investment Grade Fund | 1,517,054 | 199,686 | 245,071 | 1,471,669 | 358,882 | (43,822 | ) | 15,275,924 | ||||||||||||||||||||
| Stone Harbor Local Markets Fund | - | 228,218 | 11,986 | 216,232 | - | 3,116 | 1,894,190 | |||||||||||||||||||||
| 3,868,641 | 815,305 | 801,639 | 3,882,307 | $ | 1,539,669 | $ | (408,037 | ) | $ | 36,707,831 | ||||||||||||||||||
Stone Harbor Emerging Markets Debt Allocation Fund
| Security Name | Share Balance May 31, 2016 | Purchases | Sales | Share Balance May 31, 2017 | Dividend Income | Realized Gain | Market Value May 31, 2017 | |||||||||||||||||||||
| Stone Harbor Emerging Markets Debt Fund | 3,307,937 | 525,528 | 2,691,187 | 1,142,278 | $ | 1,416,353 | $ | 1,270,738 | $ | 12,108,147 | ||||||||||||||||||
| Stone Harbor Local Markets Fund | 4,386,315 | 751,625 | 3,371,596 | 1,766,344 | - | 880,621 | 15,473,177 | |||||||||||||||||||||
| 7,694,252 | 1,277,153 | 6,062,783 | 2,908,622 | $ | 1,416,353 | $ | 2,151,359 | $ | 27,581,324 | |||||||||||||||||||
8. SHARES OF BENEFICIAL INTEREST
At May 31, 2017, the Trust had an unlimited number of shares of beneficial interest authorized with a par value of $0.001 per share. The Funds have the ability to issue multiple classes of shares. Each share of a class represents an identical interest and has the same rights, except that each class bears certain direct expenses, including those specifically related to the distribution of its shares. Transactions in shares of the Institutional Class can be found on the Statements of Changes in Net Assets.
9. BENEFICIAL OWNERSHIP
As of May 31, 2017 IMF Retired Staff Benefits owned beneficially 34.14% of the Stone Harbor High Yield Bond Fund’s outstanding shares, an individual shareholder owned beneficially 71.76% of the Stone Harbor Emerging Markets Debt Allocation Fund’s outstanding shares, the Stone Harbor Strategic Income Fund owned beneficially 99.93% of the Stone Harbor Investment Grade Fund’s outstanding shares an individual shareholder owned 63.21% of the Stone Harbor Strategic Income Fund’s outstanding shares two separate shareholders held 27.77% and 26.39% of the Stone Harbor Emerging Markets Corporate Bond Fund’s outstanding shares, and an individual shareholder owned beneficially 99.51% of the Stone Harbor 500 Plus Fund’s outstanding shares.
10. INDEMNIFICATIONS
Under the Trust’s organizational documents, its officers and Trustees are indemnified against certain liability arising out of the performance of their duties to the Trust. Additionally, in the normal course of business, the Trust enters into contracts with service providers that may contain general indemnification clauses. The Trust’s maximum exposure under these arrangements is unknown, as this would involve future claims that may be made against the Trust that have not yet occurred.
| Stone Harbor Investment Funds Annual Report | May 31, 2017 | 101 |
| Stone Harbor Investment Funds | Notes to Financial Statements |
May 31, 2017
11. OTHER
The Funds, along with the Stone Harbor Emerging Markets Total Income Fund and the Stone Harbor Emerging Markets Income Fund (the “Stone Harbor Fund Complex”) pays each Trustee who is not an interested person, of the Investment Adviser or any of its affiliates an aggregate fee of $84,000 per year. The Chair of the Audit Committee of the Board receives additional compensation of $5,000 per year for his service as chair. These fees were allocated over the Stone Harbor Fund Complex based on the average net assets of each fund. Interested Trustees of the Trust are not compensated by the Stone Harbor Fund Complex. All Trustees are reimbursed for reasonable travel and out-of-pocket expenses incurred to attend such meetings. Officers of the Funds do not receive compensation for performing the duties of their office.
| 102 | www.shiplp.com |
| Stone Harbor Investment Funds | Additional Information |
May 31, 2017 (Unaudited)
FUND PORTFOLIO HOLDINGS
The SEC has adopted the requirement that all registered investment companies file a complete schedule of portfolio holdings with the SEC for their first and third fiscal quarters on Form N‐Q. For the Funds, this would be for the fiscal quarters ending August 31 and February 28. The Form N‐Q filing must be made within 60 days of the end of the quarter. The Funds’ Forms N‐Q will be available on the SEC’s website at http://www.sec.gov., or they may be reviewed and copied at the SEC’s Public Reference Room in Washington, DC (call 1‐800‐732‐0330 for information on the operation of the Public Reference Room).
PROXY VOTING
A description of the policies and procedures that the Funds use to determine how to vote proxies relating to portfolio securities and information regarding how the Funds voted proxies relating to portfolio securities for the 12‐month period ended June 30 are available without a charge, upon request, by contacting Stone Harbor Investment Funds at 1‐866‐699‐8158 or on the SEC website at http://www.sec.gov.
SHAREHOLDER TAX INFORMATION
Certain tax information regarding the Trust is required to be provided to shareholders based upon each Fund’s income and distributions for the year ended May 31, 2017. The Funds designate the following as a percentage of taxable ordinary income distributions, up to the maximum amount allowable, for the calendar year ended December 31, 2016:
| Stone Harbor Emerging Markets Debt Fund | Stone Harbor High Yield Bond Fund | Stone Harbor Local Markets Fund | Stone Harbor Emerging Markets Corporate Debt Fund | Stone Harbor Investment Grade Fund | Stone Harbor Strategic Income Fund | Stone Harbor Emerging Markets Debt Allocation Fund | |
| Dividends Received Deduction Percentage | 0.00% | 1.21% | 0.00% | 0.00% | 0.00% | 0.58% | 0.00% |
| Qualified Dividend Income Percentage | 0.00% | 1.21% | 0.00% | 0.00% | 0.00% | 0.57% | 0.00% |
In early 2017, if applicable, shareholders of record received this information for the distributions paid to them by the Funds during the calendar year 2016 via Form 1099. The Funds will notify shareholders in early 2018 of amounts paid to them by the Funds, if any, during the calendar year 2017.
Pursuant to Section 852(b)(3) of the Internal Revenue Code, the Stone Harbor Investment Grade Fund designated $7,434 as long term capital gain dividends.
BENCHMARK DESCRIPTIONS
| Index | Description |
| Bloomberg Barclays U.S. Aggregate Index | The Bloomberg Barclays U.S. Aggregate Index represents securities that are SEC‐registered, taxable, and dollar denominated. The index covers the U.S. investment grade fixed rate bond market, with index components for government and corporate securities, mortgage pass‐through securities, and asset‐backed securities. These major sectors are subdivided into more specific indices that are calculated and reported on a regular basis. |
| Bloomberg Barclays Global Credit Index (Hedged USD) | Bloomberg Barclays Global Credit Index is a subset of the Global Aggregate Index and is subject to the same quality, liquidity, and maturity requirements and exclusion rules of the latter. Constituents must be rated investment grade by at least two of the three major ratings agencies. Constituents must have a remaining maturity of at least one year. The index does not include convertibles, floating‐rate notes, fixed‐rate perpetuals, warrants, linked bonds, and structured products. |
| CEMBI Broad Diversified | The JPMorgan CEMBI Broad Diversified limits the current face amount allocations of the bonds in the CEMBI Broad by constraining the total face amount outstanding for countries with larger debt stocks. Qualifying corporate bonds have a face amount greater than USD 300 million, maturity greater than 5 years, verifiable prices and cash flows, and from countries within Asia ex‐Japan, Latin America, Eastern Europe, Middle East, and Africa. |
| Citigroup High Yield Market Capped Index | The Citigroup High Yield Market Capped Index represents a modified version of the High Yield Market Index by delaying the entry of “fallen angel” issues and capping the par value of individual issuers at US $15 billion par amount outstanding. The index is a total rate of return index which captures the performance of below investment grade debt issued by corporations domiciled in the United States or Canada. |
| JPMorgan CEMBI Broad Diversified Index | The JPMorgan CEMBI Broad Diversified tracks total returns of U.S. dollar‐denominated debt instruments issued by corporate entities in emerging market countries and consists of an investable universe of corporate bonds. The minimum amount outstanding required is $350 mm for the CEMBI Broad Diversified. The CEMBI Broad Diversified limits the weights of those index countries with larger corporate debt stocks by only including a specified portion of these countries’ eligible current face amounts of debt outstanding. |
| JPMorgan EMBI Global Diversified Index | The JPMorgan EMBI Global Diversified (EMBI Global Diversified) tracks total returns for U.S. dollar‐denominated debt instruments issued by emerging markets sovereign and quasi‐sovereign entities: Brady bonds, loans, and Eurobonds. The index limits the weights of those index countries with larger debt stocks by only including specified portions of these countries' eligible current face amounts outstanding. The countries covered in the EMBI Global Diversified are identical to those covered by the EMBI Global. |
| JPMorgan GBI EM Global Diversified Index | The JPMorgan GBI EM Global Diversified consists of regularly traded, liquid fixed‐rate, domestic currency government bonds to which international investors can gain exposure. The weightings among the countries are more evenly distributed within this index. |
| S&P 500 Index | The S&P 500 is an index of 500 stocks chosen for market size, liquidity and industry grouping, among other factors. The S&P 500 is designed to be a leading indicator of U.S. equities and is meant to reflect the risk/return characteristics of the large cap universe. |
| Stone Harbor Investment Funds Annual Report | May 31, 2017 | 103 |
| Stone Harbor Investment Funds | Additional Information |
May 31, 2017 (Unaudited)
DEFINITIONS
ABS – An asset‐backed security (ABS) is a financial security backed by a loan, lease or receivables against assets other than real estate and mortgage‐backed securities.
Alpha – A measure of performance on a risk‐adjusted basis. The excess return of the fund relative to the return of the benchmark index is a fund's alpha.
Basis Point – A unit equal to one hundredth of a percentage point.
Beta – A measure of the volatility, or systematic risk, of a security or a portfolio in comparison to the market as a whole.
Broad‐based securities indices are unmanaged and are not subject to fees and expenses typically associated with managed accounts or investment funds. Investments cannot be made directly in a broad‐based securities index.
CMBS – Commercial mortgage‐backed securities (CMBS) are a type of mortgage‐backed security that is secured by mortgages on commercial properties, instead of residential real estate.
Credit Spread – The difference in yield between a U.S. Treasury bond and a debt security with the same maturity.
Derivative – A security with a price that is dependent on or derived from one or more underlying assets.
Duration – A measure of the sensitivity of the price (the value of principal) of a fixed‐income investment to a change in interest rates. Duration is expressed as a number of years.
High Yield Spread – The percentage difference in current yields of high‐yield bonds compared to investment grade corporate bonds.
Investment Grade – Refers to bonds that are considered to have a relatively low risk of default, ranging from highest credit quality to good credit quality. Bonds rated below investment grade are considered to have significant speculative characteristics.
Par Value – The face value of a bond.
RMBS – Residential mortgage‐backed securities (RMBS) are a type of mortgage‐backed debt obligation whose cash flows come from residential debt, such as mortgages, home‐equity loans and subprime mortgages.
S&P Futures – S&P 500 futures are a type of capital asset contract that provides a buyer the right to a predetermined selection of stocks and on a predetermined future date listed on the S&P 500 stock market index.
Sovereign Debt – Refers to bonds issued by a national government in order to finance the issuing country’s growth. Sovereign debt described as external is denominated in U.S. dollar, while sovereign debt described as local is issued in a foreign currency.
Spread – The difference between the bid and ask price of a security or asset.
Standard and Poor’s ratings are measured on a scale that generally ranges from AAA (highest) to D (lowest). A security that has not been given a credit rating by Standard and Poor’s is listed as “not rated”. For additional information please go to the Understanding Ratings section at www.standardpoors.com.
Tranche – Portions of debt or structured financing. Each portion (or tranche) is one of several related securities offered at the same time but with a different set of risks, rewards, and maturities.
USD 3‐Month LIBOR – The average interest rate at which a selection of banks in London are prepared to lend to one another in American dollars with a maturity of 3 months. The LIBOR interest rates are used by banks as the base rate in setting the level of their savings, mortgage and loan interest rates.
| 104 | www.shiplp.com |
| Stone Harbor Investment Funds | Additional Information |
May 31, 2017 (Unaudited)
Yield‐To‐Maturity – The total return anticipated on a bond if the bond is held until the end of its lifetime. Yield to maturity is considered a long‐term bond yield, but is expressed as an annual rate.
| Stone Harbor Investment Funds Annual Report | May 31, 2017 | 105 |
| Stone Harbor Investment Funds | Board Approval of Investment Advisory Agreement |
May 31, 2017 (Unaudited)
The investment advisory agreements (each an “Agreement” and, together, the “Agreements”) for each of Stone Harbor Emerging Markets Debt Fund, Stone Harbor High Yield Bond Fund, Stone Harbor Local Markets Fund, Stone Harbor Emerging Markets Corporate Debt Fund, Stone Harbor Investment Grade Fund, Stone Harbor Strategic Income Fund, Stone Harbor Emerging Markets Debt Allocation Fund and Stone Harbor Emerging Markets Debt Blend Fund (each, a “Fund” and together, the “Funds”) is subject to annual approval by (i) the vote of a majority of the entire Board of Trustees, or of a majority of the outstanding voting securities (as defined in the Investment Company Act of 1940, as amended (the “1940 Act”)), of the applicable Fund, and (ii) the vote of a majority of the Trustees who are not interested persons of the Funds (the “Independent Trustees”). Each Agreement is terminable with respect to a Fund by Stone Harbor Investment Partners LP, each Fund’s investment adviser (the “Adviser”), a majority of the Trustees, or a vote of a majority of the outstanding voting securities of the applicable Fund, without penalty, by not less than 60 days’ prior written notice. Each Agreement will terminate automatically in the event of its assignment (as defined for purposes of the 1940 Act).
The Board of Trustees, including the Independent Trustees, meets over the course of the year with representatives of the Adviser, including the Funds’ respective portfolio managers, and regularly reviews detailed information regarding the investment program and performance of each Fund. The Board of Trustees also receives periodic updates between meetings. The Trustees, including the Independent Trustees, met on April 19, 2017 to review the Agreements for each Fund and to determine whether to approve the continuation of the Agreements for an additional one‐year period. The Trustees considered all information they deemed reasonably necessary to evaluate the terms thereof. In connection with this meeting, the Trustees received materials to assist them with their review. These materials included, among other things, (i) information provided in response to a request for information from the Independent Trustees’ independent legal counsel; (ii) information about the Adviser, including the Adviser’s financial results and financial condition, and services provided by the Adviser; (iii) information on each Fund’s investment objective and strategies and the size, education and experience of the Adviser’s investment staff; (iv) information on each Fund’s investment performance and the performance of a group of comparable funds (some of which was prepared by a third party); (v) information on each Fund’s advisory fees and other expenses, including information about the fees charged to institutional accounts managed by the Adviser and other Funds where the Adviser serves as sub‐adviser, comparisons of the Funds’ fees to the fees of a group of similar funds prepared by a third party and information about any applicable expense caps; (vi) information about the profitability of each Agreement to the Adviser; and (vii) information regarding arrangements in respect of the distribution of the Funds’ shares. Throughout the process, the Independent Trustees were afforded the opportunity to ask questions and request additional information. In addition, the Independent Trustees were assisted by independent legal counsel throughout the process.
In considering whether to approve the continuation of each Agreement, the Board of Trustees, including the Independent Trustees, did not identify any single factor as determinative. Individual Trustees may have evaluated the information presented differently from one another, giving different weights to various factors. Matters considered by the Trustees, including the Independent Trustees, in connection with their approval of the Agreements included, but were not limited to, the following:
The nature, extent and quality of the services provided to the Funds under the Agreements.
The Trustees considered the nature, extent and quality of the services provided by the Adviser to the Funds. In this regard, the Trustees took into account the experience of each Fund’s portfolio management team and of the Adviser’s senior management, and the time and attention they devote to the Funds. The Trustees also considered each Fund’s record of compliance with its investment restrictions and the compliance programs of the Funds and the Adviser. They also considered the compliance‐related resources the Adviser provided to the Funds, including resources designed to ensure compliance with the investment objectives, policies and restrictions of each Fund.
After reviewing these and related factors, the Trustees concluded, within the context of their overall conclusions regarding each Agreement, that the nature, extent and quality of the services provided by the Adviser supported the renewal of the Agreements.
Investment performance of the Funds and the Adviser.
The Trustees reviewed performance information for each Fund, including information prepared by a third party, for various time periods since each Fund’s inception. The review included a comparison of each Fund’s performance to the performance of a group of comparable funds selected by a third party and each Fund’s respective benchmark. The Trustees also considered the Adviser’s performance and reputation generally and its investment techniques, risk management controls and decision‐making processes. The Trustees noted that: (1) although Stone Harbor Emerging Markets Corporate Debt Fund 's performance lagged the relevant benchmark and peer group median for the one‐year period, the Fund's performance exceeded that of its benchmark and peer group median for the three‐year and five‐year periods; (2) Stone Harbor Emerging Markets Debt Fund’s performance exceeded the relevant benchmark and peer group median for all relevant time periods; (3) Stone Harbor High Yield Bond Fund’s performance lagged the performance of its relevant benchmark and peer group for all time periods, except that its performance was the same as the peer group median over the five‐year period; (4) although the Stone Harbor Investment Grade Fund’s performance lagged its relevant benchmark’s performance over the three‐year period, the Fund exceeded both its benchmark and its peer median group over the one‐year period and exceeded it peer median group over the three‐year period; (5) Stone Harbor Local Markets Fund’s performance exceeded the performance of its peer group median over the one‐year period, but lagged the peer group median over one‐year, three‐year and five‐year periods and lagged the relevant benchmark’s performance over the one‐year and three‐year periods; (6) although Stone Harbor Strategic Income Fund’s performance lagged its relevant benchmark over the one‐year period, it exceeded its benchmark over the three‐year period and exceeded its peer group median over the one‐year and three‐year period; and (7) Stone Harbor Emerging Markets Debt Allocation Fund’s performance lagged its benchmark, and was equal to its peer group median, for the one‐year period. With respect to Funds whose performance lagged the relevant benchmark or peer group average for certain (although not necessarily all) periods, the Trustees concluded that other factors relevant to performance supported renewal of the Agreements. These factors included one or more of the following: (1) that the underperformance was attributable, to a significant extent, to investment decisions (such as security selection or sector or country allocation) by the Adviser that were consistent with the Fund’s investment objective and strategies, (2) that the Fund’s more recent performance, although lagging in certain periods, had shown improvement when compared to relevant performance benchmarks and categories, (3) any performance issues were attributable in part to market or economic conditions, or (4) that the Fund’s long‐term performance was strong when compared to relevant performance benchmarks and/or peer groups. With respect to Stone Harbor Emerging Markets Debt Blend Fund, the Trustees noted that the Fund was not yet operational and therefore no performance information had been provided for the Fund.
| 106 | www.shiplp.com |
| Stone Harbor Investment Funds | Board Approval of Investment Advisory Agreement |
May 31, 2017 (Unaudited)
After reviewing these and related factors, the Trustees concluded, within the context of their overall conclusions regarding each Agreement, that these factors supported the renewal of the Agreements.
The costs of the services to be provided and profits to be realized by the Adviser from its relationship with the Funds.
The Trustees considered the fees charged to each Fund for advisory services as well as the total expense level of each Fund. The Adviser furnished information to the Trustees compiled by a third party showing a comparison of each Fund’s advisory fees and total expense levels compared to a group of comparable funds selected by the third party. The Trustees noted that each of the Funds is subject to expense caps (although the total expense ratios for certain Funds are below the cap), and each of the Fund’s advisory fee and total expenses (after application of the expense caps and waivers) align competitively with comparable groups of mutual funds. The Trustees noted that each of the Fund's total expenses was below the median total expenses of the comparable funds selected by the third party, other than the Stone Harbor Emerging Markets Corporate Debt Fund, whose total expenses and management fees were higher than average. The Adviser also provided information about the costs to it of providing services to the Funds, including information about how such costs are determined for each Fund, and information about its profitability with respect to its management of each of the Funds, as well as information about the advisory fees it charges with respect to other funds, institutional separate accounts and sub‐advised funds with similar strategies, and information about differences in such fees and the reasons for such differences. In this regard, the Trustees noted that the effective management fee rates received by the Adviser from the Funds (after application of expense caps and waivers) are generally comparable to the fees charged to similarly managed institutional accounts. They also noted that the Funds were offered primarily to institutional investors, many of whom were focused on the Funds’ fees and expenses, and that the Funds are relatively small when compared to certain of the Adviser’s institutional accounts and therefore are able to take advantage of resources that the Adviser devotes to institutional accounts. With respect to funds for which the Adviser serves as sub‐adviser, the Board took into account the additional and different services provided as an adviser and the additional risks faced as an adviser of a fund compared to serving as a sub‐adviser of a fund. The Trustees also considered the demands and complexity of the investment management of the Funds as compared to the complexity of managing (or sub‐advising) other funds and separate accounts. The Trustees also considered the Adviser’s description of how profitability is determined and the reasons for differences in profitability between Funds and from year to year.
After reviewing these and related factors, the Trustees concluded, within the context of their overall conclusions regarding each Agreement, that the advisory fees for each of the Funds were fair and reasonable, and that the costs of these services generally and the related profitability of the Adviser in respect of its relationship with the Funds supported the renewal of the Agreements.
Economies of Scale.
The Trustees considered to what extent economies of scale would likely be realized as the Funds grow and whether those economies would be shared with the Funds through breakpoints in their investment advisory fees or other means, such as expense caps. The Trustees also considered the investments in personnel and technology, which the Adviser had made over the years, and the extent to which those investments could benefit the Funds. The Trustees noted that the Funds’ expenses are capped, and that the Adviser proposed to maintain the Funds’ fee waiver/expense reimbursement arrangements at current levels until September 30, 2018. They also noted that some of the Funds had expense ratios that were below the cap. The Trustees also considered whether breakpoints in the investment advisory fees would be appropriate and, after discussion, decided not to propose the implementation of breakpoints at this time but indicated that the implementation of breakpoints might be considered in the future.
After reviewing these and related factors, the Trustees concluded, within the context of their overall conclusions regarding each Agreement, that the extent to which economies of scale would be shared with the Funds supported the approval of the Agreements.
| Stone Harbor Investment Funds Annual Report | May 31, 2017 | 107 |
| Stone Harbor Investment Funds | Board Approval of Investment Advisory Agreement |
May 31, 2017 (Unaudited)
The Trustees also considered other factors, which included but were not limited to the following:
| · | So‐called “fallout benefits” to the Adviser, such as the benefits from offering its institutional clients the ability to invest in a registered investment company. The Trustees also considered the possible conflicts of interest associated with these fallout and other benefits, and the reporting, disclosure and other processes in place to disclose and monitor such possible conflicts of interest. |
| · | The Trustees’ review and discussion of the Funds’ advisory arrangements in prior years, and management’s record of responding to Trustee concerns raised during the year and in prior years. |
Based on their evaluation of all factors they deemed to be material, including those factors described above, the Trustees, including the Independent Trustees, concluded that the existing investment advisory agreements for Stone Harbor Emerging Markets Debt Fund, Stone Harbor High Yield Bond Fund, Stone Harbor Local Markets Fund, Stone Harbor Emerging Markets Corporate Debt Fund, Stone Harbor Investment Grade Fund, Stone Harbor Strategic Income Fund, Stone Harbor Emerging Markets Debt Allocation Fund and Stone Harbor Emerging Markets Debt Blend Fund should be continued through June 20, 2018.
| 108 | www.shiplp.com |
| Stone Harbor Investment Funds | Trustees & Officers |
May 31, 2017 (Unaudited)
The business and affairs of each Fund are managed under the direction of its Board of Trustees. The Board of Trustees approves all significant agreements between a Fund and the persons or companies that furnish services to the Fund, including agreements with its distributor, investment adviser, administrator, custodian and transfer agent. The day‐to‐day operations of the Fund are delegated to the Fund’s Adviser and administrator.
The name, age and principal occupations for the past five years of the Trustees and officers of the Funds are listed below, along with the number of portfolios in the Fund complex overseen by and the other directorships held by each Trustee. Except as otherwise noted, the address of each Trustee and officer is c/o Stone Harbor Investment Partners LP, 31 W. 52nd Street, 16th Floor, New York, New York 10019. The Trust’s Statement of Additional Information includes additional information about the Trustees and is available without a charge, upon request, by calling 1‐866‐699‐8158.
INDEPENDENT TRUSTEES
Name and Year of Birth(1) | Position(s) Held with the Trust | Term of Office and Length of Time Served(2) | Principal Occupation (s) During Past 5 Years | Number of Portfolios in Fund Complex Overseen by Trustee(3) | Other Directorships Held by Trustee |
Alan Brott 1942 | Chairman of the Audit Committee; Trustee | Since 2007 | Columbia University ‐ Associate Professor, 2000‐Present; Consultant, 1991‐Present. | 11 | Stone Harbor Emerging Markets Income Fund, Stone Harbor Emerging Markets Total Income Fund, Grosvenor Registered Multi‐Strategy Fund, Man FRM Alternative Multi‐Strategy Fund, Excelsior Private Markets Fund II, Excelsior Private Markets Fund III, Excelsior Venture Partners III, UST Global Private Markets, and NB CrossRoads Private Markets Fund. |
Heath B. McLendon 1933 | Trustee | Since 2007 | Retired since 2006; formerly Citigroup ‐ Chairman of Equity Research Oversight Committee. | 11 | Stone Harbor Emerging Markets Income Fund and Stone Harbor Emerging Markets Total Income Fund. |
Patrick Sheehan 1947 | Trustee | Since 2007 | Retired since 2002; formerly, Citigroup Asset Management‐Managing Director and Fixed Income Portfolio Manager. | 11 | Stone Harbor Emerging Markets Income Fund and Stone Harbor Emerging Markets Total Income Fund. |
| Stone Harbor Investment Funds Annual Report | May 31, 2017 | 109 |
| Stone Harbor Investment Funds | Trustees & Officers |
May 31, 2017 (Unaudited)
INDEPENDENT TRUSTEES (continued)
Name and Year of Birth(1) | Position(s) Held with the Trust | Term of Office and Length of Time Served(2) | Principal Occupation(s) During Past 5 Years | Number of Portfolios in Fund Complex Overseen by Trustee(3) | Other Directorships Held by Trustee |
Glenn Marchak 1956 | Trustee | Since 2015 | Consultant and Private Investor. | 11 | Stone Harbor Emerging Markets Income Fund, Stone Harbor Emerging Markets Total Income Fund, Apollo Tactical Income Fund Inc. and Apollo Senior Floating Rate Fund Inc. |
Bruce Speca 1956 | Trustee | Since 2016 | Trustee, the Advisors’ Inner Circle Fund, The Advisors’ Inner Circle Fund II, Bishop Street Funds and The KP Funds (November 2011‐Present); Global Head of Asset Allocation, Manulife Asset Management (subsidiary of Manulife Financial), 2010 to 2011. Executive Vice President – Investment Management Services, John Hancock Financial Services (subsidiary of Manulife Financial), 2003 to 2010. | 11 | Stone Harbor Emerging Markets Income Fund, Stone Harbor Emerging Markets Total Income Fund, The Advisors’ Inner Circle Fund, The Advisors’ Inner Circle Fund II, Bishop Street Funds and The KP Funds. |
INTERESTED TRUSTEE
Name and Year of Birth(1) | Position(s) Held with the Trust | Term of Office and Length of Time Served(2) | Principal Occupation(s) During Past 5 Years | Number of Portfolios in Fund Complex Overseen by Trustee(3) | Other Directorships Held by Trustee |
Thomas K. Flanagan* 1953 | Chairman and Trustee | Since 2012 | Since April 2006, Portfolio Manager of Stone Harbor; prior to April 2006, Managing Director and Senior Portfolio Manager for emerging markets debt portfolios at Salomon Brothers Asset Management Inc.; joined Salomon Brothers Asset Management Inc. in 1991. | 11 | Stone Harbor Emerging Markets Income Fund and Stone Harbor Emerging Markets Total Income Fund. |
| 110 | www.shiplp.com |
| Stone Harbor Investment Funds | Trustees & Officers |
May 31, 2017 (Unaudited)
OFFICERS
Name and Year of Birth(1) | Position(s) Held with the Trust | Term of Office and Length of Time Served(2) | Principal Occupation(s) During Past 5 Years |
Peter J. Wilby 1958 | President | Since 2007 | Co‐portfolio manager of the Fund; since April 2006, Chief Investment Officer of Stone Harbor; prior to April 2006, Chief Investment Officer — North American Fixed Income at Citigroup Asset Management; joined Citigroup or its predecessor firms in 1989. |
Jeffrey S. Scott 1959 | Chief Compliance Officer | Since 2007 | Since April 2006, Chief Compliance Officer of Stone Harbor; from October 2006 to March 2007, Director of Compliance, New York Life Investment Management LLC; from July 1998 to September 2006, Chief Compliance Officer, Salomon Brothers Asset Management Inc. |
Thomas M. Reynolds 1960 | Principal Financial and Accounting Officer | Since 2014 | Since February 2008, Controller of Stone Harbor; from February 2006 to February 2008, Vice President of Portfolio Administration for Goldman Sachs Asset Management; from 1991 to 2006, Citigroup Asset Management. |
Amanda Suss 1969 | Treasurer | Since 2014 | Since July 2011, Senior Finance Associate of Stone Harbor; from 2000 to July 2006, Director of Business Operations at Citigroup Asset Management; From April 1994 to April 2000, Mutual Fund Accounting Manager at Smith Barney Asset Management. |
Adam J. Shapiro 1963 | Secretary; Anti‐Money Laundering Officer | Since 2007 | Since April 2006, General Counsel of Stone Harbor; from April 2004 to March 2006, General Counsel, North American Fixed Income, Salomon Brothers Asset Management Inc.; from August 1999 to March 2004, Director of Product and Business Development, Citigroup Asset Management. |
Vilma V. DeVooght 1977 | Assistant Secretary | Since 2015 | Senior Counsel, ALPS, since 2014; Associate Counsel, First Data Corporation 2012 to 2014; Legal Counsel, Invesco 2009 to 2011 |
Erich Rettinger 1985 | Assistant Treasurer | Since 2016 | Fund Controller, since 2013, and Fund Accountant, 2007 to 2013, ALPS |
| * | Mr. Flanagan is an interested person of the Trust (as defined in the 1940 Act) (an “Interested Trustee”) because of his position with the Adviser |
(1) | The business address of each Trustee and Officer of the Fund is c/o Stone Harbor Investment Partners LP, 31 West 52nd Street, 16th Floor, New York, NY 10019. |
(2) | Each Trustee serves until retirement, resignation or removal from the Board. Officers are typically elected every year, unless an officer earlier retires, resigns or is removed from office. |
(3) | The term “Fund Complex” as used in this table includes each Fund of the Trust, the Stone Harbor Emerging Markets Income Fund and the Stone Harbor Emerging Markets Total Income Fund, two closed-end funds advised by the Adviser. |
| Stone Harbor Investment Funds Annual Report | May 31, 2017 | 111 |
Intentionally Left Blank

INVESTMENT ADVISER
Stone Harbor Investment Partners LP
31 W. 52nd Street 16th Floor
New York, New York 10019
31 W. 52nd Street 16th Floor
New York, New York 10019
ADMINISTRATOR & FUND ACCOUNTANT
ALPS Fund Services, Inc.
1290 Broadway, Suite 1100
Denver, Colorado 80203
1290 Broadway, Suite 1100
Denver, Colorado 80203
DISTRIBUTOR
ALPS Distributors, Inc.
1290 Broadway, Suite 1100
Denver, Colorado 80203
1290 Broadway, Suite 1100
Denver, Colorado 80203
TRANSFER AGENT
ALPS Fund Services, Inc.
1290 Broadway, Suite 1100
Denver, Colorado 80203
1290 Broadway, Suite 1100
Denver, Colorado 80203
CUSTODIAN
State Street Bank and Trust Company
One Iron Street
Boston, MA 02210
One Iron Street
Boston, MA 02210
LEGAL COUNSEL
Ropes & Gray LLP
1211 Avenue of the Americas
New York, New York 10036
1211 Avenue of the Americas
New York, New York 10036
INDEPENDENT REGISTERED PUBLIC ACCOUNTING FIRM
Deloitte & Touche LLP
555 17th Street, Suite 3600
Denver, Colorado 80202
555 17th Street, Suite 3600
Denver, Colorado 80202
This report and its financial statements are submitted for the general information of the shareholders of the Funds. The report is not authorized for distribution to prospective investors in the Funds unless preceded or accompanied by a prospectus. Investors should carefully consider the investment objectives, risks, charges, and expenses of a Fund, which are described in its prospectus. For this and other information or to request a prospectus or summary prospectus, call 1-866-699-8125 toll free. Please read the prospectus carefully before investing. The Funds’ Statement of Additional Information contains additional information about the Funds’ Trustees and is available without charge upon request by calling 1-866-699-8125.
SHF000862 exp. 7/30/2018
| Item 2. | Code of Ethics. |
| (a) | The Registrant, as of the end of the period covered by this report, has adopted a code of ethics that applies to the Registrant’s principal executive officer, principal financial officer, principal accounting officer or controller or any persons performing similar functions on behalf of the Registrant. |
| (b) | Not applicable. |
| (c) | During the period covered by this report, no amendments to the provisions of the code of ethics adopted in Item 2(a) above were made. |
| (d) | During the period covered by this report, no implicit or explicit waivers to the provisions of the code of ethics adopted in Item 2(a) above were granted. |
| (e) | Not applicable. |
| (f) | The Registrant’s Code of Ethics is attached as Exhibit 12.A.1. hereto. |
| Item 3. | Audit Committee Financial Expert. |
The Board of Trustees of the Registrant has determined that the Registrant has at least one audit committee financial expert serving on its Audit Committee. The Board of Trustees has designated Alan J. Brott as the Registrant’s “audit committee financial expert.” Mr. Brott is “independent” as defined in paragraph (a)(2) of Item 3 to Form N‑CSR.
Mr. Brott has significant public accounting experience, including significant experience as a partner at a public accounting firm.
| Item 4. | Principal Accountant Fees and Services. |
| (a) | Audit Fees: For the Registrant’s fiscal years ended May 31, 2016 and May 31, 2017, the aggregate fees billed for professional services rendered by the principal accountant for the audit of the Registrant’s annual financial statements were $297,200 and $333,000, respectively. |
| (b) | Audit-Related Fees: For the Registrant’s fiscal years ended May 31, 2016 and May 31, 2017, there were no fees billed for assurance and related services by the principal accountant that were reasonably related to the performance of the audit of the Registrant’s financial statements and were not reported in paragraph (a) of this Item 4. |
2
| (c) | Tax Fees: For the Registrant’s fiscal years ended May 31, 2016 and May 31, 2017, the aggregate fees billed for professional services rendered by the principal accountant for tax compliance, tax advice and tax planning were $35,280 and $32,600, respectively. The fiscal year 2016 and 2017 tax fees were for services pertaining to federal and state income tax return review, review of year-end dividend distributions and excise tax preparation. |
| (d) | All Other Fees: For the Registrant’s fiscal years ended May 31, 2016 and May 31, 2017, aggregate fees billed to the Registrant by the principal accountant for services provided by the principal accountant other than the services reported in paragraphs (a) through (c) of this Item 4 were $1,000 and $0, respectively. These fees were related to services provided to assist Stone Harbor Investment Funds in Indian tax matters. |
| (e)(1) | Audit Committee Pre-Approval Policies and Procedures: All services to be performed by the Registrant's principal accountant must be pre-approved by the Registrant's Audit Committee. |
| (e)(2) | No services described in paragraphs (b) through (d) of this Item 4 were approved by the Registrant’s audit committee pursuant to paragraph (c)(7)(i)(C) of Rule 2‑01 of Regulation S-X. |
| (f) | Not applicable. |
| (g) | The aggregate non-audit fees billed by the registrant’s accountant for services rendered to the registrant, and rendered to the registrant’s investment adviser, and any entity controlling, controlled by, or under common control with the adviser that provides ongoing services to the registrant for the fiscal year ended May 31, 2016 and May 31, 2017 were $0 and $0, respectively. |
| (h) | Not applicable. |
| Item 5. | Audit Committee of Listed Registrants. |
Not applicable to Registrant.
| Item 6. | Investments. |
| (a) | Schedule of Investments is included as part of the Report to Stockholders filed under Item 1 of this Form N-CSR. |
| (b) | Not applicable. |
3
| Item 7. | Disclosure of Proxy Voting Policies and Procedures for Closed-End Management Investment Companies. |
Not applicable to Registrant.
| Item 8. | Portfolio Managers of Closed-End Management Investment Companies. |
Not applicable to Registrant.
| Item 9. | Purchases of Equity Securities by Closed-End Management Investment Company and Affiliated Purchasers. |
Not applicable to Registrant.
| Item 10. | Submission of Matters to Vote of Security Holders. |
There have been no material changes to the procedures by which shareholders may recommend nominees to the Registrant’s Board of Trustees, where those changes were implemented after the Registrant last provided disclosure in response to the requirements of Item 407(c)(2) of Regulation S-K, or this Item.
| Item 11. | Controls and Procedures. |
| (a) | The Registrant’s principal executive officer and principal financial officer have concluded that the Registrant’s disclosure controls and procedures (as defined in Rule 30a-3(c) under the Investment Company Act of 1940, as amended) are effective based on their evaluation of these controls and procedures as of a date within 90 days of the filing date of this report. |
| (b) | There was no change in the Registrant's internal control over financial reporting (as defined in Rule 30a-3(d) under the Investment Company Act of 1940, as amended) during the second fiscal quarter of the period covered by this report that has materially affected, or is reasonably likely to materially affect, the Registrant's internal control over financial reporting. |
| Item 12. | Exhibits. |
| (a)(1) | The Code of Ethics that applies to the Registrant’s principal executive officer and principal financial officer is attached hereto as Exhibit 12.A.1. |
| (a)(2) | The certifications required by Rule 30a-2(a) of the Investment Company Act of 1940, as amended, and Section 302 of the Sarbanes-Oxley Act of 2002 are attached hereto as Exhibit 99.Cert. |
| (a)(3) | Not applicable. |
4
| (b) | The certifications by the Registrant’s principal executive officer and principal financial officer, as required by Rule 30a-2(b) of the Investment Company Act of 1940, as amended, and Section 906 of the Sarbanes-Oxley Act of 2002 are attached hereto as Exhibit 99.906Cert. |
5
SIGNATURES
Pursuant to the requirements of the Securities Exchange Act of 1934 and the Investment Company Act of 1940, the Registrant has duly caused this Report to be signed on its behalf by the undersigned, thereunto duly authorized.
Stone Harbor Investment Funds | |||
By: | /s/ Peter J. Wilby | ||
| Peter J. Wilby | |||
| President and Chief Executive Officer/Principal Executive Officer | |||
| Date: | August 10, 2017 | ||
Pursuant to the requirements of the Securities Exchange Act of 1934 and the Investment Company Act of 1940, this Report has been signed below by the following persons on behalf of the Registrant and in the capacities and on the dates indicated.
Stone Harbor Investment Funds | |||
By: | /s/ Peter J. Wilby | ||
| Peter J. Wilby | |||
| President and Chief Executive Officer/Principal Executive Officer | |||
| Date: | August 10, 2017 | ||
| By: | /s/ Thomas M. Reynolds | ||
| Thomas M. Reynolds | |||
| Principal Financial Officer/Principal Accounting Officer | |||
| Date: | August 10, 2017 | ||
6